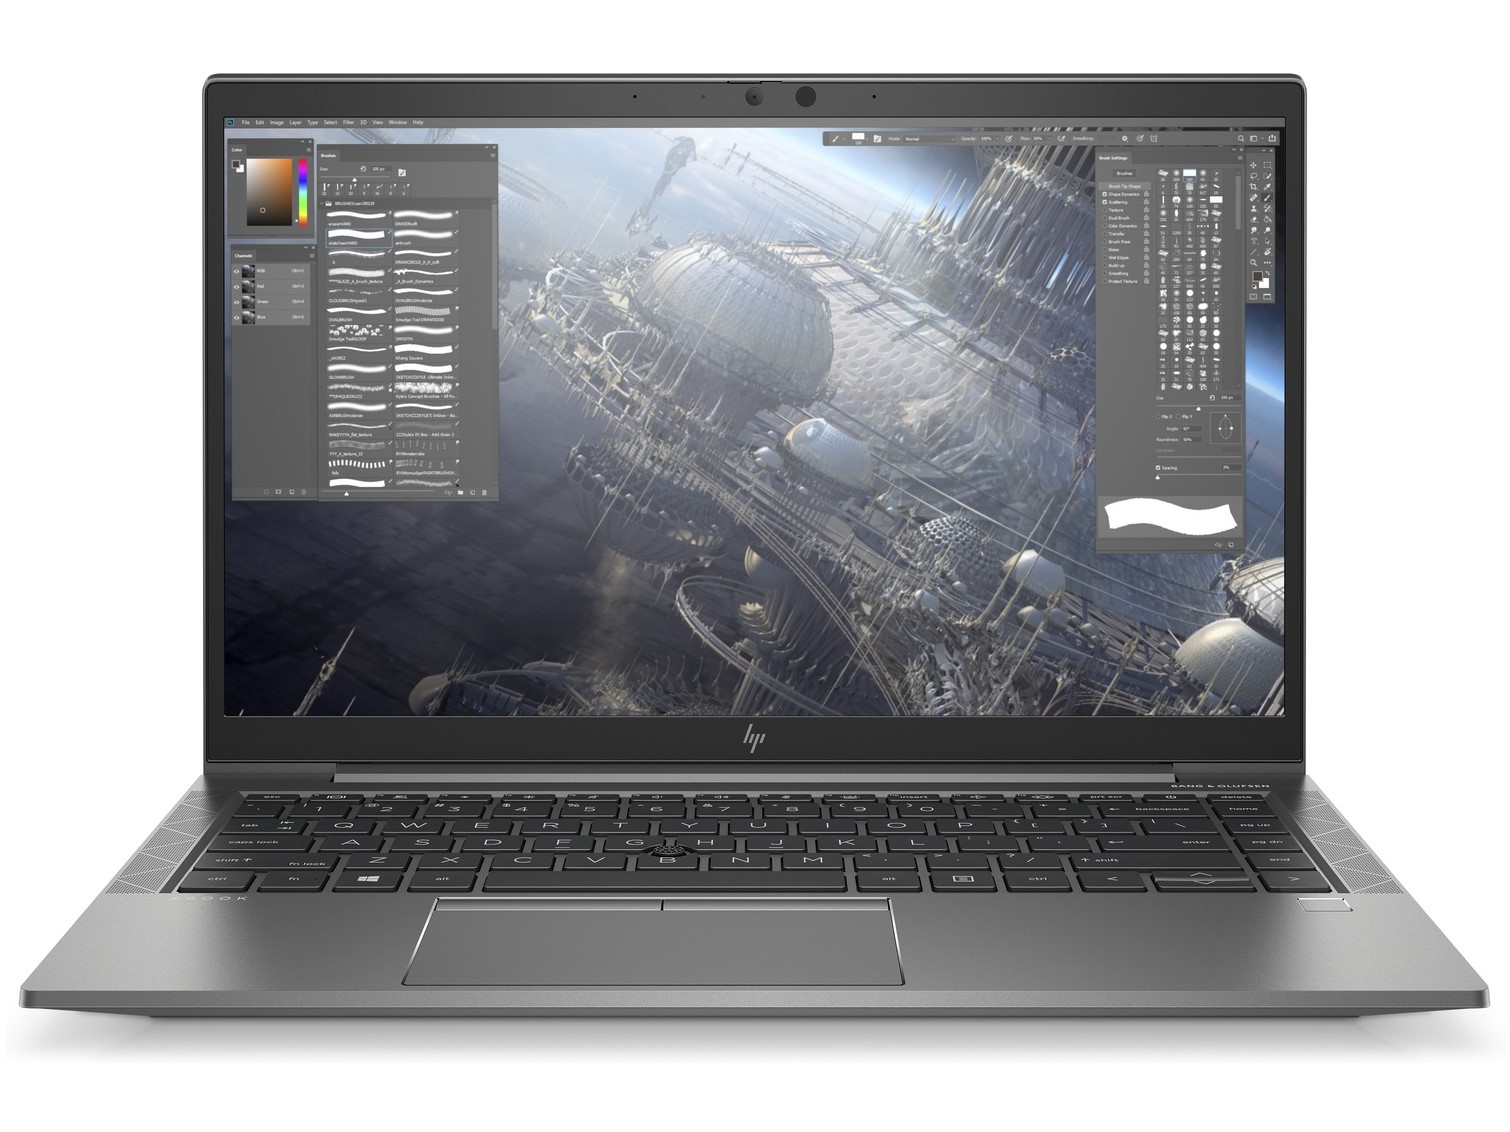
HP ZBook Firefly 14 G8 laptop in review: Small workstation with faster ports

In terms of looks, HP has left the ZBook Firefly 14 G8 unchanged, which is why we will refer to the description of the HP ZBook Firefly 14 G7 in the corresponding sections of this review. On the other hand, the Intel Core i7-1165G7 Tiger Lake CPU and the Nvidia Quadro T500 Mobile workstation GPU are new. They are accompanied by 16 GB of RAM and a 1 TB SSD.
With this configuration and a price of approximately 1,700 Euros (~$2,007), we pit the HP ZBook Firefly G8 against the contenders listed below. Other devices from our database can also be added to these under each section.
Possible contenders in comparison
Rating | Date | Model | Weight | Height | Size | Resolution | Price |
|---|---|---|---|---|---|---|---|
| 85.2 % v7 (old) | 04 / 2021 | HP ZBook Firefly 14 G8 2C9Q2EA i7-1165G7, T500 Laptop GPU | 1.4 kg | 17.9 mm | 14.00" | 1920x1080 | |
| 83.8 % v7 (old) | 03 / 2021 | Lenovo ThinkPad P14s Gen1-20Y10002GE R7 PRO 4750U, Vega 7 | 1.6 kg | 17.9 mm | 14.00" | 1920x1080 | |
| 82.4 % v7 (old) | 01 / 2021 | HP ZBook Firefly 14 G7 i7-10610U, Quadro P520 | 1.4 kg | 17.9 mm | 14.00" | 1920x1080 | |
| 82.6 % v7 (old) | 02 / 2021 | Dell Latitude 14 5411-WJ40N i7-10850H, GeForce MX250 | 1.5 kg | 21 mm | 14.00" | 1920x1080 |
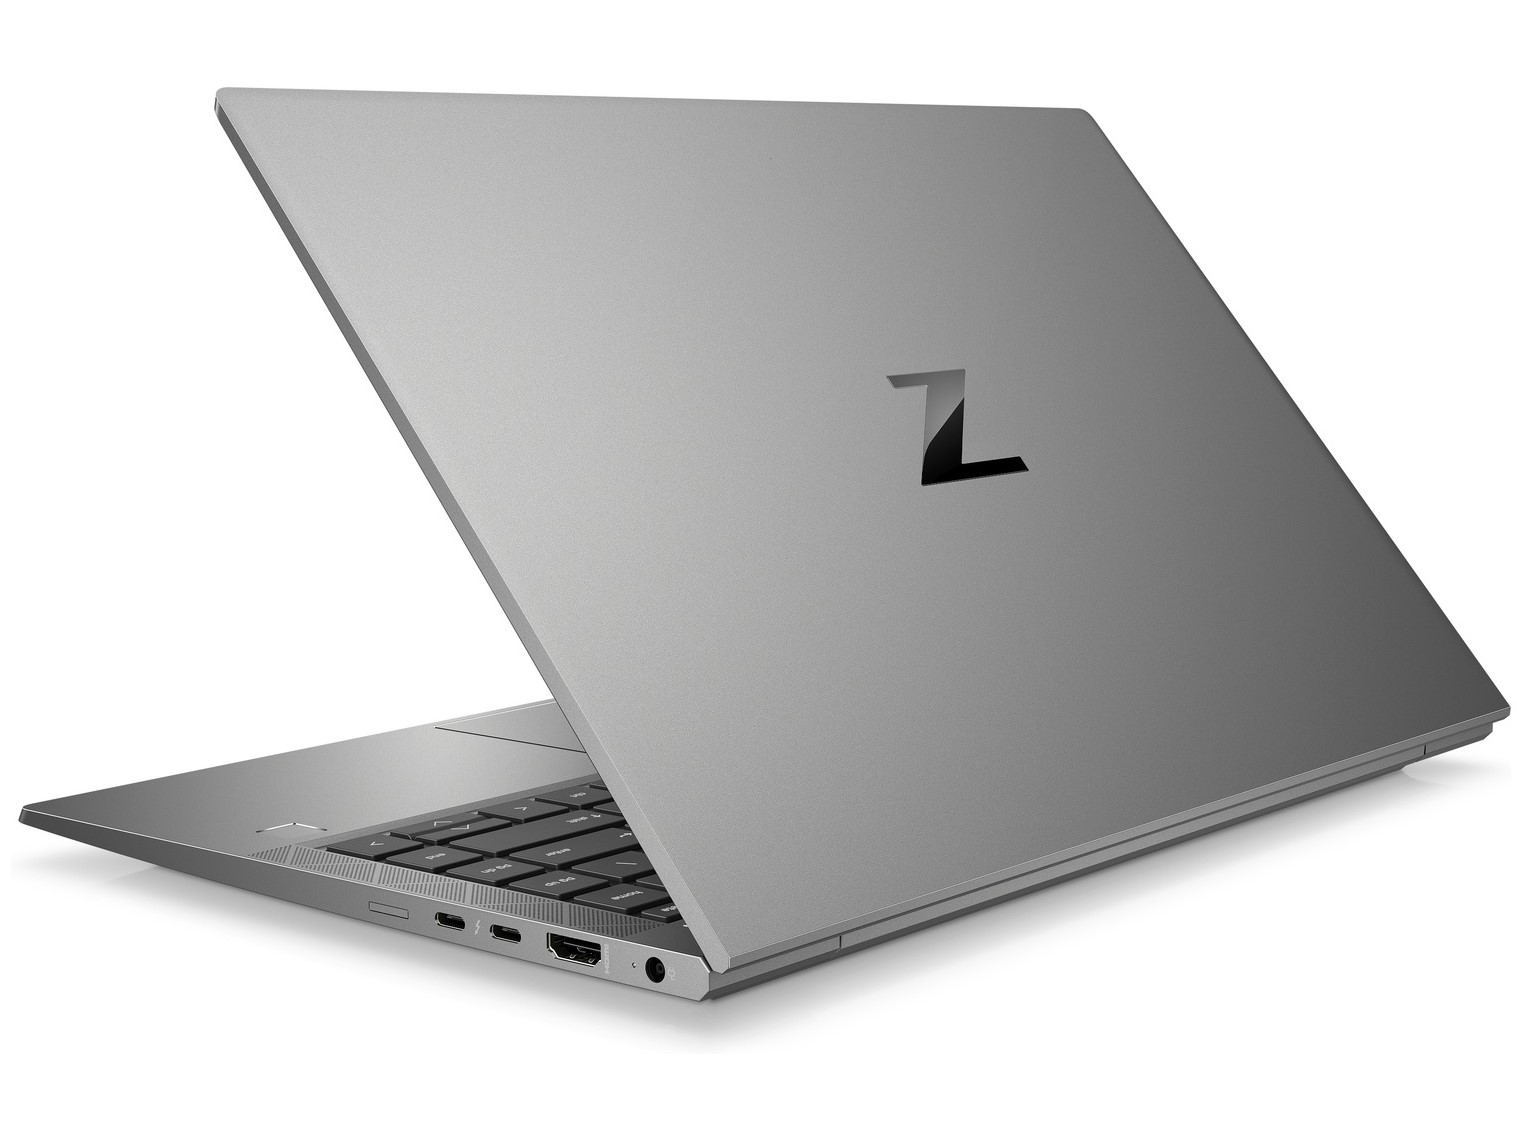
Case - 14-inch workstation
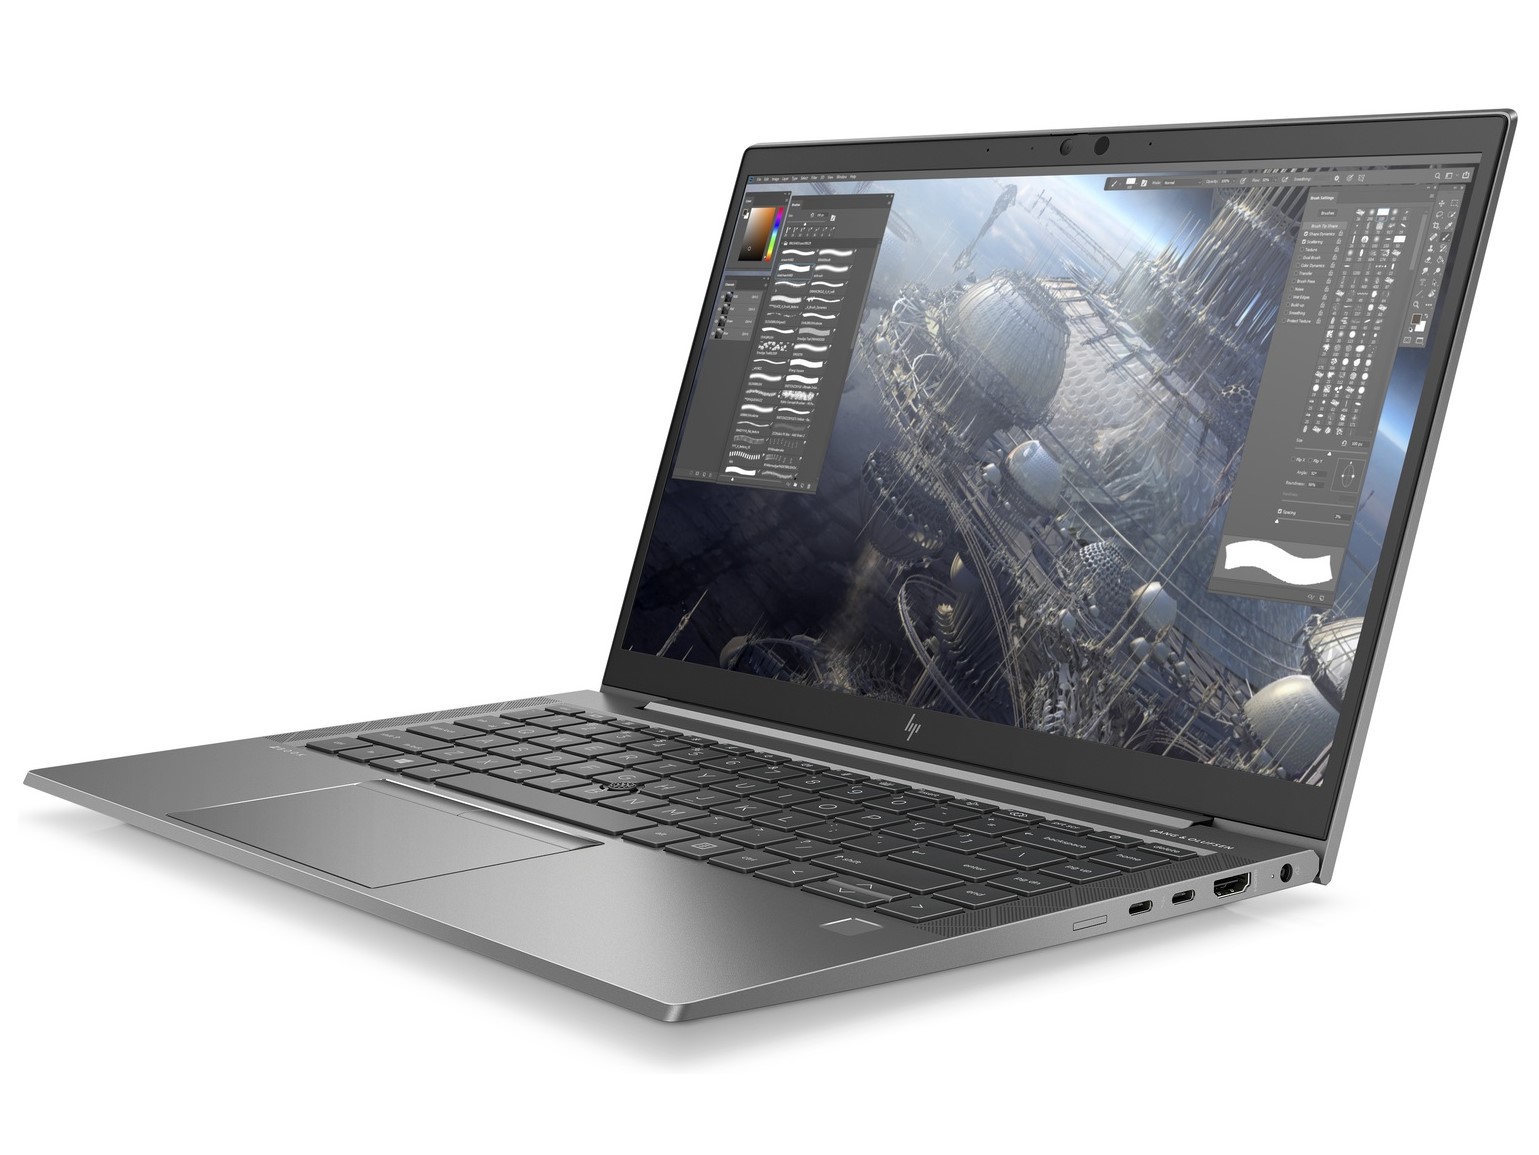
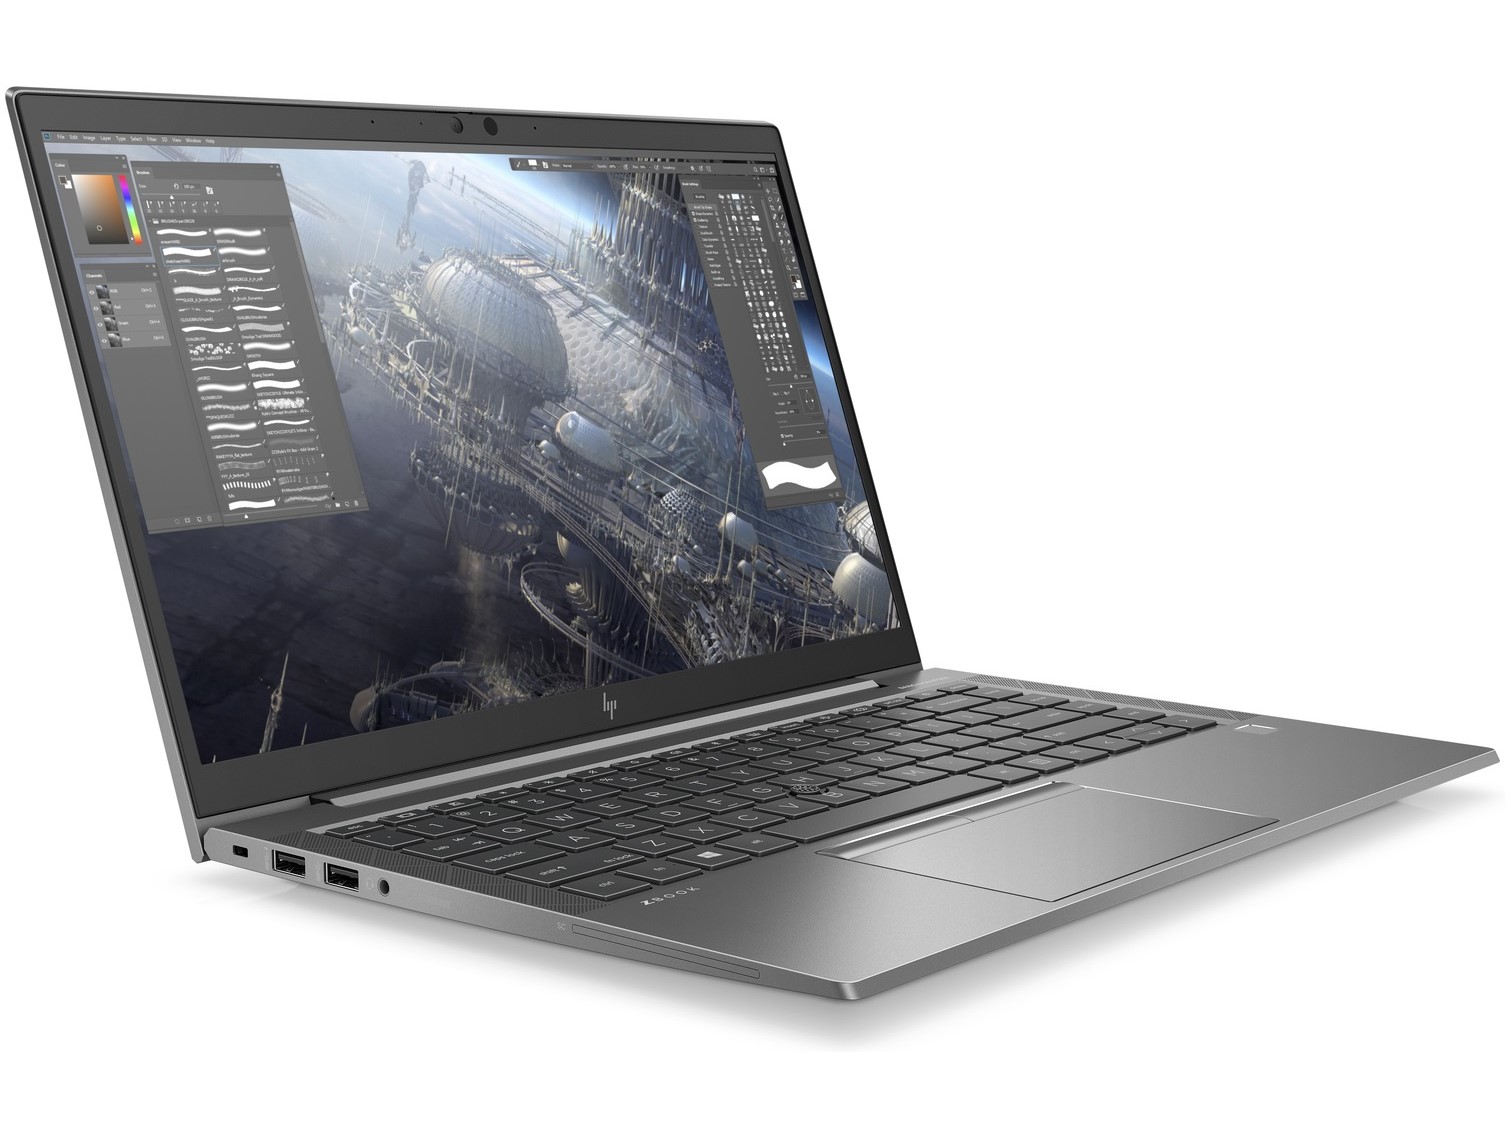
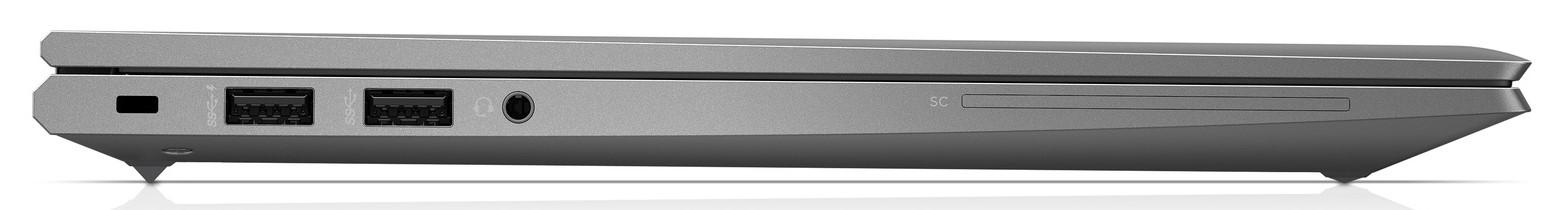
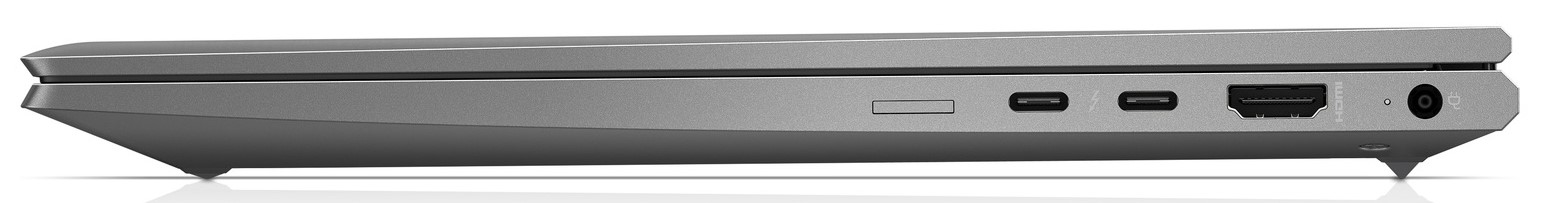
Connectivity - HP ZBook Firefly comes with Thunderbolt 4
From the outside, the ports of the ZBook Firefly G8 look identical to those of the predecessor, but there have been some changes in terms of communication standards. Instead of two Thunderbolt 3 ports, there are now two Thunderbolt 4 ports that also meet the USB 4 standard according to HP. The HDMI standard has increased from 1.4b to 2.0, and the remaining USB-A ports are now specified as USB 3.1 Gen. 1.
Communication
HP also uses the Intel AX201 Wi-Fi 6 module in the Firefly G8. At 1,402 Mb/s for receiving data and 1,396 Mb/s for sending data, the device reaches significantly higher speeds with our Netgear Nighthwak AX12 reference router than the HP ZBook Firefly 14 G7.
Webcam
A low-resolution 0.9 MP webcam with a correspondingly low image quality is also installed in the HP ZBook G8.


Security
Besides a mechanical webcam shutter, a fingerprint sensor, and the smart card reader, the HP ZBook Firefly G8 offers numerous additional security features such as an automatic drive lock, pre-boot authentication, and hardware diagnostics. An Absolute Persistence Module that can be activated by purchasing a subscription is also installed.
Display - ZBook Firefly 14 G8 without SureView

The display in our test model of the HP ZBook Firefly 14 G8 consists of a 14-inch IPS panel in the 16:9 format and offers a resolution of 1920x1080 pixels. The average maximum brightness is a very good 439 cd/m², but it doesn't match the very high value of the predecessor. However, HP omits the SureView technology in the Firefly 14 G8, which means that there are no restrictions in terms of brightness.
Furthermore, PWM isn't used for brightness control, which is convenient for users with sensitive eyes. Besides the display installed here, the ZBook Firefly G8 is also available with a UHD panel.
| |||||||||||||||||||||||||
Brightness Distribution: 89 %
Center on Battery: 462 cd/m²
Contrast: 1921:1 (Black: 0.24 cd/m²)
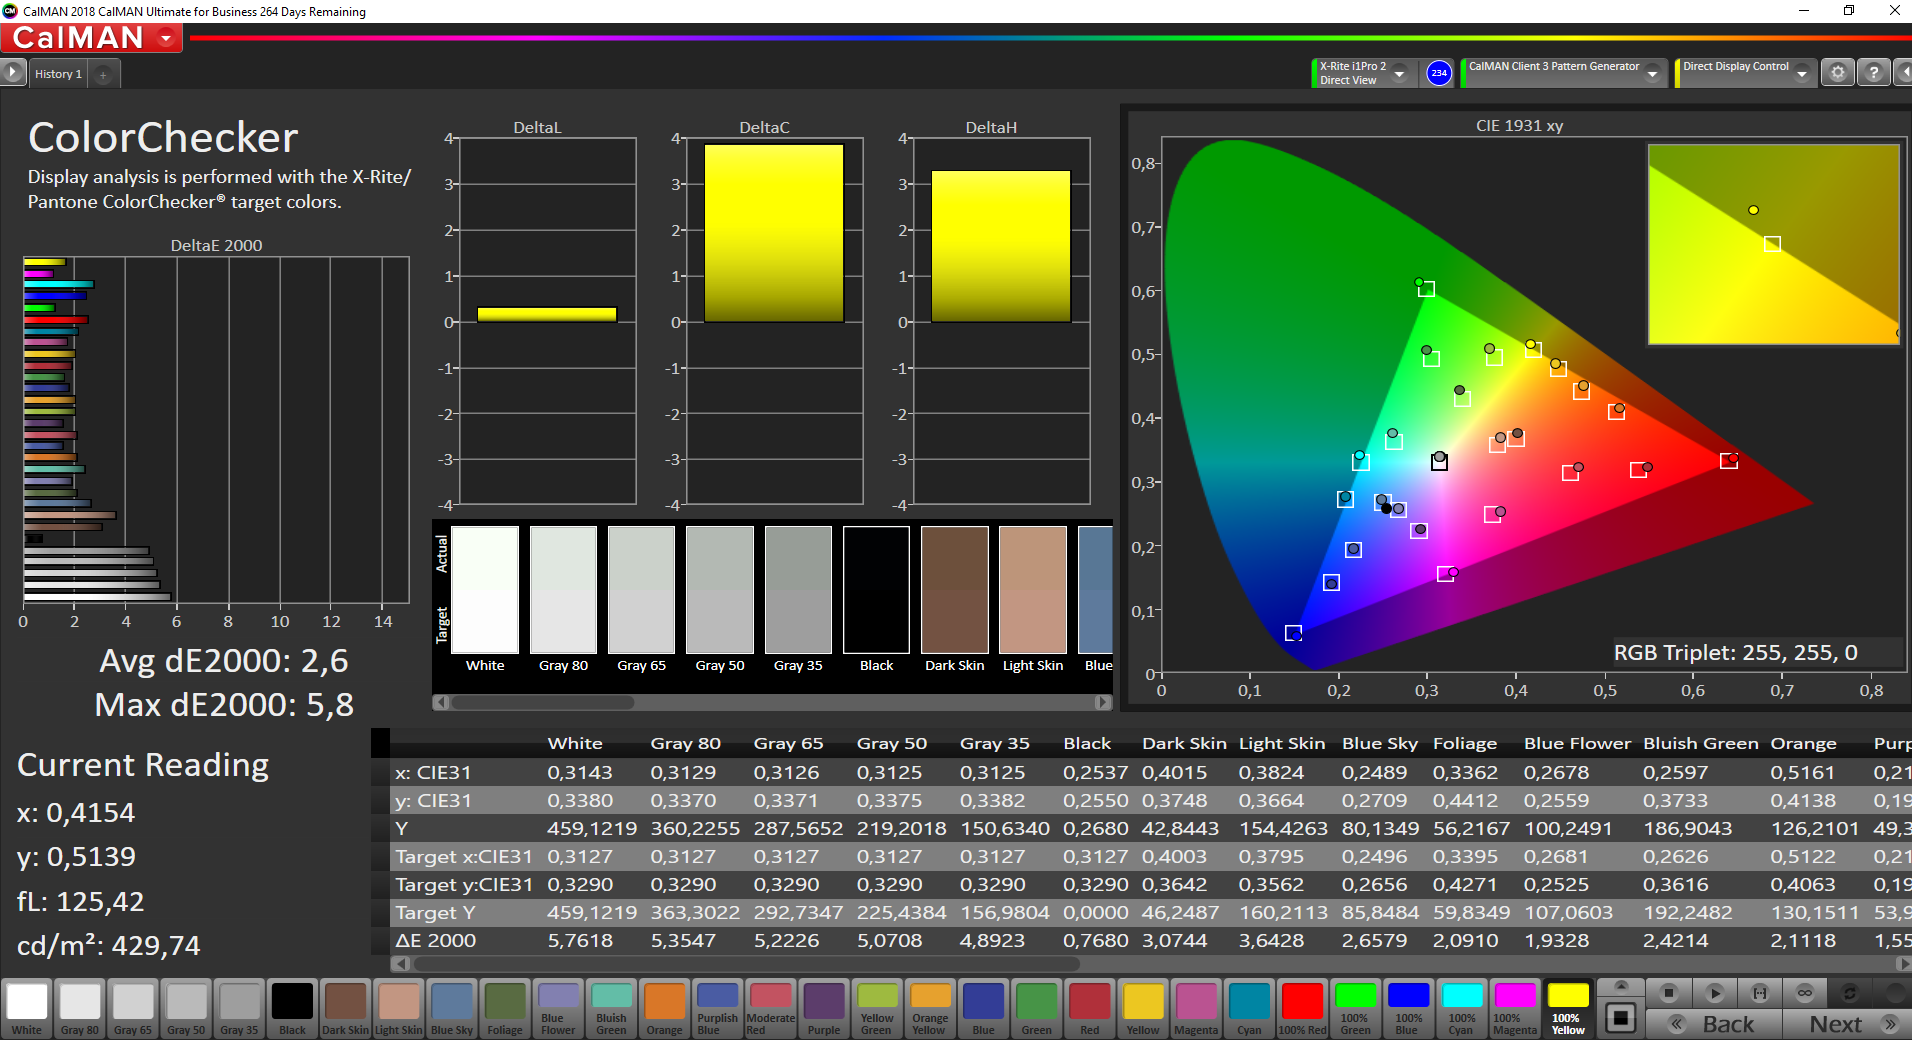
ΔE ColorChecker Calman: 2.6 | ∀{0.5-29.43 Ø4.77}
calibrated: 1.1
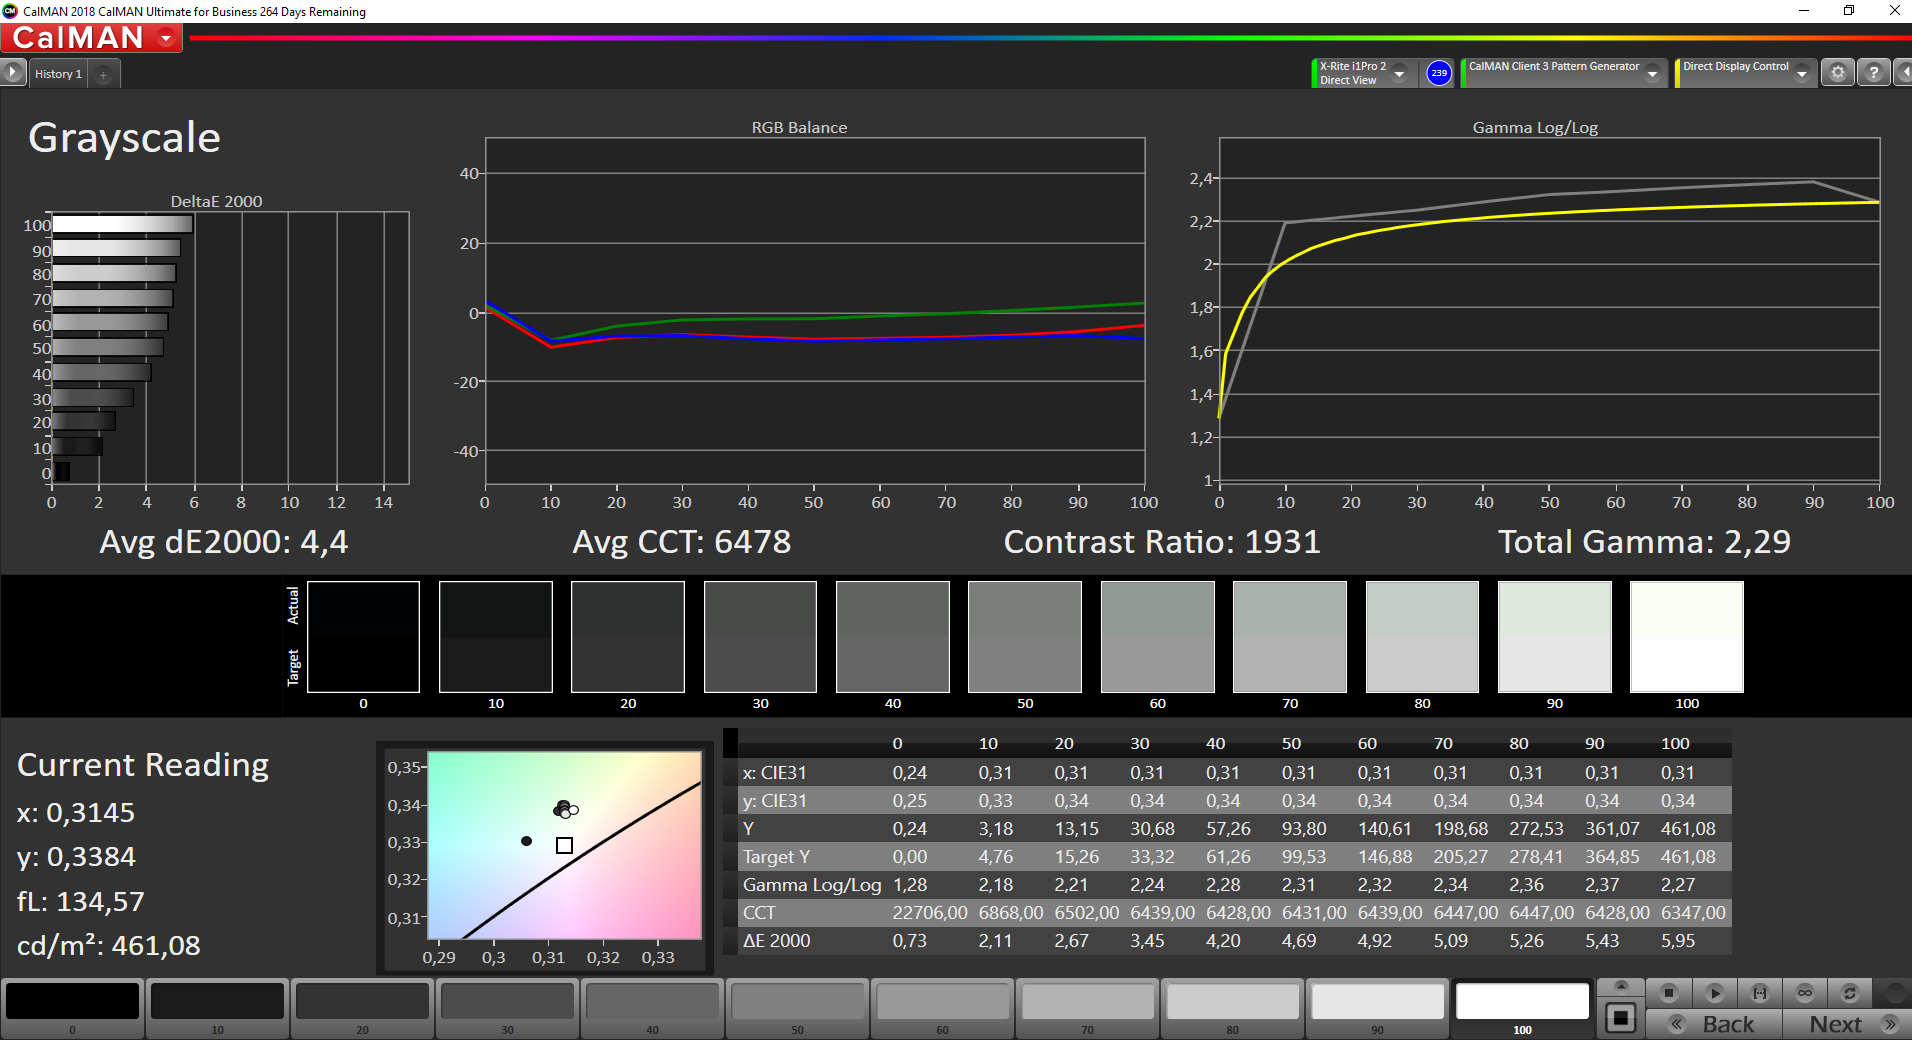
ΔE Greyscale Calman: 4.4 | ∀{0.09-98 Ø5}
99.4% sRGB (Argyll 1.6.3 3D)
65.2% AdobeRGB 1998 (Argyll 1.6.3 3D)
71.4% AdobeRGB 1998 (Argyll 3D)
99.5% sRGB (Argyll 3D)
70% Display P3 (Argyll 3D)
Gamma: 2.29
CCT: 6478 K
| HP ZBook Firefly 14 G8 2C9Q2EA AU Optronics AUO068B, IPS, 1920x1080, 14" | Lenovo ThinkPad P14s Gen1-20Y10002GE N140HCR-GL2, a-Si IPS LED, 1920x1080, 14" | HP ZBook Firefly 14 G7 InfoVision IVO8C78 (X140NVFC R0), IPS, 1920x1080, 14" | Dell Latitude 14 5411-WJ40N AU Optronics AUO463D, IPS, 1920x1080, 14" | |
|---|---|---|---|---|
| Display | -3% | 3% | -46% | |
| Display P3 Coverage (%) | 70 | 67.3 -4% | 73.8 5% | 37.43 -47% |
| sRGB Coverage (%) | 99.5 | 98.5 -1% | 99 -1% | 56.2 -44% |
| AdobeRGB 1998 Coverage (%) | 71.4 | 69.4 -3% | 75.5 6% | 38.67 -46% |
| Response Times | 29% | -17% | 52% | |
| Response Time Grey 50% / Grey 80% * (ms) | 64.4 ? | 38.4 ? 40% | 54.8 ? 15% | 31 ? 52% |
| Response Time Black / White * (ms) | 29.2 ? | 24 ? 18% | 43.2 ? -48% | 14 ? 52% |
| PWM Frequency (Hz) | 284.1 ? | |||
| Screen | 5% | -7% | -59% | |
| Brightness middle (cd/m²) | 461 | 430 -7% | 934 103% | 256 -44% |
| Brightness (cd/m²) | 439 | 432 -2% | 937 113% | 236 -46% |
| Brightness Distribution (%) | 89 | 88 -1% | 87 -2% | 86 -3% |
| Black Level * (cd/m²) | 0.24 | 0.27 -13% | 0.37 -54% | 0.23 4% |
| Contrast (:1) | 1921 | 1593 -17% | 2524 31% | 1113 -42% |
| Colorchecker dE 2000 * | 2.6 | 2.2 15% | 4.7 -81% | 5.76 -122% |
| Colorchecker dE 2000 max. * | 5.8 | 4.4 24% | 10.5 -81% | 20.65 -256% |
| Colorchecker dE 2000 calibrated * | 1.1 | 0.7 36% | 1.6 -45% | |
| Greyscale dE 2000 * | 4.4 | 3.3 25% | 7.1 -61% | 4 9% |
| Gamma | 2.29 96% | 2.21 100% | 2.31 95% | 2.52 87% |
| CCT | 6478 100% | 6056 107% | 6348 102% | 6182 105% |
| Color Space (Percent of AdobeRGB 1998) (%) | 65.2 | 63 -3% | 68.5 5% | 36 -45% |
| Color Space (Percent of sRGB) (%) | 99.4 | 98.5 -1% | 98.9 -1% | 56 -44% |
| Total Average (Program / Settings) | 10% /
7% | -7% /
-6% | -18% /
-41% |
* ... smaller is better
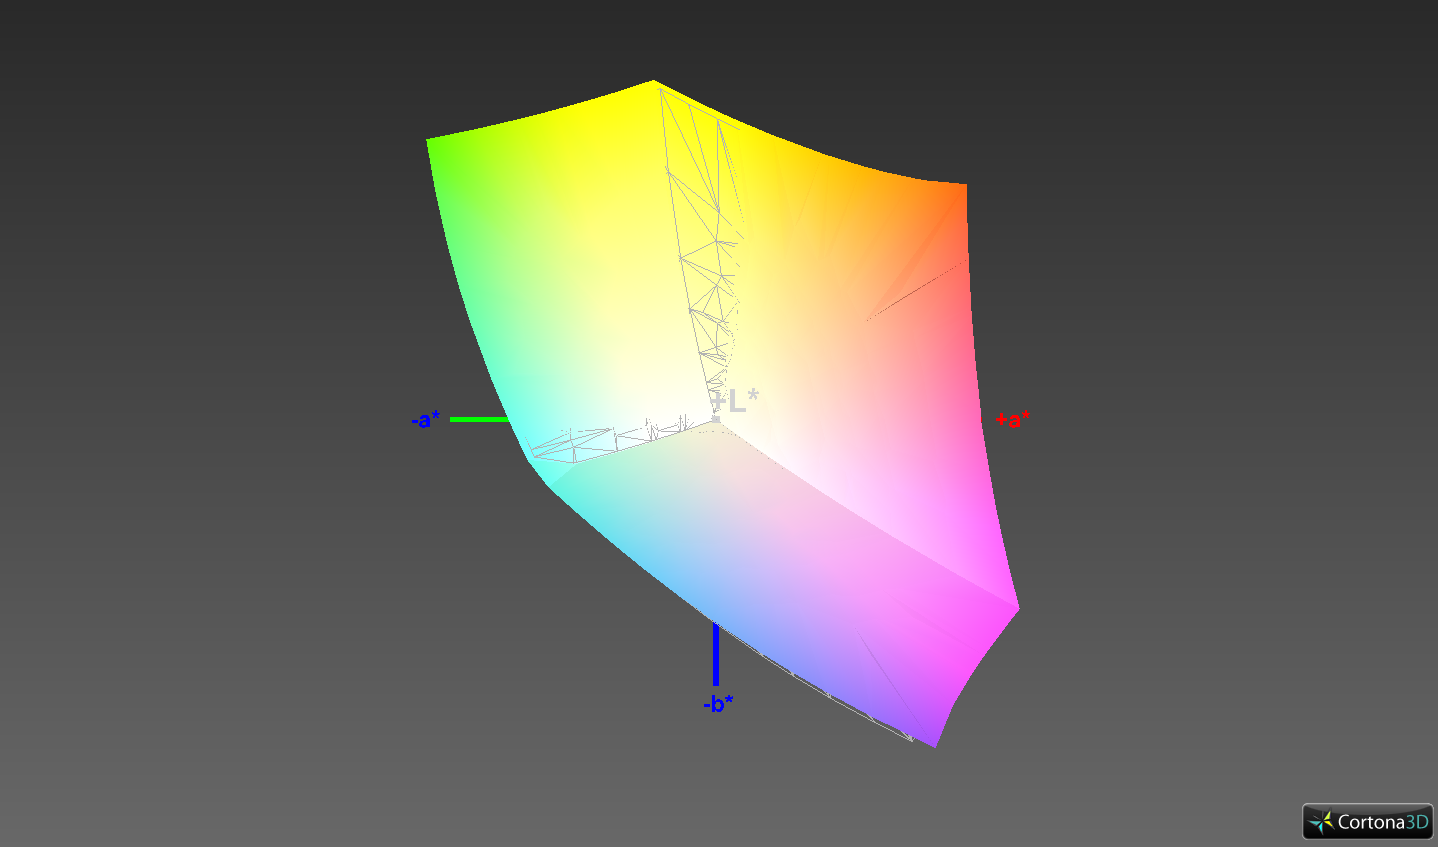
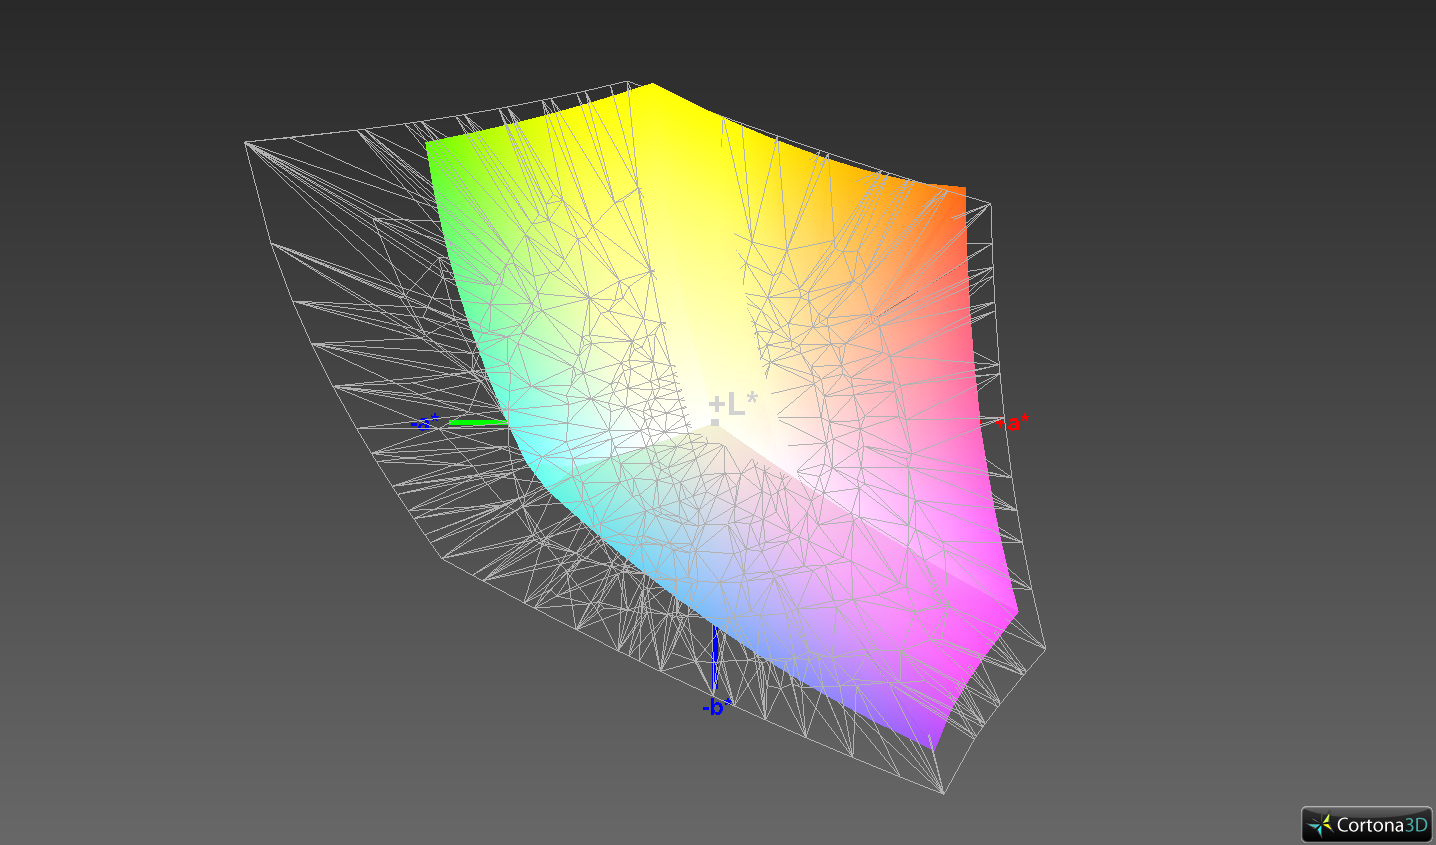
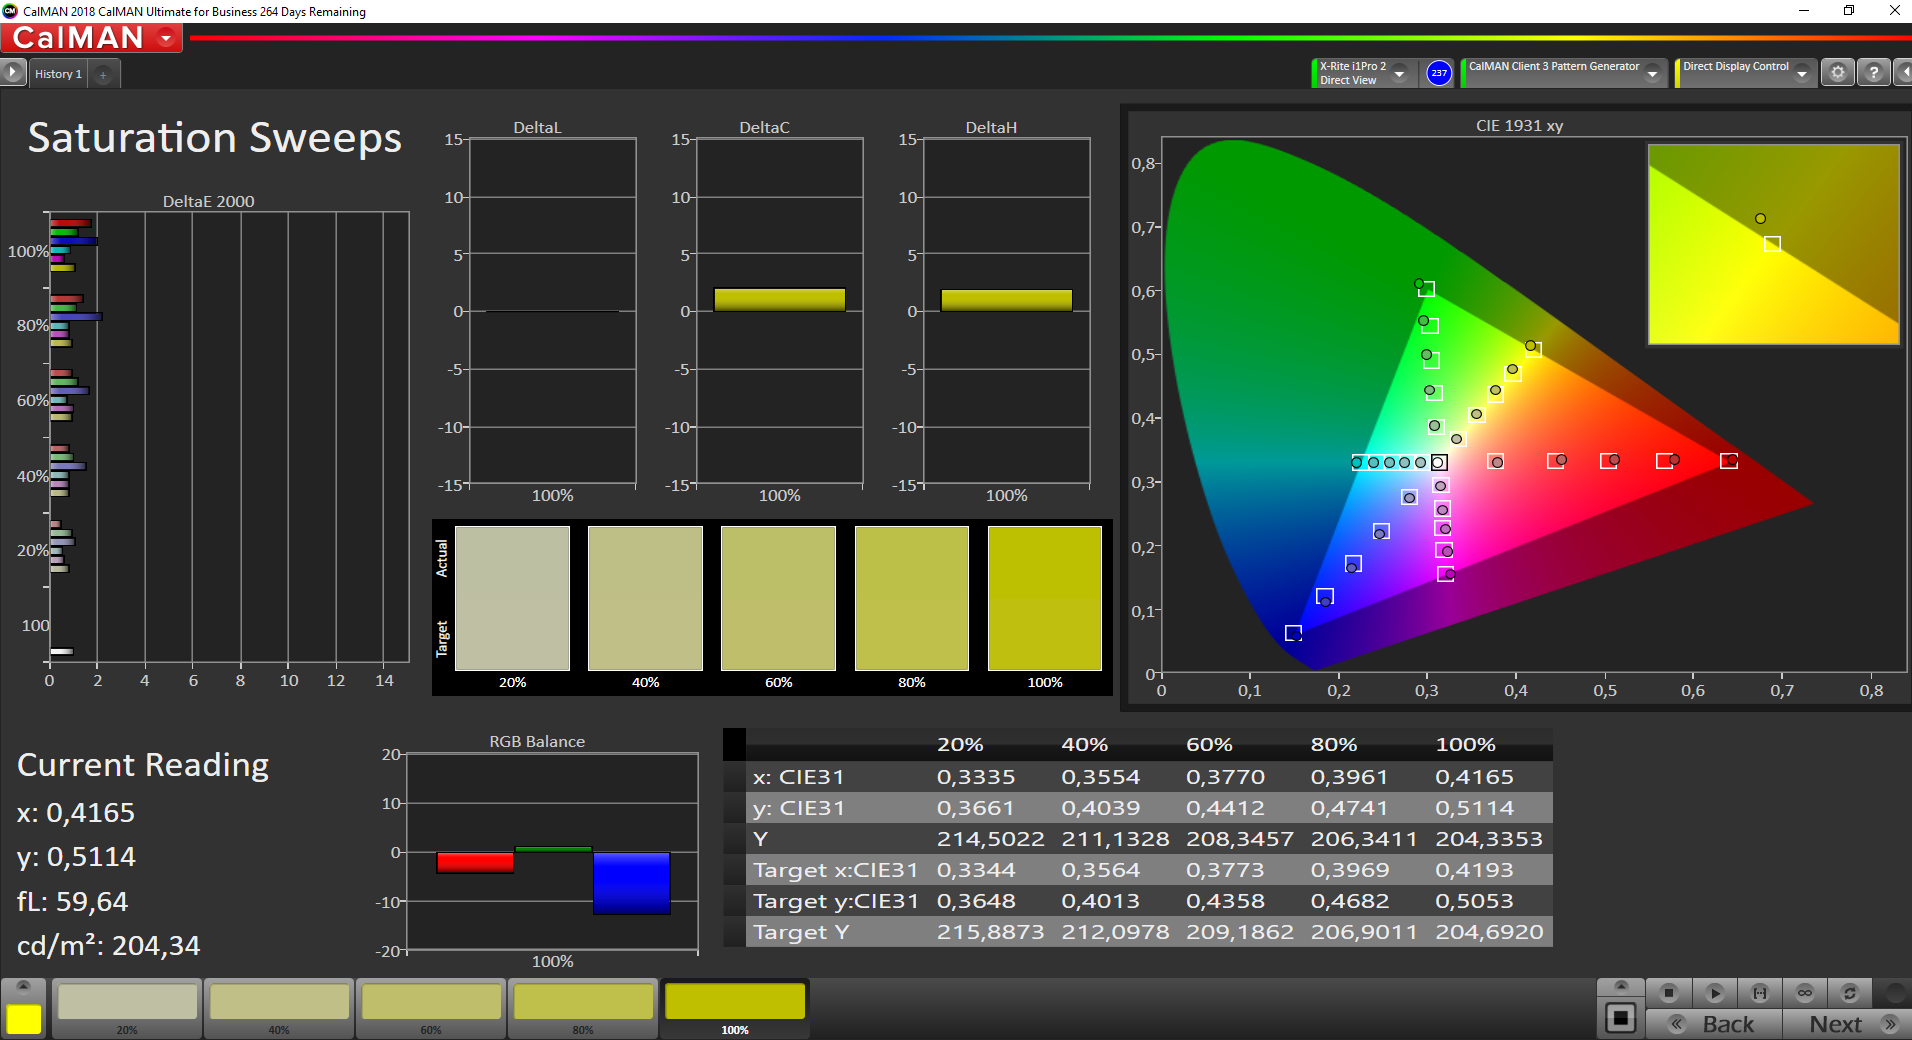
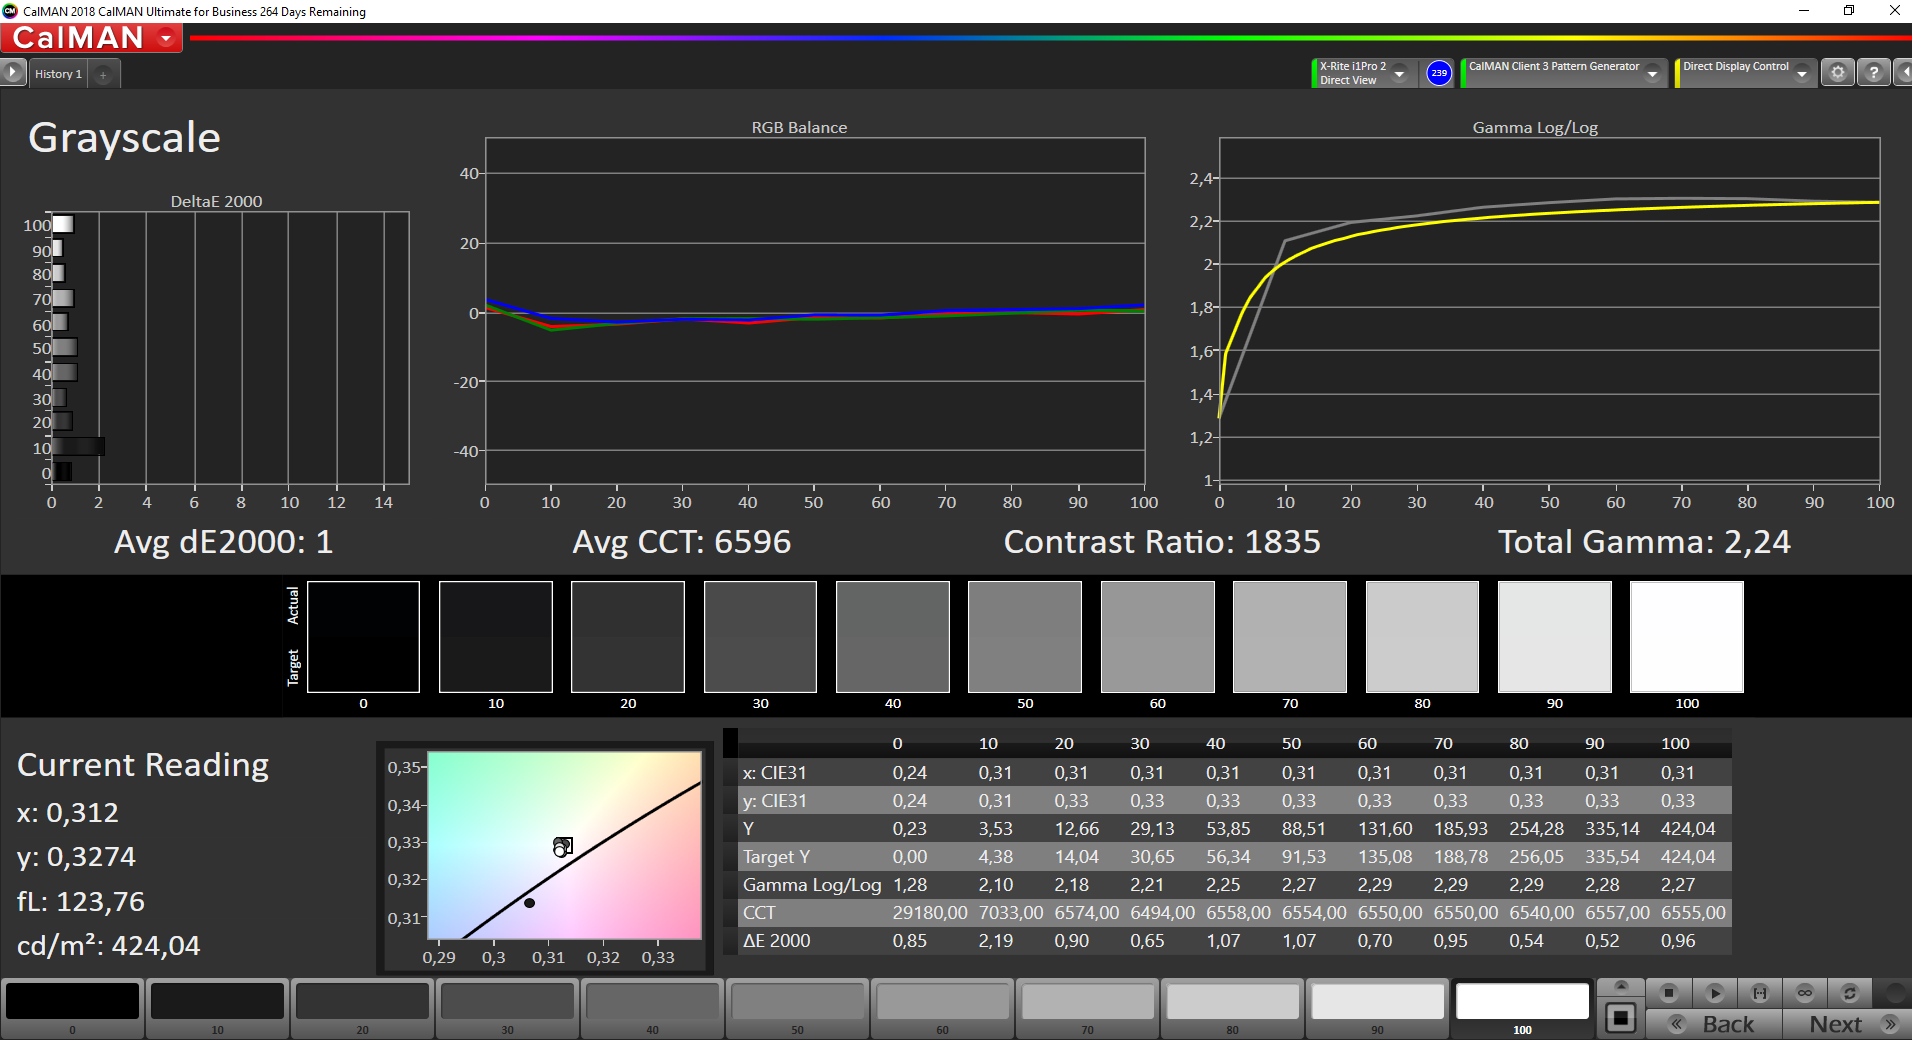
Our measurements show that the HP workstation's display has a contrast ratio of 1,921:1 and a good black level of 0.24 cd/m². The color-space coverage is 99.4% (sRGB) and 65.2% (AdobeRGB). Compared with the HP ZBook Firefly 14 G7, the display offers a slightly lower contrast ratio, which can still be considered to be very good in relation to the competition.
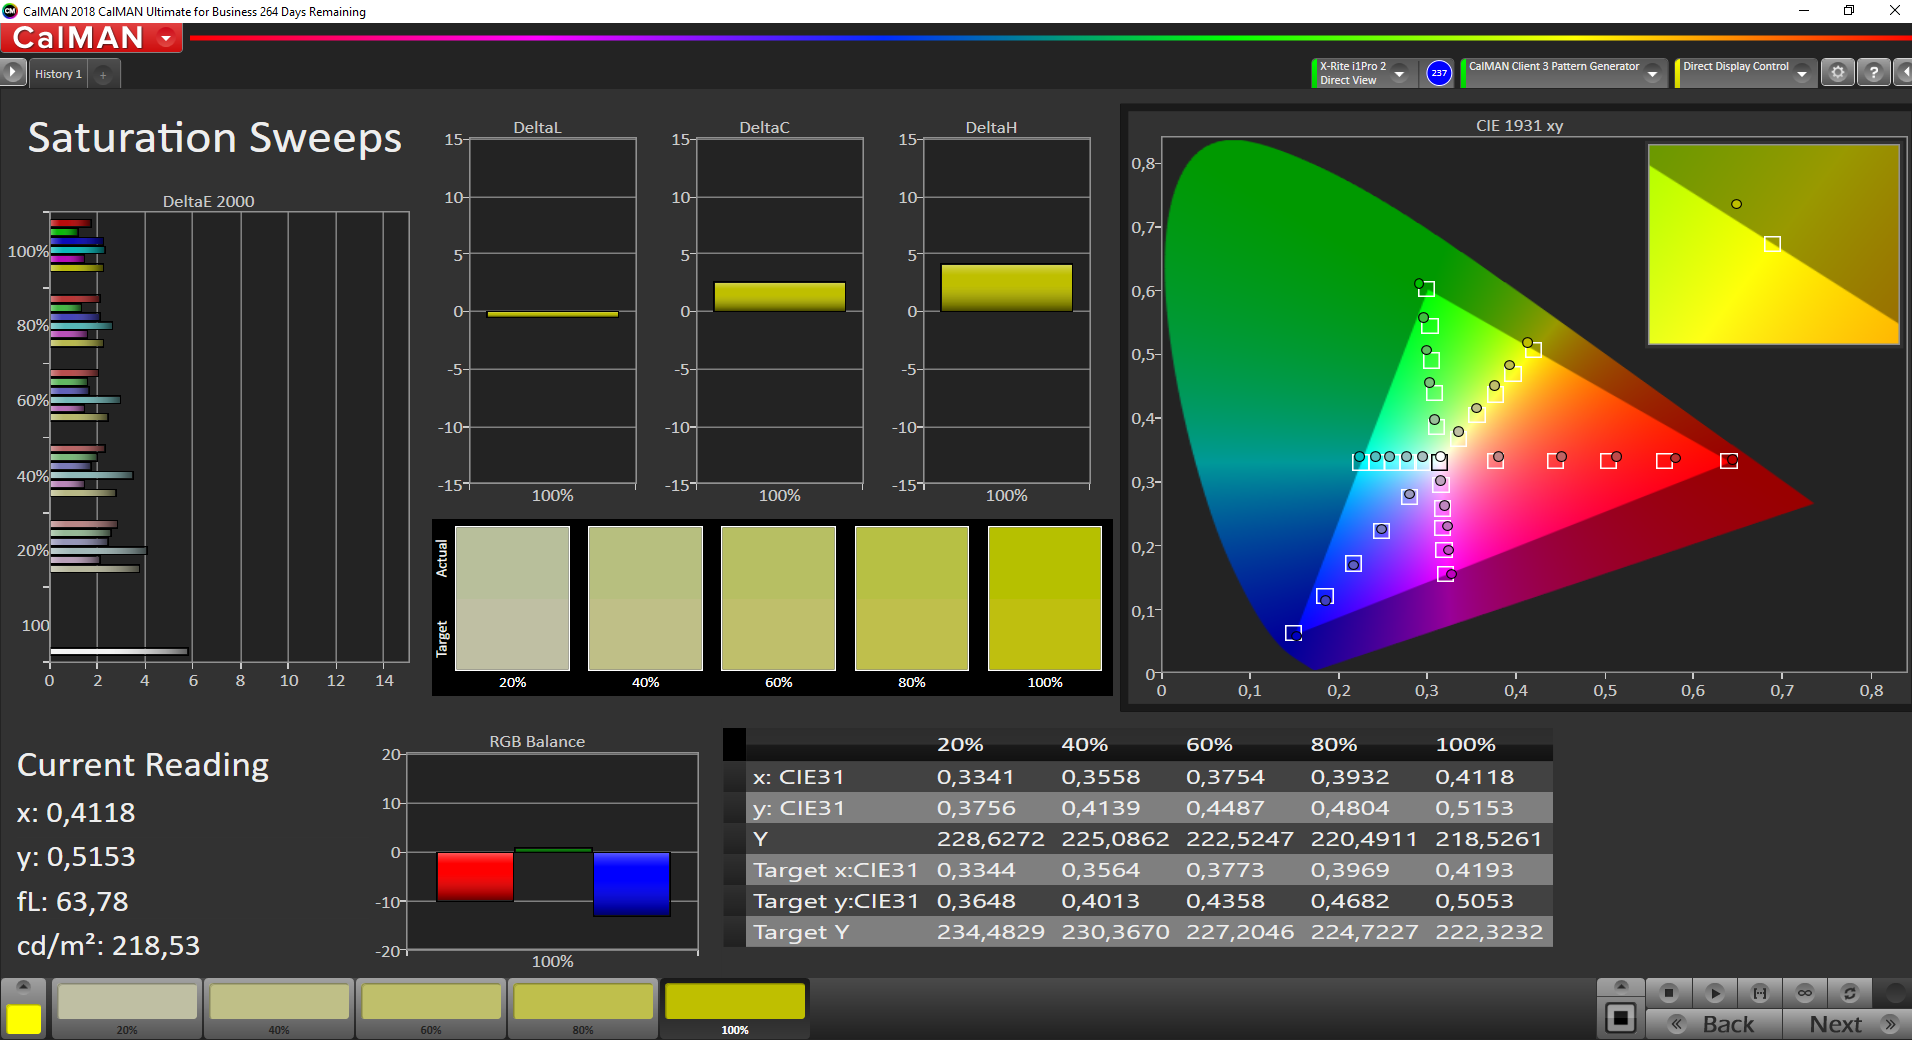
The CalMAN analysis also reveals that colors are displayed with just a slight deviation out of the box. However, this can still be improved a bit with calibration. The corresponding ICC file can be downloaded in the window located at the top, to the right of the display's brightness distribution graph.


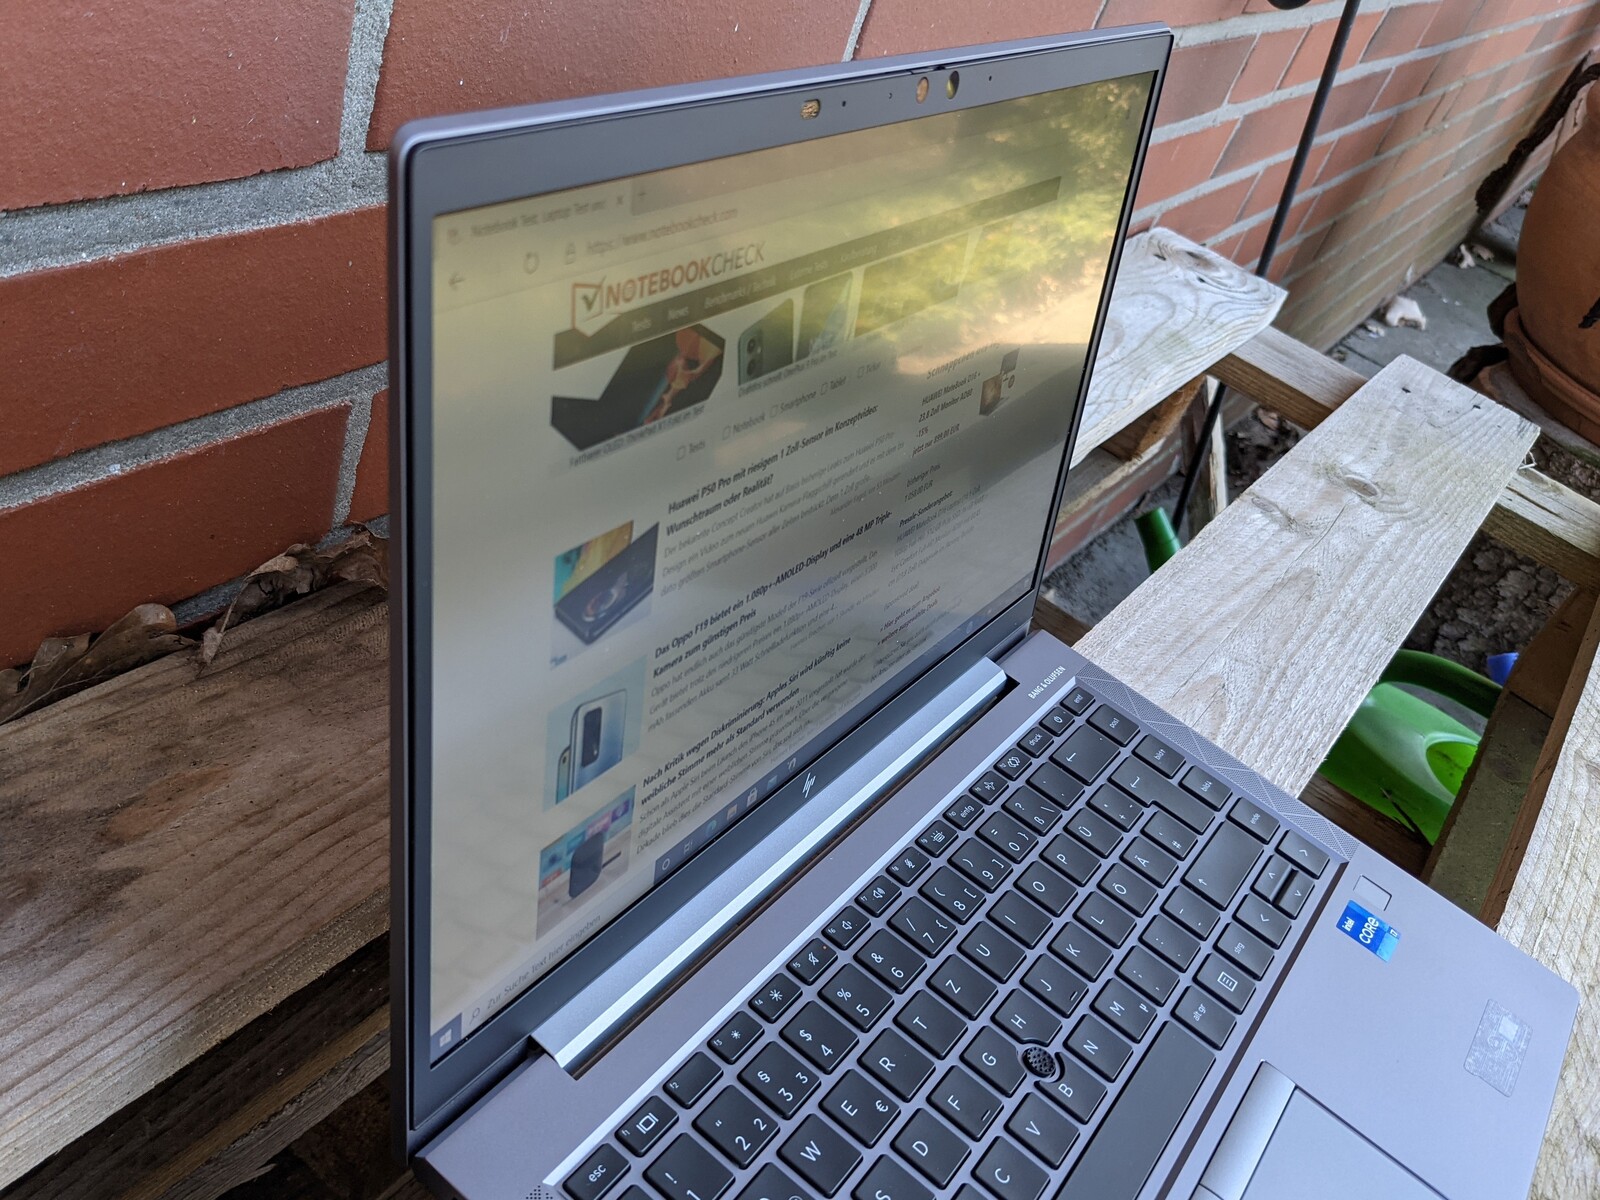
The HP ZBook Firefly 14 G8 can be used well outdoors. There's hardly any glare or reflections due to the matte screen surface. However, it's still difficult to read the display's content in direct sunlight.
Display Response Times
| ↔ Response Time Black to White | ||
|---|---|---|
| 29.2 ms ... rise ↗ and fall ↘ combined | ↗ 12.4 ms rise | 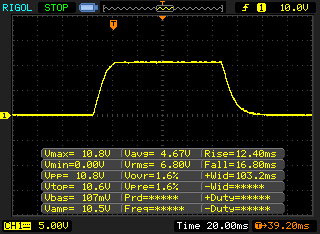 |
| ↘ 16.8 ms fall | ||
| The screen shows relatively slow response rates in our tests and may be too slow for gamers. In comparison, all tested devices range from 0.1 (minimum) to 240 (maximum) ms. » 77 % of all devices are better. This means that the measured response time is worse than the average of all tested devices (20.2 ms). | ||
| ↔ Response Time 50% Grey to 80% Grey | ||
| 64.4 ms ... rise ↗ and fall ↘ combined | ↗ 30.4 ms rise | 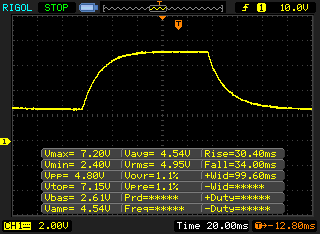 |
| ↘ 34 ms fall | ||
| The screen shows slow response rates in our tests and will be unsatisfactory for gamers. In comparison, all tested devices range from 0.165 (minimum) to 636 (maximum) ms. » 97 % of all devices are better. This means that the measured response time is worse than the average of all tested devices (31.5 ms). | ||
Screen Flickering / PWM (Pulse-Width Modulation)
| Screen flickering / PWM not detected | 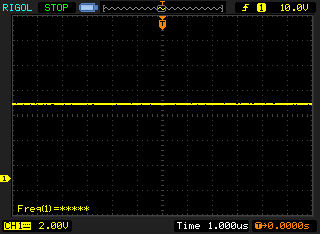 | ||
In comparison: 53 % of all tested devices do not use PWM to dim the display. If PWM was detected, an average of 8073 (minimum: 5 - maximum: 343500) Hz was measured. | |||
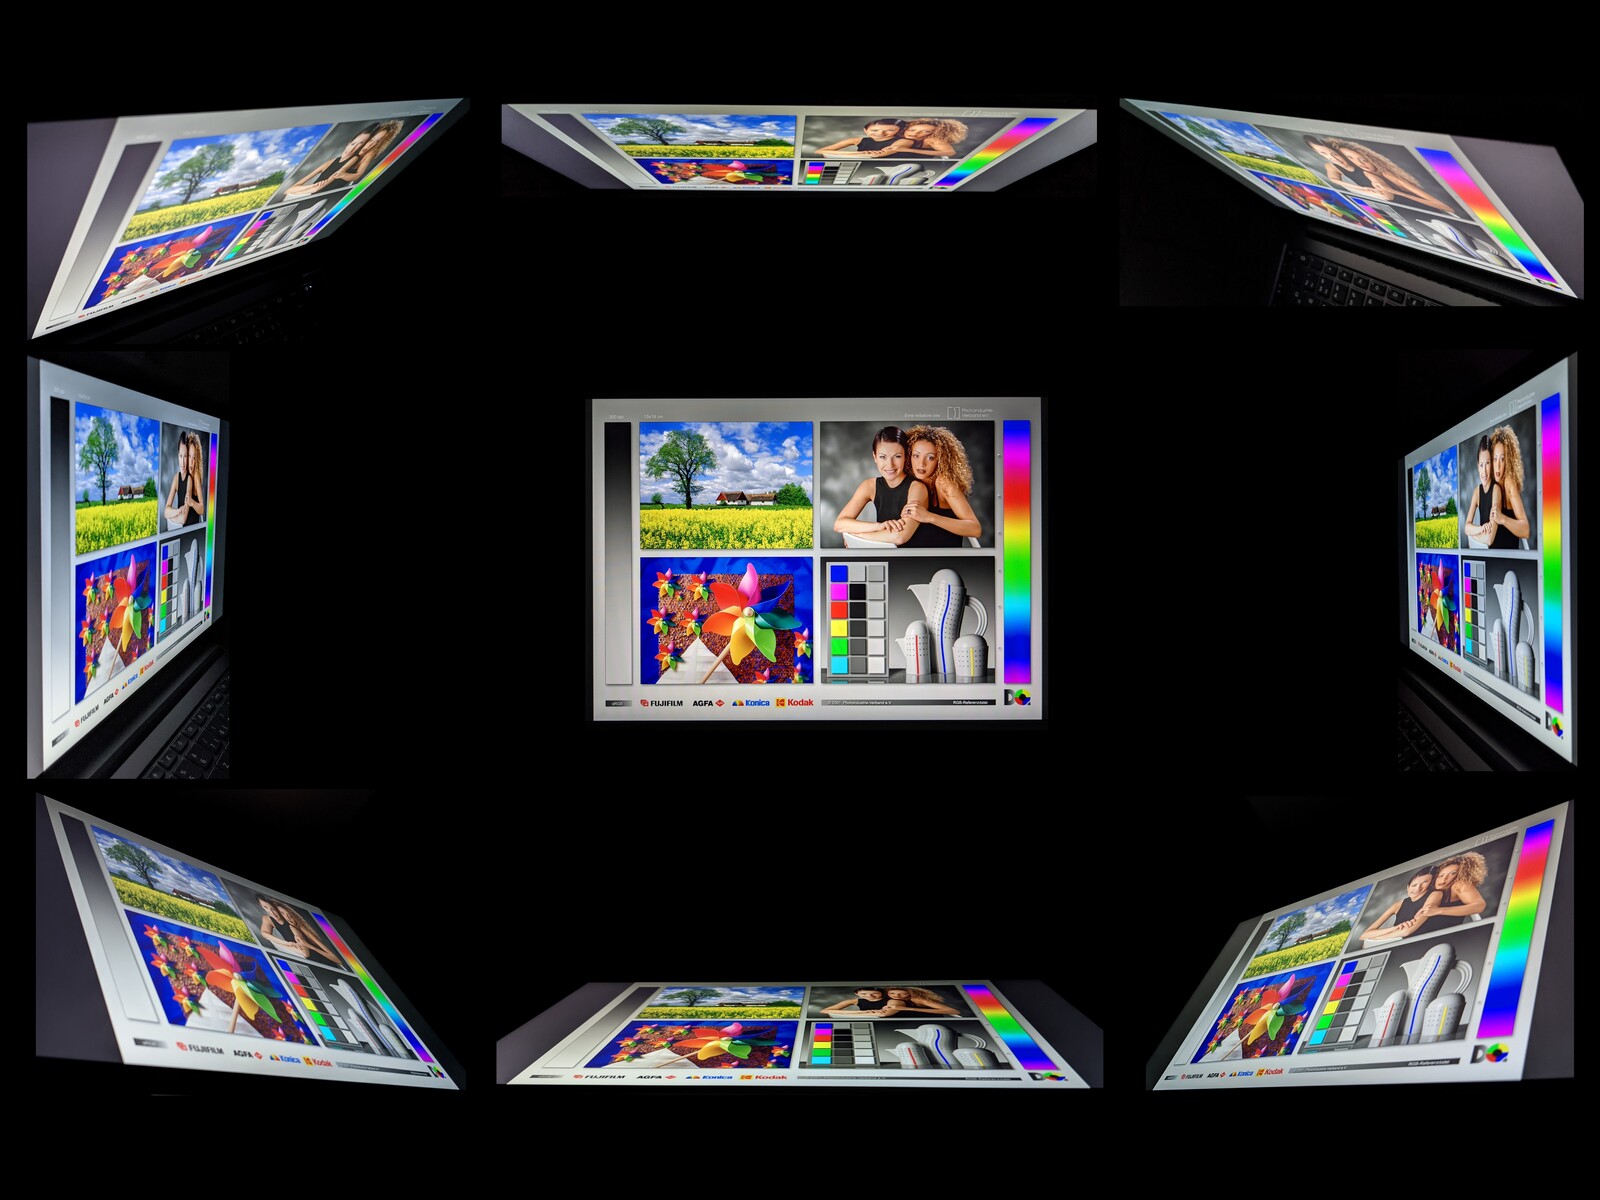
The IPS panel of the ZBook Firefly 14 G8 is very viewing-angle stable. Image content can be read from almost any angle without it becoming distorted or displaying the wrong colors.
Performance - Tiger Lake improves single-core performance
With the ZBook Firefly 14 G8, HP targets mobile users who need high processor performance and a dedicated graphics card for rendering tasks, for example. While an Nvidia Quadro T500 Mobile is installed in all the variants that are currently offered, Intel's Core i7-1185G7 is also available in addition to the CPU used here. The storage and RAM configurations also vary depending on the selected model.
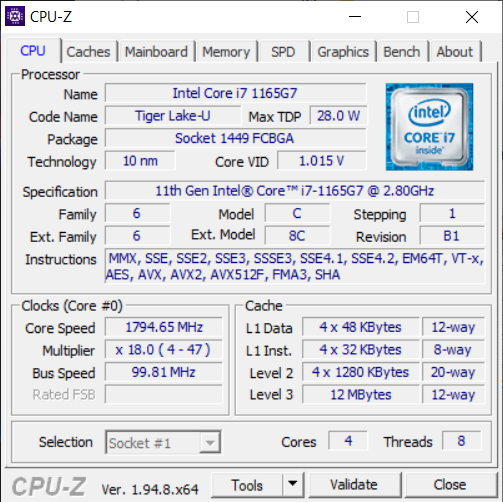
Processor
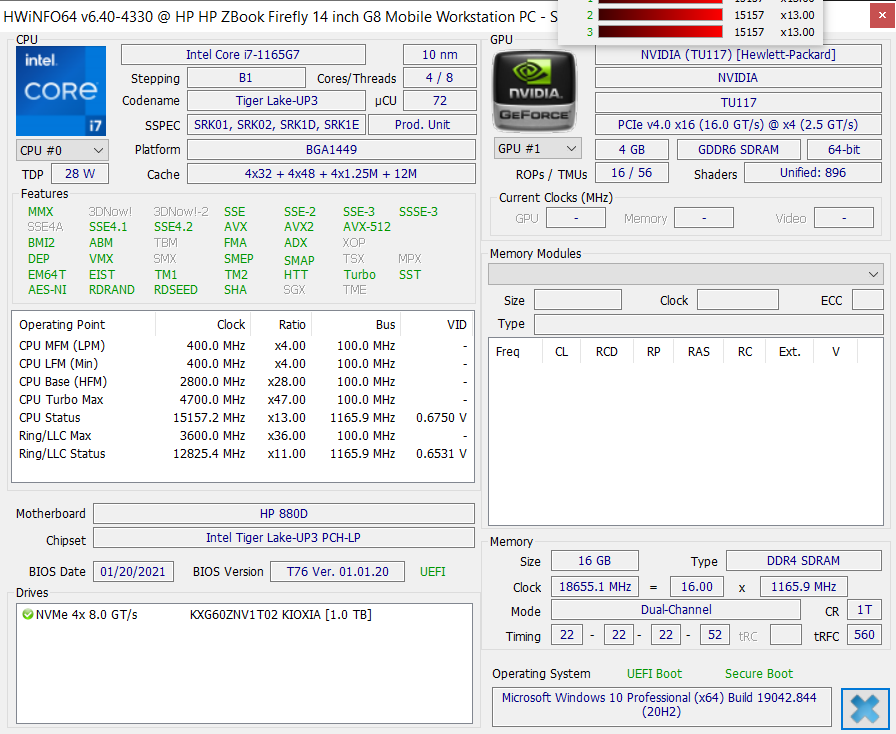
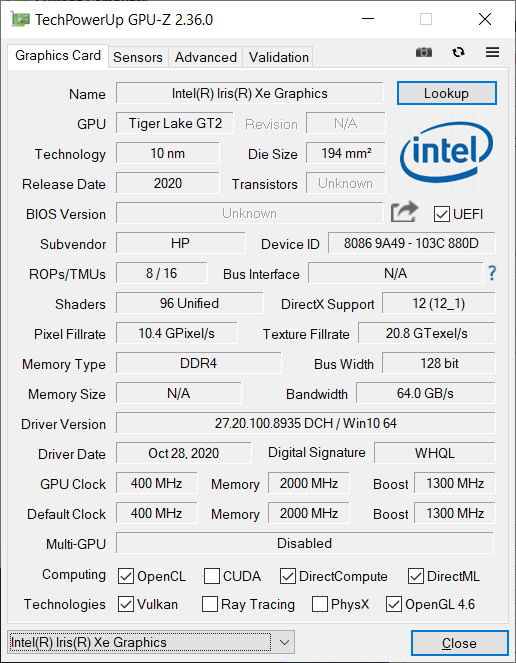
HP equips the ZBook Firefly G8 with an Intel Core i7-1165G7 in our test configuration. This processor belongs to Intel's Tiger Lake generation and can process up to eight tasks simultaneously with its four cores. Its clock speeds are between 2.8 and 4.7 GHz, and the maximum performance is determined by the cooling system as well as the configured TDP. The Firefly 14 G8 has a short-term TDP of 51 watts (PL2) and a long-term TDP of 25 watts (PL1).
In our Cinebench R15 endurance test, the HP workstation shows a good initial value that drops by about 17% shortly after and then settles at this value. In the individual disciplines, the Core i7-1165G7 in the ZBook G8 stands out with very good single-core performance in particular. On the other hand, the multi-core results are partly below average. Compared to the predecessor, the HP ZBook Firefly 14 G7, users can expect an increase in performance between 10% and 20%, but depending on the application, a slightly lower or higher performance increase is possible.
Cinebench R15: CPU Single 64Bit | CPU Multi 64Bit
Blender: v2.79 BMW27 CPU
7-Zip 18.03: 7z b 4 -mmt1 | 7z b 4
Geekbench 5.5: Single-Core | Multi-Core
HWBOT x265 Benchmark v2.2: 4k Preset
LibreOffice : 20 Documents To PDF
R Benchmark 2.5: Overall mean
| Cinebench R20 / CPU (Single Core) | |
| Average of class Workstation (671 - 849, n=26, last 2 years) | |
| Acer SF514-55T | |
| HP ZBook Firefly 14 G8 2C9Q2EA | |
| Average Intel Core i7-1165G7 (442 - 589, n=81) | |
| Dell Latitude 14 5411-WJ40N | |
| HP ZBook Firefly 14 G7 | |
| Lenovo ThinkPad P14s Gen1-20Y10002GE | |
| Cinebench R20 / CPU (Multi Core) | |
| Average of class Workstation (5471 - 15043, n=26, last 2 years) | |
| Lenovo ThinkPad P14s Gen1-20Y10002GE | |
| Dell Latitude 14 5411-WJ40N | |
| Acer SF514-55T | |
| HP ZBook Firefly 14 G8 2C9Q2EA | |
| Average Intel Core i7-1165G7 (1060 - 2657, n=81) | |
| HP ZBook Firefly 14 G7 | |
| Cinebench R15 / CPU Single 64Bit | |
| Average of class Workstation (191.4 - 328, n=26, last 2 years) | |
| HP ZBook Firefly 14 G8 2C9Q2EA | |
| Average Intel Core i7-1165G7 (115 - 230, n=78) | |
| Acer SF514-55T | |
| Dell Latitude 14 5411-WJ40N | |
| HP ZBook Firefly 14 G7 | |
| Lenovo ThinkPad P14s Gen1-20Y10002GE | |
| Cinebench R15 / CPU Multi 64Bit | |
| Average of class Workstation (2404 - 5810, n=26, last 2 years) | |
| Lenovo ThinkPad P14s Gen1-20Y10002GE | |
| Dell Latitude 14 5411-WJ40N | |
| Acer SF514-55T | |
| Average Intel Core i7-1165G7 (553 - 1027, n=86) | |
| HP ZBook Firefly 14 G8 2C9Q2EA | |
| HP ZBook Firefly 14 G7 | |
| Blender / v2.79 BMW27 CPU | |
| Acer SF514-55T | |
| HP ZBook Firefly 14 G7 | |
| Average Intel Core i7-1165G7 (468 - 1138, n=80) | |
| HP ZBook Firefly 14 G8 2C9Q2EA | |
| Dell Latitude 14 5411-WJ40N | |
| Lenovo ThinkPad P14s Gen1-20Y10002GE | |
| Average of class Workstation (91 - 261, n=26, last 2 years) | |
| 7-Zip 18.03 / 7z b 4 -mmt1 | |
| Average of class Workstation (4981 - 6960, n=26, last 2 years) | |
| HP ZBook Firefly 14 G8 2C9Q2EA | |
| Acer SF514-55T | |
| Dell Latitude 14 5411-WJ40N | |
| Average Intel Core i7-1165G7 (4478 - 5507, n=80) | |
| HP ZBook Firefly 14 G7 | |
| Lenovo ThinkPad P14s Gen1-20Y10002GE | |
| 7-Zip 18.03 / 7z b 4 | |
| Average of class Workstation (53407 - 116969, n=26, last 2 years) | |
| Lenovo ThinkPad P14s Gen1-20Y10002GE | |
| Dell Latitude 14 5411-WJ40N | |
| Acer SF514-55T | |
| Average Intel Core i7-1165G7 (15347 - 27405, n=80) | |
| HP ZBook Firefly 14 G8 2C9Q2EA | |
| HP ZBook Firefly 14 G7 | |
| Geekbench 5.5 / Single-Core | |
| Average of class Workstation (1759 - 2183, n=26, last 2 years) | |
| Acer SF514-55T | |
| HP ZBook Firefly 14 G8 2C9Q2EA | |
| Average Intel Core i7-1165G7 (1302 - 1595, n=77) | |
| Dell Latitude 14 5411-WJ40N | |
| HP ZBook Firefly 14 G7 | |
| Lenovo ThinkPad P14s Gen1-20Y10002GE | |
| Geekbench 5.5 / Multi-Core | |
| Average of class Workstation (11542 - 25554, n=26, last 2 years) | |
| Lenovo ThinkPad P14s Gen1-20Y10002GE | |
| Acer SF514-55T | |
| Dell Latitude 14 5411-WJ40N | |
| Average Intel Core i7-1165G7 (3078 - 5926, n=77) | |
| HP ZBook Firefly 14 G8 2C9Q2EA | |
| HP ZBook Firefly 14 G7 | |
| HWBOT x265 Benchmark v2.2 / 4k Preset | |
| Average of class Workstation (14.4 - 40.5, n=26, last 2 years) | |
| Lenovo ThinkPad P14s Gen1-20Y10002GE | |
| Dell Latitude 14 5411-WJ40N | |
| HP ZBook Firefly 14 G8 2C9Q2EA | |
| Average Intel Core i7-1165G7 (1.39 - 8.47, n=80) | |
| HP ZBook Firefly 14 G7 | |
| Acer SF514-55T | |
| LibreOffice / 20 Documents To PDF | |
| HP ZBook Firefly 14 G7 | |
| Lenovo ThinkPad P14s Gen1-20Y10002GE | |
| HP ZBook Firefly 14 G8 2C9Q2EA | |
| Acer SF514-55T | |
| Average Intel Core i7-1165G7 (21.5 - 88.1, n=78) | |
| Average of class Workstation (37.1 - 74.7, n=26, last 2 years) | |
| Dell Latitude 14 5411-WJ40N | |
| R Benchmark 2.5 / Overall mean | |
| HP ZBook Firefly 14 G7 | |
| Lenovo ThinkPad P14s Gen1-20Y10002GE | |
| Dell Latitude 14 5411-WJ40N | |
| Average Intel Core i7-1165G7 (0.552 - 1.002, n=80) | |
| HP ZBook Firefly 14 G8 2C9Q2EA | |
| Acer SF514-55T | |
| Average of class Workstation (0.3825 - 0.603, n=26, last 2 years) | |
* ... smaller is better
System performance
The HP ZBook Firefly 14 G8 achieves a very good result in the PCMark 10 test for evaluating system performance, which puts it at the top of our test field. Its strengths are in the individual disciplines "Digital Content Creation" and "Productivity". The ZBook's system always runs smoothly in everyday use and doesn't exhibit any micro stuttering or the like. Files are accessed without delays, and applications are launched quickly. The performance increase compared to the HP ZBook Firefly 14 G7 is of up to 20% here as well.
Our CPU Benchmarks article shows the performance offered by other laptops.
| PCMark 10 Score | 5282 points | |
Help | ||
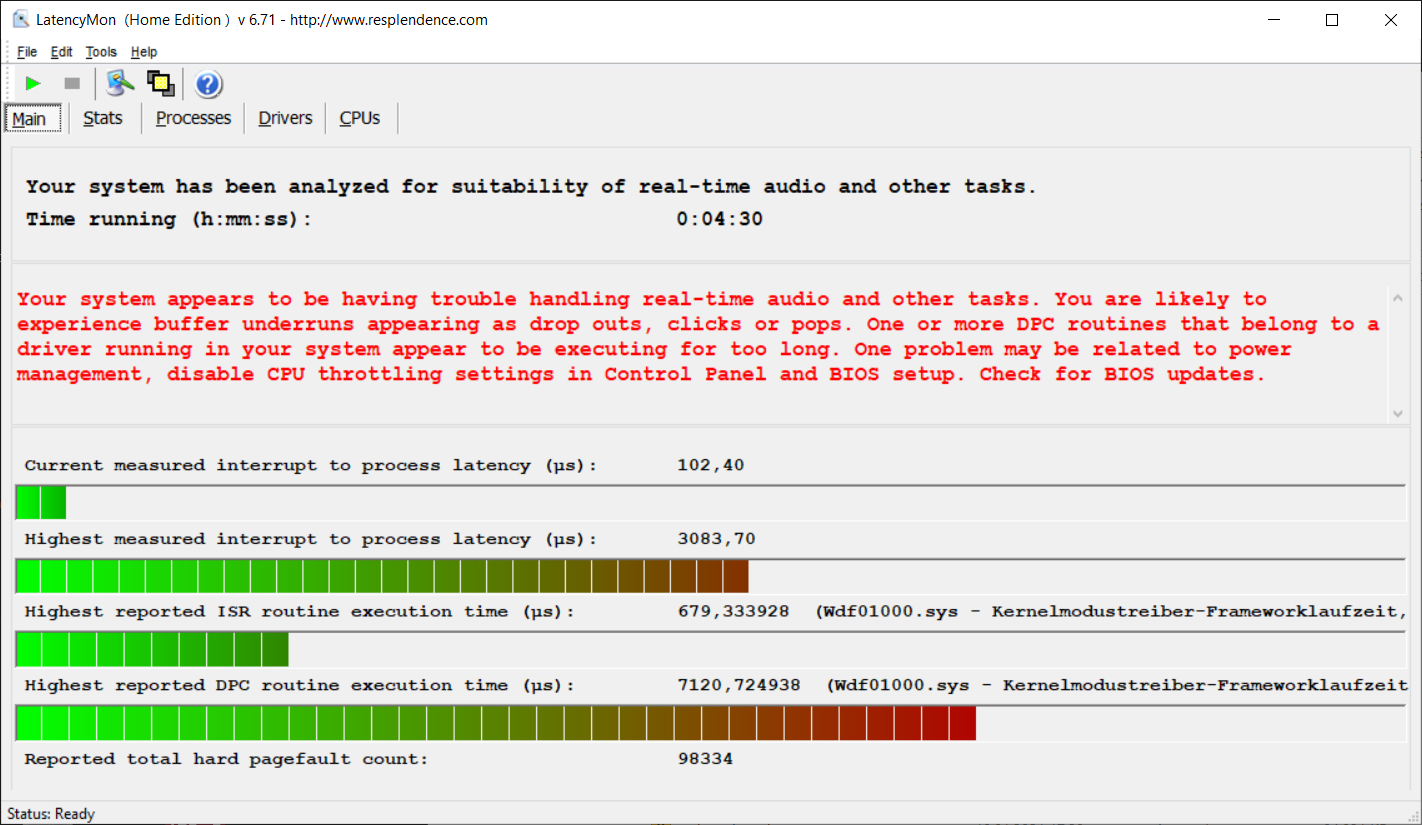
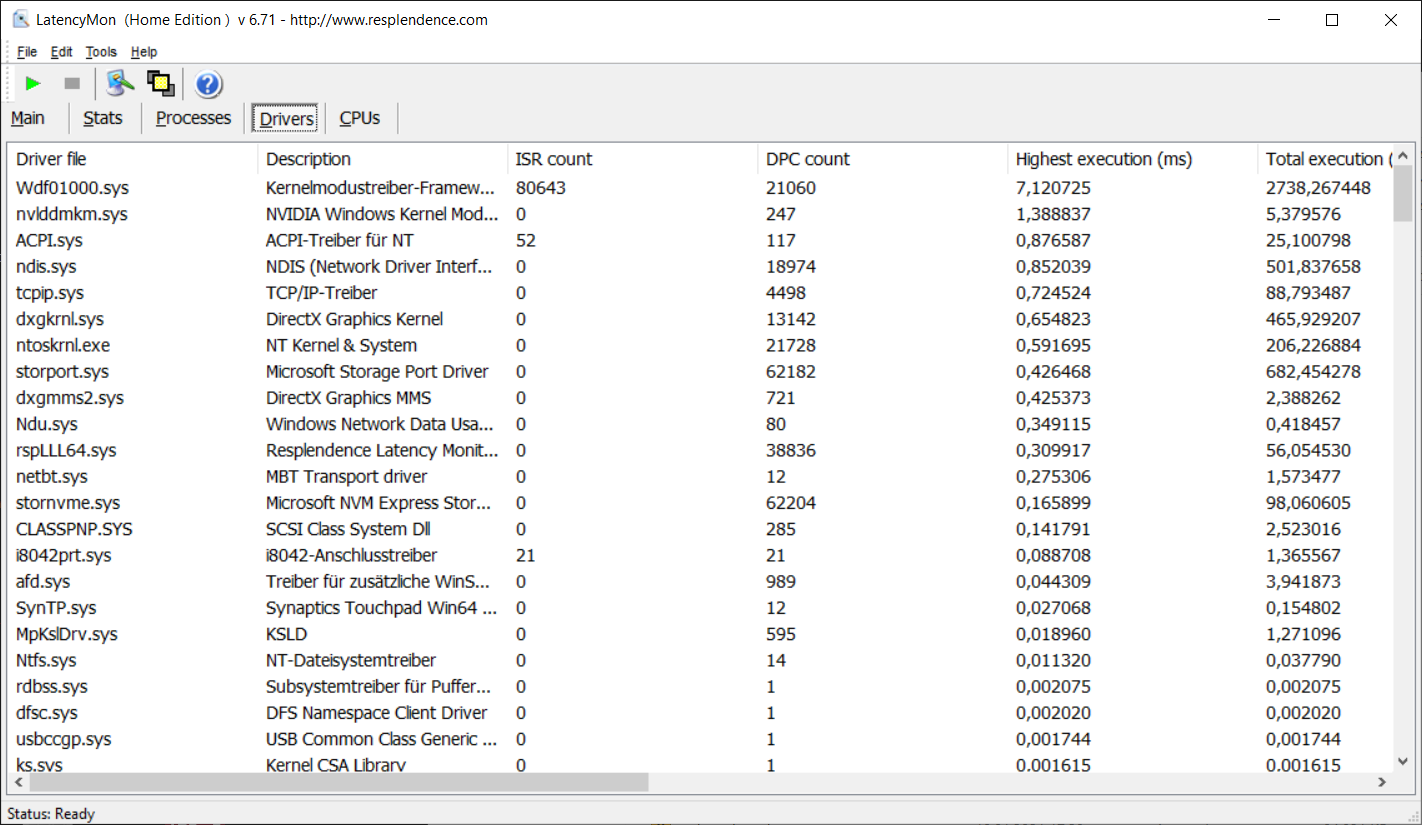
DPC latencies
The HP ZBook Firefly 14 G8 shows increased interruption times in our test with LatencyMon. As a result, it's not suitable for real-time applications.
| DPC Latencies / LatencyMon - interrupt to process latency (max), Web, Youtube, Prime95 | |
| Dell Latitude 14 5411-WJ40N | |
| HP ZBook Firefly 14 G8 2C9Q2EA | |
| HP ZBook Firefly 14 G7 | |
| Lenovo ThinkPad P14s Gen1-20Y10002GE | |
* ... smaller is better
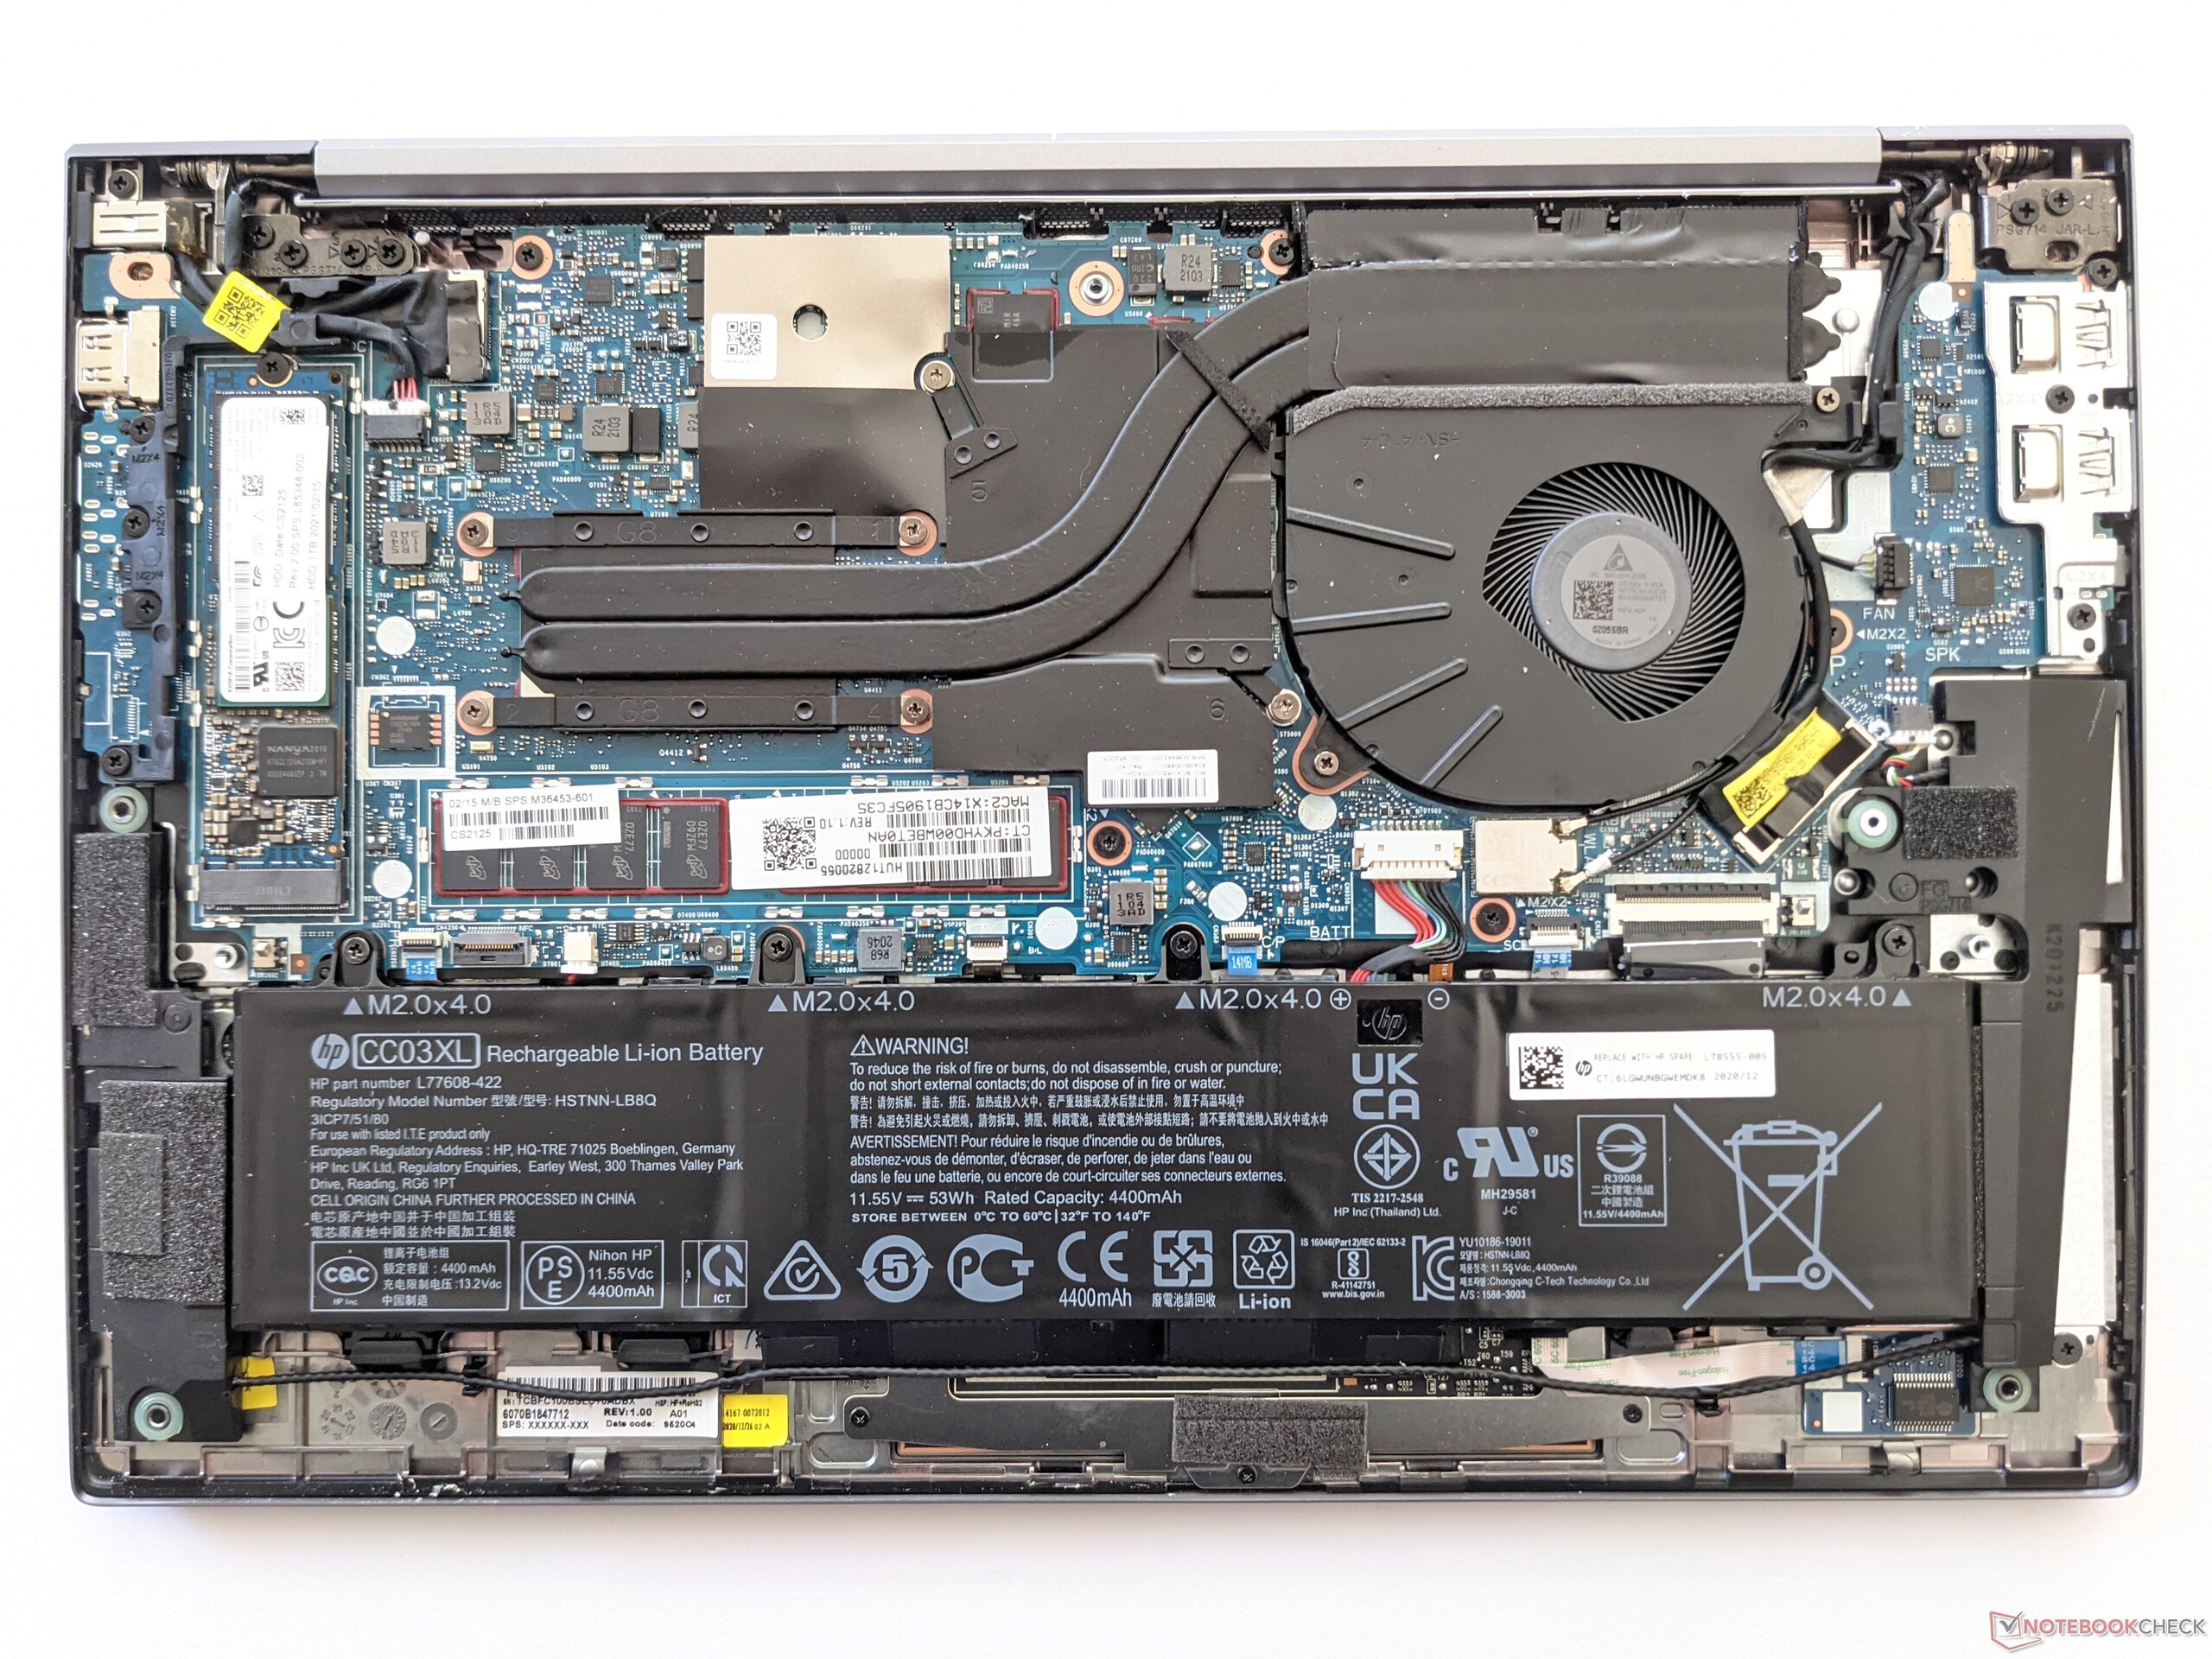
Storage
HP installs a 1 TB SSD from Toshiba in the ZBook Firefly 14 G8. It performs slightly better in the storage benchmarks than the 512 GB model in the ZBook Firefly 14 G7. However, the read and write speeds are similar to those of our chosen competitors.
Our HDD/SSD Benchmarks article shows how other mass storage devices performed in our tests.
| HP ZBook Firefly 14 G8 2C9Q2EA Toshiba XG6 KXG60ZNV1T02 | Lenovo ThinkPad P14s Gen1-20Y10002GE Samsung PM981a MZVLB1T0HBLR | HP ZBook Firefly 14 G7 Toshiba XG6 KXG60ZNV512G | Dell Latitude 14 5411-WJ40N SK Hynix PC611 512GB | Average Toshiba XG6 KXG60ZNV1T02 | |
|---|---|---|---|---|---|
| CrystalDiskMark 5.2 / 6 | -9% | -25% | -8% | -3% | |
| Write 4K (MB/s) | 132.4 | 86.3 -35% | 98.1 -26% | 125.9 -5% | 136.3 ? 3% |
| Read 4K (MB/s) | 52.6 | 47.66 -9% | 45.16 -14% | 42.45 -19% | 50.7 ? -4% |
| Write Seq (MB/s) | 1827 | 2030 11% | 1623 -11% | 2064 13% | 1869 ? 2% |
| Read Seq (MB/s) | 2255 | 2345 4% | 1993 -12% | 1627 -28% | 1984 ? -12% |
| Write 4K Q32T1 (MB/s) | 429 | 379.7 -11% | 311.7 -27% | 419.8 -2% | 435 ? 1% |
| Read 4K Q32T1 (MB/s) | 446.7 | 289 -35% | 289.9 -35% | 382.1 -14% | 439 ? -2% |
| Write Seq Q32T1 (MB/s) | 3074 | 2982 -3% | 853 -72% | 2729 -11% | 3019 ? -2% |
| Read Seq Q32T1 (MB/s) | 3283 | 3567 9% | 3274 0% | 3441 5% | 3016 ? -8% |
| AS SSD | 7% | -6% | 3% | 1% | |
| Seq Read (MB/s) | 2674 | 2579 -4% | 2613 -2% | 2681 0% | 2385 ? -11% |
| Seq Write (MB/s) | 1289 | 1456 13% | 908 -30% | 1430 11% | 1491 ? 16% |
| 4K Read (MB/s) | 49.52 | 50.9 3% | 48.25 -3% | 49.22 -1% | 47.9 ? -3% |
| 4K Write (MB/s) | 128 | 115.7 -10% | 137.9 8% | 118 -8% | 129.5 ? 1% |
| 4K-64 Read (MB/s) | 1113 | 858 -23% | 1004 -10% | 1139 2% | 1099 ? -1% |
| 4K-64 Write (MB/s) | 1470 | 2152 46% | 1271 -14% | 1488 1% | 1440 ? -2% |
| Access Time Read * (ms) | 0.072 | 0.053 26% | 0.066 8% | 0.057 21% | 0.05788 ? 20% |
| Access Time Write * (ms) | 0.032 | 0.032 -0% | 0.03 6% | 0.031 3% | 0.03213 ? -0% |
| Score Read (Points) | 1430 | 1166 -18% | 1314 -8% | 1456 2% | 1386 ? -3% |
| Score Write (Points) | 1727 | 2414 40% | 1500 -13% | 1749 1% | 1718 ? -1% |
| Score Total (Points) | 3827 | 4132 8% | 3409 -11% | 3895 2% | 3776 ? -1% |
| Copy ISO MB/s (MB/s) | 1769 | 1986 ? | |||
| Copy Program MB/s (MB/s) | 324.7 | 564 ? | |||
| Copy Game MB/s (MB/s) | 755 | 1110 ? | |||
| Total Average (Program / Settings) | -1% /
1% | -16% /
-14% | -3% /
-1% | -1% /
-0% |
* ... smaller is better

Continuous load read: DiskSpd Read Loop, Queue Depth 8
Graphics card
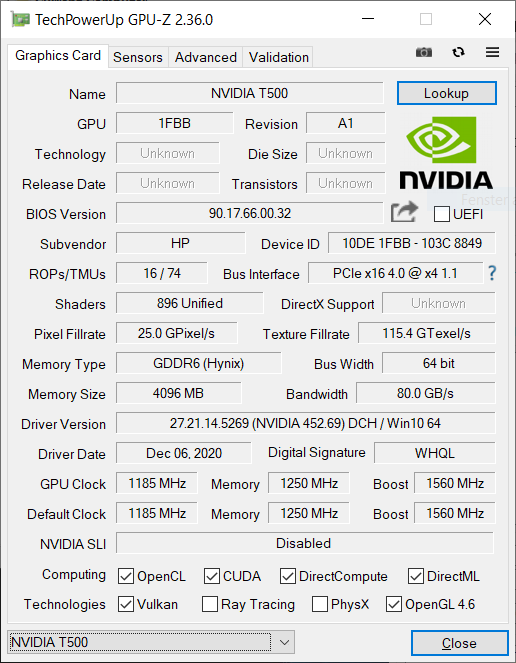
Nvidia's Quadro T500 Mobile is a graphics card for entry-level workstations. It's based on the same architecture as the Nvidia GeForce MX450, but it offers a higher clock rate and a driver that is optimized for professional applications. The T500 Mobile installed in the ZBook Firefly 14 G8 can access 4 GB of graphics memory; consequently, it achieves results in the 3DMark benchmarks that are at least 40% better than those of the Nvidia Quadro P520 in the ZBook Firefly 14 G7.
Our GPU Benchmarks article lists the performance offered by other graphics cards in comparison.
| 3DMark 06 Standard Score | 31133 points | |
| 3DMark 11 Performance | 8104 points | |
| 3DMark Ice Storm Standard Score | 70066 points | |
| 3DMark Cloud Gate Standard Score | 15851 points | |
| 3DMark Fire Strike Score | 4347 points | |
| 3DMark Time Spy Score | 2095 points | |
Help | ||
Gaming performance
The Nvidia Quadro T500 Mobile can also run games. Depending on the graphics performance requirements, even modern titles in Full HD resolution can be run smoothly at medium graphics settings.
The gaming performance that can be expected in comparison to other graphics cards is listed in our GPU Games article.
| The Witcher 3 - 1920x1080 High Graphics & Postprocessing (Nvidia HairWorks Off) | |
| Average of class Workstation (53.4 - 259, n=6, last 2 years) | |
| HP ZBook Firefly 14 G8 2C9Q2EA | |
| Asus Zenbook 14 UX435EG | |
| Acer SF514-55T | |
| Average NVIDIA T500 Laptop GPU (27.6 - 31.4, n=3) | |
| Dell Latitude 14 5411-WJ40N | |
| HP ZBook Firefly 14 G7 | |
| Cyberpunk 2077 1.0 - 1280x720 Low Preset | |
| Asus Zenbook 14 UX435EG | |
| HP ZBook Firefly 14 G8 2C9Q2EA | |
| Average NVIDIA T500 Laptop GPU (27.8 - 34.3, n=2) | |
| Far Cry 5 - 1920x1080 Medium Preset AA:T | |
| Average of class Workstation (42 - 148, n=14, last 2 years) | |
| HP ZBook Firefly 14 G8 2C9Q2EA | |
| Asus Zenbook 14 UX435EG | |
| Average NVIDIA T500 Laptop GPU (25 - 34, n=2) | |
| Acer SF514-55T | |
| low | med. | high | ultra | |
|---|---|---|---|---|
| The Witcher 3 (2015) | 96.2 | 56.9 | 31.4 | 21.9 |
| Dota 2 Reborn (2015) | 133 | 117 | 101 | 77.8 |
| Final Fantasy XV Benchmark (2018) | 49.1 | 25.2 | 16.7 | |
| X-Plane 11.11 (2018) | 75.6 | 64.2 | 56.4 | |
| Far Cry 5 (2018) | 72 | 34 | 33 | 32 |
| Star Wars Squadrons (2020) | 54.7 | 47.2 | 42.4 | |
| Immortals Fenyx Rising (2020) | 65 | 35 | 29 | 24 |
| Cyberpunk 2077 1.0 (2020) | 34.3 | 19.3 | 15 |
Emissions - High-frequency fan noise
Noise emissions
The fan of the HP ZBook Firefly 14 G8 reaches a noise level of up to 40.1 dB(A) under load. The resulting noise is uniform but also somewhat high-frequency. Users with sensitive ears might find this unpleasant. In office mode, however, the HP workstation is almost silent.
Noise level
| Idle |
| 28.7 / 28.7 / 28.7 dB(A) |
| Load |
| 34 / 40.1 dB(A) |
 | ||
30 dB silent 40 dB(A) audible 50 dB(A) loud |
||
min: | ||
Temperature
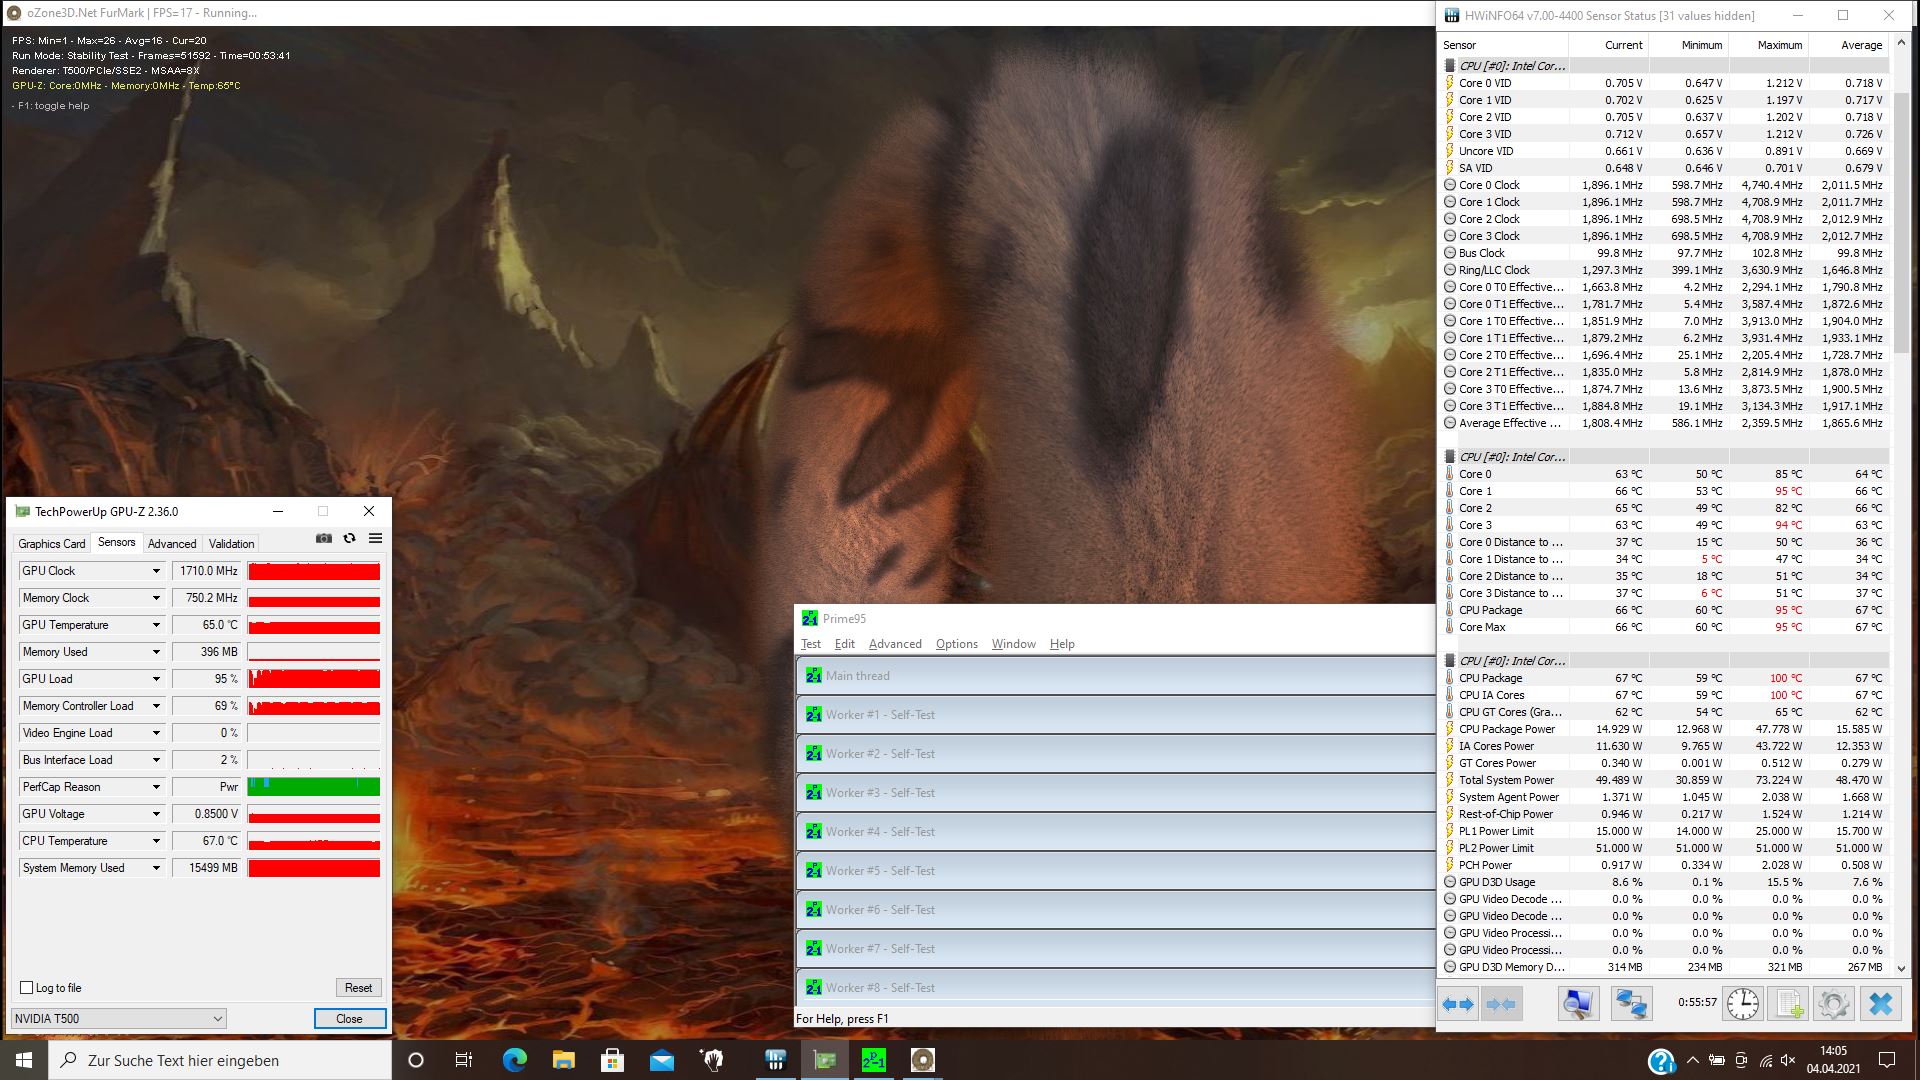
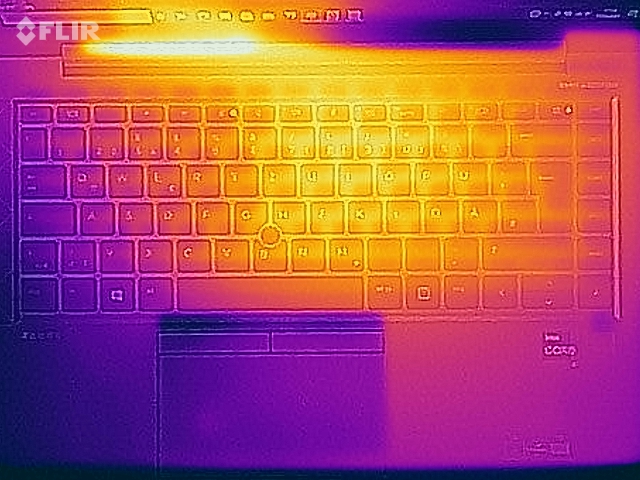
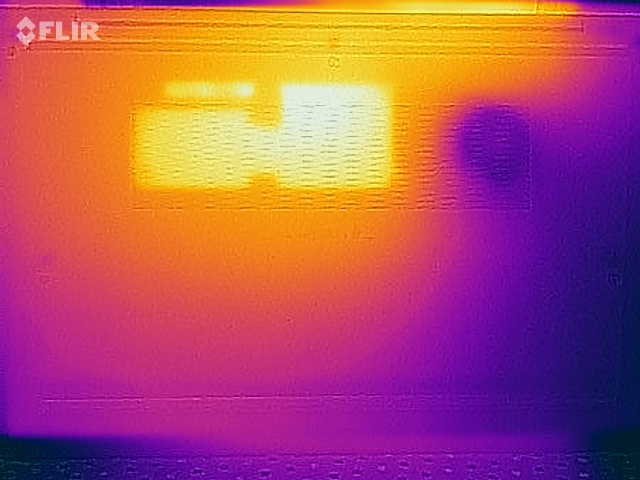
According to our measurements, the surface of the ZBook Firefly 14 G8 heats up to 49 °C (~120 °F) under load. The warmest point is at the center of the underside's rear section. The temperatures of the palm rests always remain moderate, so that the laptop can be used even under load.
During our approximately one-hour endurance stress test, the core temperatures in the interior of the HP ZBook 14 G8 rose up to 95 °C (~203 °F). The clock rates dropped below the base clock speed for a short time here, but they stabilized to an average value of about 2 GHz until the end of the test run. The system ran smoothly at all times; therefore, users don't need to worry about experiencing limitations due to excessive temperatures.
(±) The maximum temperature on the upper side is 42.6 °C / 109 F, compared to the average of 38.2 °C / 101 F, ranging from 22.2 to 69.8 °C for the class Workstation.
(-) The bottom heats up to a maximum of 49.4 °C / 121 F, compared to the average of 41.1 °C / 106 F
(+) In idle usage, the average temperature for the upper side is 23.9 °C / 75 F, compared to the device average of 32 °C / 90 F.
(±) Playing The Witcher 3, the average temperature for the upper side is 35.3 °C / 96 F, compared to the device average of 32 °C / 90 F.
(+) The palmrests and touchpad are cooler than skin temperature with a maximum of 31.4 °C / 88.5 F and are therefore cool to the touch.
(-) The average temperature of the palmrest area of similar devices was 27.8 °C / 82 F (-3.6 °C / -6.5 F).
Speakers
HP ZBook Firefly 14 G8 2C9Q2EA audio analysis
(±) | speaker loudness is average but good (80.2 dB)
Bass 100 - 315 Hz
(±) | reduced bass - on average 13.5% lower than median
(±) | linearity of bass is average (10.6% delta to prev. frequency)
Mids 400 - 2000 Hz
(+) | balanced mids - only 4% away from median
(+) | mids are linear (3.2% delta to prev. frequency)
Highs 2 - 16 kHz
(+) | balanced highs - only 3.1% away from median
(+) | highs are linear (3.1% delta to prev. frequency)
Overall 100 - 16.000 Hz
(±) | linearity of overall sound is average (15.2% difference to median)
Compared to same class
» 32% of all tested devices in this class were better, 10% similar, 58% worse
» The best had a delta of 7%, average was 17%, worst was 35%
Compared to all devices tested
» 21% of all tested devices were better, 4% similar, 75% worse
» The best had a delta of 4%, average was 24%, worst was 134%
Lenovo ThinkPad P14s Gen1-20Y10002GE audio analysis
(±) | speaker loudness is average but good (76.3 dB)
Bass 100 - 315 Hz
(±) | reduced bass - on average 13.7% lower than median
(±) | linearity of bass is average (10.4% delta to prev. frequency)
Mids 400 - 2000 Hz
(±) | higher mids - on average 6% higher than median
(+) | mids are linear (5.2% delta to prev. frequency)
Highs 2 - 16 kHz
(+) | balanced highs - only 2.7% away from median
(+) | highs are linear (4.3% delta to prev. frequency)
Overall 100 - 16.000 Hz
(±) | linearity of overall sound is average (16.7% difference to median)
Compared to same class
» 45% of all tested devices in this class were better, 9% similar, 45% worse
» The best had a delta of 7%, average was 17%, worst was 35%
Compared to all devices tested
» 28% of all tested devices were better, 7% similar, 65% worse
» The best had a delta of 4%, average was 24%, worst was 134%
Energy management - Considerably improved battery life
Energy consumption
Our measurements show that the ZBook Firefly 14 G8 has an average idle power consumption of 4.7 watts. This makes it much more energy-efficient in moderate use than its predecessor, the HP ZBook Firefly 14 G7. However, the gap is much smaller in terms of maximum energy consumption with up to 68.5 watts compared to 69.4 watts.
With a rated output of 65 watts, the capacity of the power adapter that is included with the ZBook Firefly 14 G8 is somewhat limited.
| Off / Standby | |
| Idle | |
| Load |
|
Key:
min: | |
| HP ZBook Firefly 14 G8 2C9Q2EA i7-1165G7, T500 Laptop GPU, Toshiba XG6 KXG60ZNV1T02, IPS, 1920x1080, 14" | Lenovo ThinkPad P14s Gen1-20Y10002GE R7 PRO 4750U, Vega 7, Samsung PM981a MZVLB1T0HBLR, a-Si IPS LED, 1920x1080, 14" | HP ZBook Firefly 14 G7 i7-10610U, Quadro P520, Toshiba XG6 KXG60ZNV512G, IPS, 1920x1080, 14" | Dell Latitude 14 5411-WJ40N i7-10850H, GeForce MX250, SK Hynix PC611 512GB, IPS, 1920x1080, 14" | Average NVIDIA T500 Laptop GPU | Average of class Workstation | |
|---|---|---|---|---|---|---|
| Power Consumption | -15% | -21% | -28% | -20% | -133% | |
| Idle Minimum * (Watt) | 3.1 | 4.8 -55% | 3.3 -6% | 3.1 -0% | 4.18 ? -35% | 8.89 ? -187% |
| Idle Average * (Watt) | 4.7 | 8.8 -87% | 9.3 -98% | 5.4 -15% | 7.68 ? -63% | 13.4 ? -185% |
| Idle Maximum * (Watt) | 8.6 | 11.4 -33% | 12.1 -41% | 9 -5% | 10.7 ? -24% | 17.6 ? -105% |
| Load Average * (Watt) | 64.8 | 45.2 30% | 59.4 8% | 84 -30% | 52.6 ? 19% | 91.7 ? -42% |
| Witcher 3 ultra * (Watt) | 59.6 | 42.2 29% | 52.7 12% | |||
| Load Maximum * (Watt) | 68.5 | 50 27% | 69.4 -1% | 131 -91% | 67.4 ? 2% | 170.2 ? -148% |
* ... smaller is better
Battery life
In our real-world Wi-Fi test, the ZBook Firefly 14 G8 achieves a very good runtime of almost 13 hours. This means that it can utilize its 53 Wh battery very well; it also outperforms the rivals in our test field that are equipped with a larger battery capacity.
When the HP laptop is charged with a 65-watt power adapter, it's provided with enough power to last another five hours after being charged for only half an hour thanks to its fast-charging capability.
| HP ZBook Firefly 14 G8 2C9Q2EA i7-1165G7, T500 Laptop GPU, 53 Wh | Lenovo ThinkPad P14s Gen1-20Y10002GE R7 PRO 4750U, Vega 7, 50 Wh | HP ZBook Firefly 14 G7 i7-10610U, Quadro P520, 53 Wh | Dell Latitude 14 5411-WJ40N i7-10850H, GeForce MX250, 68 Wh | Average of class Workstation | |
|---|---|---|---|---|---|
| Battery runtime | -65% | -43% | -34% | -51% | |
| WiFi v1.3 (h) | 12.8 | 5.8 -55% | 10.1 -21% | 8.5 -34% | 8.4 ? -34% |
| Load (h) | 4.3 | 1.1 -74% | 1.5 -65% | 1.364 ? -68% |
Pros
Cons
Verdict - HP significantly improves the ZBook Firefly 14

In the configuration before us, the HP ZBook Firefly 14 G8 presents itself as thoroughly improved laptop compared to the Firefly 14 G7 predecessor. The omission of SureView benefits the display quality, and PWM is no longer present either. The upgrade to Intel's Tiger Lake CPU increases the processor's performance significantly, especially in single-core mode, and the Quadro T500 also proves to be much stronger than the previously used Quadro P520, even though it's an entry-level graphics card for workstations.
The upgrade to Tiger Lake and Nvidia's Quadro T500 make the HP ZBook Firefly 14 G8 significantly more powerful. However, some of the predecessor's points of criticism are still present.
Nevertheless, some points of criticism remain, and the intensity of their impact will vary based on the user's behavior. For instance, the lack of a memory card reader and Gigabit LAN port is certainly bearable. On the other hand, the fact that you can't upgrade RAM is a bit more annoying. While this is admittedly beneficial for the slim build, it's not if you want to use the device for as long as possible. Users who need 32 GB of RAM will only find it in the most expensive configuration with the Intel Core i7-1185G7.
Price and availability
You can find the HP ZBook Firefly 14 G8 with the Intel Core i7-1165G7, 16 GB of RAM, and a 512 GB SSD on Amazon for about $2,245. Alternatively, you can also find further configurations of the Firefly 14 G8 on the manufacturer's webstore.
HP ZBook Firefly 14 G8 2C9Q2EA
- 04/05/2021 v7 (old)
Mike Wobker
Price comparison

