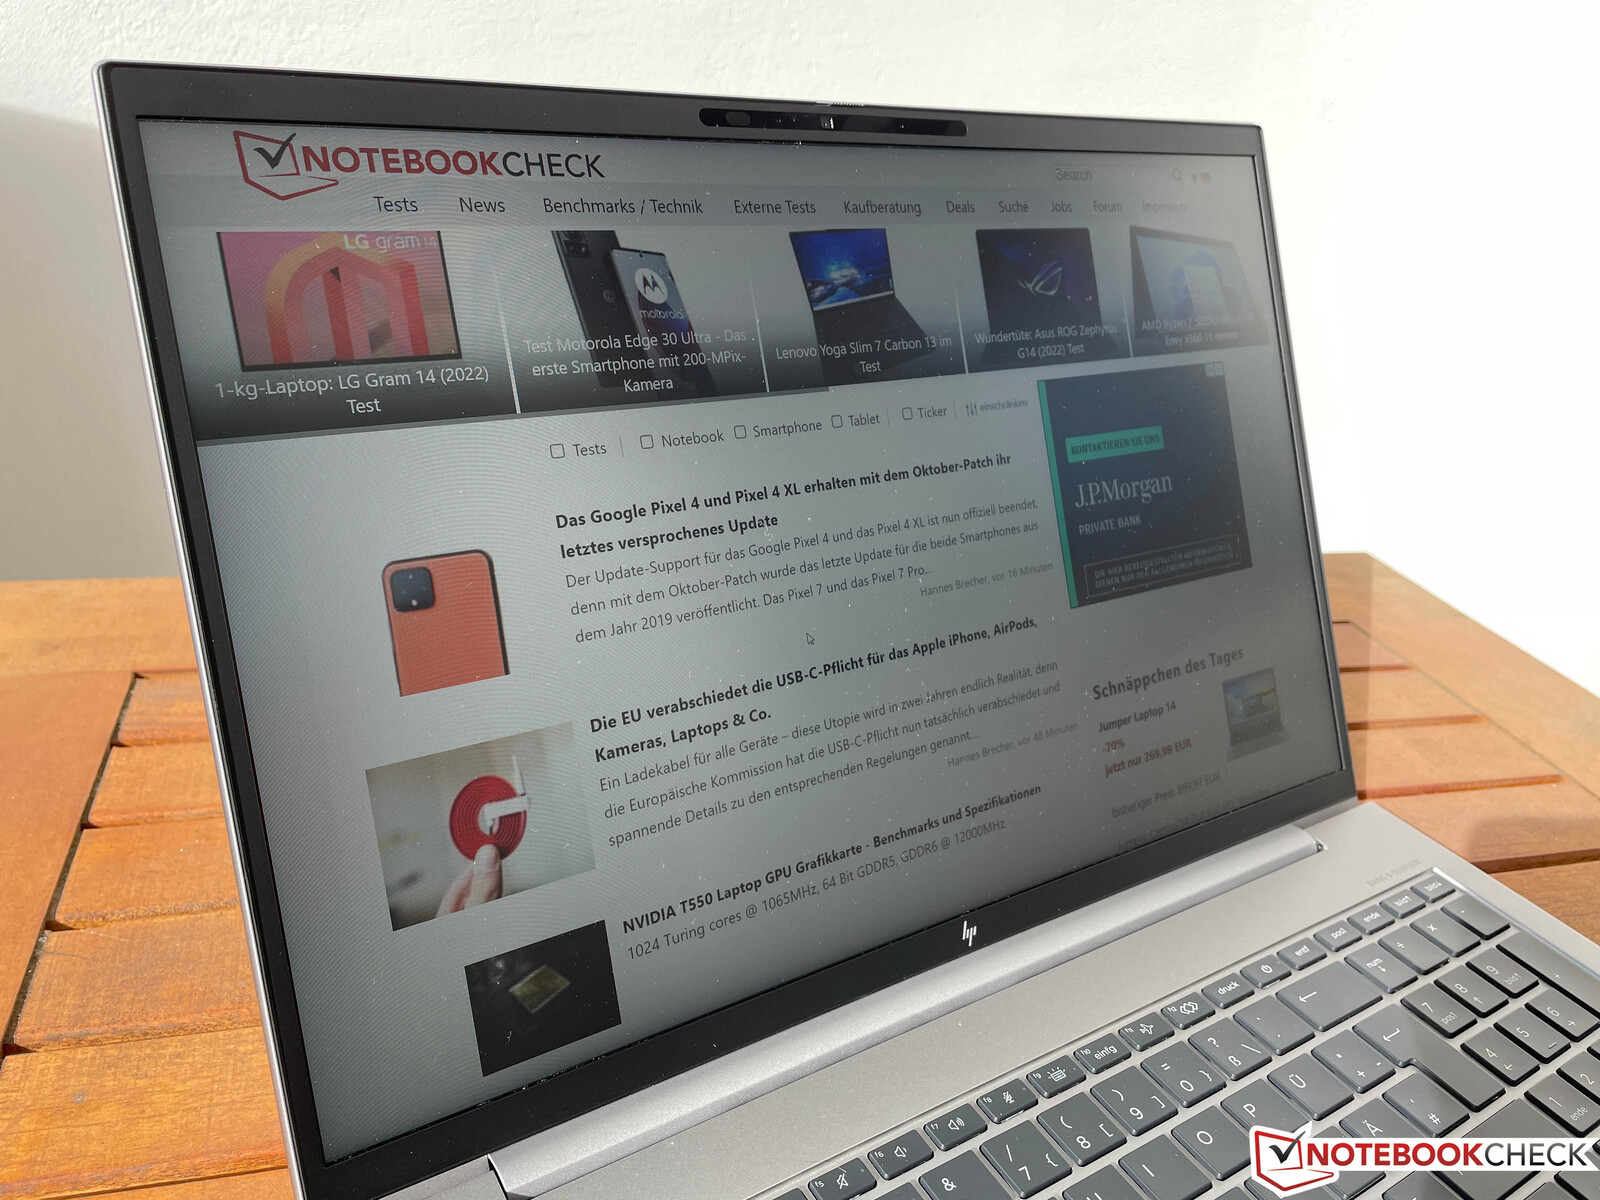
HP ZBook Firefly 16 G9 laptop in review - Mobile workstation with underwhelming performance
HP's ZBook Firefly series has consisted of slim workstation with entry-level professional GPUs for years, albeit only in the 14-inch and 15-inch form factor. This year's Firefly 16 G9 comes with a larger 16-inch display and like the smaller models, has been labelled the 9th generation by HP. The aluminum case contains a new Alder Lake-U processor from Intel and a professional-grade T550 GPU from Nvidia. Additionally, the laptop comes with 32 GB of RAM, a 1-TB SSD, and a matte IPS display with a 16:10 aspect ratio (1920 x 1200 pixels) for around 3000 USD currently.
Potential Competitors in Comparison
Rating | Date | Model | Weight | Height | Size | Resolution | Price |
|---|---|---|---|---|---|---|---|
| 82.9 % v7 (old) | 10 / 2022 | HP ZBook Firefly 16 G9-6B897EA i7-1265U, T550 Laptop GPU | 2 kg | 19.2 mm | 16.00" | 1920x1200 | |
| 89.3 % v7 (old) | 02 / 2022 | Lenovo ThinkPad P1 G4-20Y4Z9DVUS i7-11800H, T1200 Laptop GPU | 1.8 kg | 17.7 mm | 16.00" | 2560x1600 | |
| 88.3 % v7 (old) | 10 / 2021 | Dell Precision 5000 5560 i7-11850H, RTX A2000 Laptop GPU | 2 kg | 18 mm | 15.60" | 3840x2400 | |
| 85.3 % v7 (old) | 06 / 2021 | Lenovo ThinkPad P15s Gen2-20W6000GGE i7-1165G7, T500 Laptop GPU | 1.9 kg | 19.1 mm | 15.60" | 3840x2160 | |
| 83.8 % v7 (old) | 04 / 2021 | HP ZBook Firefly 15 G8 2C9R7EA i7-1165G7, T500 Laptop GPU | 1.8 kg | 19.2 mm | 15.60" | 1920x1080 | |
| 93.2 % v7 (old) | 11 / 2021 | Apple MacBook Pro 16 2021 M1 Pro M1 Pro, M1 Pro 16-Core GPU | 2.2 kg | 16.8 mm | 16.20" | 3456x2234 |
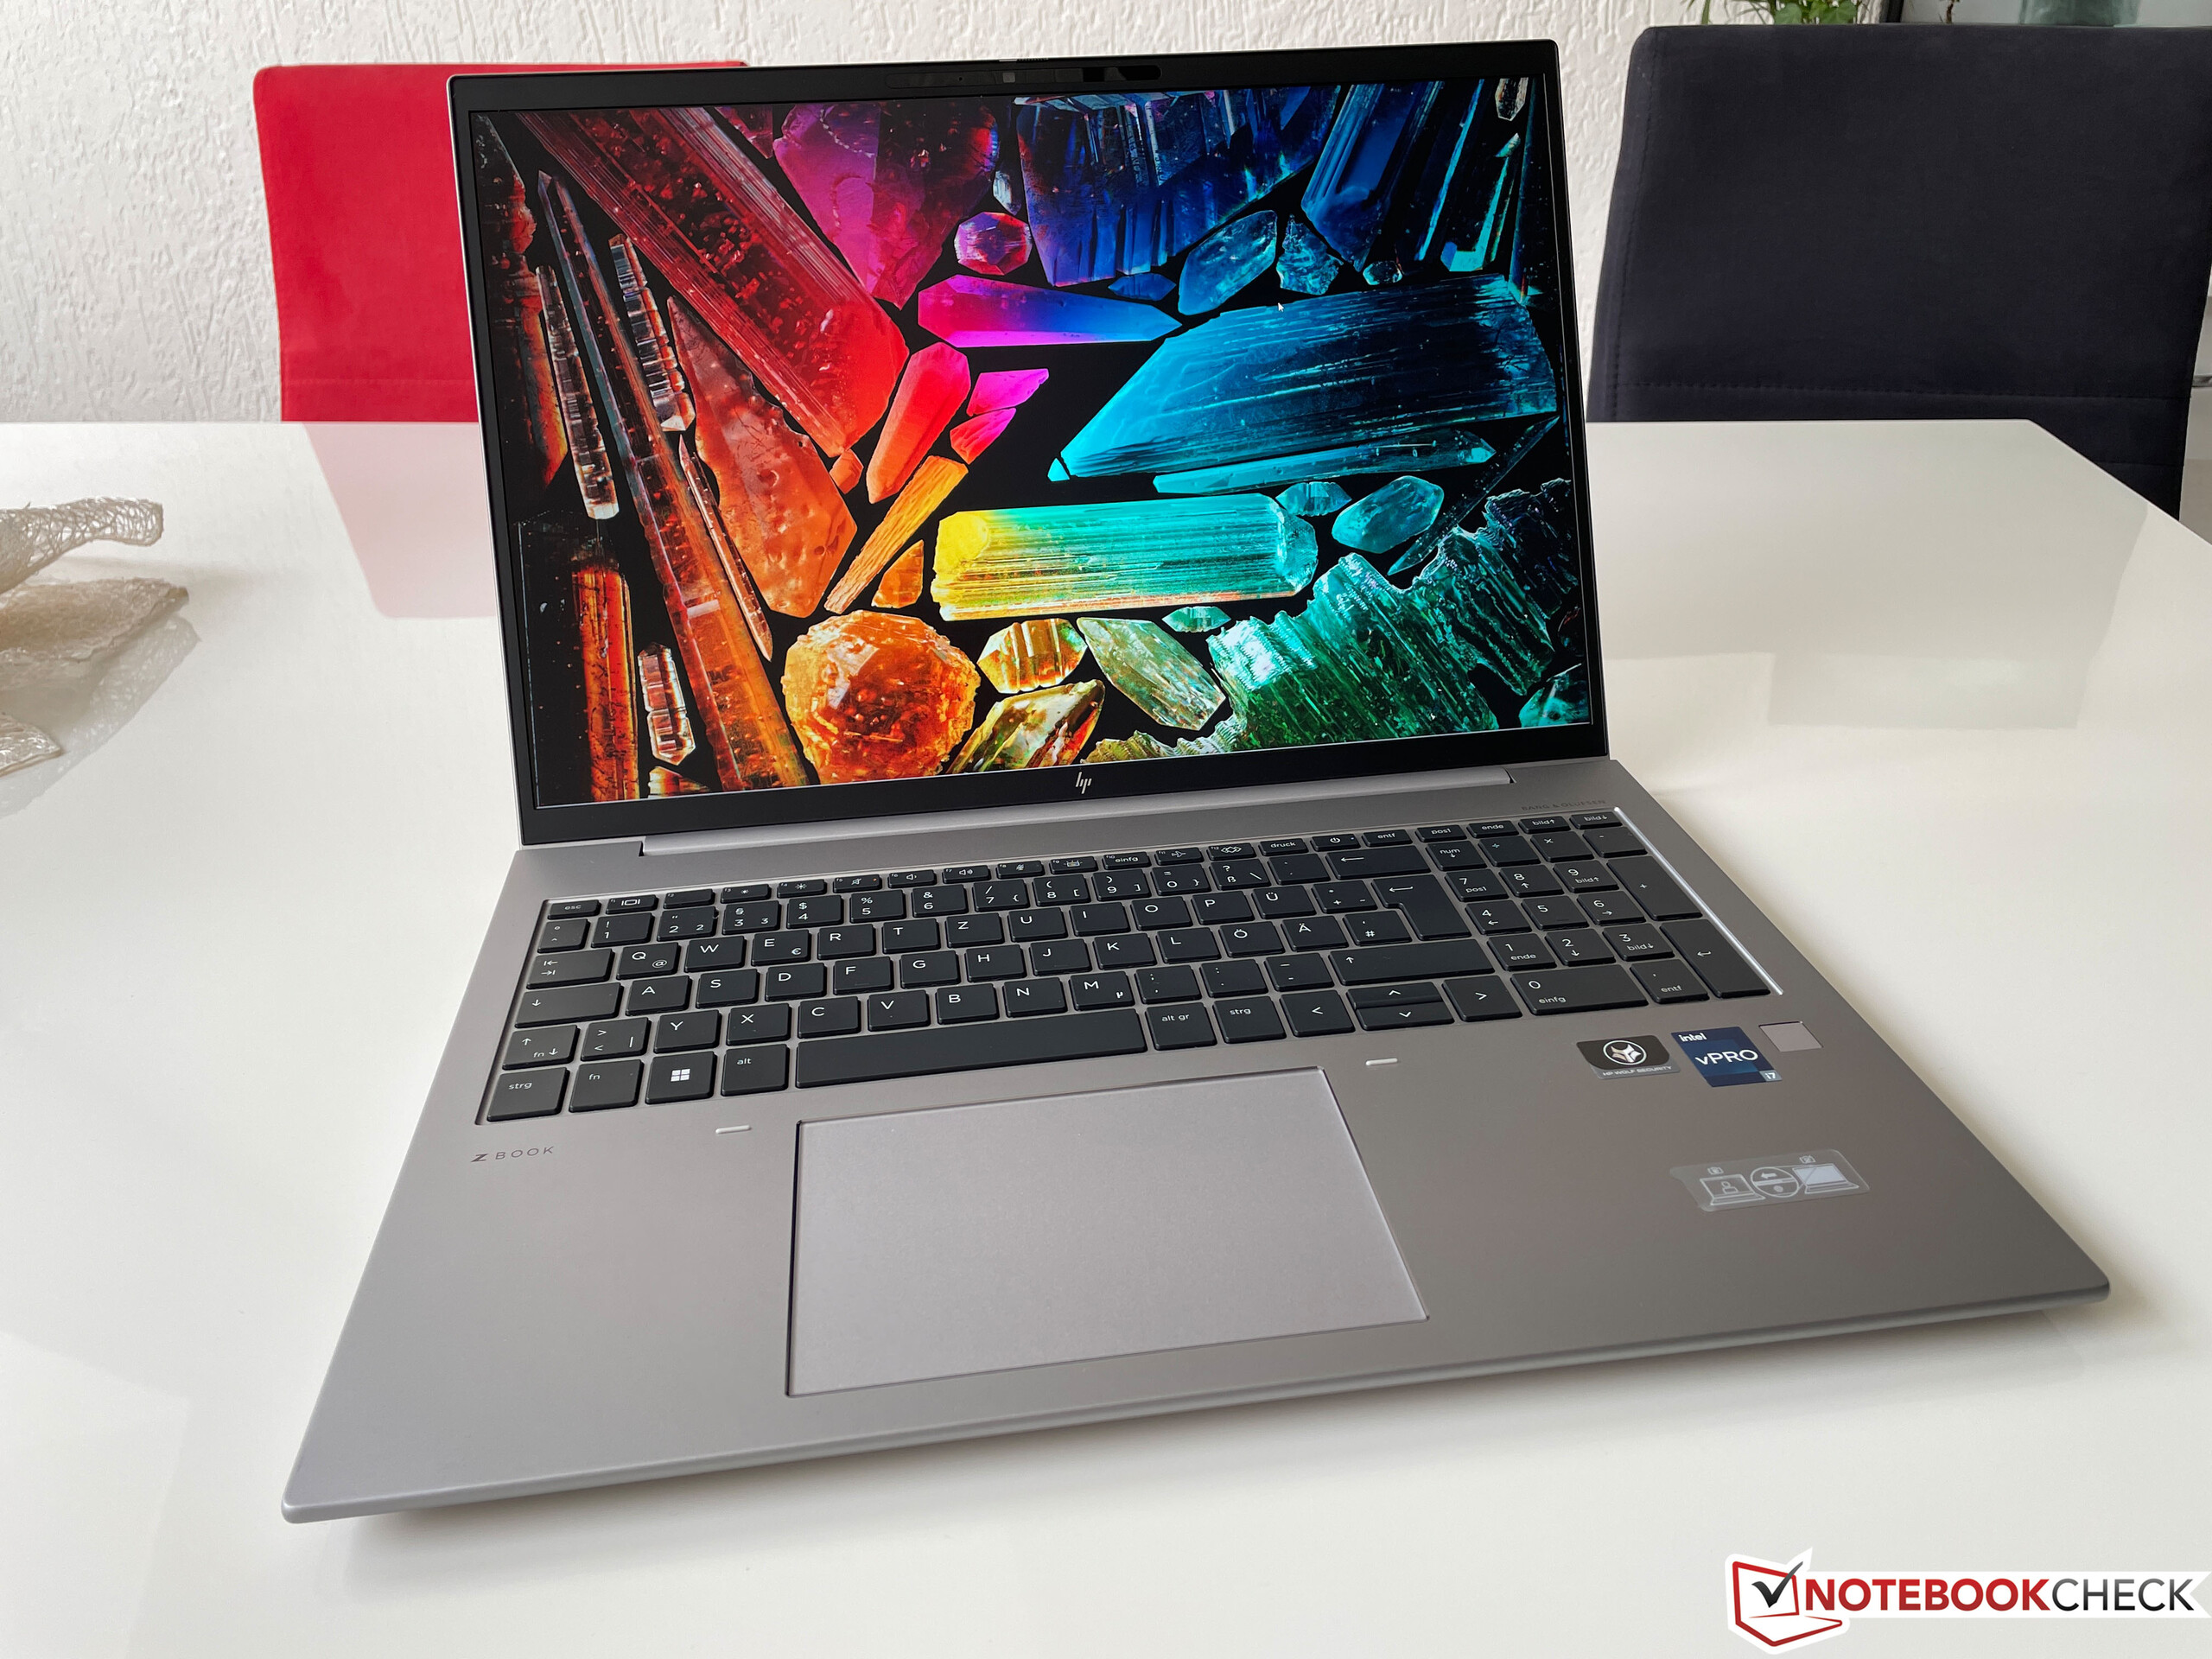
Case - HP Uses a Premium Aluminum Shell
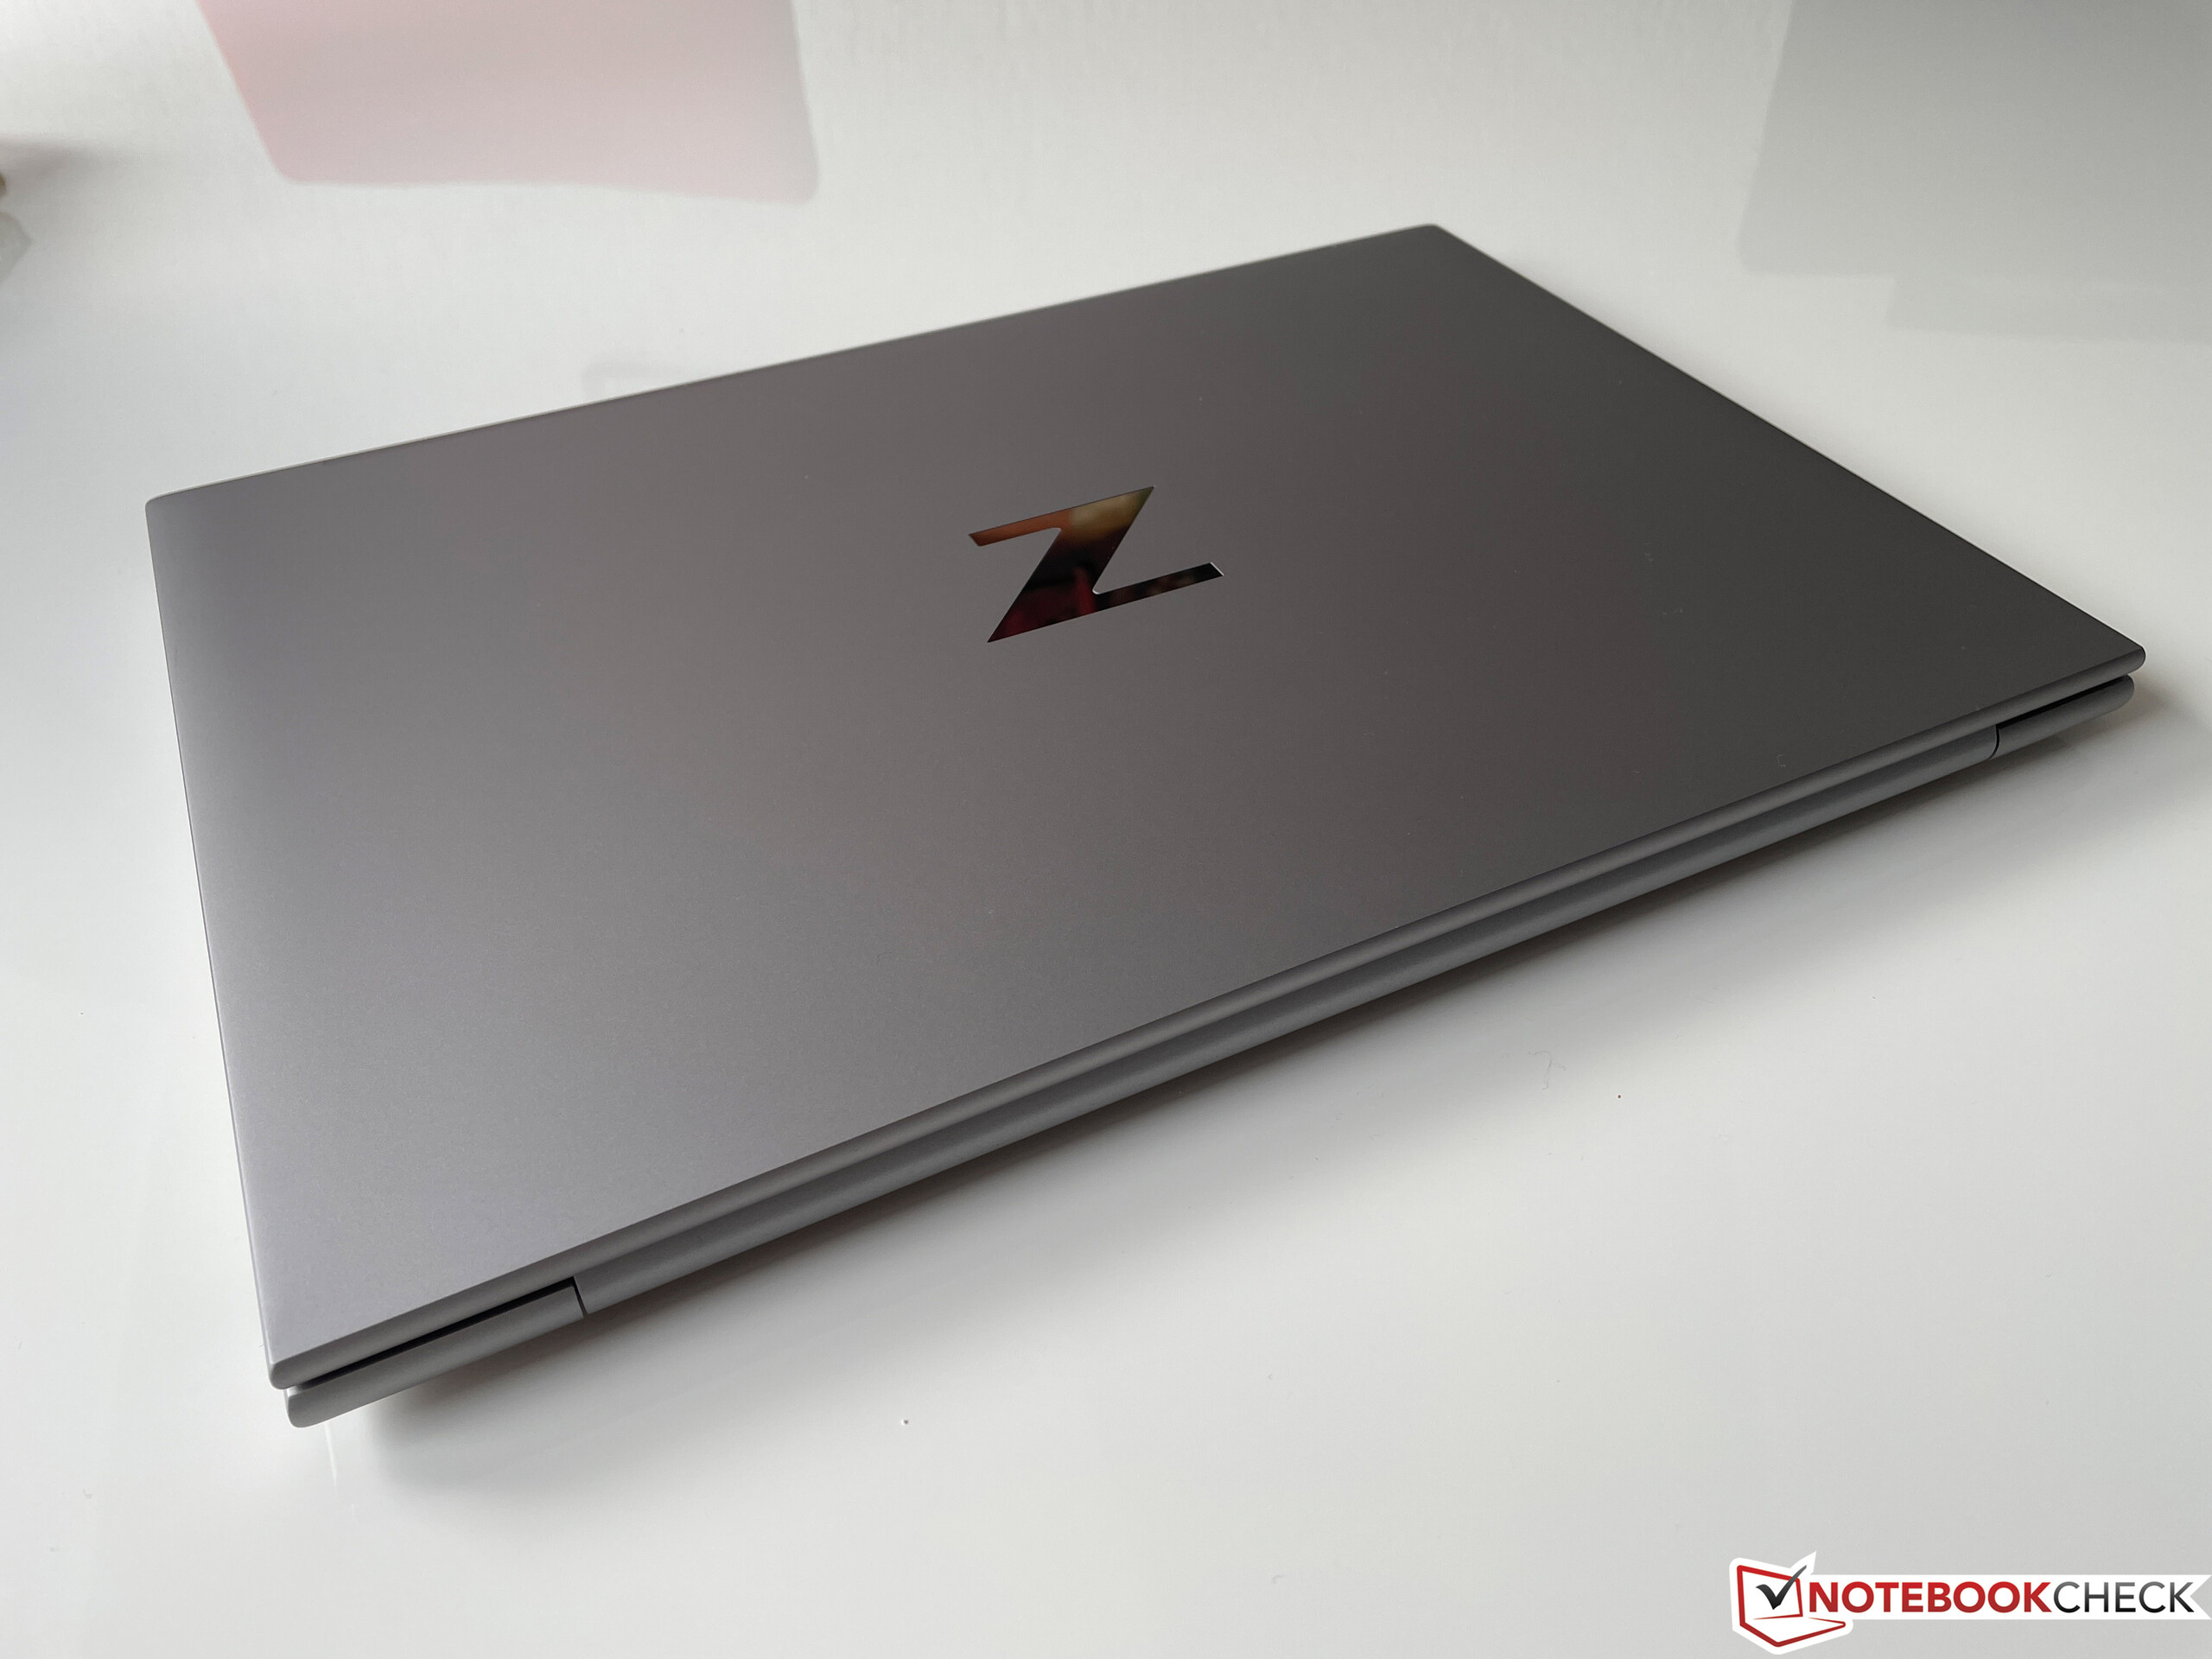
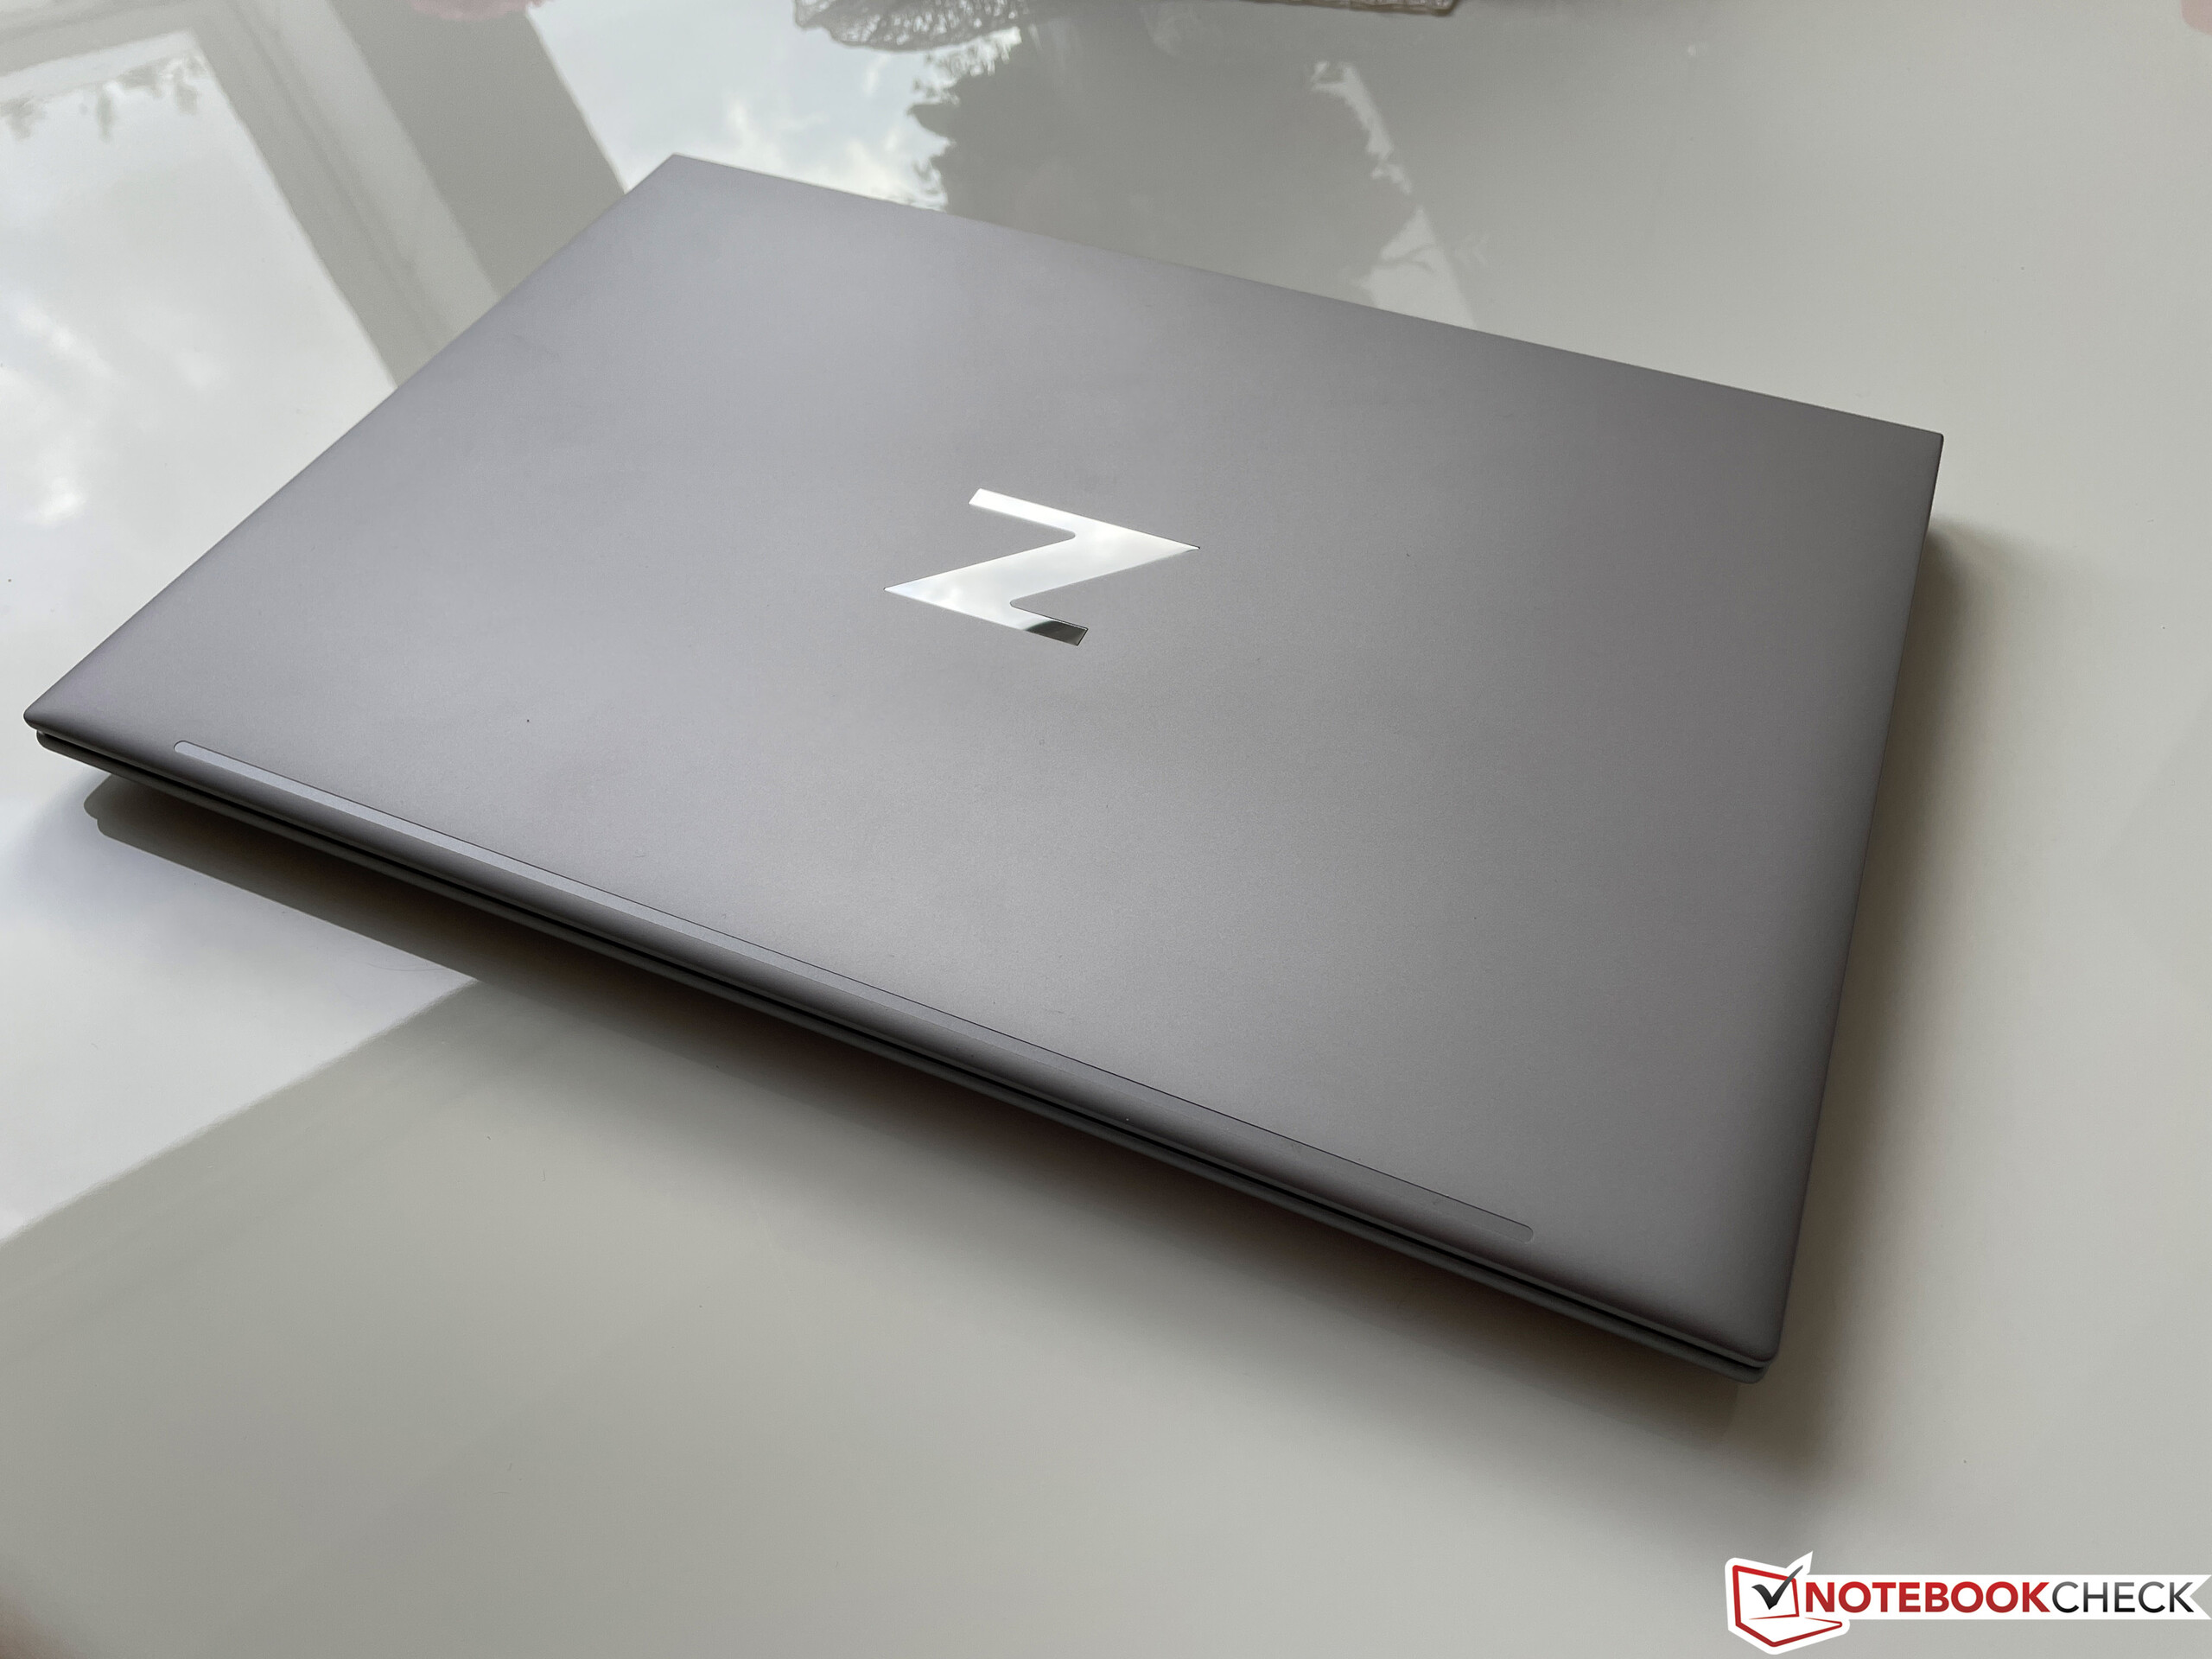
Compared to last year's G8 models, HP uses more rounded-off design elements for the newer Firefly G9 (this includes both the 16-inch and the 14-inch models) with good haptics. It offers no big surprises and the silver chassis, which consists entirely of aluminum, makes a very premium impression. The base unit is extremely resistant against twisting from the corners and barely yields under pressure. The lid continues this trend with minimal susceptibility to twisting and no distortions on the display even under focused pressure on the back. Meanwhile, the hinges are slightly too loose. While the display can easily be opened with one hand, the hinges do not completely prevent teetering or the display from closing at small angles. The display can be opened to a maximum angle of 180 degrees.
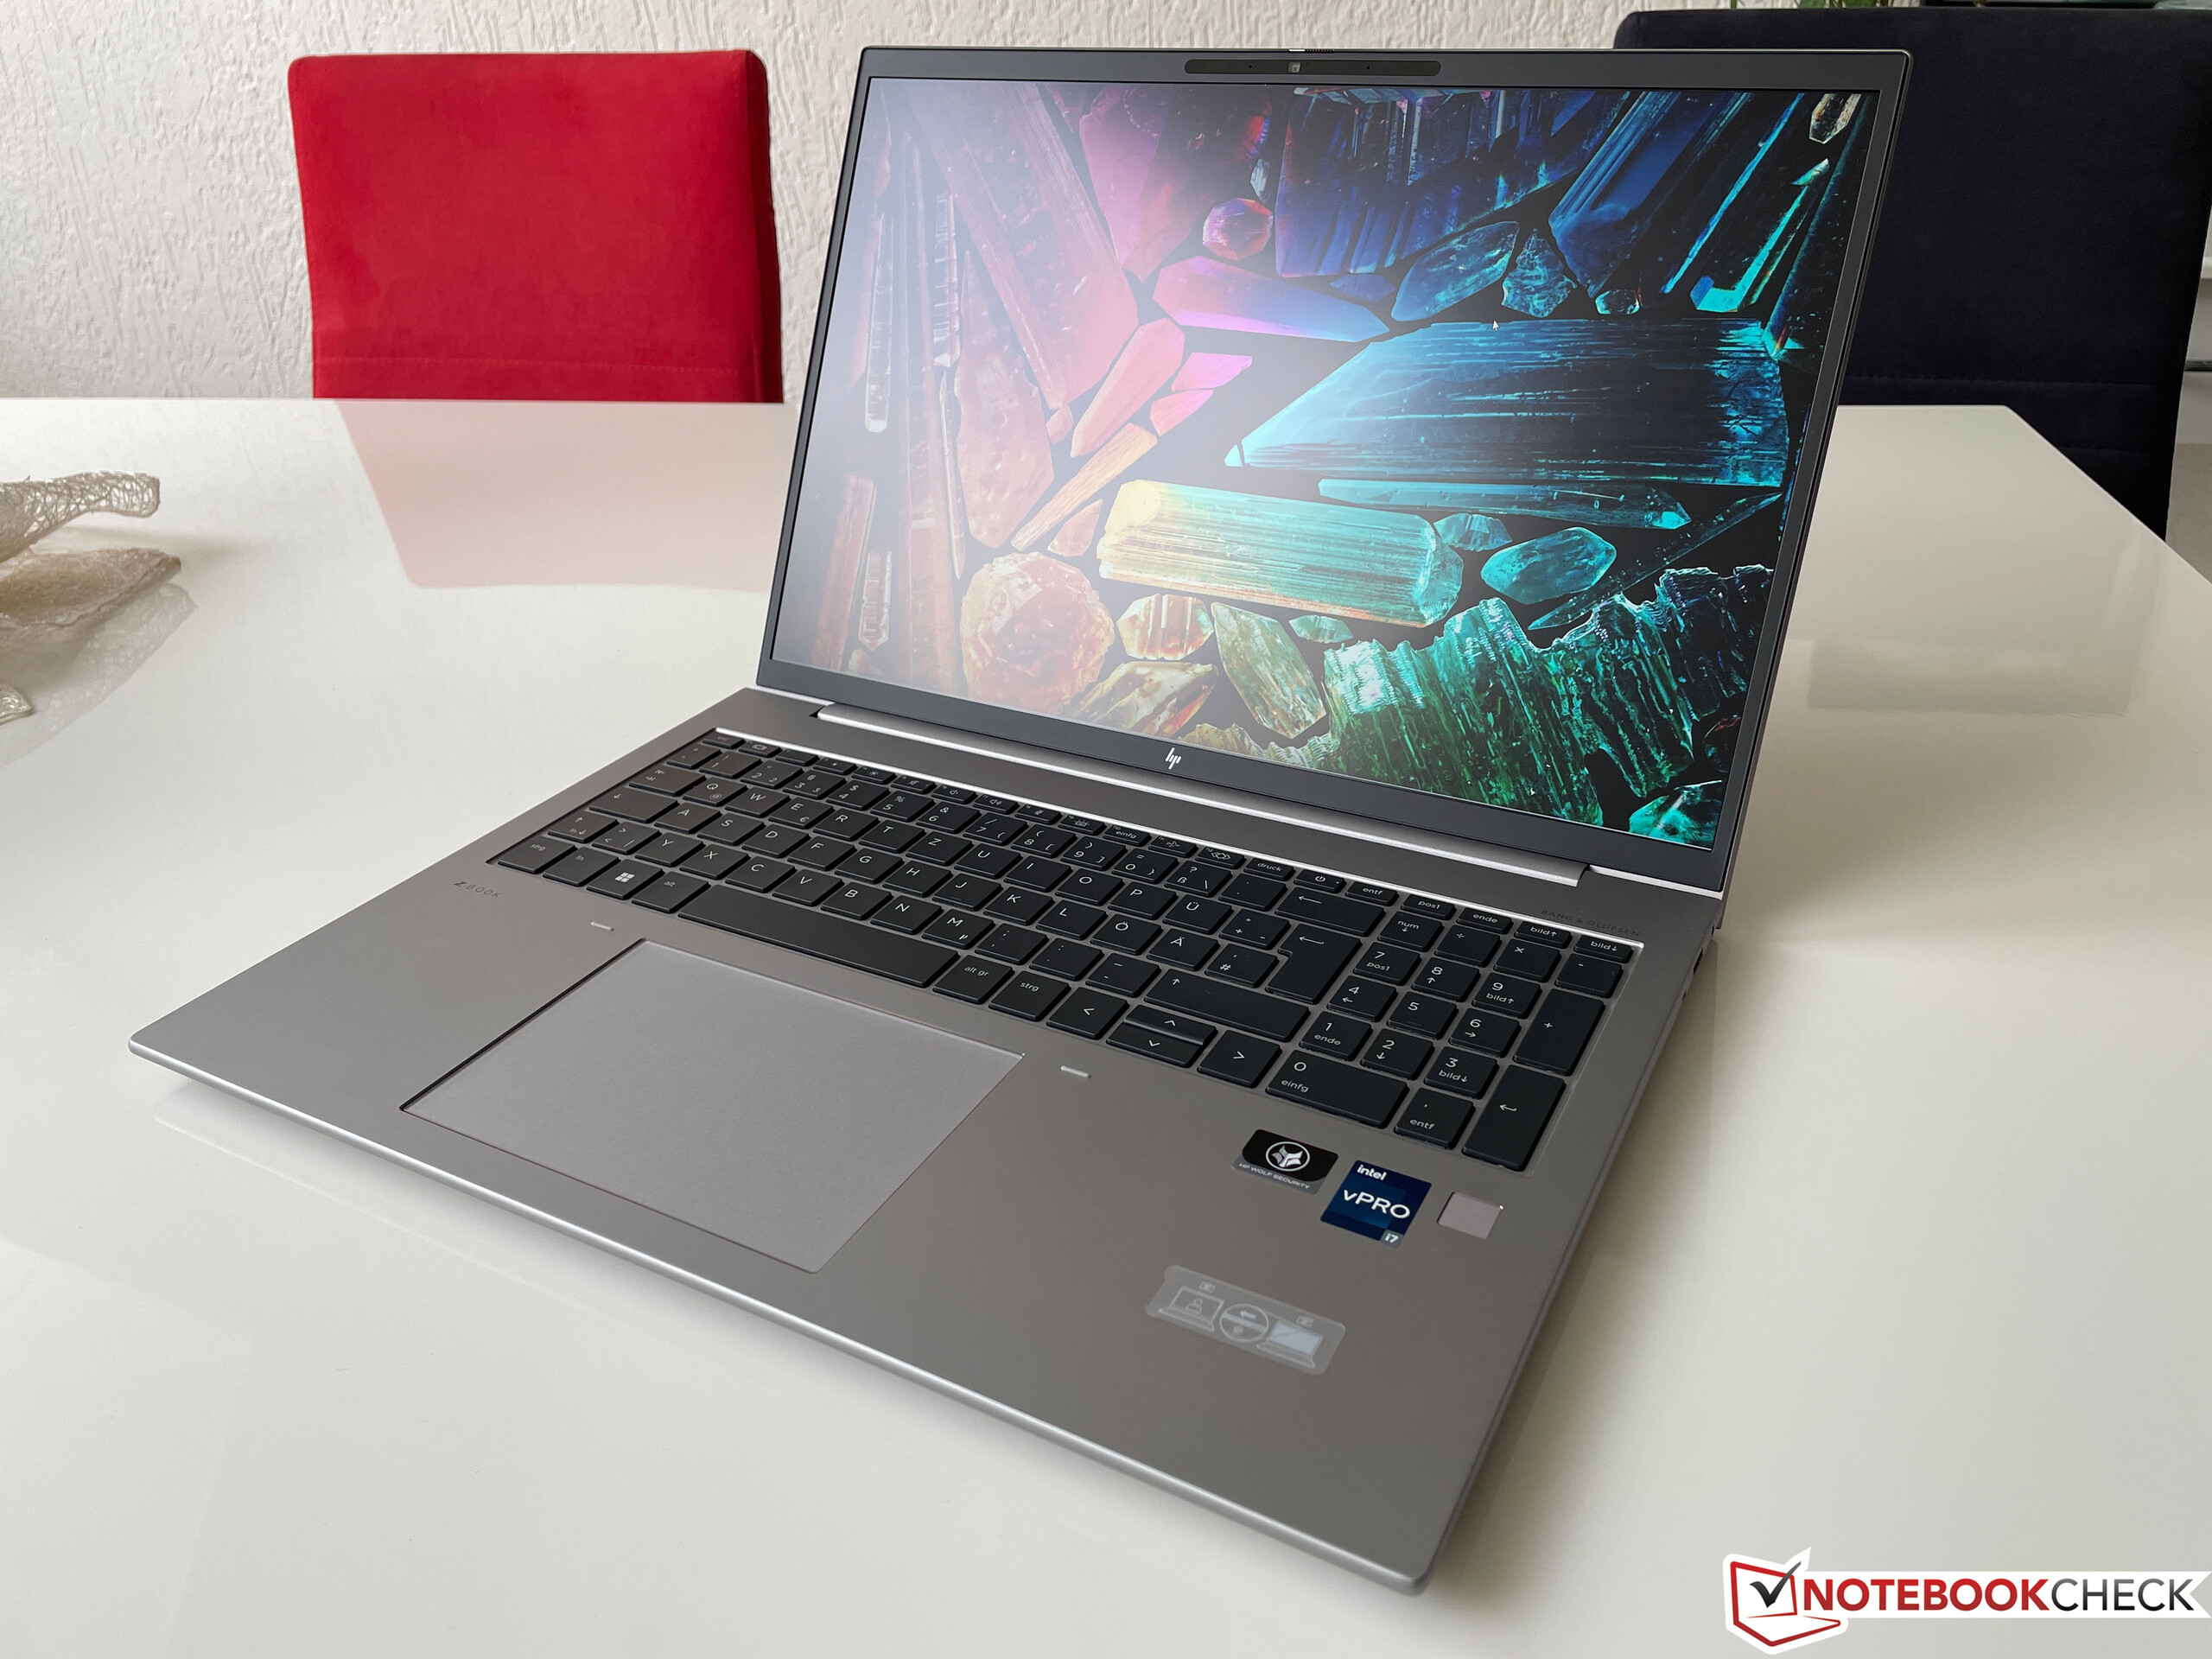
The ZBook Firefly is fairly subtle visually, since the glossy Z logo on the lid, the black keyboard, and the black display bezels are the only noticeable contrasting elements. The bezels on all sides are fairly narrow and the device looks very modern overall.
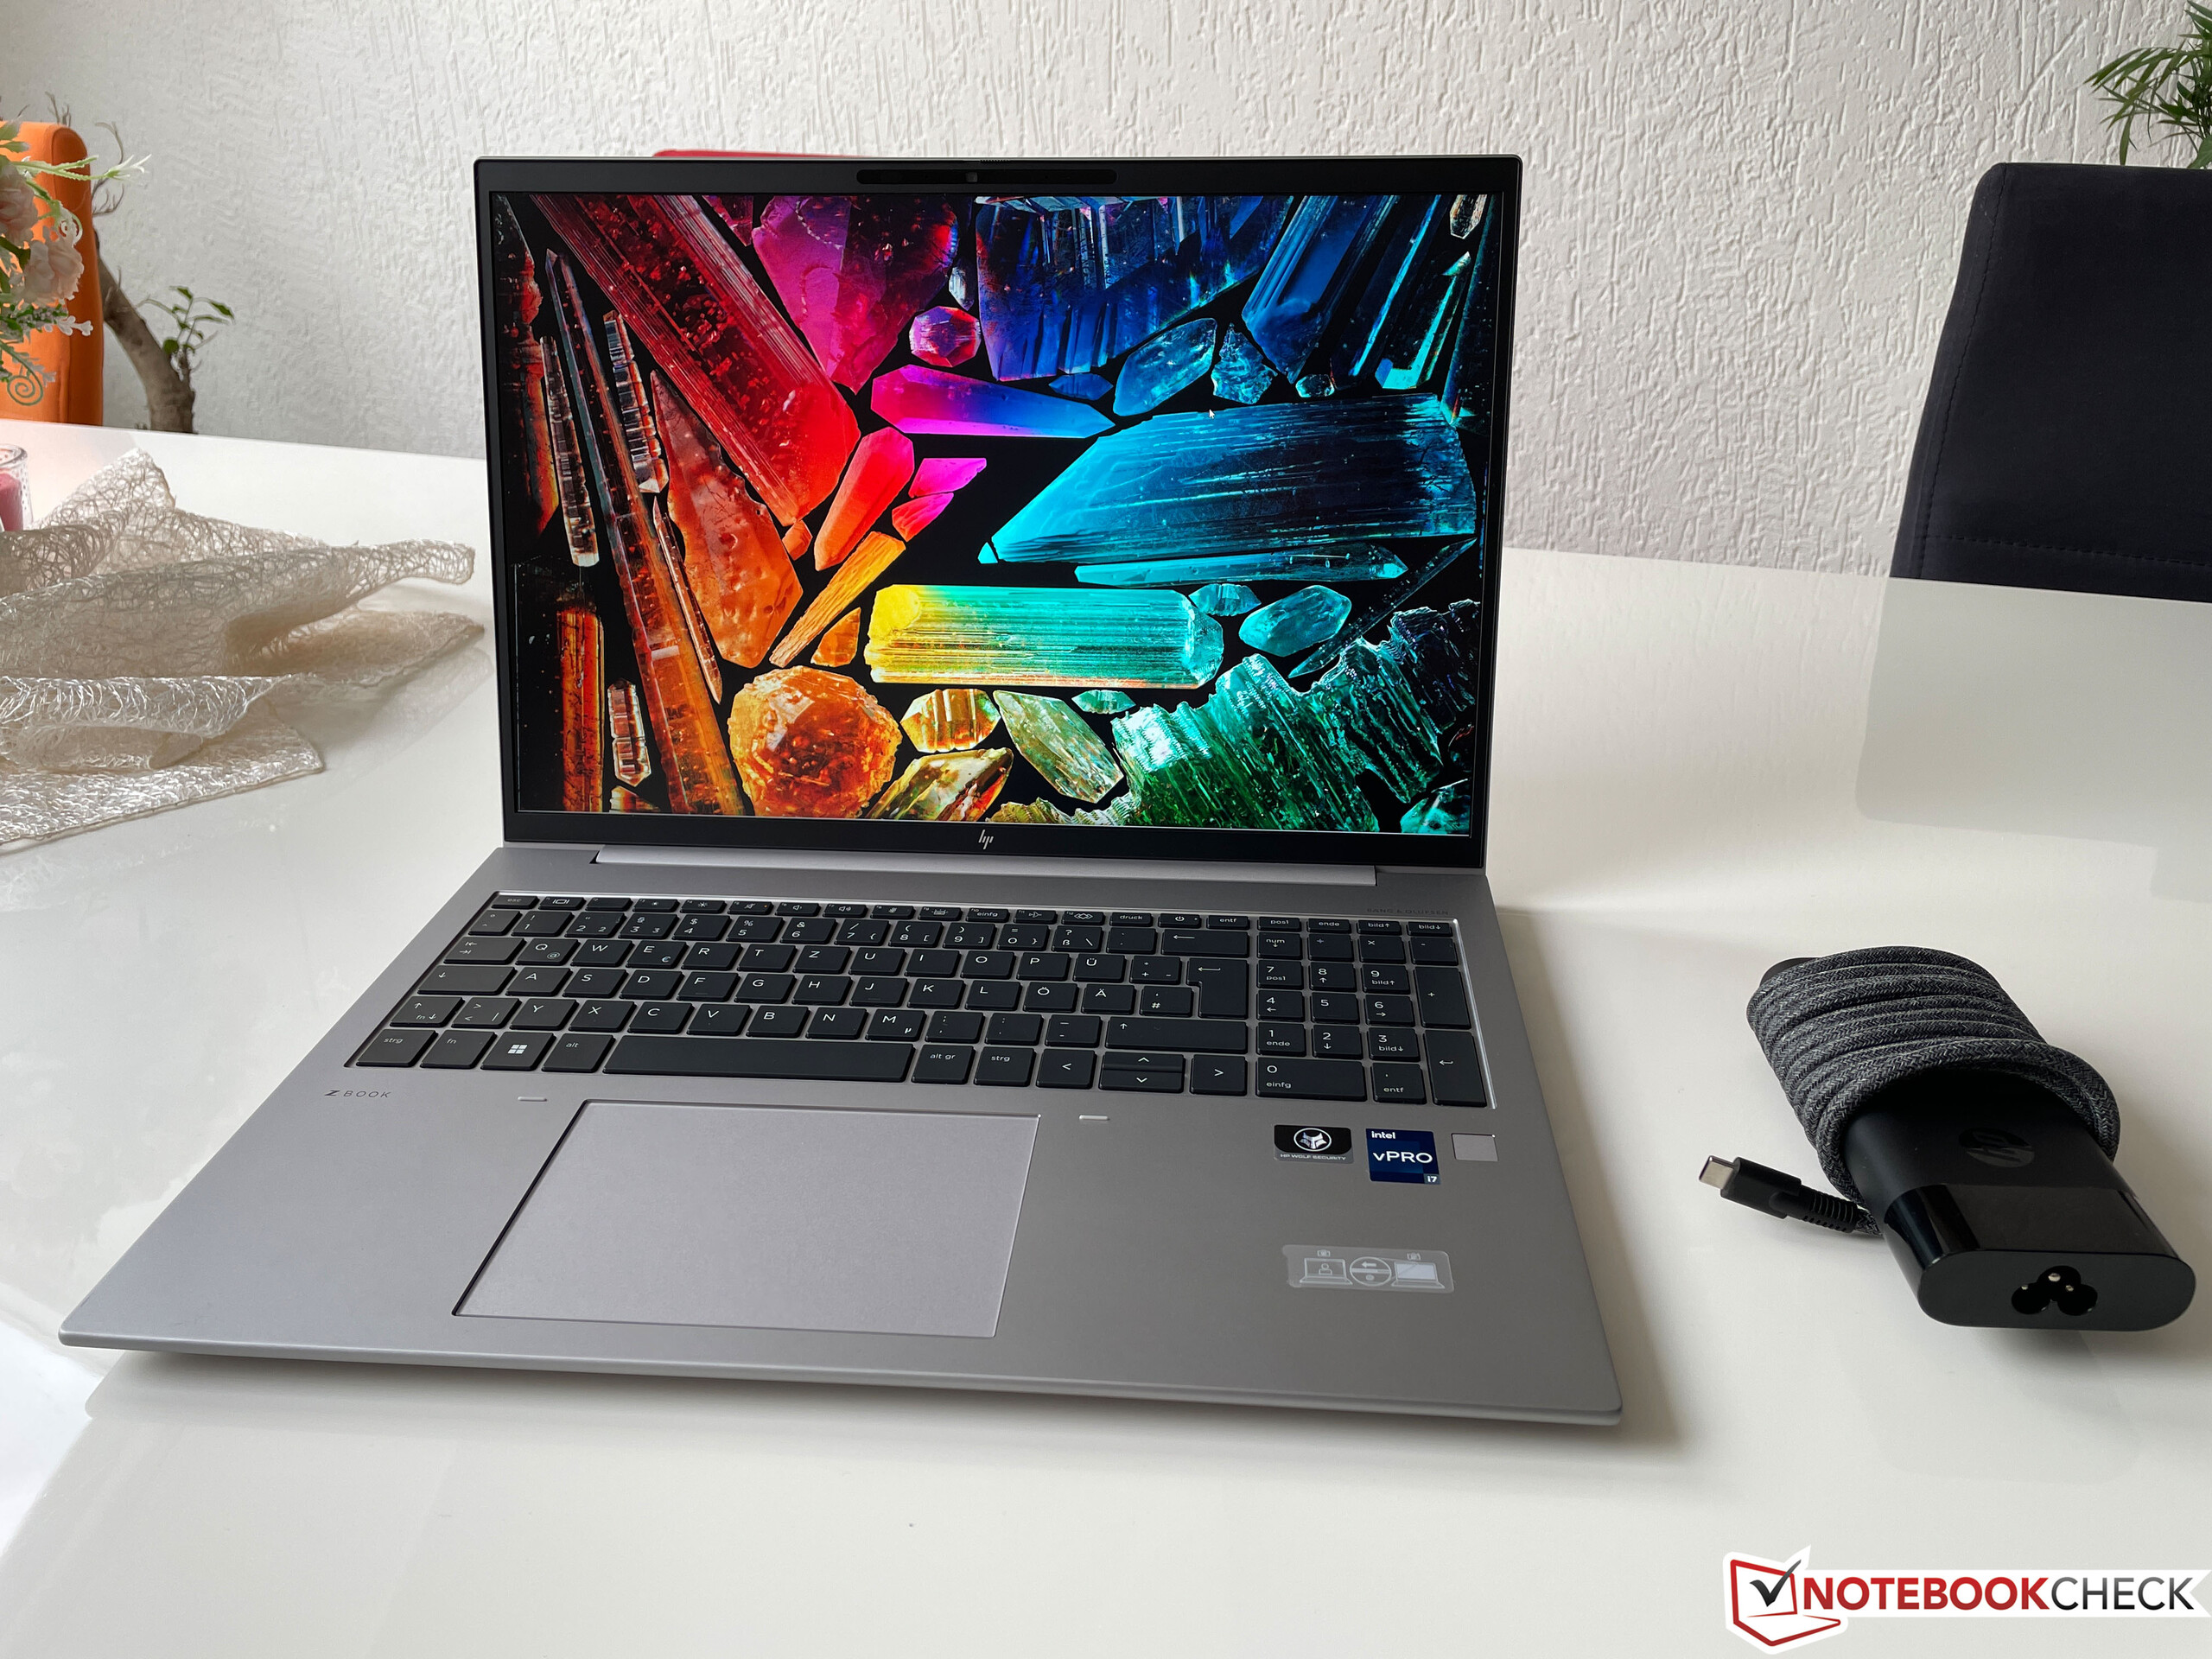
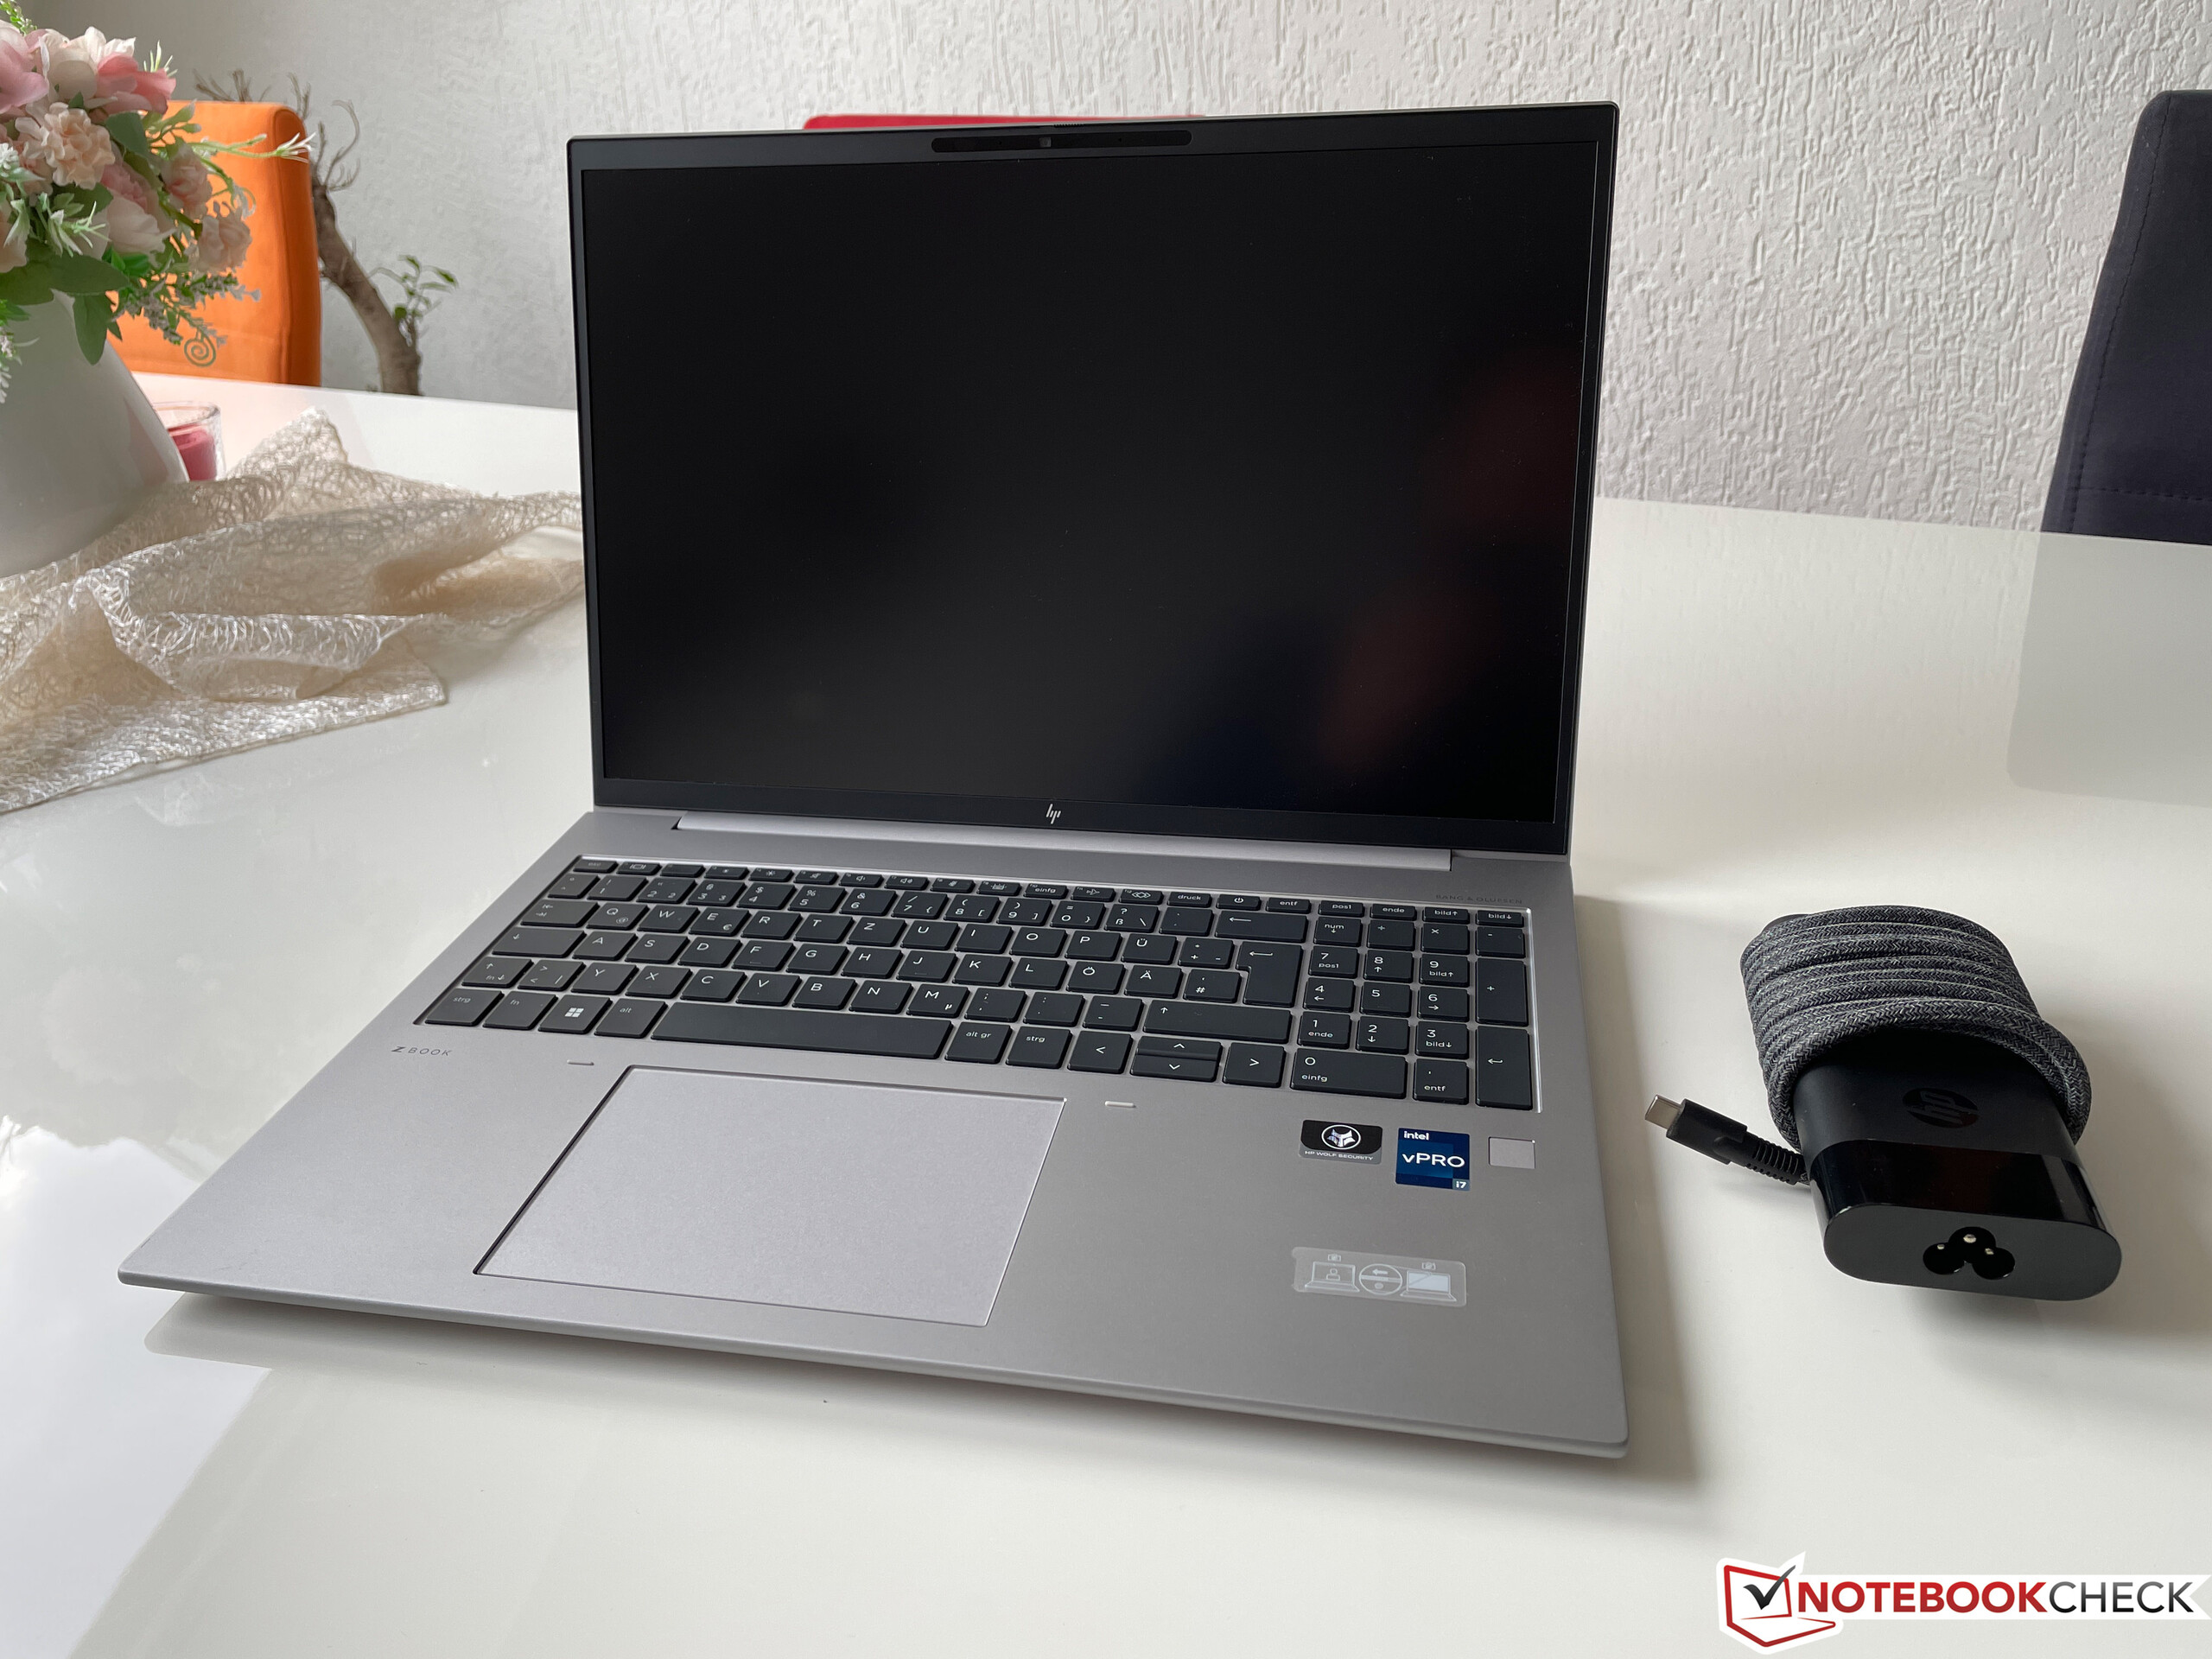
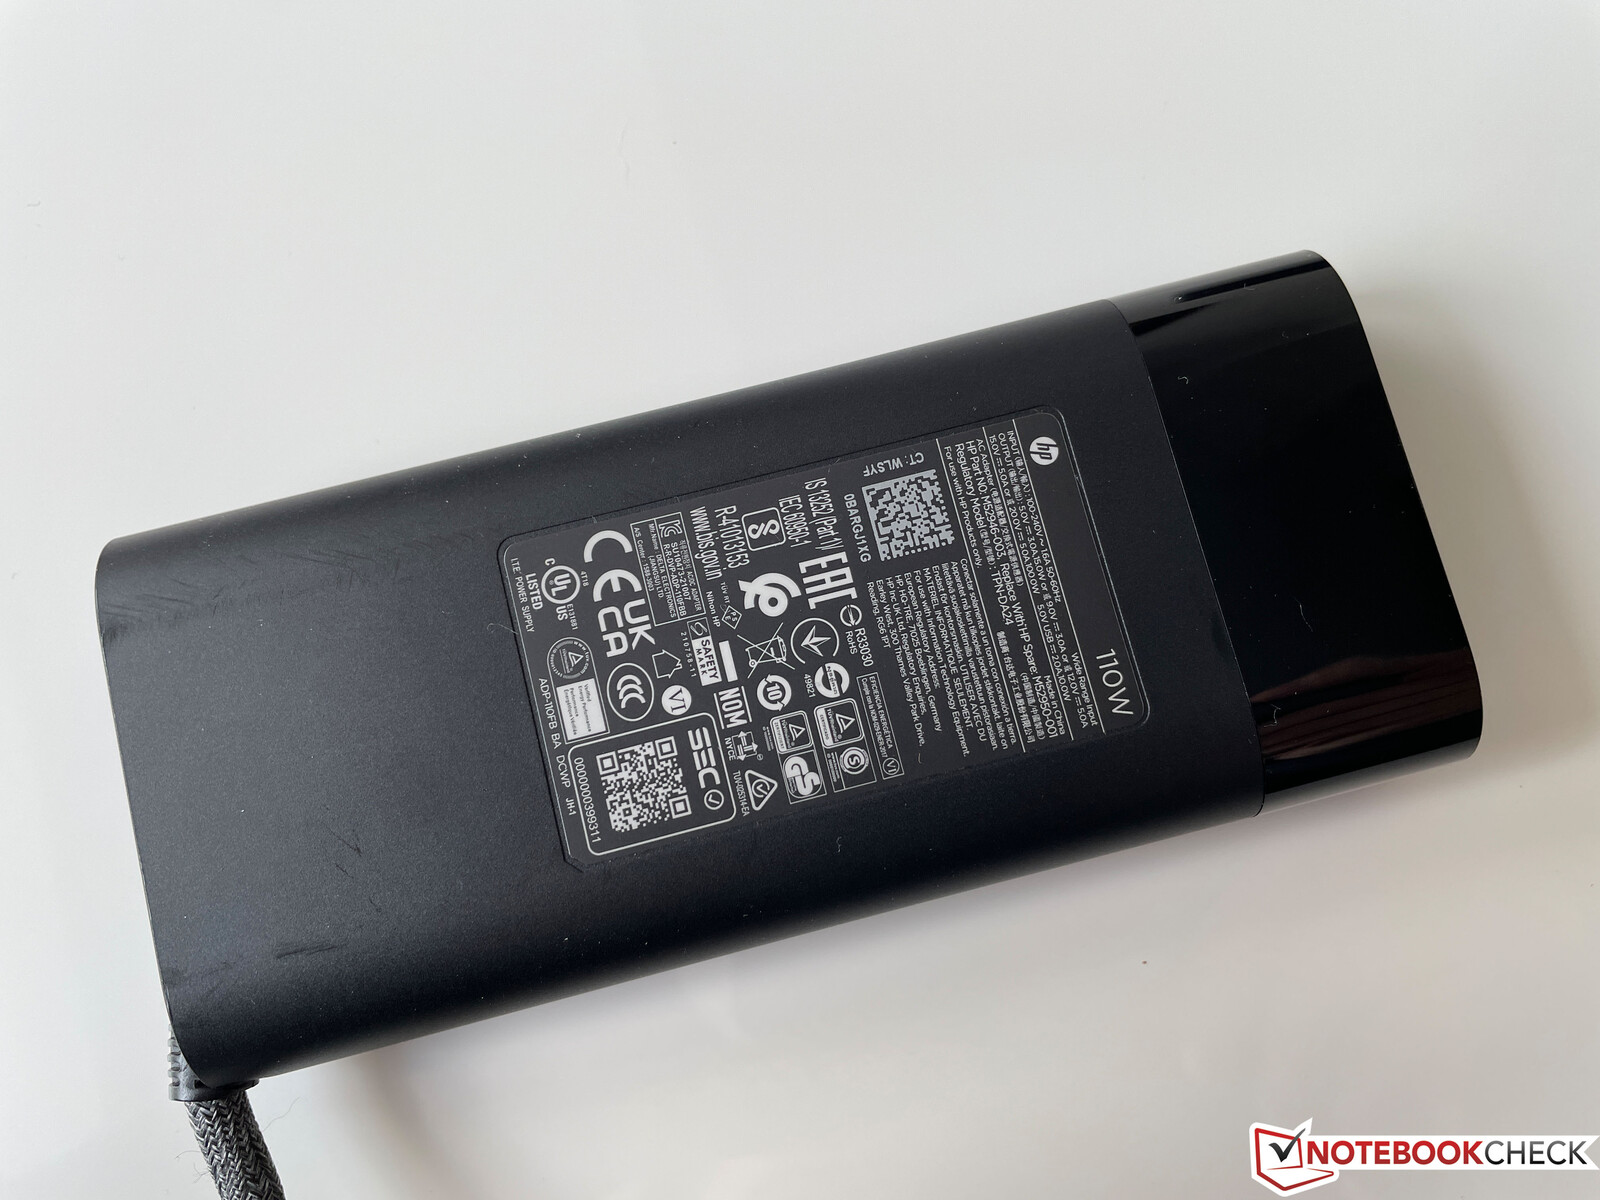
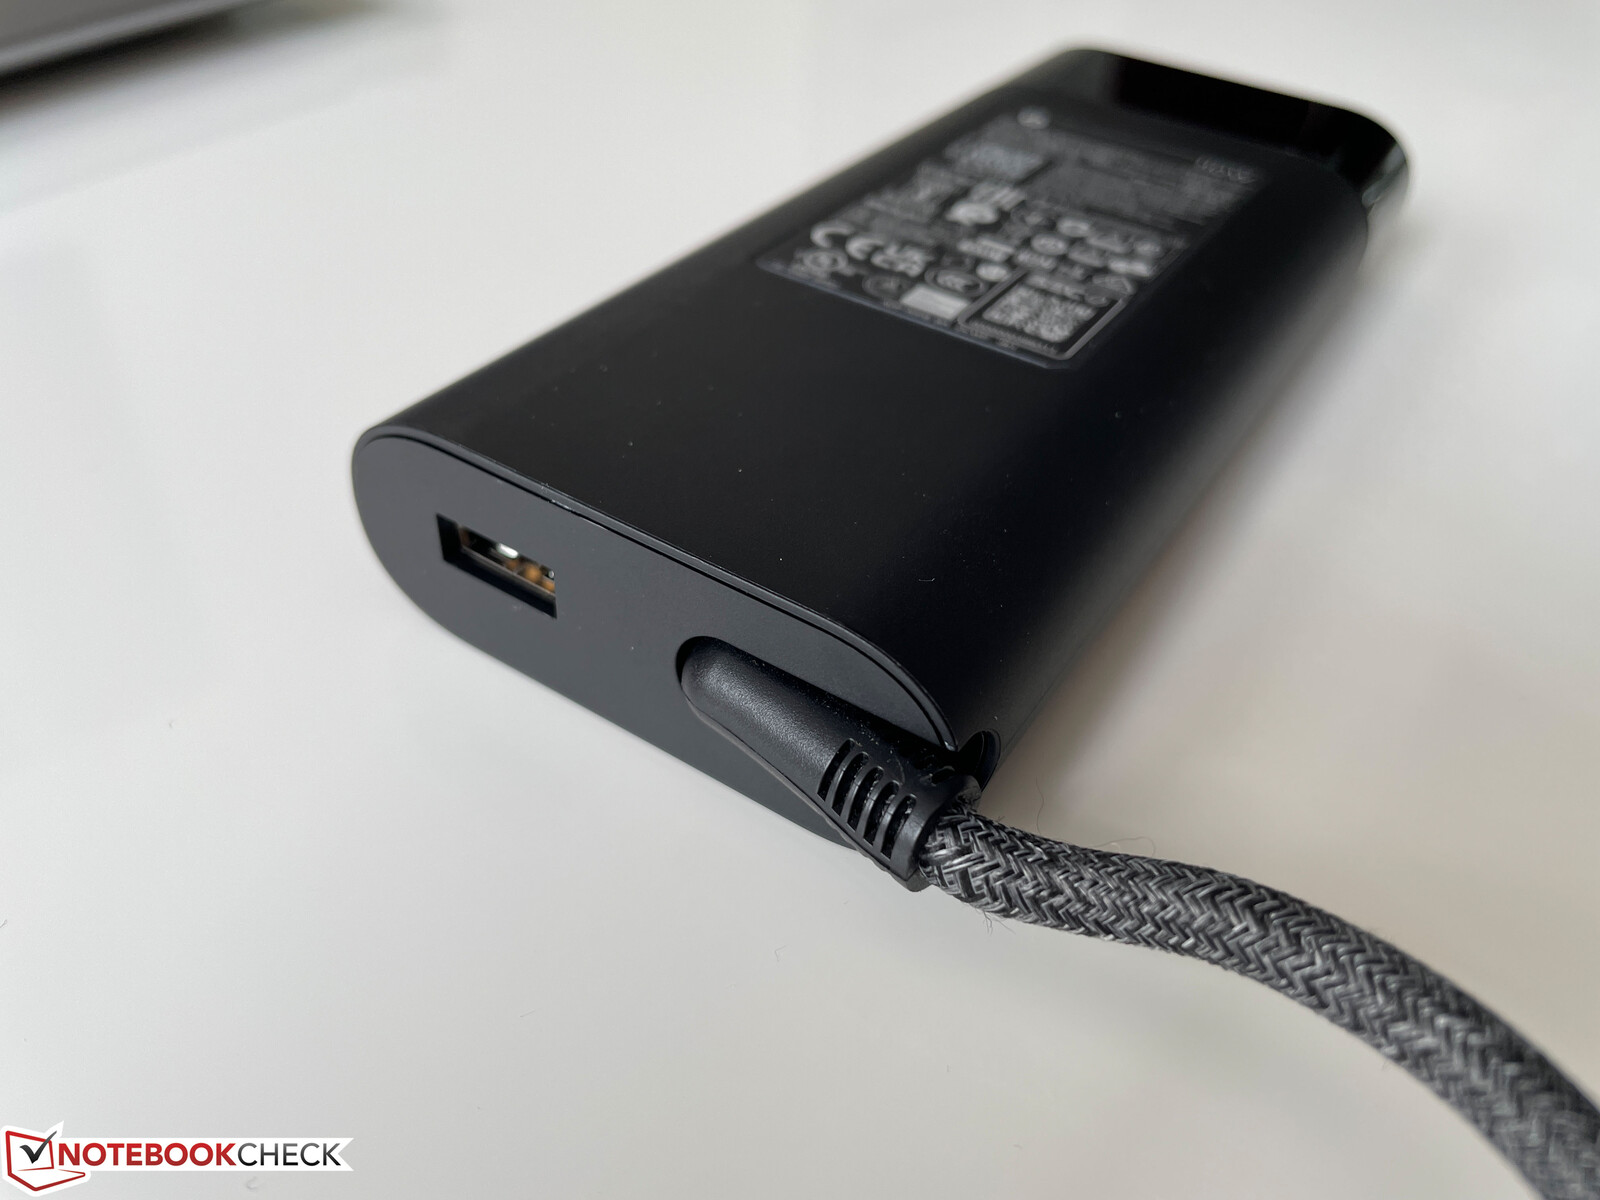
The Firefly 16 G9 is relatively compact for a 16-inch model and only slightly wider than for example the older ZBook Firefly 15 G8. It comes in at a weight of close to 2 kg (~4.4 lbs), while the 110-watt charger weighs close another 500 grams (~1.1 lbs).
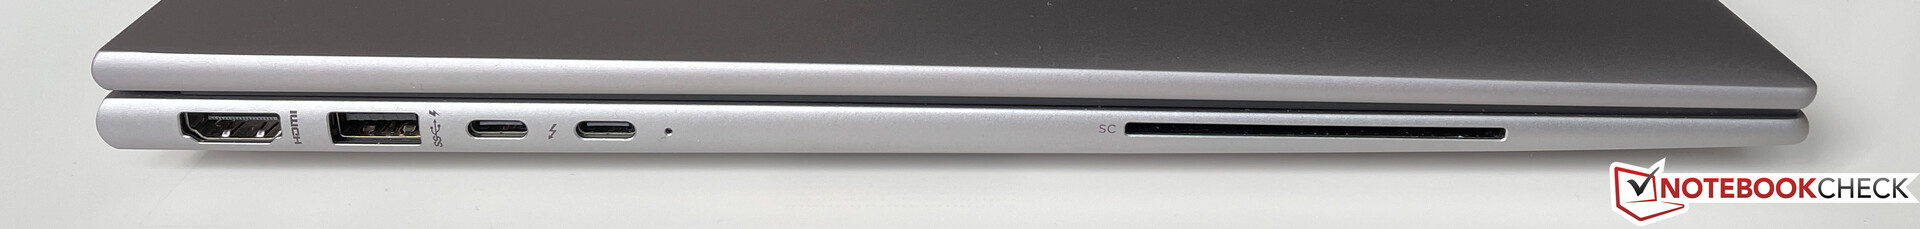
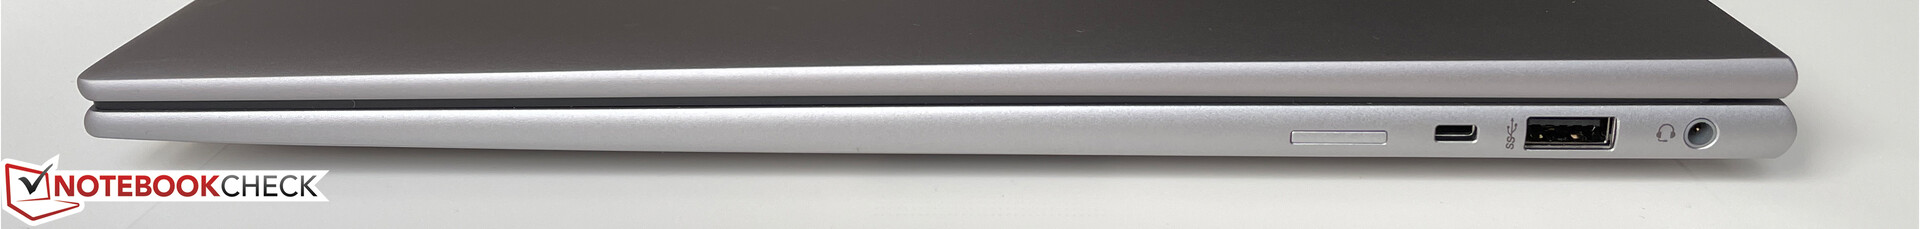
Connectivity - Firefly with Thunderbolt 4 and Wi-Fi 6E
Most of the ports are located on the left side of the case, where there is a regular USB type-A port, HDMI output, and a smart card reader in addition to two USB type-C ports. With onboard Thunderbolt 4, the ZBook is up to date with current standards, although the workstation comes without an Ethernet port (which can instead be added via a USB-C adapter).
Communication
The ZBook Firefly can be configured - but not retrofitted - with an optional LTE or even 5G module. Intel's modern AX211E module handles wireless communications and supports all of the latest Wi-Fi standards as well as Bluetooth 5.2. In our testing, the connection to the 6-GHz network of our Asus reference router was established without any issues and the transfer rates were consistently excellent.
Webcam
The webcam specifications on the data sheet are somewhat confusing, since HP mentions a 5-MP IR camera. While we are unable to make any statements about the resolution of the IR camera (which is used for facial recognition via Windows Hello), the main camera captures pictures at up to 3.7 MP (2560 x 1440 pixels). The advantages of the higher resolution compared to older webcams are very noticeable, although the color accuracy is nothing to write home about.


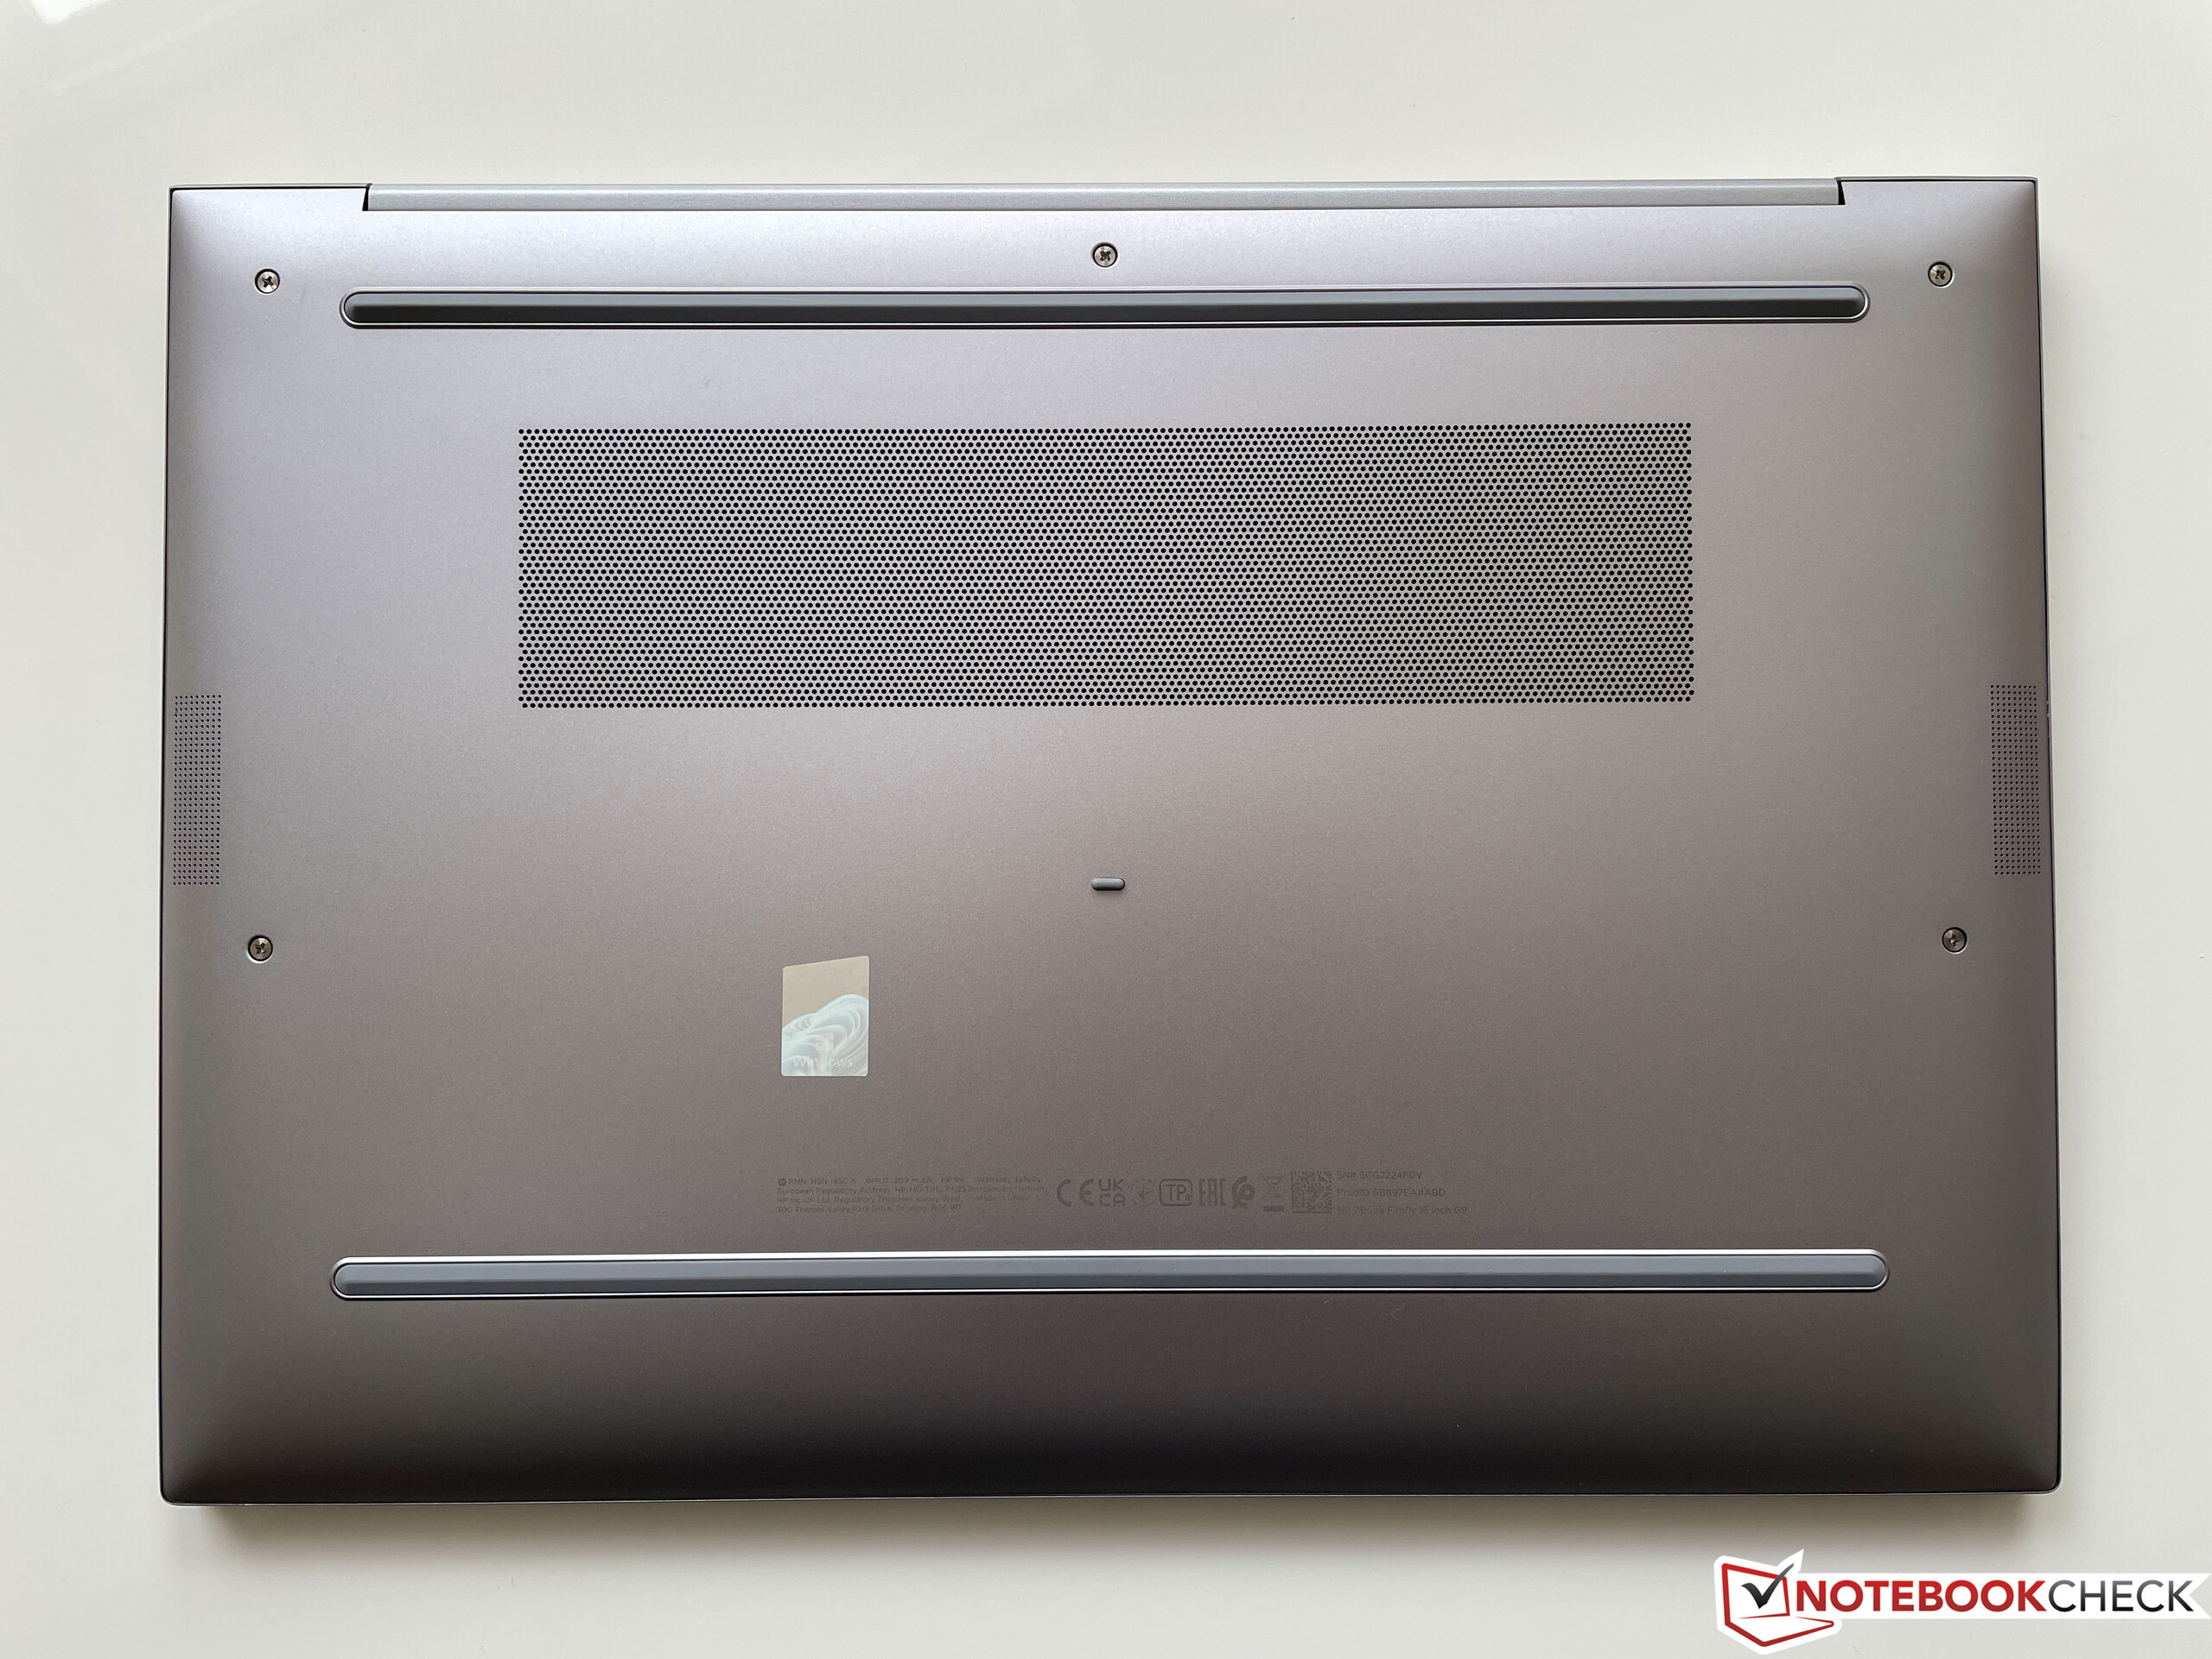
Maintenance
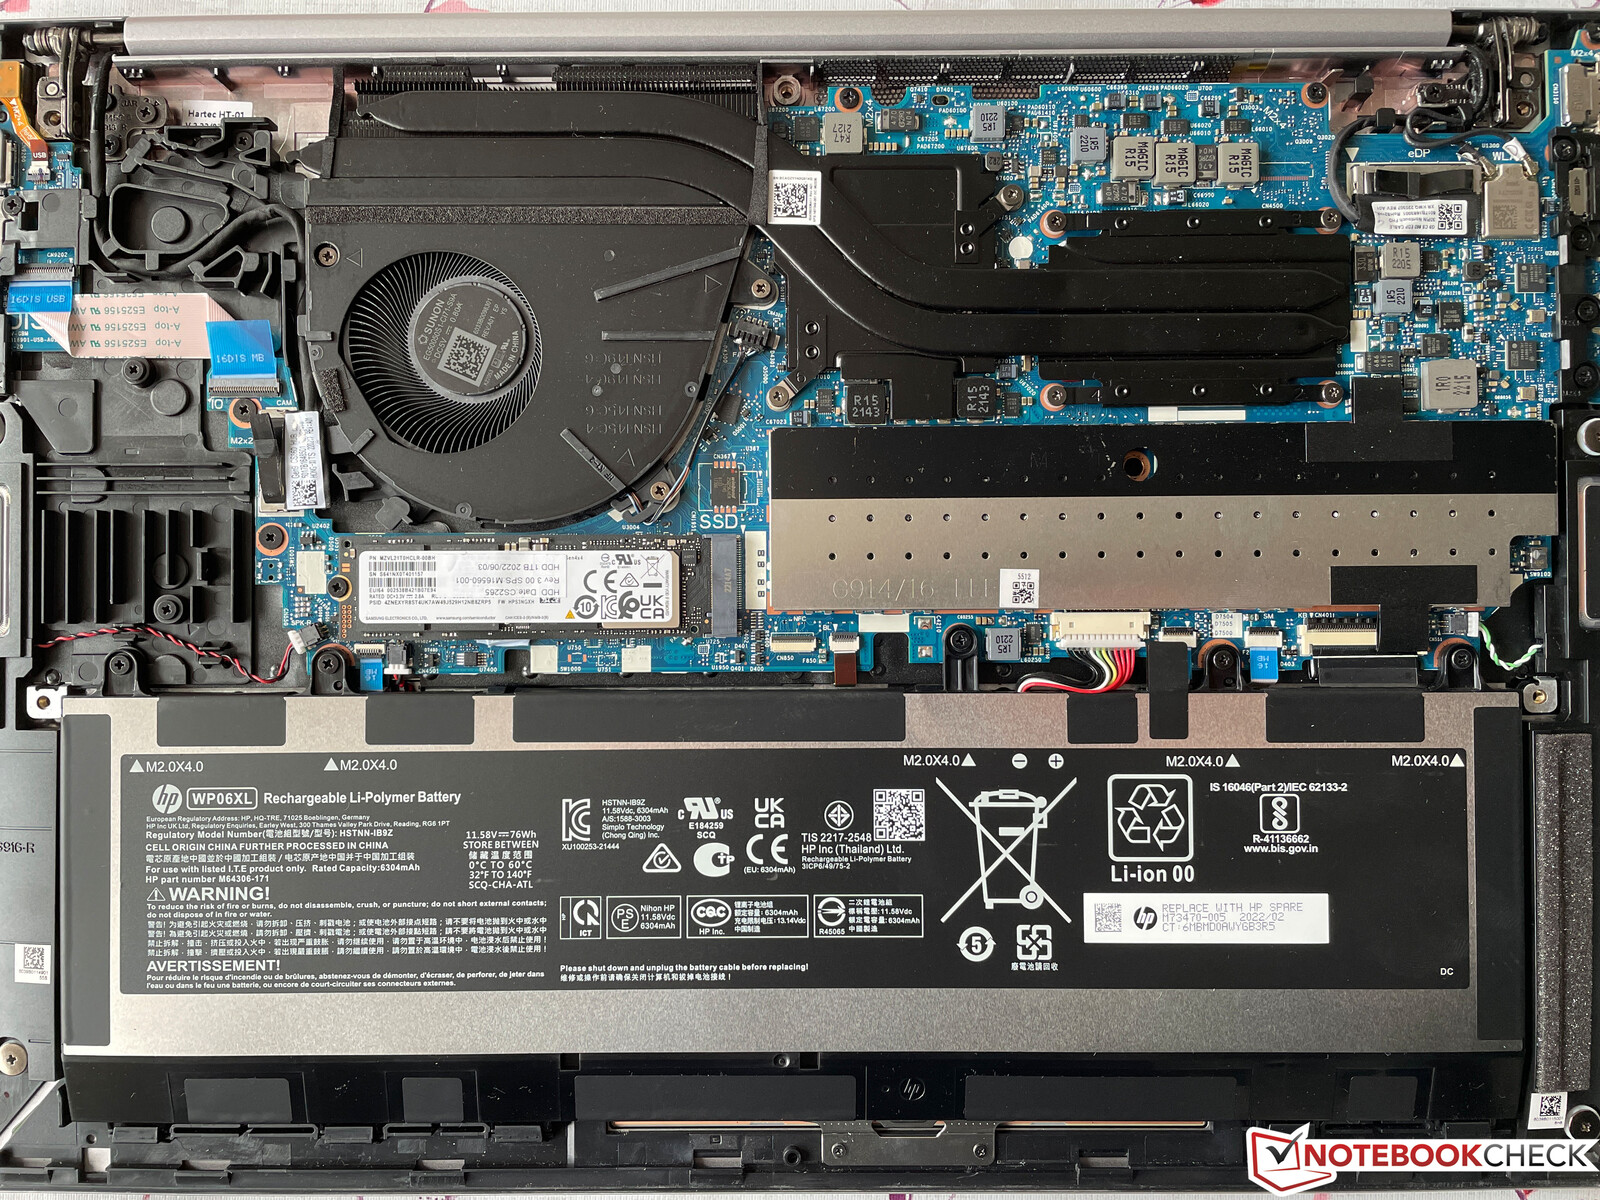
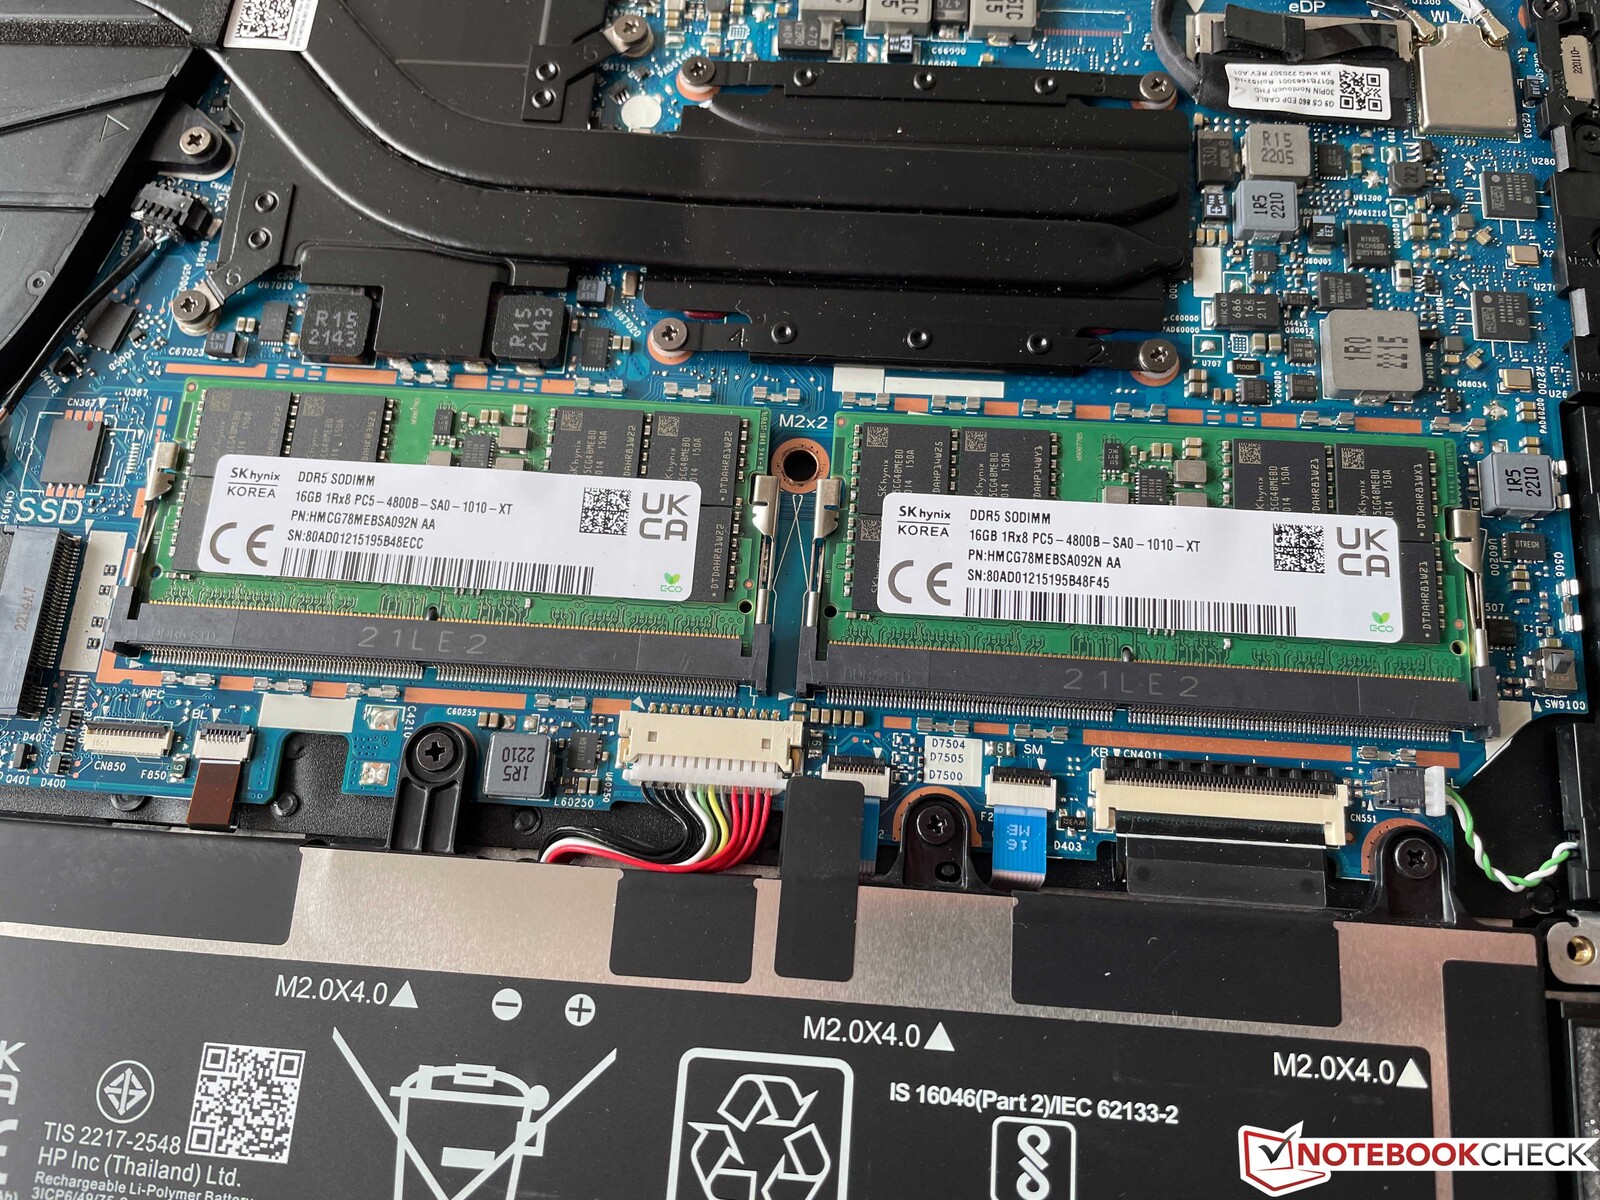
The bottom plate can be easily removed, since standard Philips-head screws (which should only be loosened, not removed by force) are used exclusively. On the inside, users have access to the battery, fan, M.2-2280 SSD, and both SODIMM modules, which are hidden beneath an additional cover. The Wi-Fi module cannot be upgraded.
Input Devices - ZBook with an Excellent Keyboard
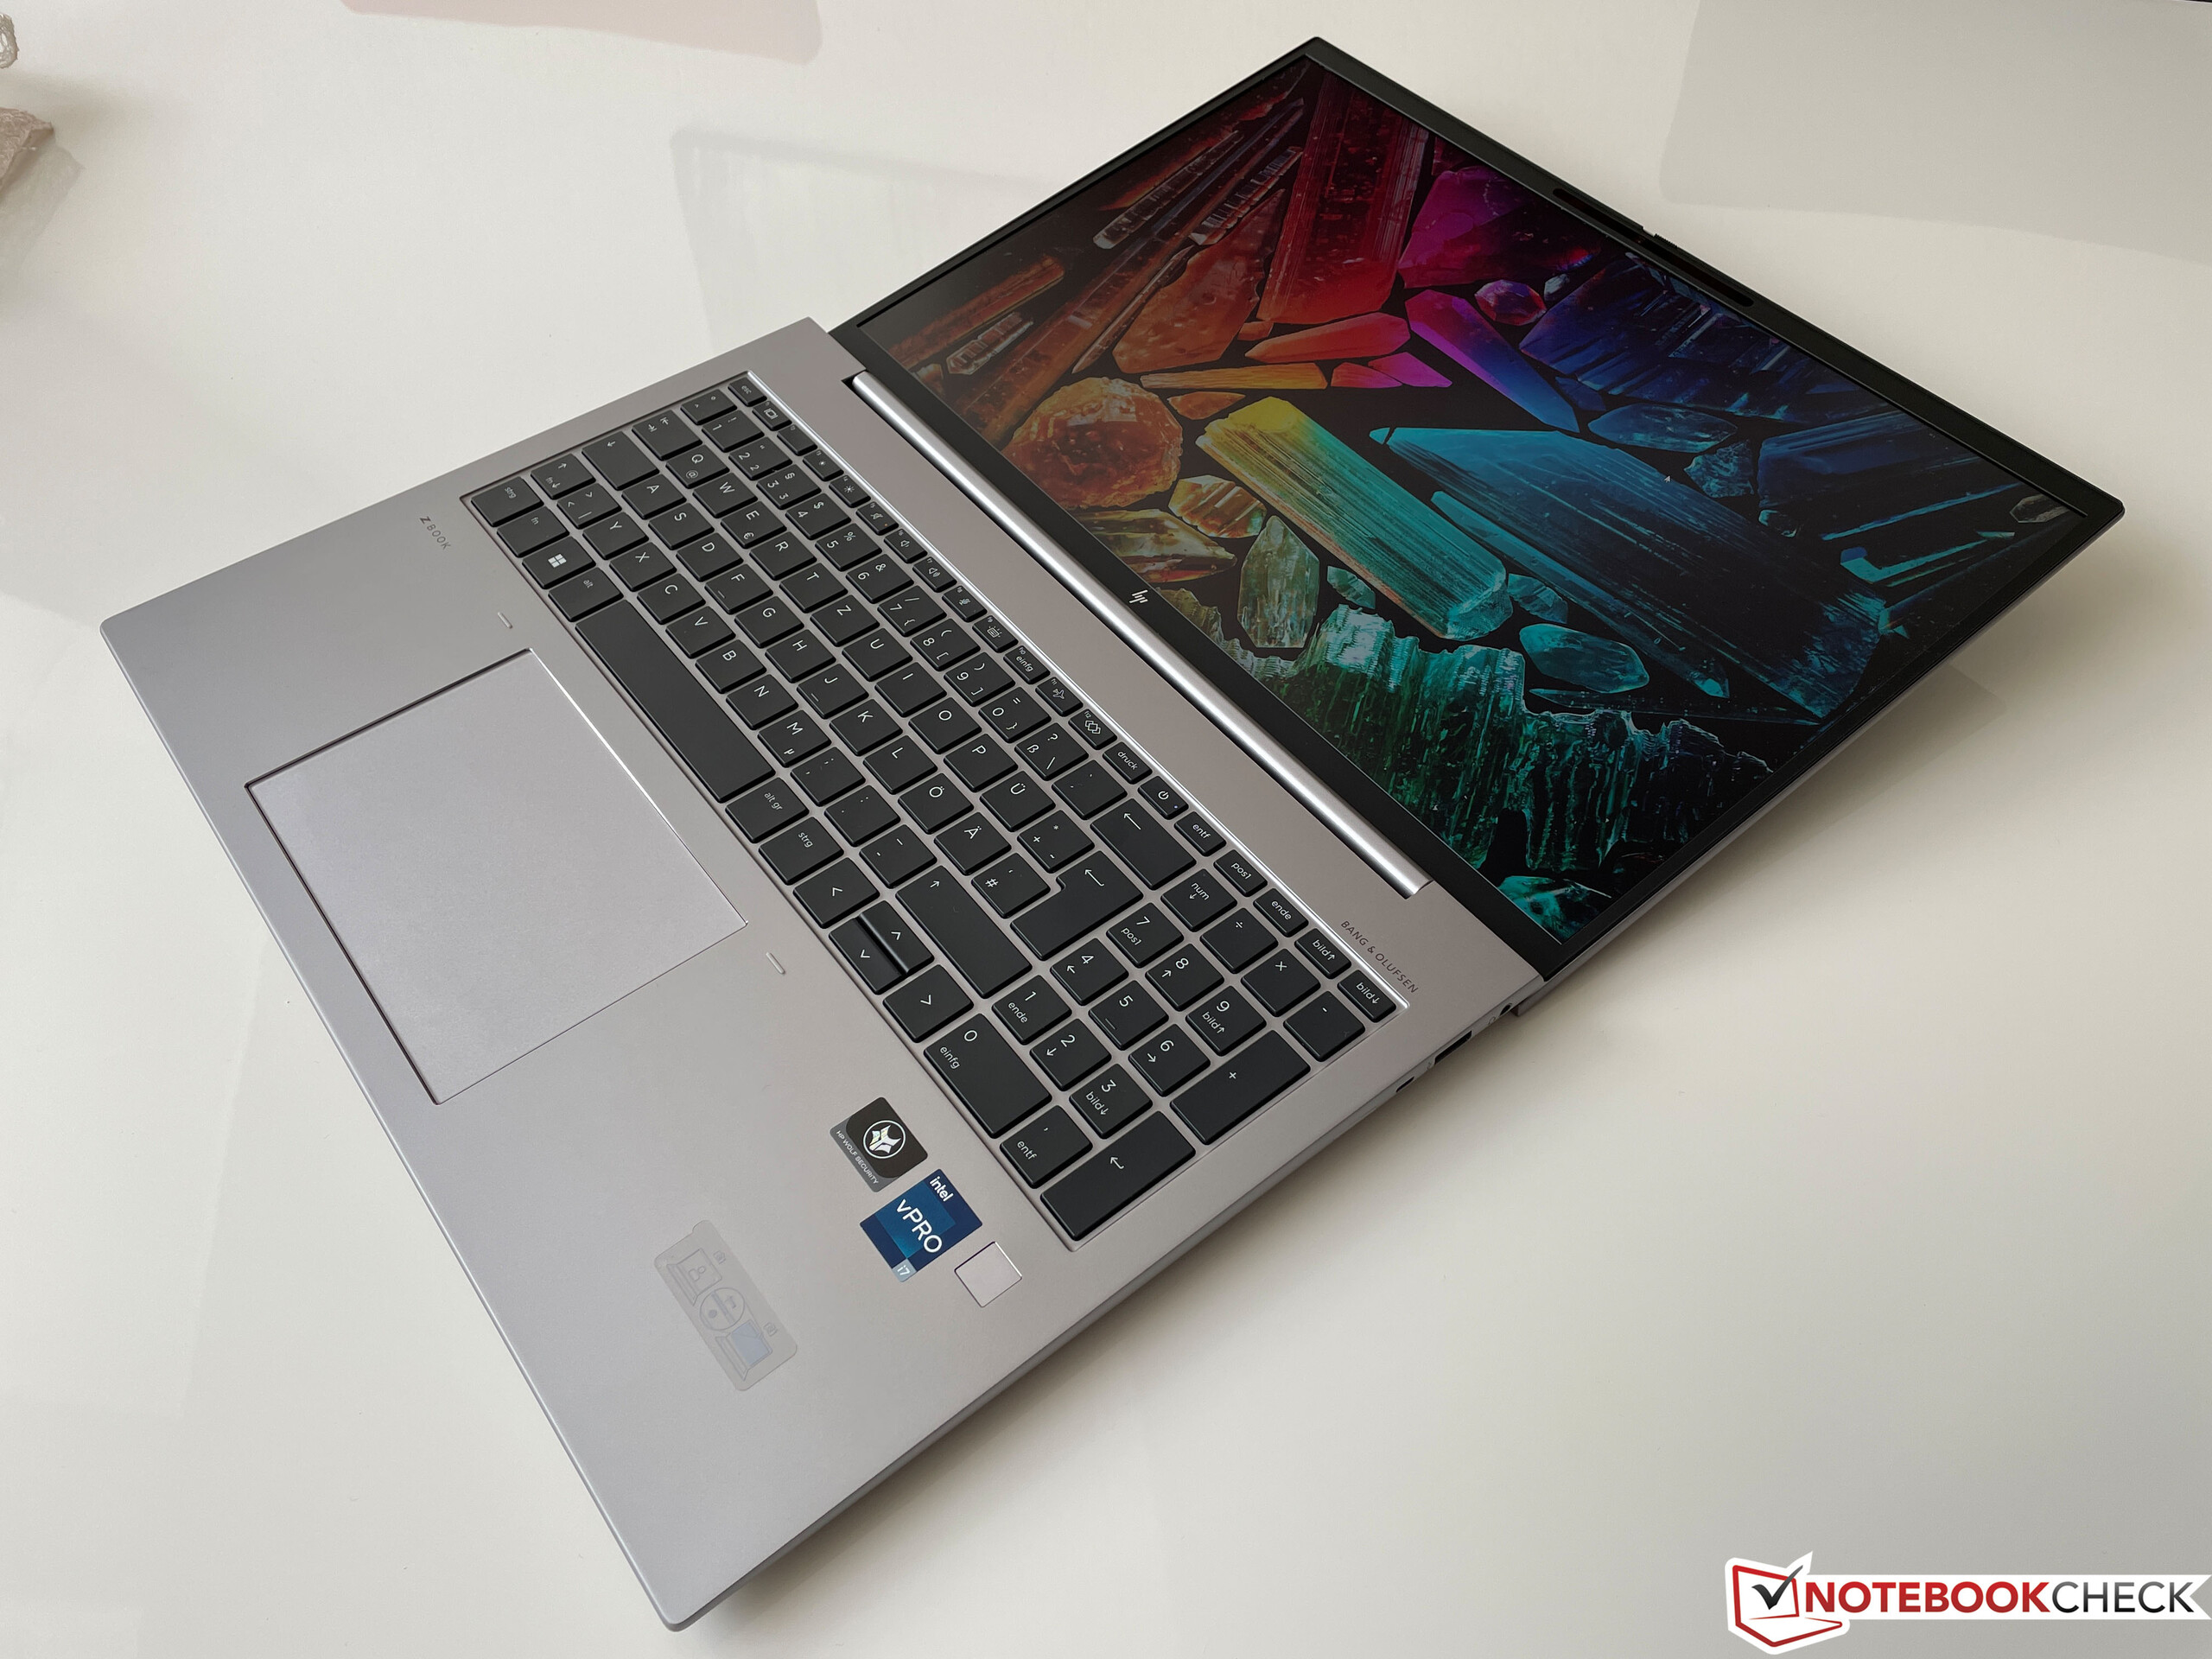
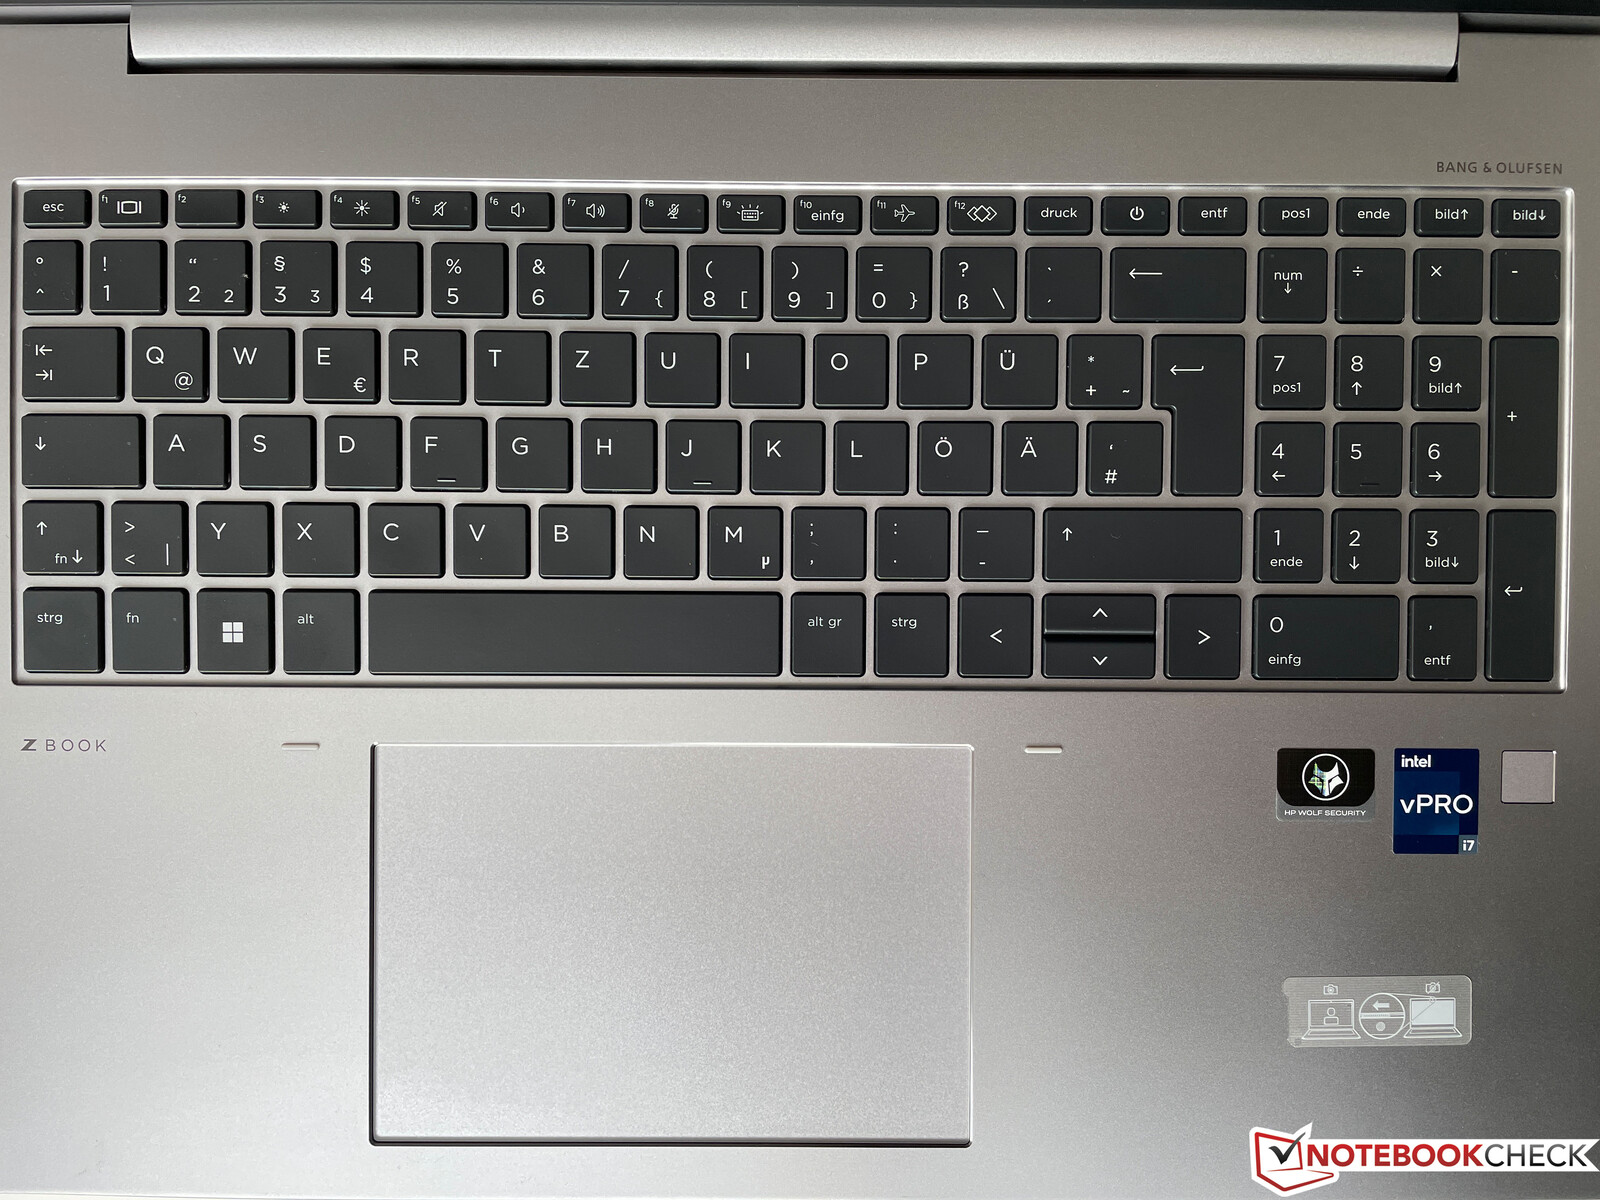
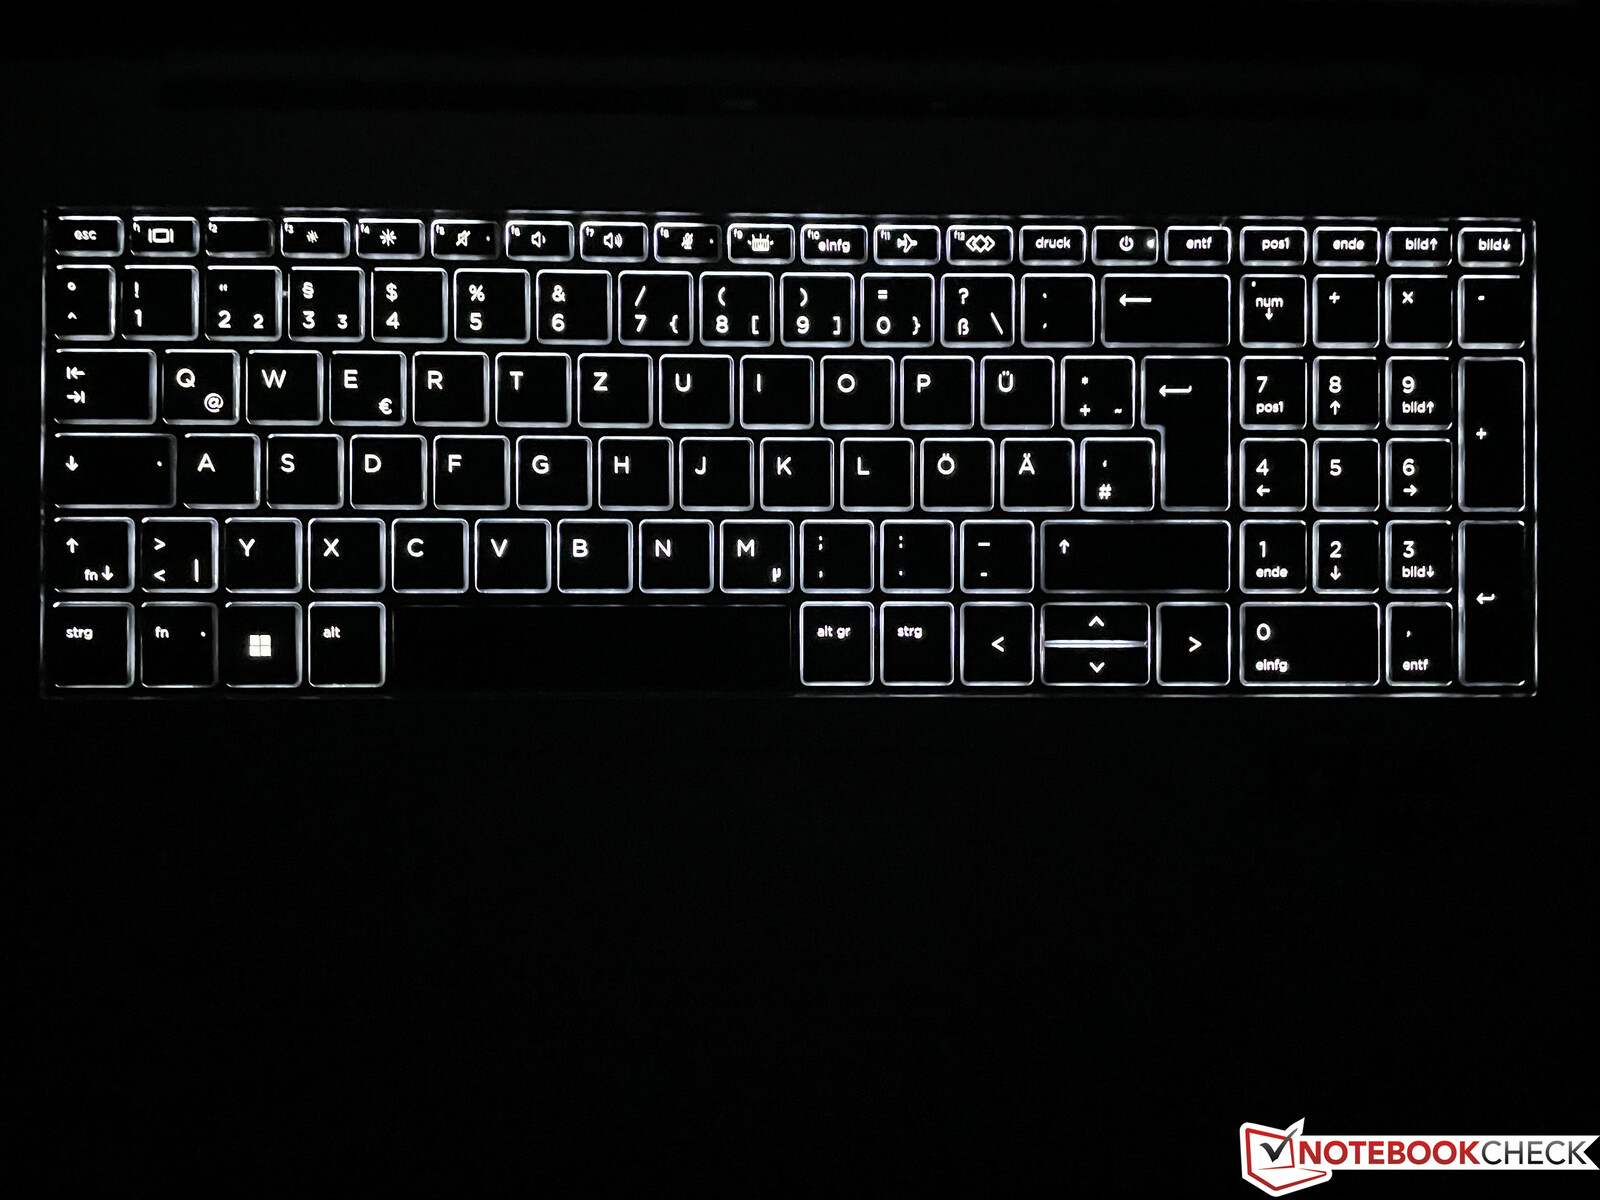
HP uses a keyboard with a numpad, a white backlight with two brightness settings, and splash water resistance. We are very pleased with the keyboard overall and since HP has not repeatedly reduced the key travel, the keyboard subjectively even feels better than on the current Lenovo ThinkPad models. Since the feedback is quite firm, however, your impression of the keyboard may change depending on personal preferences. The power button is integrated into the keyboard, which is less than ideal and there is a fingerprint scanner below the bottom right part of the keyboard.
Since HP omits the trackpoint in the keyboard center, the large clickpad is the only mouse input method that is available by default. It is shifted slightly towards the left and at 12.8 x 8.7 cm (~5.04 x 3.43 in), sufficiently large even for gestures requiring up to four fingers. The smooth surface offers good gliding properties and the cursor control is flawless. Clicks can be triggered in the bottom part of the pad and sound pleasantly deep.
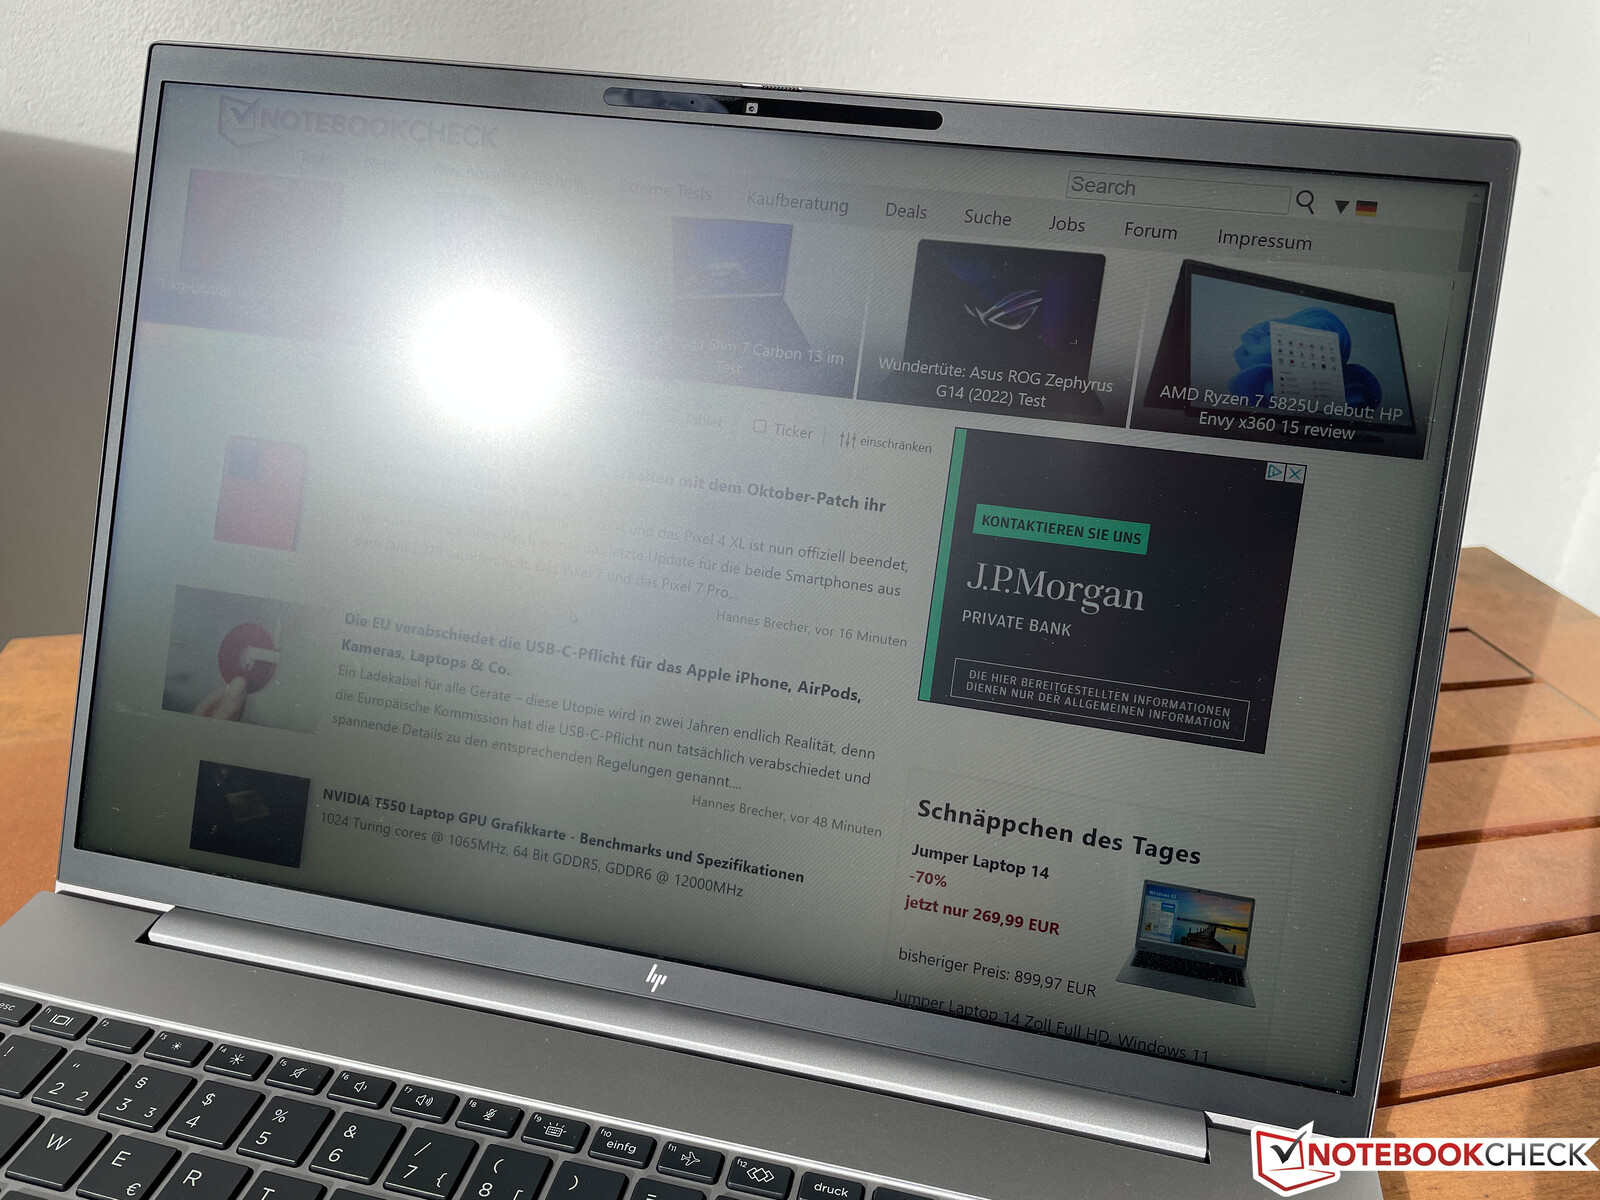
Display - HP Uses a Matte 16:10 Panel
The ZBook Firefly 16 G9 exclusively uses matte IPS panels with a native resolution of 1920 x 1200 pixels. There are no display options with higher resolutions or extended color space coverage available. The two standard options (45 percent NTSC color space coverage) should be skipped, since they are specified for a low maximum brightness of just 250 nits.
- WUXGA (1920 x 1200), 250 nits, matte, IPS, 45 % NTSC
- WUXGA (1920 x 1200), 250 nits, matte, IPS, 45 % NTSC, touchscreen
- WUXGA (1920 x 1200), 400 nits, matte, IPS, 100 % sRGB
- WUXGA (1920 x 1200), 1000 nits SureView, matte, IPS, 100 % sRGB
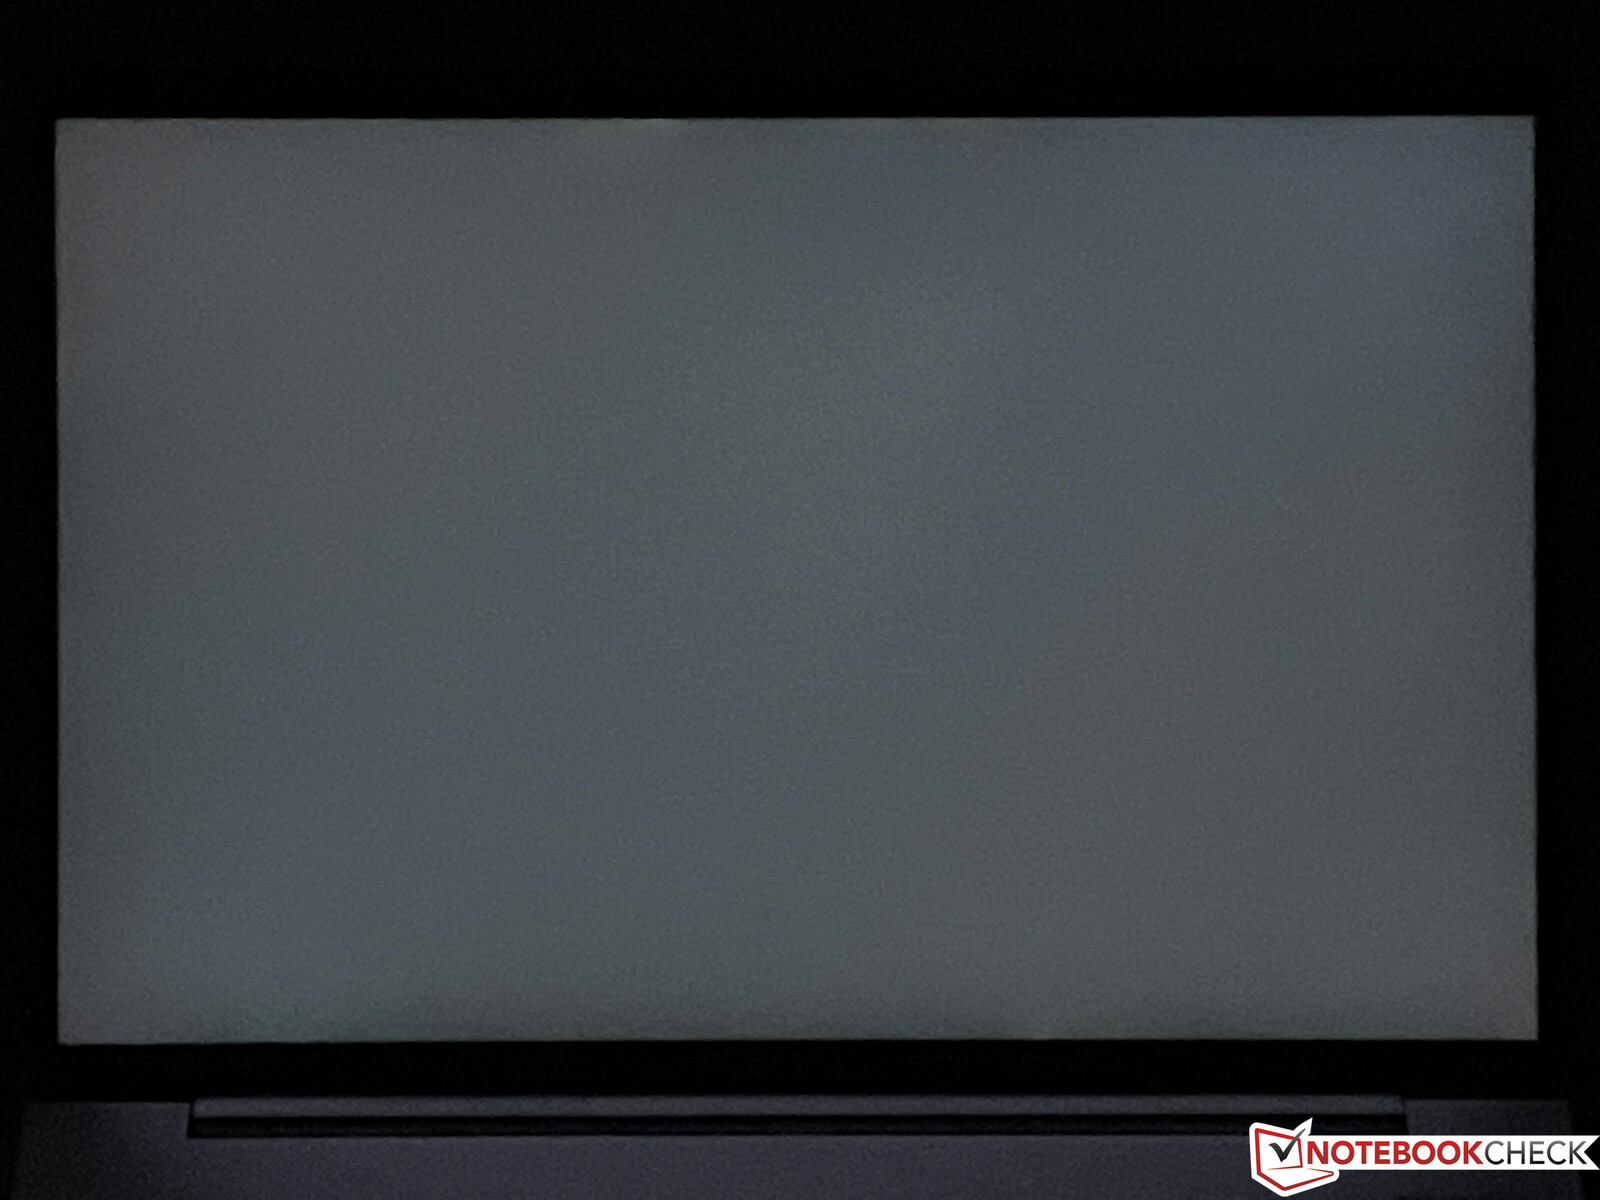
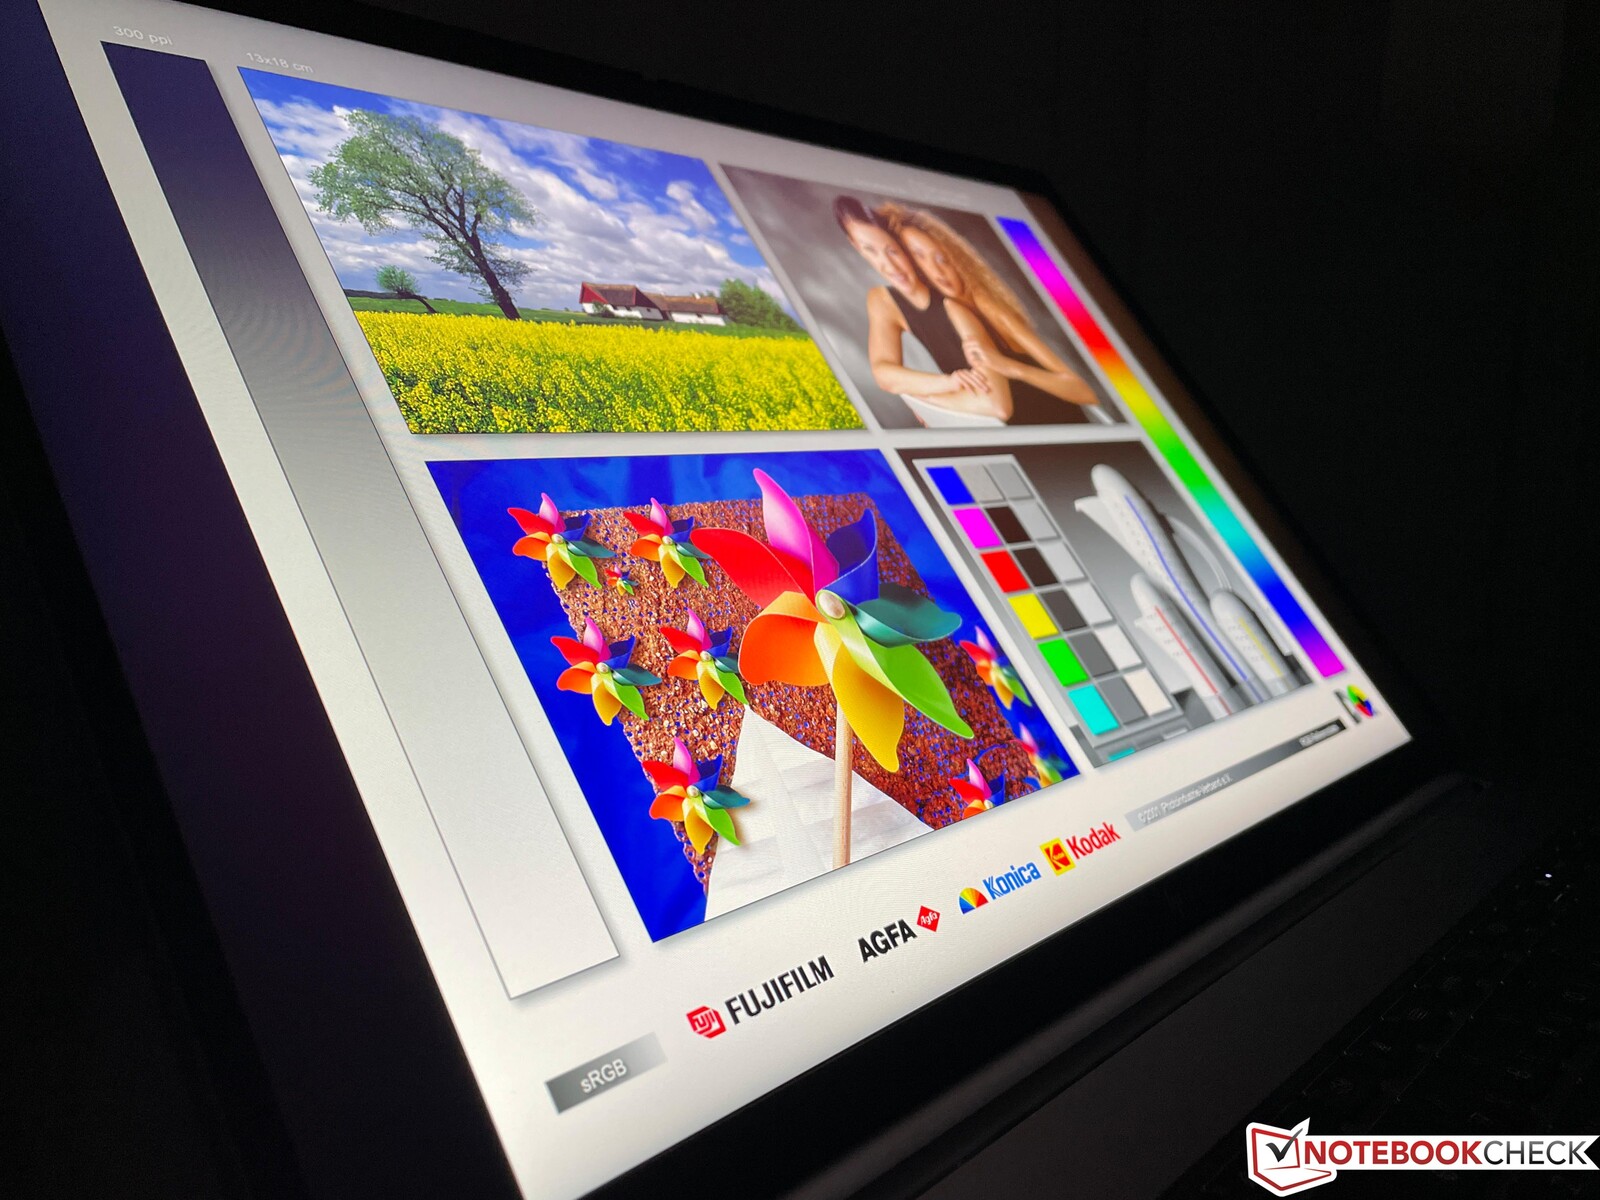
As we have seen many times before, the optional SureView display is not without its weaknesses, making the panel with 400 nits and full sRGB color space coverage, which is also what our test configuration uses, the best option for a good balance of brightness and image quality. We were pleasantly surprised by our BOE test sample, which significantly exceeds its specifications with an average of almost 500 nits. At the same time, its black value of 0.31 nits is good, resulting in an excellent contrast ratio of ~1700:1.
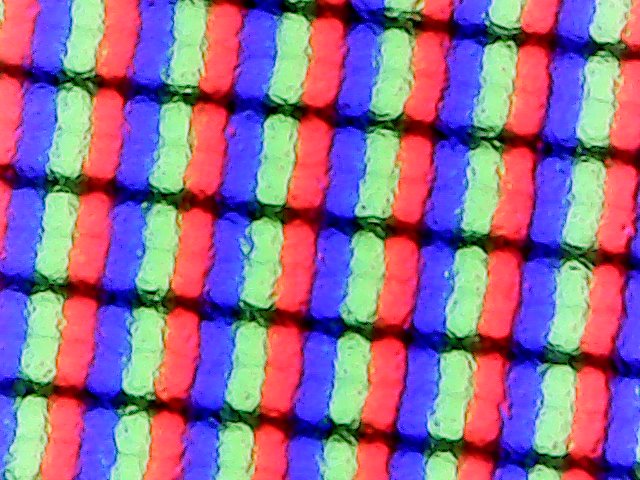
Subjectively, the image looks great and even brighter areas do not look grainy despite the matte layer. The screen offers a sufficient degree of sharpness for productivity despite its FHD resolution. The response times are somewhat slow, however, and there is slight, but noticeable ghosting for example while moving the cursor. Even at maximum brightness, we observed no major backlight bleeding and there is no PWM flickering, either.
| |||||||||||||||||||||||||
Brightness Distribution: 93 %
Center on Battery: 524 cd/m²
Contrast: 1697:1 (Black: 0.31 cd/m²)
ΔE ColorChecker Calman: 3.6 | ∀{0.5-29.43 Ø4.71}
calibrated: 2.6
ΔE Greyscale Calman: 5.5 | ∀{0.09-98 Ø4.96}
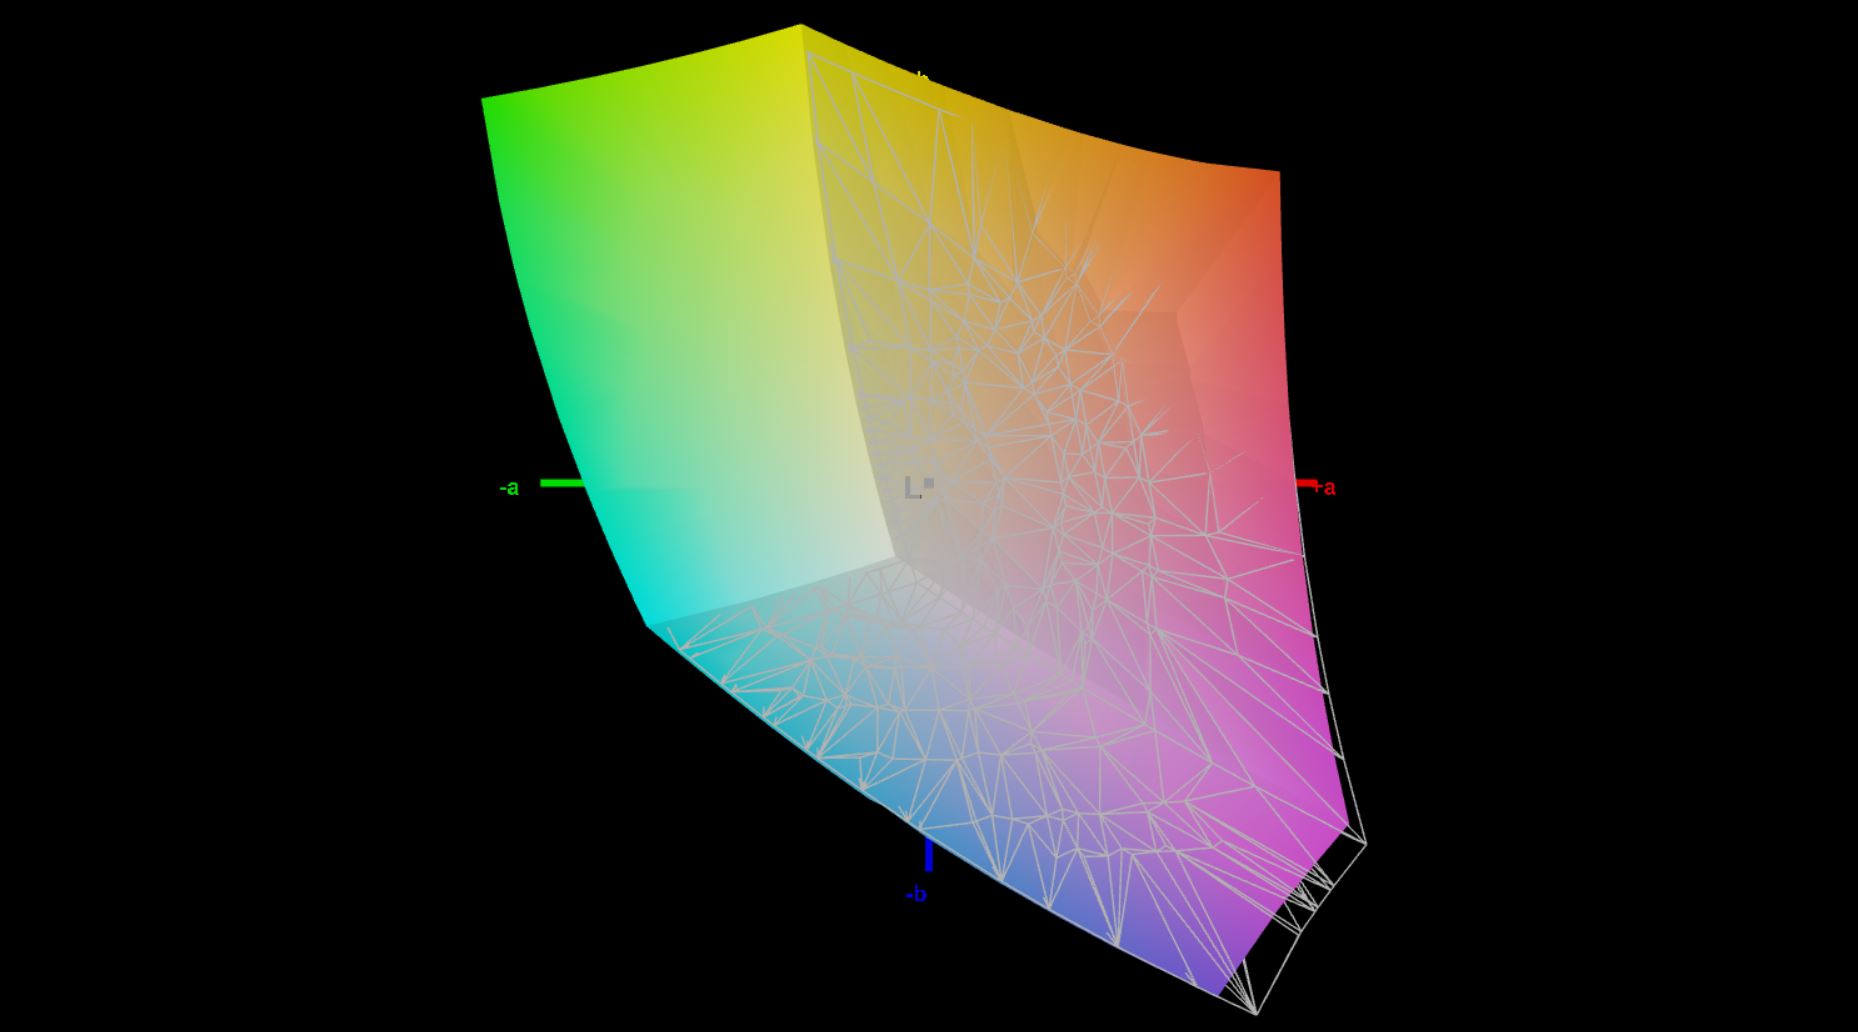
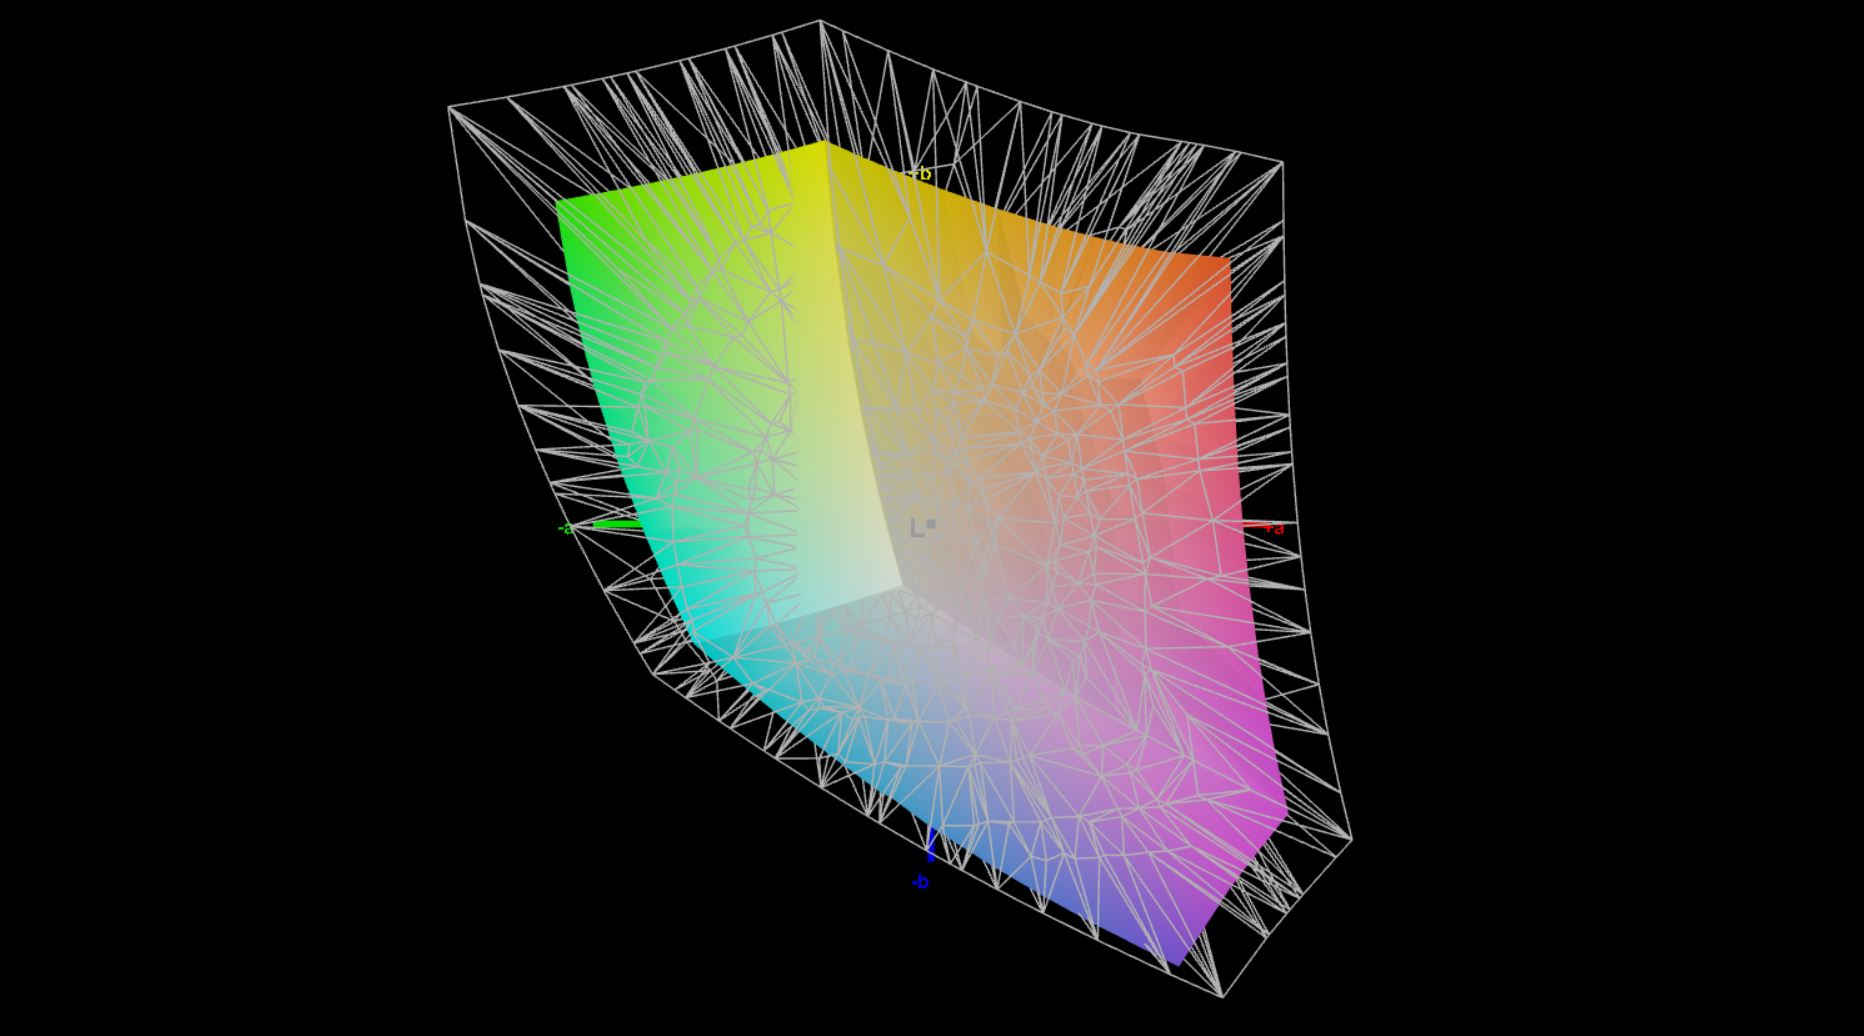
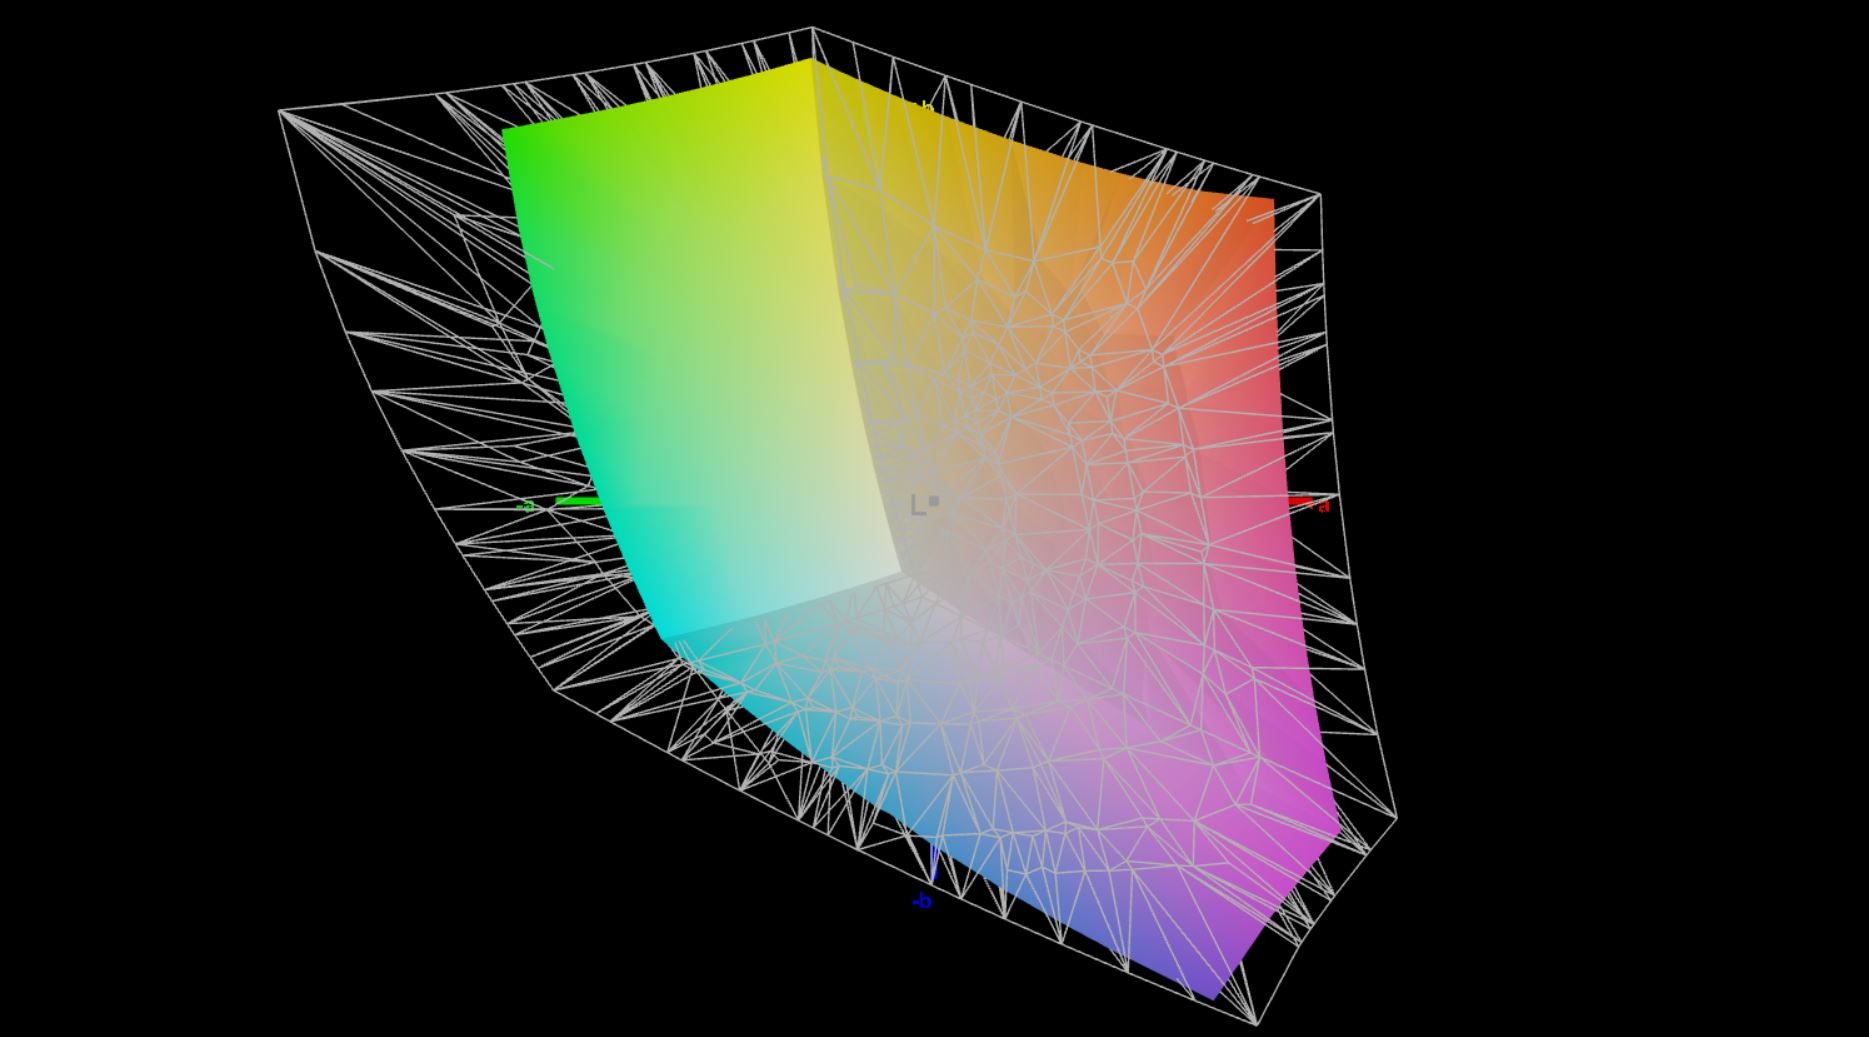
70% AdobeRGB 1998 (Argyll 3D)
96.1% sRGB (Argyll 3D)
68.1% Display P3 (Argyll 3D)
Gamma: 2.02
CCT: 6527 K
| HP ZBook Firefly 16 G9-6B897EA BOE0A02, IPS, 1920x1200, 16" | Lenovo ThinkPad P1 G4-20Y4Z9DVUS NE160QDM-N63, IPS, 2560x1600, 16" | Dell Precision 5000 5560 Sharp LQ156R1, IPS, 3840x2400, 15.6" | Lenovo ThinkPad P15s Gen2-20W6000GGE MNF601EA1-1, IPS LED, 3840x2160, 15.6" | HP ZBook Firefly 15 G8 2C9R7EA LGD069B, IPS, 1920x1080, 15.6" | Apple MacBook Pro 16 2021 M1 Pro Liquid Retina XDR, Mini-LED, 3456x2234, 16.2" | |
|---|---|---|---|---|---|---|
| Display | 6% | 29% | 22% | 1% | 25% | |
| Display P3 Coverage (%) | 68.1 | 72.7 7% | 94.9 39% | 84.5 24% | 68.6 1% | 99.1 46% |
| sRGB Coverage (%) | 96.1 | 99.3 3% | 100 4% | 98.7 3% | 98.5 2% | 100 4% |
| AdobeRGB 1998 Coverage (%) | 70 | 74.7 7% | 100 43% | 97.8 40% | 70 0% | 88 26% |
| Response Times | 8% | -23% | 3% | -35% | -176% | |
| Response Time Grey 50% / Grey 80% * (ms) | 52.8 ? | 40.8 23% | 47.2 ? 11% | 40 ? 24% | 56 ? -6% | 42.8 ? 19% |
| Response Time Black / White * (ms) | 19.5 ? | 20.8 -7% | 30.4 ? -56% | 23.2 ? -19% | 32 ? -64% | 91.6 ? -370% |
| PWM Frequency (Hz) | 14880 | |||||
| Screen | 9% | -5% | 35% | -3% | 211% | |
| Brightness middle (cd/m²) | 526 | 441 -16% | 501.5 -5% | 604 15% | 397 -25% | 514 -2% |
| Brightness (cd/m²) | 499 | 420 -16% | 467 -6% | 609 22% | 402 -19% | 497 0% |
| Brightness Distribution (%) | 93 | 90 -3% | 83 -11% | 91 -2% | 84 -10% | 95 2% |
| Black Level * (cd/m²) | 0.31 | 0.27 13% | 0.44 -42% | 0.34 -10% | 0.13 58% | 0.02 94% |
| Contrast (:1) | 1697 | 1633 -4% | 1140 -33% | 1776 5% | 3054 80% | 25700 1414% |
| Colorchecker dE 2000 * | 3.6 | 2.6 28% | 4.73 -31% | 0.9 75% | 5.9 -64% | 1.4 61% |
| Colorchecker dE 2000 max. * | 6.6 | 6 9% | 8.45 -28% | 2.6 61% | 9.4 -42% | 2.8 58% |
| Colorchecker dE 2000 calibrated * | 2.6 | 1.2 54% | 0.51 80% | 0.8 69% | 1.1 58% | |
| Greyscale dE 2000 * | 5.5 | 4.5 18% | 3.6 35% | 1.1 80% | 8.8 -60% | 2.3 58% |
| Gamma | 2.02 109% | 2.18 101% | 2.08 106% | 2.15 102% | 2.47 89% | 2.27 97% |
| CCT | 6527 100% | 6623 98% | 6447 101% | 6656 98% | 6416 101% | 6792 96% |
| Color Space (Percent of AdobeRGB 1998) (%) | 84.5 | 63.7 | ||||
| Color Space (Percent of sRGB) (%) | 98.6 | 98.5 | ||||
| Total Average (Program / Settings) | 8% /
8% | 0% /
0% | 20% /
28% | -12% /
-7% | 20% /
108% |
* ... smaller is better
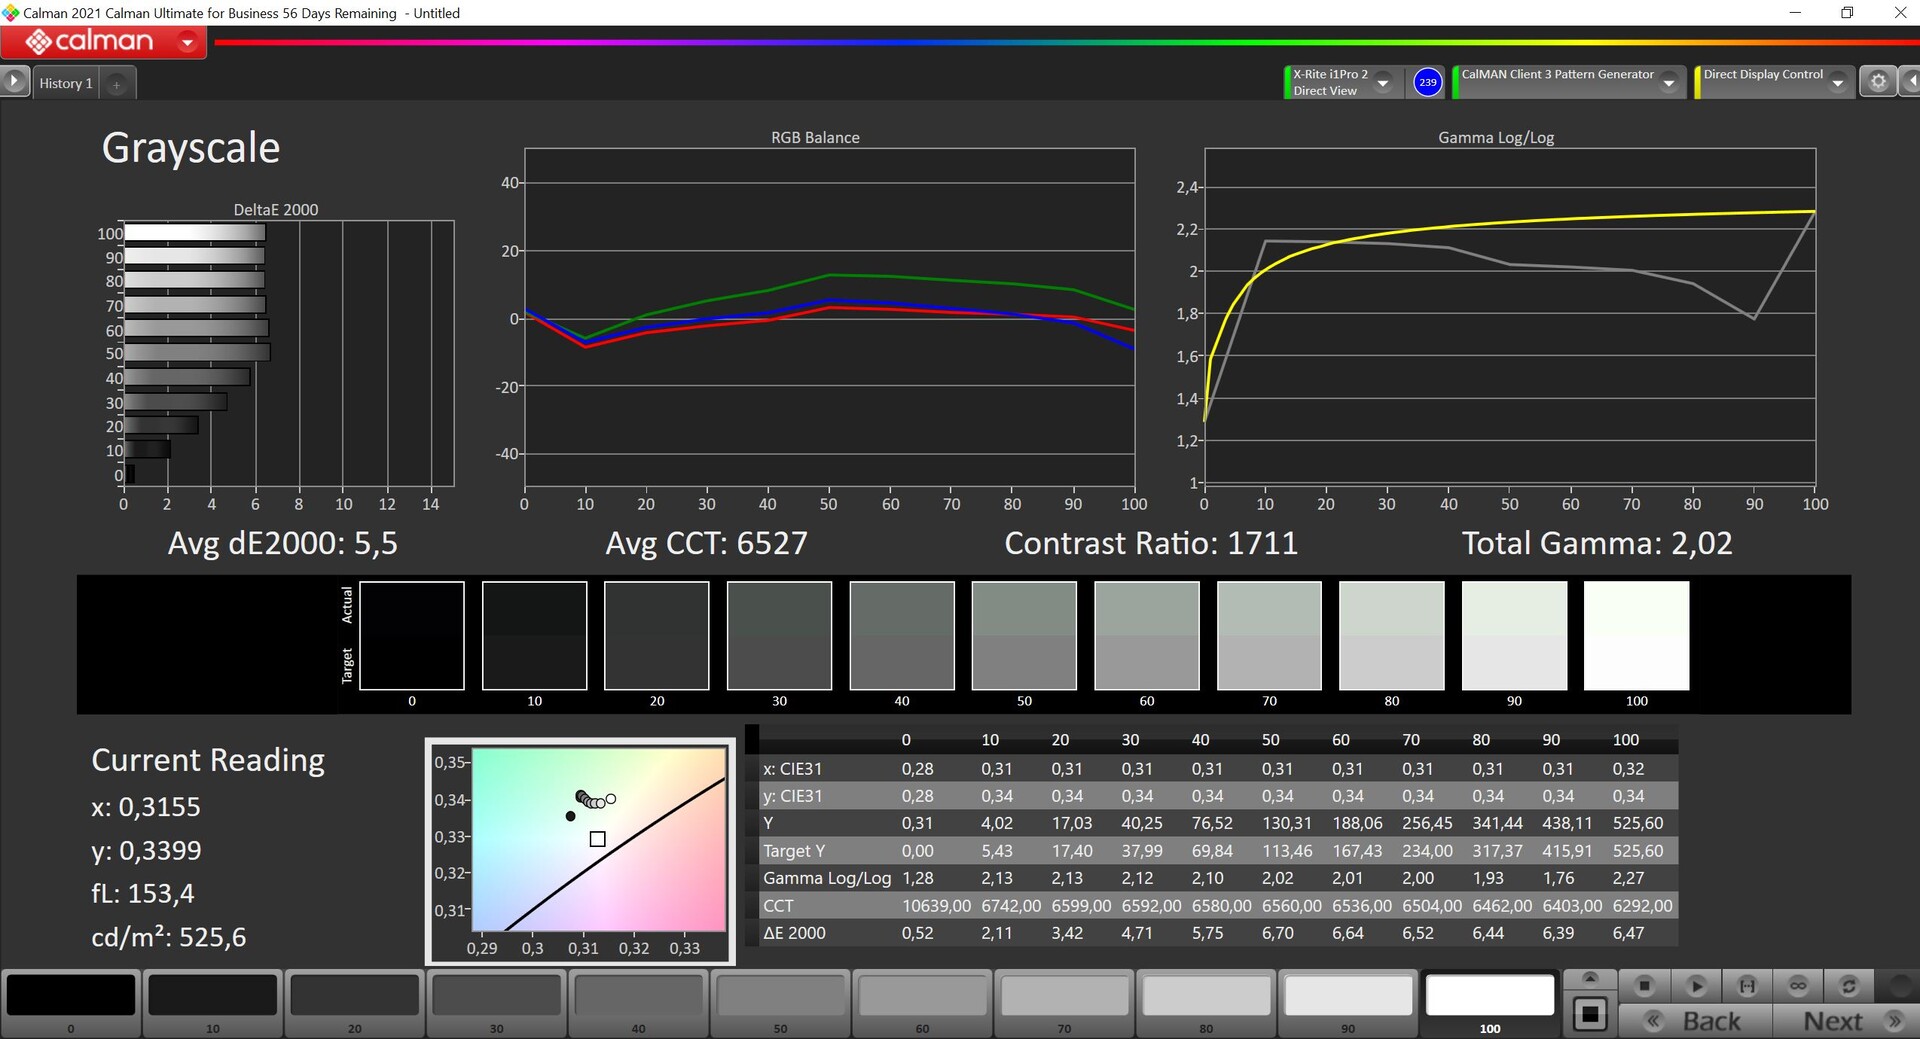
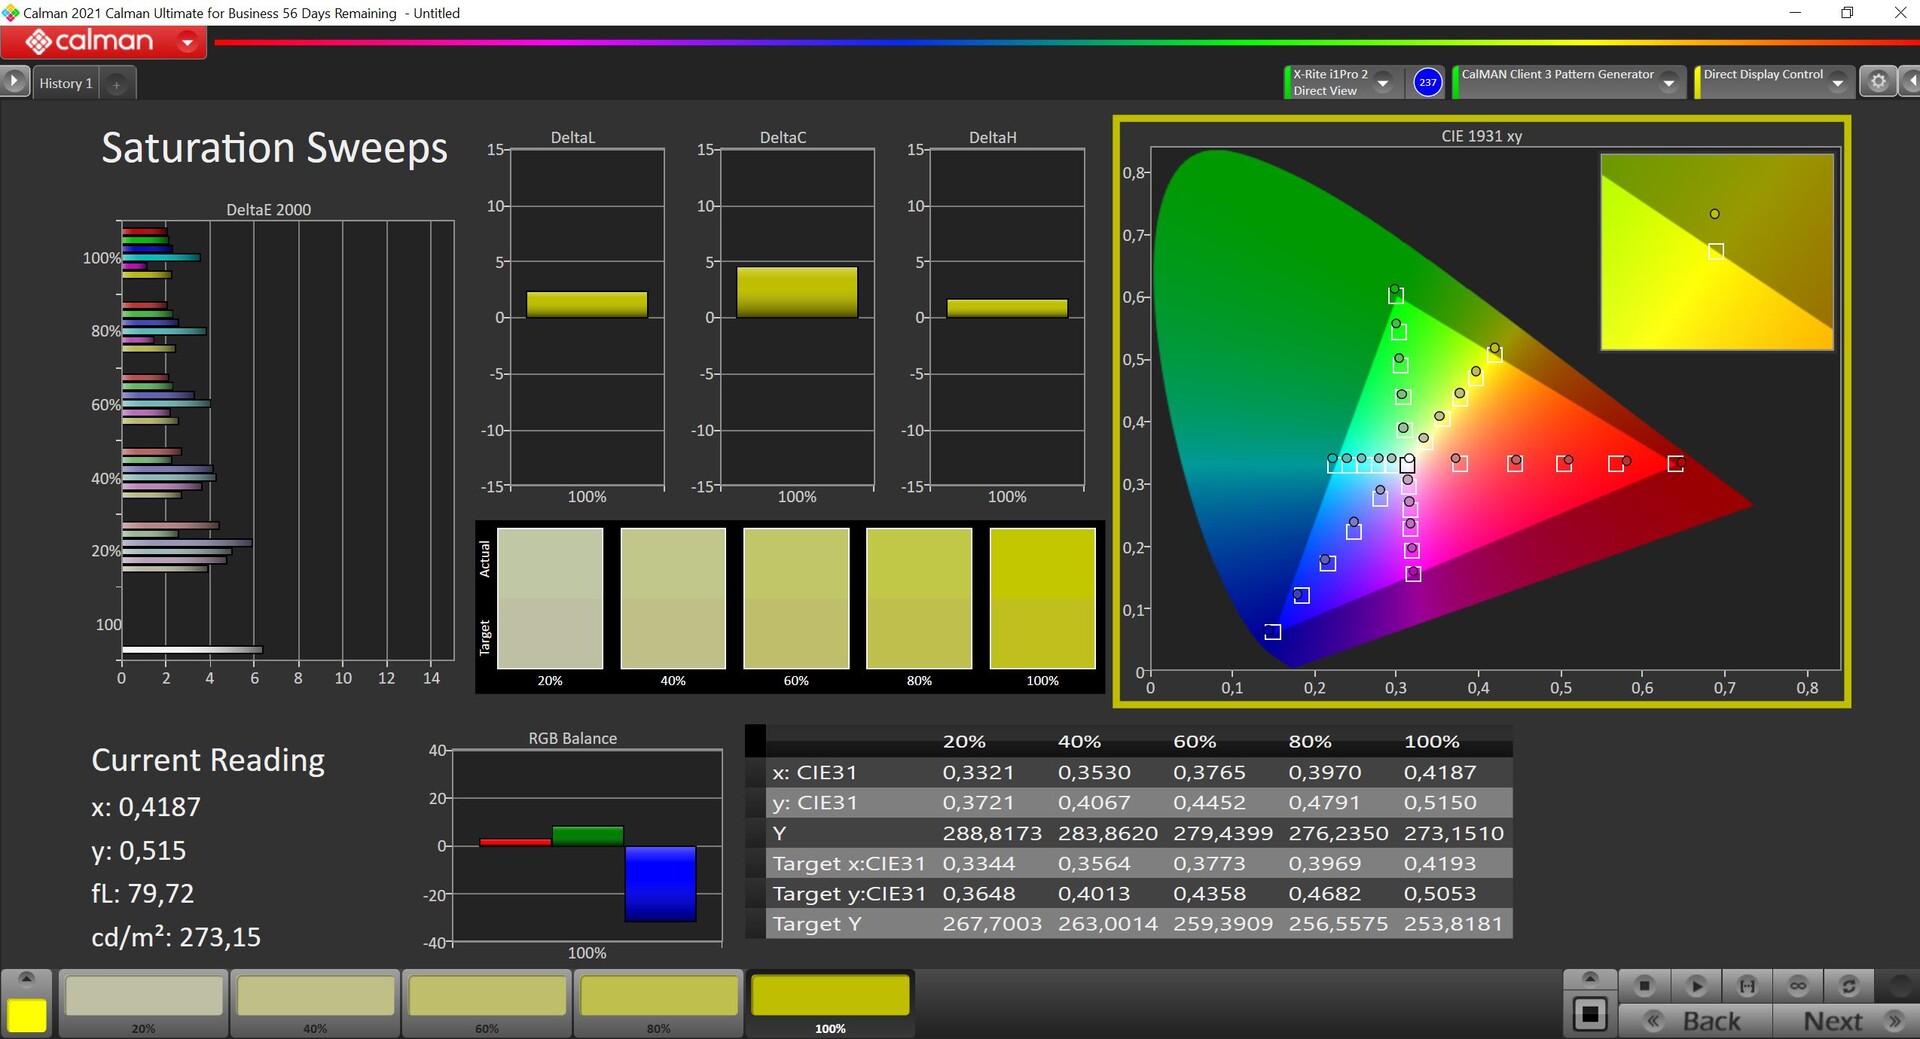
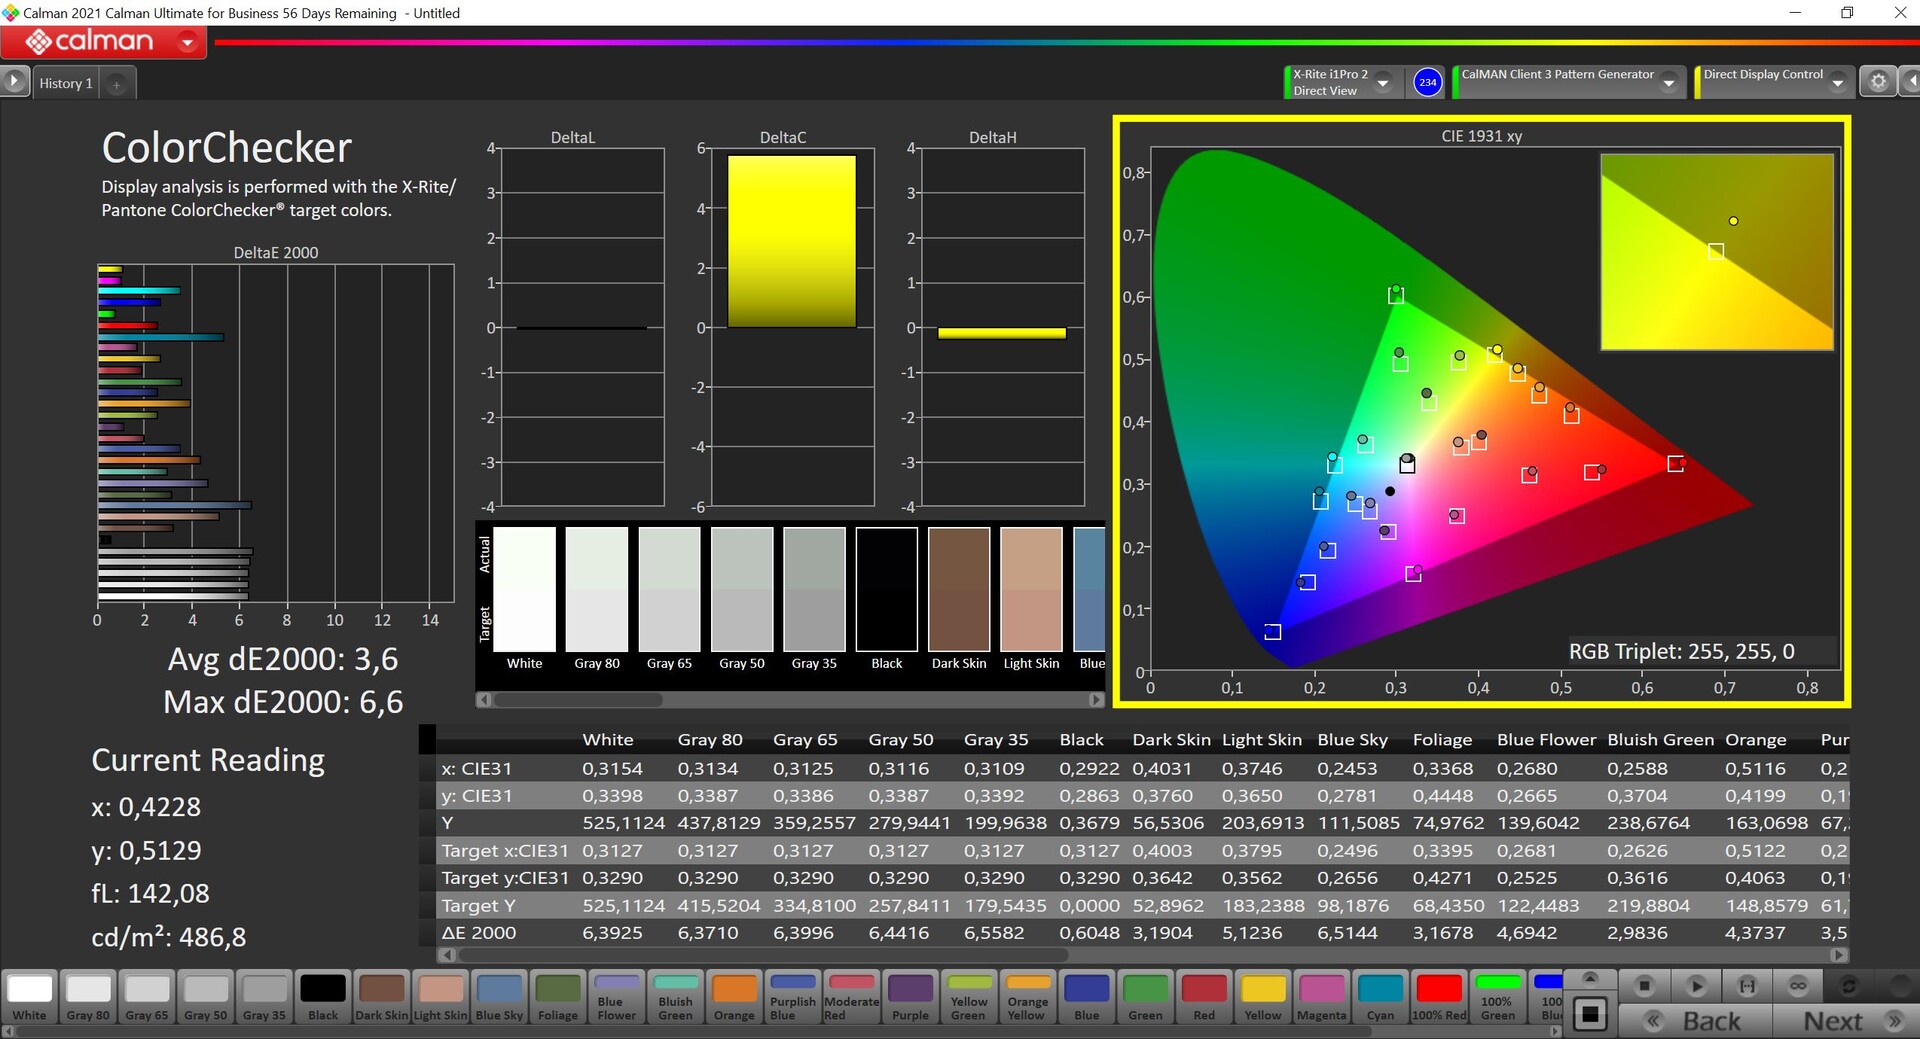
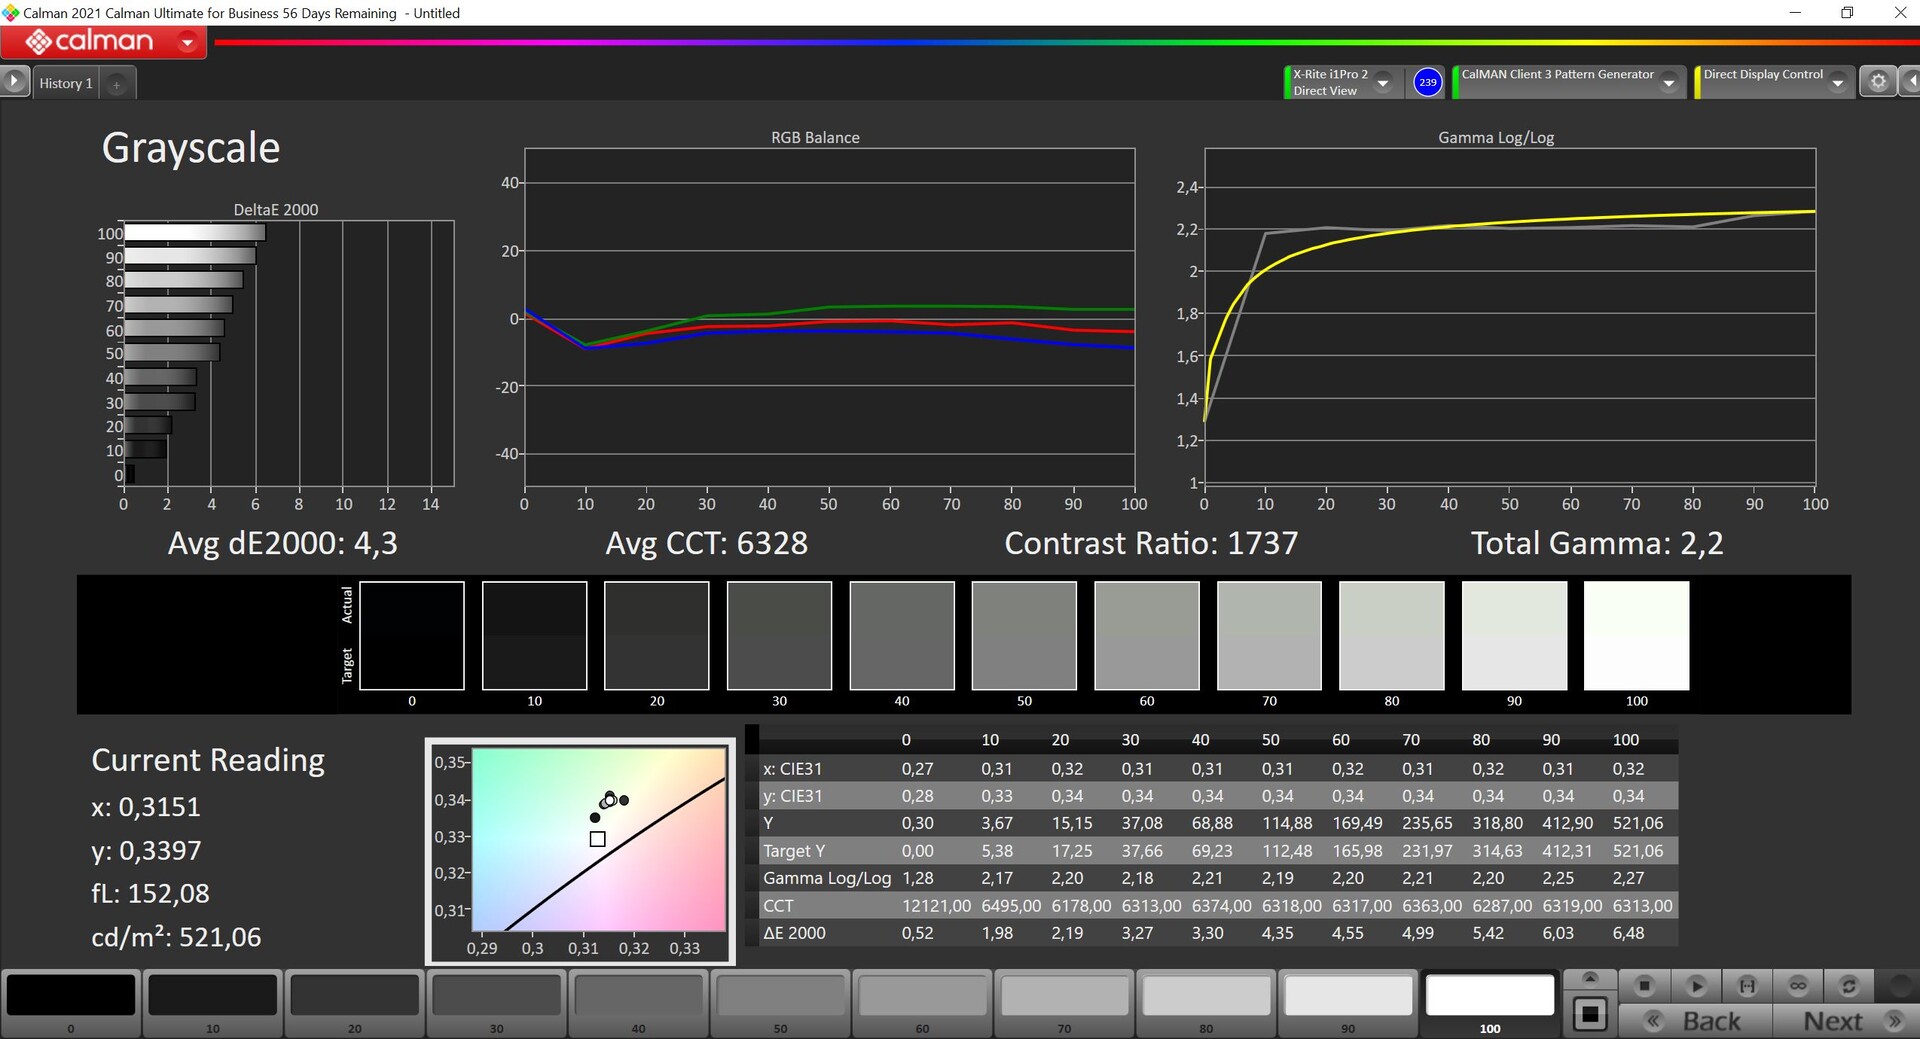
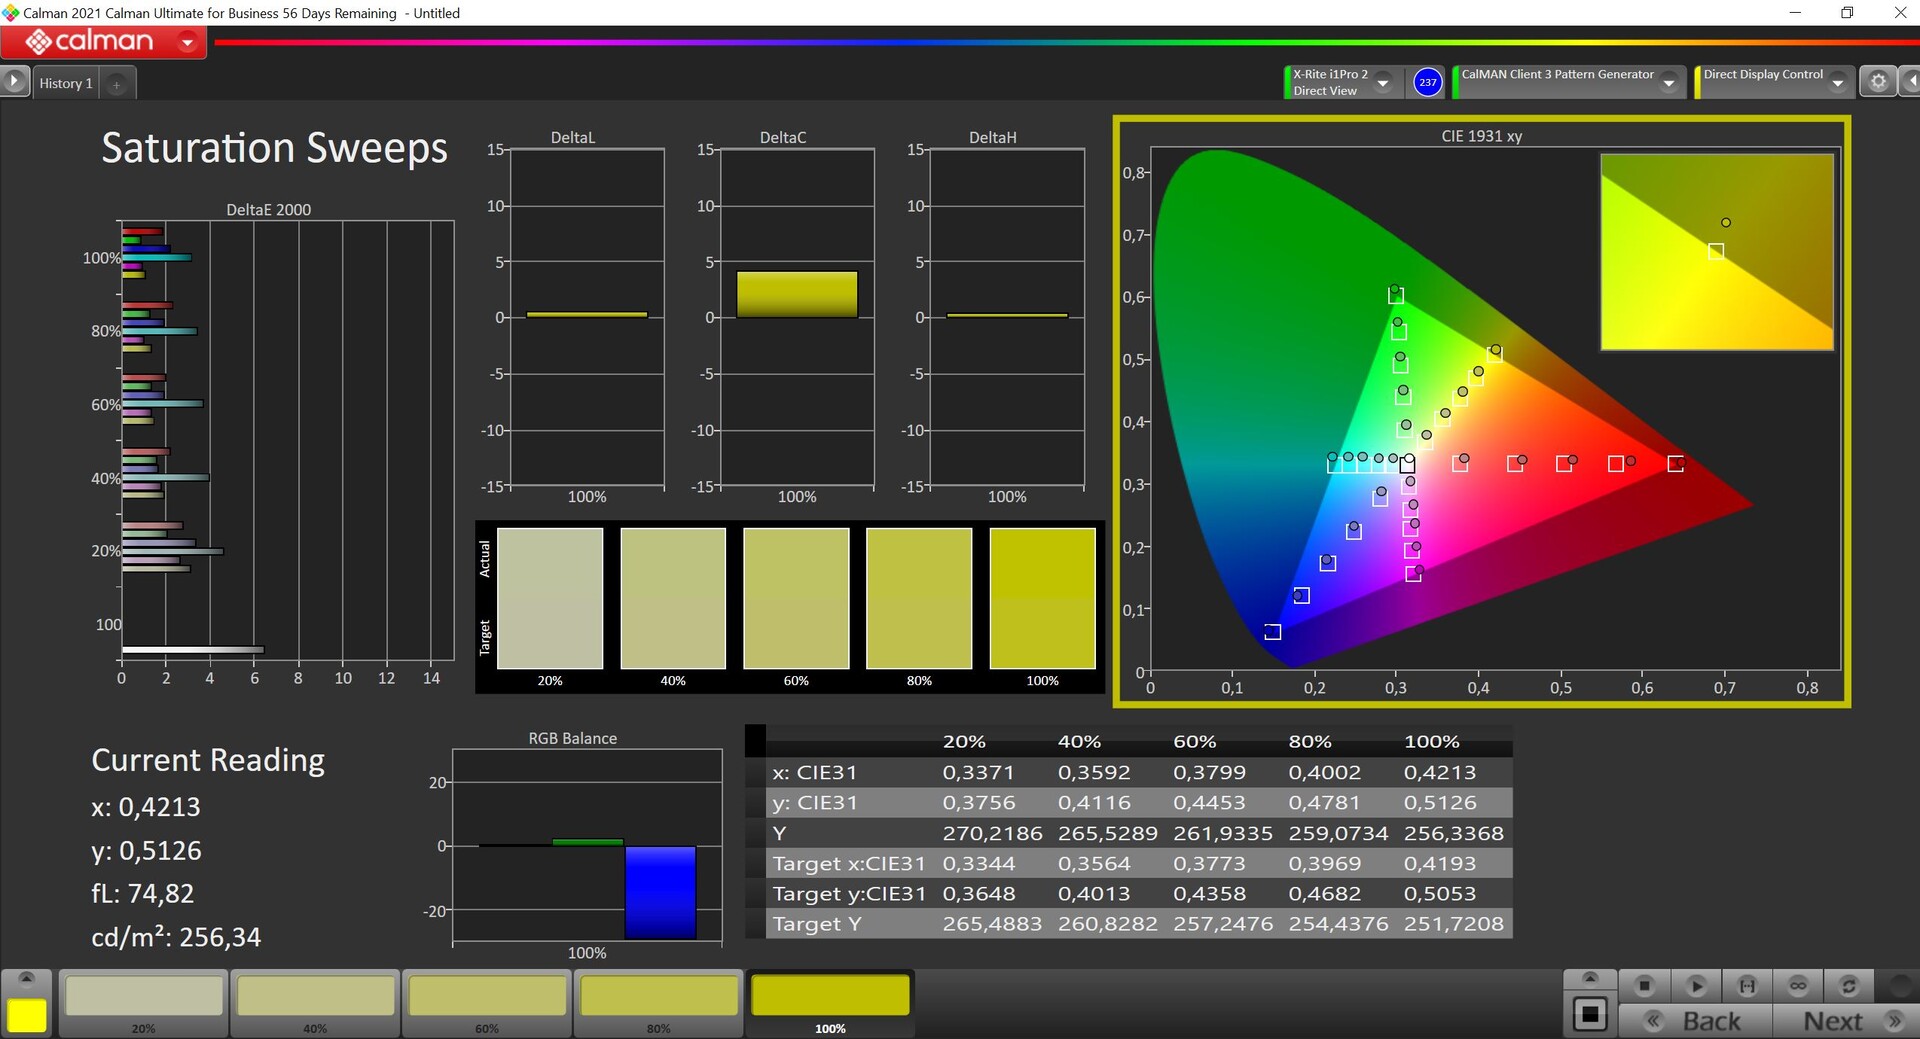
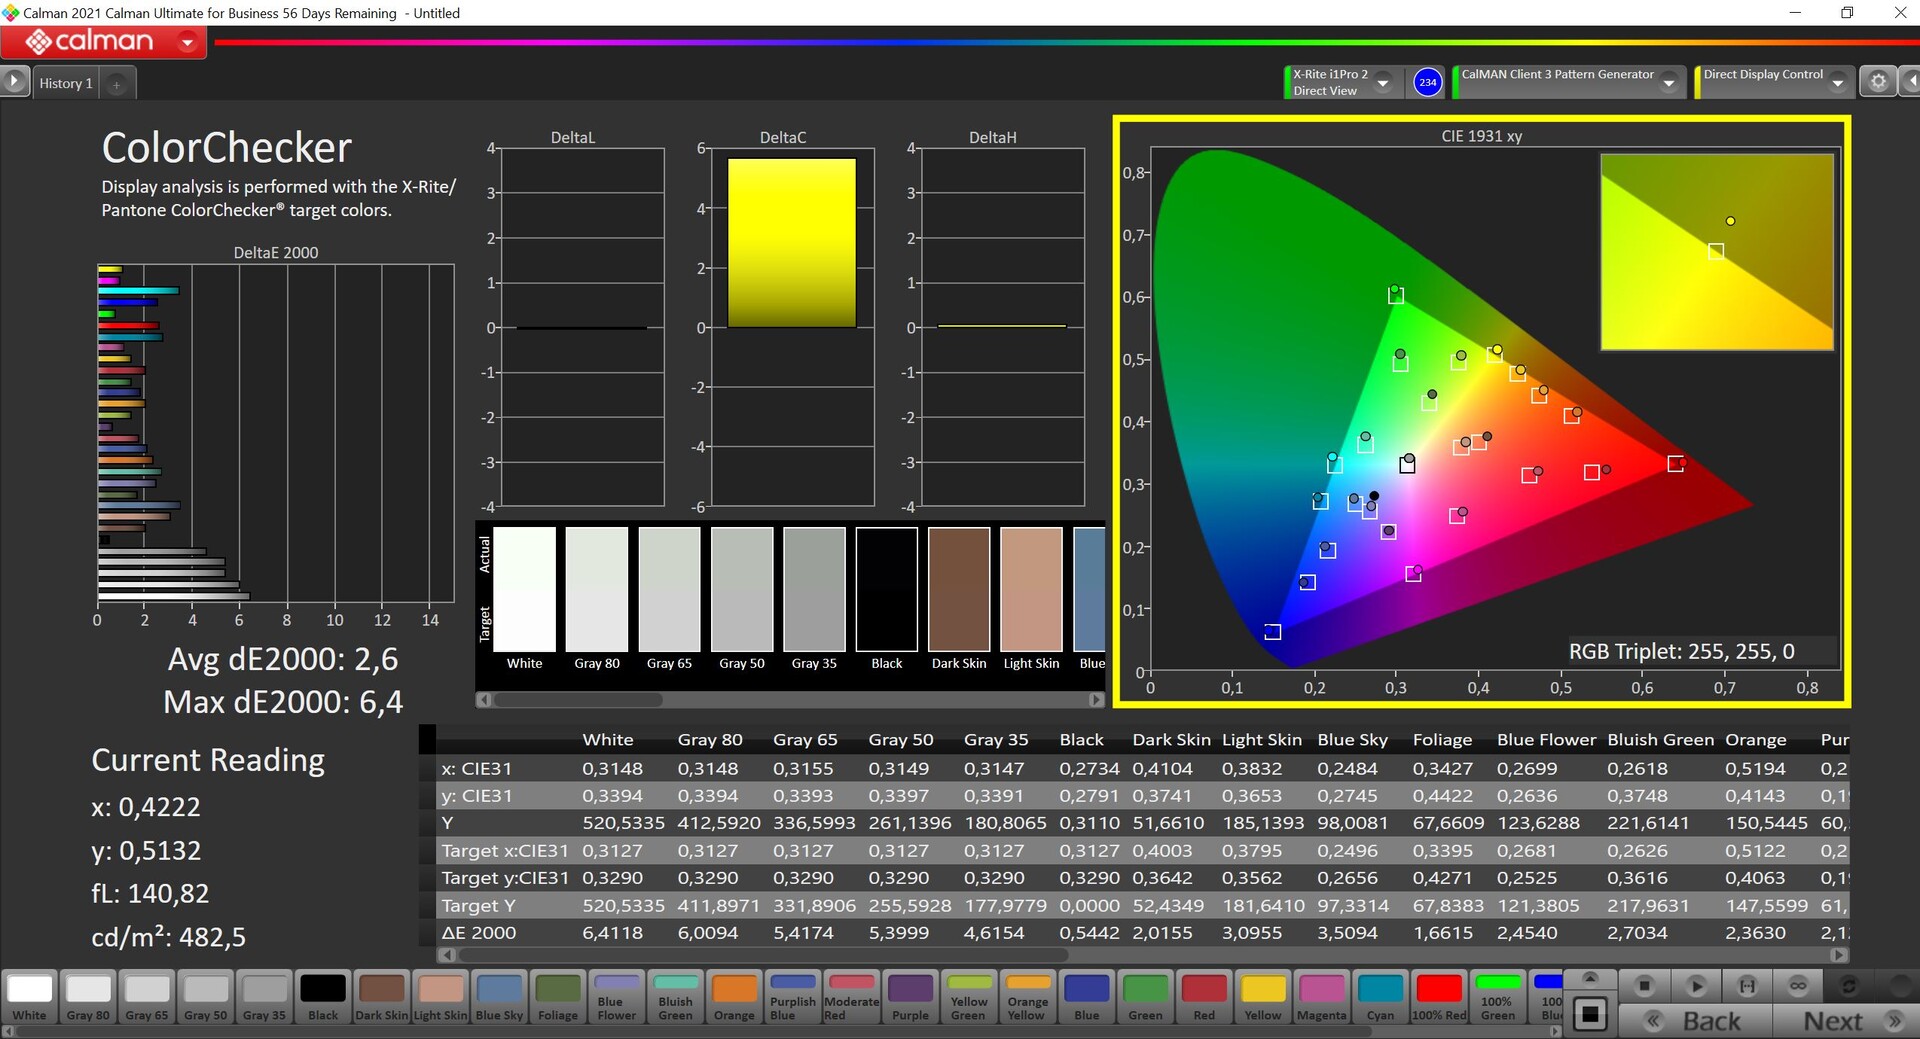
During our professional CalMAN analysis (X-Rite i1 Pro 2), we observe a faint green tint and average grayscale as well as color deviations in excess of 3 relative to the sRGB reference color space. After calibrating the display, the green tint is no longer an issue and the color accuracy of most colors falls into the ideal range. Thanks to the close-to-full sRGB color space coverage, photo editing is a real possibility.
Display Response Times
| ↔ Response Time Black to White | ||
|---|---|---|
| 19.5 ms ... rise ↗ and fall ↘ combined | ↗ 6 ms rise | 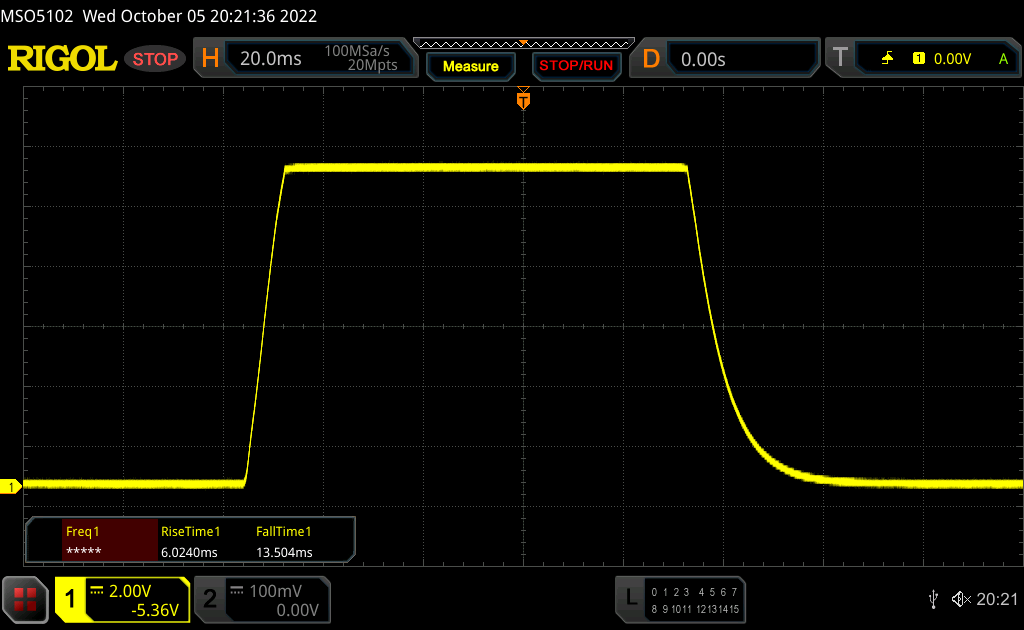 |
| ↘ 13.5 ms fall | ||
| The screen shows good response rates in our tests, but may be too slow for competitive gamers. In comparison, all tested devices range from 0.1 (minimum) to 240 (maximum) ms. » 43 % of all devices are better. This means that the measured response time is similar to the average of all tested devices (19.8 ms). | ||
| ↔ Response Time 50% Grey to 80% Grey | ||
| 52.8 ms ... rise ↗ and fall ↘ combined | ↗ 22.9 ms rise | 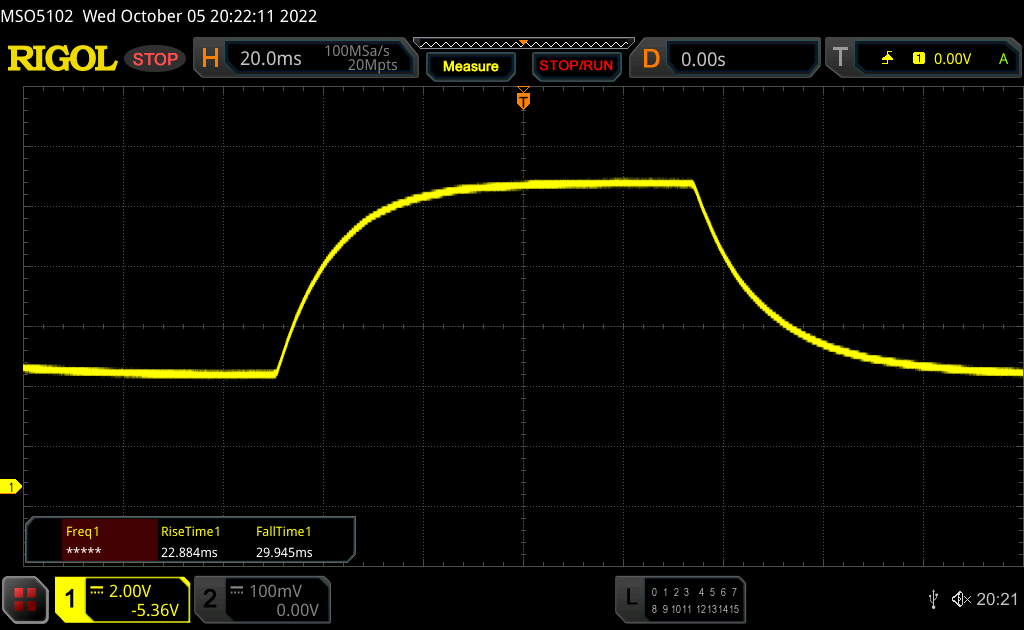 |
| ↘ 29.9 ms fall | ||
| The screen shows slow response rates in our tests and will be unsatisfactory for gamers. In comparison, all tested devices range from 0.165 (minimum) to 636 (maximum) ms. » 89 % of all devices are better. This means that the measured response time is worse than the average of all tested devices (30.9 ms). | ||
Screen Flickering / PWM (Pulse-Width Modulation)
| Screen flickering / PWM not detected | 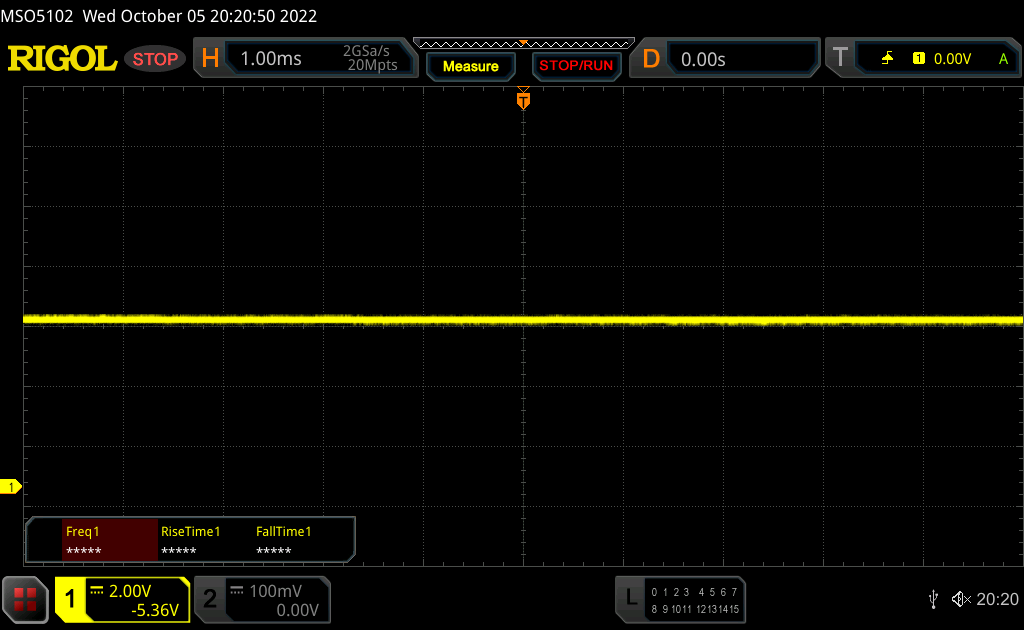 | ||
In comparison: 52 % of all tested devices do not use PWM to dim the display. If PWM was detected, an average of 7744 (minimum: 5 - maximum: 343500) Hz was measured. | |||
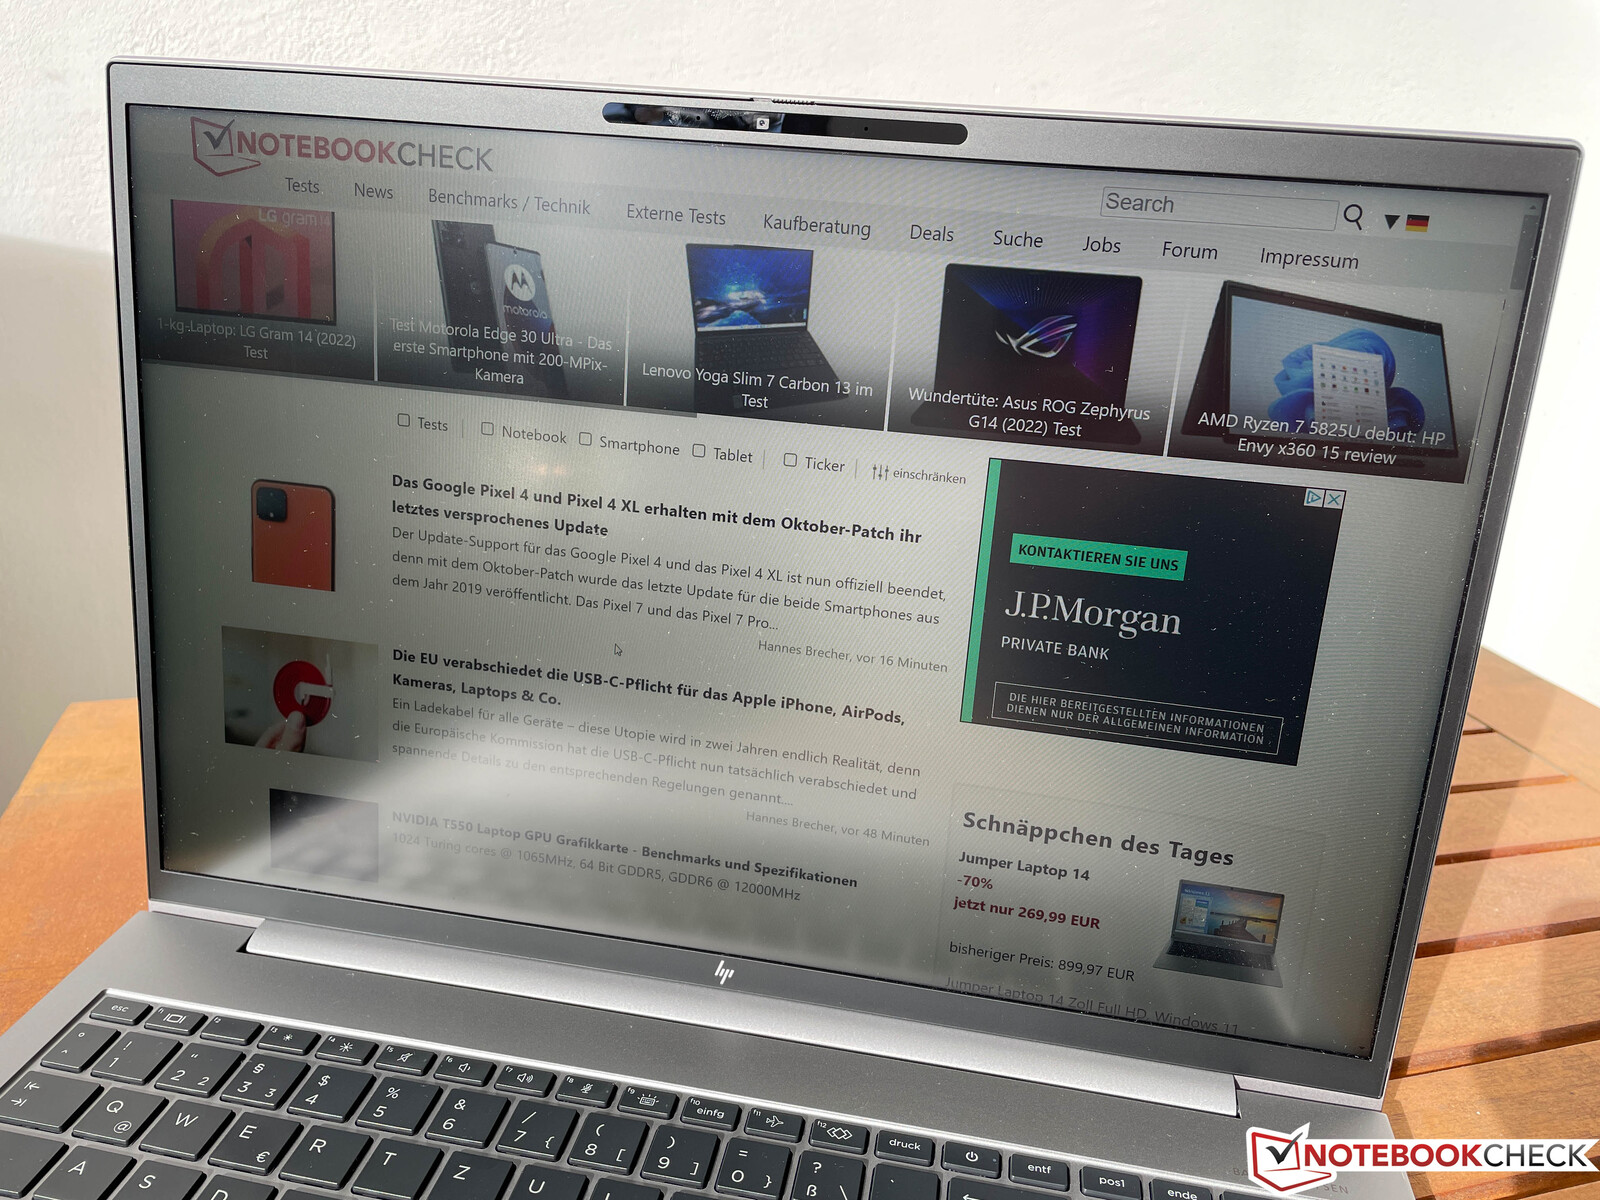
The ZBook Firefly 16 G9 is well suited to outdoor use, where the matte panel and the high maximum brightness are very useful. Even sunny days should not be a problems, provided sunlight does not hit the screen directly.
Performance - Alder Lake-U & Nvidia T550
Testing Conditions
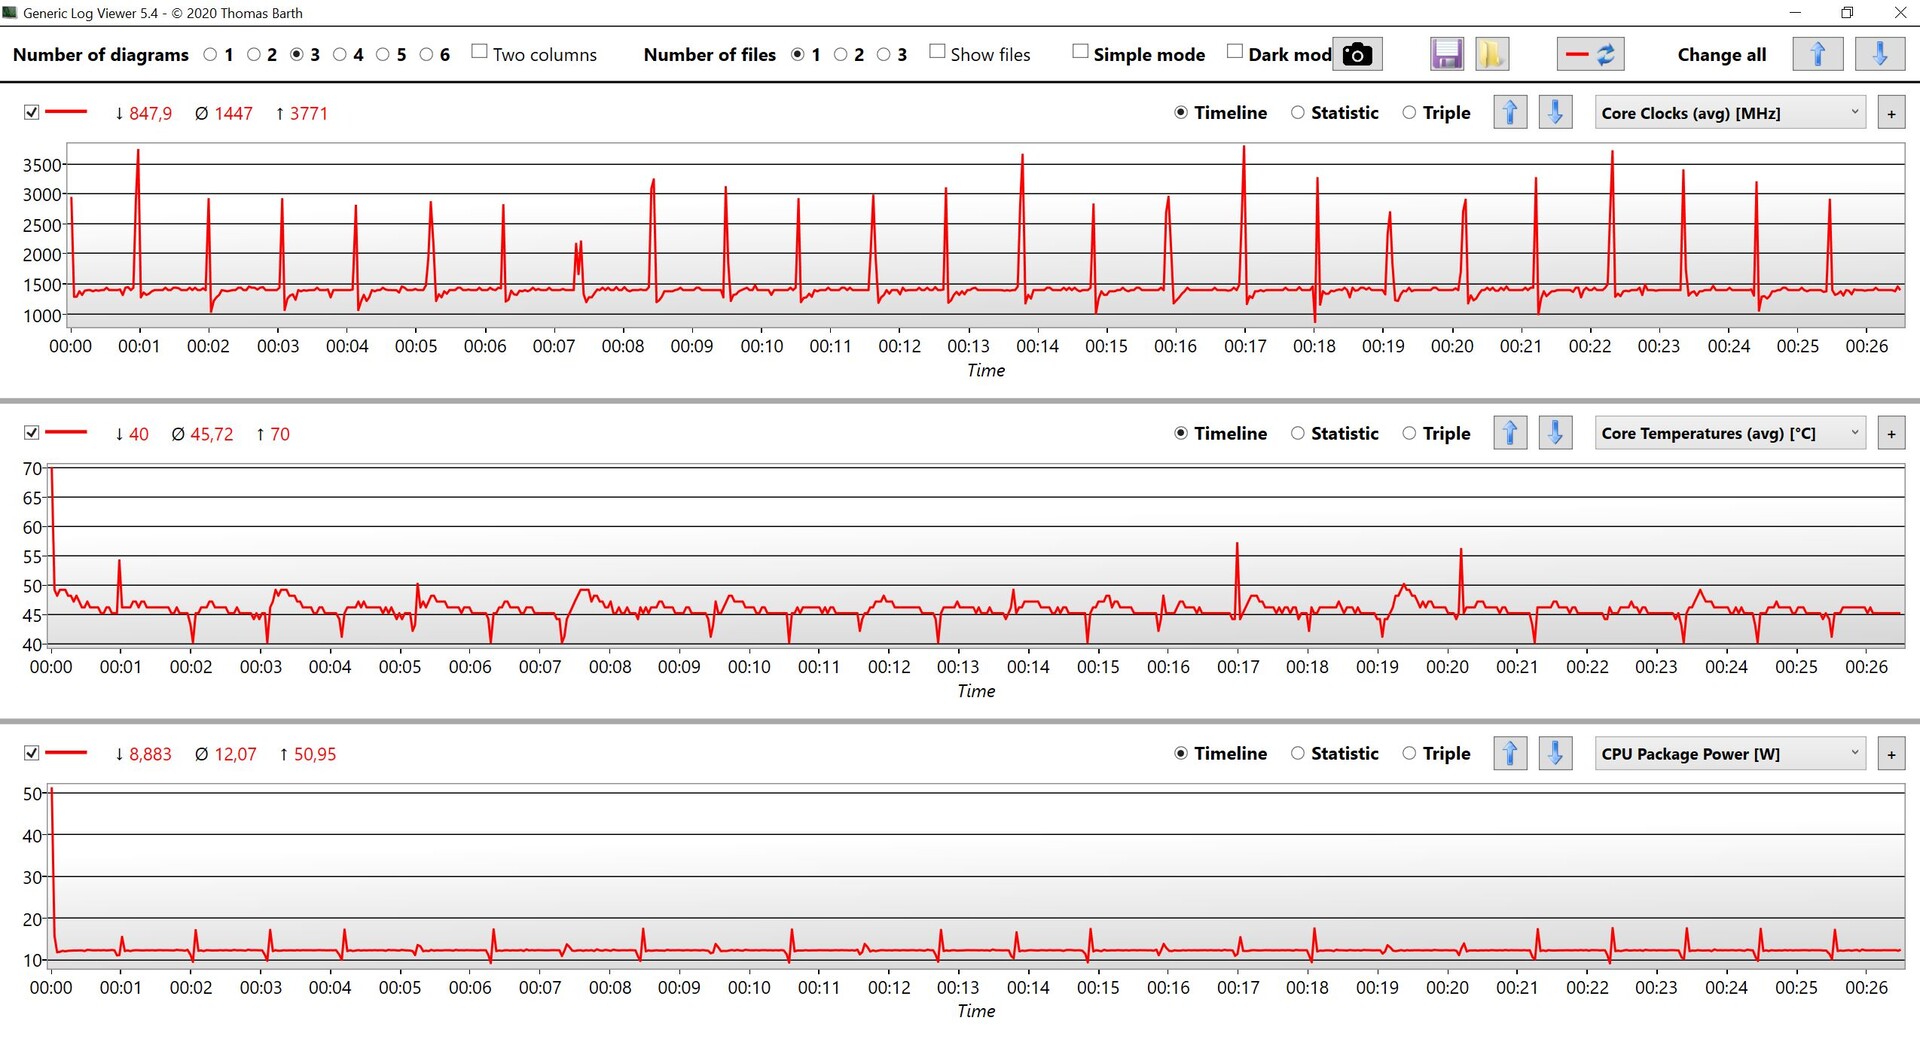
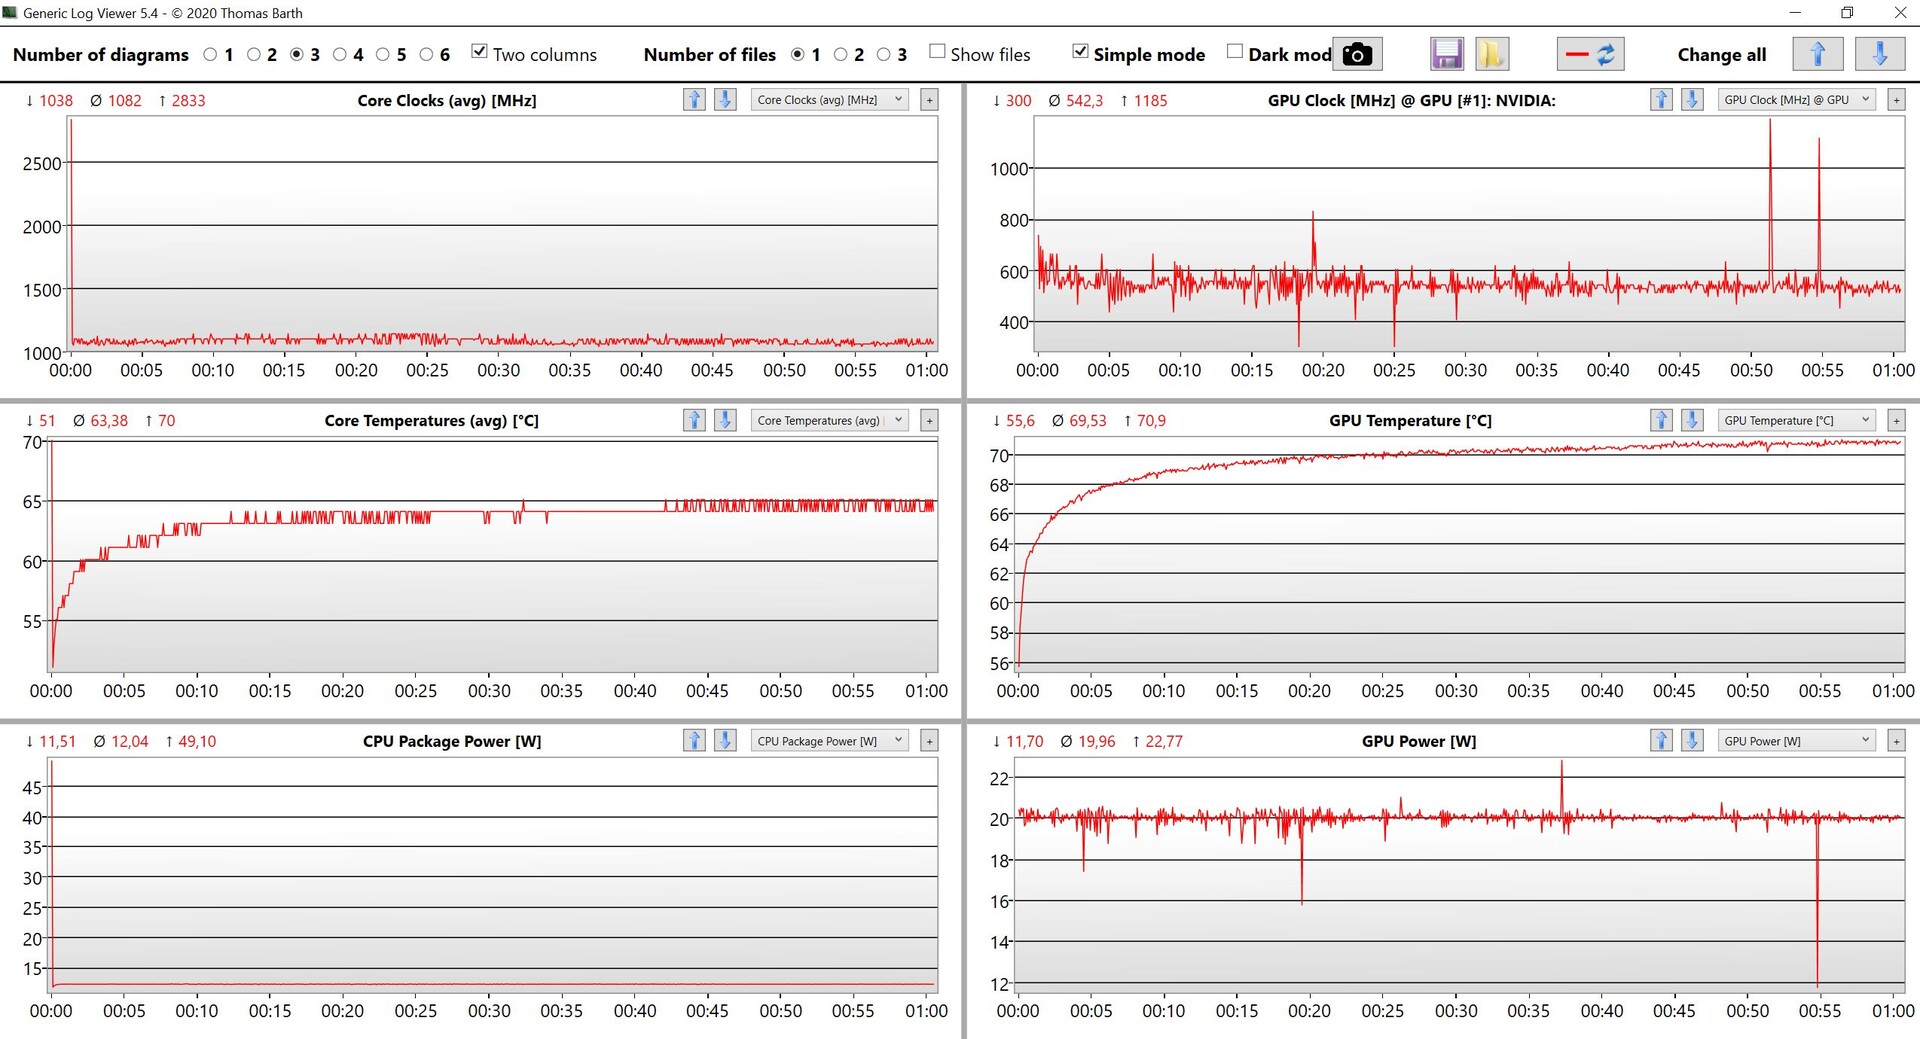
There are no power profiles other than the default Windows performance settings. We were extremely surprised to see very low power limits of 51 watts during short bursts and 12 watts under continuous stress. Most importantly, the high Turbo Boost is only available for about one second. We checked all settings (including the BIOS) and installed all the available updates, but the limits would not change. Similarly, the graphics card's 20-watt limit represents the absolute lowest value for this chip. Since we observe similar behavior on our 14-inch version, an issue with our test device seems unlikely. Even if the cooling solution is at its limits under combined CPU/GPU stress, we can find no reason for the CPU throttling this severely under a pure CPU load. According to the data sheet, Alder Lake-P chips such as the Core i5-1240P or Core i7-1260P are also available, although we are currently unable to determine whether their power limits are more reasonable.
Processor
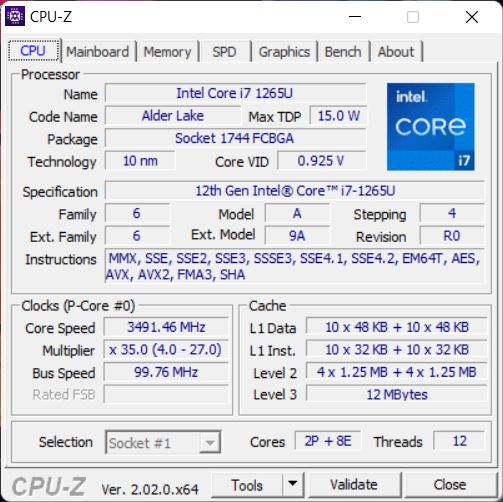
Nominally, the Intel Core i7-1265U is a fast processor with two performance and eight efficiency cores. Due to its TDP being massively limited to just 12 watts, however, the performance is abysmal with throttling occuring even during the single-core benchmarks. Although the actual performance of current Intel GPUs can vary widely depending on the TDP set by the manufacturer, we have never seen results this low and even the older Firefly 15 G8 with the Core i7-1165G7 outperforms our ZBook Firefly 16 G9. While the deficit is less dramatic in the single-core benchmarks, making the poor performance not as noticeable during daily use, the multi-core benchmark results make this mobile workstation more or less one of the slowest laptops available. To our surprise, the performance in battery mode is even worse with power limits of just 30/10 watts. More benchmarks are available here.
Cinebench R15 Multi Loop
Cinebench R23: Multi Core | Single Core
Cinebench R20: CPU (Multi Core) | CPU (Single Core)
Cinebench R15: CPU Multi 64Bit | CPU Single 64Bit
Blender: v2.79 BMW27 CPU
7-Zip 18.03: 7z b 4 | 7z b 4 -mmt1
Geekbench 5.5: Multi-Core | Single-Core
HWBOT x265 Benchmark v2.2: 4k Preset
LibreOffice : 20 Documents To PDF
R Benchmark 2.5: Overall mean
| CPU Performance rating | |
| Average of class Workstation | |
| Apple MacBook Pro 16 2021 M1 Pro -5! | |
| Lenovo ThinkPad P1 G4-20Y4Z9DVUS | |
| Dell Precision 5000 5560 -2! | |
| Average Intel Core i7-1265U | |
| Lenovo ThinkPad P15s Gen2-20W6000GGE | |
| HP ZBook Firefly 15 G8 2C9R7EA -2! | |
| HP ZBook Firefly 16 G9-6B897EA | |
| Cinebench R23 / Multi Core | |
| Average of class Workstation (14621 - 38520, n=23, last 2 years) | |
| Lenovo ThinkPad P1 G4-20Y4Z9DVUS | |
| Apple MacBook Pro 16 2021 M1 Pro | |
| Dell Precision 5000 5560 | |
| Average Intel Core i7-1265U (4332 - 9219, n=10) | |
| Lenovo ThinkPad P15s Gen2-20W6000GGE | |
| HP ZBook Firefly 16 G9-6B897EA | |
| Cinebench R23 / Single Core | |
| Average of class Workstation (1712 - 2228, n=23, last 2 years) | |
| Average Intel Core i7-1265U (1144 - 1820, n=10) | |
| Apple MacBook Pro 16 2021 M1 Pro | |
| Dell Precision 5000 5560 | |
| Lenovo ThinkPad P1 G4-20Y4Z9DVUS | |
| Lenovo ThinkPad P15s Gen2-20W6000GGE | |
| HP ZBook Firefly 16 G9-6B897EA | |
| Cinebench R20 / CPU (Multi Core) | |
| Average of class Workstation (5760 - 15043, n=23, last 2 years) | |
| Lenovo ThinkPad P1 G4-20Y4Z9DVUS | |
| Dell Precision 5000 5560 | |
| Average Intel Core i7-1265U (1669 - 3584, n=10) | |
| Apple MacBook Pro 16 2021 M1 Pro | |
| HP ZBook Firefly 15 G8 2C9R7EA | |
| Lenovo ThinkPad P15s Gen2-20W6000GGE | |
| HP ZBook Firefly 16 G9-6B897EA | |
| Cinebench R20 / CPU (Single Core) | |
| Average of class Workstation (671 - 857, n=23, last 2 years) | |
| Average Intel Core i7-1265U (528 - 701, n=10) | |
| HP ZBook Firefly 15 G8 2C9R7EA | |
| Lenovo ThinkPad P1 G4-20Y4Z9DVUS | |
| Dell Precision 5000 5560 | |
| Lenovo ThinkPad P15s Gen2-20W6000GGE | |
| HP ZBook Firefly 16 G9-6B897EA | |
| Apple MacBook Pro 16 2021 M1 Pro | |
| Cinebench R15 / CPU Multi 64Bit | |
| Average of class Workstation (2489 - 5810, n=23, last 2 years) | |
| Lenovo ThinkPad P1 G4-20Y4Z9DVUS | |
| Apple MacBook Pro 16 2021 M1 Pro | |
| Dell Precision 5000 5560 | |
| Average Intel Core i7-1265U (706 - 1572, n=10) | |
| Lenovo ThinkPad P15s Gen2-20W6000GGE | |
| HP ZBook Firefly 15 G8 2C9R7EA | |
| HP ZBook Firefly 16 G9-6B897EA | |
| Cinebench R15 / CPU Single 64Bit | |
| Average of class Workstation (191.4 - 328, n=23, last 2 years) | |
| Dell Precision 5000 5560 | |
| Lenovo ThinkPad P1 G4-20Y4Z9DVUS | |
| Average Intel Core i7-1265U (165.3 - 260, n=10) | |
| HP ZBook Firefly 15 G8 2C9R7EA | |
| Lenovo ThinkPad P15s Gen2-20W6000GGE | |
| Apple MacBook Pro 16 2021 M1 Pro | |
| HP ZBook Firefly 16 G9-6B897EA | |
| Blender / v2.79 BMW27 CPU | |
| HP ZBook Firefly 16 G9-6B897EA | |
| HP ZBook Firefly 15 G8 2C9R7EA | |
| Lenovo ThinkPad P15s Gen2-20W6000GGE | |
| Average Intel Core i7-1265U (364 - 684, n=10) | |
| Dell Precision 5000 5560 | |
| Lenovo ThinkPad P1 G4-20Y4Z9DVUS | |
| Apple MacBook Pro 16 2021 M1 Pro | |
| Average of class Workstation (91 - 222, n=23, last 2 years) | |
| 7-Zip 18.03 / 7z b 4 | |
| Average of class Workstation (60489 - 116969, n=23, last 2 years) | |
| Lenovo ThinkPad P1 G4-20Y4Z9DVUS | |
| Dell Precision 5000 5560 | |
| Average Intel Core i7-1265U (20087 - 38715, n=10) | |
| HP ZBook Firefly 15 G8 2C9R7EA | |
| Lenovo ThinkPad P15s Gen2-20W6000GGE | |
| HP ZBook Firefly 16 G9-6B897EA | |
| 7-Zip 18.03 / 7z b 4 -mmt1 | |
| Average of class Workstation (5126 - 6960, n=23, last 2 years) | |
| Dell Precision 5000 5560 | |
| Lenovo ThinkPad P1 G4-20Y4Z9DVUS | |
| HP ZBook Firefly 15 G8 2C9R7EA | |
| Lenovo ThinkPad P15s Gen2-20W6000GGE | |
| Average Intel Core i7-1265U (4614 - 5617, n=10) | |
| HP ZBook Firefly 16 G9-6B897EA | |
| Geekbench 5.5 / Multi-Core | |
| Average of class Workstation (11542 - 25554, n=23, last 2 years) | |
| Apple MacBook Pro 16 2021 M1 Pro | |
| Lenovo ThinkPad P1 G4-20Y4Z9DVUS | |
| Average Intel Core i7-1265U (5022 - 8981, n=10) | |
| Lenovo ThinkPad P15s Gen2-20W6000GGE | |
| HP ZBook Firefly 16 G9-6B897EA | |
| HP ZBook Firefly 15 G8 2C9R7EA | |
| Geekbench 5.5 / Single-Core | |
| Average of class Workstation (1783 - 2183, n=23, last 2 years) | |
| HP ZBook Firefly 16 G9-6B897EA | |
| Apple MacBook Pro 16 2021 M1 Pro | |
| Average Intel Core i7-1265U (1429 - 1806, n=10) | |
| Lenovo ThinkPad P1 G4-20Y4Z9DVUS | |
| HP ZBook Firefly 15 G8 2C9R7EA | |
| Lenovo ThinkPad P15s Gen2-20W6000GGE | |
| HWBOT x265 Benchmark v2.2 / 4k Preset | |
| Average of class Workstation (17.8 - 40.5, n=23, last 2 years) | |
| Lenovo ThinkPad P1 G4-20Y4Z9DVUS | |
| Dell Precision 5000 5560 | |
| Average Intel Core i7-1265U (5.09 - 10.6, n=10) | |
| Lenovo ThinkPad P15s Gen2-20W6000GGE | |
| HP ZBook Firefly 15 G8 2C9R7EA | |
| HP ZBook Firefly 16 G9-6B897EA | |
| LibreOffice / 20 Documents To PDF | |
| HP ZBook Firefly 16 G9-6B897EA | |
| Lenovo ThinkPad P1 G4-20Y4Z9DVUS | |
| Average Intel Core i7-1265U (44 - 61.6, n=10) | |
| Dell Precision 5000 5560 | |
| Average of class Workstation (37.1 - 74.7, n=23, last 2 years) | |
| Lenovo ThinkPad P15s Gen2-20W6000GGE | |
| HP ZBook Firefly 15 G8 2C9R7EA | |
| R Benchmark 2.5 / Overall mean | |
| HP ZBook Firefly 15 G8 2C9R7EA | |
| Lenovo ThinkPad P15s Gen2-20W6000GGE | |
| Lenovo ThinkPad P1 G4-20Y4Z9DVUS | |
| HP ZBook Firefly 16 G9-6B897EA | |
| Dell Precision 5000 5560 | |
| Average Intel Core i7-1265U (0.4666 - 0.578, n=10) | |
| Average of class Workstation (0.3825 - 0.603, n=23, last 2 years) | |
* ... smaller is better
AIDA64: FP32 Ray-Trace | FPU Julia | CPU SHA3 | CPU Queen | FPU SinJulia | FPU Mandel | CPU AES | CPU ZLib | FP64 Ray-Trace | CPU PhotoWorxx
| Performance rating | |
| Average of class Workstation | |
| Lenovo ThinkPad P1 G4-20Y4Z9DVUS | |
| Lenovo ThinkPad P15s Gen2-20W6000GGE | |
| Average Intel Core i7-1265U | |
| HP ZBook Firefly 15 G8 2C9R7EA | |
| HP ZBook Firefly 16 G9-6B897EA | |
| AIDA64 / FP32 Ray-Trace | |
| Average of class Workstation (16730 - 61611, n=23, last 2 years) | |
| Lenovo ThinkPad P1 G4-20Y4Z9DVUS | |
| Lenovo ThinkPad P15s Gen2-20W6000GGE | |
| HP ZBook Firefly 15 G8 2C9R7EA | |
| Average Intel Core i7-1265U (2619 - 8178, n=10) | |
| HP ZBook Firefly 16 G9-6B897EA | |
| AIDA64 / FPU Julia | |
| Average of class Workstation (89597 - 186971, n=23, last 2 years) | |
| Lenovo ThinkPad P1 G4-20Y4Z9DVUS | |
| Average Intel Core i7-1265U (12909 - 41649, n=10) | |
| Lenovo ThinkPad P15s Gen2-20W6000GGE | |
| HP ZBook Firefly 15 G8 2C9R7EA | |
| HP ZBook Firefly 16 G9-6B897EA | |
| AIDA64 / CPU SHA3 | |
| Average of class Workstation (4178 - 8975, n=23, last 2 years) | |
| Lenovo ThinkPad P1 G4-20Y4Z9DVUS | |
| Lenovo ThinkPad P15s Gen2-20W6000GGE | |
| HP ZBook Firefly 15 G8 2C9R7EA | |
| Average Intel Core i7-1265U (824 - 2183, n=10) | |
| HP ZBook Firefly 16 G9-6B897EA | |
| AIDA64 / CPU Queen | |
| Average of class Workstation (60778 - 144411, n=23, last 2 years) | |
| Lenovo ThinkPad P1 G4-20Y4Z9DVUS | |
| Average Intel Core i7-1265U (63615 - 67065, n=10) | |
| HP ZBook Firefly 16 G9-6B897EA | |
| Lenovo ThinkPad P15s Gen2-20W6000GGE | |
| HP ZBook Firefly 15 G8 2C9R7EA | |
| AIDA64 / FPU SinJulia | |
| Average of class Workstation (8165 - 29343, n=23, last 2 years) | |
| Lenovo ThinkPad P1 G4-20Y4Z9DVUS | |
| Lenovo ThinkPad P15s Gen2-20W6000GGE | |
| HP ZBook Firefly 15 G8 2C9R7EA | |
| Average Intel Core i7-1265U (3105 - 5135, n=10) | |
| HP ZBook Firefly 16 G9-6B897EA | |
| AIDA64 / FPU Mandel | |
| Average of class Workstation (44497 - 98153, n=23, last 2 years) | |
| Lenovo ThinkPad P1 G4-20Y4Z9DVUS | |
| Lenovo ThinkPad P15s Gen2-20W6000GGE | |
| HP ZBook Firefly 15 G8 2C9R7EA | |
| Average Intel Core i7-1265U (6967 - 20804, n=10) | |
| HP ZBook Firefly 16 G9-6B897EA | |
| AIDA64 / CPU AES | |
| Average of class Workstation (73133 - 187841, n=23, last 2 years) | |
| Lenovo ThinkPad P1 G4-20Y4Z9DVUS | |
| Lenovo ThinkPad P15s Gen2-20W6000GGE | |
| HP ZBook Firefly 15 G8 2C9R7EA | |
| Average Intel Core i7-1265U (19489 - 42966, n=10) | |
| HP ZBook Firefly 16 G9-6B897EA | |
| AIDA64 / CPU ZLib | |
| Average of class Workstation (929 - 2148, n=23, last 2 years) | |
| Lenovo ThinkPad P1 G4-20Y4Z9DVUS | |
| Average Intel Core i7-1265U (314 - 632, n=10) | |
| Lenovo ThinkPad P15s Gen2-20W6000GGE | |
| HP ZBook Firefly 15 G8 2C9R7EA | |
| HP ZBook Firefly 16 G9-6B897EA | |
| AIDA64 / FP64 Ray-Trace | |
| Average of class Workstation (8545 - 32891, n=23, last 2 years) | |
| Lenovo ThinkPad P1 G4-20Y4Z9DVUS | |
| Lenovo ThinkPad P15s Gen2-20W6000GGE | |
| HP ZBook Firefly 15 G8 2C9R7EA | |
| Average Intel Core i7-1265U (1473 - 4376, n=10) | |
| HP ZBook Firefly 16 G9-6B897EA | |
| AIDA64 / CPU PhotoWorxx | |
| Average of class Workstation (37151 - 93684, n=23, last 2 years) | |
| Average Intel Core i7-1265U (20213 - 47031, n=10) | |
| Lenovo ThinkPad P15s Gen2-20W6000GGE | |
| HP ZBook Firefly 16 G9-6B897EA | |
| HP ZBook Firefly 15 G8 2C9R7EA | |
| Lenovo ThinkPad P1 G4-20Y4Z9DVUS | |
System Performance
Subjectively, the performance during day-to-day use is excellent and the poor CPU performance is not as apparent from the synthetic benchmarks, which can of course be partially attributed to the blazing fast PCIe-4.0 SSD. That being said, users will quickly run into limitations when stressing the system for example by multi tasking. The slow CPU performance also means the system certainly is not future-proof.
CrossMark: Overall | Productivity | Creativity | Responsiveness
| PCMark 10 / Score | |
| Average of class Workstation (6563 - 10409, n=19, last 2 years) | |
| Dell Precision 5000 5560 | |
| Lenovo ThinkPad P1 G4-20Y4Z9DVUS | |
| Average Intel Core i7-1265U, NVIDIA T550 Laptop GPU (5488 - 6181, n=3) | |
| HP ZBook Firefly 16 G9-6B897EA | |
| HP ZBook Firefly 15 G8 2C9R7EA | |
| Lenovo ThinkPad P15s Gen2-20W6000GGE | |
| PCMark 10 / Essentials | |
| Dell Precision 5000 5560 | |
| Average of class Workstation (9622 - 11157, n=19, last 2 years) | |
| HP ZBook Firefly 16 G9-6B897EA | |
| Average Intel Core i7-1265U, NVIDIA T550 Laptop GPU (9960 - 10250, n=3) | |
| Lenovo ThinkPad P1 G4-20Y4Z9DVUS | |
| Lenovo ThinkPad P15s Gen2-20W6000GGE | |
| HP ZBook Firefly 15 G8 2C9R7EA | |
| PCMark 10 / Productivity | |
| Average of class Workstation (8789 - 20616, n=19, last 2 years) | |
| Lenovo ThinkPad P15s Gen2-20W6000GGE | |
| Dell Precision 5000 5560 | |
| HP ZBook Firefly 15 G8 2C9R7EA | |
| Average Intel Core i7-1265U, NVIDIA T550 Laptop GPU (8315 - 9474, n=3) | |
| HP ZBook Firefly 16 G9-6B897EA | |
| Lenovo ThinkPad P1 G4-20Y4Z9DVUS | |
| PCMark 10 / Digital Content Creation | |
| Average of class Workstation (8108 - 15631, n=19, last 2 years) | |
| Dell Precision 5000 5560 | |
| Lenovo ThinkPad P1 G4-20Y4Z9DVUS | |
| Average Intel Core i7-1265U, NVIDIA T550 Laptop GPU (5399 - 6793, n=3) | |
| HP ZBook Firefly 15 G8 2C9R7EA | |
| HP ZBook Firefly 16 G9-6B897EA | |
| Lenovo ThinkPad P15s Gen2-20W6000GGE | |
| CrossMark / Overall | |
| Average of class Workstation (1307 - 2267, n=22, last 2 years) | |
| HP ZBook Firefly 16 G9-6B897EA | |
| Average Intel Core i7-1265U, NVIDIA T550 Laptop GPU (1591 - 1623, n=3) | |
| Apple MacBook Pro 16 2021 M1 Pro | |
| Lenovo ThinkPad P1 G4-20Y4Z9DVUS | |
| CrossMark / Productivity | |
| Average of class Workstation (1130 - 2122, n=22, last 2 years) | |
| HP ZBook Firefly 16 G9-6B897EA | |
| Average Intel Core i7-1265U, NVIDIA T550 Laptop GPU (1553 - 1592, n=3) | |
| Lenovo ThinkPad P1 G4-20Y4Z9DVUS | |
| Apple MacBook Pro 16 2021 M1 Pro | |
| CrossMark / Creativity | |
| Average of class Workstation (1657 - 2725, n=22, last 2 years) | |
| Apple MacBook Pro 16 2021 M1 Pro | |
| HP ZBook Firefly 16 G9-6B897EA | |
| Average Intel Core i7-1265U, NVIDIA T550 Laptop GPU (1723 - 1751, n=3) | |
| Lenovo ThinkPad P1 G4-20Y4Z9DVUS | |
| CrossMark / Responsiveness | |
| Average of class Workstation (993 - 2096, n=22, last 2 years) | |
| HP ZBook Firefly 16 G9-6B897EA | |
| Average Intel Core i7-1265U, NVIDIA T550 Laptop GPU (1344 - 1376, n=3) | |
| Lenovo ThinkPad P1 G4-20Y4Z9DVUS | |
| Apple MacBook Pro 16 2021 M1 Pro | |
| PCMark 10 Score | 5634 points | |
Help | ||
| AIDA64 / Memory Copy | |
| Average of class Workstation (56003 - 164795, n=23, last 2 years) | |
| Average Intel Core i7-1265U (40212 - 72204, n=10) | |
| HP ZBook Firefly 16 G9-6B897EA | |
| Lenovo ThinkPad P15s Gen2-20W6000GGE | |
| Lenovo ThinkPad P1 G4-20Y4Z9DVUS | |
| HP ZBook Firefly 15 G8 2C9R7EA | |
| AIDA64 / Memory Read | |
| Average of class Workstation (55795 - 121563, n=23, last 2 years) | |
| Average Intel Core i7-1265U (41808 - 69493, n=10) | |
| HP ZBook Firefly 16 G9-6B897EA | |
| Lenovo ThinkPad P15s Gen2-20W6000GGE | |
| Lenovo ThinkPad P1 G4-20Y4Z9DVUS | |
| HP ZBook Firefly 15 G8 2C9R7EA | |
| AIDA64 / Memory Write | |
| Average of class Workstation (55663 - 214520, n=23, last 2 years) | |
| HP ZBook Firefly 16 G9-6B897EA | |
| Average Intel Core i7-1265U (41382 - 76027, n=10) | |
| Lenovo ThinkPad P15s Gen2-20W6000GGE | |
| Lenovo ThinkPad P1 G4-20Y4Z9DVUS | |
| HP ZBook Firefly 15 G8 2C9R7EA | |
| AIDA64 / Memory Latency | |
| Average of class Workstation (84.5 - 165.2, n=23, last 2 years) | |
| Average Intel Core i7-1265U (74.6 - 112.4, n=10) | |
| HP ZBook Firefly 16 G9-6B897EA | |
| Lenovo ThinkPad P1 G4-20Y4Z9DVUS | |
| Lenovo ThinkPad P15s Gen2-20W6000GGE | |
| HP ZBook Firefly 15 G8 2C9R7EA | |
* ... smaller is better
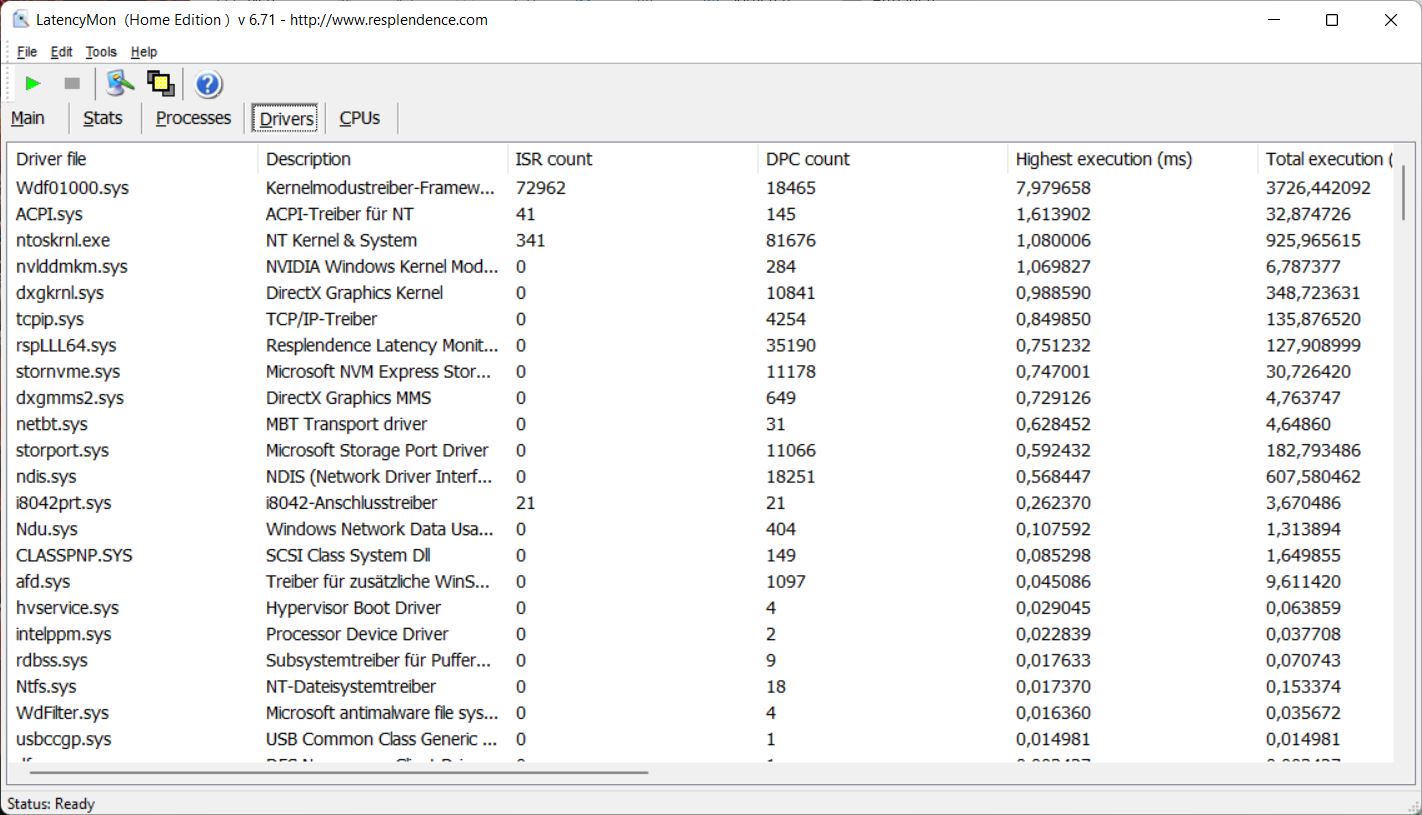
DPC Latency
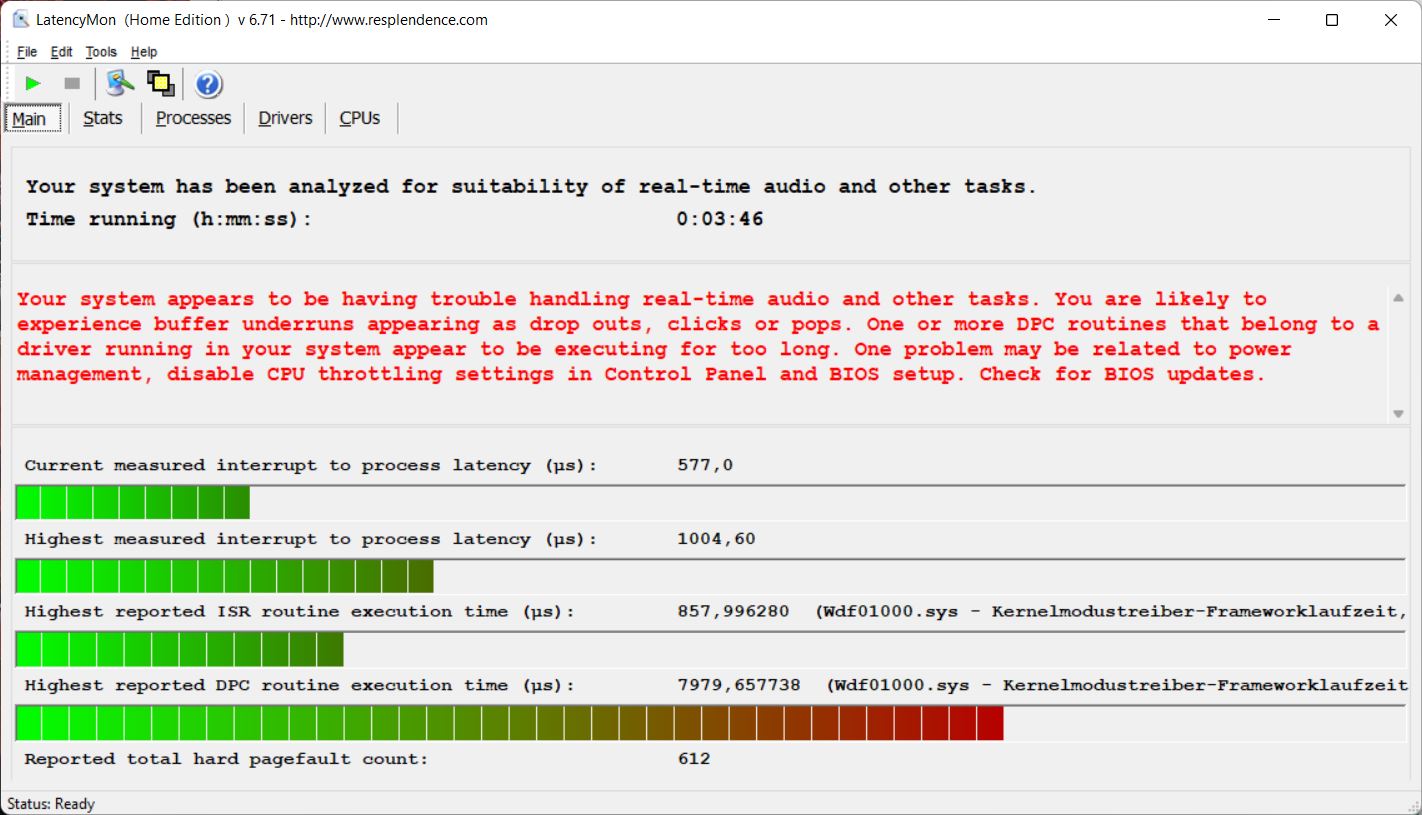
With the most up-to-date BIOS version at the time of testing, our test device suffers from slightly increased DPC latencies during our standardized Wi-Fi test (web browsing, watching a 4K YouTube video, CPU stress), making the ZBook a suboptimal choice for the use of real-time audio software.
| DPC Latencies / LatencyMon - interrupt to process latency (max), Web, Youtube, Prime95 | |
| Lenovo ThinkPad P15s Gen2-20W6000GGE | |
| Lenovo ThinkPad P1 G4-20Y4Z9DVUS | |
| HP ZBook Firefly 15 G8 2C9R7EA | |
| HP ZBook Firefly 16 G9-6B897EA | |
| Dell Precision 5000 5560 | |
* ... smaller is better
Storage Solution
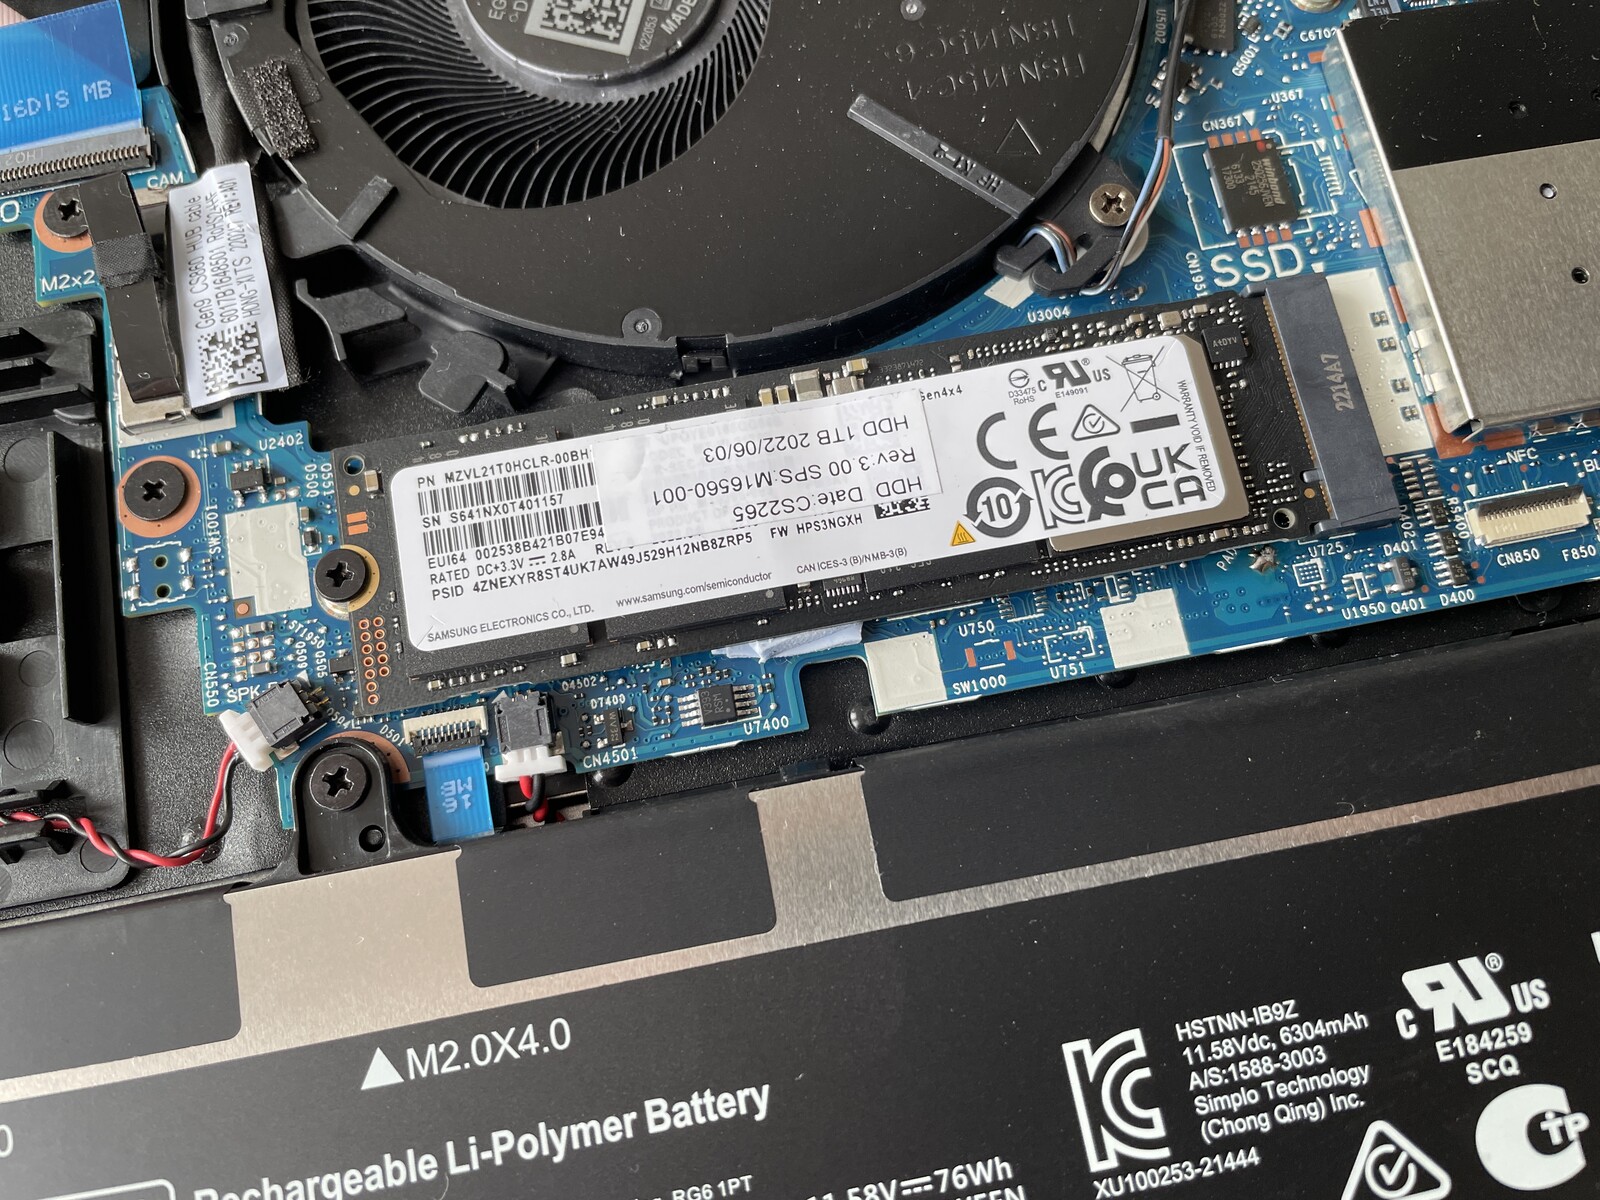
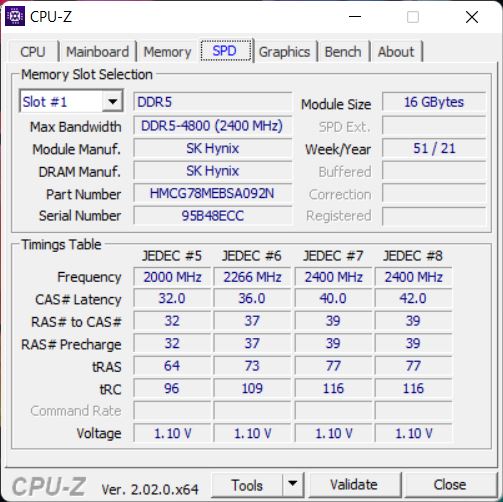
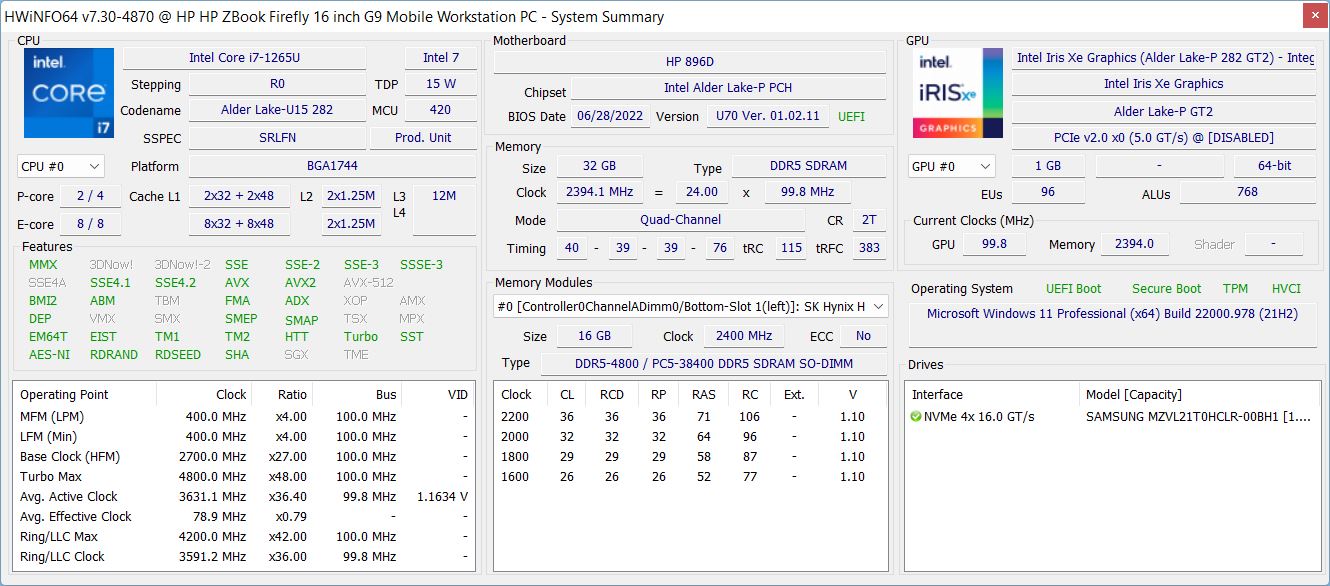
The ZBook Firefly 16 G9 comes with a fast PCIe-4.0 slot and in the case of our test sample, a 1-TB Samsung M.2-2280 SSD. The PM9A1 is one of the fastest SSDs available and we measured excellent transfer rates. Even though the SSD does not feature a cooler, the performance notably does not decrease under continuous stress. Here, the positioning inside the case is of course also a factor. Ex-factory, 890 GB is available to the user. More SSD benchmarks can be found here.

* ... smaller is better
Disk Throttling: DiskSpd Read Loop, Queue Depth 8
GPU Performance
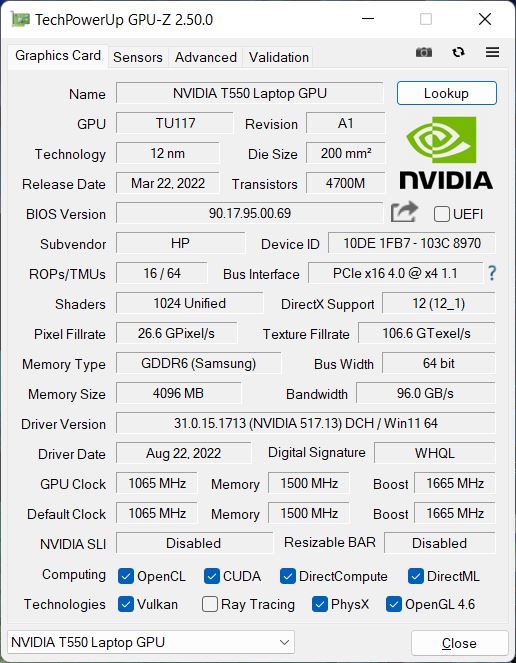
The new Nvidia T550 is a small upgrade compared to the older T500 and still based on the TU-117 chip that is also used by the GeForce MX550 & MX450. In other words, this is very much an entry-level card, particularly since HP set its TGP to just 20 watts (up to 60 watts would have been possible). Depending on the use case, the professional drivers grant the GPU some legitimacy.
The performance results of our synthetic 3DMark benchmarks are disappointing, since the T500 in the older Firefly 15 G8 is slightly faster and the consumer chip MX550, which we tested at a TGP of 35 watts, offers significantly better performance. At least in the professional SPECViewperf benchmarks, the T550 secures a small lead over the older T500.
The GPU performance remains consistently at this generally low level even under continuous load and in battery mode. More GPU benchmarks can be found in our benchmark list.
| GFXBench | |
| 2560x1440 Aztec Ruins High Tier Offscreen | |
| Apple MacBook Pro 16 2021 M1 Pro | |
| Average of class Workstation (60.6 - 224, n=6, last 2 years) | |
| Lenovo IdeaCentre AIO 3 24IAP7 | |
| HP ZBook Firefly 16 G9-6B897EA | |
| Average NVIDIA T550 Laptop GPU (n=1) | |
| 1920x1080 Aztec Ruins Normal Tier Offscreen | |
| Apple MacBook Pro 16 2021 M1 Pro | |
| Average of class Workstation (152.8 - 583, n=6, last 2 years) | |
| Lenovo IdeaCentre AIO 3 24IAP7 | |
| HP ZBook Firefly 16 G9-6B897EA | |
| Average NVIDIA T550 Laptop GPU (n=1) | |
| 1920x1080 Car Chase Offscreen | |
| Apple MacBook Pro 16 2021 M1 Pro | |
| Average of class Workstation (157.3 - 526, n=6, last 2 years) | |
| Lenovo IdeaCentre AIO 3 24IAP7 | |
| HP ZBook Firefly 16 G9-6B897EA | |
| Average NVIDIA T550 Laptop GPU (n=1) | |
| 3DMark 06 Standard Score | 31003 points | |
| 3DMark Vantage P Result | 25155 points | |
| 3DMark 11 Performance | 7405 points | |
| 3DMark Cloud Gate Standard Score | 17399 points | |
| 3DMark Fire Strike Score | 4581 points | |
| 3DMark Time Spy Score | 2066 points | |
Help | ||
| Blender | |
| v3.3 Classroom HIP/AMD | |
| Lenovo Legion 5 Pro 16 ARH7H-82RG0047GE | |
| Lenovo ThinkPad T14 G3-21CF004NGE | |
| v3.3 Classroom OPTIX/RTX | |
| HP ZBook Firefly 16 G9-6B897EA | |
| Dell Precision 5000 5470 | |
| Asus VivoBook Pro 16X OLED N7600PC-L2026X | |
| Lenovo Legion 5 Pro 16 ARH7H-82RG0047GE | |
| Average of class Workstation (10 - 43, n=17, last 2 years) | |
| v3.3 Classroom CUDA | |
| HP ZBook Firefly 16 G9-6B897EA | |
| Dell Precision 5000 5470 | |
| Asus VivoBook Pro 16X OLED N7600PC-L2026X | |
| Lenovo Legion 5 Pro 16 ARH7H-82RG0047GE | |
| Average of class Workstation (16 - 74, n=17, last 2 years) | |
| v3.3 Classroom CPU | |
| HP ZBook Firefly 16 G9-6B897EA | |
| Asus VivoBook Pro 16X OLED N7600PC-L2026X | |
| Lenovo ThinkPad T14 G3-21CF004NGE | |
| Lenovo Legion 5 Pro 16 ARH7H-82RG0047GE | |
| Dell Precision 5000 5470 | |
| Average of class Workstation (148 - 364, n=23, last 2 years) | |
* ... smaller is better
SPECviewperf 13: Solidworks (sw-04) | Siemens NX (snx-03) | Showcase (showcase-02) | Medical (medical-02) | Maya (maya-05) | Energy (energy-02) | Creo (creo-02) | Catia (catia-05) | 3ds Max (3dsmax-06)
| SPECviewperf 2020 / Solidworks (solidworks-05) | |
| Dell Precision 5000 5560 | |
| Lenovo ThinkPad P1 G4-20Y4Z9DVUS | |
| HP ZBook Firefly 16 G9-6B897EA | |
| HP ZBook Firefly 15 G8 2C9R7EA | |
| Lenovo ThinkPad P15s Gen2-20W6000GGE | |
| SPECviewperf 2020 / Siemens NX (snx-04) | |
| Dell Precision 5000 5560 | |
| Lenovo ThinkPad P1 G4-20Y4Z9DVUS | |
| HP ZBook Firefly 16 G9-6B897EA | |
| HP ZBook Firefly 15 G8 2C9R7EA | |
| Lenovo ThinkPad P15s Gen2-20W6000GGE | |
| SPECviewperf 2020 / Medical (medical-03) | |
| Dell Precision 5000 5560 | |
| Lenovo ThinkPad P1 G4-20Y4Z9DVUS | |
| HP ZBook Firefly 16 G9-6B897EA | |
| HP ZBook Firefly 15 G8 2C9R7EA | |
| Lenovo ThinkPad P15s Gen2-20W6000GGE | |
| SPECviewperf 2020 / Maya (maya-06) | |
| Dell Precision 5000 5560 | |
| Lenovo ThinkPad P1 G4-20Y4Z9DVUS | |
| HP ZBook Firefly 16 G9-6B897EA | |
| HP ZBook Firefly 15 G8 2C9R7EA | |
| Lenovo ThinkPad P15s Gen2-20W6000GGE | |
| SPECviewperf 2020 / Energy (energy-03) | |
| Dell Precision 5000 5560 | |
| Lenovo ThinkPad P1 G4-20Y4Z9DVUS | |
| HP ZBook Firefly 16 G9-6B897EA | |
| HP ZBook Firefly 15 G8 2C9R7EA | |
| Lenovo ThinkPad P15s Gen2-20W6000GGE | |
| SPECviewperf 2020 / Creo (creo-03) | |
| Dell Precision 5000 5560 | |
| Lenovo ThinkPad P1 G4-20Y4Z9DVUS | |
| HP ZBook Firefly 16 G9-6B897EA | |
| HP ZBook Firefly 15 G8 2C9R7EA | |
| Lenovo ThinkPad P15s Gen2-20W6000GGE | |
| SPECviewperf 2020 / CATIA (catia-06) | |
| Dell Precision 5000 5560 | |
| Lenovo ThinkPad P1 G4-20Y4Z9DVUS | |
| HP ZBook Firefly 16 G9-6B897EA | |
| HP ZBook Firefly 15 G8 2C9R7EA | |
| Lenovo ThinkPad P15s Gen2-20W6000GGE | |
| SPECviewperf 2020 / 3ds Max (3dsmax-07) | |
| Dell Precision 5000 5560 | |
| Lenovo ThinkPad P1 G4-20Y4Z9DVUS | |
| HP ZBook Firefly 16 G9-6B897EA | |
| HP ZBook Firefly 15 G8 2C9R7EA | |
| Lenovo ThinkPad P15s Gen2-20W6000GGE | |
| SPECviewperf 13 / Solidworks (sw-04) | |
| Dell Precision 5000 5560 | |
| Lenovo ThinkPad P1 G4-20Y4Z9DVUS | |
| HP ZBook Firefly 16 G9-6B897EA | |
| HP ZBook Firefly 15 G8 2C9R7EA | |
| Lenovo ThinkPad P15s Gen2-20W6000GGE | |
| SPECviewperf 13 / Siemens NX (snx-03) | |
| Dell Precision 5000 5560 | |
| Lenovo ThinkPad P1 G4-20Y4Z9DVUS | |
| HP ZBook Firefly 16 G9-6B897EA | |
| HP ZBook Firefly 15 G8 2C9R7EA | |
| Lenovo ThinkPad P15s Gen2-20W6000GGE | |
| SPECviewperf 13 / Showcase (showcase-02) | |
| Dell Precision 5000 5560 | |
| Lenovo ThinkPad P1 G4-20Y4Z9DVUS | |
| HP ZBook Firefly 16 G9-6B897EA | |
| HP ZBook Firefly 15 G8 2C9R7EA | |
| Lenovo ThinkPad P15s Gen2-20W6000GGE | |
| SPECviewperf 13 / Medical (medical-02) | |
| Dell Precision 5000 5560 | |
| Lenovo ThinkPad P1 G4-20Y4Z9DVUS | |
| HP ZBook Firefly 16 G9-6B897EA | |
| HP ZBook Firefly 15 G8 2C9R7EA | |
| Lenovo ThinkPad P15s Gen2-20W6000GGE | |
| SPECviewperf 13 / Maya (maya-05) | |
| Dell Precision 5000 5560 | |
| Lenovo ThinkPad P1 G4-20Y4Z9DVUS | |
| HP ZBook Firefly 16 G9-6B897EA | |
| HP ZBook Firefly 15 G8 2C9R7EA | |
| Lenovo ThinkPad P15s Gen2-20W6000GGE | |
| SPECviewperf 13 / Energy (energy-02) | |
| Dell Precision 5000 5560 | |
| Lenovo ThinkPad P1 G4-20Y4Z9DVUS | |
| HP ZBook Firefly 15 G8 2C9R7EA | |
| HP ZBook Firefly 16 G9-6B897EA | |
| Lenovo ThinkPad P15s Gen2-20W6000GGE | |
| SPECviewperf 13 / Creo (creo-02) | |
| Dell Precision 5000 5560 | |
| Lenovo ThinkPad P1 G4-20Y4Z9DVUS | |
| HP ZBook Firefly 16 G9-6B897EA | |
| HP ZBook Firefly 15 G8 2C9R7EA | |
| Lenovo ThinkPad P15s Gen2-20W6000GGE | |
| SPECviewperf 13 / Catia (catia-05) | |
| Dell Precision 5000 5560 | |
| Lenovo ThinkPad P1 G4-20Y4Z9DVUS | |
| HP ZBook Firefly 16 G9-6B897EA | |
| HP ZBook Firefly 15 G8 2C9R7EA | |
| Lenovo ThinkPad P15s Gen2-20W6000GGE | |
| SPECviewperf 13 / 3ds Max (3dsmax-06) | |
| Dell Precision 5000 5560 | |
| Lenovo ThinkPad P1 G4-20Y4Z9DVUS | |
| HP ZBook Firefly 16 G9-6B897EA | |
| HP ZBook Firefly 15 G8 2C9R7EA | |
| Lenovo ThinkPad P15s Gen2-20W6000GGE | |
Gaming Performance
Even though the Nvidia T550 is naturally somewhat suitable for gaming, the performance suffers due to the slow CPU and the T550 is barely any faster than the integrated Radeon 680M of the ThinkPad T14 G3, for example. Provided the title in question is less demanding, medium to high settings should still be possible most of the time.
| The Witcher 3 | |
| 1920x1080 High Graphics & Postprocessing (Nvidia HairWorks Off) | |
| Average of class Workstation (n=1last 2 years) | |
| Dell Precision 5000 5560 | |
| Lenovo ThinkPad P1 G4-20Y4Z9DVUS | |
| Lenovo ThinkPad T14 G3-21CF004NGE | |
| Average NVIDIA T550 Laptop GPU (39 - 43, n=3) | |
| HP ZBook Firefly 16 G9-6B897EA | |
| Lenovo ThinkPad P15s Gen2-20W6000GGE | |
| 1920x1080 Ultra Graphics & Postprocessing (HBAO+) | |
| Average of class Workstation (n=1last 2 years) | |
| Dell Precision 5000 5560 | |
| Lenovo ThinkPad P1 G4-20Y4Z9DVUS | |
| Lenovo ThinkPad T14 G3-21CF004NGE | |
| HP ZBook Firefly 15 G8 2C9R7EA | |
| Average NVIDIA T550 Laptop GPU (19.6 - 23.2, n=3) | |
| HP ZBook Firefly 16 G9-6B897EA | |
| Lenovo ThinkPad P15s Gen2-20W6000GGE | |
| GTA V | |
| 1920x1080 High/On (Advanced Graphics Off) AA:2xMSAA + FX AF:8x | |
| Average of class Workstation (44.4 - 179.4, n=21, last 2 years) | |
| Dell Precision 5000 5560 | |
| Lenovo ThinkPad T14 G3-21CF004NGE | |
| Average NVIDIA T550 Laptop GPU (61.5 - 63.9, n=3) | |
| HP ZBook Firefly 16 G9-6B897EA | |
| Lenovo ThinkPad P15s Gen2-20W6000GGE | |
| 1920x1080 Highest AA:4xMSAA + FX AF:16x | |
| Average of class Workstation (18.1 - 156.1, n=23, last 2 years) | |
| Dell Precision 5000 5560 | |
| Average NVIDIA T550 Laptop GPU (29 - 29.6, n=3) | |
| HP ZBook Firefly 16 G9-6B897EA | |
| Lenovo ThinkPad P15s Gen2-20W6000GGE | |
| Lenovo ThinkPad T14 G3-21CF004NGE | |
| F1 2021 | |
| 1920x1080 High Preset AA:T AF:16x | |
| Dell Precision 5000 5560 | |
| HP ZBook Firefly 16 G9-6B897EA | |
| Average NVIDIA T550 Laptop GPU (56.5 - 59.9, n=3) | |
| Lenovo ThinkPad T14 G3-21CF004NGE | |
| 1920x1080 Ultra High Preset + Raytracing AA:T AF:16x | |
| Dell Precision 5000 5560 | |
| HP ZBook Firefly 16 G9-6B897EA | |
| Average NVIDIA T550 Laptop GPU (36.1 - 37, n=3) | |
| Lenovo ThinkPad T14 G3-21CF004NGE | |
Witcher 3 FPS Graph
| low | med. | high | ultra | |
|---|---|---|---|---|
| GTA V (2015) | 106.2 | 103.3 | 61.5 | 29.2 |
| The Witcher 3 (2015) | 123 | 75 | 40 | 19.9 |
| Dota 2 Reborn (2015) | 111.4 | 100.3 | 92.1 | 85.2 |
| Final Fantasy XV Benchmark (2018) | 60.7 | 31.2 | 22.3 | |
| X-Plane 11.11 (2018) | 65.5 | 59.4 | 55.5 | |
| Far Cry 5 (2018) | 75 | 41 | 38 | 35 |
| Strange Brigade (2018) | 128 | 51 | 42 | 36 |
| F1 2021 (2021) | 151.1 | 74.4 | 59.5 | 37 |
| F1 22 (2022) | 69.6 | 62 | 43.3 | 31 |
Emissions & Energy
System Noise
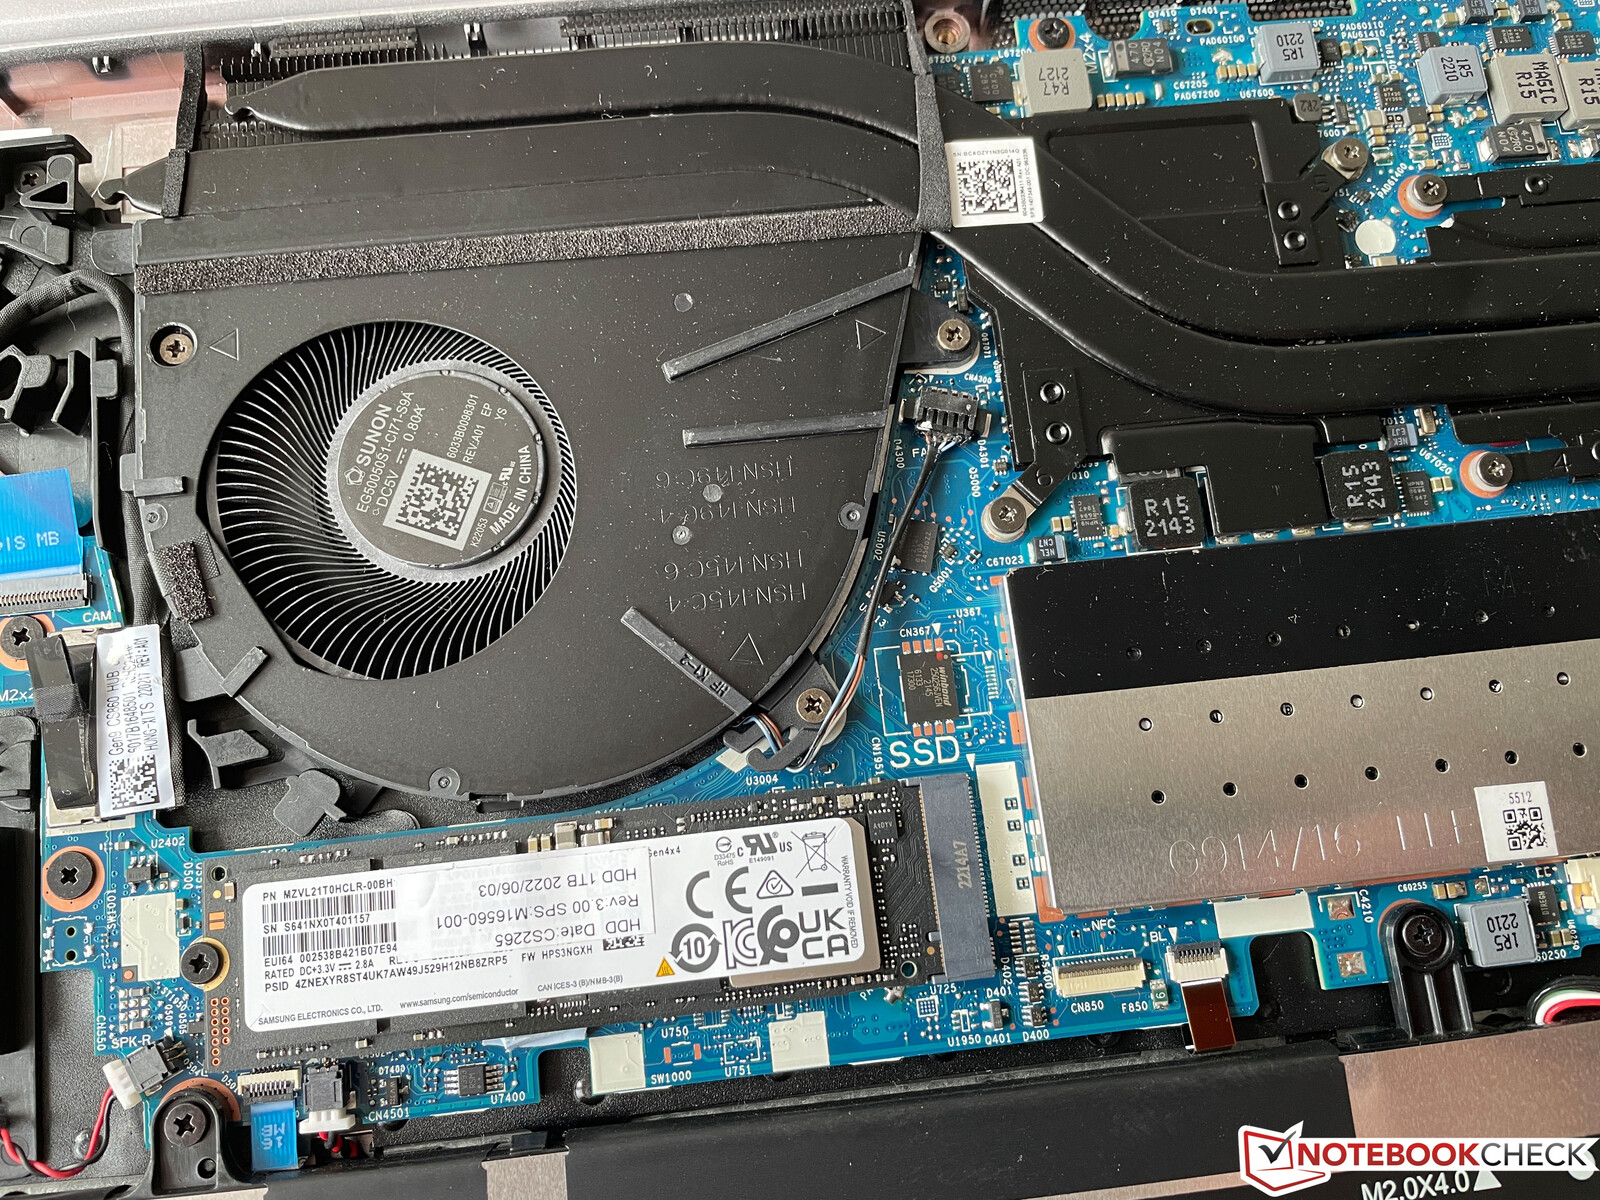
One possible reason for the poor performance of the two main components can be seen on the inside of the case: There is only one fan. The one clear benefit of the low performance is the quiet fan, which always idles under low loads and is barely noticeable under full CPU load at 29 dB(A). When the dedicated GPU enters the picture, things get more noisy with around 40-41 dB(A). This puts the ZBook on par with the significantly faster Dell Precision 5560, while simultaneously making it noticeably louder than for example the MacBook Pro 16 or the predecessor ZBook Firefly 15 G8, which offered better performance. We did not notice any electronic noises or coil whine.
Noise level
| Idle |
| 23.8 / 23.8 / 23.8 dB(A) |
| Load |
| 39.4 / 41.4 dB(A) |
 | ||
30 dB silent 40 dB(A) audible 50 dB(A) loud |
||
min: | ||
| HP ZBook Firefly 16 G9-6B897EA T550 Laptop GPU, i7-1265U, Samsung PM9A1 MZVL21T0HCLR | Lenovo ThinkPad P1 G4-20Y4Z9DVUS T1200 Laptop GPU, i7-11800H, Samsung PM9A1 MZVL2512HCJQ | Dell Precision 5000 5560 RTX A2000 Laptop GPU, i7-11850H, Samsung PM9A1 MZVL22T0HBLB | Lenovo ThinkPad P15s Gen2-20W6000GGE T500 Laptop GPU, i7-1165G7, WDC PC SN720 SDAQNTW-1T00 | HP ZBook Firefly 15 G8 2C9R7EA T500 Laptop GPU, i7-1165G7, Toshiba XG6 KXG60ZNV1T02 | Apple MacBook Pro 16 2021 M1 Pro M1 Pro 16-Core GPU, M1 Pro, Apple SSD AP1024R | |
|---|---|---|---|---|---|---|
| Noise | -9% | 6% | 0% | 3% | 5% | |
| off / environment * (dB) | 23.8 | 24.3 -2% | 23.4 2% | 24.3 -2% | 24.1 -1% | 24.7 -4% |
| Idle Minimum * (dB) | 23.8 | 24.3 -2% | 23.6 1% | 25.5 -7% | 24.1 -1% | 24.7 -4% |
| Idle Average * (dB) | 23.8 | 24.3 -2% | 23.6 1% | 25.5 -7% | 24.1 -1% | 24.7 -4% |
| Idle Maximum * (dB) | 23.8 | 26.6 -12% | 23.6 1% | 25.5 -7% | 27.1 -14% | 24.7 -4% |
| Load Average * (dB) | 39.4 | 46.8 -19% | 25.8 35% | 35.65 10% | 32.8 17% | 26.1 34% |
| Witcher 3 ultra * (dB) | 40.5 | 46.8 -16% | 40.1 1% | 36.1 11% | ||
| Load Maximum * (dB) | 41.4 | 46.8 -13% | 41.4 -0% | 35.65 14% | 36.1 13% | 37.4 10% |
* ... smaller is better
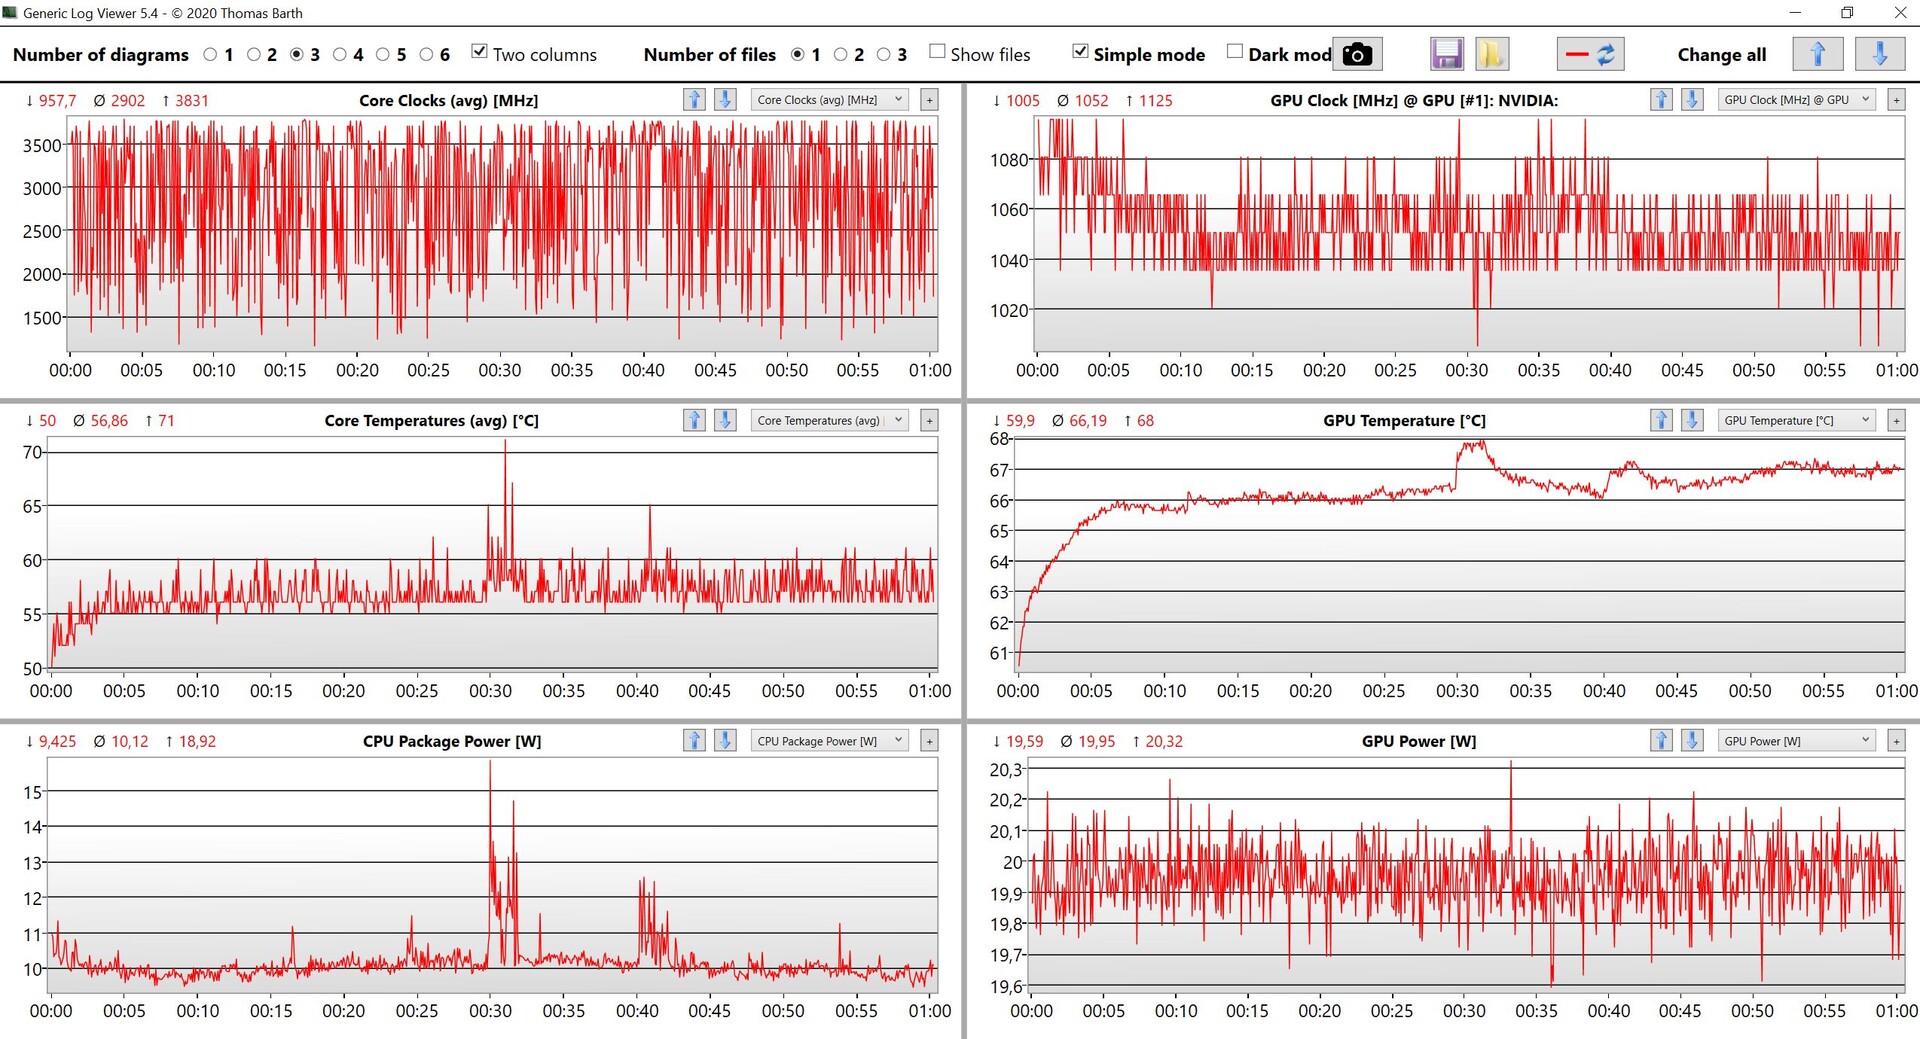
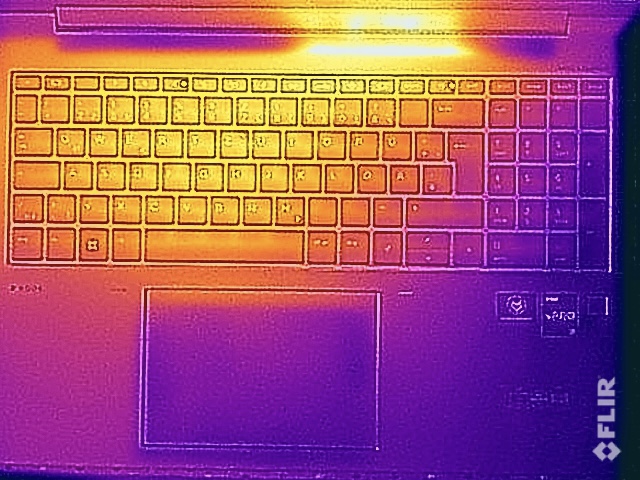
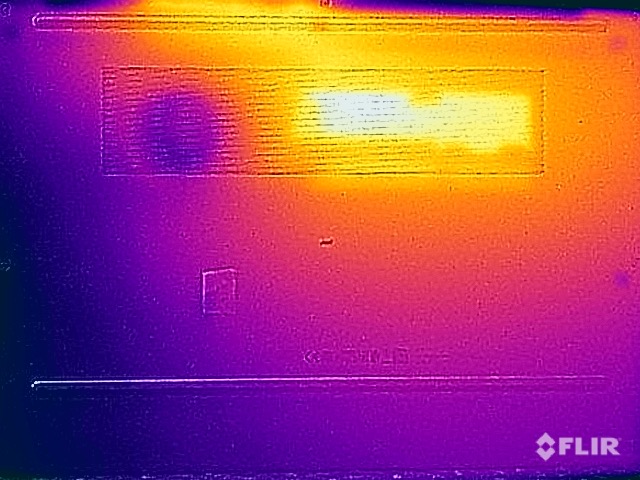
Temperature
Users benefit from the low power draw of the CPU particularly during day-to-day use, when the dedicated GPU idles while the metal surfaces are only lukewarm, making it suitable for comfortable use on your lap. However, stressing the GPU results in significantly higher temperatures. While 48 °C (118.4 °F) on the bottom is far from being critical, it is fairly warm considering the poor performance (total system power of just 32 watts). During the stress test, the processor almost instantly drops to 12 watts, while the GPU remains at a consistent 20 watts.
(±) The maximum temperature on the upper side is 42.1 °C / 108 F, compared to the average of 38.2 °C / 101 F, ranging from 22.2 to 69.8 °C for the class Workstation.
(-) The bottom heats up to a maximum of 48 °C / 118 F, compared to the average of 41.1 °C / 106 F
(+) In idle usage, the average temperature for the upper side is 27.4 °C / 81 F, compared to the device average of 32 °C / 90 F.
(±) Playing The Witcher 3, the average temperature for the upper side is 33.6 °C / 92 F, compared to the device average of 32 °C / 90 F.
(+) The palmrests and touchpad are cooler than skin temperature with a maximum of 30.9 °C / 87.6 F and are therefore cool to the touch.
(-) The average temperature of the palmrest area of similar devices was 27.8 °C / 82 F (-3.1 °C / -5.6 F).
| HP ZBook Firefly 16 G9-6B897EA Intel Core i7-1265U, NVIDIA T550 Laptop GPU | Lenovo ThinkPad P1 G4-20Y4Z9DVUS Intel Core i7-11800H, NVIDIA T1200 Laptop GPU | Dell Precision 5000 5560 Intel Core i7-11850H, NVIDIA RTX A2000 Laptop GPU | Lenovo ThinkPad P15s Gen2-20W6000GGE Intel Core i7-1165G7, NVIDIA T500 Laptop GPU | HP ZBook Firefly 15 G8 2C9R7EA Intel Core i7-1165G7, NVIDIA T500 Laptop GPU | Apple MacBook Pro 16 2021 M1 Pro Apple M1 Pro, Apple M1 Pro 16-Core GPU | |
|---|---|---|---|---|---|---|
| Heat | -1% | -7% | -0% | 13% | 17% | |
| Maximum Upper Side * (°C) | 42.1 | 49.9 -19% | 48.2 -14% | 42.8 -2% | 41.2 2% | 41 3% |
| Maximum Bottom * (°C) | 48 | 56.7 -18% | 42.6 11% | 59.1 -23% | 47.2 2% | 39 19% |
| Idle Upper Side * (°C) | 29.9 | 25.5 15% | 34.8 -16% | 26.4 12% | 23.7 21% | 24 20% |
| Idle Bottom * (°C) | 32.9 | 26.2 20% | 35.2 -7% | 28.9 12% | 23.9 27% | 24 27% |
* ... smaller is better
Speakers
The two downfiring stereo speakers are located in the center part to the left and right sides of the keyboard. Although the sound is not as good as on the MacBook Pro 16, it is still excellent overall with very roomy and full-bodied characteristics. There is still room for improvement particularly in terms of the bass.
HP ZBook Firefly 16 G9-6B897EA audio analysis
(+) | speakers can play relatively loud (83 dB)
Bass 100 - 315 Hz
(-) | nearly no bass - on average 17.5% lower than median
(±) | linearity of bass is average (12.1% delta to prev. frequency)
Mids 400 - 2000 Hz
(+) | balanced mids - only 2.7% away from median
(+) | mids are linear (3.8% delta to prev. frequency)
Highs 2 - 16 kHz
(+) | balanced highs - only 3% away from median
(+) | highs are linear (5.3% delta to prev. frequency)
Overall 100 - 16.000 Hz
(+) | overall sound is linear (13.3% difference to median)
Compared to same class
» 25% of all tested devices in this class were better, 4% similar, 71% worse
» The best had a delta of 7%, average was 17%, worst was 35%
Compared to all devices tested
» 14% of all tested devices were better, 3% similar, 83% worse
» The best had a delta of 4%, average was 23%, worst was 134%
Apple MacBook Pro 16 2021 M1 Pro audio analysis
(+) | speakers can play relatively loud (84.7 dB)
Bass 100 - 315 Hz
(+) | good bass - only 3.8% away from median
(+) | bass is linear (5.2% delta to prev. frequency)
Mids 400 - 2000 Hz
(+) | balanced mids - only 1.3% away from median
(+) | mids are linear (2.1% delta to prev. frequency)
Highs 2 - 16 kHz
(+) | balanced highs - only 1.9% away from median
(+) | highs are linear (2.7% delta to prev. frequency)
Overall 100 - 16.000 Hz
(+) | overall sound is linear (4.6% difference to median)
Compared to same class
» 0% of all tested devices in this class were better, 0% similar, 100% worse
» The best had a delta of 5%, average was 17%, worst was 45%
Compared to all devices tested
» 0% of all tested devices were better, 0% similar, 100% worse
» The best had a delta of 4%, average was 23%, worst was 134%
Energy Consumption
During idle testing, the ZBook Firefly 16 G9 presents itself as a very energy-efficient laptop with a bright, but economical FHD panel. While the device is also very economical under load, this comes at the expense of the performance. We occasionally measure just above 90 watts during the stress test, but the value then quickly drops and stabilizes at 47 watts. A 65-watt charger would have been sufficient. The 110-W model is rated for 100 watts over USB-C and 10 watts via the additional USB-A port.
| HP ZBook Firefly 16 G9-6B897EA T550 Laptop GPU, i7-1265U, Samsung PM9A1 MZVL21T0HCLR | Lenovo ThinkPad P1 G4-20Y4Z9DVUS T1200 Laptop GPU, i7-11800H, Samsung PM9A1 MZVL2512HCJQ | Dell Precision 5000 5560 RTX A2000 Laptop GPU, i7-11850H, Samsung PM9A1 MZVL22T0HBLB | Lenovo ThinkPad P15s Gen2-20W6000GGE T500 Laptop GPU, i7-1165G7, WDC PC SN720 SDAQNTW-1T00 | HP ZBook Firefly 15 G8 2C9R7EA T500 Laptop GPU, i7-1165G7, Toshiba XG6 KXG60ZNV1T02 | Apple MacBook Pro 16 2021 M1 Pro M1 Pro 16-Core GPU, M1 Pro, Apple SSD AP1024R | |
|---|---|---|---|---|---|---|
| Power Consumption | -93% | -86% | -19% | 6% | -37% | |
| Idle Minimum * (Watt) | 4.5 | 9.9 -120% | 6.2 -38% | 5.8 -29% | 3.3 27% | 5 -11% |
| Idle Average * (Watt) | 8 | 13.9 -74% | 13.9 -74% | 13.3 -66% | 5.6 30% | 15.1 -89% |
| Idle Maximum * (Watt) | 8.7 | 14.6 -68% | 23.8 -174% | 15.6 -79% | 8.7 -0% | 15.5 -78% |
| Load Average * (Watt) | 48.3 | 95 -97% | 95.7 -98% | 43.2 11% | 64.4 -33% | 54 -12% |
| Witcher 3 ultra * (Watt) | 45.3 | 98.9 -118% | 87 -92% | 37.1 18% | 53 -17% | |
| Load Maximum * (Watt) | 94.7 | 170.8 -80% | 132.6 -40% | 67.3 29% | 69 27% | 90 5% |
* ... smaller is better
| Off / Standby | |
| Idle | |
| Load |
|
Key:
min: | |
Energy Consumption Witcher 3 / Stress Test
Energy Consumption external Monitor
Battery Life
The battery life is excellent thanks to the large battery (76 Wh) and the low power draw. In our Wi-Fi test, the system lasts for almost 10 hours at maximum brightness and an impressive 13 hours at an adjusted brightness of 150 nits (in the case of our test device, 57 % brightness), while the video test runs for over 18 hours. These results make the ZBook a strong competitor in this category for even the MacBook Pro 16. Under maximum stress, the battery still lasts for two hours, which is once again due to the low performance. Fully charging the device while it is running takes only 90 minutes with 50 % charge being available after just 30 minutes.
| HP ZBook Firefly 16 G9-6B897EA i7-1265U, T550 Laptop GPU, 76 Wh | Lenovo ThinkPad P1 G4-20Y4Z9DVUS i7-11800H, T1200 Laptop GPU, 90 Wh | Dell Precision 5000 5560 i7-11850H, RTX A2000 Laptop GPU, 86 Wh | Lenovo ThinkPad P15s Gen2-20W6000GGE i7-1165G7, T500 Laptop GPU, 57 Wh | HP ZBook Firefly 15 G8 2C9R7EA i7-1165G7, T500 Laptop GPU, 56 Wh | Apple MacBook Pro 16 2021 M1 Pro M1 Pro, M1 Pro 16-Core GPU, 99.6 Wh | Average of class Workstation | |
|---|---|---|---|---|---|---|---|
| Battery runtime | -32% | -31% | -31% | -7% | 13% | -36% | |
| H.264 (h) | 18.4 | 9.9 -46% | 15.3 -17% | 17.5 -5% | 10.1 ? -45% | ||
| WiFi v1.3 (h) | 13 | 8.8 -32% | 6.3 -52% | 7.7 -41% | 10.5 -19% | 16.9 30% | 8.55 ? -34% |
| Load (h) | 2 | 1.8 -10% | 1.9 -5% | 2.3 15% | 1.441 ? -28% |
Pros
Cons
Verdict - Mobile Workstation Is Slower than Last Year's Model

Good, consistent performance should be the number one priority for a mobile workstation. Even though the ZBook Firefly models are slim workstations with entry-level components, the extremely low power limit of the processor clearly shows that HP has missed the mark. We are dumbfounded at how a current-generation Alder Lake-U processor has to run at just 12 watts after one second, particularly in a large 16-inch chassis. Here, any 13-inch subnotebook delivers a (much) better performance.
The performance of the Nvidia T550 GPU is similarly disappointing, since it only runs at 20 watts - the minimum value for this GPU. As a result, the graphics performance is just marginally better and in certain scenarios even worse compared to the older ZBook Firefly 15 G8 with the Nvidia T500. This is a step in the wrong direction. Despite the slow performance, we measured high surface temperatures under load, indicating a poor cooling performance.
Other aspects of the laptop are barely worth mentioning, since the Firefly 16 G9 fails to fulfill its main purpose as a workstation. The quiet fan and the long battery life can do little to change this fact. This is a pity, since the premium chassis, excellent keyboard, and matte screen would otherwise be a solid foundation for a good product.
Although the HP ZBook Firefly 16 G9 shows potential as a solid entry-level mobile workstation, the poor CPU and mediocre GPU performance disqualify it from its intended use case. While it is not necessarily a bad laptop, the CPU performance looks outdated even by consumer-grade standards.
While we have yet to review competing workstations, we advise against buying the HP due to the poor processor performance. We will try to get our hands on another test model with an Alder Lake-P processor and hopefully better CPU performance characteristics overall.
Price and Availability
Our test configuration is available from various online retailers or HP's online shop directly for around 3000 USD.
HP ZBook Firefly 16 G9-6B897EA
- 10/07/2022 v7 (old)
Andreas Osthoff
Price comparison

