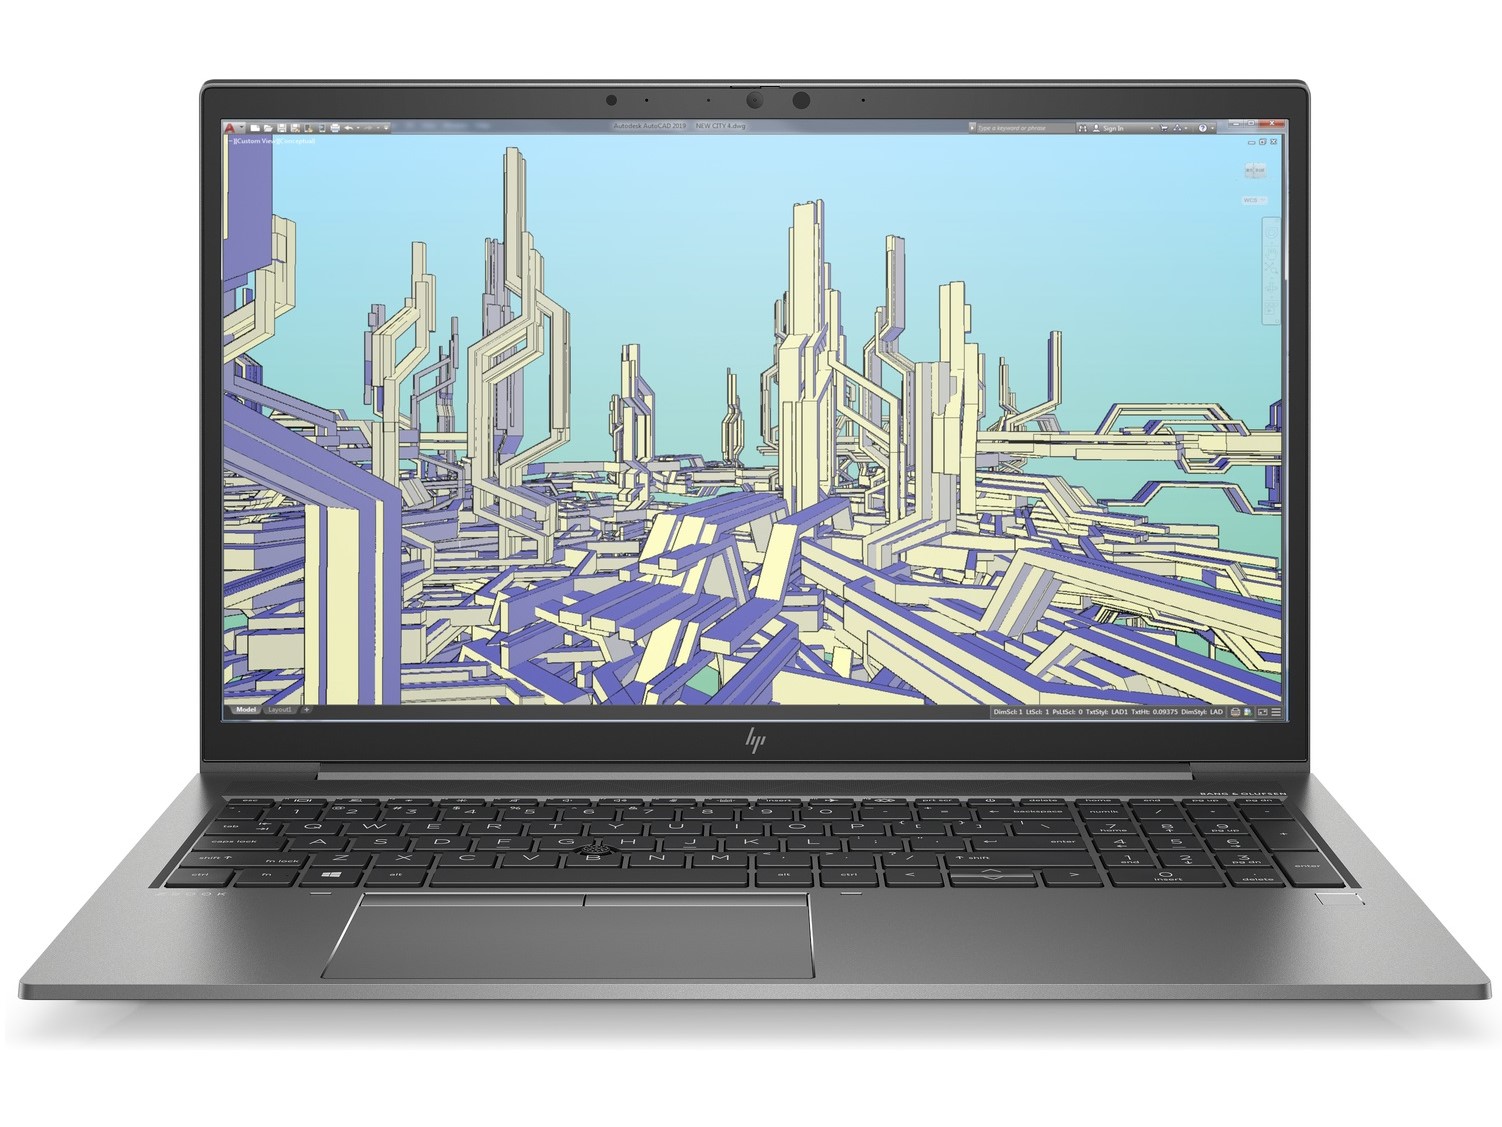
HP ZBook Firefly 15 G8 laptop in review: Quadro T500 and Tiger Lake in a 15-inch model

The hardware configuration of the ZBook Firefly 15 G8 that we have before us already achieved a good result in our review of the HP ZBook Firefly 14 G8. However, we'll compare the performance provided by this combination of the Intel Core i7-1165G7, the Nvidia Quadro T500, 16 GB of RAM, and a 1 TB SSD with the predecessor model, the ZBook Firefly 15 G7.
Since the looks and basic connectivity haven't changed much, we will also refer to the review of the Firefly 15 G7 in some places. In addition, we have the competing devices listed below, to which further laptops from our database can be added under each section.
Possible contenders in comparison
Rating | Date | Model | Weight | Height | Size | Resolution | Price |
|---|---|---|---|---|---|---|---|
| 83.8 % v7 (old) | 04 / 2021 | HP ZBook Firefly 15 G8 2C9R7EA i7-1165G7, T500 Laptop GPU | 1.8 kg | 19.2 mm | 15.60" | 1920x1080 | |
| 82.7 % v7 (old) | 10 / 2020 | HP ZBook Firefly 15 G7 i7-10610U, Quadro P520 | 1.8 kg | 19.2 mm | 15.60" | 3840x2160 | |
| 81.2 % v7 (old) | 10 / 2020 | Dell Precision 3000 3551 i9-10885H, Quadro P620 | 2.2 kg | 24.92 mm | 15.60" | 1920x1080 | |
| 85.6 % v7 (old) | 03 / 2021 | Lenovo ThinkPad P15 Gen1-20ST000DGE i7-10750H, Quadro T1000 (Laptop) | 2.7 kg | 31.45 mm | 15.60" | 1920x1080 |
Case - Compact 15-inch workstation from HP
A detailed description of the case can be found in the review of the HP ZBook Firefly 15 G7.
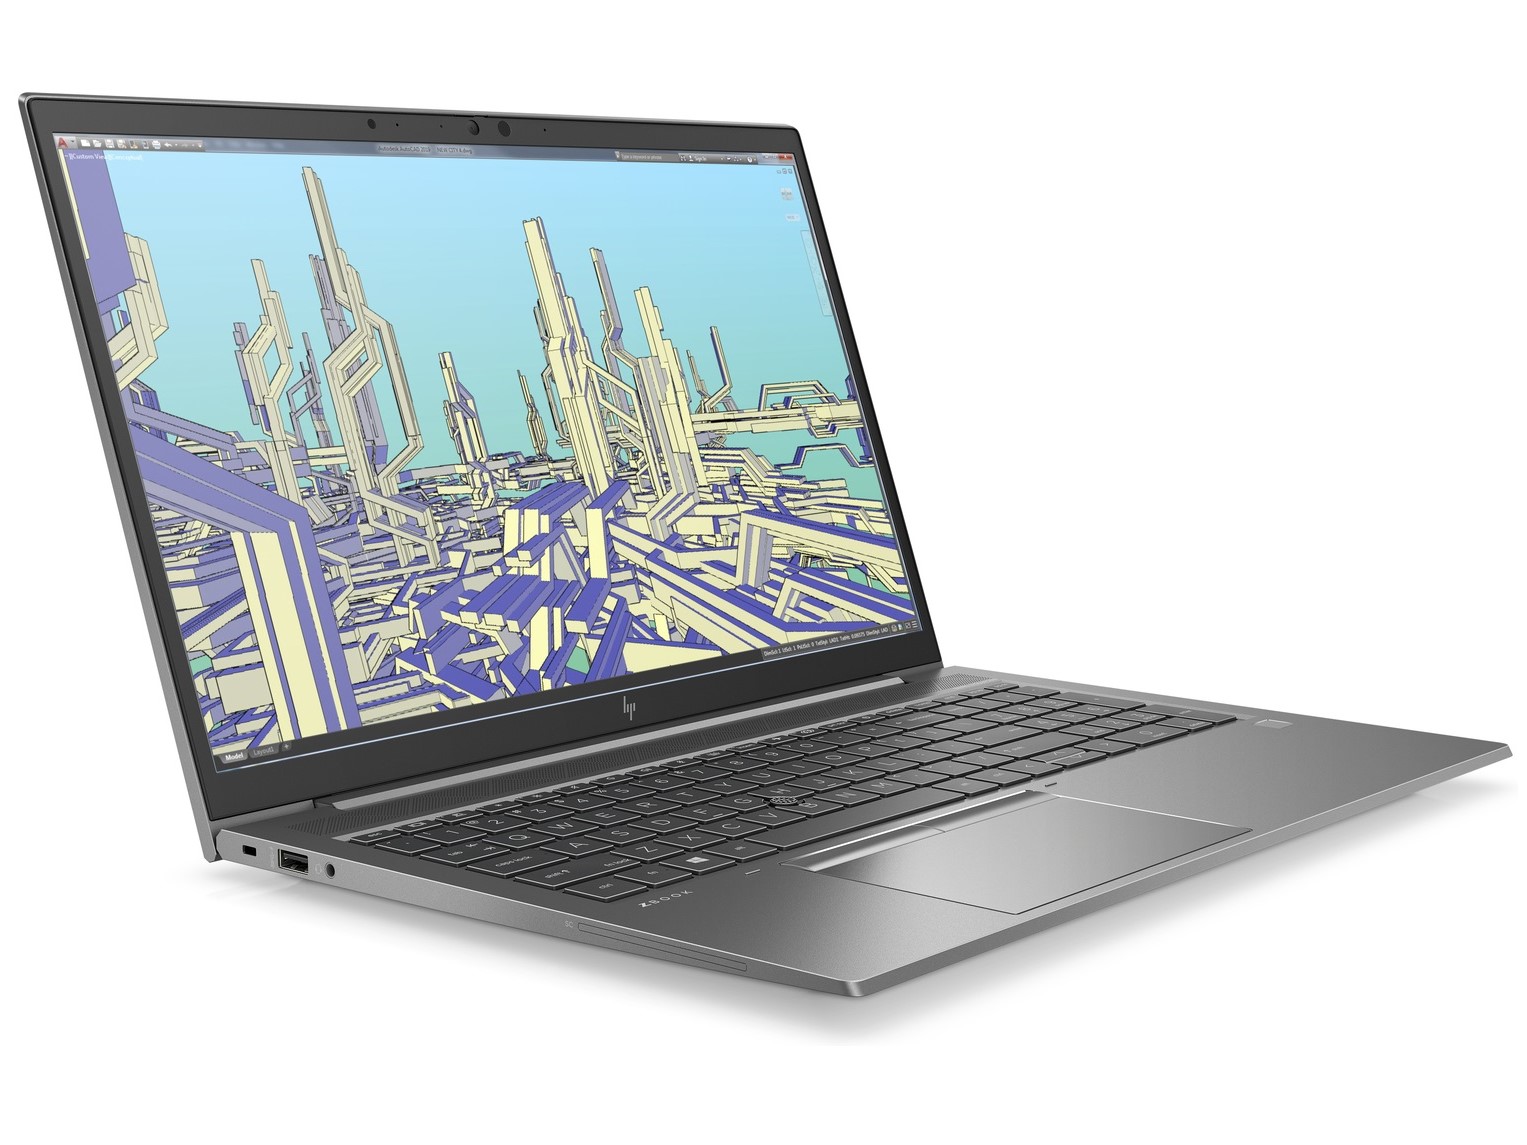
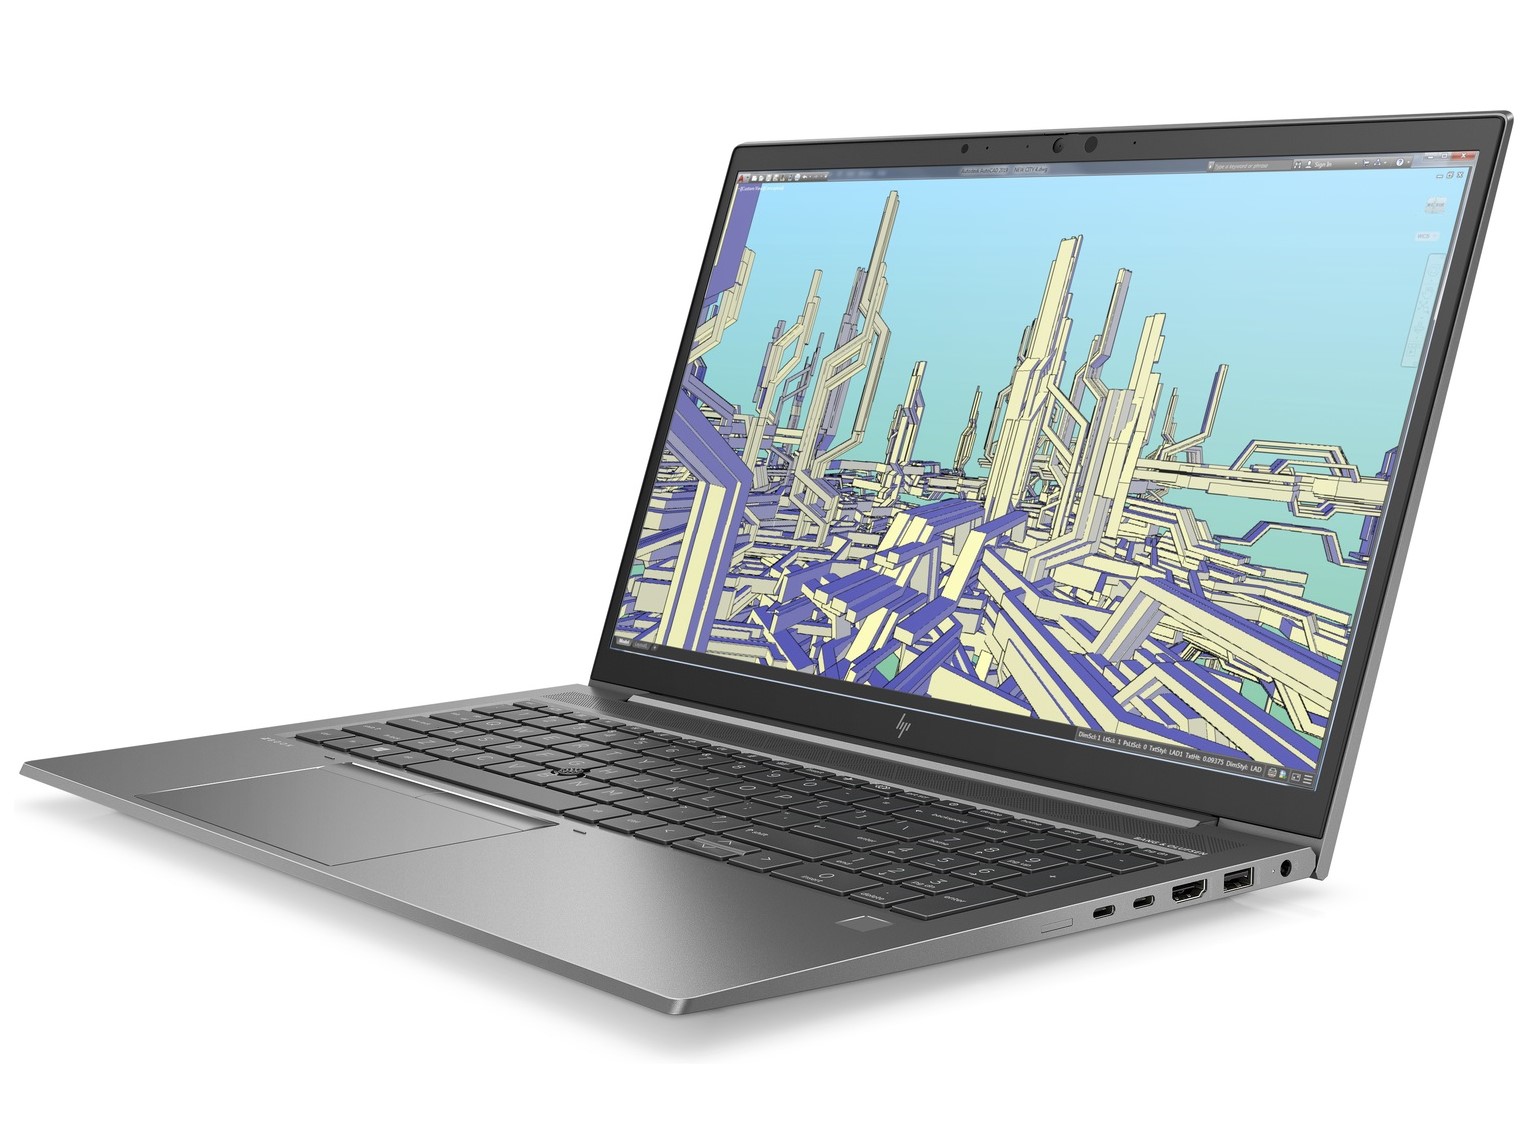
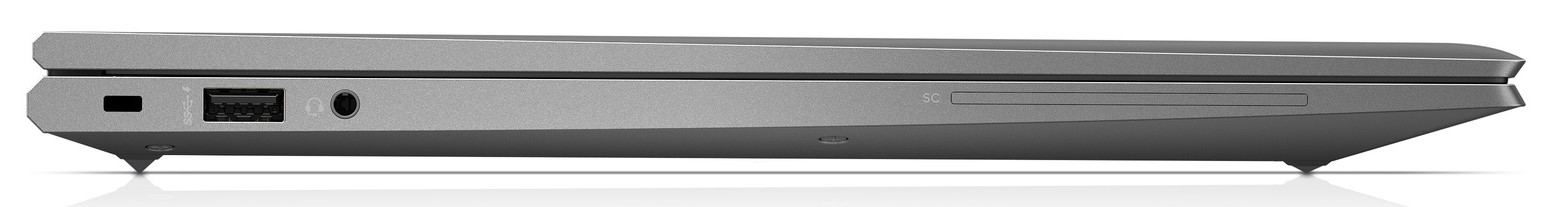
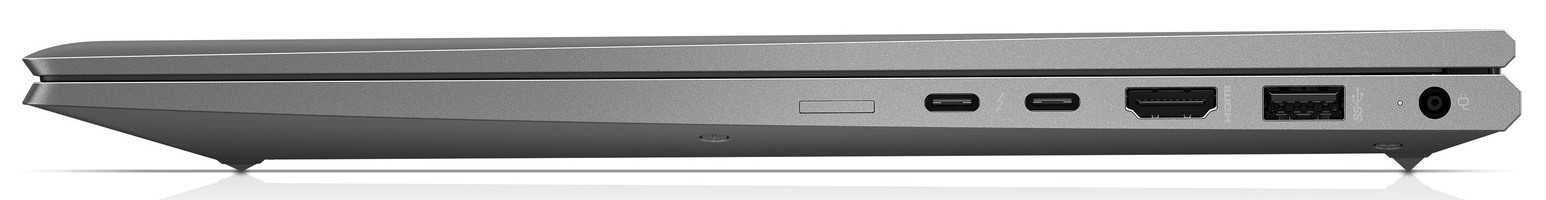
Connectivity - ZBook Firefly 15 G8 comes with two Thunderbolt 4 ports
In terms of connectivity, HP now uses Thunderbolt 4 ports and an HDMI 2.0b port.
Communication
The HP ZBook Firefly 15 G8 can establish wireless connections via Wi-Fi 6 and Bluetooth 5. In combination with our Netgear Nighthawk AX12 reference router, speeds of 1,396 Mb/s are achieved for receiving data and 1,330 Mb/s for sending data. Therefore, the rates are higher than those of the ZBook Firefly 15 G7, even though the same WLAN adapter is used.
Killer USB-C Ethernet adapter - Upgrade to a stable connection
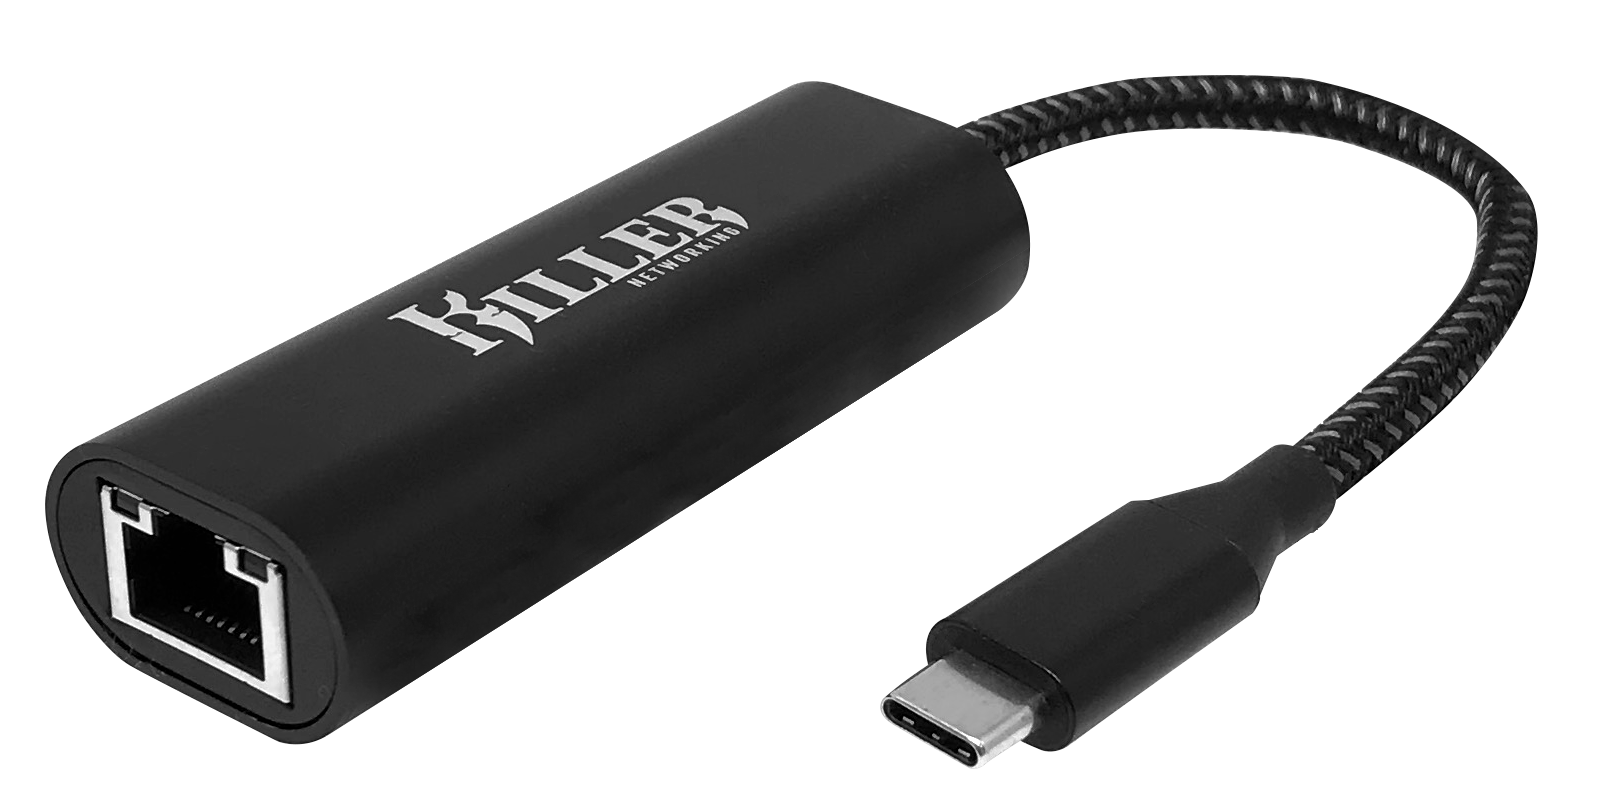
Despite advances in wireless networking, Ethernet is still the top choice for gamers and power users. The Killer 2.5G Ethernet to USB-C adapter enables seamless Ethernet connectivity with full 2.5 Gb/s throughput. It also brings the best of Killer technologies including the much acclaimed Killer Prioritization Engine, GameFast, Extreme Mode, and Intelligence Engine that ensure your favorite game or app gets the bandwidth and priority it deserves. For laptops already equipped with a Killer wireless card, Killer DoubleShot Pro offers bandwidth doubling and fine-grained control over network packets passing through each connection.
In our testing, the Killer 2.5G Ethernet adapter lived up to the advertised speeds consistently throughout testing. You can read more about performance comparisons with other USB Ethernet Adapters in our article. The Killer 2.5G Ethernet to USB-C adapter can be purchased on Amazon for $49.99.
Webcam
The webcam continues to capture images at a low resolution of 0.9 MP and with a correspondingly mediocre image quality.


Security
The ZBook Firefly offers a variety of software solutions to safeguard the system. In addition, there's a fingerprint sensor, a mechanical webcam shutter, and a smart card reader.
Accessories
The HP workstation only comes with a 65-watt power adapter equipped with a USB-C connector. However, the manufacturer offers an extensive range of common laptop accessories on its own website.
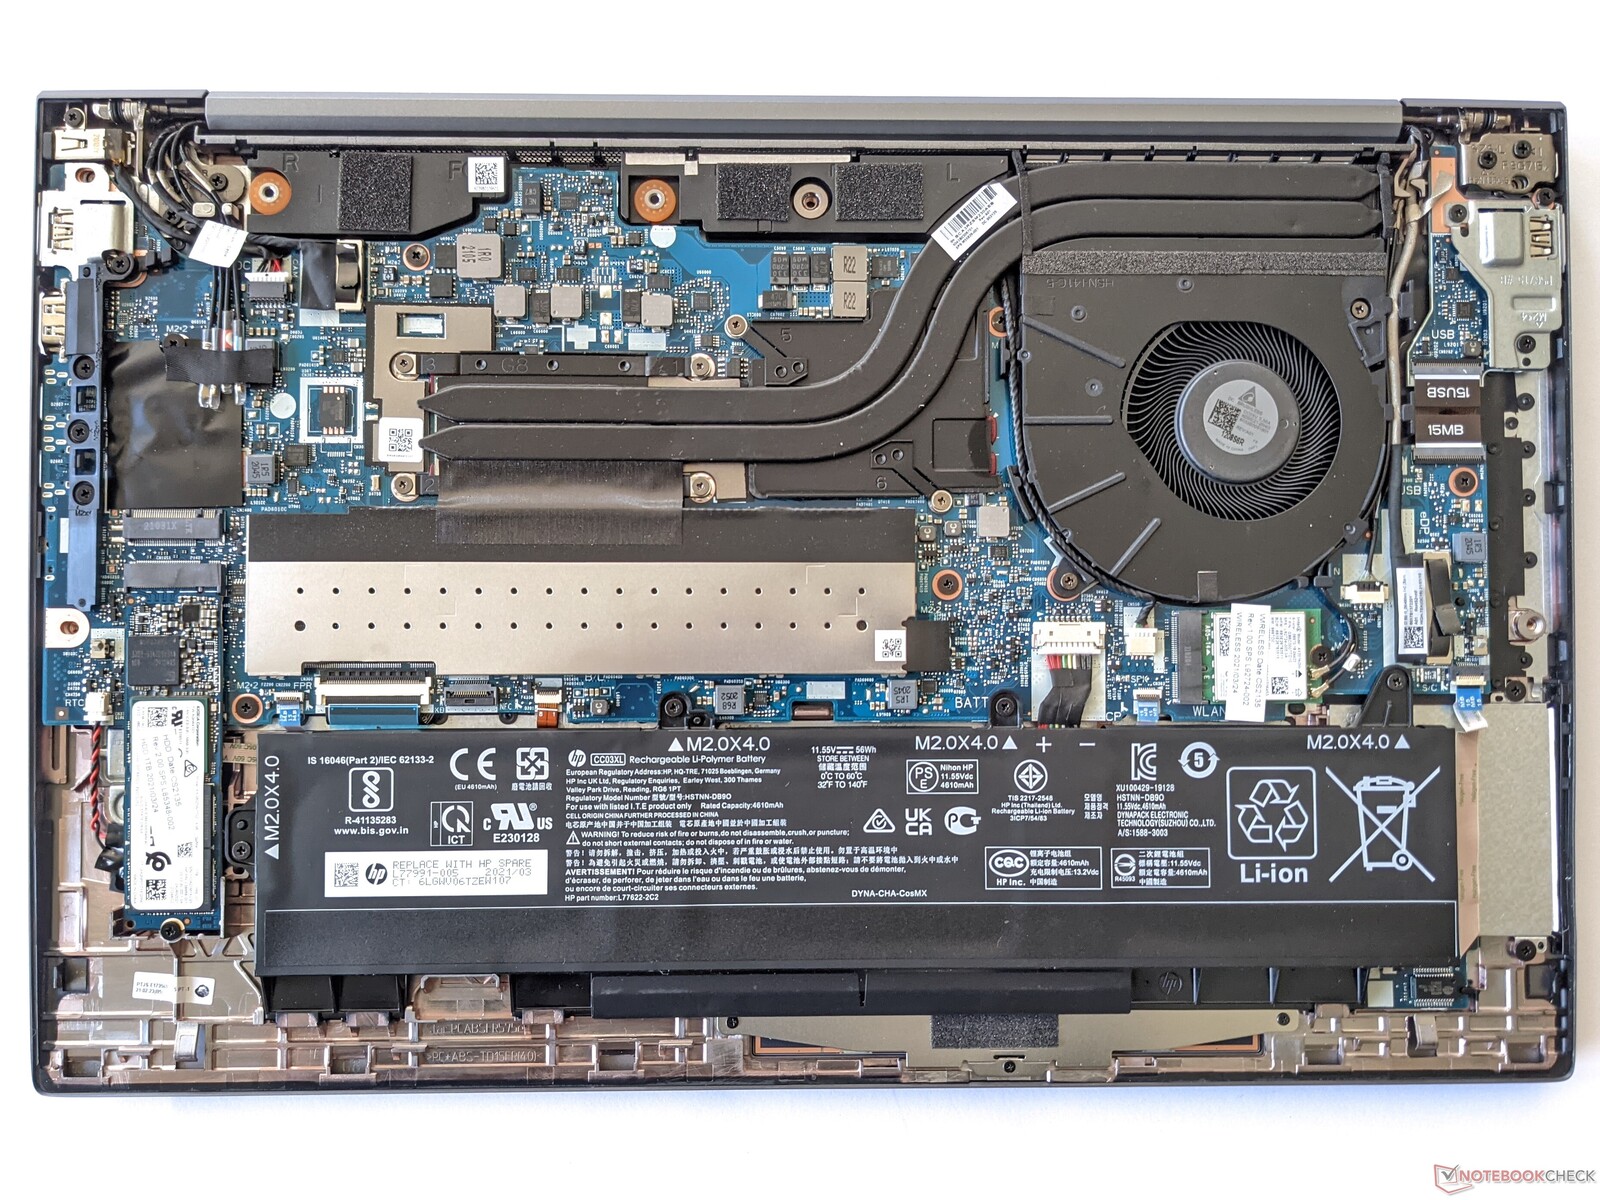
Maintenance
The maintenance options remain unchanged compared with the HP ZBook Firefly 15 G7.

Warranty
HP grants a 36-month warranty period for the HP ZBook Firefly 15 G8.
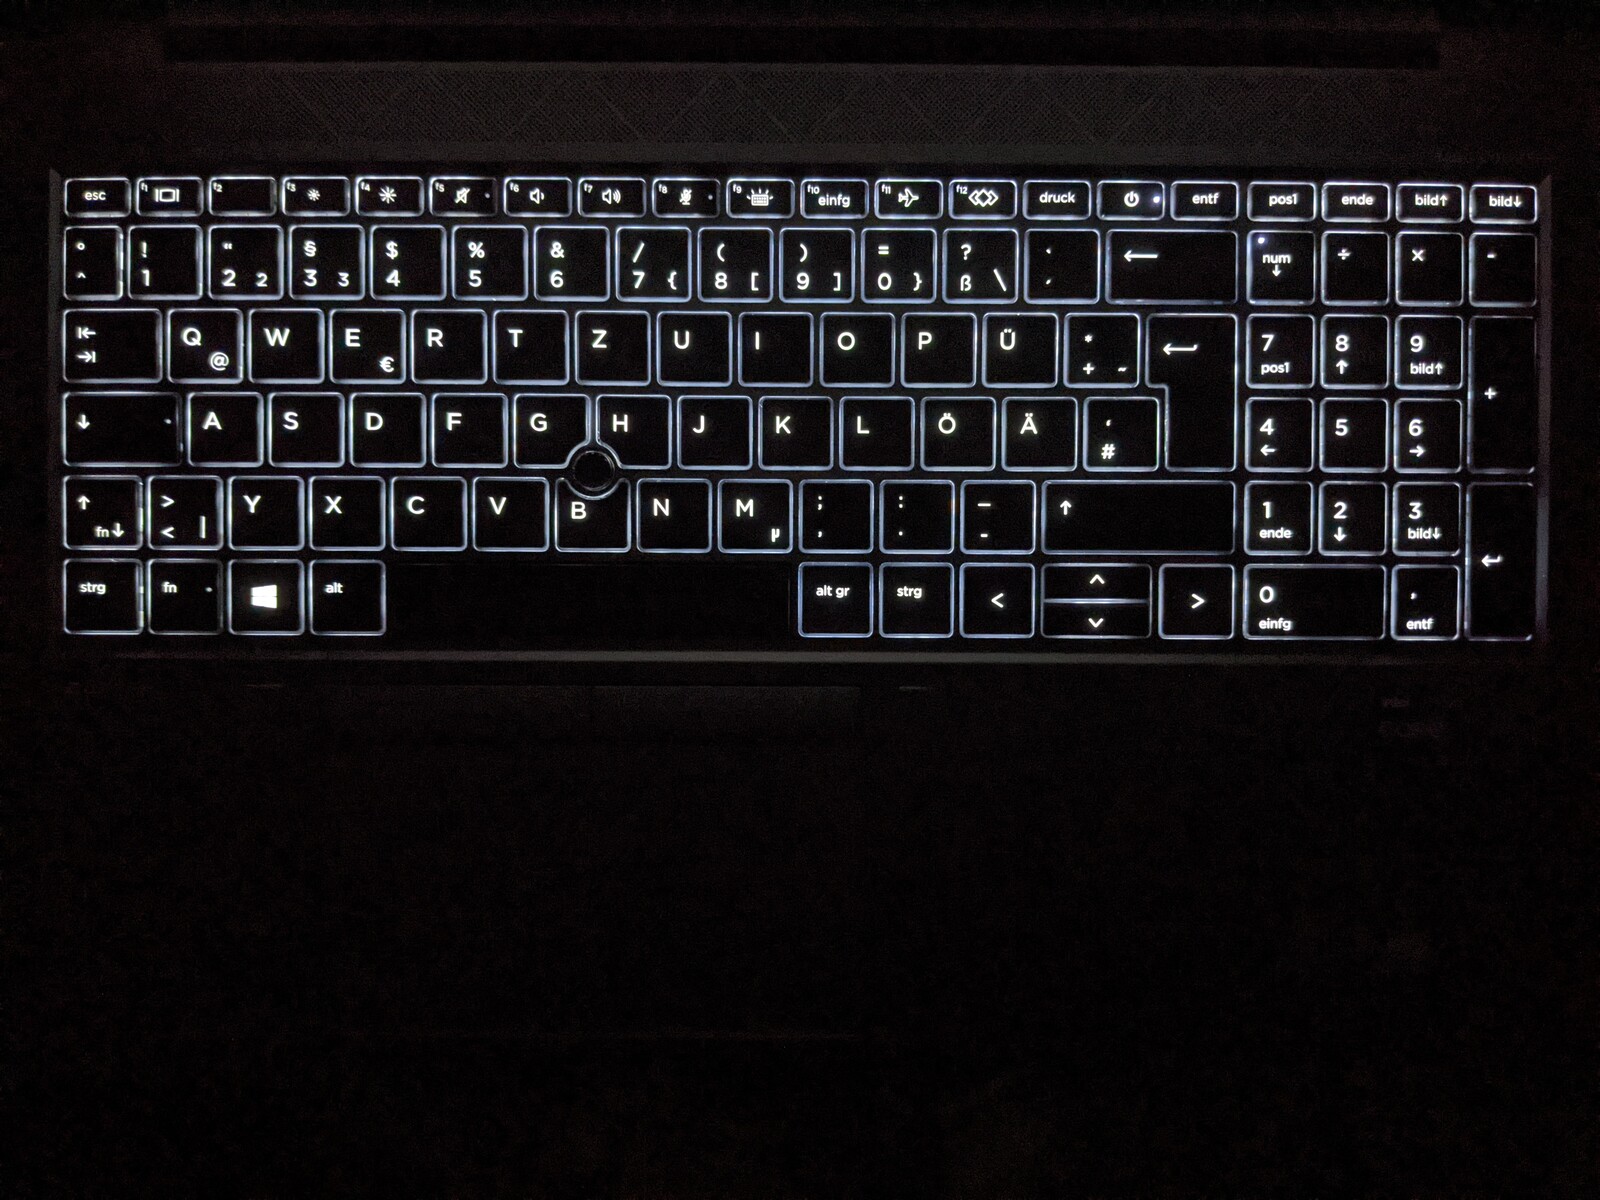
Input devices - With keyboard backlighting and trackpoint
The input devices have remained unchanged as well, which is why we refer to the review of the ZBook Firefly 15 G7 for their description.

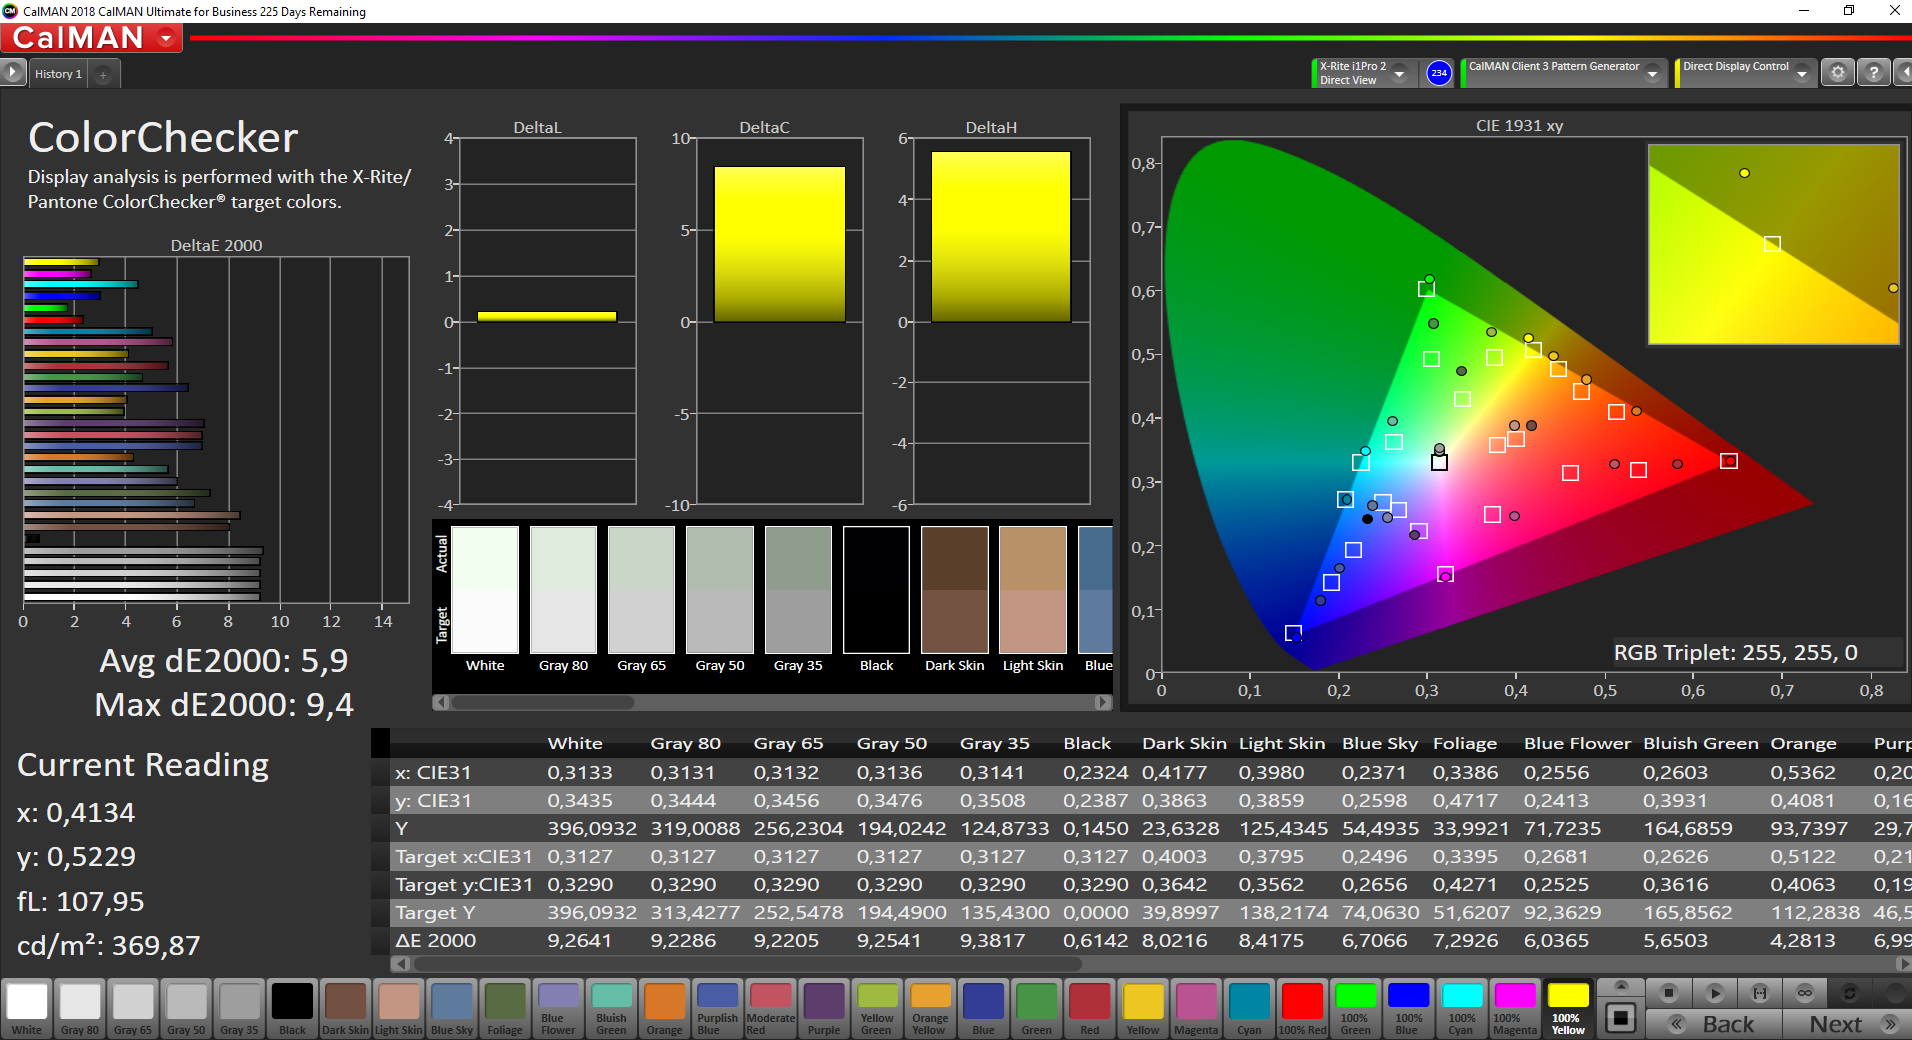
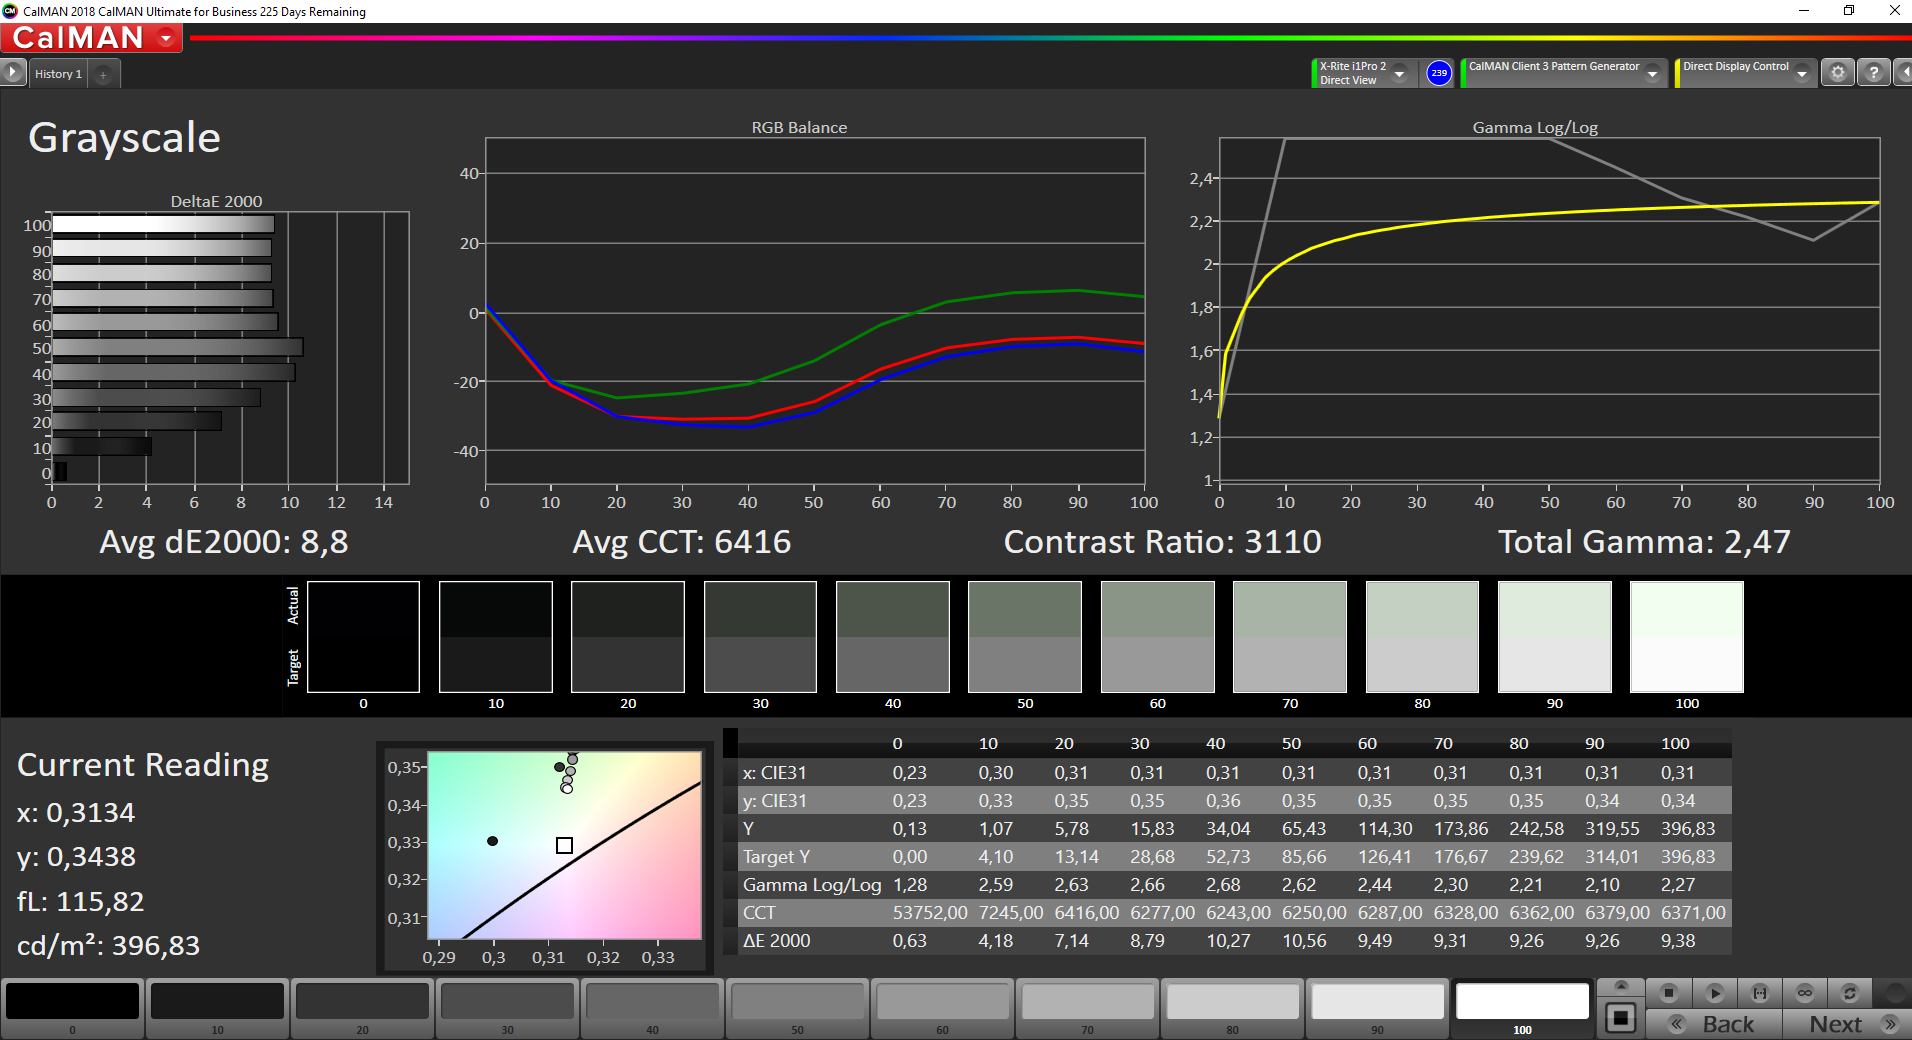
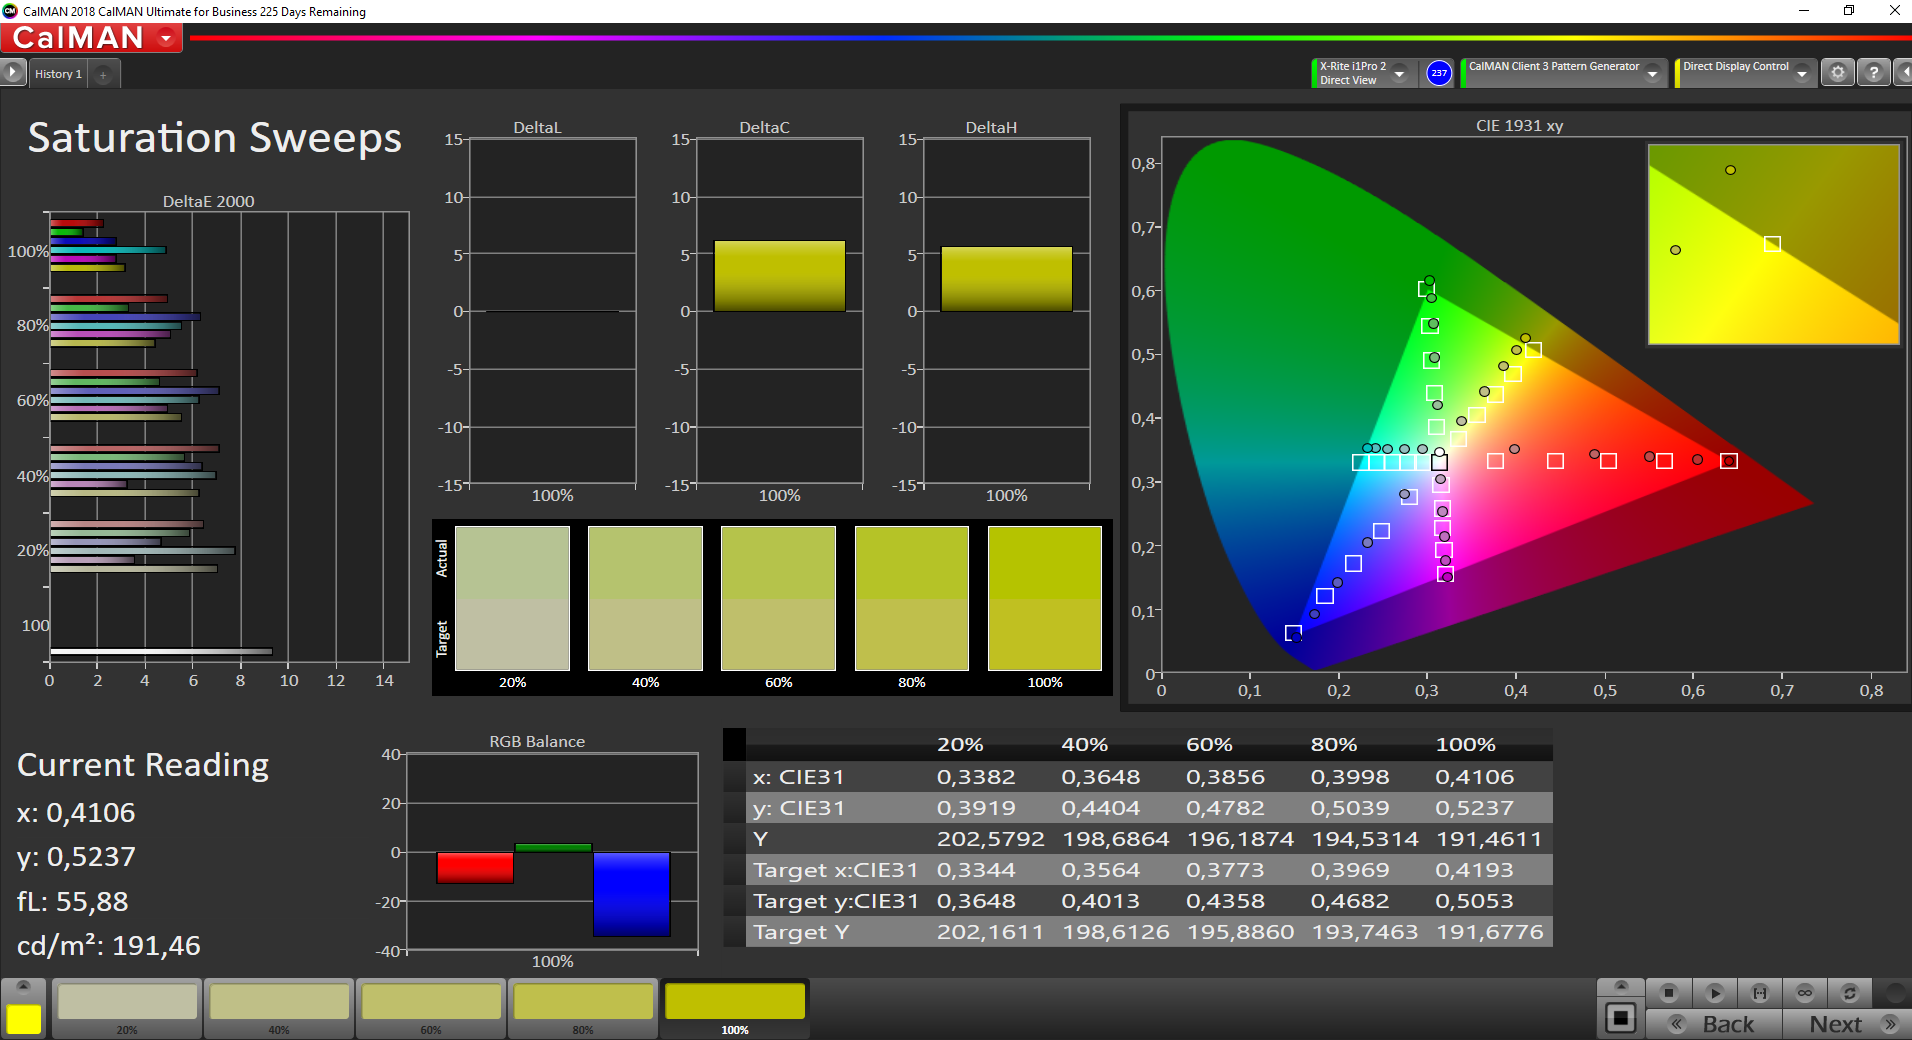
Display - Weak out of the box, solid after calibration
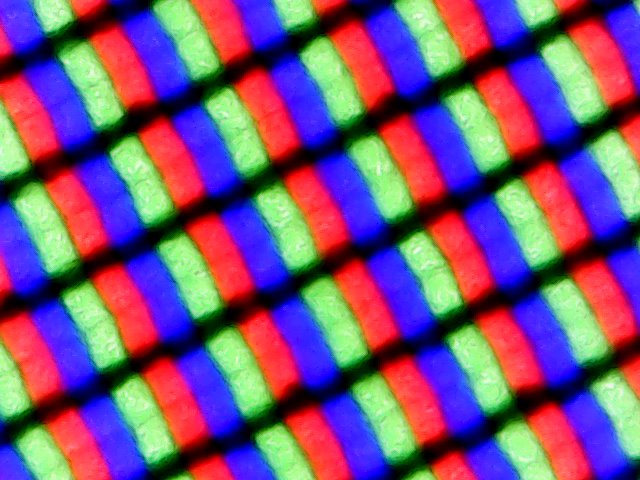
The screen of the HP ZBook Firefly 15 G8 consists of a 15.6-inch IPS panel and offers a resolution of 1920x1080 pixels. The maximum brightness of 397 cd/m² on average is slightly above the level of our chosen competition. However, brightness distribution is only moderate at 84%. Furthermore, HP doesn't use PWM for brightness control.
Besides the display variant used here, the Firefly 15 G8 is also available with an anti-glare Full HD touchscreen (250 cd/m²), a 4K panel (400 cd/m²), and a Full HD panel (1,000 cd/m²) with HP's SureView privacy technology.

| |||||||||||||||||||||||||
Brightness Distribution: 84 %
Center on Battery: 399 cd/m²
Contrast: 3054:1 (Black: 0.13 cd/m²)
ΔE ColorChecker Calman: 5.9 | ∀{0.5-29.43 Ø4.71}
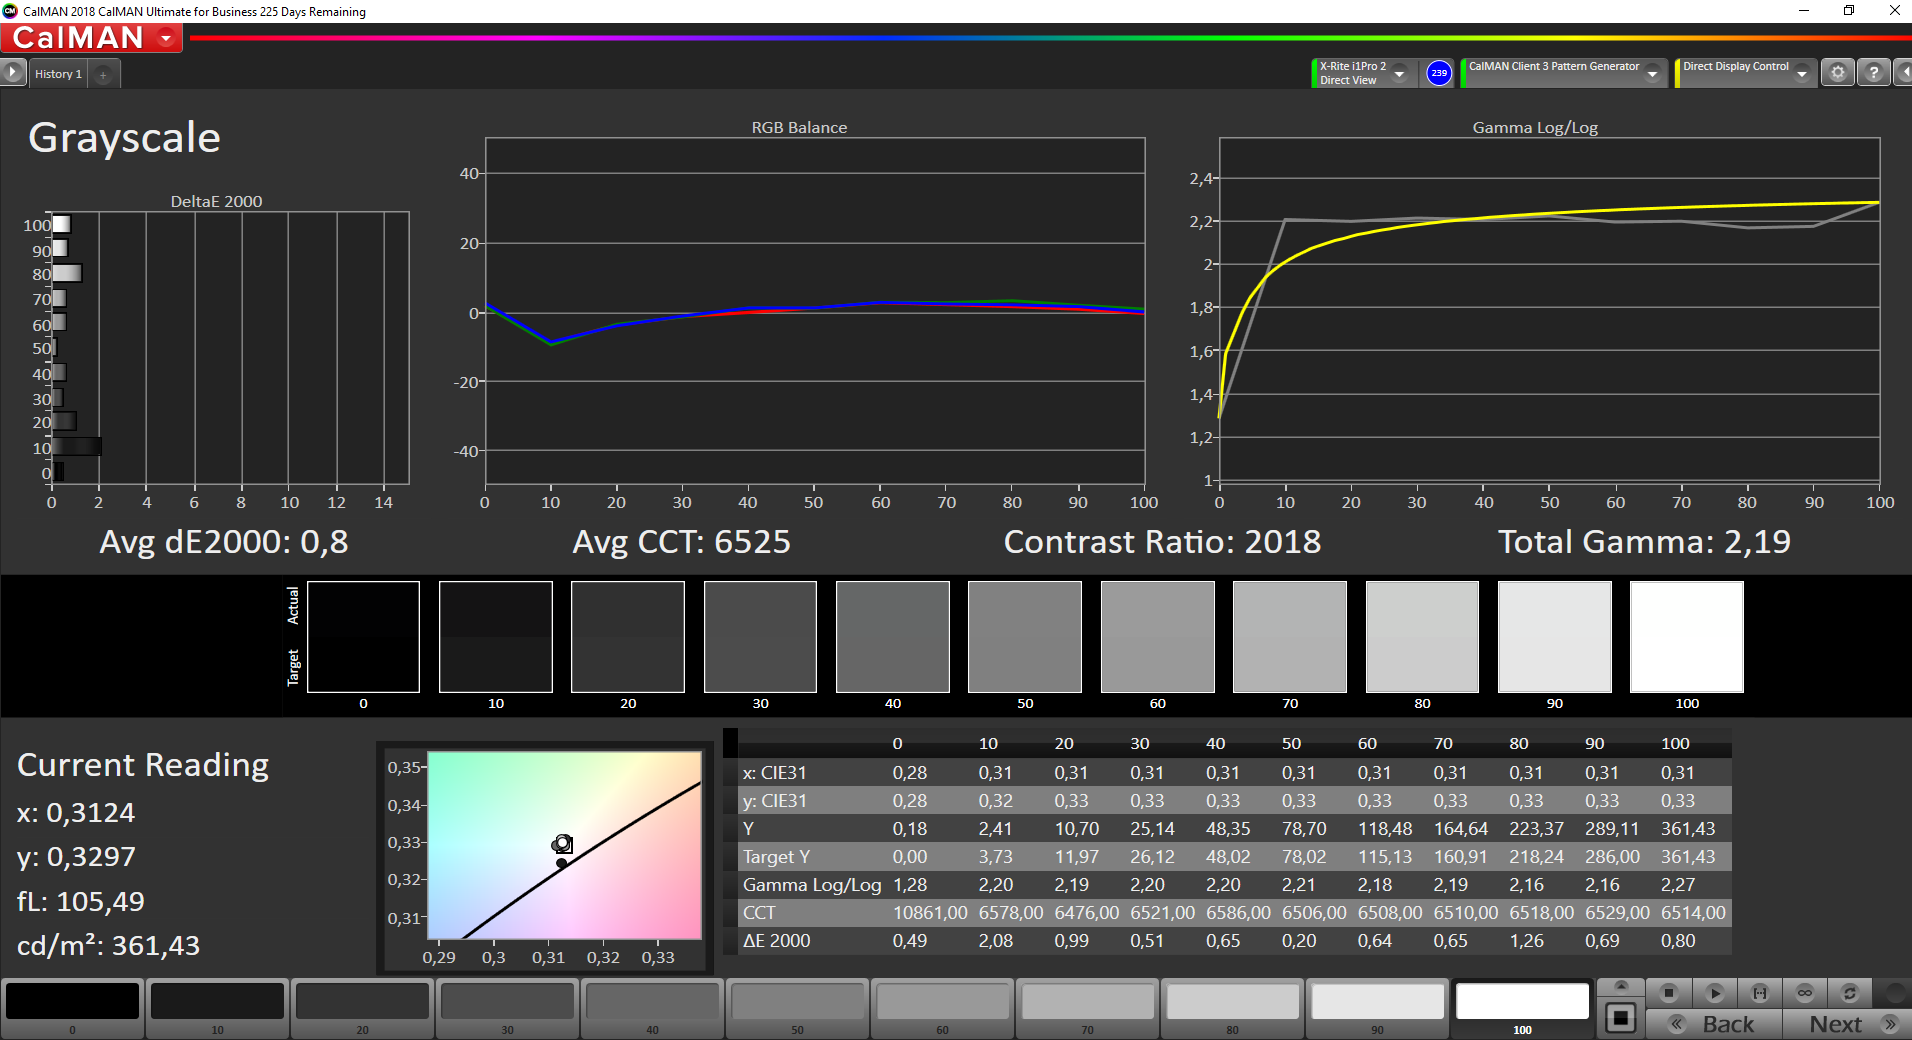
calibrated: 1.1
ΔE Greyscale Calman: 8.8 | ∀{0.09-98 Ø4.96}
98.5% sRGB (Argyll 1.6.3 3D)
63.7% AdobeRGB 1998 (Argyll 1.6.3 3D)
70% AdobeRGB 1998 (Argyll 3D)
98.5% sRGB (Argyll 3D)
68.6% Display P3 (Argyll 3D)
Gamma: 2.47
CCT: 6416 K
| HP ZBook Firefly 15 G8 2C9R7EA LGD069B, IPS, 1920x1080, 15.6" | HP ZBook Firefly 15 G7 LGD064F, IPS LED, 3840x2160, 15.6" | Dell Precision 3000 3551 LG Philips 156WFD, IPS, 1920x1080, 15.6" | Lenovo ThinkPad P15 Gen1-20ST000DGE N156HCE-EN1, a-Si IPS LED, 1920x1080, 15.6" | |
|---|---|---|---|---|
| Display | -0% | -44% | -4% | |
| Display P3 Coverage (%) | 68.6 | 68.8 0% | 37.5 -45% | 66.6 -3% |
| sRGB Coverage (%) | 98.5 | 97.7 -1% | 56.5 -43% | 92.3 -6% |
| AdobeRGB 1998 Coverage (%) | 70 | 69.8 0% | 38.74 -45% | 67.1 -4% |
| Response Times | 13% | 32% | 12% | |
| Response Time Grey 50% / Grey 80% * (ms) | 56 ? | 44 ? 21% | 29.6 ? 47% | 41.2 ? 26% |
| Response Time Black / White * (ms) | 32 ? | 30.8 ? 4% | 26.4 ? 17% | 32.8 ? -2% |
| PWM Frequency (Hz) | 24270 | |||
| Screen | 1% | -61% | -41% | |
| Brightness middle (cd/m²) | 397 | 381 -4% | 235.5 -41% | 338 -15% |
| Brightness (cd/m²) | 402 | 382 -5% | 228 -43% | 304 -24% |
| Brightness Distribution (%) | 84 | 92 10% | 89 6% | 81 -4% |
| Black Level * (cd/m²) | 0.13 | 0.21 -62% | 0.25 -92% | 0.45 -246% |
| Contrast (:1) | 3054 | 1814 -41% | 942 -69% | 751 -75% |
| Colorchecker dE 2000 * | 5.9 | 3 49% | 5.44 8% | 5.5 7% |
| Colorchecker dE 2000 max. * | 9.4 | 5.2 45% | 13.58 -44% | 11.5 -22% |
| Colorchecker dE 2000 calibrated * | 1.1 | 1.5 -36% | 5.2 -373% | 1.9 -73% |
| Greyscale dE 2000 * | 8.8 | 3.5 60% | 3.1 65% | 7.8 11% |
| Gamma | 2.47 89% | 2.26 97% | 2.42 91% | 2.24 98% |
| CCT | 6416 101% | 7254 90% | 7070 92% | 6764 96% |
| Color Space (Percent of AdobeRGB 1998) (%) | 63.7 | 64.3 1% | 35.5 -44% | 60 -6% |
| Color Space (Percent of sRGB) (%) | 98.5 | 97.5 -1% | 56.1 -43% | 92.1 -6% |
| Total Average (Program / Settings) | 5% /
3% | -24% /
-46% | -11% /
-28% |
* ... smaller is better
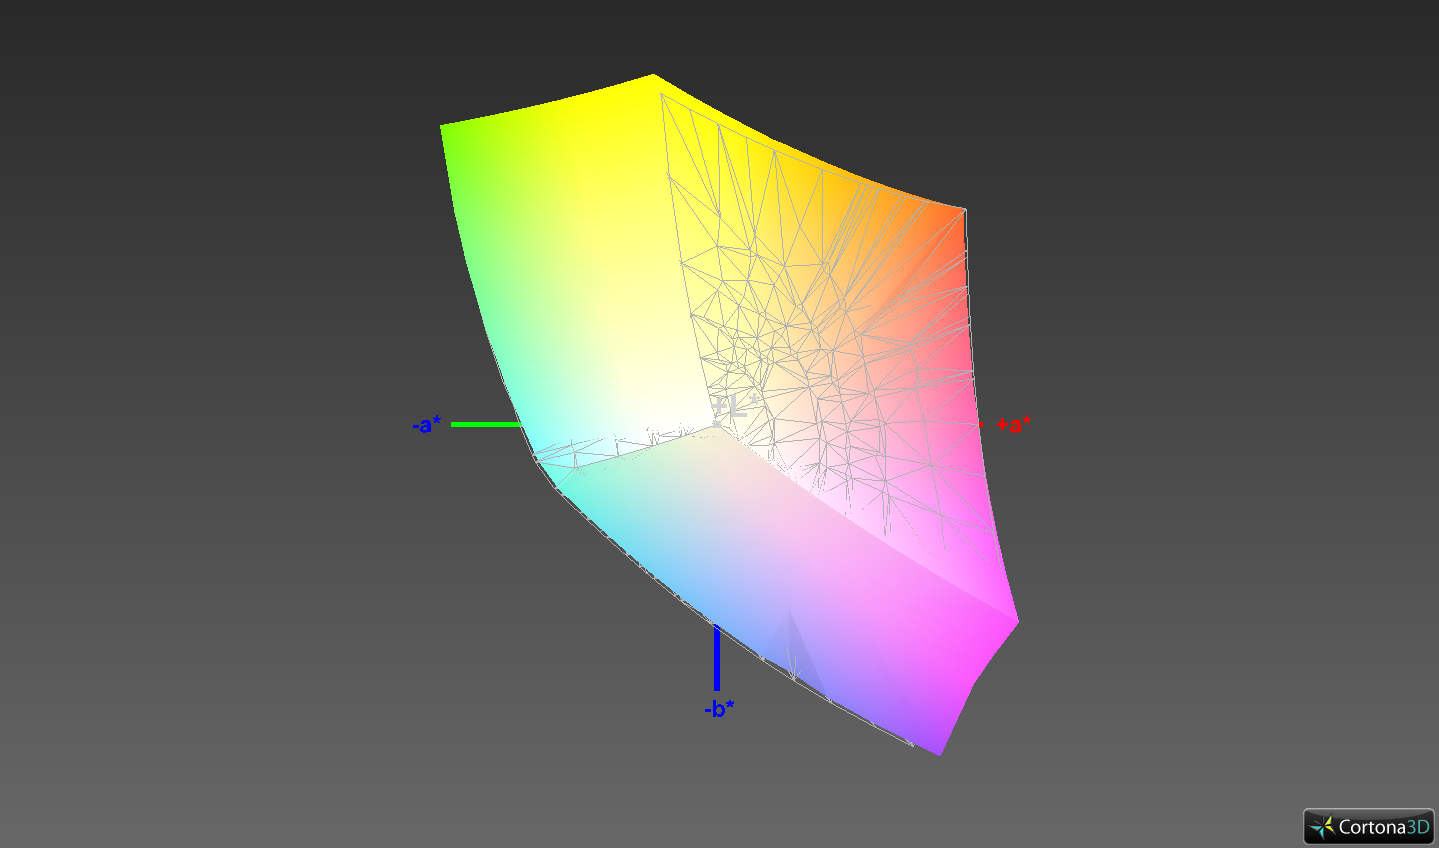
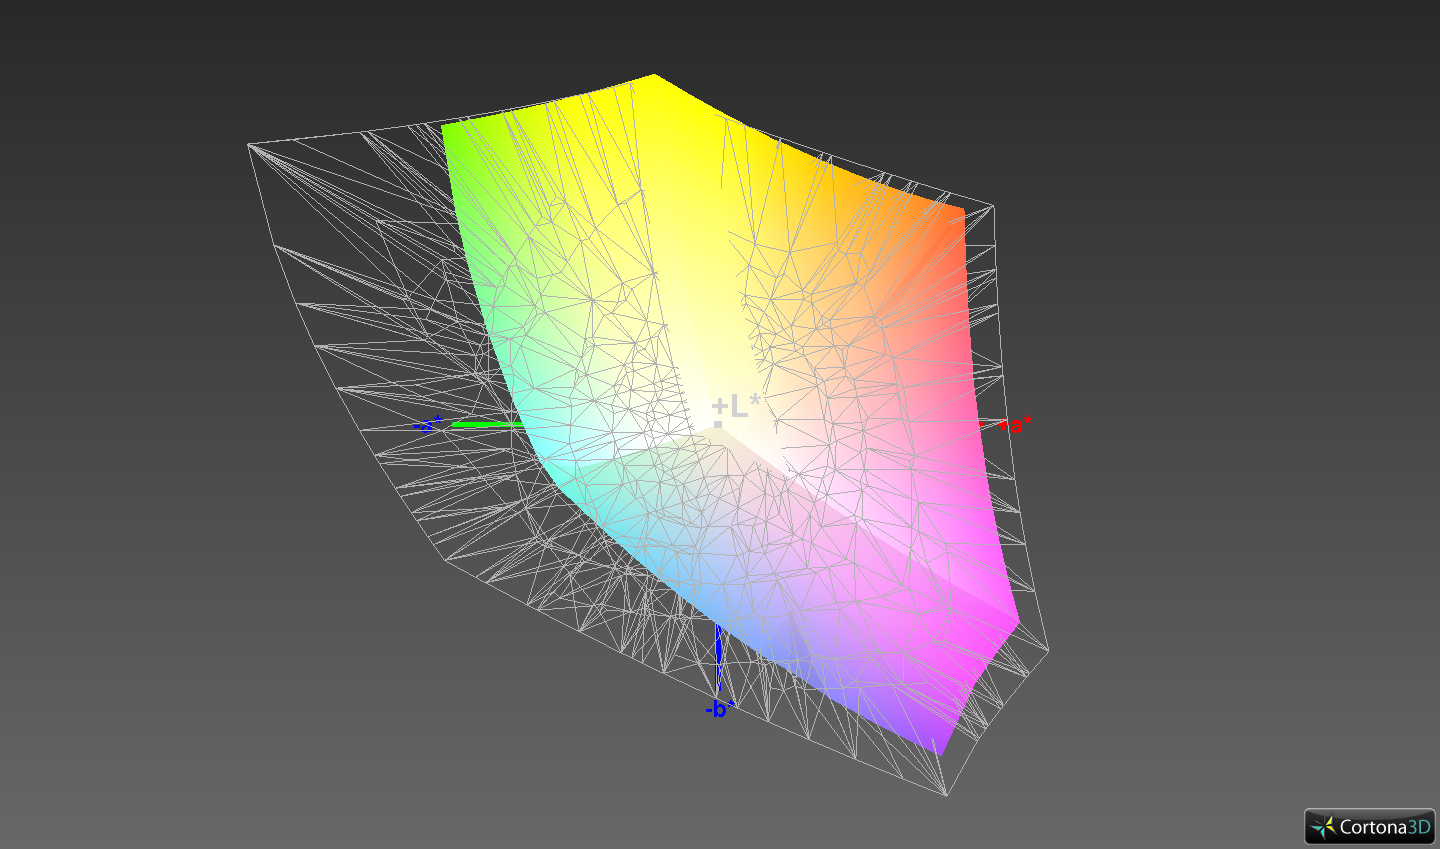
The HP workstation's display offers a very good contrast ratio of 3,054:1 and an equally very good black level of 0.13 cd/m². The color-space coverage of 98.5% (sRGB) and 63.7% (AdobeRGB) is very good as well.
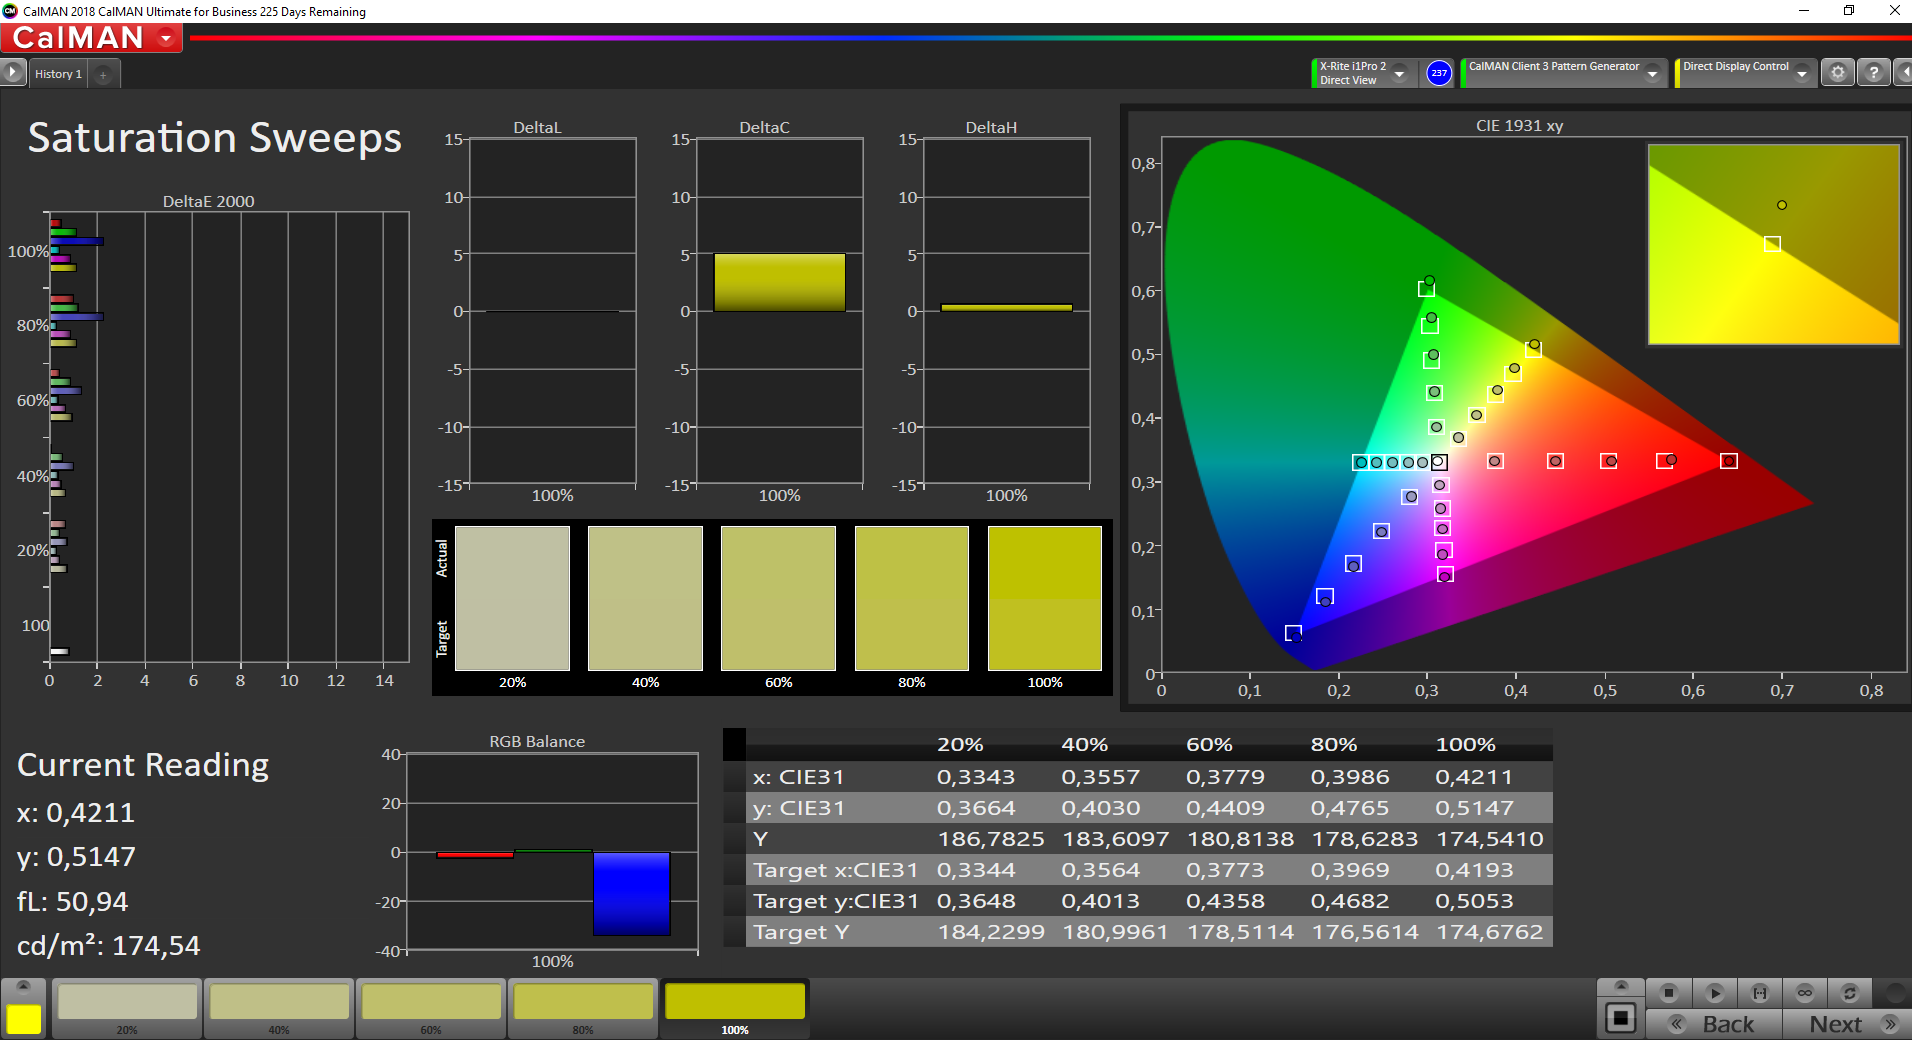
The CalMAN analysis shows that the display isn't well calibrated out of the box. The Delta E 2000 deviation is 8.8, and colors show a greenish tint. After calibration, the maximum brightness falls by 40 cd/m², but the Delta E 2000 deviation drops to a very good value of 0.8, and colors are now displayed in a balanced way. The corresponding ICC file can be downloaded in the window located at the top, to the right of the display's brightness distribution graph.

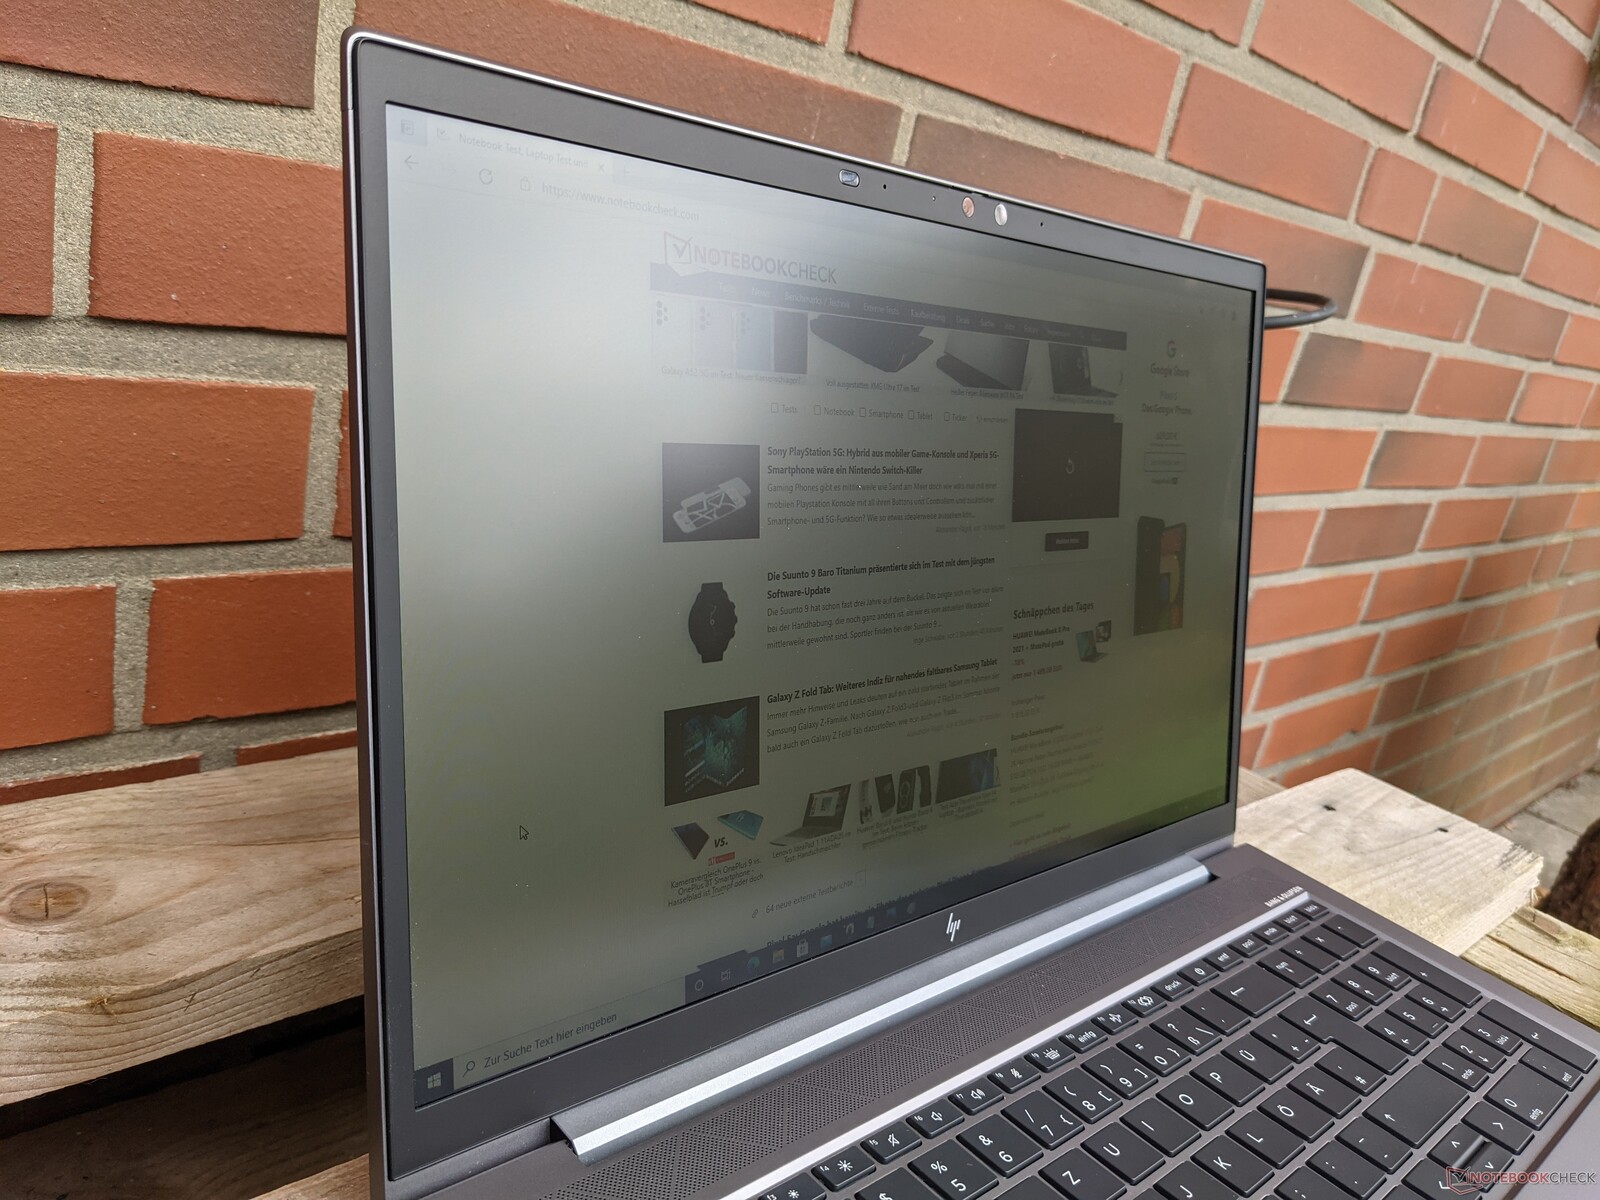
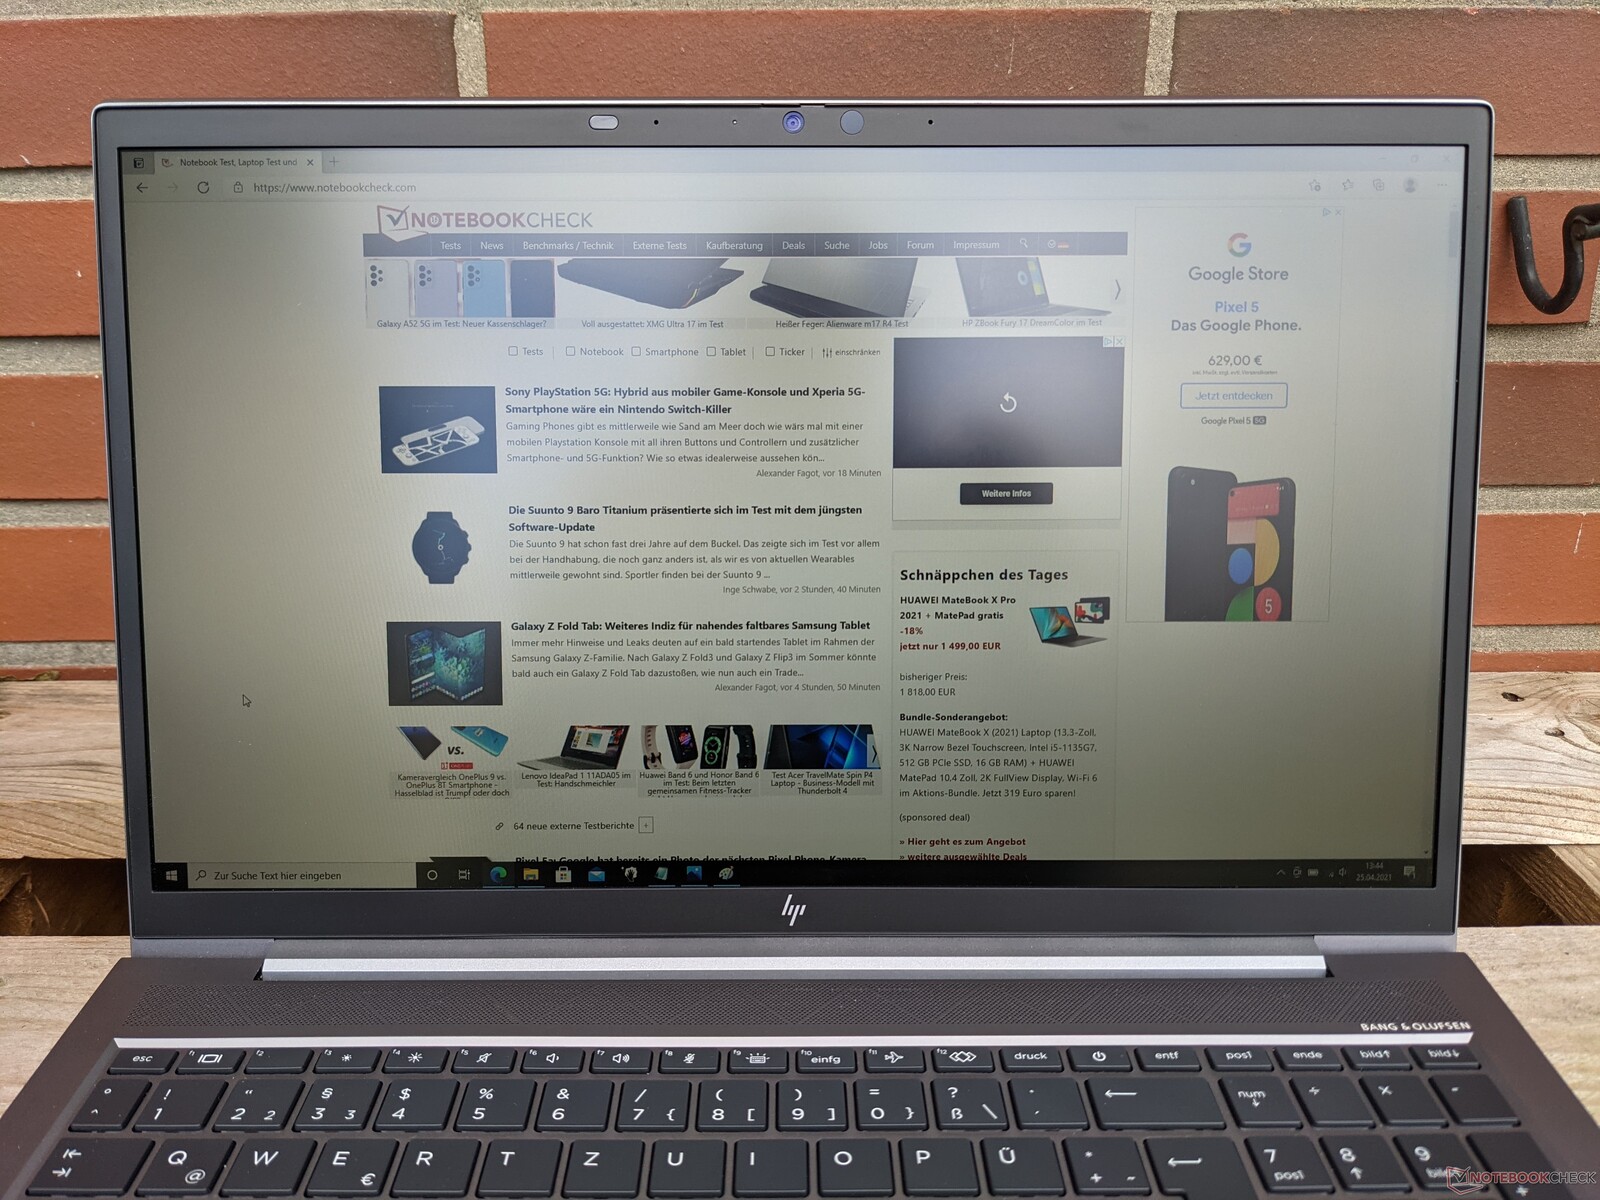
Outdoors, the laptop can be used well in the shade. However, it's hard to read the display's content in direct sunlight.
Display Response Times
| ↔ Response Time Black to White | ||
|---|---|---|
| 32 ms ... rise ↗ and fall ↘ combined | ↗ 18 ms rise | 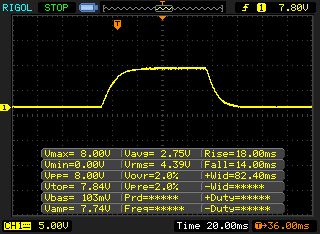 |
| ↘ 14 ms fall | ||
| The screen shows slow response rates in our tests and will be unsatisfactory for gamers. In comparison, all tested devices range from 0.1 (minimum) to 240 (maximum) ms. » 86 % of all devices are better. This means that the measured response time is worse than the average of all tested devices (19.8 ms). | ||
| ↔ Response Time 50% Grey to 80% Grey | ||
| 56 ms ... rise ↗ and fall ↘ combined | ↗ 27.2 ms rise | 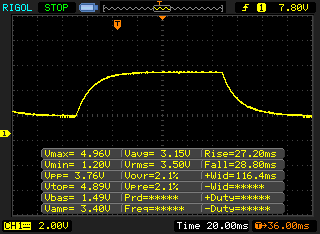 |
| ↘ 28.8 ms fall | ||
| The screen shows slow response rates in our tests and will be unsatisfactory for gamers. In comparison, all tested devices range from 0.165 (minimum) to 636 (maximum) ms. » 93 % of all devices are better. This means that the measured response time is worse than the average of all tested devices (31 ms). | ||
Screen Flickering / PWM (Pulse-Width Modulation)
| Screen flickering / PWM not detected | 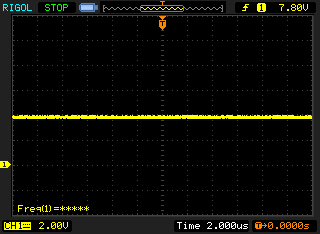 | ||
In comparison: 52 % of all tested devices do not use PWM to dim the display. If PWM was detected, an average of 7754 (minimum: 5 - maximum: 343500) Hz was measured. | |||
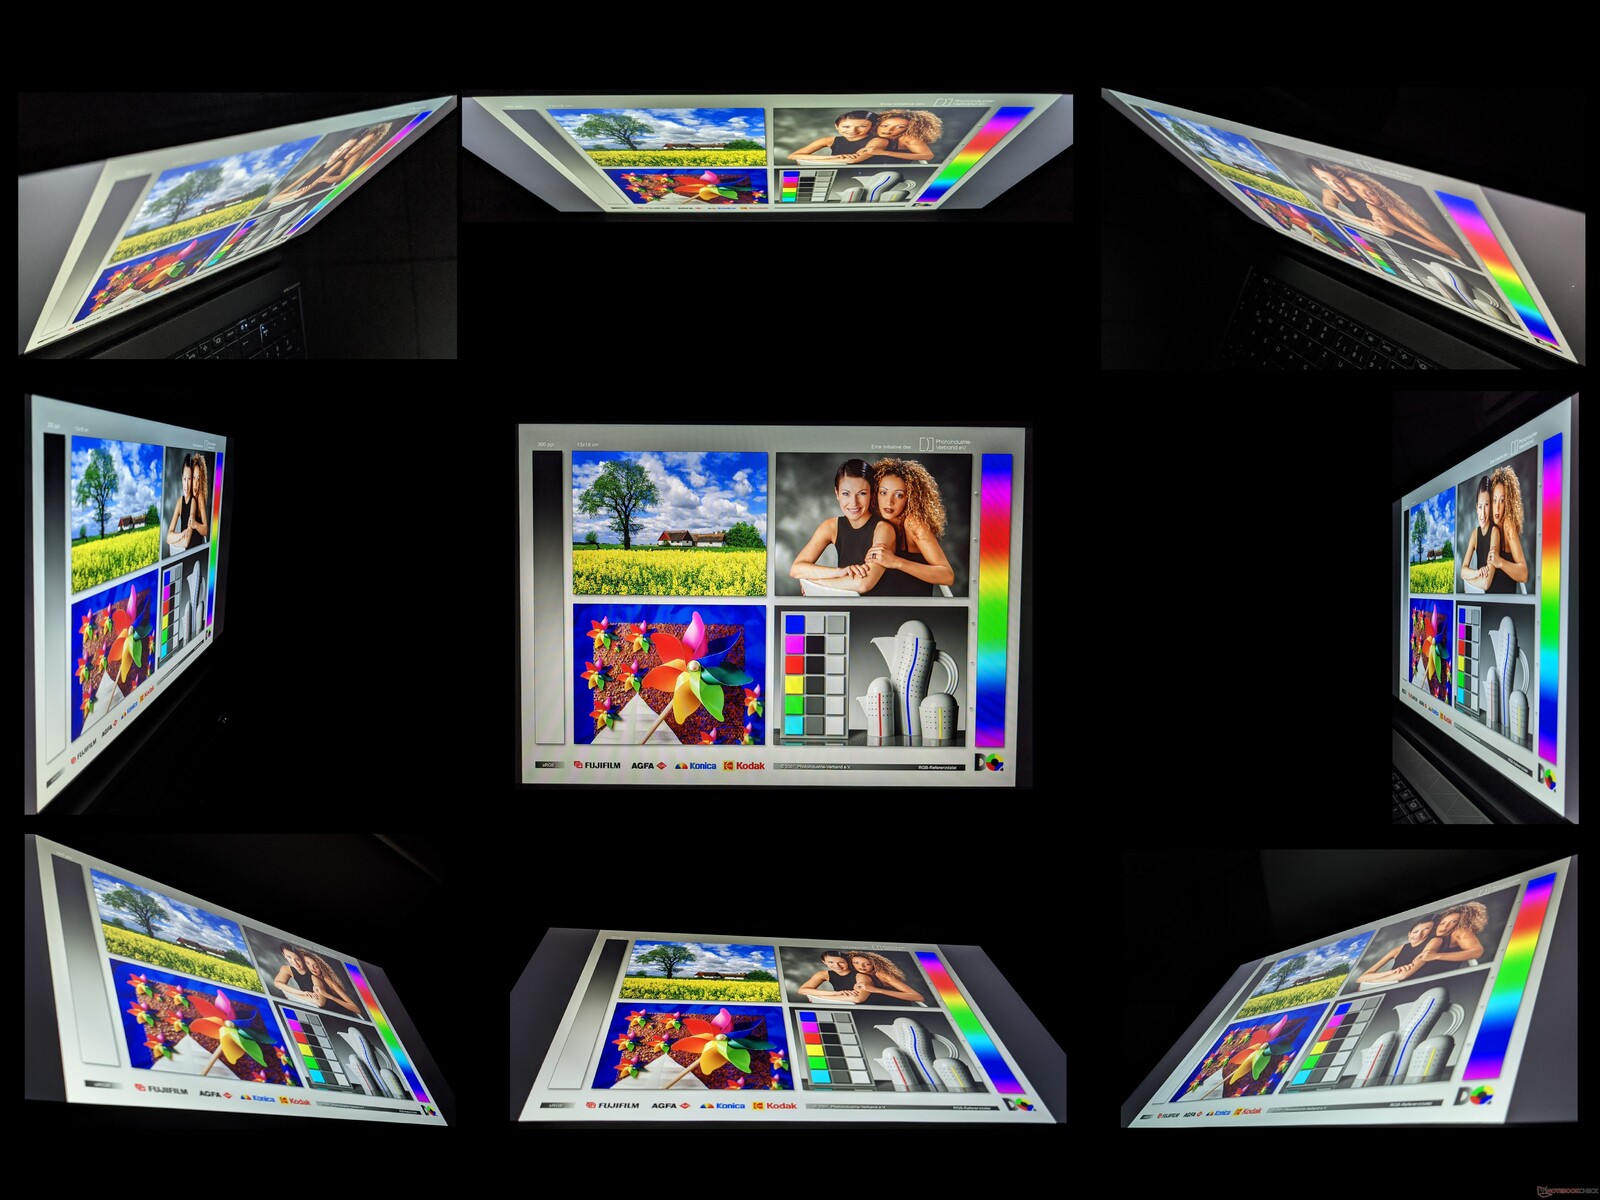
The IPS panel of the ZBook Firefly 15 G8 is very viewing-angle stable. Content can be read from almost any angle without becoming distorted or showing incorrect colors.
Performance - Significantly increased GPU performance
HP offers the ZBook Firefly 15 G8 in different configurations and targets mobile users who need a dedicated graphics card in addition to a strong CPU. Besides the processor used here, the Intel Core i5-1135G7 is also available. In addition, there are different storage configurations, which ultimately also have an impact on the purchase price.
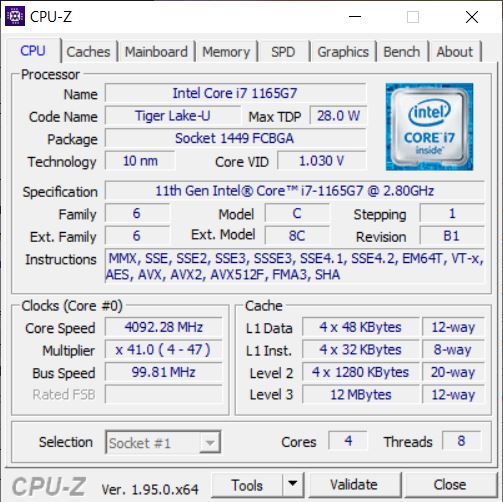


Processor
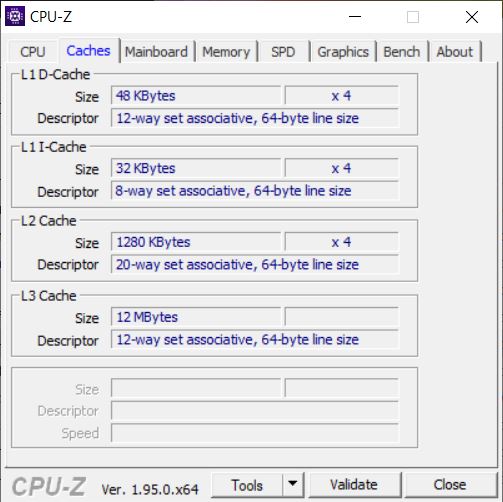
The Intel Core i7-1165G7 used here is a quad-core processor from Intel's Tiger Lake generation. Its clock rates are between 2.8 and 4.7 GHz, and it can process up to eight tasks simultaneously. HP configures the i7-1165G7 with a PL1 of 25 watts and a PL2 of 51 watts. The 25-watt mark was also consistently reached during CPU-heavy tests.
Our benchmarks also show that depending on the discipline, the CPU performance of the ZBook Firefly 15 G8 is up to 25% higher than that of the ZBook Firefly 15 G7 predecessor. The HP workstation can also maintain its performance well under continuous load. Our Cinebench R15 long-term load curve only shows a slight drop of approximately 5%.
Cinebench R15: CPU Single 64Bit | CPU Multi 64Bit
Blender: v2.79 BMW27 CPU
7-Zip 18.03: 7z b 4 -mmt1 | 7z b 4
Geekbench 5.5: Single-Core | Multi-Core
HWBOT x265 Benchmark v2.2: 4k Preset
LibreOffice : 20 Documents To PDF
R Benchmark 2.5: Overall mean
| Cinebench R20 / CPU (Single Core) | |
| Average of class Workstation (671 - 857, n=23, last 2 years) | |
| HP ZBook Firefly 15 G8 2C9R7EA | |
| Average Intel Core i7-1165G7 (442 - 589, n=81) | |
| Lenovo ThinkPad P15 Gen1-20ST000DGE | |
| HP ZBook Firefly 15 G7 | |
| Dell Precision 3000 3551 | |
| Cinebench R20 / CPU (Multi Core) | |
| Average of class Workstation (5760 - 15043, n=23, last 2 years) | |
| Lenovo ThinkPad P15 Gen1-20ST000DGE | |
| Dell Precision 3000 3551 | |
| HP ZBook Firefly 15 G8 2C9R7EA | |
| Average Intel Core i7-1165G7 (1060 - 2657, n=81) | |
| HP ZBook Firefly 15 G7 | |
| Cinebench R15 / CPU Single 64Bit | |
| Average of class Workstation (191.4 - 328, n=23, last 2 years) | |
| HP ZBook Firefly 15 G8 2C9R7EA | |
| Average Intel Core i7-1165G7 (115 - 230, n=78) | |
| Lenovo ThinkPad P15 Gen1-20ST000DGE | |
| Dell Precision 3000 3551 | |
| HP ZBook Firefly 15 G7 | |
| Cinebench R15 / CPU Multi 64Bit | |
| Average of class Workstation (2489 - 5810, n=23, last 2 years) | |
| Lenovo ThinkPad P15 Gen1-20ST000DGE | |
| Dell Precision 3000 3551 | |
| HP ZBook Firefly 15 G8 2C9R7EA | |
| Average Intel Core i7-1165G7 (553 - 1027, n=86) | |
| HP ZBook Firefly 15 G7 | |
| Blender / v2.79 BMW27 CPU | |
| HP ZBook Firefly 15 G7 | |
| Average Intel Core i7-1165G7 (468 - 1138, n=80) | |
| HP ZBook Firefly 15 G8 2C9R7EA | |
| Lenovo ThinkPad P15 Gen1-20ST000DGE | |
| Dell Precision 3000 3551 | |
| Average of class Workstation (91 - 222, n=23, last 2 years) | |
| 7-Zip 18.03 / 7z b 4 -mmt1 | |
| Average of class Workstation (5126 - 6960, n=23, last 2 years) | |
| HP ZBook Firefly 15 G8 2C9R7EA | |
| Dell Precision 3000 3551 | |
| Lenovo ThinkPad P15 Gen1-20ST000DGE | |
| Average Intel Core i7-1165G7 (4478 - 5507, n=80) | |
| HP ZBook Firefly 15 G7 | |
| 7-Zip 18.03 / 7z b 4 | |
| Average of class Workstation (60489 - 116969, n=23, last 2 years) | |
| Lenovo ThinkPad P15 Gen1-20ST000DGE | |
| Dell Precision 3000 3551 | |
| HP ZBook Firefly 15 G8 2C9R7EA | |
| Average Intel Core i7-1165G7 (15347 - 27405, n=80) | |
| HP ZBook Firefly 15 G7 | |
| Geekbench 5.5 / Single-Core | |
| Average of class Workstation (1783 - 2183, n=23, last 2 years) | |
| HP ZBook Firefly 15 G8 2C9R7EA | |
| Average Intel Core i7-1165G7 (1302 - 1595, n=77) | |
| Lenovo ThinkPad P15 Gen1-20ST000DGE | |
| HP ZBook Firefly 15 G7 | |
| Dell Precision 3000 3551 | |
| Geekbench 5.5 / Multi-Core | |
| Average of class Workstation (11542 - 25554, n=23, last 2 years) | |
| Dell Precision 3000 3551 | |
| Lenovo ThinkPad P15 Gen1-20ST000DGE | |
| Average Intel Core i7-1165G7 (3078 - 5926, n=77) | |
| HP ZBook Firefly 15 G8 2C9R7EA | |
| HP ZBook Firefly 15 G7 | |
| HWBOT x265 Benchmark v2.2 / 4k Preset | |
| Average of class Workstation (17.8 - 40.5, n=23, last 2 years) | |
| Dell Precision 3000 3551 | |
| Lenovo ThinkPad P15 Gen1-20ST000DGE | |
| HP ZBook Firefly 15 G8 2C9R7EA | |
| Average Intel Core i7-1165G7 (1.39 - 8.47, n=80) | |
| HP ZBook Firefly 15 G7 | |
| LibreOffice / 20 Documents To PDF | |
| HP ZBook Firefly 15 G7 | |
| Lenovo ThinkPad P15 Gen1-20ST000DGE | |
| Average Intel Core i7-1165G7 (21.5 - 88.1, n=78) | |
| Average of class Workstation (37.1 - 74.7, n=23, last 2 years) | |
| Dell Precision 3000 3551 | |
| HP ZBook Firefly 15 G8 2C9R7EA | |
| R Benchmark 2.5 / Overall mean | |
| HP ZBook Firefly 15 G7 | |
| Lenovo ThinkPad P15 Gen1-20ST000DGE | |
| Average Intel Core i7-1165G7 (0.552 - 1.002, n=80) | |
| Dell Precision 3000 3551 | |
| HP ZBook Firefly 15 G8 2C9R7EA | |
| Average of class Workstation (0.3825 - 0.603, n=23, last 2 years) | |
* ... smaller is better
System performance
The HP ZBook Firefly 15 G8 achieves a very good result in the PCMark 10 test for evaluating system performance, and it places itself just behind the Lenovo ThinkPad P15 Gen 1 in the overall score. In everyday use, this score is reflected in a smooth system operation. Applications are launched quickly, and data is accessed without delays.
The results achieved by other laptops in comparison can be found in our CPU Benchmarks article.
| PCMark 10 Score | 5550 points | |
Help | ||
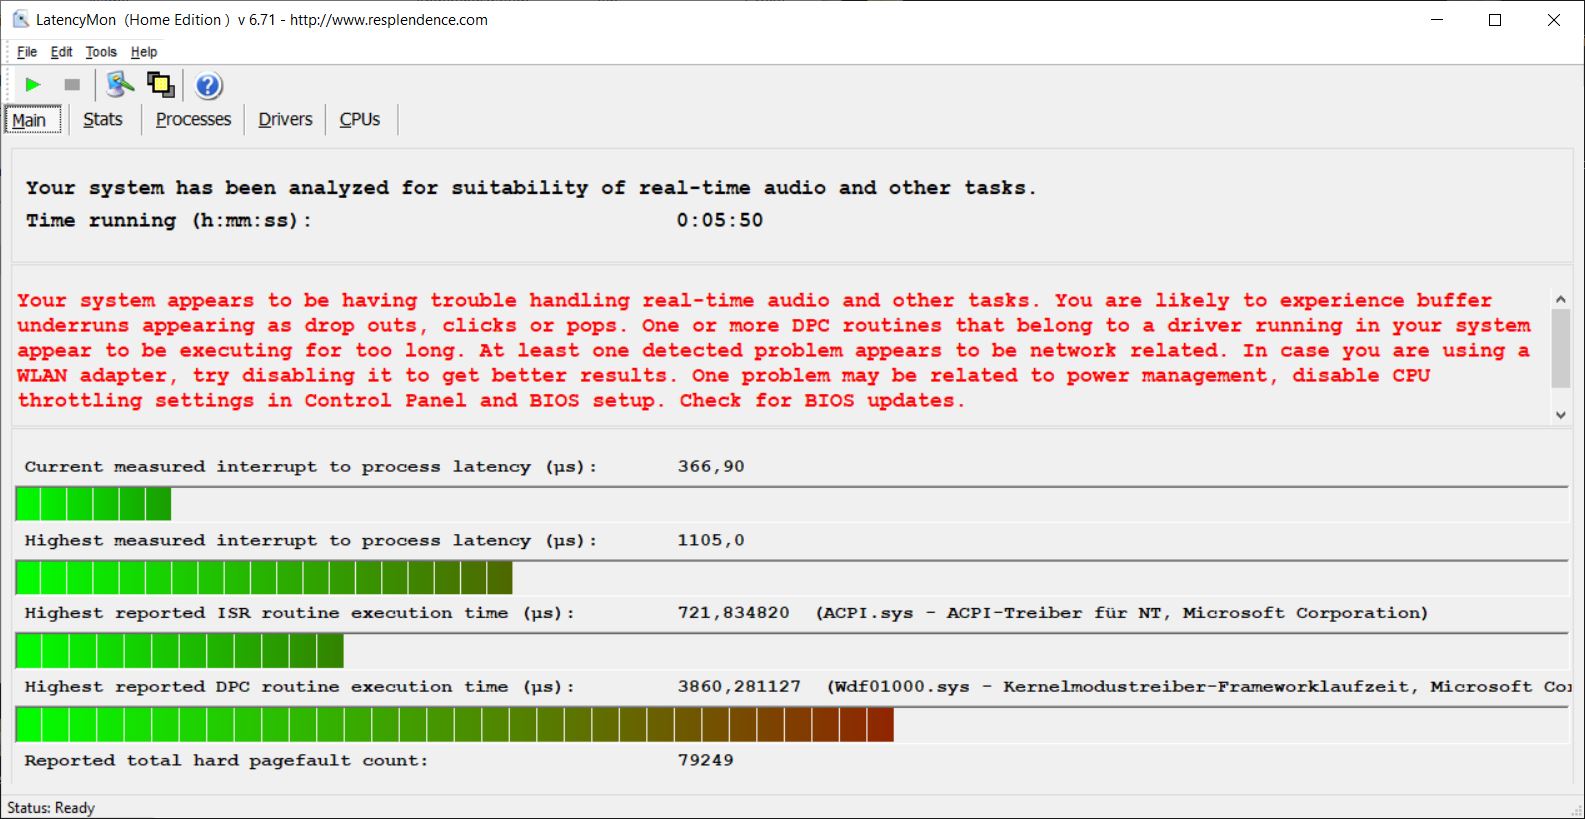
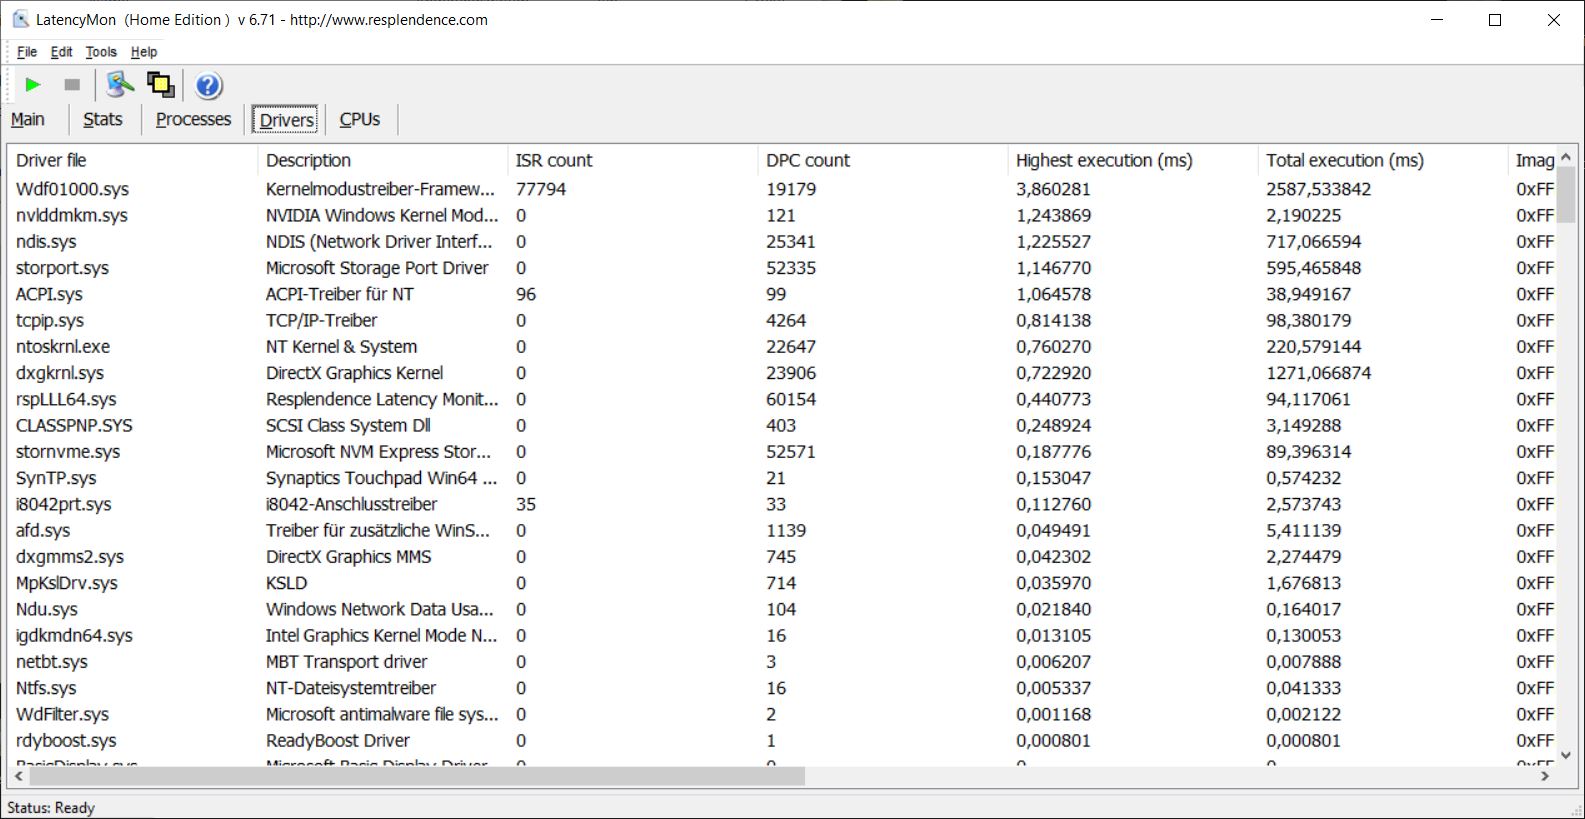
DPC latencies
In the test with LatencyMon, the ZBook Firefly 15 G8 shows increased interruption times. As a result, it's only suitable for real-time applications to a limited extent.
| DPC Latencies / LatencyMon - interrupt to process latency (max), Web, Youtube, Prime95 | |
| HP ZBook Firefly 15 G7 | |
| Dell Precision 3000 3551 | |
| HP ZBook Firefly 15 G8 2C9R7EA | |
| Lenovo ThinkPad P15 Gen1-20ST000DGE | |
* ... smaller is better
Storage
HP installs a 1 TB SSD from Toshiba in our test configuration of the ZBook Firefly 15 G8. It offers very good read and write speeds that are on par with the competition.
How other mass storage devices perform in comparison can be found in our HDD/SSD Benchmarks article.
| HP ZBook Firefly 15 G8 2C9R7EA Toshiba XG6 KXG60ZNV1T02 | HP ZBook Firefly 15 G7 Toshiba XG6 KXG60ZNV1T02 | Dell Precision 3000 3551 Toshiba Kioxia XG6 KXG60PNV512G | Lenovo ThinkPad P15 Gen1-20ST000DGE Toshiba XG6 KXG6AZNV512G | Average Toshiba XG6 KXG60ZNV1T02 | |
|---|---|---|---|---|---|
| CrystalDiskMark 5.2 / 6 | 0% | -7% | 6% | -3% | |
| Write 4K (MB/s) | 140.6 | 133.1 -5% | 120.9 -14% | 129.5 -8% | 136.3 ? -3% |
| Read 4K (MB/s) | 52.8 | 51.6 -2% | 46.79 -11% | 49.54 -6% | 50.7 ? -4% |
| Write Seq (MB/s) | 1844 | 1986 8% | 1916 4% | 2379 29% | 1869 ? 1% |
| Read Seq (MB/s) | 2108 | 2208 5% | 2216 5% | 1989 -6% | 1984 ? -6% |
| Write 4K Q32T1 (MB/s) | 418 | 462.3 11% | 393.9 -6% | 663 59% | 435 ? 4% |
| Read 4K Q32T1 (MB/s) | 476.8 | 400.2 -16% | 375.1 -21% | 425.2 -11% | 439 ? -8% |
| Write Seq Q32T1 (MB/s) | 3064 | 3074 0% | 2795 -9% | 2960 -3% | 3019 ? -1% |
| Read Seq Q32T1 (MB/s) | 3289 | 3268 -1% | 3106 -6% | 3182 -3% | 3016 ? -8% |
| AS SSD | -7% | -36% | -4% | -2% | |
| Seq Read (MB/s) | 2599 | 2666 3% | 1833 -29% | 2747 6% | 2385 ? -8% |
| Seq Write (MB/s) | 1305 | 1257 -4% | 1283 -2% | 1192 -9% | 1491 ? 14% |
| 4K Read (MB/s) | 49.65 | 48.04 -3% | 44.56 -10% | 46.49 -6% | 47.9 ? -4% |
| 4K Write (MB/s) | 128.1 | 137.5 7% | 112.4 -12% | 131.9 3% | 129.5 ? 1% |
| 4K-64 Read (MB/s) | 1157 | 977 -16% | 1106 -4% | 1431 24% | 1099 ? -5% |
| 4K-64 Write (MB/s) | 1475 | 1142 -23% | 1262 -14% | 1437 -3% | 1440 ? -2% |
| Access Time Read * (ms) | 0.057 | 0.053 7% | 0.084 -47% | 0.102 -79% | 0.05787 ? -2% |
| Access Time Write * (ms) | 0.03 | 0.03 -0% | 0.105 -250% | 0.031 -3% | 0.03213 ? -7% |
| Score Read (Points) | 1467 | 1292 -12% | 1334 -9% | 1752 19% | 1386 ? -6% |
| Score Write (Points) | 1734 | 1406 -19% | 1503 -13% | 1688 -3% | 1718 ? -1% |
| Score Total (Points) | 3894 | 3297 -15% | 3498 -10% | 4261 9% | 3776 ? -3% |
| Total Average (Program / Settings) | -4% /
-4% | -22% /
-24% | 1% /
0% | -3% /
-3% |
* ... smaller is better

Continuous load read: DiskSpd Read Loop, Queue Depth 8
Graphics card
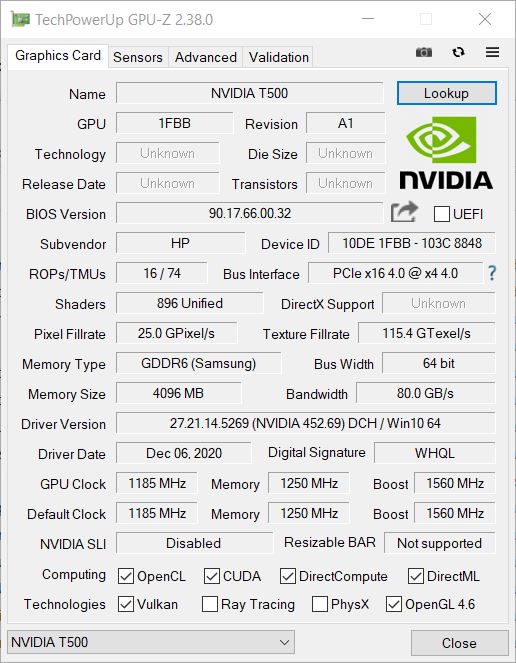
The ZBook Firefly 15 G8 is equipped with an Nvidia Quadro T500. This entry-level graphics card for workstations is based on the GeForce MX450, but it offers slightly higher clock rates. The variant with 4 GB of video memory is installed here; HP doesn't offer the 2 GB version.
In the 3DMark benchmarks, the ZBook Firefly 15 G8 can almost double its performance compared to the Nvidia Quadro P520 in the ZBook Firefly 15 G7. The performance that can be expected from other graphics cards in comparison can be found in our GPU Benchmarks article.
| 3DMark 11 Performance | 8160 points | |
| 3DMark Cloud Gate Standard Score | 15562 points | |
| 3DMark Fire Strike Score | 4833 points | |
| 3DMark Time Spy Score | 2270 points | |
Help | ||
Gaming performance
The Nvidia Quadro T500 used here is only suitable for games to a limited extent. Although you can run recent titles in Full HD depending on the graphics performance requirements, you will have to use significantly lower detail settings for smooth frame rates in some cases.
We have listed the performance that can be expected in various games in our GPU Games article.
| Cyberpunk 2077 1.0 - 1280x720 Low Preset | |
| Average NVIDIA T500 Laptop GPU (27.8 - 34.3, n=2) | |
| HP ZBook Firefly 15 G8 2C9R7EA | |
| The Witcher 3 - 1920x1080 Ultra Graphics & Postprocessing (HBAO+) | |
| Average of class Workstation (n=1last 2 years) | |
| Lenovo ThinkPad P15 Gen1-20ST000DGE | |
| HP ZBook Firefly 15 G8 2C9R7EA | |
| Average NVIDIA T500 Laptop GPU (16.9 - 22.3, n=4) | |
| Dell Precision 3000 3551 | |
| HP ZBook Firefly 15 G7 | |
| Far Cry 5 - 1280x720 Low Preset AA:T | |
| Average of class Workstation (75 - 168, n=7, last 2 years) | |
| Average NVIDIA T500 Laptop GPU (31 - 72, n=2) | |
| HP ZBook Firefly 15 G8 2C9R7EA | |
| Final Fantasy XV Benchmark - 1280x720 Lite Quality | |
| Average of class Workstation (77.6 - 233, n=22, last 2 years) | |
| Dell Precision 3000 3551 | |
| Average NVIDIA T500 Laptop GPU (49.1 - 51.1, n=3) | |
| Dota 2 Reborn - 1920x1080 ultra (3/3) best looking | |
| Average of class Workstation (50.7 - 178.4, n=23, last 2 years) | |
| Lenovo ThinkPad P15 Gen1-20ST000DGE | |
| HP ZBook Firefly 15 G8 2C9R7EA | |
| Dell Precision 3000 3551 | |
| Average NVIDIA T500 Laptop GPU (70.5 - 96.2, n=4) | |
| HP ZBook Firefly 15 G7 | |
Our continuous load test with The Witcher 3 on the "Ultra" setting shows that the ZBook Firefly 15 G8 gradually loses performance in games. The cooling system can stop this trend after a while, but performance takes a sawtooth trajectory afterwards, which manifests itself in stagnant frame rates.
| low | med. | high | ultra | |
|---|---|---|---|---|
| The Witcher 3 (2015) | 22.3 | |||
| Dota 2 Reborn (2015) | 134 | 117 | 104 | 96.2 |
| X-Plane 11.11 (2018) | 81.1 | 69 | 60 | |
| Far Cry 5 (2018) | 31 | 25 | 22 | 21 |
| Cyberpunk 2077 1.0 (2020) | 27.8 | 14.4 | 10.9 | 10.1 |
Emissions
Noise emissions
The fan of the Firefly 15 G8 is audible at up to 36.1 dB(A) under load, but it's not annoyingly loud. Furthermore, the resulting noise is uniform, and it blends well into the background noise. We didn't notice any coil whine or the like in our test device.
Noise level
| Idle |
| 24.1 / 24.1 / 27.1 dB(A) |
| Load |
| 32.8 / 36.1 dB(A) |
 | ||
30 dB silent 40 dB(A) audible 50 dB(A) loud |
||
min: | ||
Temperature
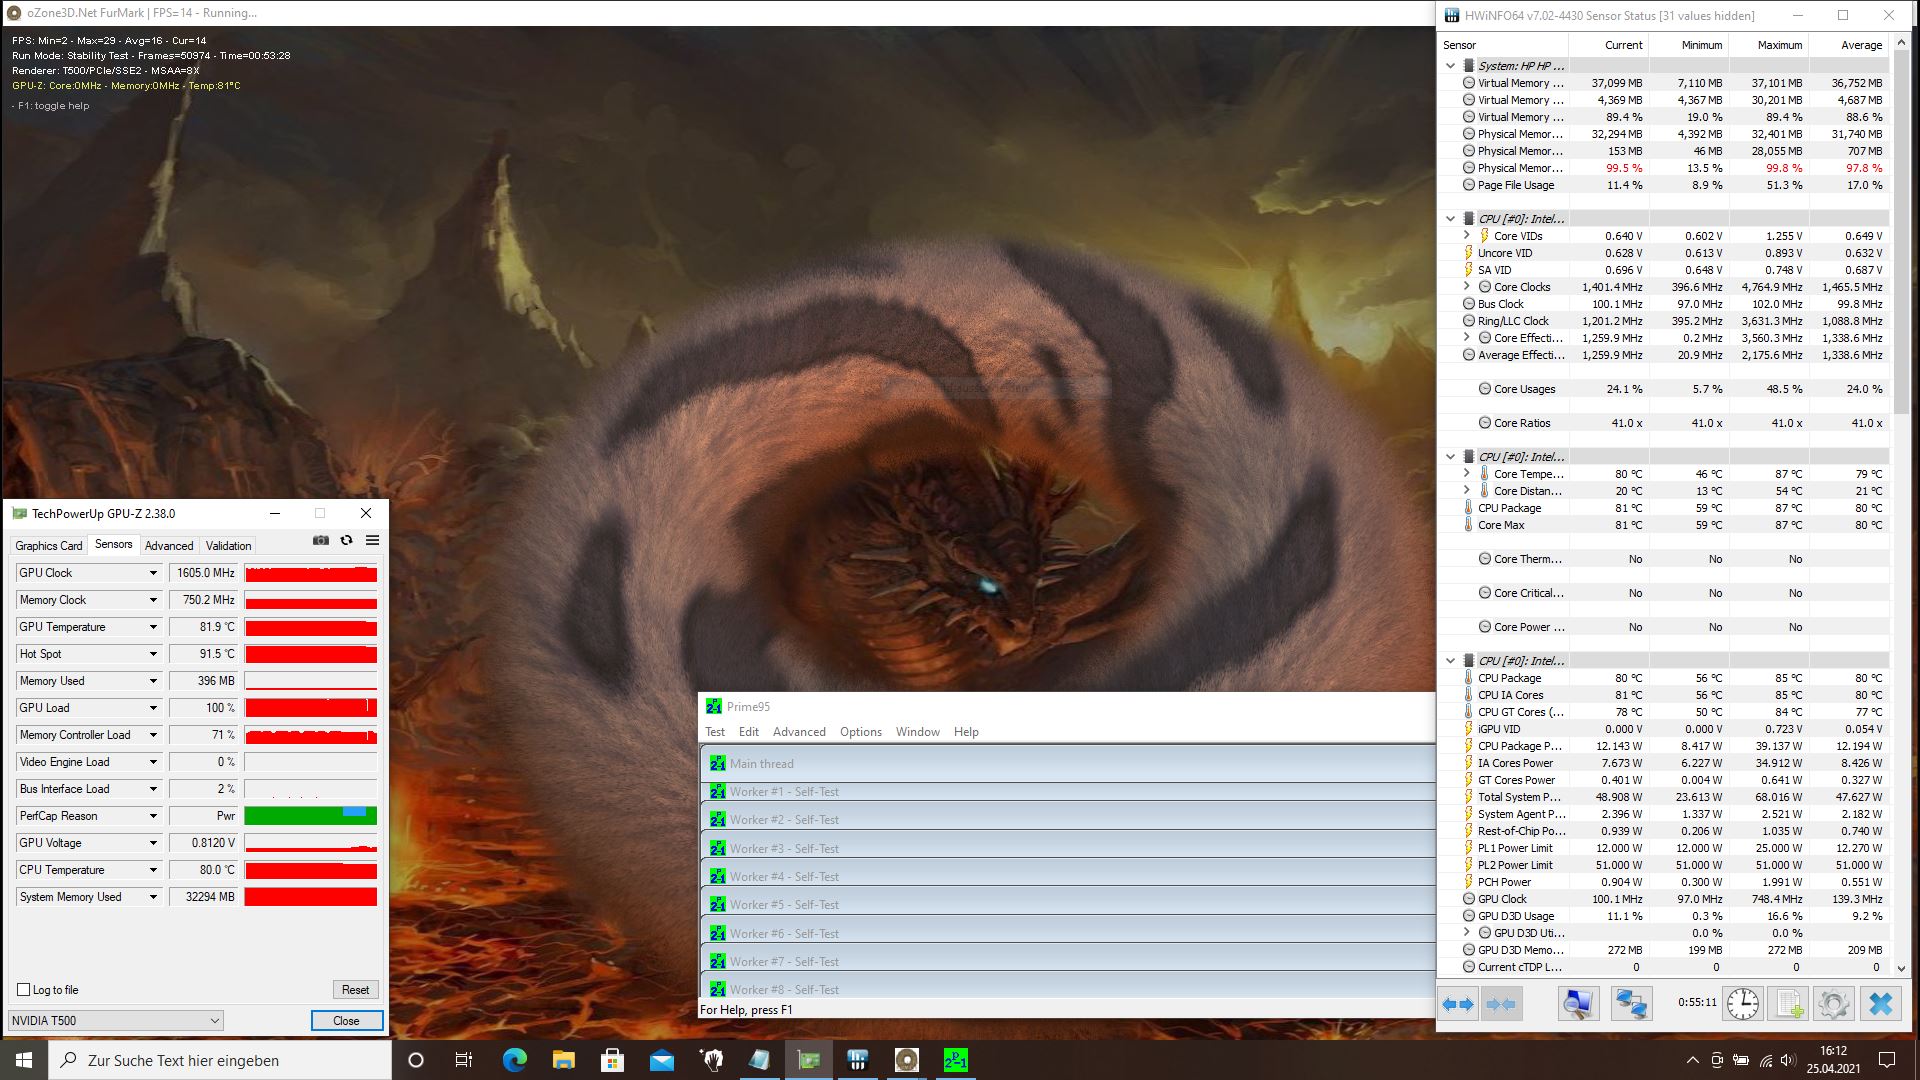
According to our measurements, the surfaces of the ZBook Firefly G8 reach up to 47.2 °C (~117 °F) under load. The warmest spot is at the bottom on the center of the rear section, which means that the workstation can no longer be used without limitations on the lap, for example.
During our approximately one-hour stress test, the temperatures inside HP's workstation rose up to 85 °C (~185 °F). The clock rates also dropped to an average of 1.4 GHz, which is below the base clock speed. In addition, the CPU's power consumption of 12 watts only corresponded to the minimum TDP of the i7-1165G7. Since the system stabilized quite quickly after the test, and an amount of load such as in our stress test scenario shouldn't occur in everyday situations, users won't necessarily experience limitations due to excessively high temperatures.
(±) The maximum temperature on the upper side is 41.2 °C / 106 F, compared to the average of 38.2 °C / 101 F, ranging from 22.2 to 69.8 °C for the class Workstation.
(-) The bottom heats up to a maximum of 47.2 °C / 117 F, compared to the average of 41.1 °C / 106 F
(+) In idle usage, the average temperature for the upper side is 23.4 °C / 74 F, compared to the device average of 32 °C / 90 F.
(±) Playing The Witcher 3, the average temperature for the upper side is 35.5 °C / 96 F, compared to the device average of 32 °C / 90 F.
(+) The palmrests and touchpad are cooler than skin temperature with a maximum of 29.9 °C / 85.8 F and are therefore cool to the touch.
(-) The average temperature of the palmrest area of similar devices was 27.8 °C / 82 F (-2.1 °C / -3.8 F).
Speakers
The speakers of the ZBook Firefly 15 G8 offer medium volume and a fairly broad sound spectrum. This makes them suitable for occasional media playback in quiet environments, but external speakers or headphones are still recommended in the long run.
HP ZBook Firefly 15 G8 2C9R7EA audio analysis
(±) | speaker loudness is average but good (79.1 dB)
Bass 100 - 315 Hz
(-) | nearly no bass - on average 18% lower than median
(±) | linearity of bass is average (11.3% delta to prev. frequency)
Mids 400 - 2000 Hz
(+) | balanced mids - only 3% away from median
(+) | mids are linear (4.1% delta to prev. frequency)
Highs 2 - 16 kHz
(+) | balanced highs - only 3.3% away from median
(+) | highs are linear (5.6% delta to prev. frequency)
Overall 100 - 16.000 Hz
(±) | linearity of overall sound is average (16.2% difference to median)
Compared to same class
» 43% of all tested devices in this class were better, 7% similar, 50% worse
» The best had a delta of 7%, average was 17%, worst was 35%
Compared to all devices tested
» 26% of all tested devices were better, 6% similar, 68% worse
» The best had a delta of 4%, average was 23%, worst was 134%
Apple MacBook 12 (Early 2016) 1.1 GHz audio analysis
(+) | speakers can play relatively loud (83.6 dB)
Bass 100 - 315 Hz
(±) | reduced bass - on average 11.3% lower than median
(±) | linearity of bass is average (14.2% delta to prev. frequency)
Mids 400 - 2000 Hz
(+) | balanced mids - only 2.4% away from median
(+) | mids are linear (5.5% delta to prev. frequency)
Highs 2 - 16 kHz
(+) | balanced highs - only 2% away from median
(+) | highs are linear (4.5% delta to prev. frequency)
Overall 100 - 16.000 Hz
(+) | overall sound is linear (10.2% difference to median)
Compared to same class
» 7% of all tested devices in this class were better, 2% similar, 90% worse
» The best had a delta of 5%, average was 18%, worst was 53%
Compared to all devices tested
» 5% of all tested devices were better, 1% similar, 94% worse
» The best had a delta of 4%, average was 23%, worst was 134%
Energy management - Long battery life
Energy consumption
With an average power consumption of 5.6 watts in idle usage and 64.4 watts under load, the HP ZBook Firefly 15 G8 is one of the most energy-efficient devices in our test field. Although the maximum consumption under load of 69 watts exceeds the 65-watt power adapter's capacity, this value is only reached for a short time, and it quickly settles between 49 and 60 watts.
Furthermore, the maximum values in the idle scenario are 6.5 watts without the keyboard backlight enabled, 7.7 watts when it's set to level 1, and 8.7 watts when it's set to level 2.
| Off / Standby | |
| Idle | |
| Load |
|
Key:
min: | |
| HP ZBook Firefly 15 G8 2C9R7EA i7-1165G7, T500 Laptop GPU, Toshiba XG6 KXG60ZNV1T02, IPS, 1920x1080, 15.6" | HP ZBook Firefly 15 G7 i7-10610U, Quadro P520, Toshiba XG6 KXG60ZNV1T02, IPS LED, 3840x2160, 15.6" | Dell Precision 3000 3551 i9-10885H, Quadro P620, Toshiba Kioxia XG6 KXG60PNV512G, IPS, 1920x1080, 15.6" | Lenovo ThinkPad P15 Gen1-20ST000DGE i7-10750H, Quadro T1000 (Laptop), Toshiba XG6 KXG6AZNV512G, a-Si IPS LED, 1920x1080, 15.6" | Average NVIDIA T500 Laptop GPU | Average of class Workstation | |
|---|---|---|---|---|---|---|
| Power Consumption | -4% | -48% | -102% | -13% | -128% | |
| Idle Minimum * (Watt) | 3.3 | 3.5 -6% | 5.7 -73% | 8.4 -155% | 4.18 ? -27% | 9.11 ? -176% |
| Idle Average * (Watt) | 5.6 | 6.7 -20% | 8.7 -55% | 12.3 -120% | 7.68 ? -37% | 13.8 ? -146% |
| Idle Maximum * (Watt) | 8.7 | 9.6 -10% | 9 -3% | 14.2 -63% | 10.6 ? -22% | 17.9 ? -106% |
| Load Average * (Watt) | 64.4 | 60 7% | 100.2 -56% | 96 -49% | 52.6 ? 18% | 96 ? -49% |
| Witcher 3 ultra * (Watt) | 53 | 49.3 7% | 56 -6% | 95 -79% | ||
| Load Maximum * (Watt) | 69 | 68.6 1% | 133.2 -93% | 168.8 -145% | 67.4 ? 2% | 180.3 ? -161% |
* ... smaller is better
Battery life
The ZBook Firefly 15 G8 achieves a runtime of 10.5 hours in our real-world Wi-Fi test. This means that it can make good use of its 56 Wh battery, and it only has to admit defeat to competing devices with higher capacities. According to HP, fast charging is also supported with the included 65-watt power adapter, allowing 50% of the battery charge to be available again after half an hour.
| HP ZBook Firefly 15 G8 2C9R7EA i7-1165G7, T500 Laptop GPU, 56 Wh | HP ZBook Firefly 15 G7 i7-10610U, Quadro P520, 53 Wh | Dell Precision 3000 3551 i9-10885H, Quadro P620, 97 Wh | Lenovo ThinkPad P15 Gen1-20ST000DGE i7-10750H, Quadro T1000 (Laptop), 94 Wh | Average of class Workstation | |
|---|---|---|---|---|---|
| Battery runtime | -15% | 30% | -8% | -30% | |
| H.264 (h) | 15.3 | 12.2 -20% | 13.9 -9% | 10.1 ? -34% | |
| WiFi v1.3 (h) | 10.5 | 9.1 -13% | 13.6 30% | 14.1 34% | 8.55 ? -19% |
| Load (h) | 2.3 | 2 -13% | 1.2 -48% | 1.441 ? -37% |
Pros
Cons
Verdict - Improved performance at the expense of heat development
With the upgrade to a Tiger Lake CPU and the new Nvidia Quadro T500, HP accomplishes one goal in particular, namely a significant increase in performance compared to the predecessor. The graphics unit represents the biggest leap. Although it still belongs to the entry-level segment, performance is practically doubled. Connectivity has also been upgraded, and Thunderbolt 4 is supported now.
The ZBook Firefly 15 G8 can almost double its graphics performance with the new Nvidia Quadro T500. However, the cooling system reaches its limits under maximum load.
HP leaves the design unchanged, which isn't a negative thing. However, the cooling system seems to slowly be reaching its limits, and there are also fluctuations in performance under prolonged load. This is not ideal for a mobile workstation, and this aspect should definitely be improved in the next model.
Price and availability
You can find the HP ZBook Firefly 15 G8 in the manufacturer's online store where you can customize it quite extensively. Prices will vary accordingly. For instance, the model with the same configuration as our test device currently costs around $2,600.
HP ZBook Firefly 15 G8 2C9R7EA
- 04/26/2021 v7 (old)
Mike Wobker
Price comparison

