Dell Precision 3551 Laptop Review: Intel Core i9-10885H Debut
Unlike the Precision 3550 which runs on slower Intel U-class series CPUs with optional Quadro P520 graphics, the Precision 3551 bumps up the performance factor with Core H-class CPUs and the optional Quadro P620 GPU. The laptop is an entry-level mobile workstation sitting below the mid-range Precision 5000 series and top-end Precision 7000 series.
More Dell reviews:
Rating | Date | Model | Weight | Height | Size | Resolution | Price |
|---|---|---|---|---|---|---|---|
| 81.2 % v7 (old) | 10 / 2020 | Dell Precision 3000 3551 i9-10885H, Quadro P620 | 2.2 kg | 24.92 mm | 15.60" | 1920x1080 | |
| 82.7 % v7 (old) | 10 / 2020 | HP ZBook Firefly 15 G7 i7-10610U, Quadro P520 | 1.8 kg | 19.2 mm | 15.60" | 3840x2160 | |
| 86.3 % v7 (old) | 08 / 2020 | Dell Precision 5550 P91F i7-10875H, Quadro T2000 Max-Q | 2 kg | 18 mm | 15.60" | 3840x2400 | |
| 81.2 % v7 (old) | 11 / 2019 | Lenovo ThinkPad P53s-20N6001NGE i7-8565U, Quadro P520 | 1.9 kg | 19.95 mm | 15.60" | 1920x1080 | |
| 76 % v7 (old) | 10 / 2019 | MSI WP65 i7-9750H, Quadro P620 | 1.9 kg | 21.7 mm | 15.60" | 1920x1080 | |
| 84.3 % v6 (old) | 08 / 2018 | Dell Precision 3530 E-2176M, Quadro P600 | 2.3 kg | 24.3 mm | 15.60" | 1920x1080 |
Case
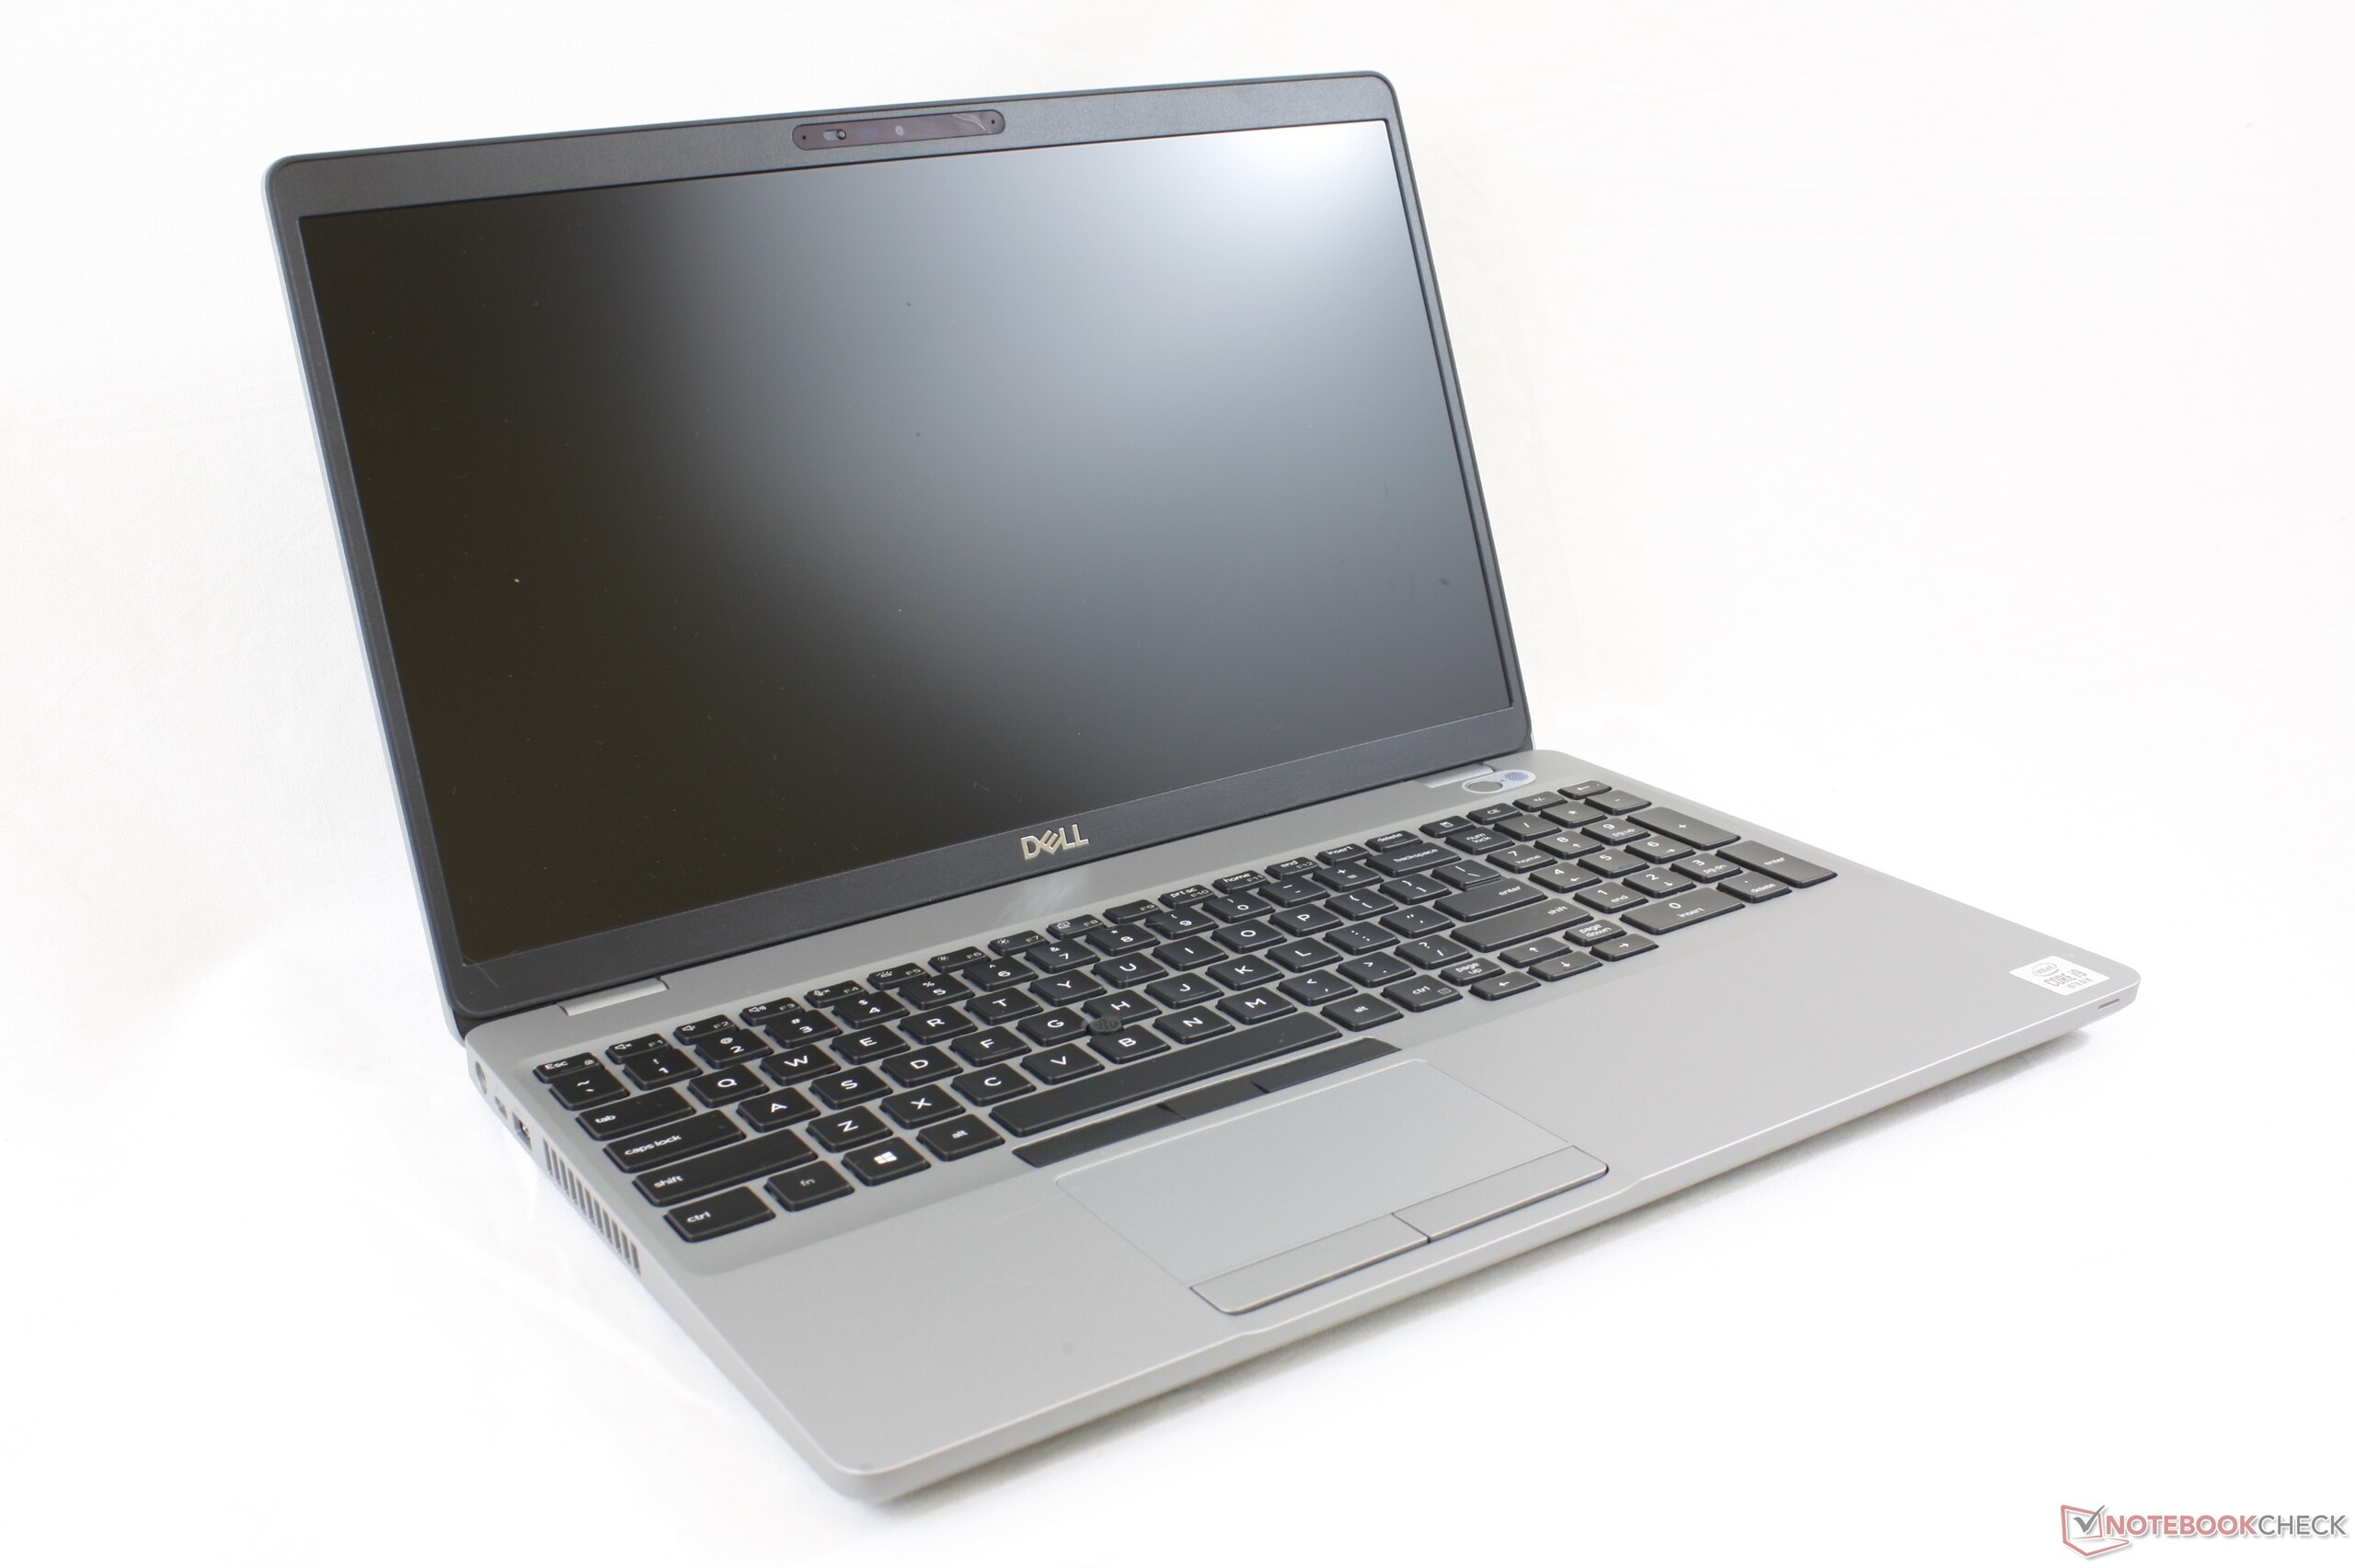
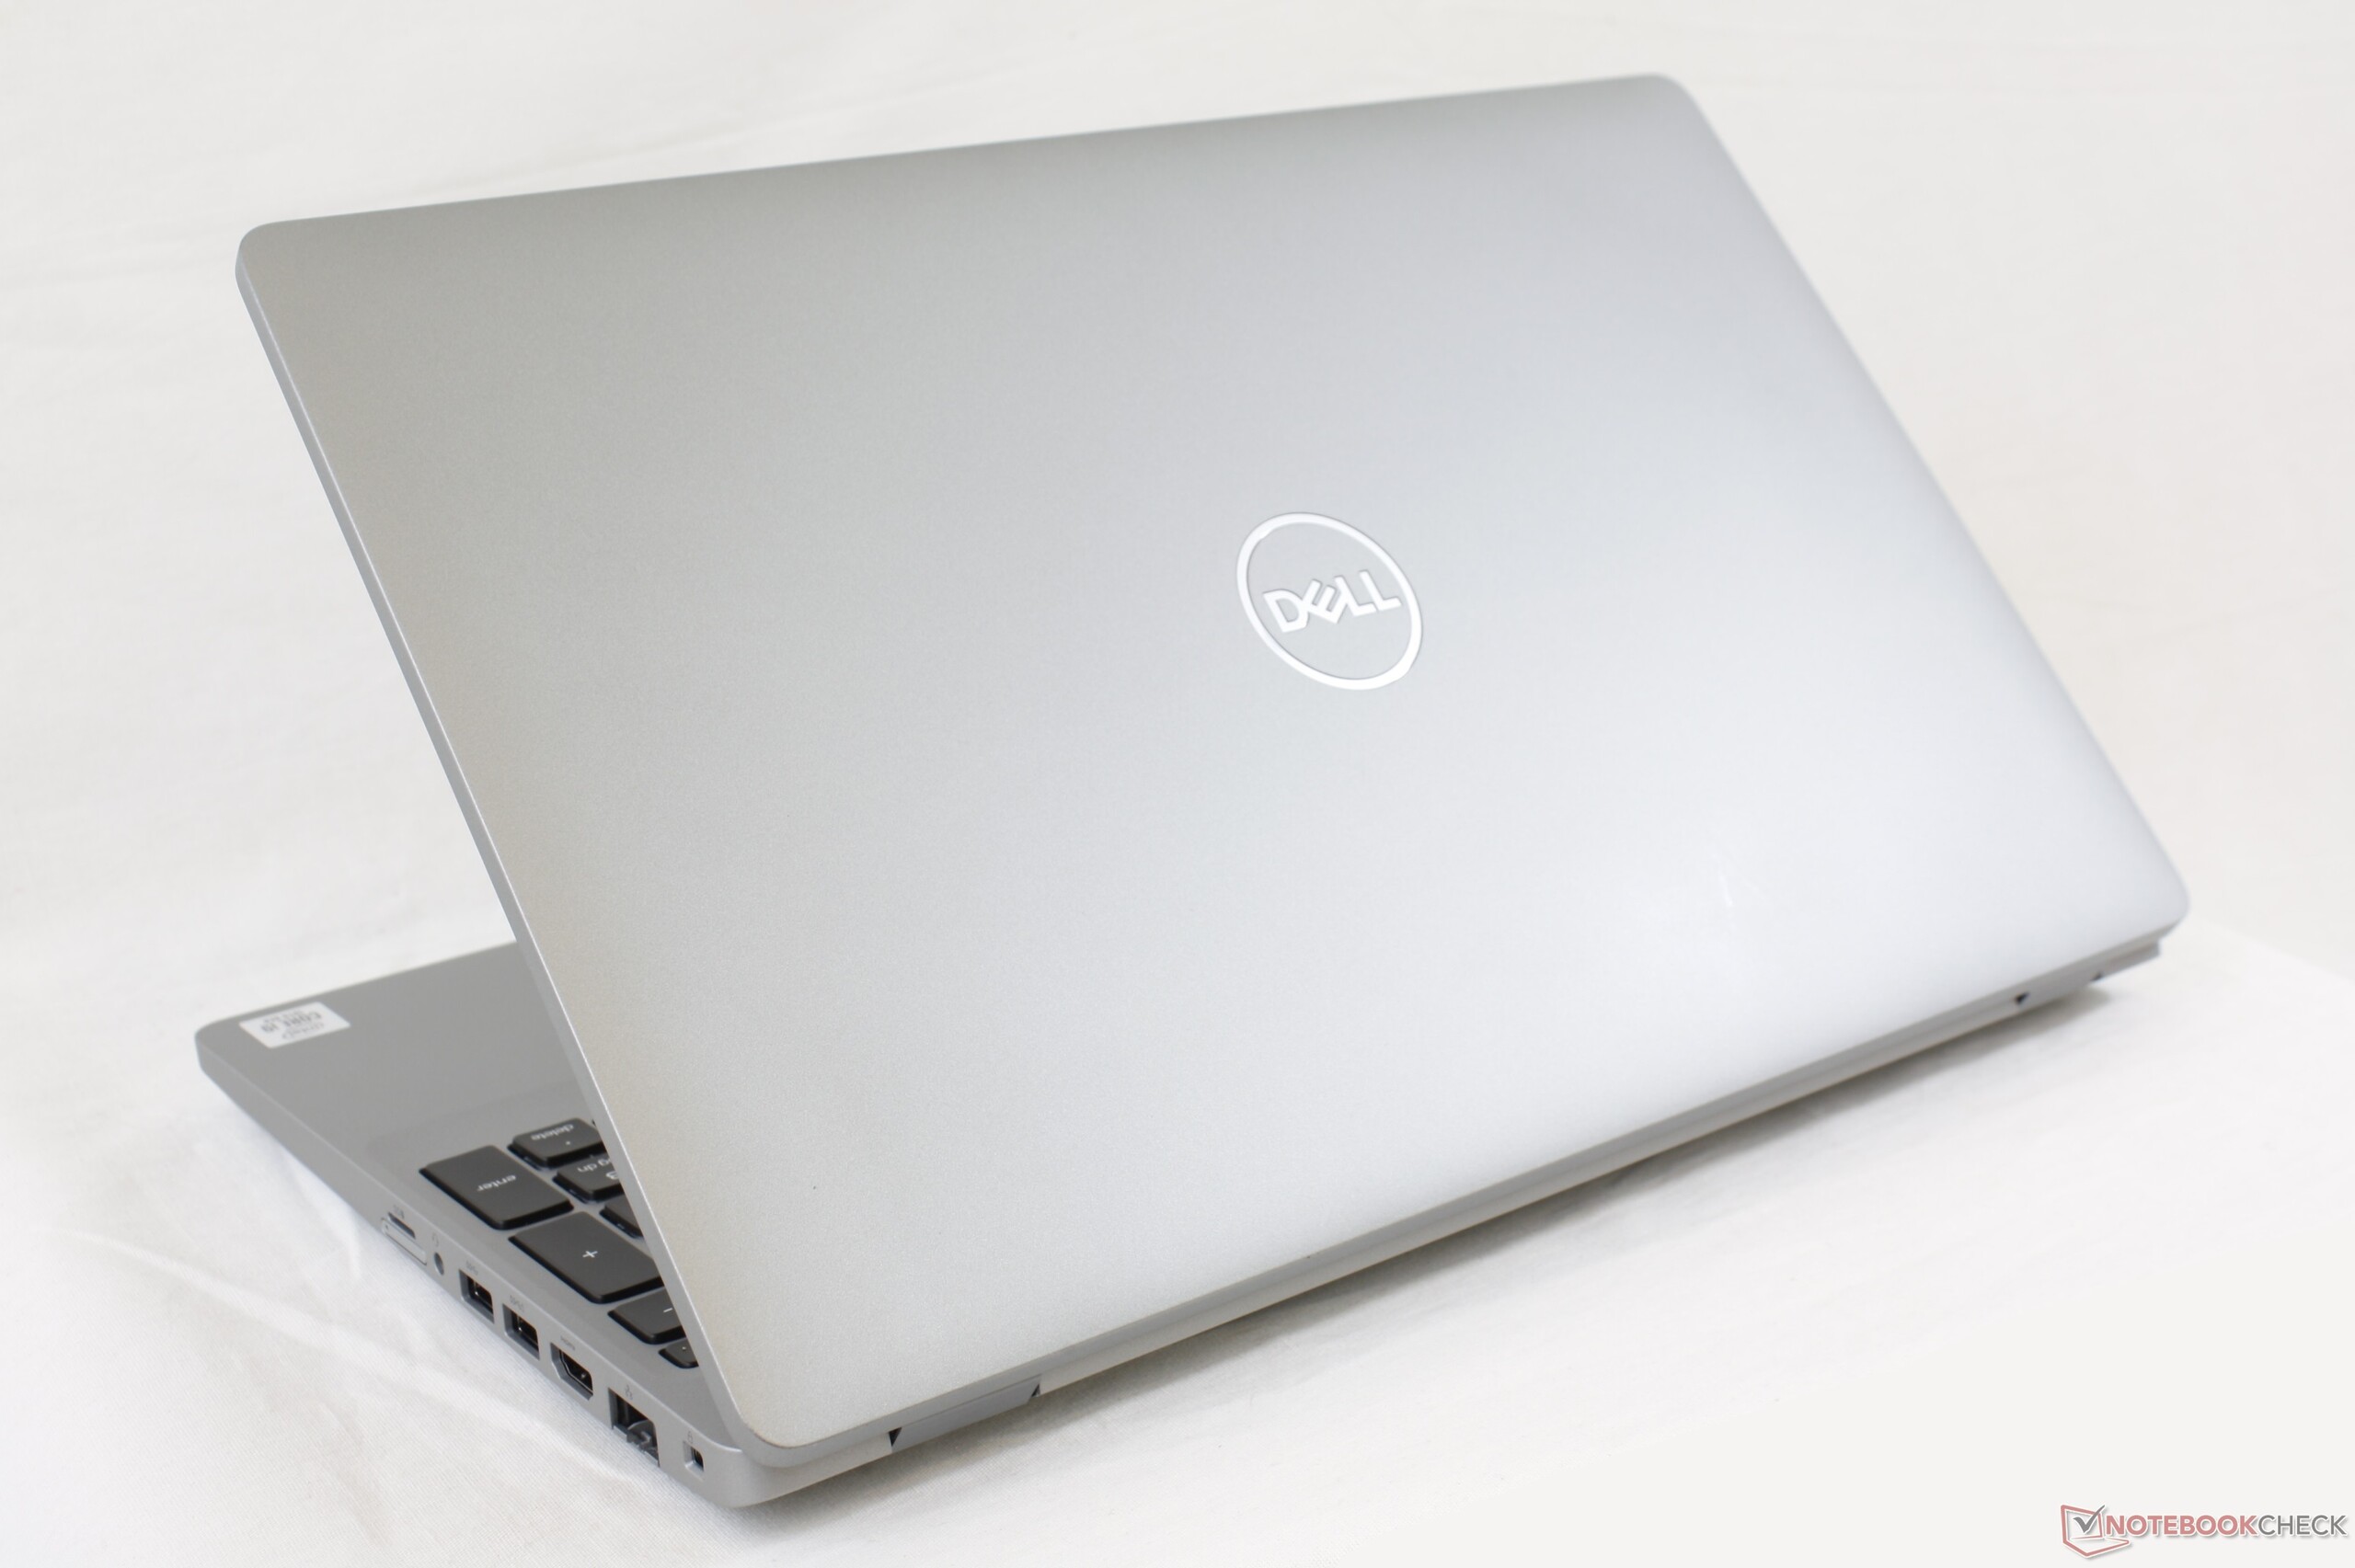
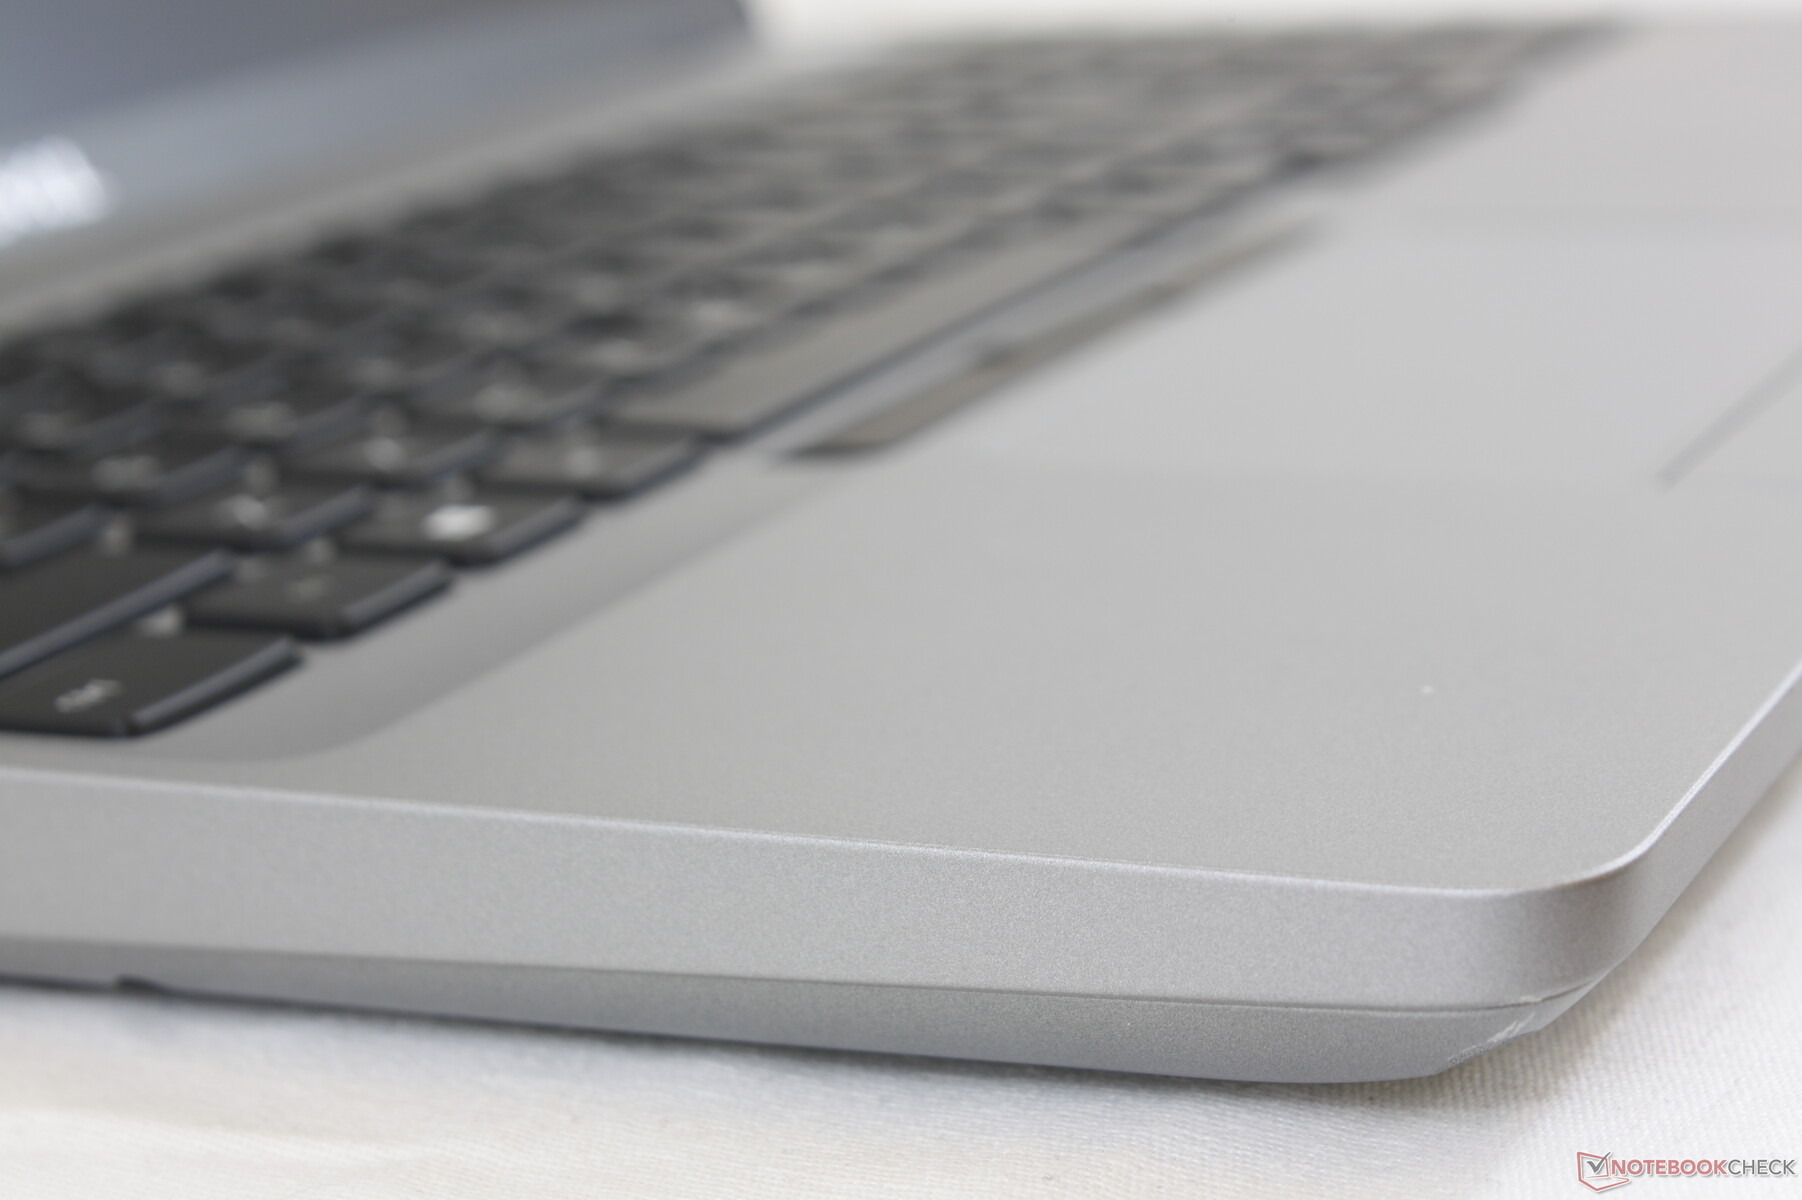
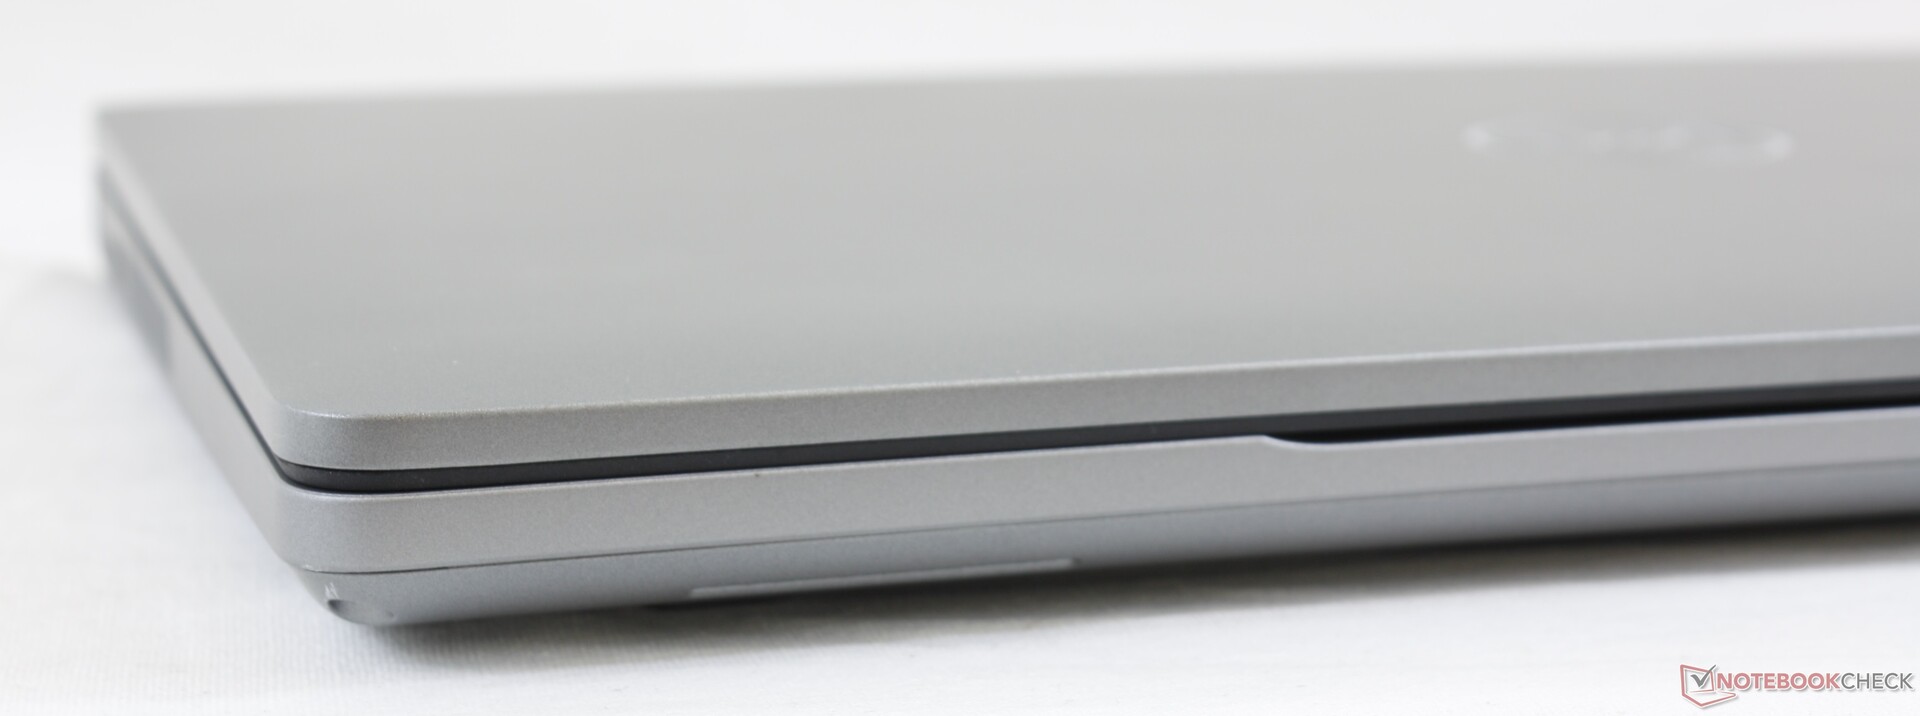
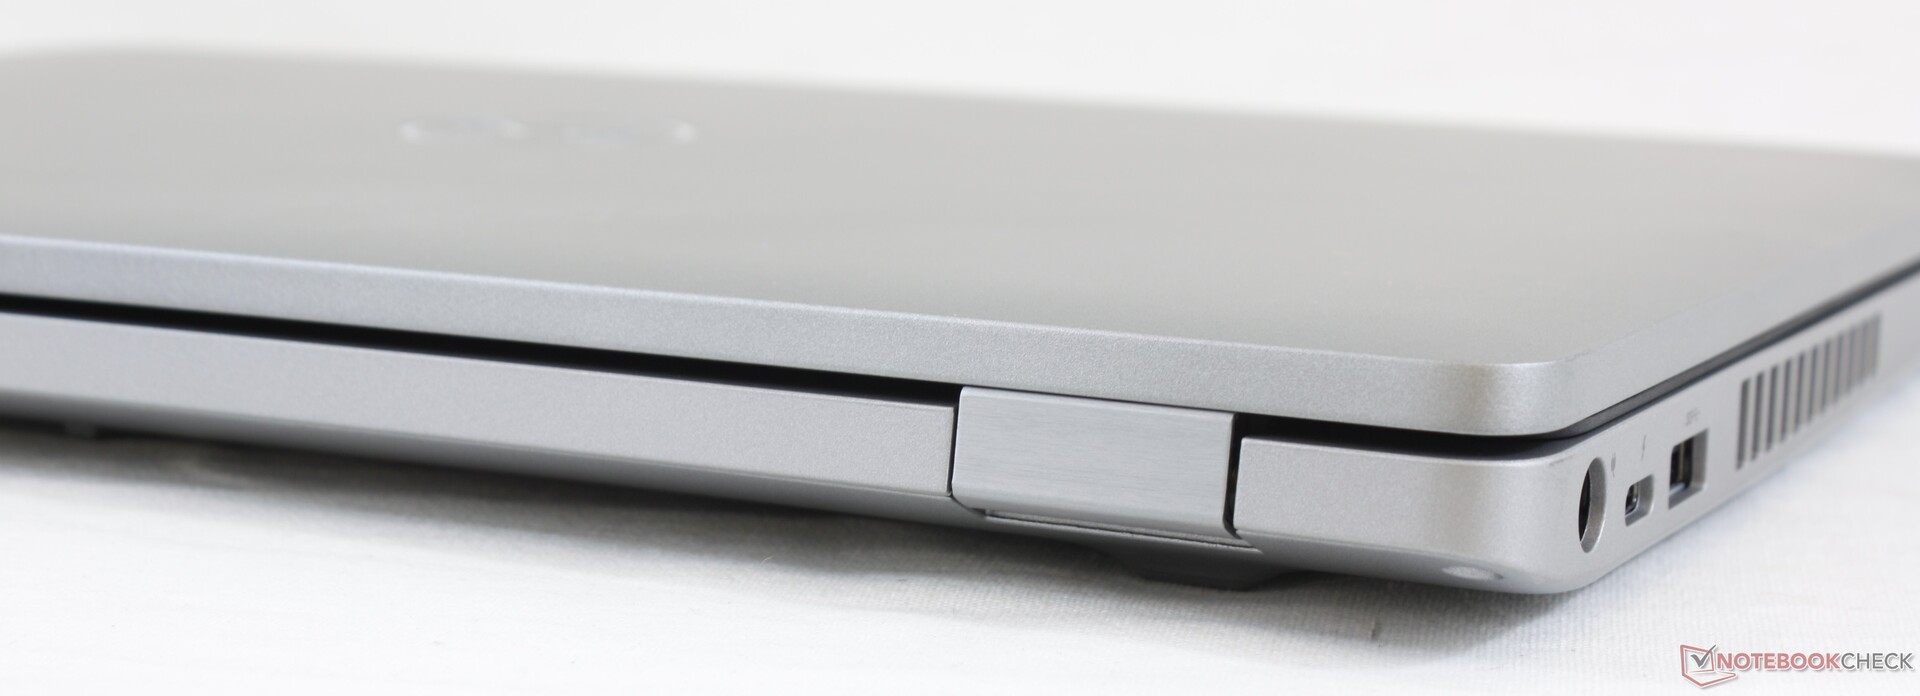
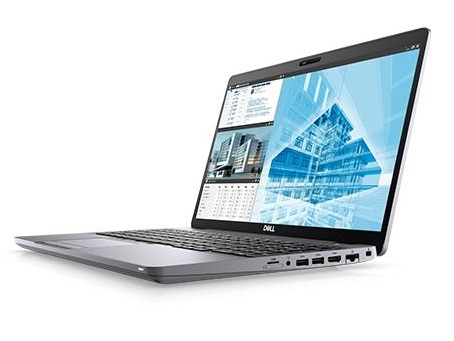
The chassis is rotund by today's standards where sharp and sleek designs are common. Edges and corners are rounded for an old-school look and feel despite the narrow side bezels and size reduction when compared to the older Precision 3530. This is all intentional, of course, as users will have to consider the pricier Precision 5000 or 7000 series if they want more visually appealing workstations.
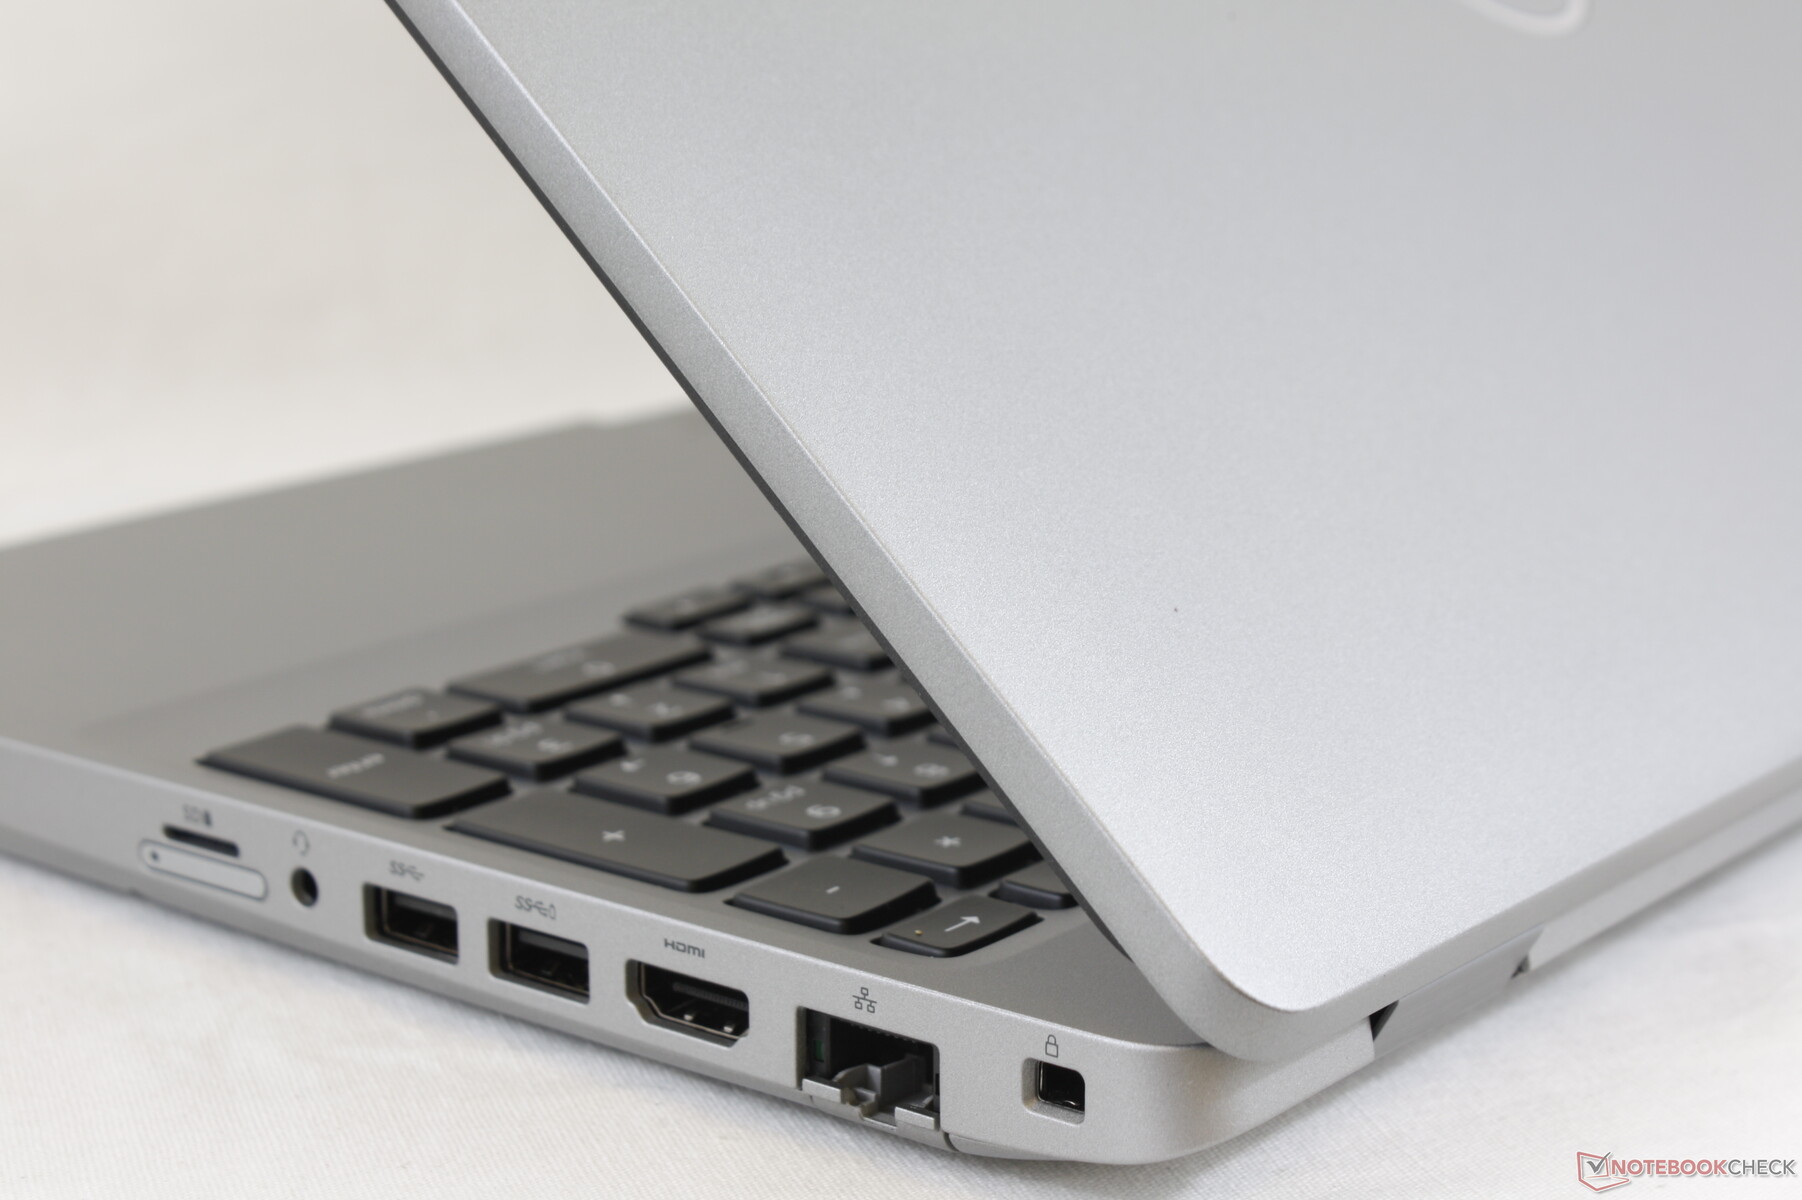
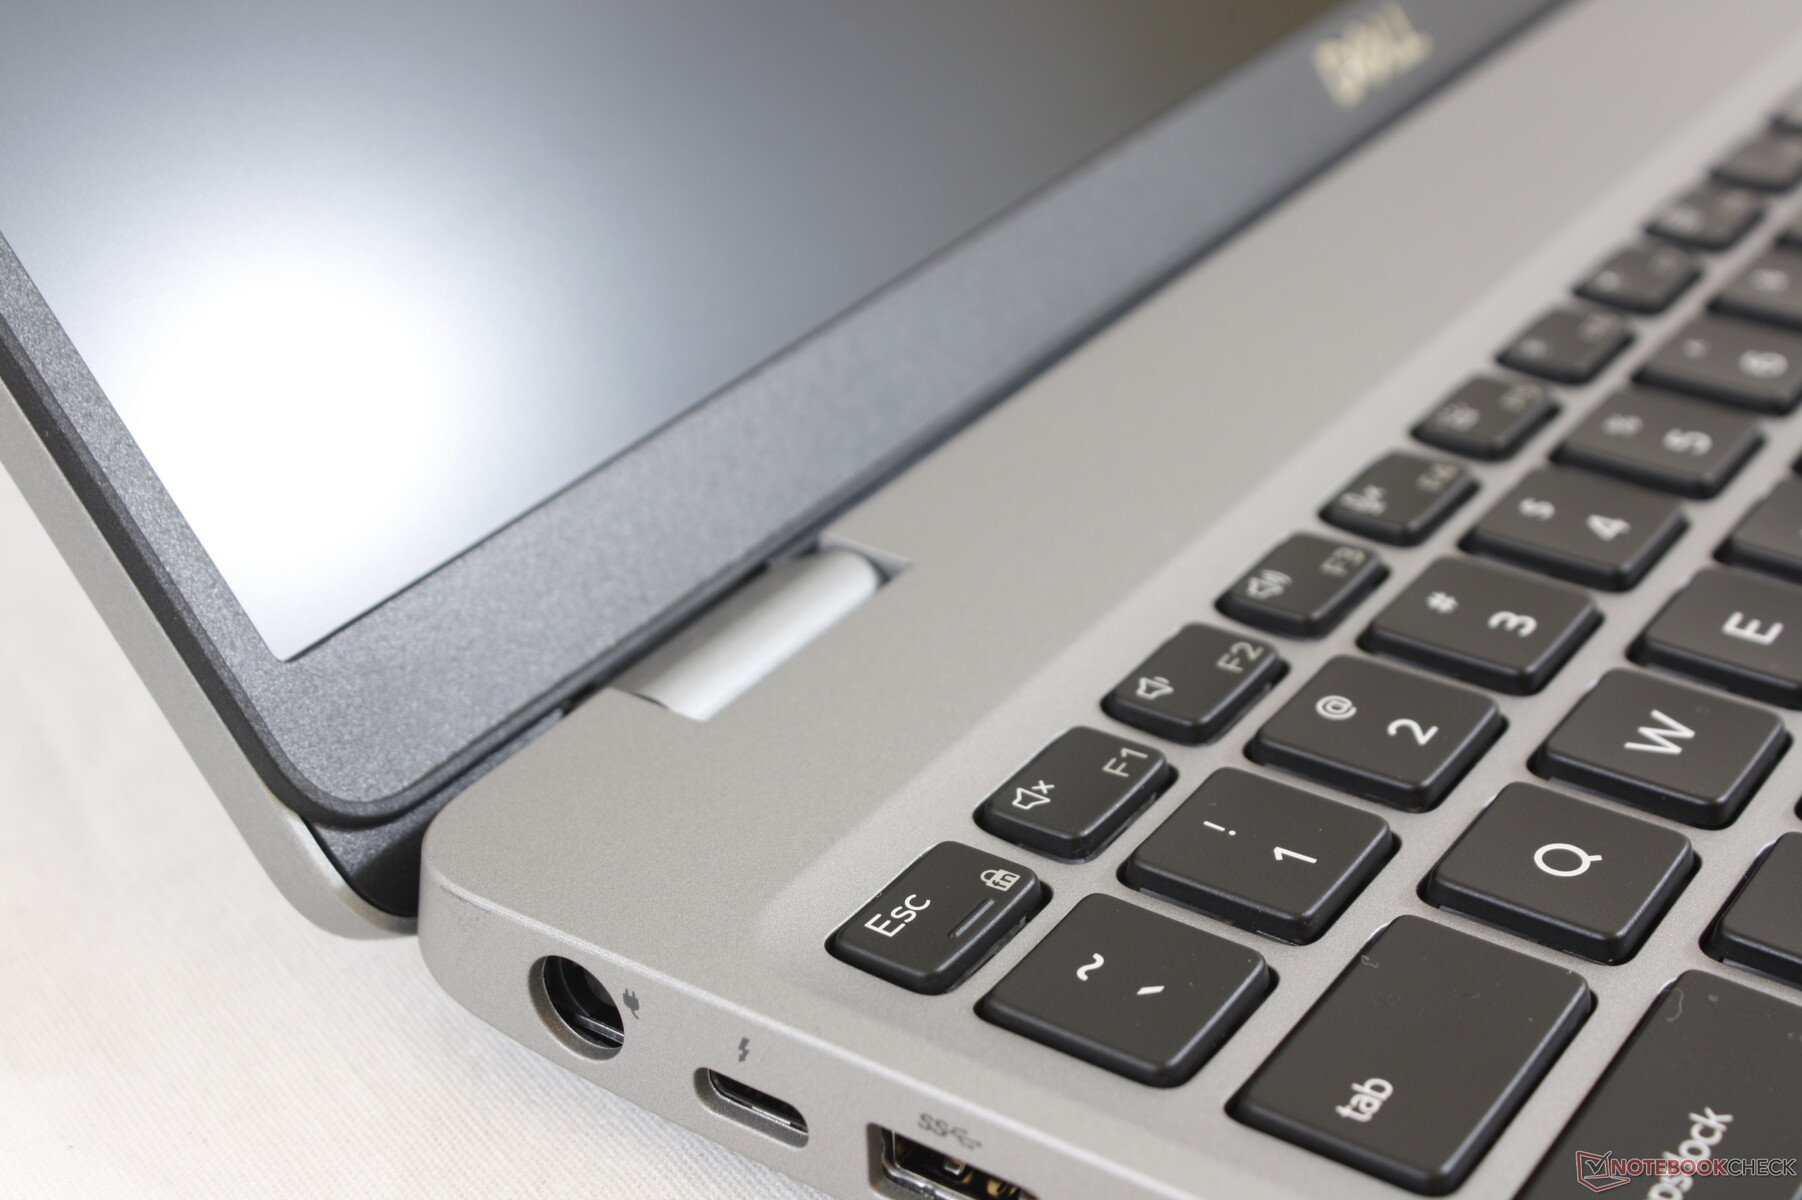
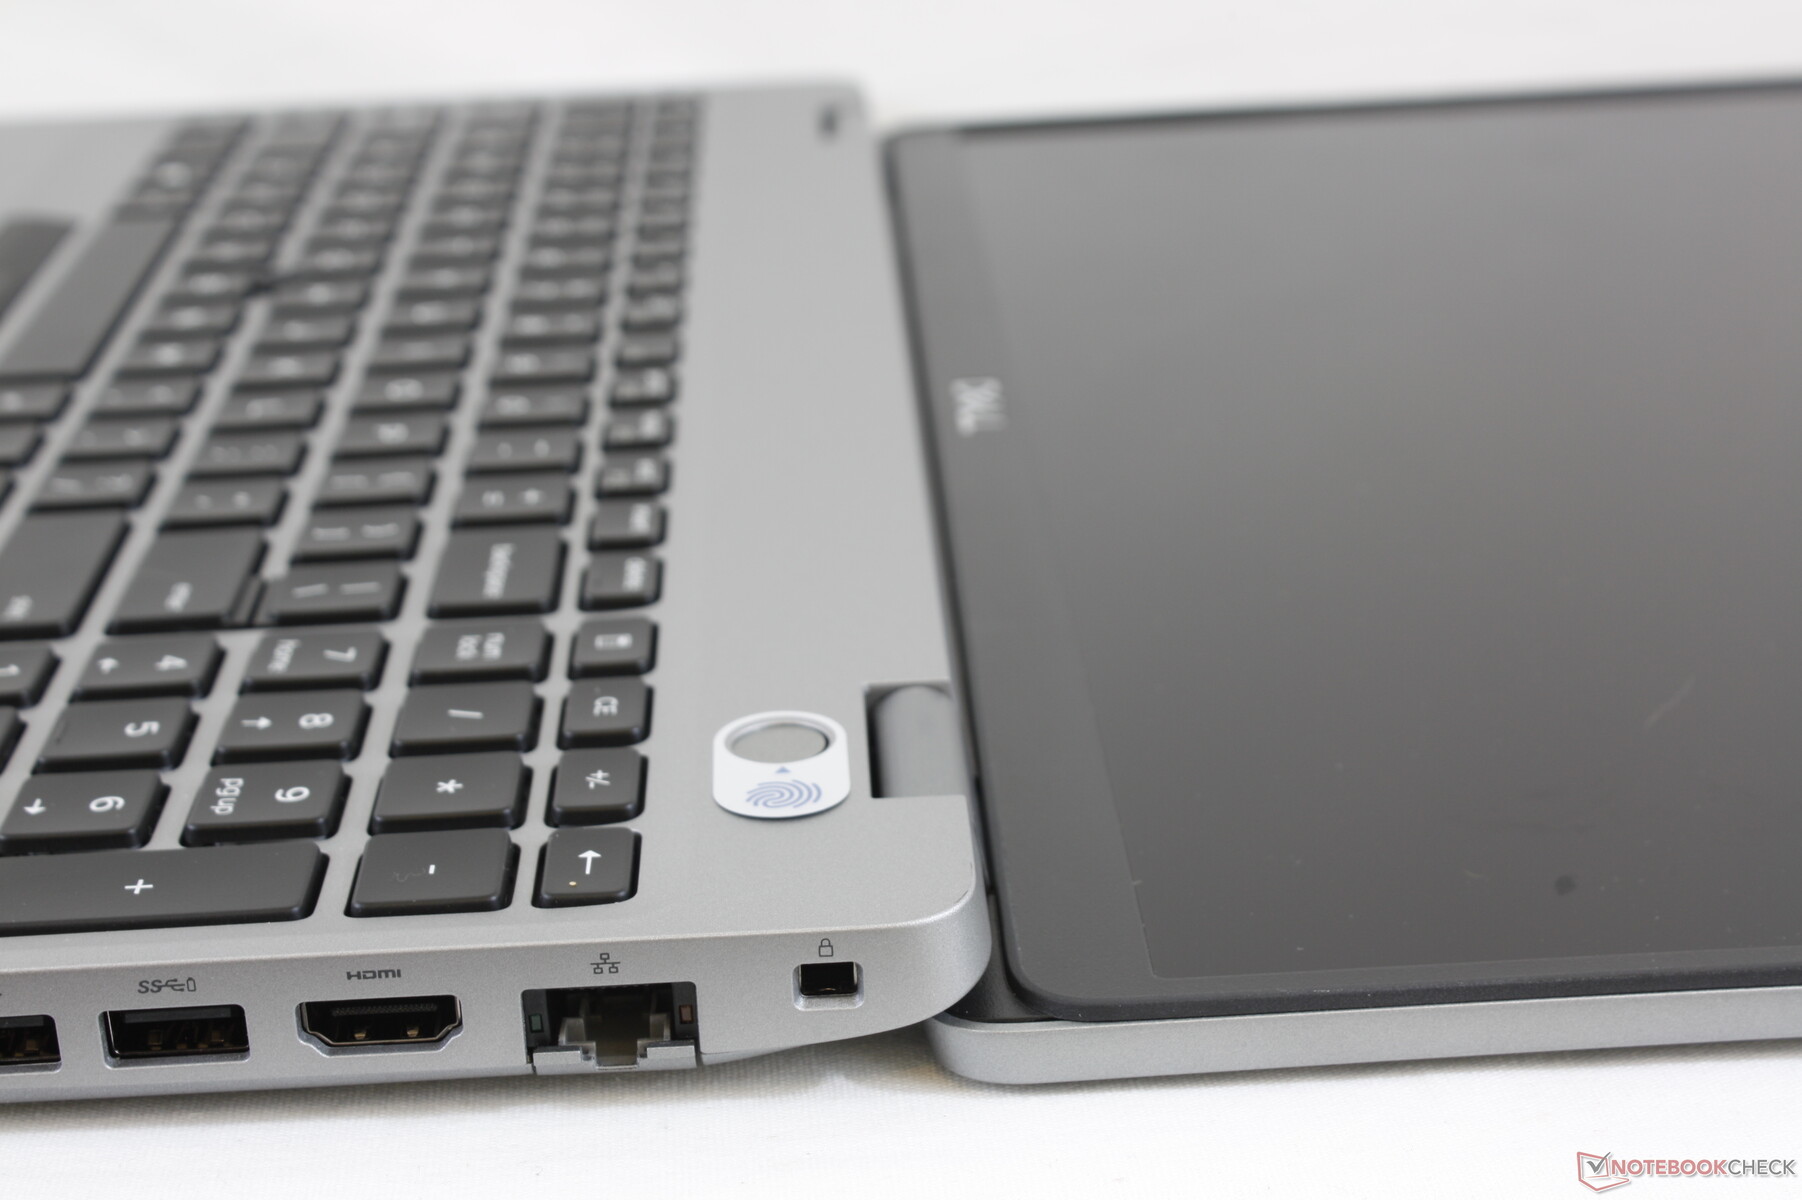
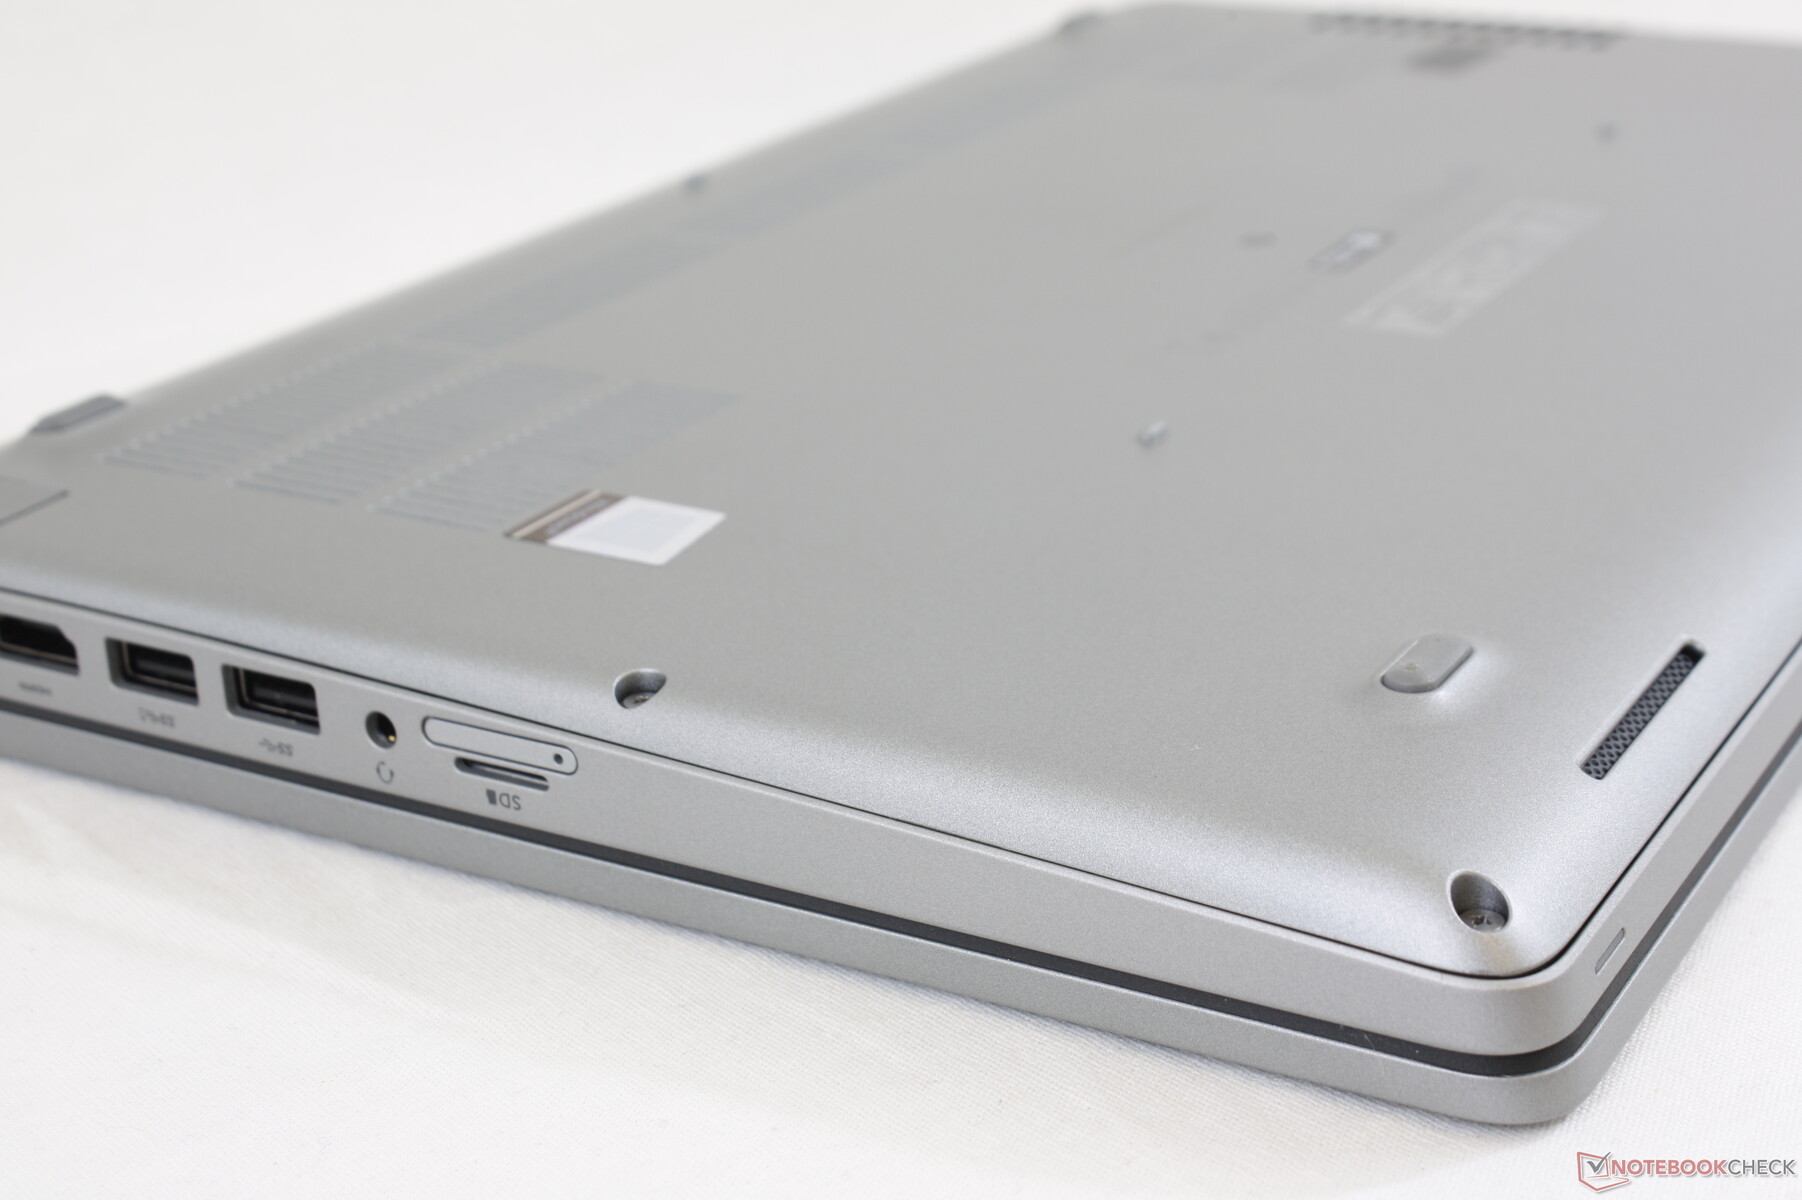
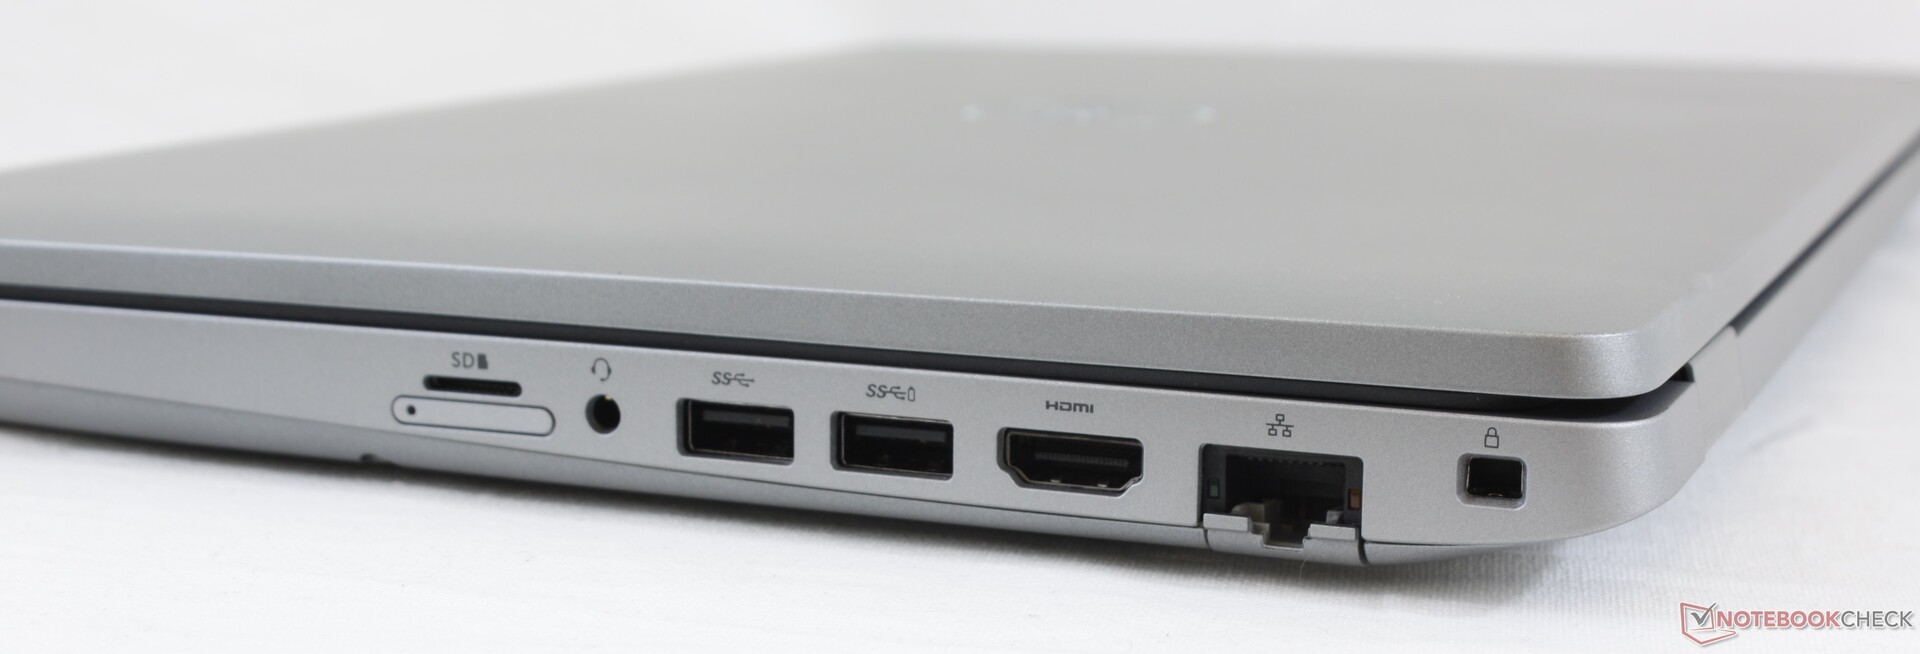
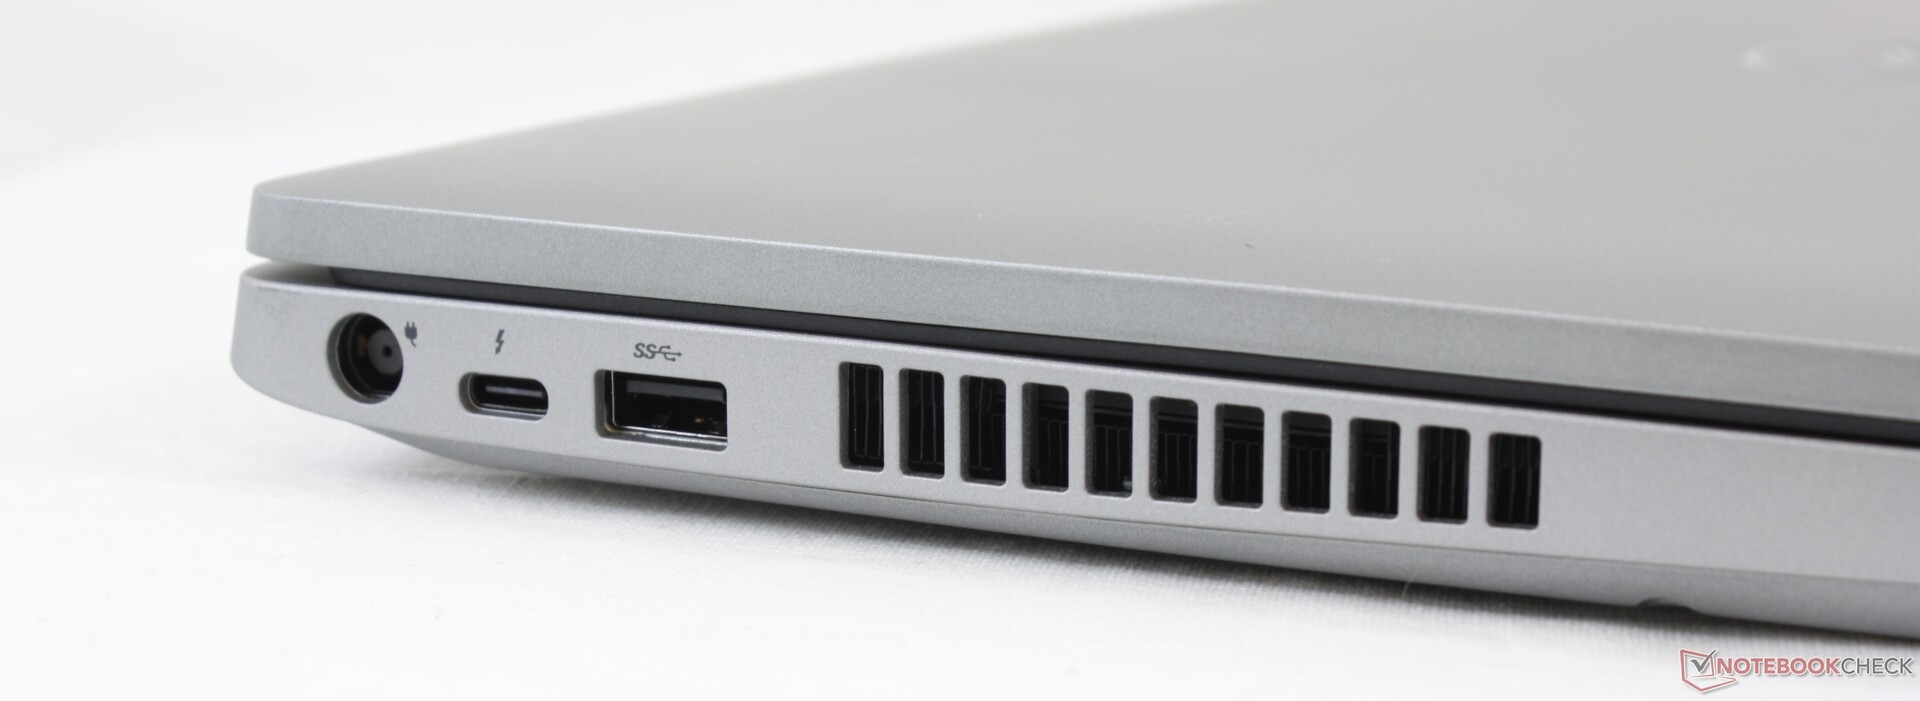
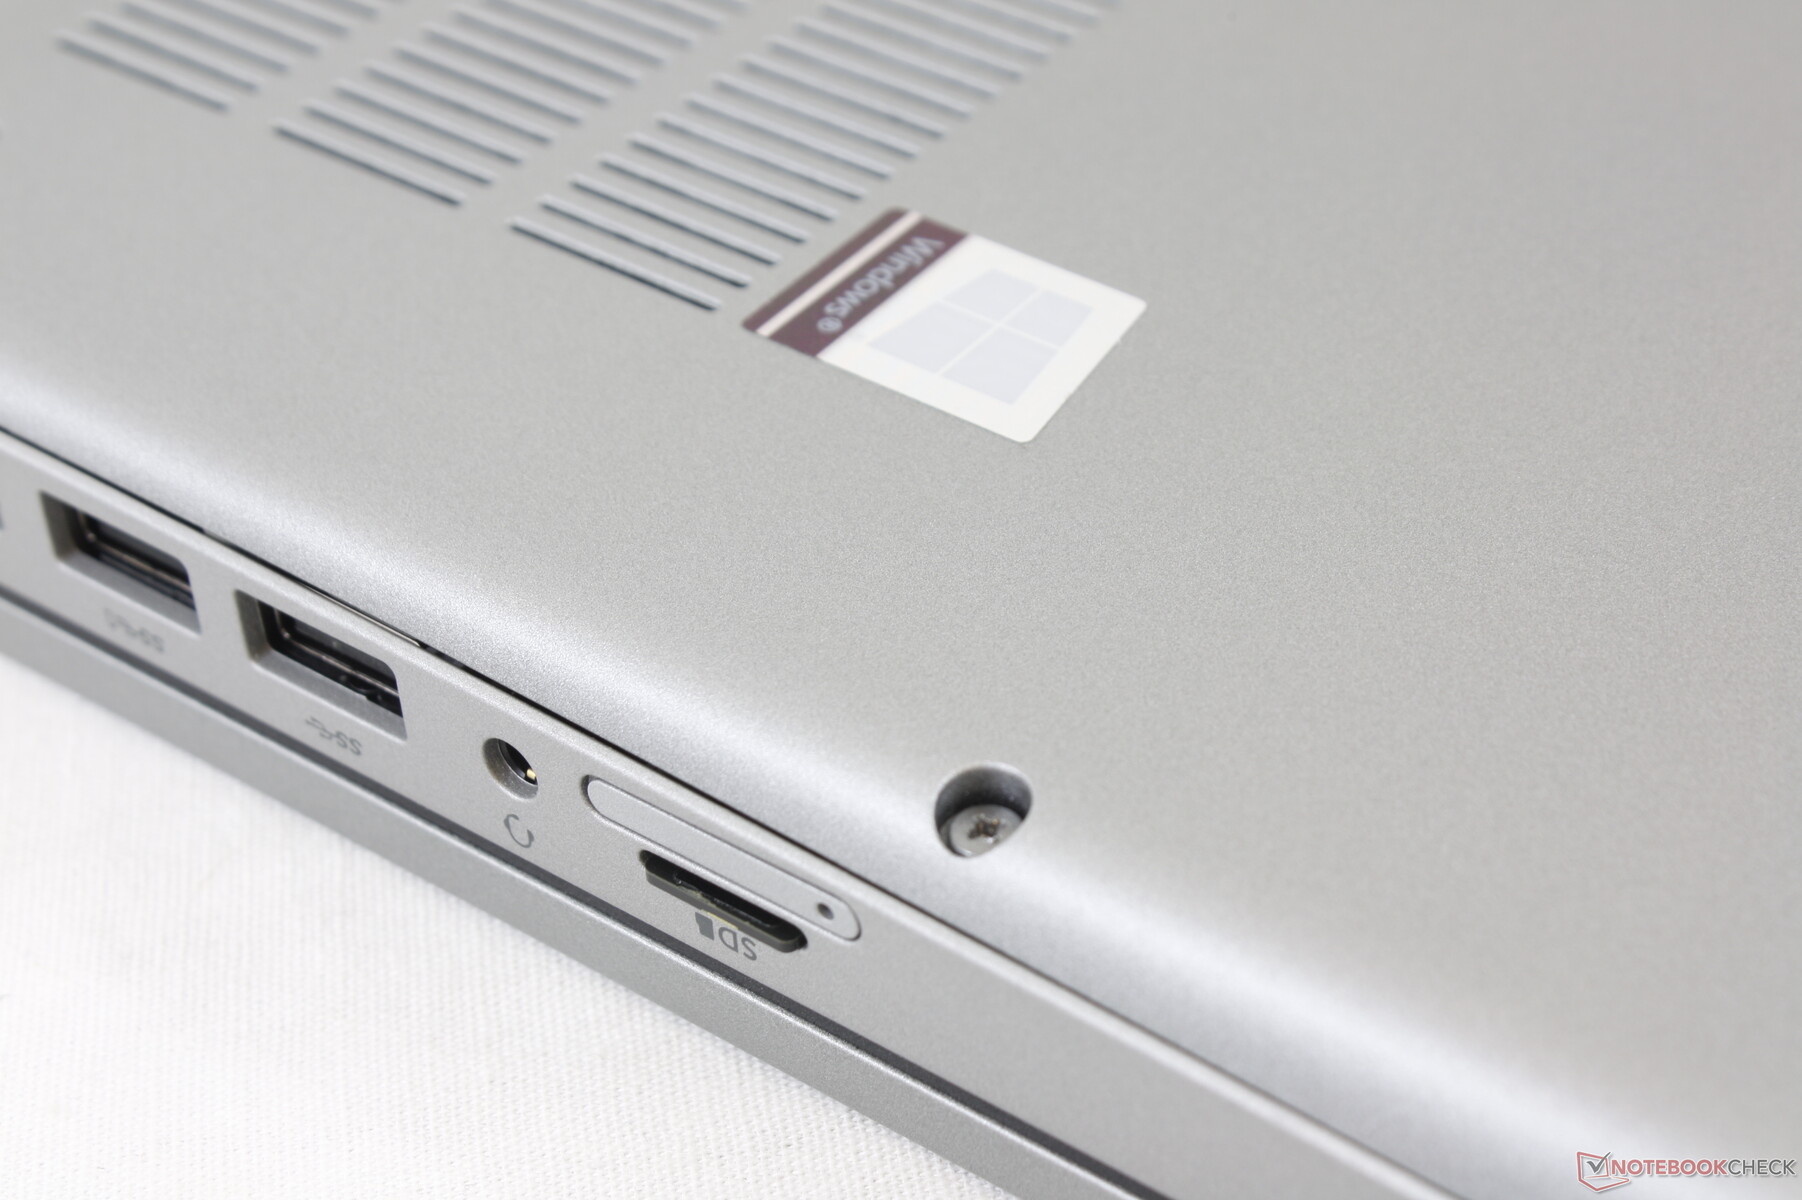
Connectivity
SD Card Reader
| SD Card Reader | |
| average JPG Copy Test (av. of 3 runs) | |
| Dell Precision 5550 P91F (Toshiba Exceria Pro SDXC 64 GB UHS-II) | |
| Dell Precision 3530 (Toshiba Exceria Pro SDXC 64 GB UHS-II) | |
| Dell Precision 3000 3551 (Toshiba Exceria Pro M501 64 GB UHS-II) | |
| Lenovo ThinkPad P53s-20N6001NGE (Toshiba Exceria Pro M501 64 GB UHS-II) | |
| maximum AS SSD Seq Read Test (1GB) | |
| Dell Precision 3530 (Toshiba Exceria Pro SDXC 64 GB UHS-II) | |
| Dell Precision 5550 P91F (Toshiba Exceria Pro SDXC 64 GB UHS-II) | |
| Dell Precision 3000 3551 (Toshiba Exceria Pro M501 64 GB UHS-II) | |
| Lenovo ThinkPad P53s-20N6001NGE (Toshiba Exceria Pro M501 64 GB UHS-II) | |
Communication
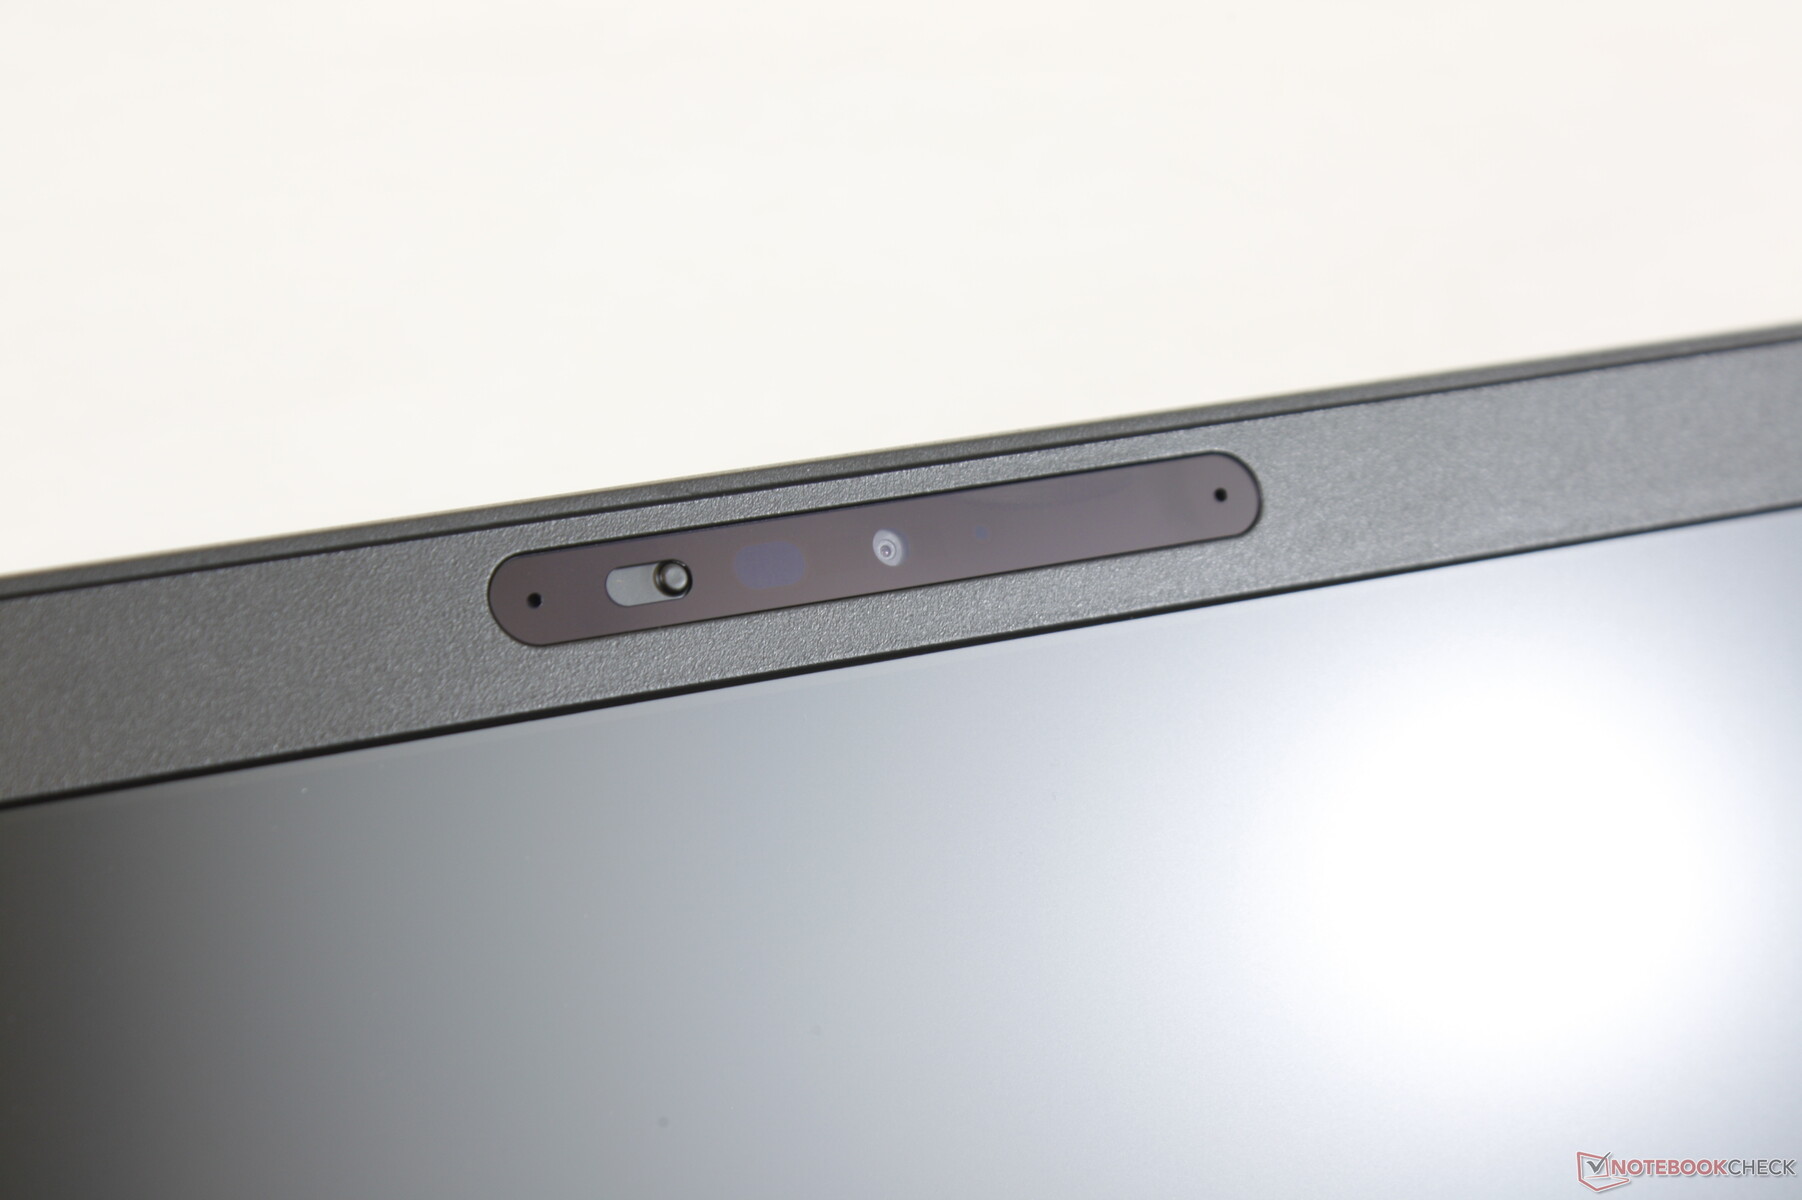
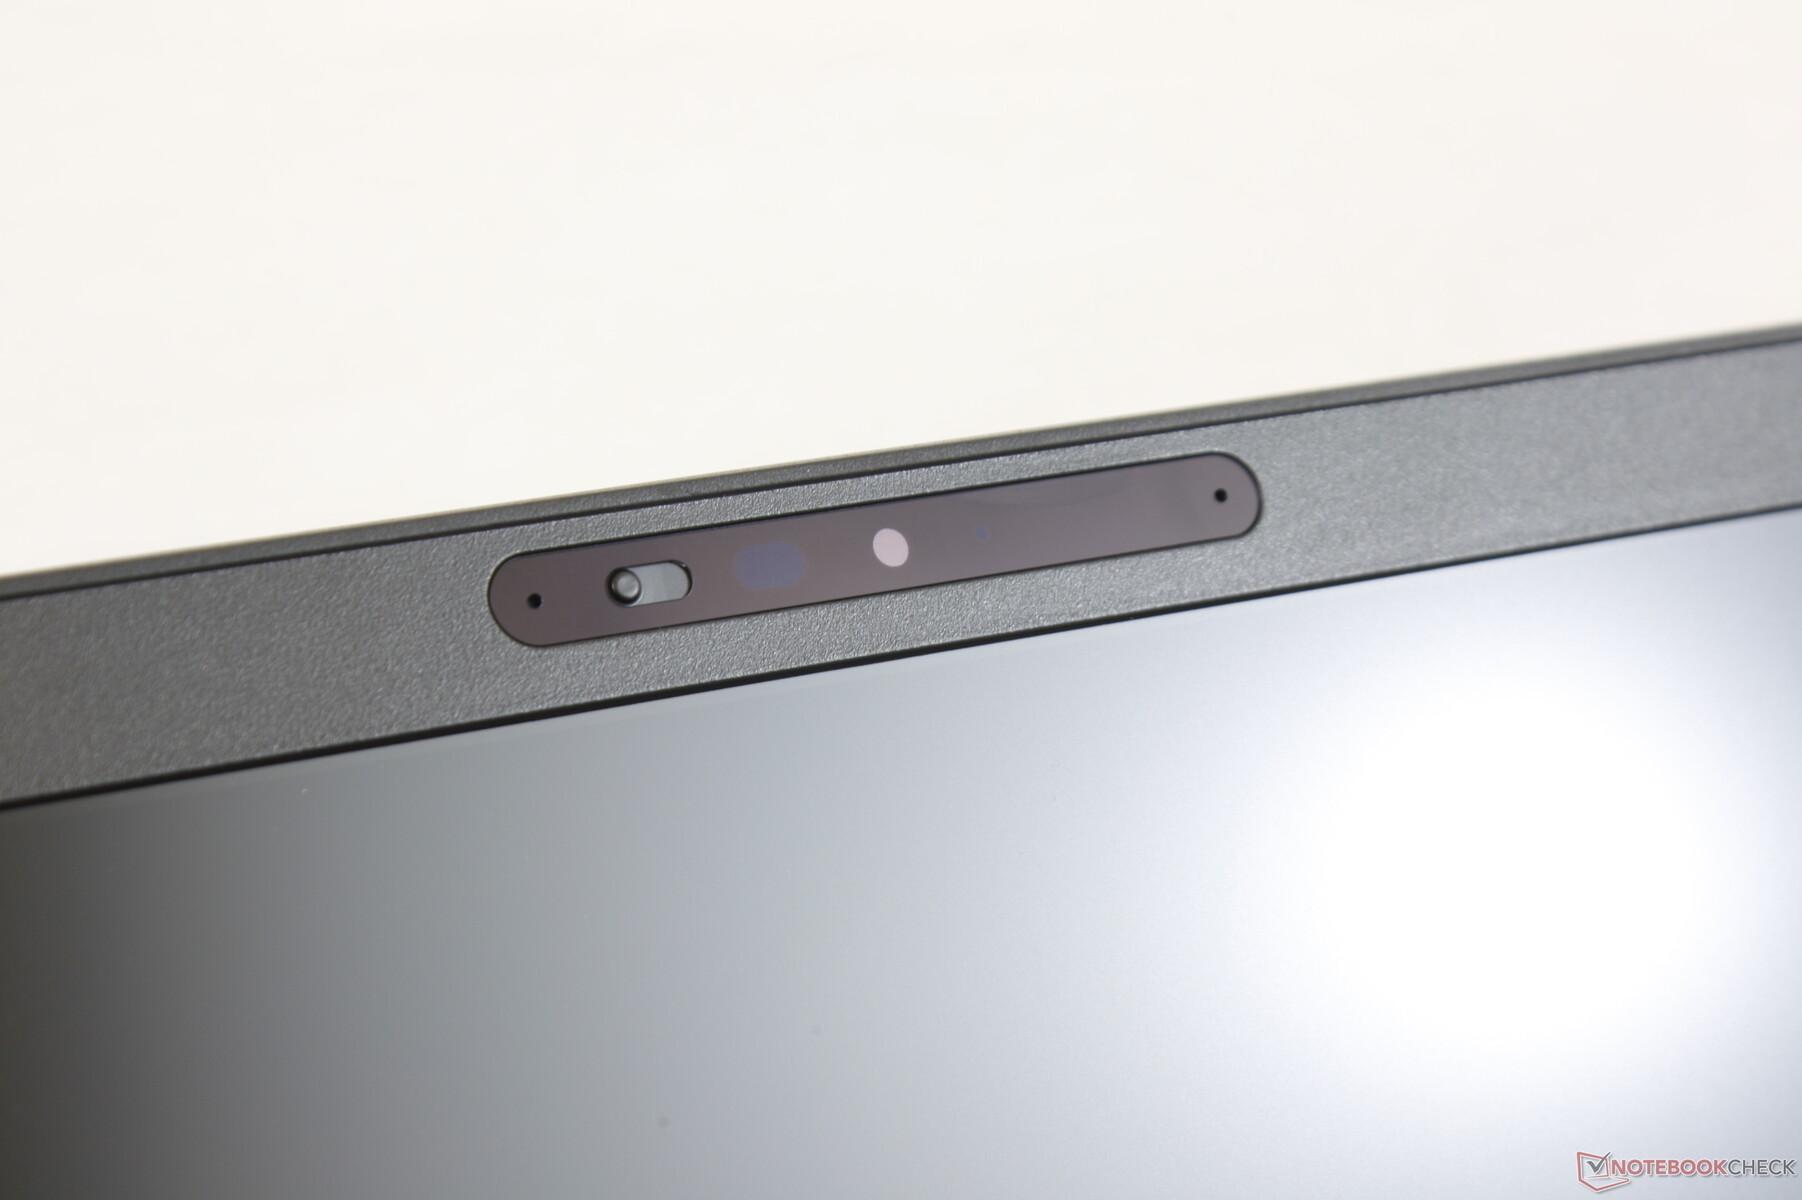
Webcam


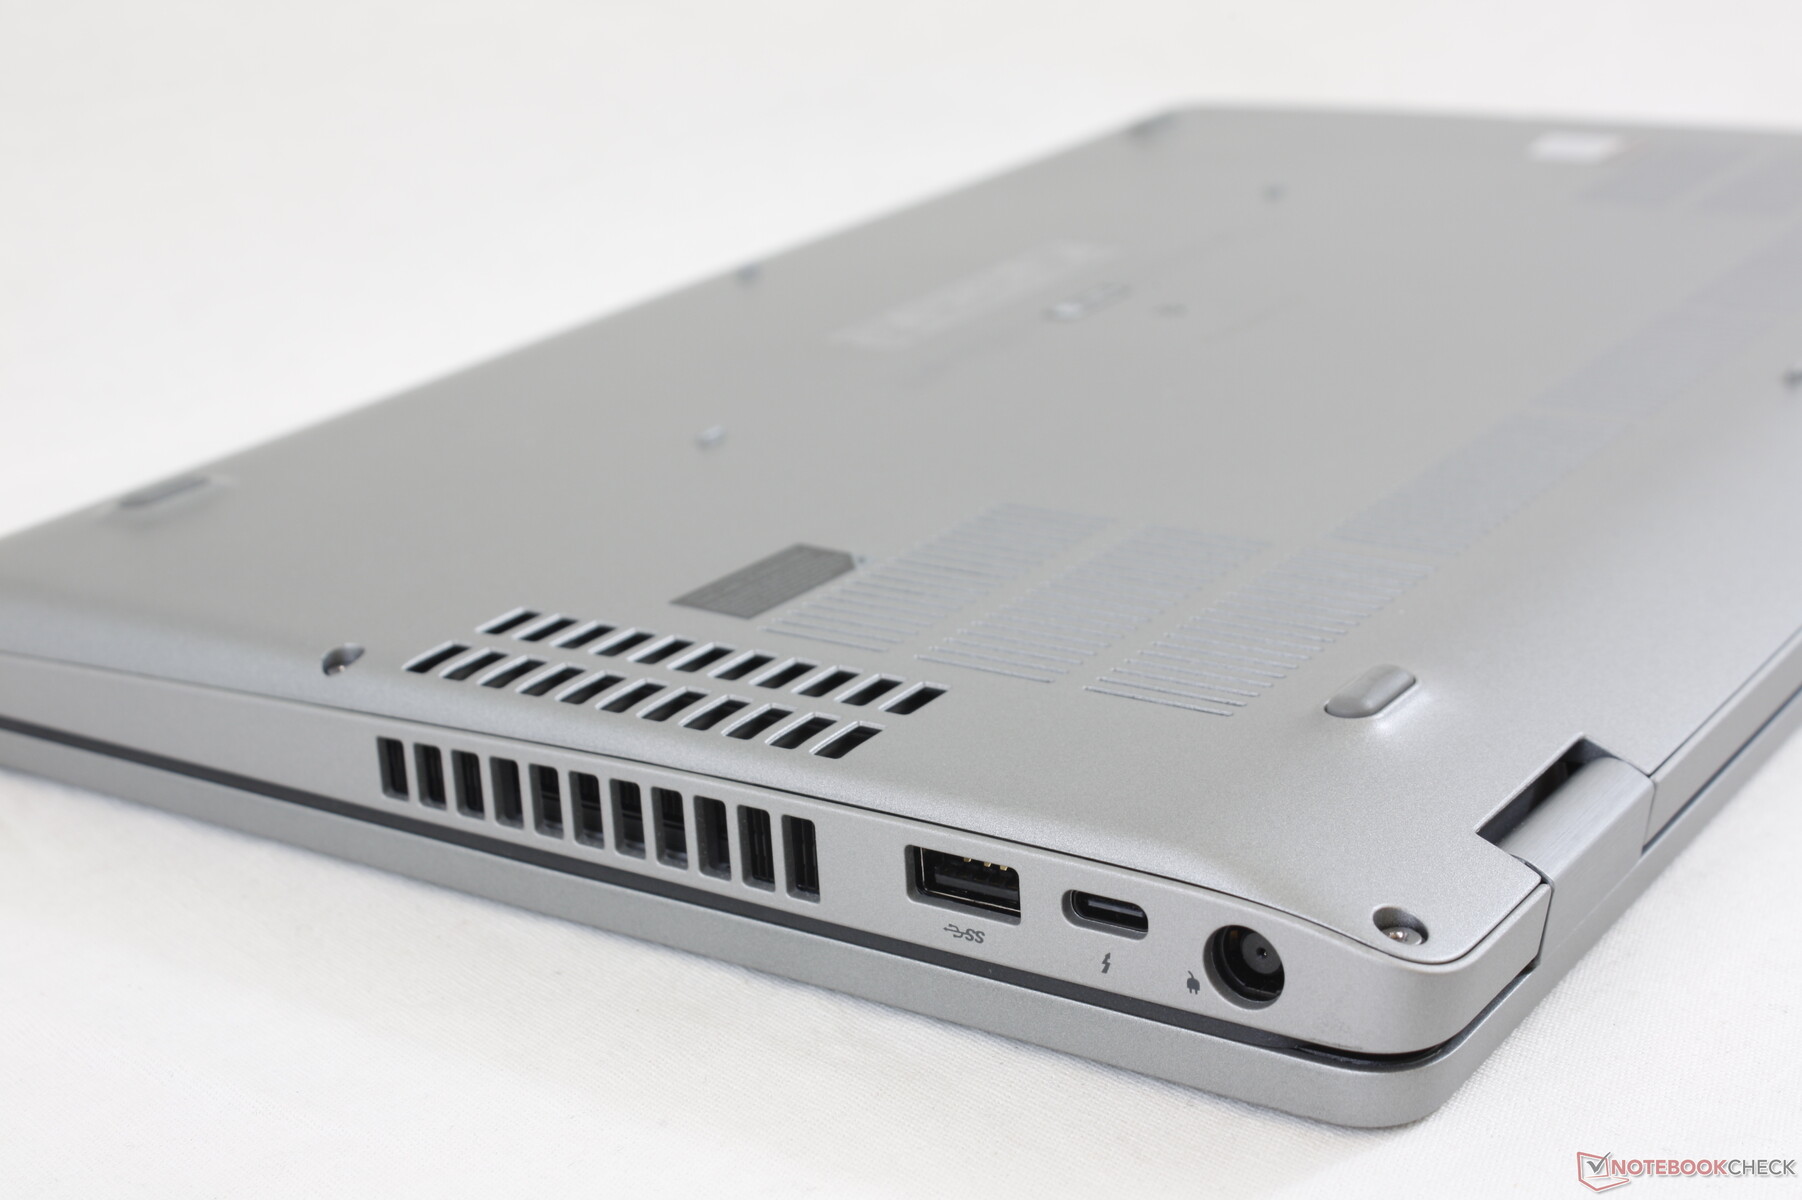
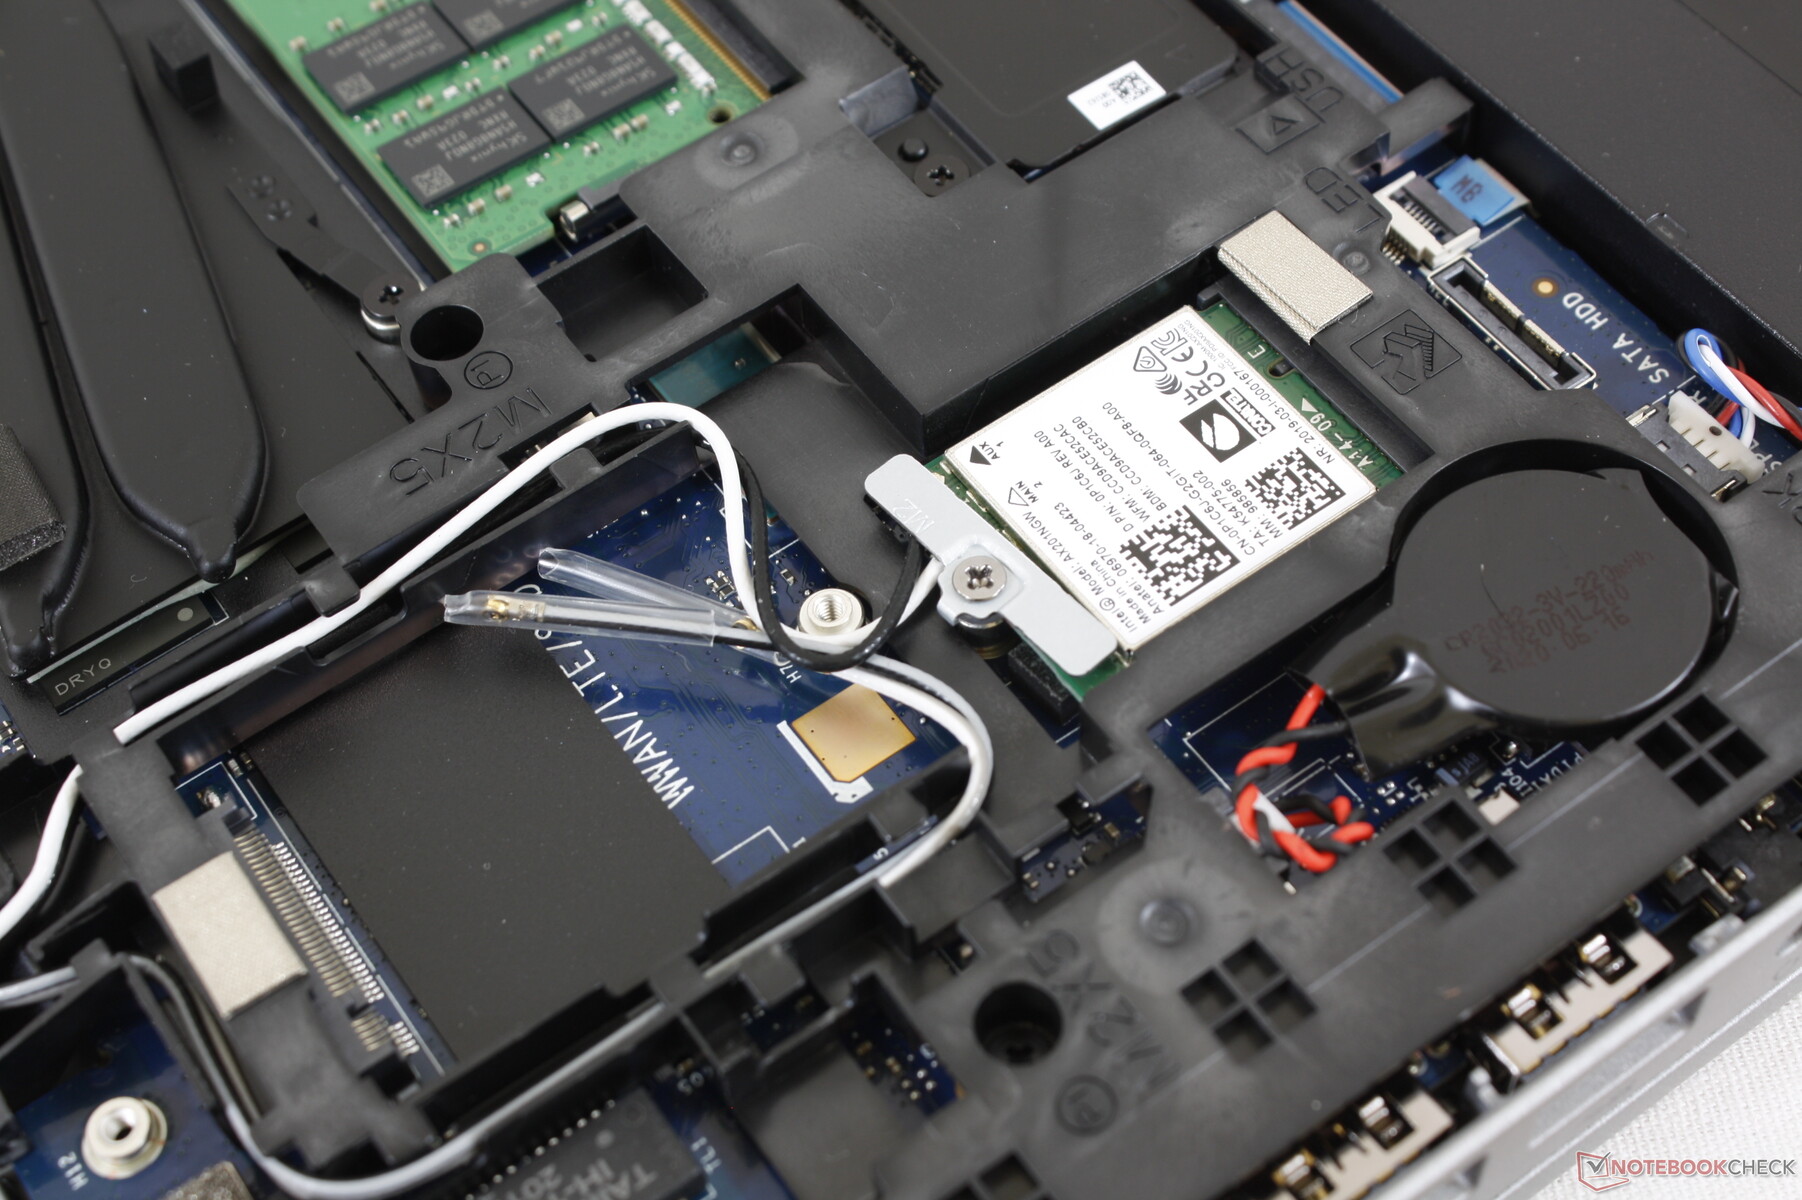
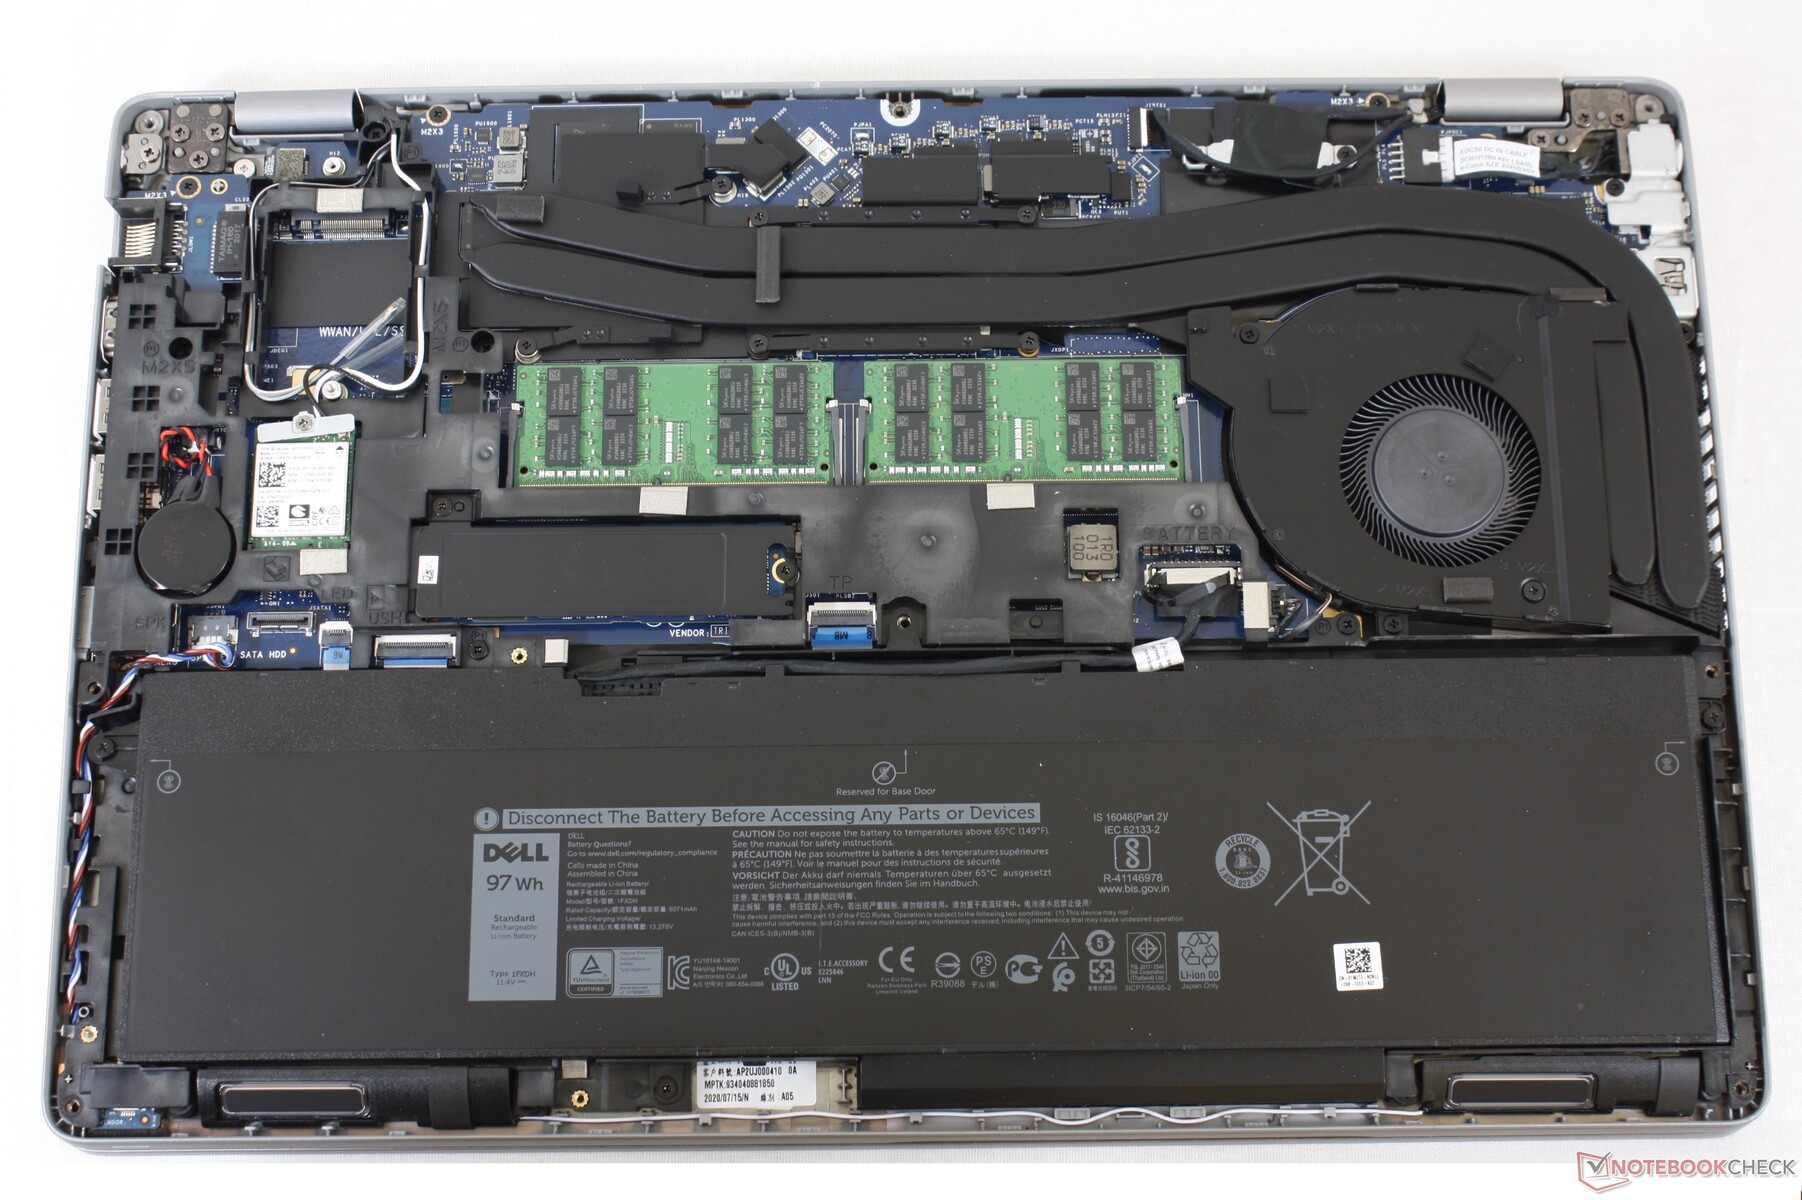
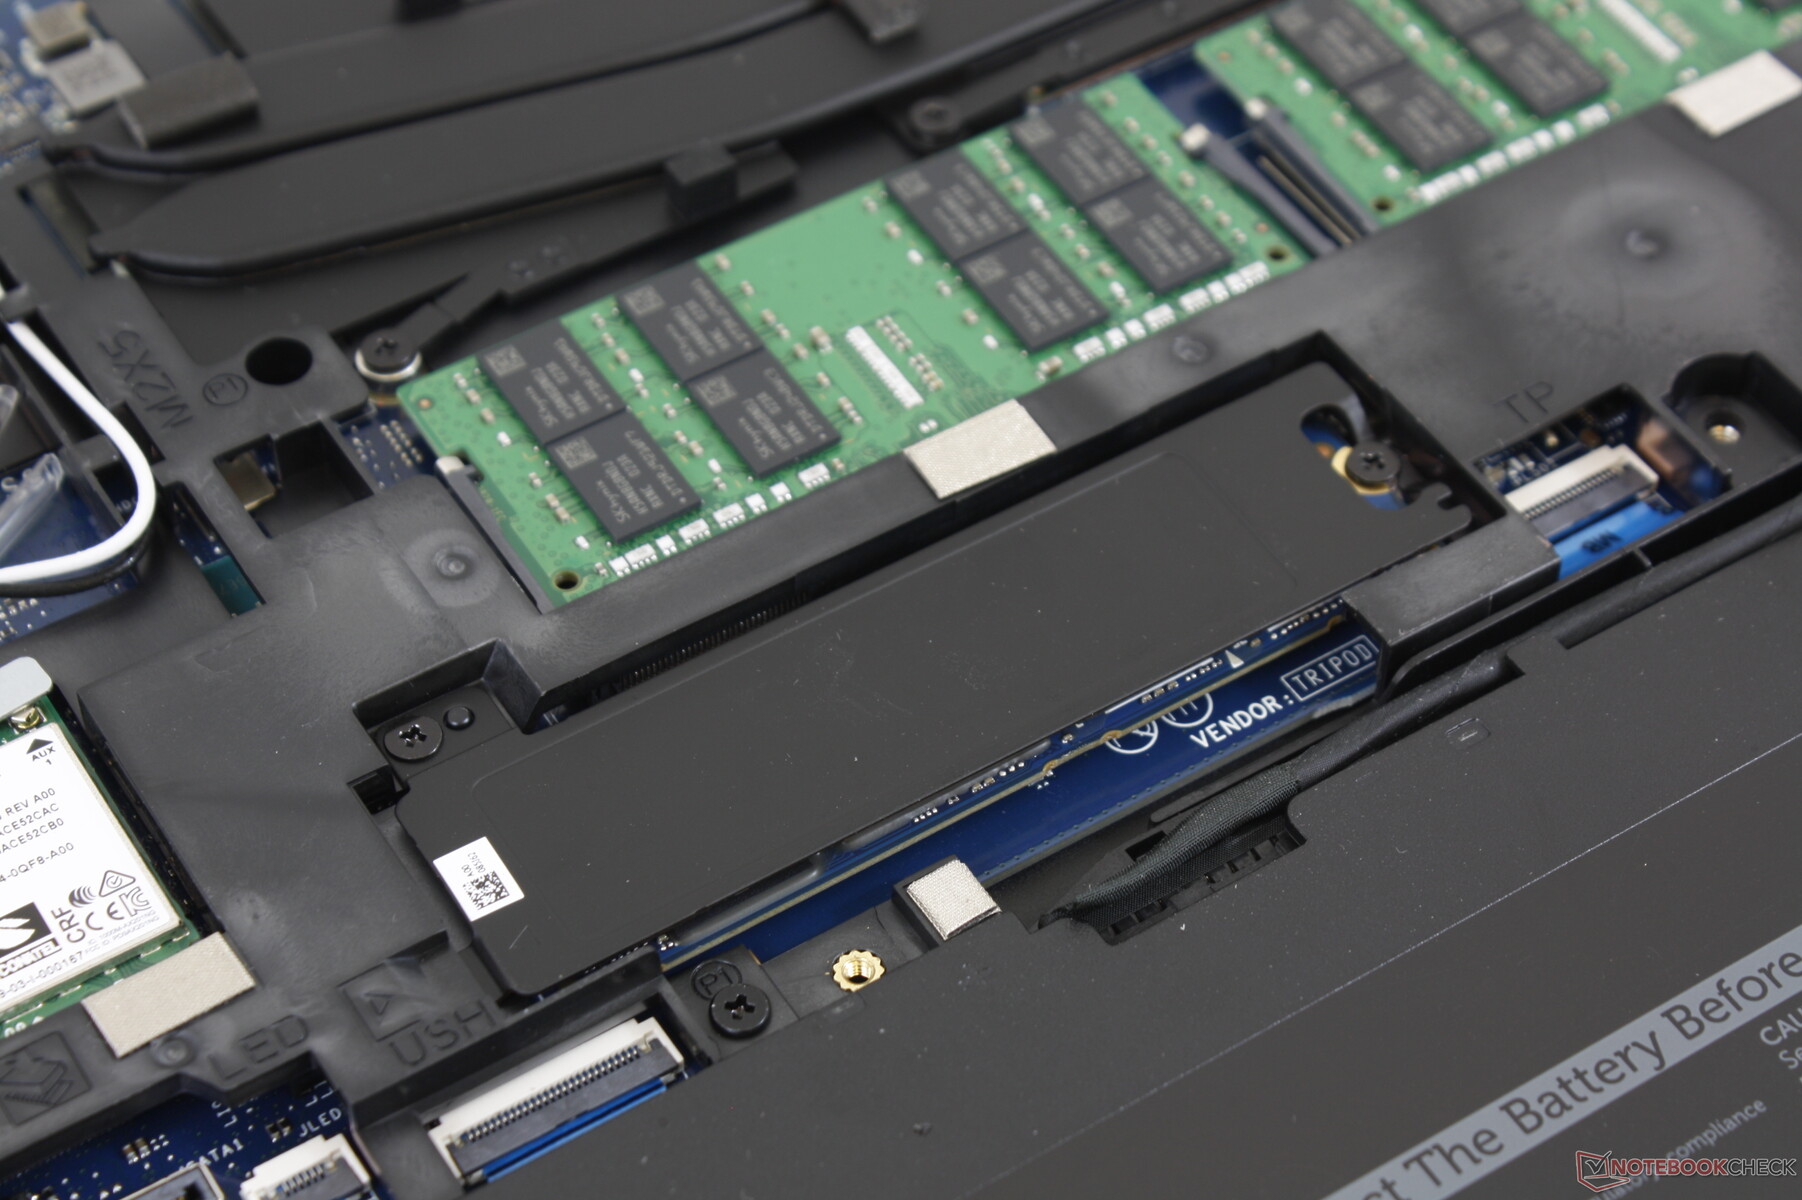
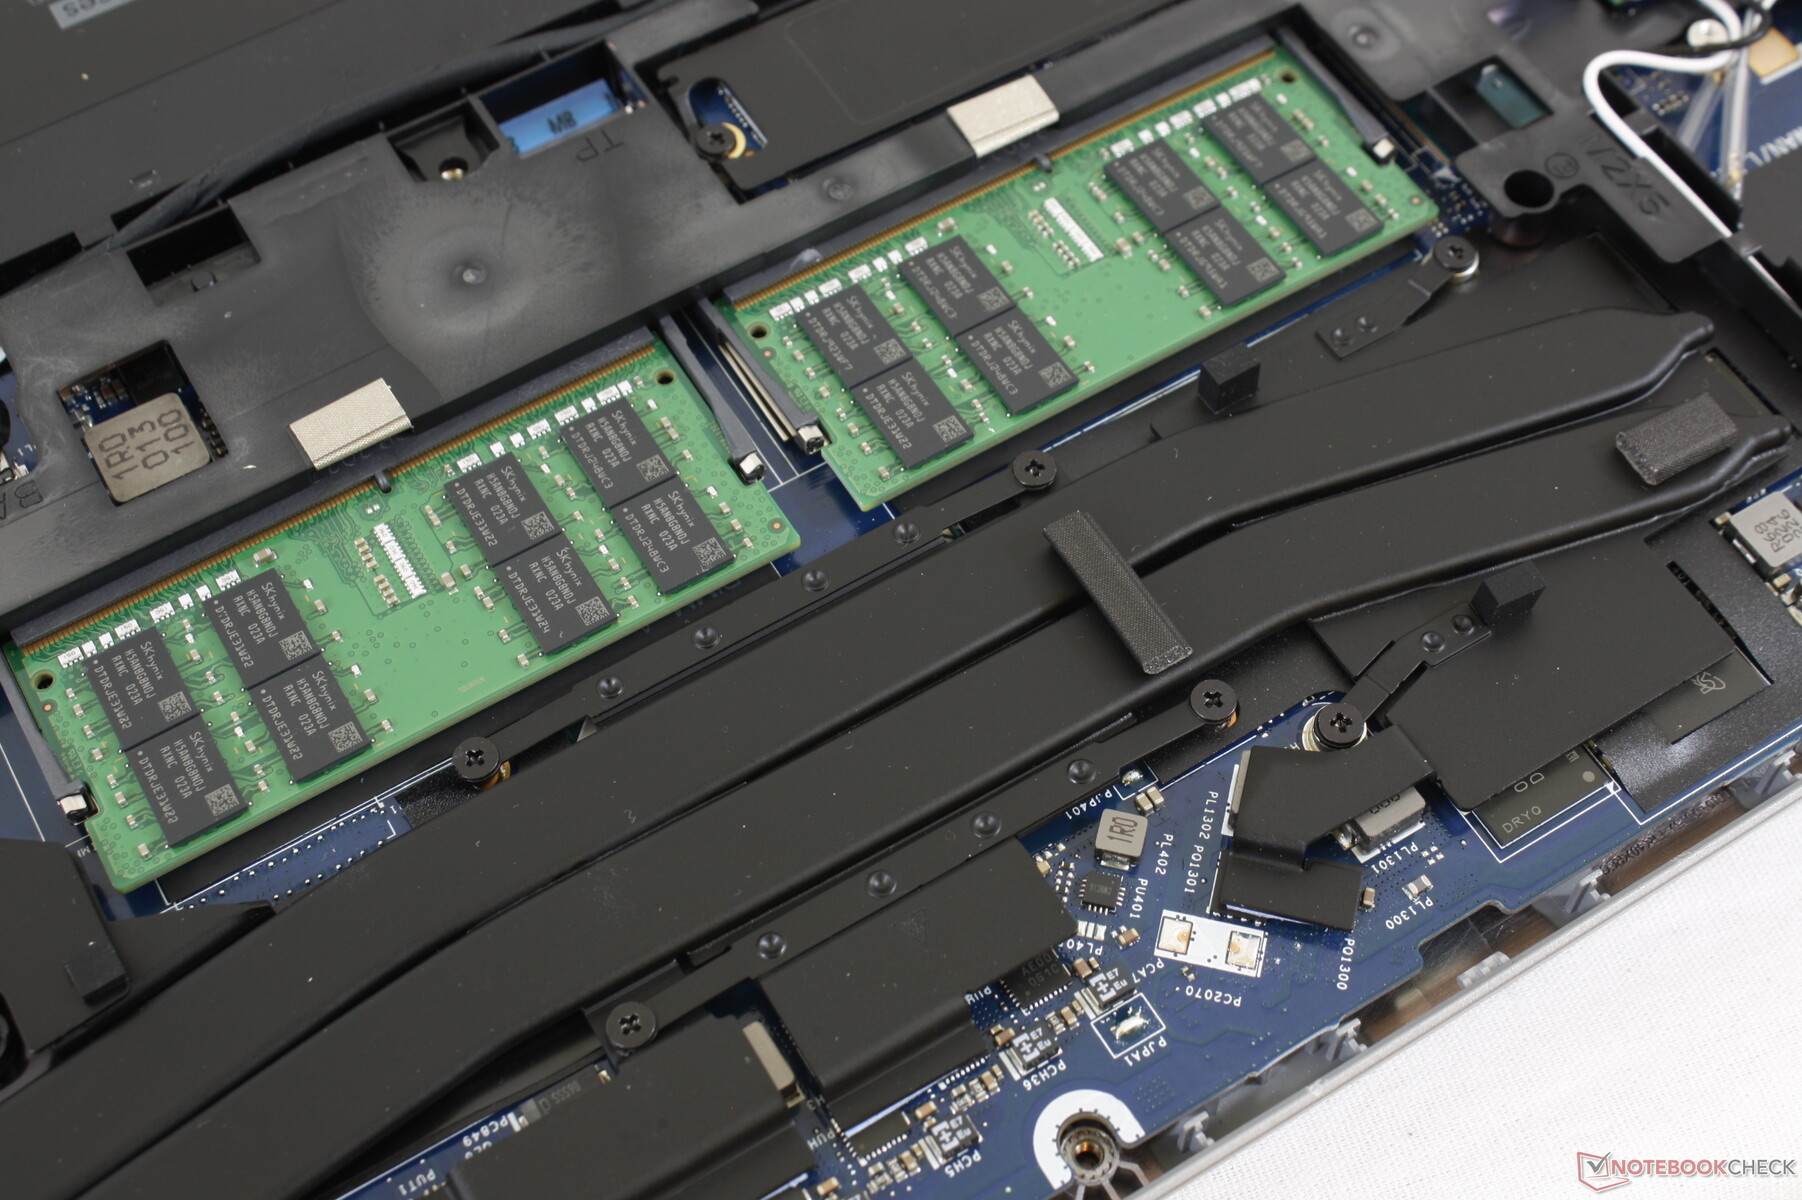
Maintenance
Accessories and Warranty
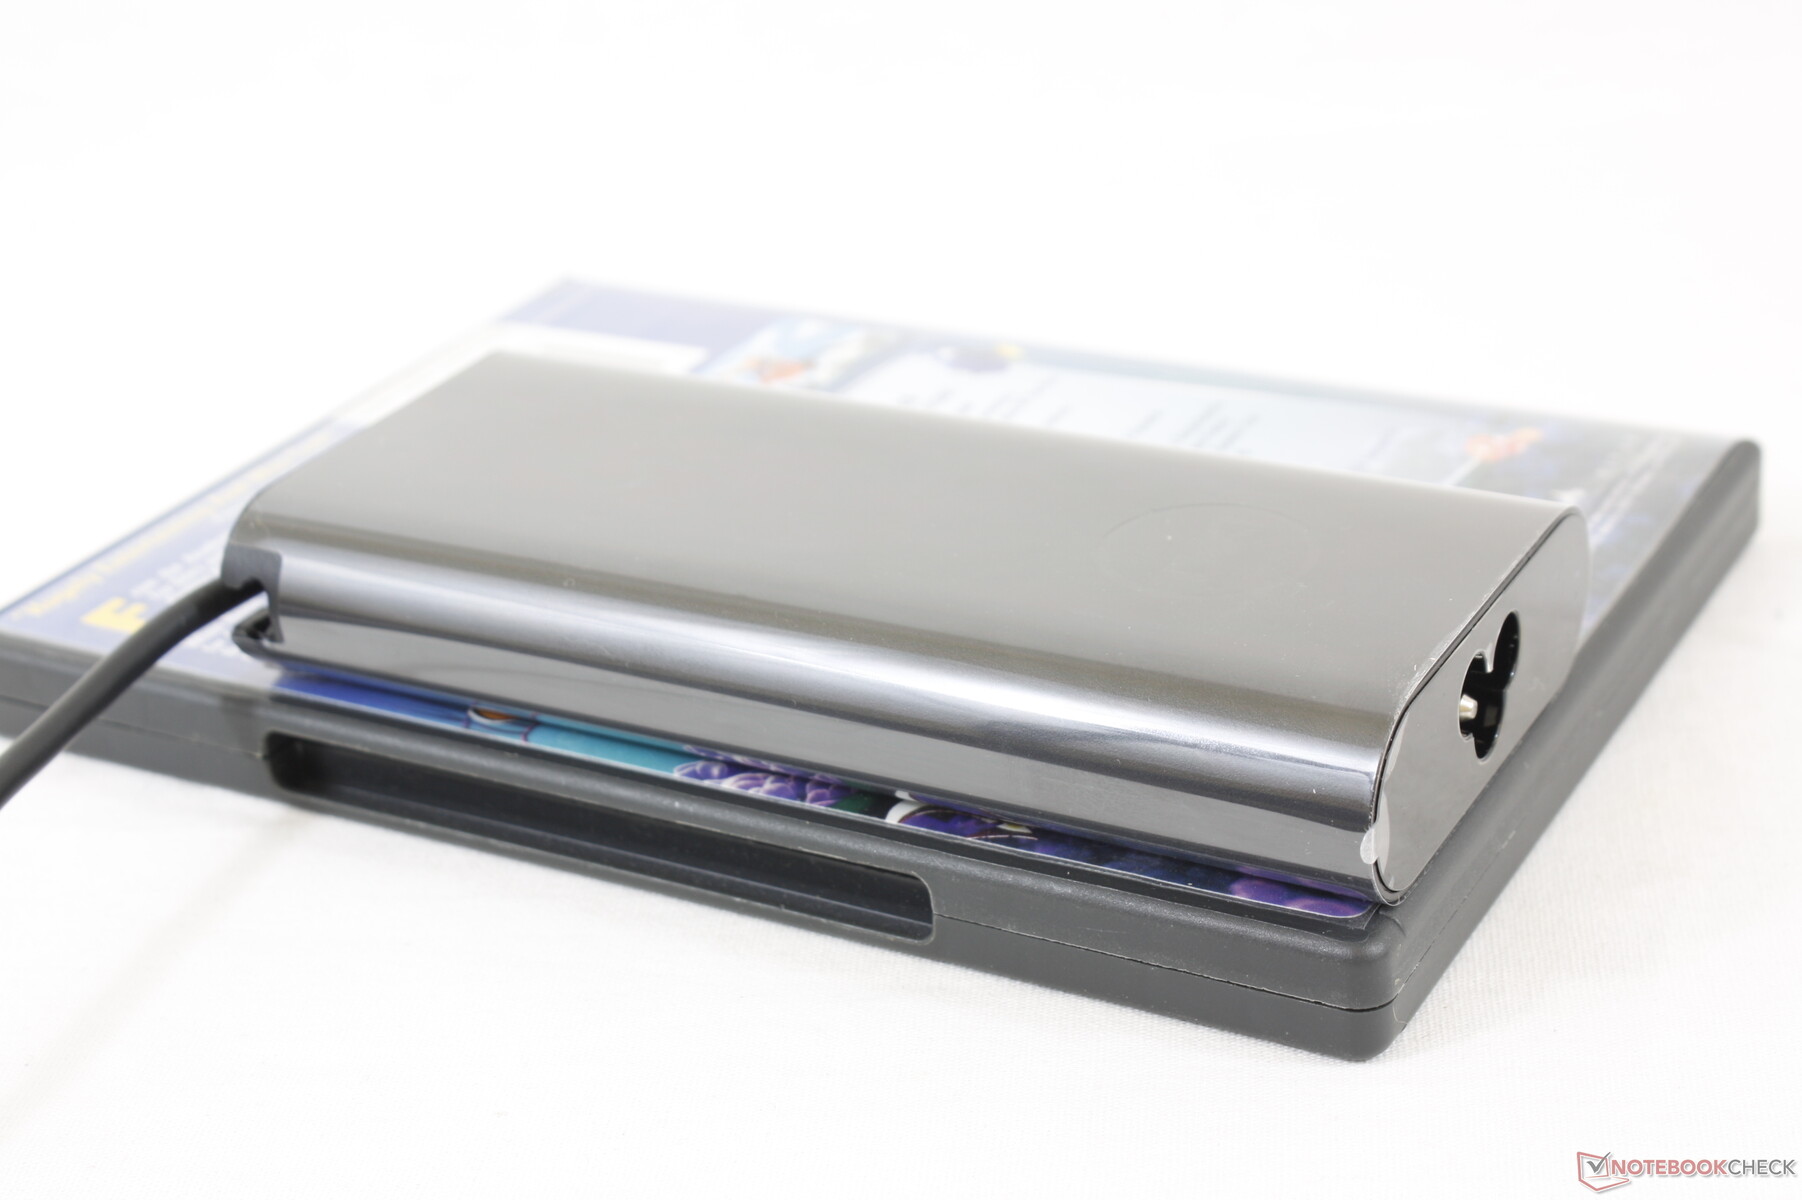
There are no extra accessories in the box other than the AC adapter and paperwork. Users can choose between a USB-C or the barrel charger if purchased directly from Dell.
The standard limited warranty is only one year as opposed to three years for the Precision 7000 series. This is definitely a cost-saving measure since the Precision 3000 series is targeting budget users.
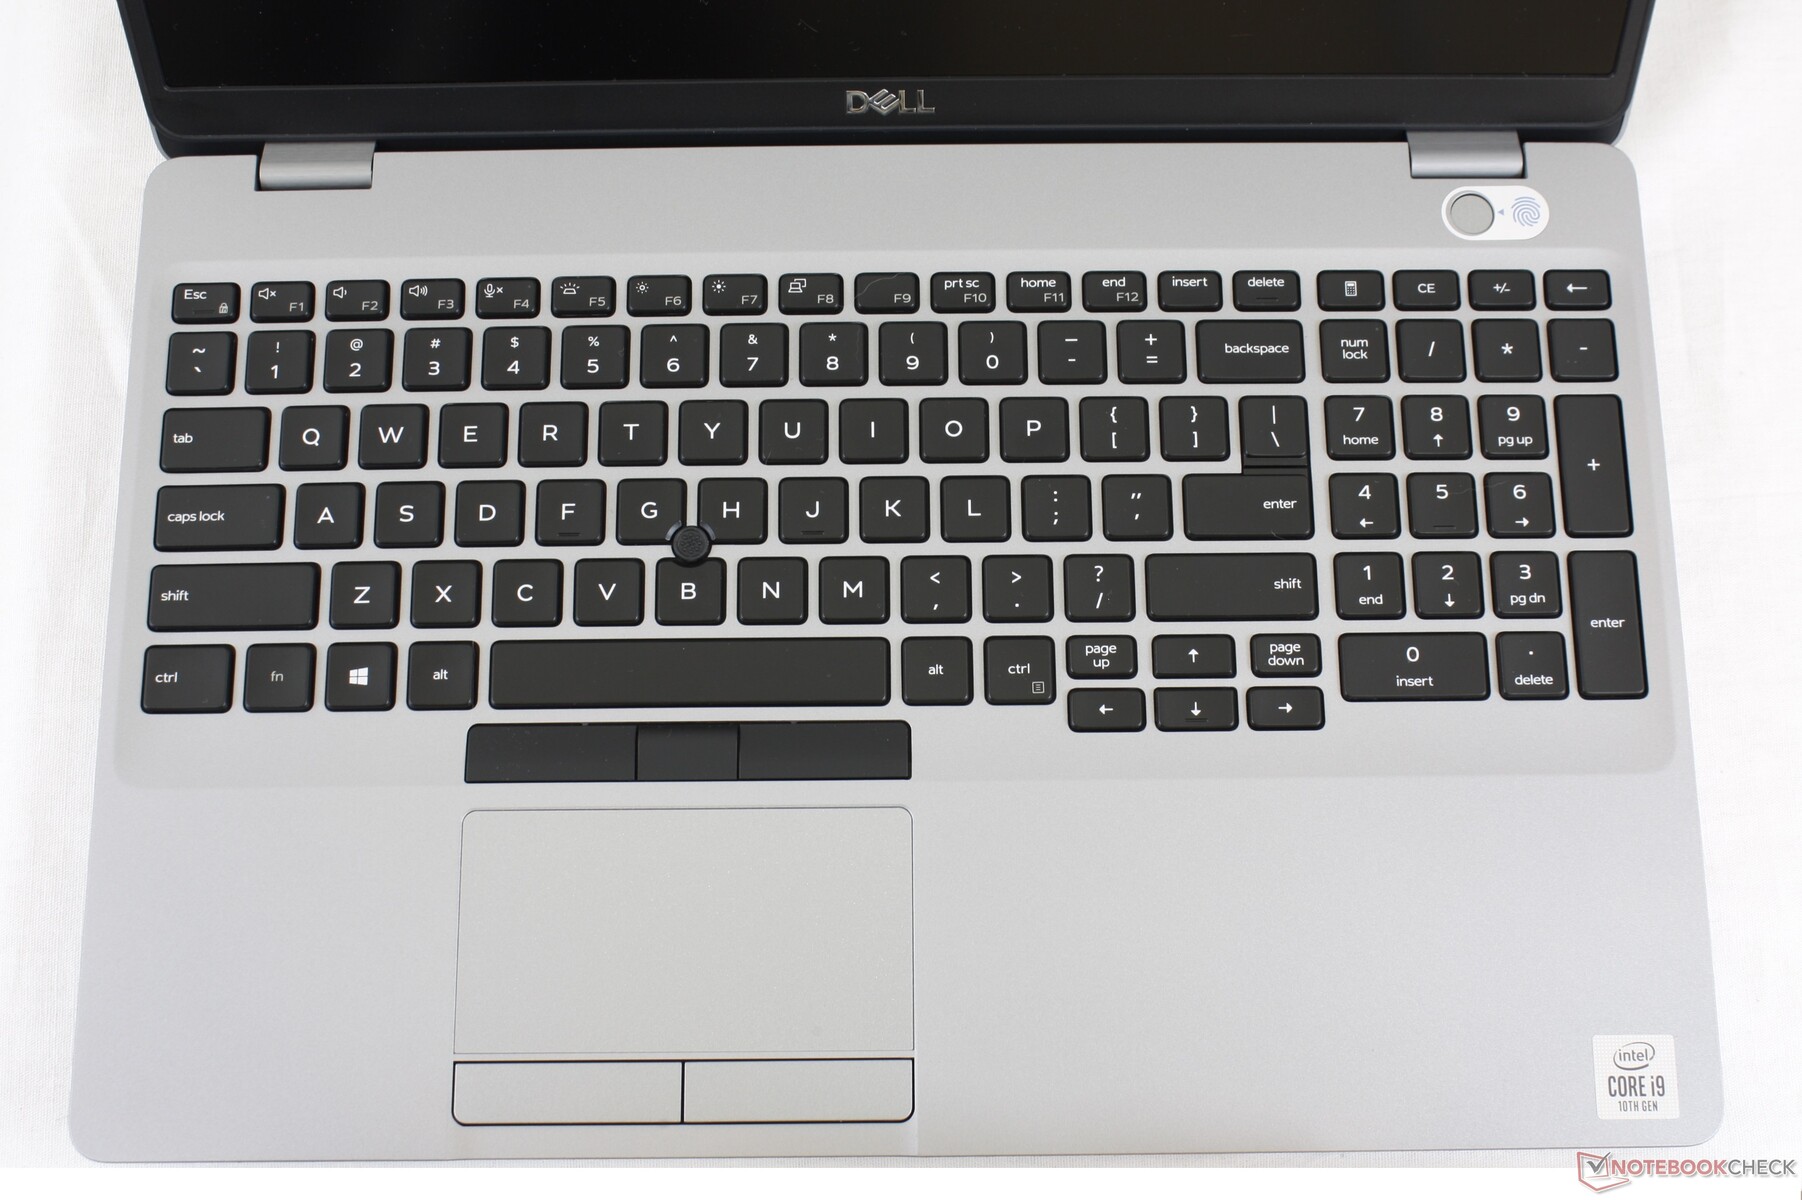
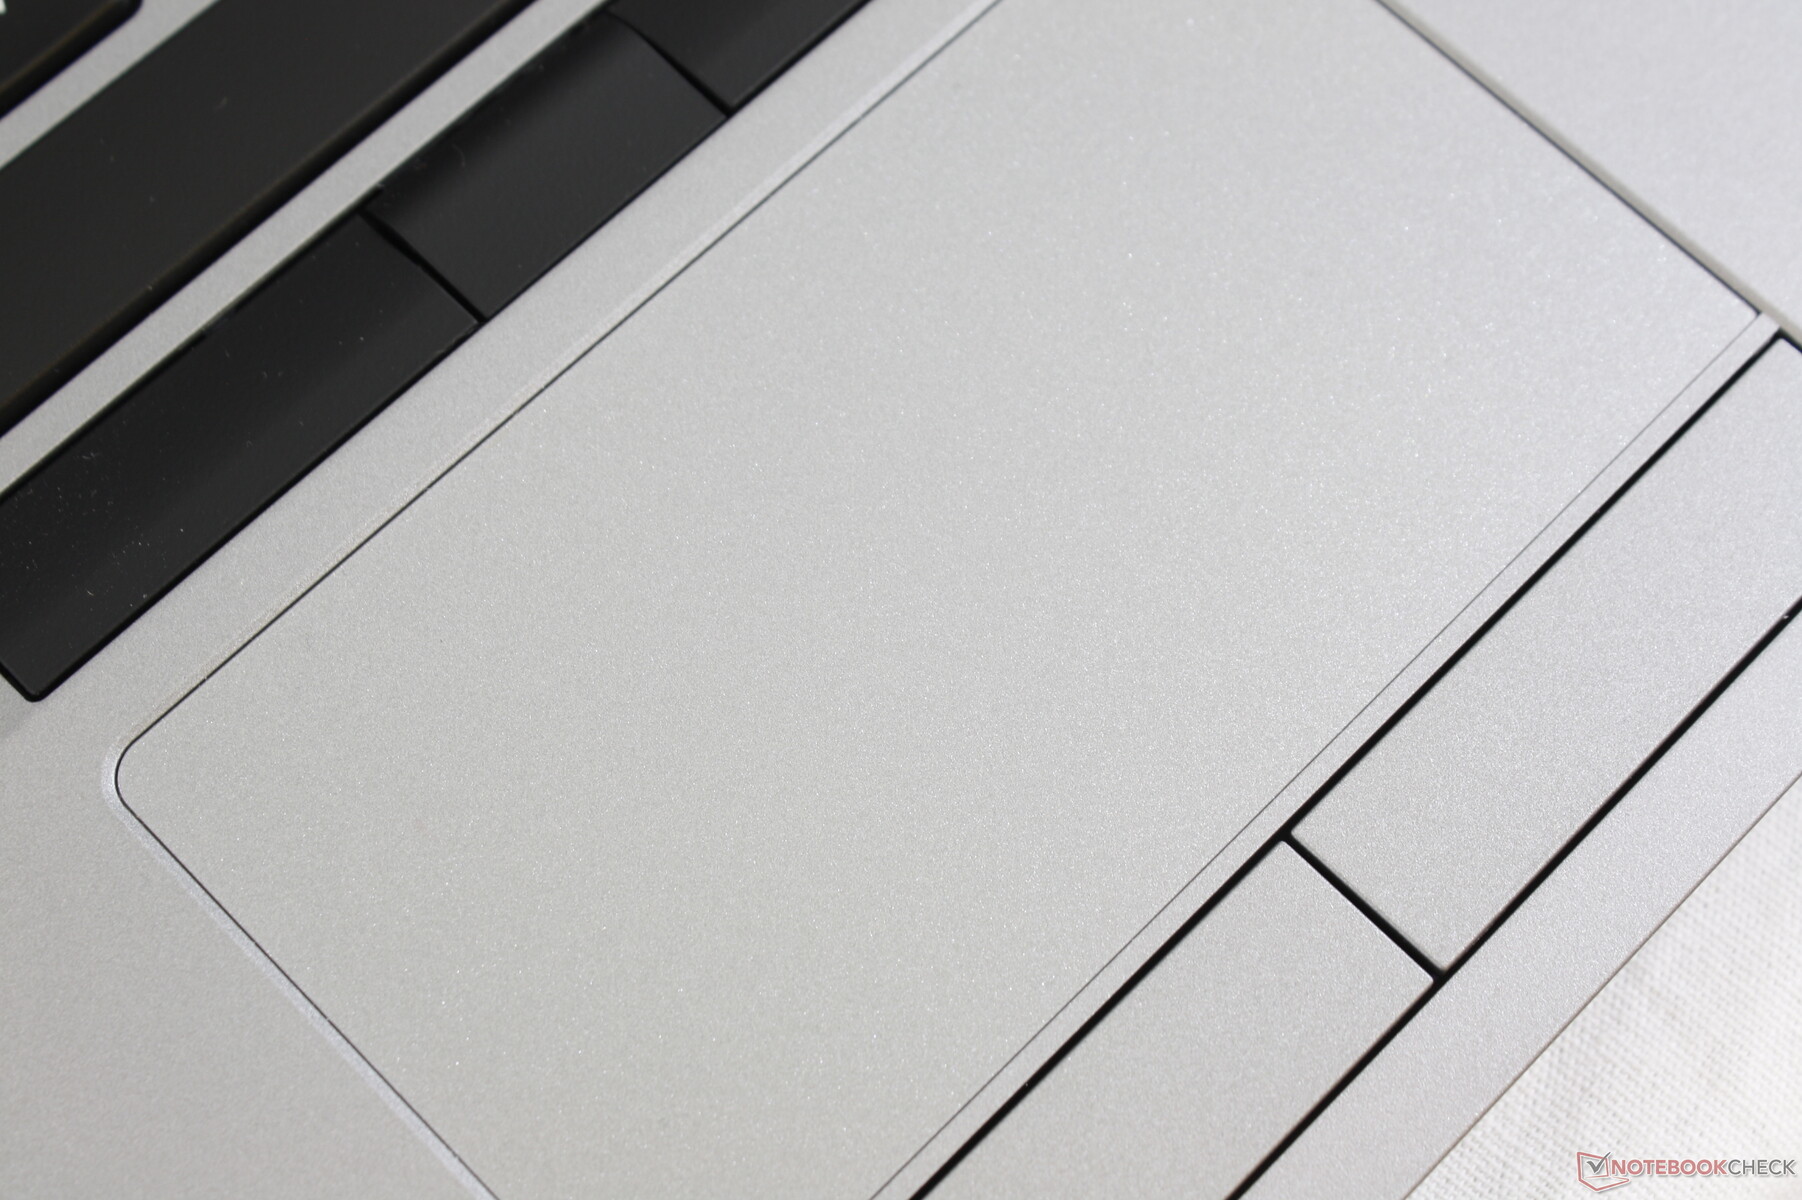
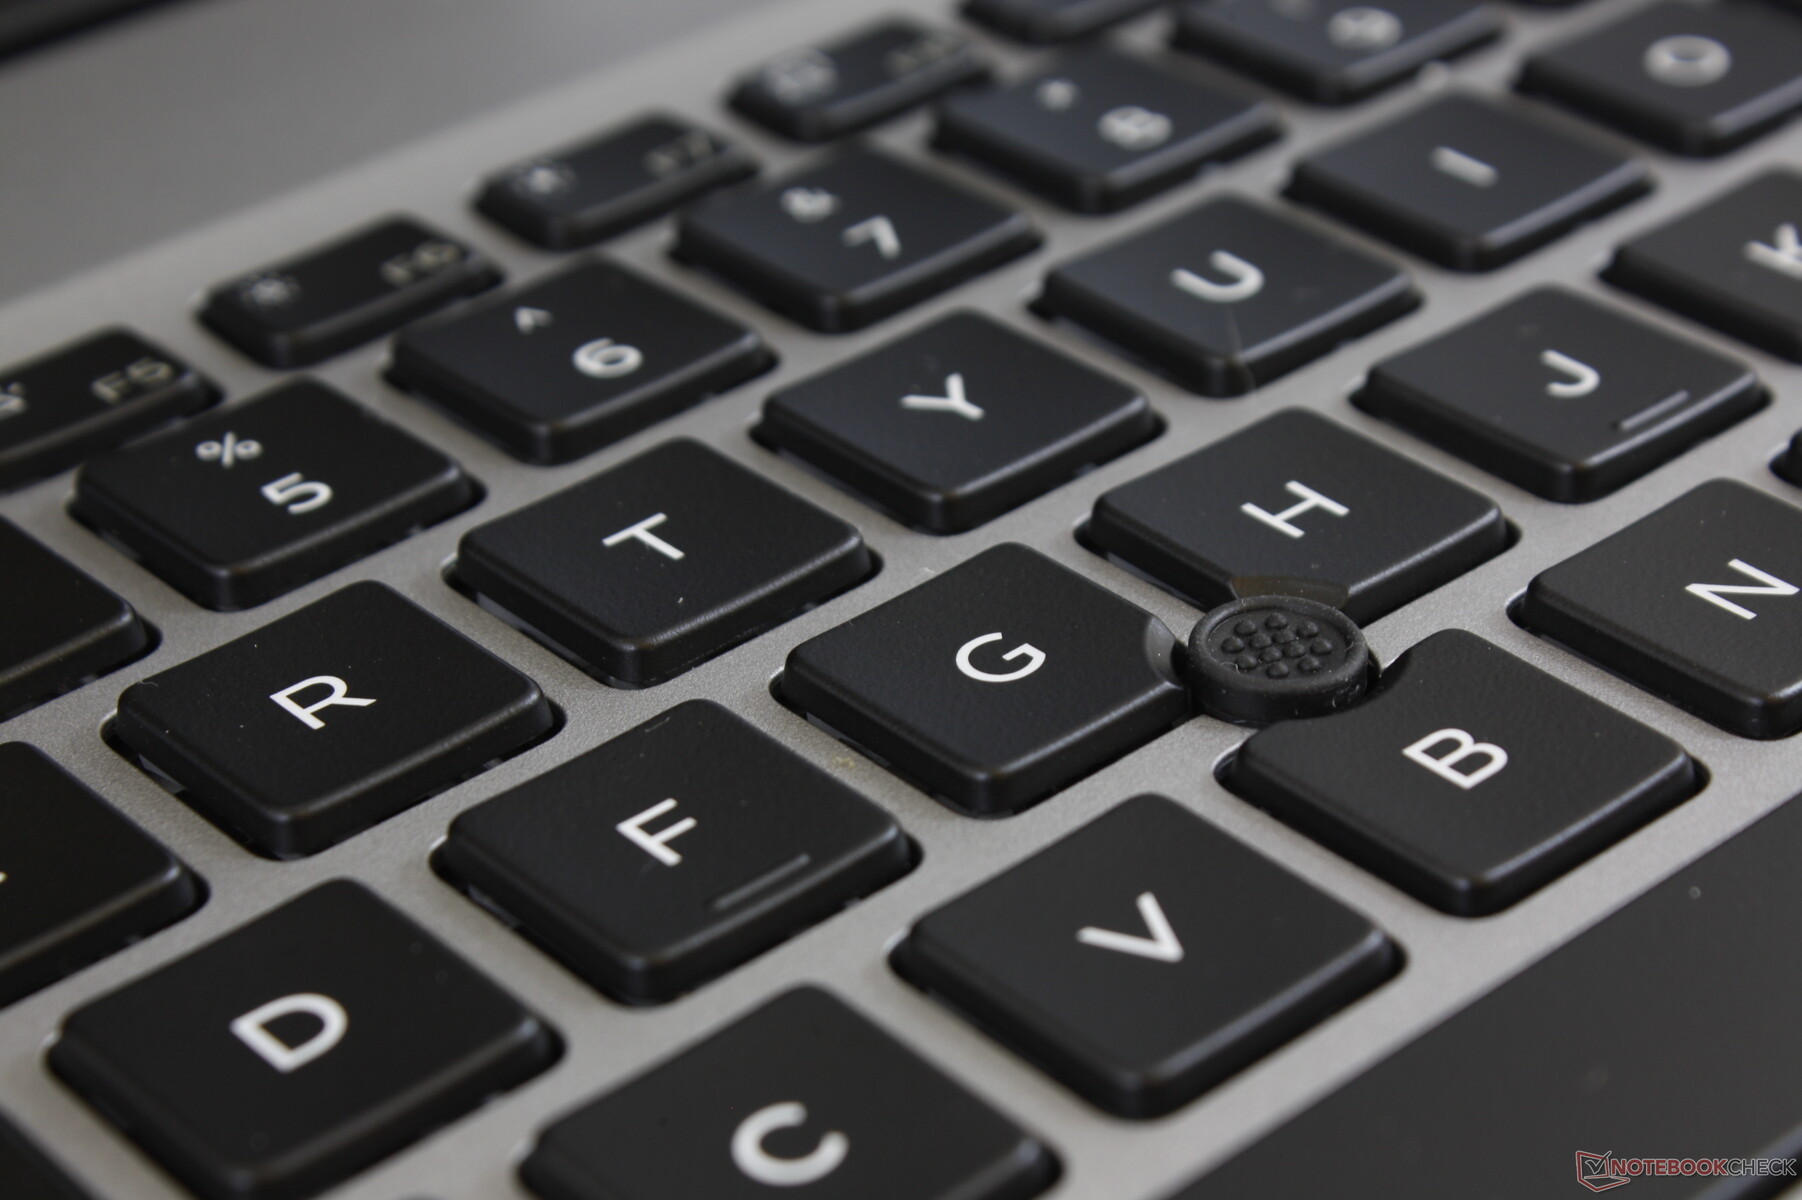
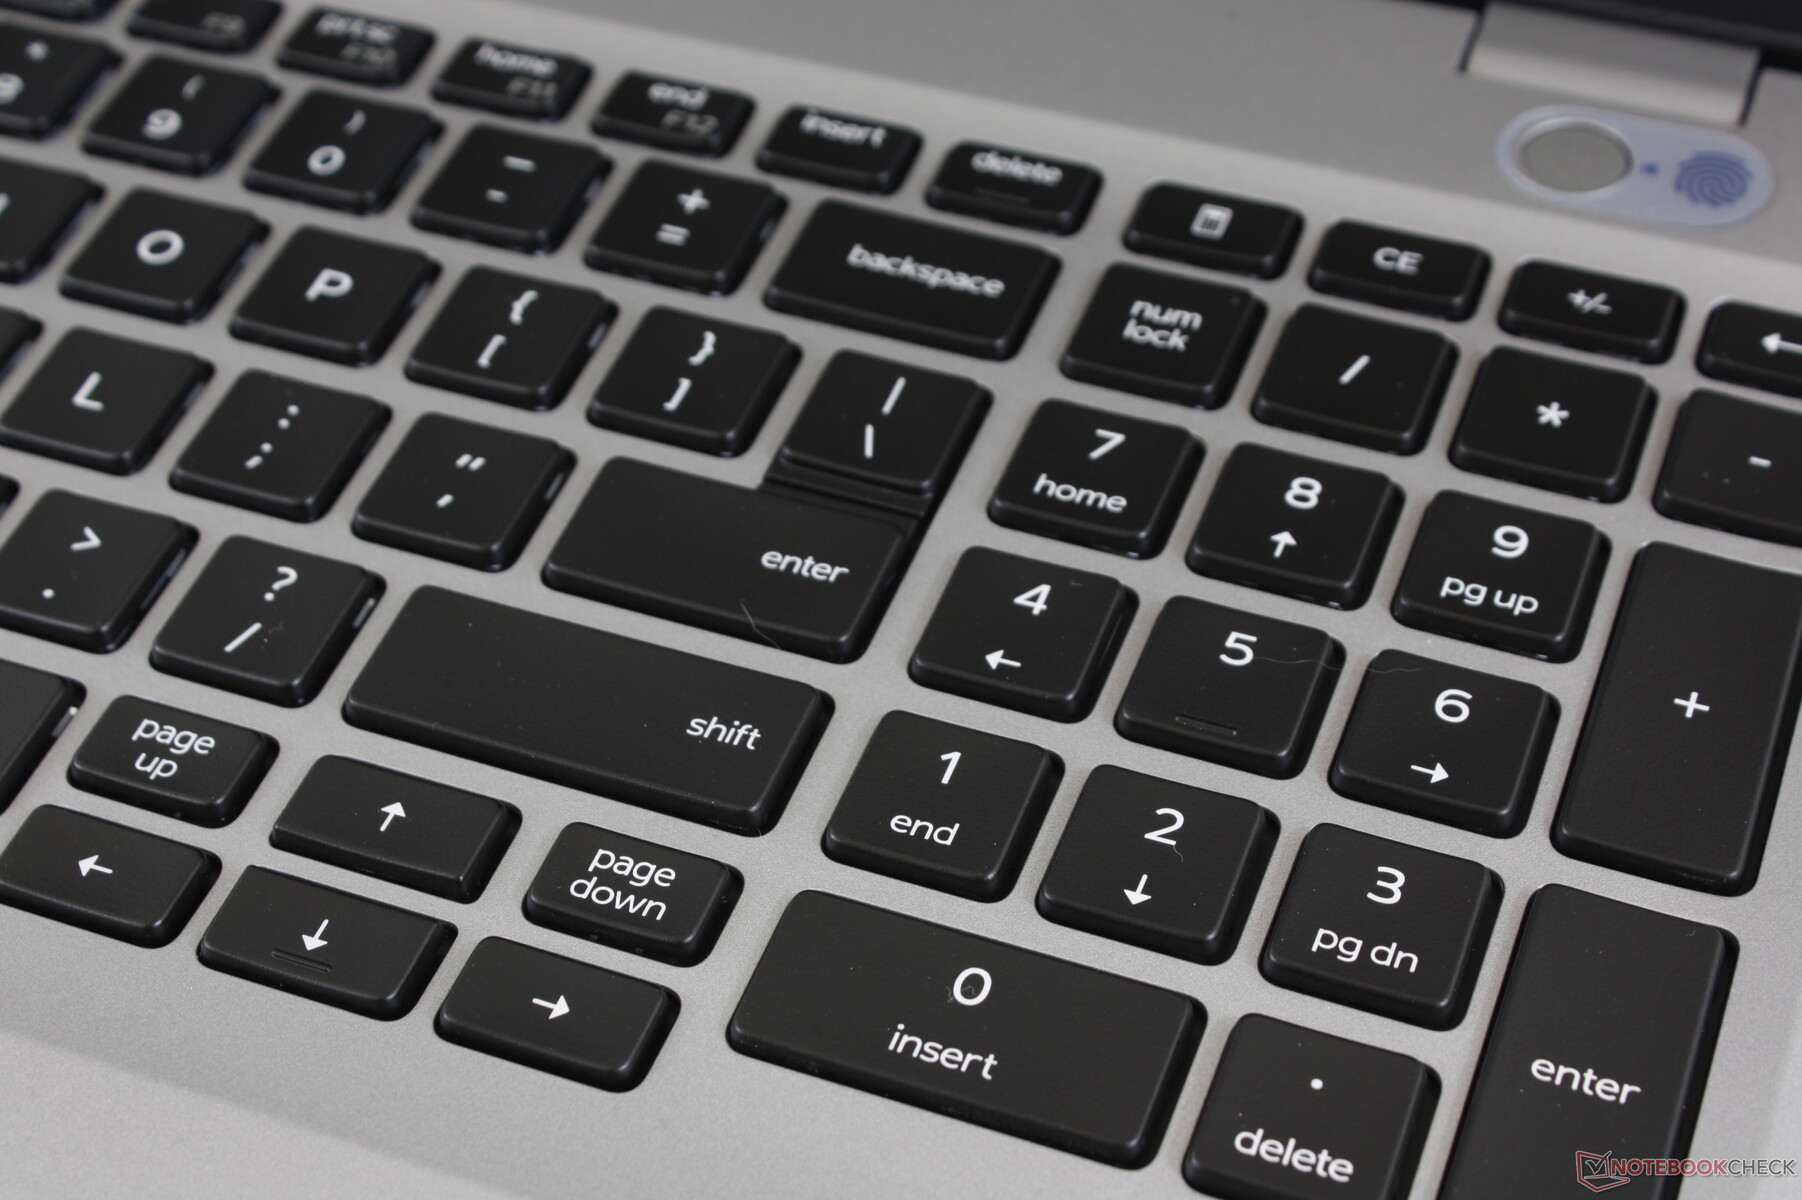
Input Devices
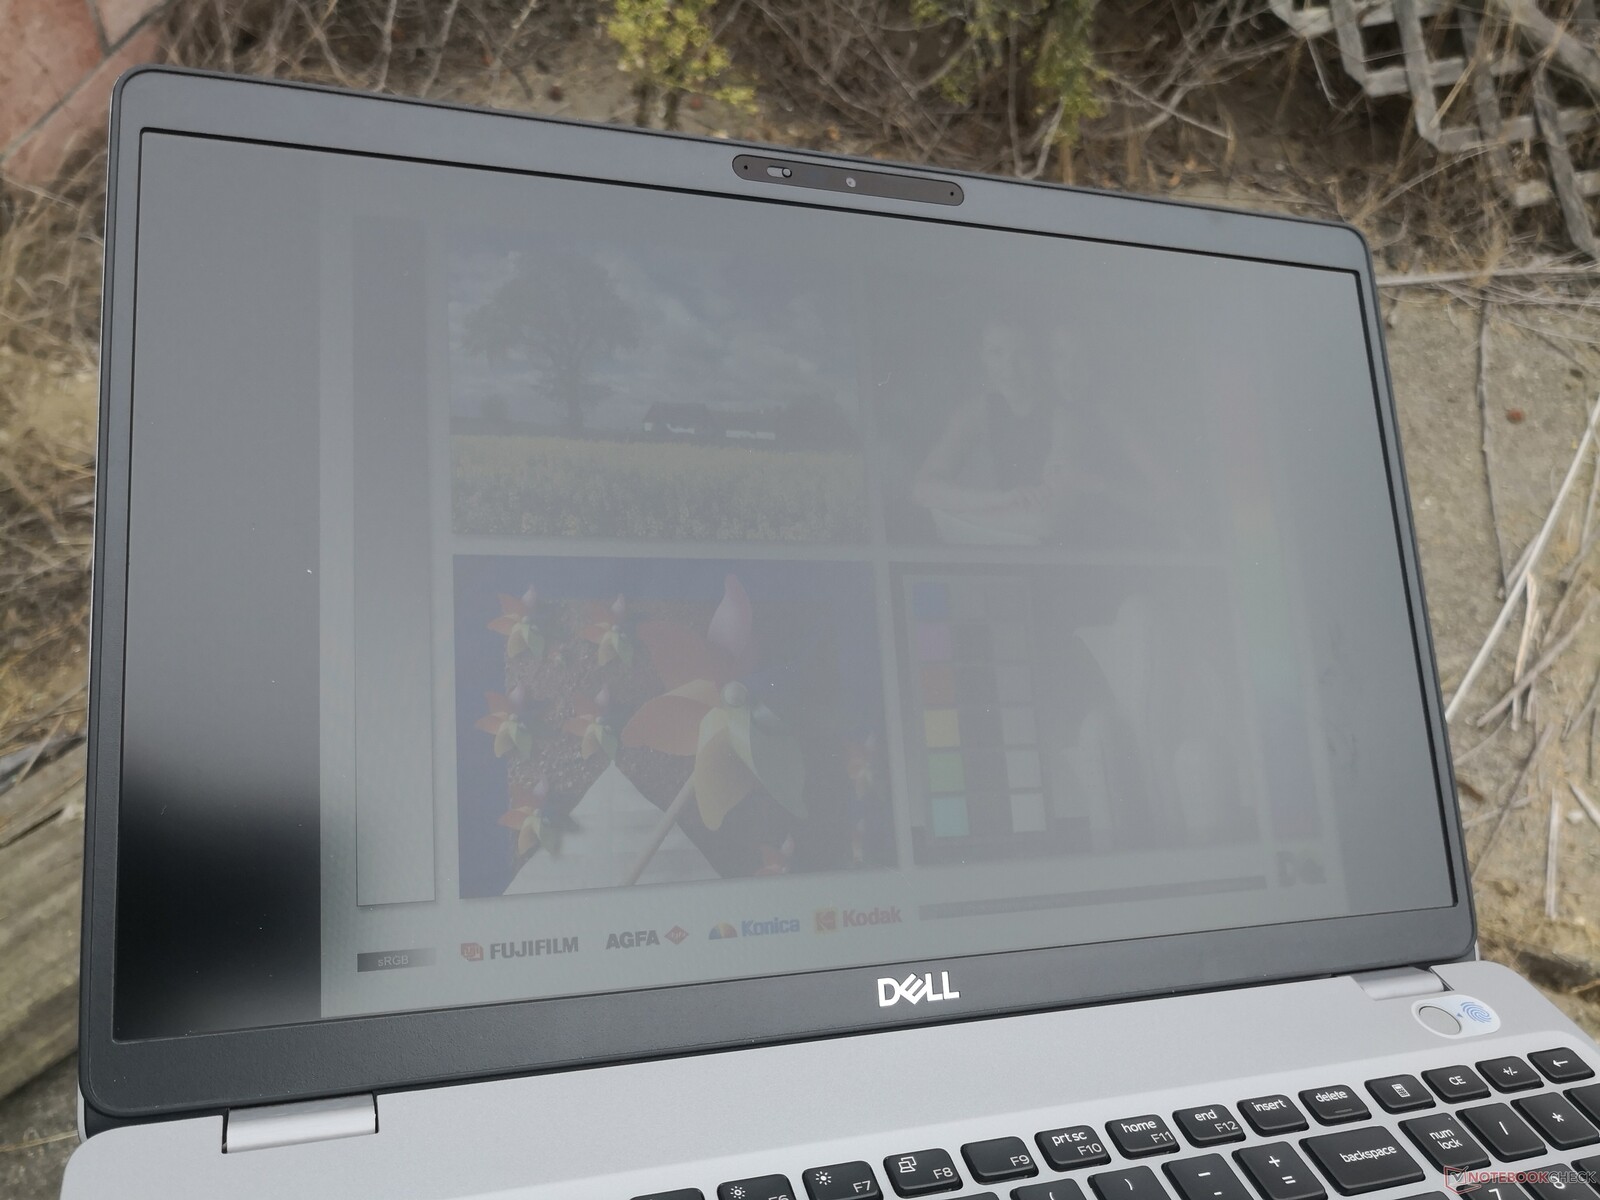
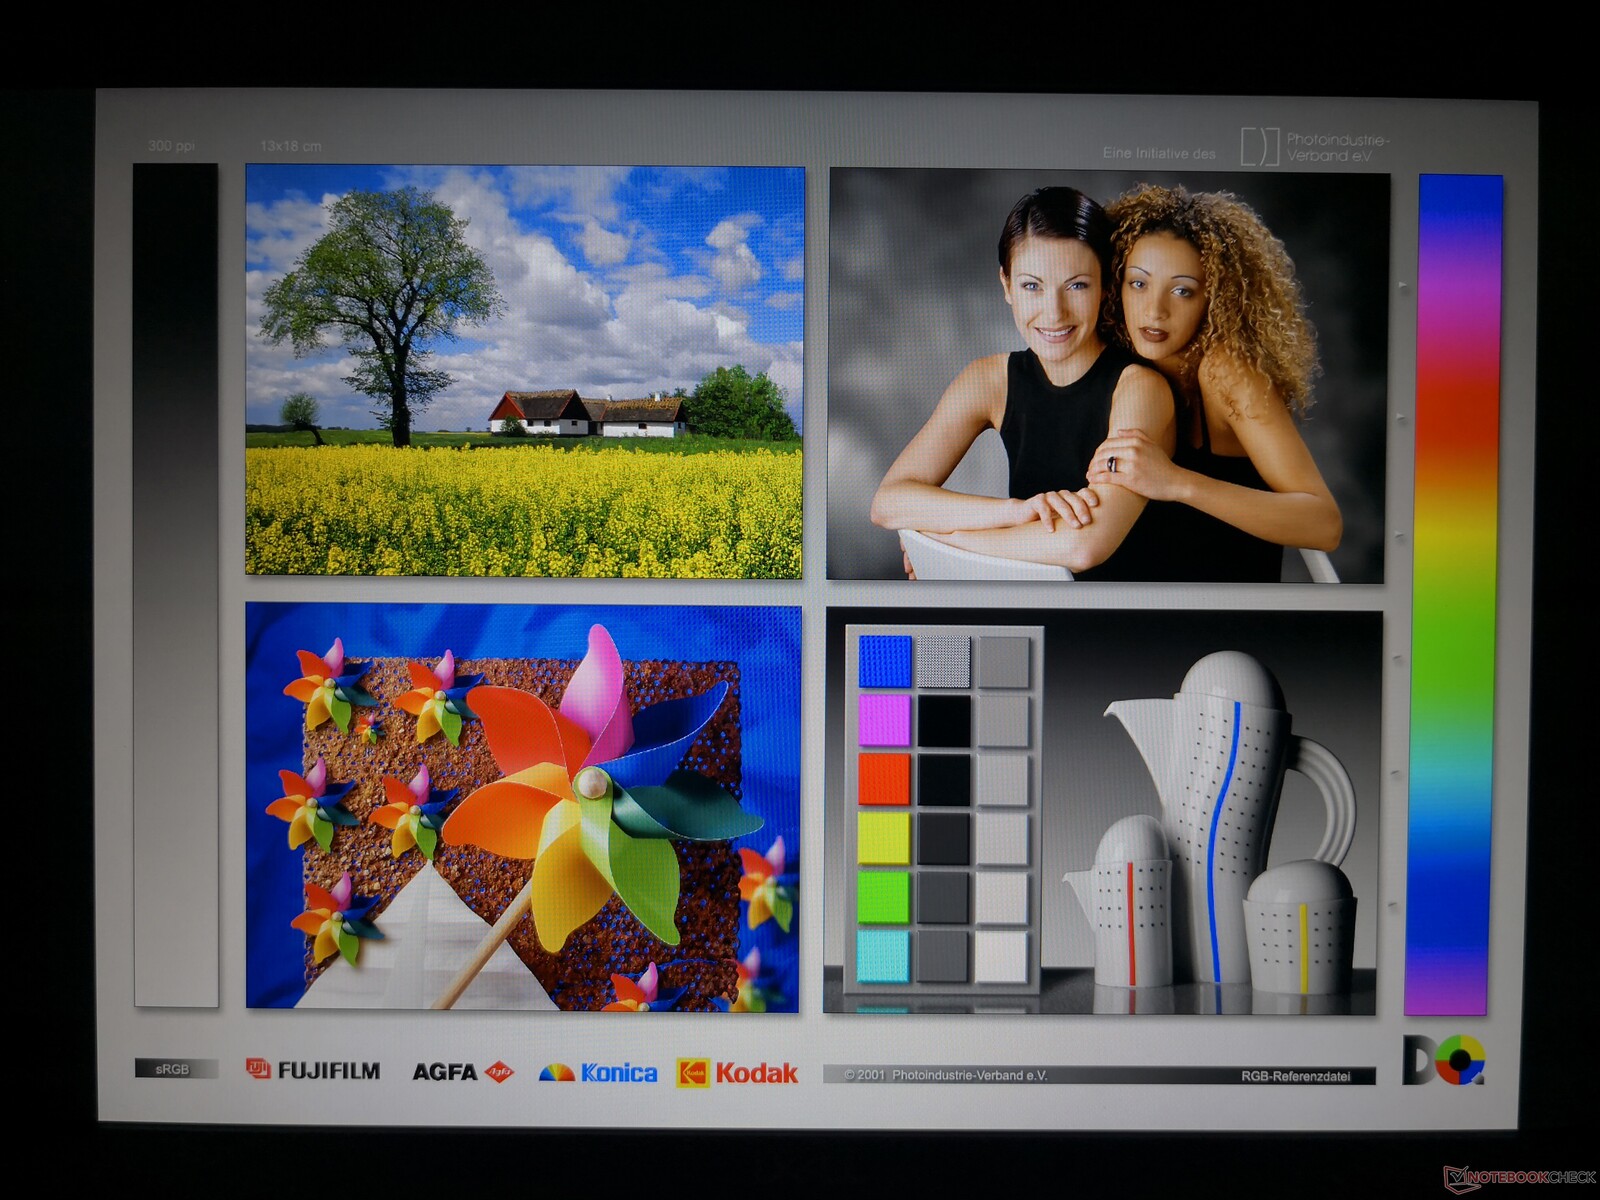
Display
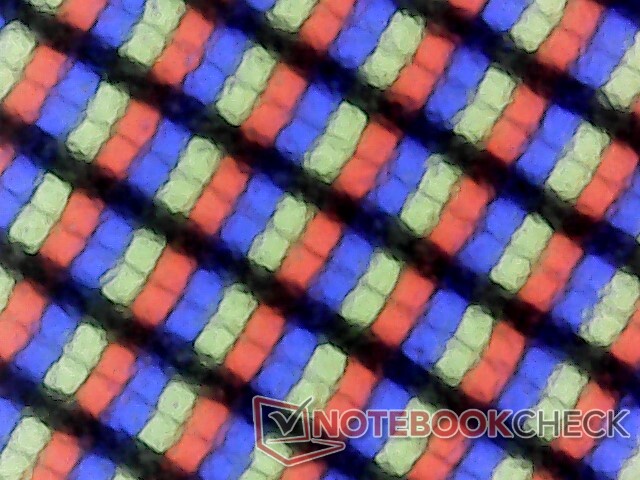
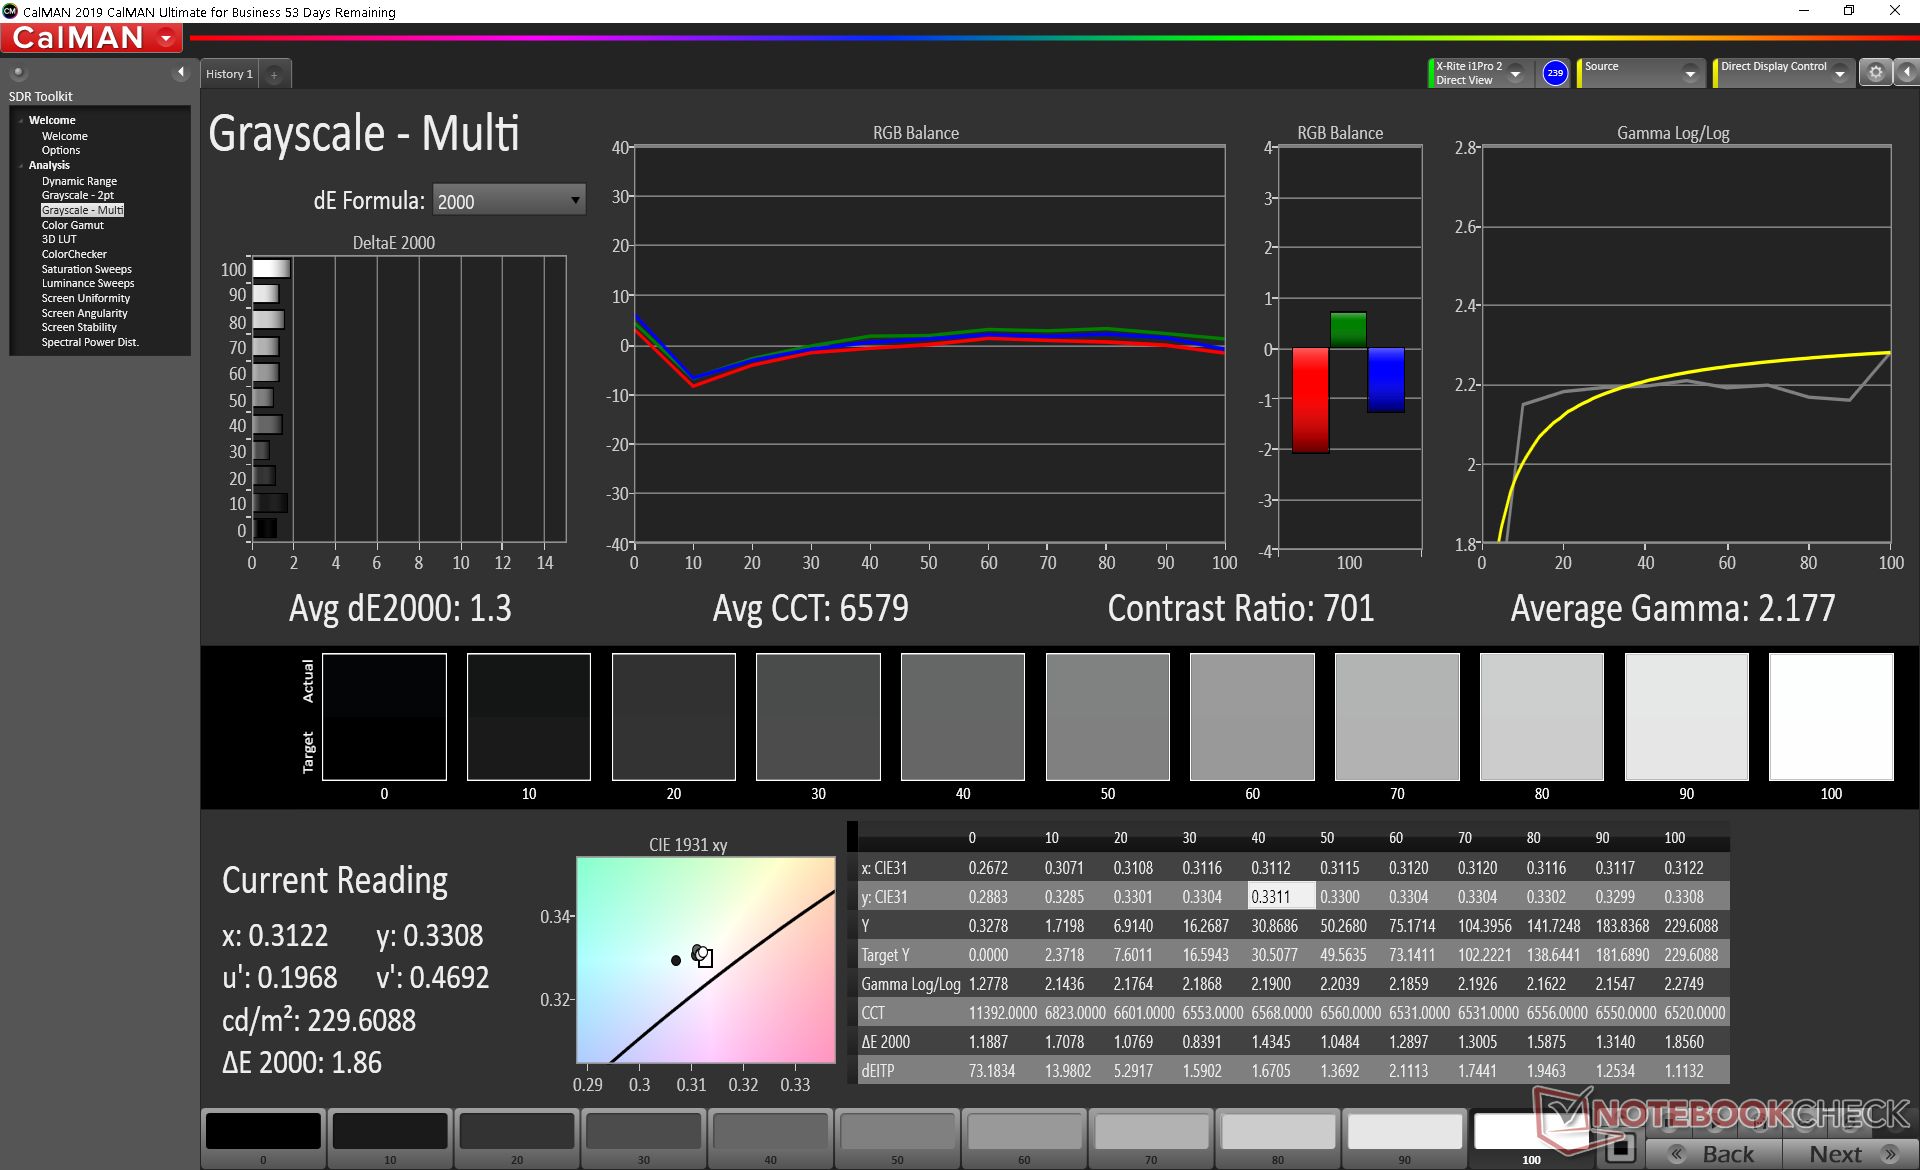
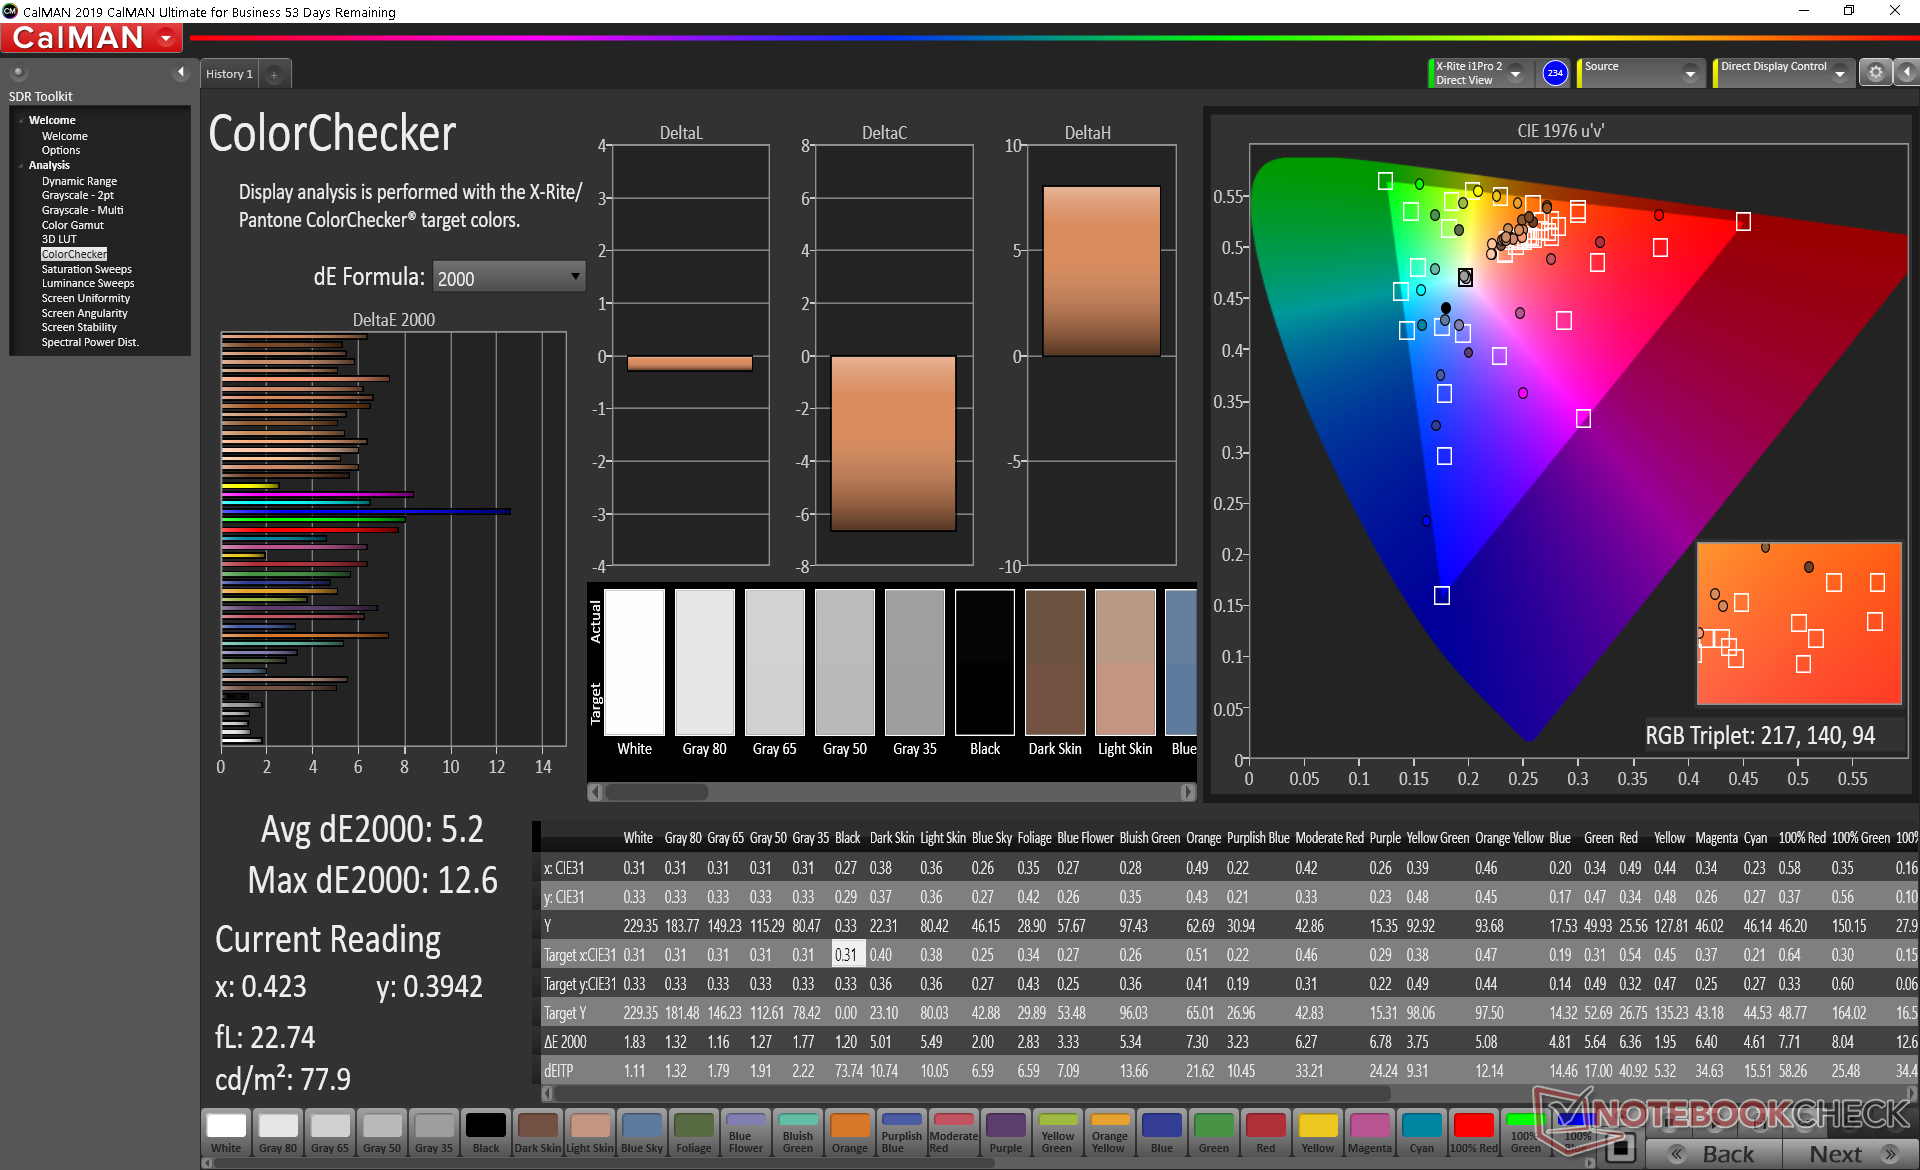
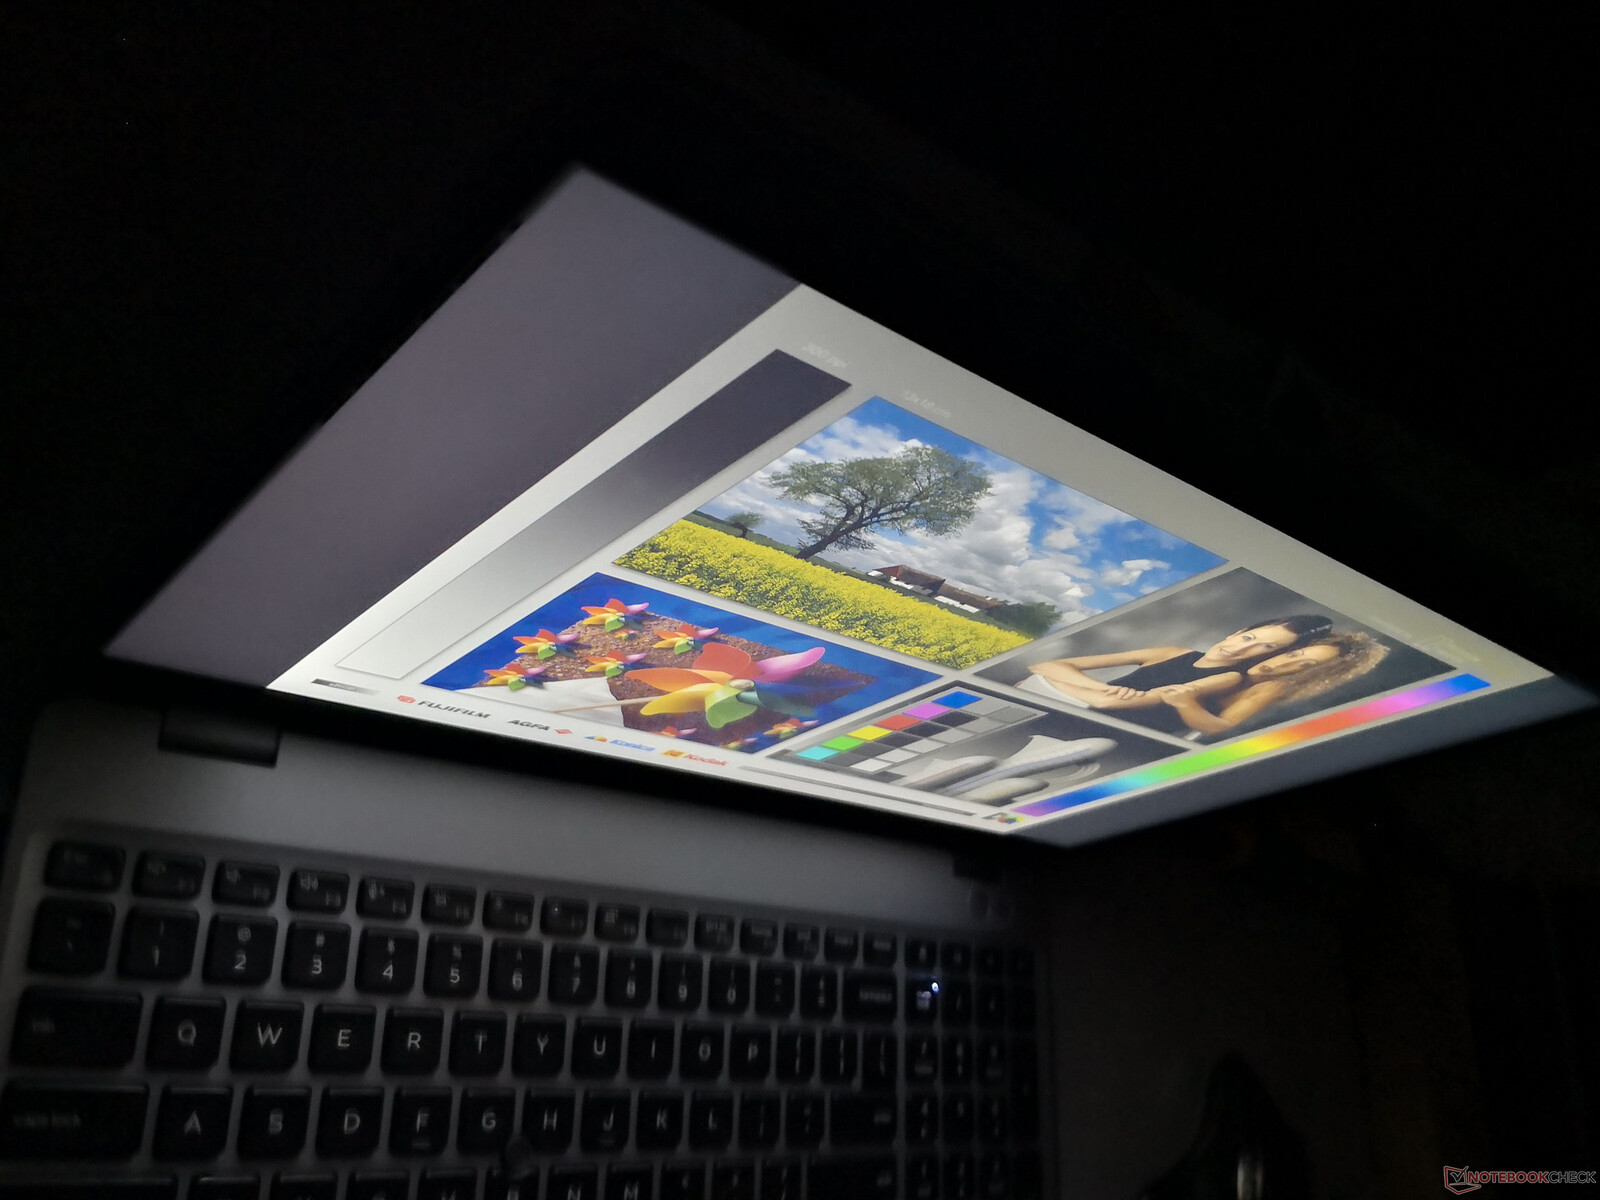
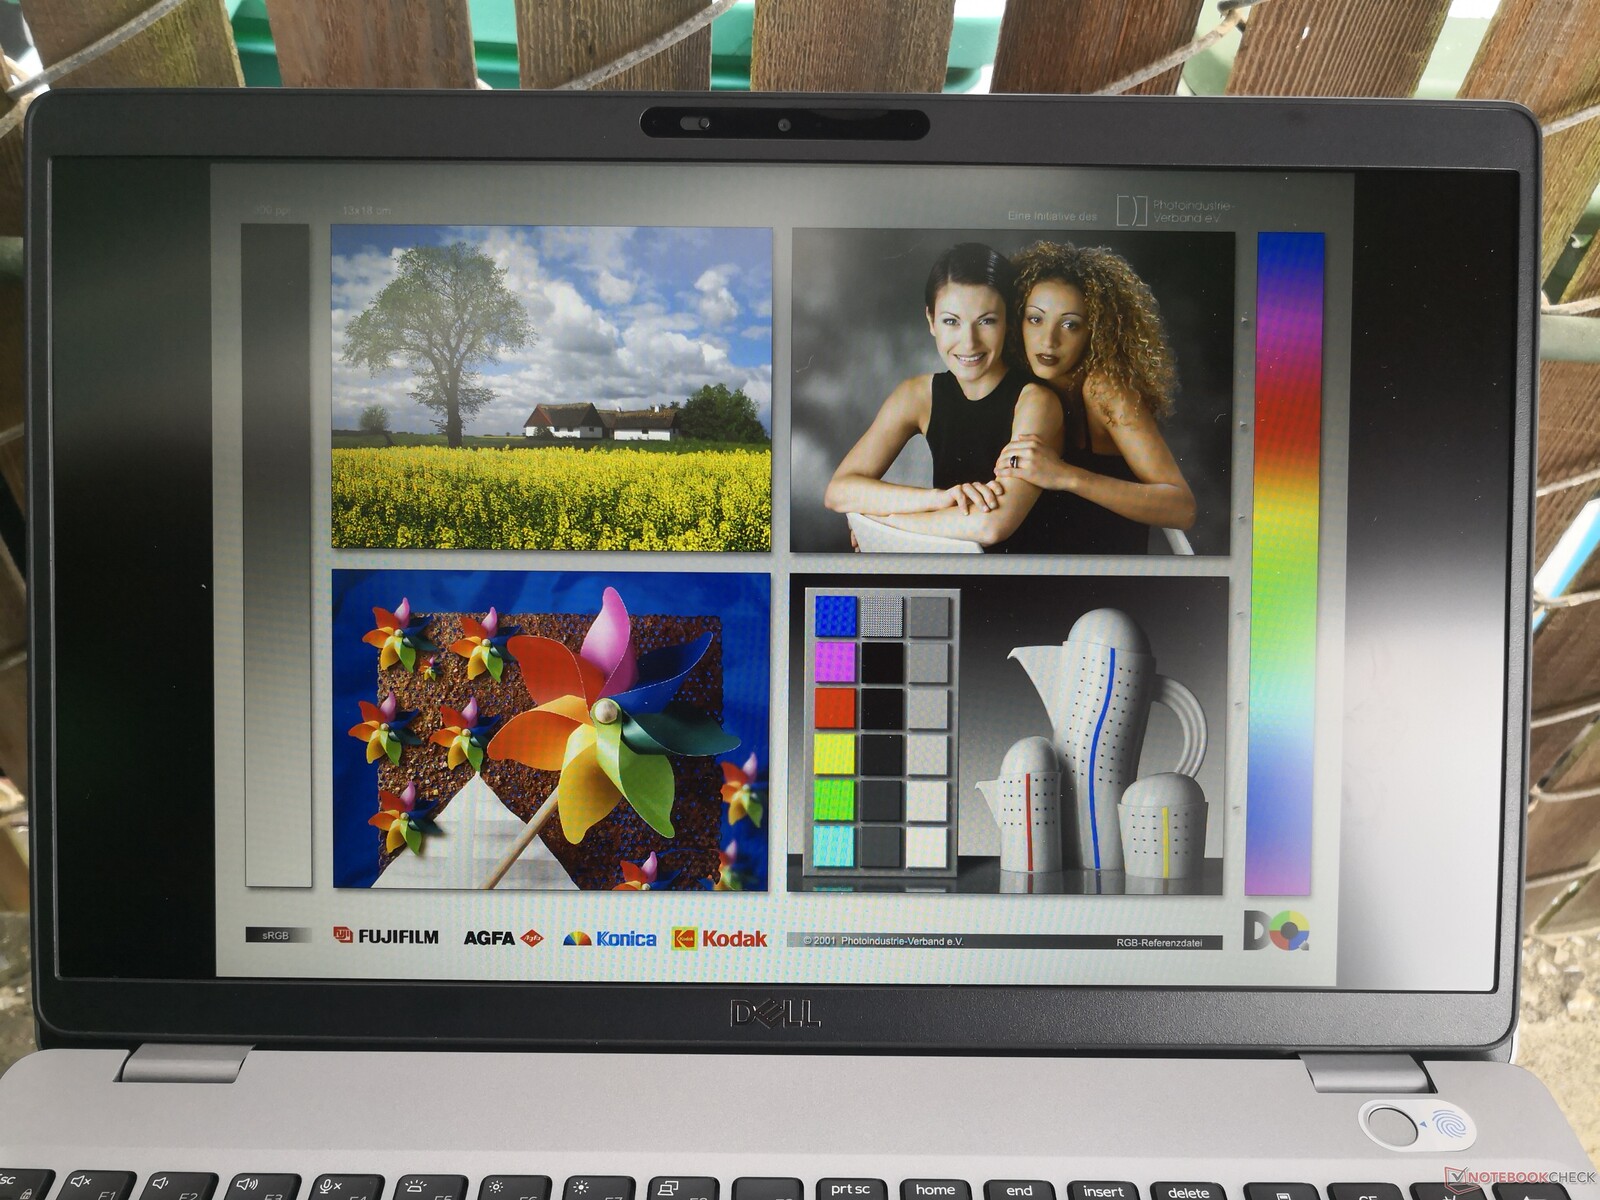
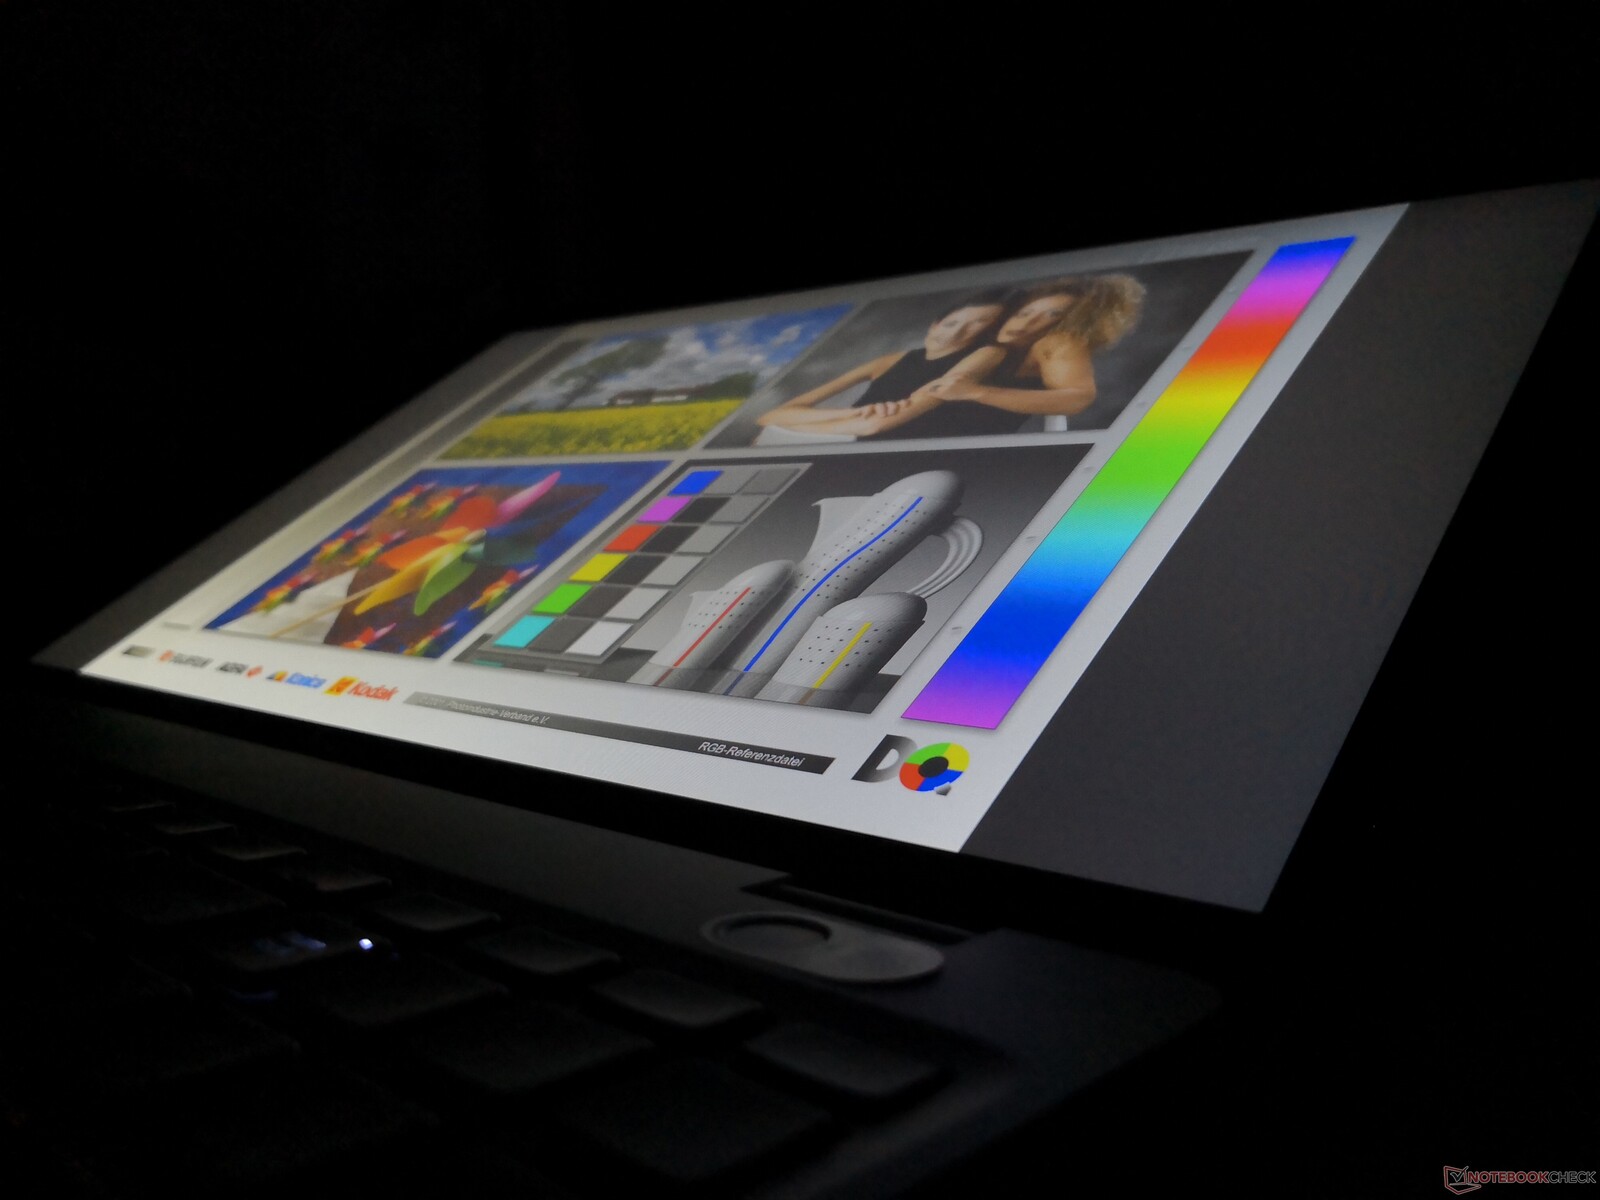
Dell utilizes the same LG Philips 156WFD 1080p IPS panel for both its Precision 3551 and Latitude 5500. Though contrast is good at almost 1000:1, other characteristics like brightness, response times, and colors are average at best to represent a budget display. This is definitely not the panel option you want if color accuracy is vital. Luckily, the system can be configured with higher-end display options that promise full sRGB coverage if desired.
| |||||||||||||||||||||||||
Brightness Distribution: 89 %
Center on Battery: 235.5 cd/m²
Contrast: 942:1 (Black: 0.25 cd/m²)
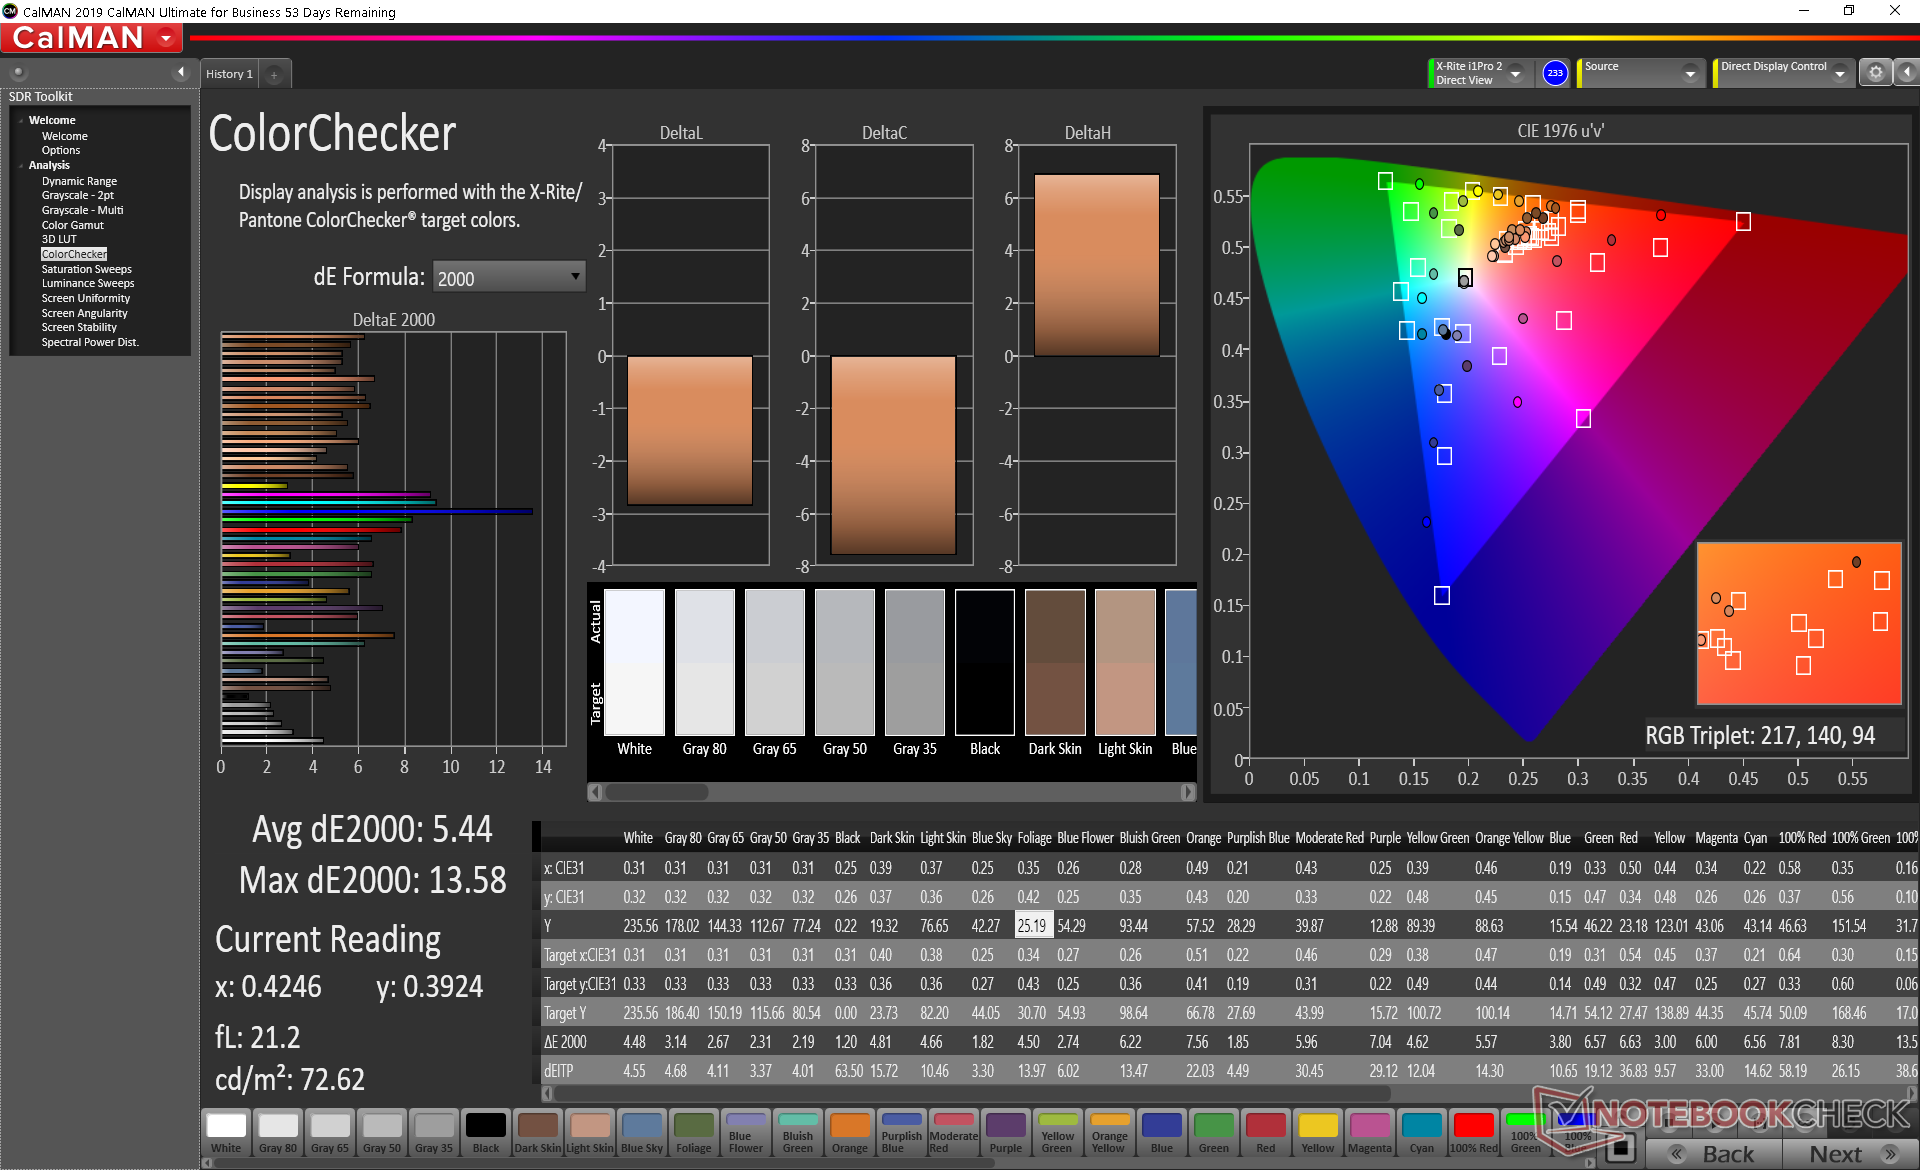
ΔE ColorChecker Calman: 5.44 | ∀{0.5-29.43 Ø4.72}
calibrated: 5.2
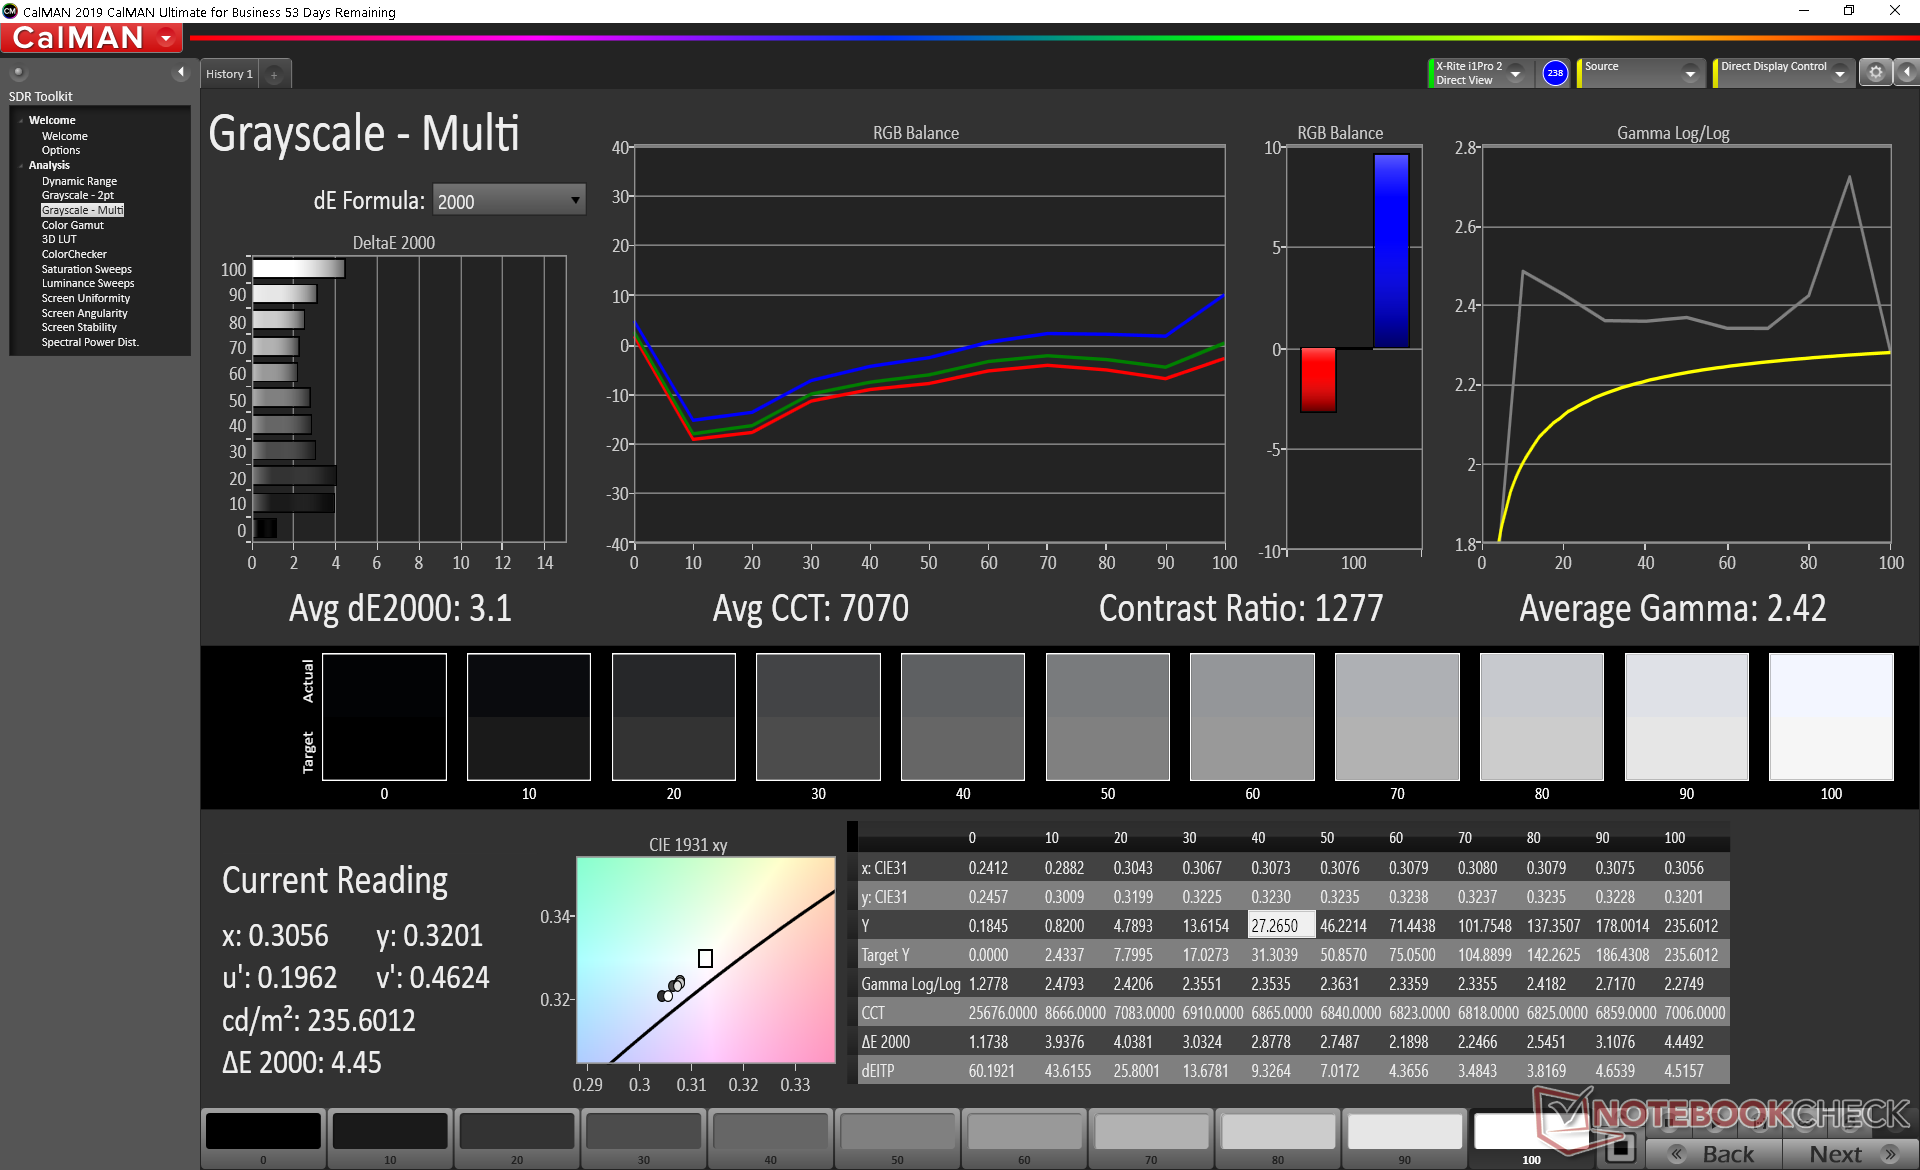
ΔE Greyscale Calman: 3.1 | ∀{0.09-98 Ø4.97}
56.1% sRGB (Argyll 1.6.3 3D)
35.5% AdobeRGB 1998 (Argyll 1.6.3 3D)
38.74% AdobeRGB 1998 (Argyll 3D)
56.5% sRGB (Argyll 3D)
37.5% Display P3 (Argyll 3D)
Gamma: 2.42
CCT: 7070 K
| Dell Precision 3000 3551 LG Philips 156WFD, IPS, 15.6", 1920x1080 | HP ZBook Firefly 15 G7 LGD064F, IPS LED, 15.6", 3840x2160 | Dell Precision 5550 P91F Sharp LQ156R1, IPS, 15.6", 3840x2400 | Lenovo ThinkPad P53s-20N6001NGE Lenovo LEN40BA, IPS, 15.6", 1920x1080 | MSI WP65 AU Optronics B156HAN02.1, IPS, 15.6", 1920x1080 | Dell Precision 3530 BOE BOE06F1, IPS, 15.6", 1920x1080 | |
|---|---|---|---|---|---|---|
| Display | 79% | 125% | 5% | 5% | 80% | |
| Display P3 Coverage (%) | 37.5 | 68.8 83% | 89.9 140% | 39.58 6% | 39.46 5% | 72.8 94% |
| sRGB Coverage (%) | 56.5 | 97.7 73% | 100 77% | 57.6 2% | 58.8 4% | 94.6 67% |
| AdobeRGB 1998 Coverage (%) | 38.74 | 69.8 80% | 99.9 158% | 40.89 6% | 40.69 5% | 69.3 79% |
| Response Times | -33% | -42% | -50% | -16% | -34% | |
| Response Time Grey 50% / Grey 80% * (ms) | 29.6 ? | 44 ? -49% | 46 ? -55% | 51.2 ? -73% | 37.6 ? -27% | 40.4 ? -36% |
| Response Time Black / White * (ms) | 26.4 ? | 30.8 ? -17% | 34 ? -29% | 33.6 ? -27% | 27.6 ? -5% | 34.8 ? -32% |
| PWM Frequency (Hz) | 1053 ? | |||||
| Screen | 51% | 33% | 4% | -2% | 10% | |
| Brightness middle (cd/m²) | 235.5 | 381 62% | 469.8 99% | 260 10% | 267.4 14% | 285.7 21% |
| Brightness (cd/m²) | 228 | 382 68% | 464 104% | 243 7% | 259 14% | 275 21% |
| Brightness Distribution (%) | 89 | 92 3% | 85 -4% | 88 -1% | 86 -3% | 85 -4% |
| Black Level * (cd/m²) | 0.25 | 0.21 16% | 0.42 -68% | 0.18 28% | 0.37 -48% | 0.31 -24% |
| Contrast (:1) | 942 | 1814 93% | 1119 19% | 1444 53% | 723 -23% | 922 -2% |
| Colorchecker dE 2000 * | 5.44 | 3 45% | 5.16 5% | 6 -10% | 4.21 23% | 5.84 -7% |
| Colorchecker dE 2000 max. * | 13.58 | 5.2 62% | 9.33 31% | 19.2 -41% | 21.1 -55% | 8.76 35% |
| Colorchecker dE 2000 calibrated * | 5.2 | 1.5 71% | 3.75 28% | 4.3 17% | 4.27 18% | 3.14 40% |
| Greyscale dE 2000 * | 3.1 | 3.5 -13% | 5.5 -77% | 4.2 -35% | 2.3 26% | 6.5 -110% |
| Gamma | 2.42 91% | 2.26 97% | 2 110% | 2.49 88% | 2.2 100% | 2.383 92% |
| CCT | 7070 92% | 7254 90% | 6198 105% | 6865 95% | 6578 99% | 7176 91% |
| Color Space (Percent of AdobeRGB 1998) (%) | 35.5 | 64.3 81% | 89.2 151% | 37.6 6% | 37.2 5% | 62 75% |
| Color Space (Percent of sRGB) (%) | 56.1 | 97.5 74% | 100 78% | 59.2 6% | 58.5 4% | 94 68% |
| Total Average (Program / Settings) | 32% /
46% | 39% /
41% | -14% /
-3% | -4% /
-3% | 19% /
18% |
* ... smaller is better
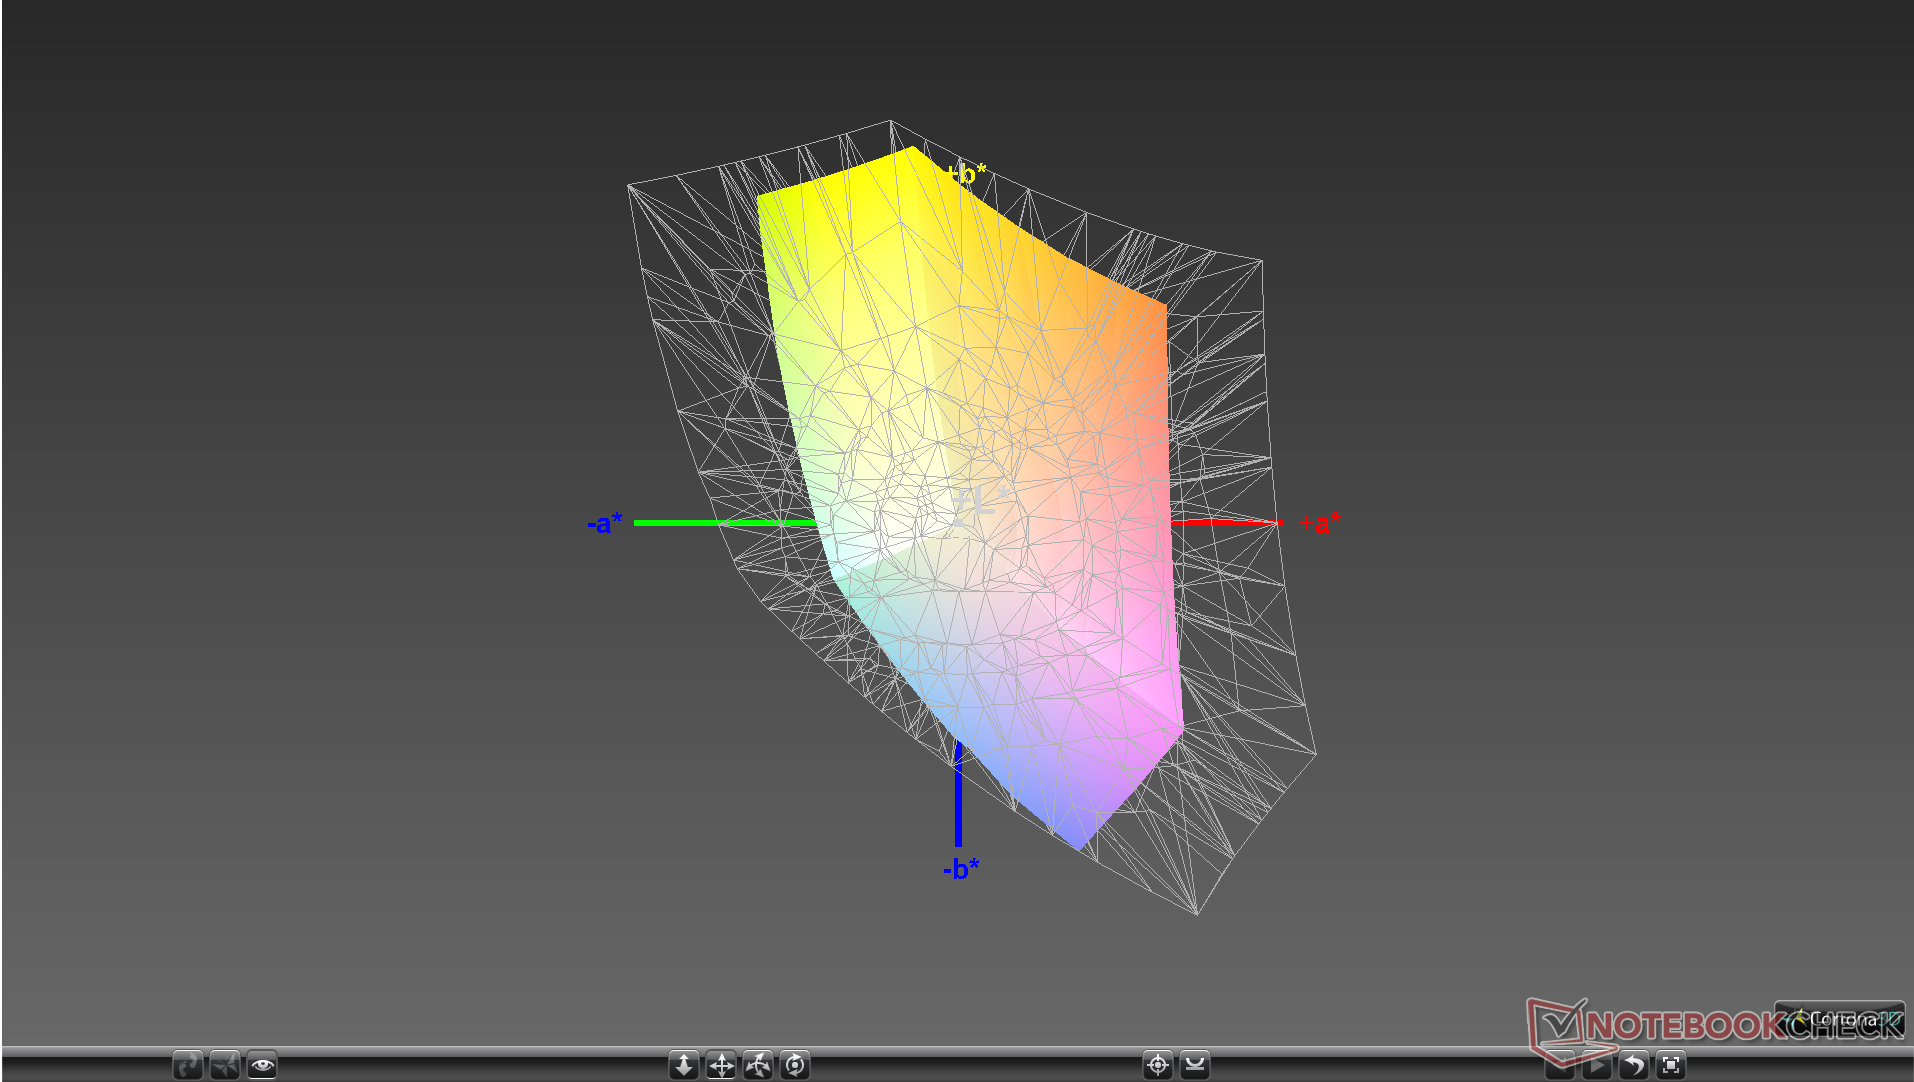
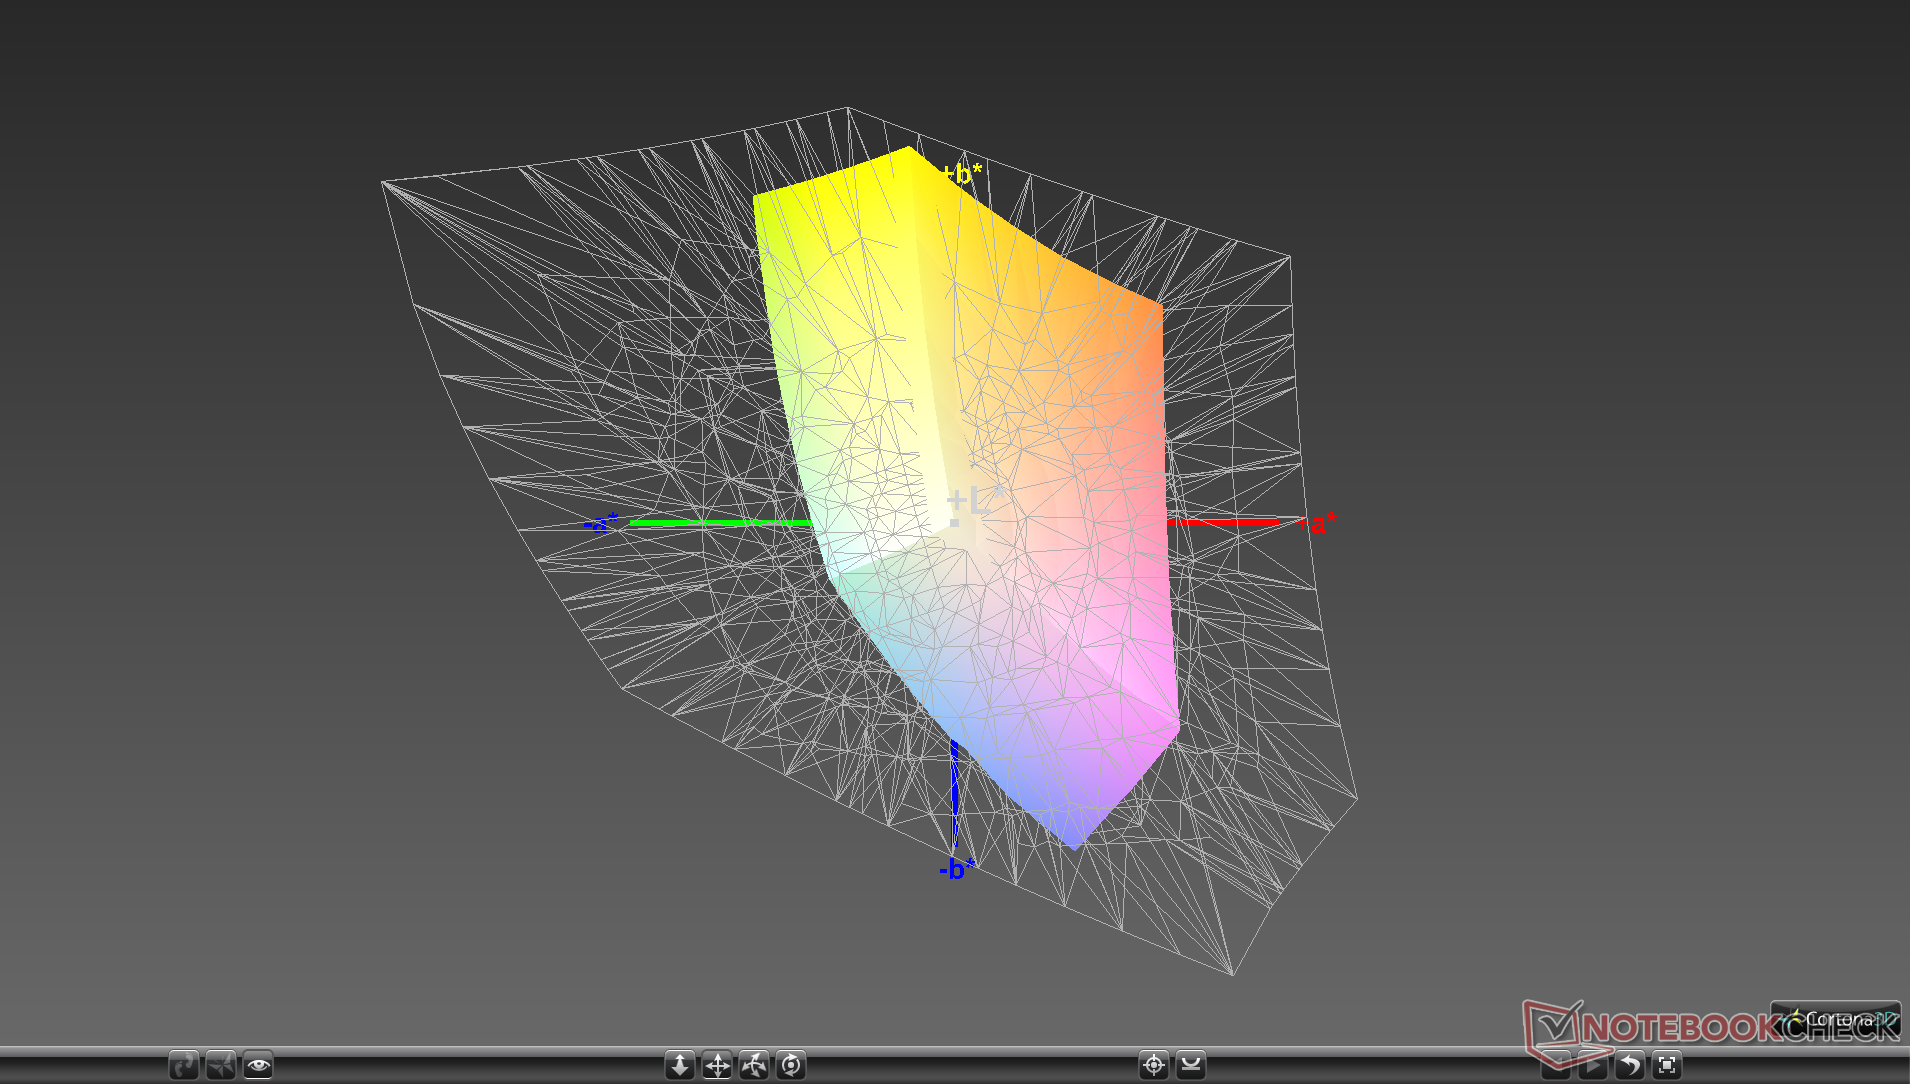
The display is decently calibrated out of the box with a color temperature leaning on the cool side. Our calibration fixes this, but colors remain average at best due to the limited color space mentioned above.


Display Response Times
| ↔ Response Time Black to White | ||
|---|---|---|
| 26.4 ms ... rise ↗ and fall ↘ combined | ↗ 14 ms rise | 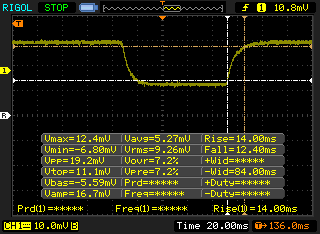 |
| ↘ 12.4 ms fall | ||
| The screen shows relatively slow response rates in our tests and may be too slow for gamers. In comparison, all tested devices range from 0.1 (minimum) to 240 (maximum) ms. » 66 % of all devices are better. This means that the measured response time is worse than the average of all tested devices (19.8 ms). | ||
| ↔ Response Time 50% Grey to 80% Grey | ||
| 29.6 ms ... rise ↗ and fall ↘ combined | ↗ 16.4 ms rise | 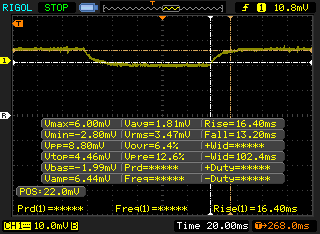 |
| ↘ 13.2 ms fall | ||
| The screen shows relatively slow response rates in our tests and may be too slow for gamers. In comparison, all tested devices range from 0.165 (minimum) to 636 (maximum) ms. » 40 % of all devices are better. This means that the measured response time is similar to the average of all tested devices (31 ms). | ||
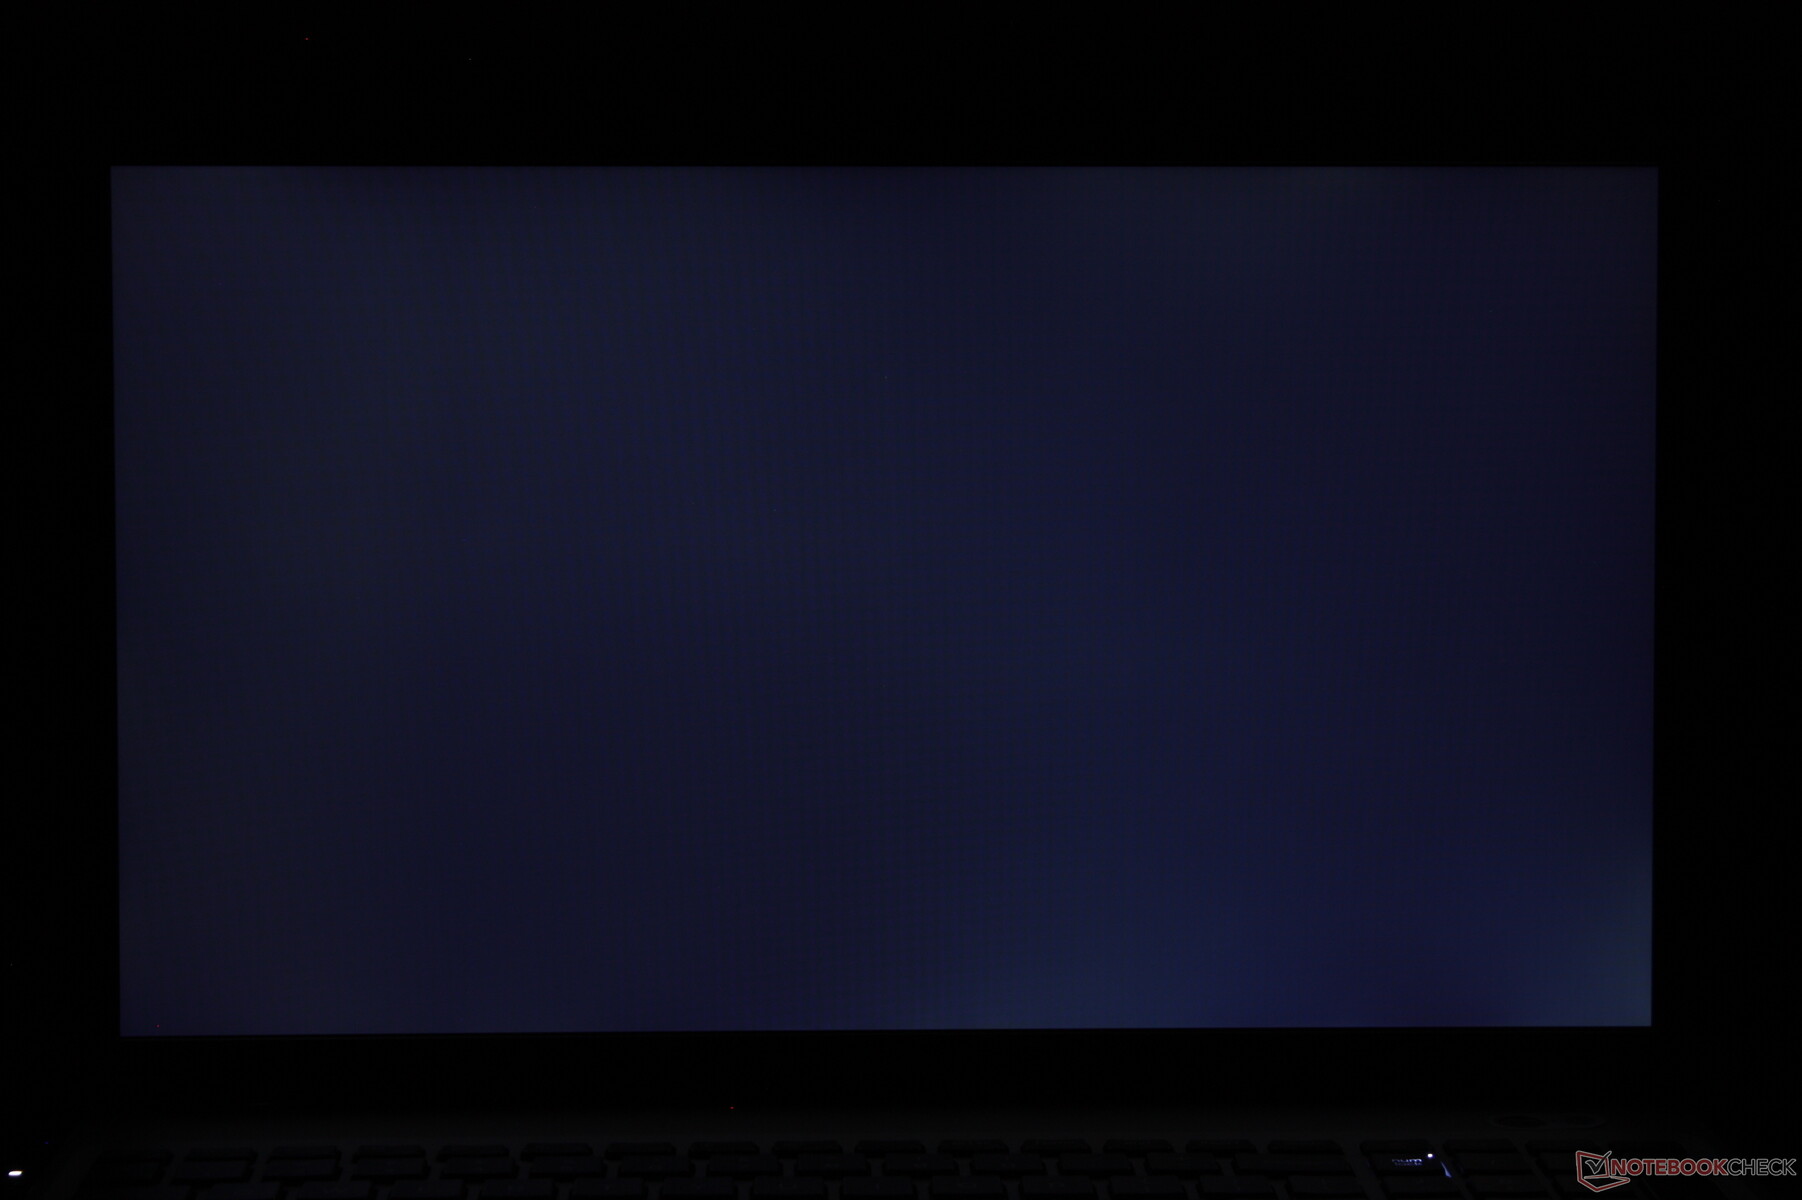
Screen Flickering / PWM (Pulse-Width Modulation)
| Screen flickering / PWM not detected | 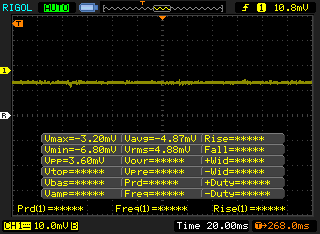 | ||
In comparison: 52 % of all tested devices do not use PWM to dim the display. If PWM was detected, an average of 7769 (minimum: 5 - maximum: 343500) Hz was measured. | |||
Performance
Processor
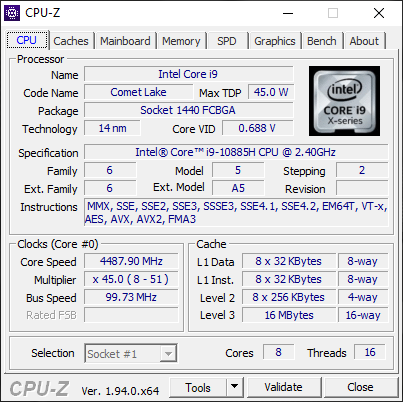
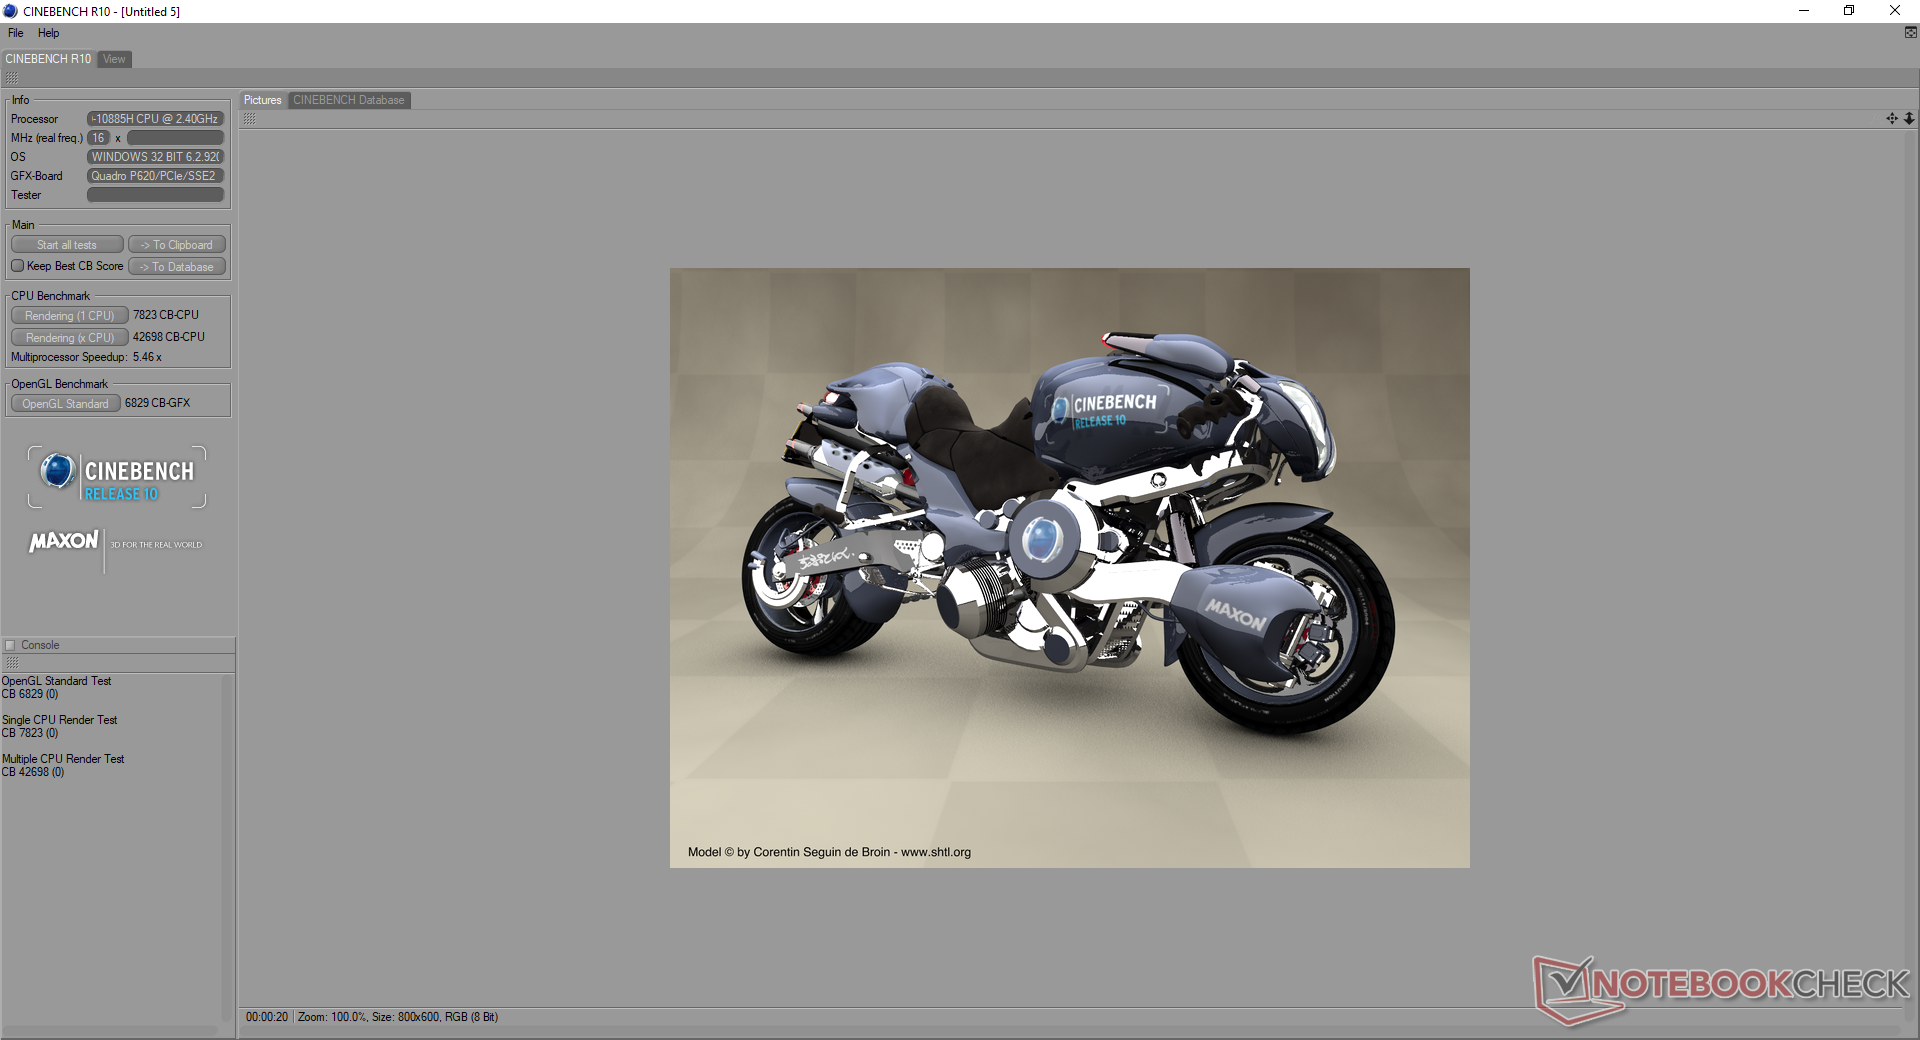
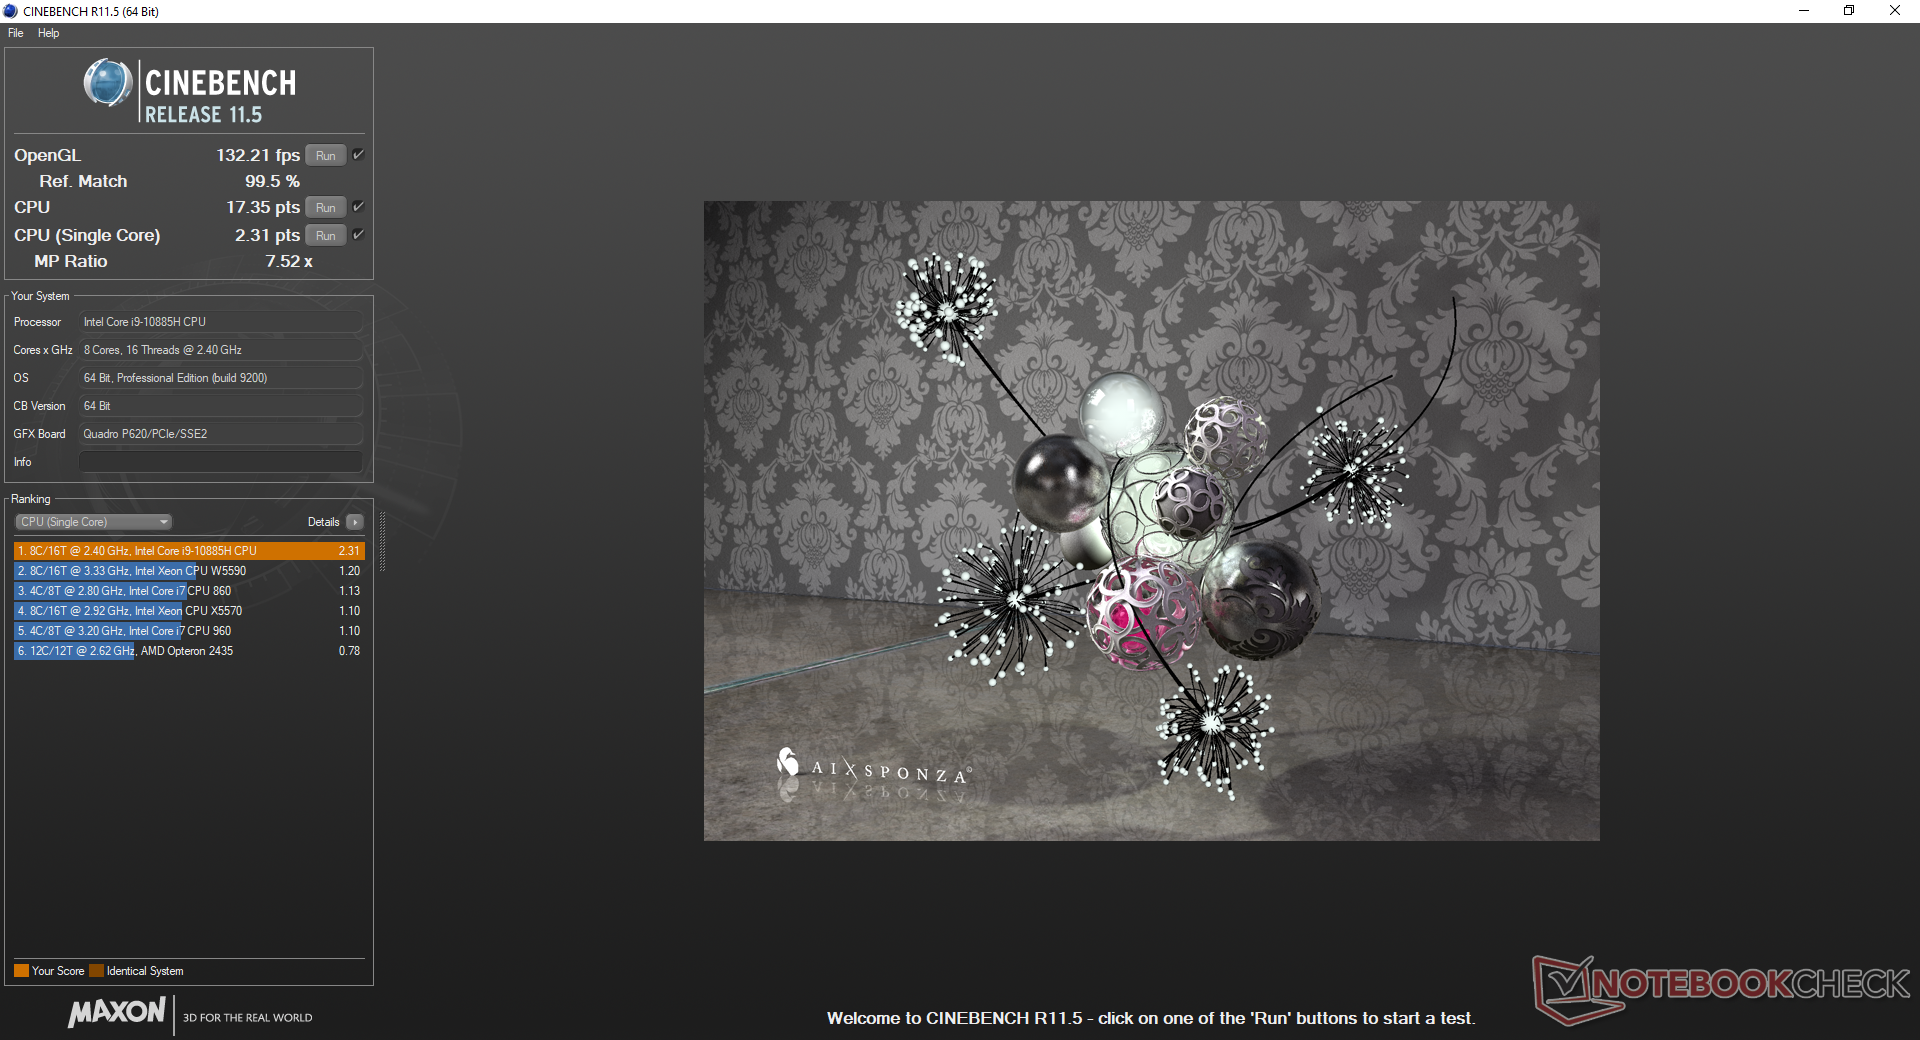
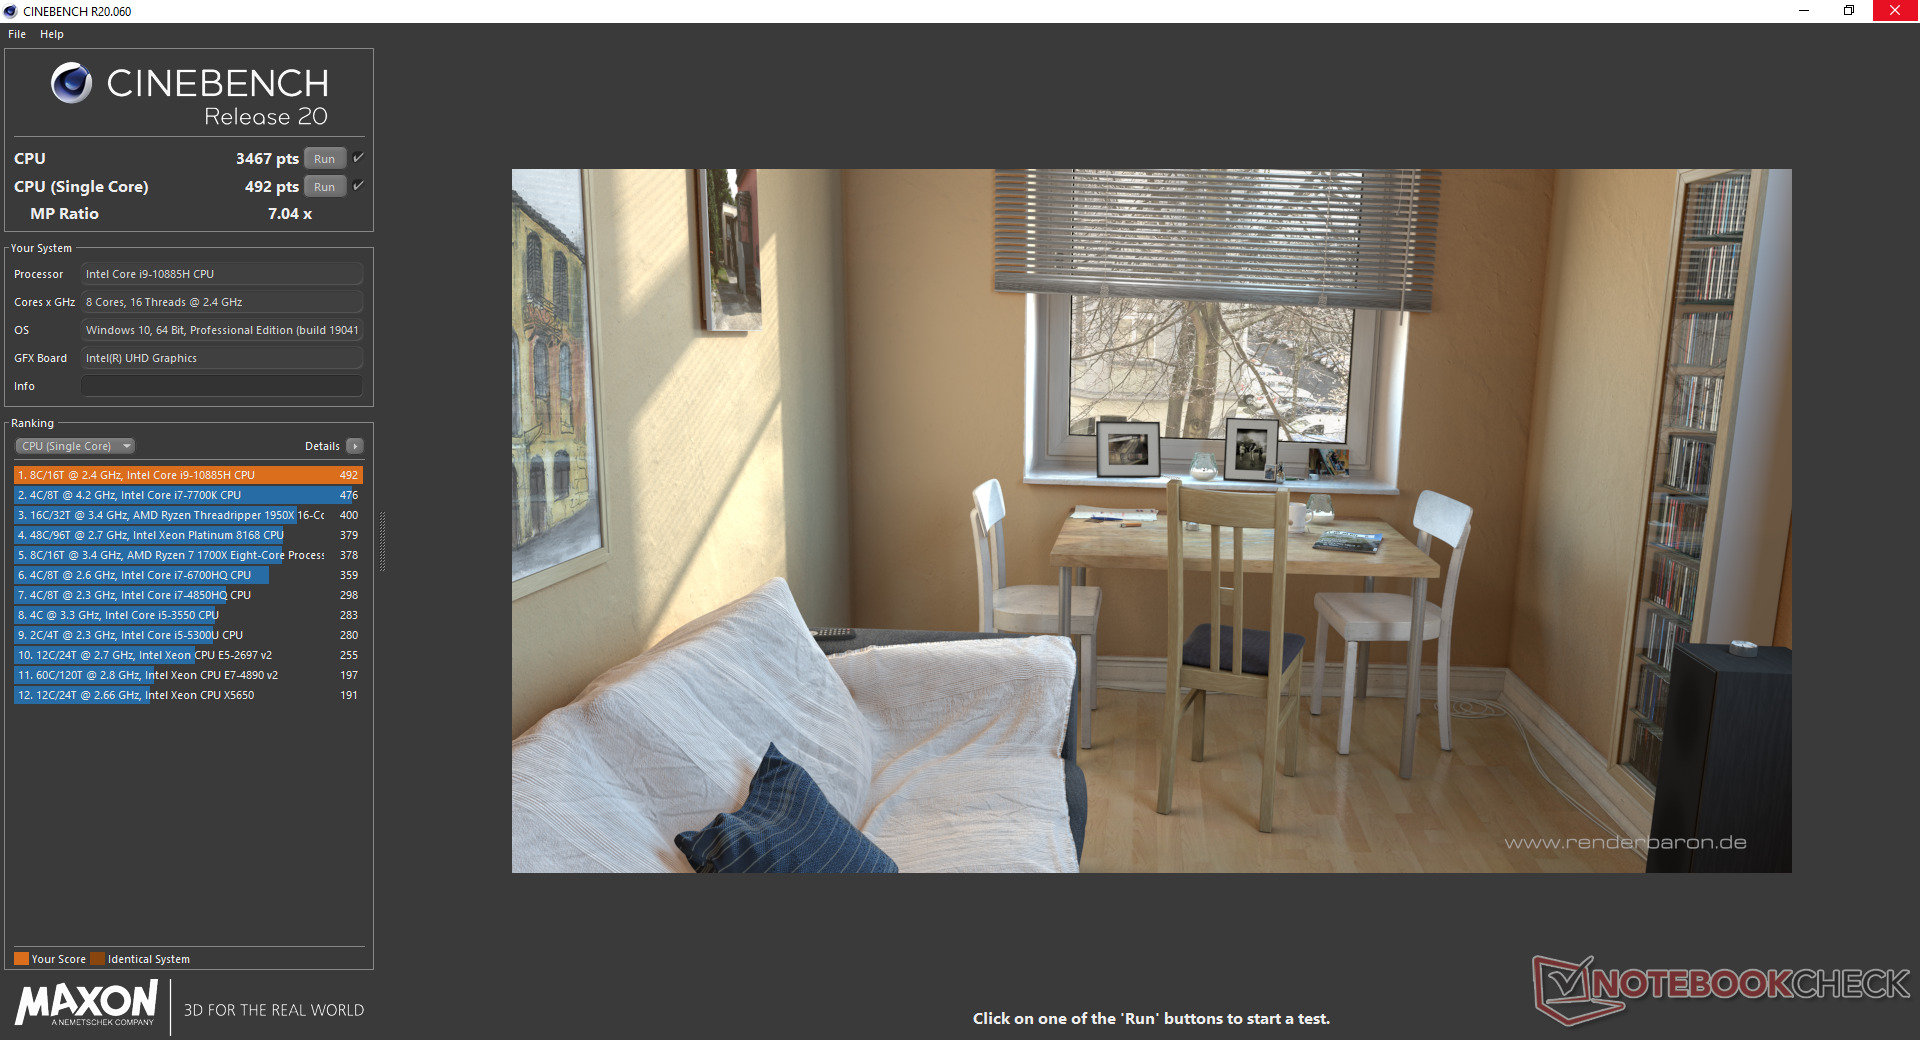
CPU performance is almost 20 percent slower than the non-vPro-enabled Core i7-10875H in the Precision 5550 according to CineBench benchmarks. Raw performance is nonetheless almost 1.5x faster than the Precision 3550 if it were configured with the Core i7-10510U.
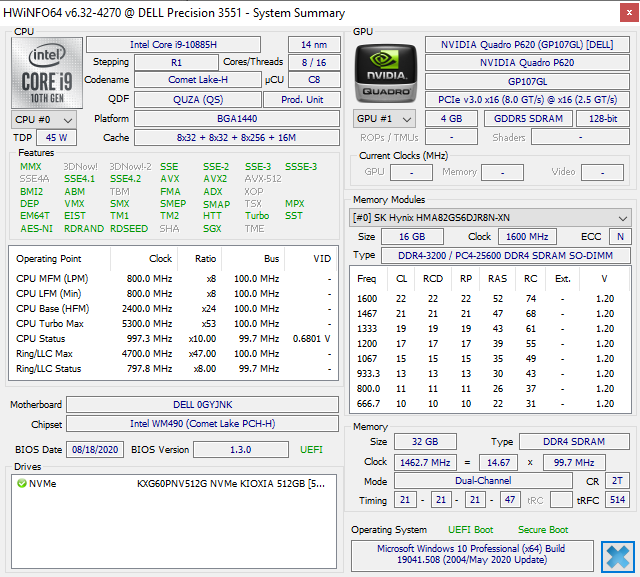
See our dedicated page on the Core i9-10885H for more technical information and benchmarks. Our unit was set to Ultra Performance mode via the Dell Power Manager software prior to running these benchmarks.
(October 16, 2020 update: Dell has confirmed that the Precision 3551 uses a 35 W CPU design while the Latitude 7550 is a 45 W design which explains why our Core i9 Precision can perform slower in multi-threaded workloads than a Core i7 Latitude.)
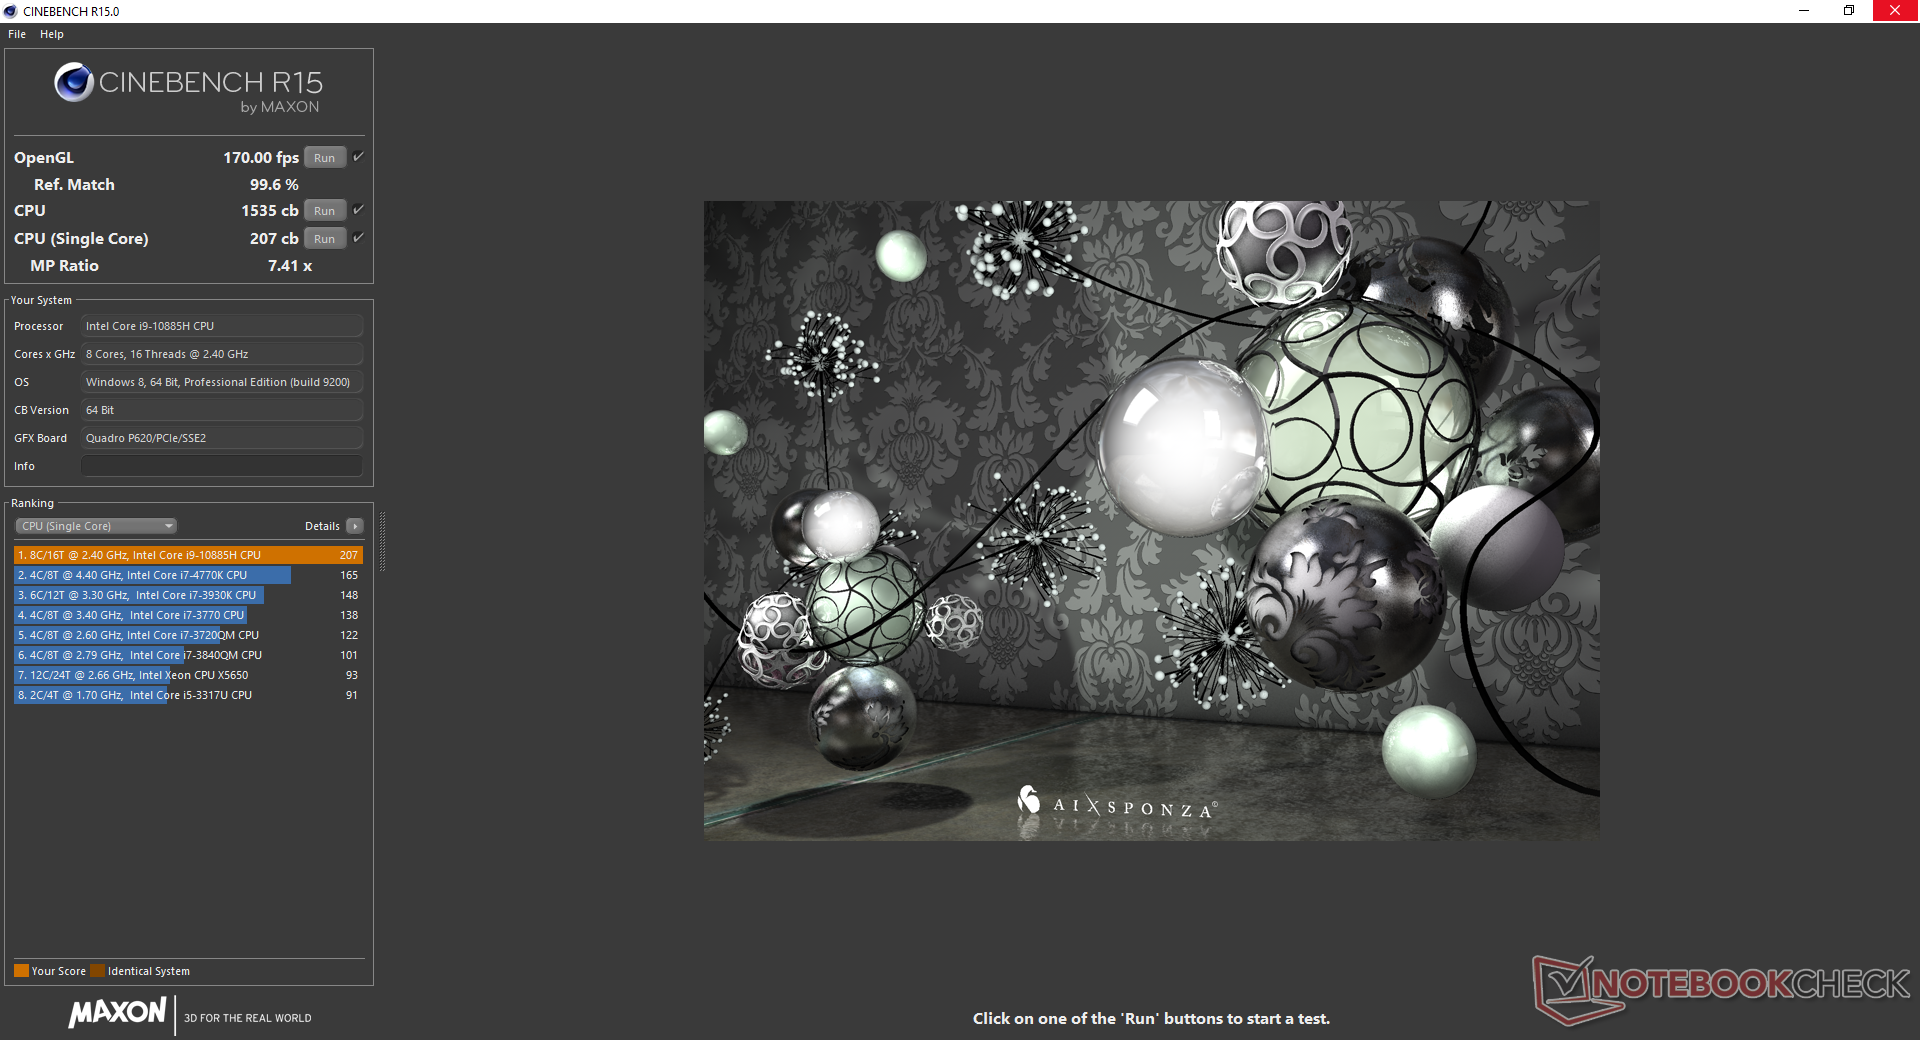
Cinebench R15: CPU Multi 64Bit | CPU Single 64Bit
Blender: v2.79 BMW27 CPU
7-Zip 18.03: 7z b 4 -mmt1 | 7z b 4
Geekbench 5.5: Single-Core | Multi-Core
HWBOT x265 Benchmark v2.2: 4k Preset
LibreOffice : 20 Documents To PDF
R Benchmark 2.5: Overall mean
| Cinebench R20 / CPU (Multi Core) | |
| MSI WS66 10TMT-207US | |
| Dell Precision 7550 | |
| Dell Precision 5550 P91F | |
| Average Intel Core i9-10885H (2798 - 3762, n=3) | |
| Dell Precision 3000 3551 | |
| Acer ConceptD 3 Pro CN315-71P-73W1 | |
| Lenovo ThinkPad P1 2019-20QT000RGE | |
| HP ZBook Firefly 15 G7 | |
| Acer TravelMate P215-52 | |
| Cinebench R20 / CPU (Single Core) | |
| MSI WS66 10TMT-207US | |
| Dell Precision 5550 P91F | |
| Dell Precision 7550 | |
| Average Intel Core i9-10885H (460 - 513, n=3) | |
| HP ZBook Firefly 15 G7 | |
| Dell Precision 3000 3551 | |
| Acer ConceptD 3 Pro CN315-71P-73W1 | |
| Lenovo ThinkPad P1 2019-20QT000RGE | |
| Acer TravelMate P215-52 | |
| Geekbench 5.5 / Single-Core | |
| MSI WS66 10TMT-207US | |
| Dell Precision 7550 | |
| Dell Precision 5550 P91F | |
| Average Intel Core i9-10885H (1216 - 1376, n=3) | |
| HP ZBook Firefly 15 G7 | |
| Dell Precision 3000 3551 | |
| Acer ConceptD 3 Pro CN315-71P-73W1 | |
| Acer TravelMate P215-52 | |
| Geekbench 5.5 / Multi-Core | |
| Dell Precision 5550 P91F | |
| Dell Precision 7550 | |
| MSI WS66 10TMT-207US | |
| Average Intel Core i9-10885H (6529 - 7693, n=3) | |
| Dell Precision 3000 3551 | |
| Acer ConceptD 3 Pro CN315-71P-73W1 | |
| HP ZBook Firefly 15 G7 | |
| Acer TravelMate P215-52 | |
| LibreOffice / 20 Documents To PDF | |
| HP ZBook Firefly 15 G7 | |
| Acer ConceptD 3 Pro CN315-71P-73W1 | |
| Acer TravelMate P215-52 | |
| Average Intel Core i9-10885H (45.9 - 59.6, n=3) | |
| Dell Precision 7550 | |
| Dell Precision 3000 3551 | |
| MSI WS66 10TMT-207US | |
| Dell Precision 5550 P91F | |
| R Benchmark 2.5 / Overall mean | |
| Acer TravelMate P215-52 | |
| Acer ConceptD 3 Pro CN315-71P-73W1 | |
| HP ZBook Firefly 15 G7 | |
| Dell Precision 5550 P91F | |
| MSI WS66 10TMT-207US | |
| Dell Precision 3000 3551 | |
| Dell Precision 7550 | |
| Average Intel Core i9-10885H (0.564 - 0.572, n=3) | |
Cinebench R15: CPU Multi 64Bit | CPU Single 64Bit
Blender: v2.79 BMW27 CPU
7-Zip 18.03: 7z b 4 -mmt1 | 7z b 4
Geekbench 5.5: Single-Core | Multi-Core
HWBOT x265 Benchmark v2.2: 4k Preset
LibreOffice : 20 Documents To PDF
R Benchmark 2.5: Overall mean
* ... smaller is better
System Performance
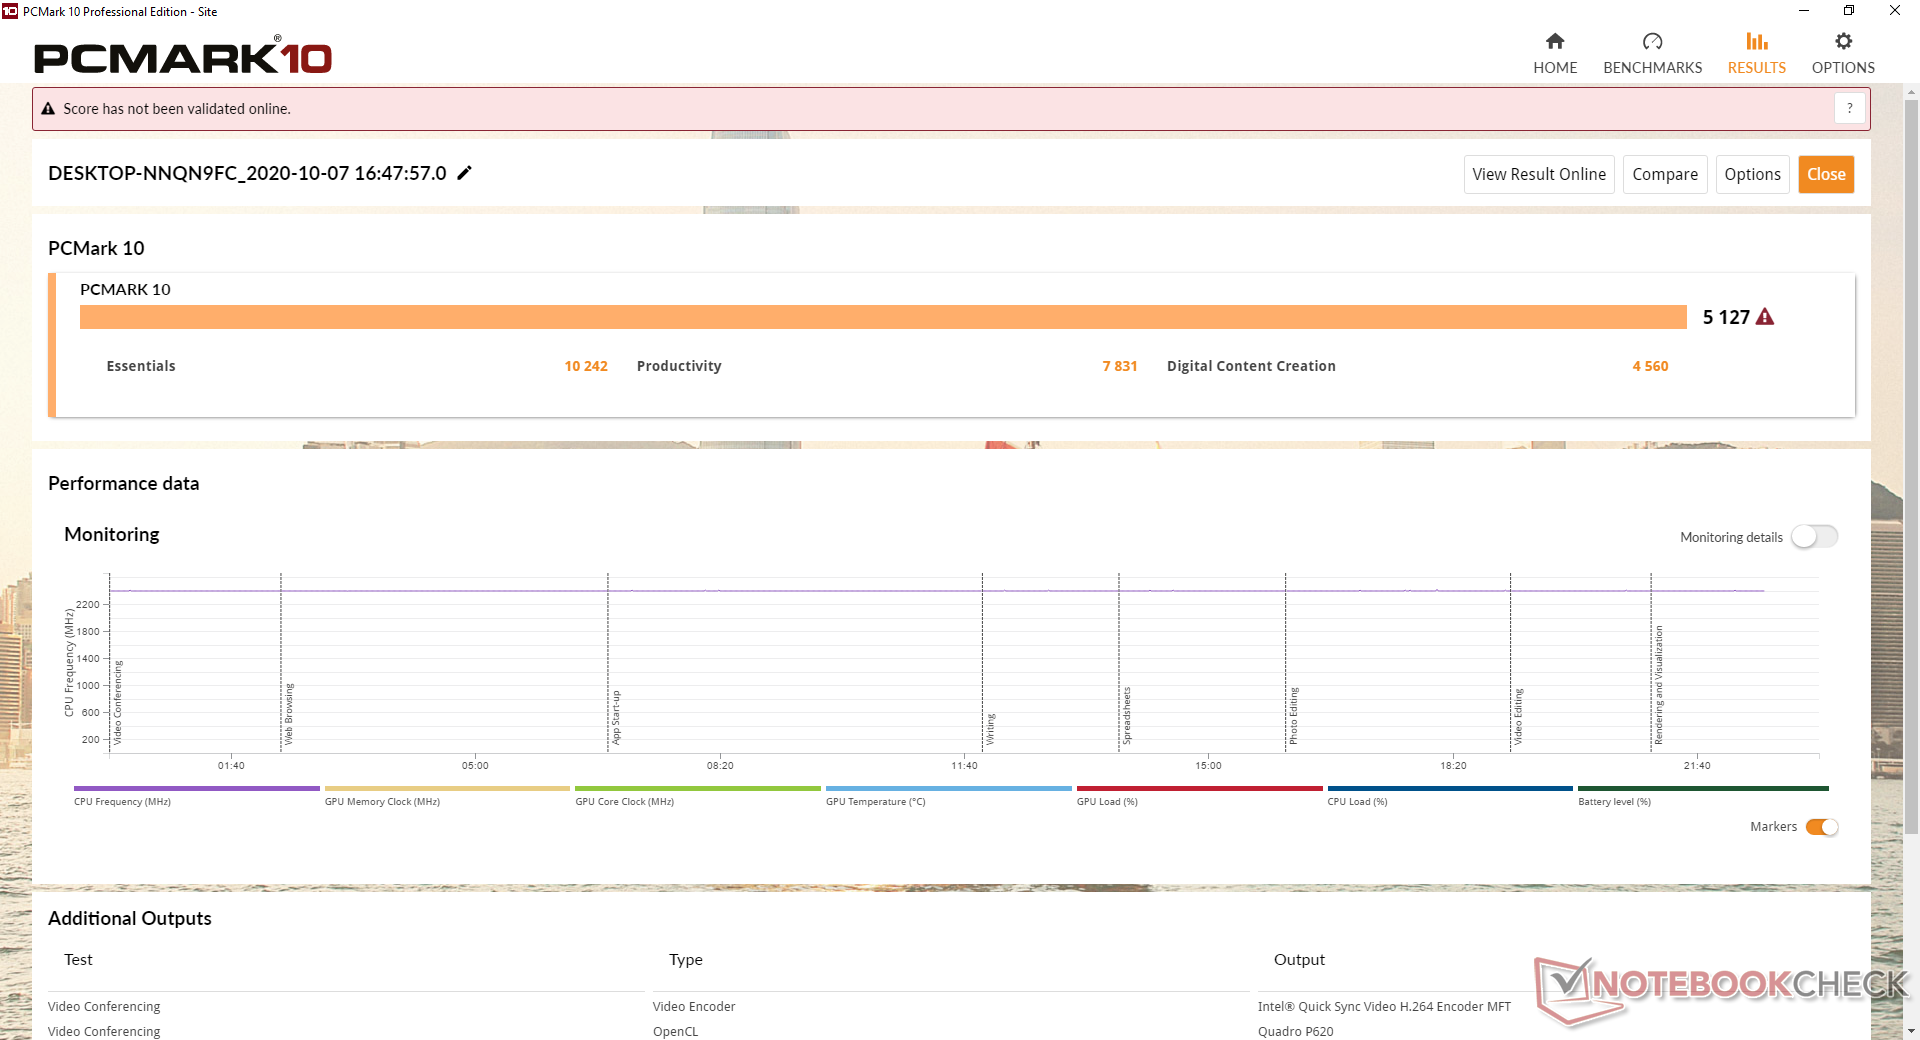
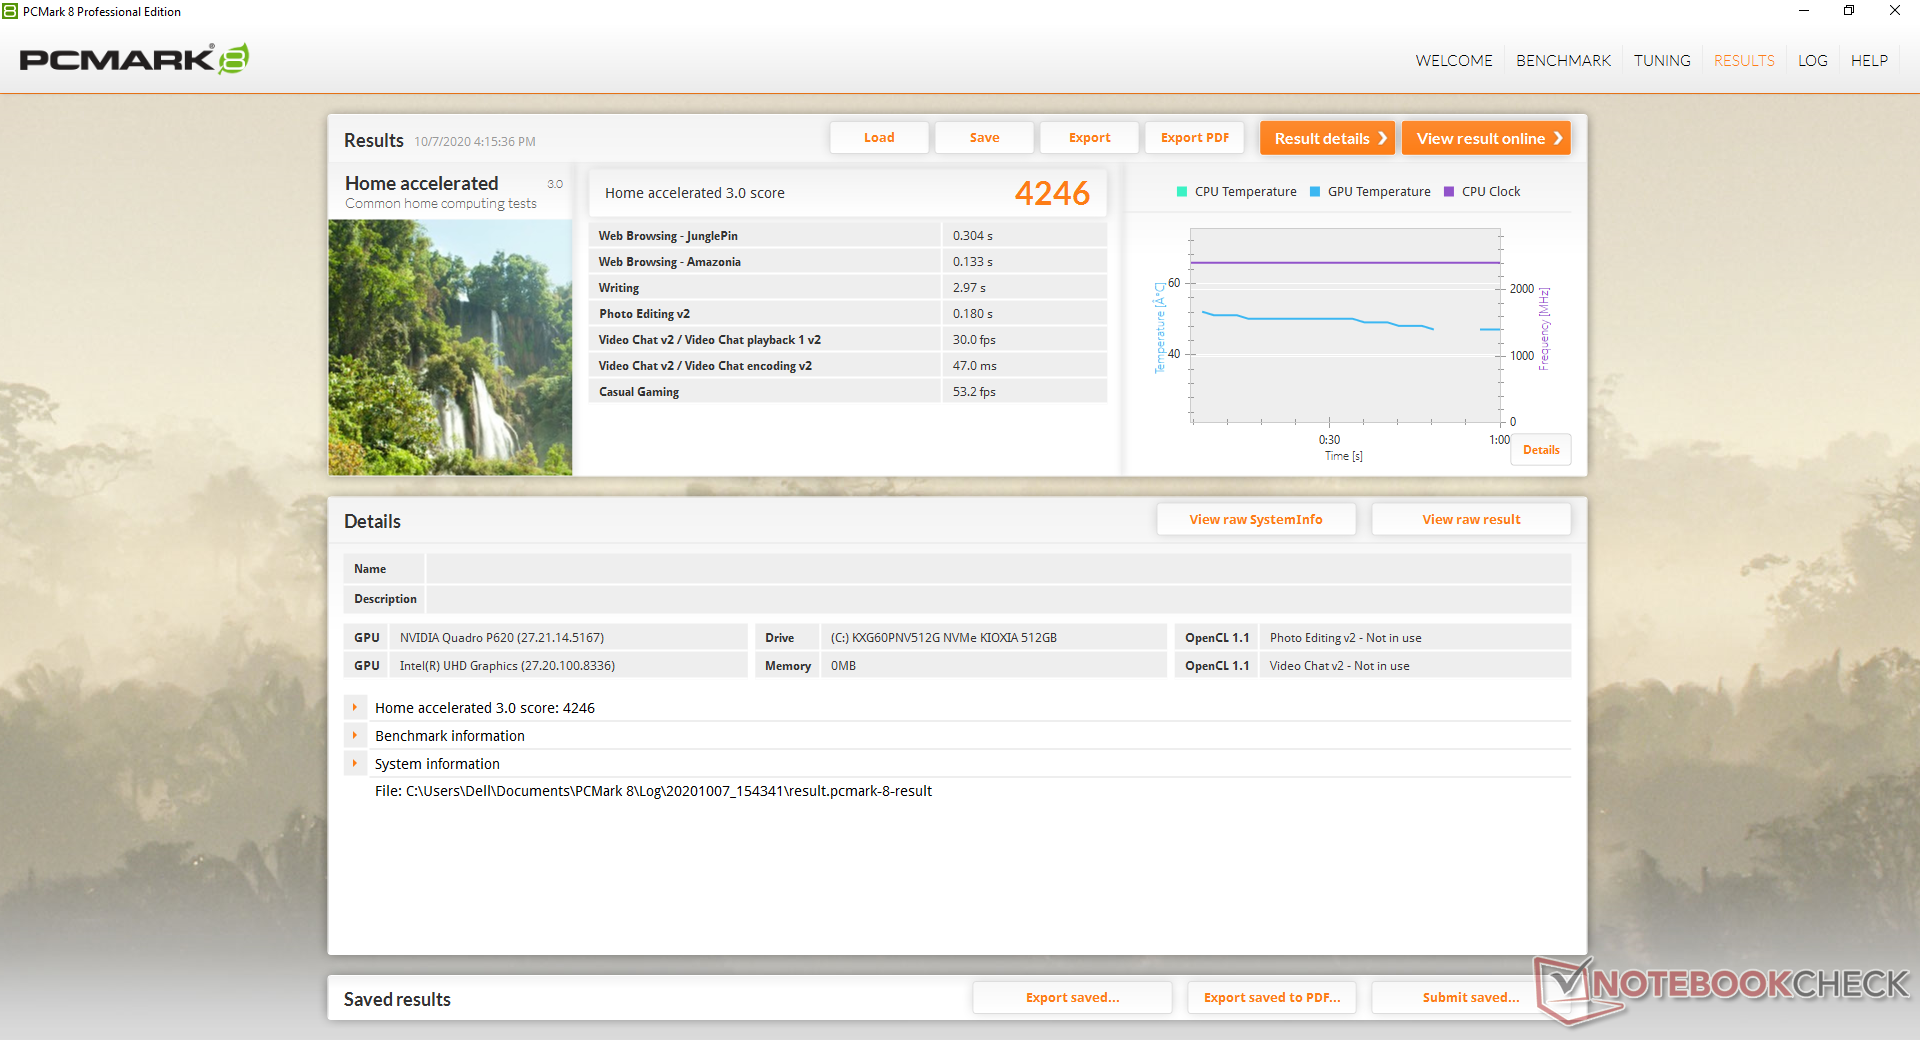
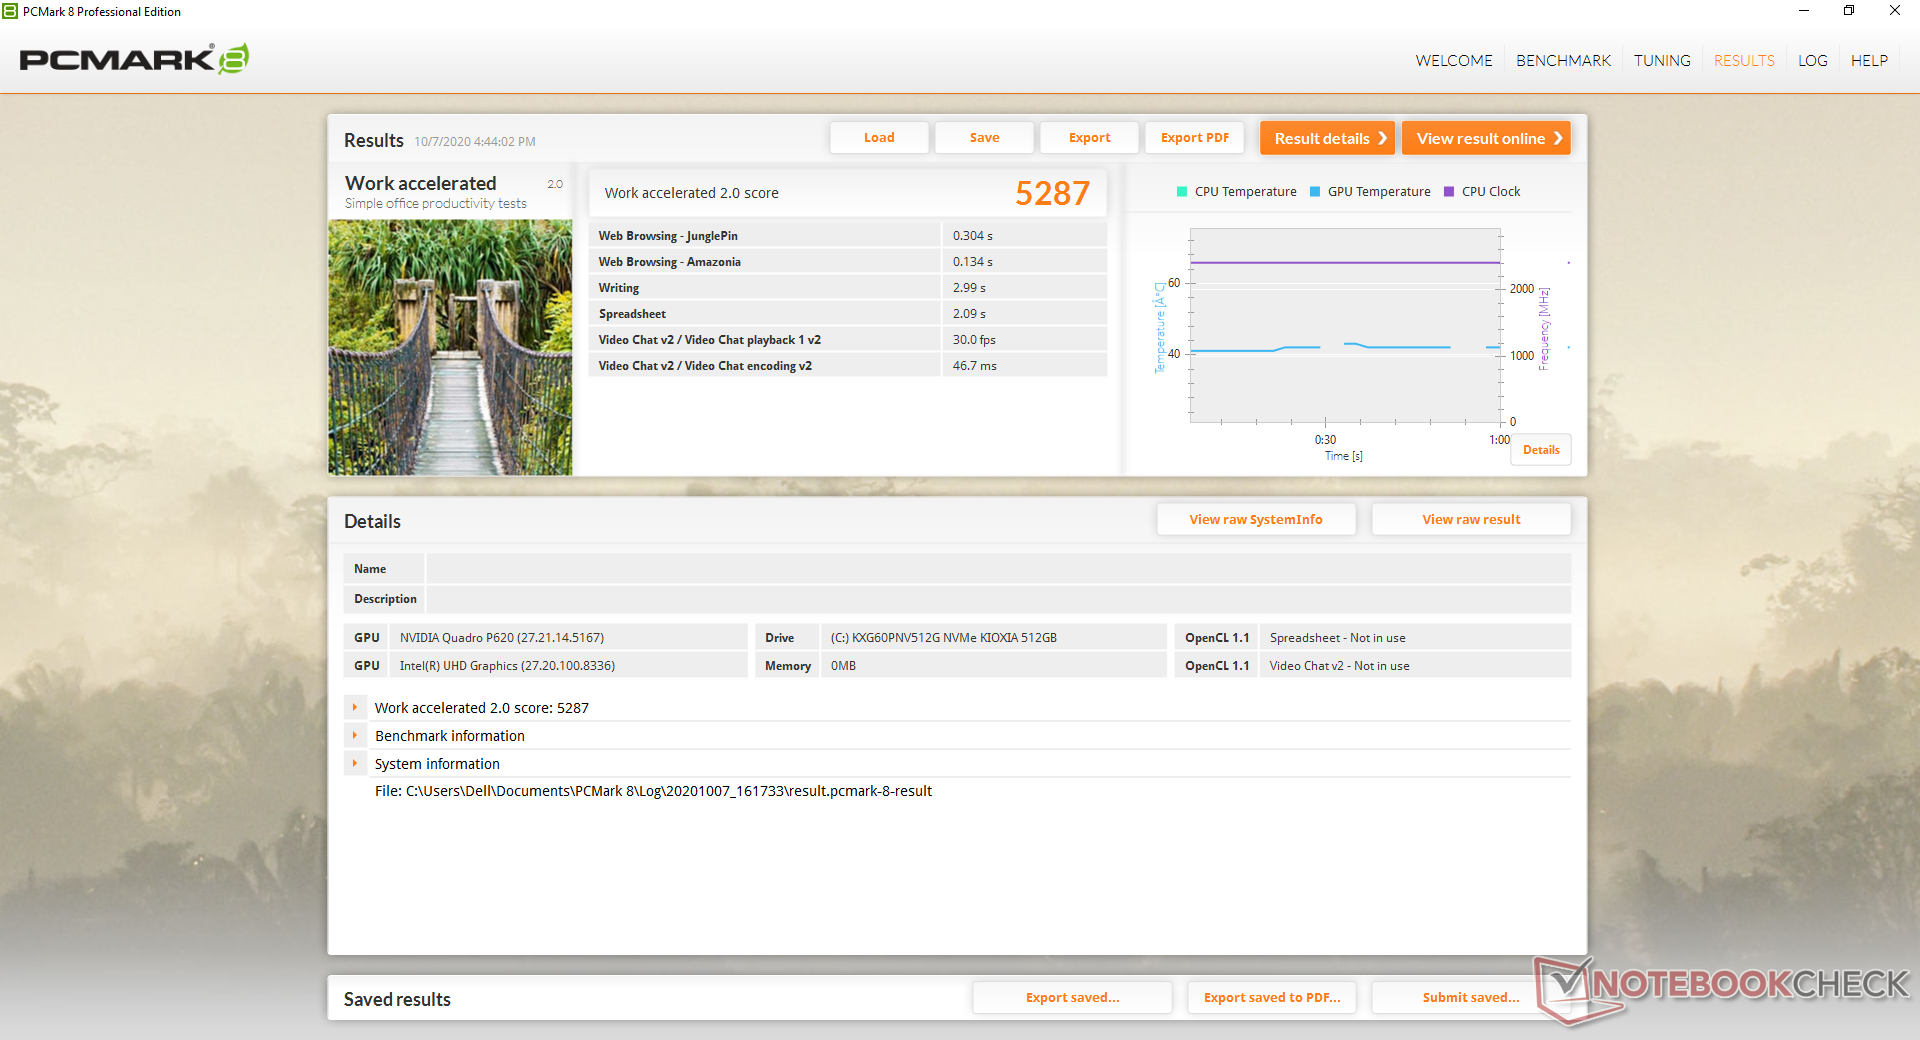
| PCMark 8 Home Score Accelerated v2 | 4246 points | |
| PCMark 8 Work Score Accelerated v2 | 5287 points | |
| PCMark 10 Score | 5127 points | |
Help | ||
DPC Latency
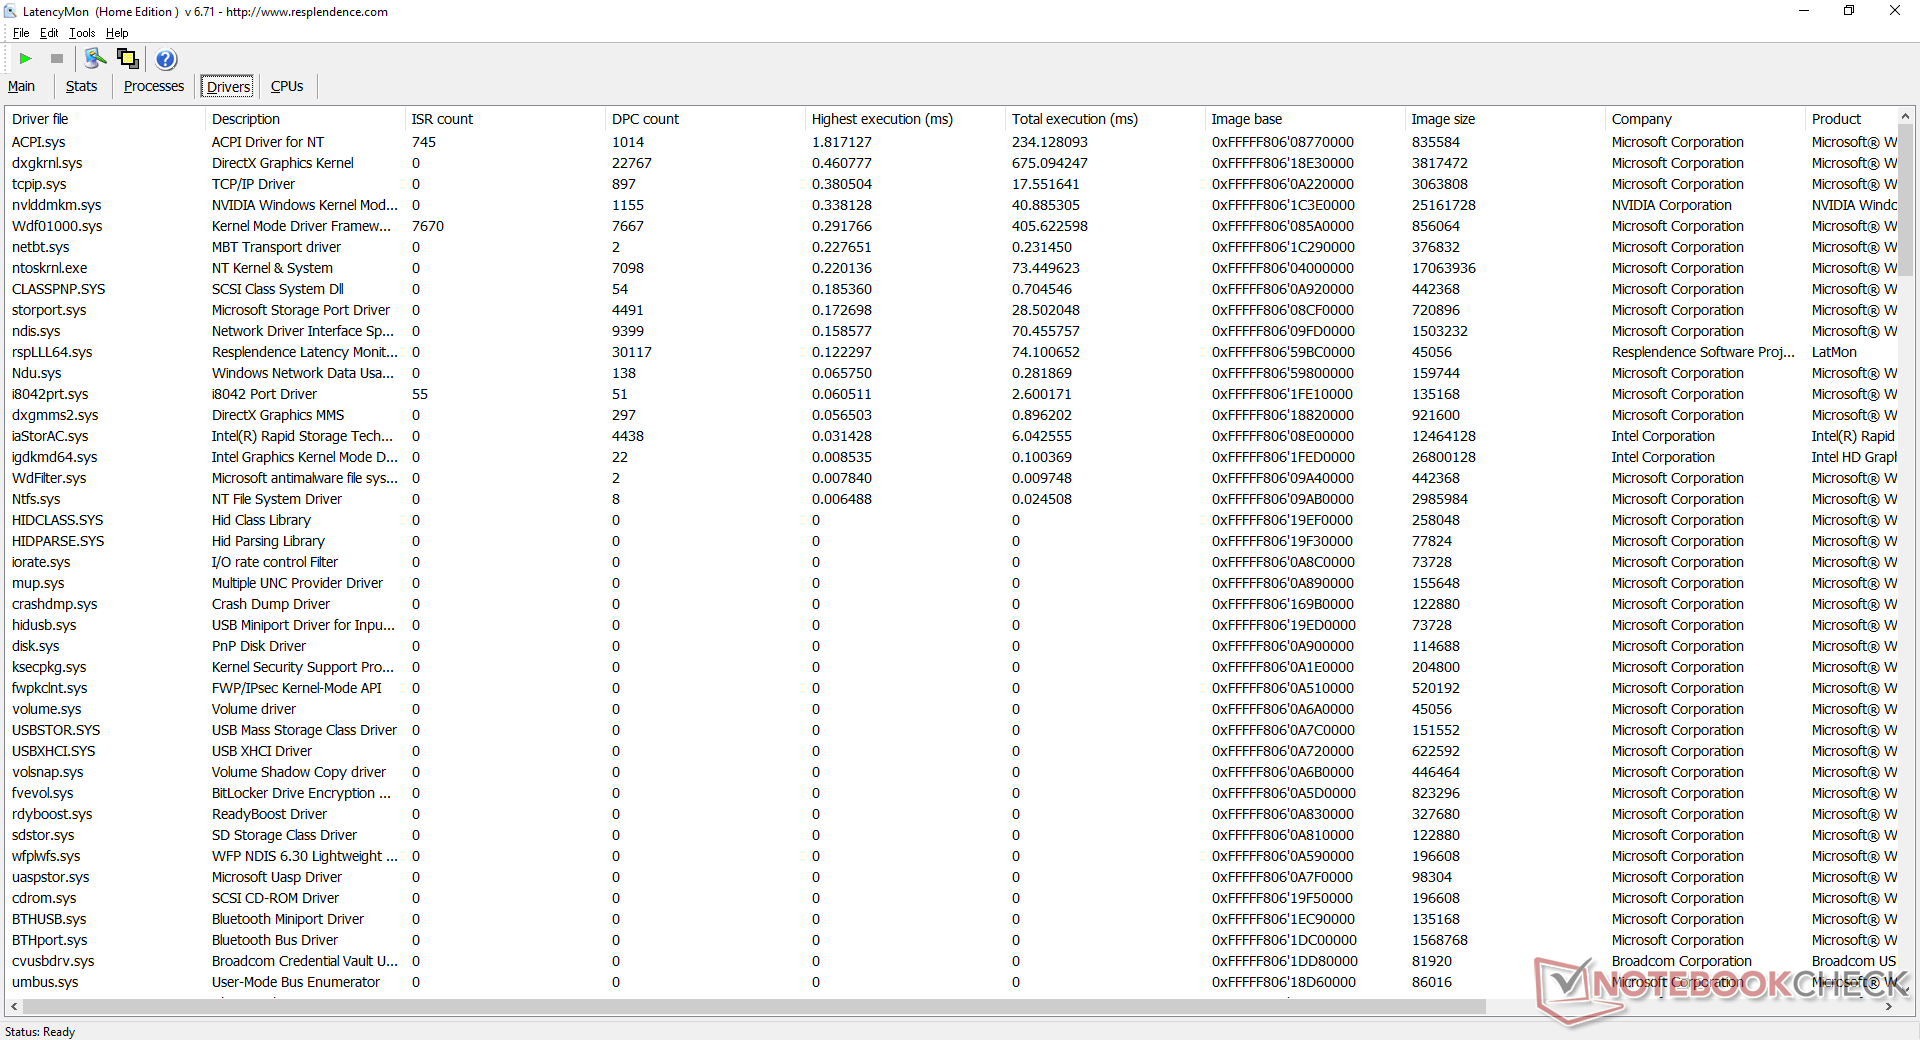
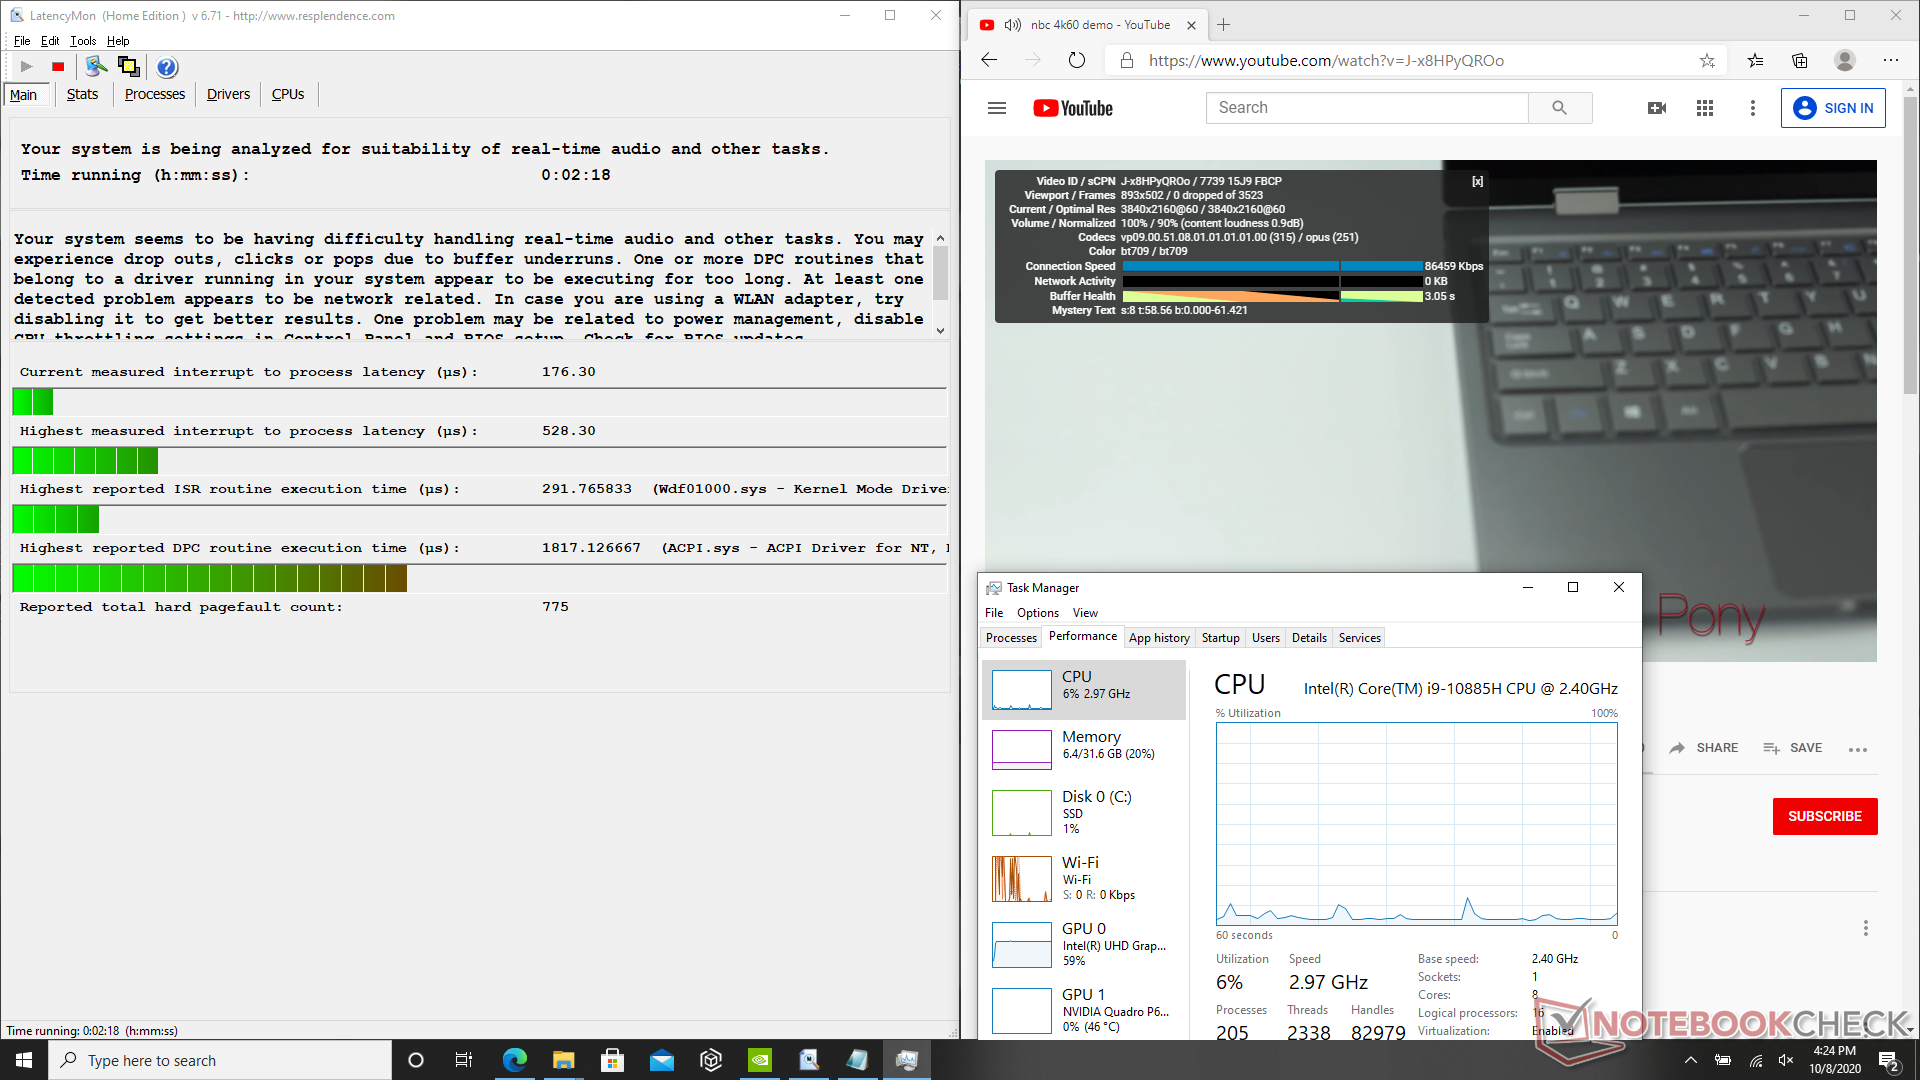
| DPC Latencies / LatencyMon - interrupt to process latency (max), Web, Youtube, Prime95 | |
| Dell Precision 7550 | |
| HP ZBook Firefly 15 G7 | |
| MSI WS66 10TMT-207US | |
| Dell Precision 3000 3551 | |
| Dell Precision 5000 5750 P92F | |
| Dell Precision 5550 P91F | |
* ... smaller is better
Storage Devices
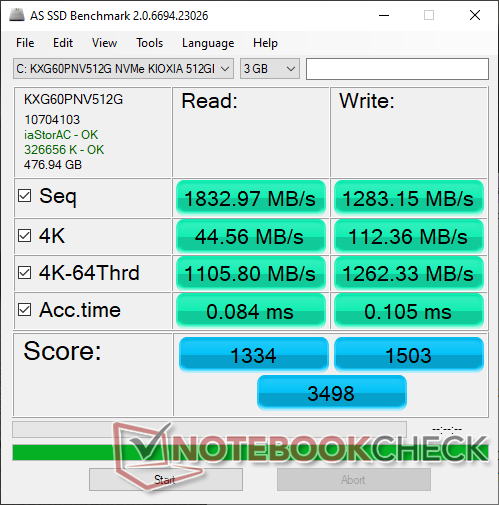
| Dell Precision 3000 3551 Toshiba Kioxia XG6 KXG60PNV512G | HP ZBook Firefly 15 G7 Toshiba XG6 KXG60ZNV1T02 | Dell Precision 5550 P91F SK Hynix PC601A NVMe 1TB | Lenovo ThinkPad P53s-20N6001NGE Intel SSD 760p SSDPEKKW256G8 | MSI WP65 Samsung SSD PM981 MZVLB512HAJQ | Dell Precision 3530 SK hynix PC400 512 GB | |
|---|---|---|---|---|---|---|
| AS SSD | 13% | -53% | 4% | 10% | -13% | |
| Seq Read (MB/s) | 1833 | 2666 45% | 2039 11% | 2283 25% | 1097 -40% | 2682 46% |
| Seq Write (MB/s) | 1283 | 1257 -2% | 1376 7% | 1042 -19% | 1838 43% | 1272 -1% |
| 4K Read (MB/s) | 44.56 | 48.04 8% | 44.11 -1% | 46.62 5% | 52.9 19% | 25.98 -42% |
| 4K Write (MB/s) | 112.4 | 137.5 22% | 113.3 1% | 172.6 54% | 108.4 -4% | 102.8 -9% |
| 4K-64 Read (MB/s) | 1106 | 977 -12% | 1094 -1% | 759 -31% | 1509 36% | 994 -10% |
| 4K-64 Write (MB/s) | 1262 | 1142 -10% | 1630 29% | 916 -27% | 1695 34% | 908 -28% |
| Access Time Read * (ms) | 0.084 | 0.053 37% | 0.059 30% | 0.06 29% | 0.067 20% | 0.099 -18% |
| Access Time Write * (ms) | 0.105 | 0.03 71% | 0.99 -843% | 0.022 79% | 0.103 2% | 0.053 50% |
| Score Read (Points) | 1334 | 1292 -3% | 1342 1% | 1034 -22% | 1671 25% | 1288 -3% |
| Score Write (Points) | 1503 | 1406 -6% | 1881 25% | 1192 -21% | 1988 32% | 1138 -24% |
| Score Total (Points) | 3498 | 3297 -6% | 3883 11% | 2705 -23% | 4558 30% | 3013 -14% |
| Copy ISO MB/s (MB/s) | 2940 | 2489 -15% | 1800 -39% | 1701 -42% | ||
| Copy Program MB/s (MB/s) | 733 | 682 -7% | 569 -22% | 346.1 -53% | ||
| Copy Game MB/s (MB/s) | 1442 | 1515 5% | 1409 -2% | 1050 -27% | ||
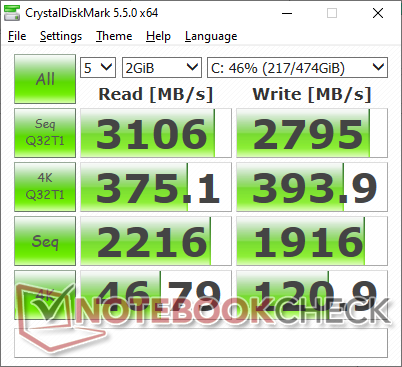
| CrystalDiskMark 5.2 / 6 | 8% | -2% | 16% | 3% | -14% | |
| Write 4K (MB/s) | 120.9 | 133.1 10% | 122.6 1% | 195.9 62% | 126.9 5% | 113.6 -6% |
| Read 4K (MB/s) | 46.79 | 51.6 10% | 42.4 -9% | 74.9 60% | 44.91 -4% | 41.18 -12% |
| Write Seq (MB/s) | 1916 | 1986 4% | 2167 13% | 1194 -38% | 1944 1% | 1417 -26% |
| Read Seq (MB/s) | 2216 | 2208 0% | 1747 -21% | 2309 4% | 1449 -35% | 1896 -14% |
| Write 4K Q32T1 (MB/s) | 393.9 | 462.3 17% | 388.8 -1% | 507 29% | 531 35% | 355 -10% |
| Read 4K Q32T1 (MB/s) | 375.1 | 400.2 7% | 367.3 -2% | 624 66% | 579 54% | 404.3 8% |
| Write Seq Q32T1 (MB/s) | 2795 | 3074 10% | 2629 -6% | 1206 -57% | 1970 -30% | 1411 -50% |
| Read Seq Q32T1 (MB/s) | 3106 | 3268 5% | 3460 11% | 3091 0% | 2990 -4% | 3095 0% |
| Total Average (Program / Settings) | 11% /
11% | -28% /
-35% | 10% /
9% | 7% /
7% | -14% /
-13% |
* ... smaller is better

Disk Throttling: DiskSpd Read Loop, Queue Depth 8
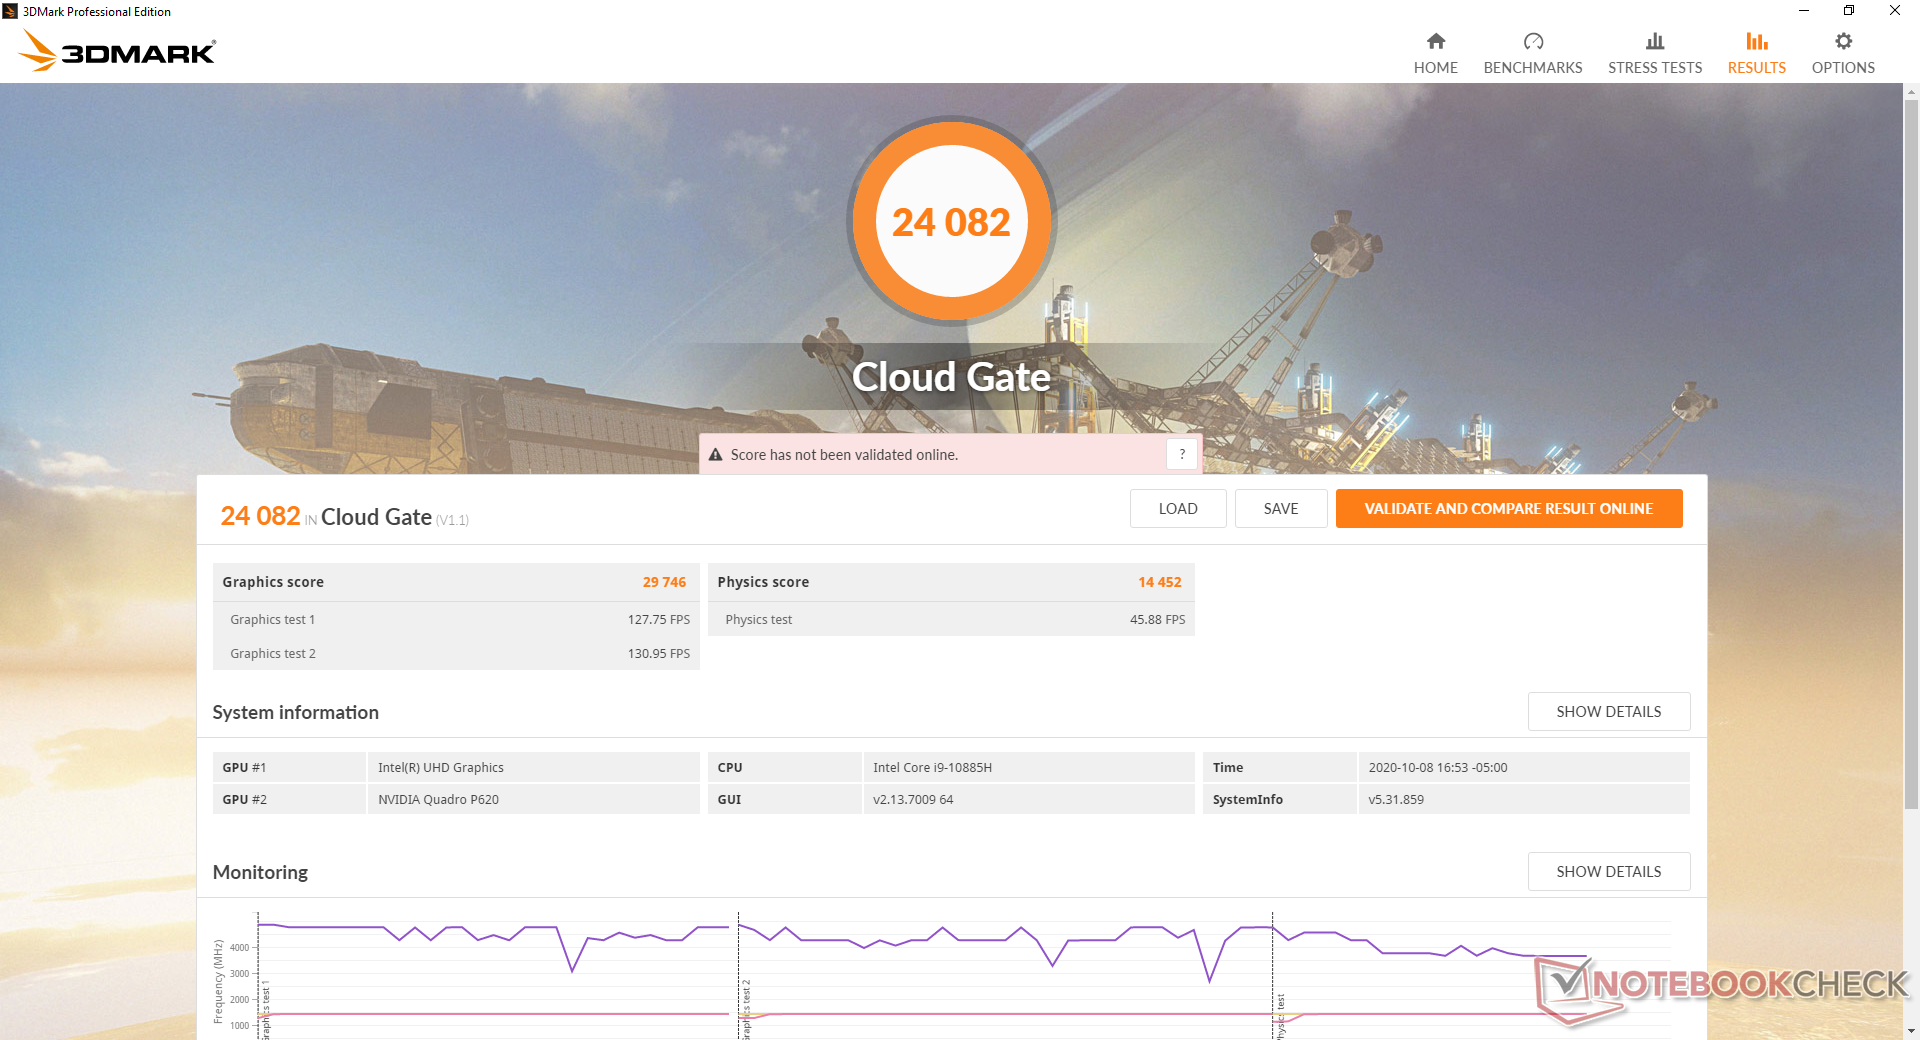
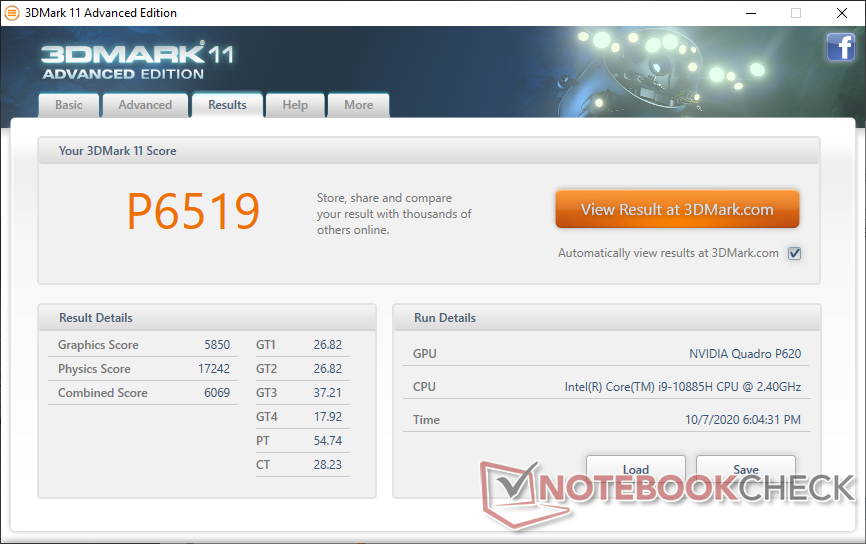
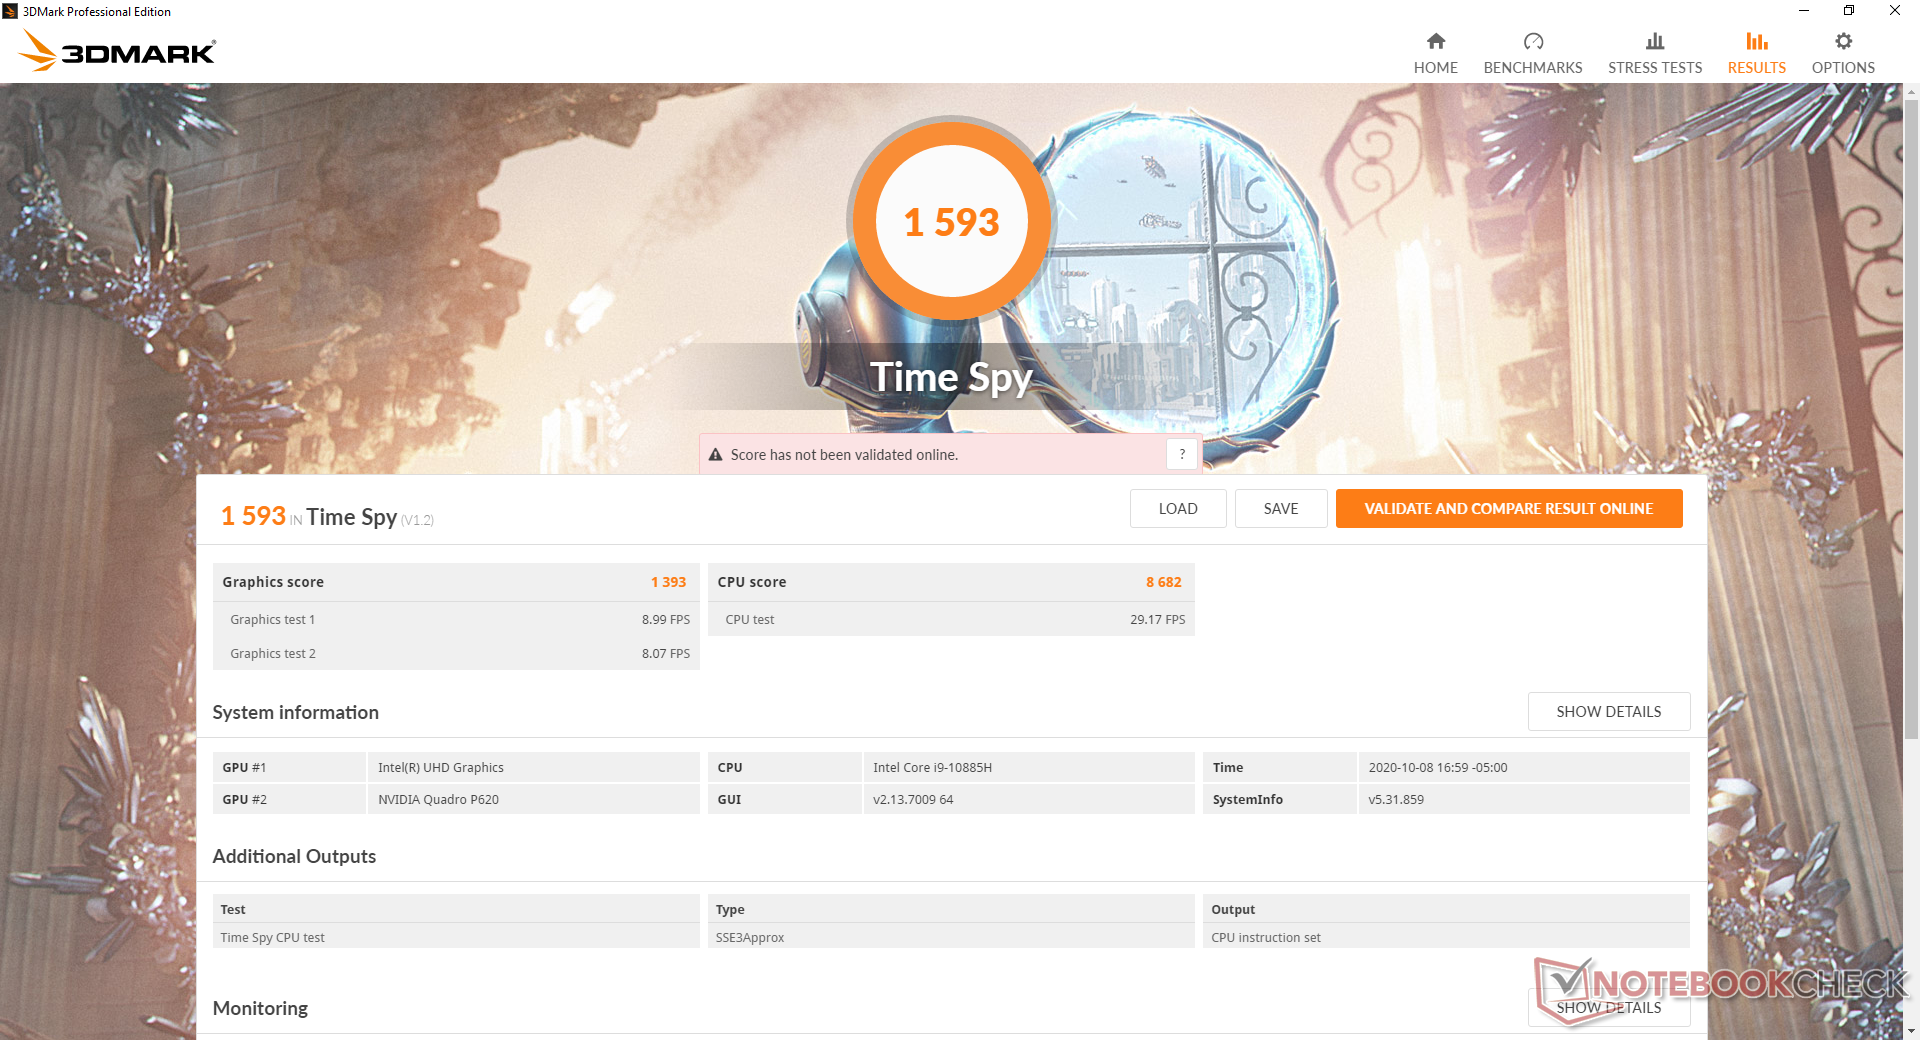
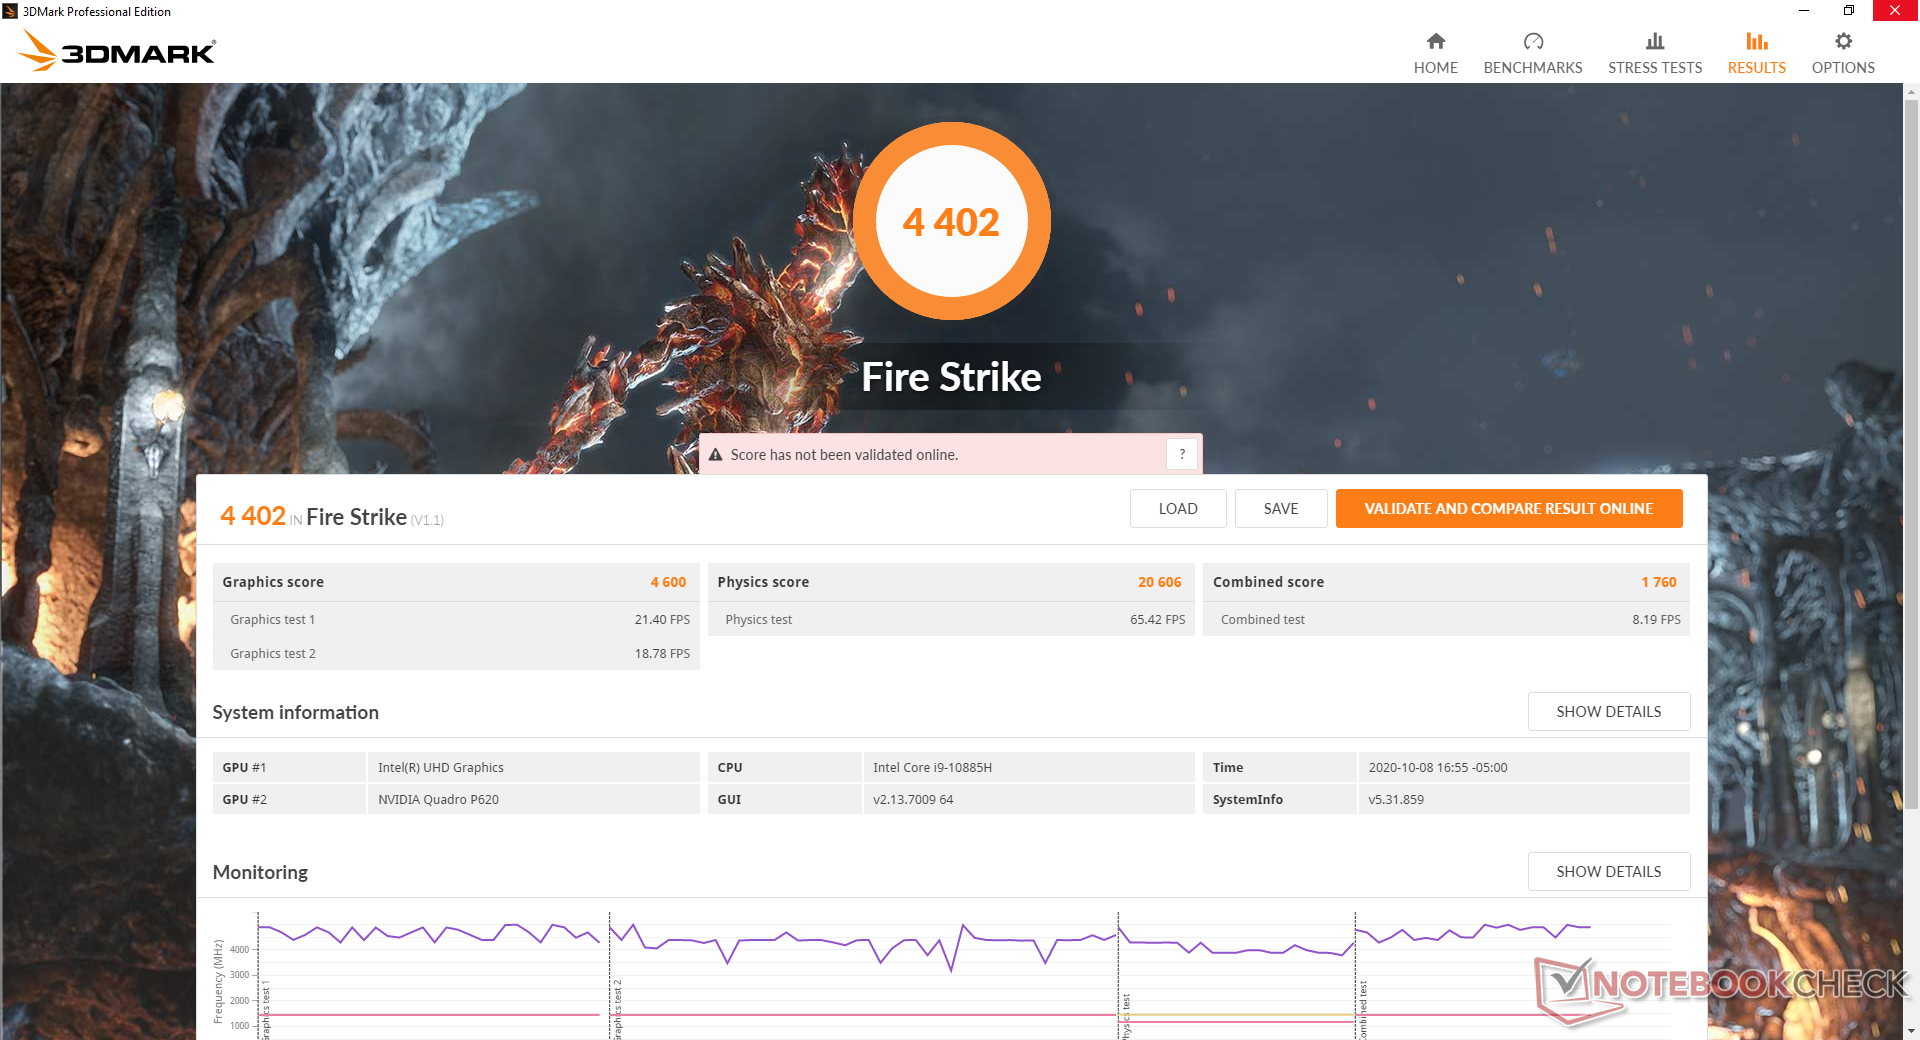
GPU Performance
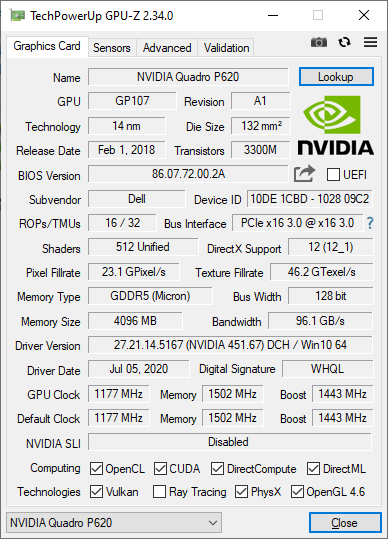
Raw graphics performance is slightly below the newer Quadro T1000 Max-Q and without the higher performance-per-watt benefits of the newer Turing architecture. The Quadro P620 is a generation behind in this regard and it's not designed for intensive graphical applications.
| 3DMark 06 Standard Score | 35322 points | |
| 3DMark 11 Performance | 6519 points | |
| 3DMark Cloud Gate Standard Score | 24082 points | |
| 3DMark Fire Strike Score | 4402 points | |
| 3DMark Time Spy Score | 1593 points | |
Help | ||
| low | med. | high | ultra | |
|---|---|---|---|---|
| The Witcher 3 (2015) | 90.7 | 51.7 | 31.5 | 16.5 |
| Dota 2 Reborn (2015) | 156 | 139 | 90.2 | 82.8 |
| Final Fantasy XV Benchmark (2018) | 51.7 | 25.8 | 18.5 | |
| X-Plane 11.11 (2018) | 104 | 71.3 | 63.9 |
Emissions
System Noise
The fan is quiet when simply browsing the web or streaming video. Higher loads, it will begin revving up close to its maximum without hesitation when running higher loads. Expect a loud and slightly high-pitched fan noise between 42 dB(A) and 51 dB(A) when the system is stressed.
| Dell Precision 3000 3551 Quadro P620, i9-10885H, Toshiba Kioxia XG6 KXG60PNV512G | HP ZBook Firefly 15 G7 Quadro P520, i7-10610U, Toshiba XG6 KXG60ZNV1T02 | Dell Precision 5550 P91F Quadro T2000 Max-Q, i7-10875H, SK Hynix PC601A NVMe 1TB | Lenovo ThinkPad P53s-20N6001NGE Quadro P520, i7-8565U, Intel SSD 760p SSDPEKKW256G8 | MSI WP65 Quadro P620, i7-9750H, Samsung SSD PM981 MZVLB512HAJQ | Dell Precision 3530 Quadro P600, E-2176M, SK hynix PC400 512 GB | |
|---|---|---|---|---|---|---|
| Noise | 6% | 4% | 3% | -11% | -3% | |
| off / environment * (dB) | 25.8 | 29.3 -14% | 26.2 -2% | 29.2 -13% | 28.7 -11% | 28.1 -9% |
| Idle Minimum * (dB) | 26.2 | 29.3 -12% | 26.2 -0% | 29.2 -11% | 33.4 -27% | 28.3 -8% |
| Idle Average * (dB) | 26.2 | 29.3 -12% | 26.2 -0% | 29.2 -11% | 33.5 -28% | 28.3 -8% |
| Idle Maximum * (dB) | 26.2 | 30 -15% | 26.2 -0% | 30.8 -18% | 33.5 -28% | 28.4 -8% |
| Load Average * (dB) | 51.2 | 32.8 36% | 39.2 23% | 32.6 36% | 37 28% | 46.2 10% |
| Witcher 3 ultra * (dB) | 42.7 | 32.8 23% | 39 9% | 38.7 9% | ||
| Load Maximum * (dB) | 50.7 | 32.8 35% | 50.6 -0% | 33.8 33% | 59.5 -17% | 48.6 4% |
* ... smaller is better
Noise level
| Idle |
| 26.2 / 26.2 / 26.2 dB(A) |
| Load |
| 51.2 / 50.7 dB(A) |
 | ||
30 dB silent 40 dB(A) audible 50 dB(A) loud |
||
min: | ||
Temperature
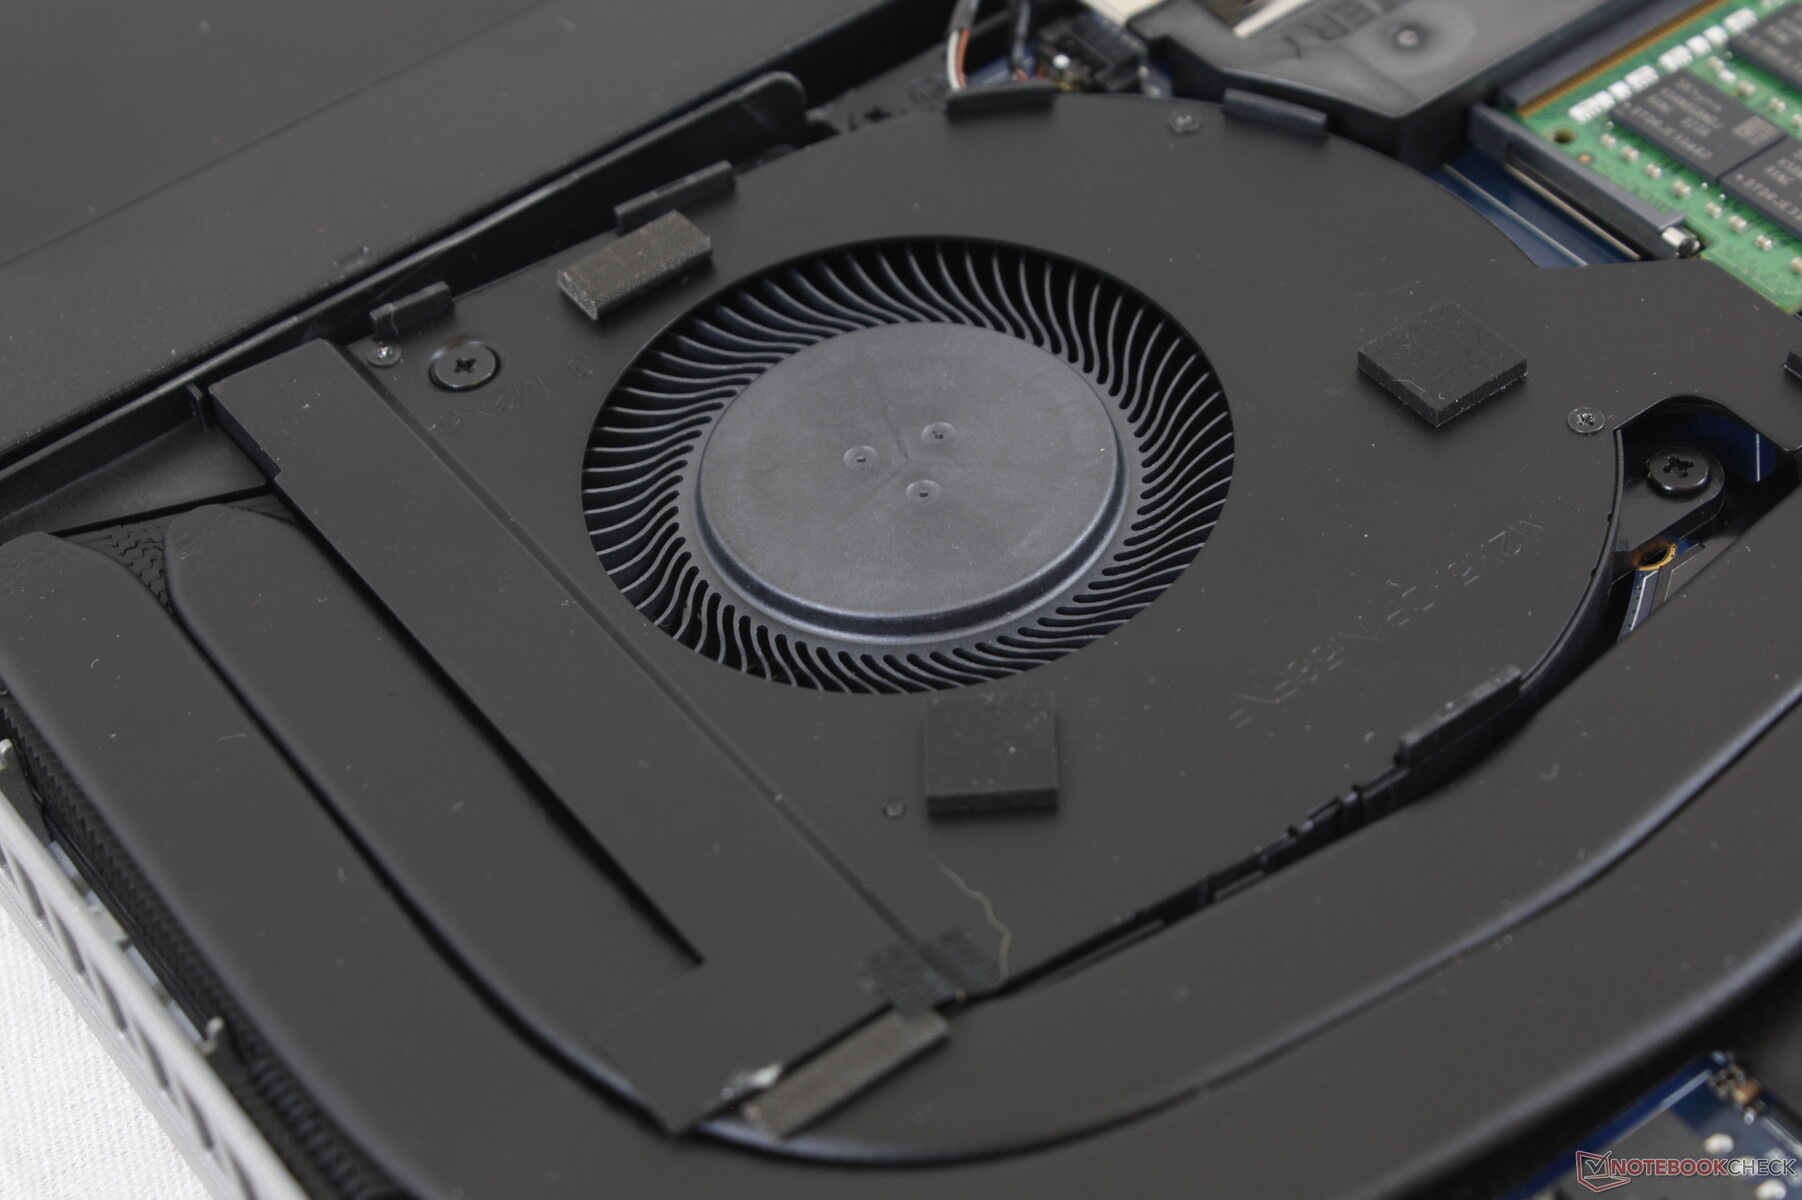
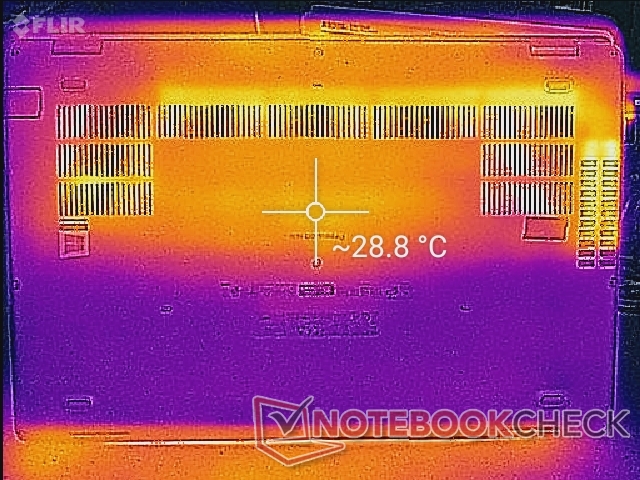
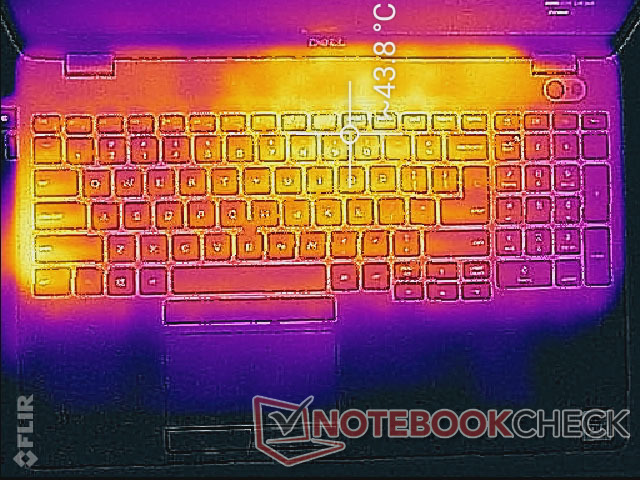
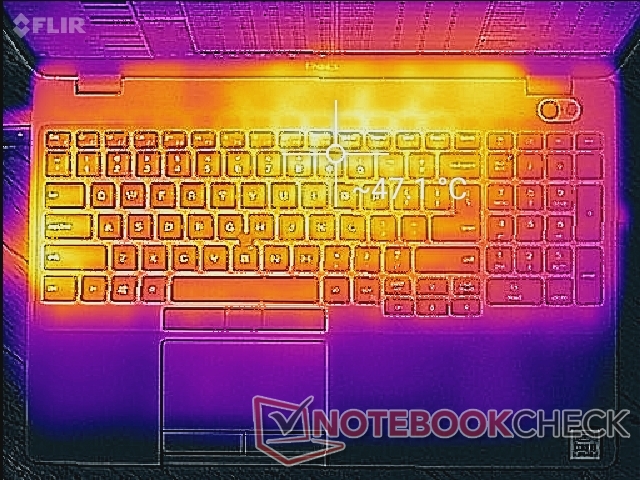
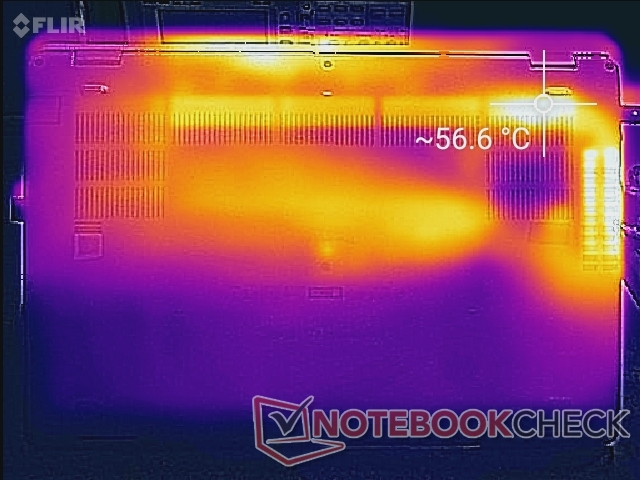
Surface temperatures are warmest toward the center of the keyboard and along the left edge due to the L-shaped heat pipes inside. The palm rests remain cool and we never found the hot spots to be uncomfortable during use.
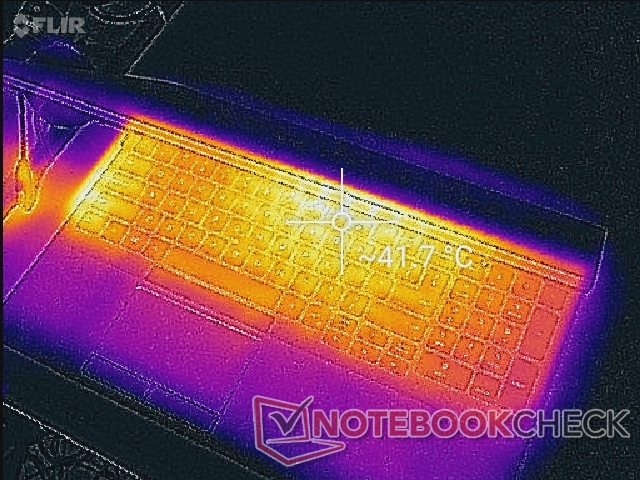
(-) The maximum temperature on the upper side is 47 °C / 117 F, compared to the average of 38.2 °C / 101 F, ranging from 22.2 to 69.8 °C for the class Workstation.
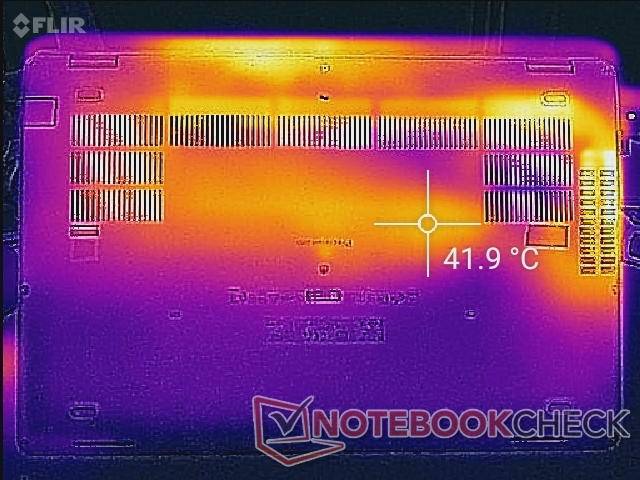
(-) The bottom heats up to a maximum of 54.6 °C / 130 F, compared to the average of 41.1 °C / 106 F
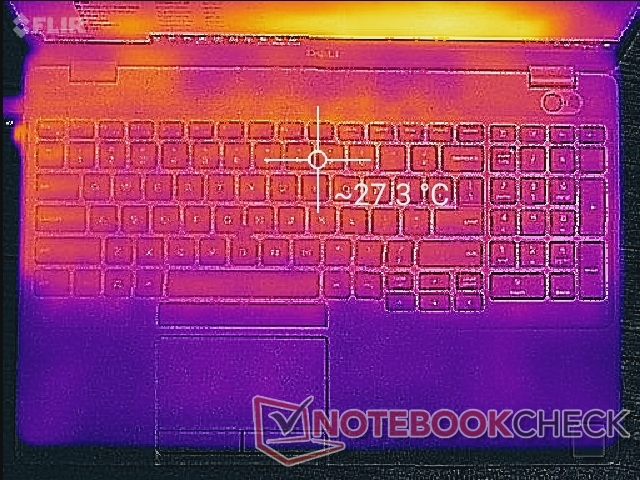
(+) In idle usage, the average temperature for the upper side is 26.3 °C / 79 F, compared to the device average of 32 °C / 90 F.
(±) Playing The Witcher 3, the average temperature for the upper side is 35.1 °C / 95 F, compared to the device average of 32 °C / 90 F.
(+) The palmrests and touchpad are cooler than skin temperature with a maximum of 27.4 °C / 81.3 F and are therefore cool to the touch.
(±) The average temperature of the palmrest area of similar devices was 27.8 °C / 82 F (+0.4 °C / 0.7 F).
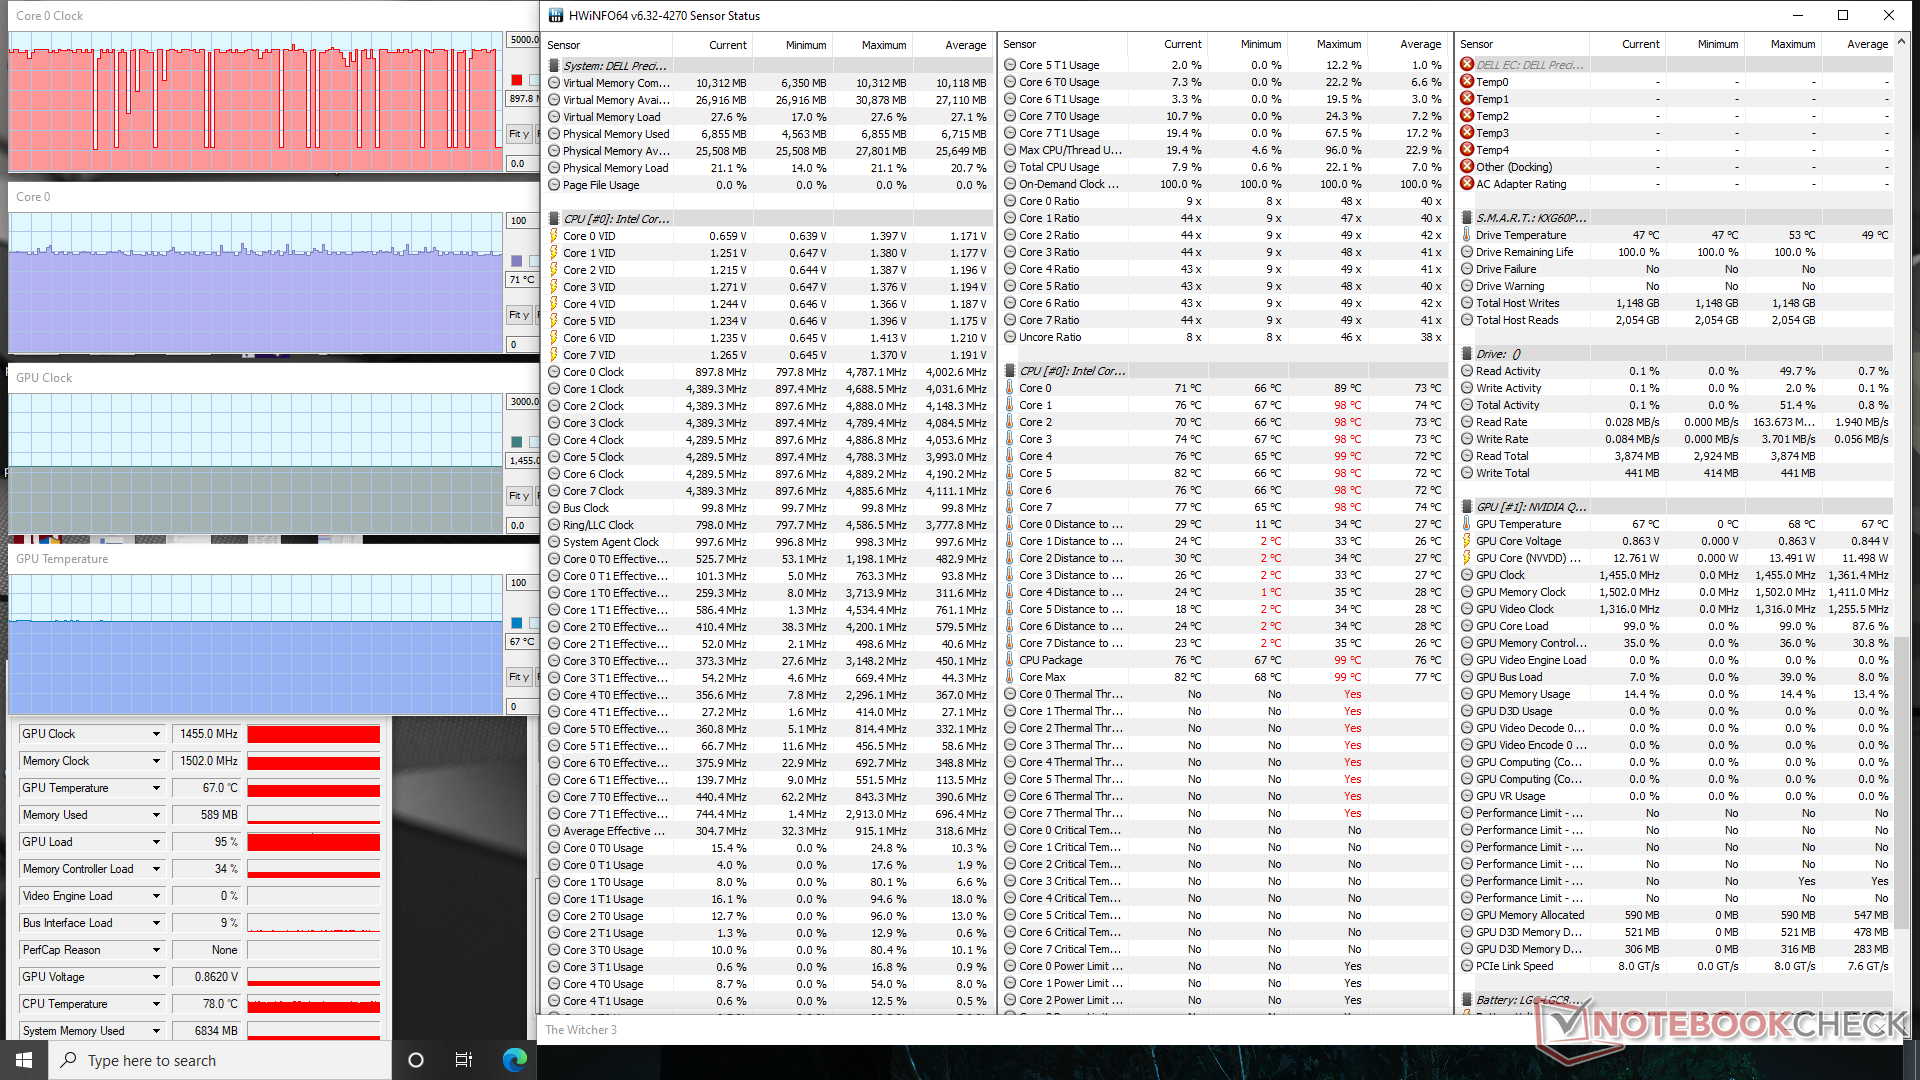
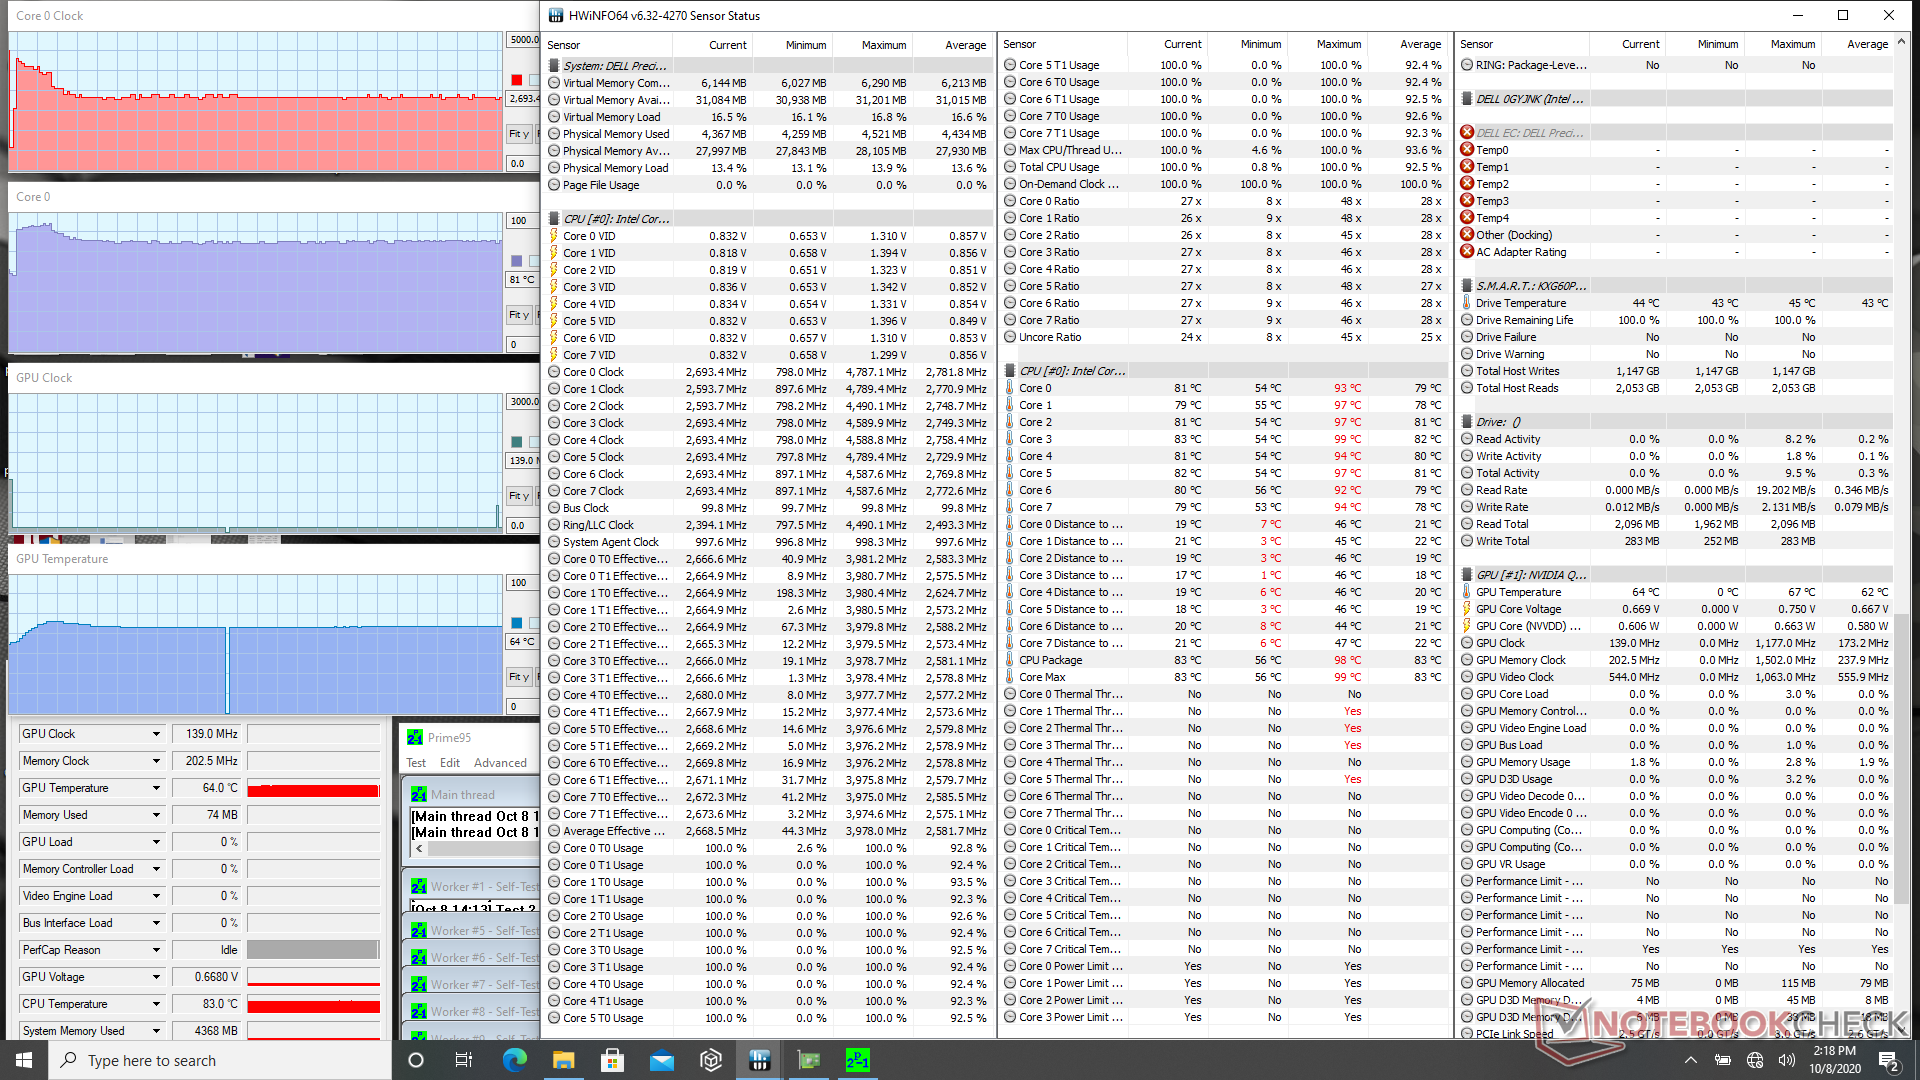
Stress Test
When running Prime95, clock rates would boost to 4 Ghz for the first few seconds until hitting a core temperature of 98 C. Clock rates would then stabilize at 2.7 to 2.8 GHz and 80 C thereafter. Maximum Turbo Boost clock rates are not sustainable on this system even when on Ultra Performance mode and these results reflect our CineBench and power consumption readings as well.
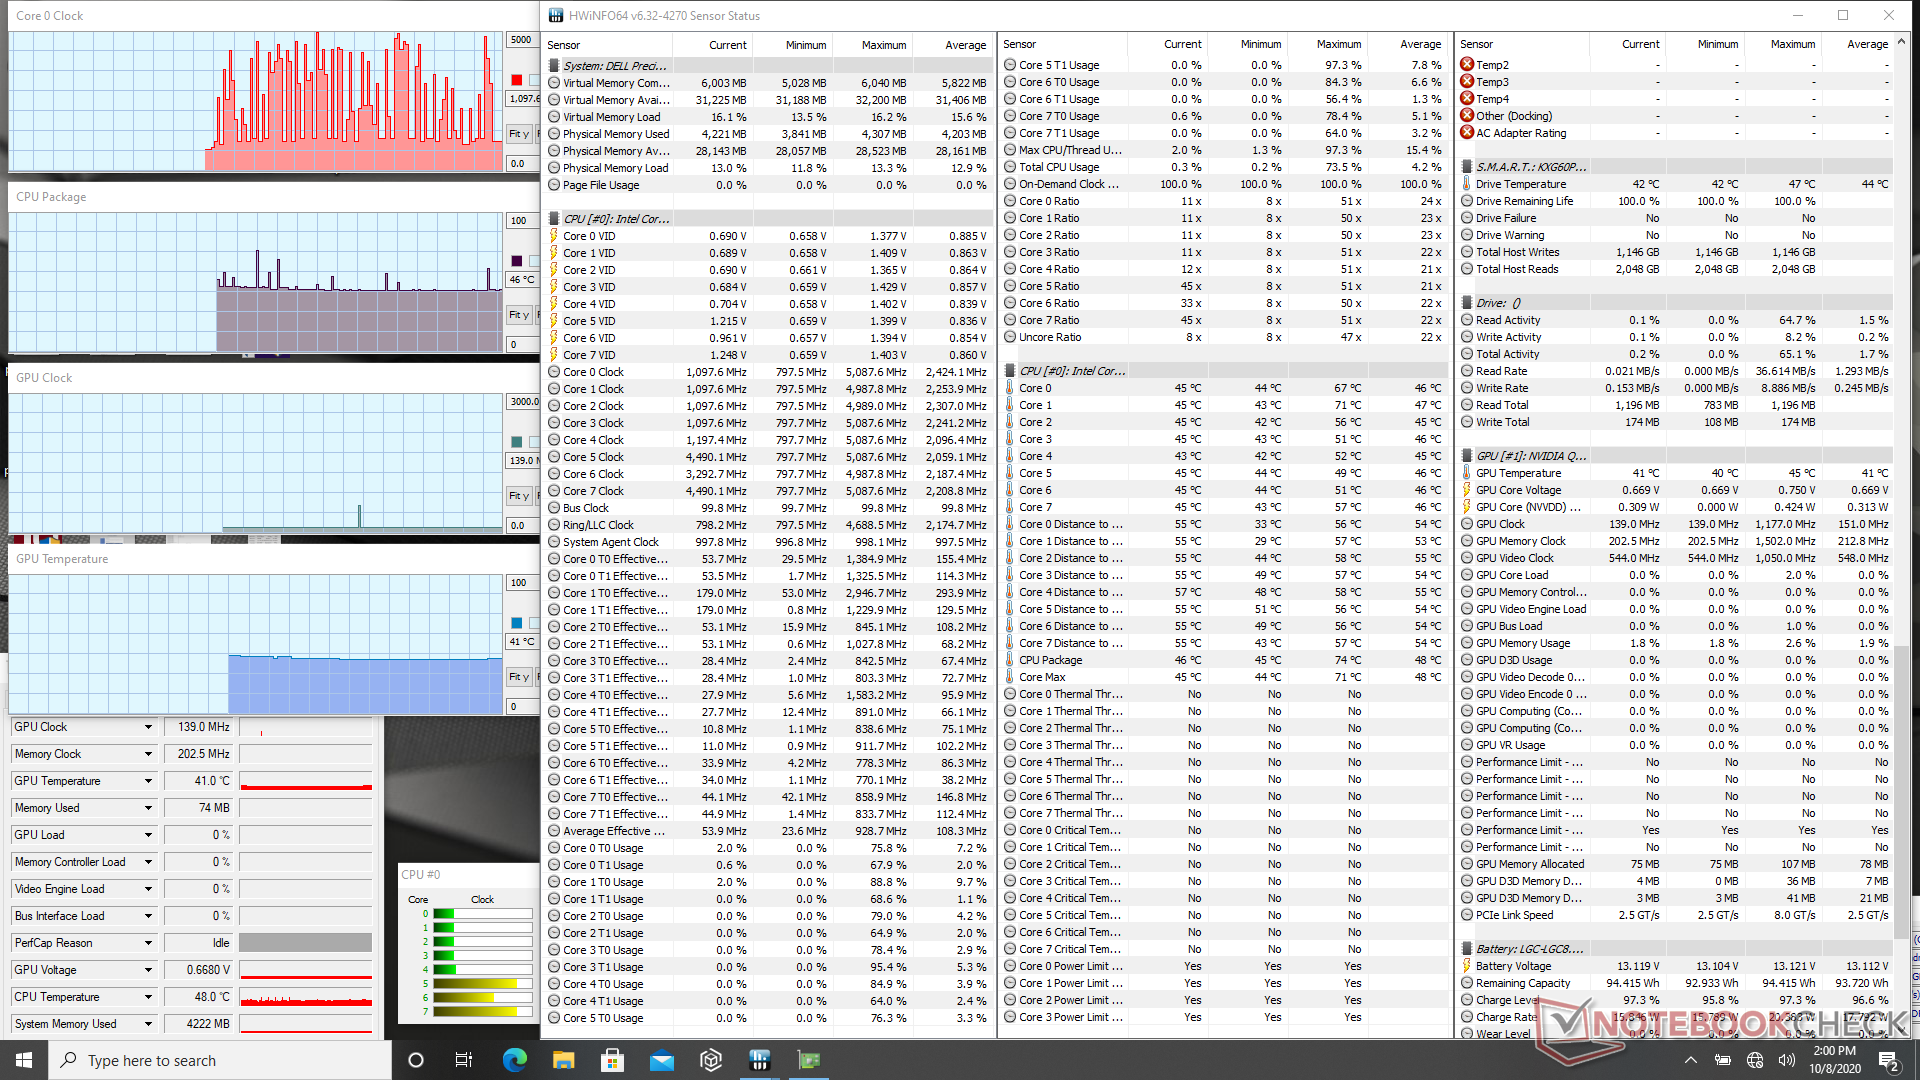
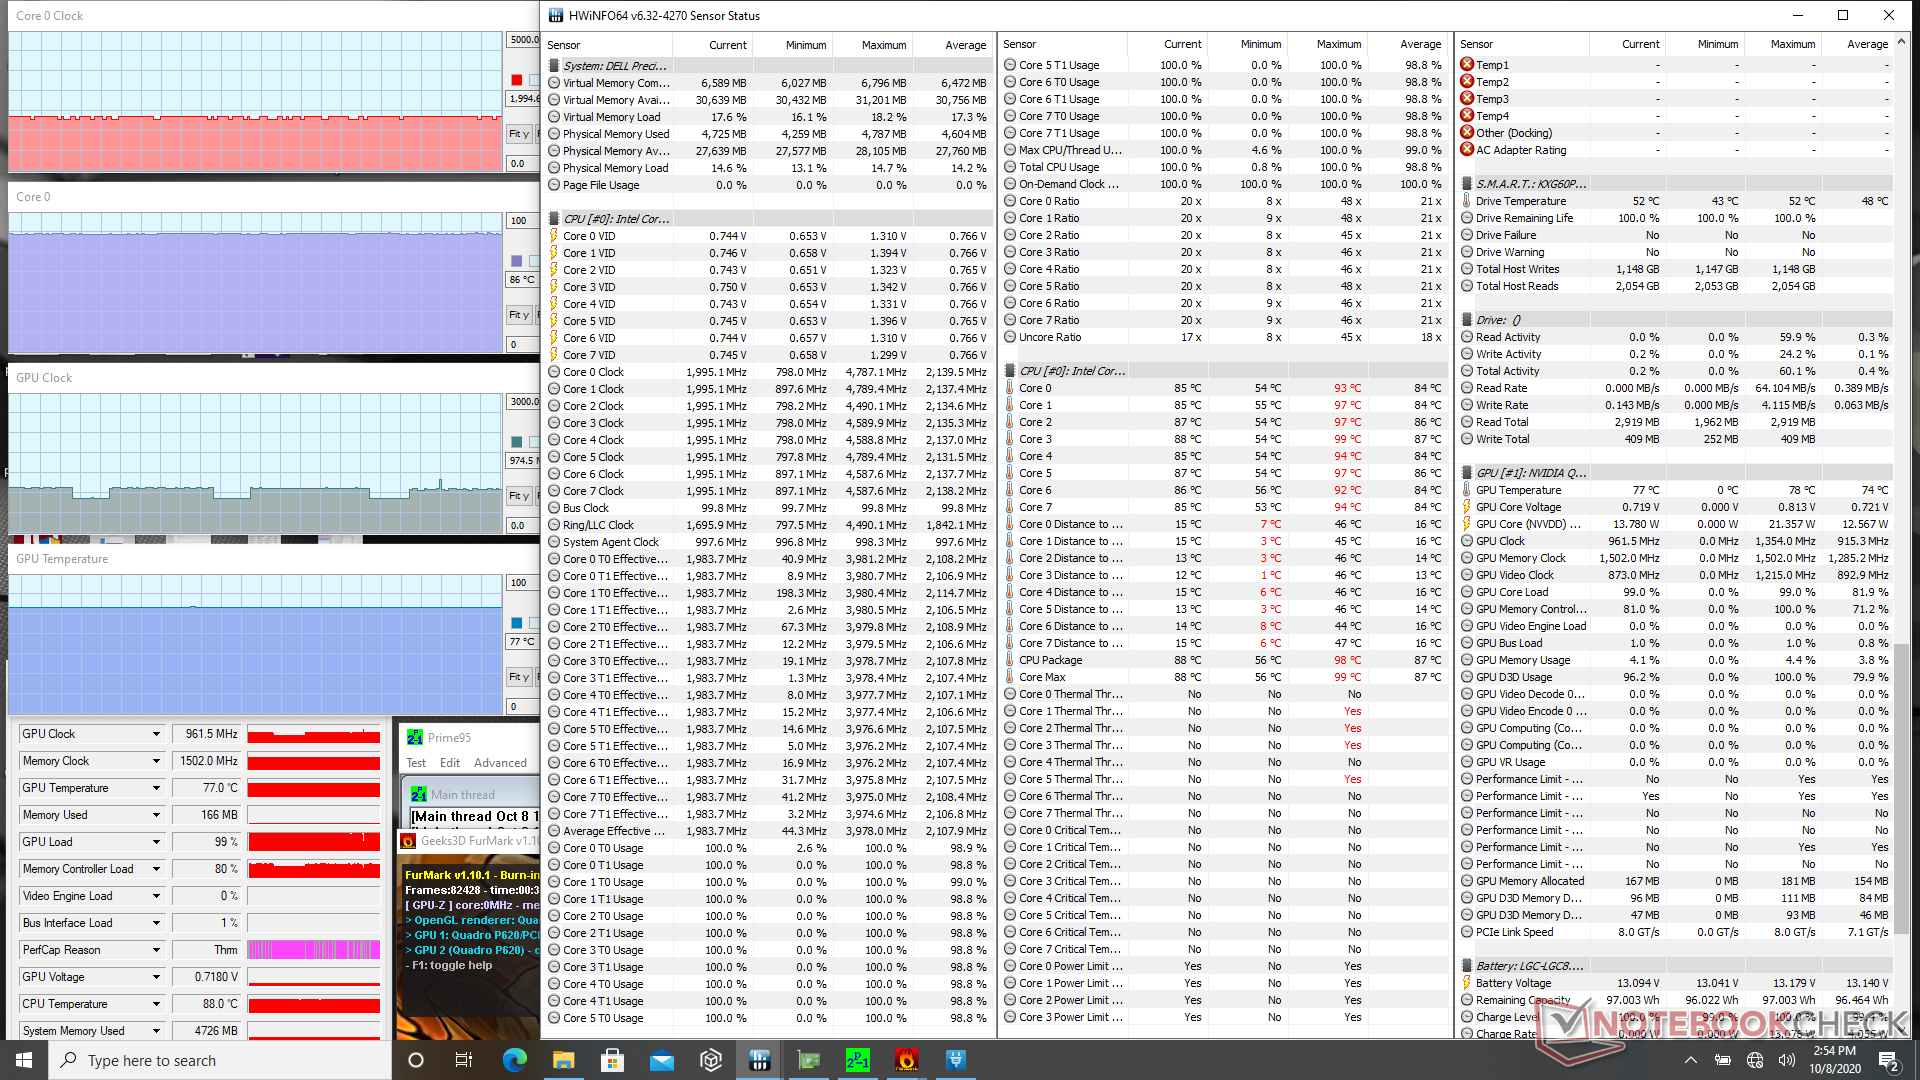
| CPU Clock (GHz) | GPU Clock (MHz) | Average CPU Temperature (°C) | Average GPU Temperature (°C) | |
| System Idle | -- | -- | 46 | 41 |
| Prime95 Stress | 2.7 | -- | 81 | 64 |
| Prime95 + FurMark Stress | 1.9 - 2.0 | ~660 - 975 | 86 | 77 |
| Witcher 3 Stress | 0.9 - 4.2 | 1455 | 71 | 67 |
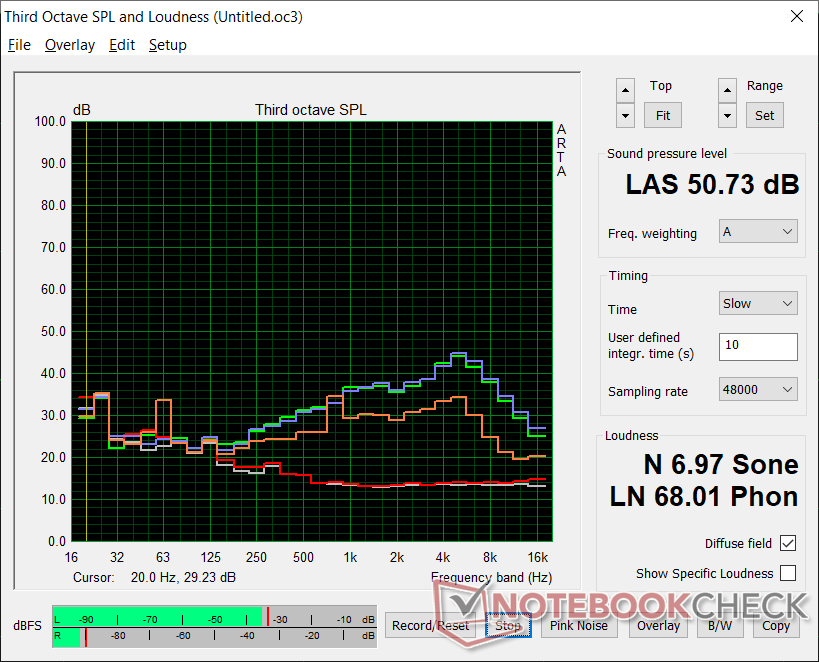
Speakers


Dell Precision 3000 3551 audio analysis
(+) | speakers can play relatively loud (84.5 dB)
Bass 100 - 315 Hz
(-) | nearly no bass - on average 19.8% lower than median
(±) | linearity of bass is average (10.1% delta to prev. frequency)
Mids 400 - 2000 Hz
(+) | balanced mids - only 4% away from median
(+) | mids are linear (5.4% delta to prev. frequency)
Highs 2 - 16 kHz
(+) | balanced highs - only 3.4% away from median
(+) | highs are linear (2.9% delta to prev. frequency)
Overall 100 - 16.000 Hz
(±) | linearity of overall sound is average (15.5% difference to median)
Compared to same class
» 35% of all tested devices in this class were better, 10% similar, 55% worse
» The best had a delta of 7%, average was 17%, worst was 35%
Compared to all devices tested
» 23% of all tested devices were better, 4% similar, 73% worse
» The best had a delta of 4%, average was 24%, worst was 134%
Apple MacBook 12 (Early 2016) 1.1 GHz audio analysis
(+) | speakers can play relatively loud (83.6 dB)
Bass 100 - 315 Hz
(±) | reduced bass - on average 11.3% lower than median
(±) | linearity of bass is average (14.2% delta to prev. frequency)
Mids 400 - 2000 Hz
(+) | balanced mids - only 2.4% away from median
(+) | mids are linear (5.5% delta to prev. frequency)
Highs 2 - 16 kHz
(+) | balanced highs - only 2% away from median
(+) | highs are linear (4.5% delta to prev. frequency)
Overall 100 - 16.000 Hz
(+) | overall sound is linear (10.2% difference to median)
Compared to same class
» 7% of all tested devices in this class were better, 2% similar, 91% worse
» The best had a delta of 5%, average was 18%, worst was 53%
Compared to all devices tested
» 5% of all tested devices were better, 1% similar, 94% worse
» The best had a delta of 4%, average was 24%, worst was 134%
Energy Management
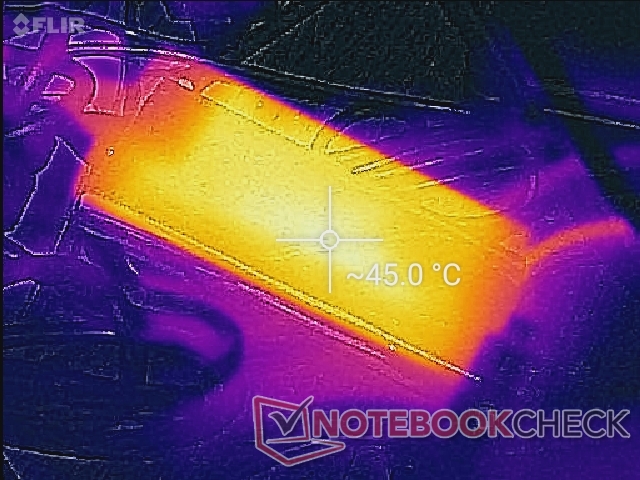
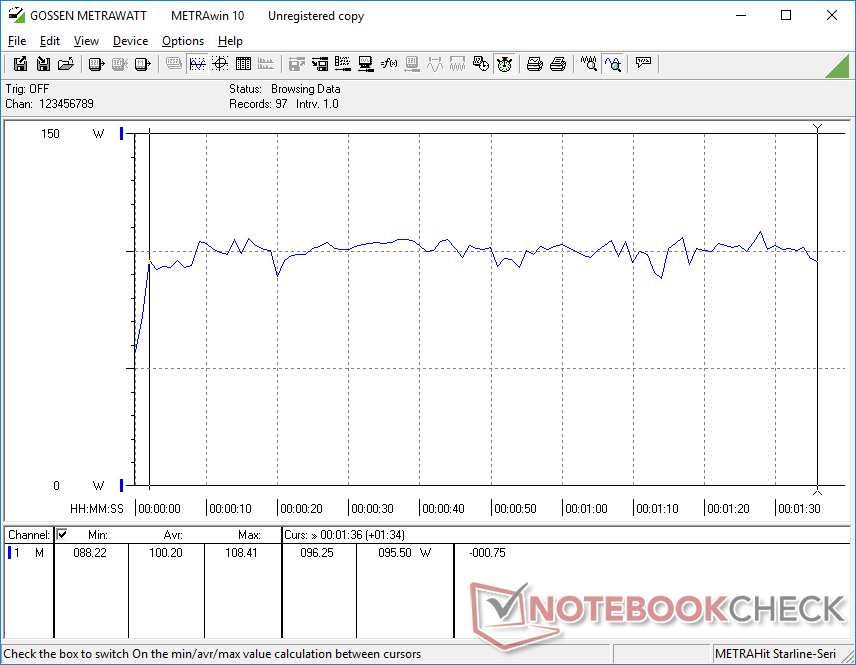
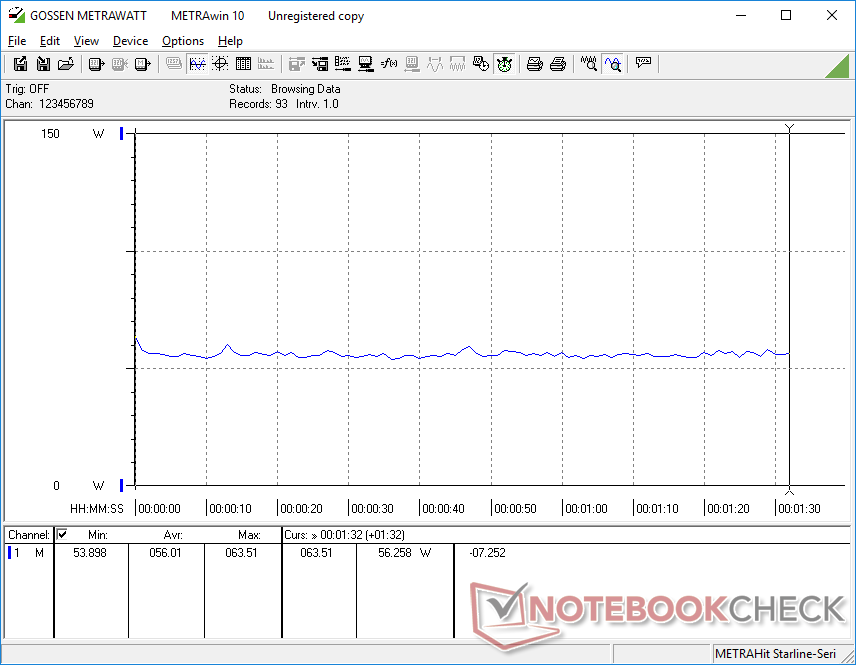
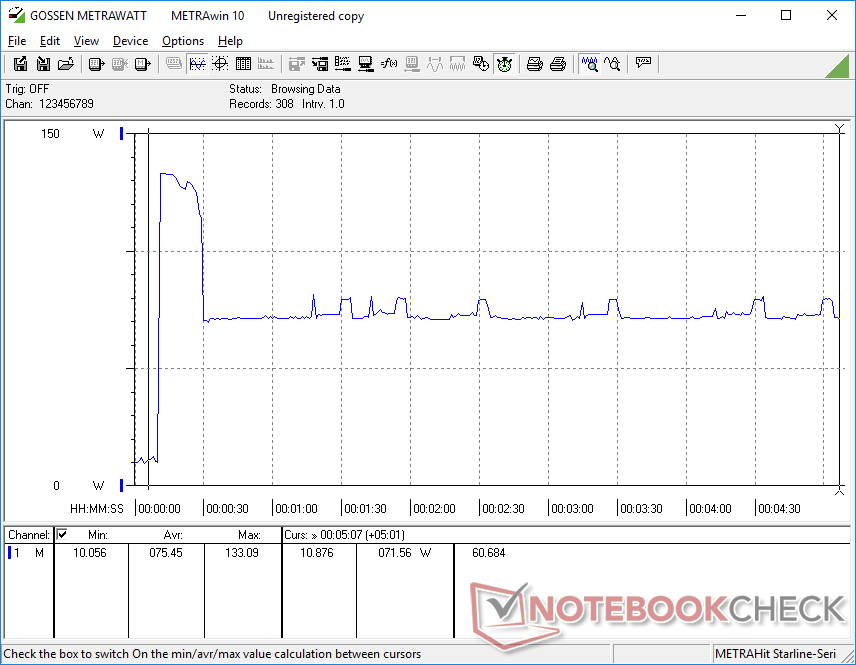
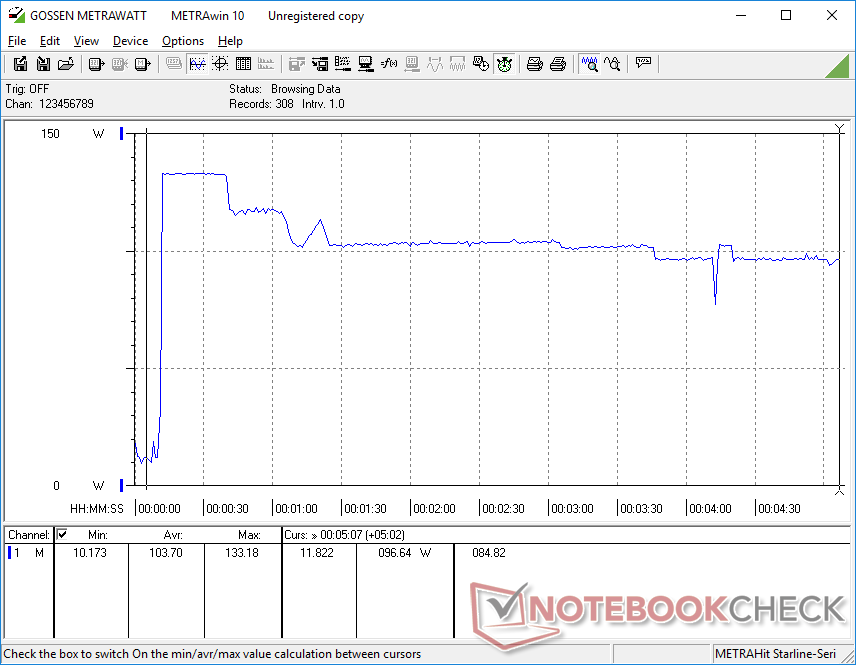
Power Consumption
When under high processing loads, the system will use up most of its 130 W AC adapter at almost 100 W. Fortunately, the battery will not slowly drain unlike on some early XPS 17 or Precision 5750 production units. Consumption never stabilizes anywhere near 130 W due to the thermal limitations of the system.
| Off / Standby | |
| Idle | |
| Load |
|
Key:
min: | |
| Dell Precision 3000 3551 i9-10885H, Quadro P620, Toshiba Kioxia XG6 KXG60PNV512G, IPS, 1920x1080, 15.6" | HP ZBook Firefly 15 G7 i7-10610U, Quadro P520, Toshiba XG6 KXG60ZNV1T02, IPS LED, 3840x2160, 15.6" | Dell Precision 5550 P91F i7-10875H, Quadro T2000 Max-Q, SK Hynix PC601A NVMe 1TB, IPS, 3840x2400, 15.6" | Lenovo ThinkPad P53s-20N6001NGE i7-8565U, Quadro P520, Intel SSD 760p SSDPEKKW256G8, IPS, 1920x1080, 15.6" | MSI WP65 i7-9750H, Quadro P620, Samsung SSD PM981 MZVLB512HAJQ, IPS, 1920x1080, 15.6" | Dell Precision 3530 E-2176M, Quadro P600, SK hynix PC400 512 GB, IPS, 1920x1080, 15.6" | |
|---|---|---|---|---|---|---|
| Power Consumption | 26% | -31% | 33% | -43% | -10% | |
| Idle Minimum * (Watt) | 5.7 | 3.5 39% | 5.6 2% | 2.74 52% | 5.6 2% | 5.3 7% |
| Idle Average * (Watt) | 8.7 | 6.7 23% | 11.2 -29% | 6.4 26% | 8.6 1% | 10.7 -23% |
| Idle Maximum * (Watt) | 9 | 9.6 -7% | 18.4 -104% | 9.7 -8% | 30.7 -241% | 14.1 -57% |
| Load Average * (Watt) | 100.2 | 60 40% | 114 -14% | 55.2 45% | 78 22% | 85.4 15% |
| Witcher 3 ultra * (Watt) | 56 | 49.3 12% | 76.7 -37% | 63.5 -13% | 75.5 -35% | |
| Load Maximum * (Watt) | 133.2 | 68.6 48% | 134.2 -1% | 69.4 48% | 170.2 -28% | 91.9 31% |
* ... smaller is better
Battery Life
Runtimes are very long at over 13.5 hours of real-world WLAN use from our 97 Wh battery. Dell offers smaller 68 Wh and 51 Wh options to lower the overall weight of the system.
Recharging from empty to full capacity takes about 2 hours. The system can be recharged via USB-C or the proprietary AC barrel adapter unlike on most other laptops.
| Dell Precision 3000 3551 i9-10885H, Quadro P620, 97 Wh | HP ZBook Firefly 15 G7 i7-10610U, Quadro P520, 53 Wh | Dell Precision 5550 P91F i7-10875H, Quadro T2000 Max-Q, 86 Wh | Lenovo ThinkPad P53s-20N6001NGE i7-8565U, Quadro P520, 57 Wh | MSI WP65 i7-9750H, Quadro P620, 51 Wh | Dell Precision 3530 E-2176M, Quadro P600, 92 Wh | |
|---|---|---|---|---|---|---|
| Battery runtime | -33% | -34% | -37% | -56% | -32% | |
| WiFi v1.3 (h) | 13.6 | 9.1 -33% | 9 -34% | 8.6 -37% | 6 -56% | 9.3 -32% |
| Load (h) | 2 | 1.4 | 2.5 | 0.6 | 1.6 | |
| Reader / Idle (h) | 22.6 | 25.2 | 10.1 | 18.8 |
Pros
Cons
Verdict
The Precision 3551 has got all the basics of a classic mobile workstation. TrackPoint, actual mouse buttons, Smart Card, WWAN, serviceability, and plenty of other hardware options including dual storage are all here. Thunderbolt 3 compatibility is a nice touch especially for what is considered to be a "low-end" workstation. If connectivity and usability are on the top of your list, then the no-frills Precision 3551 will check off those boxes without breaking the bank.
The workstation becomes less impressive when talking about performance and visual design. Graphics are limited to the older Quadro P620 and the Core i9-109880H could have been better when it comes to Turbo Boost sustainability. The look of the system is functional, but also dull. You'll need to search a bit higher in the stack through the pricier Precision 5000 or 7000 series for sleeker systems with faster performance.
Great selection of ports and usability features even though graphics performance is limited and the chassis design is old-fashioned.
Dell Precision 3000 3551
- 10/09/2020 v7 (old)
Allen Ngo
Price comparison
