Dell XPS 17 9700 Core i7 Laptop Review: Pretty Much A MacBook Pro 17
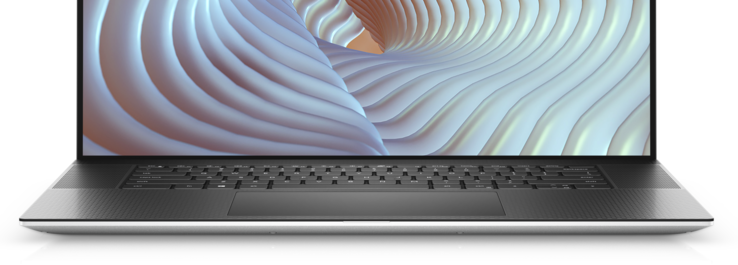
The XPS 17 9700 is Dell's newest (and biggest) family member in its venerable XPS series. It inherits most of the physical attributes of the smaller XPS 13 9300 and XPS 15 9500 including the 16:10 aspect ratio, super-sized clickpad, chassis design and materials, and the narrow bezels on all four sides of the display.
Internally, the larger form factor has allowed Dell to incorporate both vapor chamber cooling and a faster GeForce RTX 2060 Max-Q GPU while keeping the same CPU options as found on the XPS 15. SKUs start with the quad-core Core i5-10300H CPU, 8 GB of DDR4-2933 RAM, 256 GB SSD, and 1200p 500-nit non-touch display for $1400 USD while higher-end SKUs double the native resolution and add touchscreen support, octa-core Core i7-10875H options, and GeForce GTX 1650 Ti or RTX 2060 Max-Q graphics for up to $3000 USD. A Core i9-10980HK option is planned for the near future.
Our test unit is the higher-end configuration equipped to the brim, but expect another review on a lower-end Core i5 SKU in the near future to get a bigger picture of the XPS 17 series. Competitors to the XPS 17 include other high-performance 17-inch multimedia or professional laptops like the HP Envy 17, Gigabyte Aero 17, MSI Creator 17, and the 16-inch MacBook Pro 16.
More Dell reviews:
Rating | Date | Model | Weight | Height | Size | Resolution | Price |
|---|---|---|---|---|---|---|---|
| 87.9 % v7 (old) | 07 / 2020 | Dell XPS 17 9700 Core i7 RTX 2060 Max-Q i7-10875H, GeForce RTX 2060 Max-Q | 2.5 kg | 19.5 mm | 17.00" | 3840x2400 | |
| 82.5 % v7 (old) | 07 / 2020 | MSI Creator 17 A10SGS i7-10875H, GeForce RTX 2080 Super Max-Q | 2.4 kg | 20 mm | 17.30" | 3840x2160 | |
| 80.9 % v7 (old) | 06 / 2020 | HP Envy 17t-cg000 i7-1065G7, GeForce MX330 | 2.7 kg | 19.3 mm | 17.30" | 3840x2160 | |
| 87 % v7 (old) | 04 / 2020 | Gigabyte Aero 17 HDR XB i7-10875H, GeForce RTX 2070 Super Max-Q | 2.7 kg | 21 mm | 17.30" | 3840x2160 | |
| 87.4 % v7 (old) | 06 / 2020 | Razer Blade Pro 17 RTX 2070 Max-Q 300 Hz i7-10875H, GeForce RTX 2070 Max-Q | 2.7 kg | 19.9 mm | 17.30" | 1920x1080 |
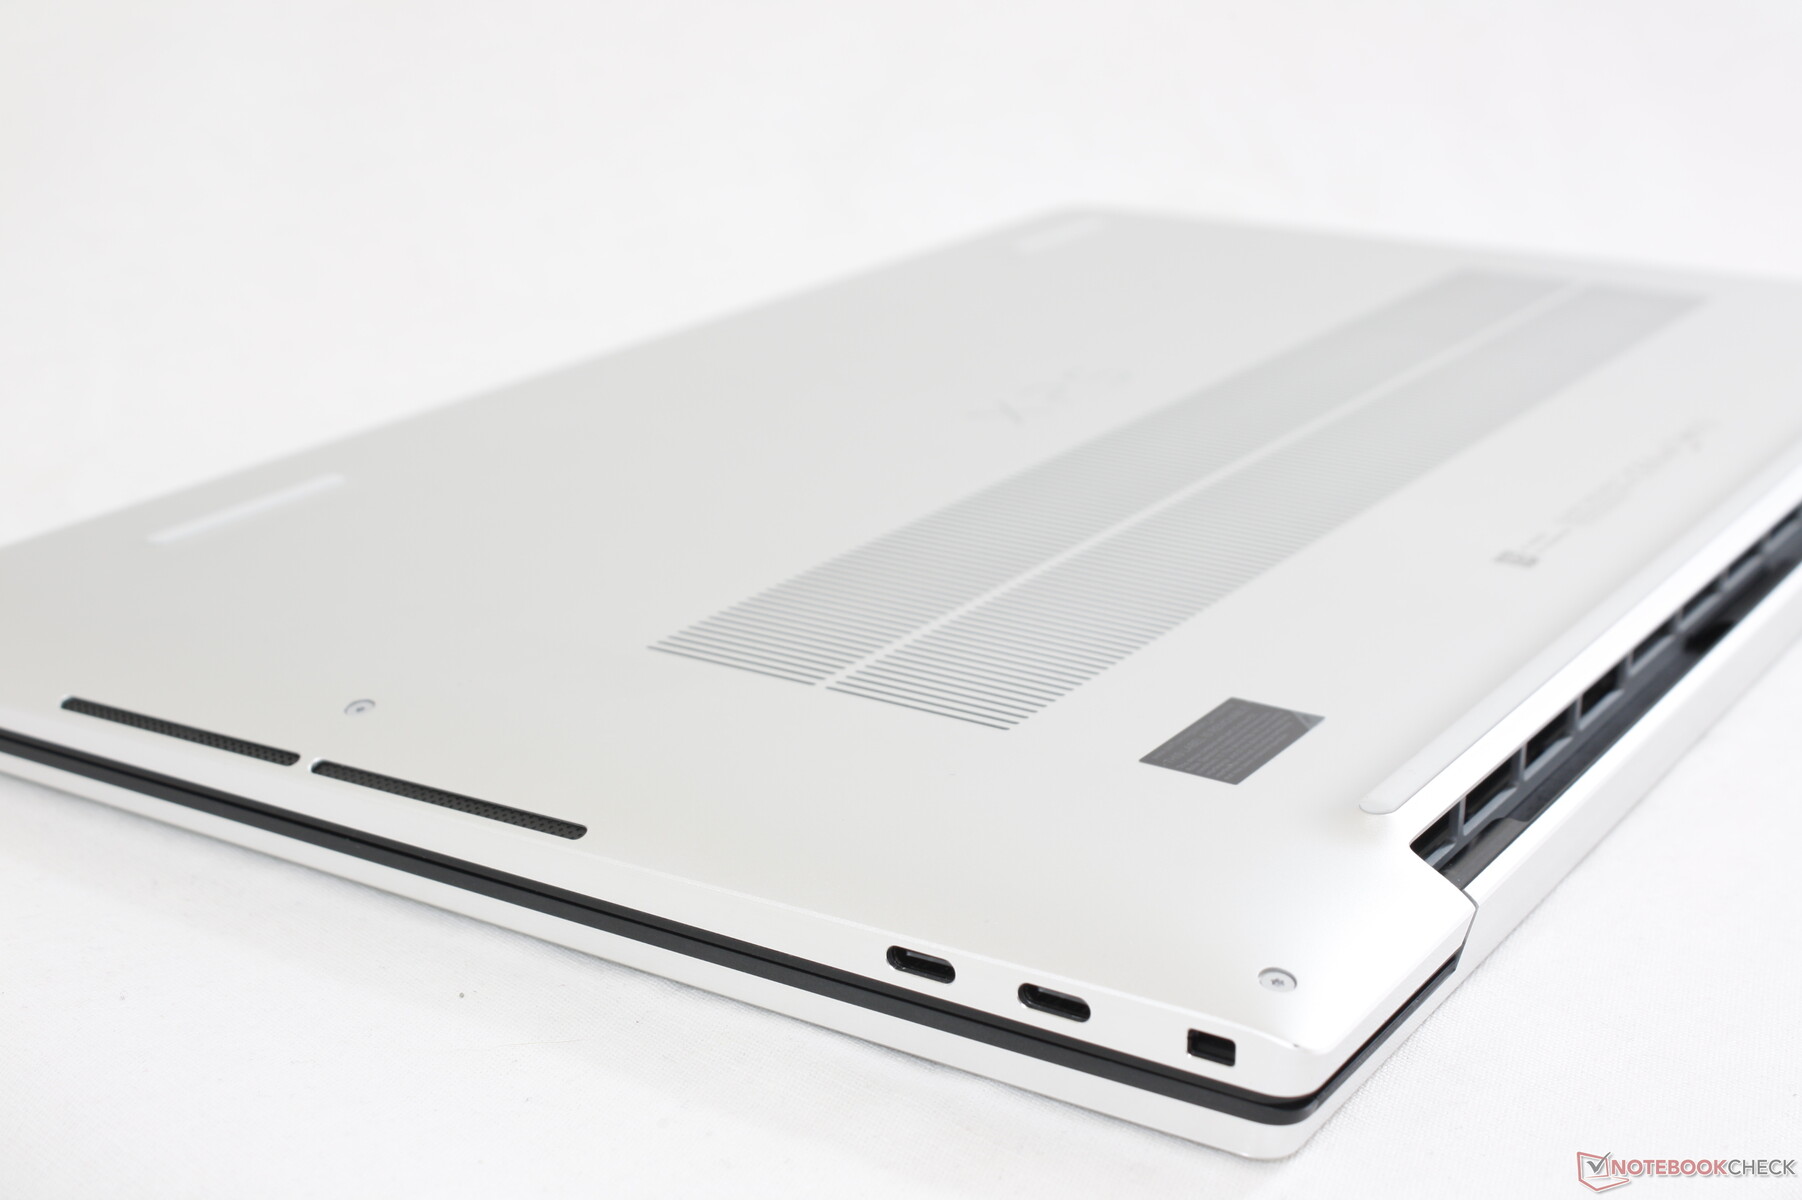
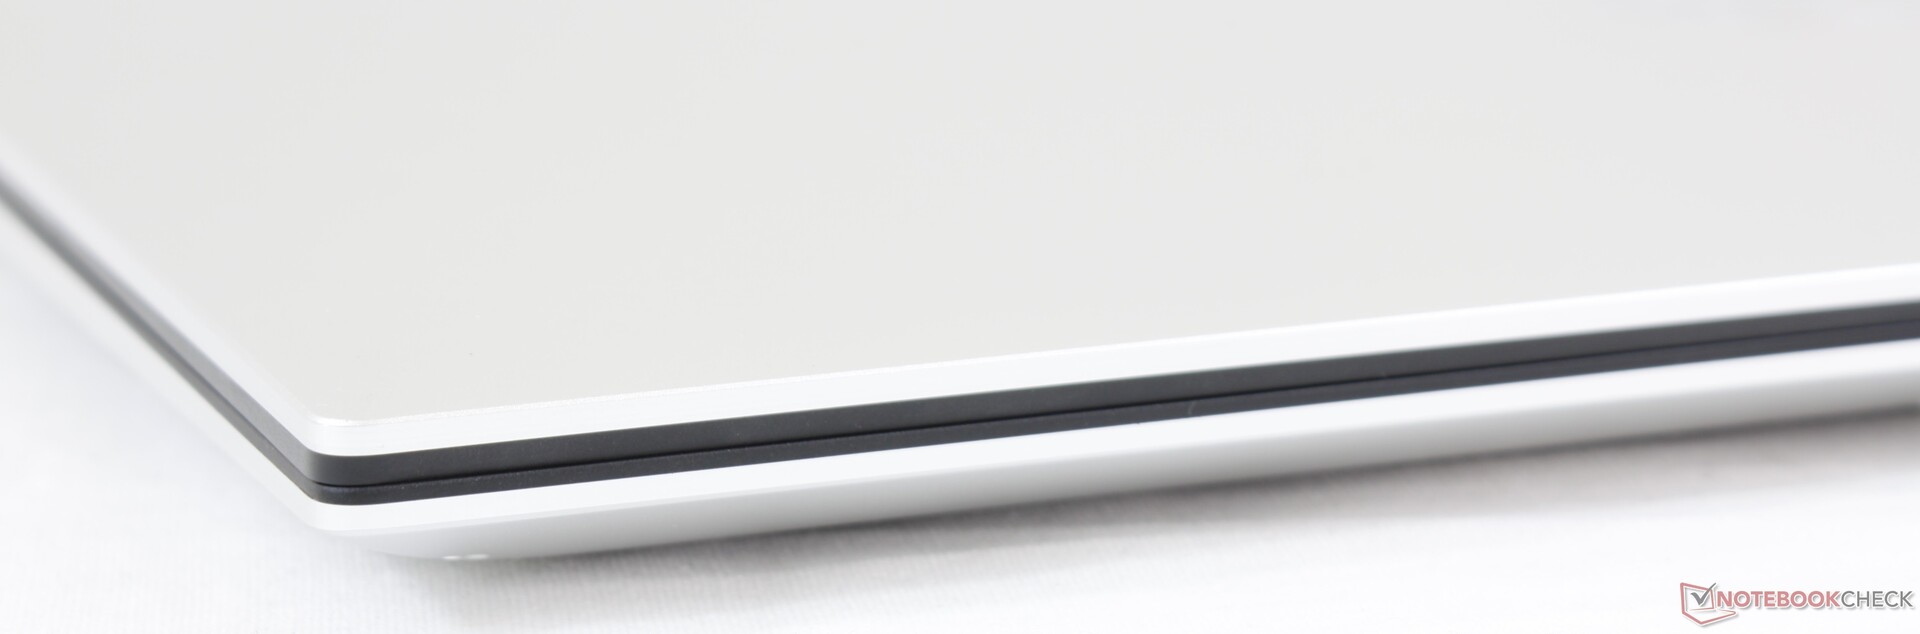
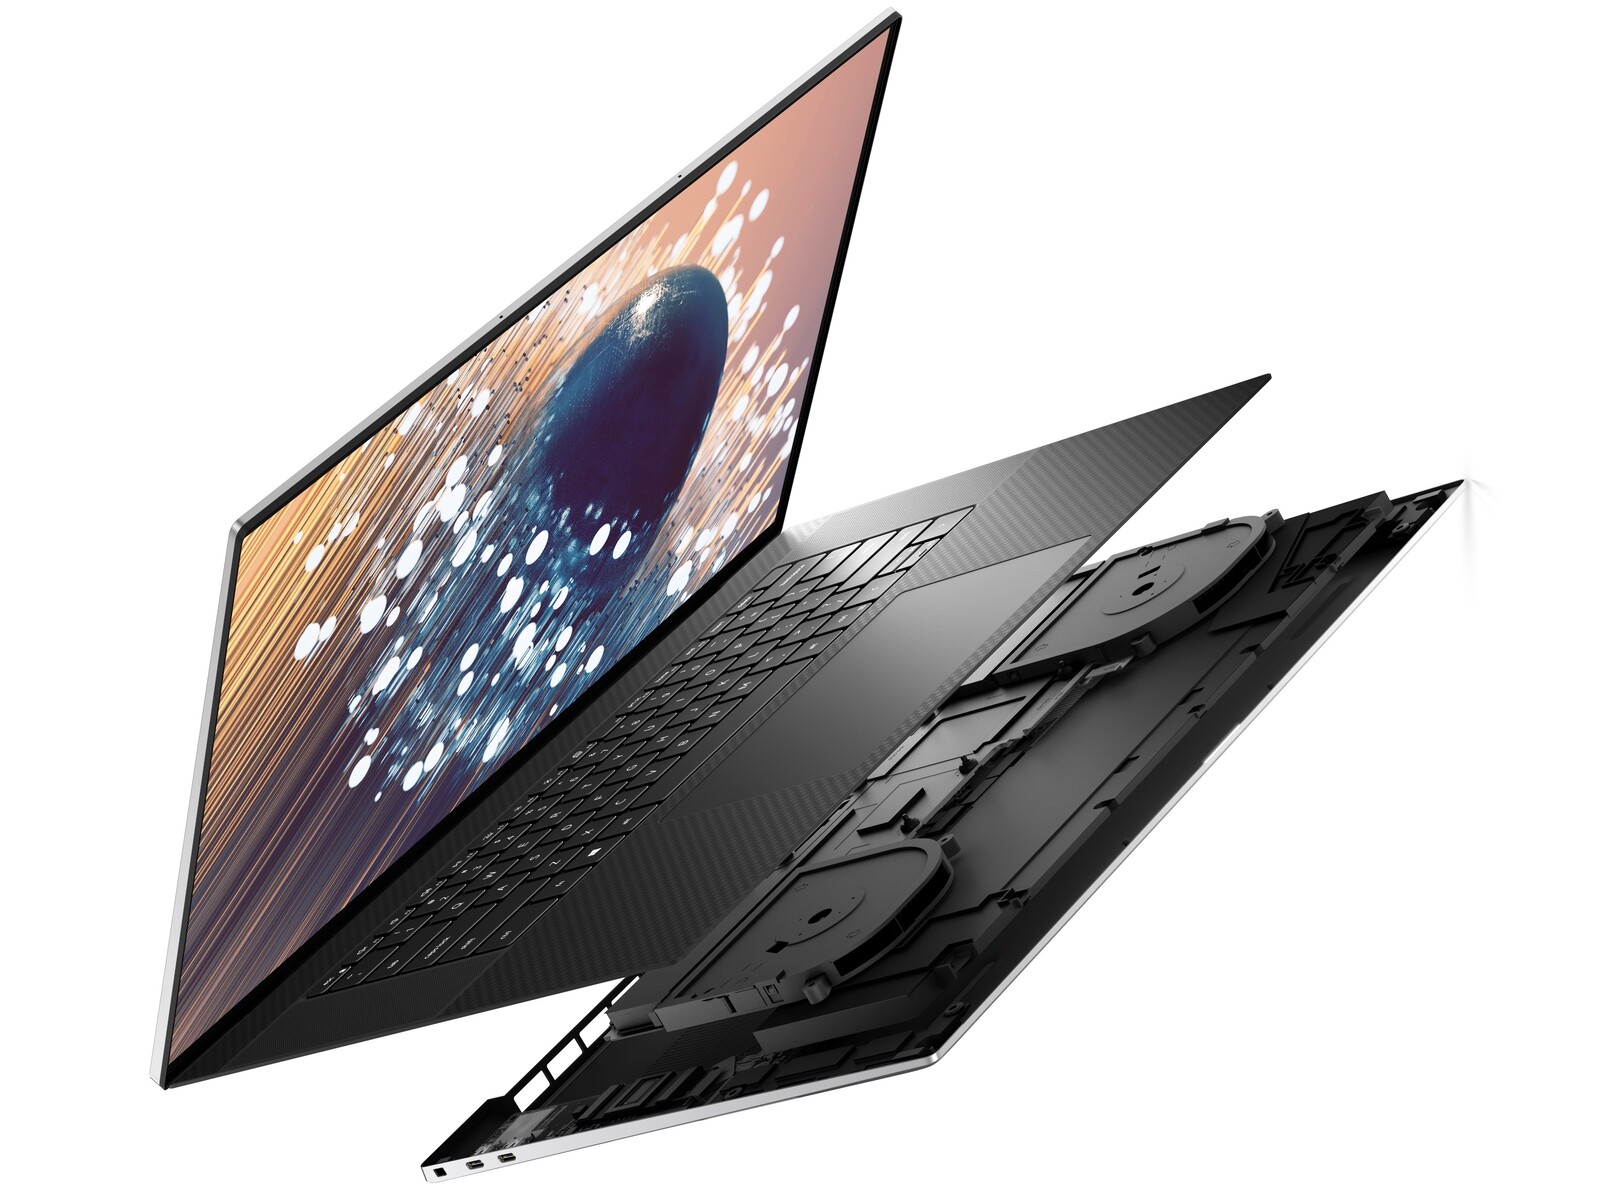
Case — An Enlarged XPS 15
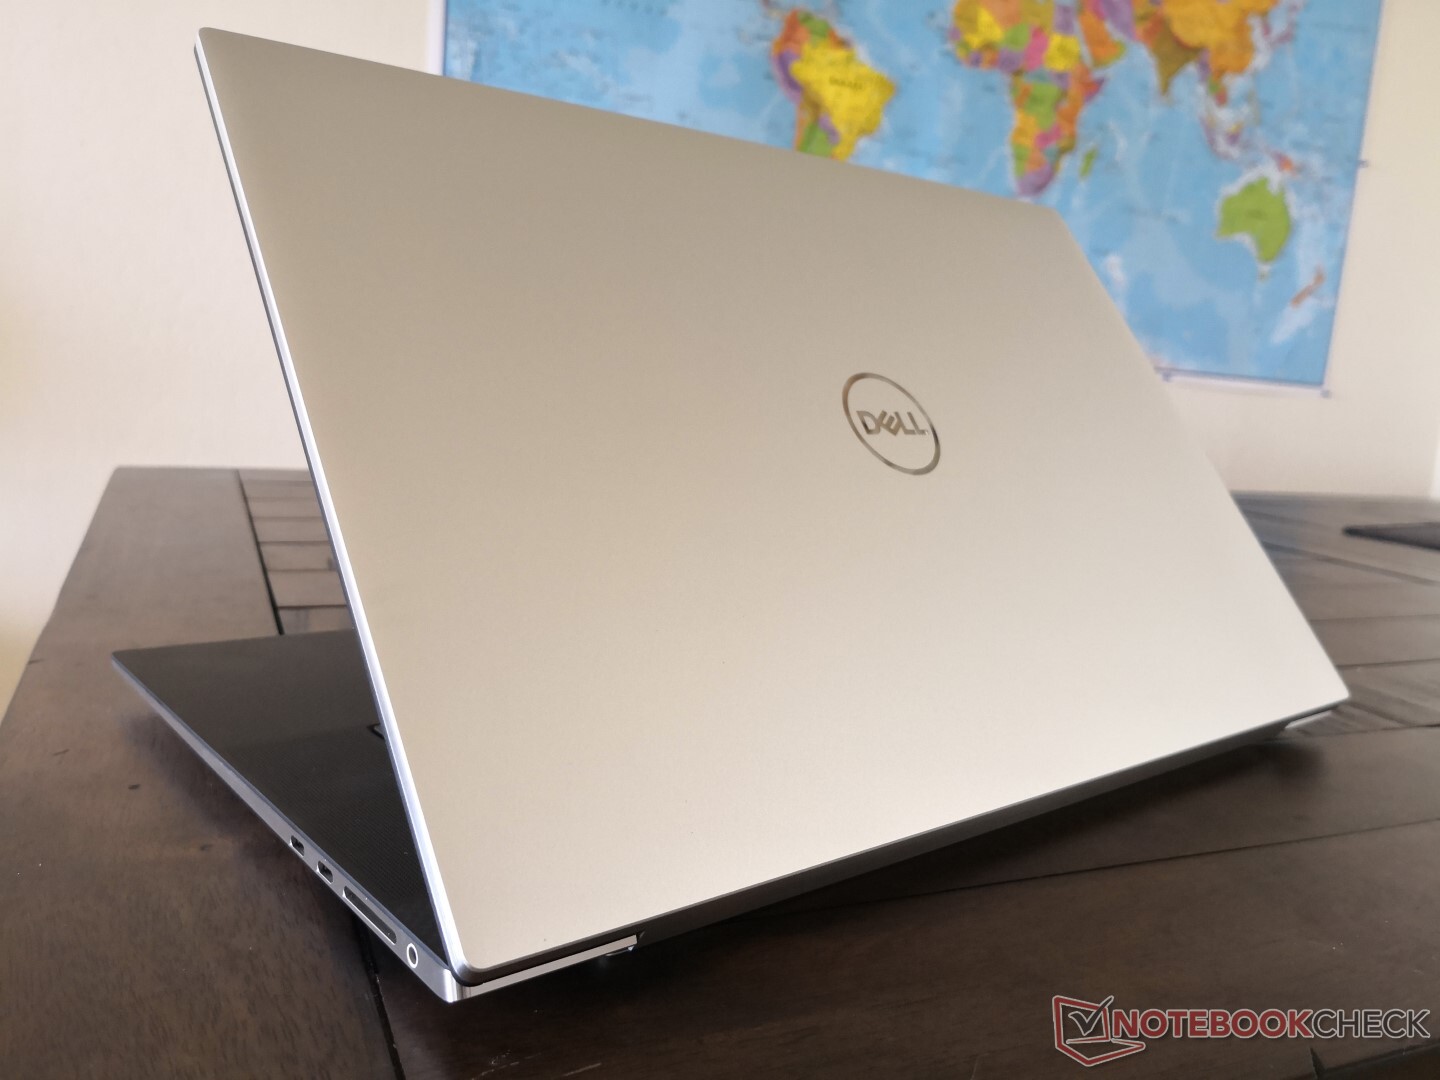
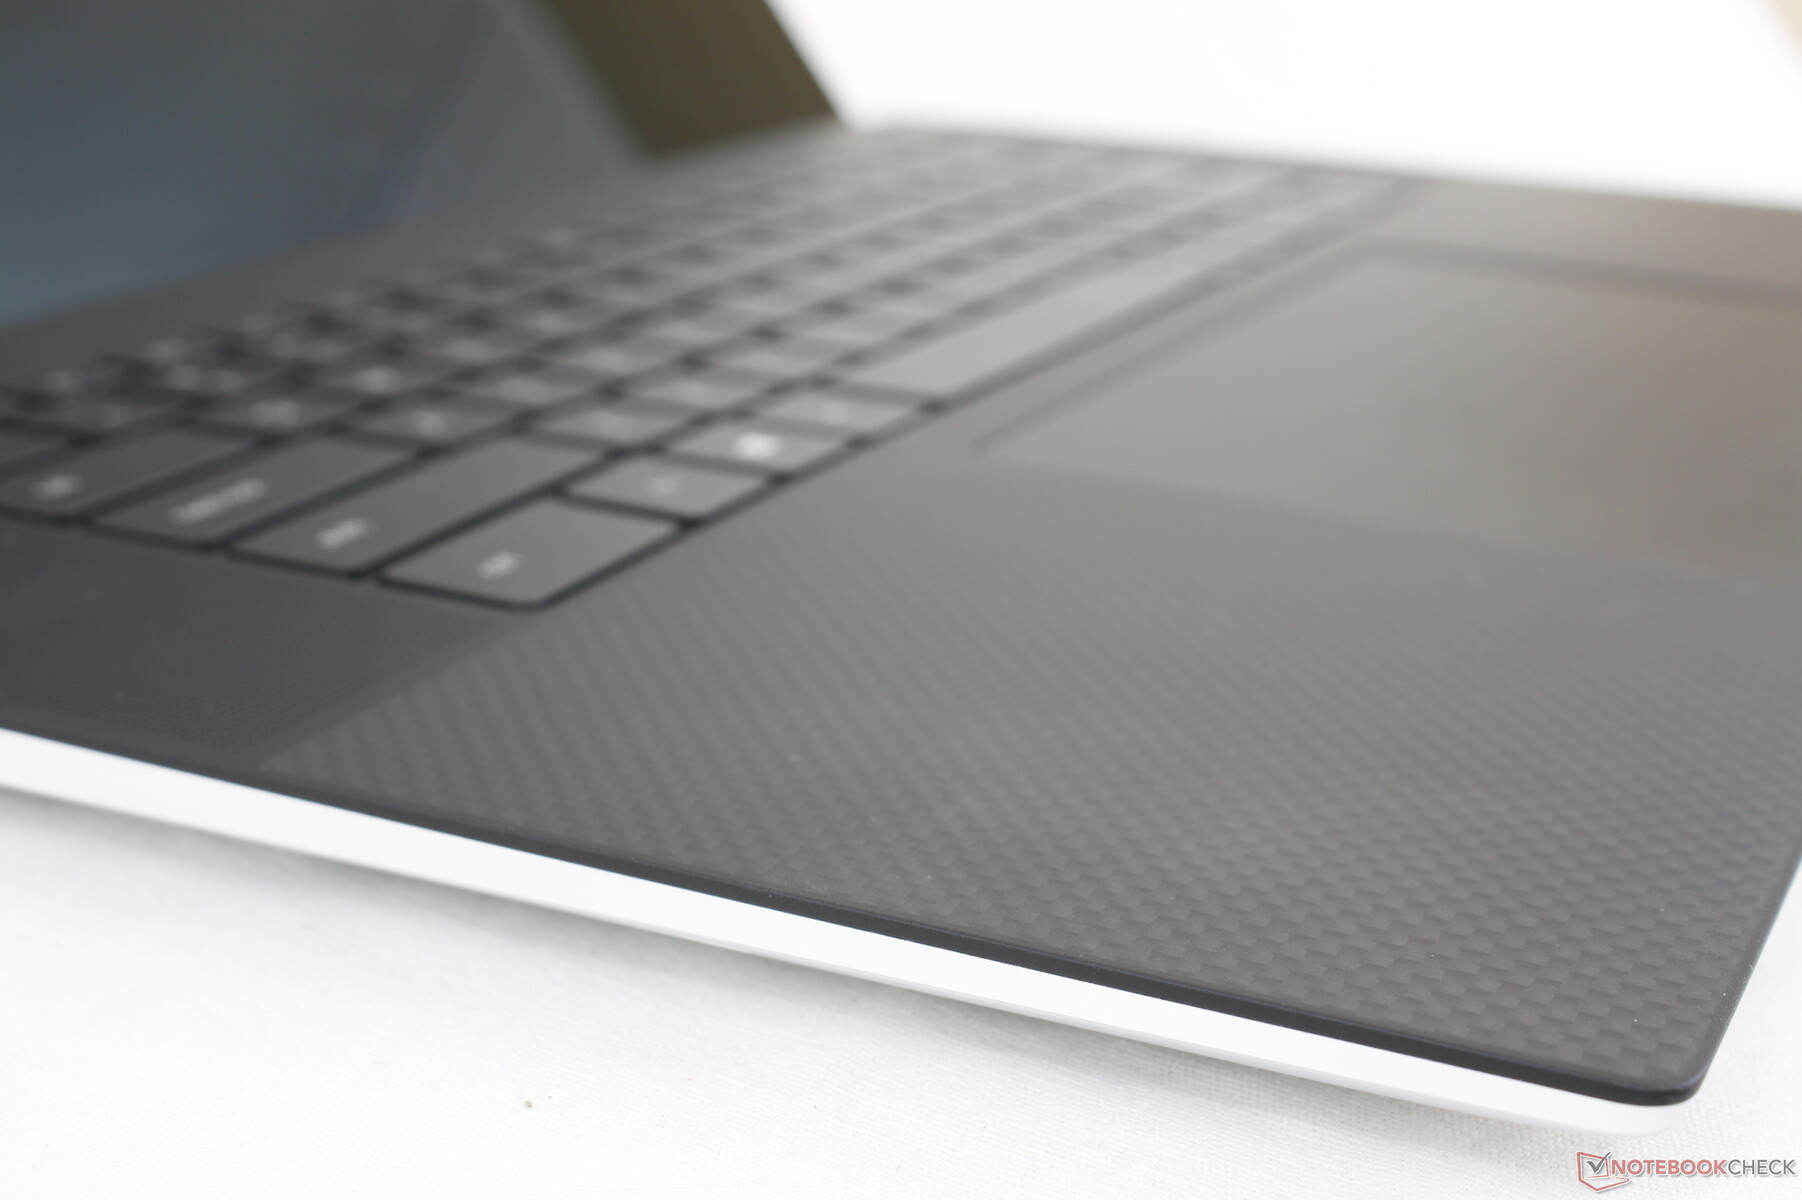
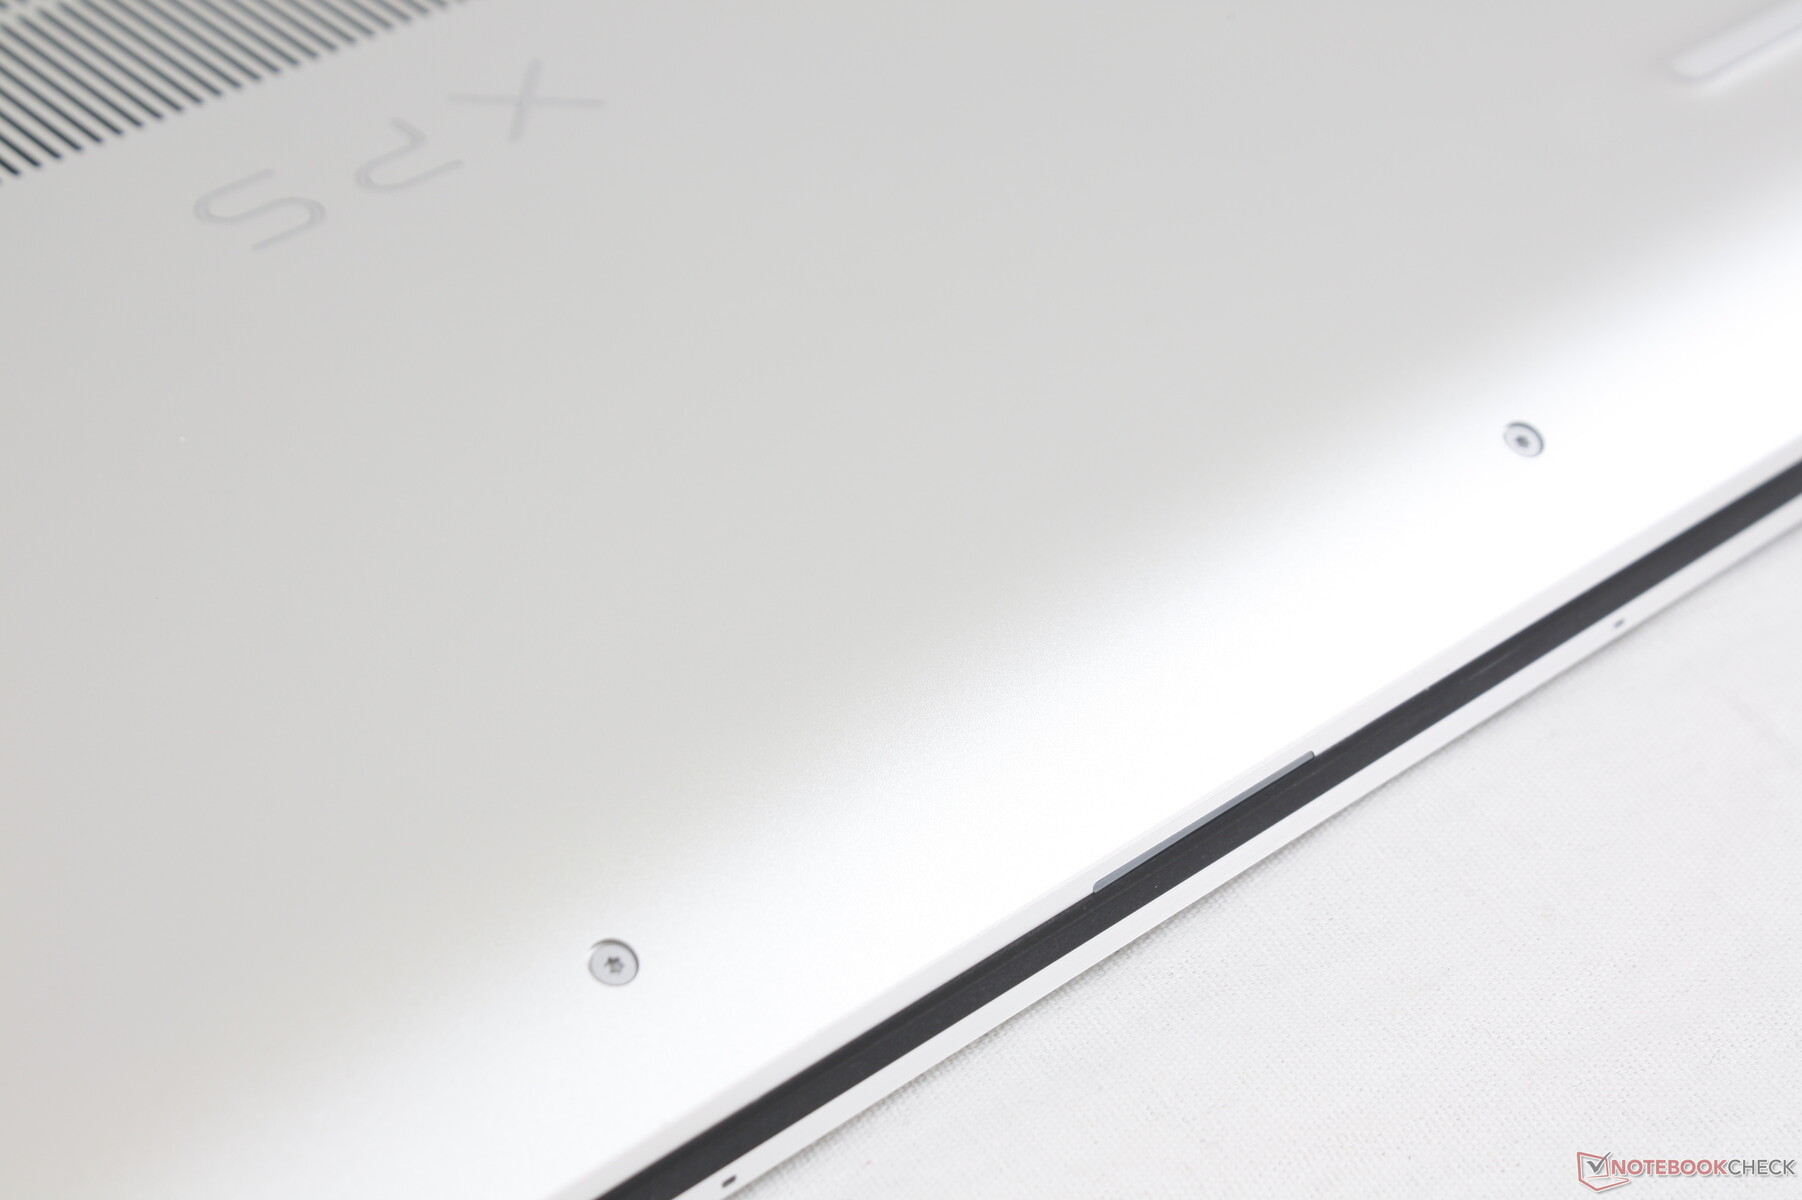
It's easy to become enamored by the design and visual style of the XPS 17. This is one of the best-looking 17-inch laptops available as Dell has translated the look and feel of the already excellent XPS 15 to a 17-inch size almost perfectly.
We have to say "almost perfectly" because some aspects of the chassis feel weaker than they do on the XPS 15. The display and base, for example, flex and creak slightly more when twisting its corners while the hinges could be stiffer as well to give a better sense of longevity. Thicker and larger 17-inch laptops like the Razer Blade Pro 17 have the advantage in this regard.
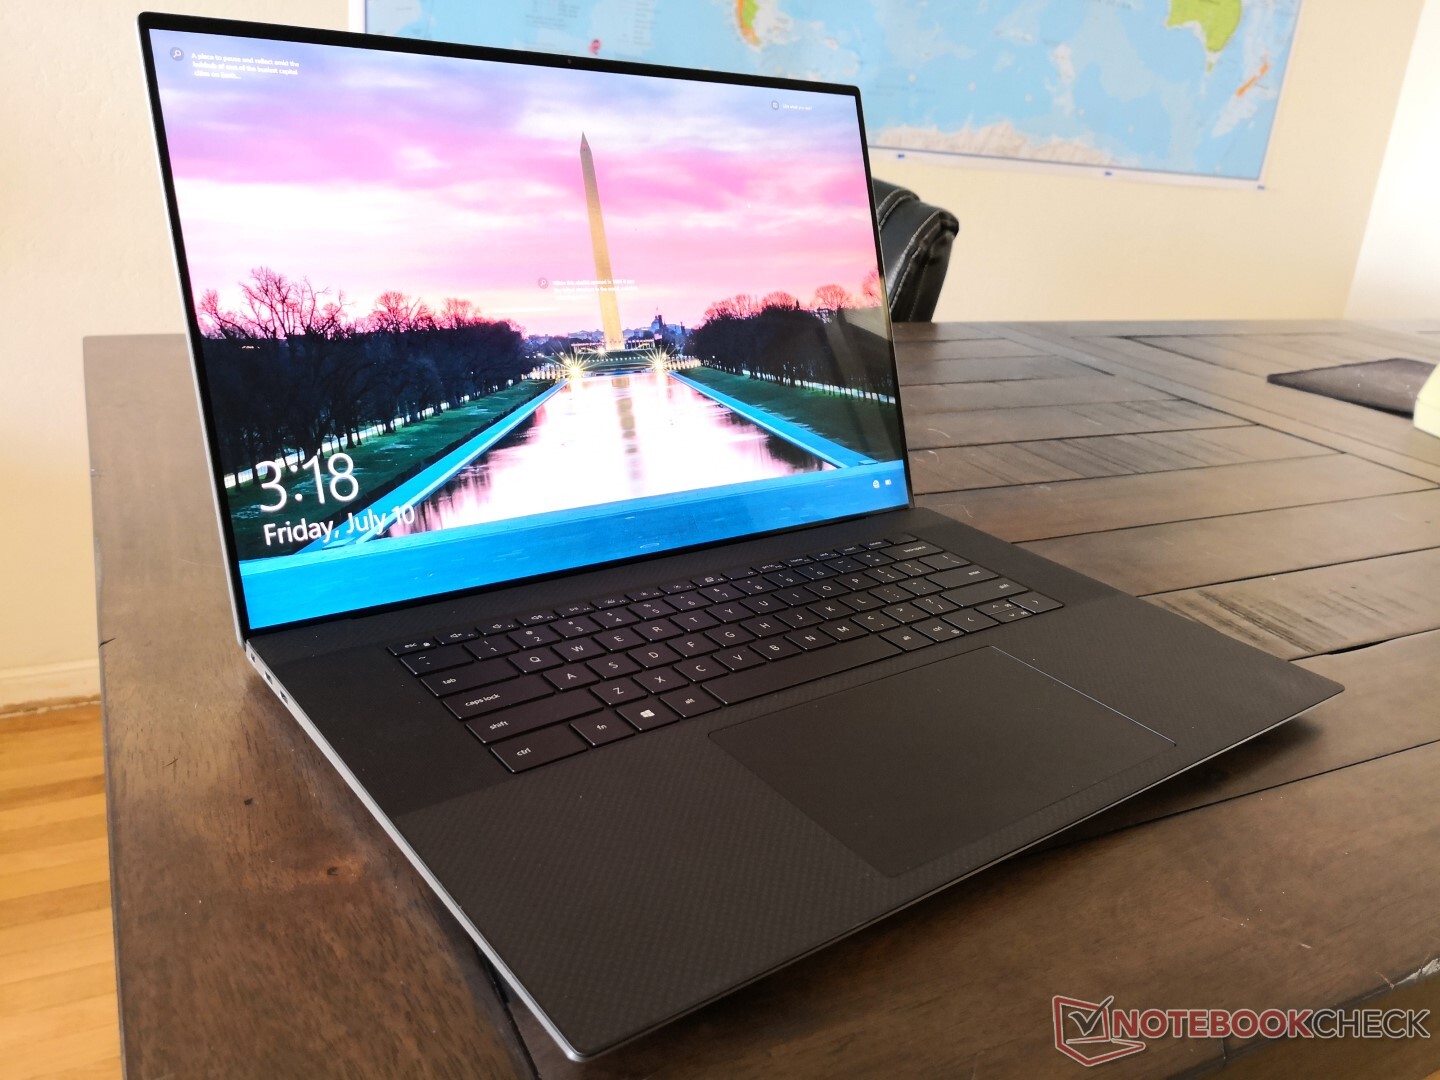
Much like how the XPS 15 has some of the smallest footprints of any 15.6-inch laptop, the XPS 17 is probably the most portable 17-inch laptop we've seen. This is partly due to its slightly smaller 17-inch screen size when compared to the more common 17.3-inch, but the taller 16:10 aspect ratio makes up for this difference.
The system is still hefty at 2.5 kg despite its smaller dimensions as vapor chambers are traditionally heavier than standard copper heat pipes. If you plan to travel frequently with a 17-inch laptop, then this or the LG Gram 17 would be your two best options.
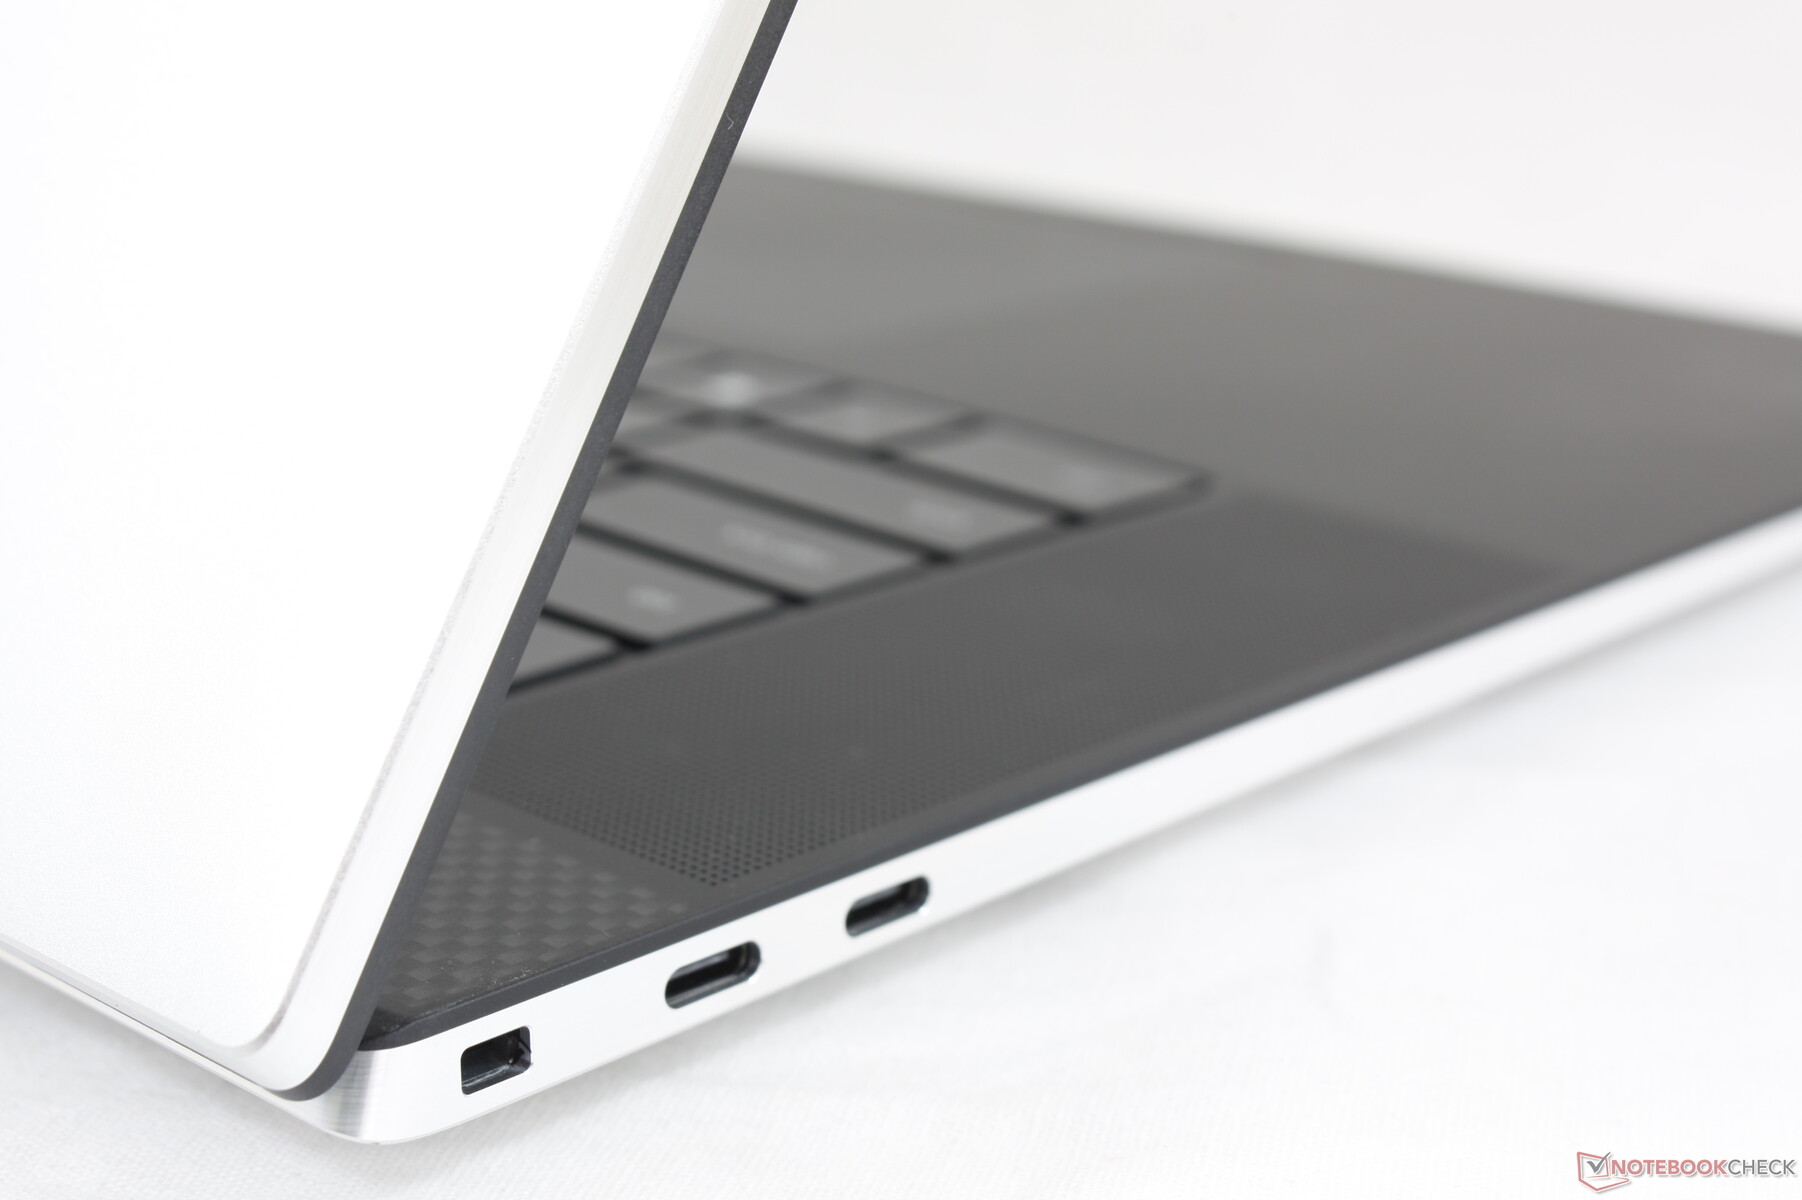
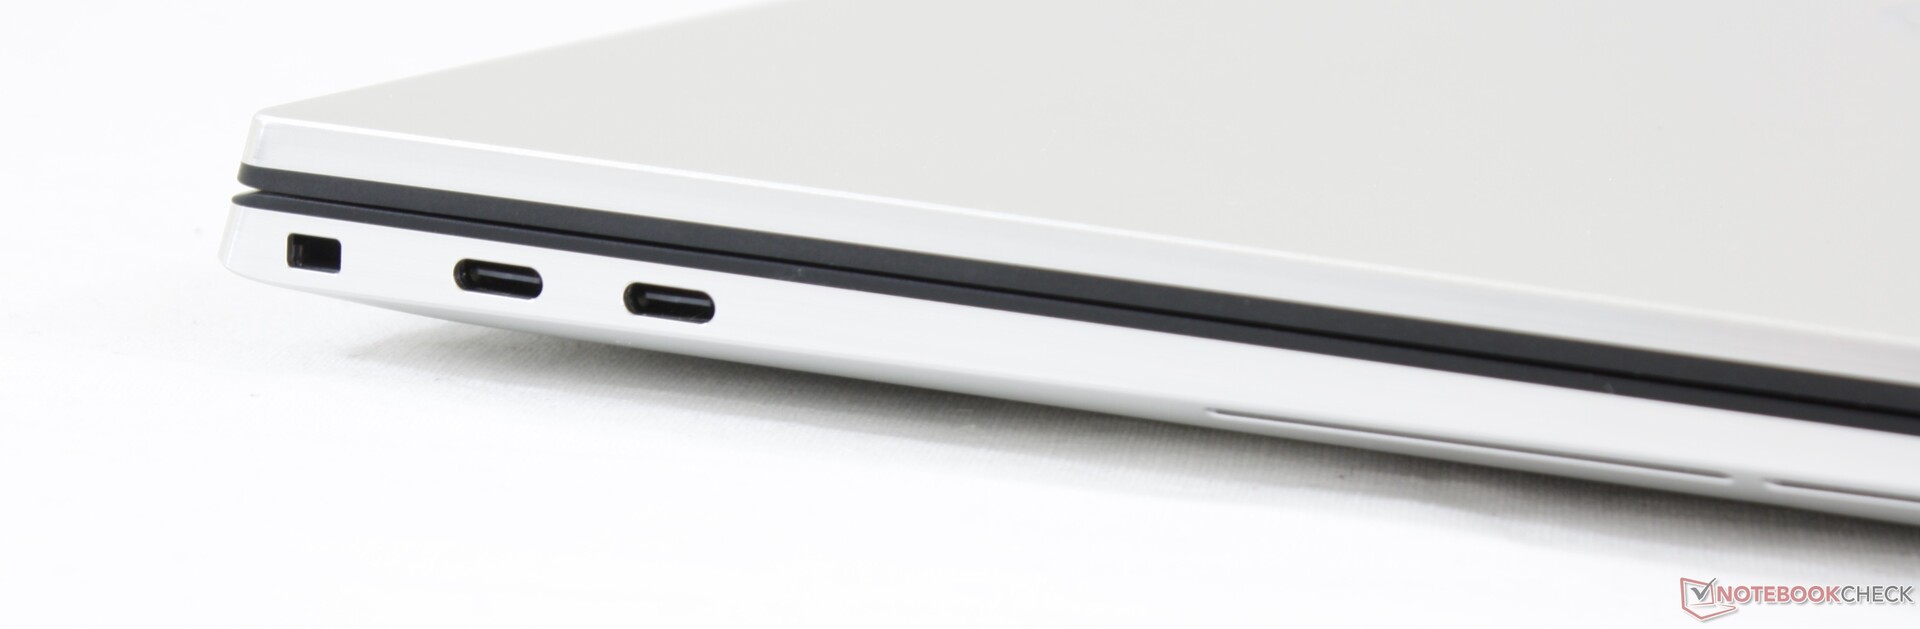
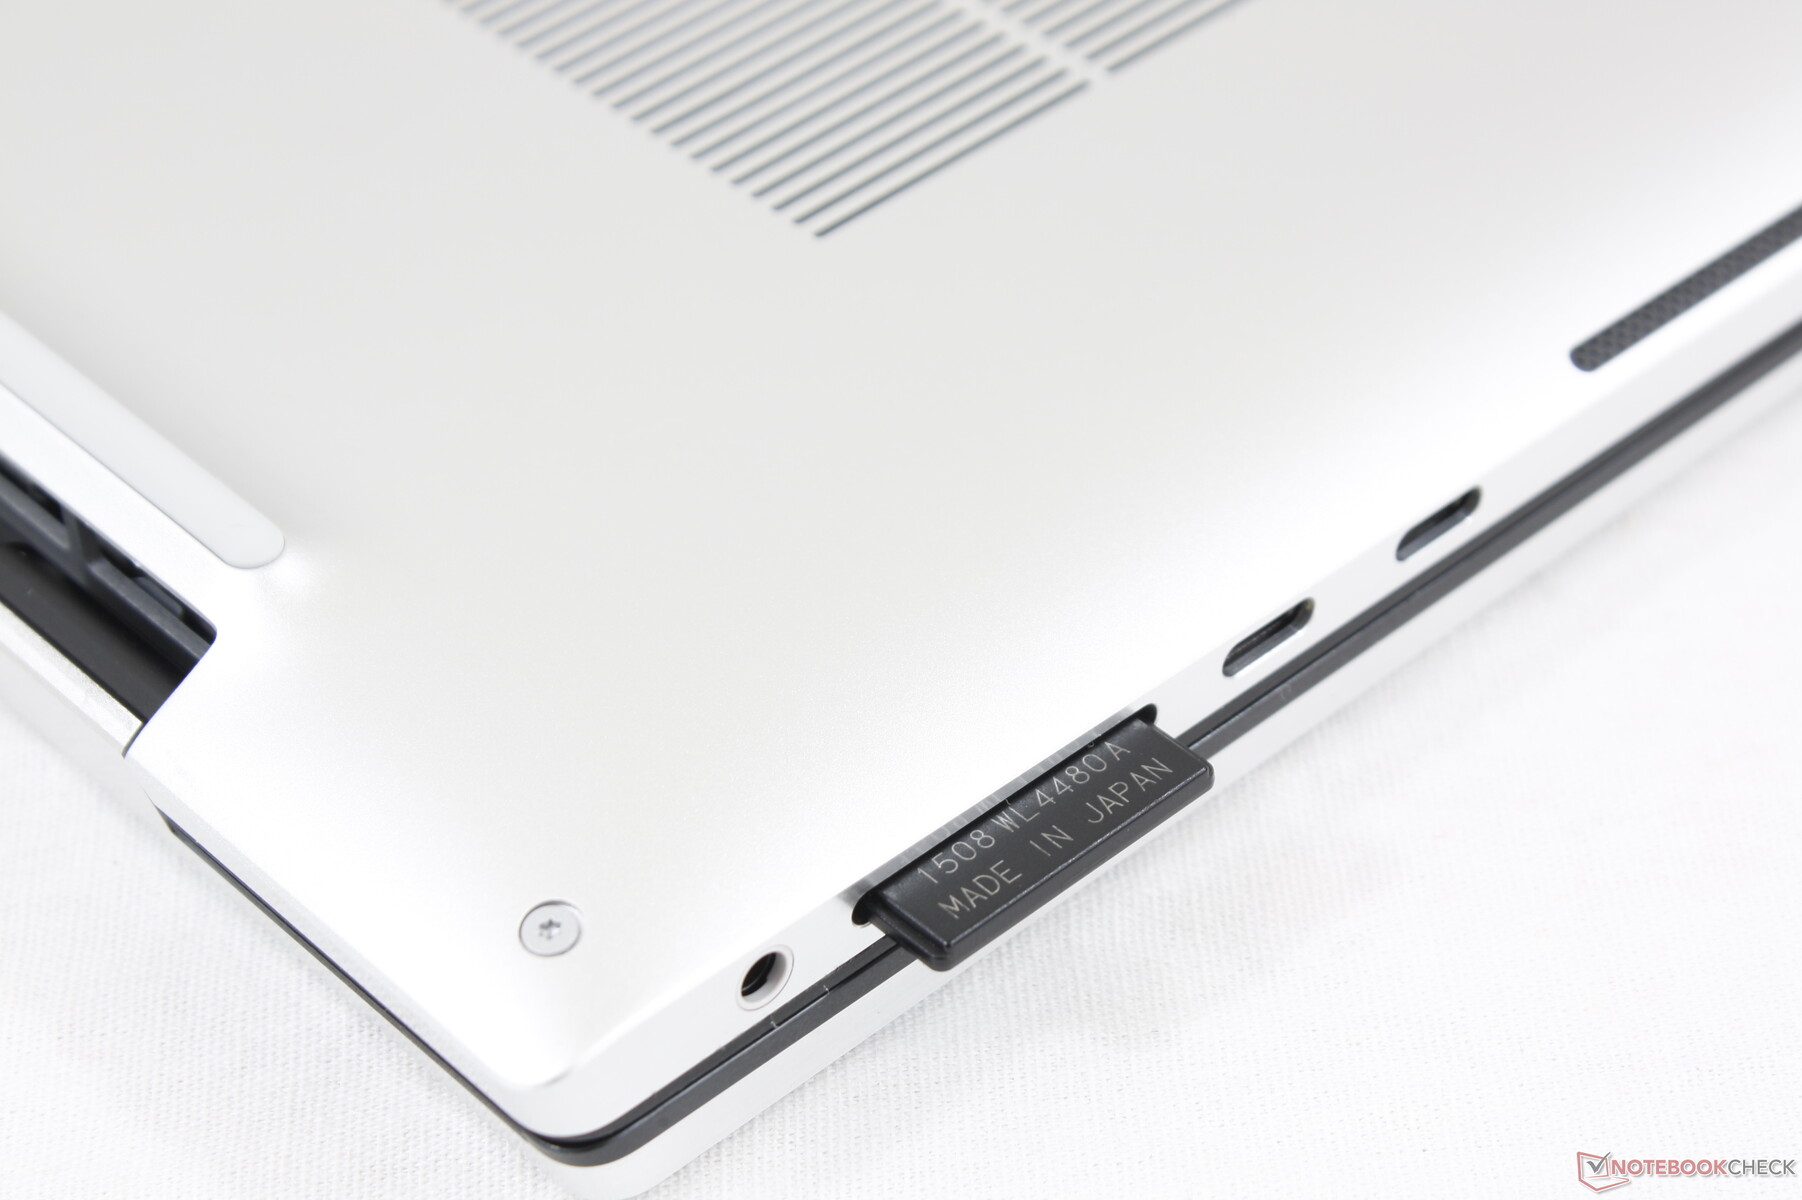
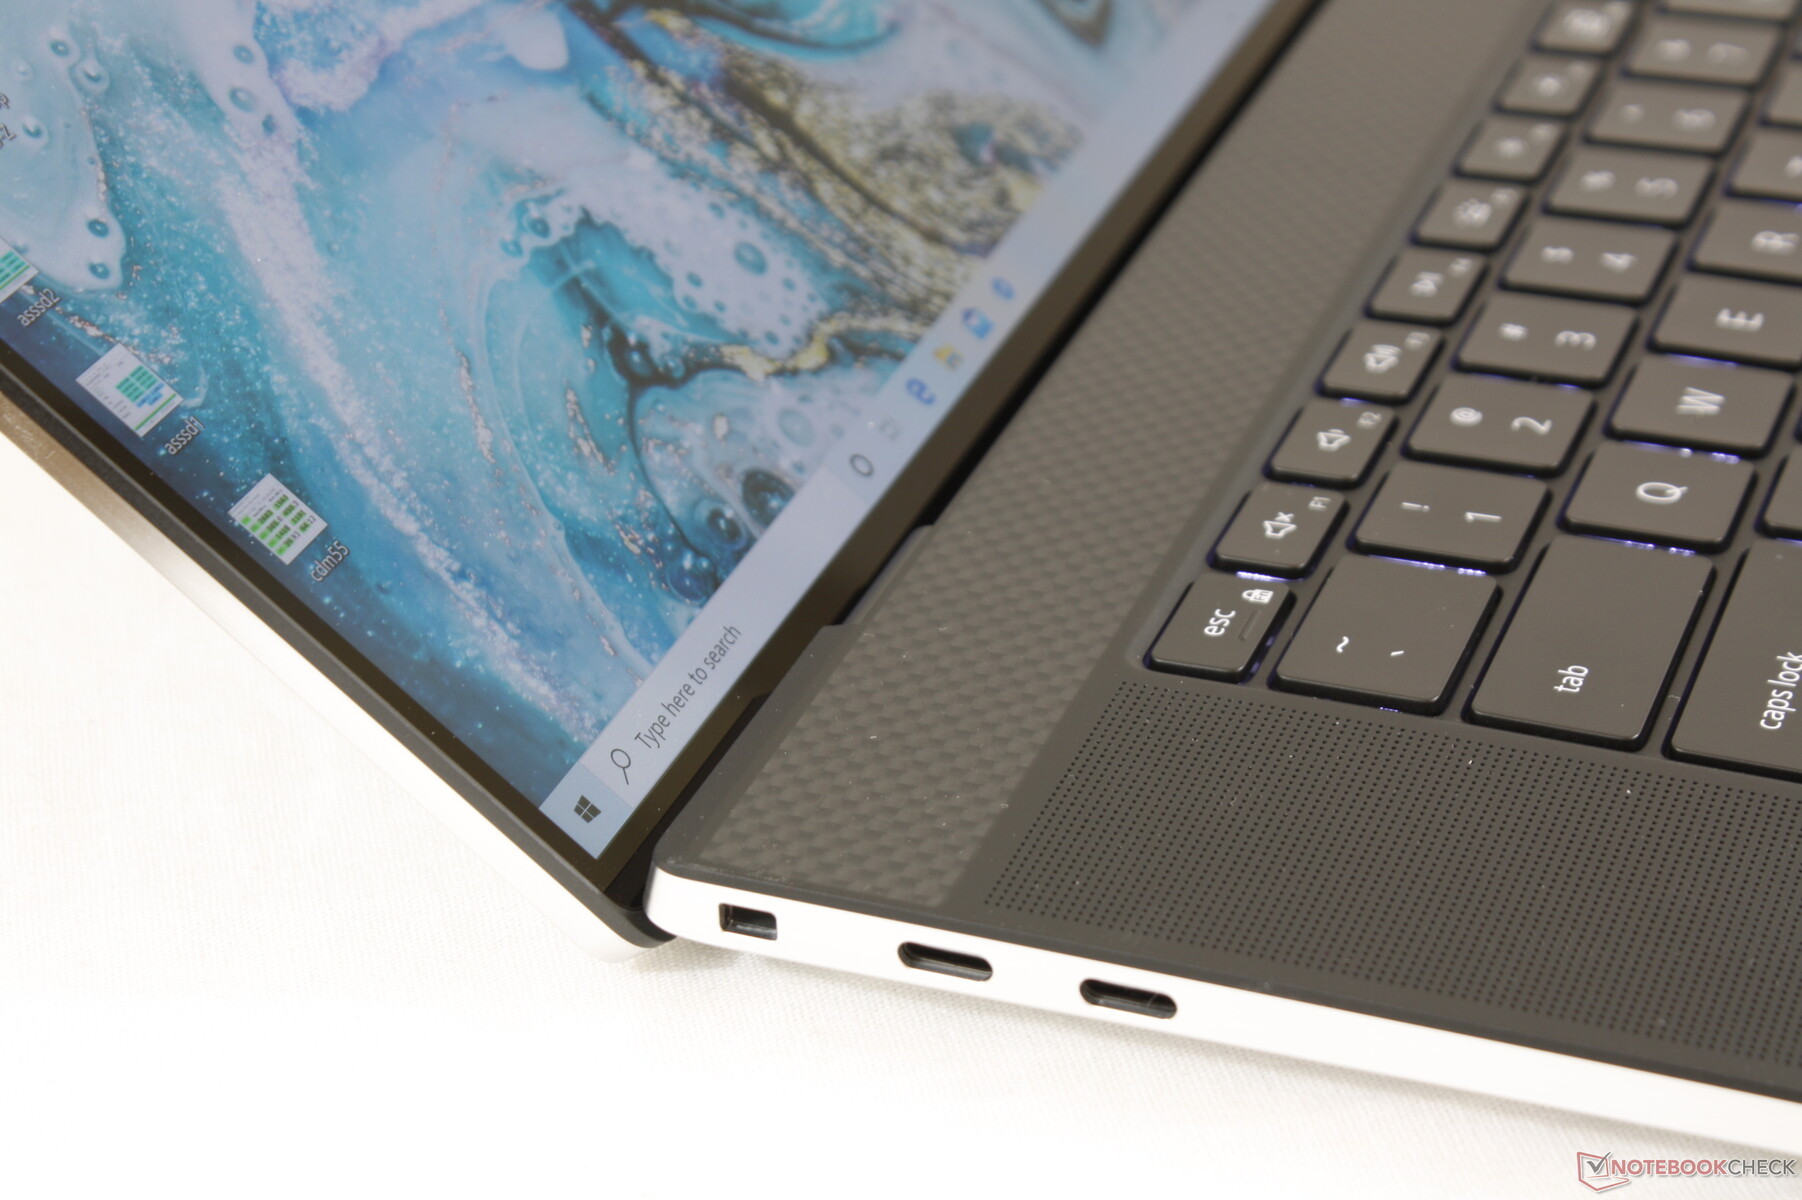
Connectivity — Copying the MacBook Pro to a Tee
During a conference call with HP a few months ago, a company rep had this to say about the MacBook Pro 15:
"What are you going to do with four Thunderbolt 3 ports?"
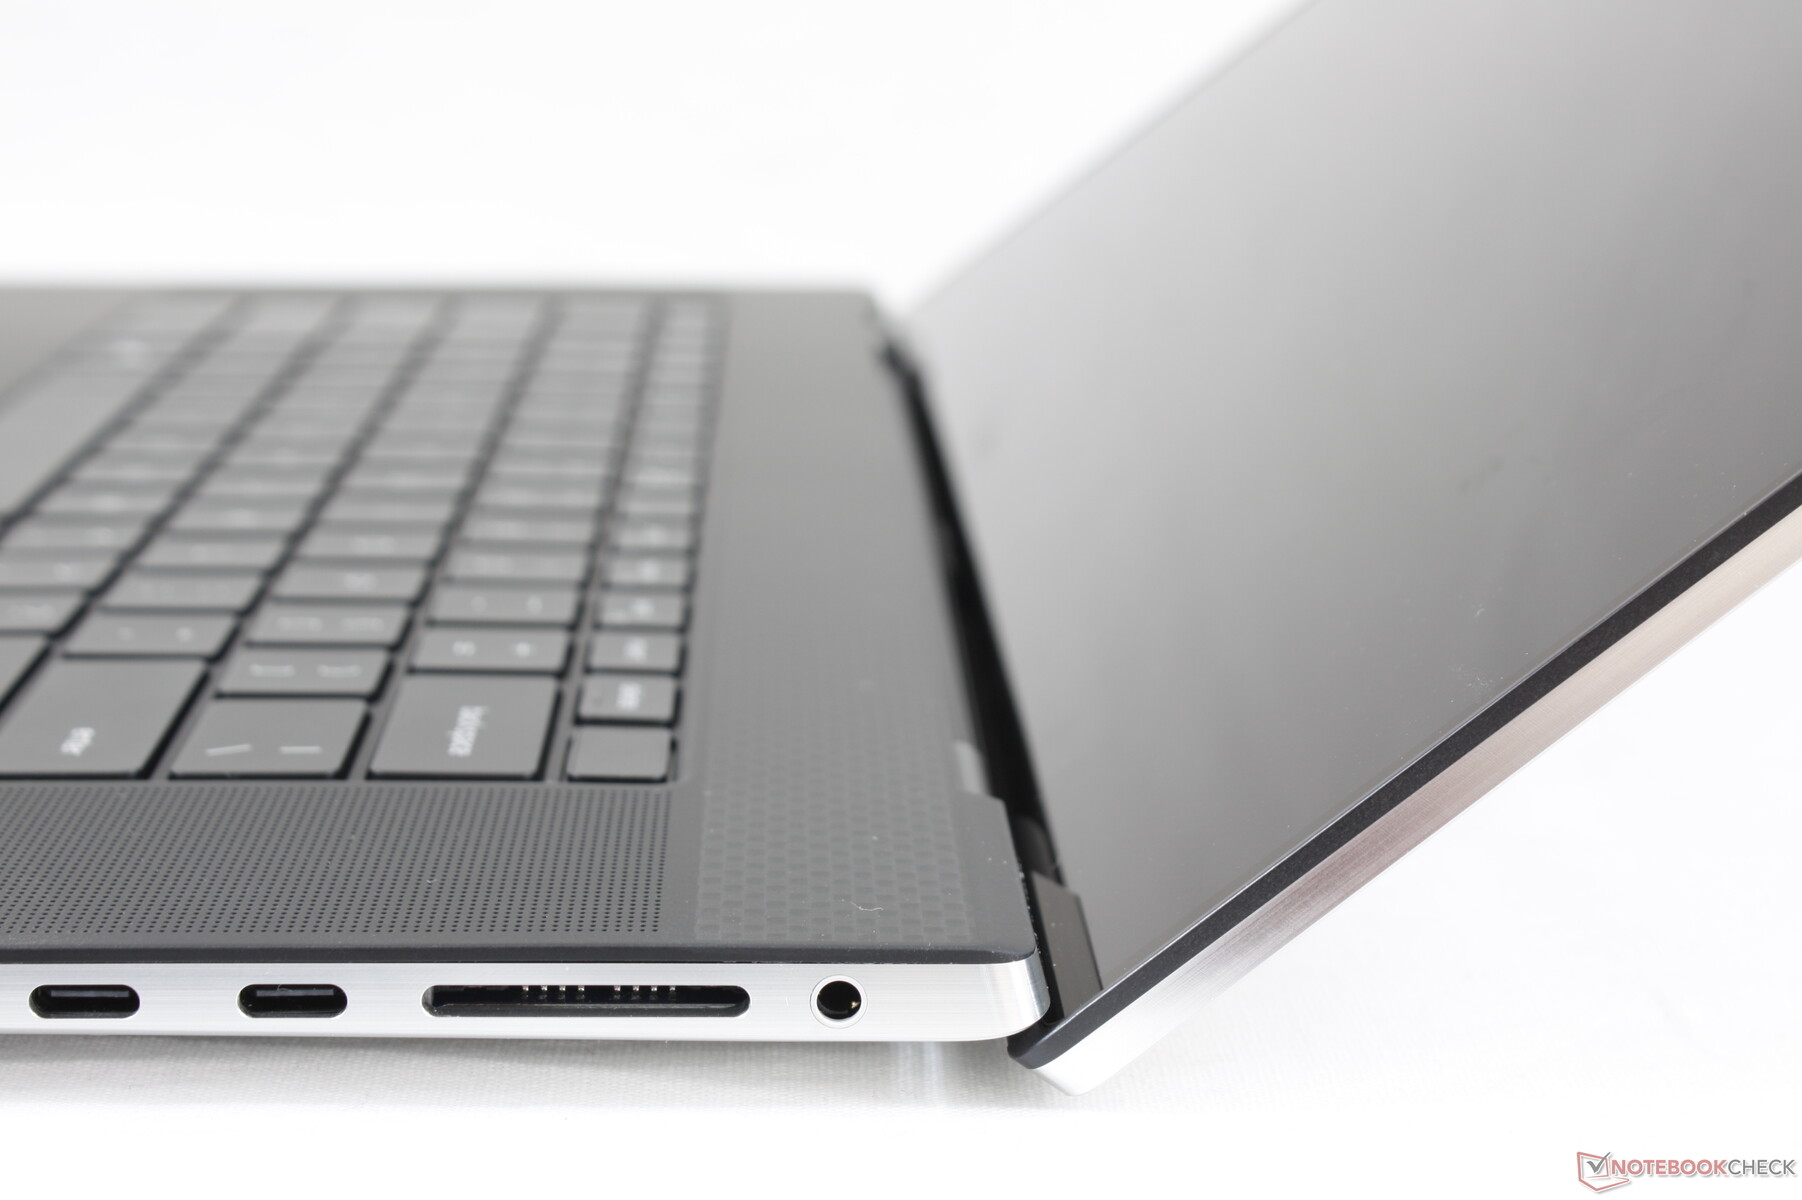
We're not really sure, either, but one thing's for certain: be prepared to carry a bunch of adapters with you. It's a bit unfortunate that Dell couldn't squeeze in any other ports despite the larger 17-inch form factor. The HP Envy 17t, for example, integrates both HDMI and USB Type-A in addition to USB Type-C.
Annoyingly, the ports are packed tightly together along the edges so thicker adapters and docking stations may block access to adjacent ports.
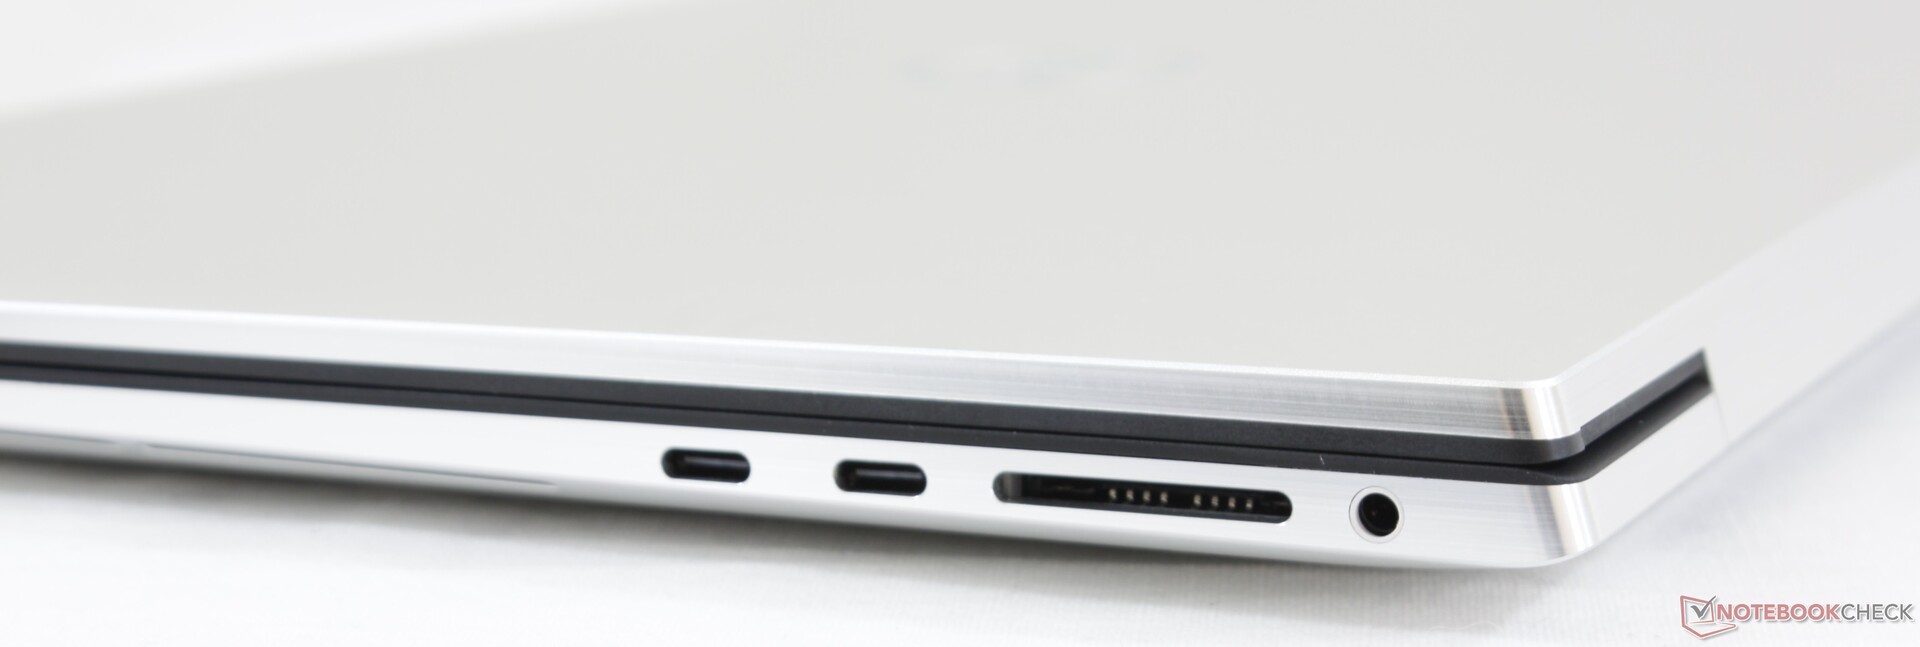
SD Card Reader
The integrated SD card reader returns very fast transfer rates much like on the XPS 15. Moving 1 GB of pictures from our UHS-II test card to desktop takes just 5 to 6 seconds. Note that the card reader is not spring-loaded.
| SD Card Reader | |
| average JPG Copy Test (av. of 3 runs) | |
| Razer Blade Pro 17 RTX 2070 Max-Q 300 Hz (Toshiba Exceria Pro SDXC 64 GB UHS-II) | |
| Gigabyte Aero 17 HDR XB (Toshiba Exceria Pro SDXC 64 GB UHS-II) | |
| Dell XPS 17 9700 Core i7 RTX 2060 Max-Q (Toshiba Exceria Pro SDXC 64 GB UHS-II) | |
| HP Envy 17t-cg000 (Toshiba Exceria Pro SDXC 64 GB UHS-II) | |
| maximum AS SSD Seq Read Test (1GB) | |
| Gigabyte Aero 17 HDR XB (Toshiba Exceria Pro SDXC 64 GB UHS-II) | |
| Razer Blade Pro 17 RTX 2070 Max-Q 300 Hz (Toshiba Exceria Pro SDXC 64 GB UHS-II) | |
| Dell XPS 17 9700 Core i7 RTX 2060 Max-Q (Toshiba Exceria Pro SDXC 64 GB UHS-II) | |
| HP Envy 17t-cg000 (Toshiba Exceria Pro SDXC 64 GB UHS-II) | |
Communication
The Wi-Fi 6-enabled Killer 1650 comes standard on all SKUs. We would have preferred the Intel AX200/201 instead because Killer Wi-Fi typically targets gamers and the XPS 17 is not marketed as a gaming machine. Nonetheless, we didn't experience any issues when connected to our Netgear RAX200 test router.
Webcam


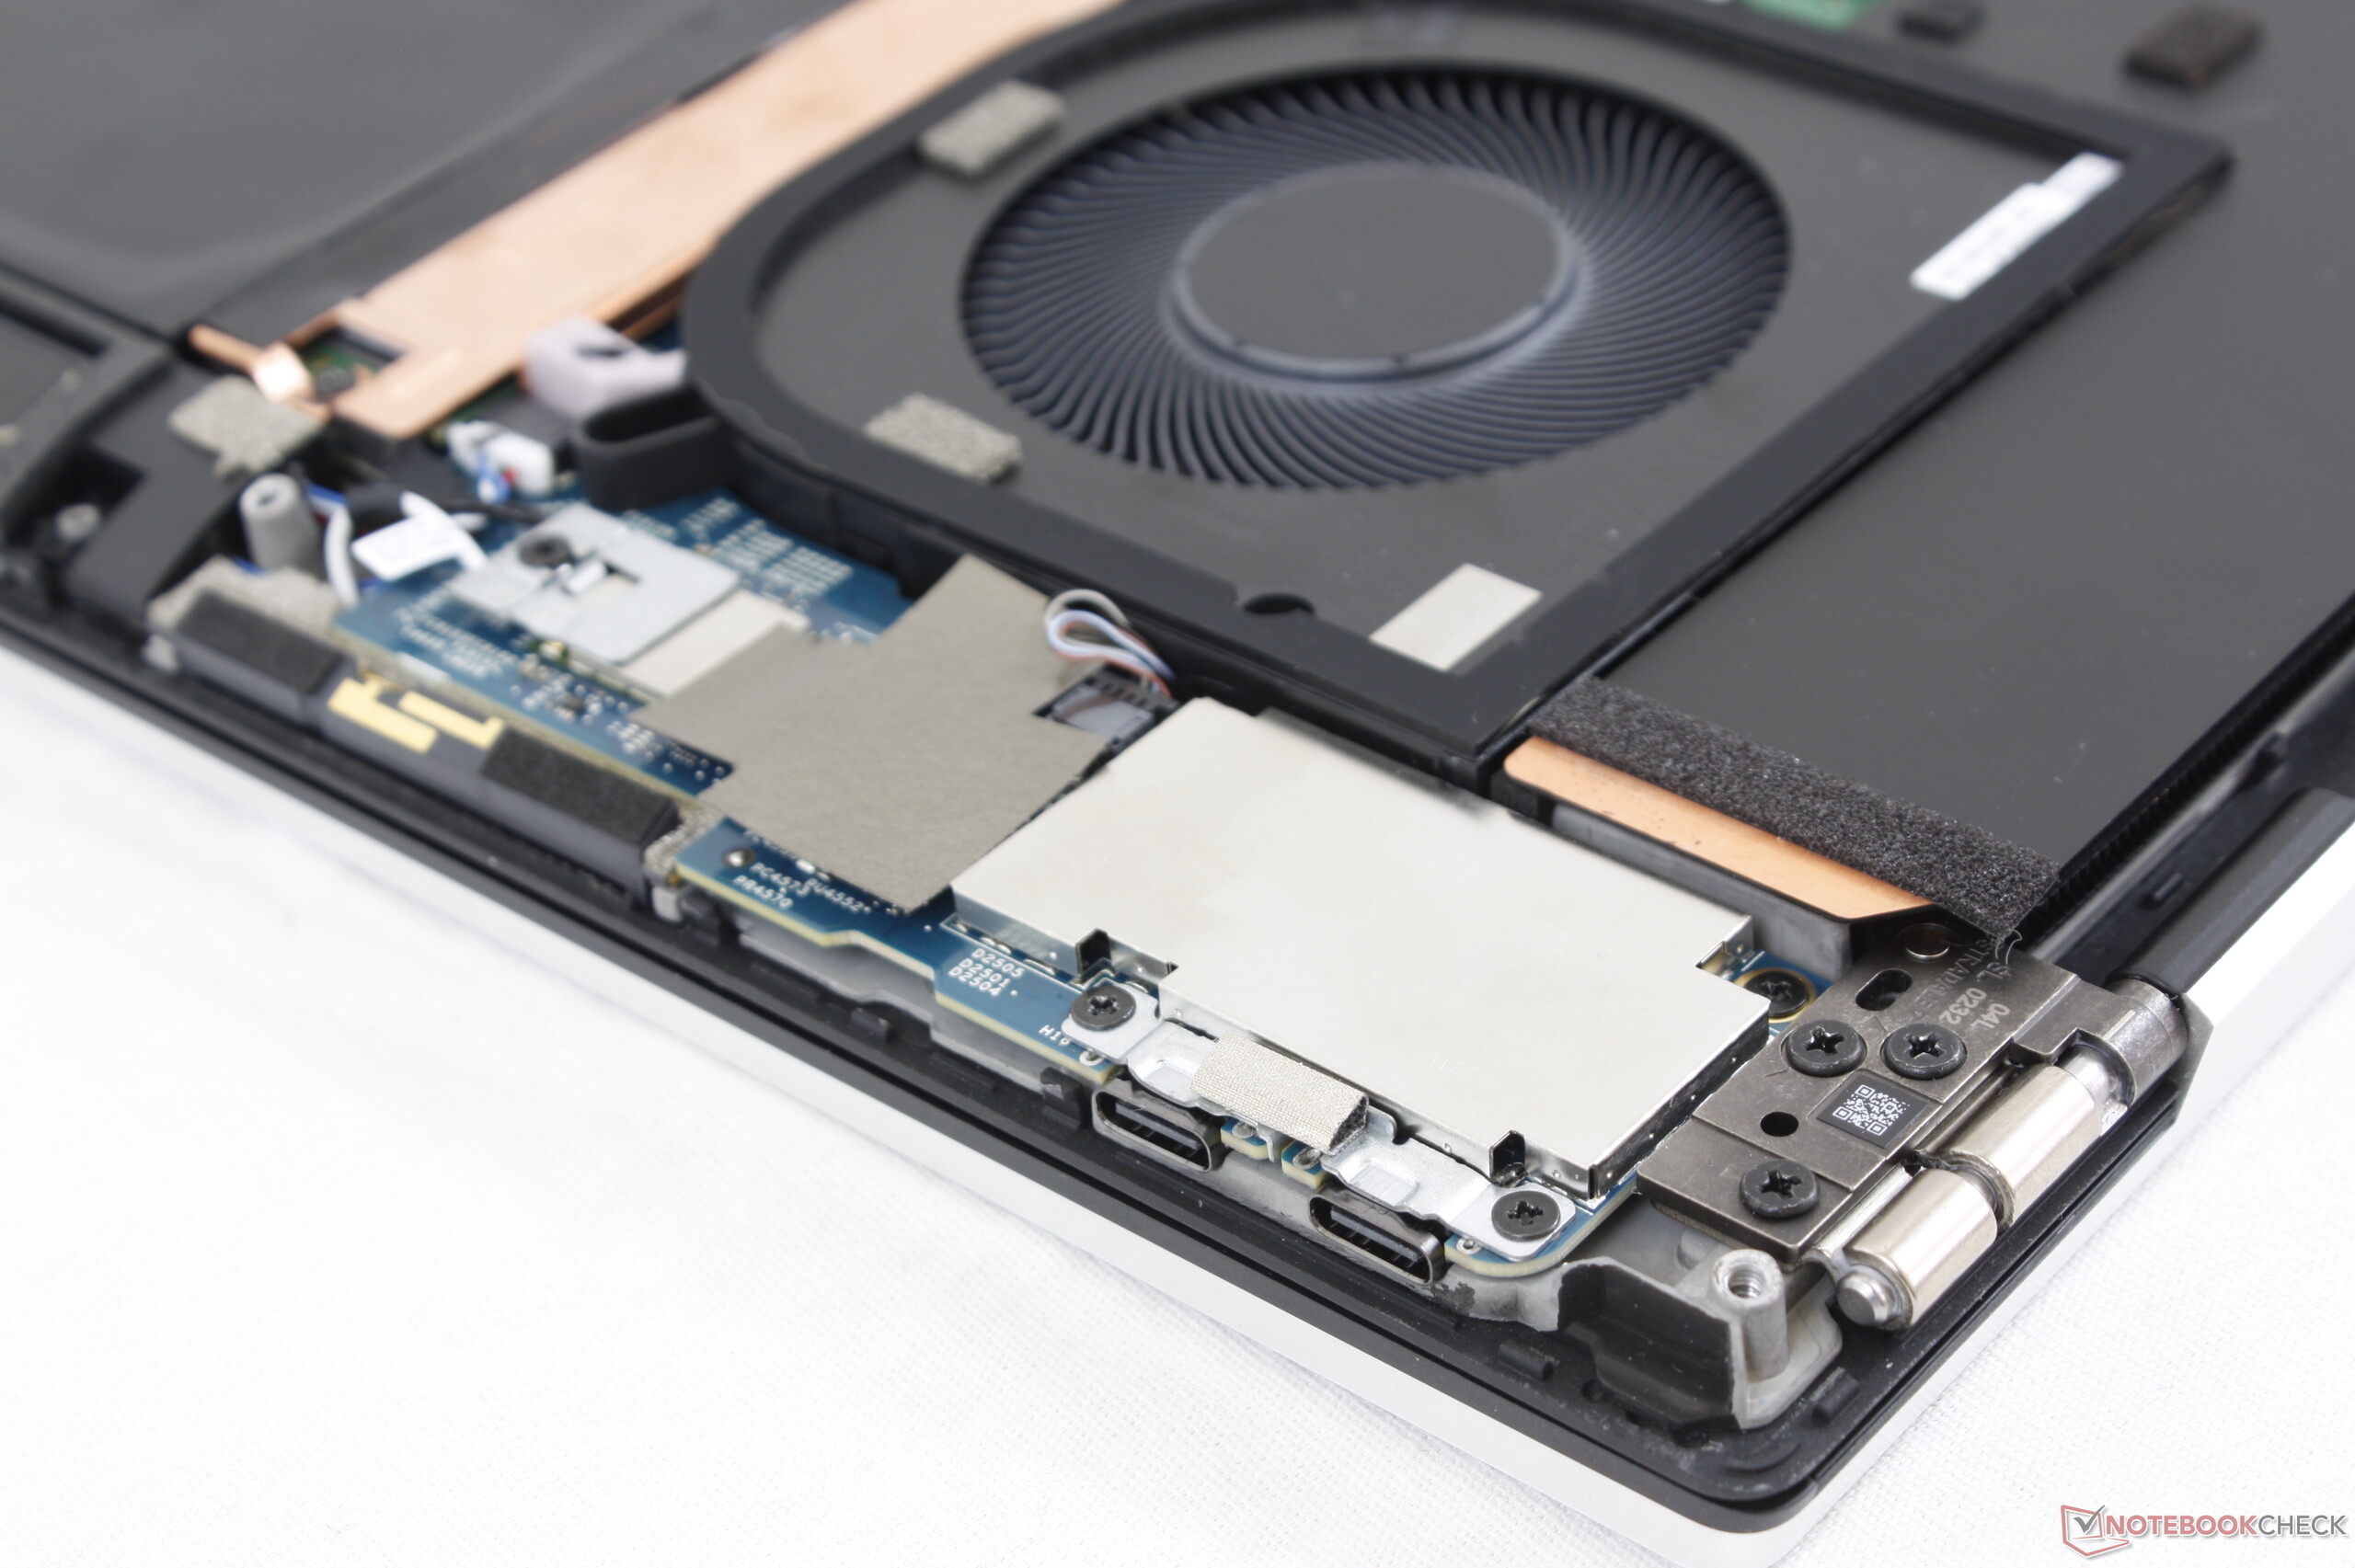
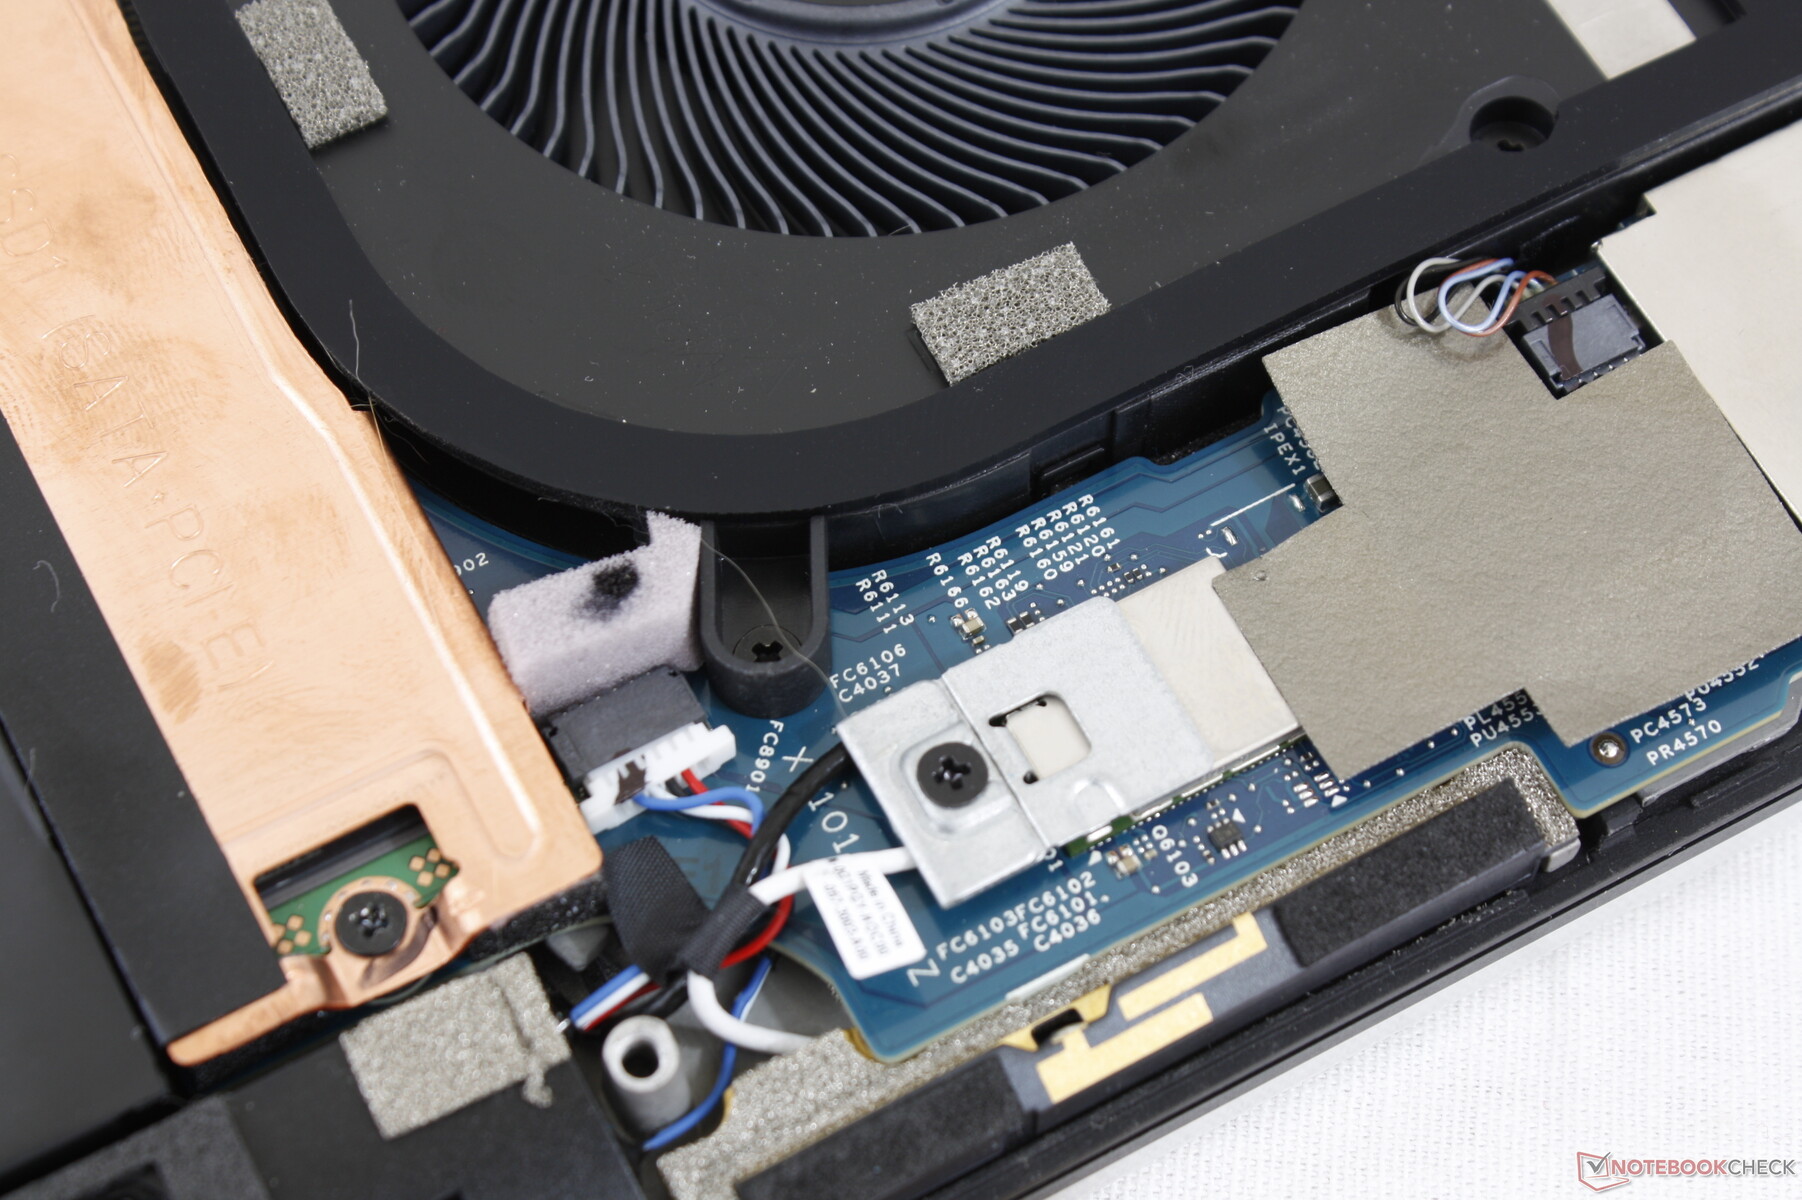
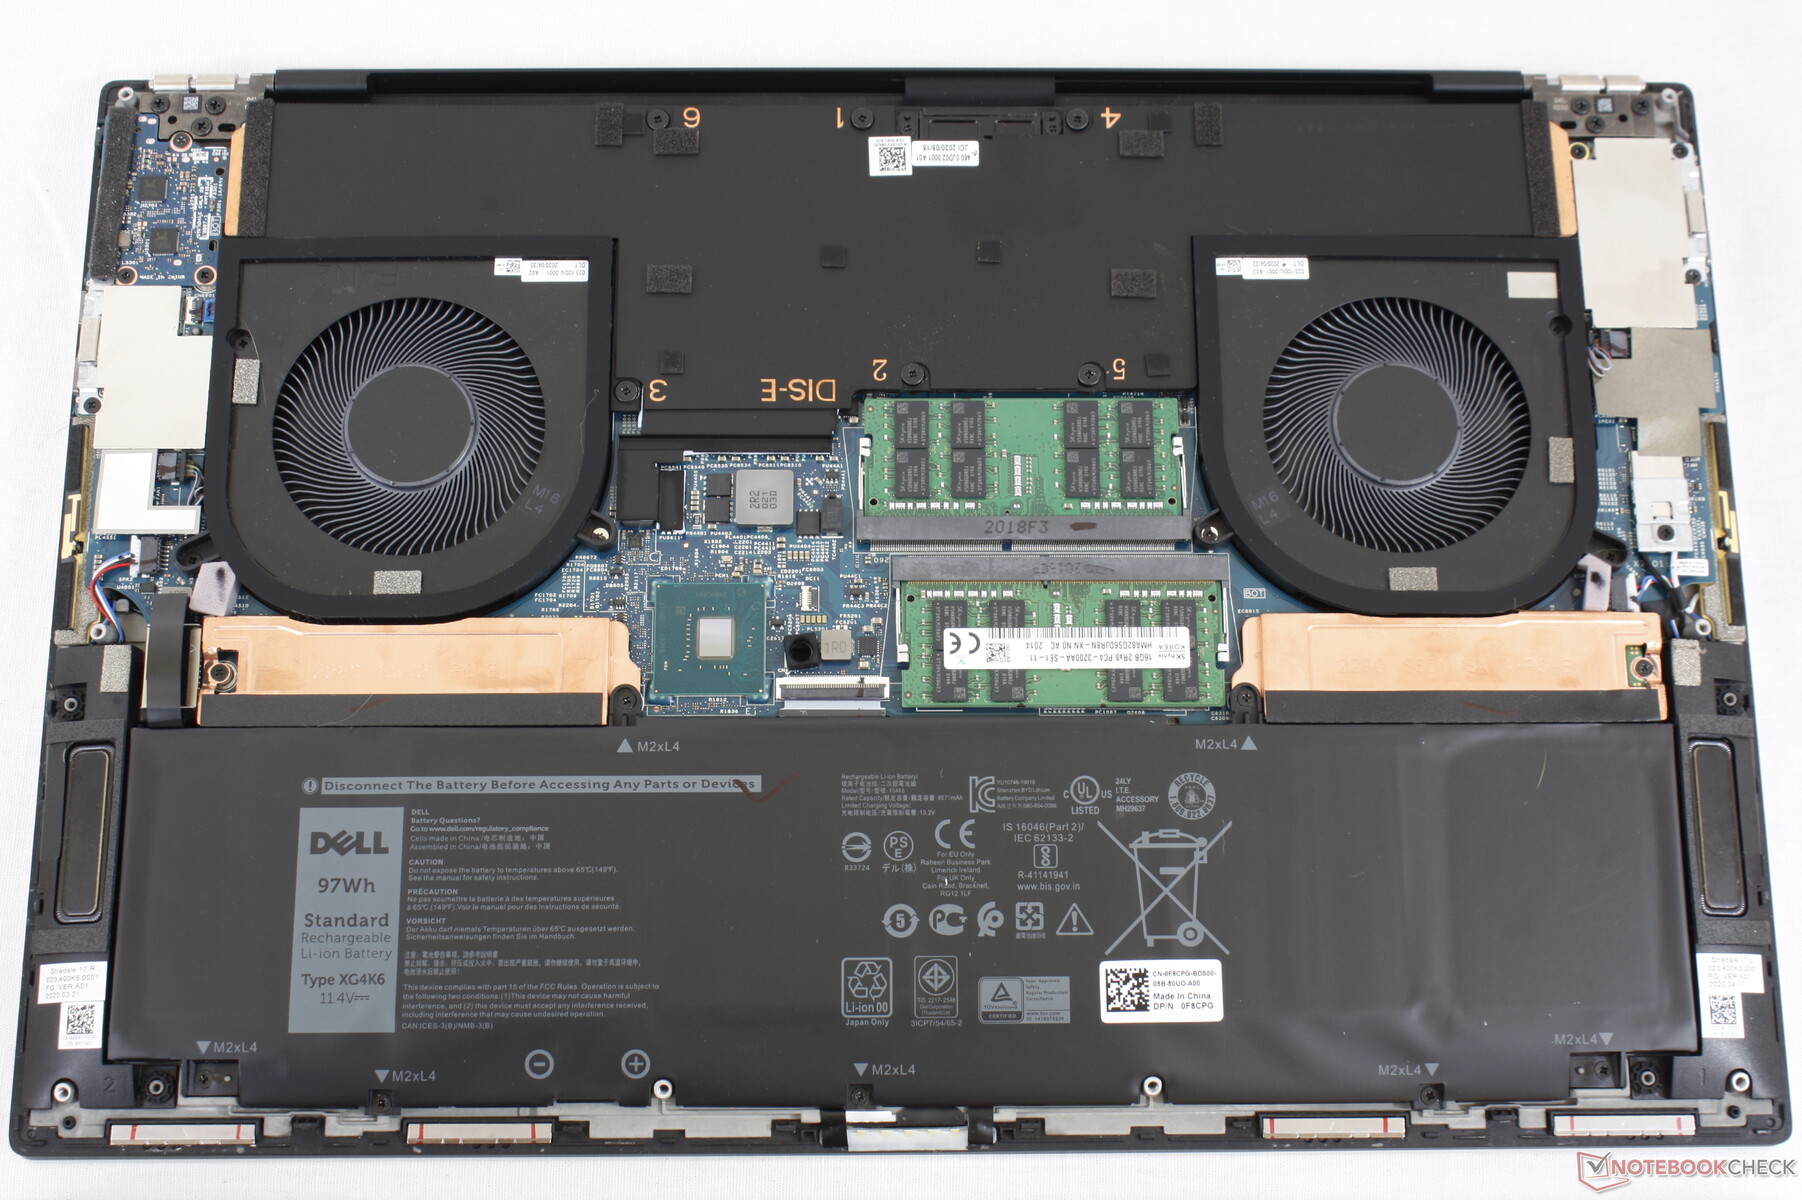
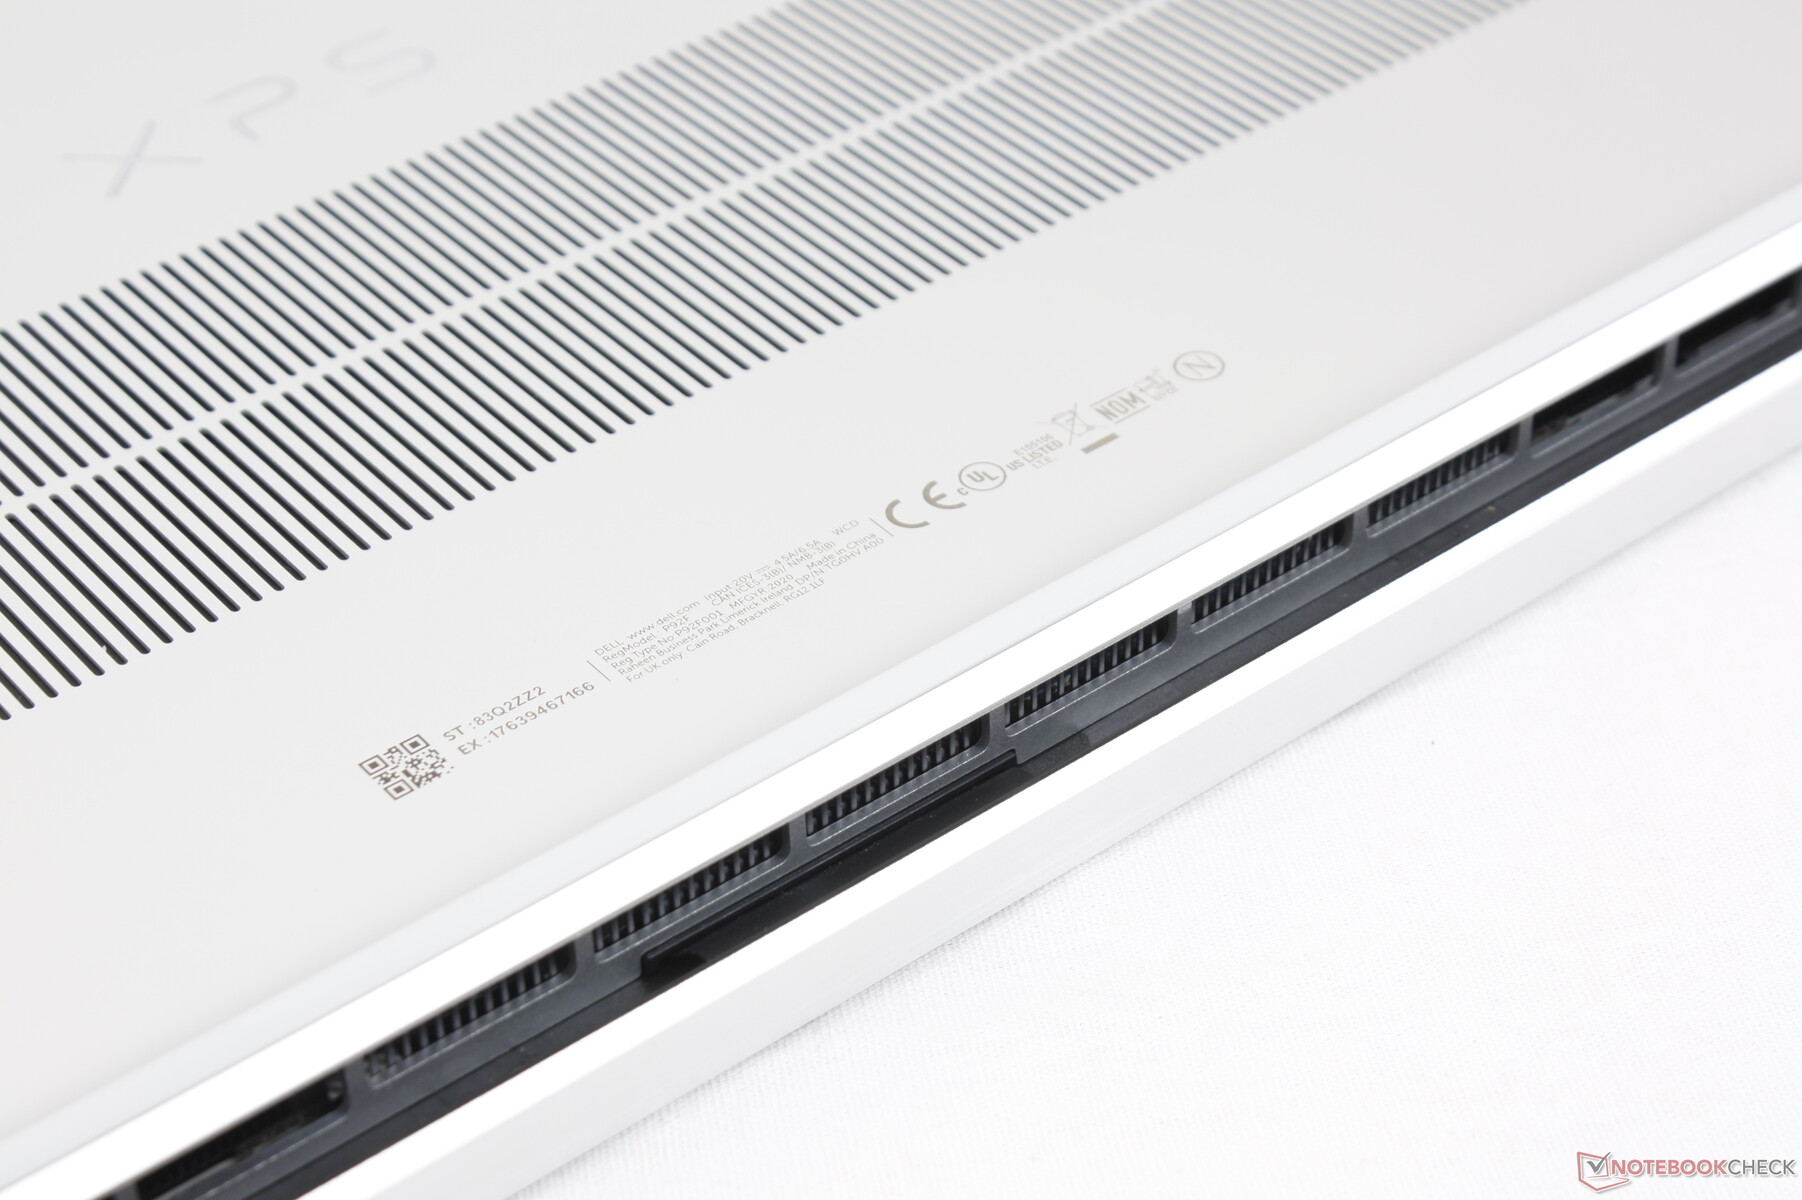
Maintenance
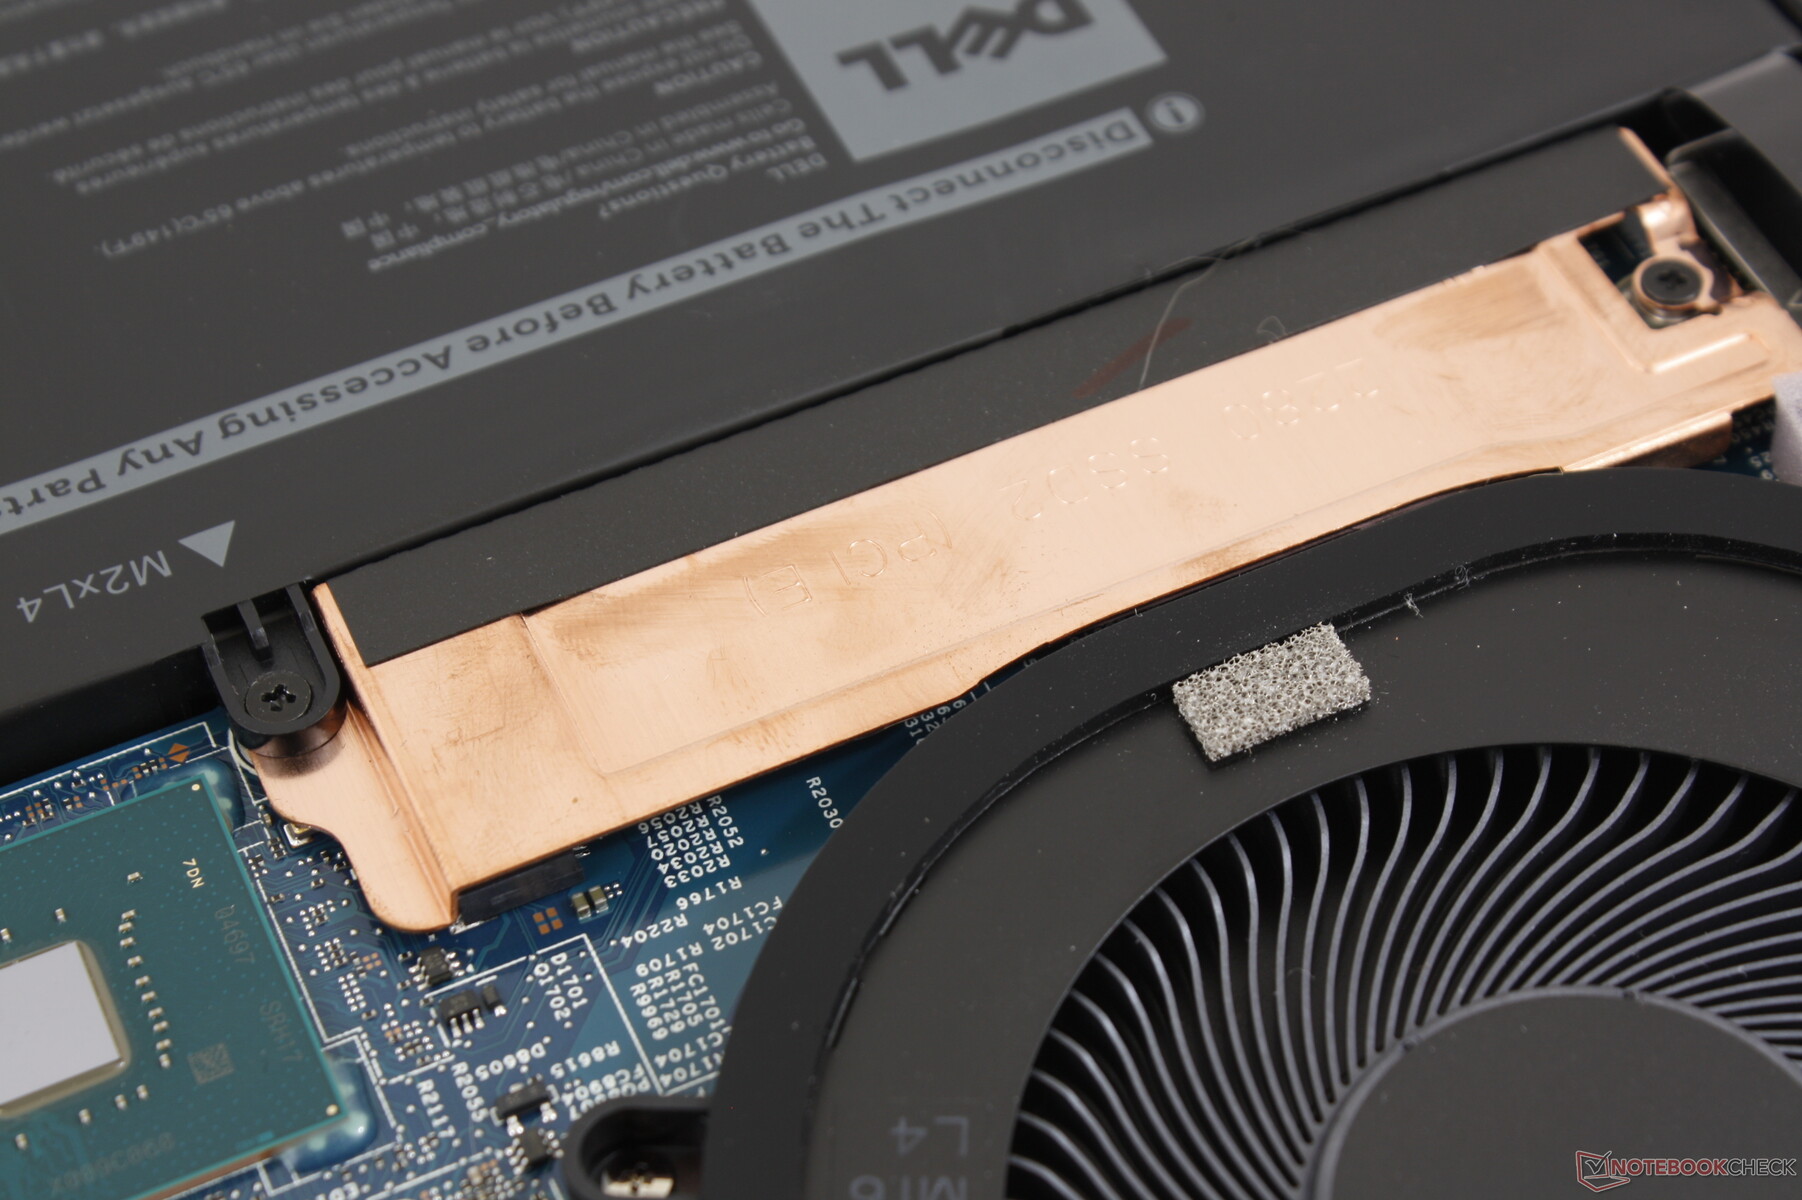
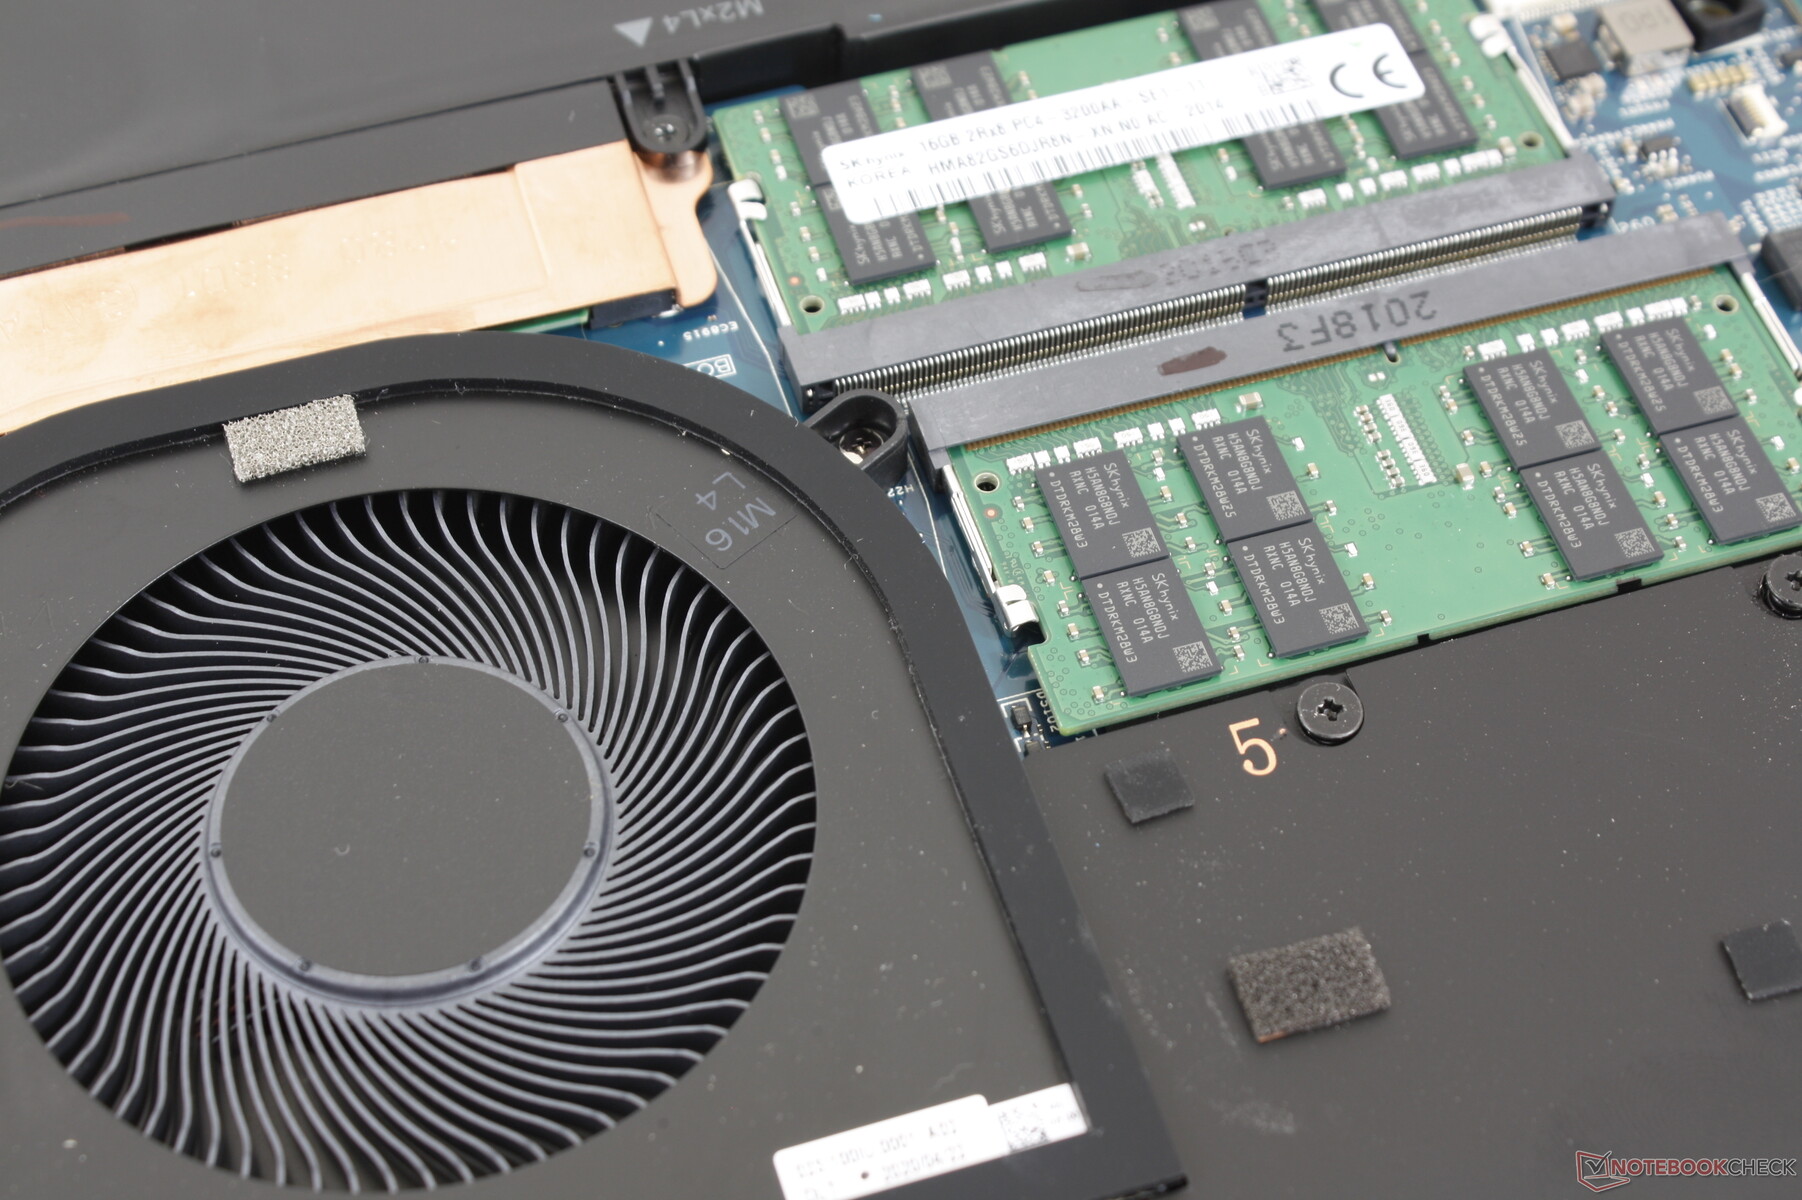
The bottom panel is secured by eight T5 Torx screws and it's generally more difficult to open up than the XPS 15 7590 since the edges and corners are tighter and sharper. A plastic edge like an old credit card is recommended to avoid any finger cuts.
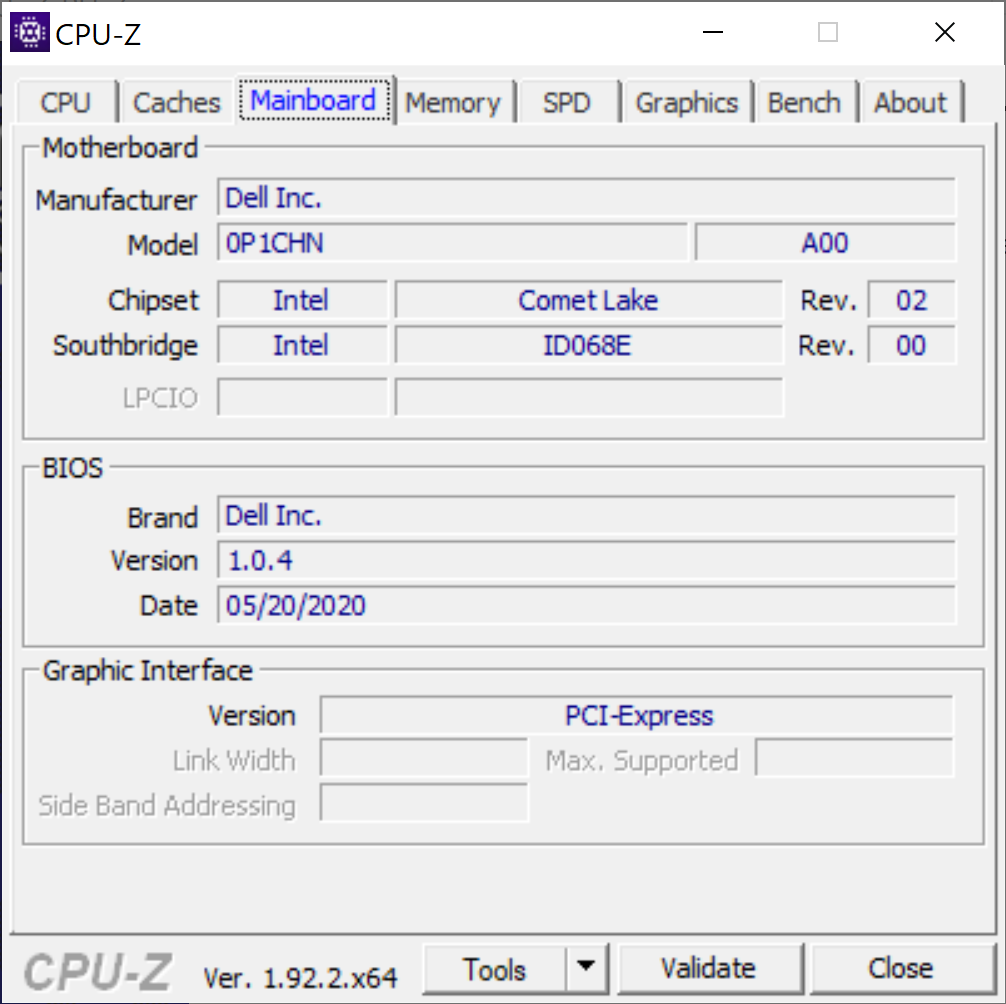
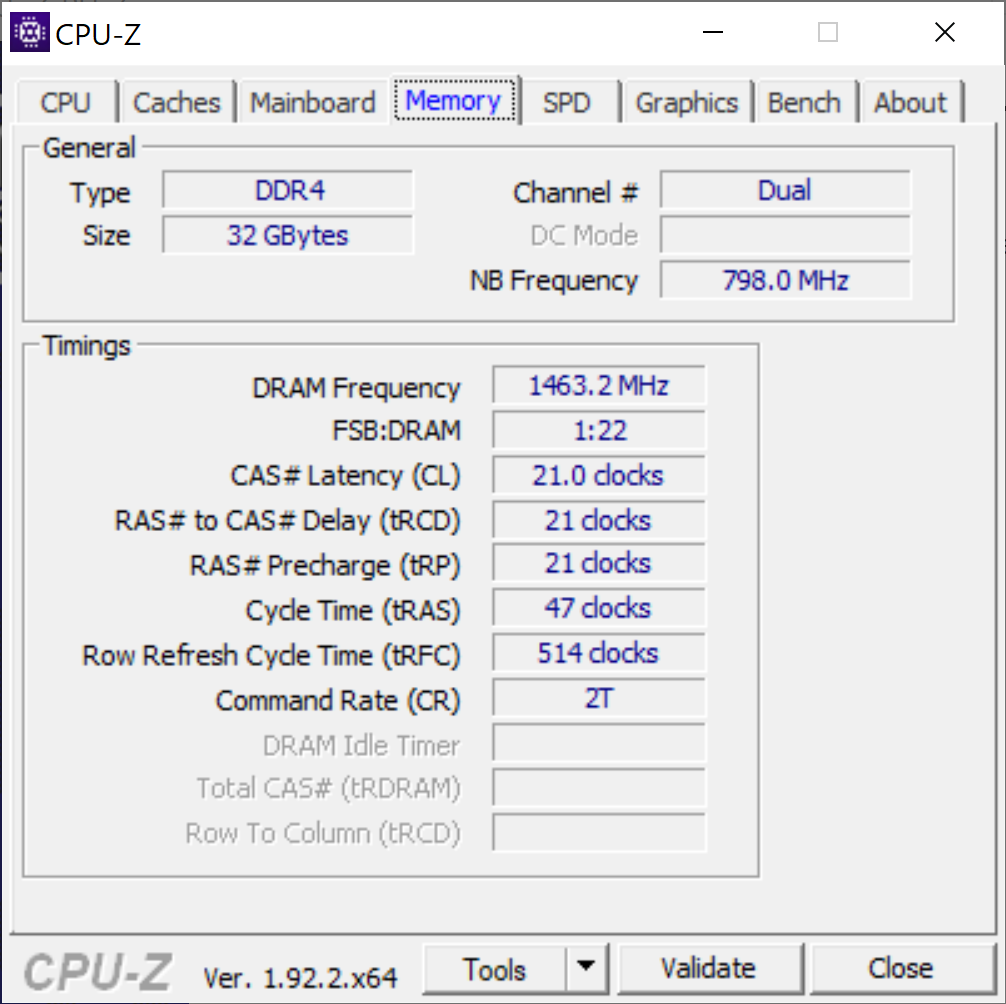
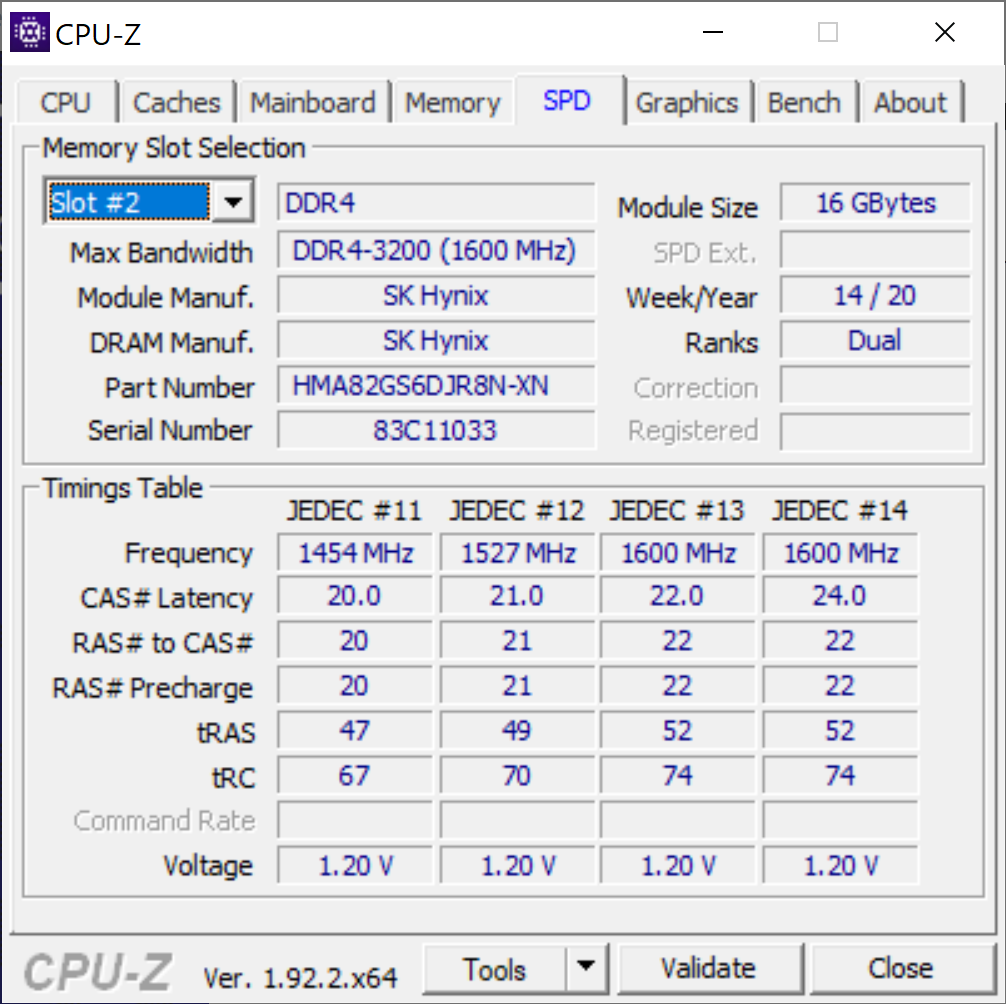
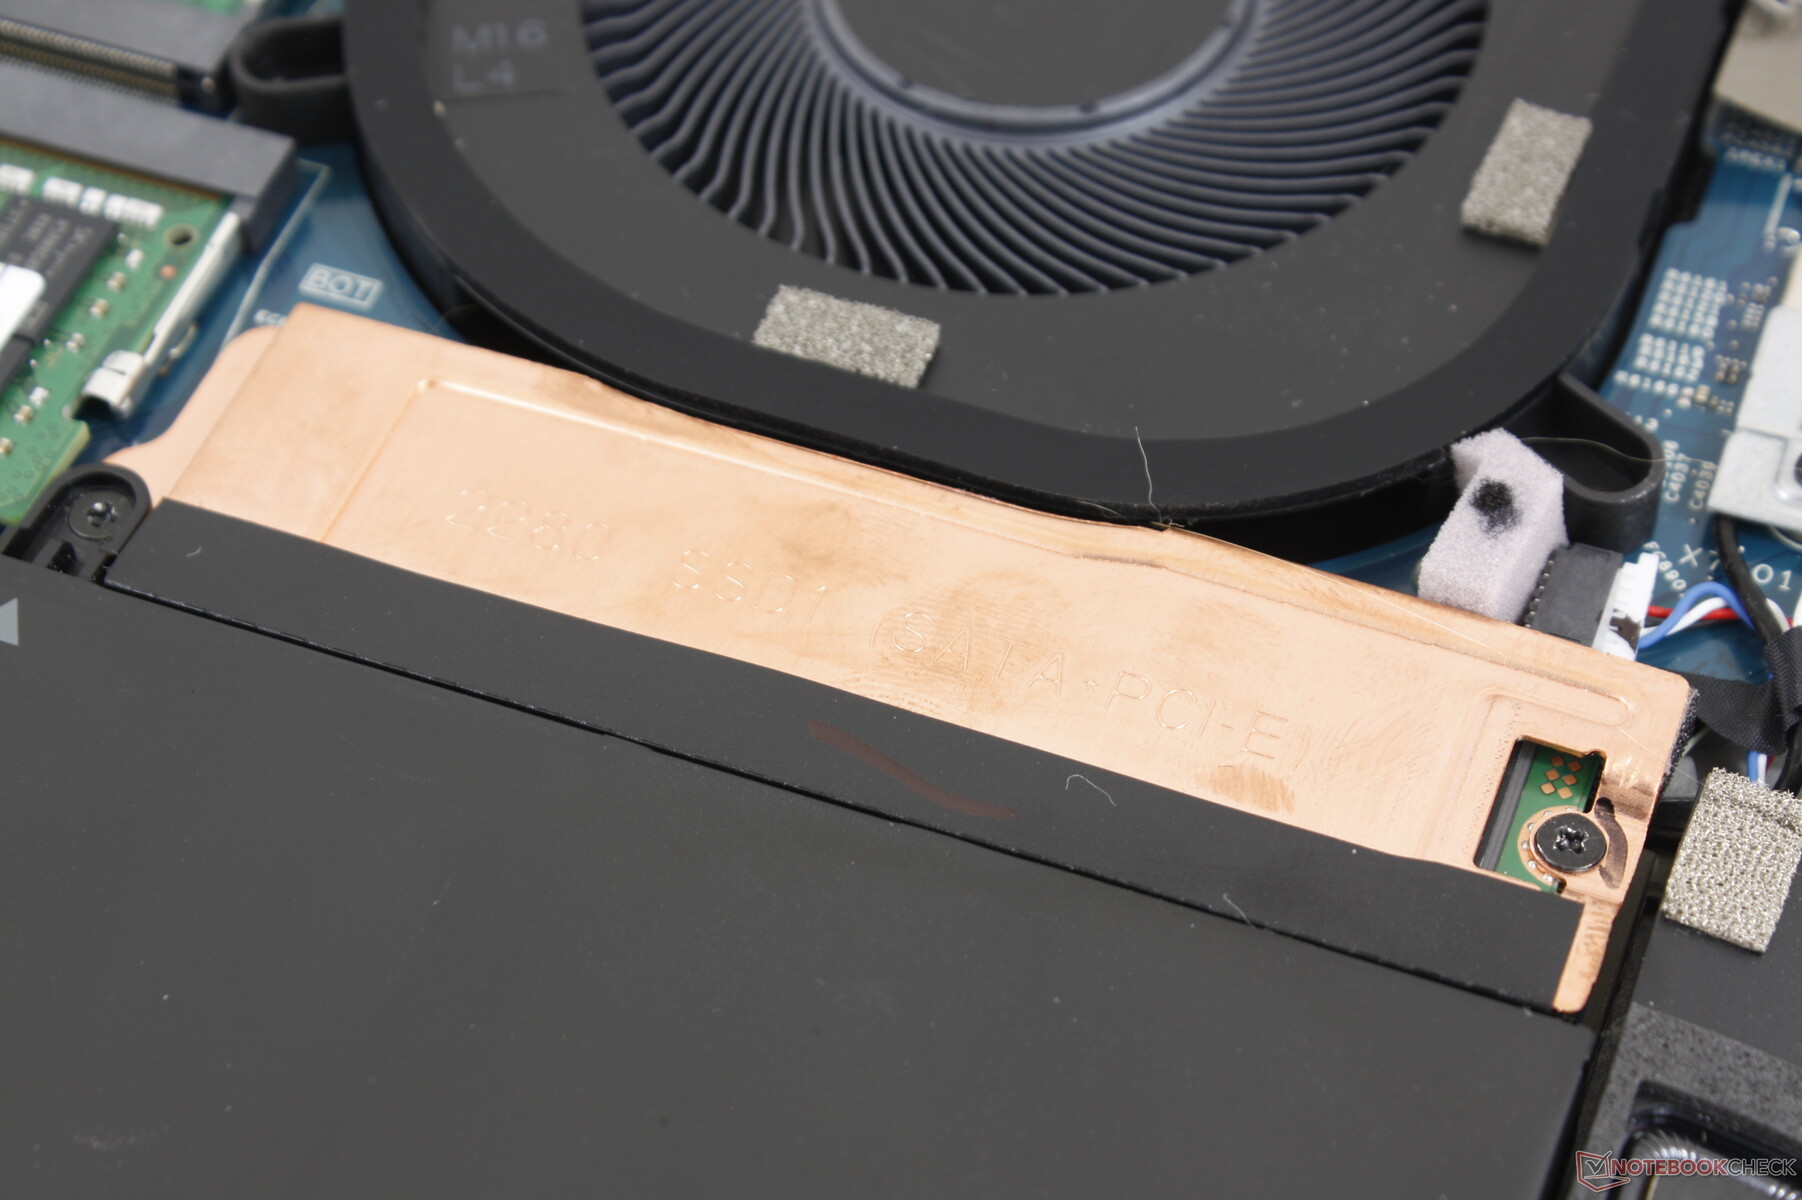
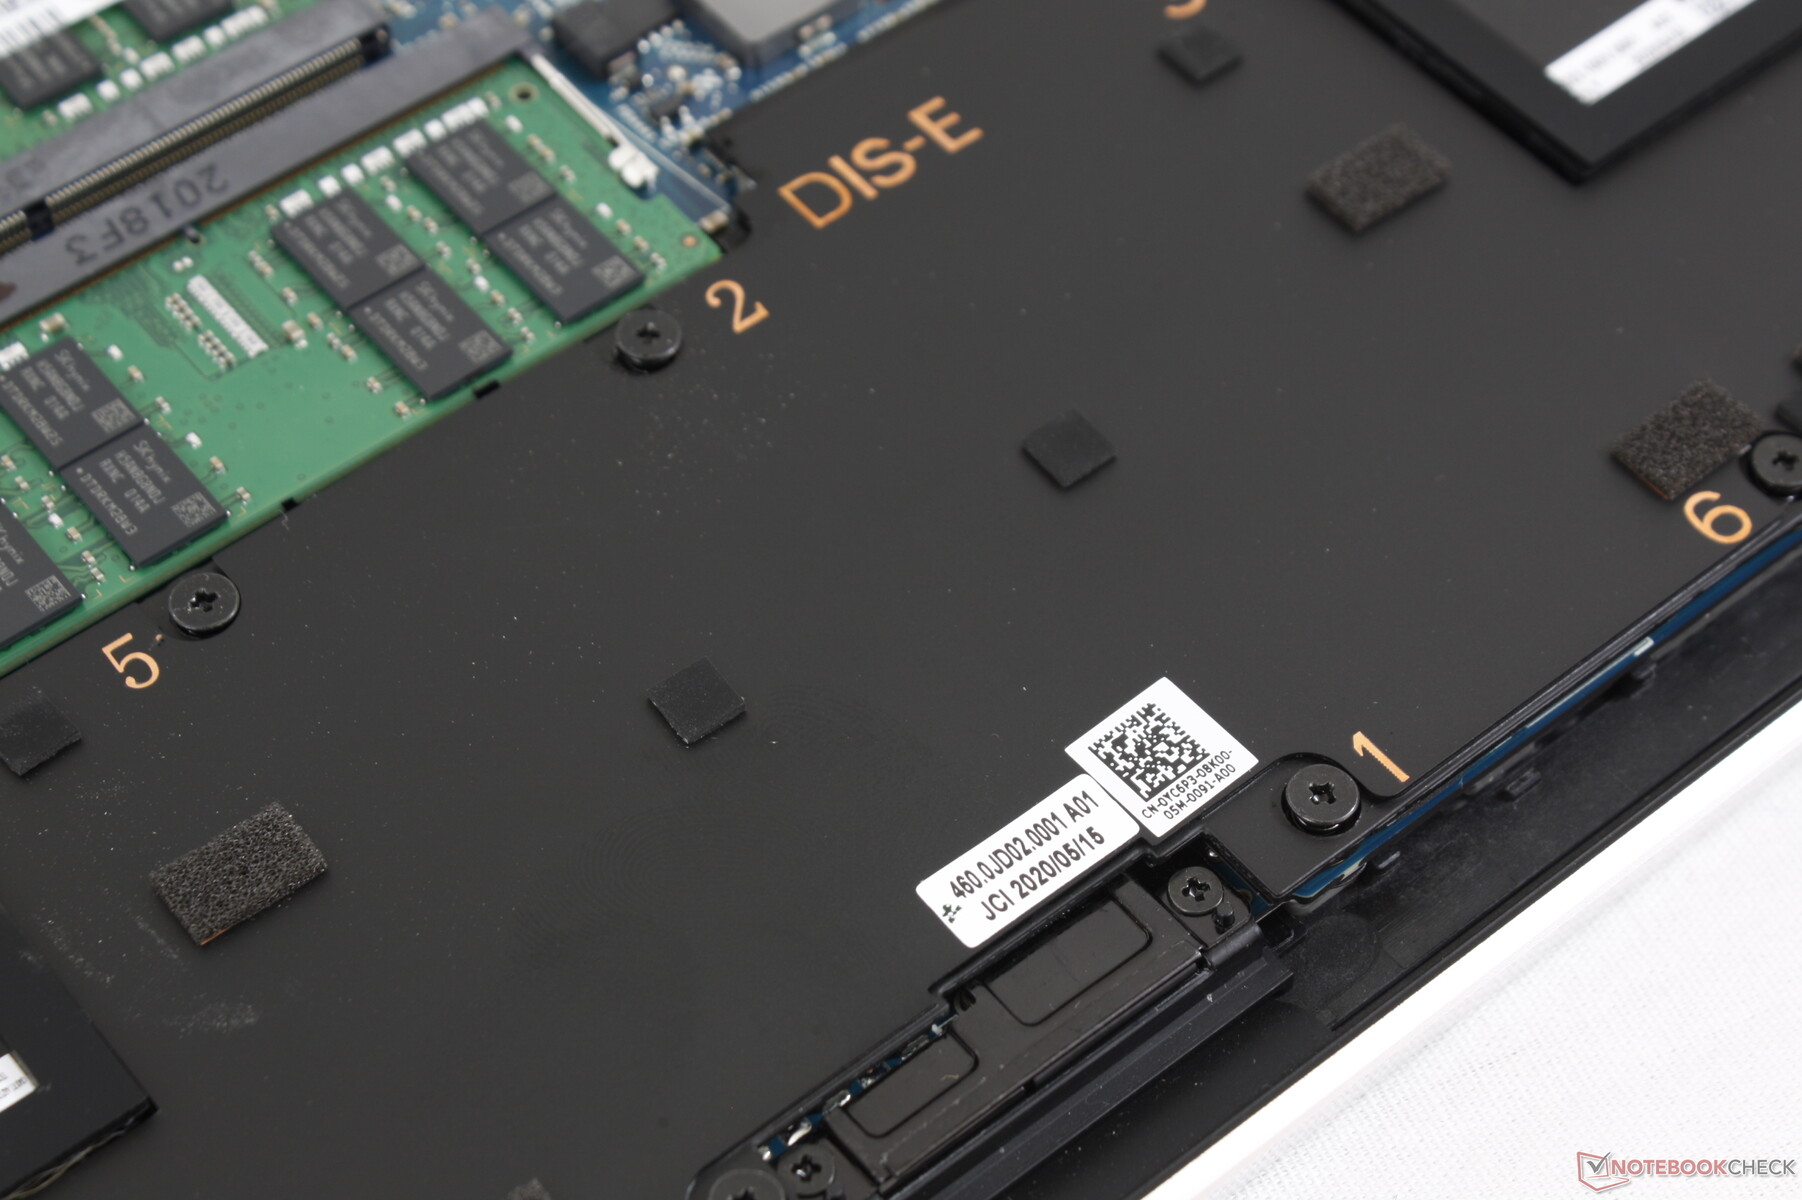
Two DDR4 SODIMM RAM slots are available alongside two M.2 2280 slots for storage.
Accessories and Warranty
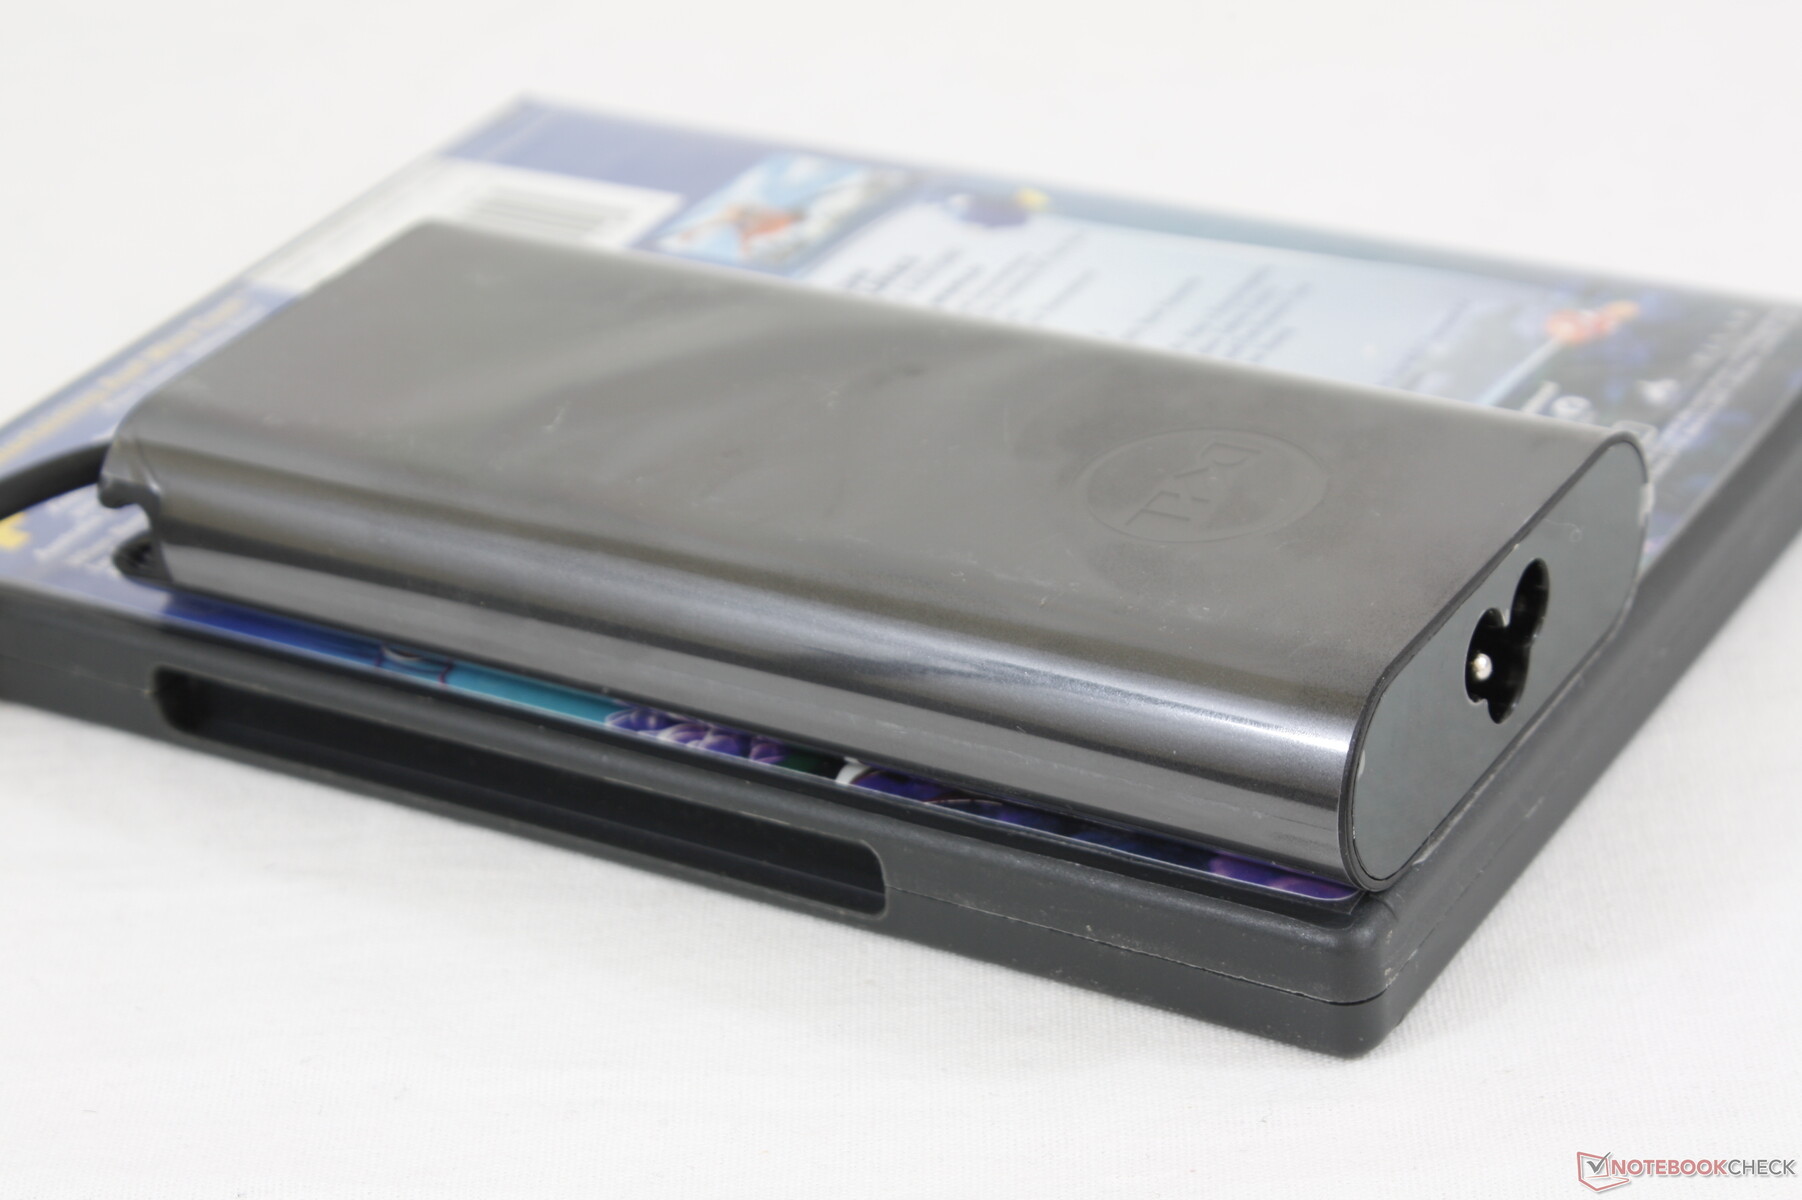
The retail box includes a handy adapter for both USB-A and HDMI 2.0 connectivity which is more than what we can say for the MacBook Pro 15. Other USB-C or Thunderbolt 3 docking stations and monitors will be a natural fit for the system.
The standard one-year limited warranty applies with plenty of extension options if ordered directly from Dell.
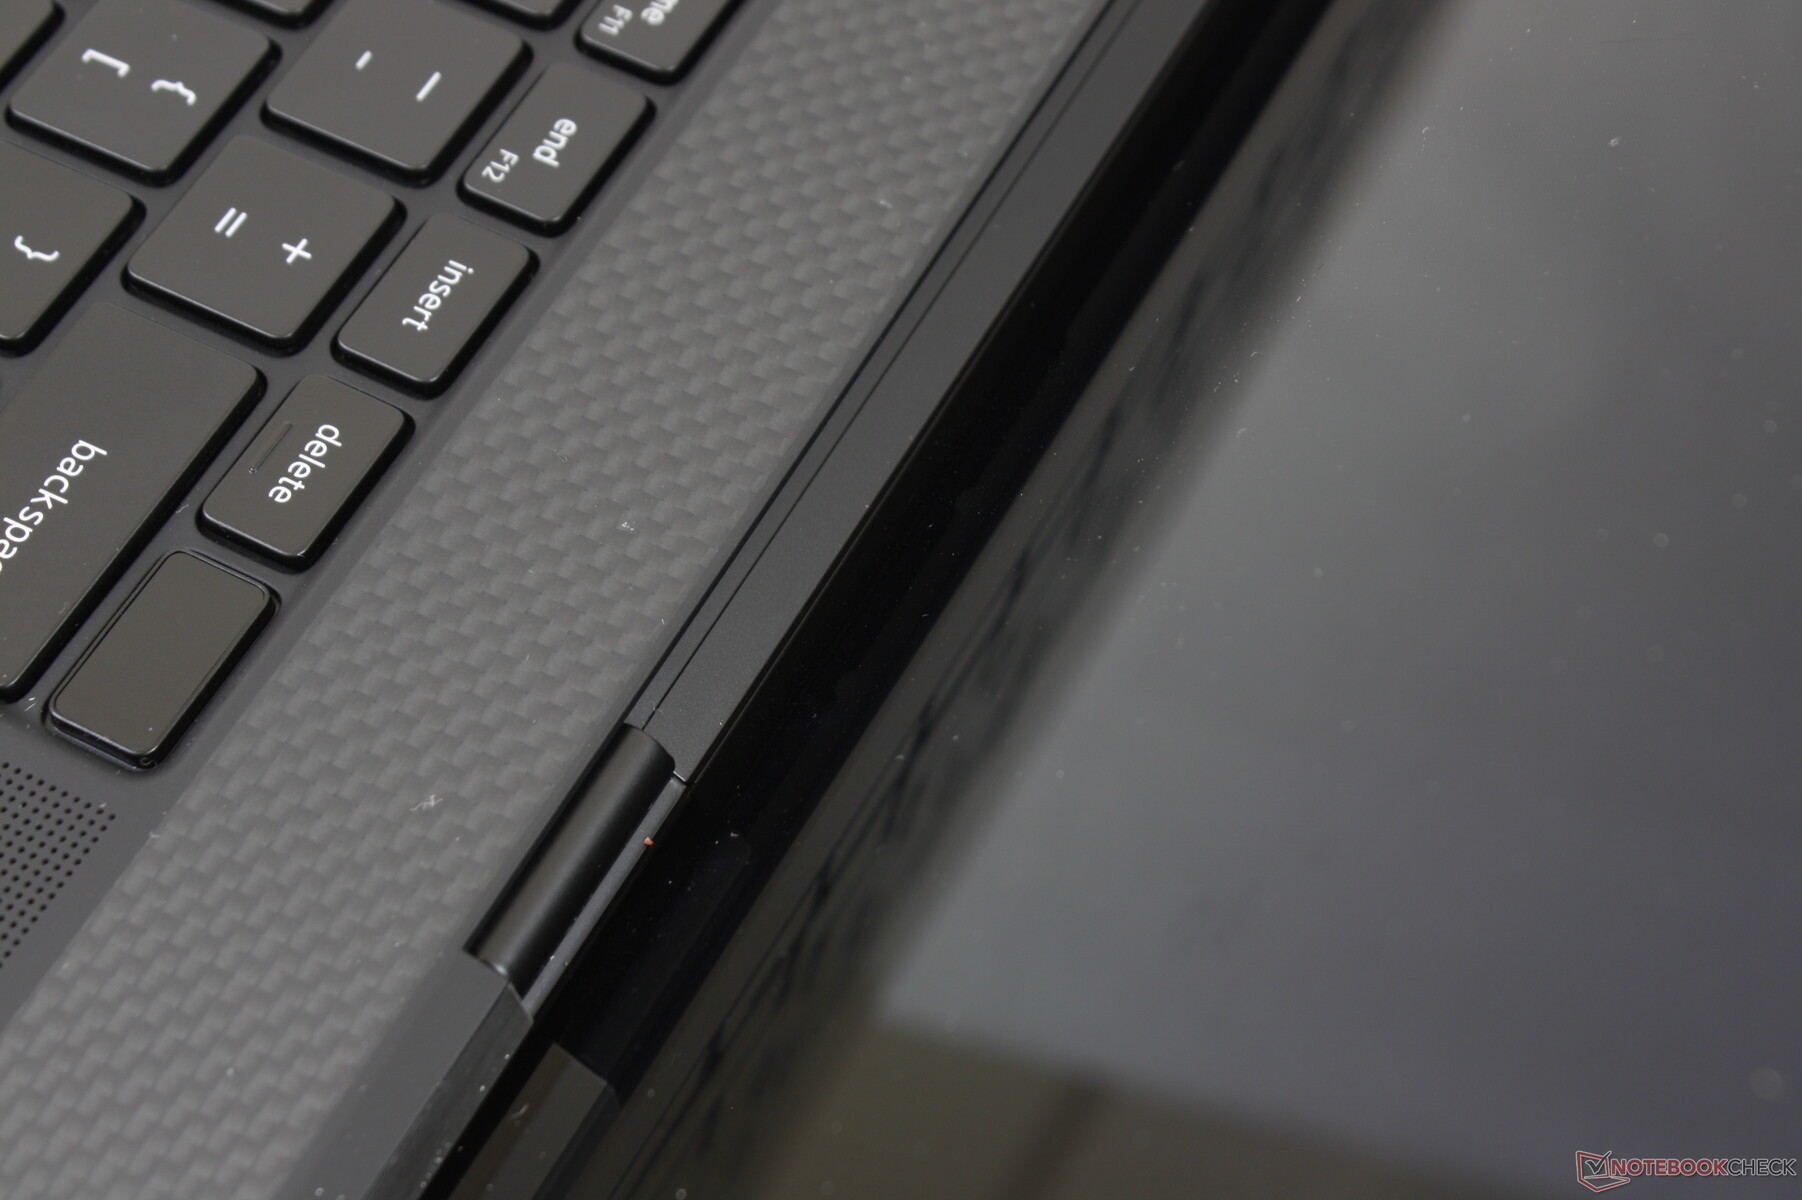
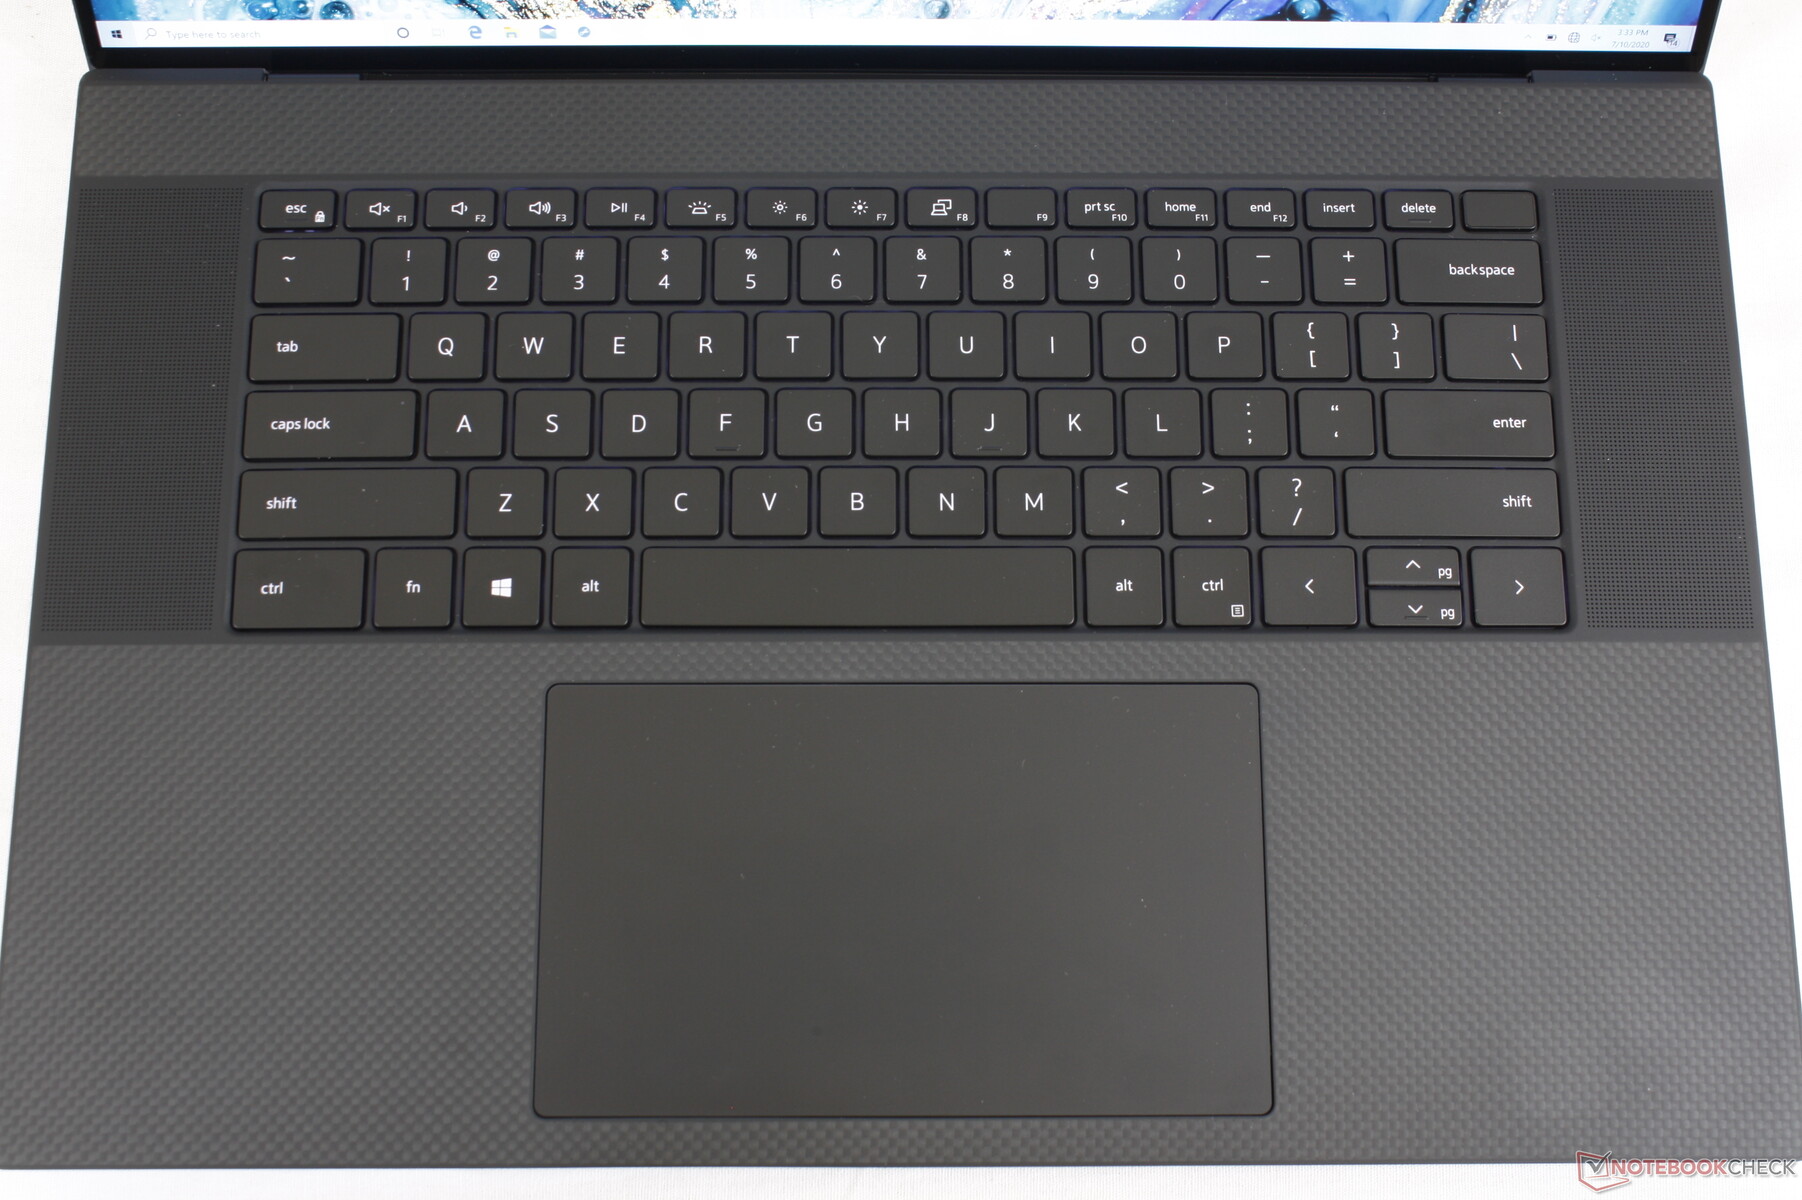
Input Devices — Like Typing on an XPS 15
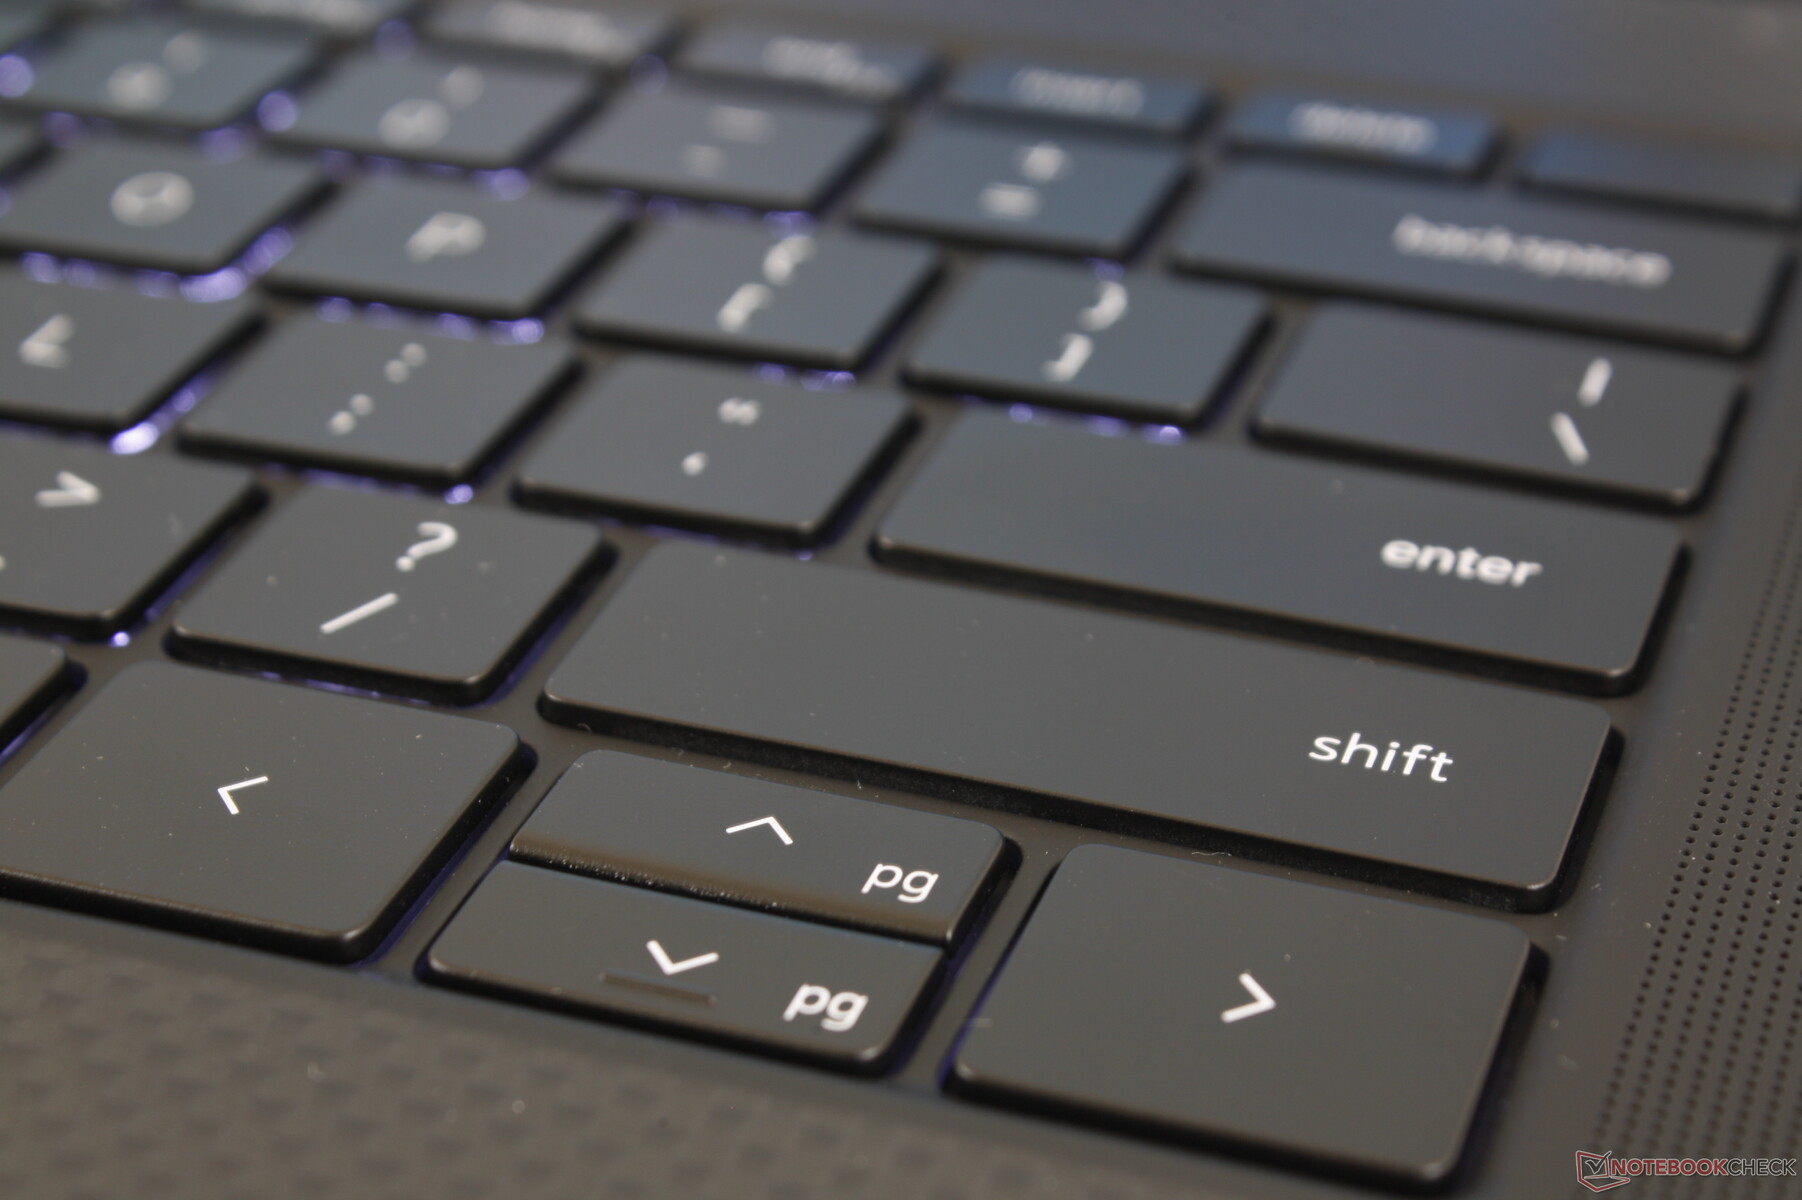
Keyboard
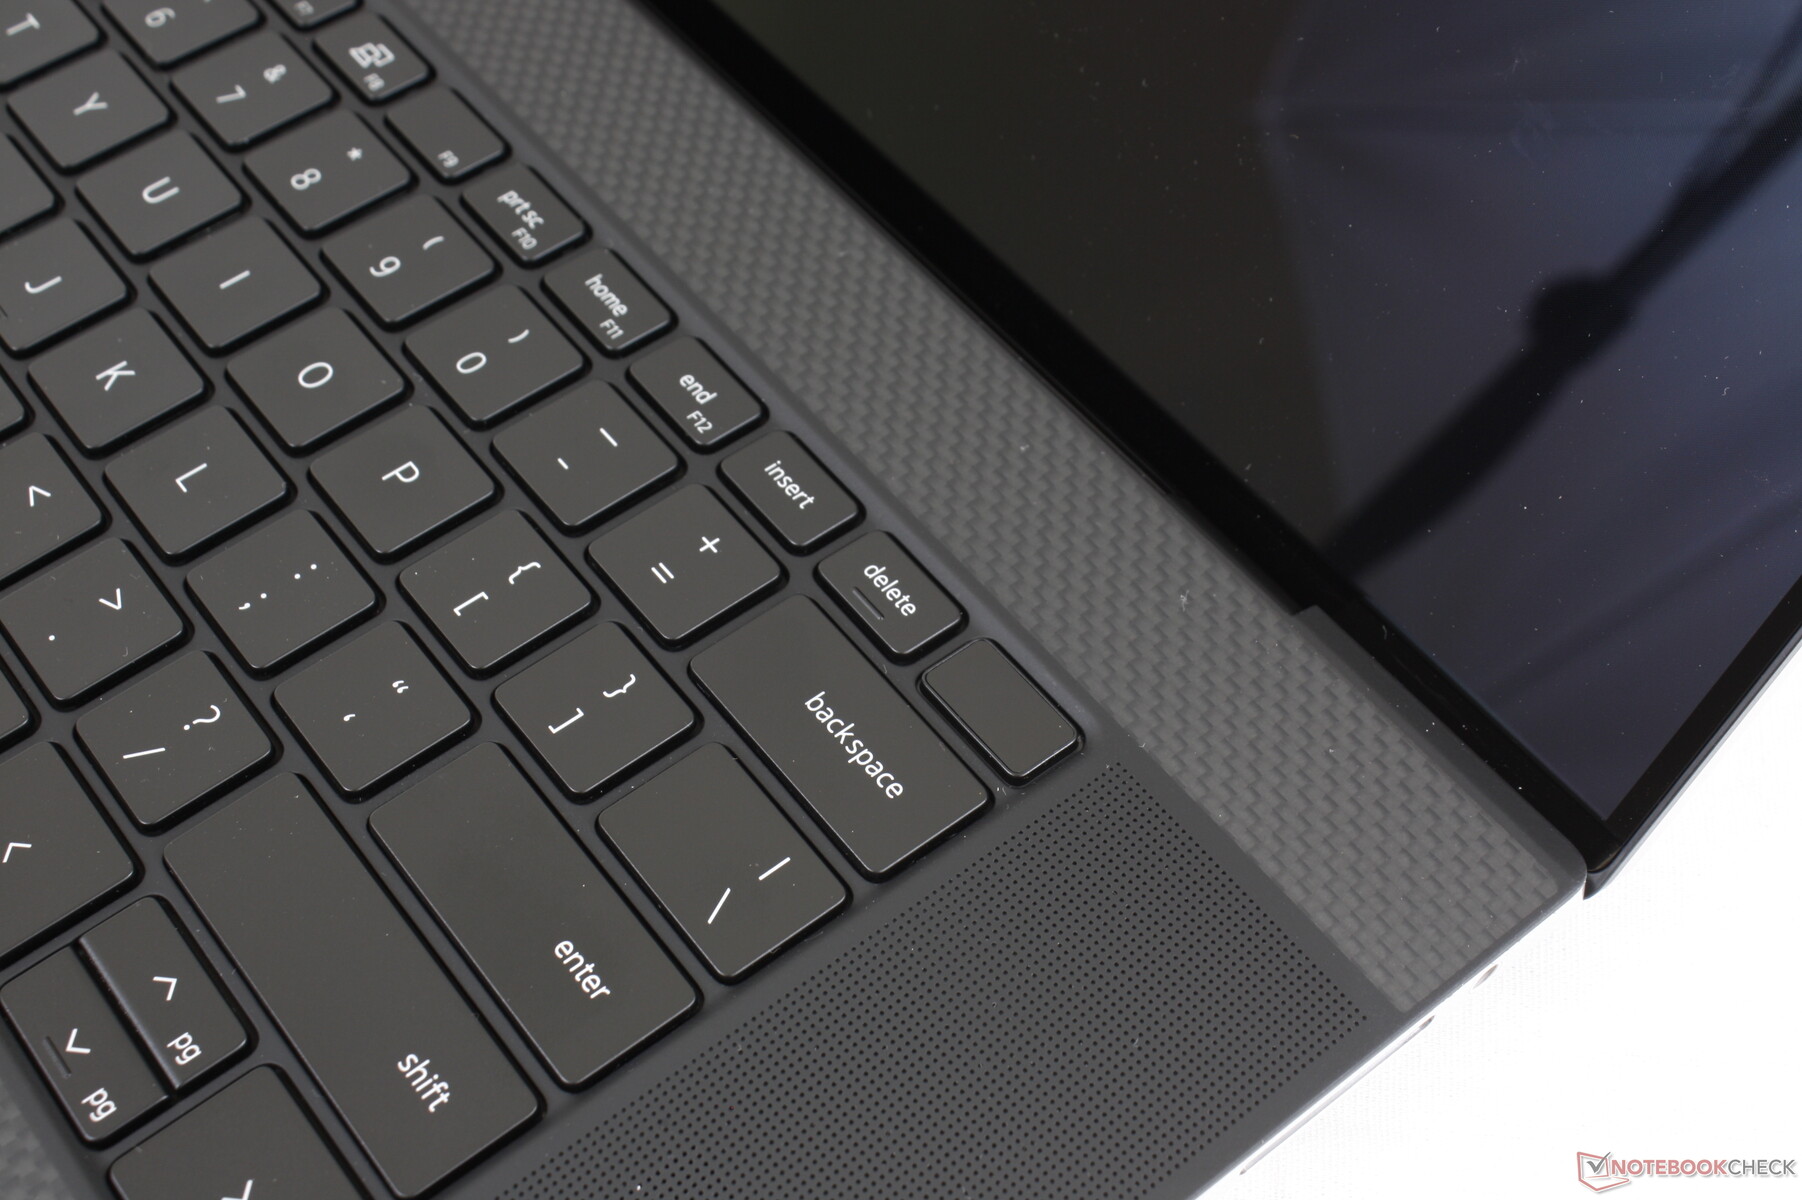
Dell uses the same keyboard keys and layout between the XPS 15 9500 and XPS 17 9700 for a similar typing experience between them. Thus, if you're comfortable typing on the XPS 15, then you'll feel right at home on the XPS 17 as key sizes are identical. Key travel is shallower than an HP Spectre or Dell Latitude but feedback remains crisp with moderate clatter.
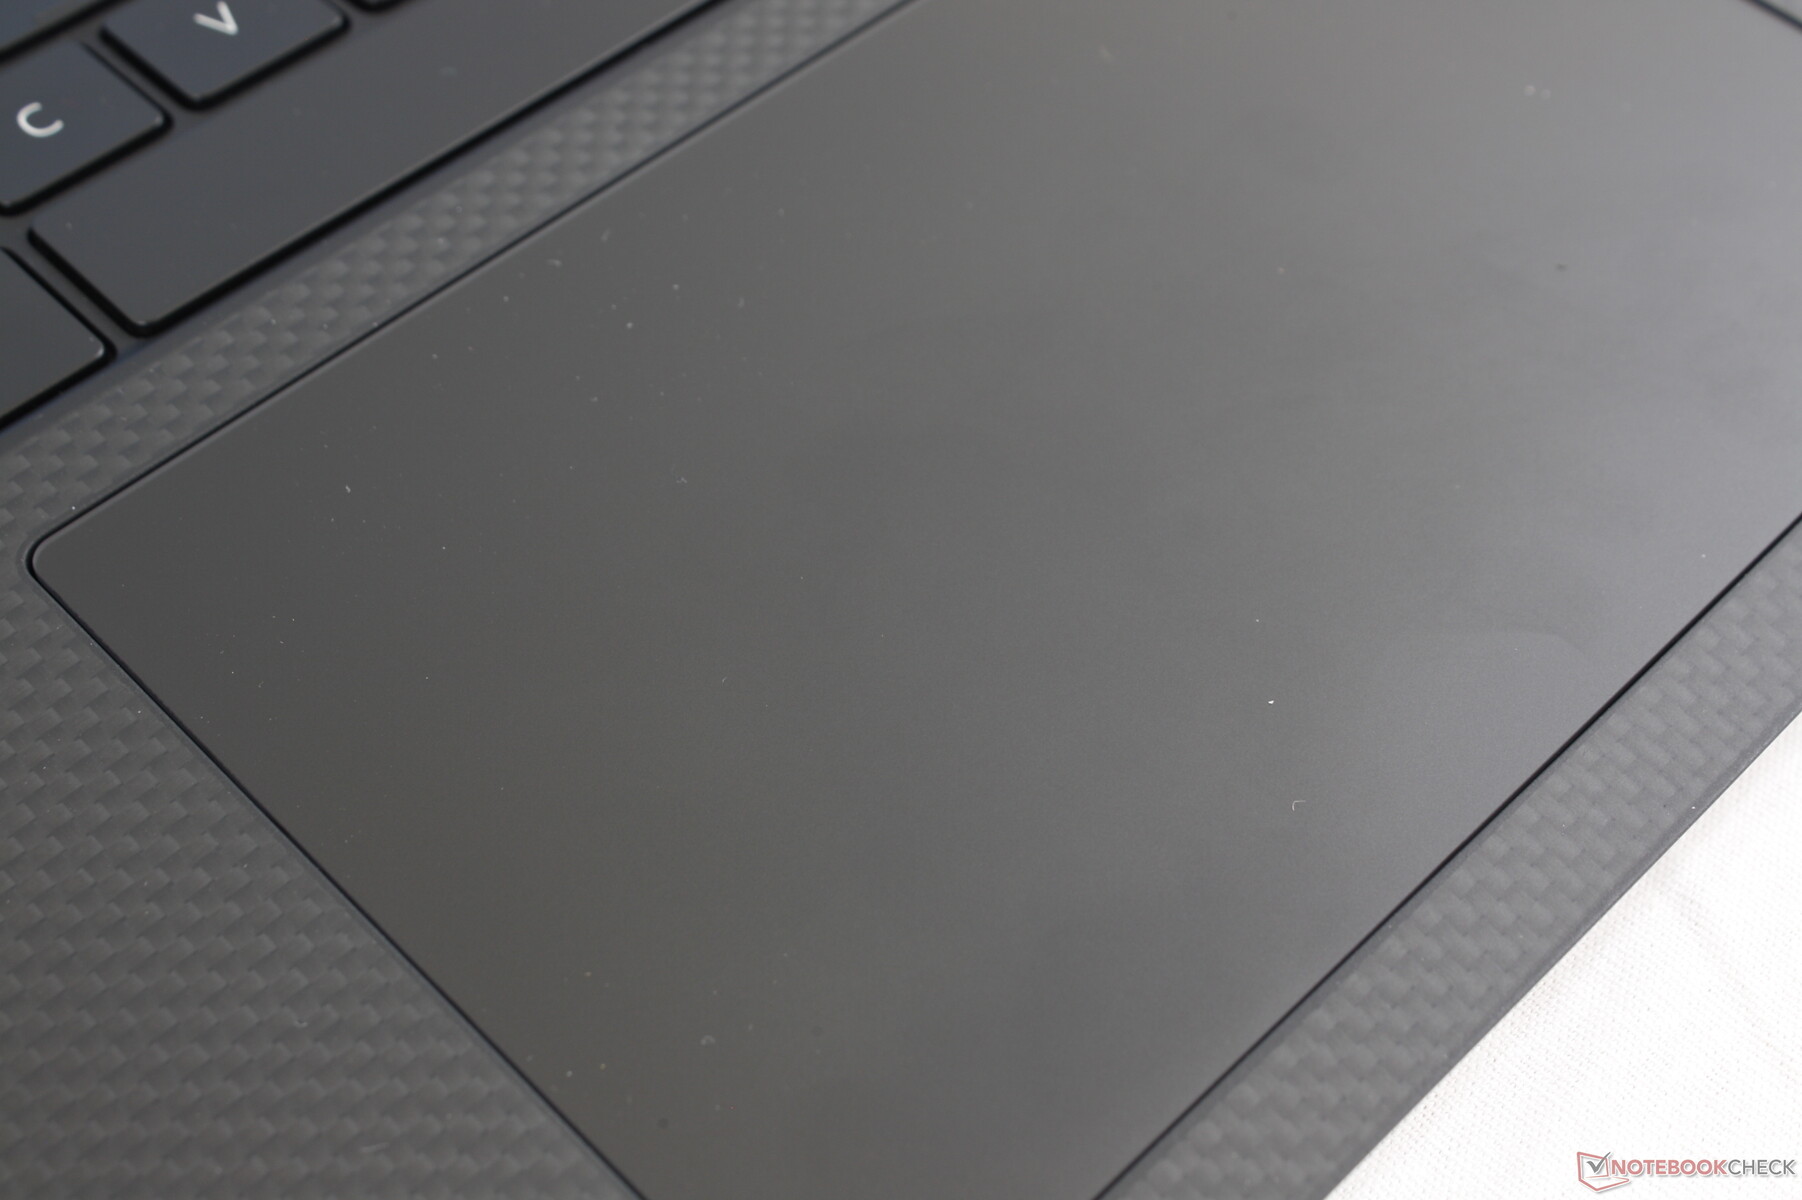
Touchpad
The clickpad is the same size as the one on the latest XPS 15 (~15.1 x 9 cm) with similar traction for easy scrolling and cursor control.
No matter how big and roomy the clickpad may be, however, it can't replace the more tactile and accurate feeling of dedicated mouse buttons. The integrated buttons here are soft in feedback for an unsatisfying click when pressed. Multi-touch actions like dragging and dropping are much easier to perform with two hands due to the sheer size of the clickpad.

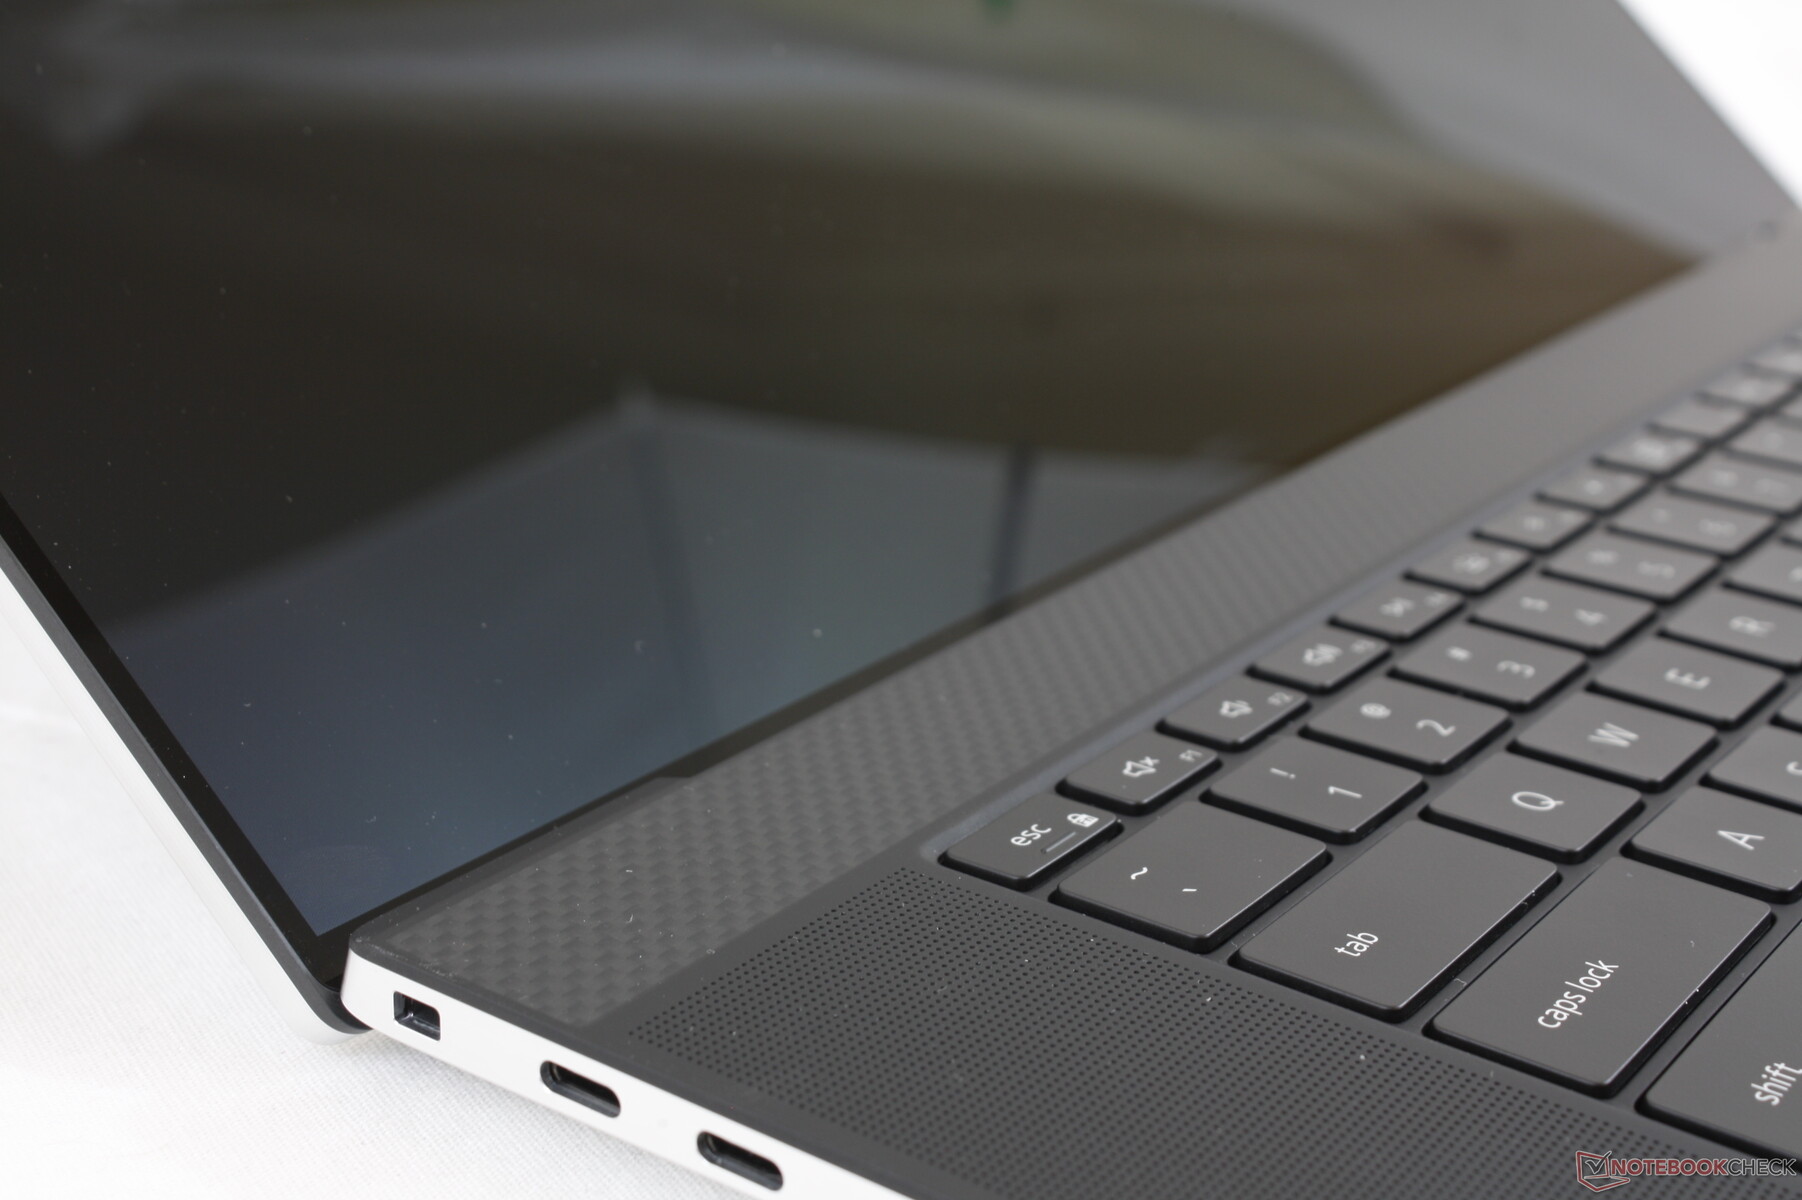
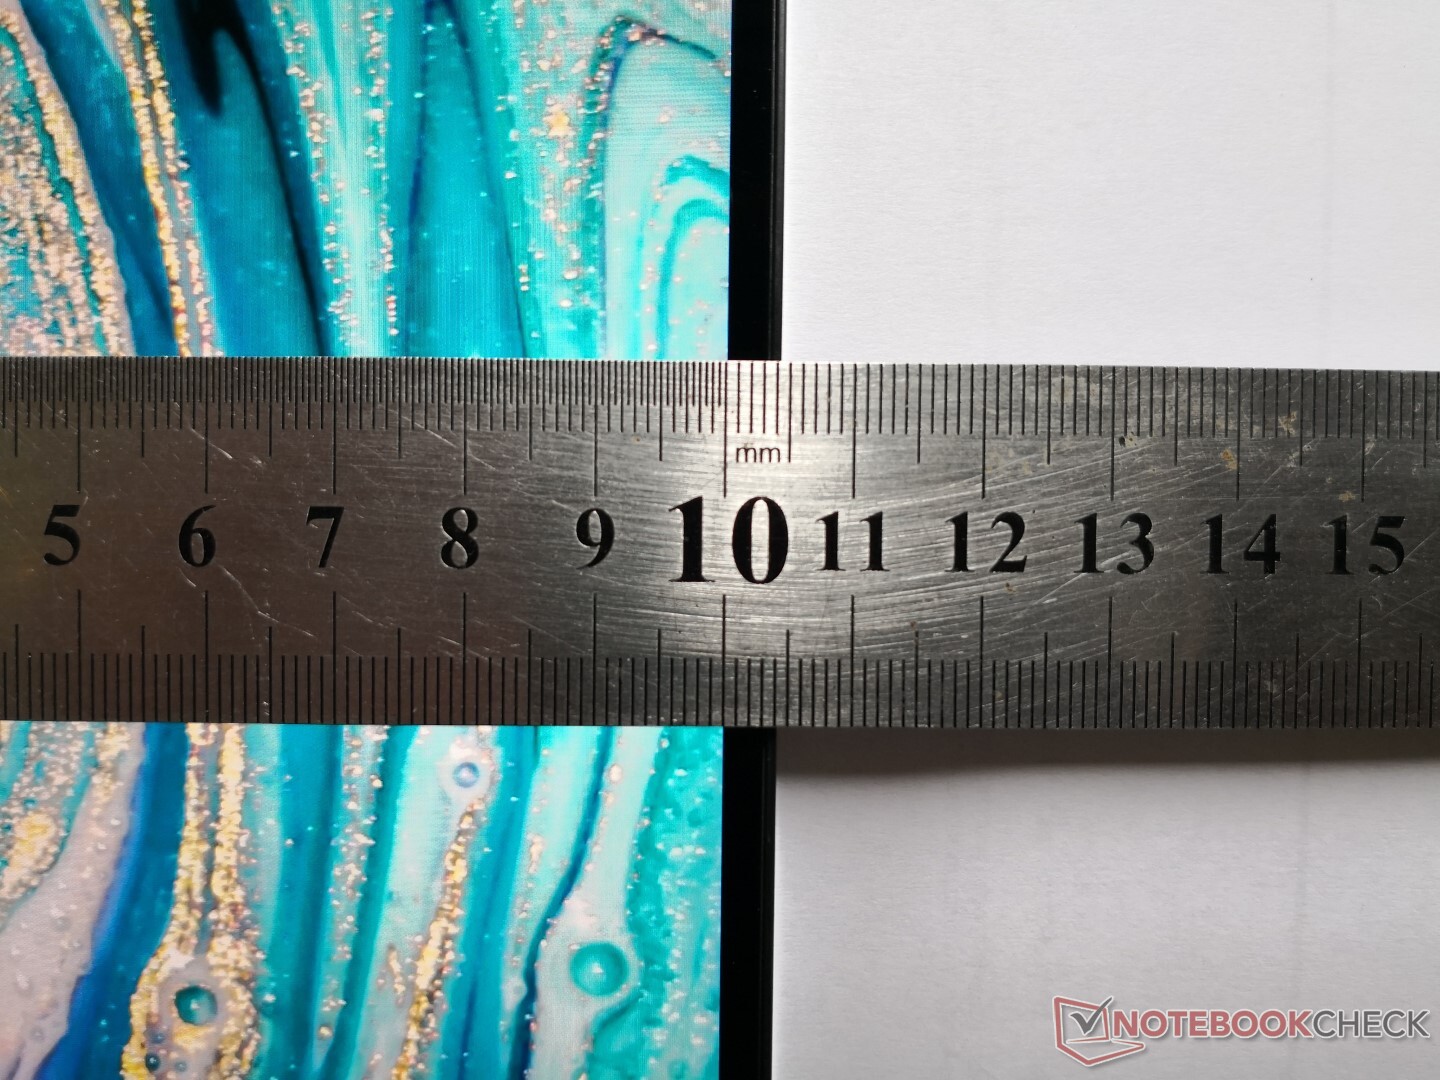
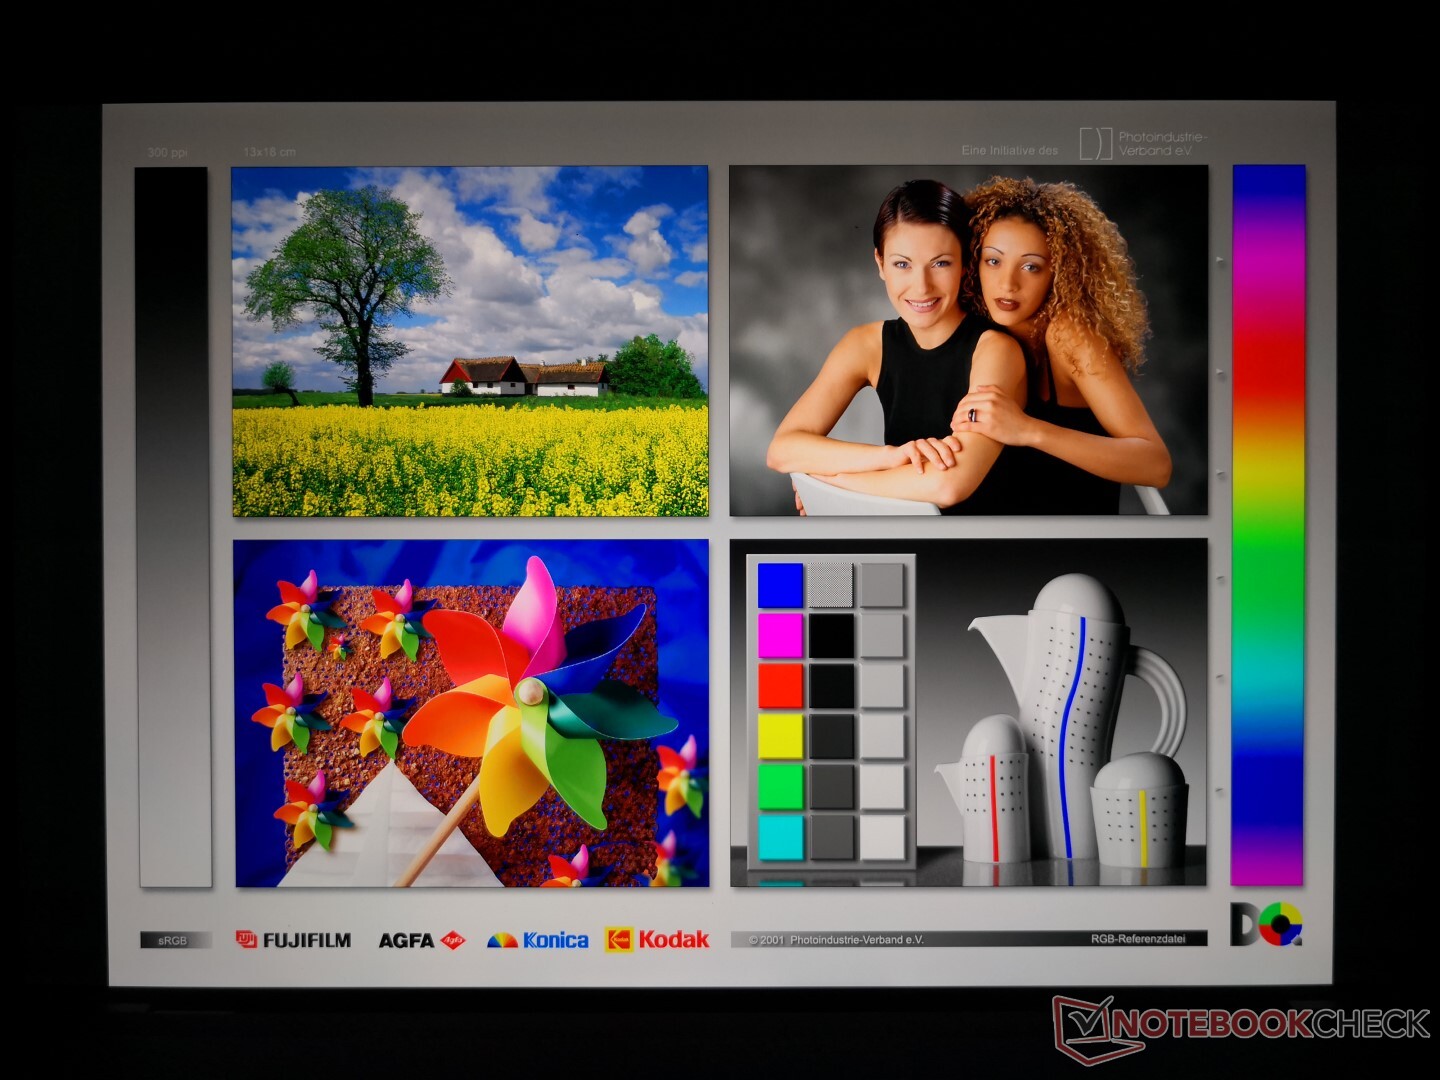
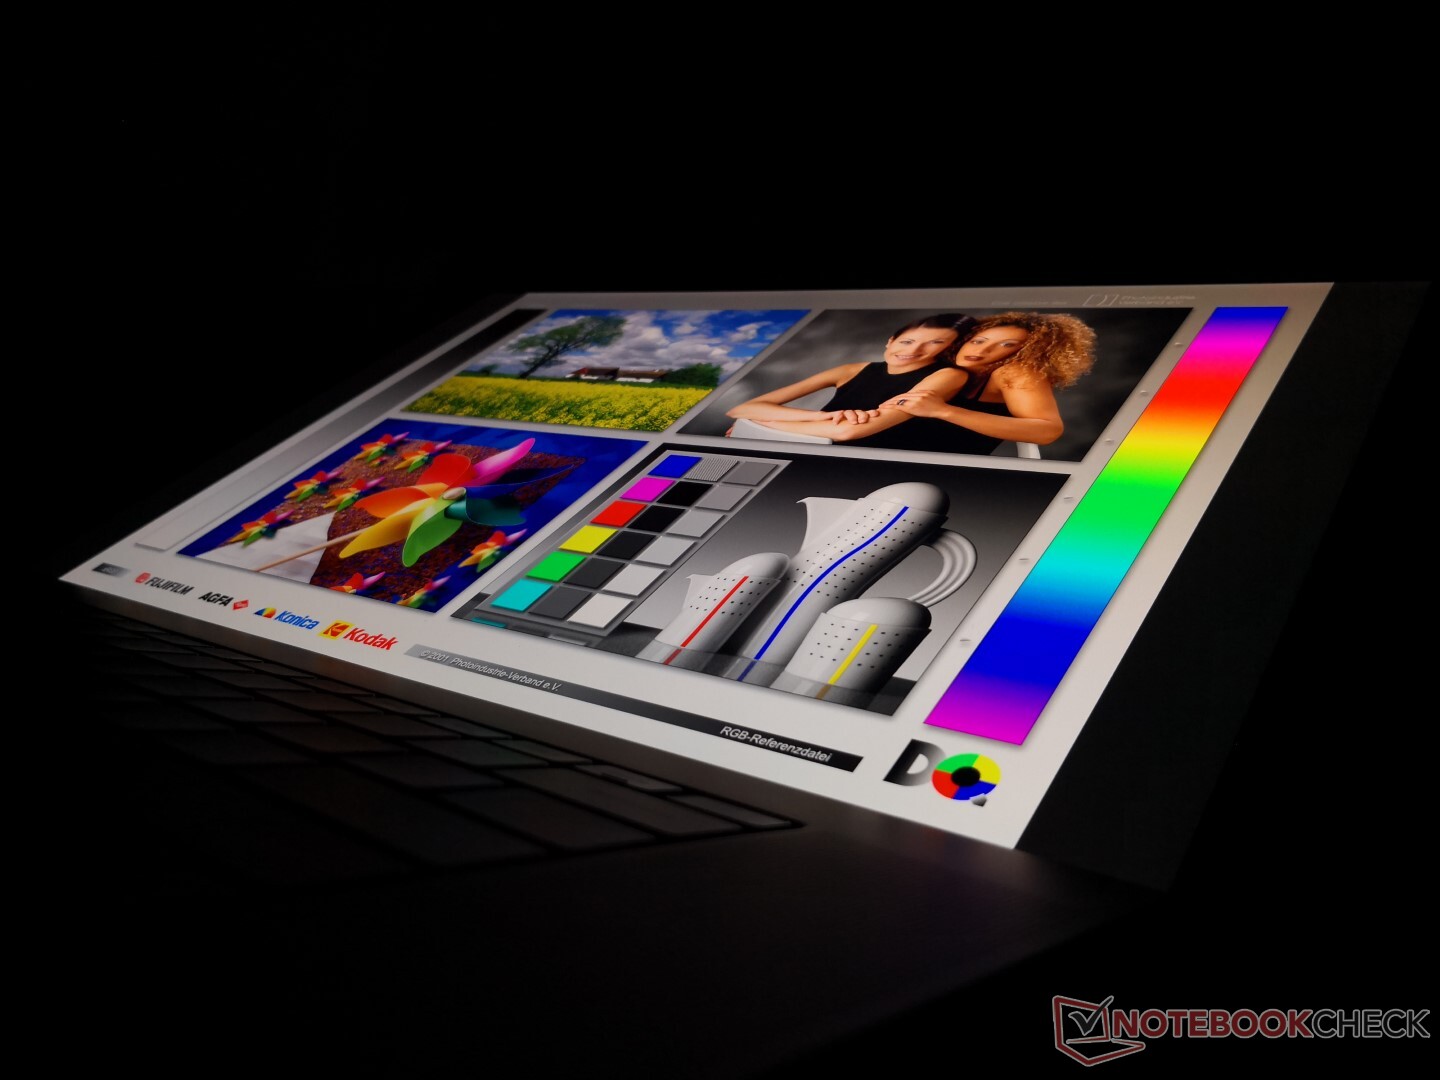
Display — Highest Screen-to-Body Ratio On Any 17-inch Laptop
Sharp is once again responsible for the XPS display and it is easily one of the best aspects of the XPS 17. Open up the display for the first time and most everyone will be taken aback by how huge the screen is relative to the rest of the chassis. Perhaps not by coincidence, measured brightness, response times, and contrast ratio are very close to what we observed on the MacBook Pro 16 which uses a high quality panel as well. Nonetheless, Dell still edges out the MacBook Pro display due to its higher PPI and wider gamut for deeper colors.

| |||||||||||||||||||||||||
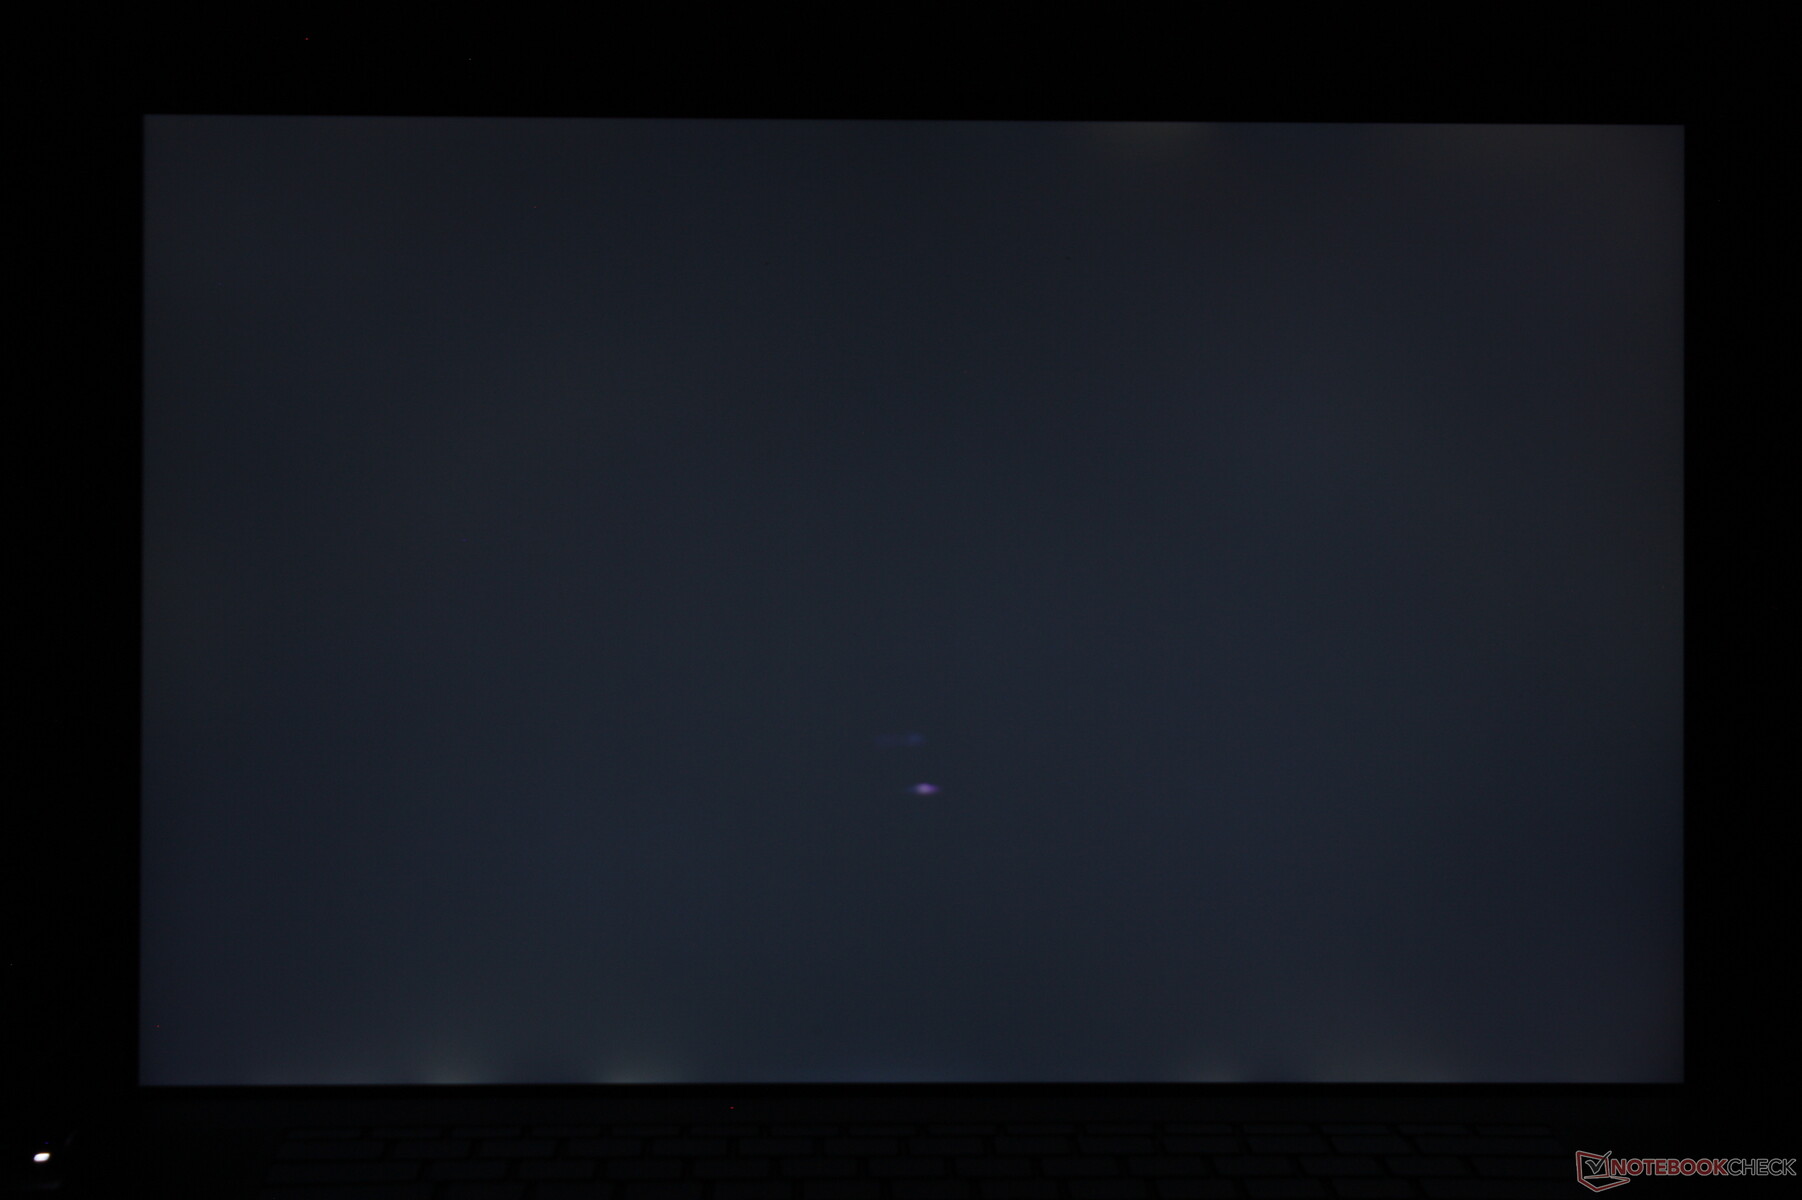
Brightness Distribution: 84 %
Center on Battery: 539.4 cd/m²
Contrast: 1686:1 (Black: 0.32 cd/m²)
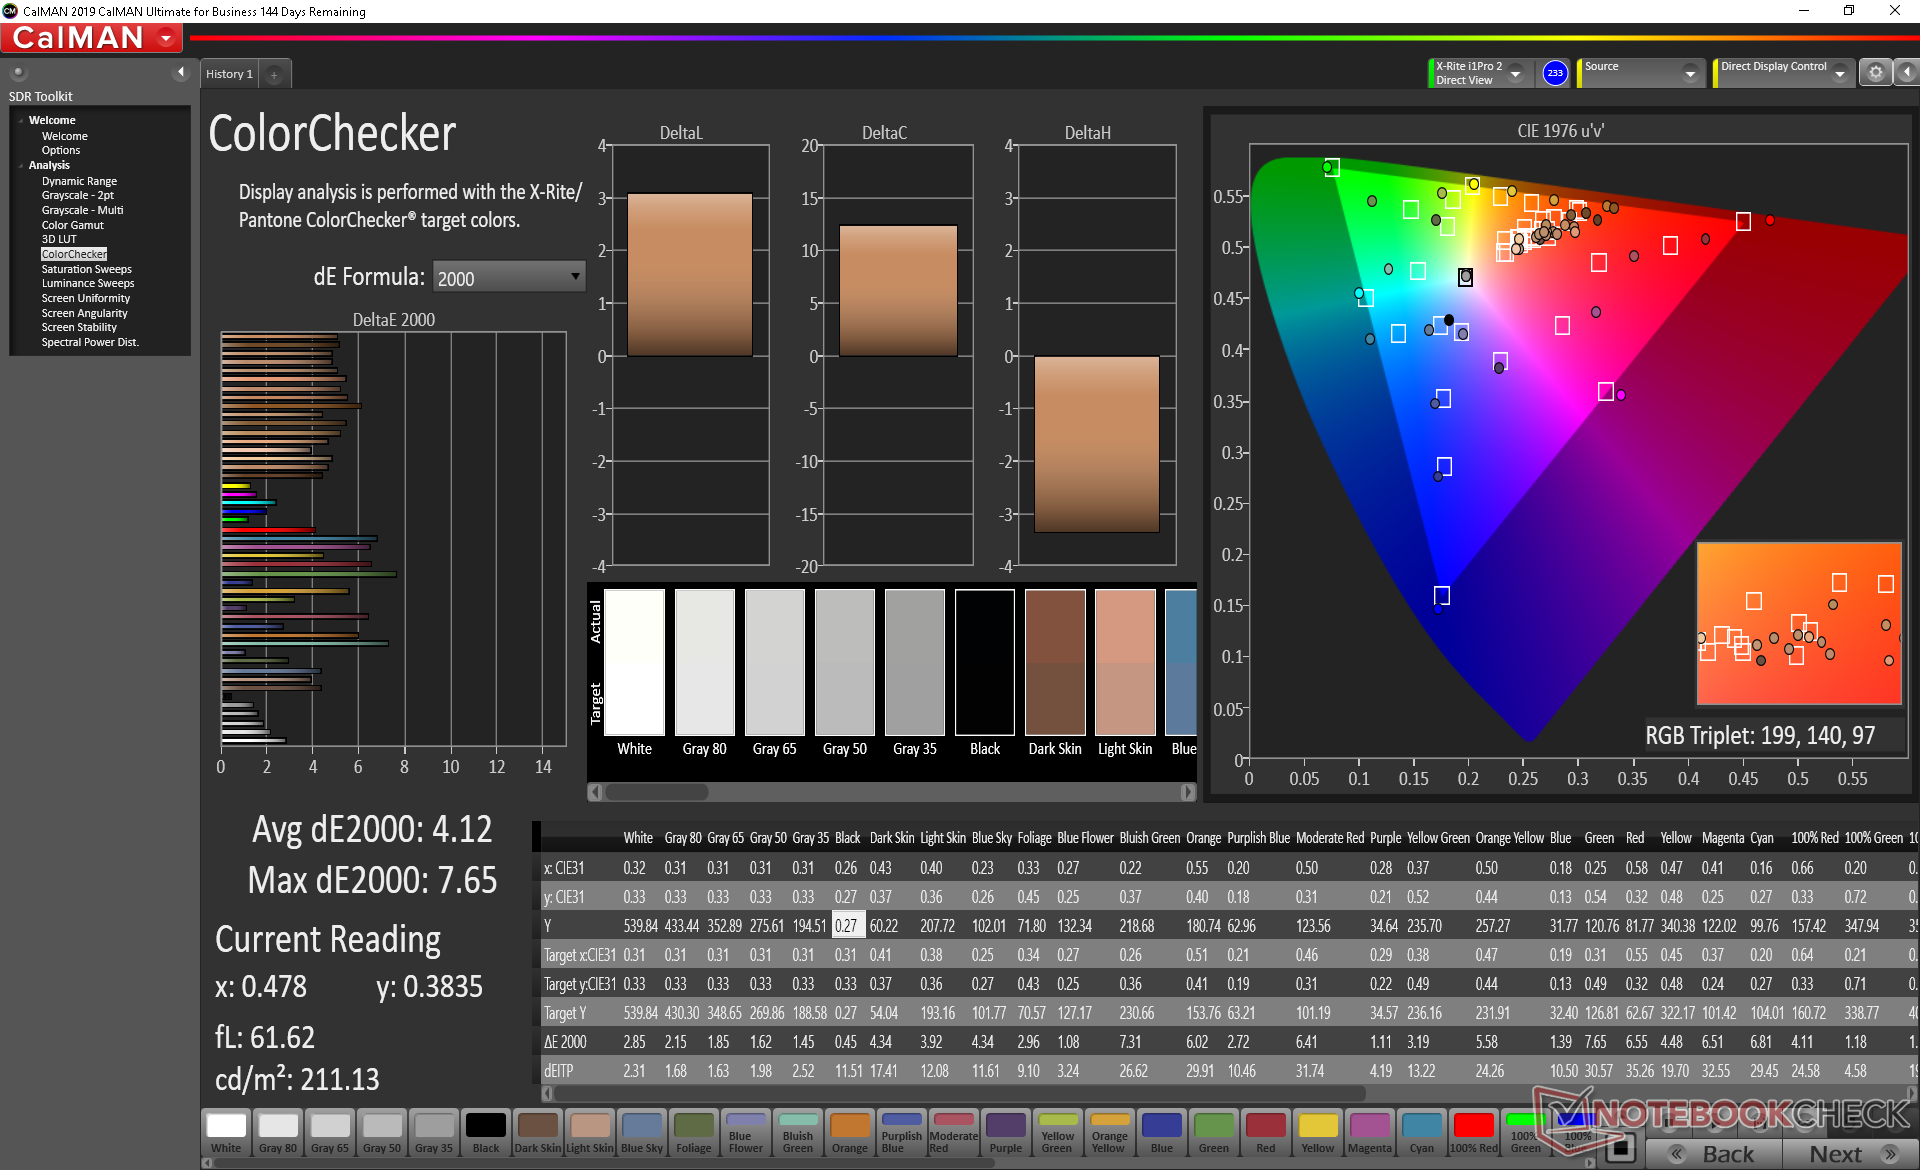
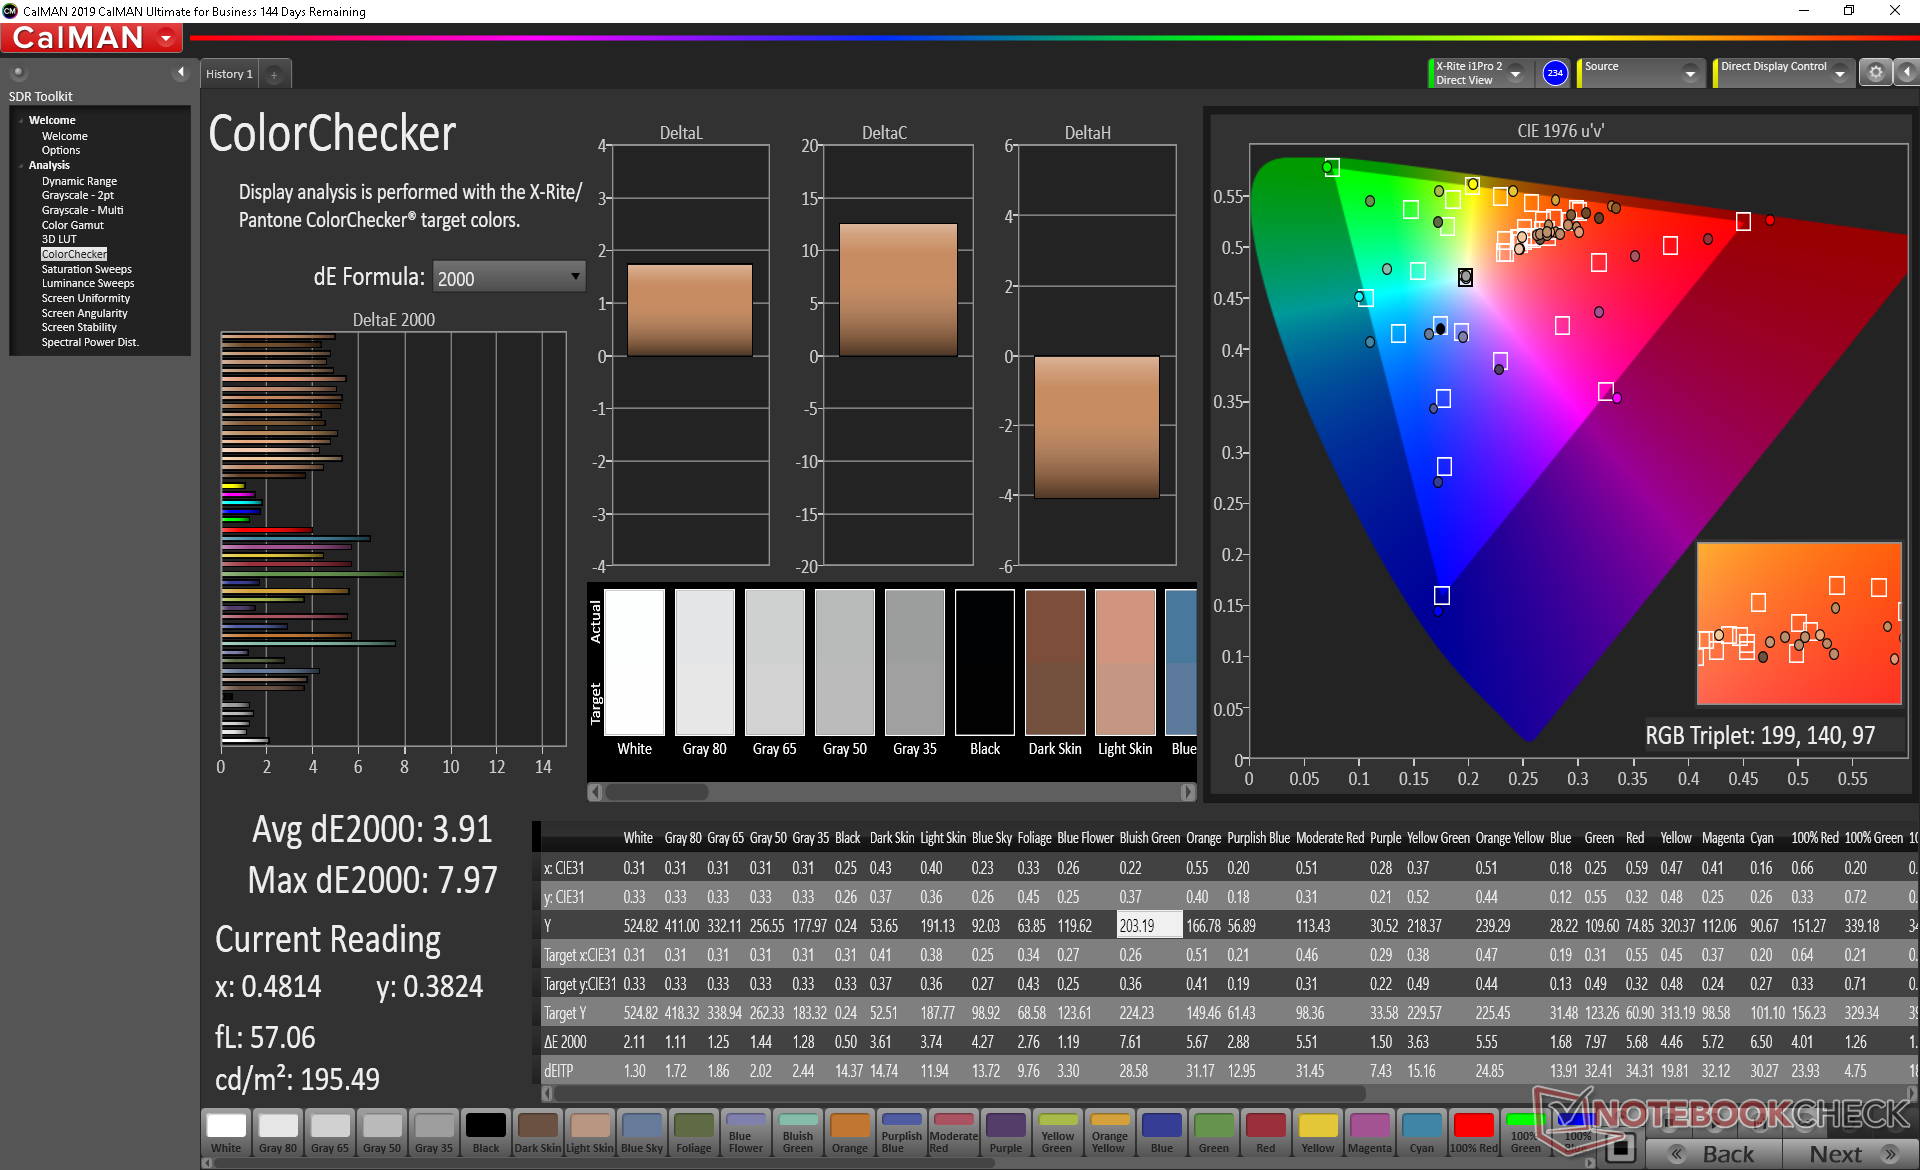
ΔE ColorChecker Calman: 4.12 | ∀{0.5-29.43 Ø4.71}
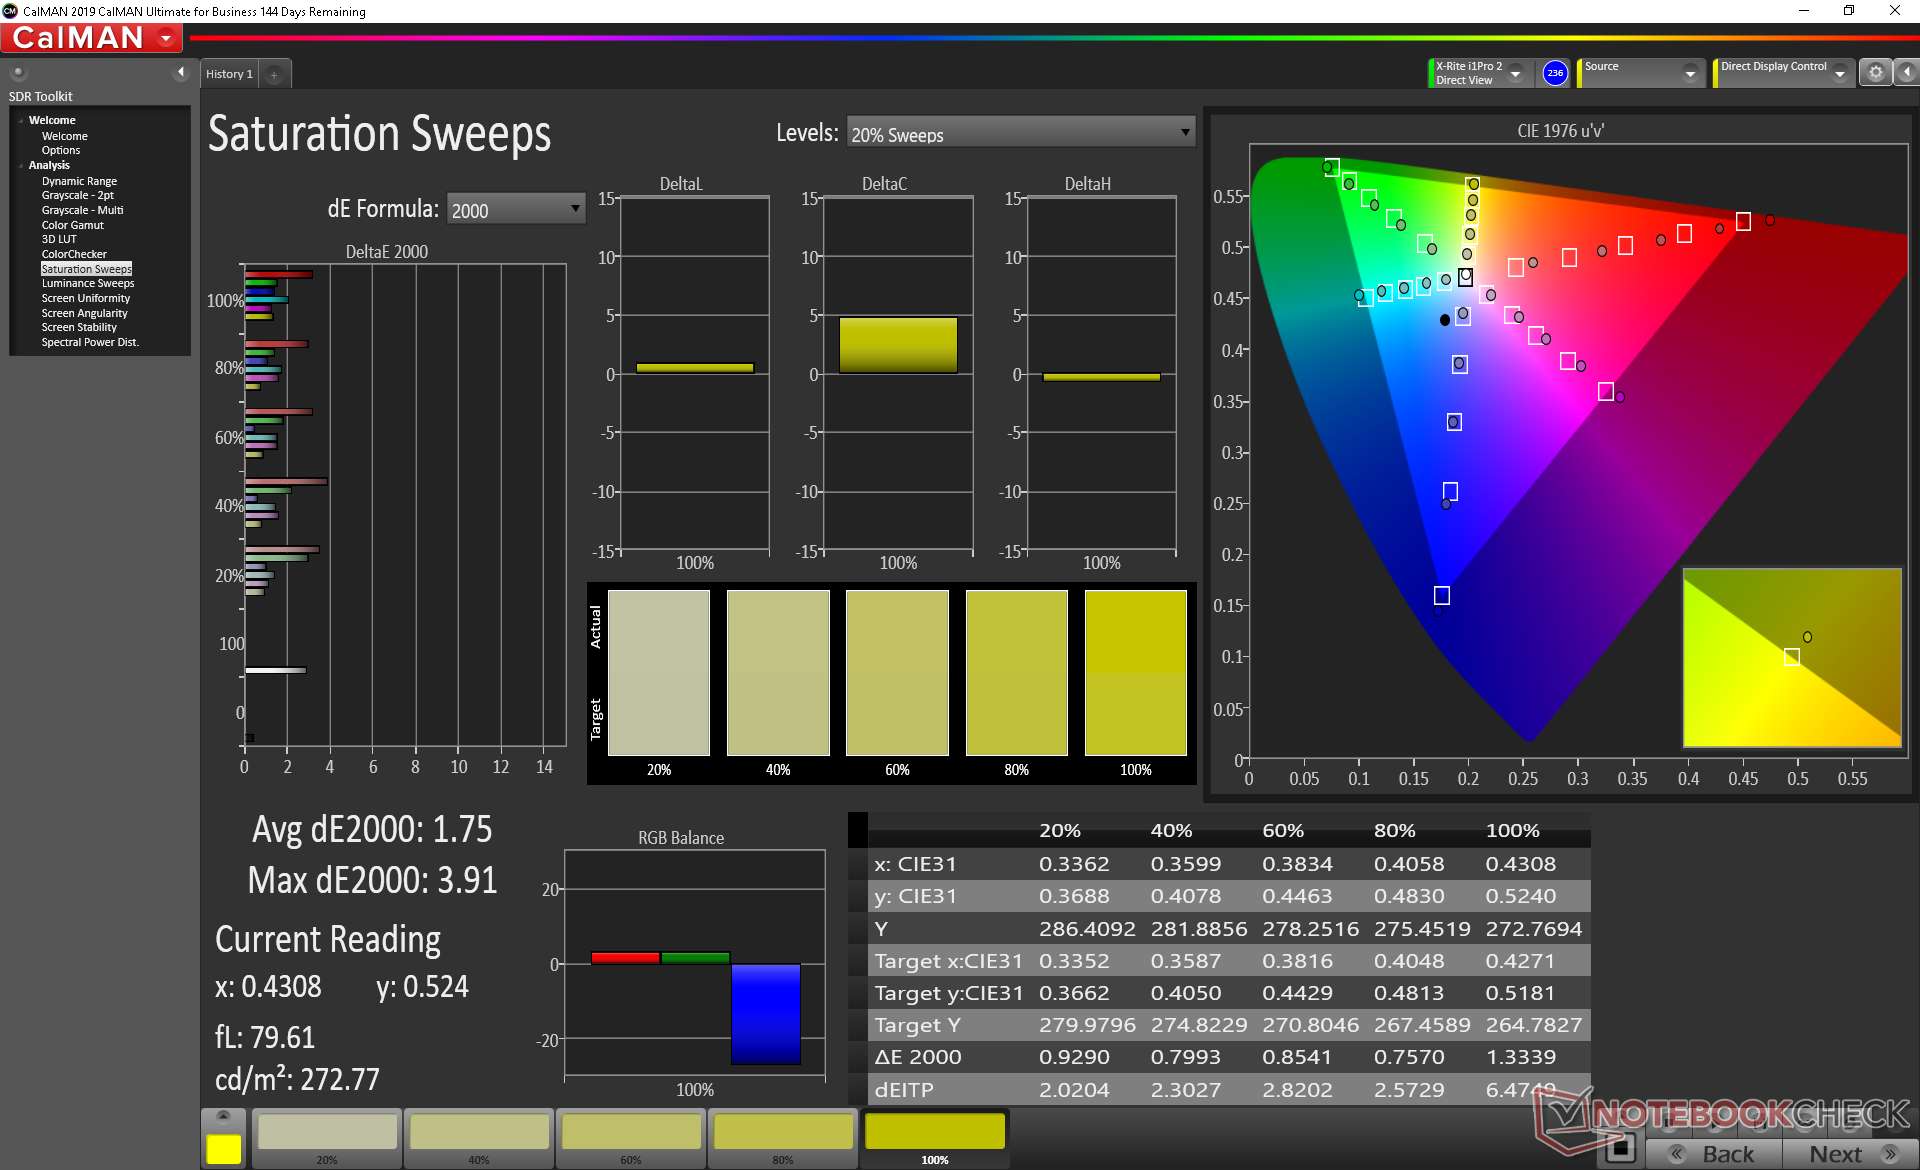
calibrated: 3.91
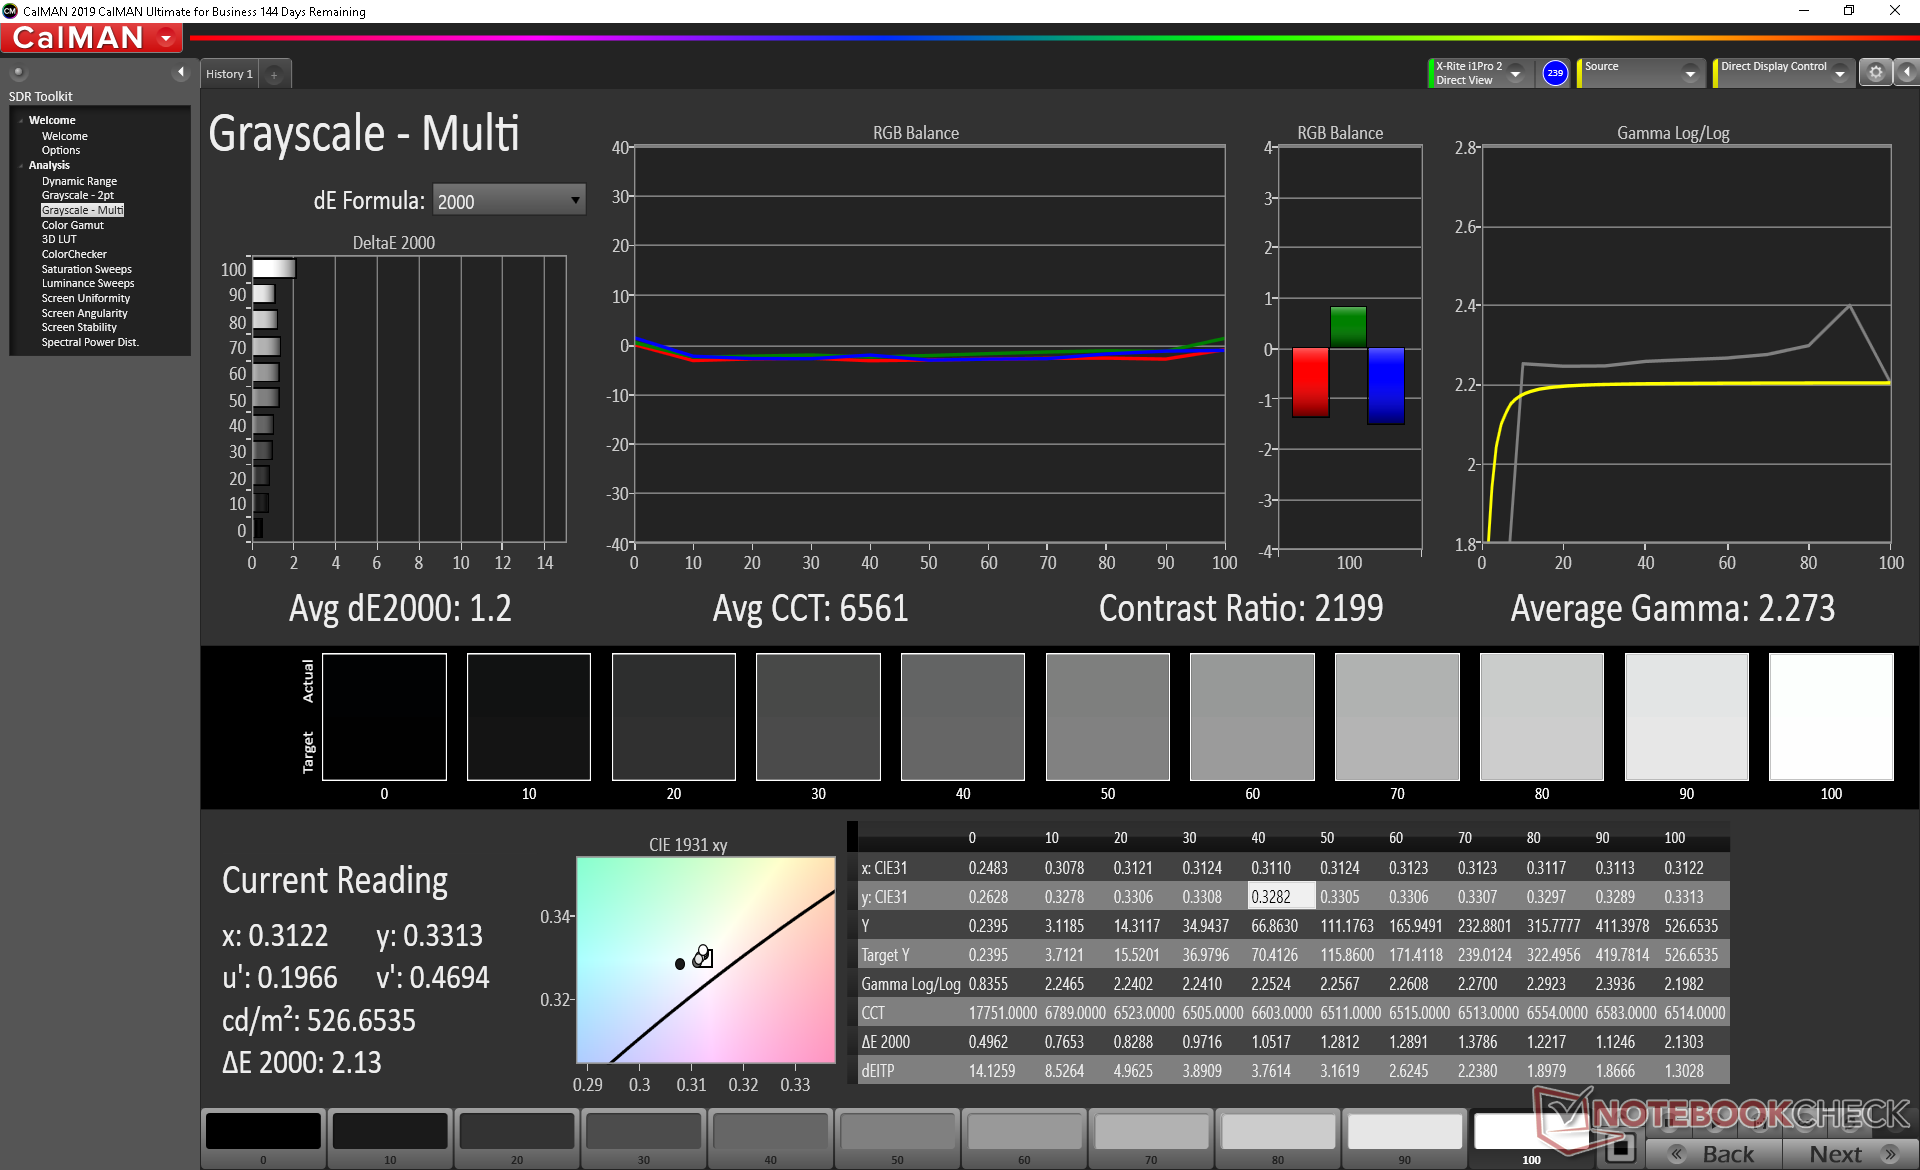
ΔE Greyscale Calman: 1.5 | ∀{0.09-98 Ø4.96}
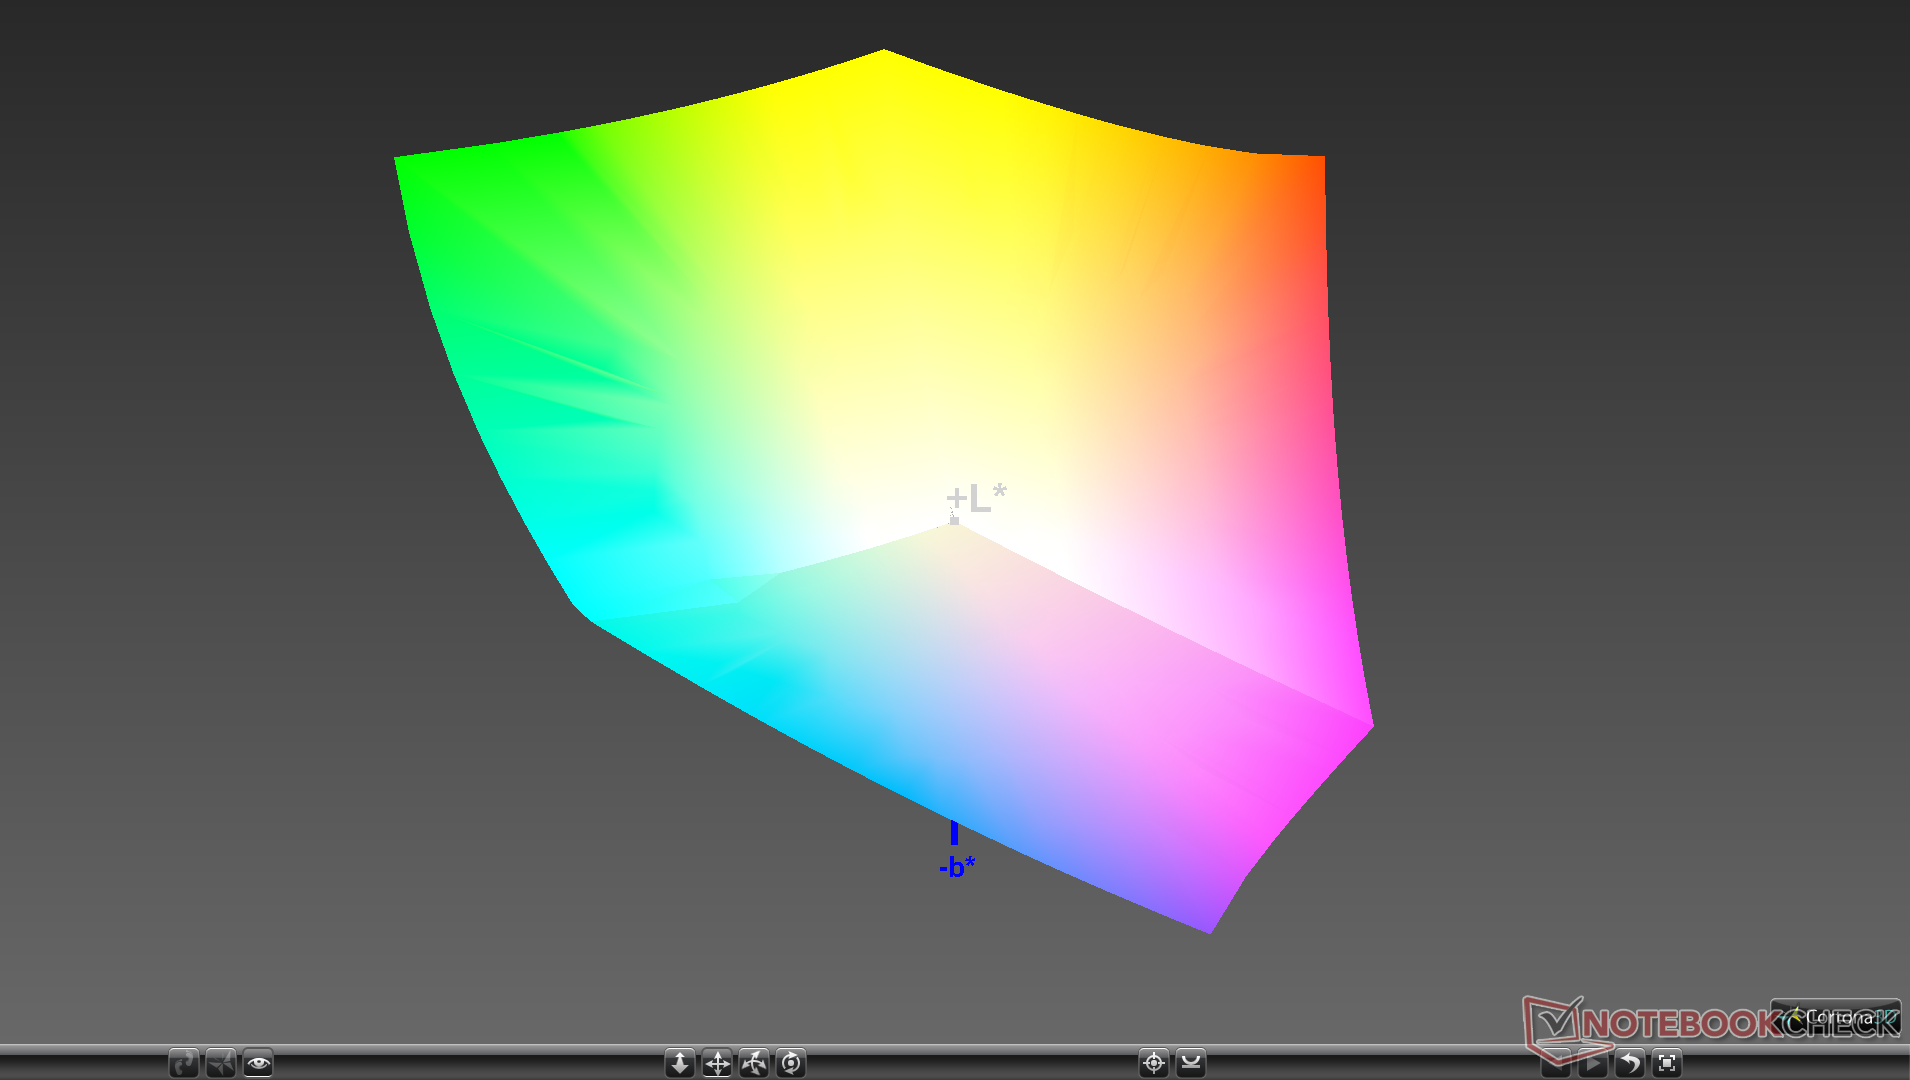
100% sRGB (Argyll 1.6.3 3D)
90.4% AdobeRGB 1998 (Argyll 1.6.3 3D)
99.8% AdobeRGB 1998 (Argyll 3D)
100% sRGB (Argyll 3D)
90.5% Display P3 (Argyll 3D)
Gamma: 2.15
CCT: 6438 K
| Dell XPS 17 9700 Core i7 RTX 2060 Max-Q Sharp LQ170R1, IPS, 17", 3840x2400 | Razer Blade Pro 17 RTX 2070 Max-Q 300 Hz Sharp LQ173M1JW02, IPS, 17.3", 1920x1080 | MSI Creator 17 A10SGS B173ZAN05.0 (AUO278E), Mini-LED IPS-Level, 17.3", 3840x2160 | HP Envy 17t-cg000 AU Optronics AUO168E, IPS, 17.3", 3840x2160 | Gigabyte Aero 17 HDR XB AUO B173ZAN03.2 (AUO329B), IPS, 17.3", 3840x2160 | Apple MacBook Pro 16 2019 i9 5500M APPA044, IPS, 16", 3072x1920 | |
|---|---|---|---|---|---|---|
| Display | -16% | -9% | -2% | -1% | ||
| Display P3 Coverage (%) | 90.5 | 72.2 -20% | 82 -9% | 86.2 -5% | 86.5 -4% | |
| sRGB Coverage (%) | 100 | 98.5 -1% | 97.5 -2% | 100 0% | 100 0% | |
| AdobeRGB 1998 Coverage (%) | 99.8 | 73 -27% | 84 -16% | 99.8 0% | 100 0% | |
| Response Times | 80% | 72% | 10% | 6% | -6% | |
| Response Time Grey 50% / Grey 80% * (ms) | 51.2 ? | 5.6 ? 89% | 45.2 ? 12% | 55.2 ? -8% | 52.4 ? -2% | |
| Response Time Black / White * (ms) | 32 ? | 9.6 ? 70% | 8.8 ? 72% | 29.6 ? 7% | 26 ? 19% | 34.9 ? -9% |
| PWM Frequency (Hz) | 26600 ? | 131700 | ||||
| Screen | -46% | -6% | -46% | 17% | 12% | |
| Brightness middle (cd/m²) | 539.4 | 328 -39% | 996 85% | 383.4 -29% | 487 -10% | 519 -4% |
| Brightness (cd/m²) | 494 | 329 -33% | 952 93% | 382 -23% | 475 -4% | 477 -3% |
| Brightness Distribution (%) | 84 | 78 -7% | 93 11% | 86 2% | 95 13% | 86 2% |
| Black Level * (cd/m²) | 0.32 | 0.35 -9% | 0.68 -113% | 0.34 -6% | 0.38 -19% | 0.39 -22% |
| Contrast (:1) | 1686 | 937 -44% | 1465 -13% | 1128 -33% | 1282 -24% | 1331 -21% |
| Colorchecker dE 2000 * | 4.12 | 4.74 -15% | 4.21 -2% | 6.24 -51% | 1.19 71% | 2.28 45% |
| Colorchecker dE 2000 max. * | 7.65 | 8.99 -18% | 6.79 11% | 10.18 -33% | 2.43 68% | 6.54 15% |
| Colorchecker dE 2000 calibrated * | 3.91 | 2.12 46% | 2.03 48% | 3.7 5% | 0.5 87% | 0.86 78% |
| Greyscale dE 2000 * | 1.5 | 6.8 -353% | 4.1 -173% | 6.6 -340% | 1.45 3% | 0.9 40% |
| Gamma | 2.15 102% | 2.2 100% | 2.207 100% | 2.272 97% | 2.21 100% | 2145 0% |
| CCT | 6438 101% | 6446 101% | 7491 87% | 5973 109% | 6557 99% | 6572 99% |
| Color Space (Percent of AdobeRGB 1998) (%) | 90.4 | 64.8 -28% | 84 -7% | 88 -3% | 88 -3% | 78 -14% |
| Color Space (Percent of sRGB) (%) | 100 | 98.6 -1% | 97 -3% | 100 0% | 100 0% | |
| Total Average (Program / Settings) | 6% /
-24% | 19% /
-1% | -13% /
-31% | 7% /
12% | 3% /
9% |
* ... smaller is better
Color space covers all of sRGB and over 90 percent of AdobeRGB to be similar to most professional laptops like the MSI Creator 17 or Gigabyte Aero 17. The typical consumer Ultrabook covers about 60 percent of AdobeRGB in comparison.

The display is well calibrated out of the box with average grayscale DeltaE and ColorChecker values of just 1.5 and 4.12, respectively. Attempting to calibrate the panel even further ourselves would result in insignificant changes and so an end-user calibration is not necessary.


Display Response Times
| ↔ Response Time Black to White | ||
|---|---|---|
| 32 ms ... rise ↗ and fall ↘ combined | ↗ 18 ms rise | 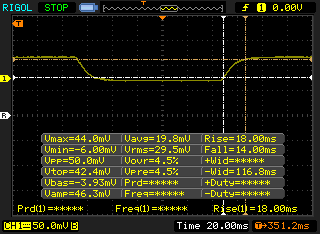 |
| ↘ 14 ms fall | ||
| The screen shows slow response rates in our tests and will be unsatisfactory for gamers. In comparison, all tested devices range from 0.1 (minimum) to 240 (maximum) ms. » 86 % of all devices are better. This means that the measured response time is worse than the average of all tested devices (19.8 ms). | ||
| ↔ Response Time 50% Grey to 80% Grey | ||
| 51.2 ms ... rise ↗ and fall ↘ combined | ↗ 27.2 ms rise |  |
| ↘ 24 ms fall | ||
| The screen shows slow response rates in our tests and will be unsatisfactory for gamers. In comparison, all tested devices range from 0.165 (minimum) to 636 (maximum) ms. » 88 % of all devices are better. This means that the measured response time is worse than the average of all tested devices (30.9 ms). | ||
Screen Flickering / PWM (Pulse-Width Modulation)
| Screen flickering / PWM not detected | 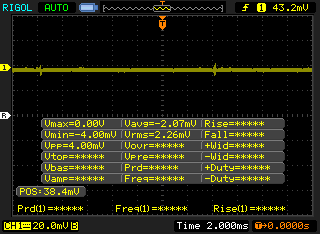 | ||
In comparison: 52 % of all tested devices do not use PWM to dim the display. If PWM was detected, an average of 7744 (minimum: 5 - maximum: 343500) Hz was measured. | |||
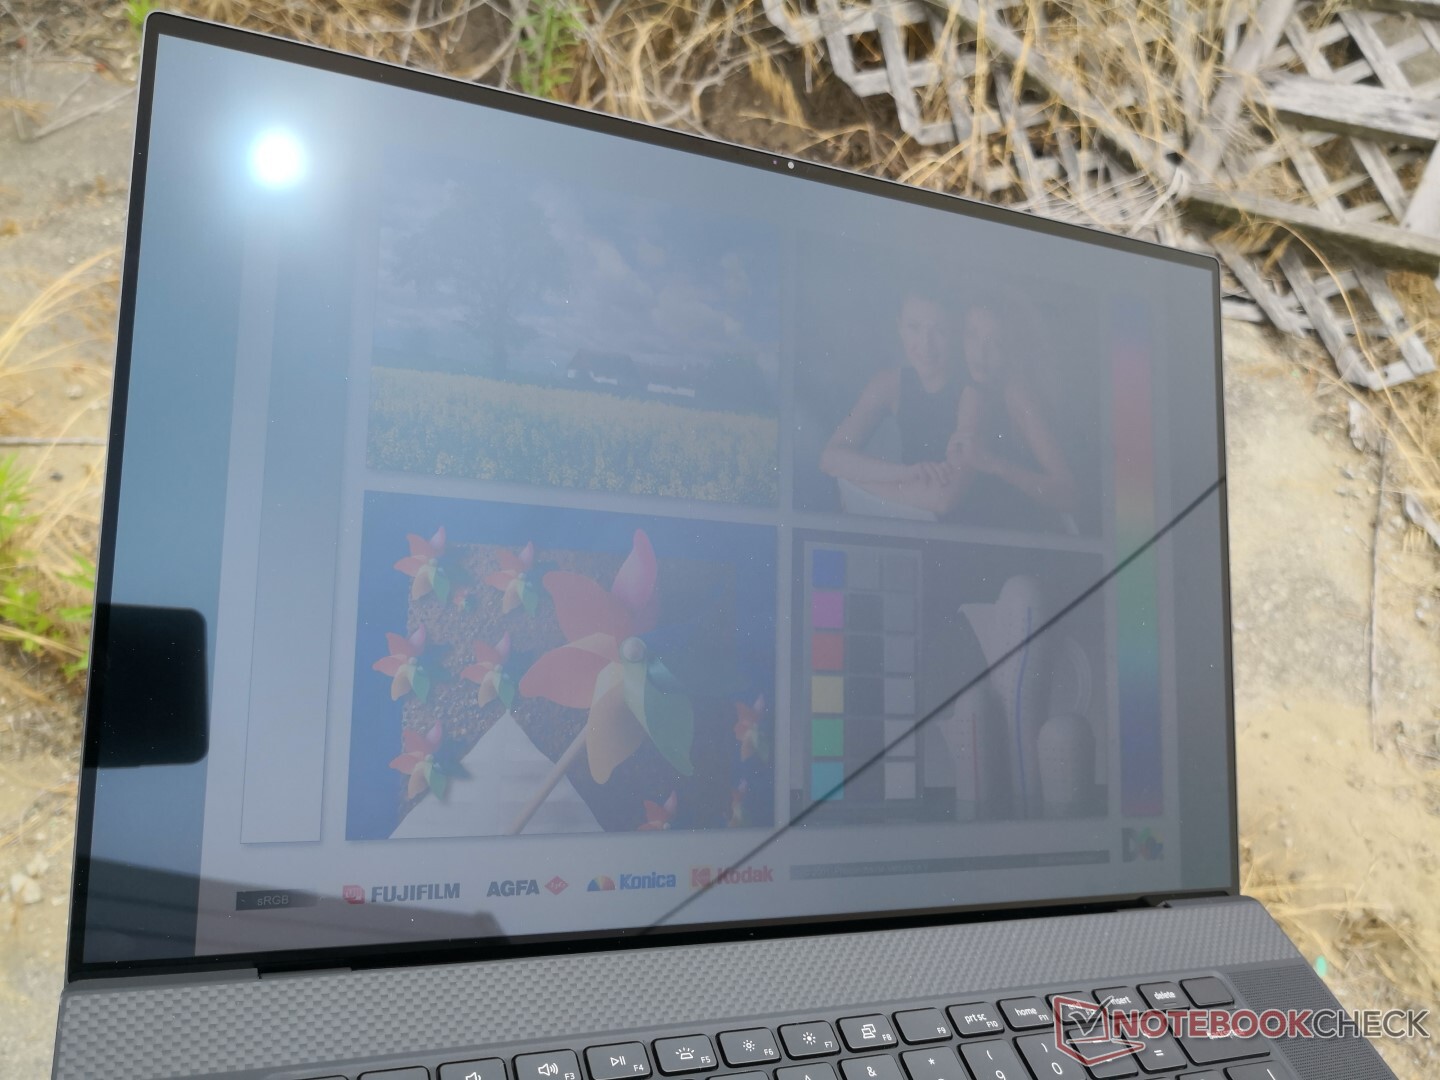
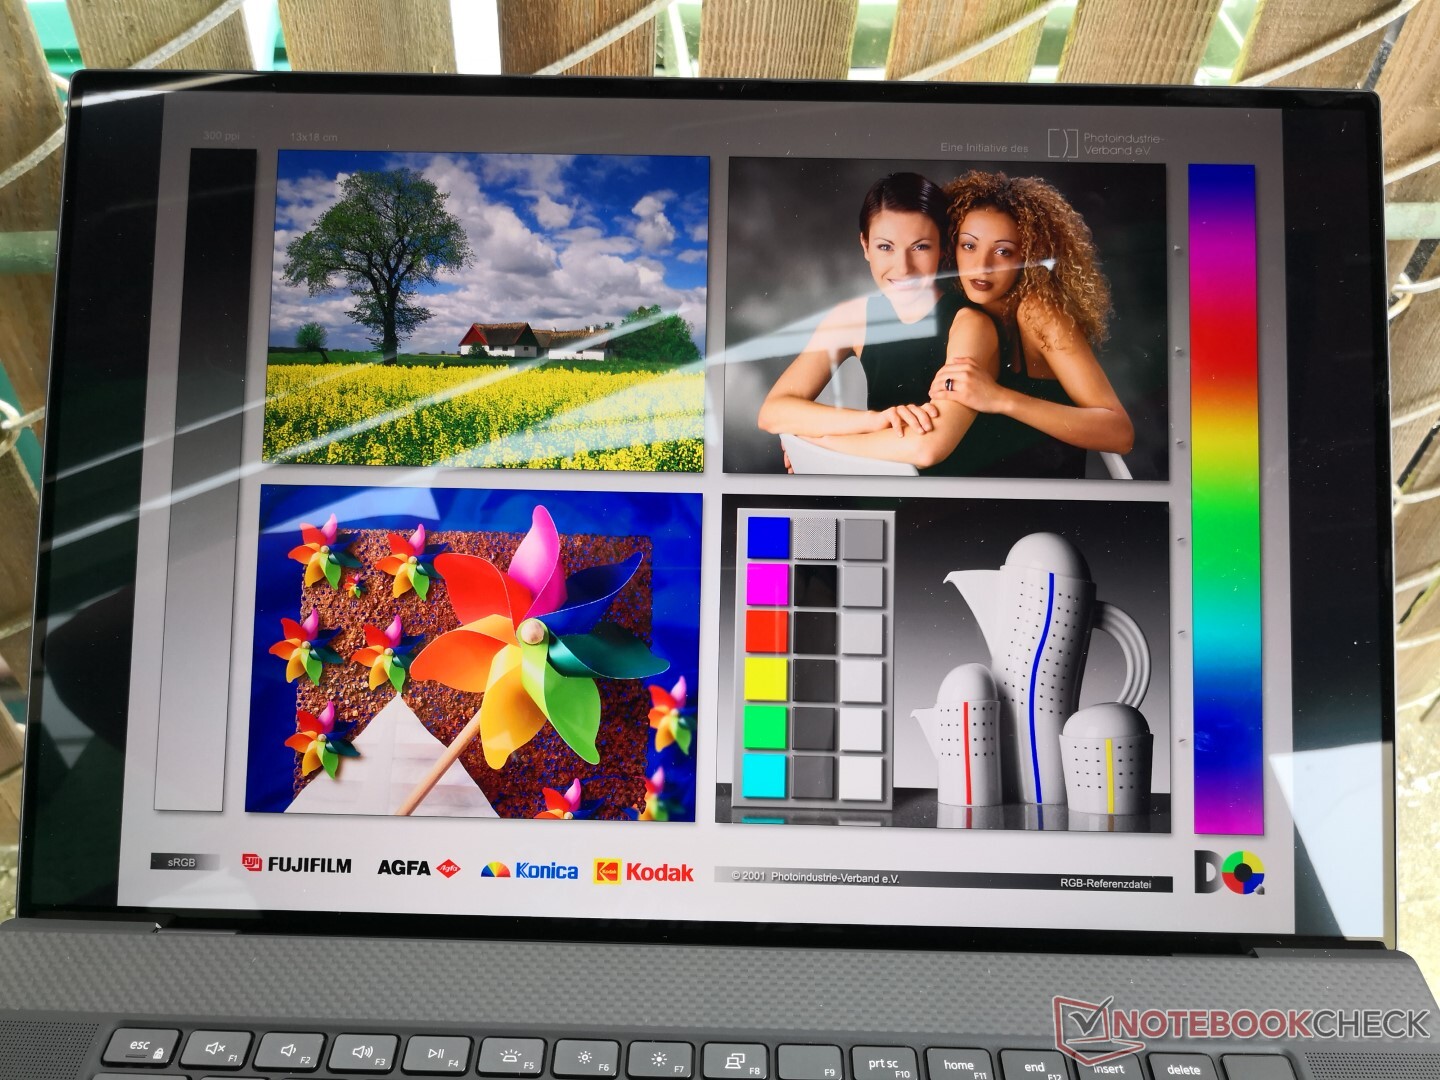
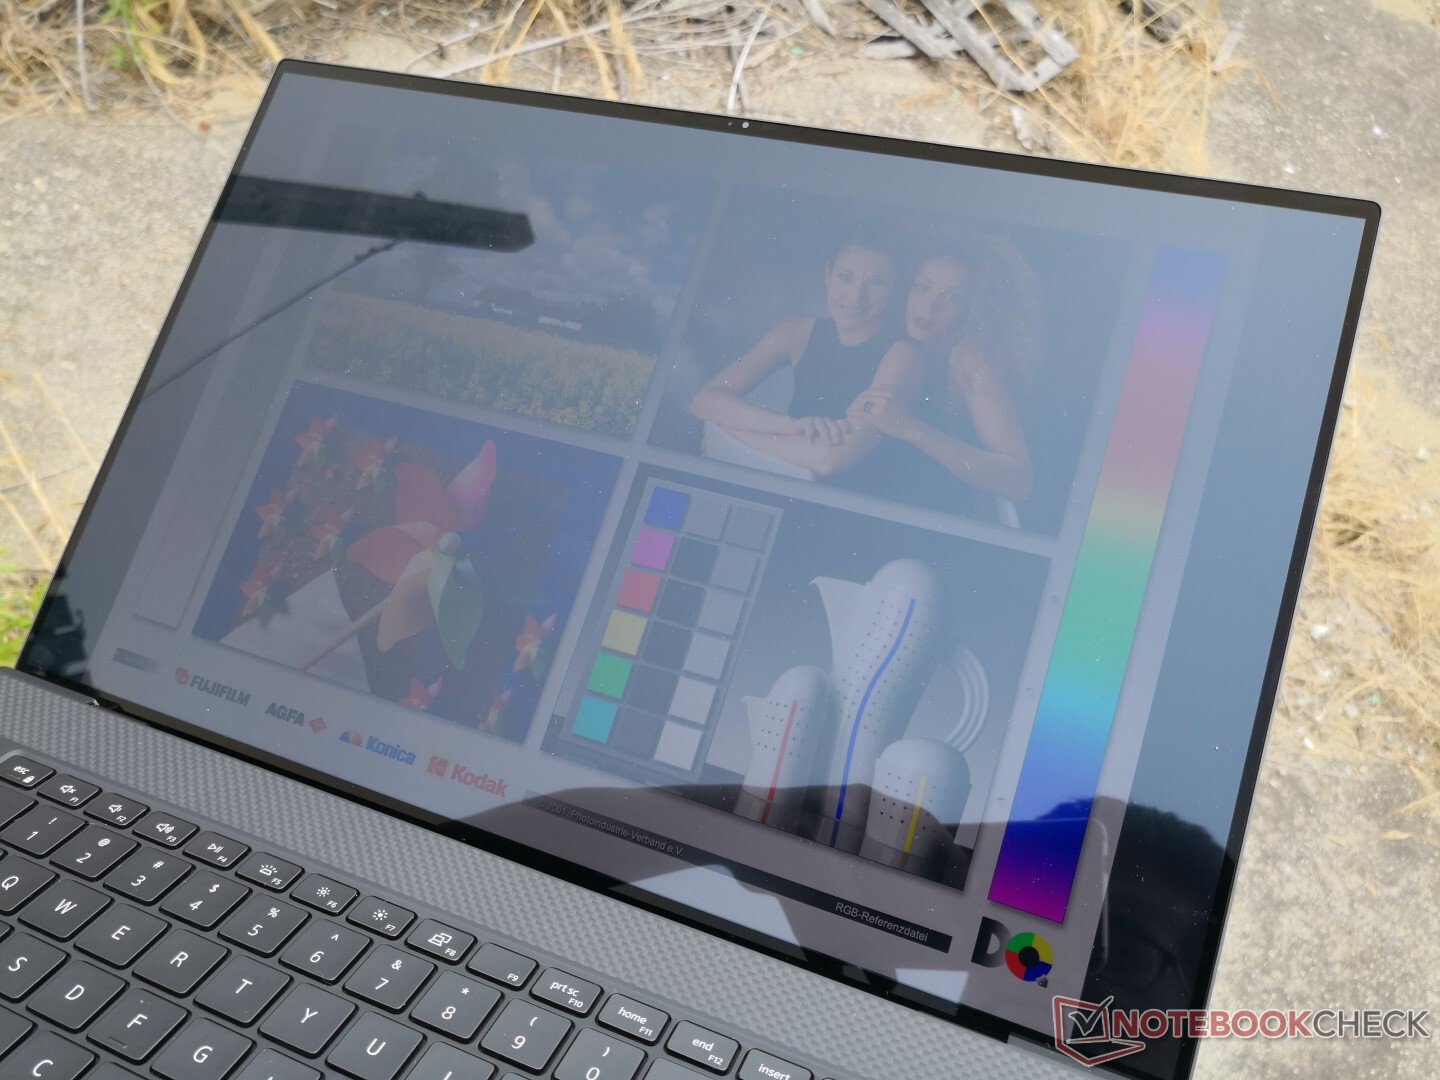
Outdoor visibility is tolerable when under shade even though there will be some glare from the glossy screen. We recommend setting the brightness to maximum and increasing the font scale to avoid squinting. Direct sunlight will wash out colors and should be avoided.

Performance — Now with GeForce RTX 2060 Max-Q Options
Much like the XPS 15, Dell is targeting both multimedia users and high-performance users with the XPS 17. Users who just want to use the system for schoolwork, browsing, or video can go with a Core i5 UHD graphics SKU while more demanding users can configure with the Core i7 and discrete GeForce GTX 1650 Ti or RTX 2060 Max-Q. Dell says Core i9 options will be coming in the near future, but it's kind of a bummer that there are no Ryzen options planned.
Nvidia Optimus comes standard with our GeForce configuration while RAM is expandable up to 64 GB-2933. All benchmarks below were performed on Dell's Ultra Performance mode for the highest possible scores.
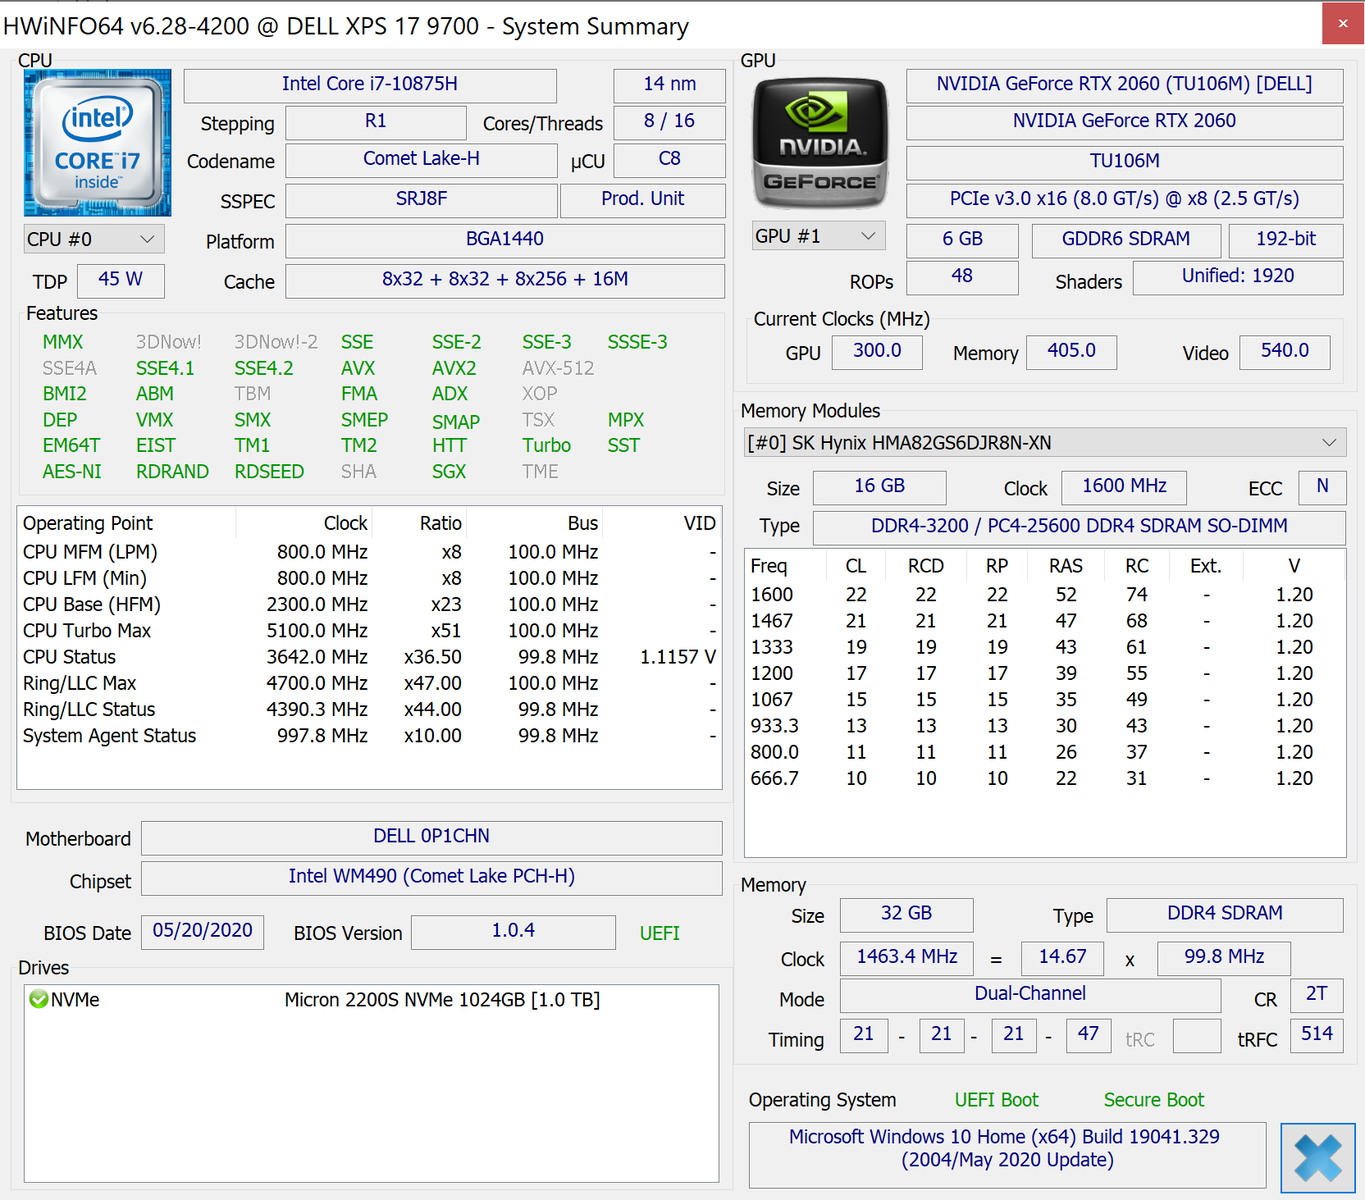
Processor
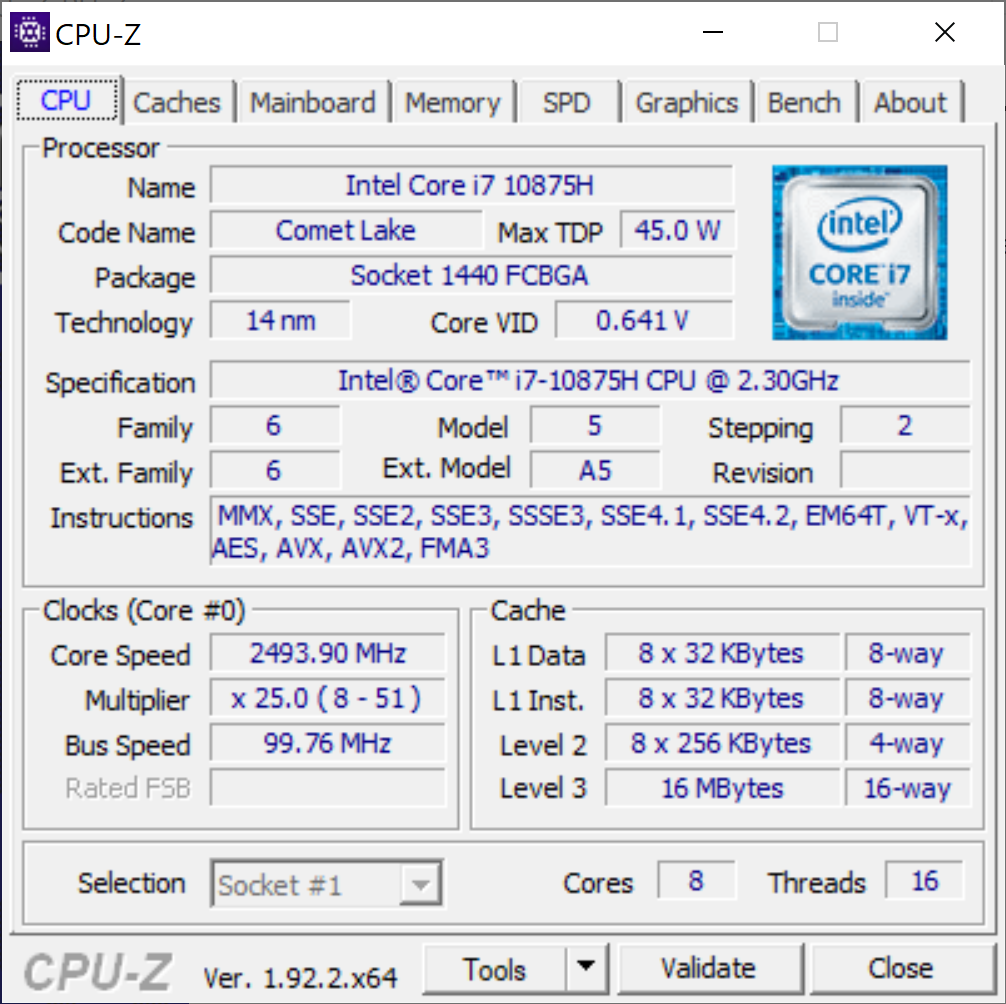
CPU performance is essentially identical to the Razer Blade Pro 17 while being slightly faster than the XPS 15 9500 all equipped with the same Core i7-10875H CPU. Upgrading from the lower-end Core i5-10300H option or last year's Core i7-9750H will net roughly 60 percent and 40 percent faster multi-thread performance, respectively. Thicker systems like the Alienware m17 R2 or MSI GE75 with the older Core i9-9880H will still outperform our Dell system by virtue of having larger cooling solutions for higher sustained clock rates.
Jumping from the i7-10875H to the i9-10980HK will likely just bring just minimal benefits again much like what we observed on the XPS 15.
See our dedicated page on the Core i7-10875H here for more technical information and benchmark comparisons.
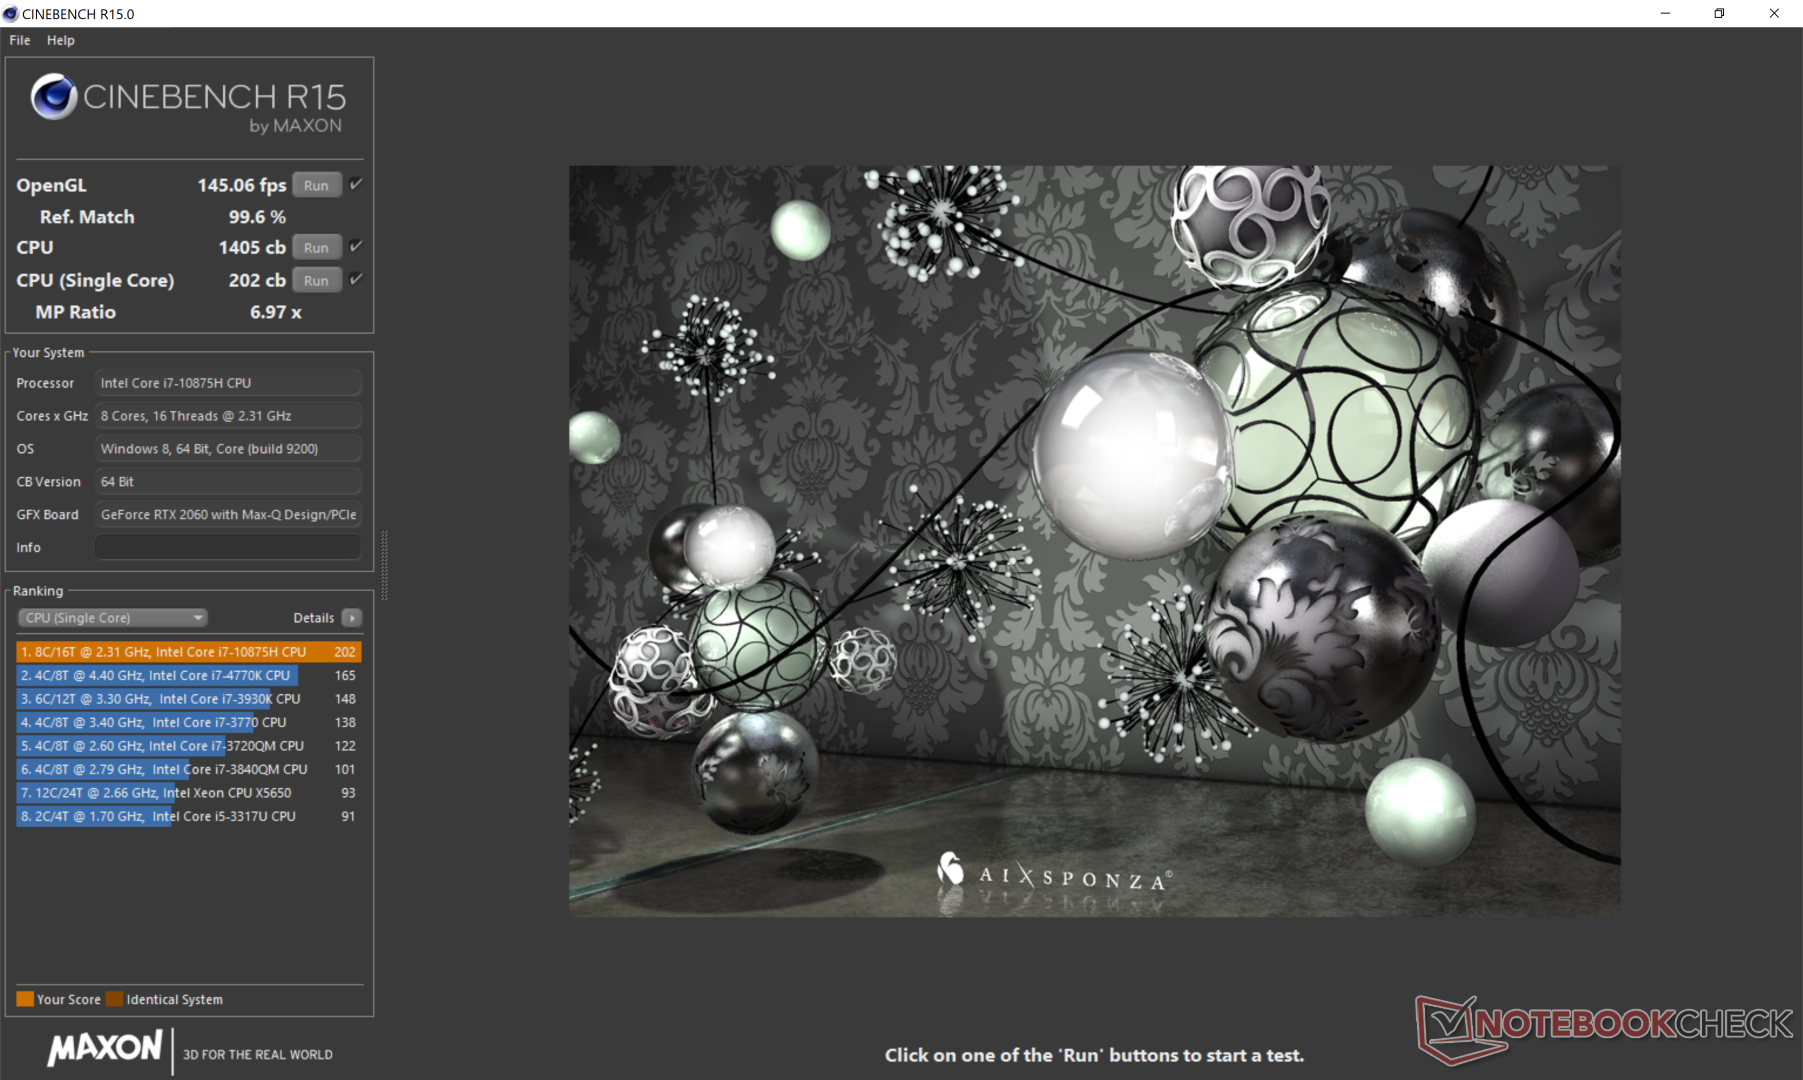
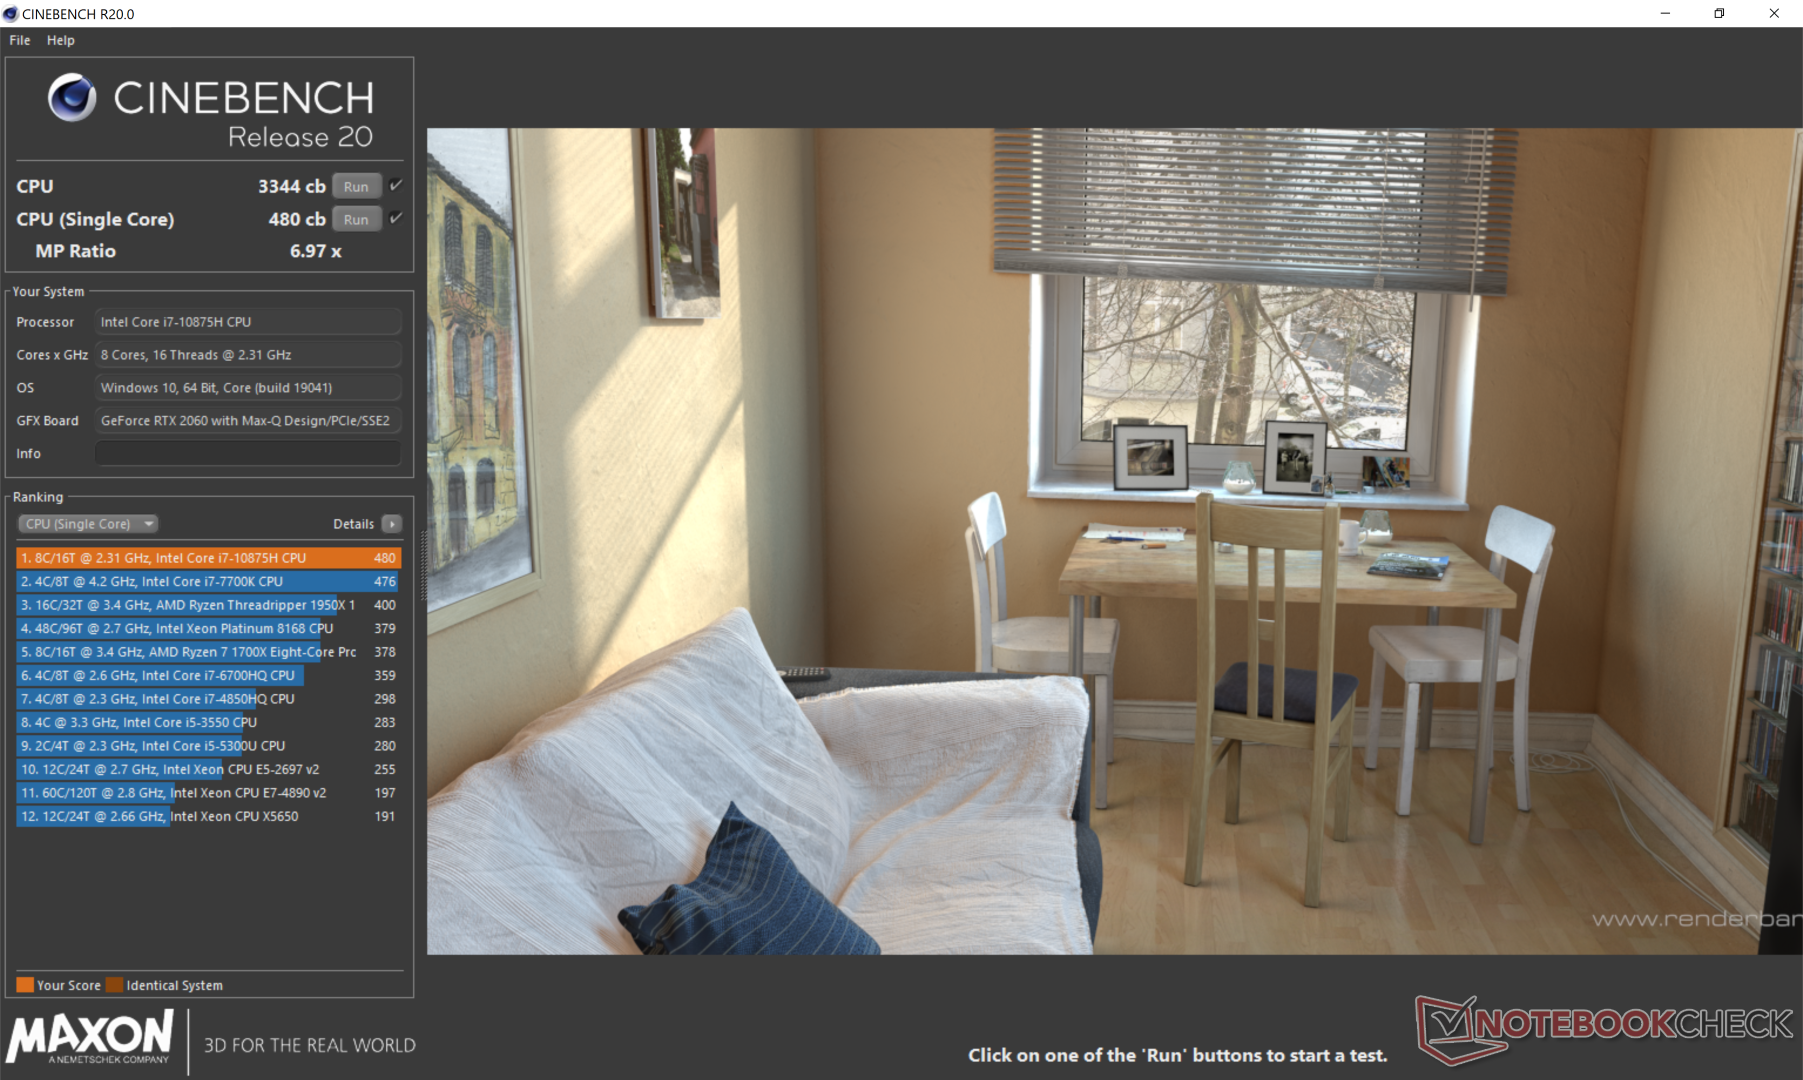
Cinebench R15: CPU Multi 64Bit | CPU Single 64Bit
Blender: v2.79 BMW27 CPU
7-Zip 18.03: 7z b 4 -mmt1 | 7z b 4
Geekbench 5.5: Single-Core | Multi-Core
HWBOT x265 Benchmark v2.2: 4k Preset
LibreOffice : 20 Documents To PDF
R Benchmark 2.5: Overall mean
| Blender / v2.79 BMW27 CPU | |
| Dell XPS 15 9500 Core i5 | |
| MSI GE75 Raider 10SE-008US | |
| Acer Nitro 5 AN515-44-R5FT | |
| Dell XPS 17 9700 Core i7 RTX 2060 Max-Q | |
| Average Intel Core i7-10875H (259 - 535, n=30) | |
| Asus Zephyrus G14 GA401IV | |
| MSI GE75 9SG | |
| Asus Strix Scar 17 G732LXS | |
| MSI Bravo 17 A4DDR | |
| 7-Zip 18.03 / 7z b 4 -mmt1 | |
| Average Intel Core i7-10875H (5071 - 5780, n=31) | |
| Asus Strix Scar 17 G732LXS | |
| Dell XPS 17 9700 Core i7 RTX 2060 Max-Q | |
| MSI GE75 Raider 10SE-008US | |
| MSI GE75 9SG | |
| Dell XPS 15 9500 Core i5 | |
| MSI Bravo 17 A4DDR | |
| Asus Zephyrus G14 GA401IV | |
| Acer Nitro 5 AN515-44-R5FT | |
| Geekbench 5.5 / Single-Core | |
| Dell XPS 17 9700 Core i7 RTX 2060 Max-Q | |
| Average Intel Core i7-10875H (1233 - 1371, n=29) | |
| Asus Strix Scar 17 G732LXS | |
| MSI GE75 Raider 10SE-008US | |
| Asus Zephyrus G14 GA401IV | |
| MSI Bravo 17 A4DDR | |
| Dell XPS 15 9500 Core i5 | |
| Acer Nitro 5 AN515-44-R5FT | |
| Geekbench 5.5 / Multi-Core | |
| Asus Strix Scar 17 G732LXS | |
| MSI Bravo 17 A4DDR | |
| Dell XPS 17 9700 Core i7 RTX 2060 Max-Q | |
| Average Intel Core i7-10875H (5715 - 8620, n=29) | |
| Asus Zephyrus G14 GA401IV | |
| MSI GE75 Raider 10SE-008US | |
| Acer Nitro 5 AN515-44-R5FT | |
| Dell XPS 15 9500 Core i5 | |
| HWBOT x265 Benchmark v2.2 / 4k Preset | |
| MSI Bravo 17 A4DDR | |
| Asus Strix Scar 17 G732LXS | |
| Asus Zephyrus G14 GA401IV | |
| MSI GE75 9SG | |
| Average Intel Core i7-10875H (7.27 - 14.1, n=27) | |
| Dell XPS 17 9700 Core i7 RTX 2060 Max-Q | |
| MSI GE75 Raider 10SE-008US | |
| Acer Nitro 5 AN515-44-R5FT | |
| Dell XPS 15 9500 Core i5 | |
| LibreOffice / 20 Documents To PDF | |
| MSI Bravo 17 A4DDR | |
| Acer Nitro 5 AN515-44-R5FT | |
| Dell XPS 15 9500 Core i5 | |
| MSI GE75 Raider 10SE-008US | |
| Asus Strix Scar 17 G732LXS | |
| Average Intel Core i7-10875H (30.2 - 84.3, n=30) | |
| Dell XPS 17 9700 Core i7 RTX 2060 Max-Q | |
| R Benchmark 2.5 / Overall mean | |
| Dell XPS 15 9500 Core i5 | |
| Acer Nitro 5 AN515-44-R5FT | |
| MSI GE75 Raider 10SE-008US | |
| Dell XPS 17 9700 Core i7 RTX 2060 Max-Q | |
| Average Intel Core i7-10875H (0.546 - 0.662, n=29) | |
| Asus Strix Scar 17 G732LXS | |
| MSI Bravo 17 A4DDR | |
* ... smaller is better
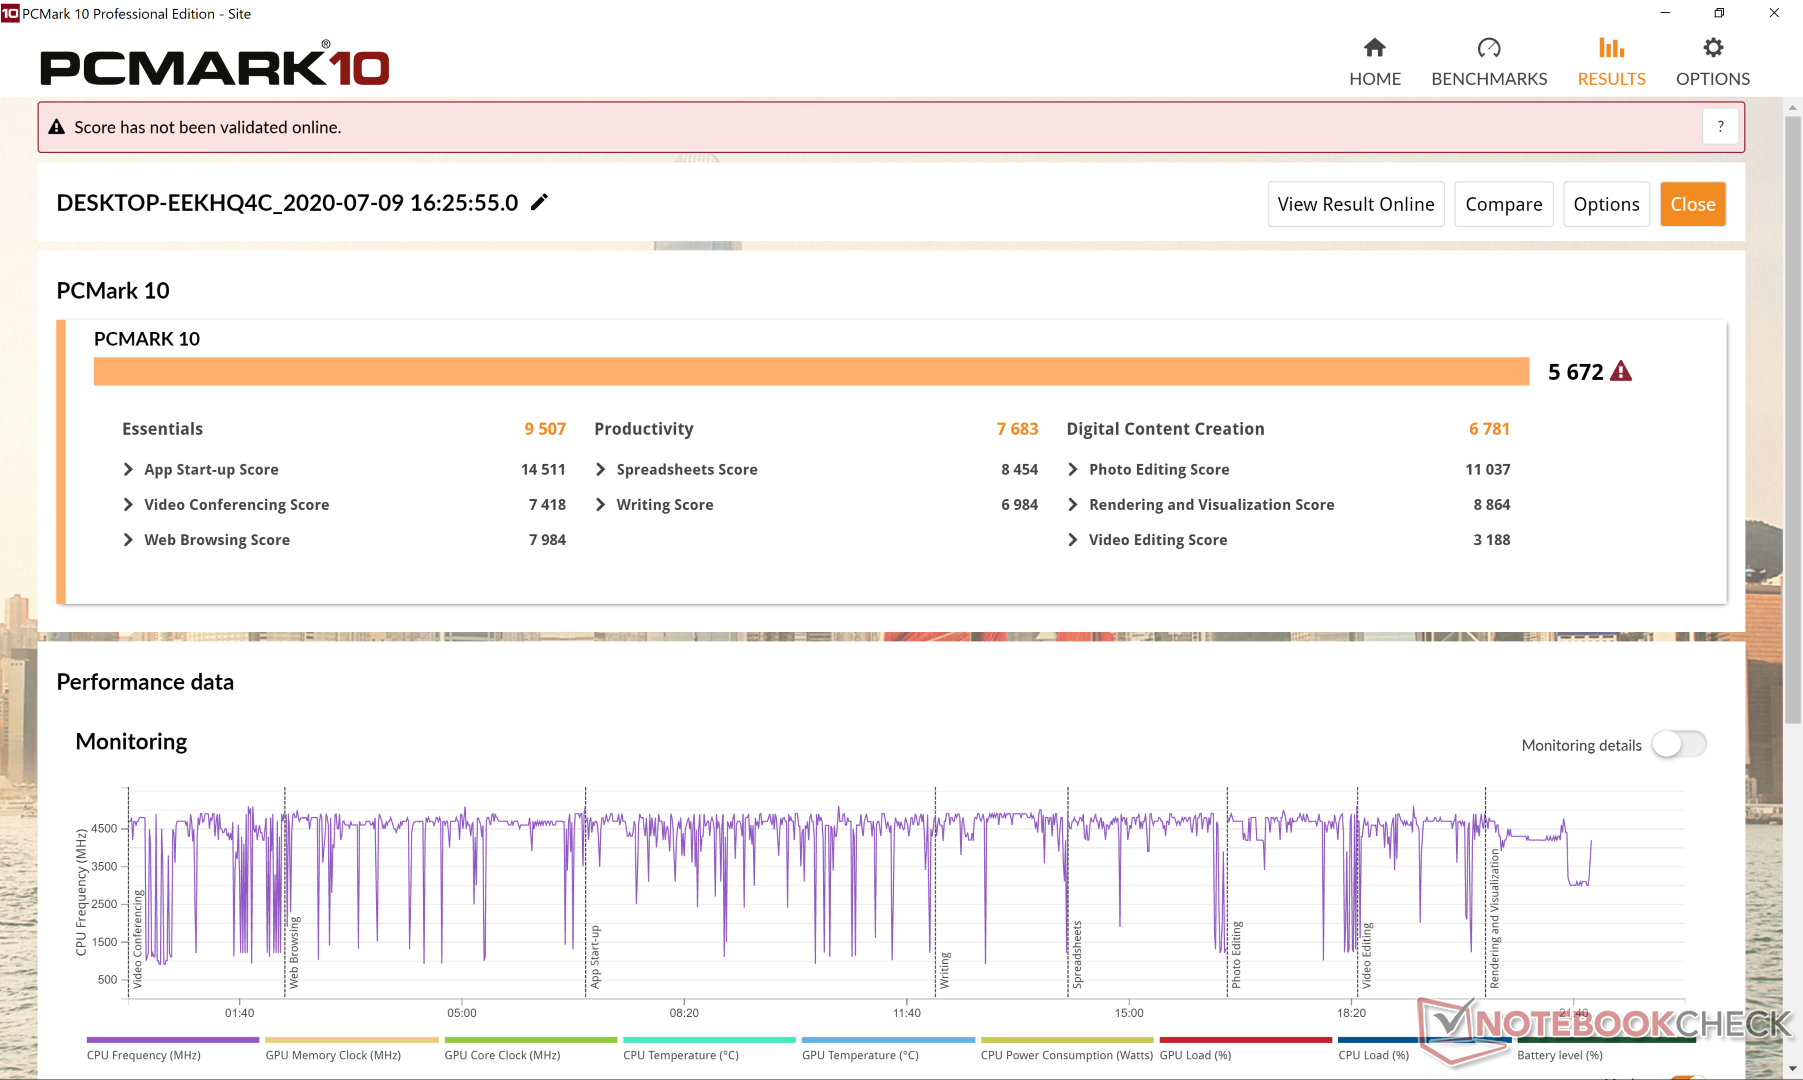
System Performance
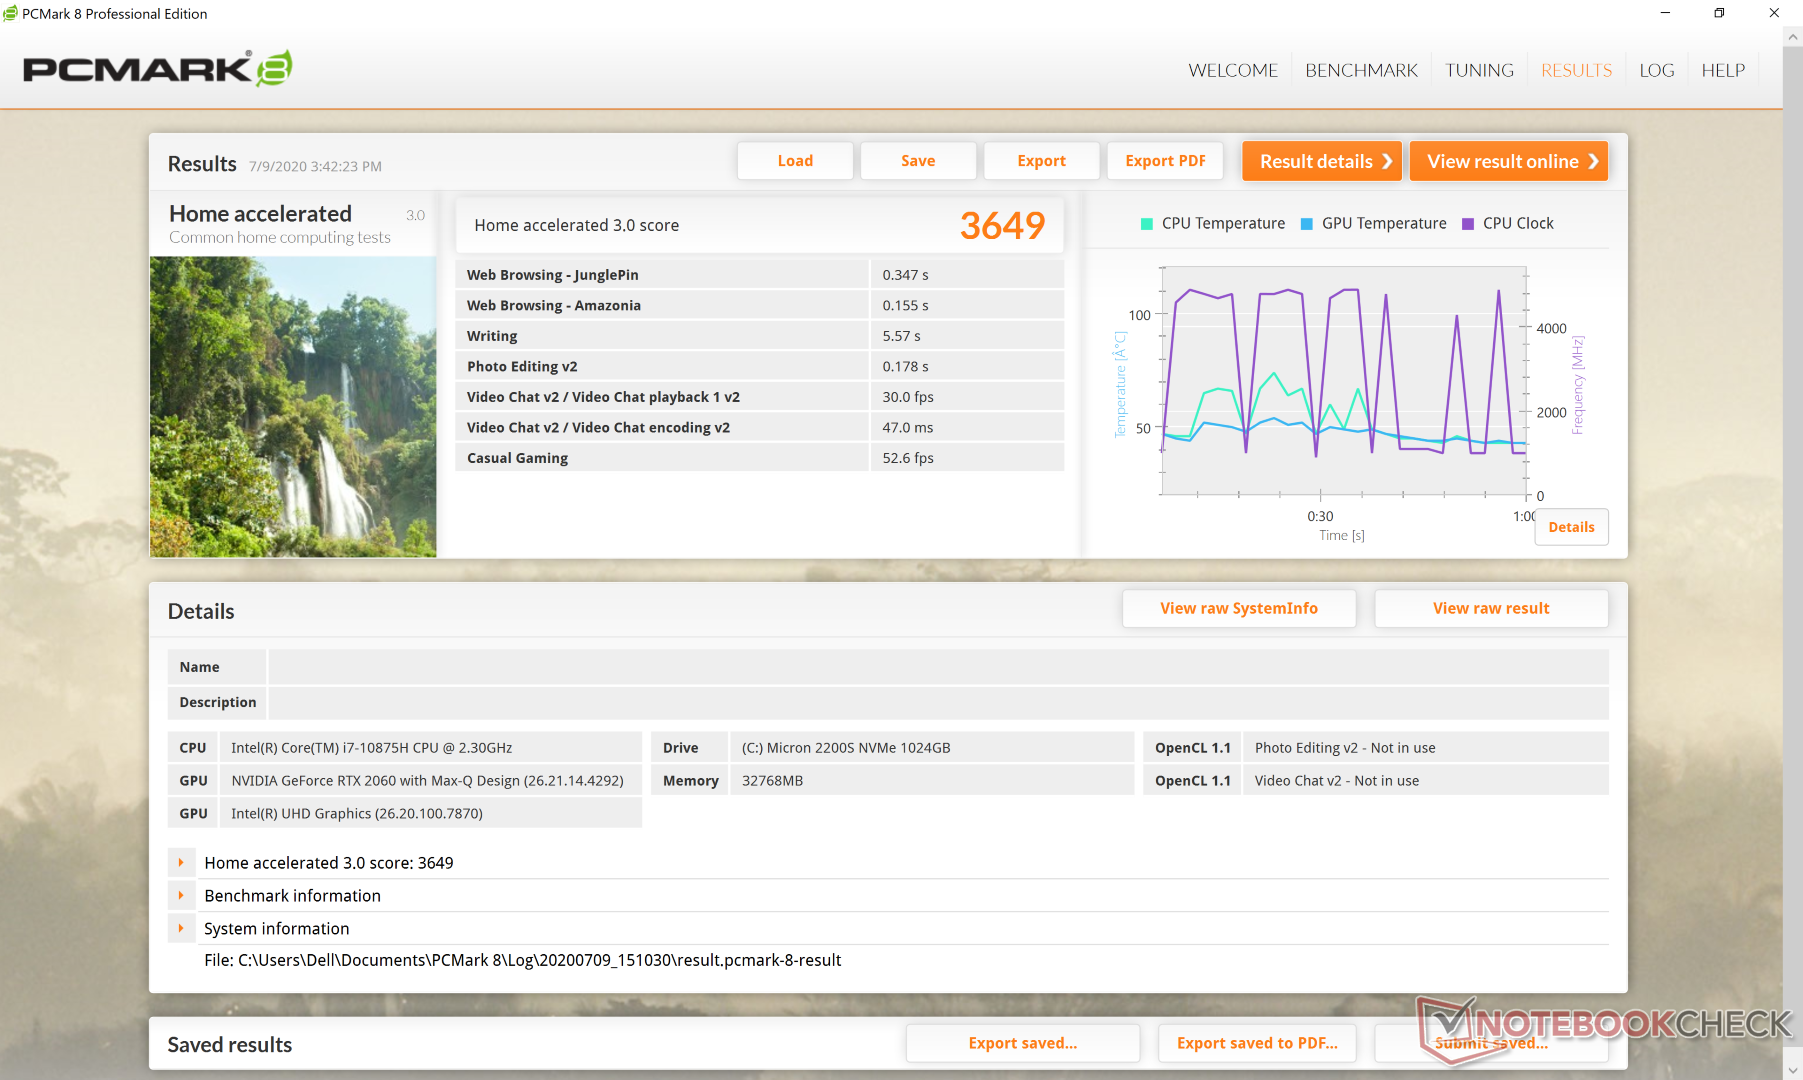
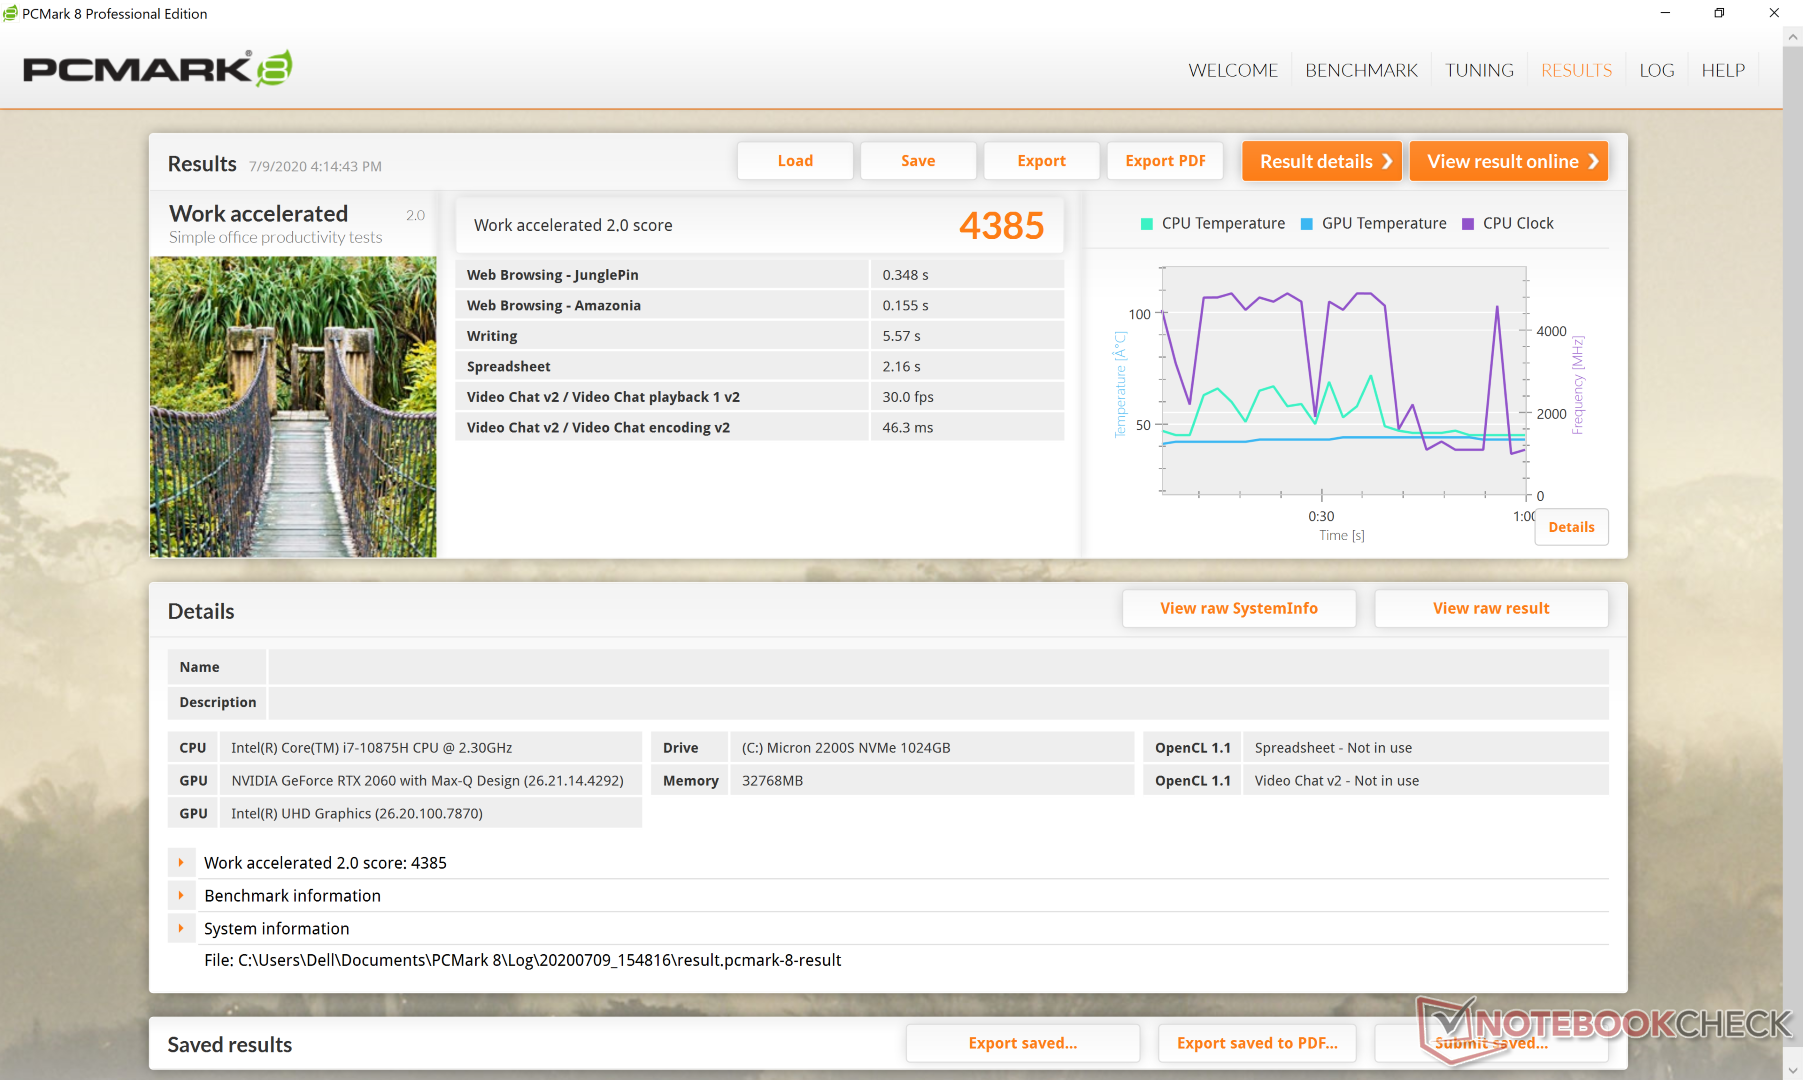
PCMark benchmarks are within single-digit percentage points of the XPS 15 9500 with the exception of our much higher Digital Creation score due to the faster GPU. We recommend that users become familiar with the pre-installed Dell Power Manager application as its settings more closely influence system performance, battery life, and fan behavior than the standard Windows power profiles.
| PCMark 8 | |
| Home Score Accelerated v2 | |
| Razer Blade Pro 17 RTX 2070 Max-Q 300 Hz | |
| HP Envy 17t-cg000 | |
| Dell XPS 17 9700 Core i7 RTX 2060 Max-Q | |
| Work Score Accelerated v2 | |
| Razer Blade Pro 17 RTX 2070 Max-Q 300 Hz | |
| HP Envy 17t-cg000 | |
| Dell XPS 17 9700 Core i7 RTX 2060 Max-Q | |
| PCMark 8 Home Score Accelerated v2 | 3649 points | |
| PCMark 8 Work Score Accelerated v2 | 4385 points | |
| PCMark 10 Score | 5672 points | |
Help | ||
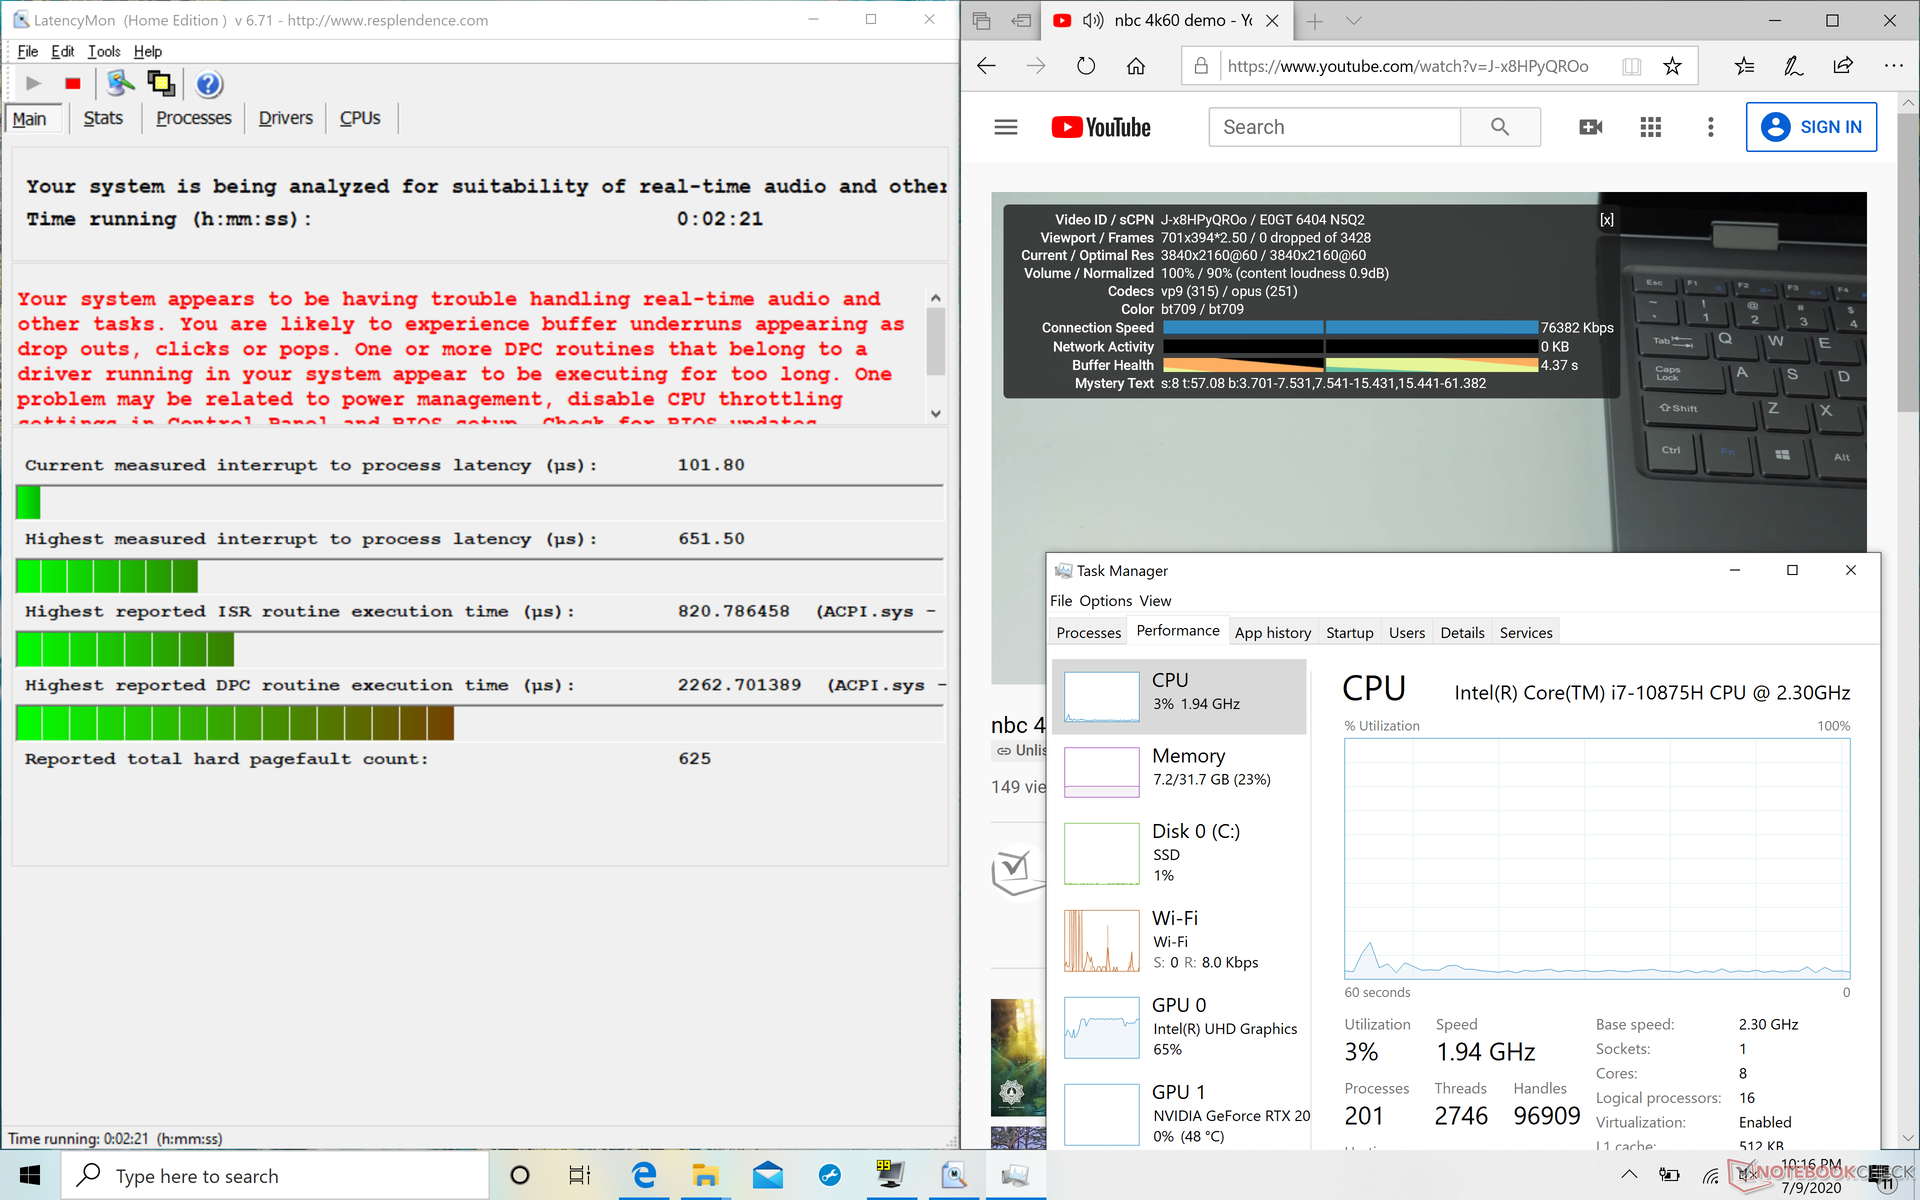
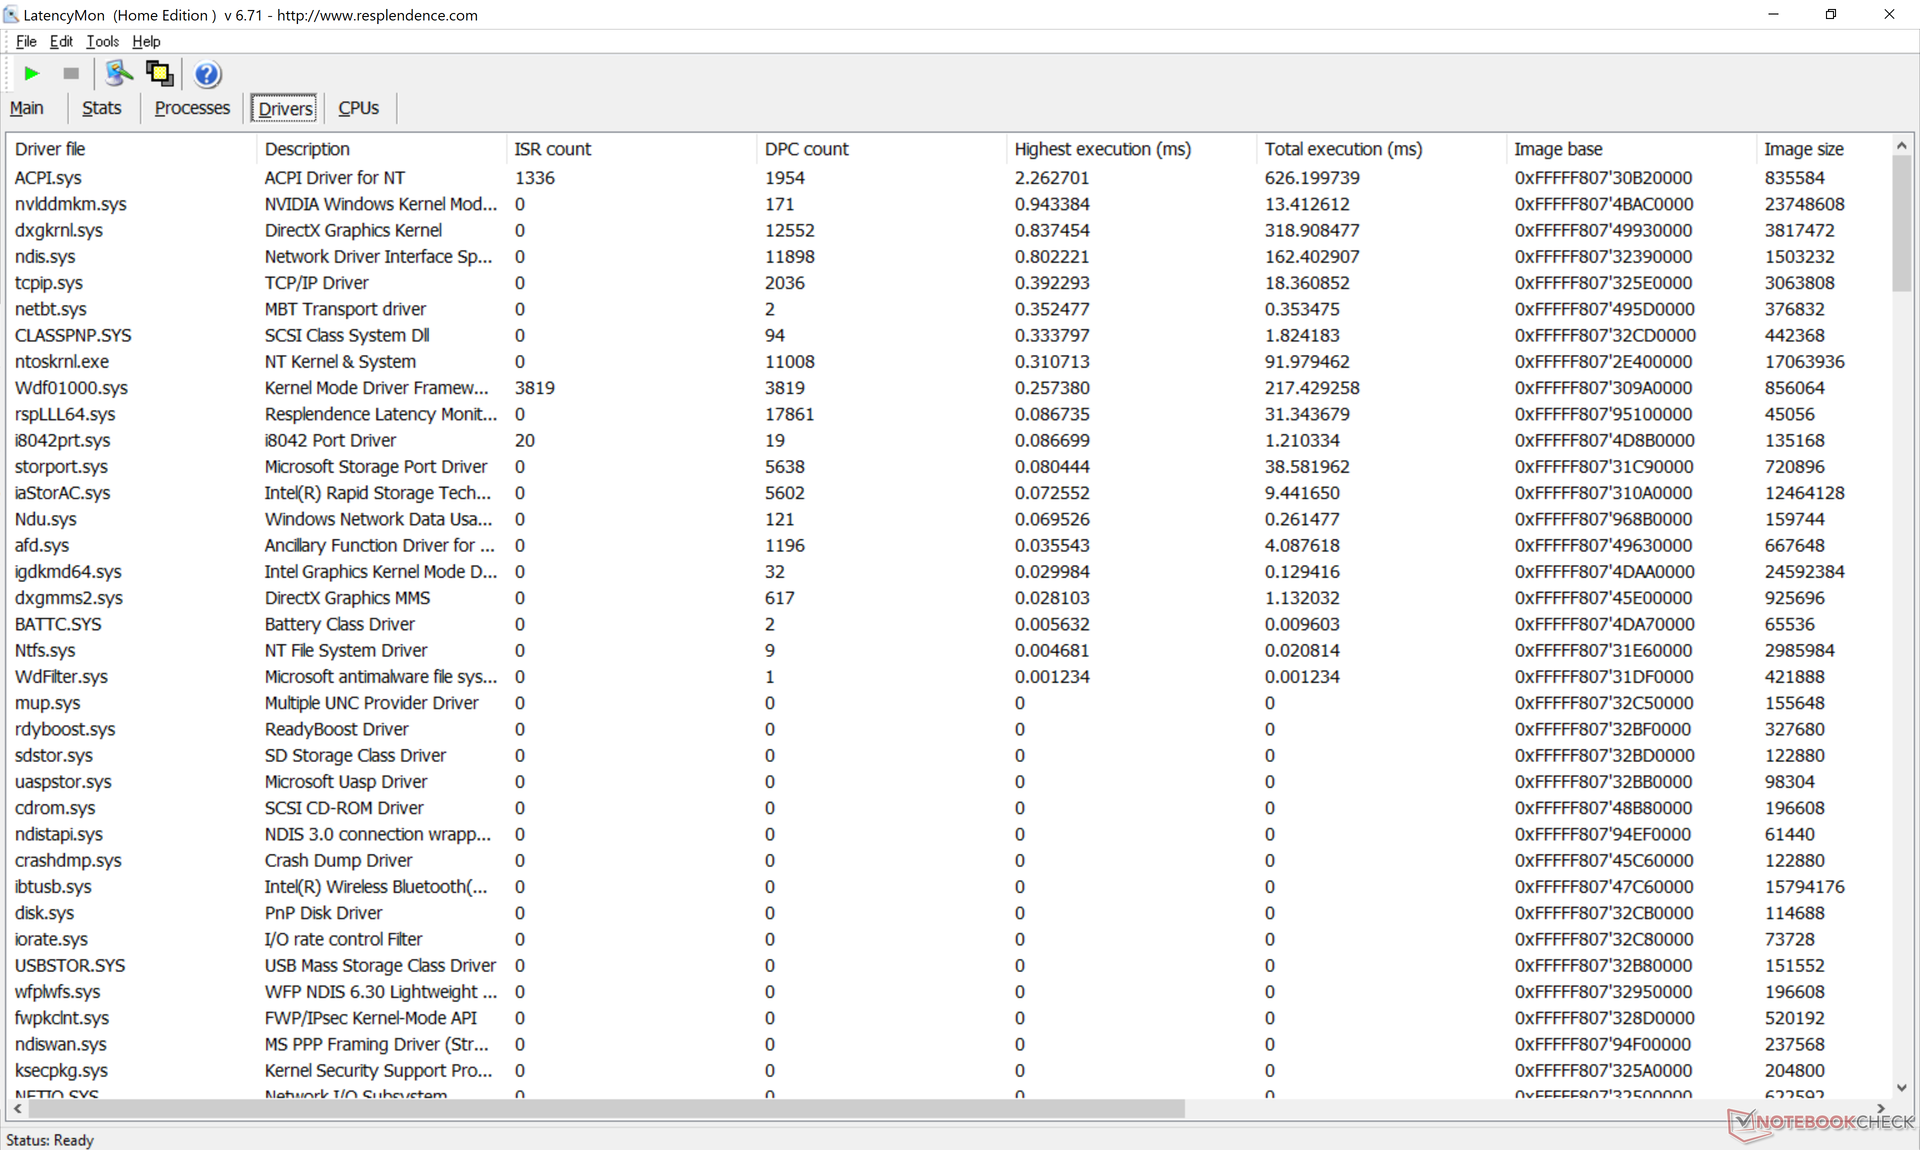
DPC Latency
LatencyMon shows high execution times caused by ACPI.sys even though interrupt times are short. 4K video playback is otherwise smooth and with no dropped frames recorded.
| DPC Latencies / LatencyMon - interrupt to process latency (max), Web, Youtube, Prime95 | |
| HP Envy 17t-cg000 | |
| Gigabyte Aero 17 HDR XB | |
| Razer Blade Pro 17 RTX 2070 Max-Q 300 Hz | |
| MSI Creator 17 A10SGS | |
| Dell XPS 17 9700 Core i7 RTX 2060 Max-Q | |
| Asus Zephyrus S17 GX701LXS | |
* ... smaller is better
Storage Devices
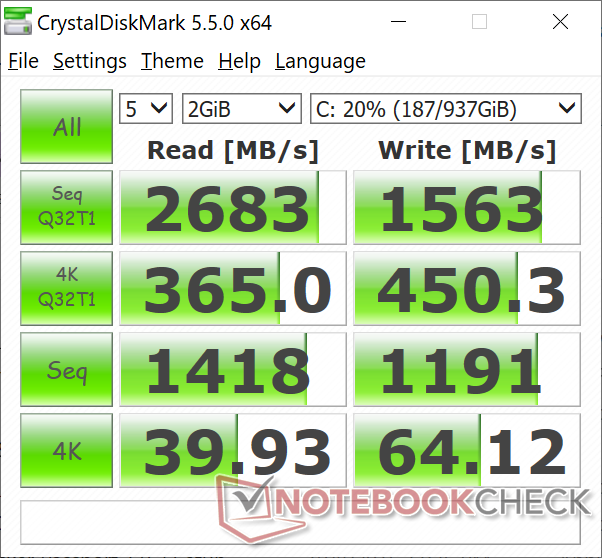
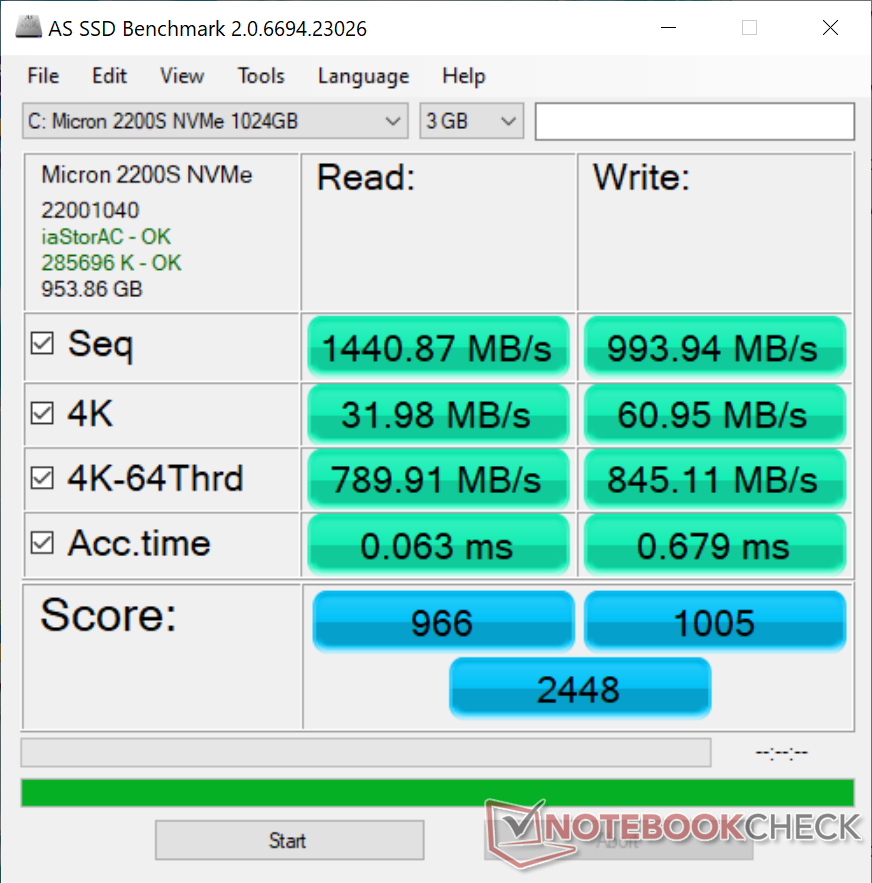
The two internal M.2 2280 storage slots support PCIe SSDs with one supporting SATA as well. Dell sources SSDs from a handful of OEMs so it's a gamble between Micron, SK Hynix, Toshiba, and Intel based on our experience with previous XPS systems. The 1 TB Micron 2200S in our unit is still fast even if it doesn't quite seem to reach the speeds of a 1 TB Samsung PM981.
| Dell XPS 17 9700 Core i7 RTX 2060 Max-Q Micron 2200S 1TB MTFDHBA1T0TCK | Razer Blade Pro 17 RTX 2070 Max-Q 300 Hz Lite-On CA5-8D512 | HP Envy 17t-cg000 WDC PC SN520 SDAPNUW-512G | Gigabyte Aero 17 HDR XB Samsung SSD PM981a MZVLB512HBJQ | Apple MacBook Pro 16 2019 i9 5500M Apple SSD AP1024 7171 | Asus ProArt StudioBook Pro 17 W700G3T Samsung SSD PM981 MZVLB1T0HALR | |
|---|---|---|---|---|---|---|
| AS SSD | 19% | 20% | 79% | 39% | 104% | |
| Seq Read (MB/s) | 1141 | 2019 77% | 1161 2% | 1762 54% | 2531 122% | 2958 159% |
| Seq Write (MB/s) | 994 | 1314 32% | 809 -19% | 2309 132% | 2289 130% | 2350 136% |
| 4K Read (MB/s) | 31.98 | 46.61 46% | 40.63 27% | 49.45 55% | 15.85 -50% | 56.6 77% |
| 4K Write (MB/s) | 61 | 90.2 48% | 138.6 127% | 117.1 92% | 39.88 -35% | 106.1 74% |
| 4K-64 Read (MB/s) | 790 | 665 -16% | 857 8% | 1237 57% | 1267 60% | 1836 132% |
| 4K-64 Write (MB/s) | 845 | 813 -4% | 1041 23% | 1986 135% | 1749 107% | 1789 112% |
| Access Time Read * (ms) | 0.063 | 0.058 8% | 0.067 -6% | 0.076 -21% | 0.122 -94% | 0.061 3% |
| Access Time Write * (ms) | 0.679 | 0.167 75% | 0.026 96% | 0.032 95% | 0.095 86% | 0.036 95% |
| Score Read (Points) | 966 | 913 -5% | 1013 5% | 1463 51% | 1536 59% | 2189 127% |
| Score Write (Points) | 1005 | 1034 3% | 1260 25% | 2334 132% | 2018 101% | 2130 112% |
| Score Total (Points) | 2448 | 2392 -2% | 2783 14% | 4581 87% | 4317 76% | 5411 121% |
| Copy ISO MB/s (MB/s) | 1732 | 1715 -1% | 1350 -22% | 1995 15% | ||
| Copy Program MB/s (MB/s) | 717 | 622 -13% | 766 7% | 584 -19% | ||
| Copy Game MB/s (MB/s) | 1343 | 1506 12% | 1190 -11% | 1135 -15% | ||
| CrystalDiskMark 5.2 / 6 | 48% | 11% | 53% | 22% | 53% | |
| Write 4K (MB/s) | 64.1 | 119 86% | 124.2 94% | 123.4 93% | 55.5 -13% | 147.6 130% |
| Read 4K (MB/s) | 39.93 | 51.9 30% | 46.11 15% | 45.59 14% | 16.21 -59% | 47.57 19% |
| Write Seq (MB/s) | 1191 | 2258 90% | 2320 95% | 1959 64% | 2222 87% | |
| Read Seq (MB/s) | 1418 | 2283 61% | 2013 42% | 1763 24% | 2543 79% | |
| Write 4K Q32T1 (MB/s) | 450.3 | 491 9% | 447 -1% | 489.3 9% | 398.5 -12% | 459.2 2% |
| Read 4K Q32T1 (MB/s) | 365 | 540 48% | 350.1 -4% | 559 53% | 648 78% | 515 41% |
| Write Seq Q32T1 (MB/s) | 1563 | 2253 44% | 1463 -6% | 2979 91% | 2727 74% | 2167 39% |
| Read Seq Q32T1 (MB/s) | 2683 | 3172 18% | 1751 -35% | 3432 28% | 3242 21% | 3430 28% |
| Write 4K Q8T8 (MB/s) | 445.5 | |||||
| Read 4K Q8T8 (MB/s) | 926 | |||||
| Total Average (Program / Settings) | 34% /
29% | 16% /
17% | 66% /
68% | 31% /
33% | 79% /
83% |
* ... smaller is better

Disk Throttling: DiskSpd Read Loop, Queue Depth 8
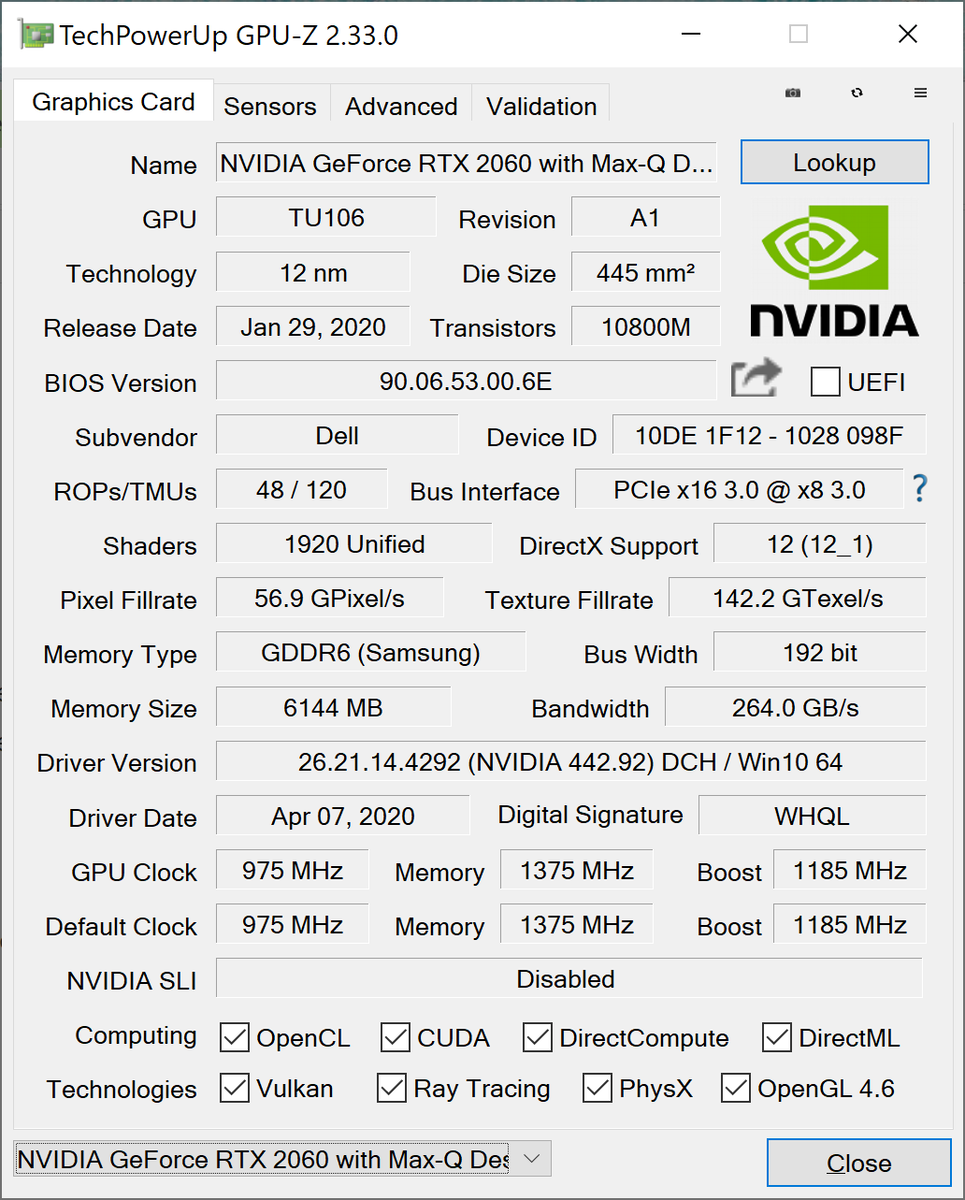
GPU Performance — Gaming Capable, But Not Gaming Optimal
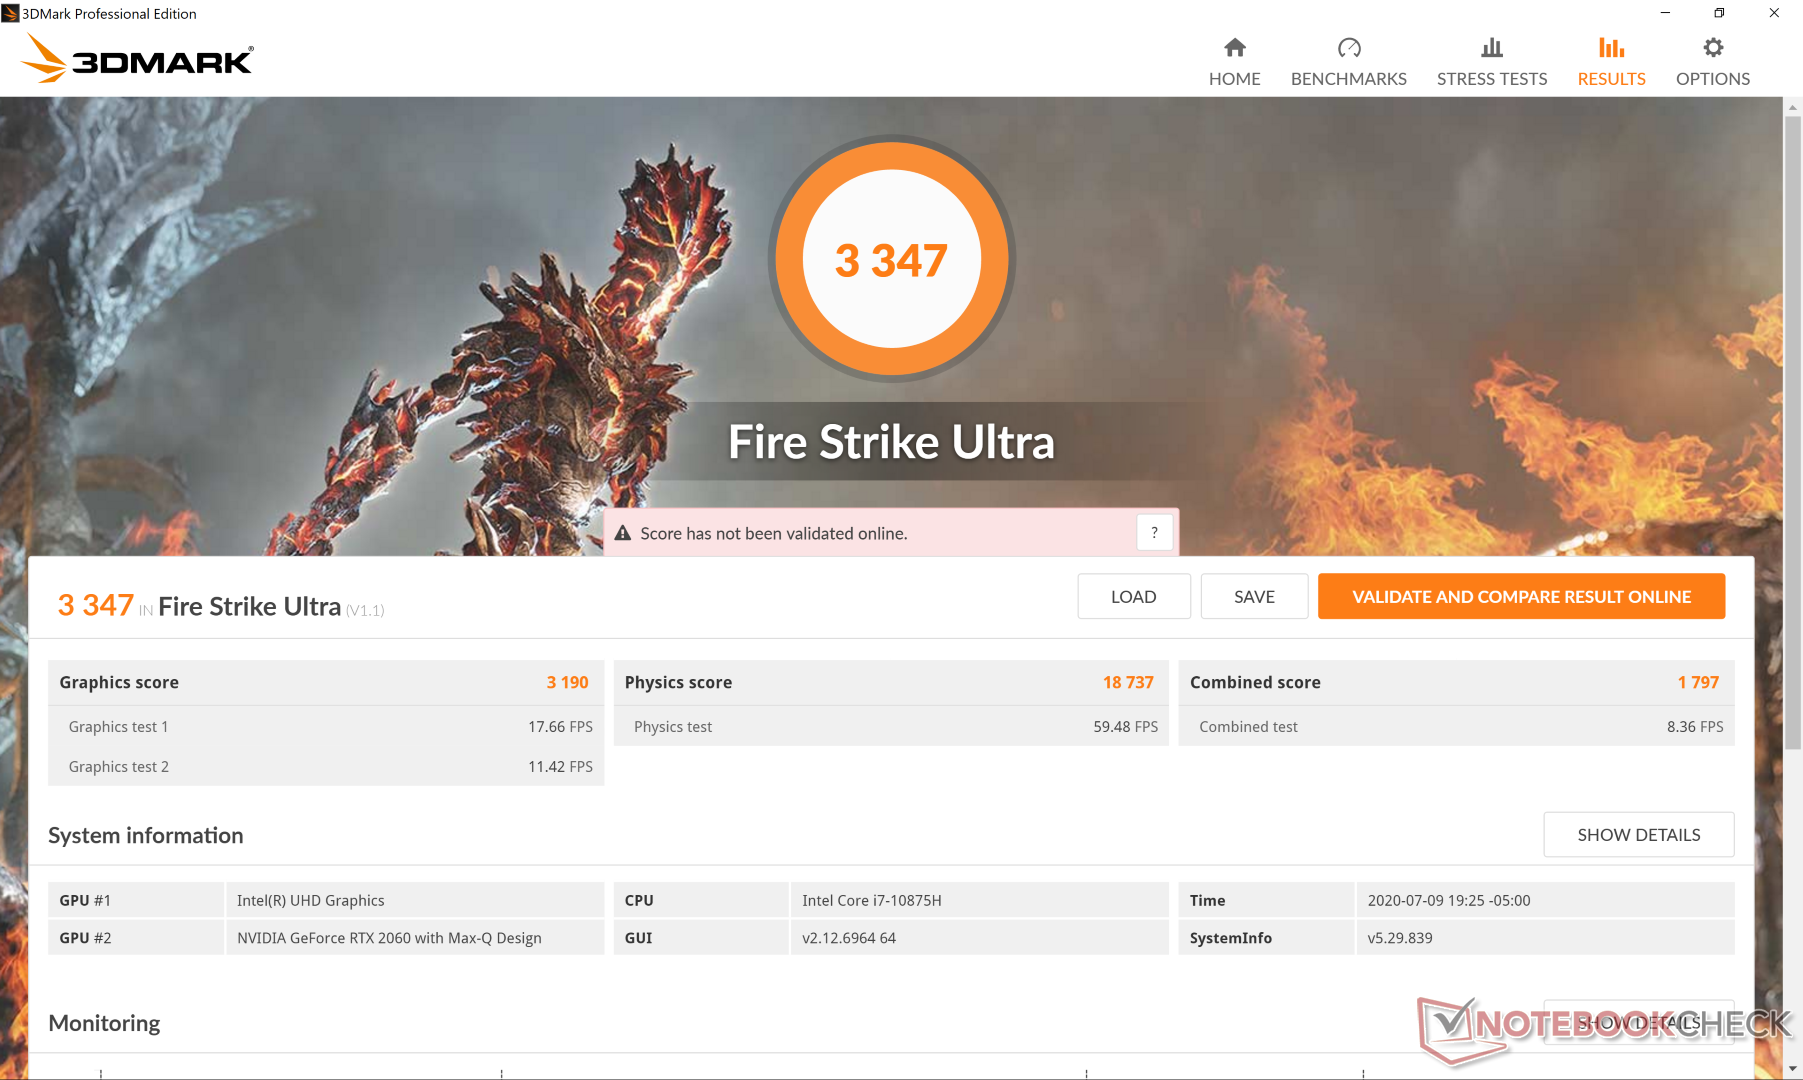
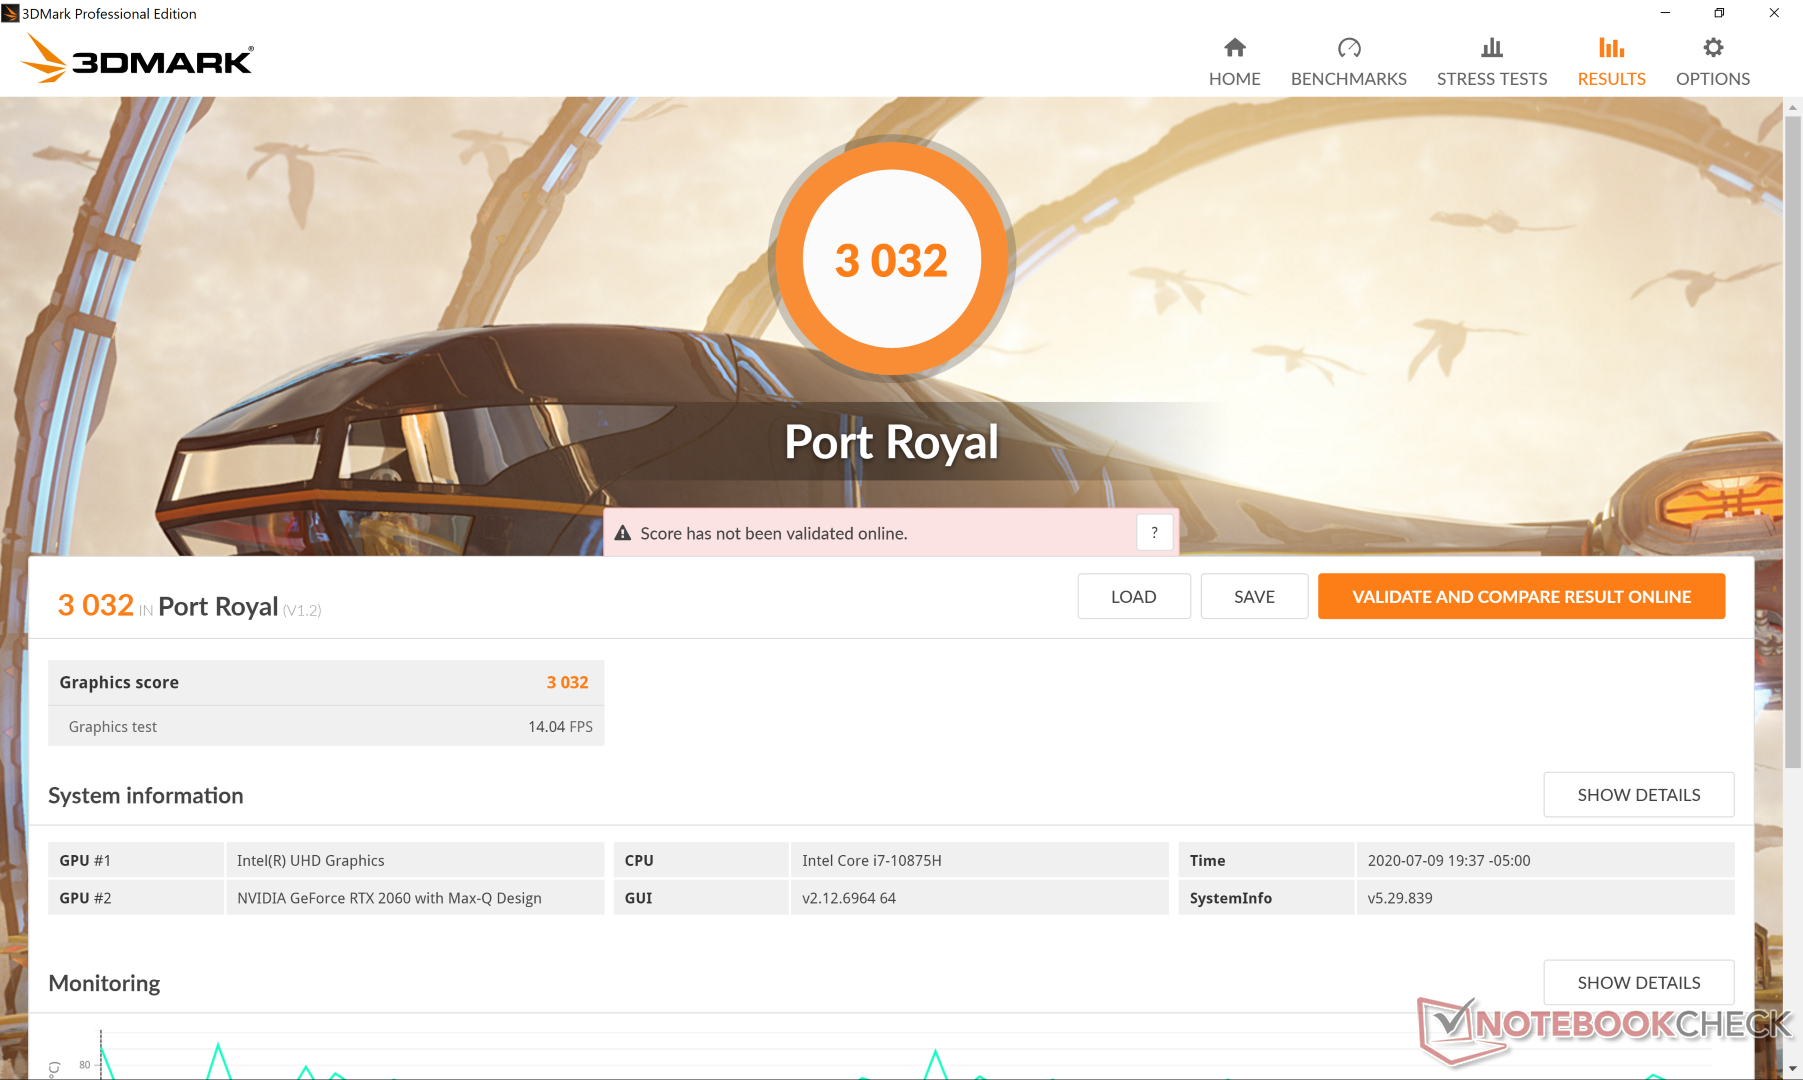
The XPS 17 is the second laptop ever to ship with the uncommon GeForce RTX 2060 Max-Q (the first being the Asus Zephyrus G14). Though it's about 10 to 15 percent slower here than the standard mobile RTX 2060, it's still significantly faster than the GTX 1650 options as found on the XPS 15 series or less expensive XPS 17 SKUs by about 50 percent each.
It's too bad that Dell isn't offering a GTX 1660 Ti option as raw gaming performance is nearly identical to the pricier RTX 2060 Max-Q sans ray-tracing acceleration.
See our dedicated page on the GeForce RTX 2060 Max-Q for more technical information and benchmark details.
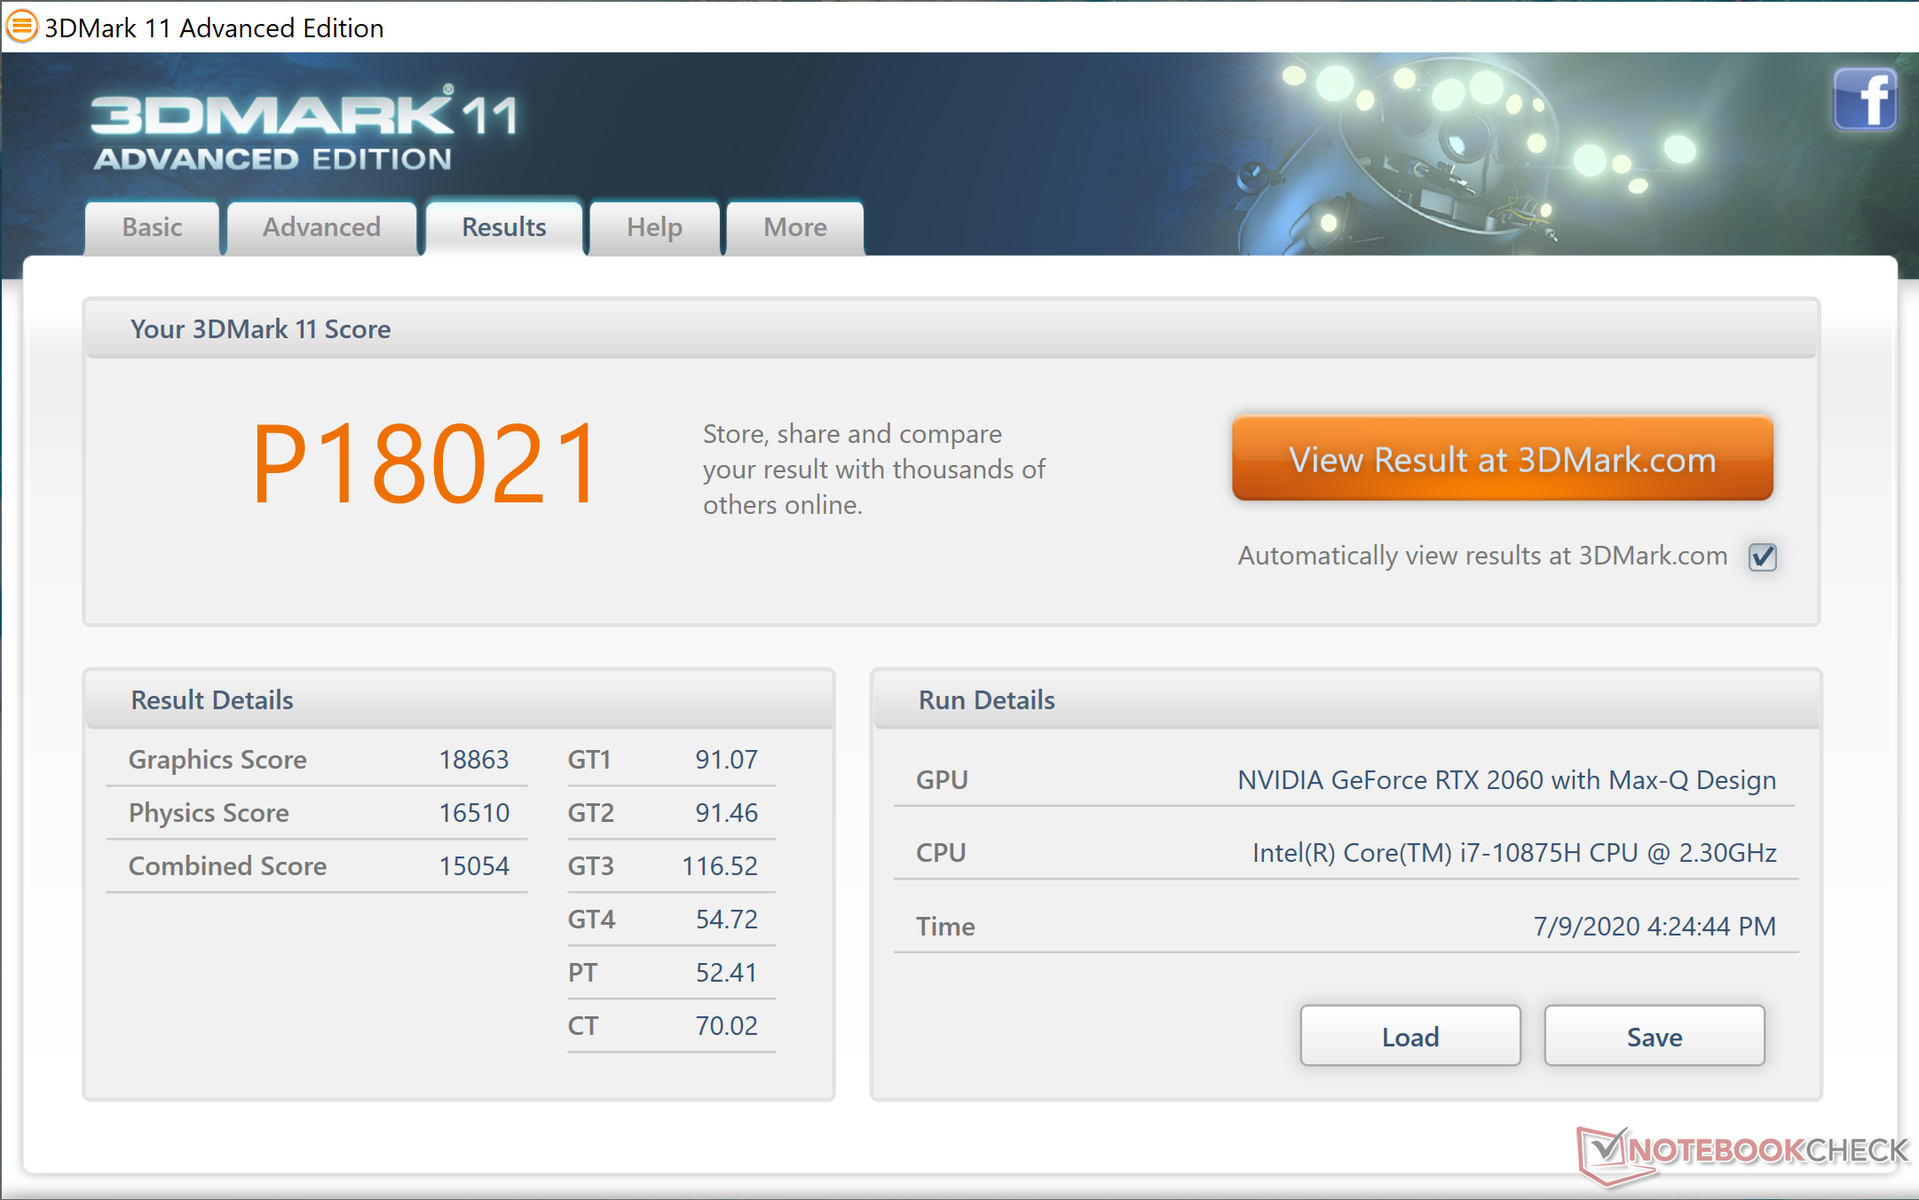

| 3DMark 11 Performance | 18021 points | |
| 3DMark Cloud Gate Standard Score | 31845 points | |
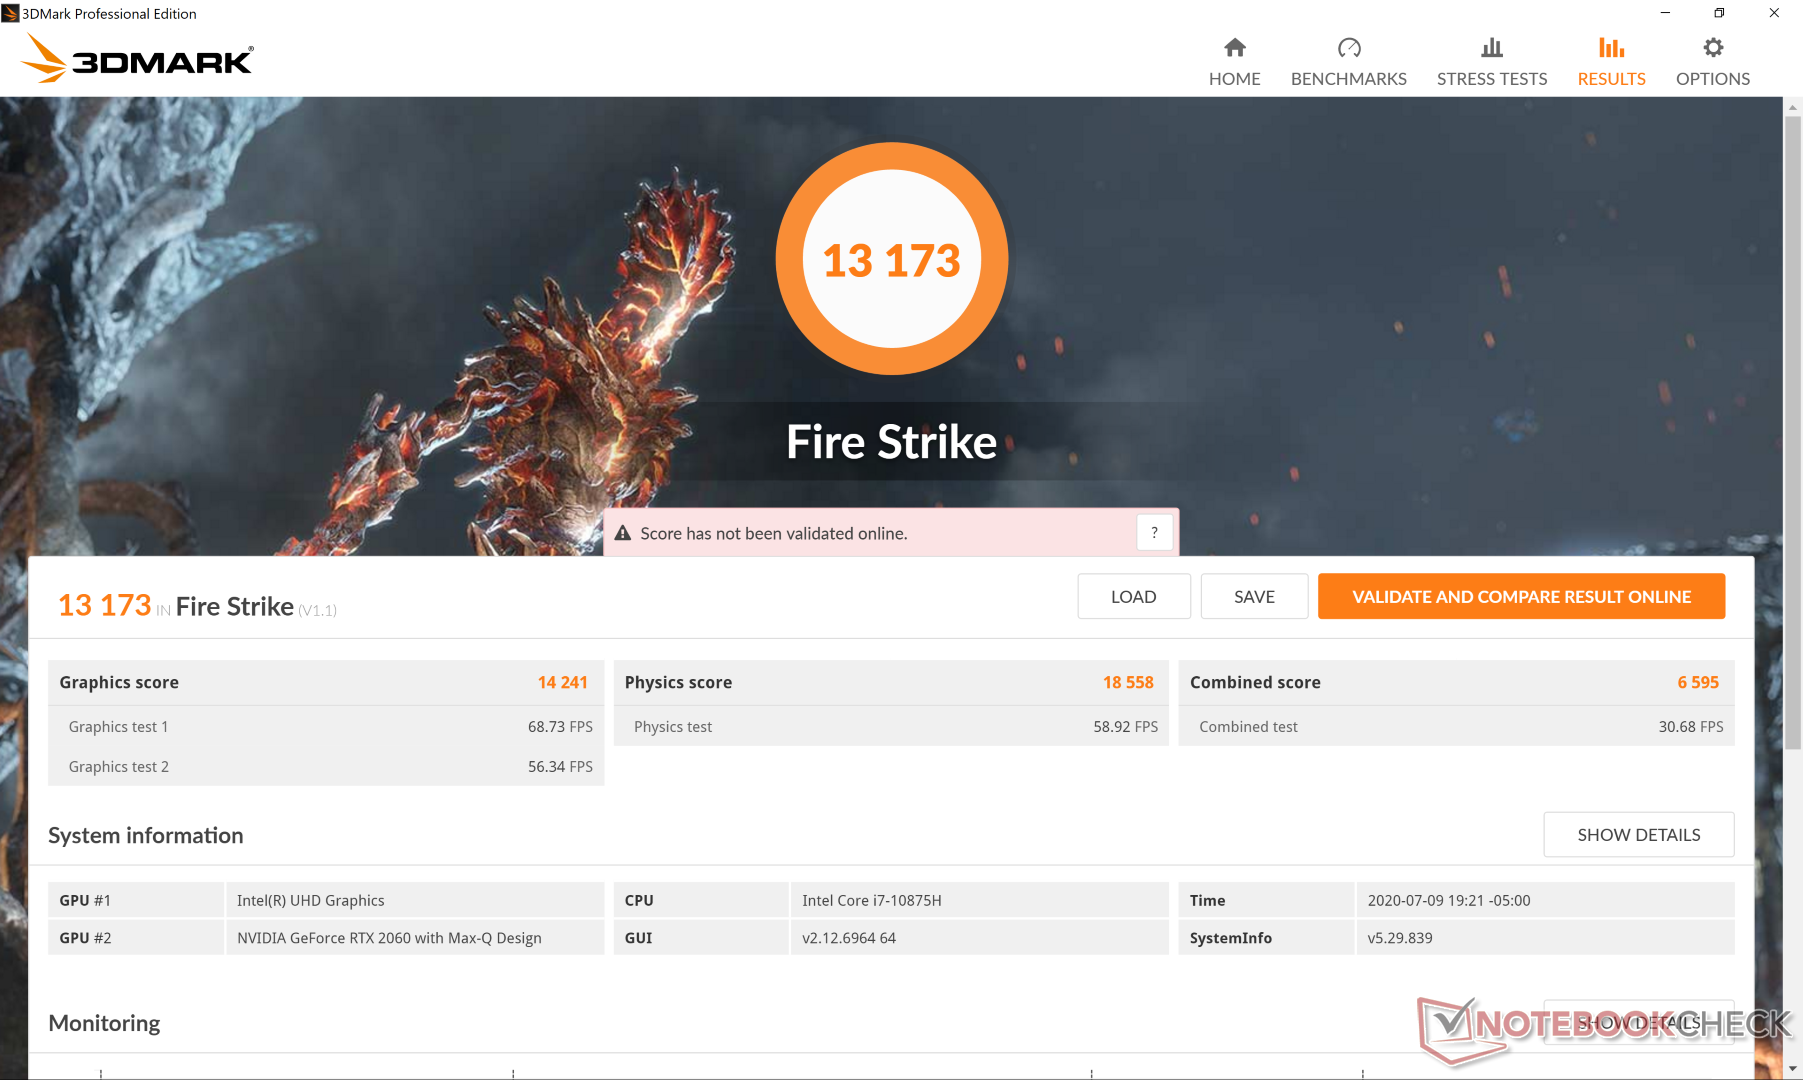
| 3DMark Fire Strike Score | 13173 points | |
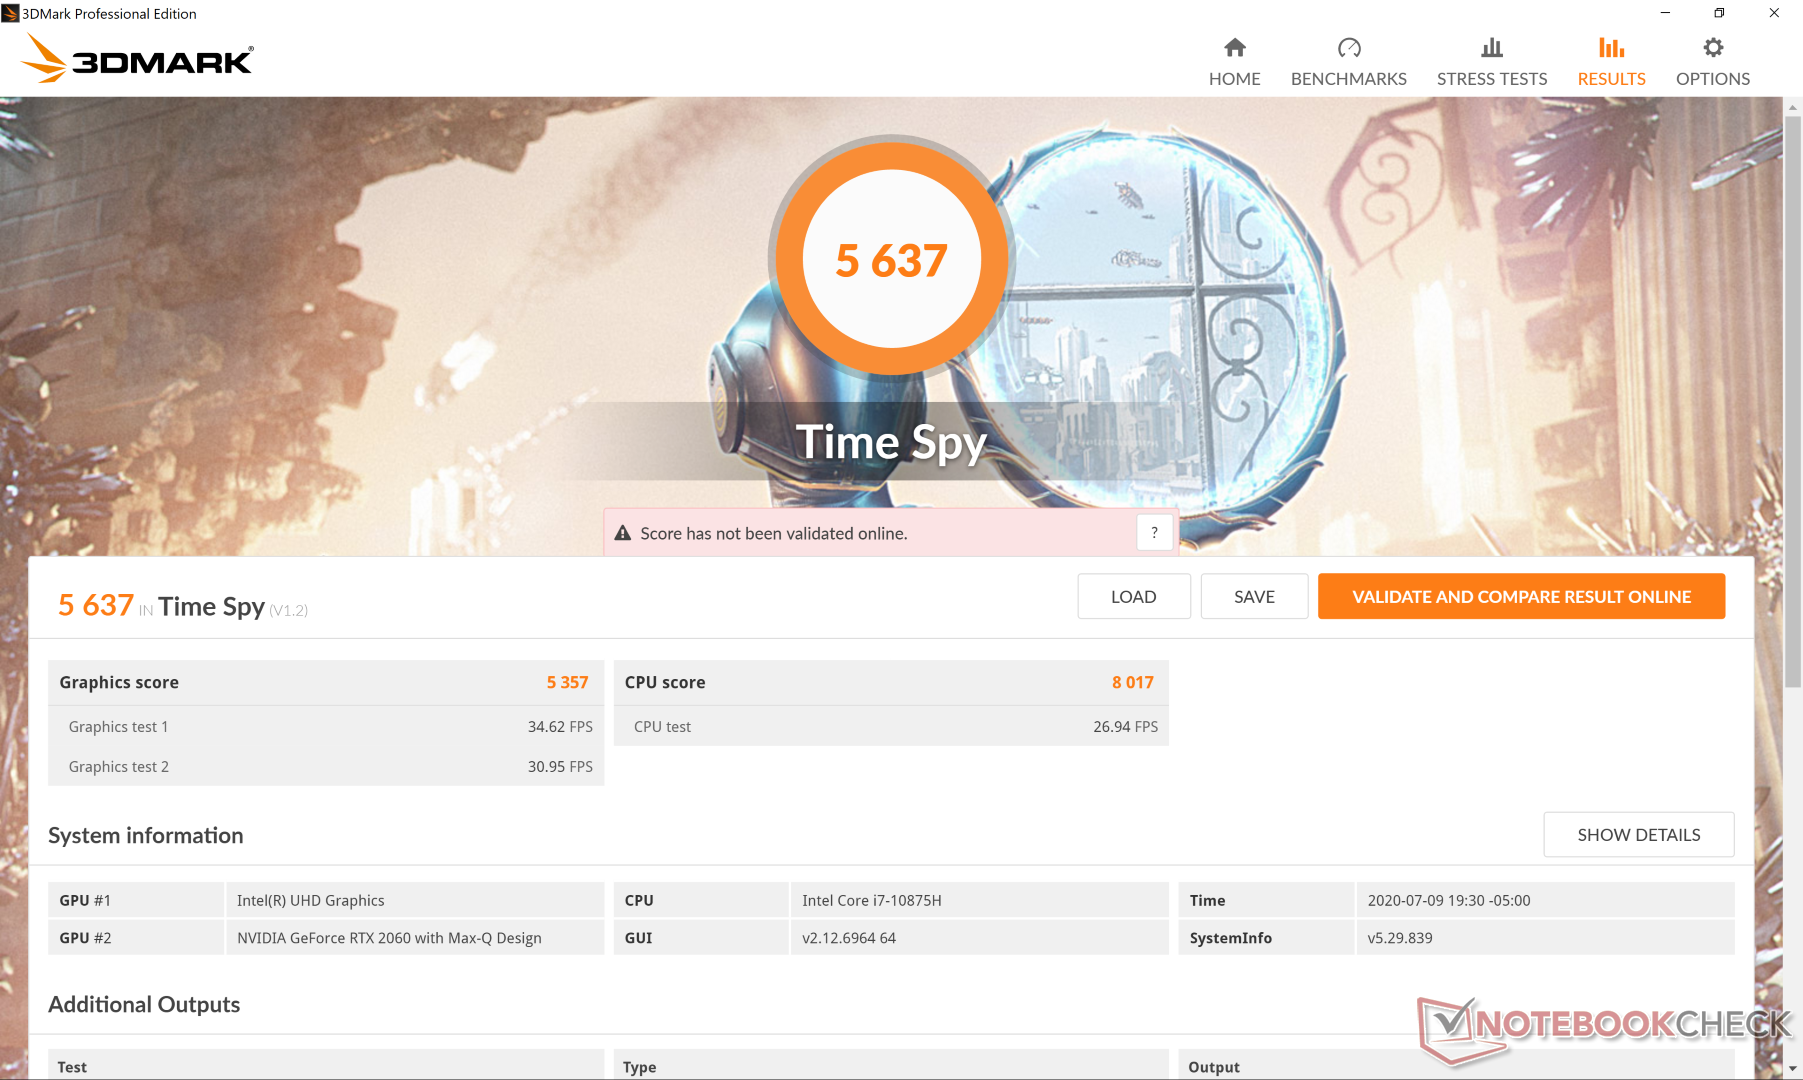
| 3DMark Time Spy Score | 5637 points | |
Help | ||
Gaming Performance
Dell doesn't market its XPS series to gamers, but the XPS 17 is wholly capable of playing the latest games nonetheless. However, a couple of roadblocks prevent it from being a "proper" gaming machine. Response times on the 4K panel are somewhat slow so gamers can expect a lot of ghosting when playing fast-paced games. There are certainly better alternatives out there if you're going to spend this much on a laptop for gaming.
| The Witcher 3 - 1920x1080 Ultra Graphics & Postprocessing (HBAO+) | |
| Gigabyte Aero 17 HDR XB | |
| MSI RTX 2060 Gaming Z 6G | |
| Dell G5 15 SE 5505 P89F | |
| Average NVIDIA GeForce RTX 2060 Max-Q (51.2 - 62.9, n=4) | |
| Dell XPS 17 9700 Core i7 RTX 2060 Max-Q | |
| Asus TUF A17 FA706IU-AS76 | |
| MSI Bravo 15 A4DCR | |
| MSI GF75 Thin 10SCXR | |
| Asus TUF FX705GM | |
| Shadow of the Tomb Raider - 1920x1080 Highest Preset AA:T | |
| Gigabyte Aero 17 HDR XB | |
| MSI RTX 2060 Gaming Z 6G | |
| Asus TUF A17 FA706IU-AS76 | |
| Average NVIDIA GeForce RTX 2060 Max-Q (65 - 74, n=2) | |
| Dell G5 15 SE 5505 P89F | |
| Dell XPS 17 9700 Core i7 RTX 2060 Max-Q | |
| Asus TUF FX705GM | |
| MSI GF75 Thin 10SCXR | |
| MSI Bravo 15 A4DCR | |
(September 9, 2020 update: We reran our Witcher 3 test on a newer second unit with better results. The dips recorded below did not appear during a re-test on the second unit.)
Idling on Witcher 3 should result in stable frame rates throughout, but that is not the case on the XPS 17 as frame rates would begin to periodically dip to to the 10 to 20 FPS range after the first 30 minutes into the stress test. We re-tested this twice on Dell's Ultra Performance profile and results would remain the same. We're not sure what is responsible as we can notice no dip in GPU clock rates while running the game, but this is extremely unusual and not something we've recorded before on any other laptop.
| low | med. | high | ultra | 4K | |
|---|---|---|---|---|---|
| The Witcher 3 (2015) | 284.8 | 182.1 | 109 | 56.1 | 24.9 |
| Dota 2 Reborn (2015) | 152 | 140 | 131 | 123 | 75.5 |
| X-Plane 11.11 (2018) | 111 | 97.8 | 79.8 | 63.7 | |
| Shadow of the Tomb Raider (2018) | 118 | 84 | 75 | 65 | 20 |
| Far Cry New Dawn (2019) | 105 | 75 | 70 | 63 | |
| Dirt Rally 2.0 (2019) | 276.7 | 125.3 | 105.3 | 60.5 | 24.4 |
| Control (2019) | 183.7 | 67.1 | 50.4 | ||
| GRID 2019 (2019) | 157.4 | 109.4 | 103.4 | 73.5 | 33.1 |
| Star Wars Jedi Fallen Order (2019) | 92.9 | 88 | 77.8 | ||
| Gears Tactics (2020) | 257.9 | 120.4 | 76.4 | 56.9 | 18.9 |
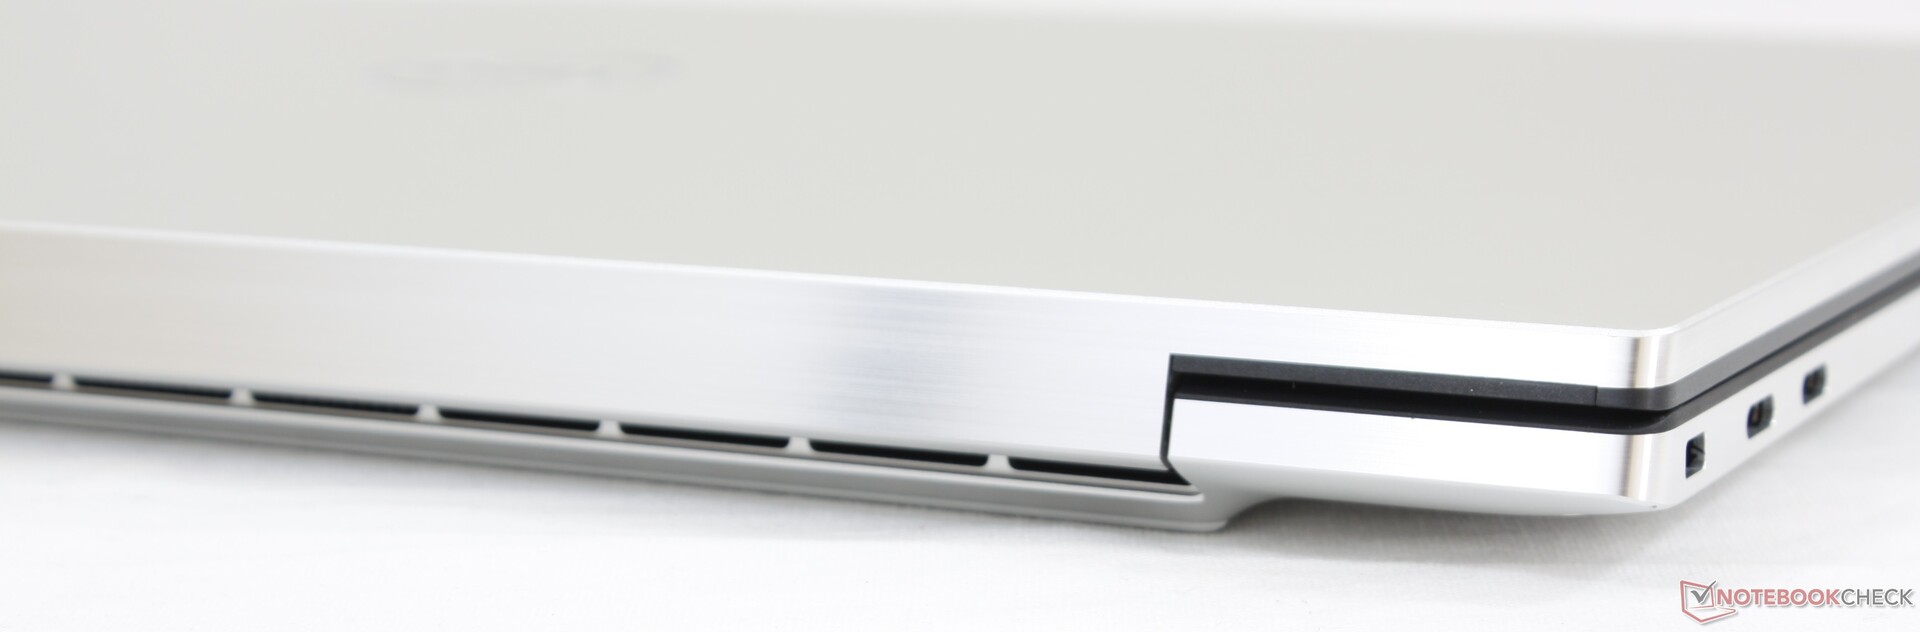
Emissions
System Noise — Very Quiet when Low, Very Loud when High
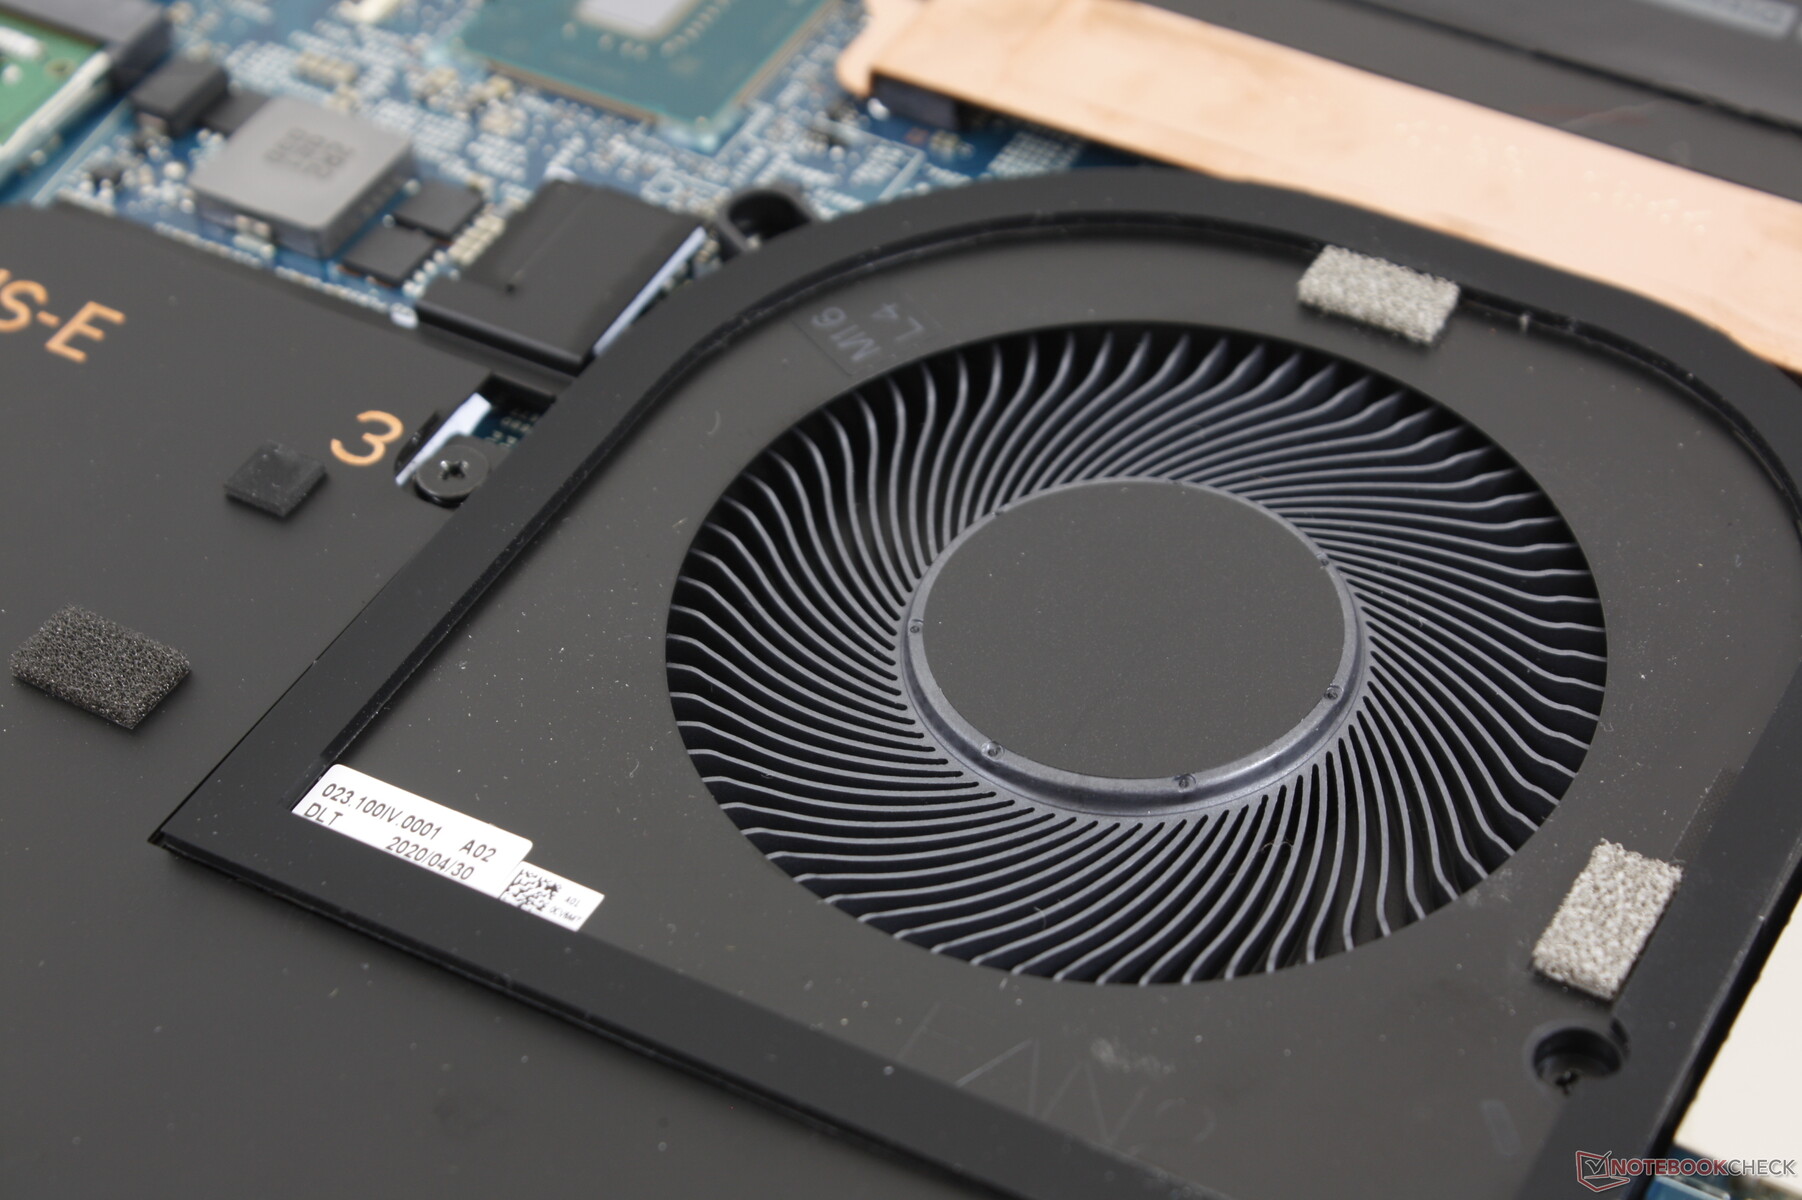
Dell has taken a page out of the Razer playbook by equipping its XPS 17 with a vapor chamber cooler in contrast to the traditional copper heat pipe solution as found on the XPS 15. The twin fans are also larger this time around at 65 to 70 mm in diameter compared to the 45 mm fans of its smaller sibling.
Even with these significant cooling changes, we can't say that fan noise isn't any quieter when under high loads. Running the first 90-second benchmark scene of 3DMark 06 results in a fan noise of 43 dB(A) while gaming on Ultra Performance mode will induce 49 dB(A). Such numbers are more comparable to ultra-thin gaming laptops rather than other multimedia laptops which is probably unsurprising given that the XPS 17 comes equipped with a GeForce RTX GPU.
However, the Dell system is able to remain silent for very long periods with little to no fan pulsing behavior when simply browsing the web or streaming video. At worst, we're able to record 30.5 dB(A) during these low loads against a silent background of 28 dB(A). We like that the fans are mostly idle during undemanding loads whereas the fans on many other high-performance laptops tend to kick into gear sooner and more abruptly.
| Dell XPS 17 9700 Core i7 RTX 2060 Max-Q GeForce RTX 2060 Max-Q, i7-10875H, Micron 2200S 1TB MTFDHBA1T0TCK | Razer Blade Pro 17 RTX 2070 Max-Q 300 Hz GeForce RTX 2070 Max-Q, i7-10875H, Lite-On CA5-8D512 | MSI Creator 17 A10SGS GeForce RTX 2080 Super Max-Q, i7-10875H, Samsung SSD PM981 MZVLB2T0HMLB | HP Envy 17t-cg000 GeForce MX330, i7-1065G7, WDC PC SN520 SDAPNUW-512G | Gigabyte Aero 17 HDR XB GeForce RTX 2070 Super Max-Q, i7-10875H, Samsung SSD PM981a MZVLB512HBJQ | Asus Zephyrus S17 GX701LXS GeForce RTX 2080 Super Max-Q, i7-10875H, Samsung PM981a MZVLB1T0HBLR | |
|---|---|---|---|---|---|---|
| Noise | -4% | -11% | 2% | -16% | -8% | |
| off / environment * (dB) | 28 | 28.2 -1% | 30 -7% | 28.2 -1% | 30 -7% | 25 11% |
| Idle Minimum * (dB) | 28 | 28.2 -1% | 32 -14% | 28.2 -1% | 35 -25% | 32 -14% |
| Idle Average * (dB) | 28 | 28.2 -1% | 33 -18% | 28.2 -1% | 36 -29% | 35 -25% |
| Idle Maximum * (dB) | 28 | 30.5 -9% | 40 -43% | 29.5 -5% | 38 -36% | 43 -54% |
| Load Average * (dB) | 43.2 | 42.2 2% | 47 -9% | 43.9 -2% | 47 -9% | 44 -2% |
| Witcher 3 ultra * (dB) | 49 | 53 -8% | 46 6% | 43.9 10% | 49 -0% | 41 16% |
| Load Maximum * (dB) | 50.5 | 55.5 -10% | 48 5% | 43.9 13% | 54 -7% | 45 11% |
* ... smaller is better
Noise level
| Idle |
| 28 / 28 / 28 dB(A) |
| Load |
| 43.2 / 50.5 dB(A) |
 | ||
30 dB silent 40 dB(A) audible 50 dB(A) loud |
||
min: | ||
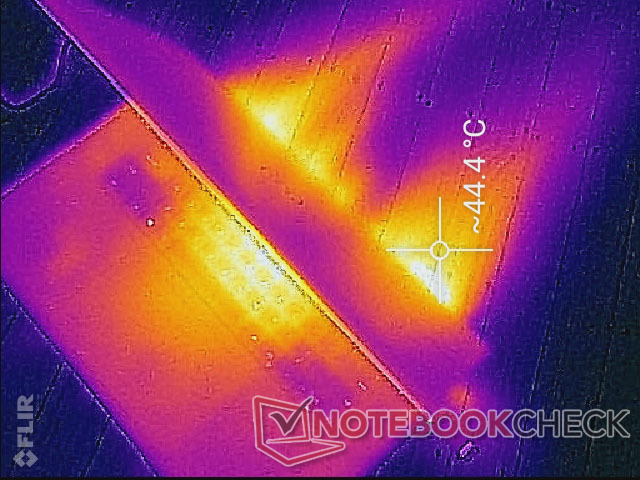
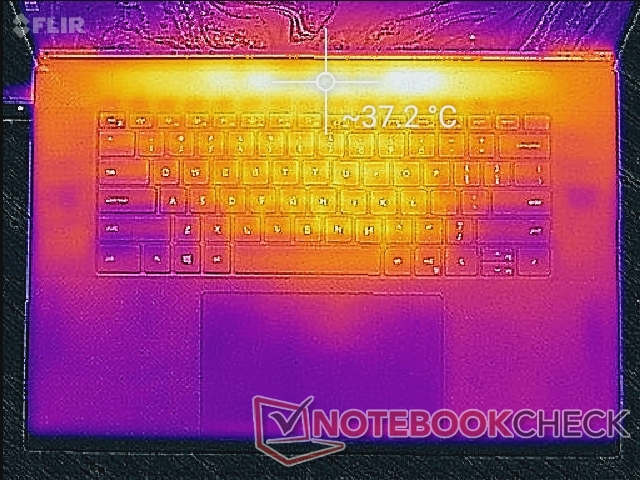
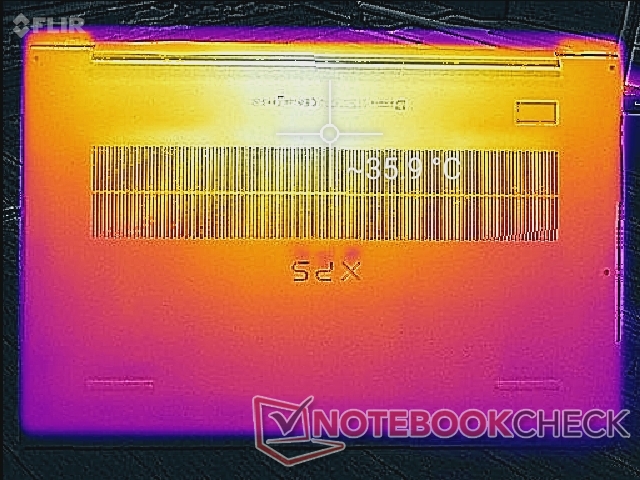
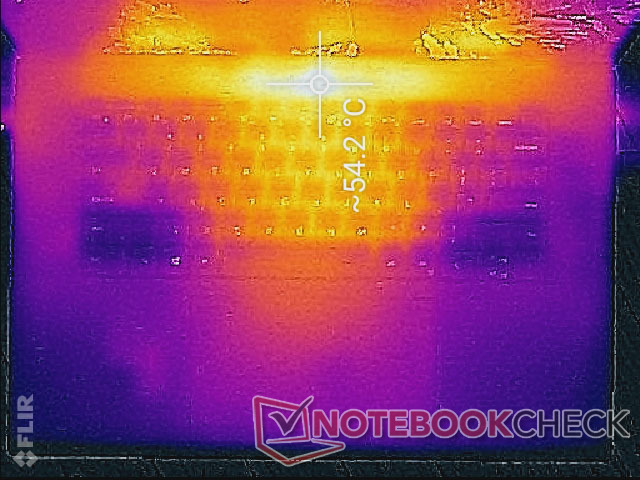
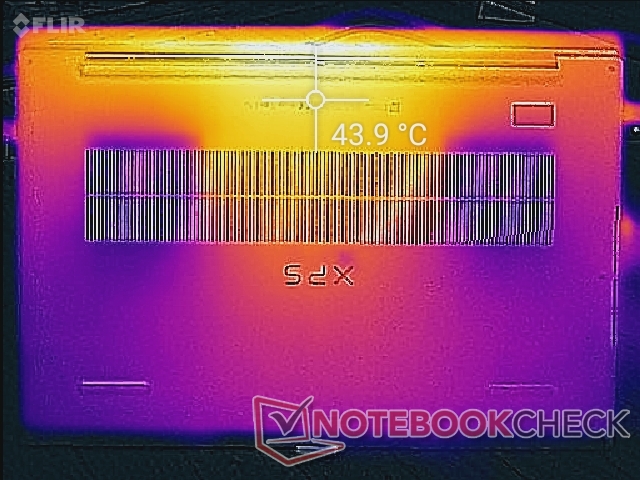
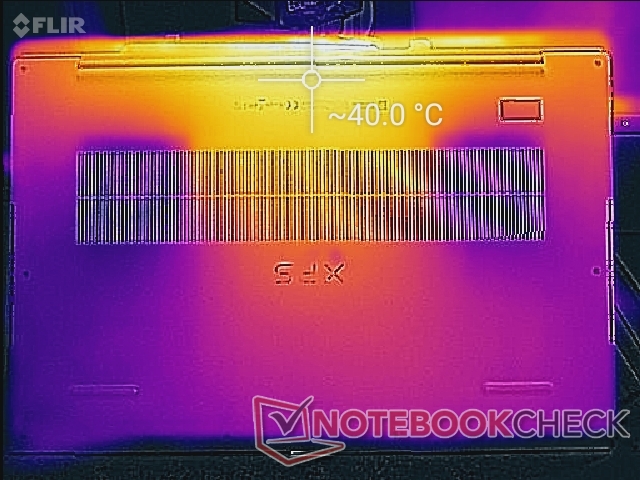
Temperature
Surface temperature gradient is largely symmetrical meaning that any hot spots are nearest the keyboard center. When gaming or running extreme loads, this area can be as warm as 54 C while the bottom can reach 44 C as shown by our temperature maps below. Results are about the same as on the XPS 15 if not slightly warmer despite the larger form factor and vapor chamber cooling.
It's worth noting that surface temperatures will be warmer than usual during low loads since the fans will likely be idling. It's a small trade off for having the fans be as quiet as possible when typing, browsing, or watching videos. Surface temperatures will also be quite warm when on Standby mode and plugged into an outlet.
(-) The maximum temperature on the upper side is 53 °C / 127 F, compared to the average of 36.8 °C / 98 F, ranging from 21 to 71 °C for the class Multimedia.
(+) The bottom heats up to a maximum of 39.2 °C / 103 F, compared to the average of 39.1 °C / 102 F
(+) In idle usage, the average temperature for the upper side is 31.4 °C / 89 F, compared to the device average of 31.3 °C / 88 F.
(±) Playing The Witcher 3, the average temperature for the upper side is 37.3 °C / 99 F, compared to the device average of 31.3 °C / 88 F.
(+) The palmrests and touchpad are reaching skin temperature as a maximum (34.2 °C / 93.6 F) and are therefore not hot.
(-) The average temperature of the palmrest area of similar devices was 28.7 °C / 83.7 F (-5.5 °C / -9.9 F).

Stress Test — High Core Temperatures Under Full Load
For better or worse, Dell likes to run its processors at extremely warm temperatures as exemplified by the Alienware series, the XPS 13/15, and the recent G5 15 SE. This is good in that users are getting as much CPU performance as the cooling solution can allow, but also unfavorable in terms of processor lifespan. Running Prime95 results in stable CPU clock rates and temperature of 2.9 to 3.1 GHz and 99 C, respectively, compared to 3.2 to 3.3 GHz and just 66 C on the larger Razer Blade Pro 17 equipped with the same processor.
Running Witcher 3 is more representative of real-world loads. The CPU and GPU would stabilize at much cooler and respectable temperatures of 73 C and 62 C, respectively.
Running on battery power will limit performance. A Fire Strike run on batteries would returns Physics and Graphics scores of 15946 and 4425 points, respectively, compared to 18558 and 14241 points when on mains.
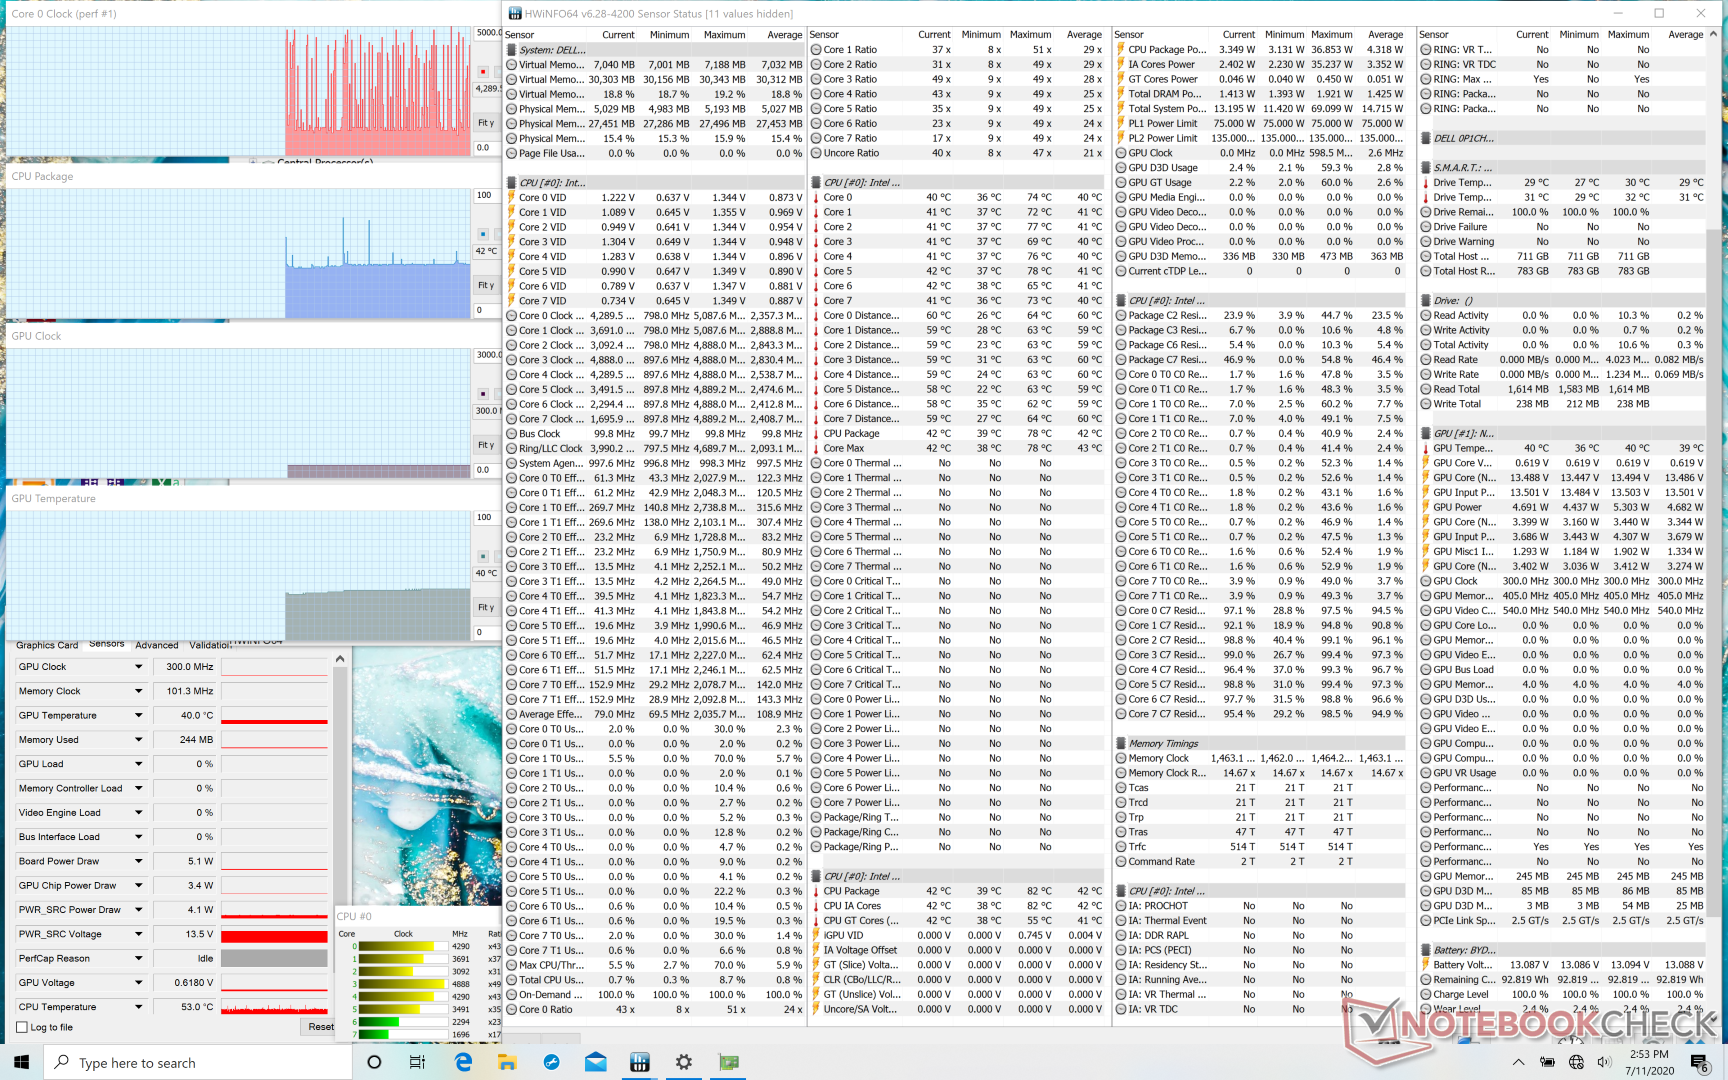
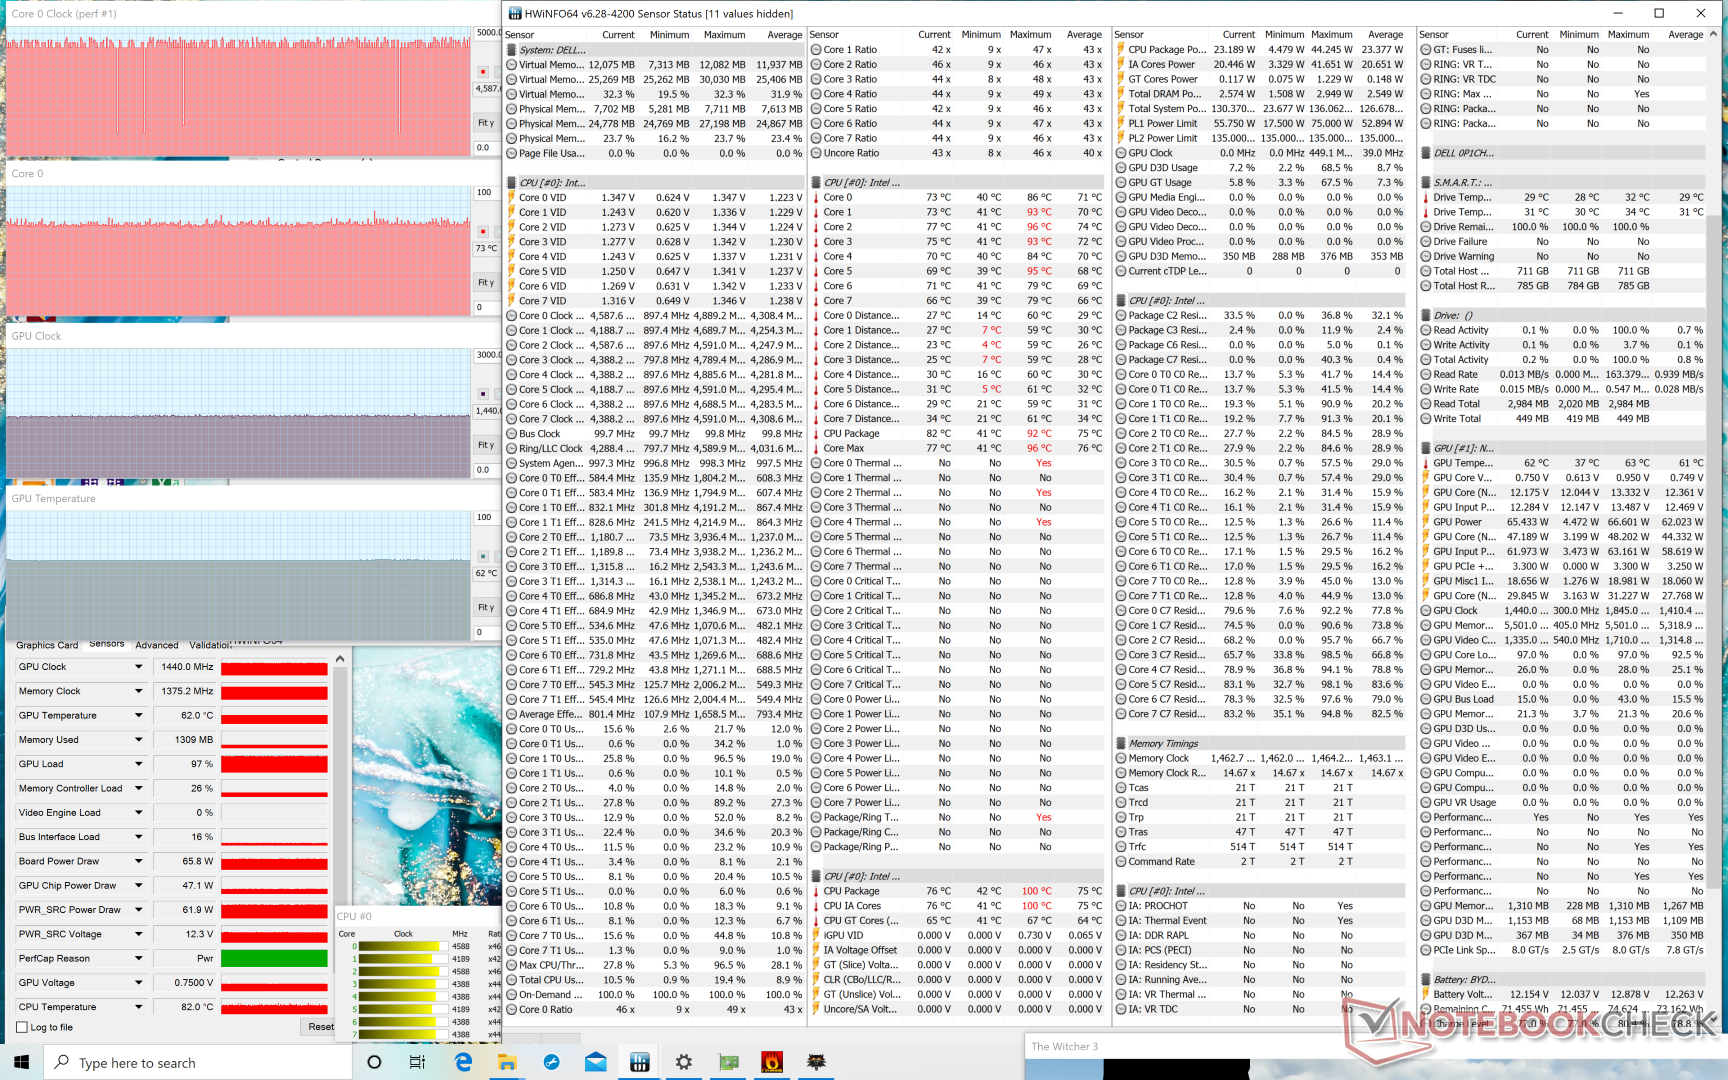
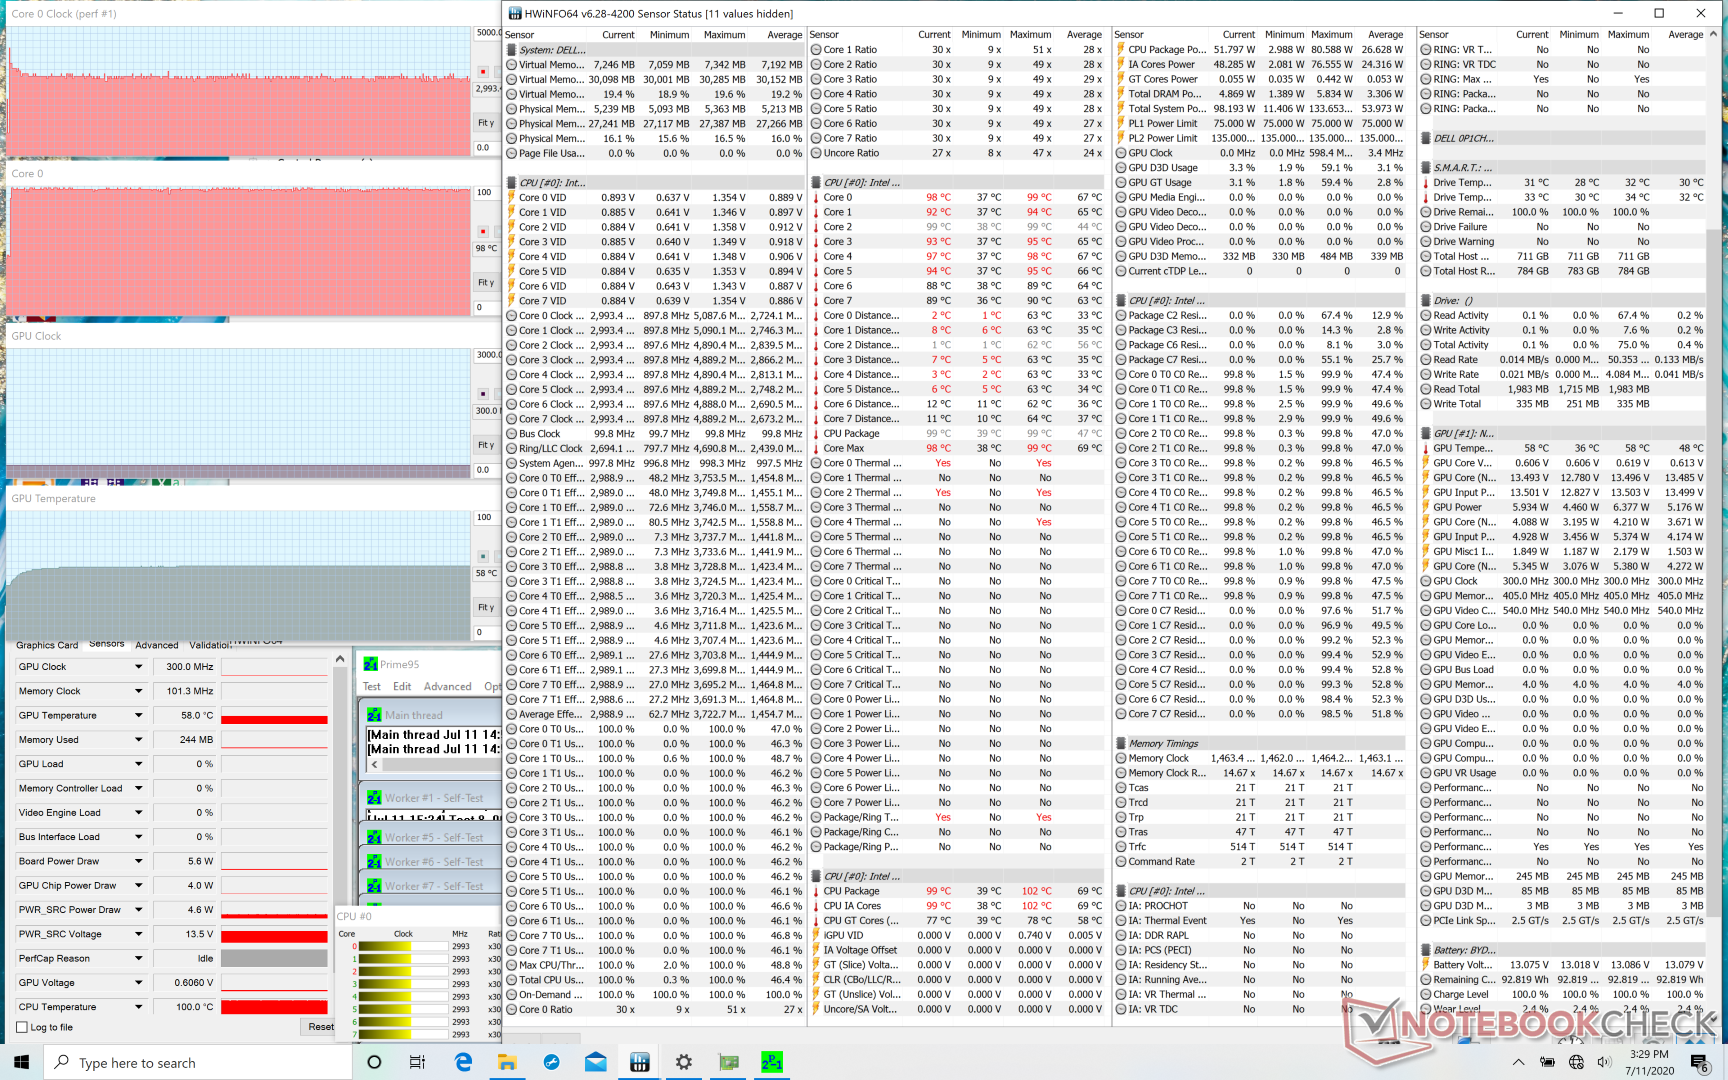
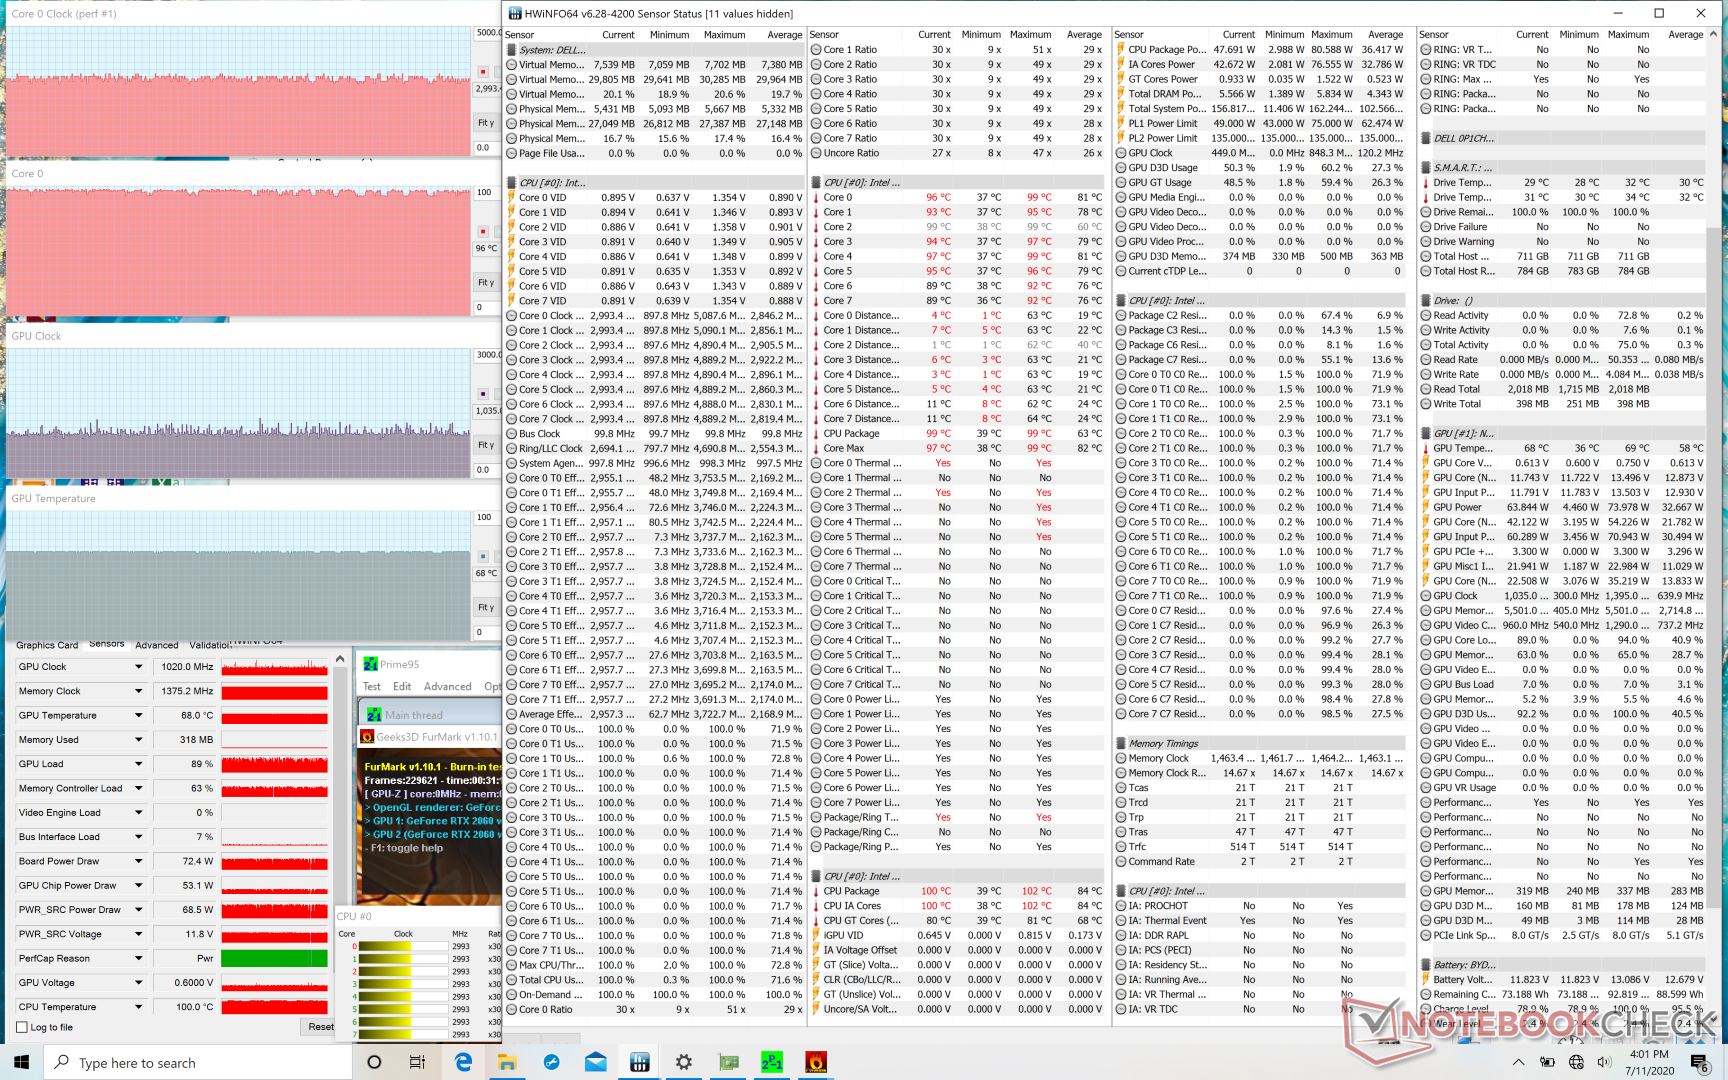
| CPU Clock (GHz) | GPU Clock (MHz) | Average CPU Temperature (°C) | Average GPU Temperature (°C) | |
| System Idle | -- | -- | 42 | 40 |
| Prime95 Stress | 2.9 - 3.1 | -- | 99 | 58 |
| Prime95 + FurMark Stress | 2.0 - 3.1 | ~1020 | 99 | 68 |
| Witcher 3 Stress | ~4.6 | 1440 | 73 | 62 |
Speakers
Even though the XPS 17 is larger than the XPS 15 and has larger speaker grilles along the sides of its keyboard, audio quality remains the same. The system still comes with two 2.5 W speakers and two 1.5 W tweeters for the same 8 W audio output. Bass reproduction is excellent for an ultra-thin laptop and comparable to the HP Spectre x360 15. The palm rests will vibrate to the touch when audio is set to 50 percent or higher.


Dell XPS 17 9700 Core i7 RTX 2060 Max-Q audio analysis
(±) | speaker loudness is average but good (75.8 dB)
Bass 100 - 315 Hz
(±) | reduced bass - on average 8.3% lower than median
(±) | linearity of bass is average (8.6% delta to prev. frequency)
Mids 400 - 2000 Hz
(+) | balanced mids - only 2.2% away from median
(+) | mids are linear (3.8% delta to prev. frequency)
Highs 2 - 16 kHz
(+) | balanced highs - only 2.1% away from median
(+) | highs are linear (5.3% delta to prev. frequency)
Overall 100 - 16.000 Hz
(+) | overall sound is linear (10.9% difference to median)
Compared to same class
» 16% of all tested devices in this class were better, 3% similar, 81% worse
» The best had a delta of 5%, average was 17%, worst was 45%
Compared to all devices tested
» 6% of all tested devices were better, 2% similar, 92% worse
» The best had a delta of 4%, average was 23%, worst was 134%
Apple MacBook 12 (Early 2016) 1.1 GHz audio analysis
(+) | speakers can play relatively loud (83.6 dB)
Bass 100 - 315 Hz
(±) | reduced bass - on average 11.3% lower than median
(±) | linearity of bass is average (14.2% delta to prev. frequency)
Mids 400 - 2000 Hz
(+) | balanced mids - only 2.4% away from median
(+) | mids are linear (5.5% delta to prev. frequency)
Highs 2 - 16 kHz
(+) | balanced highs - only 2% away from median
(+) | highs are linear (4.5% delta to prev. frequency)
Overall 100 - 16.000 Hz
(+) | overall sound is linear (10.2% difference to median)
Compared to same class
» 7% of all tested devices in this class were better, 2% similar, 90% worse
» The best had a delta of 5%, average was 18%, worst was 53%
Compared to all devices tested
» 5% of all tested devices were better, 1% similar, 94% worse
» The best had a delta of 4%, average was 23%, worst was 134%
Energy Management
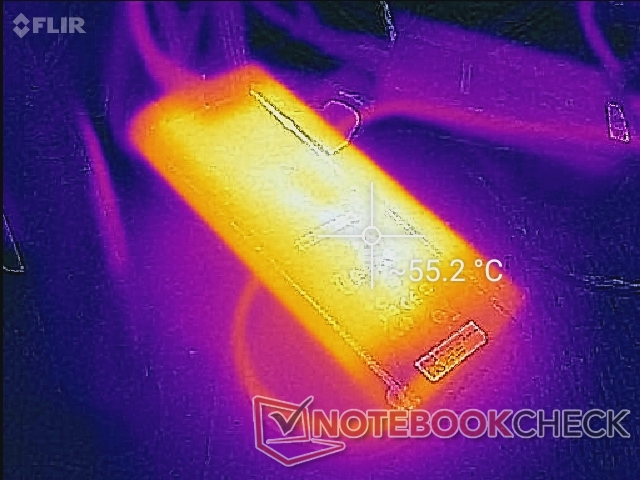
Power Consumption — Can USB-C Really Power a 17-inch GeForce RTX 2060 Max-Q Laptop?
(September 9, 2020 update: We've re-tested power consumption on a second unit. Details can be found here.)
Idling on desktop consumes just 5 W to 6 W when on the lowest brightness setting and power profile which likely explains the long battery life we recorded in the next section below. Simply switching to High Performance mode with the discrete GPU enabled and at maximum screen brightness would consume 21 W meaning it's well worth setting the system to Power Saver mode if battery life is of importance. Even so, the system is very power efficient when compared to other performance 17-inch laptops with the same CPU and GPU class.
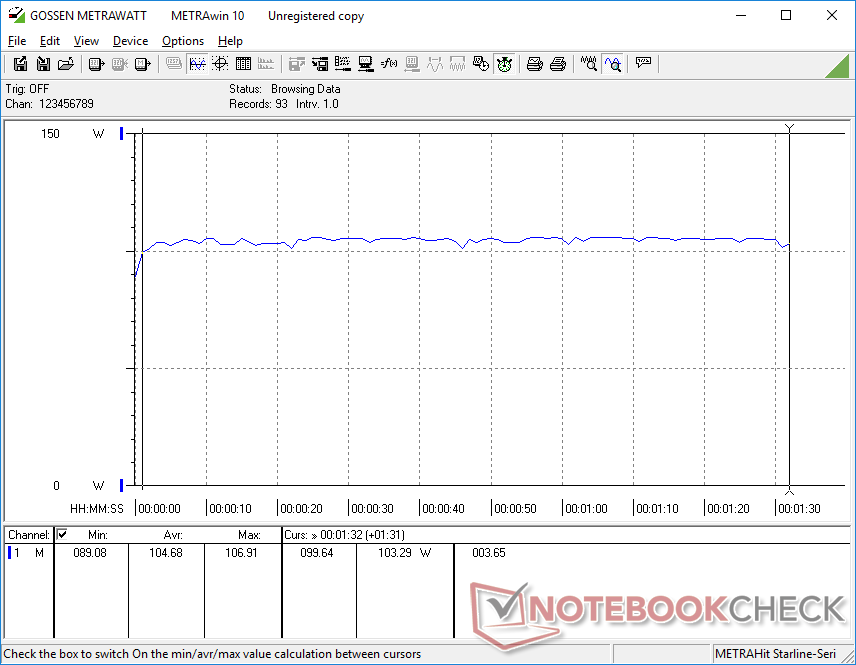
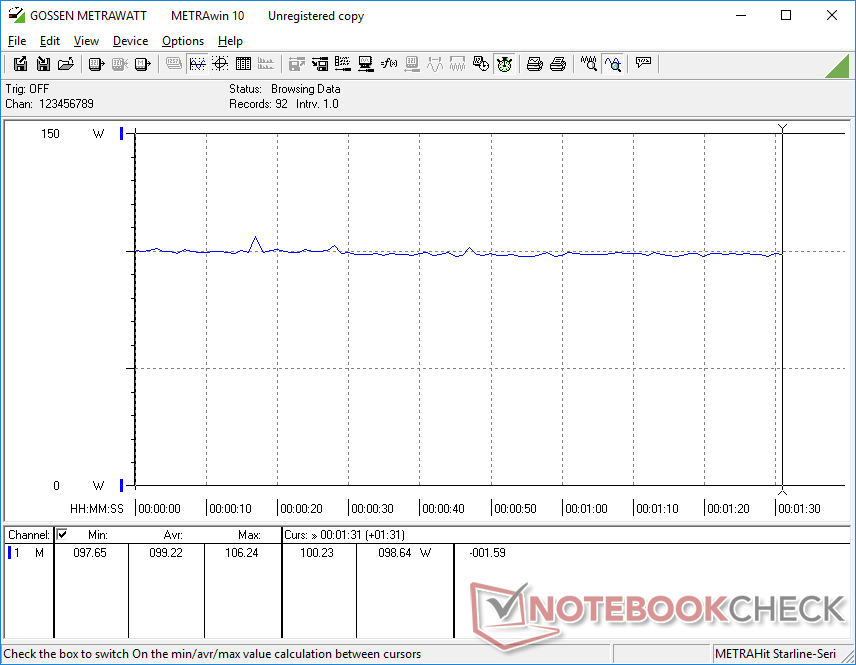
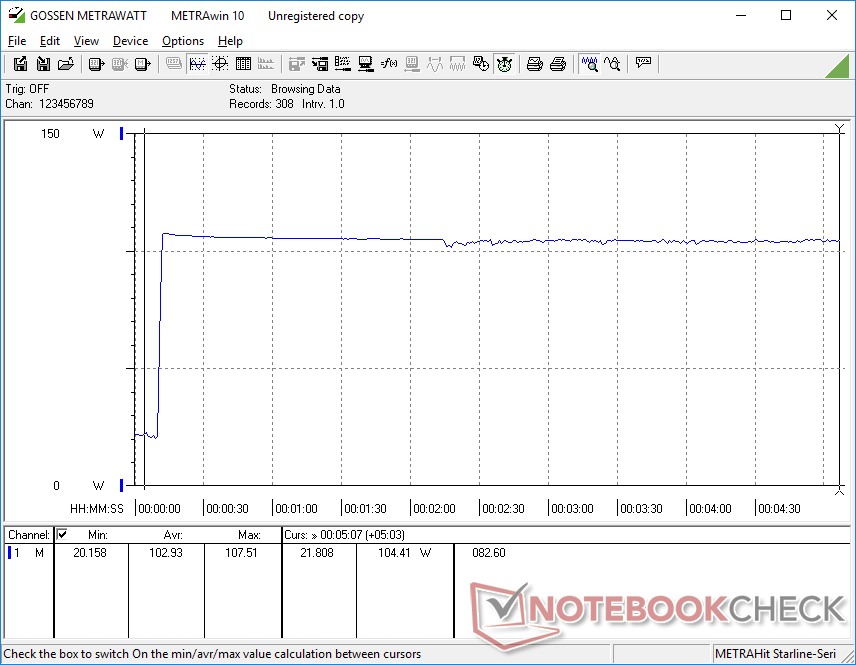
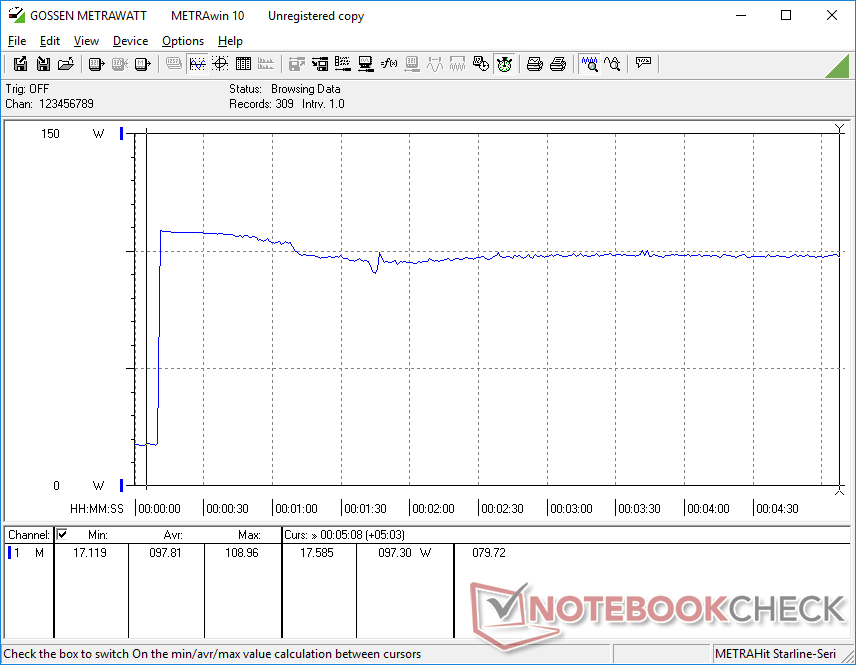
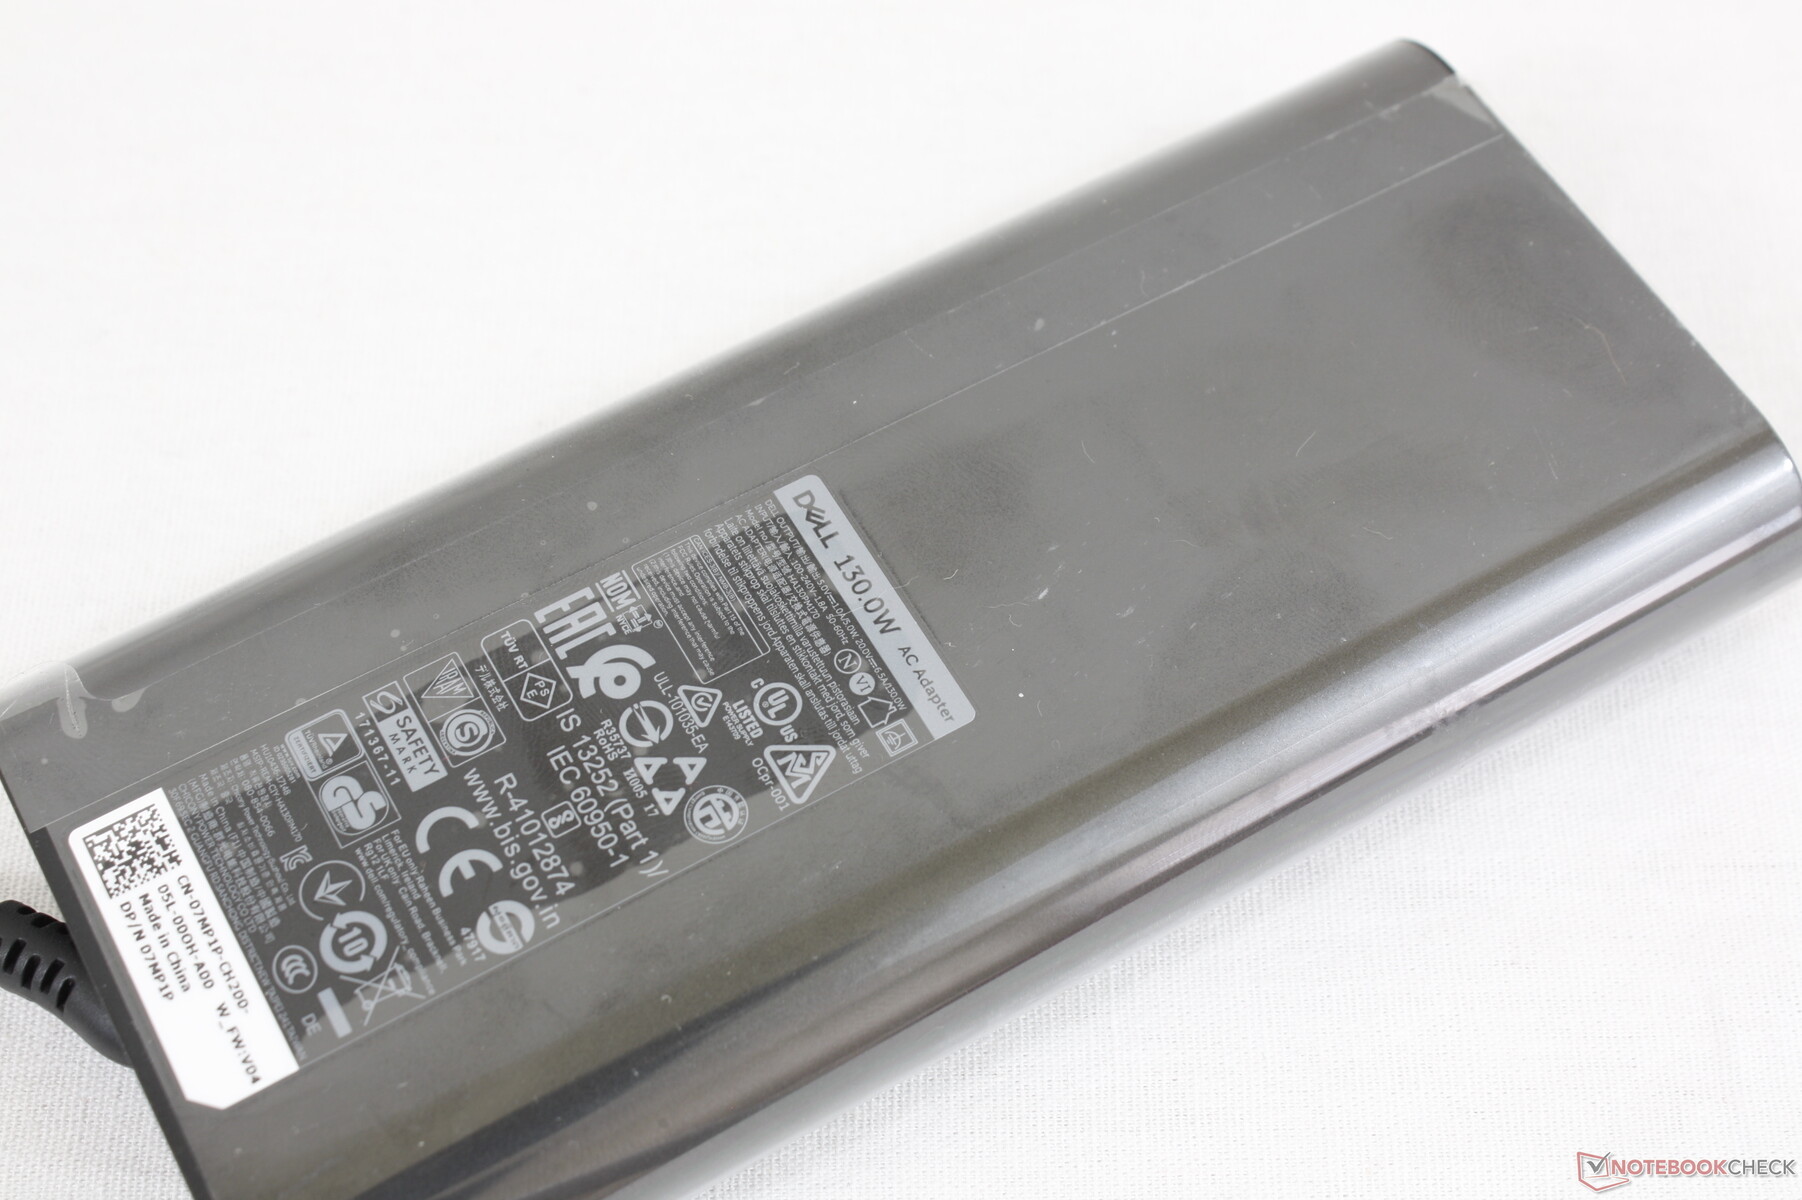
Power consumption becomes strange when running higher loads like gaming. Although the XPS 17 uses the same 130 W AC adapter as the XPS 15, it is unable to pull more than ~100 W no matter the onscreen load. The system must then pull power from the battery to make up for this difference which results in faster-than-expected battery drain over time even when connected to an outlet. When running Witcher 3, for example, battery percentage would drop by about 13 percent per hour.
Dell says it's currently investigating this issue with our full details here. Should anything change, we'll update this section as well. But for now, the system appears "capped" at ~100 W despite shipping with a 130 W AC adapter.
Also of note is that the system will pull 6.8 W from the outlet when in Sleep mode whereas most other laptops typically pull just 1 W to 2 W when under similar conditions.
| Off / Standby | |
| Idle | |
| Load |
|
Key:
min: | |
| Dell XPS 17 9700 Core i7 RTX 2060 Max-Q i7-10875H, GeForce RTX 2060 Max-Q, Micron 2200S 1TB MTFDHBA1T0TCK, IPS, 3840x2400, 17" | Acer Aspire Nitro 5 AN517-51-7887 i7-9750H, GeForce GTX 1660 Ti Mobile, WDC PC SN520 SDAPNUW-512G, IPS, 1920x1080, 17.3" | MSI Creator 17 A10SGS i7-10875H, GeForce RTX 2080 Super Max-Q, Samsung SSD PM981 MZVLB2T0HMLB, Mini-LED IPS-Level, 3840x2160, 17.3" | HP Envy 17t-cg000 i7-1065G7, GeForce MX330, WDC PC SN520 SDAPNUW-512G, IPS, 3840x2160, 17.3" | Gigabyte Aero 17 HDR XB i7-10875H, GeForce RTX 2070 Super Max-Q, Samsung SSD PM981a MZVLB512HBJQ, IPS, 3840x2160, 17.3" | Apple MacBook Pro 16 2019 i9 5500M i9-9880H, Radeon Pro 5500M, Apple SSD AP1024 7171, IPS, 3072x1920, 16" | |
|---|---|---|---|---|---|---|
| Power Consumption | 11% | -78% | 24% | -69% | 18% | |
| Idle Minimum * (Watt) | 5.8 | 3.9 33% | 15 -159% | 6.1 -5% | 16 -176% | 3.7 36% |
| Idle Average * (Watt) | 20.6 | 8.9 57% | 20 3% | 13 37% | 19 8% | 12.1 41% |
| Idle Maximum * (Watt) | 21 | 12.2 42% | 42 -100% | 13.5 36% | 30 -43% | 17 19% |
| Load Average * (Watt) | 104.7 | 83 21% | 150 -43% | 72.7 31% | 109 -4% | 91.5 13% |
| Witcher 3 ultra * (Watt) | 99.2 | 130 -31% | 170 -71% | 62.2 37% | 167 -68% | 103 -4% |
| Load Maximum * (Watt) | 107.6 | 168 -56% | 210 -95% | 97.1 10% | 246 -129% | 102.3 5% |
* ... smaller is better
Battery Life — 97 Wh For Travelers
Runtimes are almost identical to what we recorded on the XPS 15 despite the larger form factor and faster GPU. We got around 9.5 hours of real-world WLAN use which is very long for a 17-inch laptop with a Core H series processor and GeForce RTX GPU. Our WLAN test involves looping web pages every 40 seconds on the Balanced power profile with the integrated GPU enabled and at a display brightness of 150 nits.
Charging from empty to full capacity takes about 2 hours. Remember that charging will slow to a halt or even discharge when running very high processing loads for long periods.
| Dell XPS 17 9700 Core i7 RTX 2060 Max-Q i7-10875H, GeForce RTX 2060 Max-Q, 97 Wh | Razer Blade Pro 17 RTX 2070 Max-Q 300 Hz i7-10875H, GeForce RTX 2070 Max-Q, 70 Wh | MSI Creator 17 A10SGS i7-10875H, GeForce RTX 2080 Super Max-Q, 82 Wh | HP Envy 17t-cg000 i7-1065G7, GeForce MX330, 55 Wh | Gigabyte Aero 17 HDR XB i7-10875H, GeForce RTX 2070 Super Max-Q, 94 Wh | Apple MacBook Pro 16 2019 i9 5500M i9-9880H, Radeon Pro 5500M, 99.8 Wh | |
|---|---|---|---|---|---|---|
| Battery runtime | -49% | -57% | -39% | -26% | -13% | |
| Reader / Idle (h) | 23.8 | 7.2 -70% | 15.4 -35% | 9.9 -58% | ||
| WiFi v1.3 (h) | 9.7 | 4.9 -49% | 4.4 -55% | 4.6 -53% | 6.2 -36% | 12 24% |
| Load (h) | 2 | 1.1 -45% | 1.4 -30% | 2.3 15% | 1 -50% | |
| Witcher 3 ultra (h) | 0.9 |
Pros
Cons
Verdict — One of a Kind
We commend the XPS 17 for pushing limits further than most other manufacturers out there. Nobody else has an ultra-thin 17.0-inch 16:10 laptop with an 8-core Core i7 CPU (soon to be Core i9) running at 99 C on full load alongside a GeForce RTX 2060 Max-Q GPU all powered by a USB-C adapter. It even manages to integrate a vapor chamber cooler — a feature mostly found on select gaming laptops. The risks and hardware involved are pretty insane relative to alternatives that usually play it safer.
From our time with the system, we think it could benefit from taking a step back and focusing on some of the basics again. Strengthen the hinges, make the clickpad keys firmer, integrate a webcam shutter, and improve the charging rate — all aspects that many laptops costing half the price have already nailed down.
Users intending to run the XPS 17 at high loads for extended periods should be aware of a few drawbacks. Firstly, the battery may not recharge since the USB-C adapter is limited to 130 W. There's a reason why most other GeForce RTX-powered laptops don't run on USB-C adapters and that's because proprietary barrel chargers are able to push much more power to the demanding system. Secondly, sustained gaming performance may not be steady as we are able to record recurring frame rate drops. When coupled with the noticeable ghosting, users shouldn't look at this as a gaming machine despite the Killer wireless and GeForce RTX graphics.
The XPS 17 is at its best for "bursty" operations like browsing or video editing where the system isn't at high utilization for hours at a time. The display, design, and performance-per-volume are what make the system more attractive than most other 15.6-inch and 17.3-inch solutions.
A one-of-a-kind 17-inch powerhouse laptop with no direct equal. The impressive hardware and appealing visual design will draw eyes, but some basic aspects need some more attention.
Dell XPS 17 9700 Core i7 RTX 2060 Max-Q
- 07/15/2020 v7 (old)
Allen Ngo
