HP Envy 17t (Core i7-1065G7, Nvidia MX330, 4K) Laptop Review
The Envy line is used for HP's high-end consumer-grade laptops, and today's review covers a notebook that fully fits that description. The Envy 17t is a bump up from the HP Envy 17, which we recently covered. The Envy 17t sheds the 17's DVD burner and instead opts for an aluminum chassis housing significantly more powerful hardware.
The 17t screams premium, thanks in part to its Ice Lake Core i7-1065G7 and Nvidia GeForce MX330 GPU. It's a large machine, especially outside of the gaming realm, but the big 17.3-inch display offers a lot of screen real estate. Purchasers can also opt for a UHD (3840x2160) display. As we'll see later in this review, that display option is the highlight of the machine.
Otherwise, the HP Envy 17t is in line with other 17.3-inch multimedia laptops, including the base HP Envy 17, Medion Akoya P17605, Asus VivoBook 17, Dell Inspiron 17 3780, and the LG Gram 17. The MSI Prestige 15 and Dell XPS 15 9500 target a similar audience, though they offer more power for more money.
Rating | Date | Model | Weight | Height | Size | Resolution | Price |
|---|---|---|---|---|---|---|---|
| 80.9 % v7 (old) | 06 / 2020 | HP Envy 17t-cg000 i7-1065G7, GeForce MX330 | 2.7 kg | 19.3 mm | 17.30" | 3840x2160 | |
| 79.3 % v7 (old) | Medion Akoya P17605 i7-10510U, GeForce MX250 | 2.3 kg | 18.45 mm | 17.30" | 1920x1080 | ||
| 75.6 % v7 (old) | 01 / 2020 | Asus VivoBook 17 M712DA-AU017T R5 3500U, Vega 8 | 2.3 kg | 21 mm | 17.30" | 1920x1080 | |
| 78.5 % v7 (old) | 11 / 2019 | HP Envy 17-ce1004ng i7-10510U, GeForce MX250 | 2.8 kg | 23 mm | 17.30" | 1920x1080 | |
| 78.9 % v6 (old) | 05 / 2019 | Dell Inspiron 17 3780 i7-8565U, Radeon 520 | 2.8 kg | 25 mm | 17.30" | 1920x1080 | |
| 83.5 % v6 (old) | 04 / 2019 | LG Gram 17Z990-R.AAS7U1 i7-8565U, UHD Graphics 620 | 1.3 kg | 17.8 mm | 17.00" | 2560x1600 |
Case
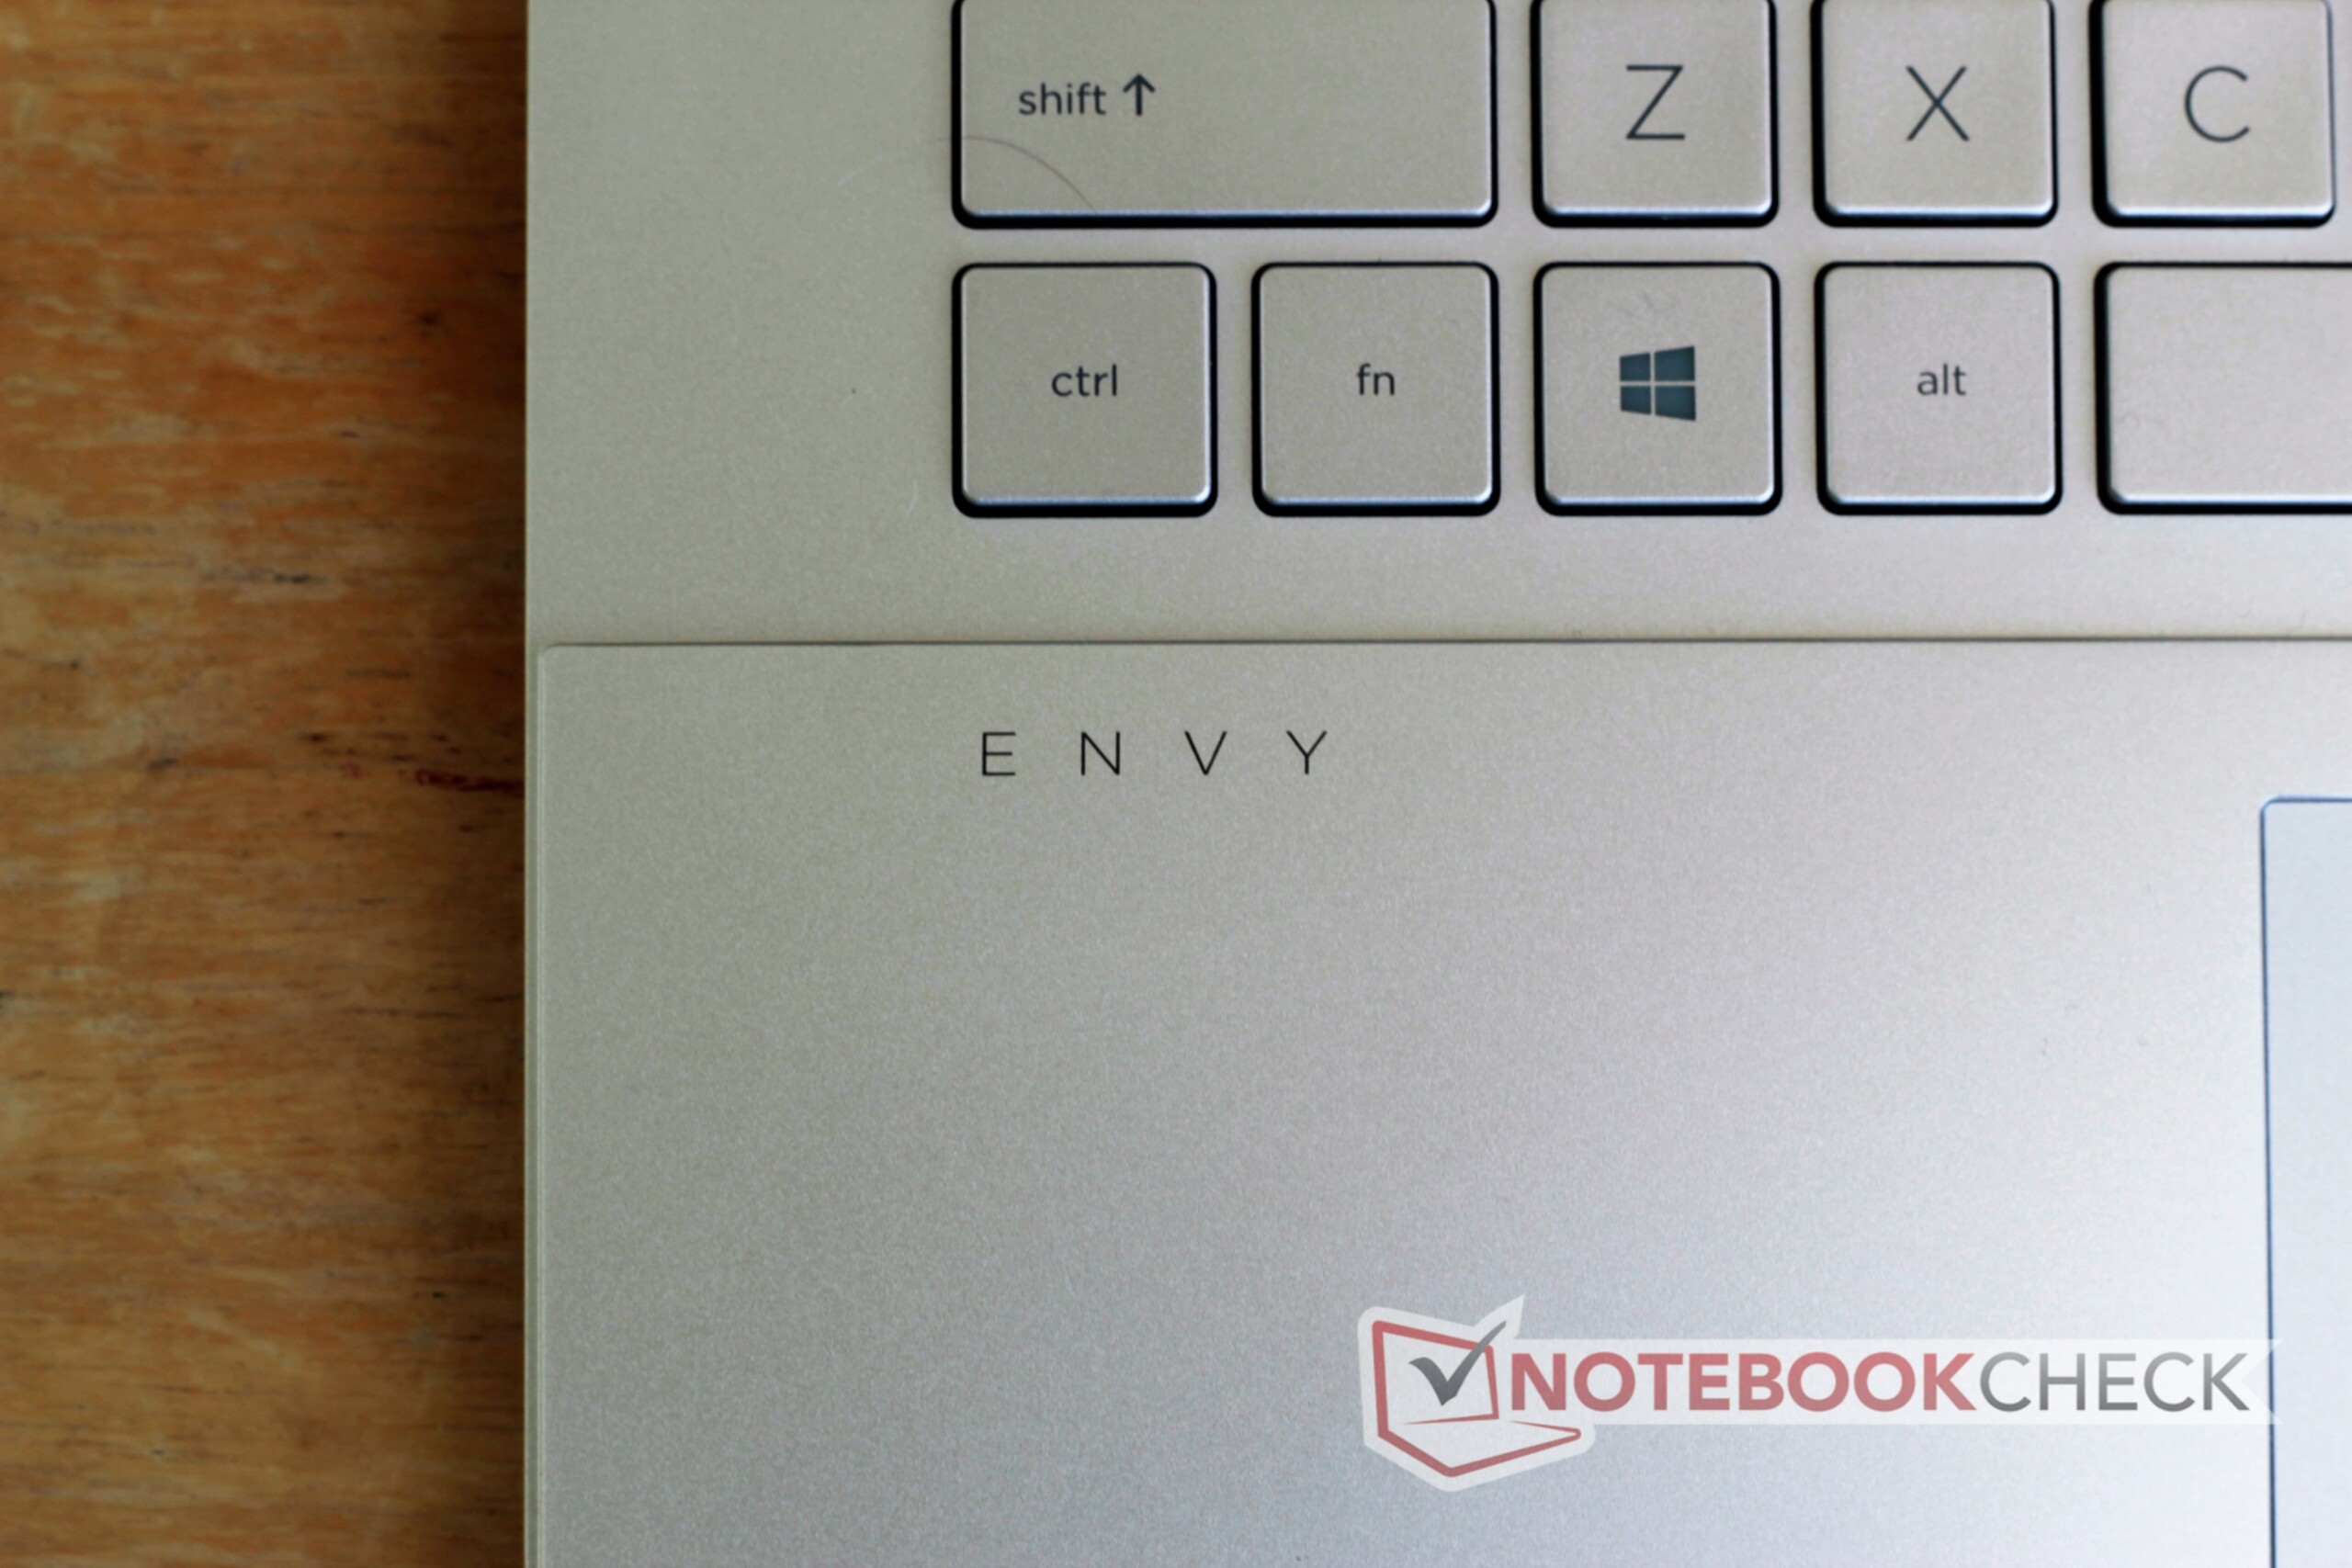
The HP Envy 17t is solidly built with a decidedly premium look and feel. The aluminum body looks gorgeous thanks to its anodized finish, which resists fingerprints and smudges. Gaps are tight and consistent along the bottom panel and touchpad seams. The keyboard deck is rigid and does not flex under directed pressure.
Similarly, the lid holds firm when intentionally twisted, contorting only slightly. The hinges are strong but stiff; they hold the display steady when the keyboard is engaged but do not allow for one-handed opening. The display opens to a maximum of about 120 degrees, which may be a bit restrictive for some.
A nice feature is the addition of tiny rubber pads on the back edge of the lid; when the laptop is opened, these become the back feet of the notebook, lifting the keyboard and angling it to about 10 degrees for better ergonomics.
Overall, HP hit a home run with the design. The machine's chassis certainly lives up to the "Envy" name.
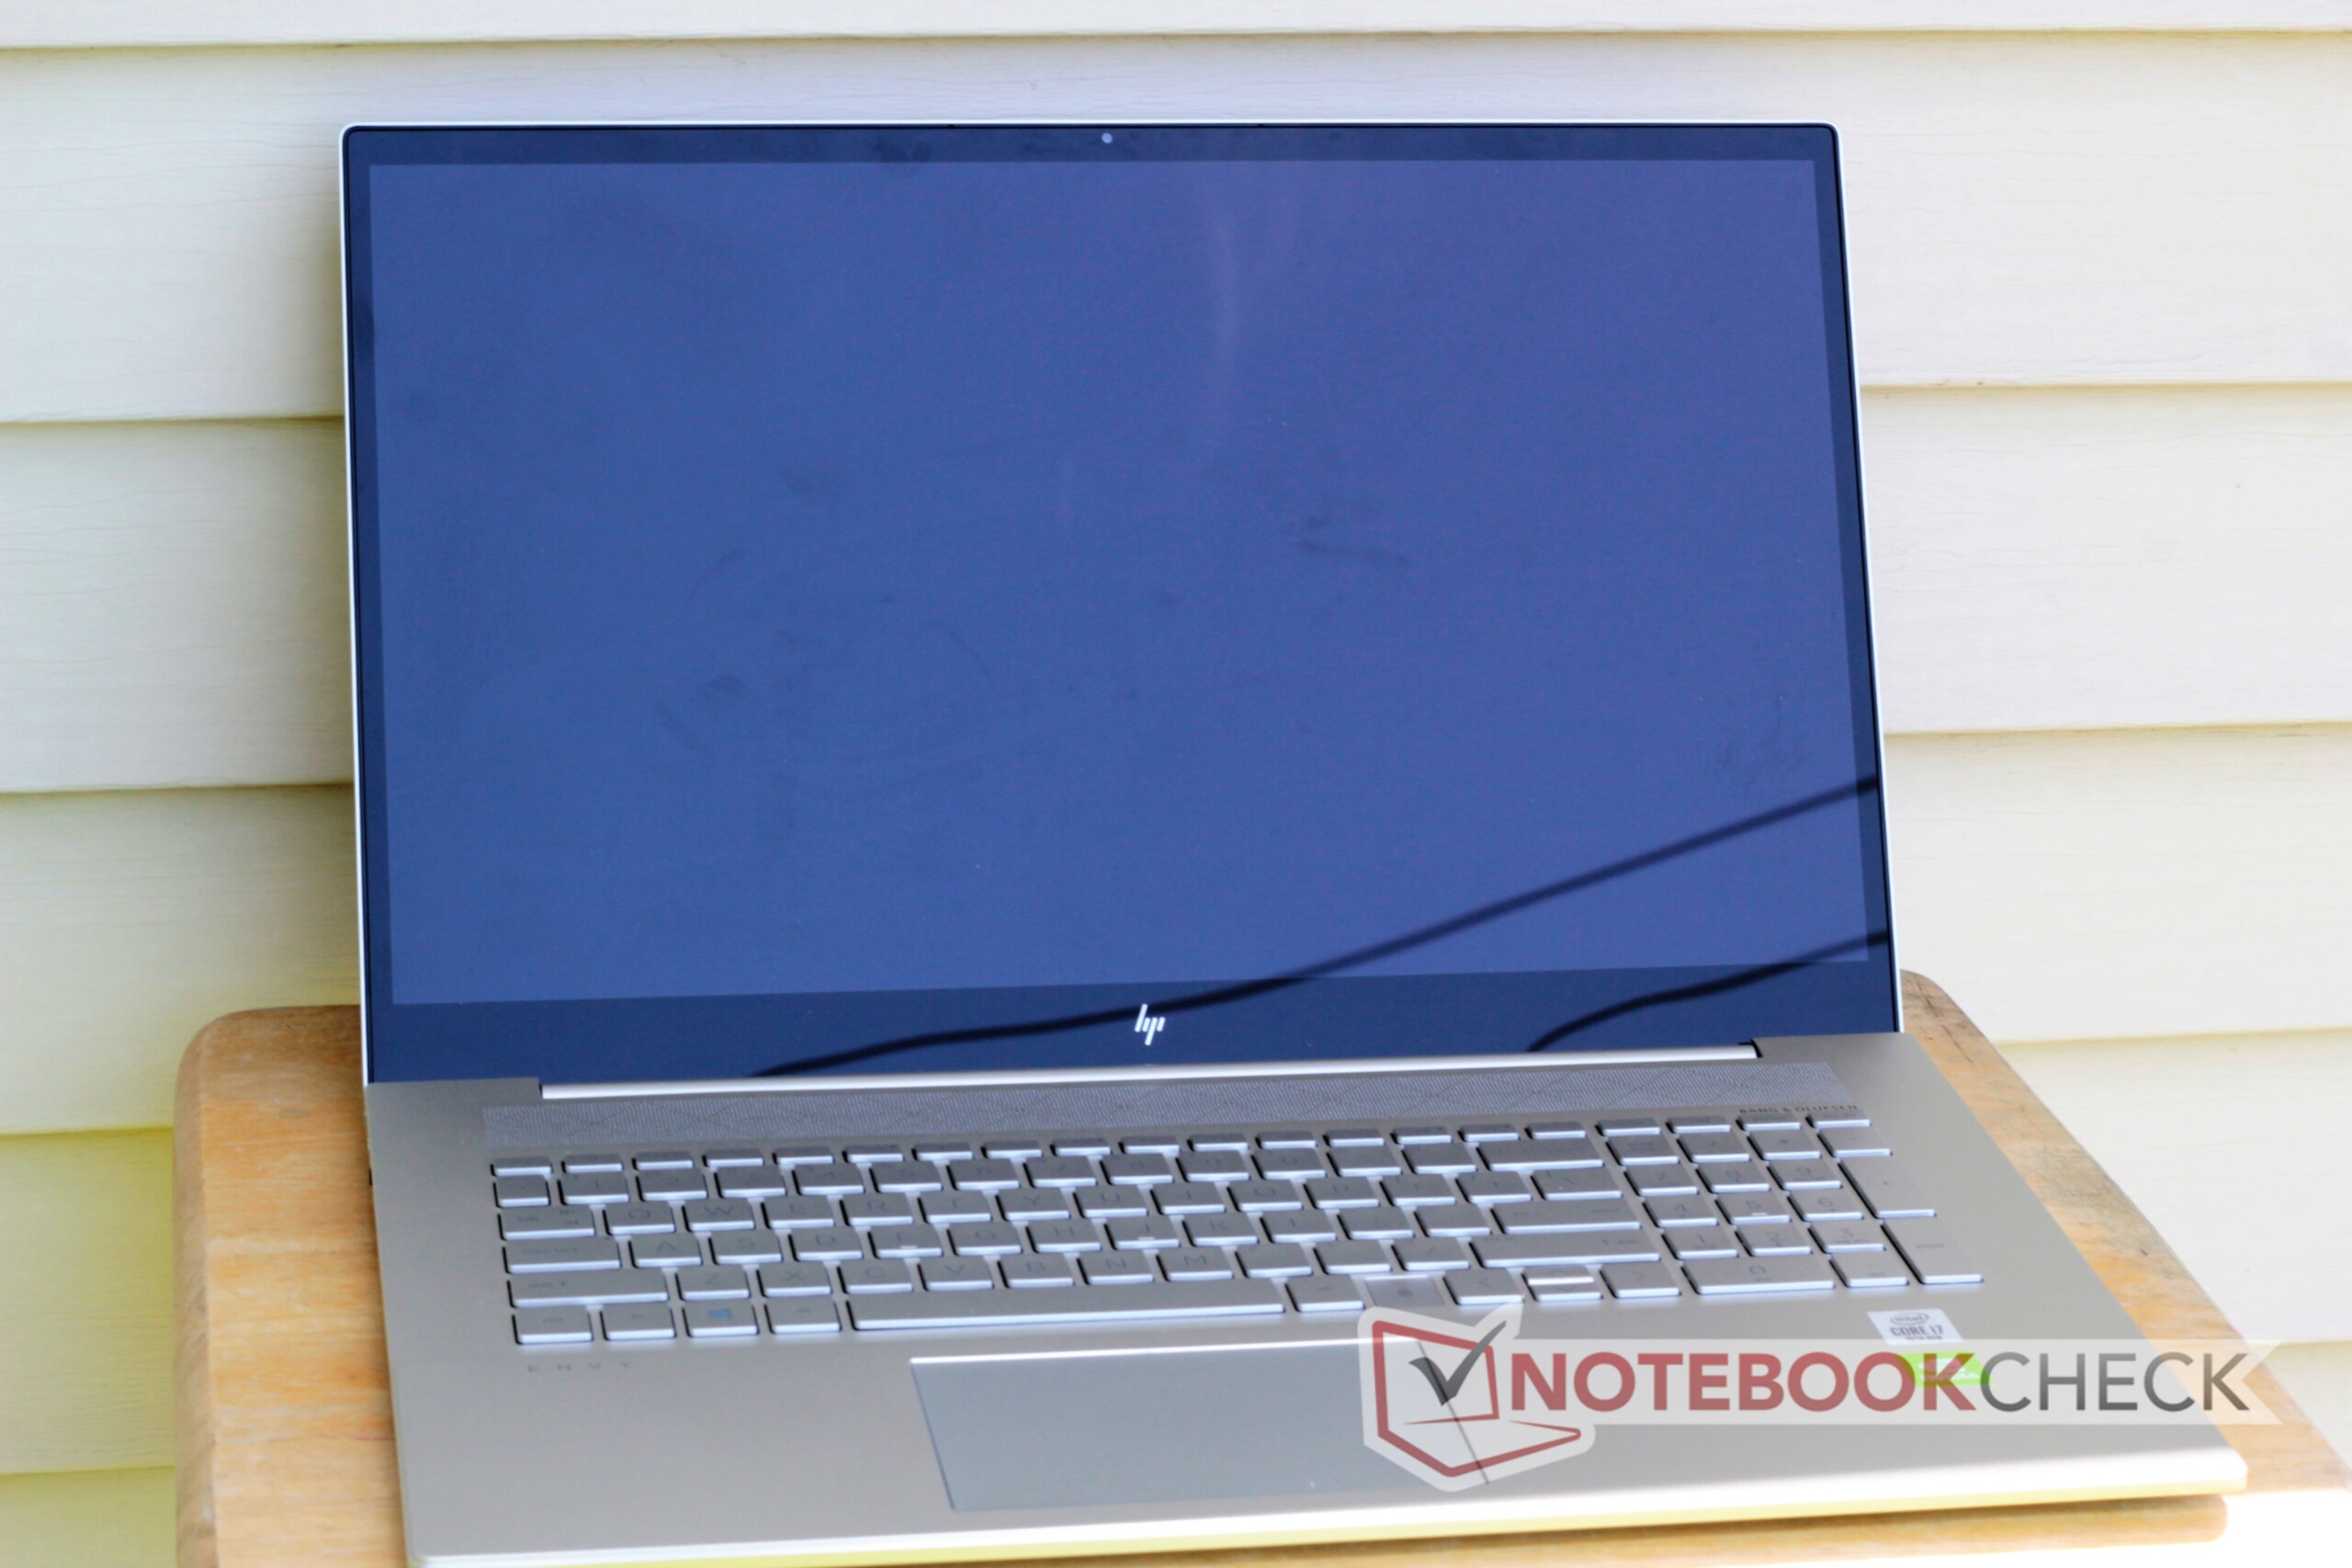
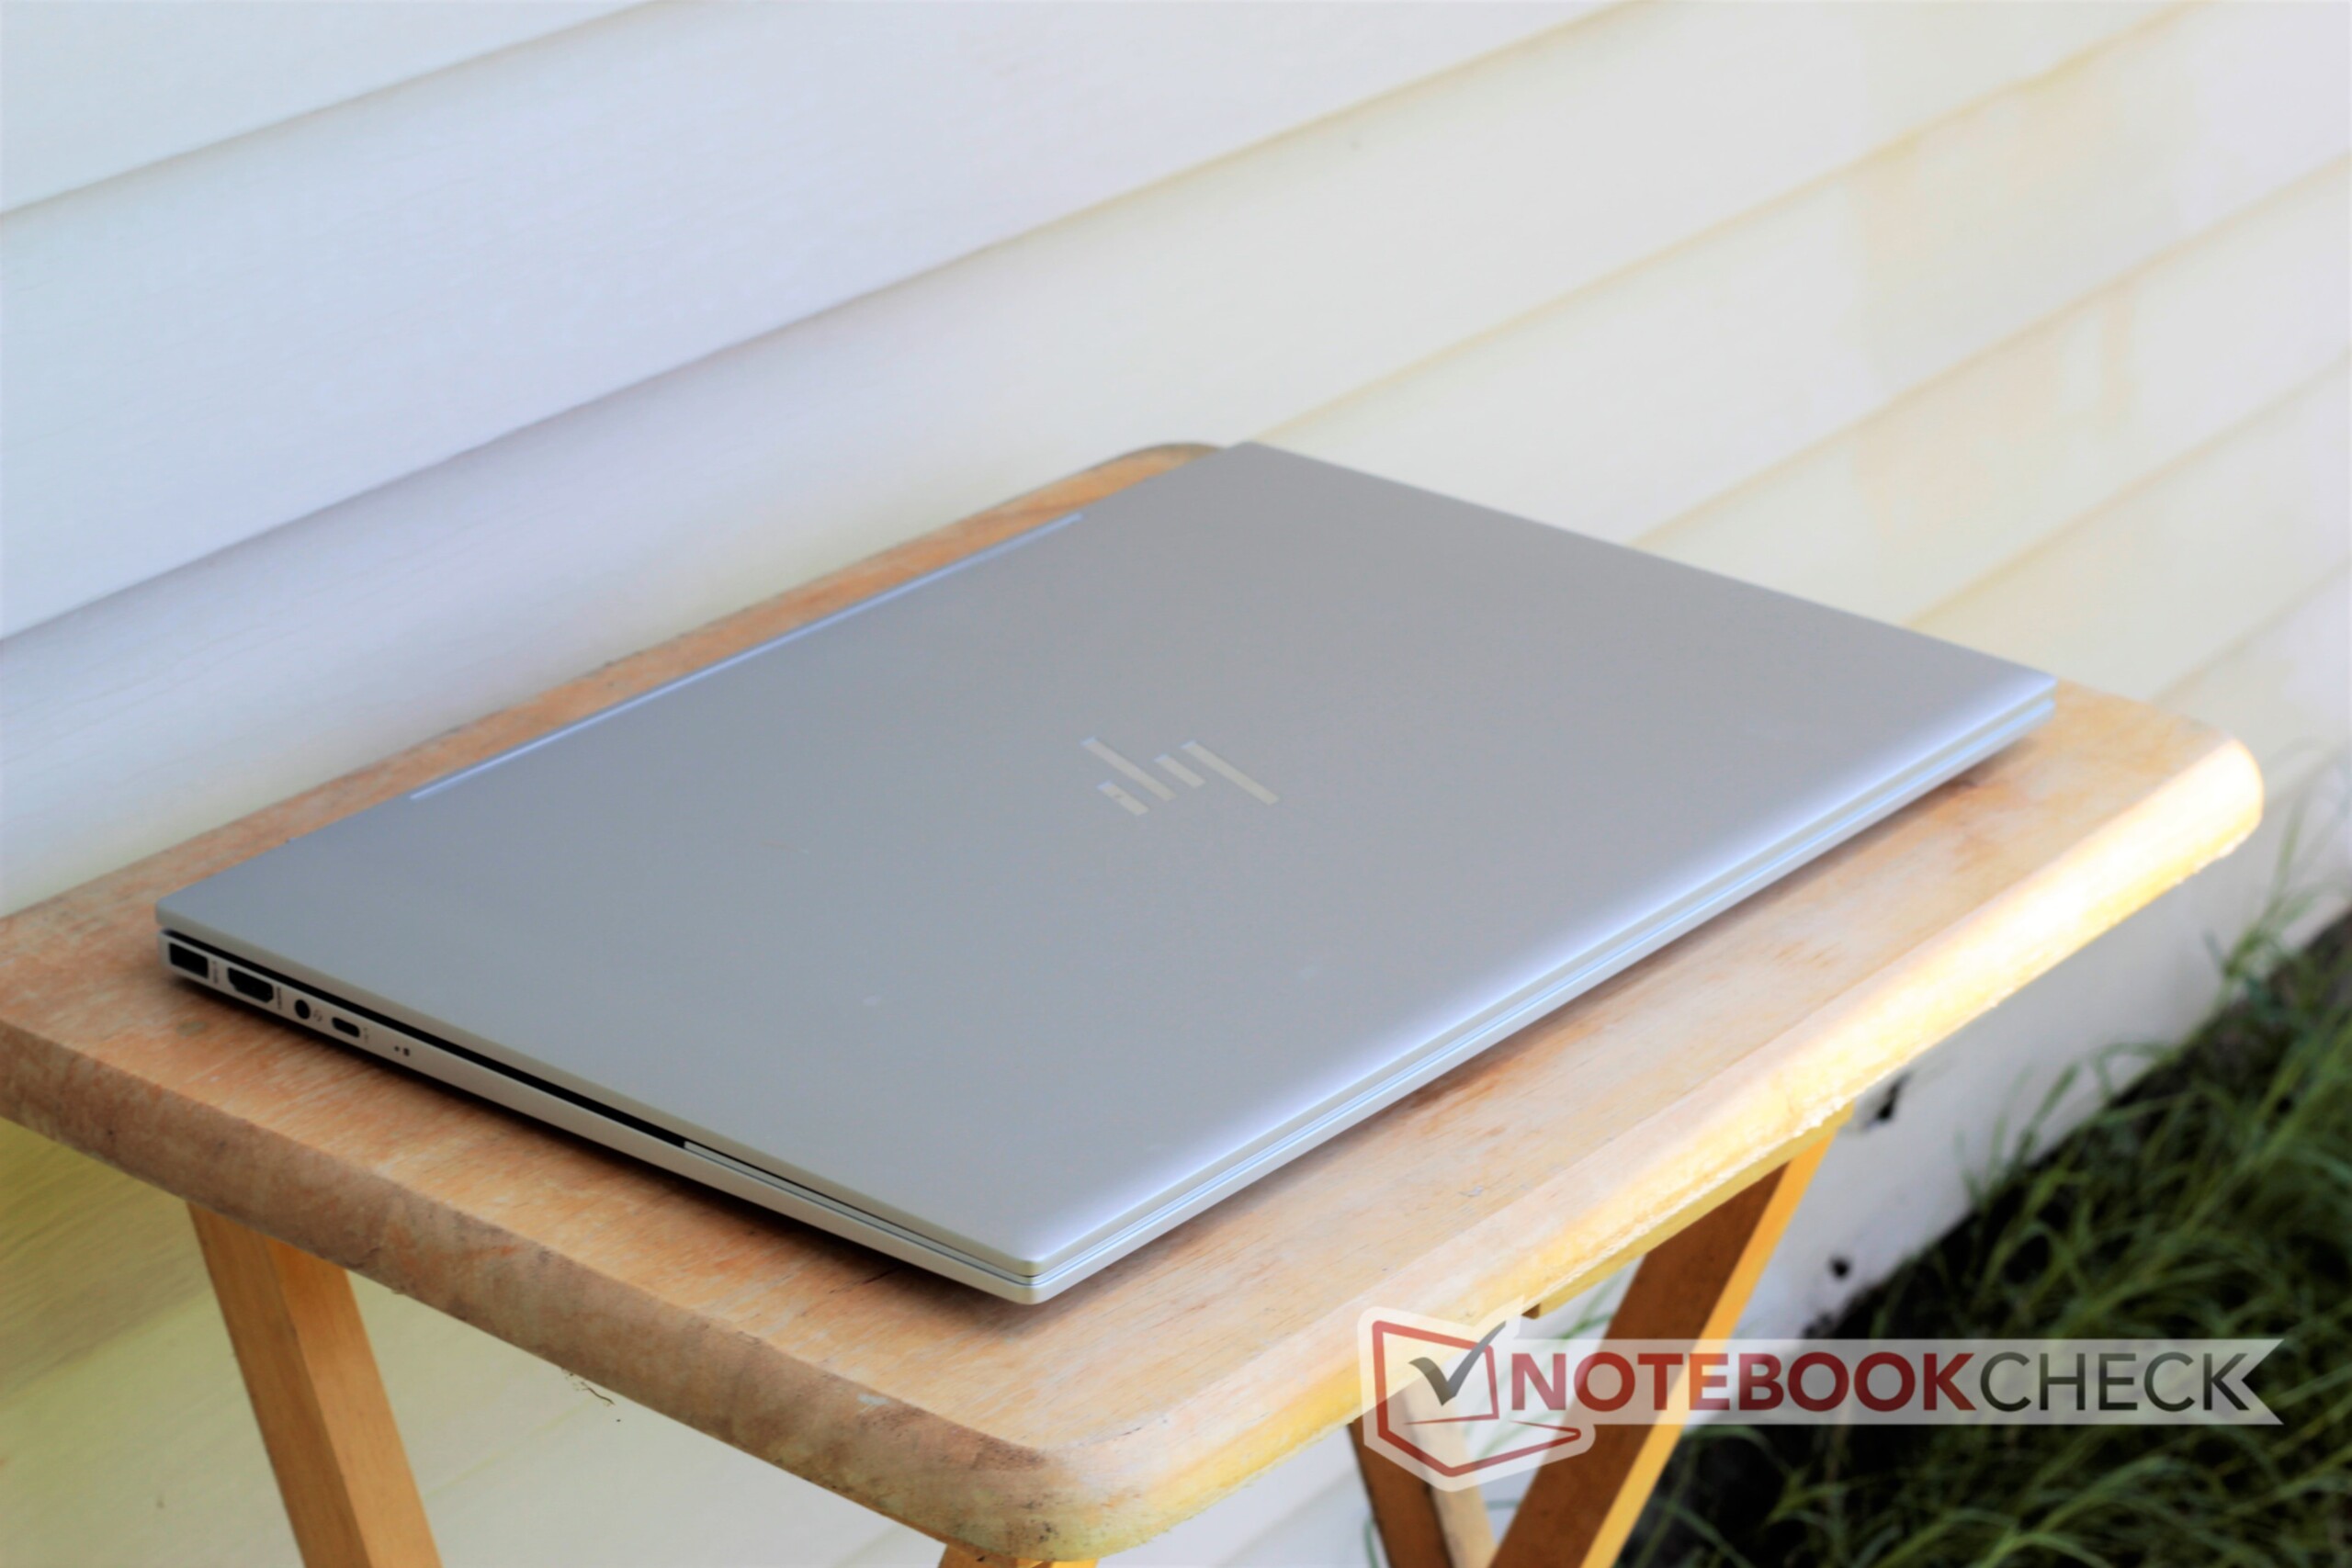
One downside of the larger display is the Envy 17t's massive footprint. The display's bezels are reasonably small and the device's screen-to-body ratio is good (~80%). The Envy 17t is a hair smaller than other 17-inch multimedia laptops, but at 2.7 kg, it is among the heaviest. As a result, the notebook is cumbersome. It is awkward to carry with one hand (especially while open) and may not fit nicely onto a lap. However, the Envy 17t is still fairly thin (19.3 mm).
Connectivity
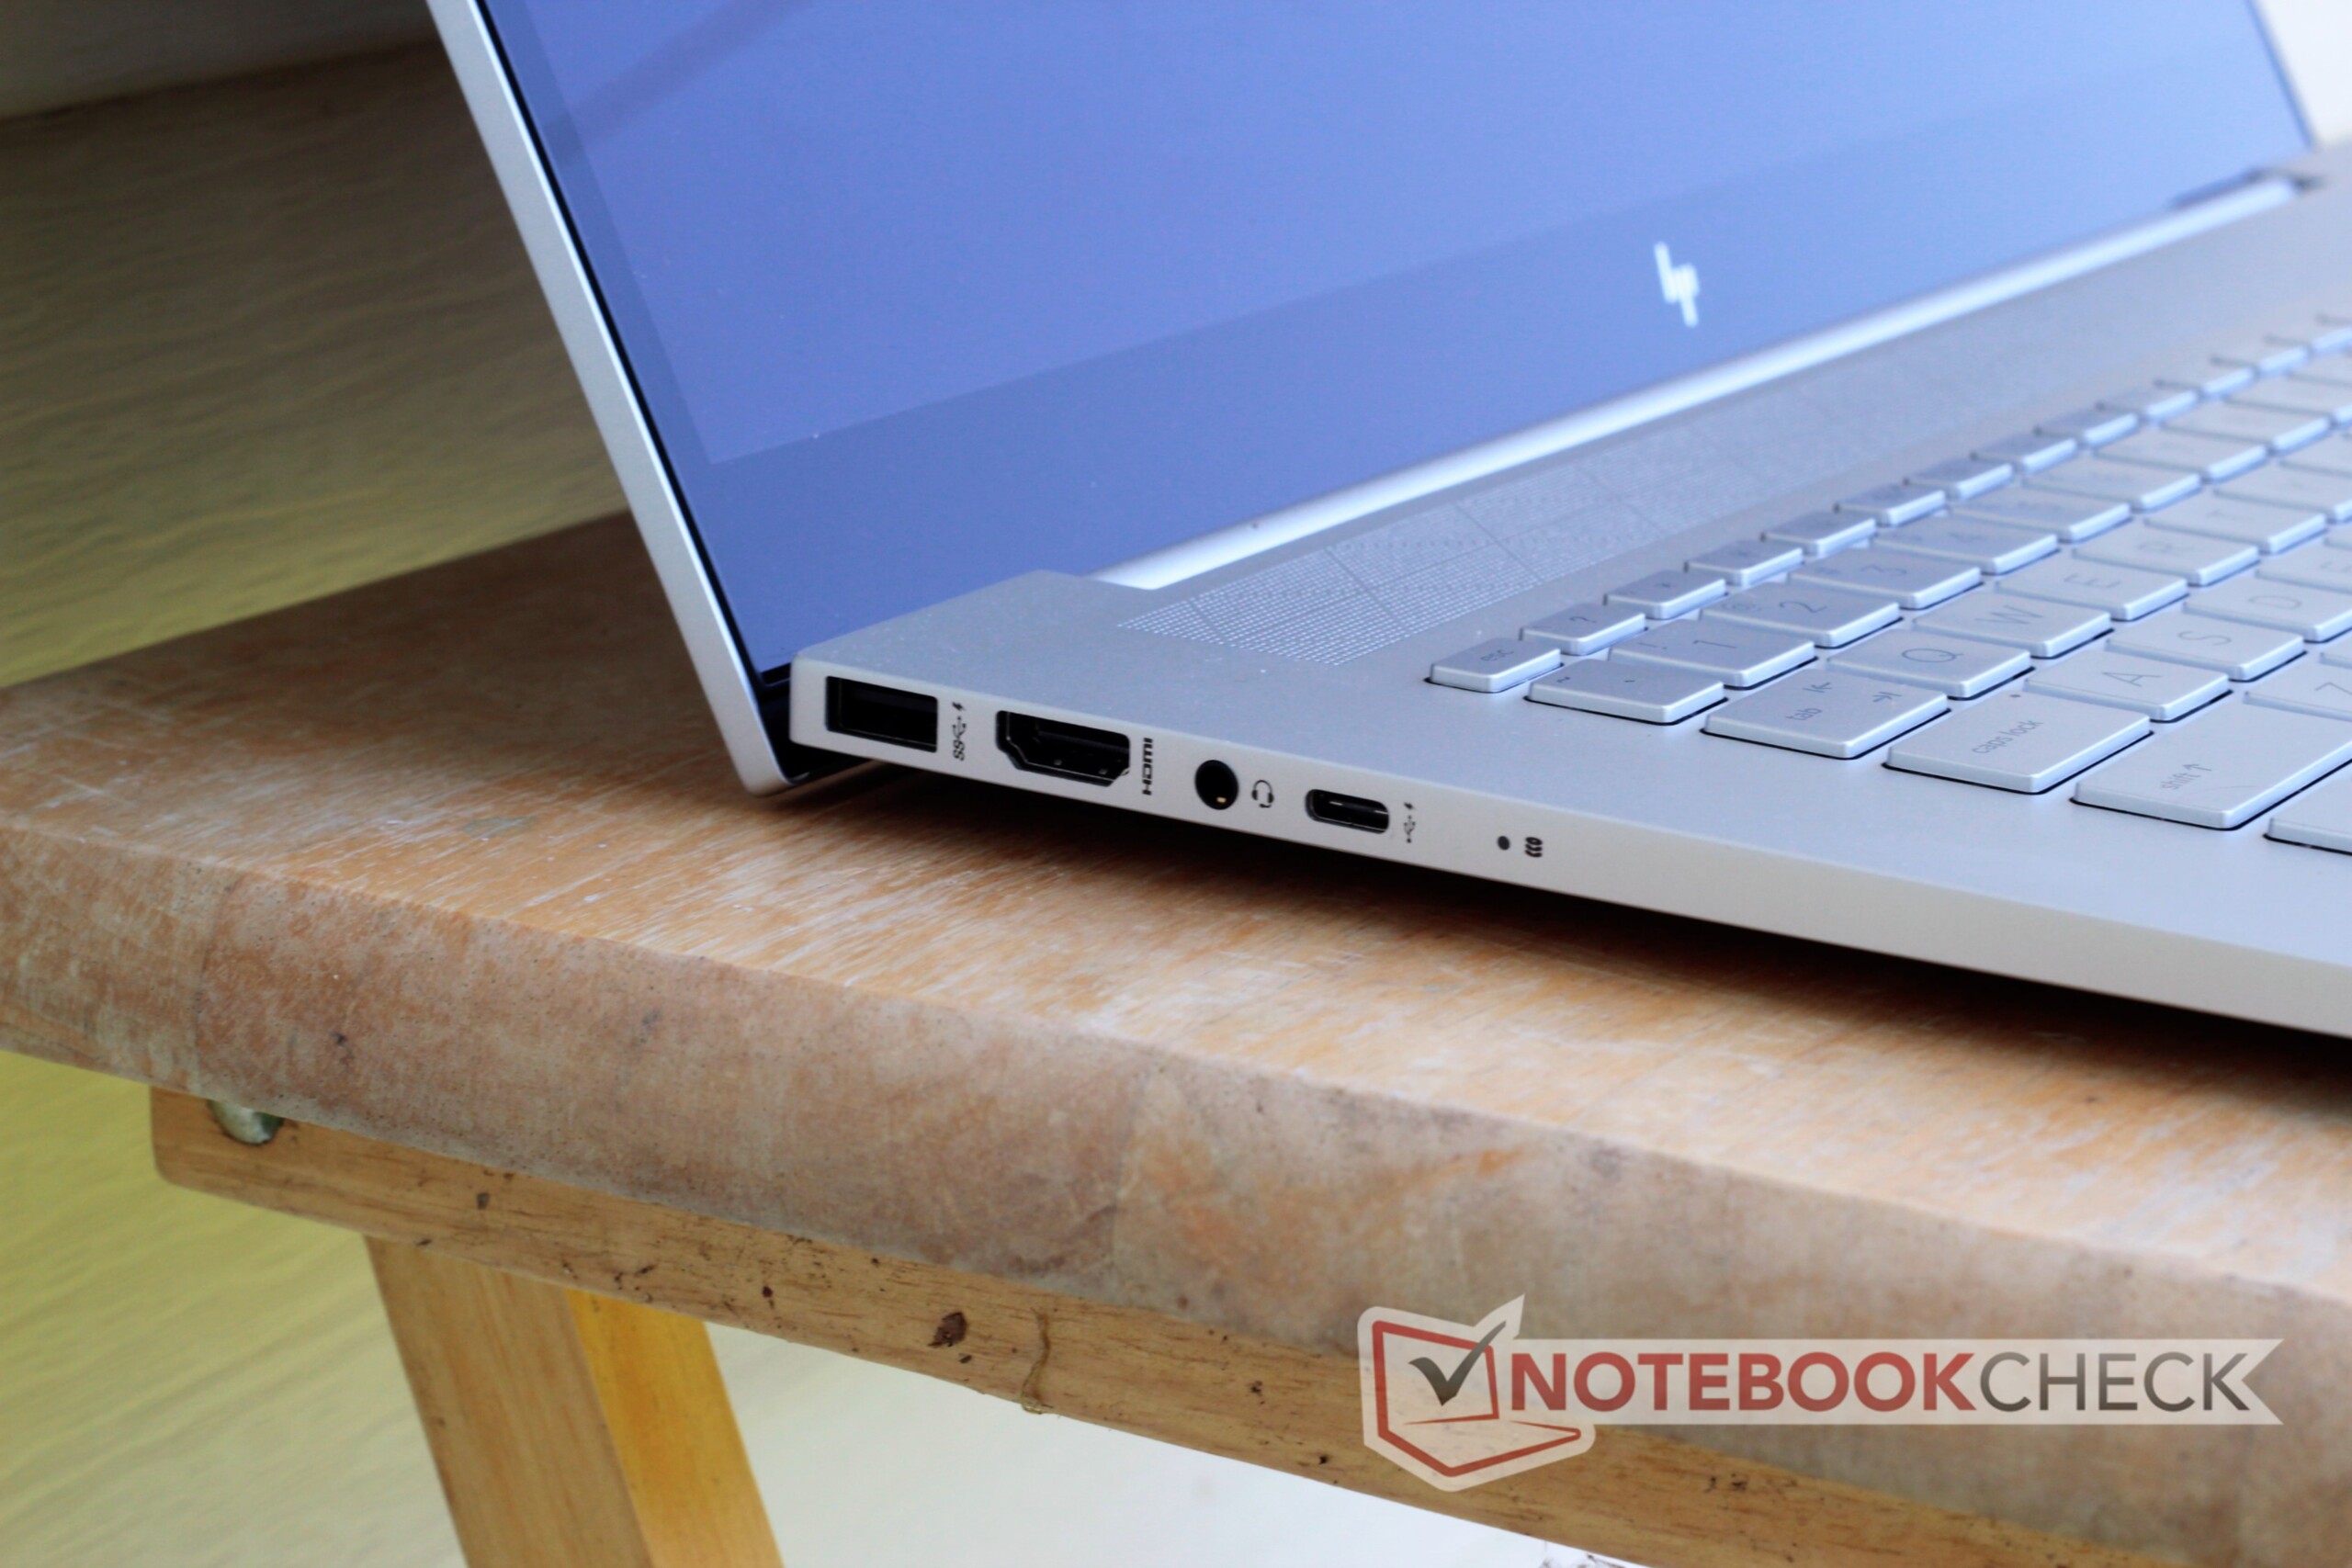
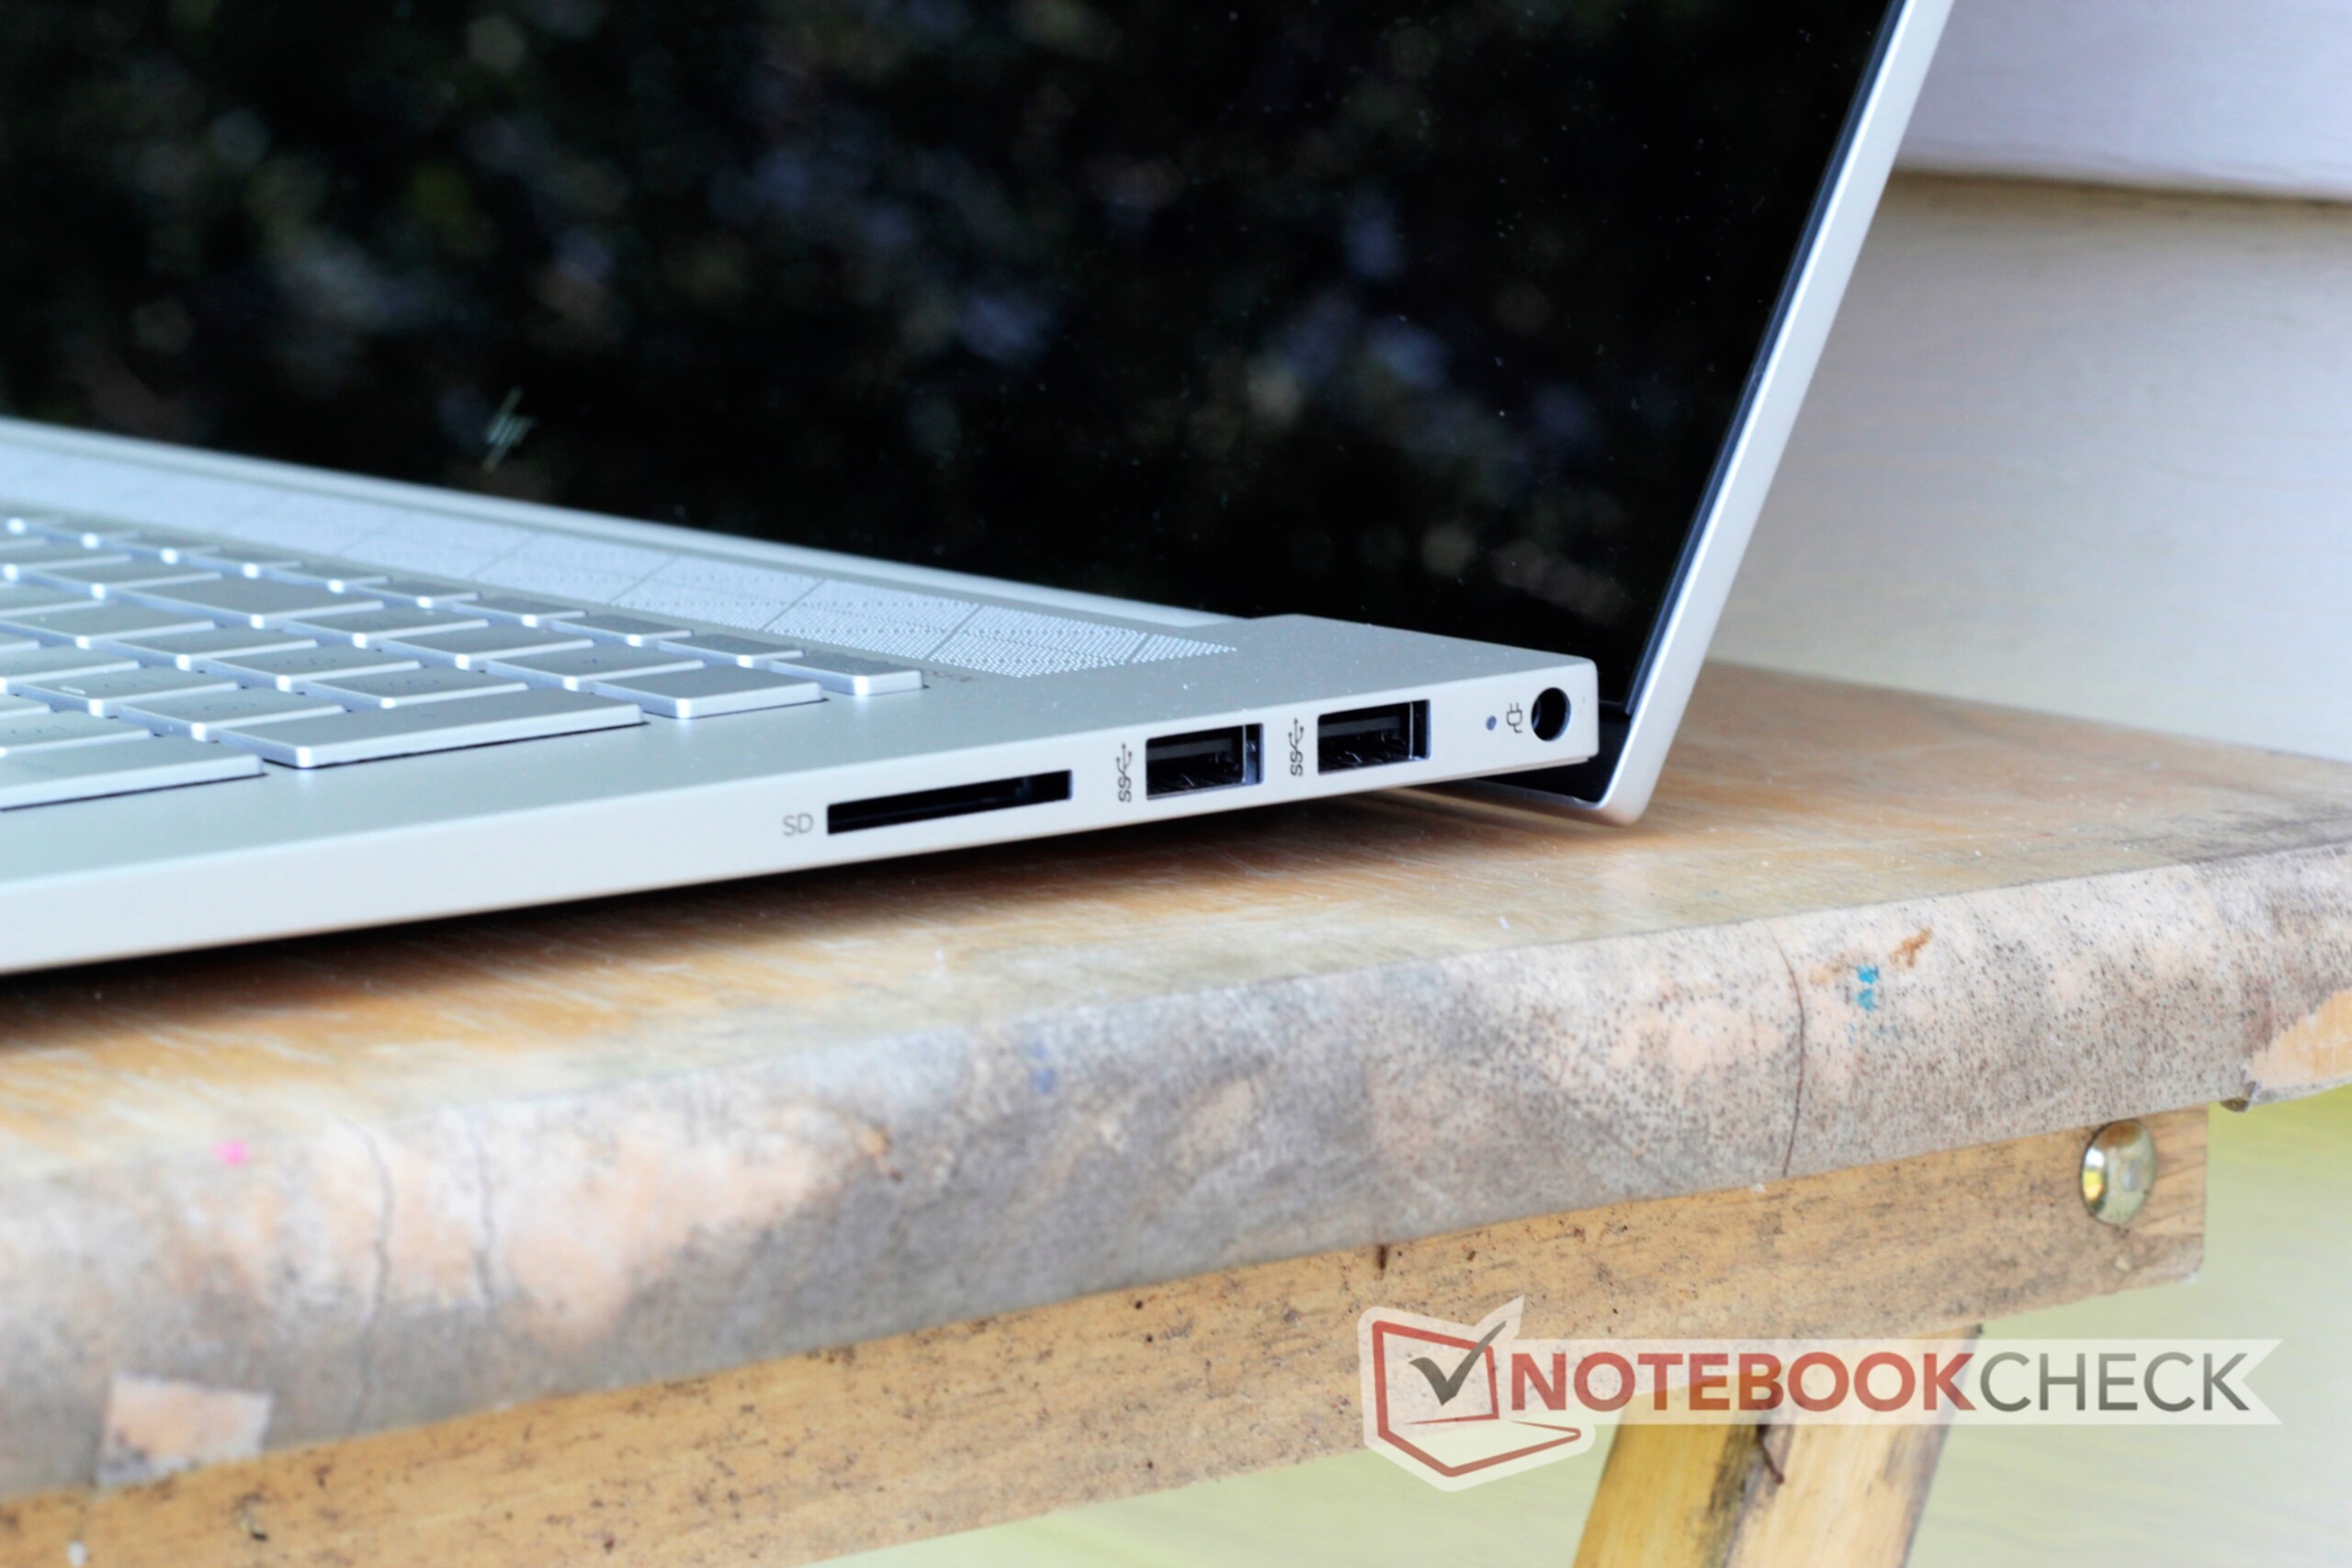
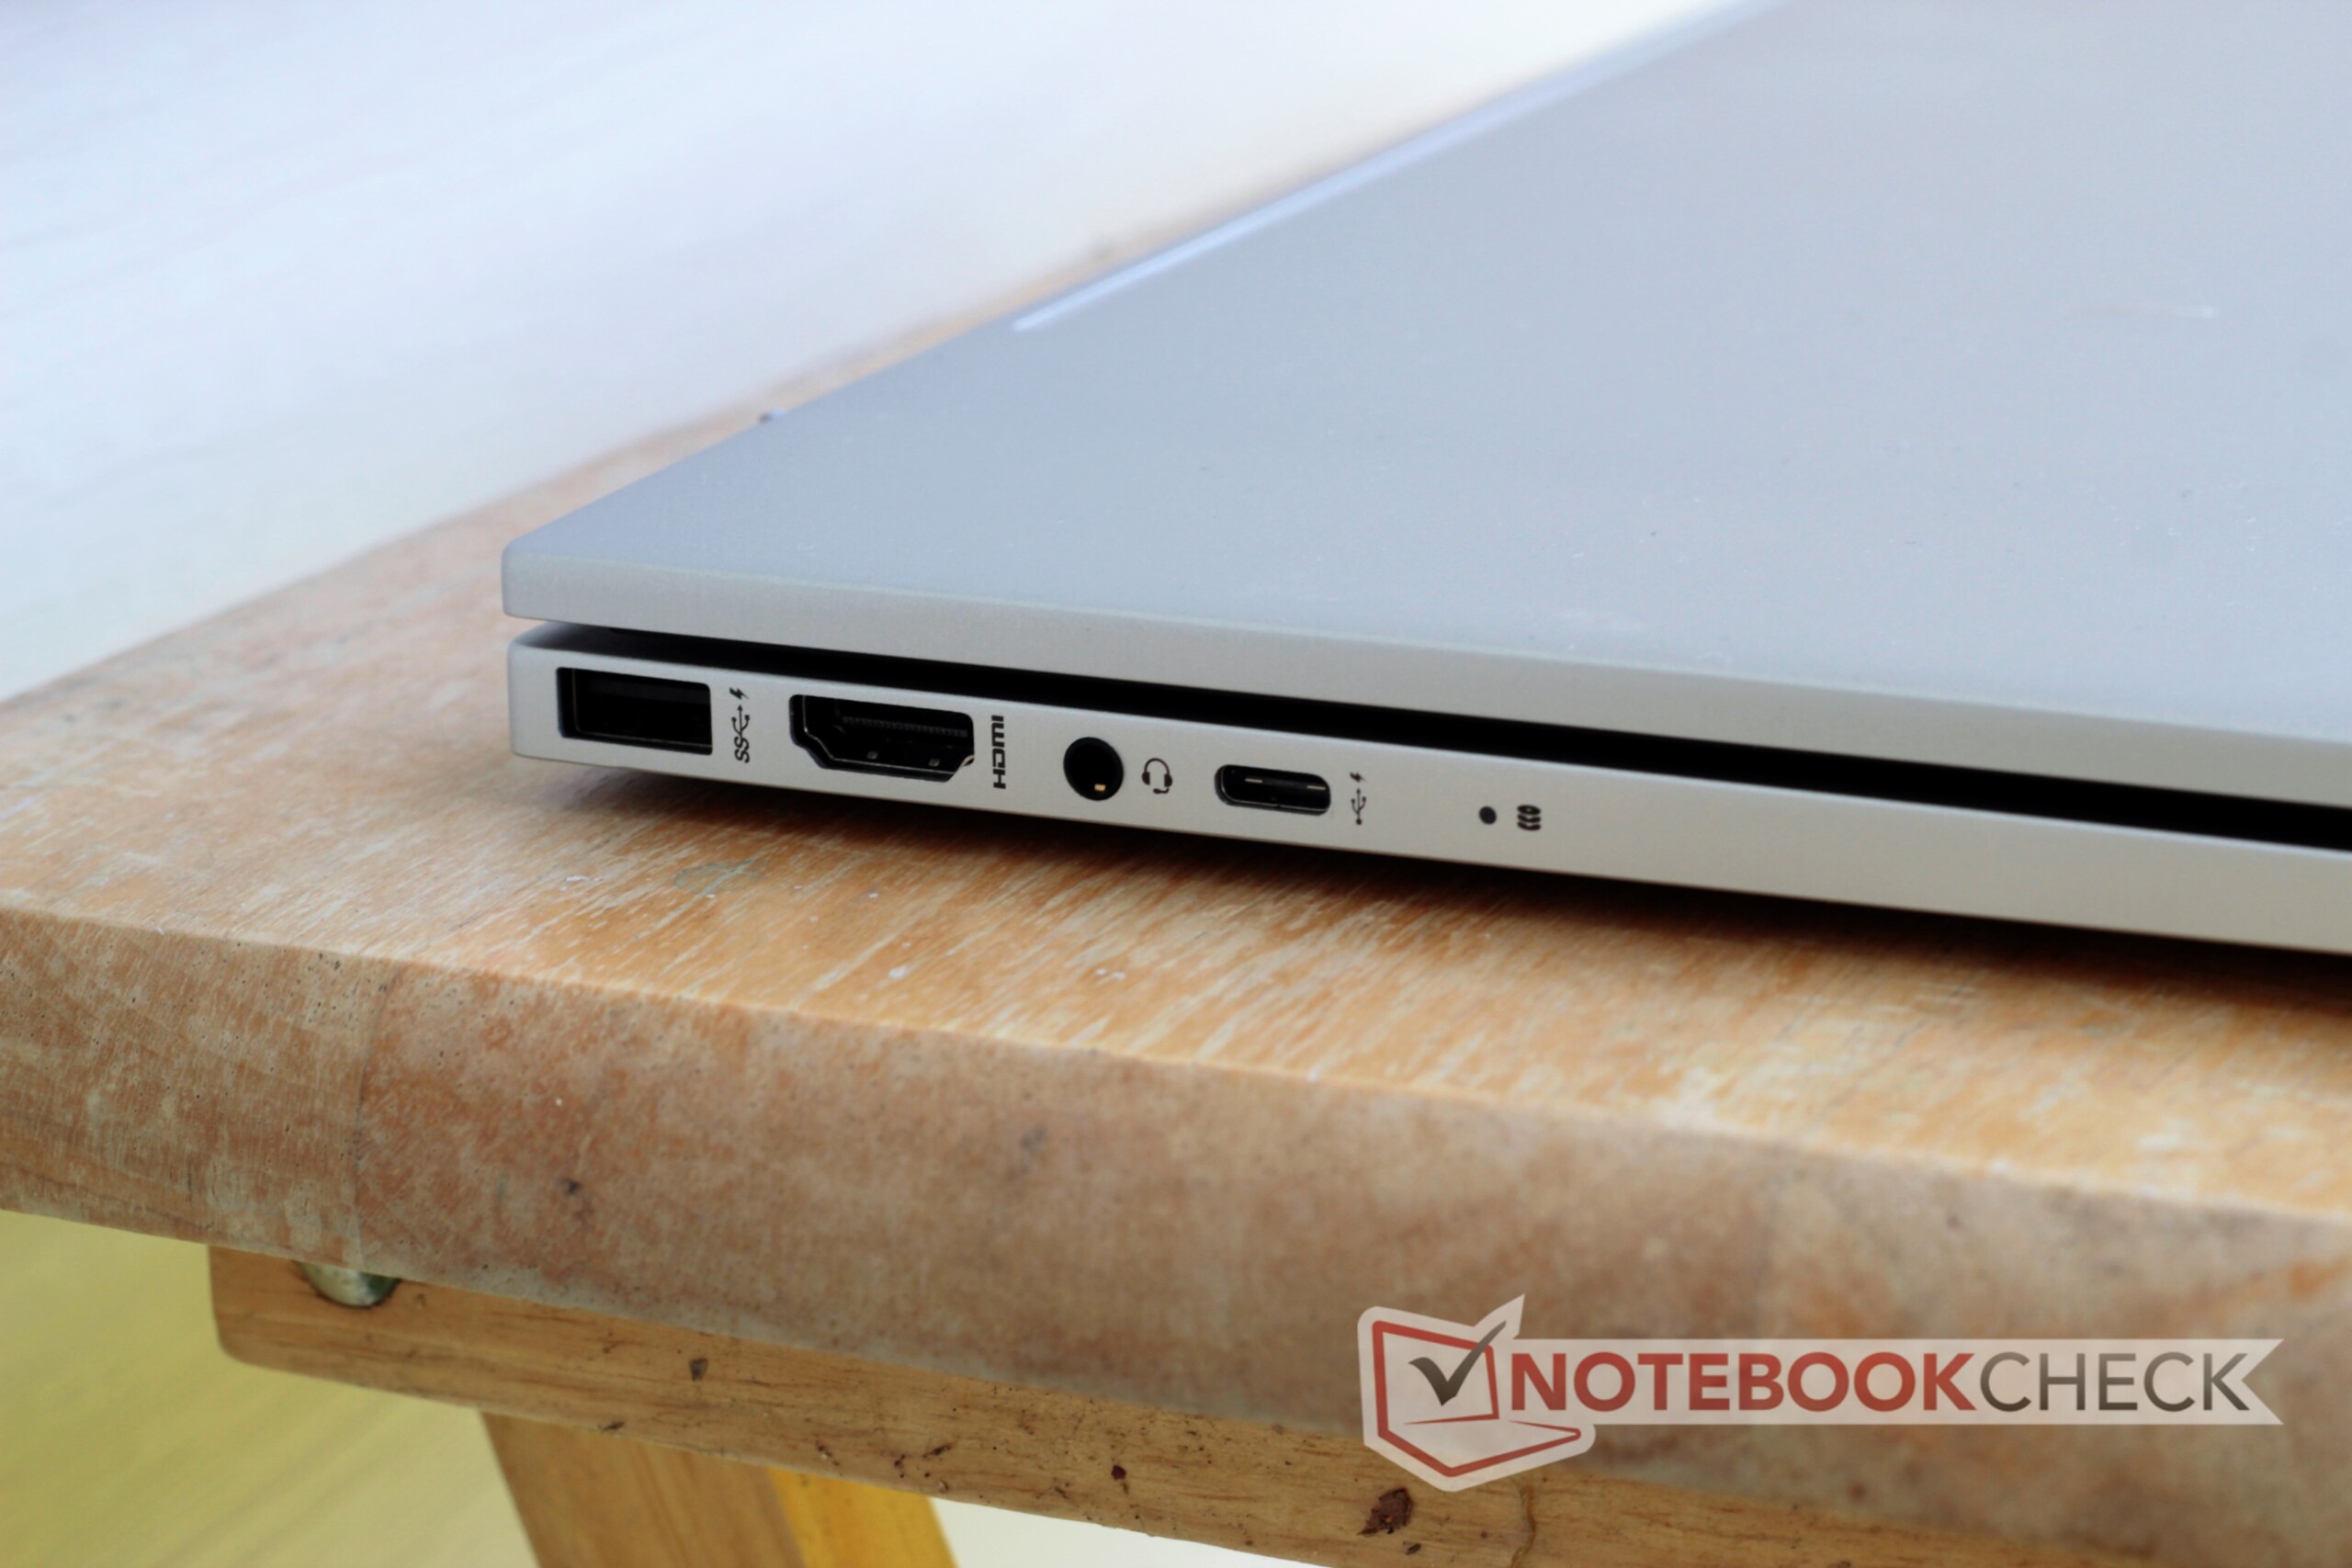
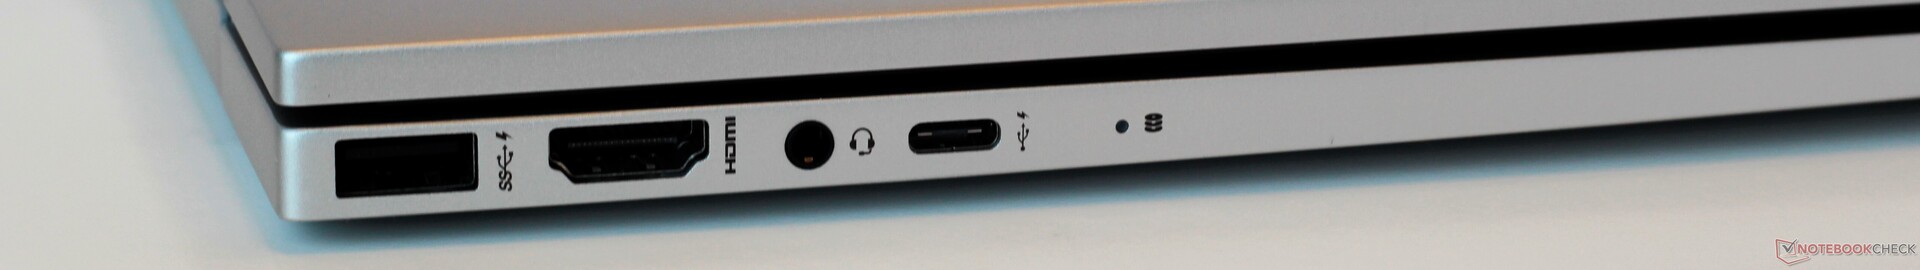
The Envy 17t offers an adequate selection of ports. Both USB ports on the left side support HP Sleep and Charge, allowing users to charge a connected USB device (like a phone) even when the laptop is asleep. Multiple displays can be connected via the HDMI 2.0 and USB-C port, which supports both HDMI 2.0 and DisplayPort 1.4 connections.
A quick note: the USB ports are situated close to each other, which may cause large flash drives or cables to block adjacent ports.
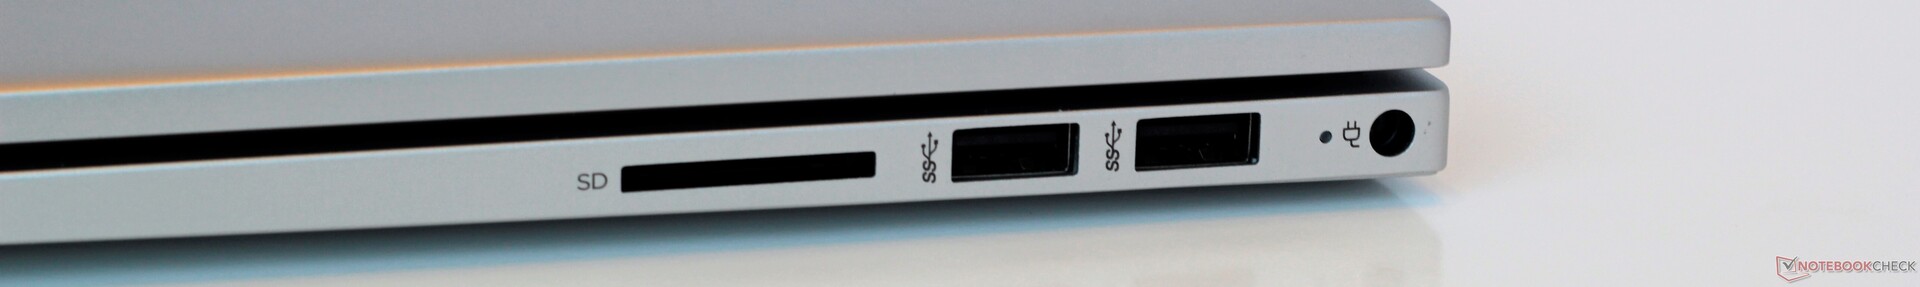
SD Card Reader
The full-size SD card reader offers average speeds (~75-80 MB/s) and is adequate for most consumers. Professionals that rely on transferring large batches of files via SD card may want to look to other devices like the XPS 15. Cards can be fully inserted into the reader and sit flush with the side of the chassis.
| SD Card Reader | |
| average JPG Copy Test (av. of 3 runs) | |
| Dell XPS 15 9500 Core i7 4K UHD (Toshiba Exceria Pro SDXC 64 GB UHS-II) | |
| HP Envy 17t-cg000 (Toshiba Exceria Pro SDXC 64 GB UHS-II) | |
| LG Gram 17Z990-R.AAS7U1 (Toshiba Exceria Pro M501 64 GB UHS-II) | |
| HP Envy 17-ce1004ng (Toshiba Exceria Pro SDXC 64 GB UHS-II) | |
| Asus VivoBook 17 M712DA-AU017T (Toshiba Exceria Pro M501 microSDXC 64GB) | |
| Dell Inspiron 17 3780 (Toshiba Exceria Pro SDXC 64 GB UHS-II) | |
| Medion Akoya P17605 (Toshiba Exceria Pro SDXC 64 GB UHS-II) | |
| maximum AS SSD Seq Read Test (1GB) | |
| Dell XPS 15 9500 Core i7 4K UHD (Toshiba Exceria Pro SDXC 64 GB UHS-II) | |
| LG Gram 17Z990-R.AAS7U1 (Toshiba Exceria Pro M501 64 GB UHS-II) | |
| HP Envy 17t-cg000 (Toshiba Exceria Pro SDXC 64 GB UHS-II) | |
| HP Envy 17-ce1004ng (Toshiba Exceria Pro SDXC 64 GB UHS-II) | |
| Asus VivoBook 17 M712DA-AU017T (Toshiba Exceria Pro M501 microSDXC 64GB) | |
| Dell Inspiron 17 3780 (Toshiba Exceria Pro SDXC 64 GB UHS-II) | |
| Medion Akoya P17605 (Toshiba Exceria Pro SDXC 64 GB UHS-II) | |
Communication
The Intel WiFi 6 card in the Envy 17t offers fast wireless speeds. The Envy 17t averages ~1300 MBit/s in both send and receive tests when connected to the Netgear RAX200 router. This far exceeds most consumer internet speeds. Connections were stable; during our testing period, we experienced no dropped connections or interruptions.
| Networking | |
| iperf3 transmit AX12 | |
| Medion Akoya P17605 | |
| HP Envy 17t-cg000 | |
| LG Gram 17Z990-R.AAS7U1 | |
| HP Envy 17-ce1004ng | |
| Asus VivoBook 17 M712DA-AU017T | |
| Dell Inspiron 17 3780 | |
| iperf3 receive AX12 | |
| HP Envy 17t-cg000 | |
| Medion Akoya P17605 | |
| HP Envy 17-ce1004ng | |
| LG Gram 17Z990-R.AAS7U1 | |
| Asus VivoBook 17 M712DA-AU017T | |
| Dell Inspiron 17 3780 | |
Webcam
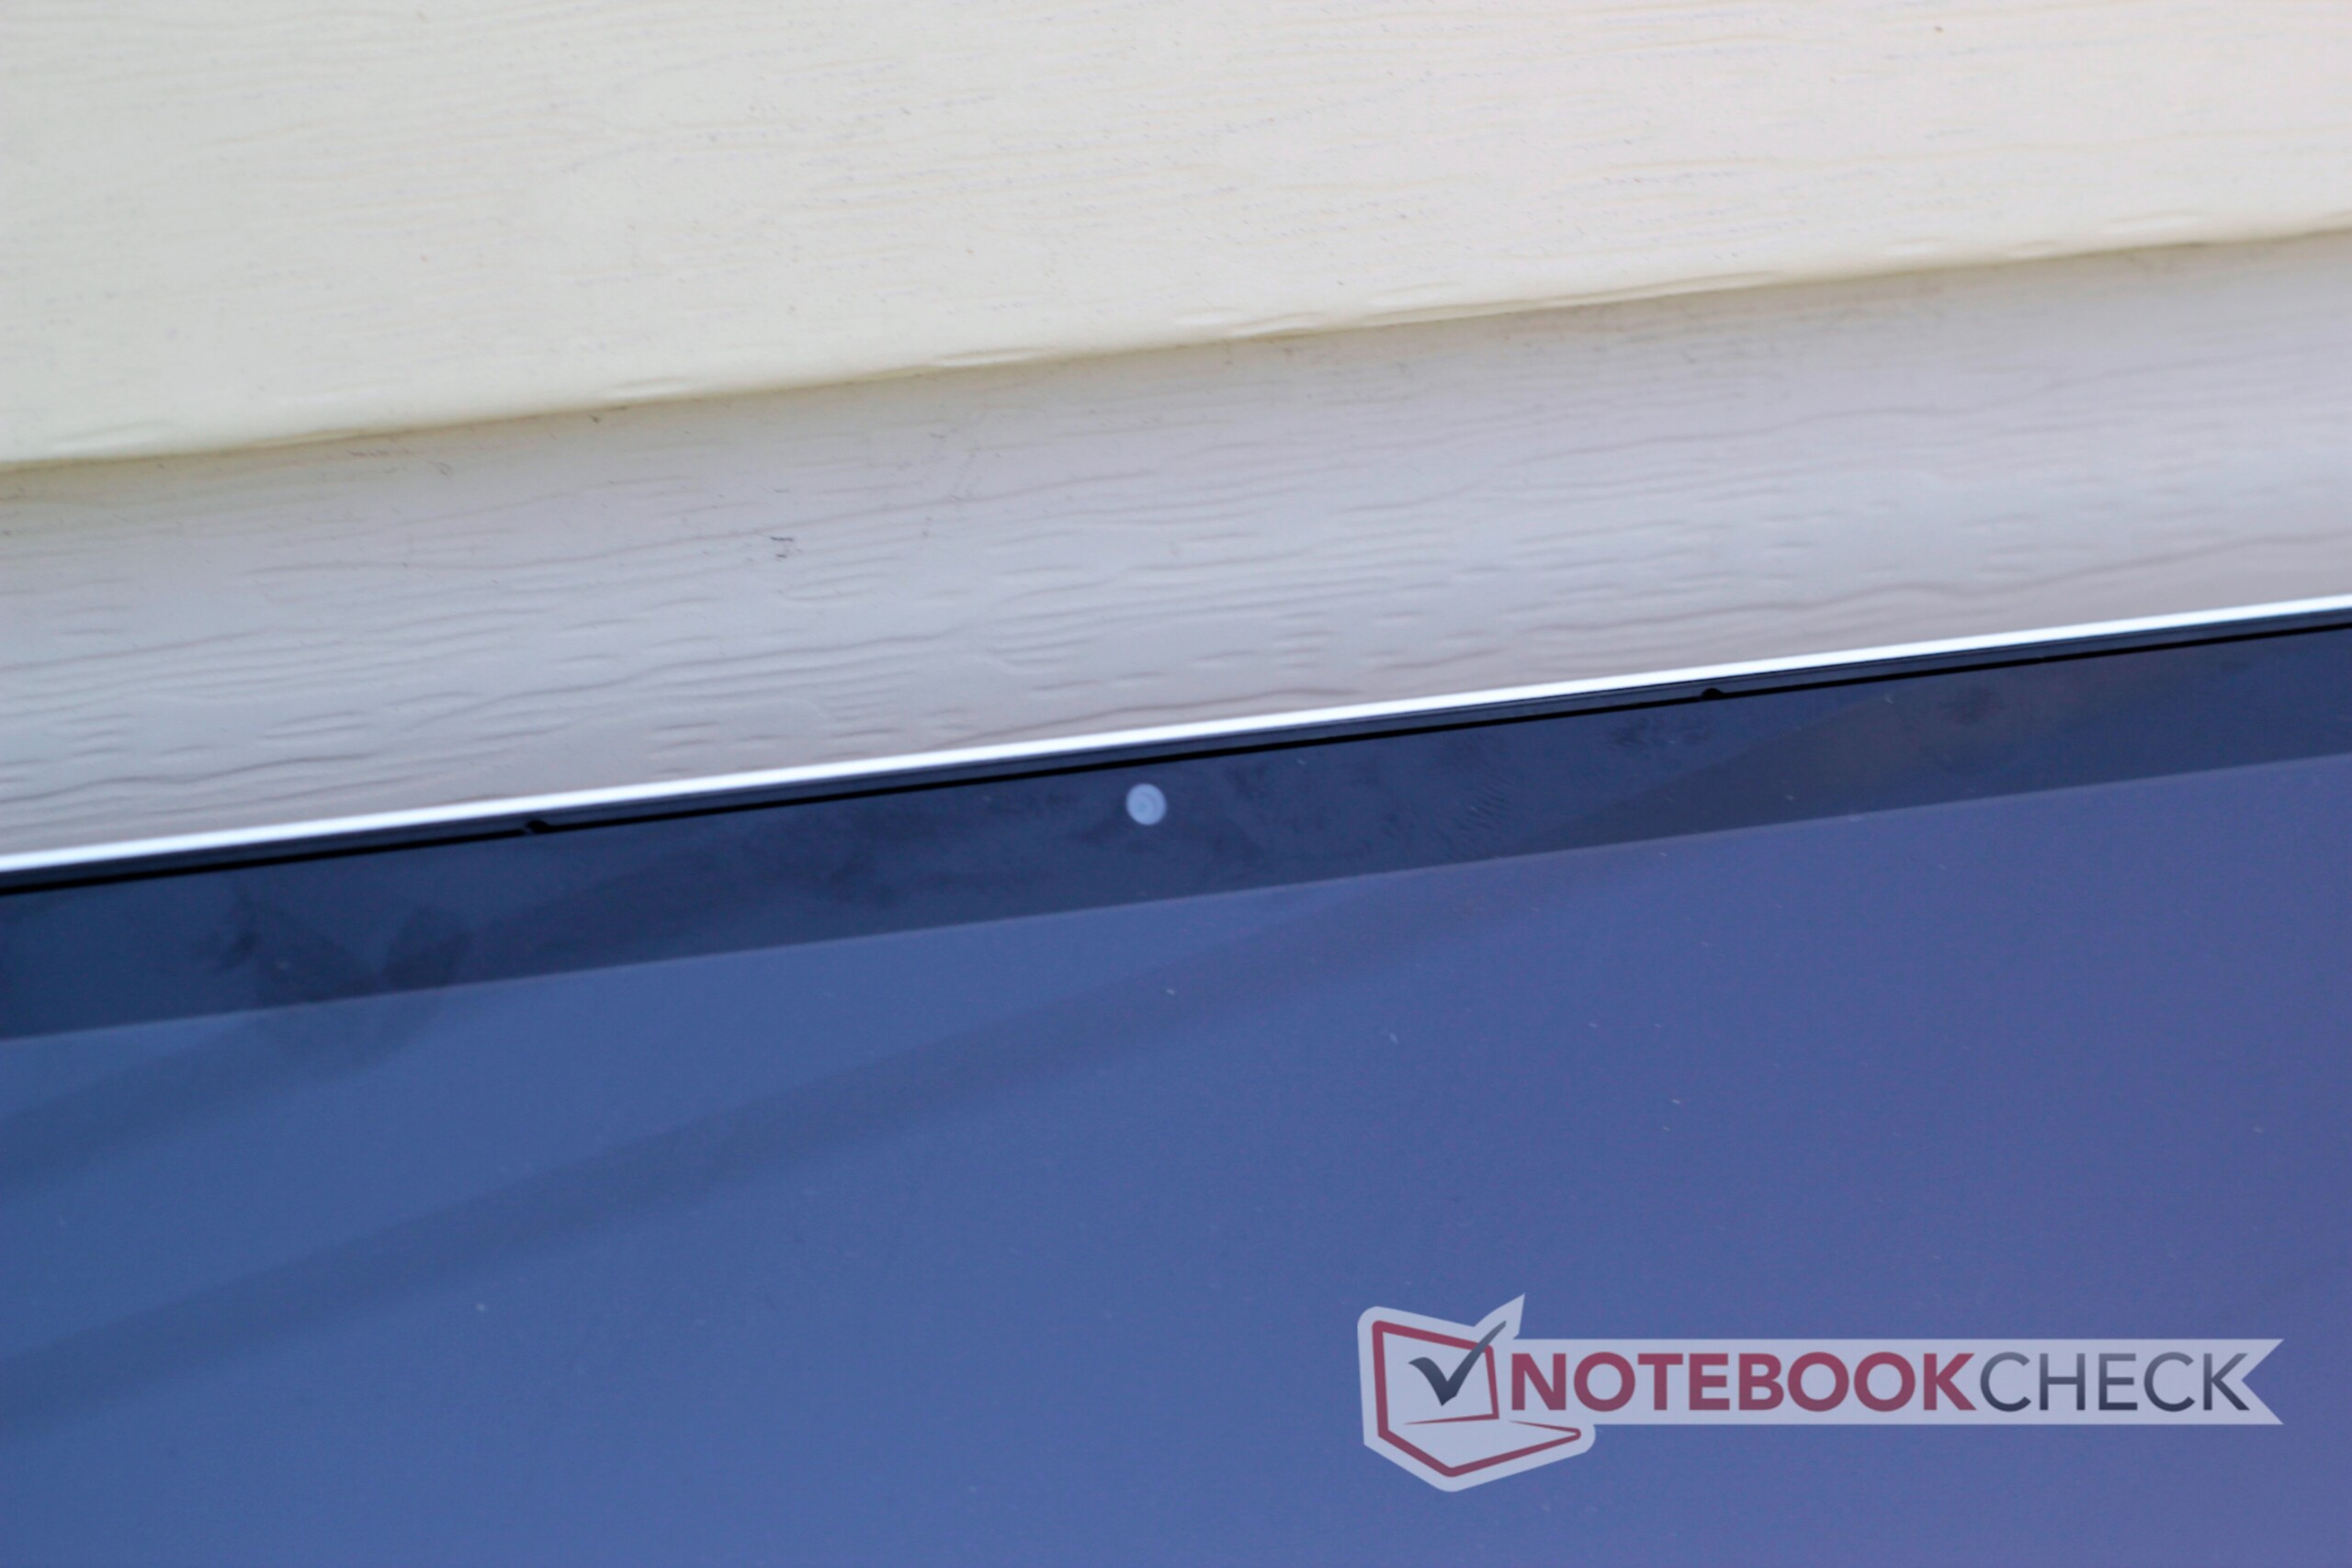
The Envy 17t's webcam is a definite low point. It is usable for the occasional video chat, but images look fuzzy. Edges are poorly defined with an unpleasant "crunch," particularly at areas of sharp contrast (e.g., hairlines). Most laptops struggle in this regard, and these issues are not uncommon.


Maintenance
Two Torx T5 screws hold the back panel, as well as several small Philips Head screws hidden under the long rubber feet. These rubber feet must be peeled away to access the Philips Head screws, and the process is somewhat destructive. As such, we did not proceed with the removal of the bottom panel.
Warranty
The HP Envy 17t offers a standard 12-month limited warranty. We could not find any options to extend this warranty through HP's website.
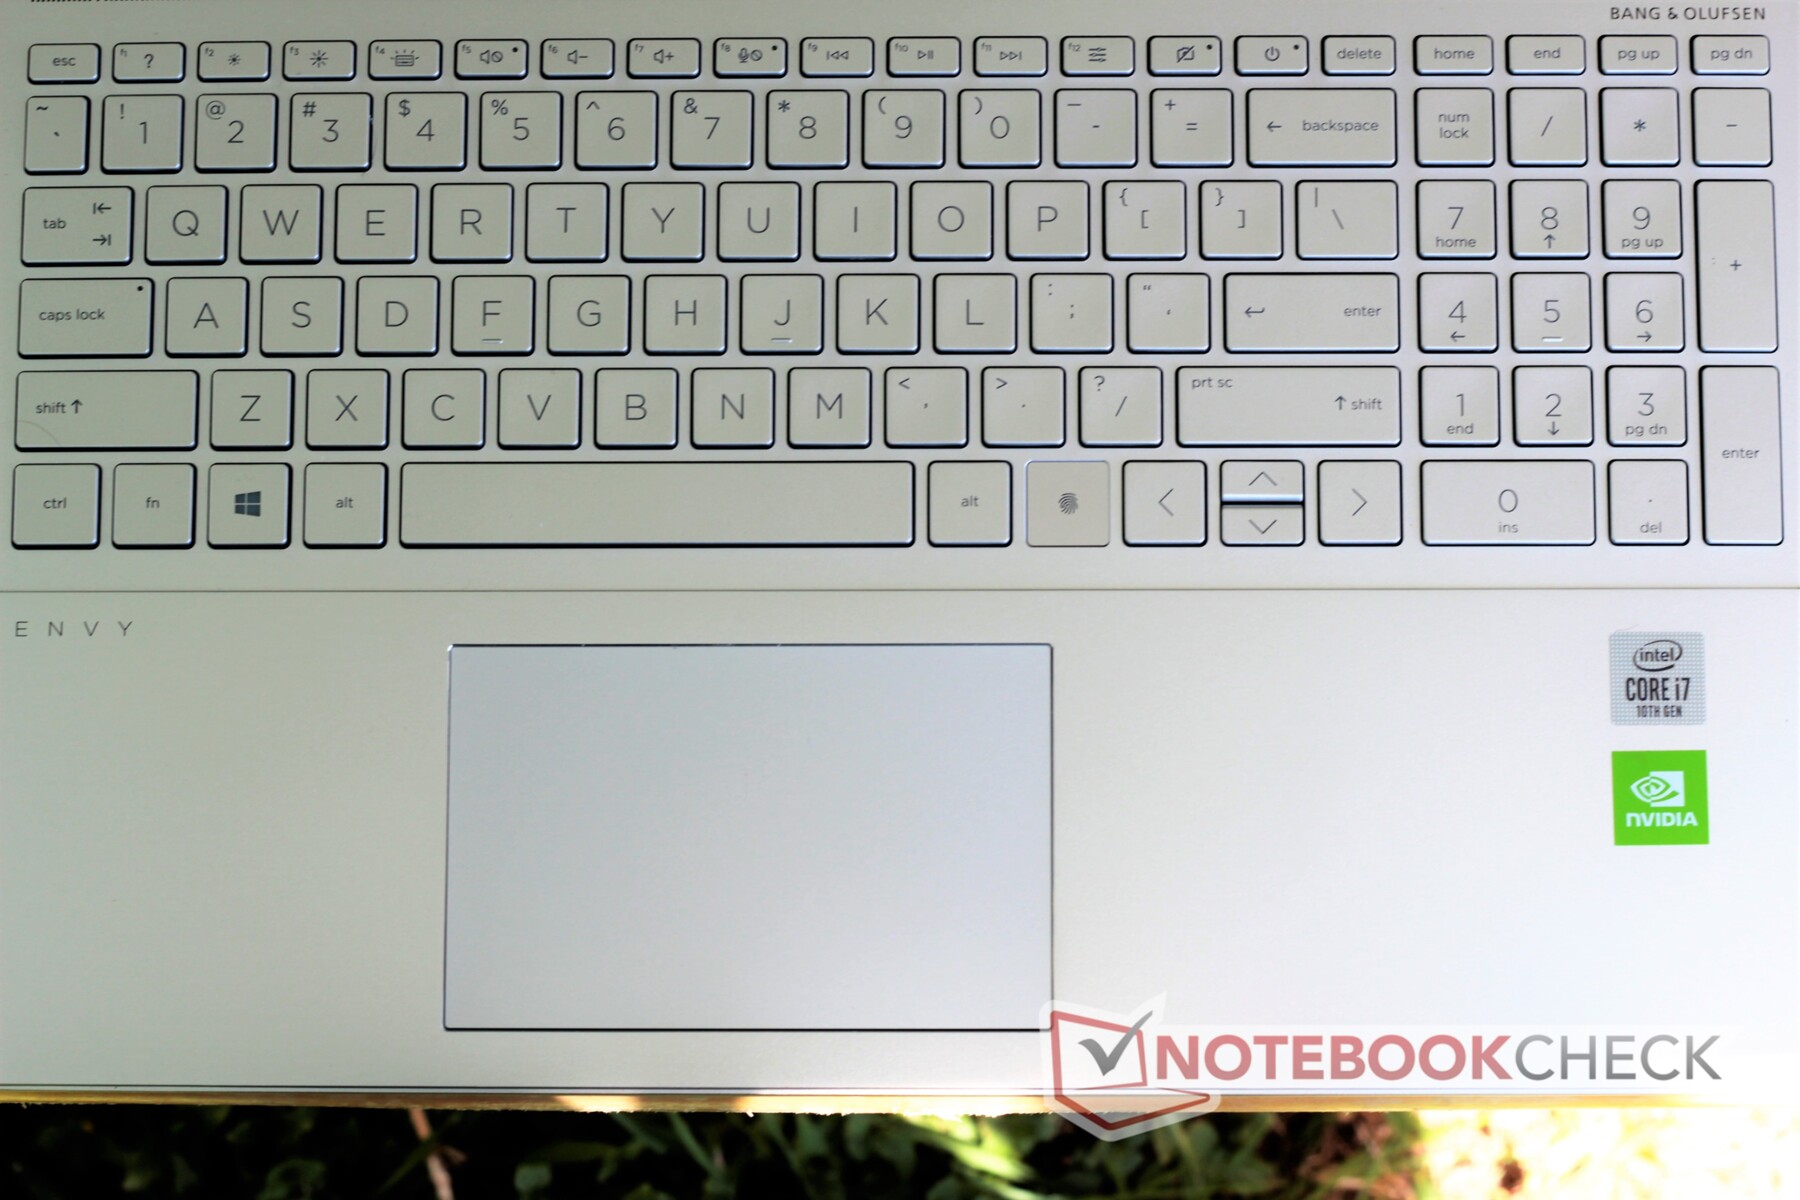
Input Devices
Keyboard
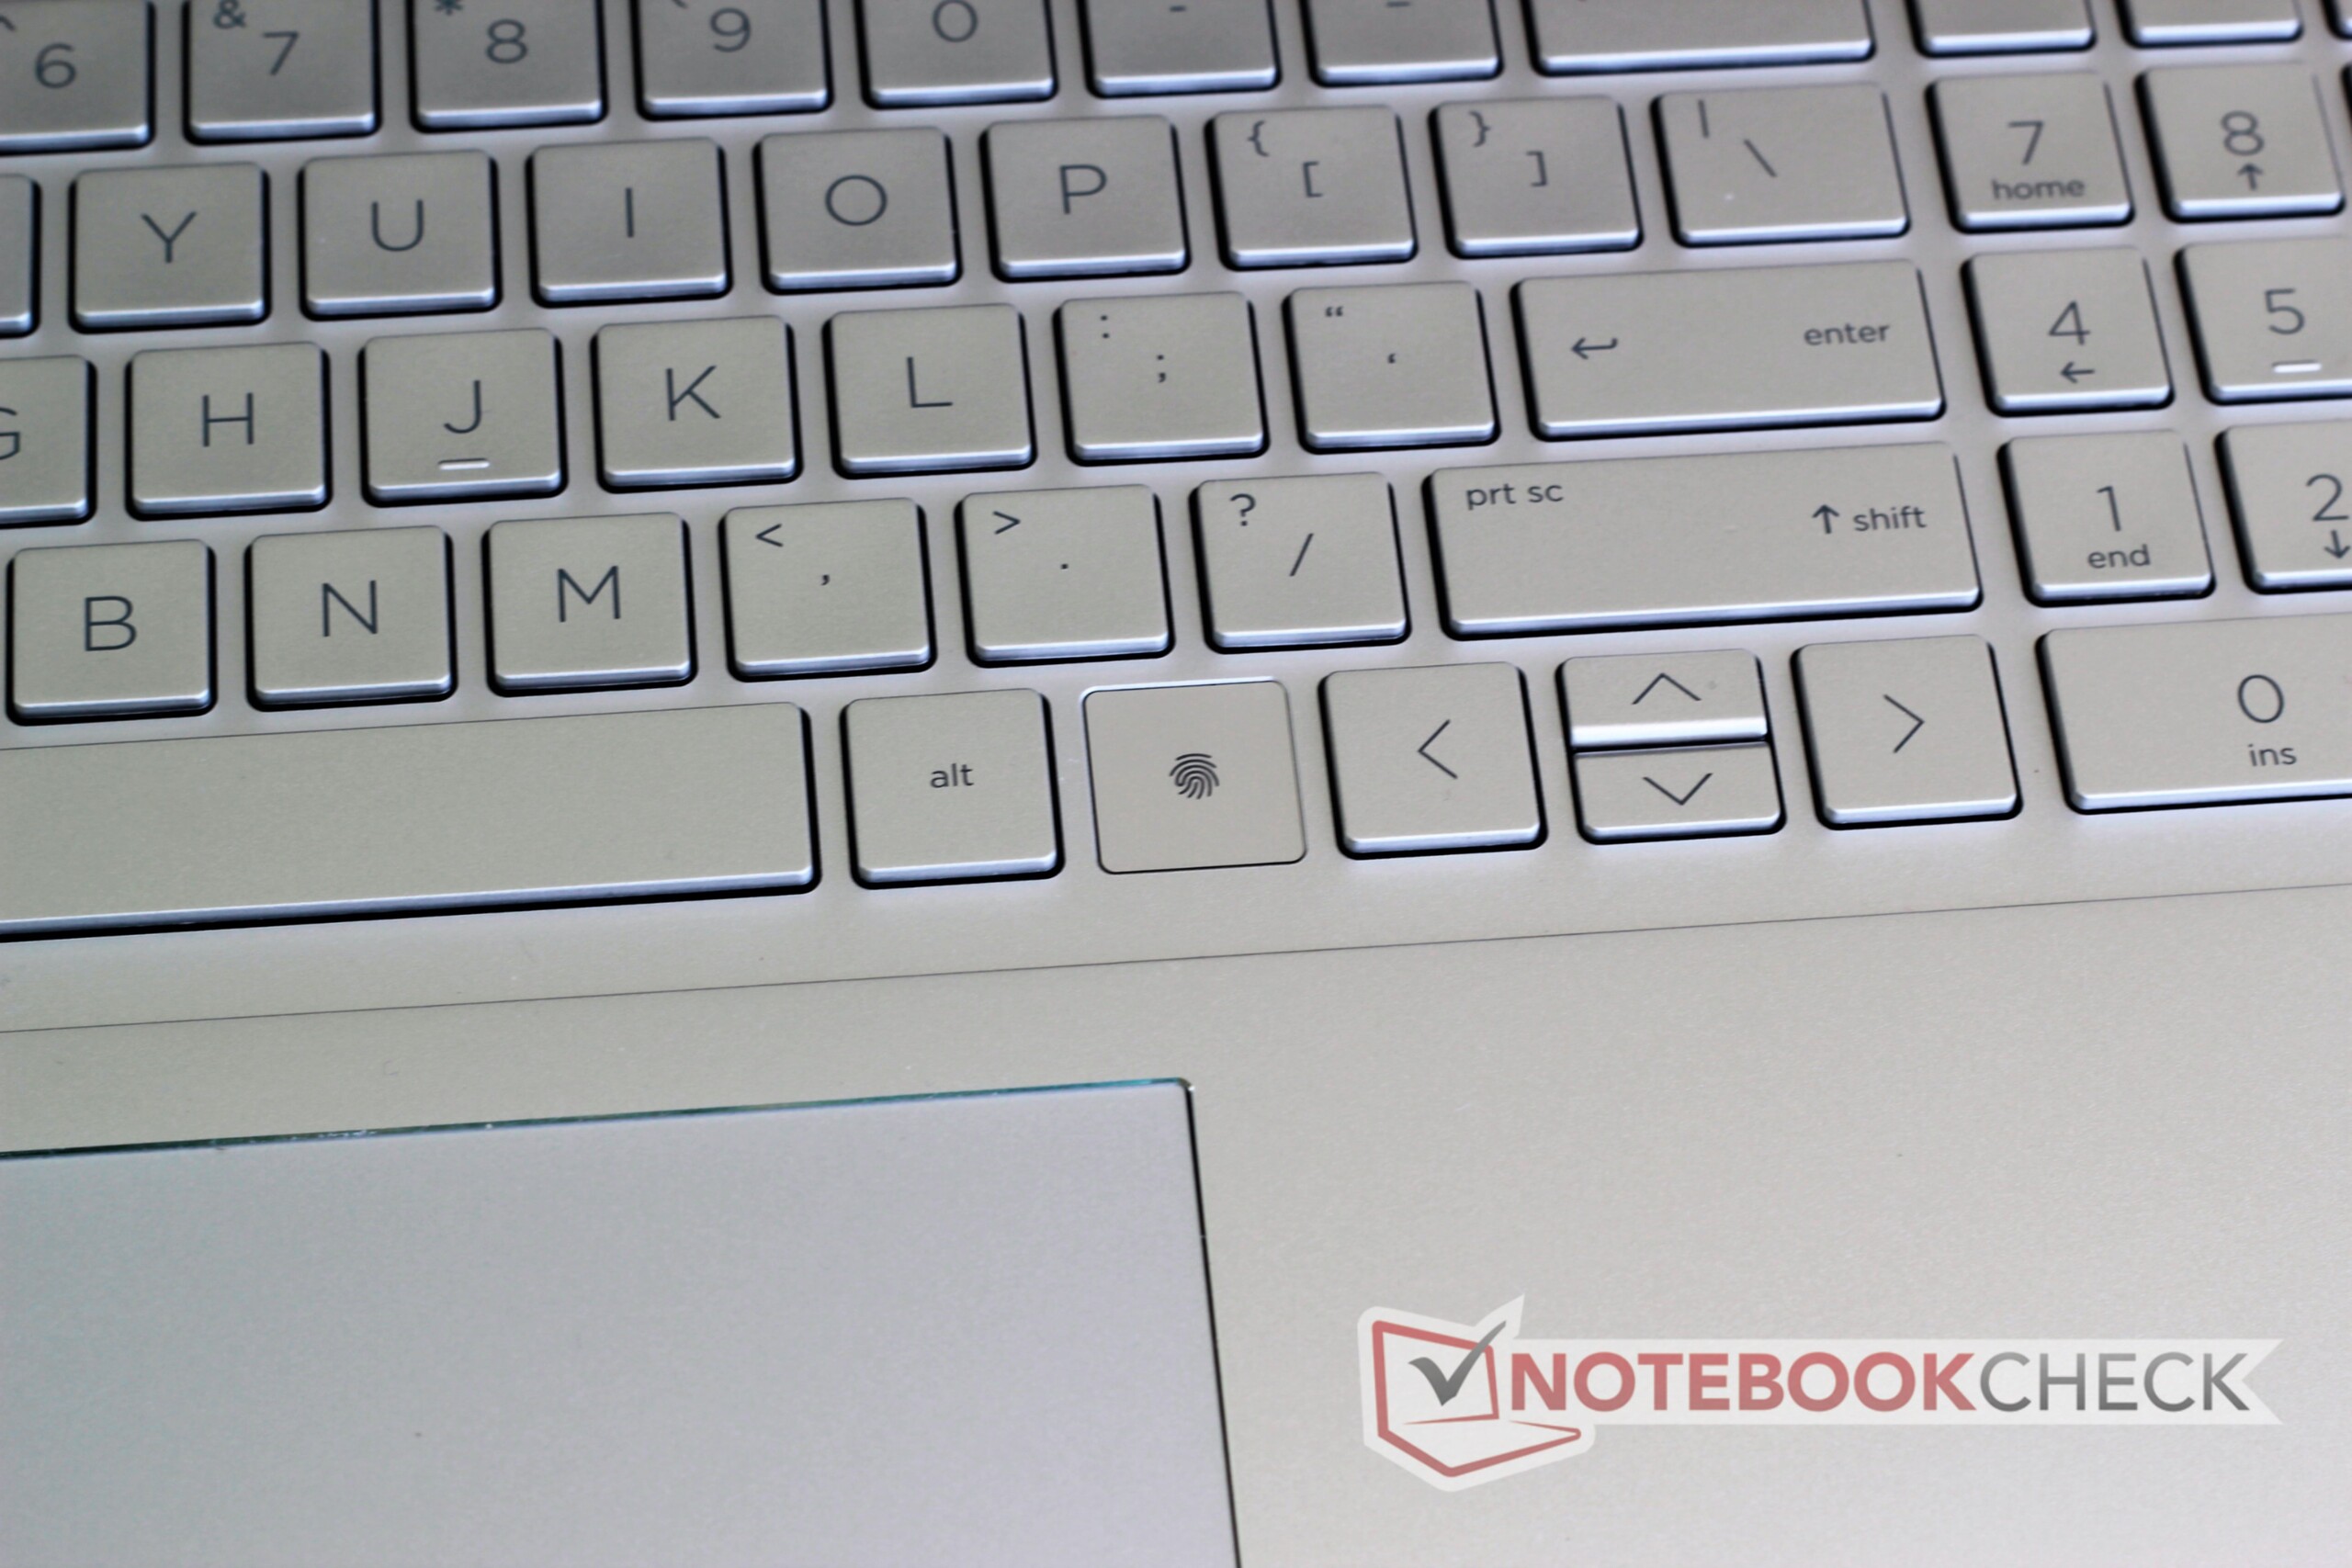
The keyboard's tactility is excellent. The keys have good travel and offer great feedback. Typists will enjoy this keyboard; it feels good underhand, and the keys are well-sized and well-spaced. The half-sized up and down arrow keys are annoying, but this is up to personal preferences.
One aspect almost all users will find annoying is the loss of the right Ctrl button. HP has replaced this key with the fingerprint scanner. While the scanner is a welcome addition, the absence of Ctrl on the right side is a huge detriment to the keyboard as a whole. Hotkeys that rely on Ctrl will force some users to stretch their hands across the keyboard, which can be frustrating. Replacing Alt would have been a better choice.
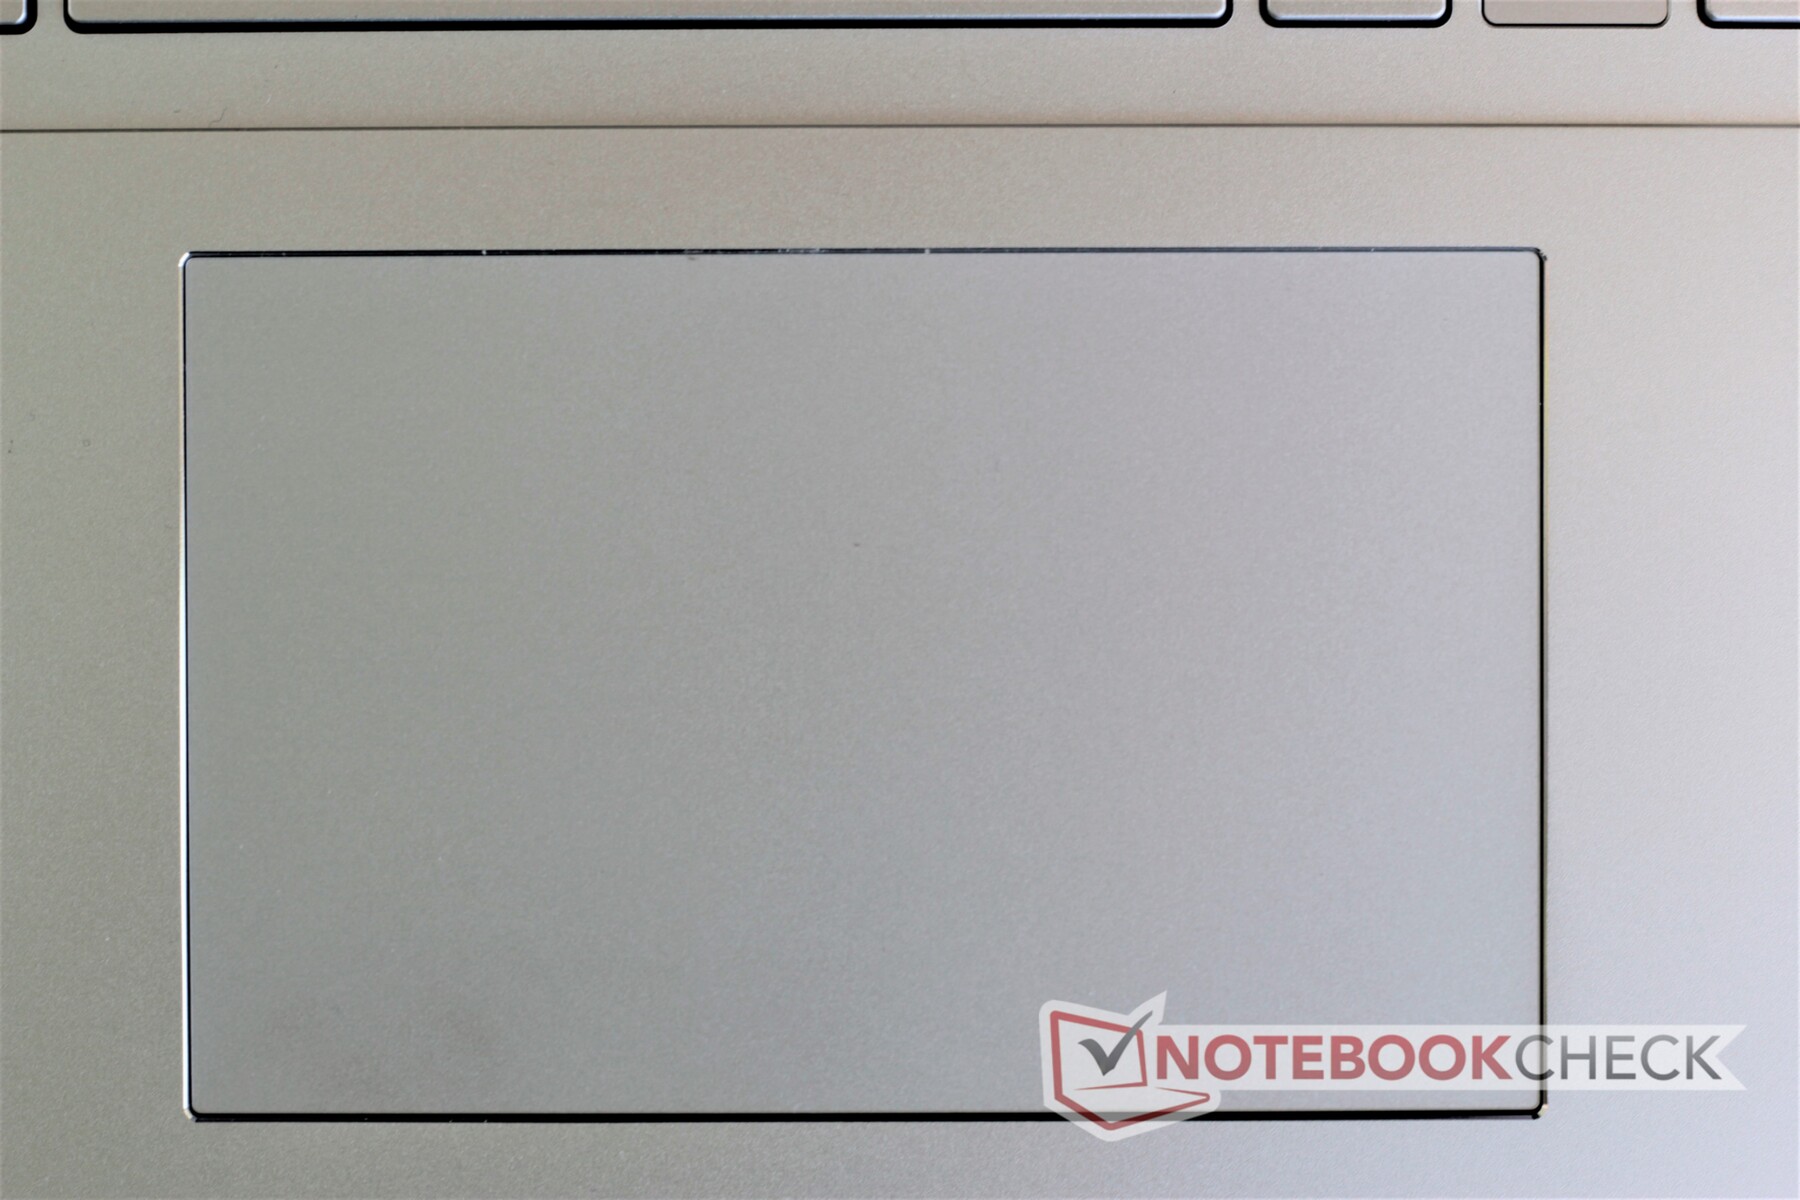
Touchpad
The touchpad is large and feels great. It is a single surface with no dedicated buttons for right- or left-clicks. Instead, users will need to click on the right and left sides of the bottom of the trackpad, á lá early unibody MacBook Pros. Gestures fire off reliably, and tracking is accurate. Clicks feel solid but sound hollow.
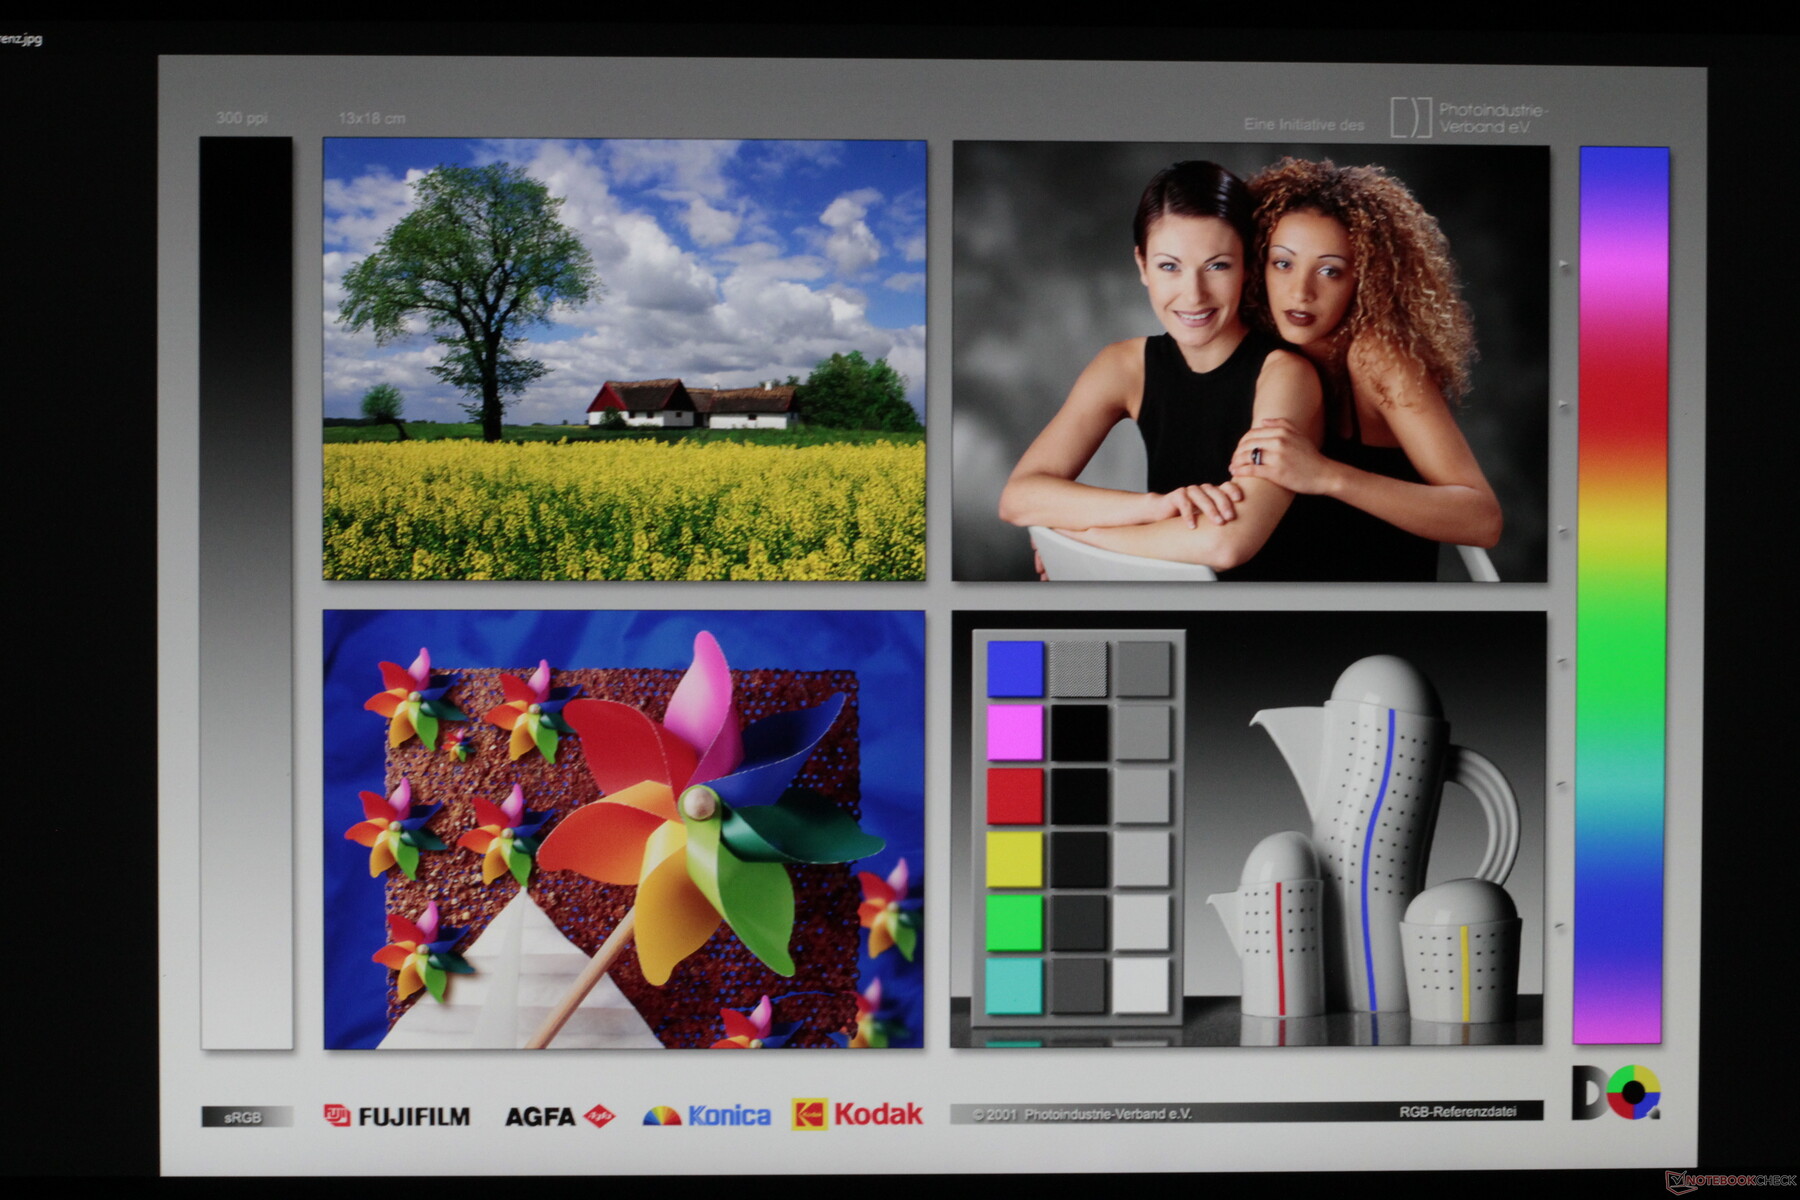
Display
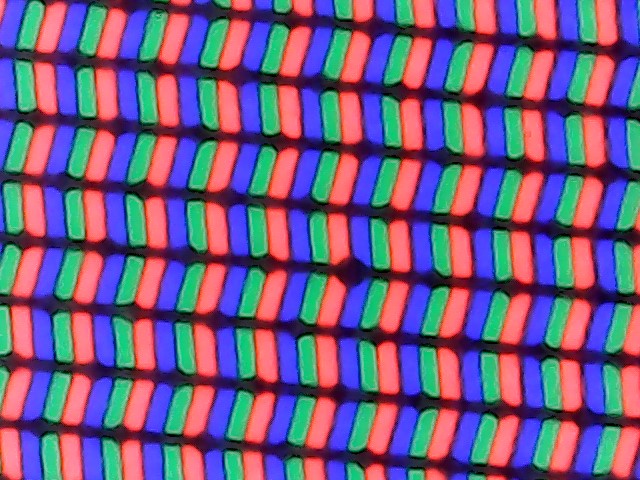
The defining feature of the HP Envy 17t is its 4K (3840x2160) display. In short, the display is bright, beautiful, and sharp. The backlight averages 382 nits, which is on the lower end for a premium multimedia laptop. While the Envy 17t's display doesn't quite measure up to the likes of the MSI Prestige 15 or Dell XPS 15 9500, it should be more than bright enough for most people. The 17t's screen is a fair bit bright than most other 17-inch multimedia laptops. Black levels are good at 0.34, making for good contrast. Response times are reasonable for an IPS display. There is no PWM.
HP also sells a model with a standard 1080p IPS display and a model with a 1080p touch display. Both of these, like the 4K screen in our review device, are covered with glossy glass. There is no option for a 4K touch panel.
| |||||||||||||||||||||||||
Brightness Distribution: 86 %
Center on Battery: 383.4 cd/m²
Contrast: 1128:1 (Black: 0.34 cd/m²)
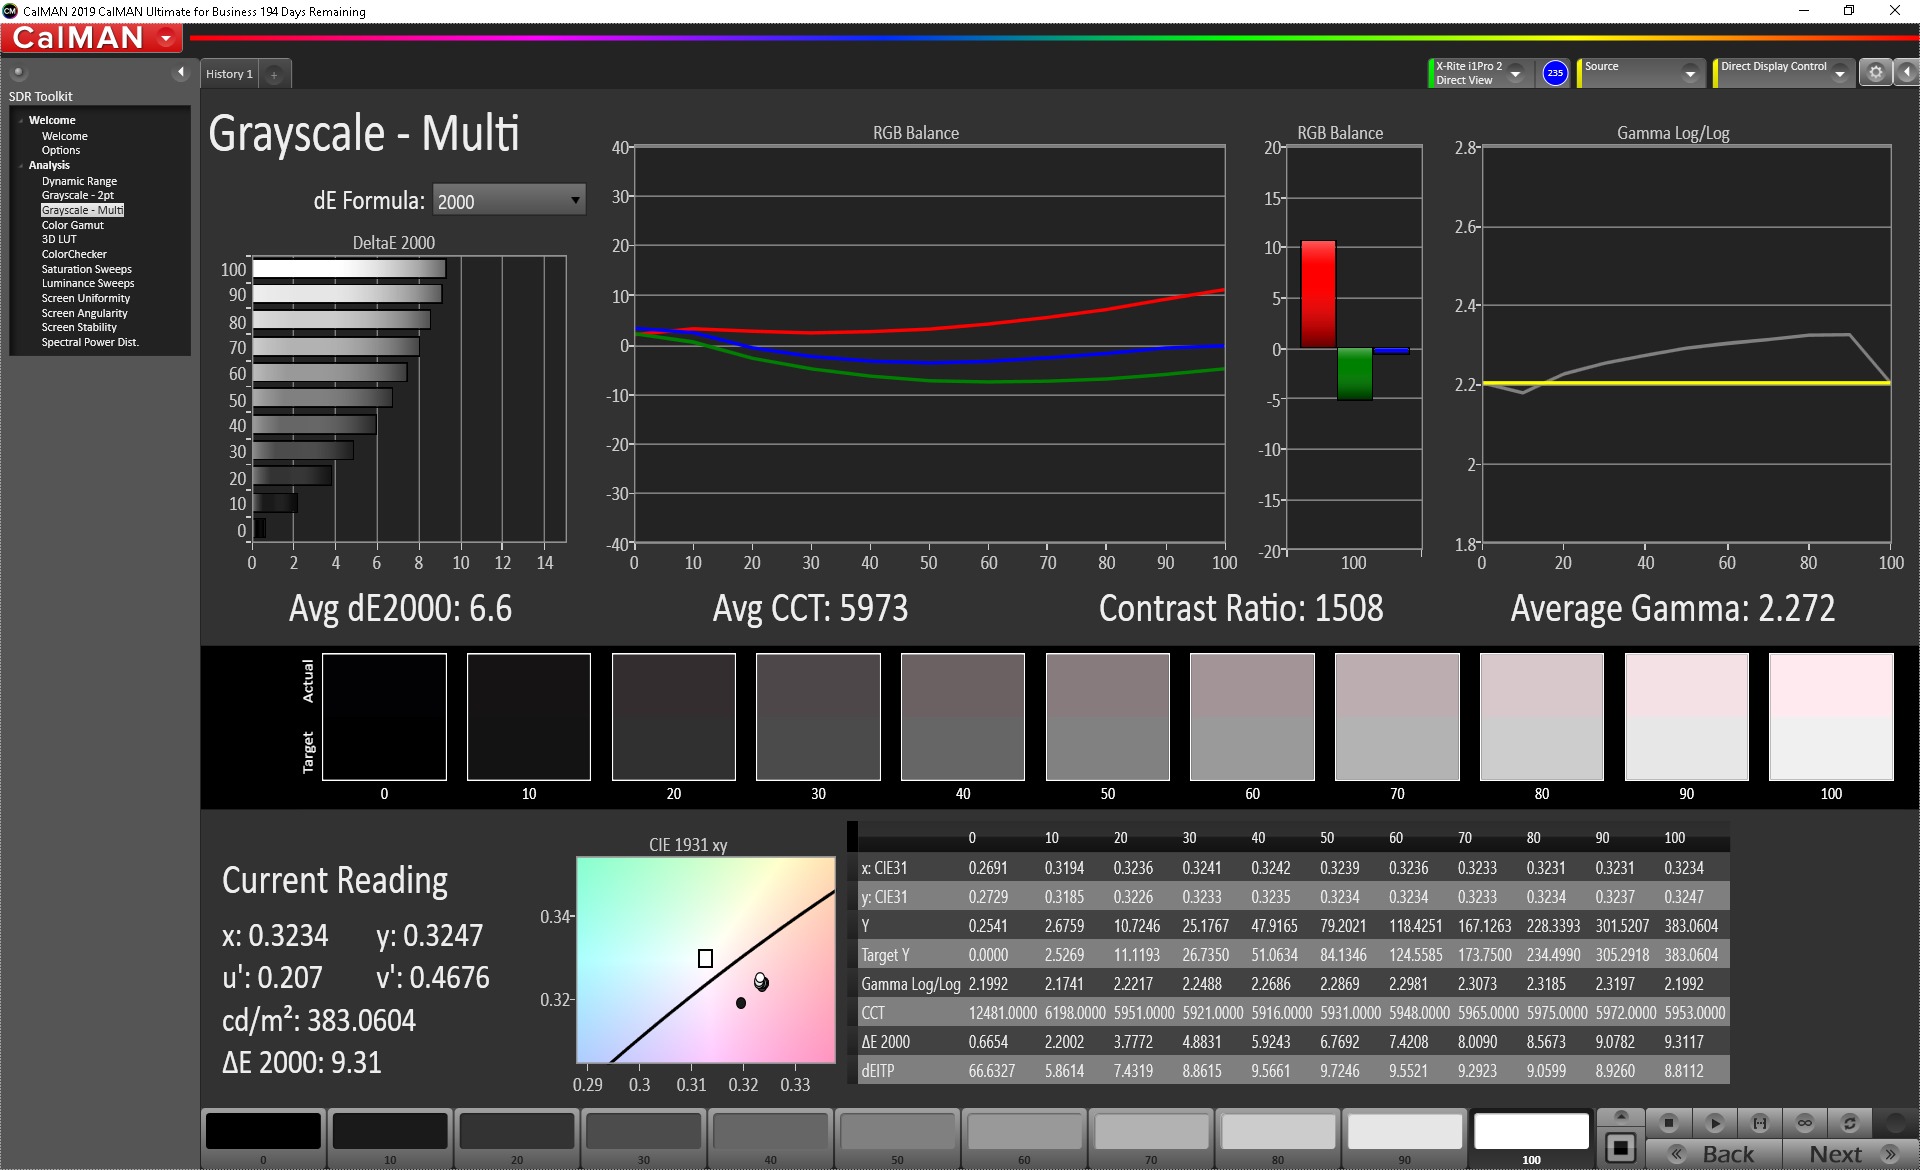
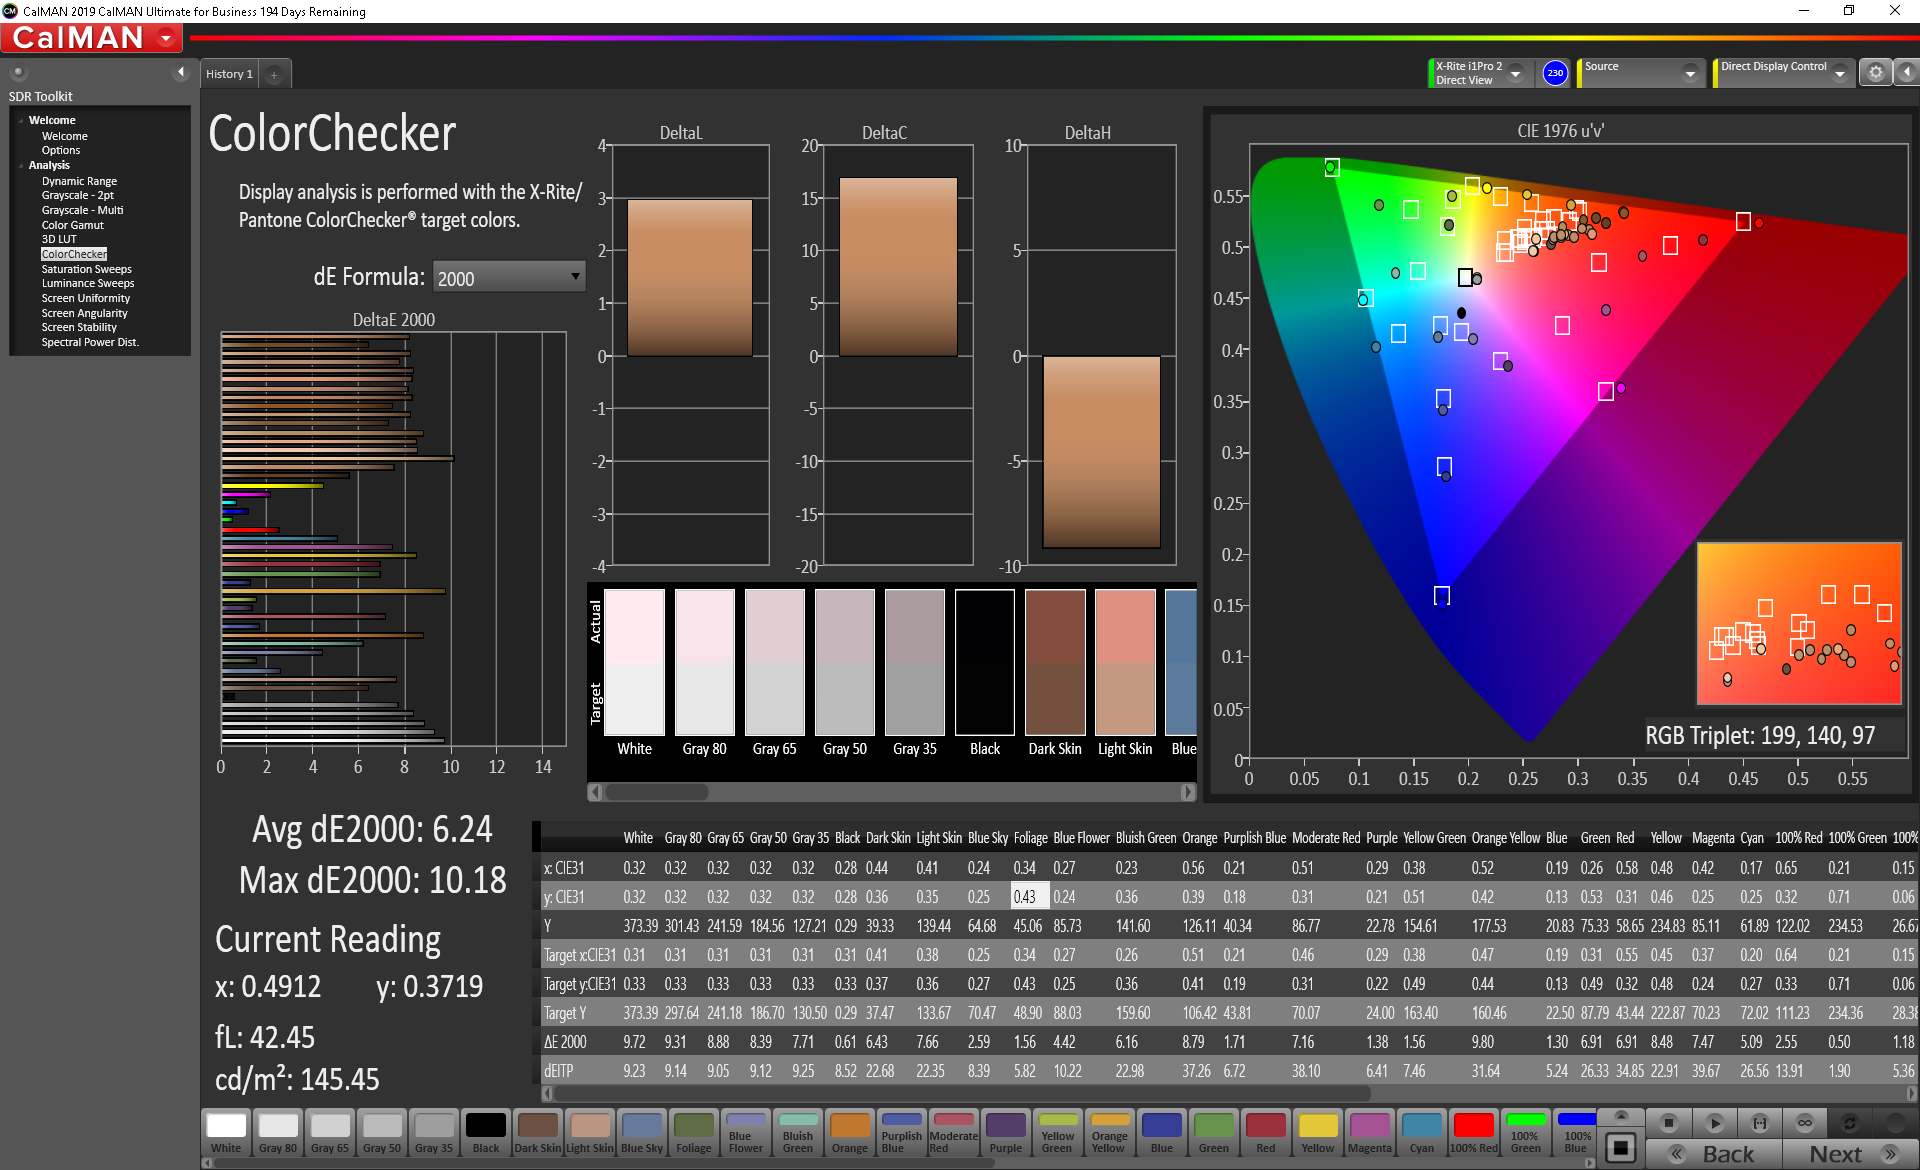
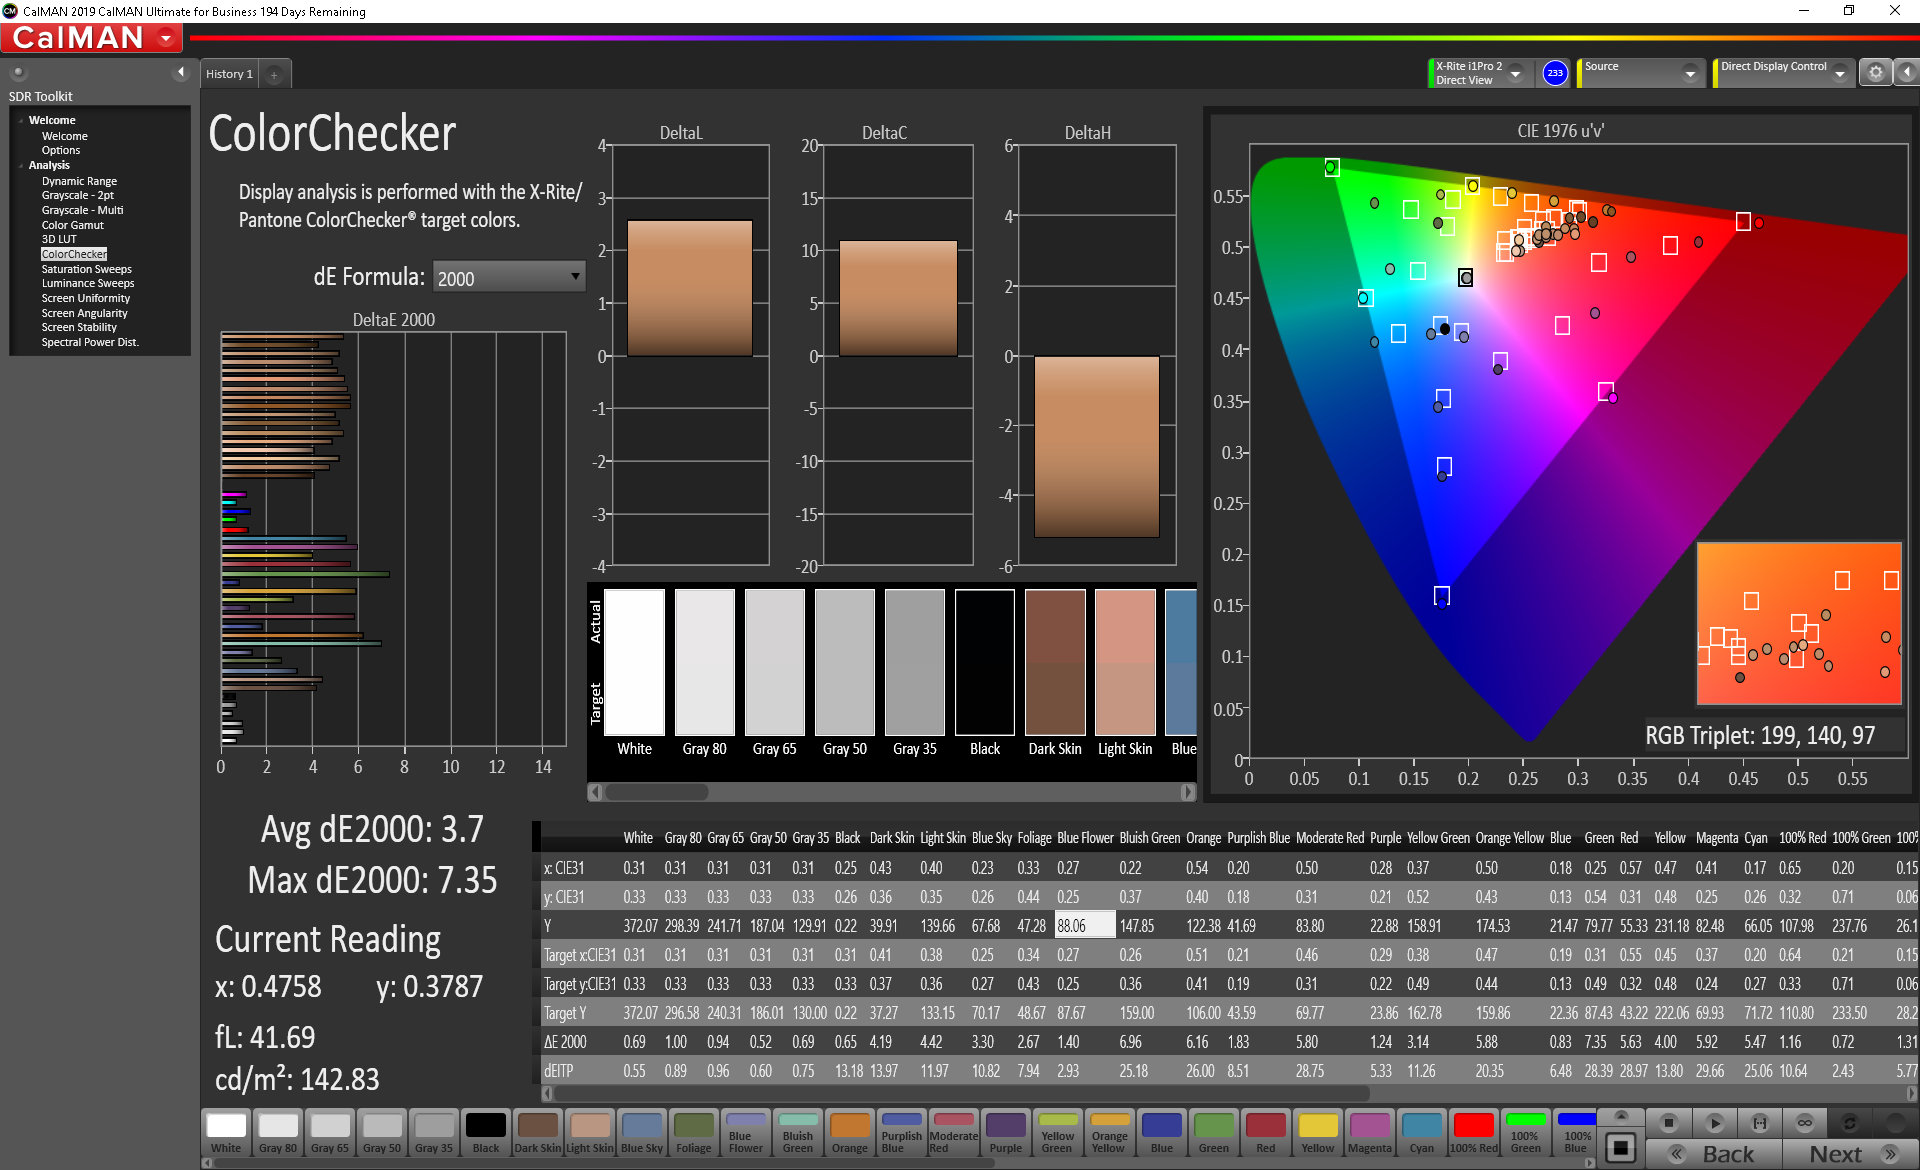
ΔE ColorChecker Calman: 6.24 | ∀{0.5-29.43 Ø4.73}
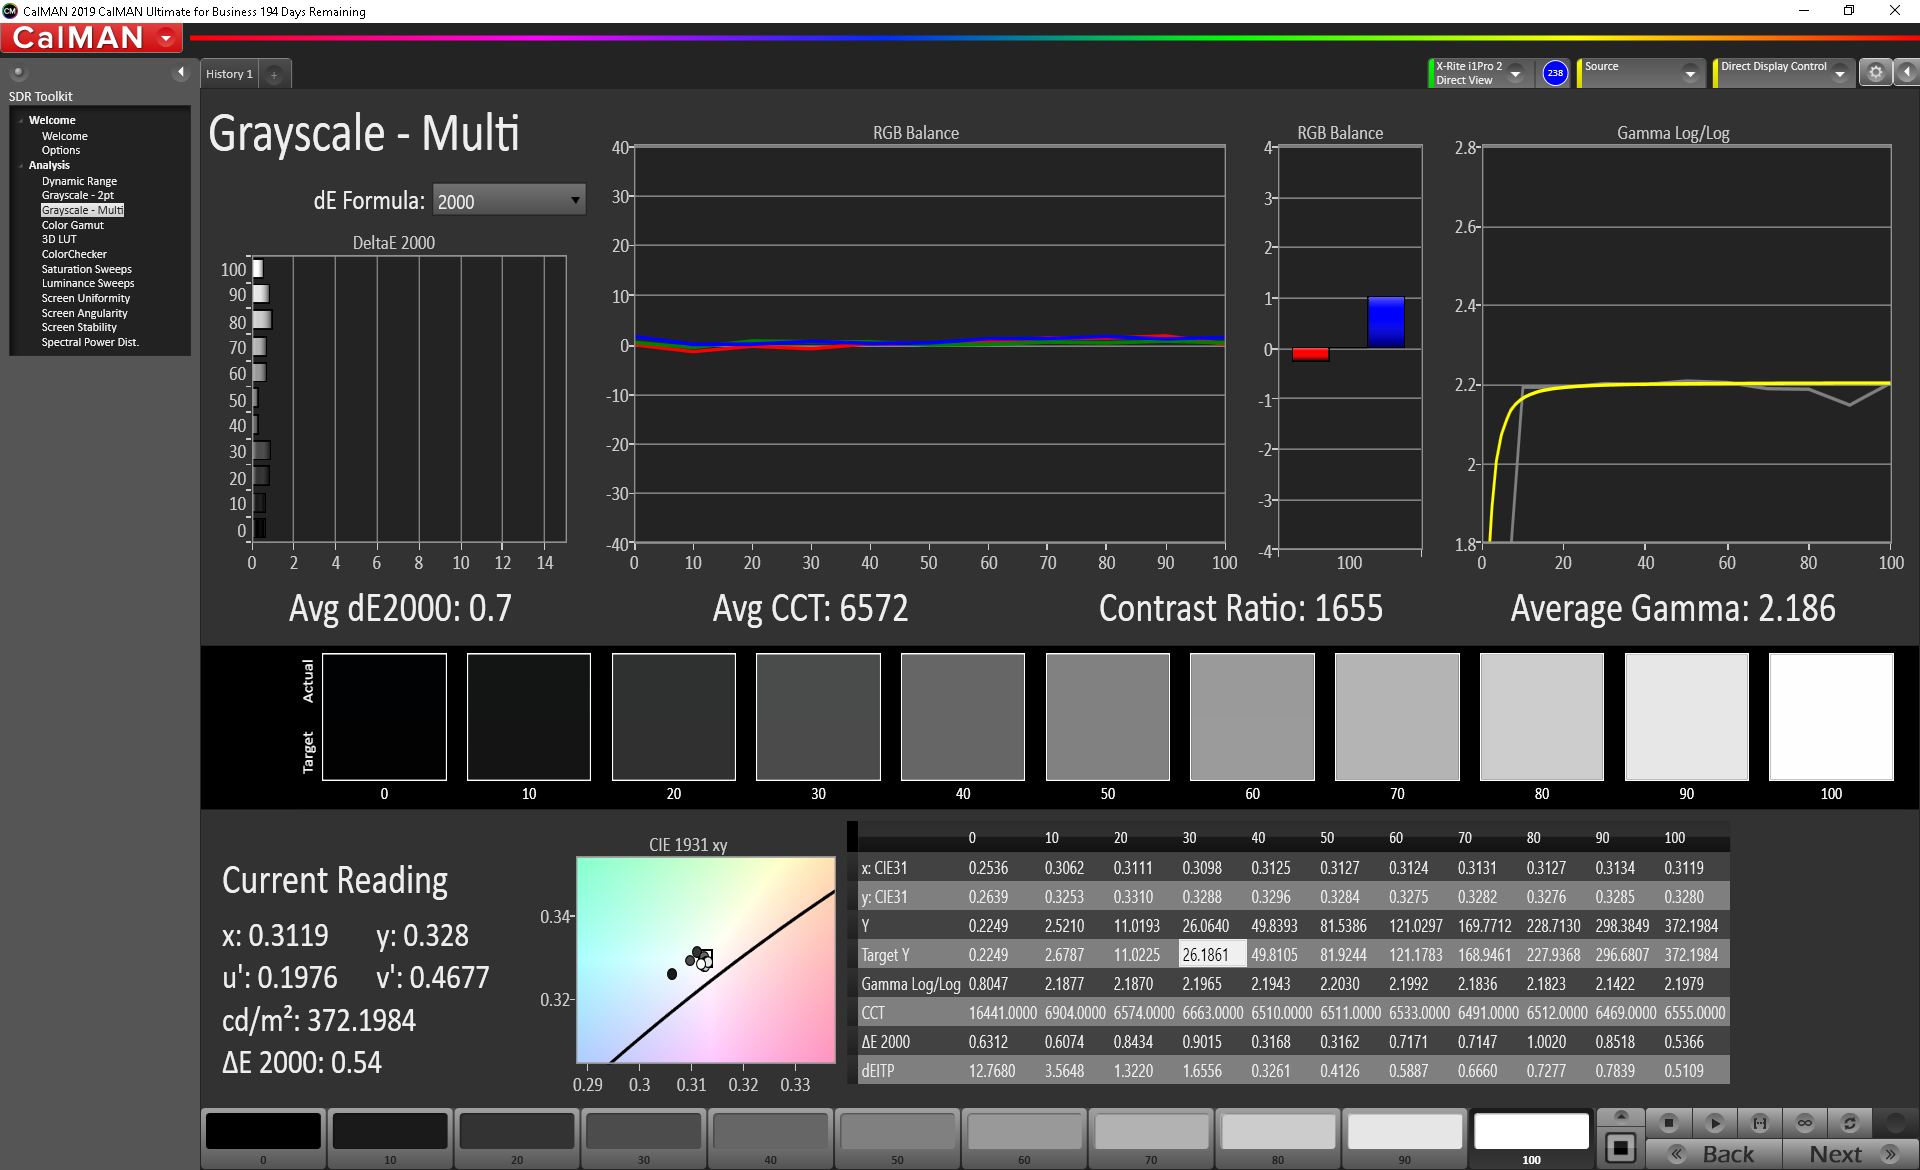
calibrated: 3.7
ΔE Greyscale Calman: 6.6 | ∀{0.09-98 Ø4.97}
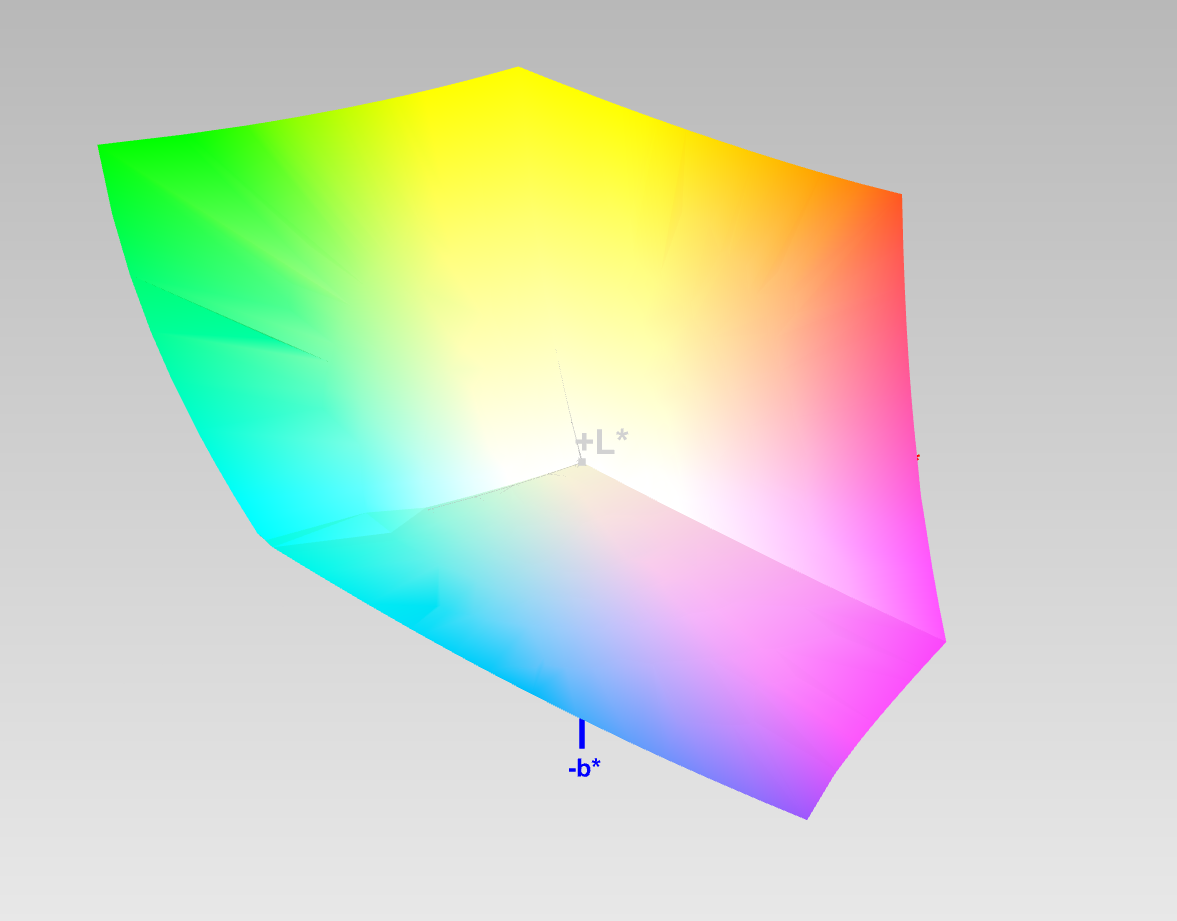
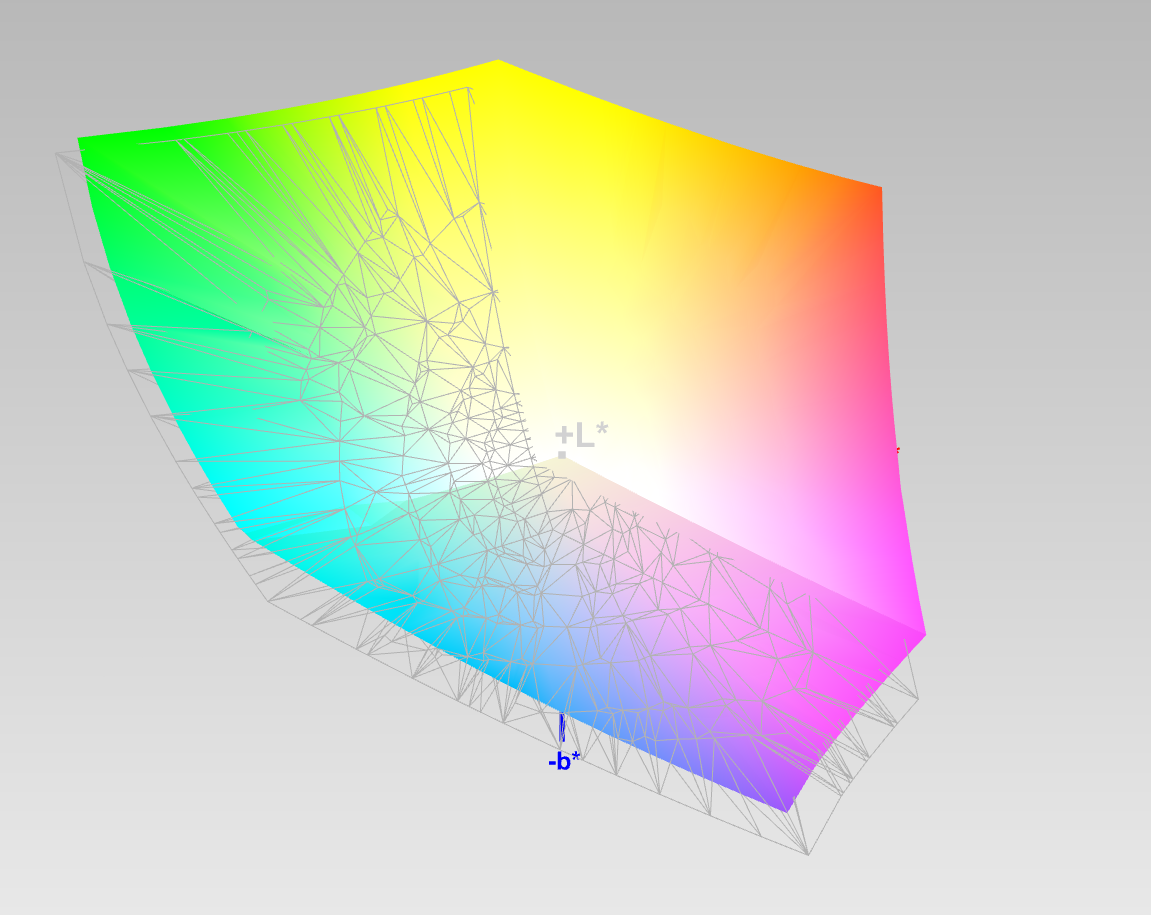
100% sRGB (Argyll 1.6.3 3D)
88% AdobeRGB 1998 (Argyll 1.6.3 3D)
99.8% AdobeRGB 1998 (Argyll 3D)
100% sRGB (Argyll 3D)
86.2% Display P3 (Argyll 3D)
Gamma: 2.272
CCT: 5973 K
| HP Envy 17t-cg000 AU Optronics AUO168E, IPS, 17.3", 3840x2160 | Medion Akoya P17605 AU Optronics AUO429D, IPS, 17.3", 1920x1080 | Asus VivoBook 17 M712DA-AU017T BOE084E, IPS, 17.3", 1920x1080 | HP Envy 17-ce1004ng BOE0825, IPS, 17.3", 1920x1080 | Dell Inspiron 17 3780 AU Optronics B173HAN01.3, IPS, 17.3", 1920x1080 | LG Gram 17Z990-R.AAS7U1 LG Philips LP170WQ1-SPA1, IPS, 17", 2560x1600 | Dell XPS 15 9500 Core i7 4K UHD Sharp LQ156R1, IPS, 15.6", 3840x2400 | |
|---|---|---|---|---|---|---|---|
| Display | -25% | -50% | -23% | -24% | -21% | 1% | |
| Display P3 Coverage (%) | 86.2 | 62.3 -28% | 40.76 -53% | 63.3 -27% | 63.7 -26% | 64.2 -26% | 89.7 4% |
| sRGB Coverage (%) | 100 | 88.6 -11% | 59.7 -40% | 91.5 -8% | 88.9 -11% | 96.3 -4% | 100 0% |
| AdobeRGB 1998 Coverage (%) | 99.8 | 63.7 -36% | 42.11 -58% | 64.6 -35% | 64.6 -35% | 66.3 -34% | 99.8 0% |
| Response Times | -3% | 43% | 37% | -11% | 1% | -16% | |
| Response Time Grey 50% / Grey 80% * (ms) | 45.2 ? | 45 ? -0% | 24 ? 47% | 30 ? 34% | 46 ? -2% | 42 ? 7% | 54 ? -19% |
| Response Time Black / White * (ms) | 29.6 ? | 31 ? -5% | 18 ? 39% | 18 ? 39% | 35.2 ? -19% | 31.2 ? -5% | 33.2 ? -12% |
| PWM Frequency (Hz) | |||||||
| Screen | 14% | -14% | -5% | 5% | 17% | 19% | |
| Brightness middle (cd/m²) | 383.4 | 298 -22% | 262 -32% | 293 -24% | 322.9 -16% | 370.6 -3% | 557.9 46% |
| Brightness (cd/m²) | 382 | 294 -23% | 234 -39% | 280 -27% | 322 -16% | 356 -7% | 541 42% |
| Brightness Distribution (%) | 86 | 88 2% | 84 -2% | 83 -3% | 84 -2% | 89 3% | 91 6% |
| Black Level * (cd/m²) | 0.34 | 0.255 25% | 0.265 22% | 0.335 1% | 0.26 24% | 0.28 18% | 0.39 -15% |
| Contrast (:1) | 1128 | 1169 4% | 989 -12% | 875 -22% | 1242 10% | 1324 17% | 1431 27% |
| Colorchecker dE 2000 * | 6.24 | 3.01 52% | 5.13 18% | 4.79 23% | 4.19 33% | 3.28 47% | 4.54 27% |
| Colorchecker dE 2000 max. * | 10.18 | 4.59 55% | 19.16 -88% | 11.42 -12% | 7.04 31% | 5.85 43% | 7.92 22% |
| Colorchecker dE 2000 calibrated * | 3.7 | 2.1 43% | 3.96 -7% | 1.76 52% | 3.55 4% | 1.03 72% | 3.82 -3% |
| Greyscale dE 2000 * | 6.6 | 2.29 65% | 1.22 82% | 6.32 4% | 4.5 32% | 4.9 26% | 3.2 52% |
| Gamma | 2.272 97% | 2.62 84% | 2.42 91% | 2.49 88% | 1.97 112% | 2.19 100% | 1.99 111% |
| CCT | 5973 109% | 6655 98% | 6584 99% | 8002 81% | 7041 92% | 6376 102% | 6451 101% |
| Color Space (Percent of AdobeRGB 1998) (%) | 88 | 58 -34% | 38 -57% | 59 -33% | 57.6 -35% | 60.8 -31% | 89.5 2% |
| Color Space (Percent of sRGB) (%) | 100 | 89 -11% | 59 -41% | 91 -9% | 88.4 -12% | 96.6 -3% | 100 0% |
| Total Average (Program / Settings) | -5% /
5% | -7% /
-14% | 3% /
-3% | -10% /
-3% | -1% /
8% | 1% /
11% |
* ... smaller is better
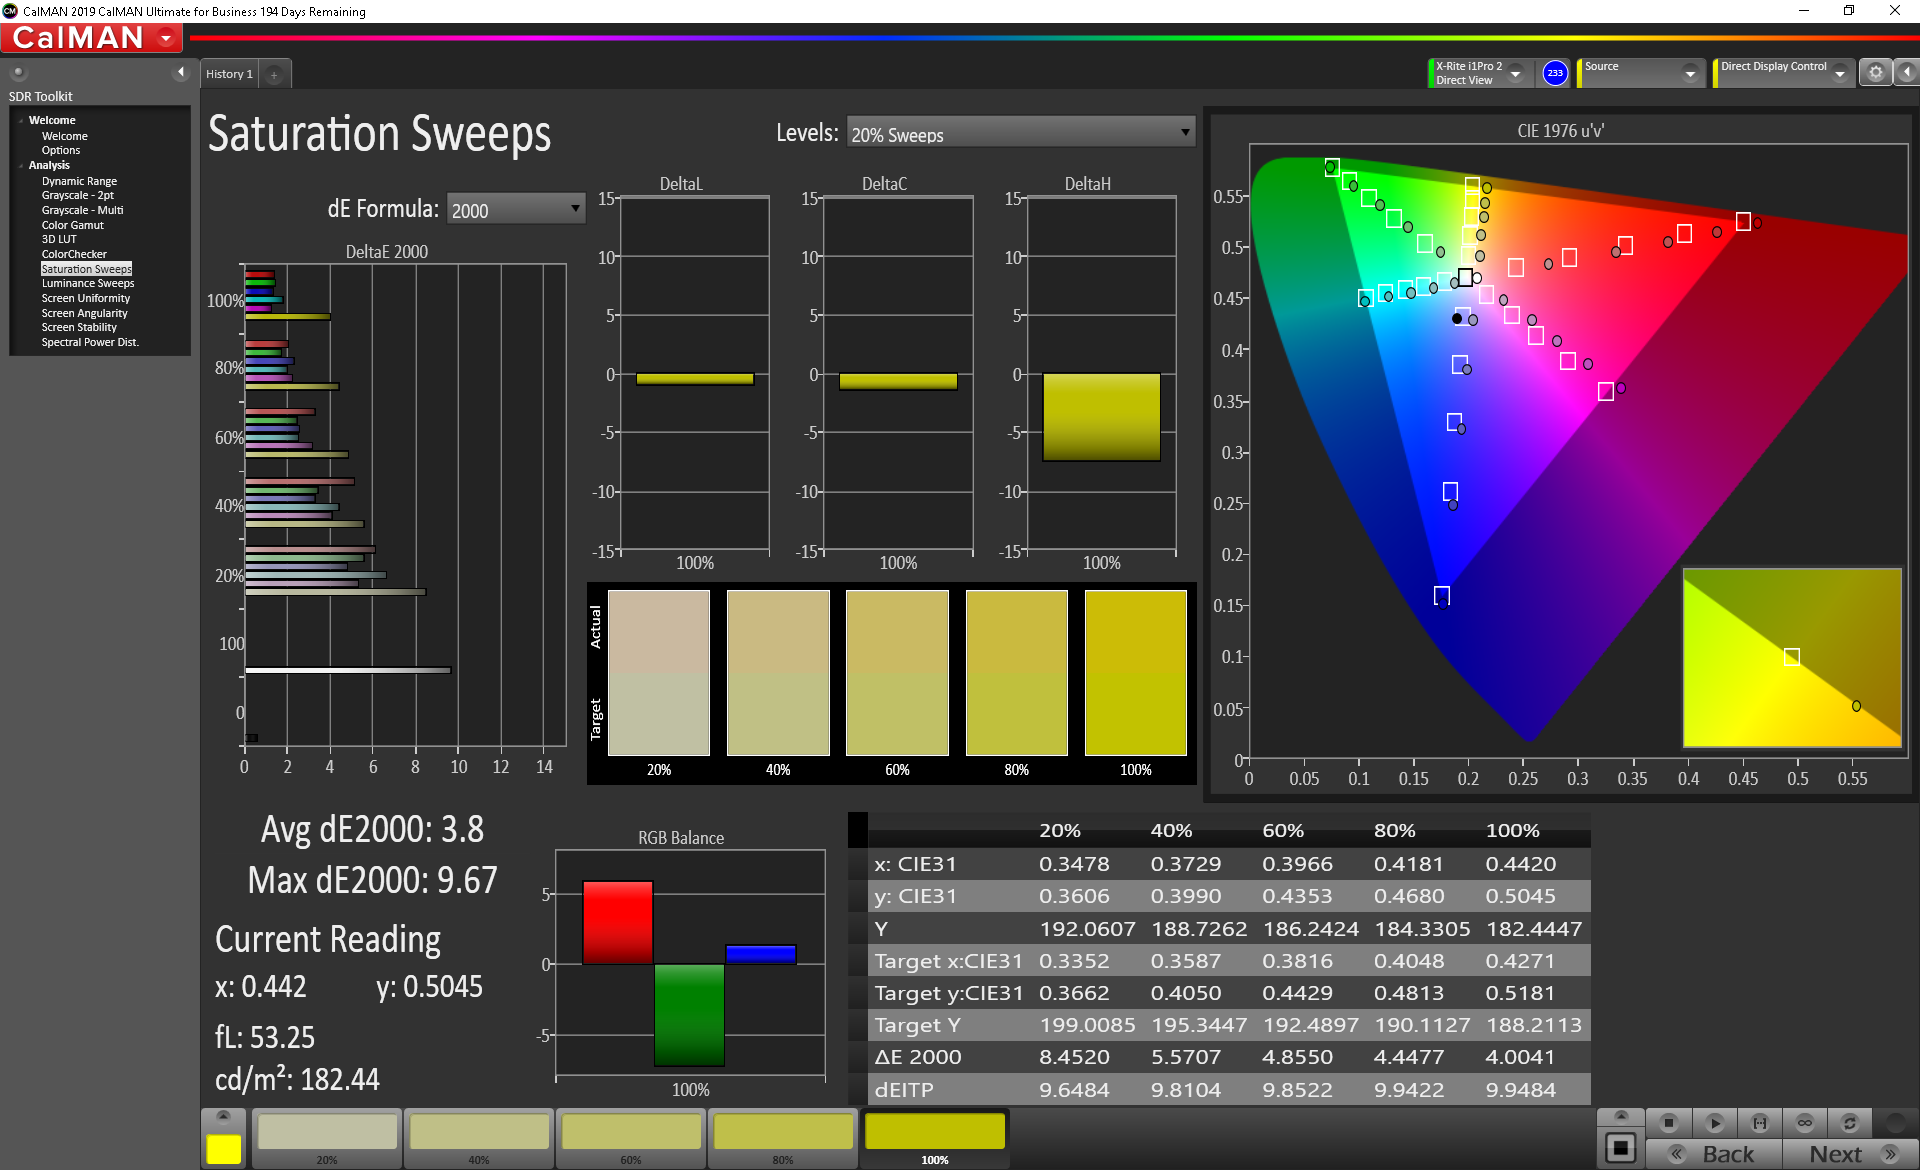
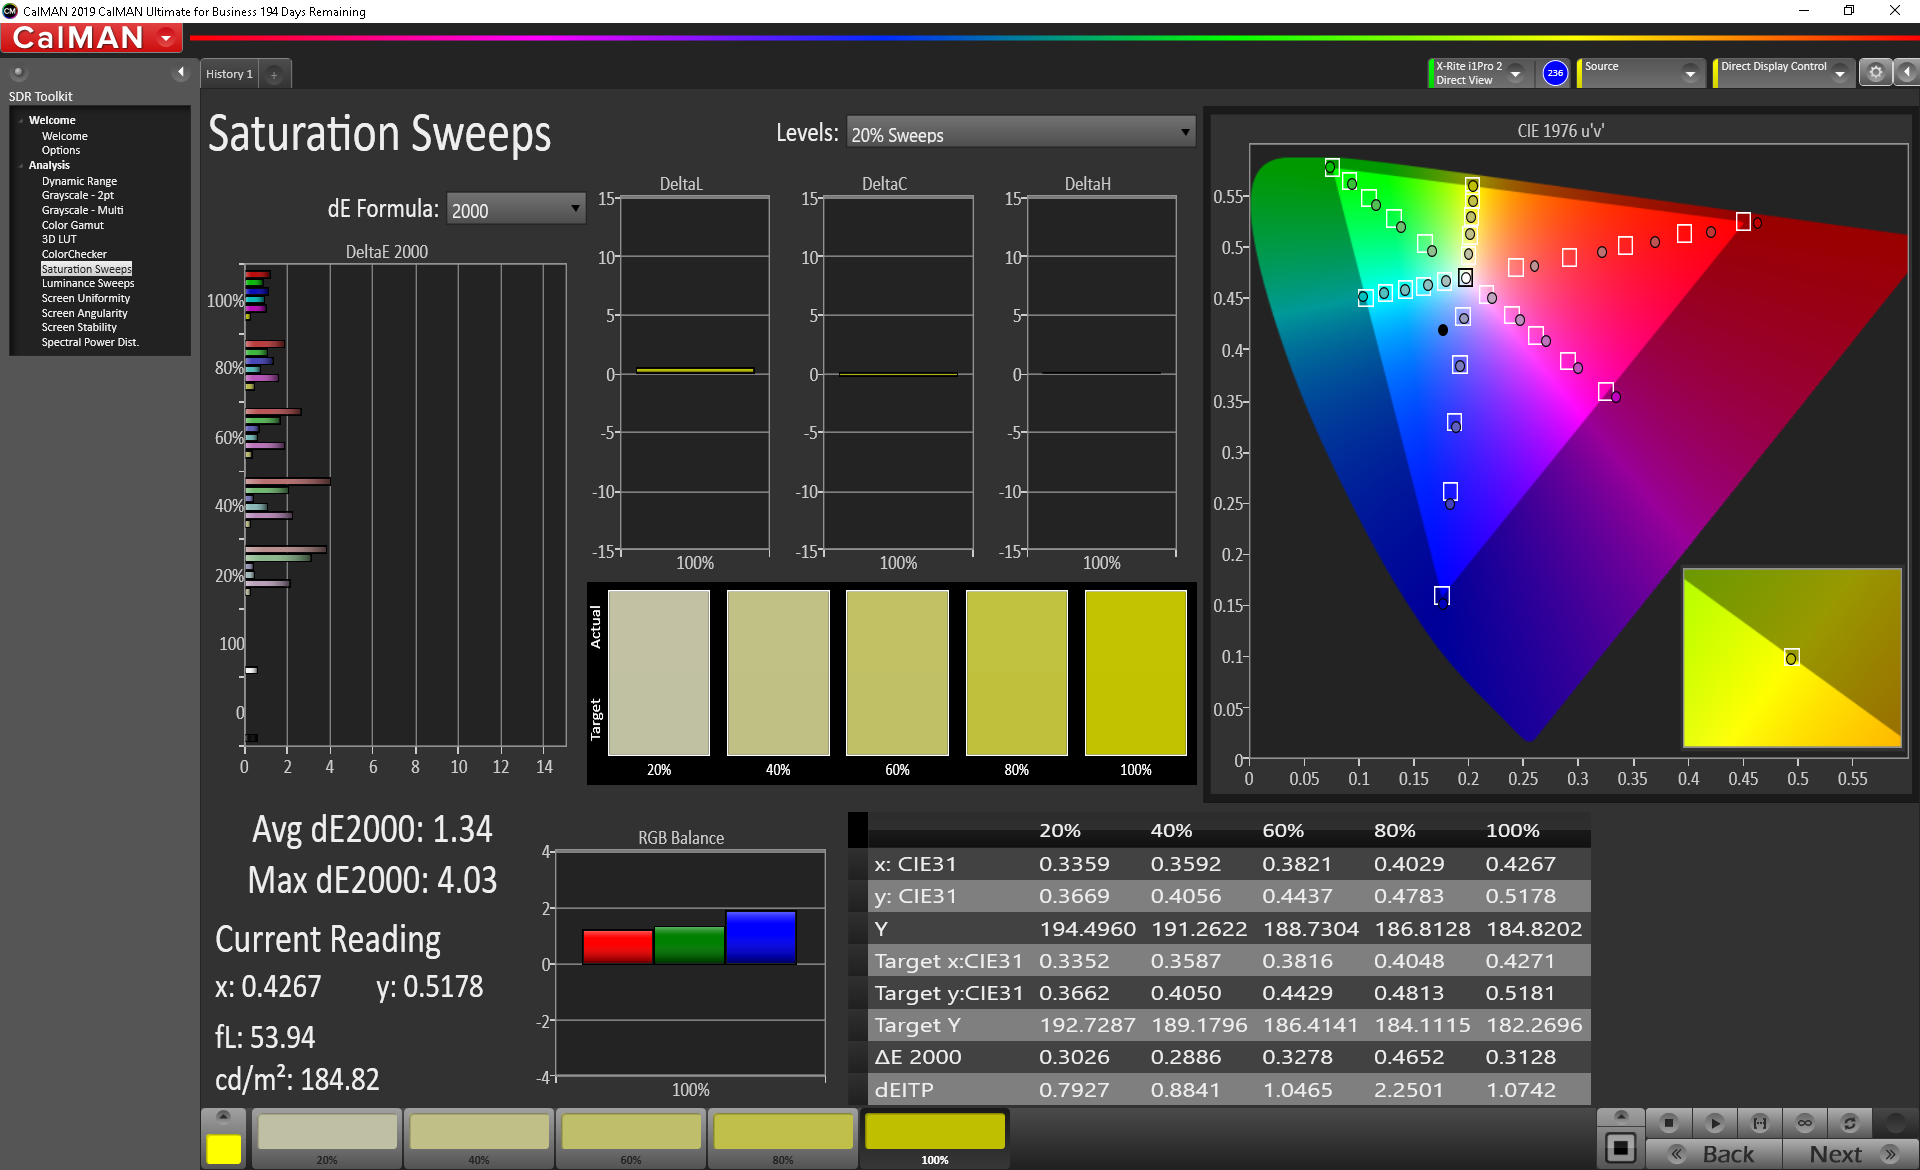
One of the strengths of the HP Envy 17t's 4K display is its color coverage. The panel covers the entirety of the sRGB gamut and 88% of the AdobeRGB gamut. While color coverage is good, color accuracy leaves something to be desired. Prior to calibration, the panel hits DeltaE2000 scores of 6.24 and 6.6 for colors and grays, respectively. These scores edge the Envy 17t out of the acceptable range for professional color work (DeltaE2000 of 3 or lower). However, colors are vibrant on the display, and multimedia pops on the large panel.
Other aspects of color are more than good enough for general consumers. Gamma is nearly perfect at 2.272, and the panel's color temperature, while a bit cool at 5973 K, is acceptable.
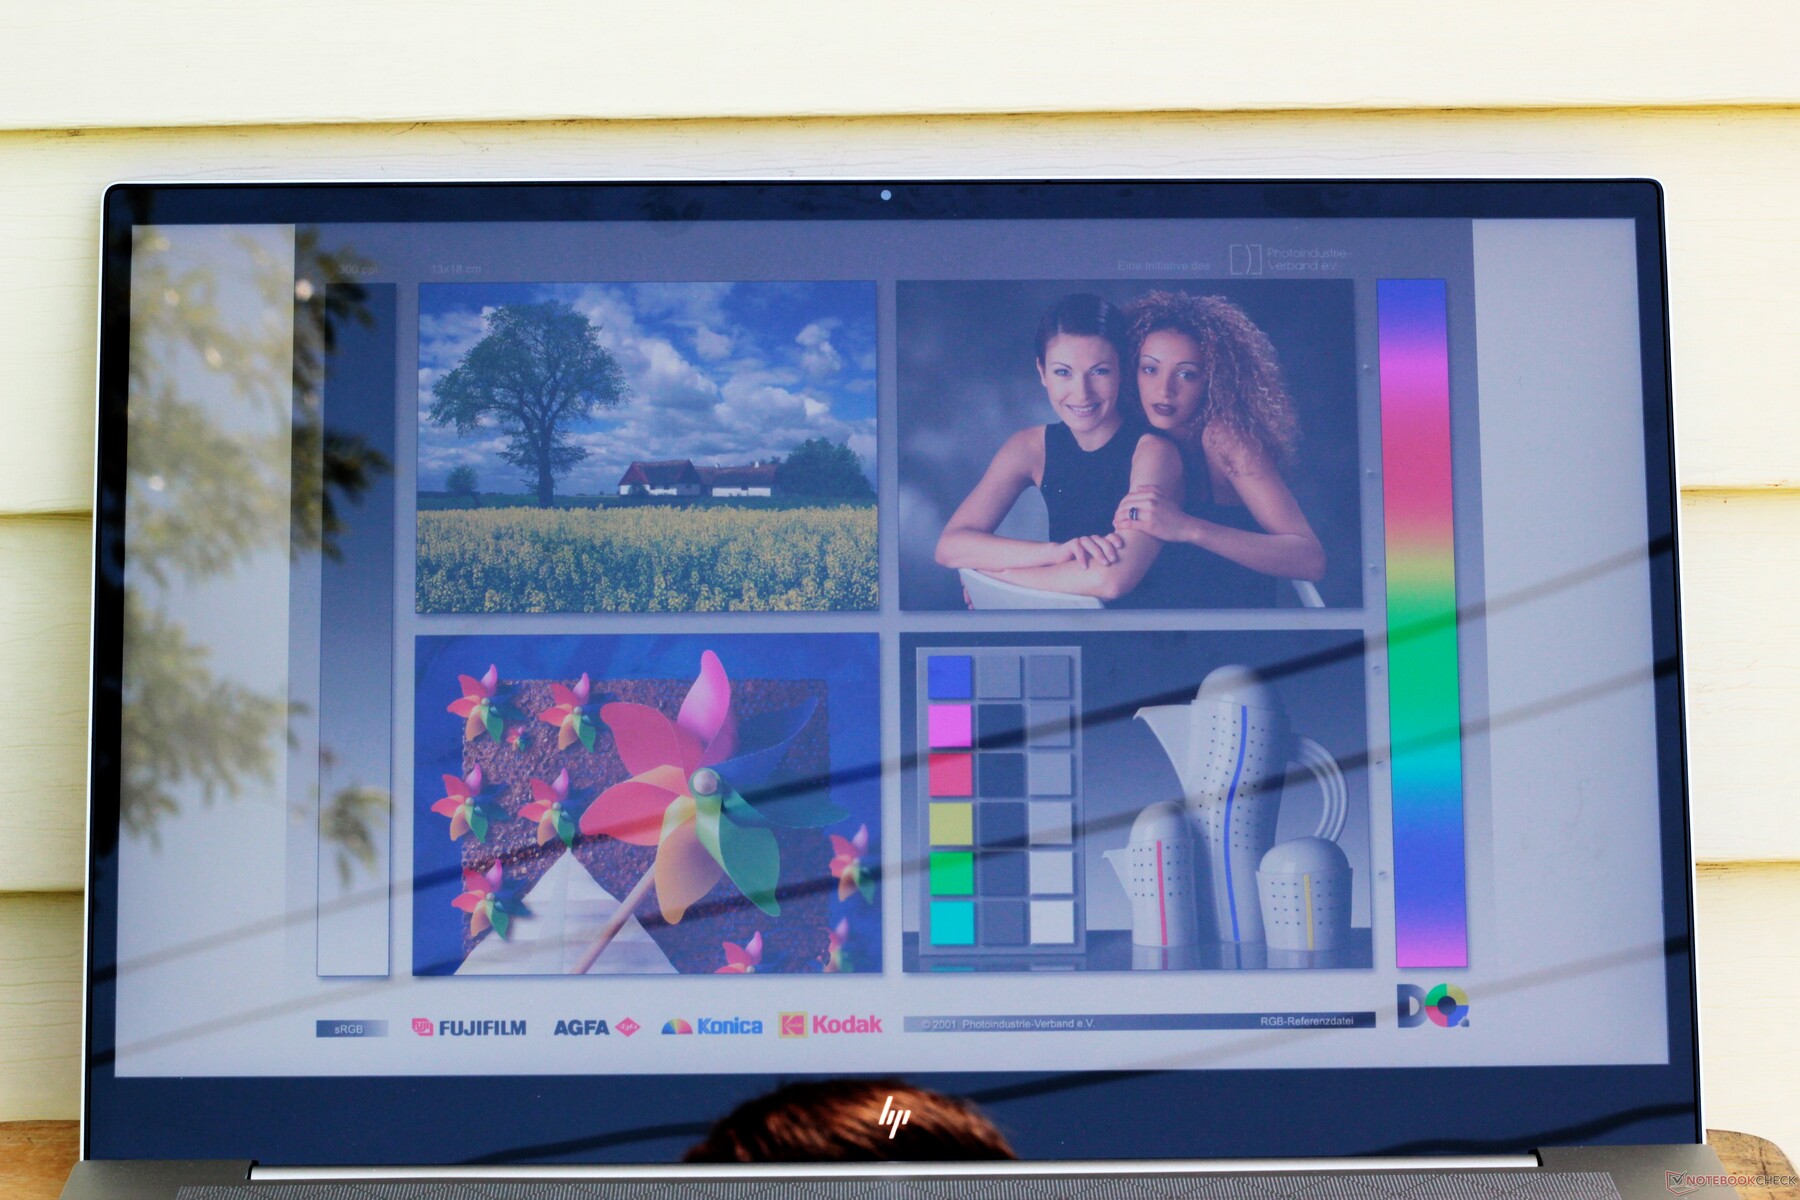
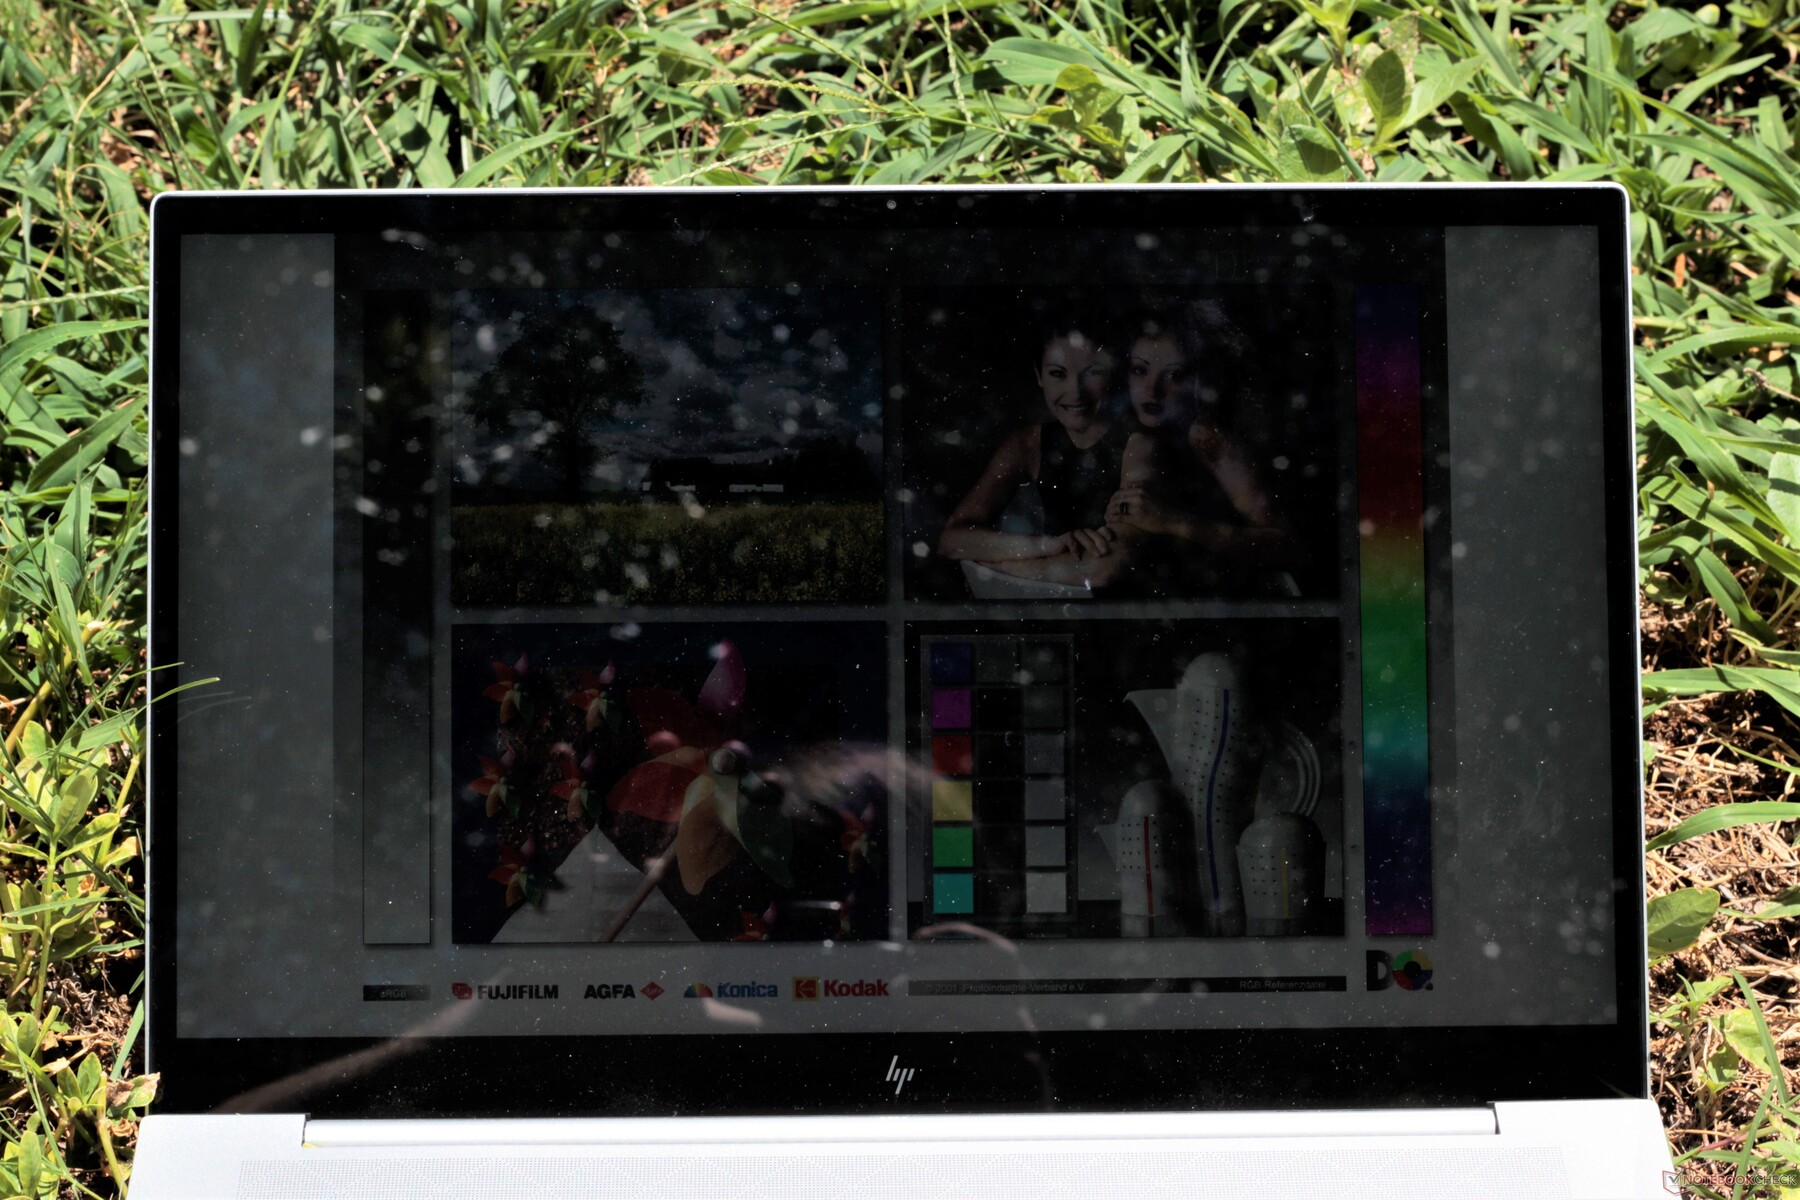
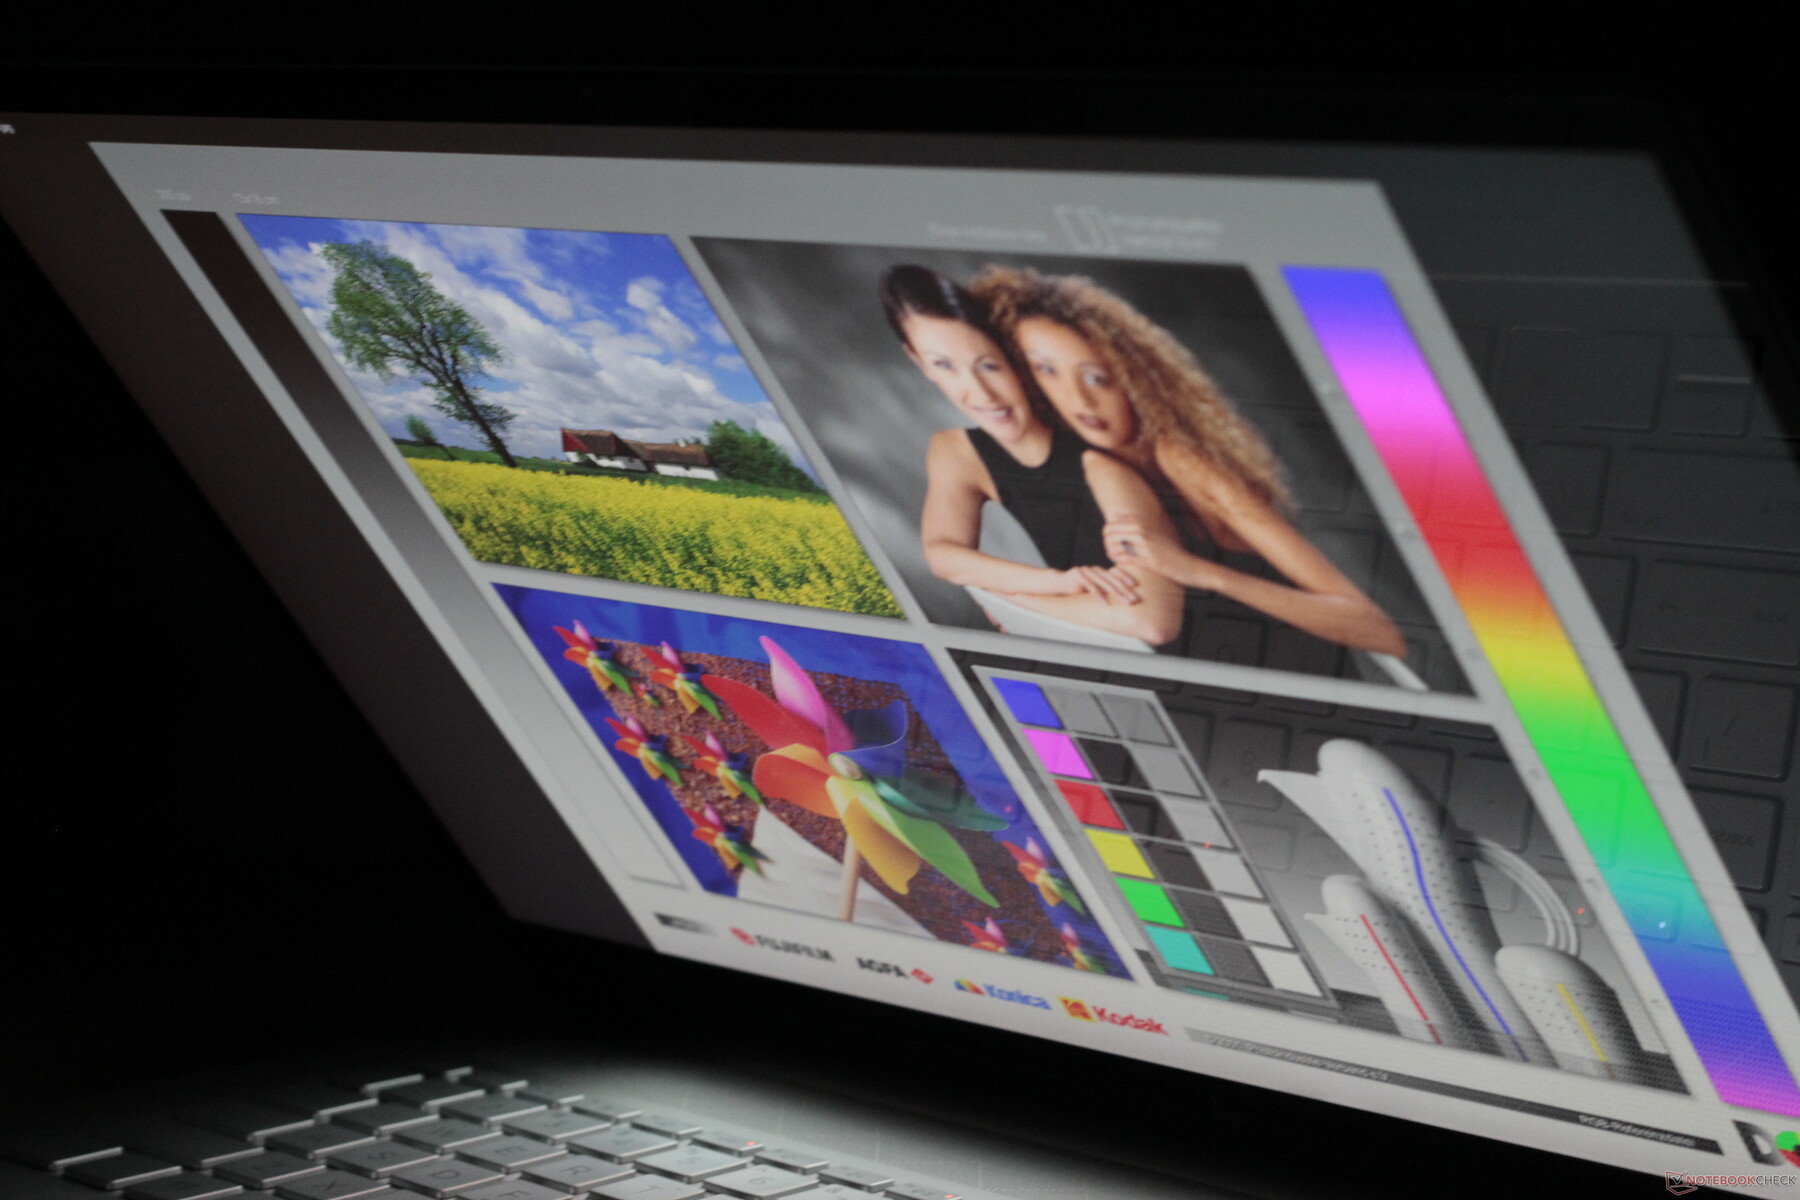
While the display is fairly bright, its glossy glass makes it difficult to see the screen in sunny conditions. In the shade, the screen is perfectly usable, but under direct sunlight, images and text are extremely difficult to make out.
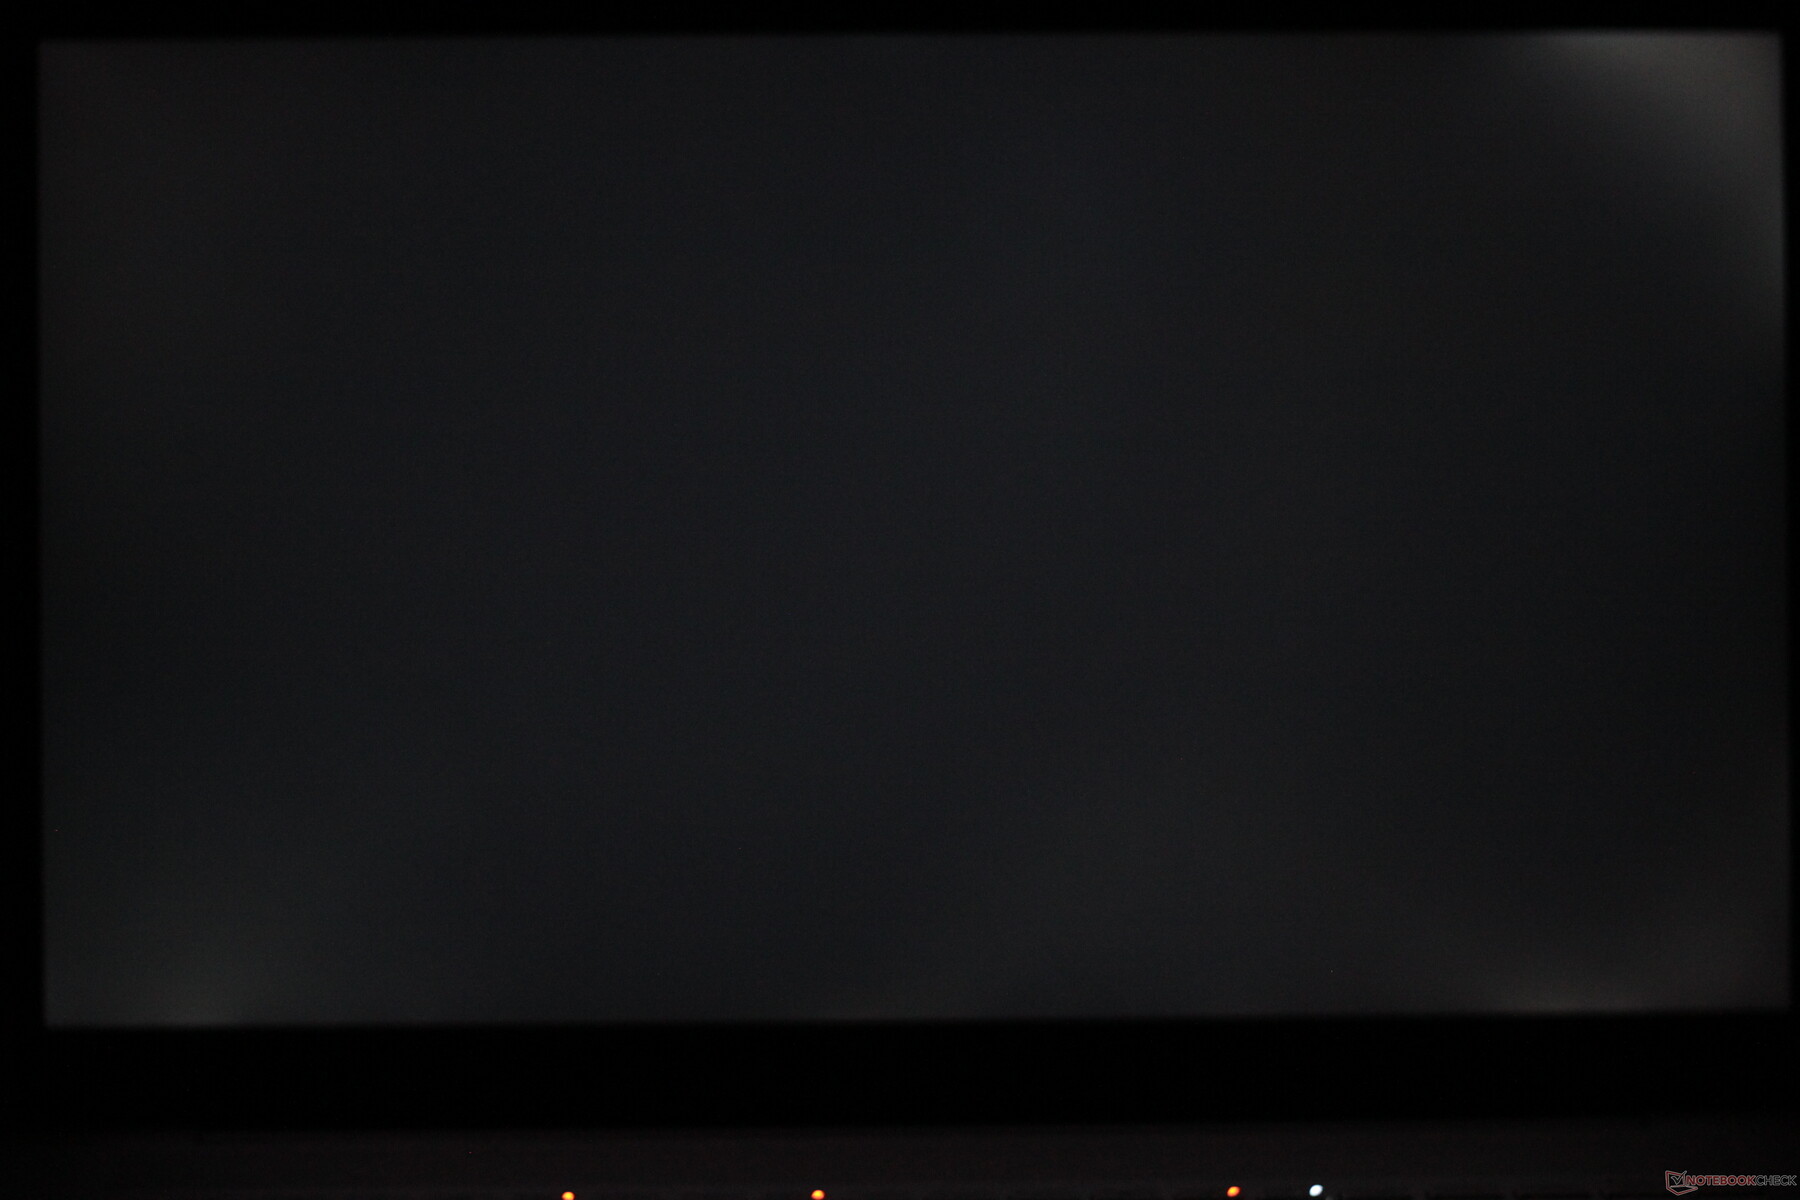
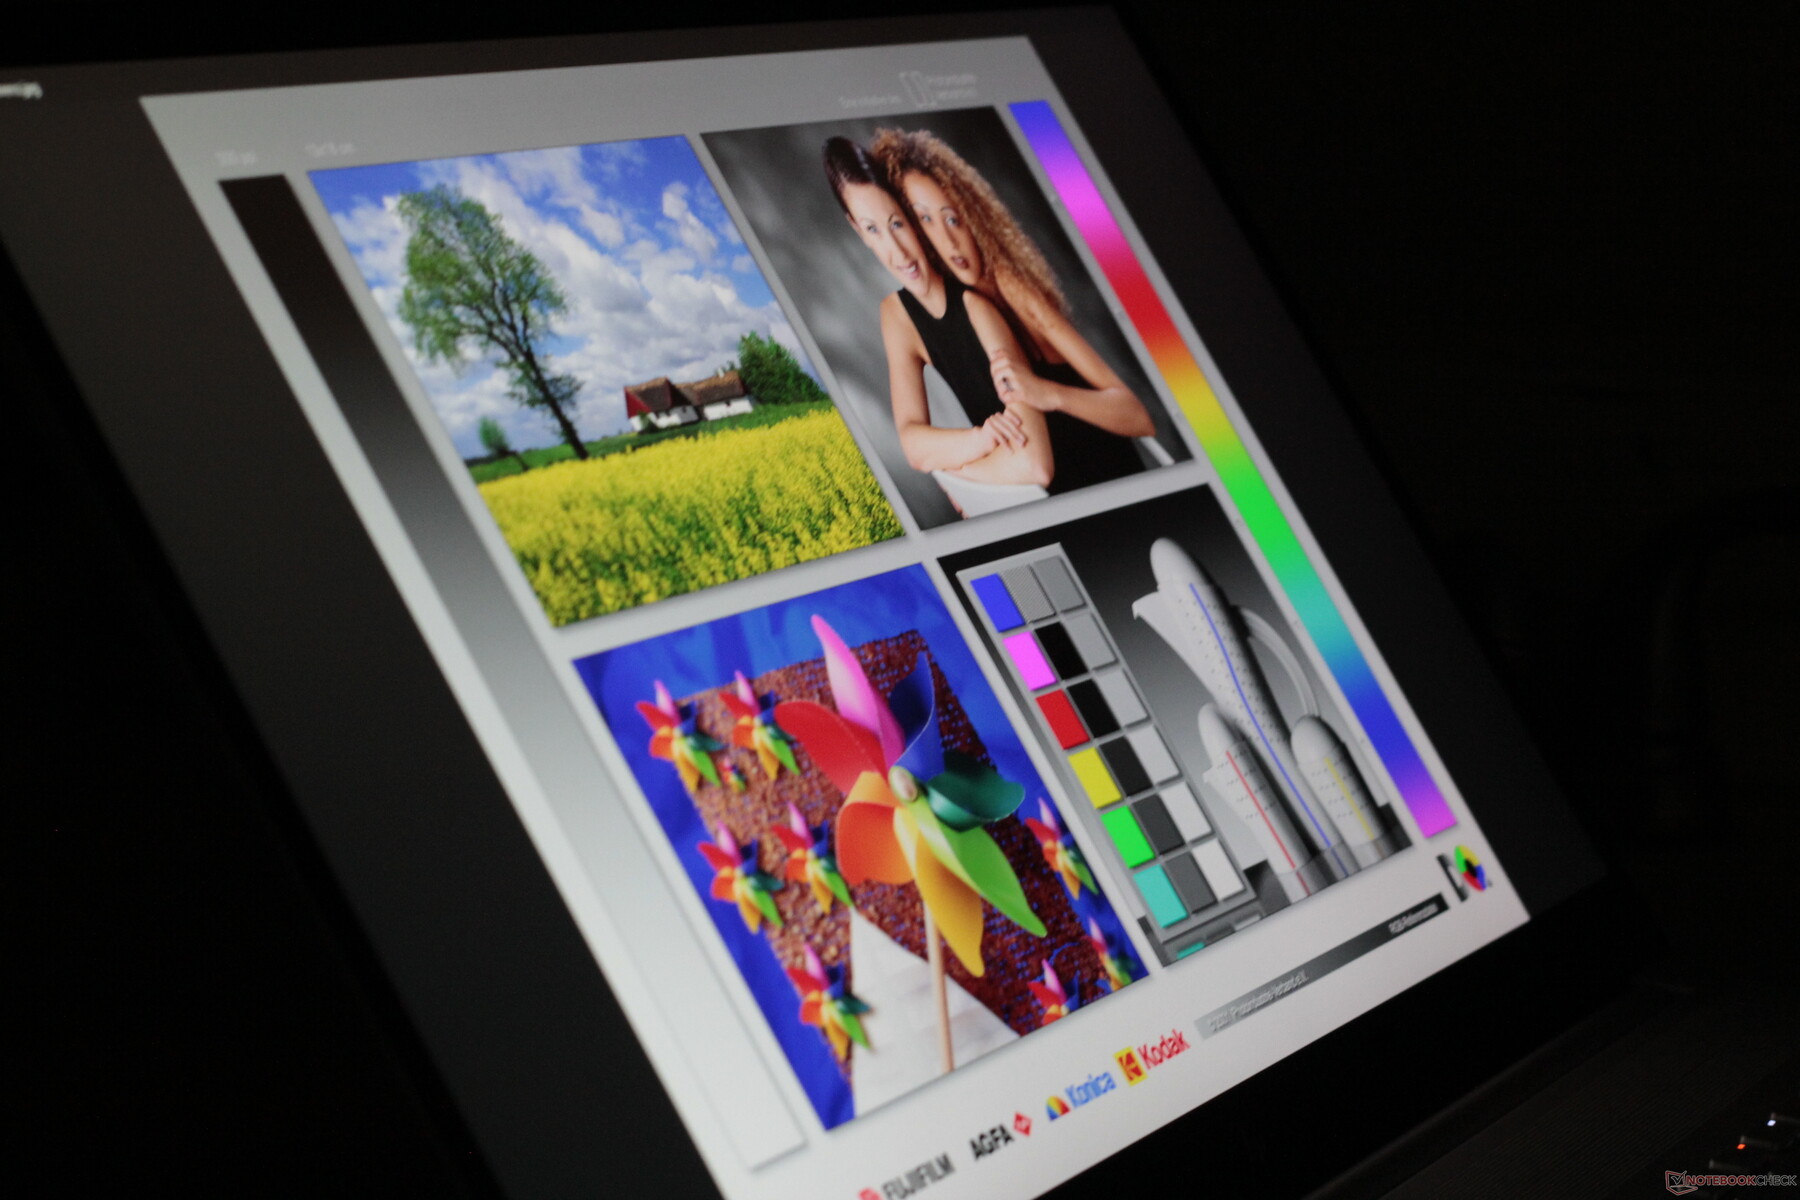
Viewing angles are excellent, as is expected of an IPS panel. There is noticeable backlight bleed in the upper and lower right corners of the screen. This is only visible on black or dark screens at high brightness levels.
Display Response Times
| ↔ Response Time Black to White | ||
|---|---|---|
| 29.6 ms ... rise ↗ and fall ↘ combined | ↗ 16.4 ms rise | 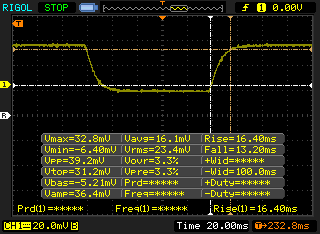 |
| ↘ 13.2 ms fall | ||
| The screen shows relatively slow response rates in our tests and may be too slow for gamers. In comparison, all tested devices range from 0.1 (minimum) to 240 (maximum) ms. » 79 % of all devices are better. This means that the measured response time is worse than the average of all tested devices (19.9 ms). | ||
| ↔ Response Time 50% Grey to 80% Grey | ||
| 45.2 ms ... rise ↗ and fall ↘ combined | ↗ 24 ms rise | 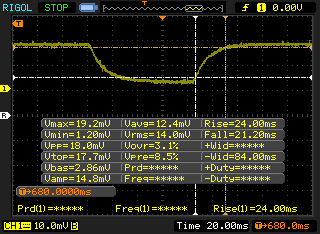 |
| ↘ 21 ms fall | ||
| The screen shows slow response rates in our tests and will be unsatisfactory for gamers. In comparison, all tested devices range from 0.165 (minimum) to 636 (maximum) ms. » 77 % of all devices are better. This means that the measured response time is worse than the average of all tested devices (31.1 ms). | ||
Screen Flickering / PWM (Pulse-Width Modulation)
| Screen flickering / PWM not detected |  | ||
In comparison: 52 % of all tested devices do not use PWM to dim the display. If PWM was detected, an average of 7798 (minimum: 5 - maximum: 343500) Hz was measured. | |||
Performance
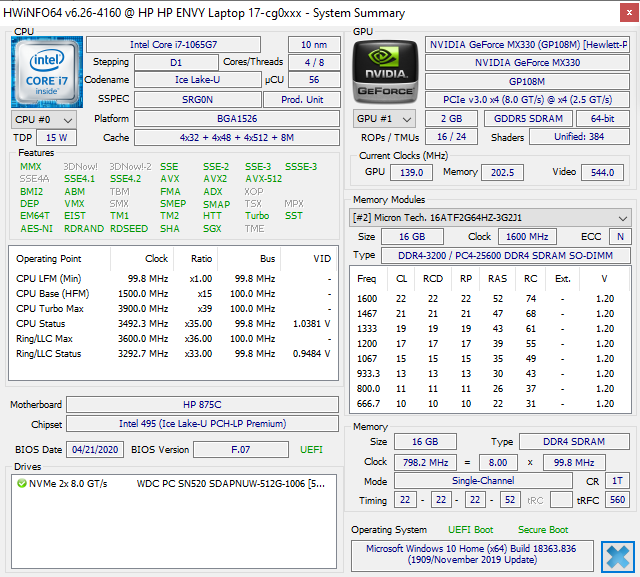
The HP Envy 17t is powered by an Intel Core i7-1065G7. The quad-core Ice Lake CPU is paired with an Nvidia GeForce MX330, a low-powered dGPU designed to handle simple graphical tasks. This combination posits the Envy 17t as a well-equipped multimedia laptop that can handle video playback, light gaming, and some simpler creative workloads.
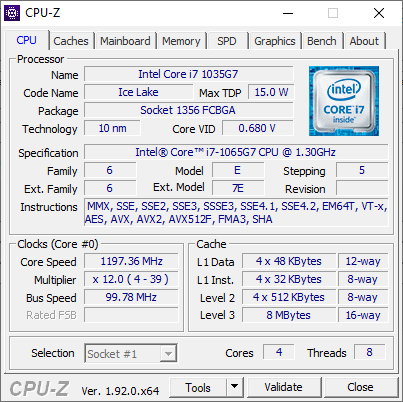

Processor
The Core i7-1065G7 in the HP Envy 17t performs in line with other laptops using the same chip. While it handles short bursts very well, longer workloads (like our Cinebench R15 loop test) slow the CPU down a fair bit. Still, the Envy 17t edges out the Razer Blade Stealth, which uses the same Core i7-1065G7, in the loop test. In fact, the HP Envy 17t outperforms the average Core i7-1065G7-equipped laptop.
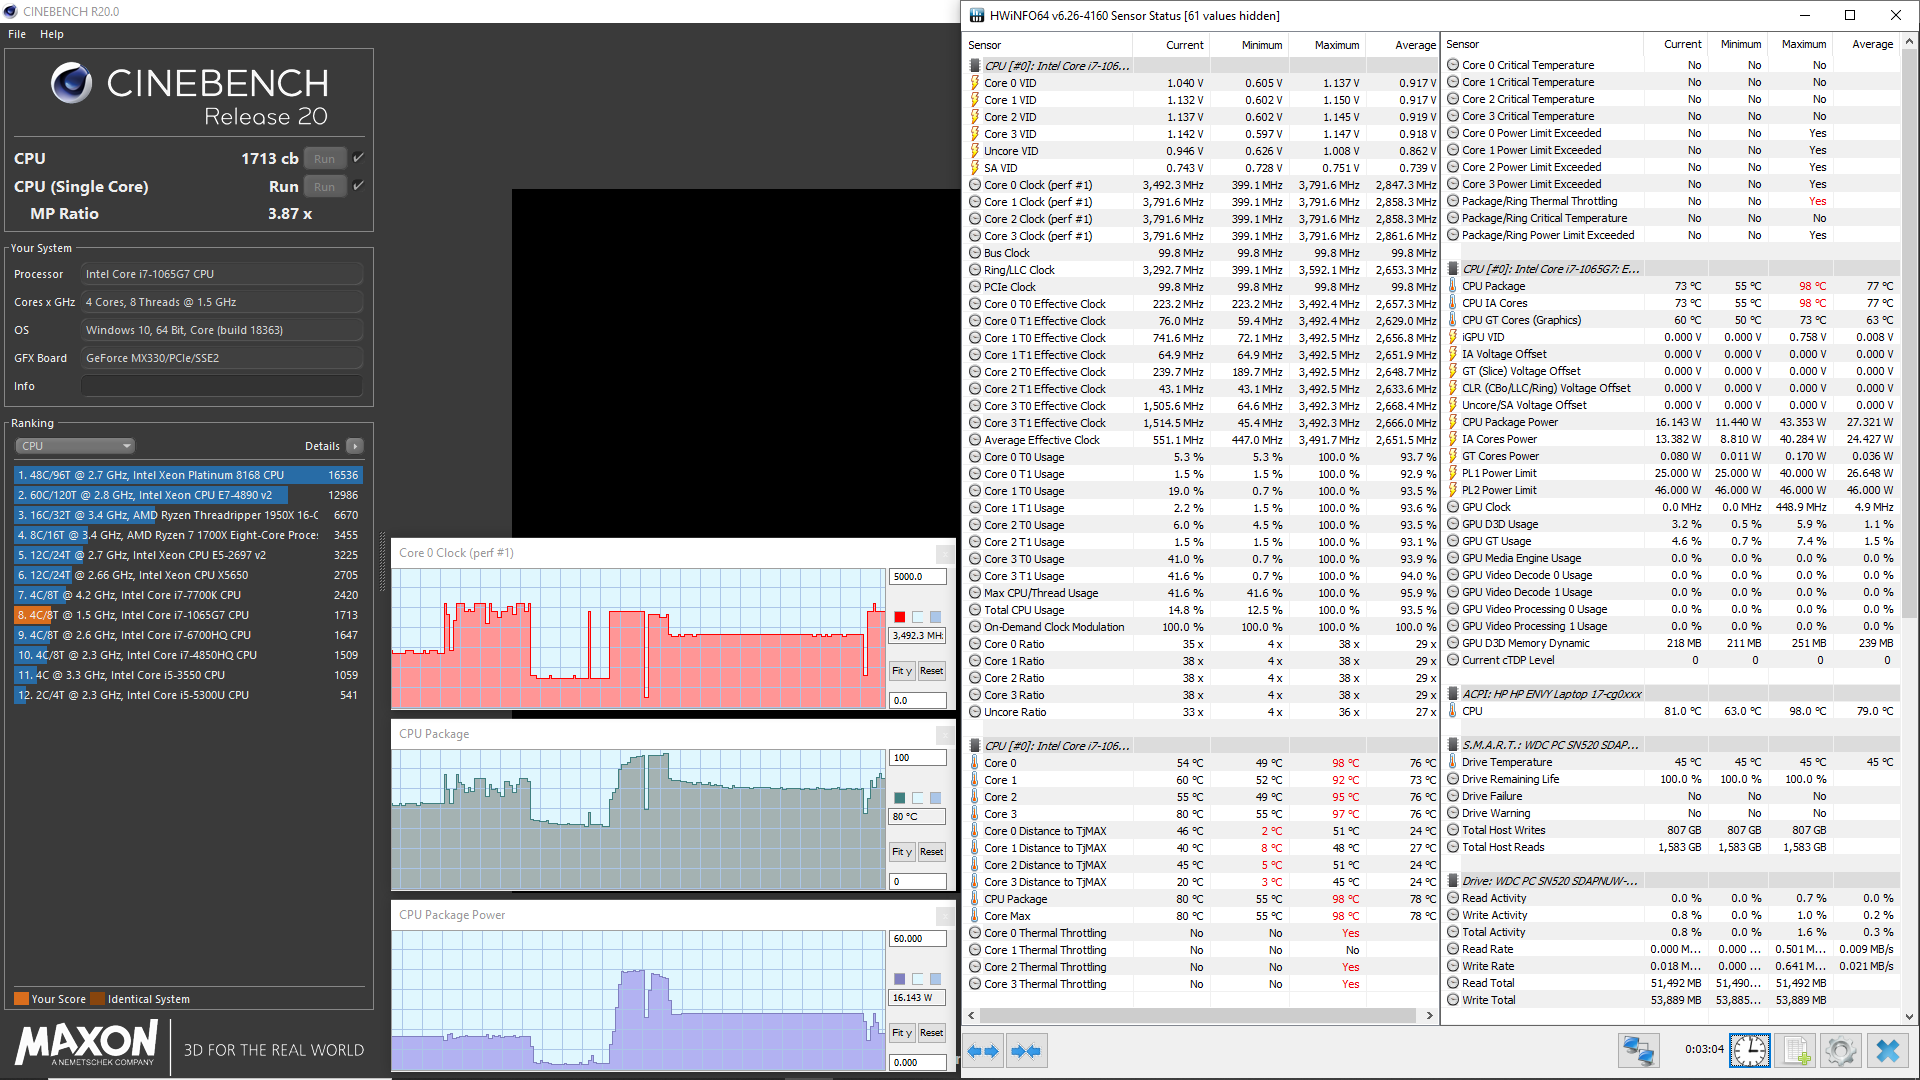
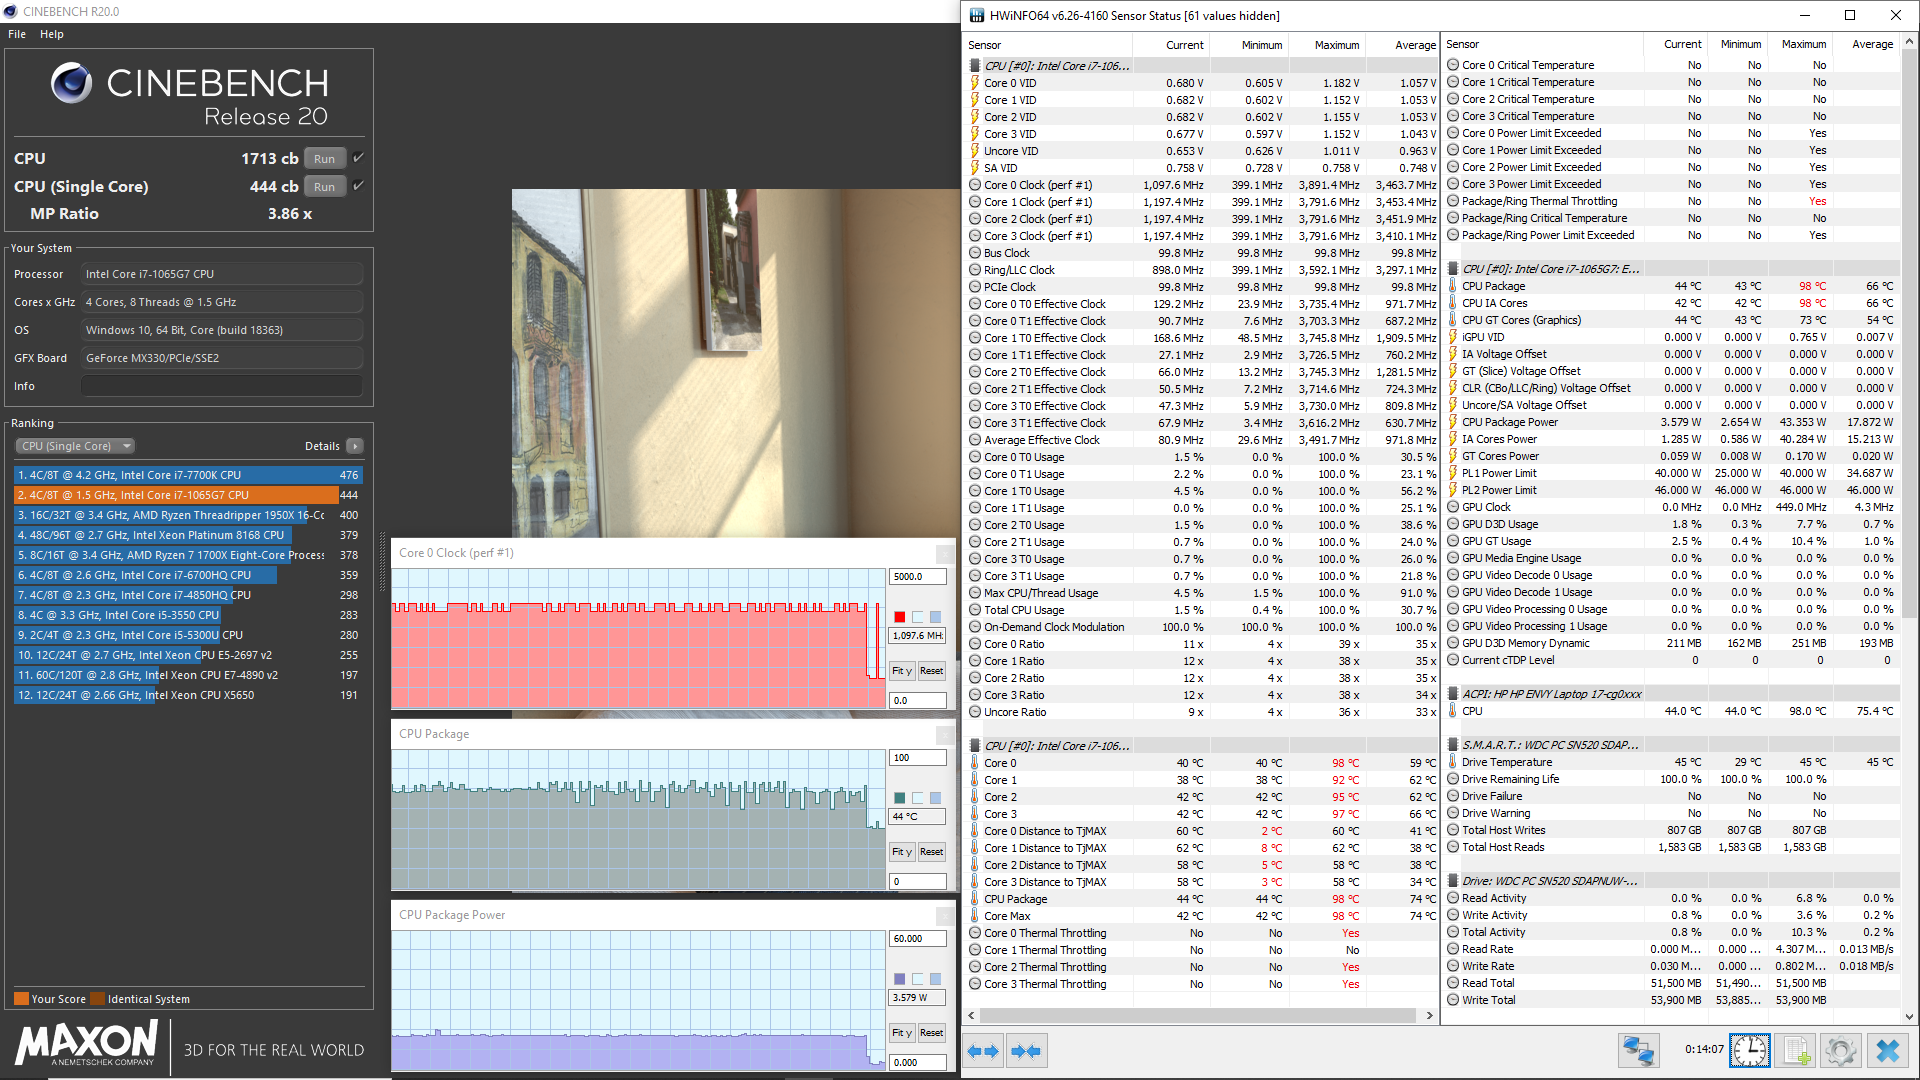
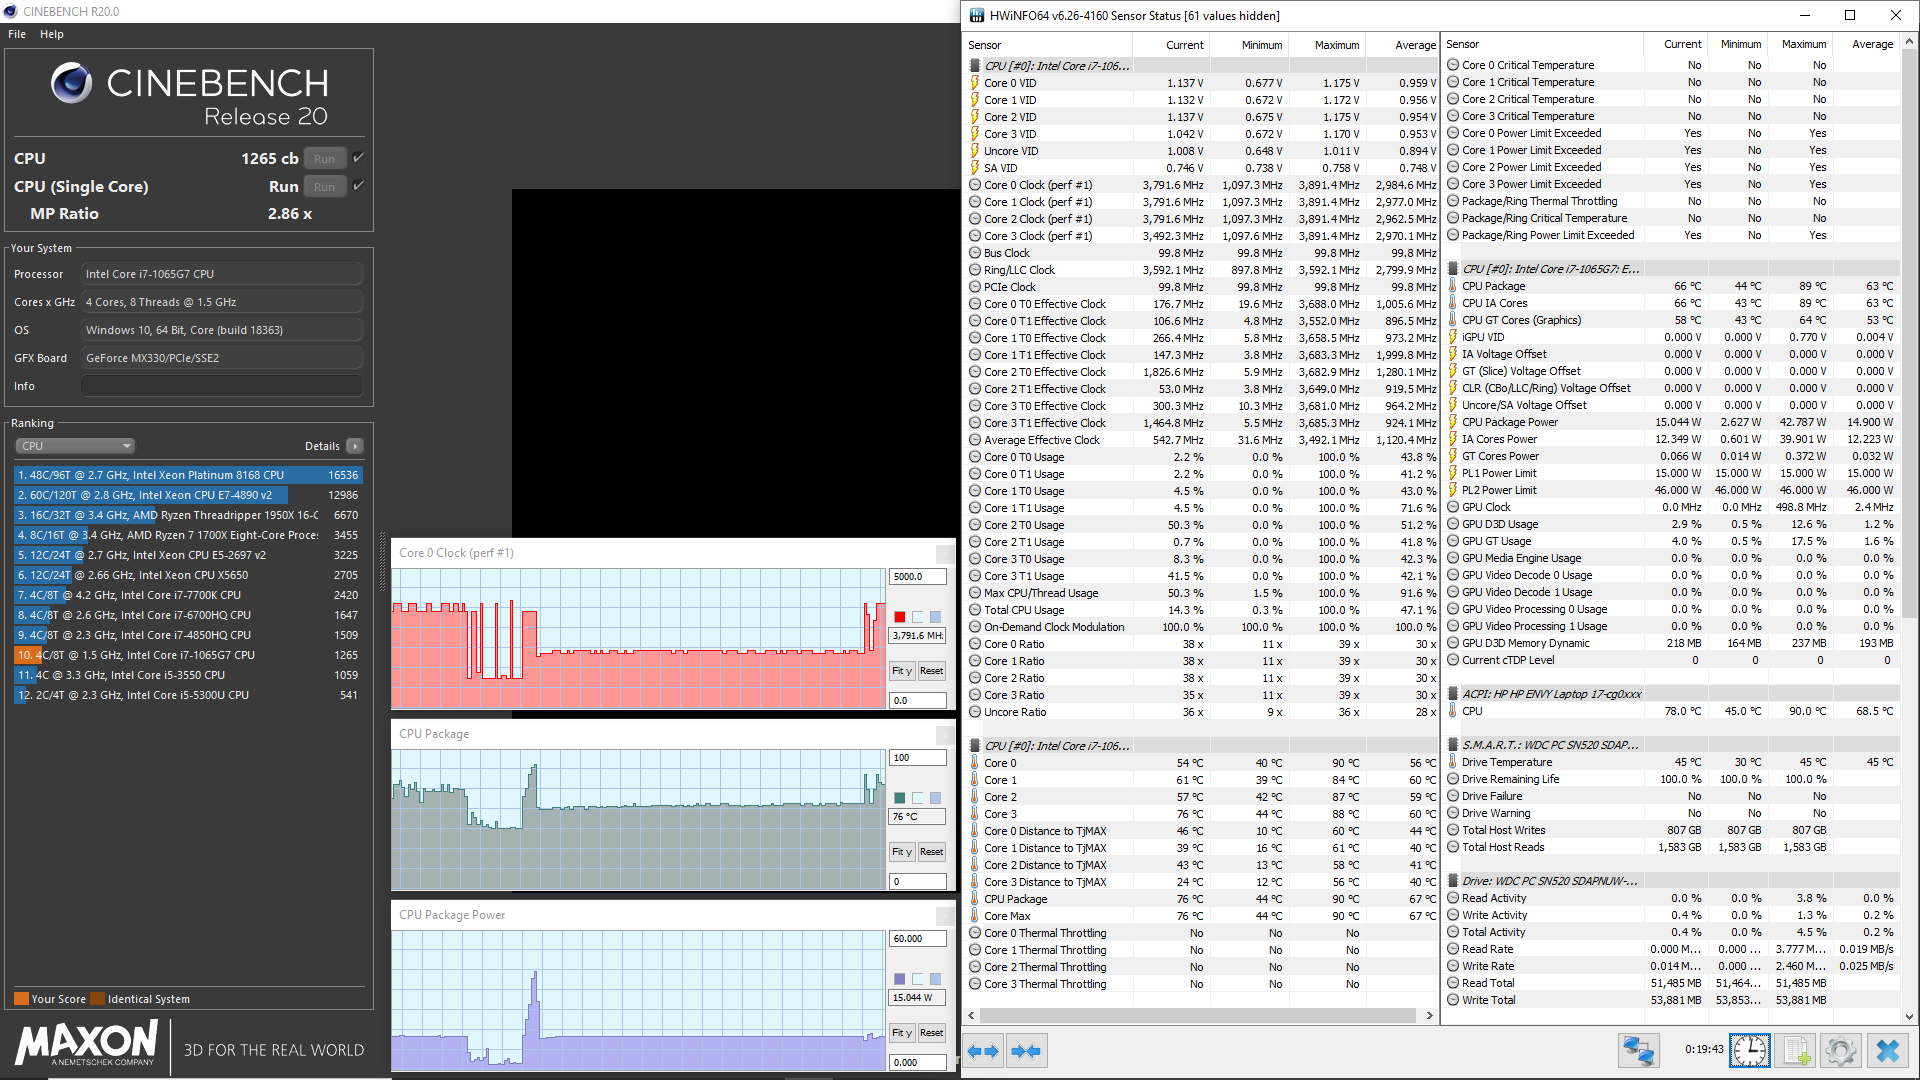
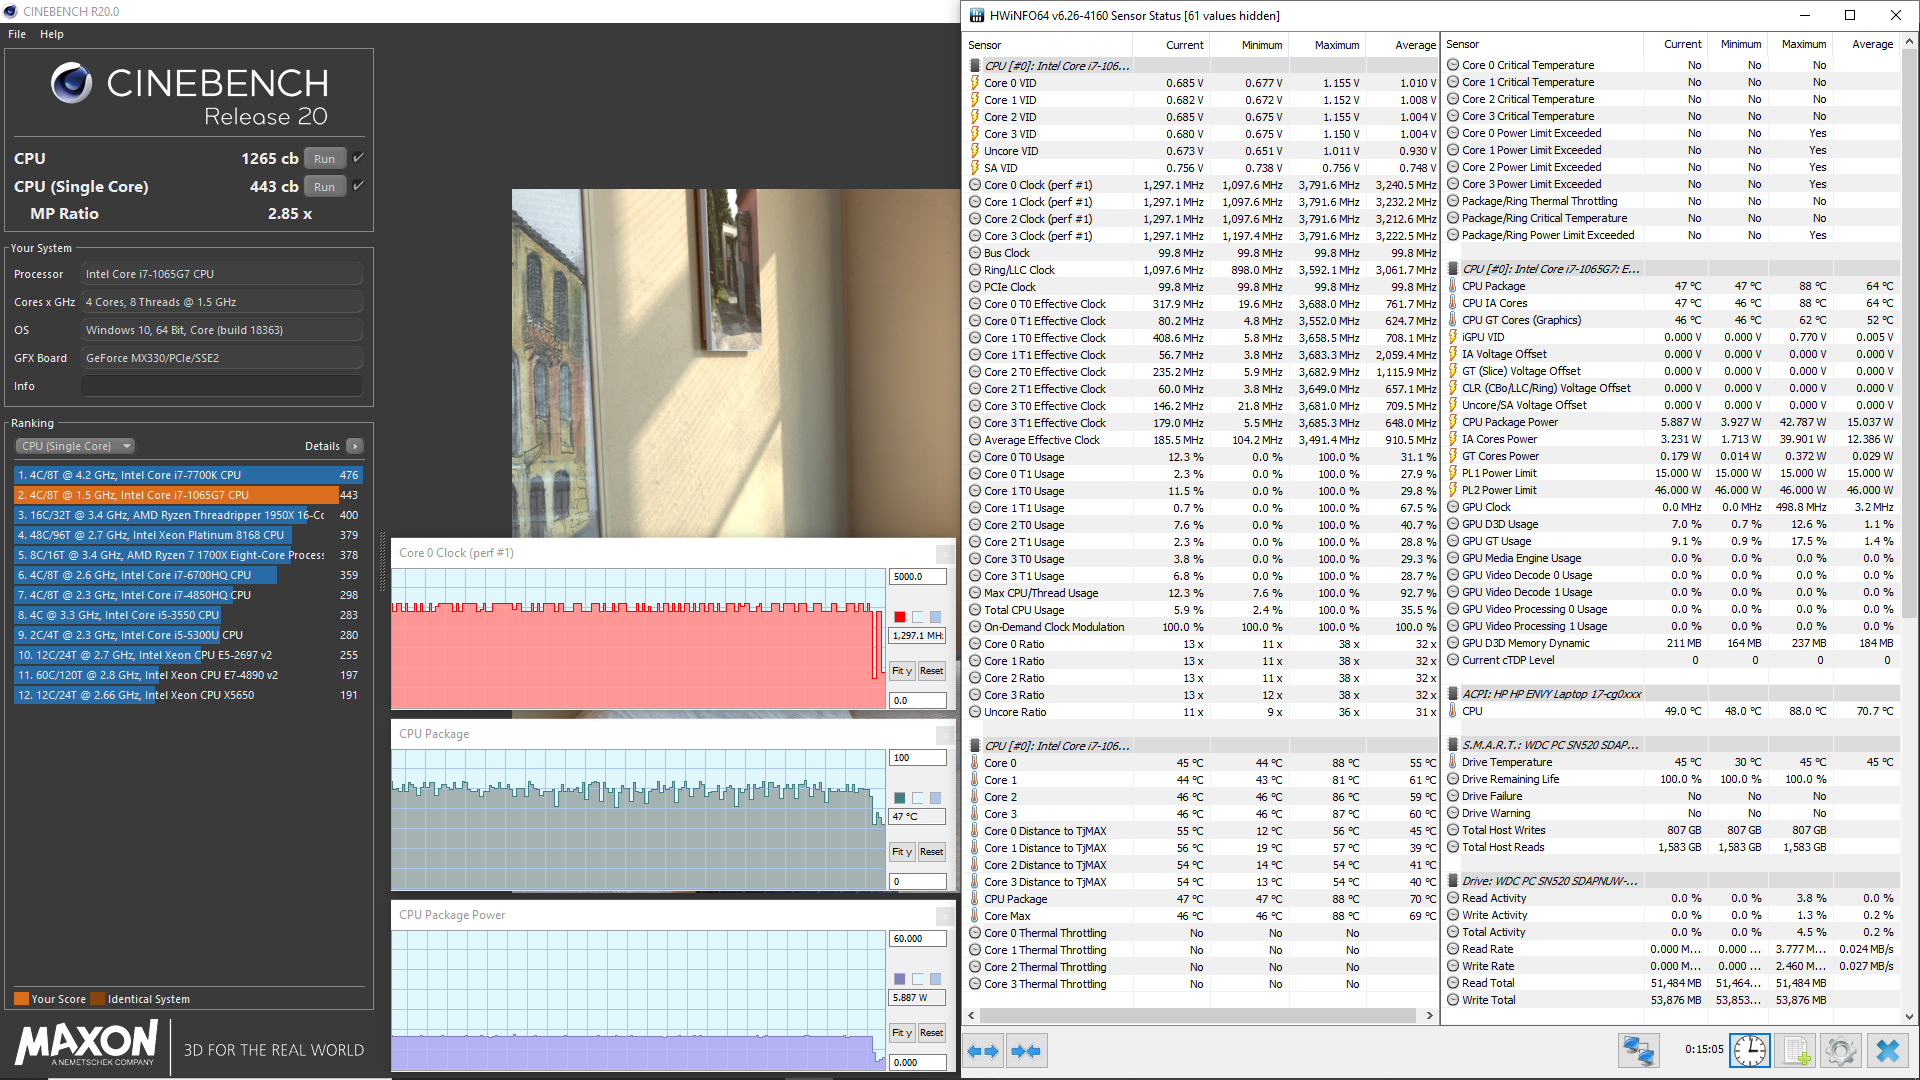
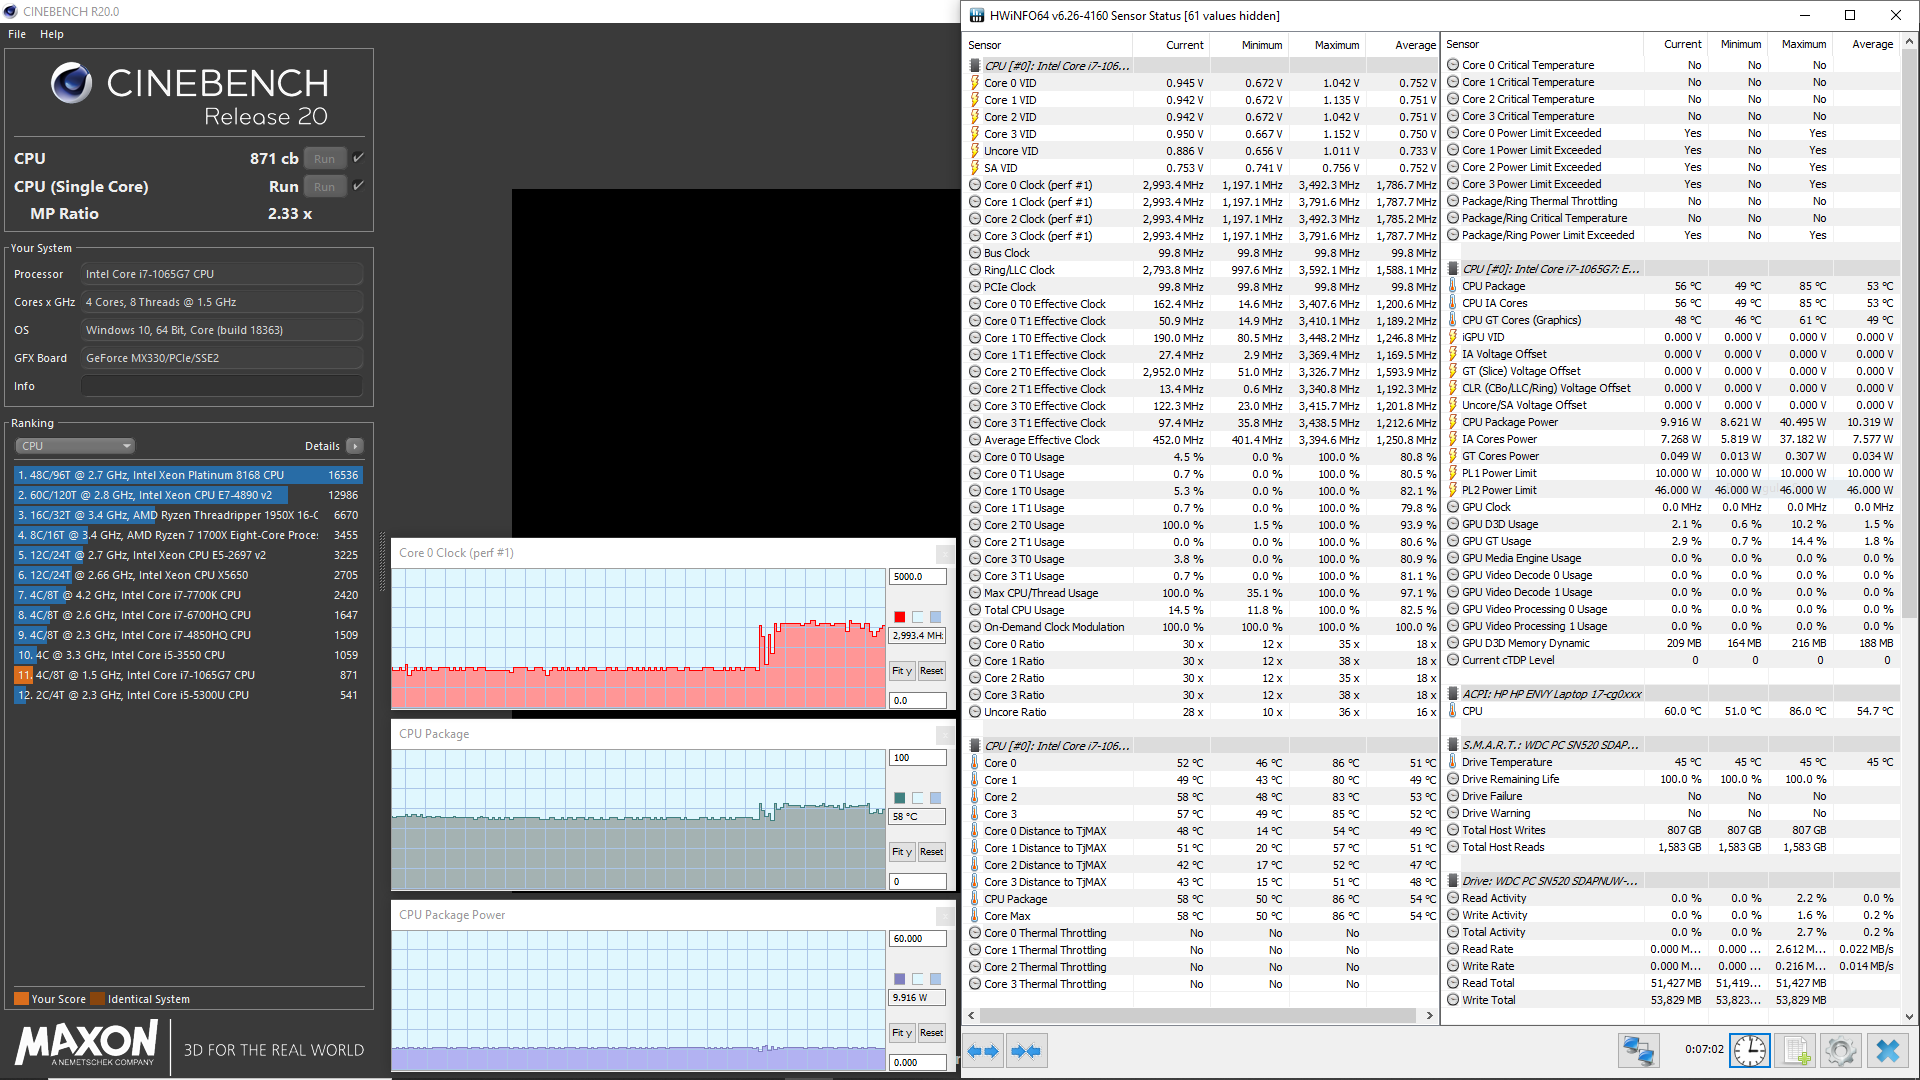
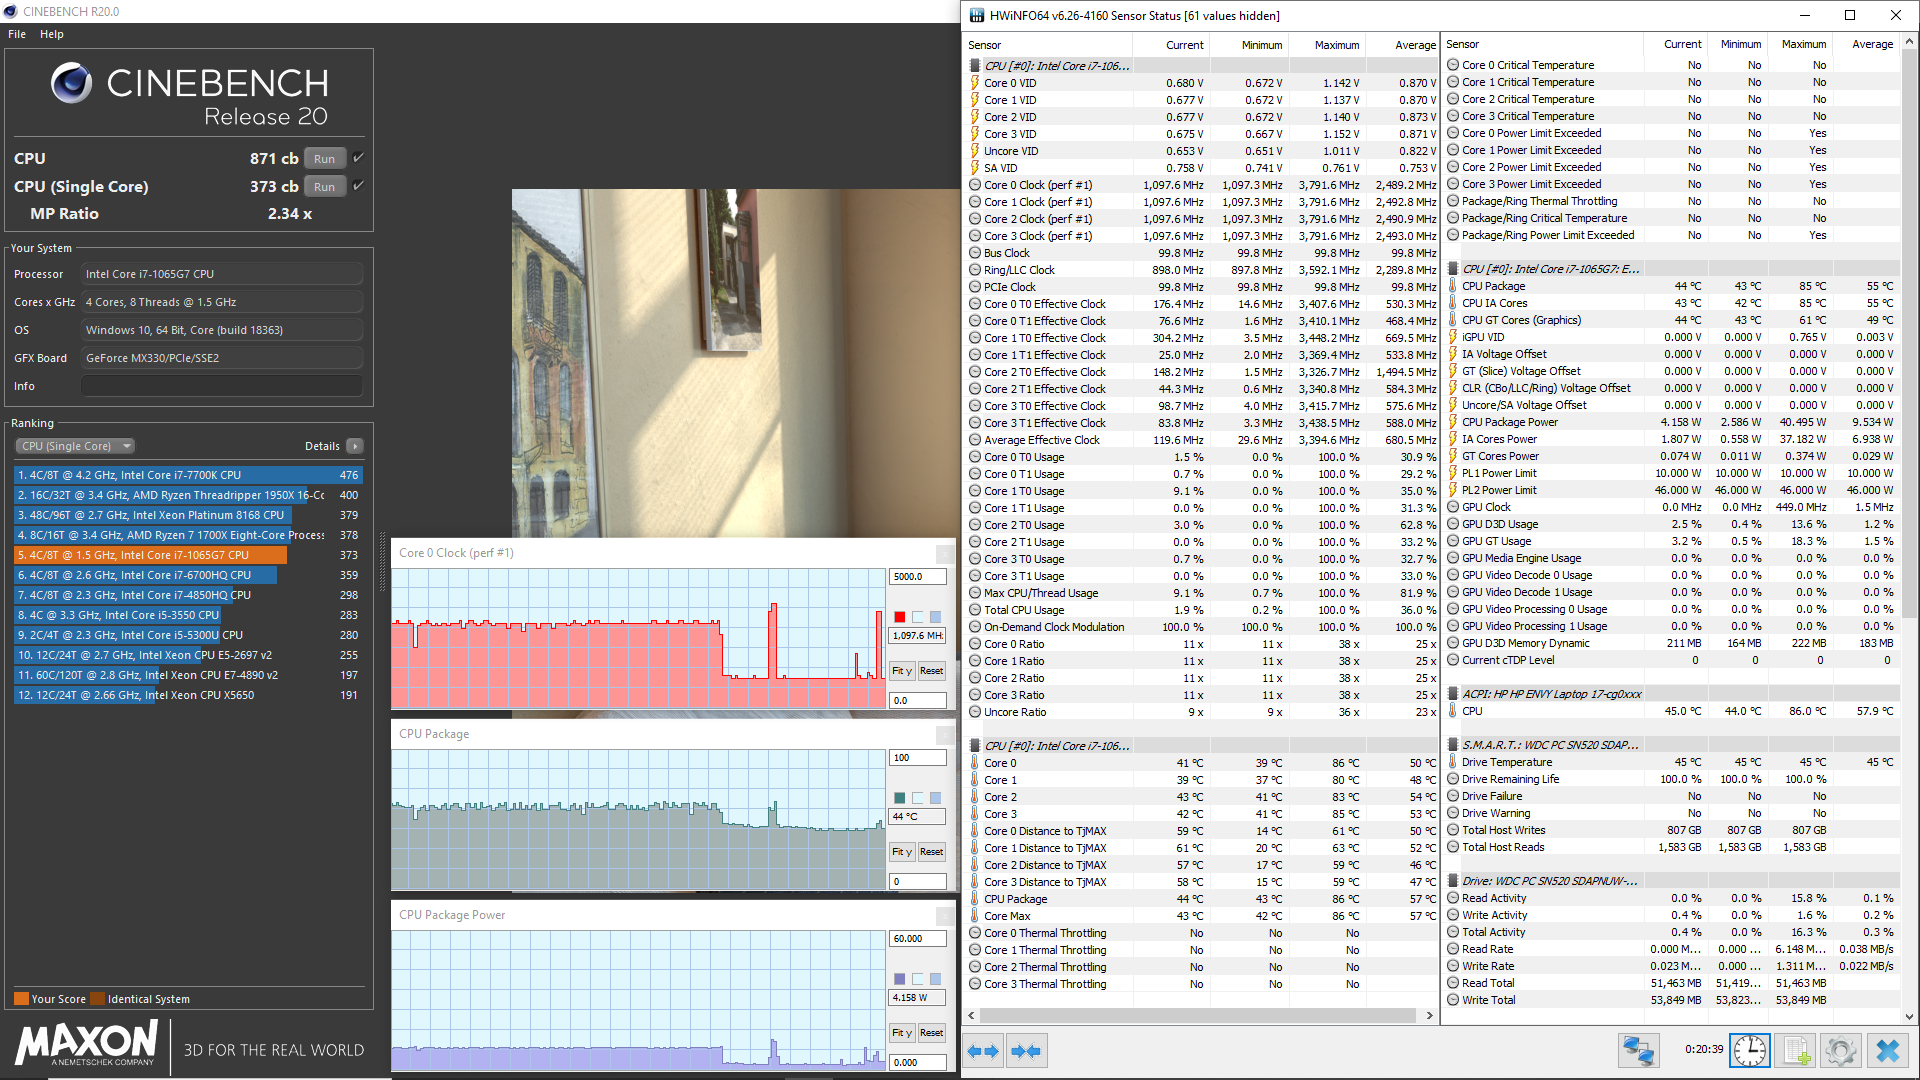
The HP Envy 17t has multiple performance modes that can be accessed through the HP Command Center. CPU performance is noticeably different between these modes, as evidenced by Cinebench R20. The HP Recommended and Comfort modes see performance throttled by about 26% and 50%, respectively, in Cinebench's multi-core test. The Envy 17t's CPU would throttle to keep fan speeds lower while still controlling temperatures.
Cinebench R15: CPU Single 64Bit | CPU Multi 64Bit
Blender: v2.79 BMW27 CPU
7-Zip 18.03: 7z b 4 -mmt1 | 7z b 4
Geekbench 5.5: Single-Core | Multi-Core
HWBOT x265 Benchmark v2.2: 4k Preset
LibreOffice : 20 Documents To PDF
R Benchmark 2.5: Overall mean
| Cinebench R20 / CPU (Single Core) | |
| Average of class Multimedia (425 - 853, n=64, last 2 years) | |
| HP Envy 17t-cg000 | |
| Acer Swift 3 SF314-42-R4XJ | |
| HP ProBook 445 G7 175W4EA | |
| Dell XPS 15 9500 Core i5 | |
| Average Intel Core i7-1065G7 (358 - 474, n=31) | |
| Cinebench R20 / CPU (Multi Core) | |
| Average of class Multimedia (1887 - 12912, n=64, last 2 years) | |
| Acer Swift 3 SF314-42-R4XJ | |
| HP ProBook 445 G7 175W4EA | |
| Dell XPS 15 9500 Core i5 | |
| HP Envy 17t-cg000 | |
| Average Intel Core i7-1065G7 (1081 - 2024, n=31) | |
| Cinebench R15 / CPU Single 64Bit | |
| Average of class Multimedia (184.8 - 326, n=66, last 2 years) | |
| HP Envy 17-ce1004ng | |
| HP Envy 17t-cg000 | |
| Dell XPS 15 9500 Core i5 | |
| Acer Swift 3 SF314-42-R4XJ | |
| HP ProBook 445 G7 175W4EA | |
| Average Intel Core i7-1065G7 (141 - 190, n=35) | |
| LG Gram 17Z990-R.AAS7U1 | |
| Dell Inspiron 17 3780 | |
| Asus VivoBook 17 M712DA-AU017T | |
| Cinebench R15 / CPU Multi 64Bit | |
| Average of class Multimedia (856 - 5224, n=68, last 2 years) | |
| Acer Swift 3 SF314-42-R4XJ | |
| HP ProBook 445 G7 175W4EA | |
| Dell XPS 15 9500 Core i5 | |
| HP Envy 17t-cg000 | |
| Average Intel Core i7-1065G7 (288 - 836, n=36) | |
| Asus VivoBook 17 M712DA-AU017T | |
| Dell Inspiron 17 3780 | |
| HP Envy 17-ce1004ng | |
| LG Gram 17Z990-R.AAS7U1 | |
| Blender / v2.79 BMW27 CPU | |
| Average Intel Core i7-1065G7 (675 - 1650, n=23) | |
| HP Envy 17t-cg000 | |
| HP ProBook 445 G7 175W4EA | |
| Acer Swift 3 SF314-42-R4XJ | |
| Dell XPS 15 9500 Core i5 | |
| Average of class Multimedia (100 - 557, n=65, last 2 years) | |
| 7-Zip 18.03 / 7z b 4 -mmt1 | |
| Average of class Multimedia (3666 - 7545, n=63, last 2 years) | |
| Dell XPS 15 9500 Core i5 | |
| HP Envy 17t-cg000 | |
| HP ProBook 445 G7 175W4EA | |
| Acer Swift 3 SF314-42-R4XJ | |
| Average Intel Core i7-1065G7 (3289 - 4589, n=24) | |
| 7-Zip 18.03 / 7z b 4 | |
| Average of class Multimedia (29095 - 130368, n=62, last 2 years) | |
| Acer Swift 3 SF314-42-R4XJ | |
| Dell XPS 15 9500 Core i5 | |
| HP ProBook 445 G7 175W4EA | |
| Average Intel Core i7-1065G7 (10406 - 22898, n=24) | |
| HP Envy 17t-cg000 | |
| Geekbench 5.5 / Single-Core | |
| Average of class Multimedia (805 - 2974, n=62, last 2 years) | |
| HP Envy 17t-cg000 | |
| Average Intel Core i7-1065G7 (948 - 1348, n=18) | |
| Dell XPS 15 9500 Core i5 | |
| Acer Swift 3 SF314-42-R4XJ | |
| HP ProBook 445 G7 175W4EA | |
| Geekbench 5.5 / Multi-Core | |
| Average of class Multimedia (4652 - 20422, n=62, last 2 years) | |
| Acer Swift 3 SF314-42-R4XJ | |
| HP ProBook 445 G7 175W4EA | |
| Dell XPS 15 9500 Core i5 | |
| Average Intel Core i7-1065G7 (2464 - 4855, n=18) | |
| HP Envy 17t-cg000 | |
| HWBOT x265 Benchmark v2.2 / 4k Preset | |
| Average of class Multimedia (5.26 - 36.1, n=63, last 2 years) | |
| Acer Swift 3 SF314-42-R4XJ | |
| Dell XPS 15 9500 Core i5 | |
| HP Envy 17t-cg000 | |
| Average Intel Core i7-1065G7 (2.2 - 6.38, n=22) | |
| LibreOffice / 20 Documents To PDF | |
| HP ProBook 445 G7 175W4EA | |
| Dell XPS 15 9500 Core i5 | |
| Average Intel Core i7-1065G7 (46.9 - 85.3, n=19) | |
| Acer Swift 3 SF314-42-R4XJ | |
| HP Envy 17t-cg000 | |
| Average of class Multimedia (23.9 - 146.7, n=64, last 2 years) | |
| R Benchmark 2.5 / Overall mean | |
| Average Intel Core i7-1065G7 (0.661 - 0.798, n=18) | |
| HP Envy 17t-cg000 | |
| Dell XPS 15 9500 Core i5 | |
| Acer Swift 3 SF314-42-R4XJ | |
| Average of class Multimedia (0.3604 - 0.947, n=63, last 2 years) | |
* ... smaller is better
System Performance
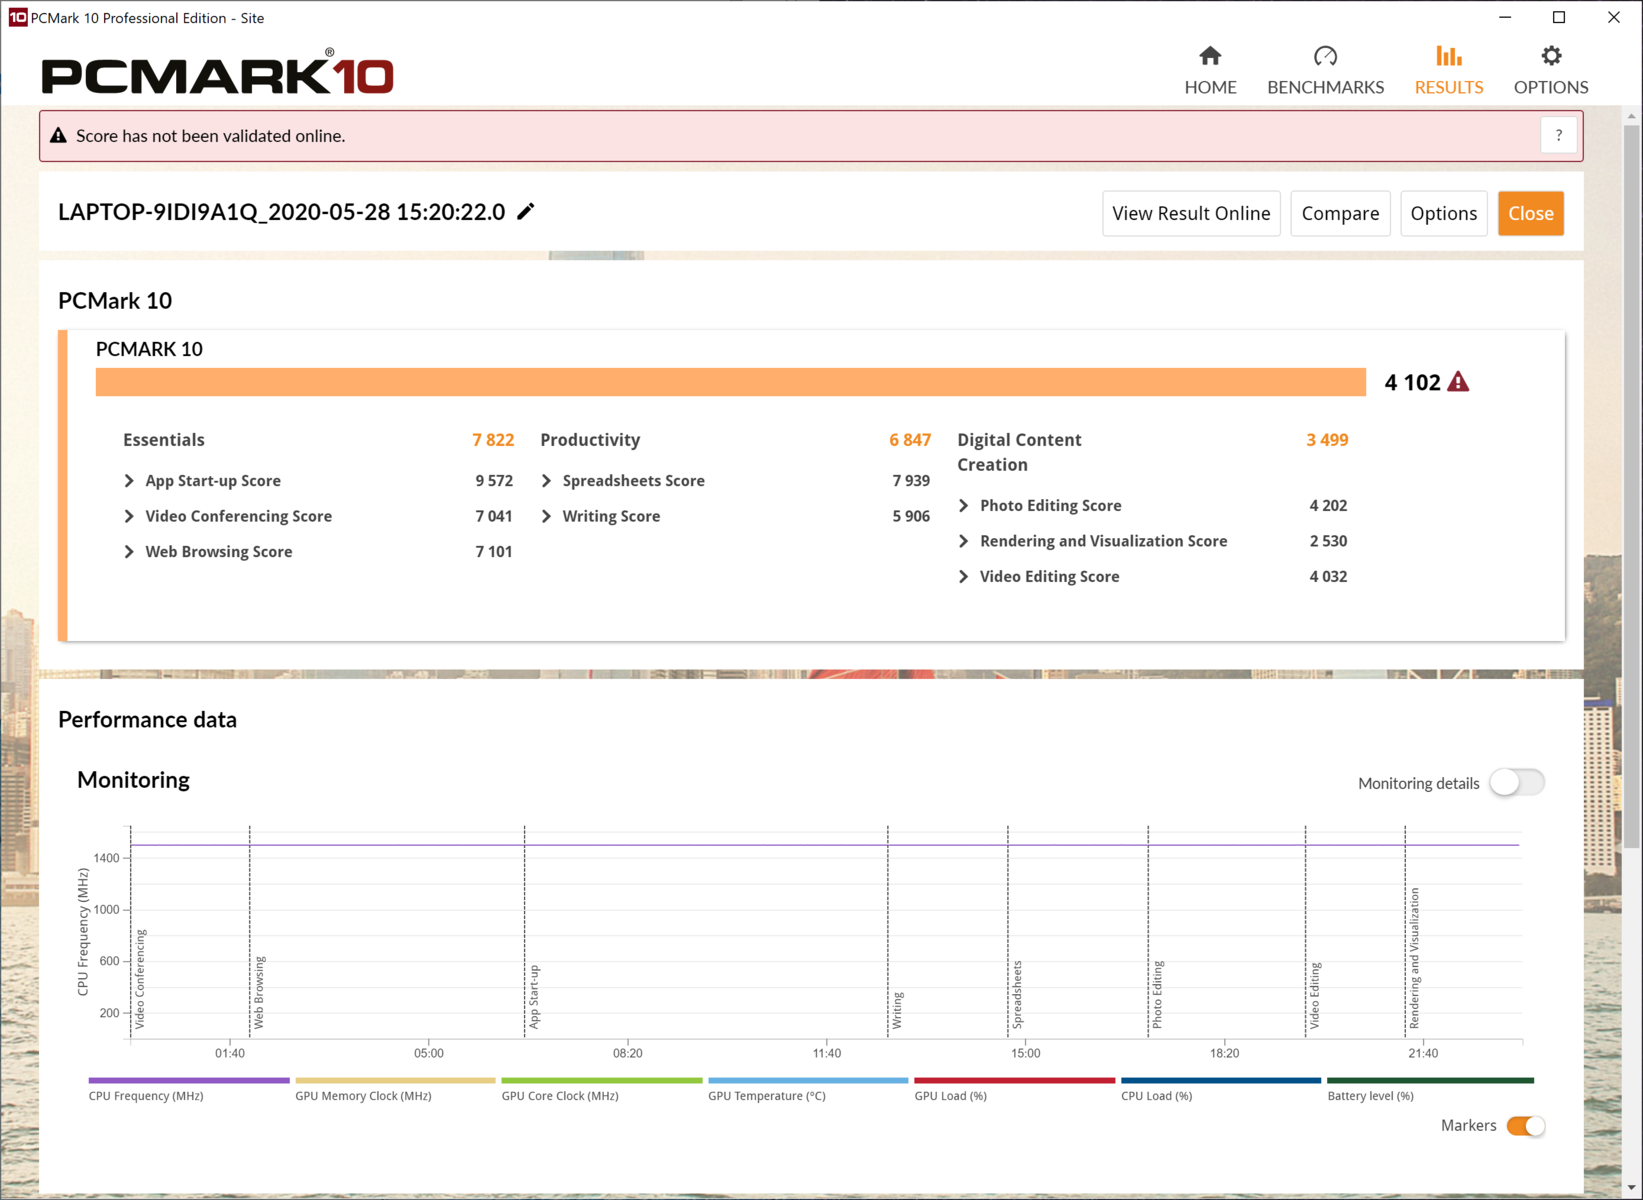
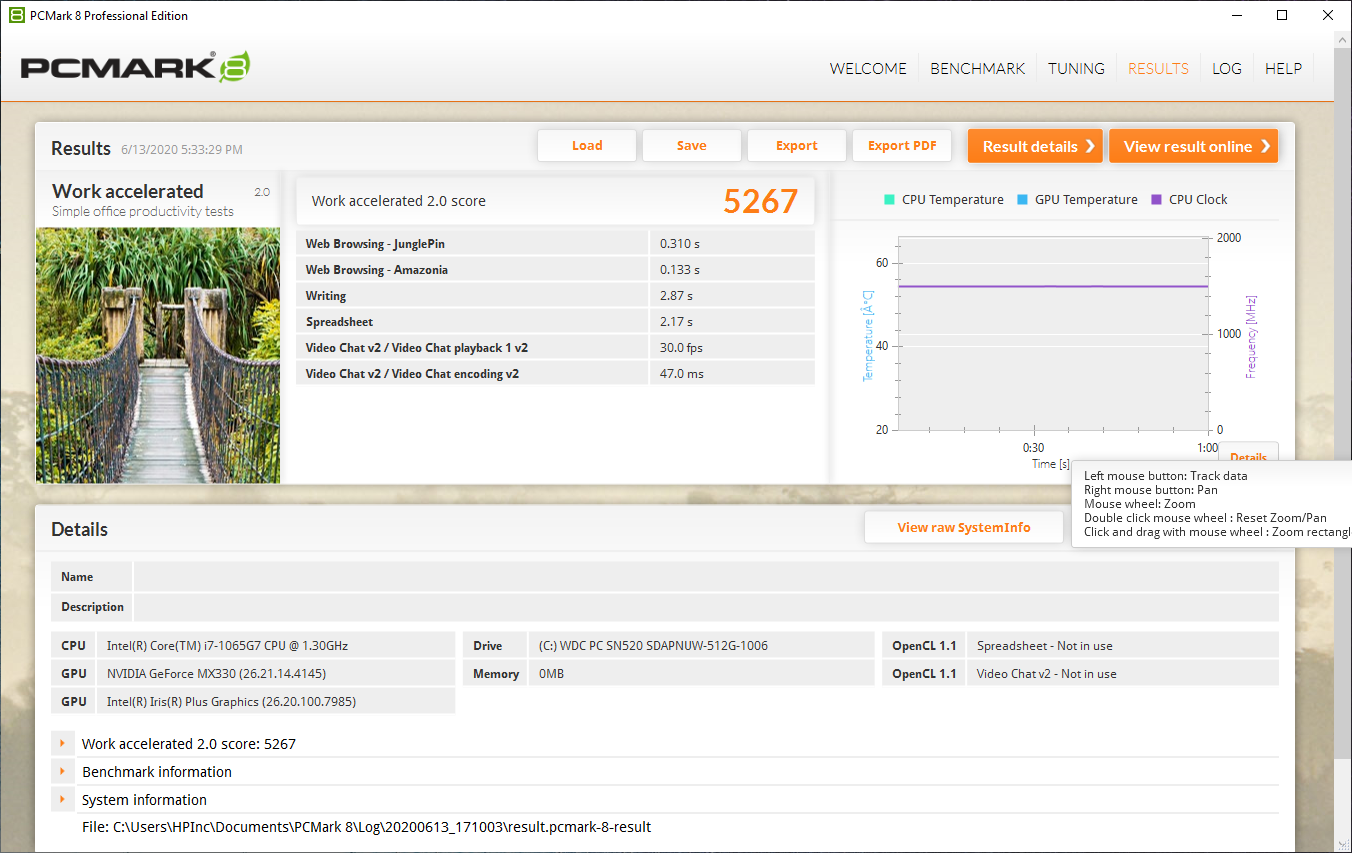
Overall system performance is snappy and in line with expectations for a device with these specifications. The Envy 17t chews through office tasks and web browsing without much problem. Additionally, it can handle some light creative work and graphical loads thanks to the Nvidia GeForce MX330 GPU.

| PCMark 8 Home Score Accelerated v2 | 3762 points | |
| PCMark 8 Work Score Accelerated v2 | 5267 points | |
| PCMark 10 Score | 4102 points | |
Help | ||
DPC Latency
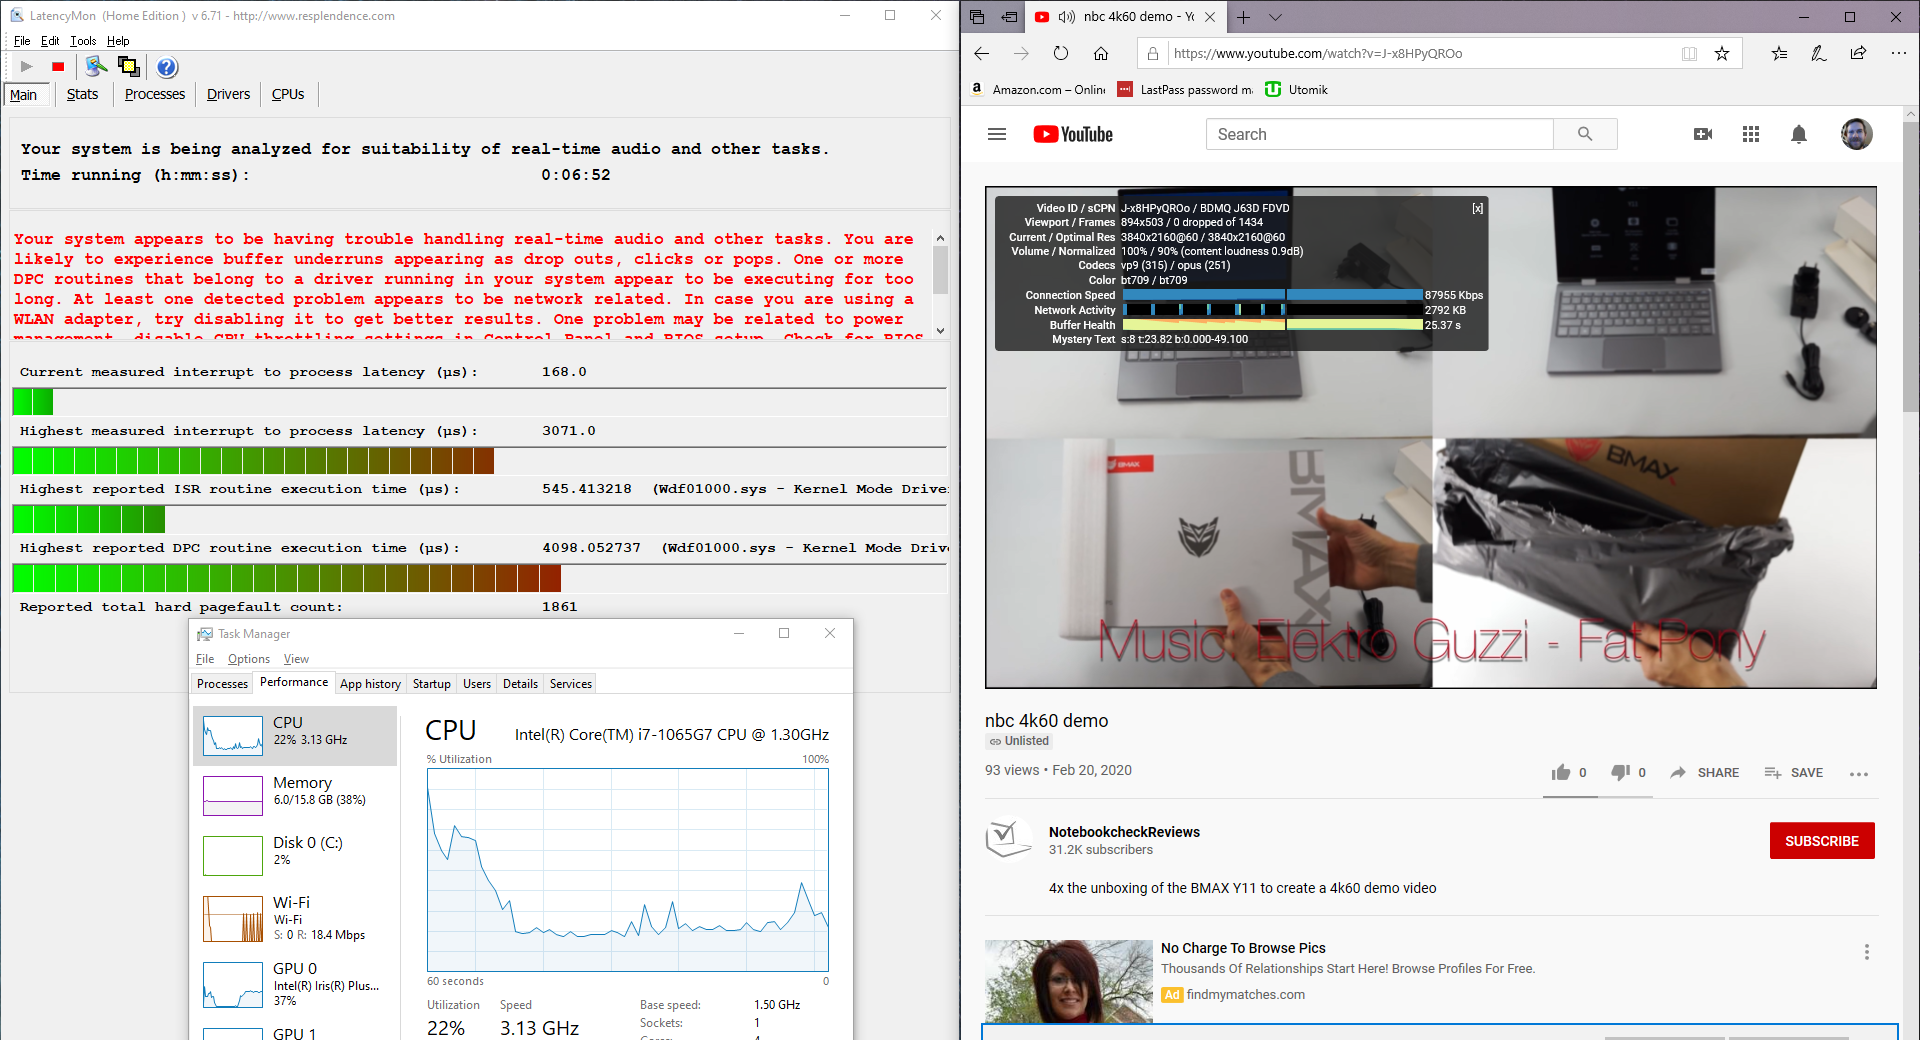
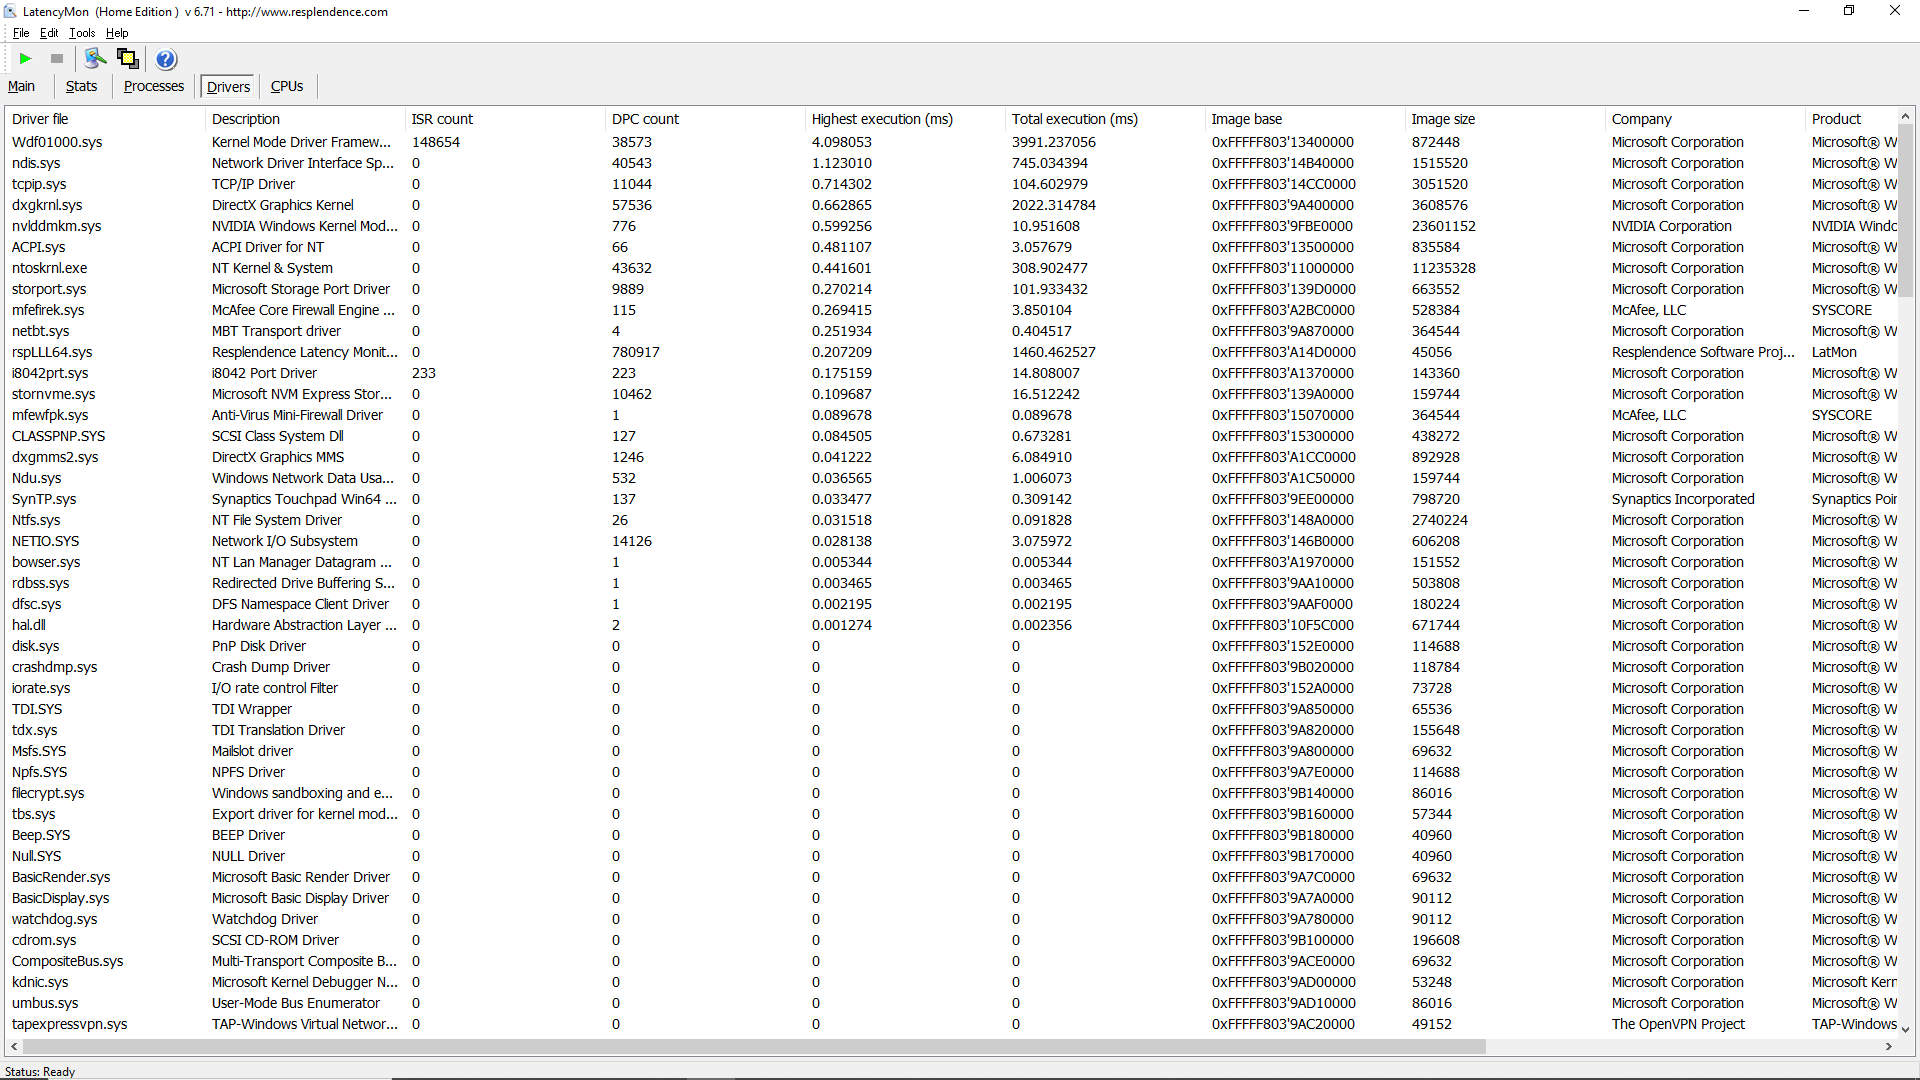
Some significant DPC latency can be observed when opening multiple browser tabs, which may cause annoyances in some workloads (e.g., video editing). However, 4K streaming and playback are perfectly smooth; we saw no dropped frames when streaming 4K video from YouTube.

| DPC Latencies / LatencyMon - interrupt to process latency (max), Web, Youtube, Prime95 | |
| Dell XPS 15 9500 Core i7 4K UHD | |
| Razer Blade Stealth Core i7 GTX 1650 Ti Max-Q 4K | |
| HP Envy 17t-cg000 | |
* ... smaller is better
Storage Devices
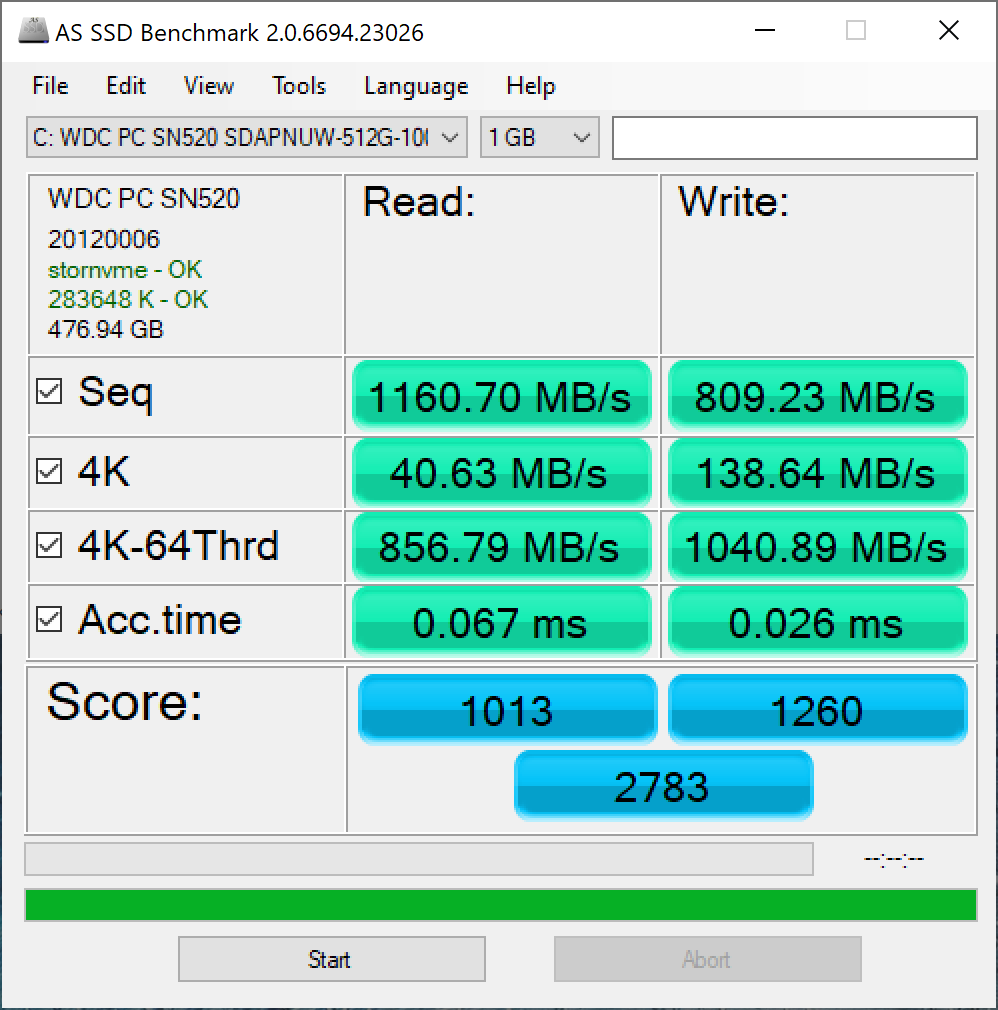
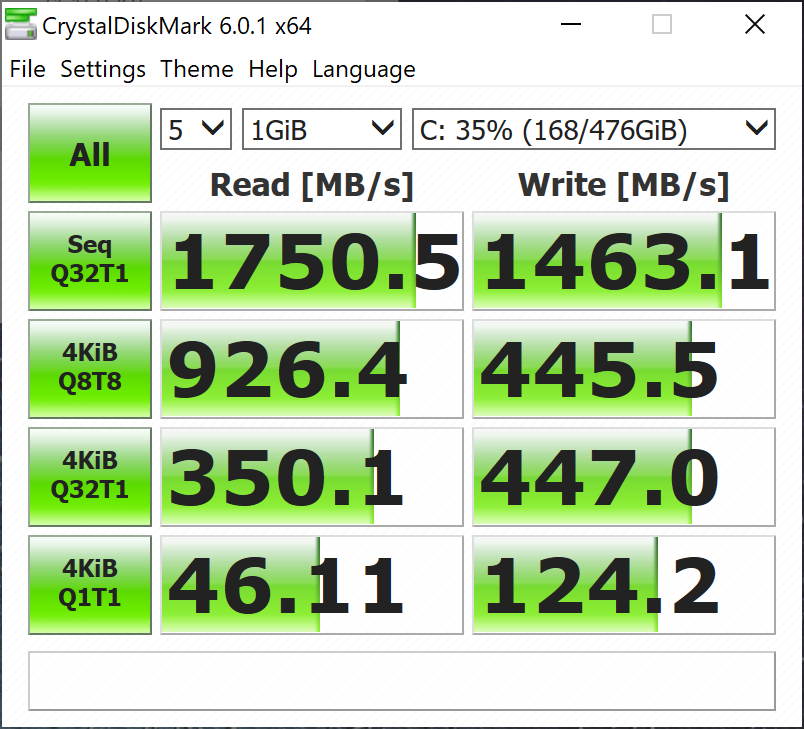
The Western Digital NVMe SSD in the HP Envy 17t is speedy. Though it does not offer read/write speeds as high as the Samsung PM981, average 4KiB speeds are more than fast enough for general consumers. Apps open quickly, and load times in most games are reasonably quick.
The Envy 17t can be configured with an additional 32 GB of Intel Optane memory or a 1 TB 2.5" SATA hard drive. Prospective buyers should be able to add an extra NVMe SSD and SATA drive themselves, though the process is somewhat destructive.
| HP Envy 17t-cg000 WDC PC SN520 SDAPNUW-512G | Medion Akoya P17605 Phison E12-256G-Phison-SSD-B16-BB1 | Asus VivoBook 17 M712DA-AU017T Intel SSD 660p SSDPEKNW512G8 | HP Envy 17-ce1004ng Intel SSD 660p SSDPEKNW512G8 | Dell Inspiron 17 3780 SK Hynix BC501 NVMe 256 GB | LG Gram 17Z990-R.AAS7U1 Samsung SSD PM871b MZNLN256HAJQ | |
|---|---|---|---|---|---|---|
| AS SSD | 38% | -20% | -24% | -33% | -52% | |
| Seq Read (MB/s) | 1161 | 2482 114% | 1592 37% | 1620 40% | 1061 -9% | 454.5 -61% |
| Seq Write (MB/s) | 809 | 1079 33% | 900 11% | 373.7 -54% | 491.4 -39% | 461 -43% |
| 4K Read (MB/s) | 40.63 | 59.3 46% | 45.24 11% | 53.8 32% | 39.13 -4% | 30.18 -26% |
| 4K Write (MB/s) | 138.6 | 194.6 40% | 104.3 -25% | 170.3 23% | 104 -25% | 71 -49% |
| 4K-64 Read (MB/s) | 857 | 1180 38% | 324 -62% | 321.5 -62% | 505 -41% | 369.6 -57% |
| 4K-64 Write (MB/s) | 1041 | 1058 2% | 835 -20% | 715 -31% | 314.8 -70% | 305.5 -71% |
| Access Time Read * (ms) | 0.067 | 0.047 30% | 0.058 13% | 0.081 -21% | 0.063 6% | 0.084 -25% |
| Access Time Write * (ms) | 0.026 | 0.019 27% | 0.047 -81% | 0.046 -77% | 0.034 -31% | 0.05 -92% |
| Score Read (Points) | 1013 | 1488 47% | 528 -48% | 537 -47% | 650 -36% | 445 -56% |
| Score Write (Points) | 1260 | 1361 8% | 1030 -18% | 923 -27% | 468 -63% | 423 -66% |
| Score Total (Points) | 2783 | 3552 28% | 1810 -35% | 1693 -39% | 1434 -48% | 1106 -60% |
| Copy ISO MB/s (MB/s) | 1350 | 876 -35% | 816 -40% | |||
| Copy Program MB/s (MB/s) | 766 | 653 -15% | 614 -20% | |||
| Copy Game MB/s (MB/s) | 1190 | 512 -57% | 414.9 -65% | |||
| CrystalDiskMark 5.2 / 6 | 44% | -12% | -5% | -7% | -36% | |
| Write 4K (MB/s) | 124.2 | 213.2 72% | 132 6% | 134.8 9% | 120.3 -3% | 89.7 -28% |
| Read 4K (MB/s) | 46.11 | 59.2 28% | 52 13% | 54.7 19% | 41.81 -9% | 36.59 -21% |
| Write Seq (MB/s) | 1124 | 973 | 872 | 619 | 422.4 | |
| Read Seq (MB/s) | 1156 | 1606 | 1447 | 1119 | 454.9 | |
| Write 4K Q32T1 (MB/s) | 447 | 588 32% | 210.4 -53% | 392.2 -12% | 492.2 10% | 321.1 -28% |
| Read 4K Q32T1 (MB/s) | 350.1 | 612 75% | 312.2 -11% | 331.6 -5% | 398.8 14% | 340.1 -3% |
| Write Seq Q32T1 (MB/s) | 1463 | 1112 -24% | 982 -33% | 920 -37% | 812 -44% | 509 -65% |
| Read Seq Q32T1 (MB/s) | 1751 | 3121 78% | 1847 5% | 1723 -2% | 1616 -8% | 545 -69% |
| Write 4K Q8T8 (MB/s) | 445.5 | |||||
| Read 4K Q8T8 (MB/s) | 926 | |||||
| Total Average (Program / Settings) | 41% /
40% | -16% /
-17% | -15% /
-17% | -20% /
-25% | -44% /
-47% |
* ... smaller is better

Disk Throttling: DiskSpd Read Loop, Queue Depth 8
GPU Performance
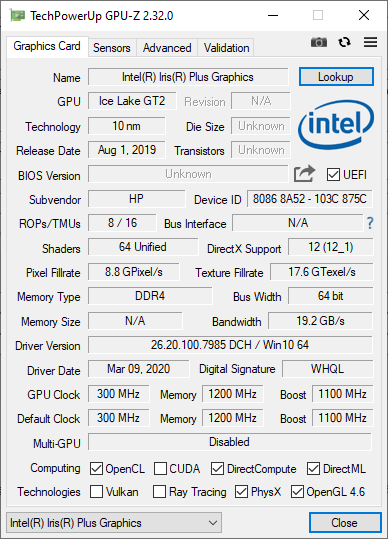
The HP Envy 17t sports an Intel Iris Plus Graphics G7 iGPU and an Nvidia GeForce MX330 dGPU. The Iris Plus iGPU is more than capable of powering the 4K display and handling most general use graphical demands (e.g., streaming video, light photo edits). The MX330 is employed for more demanding workloads to offer a bit of a graphical push, thanks in part to its 2 GB of GDDR5 VRAM.
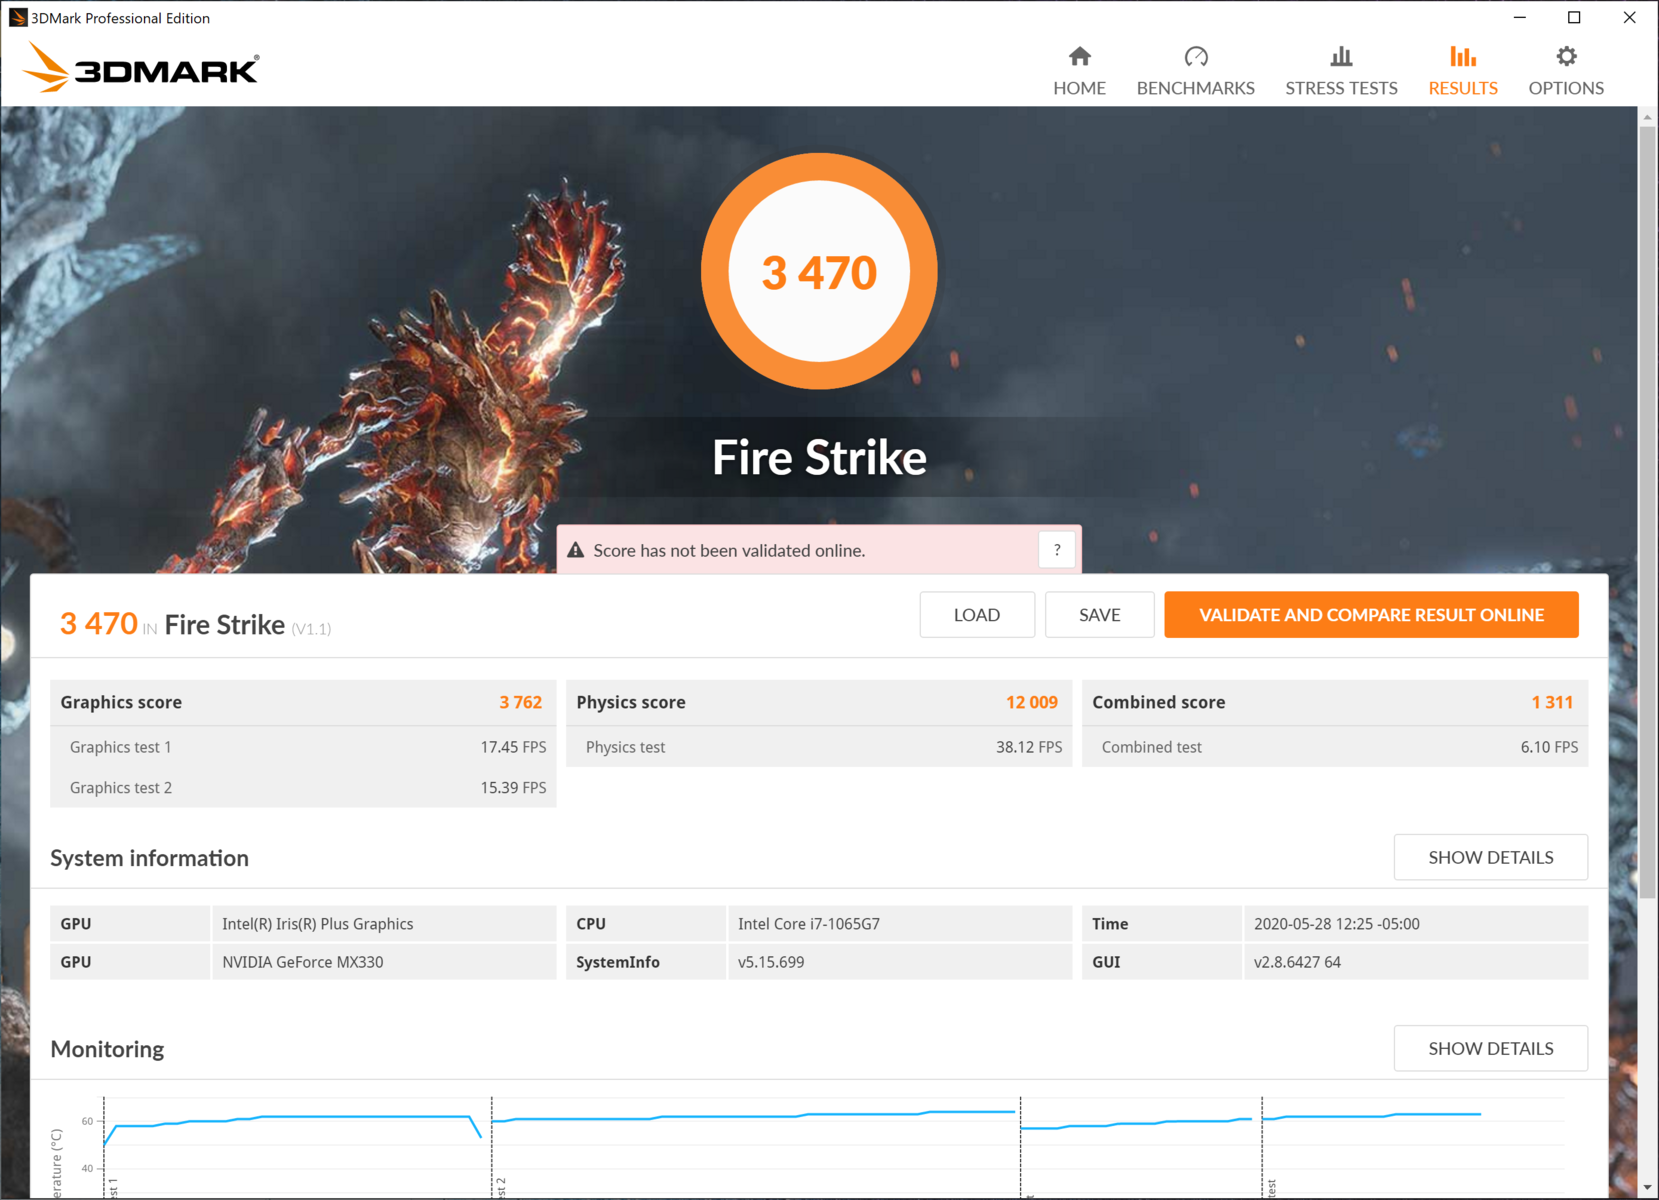
While the Envy 17t is in no way a video editing or gaming monster, it can handle lighter video editing projects and some light gaming, albeit at lower settings. The MX330 offers about a 25-35% bump in performance over the integrated Iris Plus Graphics chip (per 3DMark). When compared to the GeForce GTX 1650 Ti, the MX330 doesn't hold much muster, routinely offering less than half the performance.
Compared to AMD's APUs, though, the MX330 is a clear winner. The Nvidia GPU scores about 20% higher than the AMD RX Vega 7 in most 3DMark tests.
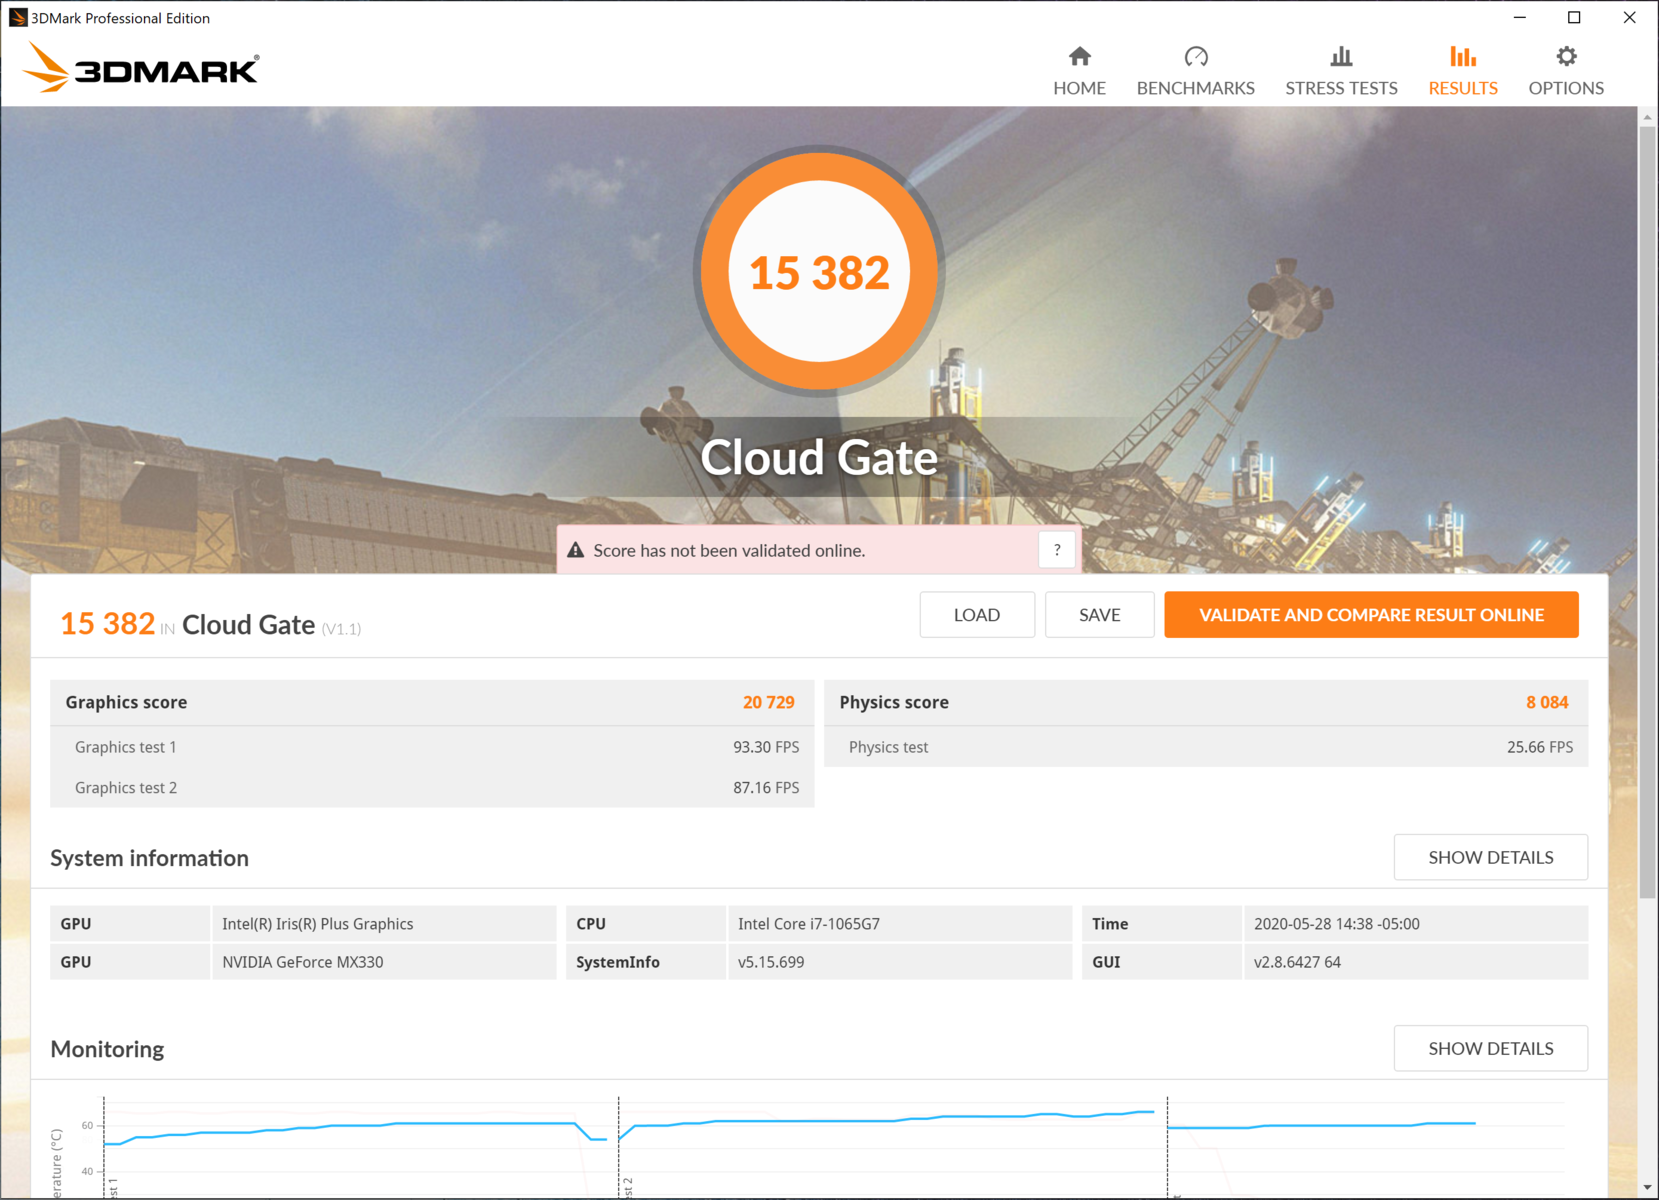
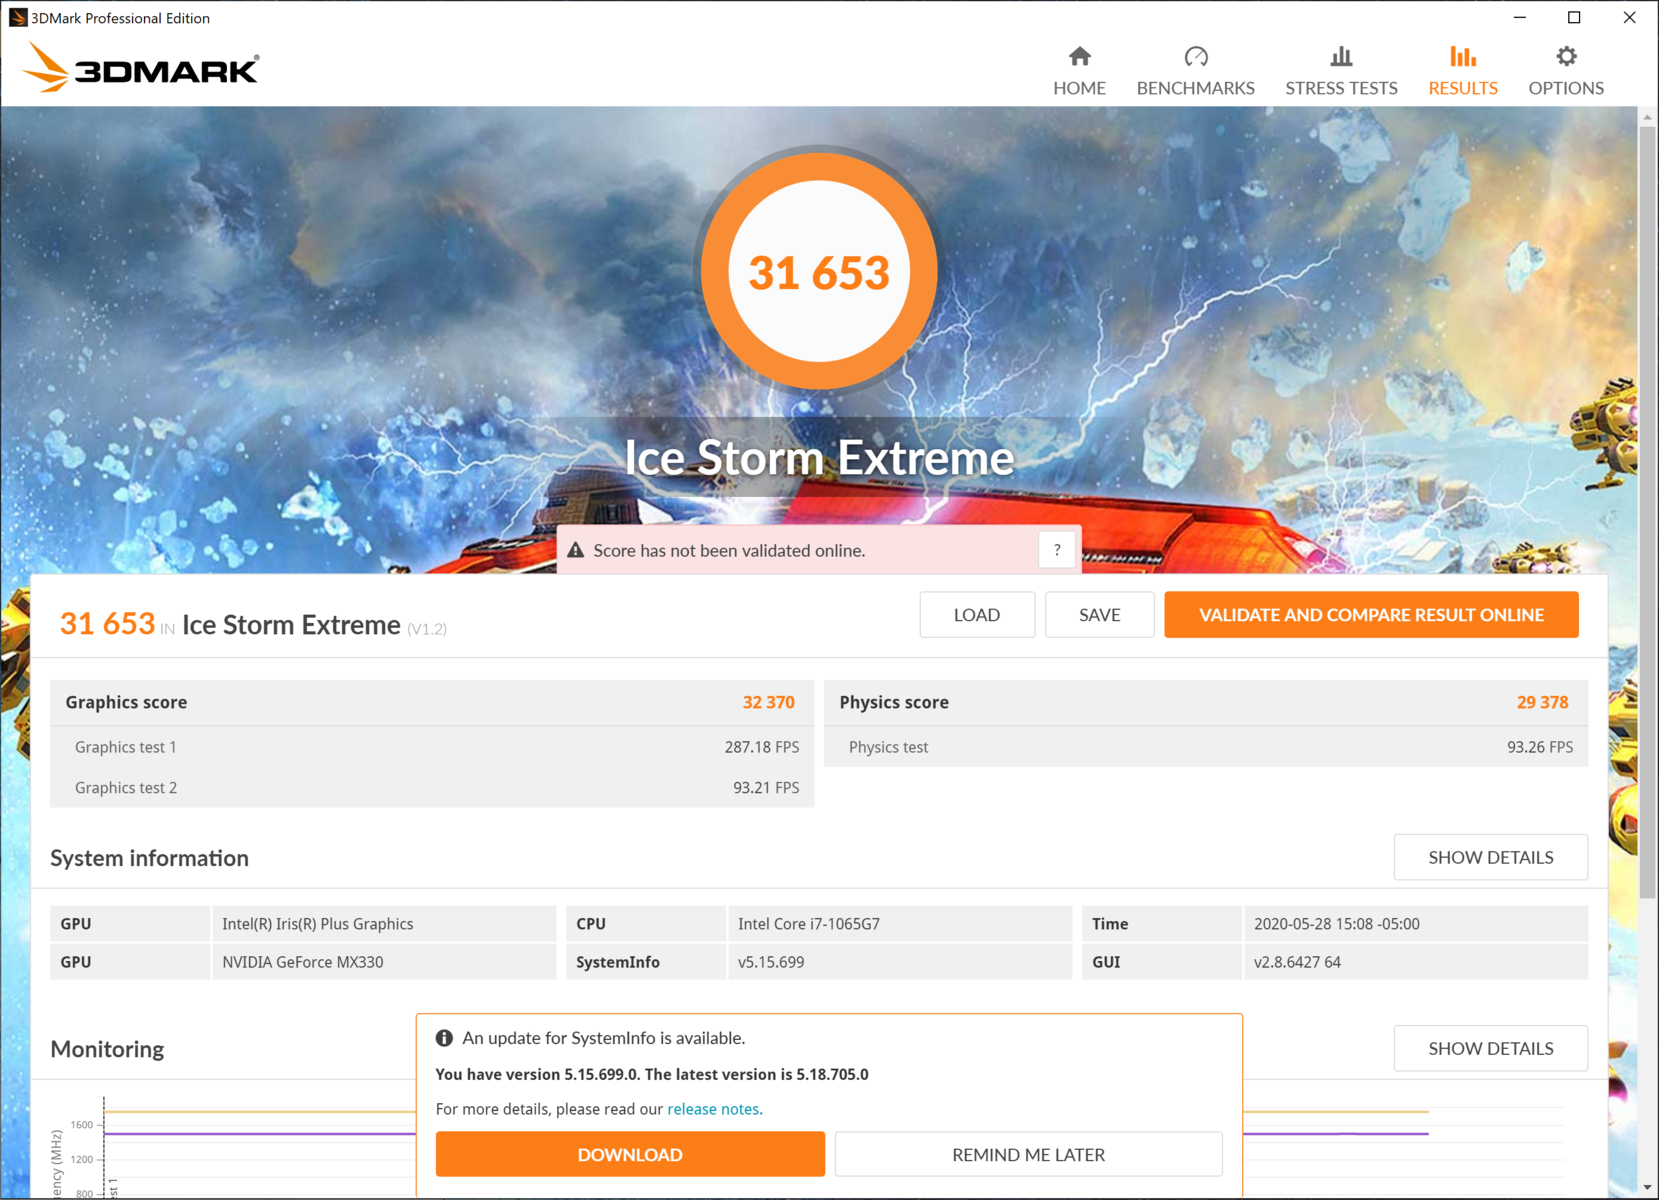
| 3DMark 11 Performance | 5180 points | |
| 3DMark Ice Storm Standard Score | 22597 points | |
| 3DMark Cloud Gate Standard Score | 15382 points | |
| 3DMark Fire Strike Score | 3470 points | |
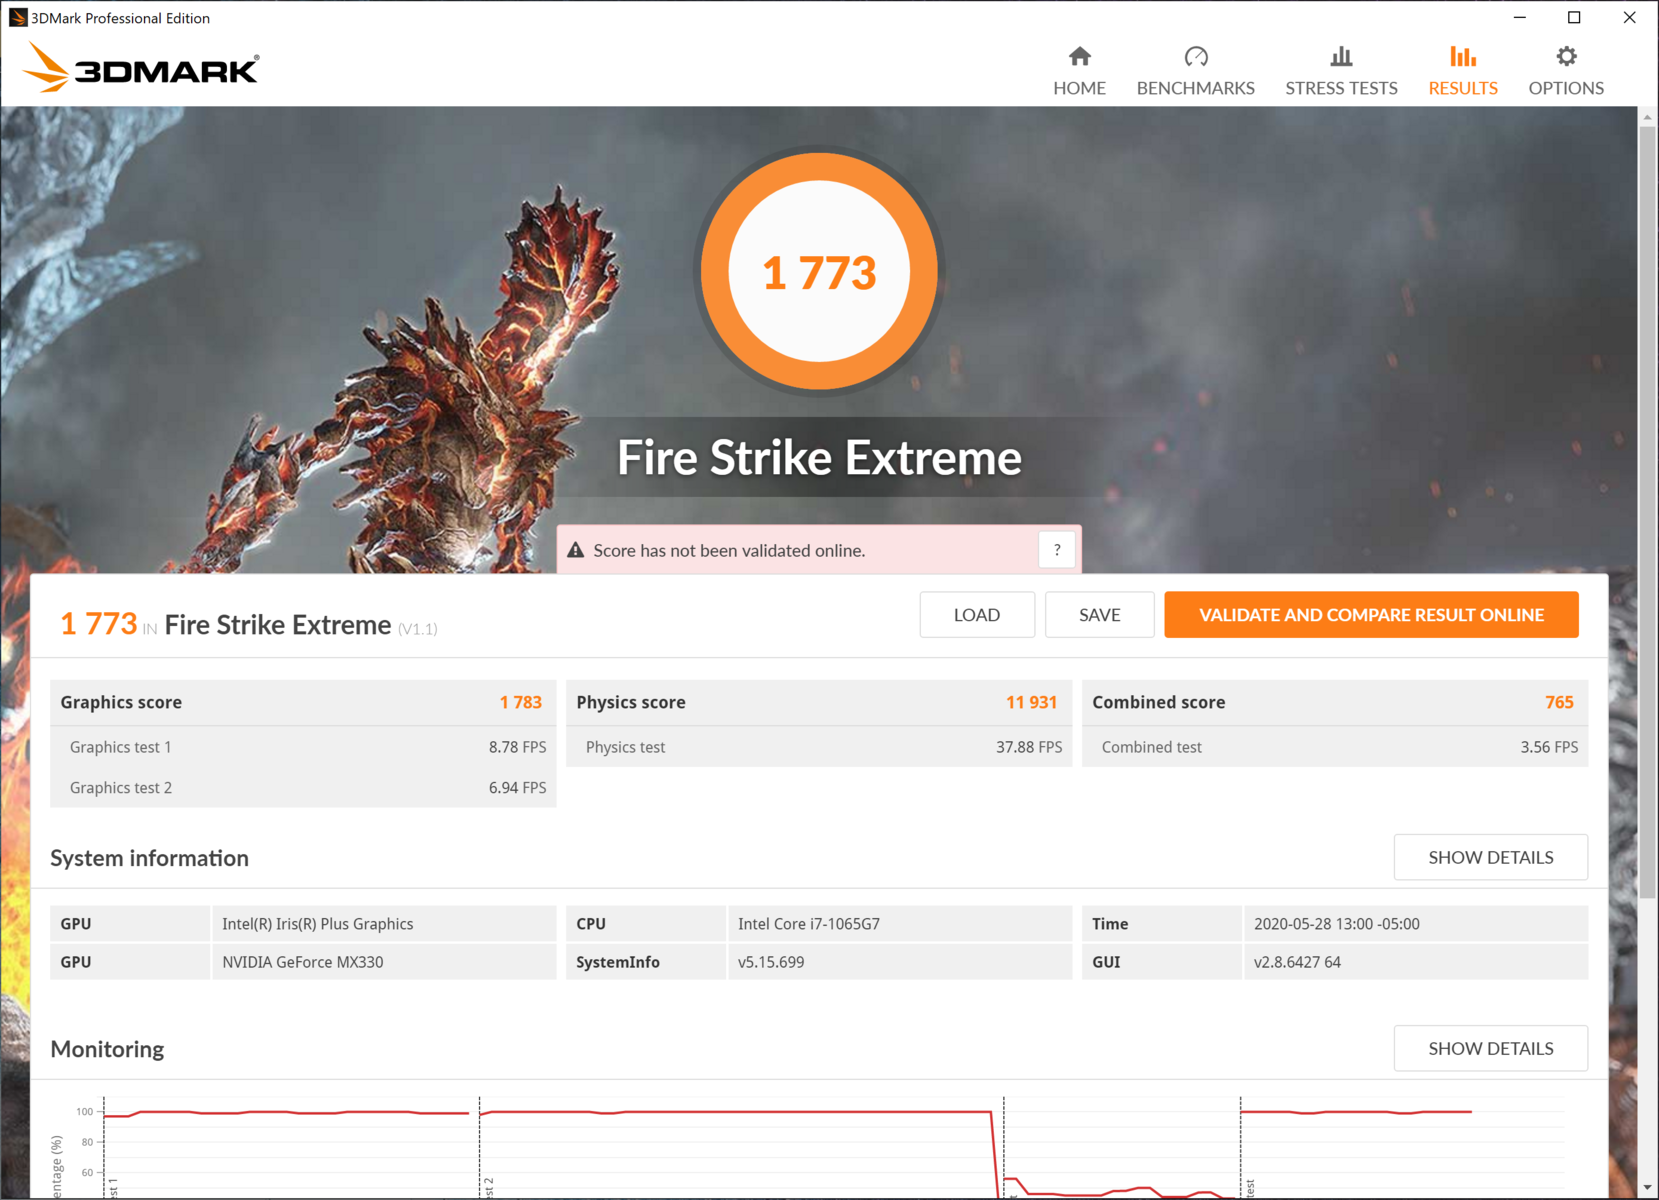
| 3DMark Fire Strike Extreme Score | 1773 points | |
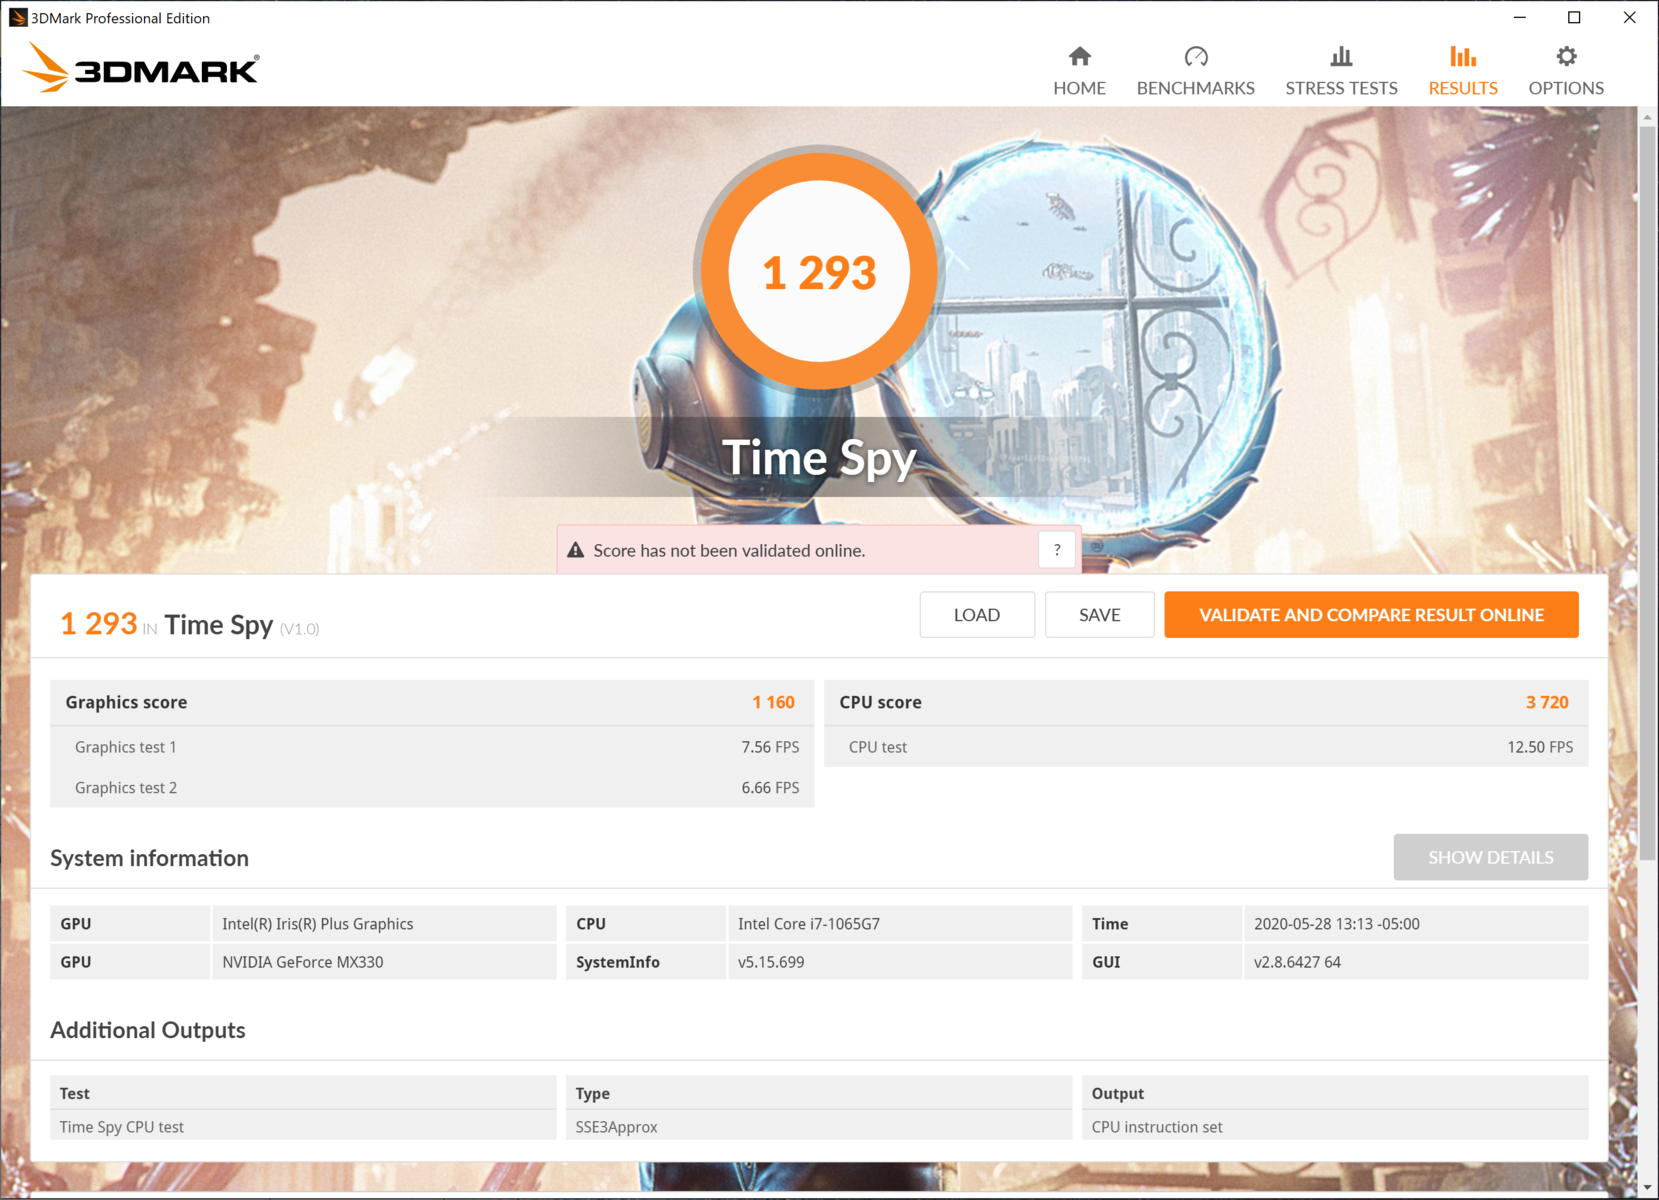
| 3DMark Time Spy Score | 1293 points | |
Help | ||
Gaming Performance
As mentioned, the HP Envy 17t is capable of playing lighter titles like Rocket League without much trouble, though settings will need to be dialed back. Even modern titles like Shadow of the Tomb Raider are within reach, albeit at 1280x720 and the lowest graphical settings. Still, for casual gamers that don't mind turning down resolutions and settings, the Envy 17t fits the bill.
| BioShock Infinite | |
| 1920x1080 Ultra Preset, DX11 (DDOF) | |
| MSI Prestige 15 A10SC | |
| HP Envy 17t-cg000 | |
| Average NVIDIA GeForce MX330 (n=1) | |
| HP Envy 17-ce1004ng | |
| Microsoft Surface Laptop 3 15 i7-1065G7 | |
| 1366x768 High Preset | |
| MSI Prestige 15 A10SC | |
| HP Envy 17-ce1004ng | |
| HP Envy 17t-cg000 | |
| Average NVIDIA GeForce MX330 (n=1) | |
| Microsoft Surface Laptop 3 15 i7-1065G7 | |
| 1366x768 Medium Preset | |
| MSI Prestige 15 A10SC | |
| HP Envy 17-ce1004ng | |
| HP Envy 17t-cg000 | |
| Average NVIDIA GeForce MX330 (n=1) | |
| Microsoft Surface Laptop 3 15 i7-1065G7 | |
| 1280x720 Very Low Preset | |
| MSI Prestige 15 A10SC | |
| HP Envy 17t-cg000 | |
| Average NVIDIA GeForce MX330 (n=1) | |
| HP Envy 17-ce1004ng | |
| Microsoft Surface Laptop 3 15 i7-1065G7 | |
Long play sessions, as analyzed by an hour-long playthrough of The Witcher 3, are stable. We noticed no frame drops or other hiccups during our review period.
| low | med. | high | ultra | 4K | |
|---|---|---|---|---|---|
| BioShock Infinite (2013) | 173.9 | 113.8 | 96 | 37.9 | |
| The Witcher 3 (2015) | 17 | ||||
| Dota 2 Reborn (2015) | 110 | 104 | 73.2 | 65.3 | 25.4 |
| X-Plane 11.11 (2018) | 71 | 56.5 | 51.3 | 23.9 | |
| Shadow of the Tomb Raider (2018) | 42 | 17 | 10 | 8 | |
| F1 2019 (2019) | 73 | 31 | 24 | 19 |
Emissions
System Noise
The fan is binary in behavior — it is either off and the system is nearly silent, or it runs at full blast. During most light tasks (office work, simple web browsing), the fan remains off. When gaming or streaming media, though, the fan ramps up quickly to its full speed. Fan noise peaks just under 44 dB(A), which is audible but not loud. The fan's high pitch can grow annoying over long workloads, though. Under the "Comfort" profile in the HP Command Center, the fan rarely ramps up. When it does, it is realtively quiet and blends into ambient noise. However, as discussed, the CPU is throttled as a result.
Coil whine is present, but it cannot be heard more than a few inches from the keyboard.
| HP Envy 17t-cg000 GeForce MX330, i7-1065G7, WDC PC SN520 SDAPNUW-512G | Medion Akoya P17605 GeForce MX250, i7-10510U, Phison E12-256G-Phison-SSD-B16-BB1 | Asus VivoBook 17 M712DA-AU017T Vega 8, R5 3500U, Intel SSD 660p SSDPEKNW512G8 | HP Envy 17-ce1004ng GeForce MX250, i7-10510U, Intel SSD 660p SSDPEKNW512G8 | Dell Inspiron 17 3780 Radeon 520, i7-8565U, SK Hynix BC501 NVMe 256 GB | LG Gram 17Z990-R.AAS7U1 UHD Graphics 620, i7-8565U, Samsung SSD PM871b MZNLN256HAJQ | |
|---|---|---|---|---|---|---|
| Noise | -2% | 4% | 2% | -5% | 7% | |
| off / environment * (dB) | 28.2 | 30.3 -7% | 30.3 -7% | 30 -6% | 28.1 -0% | 28.1 -0% |
| Idle Minimum * (dB) | 28.2 | 32.4 -15% | 30.3 -7% | 30 -6% | 31.7 -12% | 28.1 -0% |
| Idle Average * (dB) | 28.2 | 32.4 -15% | 30.3 -7% | 30 -6% | 31.8 -13% | 28.1 -0% |
| Idle Maximum * (dB) | 29.5 | 32.7 -11% | 30.3 -3% | 30 -2% | 31.8 -8% | 28.1 5% |
| Load Average * (dB) | 43.9 | 36.4 17% | 31.6 28% | 36.4 17% | 38.7 12% | 35 20% |
| Witcher 3 ultra * (dB) | 43.9 | |||||
| Load Maximum * (dB) | 43.9 | 36 18% | 35.7 19% | 36.5 17% | 48.5 -10% | 37.4 15% |
* ... smaller is better
Noise level
| Idle |
| 28.2 / 28.2 / 29.5 dB(A) |
| Load |
| 43.9 / 43.9 dB(A) |
 | ||
30 dB silent 40 dB(A) audible 50 dB(A) loud |
||
min: | ||
Temperature
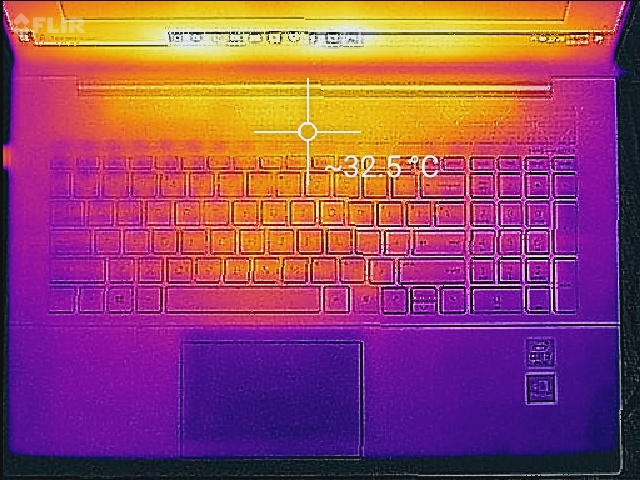
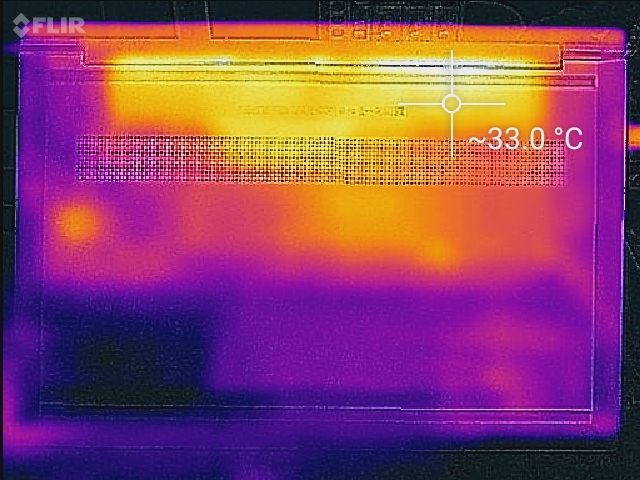
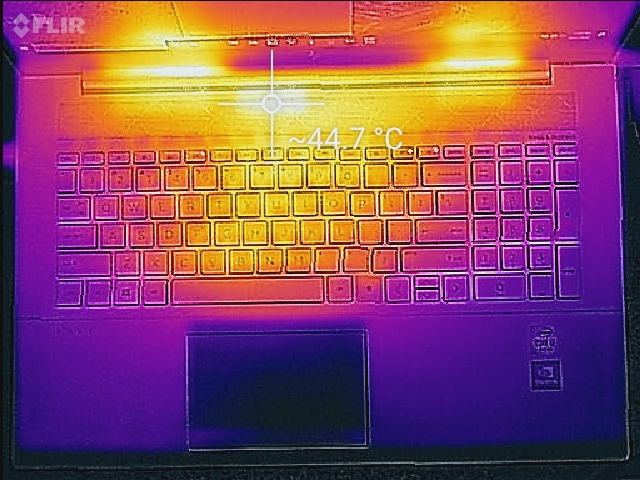
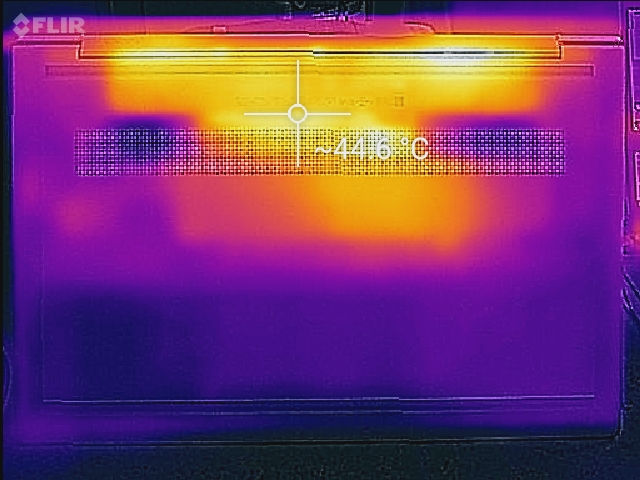
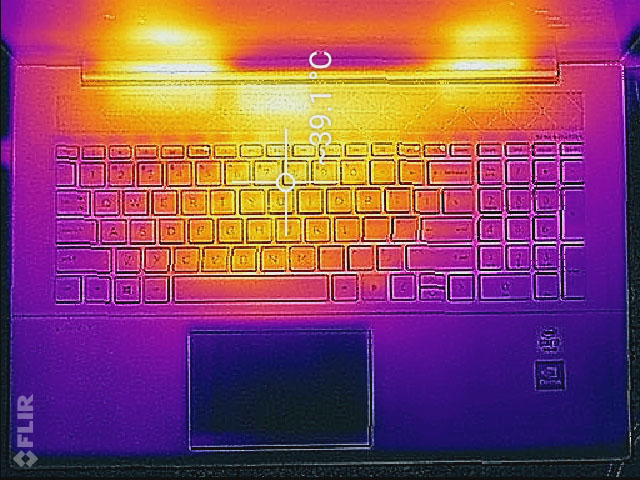
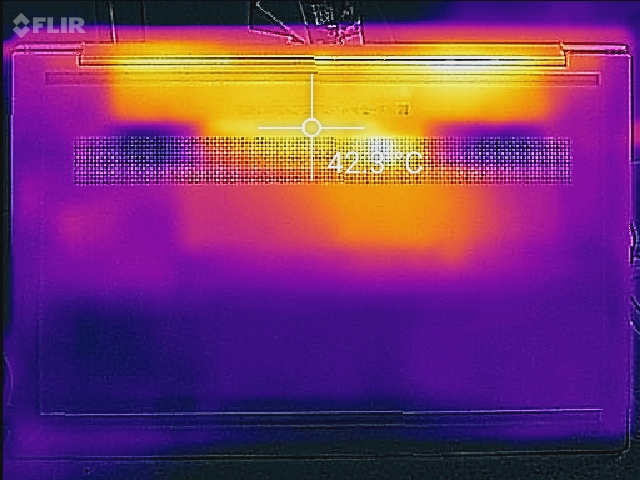
The loud fan has a plus: exterior temperatures remain cool, even under extended heavy loads. There is a hot spot above the middle of the keyboard deck, as this is where the exhaust vent dumps hot air. However, a user's hands should never be in this spot, so it is of minimal concern. It should be noted that heat is vented directly onto the display rather than out the rear or sides of the machine as with many other laptops. Even so, temperatures on the chassis only reach 42-44° C.
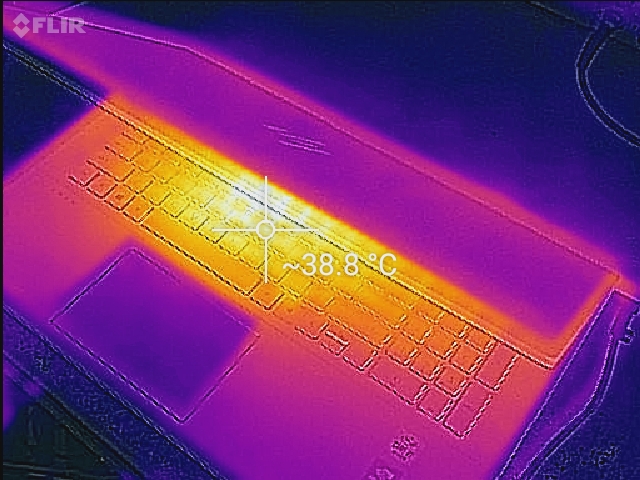
(±) The maximum temperature on the upper side is 42 °C / 108 F, compared to the average of 36.8 °C / 98 F, ranging from 21 to 71 °C for the class Multimedia.
(±) The bottom heats up to a maximum of 44.2 °C / 112 F, compared to the average of 39.1 °C / 102 F
(+) In idle usage, the average temperature for the upper side is 29.3 °C / 85 F, compared to the device average of 31.3 °C / 88 F.
(±) Playing The Witcher 3, the average temperature for the upper side is 32.2 °C / 90 F, compared to the device average of 31.3 °C / 88 F.
(+) The palmrests and touchpad are cooler than skin temperature with a maximum of 28 °C / 82.4 F and are therefore cool to the touch.
(±) The average temperature of the palmrest area of similar devices was 28.7 °C / 83.7 F (+0.7 °C / 1.3 F).
Stress Test
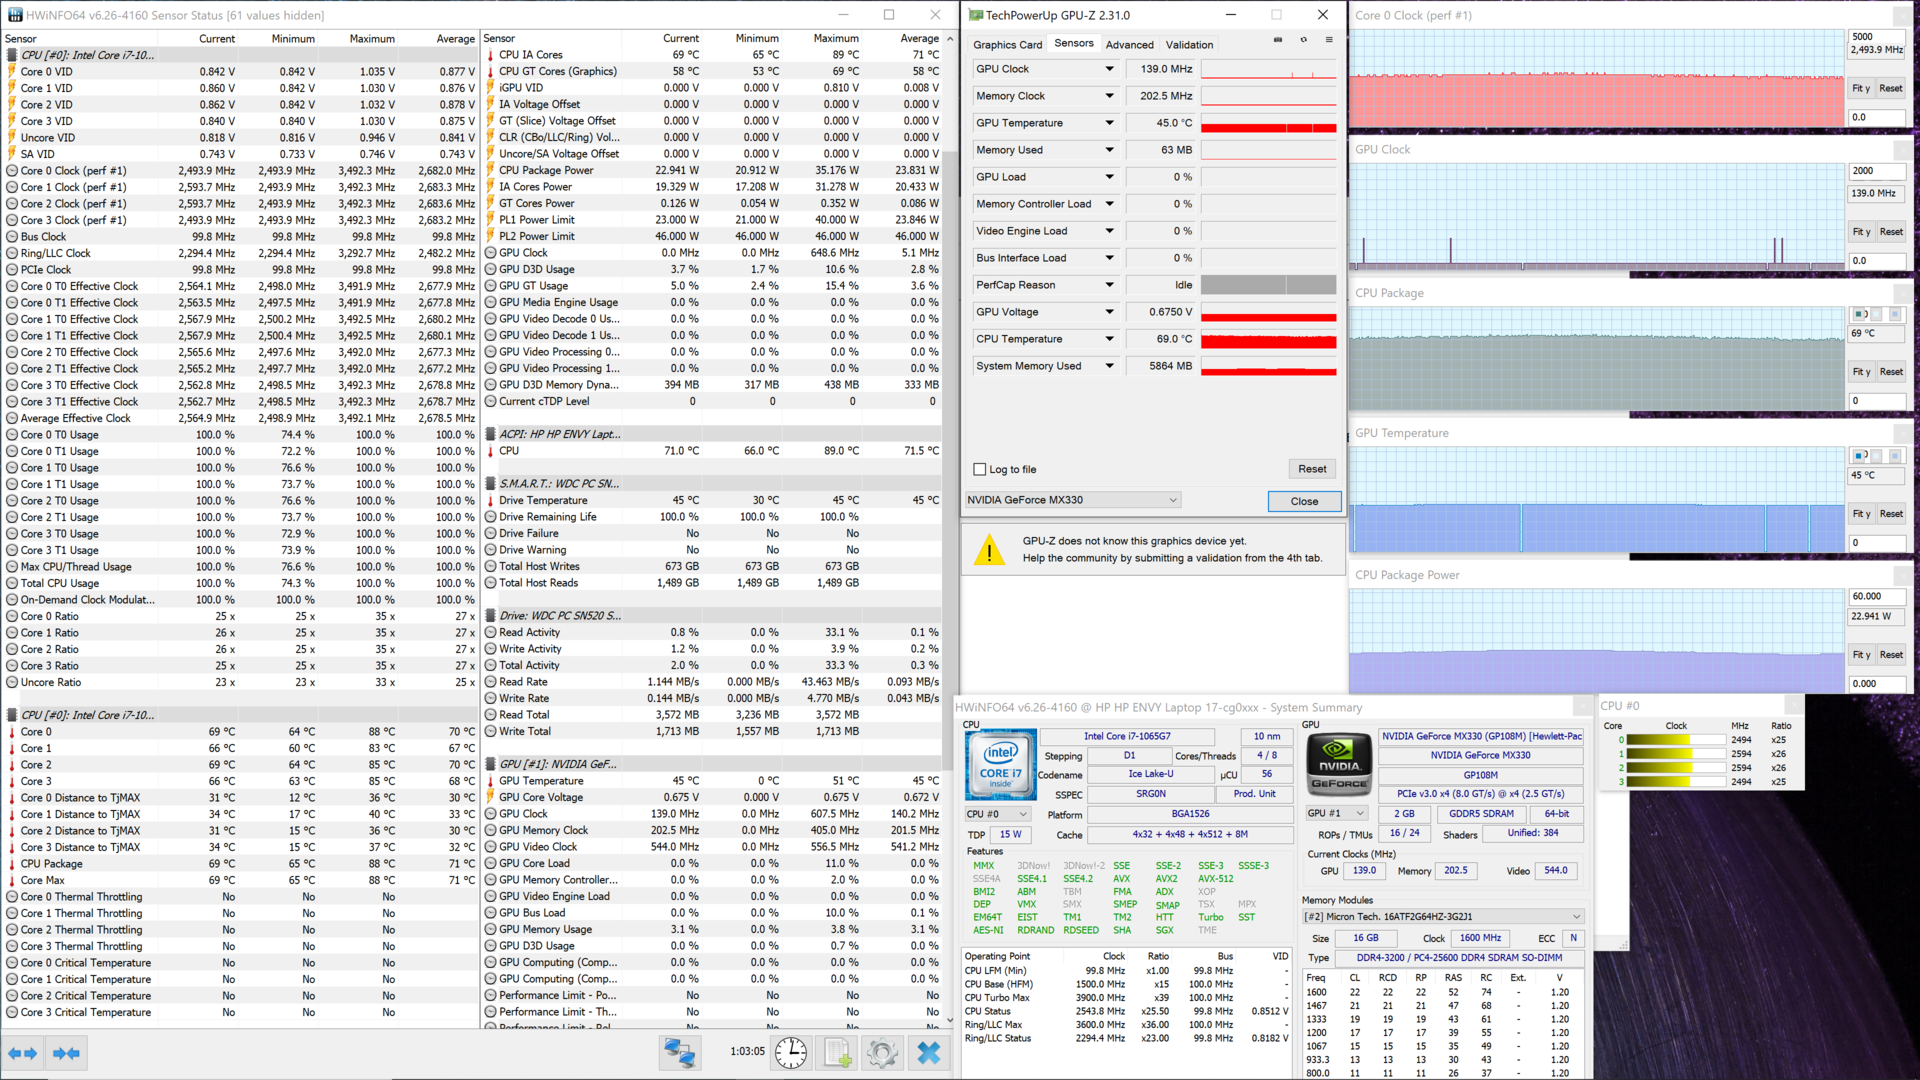
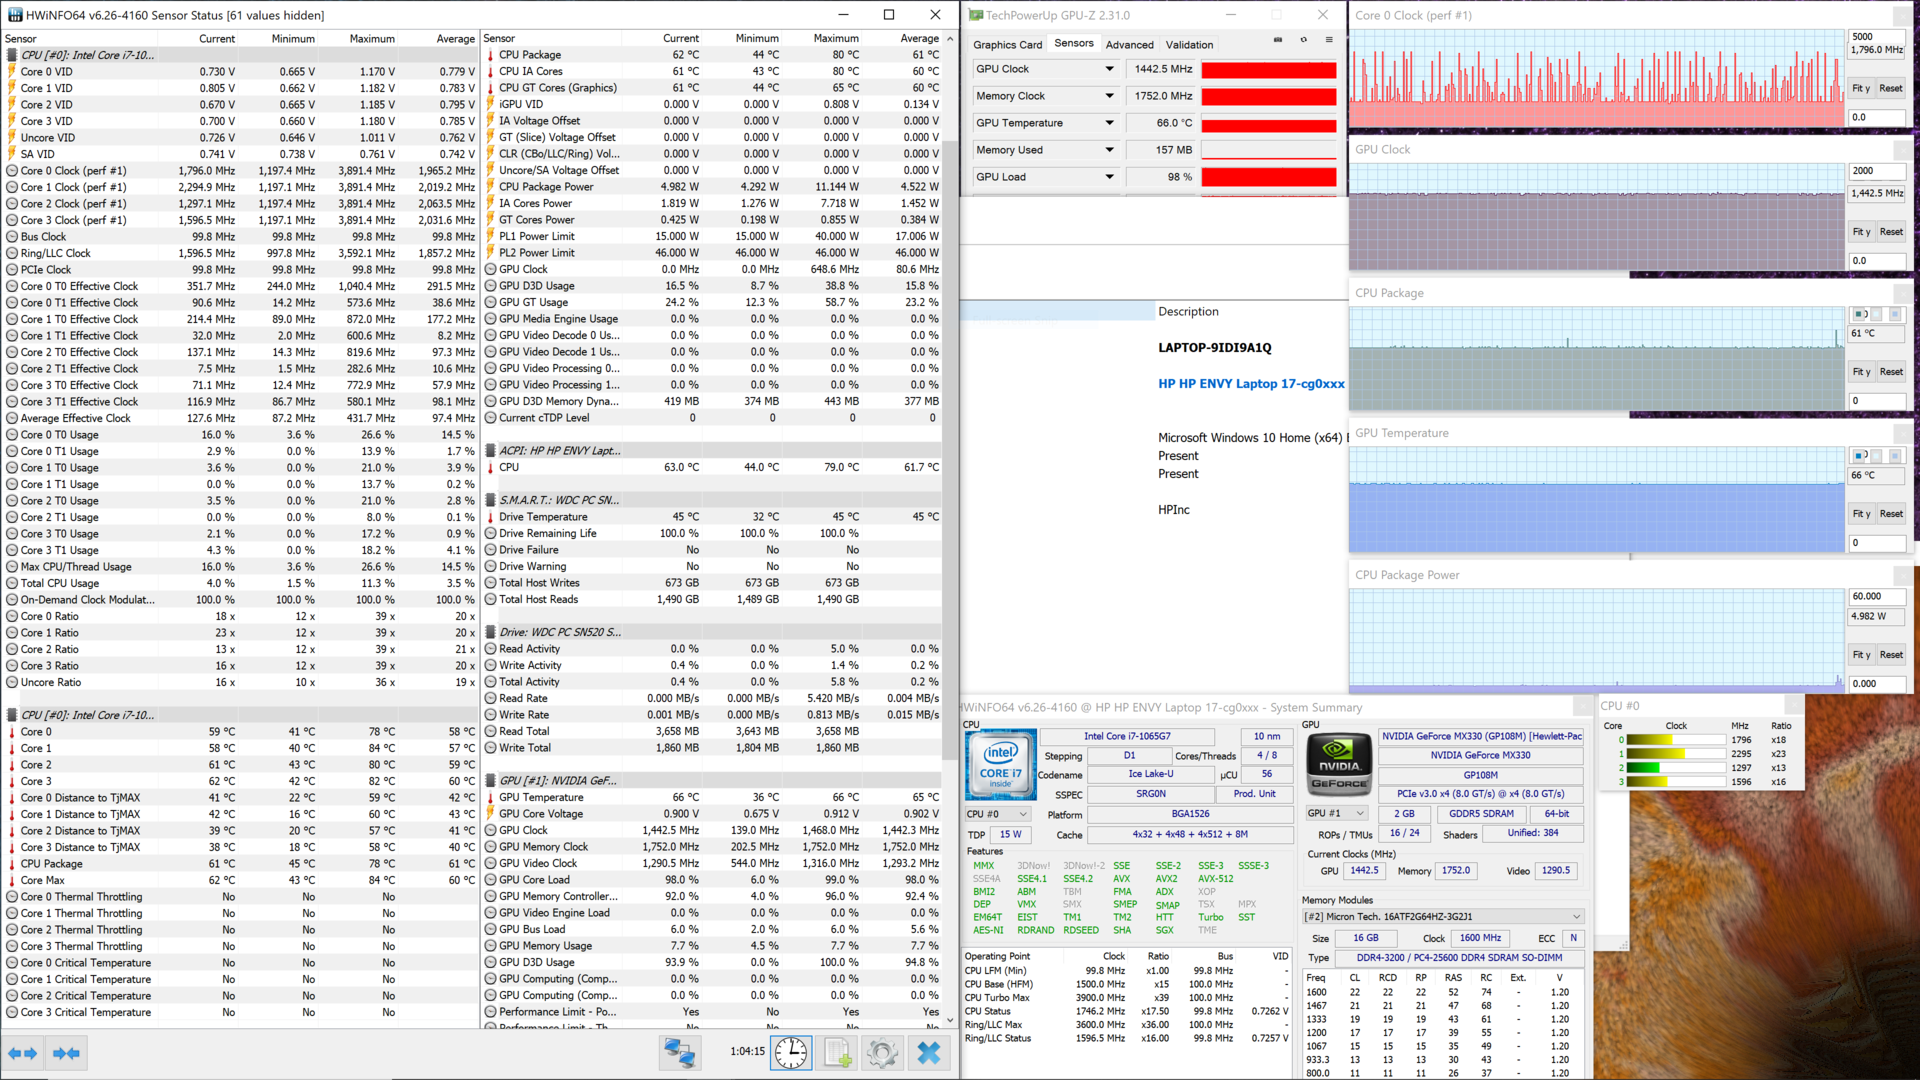
Another high point of the Envy 17t is its excellent thermal management. After fully loading all eight threads via Prime95 for an hour, CPU temperatures stay just under 70° C. Similarly, the GPU remains cool under full load, averaging 66° C after running FurMark for an hour. Running FurMark and Prime95 simultaneously sees CPU and GPU temperatures rise, but only to 77° and 71° C, respectively.
However, these well-controlled temperatures come at a cost. The CPU cannot maintain its boost clock during the Prime95 stress test and it's forced to throttle back to ~2.5-2.6 GHz on all cores. Stressing the GPU and CPU concurrently further chokes the processor; under the Prime95/FurMark combined test, the Core i7-1065G7 pulls back to 1.9 GHz. On the plus side, the GPU seems free to boost as needed, especially in real-world scenarios like gaming.
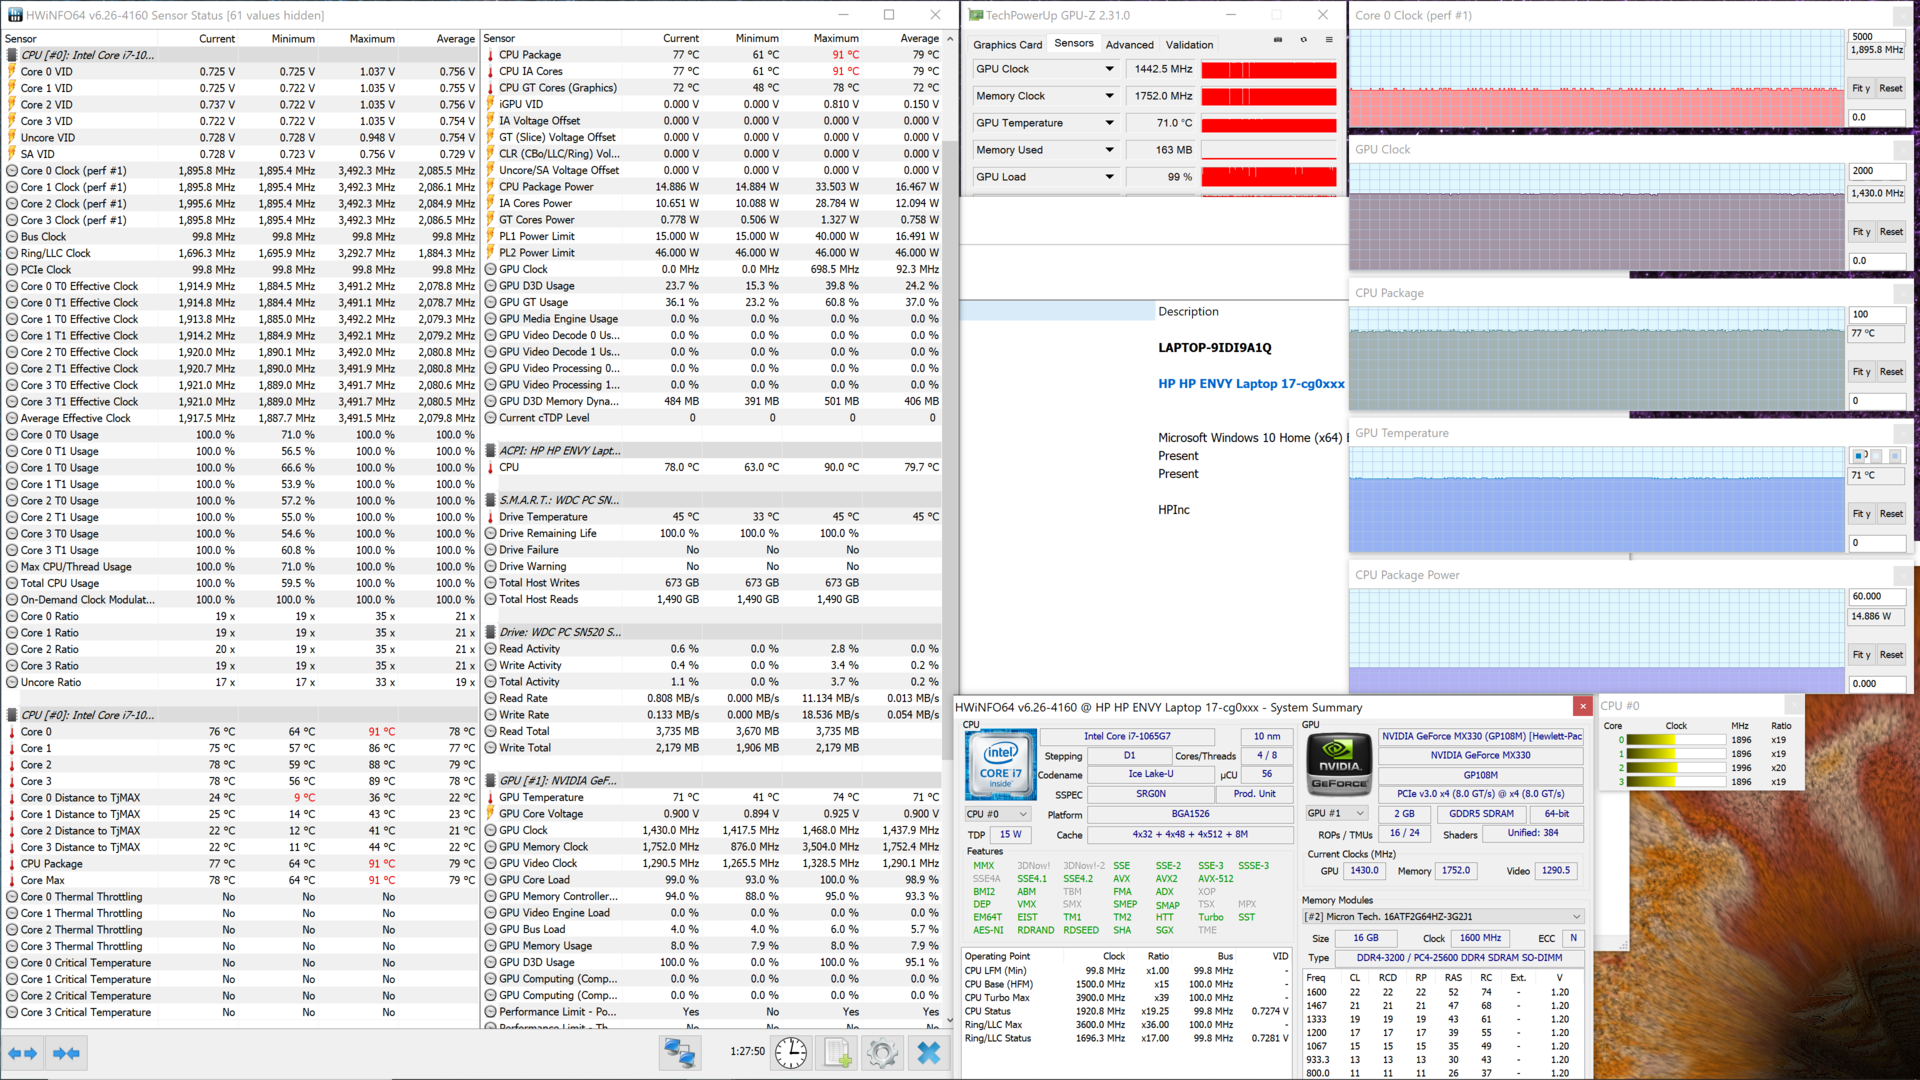
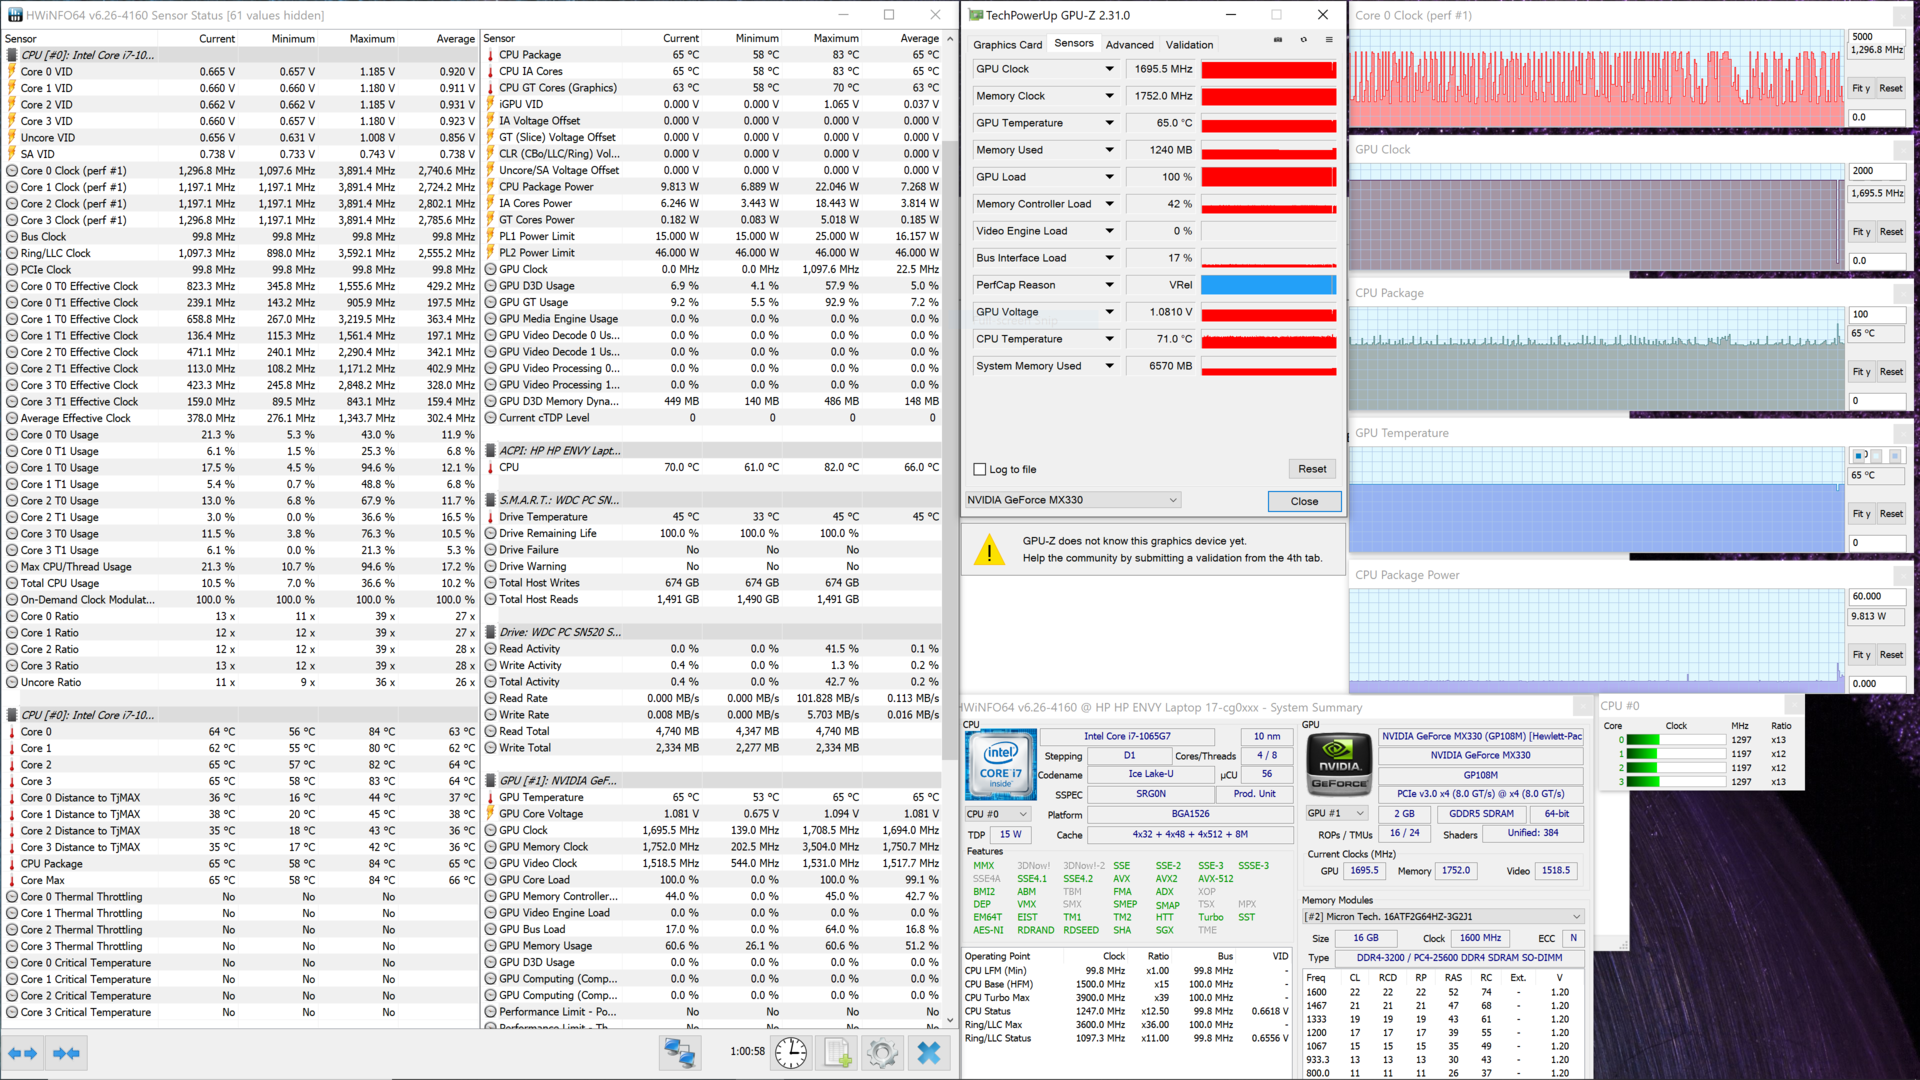
| CPU Clock (GHz) | GPU Clock (MHz) | Average CPU Temperature (°C) | Average GPU Temperature (°C) | |
| Prime95 Stress | 2.5-2.6 | - | 69 | - |
| FurMark Stress | 2.0 | 1442 | 61 | 66 |
| Prime95 + FurMark Stress | 1.9-2.1 | 1430 | 79 | 71 |
| Witcher 3 Stress | 2.8 | 1694 | 65 | 65 |
Speakers
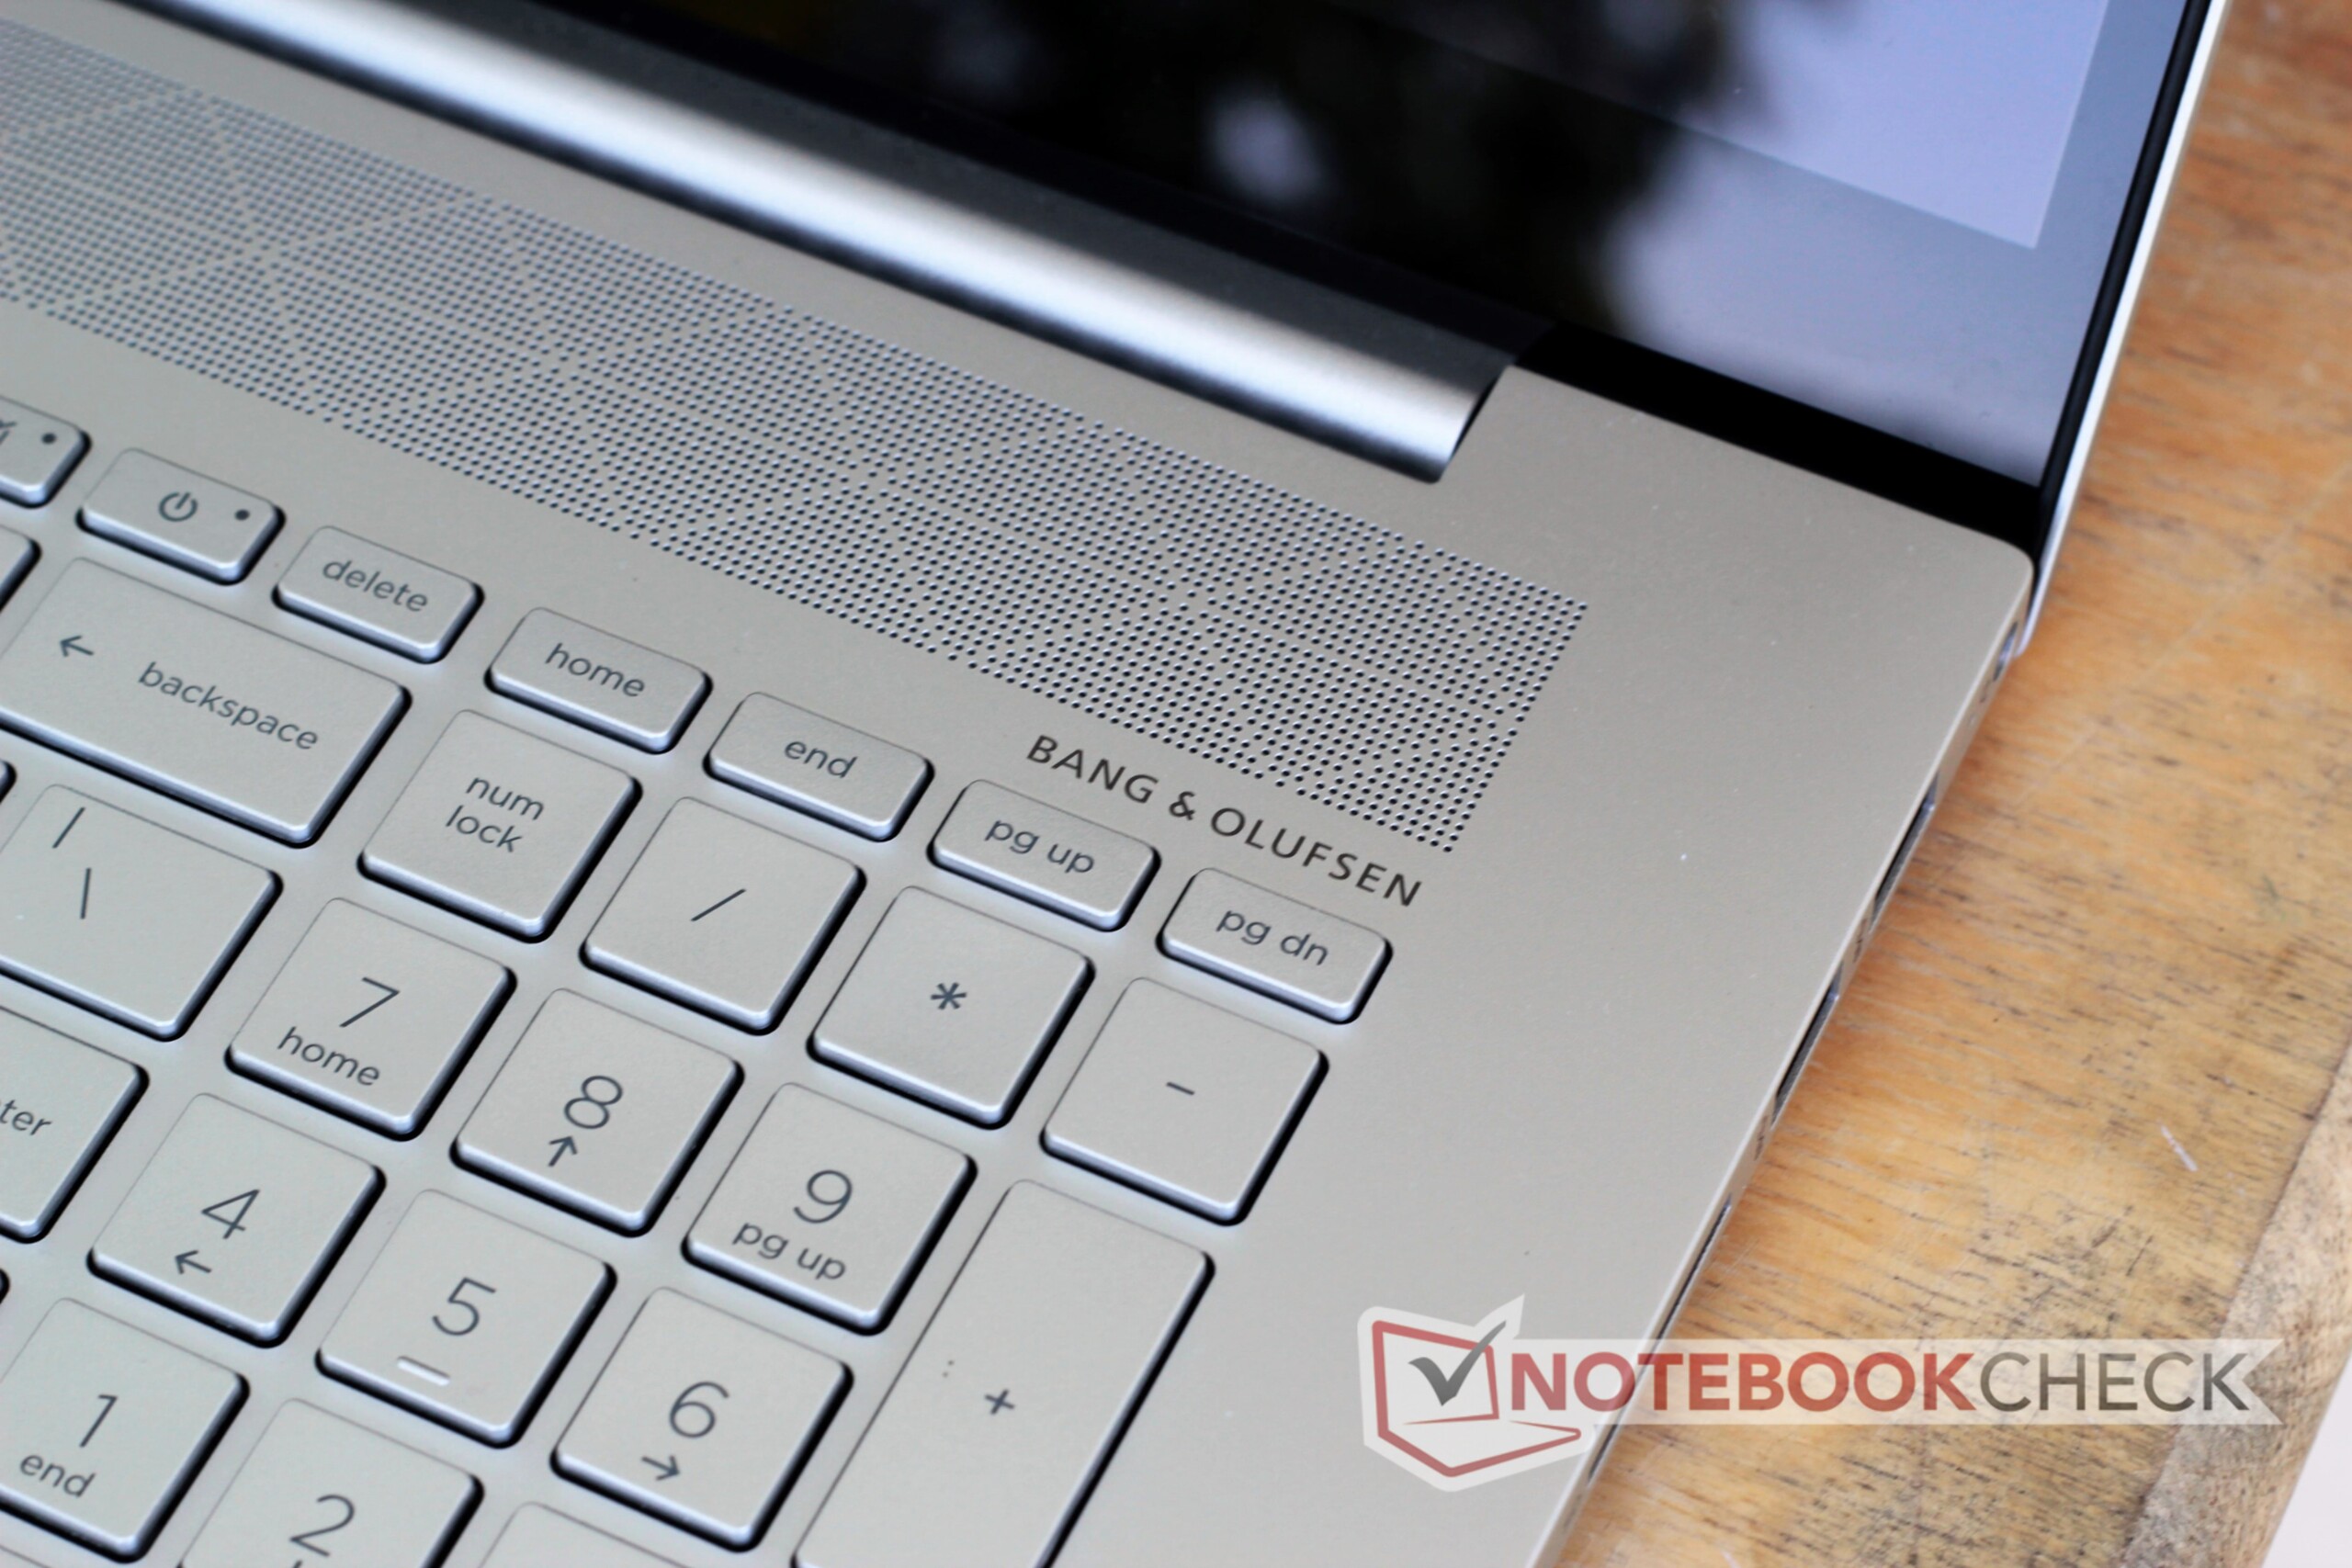
The Bang & Olufsen branded speakers are good and well-suited for a multimedia laptop. Bass is present but thin. Mids and highs are well-balanced, loud, and clear. The overall sound is punchy, especially considering the thin and tinny sound from most laptops. The inclusion of a subwoofer would have made the Envy 17t stand heads and shoulders above its competitors. As it is, though, the speakers get high marks.

Energy Management
Power Consumption
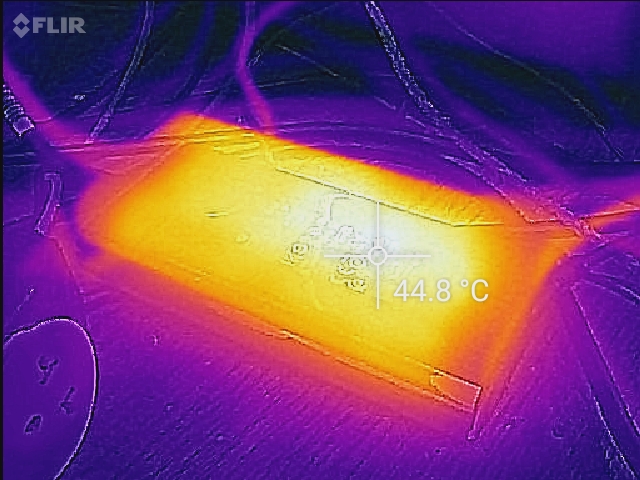
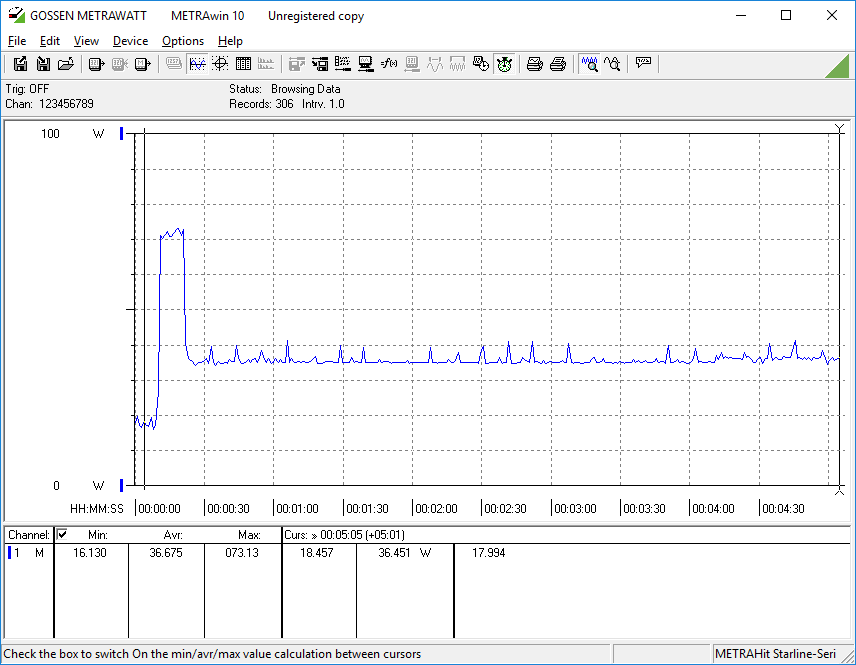
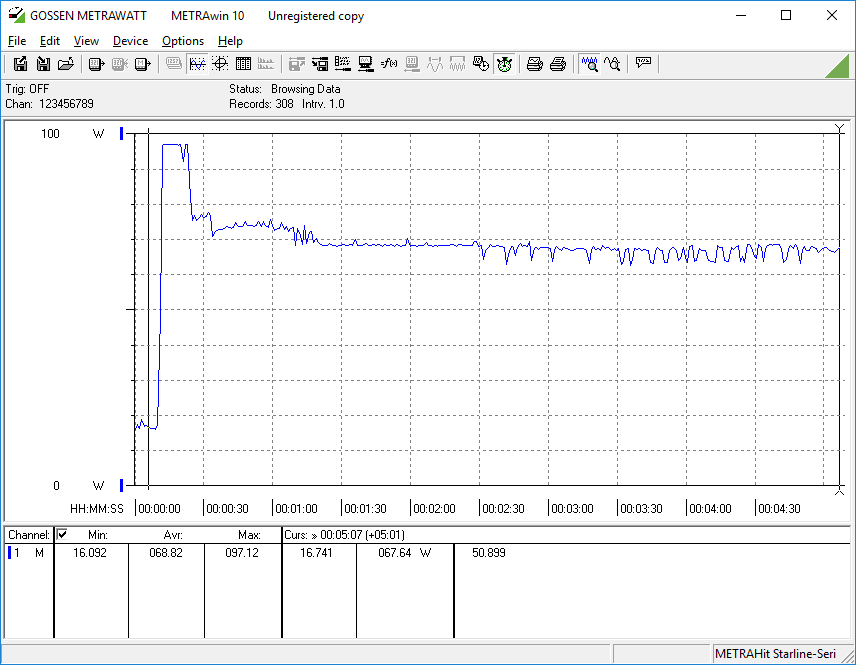
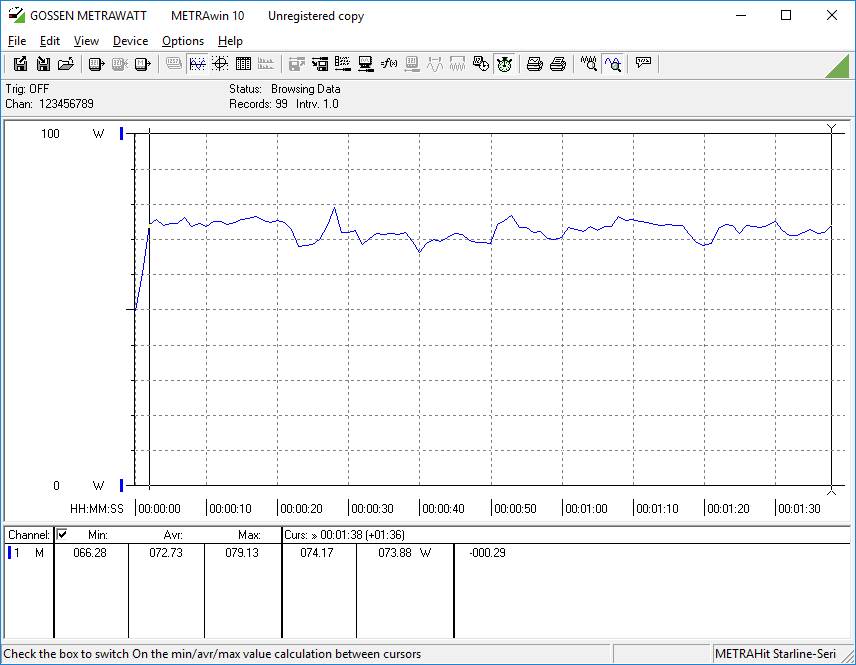
The HP Envy 17t draws more power than similar competitors, likely due to the bright 4K display and dGPU. Under load, the Envy 17t's power consumption is similar to the MSI Prestige 15, which has a more powerful GPU. The Envy 17t draws about 73 Watts on average during a full realistic load, which is not problematic for the included 90 Watt power adapter.
| Off / Standby | |
| Idle | |
| Load |
|
Key:
min: | |
| HP Envy 17t-cg000 i7-1065G7, GeForce MX330, WDC PC SN520 SDAPNUW-512G, IPS, 3840x2160, 17.3" | Medion Akoya P17605 i7-10510U, GeForce MX250, Phison E12-256G-Phison-SSD-B16-BB1, IPS, 1920x1080, 17.3" | Asus VivoBook 17 M712DA-AU017T R5 3500U, Vega 8, Intel SSD 660p SSDPEKNW512G8, IPS, 1920x1080, 17.3" | HP Envy 17-ce1004ng i7-10510U, GeForce MX250, Intel SSD 660p SSDPEKNW512G8, IPS, 1920x1080, 17.3" | Dell Inspiron 17 3780 i7-8565U, Radeon 520, SK Hynix BC501 NVMe 256 GB, IPS, 1920x1080, 17.3" | LG Gram 17Z990-R.AAS7U1 i7-8565U, UHD Graphics 620, Samsung SSD PM871b MZNLN256HAJQ, IPS, 2560x1600, 17" | |
|---|---|---|---|---|---|---|
| Power Consumption | 24% | 43% | 33% | 22% | 47% | |
| Idle Minimum * (Watt) | 6.1 | 4.2 31% | 4.2 31% | 3.6 41% | 5 18% | 2.7 56% |
| Idle Average * (Watt) | 13 | 9.9 24% | 7.9 39% | 8.5 35% | 10.9 16% | 8.1 38% |
| Idle Maximum * (Watt) | 13.5 | 11.6 14% | 8.4 38% | 10.4 23% | 12 11% | 10.2 24% |
| Load Average * (Watt) | 72.7 | 60 17% | 34 53% | 52.6 28% | 49.6 32% | 32.7 55% |
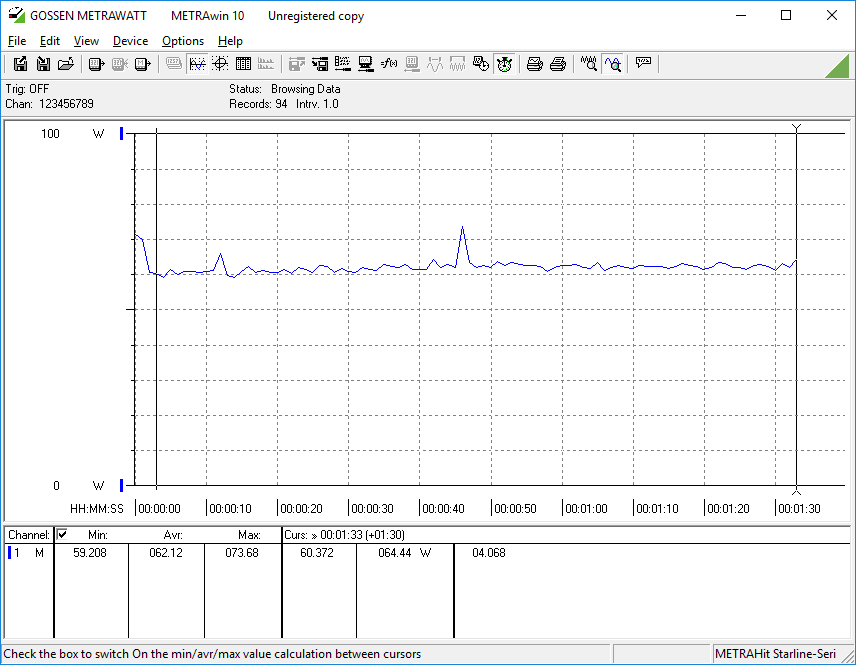
| Witcher 3 ultra * (Watt) | 62.2 | |||||
| Load Maximum * (Watt) | 97.1 | 64.1 34% | 43.7 55% | 61 37% | 66.9 31% | 34.8 64% |
* ... smaller is better
Battery Life
The 55 Wh battery offers underwhelming runtimes. Under very light loads, the Envy 17t lasts a decent 15.5 hours. However, under a normal use case like our WiFi v1.3 battery test, the Envy gives up the ghost after about 4.5 hours. Users will need to bring the power adapter with them to get through a normal workday. The FHD models will likely offer longer battery life.
| HP Envy 17t-cg000 i7-1065G7, GeForce MX330, 55 Wh | Medion Akoya P17605 i7-10510U, GeForce MX250, 42.2 Wh | Asus VivoBook 17 M712DA-AU017T R5 3500U, Vega 8, 37 Wh | HP Envy 17-ce1004ng i7-10510U, GeForce MX250, 52 Wh | Dell Inspiron 17 3780 i7-8565U, Radeon 520, 42 Wh | LG Gram 17Z990-R.AAS7U1 i7-8565U, UHD Graphics 620, 72 Wh | |
|---|---|---|---|---|---|---|
| Battery runtime | 2% | -28% | 11% | -23% | 107% | |
| Reader / Idle (h) | 15.4 | 17 10% | 9.6 -38% | 34.8 126% | ||
| WiFi v1.3 (h) | 4.6 | 4.7 2% | 3.3 -28% | 4 -13% | 4.2 -9% | 11.9 159% |
| Load (h) | 1.4 | 1.9 36% | 1.1 -21% | 1.9 36% |
Pros
Cons
Verdict
HP hit several high notes with the Envy 17t. Its aluminum chassis is well-constructed and looks great. The anodized finish should keep it look sharp for a while. The bright 4K display is gorgeous and color accurate. The Ice Lake Core i7 CPU and Nvidia Geforce MX330 GPU make for a smooth media streaming and can handle some gaming. The keyboard and touchpad are good, the speakers are punchy, and the overall experience is enjoyable... for the most part.
Several small annoyances that distract from the high points. For one, the replacement of the right Ctrl button with a fingerprint reader is baffling. Considering how reliant many hotkey combinations are one that key, it's bemusing how HP thought this configuration was a good idea. The fan, while silent under light load, gets grating when it runs. Finally, the machine's battery life is disappointing.
The Envy 17t is rather good for what it is, but at US$1600 MSRP, the annoyances we noted are more than just small quibbles. Despite these flaws, the Envy 17t is one of the better all around 17.3-inch multimedia laptops available today. Still, at this price point, there are some better options. Dell's Inspiron 17-7786 convertible offers similar hardware at a slightly lower price. The HP Pavilion Gaming 17 lacks the build quality of the Envy 17t but offers a much more powerful GPU and a faster processor for about $300 less.
The HP Envy 17t is a solid multimedia laptop marred by a few flaws that ultimately detract from the overall experience.
HP Envy 17t-cg000
- 06/10/2020 v7 (old)
Sam Medley
Price comparison
