Dell XPS 17 9720 review - The premium multimedia laptop starts to show its age
While other manufacturers increasingly move towards 16-inch multimedia laptops, Dell continues to stay faithful to the well-known XPS 17, again bringing a small update this year, although this is particularly focused on the Intel CPUs of the 12th generation. In addition to the 45-Watt CPUs (Alder Lake), you can again choose among two GeForce RTX GPUs, the RTX 3050 and RTX 3060, which both are specified with a TGP of 60 watts. This means that Dell has performed a downgrade here, since the GPUs were still allowed to consume 70 watts in last-year's XPS 17 9710.
We were already able to test a US model with the GeForce RTX 3060 and are now taking a look at the configuration with the RTX 3050. While the performance goes down, the price remains high, since Dell is asking for 3000 Euros (~$3135) for our test configuration with the Core i7-12700H, RTX 3050, 4K display, 32 GB of RAM, and a 512-GB SSD.
Possible Competitors in Comparison
Rating | Date | Model | Weight | Height | Size | Resolution | Price |
|---|---|---|---|---|---|---|---|
| 89.3 % v7 (old) | 06 / 2022 | Dell XPS 17 9720 i7-12700H, GeForce RTX 3050 4GB Laptop GPU | 2.5 kg | 19.5 mm | 17.00" | 3840x2400 | |
| 93.2 % v7 (old) | 11 / 2021 | Apple MacBook Pro 16 2021 M1 Pro M1 Pro, M1 Pro 16-Core GPU | 2.2 kg | 16.8 mm | 16.20" | 3456x2234 | |
| 88.8 % v7 (old) | 05 / 2022 | Dell XPS 17 9720 RTX 3060 i7-12700H, GeForce RTX 3060 Laptop GPU | 2.5 kg | 19.5 mm | 17.00" | 3840x2400 | |
| 89 % v7 (old) | 11 / 2021 | Lenovo ThinkPad X1 Extreme G4-20Y5CTO1WW (3050 Ti) i7-11800H, GeForce RTX 3050 Ti Laptop GPU | 2 kg | 18.2 mm | 16.00" | 3840x2400 | |
v (old) | 12 / 2021 | Asus Vivobook Pro 16X-M7600QE R9 5900HX, GeForce RTX 3050 Ti Laptop GPU | 1.9 kg | 19 mm | 16.10" | 3840x2400 | |
| 87 % v7 (old) | 09 / 2021 | Lenovo ThinkBook 16p G2 ACH R9 5900HX, GeForce RTX 3060 Laptop GPU | 2 kg | 19.5 mm | 16.00" | 2560x1600 |
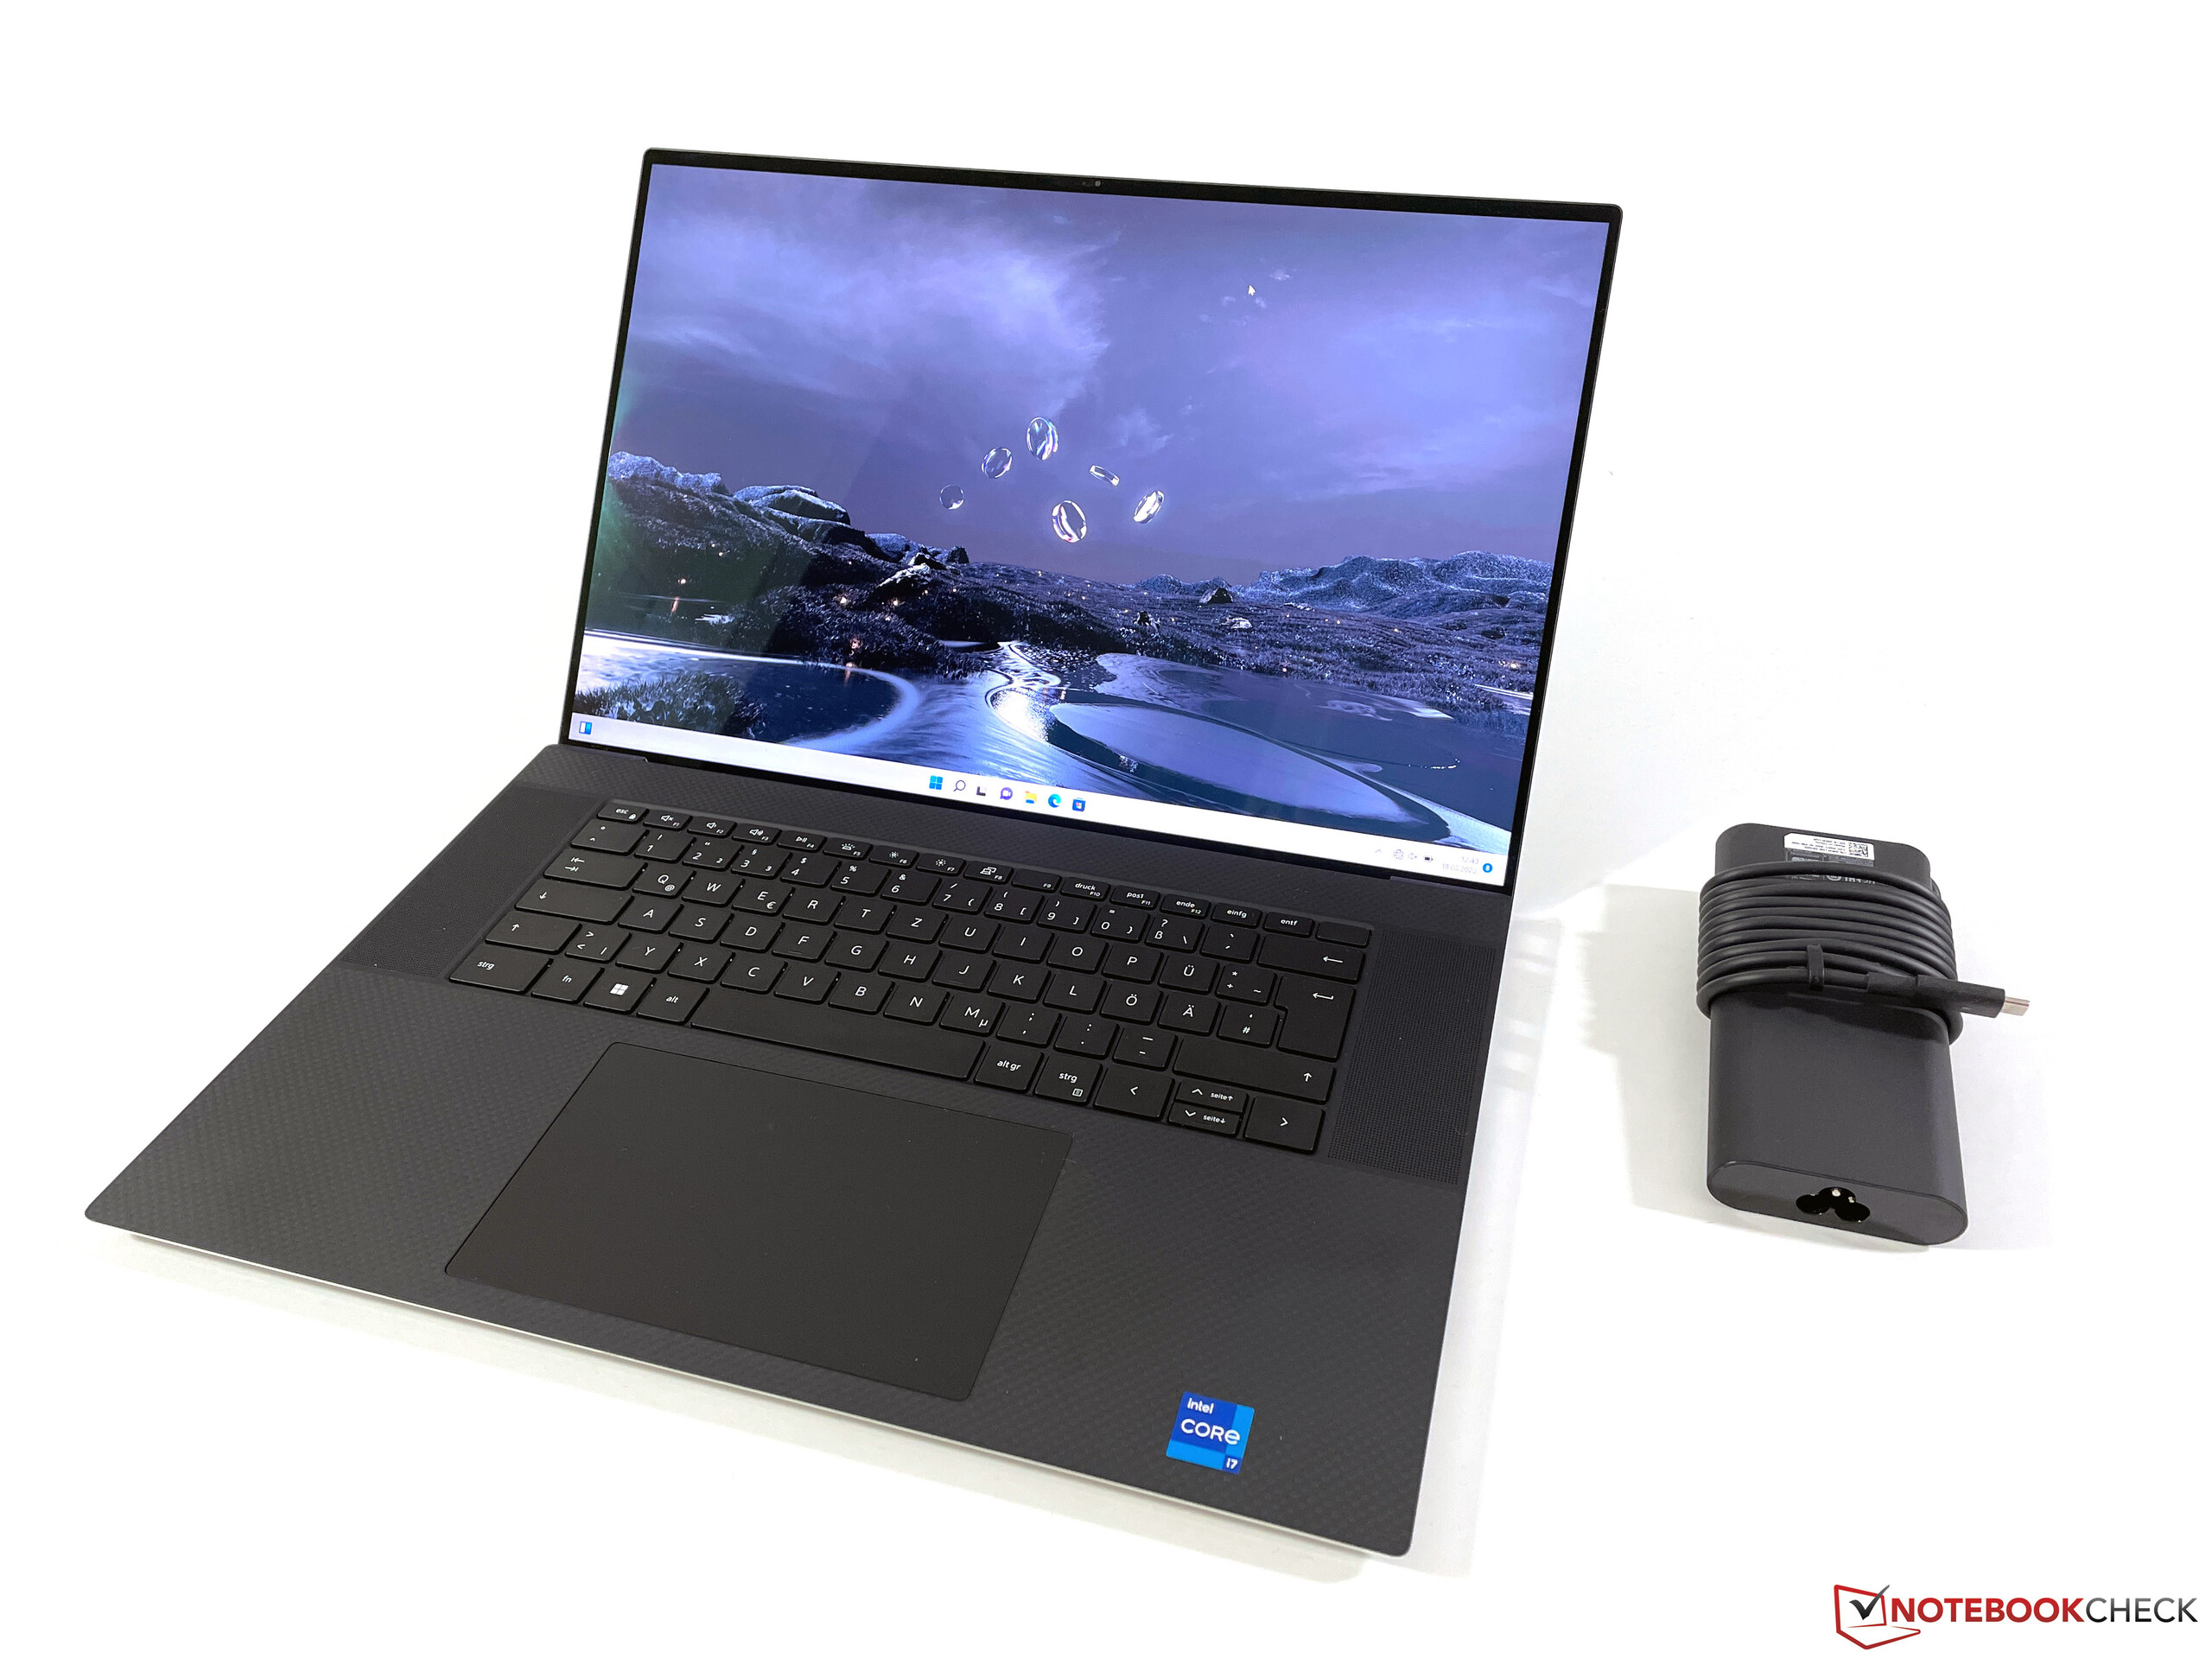
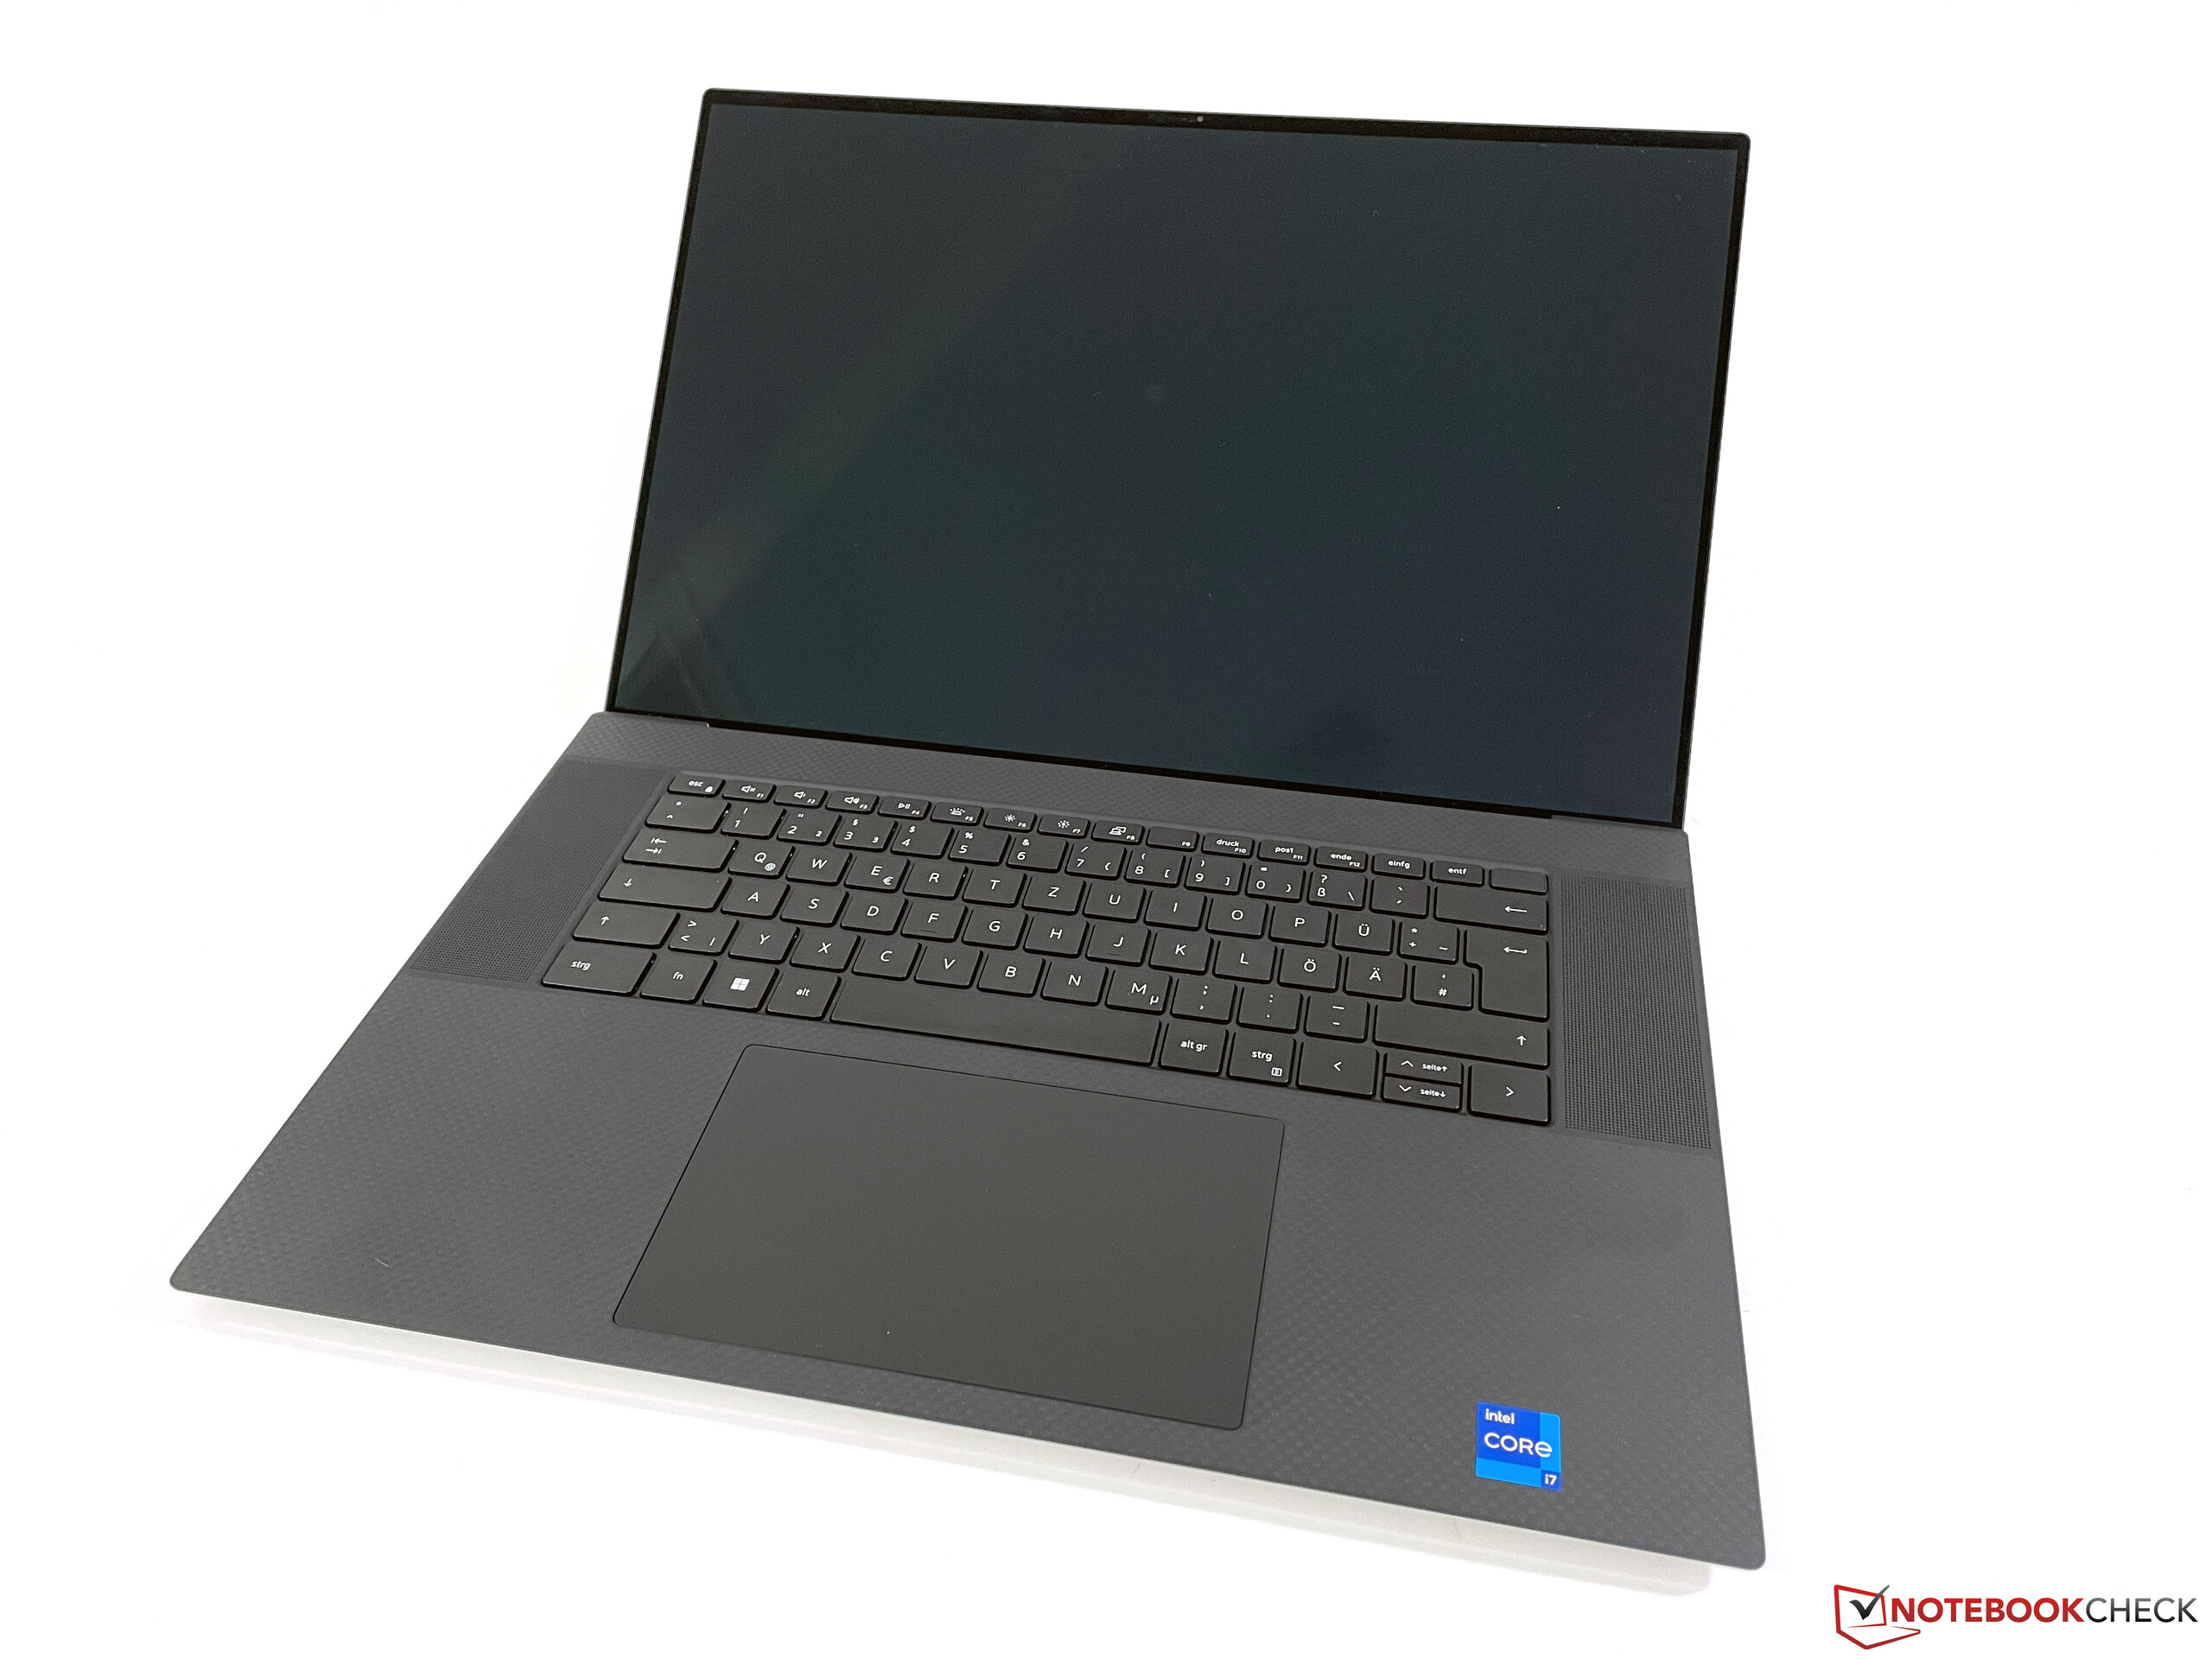
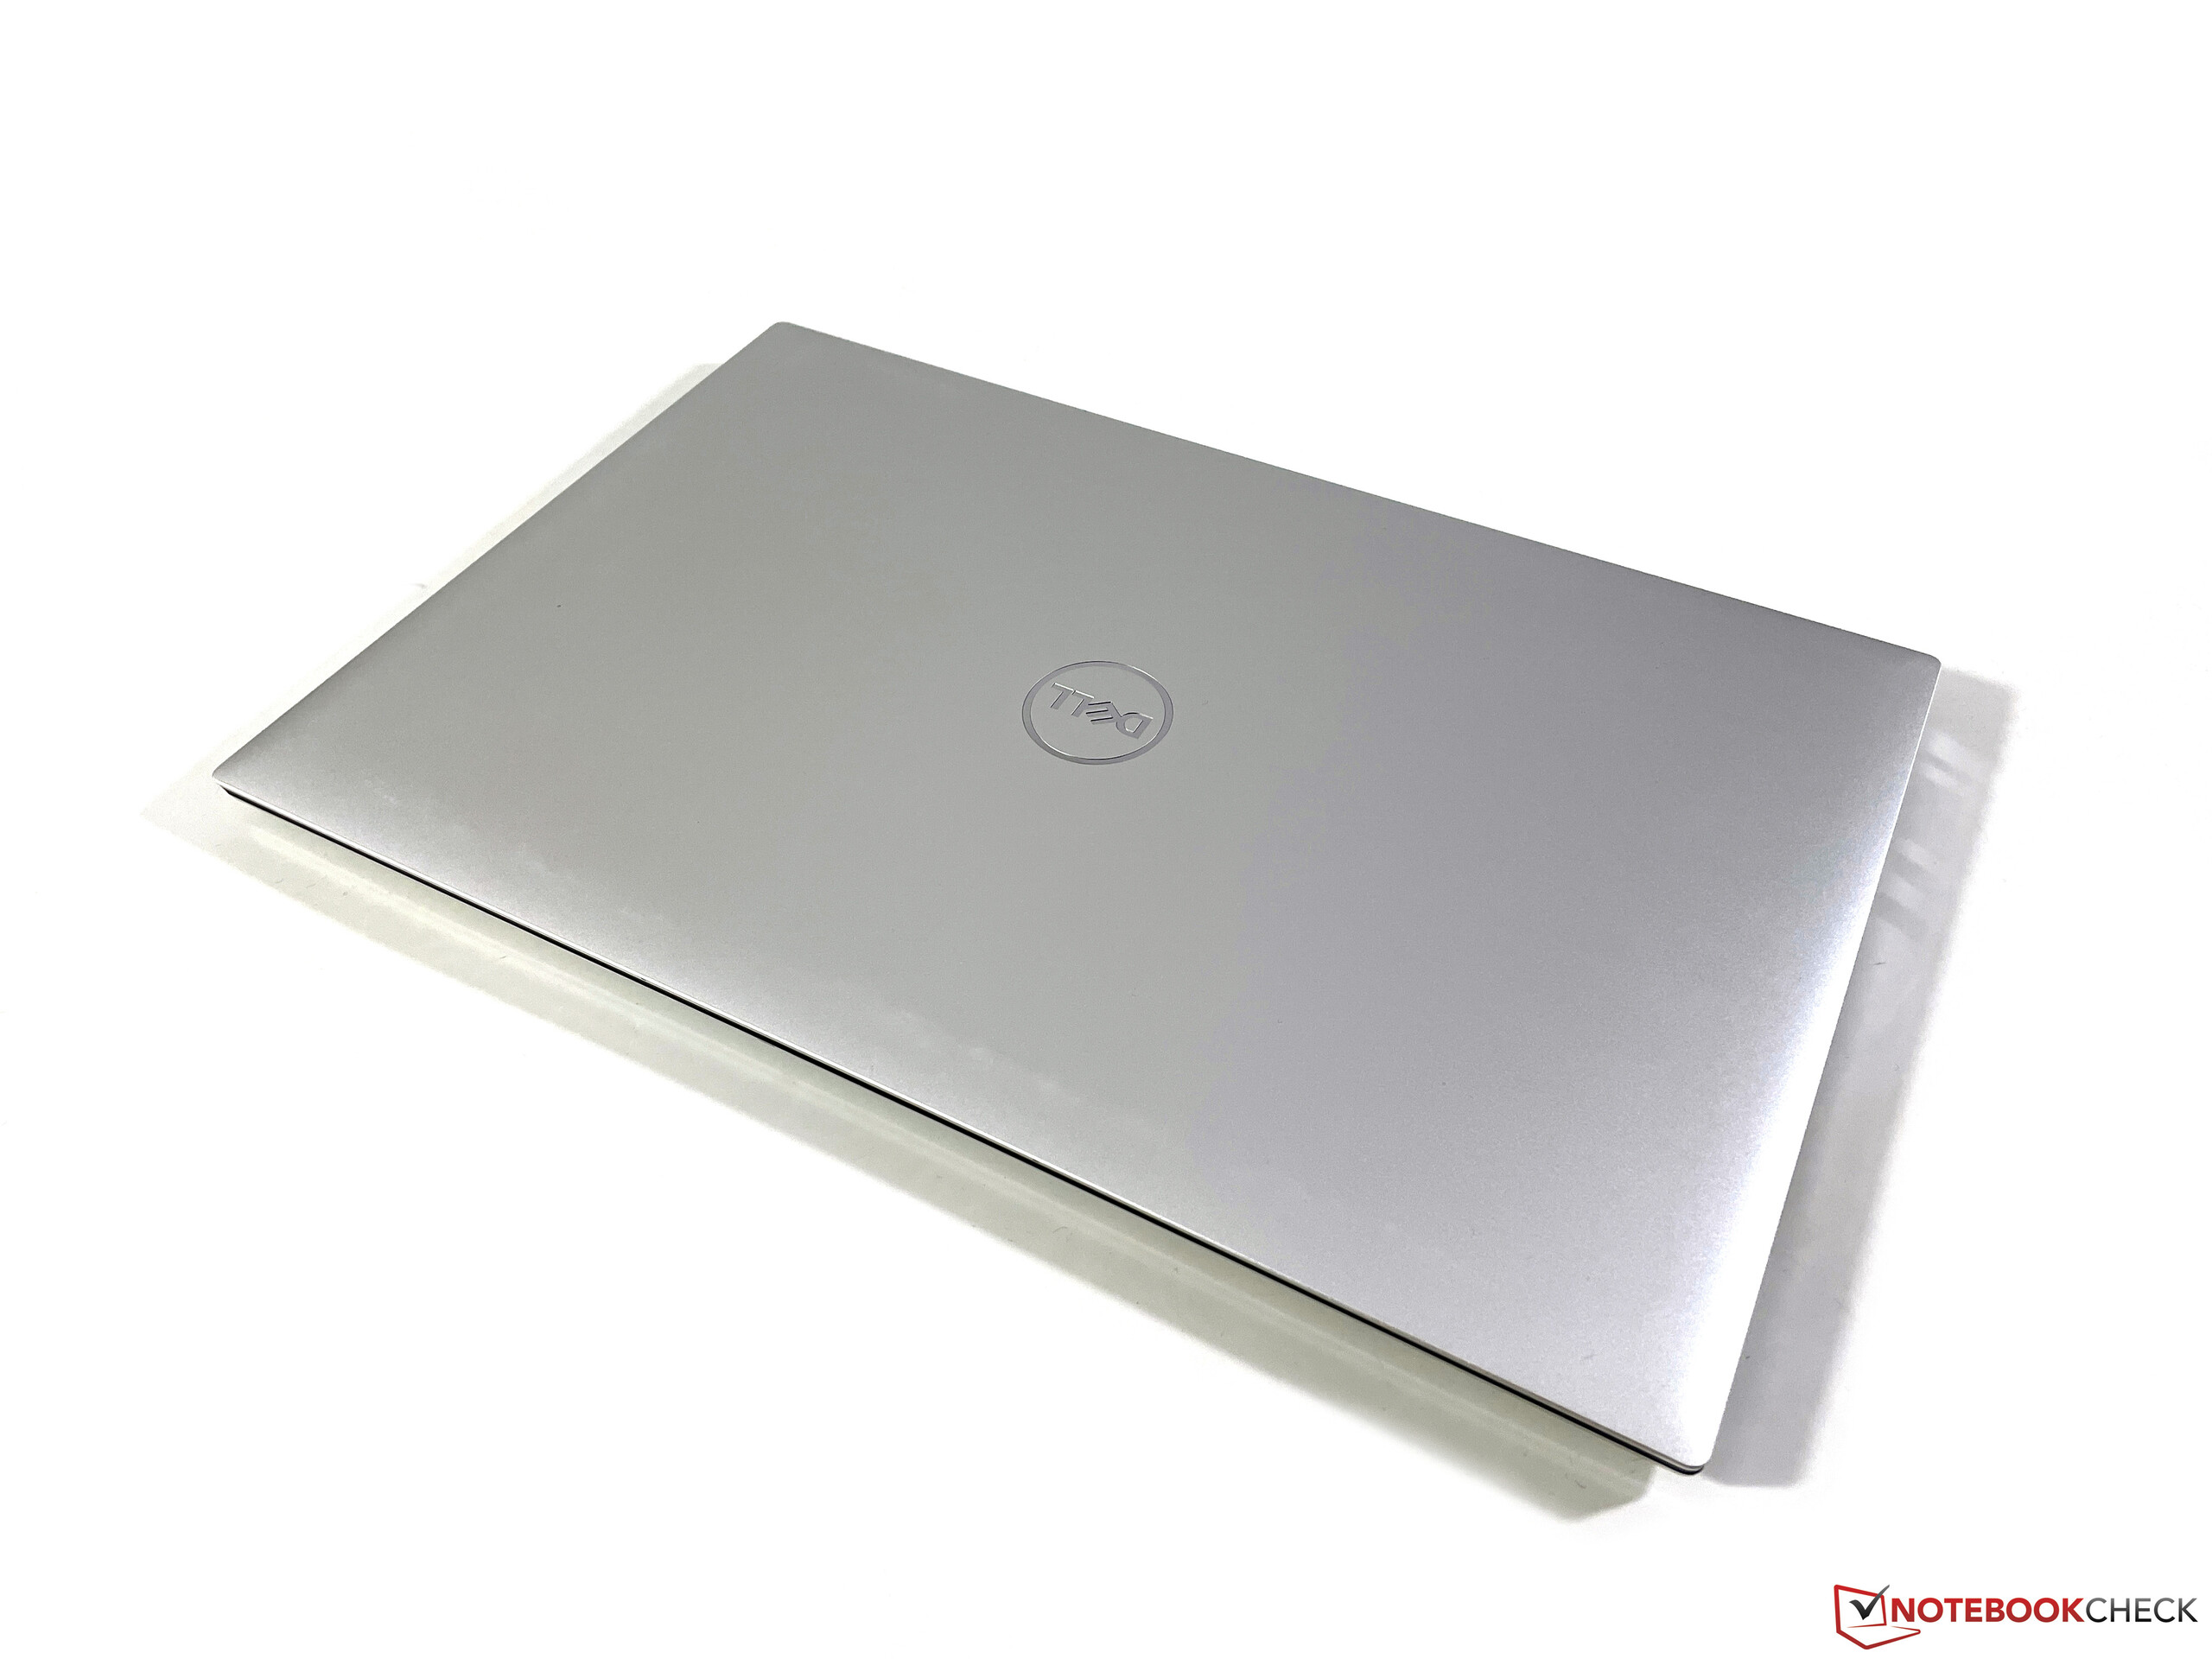
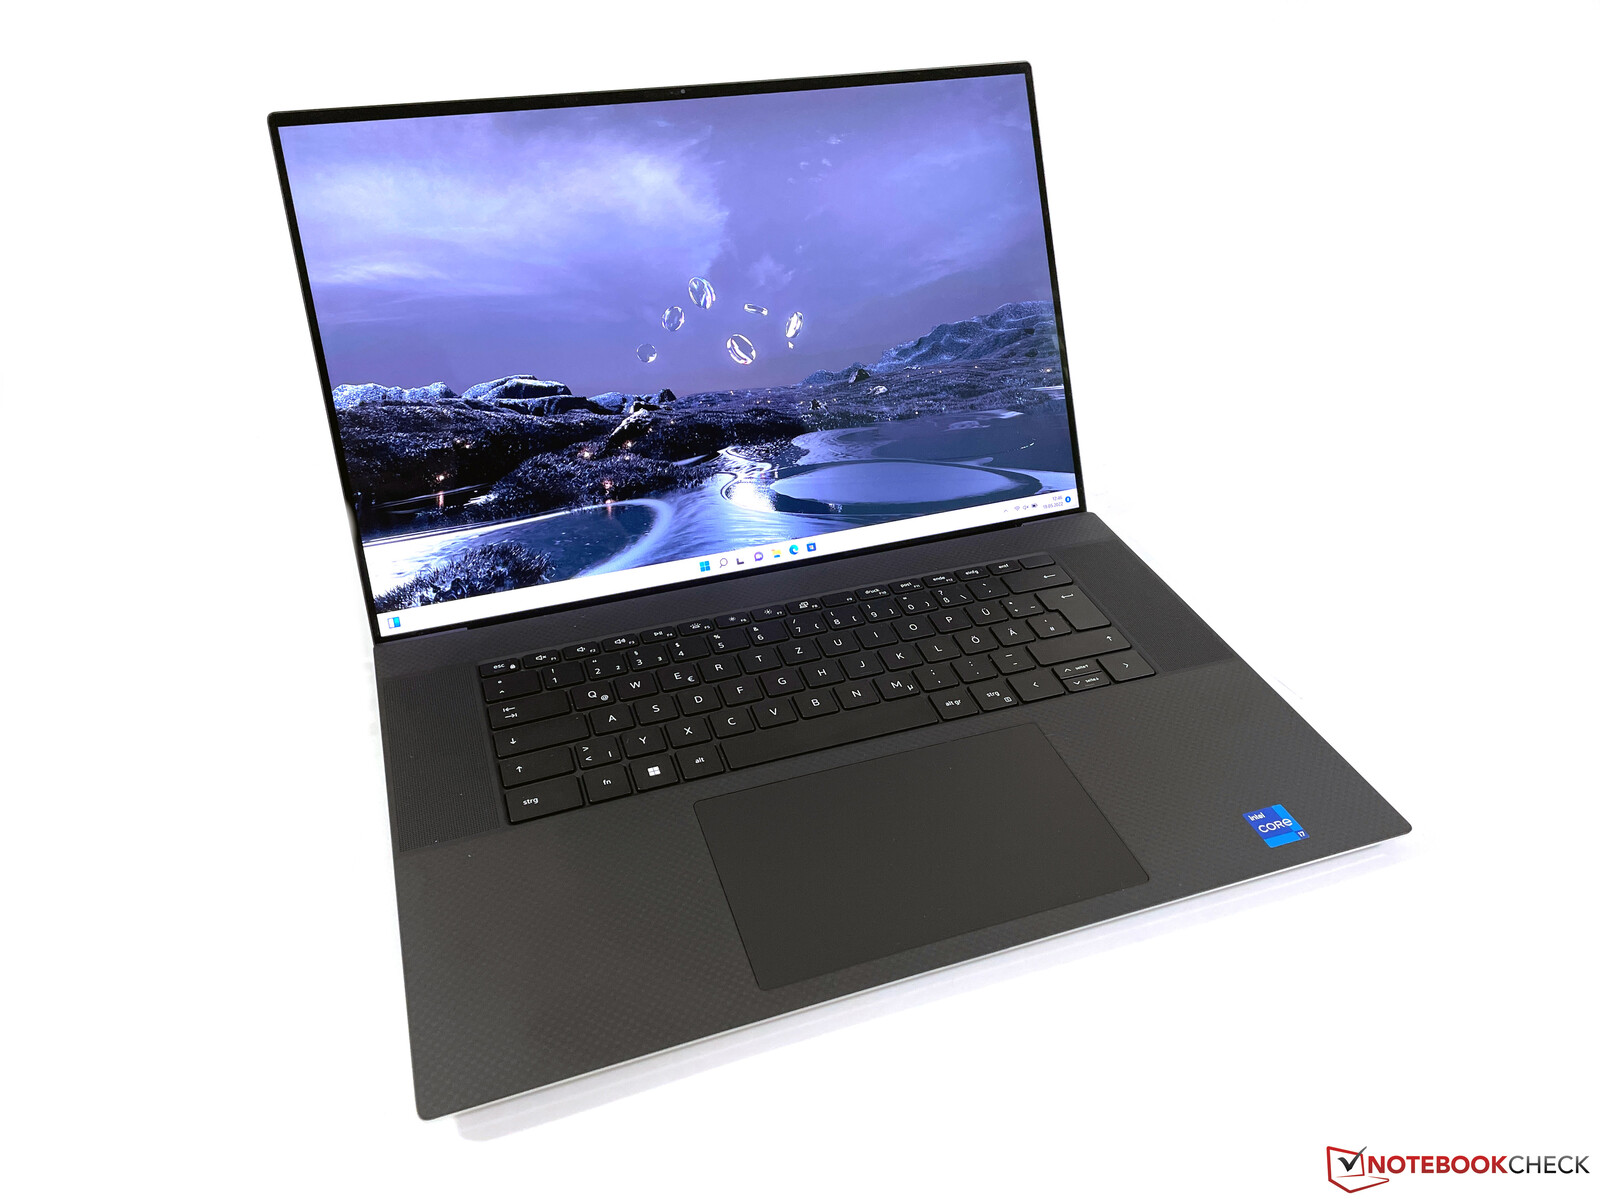
Case - The XPS 17 continues to offer a high quality and is still heavy
We don't have to say much about the case of the XPS 17, since the workmanship offers an extremely high quality, and the construction is very robust. With its very slim bezels (resulting in a screen-to-body ratio of 91%), the device continues to look very modern and not aged at all. However, the black carbon design on the top of the base unit still gets dirty easily. When you handle the XPS 17, it quickly becomes clear that it is not a light laptop, and our scale shows almost 2.5 kg (~5.5 lb). For the power supply, you also have to add another 400 grams (~0.9 lb).
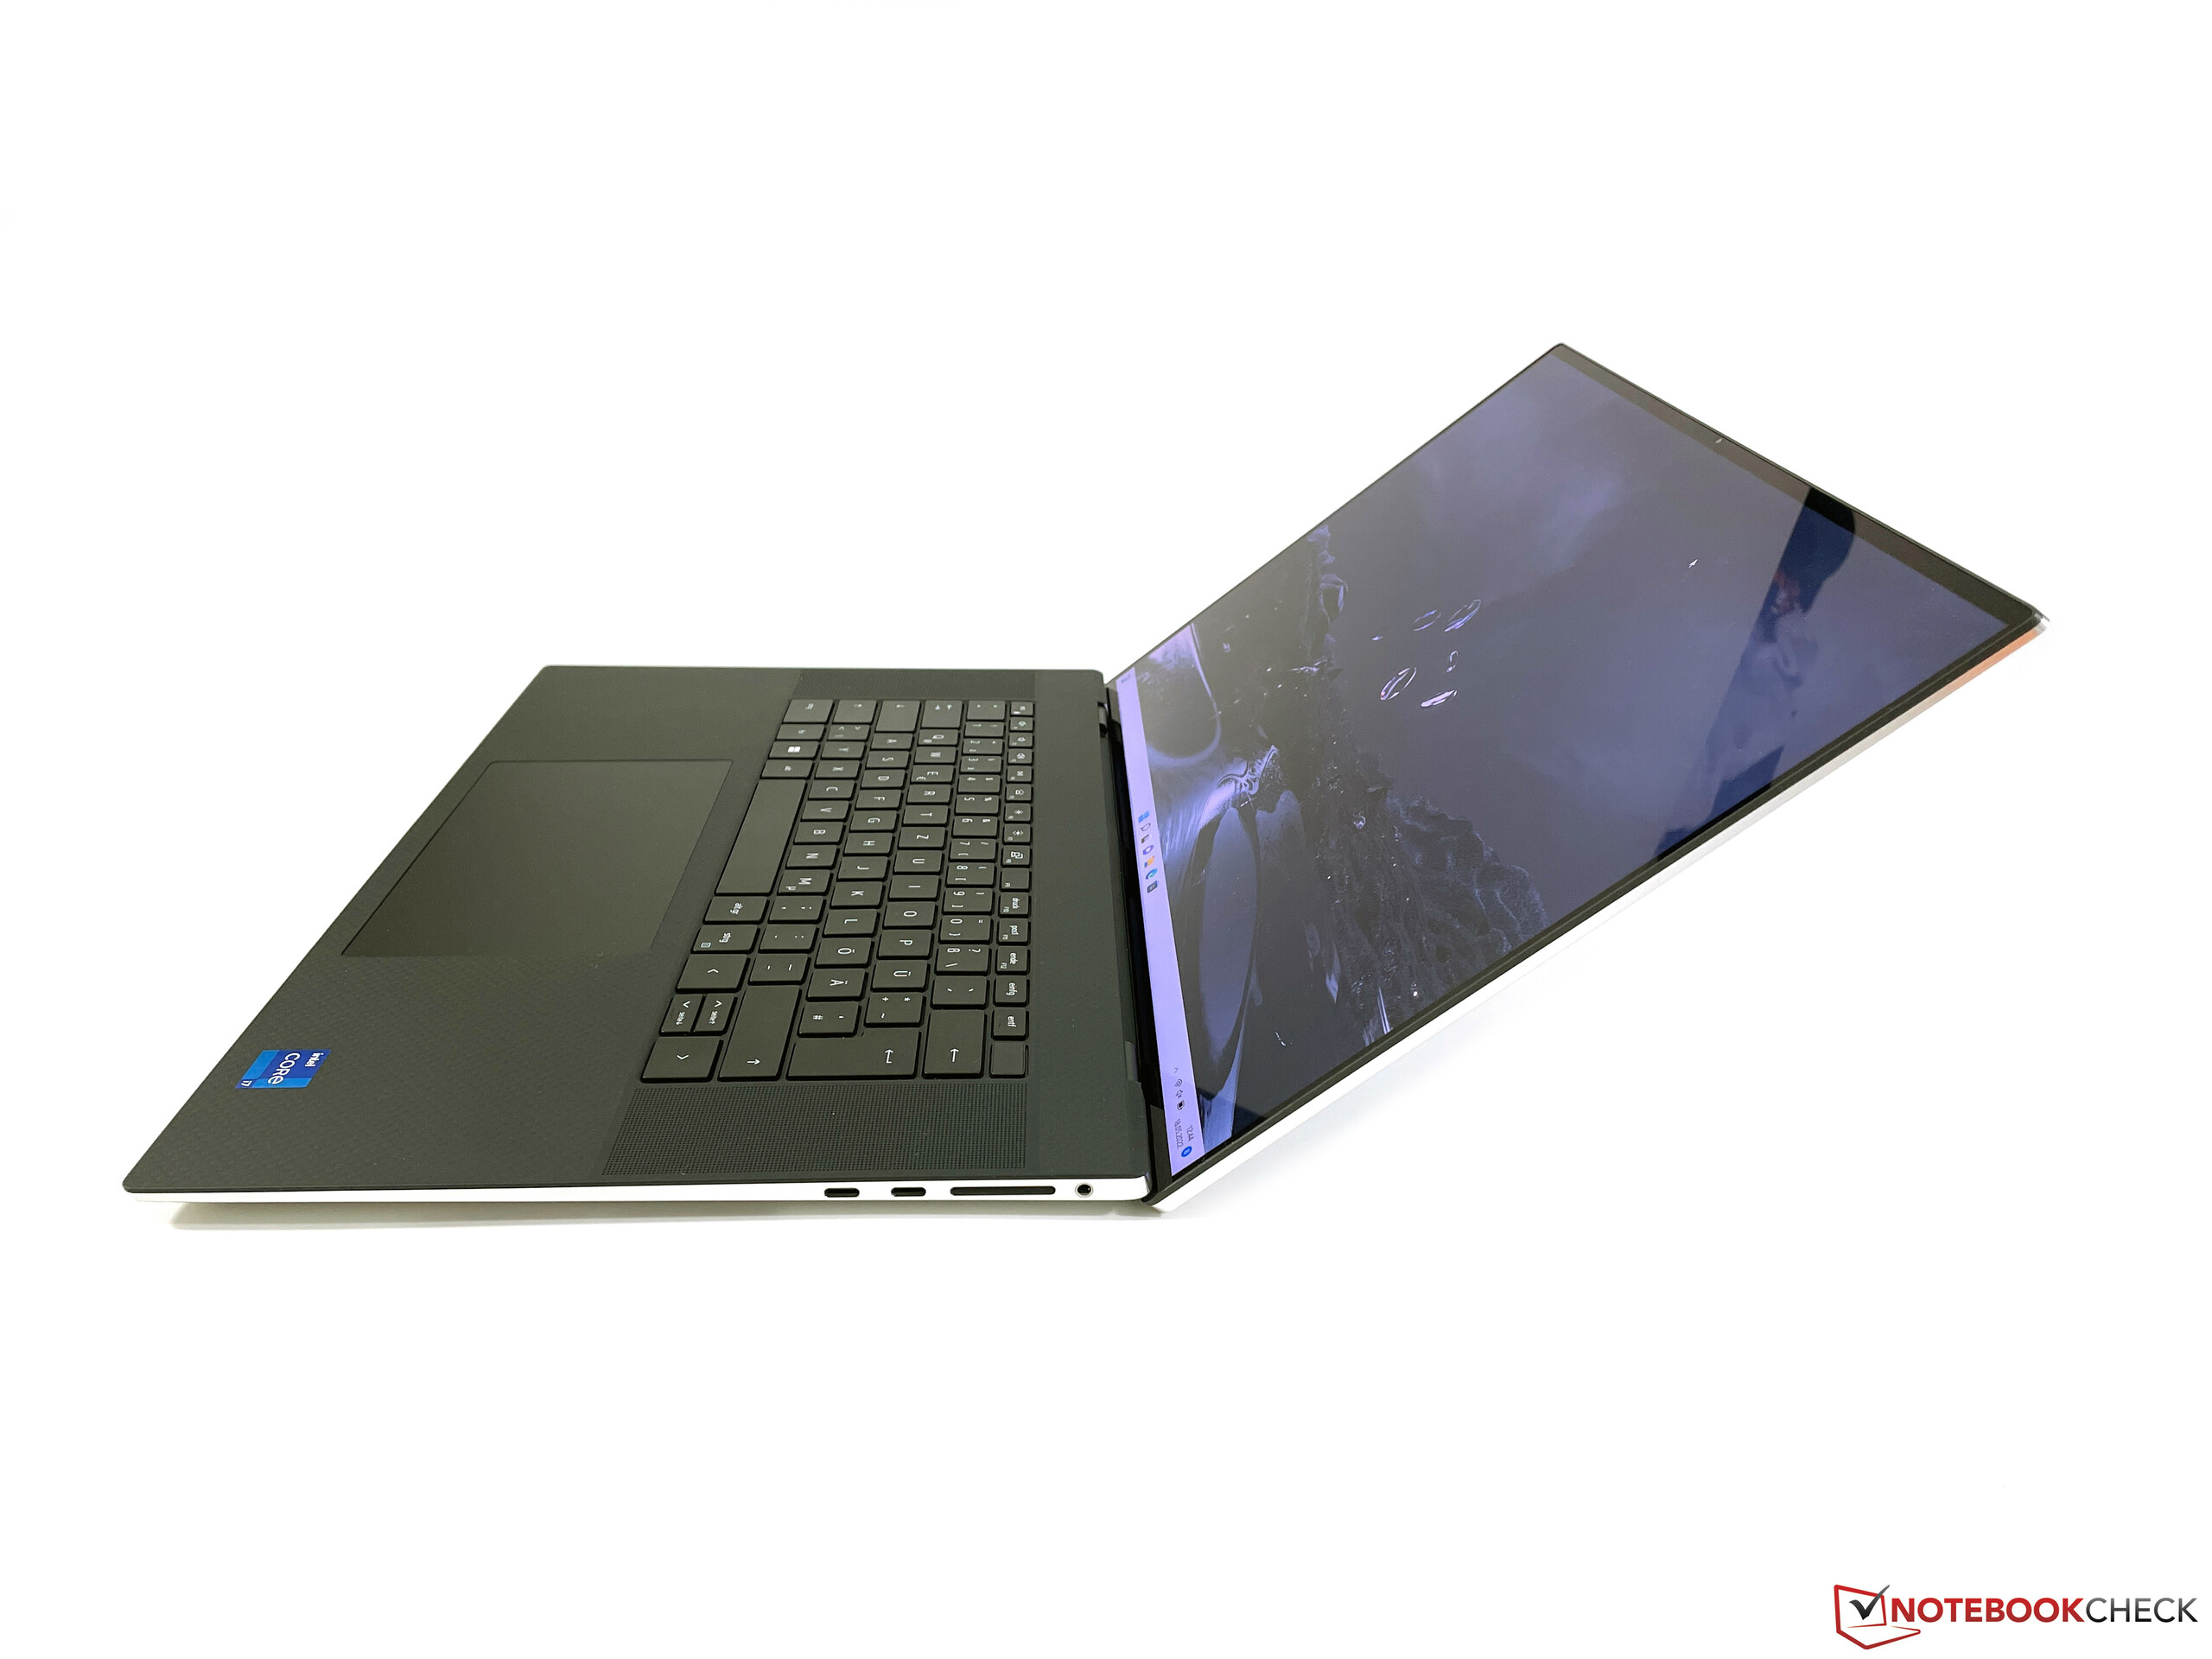
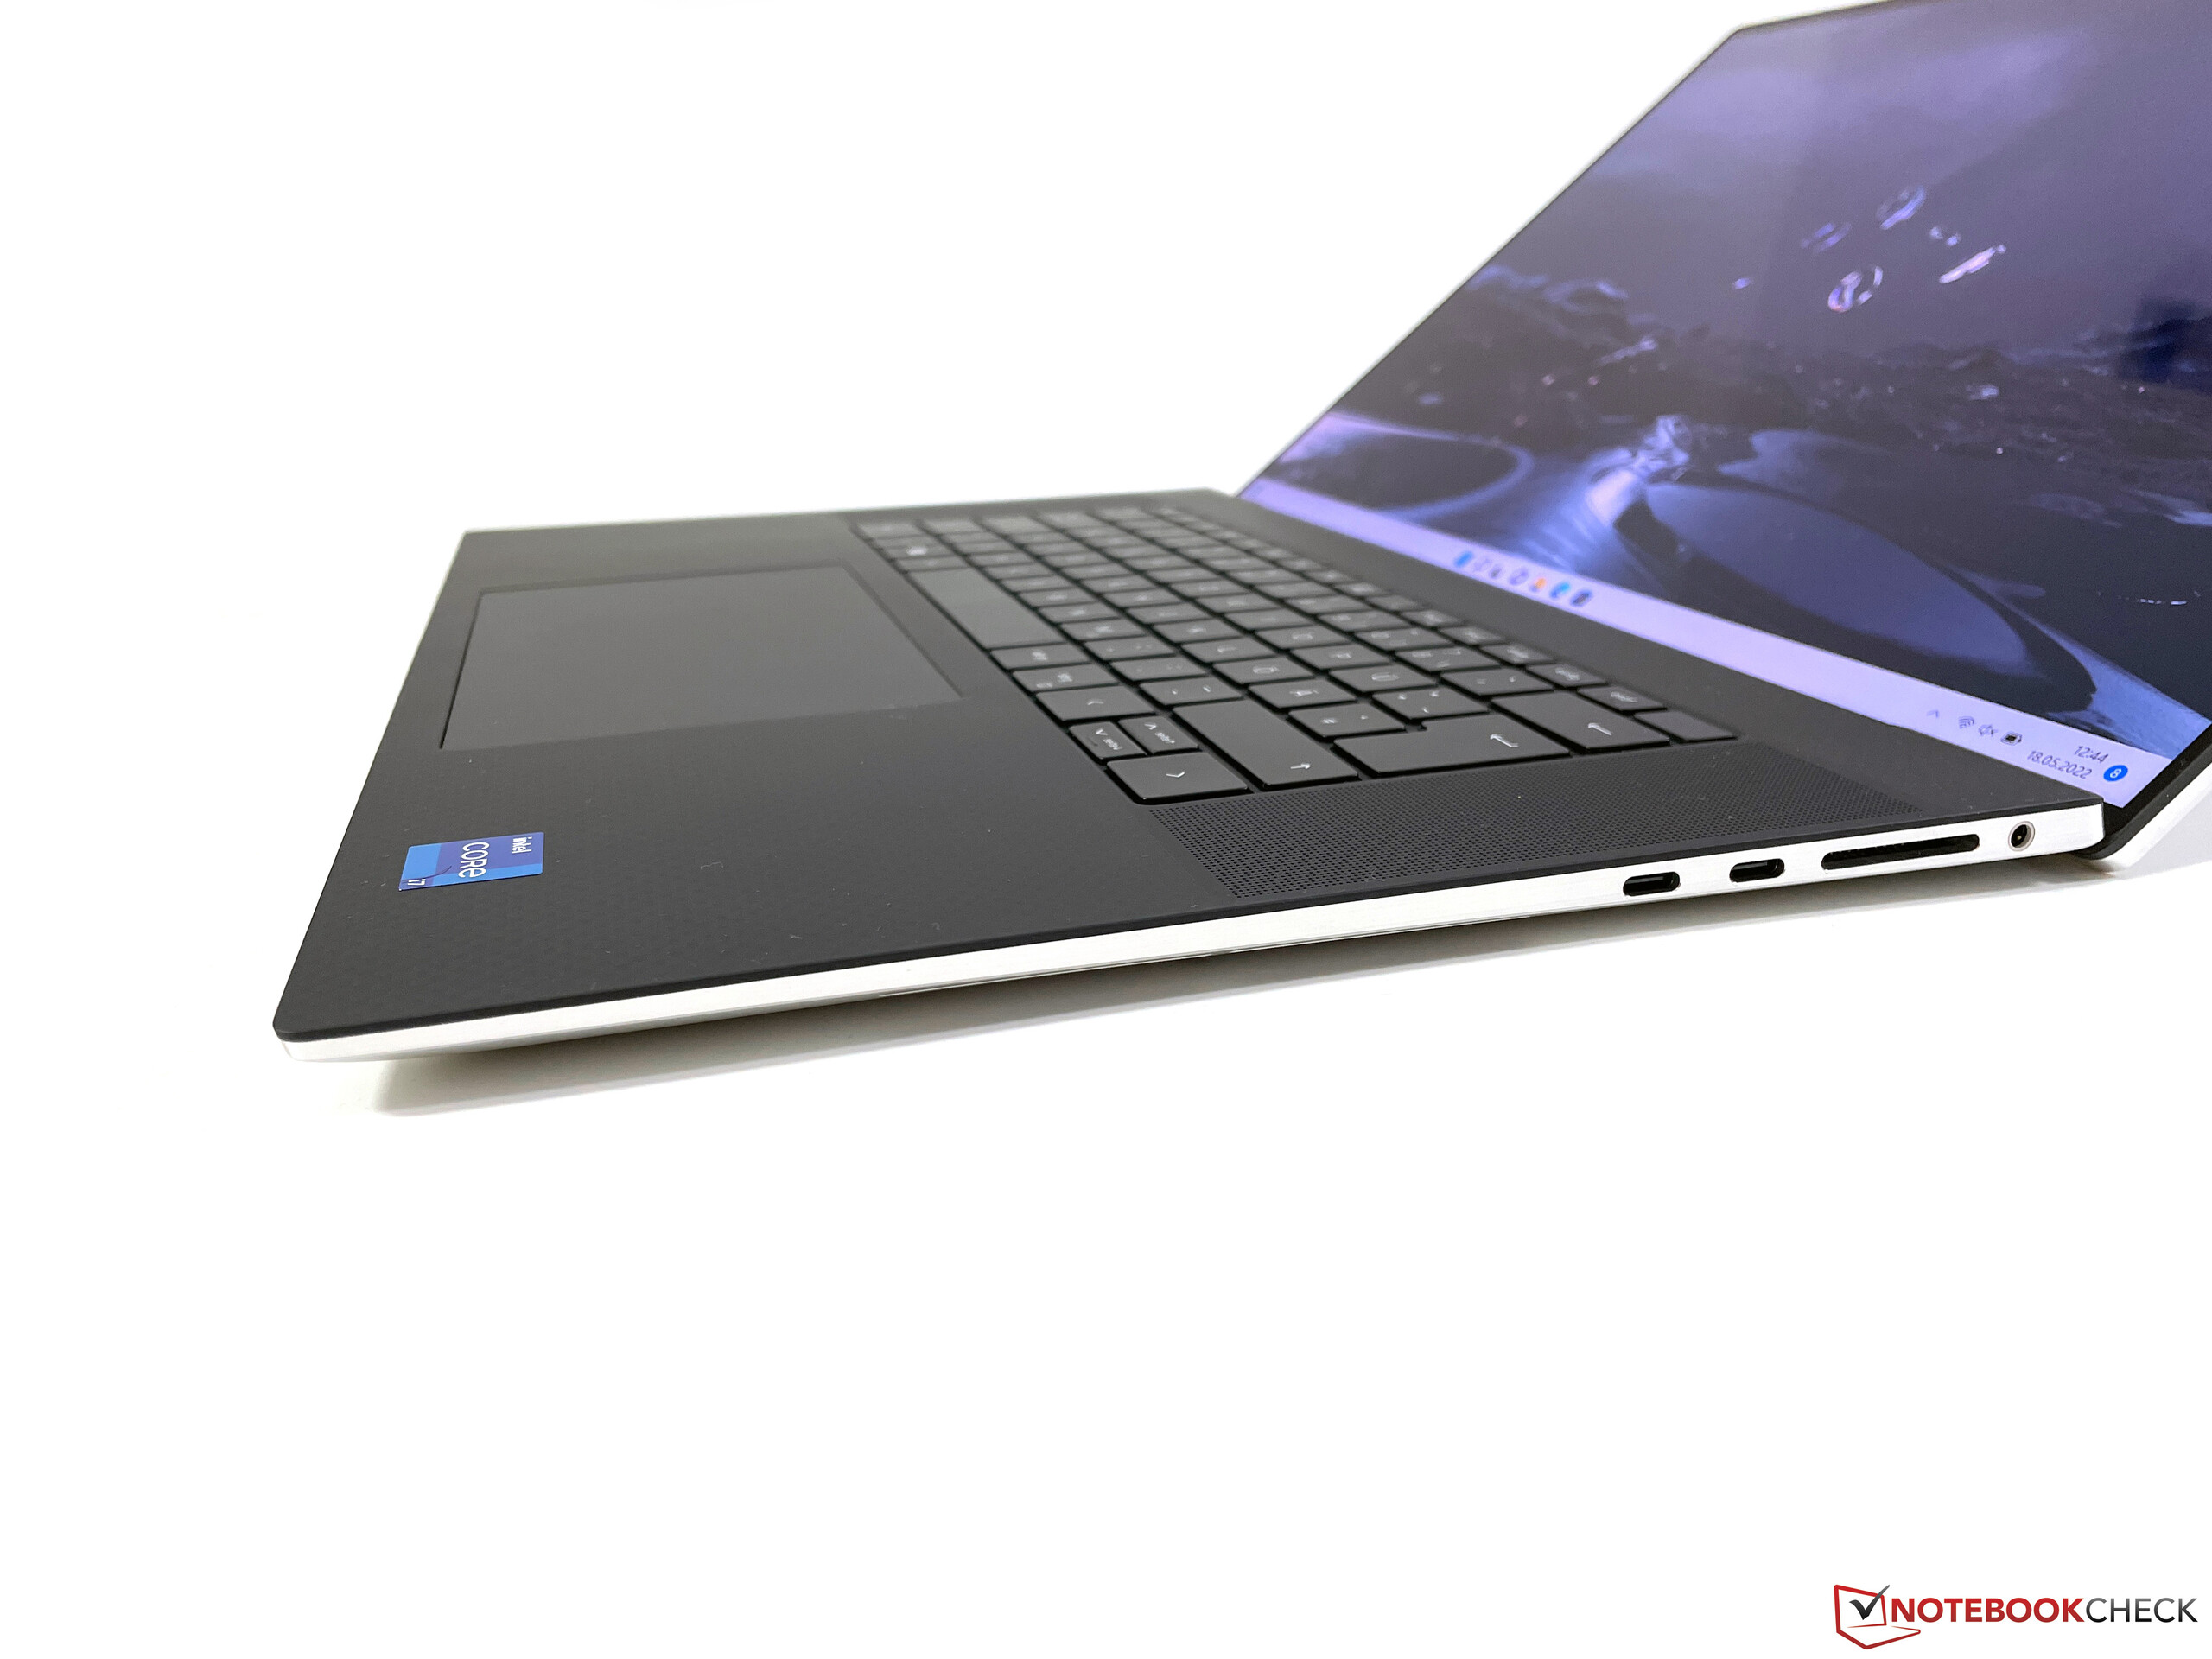
Equipment - XPS 17 without Wi-Fi 6E support
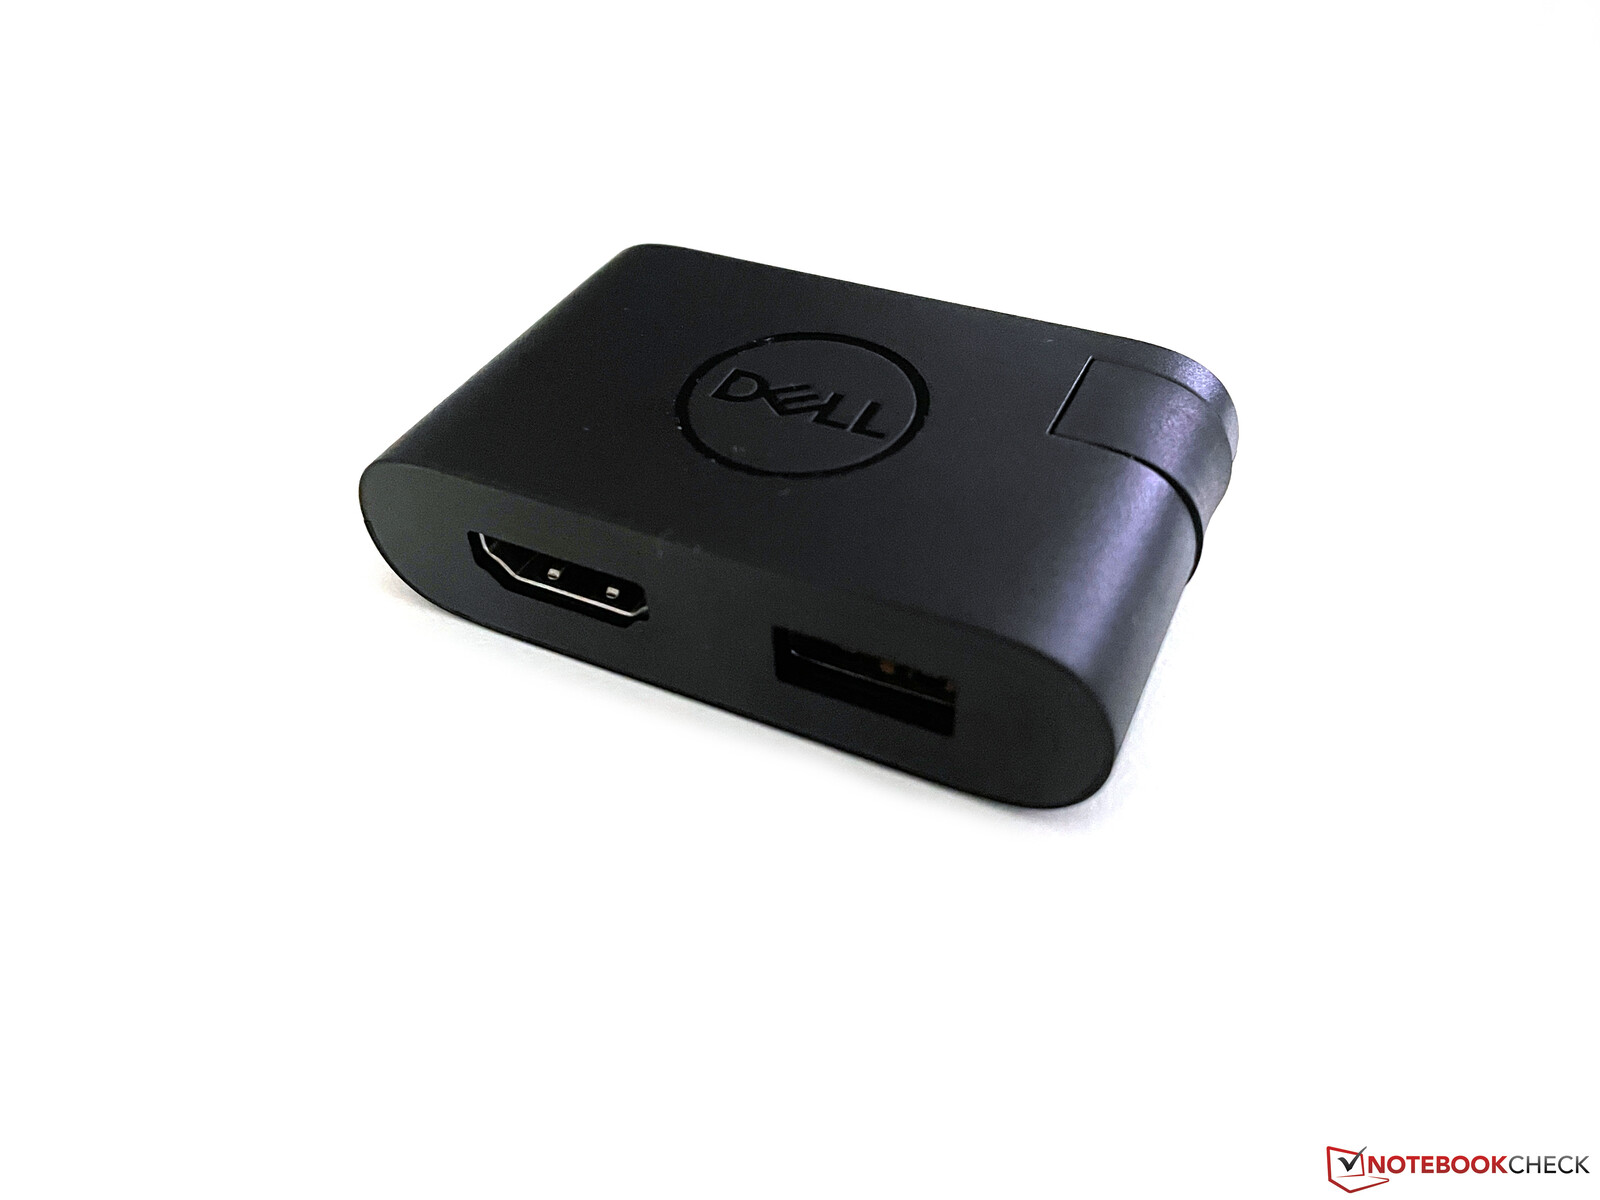
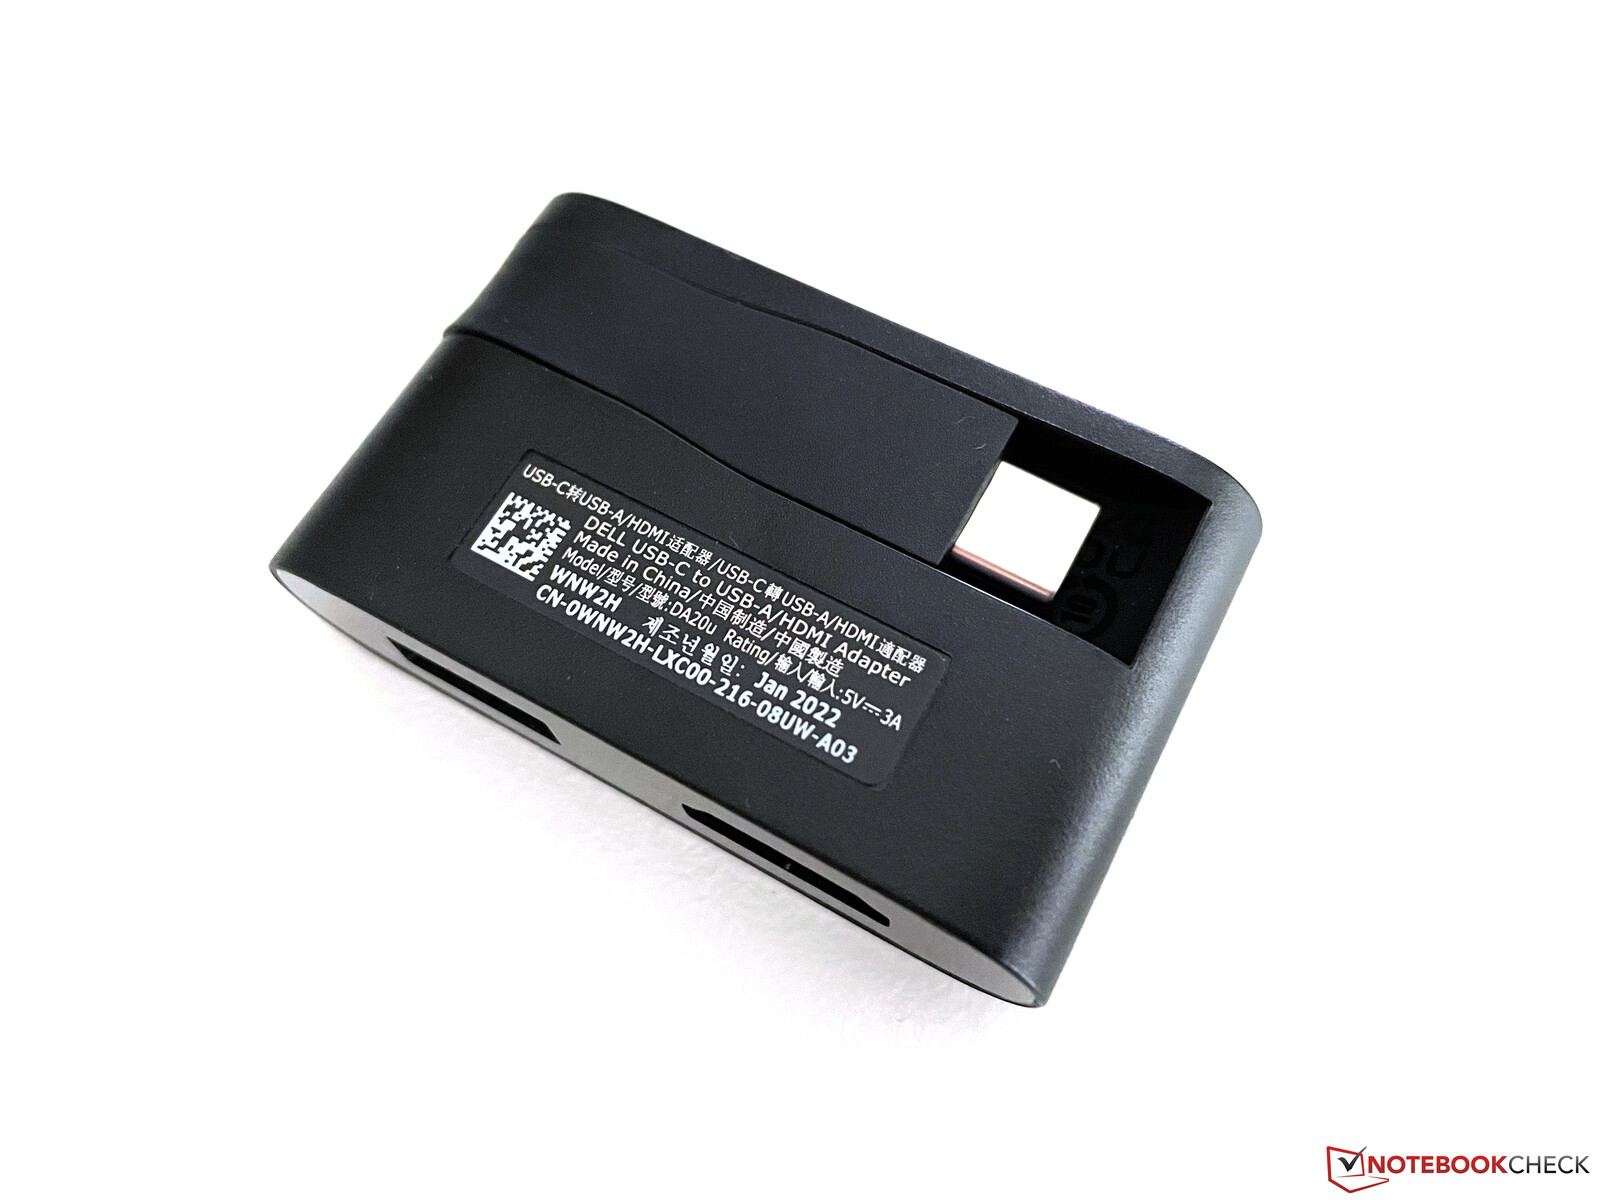
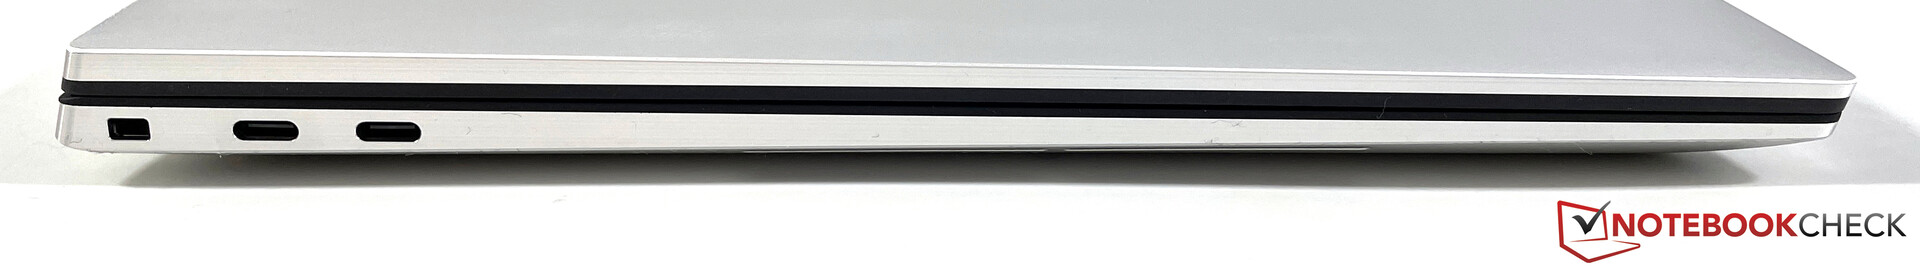
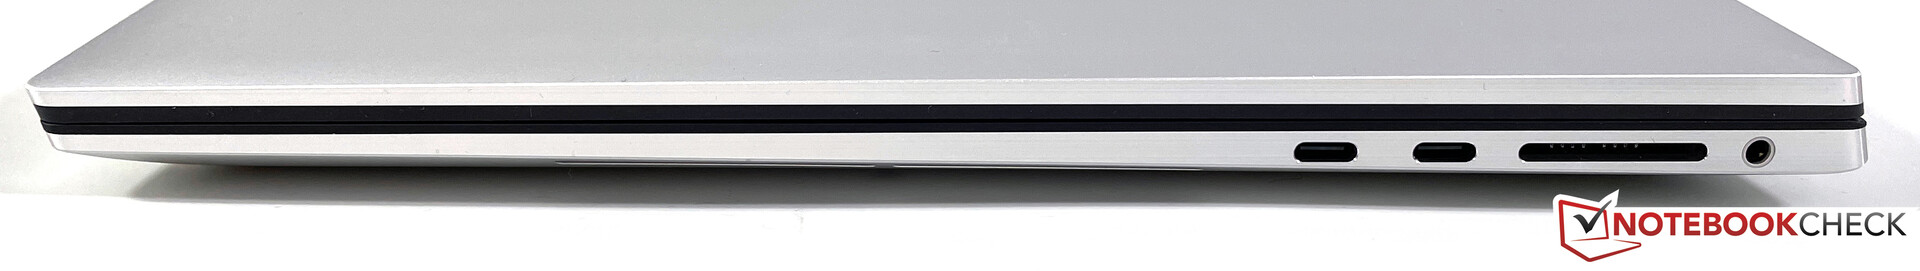
The XPS 17 continues to offer four modern Thunderbolt ports with USB-C connectors. While they are of course very versatile, in practice they also might require some adapters. Apparently Dell also knows this, since a USB-C adapter with USB-A and HDMI is included. In the past, Dell has often followed Apple, so we are curious whether the next generation of Dells will also start to offer more integrated connections again such as HDMI, for example.
SD Card Reader
As before, the XPS offers a full-size SDXC card reader, with inserted cards sticking out minimally. In terms of the speed, we can see a significant difference between our reference card, since the Angelbird AV Pro V60, which reached transfer speeds of more than 220 MB/s in other laptops, is limited to only about 84 MB/s here. On the other hand, our old Toshiba reference card is able to get along better with Dell's card reader, reaching almost 200 MB/s.
| SD Card Reader | |
| average JPG Copy Test (av. of 3 runs) | |
| Dell XPS 17 9720 RTX 3060 (Toshiba Exceria Pro SDXC 64 GB UHS-II) | |
| Dell XPS 17 9720 (Toshiba Exceria Pro SDXC 64 GB UHS-II) | |
| Dell XPS 17 9710 Core i7 RTX 3060 (AV PRO microSD 128 GB V60) | |
| Lenovo ThinkPad X1 Extreme G4-20Y5CTO1WW (3050 Ti) (AV Pro V60) | |
| Average of class Multimedia (23 - 531, n=43, last 2 years) | |
| Apple MacBook Pro 16 2021 M1 Pro (Angelbird AV Pro V60) | |
| Lenovo ThinkBook 16p G2 ACH | |
| Asus Vivobook Pro 16X-M7600QE (AV Pro SD microSD 128 GB V60) | |
| maximum AS SSD Seq Read Test (1GB) | |
| Dell XPS 17 9720 RTX 3060 (Toshiba Exceria Pro SDXC 64 GB UHS-II) | |
| Dell XPS 17 9720 (Toshiba Exceria Pro SDXC 64 GB UHS-II) | |
| Average of class Multimedia (27.9 - 1455, n=42, last 2 years) | |
| Dell XPS 17 9710 Core i7 RTX 3060 (AV PRO microSD 128 GB V60) | |
| Lenovo ThinkPad X1 Extreme G4-20Y5CTO1WW (3050 Ti) (AV Pro V60) | |
| Lenovo ThinkBook 16p G2 ACH | |
| Asus Vivobook Pro 16X-M7600QE (AV Pro SD microSD 128 GB V60) | |
Communication
As we already saw in our other current XPS tests (and was also confirmed by Dell), the antennas of the XPS 17 don't support any 6-GHz networks at all and we were also unable to connect to the 6-GHz network of our Asus reference router. The fact that Dell still uses a Wi-Fi 6E module with the Intel AX211E only makes sense for the spec sheet.
However, the performance in the regular 5-GHz networks (Wi-Fi 6) is still good, but when sending data, there are some significant variations that are reproduceable (as already in the US test unit before). On the other hand, since the values are still above 1 GB/s, there won't be any significant limitations in everyday operation.
Webcam
The XPS 17 keeps its usual 720p camera. While it does its job, the image quality isn't particularly good.


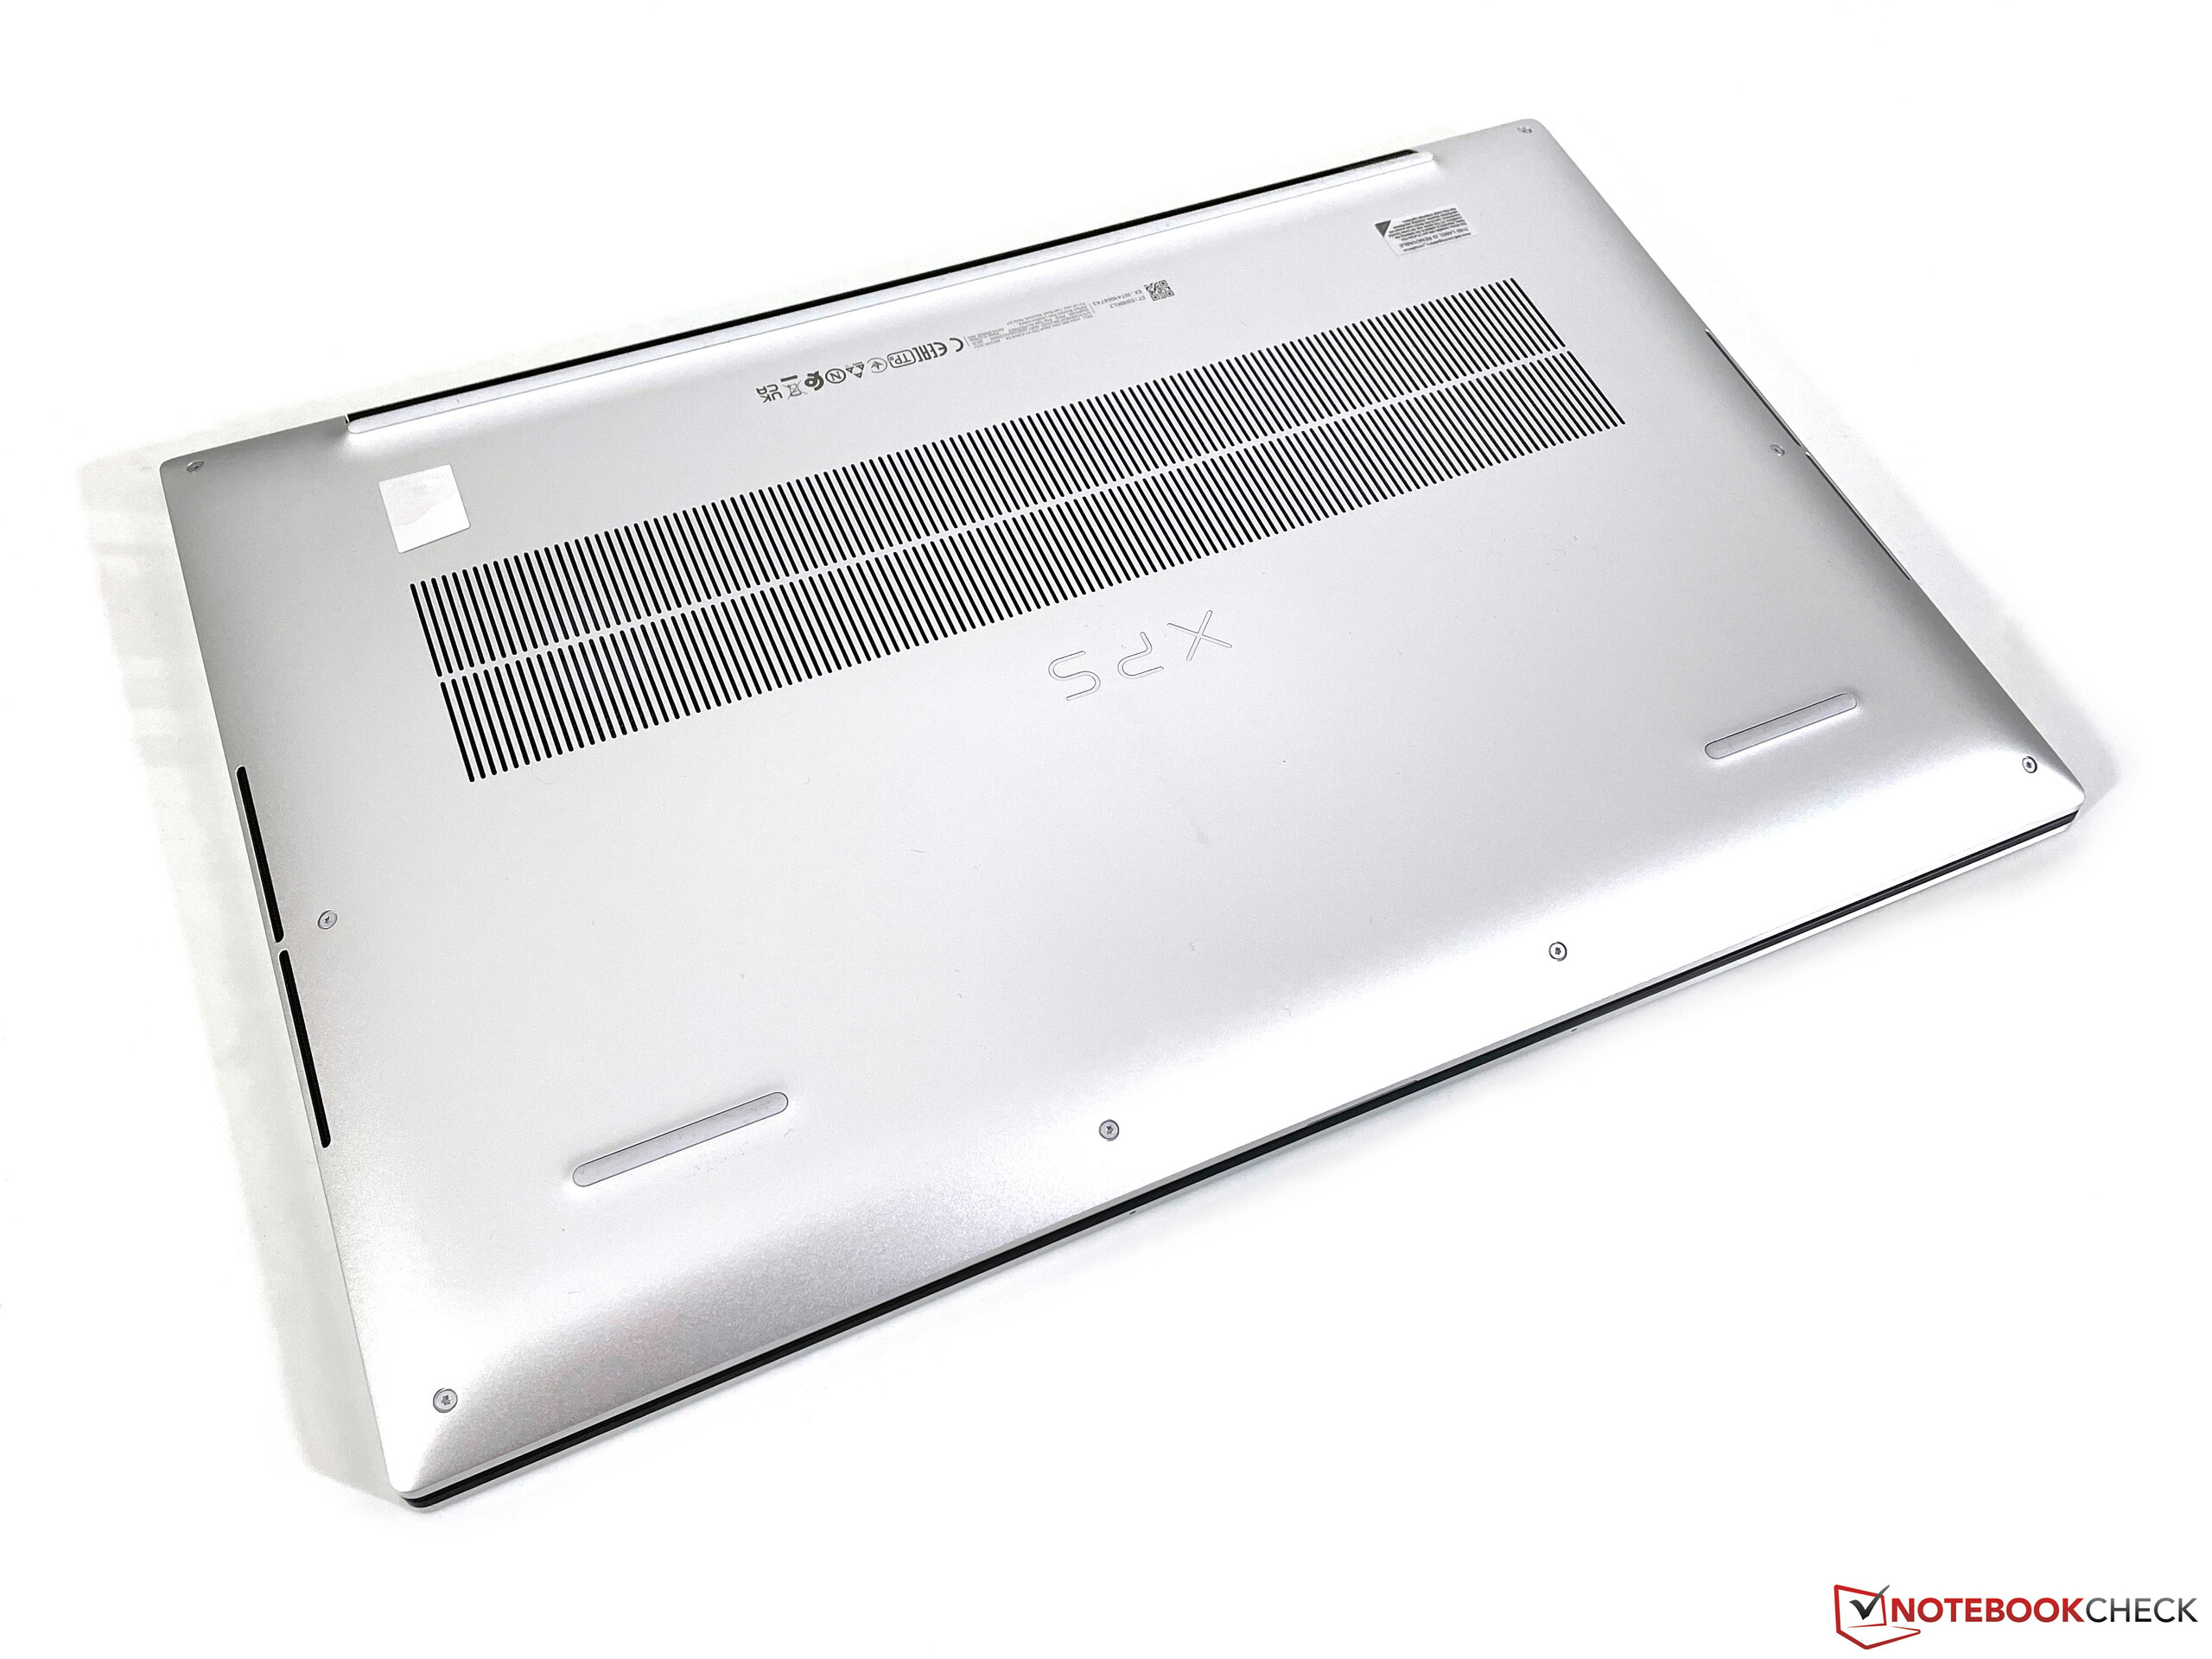
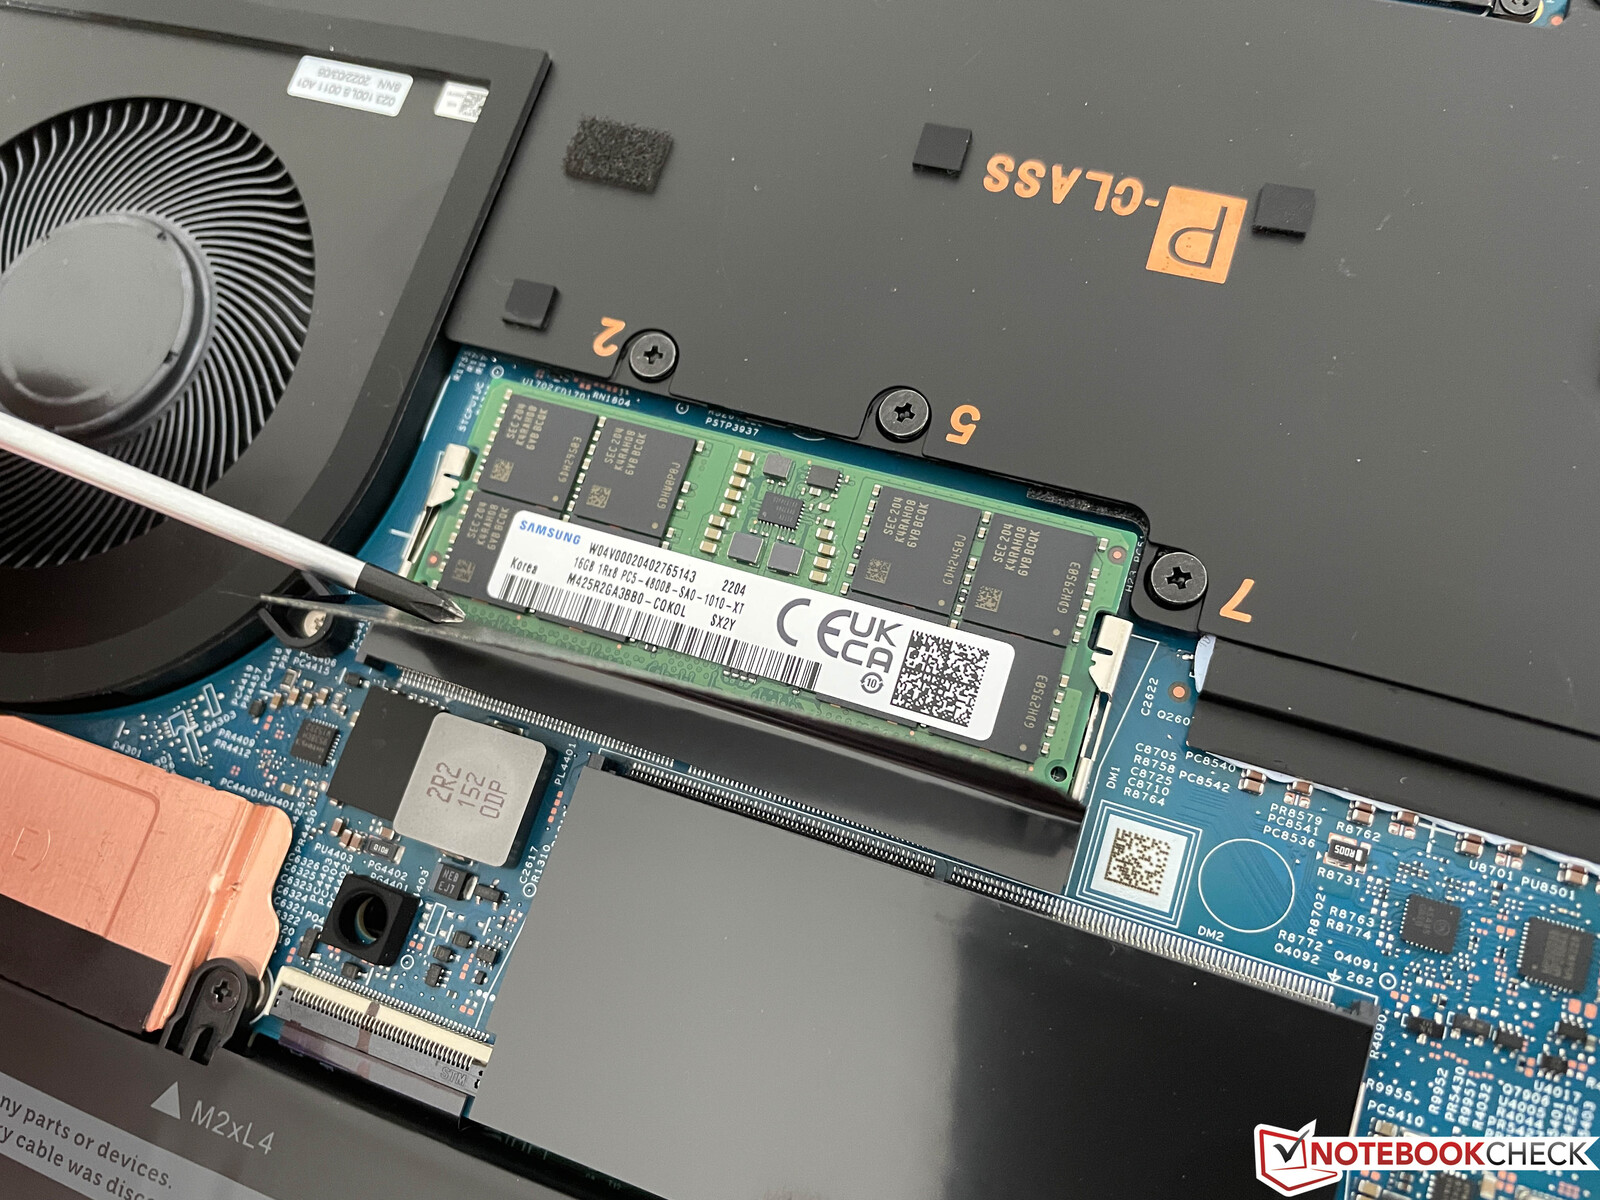
Maintenance
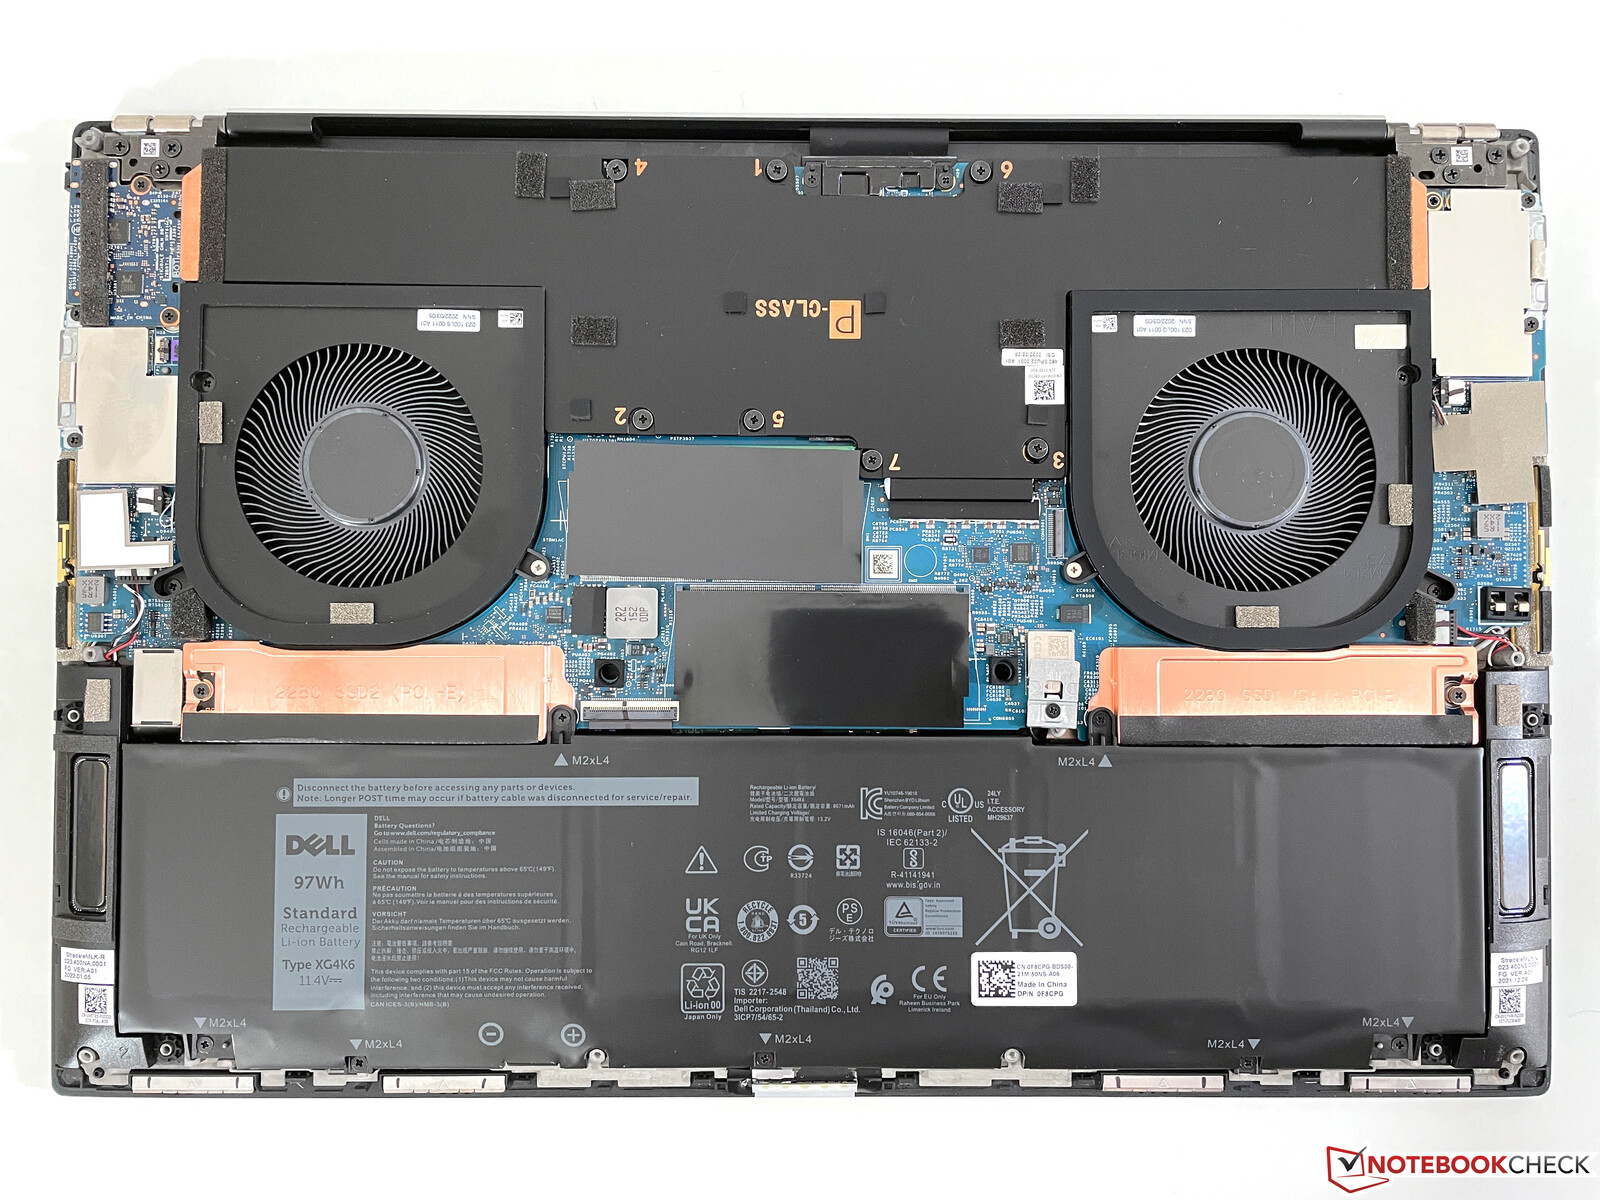
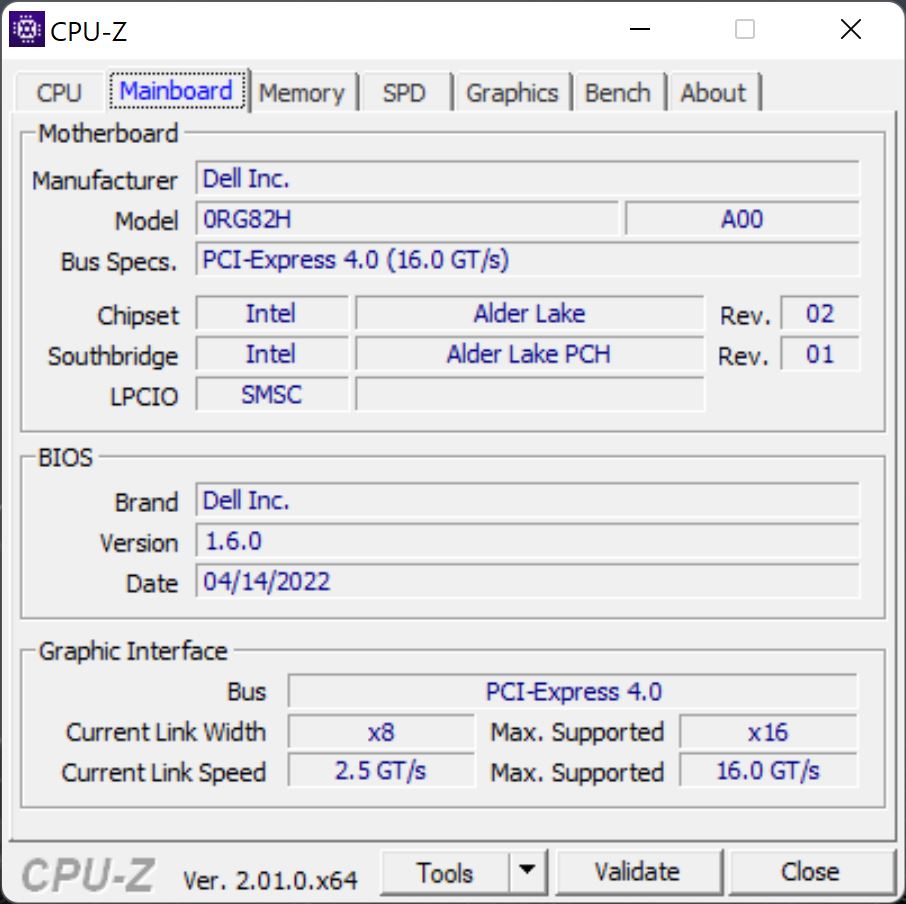
The bottom cover can be removed easily, allowing the user to access the working memory as well as the two M.2-2280 slots.
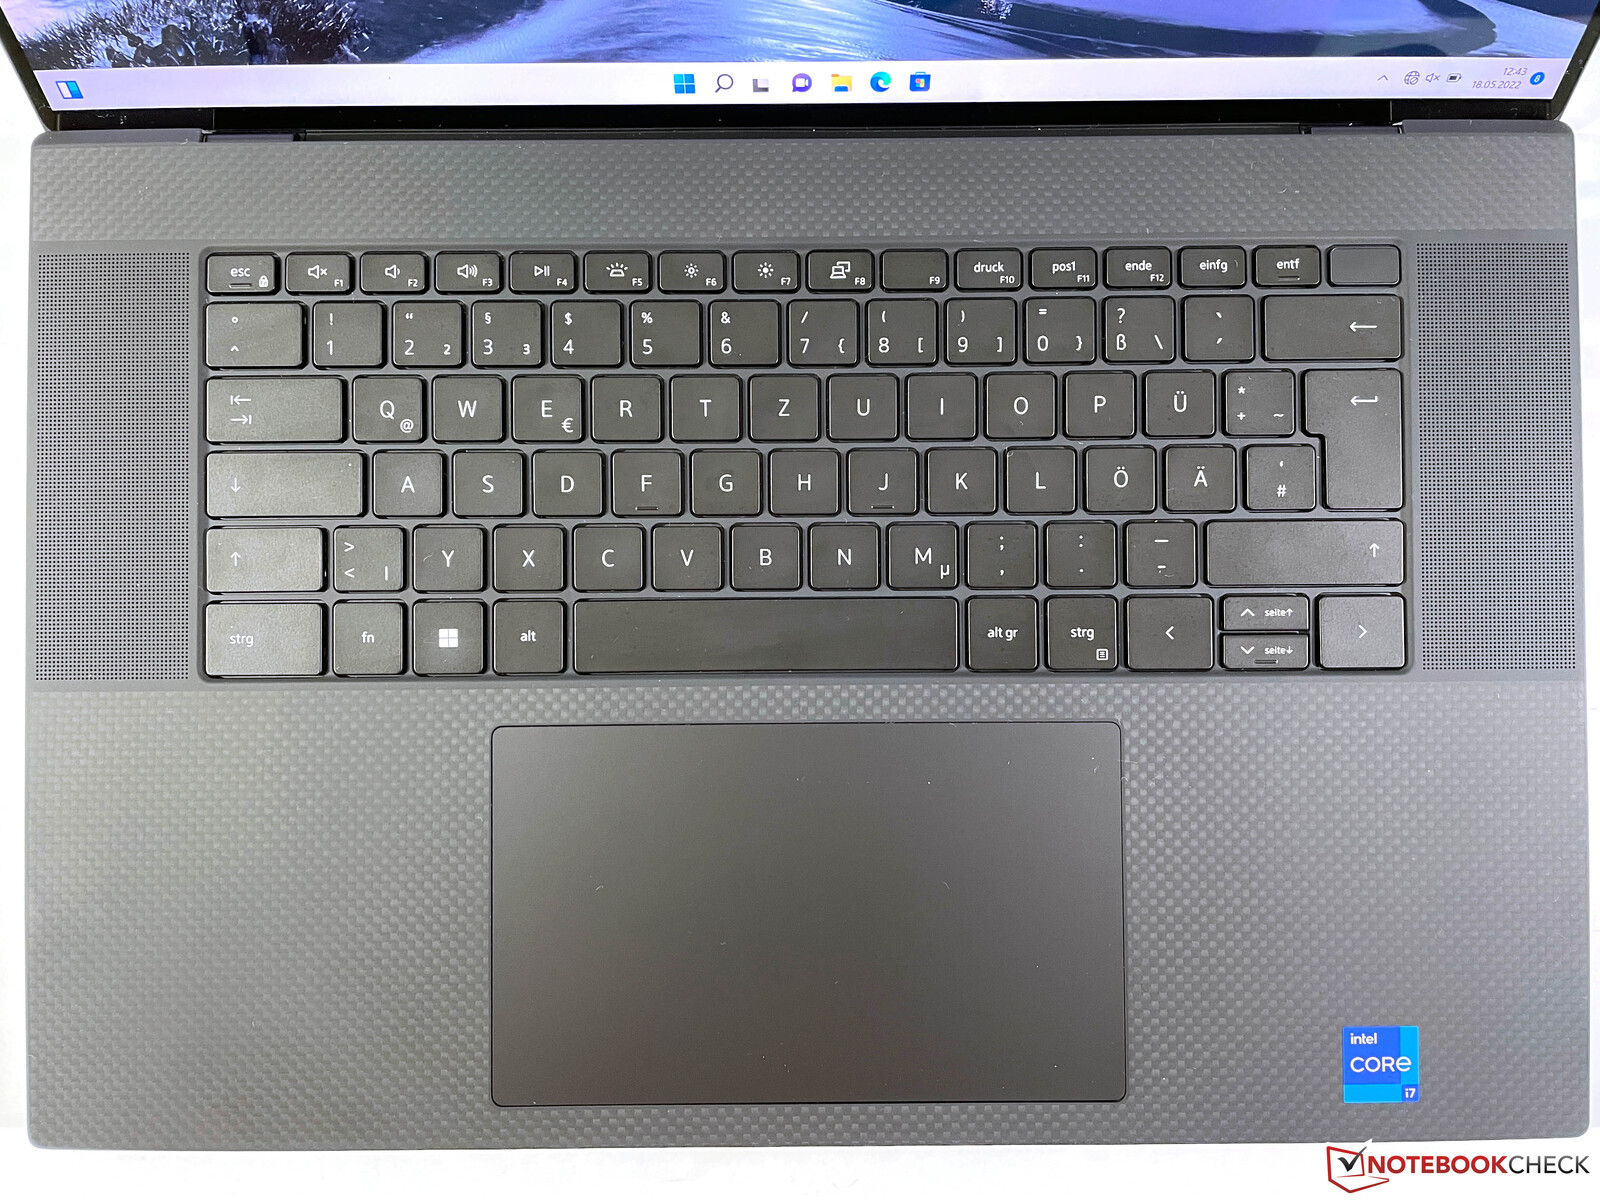
Input Devices - The keyboard is still average
Nothing has changed in the input devices compared to the older models. The keyboard is positioned in the center and flanked by the speaker openings. Its color matches the case color, so it is either black or white. In terms of the mechanics itself, you still get a short key stroke of 1.3 mm (~0.05 in) and the overall typing experience is only mediocre. But this is also due to the impression of its clattering. There is definitely some room for improvement here, and Dell also uses better keyboards in their business and workstation models. The white background illumination works well but cannot be activated automatically by the brightness sensor.
On the other hand, the large ClickPad gives no reason for complaint. Not only does it work very reliably, but it also offers plenty of space for gestures with up to four fingers. In our model, the capacitive touchscreen is also available for inputs, and there are also no problems here. However, there is no support for pen input with pressure levels.

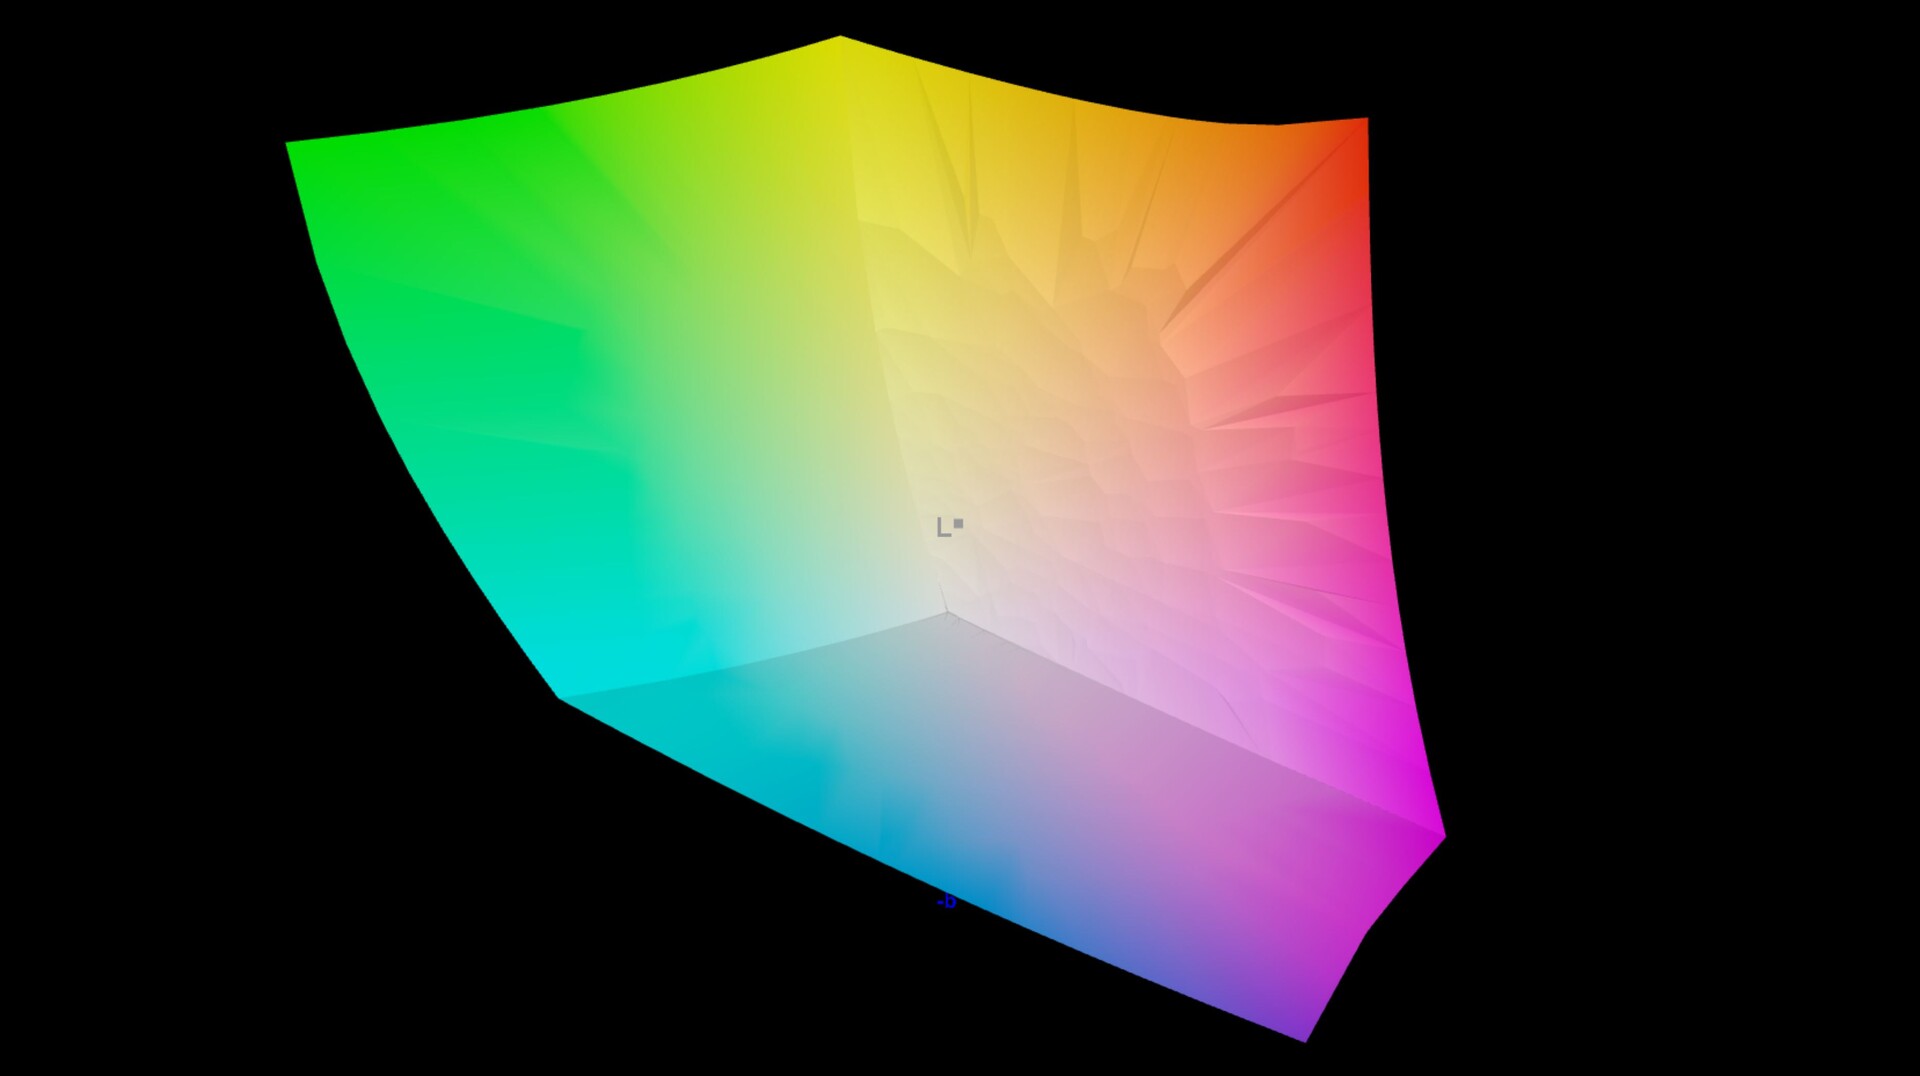
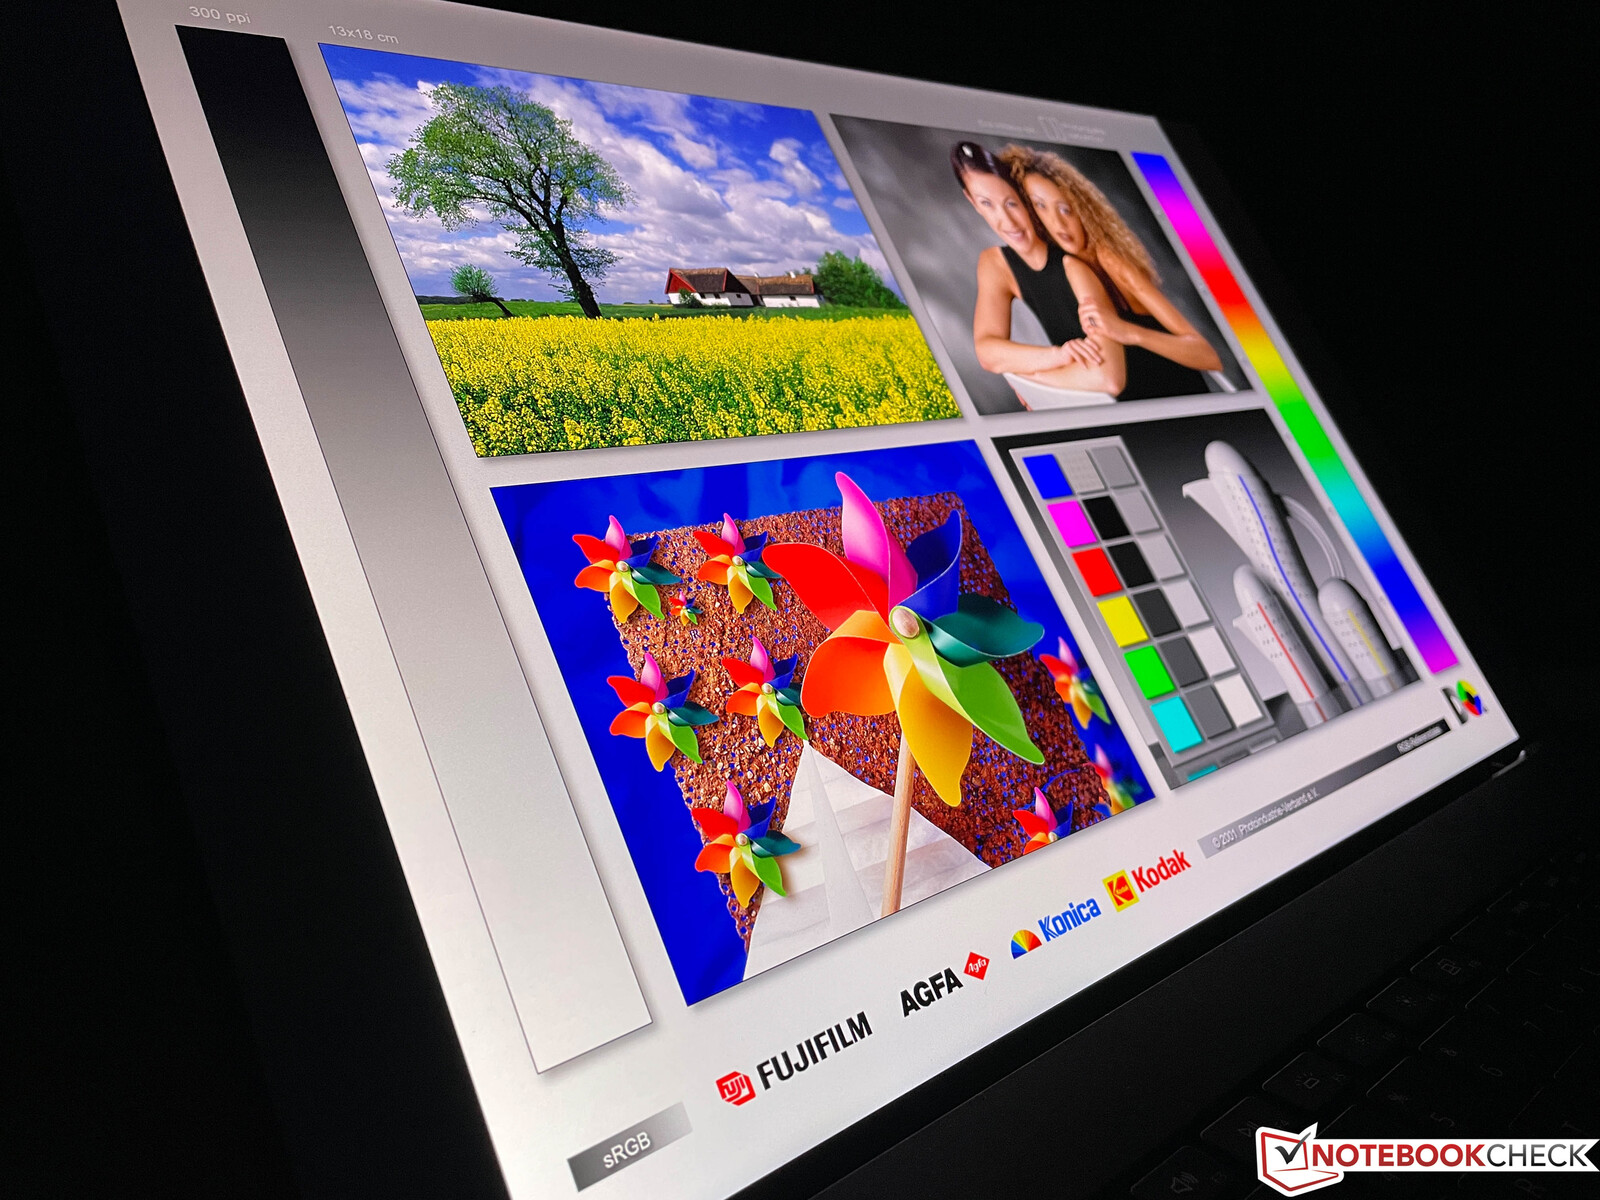
Display - XPS 17 continues to offer a great 4K IPS display
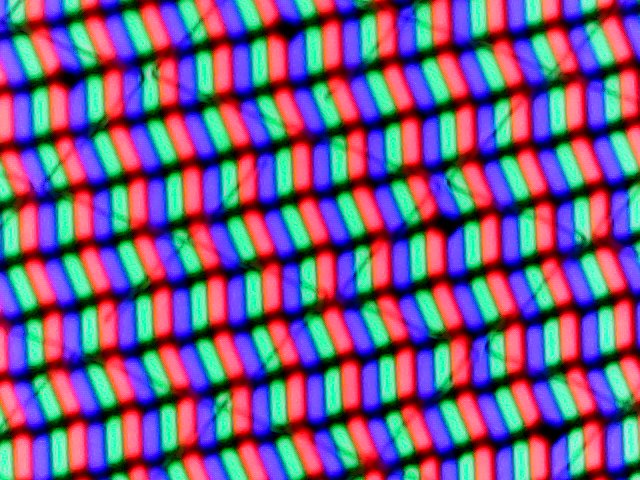
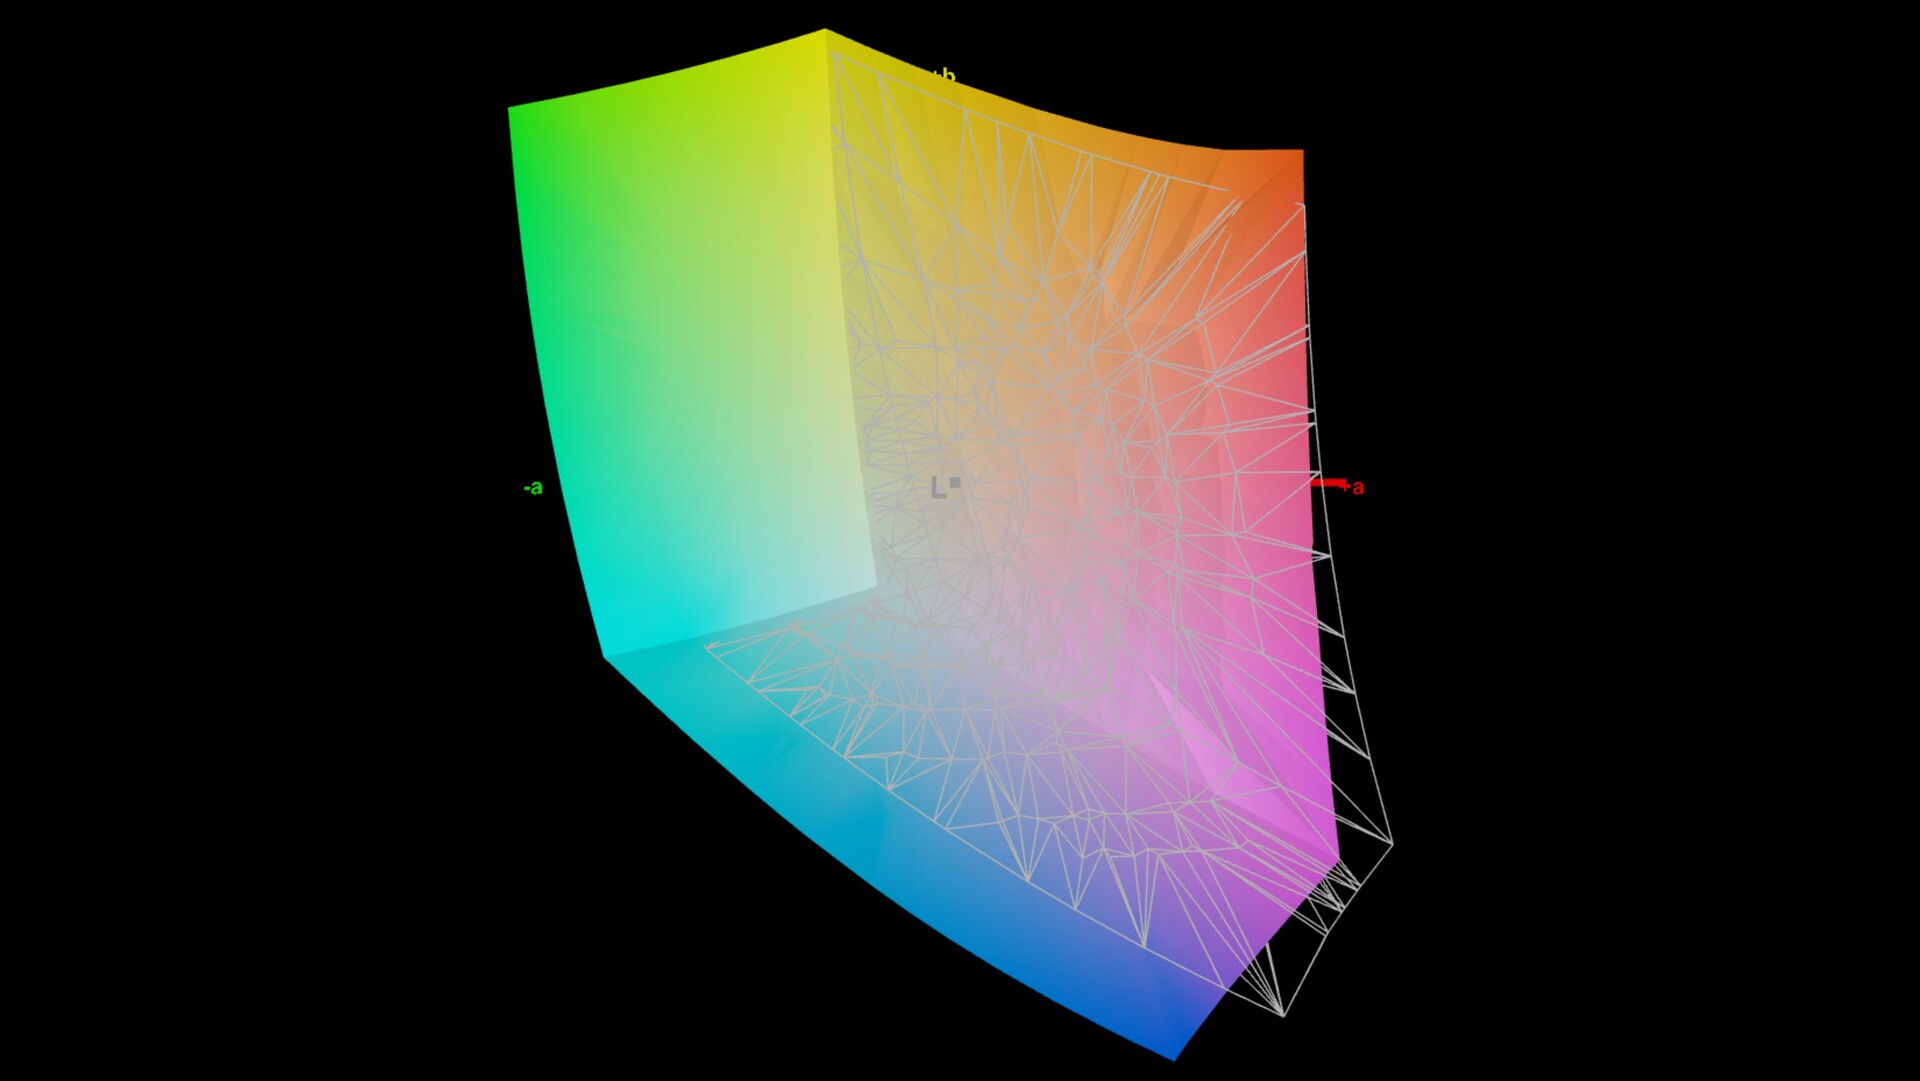
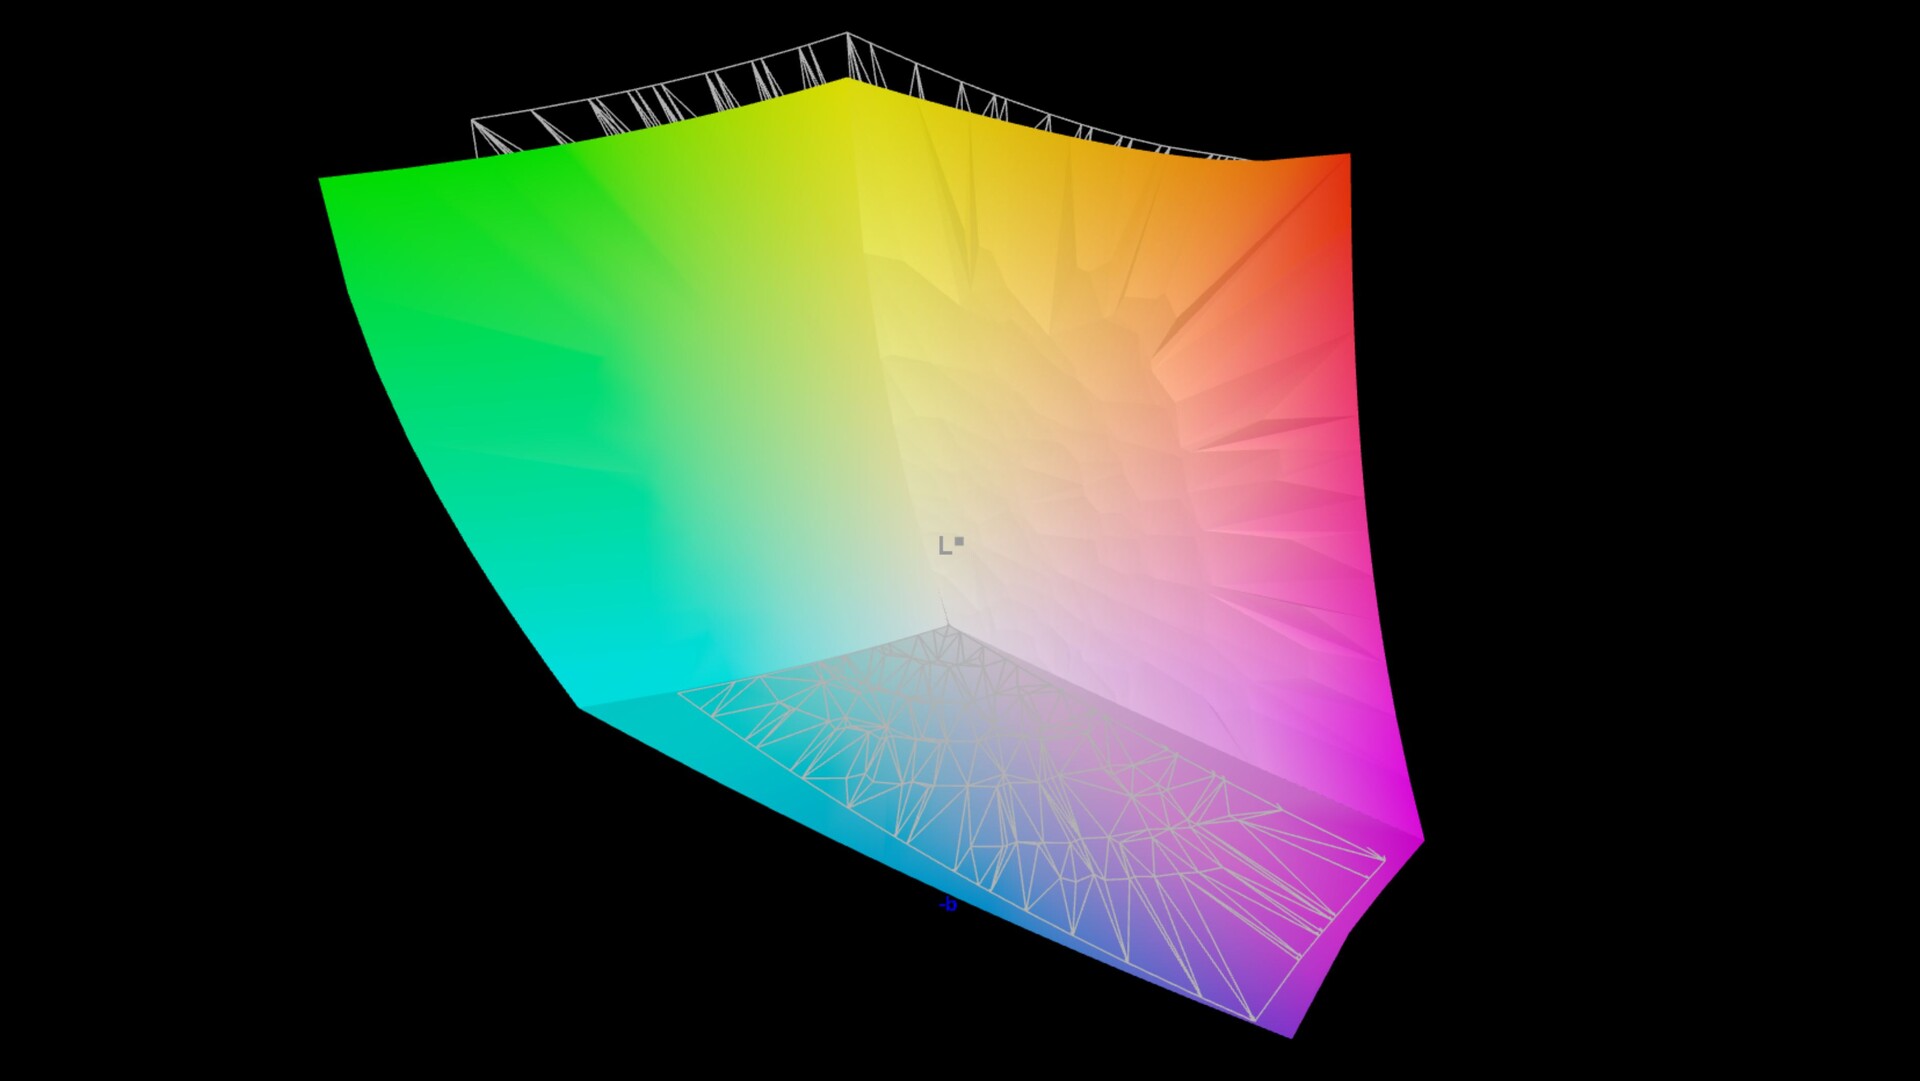
The Dell XPS 17 is still one of the few laptops that offer panels with full AdobeRGB coverage. At this point, this represents an exception, since most OLED panels and even the current DreamColor displays from HP are adjusted toward the DCI-P3 standard. We already know the 16:10 panel from Sharp with the 3840 x 2400 pixel resolution very well, and the subjective image impression is simply outstanding.
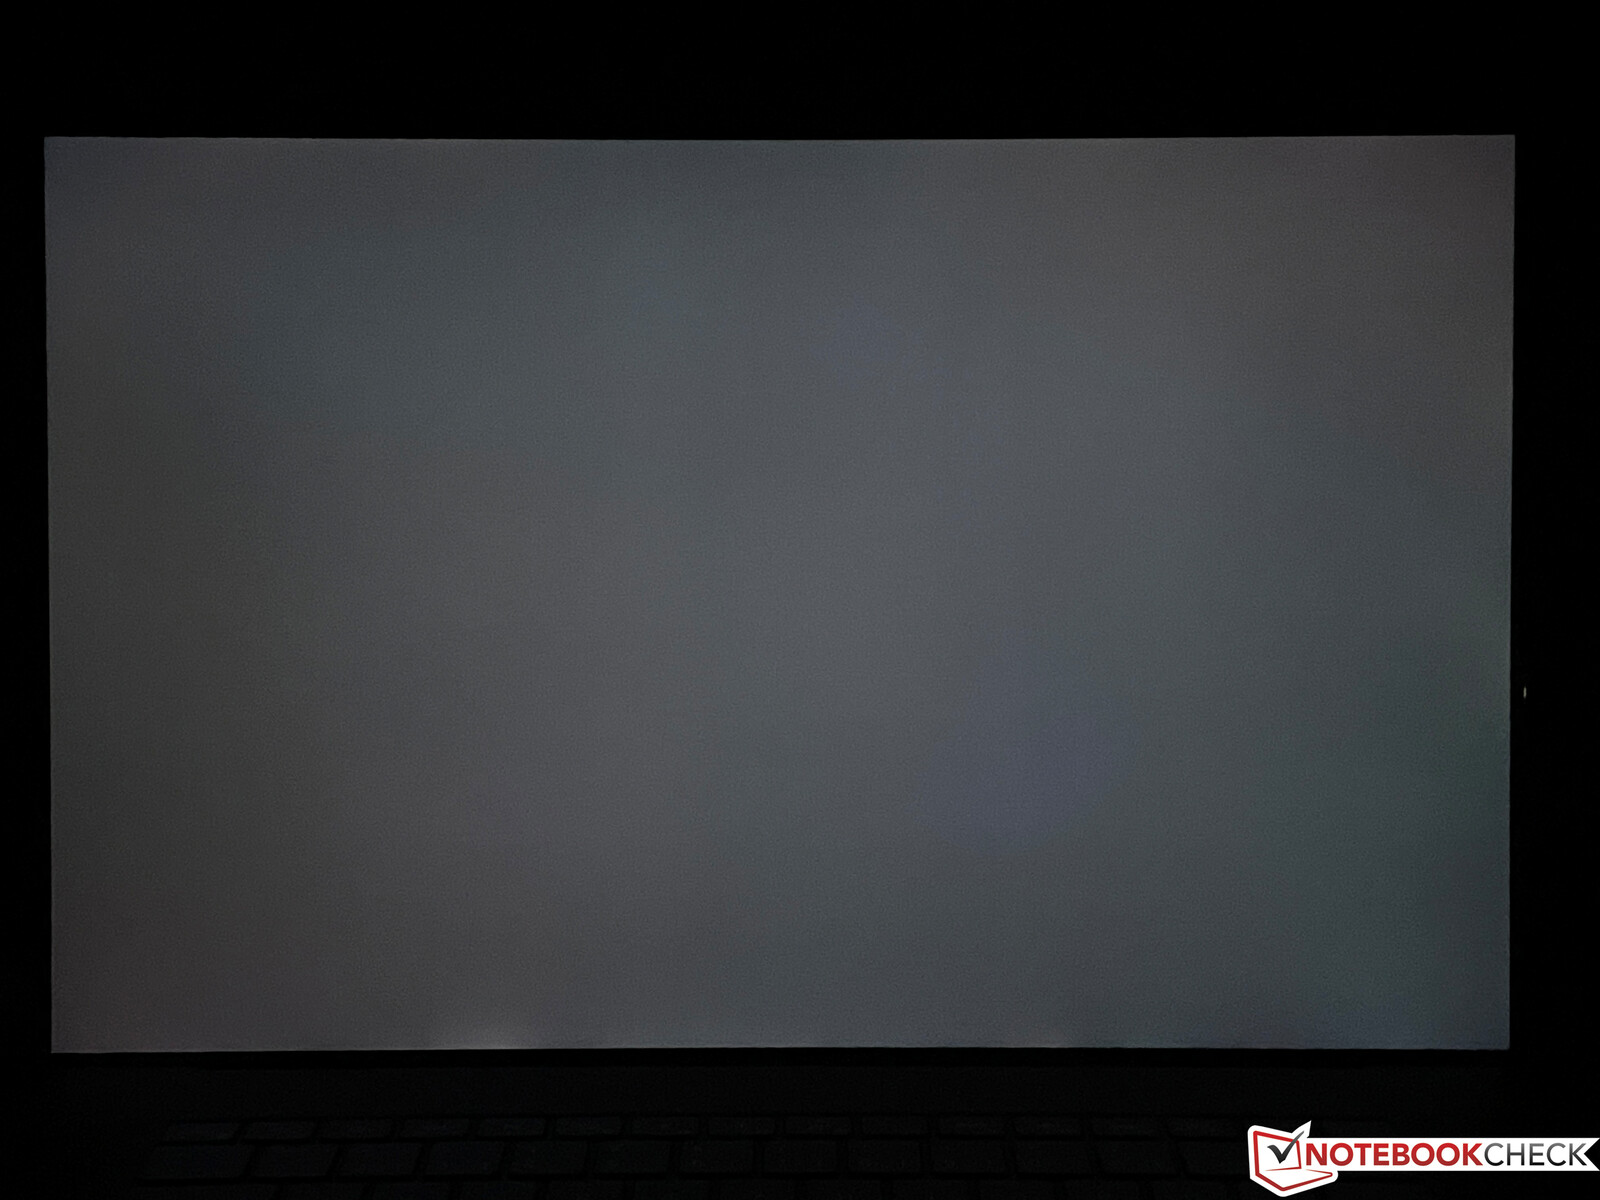
However, in terms of the brightness, our test unit deviates slightly lower, and while the US test unit achieves more than 500 cd/m², the maximum here is only 438 cd/m². On the other hand, the black value is also very low at 0.27 cd/m², resulting in a very high contrast ratio of more than 1600:1 overall. Screen bleeding is no problem, but the response times of the IPS panel don't belong to the fastest. In practice, you can also see some ghosting effects, for example at the mouse pointer. Starting at brightness levels of 40% or lower, we also notice some flickering at 17.9 kHz, but this shouldn't lead to any problems.
| |||||||||||||||||||||||||
Brightness Distribution: 86 %
Center on Battery: 437 cd/m²
Contrast: 1622:1 (Black: 0.27 cd/m²)
ΔE ColorChecker Calman: 2.5 | ∀{0.5-29.43 Ø4.73}
calibrated: 0.8
ΔE Greyscale Calman: 4.2 | ∀{0.09-98 Ø4.97}
100% AdobeRGB 1998 (Argyll 3D)
100% sRGB (Argyll 3D)
94.8% Display P3 (Argyll 3D)
Gamma: 2.22
CCT: 7034 K
| Dell XPS 17 9720 Sharp LQ170R1, IPS, 3840x2400, 17" | Apple MacBook Pro 16 2021 M1 Pro Liquid Retina XDR, Mini-LED, 3456x2234, 16.2" | Dell XPS 17 9720 RTX 3060 Sharp LQ170R1, IPS, 3840x2400, 17" | Lenovo ThinkPad X1 Extreme G4-20Y5CTO1WW (3050 Ti) LP160UQ1-SPB1, IPS LED, 3840x2400, 16" | Asus Vivobook Pro 16X-M7600QE Samsung ATNA60YV02-0, OLED, 3840x2400, 16.1" | Lenovo ThinkBook 16p G2 ACH Lenovo LEN8A95 (AUO B160QAN02.M), IPS, 2560x1600, 16" | Dell XPS 17 9710 Core i7 RTX 3060 Sharp LQ170R1, IPS, 3840x2400, 17" | |
|---|---|---|---|---|---|---|---|
| Display | -2% | -6% | -5% | 1% | -14% | 0% | |
| Display P3 Coverage (%) | 94.8 | 99.1 5% | 92.9 -2% | 84.3 -11% | 99.8 5% | 76.4 -19% | 94.8 0% |
| sRGB Coverage (%) | 100 | 100 0% | 100 0% | 98.3 -2% | 100 0% | 100 0% | 100 0% |
| AdobeRGB 1998 Coverage (%) | 100 | 88 -12% | 85.3 -15% | 97.8 -2% | 96.9 -3% | 77.4 -23% | 100 0% |
| Response Times | -102% | -10% | -31% | 95% | 37% | 2% | |
| Response Time Grey 50% / Grey 80% * (ms) | 53.2 ? | 42.8 ? 20% | 51.2 ? 4% | 60 ? -13% | 2 ? 96% | 36 32% | 44.8 ? 16% |
| Response Time Black / White * (ms) | 28.4 ? | 91.6 ? -223% | 35.2 ? -24% | 42 ? -48% | 2 ? 93% | 16.4 42% | 32 ? -13% |
| PWM Frequency (Hz) | 17990 ? | 14880 | 60 ? | ||||
| Screen | 221% | -37% | 2% | 1% | -5% | -14% | |
| Brightness middle (cd/m²) | 438 | 514 17% | 512.7 17% | 639 46% | 392 -11% | 439 0% | 536.5 22% |
| Brightness (cd/m²) | 411 | 497 21% | 463 13% | 612 49% | 396 -4% | 397 -3% | 489 19% |
| Brightness Distribution (%) | 86 | 95 10% | 85 -1% | 84 -2% | 98 14% | 83 -3% | 85 -1% |
| Black Level * (cd/m²) | 0.27 | 0.02 93% | 0.32 -19% | 0.47 -74% | 0.44 -63% | 0.37 -37% | |
| Contrast (:1) | 1622 | 25700 1484% | 1602 -1% | 1360 -16% | 998 -38% | 1450 -11% | |
| Colorchecker dE 2000 * | 2.5 | 1.4 44% | 5.98 -139% | 2.2 12% | 1.74 30% | 1.68 33% | 2.46 2% |
| Colorchecker dE 2000 max. * | 6.3 | 2.8 56% | 12.09 -92% | 5.3 16% | 3.18 50% | 2.36 63% | 7.74 -23% |
| Colorchecker dE 2000 calibrated * | 0.8 | 1.4 -75% | 1.85 -131% | 1.57 -96% | 1.85 -131% | ||
| Greyscale dE 2000 * | 4.2 | 2.3 45% | 7.2 -71% | 1.7 60% | 1.77 58% | 1.64 61% | 2.9 31% |
| Gamma | 2.22 99% | 2.27 97% | 2.54 87% | 2.31 95% | 2.22 99% | 2.39 92% | 2.12 104% |
| CCT | 7034 92% | 6792 96% | 6914 94% | 6390 102% | 6483 100% | 6616 98% | 6868 95% |
| Total Average (Program / Settings) | 39% /
120% | -18% /
-25% | -11% /
-4% | 32% /
16% | 6% /
-1% | -4% /
-9% |
* ... smaller is better
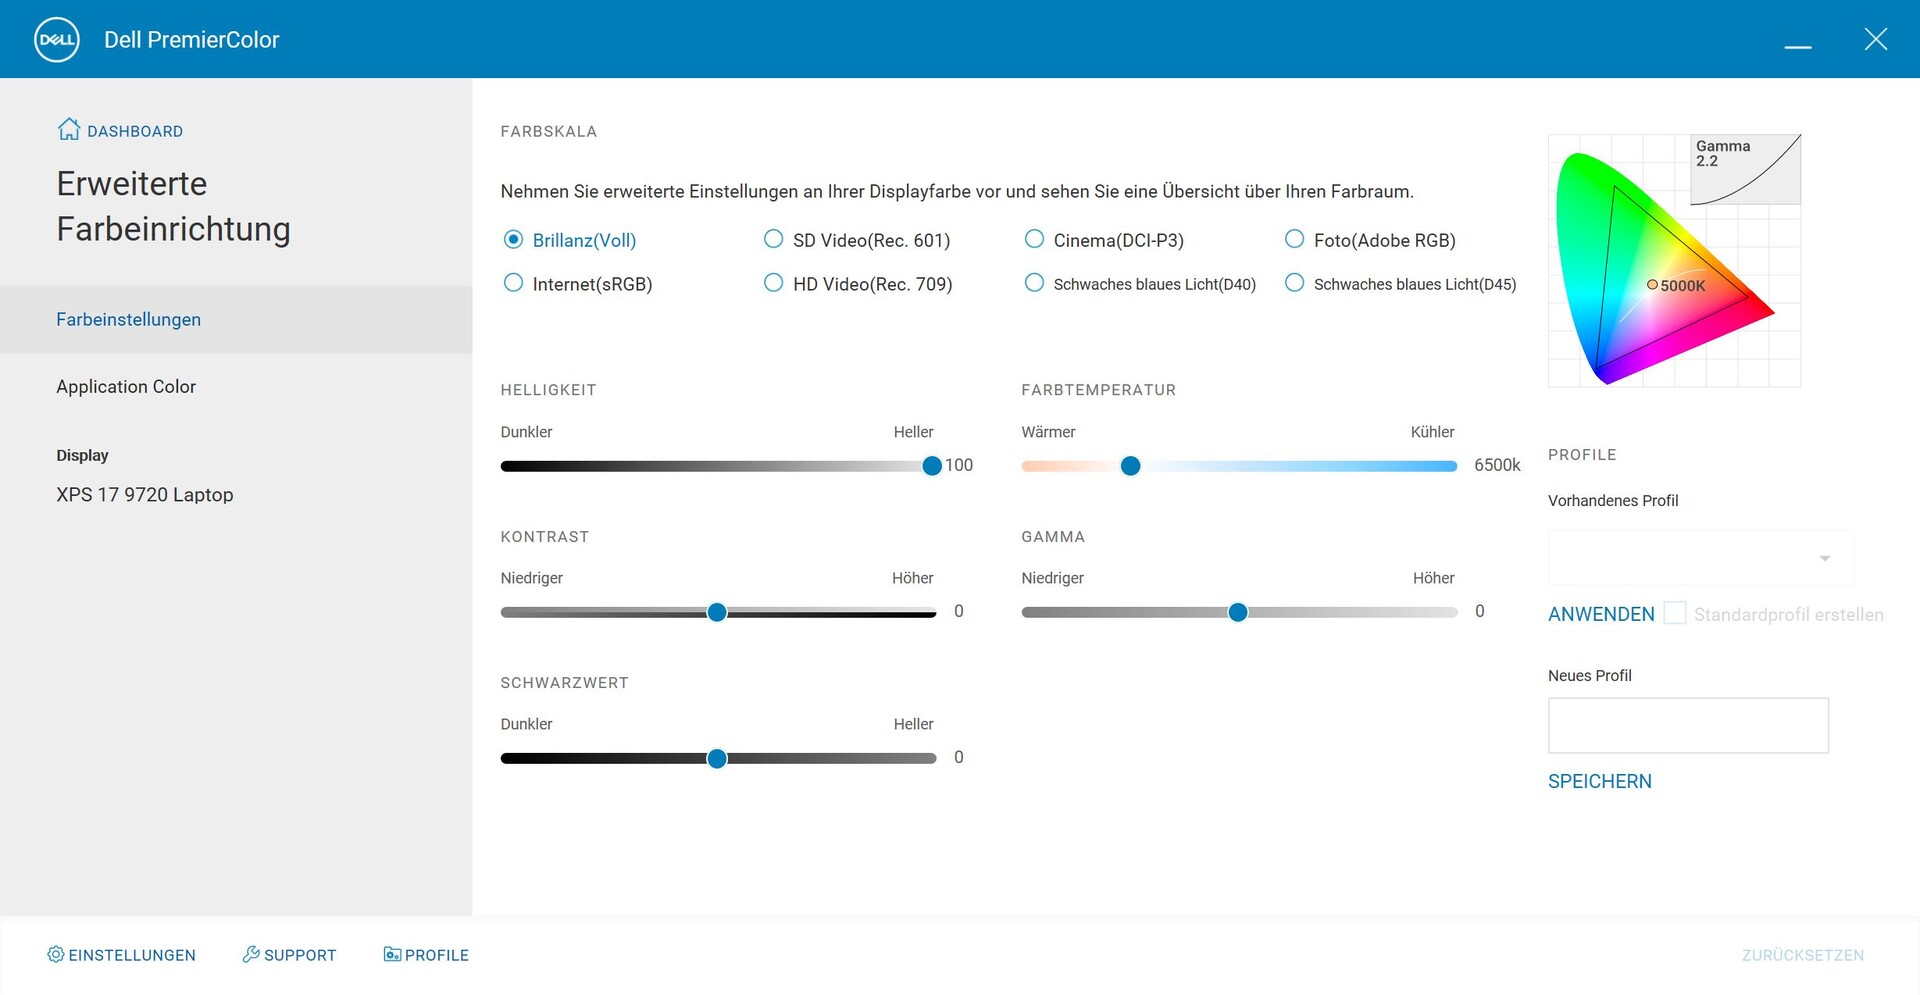
Dell includes the Premier Color software that allows you to switch between various profiles and color spaces. We measured the display with the professional CalMAN software and the X-Rite i1 Pro 2 spectral photometer and found out that the Photo profile (Adobe RGB) offers the best image quality. You should also check the adjustments in the Premier Color software, since in our test unit, the color temperature was adjusted much too warm (5000 K instead of 6500 K) by default (as you can also see in the outdoor images further below).
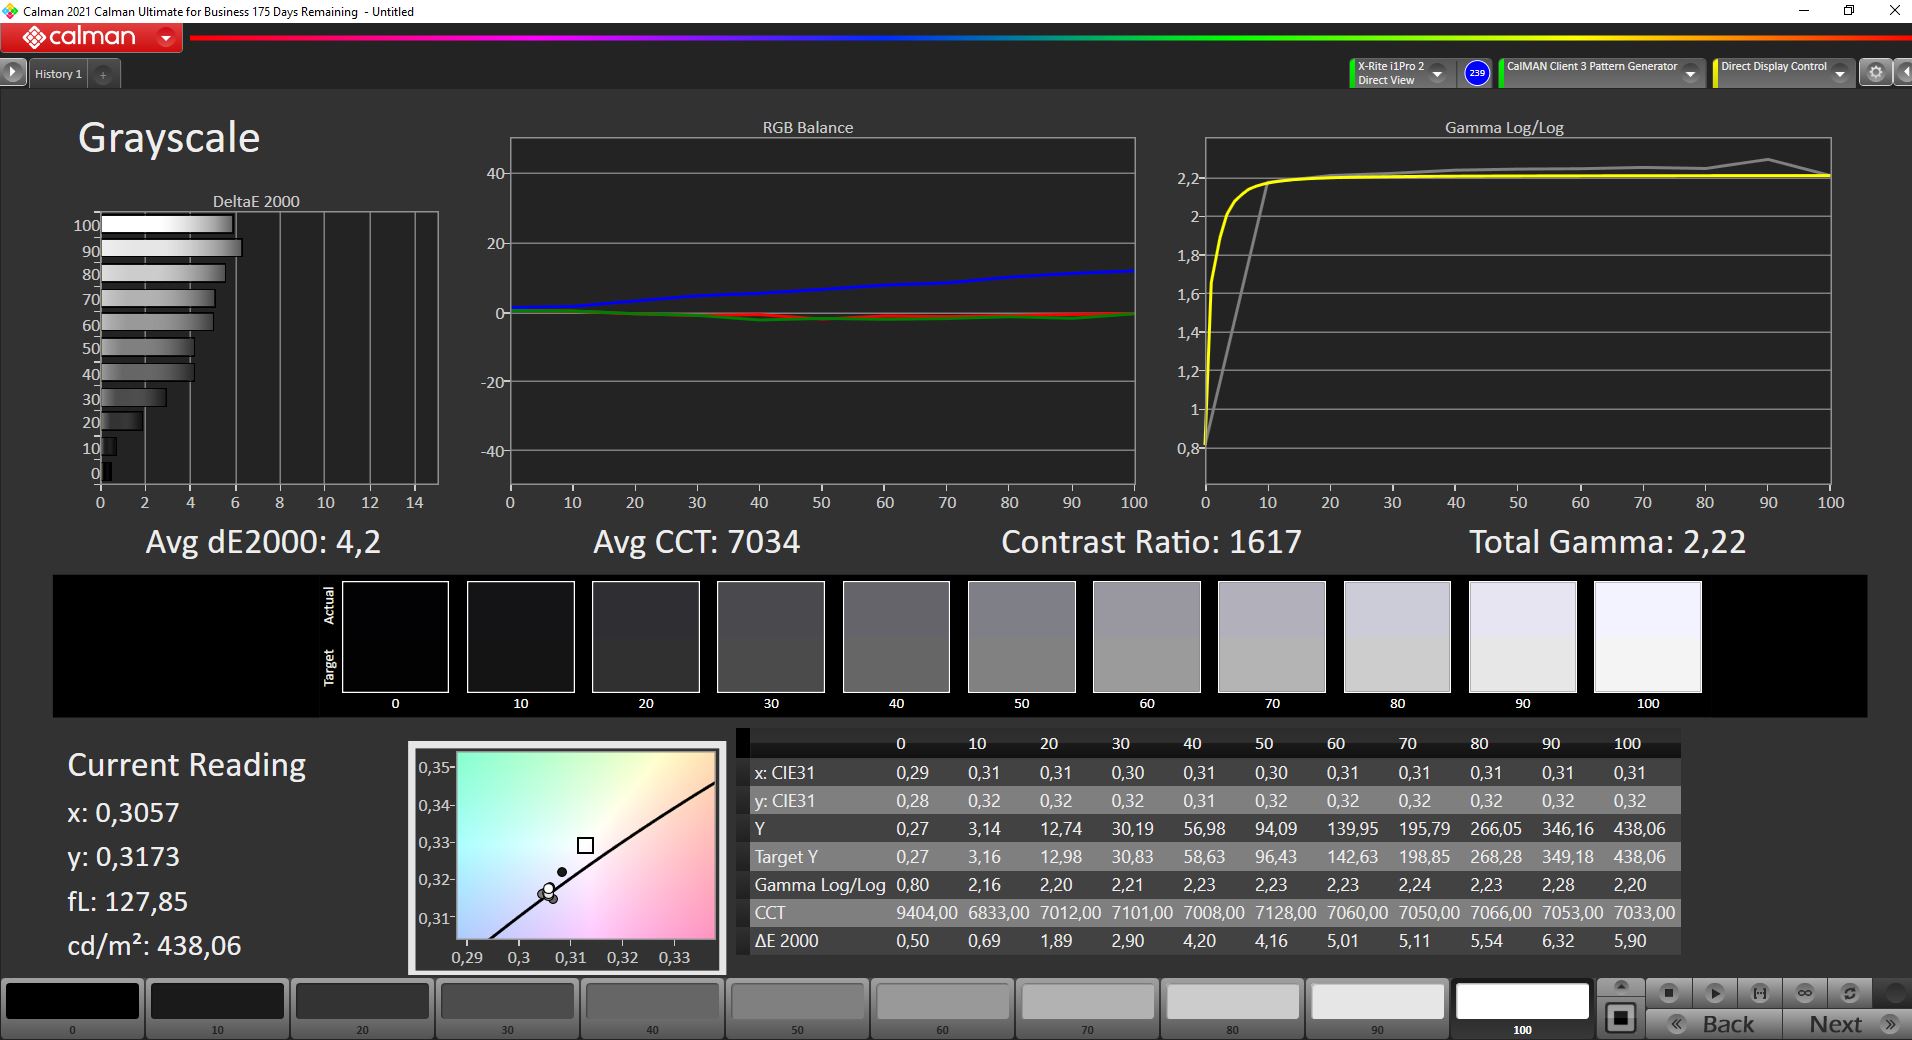
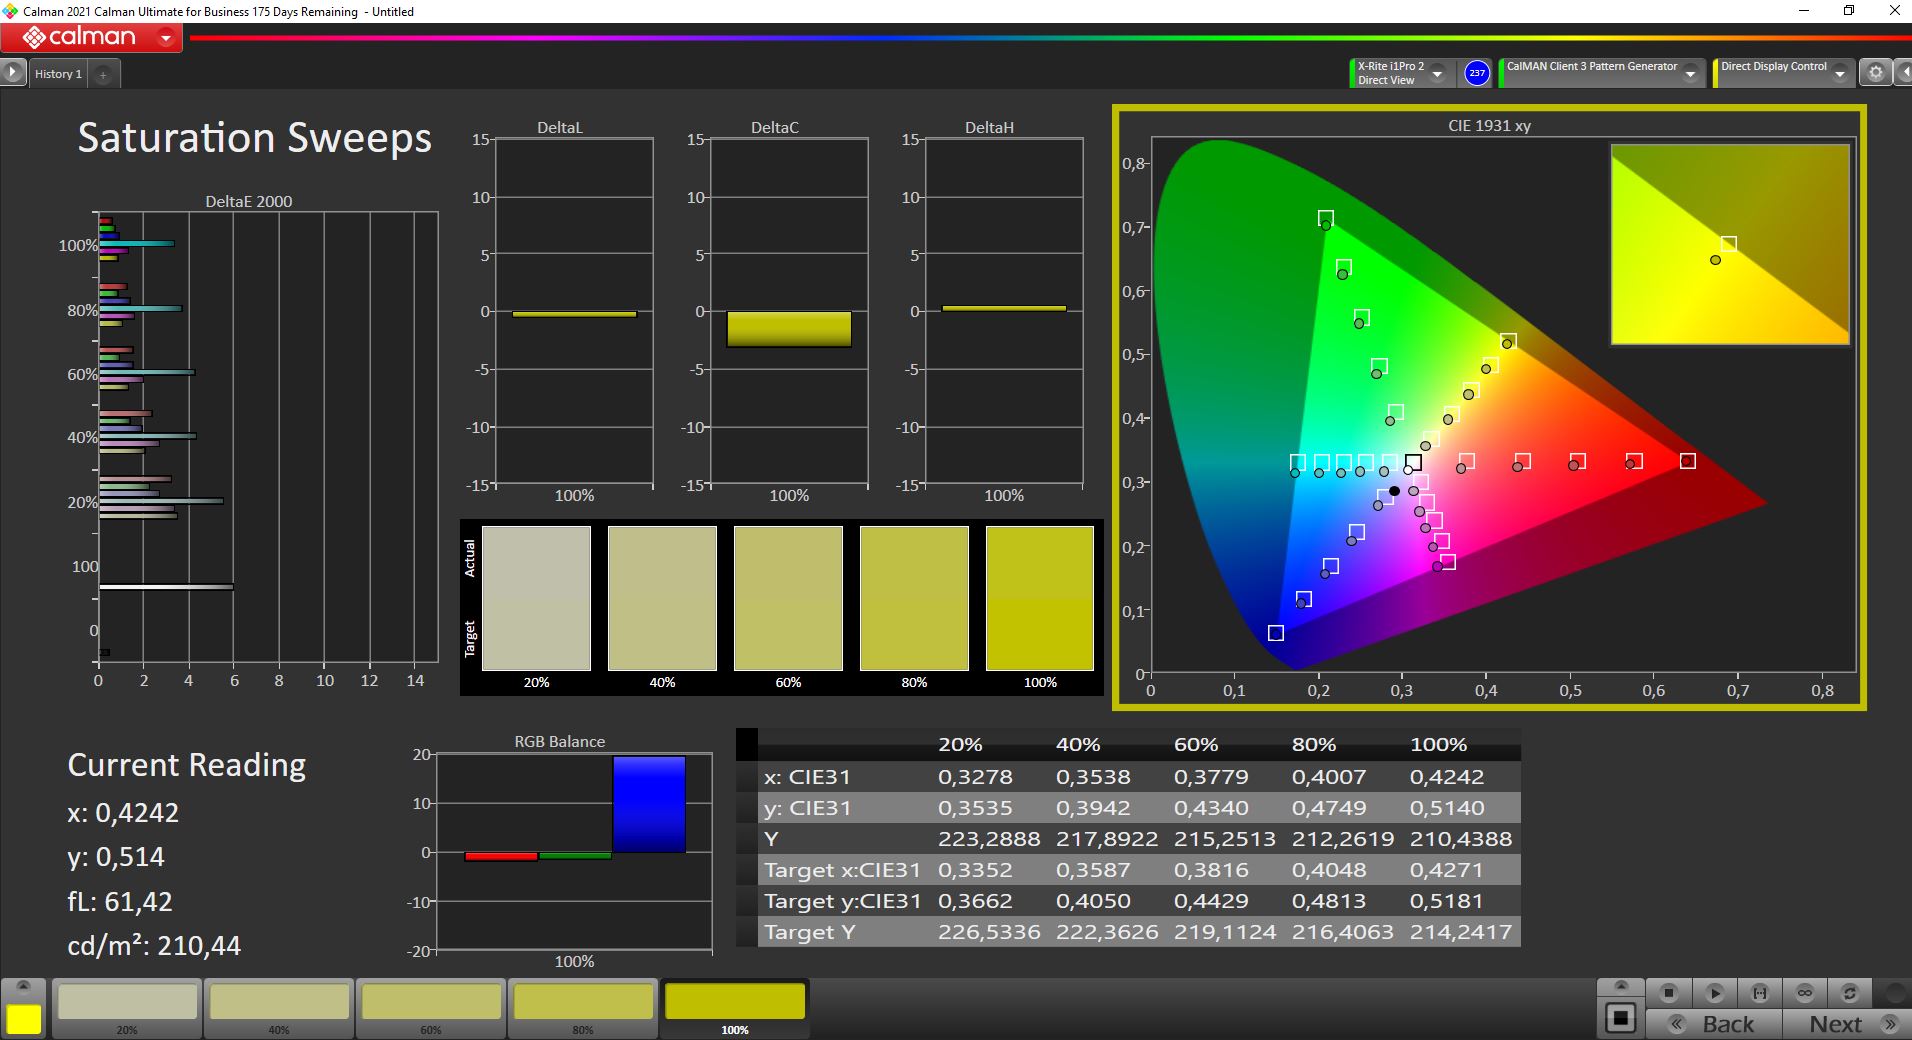
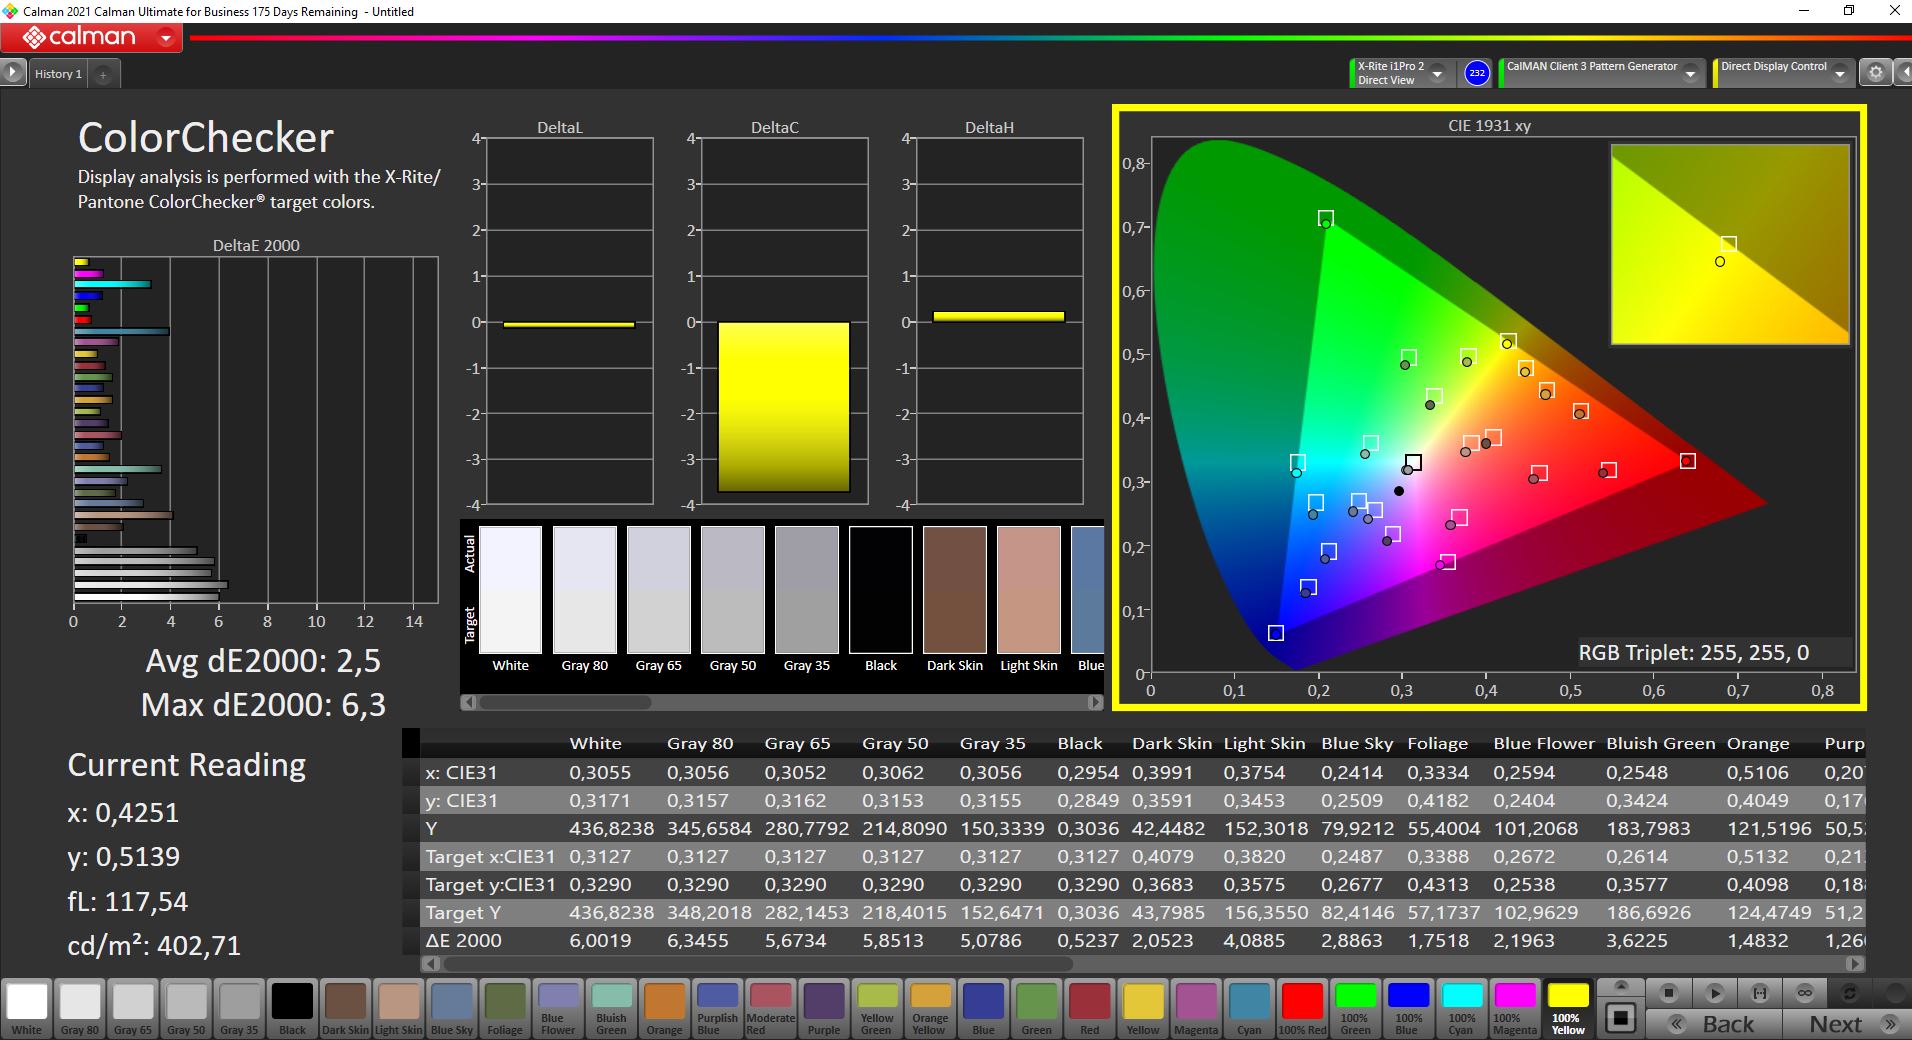
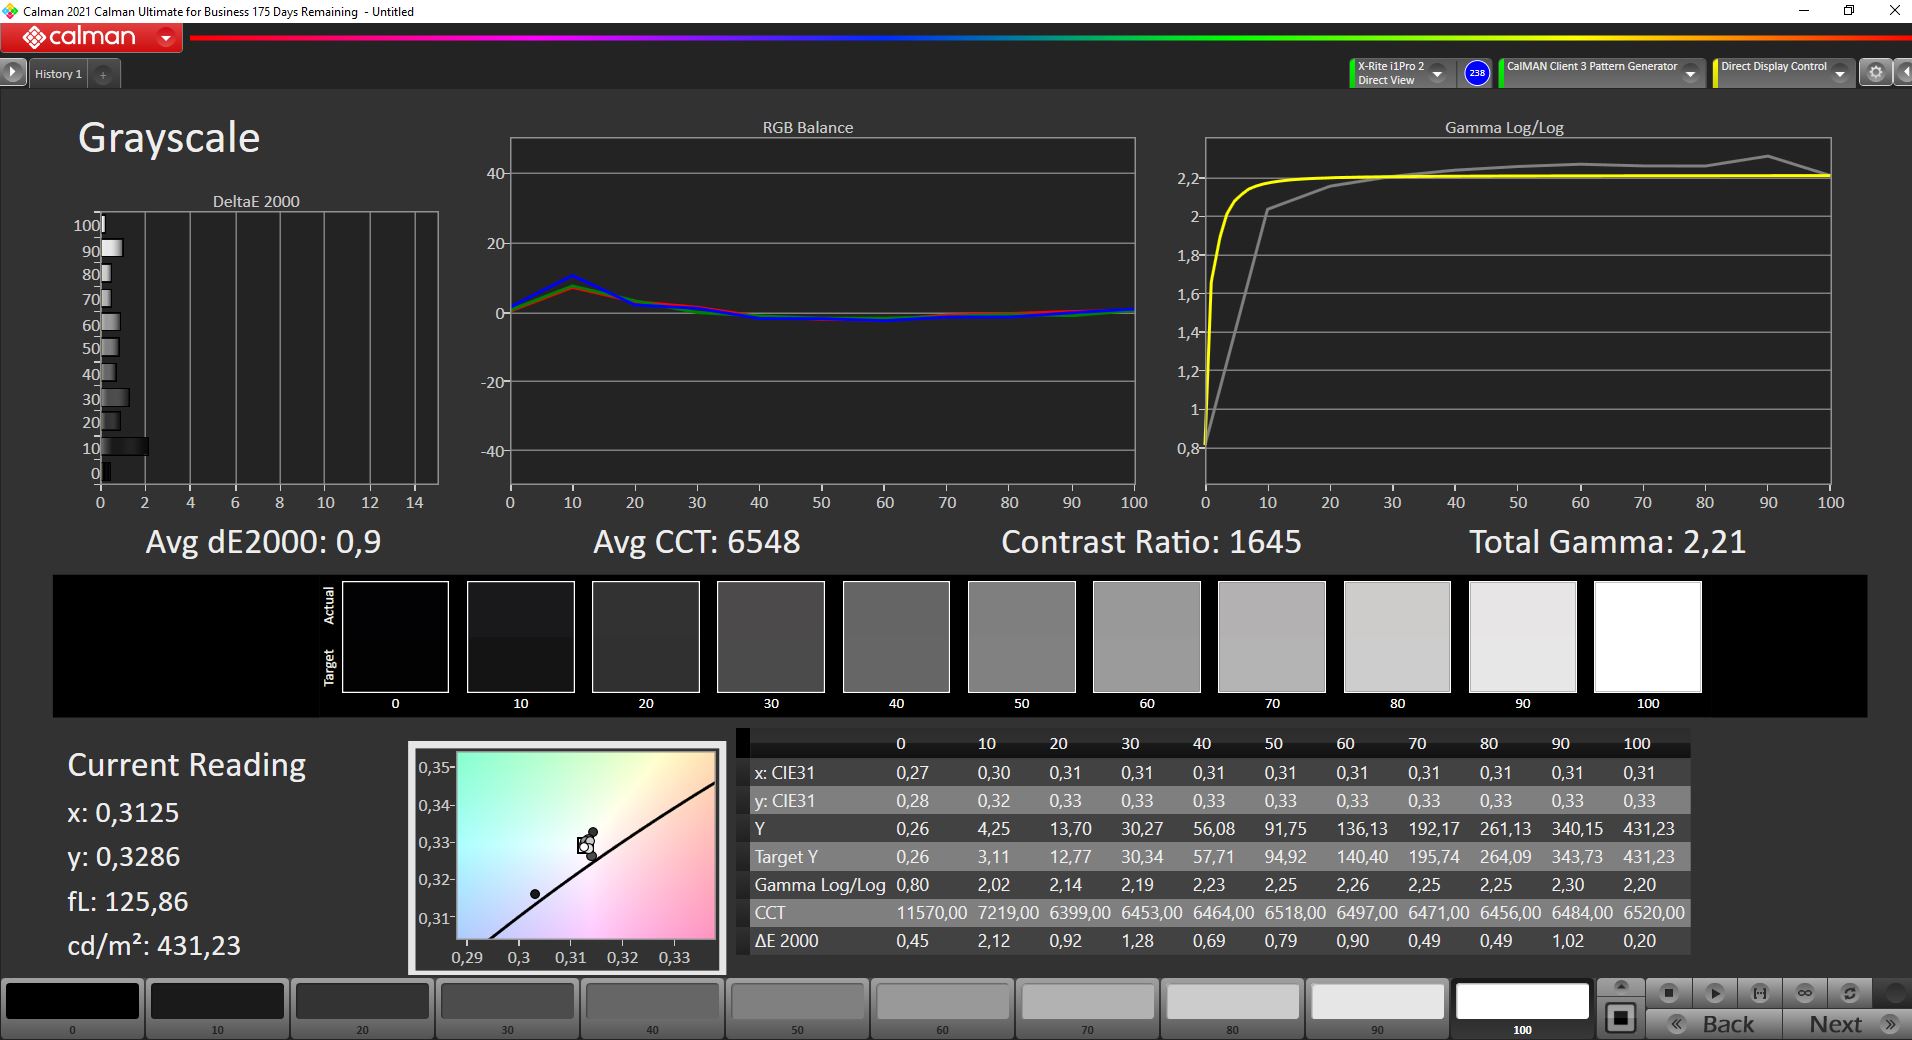

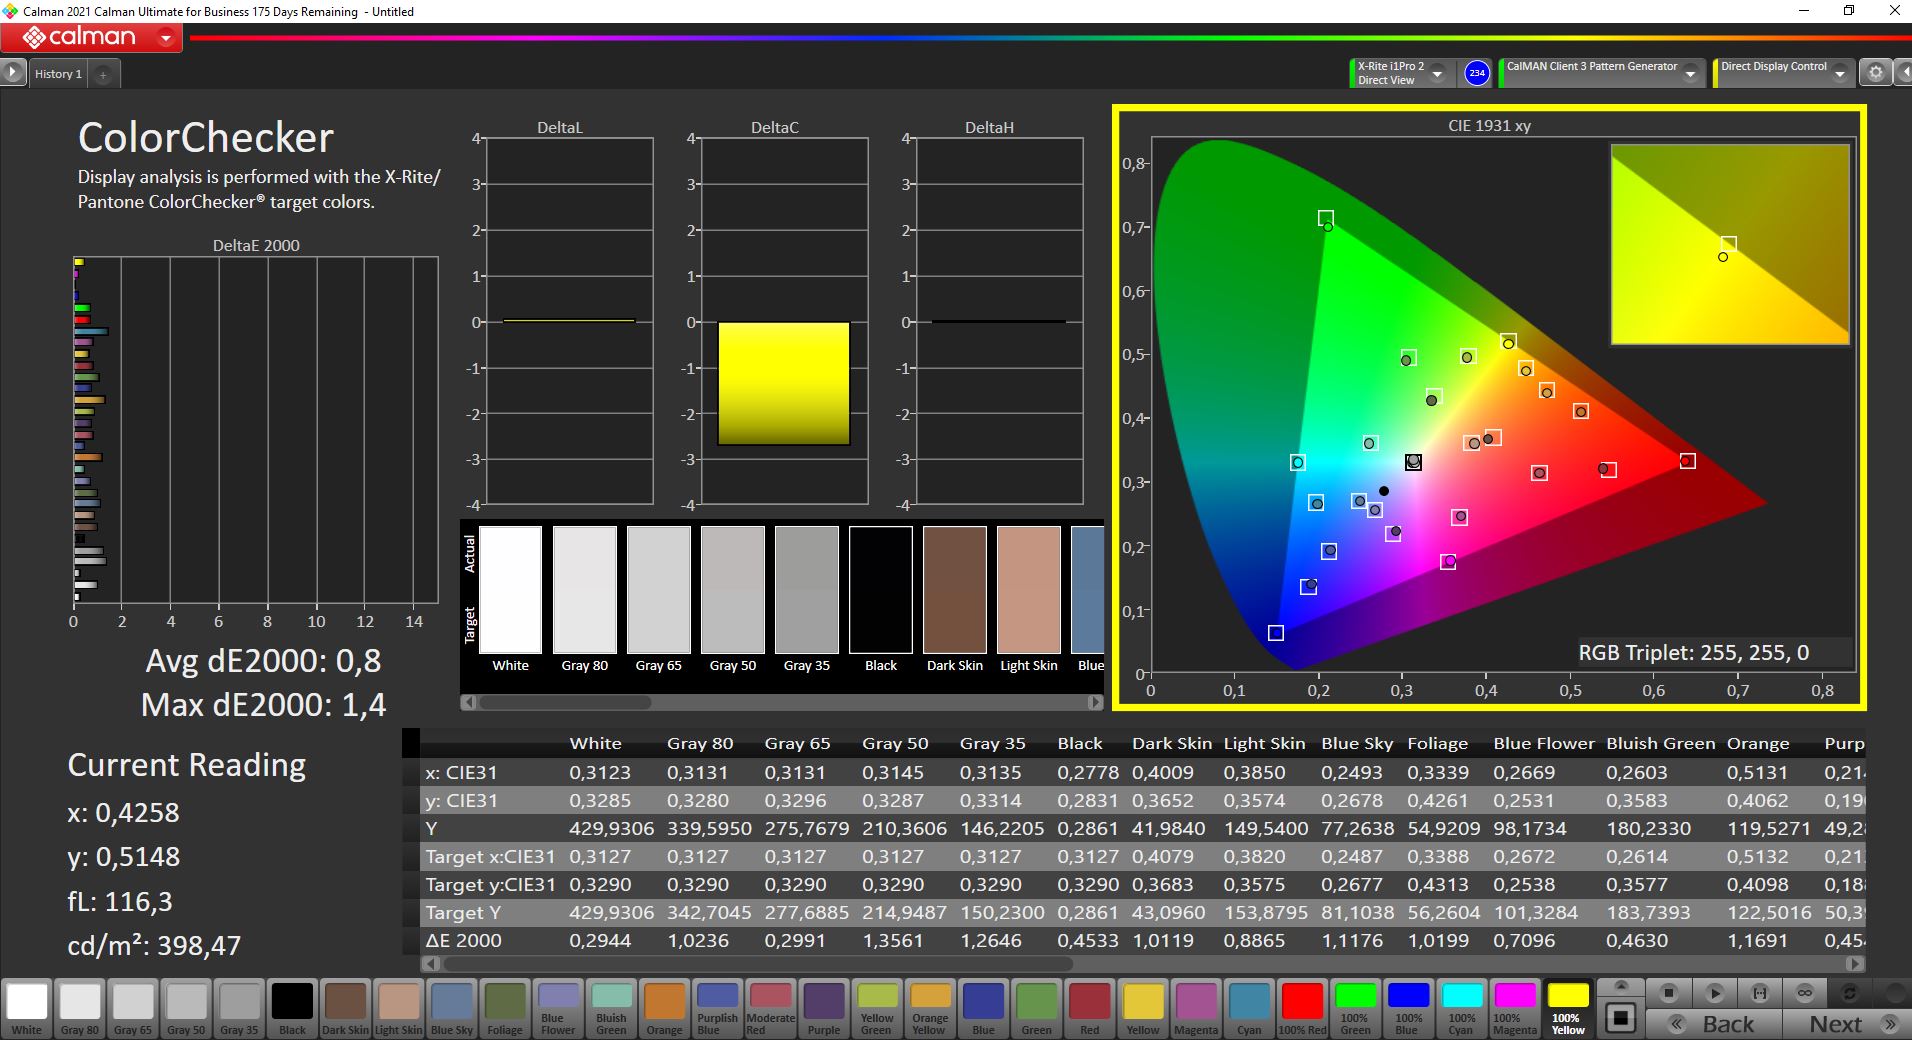
In the state of delivery, the display struggles with a slight blue tint and a color temperature that is slightly too cool. However, the color reproduction is already very good, and there are only few outliers that fall above the important DeltaE 2000 deviation of 3. Our calibration shows the full potential of the panel (the calibrated profile is available for your free download above). Thanks to the full coverage of the AdobeRGB color space, it is excellently suited for image and video processing.
Display Response Times
| ↔ Response Time Black to White | ||
|---|---|---|
| 28.4 ms ... rise ↗ and fall ↘ combined | ↗ 12.8 ms rise | 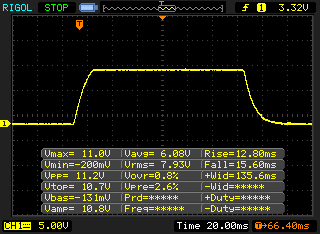 |
| ↘ 15.6 ms fall | ||
| The screen shows relatively slow response rates in our tests and may be too slow for gamers. In comparison, all tested devices range from 0.1 (minimum) to 240 (maximum) ms. » 75 % of all devices are better. This means that the measured response time is worse than the average of all tested devices (19.9 ms). | ||
| ↔ Response Time 50% Grey to 80% Grey | ||
| 53.2 ms ... rise ↗ and fall ↘ combined | ↗ 24.8 ms rise | 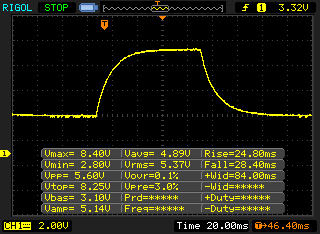 |
| ↘ 28.4 ms fall | ||
| The screen shows slow response rates in our tests and will be unsatisfactory for gamers. In comparison, all tested devices range from 0.165 (minimum) to 636 (maximum) ms. » 90 % of all devices are better. This means that the measured response time is worse than the average of all tested devices (31.1 ms). | ||
Screen Flickering / PWM (Pulse-Width Modulation)
| Screen flickering / PWM detected | 17990 Hz | ≤ 40 % brightness setting | 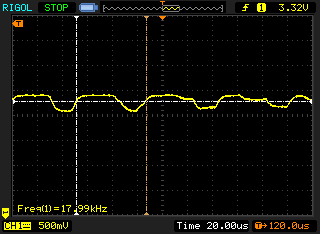 |
The display backlight flickers at 17990 Hz (worst case, e.g., utilizing PWM) Flickering detected at a brightness setting of 40 % and below. There should be no flickering or PWM above this brightness setting. The frequency of 17990 Hz is quite high, so most users sensitive to PWM should not notice any flickering. In comparison: 52 % of all tested devices do not use PWM to dim the display. If PWM was detected, an average of 7798 (minimum: 5 - maximum: 343500) Hz was measured. | |||
Outdoors, the reflective display will always struggle with reflections, and subjectively the amount of reflections is also slightly higher than in the Apple MacBooks, for example. However, thanks to the decent brightness, you should still be able to find a position from which you can easily read the display contents in most cases. The viewing angle stability of the IPS panel offers no reason for complaint.
Performance - Intel Alder Lake with 45 watts
Test Conditions
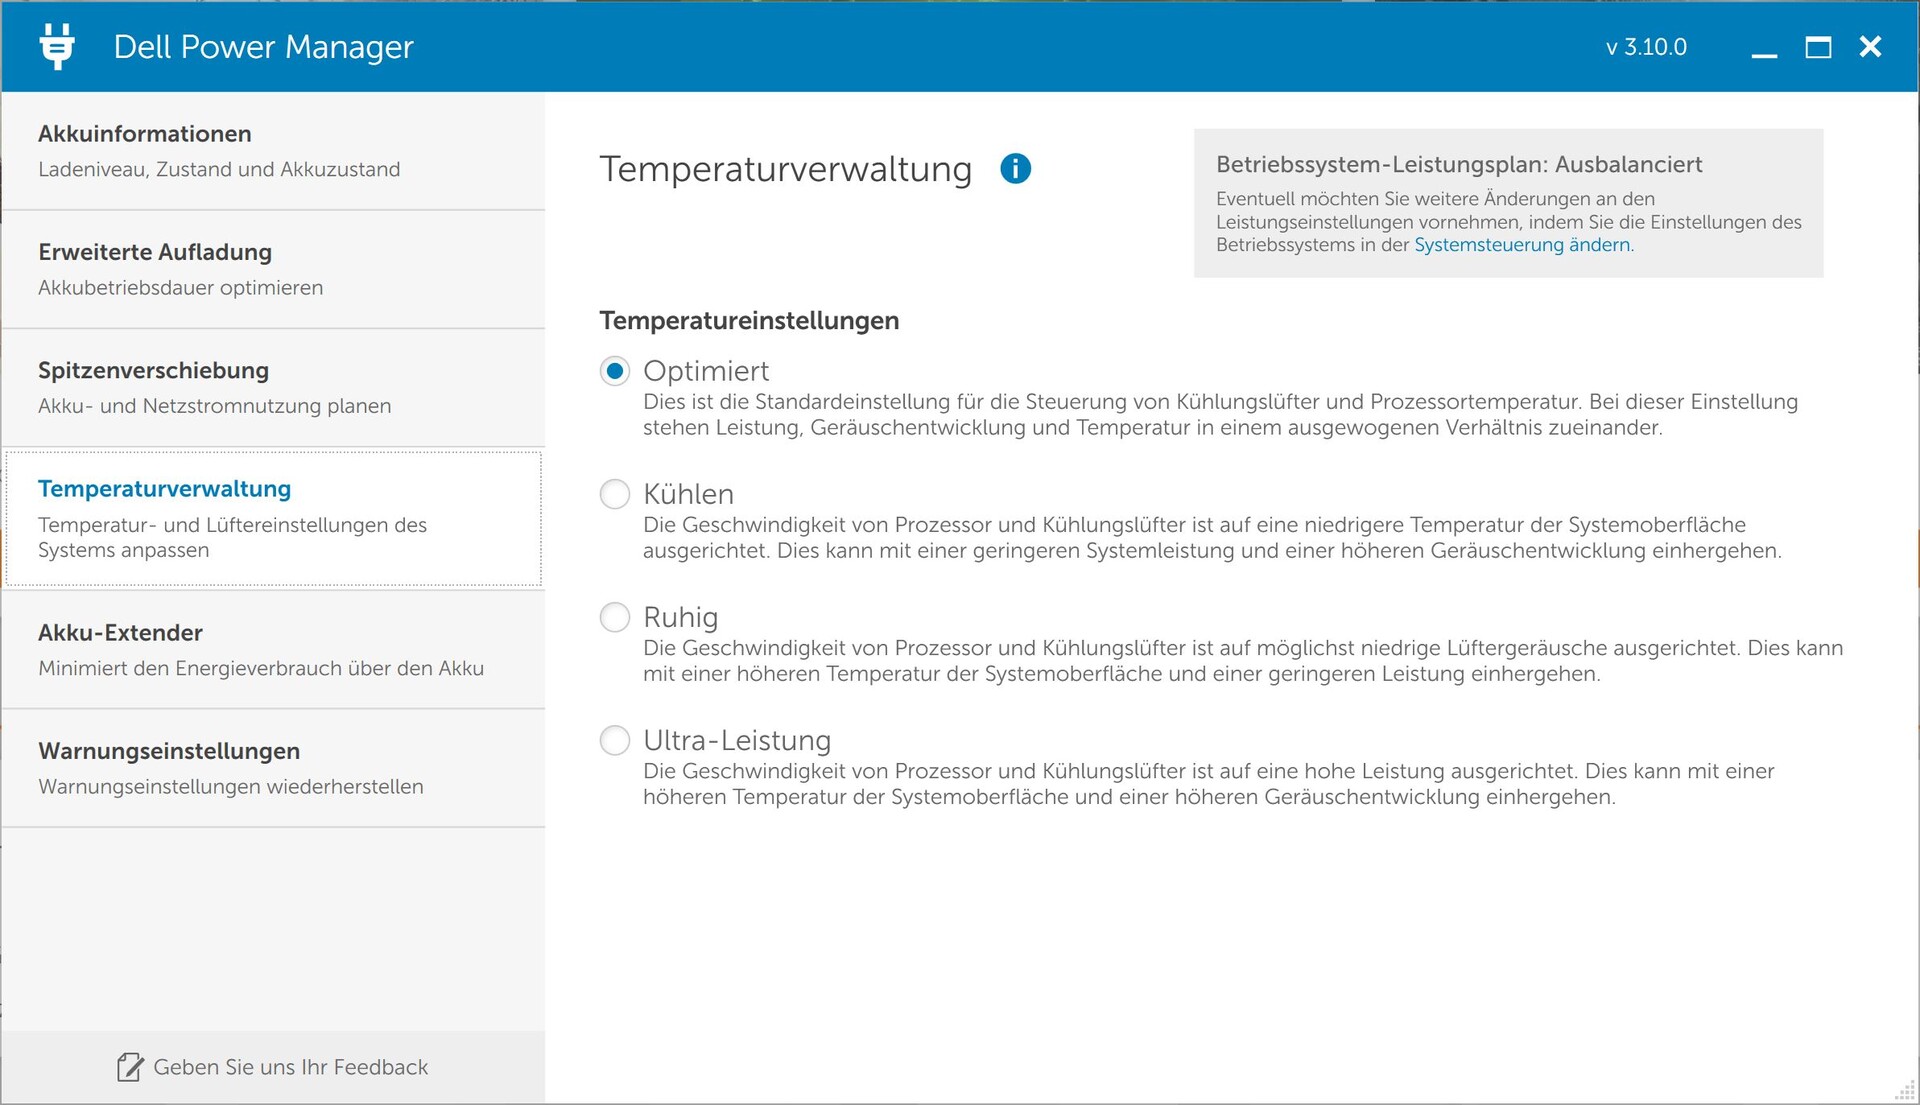
Dell offers its own power management settings that you can select from the preinstalled Power Manager app. By default, the Optimized profile is selected, which we also used for the following benchmarks and measurements. Since the cooling already runs almost from the beginning here, the Ultra performance mode only adds a moderate performance advantage under pure CPU load (multi-core) and in the stress test. However, in everyday operation this hardly makes any difference, and the slight increase in performance doesn't justify the higher fan noise, in our opinion.
| Performance Mode | CPU Load | GPU Load | Stress Test |
|---|---|---|---|
| Optimized | 115W -> 45W | 65W | CPU: 40W -> 25W GPU: 60W |
| Ultra Performance | 115W -> 55W | 65W | CPU: 40W -> 25W GPU: 65W |
| Silent | 96W -> 30W | 65W | CPU: 25W GPU: 30W |
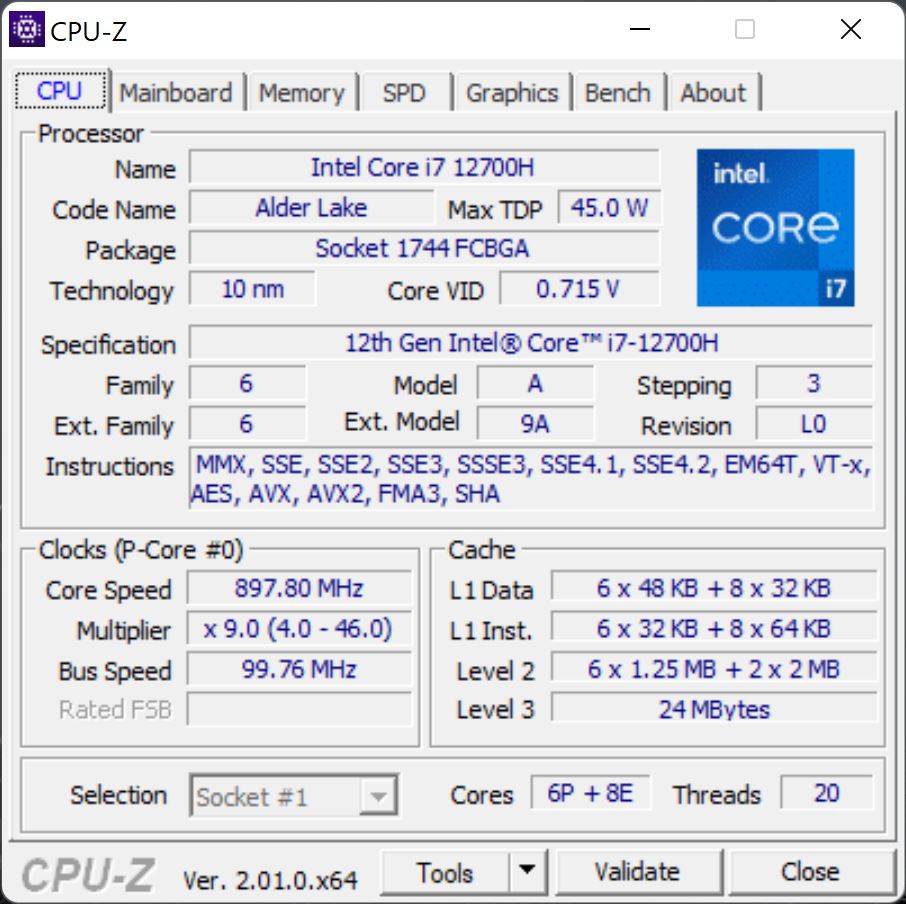
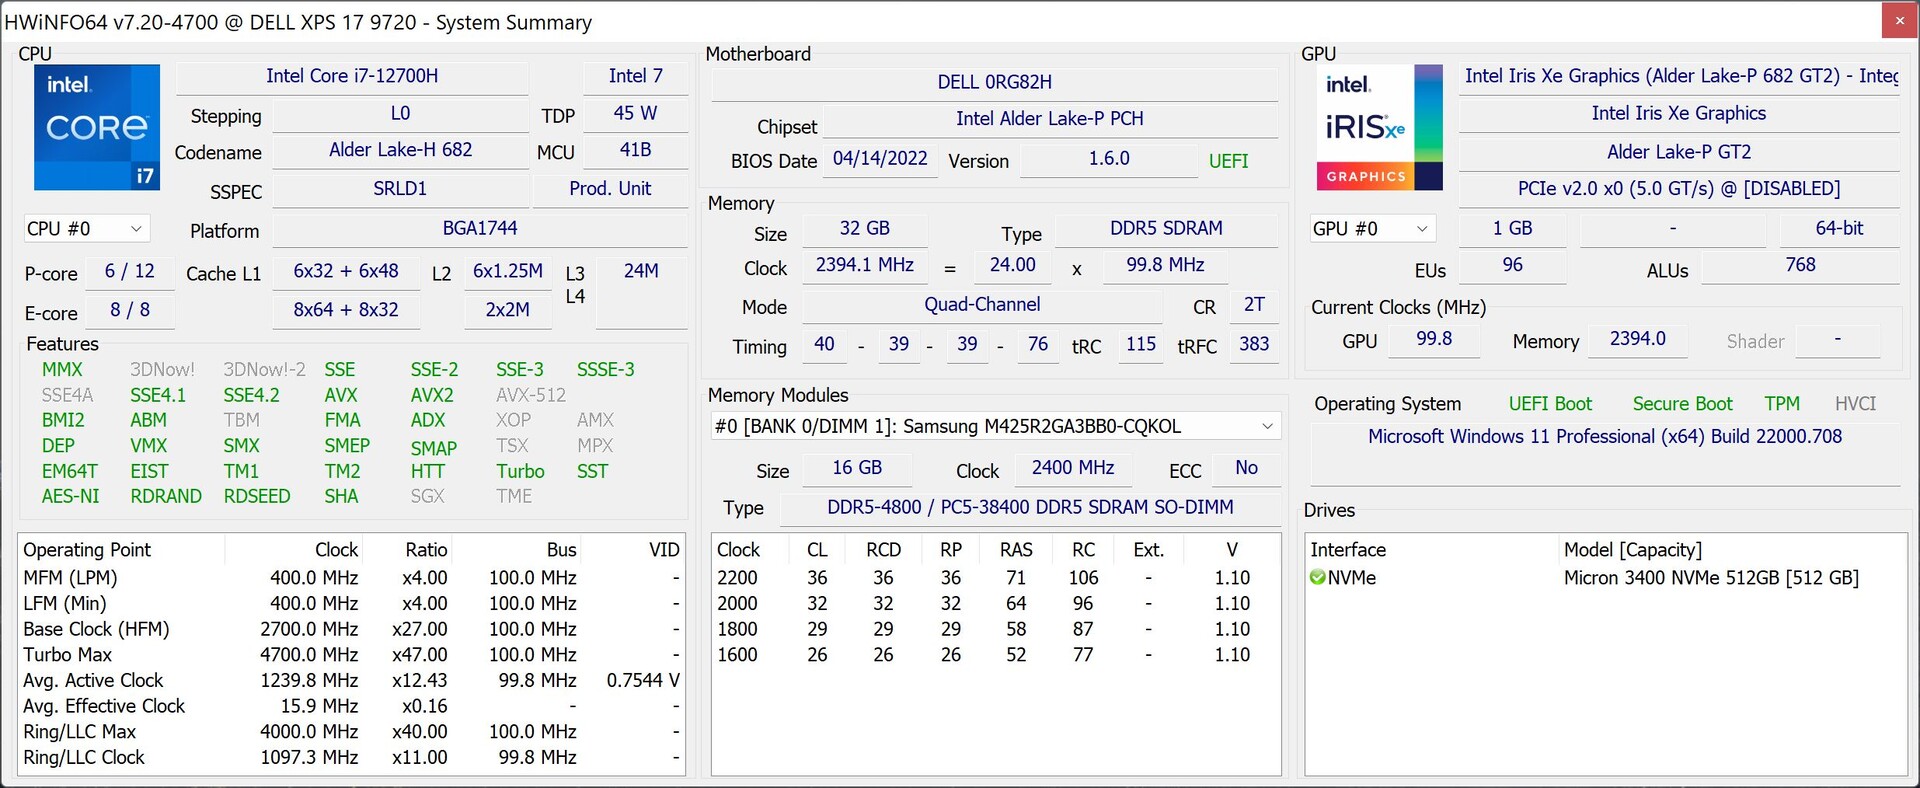
Processor - Core i7-12700H
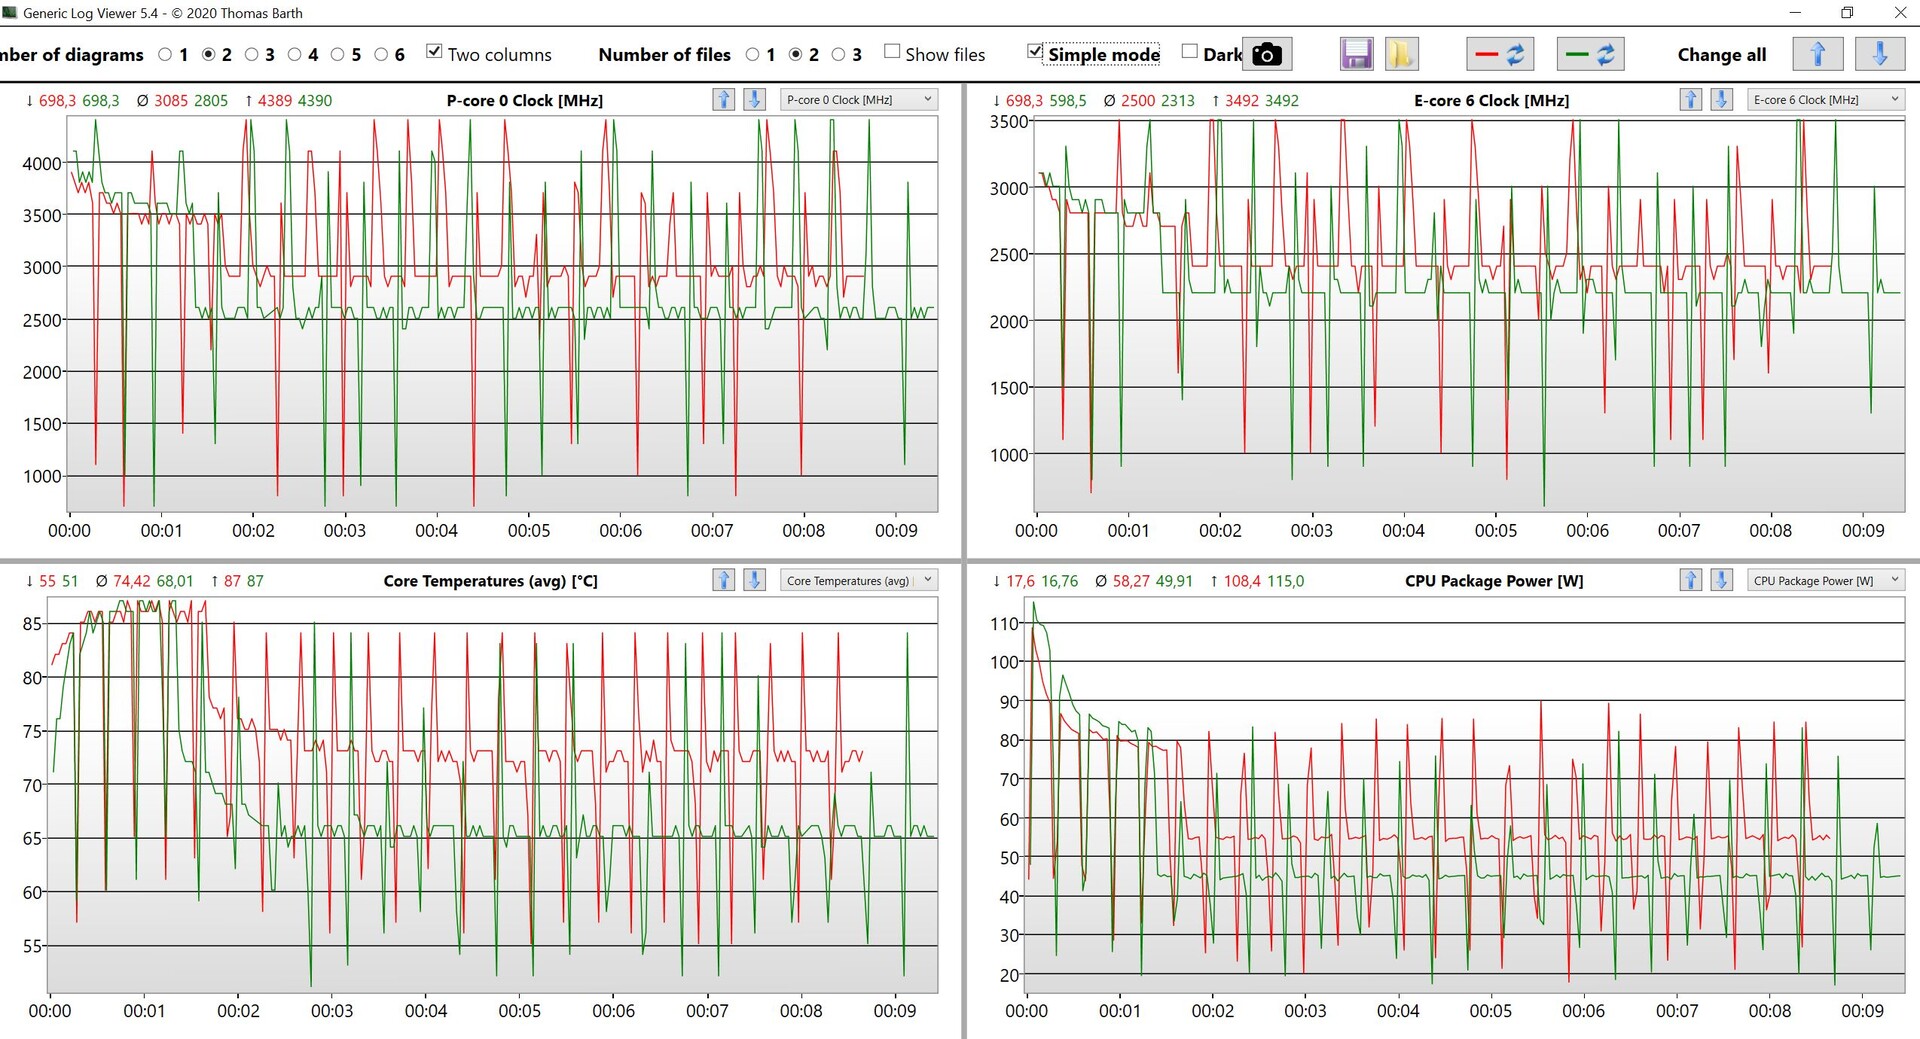
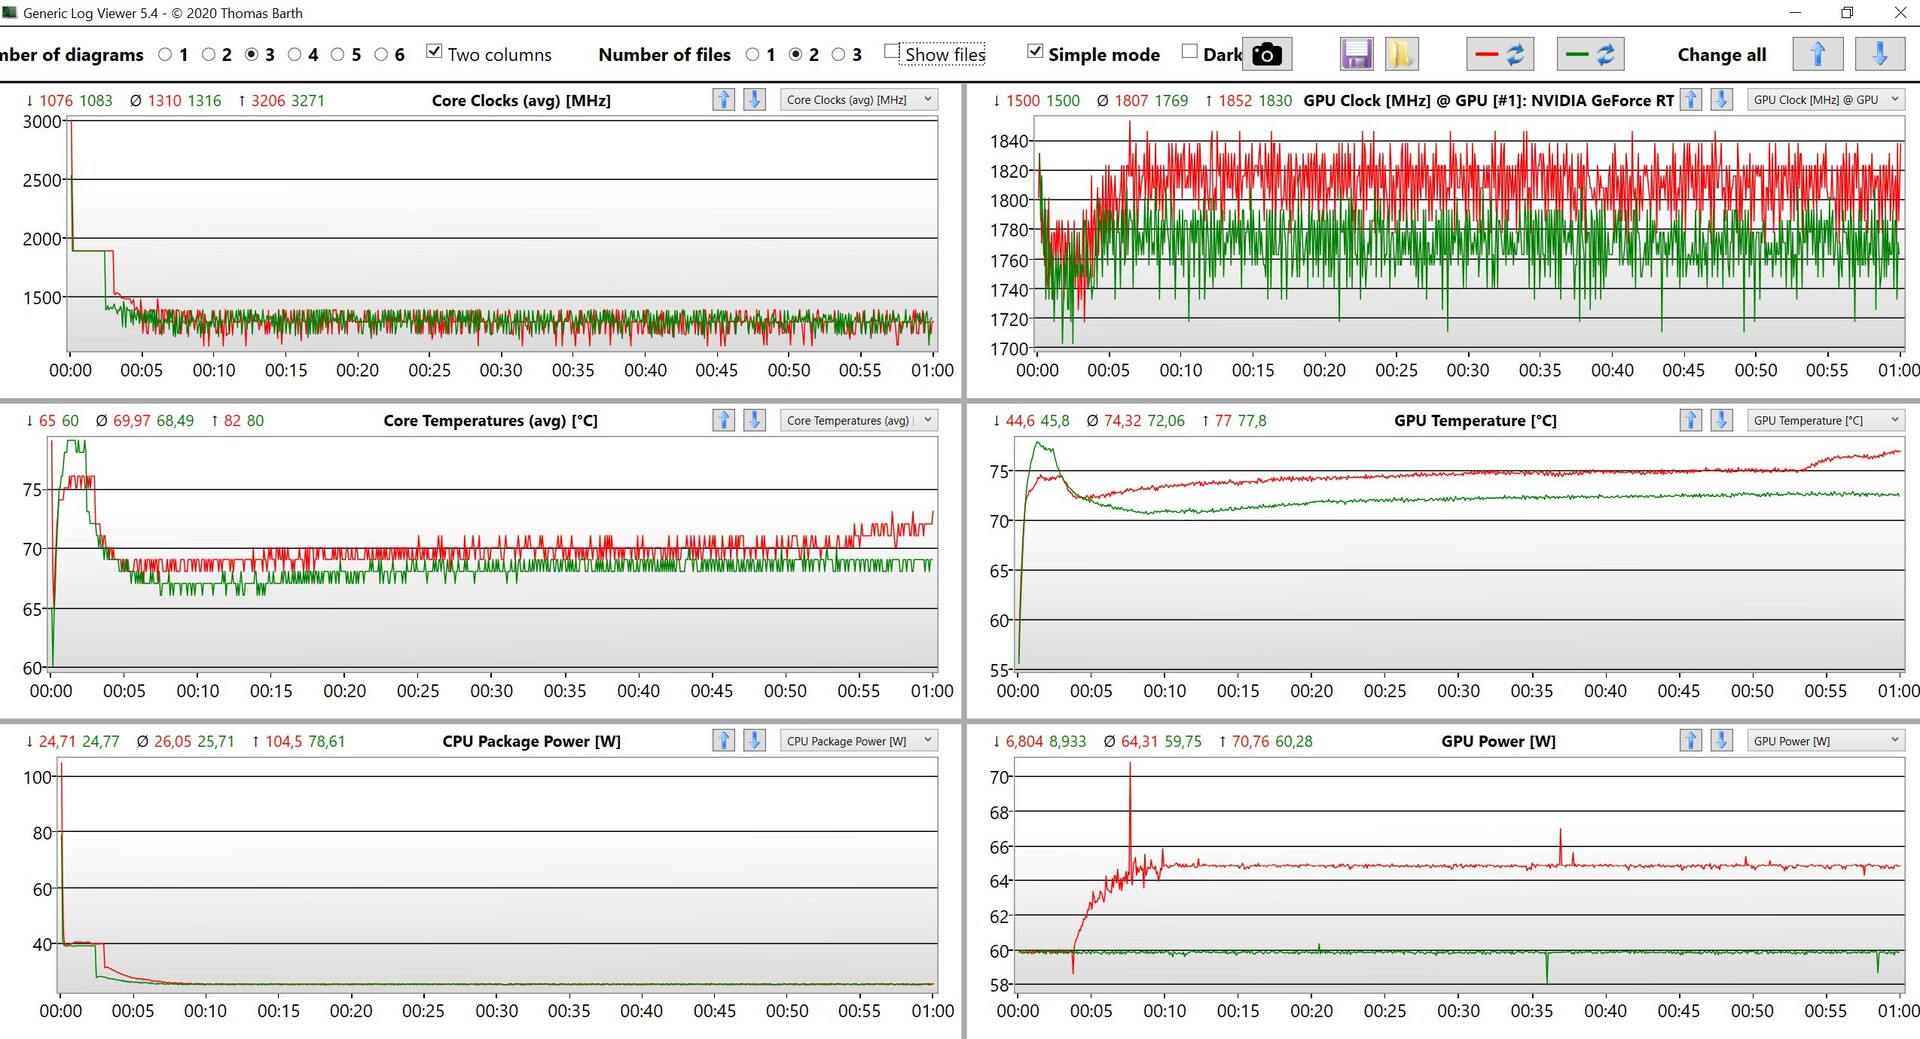
At this point, we already know the Intel Core i7-12700H very well. The hybrid architecture consisting of 6 performance and 8 efficiency cores (for a total of 20 threads) offers a lot of performance but also uses a lot of power for a 45-Watt processor. In the case of the XPS 17, it is up to 115 watts, but it is also only for a fraction of a second, before the value drops quickly. After slightly more than a minute, the consumption then stabilizes at 45 watts or 55 watts in Ultra performance mode.
Cinebench R15 Multi Constant Load Test
The high power limit naturally also leads to very good benchmark results, particularly in the short tests. However, if you really put the device under continuous load, the advantage drops drastically. For example, if it is still almost 50% more performance than in the XPS 17 9710 with the Core i7-11800H in the first CB R15 loop, the advantage drops already after the 6th run (about 3 minutes) to only barely 8%. In the Ultra performance mode, at least it is still around 20%.
Under load of only a single core, the new performance cores of the Alder Lake chips achieve high performance values, but you also pay for this with a high power consumption (~26 watts for a single core).
In battery operation, the single core performance remains the same, but under load of several cores, the CPU drops quicker to its 45-Watt limit, resulting in a performance reduction of about 25%. You can find additional CPU benchmarks here.
Cinebench R23: Multi Core | Single Core
Cinebench R20: CPU (Multi Core) | CPU (Single Core)
Cinebench R15: CPU Multi 64Bit | CPU Single 64Bit
Blender: v2.79 BMW27 CPU
7-Zip 18.03: 7z b 4 | 7z b 4 -mmt1
Geekbench 5.5: Multi-Core | Single-Core
HWBOT x265 Benchmark v2.2: 4k Preset
LibreOffice : 20 Documents To PDF
R Benchmark 2.5: Overall mean
| CPU Performance rating | |
| Average of class Multimedia | |
| Dell XPS 17 9720 RTX 3060 | |
| Dell XPS 17 9720 | |
| Average Intel Core i7-12700H | |
| Apple MacBook Pro 16 2021 M1 Pro -5! | |
| Lenovo ThinkBook 16p G2 ACH | |
| Asus Vivobook Pro 16X-M7600QE | |
| Lenovo ThinkPad X1 Extreme G4-20Y5CTO1WW (3050 Ti) | |
| Dell XPS 17 9710 Core i7 RTX 3060 -2! | |
| Cinebench R23 / Multi Core | |
| Dell XPS 17 9720 RTX 3060 | |
| Average of class Multimedia (4861 - 33362, n=81, last 2 years) | |
| Dell XPS 17 9720 | |
| Average Intel Core i7-12700H (4032 - 19330, n=64) | |
| Lenovo ThinkBook 16p G2 ACH | |
| Lenovo ThinkPad X1 Extreme G4-20Y5CTO1WW (3050 Ti) | |
| Apple MacBook Pro 16 2021 M1 Pro | |
| Asus Vivobook Pro 16X-M7600QE | |
| Asus Vivobook Pro 16X-M7600QE | |
| Dell XPS 17 9710 Core i7 RTX 3060 | |
| Cinebench R23 / Single Core | |
| Average of class Multimedia (1128 - 2459, n=73, last 2 years) | |
| Dell XPS 17 9720 RTX 3060 | |
| Average Intel Core i7-12700H (778 - 1826, n=63) | |
| Dell XPS 17 9720 | |
| Apple MacBook Pro 16 2021 M1 Pro | |
| Lenovo ThinkPad X1 Extreme G4-20Y5CTO1WW (3050 Ti) | |
| Dell XPS 17 9710 Core i7 RTX 3060 | |
| Asus Vivobook Pro 16X-M7600QE | |
| Asus Vivobook Pro 16X-M7600QE | |
| Lenovo ThinkBook 16p G2 ACH | |
| Cinebench R20 / CPU (Multi Core) | |
| Dell XPS 17 9720 RTX 3060 | |
| Average of class Multimedia (1887 - 12912, n=64, last 2 years) | |
| Average Intel Core i7-12700H (1576 - 7407, n=64) | |
| Lenovo ThinkBook 16p G2 ACH | |
| Dell XPS 17 9720 | |
| Asus Vivobook Pro 16X-M7600QE | |
| Asus Vivobook Pro 16X-M7600QE | |
| Lenovo ThinkPad X1 Extreme G4-20Y5CTO1WW (3050 Ti) | |
| Dell XPS 17 9710 Core i7 RTX 3060 | |
| Apple MacBook Pro 16 2021 M1 Pro | |
| Cinebench R20 / CPU (Single Core) | |
| Average of class Multimedia (425 - 853, n=64, last 2 years) | |
| Average Intel Core i7-12700H (300 - 704, n=64) | |
| Dell XPS 17 9720 RTX 3060 | |
| Dell XPS 17 9720 | |
| Lenovo ThinkPad X1 Extreme G4-20Y5CTO1WW (3050 Ti) | |
| Lenovo ThinkBook 16p G2 ACH | |
| Dell XPS 17 9710 Core i7 RTX 3060 | |
| Asus Vivobook Pro 16X-M7600QE | |
| Asus Vivobook Pro 16X-M7600QE | |
| Apple MacBook Pro 16 2021 M1 Pro | |
| Cinebench R15 / CPU Multi 64Bit | |
| Dell XPS 17 9720 | |
| Dell XPS 17 9720 | |
| Average of class Multimedia (856 - 5224, n=68, last 2 years) | |
| Average Intel Core i7-12700H (1379 - 2916, n=70) | |
| Dell XPS 17 9720 RTX 3060 | |
| Lenovo ThinkBook 16p G2 ACH | |
| Asus Vivobook Pro 16X-M7600QE | |
| Asus Vivobook Pro 16X-M7600QE | |
| Lenovo ThinkPad X1 Extreme G4-20Y5CTO1WW (3050 Ti) | |
| Dell XPS 17 9710 Core i7 RTX 3060 | |
| Apple MacBook Pro 16 2021 M1 Pro | |
| Cinebench R15 / CPU Single 64Bit | |
| Average of class Multimedia (184.8 - 326, n=66, last 2 years) | |
| Dell XPS 17 9720 RTX 3060 | |
| Dell XPS 17 9720 | |
| Average Intel Core i7-12700H (113 - 263, n=65) | |
| Asus Vivobook Pro 16X-M7600QE | |
| Asus Vivobook Pro 16X-M7600QE | |
| Lenovo ThinkBook 16p G2 ACH | |
| Lenovo ThinkPad X1 Extreme G4-20Y5CTO1WW (3050 Ti) | |
| Dell XPS 17 9710 Core i7 RTX 3060 | |
| Apple MacBook Pro 16 2021 M1 Pro | |
| Blender / v2.79 BMW27 CPU | |
| Dell XPS 17 9710 Core i7 RTX 3060 | |
| Asus Vivobook Pro 16X-M7600QE | |
| Asus Vivobook Pro 16X-M7600QE | |
| Lenovo ThinkPad X1 Extreme G4-20Y5CTO1WW (3050 Ti) | |
| Average of class Multimedia (100 - 557, n=65, last 2 years) | |
| Dell XPS 17 9720 | |
| Lenovo ThinkBook 16p G2 ACH | |
| Average Intel Core i7-12700H (168 - 732, n=63) | |
| Dell XPS 17 9720 RTX 3060 | |
| Apple MacBook Pro 16 2021 M1 Pro | |
| 7-Zip 18.03 / 7z b 4 | |
| Dell XPS 17 9720 RTX 3060 | |
| Average Intel Core i7-12700H (22844 - 73067, n=63) | |
| Lenovo ThinkBook 16p G2 ACH | |
| Dell XPS 17 9720 | |
| Average of class Multimedia (29095 - 130368, n=62, last 2 years) | |
| Asus Vivobook Pro 16X-M7600QE | |
| Asus Vivobook Pro 16X-M7600QE | |
| Dell XPS 17 9710 Core i7 RTX 3060 | |
| Lenovo ThinkPad X1 Extreme G4-20Y5CTO1WW (3050 Ti) | |
| 7-Zip 18.03 / 7z b 4 -mmt1 | |
| Average of class Multimedia (3666 - 7545, n=63, last 2 years) | |
| Asus Vivobook Pro 16X-M7600QE | |
| Asus Vivobook Pro 16X-M7600QE | |
| Lenovo ThinkBook 16p G2 ACH | |
| Dell XPS 17 9720 | |
| Dell XPS 17 9720 RTX 3060 | |
| Average Intel Core i7-12700H (2743 - 5972, n=63) | |
| Lenovo ThinkPad X1 Extreme G4-20Y5CTO1WW (3050 Ti) | |
| Dell XPS 17 9710 Core i7 RTX 3060 | |
| Geekbench 5.5 / Multi-Core | |
| Dell XPS 17 9720 | |
| Average of class Multimedia (4652 - 20422, n=62, last 2 years) | |
| Apple MacBook Pro 16 2021 M1 Pro | |
| Dell XPS 17 9720 RTX 3060 | |
| Average Intel Core i7-12700H (5144 - 13745, n=64) | |
| Lenovo ThinkBook 16p G2 ACH | |
| Asus Vivobook Pro 16X-M7600QE | |
| Asus Vivobook Pro 16X-M7600QE | |
| Lenovo ThinkPad X1 Extreme G4-20Y5CTO1WW (3050 Ti) | |
| Geekbench 5.5 / Single-Core | |
| Average of class Multimedia (805 - 2974, n=62, last 2 years) | |
| Apple MacBook Pro 16 2021 M1 Pro | |
| Dell XPS 17 9720 | |
| Average Intel Core i7-12700H (803 - 1851, n=64) | |
| Dell XPS 17 9720 RTX 3060 | |
| Lenovo ThinkPad X1 Extreme G4-20Y5CTO1WW (3050 Ti) | |
| Asus Vivobook Pro 16X-M7600QE | |
| Asus Vivobook Pro 16X-M7600QE | |
| Lenovo ThinkBook 16p G2 ACH | |
| HWBOT x265 Benchmark v2.2 / 4k Preset | |
| Average of class Multimedia (5.26 - 36.1, n=63, last 2 years) | |
| Average Intel Core i7-12700H (4.67 - 21.8, n=64) | |
| Lenovo ThinkBook 16p G2 ACH | |
| Dell XPS 17 9720 RTX 3060 | |
| Asus Vivobook Pro 16X-M7600QE | |
| Asus Vivobook Pro 16X-M7600QE | |
| Dell XPS 17 9720 | |
| Dell XPS 17 9710 Core i7 RTX 3060 | |
| Lenovo ThinkPad X1 Extreme G4-20Y5CTO1WW (3050 Ti) | |
| LibreOffice / 20 Documents To PDF | |
| Lenovo ThinkBook 16p G2 ACH | |
| Asus Vivobook Pro 16X-M7600QE | |
| Asus Vivobook Pro 16X-M7600QE | |
| Average of class Multimedia (23.9 - 146.7, n=64, last 2 years) | |
| Average Intel Core i7-12700H (34.2 - 95.3, n=63) | |
| Dell XPS 17 9710 Core i7 RTX 3060 | |
| Dell XPS 17 9720 | |
| Dell XPS 17 9720 RTX 3060 | |
| Lenovo ThinkPad X1 Extreme G4-20Y5CTO1WW (3050 Ti) | |
| R Benchmark 2.5 / Overall mean | |
| Dell XPS 17 9710 Core i7 RTX 3060 | |
| Lenovo ThinkPad X1 Extreme G4-20Y5CTO1WW (3050 Ti) | |
| Lenovo ThinkBook 16p G2 ACH | |
| Asus Vivobook Pro 16X-M7600QE | |
| Asus Vivobook Pro 16X-M7600QE | |
| Average Intel Core i7-12700H (0.4441 - 1.052, n=63) | |
| Average of class Multimedia (0.3604 - 0.947, n=63, last 2 years) | |
| Dell XPS 17 9720 RTX 3060 | |
| Dell XPS 17 9720 | |
* ... smaller is better
AIDA64: FP32 Ray-Trace | FPU Julia | CPU SHA3 | CPU Queen | FPU SinJulia | FPU Mandel | CPU AES | CPU ZLib | FP64 Ray-Trace | CPU PhotoWorxx
| Performance rating | |
| Lenovo ThinkBook 16p G2 ACH | |
| Average of class Multimedia | |
| Asus Vivobook Pro 16X-M7600QE | |
| Lenovo ThinkPad X1 Extreme G4-20Y5CTO1WW (3050 Ti) | |
| Average Intel Core i7-12700H | |
| Dell XPS 17 9720 RTX 3060 | |
| Dell XPS 17 9720 | |
| Dell XPS 17 9710 Core i7 RTX 3060 -9! | |
| AIDA64 / FP32 Ray-Trace | |
| Average of class Multimedia (2214 - 50388, n=60, last 2 years) | |
| Lenovo ThinkBook 16p G2 ACH | |
| Lenovo ThinkPad X1 Extreme G4-20Y5CTO1WW (3050 Ti) | |
| Asus Vivobook Pro 16X-M7600QE | |
| Asus Vivobook Pro 16X-M7600QE | |
| Average Intel Core i7-12700H (2585 - 17957, n=64) | |
| Dell XPS 17 9720 RTX 3060 | |
| Dell XPS 17 9720 | |
| AIDA64 / FPU Julia | |
| Lenovo ThinkBook 16p G2 ACH | |
| Asus Vivobook Pro 16X-M7600QE | |
| Asus Vivobook Pro 16X-M7600QE | |
| Average of class Multimedia (12867 - 201874, n=61, last 2 years) | |
| Lenovo ThinkPad X1 Extreme G4-20Y5CTO1WW (3050 Ti) | |
| Average Intel Core i7-12700H (12439 - 90760, n=64) | |
| Dell XPS 17 9720 RTX 3060 | |
| Dell XPS 17 9720 | |
| AIDA64 / CPU SHA3 | |
| Lenovo ThinkPad X1 Extreme G4-20Y5CTO1WW (3050 Ti) | |
| Average of class Multimedia (653 - 8623, n=61, last 2 years) | |
| Lenovo ThinkBook 16p G2 ACH | |
| Asus Vivobook Pro 16X-M7600QE | |
| Asus Vivobook Pro 16X-M7600QE | |
| Average Intel Core i7-12700H (833 - 4242, n=64) | |
| Dell XPS 17 9720 RTX 3060 | |
| Dell XPS 17 9720 | |
| AIDA64 / CPU Queen | |
| Lenovo ThinkBook 16p G2 ACH | |
| Asus Vivobook Pro 16X-M7600QE | |
| Asus Vivobook Pro 16X-M7600QE | |
| Dell XPS 17 9720 | |
| Dell XPS 17 9720 RTX 3060 | |
| Average Intel Core i7-12700H (57923 - 103202, n=63) | |
| Lenovo ThinkPad X1 Extreme G4-20Y5CTO1WW (3050 Ti) | |
| Average of class Multimedia (13483 - 181505, n=49, last 2 years) | |
| AIDA64 / FPU SinJulia | |
| Asus Vivobook Pro 16X-M7600QE | |
| Asus Vivobook Pro 16X-M7600QE | |
| Lenovo ThinkBook 16p G2 ACH | |
| Lenovo ThinkPad X1 Extreme G4-20Y5CTO1WW (3050 Ti) | |
| Average of class Multimedia (1240 - 28794, n=61, last 2 years) | |
| Average Intel Core i7-12700H (3249 - 9939, n=64) | |
| Dell XPS 17 9720 RTX 3060 | |
| Dell XPS 17 9720 | |
| AIDA64 / FPU Mandel | |
| Lenovo ThinkBook 16p G2 ACH | |
| Asus Vivobook Pro 16X-M7600QE | |
| Asus Vivobook Pro 16X-M7600QE | |
| Average of class Multimedia (6395 - 105740, n=60, last 2 years) | |
| Lenovo ThinkPad X1 Extreme G4-20Y5CTO1WW (3050 Ti) | |
| Average Intel Core i7-12700H (7135 - 44760, n=64) | |
| Dell XPS 17 9720 RTX 3060 | |
| Dell XPS 17 9720 | |
| AIDA64 / CPU AES | |
| Lenovo ThinkPad X1 Extreme G4-20Y5CTO1WW (3050 Ti) | |
| Lenovo ThinkBook 16p G2 ACH | |
| Asus Vivobook Pro 16X-M7600QE | |
| Asus Vivobook Pro 16X-M7600QE | |
| Average Intel Core i7-12700H (31839 - 144360, n=64) | |
| Dell XPS 17 9720 RTX 3060 | |
| Dell XPS 17 9720 | |
| Average of class Multimedia (13243 - 126790, n=61, last 2 years) | |
| AIDA64 / CPU ZLib | |
| Average of class Multimedia (167.2 - 2022, n=61, last 2 years) | |
| Average Intel Core i7-12700H (305 - 1171, n=64) | |
| Dell XPS 17 9720 RTX 3060 | |
| Dell XPS 17 9720 | |
| Lenovo ThinkBook 16p G2 ACH | |
| Asus Vivobook Pro 16X-M7600QE | |
| Asus Vivobook Pro 16X-M7600QE | |
| Lenovo ThinkPad X1 Extreme G4-20Y5CTO1WW (3050 Ti) | |
| Dell XPS 17 9710 Core i7 RTX 3060 | |
| AIDA64 / FP64 Ray-Trace | |
| Average of class Multimedia (1014 - 26875, n=61, last 2 years) | |
| Lenovo ThinkBook 16p G2 ACH | |
| Lenovo ThinkPad X1 Extreme G4-20Y5CTO1WW (3050 Ti) | |
| Asus Vivobook Pro 16X-M7600QE | |
| Asus Vivobook Pro 16X-M7600QE | |
| Average Intel Core i7-12700H (1437 - 9692, n=64) | |
| Dell XPS 17 9720 RTX 3060 | |
| Dell XPS 17 9720 | |
| AIDA64 / CPU PhotoWorxx | |
| Average of class Multimedia (12860 - 88154, n=61, last 2 years) | |
| Dell XPS 17 9720 | |
| Dell XPS 17 9720 RTX 3060 | |
| Average Intel Core i7-12700H (12863 - 52207, n=64) | |
| Asus Vivobook Pro 16X-M7600QE | |
| Asus Vivobook Pro 16X-M7600QE | |
| Lenovo ThinkBook 16p G2 ACH | |
| Lenovo ThinkPad X1 Extreme G4-20Y5CTO1WW (3050 Ti) | |
System Performance
The subjective performance impression of the XPS 17 9720 is very good. Besides the fast processor, this is of course also due to the PCIe SSD, resulting in all inputs to be translated without any noticeable delays. The XPS is delivered with Windows 11 installed, and we did not run into any problems during our test phase.
CrossMark: Overall | Productivity | Creativity | Responsiveness
| PCMark 10 / Score | |
| Average of class Multimedia (4325 - 10386, n=58, last 2 years) | |
| Dell XPS 17 9720 RTX 3060 | |
| Dell XPS 17 9720 | |
| Average Intel Core i7-12700H, NVIDIA GeForce RTX 3050 4GB Laptop GPU (6660 - 6879, n=3) | |
| Lenovo ThinkBook 16p G2 ACH | |
| Dell XPS 17 9710 Core i7 RTX 3060 | |
| Asus Vivobook Pro 16X-M7600QE | |
| Lenovo ThinkPad X1 Extreme G4-20Y5CTO1WW (3050 Ti) | |
| PCMark 10 / Essentials | |
| Lenovo ThinkPad X1 Extreme G4-20Y5CTO1WW (3050 Ti) | |
| Dell XPS 17 9720 RTX 3060 | |
| Average of class Multimedia (8025 - 11664, n=57, last 2 years) | |
| Asus Vivobook Pro 16X-M7600QE | |
| Dell XPS 17 9720 | |
| Lenovo ThinkBook 16p G2 ACH | |
| Average Intel Core i7-12700H, NVIDIA GeForce RTX 3050 4GB Laptop GPU (10150 - 10369, n=3) | |
| Dell XPS 17 9710 Core i7 RTX 3060 | |
| PCMark 10 / Productivity | |
| Average of class Multimedia (7323 - 18233, n=57, last 2 years) | |
| Asus Vivobook Pro 16X-M7600QE | |
| Dell XPS 17 9720 RTX 3060 | |
| Dell XPS 17 9720 | |
| Average Intel Core i7-12700H, NVIDIA GeForce RTX 3050 4GB Laptop GPU (8995 - 9397, n=3) | |
| Lenovo ThinkBook 16p G2 ACH | |
| Dell XPS 17 9710 Core i7 RTX 3060 | |
| Lenovo ThinkPad X1 Extreme G4-20Y5CTO1WW (3050 Ti) | |
| PCMark 10 / Digital Content Creation | |
| Average of class Multimedia (3651 - 16240, n=57, last 2 years) | |
| Dell XPS 17 9720 RTX 3060 | |
| Dell XPS 17 9710 Core i7 RTX 3060 | |
| Dell XPS 17 9720 | |
| Average Intel Core i7-12700H, NVIDIA GeForce RTX 3050 4GB Laptop GPU (8779 - 9203, n=3) | |
| Lenovo ThinkBook 16p G2 ACH | |
| Lenovo ThinkPad X1 Extreme G4-20Y5CTO1WW (3050 Ti) | |
| Asus Vivobook Pro 16X-M7600QE | |
| CrossMark / Overall | |
| Dell XPS 17 9720 RTX 3060 | |
| Dell XPS 17 9720 | |
| Average of class Multimedia (866 - 2728, n=67, last 2 years) | |
| Average Intel Core i7-12700H, NVIDIA GeForce RTX 3050 4GB Laptop GPU (1717 - 1857, n=3) | |
| Apple MacBook Pro 16 2021 M1 Pro | |
| CrossMark / Productivity | |
| Dell XPS 17 9720 RTX 3060 | |
| Average of class Multimedia (931 - 2489, n=67, last 2 years) | |
| Dell XPS 17 9720 | |
| Average Intel Core i7-12700H, NVIDIA GeForce RTX 3050 4GB Laptop GPU (1620 - 1735, n=3) | |
| Apple MacBook Pro 16 2021 M1 Pro | |
| CrossMark / Creativity | |
| Average of class Multimedia (907 - 3465, n=67, last 2 years) | |
| Dell XPS 17 9720 RTX 3060 | |
| Dell XPS 17 9720 | |
| Apple MacBook Pro 16 2021 M1 Pro | |
| Average Intel Core i7-12700H, NVIDIA GeForce RTX 3050 4GB Laptop GPU (1911 - 2067, n=3) | |
| CrossMark / Responsiveness | |
| Dell XPS 17 9720 RTX 3060 | |
| Dell XPS 17 9720 | |
| Average Intel Core i7-12700H, NVIDIA GeForce RTX 3050 4GB Laptop GPU (1481 - 1651, n=3) | |
| Average of class Multimedia (605 - 2024, n=67, last 2 years) | |
| Apple MacBook Pro 16 2021 M1 Pro | |
| PCMark 10 Score | 6879 points | |
Help | ||
| AIDA64 / Memory Copy | |
| Average of class Multimedia (21158 - 132135, n=61, last 2 years) | |
| Dell XPS 17 9720 | |
| Dell XPS 17 9720 RTX 3060 | |
| Average Intel Core i7-12700H (25615 - 80511, n=64) | |
| Asus Vivobook Pro 16X-M7600QE | |
| Asus Vivobook Pro 16X-M7600QE | |
| Lenovo ThinkBook 16p G2 ACH | |
| Lenovo ThinkPad X1 Extreme G4-20Y5CTO1WW (3050 Ti) | |
| AIDA64 / Memory Read | |
| Average of class Multimedia (19699 - 174586, n=61, last 2 years) | |
| Dell XPS 17 9720 RTX 3060 | |
| Dell XPS 17 9720 | |
| Average Intel Core i7-12700H (25586 - 79442, n=64) | |
| Asus Vivobook Pro 16X-M7600QE | |
| Asus Vivobook Pro 16X-M7600QE | |
| Lenovo ThinkBook 16p G2 ACH | |
| Lenovo ThinkPad X1 Extreme G4-20Y5CTO1WW (3050 Ti) | |
| AIDA64 / Memory Write | |
| Average of class Multimedia (17733 - 134998, n=61, last 2 years) | |
| Dell XPS 17 9720 | |
| Dell XPS 17 9720 RTX 3060 | |
| Average Intel Core i7-12700H (23679 - 88660, n=64) | |
| Asus Vivobook Pro 16X-M7600QE | |
| Asus Vivobook Pro 16X-M7600QE | |
| Lenovo ThinkBook 16p G2 ACH | |
| Lenovo ThinkPad X1 Extreme G4-20Y5CTO1WW (3050 Ti) | |
| AIDA64 / Memory Latency | |
| Average of class Multimedia (7 - 535, n=60, last 2 years) | |
| Dell XPS 17 9720 RTX 3060 | |
| Dell XPS 17 9720 | |
| Lenovo ThinkPad X1 Extreme G4-20Y5CTO1WW (3050 Ti) | |
| Average Intel Core i7-12700H (76.2 - 133.9, n=62) | |
| Lenovo ThinkBook 16p G2 ACH | |
| Asus Vivobook Pro 16X-M7600QE | |
| Asus Vivobook Pro 16X-M7600QE | |
| Dell XPS 17 9710 Core i7 RTX 3060 | |
* ... smaller is better
DPC Latencies
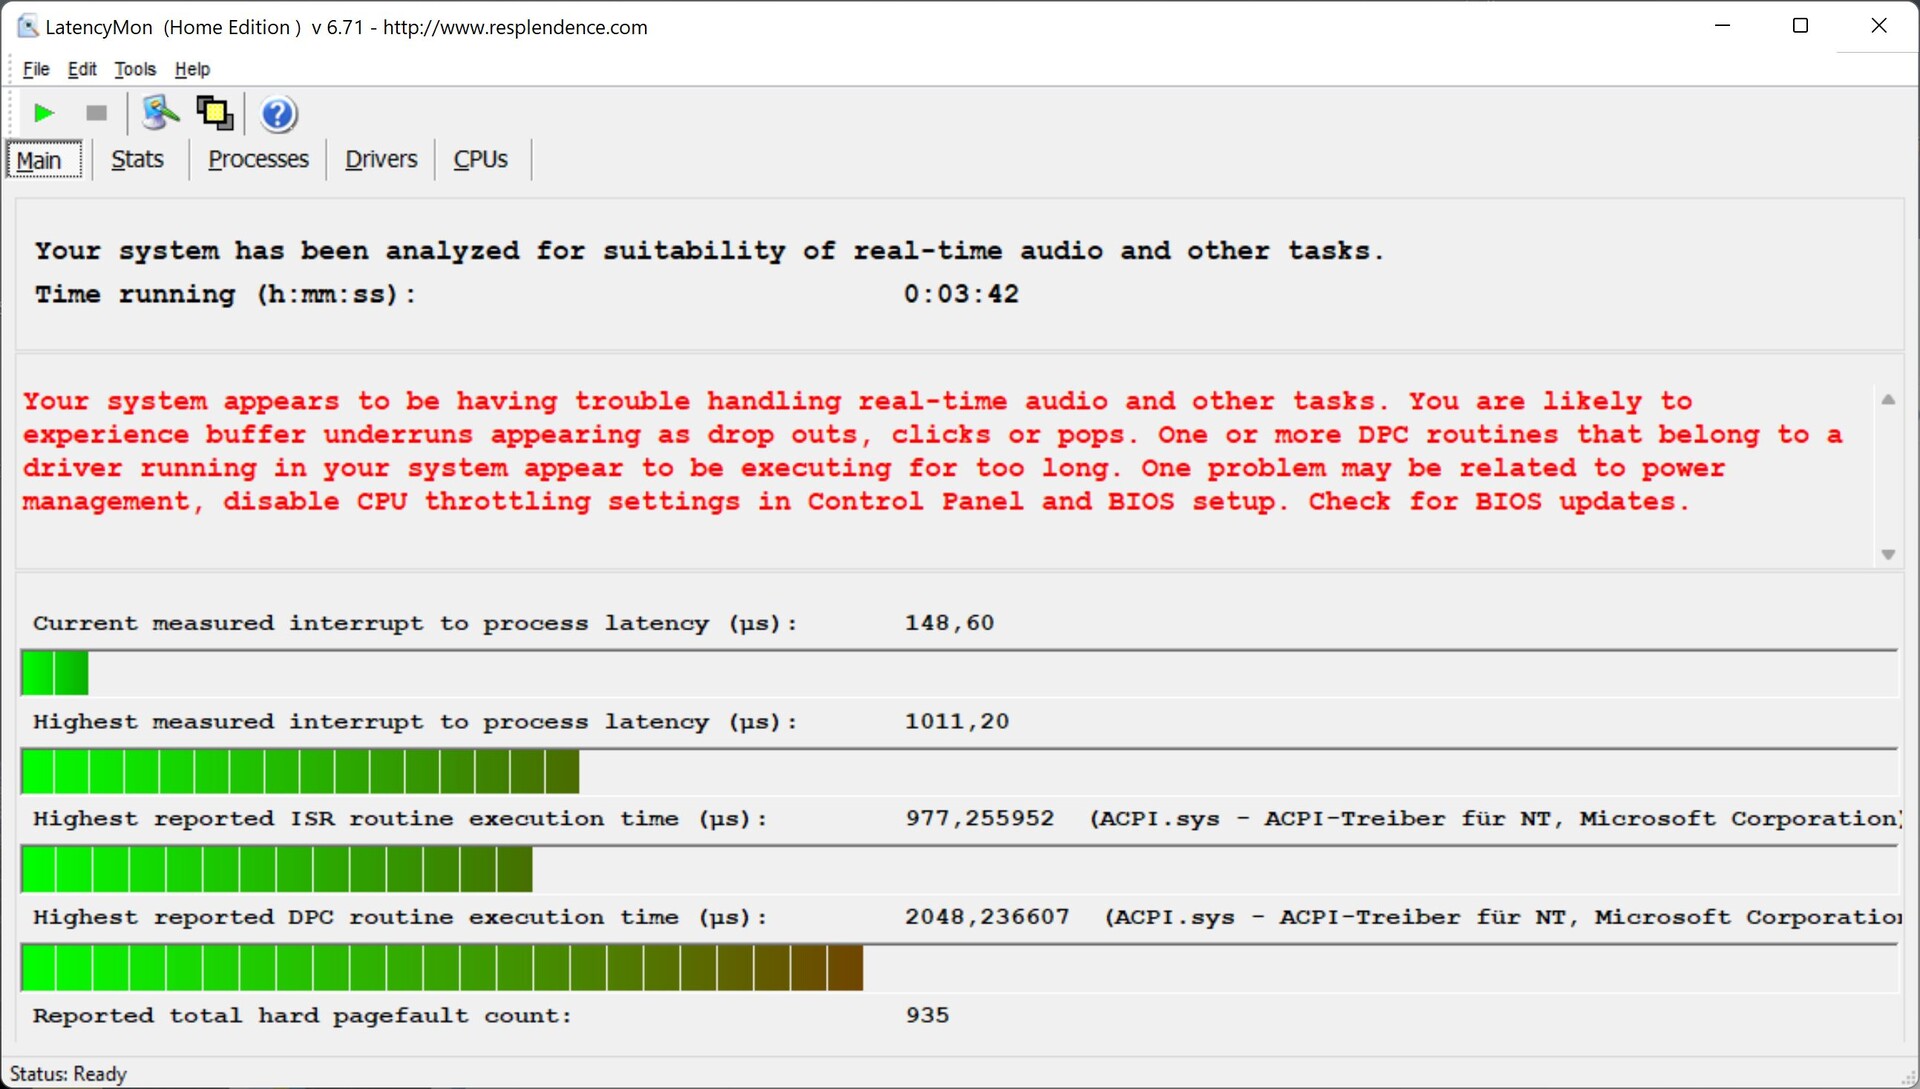
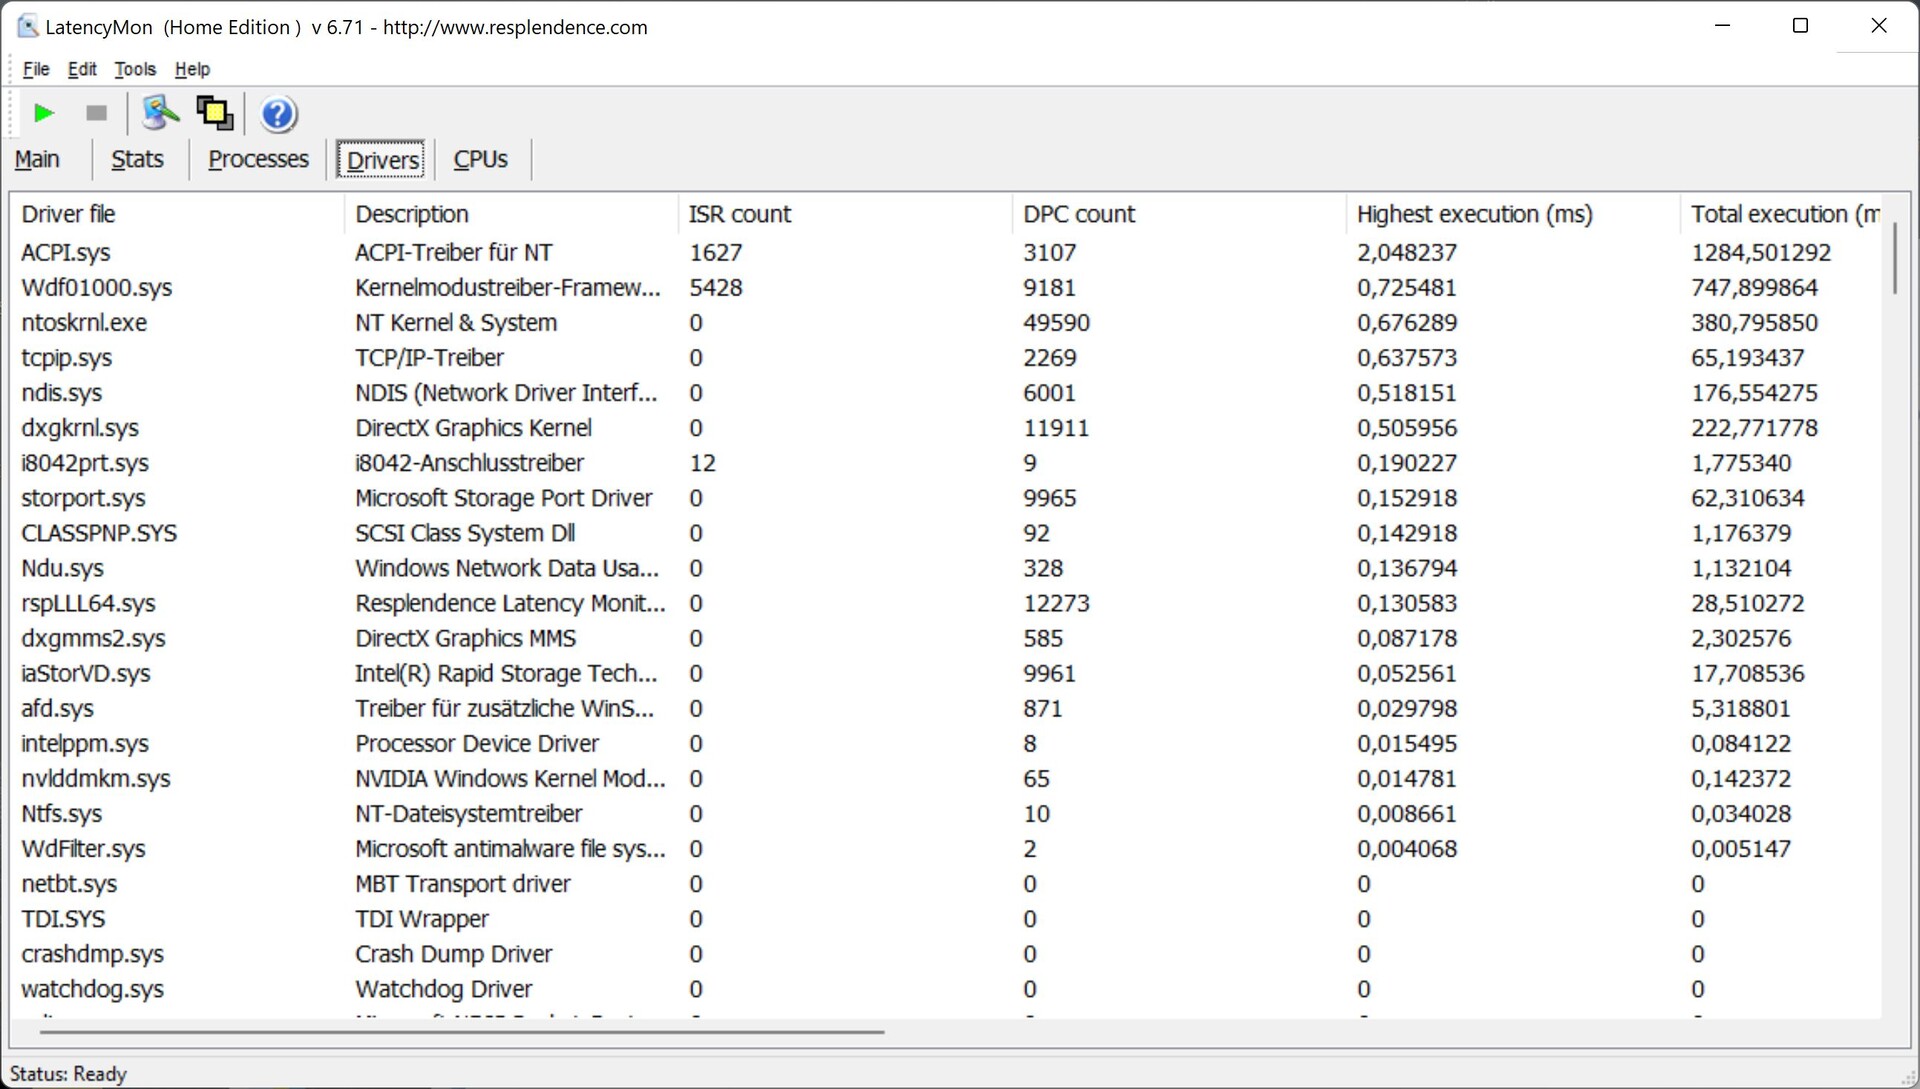
In our standardized latency test (web browsing, 4K YouTube, CPU load), our test unit with the current BIOS version shows some slight limitations and is therefore not optimally suited for the use of real-time audio applications.
| DPC Latencies / LatencyMon - interrupt to process latency (max), Web, Youtube, Prime95 | |
| Asus Vivobook Pro 16X-M7600QE | |
| Dell XPS 17 9720 | |
| Lenovo ThinkPad X1 Extreme G4-20Y5CTO1WW (3050 Ti) | |
| Dell XPS 17 9710 Core i7 RTX 3060 | |
| Lenovo ThinkBook 16p G2 ACH | |
| Dell XPS 17 9720 RTX 3060 | |
* ... smaller is better
Storage Solution
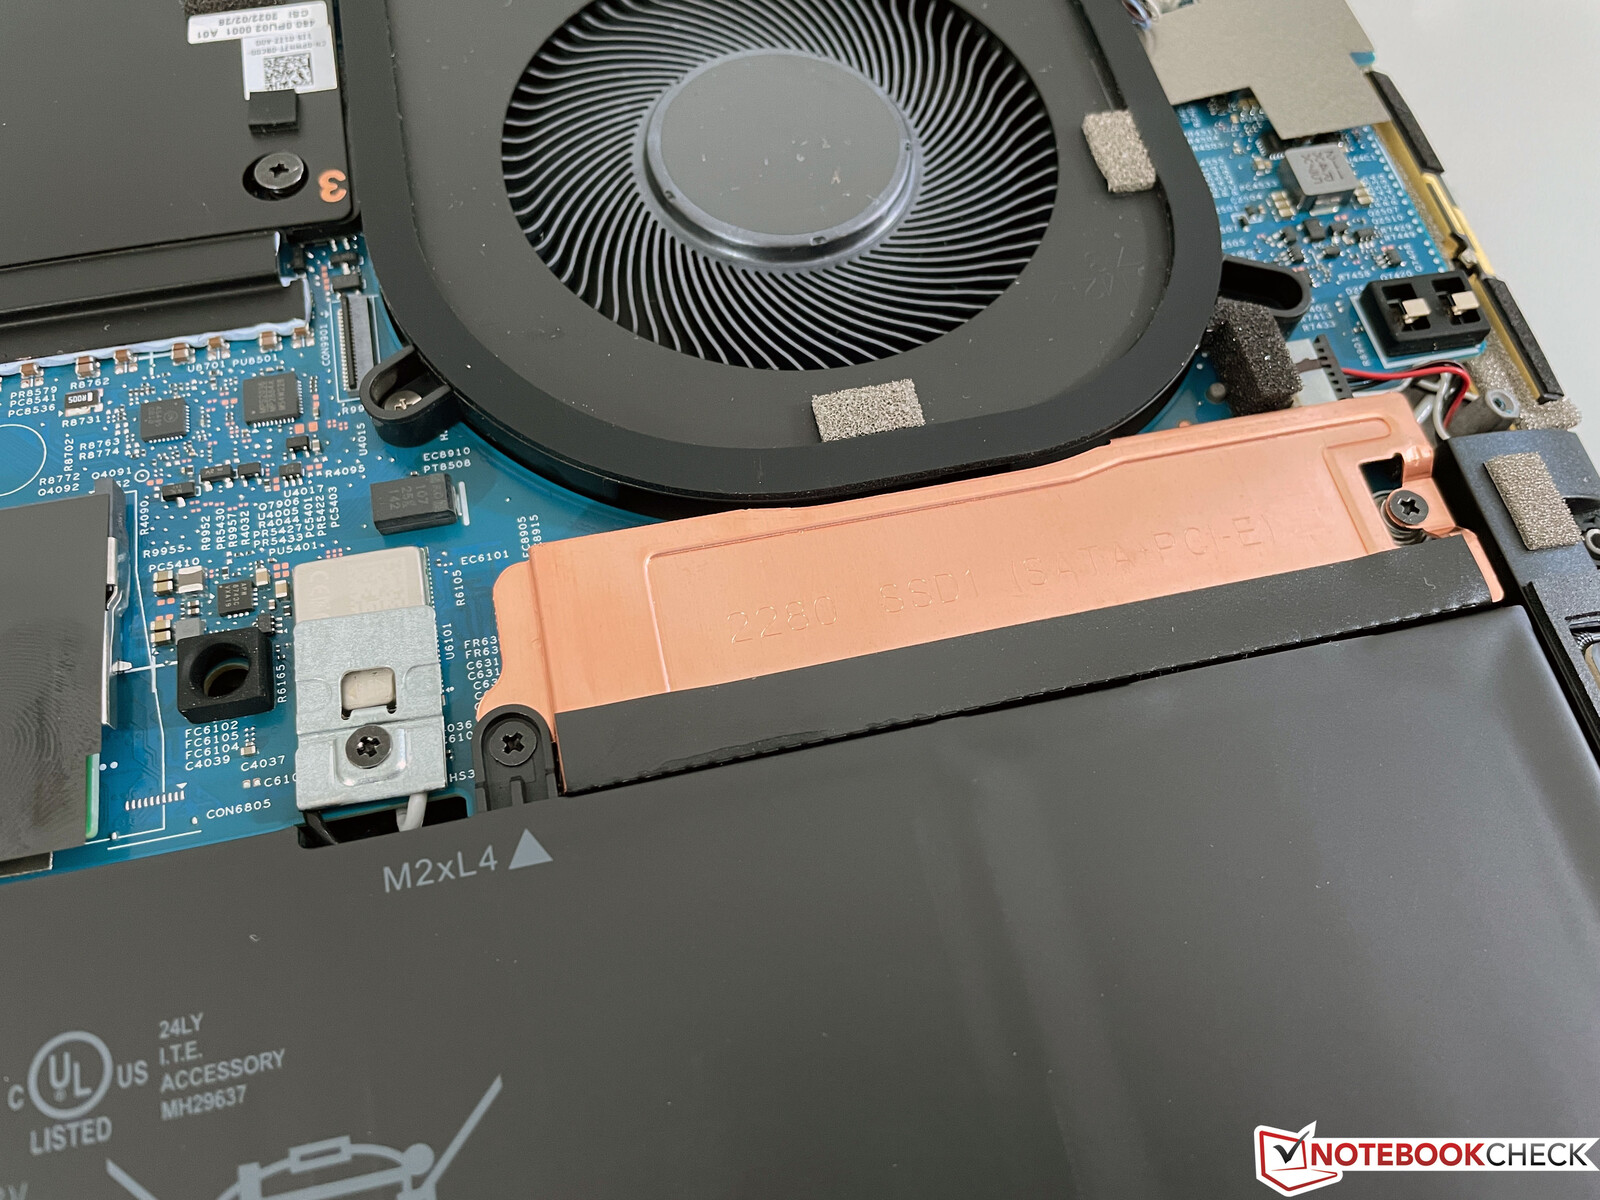
Our XPS 17 9720 test unit uses a Micron 3400 SSD with a storage capacity of 512 GB. After running for the first time, there are still 391 GB available for the user. This is a very fast PCIe 4.0 SSD that achieves transfer rates of more than 6 GB/s in the benchmarks while reading and around 4 GB/s while writing.
There are additional copper covers above the two M.2 slots that are apparently able to do their job. In contrast to the fast PCIe 4.0 drives in our tests, where we increasingly see performance drops after several minutes due to high temperatures, our test unit of the XPS 17 does not have any problems here. You can find additional SSD benchmarks in our technical section.

* ... smaller is better
Constant Performance Reading: DiskSpd Read Loop, Queue Depth 8
Graphics Card - GeForce RTX 3050

In everyday operation, mainly the integrated and efficient Iris Xe Graphics G7 of the processor is used, which is also able to handle the reproduction of high-resolution videos without any problems. If you need even more graphics performance, the dedicated Nvidia GeForce RTX 3050 with 4 GB of RAM and a maximum clock speed of 1875 MHz is automatically activated. As we already mentioned, this year only the 60-Watt versions of the RTX 3050 or RTX 3060 are used, while it was still 70 watts in the old XPS 17 9710. If there is only little processor load, it can also use an additional 5 watts from the processor.
Although we did not test the old 9710 with the RTX 3050, the RTX 3060 version of the XPS 17 9720 remains about 10% behind the predecessor particularly in the tests with high demands on the graphics, so we expect a similar distance also for the RTX 3050. This is a development that clearly moves into the wrong direction.
There are also some limitations in the stability of the performance, but this depends on the CPU load. The GPU performance itself remains stable, but under simultaneous load, the CPU consumption drops to 25 watts after a few minutes. This is also the reason for the XPS 17 9720 failing the 3DMark Time Spy stress test (not even in Ultra performance mode), and you have to expect a deficit of around 10%.
In addition, the GPU performance consumption is also limited to 30 watts in battery operation, causing the performance to drop by ~30% (4960 vs. 3438 points @ Time Spy Graphics). You can find additional GPU benchmarks here.
| 3DMark 11 Performance | 18259 points | |
| 3DMark Cloud Gate Standard Score | 42029 points | |
| 3DMark Fire Strike Score | 11906 points | |
| 3DMark Time Spy Score | 5470 points | |
Help | ||
Gaming Performance
The gaming performance of the RTX 3050 is basically decent, but the native 4K resolution is too demanding in most cases. Particularly in current games such as Cyberpunk 2077, you also have to reduce the details slightly to allow for a really smooth experience. Those who want to play more games on the XPS 17 should definitely decide for the RTX 3060 (at a 200 Euro=~$209 premium).
| Cyberpunk 2077 1.6 | |
| 1920x1080 High Preset | |
| Dell XPS 17 9720 RTX 3060 | |
| Dell XPS 17 9720 | |
| Average NVIDIA GeForce RTX 3050 4GB Laptop GPU (28.4 - 45.5, n=7) | |
| 1920x1080 Ultra Preset | |
| Dell XPS 17 9720 RTX 3060 | |
| Dell XPS 17 9720 | |
| Average NVIDIA GeForce RTX 3050 4GB Laptop GPU (25.3 - 36.5, n=7) | |
| F1 2021 | |
| 1920x1080 High Preset AA:T AF:16x | |
| Dell XPS 17 9720 | |
| Average NVIDIA GeForce RTX 3050 4GB Laptop GPU (93.4 - 130.1, n=7) | |
| Asus Vivobook Pro 16X-M7600QE | |
| 1920x1080 Ultra High Preset + Raytracing AA:T AF:16x | |
| Dell XPS 17 9720 | |
| Asus Vivobook Pro 16X-M7600QE | |
| Average NVIDIA GeForce RTX 3050 4GB Laptop GPU (44.1 - 62, n=8) | |
In our The Witcher 3 loop, the gaming performance remains stable, but the CPU is also hardly put under load here. We see in our evaluation, that the processor consumes only about 17 watts here. However, if you play a game that places more demands on the processor, there will be a slight performance deficit after several minutes, as soon as the 25-Watt limit of the processor is hit.
In battery operation, the performance of the GPU is throttled significantly, causing the gaming performance to drop as well. When playing The Witcher 3 in the Ultra setting, for example, it is only 31 instead of 49 FPS. You can find additional gaming benchmarks here.
The Witcher 3 FPS Chart
| low | med. | high | ultra | QHD | 4K | |
|---|---|---|---|---|---|---|
| GTA V (2015) | 186.8 | 180.2 | 146.6 | 72.5 | 51.3 | 43.6 |
| The Witcher 3 (2015) | 283 | 179 | 99 | 49 | ||
| Dota 2 Reborn (2015) | 187 | 170.8 | 160.3 | 145 | 70.4 | |
| Final Fantasy XV Benchmark (2018) | 128.4 | 73.1 | 52.7 | 38.5 | 21 | |
| X-Plane 11.11 (2018) | 135.7 | 114.8 | 95.8 | 66.1 | ||
| Far Cry 5 (2018) | 156 | 94 | 85 | 80 | 55 | |
| Strange Brigade (2018) | 296 | 131 | 105.3 | 90.6 | 66.1 | 35.7 |
| F1 2021 (2021) | 282 | 164.7 | 130.1 | 62 | 43 | 20.9 |
| Cyberpunk 2077 1.6 (2022) | 63 | 52 | 43 | 34 | 21 |
Emissions - XPS often silent in everyday operation
Noise Emissions
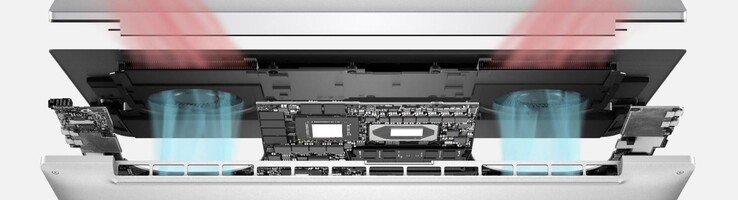
Dell uses all the materials and features for cooling that are available to the manufacturer in the XPS 17, such as a vapor chamber and the special GORE heat insulation, among others. Dell specifies to be able to cool 90 watts constantly (but the USB-C charger might also be the limiting factor here). Our tests also confirm this. But despite all these high-end solutions, the XPS 17 becomes fairly loud, particularly considering the reduced graphics performance (compared to the XPS 17 9710). Already under pure CPU load (CB R23 Multi), it is almost 44 dB(A) despite the 45-Watt limitation, and during gaming and in the stress test, almost 49 dB(A). If you use the Ultra performance profile, you even end up quickly at almost 51 dB(A).
| Performance mode | Cinebench R23 Multi | The Witcher 3 Ultra | Stress Test |
|---|---|---|---|
| Optimized | 43.9 dB(A) | 48.4 dB(A) | 48.4 dB(A) |
| Ultra Performance | 48.4 dB(A) | 50.9 dB(A) | 50.9 dB(A) |
| Silent | 38.8 dB(A) | 41.3 dB(A) | 41.3 dB(A) |
On the other hand, we also want to mention that the fan noise does not contain any uncomfortable frequencies. The XPS 17 also is usually a silent laptop during simple tasks and everyday situations, and it is able to handle short peak loads without starting the fans. We did not notice any other electronic noises.
Noise level
| Idle |
| 24 / 24 / 24 dB(A) |
| Load |
| 43.9 / 48.4 dB(A) |
 | ||
30 dB silent 40 dB(A) audible 50 dB(A) loud |
||
min: | ||
| Dell XPS 17 9720 GeForce RTX 3050 4GB Laptop GPU, i7-12700H, Micron 3400 MTFDKBA512TFH 512GB | Apple MacBook Pro 16 2021 M1 Pro M1 Pro 16-Core GPU, M1 Pro, Apple SSD AP1024R | Dell XPS 17 9720 RTX 3060 GeForce RTX 3060 Laptop GPU, i7-12700H, Samsung PM9A1 MZVL21T0HCLR | Lenovo ThinkPad X1 Extreme G4-20Y5CTO1WW (3050 Ti) GeForce RTX 3050 Ti Laptop GPU, i7-11800H, Samsung PM9A1 MZVL21T0HCLR | Asus Vivobook Pro 16X-M7600QE GeForce RTX 3050 Ti Laptop GPU, R9 5900HX, SK Hynix HFM001TD3JX013N | Lenovo ThinkBook 16p G2 ACH GeForce RTX 3060 Laptop GPU, R9 5900HX, WDC PC SN730 SDBPNTY-1T00 | Dell XPS 17 9710 Core i7 RTX 3060 GeForce RTX 3060 Laptop GPU, i7-11800H, Micron 2300 1TB MTFDHBA1T0TDV | |
|---|---|---|---|---|---|---|---|
| Noise | 9% | 1% | -1% | -6% | 5% | -4% | |
| off / environment * (dB) | 24 | 24.7 -3% | 23.8 1% | 23.52 2% | 26 -8% | 23 4% | 25.5 -6% |
| Idle Minimum * (dB) | 24 | 24.7 -3% | 24.1 -0% | 23.52 2% | 27 -13% | 23 4% | 25.2 -5% |
| Idle Average * (dB) | 24 | 24.7 -3% | 24.1 -0% | 23.52 2% | 27 -13% | 23 4% | 25.2 -5% |
| Idle Maximum * (dB) | 24 | 24.7 -3% | 24.1 -0% | 23.52 2% | 27.5 -15% | 23 4% | 25.2 -5% |
| Load Average * (dB) | 43.9 | 26.1 41% | 43.2 2% | 42.9 2% | 41.7 5% | 35.66 19% | 45.9 -5% |
| Witcher 3 ultra * (dB) | 48.4 | 48 1% | 52.5 -8% | 48.7 -1% | 49 -1% | ||
| Load Maximum * (dB) | 48.4 | 37.4 23% | 48 1% | 52.45 -8% | 45.3 6% | 48.13 1% | 50.4 -4% |
* ... smaller is better
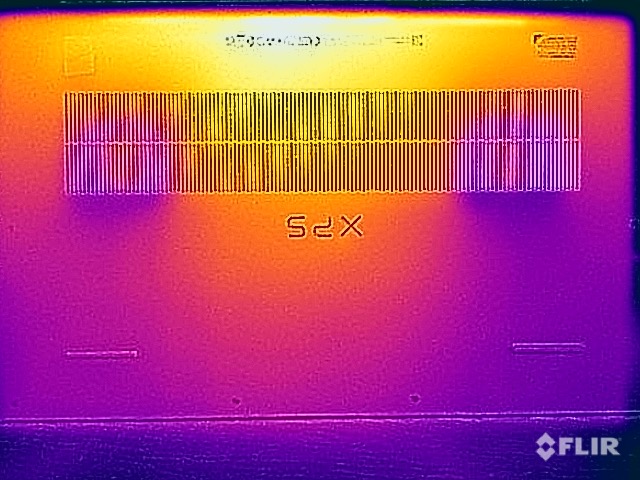
Temperatures
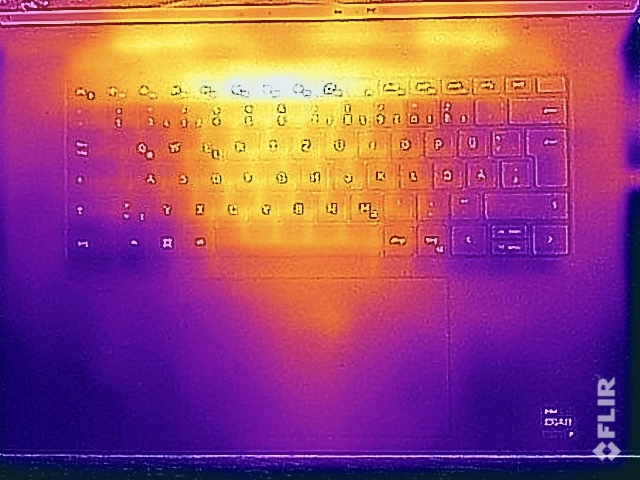
In everyday operation, the XPS 17 has no problems with high temperatures at all, and there are no concerns about placing the laptop on your lap even under load, even if this seems unlikely considering the size of the case. The hotspot is located at the top of the base unit in the central area toward the back, and the central keyboard area also warms up noticeably. Although there are no limitations or concerns here, you can still get warm fingers.
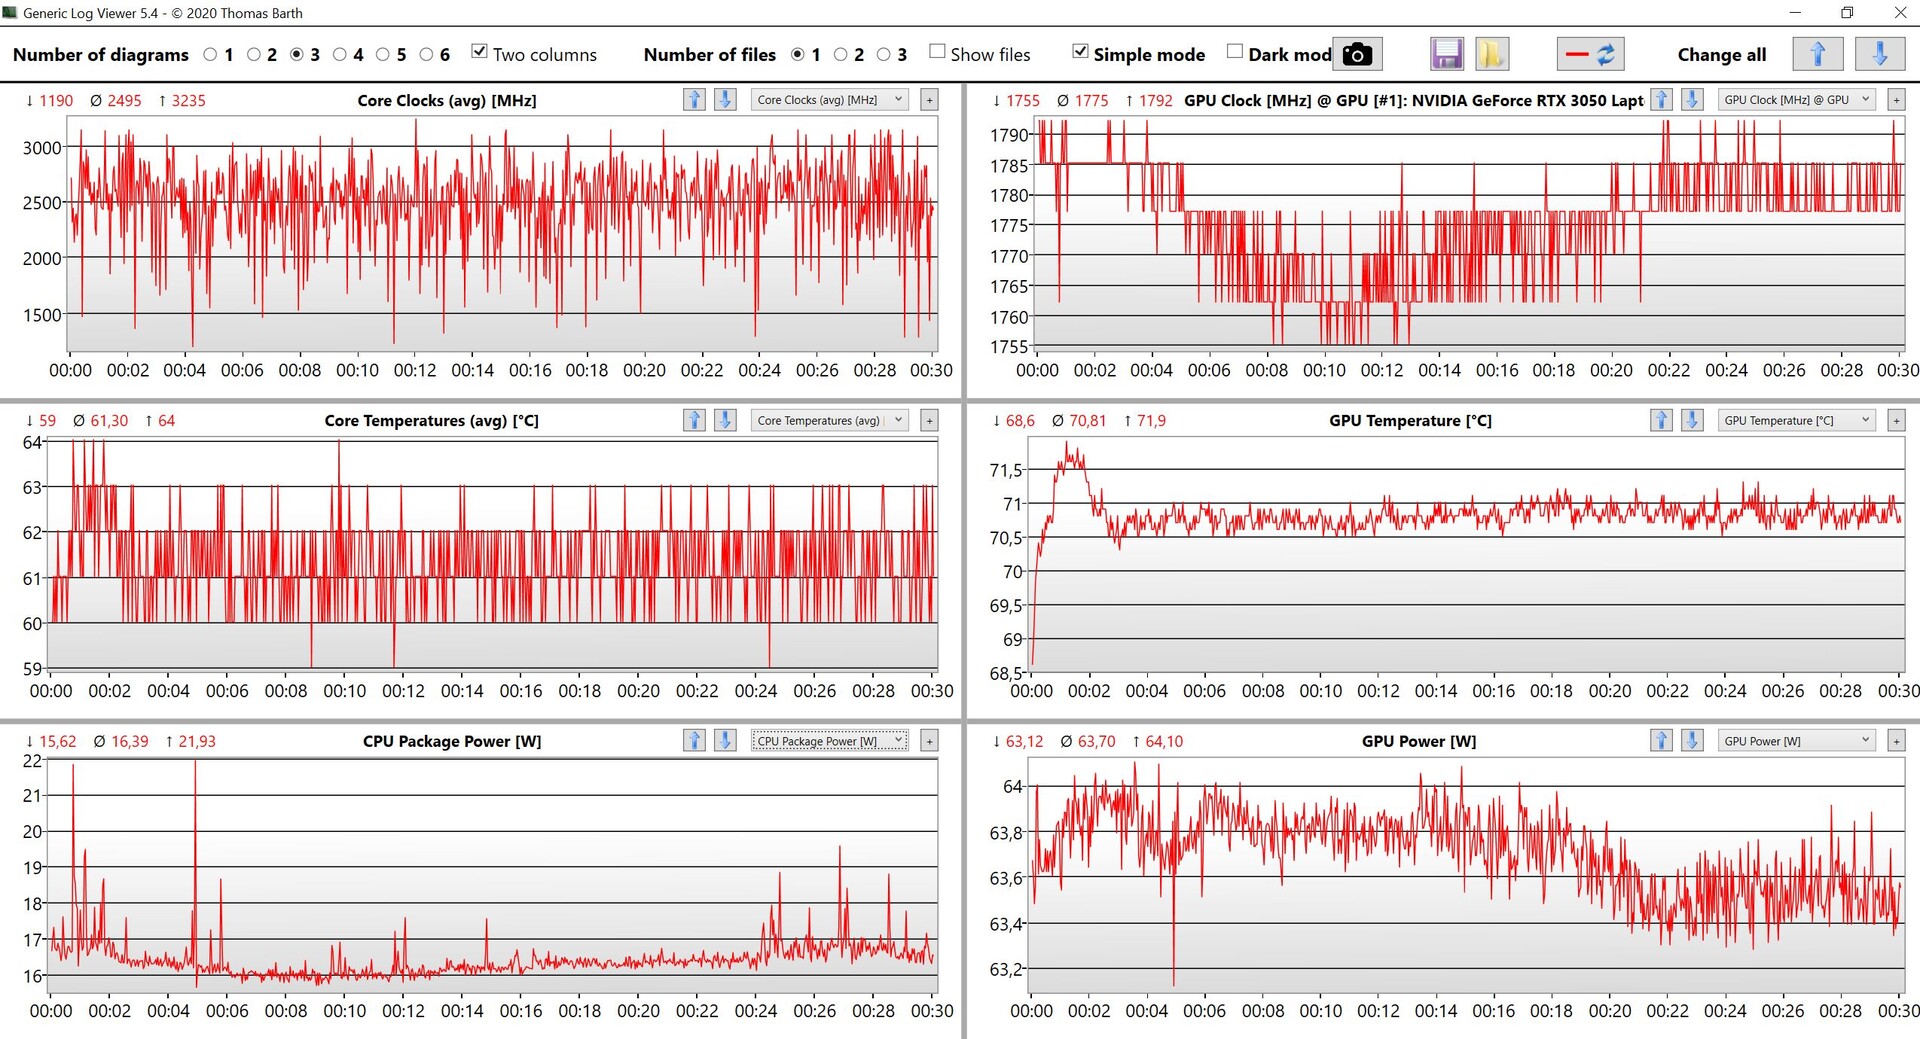
During the stress test, the performance of the graphics card remains stable at 60 watts. While the processor initially stabilizes at 40 watts, it then drops to 25 watts after a few minutes. We see the same behavior in principle also in the Ultra performance mode, but as soon as the CPU limit of 25 watts is activated, the GPU is allowed to consume an additional 5 watts (for a total of 65 watts).
(-) The maximum temperature on the upper side is 49.5 °C / 121 F, compared to the average of 36.8 °C / 98 F, ranging from 21 to 71 °C for the class Multimedia.
(+) The bottom heats up to a maximum of 38.4 °C / 101 F, compared to the average of 39.1 °C / 102 F
(+) In idle usage, the average temperature for the upper side is 26.7 °C / 80 F, compared to the device average of 31.3 °C / 88 F.
(±) Playing The Witcher 3, the average temperature for the upper side is 37.3 °C / 99 F, compared to the device average of 31.3 °C / 88 F.
(+) The palmrests and touchpad are reaching skin temperature as a maximum (33.1 °C / 91.6 F) and are therefore not hot.
(-) The average temperature of the palmrest area of similar devices was 28.7 °C / 83.7 F (-4.4 °C / -7.9 F).
| Dell XPS 17 9720 Intel Core i7-12700H, NVIDIA GeForce RTX 3050 4GB Laptop GPU | Apple MacBook Pro 16 2021 M1 Pro Apple M1 Pro, Apple M1 Pro 16-Core GPU | Dell XPS 17 9720 RTX 3060 Intel Core i7-12700H, NVIDIA GeForce RTX 3060 Laptop GPU | Lenovo ThinkPad X1 Extreme G4-20Y5CTO1WW (3050 Ti) Intel Core i7-11800H, NVIDIA GeForce RTX 3050 Ti Laptop GPU | Asus Vivobook Pro 16X-M7600QE AMD Ryzen 9 5900HX, NVIDIA GeForce RTX 3050 Ti Laptop GPU | Lenovo ThinkBook 16p G2 ACH AMD Ryzen 9 5900HX, NVIDIA GeForce RTX 3060 Laptop GPU | Dell XPS 17 9710 Core i7 RTX 3060 Intel Core i7-11800H, NVIDIA GeForce RTX 3060 Laptop GPU | |
|---|---|---|---|---|---|---|---|
| Heat | 11% | -16% | -9% | 2% | -13% | -15% | |
| Maximum Upper Side * (°C) | 49.5 | 41 17% | 51.8 -5% | 49 1% | 39.4 20% | 50 -1% | 50.2 -1% |
| Maximum Bottom * (°C) | 38.4 | 39 -2% | 44.2 -15% | 44.4 -16% | 43.6 -14% | 53 -38% | 38.4 -0% |
| Idle Upper Side * (°C) | 28 | 24 14% | 34.8 -24% | 32.1 -15% | 27.6 1% | 29 -4% | 37.6 -34% |
| Idle Bottom * (°C) | 27.8 | 24 14% | 33.2 -19% | 29.8 -7% | 27.5 1% | 30 -8% | 34.2 -23% |
* ... smaller is better
Speakers
The speaker system continues to consist of two woofers with 2.5 watts each and two tweeters with 1.5 watts each. In addition, the MaxxAudio Pro audio software is preinstalled, which also adds some noticeable dynamics to the sound. It offers some additional adjustment options, including a full equalizer. The sound appears very full, and the speakers can also become very loud. On the other hand, the system lacks some punch compared to the MacBook Pro 16.
Dell XPS 17 9720 audio analysis
(+) | speakers can play relatively loud (83.6 dB)
Bass 100 - 315 Hz
(±) | reduced bass - on average 7.3% lower than median
(±) | linearity of bass is average (11.4% delta to prev. frequency)
Mids 400 - 2000 Hz
(+) | balanced mids - only 3.4% away from median
(±) | linearity of mids is average (7.6% delta to prev. frequency)
Highs 2 - 16 kHz
(+) | balanced highs - only 3.7% away from median
(±) | linearity of highs is average (7.1% delta to prev. frequency)
Overall 100 - 16.000 Hz
(+) | overall sound is linear (8.8% difference to median)
Compared to same class
» 11% of all tested devices in this class were better, 2% similar, 87% worse
» The best had a delta of 5%, average was 17%, worst was 45%
Compared to all devices tested
» 3% of all tested devices were better, 1% similar, 97% worse
» The best had a delta of 4%, average was 24%, worst was 134%
Apple MacBook Pro 16 2021 M1 Pro audio analysis
(+) | speakers can play relatively loud (84.7 dB)
Bass 100 - 315 Hz
(+) | good bass - only 3.8% away from median
(+) | bass is linear (5.2% delta to prev. frequency)
Mids 400 - 2000 Hz
(+) | balanced mids - only 1.3% away from median
(+) | mids are linear (2.1% delta to prev. frequency)
Highs 2 - 16 kHz
(+) | balanced highs - only 1.9% away from median
(+) | highs are linear (2.7% delta to prev. frequency)
Overall 100 - 16.000 Hz
(+) | overall sound is linear (4.6% difference to median)
Compared to same class
» 0% of all tested devices in this class were better, 0% similar, 100% worse
» The best had a delta of 5%, average was 17%, worst was 45%
Compared to all devices tested
» 0% of all tested devices were better, 0% similar, 100% worse
» The best had a delta of 4%, average was 24%, worst was 134%
Power Management - 130-Watt power supply close to its limits
Power Consumption
In our measurements of the power consumption, the bright and large 4K display of course becomes noticeable, but at a maximum of 17 watts, the values during idle operation are not bad at all in the class comparison. Under load, we observe almost 136 watts (40W CPU + 60W GPU), so the included 130-Watt charger (USB-C) is hitting its limits. We checked whether the XPS 17 starts depleting the battery during the stress test, but this is not the case. As soon as the CPU hits its 25-Watt limit, the overall consumption also drops to about 122 watts. The fact that the results under load are practically identical to those of the version with the faster RTX 3060 is hardly surprising, since the same power limits are in place there.
| Off / Standby | |
| Idle | |
| Load |
|
Key:
min: | |
| Dell XPS 17 9720 i7-12700H, GeForce RTX 3050 4GB Laptop GPU, Micron 3400 MTFDKBA512TFH 512GB, IPS, 3840x2400, 17" | Apple MacBook Pro 16 2021 M1 Pro M1 Pro, M1 Pro 16-Core GPU, Apple SSD AP1024R, Mini-LED, 3456x2234, 16.2" | Dell XPS 17 9720 RTX 3060 i7-12700H, GeForce RTX 3060 Laptop GPU, Samsung PM9A1 MZVL21T0HCLR, IPS, 3840x2400, 17" | Lenovo ThinkPad X1 Extreme G4-20Y5CTO1WW (3050 Ti) i7-11800H, GeForce RTX 3050 Ti Laptop GPU, Samsung PM9A1 MZVL21T0HCLR, IPS LED, 3840x2400, 16" | Asus Vivobook Pro 16X-M7600QE R9 5900HX, GeForce RTX 3050 Ti Laptop GPU, SK Hynix HFM001TD3JX013N, OLED, 3840x2400, 16.1" | Lenovo ThinkBook 16p G2 ACH R9 5900HX, GeForce RTX 3060 Laptop GPU, WDC PC SN730 SDBPNTY-1T00, IPS, 2560x1600, 16" | Dell XPS 17 9710 Core i7 RTX 3060 i7-11800H, GeForce RTX 3060 Laptop GPU, Micron 2300 1TB MTFDHBA1T0TDV, IPS, 3840x2400, 17" | Average NVIDIA GeForce RTX 3050 4GB Laptop GPU | Average of class Multimedia | |
|---|---|---|---|---|---|---|---|---|---|
| Power Consumption | 26% | -7% | -17% | 13% | -11% | -2% | 16% | 29% | |
| Idle Minimum * (Watt) | 7.8 | 5 36% | 5.9 24% | 10.3 -32% | 8.2 -5% | 13.2 -69% | 7.5 4% | 7.17 ? 8% | 5.71 ? 27% |
| Idle Average * (Watt) | 15.1 | 15.1 -0% | 15.8 -5% | 22.06 -46% | 16.2 -7% | 17 -13% | 15.7 -4% | 10.4 ? 31% | 10.1 ? 33% |
| Idle Maximum * (Watt) | 17 | 15.5 9% | 26.7 -57% | 23 -35% | 19.7 -16% | 18.6 -9% | 23.1 -36% | 14.8 ? 13% | 12.4 ? 27% |
| Load Average * (Watt) | 114 | 54 53% | 117.4 -3% | 102.57 10% | 65.8 42% | 88.8 22% | 87.2 24% | 89.7 ? 21% | 65 ? 43% |
| Witcher 3 ultra * (Watt) | 115.2 | 114.8 -0% | 106 8% | 65.6 43% | 123 -7% 123 -7% | 116 -1% | |||
| Load Maximum * (Watt) | 135.6 | 90 34% | 136.6 -1% | 147.8 -9% | 104 23% | 132 3% | 131.6 3% | 124.8 ? 8% | 112.2 ? 17% |
* ... smaller is better
Power Consumption The Witcher 3 / Stress Test
Power Consumption With External Monitor
Battery Life
The battery life of the 97-Wh battery isn't bad at all in comparison to the competitors, and only the MacBook Pro 16 plays in a different league here. In the WLAN test at 150 cd/m² (corresponding to a brightness of 52% in our test unit), we measure a good 9 hours, and still about 6 hours at full brightness. You can even play videos at 150 cd/m² for 11 hours.
Under full load, you can expect it to last slightly longer than one hour in battery operation, despite the performance reduction. Running The Witcher 3, it lasted for an hour and 45 minutes. If the laptop is turned on, it takes around 2.5 hours to completely recharge it, with 50% of the capacity available after almost one hour, so there is no quick charge function.
| Dell XPS 17 9720 i7-12700H, GeForce RTX 3050 4GB Laptop GPU, 97 Wh | Apple MacBook Pro 16 2021 M1 Pro M1 Pro, M1 Pro 16-Core GPU, 99.6 Wh | Dell XPS 17 9720 RTX 3060 i7-12700H, GeForce RTX 3060 Laptop GPU, 97 Wh | Lenovo ThinkPad X1 Extreme G4-20Y5CTO1WW (3050 Ti) i7-11800H, GeForce RTX 3050 Ti Laptop GPU, 90 Wh | Asus Vivobook Pro 16X-M7600QE R9 5900HX, GeForce RTX 3050 Ti Laptop GPU, 96 Wh | Lenovo ThinkBook 16p G2 ACH R9 5900HX, GeForce RTX 3060 Laptop GPU, 71 Wh | Dell XPS 17 9710 Core i7 RTX 3060 i7-11800H, GeForce RTX 3060 Laptop GPU, 97 Wh | Average of class Multimedia | |
|---|---|---|---|---|---|---|---|---|
| Battery runtime | 70% | -11% | -23% | 8% | 7% | 50% | 39% | |
| H.264 (h) | 11.2 | 17.5 56% | 6.7 -40% | 7 -37% | 16.4 ? 46% | |||
| WiFi v1.3 (h) | 9.2 | 16.9 84% | 8.7 -5% | 6.6 -28% | 11.3 23% | 8.5 -8% | 7.6 -17% | 12 ? 30% |
| Witcher 3 ultra (h) | 1.7 | |||||||
| Load (h) | 1.2 | 1 -17% | 1.2 0% | 1.1 -8% | 2 67% | 2.6 117% | 1.675 ? 40% | |
| Reader / Idle (h) | 20.3 | 17.7 | 25.2 ? |
Pros
Cons
Verdict - XPS 17 9720 with GPU downgrade
The XPS 17 has been available on the market for about two years, but the basic design is based on the smaller XPS 15, which is the reason why the overall concept looks so familiar. There is no question that this is still a high-quality premium product, which you can already see when looking at the price of 3000 Euros (~$3135). However, in the test the multimedia laptop also shows a couple of weaknesses that slightly mar the overall impression.
In our opinion, the largest problem is the performance. While the new Intel processor basically offers decent performance values, it doesn't bring any major advantages under constant load compared to the predecessor. But this isn't really Dell's fault, since the new Alder Lake CPUs just consume a lot of power. So the best Dell could do is switch to AMD, but this is another subject. The graphics performance of the RTX 3050 is also okay by itself, but we don't understand why Dell runs the GPU with less power compared to the predecessor, further reducing the effective gaming performance as a result. Under combined load, the XPS 17 is also unable to shine, and the performance isn't quite stable in CPU-intensive games, for example. At the same time, the XPS 17 isn't particularly quiet under load either. Another problem is the WLAN module, since despite using a modern Wi-Fi-6E module, the XPS 17 doesn't support any 6-GHz networks at all.
The XPS 17 shines particularly with its extremely accurate-color AdobeRGB panel, which makes it especially suited for image processing. However, you have to accept some compromises in the performance, and despite using the same cooling, Dell has slightly reduced the performance of the graphics card compared to last-year's XPS 17 9710.
The case continues to offer a very high-quality workmanship, but it is no lightweight at 2.5 kg (~5.5 lb) either. The real highlight is the display, since this is one of the last laptops with a real high-quality panel that covers the AdobeRGB standard, in contrast to most competitors who jumped on the DCI-P3 bandwagon at this point, including the DreamColor displays from HP. While the panel should still be calibrated, there are no limitations afterwards.
All in all, the XPS 17 continues to be a very good multimedia laptop, but Dell has to be careful not to miss the boat compared to the competitors. The MacBook Pro 16 or the ThinkPad X1 Extreme, for example, already have been using the 16-inch form factor and are just more compact while offering comparable (or even better) performance values. We are curious how Dell will handle this situation in the future. While the well-known designs of the XPS 15 and XPS 17 might still be available for a while, we could also imagine that the manufacturer will also reintroduce an XPS 16 to the market in the near future.
Price and Availability
The new XPS 17 9720 is available from Dell starting at $1949 with various configuration options, and you can also get it from Amazon, for example.
Dell XPS 17 9720
- 06/17/2022 v7 (old)
Andreas Osthoff
Price comparison

