Asus ProArt StudioBook Pro 17 W700G3T Review: The mobile workstation is hampered by small things
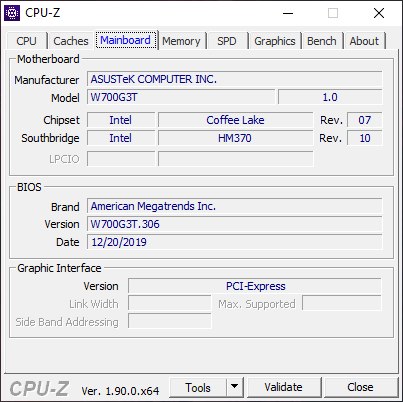
Asus' new ProArt product family is designed for (semi) professional users, starting with content creators, all the way up to game developers, product designers, architects or graphics artists. In addition to some laptops, you can also get desktop PCs, displays or individual PC components like motherboards. Today we have a look at the 17-inch StudioBook Pro 17, which is equipped with a professional Quadro GPU from Nvidia. If you don't need the ISV certifications of the Quadro GPU, you can also get the same device with a consumer GeForce GPU, which is called the StudioBook 17.
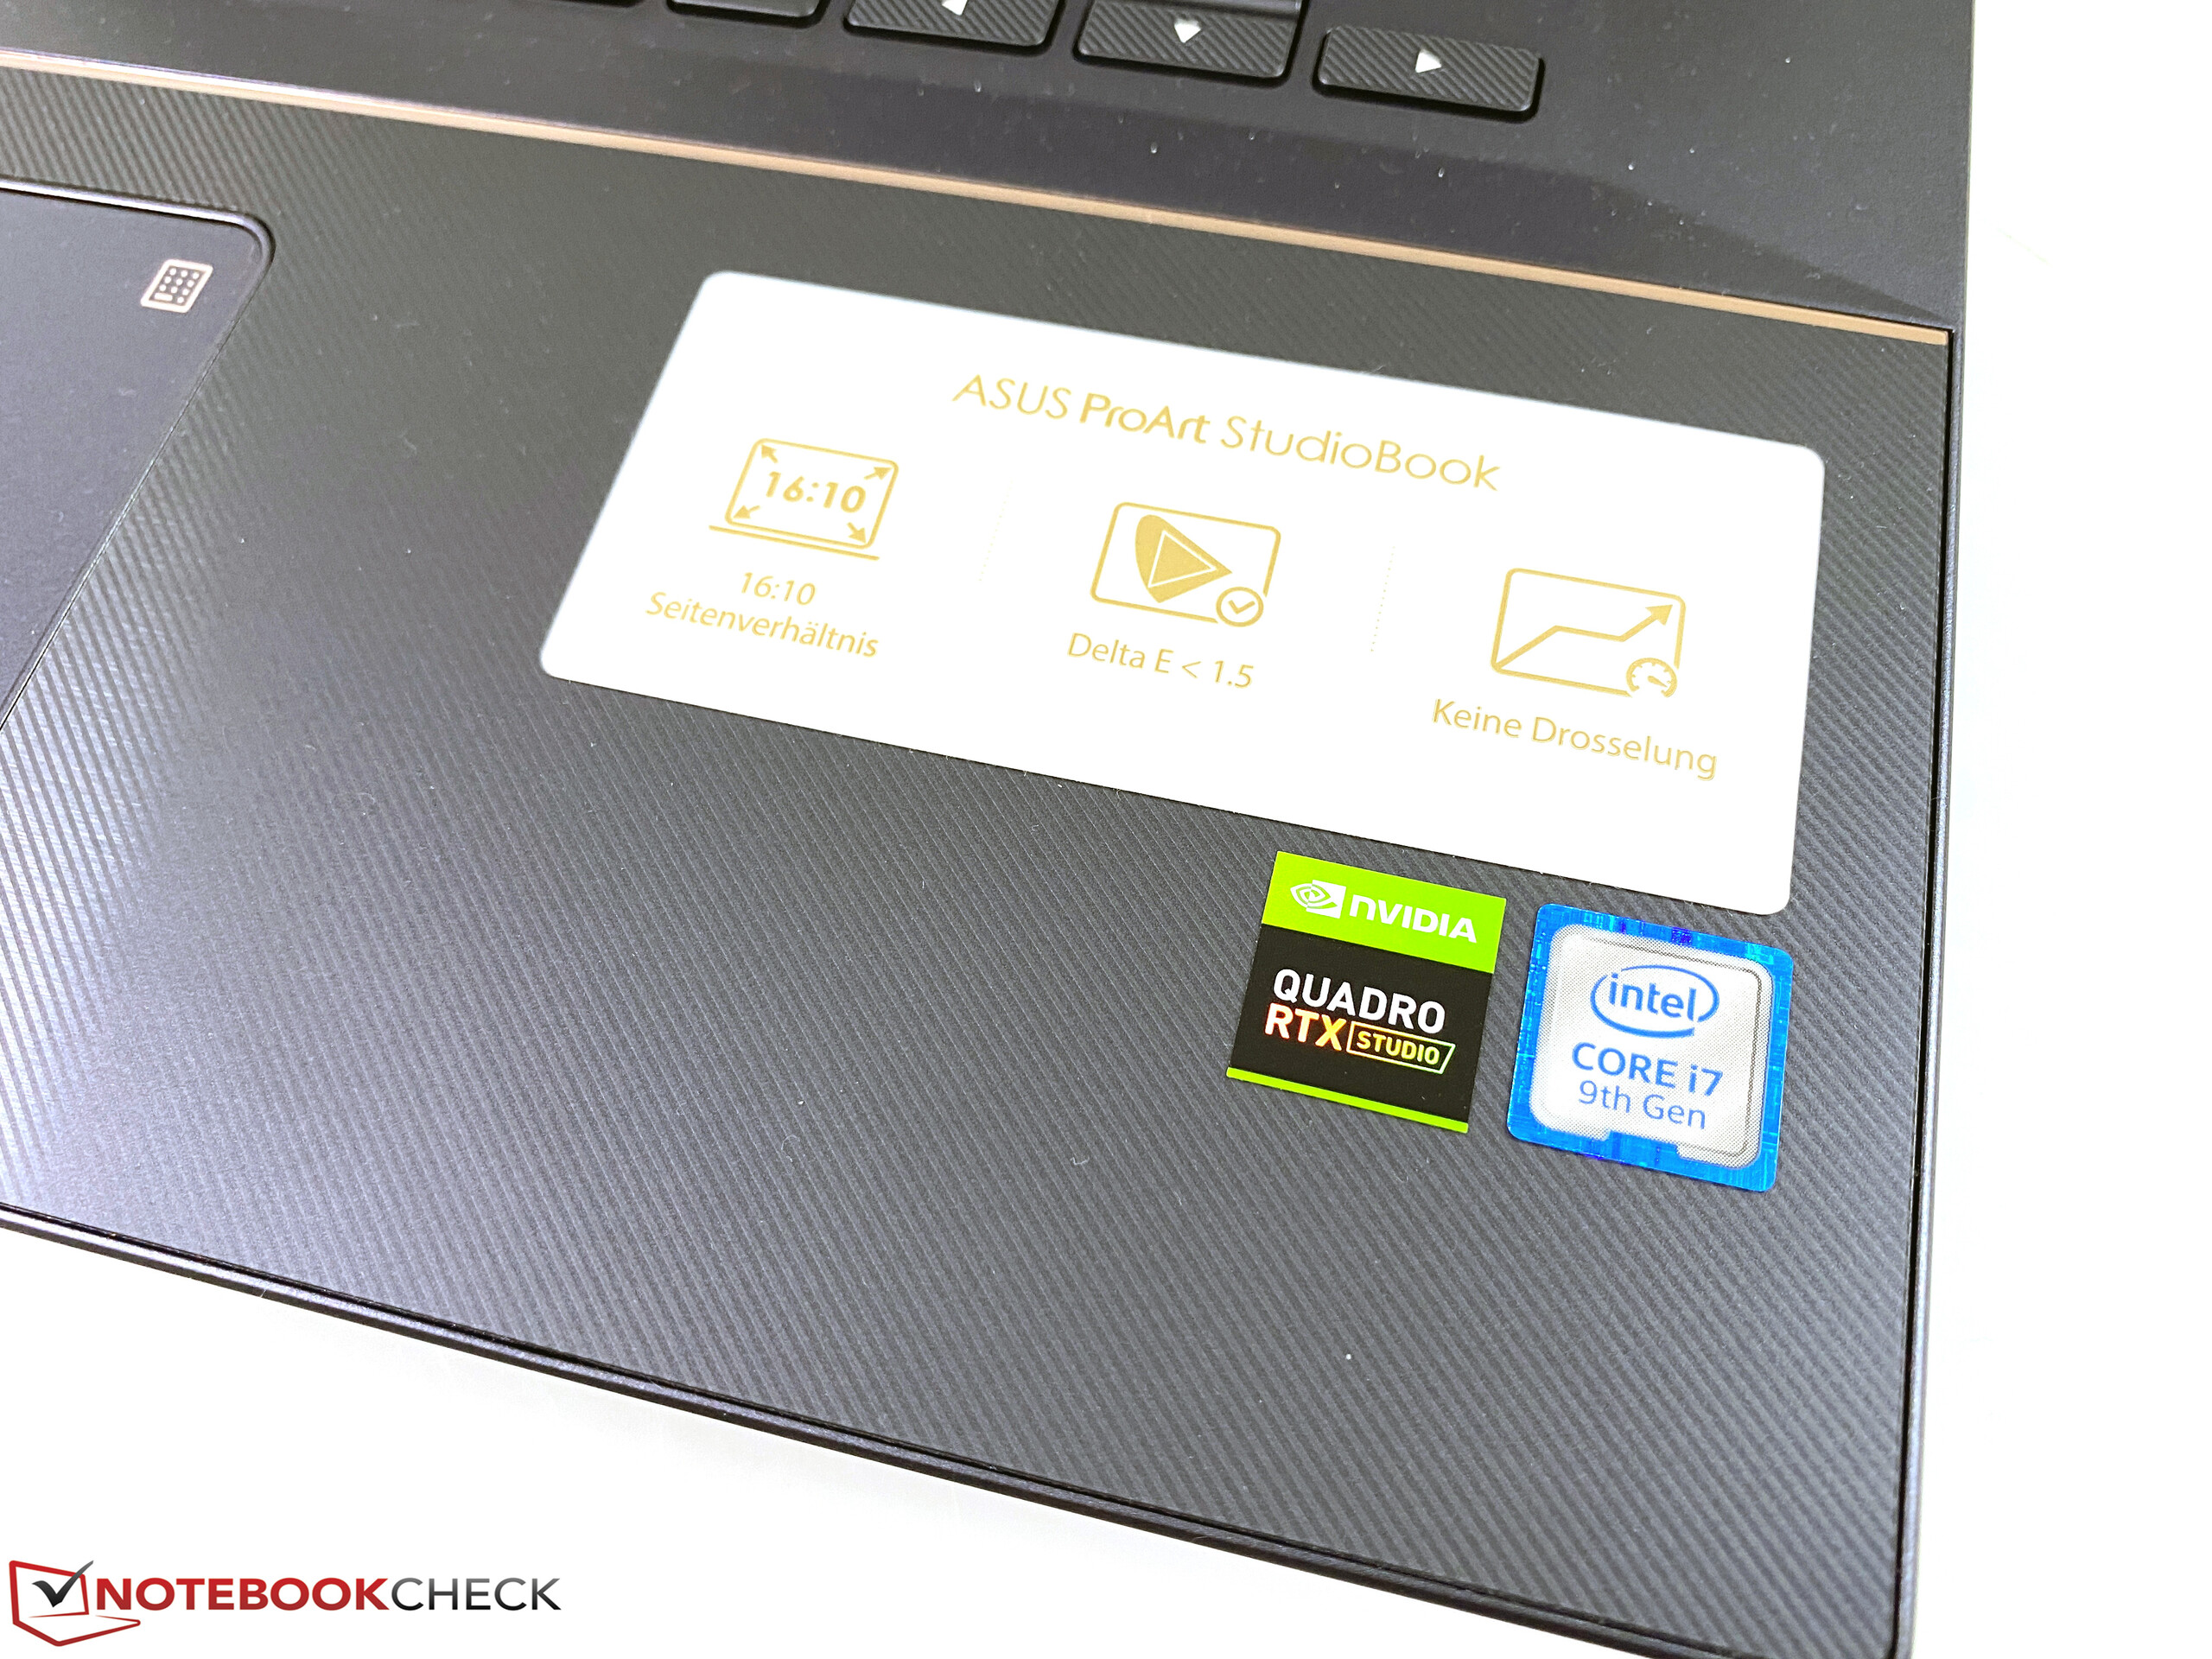
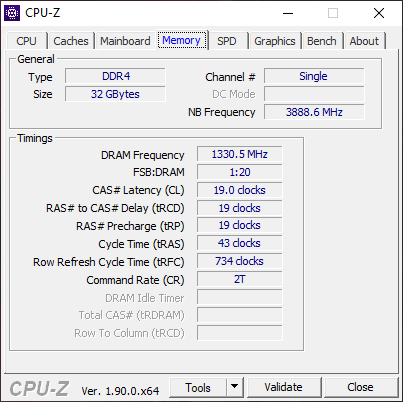
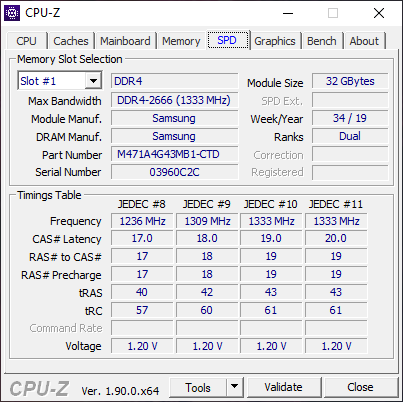
Our test unit with the designation W700G3T-AV103R for around 3900 Euros (~$4227) features the Intel Core i7-9750H processor, a Quadro RTX 3000 Max-Q GPU, 32 GB RAM, and a 1 TB NVMe-SSD. There is only one display option, a matte Full-HD panel (16:10) with high color accuracy and the P3 color gamut.
Rating | Date | Model | Weight | Height | Size | Resolution | Price |
|---|---|---|---|---|---|---|---|
| 86.4 % v7 (old) | 05 / 2020 | Asus ProArt StudioBook Pro 17 W700G3T i7-9750H, Quadro RTX 3000 Max-Q | 2.5 kg | 18.4 mm | 17.00" | 1920x1200 | |
| 83.8 % v7 (old) | 06 / 2019 | MSI WS75 9TL-636 i7-9750H, Quadro RTX 4000 (Laptop) | 2.3 kg | 18.95 mm | 17.30" | 1920x1080 | |
| 89.7 % v7 (old) | 12 / 2019 | Apple MacBook Pro 16 2019 i9 5500M i9-9880H, Radeon Pro 5500M | 2 kg | 16.2 mm | 16.00" | 3072x1920 | |
| 84.7 % v7 (old) | 04 / 2020 | Acer ConceptD 5 CN517-71-74YA i7-9750H, GeForce RTX 2060 Mobile | 2.8 kg | 24 mm | 17.30" | 3840x2160 | |
| 87 % v7 (old) | 04 / 2020 | Gigabyte Aero 17 HDR XB i7-10875H, GeForce RTX 2070 Super Max-Q | 2.7 kg | 21 mm | 17.30" | 3840x2160 |
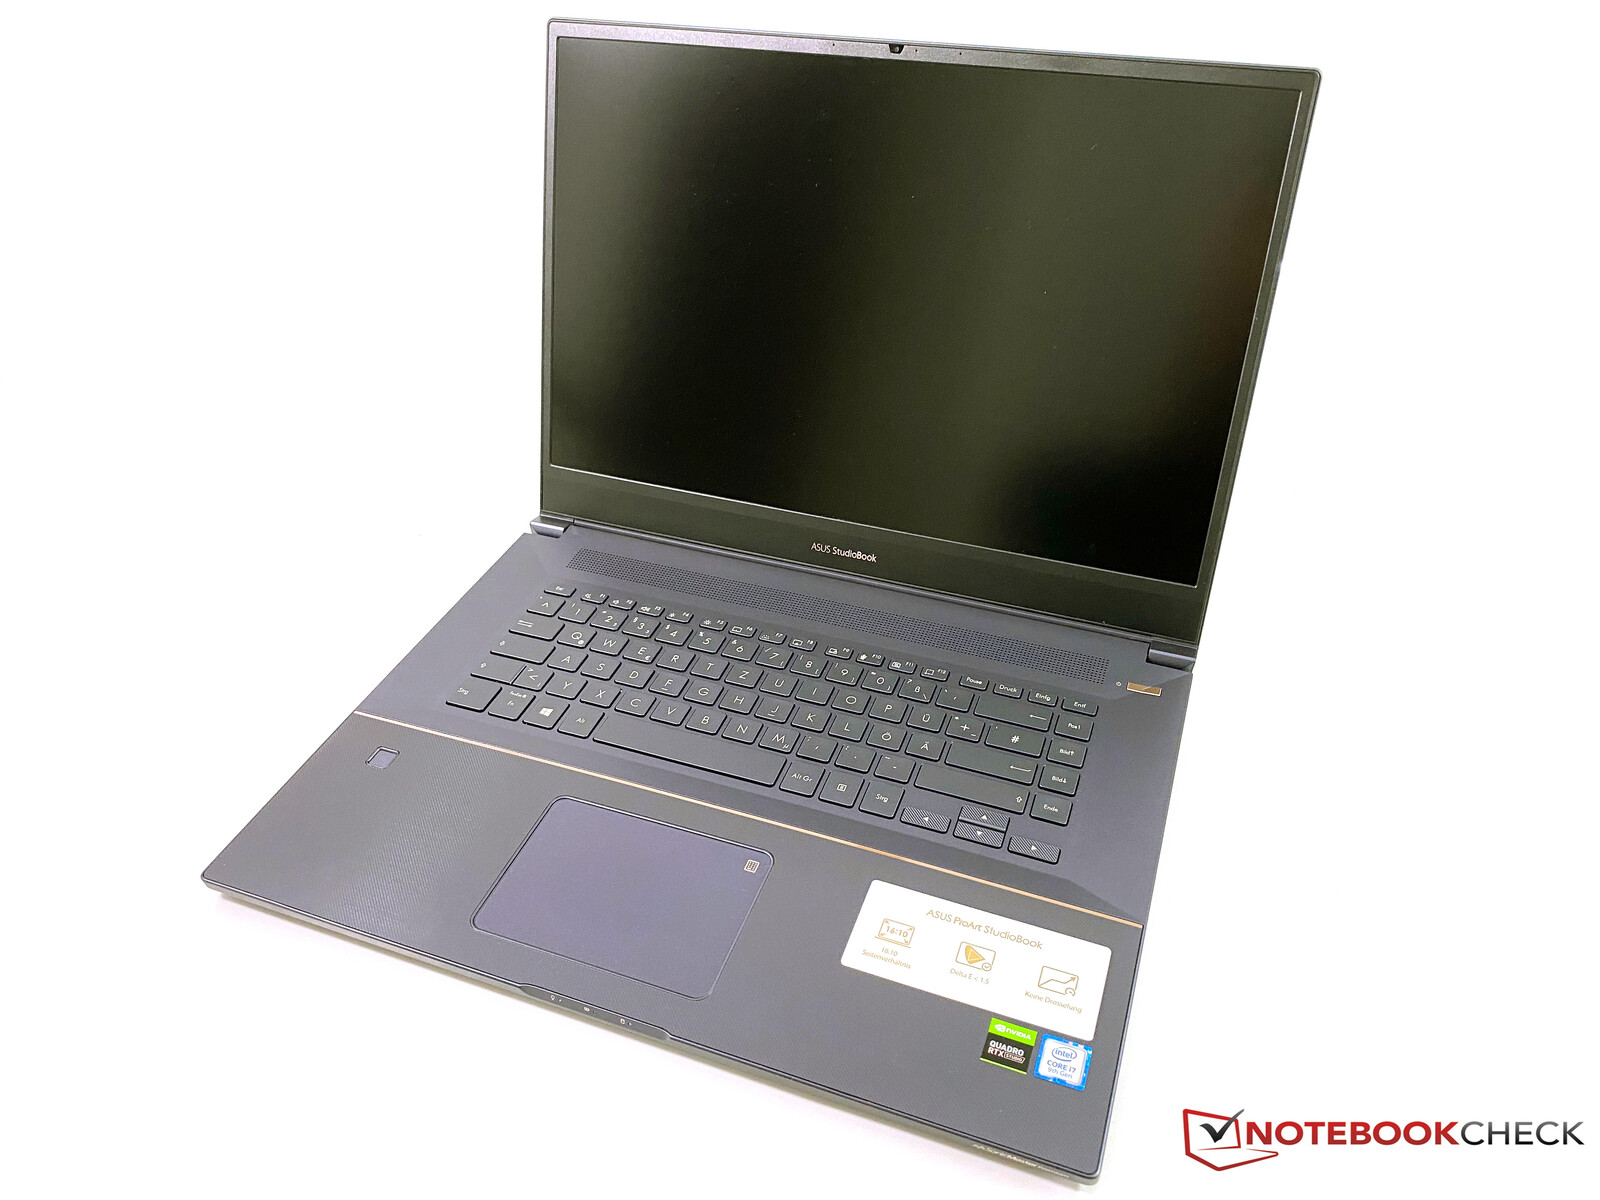
Case – StudioBook with thin metal body
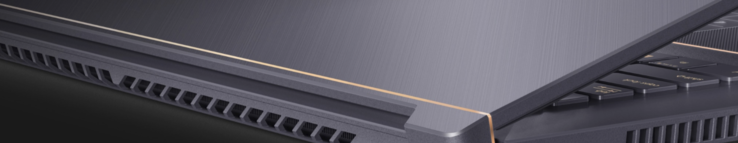
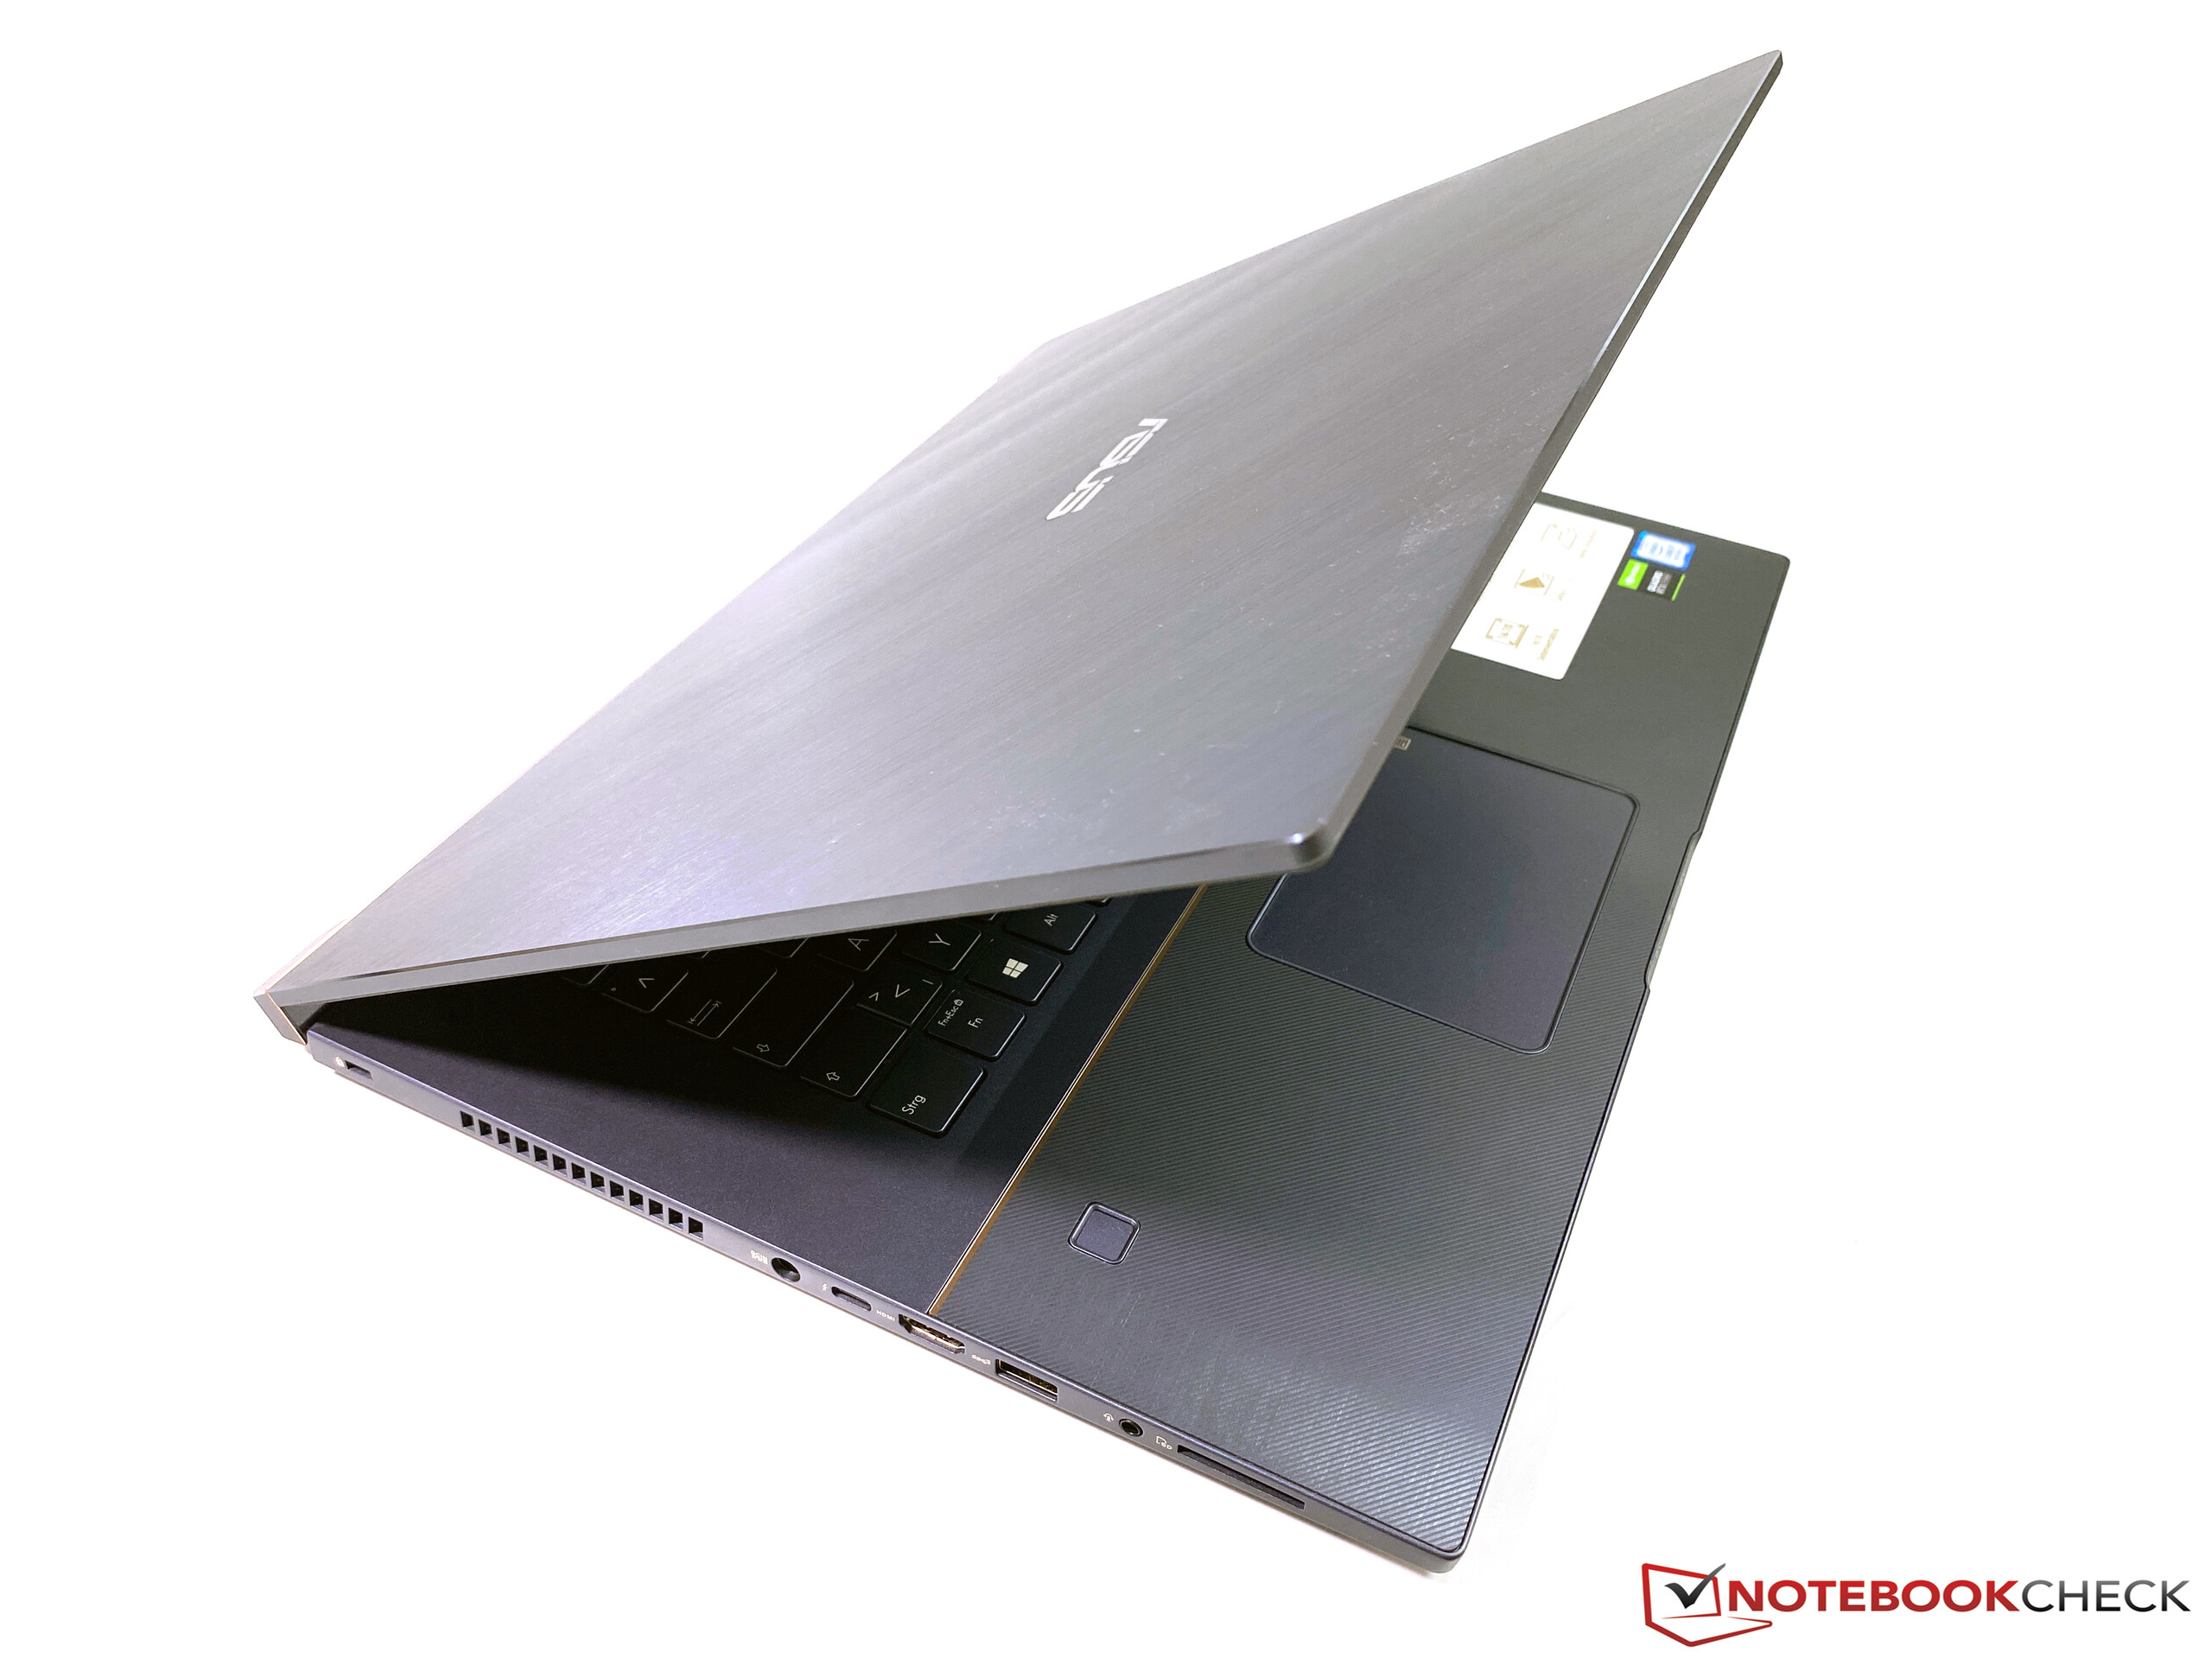
The case of the new StudioBook Pro 17 leaves a very stylish impression with its dark gray surfaces and rose gold accents, but is not too striking. The design is obviously a matter of taste, but it should be no problem to use the mobile workstation in an office environment without drawing too much attention. A quick look at the spec sheet shows another color option called Turquoise Grey, which tends more towards blue.
The chassis is made of a magnesium alloy and the base unit in particular is very sturdy for a slim device. Even the center keyboard area is very stable, and we can only slightly flex the surface with a lot of pressure. Our twisting attempts did not reveal any issues, either. The top of the base unit is divided into two parts; the textured palm rests and the smooth keyboard deck. The texture helps preventing fingerprints, which works well in practice. The central hinge is very firm and allows a maximum opening angle of 180 degrees. However, there is still some bouncing of the panel and the lid automatically falls down at an angle of ~10 degrees or less. You can only open the lid with one hand when you shake it a bit.
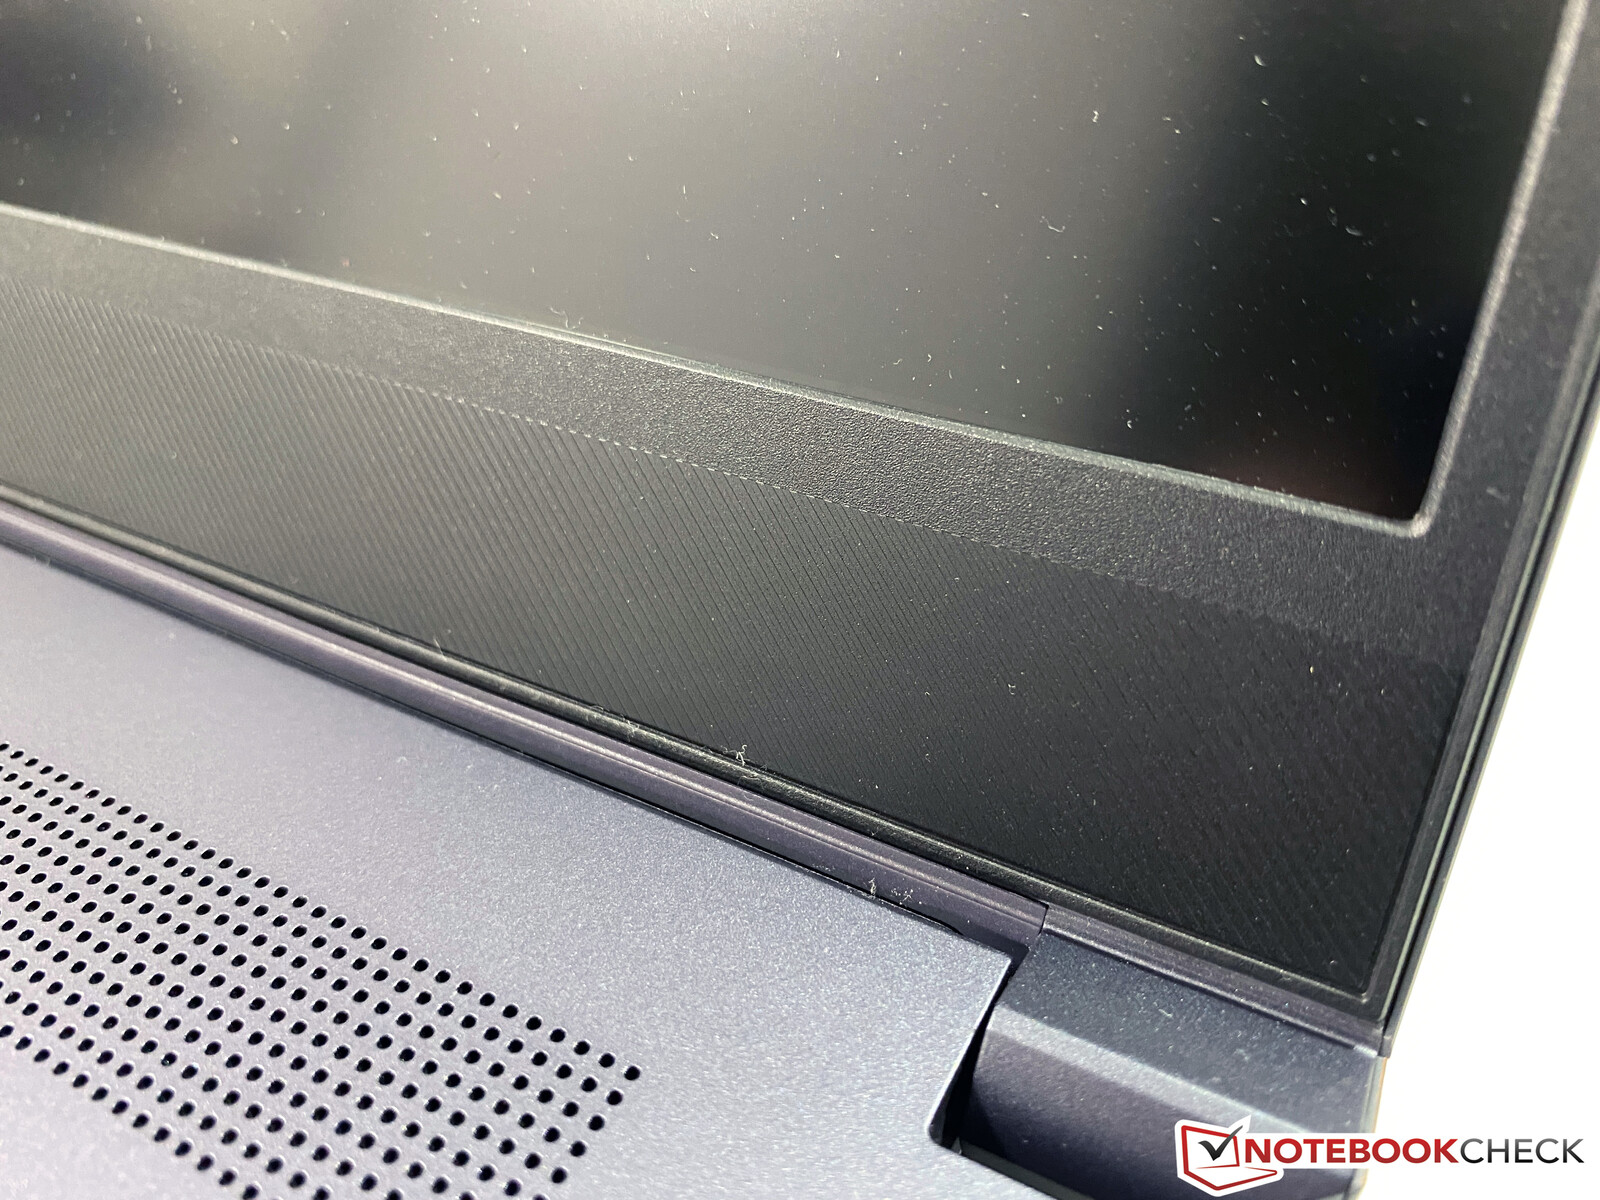
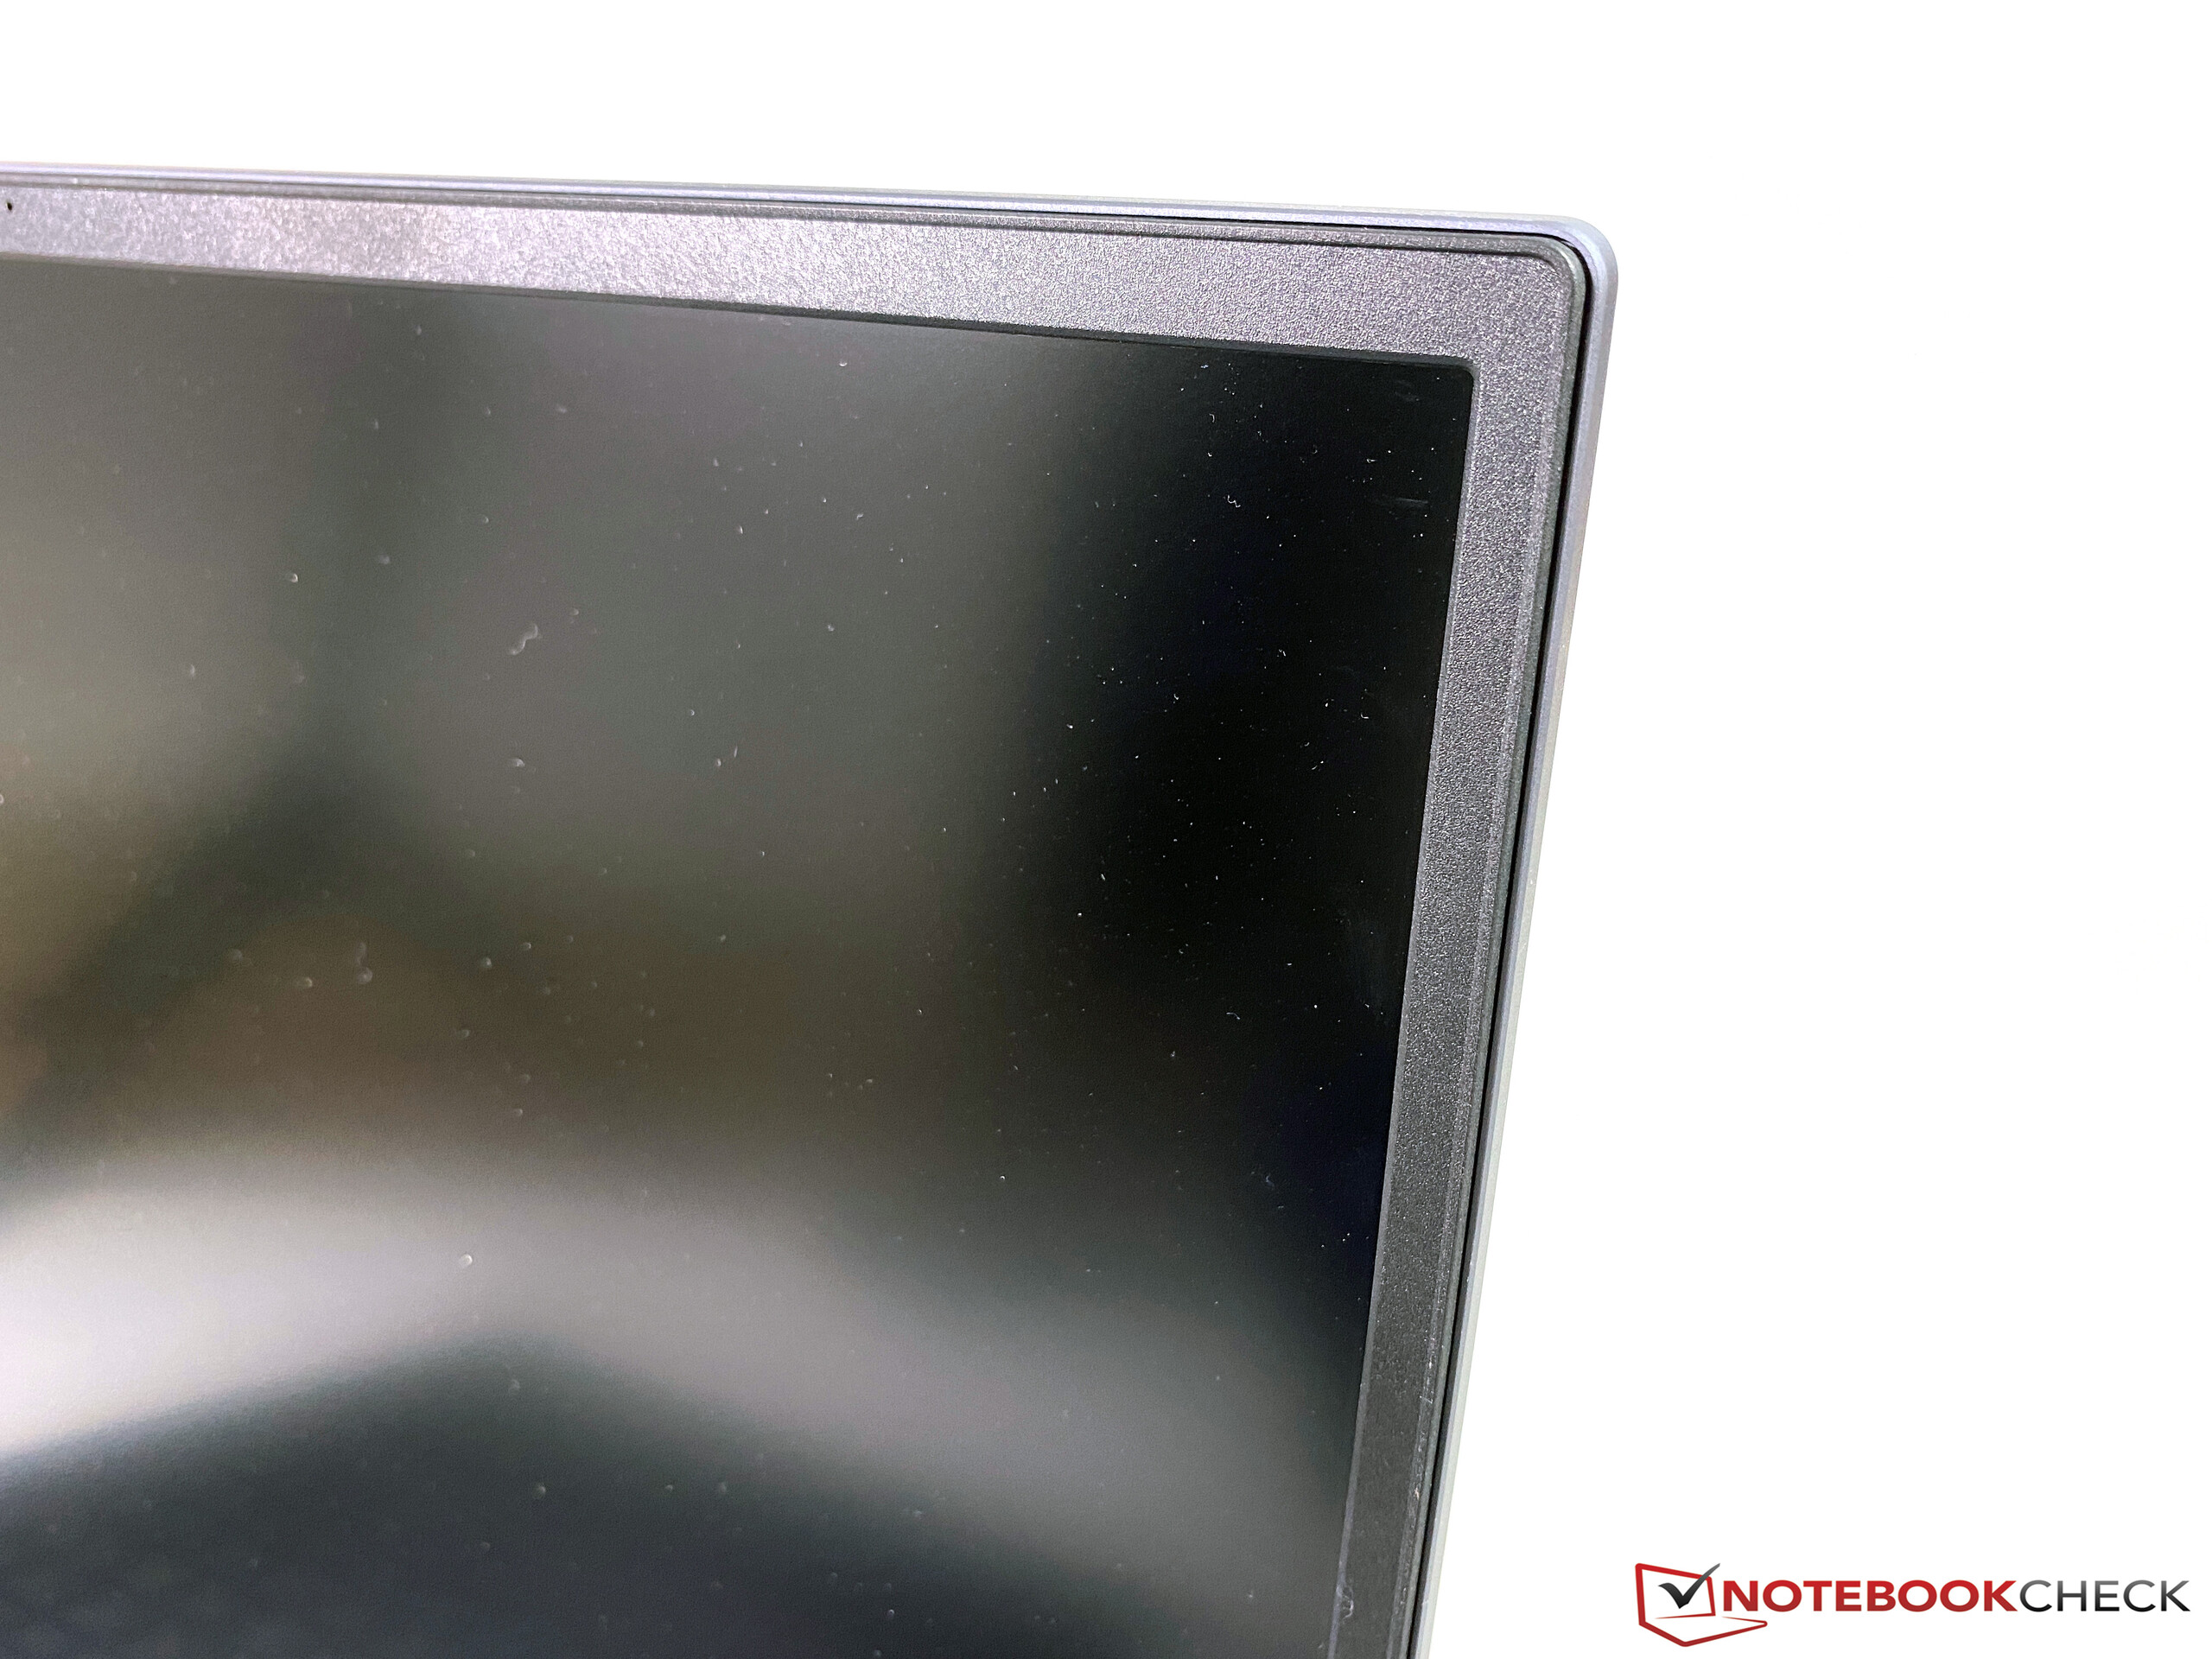
Asus advertises a so called Nano Edge display with very slim bezels. However, this is only true for the two sides and the top bezel. The lower bezel on the other hand is pretty bulky, even though it is a 16:10 panel. Asus tries to hide this fact visually by using two different surfaces (lower part similar to palm rests), but this does not really help. As a result, we cannot confirm the advertised body-to-screen ratio of up to 84%, our calculation results in 77%.
The stability of the otherwise smooth lid is completely okay. As expected, there is more movement compared to the base unit when we try to twist it, but it is not critical by any means and we could not provoke any picture distortions with concentrated pressure, either. According to the manufacturer, the notebook meets the MIL-STD specification, which includes several tests (like temperature, humidity, etc.), but the spec sheet does not list the individual tests.
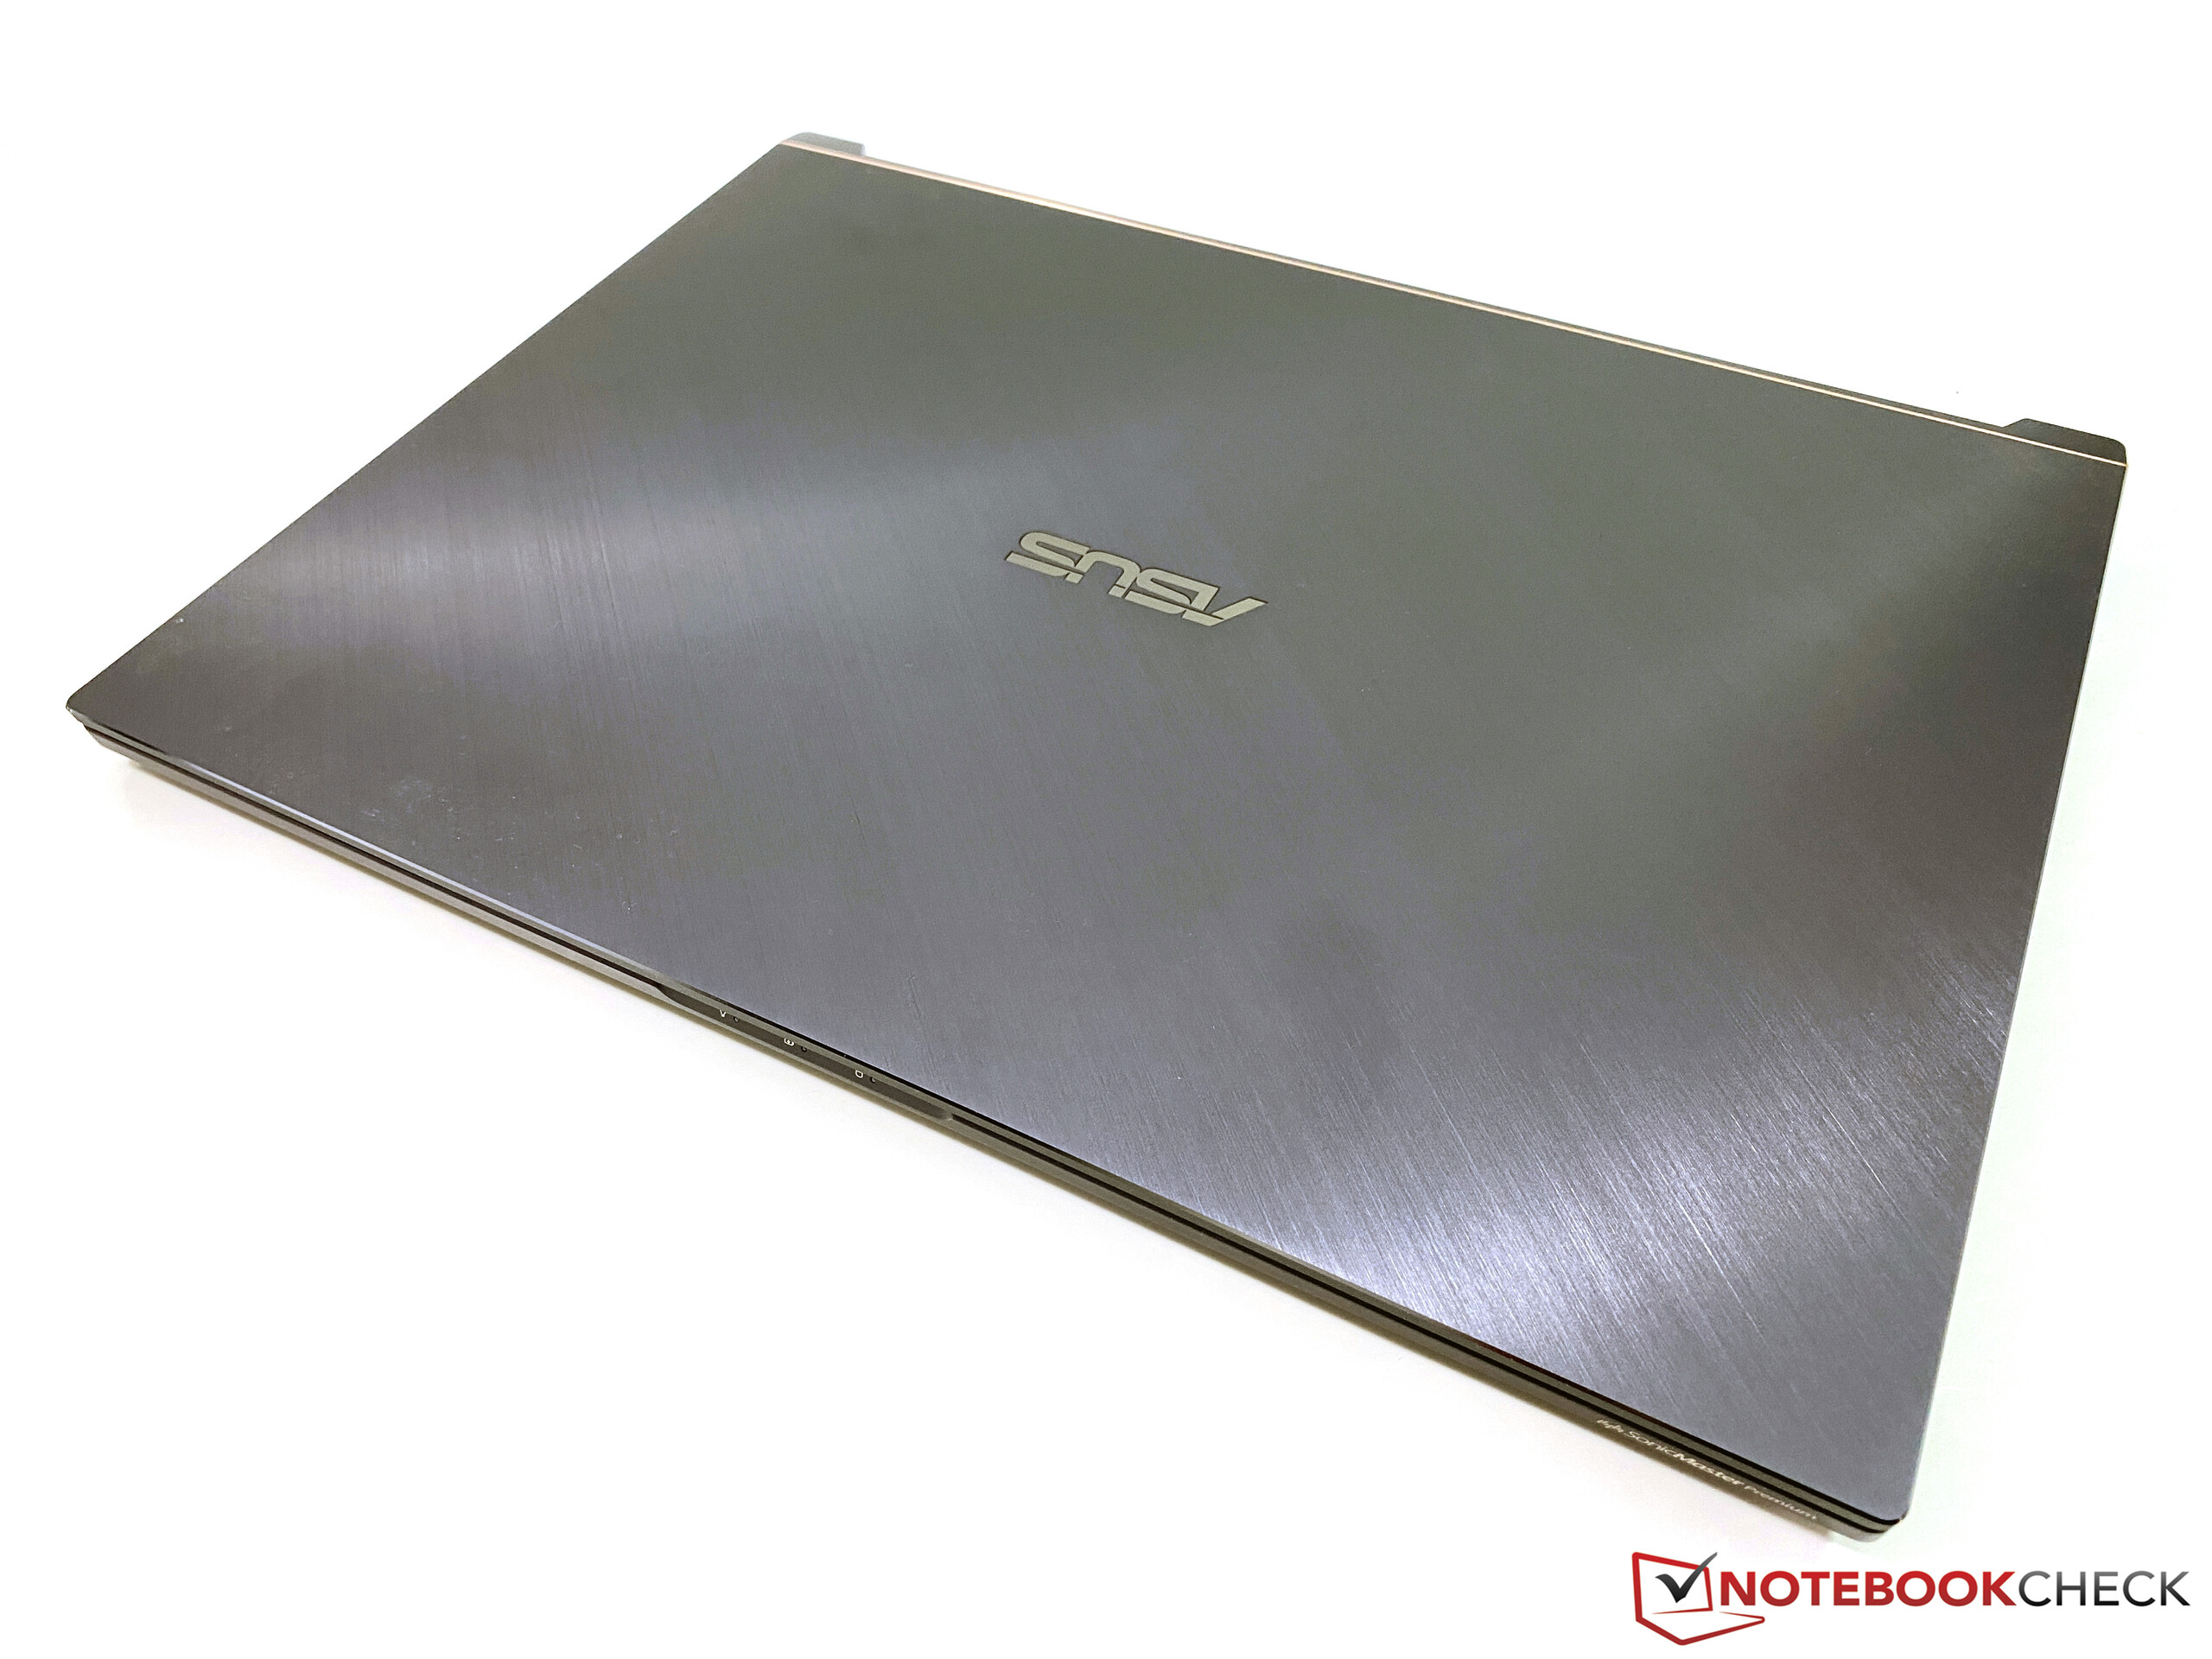
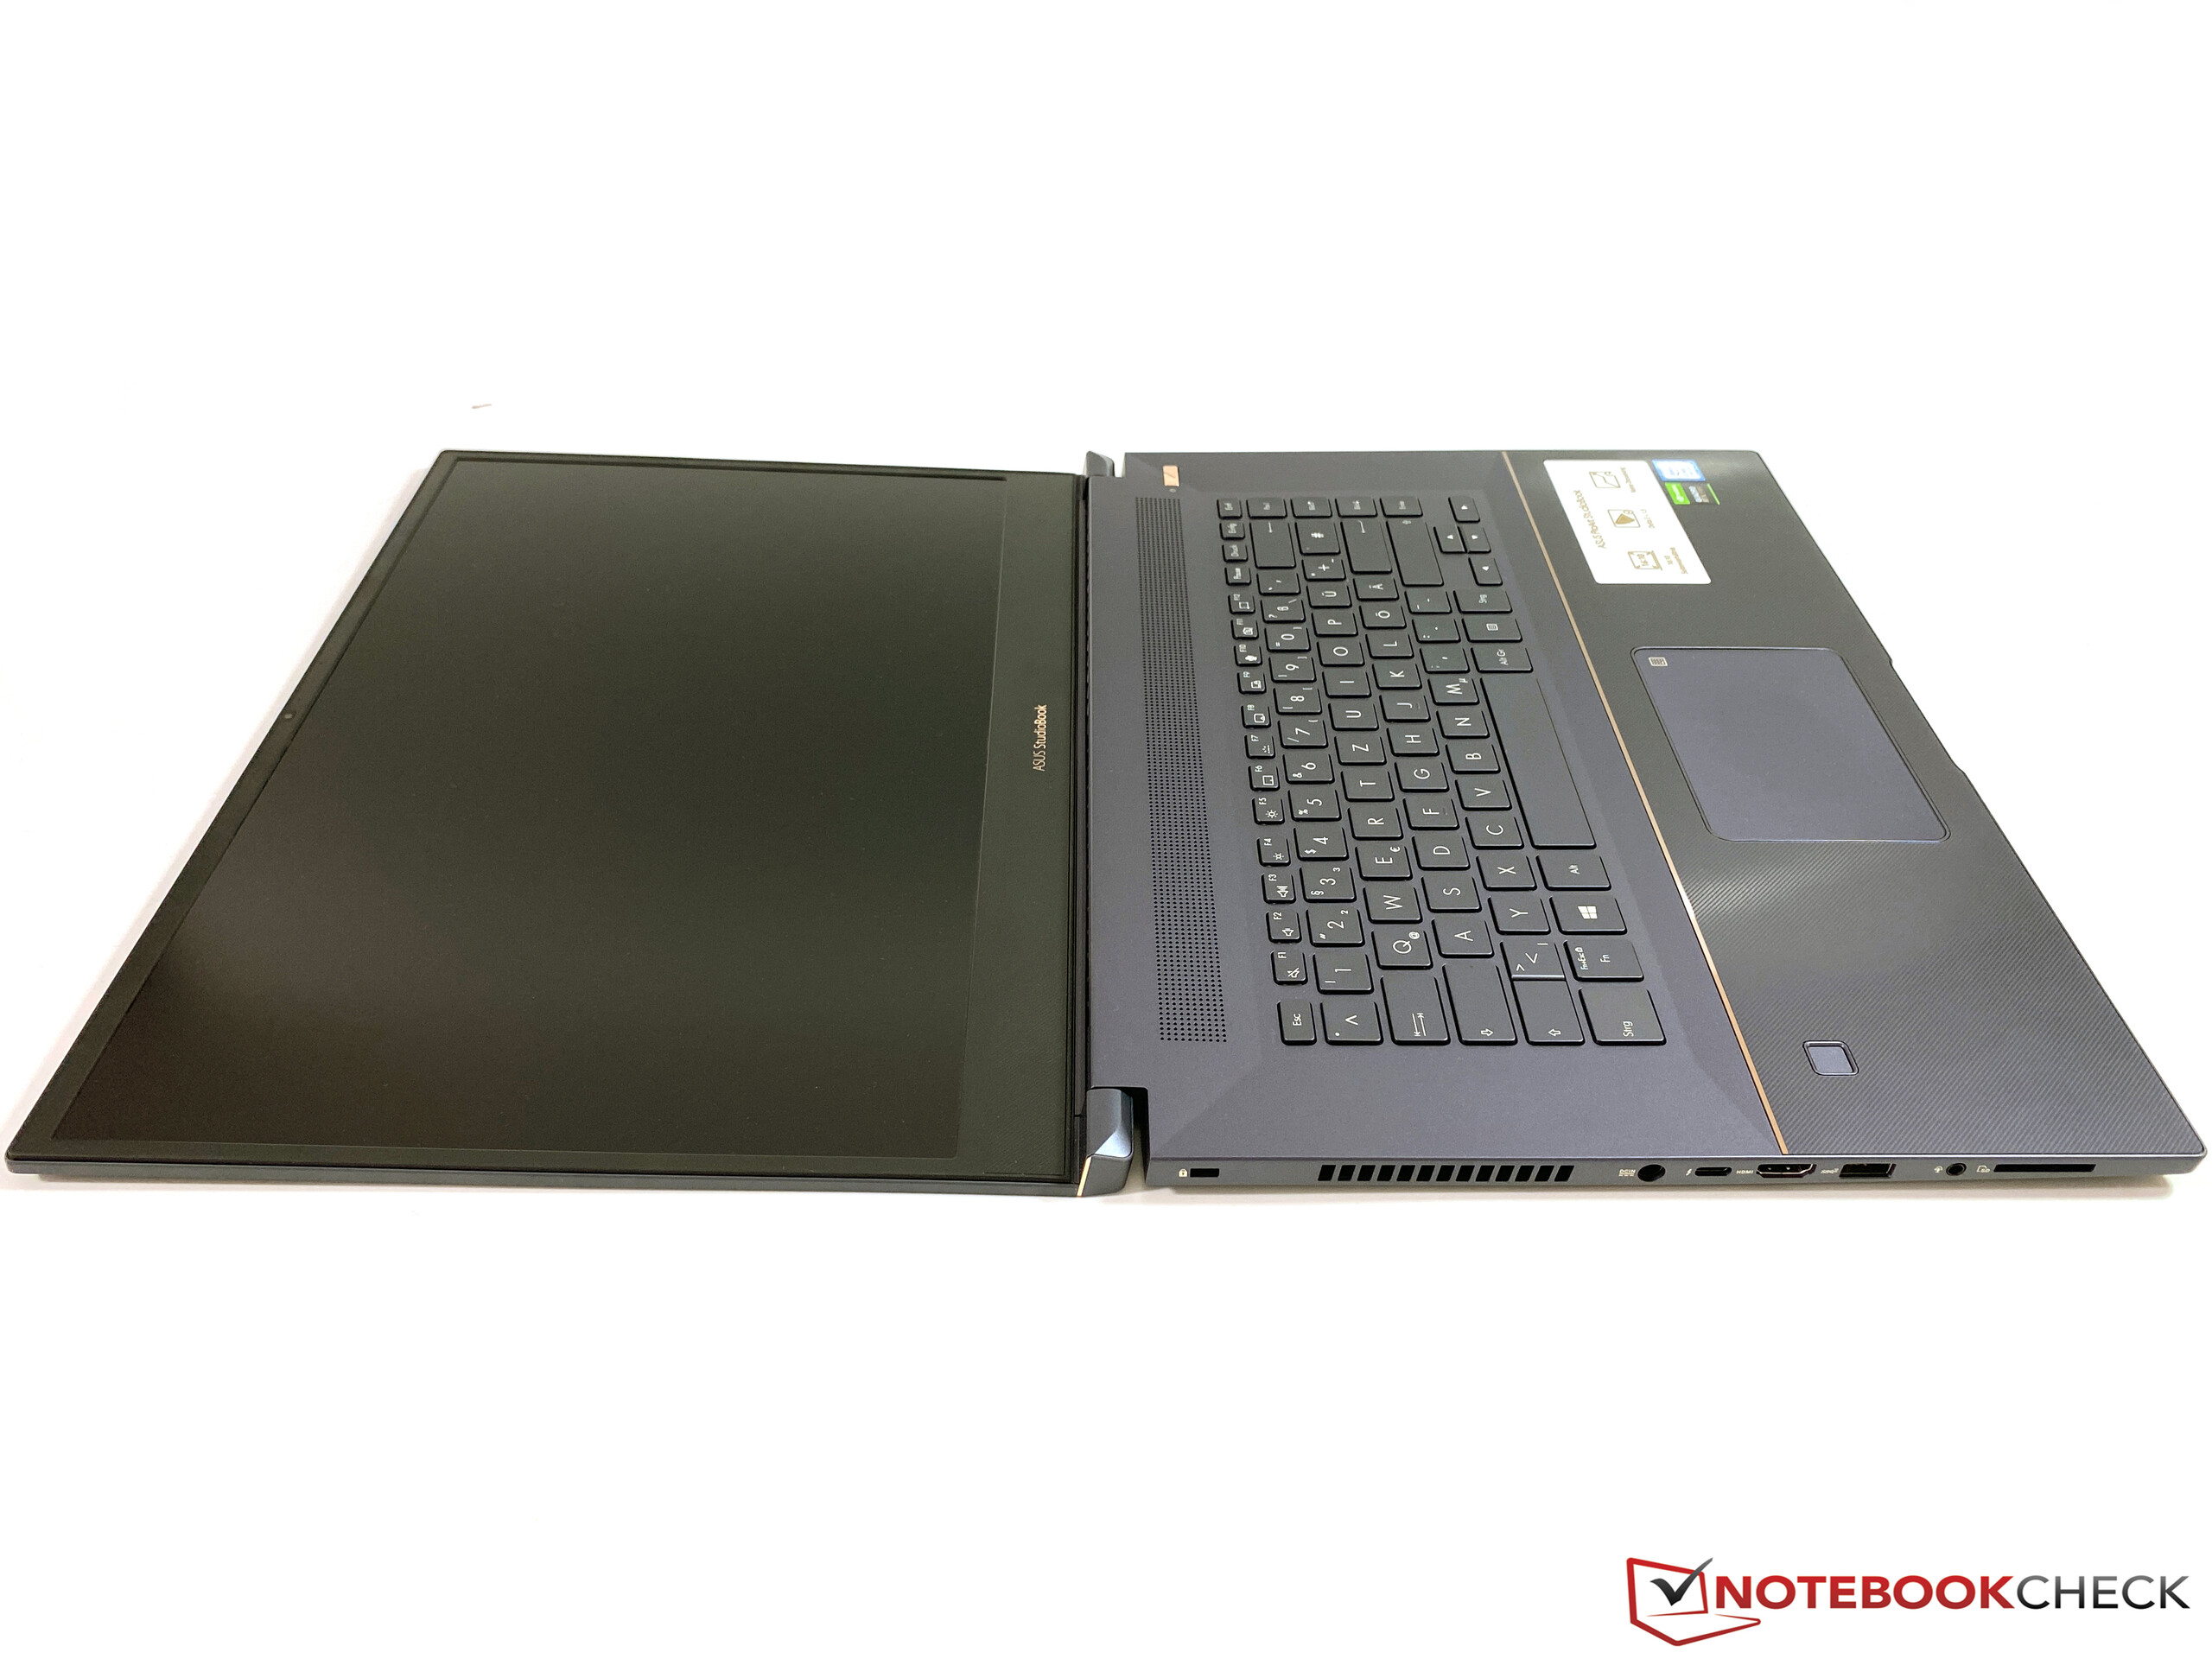
The chassis is slightly thinner towards the front so it appears even slimmer overall. The StudioBook Pro 17 is a bit narrower than its direct 17-inch competitor, but also a bit deeper in return. It is also very slim at just 1.84 cm (~0.724 inches). Apple's MacBook Pro 16 is obviously the most compact device here thanks to the smaller display.
Connectivity – StudioBook Pro with Thunderbolt 3
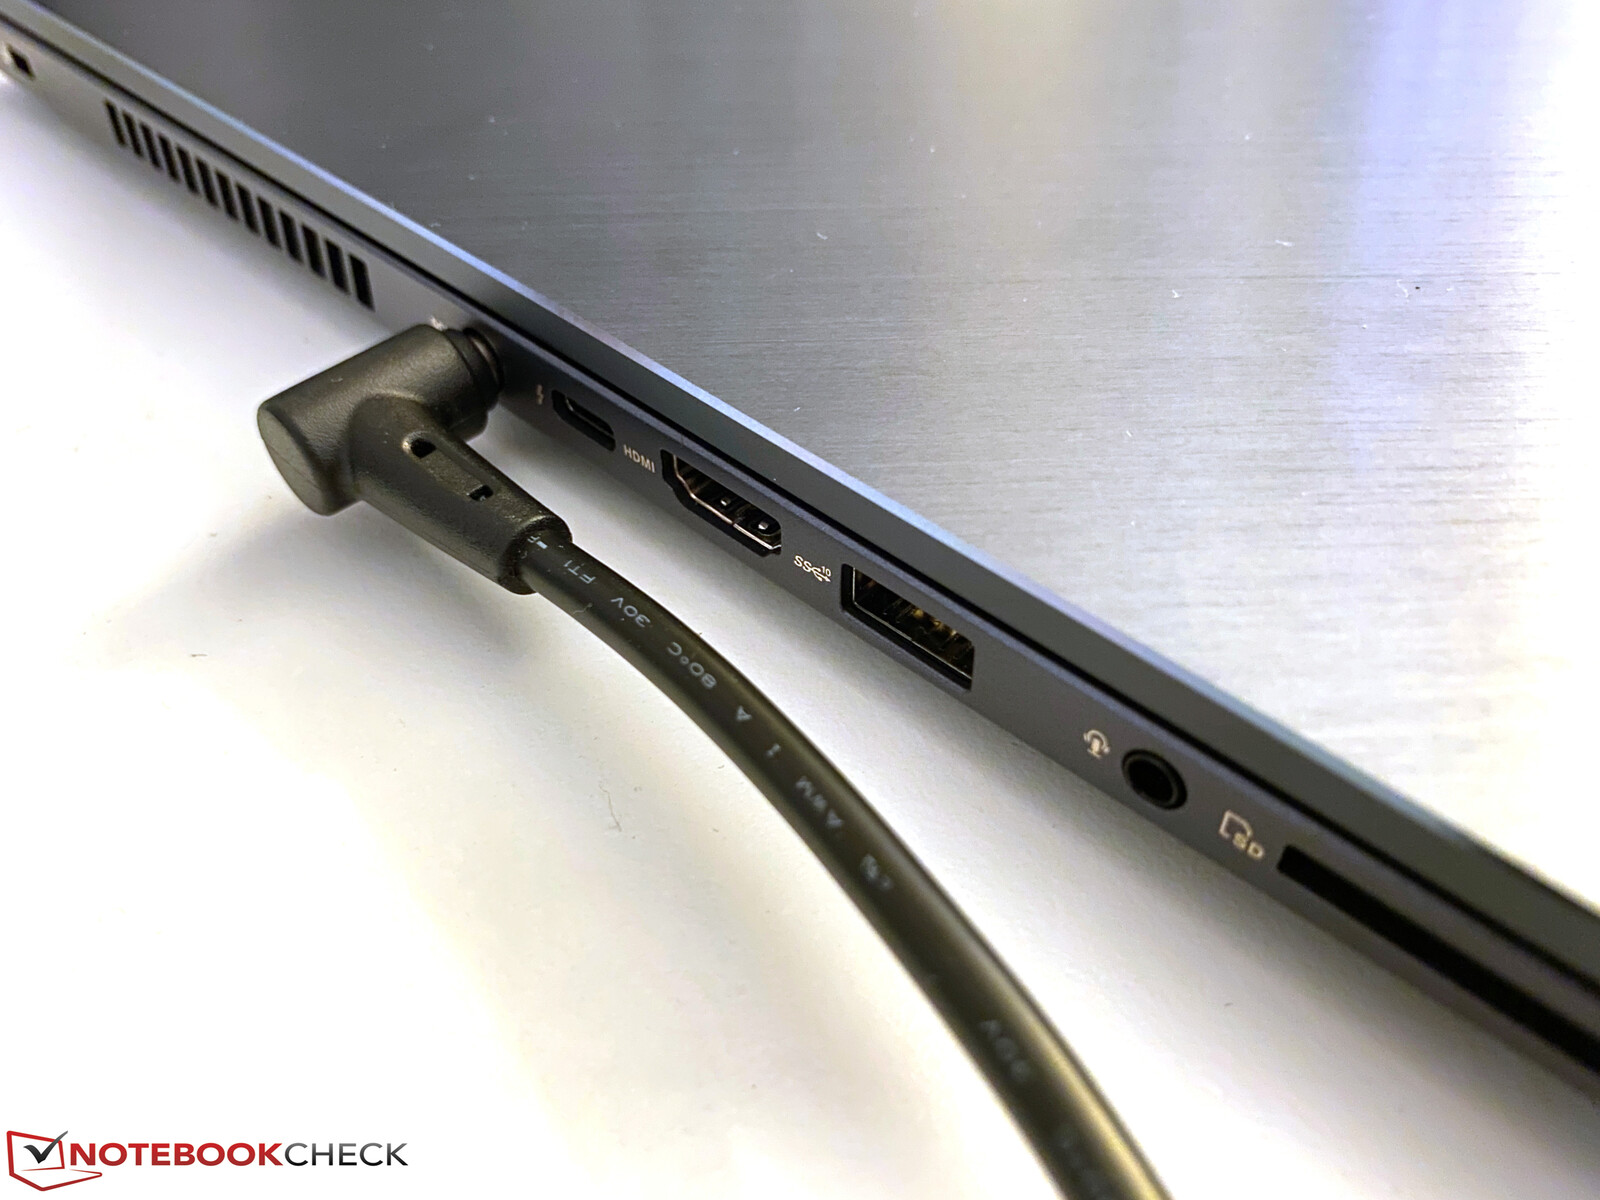
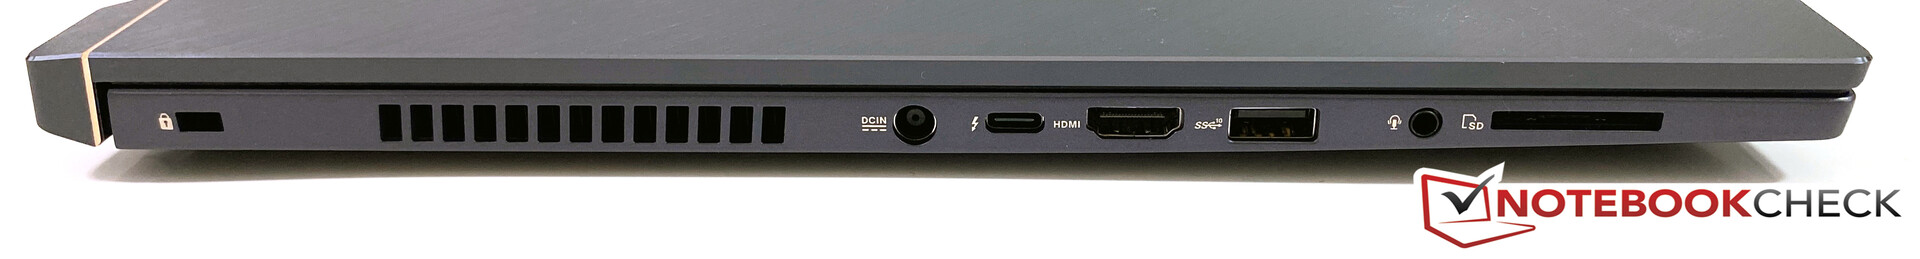
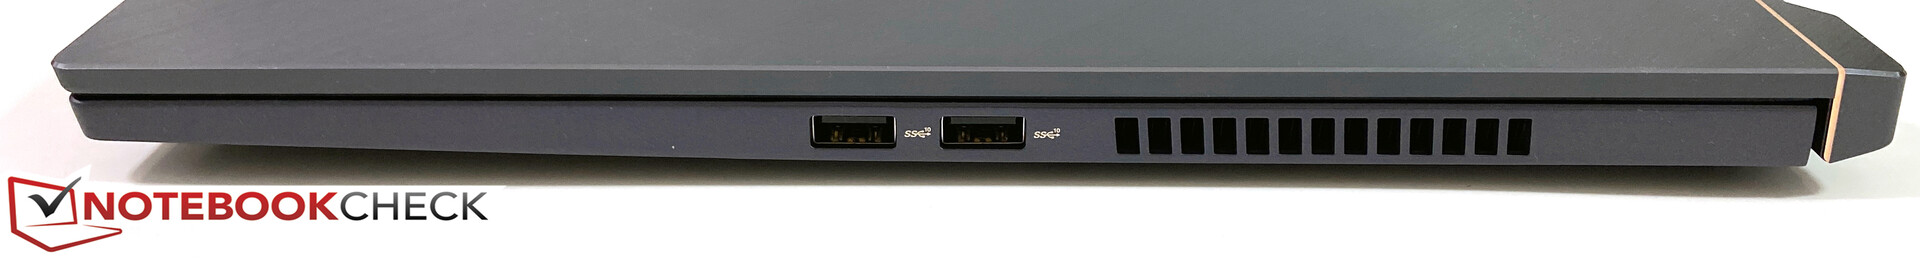
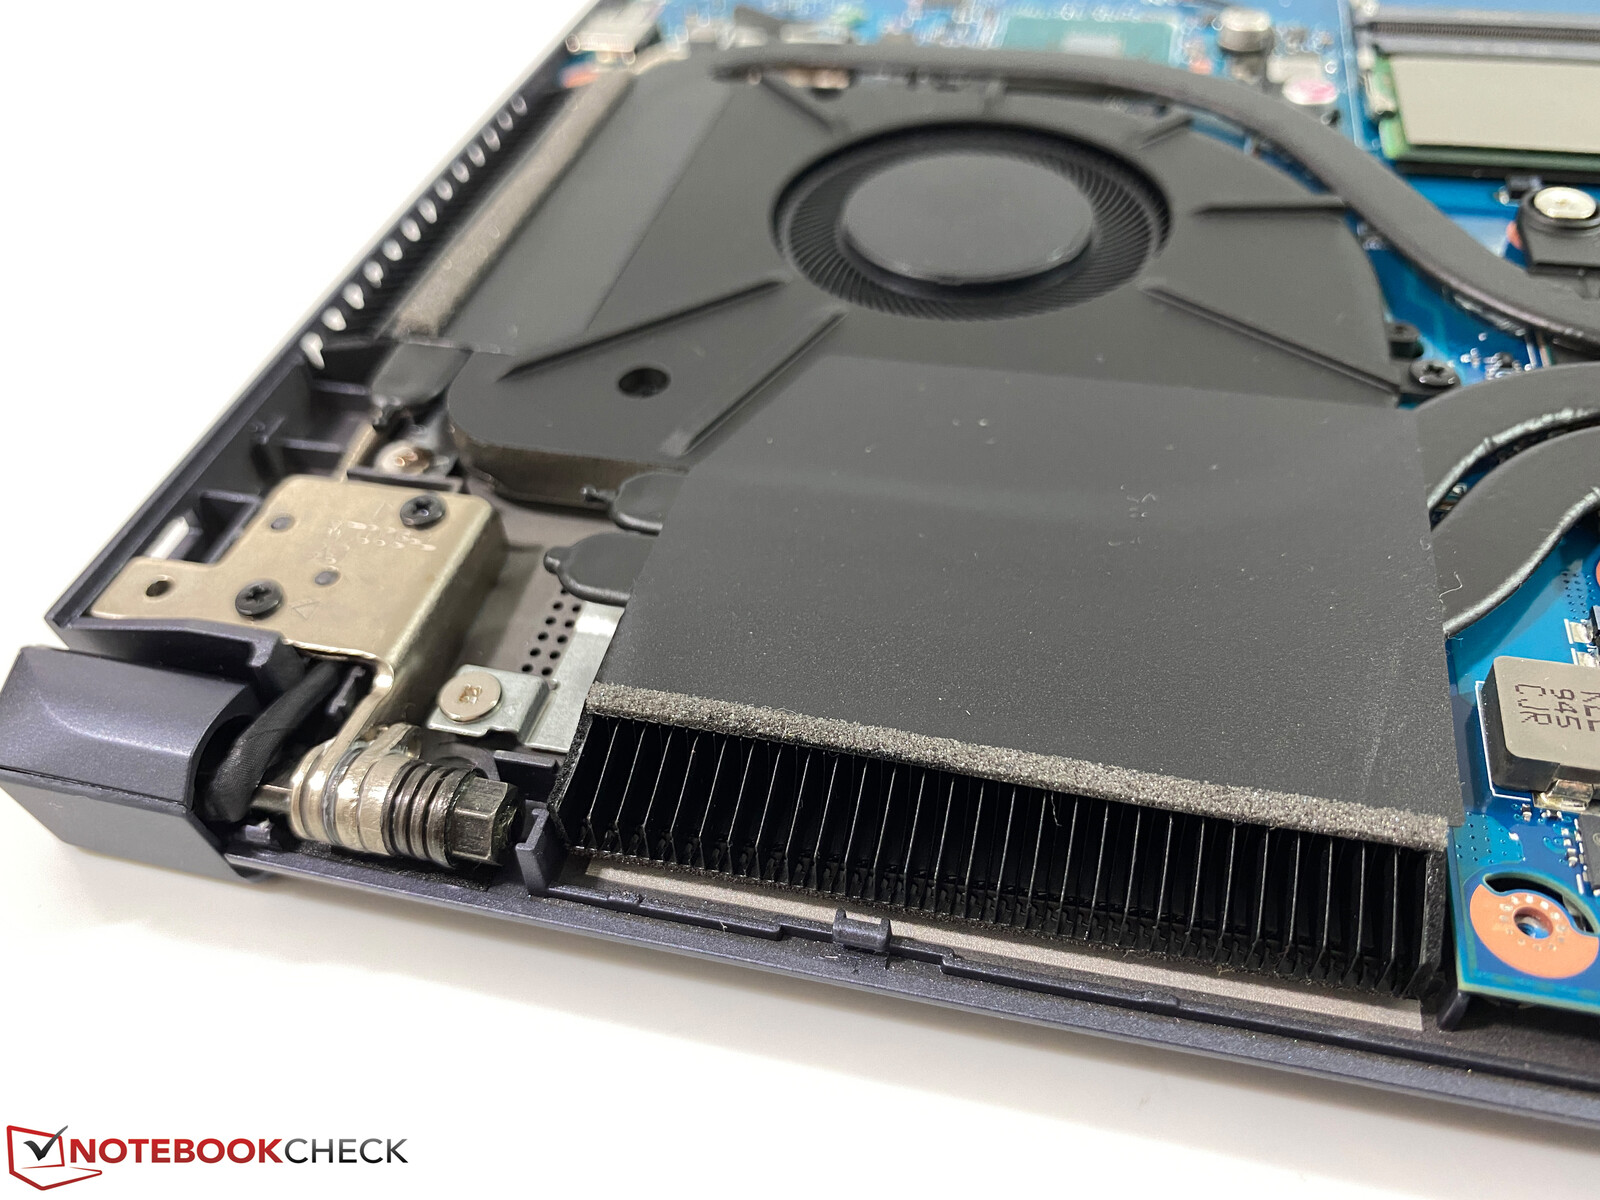
Both the rear and the two rear side areas are occupied by the cooling solution, so all the ports are limited to the center and front areas of the sides. This is not ideal in practice and especially the center power port in combination with the angled connector was often annoying during our review period. You either block some ports (USB-C and HMDI), or the power cable is sitting right in front of the cooling vent.
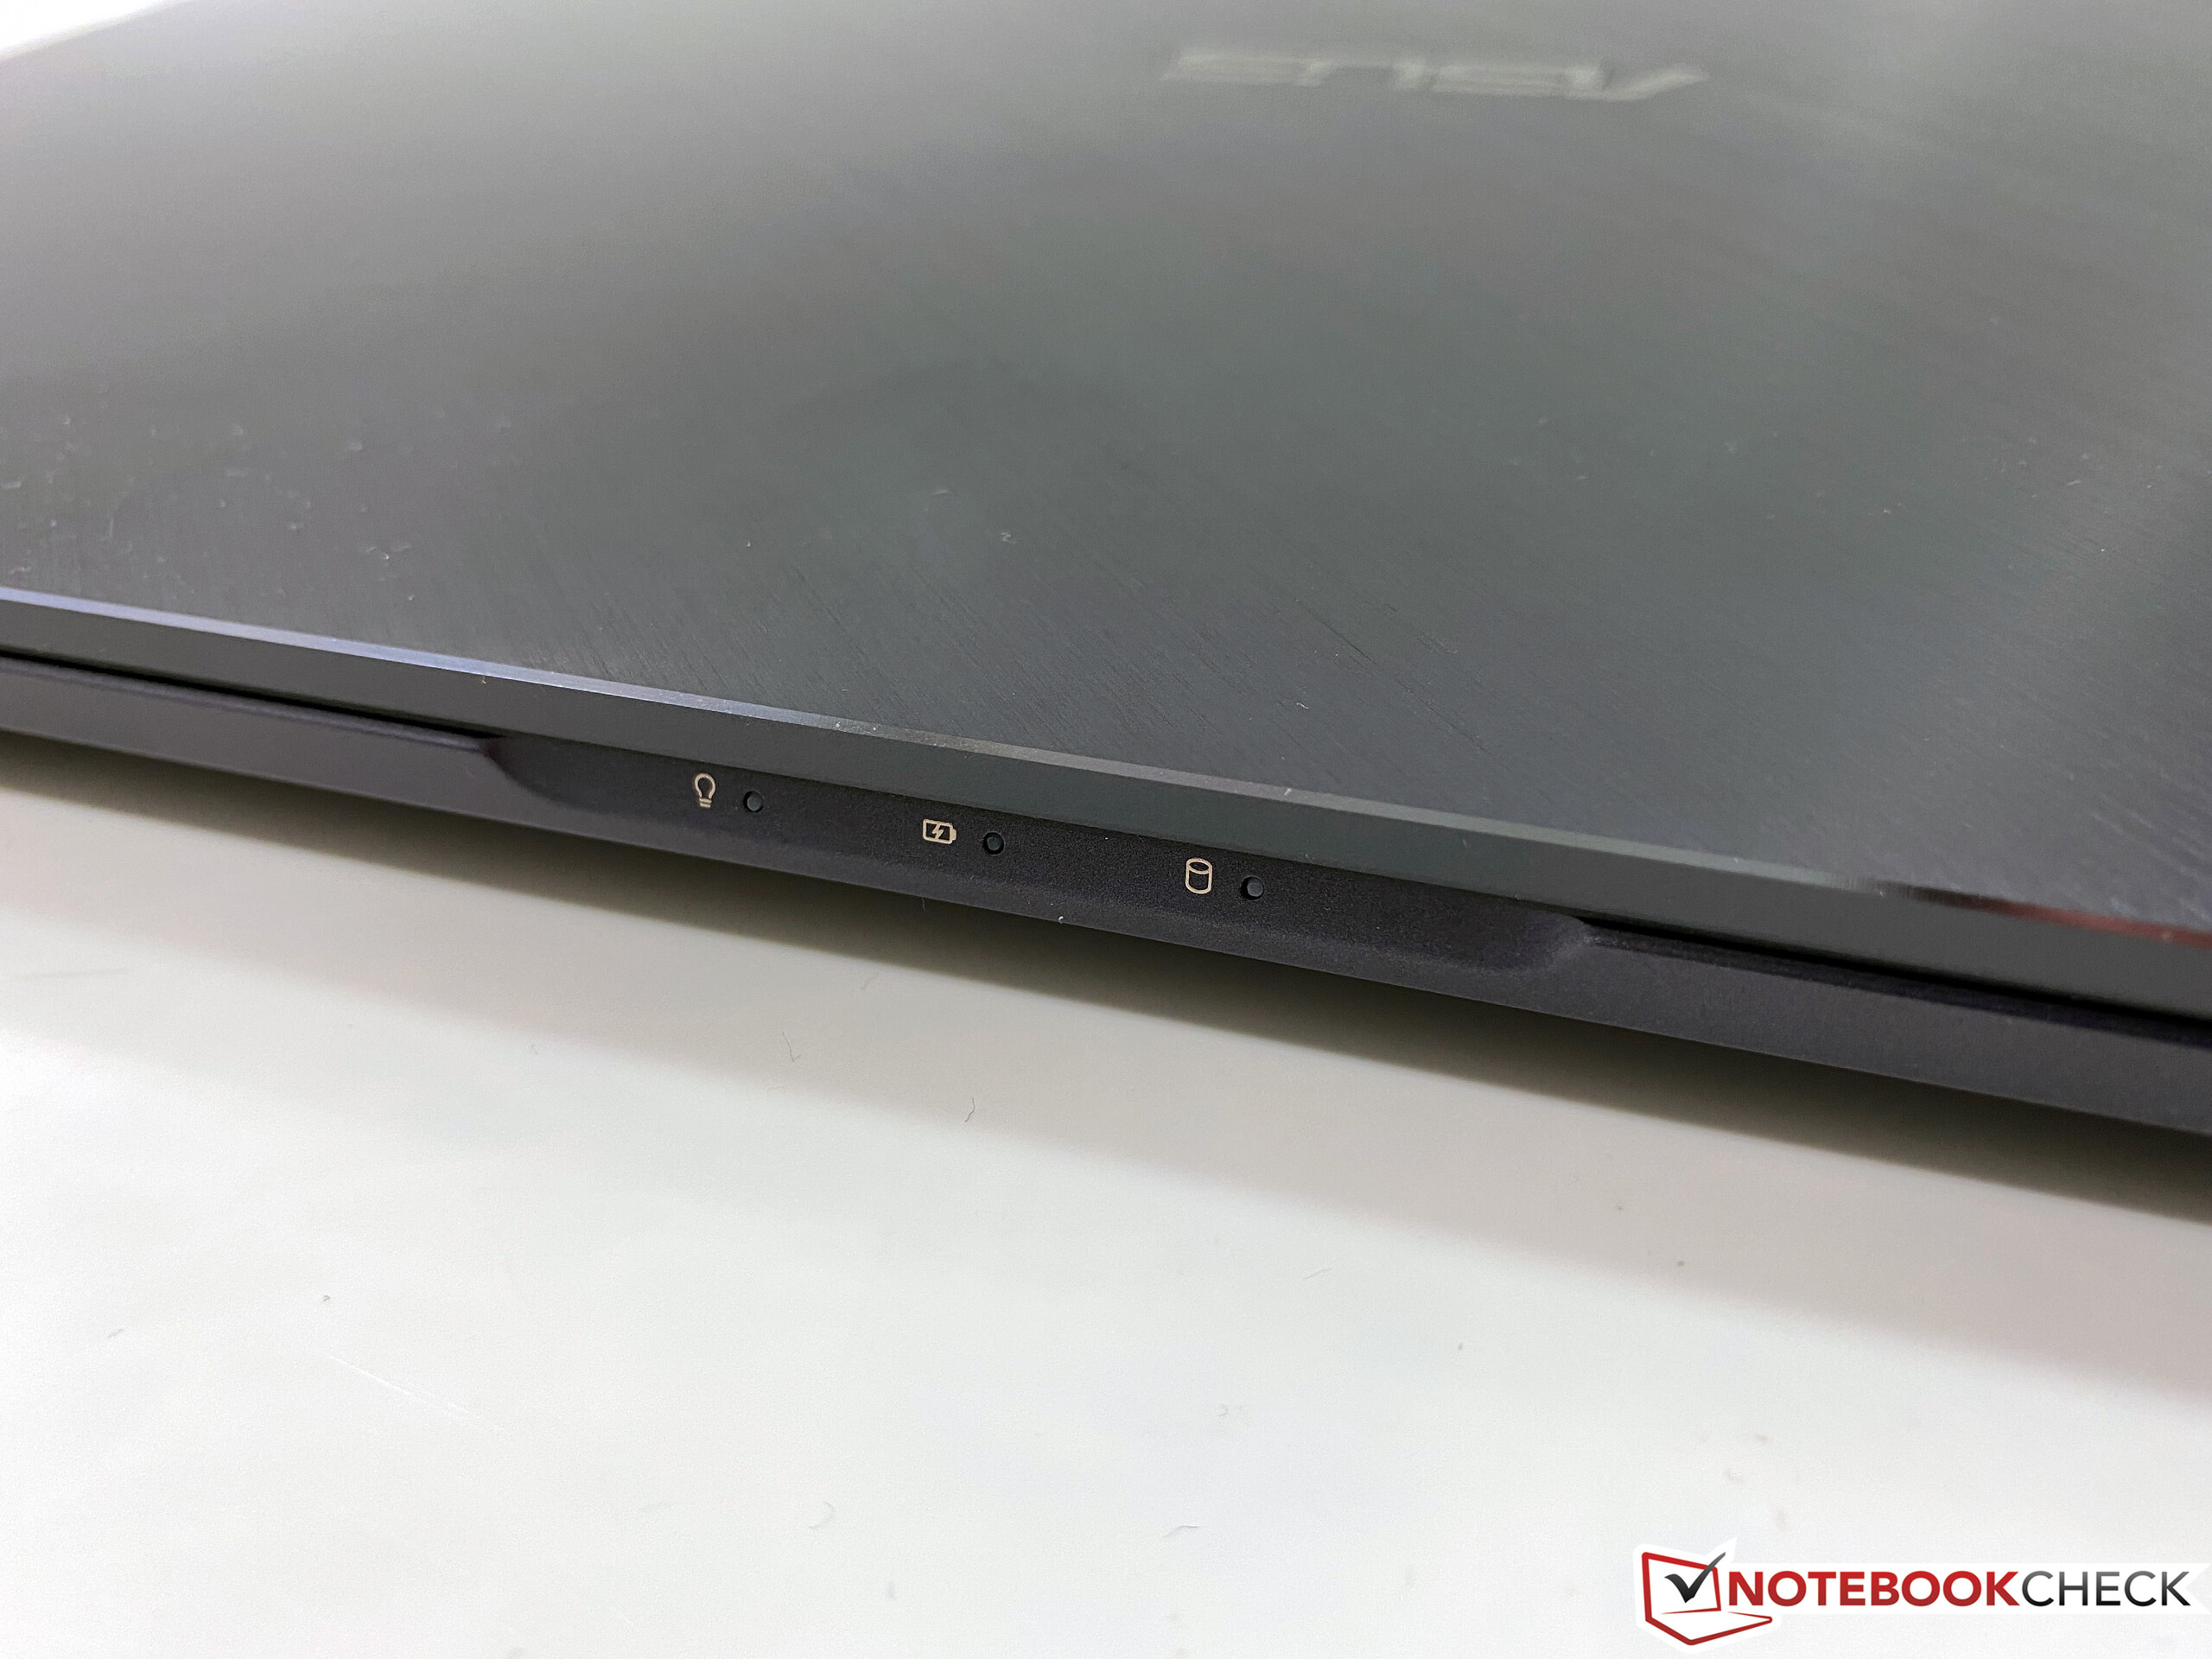
Otherwise, you get all important ports and the Thunderbolt 3 port supports the full bandwidth (40 Gbps). We also like the three status LEDs at the front of the system and the box includes a USB-Ethernet adapter.
SDCardreader
Asus implements a very fast card reader for full-size SD cards. We manage to measure transfer rates of up to 244 MB/s in combination with our reference card from Toshiba (Exceria Pro SDXC 64 GB UHS-II).
| SD Card Reader | |
| average JPG Copy Test (av. of 3 runs) | |
| Gigabyte Aero 17 HDR XB (Toshiba Exceria Pro SDXC 64 GB UHS-II) | |
| Asus ProArt StudioBook Pro 17 W700G3T (Toshiba Exceria Pro SDXC 64 GB UHS-II) | |
| MSI WS75 9TL-636 (Toshiba Exceria Pro M501 64 GB UHS-II) | |
| Average of class Workstation (49.6 - 681, n=14, last 2 years) | |
| maximum AS SSD Seq Read Test (1GB) | |
| Gigabyte Aero 17 HDR XB (Toshiba Exceria Pro SDXC 64 GB UHS-II) | |
| Asus ProArt StudioBook Pro 17 W700G3T (Toshiba Exceria Pro SDXC 64 GB UHS-II) | |
| Average of class Workstation (87.6 - 1455, n=14, last 2 years) | |
| MSI WS75 9TL-636 (Toshiba Exceria Pro M501 64 GB UHS-II) | |
Communication – Wi-Fi 6 for the workstation
Intel's AX200 is a very modern and fast Wi-Fi 6 module, which worked very well in our review. Our test with the reference router from Netgear (Nighthawk RAX120) determines transfer rates of almost 1.8 Gbps. We did not experience any issues in combination with the Netgear router or an AVM Fritz!Box 7490, either.


Warranty
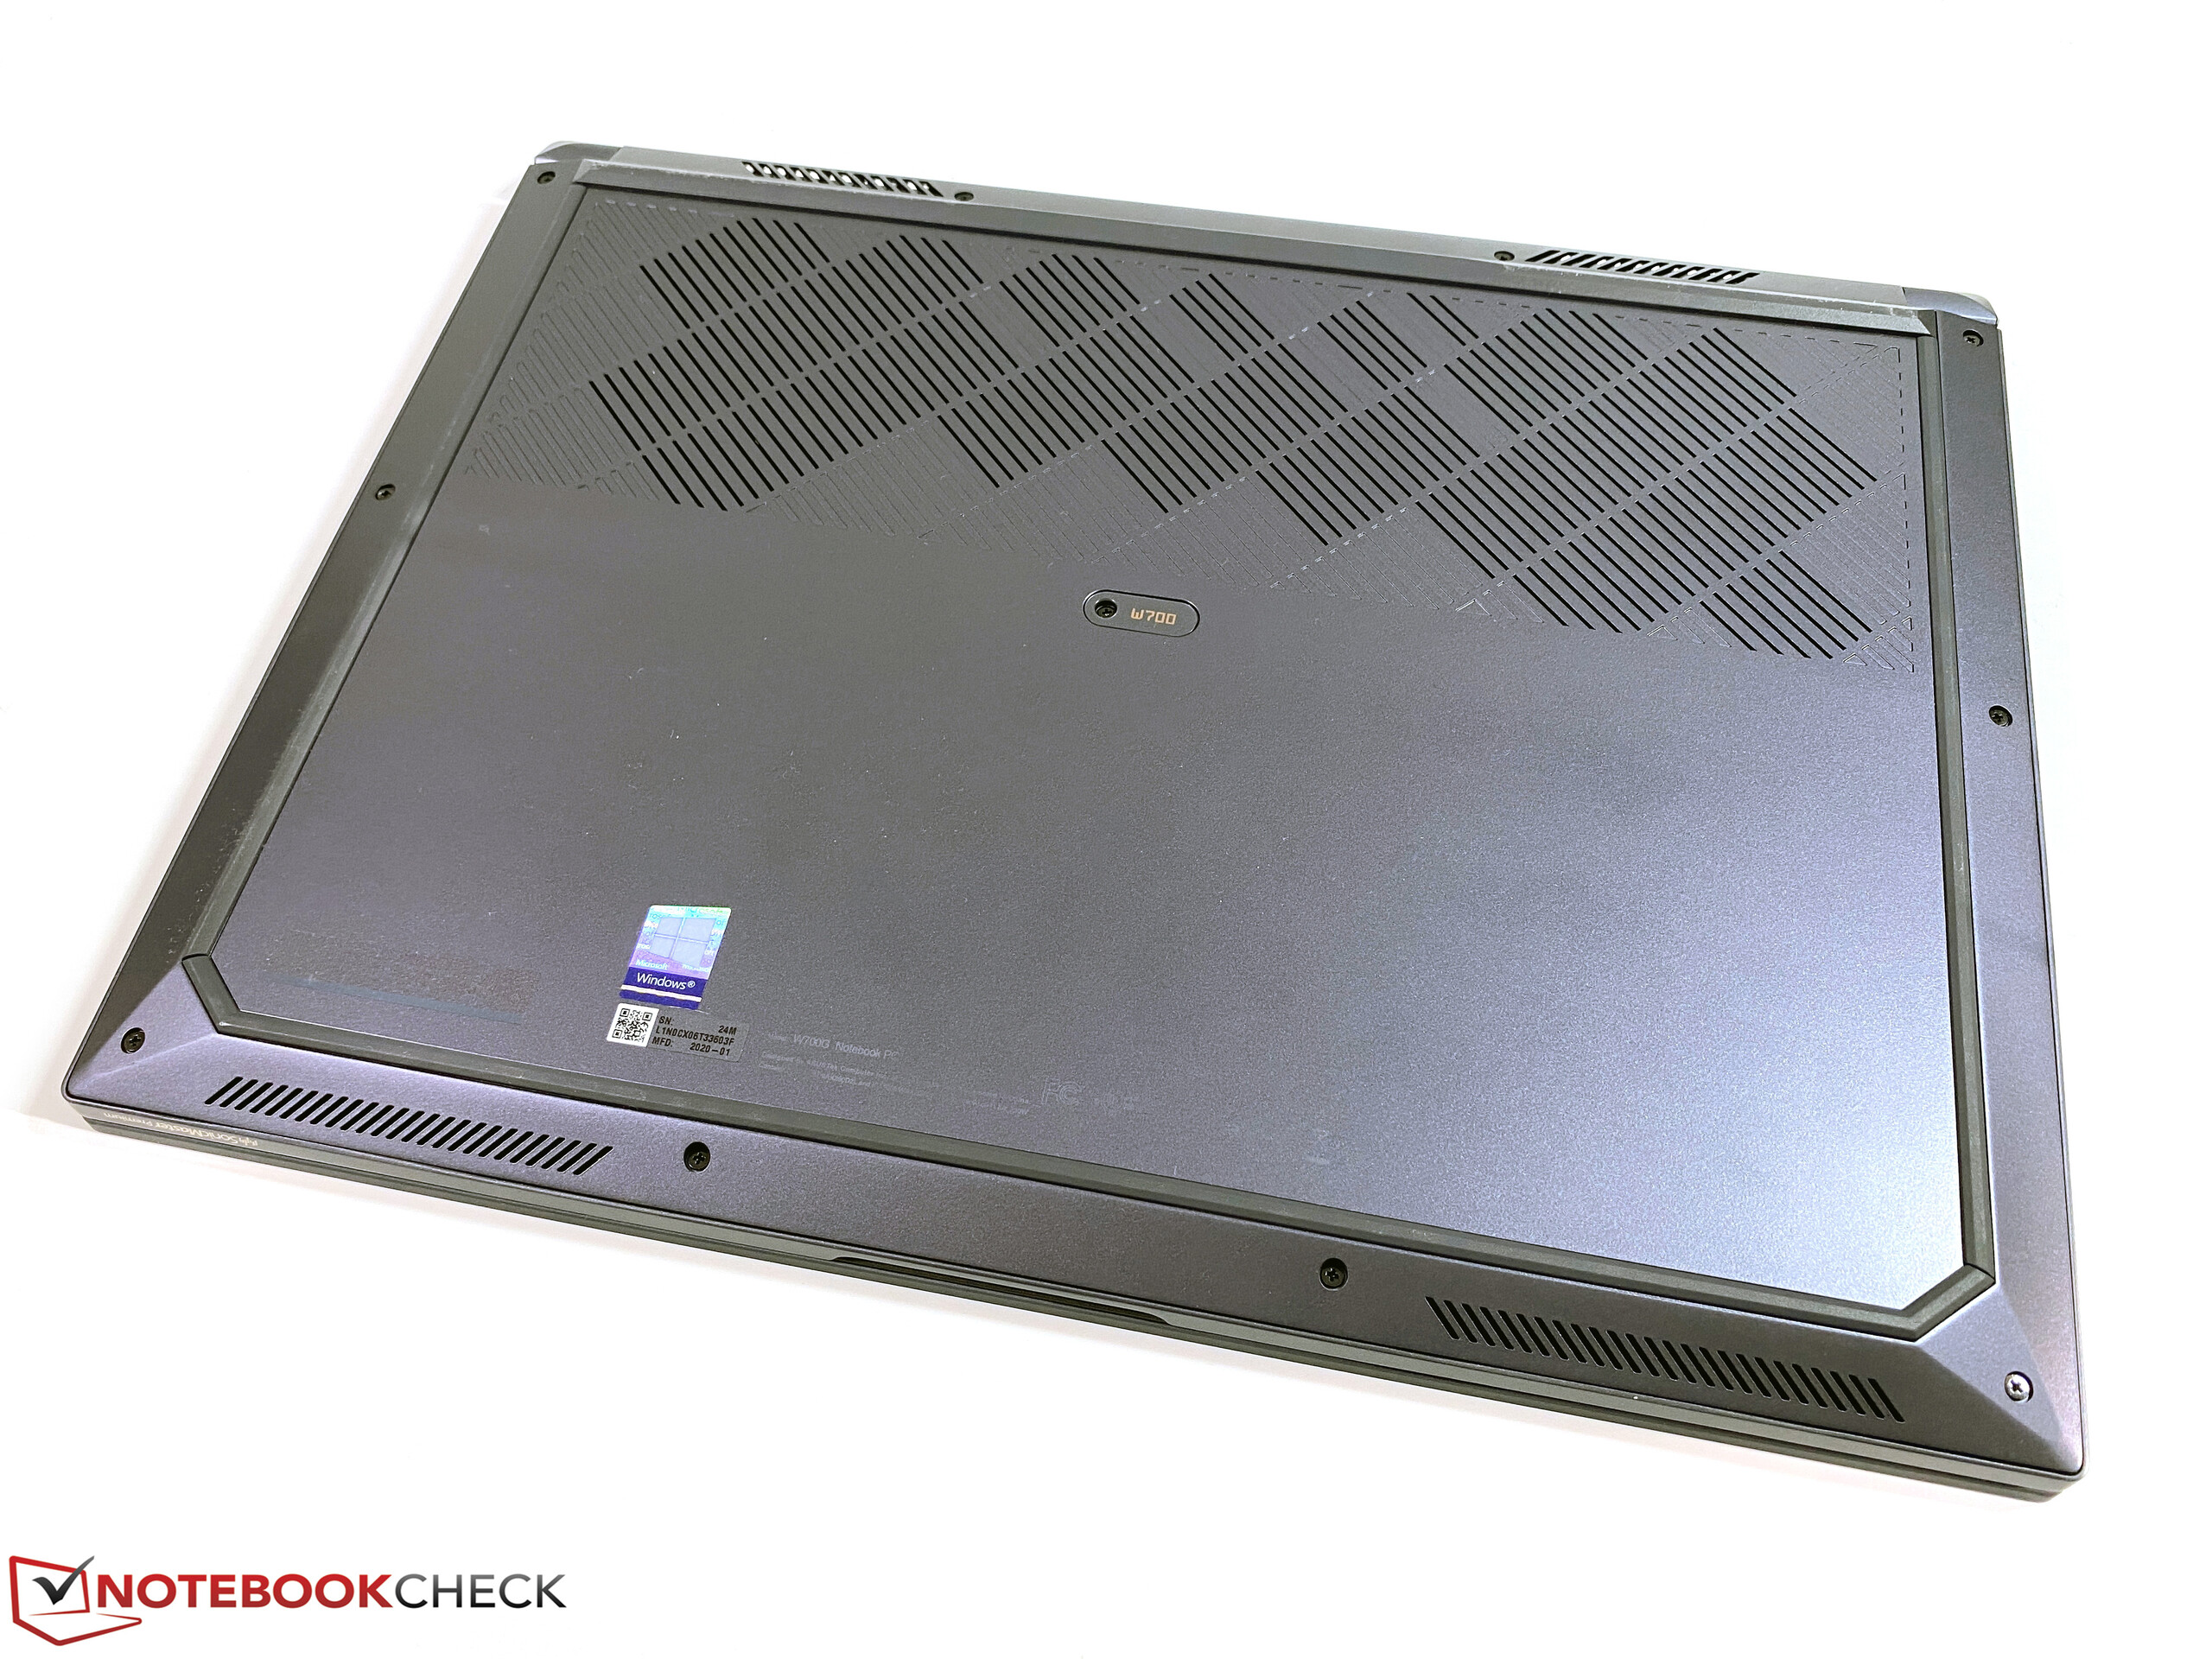
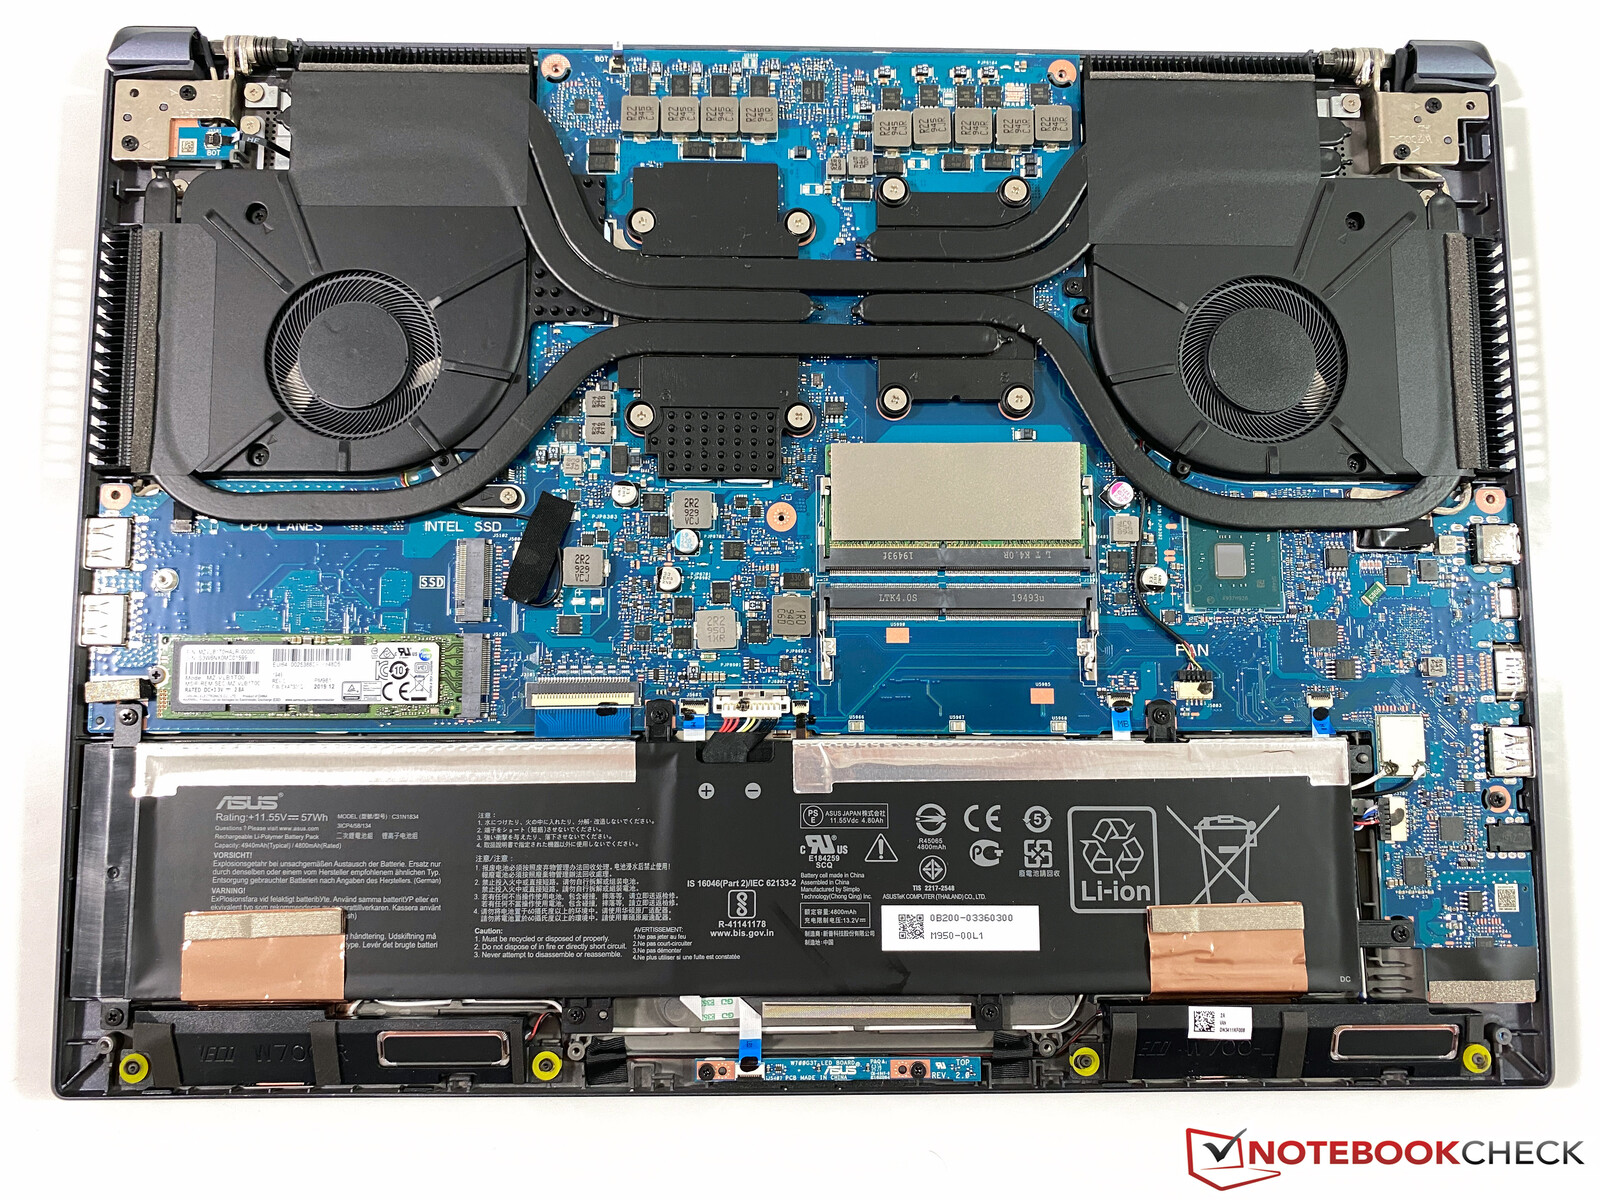
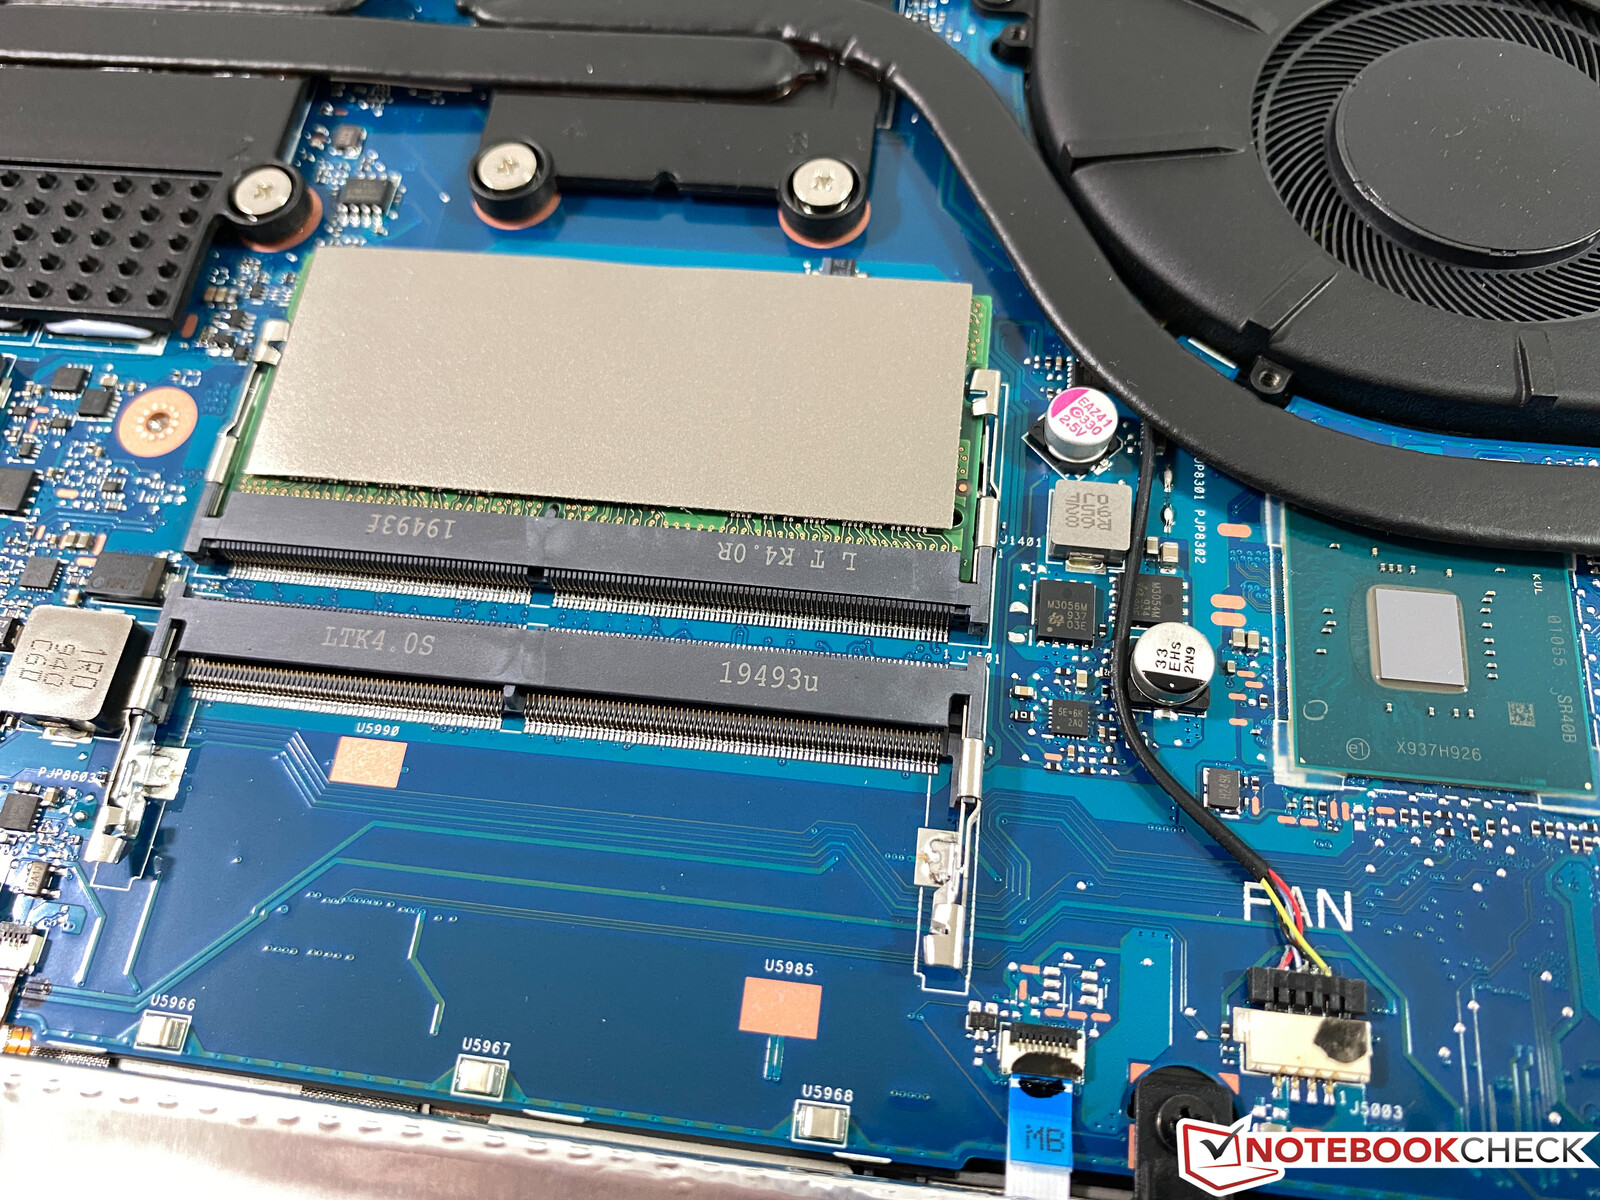
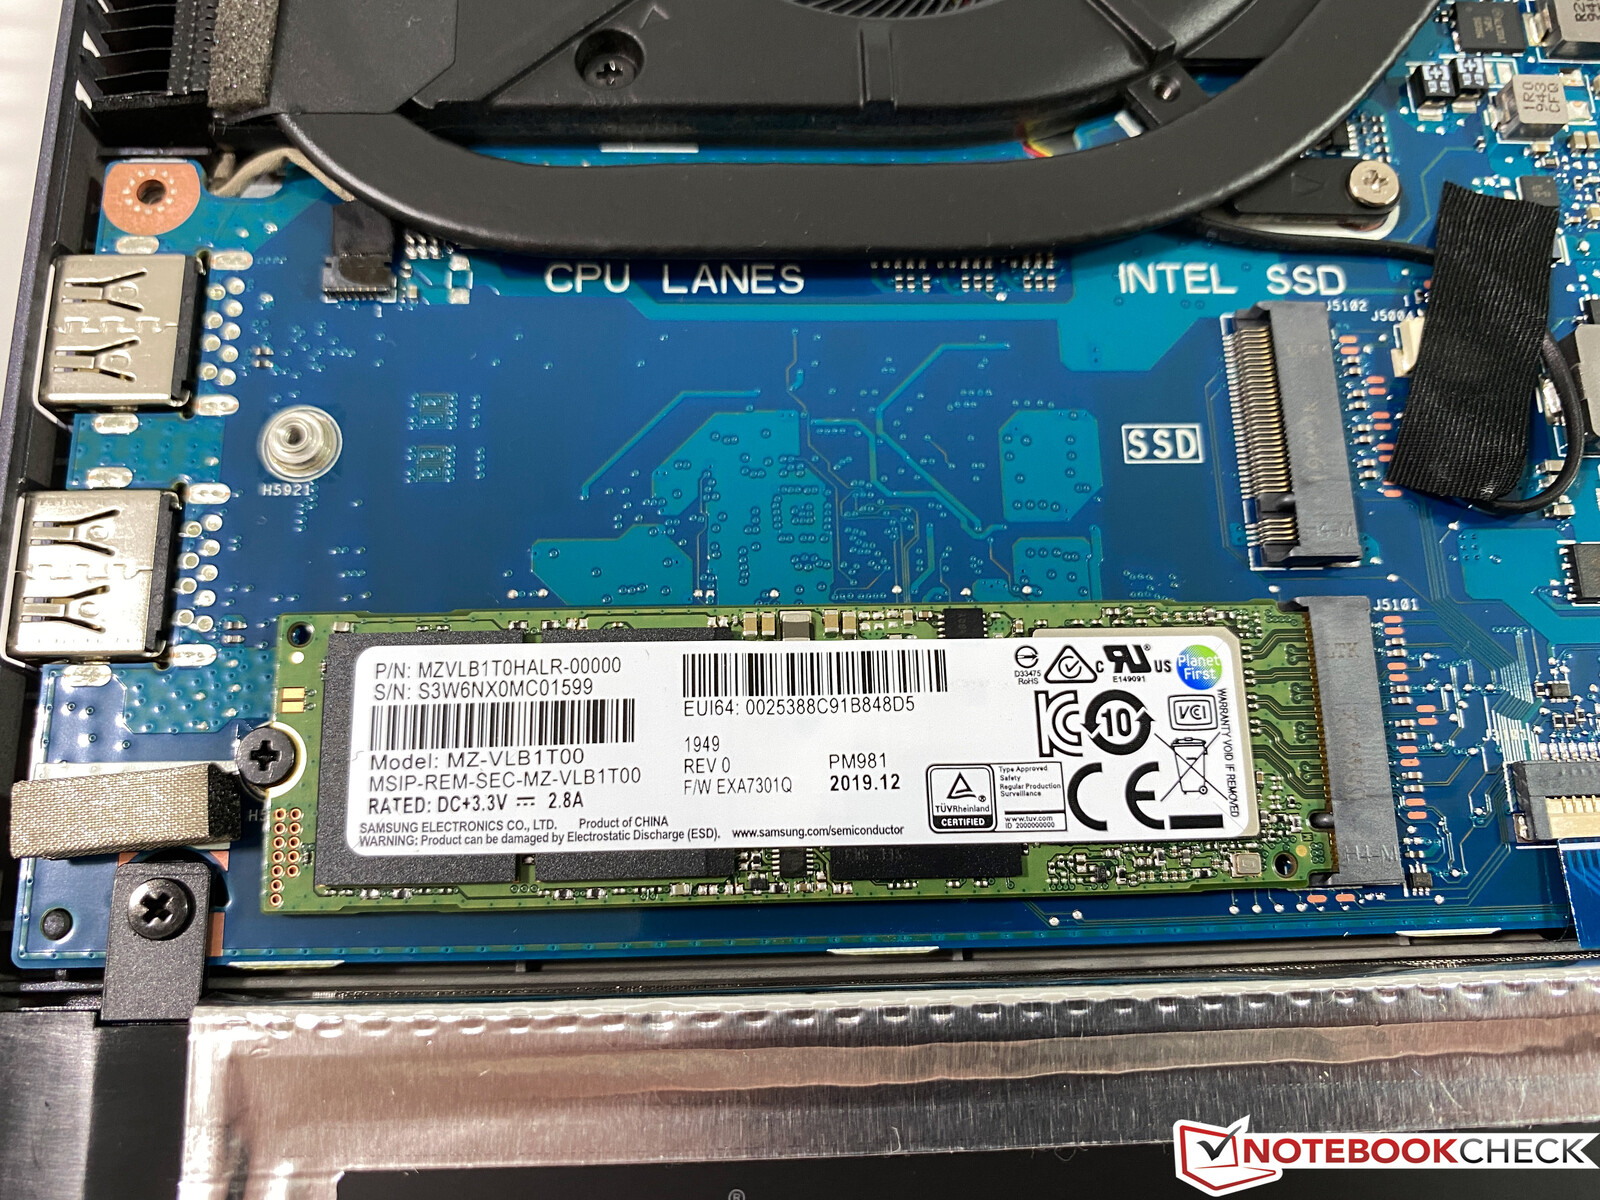
It is pretty easy to remove the whole bottom cover, which gives you access to the two RAM slots, two M.2-SSD slots as well as the battery.
Warranty
The StudioBook Pro 17 is shipped with a two-year send-in warranty by default, but it is possible to extend the warranty period to three years.
Input Devices
Keyboard
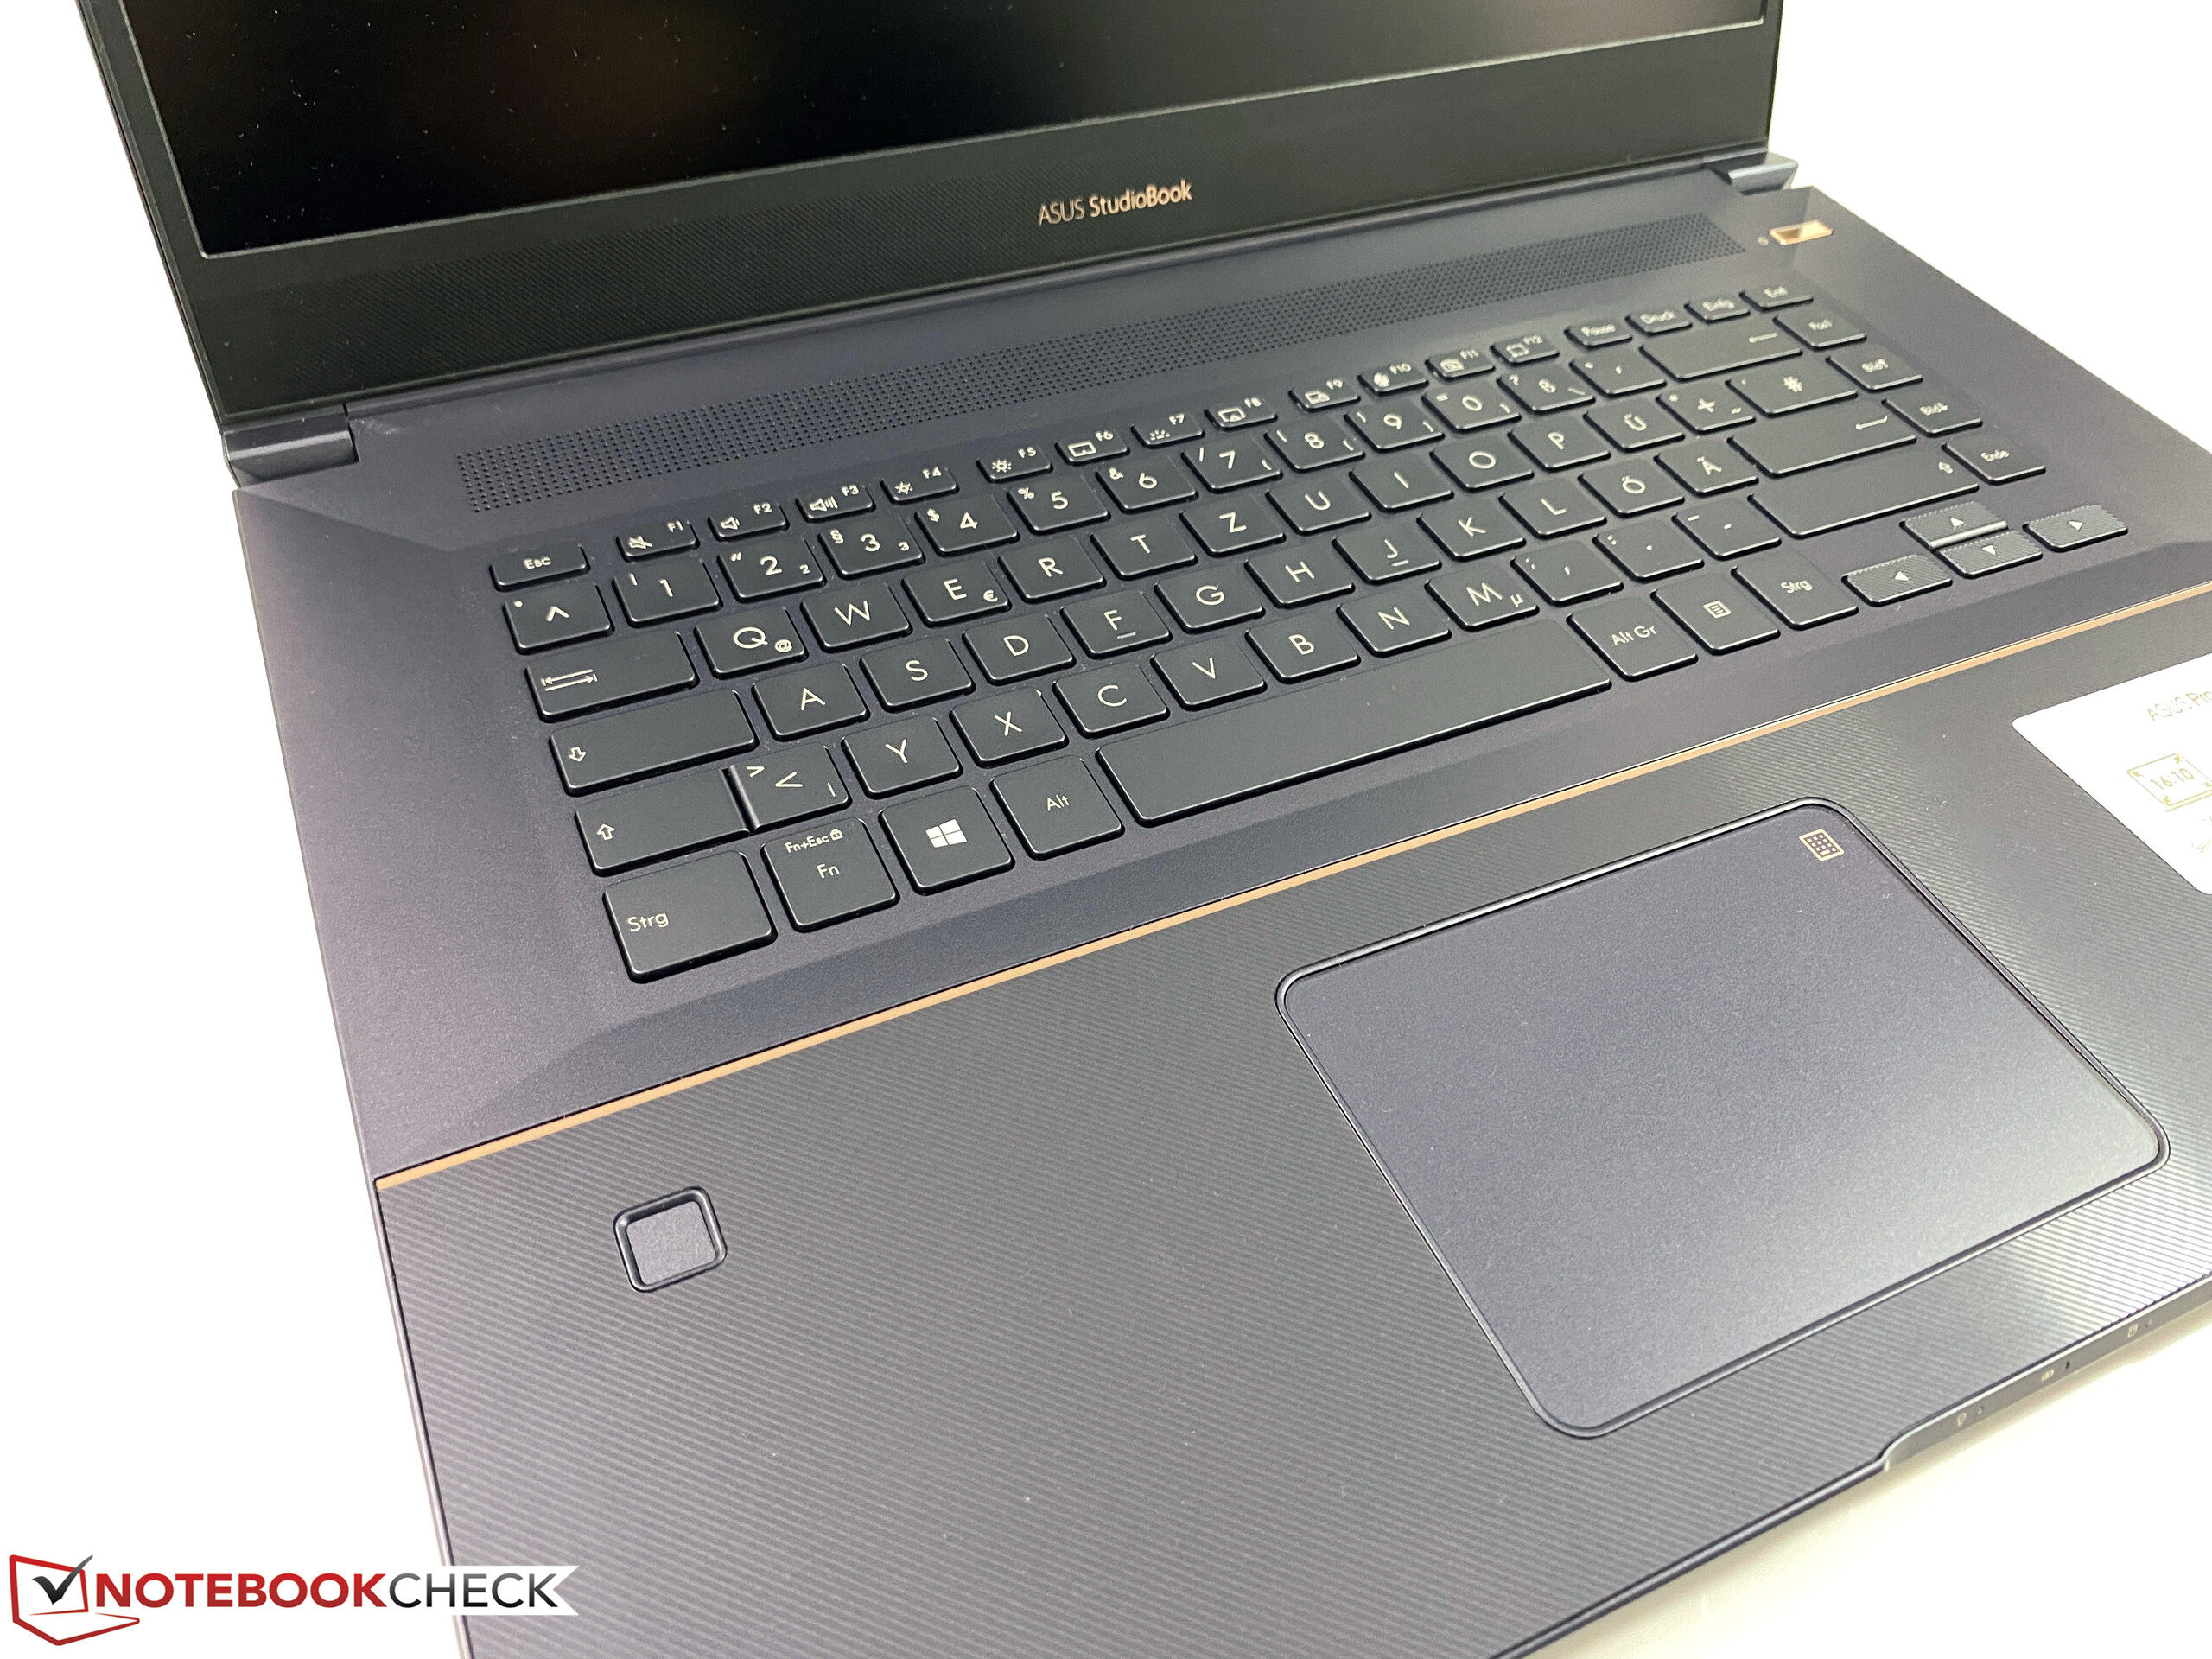
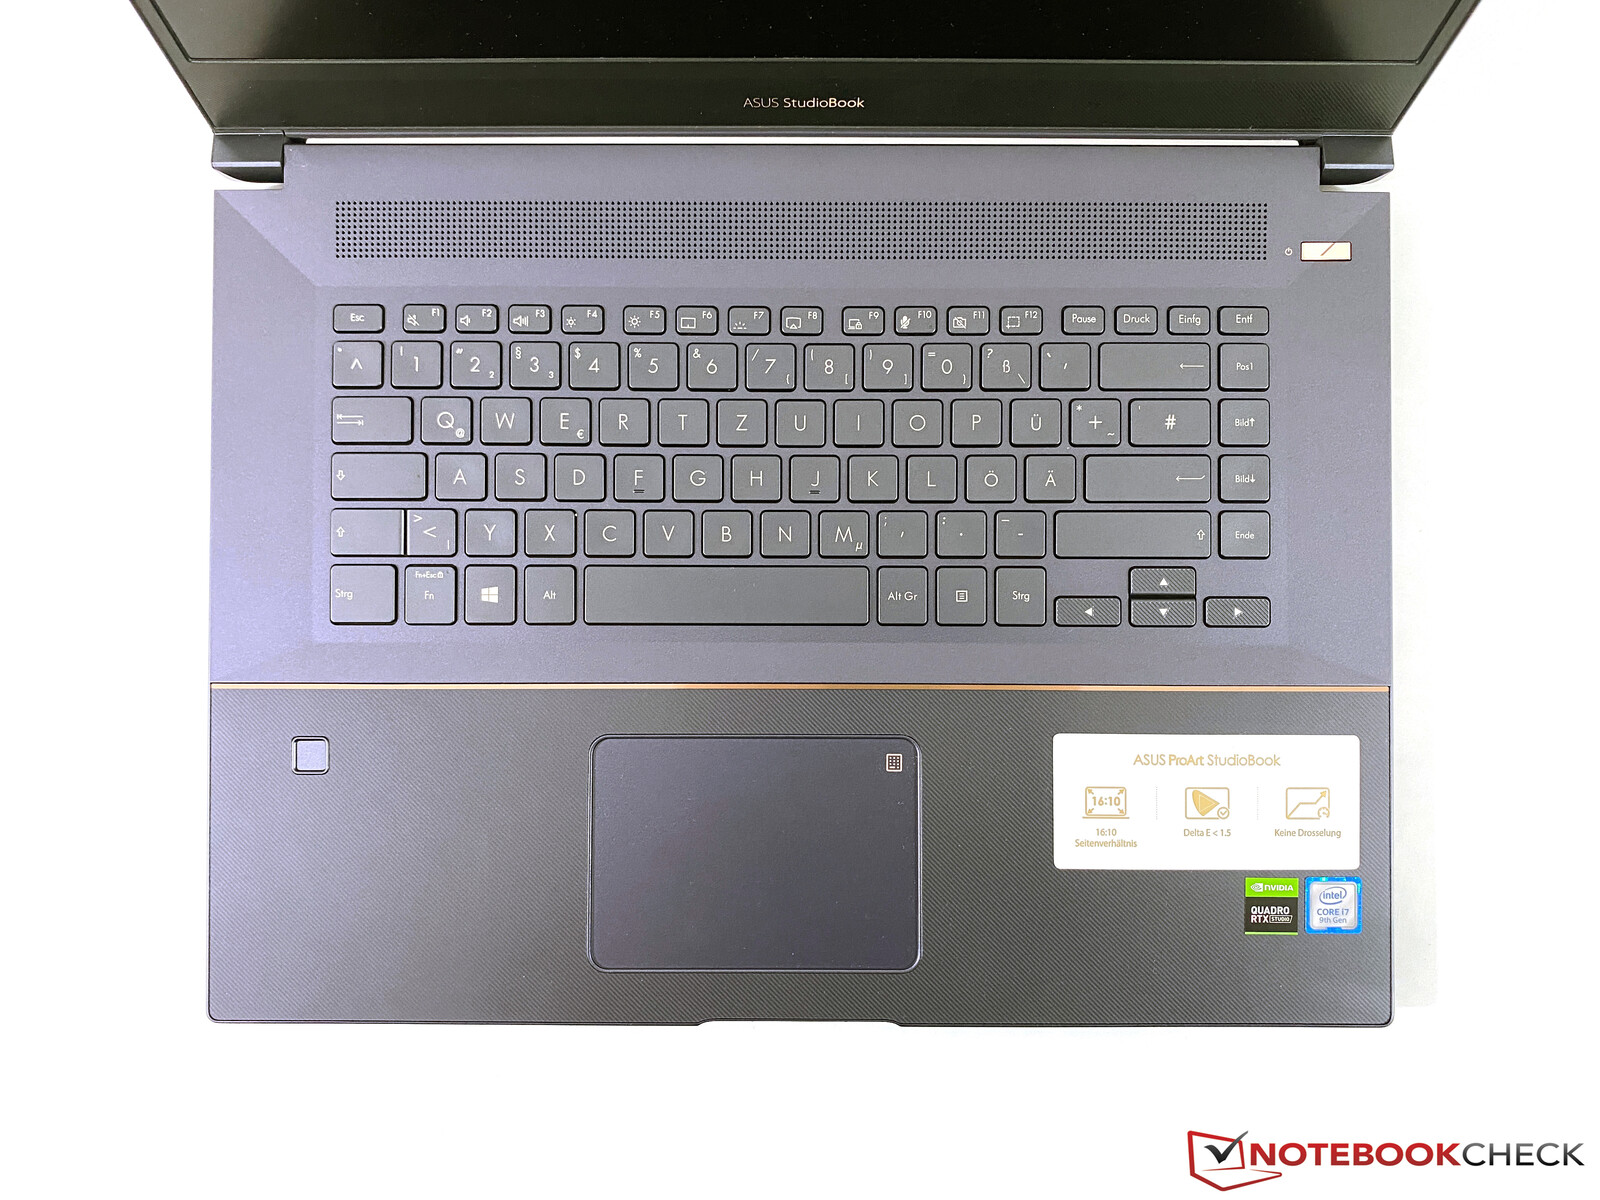
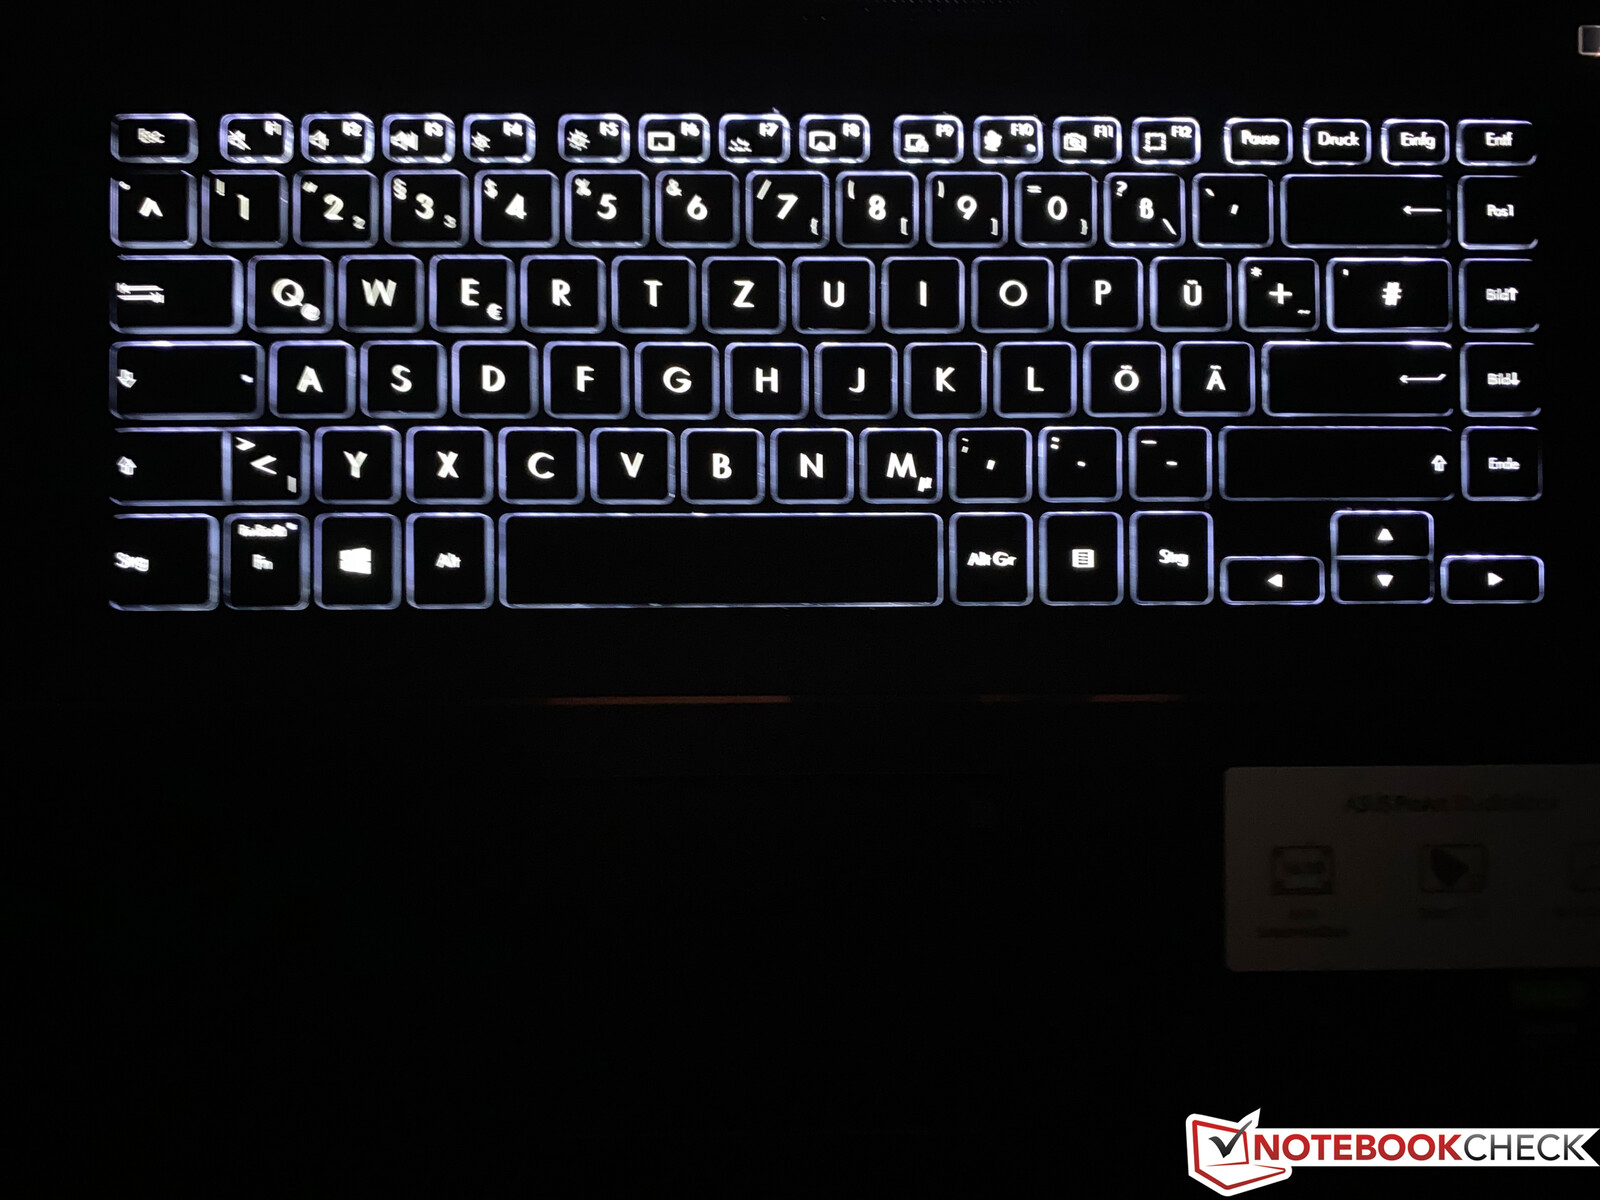
The illuminated keyboard leaves a good impression during typing with its 1.4 mm key travel and decent feedback. The keys are not too loud, either, but this only applies for the regular keys. The space bar of our unit was pretty clattery, especially when we triggered it at the sides.
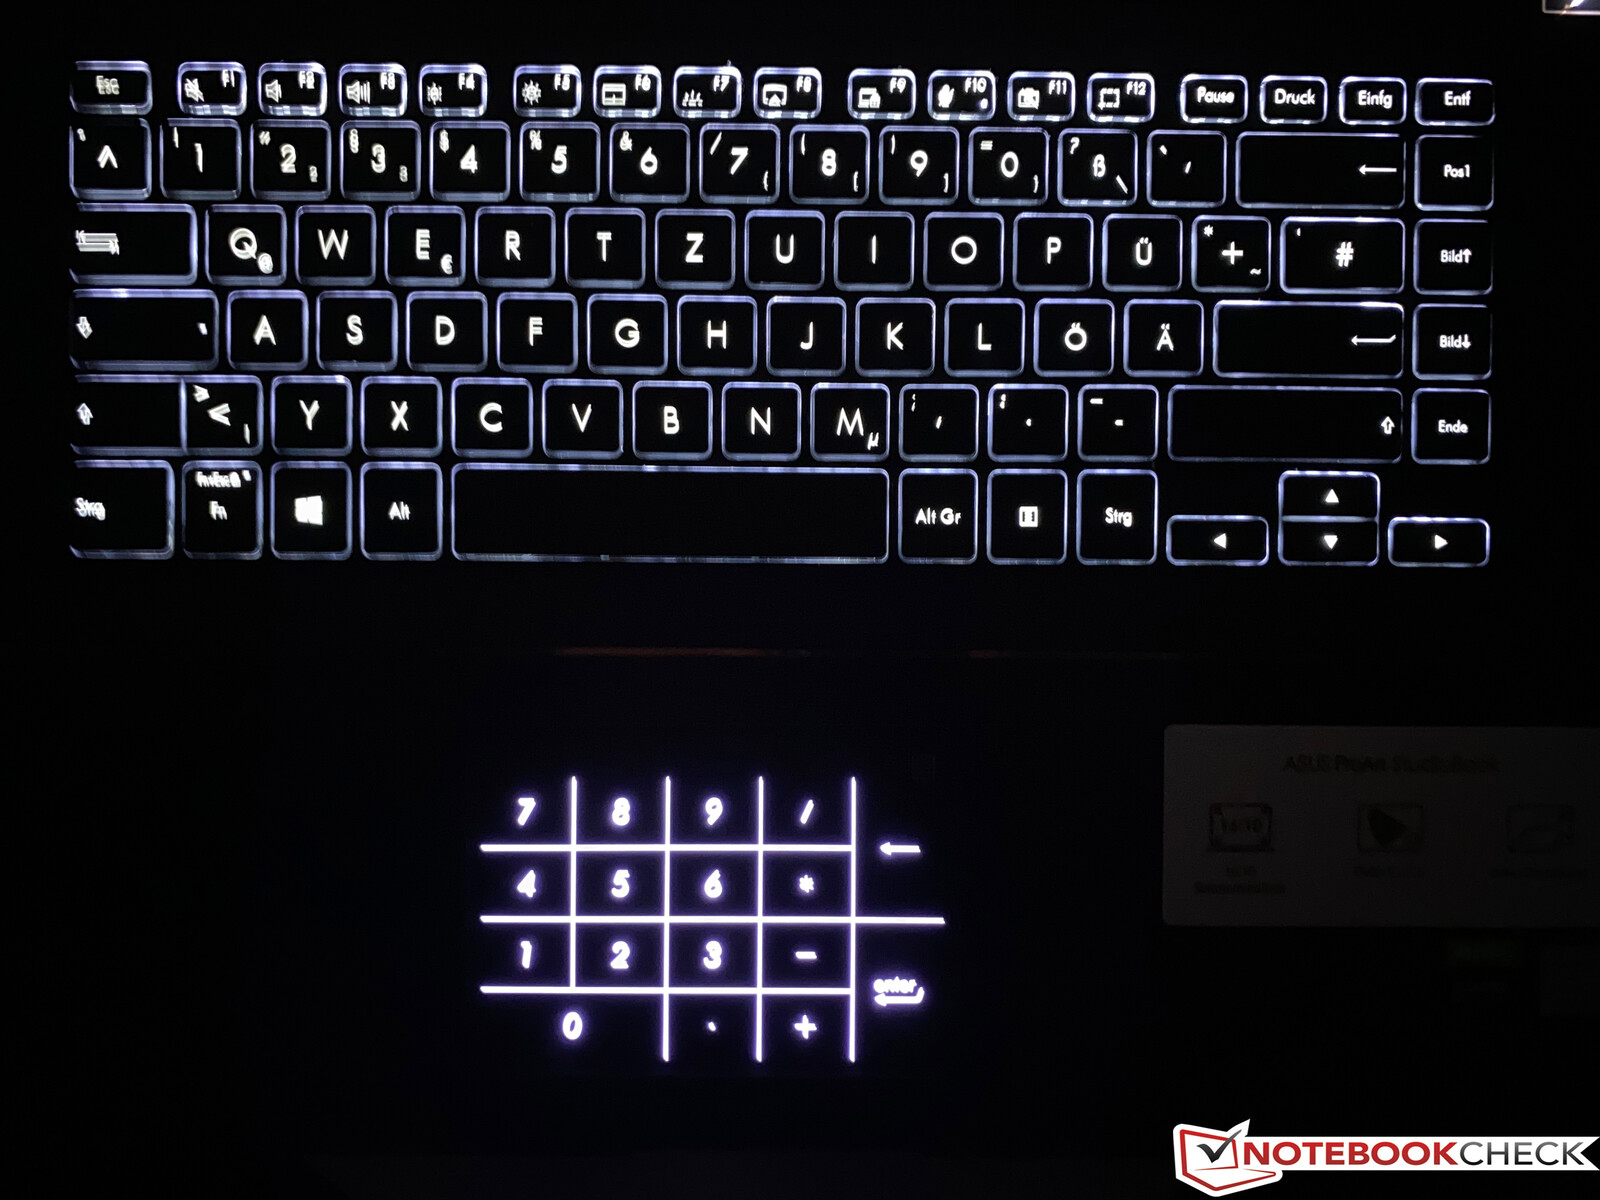
We also miss a dedicated numeric keypad. There is an alternative via touchpad (more on that in the next section), but there would have been sufficient room at the sides of the keyboard. It is easy to find the arrow keys thanks to their textured surface (similar to the palm rests).
Touchpad
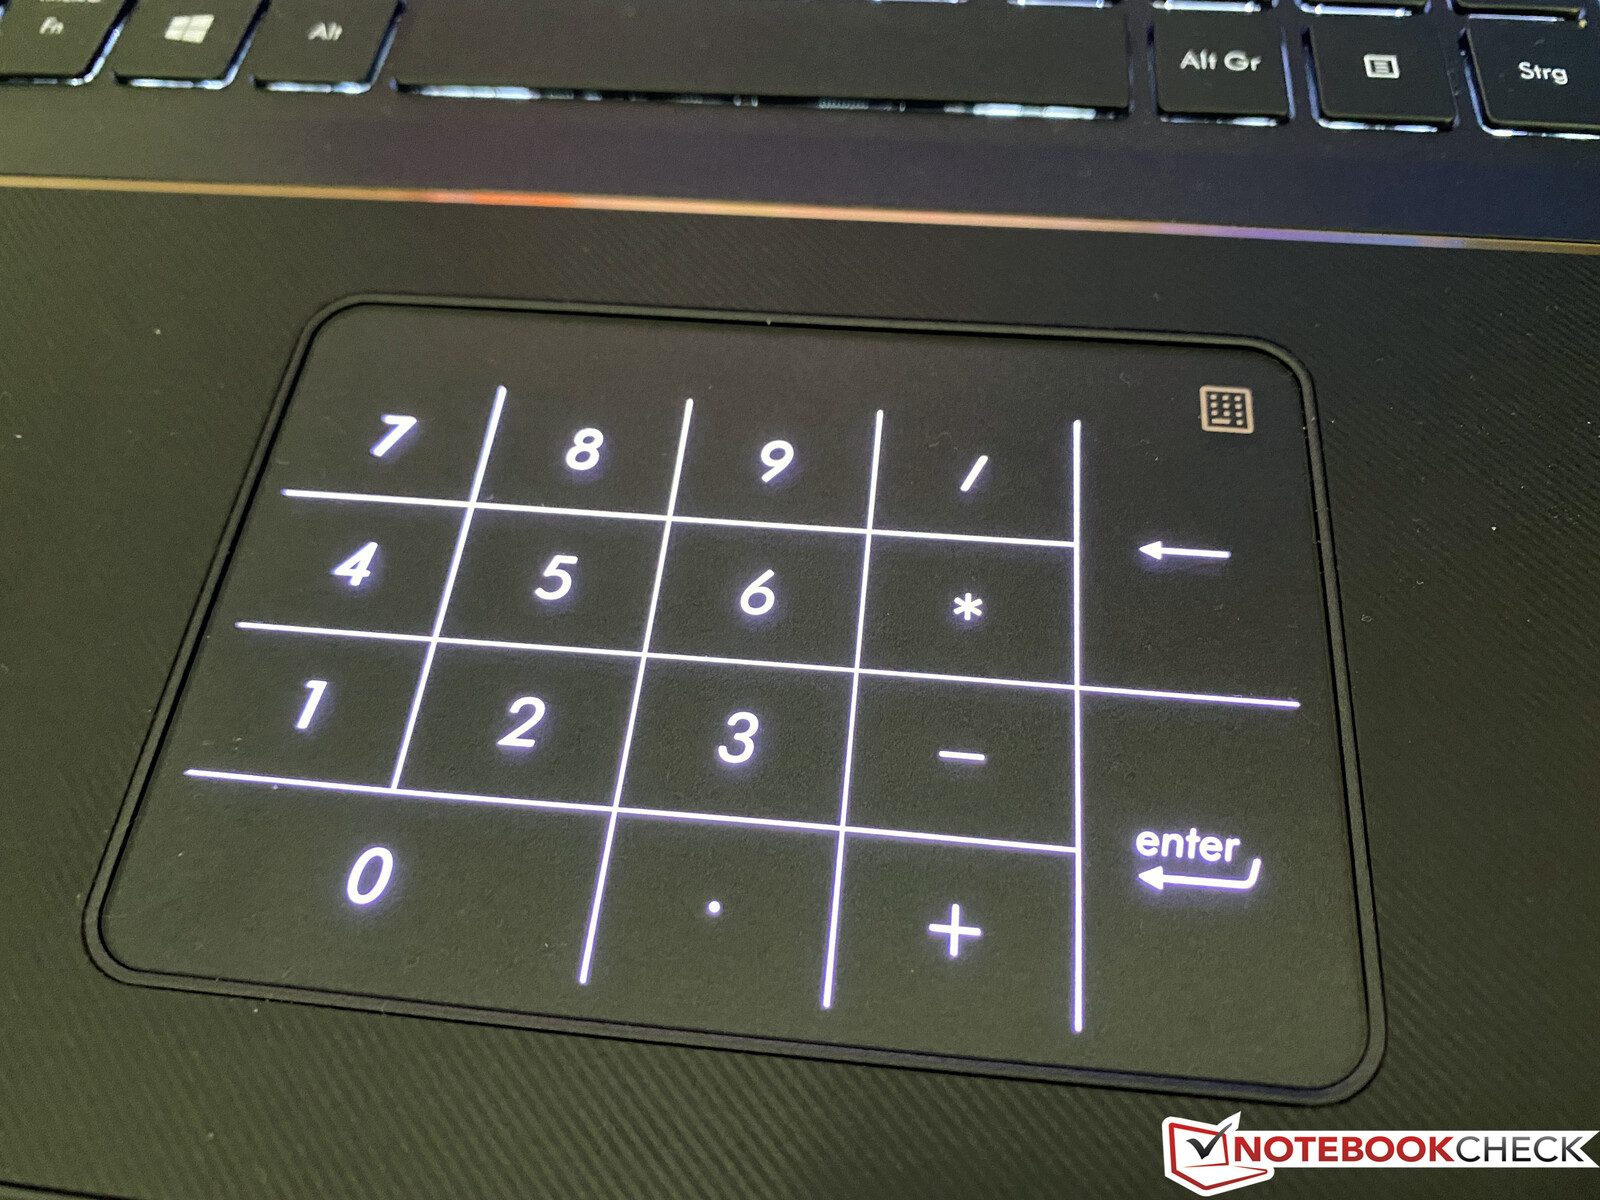
The touchpad has a glass surface and provides good gliding capabilities. The pad also sits a bit deeper inside the in the chassis, so it is easy find without looking. We did not experience any problems during regular use (including gestures with up to four fingers), but the pad (10.5 x 7.5 cm/~4.1 x 3.0 in) could have been larger. This limitation is probably connected with the secondary function as a numeric keypad, which can be activated by pressing the upper right corner of the pad. It works pretty well, but we don't think it can completely replace a dedicated numpad because of the missing feedback.
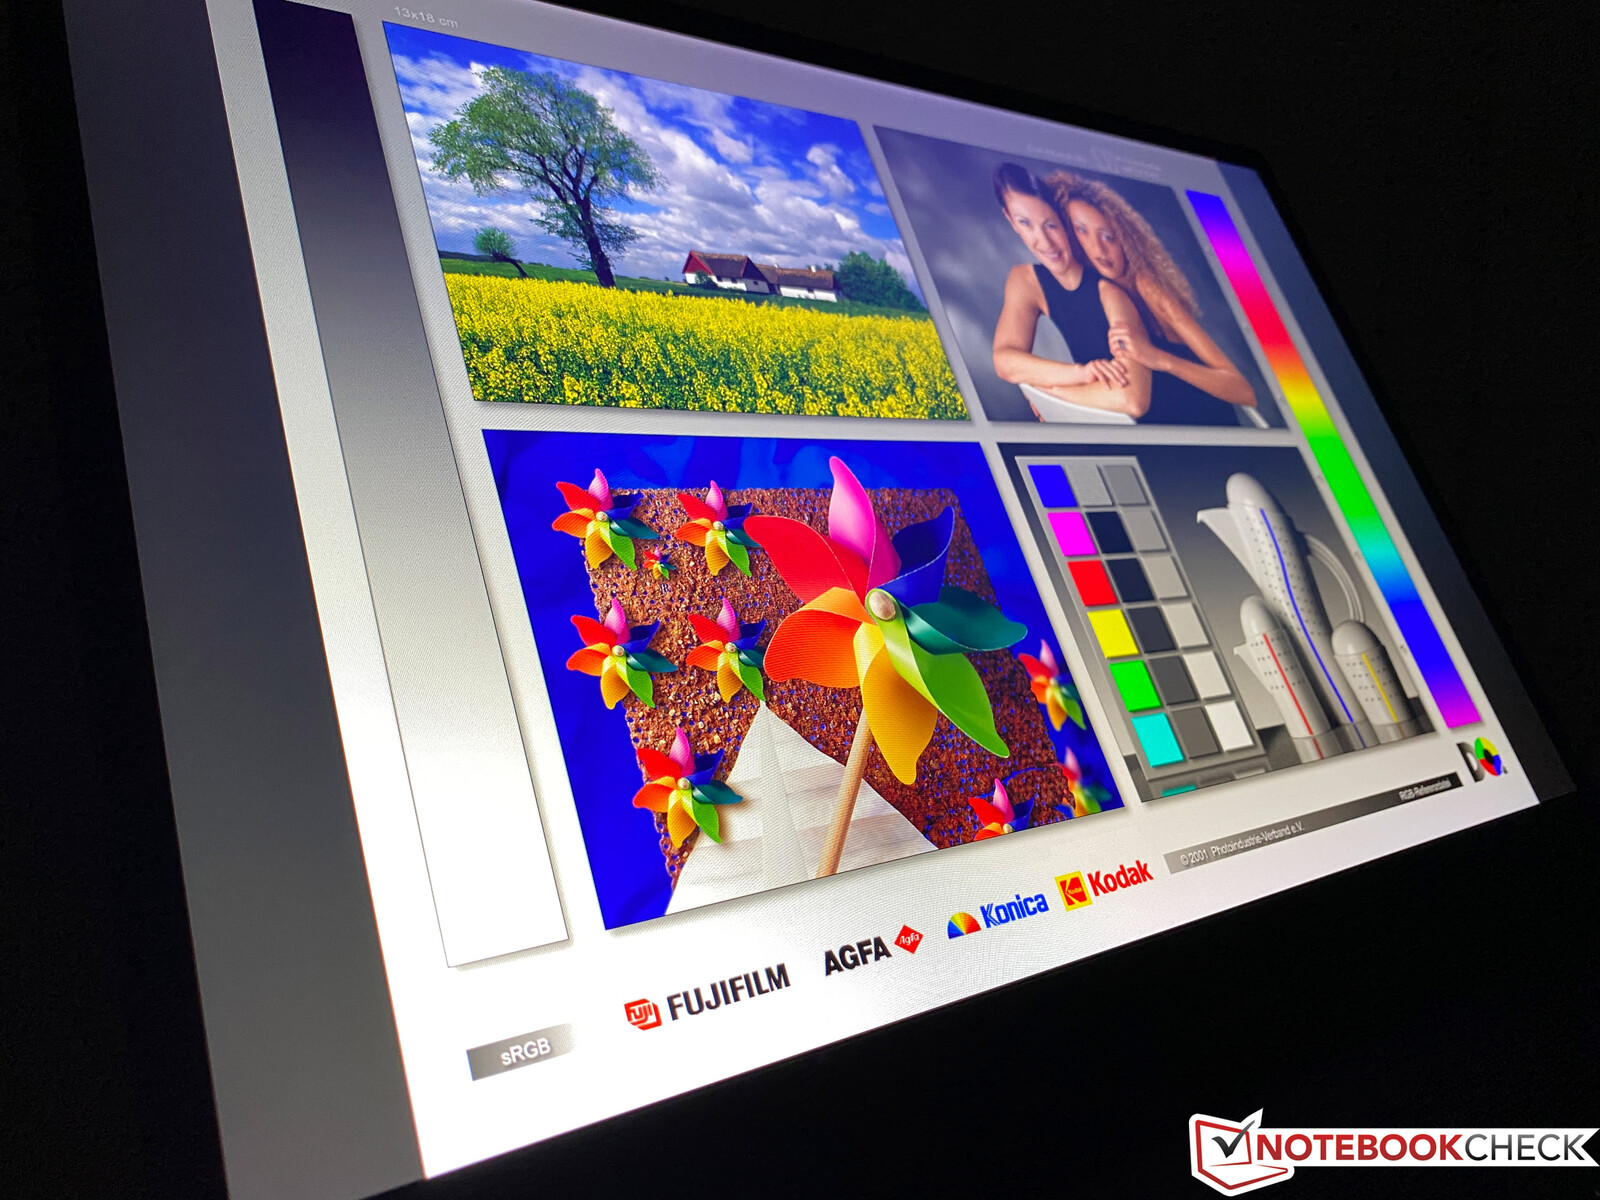
Display – Asus ProArt with 16:10 Full-HD
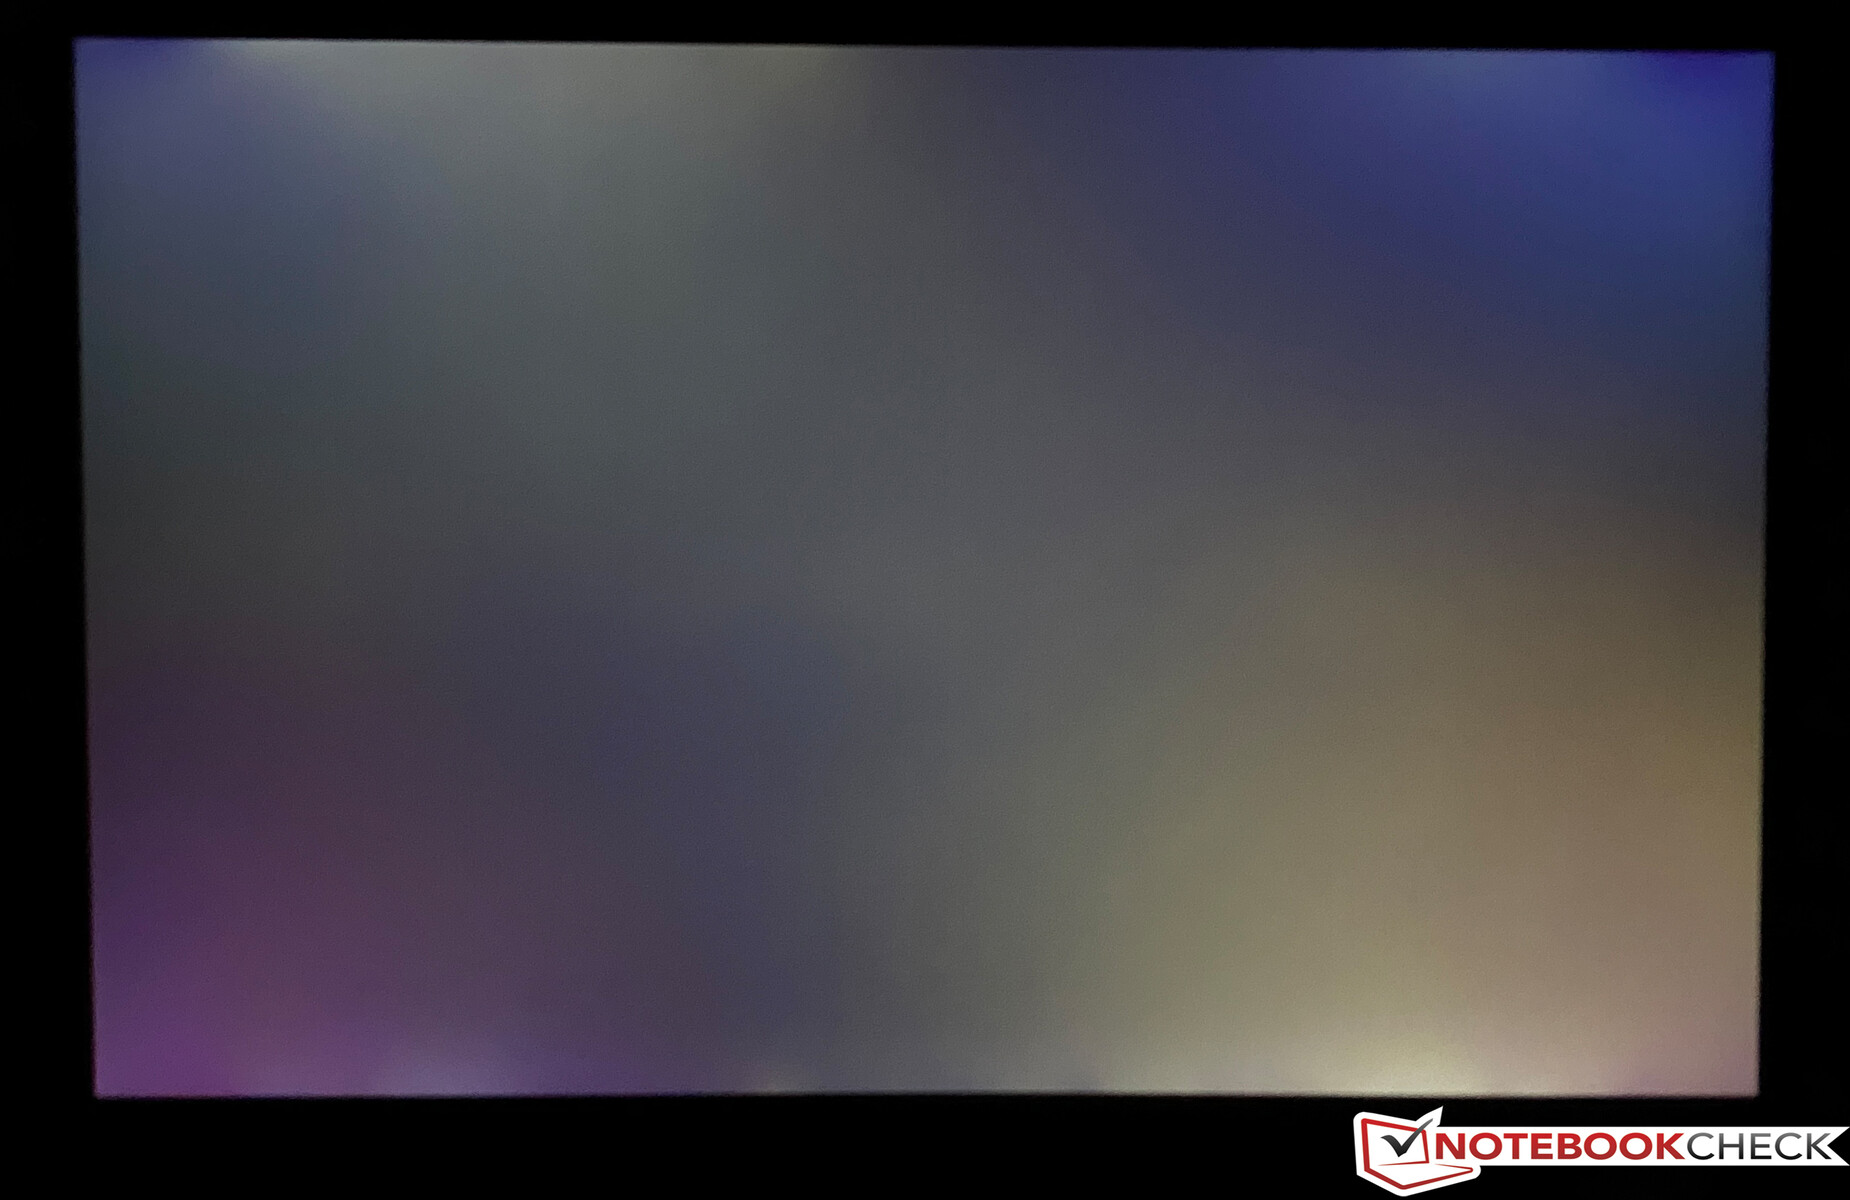
There is only one display for the StudioBook Pro 17: A 16:10 IPS screen with a matte surface and the resolution of 1920 x 1200 pixels. Subjectively, the picture impression is good and the panel does not look too grainy. Our panel is provided by HannStar and we can confirm the advertised luminance of 300 cd/m² at most measuring spots. The black value on the other hand is a bit high for this brightness at 0.36 and results in a contrast ratio of just 900:1. We expected more from the panel, especially at this price range.
PWM is not used, but there is visible backlight bleeding on dark pictures at the lower right and upper left edge.
| |||||||||||||||||||||||||
Brightness Distribution: 88 %
Center on Battery: 320 cd/m²
Contrast: 897:1 (Black: 0.36 cd/m²)
ΔE ColorChecker Calman: 1.1 | ∀{0.5-29.43 Ø4.72}
calibrated: 0.8
ΔE Greyscale Calman: 0.8 | ∀{0.09-98 Ø4.97}
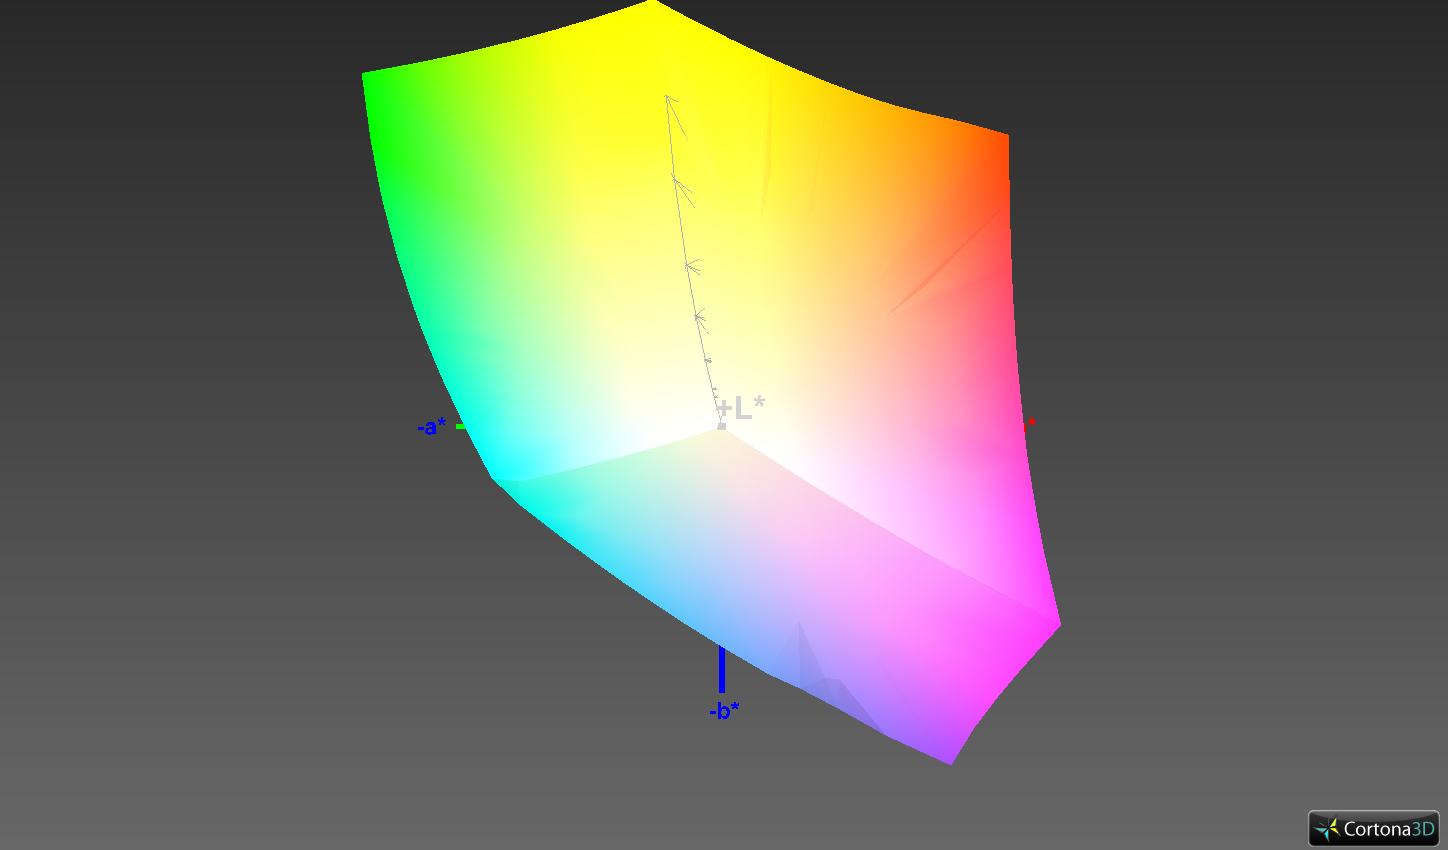
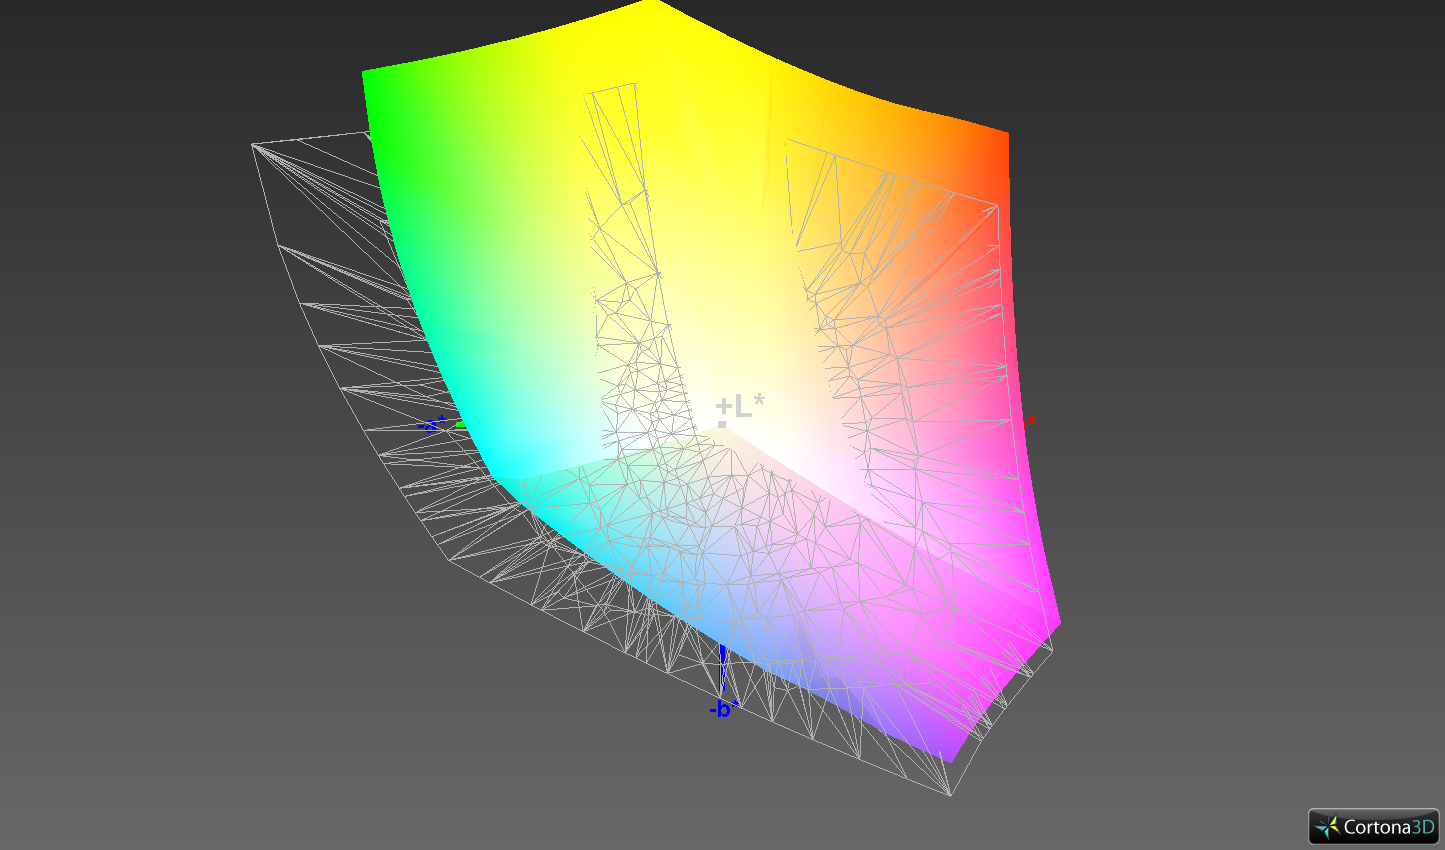
99.8% sRGB (Argyll 1.6.3 3D)
75.7% AdobeRGB 1998 (Argyll 1.6.3 3D)
84.7% AdobeRGB 1998 (Argyll 3D)
99.8% sRGB (Argyll 3D)
96.2% Display P3 (Argyll 3D)
Gamma: 2.23
CCT: 6479 K
| Asus ProArt StudioBook Pro 17 W700G3T 170PUW1-A00, IPS, 1920x1200, 17" | MSI WS75 9TL-636 B173HAN04.2, IPS, 1920x1080, 17.3" | Apple MacBook Pro 16 2019 i9 5500M APPA044, IPS, 3072x1920, 16" | Acer ConceptD 5 CN517-71-74YA AUO B173ZAN03, IPS, 3840x2160, 17.3" | Gigabyte Aero 17 HDR XB AUO B173ZAN03.2 (AUO329B), IPS, 3840x2160, 17.3" | |
|---|---|---|---|---|---|
| Display | -21% | 2% | 3% | ||
| Display P3 Coverage (%) | 96.2 | 64.5 -33% | 86.2 -10% | 86.5 -10% | |
| sRGB Coverage (%) | 99.8 | 91.1 -9% | 100 0% | 100 0% | |
| AdobeRGB 1998 Coverage (%) | 84.7 | 65.8 -22% | 99.1 17% | 100 18% | |
| Response Times | 5% | -23% | -31% | -11% | |
| Response Time Grey 50% / Grey 80% * (ms) | 41.2 ? | 39.2 ? 5% | 52.4 ? -27% | 55 ? -33% | 55.2 ? -34% |
| Response Time Black / White * (ms) | 29.6 ? | 28.4 ? 4% | 34.9 ? -18% | 38 ? -28% | 26 ? 12% |
| PWM Frequency (Hz) | 131700 | ||||
| Screen | -86% | -7% | -40% | 13% | |
| Brightness middle (cd/m²) | 323 | 300 -7% | 519 61% | 410 27% | 487 51% |
| Brightness (cd/m²) | 308 | 288 -6% | 477 55% | 383 24% | 475 54% |
| Brightness Distribution (%) | 88 | 86 -2% | 86 -2% | 88 0% | 95 8% |
| Black Level * (cd/m²) | 0.36 | 0.25 31% | 0.39 -8% | 0.58 -61% | 0.38 -6% |
| Contrast (:1) | 897 | 1200 34% | 1331 48% | 707 -21% | 1282 43% |
| Colorchecker dE 2000 * | 1.1 | 3.9 -255% | 2.28 -107% | 1.91 -74% | 1.19 -8% |
| Colorchecker dE 2000 max. * | 3.3 | 6 -82% | 6.54 -98% | 4.67 -42% | 2.43 26% |
| Colorchecker dE 2000 calibrated * | 0.8 | 2.3 -187% | 0.86 -8% | 1.09 -36% | 0.5 37% |
| Greyscale dE 2000 * | 0.8 | 4.3 -437% | 0.9 -13% | 3 -275% | 1.45 -81% |
| Gamma | 2.23 99% | 2.2 100% | 2145 0% | 2.18 101% | 2.21 100% |
| CCT | 6479 100% | 7391 88% | 6572 99% | 6338 103% | 6557 99% |
| Color Space (Percent of AdobeRGB 1998) (%) | 75.7 | 59.2 -22% | 78 3% | 87 15% | 88 16% |
| Color Space (Percent of sRGB) (%) | 99.8 | 91 -9% | 100 0% | 100 0% | |
| Total Average (Program / Settings) | -34% /
-62% | -15% /
-10% | -23% /
-31% | 2% /
8% |
* ... smaller is better
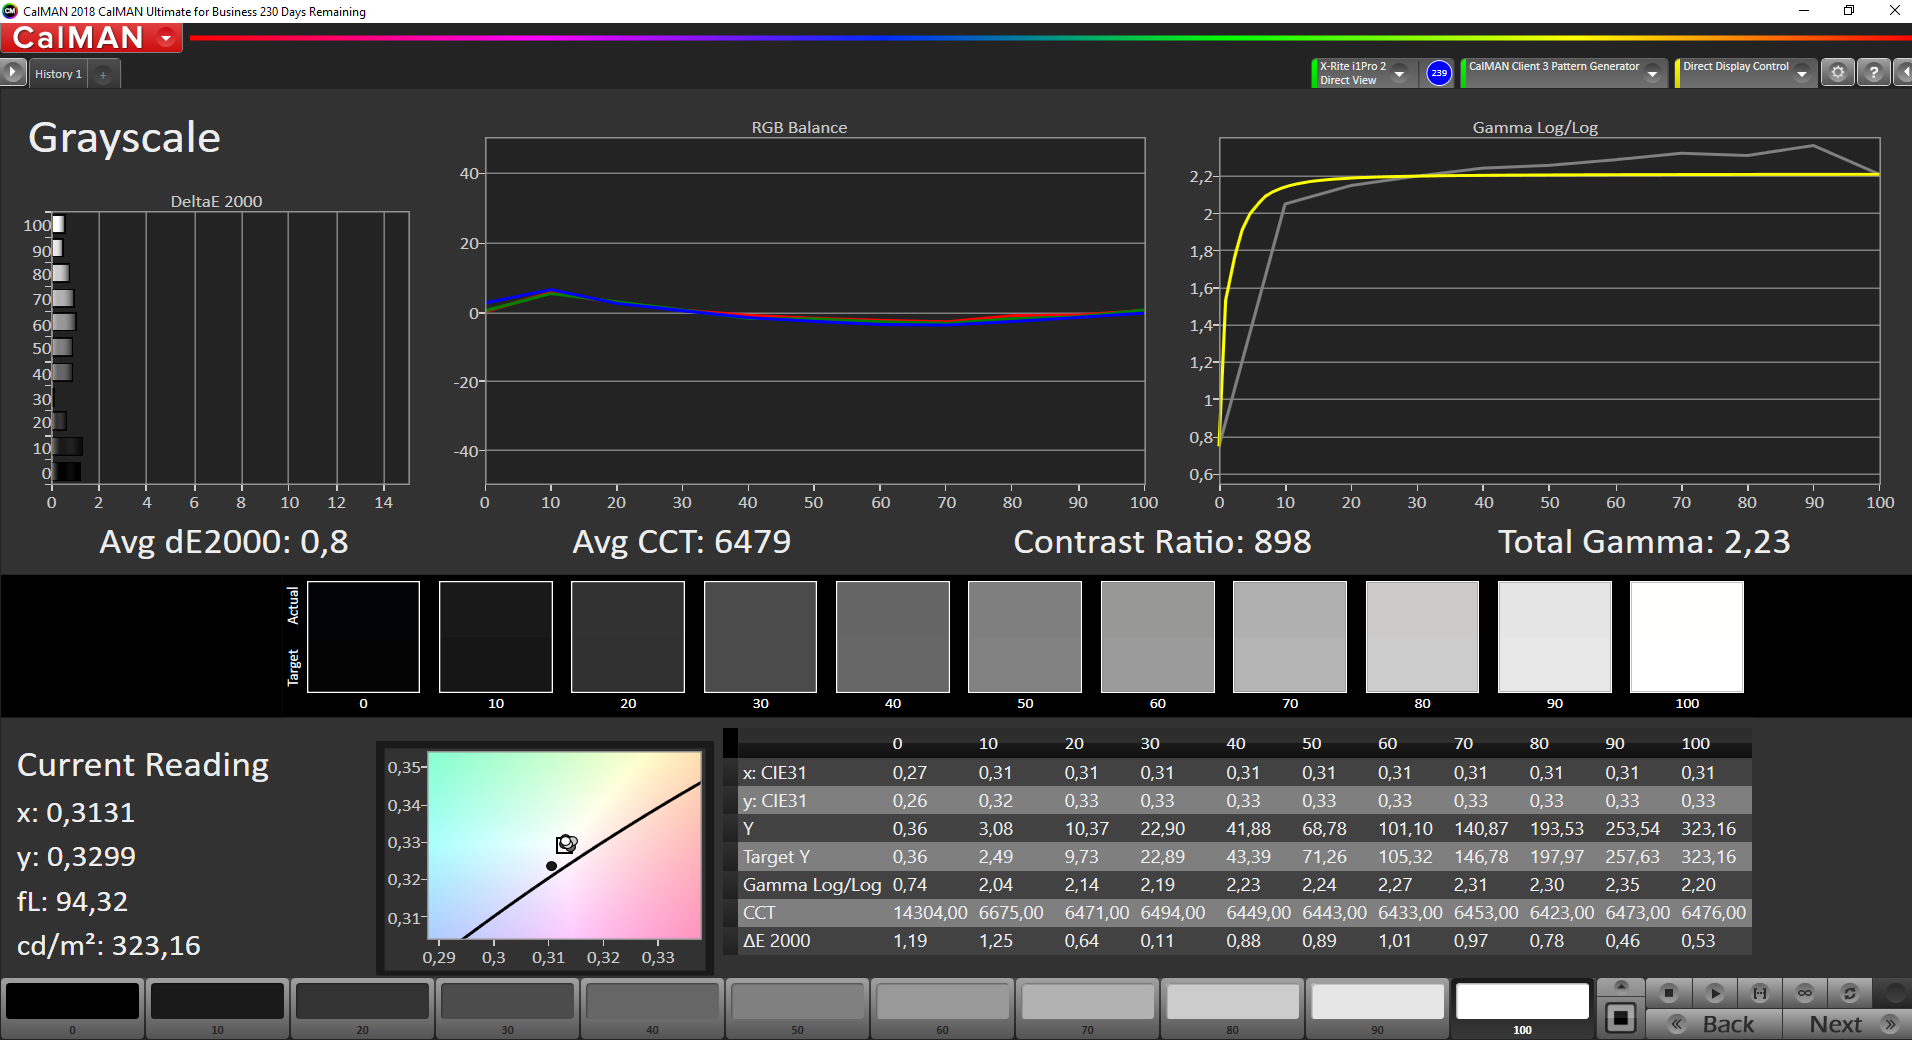

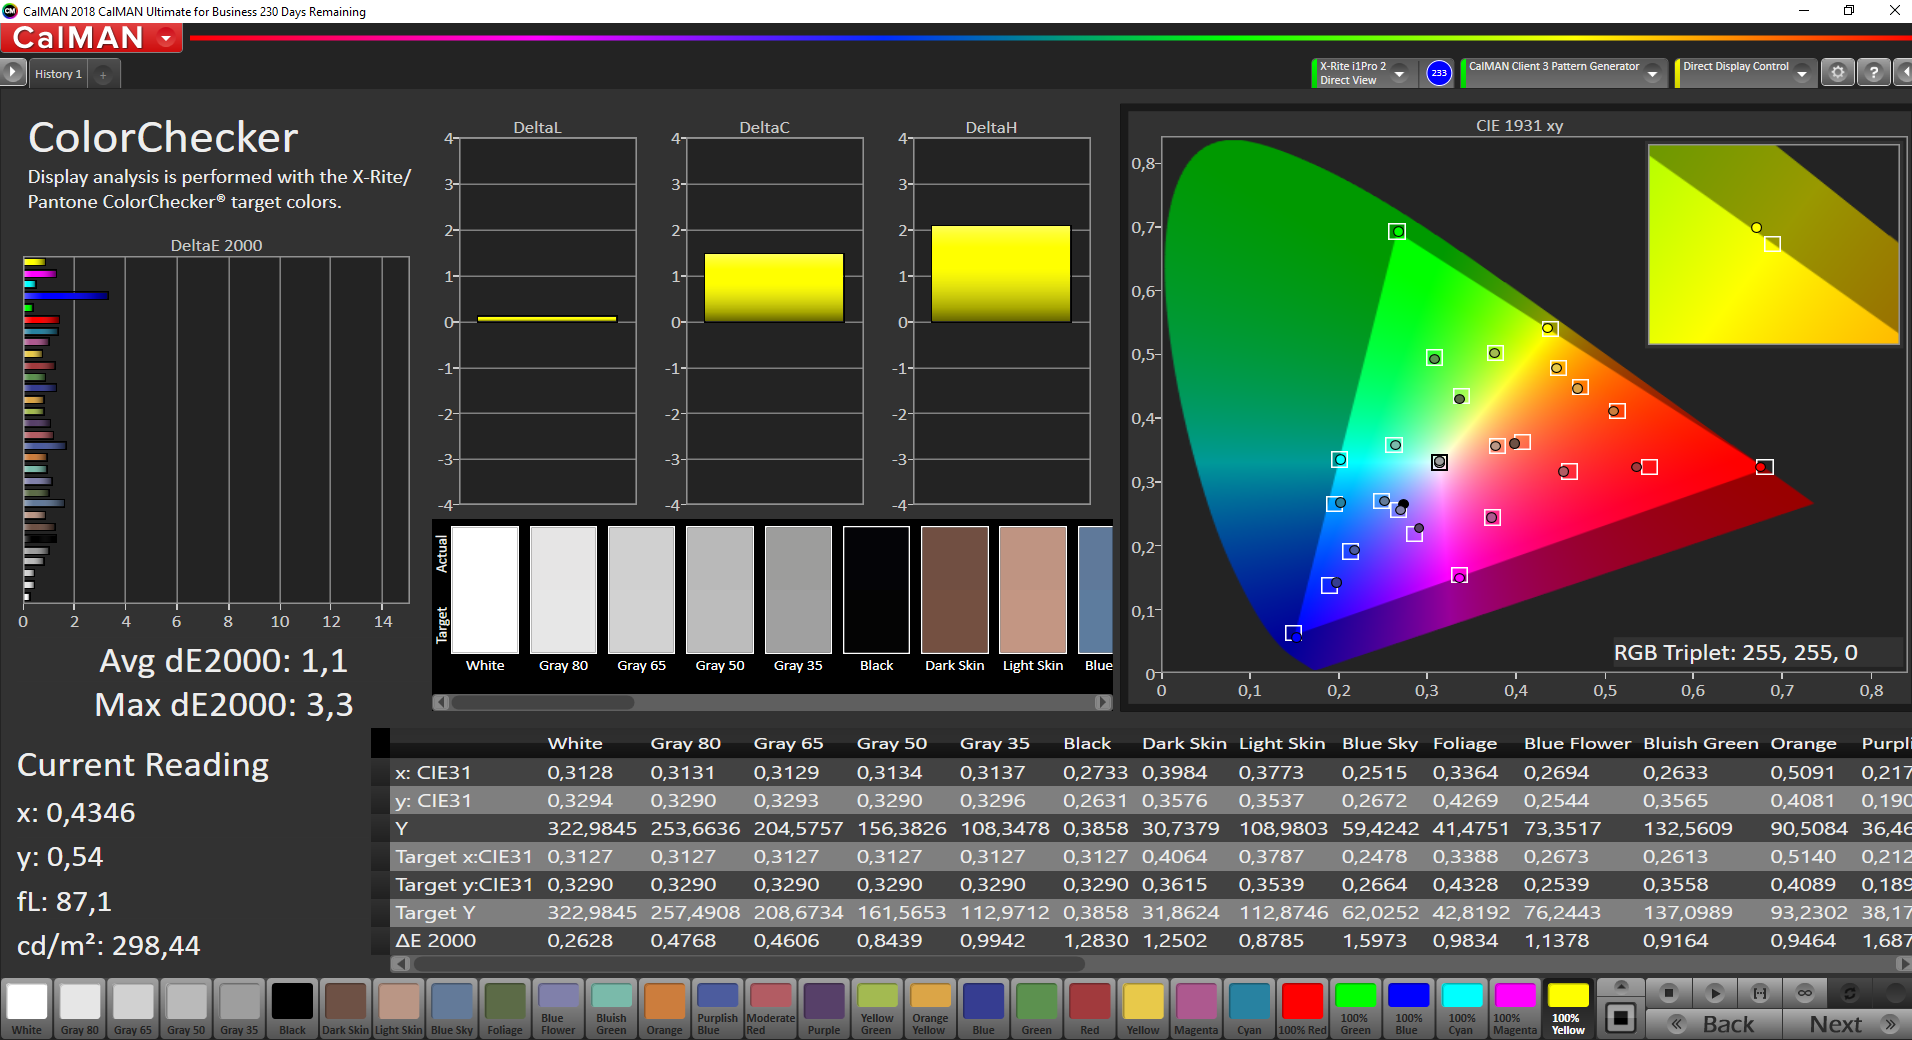
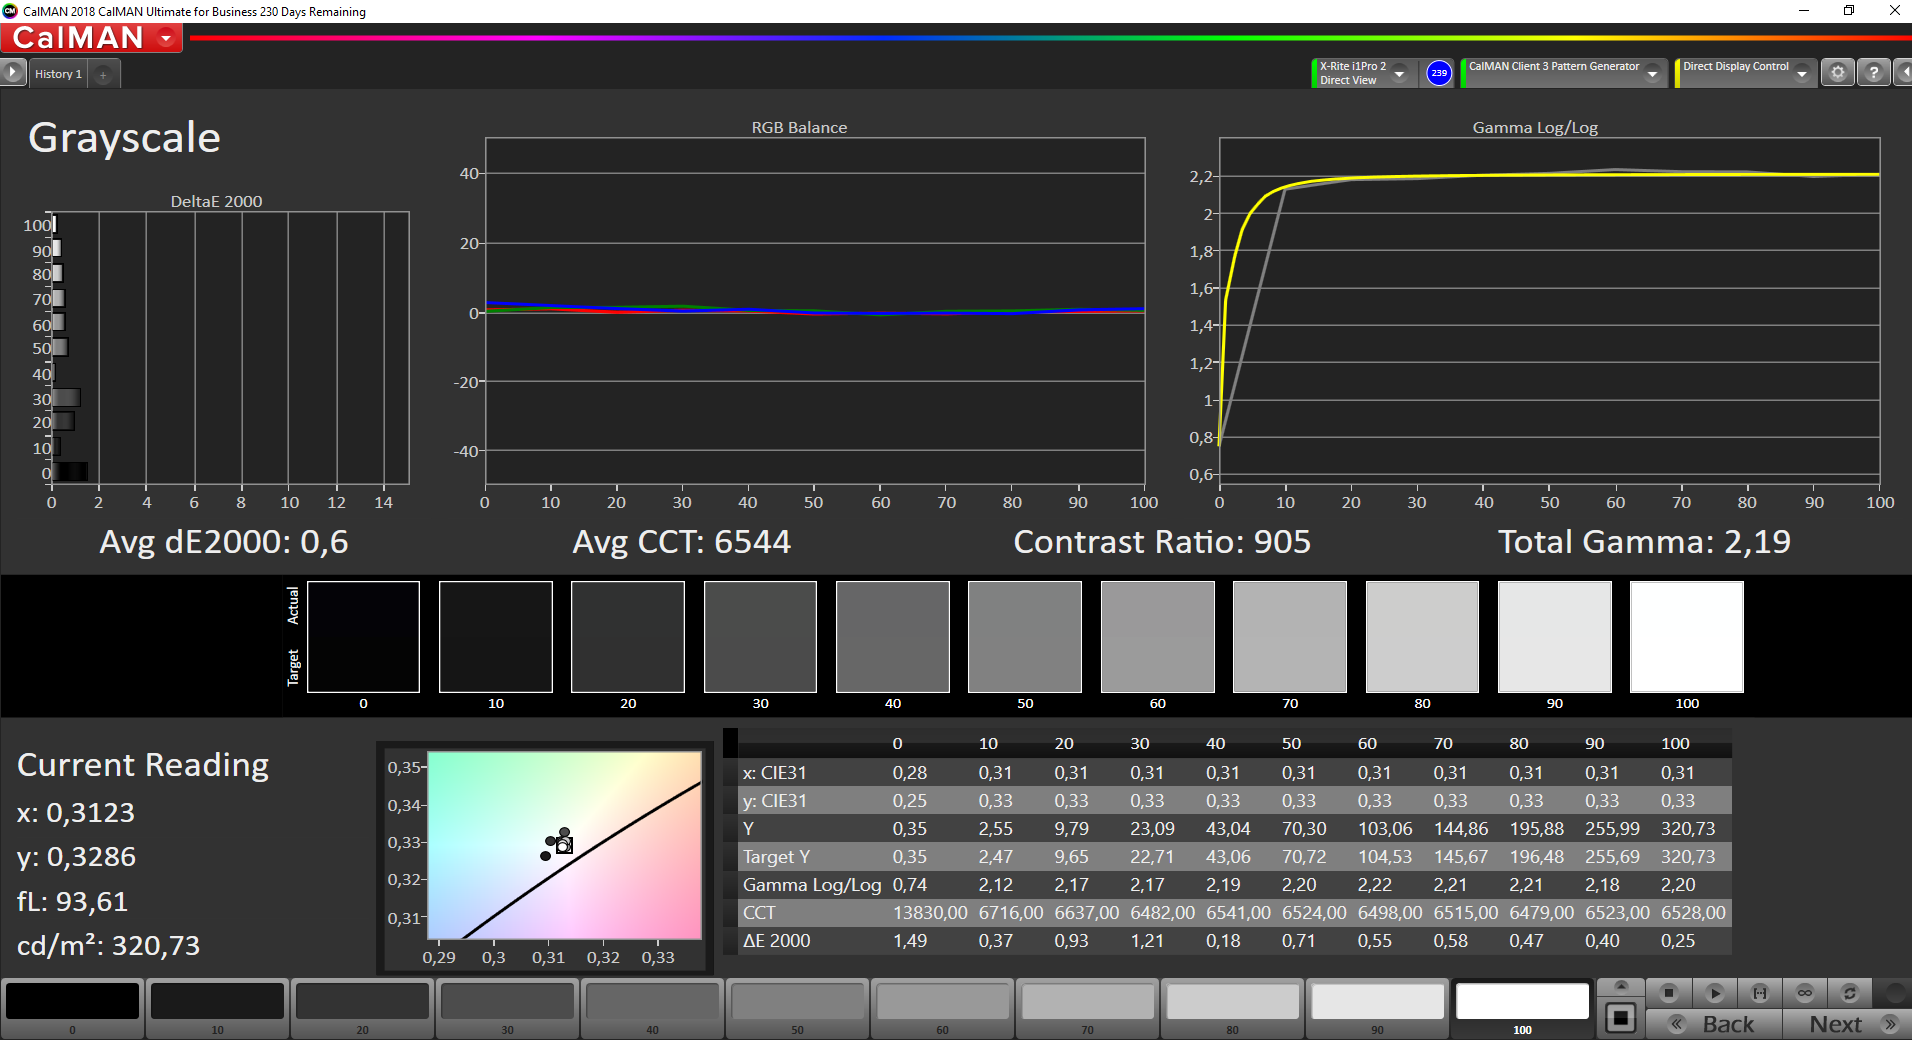
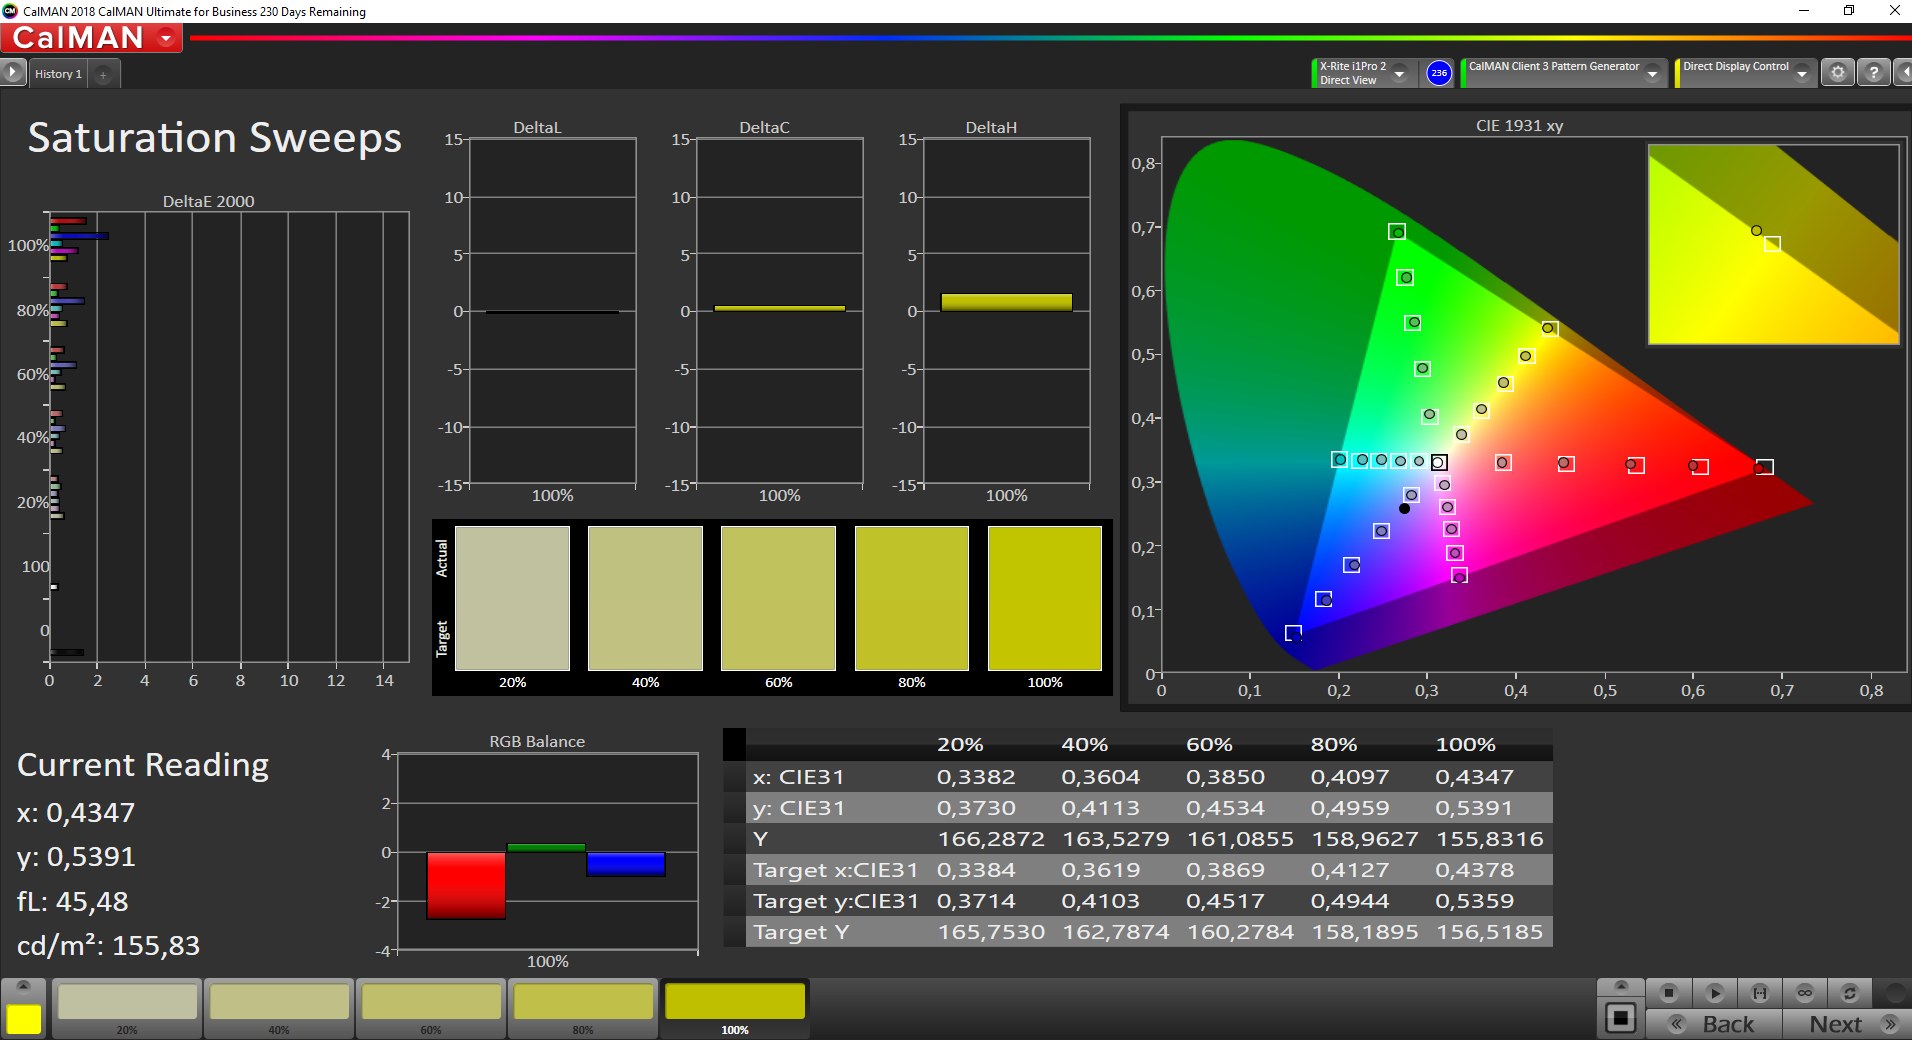

The factory calibration is very good, because we can confirm the advertised DeltaE deviation <1.5 after our measurements with the professional CalMAN software and the X-Rite i1 Pro 2 spectrophotometer. Only 100% blue is slightly above the target value at 3.3. Our own calibration only showed minor improvements, so an additional calibration by the user is not necessary.
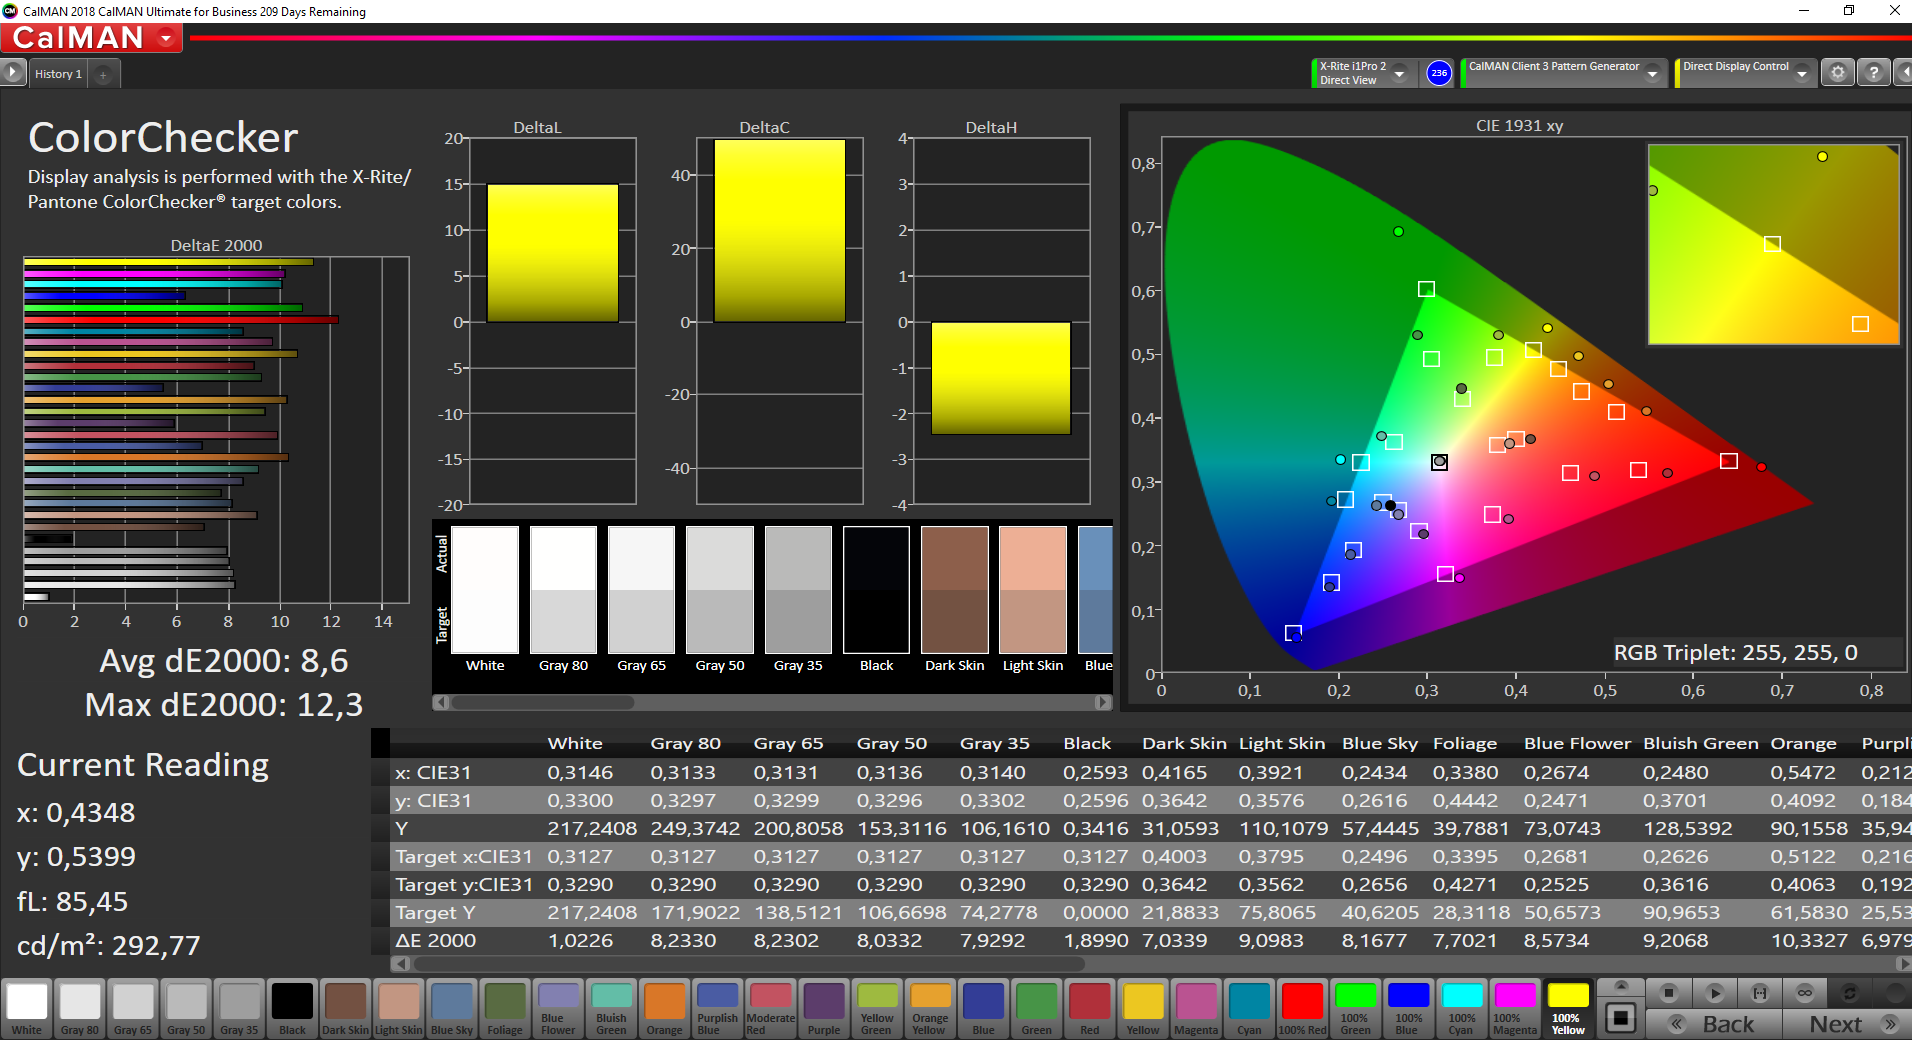
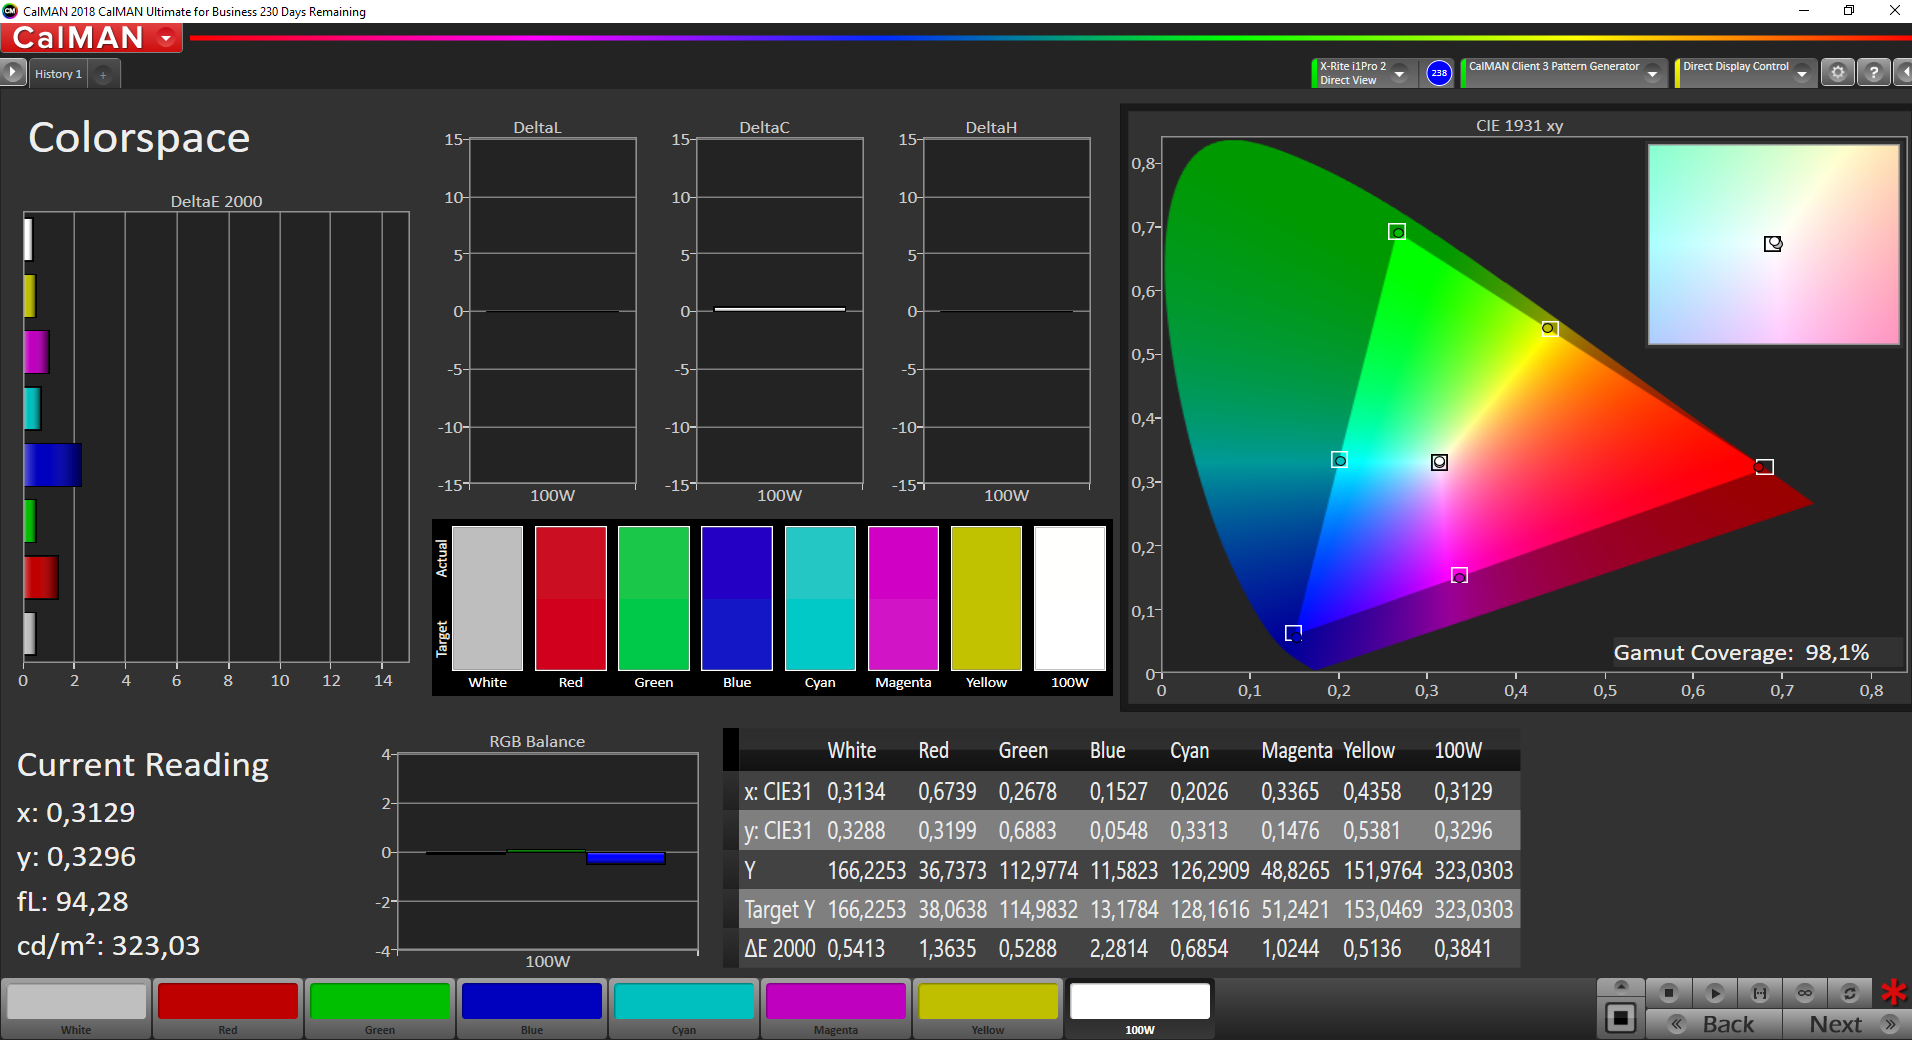
However, Asus does not provide a color profile for sRGB, so the good results only apply for the P3 gamut. This means the panel is not suited for accurate edits in the smaller sRGB color space, because the color deviations are too high. You are limited to P3, which is covered by 98.1% according to CalMAN.
Display Response Times
| ↔ Response Time Black to White | ||
|---|---|---|
| 29.6 ms ... rise ↗ and fall ↘ combined | ↗ 16.4 ms rise | 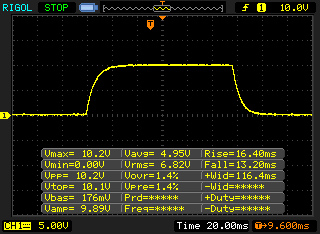 |
| ↘ 13.2 ms fall | ||
| The screen shows relatively slow response rates in our tests and may be too slow for gamers. In comparison, all tested devices range from 0.1 (minimum) to 240 (maximum) ms. » 79 % of all devices are better. This means that the measured response time is worse than the average of all tested devices (19.8 ms). | ||
| ↔ Response Time 50% Grey to 80% Grey | ||
| 41.2 ms ... rise ↗ and fall ↘ combined | ↗ 22 ms rise | 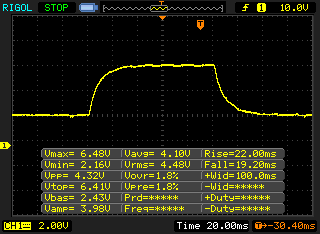 |
| ↘ 19.2 ms fall | ||
| The screen shows slow response rates in our tests and will be unsatisfactory for gamers. In comparison, all tested devices range from 0.165 (minimum) to 636 (maximum) ms. » 66 % of all devices are better. This means that the measured response time is worse than the average of all tested devices (31 ms). | ||
Screen Flickering / PWM (Pulse-Width Modulation)
| Screen flickering / PWM not detected | 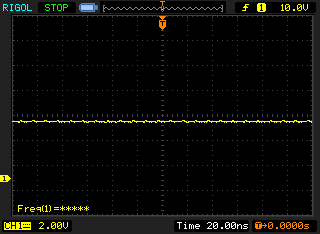 | ||
In comparison: 52 % of all tested devices do not use PWM to dim the display. If PWM was detected, an average of 7753 (minimum: 5 - maximum: 343500) Hz was measured. | |||
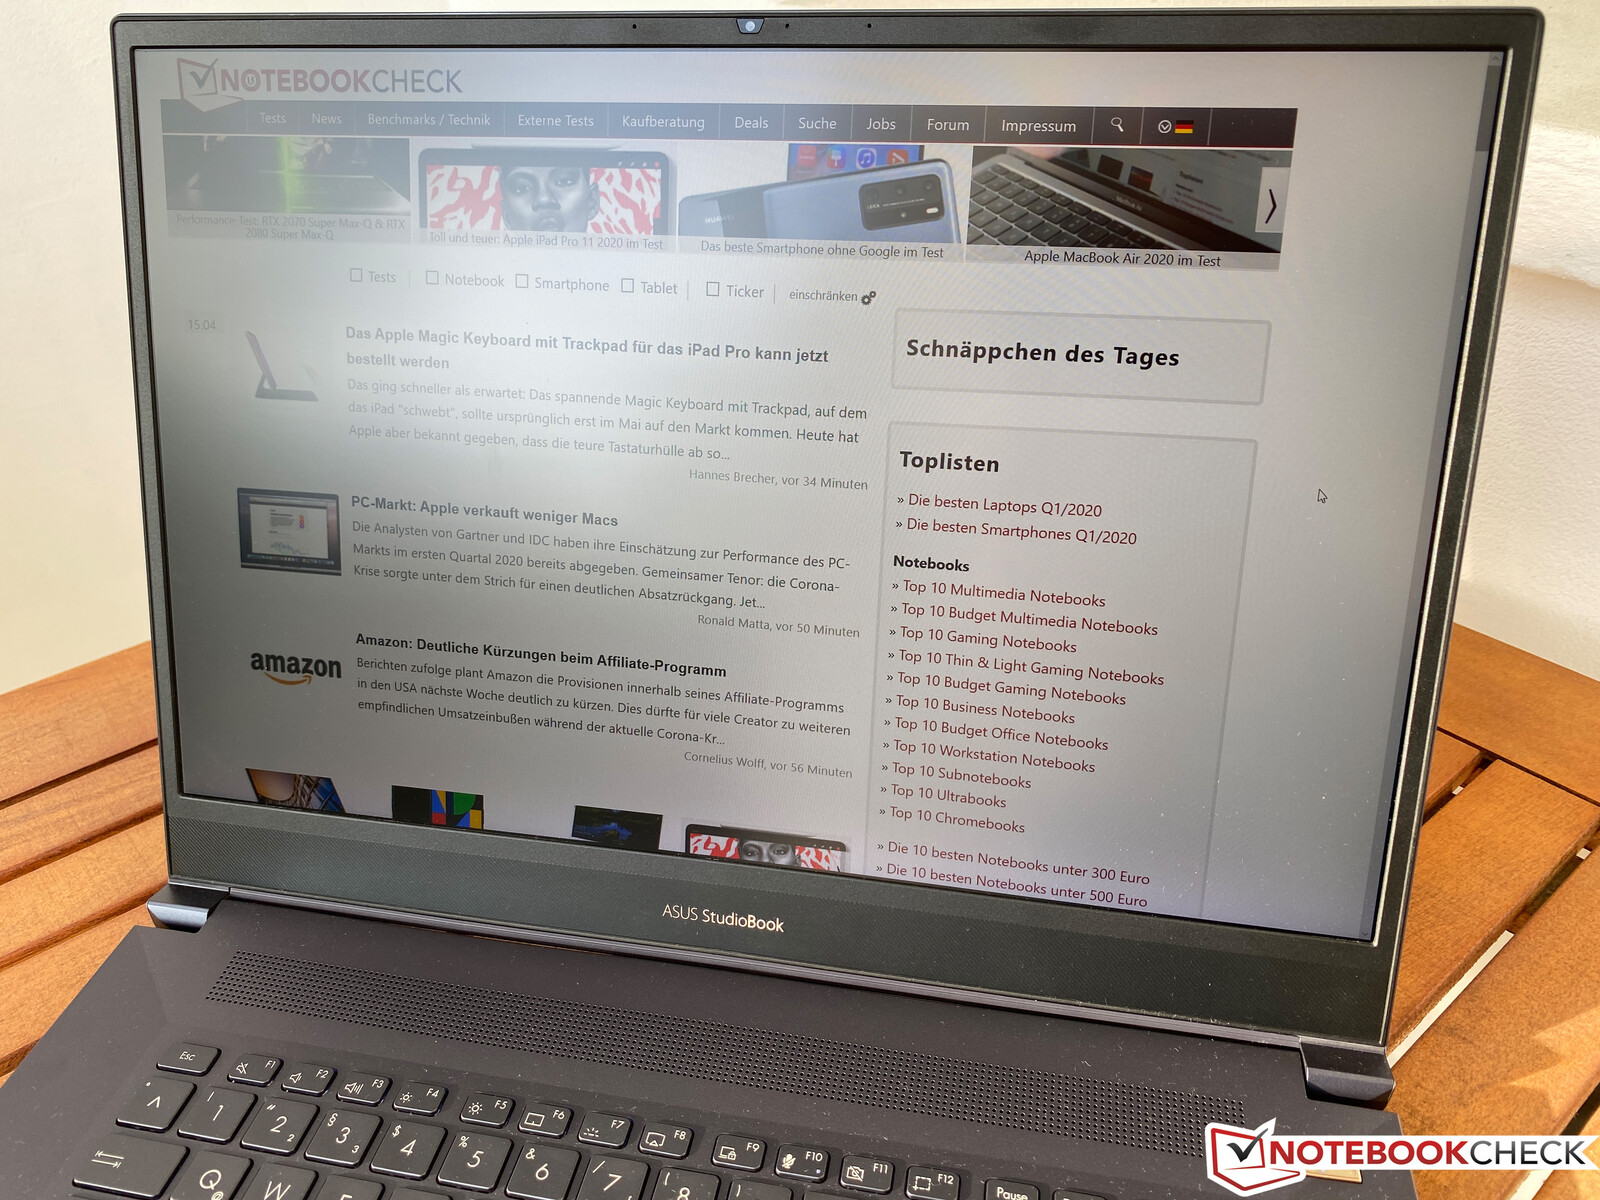
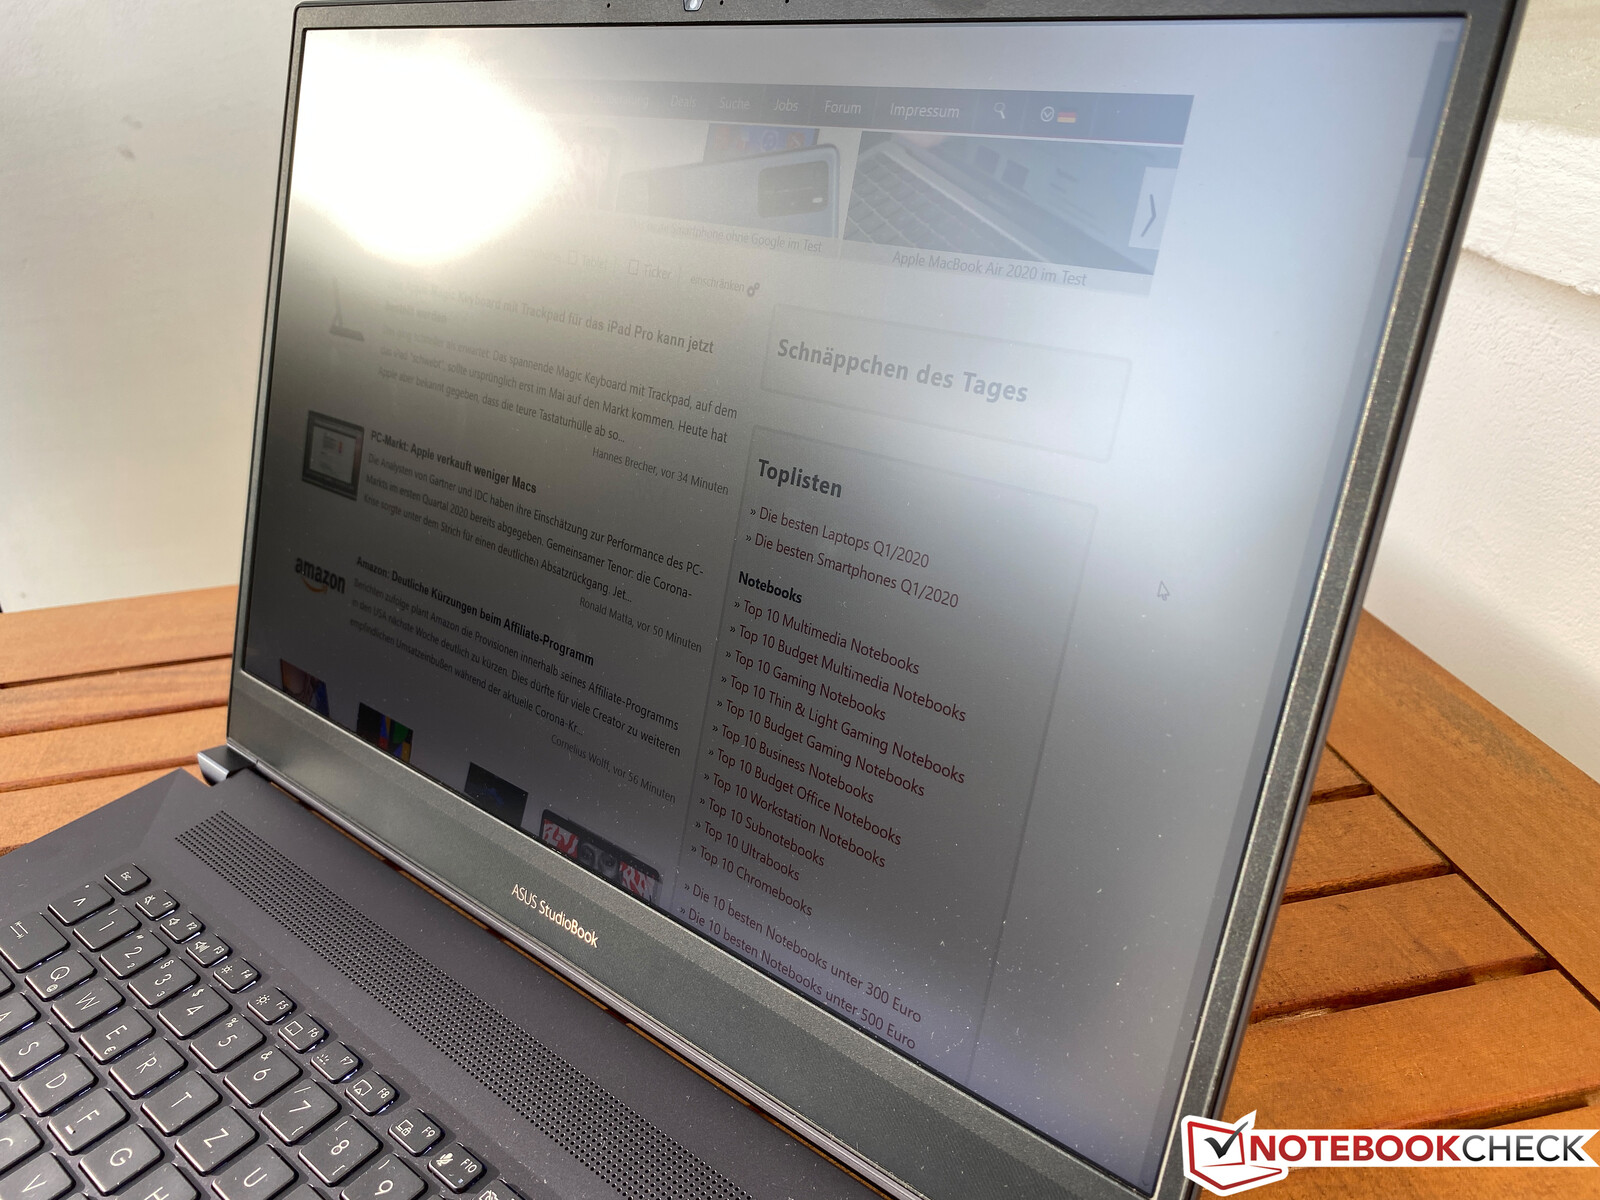
The viewing angle stability of the IPS panel is good; there is only a slight blue cast from wider angles. The device obviously benefits from the matte surface outdoors, but the brightness could be higher. We recommend a place in the shade for a comfortable working experience.
Performance – StudioBook with software calibration issues
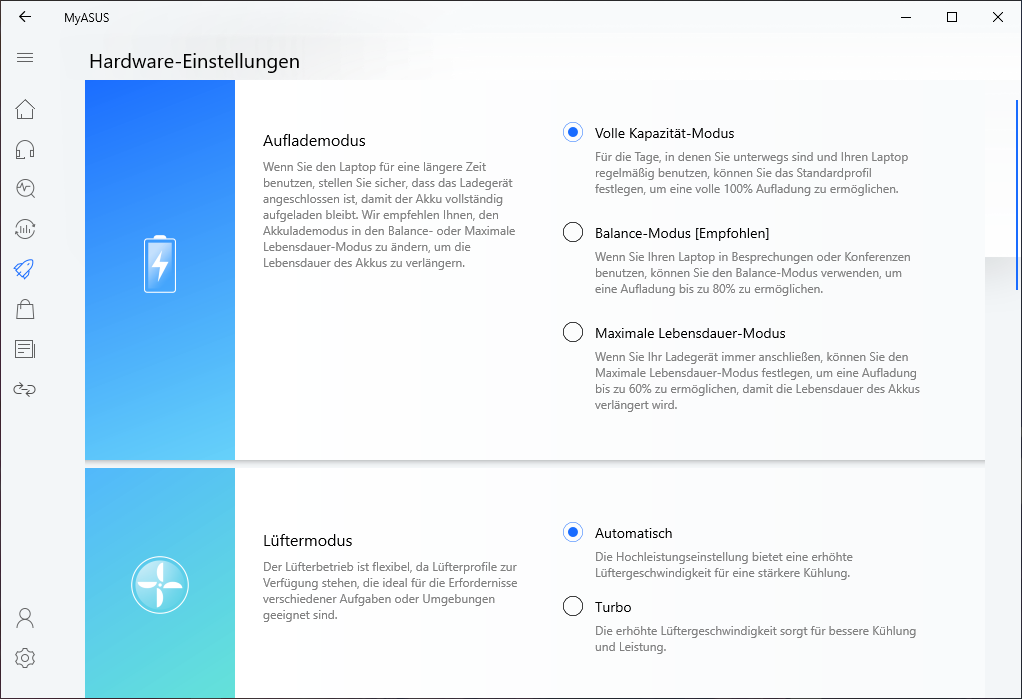
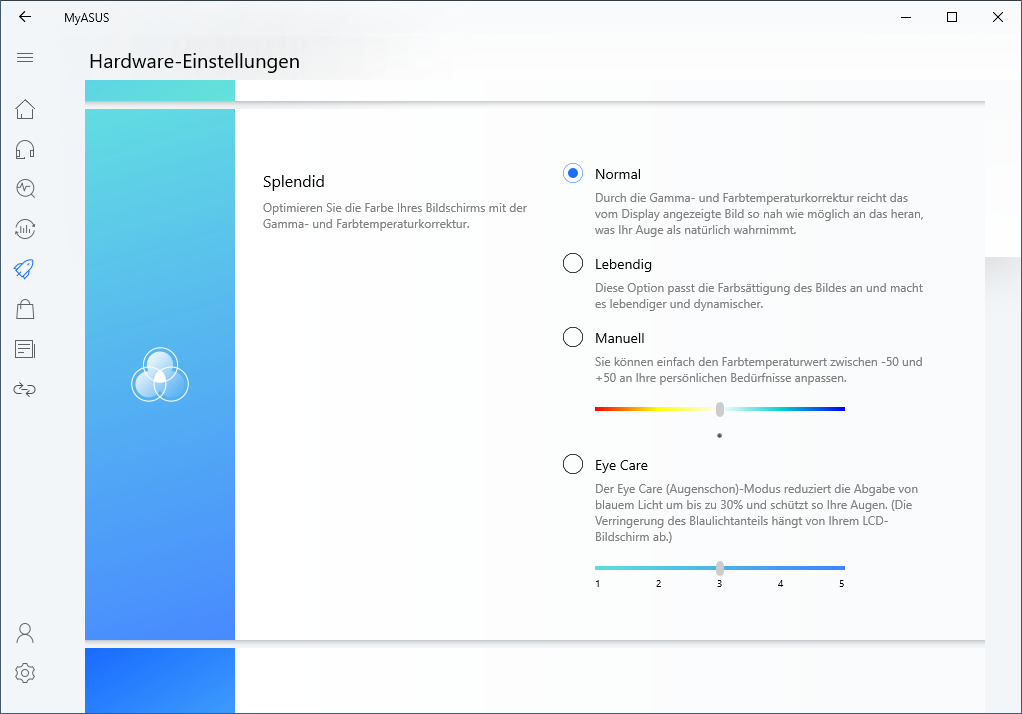
Asus provides its own MyAsus tool, which also includes two profiles for the fans. Asus unfortunately does not combine these settings with the Windows performance slider, which is unnecessarily complicated. We also think the profiles are not very well optimized and do not fit the descriptions in the software. The default "auto" setting keeps the fan speeds very low, even under load, but this affects the performance. When you select "Turbo", however, the fans are extremely sensitive to load changes, which is rather annoying (more on that later). We will show results for both profiles in some of the performance sections, but we use the results with the default "Auto" settings for our rating.
Processor – W700 with Core i7-9750H
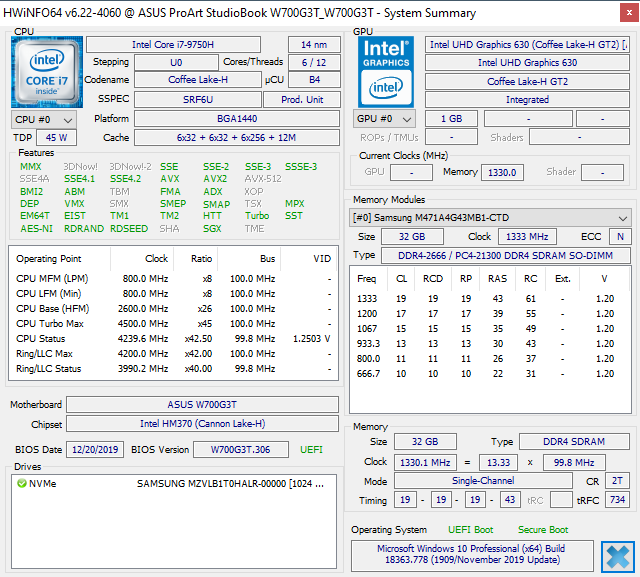
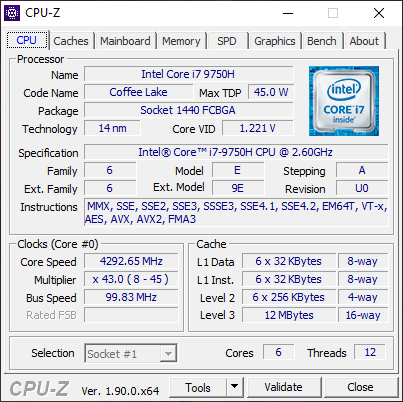
The Intel Core i7-9750H from the Coffee Lake generation (14nm) is a familiar CPU with six cores, and we refer to our tech section for more details. The performance utilization of the test unit is pretty good, independent of the selected fan profile. There are only small differences, which is also evident in the following chart with the data from our Cinebench Multi loop.
Our test unit is on par with the MSI WS75, while the Acer ConceptD with the same processor is slower. Both the MacBook Pro 16 and the Gigabyte Aero 17 with 8 cores are faster though.
There is still room for improvements on battery power. The processor is basically limited to 45 Watts (6x 3.2-3.3 GHz), but occasionally drops to just 8W (6x 0.8 GHz). The Cinebench Multi score therefore drops to around 700 points, independent of the fan profile.
System Performance – Asus ProArt with 2x M.2-SSD
Asus only uses fast components, so it is not surprising that the subjective performance impression is also very good. The synthetic benchmark scores are okay, only laptops with more powerful GPUs have an advantage.
You can install two M.2-2280 SSDs. Our test unit is equipped with a Samsung PM981 with a storage capacity of 1 TB. The drive performs very well in the benchmarks and there is no reason to replace it with another SSD.
| PCMark 8 Home Score Accelerated v2 | 4322 points | |
| PCMark 8 Creative Score Accelerated v2 | 6968 points | |
| PCMark 8 Work Score Accelerated v2 | 5241 points | |
| PCMark 10 Score | 4918 points | |
Help | ||

GPU Performance – Workstation with Quadro Max-Q
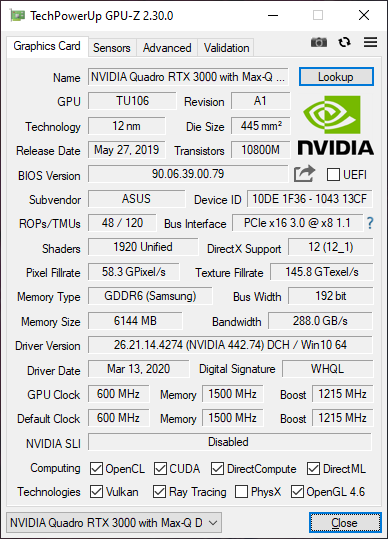
The graphics card has the designation Quadro RTX 3000 Max-Q. In theory, the clock is lower compared to a regular RTX 3000, but we saw core clocks of up to 1650 MHz during our tests. Therefore, the performance is on par with the RTX 3000 in the Lenovo ThinkPad P73. Other manufacturers like MSI, for example, offer their slim 17-inch workstations with more powerful GPUs.
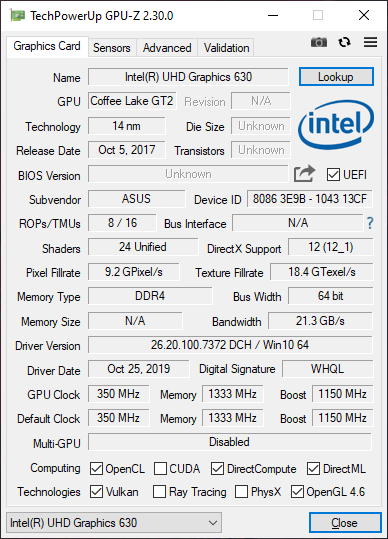
Contrary to the processor, the fan profiles have a bigger effect on the graphics performance. However, the W700 passes the challenging Time Spy stress test with both profiles. The GPU performance is massively reduced on battery power, independent of the fan profile: 13,196 vs. 4,384 points in 3DMark Fire Strike GPU (-66%). Simple graphics calculations are handled by the iGPU of the processor (Optimus).
| 3DMark | Fan "Auto" | Fan "Turbo" | Difference |
|---|---|---|---|
| Time Spy Graphics | 4943 Points | 5406 points | +9% |
| TimeSpy Stress Test | 97.3% Passed | 98.8% Passed |
| Unigine Valley 1.0 | |
| 1920x1080 Extreme HD DirectX AA:x8 | |
| MSI WS75 9TL-636 | |
| Asus ProArt StudioBook Pro 17 W700G3T | |
| Average NVIDIA Quadro RTX 3000 Max-Q (n=1) | |
| Average of class Workstation (n=1last 2 years) | |
| Lenovo ThinkPad P73-20QR002DGE | |
| 1920x1080 Extreme HD Preset OpenGL AA:x8 | |
| MSI WS75 9TL-636 | |
| Asus ProArt StudioBook Pro 17 W700G3T | |
| Average NVIDIA Quadro RTX 3000 Max-Q (n=1) | |
| Lenovo ThinkPad P73-20QR002DGE | |
| Average of class Workstation (n=1last 2 years) | |
| Apple MacBook Pro 16 2019 i9 5500M | |
| 3DMark 11 Performance | 14763 points | |
| 3DMark Ice Storm Standard Score | 79168 points | |
| 3DMark Cloud Gate Standard Score | 32299 points | |
| 3DMark Fire Strike Score | 12130 points | |
| 3DMark Fire Strike Extreme Score | 6117 points | |
| 3DMark Time Spy Score | 5070 points | |
Help | ||
Gaming Performance
It is no problem to play games with the mobile Quadro GPU since we did not experience any driver issues during our tests. The performance is sufficient for maximum details in all modern games at the native resolution, only QHD and 4K can sometimes be too demanding. The gaming performance of the consumer version RTX 2060 is a bit better, though.
| low | med. | high | ultra | QHD | 4K | |
|---|---|---|---|---|---|---|
| GTA V (2015) | 155 | 150 | 111.8 | 58.5 | 49.4 | 65 |
| The Witcher 3 (2015) | 236 | 166 | 95.9 | 48.5 | 33.8 | |
| Dota 2 Reborn (2015) | 131 | 120 | 115 | 109 | 75.6 | |
| Rise of the Tomb Raider (2016) | 195 | 139 | 96.7 | 80.8 | 34 | |
| X-Plane 11.11 (2018) | 106 | 92 | 78.6 | 64.4 | ||
| Shadow of the Tomb Raider (2018) | 86 | 76 | 71 | 65 | 43 | 21 |
| Hitman 2 (2018) | 66.3 | 63.2 | 57.5 | 55.9 | 44.8 | 24.3 |
| Dirt Rally 2.0 (2019) | 203 | 128 | 101 | 64 | 47.2 | |
| The Division 2 (2019) | 114 | 86 | 68 | 50 | 34 | 17 |
| Ghost Recon Breakpoint (2019) | 75 | 65 | 59 | 45 | 32 | 16 |
| GRID 2019 (2019) | 93 | 72.4 | 66.3 | 51.4 | 46.6 | 21.2 |
| Call of Duty Modern Warfare 2019 (2019) | 142.5 | 93.8 | 81 | 54.3 | 34 | 17.5 |
| Need for Speed Heat (2019) | 82 | 74.7 | 66.7 | 61.9 | 47.5 | 25.9 |
| Star Wars Jedi Fallen Order (2019) | 76.8 | 71.8 | 66.3 | 46.8 | 24.1 | |
| Doom Eternal (2020) | 178.3 | 119.2 | 104.4 | 102.6 | 67.5 | 31.6 |
Emissions
System Noise – Either quiet or annoying
The two fans stay very quiet in the "Auto" settings, even under maximum load. We did not measure more than 31.6 dB(A), so the device stays agreeable in every scenario. Still, the fan control is not great, because the fans are often running while idling or during very light workloads and you can hear a quiet murmur. As soon as you select the "Turbo" fan profile in the MyAsus app, the fans will react, as they are extremely sensitive to load changes. Our Cinebench loop is a good example, because there is a small break of ~2 seconds after every iteration. This time is sufficient for the fans to reduce the speed and quickly increase it again. You will have to live with fluctuating fan speeds during more demanding tasks or gaming. The maximum fan noise is 38.3 dB(A), which is still okay.
| Fan "Auto" | Fan "Turbo" | |
|---|---|---|
| Idle Max | 29.9 dB(A) | 30.6 dB(A) |
| 3DMark 06 | 31.6 dB(A) | 33.5 dB(A) |
| Witcher 3 | 31.6 dB(A) | 33.5 dB(A) |
| Stress test | 31.6 dB(A) | 38.3 dB(A) |
Noise level
| Idle |
| 29.4 / 29.9 / 29.9 dB(A) |
| Load |
| 31.6 / 31.6 dB(A) |
 | ||
30 dB silent 40 dB(A) audible 50 dB(A) loud |
||
min: | ||
| Asus ProArt StudioBook Pro 17 W700G3T Quadro RTX 3000 Max-Q, i7-9750H, Samsung SSD PM981 MZVLB1T0HALR | MSI WS75 9TL-636 Quadro RTX 4000 (Laptop), i7-9750H, Samsung SSD PM981 MZVLB1T0HALR | Apple MacBook Pro 16 2019 i9 5500M Radeon Pro 5500M, i9-9880H, Apple SSD AP1024 7171 | Acer ConceptD 5 CN517-71-74YA GeForce RTX 2060 Mobile, i7-9750H, WDC PC SN720 SDAQNTW-1T00 | Gigabyte Aero 17 HDR XB GeForce RTX 2070 Super Max-Q, i7-10875H, Samsung SSD PM981a MZVLB512HBJQ | |
|---|---|---|---|---|---|
| Noise | -14% | -18% | -12% | -35% | |
| off / environment * (dB) | 29.4 | 29.4 -0% | 29.8 -1% | 29.8 -1% | 30 -2% |
| Idle Minimum * (dB) | 29.4 | 29.4 -0% | 29.9 -2% | 29.7 -1% | 35 -19% |
| Idle Average * (dB) | 29.9 | 30.1 -1% | 29.9 -0% | 29.7 1% | 36 -20% |
| Idle Maximum * (dB) | 29.9 | 30.9 -3% | 29.9 -0% | 29.7 1% | 38 -27% |
| Load Average * (dB) | 31.6 | 40.7 -29% | 43 -36% | 39.9 -26% | 47 -49% |
| Witcher 3 ultra * (dB) | 31.6 | 41.9 -33% | 45.4 -44% | 39.5 -25% | 49 -55% |
| Load Maximum * (dB) | 31.6 | 42.7 -35% | 46.1 -46% | 41 -30% | 54 -71% |
* ... smaller is better
Temperature
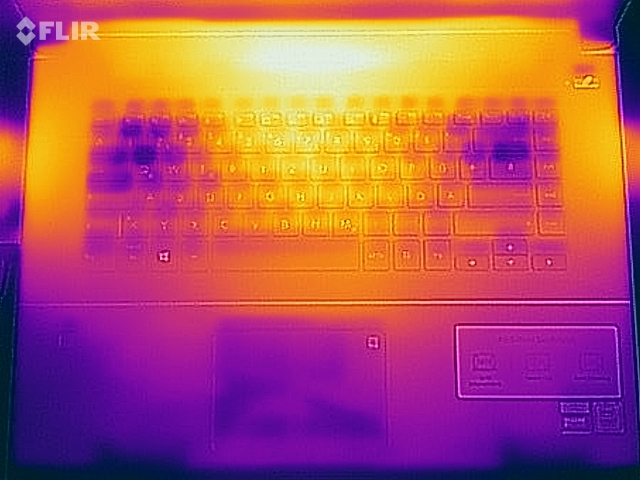
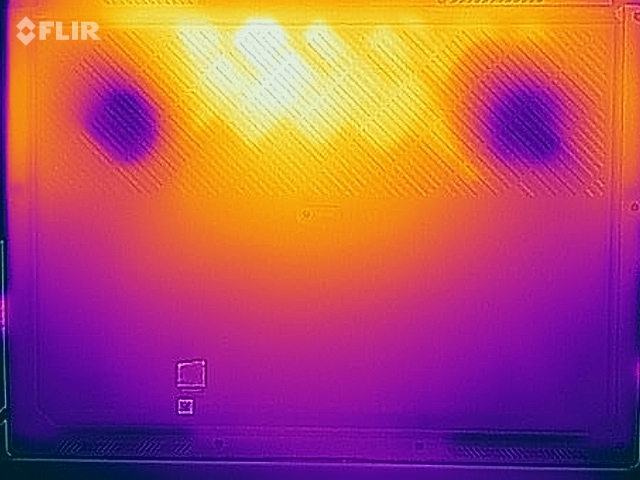
You should not place the StudioBook Pro 17 on you lap under load, because we can measure more than 50 °C (122 °F) at the upper central area of the bottom panel. The top of the base unit also gets quite warm at up to 45 °C (113 °F), but this does not limit the usability.
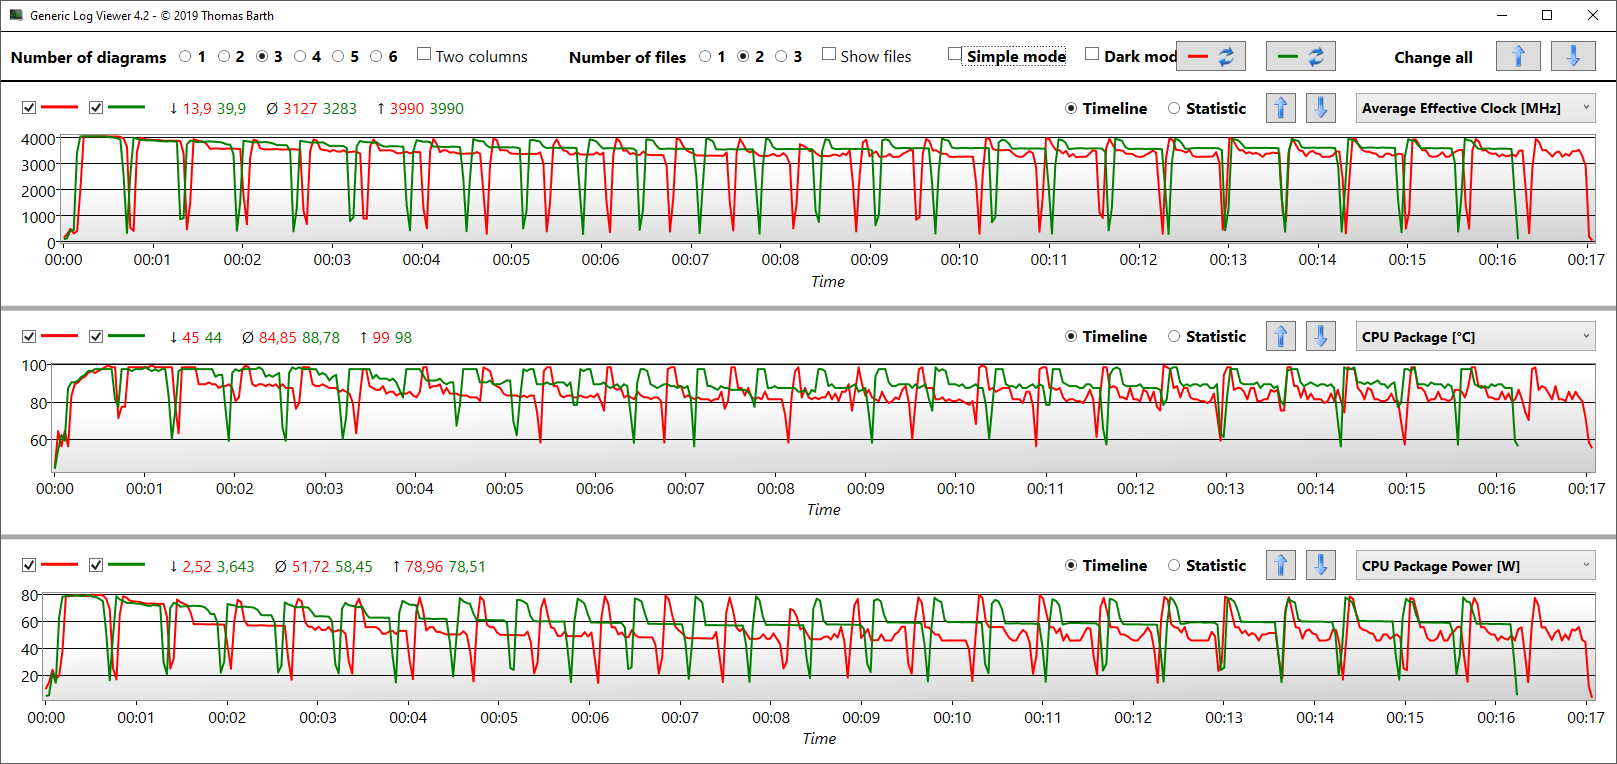
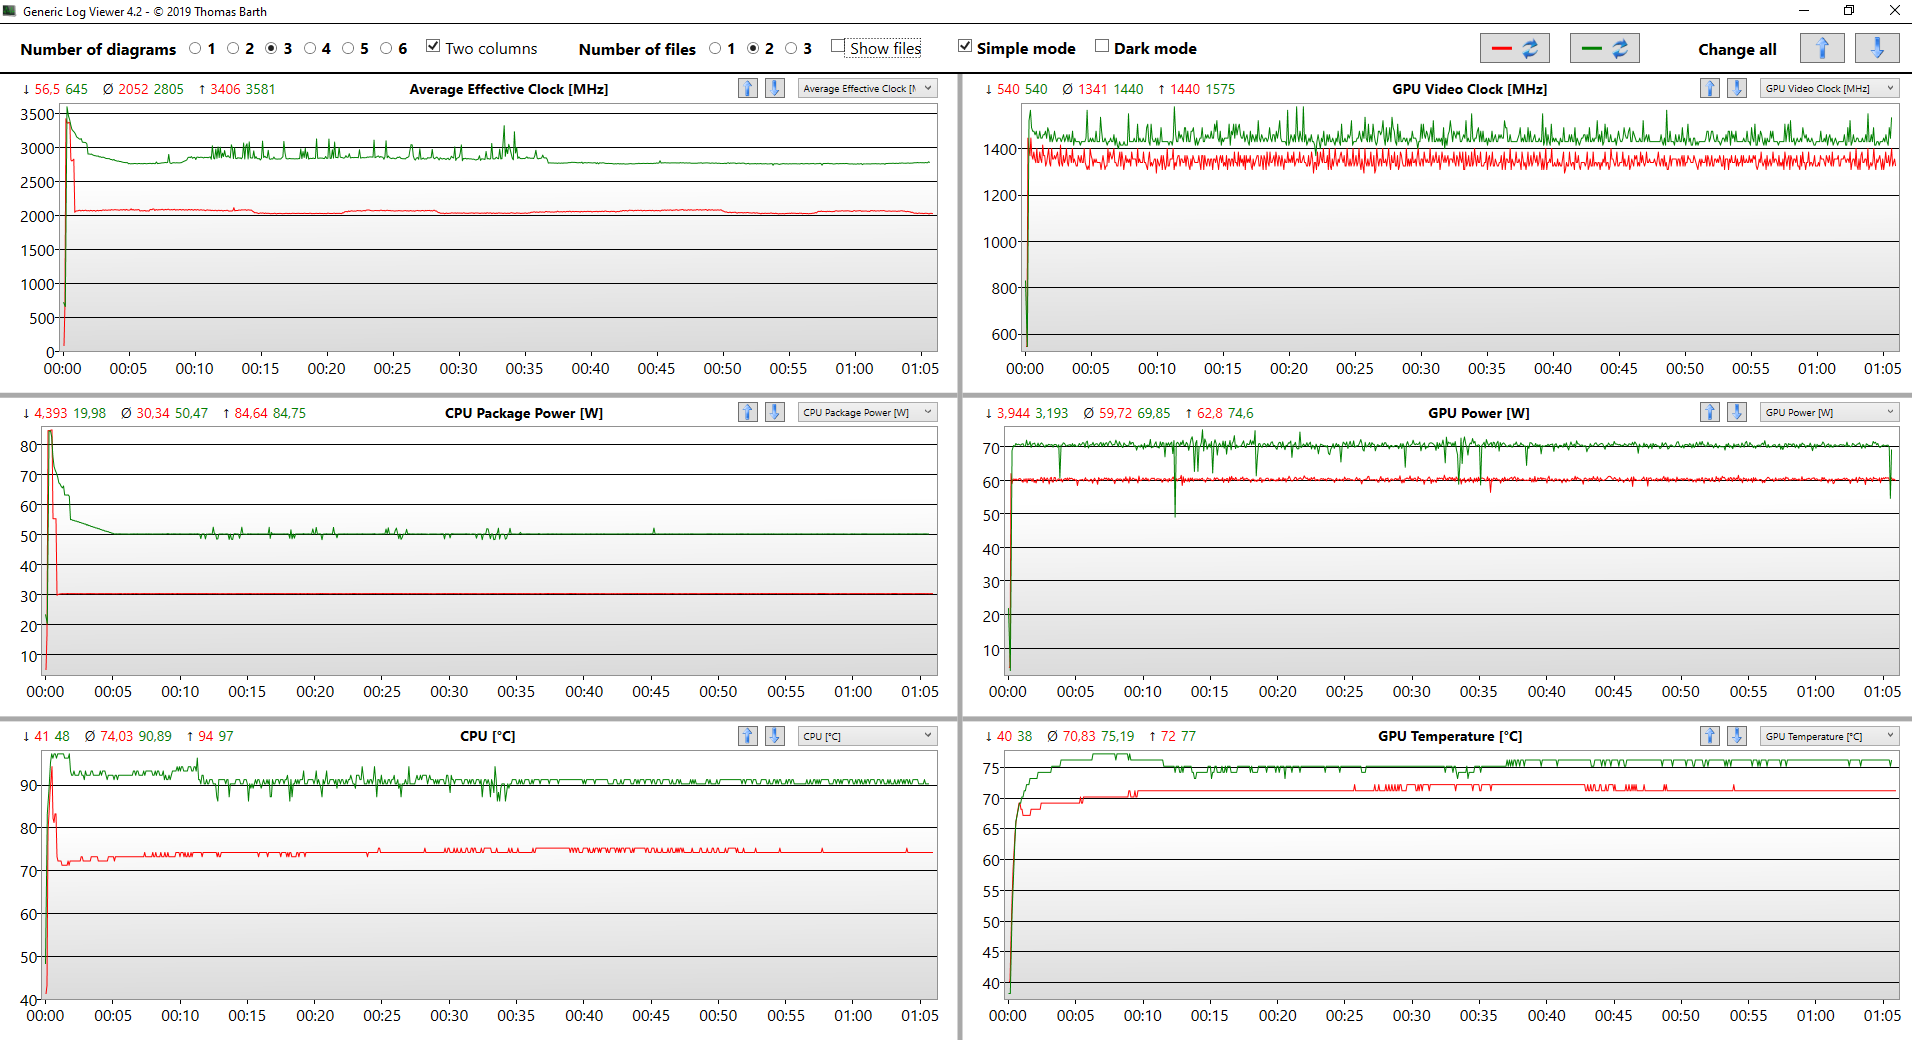
Combined workloads, which are simulated by our stress test, are heavily influenced by the two fan settings. The default "Auto" settings will reduce the power consumption of the CPU to just 30W after a couple of seconds (6x 2.1 GHz), while the GPU runs at 1300-1400 MHz. If we select the "Turbo" profile, the CPU will run faster and also gets much warmer. Over the course of the stress test, the CPU consumption levels off at 50 Watts (6x2.7 GHz) and the GPU runs at 1450-1575 MHz. Overall a very good result for the slim device. So if you need the maximum performance from both components, there is no way around the "Turbo" fan setting.
(-) The maximum temperature on the upper side is 45.4 °C / 114 F, compared to the average of 38.2 °C / 101 F, ranging from 22.2 to 69.8 °C for the class Workstation.
(-) The bottom heats up to a maximum of 53.7 °C / 129 F, compared to the average of 41.1 °C / 106 F
(+) In idle usage, the average temperature for the upper side is 21.3 °C / 70 F, compared to the device average of 32 °C / 90 F.
(±) Playing The Witcher 3, the average temperature for the upper side is 36.5 °C / 98 F, compared to the device average of 32 °C / 90 F.
(+) The palmrests and touchpad are cooler than skin temperature with a maximum of 31.5 °C / 88.7 F and are therefore cool to the touch.
(-) The average temperature of the palmrest area of similar devices was 27.8 °C / 82 F (-3.7 °C / -6.7 F).
Speakers
There are only two speakers at the front edge of the bottom panel. They can get pretty loud, but there are laptops with much better sound systems. There is no bass, either, so videos are not very enjoyable. The playback of voices on the other hand benefits from clear high tones, and the microphone also works well. This means you are well-suited for conference calls, but we recommend external speakers for a movie night.
Asus ProArt StudioBook Pro 17 W700G3T audio analysis
(±) | speaker loudness is average but good (79 dB)
Bass 100 - 315 Hz
(-) | nearly no bass - on average 15% lower than median
(±) | linearity of bass is average (11% delta to prev. frequency)
Mids 400 - 2000 Hz
(+) | balanced mids - only 3.4% away from median
(+) | mids are linear (4.4% delta to prev. frequency)
Highs 2 - 16 kHz
(+) | balanced highs - only 4.5% away from median
(+) | highs are linear (6.9% delta to prev. frequency)
Overall 100 - 16.000 Hz
(±) | linearity of overall sound is average (17.1% difference to median)
Compared to same class
» 50% of all tested devices in this class were better, 9% similar, 41% worse
» The best had a delta of 7%, average was 17%, worst was 35%
Compared to all devices tested
» 31% of all tested devices were better, 8% similar, 61% worse
» The best had a delta of 4%, average was 23%, worst was 134%
MSI WS75 9TL-636 audio analysis
(±) | speaker loudness is average but good (75.4 dB)
Bass 100 - 315 Hz
(-) | nearly no bass - on average 25.9% lower than median
(±) | linearity of bass is average (7.8% delta to prev. frequency)
Mids 400 - 2000 Hz
(±) | higher mids - on average 5.2% higher than median
(±) | linearity of mids is average (8.1% delta to prev. frequency)
Highs 2 - 16 kHz
(+) | balanced highs - only 3.3% away from median
(±) | linearity of highs is average (9.3% delta to prev. frequency)
Overall 100 - 16.000 Hz
(±) | linearity of overall sound is average (27.5% difference to median)
Compared to same class
» 94% of all tested devices in this class were better, 2% similar, 4% worse
» The best had a delta of 7%, average was 17%, worst was 35%
Compared to all devices tested
» 84% of all tested devices were better, 3% similar, 13% worse
» The best had a delta of 4%, average was 23%, worst was 134%
Energy Management – small battery prevents longer runtimes
Power Consumption
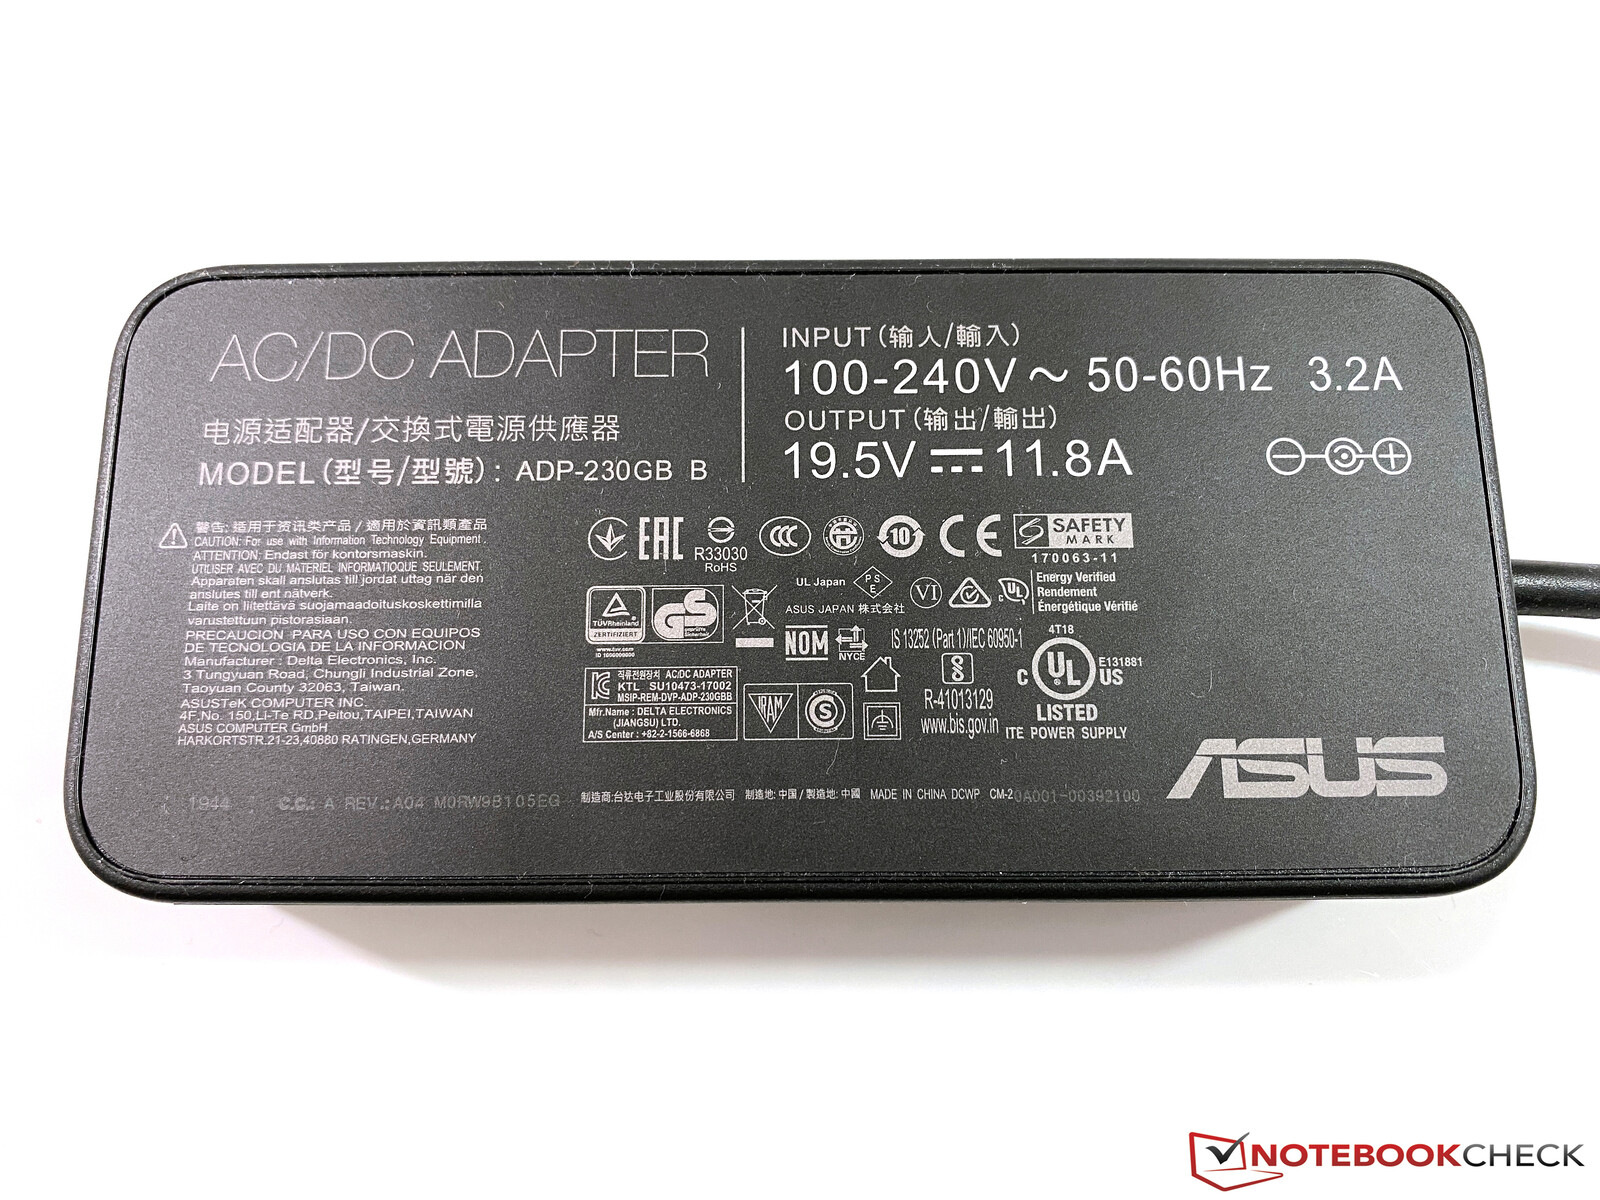
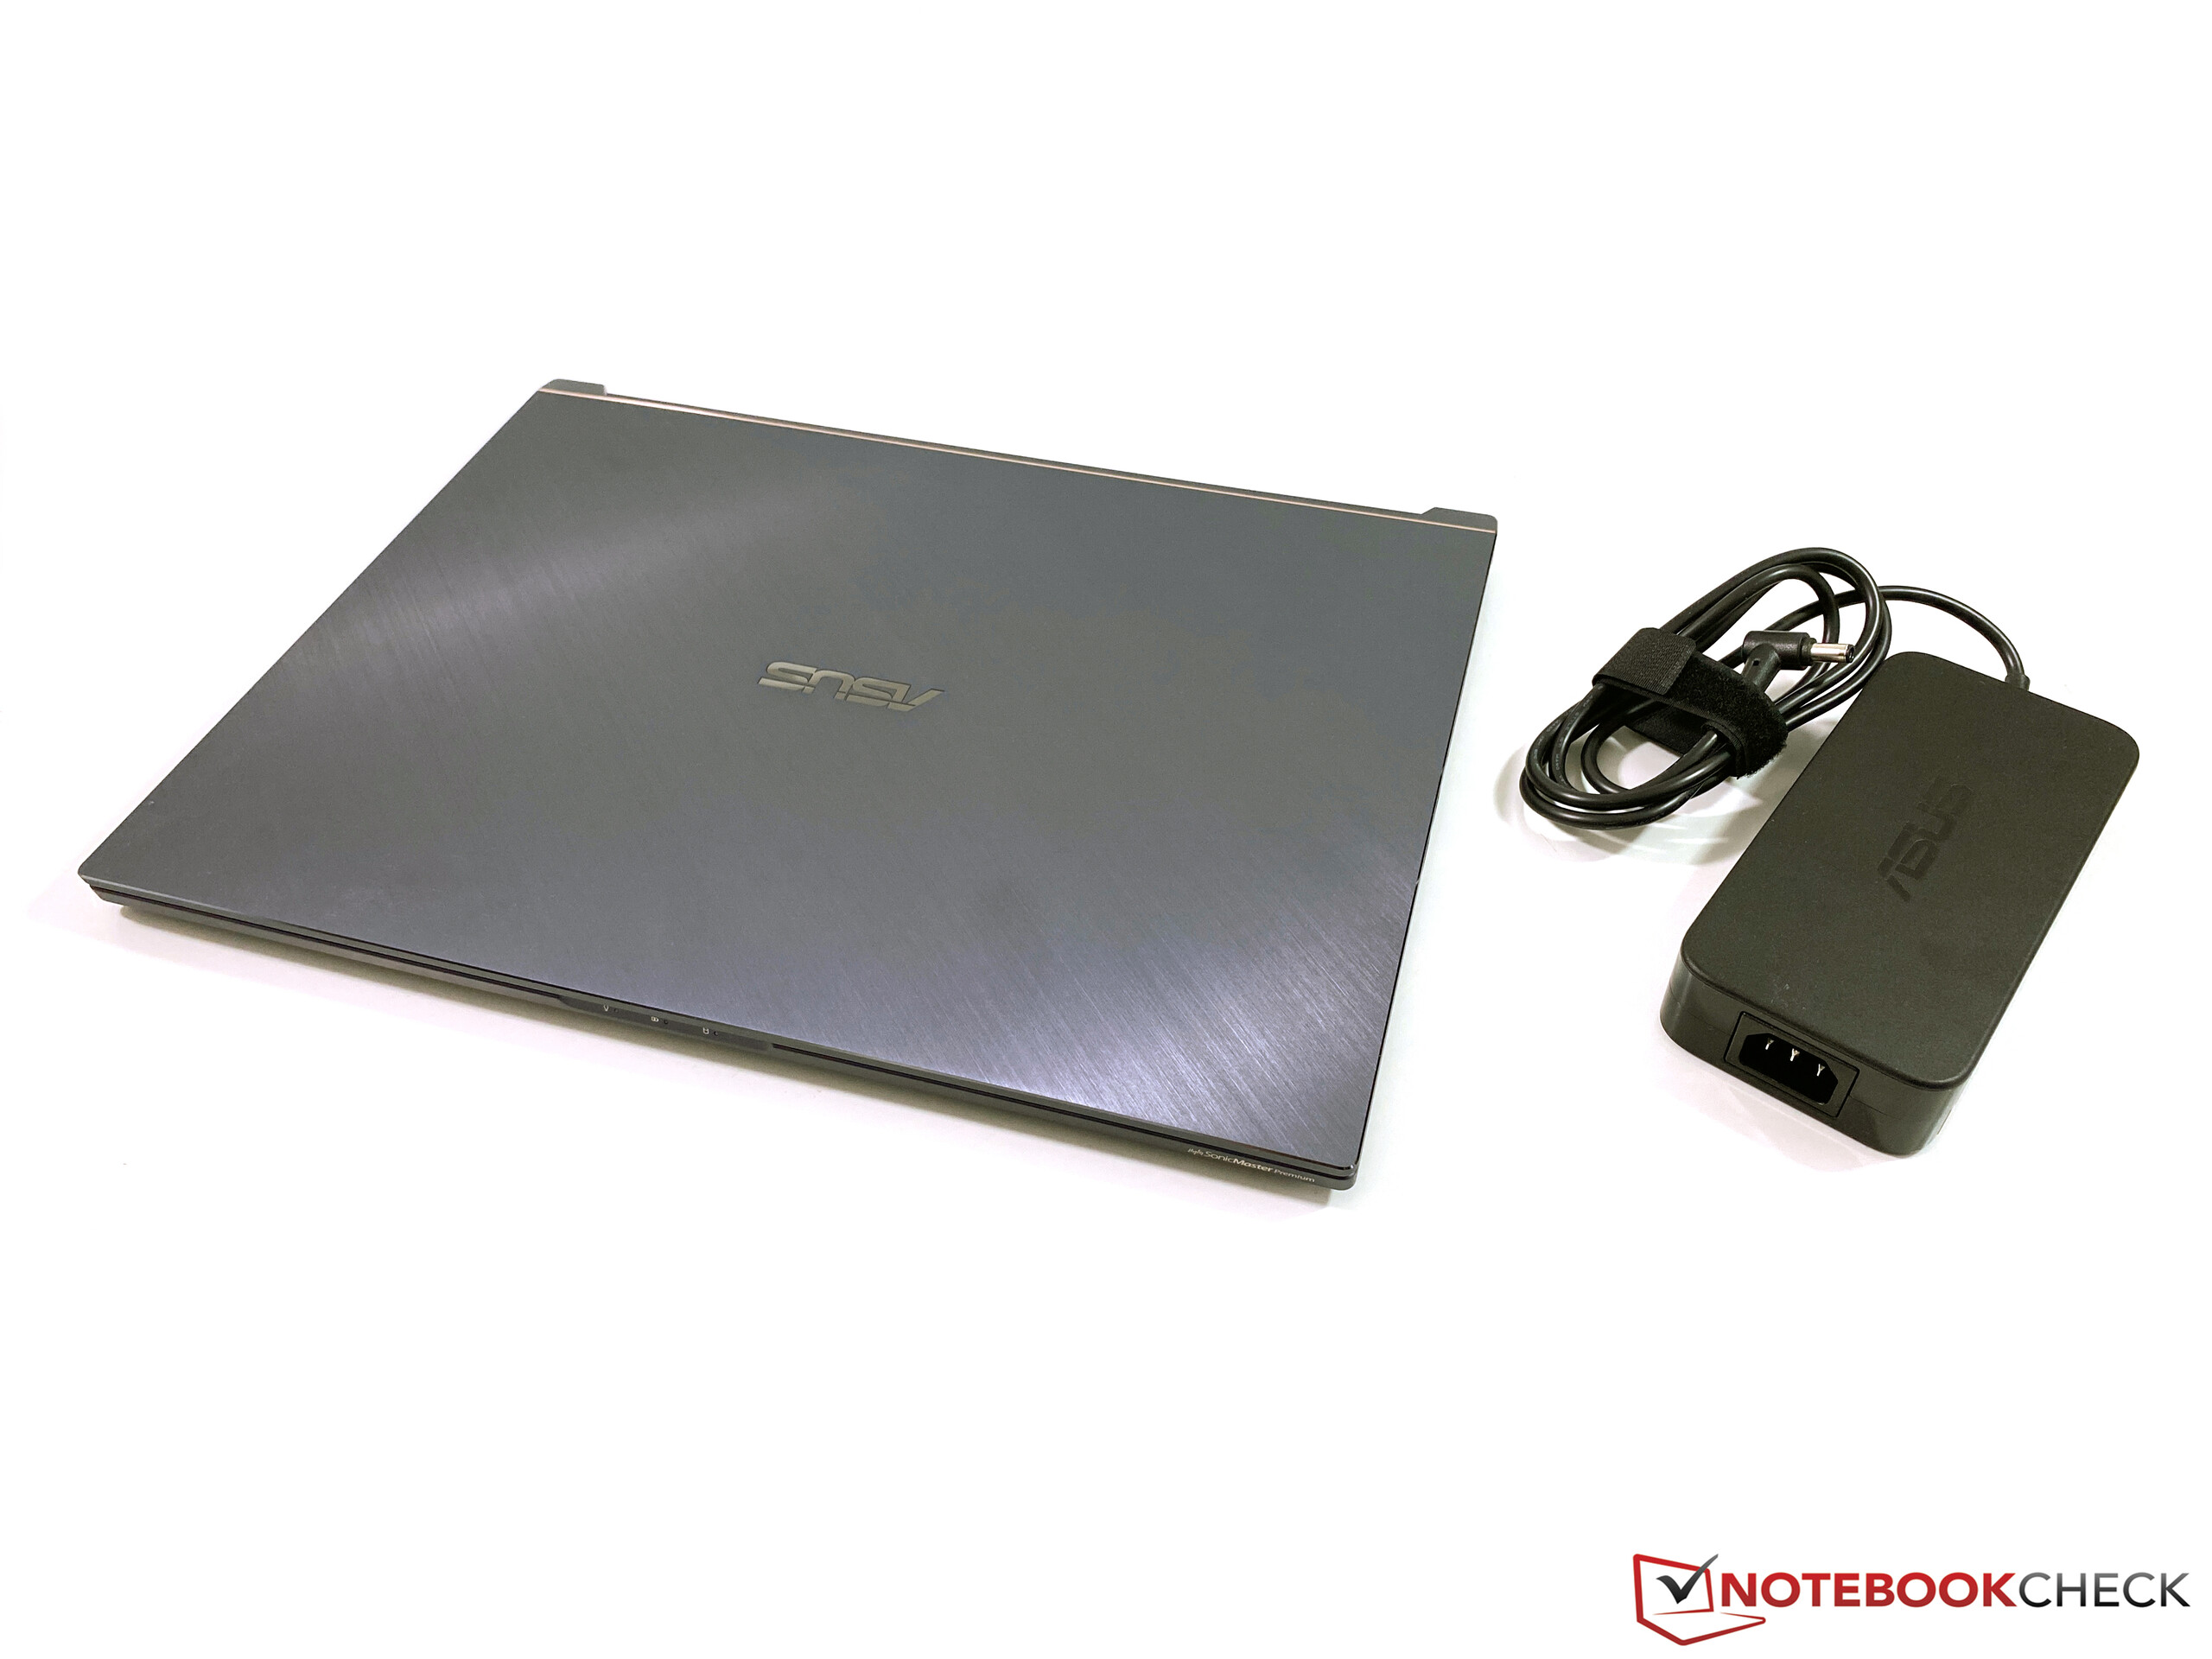
The power consumption is modest for a 17-inch device equipped with powerful components. The bulky 230W power adapter is sufficient, because we measure a maximum consumption of around 190 Watts. Depending on the fan profile, the consumption during the stress test will level off at 110 Watts (Auto) and 150 Watts (Turbo), respectively.
| Off / Standby | |
| Idle | |
| Load |
|
Key:
min: | |
| Asus ProArt StudioBook Pro 17 W700G3T i7-9750H, Quadro RTX 3000 Max-Q, Samsung SSD PM981 MZVLB1T0HALR, IPS, 1920x1200, 17" | MSI WS75 9TL-636 i7-9750H, Quadro RTX 4000 (Laptop), Samsung SSD PM981 MZVLB1T0HALR, IPS, 1920x1080, 17.3" | Apple MacBook Pro 16 2019 i9 5500M i9-9880H, Radeon Pro 5500M, Apple SSD AP1024 7171, IPS, 3072x1920, 16" | Acer ConceptD 5 CN517-71-74YA i7-9750H, GeForce RTX 2060 Mobile, WDC PC SN720 SDAQNTW-1T00, IPS, 3840x2160, 17.3" | Gigabyte Aero 17 HDR XB i7-10875H, GeForce RTX 2070 Super Max-Q, Samsung SSD PM981a MZVLB512HBJQ, IPS, 3840x2160, 17.3" | Average NVIDIA Quadro RTX 3000 Max-Q | Average of class Workstation | |
|---|---|---|---|---|---|---|---|
| Power Consumption | -24% | 23% | 7% | -41% | 6% | 6% | |
| Idle Minimum * (Watt) | 11.3 | 16.4 -45% | 3.7 67% | 6.2 45% | 16 -42% | 7.7 ? 32% | 9.04 ? 20% |
| Idle Average * (Watt) | 16 | 21.6 -35% | 12.1 24% | 15.2 5% | 19 -19% | 14.6 ? 9% | 13.8 ? 14% |
| Idle Maximum * (Watt) | 16.8 | 22.9 -36% | 17 -1% | 17.4 -4% | 30 -79% | 16.9 ? -1% | 17.7 ? -5% |
| Load Average * (Watt) | 93.6 | 88 6% | 91.5 2% | 95 -1% | 109 -16% | 111.1 ? -19% | 96.2 ? -3% |
| Witcher 3 ultra * (Watt) | 106 | 137 -29% | 103 3% | 136 -28% | 167 -58% | ||
| Load Maximum * (Watt) | 186.6 | 193 -3% | 102.3 45% | 145 22% | 246 -32% | 173.5 ? 7% | 178.5 ? 4% |
* ... smaller is better
Battery Runtime
The 3-cell battery only has a capacity of 57Wh, which is not much for a big 17-inch device. As a result, the battery runtime is not great: Our Wi-Fi test runs for about 6 hours, and around 4.5 hours at the maximum luminance. The load runtime is 1:40 hours, but at reduced performance as we have seen in previous sections. A complete recharge will take 161 minutes (device turned on); 50% of the capacity is available after 45 minutes.
| Asus ProArt StudioBook Pro 17 W700G3T i7-9750H, Quadro RTX 3000 Max-Q, 57 Wh | MSI WS75 9TL-636 i7-9750H, Quadro RTX 4000 (Laptop), 82 Wh | Apple MacBook Pro 16 2019 i9 5500M i9-9880H, Radeon Pro 5500M, 99.8 Wh | Acer ConceptD 5 CN517-71-74YA i7-9750H, GeForce RTX 2060 Mobile, 55 Wh | Gigabyte Aero 17 HDR XB i7-10875H, GeForce RTX 2070 Super Max-Q, 94 Wh | Average of class Workstation | |
|---|---|---|---|---|---|---|
| Battery runtime | 1% | 34% | -5% | 20% | 22% | |
| H.264 (h) | 6.9 | 8.2 19% | 9.7 41% | 9.51 ? 38% | ||
| WiFi v1.3 (h) | 5.9 | 6.6 12% | 12 103% | 5.6 -5% | 6.2 5% | 8.52 ? 44% |
| Load (h) | 1.7 | 1.2 -29% | 1 -41% | 2.3 35% | 1.429 ? -16% | |
| Reader / Idle (h) | 12.6 | 9.9 | 26.1 ? | |||
| Witcher 3 ultra (h) | 0.9 |
Pros
Cons
Verdict – StudioBook Pro is held back by small things
Asus tries to sell the StudioBook Pro 17 to professional customers and the so-called group of content creators. The 17-inch device convinces with a slim, yet sturdy chassis, but some details need improvements. This includes the port layout, and especially the power connector at the center of the left side has been a repeated annoyance during our review period. The input devices are decent, but there is also a compromise. Instead of a dedicated numeric keypad (there would be sufficient space), you get a rather small touchpad with a numpad function.
The display also leaves mixed impressions. We like the fact that it is a matte 16:10 panel, which was very well calibrated for the P3 gamut by the manufacturer. However, the basic measurements (luminance, black value, contrast) are rather disappointing considering the high price and there are no other display options.
A good first attempt, but many small things affect the overall impression, especially with the high price in mind. We would like to see more fine-tuning for the successor in regard to the performance profiles and the fan control.
The performance, or more precisely the performance utilization of the components is good on mains, but the fan profiles in the MyAsus app are not optimized very well. The default "Auto" setting will keep the fans very quiet (also under load), but the performance is lower, especially when you stress both components simultaneously. The "Turbo" profile on the other hand is extremely sensitive to load changes, which is quickly annoying in practice. We would also like to see an implementation of the settings with the Windows performance slider.
All in all, the StudioBook Pro 17 is still a good mobile workstation, but the price of almost 3900 Euros (~$4227) is pretty steep. Other manufacturers also offer more powerful GPUs in their slim workstations.
Asus ProArt StudioBook Pro 17 W700G3T
- 05/06/2020 v7 (old)
Andreas Osthoff
Price comparison
