MSI WS75 Review: Thin 17-inch workstation with powerful GPU
MSI is mostly known for its gaming laptops, but for a little while now the company has also been offering mobile workstations. These are often based on the same chassis and differentiate themselves mostly via their GPUs. Instead of a consumer GPU such as the Nvidia GeForce, they feature professional chips including ISV certification which guarantees problem-free operation with professional applications.
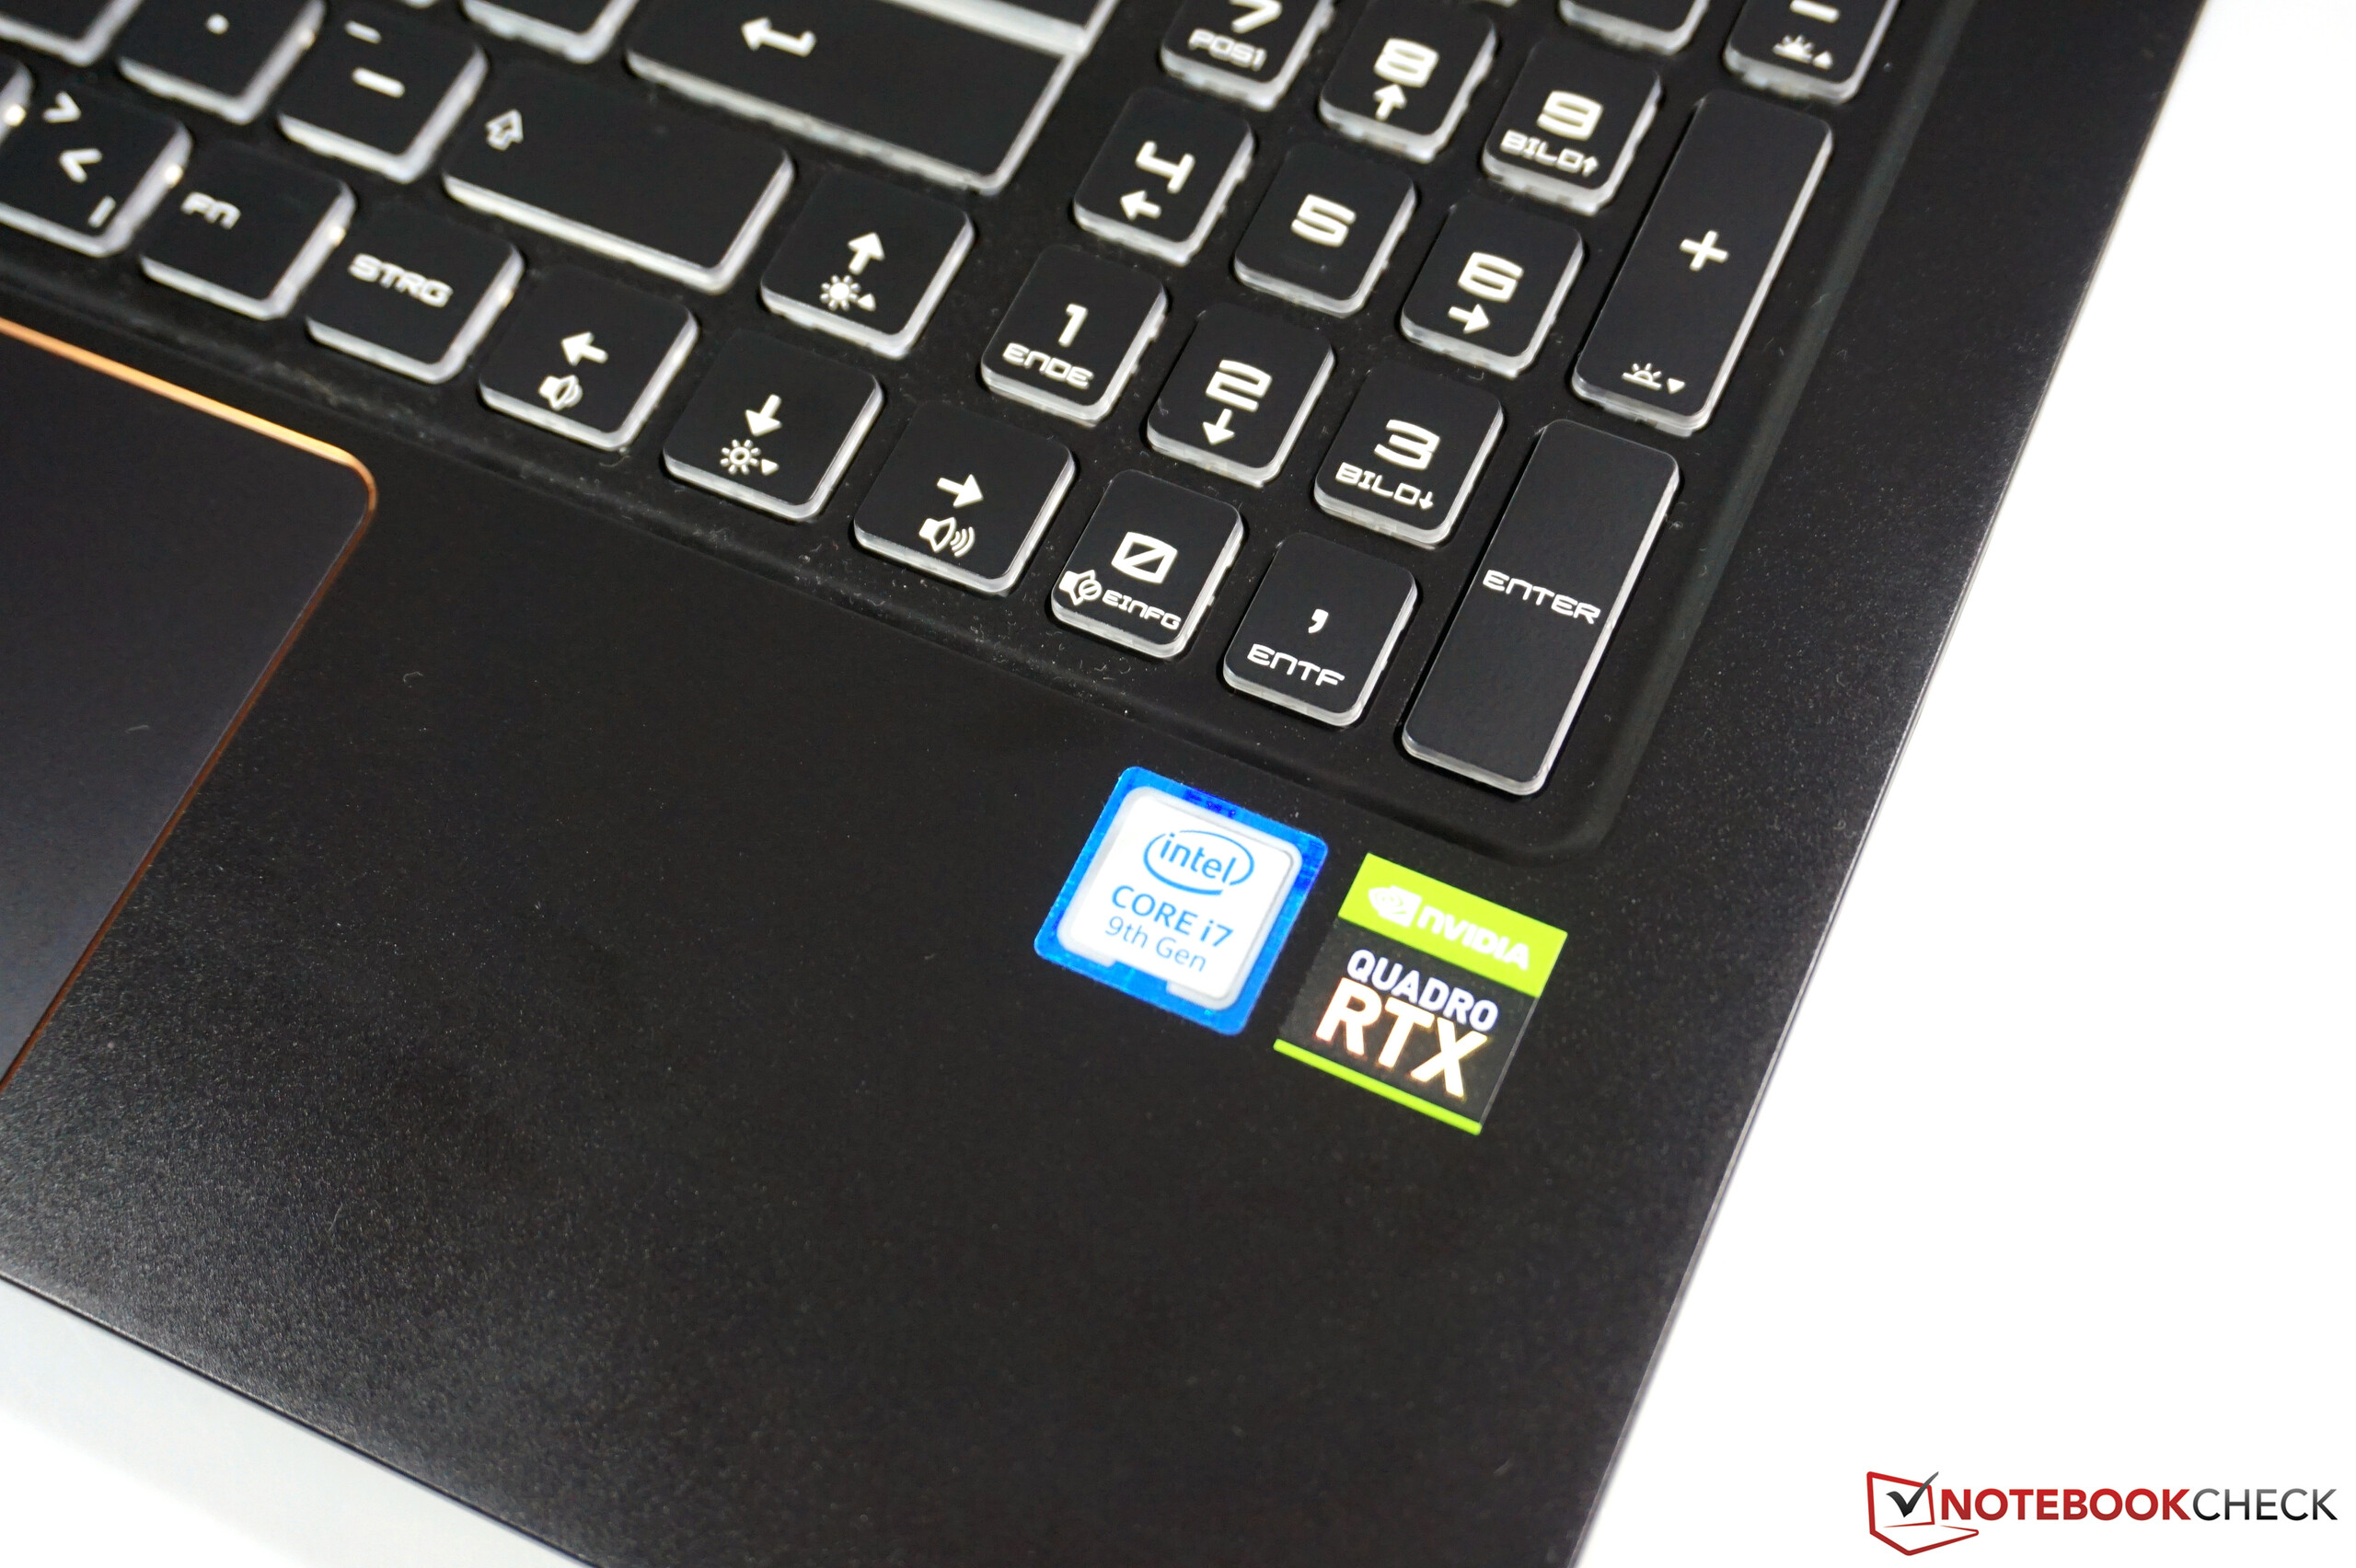
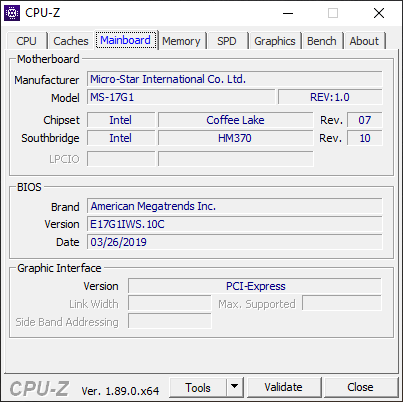
Our review model today, the MSI WS75 9TL, is one such device. The main body is already familiar to us from the MSI GS75 gaming laptop. This means we get an especially thin and light companion that doesn't have to compromise on performance. As well as a current Intel CPU from the 9th generation (i7, i9 and Xeon), it also features the new professional Quadro GPUs from Nvidia - starting with the T2000 and up to RTX 3000 and RTX 4000 options (as in our review device). A WS75 with the top model from Nvidia, the Quadro RTX 5000, should be available in the future.
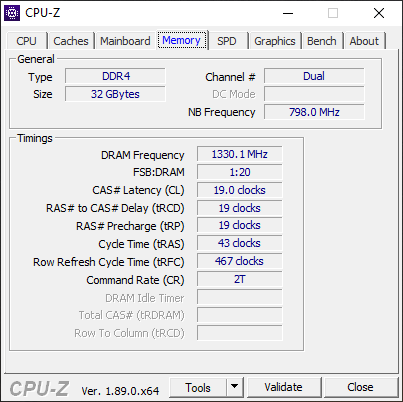
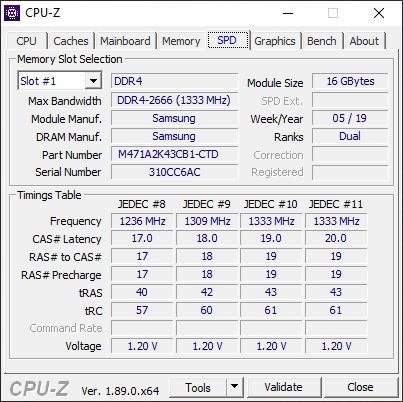
Our review sample (WS75 9TL-636) is, at around 3,700 Euros (~$4,207), hardly a bargain - but looking at the configuration this is unsurprising. Along with the Quadro RTX 4000 there is a current Core i7 from Intel, 32 GB of DDR4 RAM and a 1 TB PCIe SSD. The display is a matte Full HD IPS panel.
When thinking of competition, the 17.3-inch models from Dell (Precision 7730), Fujitsu (Celsius H980), HP (ZBook 17 G5) and Lenovo (ThinkPad P72) spring immediately to mind. As the WS75 is significantly thinner, we should also consider and compare against more mobile 15-inch models such as the Dell Precision 5530, HP ZBook Studio and Lenovo ThinkPad P1.
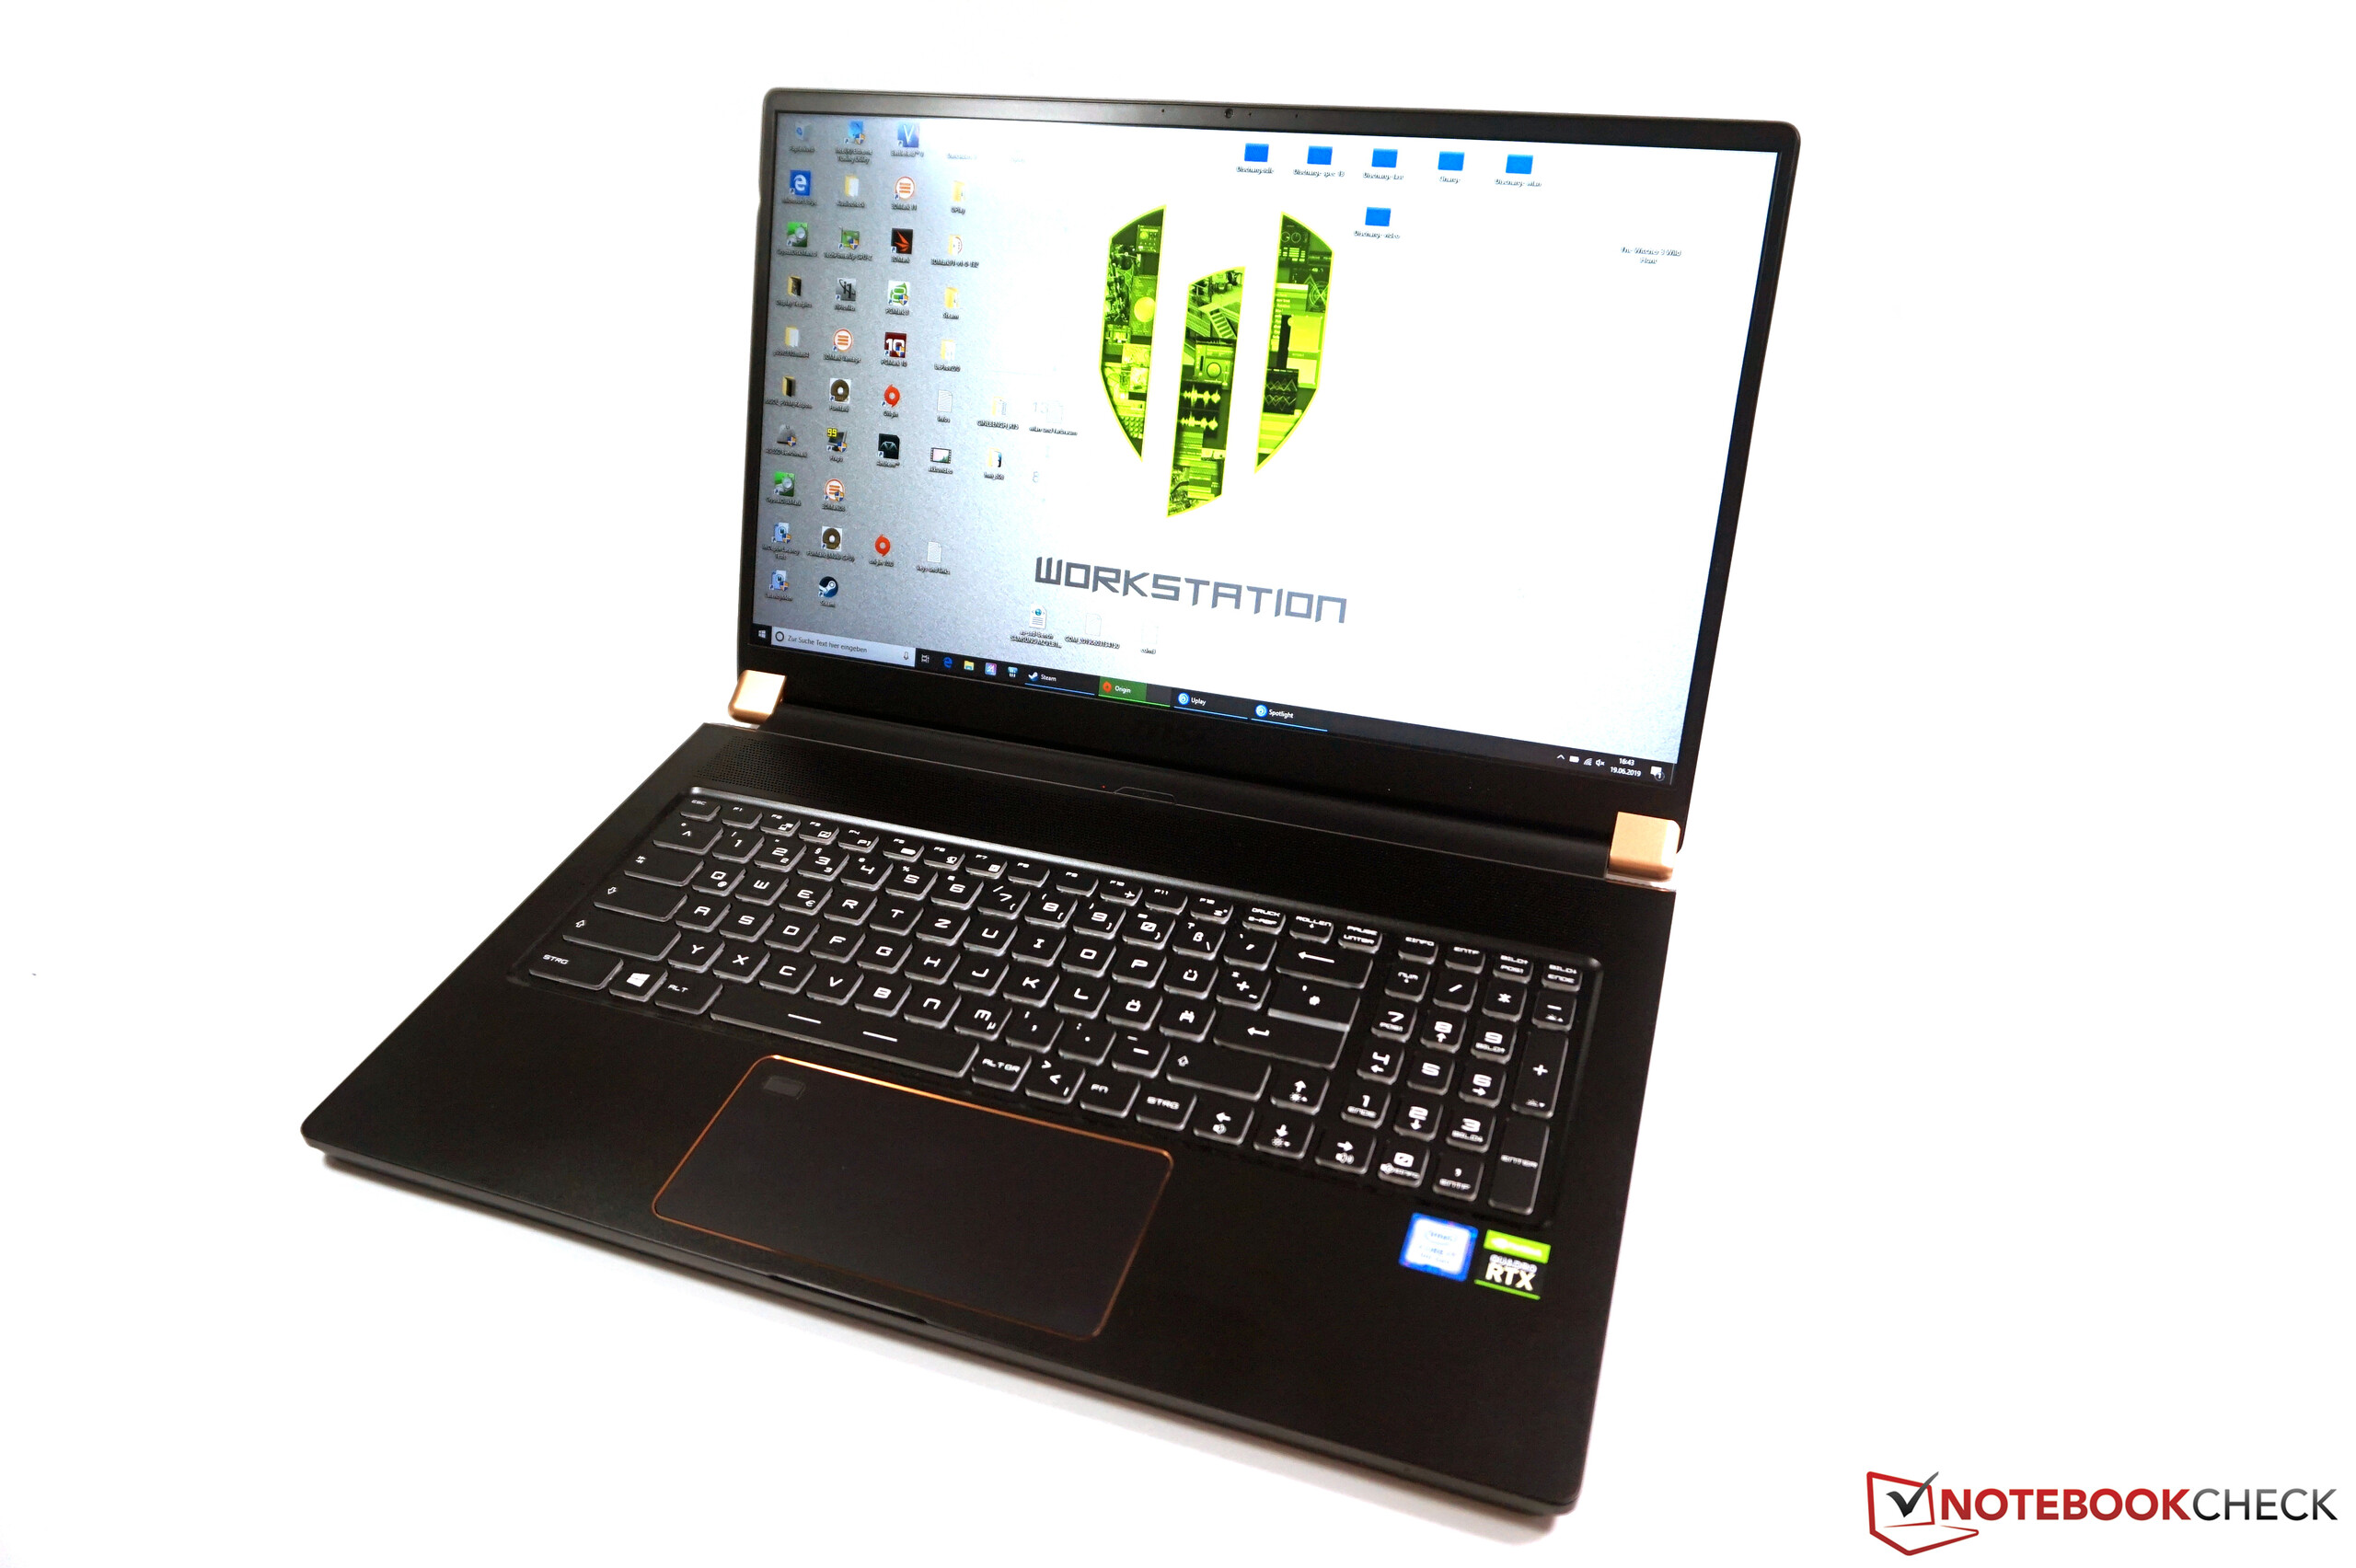
Case
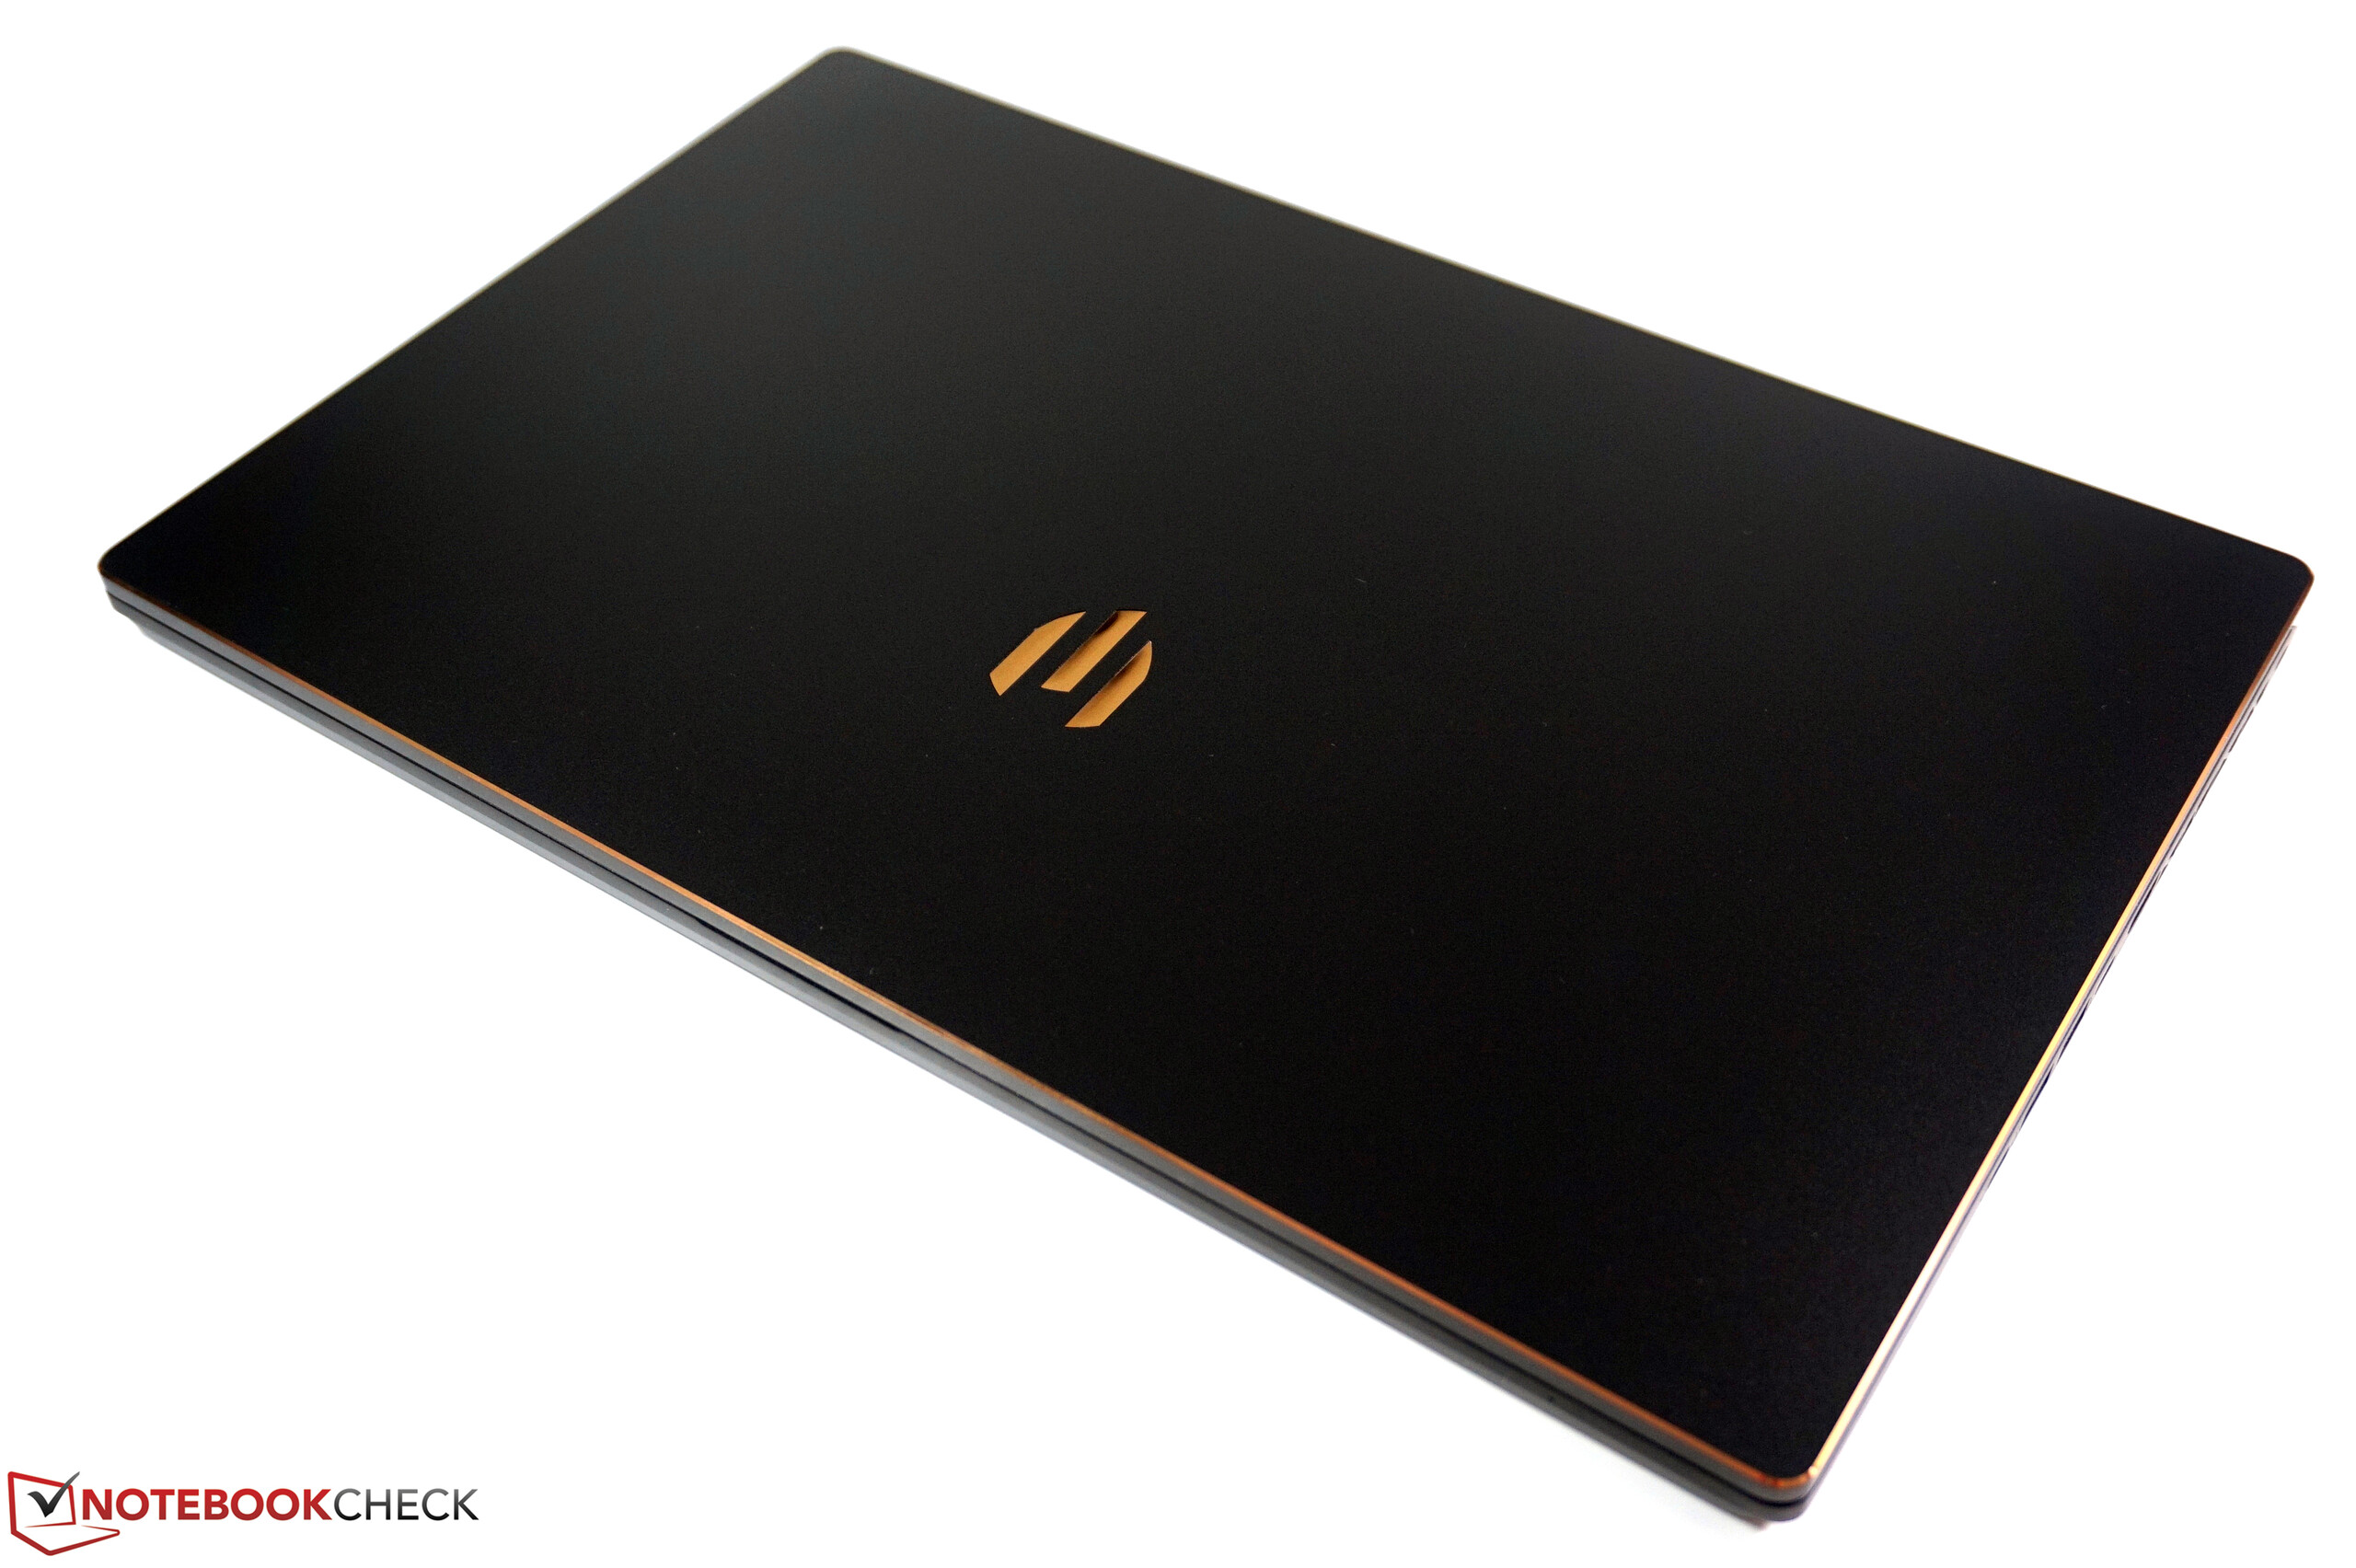
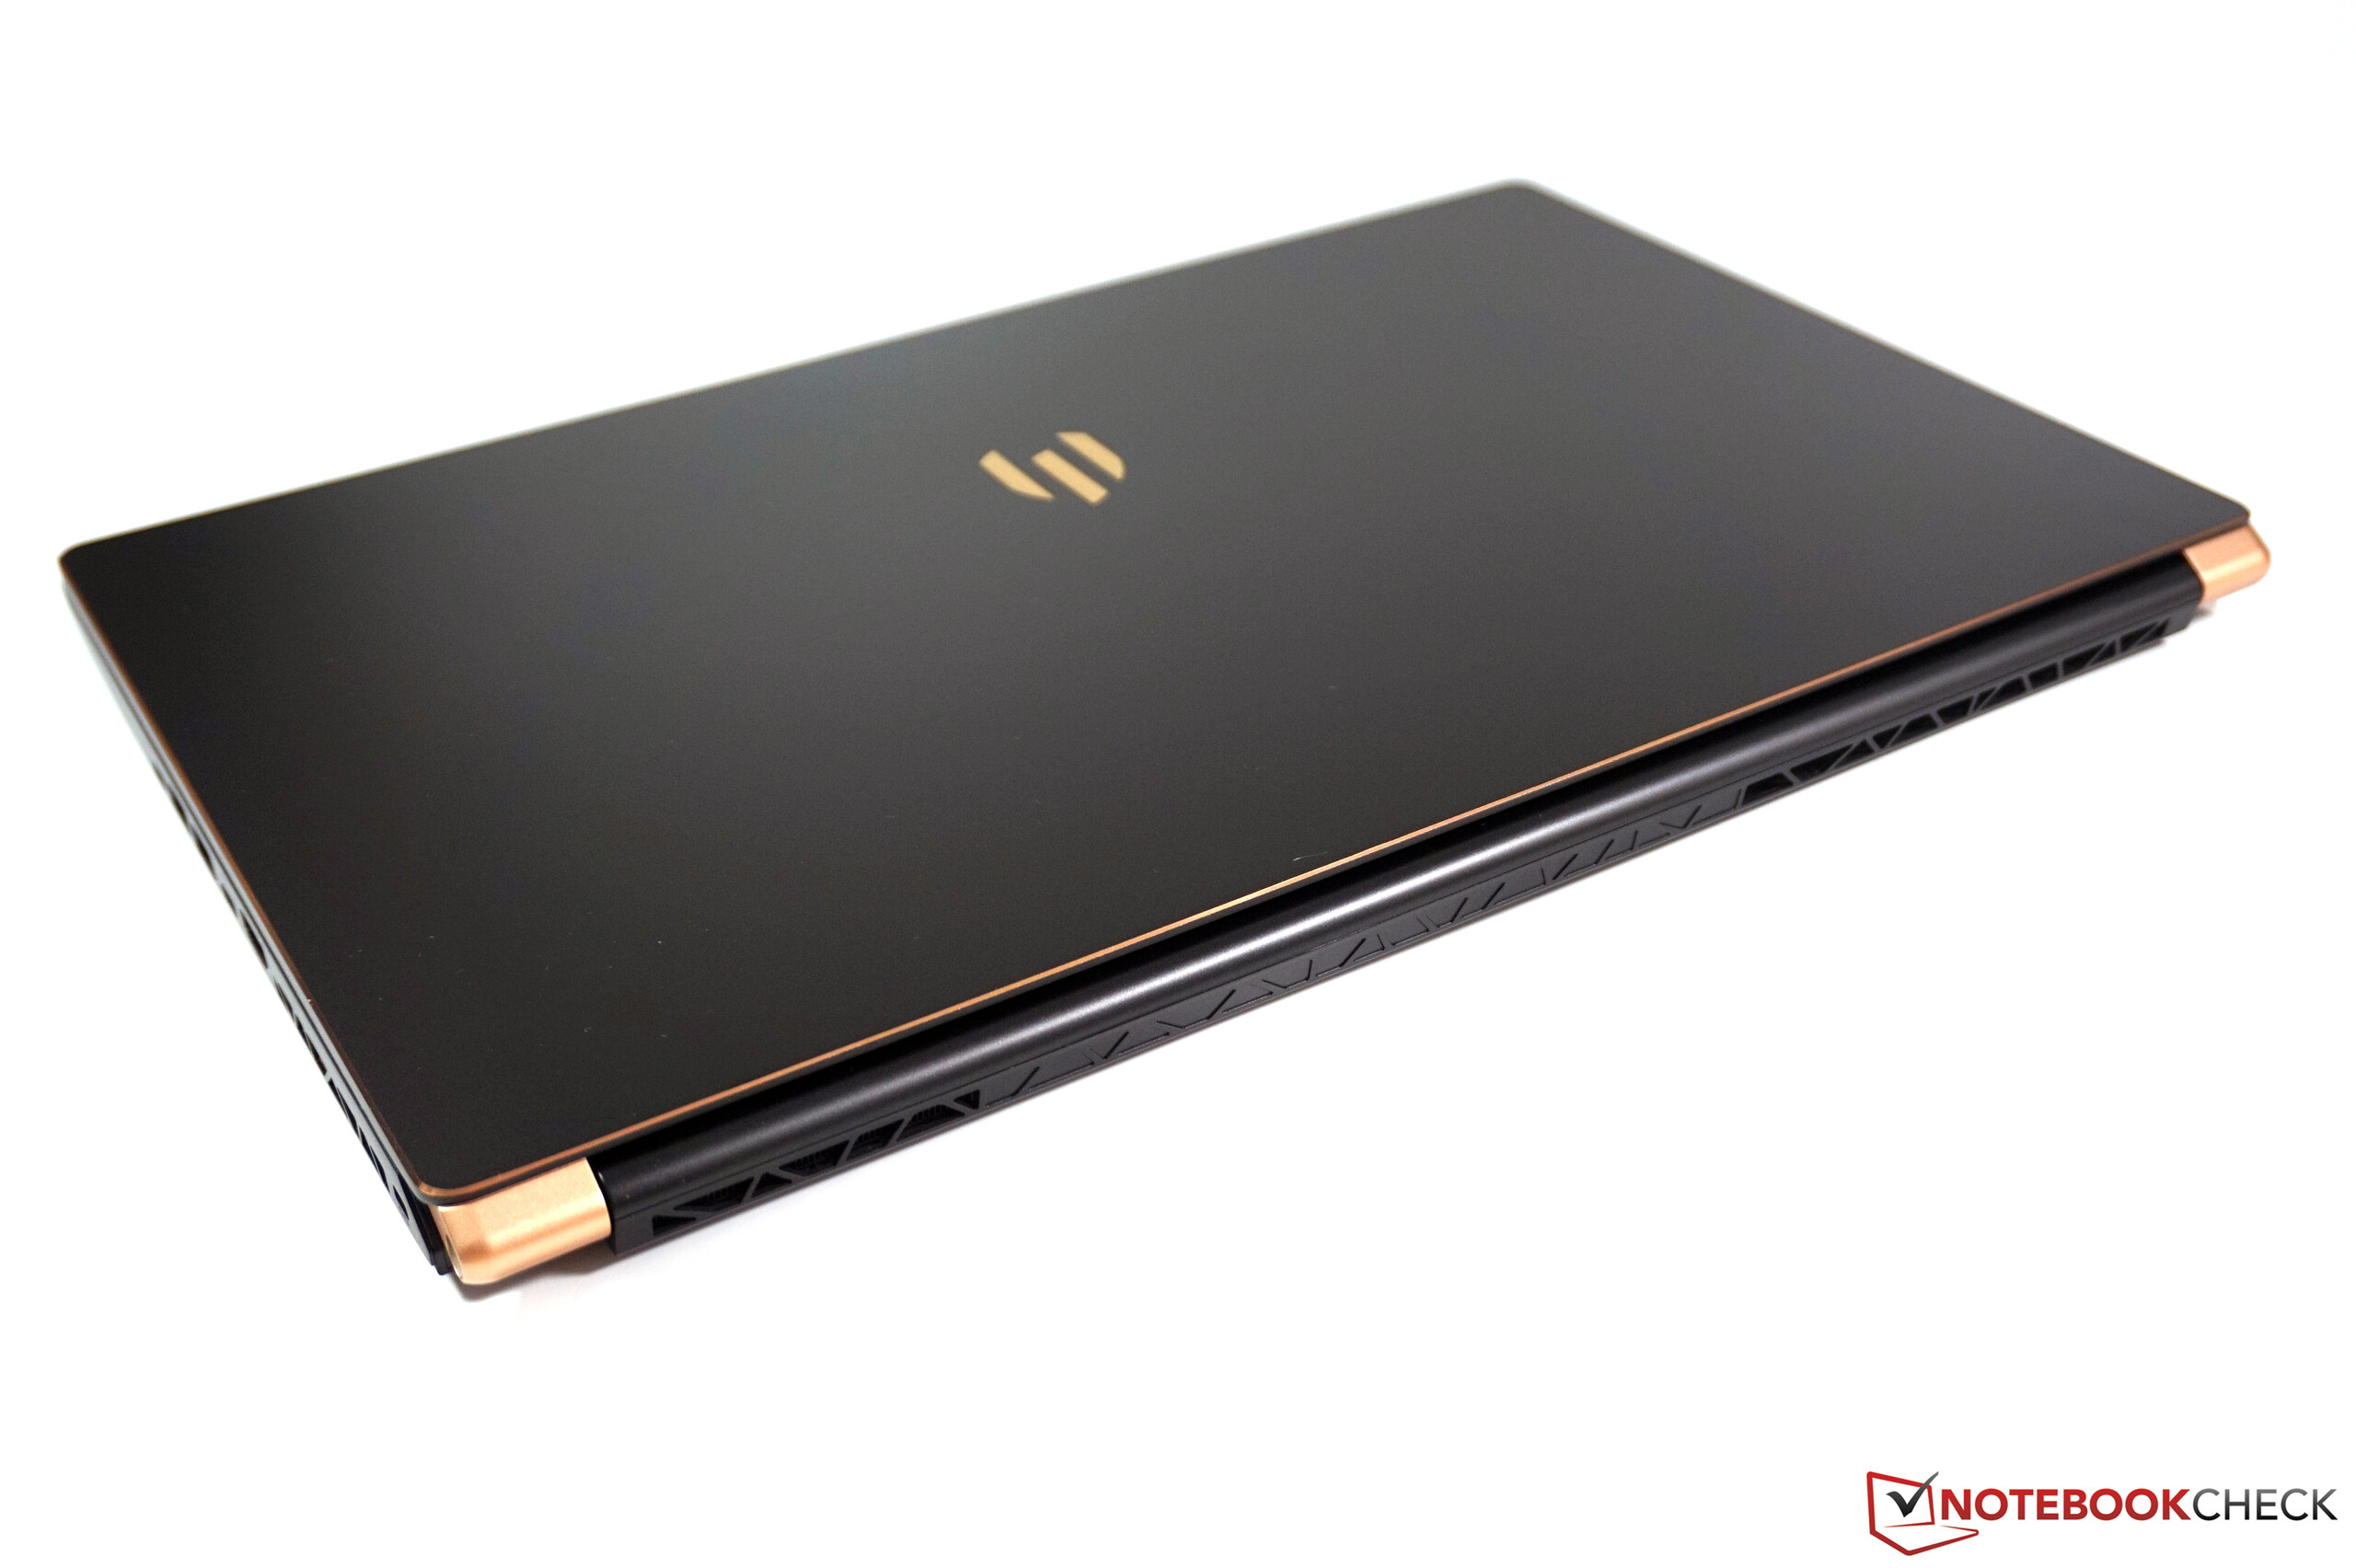
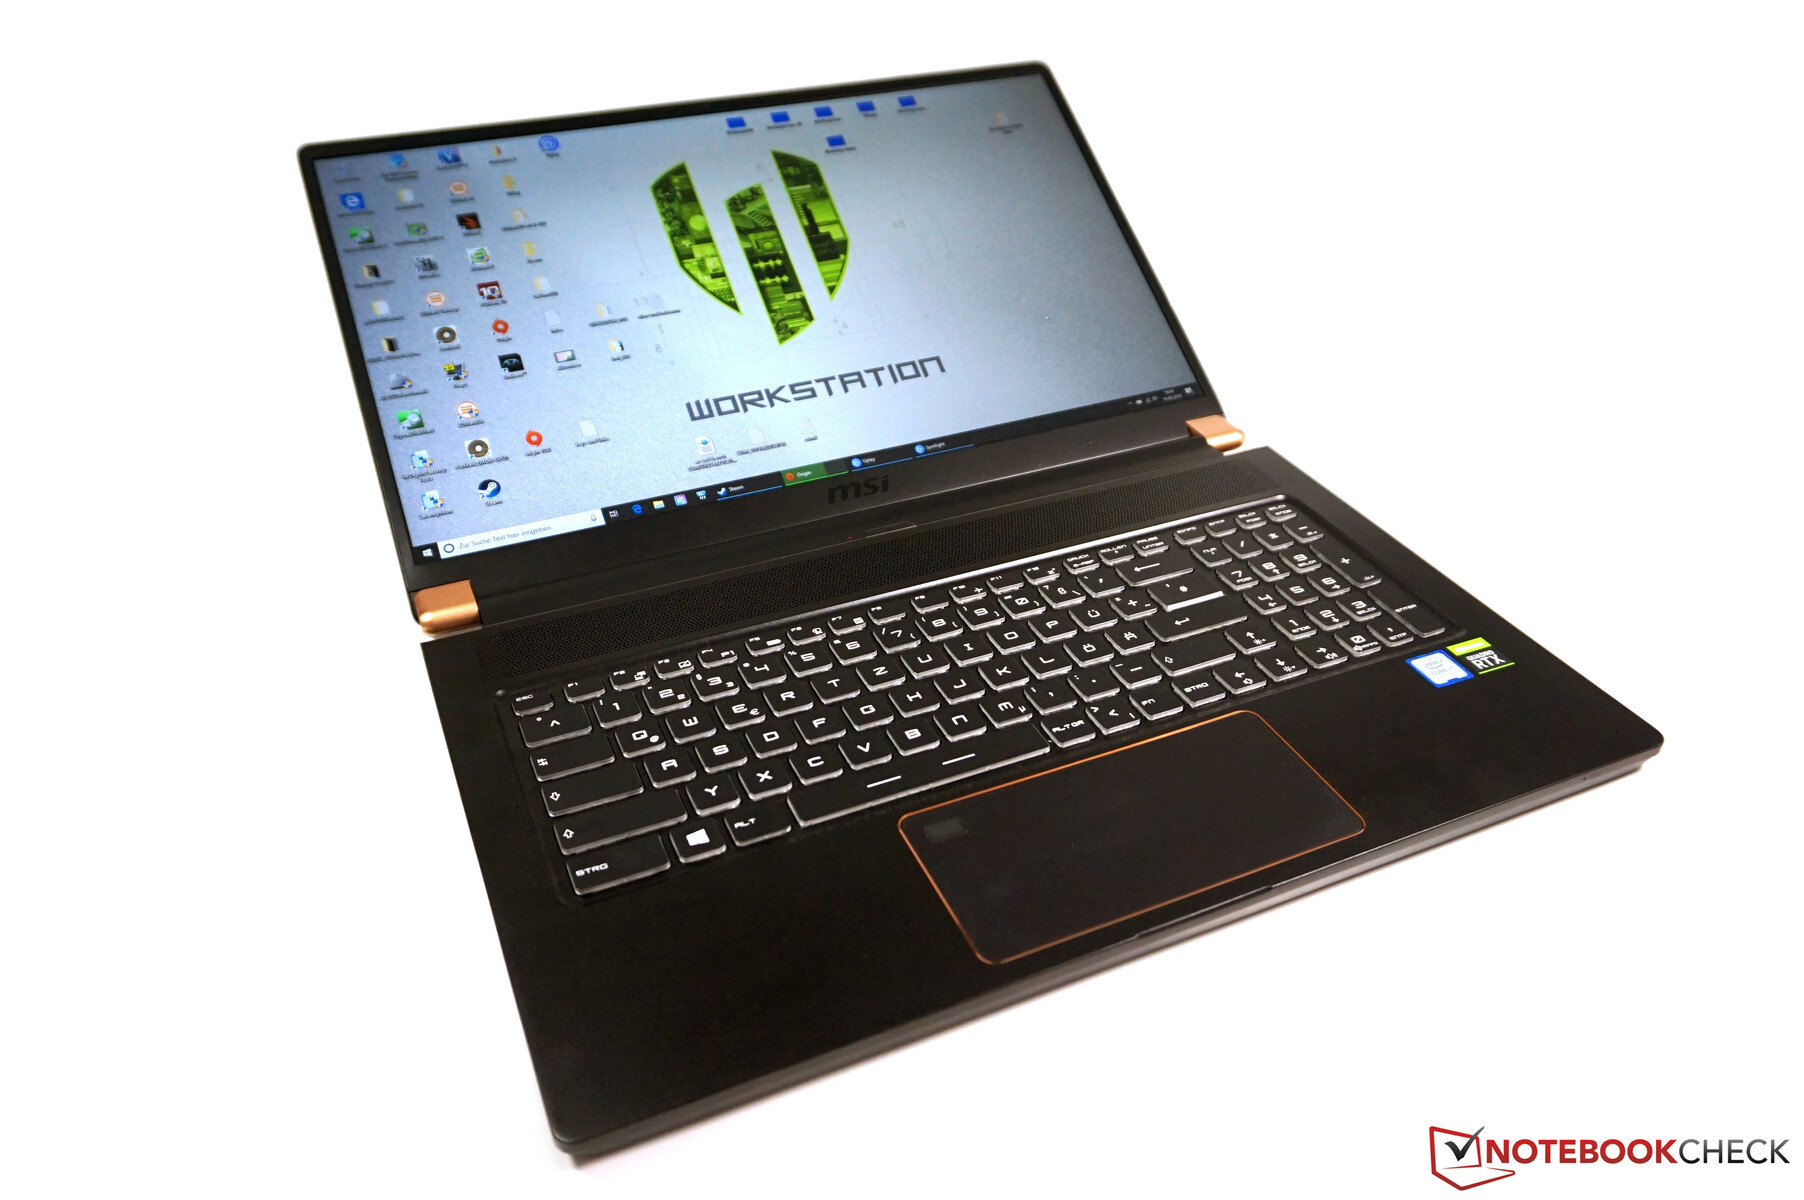
As already mentioned, the chassis of the WS75 is borrowed from its gaming sibling, the GS75, and apart from the different logos on the back of the display there are no differences. The WS75 is a very thin and, weighing in at just over 2.2 kg, very light laptop. The design is very much a prominent feature and the combination of dark metal for the upper elements (only the bottom is plastic) and the thin screen bezels make for an elegant impression. Contrasting the dark materials are copper-coloured elements such as the hinges and bordering the display and touchpad. As a result, the design is somewhat more impactful compared to the competition but not as bold as with previous models. Our overall impression is that the design of the WS75 would be at home in an office environment, and it would not stand out too much. Another colour combination is not available. The surfaces of the laptop should be cleaned regularly, as dirt and fingerprints accumulate quickly.
We come now though to the downside of the thin chassis - in terms of rigidity it cannot match its more solid and beefy competition. Considering its thinness, its rigidity is definitely not bad, but mild creaking noises when being handled and flex of the upper side of the base unit do occur.
This applies also to the thin screen/lid, which is easily twisted and light pressure on the rear of the panel results in visible distortion and waviness of the display. The two hinges could also in our opinion be somewhat stiffer. Opening the laptop with one hand is possible, but the base will tip backwards somewhat, and if the lid is open only a little it will snap shut on its own.
Overall, compared to the competition, you're trading a little solidity for improved mobility. The fact that it has passed MIL-STD 810G certification speaks to quality - this includes tests for resistance to vibration, shock and extreme temperatures.
Our size comparison shows clearly just how compact the WS75 is. When speaking of pure footprint size, the MSI mobile workstation positions itself directly in the middle between the 17.3-inch and the thinner 15-inch competition. With its 2 cm thickness, it is right at the level of the thin 15-inch models and not much heavier. Compared to the regular 17.3-inch workstation models, you're saving around 1 kg of weight. However, when travelling you have to account for the approximately 900 gram power adaptor.
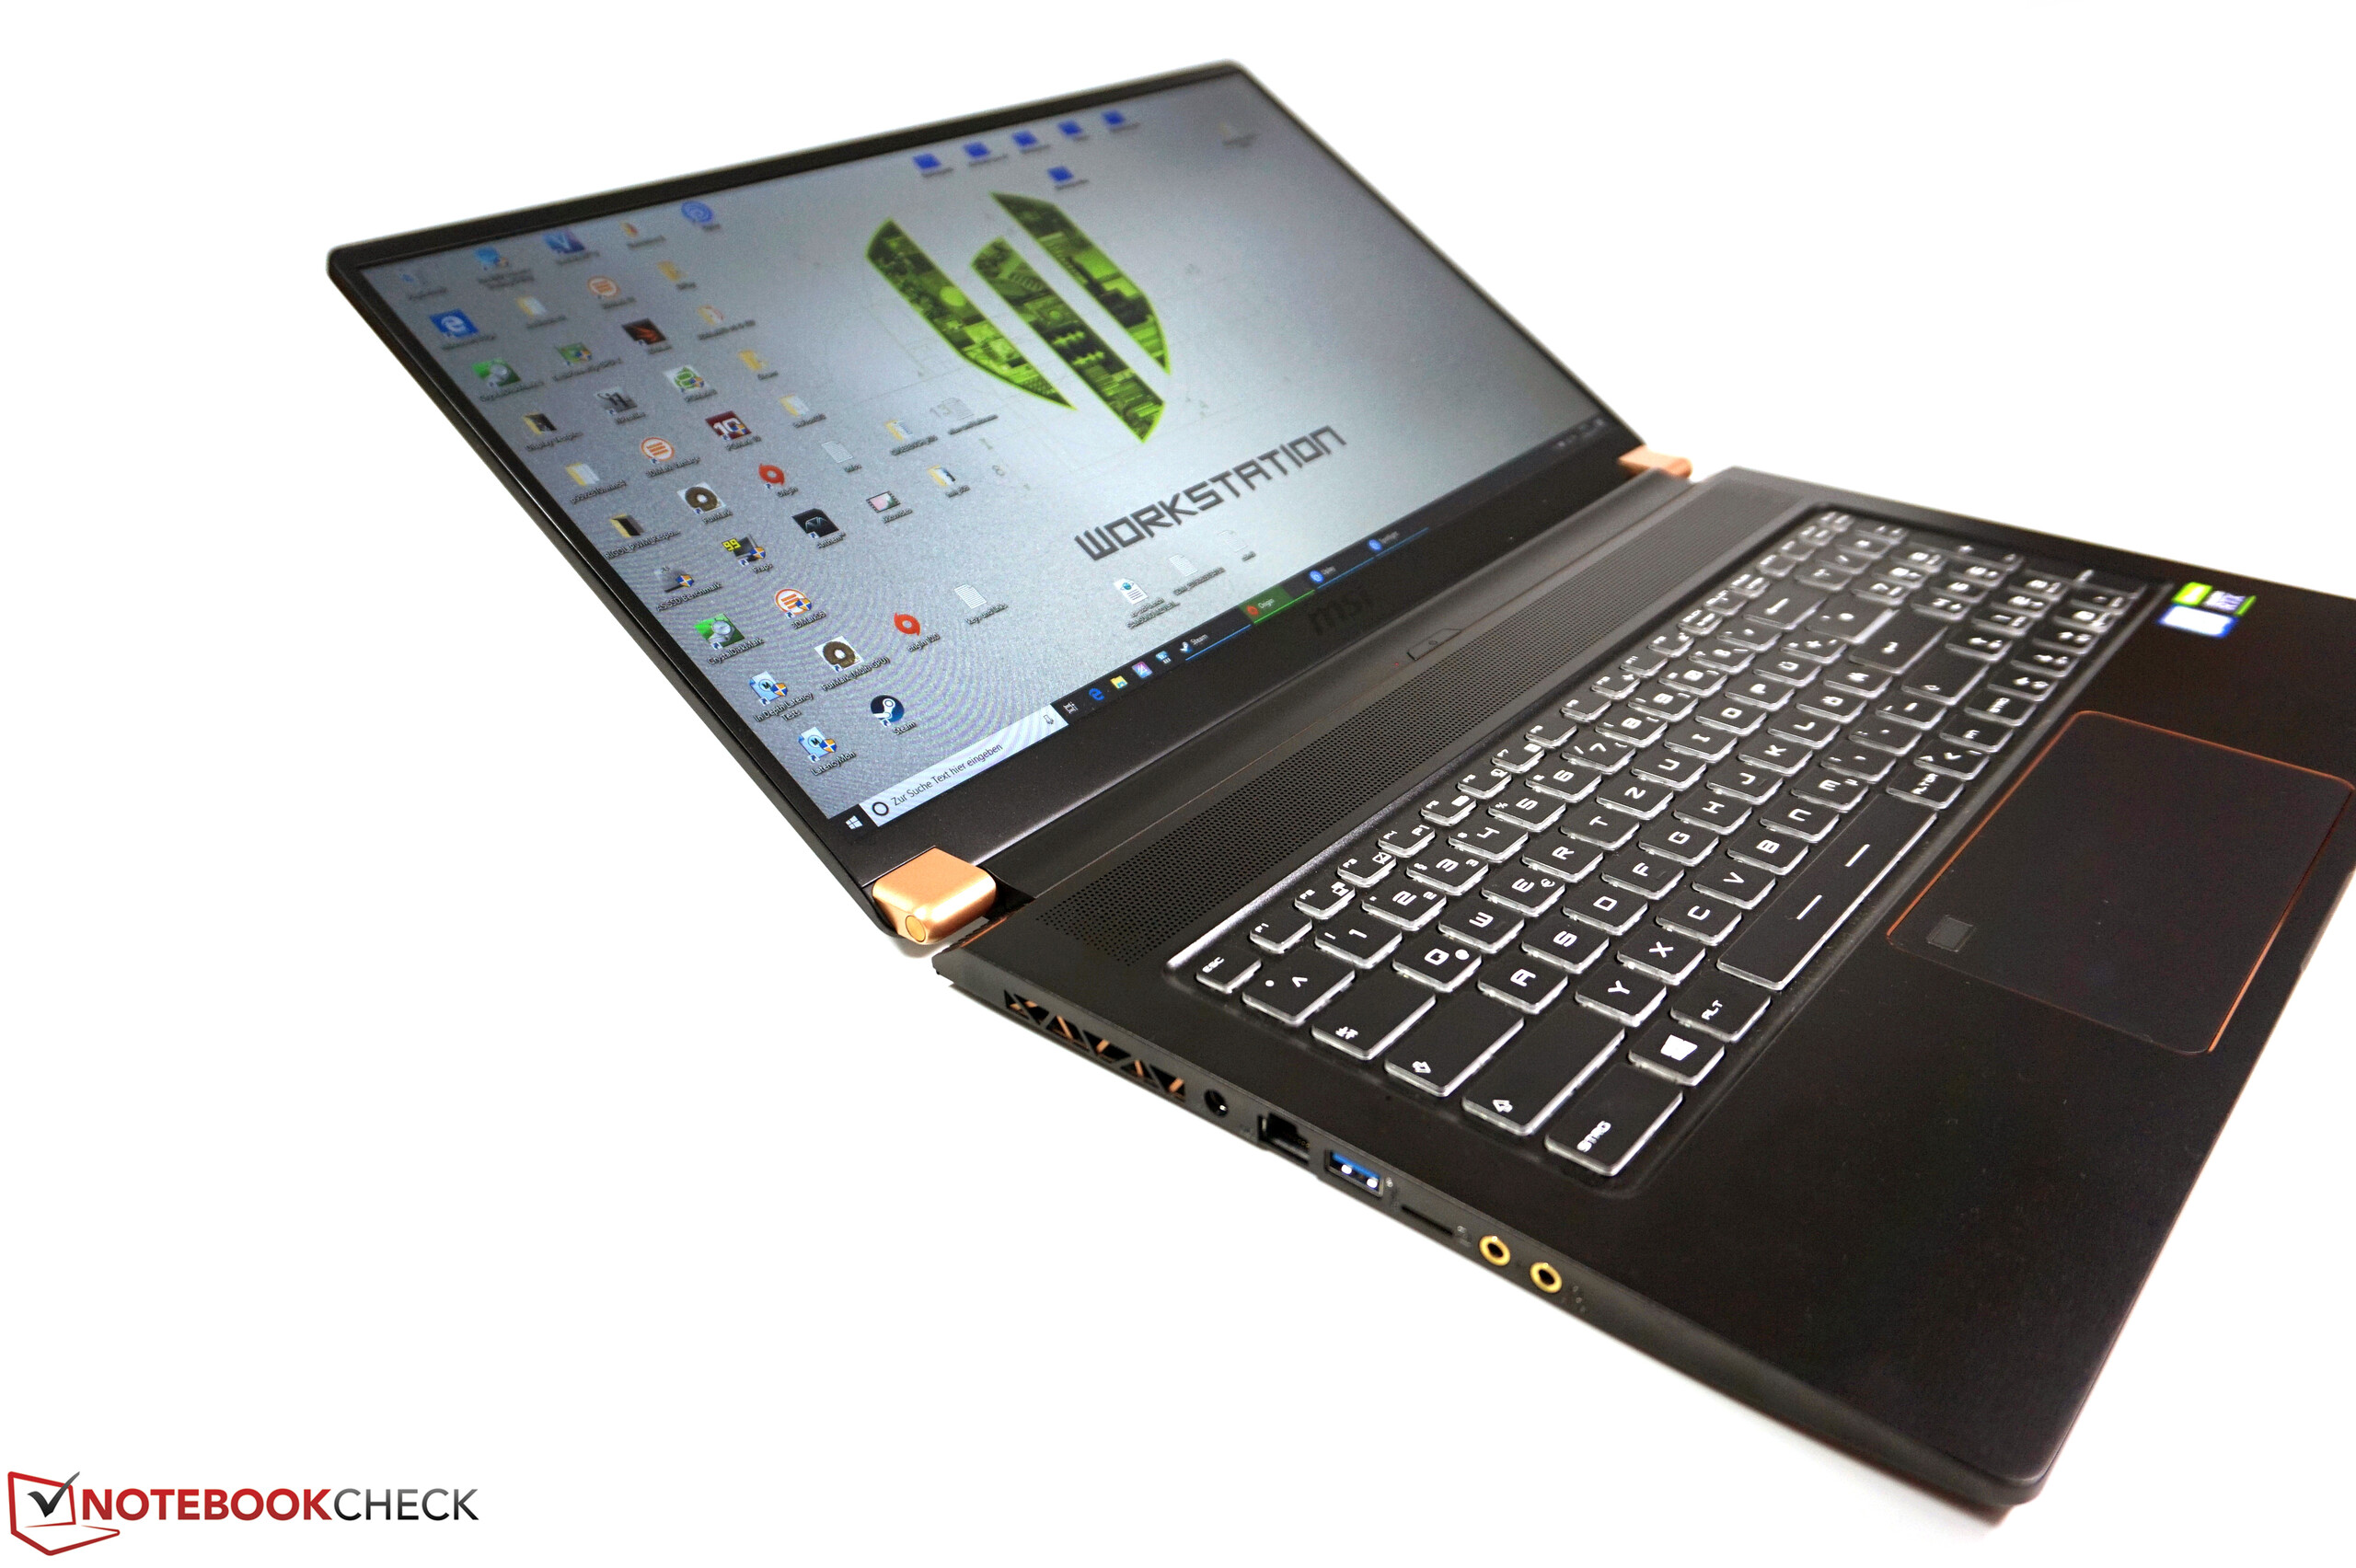
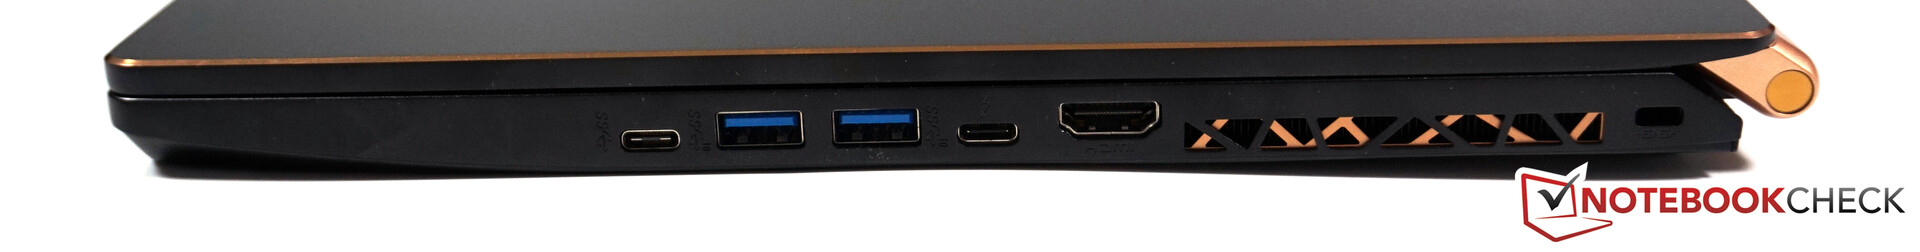
Connectivity - Thunderbolt 3 and HDMI 2.0 included
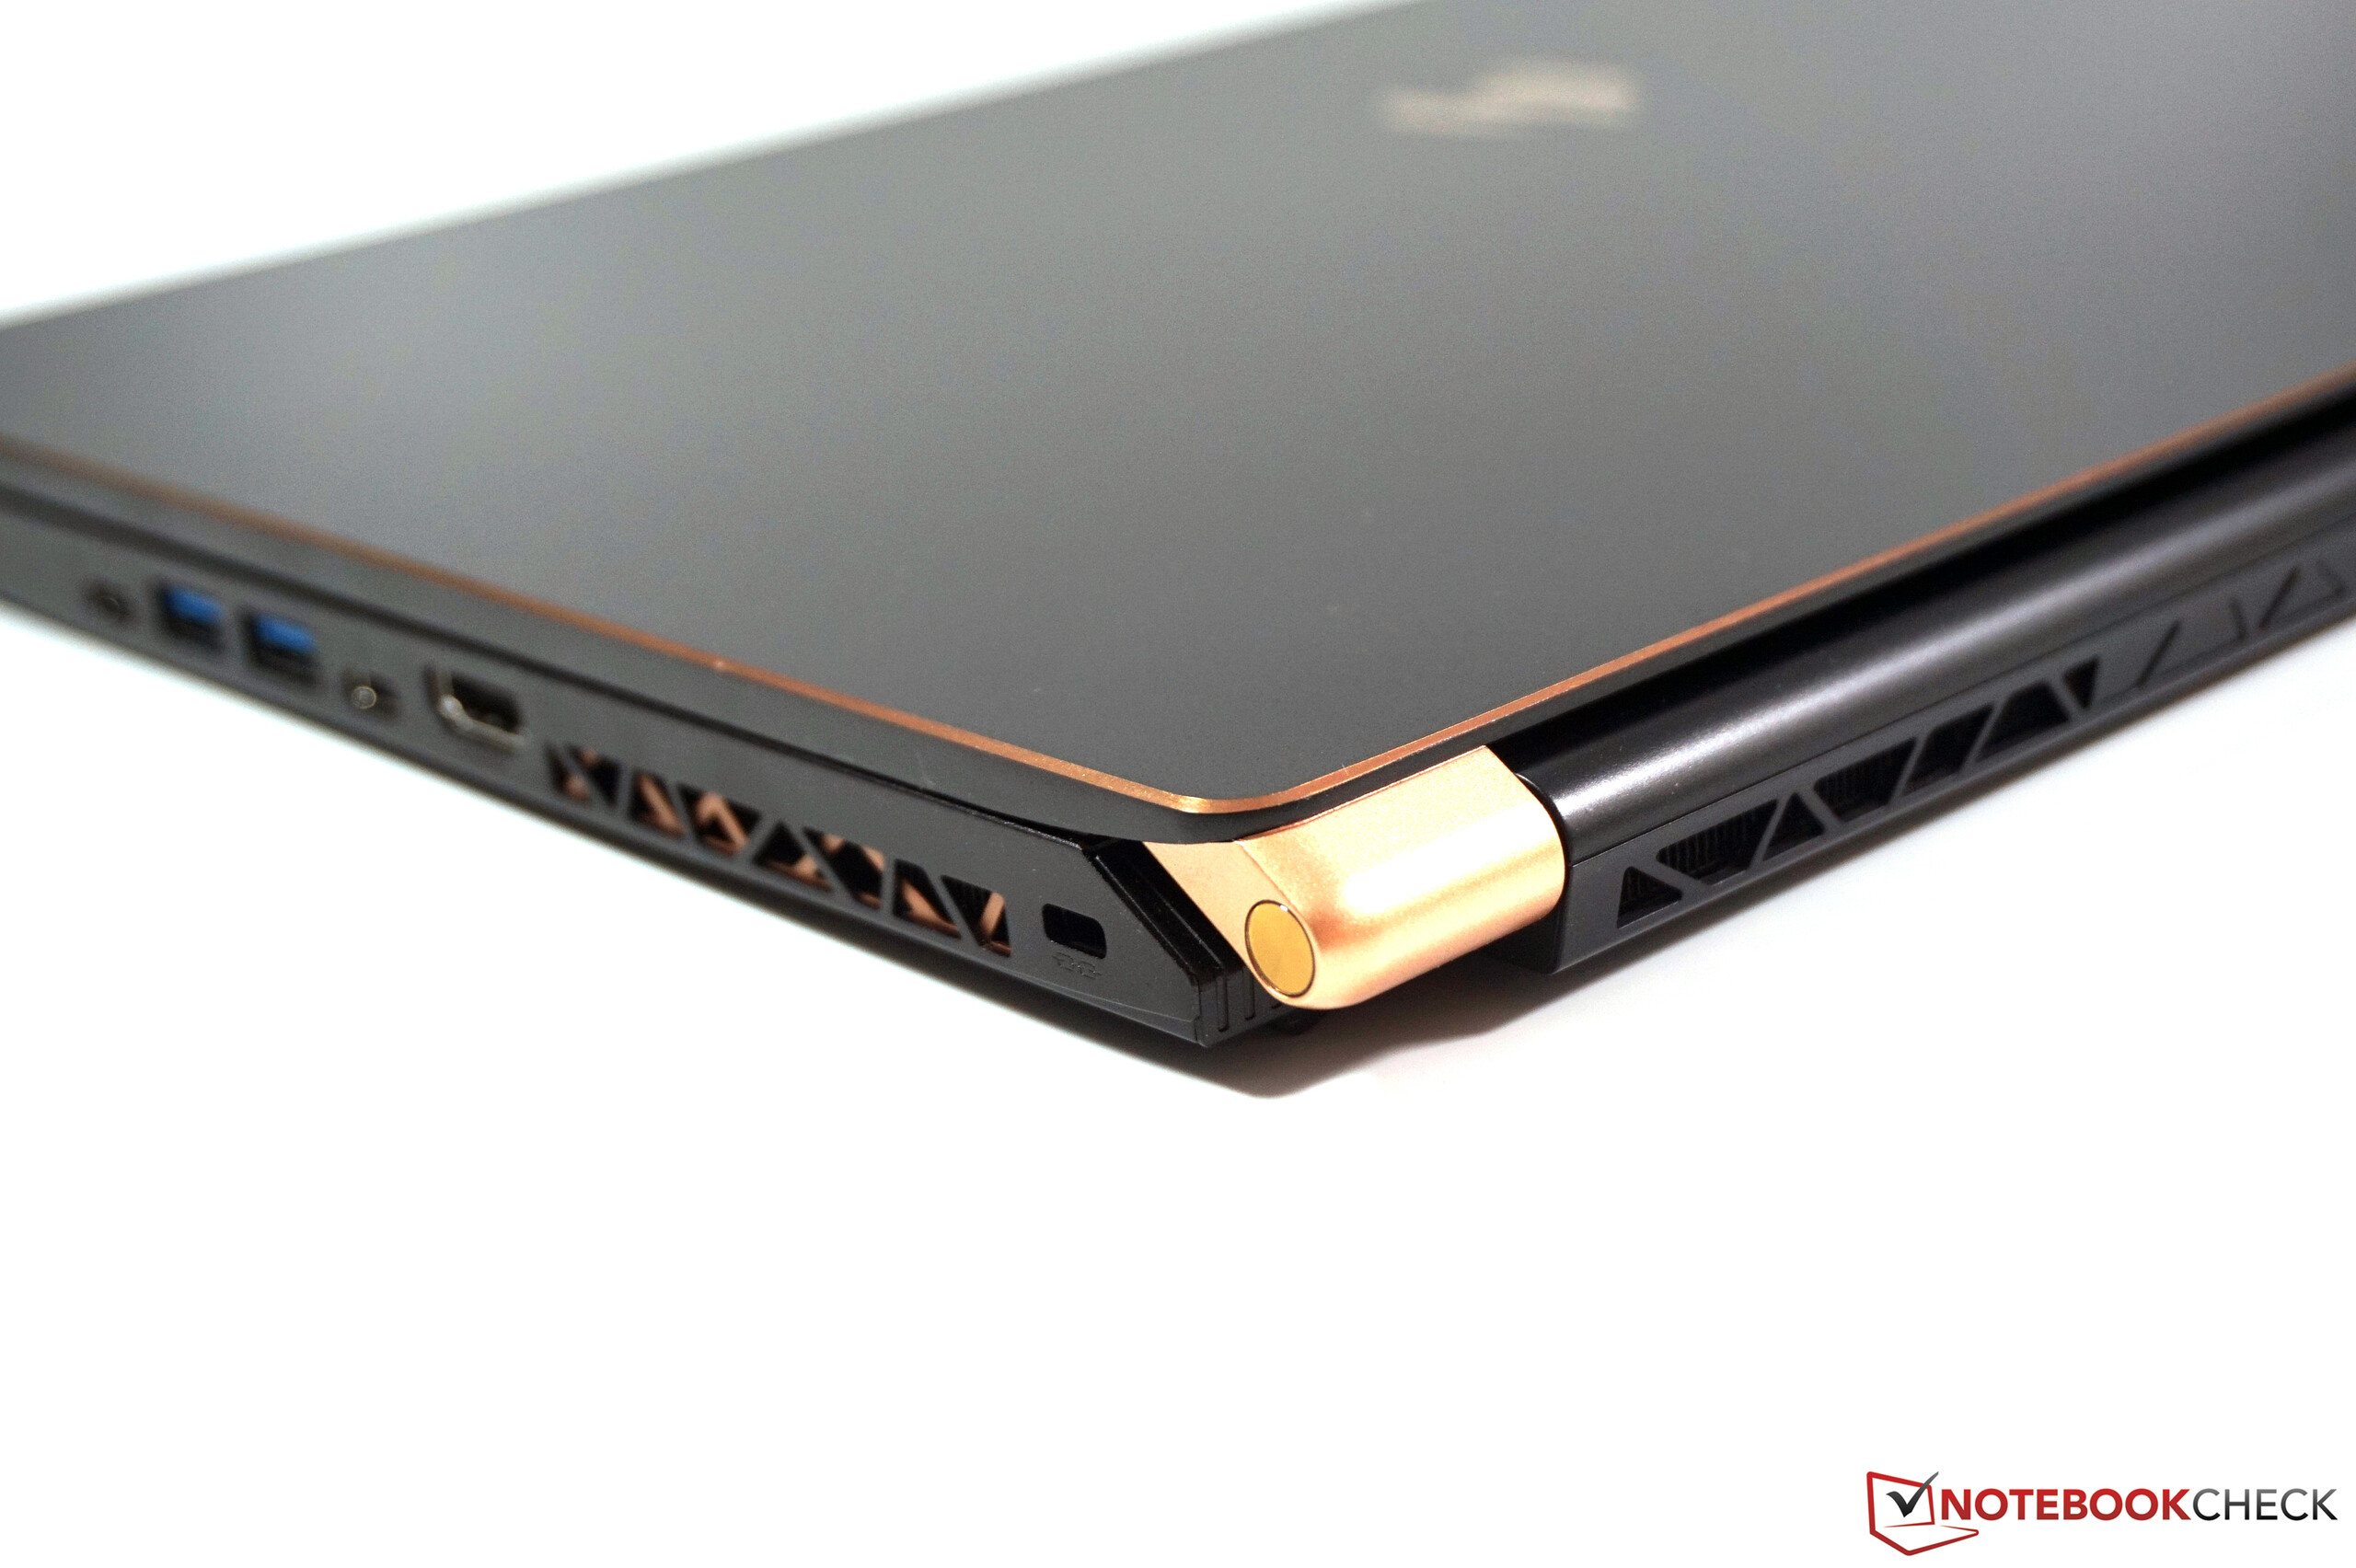
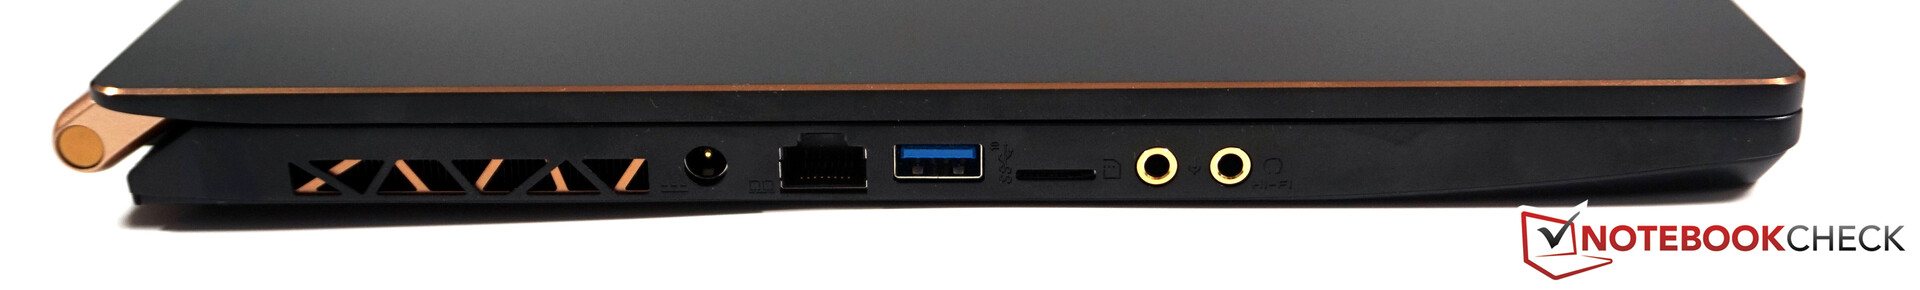
MSI's mobile workstation offers all current connectivity options including Thunderbolt 3 and HDMI 2.0, which supports 4K video at 60 Hz. With the USB ports it's important not to get confused by the new naming conventions - MSI lists USB 3.2 ports in the datasheet, but these are the already-known ports. More important is the following value listed: either Gen 1 for up to 5 Gb/s or Gen 2 for up to 10 Gb/s - Gen 2x2 is the version that supports up to 20 Gb/s.
In principle it is possible to connect a docking station via the Thunderbolt 3 port, however power for the must be provided via an external power adaptor - the competition offers better solutions in this area. The general selection of ports didn't impress us either. Due to the fact that the cooling solution dominates the rear portion of the laptop, all ports are located further towards the front of the machine. That includes also where the power adaptor plugs in, which means that either you block a port or the cable runs past the air vent, which is not optimal for airflow.
SD card reader - Only microSD, but very fast
Despite the roomy chassis, the MSI WS75 only features a microSD card reader. More and more devices are going the route of only offering support for this card size. This means that those who use normal-size SD cards cannot avoid having to use an external card reader. The other way around would have been much more convenient. There is good news however: The maximum transfer rates of the reader, at more than 200 MB/s, are very good. Copying a folder full of images using our reference card, a Toshiba Exceria Pro M501 UHS-II, was also very brisk at more than 180 MB/s.
| SD Card Reader | |
| average JPG Copy Test (av. of 3 runs) | |
| Dell Precision 7730 (Toshiba Exceria Pro SDXC 64 GB UHS-II) | |
| MSI WS75 9TL-636 (Toshiba Exceria Pro M501 64 GB UHS-II) | |
| HP ZBook 17 G5-2ZC48EA (Toshiba Exceria Pro SDXC 64 GB UHS-II) | |
| Lenovo ThinkPad P72-20MB000EGE (Toshiba Exceria Pro SDXC 64 GB UHS-II) | |
| Fujitsu Celsius H980 (Toshiba Exceria Pro SDXC 64 GB UHS-II) | |
| Average of class Workstation (49.6 - 681, n=14, last 2 years) | |
| maximum AS SSD Seq Read Test (1GB) | |
| Average of class Workstation (87.6 - 1455, n=14, last 2 years) | |
| Dell Precision 7730 (Toshiba Exceria Pro SDXC 64 GB UHS-II) | |
| MSI WS75 9TL-636 (Toshiba Exceria Pro M501 64 GB UHS-II) | |
| Lenovo ThinkPad P72-20MB000EGE (Toshiba Exceria Pro SDXC 64 GB UHS-II) | |
| HP ZBook 17 G5-2ZC48EA (Toshiba Exceria Pro SDXC 64 GB UHS-II) | |
| Fujitsu Celsius H980 (Toshiba Exceria Pro SDXC 64 GB UHS-II) | |
Communication
In contrast to the gaming-oriented GS75 with its WLAN module from Killer, MSI has equipped the WS75 with a WLAN module from Intel. The current Intel Wireless-AC 9560 supports all modern standards including fast 802.11ac as well as Bluetooth 5.0. During our practical testing we did not encounter any connectivity issues, but the transfer speeds in our standardised test with a Linksys EA8500 router could have been better.
A physical gigabit Ethernet port is included (Qualcomm Atheros), but there is no possibility to include a WWAN module.
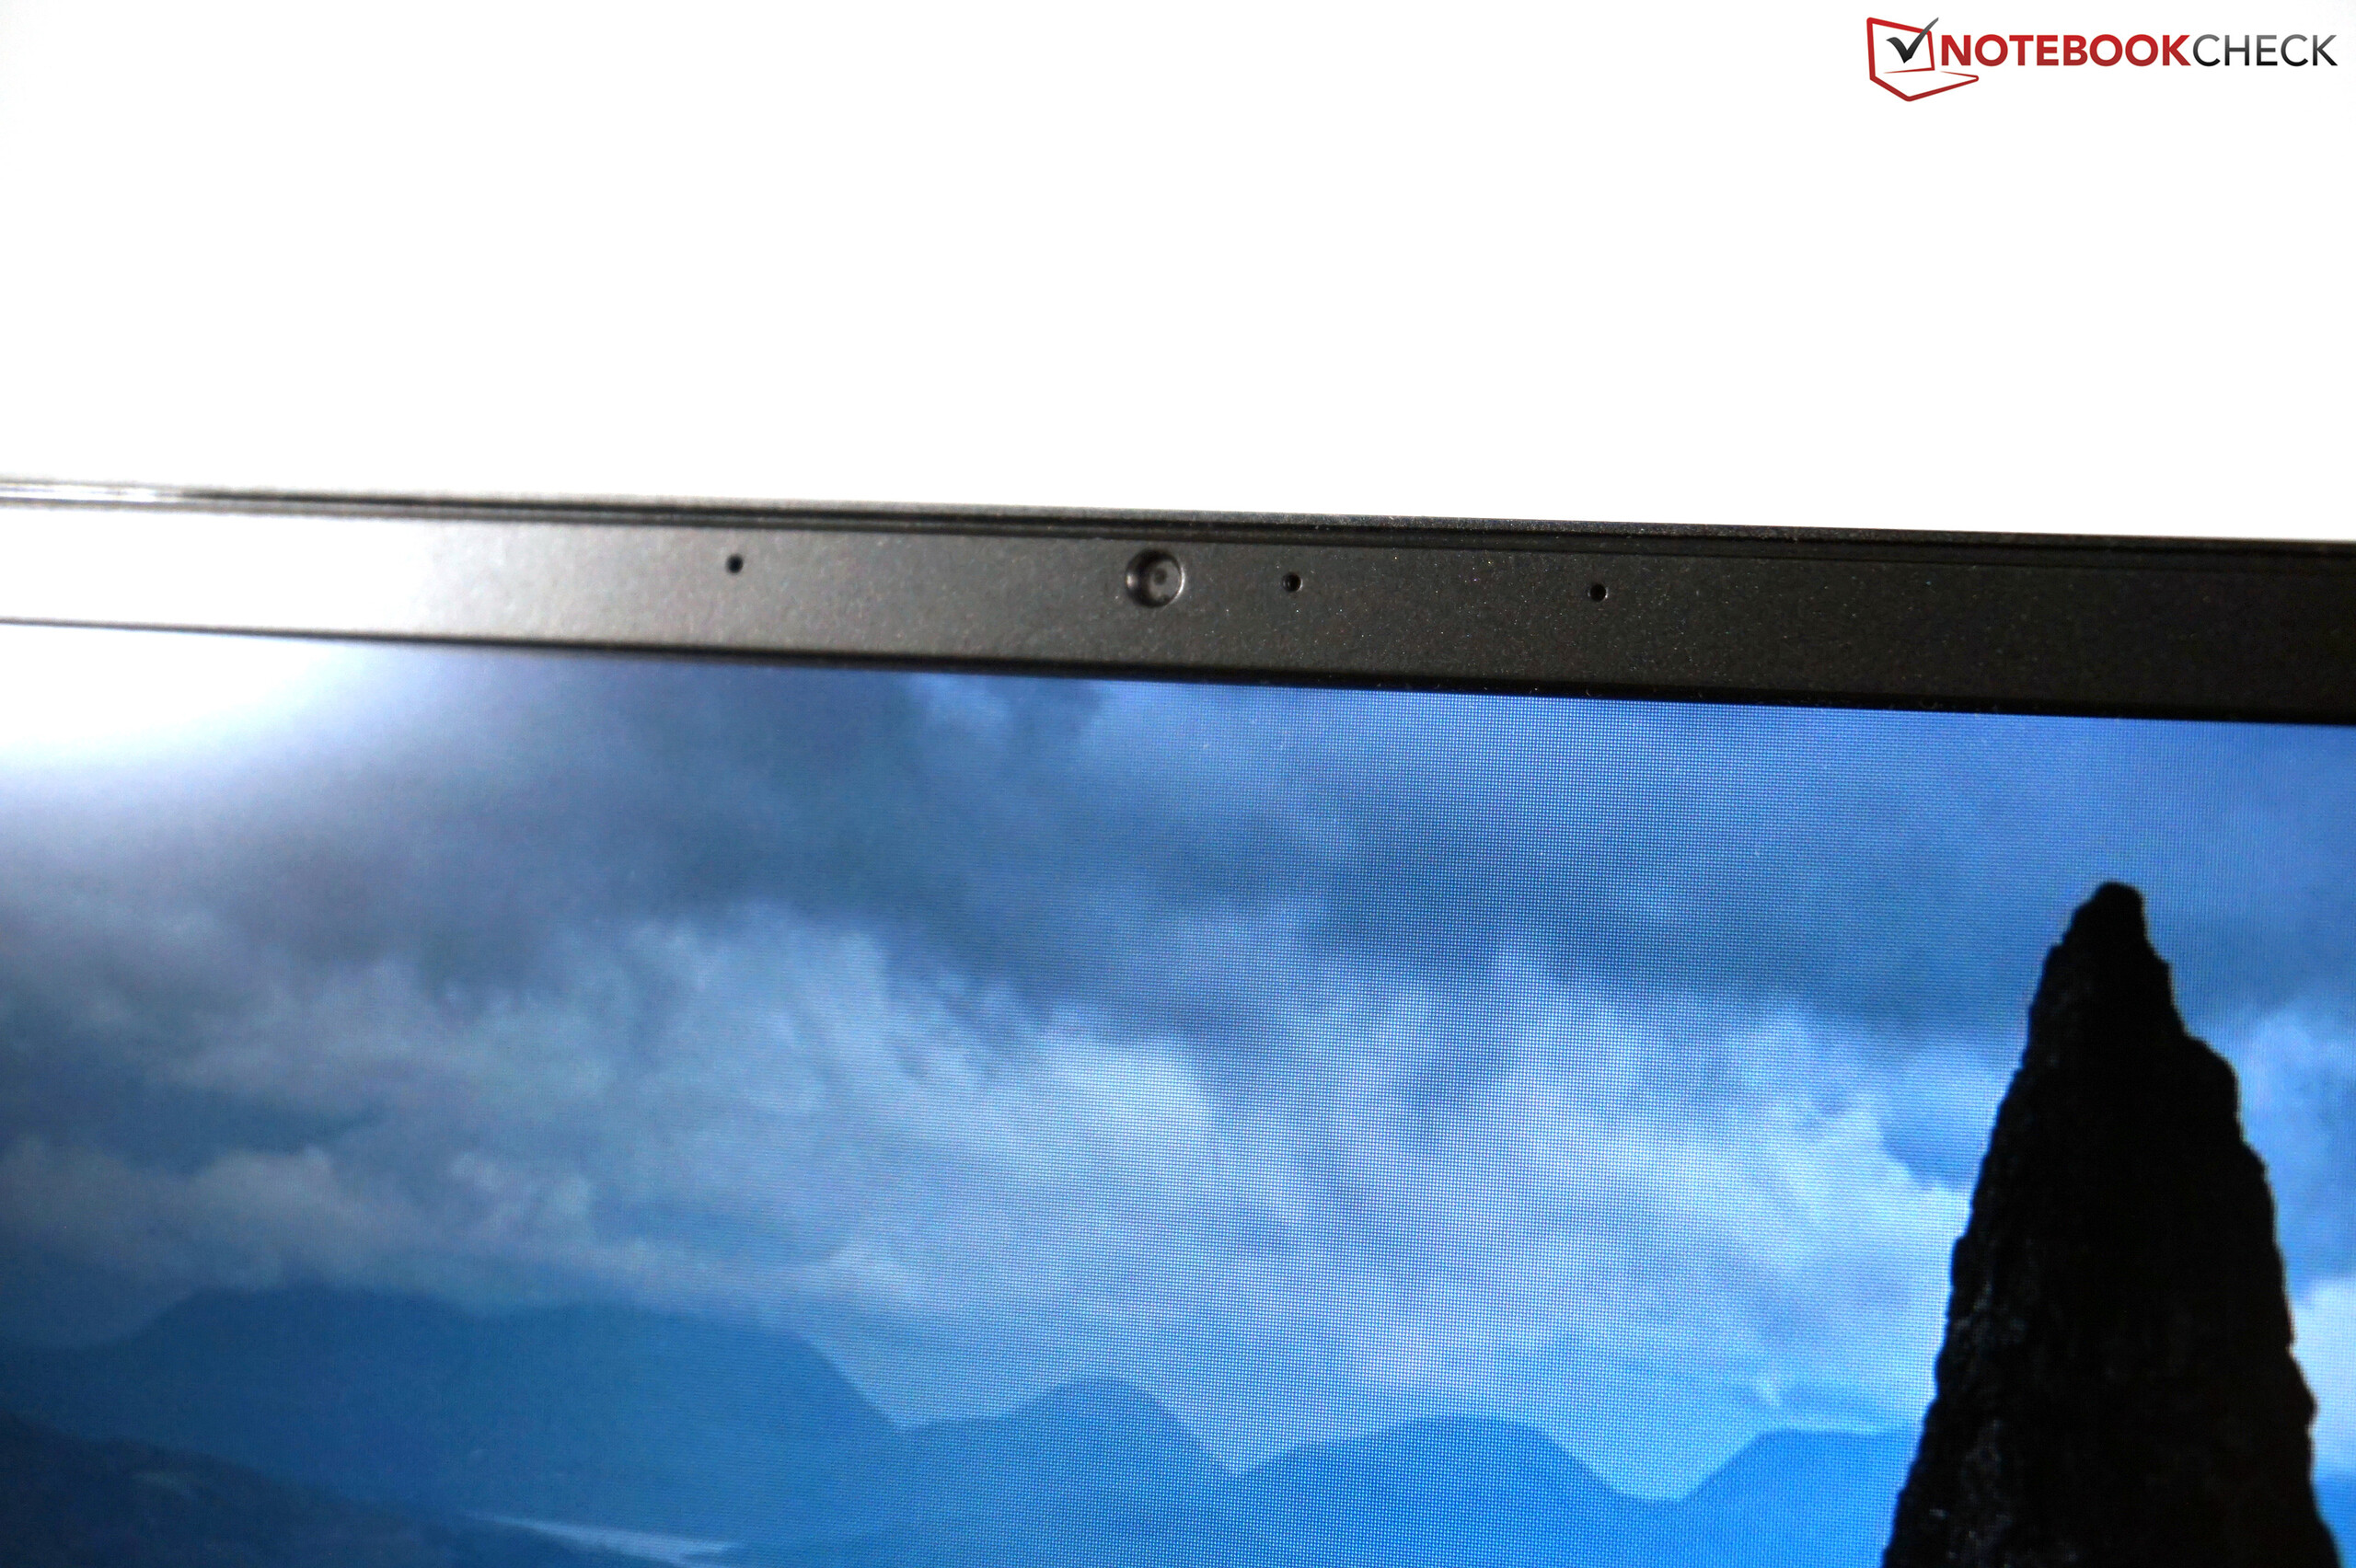
Despite the thin bezels, the webcam sits in its usual position above the display. This is a pretty standard unit and the picture quality is overall very weak. There was seemingly no space left over for an IR camera, so there's no possibility of utilising face-unlock features.
| Networking | |
| iperf3 transmit AX12 | |
| Dell Precision 7730 | |
| HP ZBook 17 G5-2ZC48EA | |
| Lenovo ThinkPad P72-20MB000EGE | |
| MSI WS75 9TL-636 | |
| iperf3 receive AX12 | |
| Lenovo ThinkPad P72-20MB000EGE | |
| HP ZBook 17 G5-2ZC48EA | |
| MSI WS75 9TL-636 | |
| Dell Precision 7730 | |
Maintenance
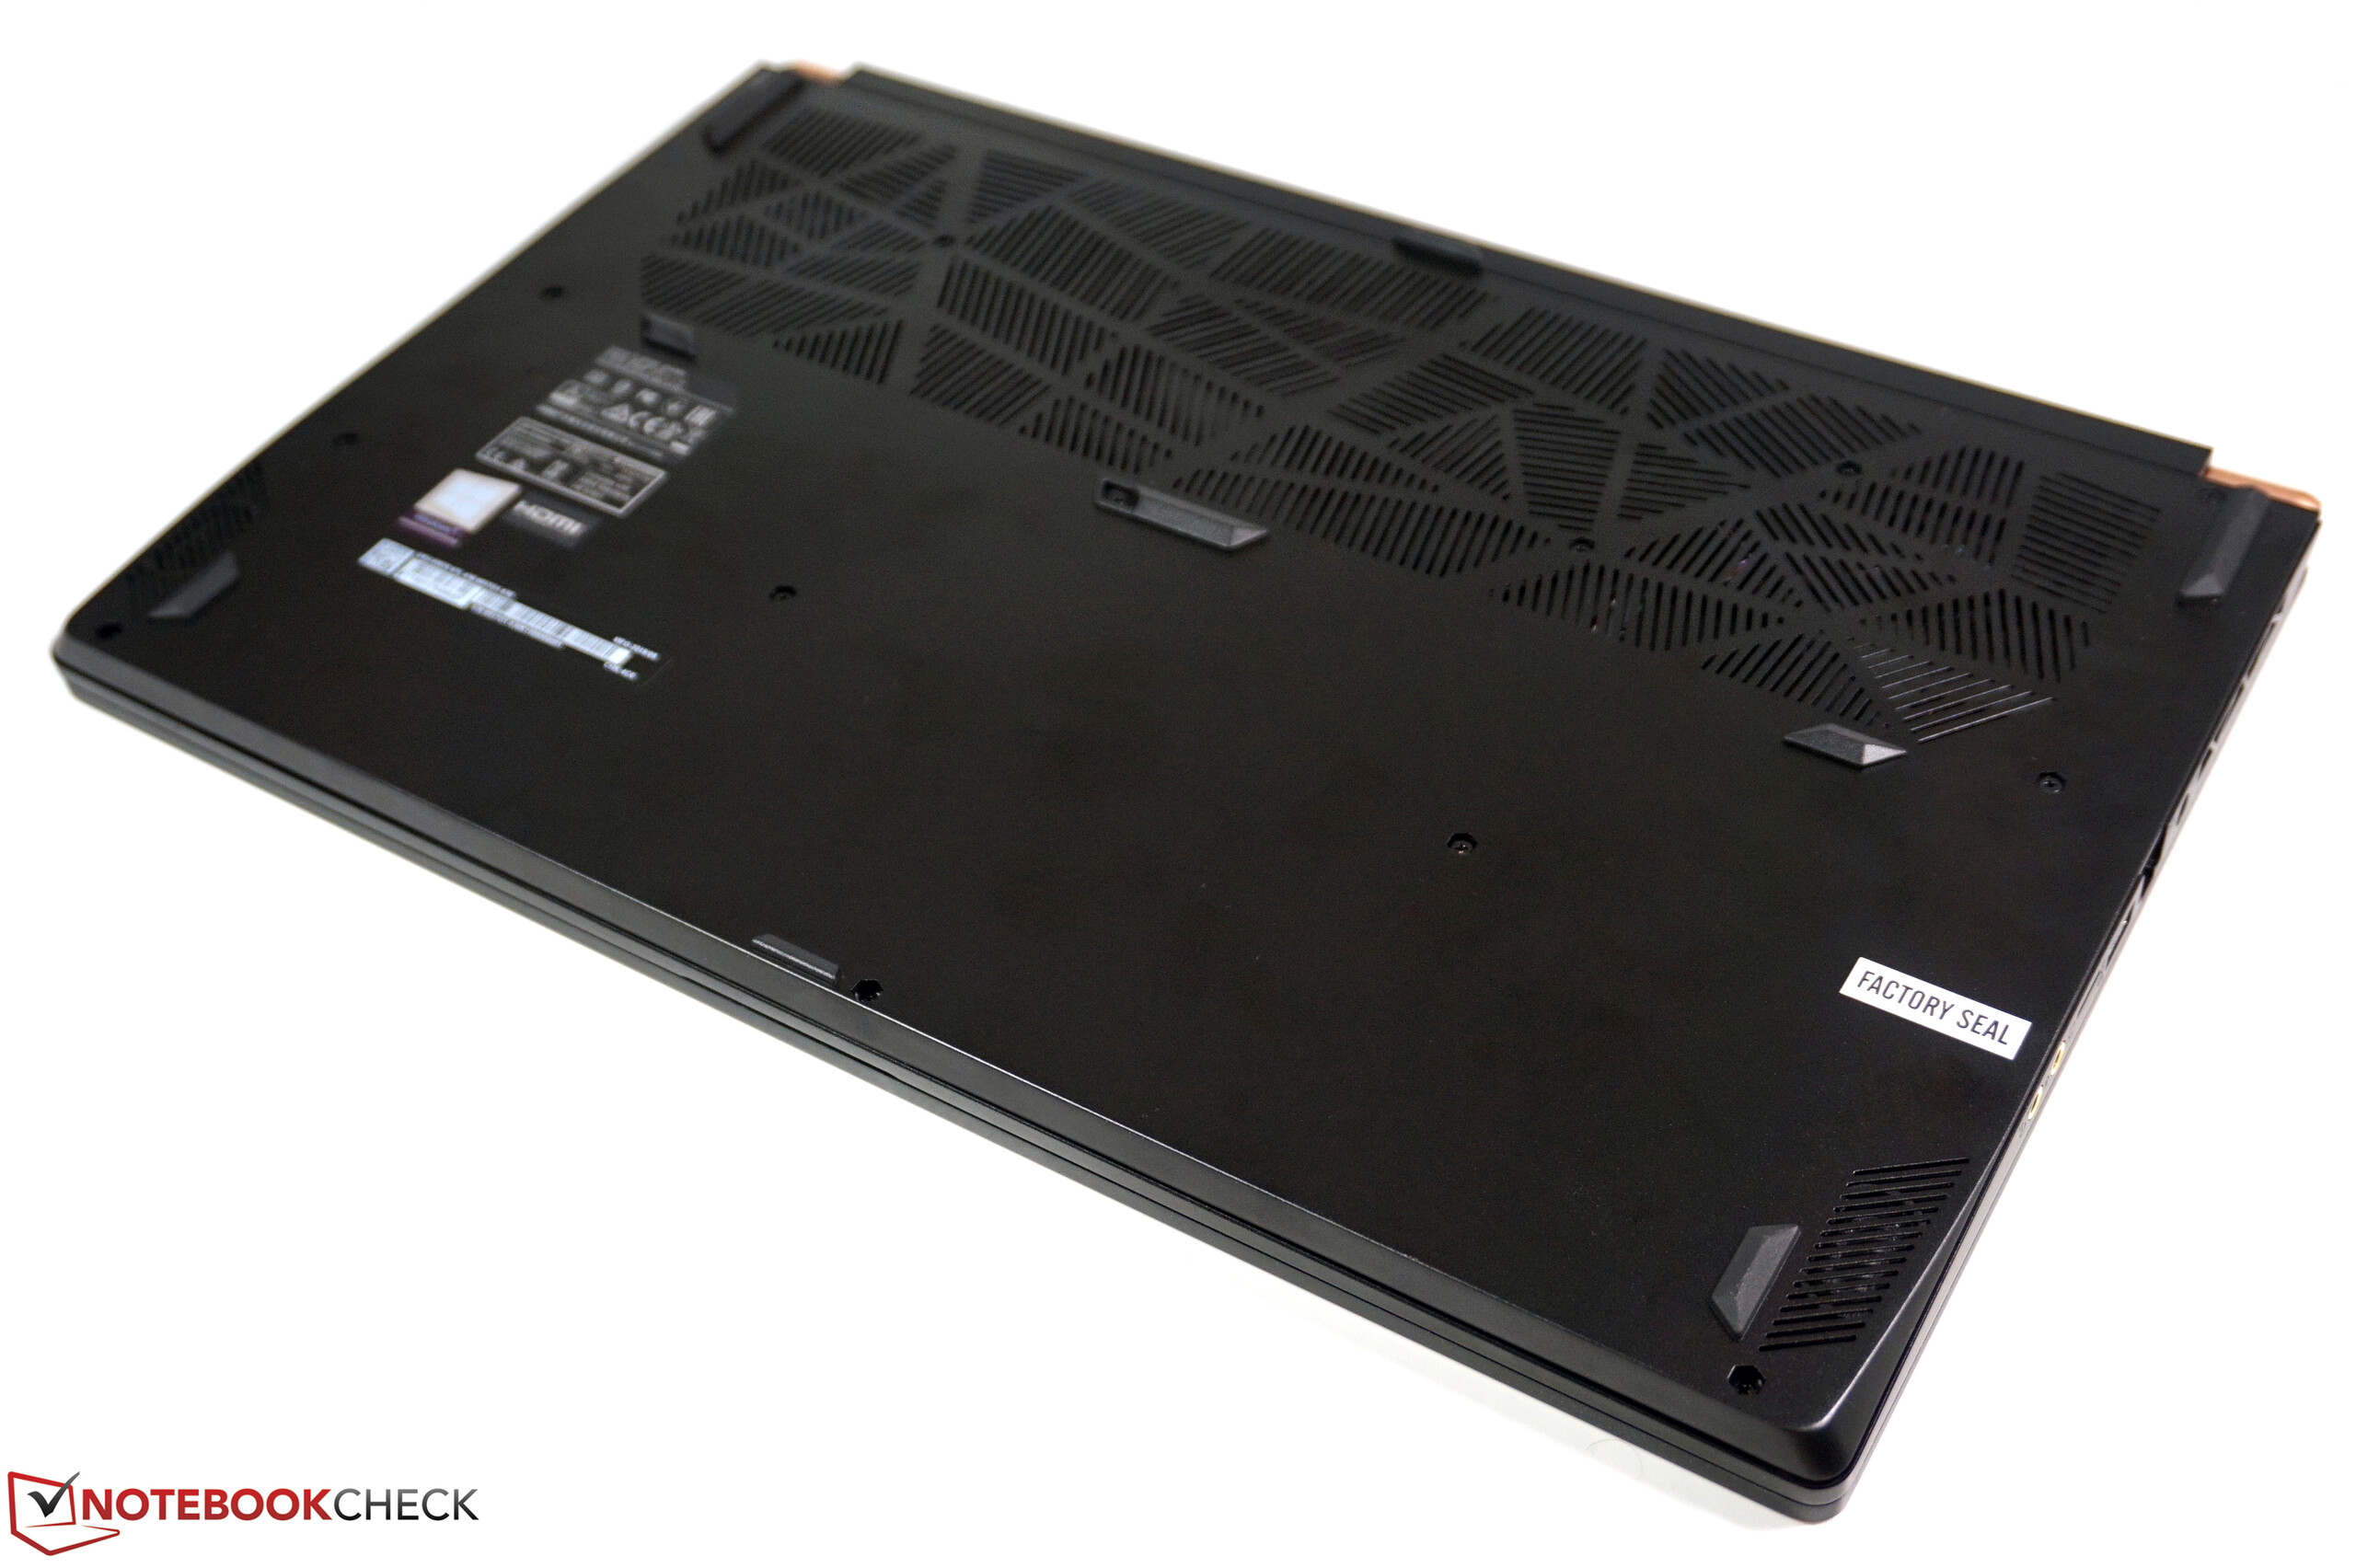
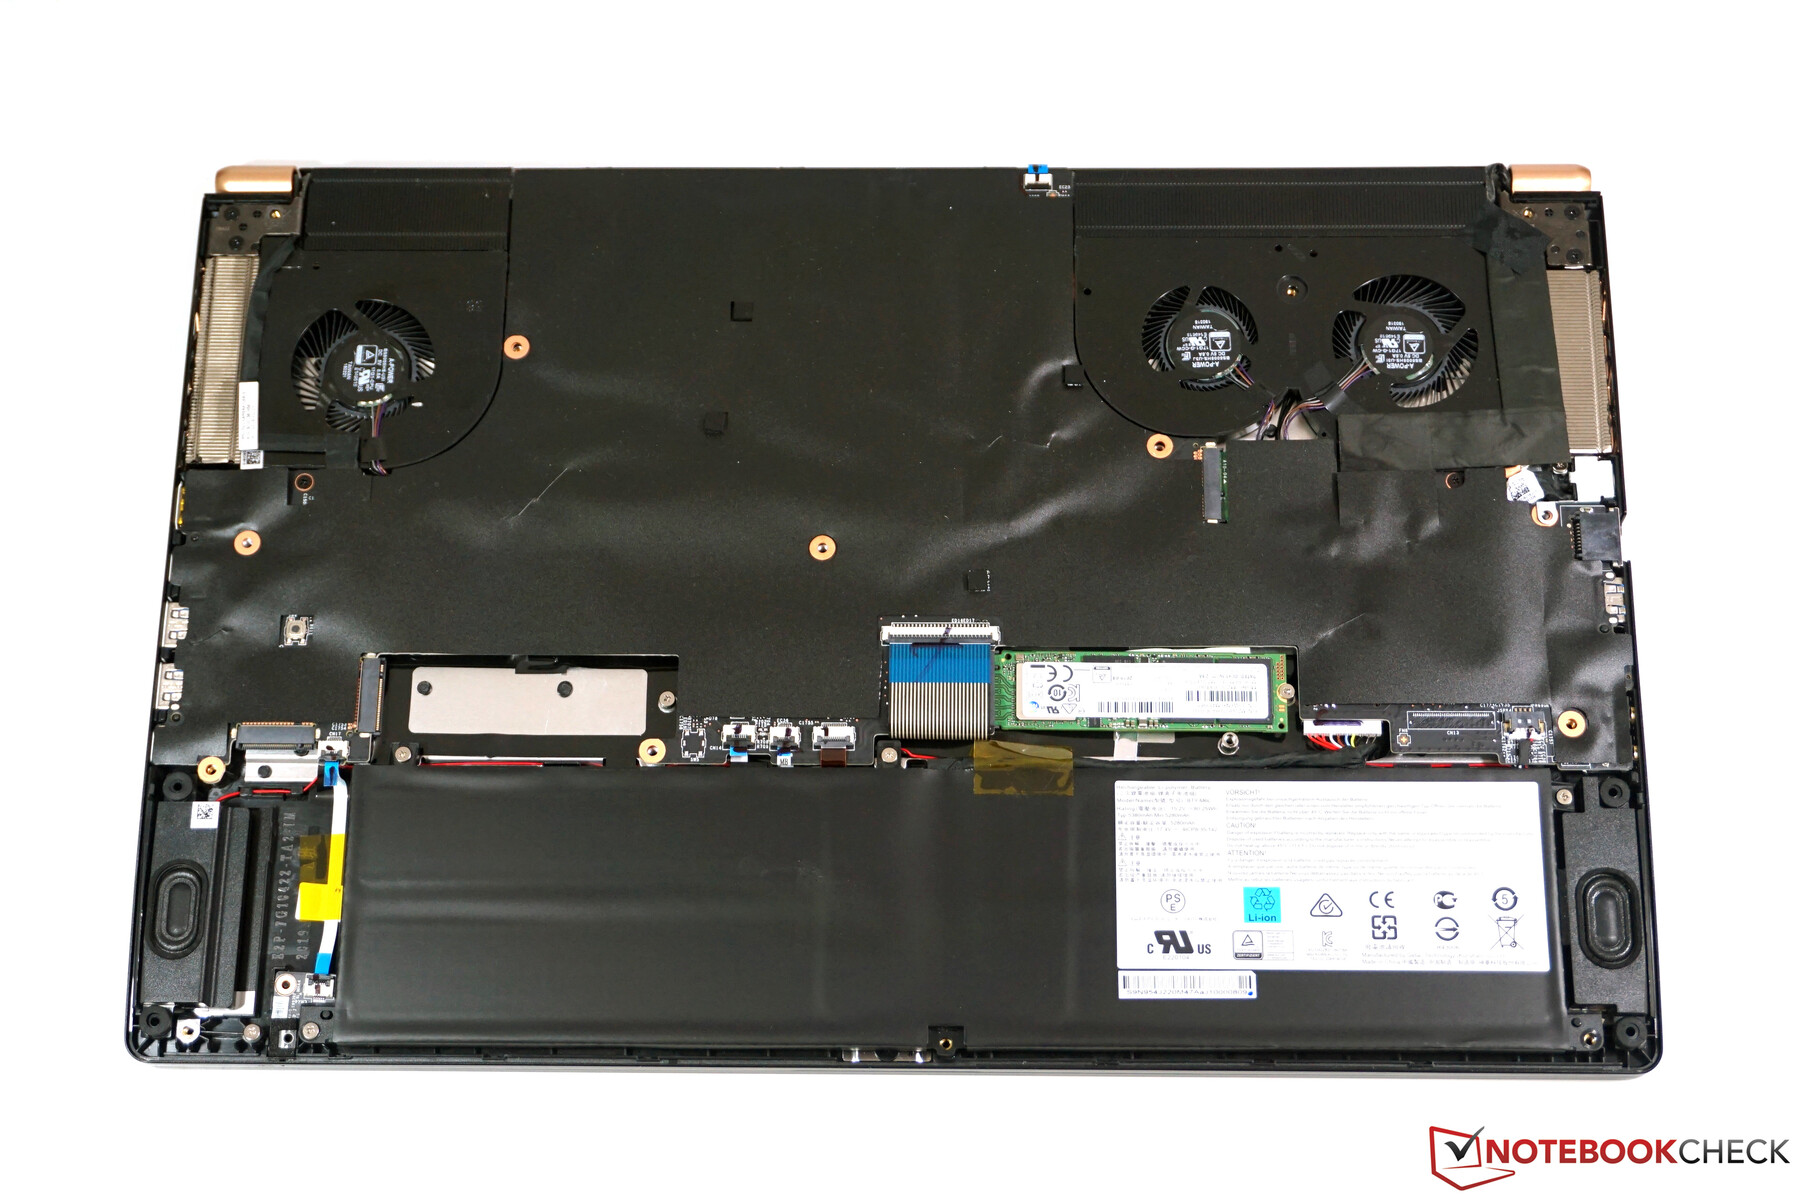
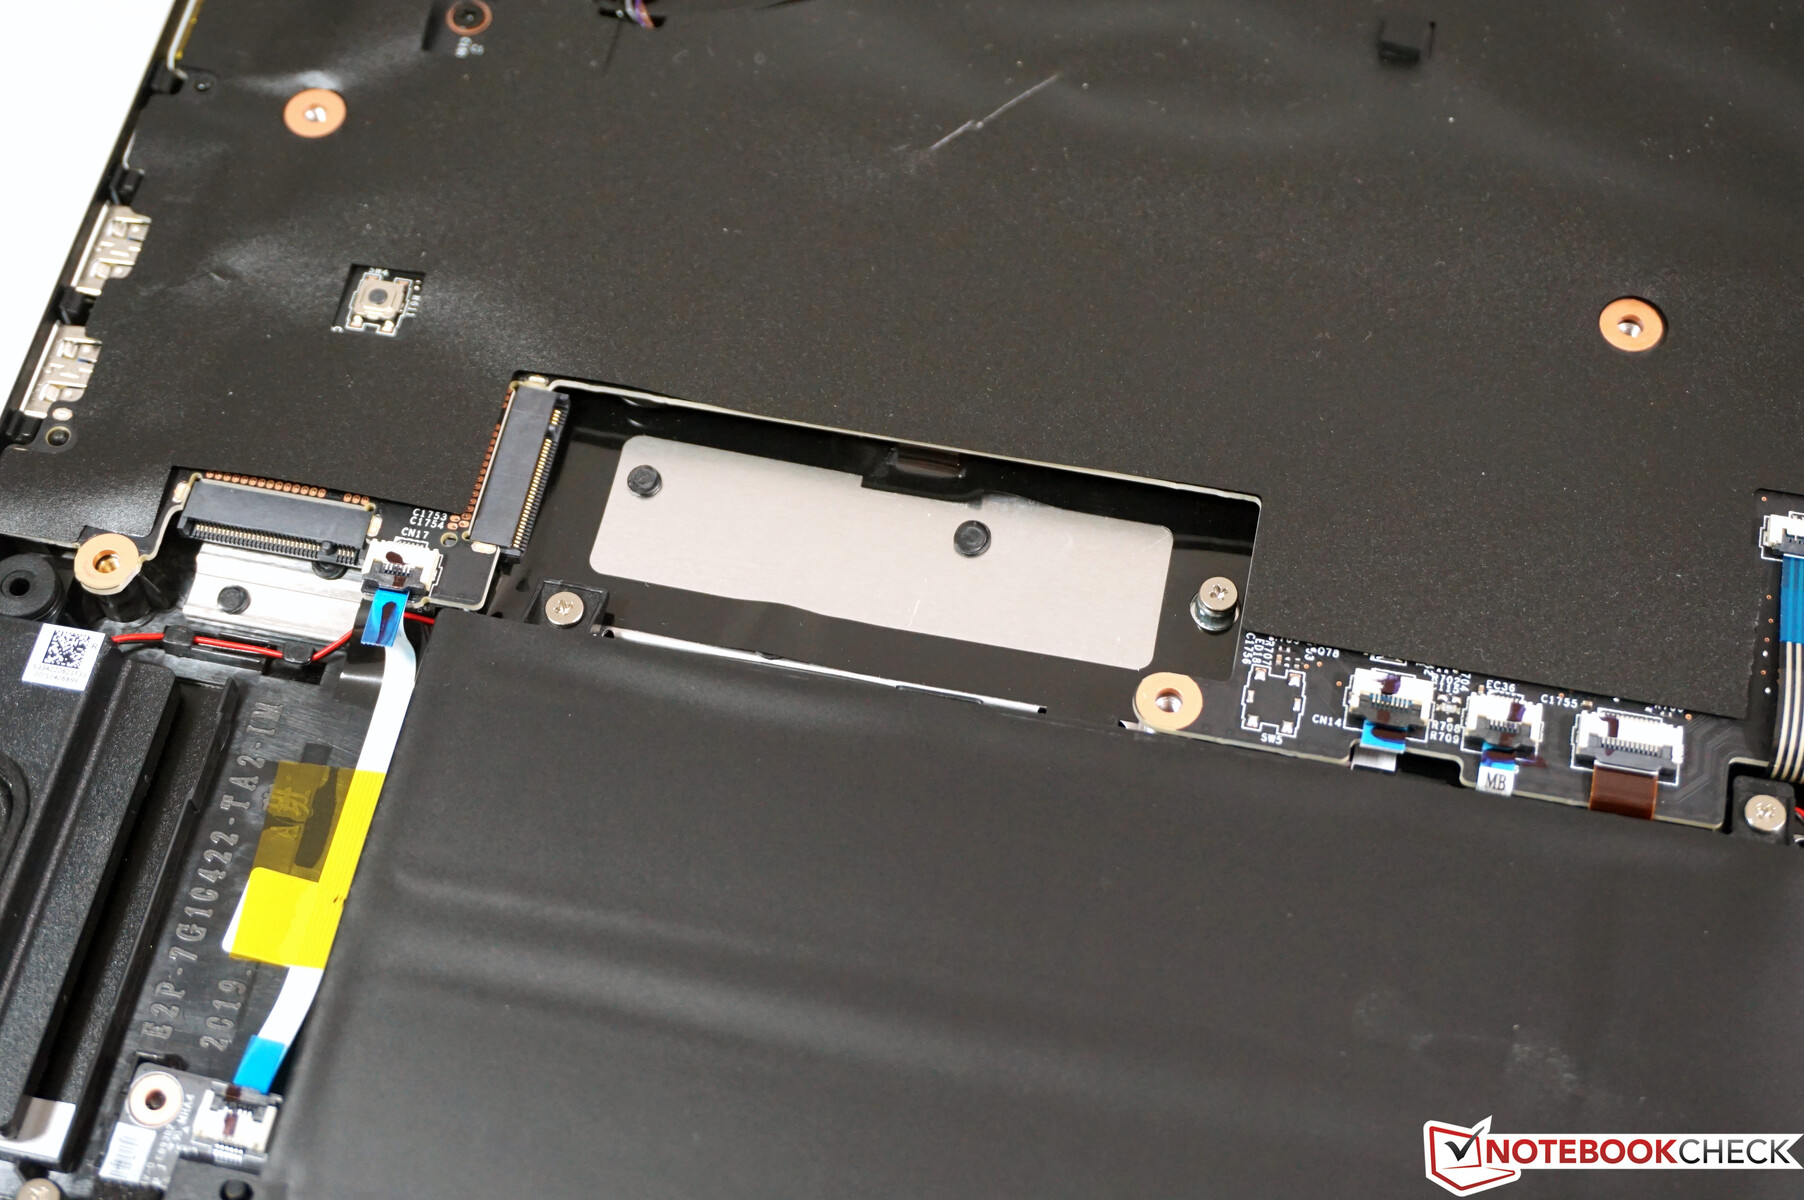
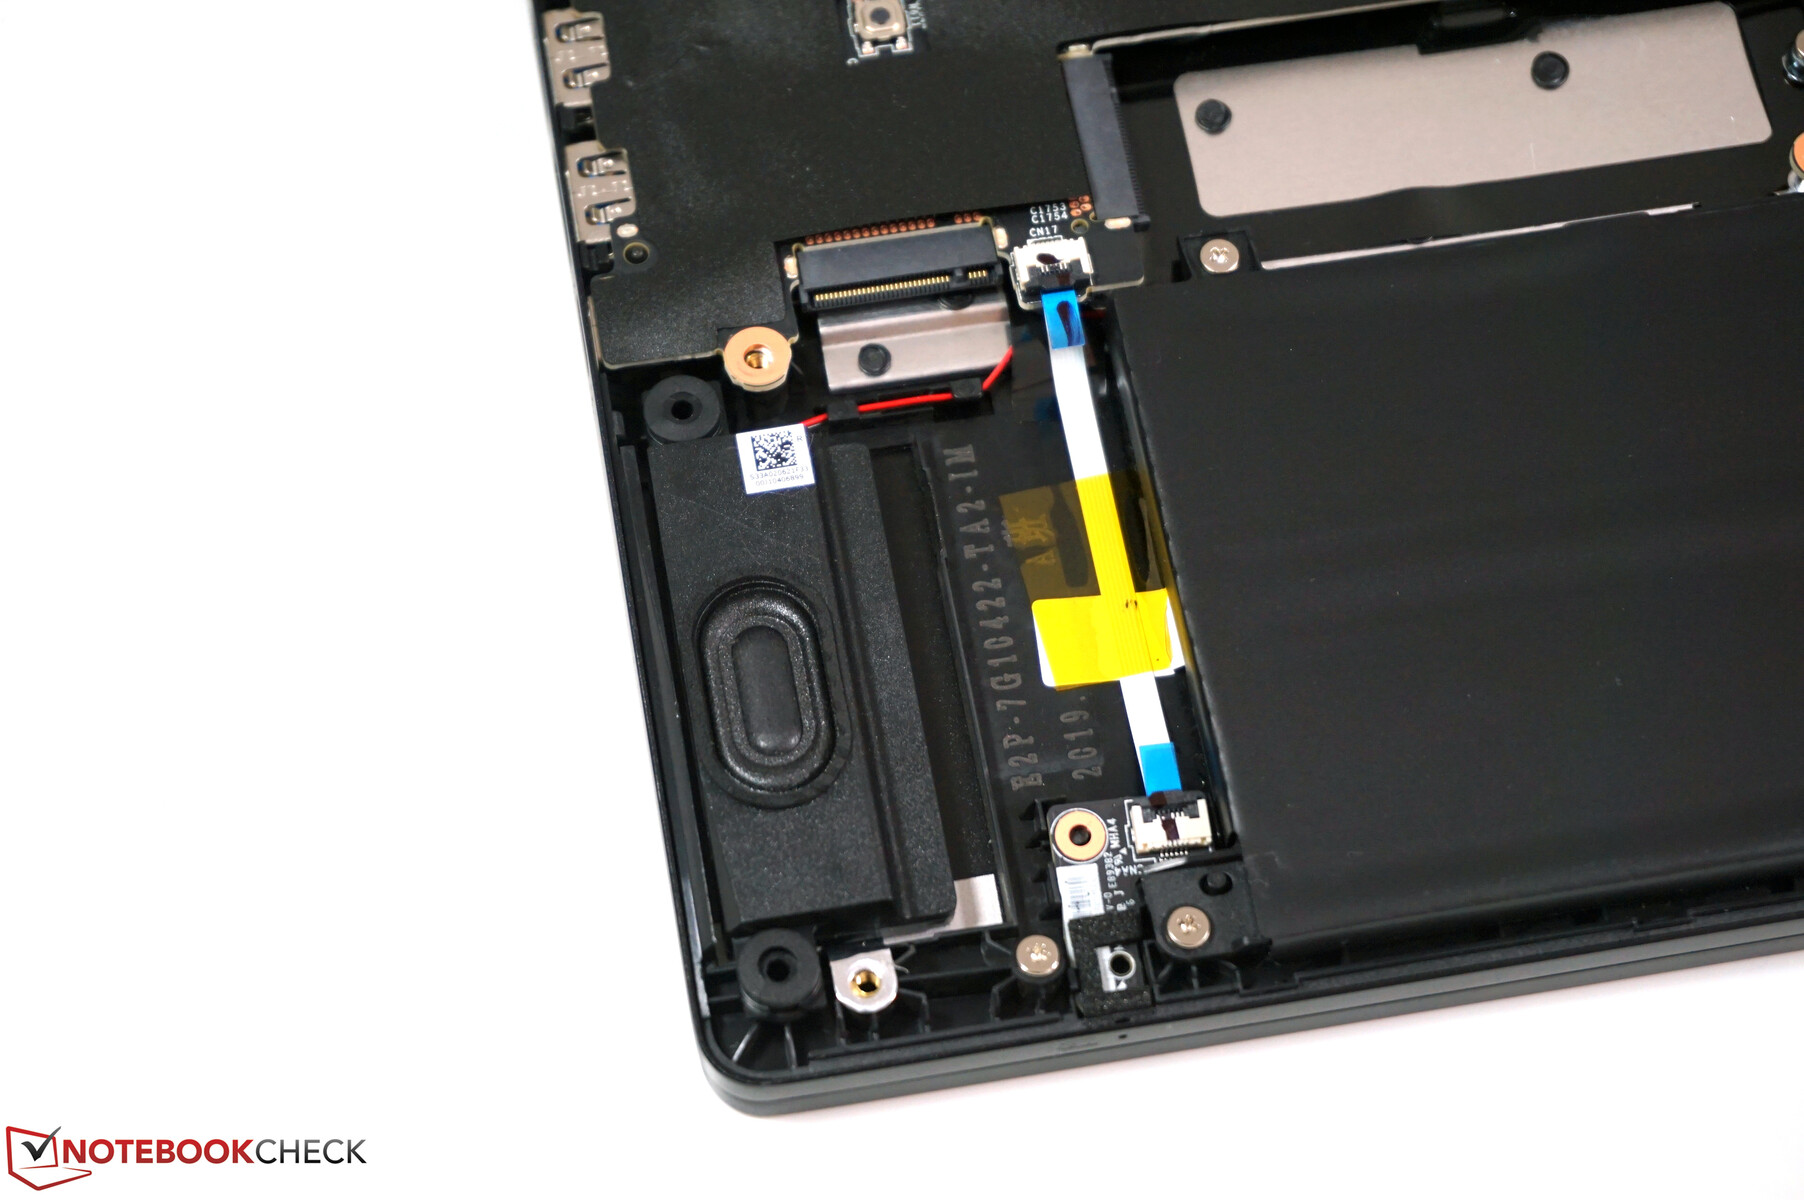
There is no separate removable panel - in order to access the components the entire base of the laptop has to be removed. After removing 15 Phillips head screws, the panel has to be levered open - we recommend beginning where the network port is located. In reality though, there's not that much that can be achieved - MSI has covered most components with dark tape and only the M.2 slots and fan are freely accessible. Covering up soldered components doesn't worry us, but the RAM slots should be freely accessible - in this case swapping out memory modules has been made unnecessarily complicated.
Input Devices
Keyboard
The keyboard of the MSI WS75 is already known to us from numerous gaming laptops from MSI. The SteelSeries layout orients itself towards gaming slightly, but the relatively soft and, most importantly, quiet typing profile wins us over. Longer periods of typing are no problem at all. The keys of the numberblock are somewhat smaller but present no problems in usage.
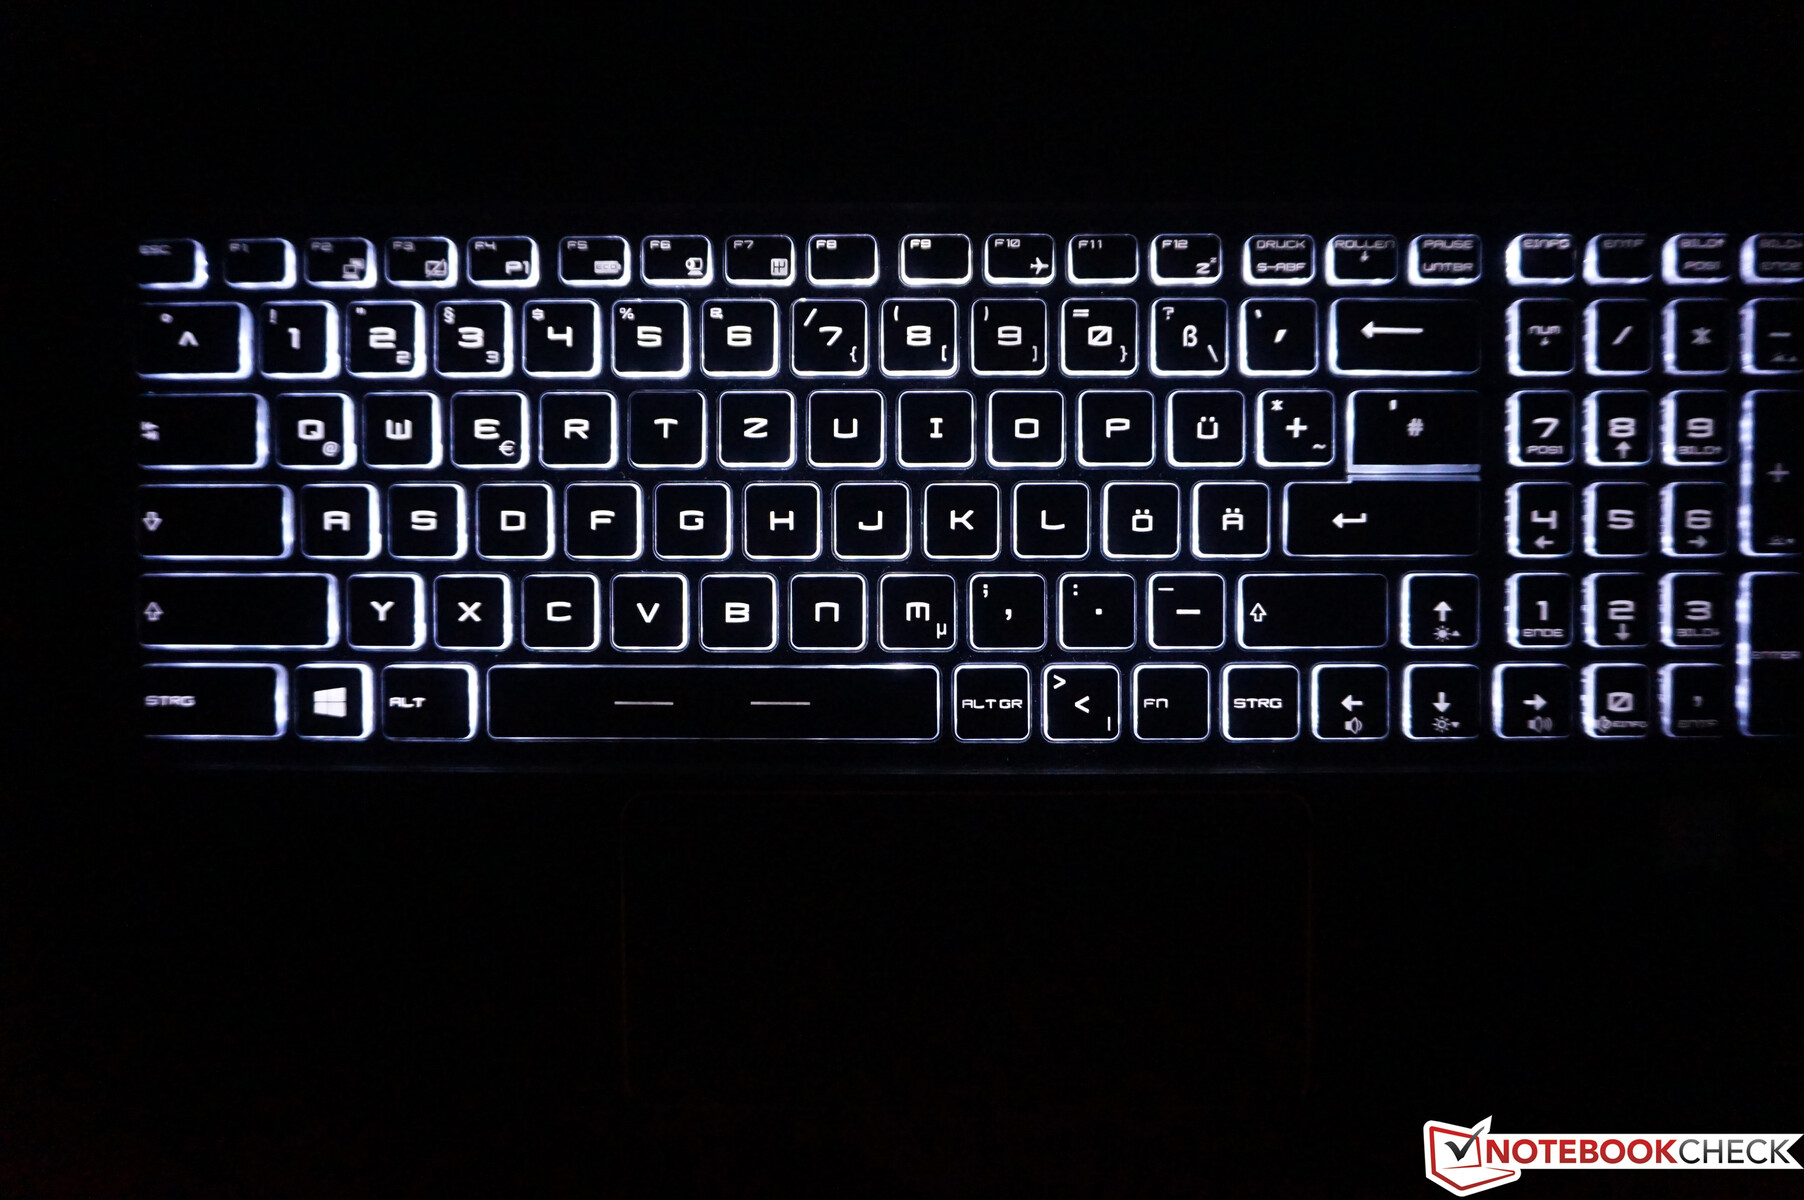
Compared to its GS75 gaming sibling, MSI has chosen not to offer colourful backlighting of the keyboard, and instead has chosen to include a 3-stage white-blue backlight. Considering its target market, we consider this to be a smart move.
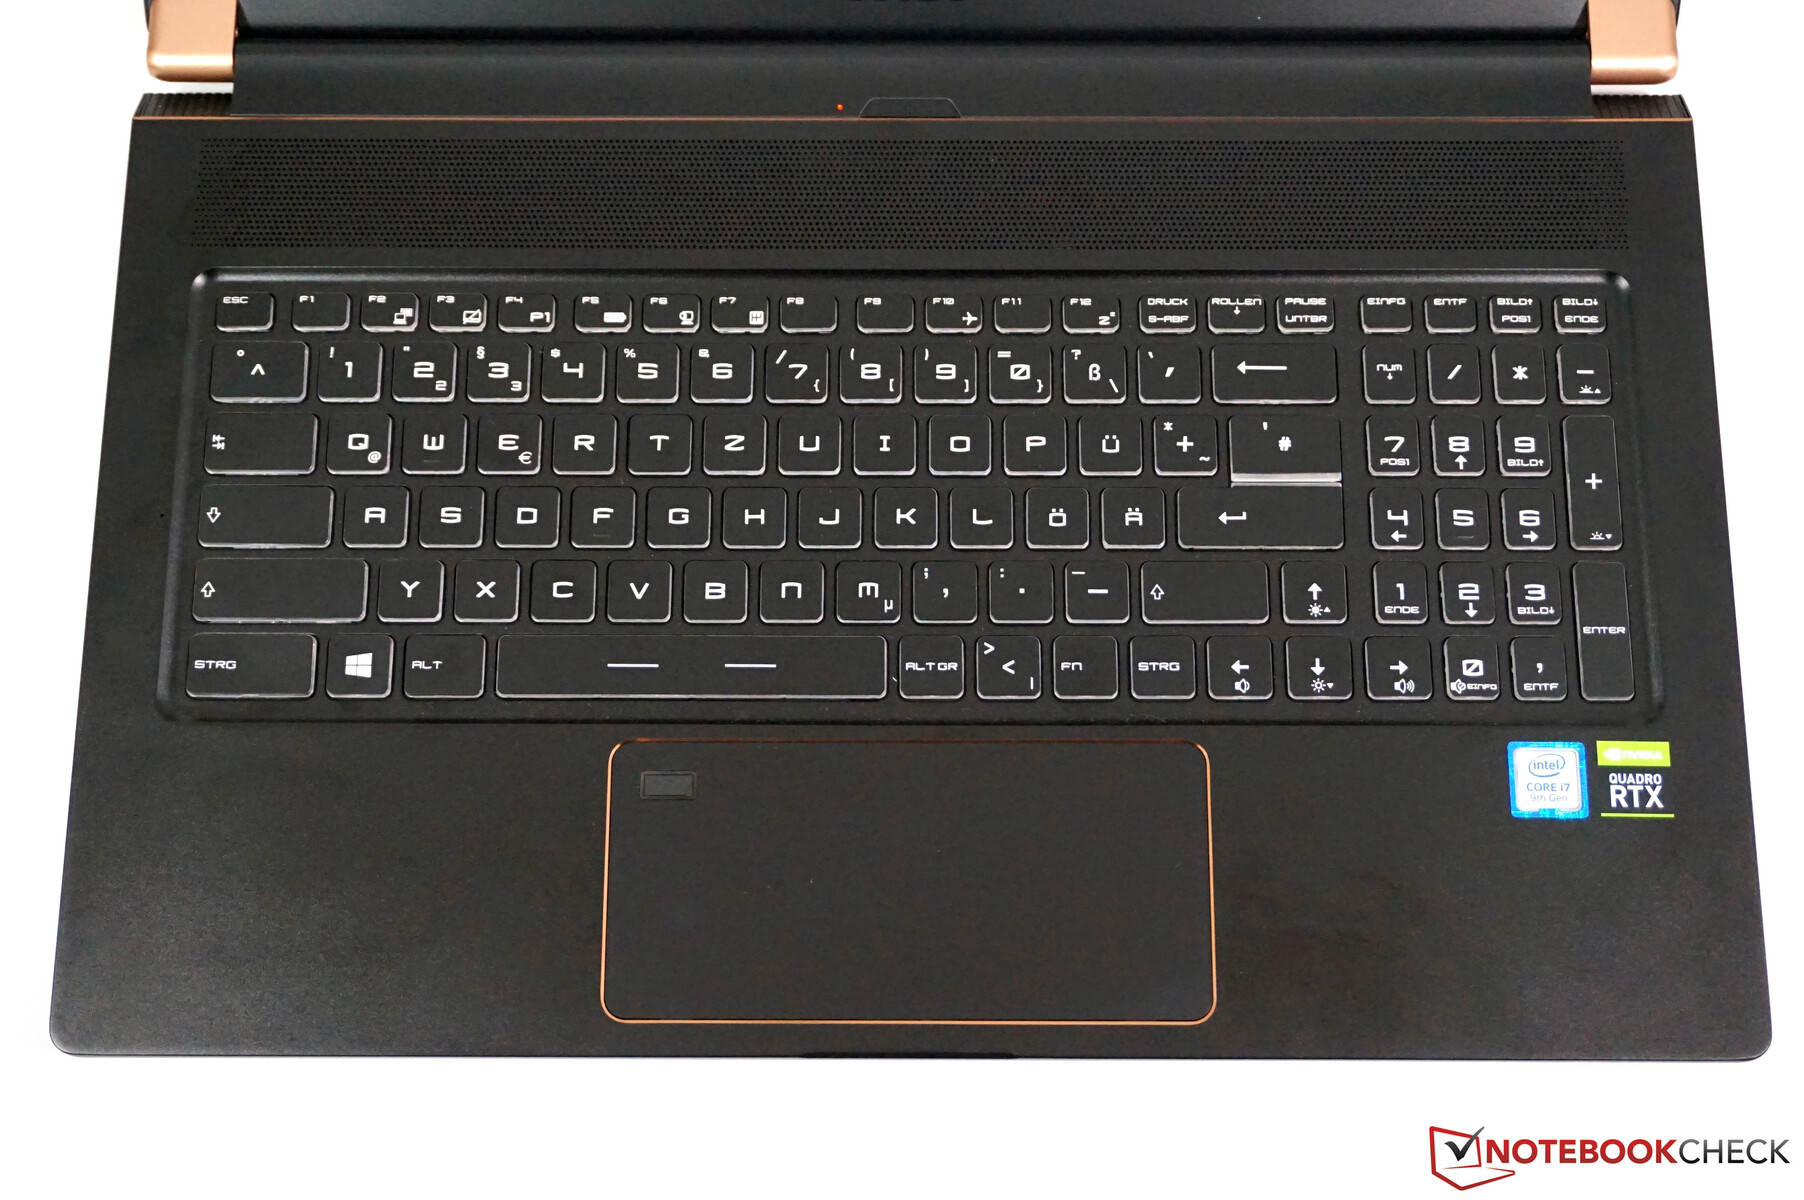
Touchpad
Below the keyboard there is a very wide ClickPad, which is not very high (14 x 6.5 cm). Usage did not present any problems though, apart from the somewhat annoyingly loud clicking noise it produces. As a result, we quickly adapted to tapping the pad to produce left-clicks. The normal range of gestures is supported and the smooth surface allows for drag-free movement.
With the touchpad we also encounter another difference compared to the MSI GS75, as there is a fingerprint sensor located in the top left corner. This was not intrusive during usage, but it also does not function perfectly - we had to occasionally repeat read attempts before our finger was recognised.
Display
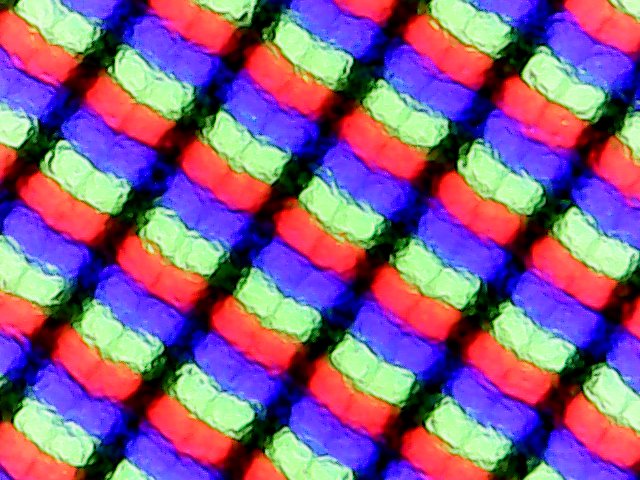
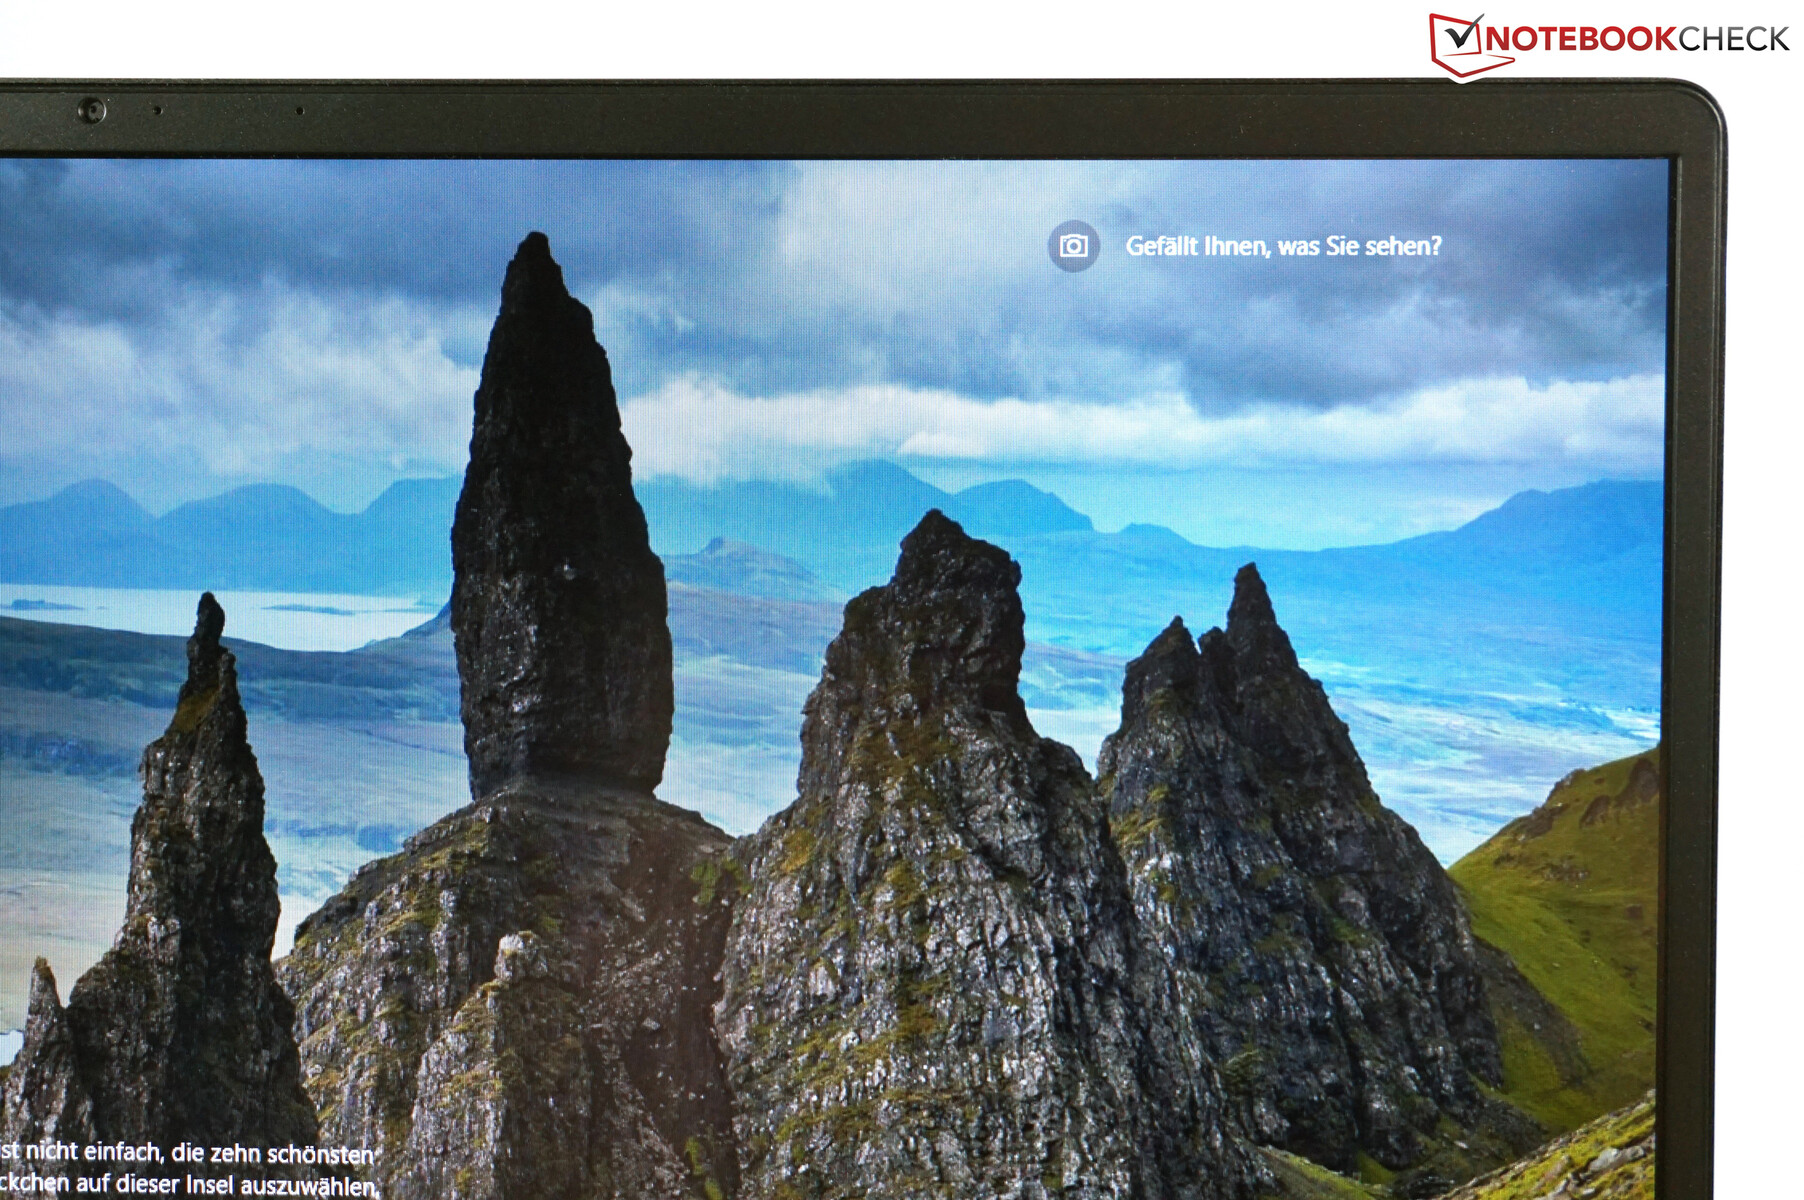
MSI offers the WS75 with two different displays. The first is the Full HD panel in our review device, which with its NTSC colour-space coverage 72% should suffice for all applications outside of image-editing. The alternative is a matte 4K display with full AdobeRGB coverage. The 1080p panel in our review sample is an AU Optronics unit (B173HAN04.2). In comparison to the gaming models, the WS75 features normal 60 Hz displays.
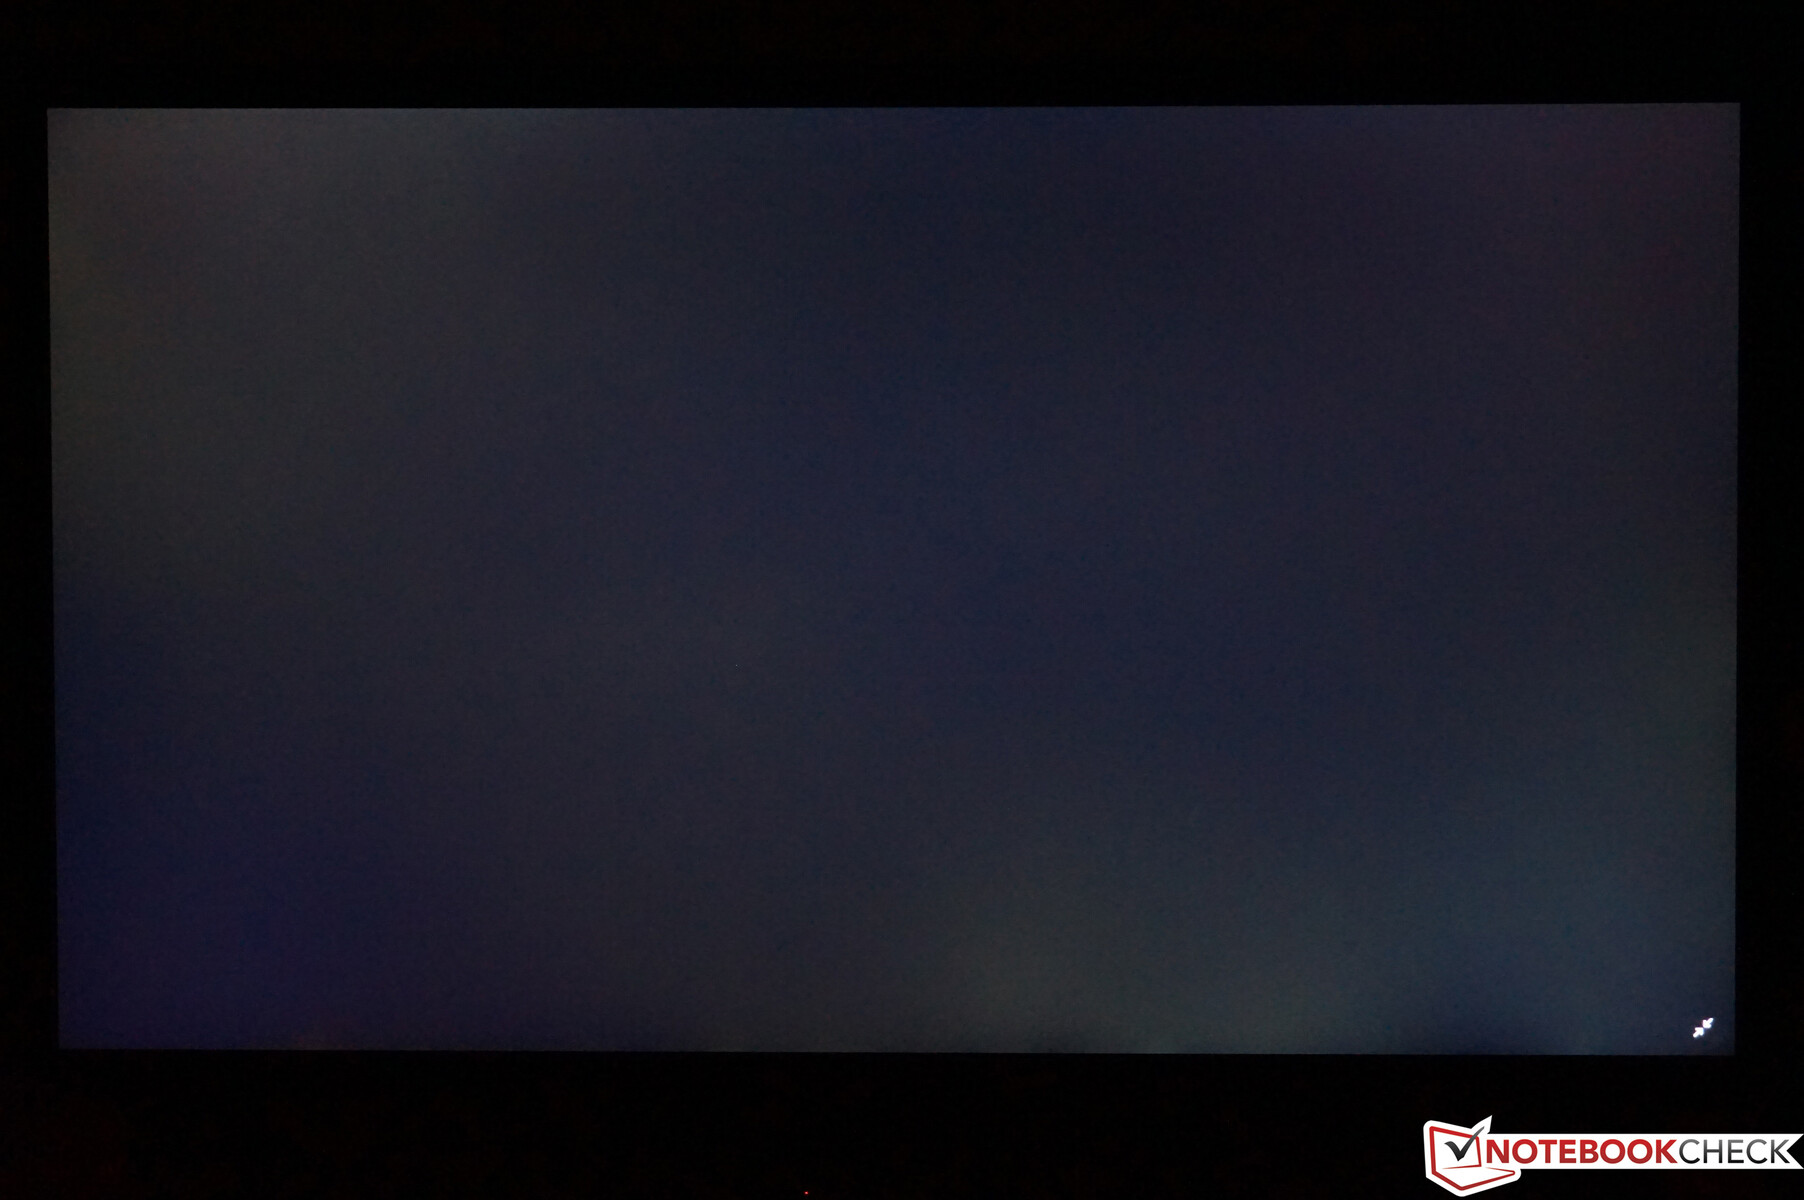
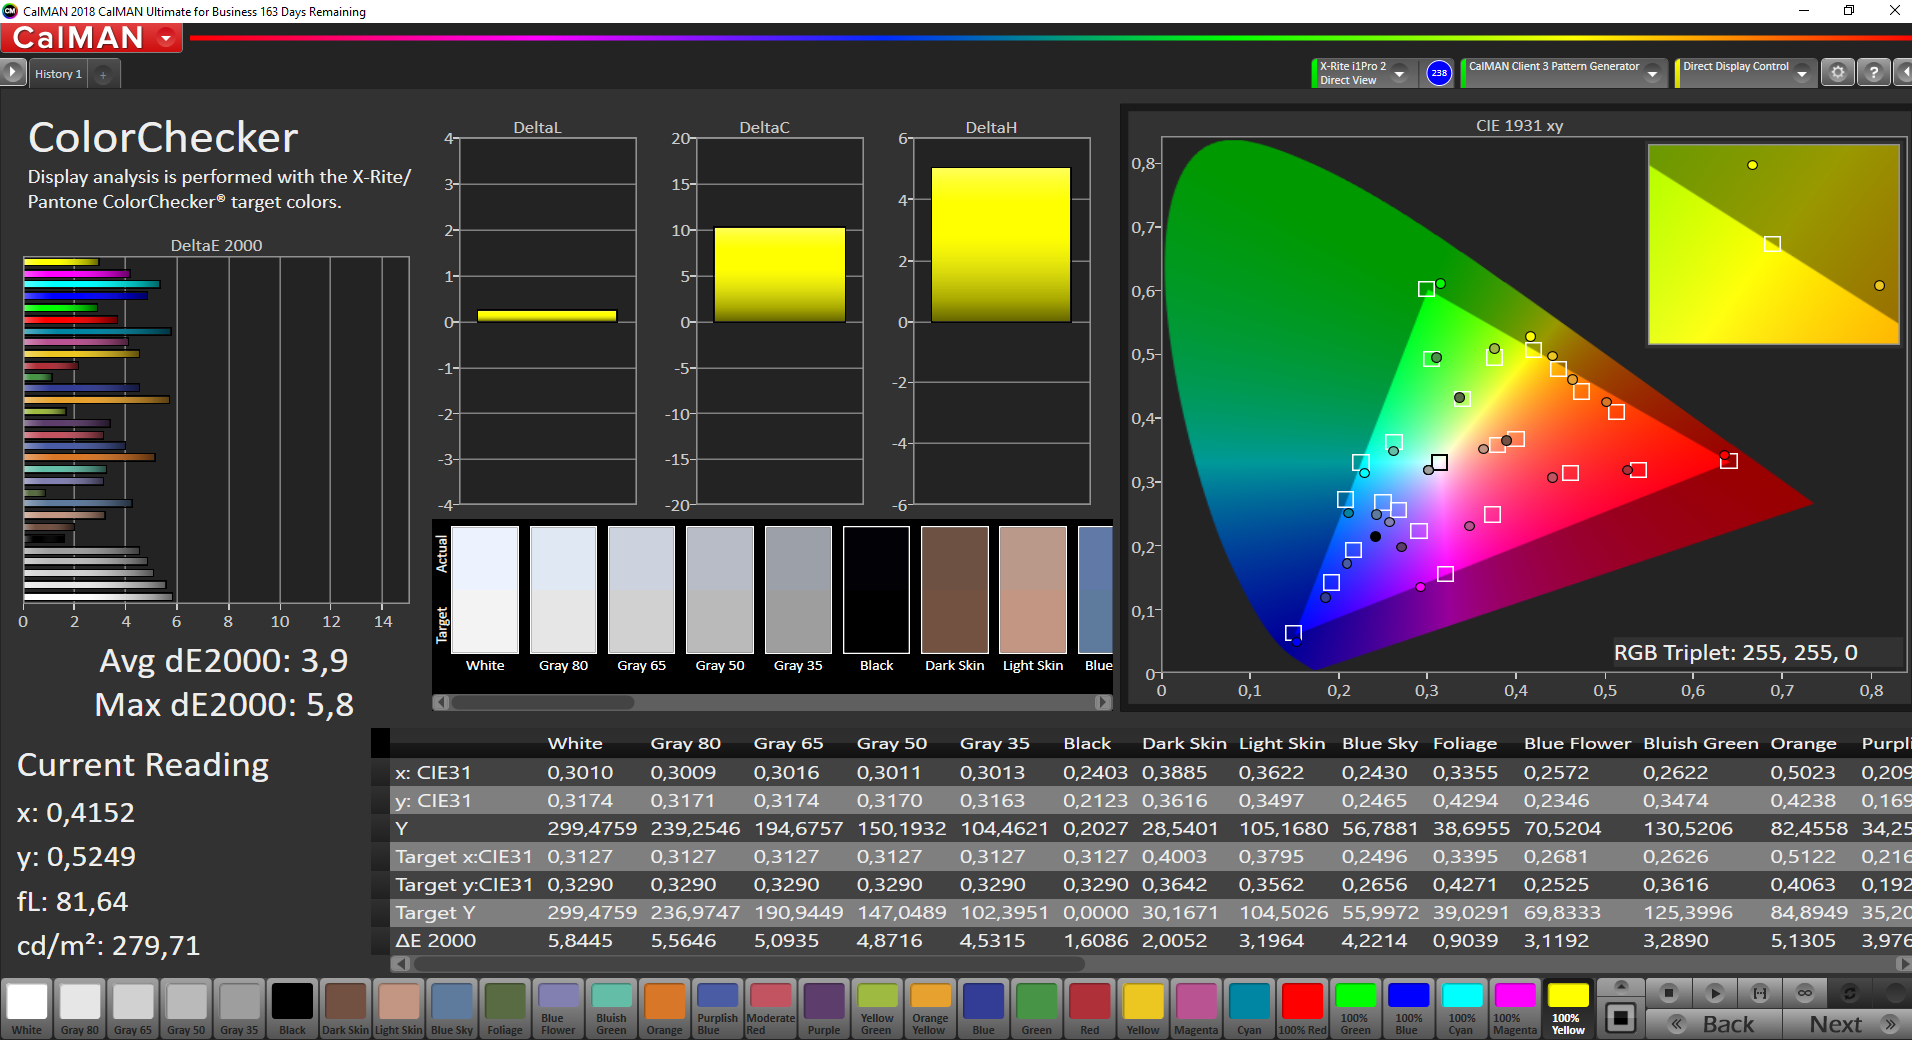
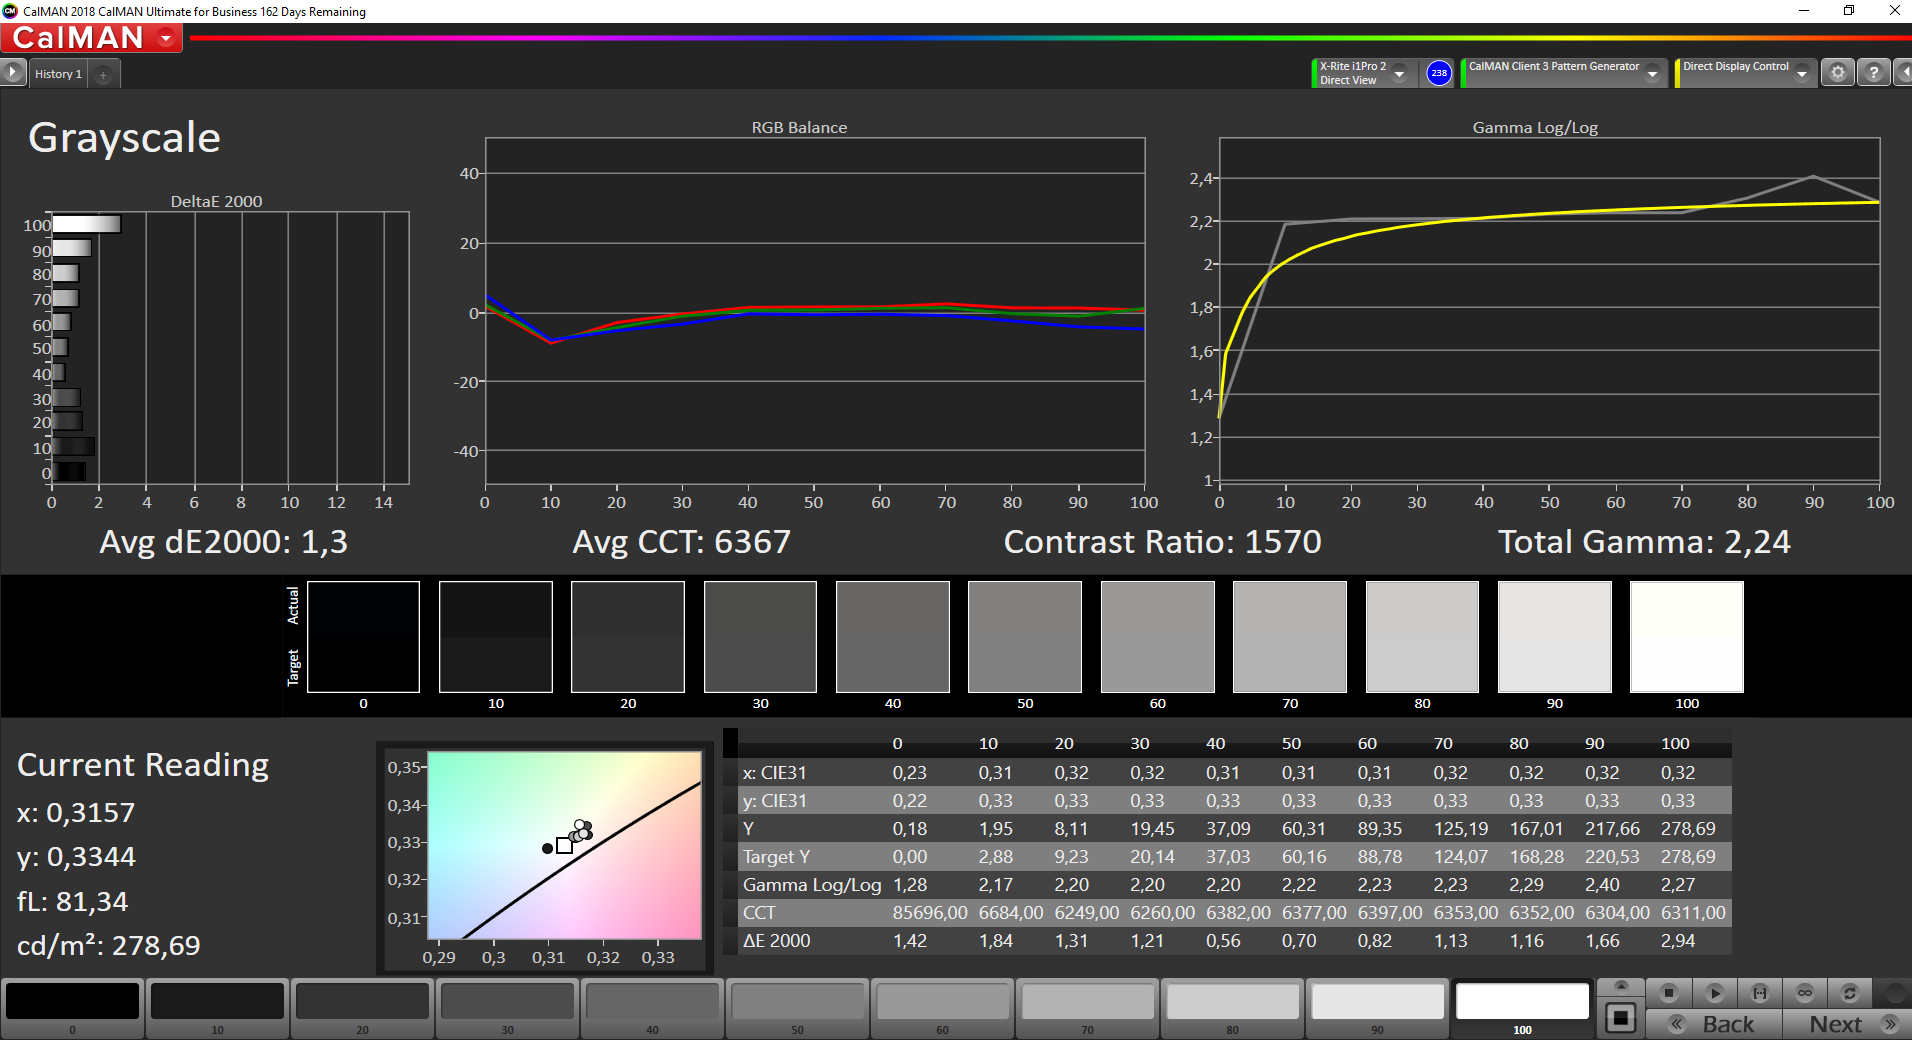
Subjective impressions from the display are fine - colours are vibrant and content is rendered crisply. A look at the test results confirms this impression: The panel is acceptable even if not exceptional for 2019. The average brightness sits at just under 290 cd/m², which in conjunction with its black level (0.25) provides for a good contrast ratio of 1,200:1. The image is not overly grainy, despite the matte surface. PWM flickering is not present with our panel, and there were no major issues with IPS glow.
| |||||||||||||||||||||||||
Brightness Distribution: 86 %
Center on Battery: 301 cd/m²
Contrast: 1200:1 (Black: 0.25 cd/m²)
ΔE ColorChecker Calman: 3.9 | ∀{0.5-29.43 Ø4.72}
calibrated: 2.3
ΔE Greyscale Calman: 4.3 | ∀{0.09-98 Ø4.97}
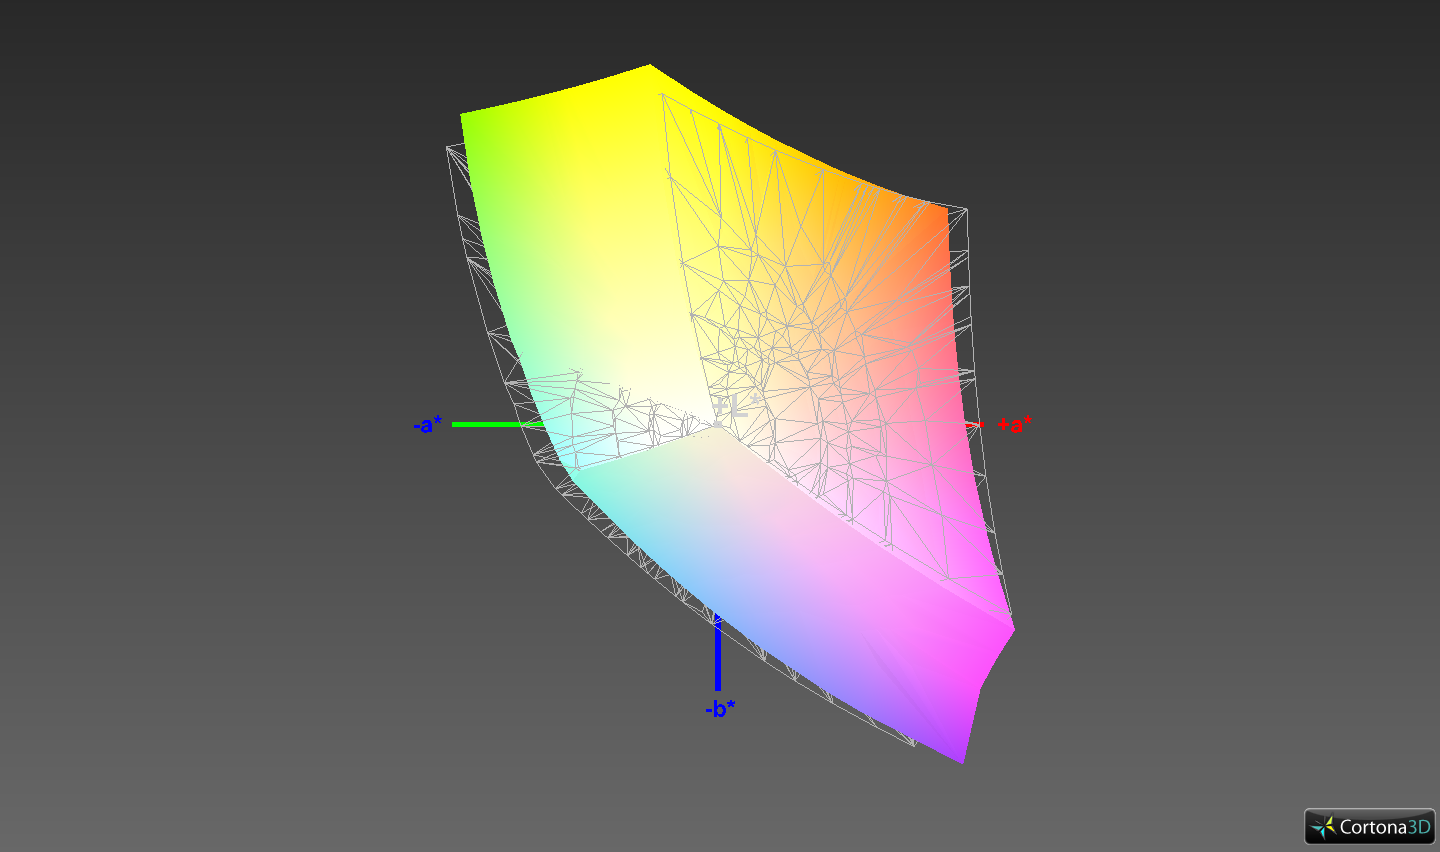
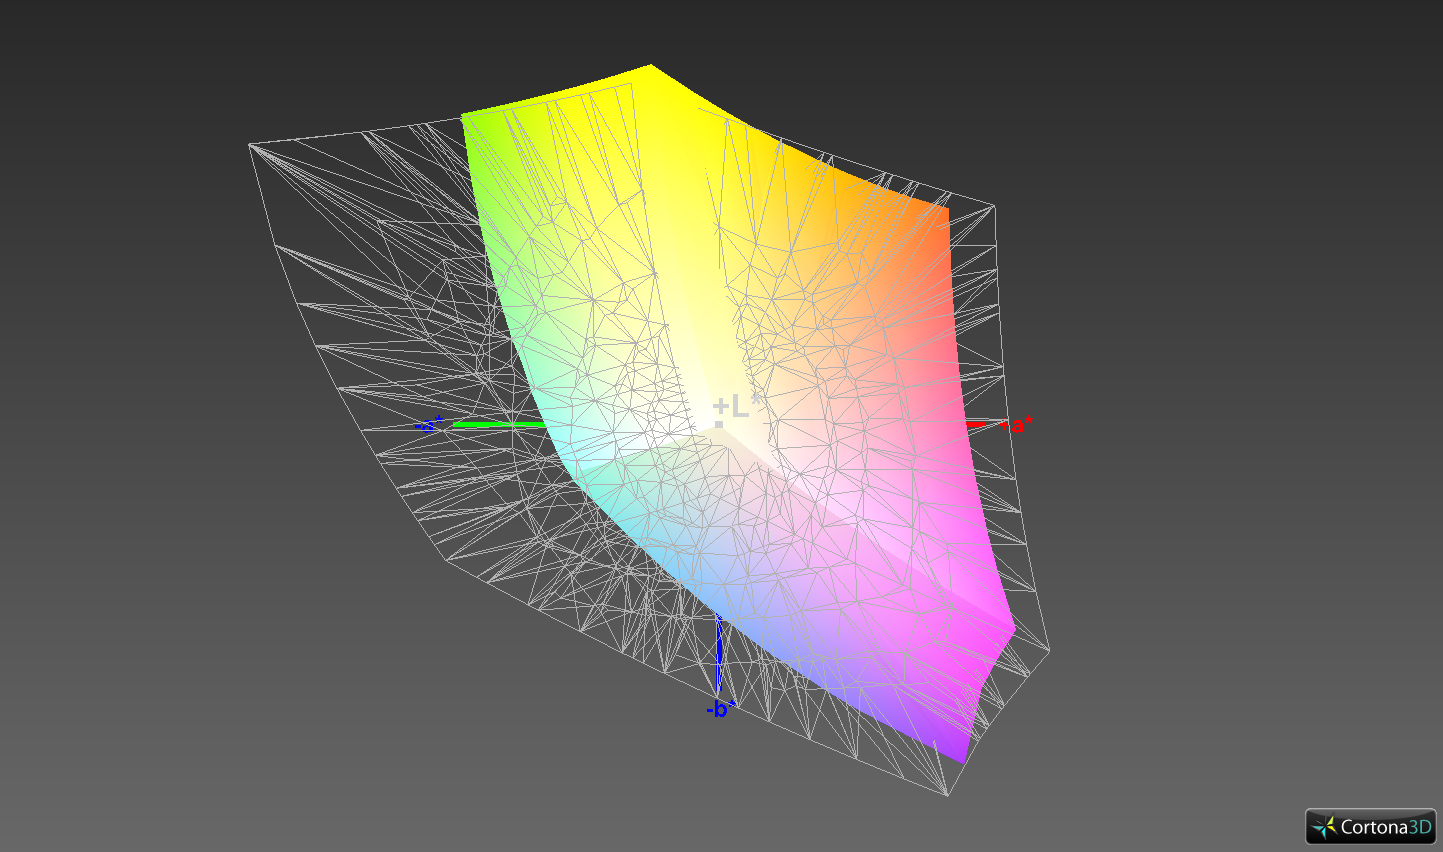
91% sRGB (Argyll 1.6.3 3D)
59.2% AdobeRGB 1998 (Argyll 1.6.3 3D)
65.8% AdobeRGB 1998 (Argyll 3D)
91.1% sRGB (Argyll 3D)
64.5% Display P3 (Argyll 3D)
Gamma: 2.2
CCT: 7391 K
| MSI WS75 9TL-636 B173HAN04.2, , 1920x1080, 17.3" | Lenovo ThinkPad P72-20MB000EGE LP173WF4_SPF7, , 1920x1080, 17.3" | HP ZBook 17 G5-2ZC48EA AUO B173HW01 V0, , 1920x1080, 17.3" | Dell Precision 7730 B173HAN01.3, , 1920x1080, 17.3" | Fujitsu Celsius H980 LG Philips, LP173WF4-SPF5, , 1920x1080, 17.3" | |
|---|---|---|---|---|---|
| Display | -3% | 1% | 2% | -3% | |
| Display P3 Coverage (%) | 64.5 | 67.4 4% | 66.3 3% | 65 1% | 67.3 4% |
| sRGB Coverage (%) | 91.1 | 85 -7% | 89.9 -1% | 93.4 3% | 85 -7% |
| AdobeRGB 1998 Coverage (%) | 65.8 | 62.2 -5% | 66.3 1% | 62.2 -5% | |
| Response Times | -3% | -4% | -20% | 11% | |
| Response Time Grey 50% / Grey 80% * (ms) | 39.2 ? | 40.8 ? -4% | 42.4 ? -8% | 48.8 ? -24% | 38 ? 3% |
| Response Time Black / White * (ms) | 28.4 ? | 28.8 ? -1% | 28.4 ? -0% | 32.8 ? -15% | 23.2 ? 18% |
| PWM Frequency (Hz) | 120500 ? | ||||
| Screen | -8% | -6% | 17% | -24% | |
| Brightness middle (cd/m²) | 300 | 338 13% | 335 12% | 322 7% | 400 33% |
| Brightness (cd/m²) | 288 | 317 10% | 326 13% | 316 10% | 394 37% |
| Brightness Distribution (%) | 86 | 86 0% | 92 7% | 84 -2% | 92 7% |
| Black Level * (cd/m²) | 0.25 | 0.28 -12% | 0.22 12% | 0.24 4% | 0.51 -104% |
| Contrast (:1) | 1200 | 1207 1% | 1523 27% | 1342 12% | 784 -35% |
| Colorchecker dE 2000 * | 3.9 | 4.3 -10% | 4.7 -21% | 2.2 44% | 5.3 -36% |
| Colorchecker dE 2000 max. * | 6 | 10.2 -70% | 8.7 -45% | 4.6 23% | 9.3 -55% |
| Colorchecker dE 2000 calibrated * | 2.3 | 3.7 -61% | 2.7 -17% | 1.9 17% | 3.8 -65% |
| Greyscale dE 2000 * | 4.3 | 2.2 49% | 6.5 -51% | 1.6 63% | 5.5 -28% |
| Gamma | 2.2 100% | 2.17 101% | 2.23 99% | 2.19 100% | 2.17 101% |
| CCT | 7391 88% | 6621 98% | 6108 106% | 6621 98% | 6686 97% |
| Color Space (Percent of AdobeRGB 1998) (%) | 59.2 | 55.8 -6% | 58.7 -1% | 60.4 2% | 55.8 -6% |
| Color Space (Percent of sRGB) (%) | 91 | 84.7 -7% | 89.7 -1% | 93.3 3% | 84.9 -7% |
| Total Average (Program / Settings) | -5% /
-7% | -3% /
-5% | -0% /
9% | -5% /
-15% |
* ... smaller is better
Included with the WS75 is MSI's TrueColor software, which offers multiple profiles and, for example, a blue light filter. The sRGB profile is selected by default, which we also used for our measurements. We tested briefly with the 'Designer' profile, but there were only minimal differences.
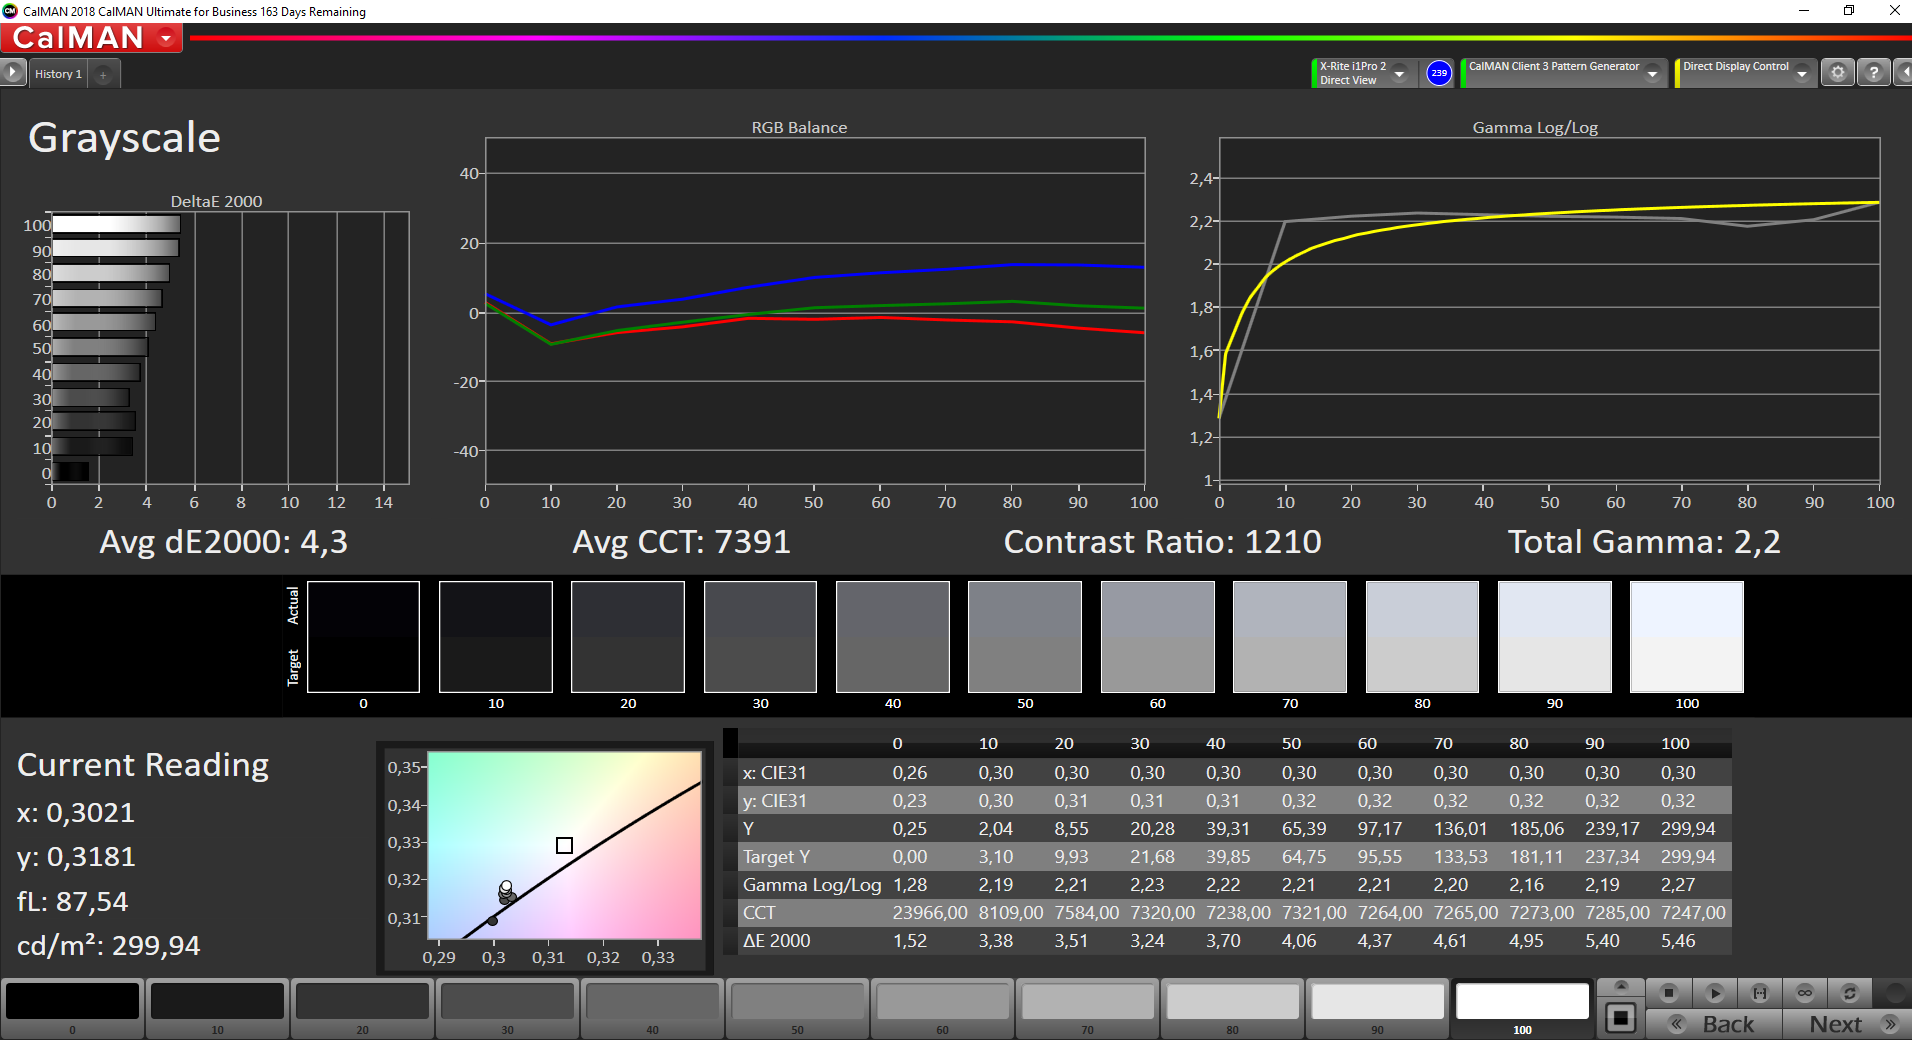
The display is not calibrated from the factory and therefore the results were not acceptable. Grey tones especially suffered from a blue tint and overall the colour temperature was too cold.
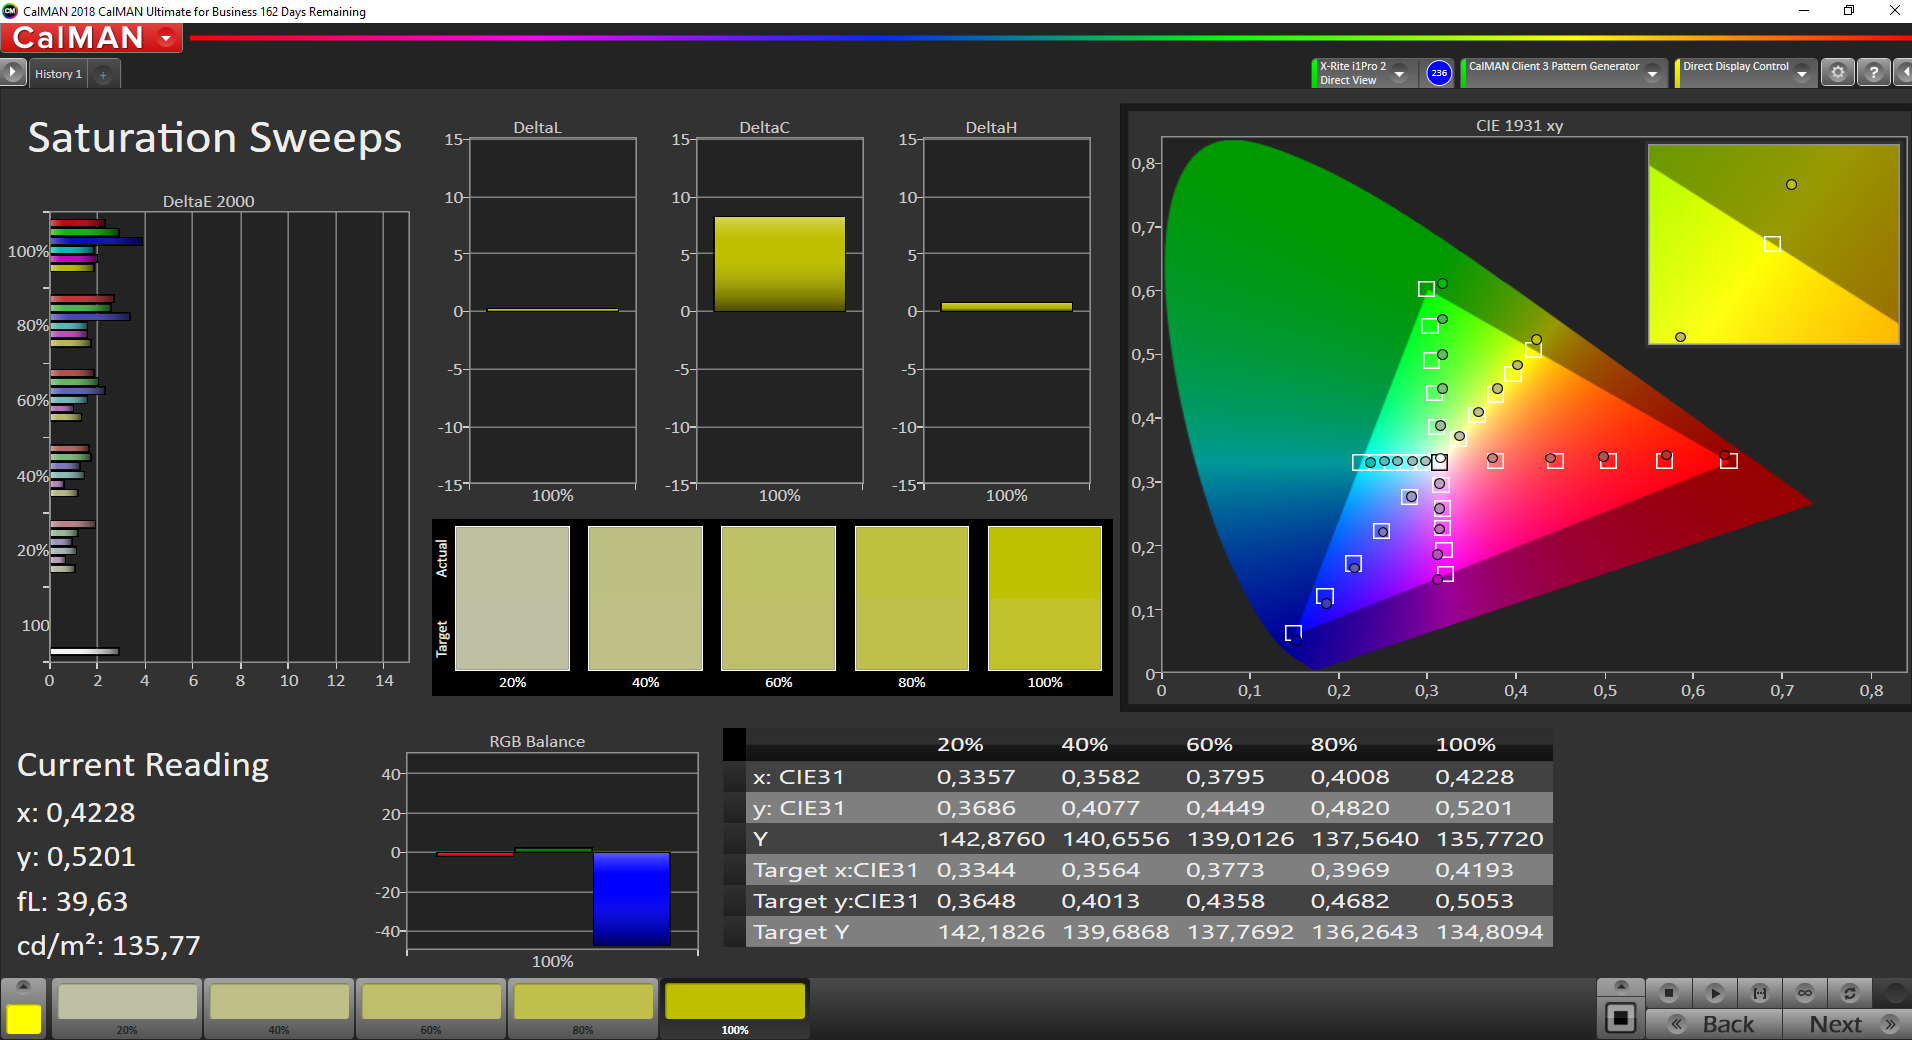
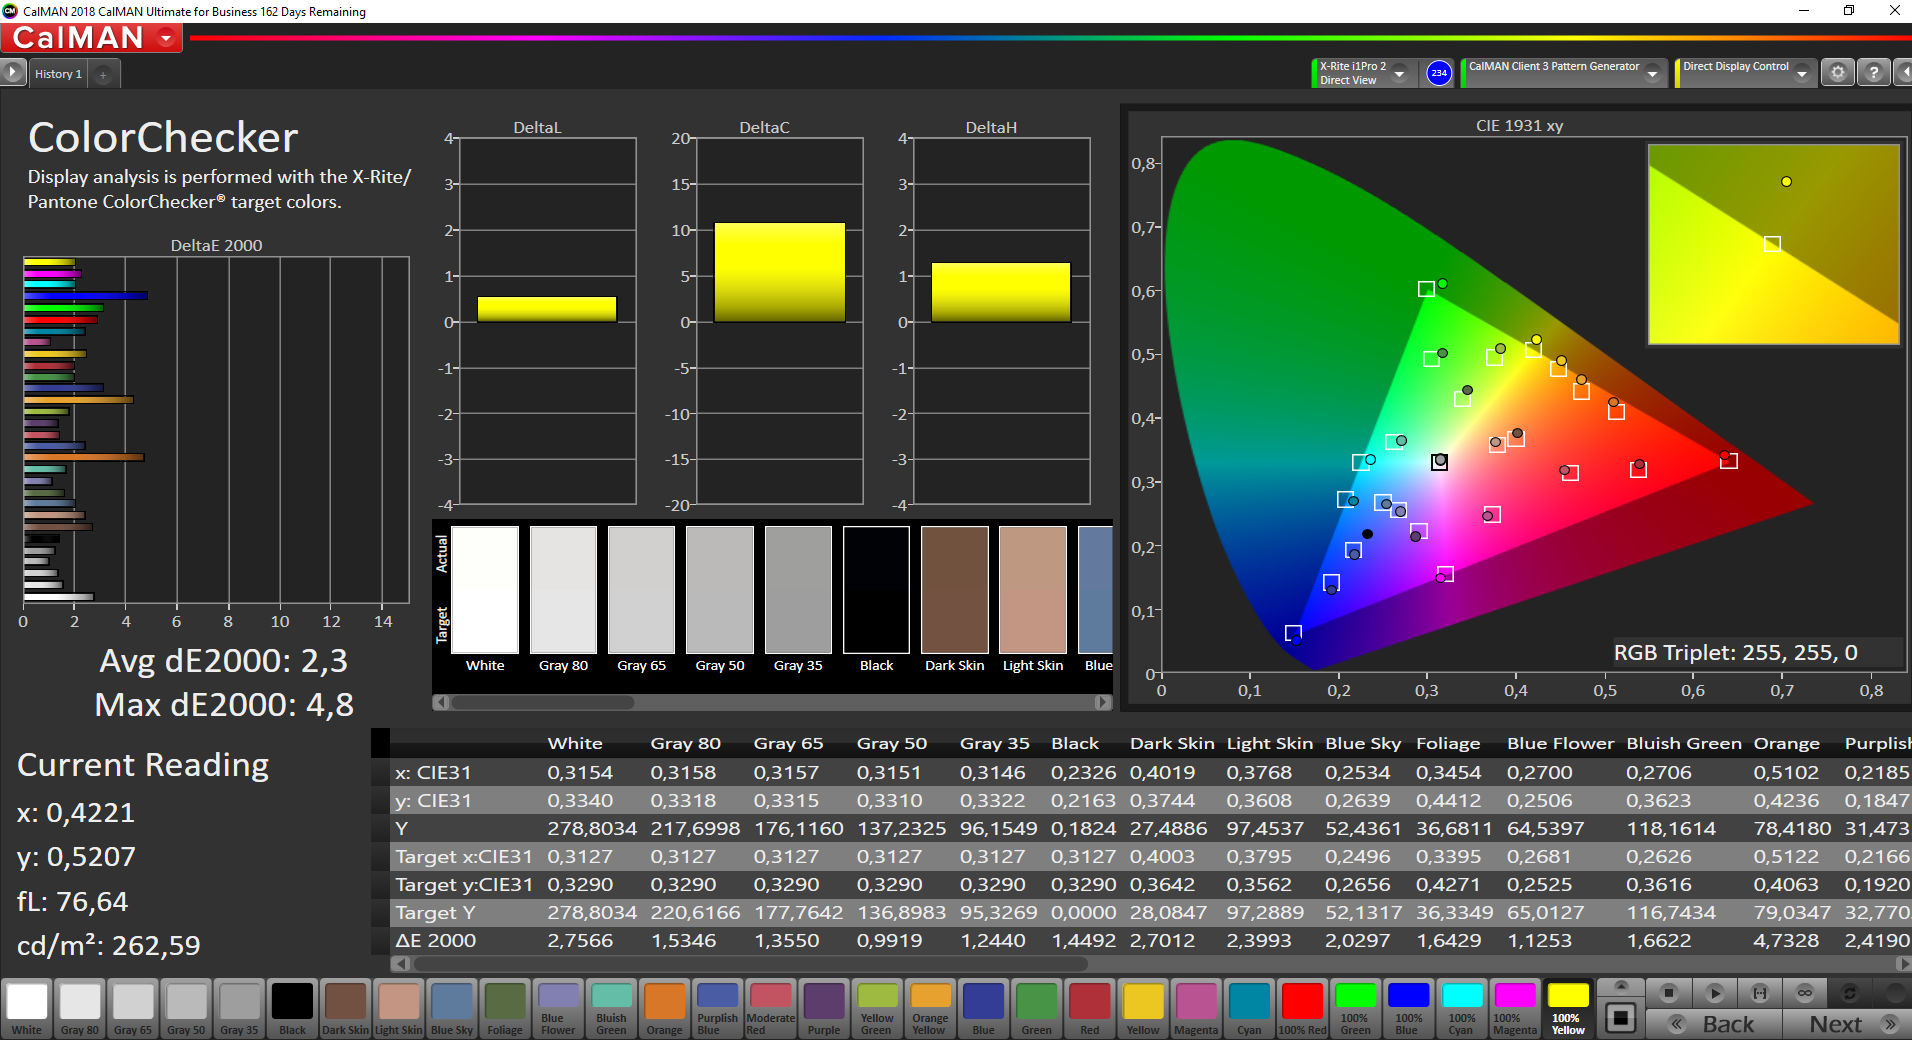
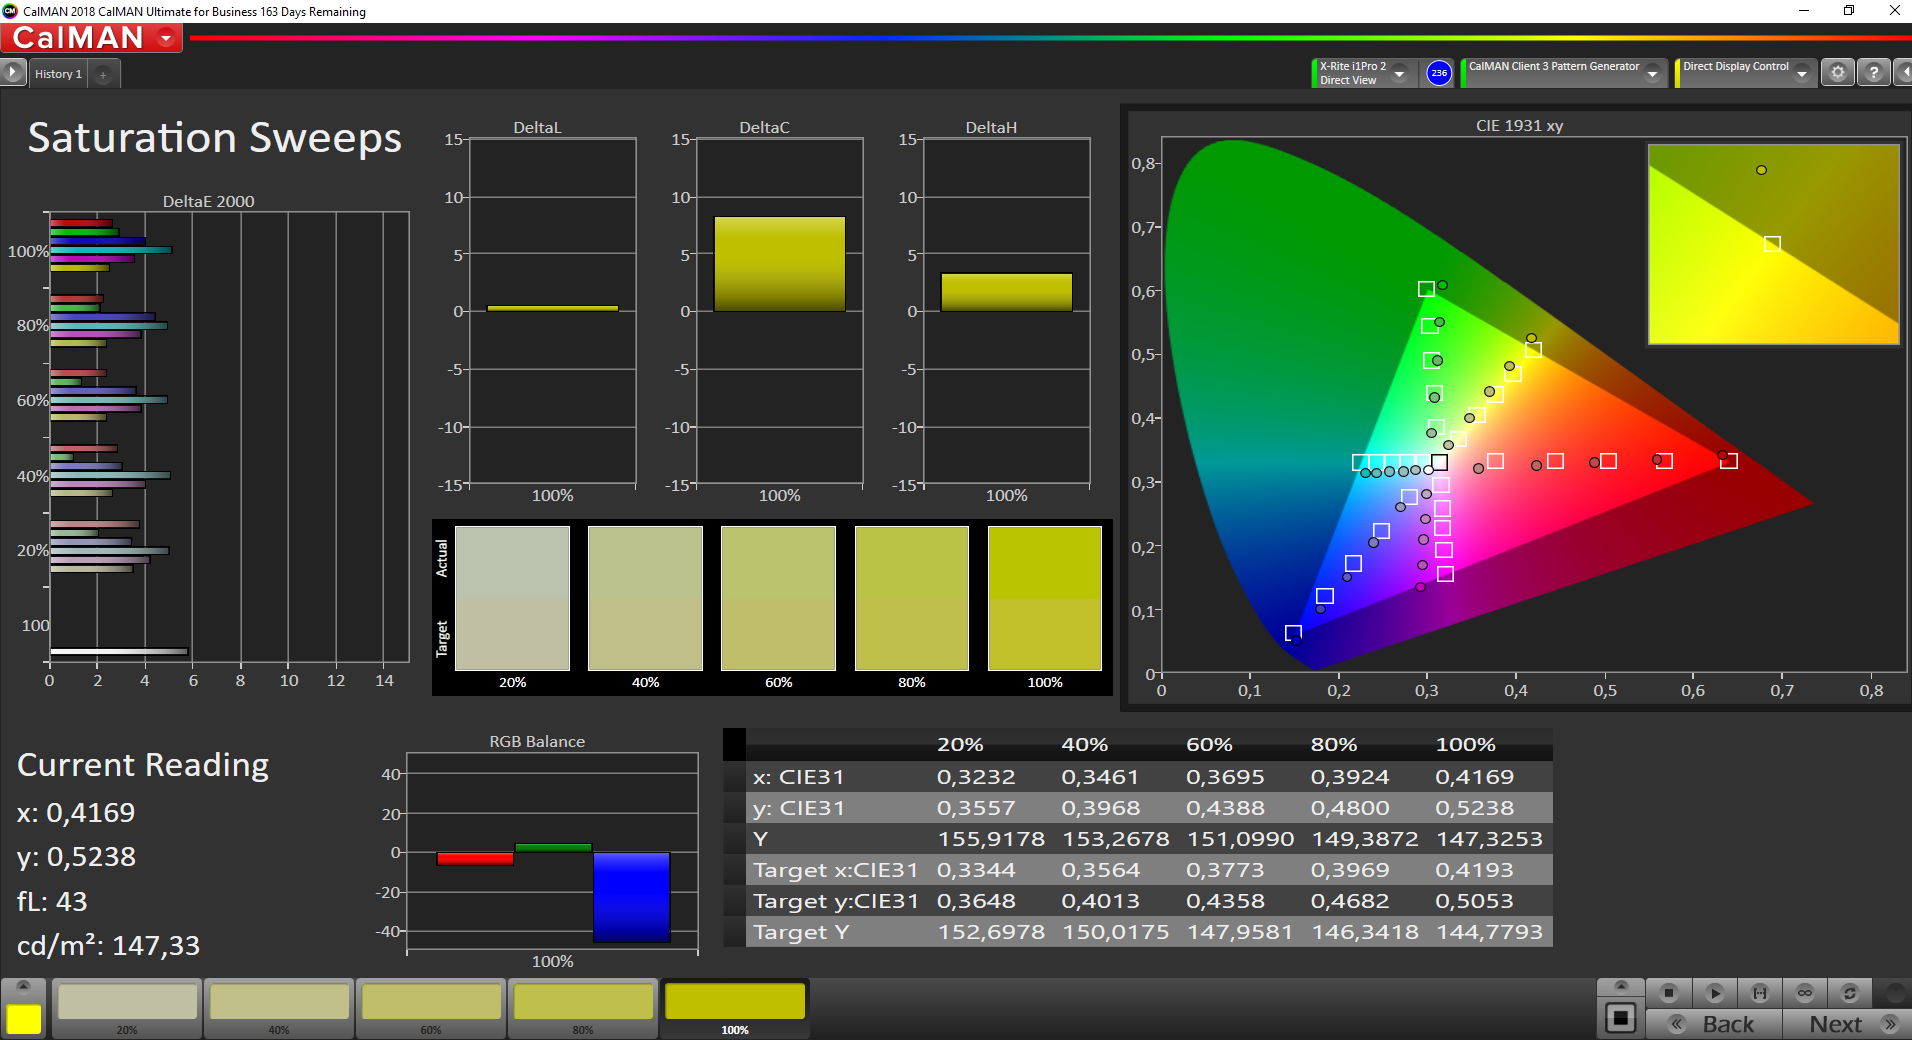
We were able to improve the display via our calibration, however this was at the cost of somewhat reduced brightness (-20 cd/m²). Colour accuracy was also improved, although there were a few outliers that were not able to be fixed. Together with its relatively low colour-space coverage (91% sRGB, 59% AdobeRGB) this means that this display is not suitable for designers or graphic artists, as they require much higher colour accuracy. These users will have to either opt for the 4K panel or use an external monitor. In the interests of fairness, it's important to note that the displays of the competition don't do much better in this area.
Display Response Times
| ↔ Response Time Black to White | ||
|---|---|---|
| 28.4 ms ... rise ↗ and fall ↘ combined | ↗ 15.6 ms rise | 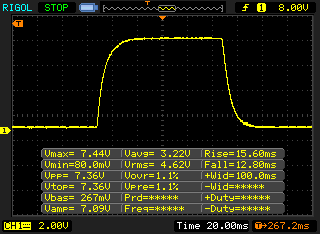 |
| ↘ 12.8 ms fall | ||
| The screen shows relatively slow response rates in our tests and may be too slow for gamers. In comparison, all tested devices range from 0.1 (minimum) to 240 (maximum) ms. » 75 % of all devices are better. This means that the measured response time is worse than the average of all tested devices (19.8 ms). | ||
| ↔ Response Time 50% Grey to 80% Grey | ||
| 39.2 ms ... rise ↗ and fall ↘ combined | ↗ 19.6 ms rise | 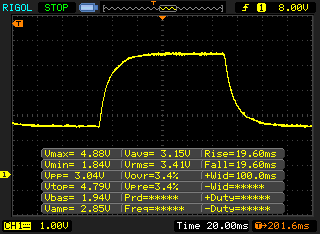 |
| ↘ 19.6 ms fall | ||
| The screen shows slow response rates in our tests and will be unsatisfactory for gamers. In comparison, all tested devices range from 0.165 (minimum) to 636 (maximum) ms. » 60 % of all devices are better. This means that the measured response time is worse than the average of all tested devices (31 ms). | ||
Screen Flickering / PWM (Pulse-Width Modulation)
| Screen flickering / PWM not detected | 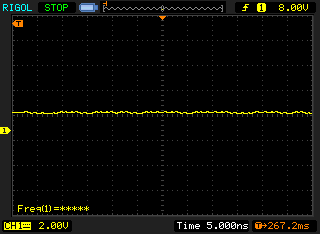 | ||
In comparison: 52 % of all tested devices do not use PWM to dim the display. If PWM was detected, an average of 7750 (minimum: 5 - maximum: 343500) Hz was measured. | |||
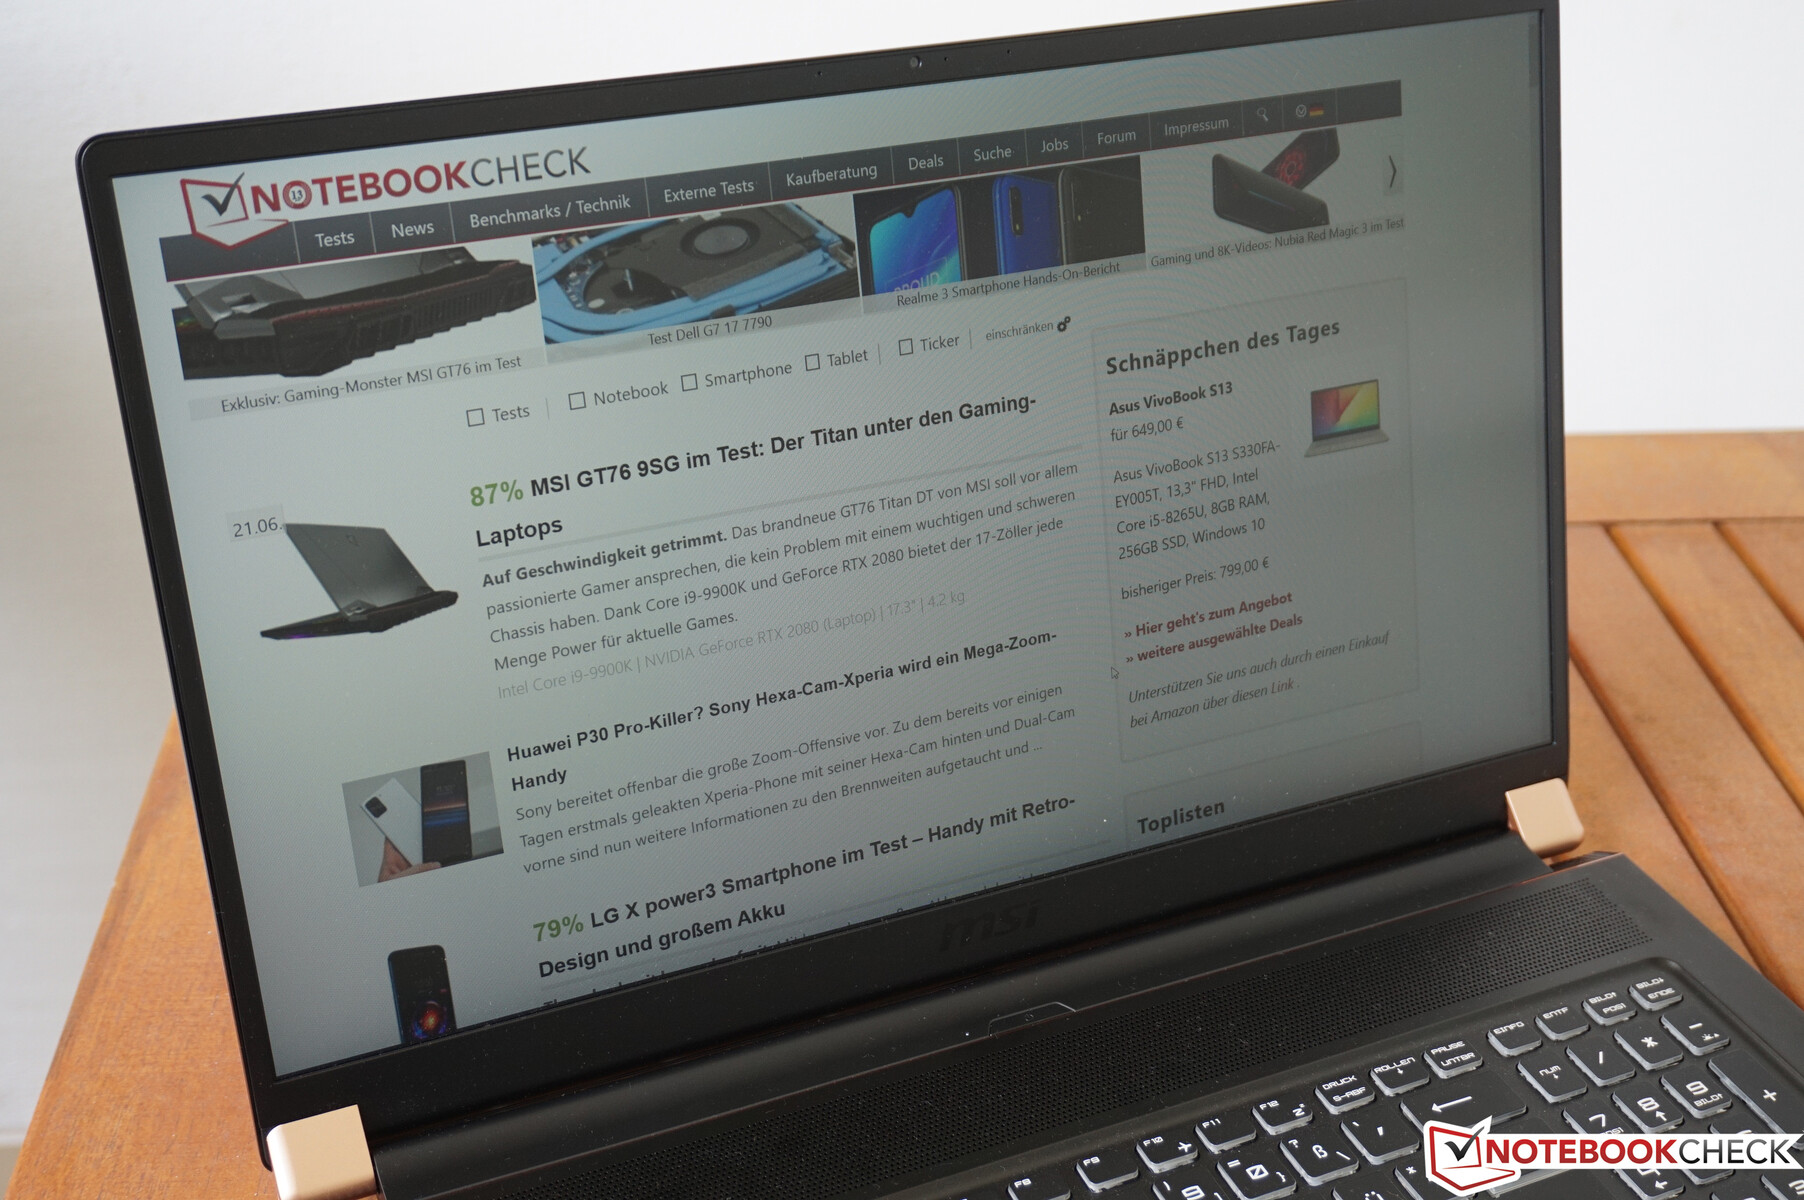
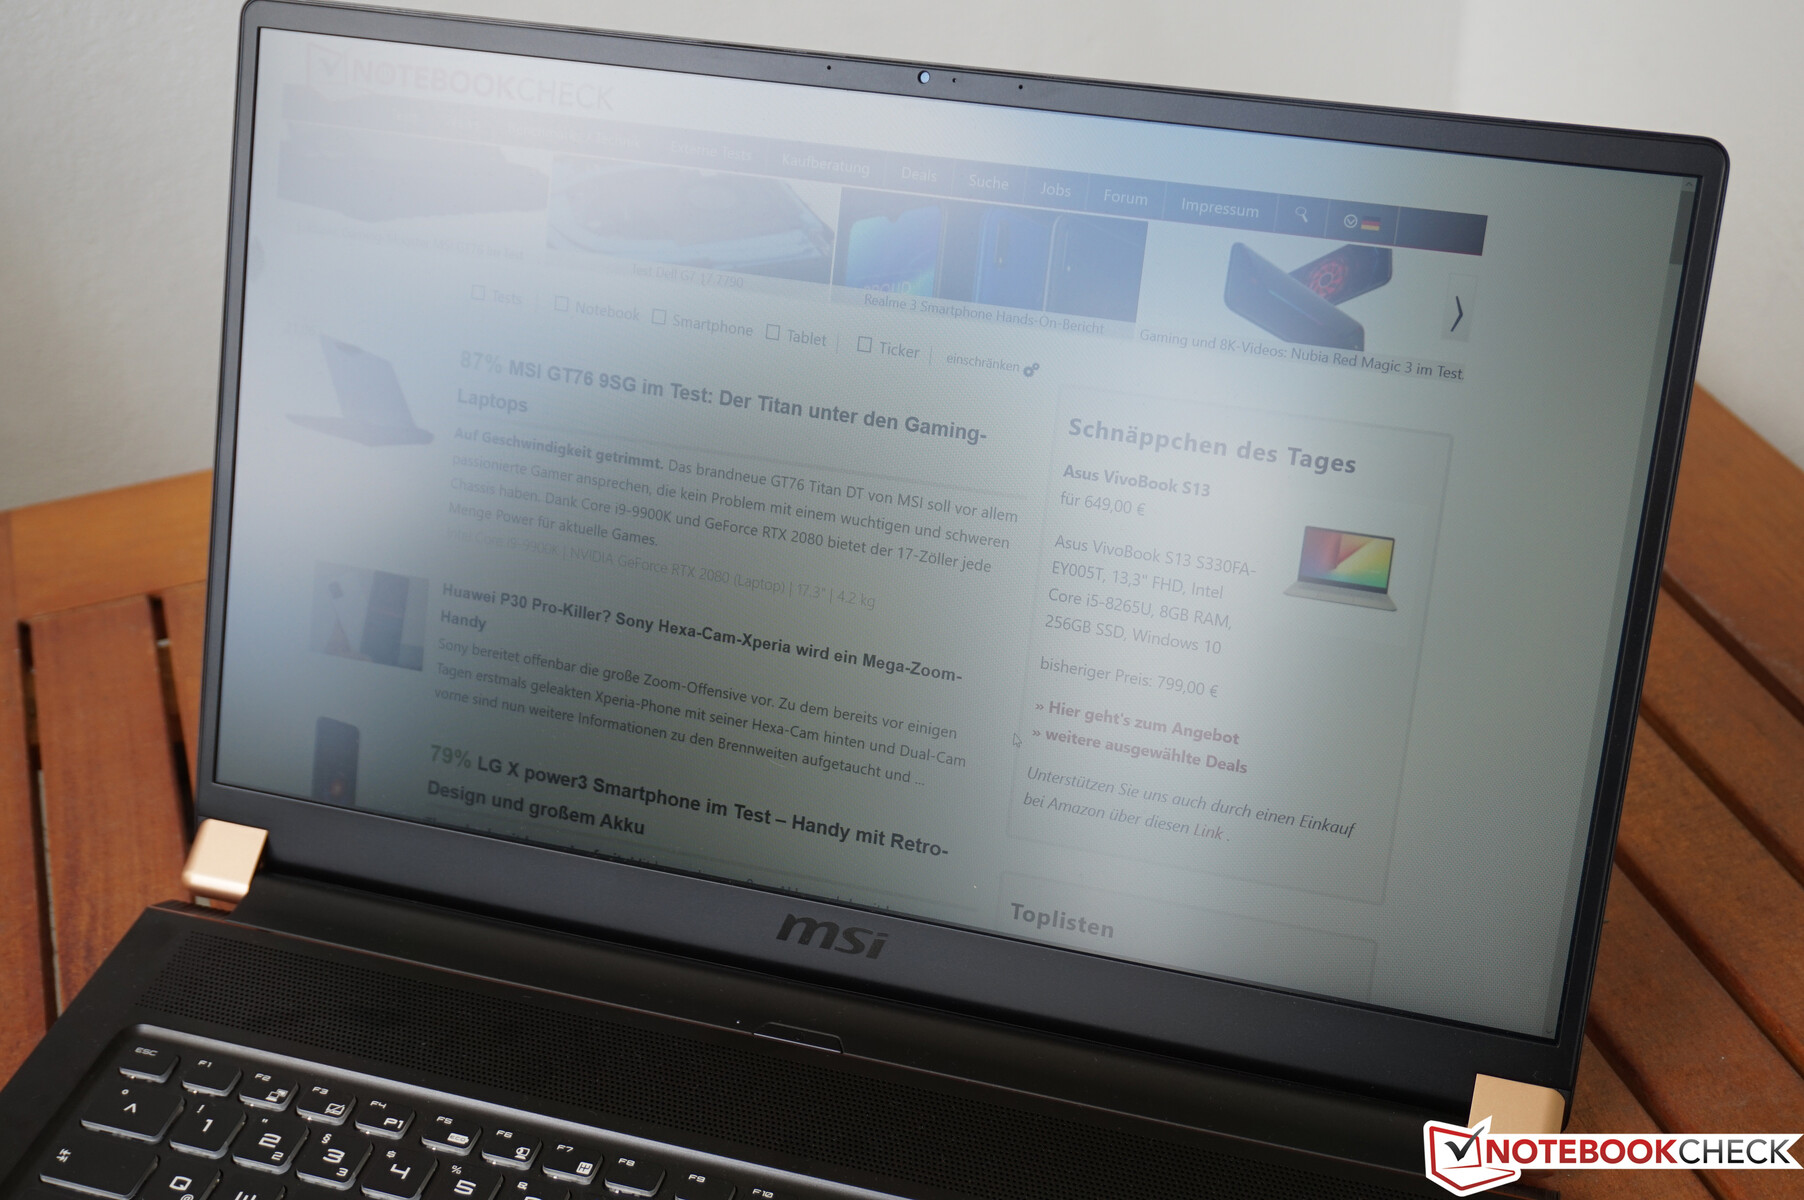
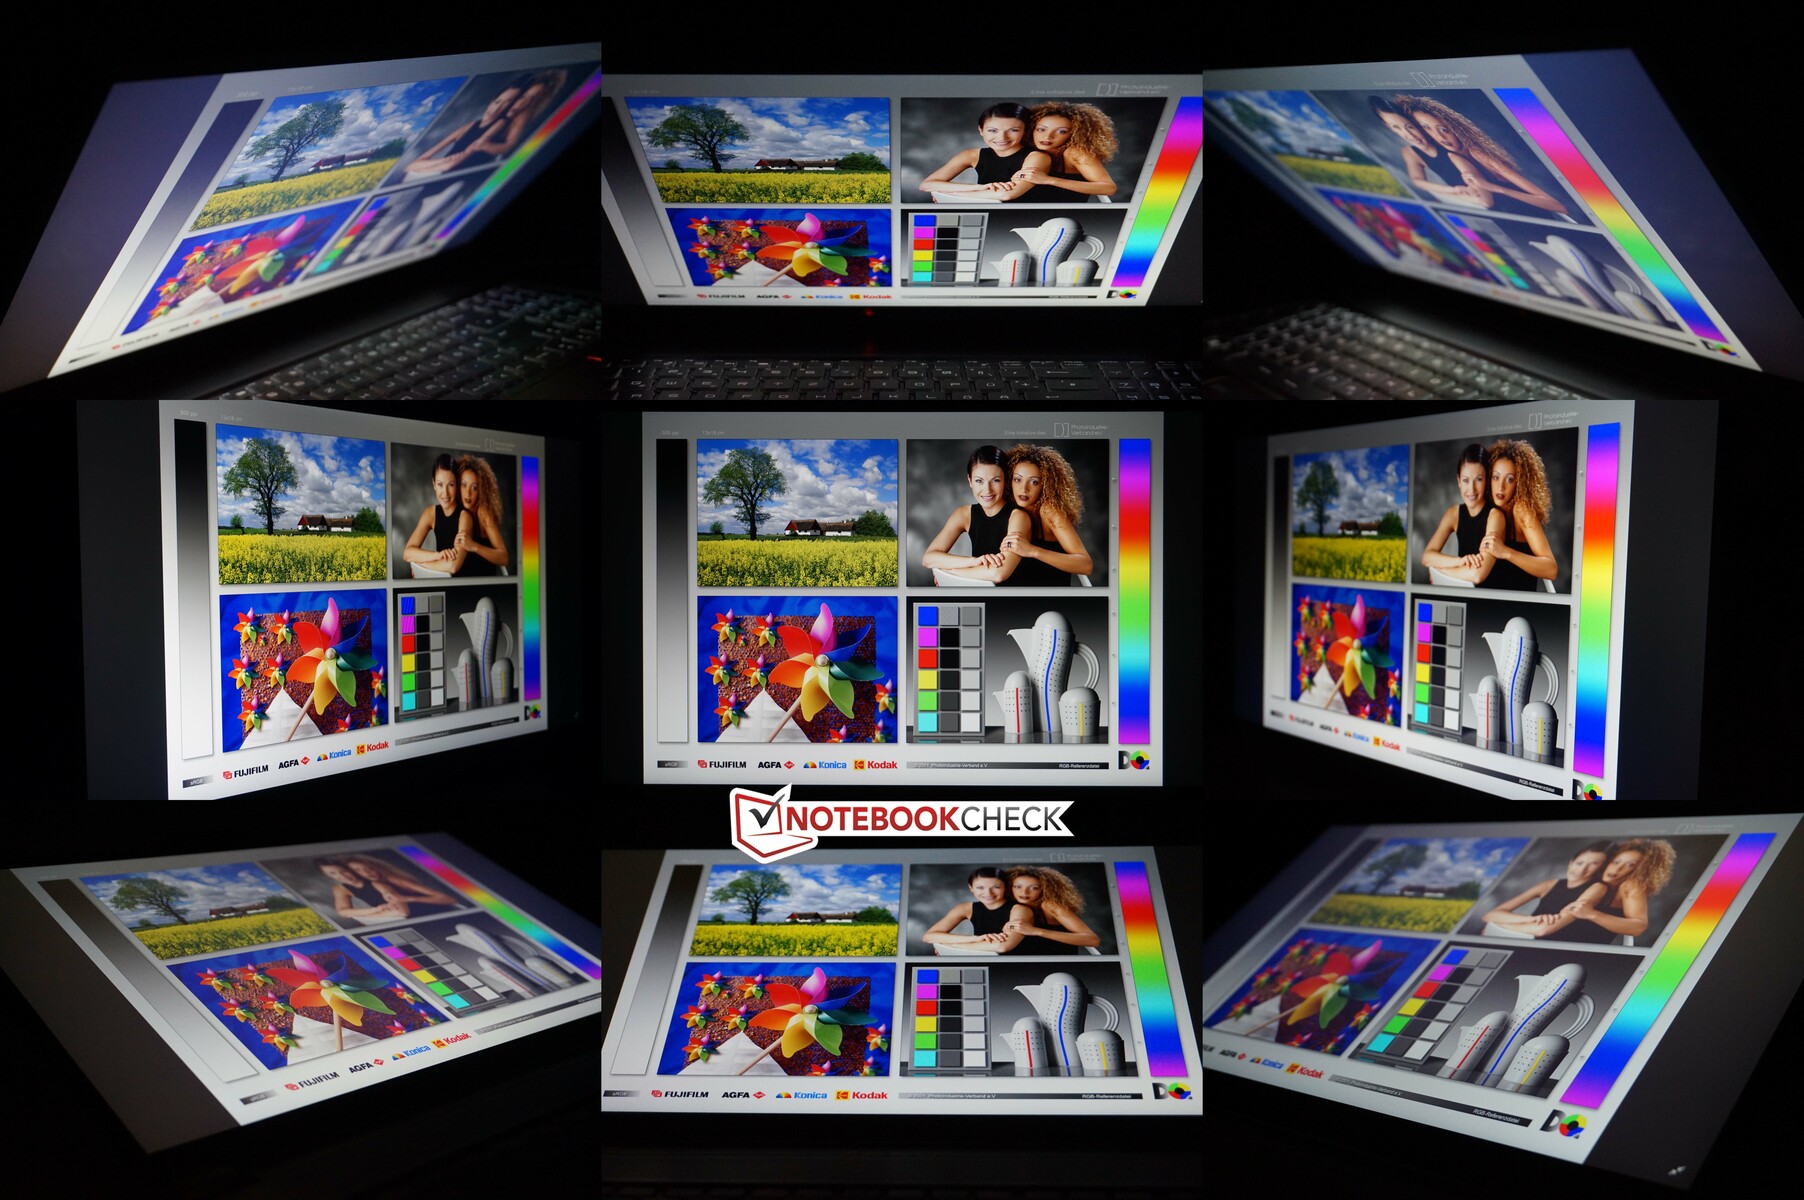
The display benefits outdoors from its matte display, although it is still only really usable in the shade. In lighter environments brightness on the display will need to be turned up. There are no issues with viewing angles - standard fare for an IPS panel.
Performance
Thanks to its up-to-date components, the MSI WS75 is a powerful machine across the board - it remains to be seen with our testing though whether or not there are any performance limitations due to its thinner chassis. It's interesting to note that the WS75, in contrast to its smaller sibling, the WS65, is equipped with regular versions of the Quadro GPUs and not the more efficient Max-Q models. When equipped with a Xeon CPU, the WS75 is also available with ECC memory.
One standout feature of MSI's mobile workstations is the certification process. The competition generally just settles for ISV-certification of the GPU, whereas MSI submits the entire laptop for certification in order to ensure a best possible compatibility scenario. The MSI workstations should therefore have no disadvantages when compared to proven hardware.
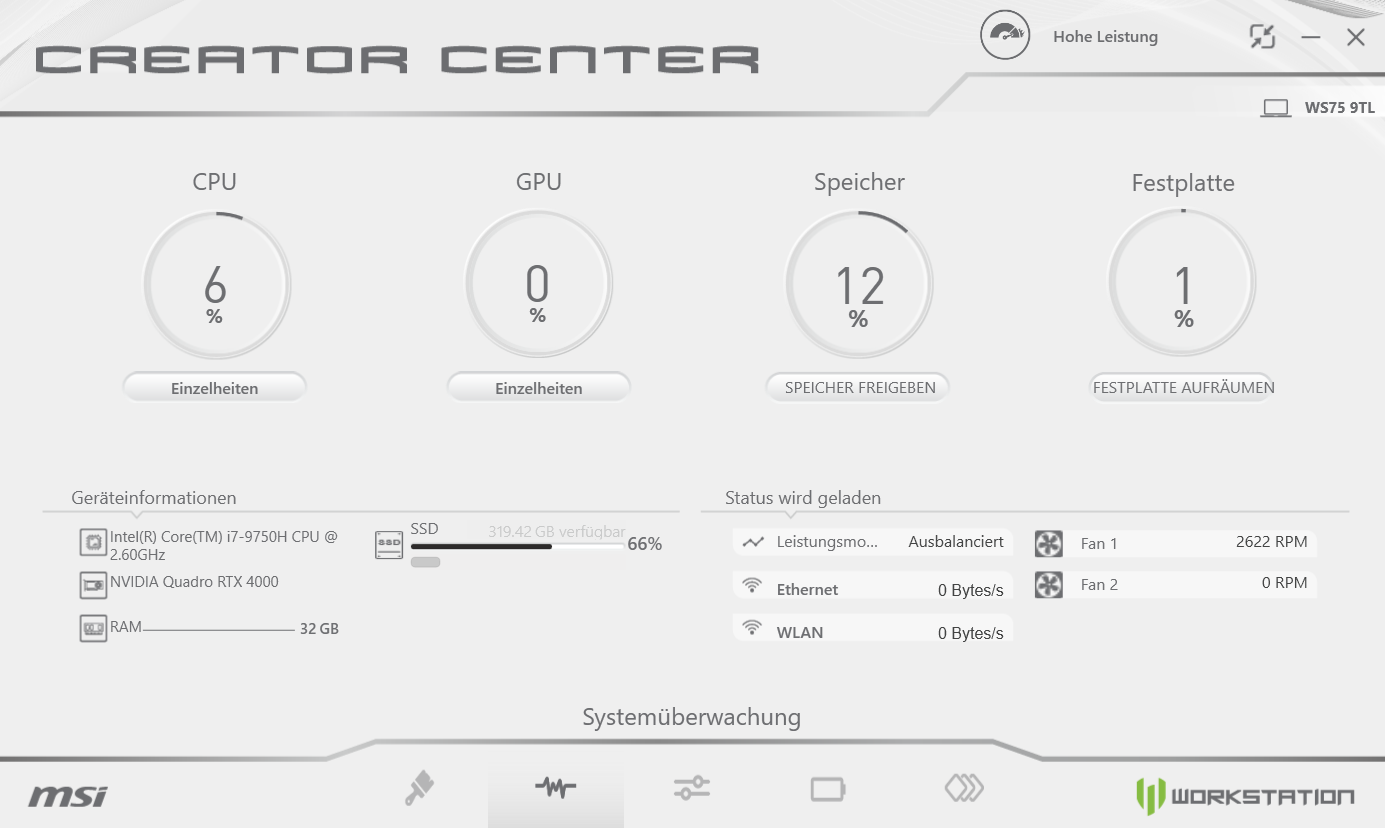
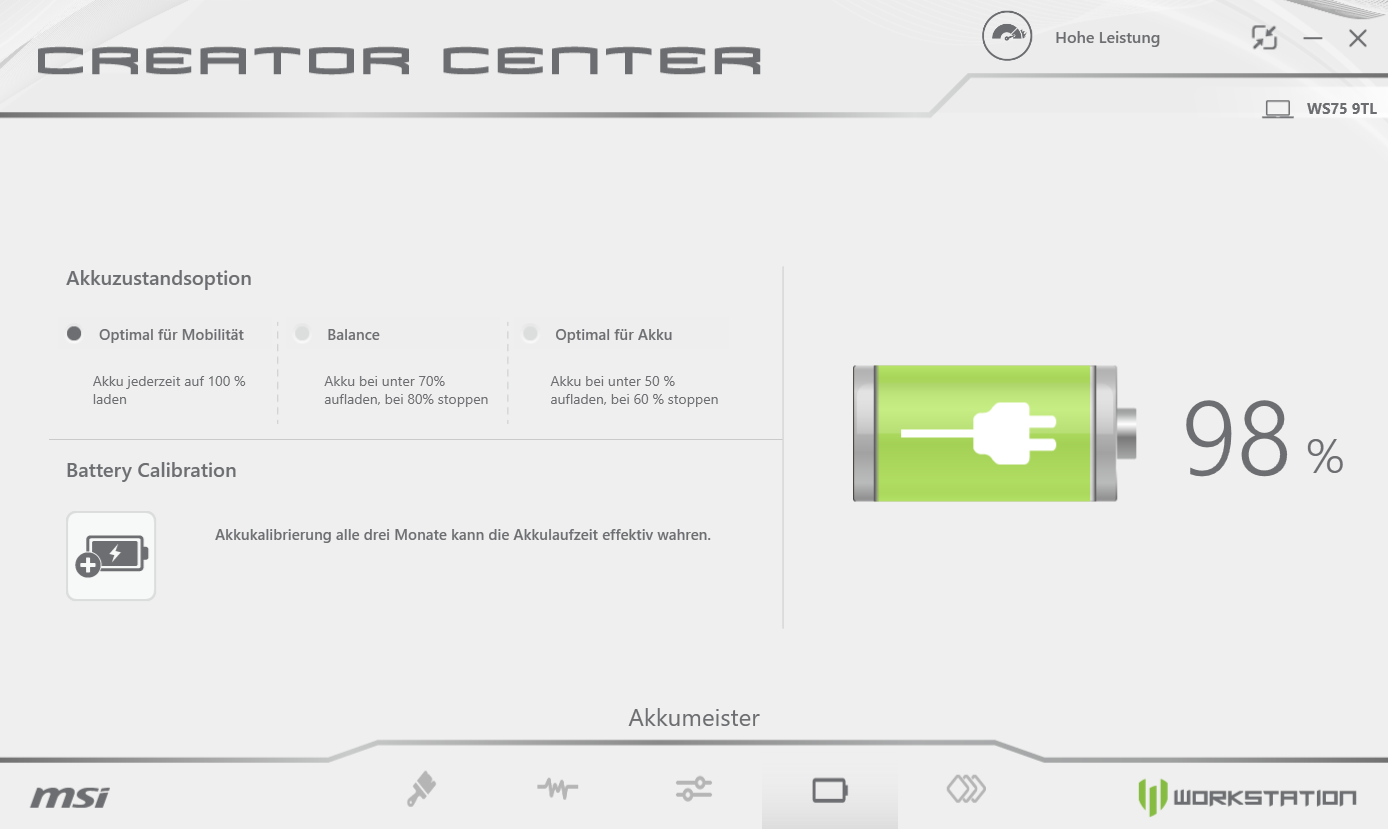
MSI ships its gaming laptops with its Dragon Center software, and the mobile workstations also come with a comprehensive software suite called Creator Center. An interesting feature of this software is "Creator Mode", which aims to optimise the system according to installed applications. Applications recognised by the software include, for example, products from Adobe.
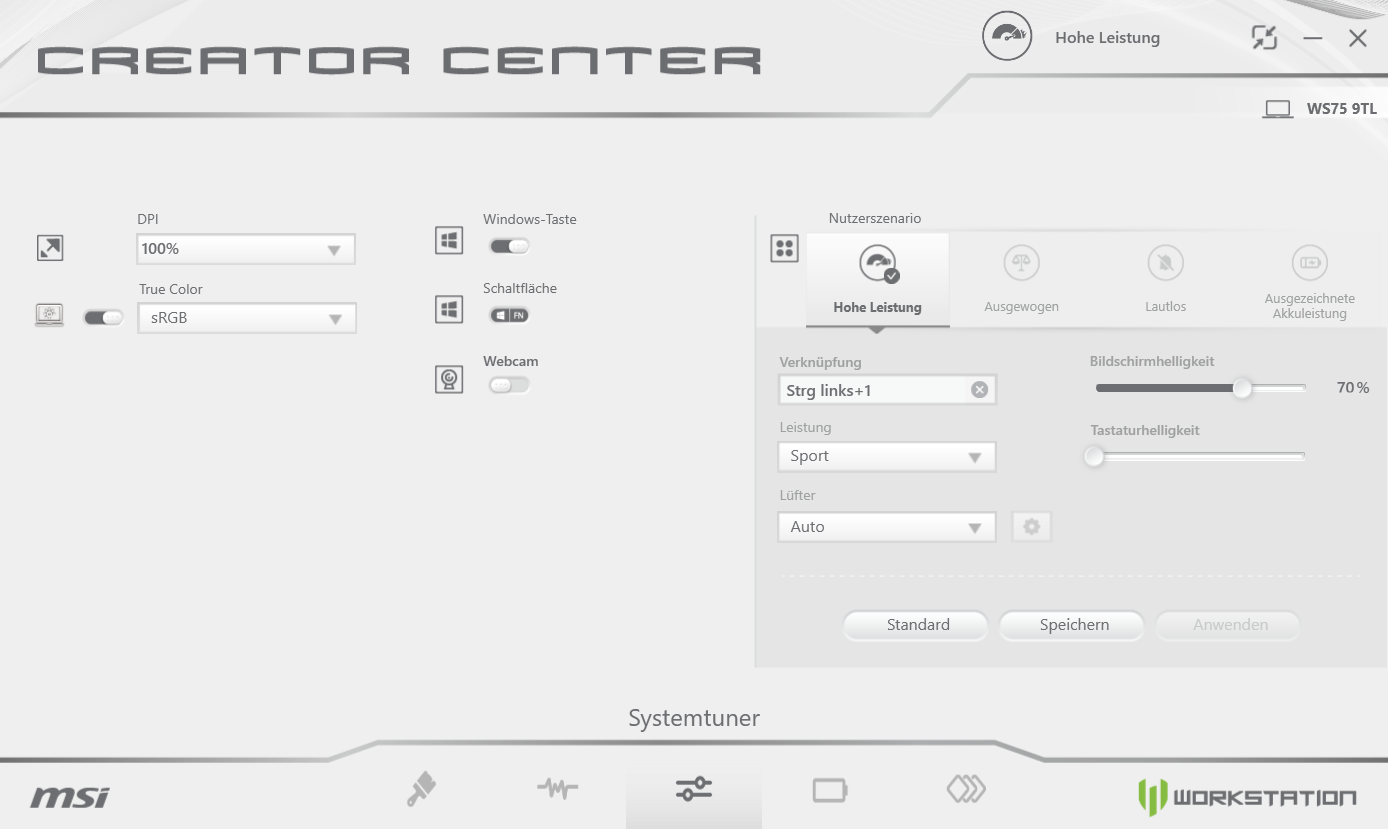
Alongside system monitoring, the Creator Center also features various power profiles, which don't work perfectly together with Windows' own power profiles. There are various performance levels that can be set (Sport, Comfort, Eco), although we weren't able to measure any difference between Sport and Comfort. Only when Eco is selected do we see performance (as well as the fan noise) reduce significantly, as can be seen in the following table. Interestingly, only the CPU is affected - the GPU performance is not changed.
| Benchmark | Performance Comfort | Performance Eco | Difference |
|---|---|---|---|
| CB R15 Single | 190 | 67 | -65% |
| CB R15 Multi | 1194 | 384 | -68% |
| Geekbench 4 CPU Single | 5377 | 1879 | -65% |
| Geekbench 4 CPU Multi | 24370 | 8563 | -65% |
| 3DMark Time Spy Graphics | 6851 | 6866 | ±0% |
For the fan there are also various profiles (Auto, Basic, CoolerBoost), which we will look into in more detail in the noise emissions section.
For our performance and emissions testing, the Balanced profile was selected (Performance: Comfort; Fan: Auto). Changing the performance slider in Windows' power settings had no effect on the results or emissions.
Processor
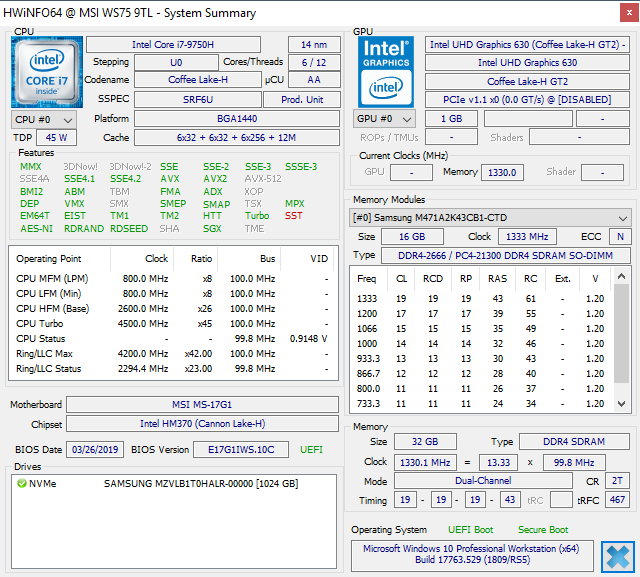
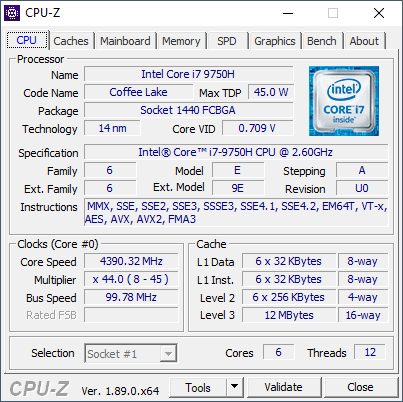
Our MSI WS75 is equipped with a standard processor, a Core i7-9750H. This is a current 6-core processor, which operates with a base frequency of 2.6 GHz and which can turbo boost up to 4.5 GHz (all six cores max. 4 GHz). MSI has been generous in terms of TDP limits: For short periods the CPU can theoretically consume up to 107 watts, which means that the CPU is able to sustain short periods of load and realise its full potential. Sustained load is also possible at a comparatively high 65 watts.
Our benchmarks show that this thin device is not able to sustain such high speeds for long. We see a maximum of 70 watts, sufficient for six cores at 3.8 GHz whereas 64 watts only allows for six cores at 3.6 - 3.7 GHz. In the Cinebench tests, the WS75 was able to compete well with its thicker competition. Running on battery sees the laptop limited to 45 watts (6 x 3.2 GHz), which was enough to achieve a score of 1,042 points.
| Cinebench R15 | |
| CPU Single 64Bit | |
| Average of class Workstation (191.4 - 328, n=24, last 2 years) | |
| MSI WS75 9TL-636 | |
| Lenovo ThinkPad P1-20MD002LUS | |
| Lenovo ThinkPad P72-20MB000EGE | |
| Average Intel Core i7-9750H (170 - 194, n=82) | |
| Dell Precision 7730 | |
| HP ZBook 17 G5-2ZC48EA | |
| HP ZBook Studio G5-4QH10EA | |
| Fujitsu Celsius H980 | |
| CPU Multi 64Bit | |
| Average of class Workstation (2489 - 5810, n=24, last 2 years) | |
| Dell Precision 7730 | |
| Lenovo ThinkPad P72-20MB000EGE (Undervolting) | |
| Lenovo ThinkPad P72-20MB000EGE (Default) | |
| HP ZBook 17 G5-2ZC48EA | |
| MSI WS75 9TL-636 | |
| Average Intel Core i7-9750H (952 - 1306, n=85) | |
| HP ZBook Studio G5-4QH10EA | |
| Lenovo ThinkPad P1-20MD002LUS | |
| Fujitsu Celsius H980 | |

It's always interesting with thin devices to see how long they are able to maintain performance levels under longer periods of load. In this area, the WS75 surprised us, as only the P72 from Lenovo and the Precision 7730 from Dell were quicker in our Cinebench benchmark runs. The results of the WS75 fluctuated a little, but the average score came in at 1,147 points - a very good result. Analysing the output showed an average power consumption level of 50 watts at a clock rate of 3.5 GHz, with a die temperature of 90 °C.
System Performance
In this section we can sum things up quickly: Thanks to current, high-end components the benchmark results, as well as subjective impressions are very good. Sluggishness or stuttering performance is not an issue here.
| PCMark 8 | |
| Home Score Accelerated v2 | |
| MSI WS75 9TL-636 | |
| Average Intel Core i7-9750H, NVIDIA Quadro RTX 4000 (Laptop) (n=1) | |
| Dell Precision 7730 | |
| Lenovo ThinkPad P72-20MB000EGE | |
| Fujitsu Celsius H980 | |
| HP ZBook 17 G5-2ZC48EA | |
| Lenovo ThinkPad P1-20MD002LUS | |
| HP ZBook Studio G5-4QH10EA | |
| Work Score Accelerated v2 | |
| Lenovo ThinkPad P72-20MB000EGE | |
| Dell Precision 7730 | |
| MSI WS75 9TL-636 | |
| Average Intel Core i7-9750H, NVIDIA Quadro RTX 4000 (Laptop) (n=1) | |
| HP ZBook 17 G5-2ZC48EA | |
| Fujitsu Celsius H980 | |
| HP ZBook Studio G5-4QH10EA | |
| Lenovo ThinkPad P1-20MD002LUS | |
| Creative Score Accelerated v2 | |
| MSI WS75 9TL-636 | |
| Average Intel Core i7-9750H, NVIDIA Quadro RTX 4000 (Laptop) (n=1) | |
| HP ZBook 17 G5-2ZC48EA | |
| Lenovo ThinkPad P72-20MB000EGE | |
| Lenovo ThinkPad P1-20MD002LUS | |
| PCMark 8 Home Score Accelerated v2 | 4732 points | |
| PCMark 8 Creative Score Accelerated v2 | 7933 points | |
| PCMark 8 Work Score Accelerated v2 | 5323 points | |
| PCMark 10 Score | 5875 points | |
Help | ||
Storage Solution
A fast PCIe NVMe SSD from Samsung can be found within our MSI WS75. The PM982 SSD is one of the fastest drives currently available, as is confirmed in the benchmarks. Not only sequential but also random 4K transfer rates are very good, and thanks to its capacity of 1 TB there's plenty of storage on hand. Should this not be sufficient, it is possible to install a second M.2 SSD, and the second slot also supports faster PCIe x4 NVMe drives. Further benchmarks and comparisons are available in our tech section.
| MSI WS75 9TL-636 Samsung SSD PM981 MZVLB1T0HALR | Lenovo ThinkPad P72-20MB000EGE Lenovo LENSE20256GMSP34MEAT2TA | Dell Precision 7730 Samsung SSD PM981 MZVLB512HAJQ | Lenovo ThinkPad P1-20MD002LUS Samsung SSD PM981 MZVLB2T0HMLB | HP ZBook Studio G5-4QH10EA Samsung SSD PM981 MZVLB512HAJQ | Fujitsu Celsius H980 Samsung SSD PM981 MZVLB512HAJQ | Average Samsung SSD PM981 MZVLB1T0HALR | |
|---|---|---|---|---|---|---|---|
| CrystalDiskMark 5.2 / 6 | -7% | -2% | -9% | -15% | -14% | 11% | |
| Write 4K (MB/s) | 103.5 | 101 -2% | 103.2 0% | 108 4% | 102.7 -1% | 111.8 8% | 165.7 ? 60% |
| Read 4K (MB/s) | 41.88 | 45.37 8% | 41.39 -1% | 37.24 -11% | 38.32 -9% | 32.02 -24% | 44.6 ? 6% |
| Write Seq (MB/s) | 1931 | 1409 -27% | 1880 -3% | 1476 -24% | 1417 -27% | 1539 -20% | 1982 ? 3% |
| Read Seq (MB/s) | 1286 | 2129 66% | 2350 83% | 1367 6% | 1289 0% | 1252 -3% | 1764 ? 37% |
| Write 4K Q32T1 (MB/s) | 414.3 | 320.3 -23% | 282.3 -32% | 302.4 -27% | 278.9 -33% | 355.4 -14% | 395 ? -5% |
| Read 4K Q32T1 (MB/s) | 470.2 | 348.3 -26% | 314.3 -33% | 375 -20% | 348.8 -26% | 408.7 -13% | 434 ? -8% |
| Write Seq Q32T1 (MB/s) | 2393 | 1529 -36% | 1881 -21% | 2433 2% | 1895 -21% | 1913 -20% | 2351 ? -2% |
| Read Seq Q32T1 (MB/s) | 3425 | 2957 -14% | 3216 -6% | 3493 2% | 3352 -2% | 2530 -26% | 3234 ? -6% |
| Write 4K Q8T8 (MB/s) | 1484 | 1575 | 1772 | 1408 ? | |||
| Read 4K Q8T8 (MB/s) | 1536 | 1607 | 1022 | 1449 ? |

GPU - New Nvidia Quadro RTX GPUs
The MSI WS75 is currently available with three different mobile Quadro GPUs from Nvidia. Those who don't need so much graphical power, and can do without ray-tracing, will be well-served by the Quadro T2000. Sitting above this are the new Quadro RTX 3000 and RTX 4000 options, as featured in our review sample. With 2560 shaders, the Quadro RTX is placed between the two consumer GPUs, the RTX 2070 and RTX 2080, although the clock rates with 780 MHz base and 1,300 MHz boost should prove to be a bit slower. In practice, we often saw a solid clock rate of 1,560 MHz. The GPU is equipped with 8 GB GDDR5 VRAM.
As we previously touched on briefly, the GPU performance is not influenced by the selected performance profile in MSI's software. Only in battery operation is the performance significantly reduced. For example, running on battery, the Time Spy benchmark score fell from 6,851 to 1,044 points (-85%).
| LuxMark v2.0 64Bit | |
| Room GPUs-only | |
| MSI WS75 9TL-636 | |
| Dell Precision 7720 | |
| MSI WS63VR 7RL-023US | |
| HP ZBook 17 G4-Y3J82AV | |
| Dell Precision 7730 | |
| Fujitsu Celsius H980 | |
| Lenovo ThinkPad P72-20MB000EGE | |
| HP ZBook 17 G5-2ZC48EA | |
| Lenovo ThinkPad P1-20MD002LUS | |
| HP ZBook Studio G5-4QH10EA | |
| Sala GPUs-only | |
| MSI WS75 9TL-636 | |
| Fujitsu Celsius H980 | |
| MSI WS63VR 7RL-023US | |
| Dell Precision 7730 | |
| Dell Precision 7720 | |
| HP ZBook 17 G4-Y3J82AV | |
| Lenovo ThinkPad P72-20MB000EGE | |
| HP ZBook 17 G5-2ZC48EA | |
| Lenovo ThinkPad P1-20MD002LUS | |
| HP ZBook Studio G5-4QH10EA | |
| SiSoft Sandra 2016 | |
| Image Processing | |
| MSI WS75 9TL-636 | |
| Dell Precision 7730 | |
| Fujitsu Celsius H980 | |
| Lenovo ThinkPad P72-20MB000EGE | |
| Dell Precision 7720 | |
| HP ZBook 17 G4-Y3J82AV | |
| HP ZBook 17 G5-2ZC48EA | |
| HP ZBook Studio G5-4QH10EA | |
| GP Cryptography (Higher Security AES256+SHA2-512) | |
| MSI WS75 9TL-636 | |
| HP ZBook 17 G4-Y3J82AV | |
| Dell Precision 7720 | |
| Lenovo ThinkPad P72-20MB000EGE | |
| Fujitsu Celsius H980 | |
| Dell Precision 7730 | |
| HP ZBook 17 G5-2ZC48EA | |
| HP ZBook Studio G5-4QH10EA | |
| GP Financial Analysis (FP High/Double Precision) | |
| MSI WS75 9TL-636 | |
| Dell Precision 7720 | |
| HP ZBook 17 G4-Y3J82AV | |
| Dell Precision 7730 | |
| Fujitsu Celsius H980 | |
| Lenovo ThinkPad P72-20MB000EGE | |
| HP ZBook 17 G5-2ZC48EA | |
| HP ZBook Studio G5-4QH10EA | |
In professional benchmarks, which we use to measure OpenGL and OpenCL performance, the Quadro RTX 4000 performs very well. Especially in the OpenCL area the new RTX is able to position itself clear at the top of the table, ahead of the old Quadro P5000. In both versions of SPECviewperf (including multiple simulations of application types such as CAD, CAM, geology and medical MRT) this trend continues, although depending on the scenario there can be occasional exceptions. In general, the OpenGL application performance is at the level of the old P5000.
With DirectX (3DMark) we also encountered no problems. Performance-wise the MSI WS75 kept pace with the larger and heavier workstations and performance was stable for longer periods. The Time Spy stress test was passed without issue, scoring 98.8%.
| Unigine Heaven 4.0 | |
| Extreme Preset OpenGL | |
| Average of class Workstation (72.4 - 185.3, n=4, last 2 years) | |
| MSI WS75 9TL-636 | |
| Average NVIDIA Quadro RTX 4000 (Laptop) (n=1) | |
| Dell Precision 7720 | |
| HP ZBook 17 G4-Y3J82AV | |
| Fujitsu Celsius H980 | |
| Lenovo ThinkPad P72-20MB000EGE | |
| HP ZBook 17 G5-2ZC48EA | |
| HP ZBook Studio G5-4QH10EA | |
| Extreme Preset DX11 | |
| Average of class Workstation (77.7 - 222, n=4, last 2 years) | |
| MSI WS75 9TL-636 | |
| Average NVIDIA Quadro RTX 4000 (Laptop) (n=1) | |
| Dell Precision 7720 | |
| HP ZBook 17 G4-Y3J82AV | |
| Fujitsu Celsius H980 | |
| HP ZBook 17 G5-2ZC48EA | |
| Lenovo ThinkPad P72-20MB000EGE | |
| Lenovo ThinkPad P1-20MD002LUS | |
| HP ZBook Studio G5-4QH10EA | |
| Unigine Valley 1.0 | |
| 1920x1080 Extreme HD DirectX AA:x8 | |
| MSI WS75 9TL-636 | |
| Average NVIDIA Quadro RTX 4000 (Laptop) (n=1) | |
| HP ZBook 17 G4-Y3J82AV | |
| Dell Precision 7720 | |
| Lenovo ThinkPad P72-20MB000EGE | |
| Fujitsu Celsius H980 | |
| Average of class Workstation (n=1last 2 years) | |
| HP ZBook 17 G5-2ZC48EA | |
| HP ZBook Studio G5-4QH10EA | |
| 1920x1080 Extreme HD Preset OpenGL AA:x8 | |
| MSI WS75 9TL-636 | |
| Average NVIDIA Quadro RTX 4000 (Laptop) (n=1) | |
| HP ZBook 17 G4-Y3J82AV | |
| Dell Precision 7720 | |
| Fujitsu Celsius H980 | |
| Average of class Workstation (n=1last 2 years) | |
| HP ZBook 17 G5-2ZC48EA | |
| Lenovo ThinkPad P72-20MB000EGE | |
| HP ZBook Studio G5-4QH10EA | |
| 3DMark Vantage P Result | 56250 points | |
| 3DMark 11 Performance | 19880 points | |
| 3DMark Cloud Gate Standard Score | 38830 points | |
| 3DMark Fire Strike Score | 15912 points | |
| 3DMark Time Spy Score | 6823 points | |
Help | ||
Gaming Performance
Thanks to its sleek chassis, the WS75 is definitely of interest for those who are looking for a single device to use for both work and at home. Therefore, we of course tested the gaming performance of the Quadro RTX 4000. We didn't have any issues with drivers and were able to play every title without problems. In general the performance of the laptop is sufficient to run current games fine with our QWHD preset - it's only with 4K resolution that the GPU begins to hit its limit.
This also means that a comparison with the consumer-grade RTX GPUs is relevant, and so we've provided comparison results in the table below. This shows that the Quadro RTX 4000 positions itself slightly ahead of the RTX 2070, but as expected cannot come close to the RTX 2080.
| The Witcher 3 | |
| 1920x1080 High Graphics & Postprocessing (Nvidia HairWorks Off) | |
| MSI GT76 Titan DT 9SG | |
| Average NVIDIA Quadro RTX 4000 (Laptop) (132 - 153, n=2) | |
| MSI WS75 9TL-636 | |
| Asus Zephyrus S GX502GW | |
| Average of class Workstation (91 - 156.4, n=2, last 2 years) | |
| Gigabyte Aero 15 Classic-XA | |
| Medion Erazer X15805 | |
| Dell G5 15 5590 | |
| 1920x1080 Ultra Graphics & Postprocessing (HBAO+) | |
| MSI GT76 Titan DT 9SG | |
| Average NVIDIA Quadro RTX 4000 (Laptop) (70 - 79, n=2) | |
| Average of class Workstation (51 - 91.7, n=2, last 2 years) | |
| Asus Zephyrus S GX502GW | |
| MSI WS75 9TL-636 | |
| Gigabyte Aero 15 Classic-XA | |
| Medion Erazer X15805 | |
| Dell G5 15 5590 | |
| Anno 1800 | |
| 1920x1080 Ultra Graphics Quality (DX11) | |
| MSI GT76 Titan DT 9SG | |
| MSI WS75 9TL-636 | |
| Average NVIDIA Quadro RTX 4000 (Laptop) (n=1) | |
| Asus Zephyrus S GX502GW | |
| Medion Erazer X15805 | |
| Dell G5 15 5590 | |
| Gigabyte Aero 15 Classic-XA | |
| 1920x1080 High Graphics Quality (DX11) | |
| MSI GT76 Titan DT 9SG | |
| MSI WS75 9TL-636 | |
| Average NVIDIA Quadro RTX 4000 (Laptop) (n=1) | |
| Asus Zephyrus S GX502GW | |
| Medion Erazer X15805 | |
| Gigabyte Aero 15 Classic-XA | |
| Dell G5 15 5590 | |
| low | med. | high | ultra | QHD | 4K | |
|---|---|---|---|---|---|---|
| The Witcher 3 (2015) | 303 | 215 | 132 | 70 | 46 | |
| Dota 2 Reborn (2015) | 152 | 140 | 133 | 129 | 100 | |
| Rise of the Tomb Raider (2016) | 199.6 | 127.8 | 104.9 | 45.1 | ||
| For Honor (2017) | 289 | 148 | 141 | 109 | 45.7 | |
| Ghost Recon Wildlands (2017) | 139.9 | 98 | 90.8 | 52.9 | 35 | |
| X-Plane 11.11 (2018) | 119 | 107 | 88 | |||
| Far Cry 5 (2018) | 129 | 106 | 100 | 96 | 69 | 36 |
| F1 2018 (2018) | 241 | 180 | 142 | 95 | 76 | 48 |
| Shadow of the Tomb Raider (2018) | 138.6 | 105.2 | 81.6 | 85 | 57.1 | 29.7 |
| Assassin´s Creed Odyssey (2018) | 99 | 87 | 75 | 54 | 41 | 28 |
| Hitman 2 (2018) | 95.4 | 93.6 | 85.8 | 81.1 | 72.9 | 39.4 |
| Battlefield V (2018) | 116.7 | 100.6 | 86.6 | 81 | 65.5 | 41.8 |
| Darksiders III (2018) | 143.8 | 119.2 | 105.2 | 69.1 | 34.2 | |
| Just Cause 4 (2018) | 150 | 125 | 93 | 86 | 60 | 33 |
| Far Cry New Dawn (2019) | 124 | 102 | 99 | 88 | 72 | 39 |
| Dirt Rally 2.0 (2019) | 267 | 180.7 | 151 | 85.6 | 63.3 | |
| The Division 2 (2019) | 180 | 122 | 96 | 70 | 47 | 25 |
| Anno 1800 (2019) | 98 | 77.5 | 42.6 | 37.7 | 22.4 |
Emissions
Noise Emissions
The MSI WS75 features three fans in total - one for the CPU, and two for the GPU. As long as the dedicated GPU is not being utilised, the two GPU fans remain inactive. The CPU fan on the right-hand side runs generally at 2,600 RPM, which results in a light background hum at 30.1 dB(A). This only changes when the Eco profile in the Creator Center software is selected, which results in a significant drop in performance (see Performance section above). This means you have a handy option to have a silent-running device when not so much performance is required. We have also asked MSI why the CPU fan spins constantly - this is done so that when sudden load is encountered, the fan is able to spin up quickly to counter it.
As soon as load is applied to the GPU, the two fans on the left side make their presence known. With a noise level of around 40 dB(A) there is a somewhat high-pitch noise which is slightly irritating. When playing games noise levels of 38.7 and 41.9 dB(A) should be expected. In our stress test this was measured at 42.7 dB(A) (CPU fan 4,500 RPM, GPU fan 4,210 RPM). Taking into account the performance slim form factor, these are good results.
In the Creator Center software there are three different options for the fan: Auto, Basic, and CoolerBooster. Auto is the standard setting and modifies fan speed according to load on the GPU. With Basic you can change the fan speed via a slider. CoolerBooster runs the fan constantly at maximum (CPU fan 5,850 RPM, GPU fan 6,000 RPM), which is very noisy, at 51.2 dB(A). We didn't reach these levels in our normal testing however.
With our review sample we didn't experience any annoying electronic noise, and spinning up and down of the fan at idle, which we did notice with the GS75, was also not encountered.
Noise level
| Idle |
| 29.4 / 30.1 / 30.9 dB(A) |
| Load |
| 40.7 / 42.7 dB(A) |
 | ||
30 dB silent 40 dB(A) audible 50 dB(A) loud |
||
min: | ||
| MSI WS75 9TL-636 Quadro RTX 4000 (Laptop), i7-9750H, Samsung SSD PM981 MZVLB1T0HALR | Lenovo ThinkPad P72-20MB000EGE Quadro P3200, i7-8850H, Lenovo LENSE20256GMSP34MEAT2TA | HP ZBook 17 G5-2ZC48EA Quadro P3200, i7-8850H, Toshiba XG5 KXG50ZNV256G | Dell Precision 7730 Quadro P3200, i7-8850H, Samsung SSD PM981 MZVLB512HAJQ | Lenovo ThinkPad P1-20MD002LUS Quadro P2000 Max-Q, E-2176M, Samsung SSD PM981 MZVLB2T0HMLB | HP ZBook Studio G5-4QH10EA Quadro P1000, i7-8750H, Samsung SSD PM981 MZVLB512HAJQ | Fujitsu Celsius H980 Quadro P3200, i7-8750H, Samsung SSD PM981 MZVLB512HAJQ | |
|---|---|---|---|---|---|---|---|
| Noise | 10% | 3% | 5% | 4% | 5% | -3% | |
| off / environment * (dB) | 29.4 | 28.6 3% | 28.7 2% | 29.7 -1% | 28.3 4% | 28.6 3% | 29.6 -1% |
| Idle Minimum * (dB) | 29.4 | 28.6 3% | 28.7 2% | 29.7 -1% | 28.4 3% | 28.6 3% | 29.6 -1% |
| Idle Average * (dB) | 30.1 | 28.6 5% | 28.7 5% | 29.7 1% | 28.4 6% | 28.6 5% | 32.5 -8% |
| Idle Maximum * (dB) | 30.9 | 28.6 7% | 30.9 -0% | 29.7 4% | 29.2 6% | 30 3% | 32.5 -5% |
| Load Average * (dB) | 40.7 | 31.9 22% | 37.3 8% | 31.4 23% | 41.8 -3% | 38.1 6% | 34.9 14% |
| Witcher 3 ultra * (dB) | 41.9 | 35.7 15% | 41.1 2% | 37.9 10% | 39.1 7% | 35 16% | |
| Load Maximum * (dB) | 42.7 | 37.7 12% | 41.4 3% | 44.2 -4% | 41.8 2% | 42.5 -0% | 49.1 -15% |
* ... smaller is better
Temperatures
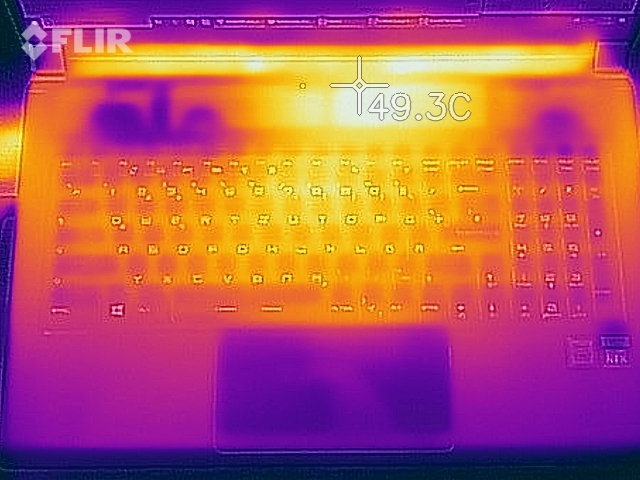
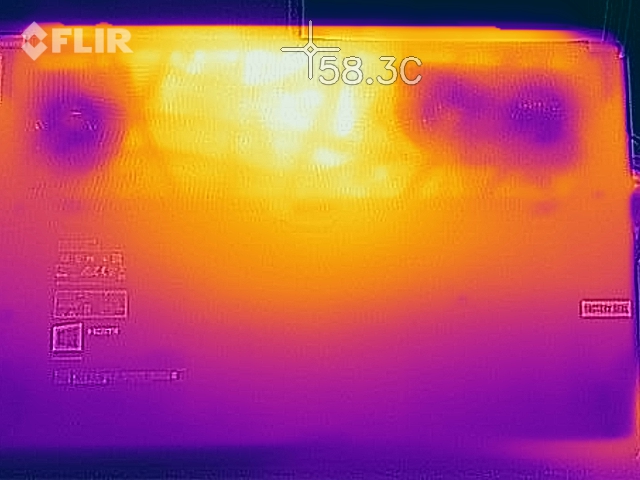
At idle and under light load the metal casing of the laptop barely heats up, and the surfaces feel comfortably cool to the touch. Once you begin to put the components under more load, it naturally starts to get a bit warmer. We measured a maximum of 55 °C on the bottom of the device and 47 °C on the upper side. The keyboard area was also noticeably warmer, but not disturbingly so. In any case, we wouldn't recommend using this laptop on your knees.
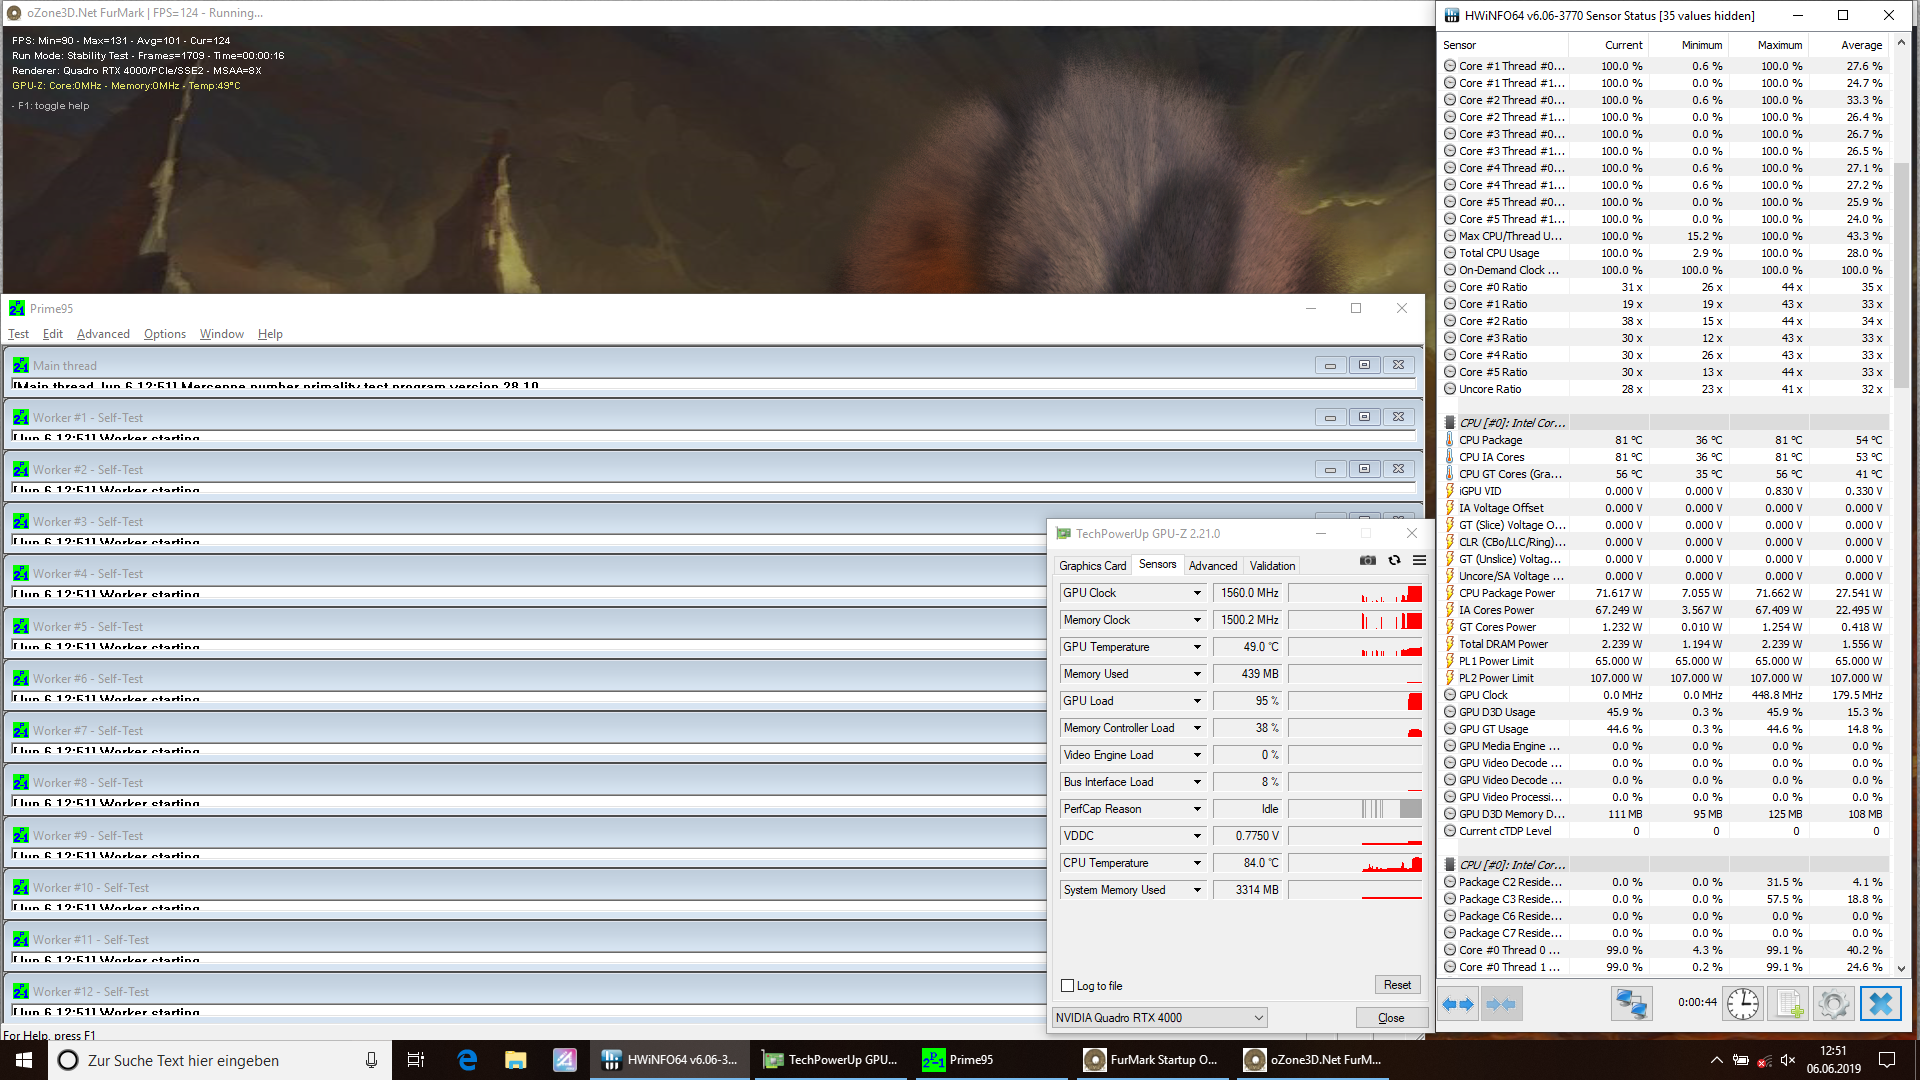
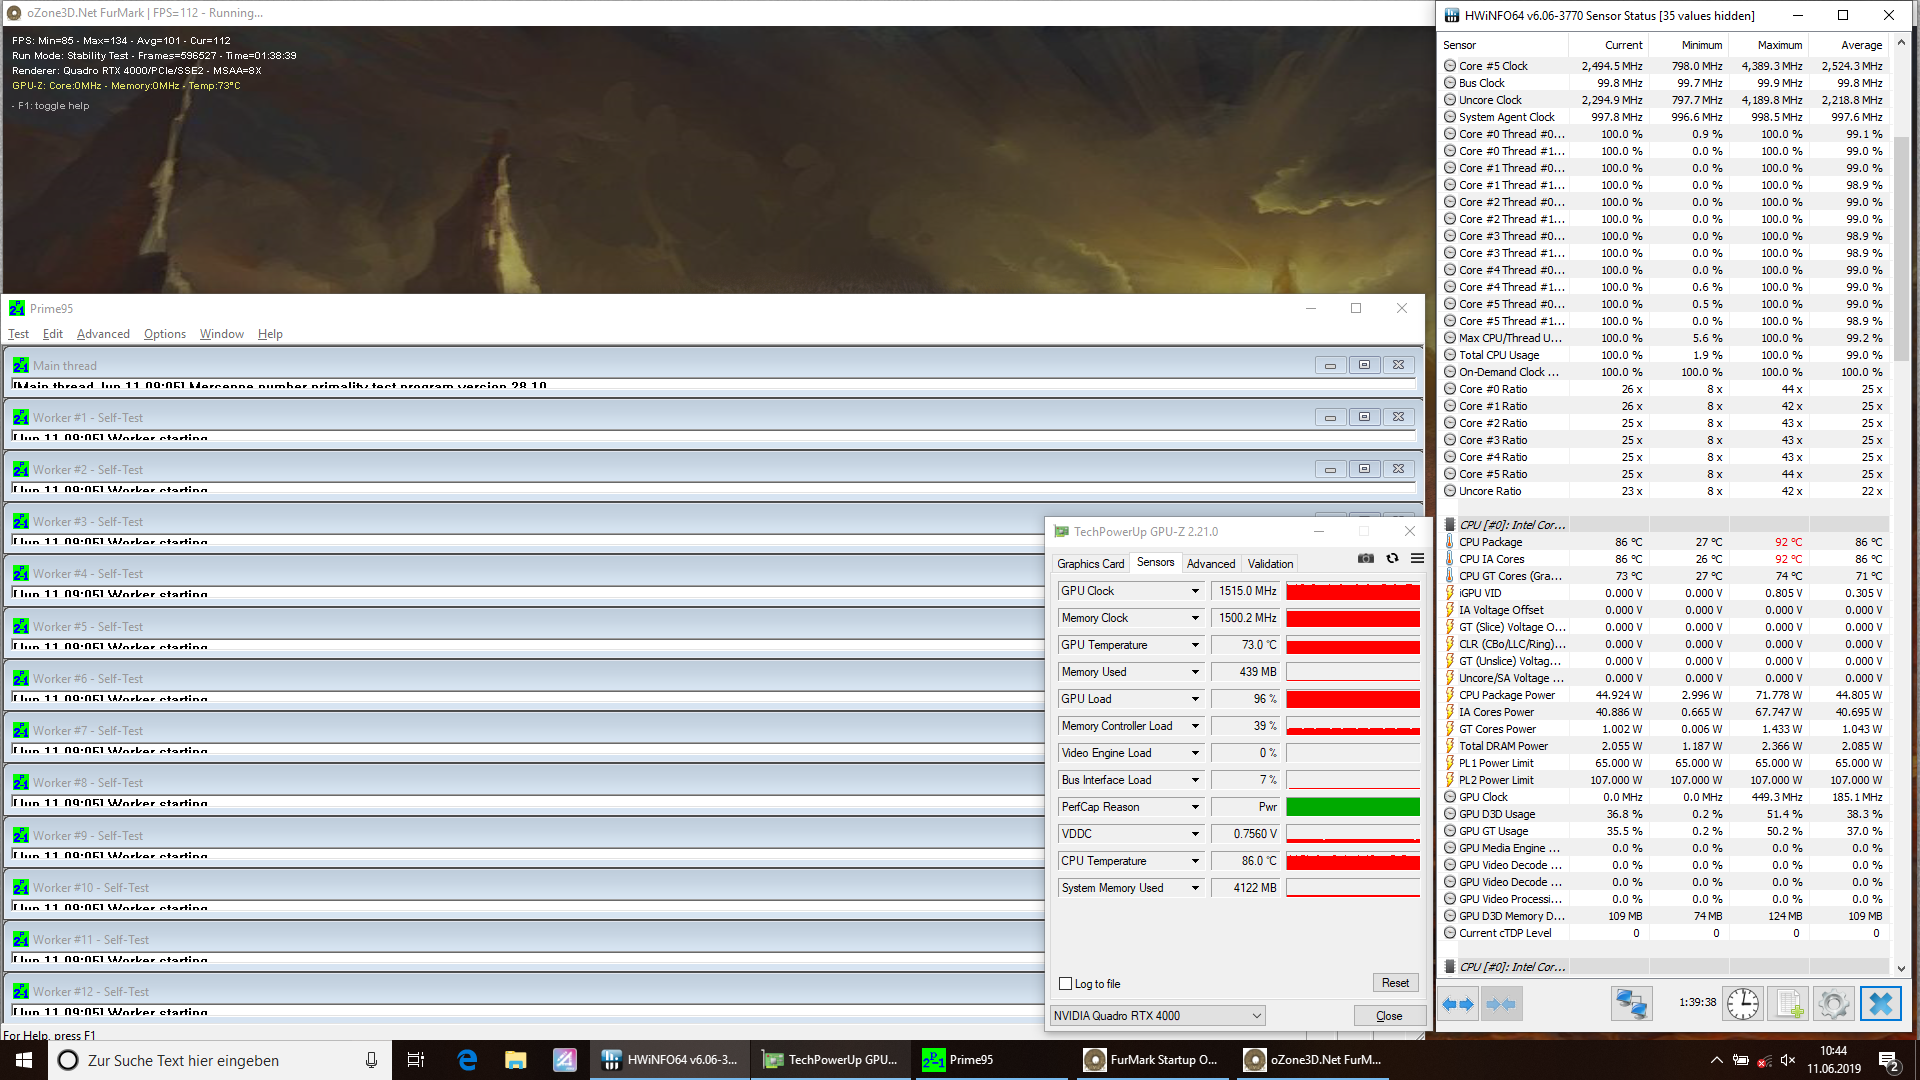
During stress testing with the two synthetic benchmarks Prime95 and FurMark, the WS75 was able to impress. The CPU set itself to 45 watts, which in Prime95 was sufficient for 6 x 2.5-2.6 GHz. We were especially surprised by the very stable GPU performance, as even after an hour of load the Quadro RTX 4000 was still able to maintain a clock rate of 1,470 - 1,540 MHz - essentially max clock rate.
As the fans are all connected to each other via heat-pipes, it's very possible that a WS75 configured with a slower GPU would have even more potential for CPU cooling. At the end of the testing, the CPU was at 86 °C and the GPU at 73 °C. With the CoolerBooster function you can drop the temperatures by a couple of degrees each, but then you have to live with the increased fan noise.
(-) The maximum temperature on the upper side is 47.4 °C / 117 F, compared to the average of 38.2 °C / 101 F, ranging from 22.2 to 69.8 °C for the class Workstation.
(-) The bottom heats up to a maximum of 55.6 °C / 132 F, compared to the average of 41.1 °C / 106 F
(+) In idle usage, the average temperature for the upper side is 22.6 °C / 73 F, compared to the device average of 32 °C / 90 F.
(±) Playing The Witcher 3, the average temperature for the upper side is 36.4 °C / 98 F, compared to the device average of 32 °C / 90 F.
(+) The palmrests and touchpad are cooler than skin temperature with a maximum of 31.9 °C / 89.4 F and are therefore cool to the touch.
(-) The average temperature of the palmrest area of similar devices was 27.8 °C / 82 F (-4.1 °C / -7.4 F).
Speakers
The two stereo speakers are definitely one of the weak points of the MSI WS75. They are located at the front and underneath and have a power output of 2 watts. The results are definitely not what one would expect from such a large and expensive laptop. In general, the sound profile is very thin and tinny, and at higher levels all detail is lost in playback. Bass is pretty much non-existent - a small subwoofer would have helped here. For a little web radio whilst working, or Skype chats, the speakers are definitely usable, but for games or films they would detract from the enjoyment.
The gaming roots of the machine are again visible in the twin 3.5 mm jacks - audio via these jacks was absolutely fine.
MSI WS75 9TL-636 audio analysis
(±) | speaker loudness is average but good (75.4 dB)
Bass 100 - 315 Hz
(-) | nearly no bass - on average 25.9% lower than median
(±) | linearity of bass is average (7.8% delta to prev. frequency)
Mids 400 - 2000 Hz
(±) | higher mids - on average 5.2% higher than median
(±) | linearity of mids is average (8.1% delta to prev. frequency)
Highs 2 - 16 kHz
(+) | balanced highs - only 3.3% away from median
(±) | linearity of highs is average (9.3% delta to prev. frequency)
Overall 100 - 16.000 Hz
(±) | linearity of overall sound is average (27.5% difference to median)
Compared to same class
» 94% of all tested devices in this class were better, 2% similar, 4% worse
» The best had a delta of 7%, average was 17%, worst was 35%
Compared to all devices tested
» 84% of all tested devices were better, 3% similar, 13% worse
» The best had a delta of 4%, average was 23%, worst was 134%
Lenovo ThinkPad P72-20MB000EGE audio analysis
(-) | not very loud speakers (69.6 dB)
Bass 100 - 315 Hz
(-) | nearly no bass - on average 17.4% lower than median
(±) | linearity of bass is average (13.5% delta to prev. frequency)
Mids 400 - 2000 Hz
(±) | higher mids - on average 7.2% higher than median
(±) | linearity of mids is average (8.7% delta to prev. frequency)
Highs 2 - 16 kHz
(+) | balanced highs - only 4.4% away from median
(±) | linearity of highs is average (12.7% delta to prev. frequency)
Overall 100 - 16.000 Hz
(-) | overall sound is not linear (30.7% difference to median)
Compared to same class
» 97% of all tested devices in this class were better, 1% similar, 1% worse
» The best had a delta of 7%, average was 17%, worst was 35%
Compared to all devices tested
» 89% of all tested devices were better, 3% similar, 8% worse
» The best had a delta of 4%, average was 23%, worst was 134%
HP ZBook 17 G5-2ZC48EA audio analysis
(±) | speaker loudness is average but good (75.8 dB)
Bass 100 - 315 Hz
(±) | reduced bass - on average 9.3% lower than median
(±) | linearity of bass is average (8.5% delta to prev. frequency)
Mids 400 - 2000 Hz
(+) | balanced mids - only 3.1% away from median
(+) | mids are linear (3.9% delta to prev. frequency)
Highs 2 - 16 kHz
(+) | balanced highs - only 2.6% away from median
(+) | highs are linear (3.4% delta to prev. frequency)
Overall 100 - 16.000 Hz
(+) | overall sound is linear (14.3% difference to median)
Compared to same class
» 30% of all tested devices in this class were better, 4% similar, 67% worse
» The best had a delta of 7%, average was 17%, worst was 35%
Compared to all devices tested
» 17% of all tested devices were better, 4% similar, 78% worse
» The best had a delta of 4%, average was 23%, worst was 134%
Dell Precision 7730 audio analysis
(±) | speaker loudness is average but good (81.1 dB)
Bass 100 - 315 Hz
(-) | nearly no bass - on average 16.7% lower than median
(±) | linearity of bass is average (11.6% delta to prev. frequency)
Mids 400 - 2000 Hz
(±) | reduced mids - on average 5.4% lower than median
(+) | mids are linear (5.4% delta to prev. frequency)
Highs 2 - 16 kHz
(+) | balanced highs - only 4% away from median
(+) | highs are linear (5.8% delta to prev. frequency)
Overall 100 - 16.000 Hz
(±) | linearity of overall sound is average (17% difference to median)
Compared to same class
» 49% of all tested devices in this class were better, 10% similar, 41% worse
» The best had a delta of 7%, average was 17%, worst was 35%
Compared to all devices tested
» 30% of all tested devices were better, 8% similar, 62% worse
» The best had a delta of 4%, average was 23%, worst was 134%
Power Management
Power Consumption
We were surprised by the high power consumption readings at idle. Despite its automatic GPU-switching tech the WS75 requires comparatively large amounts of power. The competitors in this review show how much better it can be. Even in standby, or when switched off, this workstation consumes a lot of power - clearly there is a need for optimisation here. The backlighting on the keyboard requires 0.5 watts at level 1, 1.2 watts at level 2, and 3 watts at level 3.
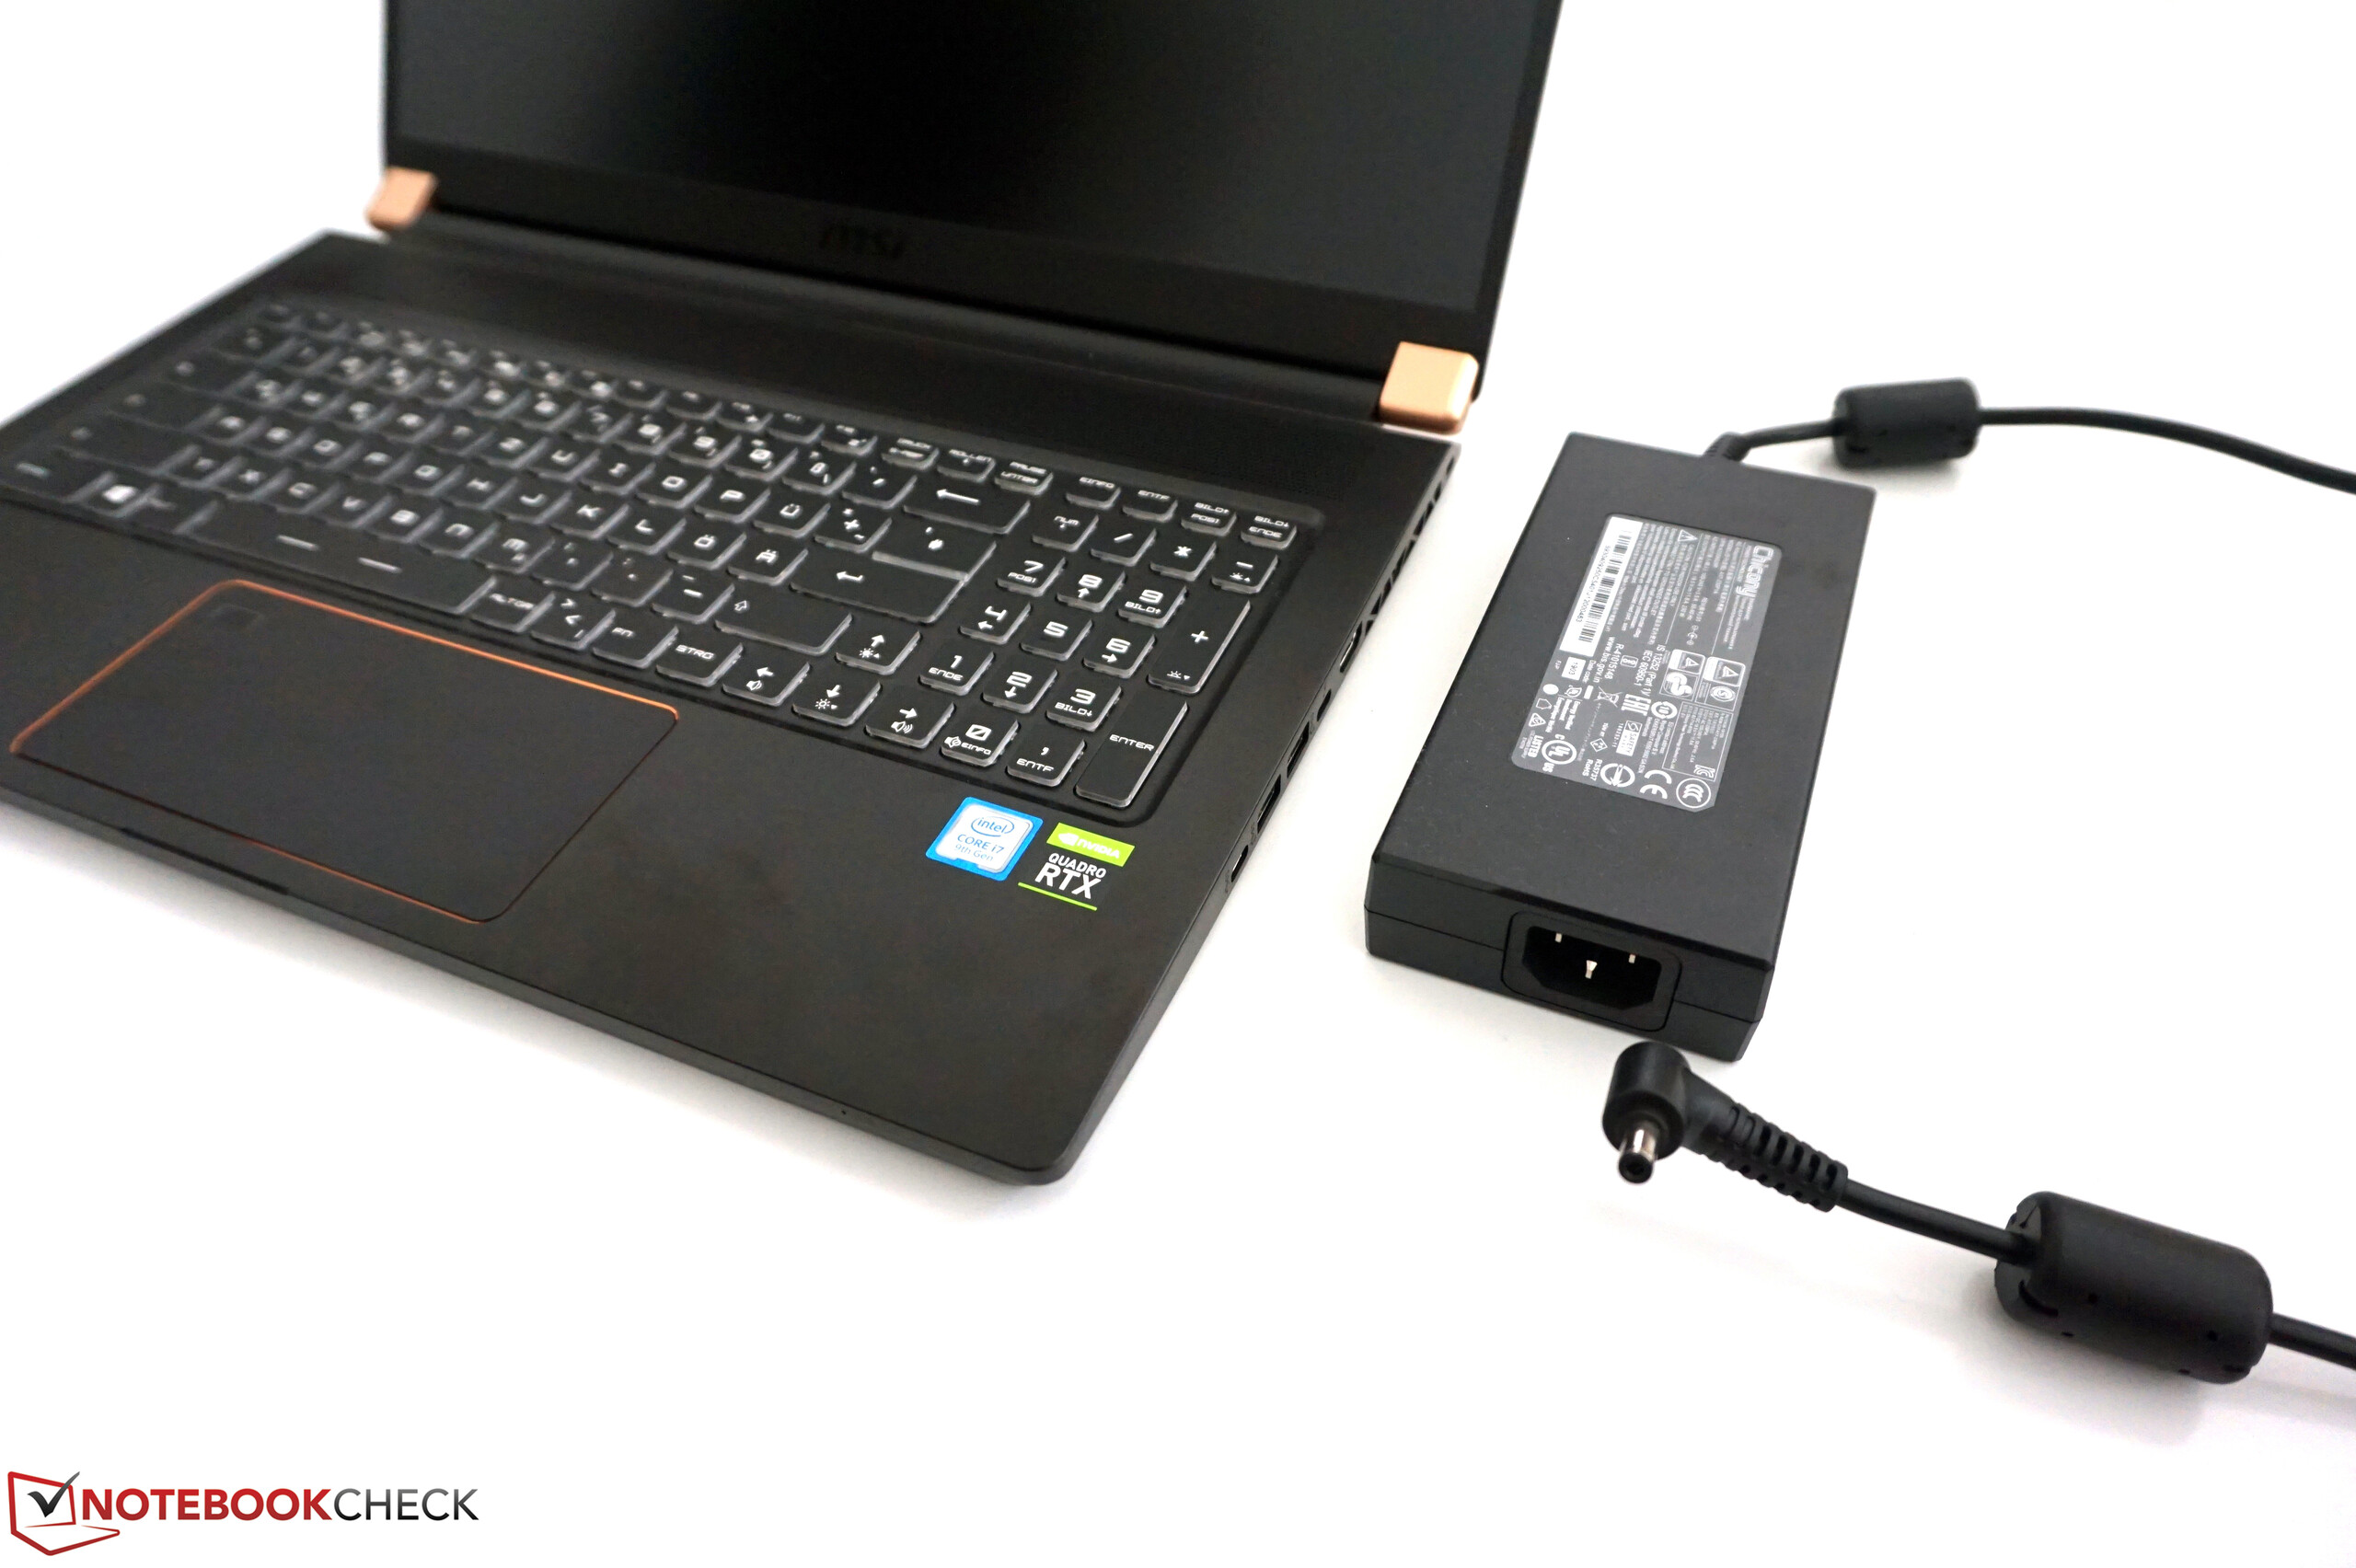
Under load however, the power consumption figures are about where they should be, which is no doubt due in part to the improved efficiency of the RTX GPU. During our stress test we measured maximum power consumption at 193 watts, which then settled to an average of 160 watts. The 230-watt power adaptor is therefore fully capable of powering the laptop and has a little elbowroom for future models with the Quadro RTX 5000.
The WS75 with the smaller Quadro T2000 is supplied with a weaker 180-watt power adapter.
| Off / Standby | |
| Idle | |
| Load |
|
Key:
min: | |
| MSI WS75 9TL-636 i7-9750H, Quadro RTX 4000 (Laptop), Samsung SSD PM981 MZVLB1T0HALR, IPS, 1920x1080, 17.3" | Lenovo ThinkPad P72-20MB000EGE i7-8850H, Quadro P3200, Lenovo LENSE20256GMSP34MEAT2TA, IPS, 1920x1080, 17.3" | HP ZBook 17 G5-2ZC48EA i7-8850H, Quadro P3200, Toshiba XG5 KXG50ZNV256G, , 1920x1080, 17.3" | Dell Precision 7730 i7-8850H, Quadro P3200, Samsung SSD PM981 MZVLB512HAJQ, IPS LED, 1920x1080, 17.3" | Lenovo ThinkPad P1-20MD002LUS E-2176M, Quadro P2000 Max-Q, Samsung SSD PM981 MZVLB2T0HMLB, IPS, 3840x2160, 15.6" | HP ZBook Studio G5-4QH10EA i7-8750H, Quadro P1000, Samsung SSD PM981 MZVLB512HAJQ, IPS LED, 3840x2160, 15.6" | Fujitsu Celsius H980 i7-8750H, Quadro P3200, Samsung SSD PM981 MZVLB512HAJQ, IPS, 1920x1080, 17.3" | Average NVIDIA Quadro RTX 4000 (Laptop) | Average of class Workstation | |
|---|---|---|---|---|---|---|---|---|---|
| Power Consumption | 34% | 20% | 11% | 36% | 41% | -0% | -16% | 21% | |
| Idle Minimum * (Watt) | 16.4 | 4.6 72% | 9.3 43% | 10.1 38% | 7.1 57% | 6.8 59% | 14.8 10% | 18.7 ? -14% | 9.04 ? 45% |
| Idle Average * (Watt) | 21.6 | 12.2 44% | 14.4 33% | 18 17% | 14.4 33% | 11.3 48% | 20.4 6% | 26 ? -20% | 13.8 ? 36% |
| Idle Maximum * (Watt) | 22.9 | 15.4 33% | 15.8 31% | 19.7 14% | 14.6 36% | 14.3 38% | 21.5 6% | 29.3 ? -28% | 17.7 ? 23% |
| Load Average * (Watt) | 88 | 79.6 10% | 89.2 -1% | 89.6 -2% | 93.9 -7% | 78 11% | 98.4 -12% | 99 ? -13% | 96.2 ? -9% |
| Witcher 3 ultra * (Watt) | 137 | 86 37% | 123 10% | 134 2% | 77.9 43% | 64 53% | |||
| Load Maximum * (Watt) | 193 | 176 9% | 189 2% | 204 -6% | 88.3 54% | 126 35% | 213.5 -11% | 204 ? -6% | 178.5 ? 8% |
* ... smaller is better
Battery Life
MSI equips the WS75 with an 82 Wh battery that provides for acceptable runtimes. Under best-case conditions (minimum brightness, at idle) more than 12 hours can be achieved, which shows that other power-saving mechanisms are at play. The real-world results with a specified brightness of 150 cd/m² were also acceptable: 6.5 hours whilst surfing the web and more than 8 hours of video playback.
However, under load results in the laptop giving up after just over an hour, even if performance is significantly reduced.
| MSI WS75 9TL-636 i7-9750H, Quadro RTX 4000 (Laptop), 82 Wh | Lenovo ThinkPad P72-20MB000EGE i7-8850H, Quadro P3200, 99 Wh | HP ZBook 17 G5-2ZC48EA i7-8850H, Quadro P3200, Wh | Dell Precision 7730 i7-8850H, Quadro P3200, 92 Wh | Lenovo ThinkPad P1-20MD002LUS E-2176M, Quadro P2000 Max-Q, 80 Wh | HP ZBook Studio G5-4QH10EA i7-8750H, Quadro P1000, 97 Wh | Fujitsu Celsius H980 i7-8750H, Quadro P3200, 96 Wh | Average of class Workstation | |
|---|---|---|---|---|---|---|---|---|
| Battery runtime | 63% | 54% | -6% | -20% | 45% | 6% | 43% | |
| Reader / Idle (h) | 12.6 | 28.3 125% | 21.9 74% | 17.3 37% | 13.5 7% | 26.1 ? 107% | ||
| H.264 (h) | 8.2 | 12.3 50% | 9.2 12% | 5.8 -29% | 9.1 11% | 5.9 -28% | 9.51 ? 16% | |
| WiFi v1.3 (h) | 6.6 | 11.2 70% | 5.6 -15% | 5.3 -20% | 9.7 47% | 8.3 26% | 8.52 ? 29% | |
| Load (h) | 1.2 | 1.3 8% | 2.1 75% | 1.5 25% | 2.2 83% | 1.4 17% | 1.429 ? 19% |
Pros
Cons
Verdict
With the WS75 MSI presents a very interesting mobile workstation. This conversion of the GS75 gaming laptop has worked very well, and this slim device really could be for many users a viable alternative to the well-known 17.3 inch models which, in comparison, are extremely chunky.
Such reductions in size and weight have of course been achieved by compromises in construction. The base and the lid are somewhat easier to bend and, when handled, the laptop does creak a little.
The matte 1080p display doesn't blow us away, but it does its job and the base display options of the competition are not any better. The optional 4K screen would deliver better image quality.
So we come to the most important element - the WS75's performance. Due to its thin and slim dimensions we were somewhat sceptical regarding the choice of a regular, non-Max-Q version of the Quadro RTX 4000. In our testing however, the GPU was able to run almost always at its maximum clock rates, including turbo, which resulted in excellent graphical performance. The CPU also did not fall short and in extreme scenarios is able to run at just 45 watts. Temperature and noise output was also acceptable - something that is definitely not a foregone conclusion with thin and light devices.
Compact, light, and stylish: The MSI WS75 impresses with an extremely nice design, abundant connectivity and a good keyboard. There are some compromises in solidity, but this slim workstation is able to keep pace with the established "heavies" without issue.
There are definitely some other weak points, such as the poor speakers, high power consumption under load, and the layout of its ports. Especially for users who are looking for one device to use for work and at home, and who are looking for as much performance as possible in a compact form factor, the WS75 is most definitely an interesting alternative.
MSI WS75 9TL-636
- 01/08/2020 v7 (old)
Andreas Osthoff
Price comparison
