MSI WS63VR (i7-7700HQ, 4K, Quadro P4000 Max-Q) Laptop Review
With their new Max-Q design philosophy, Nvidia hopes to bring improved voltage and thermal management through a fundamental redesign, and today we have one of the first iterations of an Nvidia Quadro GPU bearing the Max-Q moniker. The MSI WS63VR is a thin-and-light mobile workstation equipped with the Quadro P4000 Max-Q, a redesign of the Quadro P4000 that sits near the top of Nvidia's workstation-class GPU line. We'll see what gains the GPU makes in terms of heat management and power draw and, conversely, what performance must be sacrificed to achieve these improvements.
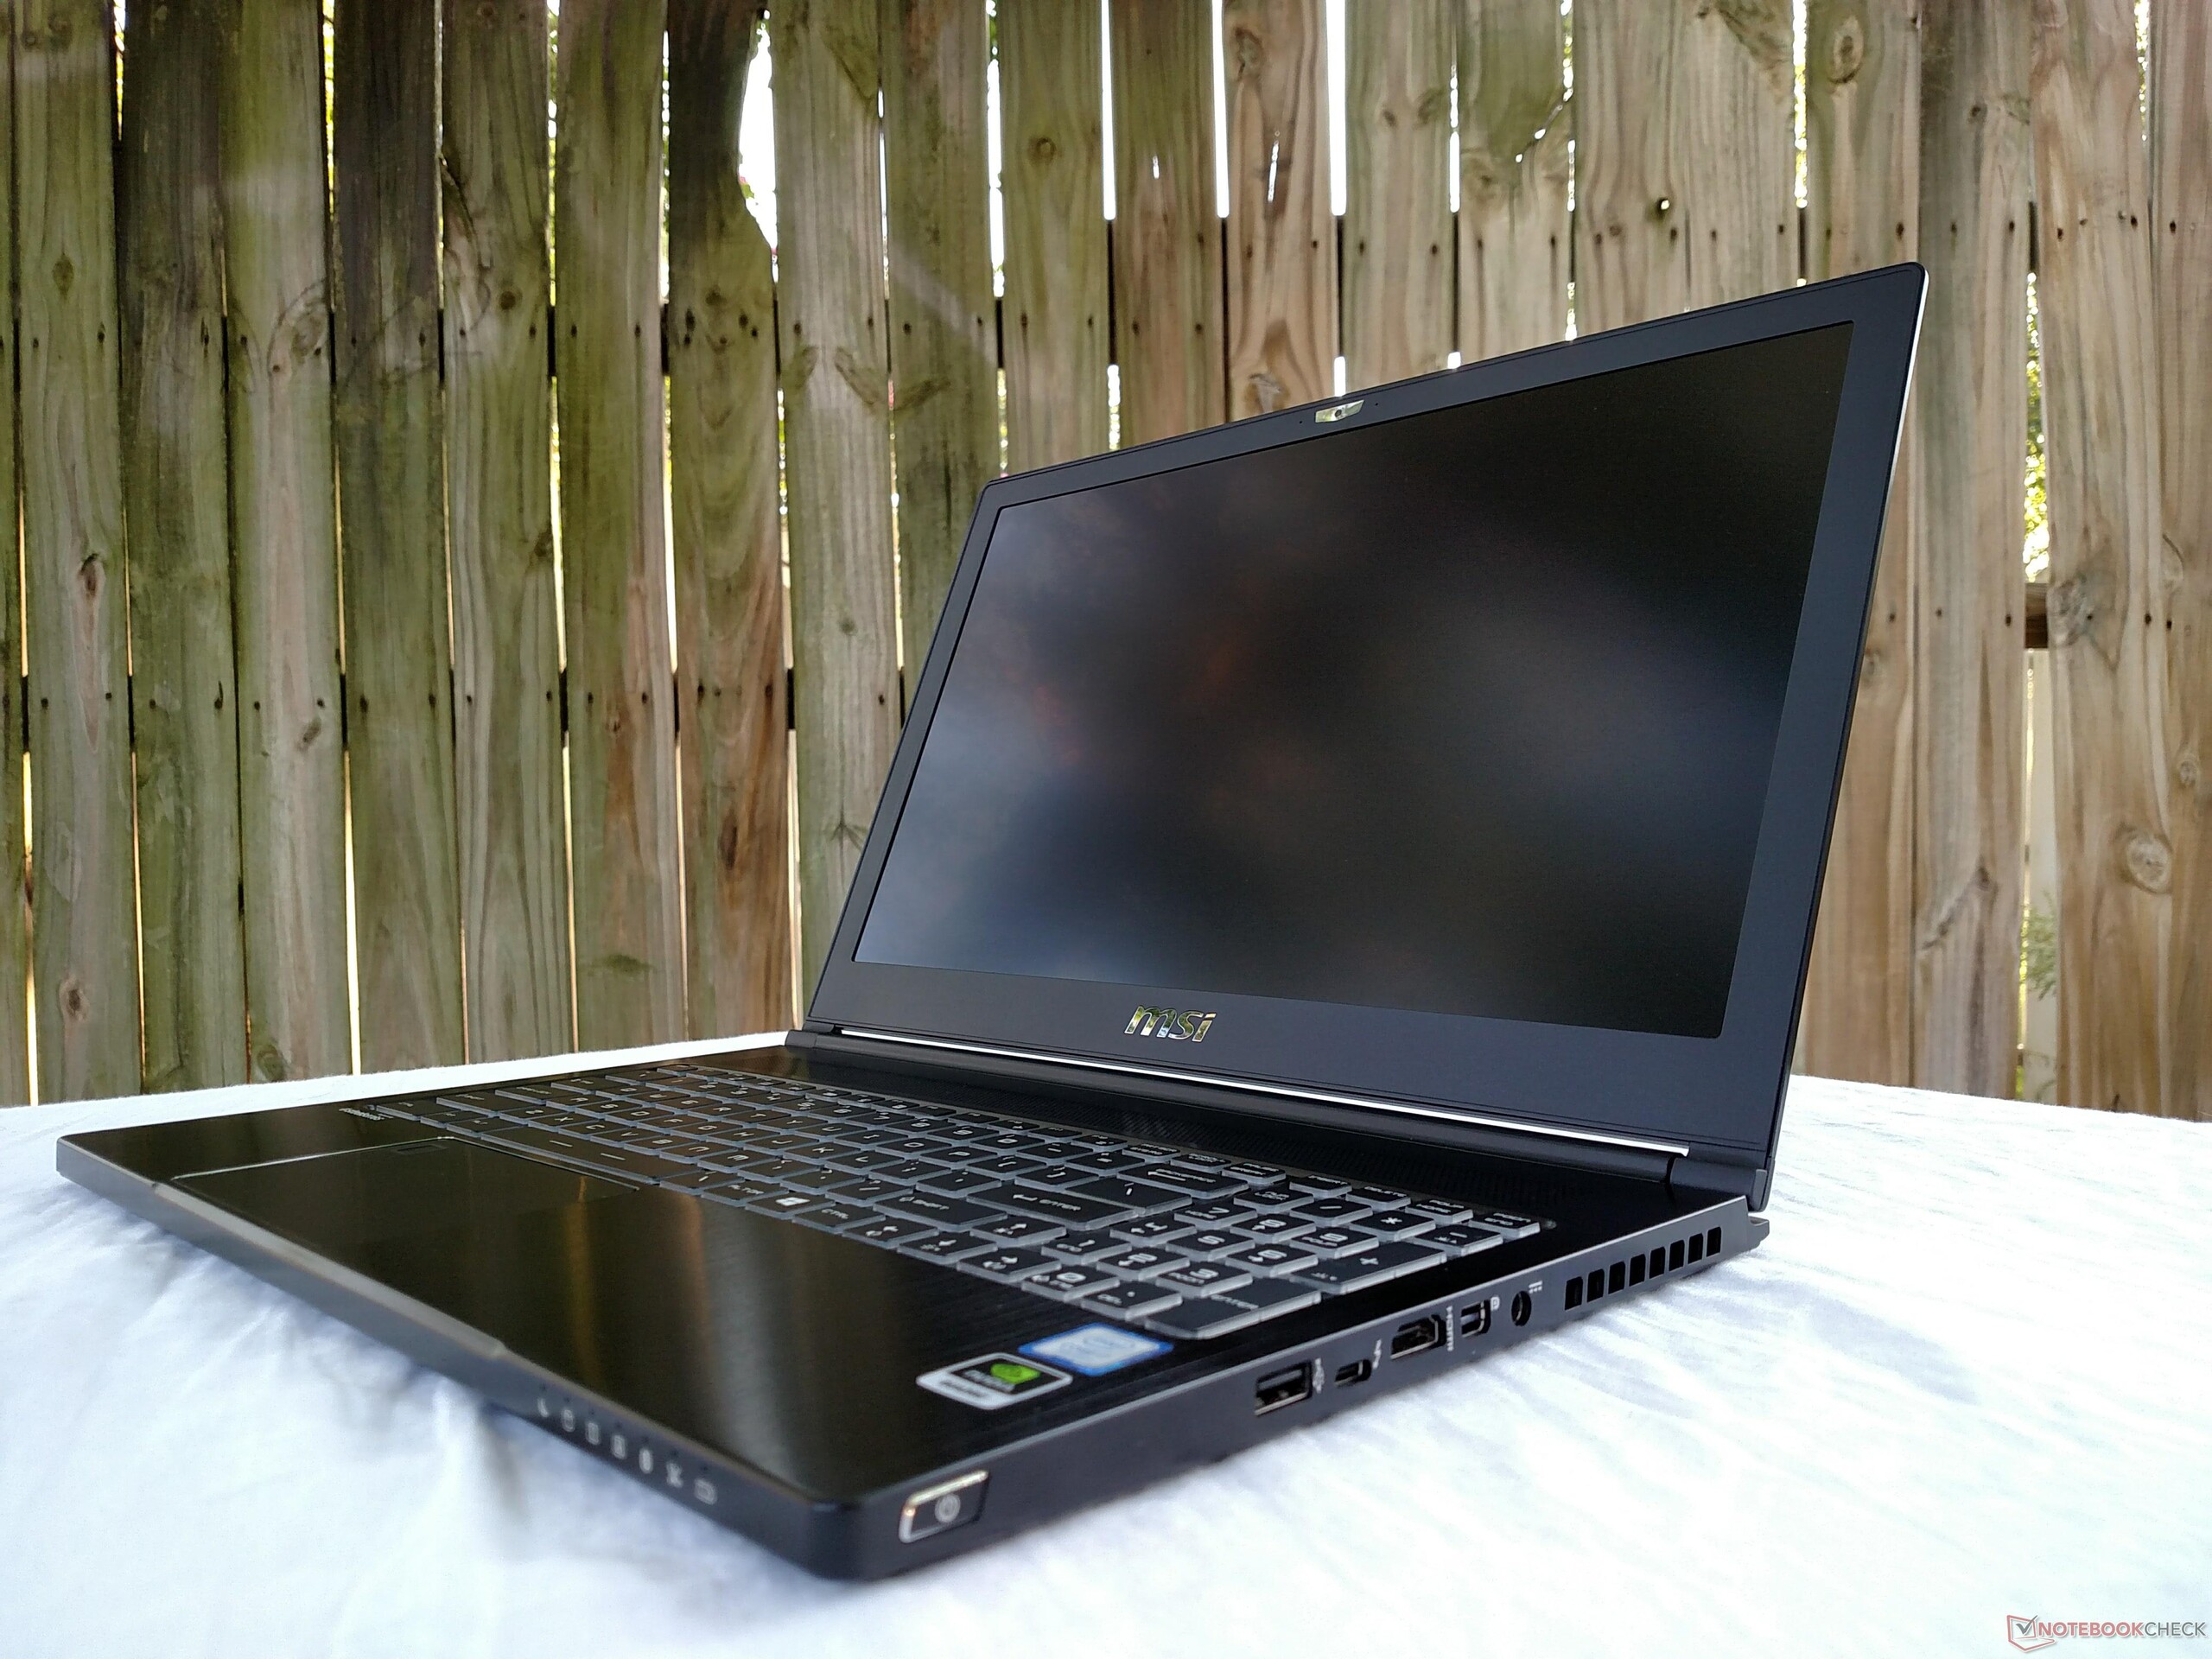
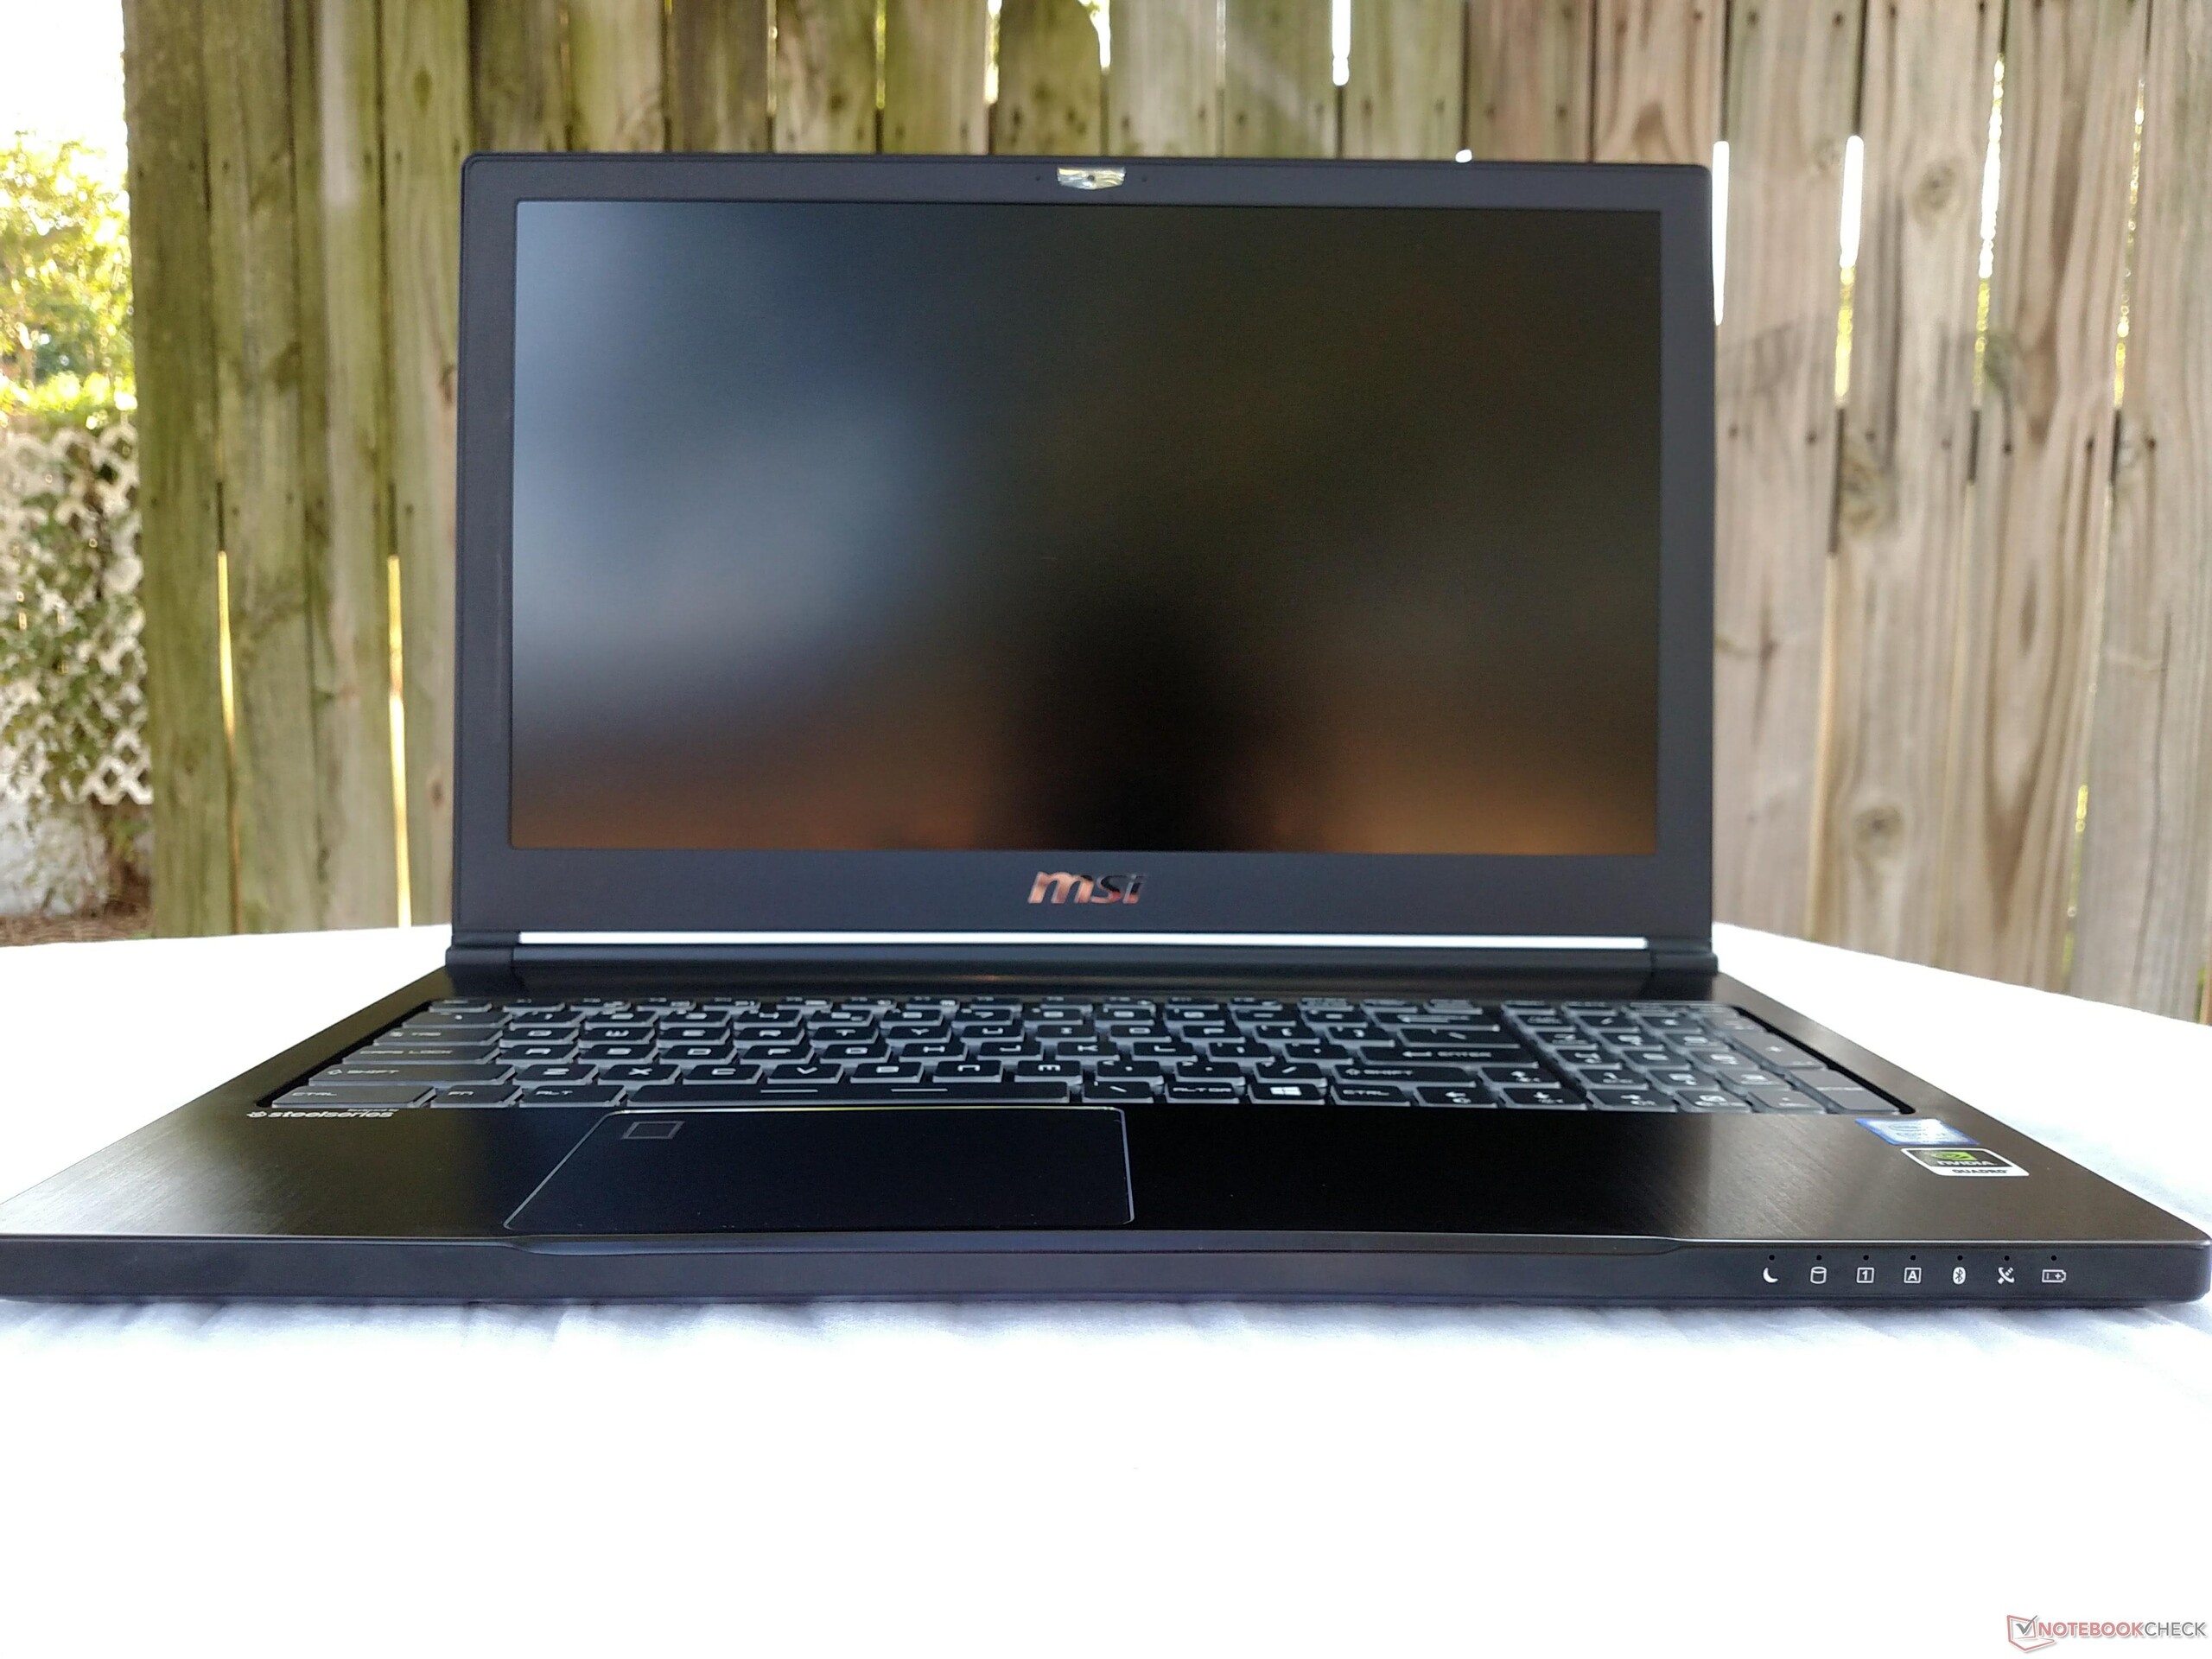
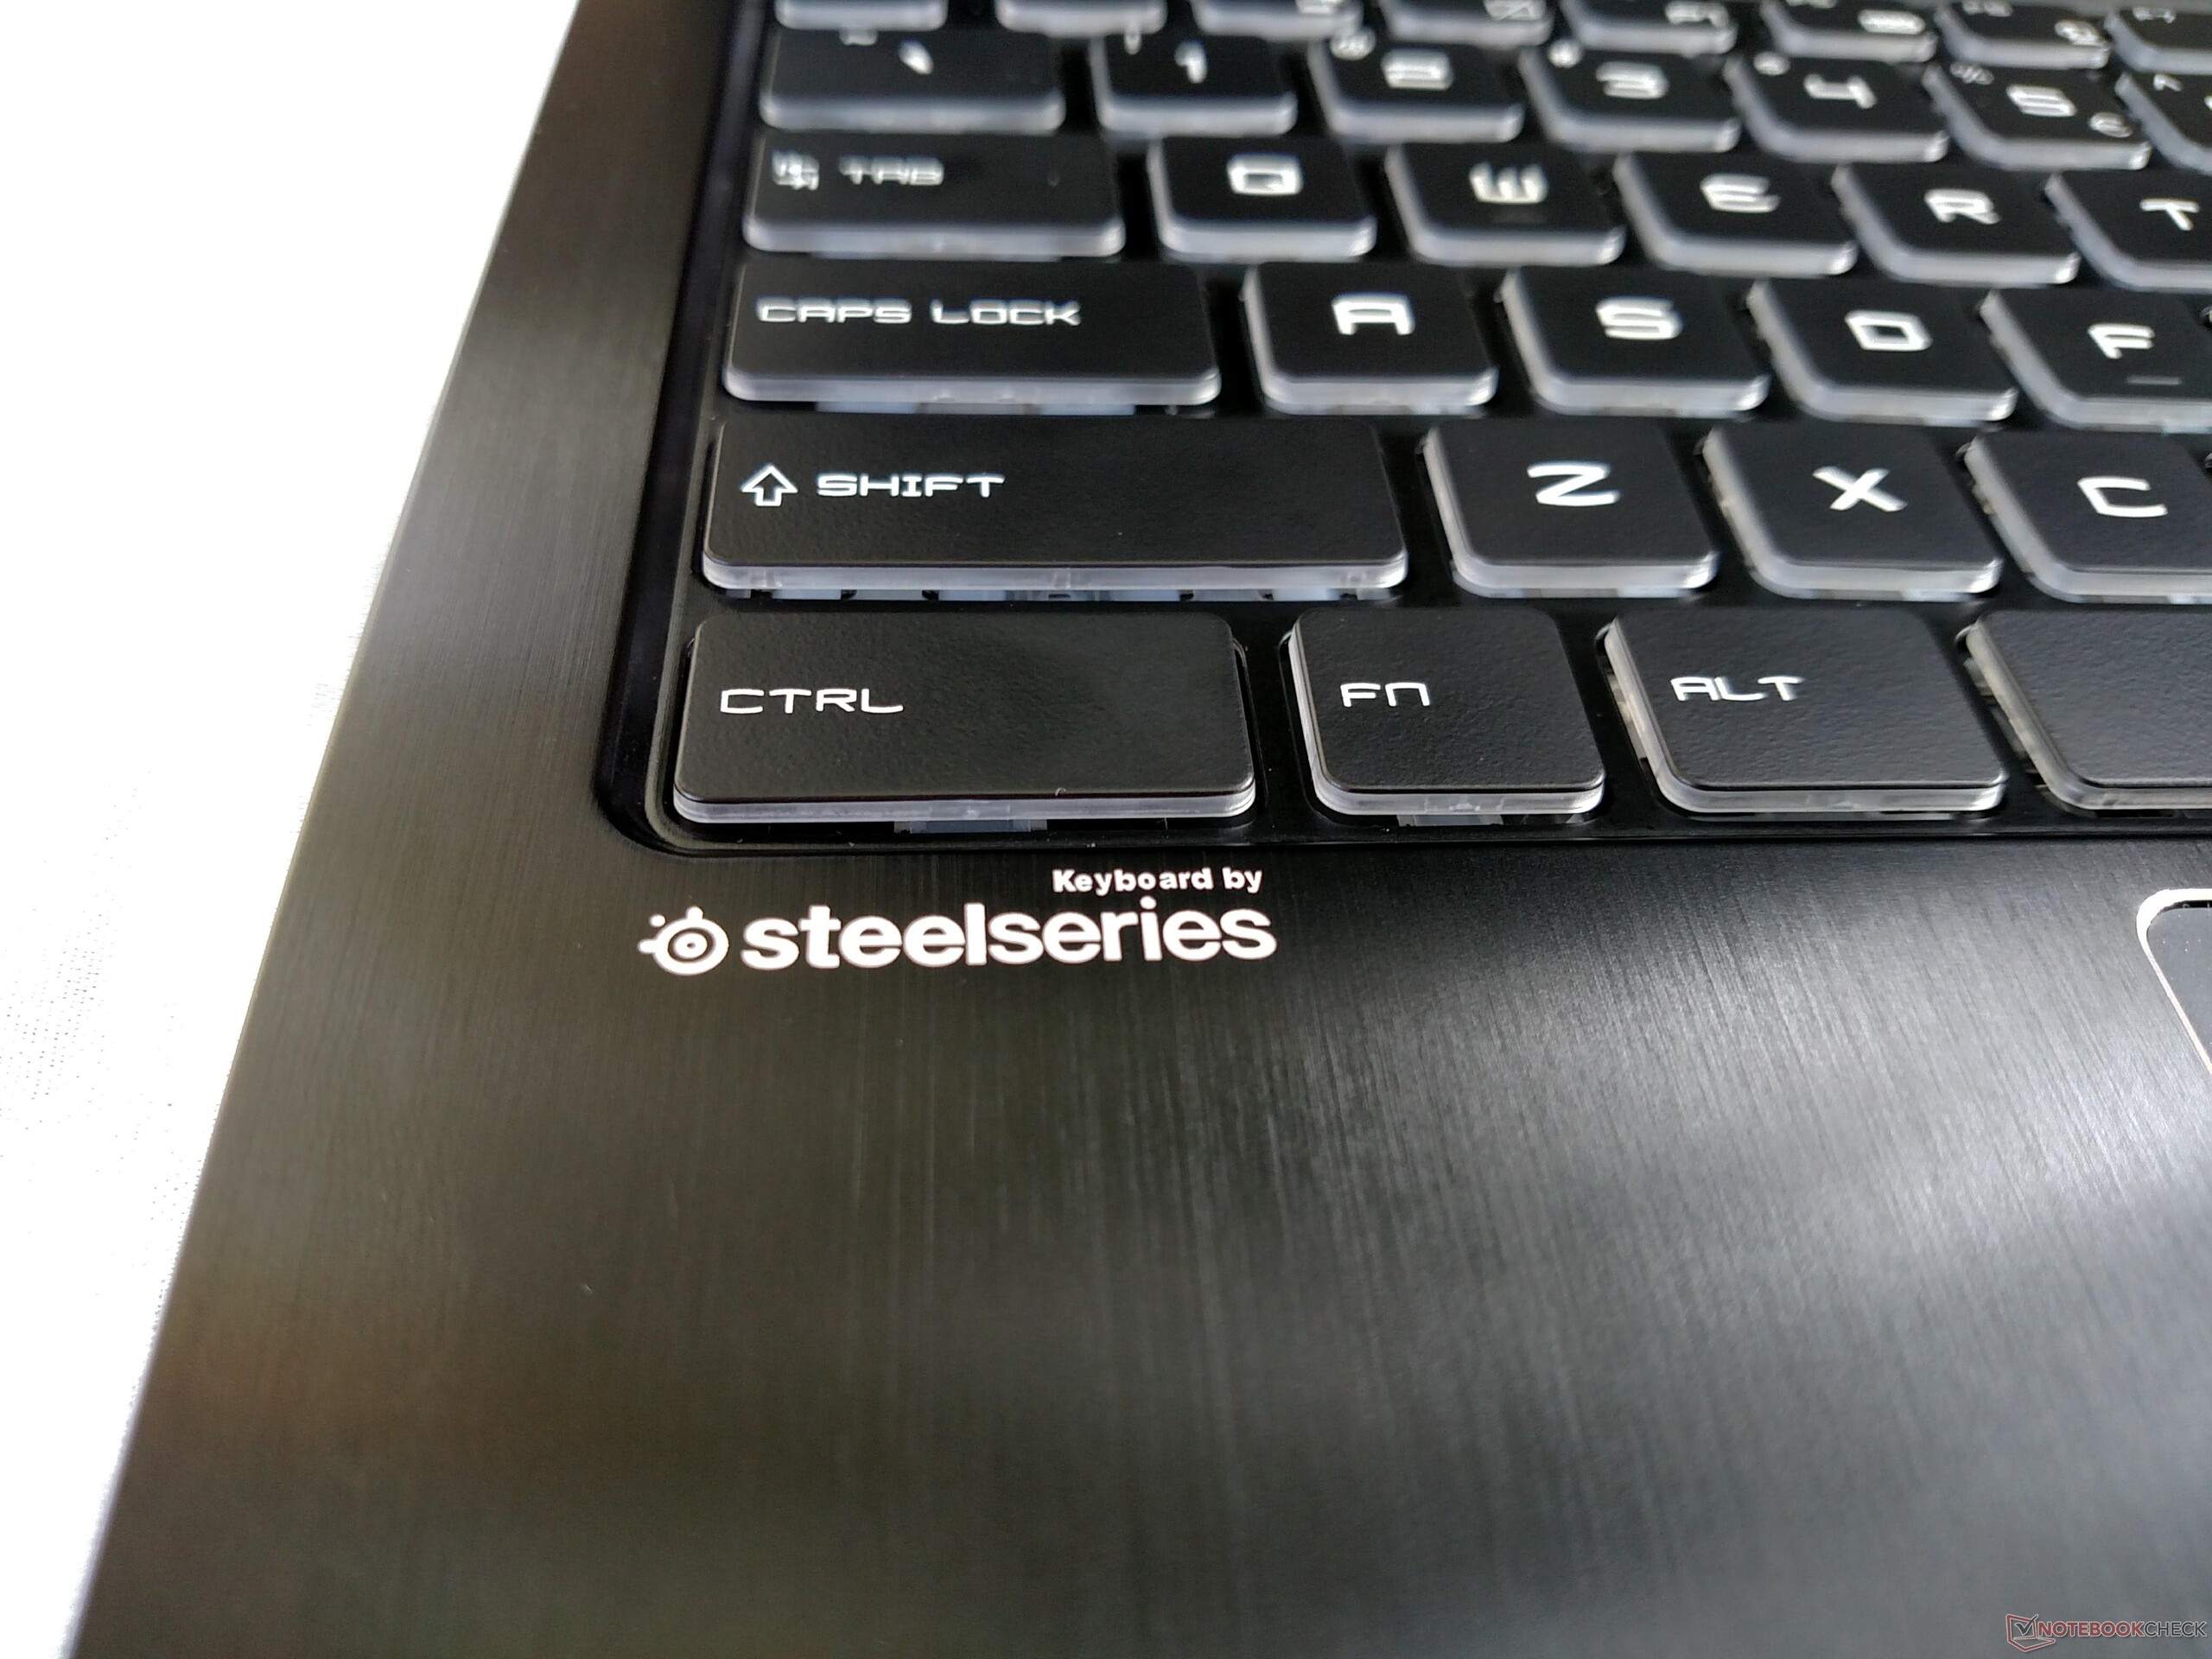
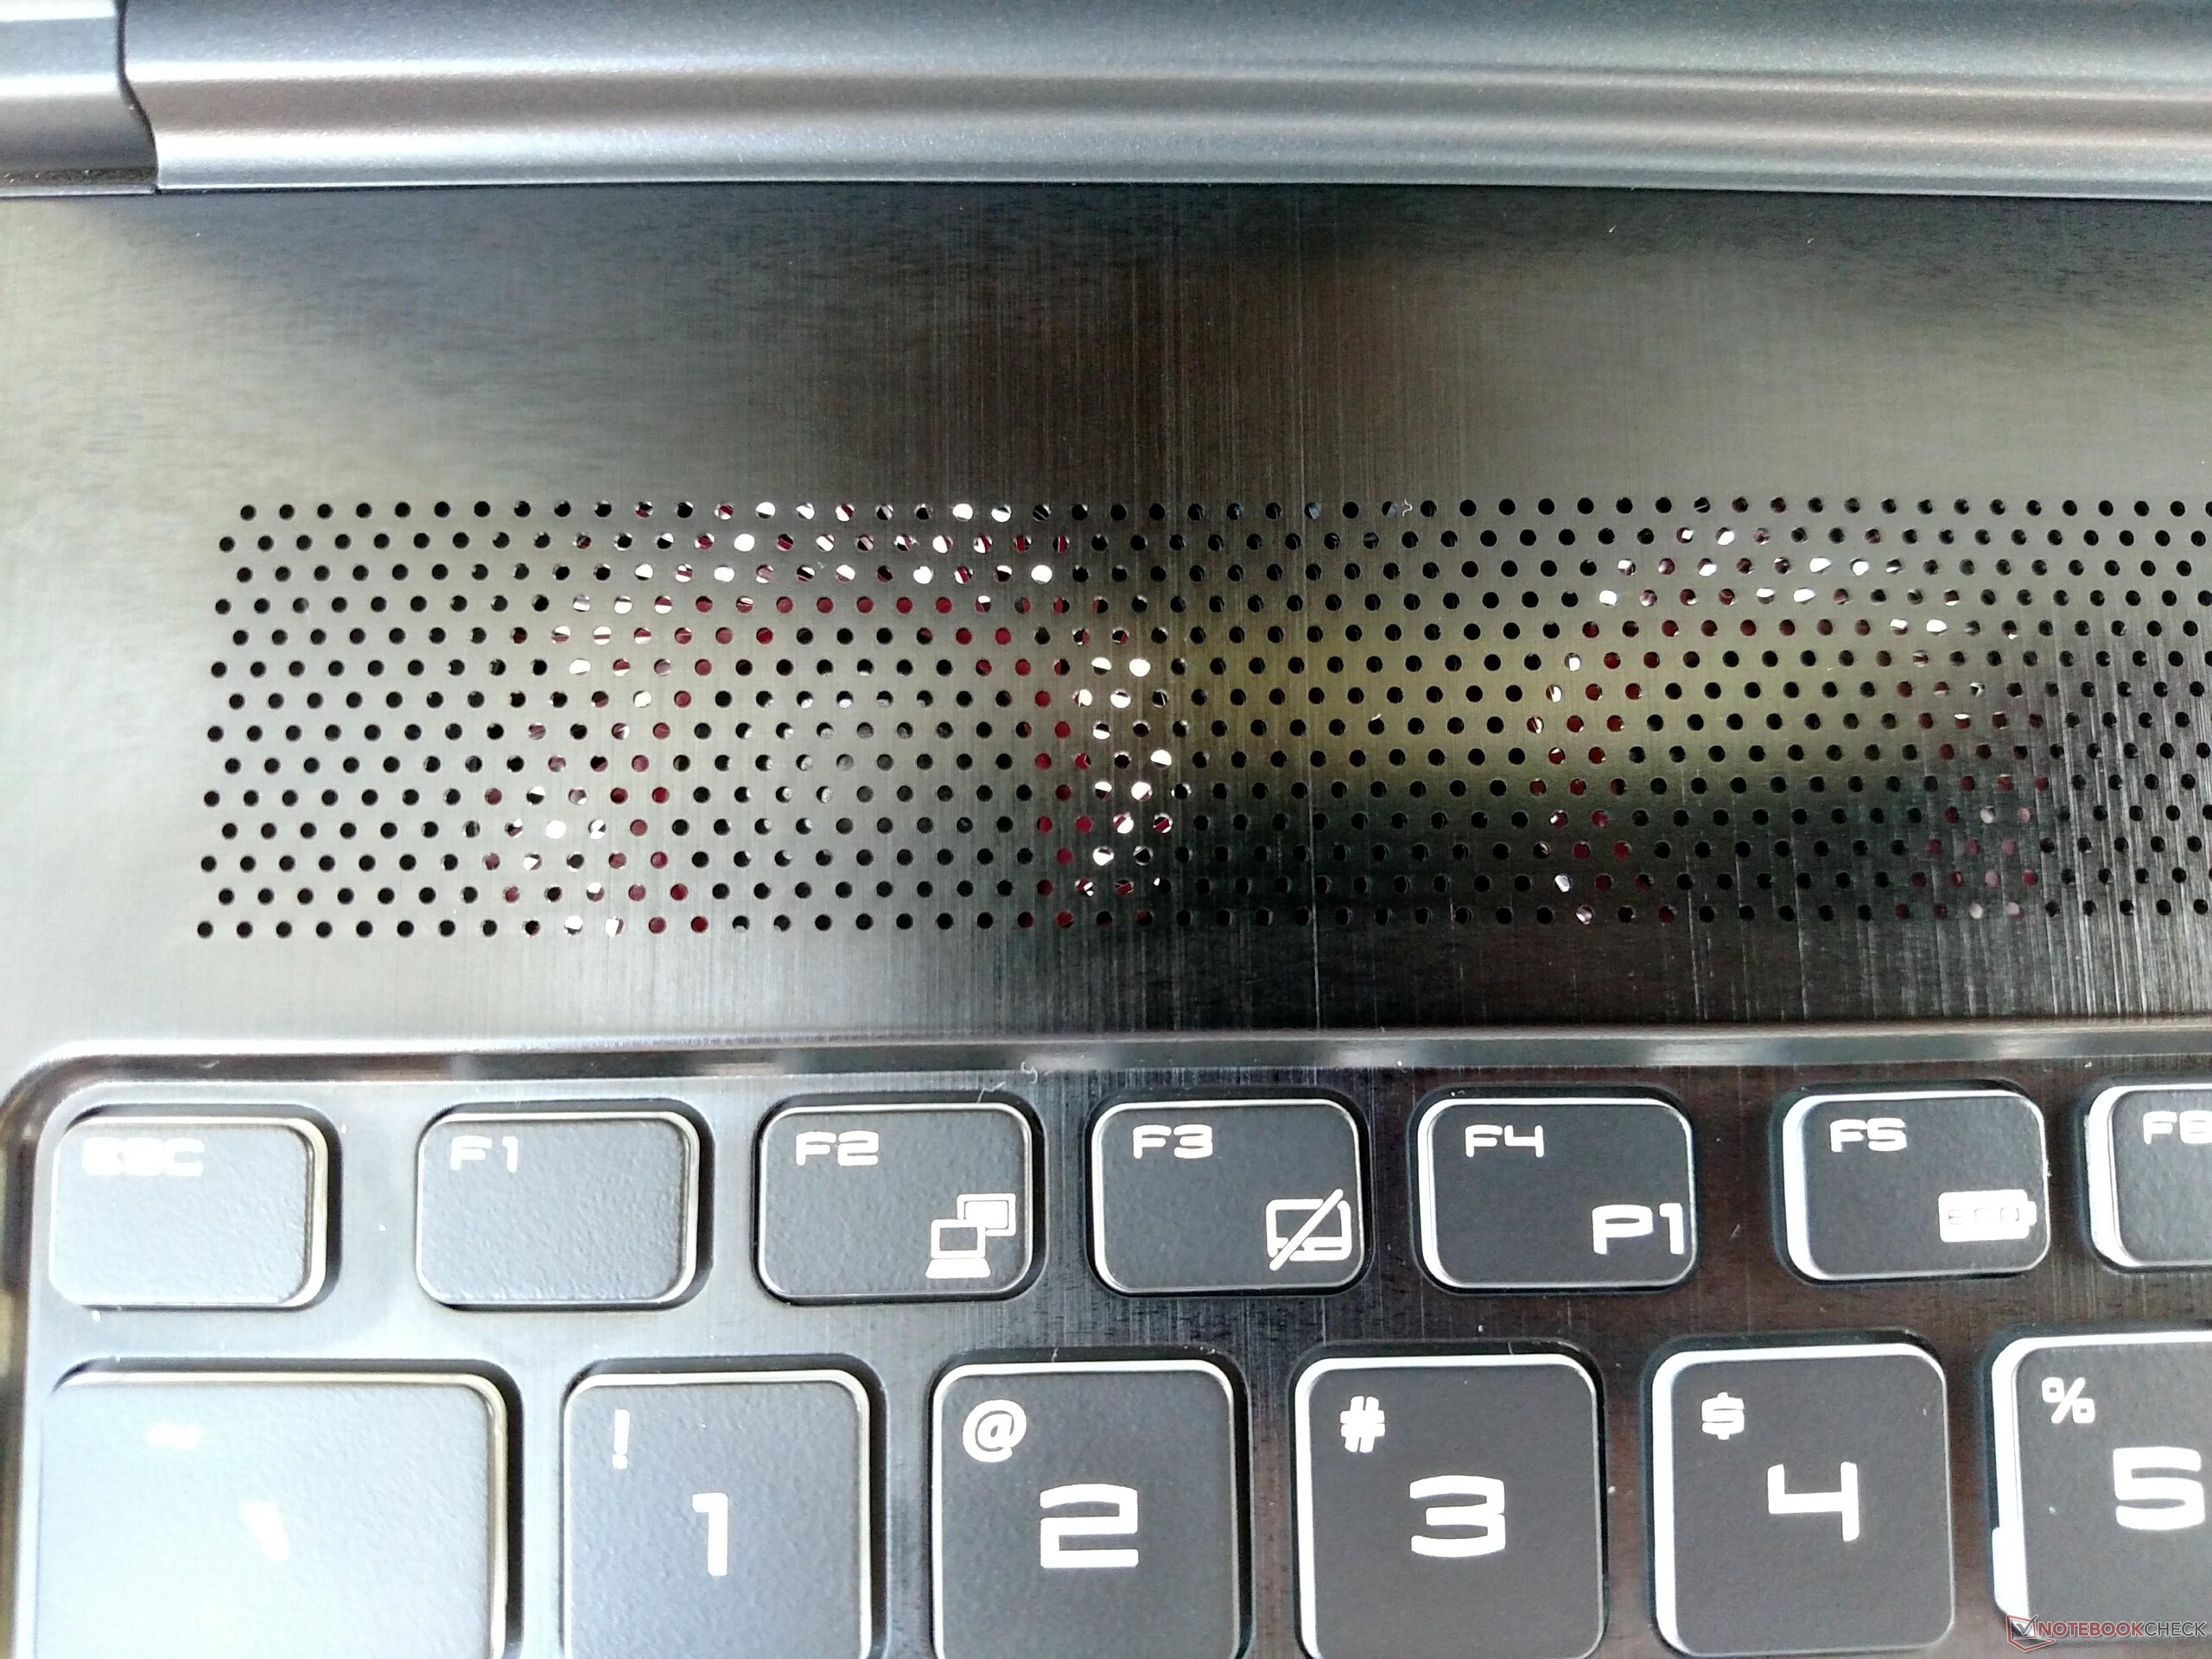
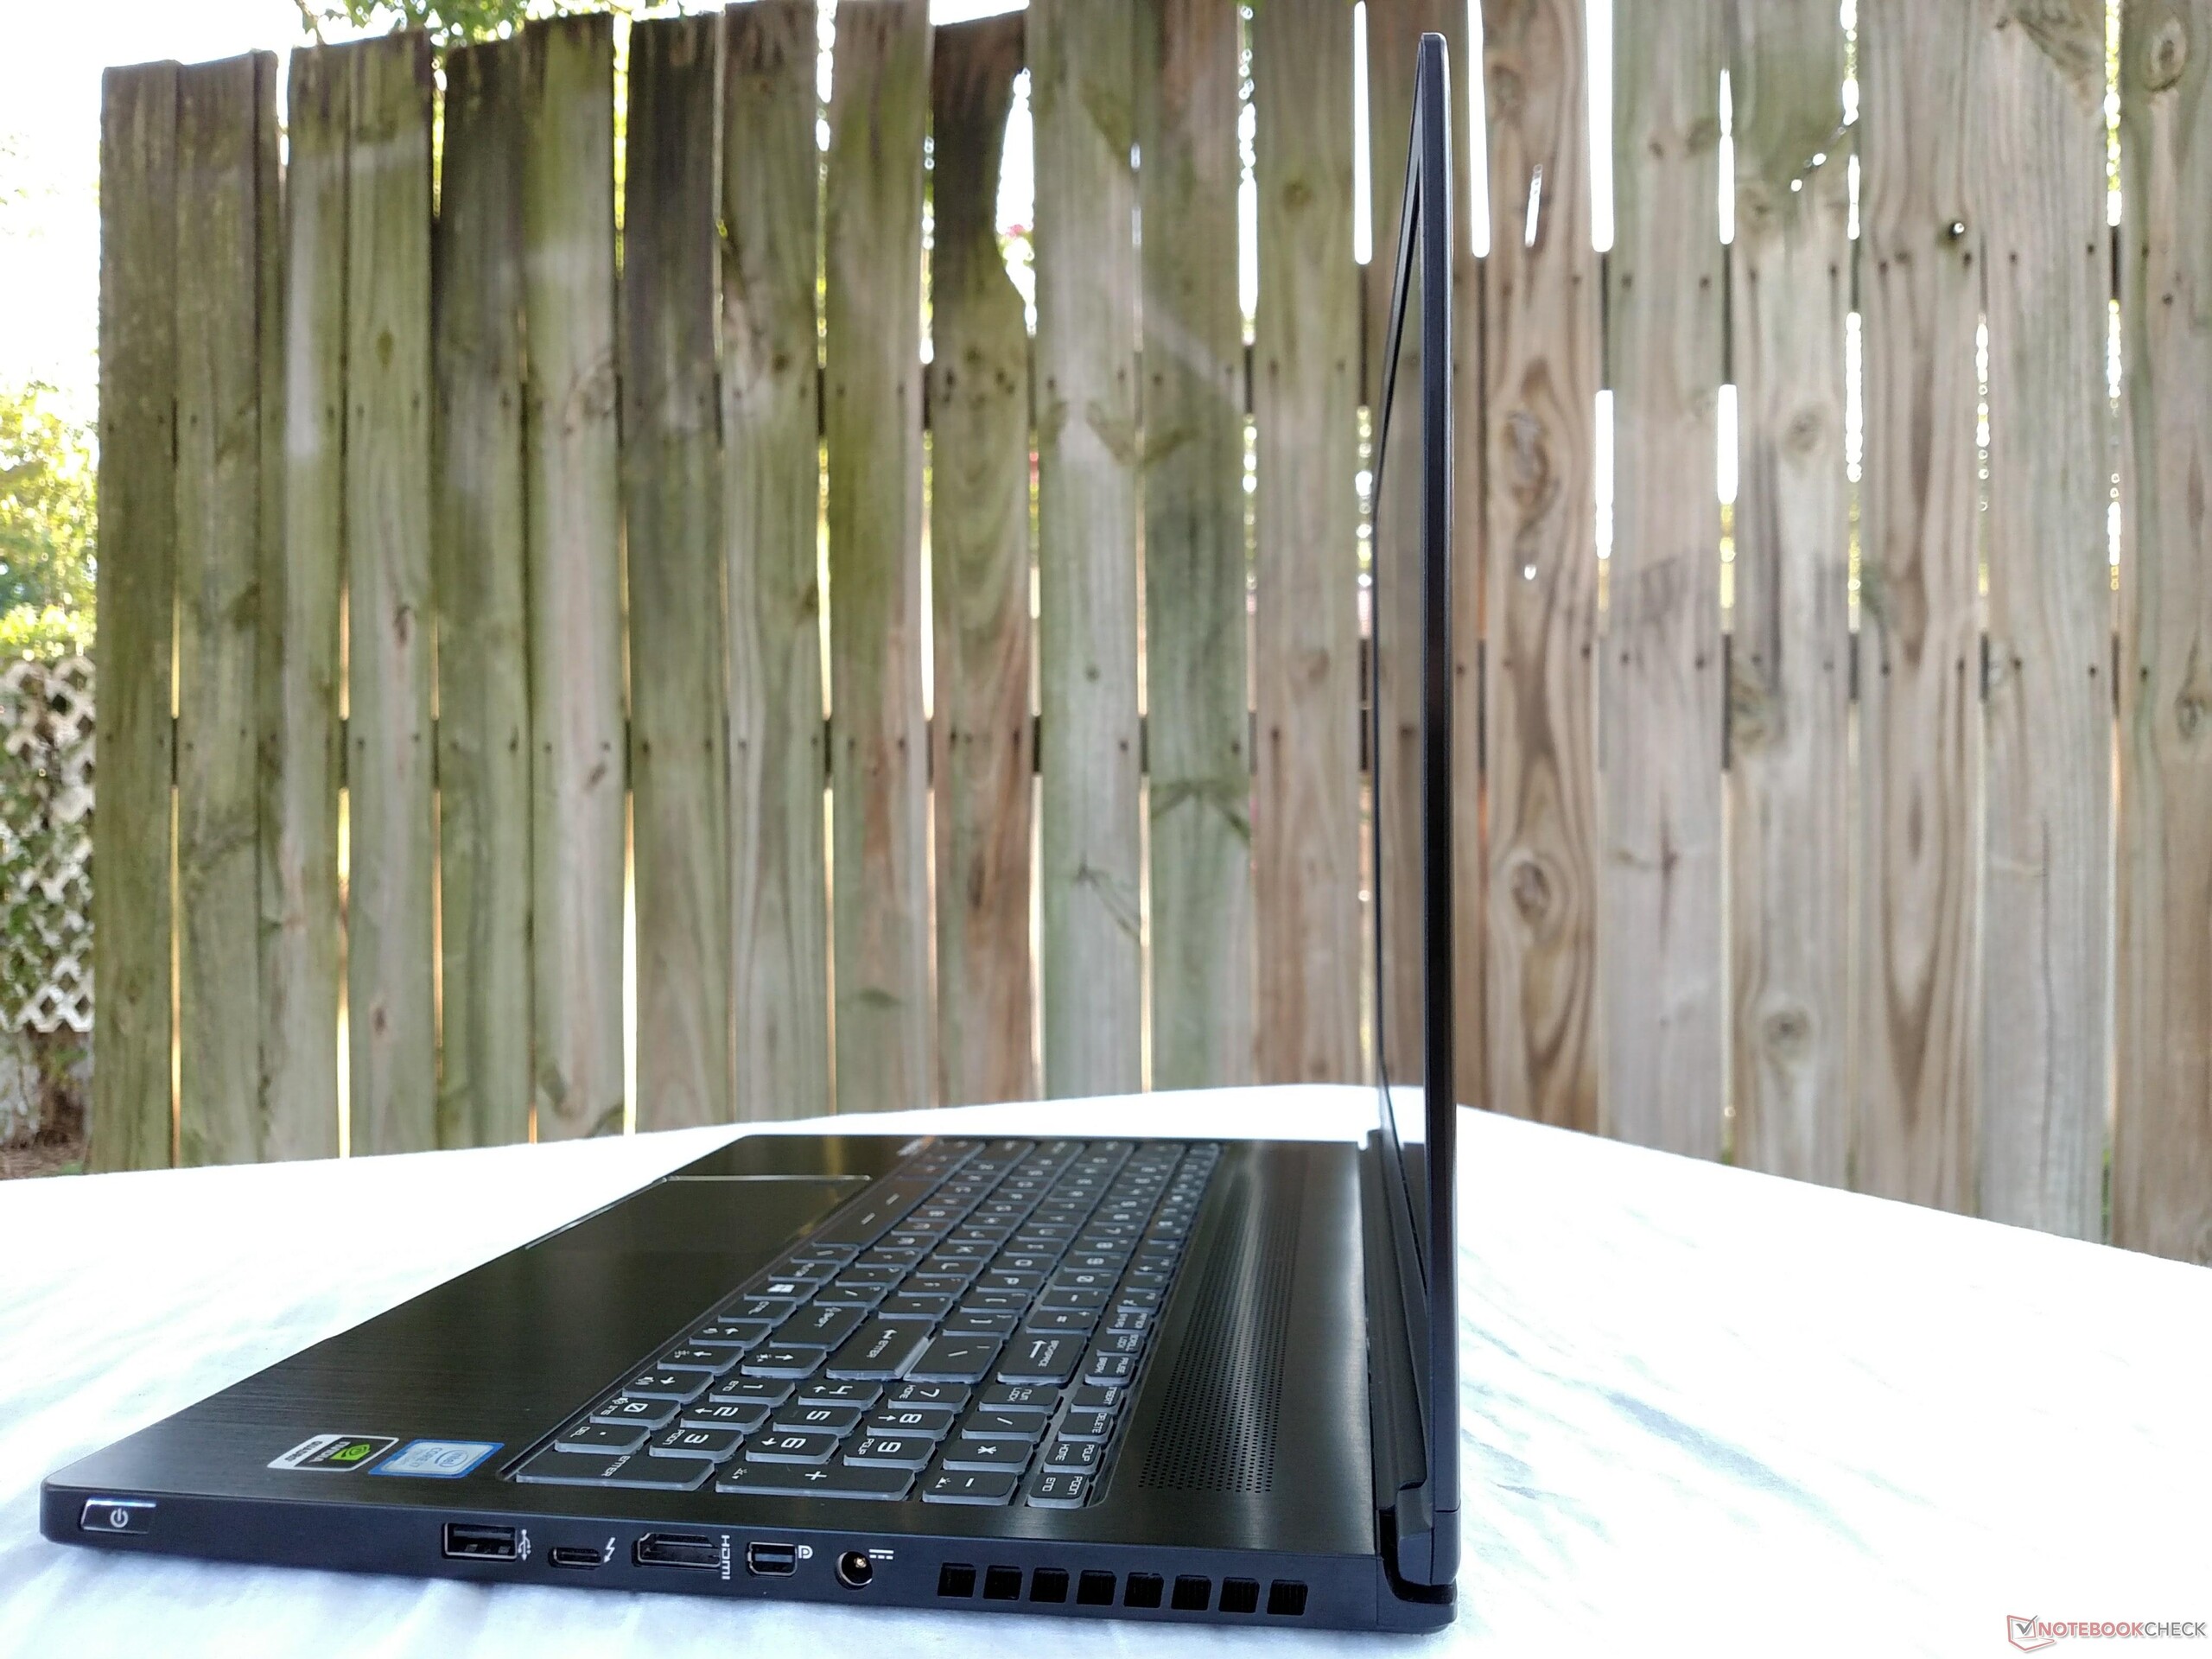
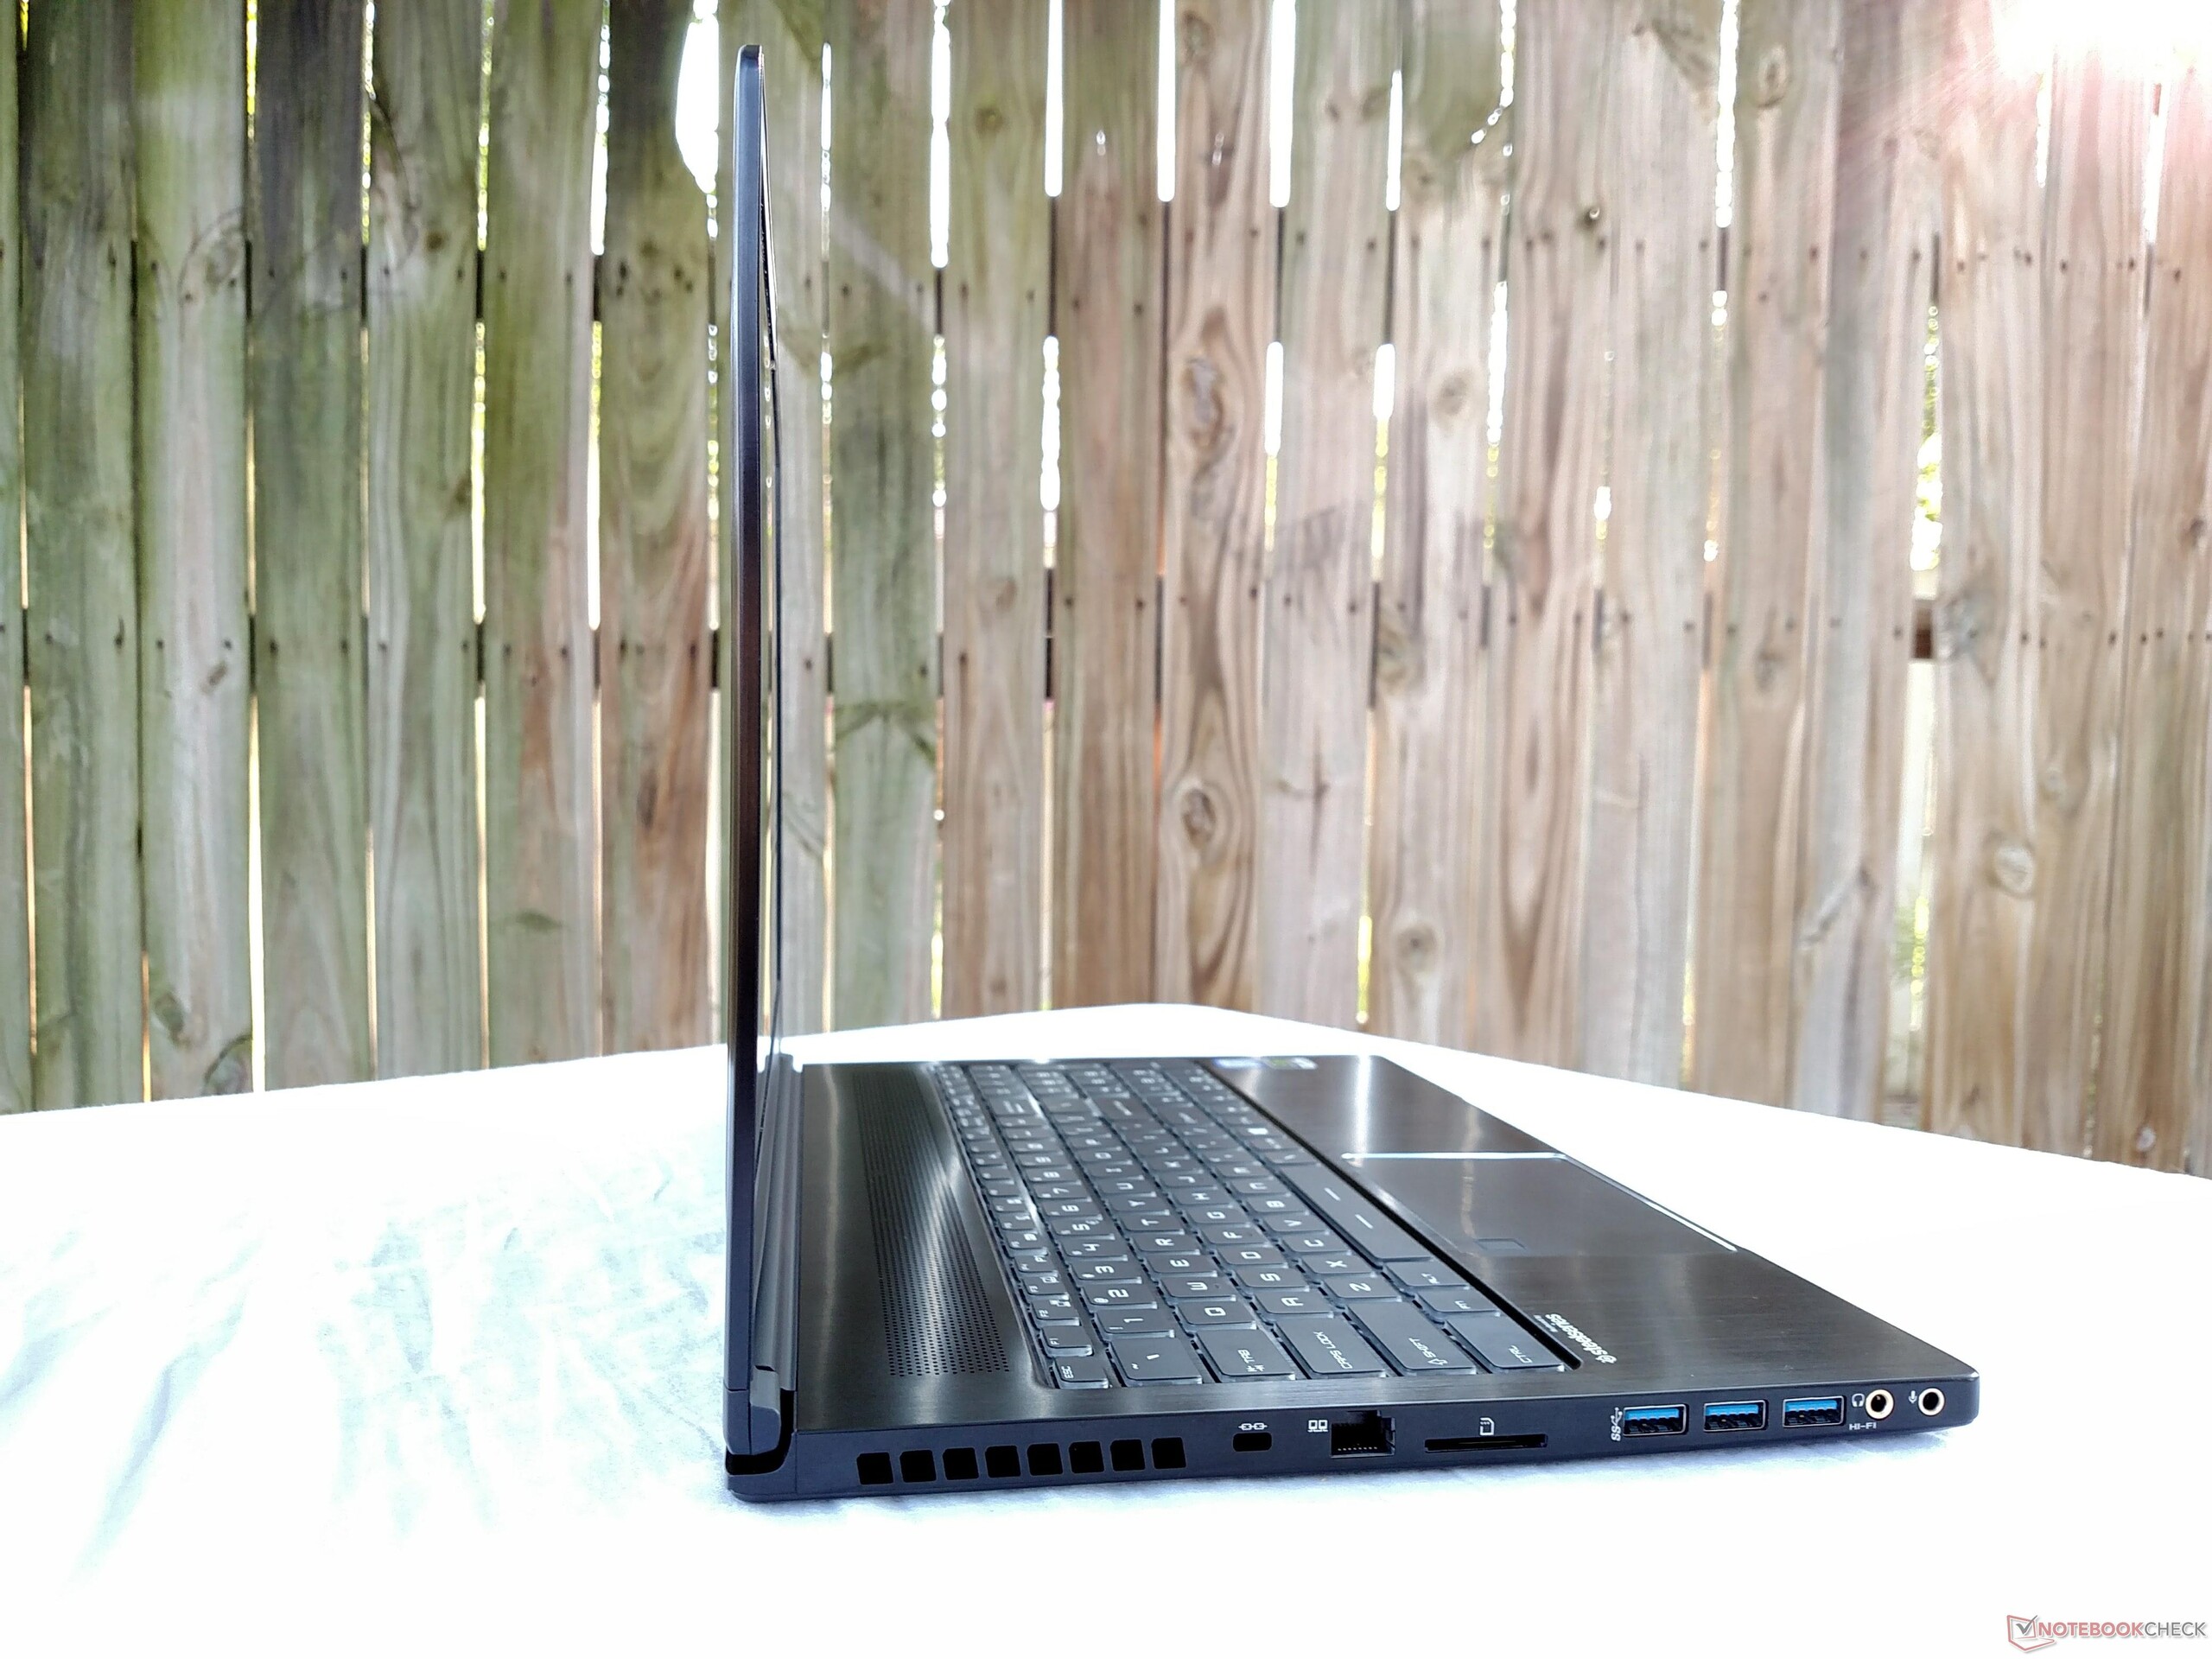
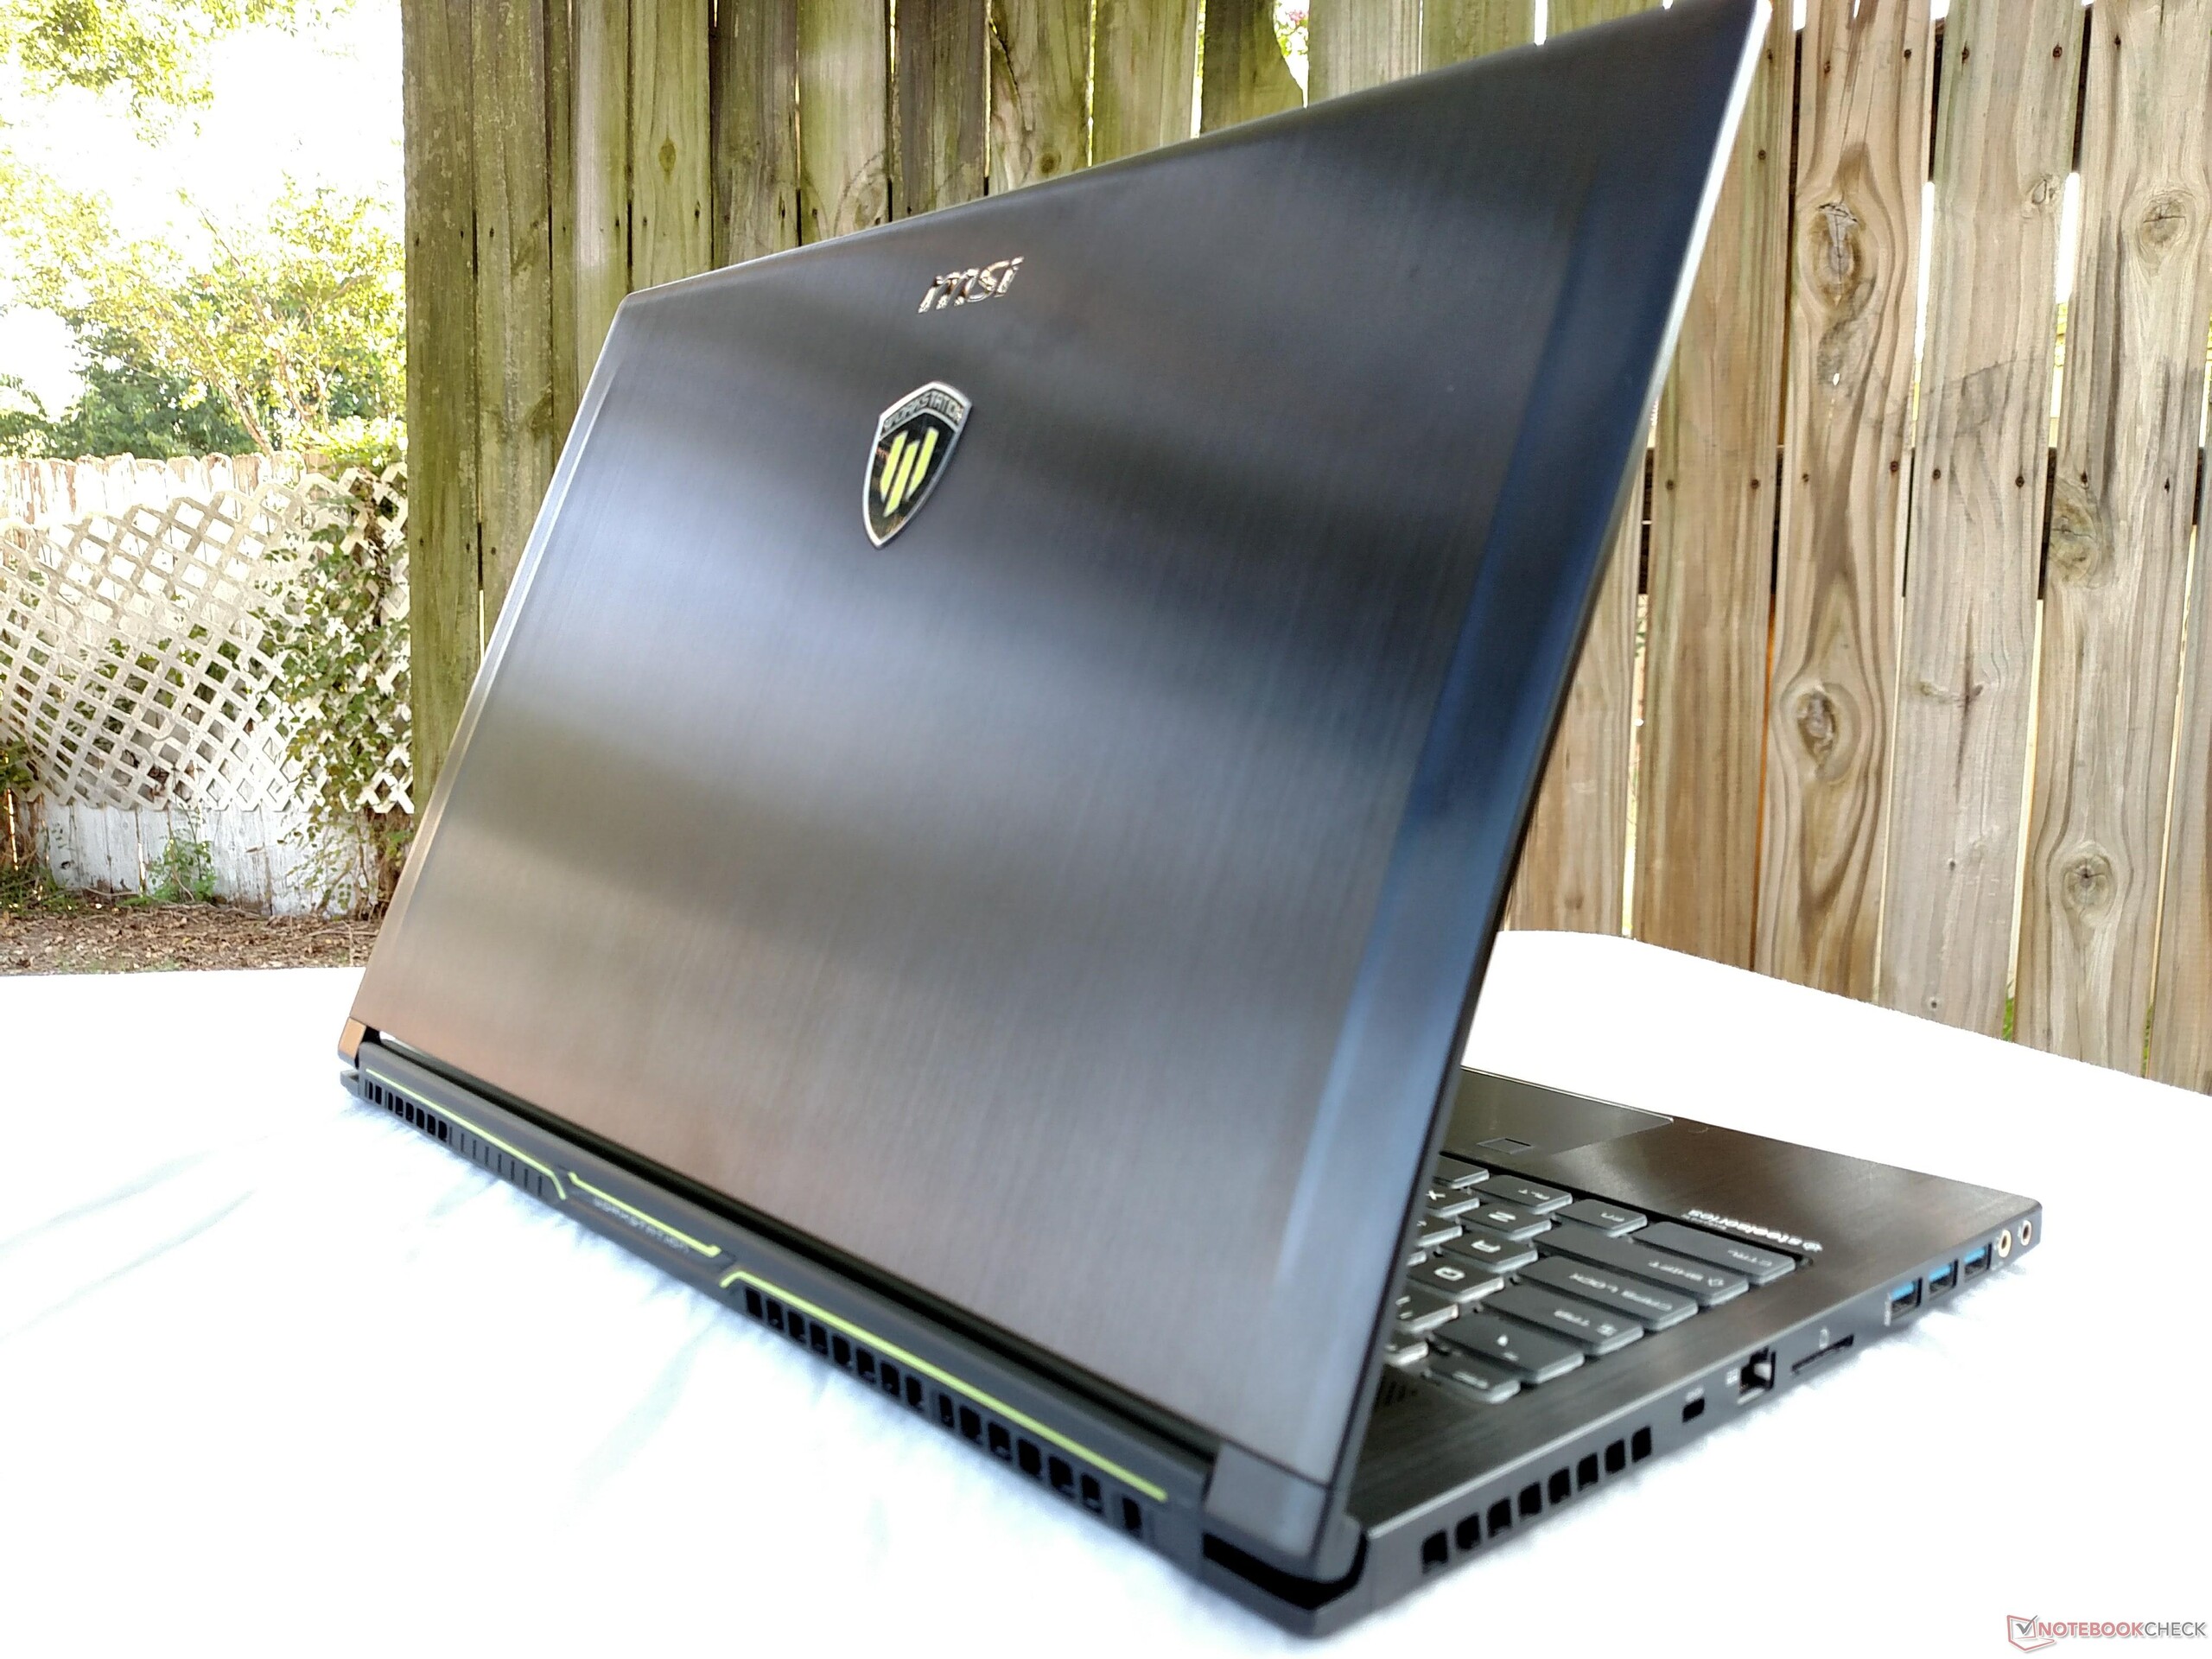
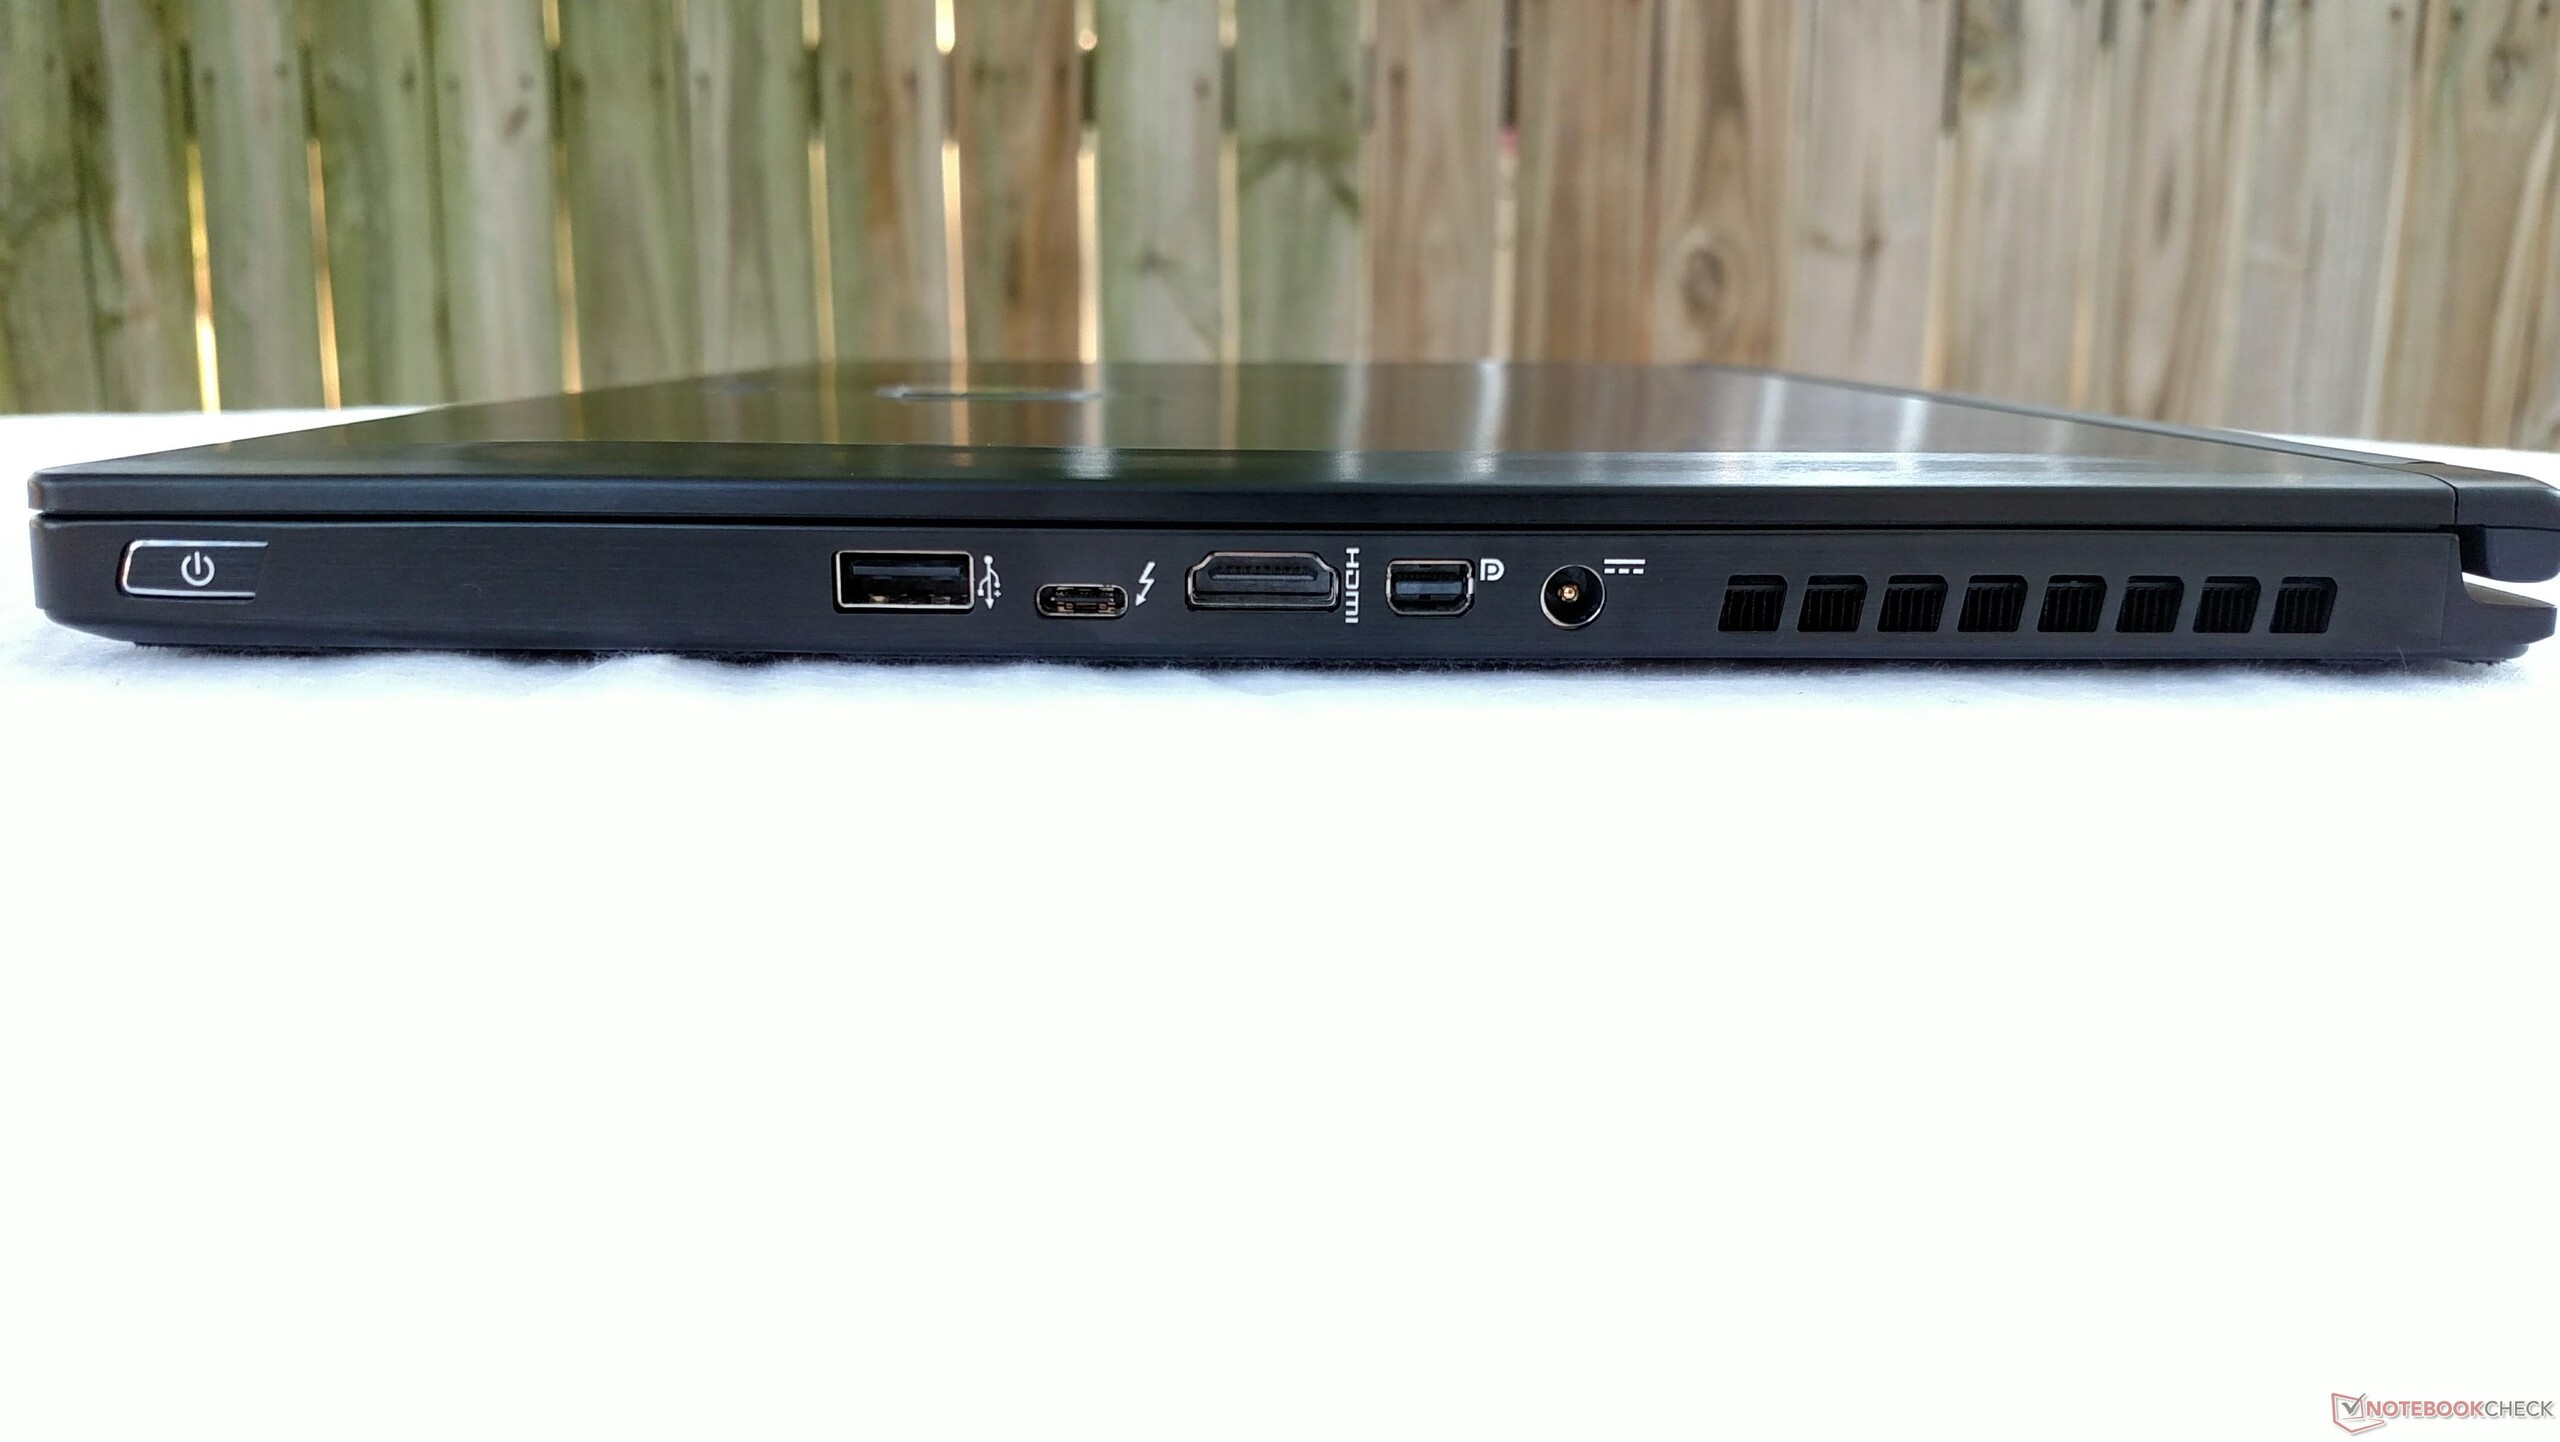
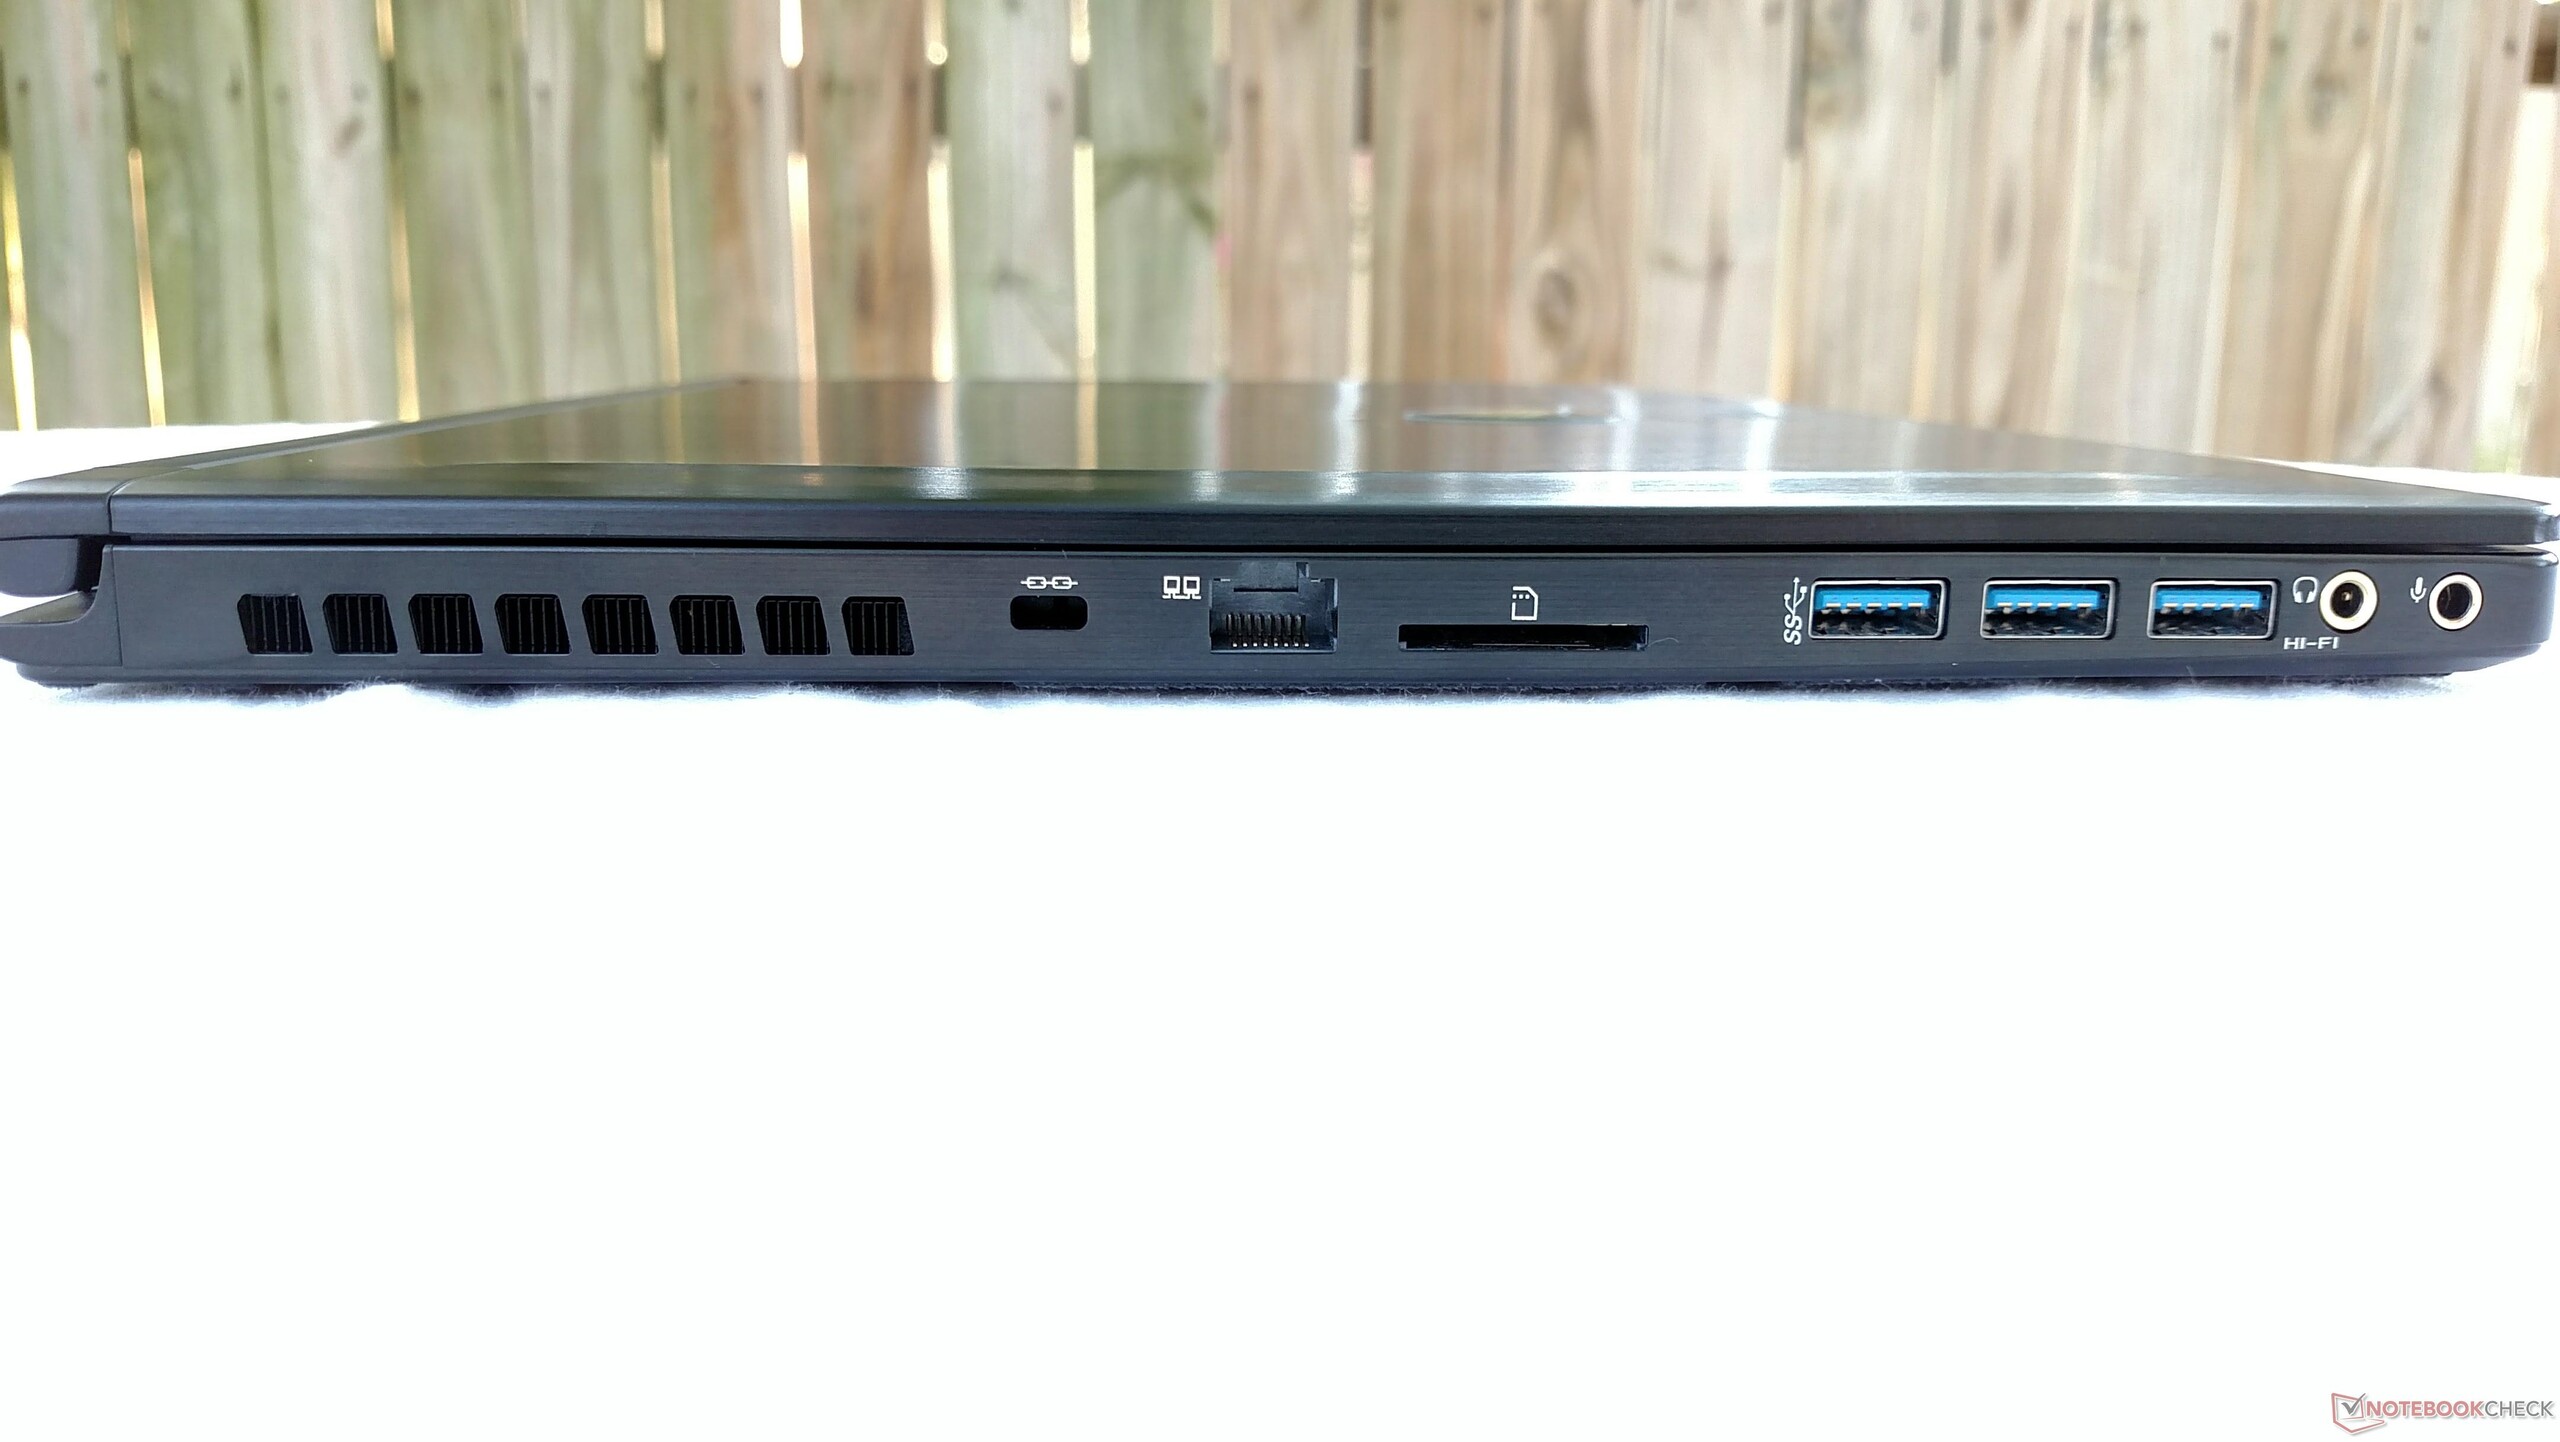
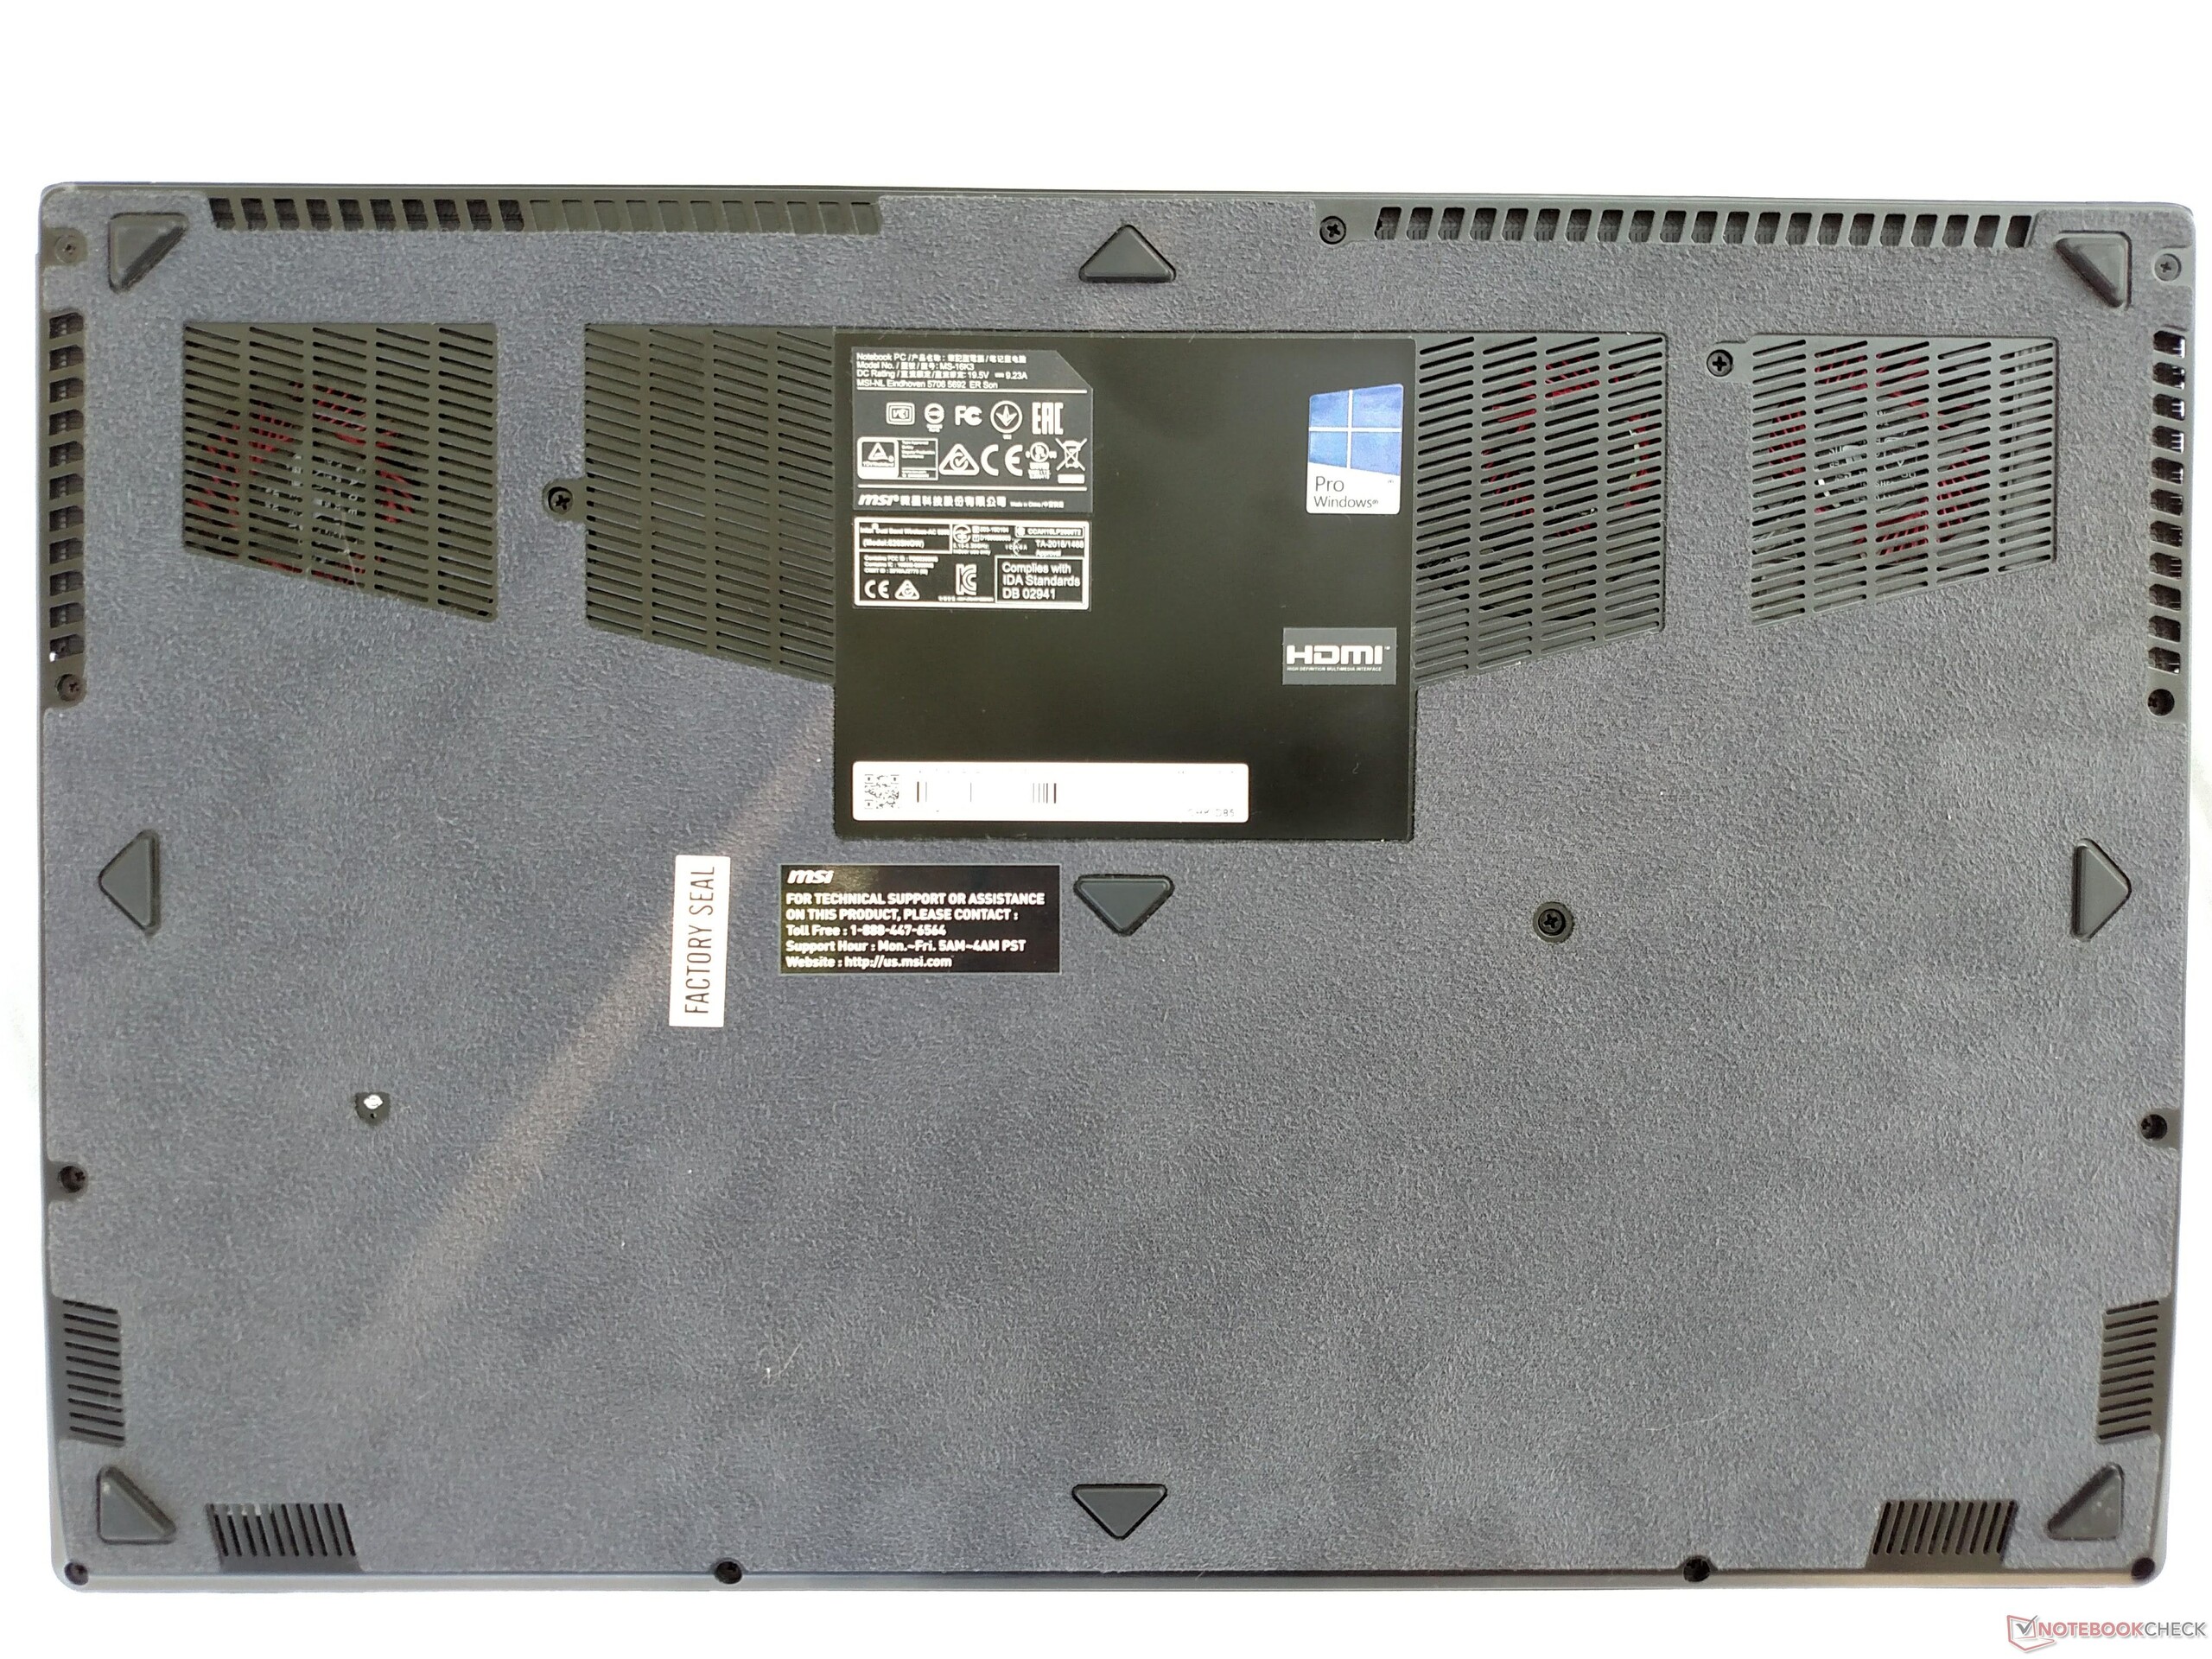
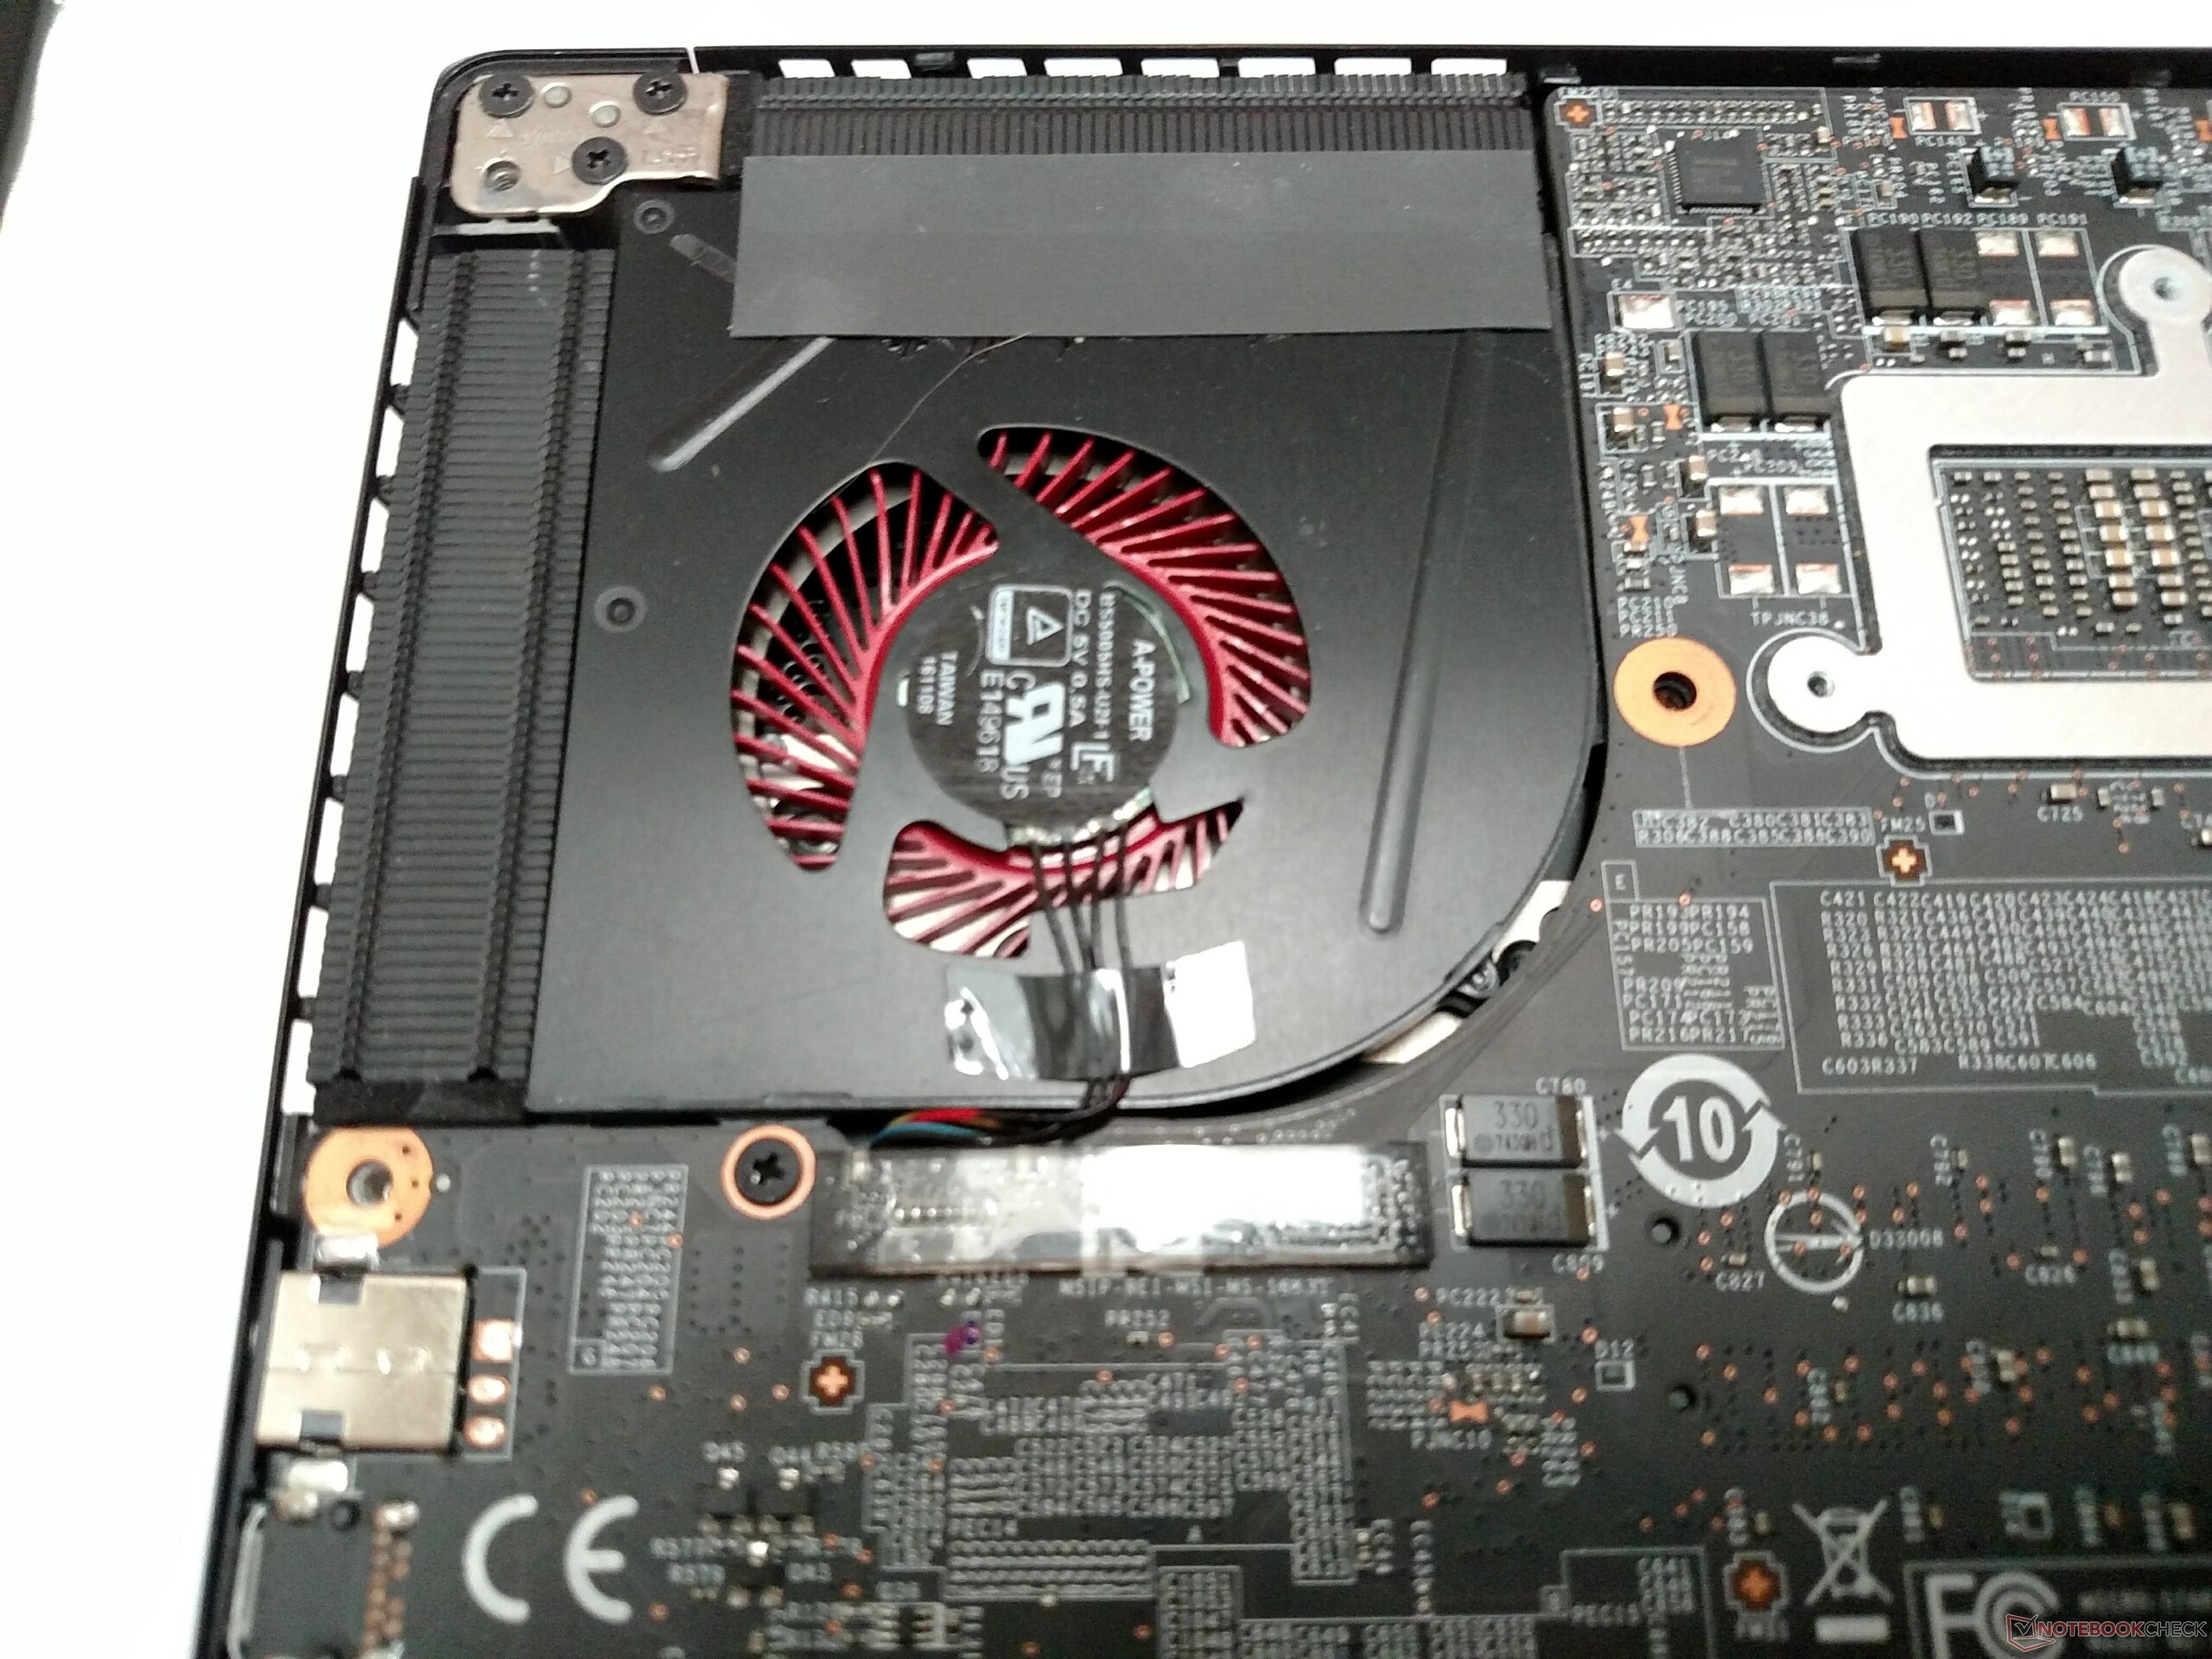
The WS63VR is very similar to many other MSI devices, particularly the WS63 and GS63VR. In fact, the chassis is identical to these machines, save for some coloration and branding. Our device also sports a Thunderbolt 3-capable USB Type-C port; the other machines have a USB Type-C port as well, but it only supports USB 3.1 (Gen 2) bandwidth. Other than this difference, everything is the same; the SteelSeries keyboard, trackpad, port layout, and maintenance options haven't changed. As such, we will skip these sections in favor of focusing on performance differences. For further information on the physical aspects of the WS63VR, please refer to either our WS63 or GS63VR reviews.
The WS63VR under review sits in a highly competitive market. Most mobile workstations require a significant investment ranging from USD$3000 to $5000. Our WS63VR as configured has an MSRP of $3400, which is relatively affordable given the components inside. While our machine has some niceties like a 4K screen, a generous 512 GB PCIe SSD, and a powerful Quadro P4000 Max-Q, MSI offers several variants, such as the aforementioned WS63. Users that need a larger display might opt for the MSI WT72 or Lenovo ThinkPad P71, both 17-inch powerhouses that are available in multiple configurations. We will also compare the WS63VR to other portable workstations; of note, we'll look at the Dell Precision 5520, the Lenovo ThinkPad P51, and the HP ZBook 15 G4.
Gamers looking for a powerful but portable machine should probably avoid workstations. The added security benefits and component stability likely won't be of any consequence, and the price of admission is commonly double or triple that of a gaming notebook in the same performance tier. For interested gamers, we will also compare the MSI GS63VR, which can be seen as the consumer counterpart to the WS63VR.
Let's take a look to determine whether or not Max-Q is qualified to join the workforce.
SD Card Reader
MSI's notebooks have long been plagued by middling SD Card Reader performance. Oftentimes, transfer rates sit between a paltry 25 and 30 MB/s, which is disheartening considering the expected performance in their price brackets. This iteration of the WS63VR might be MSI's saving grace. Using our Toshiba Exceria Pro SDXC 64 GB UHS-II Reference-Card, the card reader hit 151.3 MB/s when transferring a large amount of photos, and AS SSD pegs speeds at 211.7 MB/s. This is a tenfold improvement over other MSI notebooks and falls in with expectations set by competing workstations.
Communication
Wireless communications are strong, fast, and reliable. Transmit speeds of about 475 MBit/s and receive speeds hovering around 650 MBit/s are average for portable workstations. We find no cause for complaint in network reliability; we have yet to experience a dropped signal or network interruption in day-to-day web browsing and file transfer tests.
Display
The 4K IPS display may appeal to photo editors and CAD-based professionals thanks to generous amounts of real estate. However, at 15.6-inches, the pixel density of a Full HD screen is typically adequate; while a 3820 x 2160 resolution sounds great on paper, most users will have to scale the display via software in order to actually use the computer without straining their eyes. Don't get us wrong - 4K displays are extremely crisp and sharp, and they make for good bragging rights. However, their usefulness is limited at screen sizes under 17 inches. That said, photographers, videographers, and other professionals that rely on a sharp display for their work may appreciate the 8.25 million pixels in this panel. If 4K seems overkill, MSI offers variants of the WS63VR with a Full HD resolution. This option trades razor-sharp pixels for improved battery life and performance. It's a choice users will have to contemplate, which is a nice problem to have.
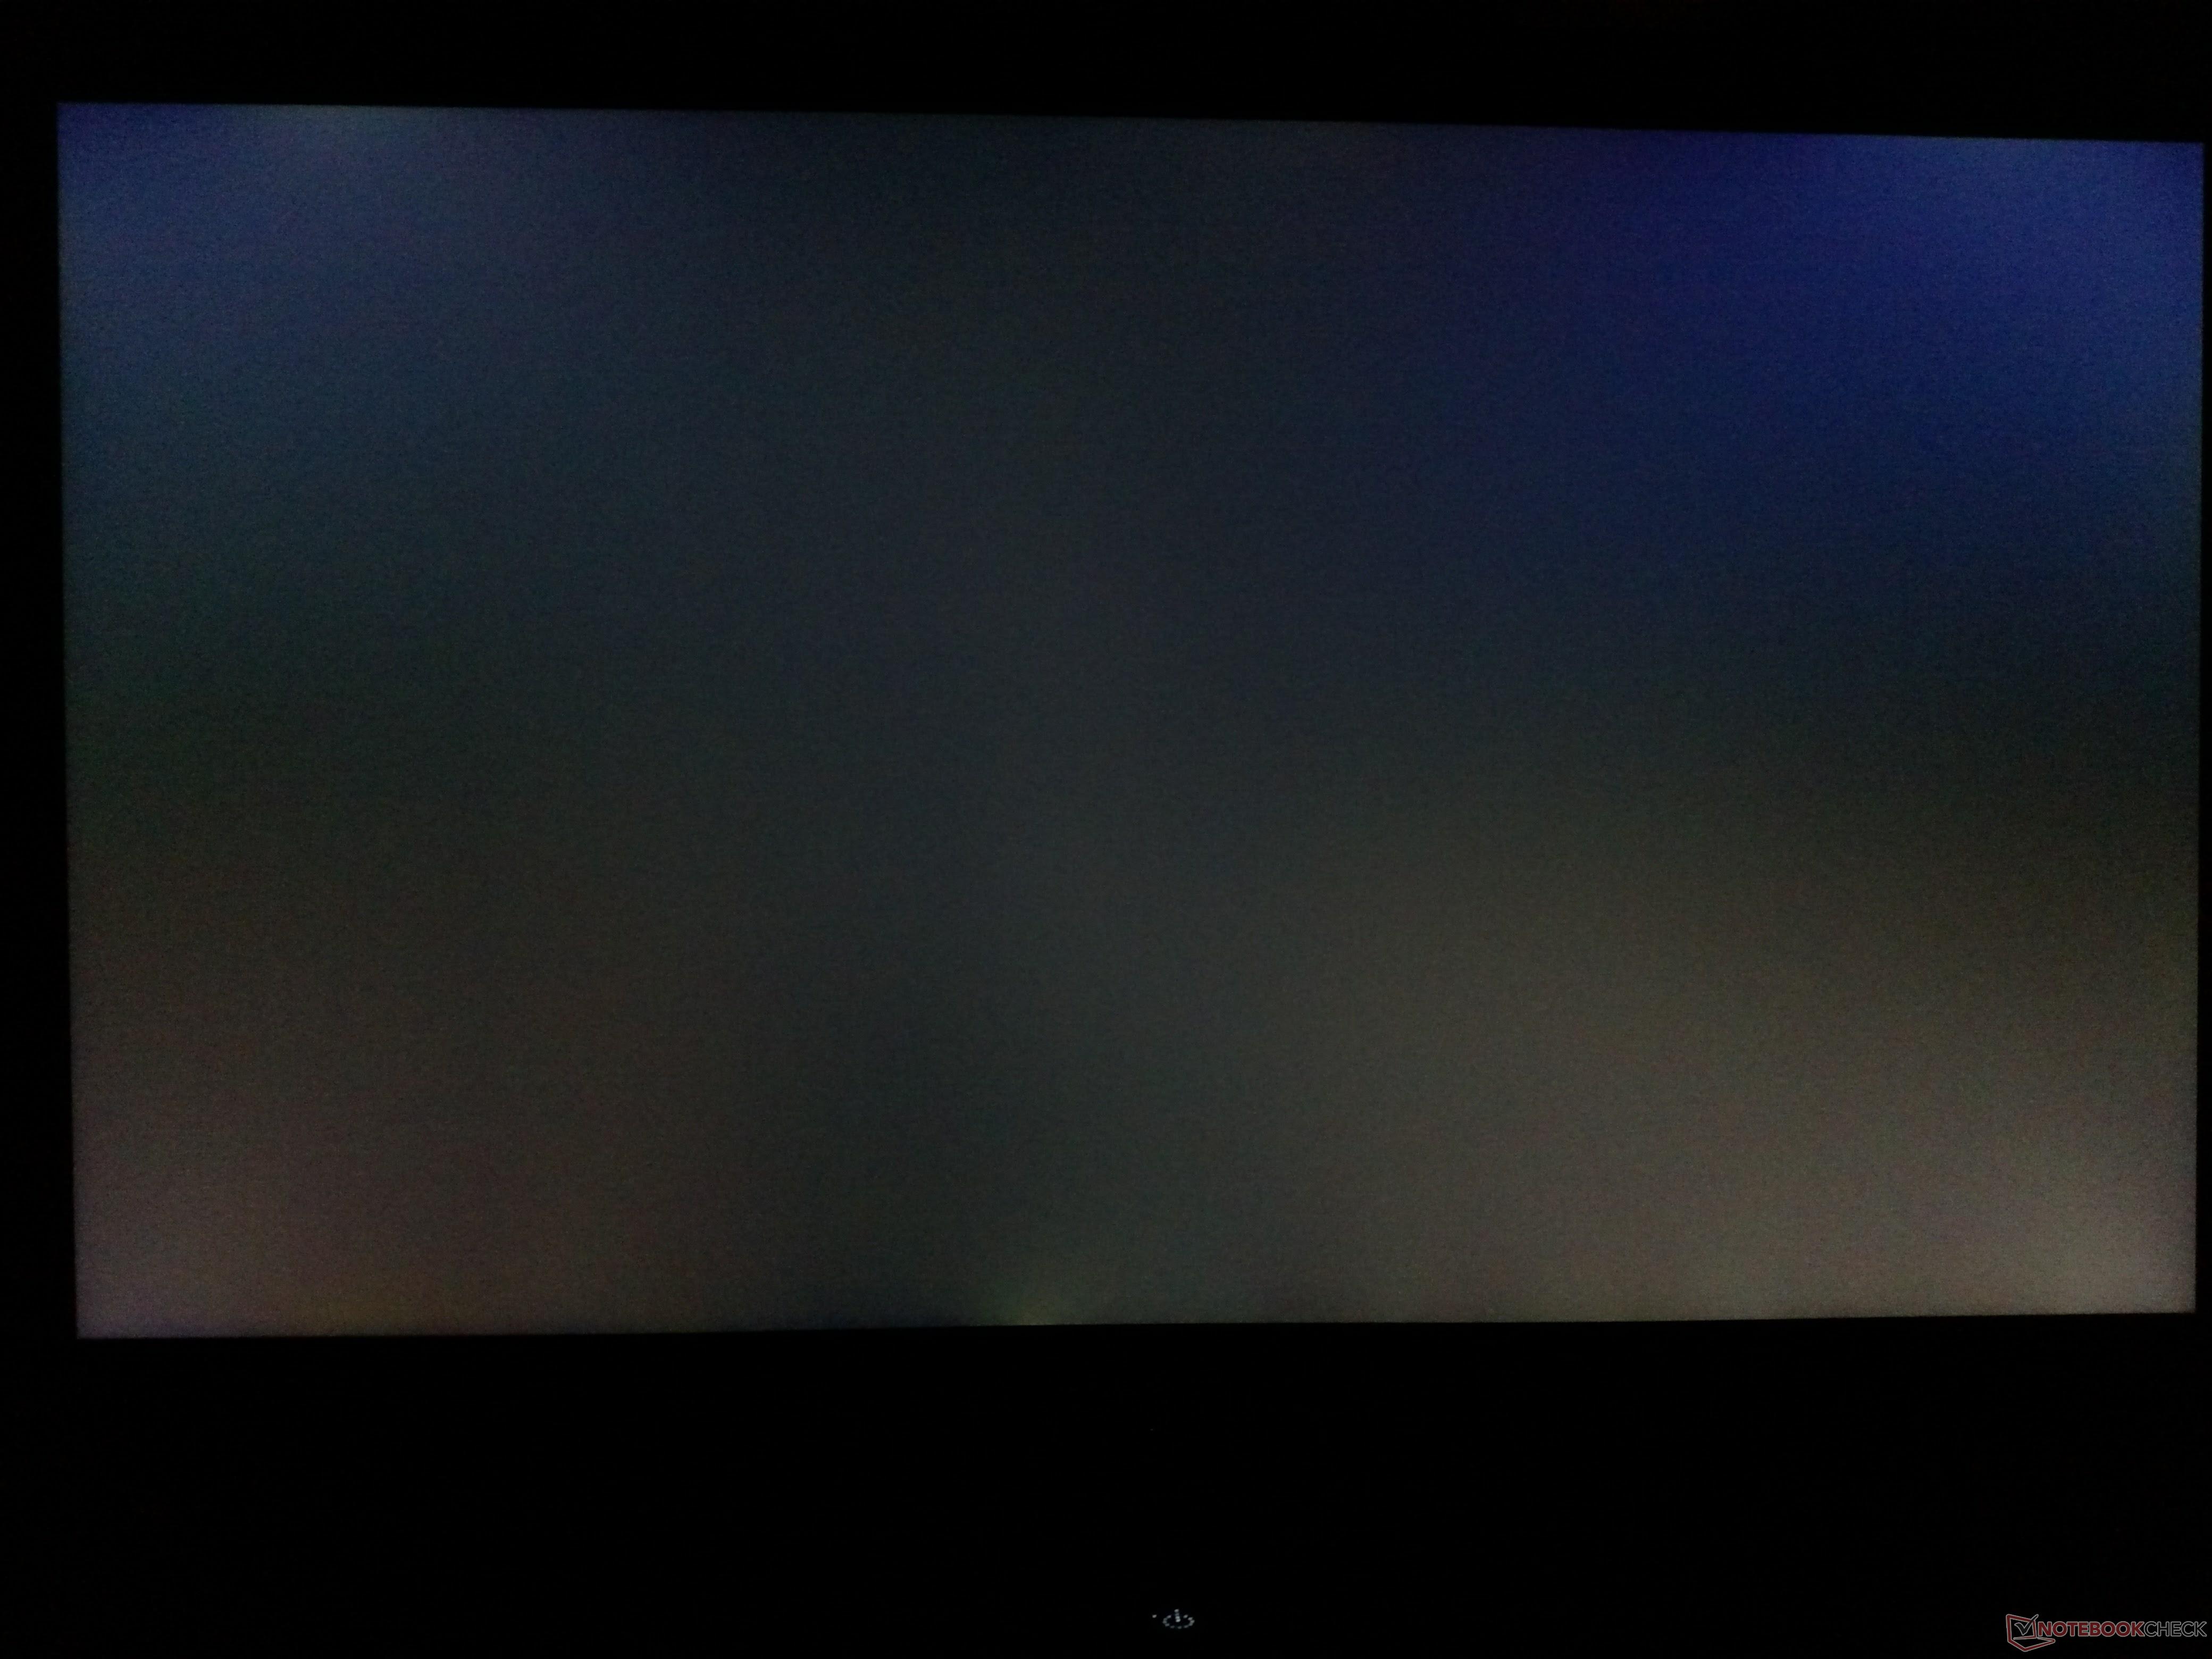
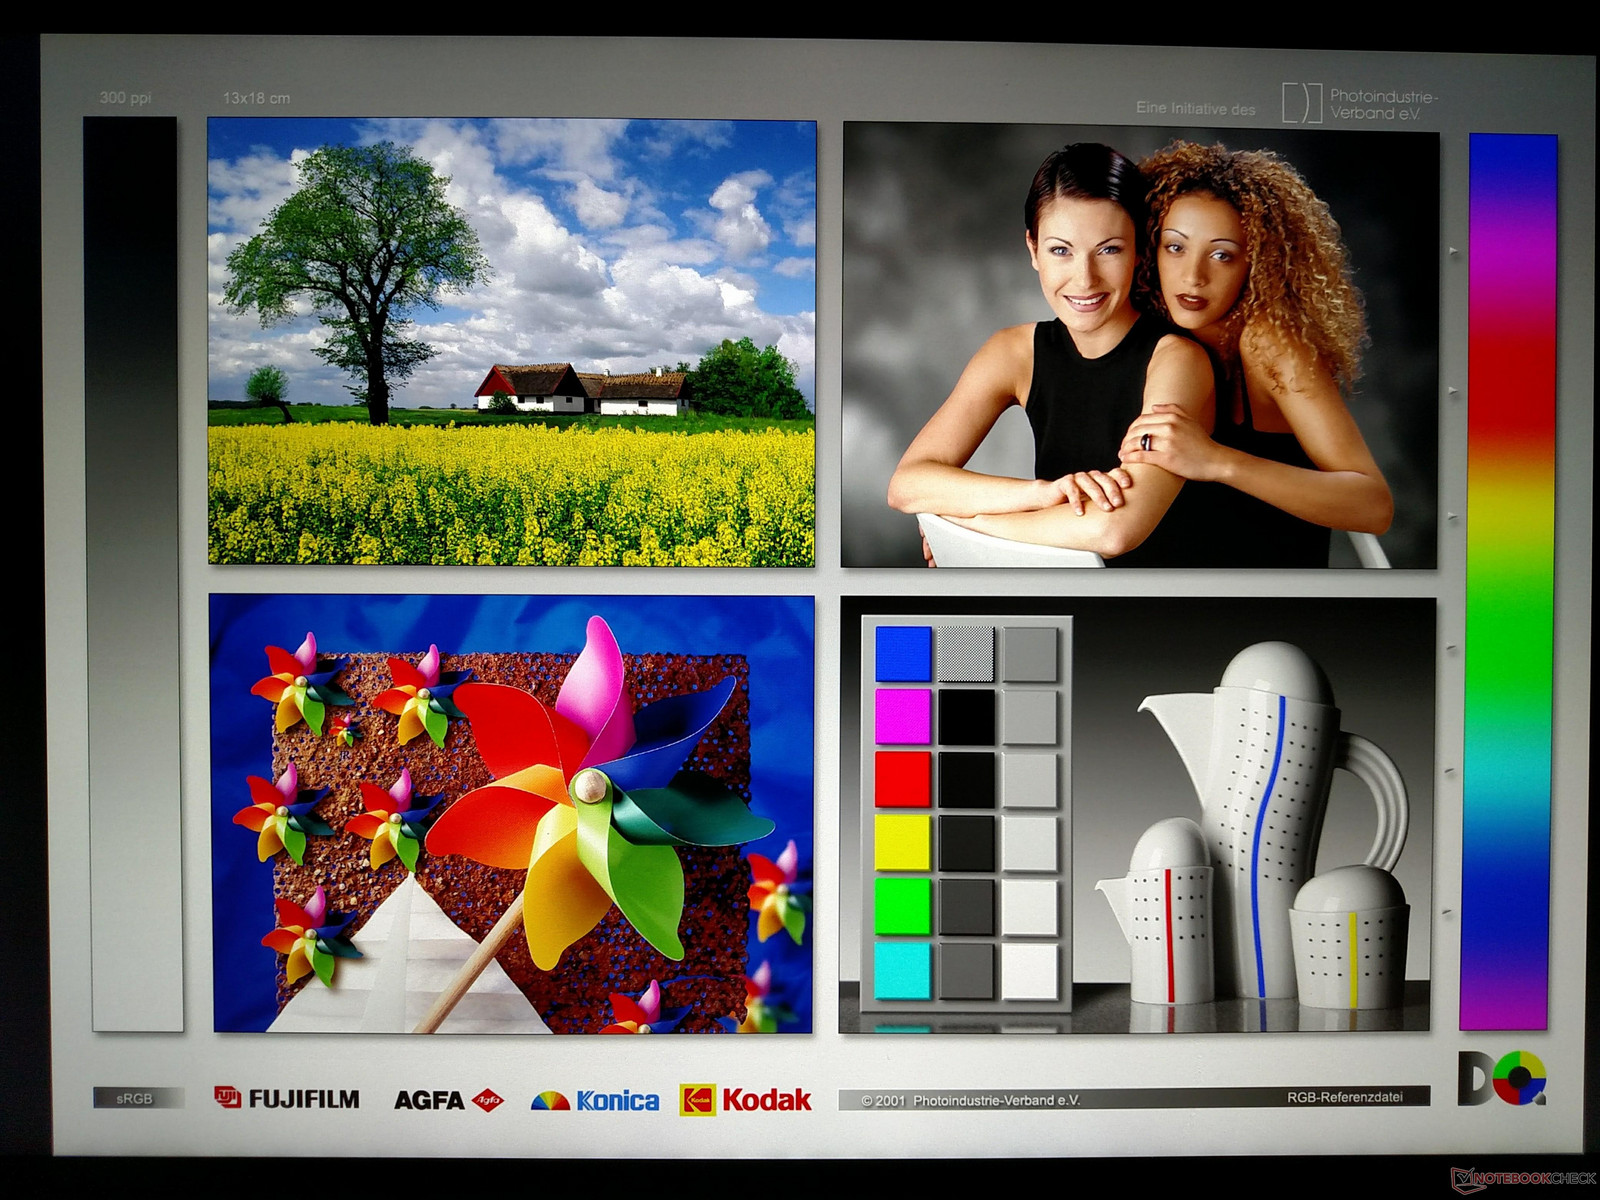
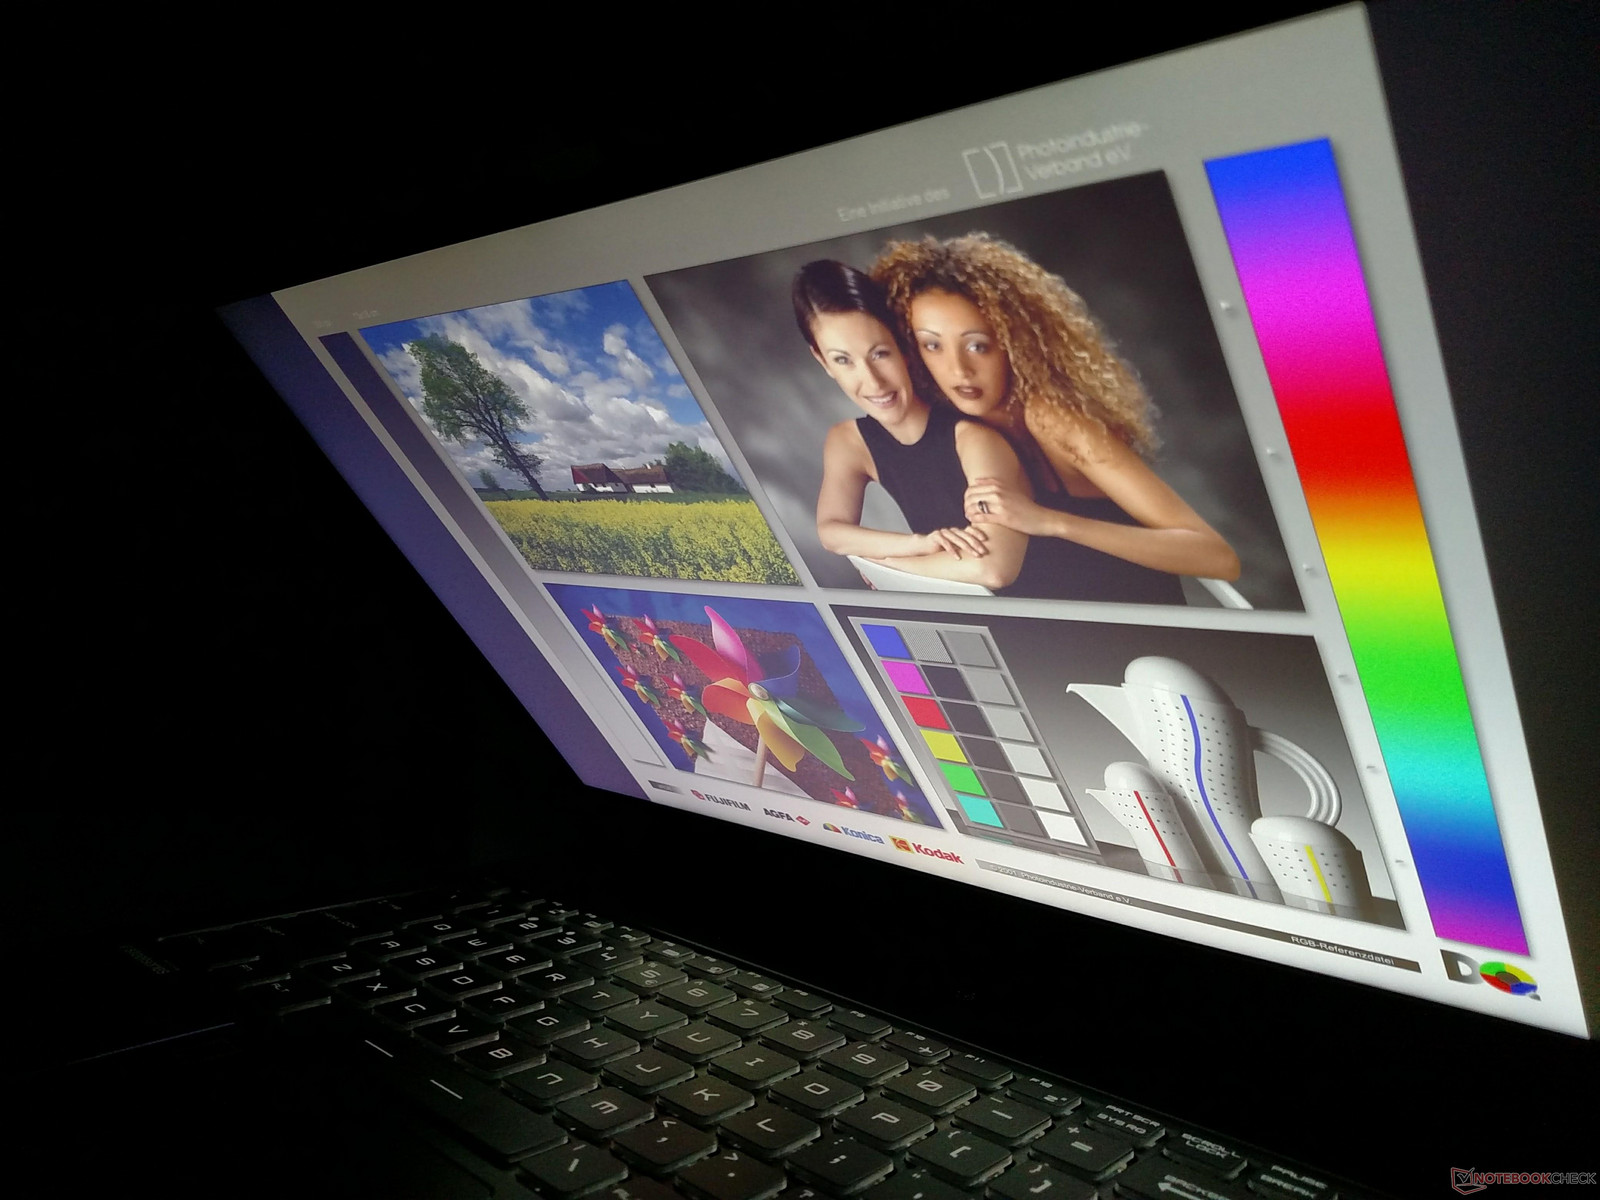
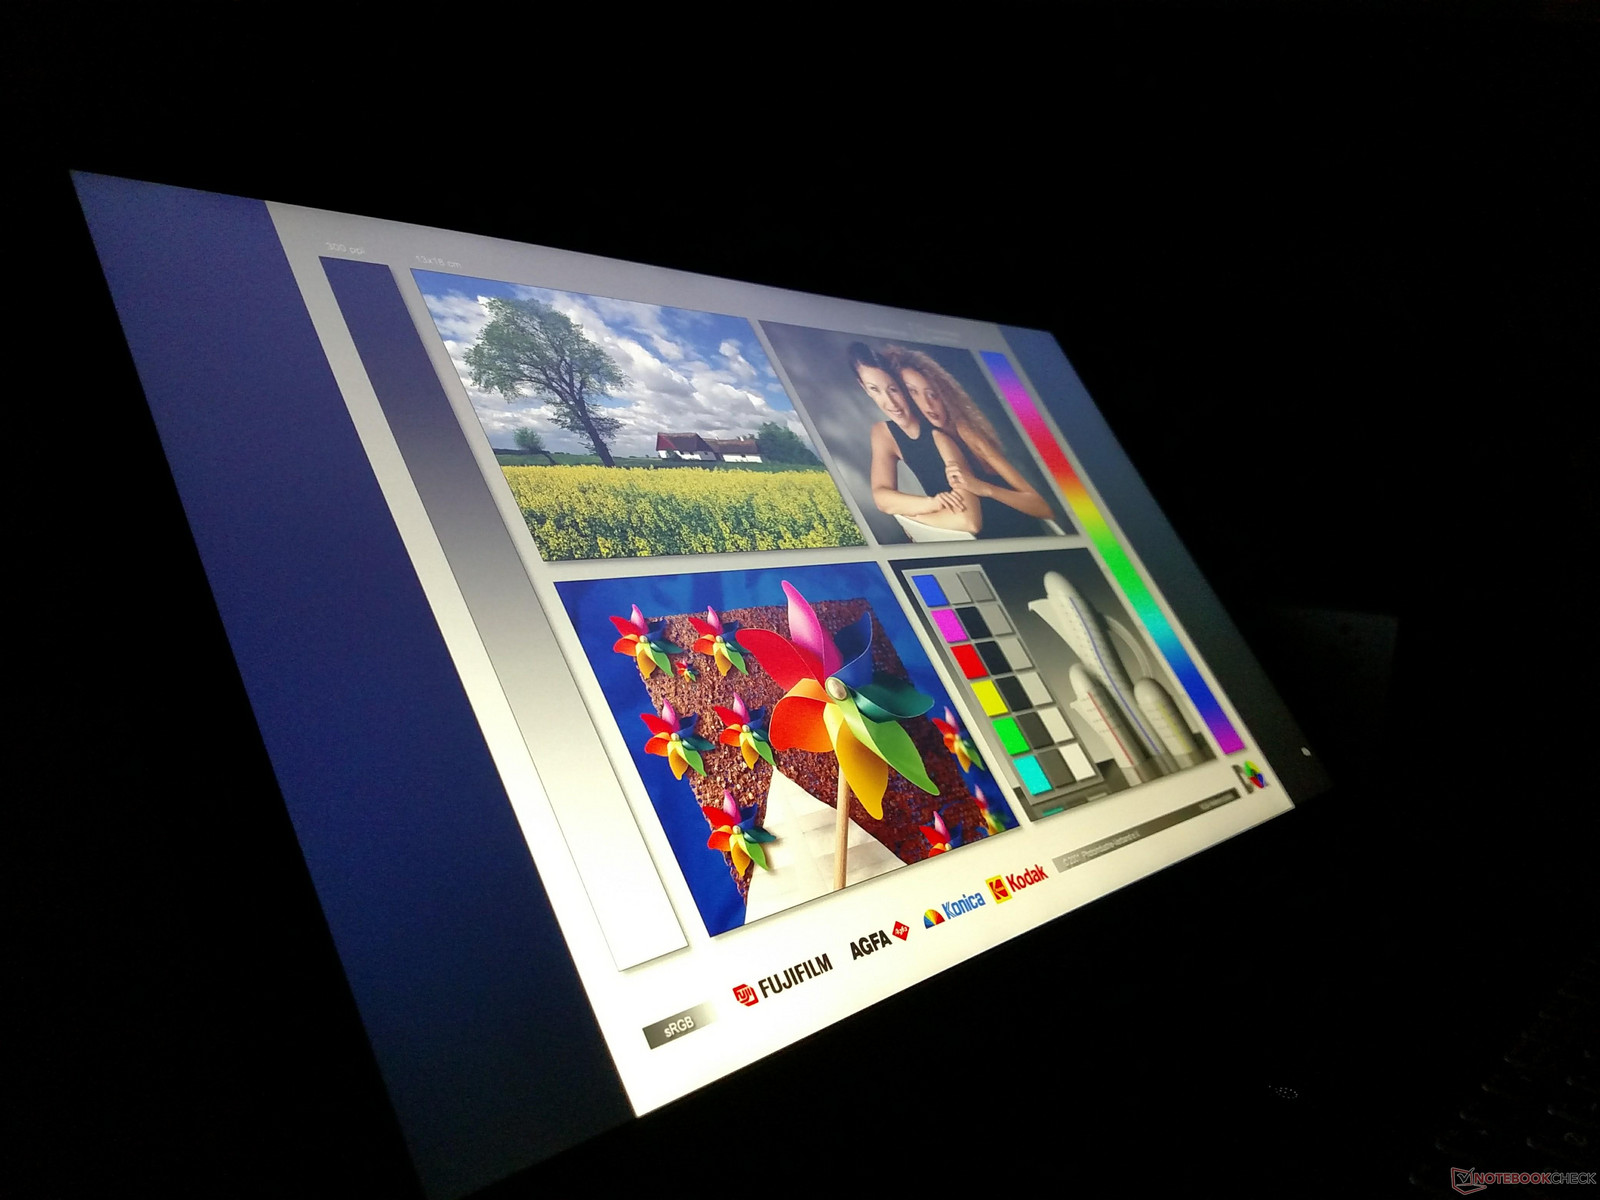
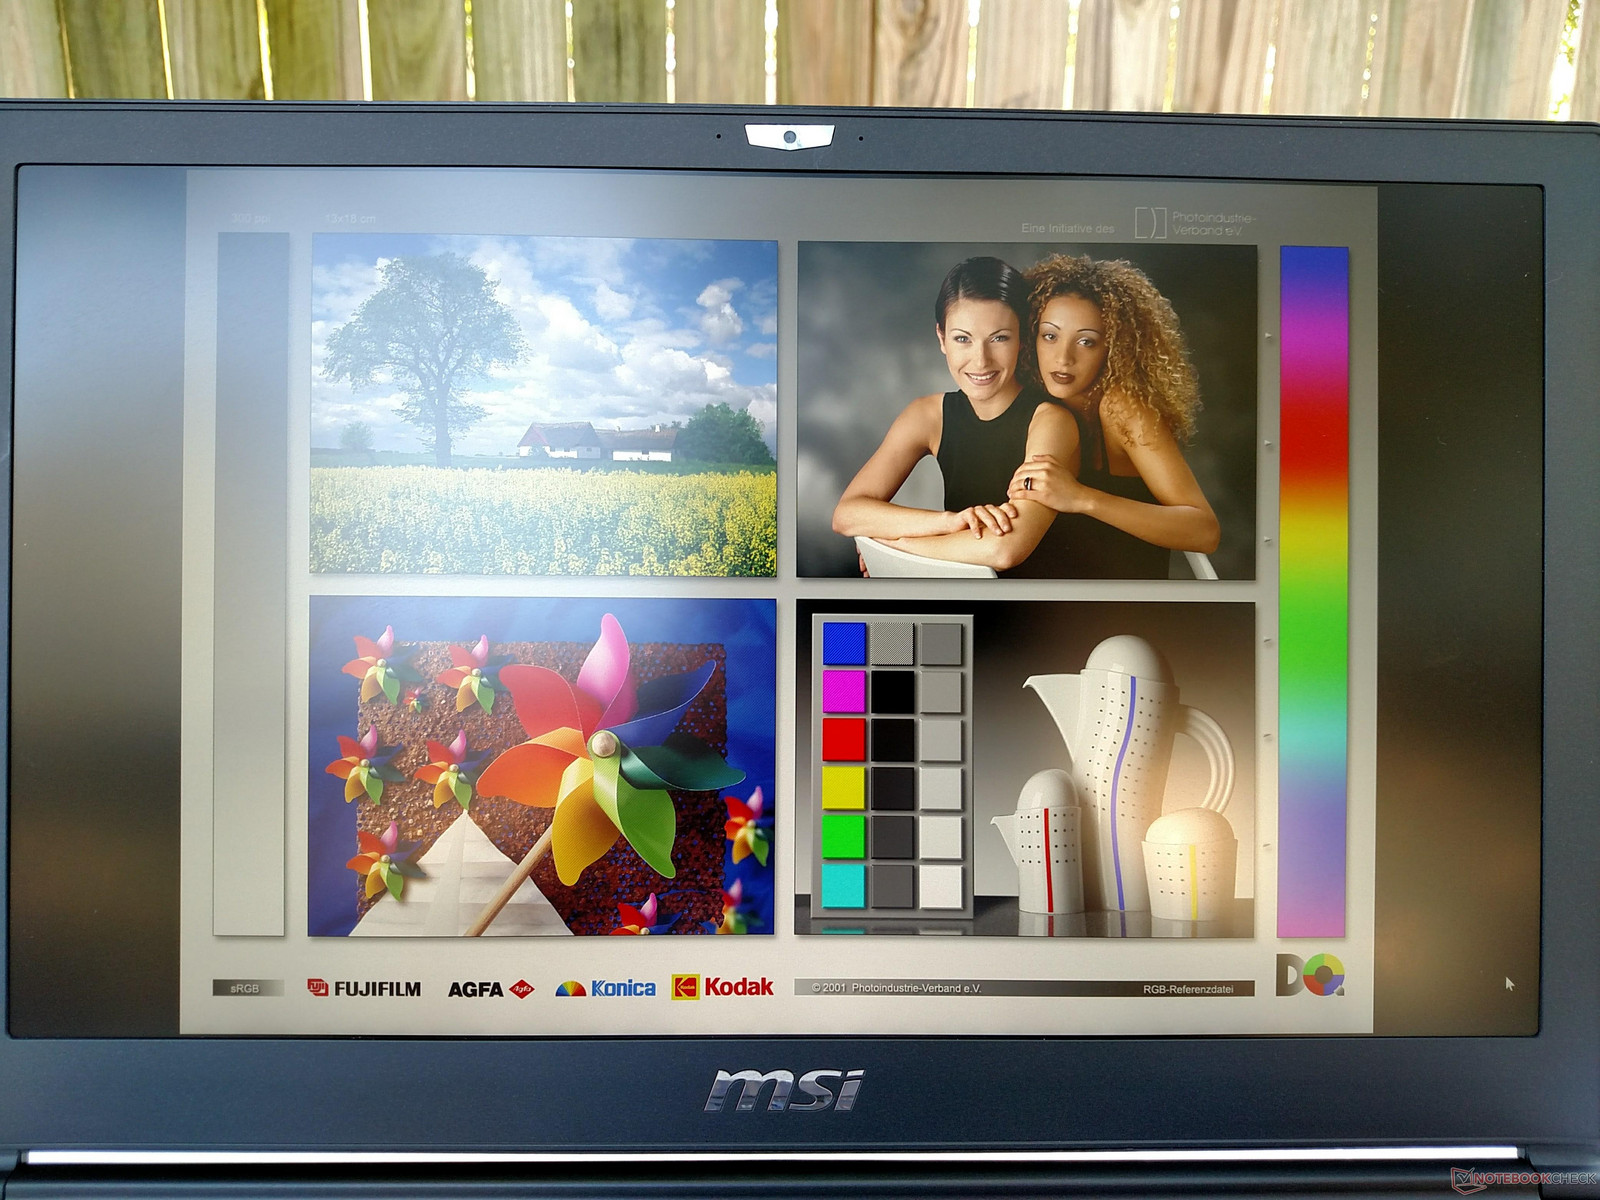
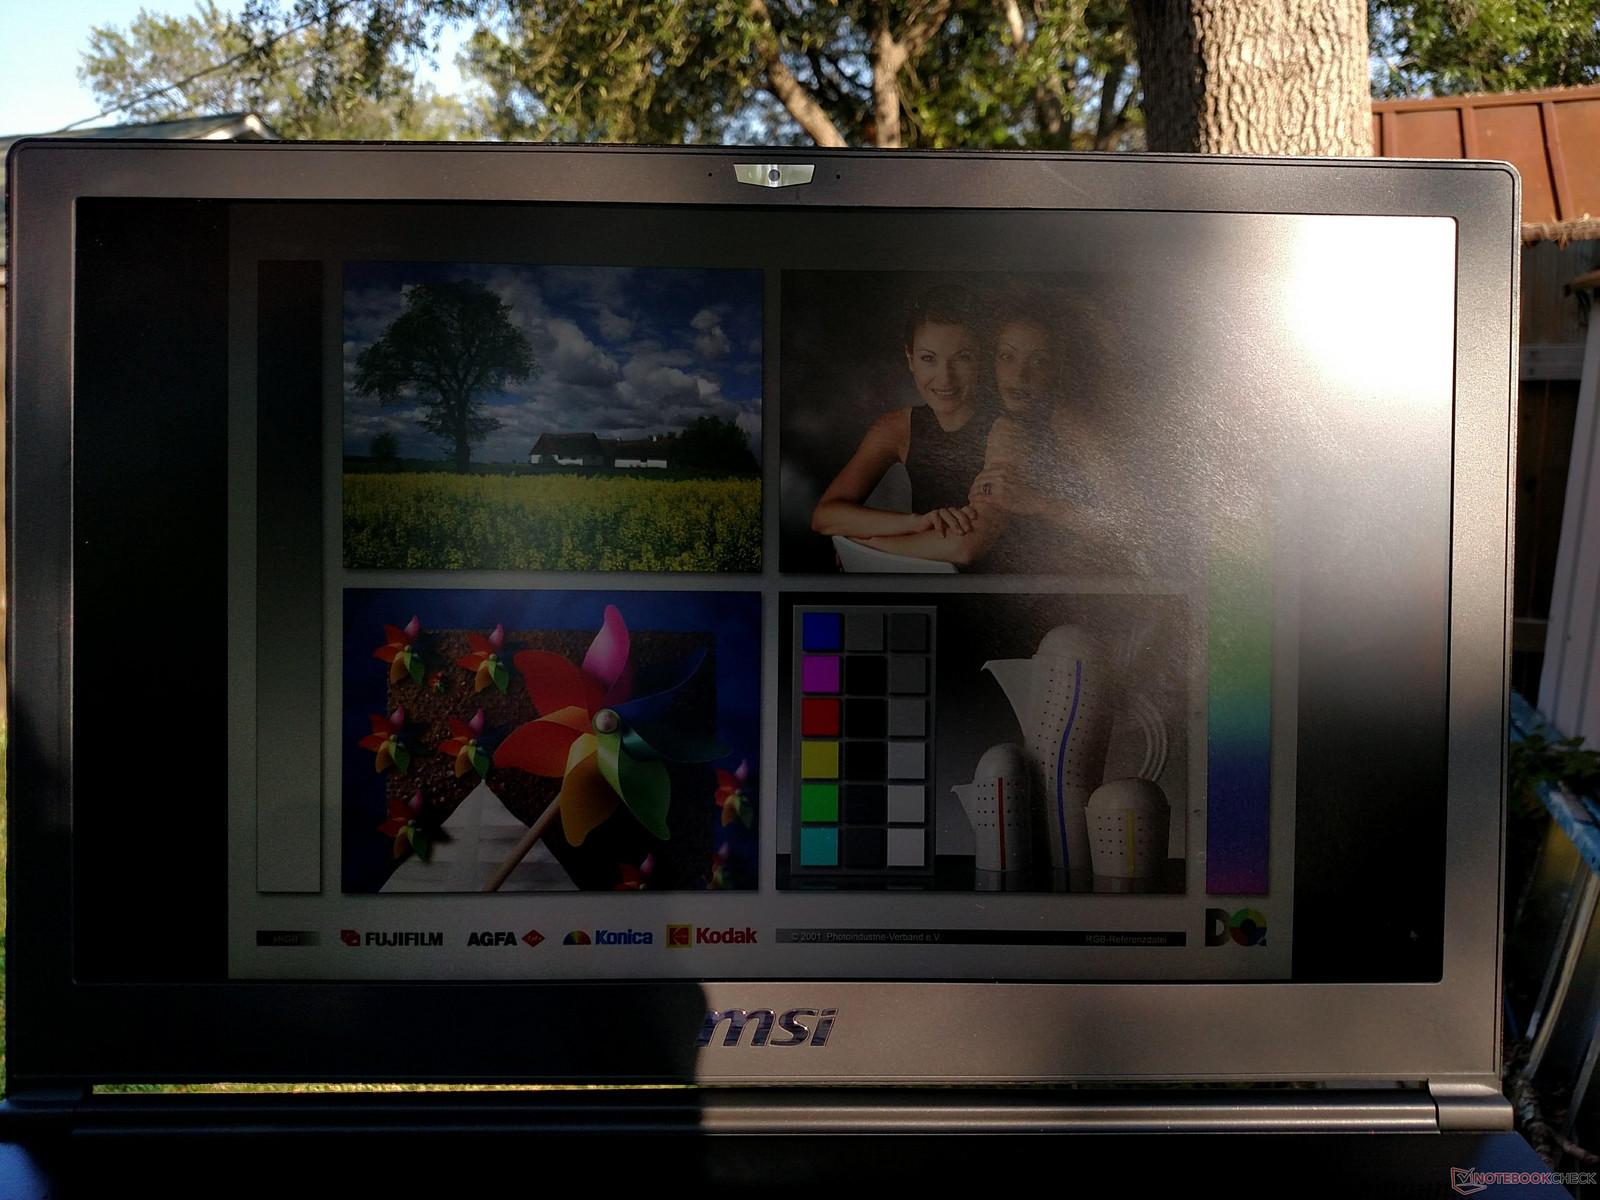
Disregarding our trepidation concerning the Ultra High-Definition screen, the display is quite pleasant. There is some unfortunate backlight bleed along the bottom bezel (particularly in the bottom-right corner), but it's not distracting outside of pitch-black environments. Our biggest complaint is that the display is relatively dim. The matte display helps quite a bit here; indoors, users should have no trouble seeing detail. However, using the device next to an open window or outdoors quickly introduces issues with legibility.
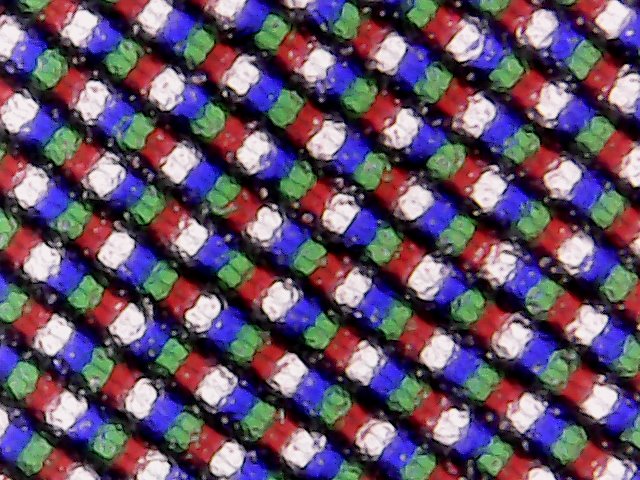
It should be noted that the display panel uses an RGBW sub-pixel arrangement, which deviates from the more common RGB array. An RGBW matrix typically reduces manufacturing expense at the cost of a slight loss in sharpness. Fine text and very small details may look a bit smudged compared to a standard RGB display, but these issues are difficult to notice and require a very close look to see. Backlight uniformity is another minor concern. The bottom right corner (oddly enough where backlight bleed is the most prevalent) is significantly dimmer than other parts of the screen. The problem is especially noticeable at lower brightness settings and may be distracting to some.
A quick note: MSI doesn't currently offer a touchscreen option for the WS63VR. Users that prefer touch input should look at other options, such as the Dell Precision 5520.
| |||||||||||||||||||||||||
Brightness Distribution: 85 %
Center on Battery: 259.4 cd/m²
Contrast: 603:1 (Black: 0.43 cd/m²)
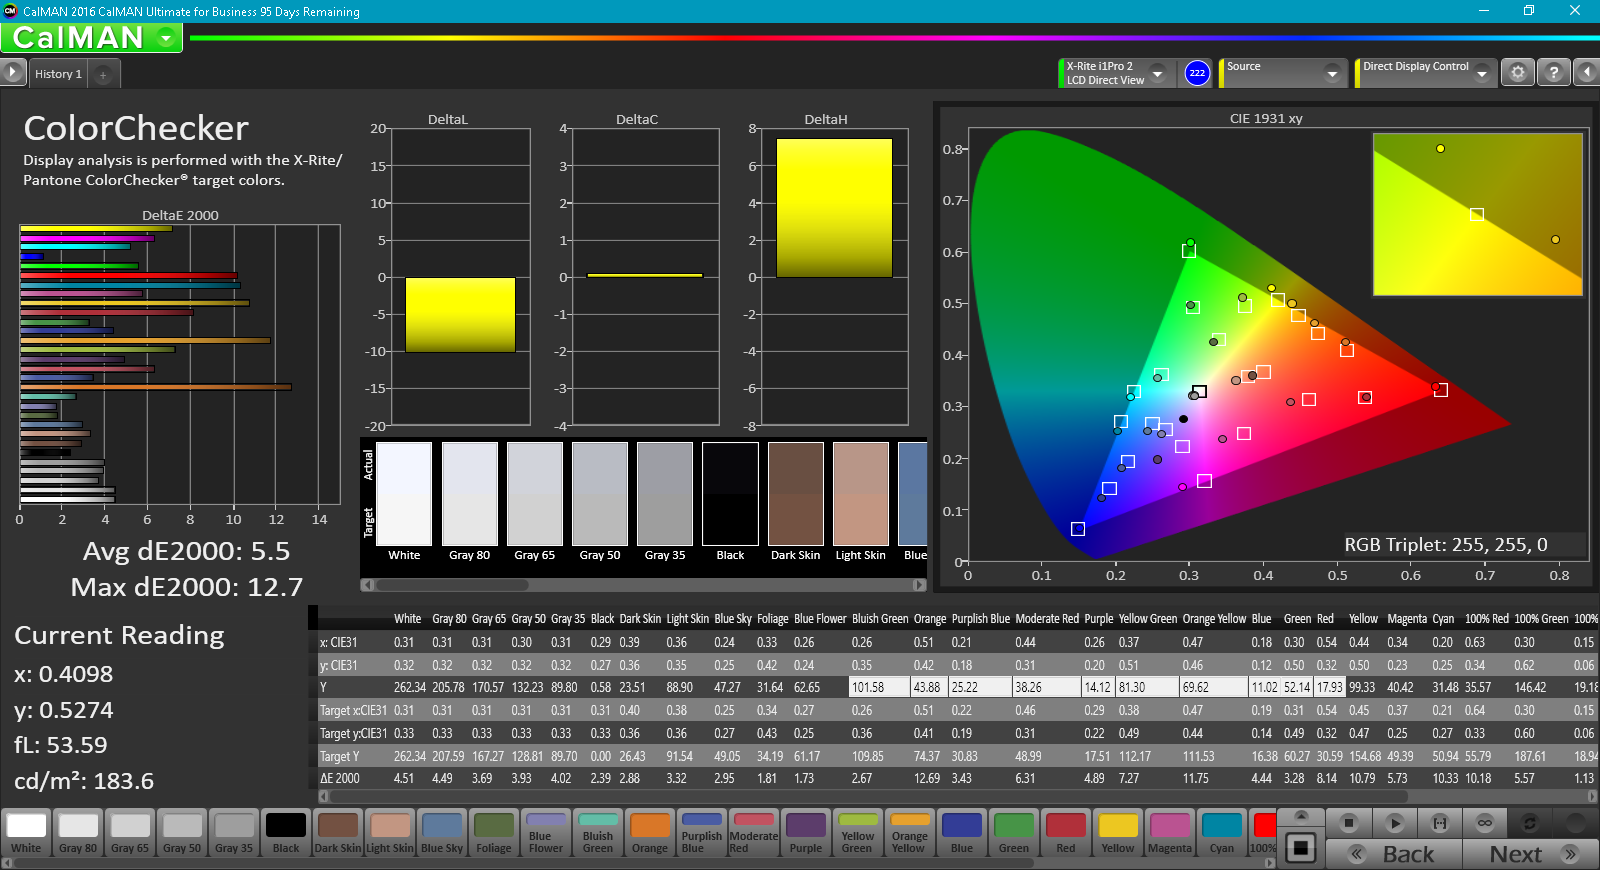
ΔE ColorChecker Calman: 5.5 | ∀{0.5-29.43 Ø4.72}
ΔE Greyscale Calman: 3.6 | ∀{0.09-98 Ø4.97}
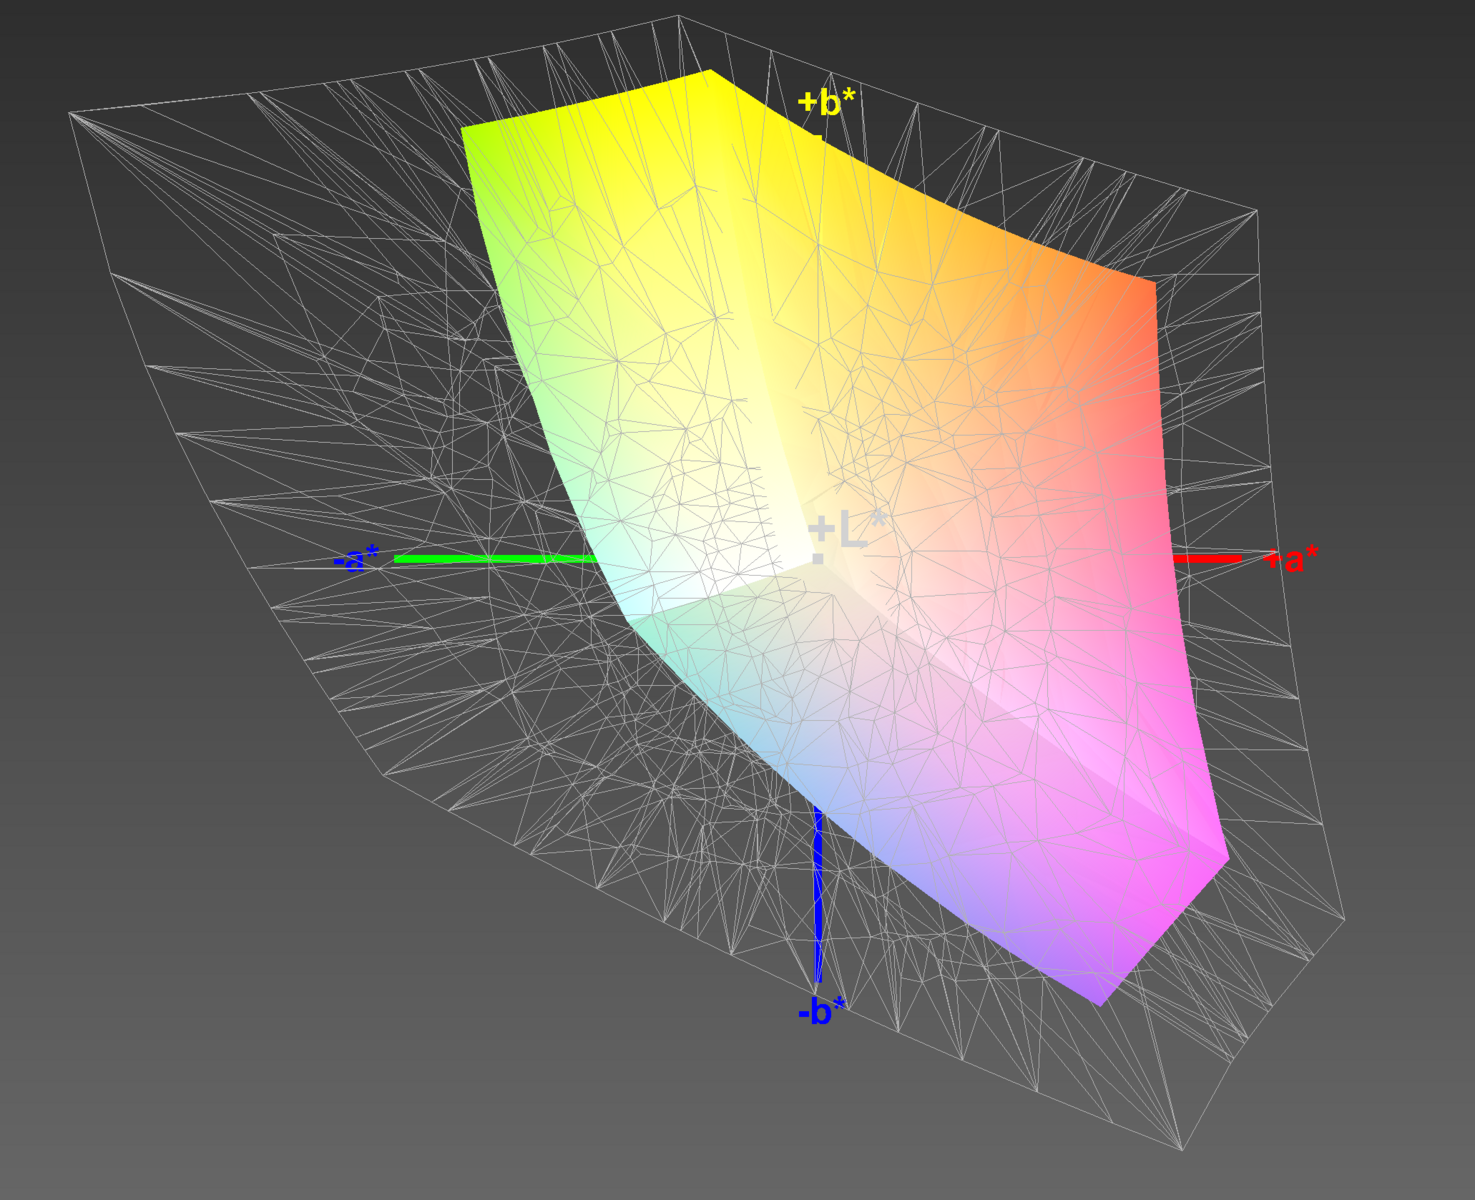
71% sRGB (Argyll 1.6.3 3D)
45% AdobeRGB 1998 (Argyll 1.6.3 3D)
49% AdobeRGB 1998 (Argyll 3D)
71.4% sRGB (Argyll 3D)
47.43% Display P3 (Argyll 3D)
Gamma: 2.24
CCT: 7163 K
| MSI WS63VR 7RL-023US SAMSUNG LƒFL156FL02-101 , IPS, 15.6", 3840x2160 | HP ZBook 15 G4-Y4E80AV LG Philips LGD057E, IPS, 15.6", 1920x1080 | MSI WS63 7RF-290US ID: LGD046F, Name: LG Philips LP156W6, Dell P/N: 3874Y, IPS, 15.6", 1920x1080 | Lenovo ThinkPad P51 20HH0016GE LEN40BD, B156ZAN02.1, IPS, 15.6", 3840x2160 | Lenovo ThinkPad P51s 20HB000SGE BOE NV156QUM-N44, IPS, 15.6", 3840x2160 | Dell Precision 5520 UHD SHP1476, IPS, 15.6", 3840x2160 | MSI GS63VR 7RF-228US IPS, 15.6", 3840x2160 | MSI WT72-6QM LG Philips LP173WF4-SPF1, IPS, 17.3", 1920x1080 | |
|---|---|---|---|---|---|---|---|---|
| Display | 25% | 26% | 75% | 37% | 40% | 2% | 30% | |
| Display P3 Coverage (%) | 47.43 | 64 35% | 63.6 34% | 86.3 82% | 69.7 47% | 67.4 42% | 48.21 2% | 67.3 42% |
| sRGB Coverage (%) | 71.4 | 82.7 16% | 84.2 18% | 99.5 39% | 91.2 28% | 98.5 38% | 72.6 2% | 85.4 20% |
| AdobeRGB 1998 Coverage (%) | 49 | 60.4 23% | 61.5 26% | 99.3 103% | 66.8 36% | 68.9 41% | 49.81 2% | 62.5 28% |
| Response Times | 2% | -10% | 0% | 5% | -54% | 21% | -3% | |
| Response Time Grey 50% / Grey 80% * (ms) | 36.8 ? | 39.2 ? -7% | 38 ? -3% | 40.8 ? -11% | 38.4 ? -4% | 59.2 ? -61% | 28 ? 24% | 42 ? -14% |
| Response Time Black / White * (ms) | 28.4 ? | 25.6 ? 10% | 33 ? -16% | 25.2 ? 11% | 24.8 ? 13% | 41.6 ? -46% | 23.6 ? 17% | 26 ? 8% |
| PWM Frequency (Hz) | 1351 ? | 20830 ? | 21740 ? | 980 ? | 1351 ? | 86 ? | ||
| Screen | 27% | 24% | 39% | 26% | 30% | -19% | 6% | |
| Brightness middle (cd/m²) | 259.4 | 321 24% | 302.5 17% | 317 22% | 317 22% | 372.4 44% | 274.2 6% | 303 17% |
| Brightness (cd/m²) | 247 | 320 30% | 295 19% | 309 25% | 290 17% | 368 49% | 263 6% | 298 21% |
| Brightness Distribution (%) | 85 | 89 5% | 92 8% | 89 5% | 85 0% | 90 6% | 92 8% | 94 11% |
| Black Level * (cd/m²) | 0.43 | 0.29 33% | 0.31 28% | 0.36 16% | 0.32 26% | 0.48 -12% | 0.44 -2% | 0.46 -7% |
| Contrast (:1) | 603 | 1107 84% | 976 62% | 881 46% | 991 64% | 776 29% | 623 3% | 659 9% |
| Colorchecker dE 2000 * | 5.5 | 4.5 18% | 4.3 22% | 2.7 51% | 3.6 35% | 2.6 53% | 8 -45% | 5.77 -5% |
| Colorchecker dE 2000 max. * | 12.7 | 9.5 25% | 9.4 26% | 4.1 68% | 6.6 48% | 5.6 56% | 14.6 -15% | |
| Greyscale dE 2000 * | 3.6 | 2.9 19% | 3.1 14% | 3 17% | 4.2 -17% | 3.7 -3% | 9.1 -153% | 4.87 -35% |
| Gamma | 2.24 98% | 2.27 97% | 2.16 102% | 2.27 97% | 2.24 98% | 2.14 103% | 2.24 98% | 1.99 111% |
| CCT | 7163 91% | 6519 100% | 7071 92% | 6077 107% | 6740 96% | 7096 92% | 5020 129% | 7363 88% |
| Color Space (Percent of AdobeRGB 1998) (%) | 45 | 54.2 20% | 55 22% | 87.6 95% | 59.5 32% | 63 40% | 45.7 2% | 56.04 25% |
| Color Space (Percent of sRGB) (%) | 71 | 82.6 16% | 84.3 19% | 99.5 40% | 91.1 28% | 99 39% | 72.1 2% | 85.27 20% |
| Total Average (Program / Settings) | 18% /
23% | 13% /
20% | 38% /
41% | 23% /
25% | 5% /
21% | 1% /
-9% | 11% /
10% |
* ... smaller is better
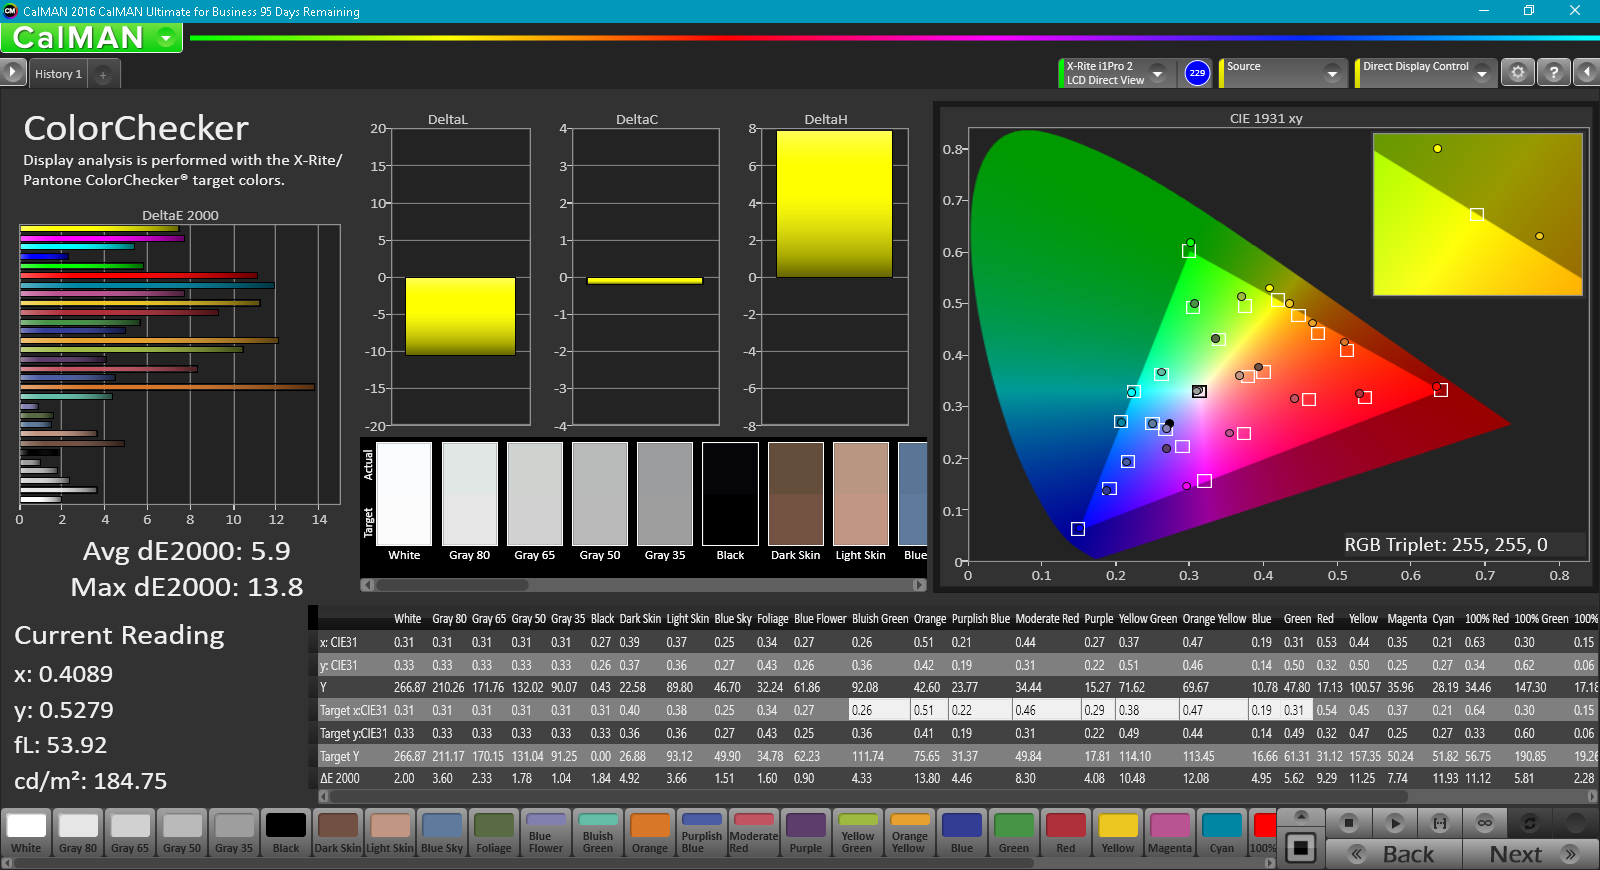
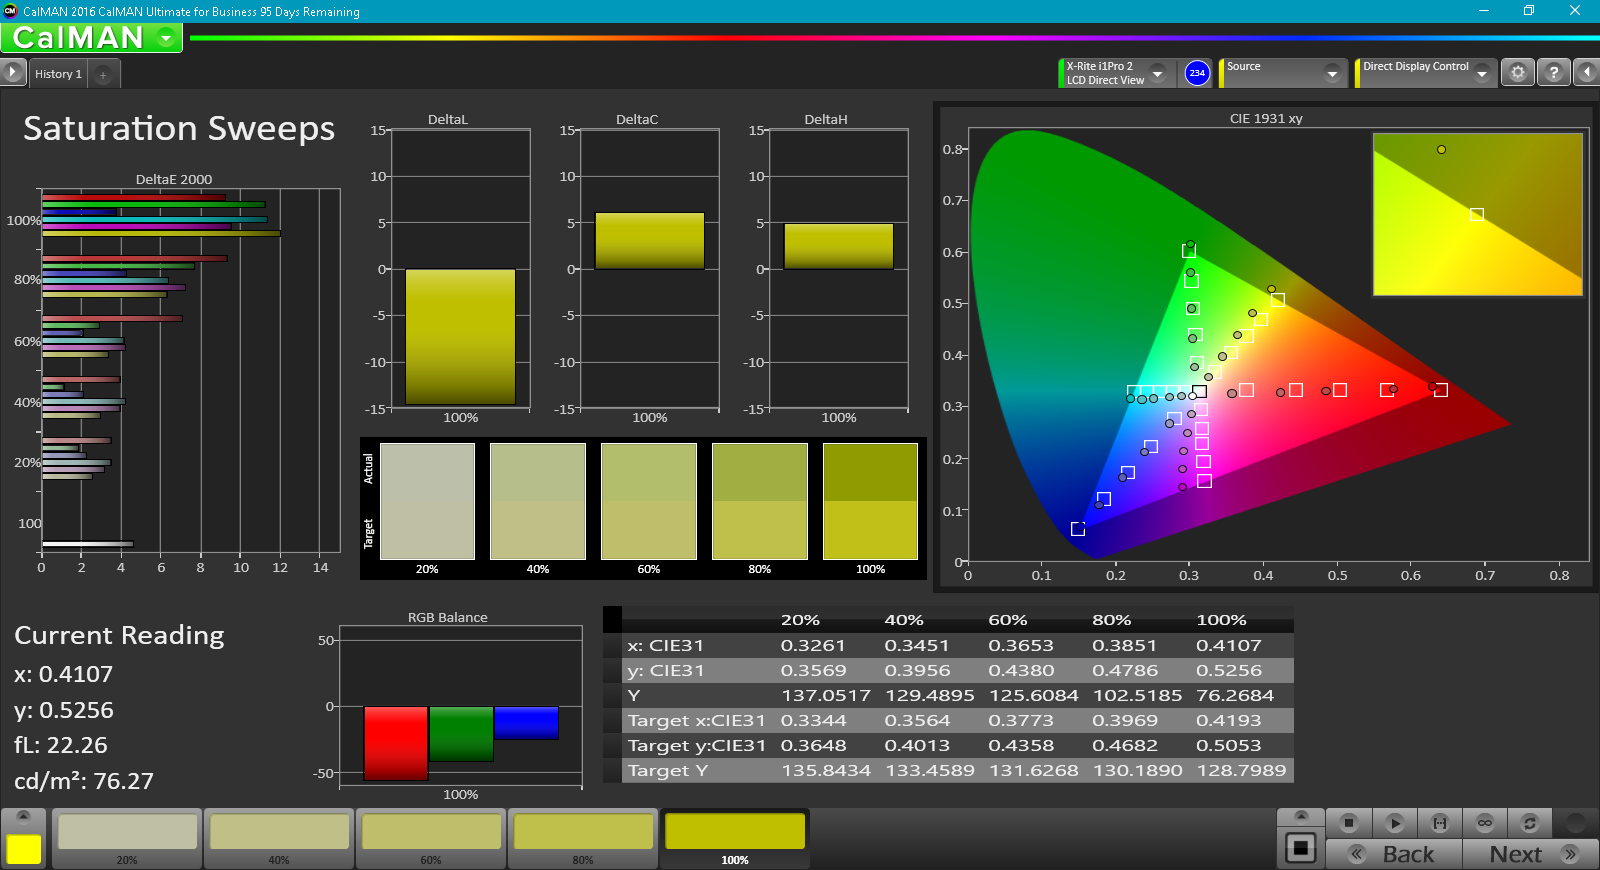
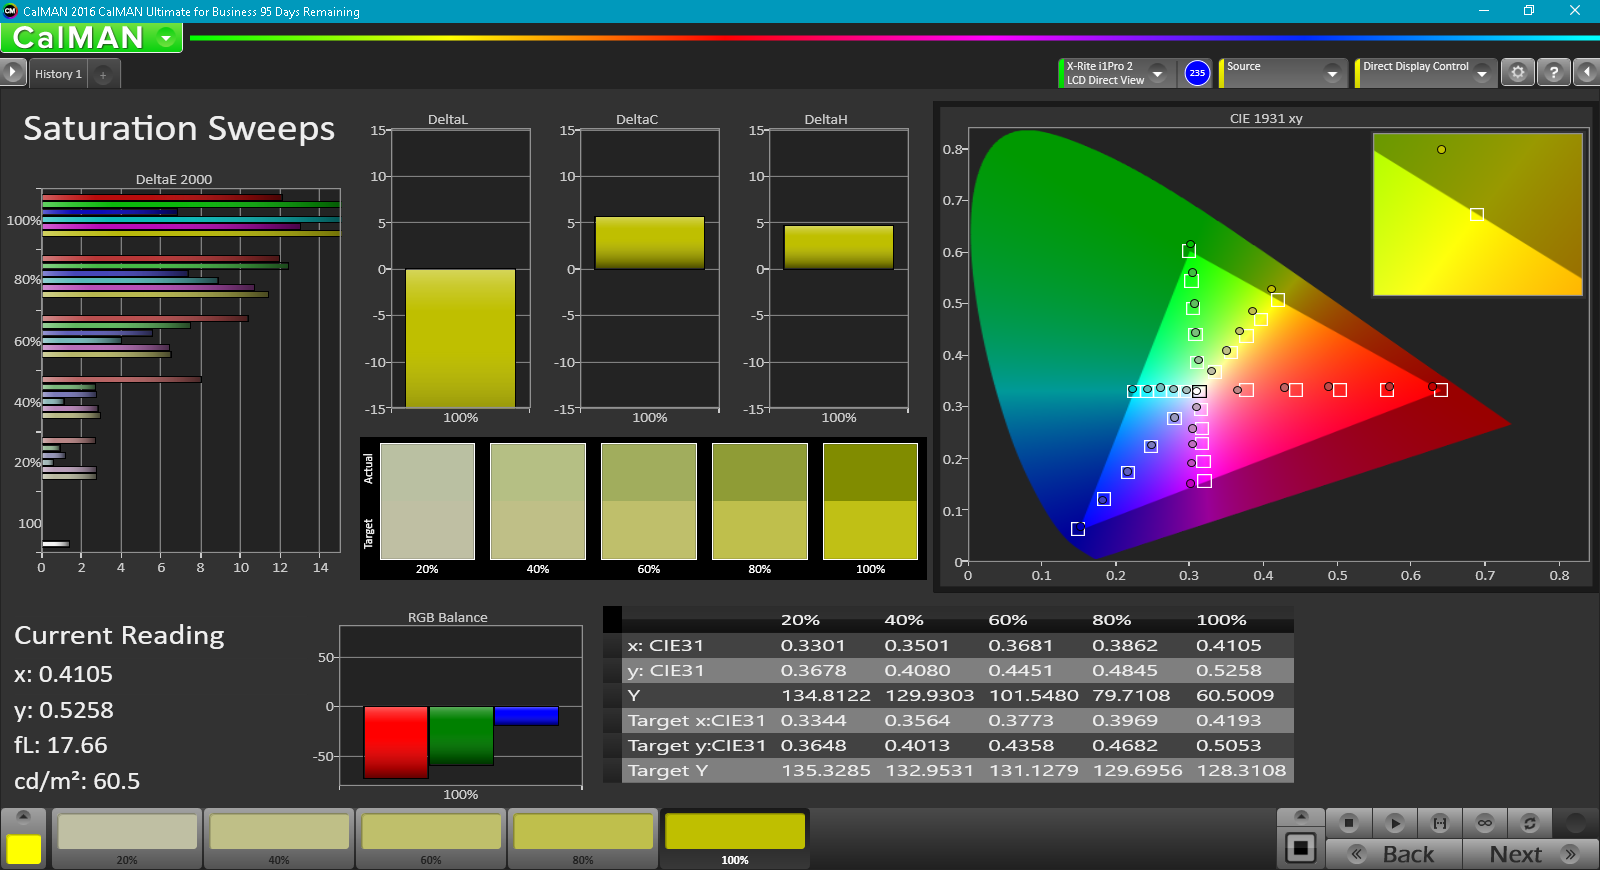
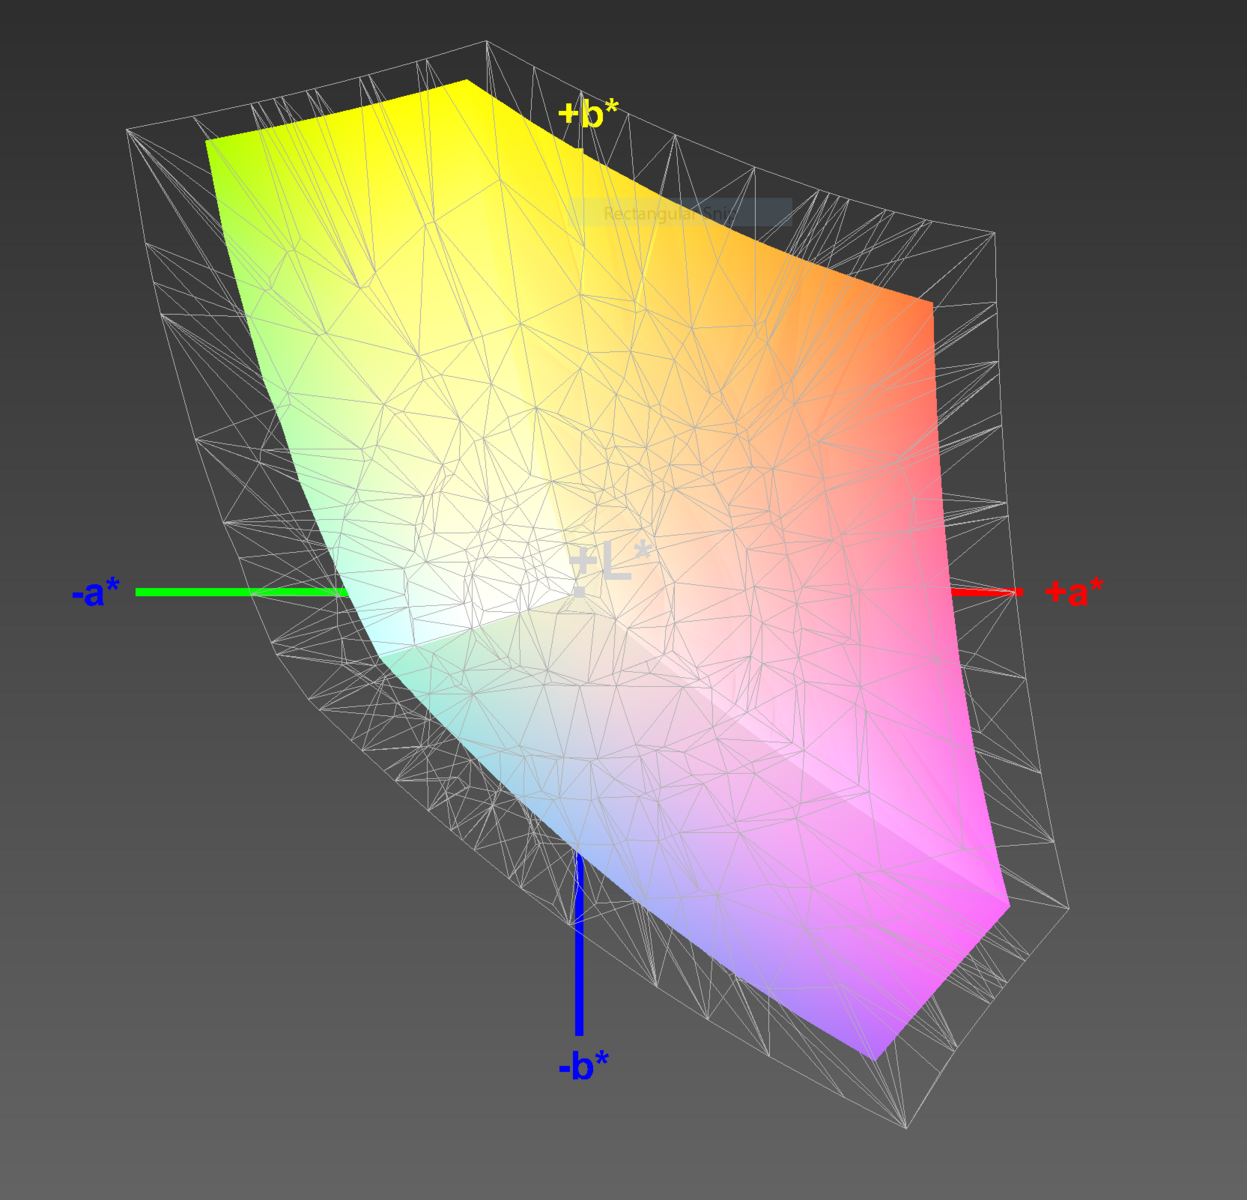
Barring the 4K resolution, the display is fairly average. Colors are fairly accurate at 5.9, although professionals will want to calibrate the screen. This should be more than accurate for engineers and modelers, but post-calibration, color accuracy still falls short of what is generally considered acceptable for professional use (DeltaE of 3 or less). Black levels are also disappointing; combined with the low overall brightness, contrast leaves a lot to be desired. Color space coverage is another weak point; the WS63VR's display only covers 71% of the sRGB color space and 45% of the AdobeRGB space. Users needing a broad range of colors with which to work should look at the Lenovo ThinkPad P51; the MSI WS63VR covers only about 47% of the P51's color space.
All said, the screen will be adequate for most users, particularly scientists, engineers, and other professionals that don't rely on color. Photographers and videographers will want to look at other options, particularly the Lenovo P51, for their improved colors.


Viewing angles are excellent, as is expected of an IPS panel. The matte finish also lends to an enjoyable viewing experience. Media and text remain vibrant and crisp when viewed from an angle, although colors will begin to wash out past 45º. As mentioned, the screen is not usable in direct sunlight. Shade is a requirement when working outdoors, but the notebook is usable in such conditions.
A last note: screen response times are average, soliciting no complaints. PWM is present at brightness levels under 30%, but at 1351 Hz, only the most sensitive users will notice it.
Display Response Times
| ↔ Response Time Black to White | ||
|---|---|---|
| 28.4 ms ... rise ↗ and fall ↘ combined | ↗ 19.6 ms rise | 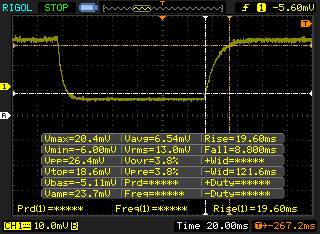 |
| ↘ 8.8 ms fall | ||
| The screen shows relatively slow response rates in our tests and may be too slow for gamers. In comparison, all tested devices range from 0.1 (minimum) to 240 (maximum) ms. » 75 % of all devices are better. This means that the measured response time is worse than the average of all tested devices (19.8 ms). | ||
| ↔ Response Time 50% Grey to 80% Grey | ||
| 36.8 ms ... rise ↗ and fall ↘ combined | ↗ 21.2 ms rise | 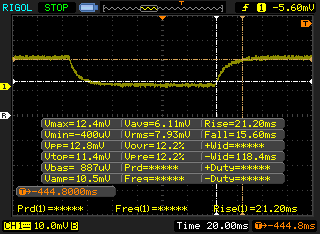 |
| ↘ 15.6 ms fall | ||
| The screen shows slow response rates in our tests and will be unsatisfactory for gamers. In comparison, all tested devices range from 0.165 (minimum) to 636 (maximum) ms. » 53 % of all devices are better. This means that the measured response time is worse than the average of all tested devices (31 ms). | ||
Screen Flickering / PWM (Pulse-Width Modulation)
| Screen flickering / PWM detected | 1351 Hz | ≤ 30 % brightness setting |  |
The display backlight flickers at 1351 Hz (worst case, e.g., utilizing PWM) Flickering detected at a brightness setting of 30 % and below. There should be no flickering or PWM above this brightness setting. The frequency of 1351 Hz is quite high, so most users sensitive to PWM should not notice any flickering. In comparison: 52 % of all tested devices do not use PWM to dim the display. If PWM was detected, an average of 7750 (minimum: 5 - maximum: 343500) Hz was measured. | |||
Performance
Workstation notebooks generally reside in the top echelon for performance, owing mainly to the demands placed on them by the target market. Workstations are designed for high-end tasks such as video editing and CAD work, usually in a professional setting. As such, consistent and powerful performance is paramount, and the WS63VR is up to the task. The combination of a top-tier processor and an incredibly powerful and efficient GPU make for a beat of a machine wrapped in a thin, light, and highly portable package.
Our review model today bears some slight upgrades compared to its predecessors, mainly with the graphics card. Nvidia's new Max-Q design philosophy emphasizes thermal and energy efficiency without sacrificing much in the way of power. As such, we should expect to see stellar performance from the Quadro P4000 with Max-Q without the major heat and noise drawbacks commonly associated with high-end GPUs. Let's take a look.

Processor
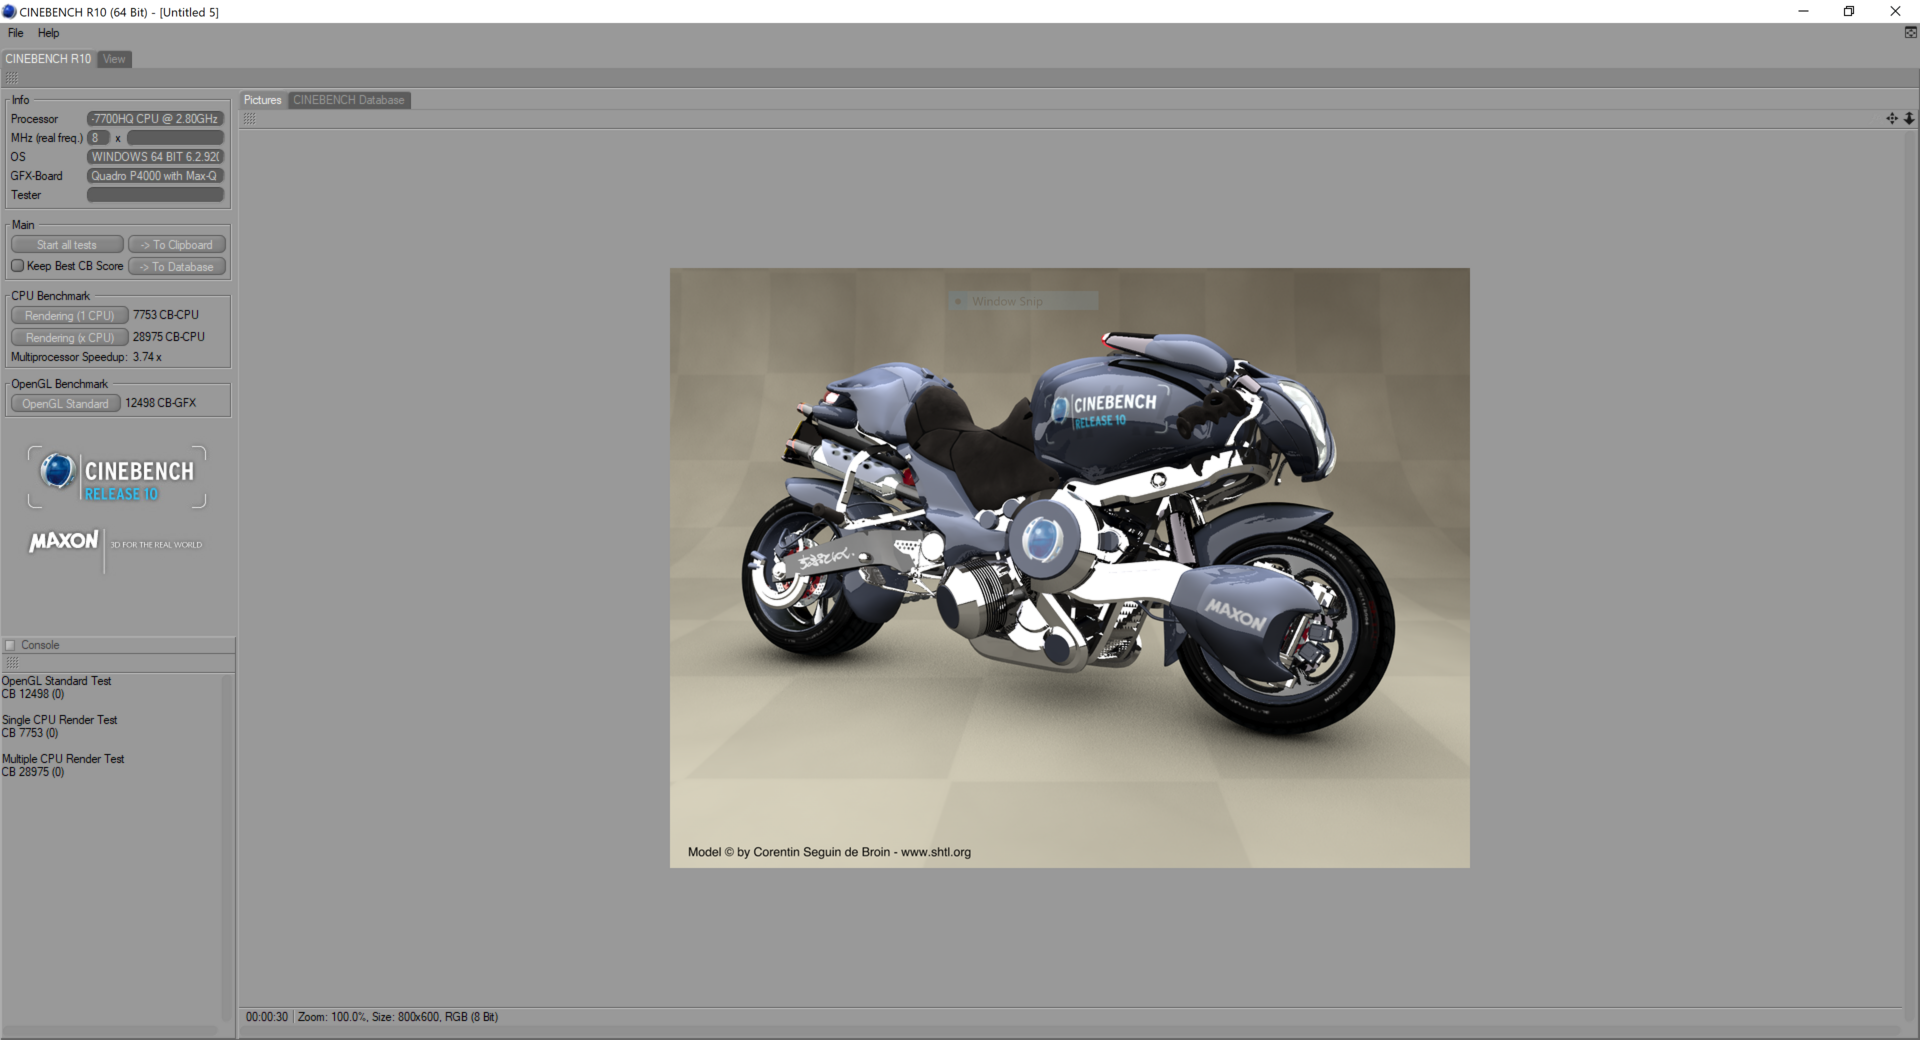
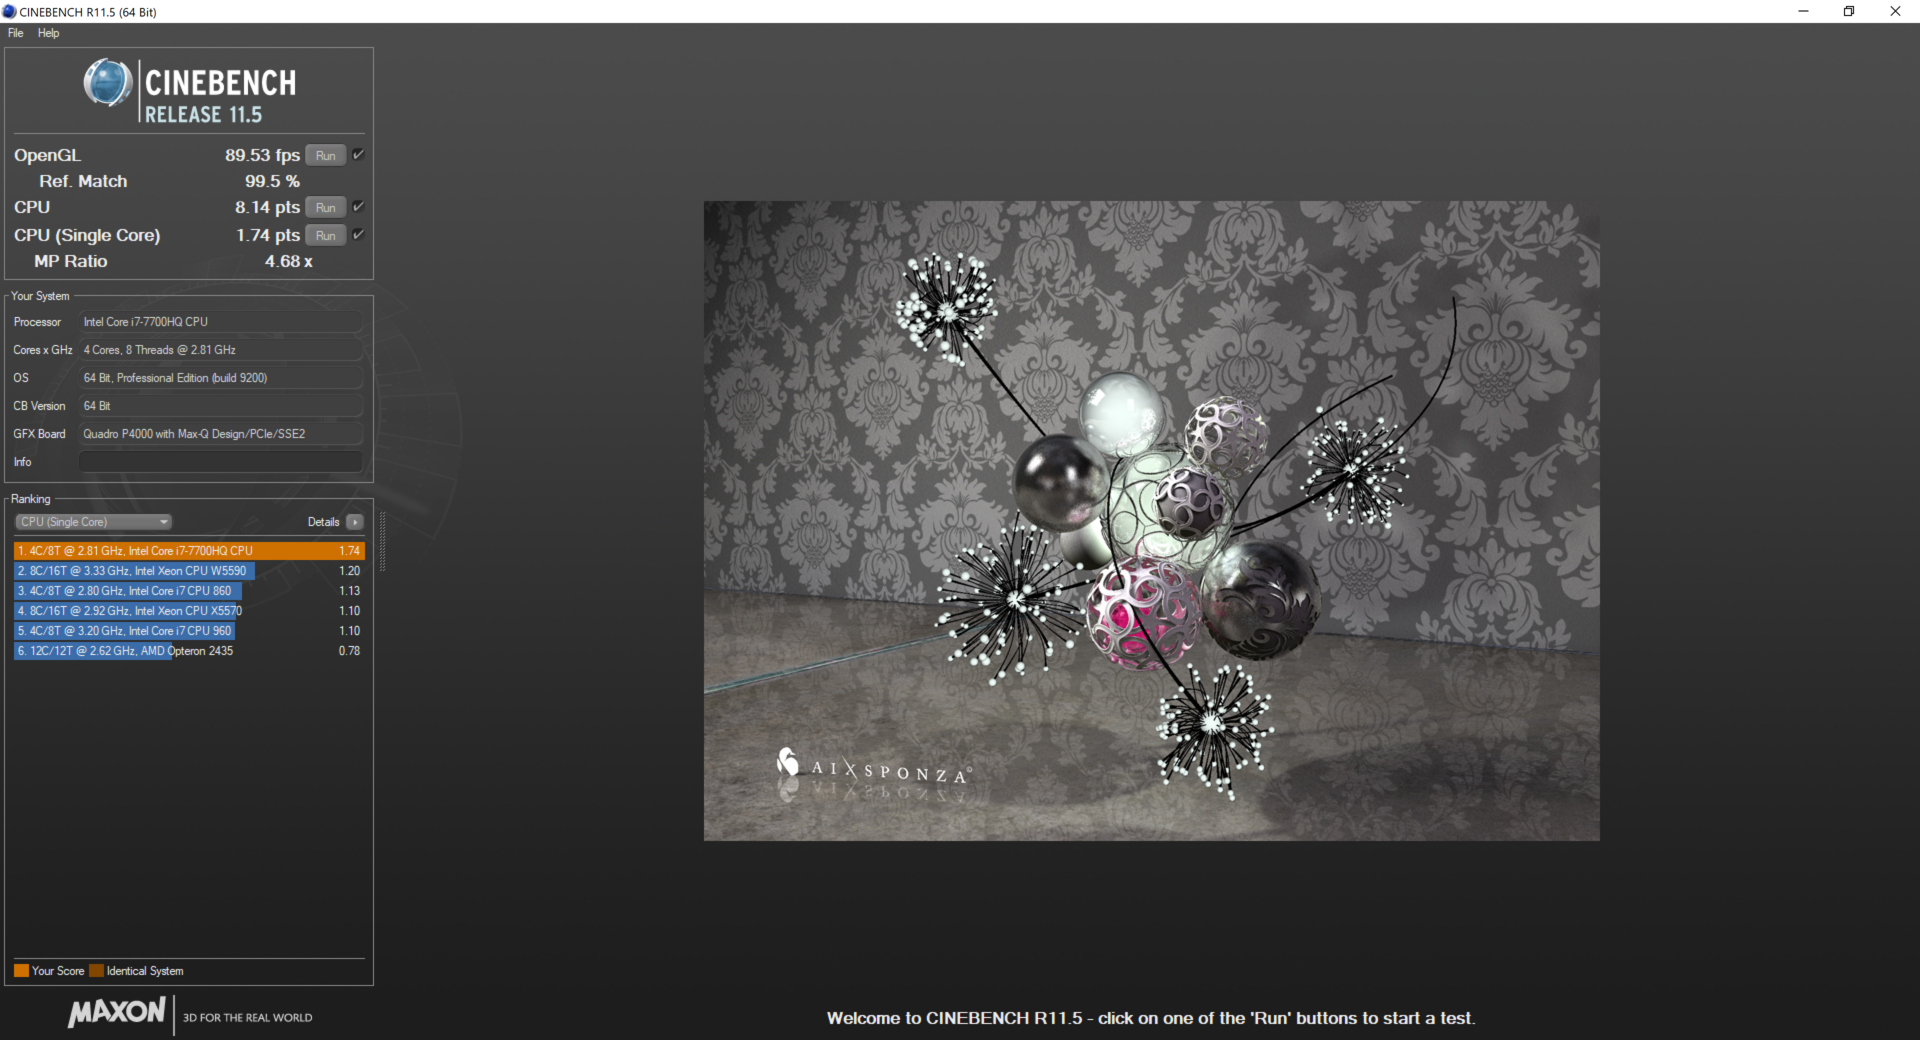
We are quite familiar with the Intel Core i7-7700HQ at this point. The Kaby Lake CPU has made its way into countless gaming and workstation notebooks since its introduction earlier this year, and with good reason. Outside of Intel's own Xeon line and processors designed for desktops, the Core i7-7700HQ is one of the most powerful pieces of silicon on the market today. Boasting four hyperthreaded cores that run from 2.8 to 3.8 GHz, the 7700HQ has proved time and time again to be a capable CPU for the most demanding workloads, particularly in gaming and 3D rendering.
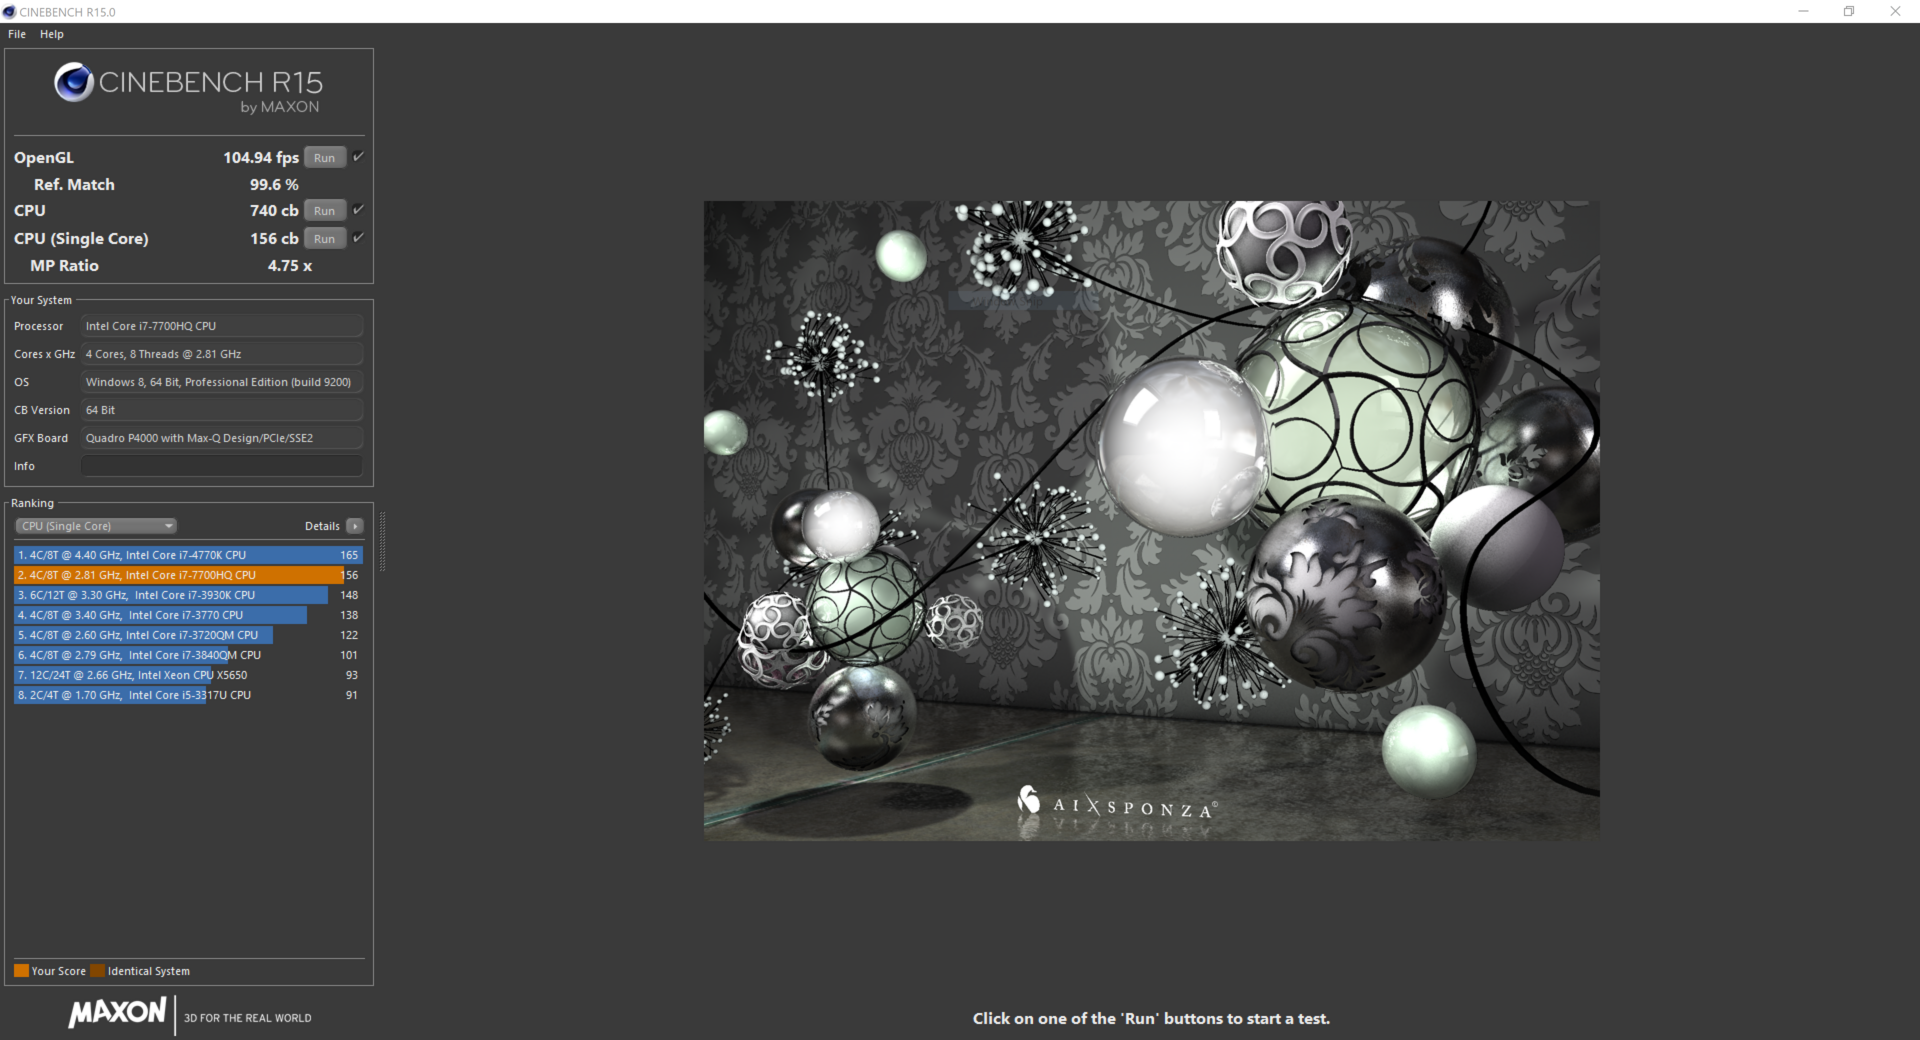
That trend continues here; The 7700HQ scores well in our Cinebench R15 tests, keeping up with other i7-equipped devices and performing nearly as well as Xeon-based machines. In multicore testing, our WS63VR even beats the MSI WT72 and Dell Precision 5520, both of which are powered by the Xeon E3-1505. While the 7700HQ may not crunch numbers as quickly as its Xeon brother (see our SuperPi and wPrime tests), users should find the performance more than enough for any task.
Long-term testing shows how consistent the i7-7700HQ is, even in a thinner chassis. Running a loop of Cinebench R15 sees scores flit around 720 CB, save for a drop about halfway through the lengthy test. This dip is likely an anomaly, especially since scores rocket back up to their average on the next pass. This consistency fits the profile for the 7700HQ we've seen over the past year. Demanding users can expect steady, dependable processor performance, even over long periods of time.
For more information on the Intel i7-7700HQ, please see our dedicated CPU page here.
| Cinebench R10 | |
| Rendering Multiple CPUs 32Bit | |
| MSI WS63VR 7RL-023US | |
| Lenovo ThinkPad P51 20HH0016GE | |
| MSI WS63 7RF-290US | |
| MSI GS63VR 7RF-228US | |
| MSI WT72-6QM | |
| Lenovo ThinkPad P51s 20HB000SGE | |
| Rendering Single 32Bit | |
| Lenovo ThinkPad P51 20HH0016GE | |
| Lenovo ThinkPad P51s 20HB000SGE | |
| MSI WS63 7RF-290US | |
| MSI GS63VR 7RF-228US | |
| MSI WT72-6QM | |
| wPrime 2.10 - 1024m | |
| Lenovo ThinkPad P51 20HH0016GE | |
| Dell Precision 5520 UHD | |
| MSI GS63VR 7RF-228US | |
| MSI WS63 7RF-290US | |
| MSI WS63VR 7RL-023US | |
* ... smaller is better
System Performance
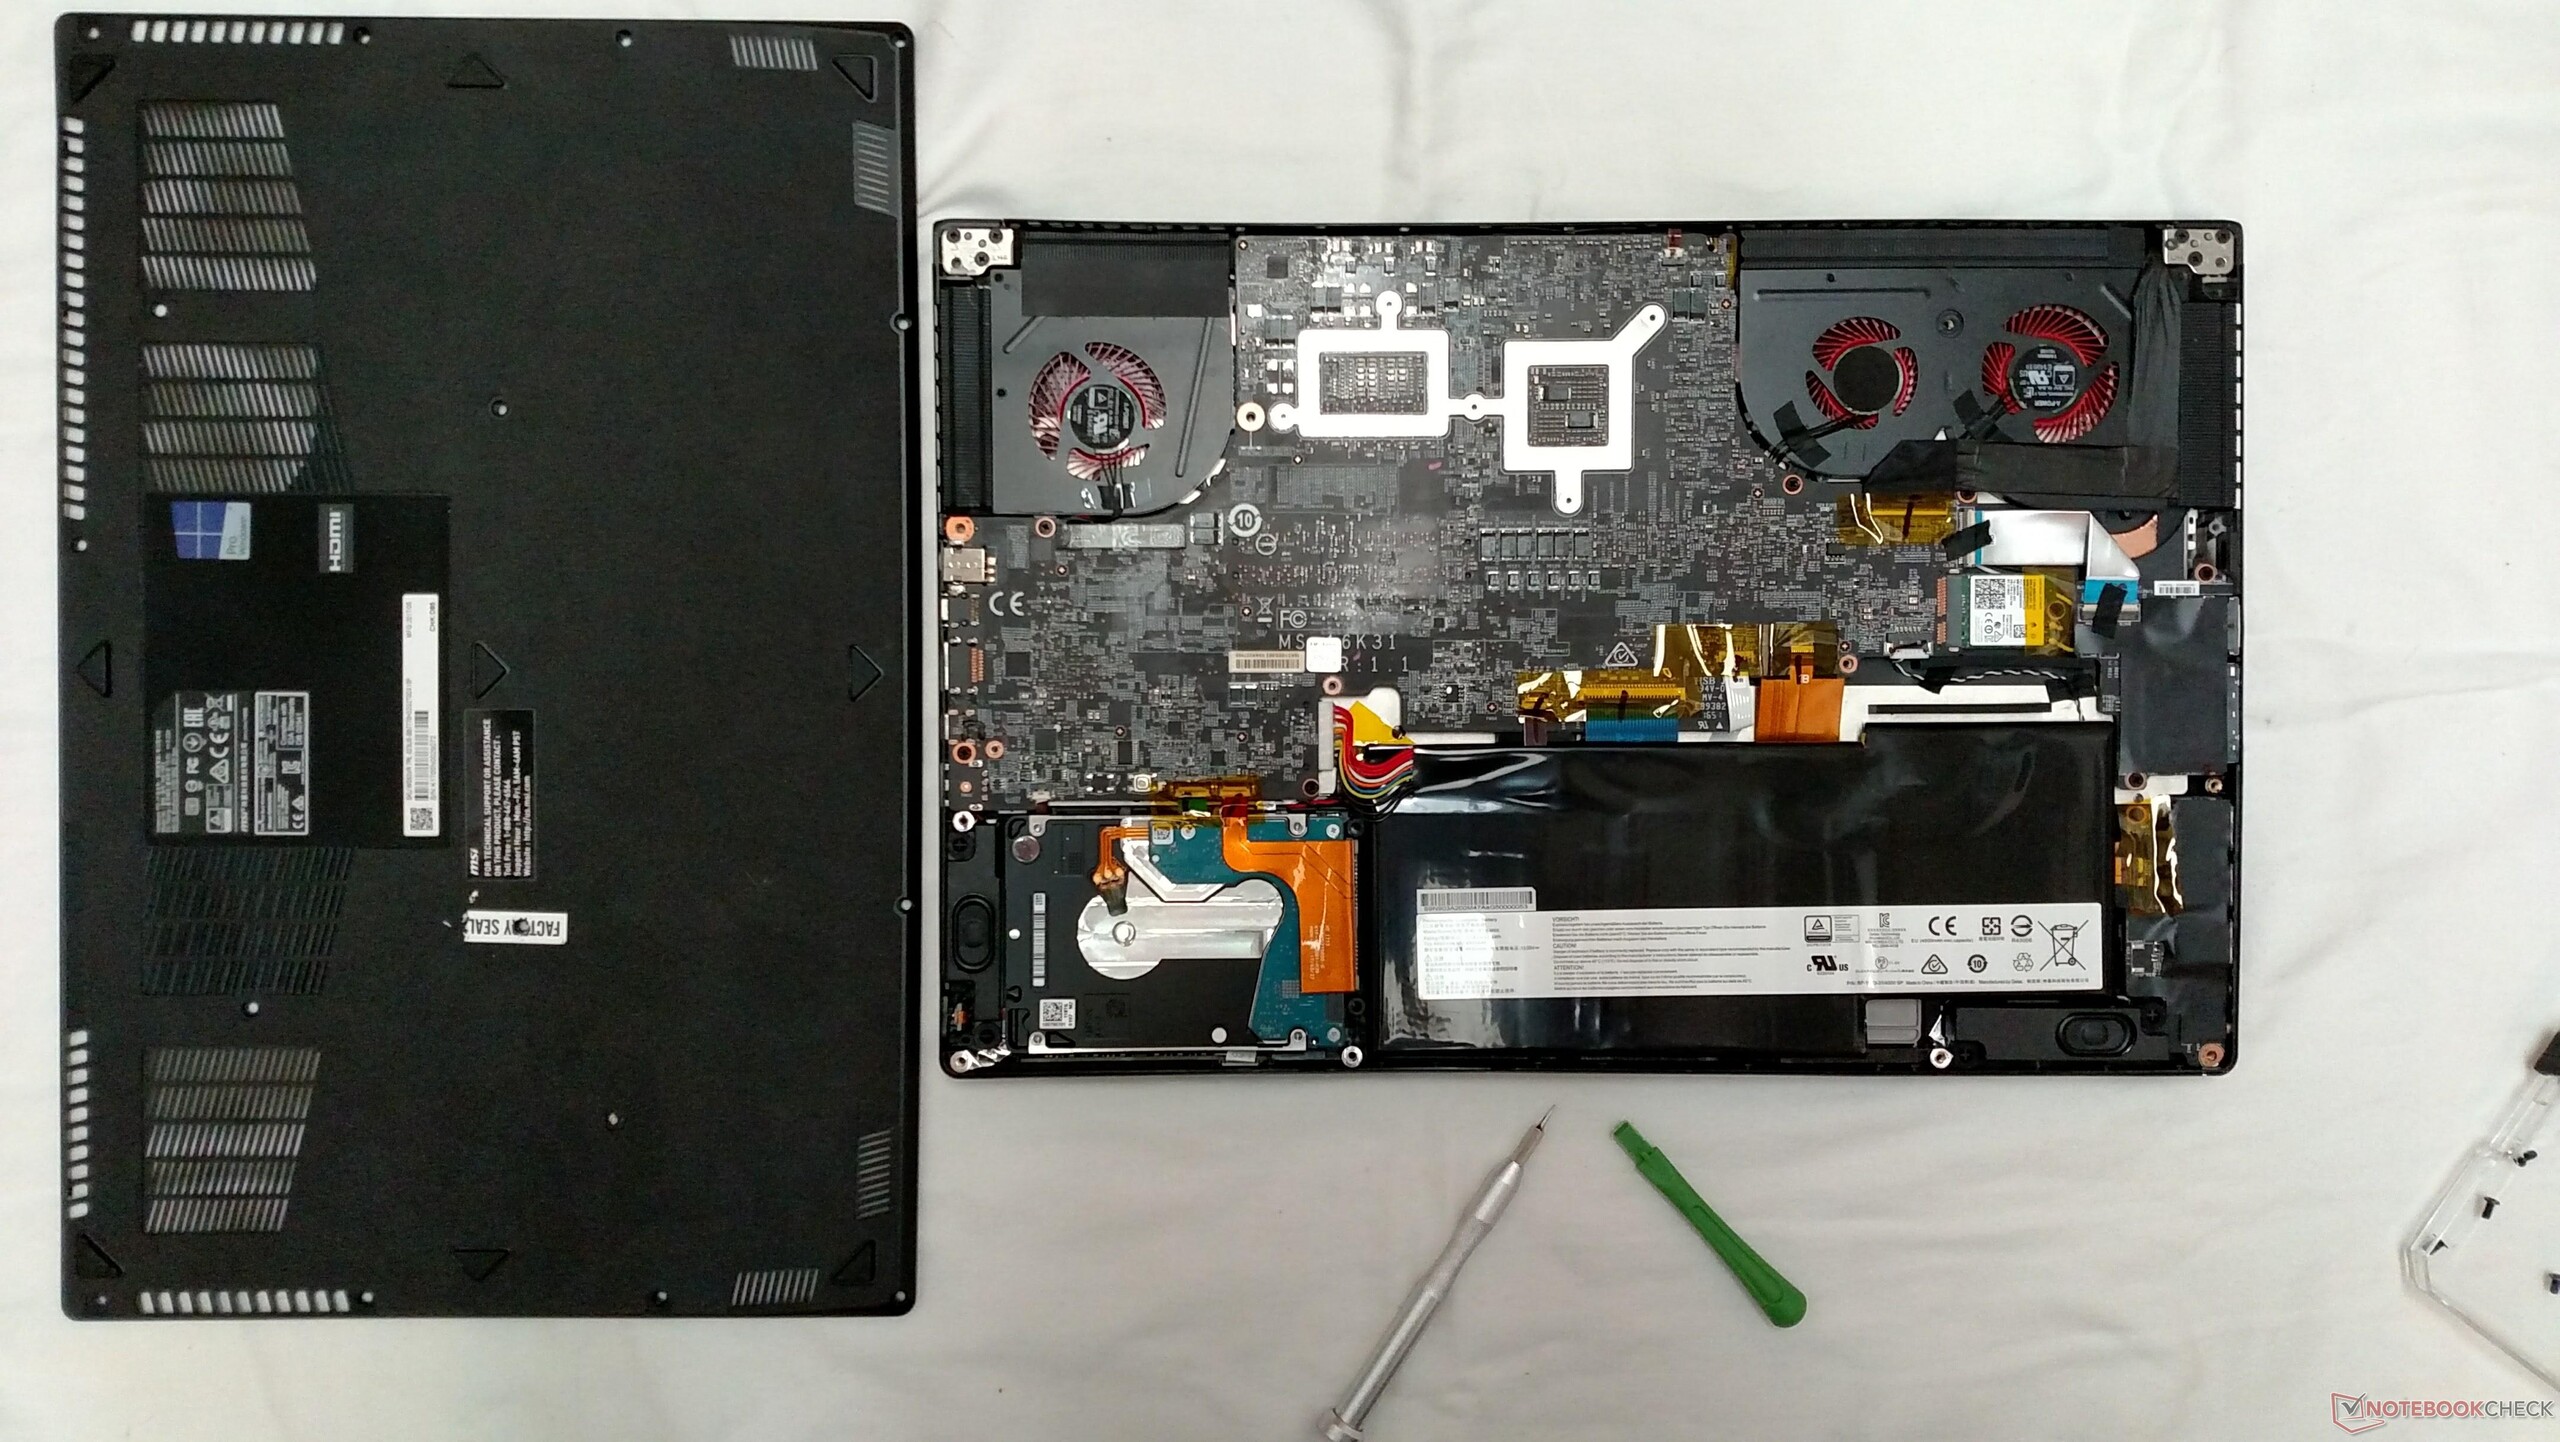
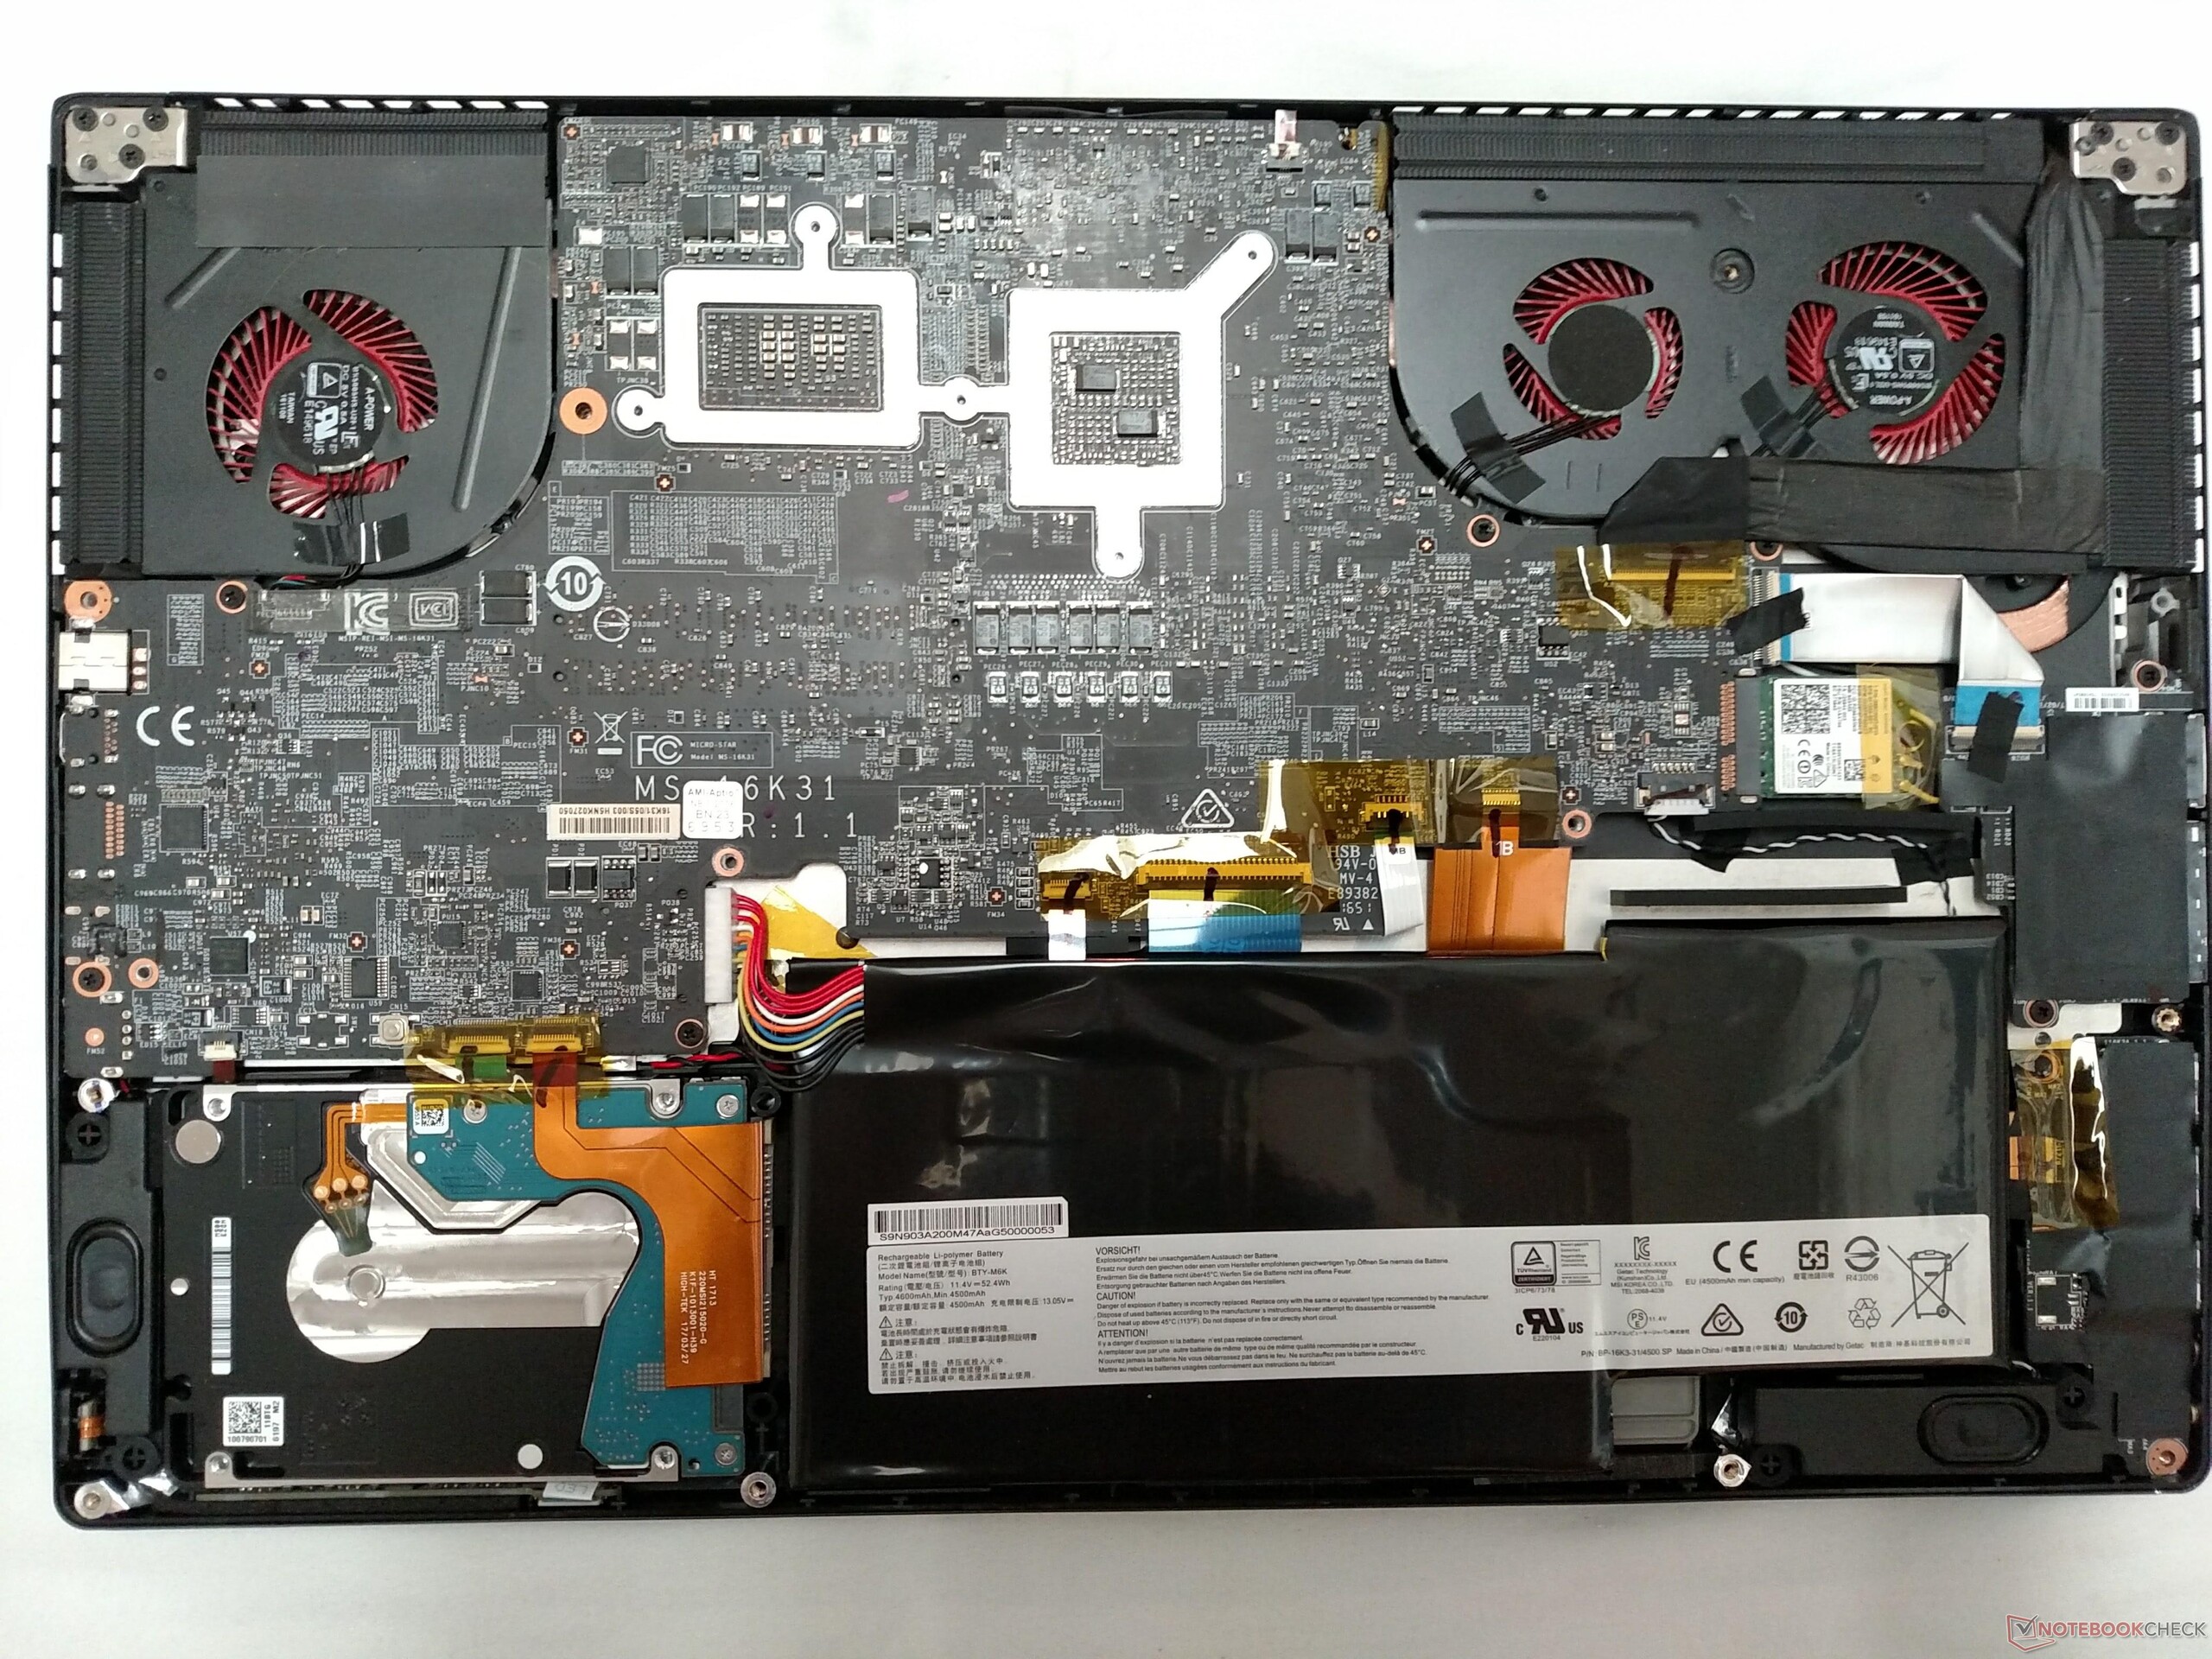
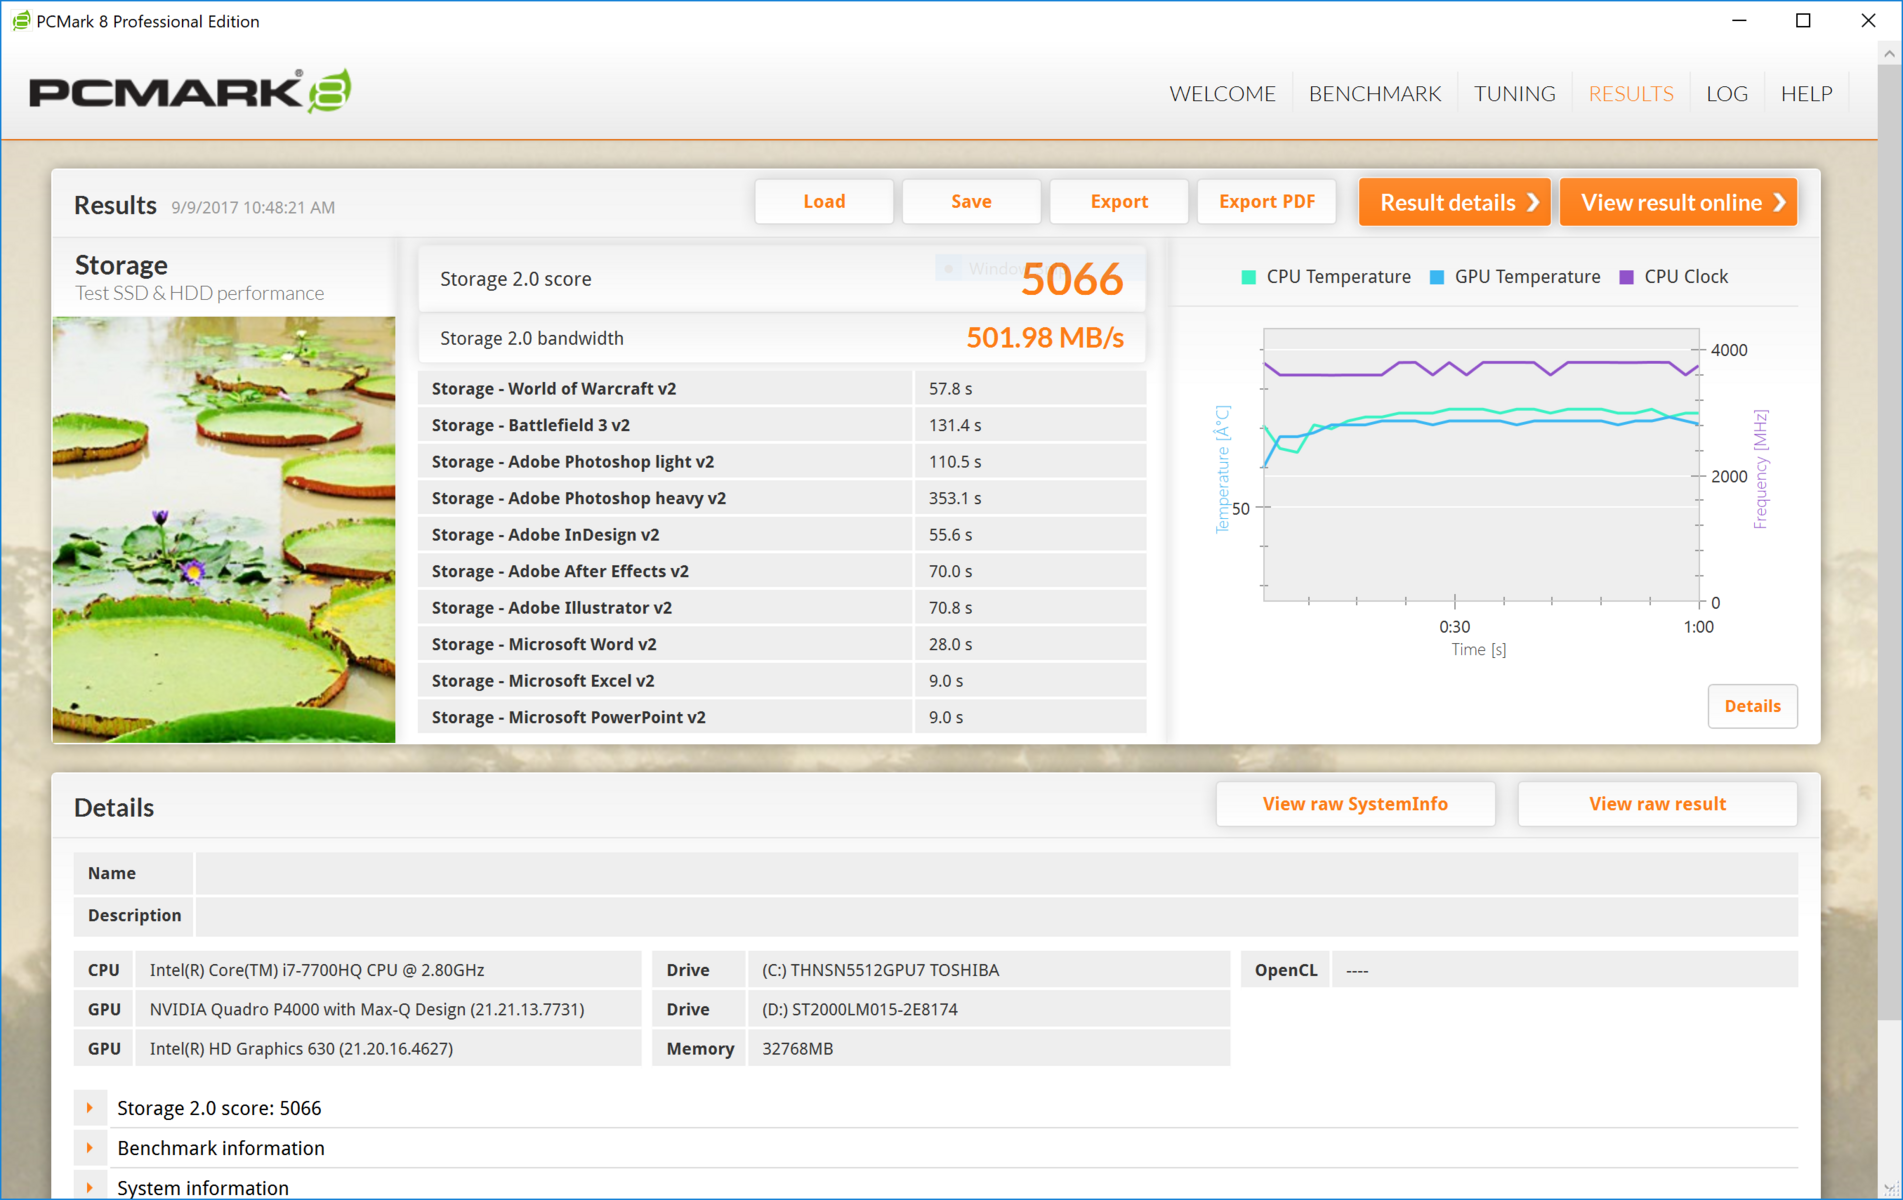
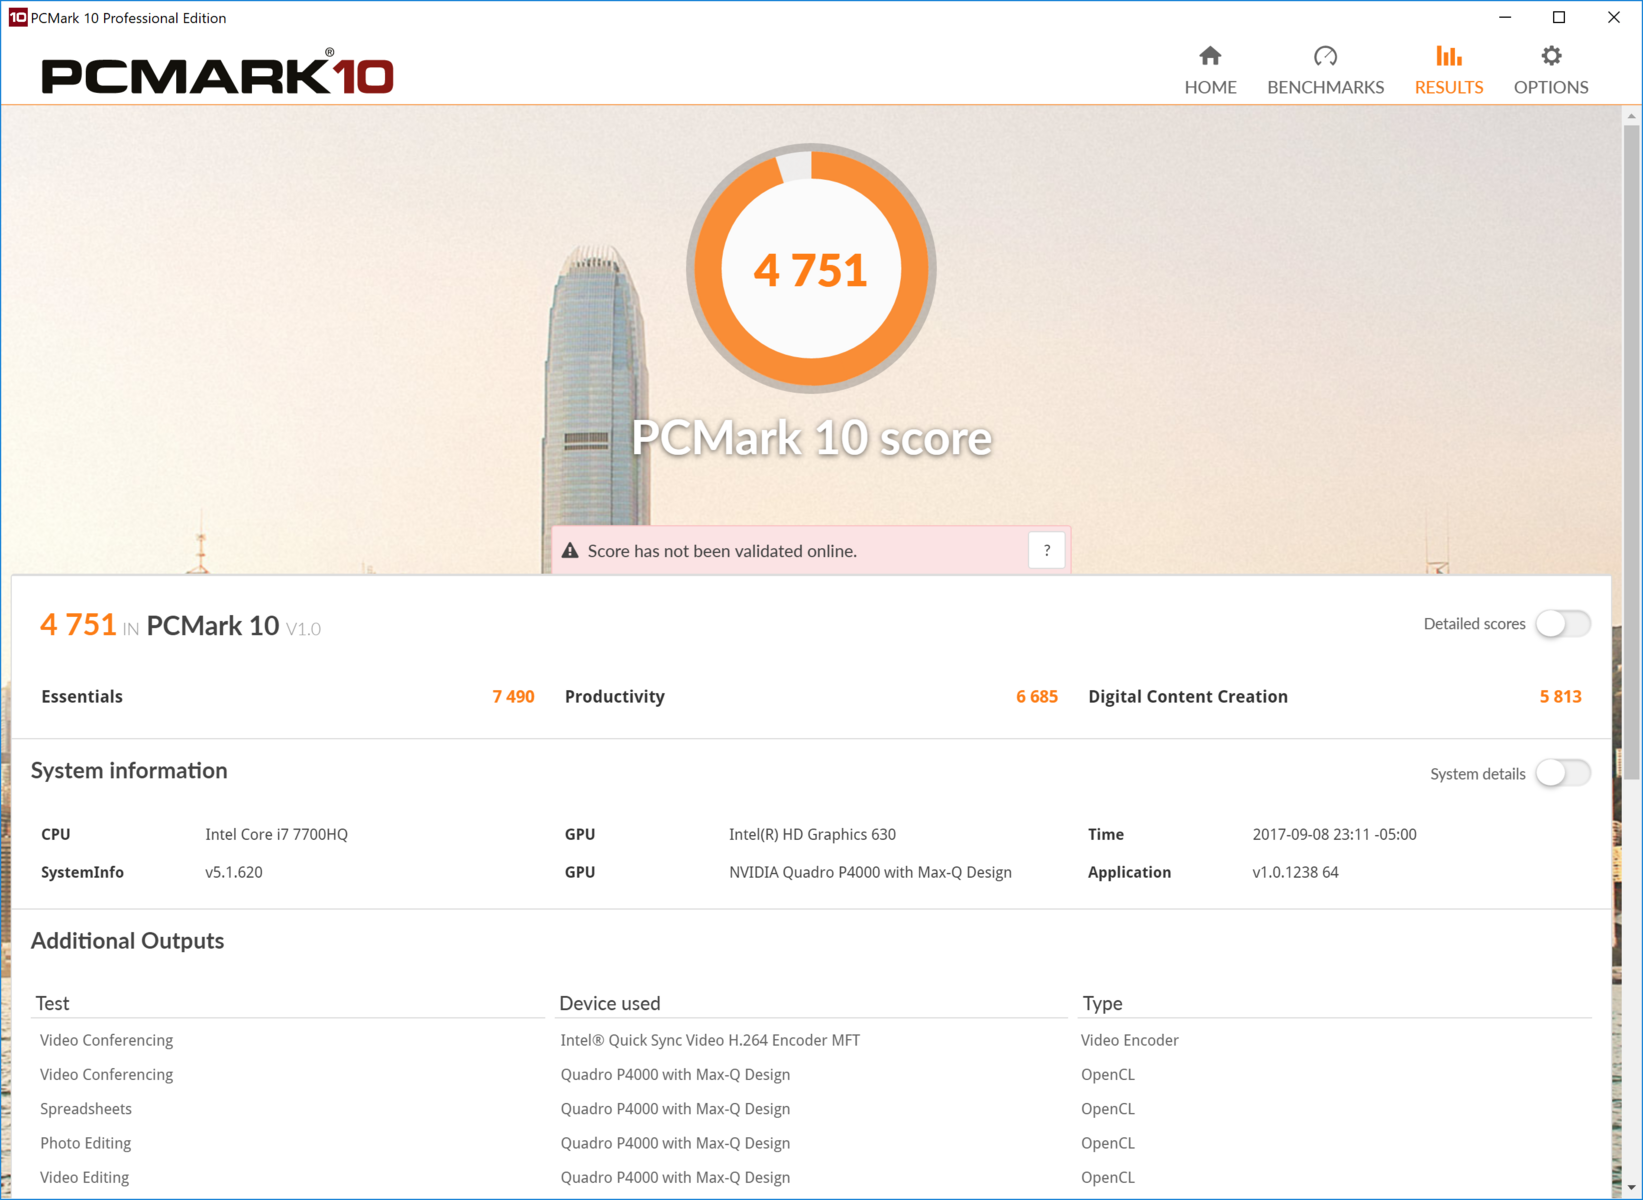
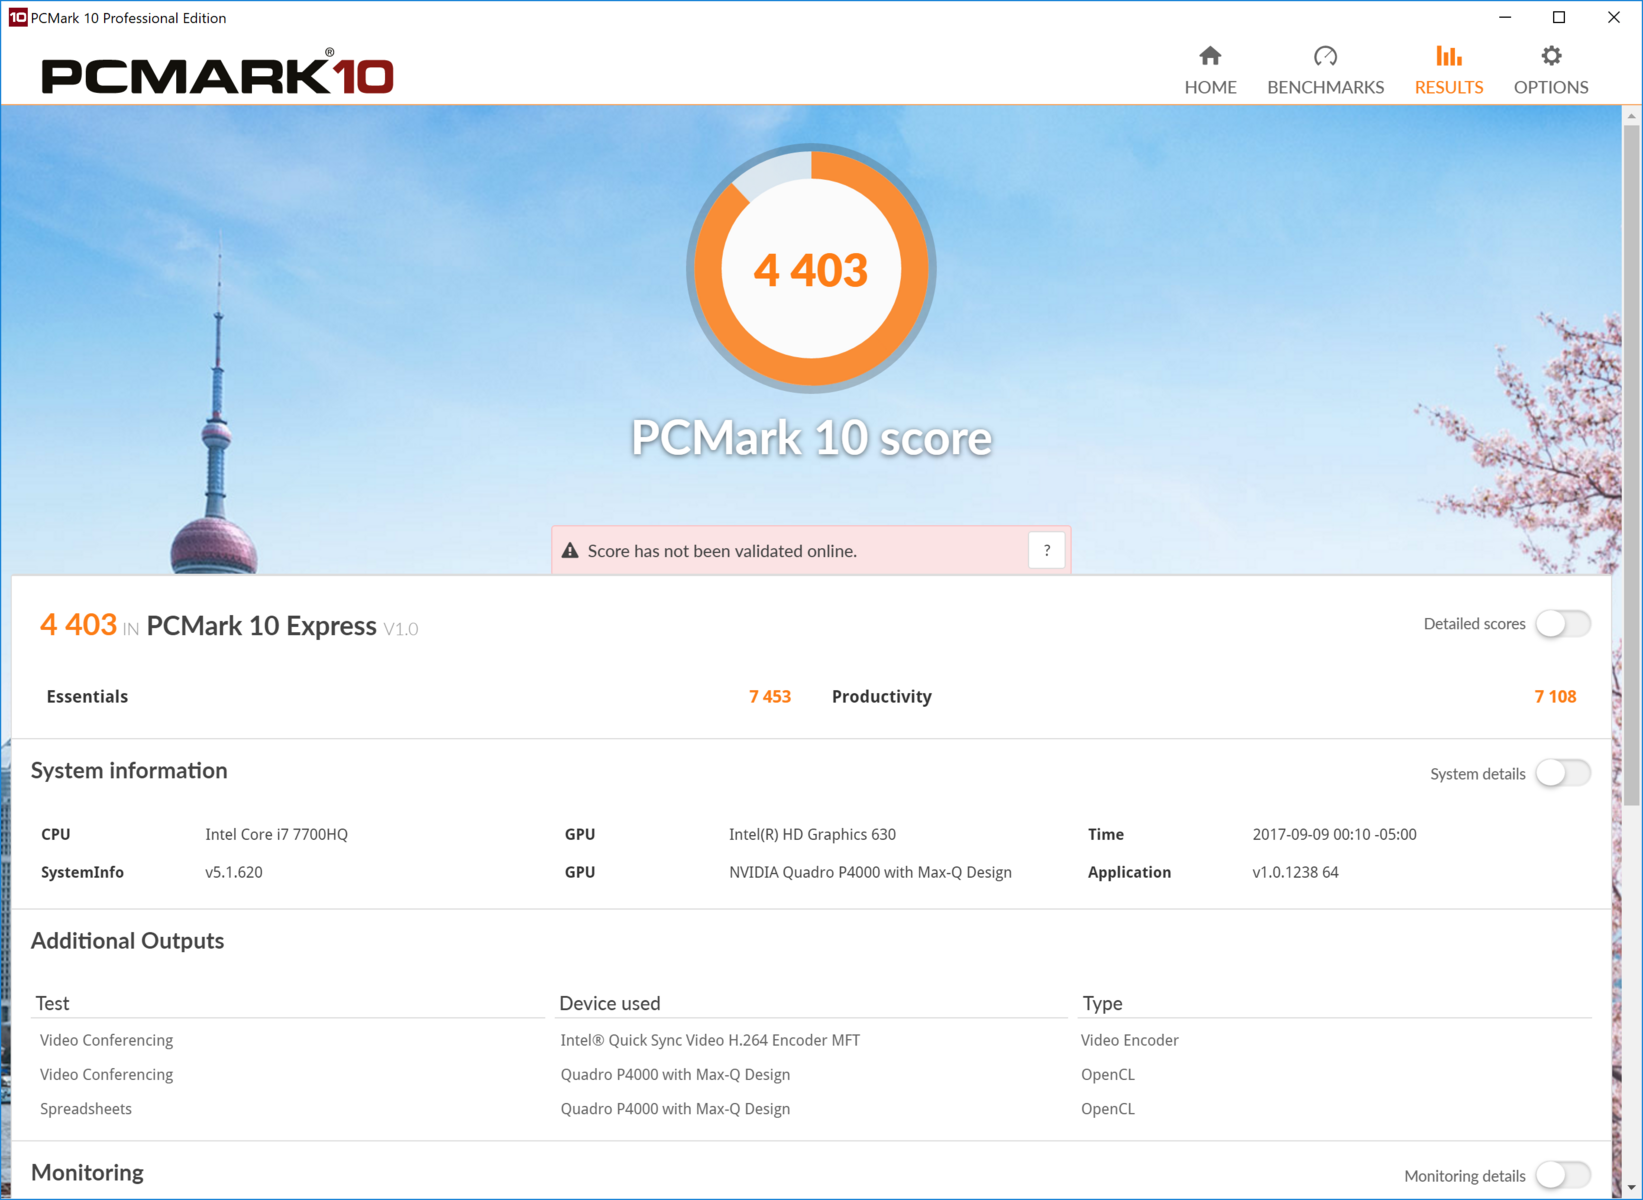
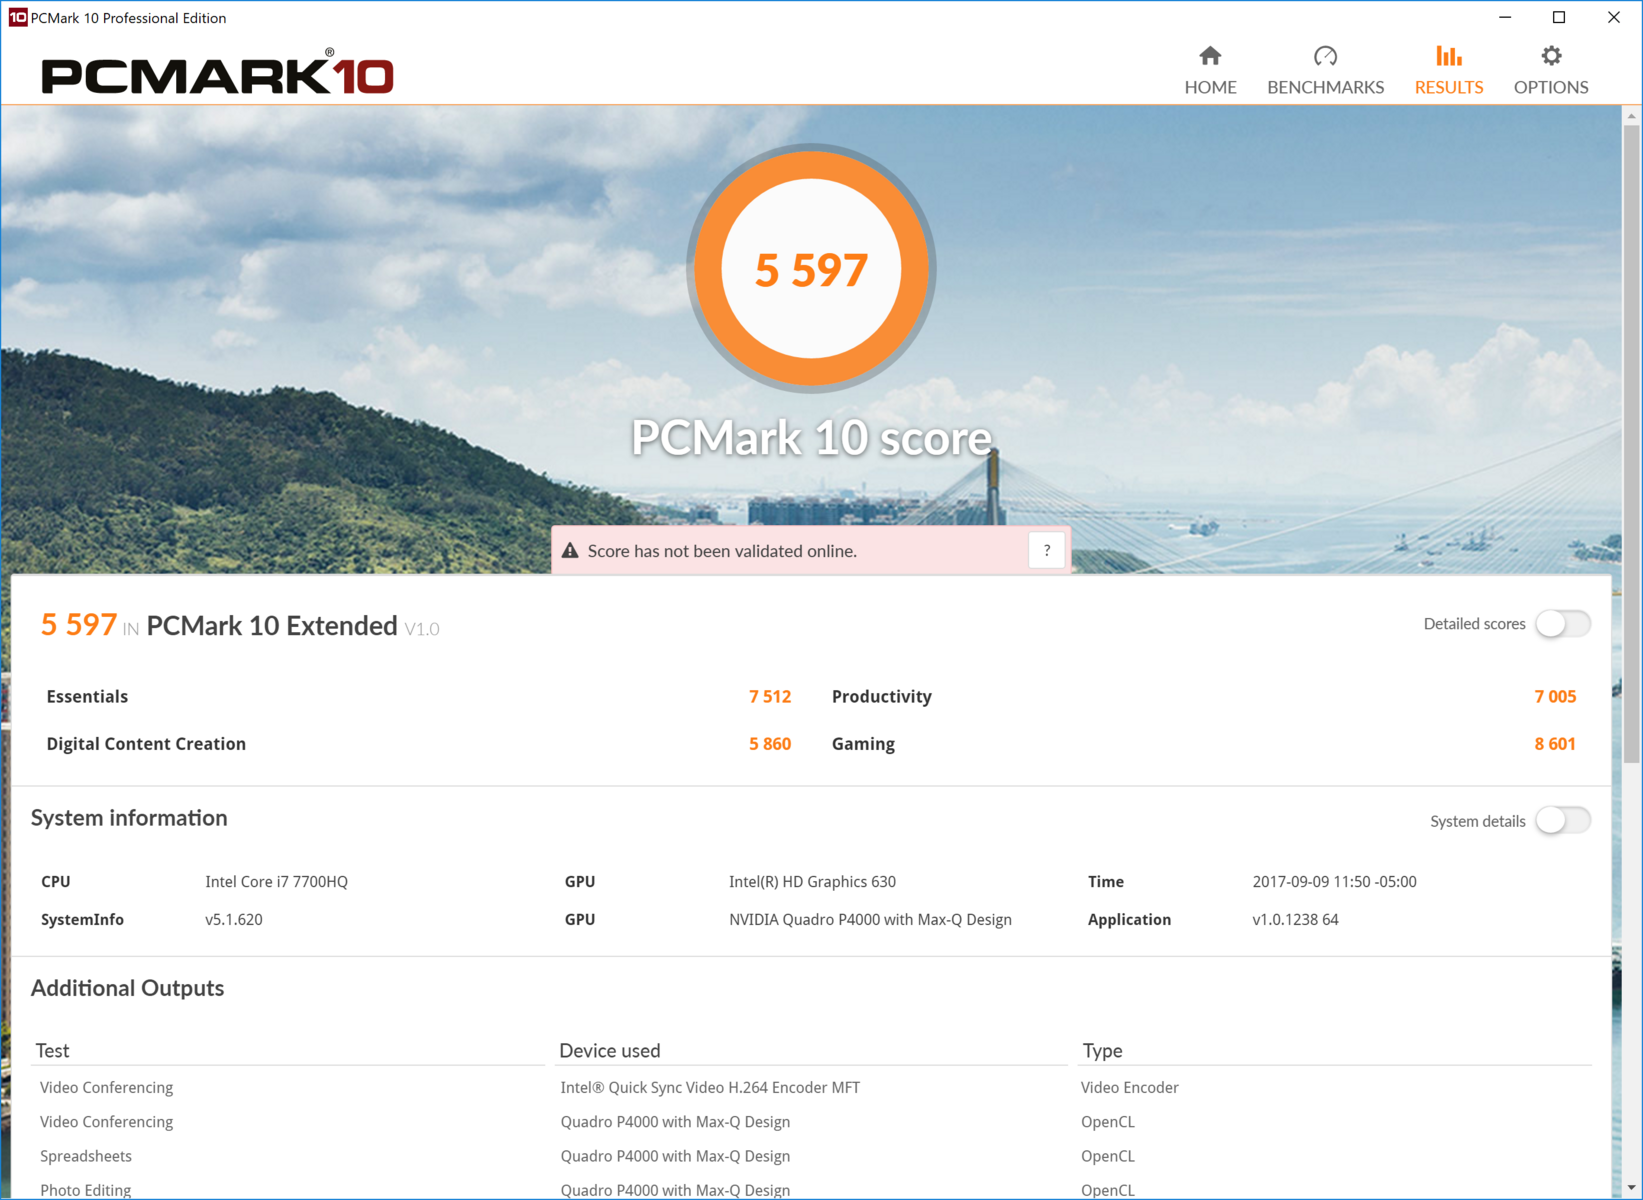
Overall system performance is snappy and responsive. The high-end CPU and GPU, coupled with a zippy NVMe SSD, make for an excellent user experience. Keep in mind that the SSD in our configuration is limited to 512 GB, which may be too small for some users. The main drive is backed up by a much slower 2 TB mechanical HDD, which may slow down some application loading. We will explore this below.
Interestingly, our WS63VR falls significantly behind other similar notebooks in various PCMark 8 tests, but there's not enough consistency in the disparities to draw a meaningful conclusion. Regardless, we find little about which to complain in day-to-day use. Even demanding workloads (e.g., browsing Chrome with 30+ tabs open, playing 4K media, transferring files, and running Cinebench R15) stands no chance at slowing the device down.
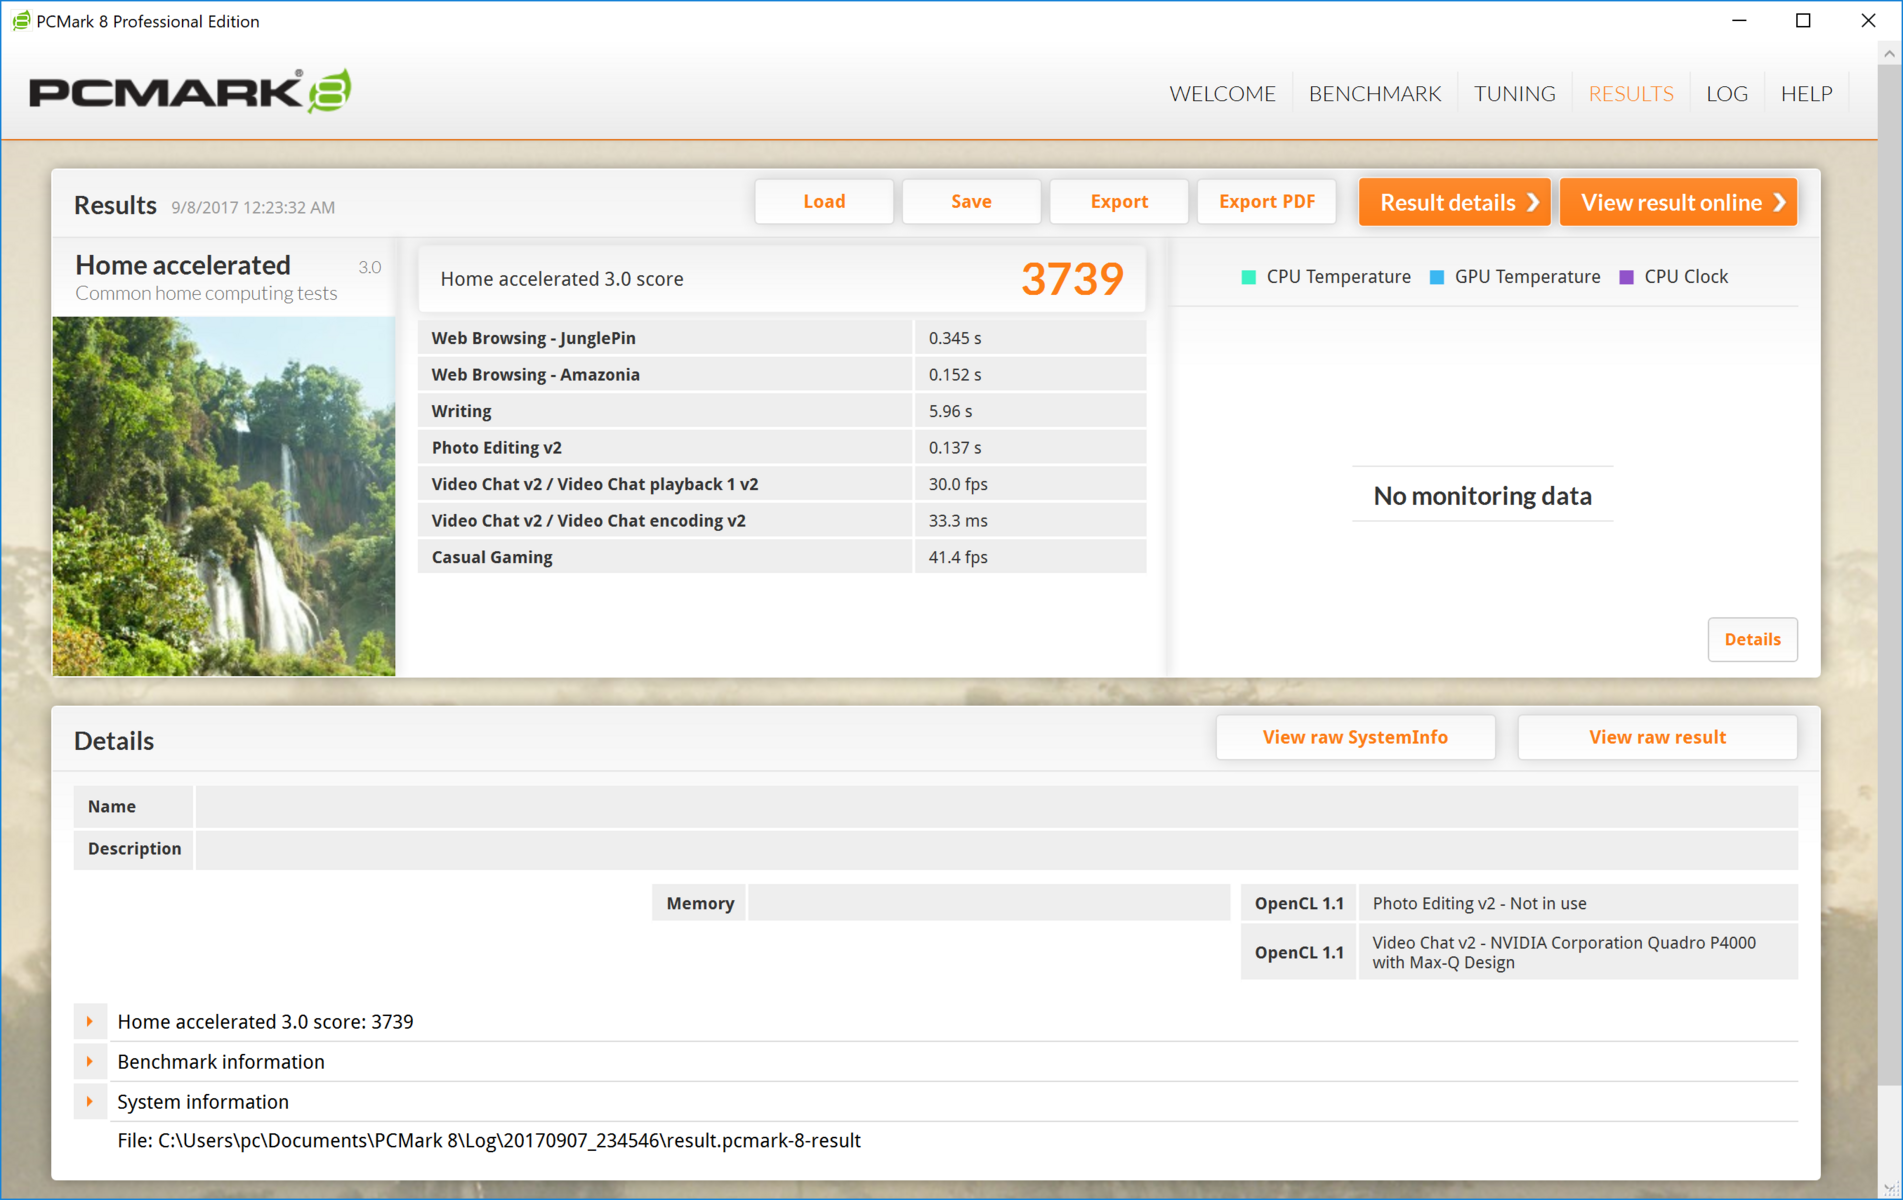
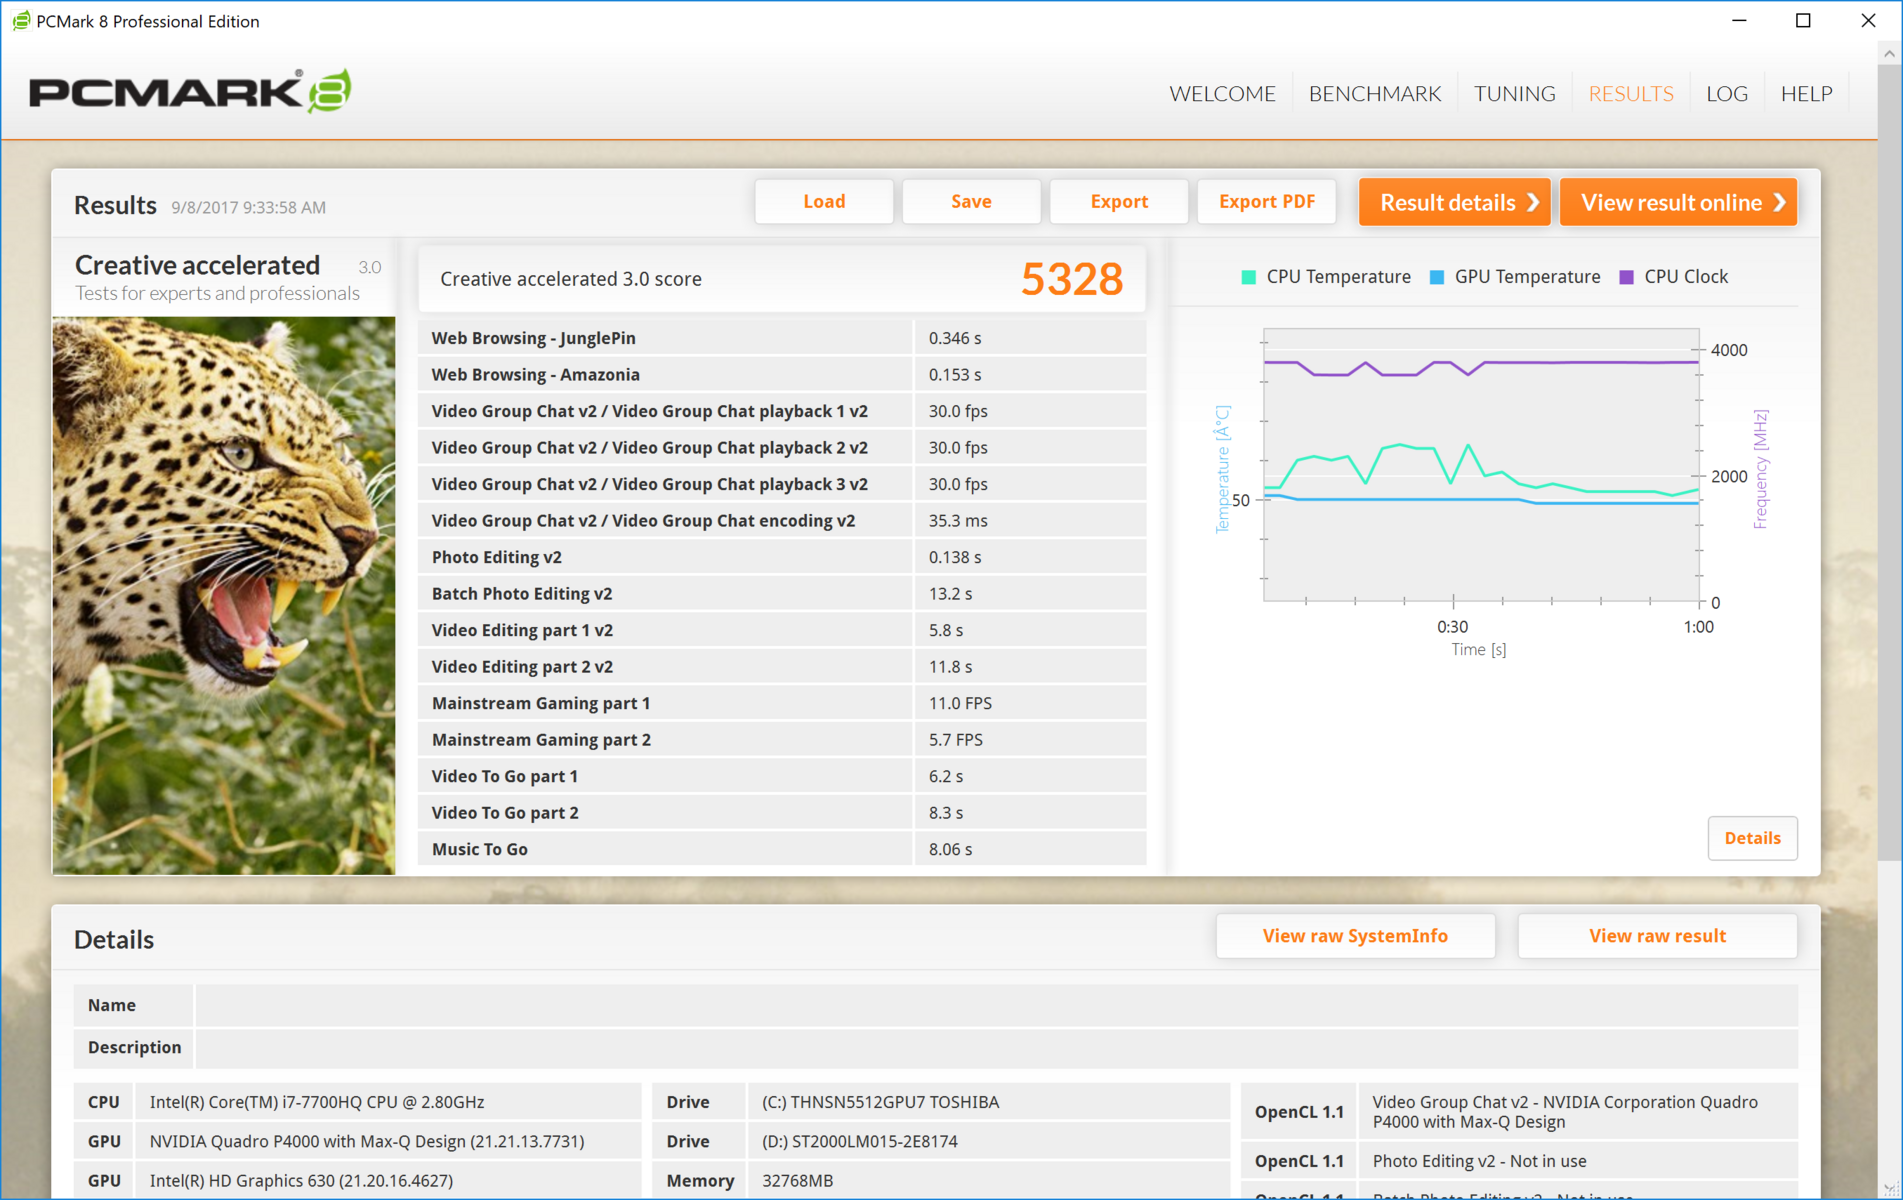
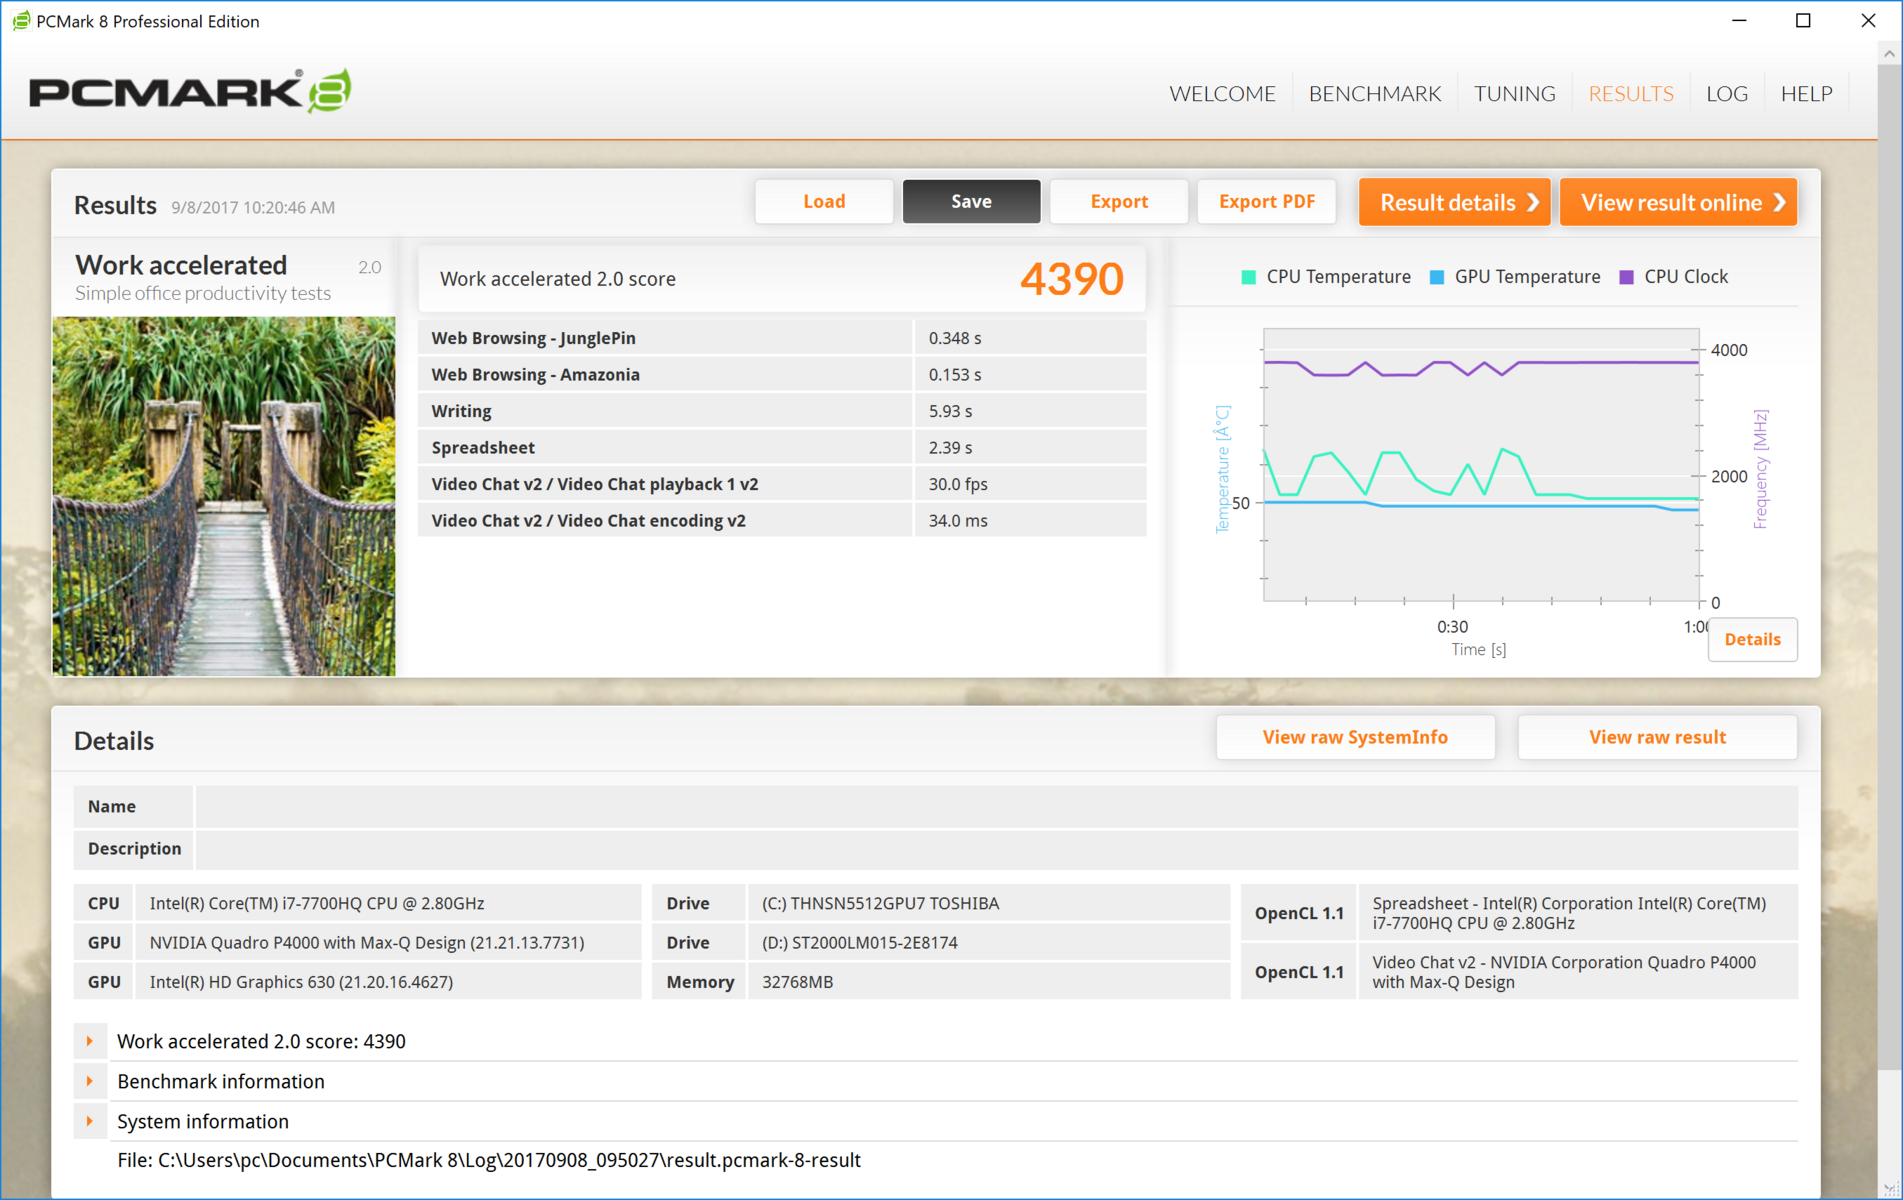
| PCMark 8 Home Score Accelerated v2 | 3739 points | |
| PCMark 8 Creative Score Accelerated v2 | 5328 points | |
| PCMark 8 Work Score Accelerated v2 | 4390 points | |
| PCMark 10 Score | 4751 points | |
Help | ||
Storage Devices
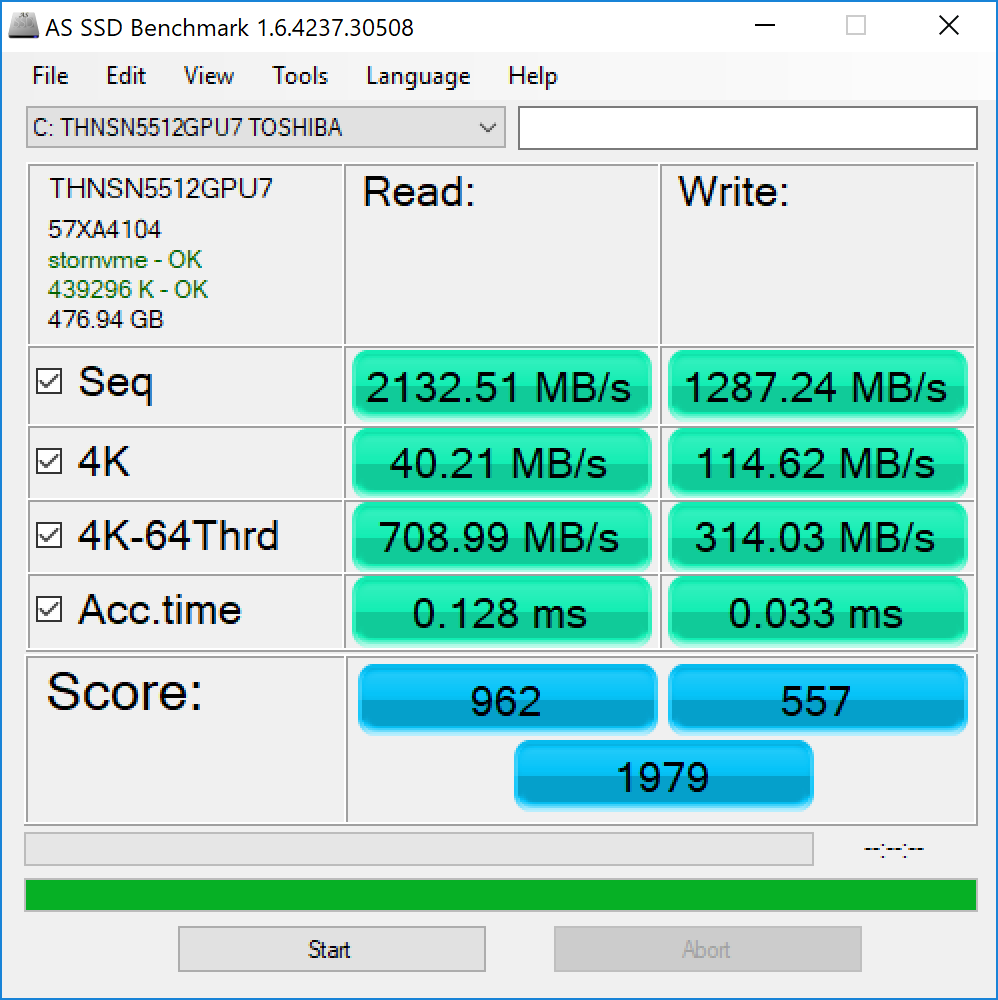
As mentioned above, the WS63VR is equipped with two drives in an effort to bring the best of both worlds to users. The main drive (a 512 GB PCIe NVMe SSD from Toshiba) is extremely fast and will not leave users waiting. It does fall behind the SSDs found in other devices, particularly those from Samsung. The Samsung SM961 found in the Dell Precision 5520, for example, is about 30% faster in AS SSD's sequential read and write tests and scored significantly better than the WS63VR's Toshiba drive in overall read and write performance. That said, the WS63VR holds its own and is still blazing fast.
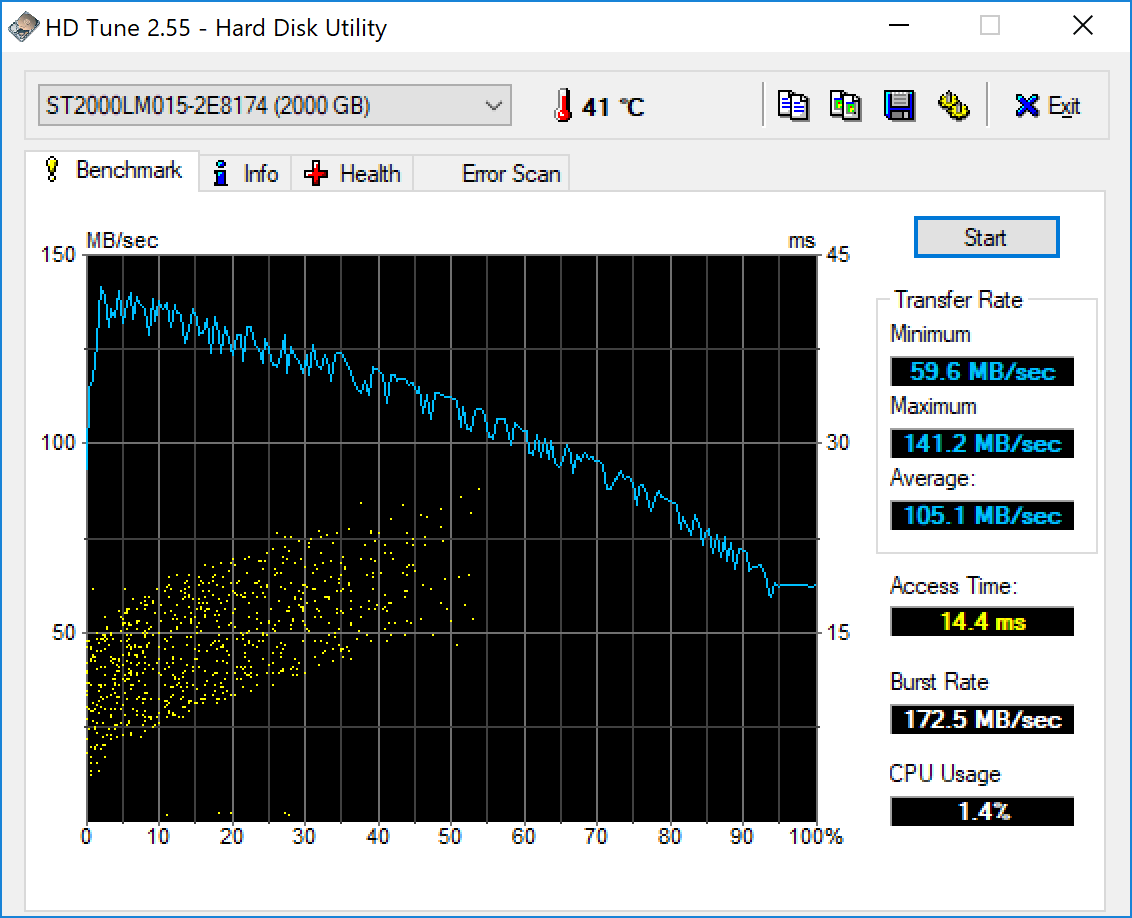
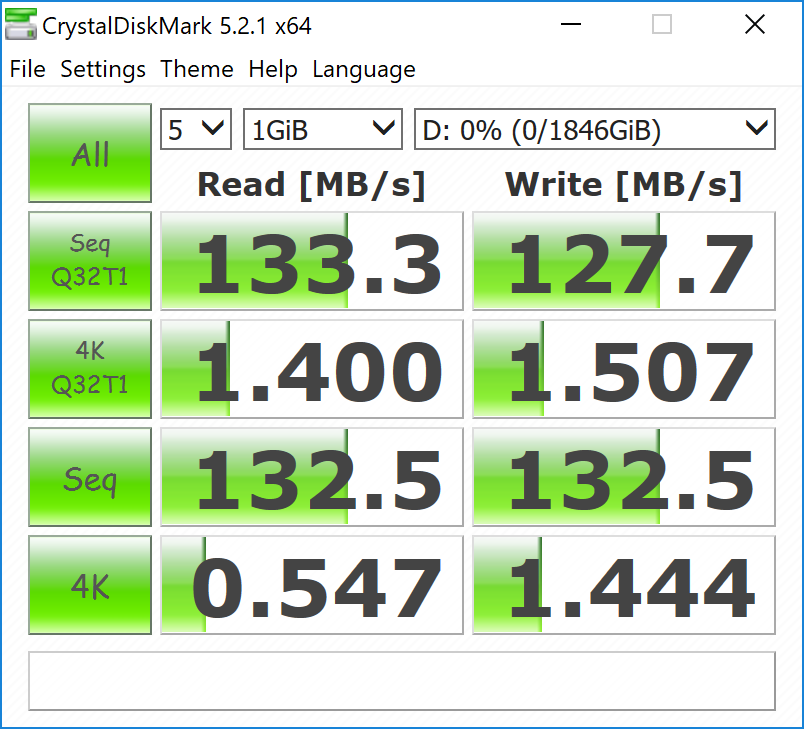
The secondary HDD, on the other hand, is much slower. The 2 TB of storage space (1.8 TB free) is extremely generous, bust drive speeds are not. Read and writes hovers around 130 MB/s, which is abysmally slow compared to the SSD. This performance is to be expected from a mechanical drive and shouldn't be surprising. The HDD is designed for mass storage of media and programs that don't require immediate access, such as photos, videos, and music. Overall, we're pleased with the combination, but some users may want to consider upgrading the NVMe drive to one with a larger capacity.

| MSI WS63VR 7RL-023US Toshiba NVMe THNSN5512GPU7 | MSI WS63 7RF-290US Samsung SM961 MZVKW512HMJP m.2 PCI-e | Lenovo ThinkPad P51 20HH0016GE Samsung PM961 NVMe MZVLW512HMJP | Lenovo ThinkPad P51s 20HB000SGE Samsung SSD PM961 1TB M.2 PCIe 3.0 x4 NVMe (MZVLW1T0) | Dell Precision 5520 UHD Samsung SM961 MZVKW512HMJP m.2 PCI-e | MSI GS63VR 7RF-228US Samsung SM961 MZVKW512HMJP m.2 PCI-e | MSI WT72-6QM Toshiba NVMe THNSN5256GPU7 | |
|---|---|---|---|---|---|---|---|
| AS SSD | 75% | 55% | 43% | 76% | 75% | 11% | |
| Copy Game MB/s (MB/s) | 1121 | 1140 | 721 | 921 | 1082 | 1025 | |
| Copy Program MB/s (MB/s) | 447.3 | 425.6 | 411.5 | 372.8 | 401.9 | 554 | |
| Copy ISO MB/s (MB/s) | 1760 | 1607 | 1200 | 1659 | 1666 | 1777 | |
| Score Total (Points) | 1979 | 3759 90% | 3424 73% | 2771 40% | 3681 86% | 3756 90% | 2433 23% |
| Score Write (Points) | 557 | 1440 159% | 917 65% | 1271 128% | 1379 148% | 1468 164% | 651 17% |
| Score Read (Points) | 962 | 1568 63% | 1690 76% | 990 3% | 1554 62% | 1549 61% | 1237 29% |
| Access Time Write * (ms) | 0.033 | 0.028 15% | 0.025 24% | 0.027 18% | 0.023 30% | 0.029 12% | 0.04 -21% |
| Access Time Read * (ms) | 0.128 | 0.036 72% | 0.032 75% | 0.082 36% | 0.038 70% | 0.041 68% | 0.092 28% |
| 4K-64 Write (MB/s) | 314 | 1151 267% | 623 98% | 1018 224% | 1055 236% | 1185 277% | 473.5 51% |
| 4K-64 Read (MB/s) | 710 | 1244 75% | 1372 93% | 792 12% | 1223 72% | 1229 73% | 935 32% |
| 4K Write (MB/s) | 114.6 | 128.5 12% | 143.1 25% | 130.8 14% | 155.3 36% | 127.6 11% | 96.4 -16% |
| 4K Read (MB/s) | 40.2 | 49.02 22% | 55.6 38% | 52.8 31% | 51.5 28% | 48.01 19% | 37.5 -7% |
| Seq Write (MB/s) | 1287 | 1603 25% | 1506 17% | 1217 -5% | 1694 32% | 1550 20% | 810 -37% |
| Seq Read (MB/s) | 2133 | 2750 29% | 2624 23% | 1450 -32% | 2799 31% | 2719 27% | 2638 24% |
* ... smaller is better

GPU Performance

Nvidia's Quadro line is their professional-grade GPU brand, intended for workstations and users that demand consistent high-power, no matter the cost. As of today, the P4000 is Nvidia's second most powerful mobile Quadro card, sitting just below the P5000 and above the P3000. Based on Nvidia's Pascal architecture, the P4000 is a capable GPU designed for professional work, such as CAD, architecture, medical, and visual projects.
Our review unit is one of the first iterations of Nvidia's new Max-Q design philosophy. Max-Q is aimed at the burgeoning thin-and-light gaming and workstation market and offers noticeably reduced power requirements at the cost of slightly reduced clock speeds. The P4000 Max-Q is equipped with 1792 shaders, 8 GB of GDDR5 VRAM, and is typically clocked between 1113 and 1240 MHz, resulting in a 20% drop in wattage requirements compared to the P4000. (80 W vs. 100 W).
The closest consumer counterpart to the P4000 with Max-Q is likely the Nvidia GeForce GTX 1060. However, it is difficult to draw a comparison between the two; while both cards are based on Nvidia's Pascal architecture, driver support and silicon binning processes are very different. The drivers for Quadro cards have a much more stringent development cycle and typically have much higher support behind them, owed mainly to their target market of graphics and engineering professionals. The same pertains to quality control; the components used to manufacture a Quadro card are under more meticulous scrutiny than those of their GeForce counterparts. The end result is a more stable card that offers better overall support, albeit at a higher cost.
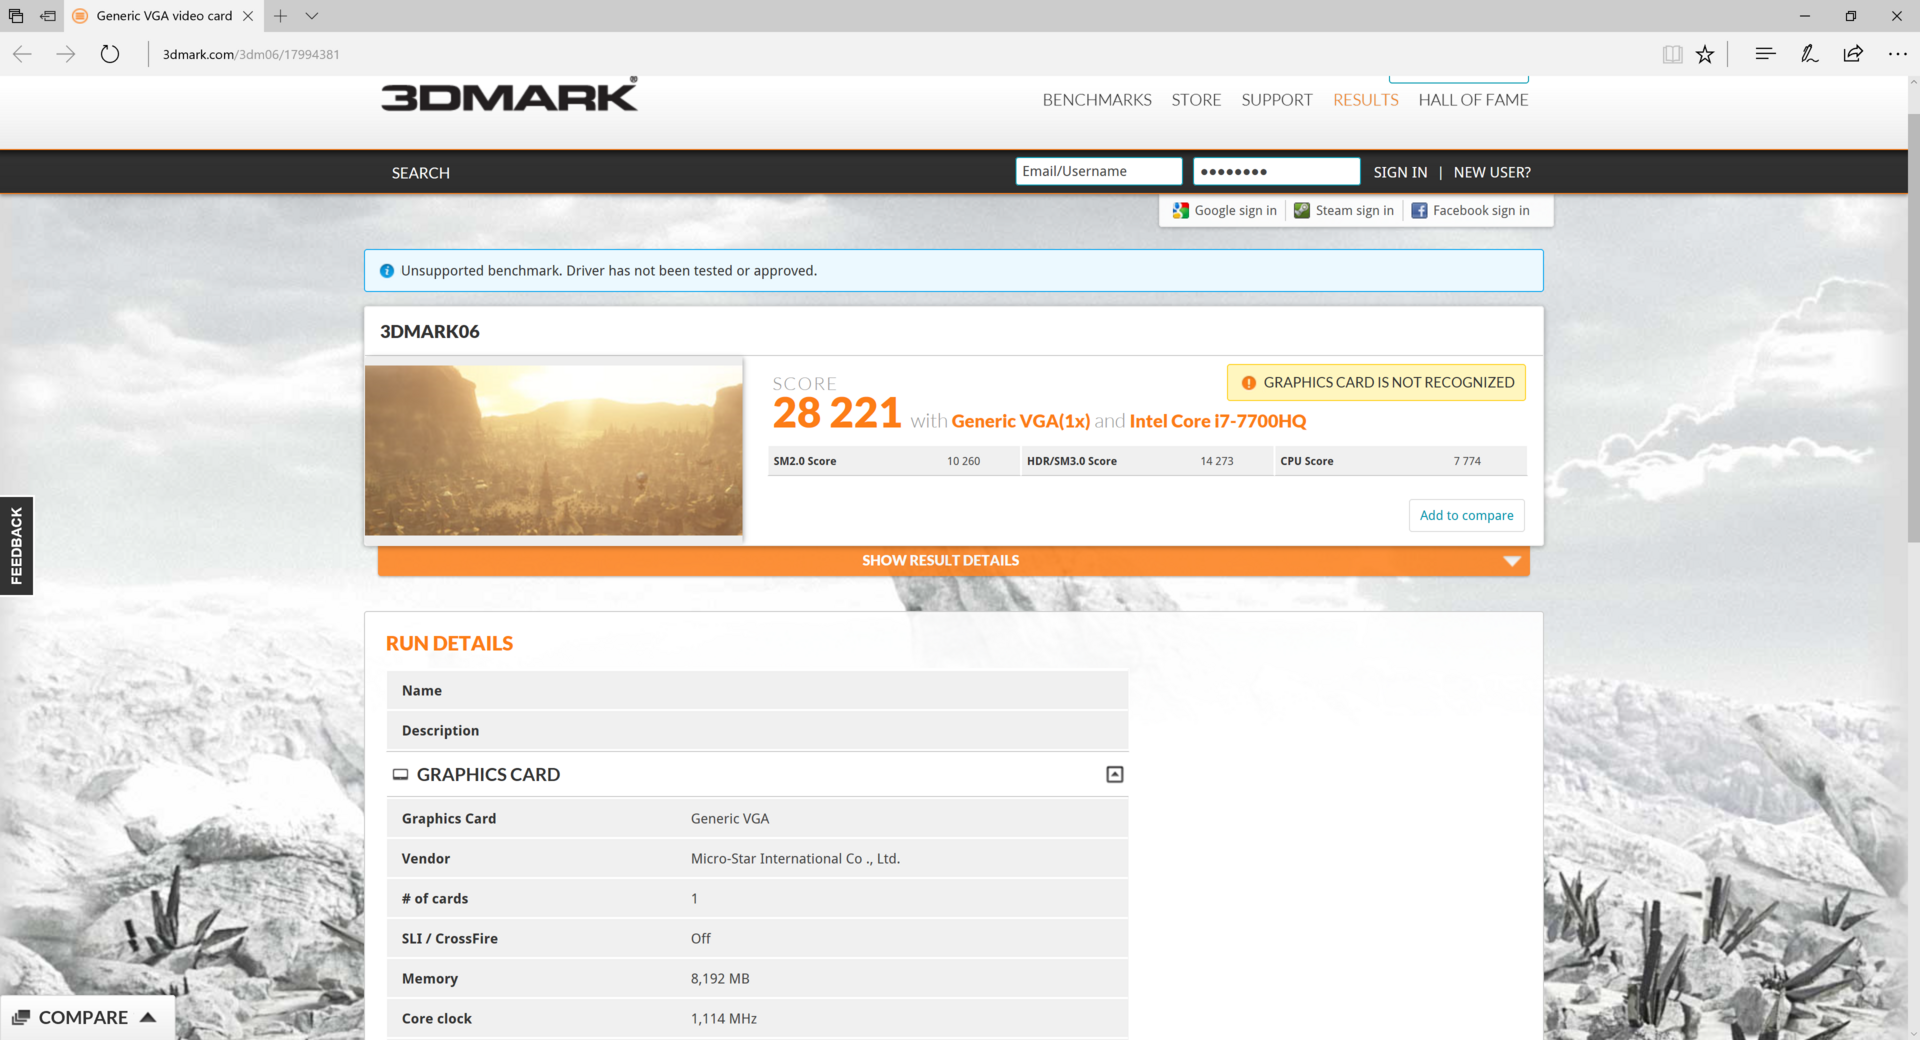
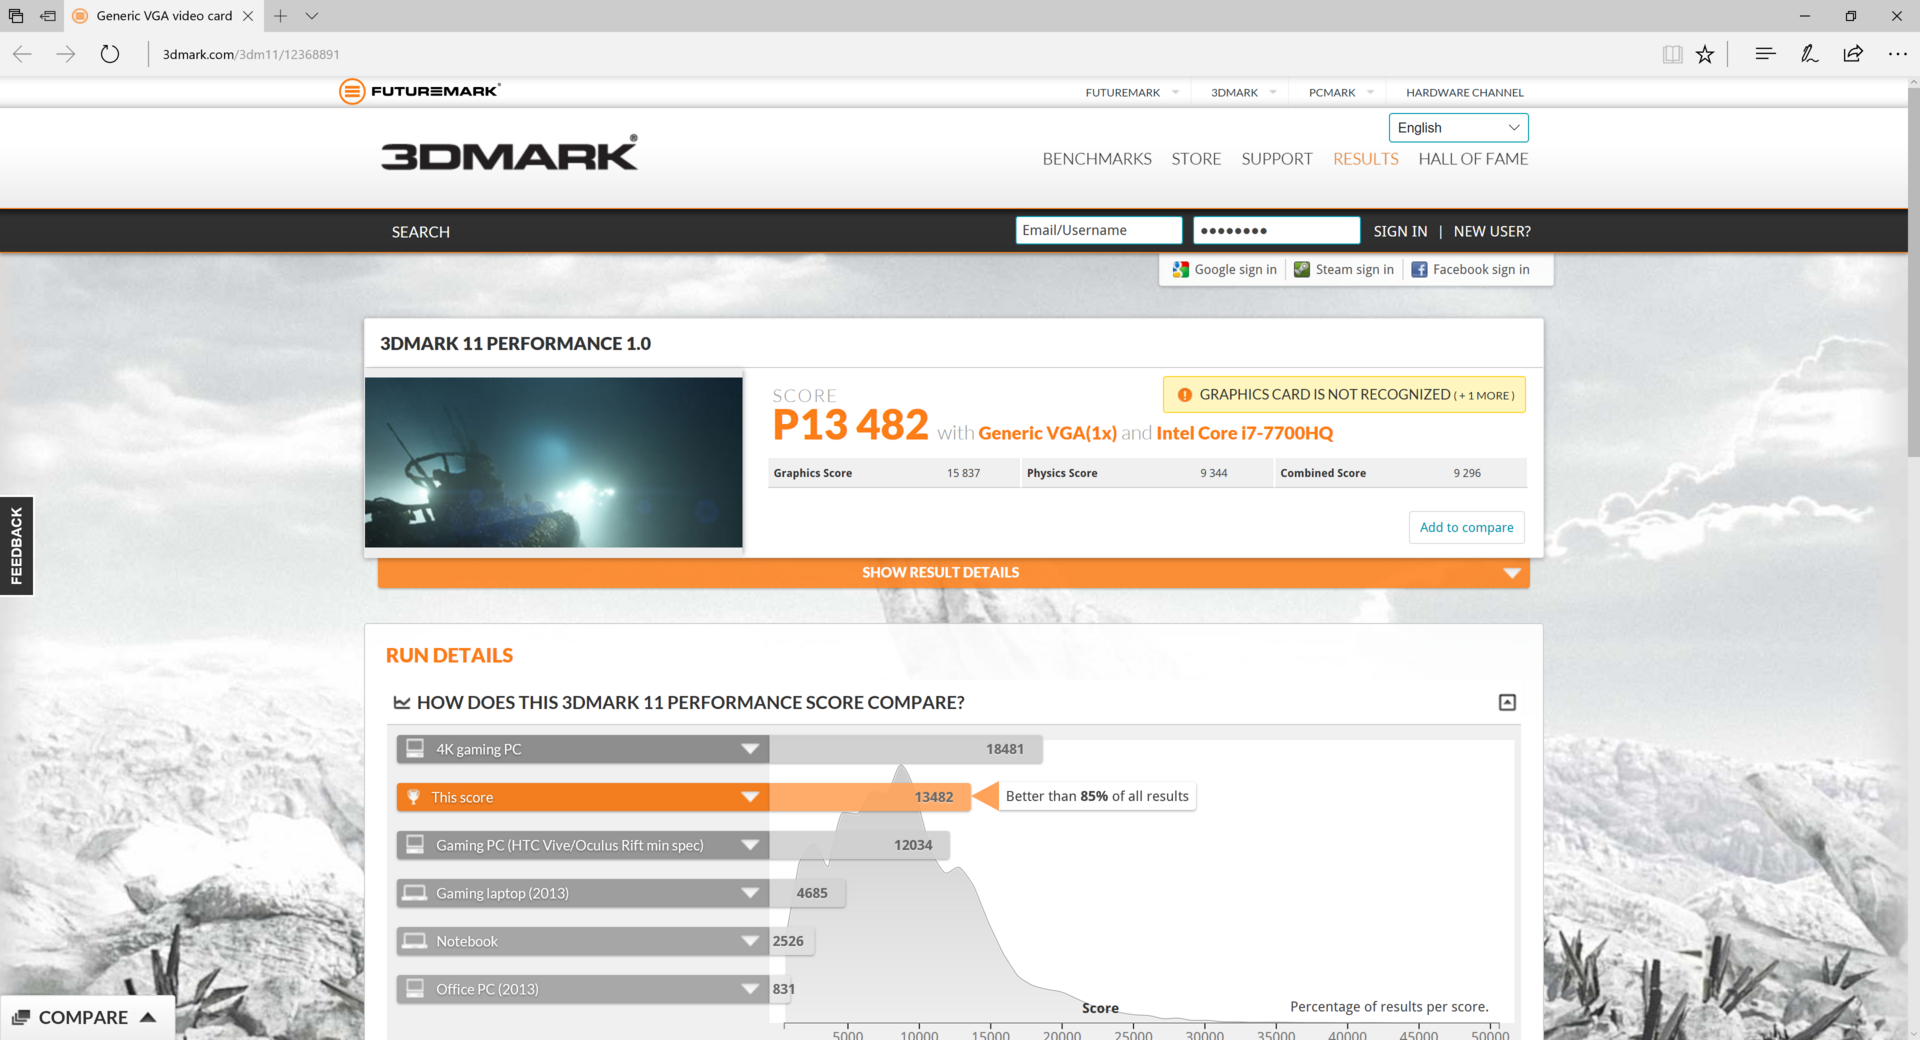
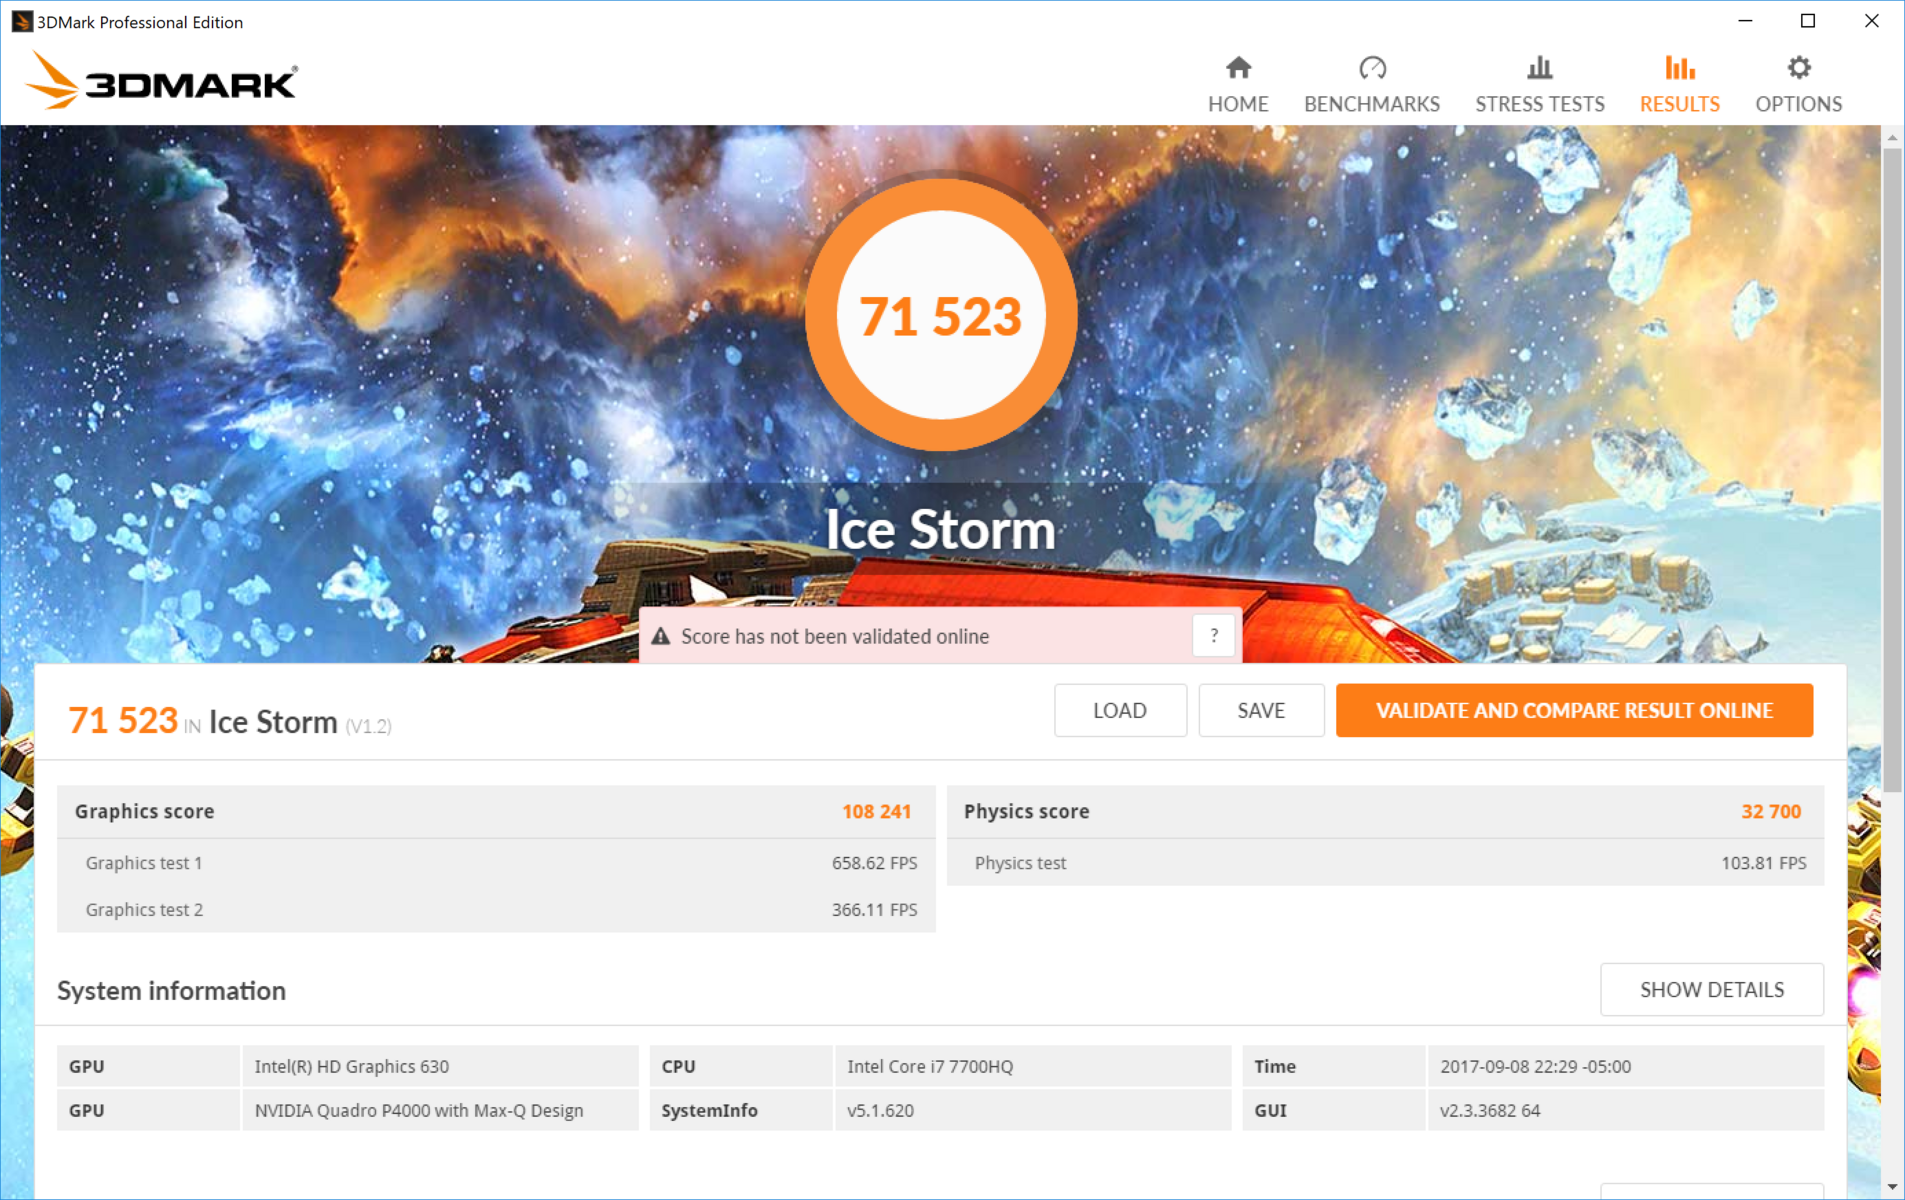
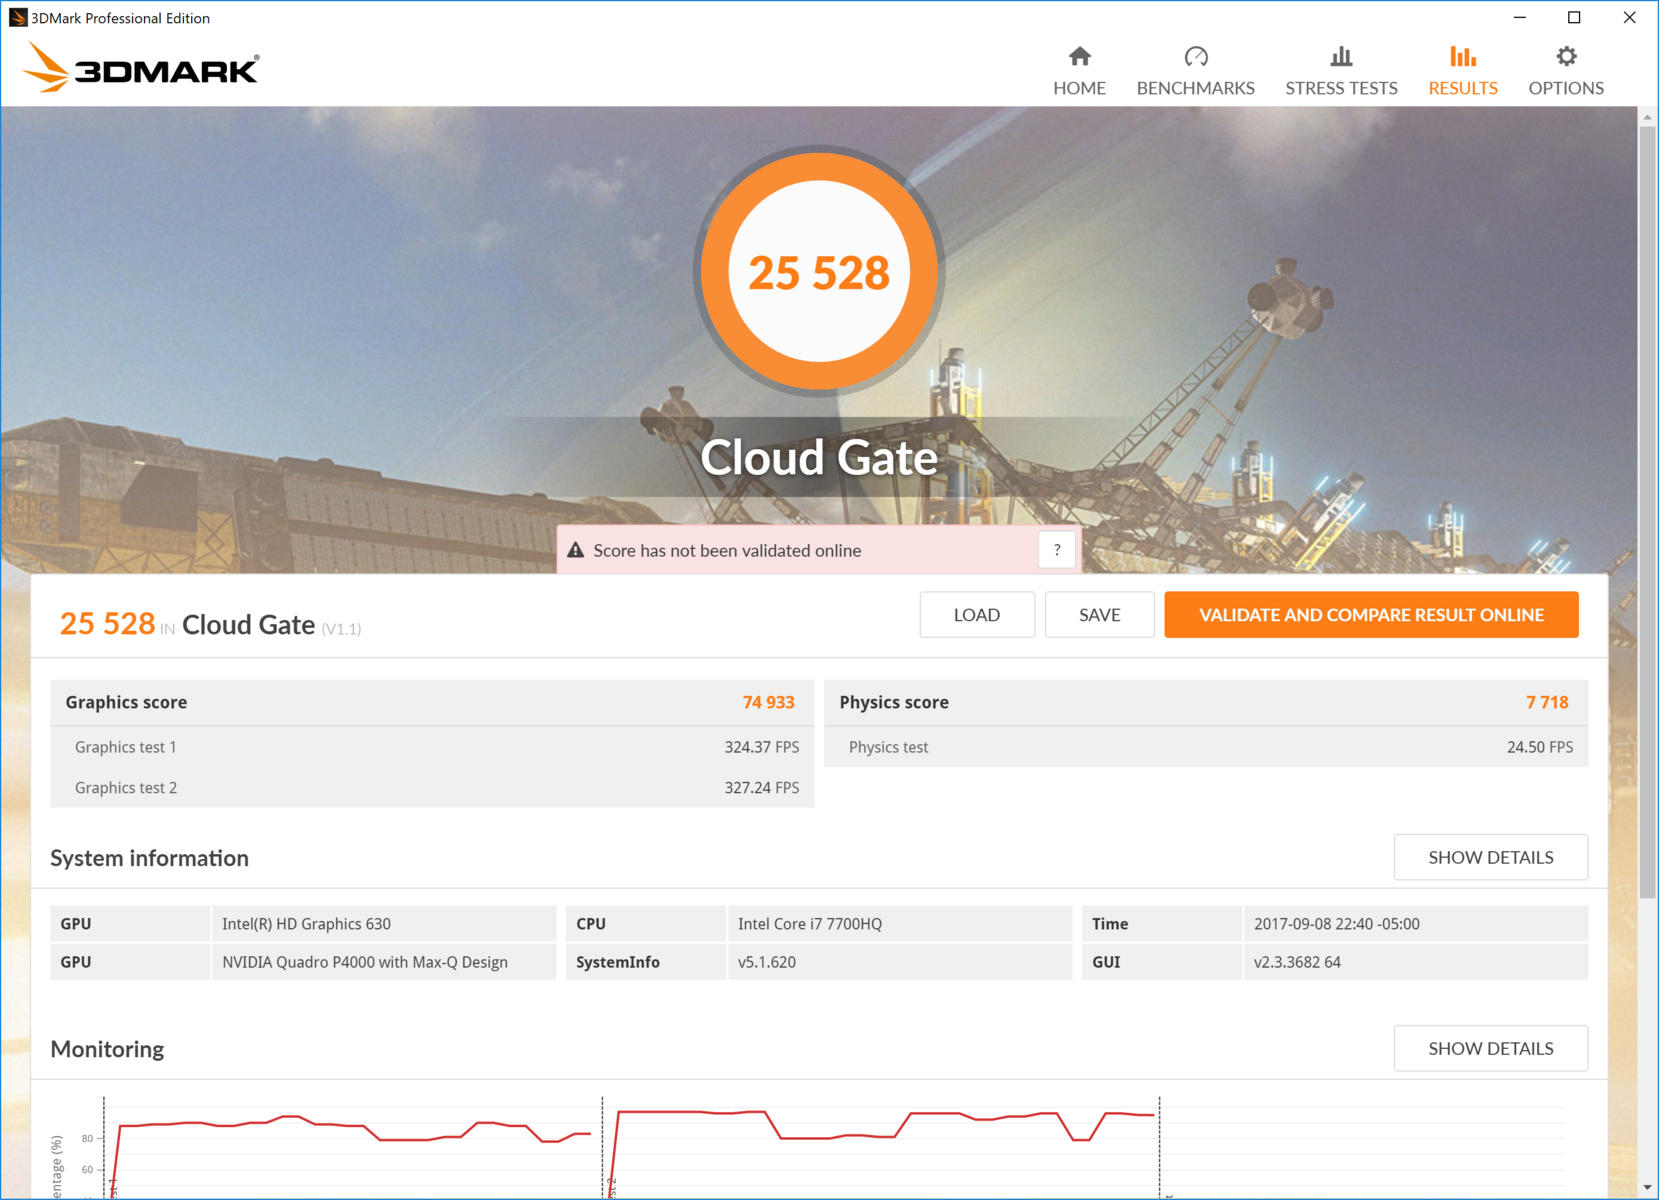
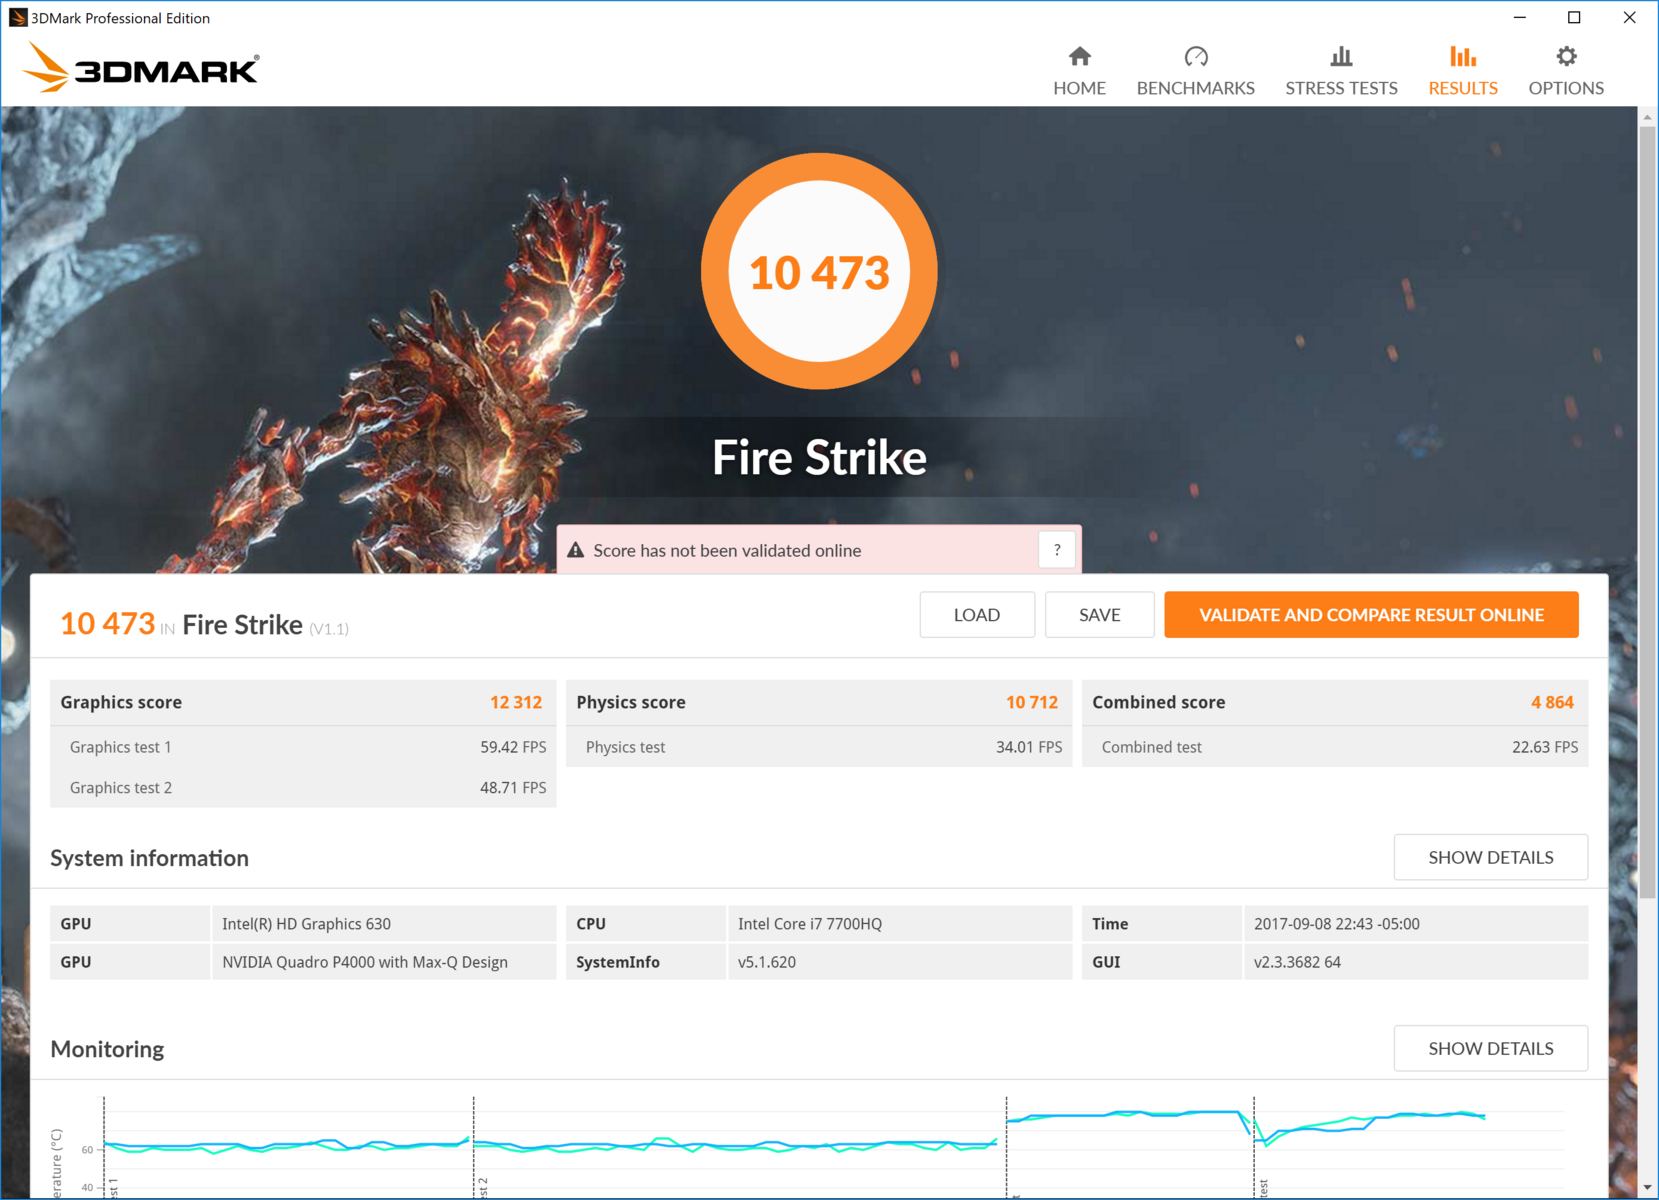
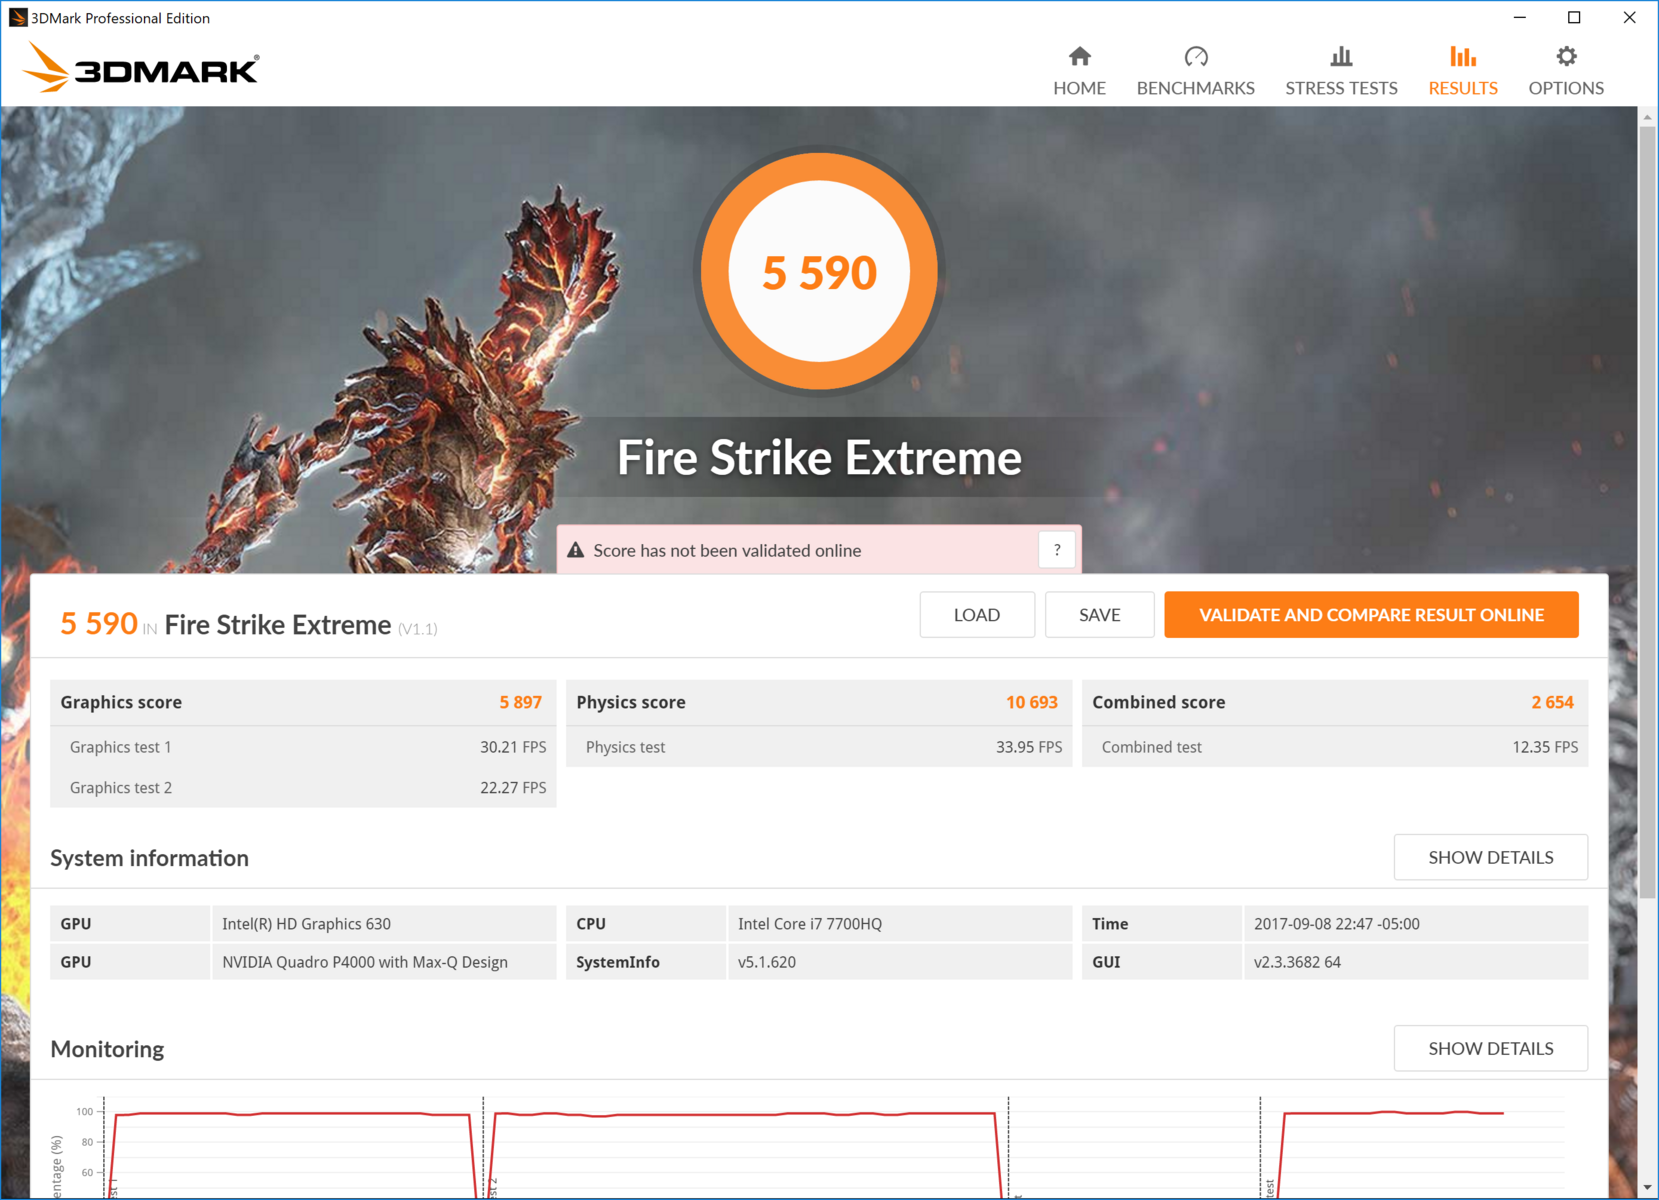
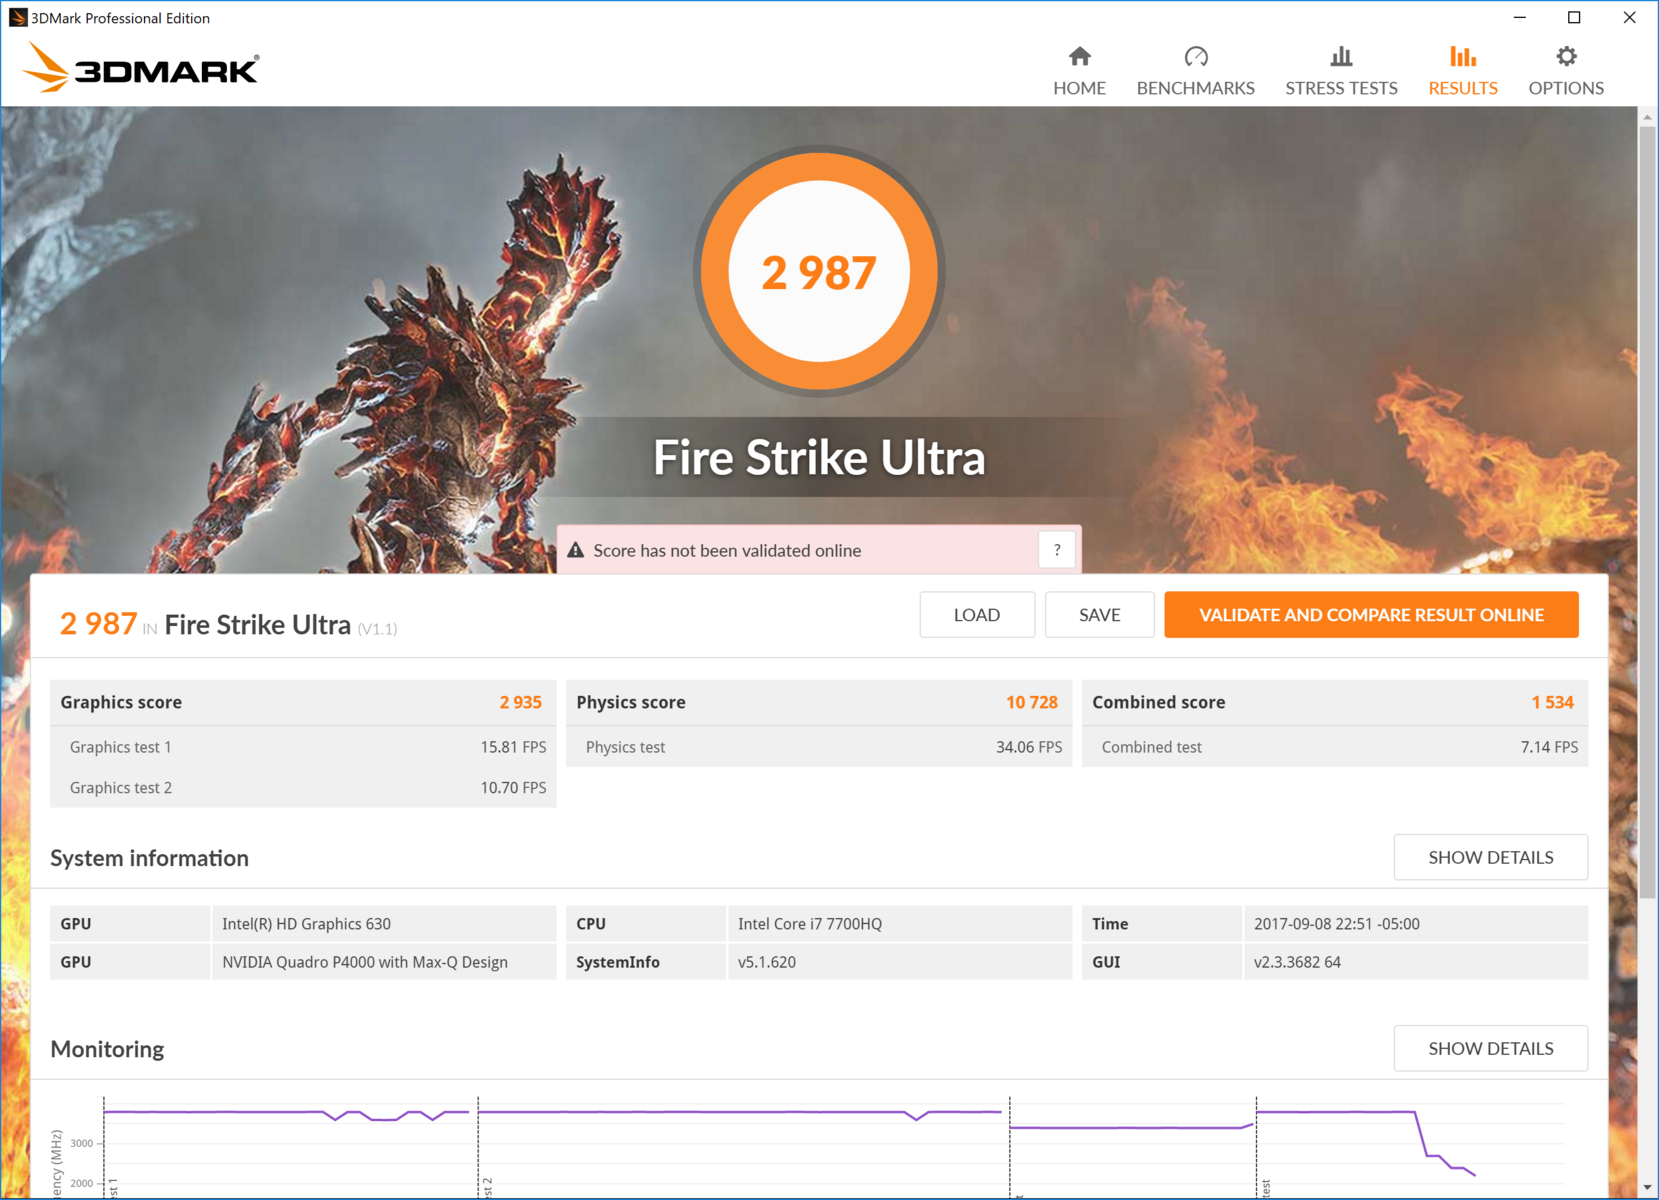
Using 3DMark to test the capabilities of the P4000 Max-Q, we see some impressive results. Even with the Max-Q design, which is aimed to essentially undervolt the GPU in the name of improved thermal and power management, the P4000 in our test unit bests the standard P4000 in the Fujitsu Celsius H970 and the GTX 1060 in the Acer Aspire 7. Not surprisingly, the P4000 Max-Q falls short of its GeForce GTX 1070-based cousins, the Asus Zephyrus GX501VS and Aorus X7 v7, by about 24% and 29%, respectively. What is surprising is the wide margin between our P4000 Max-Q and the Quadro M5000M, which was the top mobile workstation GPU of the last generation. Despite bearing a 20% lower power draw rating, the P4000 Max-Q bests the M5000M by 36% in Fire Strike.
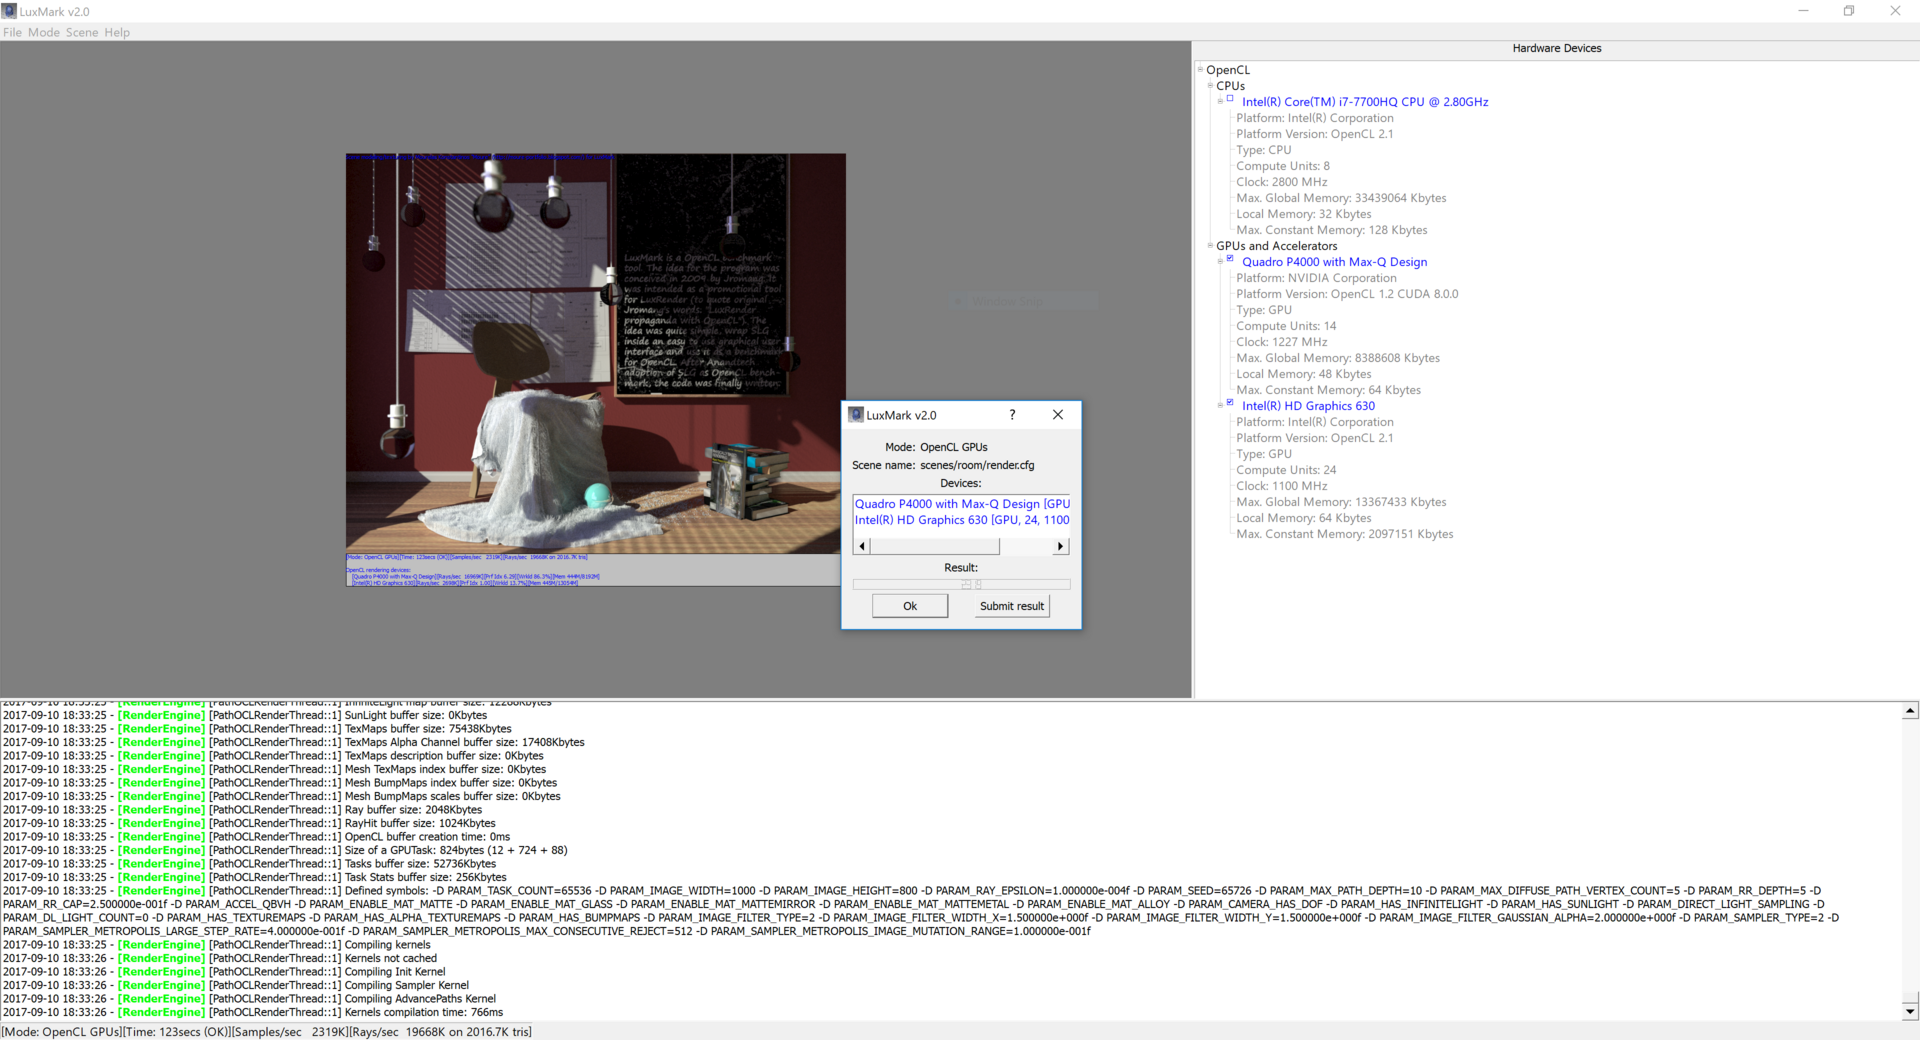
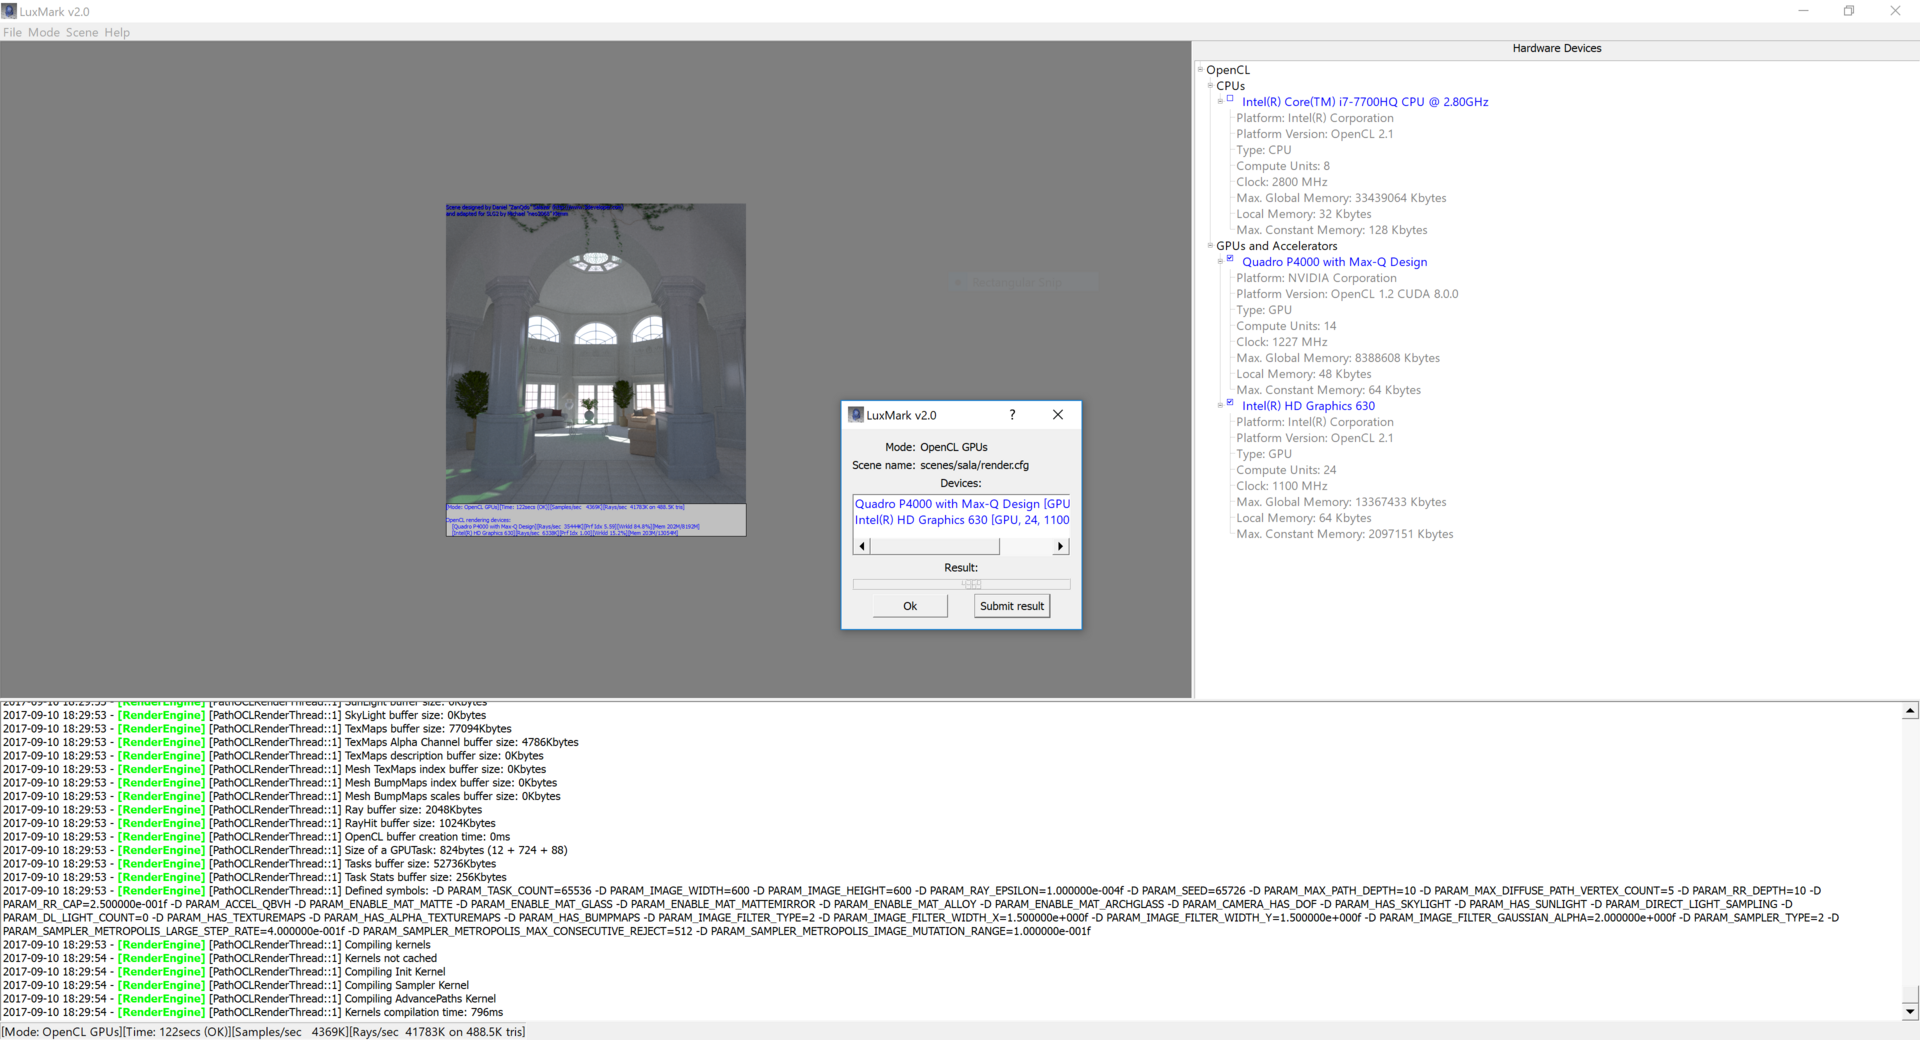
Using SPECviewperf 12 and LuxMark 2.0 to test its professional applications, we are again blown away by the stellar performance of the P4000 Max-Q. Out of the devices we chose for comparison, the P4000 Max-Q sits at the top with a healthy 20% lead in LuxMark. Interestingly, this puts the P4000 Max-Q above the standard P4000 found in the Fujitsu Celsius H970. Keep in mind that we did note problems with cooling and consistent system performance in our review of the Celsius H970; these factors may be to blame. However, what should be taken away is the 25-30% improvement the P4000 Max-Q holds over the P3000 seen in the Lenovo ThinkPad P71.
SPECviewperf offers an interesting look into the benefits of the Max-Q design. Our MSI WS63VR with a P4000 Max-Q sits right next to our P4000 test bench. The difference here is close to the margin of error and offers evidence to Nvidia's marketing; it looks as though Max-Q offers reduced power consumption and heat output with only a slight (if any) sacrifice in performance. Either way, the P4000 Max-Q is an impressive professional grade graphics card and should be adequate for all but the most demanding users. For those that need more out of their GPU, it may be worth upgrading all the way to the P5000 as the standard P4000 will likely offer similar performance with the drawbacks of increased heat output and higher voltage requirements.
We ran The Witcher 3 for an hour to test the long-term consistency of the P4000 Max-Q. Frame rates bounce between 40 and 44 fps over the entire gameplay session, which uses a part of the game world with heavy vegetation and a shifting day/night cycle. As such, we can rule that the GPU should offer steady performance over lengthy and demanding tasks without any major hiccups. To see how temperatures fared during a similar long-term test, please see the Stress Test section below.
For more information on the Nvidia Quadro P4000 Max-Q, please see our dedicated GPU page here.
| 3DMark | |
| 1280x720 Cloud Gate Standard Graphics | |
| Aorus X7 v7 | |
| Asus Zephyrus GX501VS | |
| MSI WS63VR 7RL-023US | |
| Acer Aspire 7 A717-71G-72VY | |
| MSI WS63 7RF-290US | |
| MSI WT72-6QM | |
| Lenovo ThinkPad P71-20HK0004GE | |
| Lenovo Legion Y520-15IKBM 80YY001APB | |
| Fujitsu Celsius H970 | |
| Lenovo ThinkPad P70-20ER000XUS | |
| HP ZBook 15 G4-Y4E80AV | |
| Lenovo ThinkPad P51 20HH0016GE | |
| MSI GS63VR 7RF-228US | |
| Dell Precision 5520 UHD | |
| Lenovo ThinkPad P51s 20HB000SGE | |
| 1920x1080 Fire Strike Graphics | |
| Aorus X7 v7 | |
| Asus Zephyrus GX501VS | |
| MSI WS63VR 7RL-023US | |
| Fujitsu Celsius H970 | |
| Acer Aspire 7 A717-71G-72VY | |
| MSI GS63VR 7RF-228US | |
| Lenovo Legion Y520-15IKBM 80YY001APB | |
| MSI WS63 7RF-290US | |
| MSI WT72-6QM | |
| Lenovo ThinkPad P71-20HK0004GE | |
| Lenovo ThinkPad P70-20ER000XUS | |
| Lenovo ThinkPad P51 20HH0016GE | |
| HP ZBook 15 G4-Y4E80AV | |
| Dell Precision 5520 UHD | |
| Lenovo ThinkPad P51s 20HB000SGE | |
| 1920x1080 Ice Storm Extreme Graphics | |
| Aorus X7 v7 | |
| MSI WT72-6QM | |
| Asus Zephyrus GX501VS | |
| Lenovo ThinkPad P70-20ER000XUS | |
| MSI WS63 7RF-290US | |
| Lenovo Legion Y520-15IKBM 80YY001APB | |
| Dell Precision 5520 UHD | |
| Lenovo ThinkPad P51s 20HB000SGE | |
| 3DMark 06 Standard Score | 28211 points | |
| 3DMark 11 Performance | 13482 points | |
| 3DMark Cloud Gate Standard Score | 25528 points | |
| 3DMark Fire Strike Score | 10473 points | |
Help | ||
Gaming Performance
While a mobile workstation's primary function isn't gaming, they are usually competent gaming machines. The MSI WS63VR is no exception. As the Quadro P4000 Max-Q GPU is similar in performance to the GeForce GTX 1060, users should expect to play the latest AAA titles at maximum details at Full HD and hit frame rates of 60 fps or above. More demanding titles like The Witcher 3 may need to have details turned down a notch, but gameplay should be enjoyable nonetheless. Our machine edges out the GTX 1060-equipped MSI GS63VR by about 10% in most games.
As our WS63VR is configured with a 4K screen, it would be amiss to not test gaming at a resolution of 3840 x 2160. The P4000 Max-Q sits right on the cusp of 4K gaming, hitting an average of about 30 fps in most games, but it must be noted that frame stutters are a major issue and can quickly become a game-breaking annoyance. Settings will need to trimmed back to medium or low, which may not be a worthy payoff considering the smaller screen size; the visual benefit of a 4K resolution isn't apparent on the 15.6-inch display. Full HD is the sweet spot here.
| The Witcher 3 | |
| 1920x1080 Ultra Graphics & Postprocessing (HBAO+) | |
| Aorus X7 v7 | |
| Asus Zephyrus GX501VS | |
| MSI WS63VR 7RL-023US | |
| Fujitsu Celsius H970 | |
| MSI GS63VR 7RF-228US | |
| Acer Aspire 7 A717-71G-72VY | |
| Lenovo Legion Y520-15IKBM 80YY001APB | |
| MSI WS63 7RF-290US | |
| Lenovo ThinkPad P71-20HK0004GE | |
| Lenovo ThinkPad P51 20HH0016GE | |
| HP ZBook 15 G4-Y4E80AV | |
| 3840x2160 High Graphics & Postprocessing (Nvidia HairWorks Off) | |
| MSI WS63VR 7RL-023US | |
| MSI GS63VR 7RF-228US | |
| Lenovo ThinkPad P71-20HK0004GE | |
| Lenovo ThinkPad P51 20HH0016GE | |
| Batman: Arkham Knight | |
| 3840x2160 High / On (Interactive Smoke & Paper Debris Off) AA:SM AF:8x | |
| MSI WS63VR 7RL-023US | |
| MSI GS63VR 7RF-228US | |
| Dell Precision 5520 UHD | |
| 1920x1080 High / On AA:SM AF:16x | |
| MSI WS63VR 7RL-023US | |
| Asus Zephyrus GX501VS | |
| MSI GS63VR 7RF-228US | |
| MSI WS63 7RF-290US | |
| Lenovo Legion Y520-15IKBM 80YY001APB | |
| Dell Precision 5520 UHD | |
| BioShock Infinite - 1920x1080 Ultra Preset, DX11 (DDOF) | |
| Aorus X7 v7 | |
| Asus Zephyrus GX501VS | |
| MSI WS63VR 7RL-023US | |
| MSI GS63VR 7RF-228US | |
| Fujitsu Celsius H970 | |
| MSI WS63 7RF-290US | |
| Lenovo ThinkPad P71-20HK0004GE | |
| Lenovo Legion Y520-15IKBM 80YY001APB | |
| Lenovo ThinkPad P70-20ER000XUS | |
| HP ZBook 15 G4-Y4E80AV | |
| Dell Precision 5520 UHD | |
| Lenovo ThinkPad P51s 20HB000SGE | |
| Metro: Last Light - 1920x1080 Very High (DX11) AF:16x | |
| Asus Zephyrus GX501VS | |
| MSI WS63VR 7RL-023US | |
| MSI GS63VR 7RF-228US | |
| MSI WS63 7RF-290US | |
| MSI WT72-6QM | |
| Rise of the Tomb Raider | |
| 3840x2160 High Preset AA:FX AF:4x | |
| MSI WS63VR 7RL-023US | |
| MSI GS63VR 7RF-228US | |
| Lenovo ThinkPad P71-20HK0004GE | |
| Lenovo ThinkPad P70-20ER000XUS | |
| Lenovo ThinkPad P51 20HH0016GE | |
| 1920x1080 Very High Preset AA:FX AF:16x | |
| Asus Zephyrus GX501VS | |
| Fujitsu Celsius H970 | |
| MSI WS63VR 7RL-023US | |
| MSI GS63VR 7RF-228US | |
| MSI WS63 7RF-290US | |
| Lenovo ThinkPad P71-20HK0004GE | |
| Lenovo ThinkPad P70-20ER000XUS | |
| Lenovo ThinkPad P51 20HH0016GE | |
| HP ZBook 15 G4-Y4E80AV | |
| Lenovo ThinkPad P51s 20HB000SGE | |
| Ashes of the Singularity | |
| 1920x1080 high | |
| Asus Zephyrus GX501VS | |
| MSI WS63VR 7RL-023US | |
| MSI WS63 7RF-290US | |
| Lenovo ThinkPad P51s 20HB000SGE | |
| 3840x2160 extreme | |
| MSI WS63VR 7RL-023US | |
| 3840x2160 crazy | |
| MSI WS63VR 7RL-023US | |
| Civilization 6 | |
| 3840x2160 High Preset | |
| MSI WS63VR 7RL-023US | |
| 1920x1080 Ultra Preset AA:4xMS | |
| MSI WS63VR 7RL-023US | |
| Fujitsu Celsius H970 | |
| Lenovo ThinkPad P51s 20HB000SGE | |
| low | med. | high | ultra | 4K | |
|---|---|---|---|---|---|
| Batman: Arkham City (2011) | 195 | 170 | 144 | 106 | |
| BioShock Infinite (2013) | 256 | 218 | 202 | 113 | |
| Metro: Last Light (2013) | 129 | 79 | 78 | 84 | |
| Company of Heroes 2 (2013) | 69 | 63 | 62 | 50 | |
| Batman: Arkham Origins (2013) | 330 | 270 | 177 | 82 | |
| Thief (2014) | 96 | 94 | 93 | 79 | |
| Middle-earth: Shadow of Mordor (2014) | 123 | 112 | 107 | 90 | |
| Alien: Isolation (2014) | 250 | 212 | 192 | 148 | |
| Ryse: Son of Rome (2014) | 121 | 111 | 88 | 82 | |
| The Witcher 3 (2015) | 162 | 119 | 79 | 42 | 29 |
| Batman: Arkham Knight (2015) | 171 | 152 | 96 | 94 | 32 |
| Metal Gear Solid V (2015) | 60 | 60 | 60 | 60 | 50 |
| Call of Duty: Black Ops 3 (2015) | 145 | 133 | 85 | 82 | 32 |
| Fallout 4 (2015) | 156 | 151 | 93 | 76 | 30 |
| Just Cause 3 (2015) | 140 | 133 | 89 | 77 | 35 |
| Rise of the Tomb Raider (2016) | 176 | 144 | 77 | 65 | 28 |
| Ashes of the Singularity (2016) | 76 | 67 | 62 | 26 | |
| Doom (2016) | 130 | 121 | 97 | 92 | 35 |
| Deus Ex Mankind Divided (2016) | 129 | 106 | 60 | 32 | 21 |
| Mafia 3 (2016) | 84 | 104 | 43 | 17 | |
| Civilization 6 (2016) | 80 | 76 | 63 | 60 | 44 |
| Resident Evil 7 (2017) | 354 | 195 | 161 | 135 | 60 |
| Prey (2017) | 142 | 129 | 125 | 109 | 38 |
| Rocket League (2017) | 244 | 223 | 163 | ||
| Dirt 4 (2017) | 220 | 164 | 93 | 55 | 34 |
| F1 2017 (2017) | 193 | 140 | 105 | 72 | 34 |
| Ark Survival Evolved (2017) | 92 | 52 | 51 | 27 | 27 |
Stress Test
The main purpose of Nvidia's Max-Q design philosophy is to decrease both the heat output and power requirements of GPUs based on their already efficient Pascal platform. To that end, stress testing is a particular focus for this variant of the WS63VR. In previous sections, we discovered that the P4000 Max-Q offers performance very close to that of the standard P4000; how are temperatures and clock speeds affected?
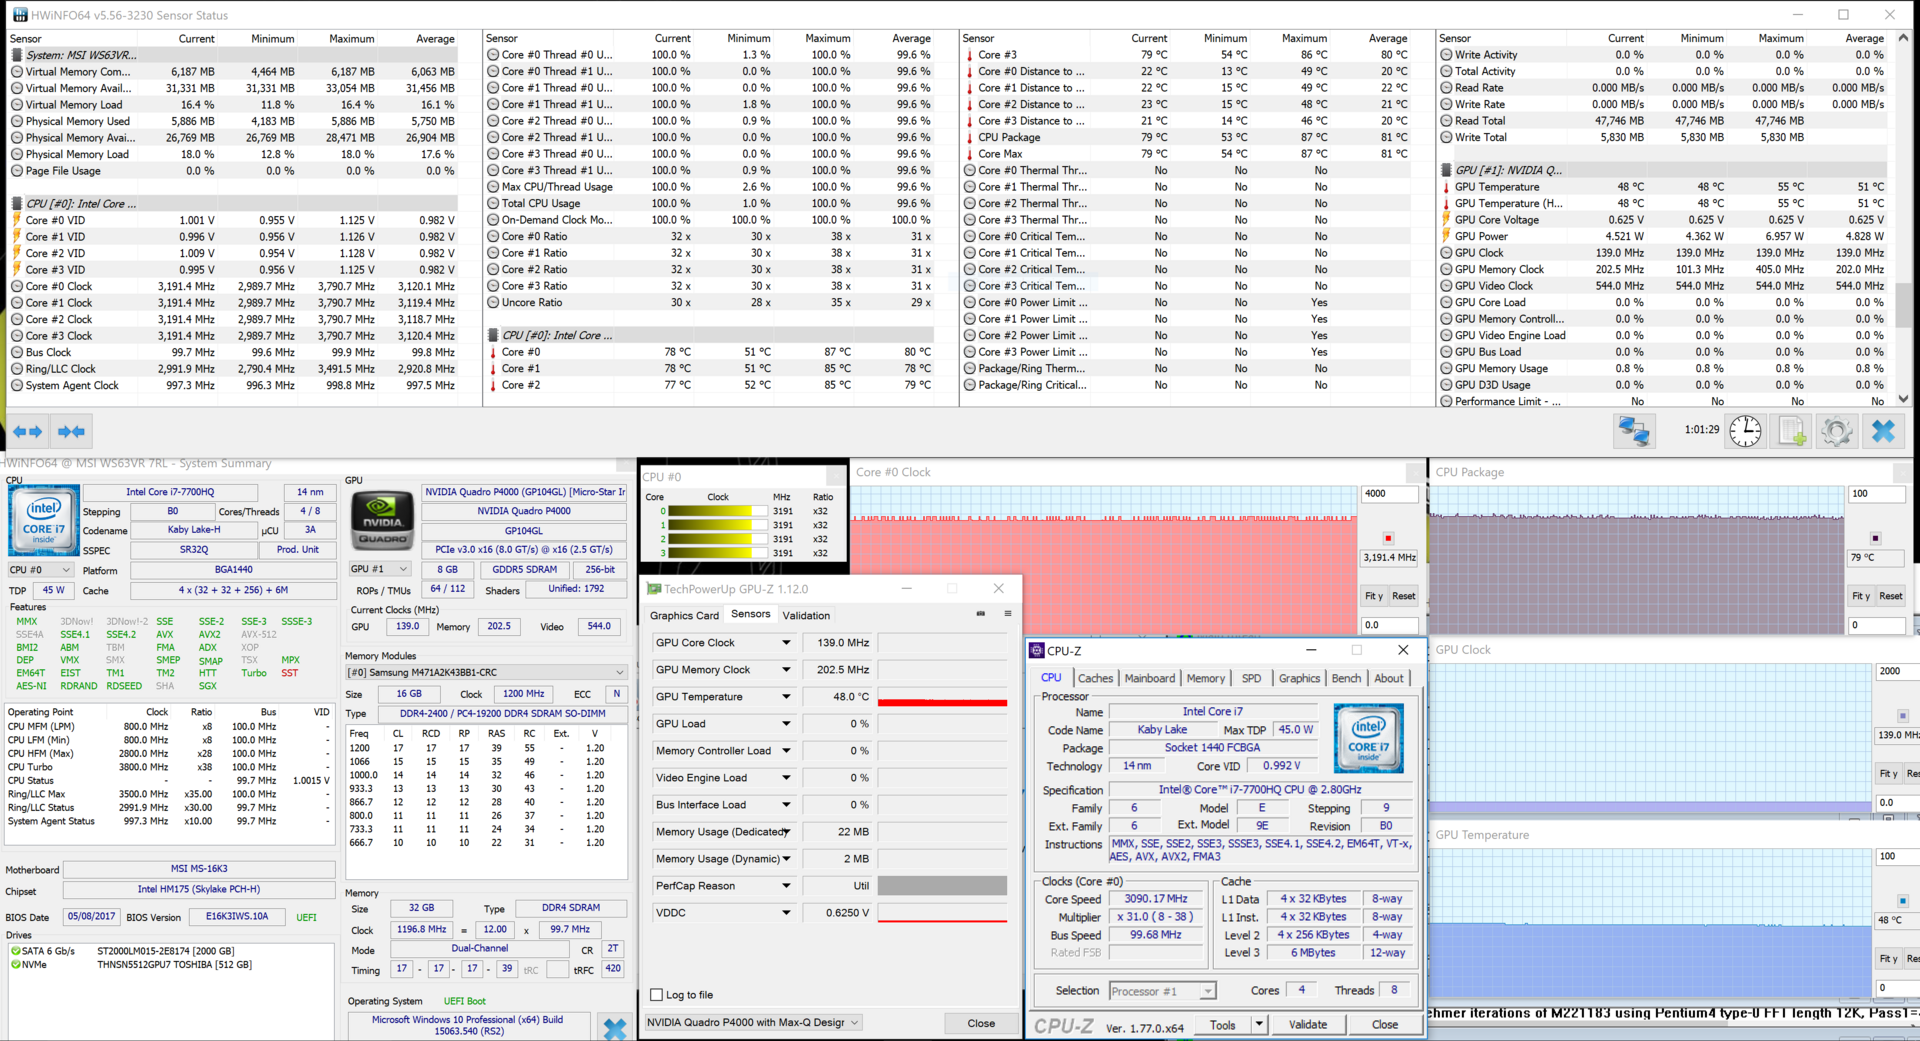
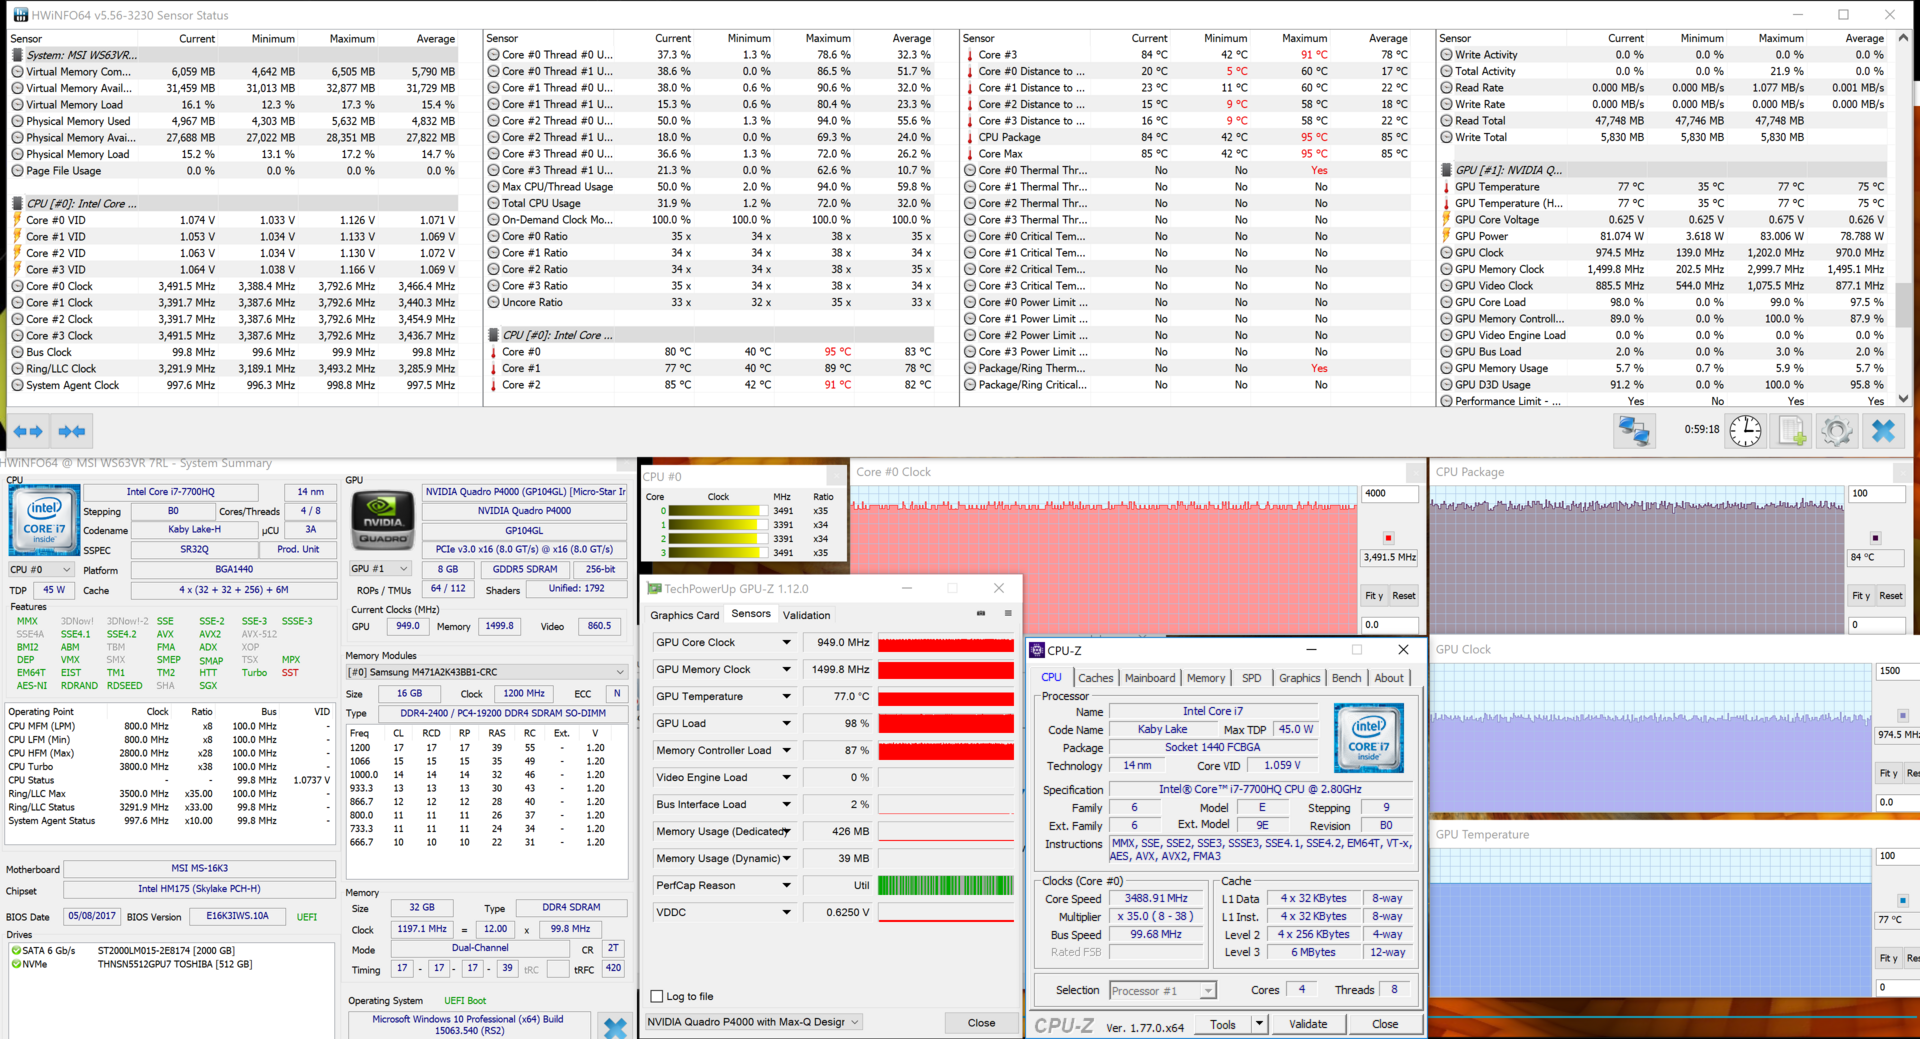
Using Prime95 to fully tax the CPU, the WS63VR does an admiral job in cooling the i7-7700HQ. Clock speeds across the CPU average about 3.2 GHz over the hour-long torture test; while the system cannot maintain its rated boost clock of 3.8 GHz, it still puts up quite a show. Temperatures remain more than acceptable at 79º C, which is well below the 100º C threshold given by Intel. Running the FurMark stress test, the system again offers stellar results. The CPU's average clock speed hits 3.5 GHz, while the GPU core clock settles in at about 975 MHz. Temperatures are again well managed at 85º C for the CPU and 77º C for the GPU.
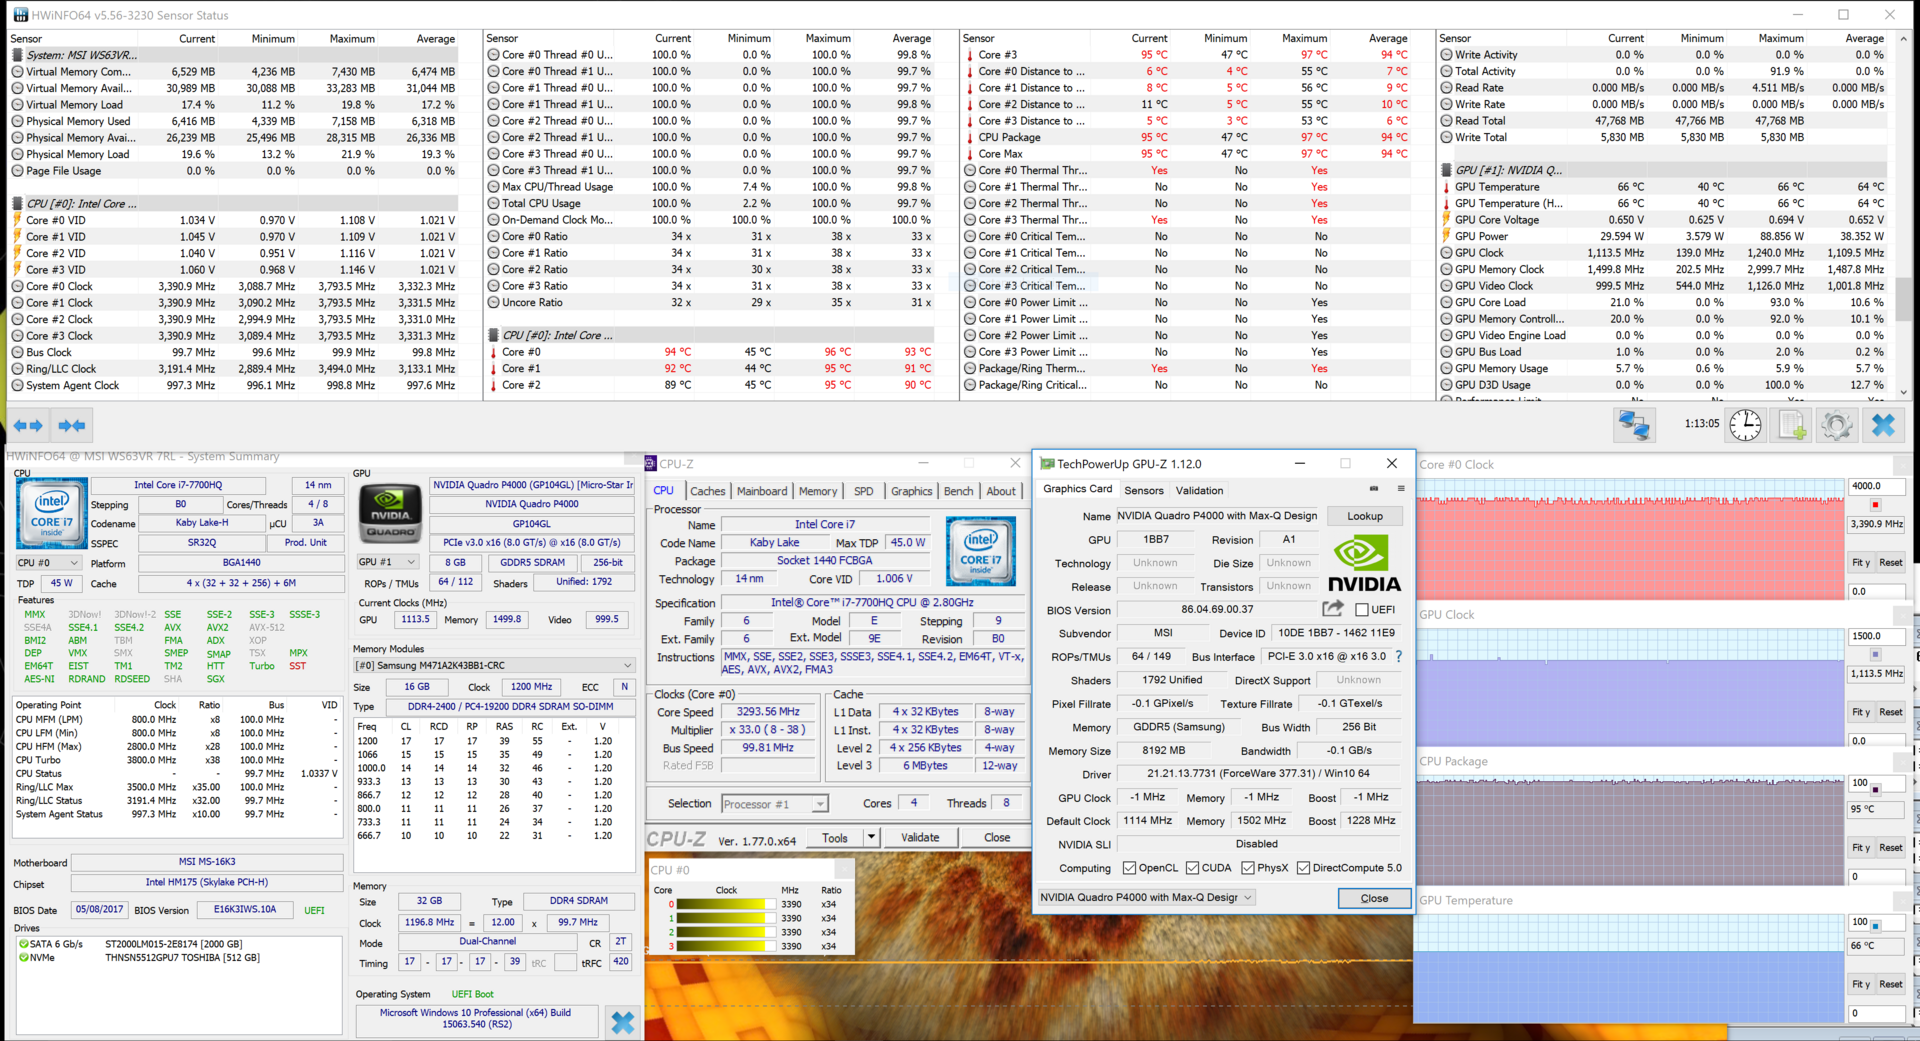
Running Prime95 and FurMark concurrently still cannot cripple system performance. The CPU remains strong; individual cores sporadically boost up to 3.8 GHz with the clocks averaging 3.3 GHz. The GPU is able to maintain a core clock of 1100 MHz, which is impressive considering that temperatures hold at 66º C. CPU heat its a bit worrying; temperatures reach 95º C but are still within limits. However, users should keep an eye on CPU temperatures when running CPU-intensive tasks.
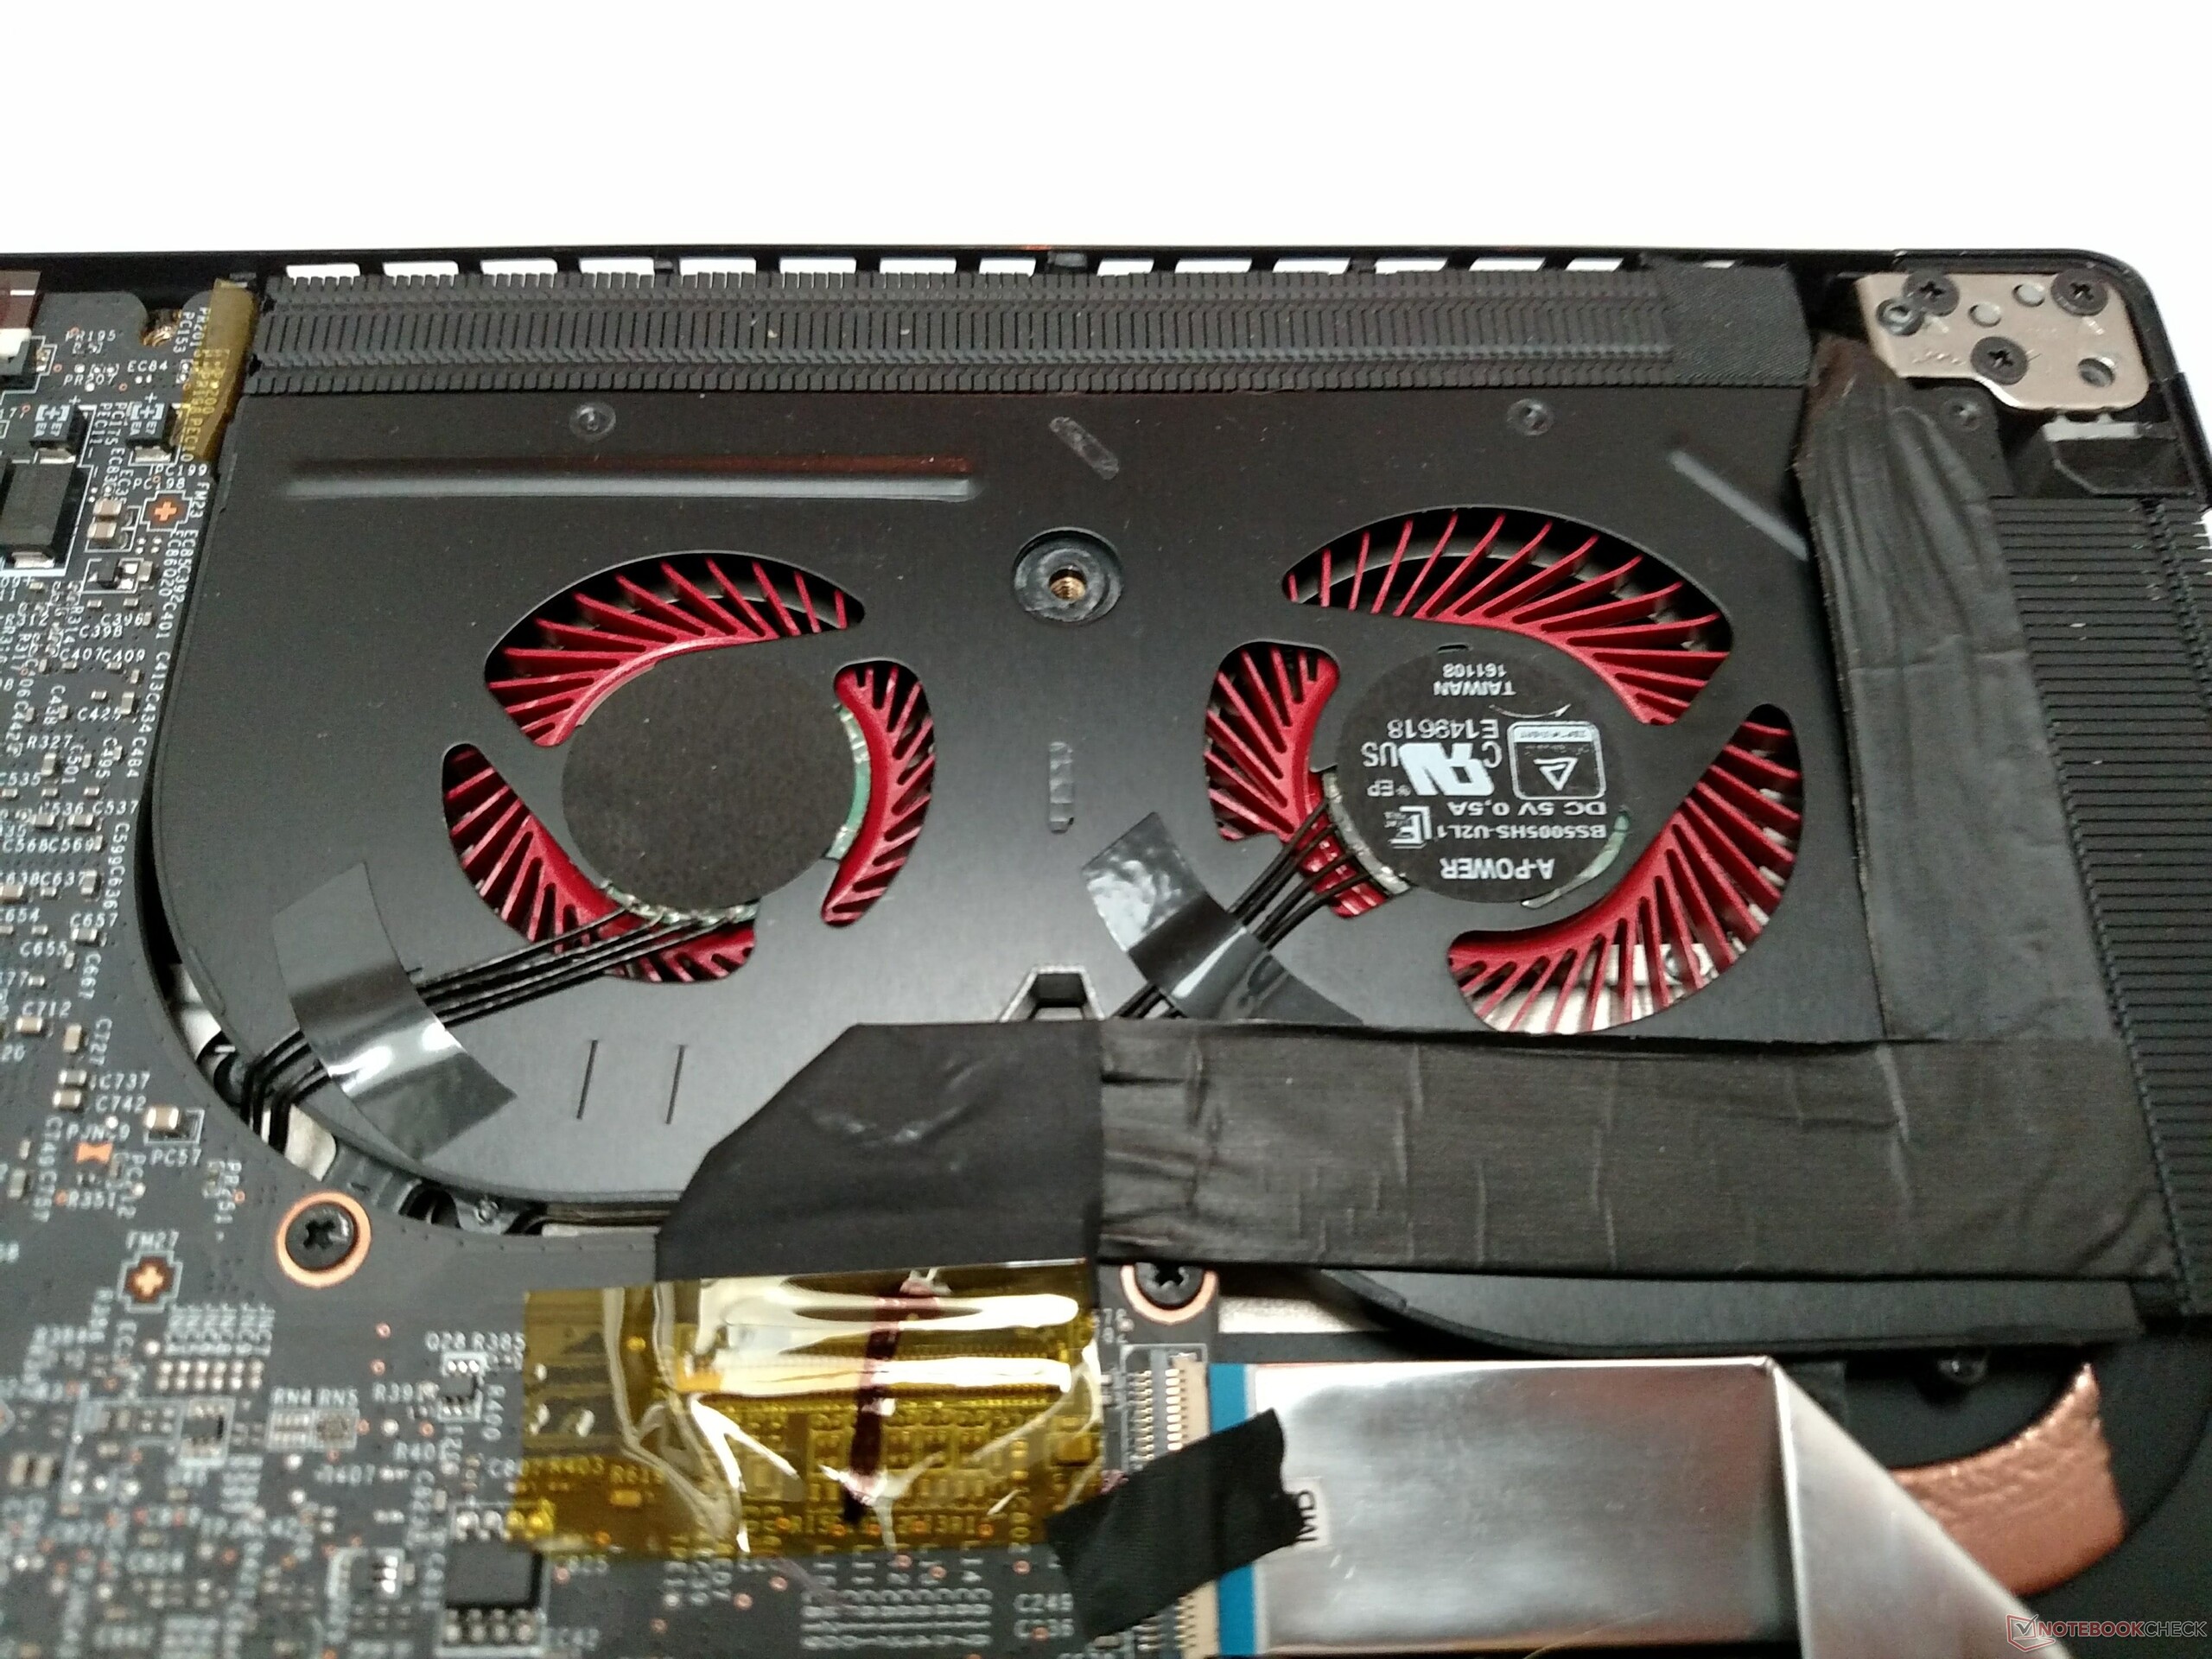
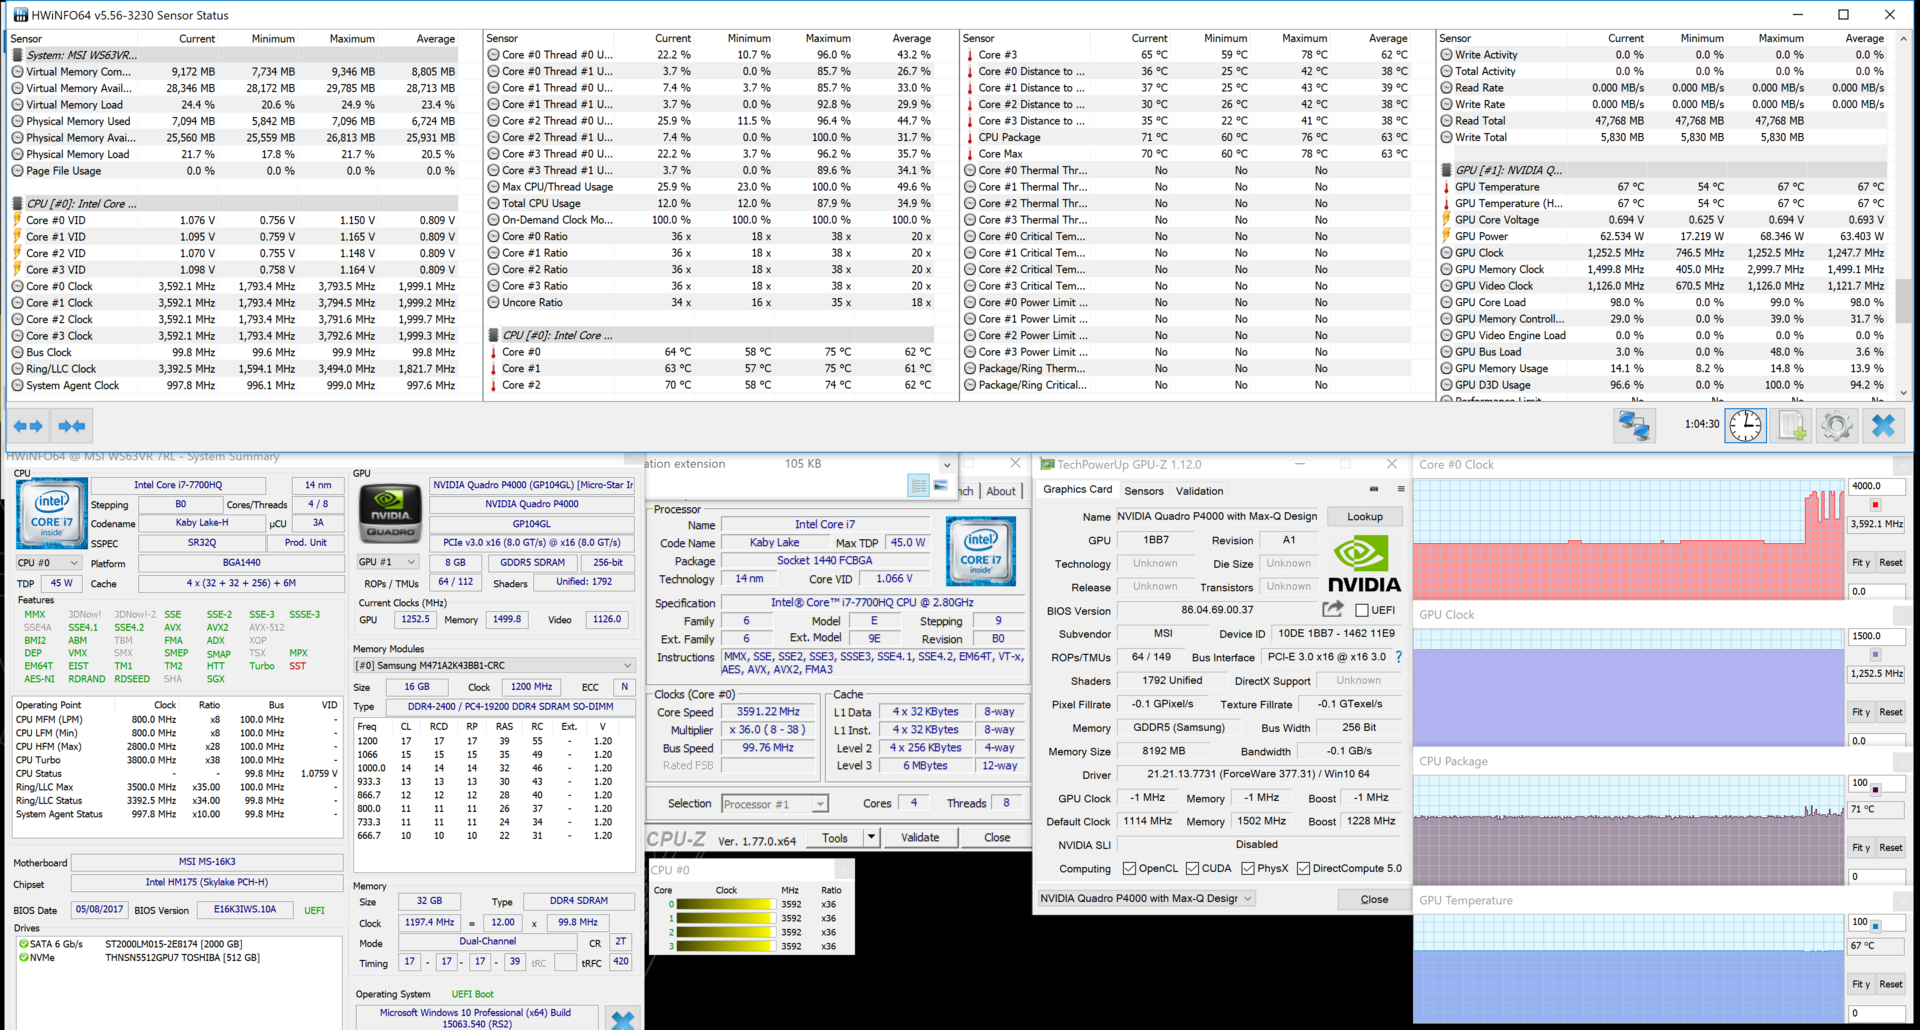
3D rendering and gaming present no problem for the machine. While the CPU pulls itself back to 2.0 GHz during an hour-long play session of The Witcher 3, this is likely to shift more power to the P4000 Max-Q. We see the GPU boost to 1250 MHz and hold steady for most of the play session. Here lies the pièce de résistance of the Max-Q design; even though the graphics core is fully loaded (about 98% utilization) and runs full tilt, temperatures stay impressively low at 67º C. Users can expect full performance from the GPU without worrying about thermals. Part of this is due to the dual-fan assembly dedicated to cooling the GPU, but even more is due to the excellent engineering behind Max-Q.
| CPU Clock (GHz) | GPU Clock (MHz) | Average CPU Temperature (°C) | Average GPU Temperature (°C) | |
| Prime95 Stress | 3.2 | - | 79 | - |
| FurMark Stress | 3.5 | 975 | 84 | 77 |
| Prime95 + FurMark Stress | 3.3 | 1100 | 95 | 66 |
| Witcher 3 Stress | 2.0 | 1250 | 63 | 67 |
Emissions
System Noise
Fan noise has always been a thorn in the side of gaming and workstation notebooks. The power-hungry GPUs and CPUs of old demand an exorbitant amount of cooling, which is usually provided via high fan speeds. This results in noise levels akin to a jet fighter prepping for takeoff. Thanks to the improved Max-Q design of the P4000, system noise is not much of a concern with the WS63VR. At idle, the fans spin very slowly (if at all) and are virtually silent. Under a full load, the fans ramp up quickly and aggressively but do not get terribly loud. Peaking at about 43 dB(A), the fans will be heard over normal room noise and are a bit louder than other mobile workstations. The fans have an unfortunate high pitch, but fan noise shouldn't grate on users' ears, even at load.
The HDD can also be heard in a quiet room if the fans aren't running. The subtle spin of the HDD platters can be heard in a silent workspace. Coil whine is also present but can only be heard when an ear is held next to the bottom panel; it should not present an audible annoyance in any setting.
Noise level
| Idle |
| 33.2 / 33.2 / 33.2 dB(A) |
| Load |
| 41.4 / 43.5 dB(A) |
 | ||
30 dB silent 40 dB(A) audible 50 dB(A) loud |
||
min: | ||
| MSI WS63VR 7RL-023US Quadro P4000 Max-Q, i7-7700HQ, Toshiba NVMe THNSN5512GPU7 | HP ZBook 15 G4-Y4E80AV Quadro M2200, E3-1535M v6, Samsung SSD SM961 1TB M.2 MZVKW1T0HMLH | MSI WS63 7RF-290US Quadro P3000, i7-7700HQ, Samsung SM961 MZVKW512HMJP m.2 PCI-e | Lenovo ThinkPad P51 20HH0016GE Quadro M2200, E3-1505M v6, Samsung PM961 NVMe MZVLW512HMJP | Lenovo ThinkPad P51s 20HB000SGE Quadro M520, i7-7600U, Samsung SSD PM961 1TB M.2 PCIe 3.0 x4 NVMe (MZVLW1T0) | Dell Precision 5520 UHD Quadro M1200, E3-1505M v6, Samsung SM961 MZVKW512HMJP m.2 PCI-e | MSI GS63VR 7RF-228US GeForce GTX 1060 Mobile, i7-7700HQ, Samsung SM961 MZVKW512HMJP m.2 PCI-e | MSI WT72-6QM Quadro M5000M, E3-1505M v5, Toshiba NVMe THNSN5256GPU7 | |
|---|---|---|---|---|---|---|---|---|
| Noise | 7% | 6% | 11% | 8% | -1% | -3% | 2% | |
| off / environment * (dB) | 28 | 29.5 -5% | 28.1 -0% | 29.6 -6% | 29.2 -4% | 28.7 -2% | 28.8 -3% | |
| Idle Minimum * (dB) | 33.2 | 29.5 11% | 28.1 15% | 29.6 11% | 29.2 12% | 28.7 14% | 33.1 -0% | 33.3 -0% |
| Idle Average * (dB) | 33.2 | 29.5 11% | 28.1 15% | 29.6 11% | 29.2 12% | 32.1 3% | 33.1 -0% | 33.4 -1% |
| Idle Maximum * (dB) | 33.2 | 30 10% | 32 4% | 29.6 11% | 31.1 6% | 32.1 3% | 34 -2% | 33.5 -1% |
| Load Average * (dB) | 41.4 | 39.5 5% | 38 8% | 32.2 22% | 36.7 11% | 41.3 -0% | 37.2 10% | 38.8 6% |
| Witcher 3 ultra * (dB) | 38.4 | 39.5 -3% | 35.8 7% | 45.5 -18% | 46.1 -20% | |||
| Load Maximum * (dB) | 43.5 | 36 17% | 47.2 -9% | 36.6 16% | 39.4 9% | 45.5 -5% | 47.1 -8% | 40.2 8% |
* ... smaller is better
Temperature
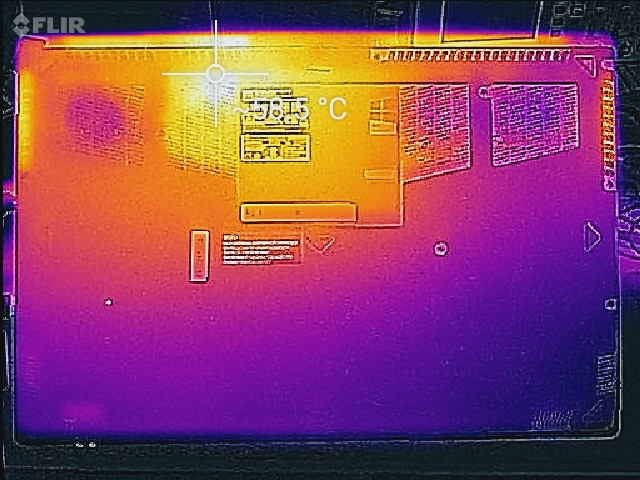
The well-managed temperatures seen in our stress testing translate to good temperatures across the chassis. For the most part, users won't notice heat output. There is a hot spot on the underside of the chassis at the middle of the back, which is right where the CPU and GPU sit. Because of this, users should avoid holding the notebook in their laps while doing heavy rendering or computational work. There is another small hot spot on the right side of the keyboard. Under load, the area around the Enter key will feel noticeably warm but is not painful to the touch. In day-to-day use, the machine remains cool to the touch.
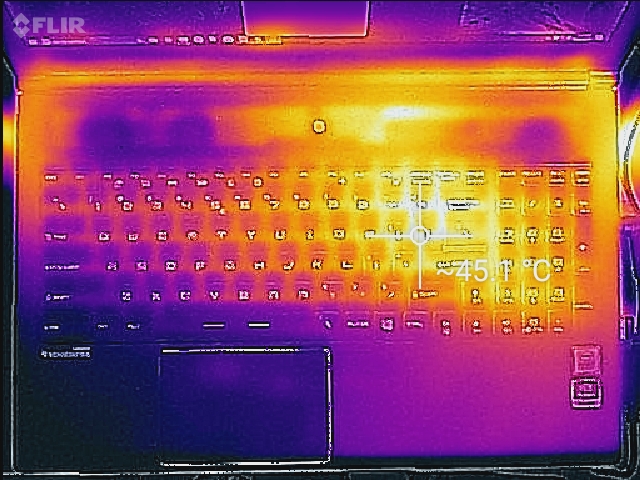
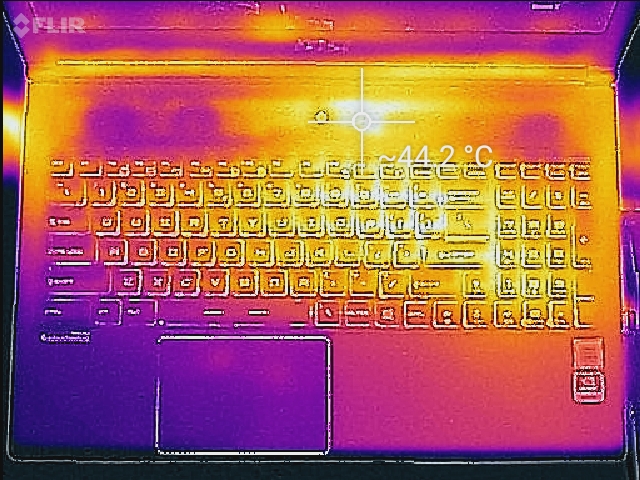
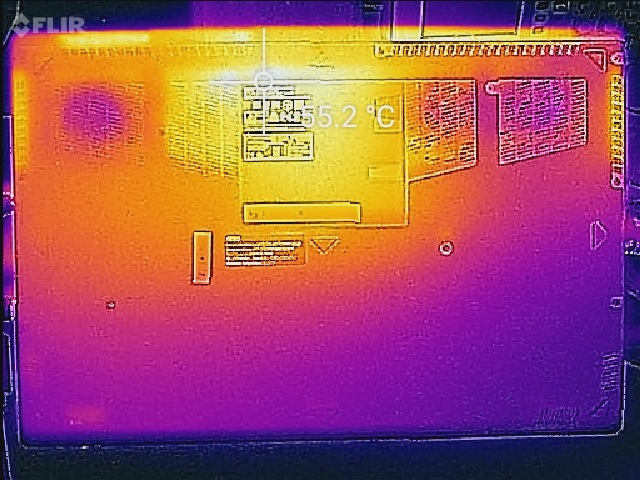
(±) The maximum temperature on the upper side is 45 °C / 113 F, compared to the average of 38.2 °C / 101 F, ranging from 22.2 to 69.8 °C for the class Workstation.
(-) The bottom heats up to a maximum of 56.8 °C / 134 F, compared to the average of 41.1 °C / 106 F
(+) In idle usage, the average temperature for the upper side is 25.9 °C / 79 F, compared to the device average of 32 °C / 90 F.
(±) Playing The Witcher 3, the average temperature for the upper side is 37.1 °C / 99 F, compared to the device average of 32 °C / 90 F.
(+) The palmrests and touchpad are reaching skin temperature as a maximum (35.4 °C / 95.7 F) and are therefore not hot.
(-) The average temperature of the palmrest area of similar devices was 27.8 °C / 82 F (-7.6 °C / -13.7 F).
Speakers

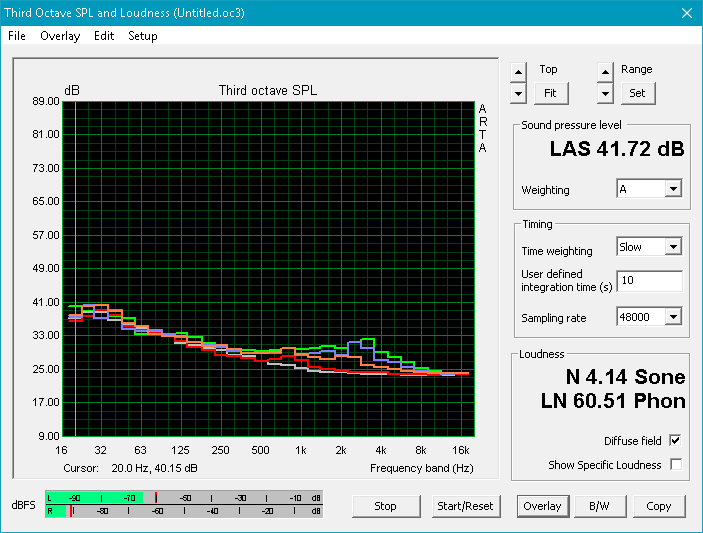
The speakers are nothing special. They fare about as well as most notebook speakers; there is a noticeable lack of bass, and music sounds tinny and thin with an emphasis in highs and upper mids. Volume is about average, and the speakers remain clear up to their maximum volume. The system seems well tuned to vocal audio, such as podcasts and video conferencing, but gamers and music enthusiasts will want to invest in a quality pair of headphones in order to take advantage of the embedded Hi-Fi audio DAC, a nice addition that is quickly becoming with higher-end MSI notebooks.
MSI WS63VR 7RL-023US audio analysis
(±) | speaker loudness is average but good (73.2 dB)
Bass 100 - 315 Hz
(±) | reduced bass - on average 11.6% lower than median
(+) | bass is linear (6% delta to prev. frequency)
Mids 400 - 2000 Hz
(±) | higher mids - on average 6.7% higher than median
(±) | linearity of mids is average (14% delta to prev. frequency)
Highs 2 - 16 kHz
(+) | balanced highs - only 1.4% away from median
(+) | highs are linear (5.5% delta to prev. frequency)
Overall 100 - 16.000 Hz
(±) | linearity of overall sound is average (26% difference to median)
Compared to same class
» 87% of all tested devices in this class were better, 6% similar, 6% worse
» The best had a delta of 7%, average was 17%, worst was 35%
Compared to all devices tested
» 80% of all tested devices were better, 4% similar, 16% worse
» The best had a delta of 4%, average was 23%, worst was 134%
Lenovo ThinkPad P51 20HH0016GE audio analysis
(-) | not very loud speakers (64.5 dB)
Bass 100 - 315 Hz
(±) | reduced bass - on average 12.3% lower than median
(±) | linearity of bass is average (10.4% delta to prev. frequency)
Mids 400 - 2000 Hz
(+) | balanced mids - only 3.9% away from median
(+) | mids are linear (6.4% delta to prev. frequency)
Highs 2 - 16 kHz
(+) | balanced highs - only 2.7% away from median
(±) | linearity of highs is average (13.3% delta to prev. frequency)
Overall 100 - 16.000 Hz
(±) | linearity of overall sound is average (24.7% difference to median)
Compared to same class
» 86% of all tested devices in this class were better, 2% similar, 12% worse
» The best had a delta of 7%, average was 17%, worst was 35%
Compared to all devices tested
» 75% of all tested devices were better, 5% similar, 19% worse
» The best had a delta of 4%, average was 23%, worst was 134%
Dell Precision 5520 UHD audio analysis
(±) | speaker loudness is average but good (79.6 dB)
Bass 100 - 315 Hz
(±) | reduced bass - on average 12.8% lower than median
(±) | linearity of bass is average (14.2% delta to prev. frequency)
Mids 400 - 2000 Hz
(+) | balanced mids - only 4% away from median
(±) | linearity of mids is average (9.9% delta to prev. frequency)
Highs 2 - 16 kHz
(+) | balanced highs - only 3.3% away from median
(±) | linearity of highs is average (12% delta to prev. frequency)
Overall 100 - 16.000 Hz
(±) | linearity of overall sound is average (16.7% difference to median)
Compared to same class
» 46% of all tested devices in this class were better, 9% similar, 45% worse
» The best had a delta of 7%, average was 17%, worst was 35%
Compared to all devices tested
» 29% of all tested devices were better, 7% similar, 64% worse
» The best had a delta of 4%, average was 23%, worst was 134%
Frequency Comparison (Checkbox selectable!)
Graph 1: Pink Noise 100% Vol.; Graph 2: Audio off
Energy Management
Power Consumption
Another major focus of the Max-Q redesign is on power-draw. The P4000 Max-Q is rated at 80 Watts, a 20% drop compared to the 100 Watt P4000. Overall power draw is similar to that of the Fujitsu Celsius H970, which sports a Xeon E3-1535M and standard Quadro P4000. Under load, however, we see a 10-20% drop in wattage. Average load sits about 7% above the previous WS63, which is equipped with a Quadro P3000.
Perhaps the best example of how far this generation of GPUs has come lies in comparison to the MSI WT72. The Quadro M5000M, which sat on top of last generation's mobile workstation graphics cards, draws significantly more power while offering noticeably less performance. The total system power draw of our WS63VR sits about 25% lower than that of the MSI WT72 under average load, which is an impressive improvement in efficiency considering the WS63VR's major boost in performance. The included 180 Watt power adapter provides more than enough power for the system under any load.
| Off / Standby | |
| Idle | |
| Load |
|
Key:
min: | |
| MSI WS63VR 7RL-023US i7-7700HQ, Quadro P4000 Max-Q, Toshiba NVMe THNSN5512GPU7, IPS, 3840x2160, 15.6" | Fujitsu Celsius H970 E3-1535M v6, Quadro P4000, Samsung SM961 MZVKW512HMJP m.2 PCI-e, IPS LED, 1920x1080, 17.3" | MSI WS63 7RF-290US i7-7700HQ, Quadro P3000, Samsung SM961 MZVKW512HMJP m.2 PCI-e, IPS, 1920x1080, 15.6" | MSI GS63VR 7RF-228US i7-7700HQ, GeForce GTX 1060 Mobile, Samsung SM961 MZVKW512HMJP m.2 PCI-e, IPS, 3840x2160, 15.6" | MSI WT72-6QM E3-1505M v5, Quadro M5000M, Toshiba NVMe THNSN5256GPU7, IPS, 1920x1080, 17.3" | HP ZBook 15 G4-Y4E80AV E3-1535M v6, Quadro M2200, Samsung SSD SM961 1TB M.2 MZVKW1T0HMLH, IPS, 1920x1080, 15.6" | Lenovo ThinkPad P51 20HH0016GE E3-1505M v6, Quadro M2200, Samsung PM961 NVMe MZVLW512HMJP, IPS, 3840x2160, 15.6" | Lenovo ThinkPad P51s 20HB000SGE i7-7600U, Quadro M520, Samsung SSD PM961 1TB M.2 PCIe 3.0 x4 NVMe (MZVLW1T0), IPS, 3840x2160, 15.6" | Dell Precision 5520 UHD E3-1505M v6, Quadro M1200, Samsung SM961 MZVKW512HMJP m.2 PCI-e, IPS, 3840x2160, 15.6" | |
|---|---|---|---|---|---|---|---|---|---|
| Power Consumption | -0% | 5% | -9% | -64% | 16% | 1% | 36% | 8% | |
| Idle Minimum * (Watt) | 13.3 | 10.7 20% | 11 17% | 14.5 -9% | 24.8 -86% | 5.9 56% | 8.6 35% | 5.8 56% | 8.9 33% |
| Idle Average * (Watt) | 17.2 | 15.8 8% | 14.2 17% | 17.3 -1% | 29.7 -73% | 8.9 48% | 15.9 8% | 10.4 40% | 13.6 21% |
| Idle Maximum * (Watt) | 17.9 | 17.8 1% | 14.6 18% | 17.4 3% | 30.1 -68% | 12.7 29% | 22.1 -23% | 13.5 25% | 14.1 21% |
| Load Average * (Watt) | 83.7 | 92 -10% | 77.7 7% | 93 -11% | 105.2 -26% | 95.2 -14% | 84.4 -1% | 62.4 25% | 100.3 -20% |
| Witcher 3 ultra * (Watt) | 101.9 | 89.1 13% | 128.8 -26% | 87.7 14% | 100.2 2% | ||||
| Load Maximum * (Watt) | 114.3 | 137 -20% | 161.7 -41% | 192.2 -68% | 154 -35% | 130.6 -14% | 73.1 36% | 126.3 -10% |
* ... smaller is better
Battery Life
Battery life typically isn't a strong suit in powerful notebooks. Size constraints and the power requirements of high-end components typically limit time away from the wall, but modern workstations can usually survive 6 or more hours between charges. That is not the case with the WS63VR. Battery life is abysmal, offering a paltry 2 hours 45 minutes during our WiFi battery test (Balanced power profile, brightness set to 150 nits, loading a new web page every 30-40 seconds). Compared to rivals, run times are very disappointing. Even disabling the dedicated GPU (using the Nvidia Control Panel) results in a mere 10 minute increase. The power adapter will need to be kept on hand during the work day.
It must be mentioned that the 48 Wh battery powering the WS63VR is significantly smaller than the 65 Wh batteries in both the GS63VR and WS63. This is part of the reason behind the large disparity in runtimes between devices.
| MSI WS63VR 7RL-023US i7-7700HQ, Quadro P4000 Max-Q, 48 Wh | MSI WS63 7RF-290US i7-7700HQ, Quadro P3000, 65 Wh | Lenovo ThinkPad P51 20HH0016GE E3-1505M v6, Quadro M2200, 90 Wh | Lenovo ThinkPad P51s 20HB000SGE i7-7600U, Quadro M520, 104 Wh | Dell Precision 5520 UHD E3-1505M v6, Quadro M1200, 97 Wh | MSI GS63VR 7RF-228US i7-7700HQ, GeForce GTX 1060 Mobile, 65 Wh | MSI WT72-6QM E3-1505M v5, Quadro M5000M, Wh | |
|---|---|---|---|---|---|---|---|
| Battery runtime | 59% | 179% | 462% | 89% | 47% | 54% | |
| Reader / Idle (h) | 3.9 | 7.1 82% | 16.4 321% | 26.4 577% | 12.1 210% | 6.4 64% | 6.9 77% |
| WiFi v1.3 (h) | 2.9 | 4.7 62% | 6.9 138% | 11.9 310% | 4.2 45% | 3.9 34% | 4.1 41% |
| Load (h) | 0.9 | 1.2 33% | 1.6 78% | 5.4 500% | 1 11% | 1.3 44% | 1.3 44% |
Pros
Cons
Verdict
MSI's WS63VR is an excellent example of what Max-Q has to offer the professional segment. The Nvidia Quadro P4000 Max-Q offers incredible performance considering the low heat output and 80 Watt TDP; performance on par with the standard P4000 and miles ahead of last year's Quadro M5000M. Heat is also very well managed, which is quite the feat in such a thin and light chassis. Mix this performance with an excellent keyboard, almost every type of connection imaginable, and a beautifully designed and mobile body, and MSI has a clear winner here.
The major drawbacks continue from other MSI machines: the middling trackpad is aggravating and will make users reach for an external mouse, the screen is dim and lacks the color panache of other machines, and battery life is almost inexcusable. Professional photographers that rely on an accurate and wide color space and long battery life for field work will want to look past the WS63VR for other machines, particularly the Lenovo ThinkPad P51. The loss in performance may be a worthy tradeoff for improved battery life and an incredibly color accurate display.
However, office workers may want to give MSI a second thought. At this price point (~USD $3400), choosing a mobile workstation requires a heavy investment. Engineers, scientists, medical professionals, and other users in need of a reliable, well-support, and powerful GPU have never had a tougher decision before them. MSI has developed a tough competitor to the reigning champions from Lenovo, Dell, and HP and is sure to steal some market share. Potential buyers may want to consider saving some money and opting for a Full HD display; a lower resolution panel will likely improve battery life and take a further burden off the GPU. Gamers will also want to keep their eyes on the MSI GS63VR, which will probably be updated with Max-Q GPUs in the near future. The Asus Zephyrus GX501 is another tempting thin-and-light that also bears a Max-Q designed GPU.
The MSI WS63VR is an exemplar of the benefits brought by Nvidia's Max-Q design. For a small hit to performance, the GPUs are better able to manage temperatures and require noticeably less power. If you can compromise on a slightly dimmer screen, a slightly less accurate trackpad, and are near an outlet most of the day, the WS63VR is a workstation worth considering. It's an exciting time for thin-and-light machines, and Max-Q may be the first step toward making the form factor fully viable as a desktop replacement.
MSI WS63VR 7RL-023US
- 09/18/2017 v6 (old)
Sam Medley
Price comparison
