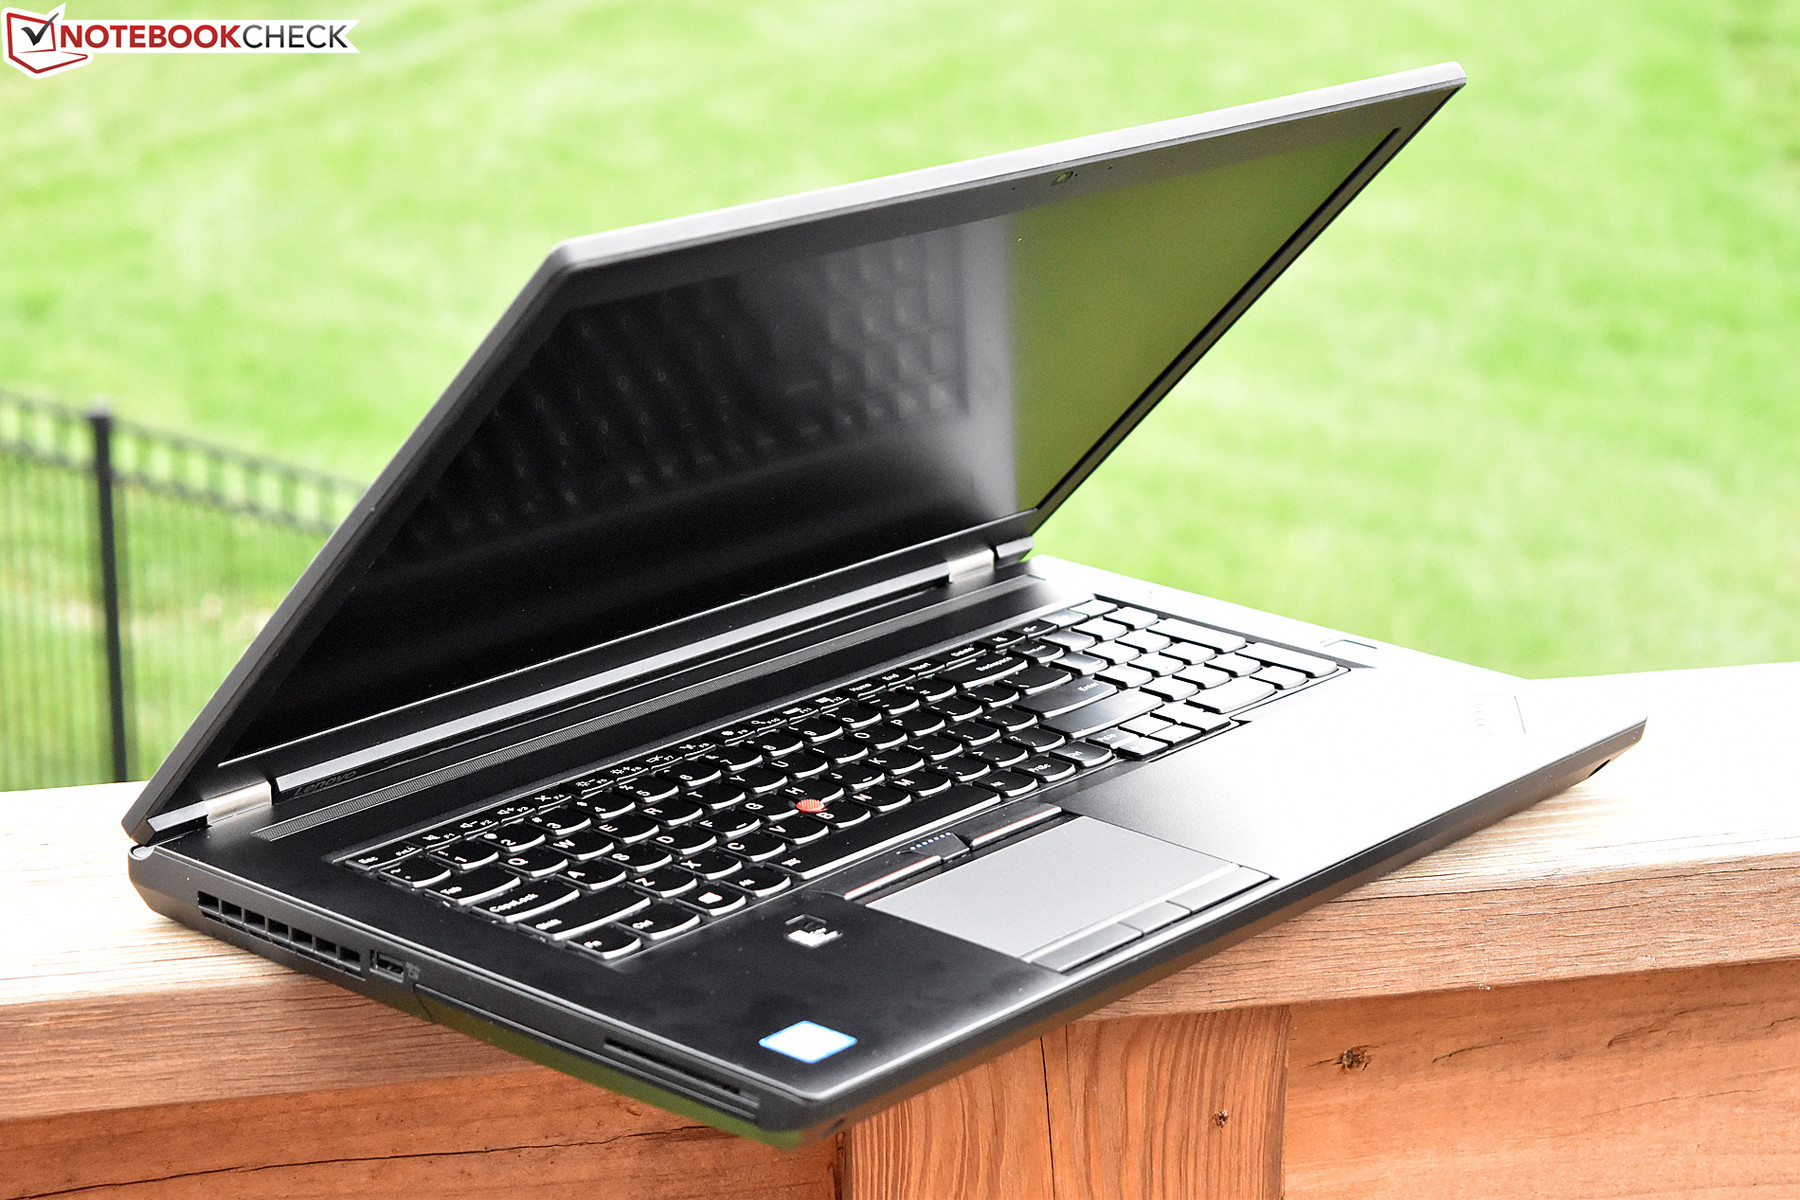
Lenovo ThinkPad P70-20ER000XUS Workstation Review

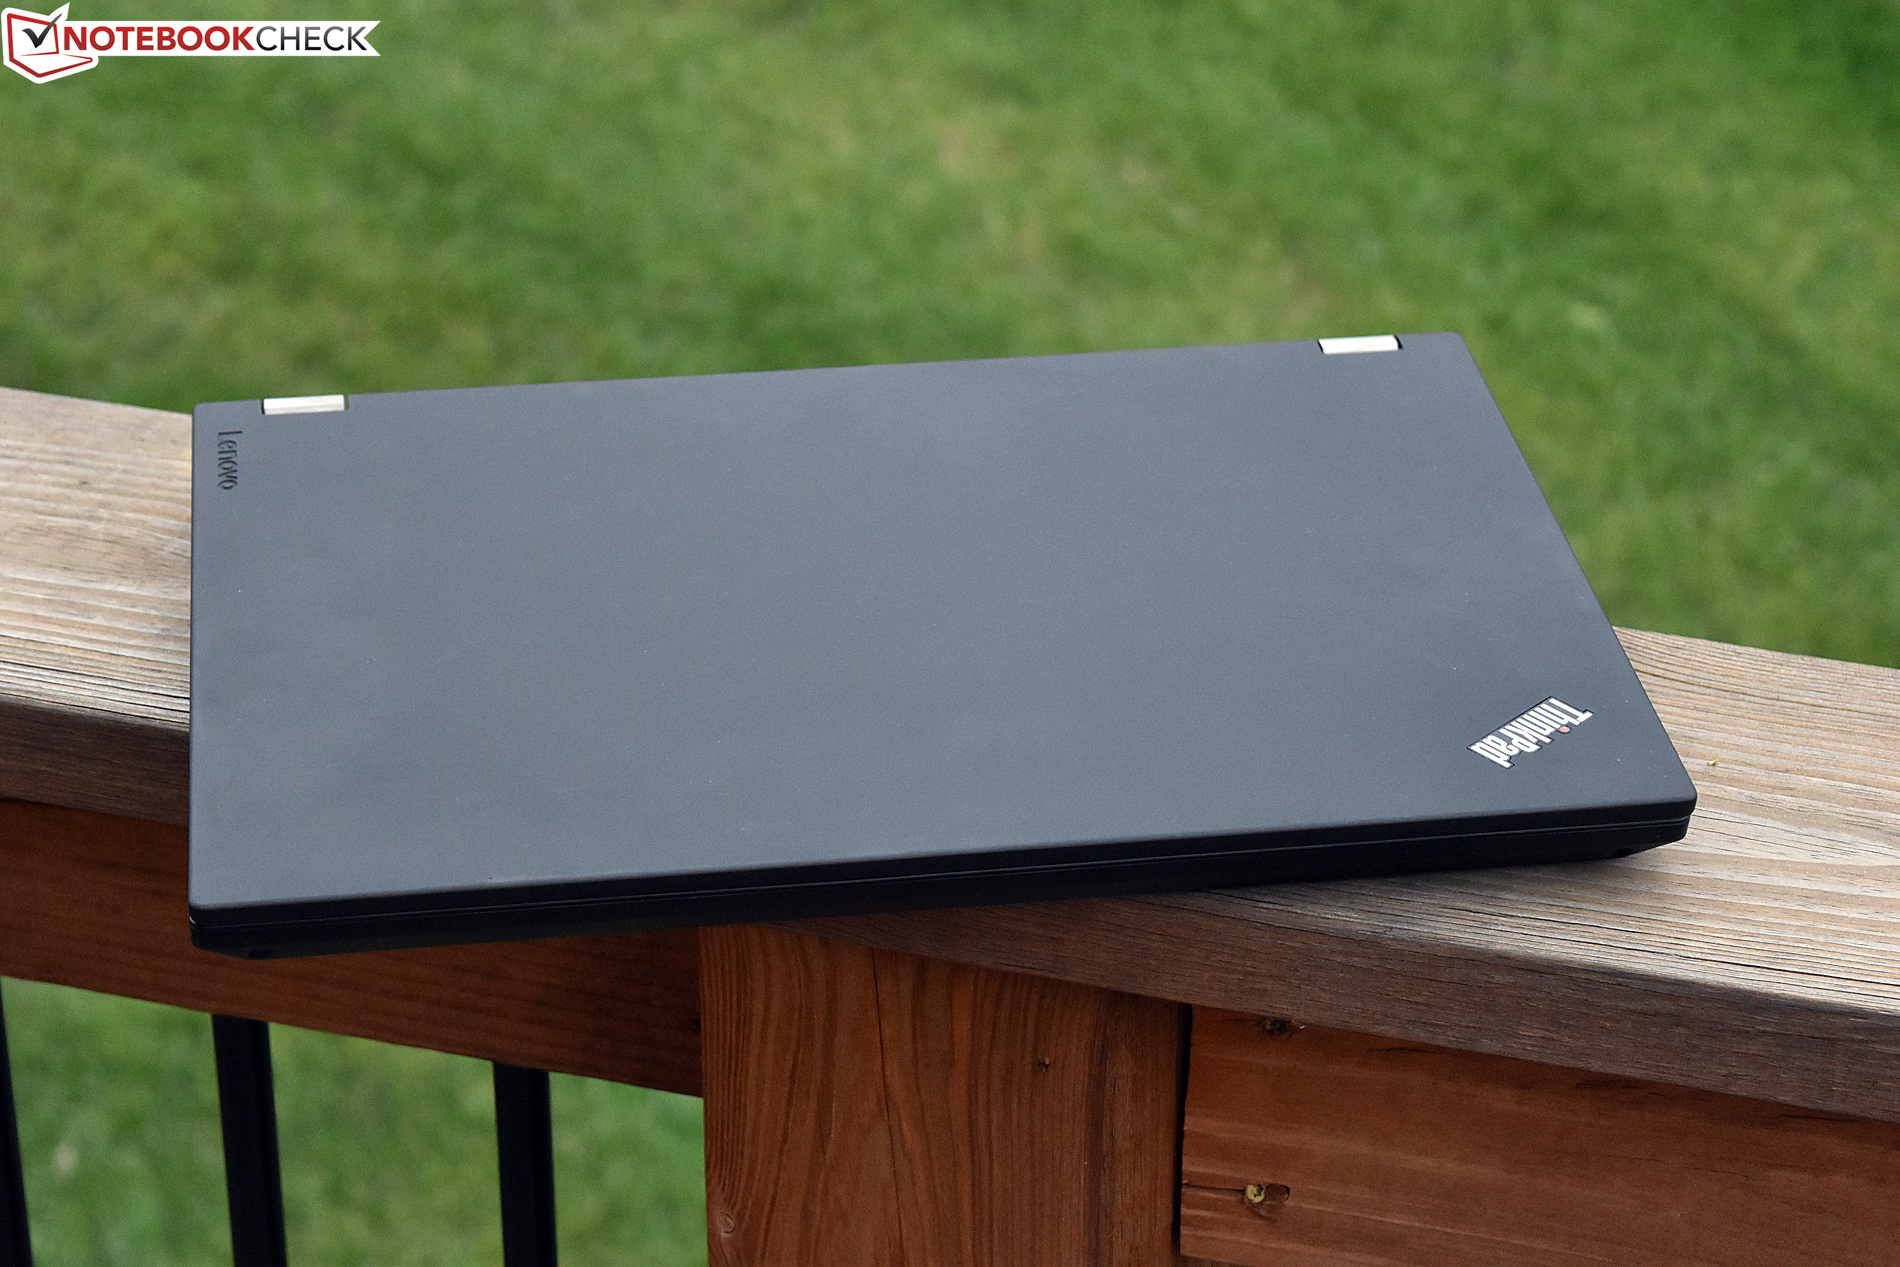
Back in January, we evaluated the Lenovo ThinkPad P70, which, at the time, was the first 17.3-inch workstation to be released by the manufacturer in roughly five years. Since then, we’ve evaluated units from HP, Gigabyte, and Dell in that same size and class—so the segment is certainly not short on competitors. Today, we take another look at the P70 with revised specifications and some minor revisions.
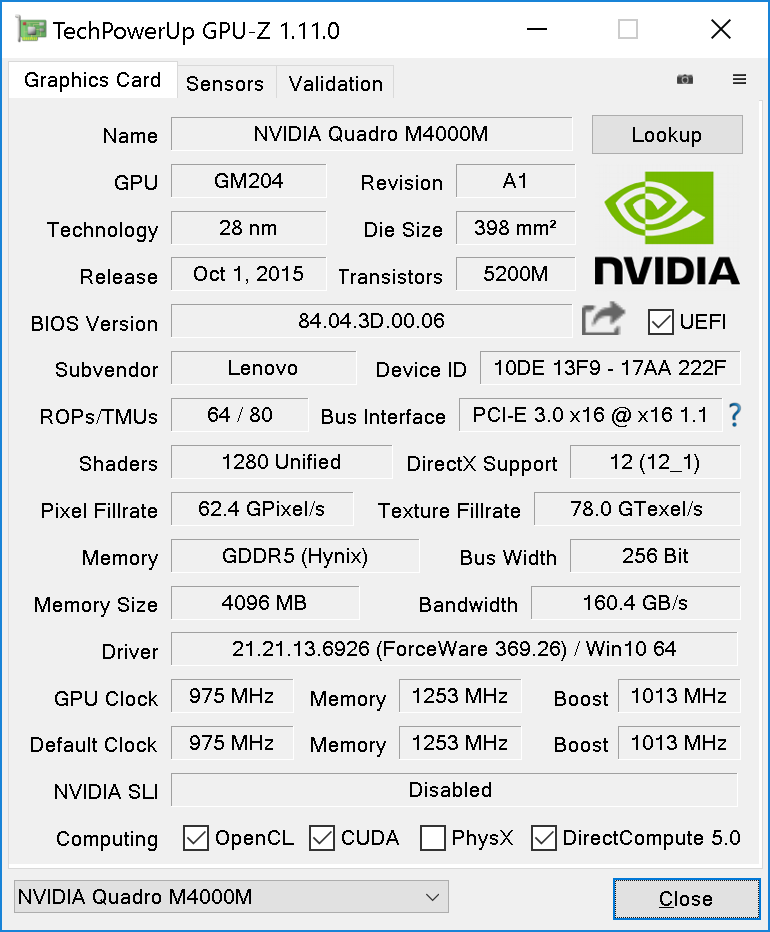
Specifically, our review unit—which retails for a cool $3,849—boasts an Intel Xeon E3-1505M v5 quad-core CPU, an NVIDIA Quadro M4000M GPU, 16 GB of DDR4-2133 MHz ECC RAM, and an ultra-fast Samsung SM951a 512 GB NVMe SSD. In other words, it’s decked-out—and with combined CPU And GPU TDP values of 145 W, it’s not afraid to burn some energy to get the job done, either.
Is it really that much of an upgrade over our previous configuration? And can it stand among the latest competition otherwise?
Case
Case, Connectivity, and Input Devices
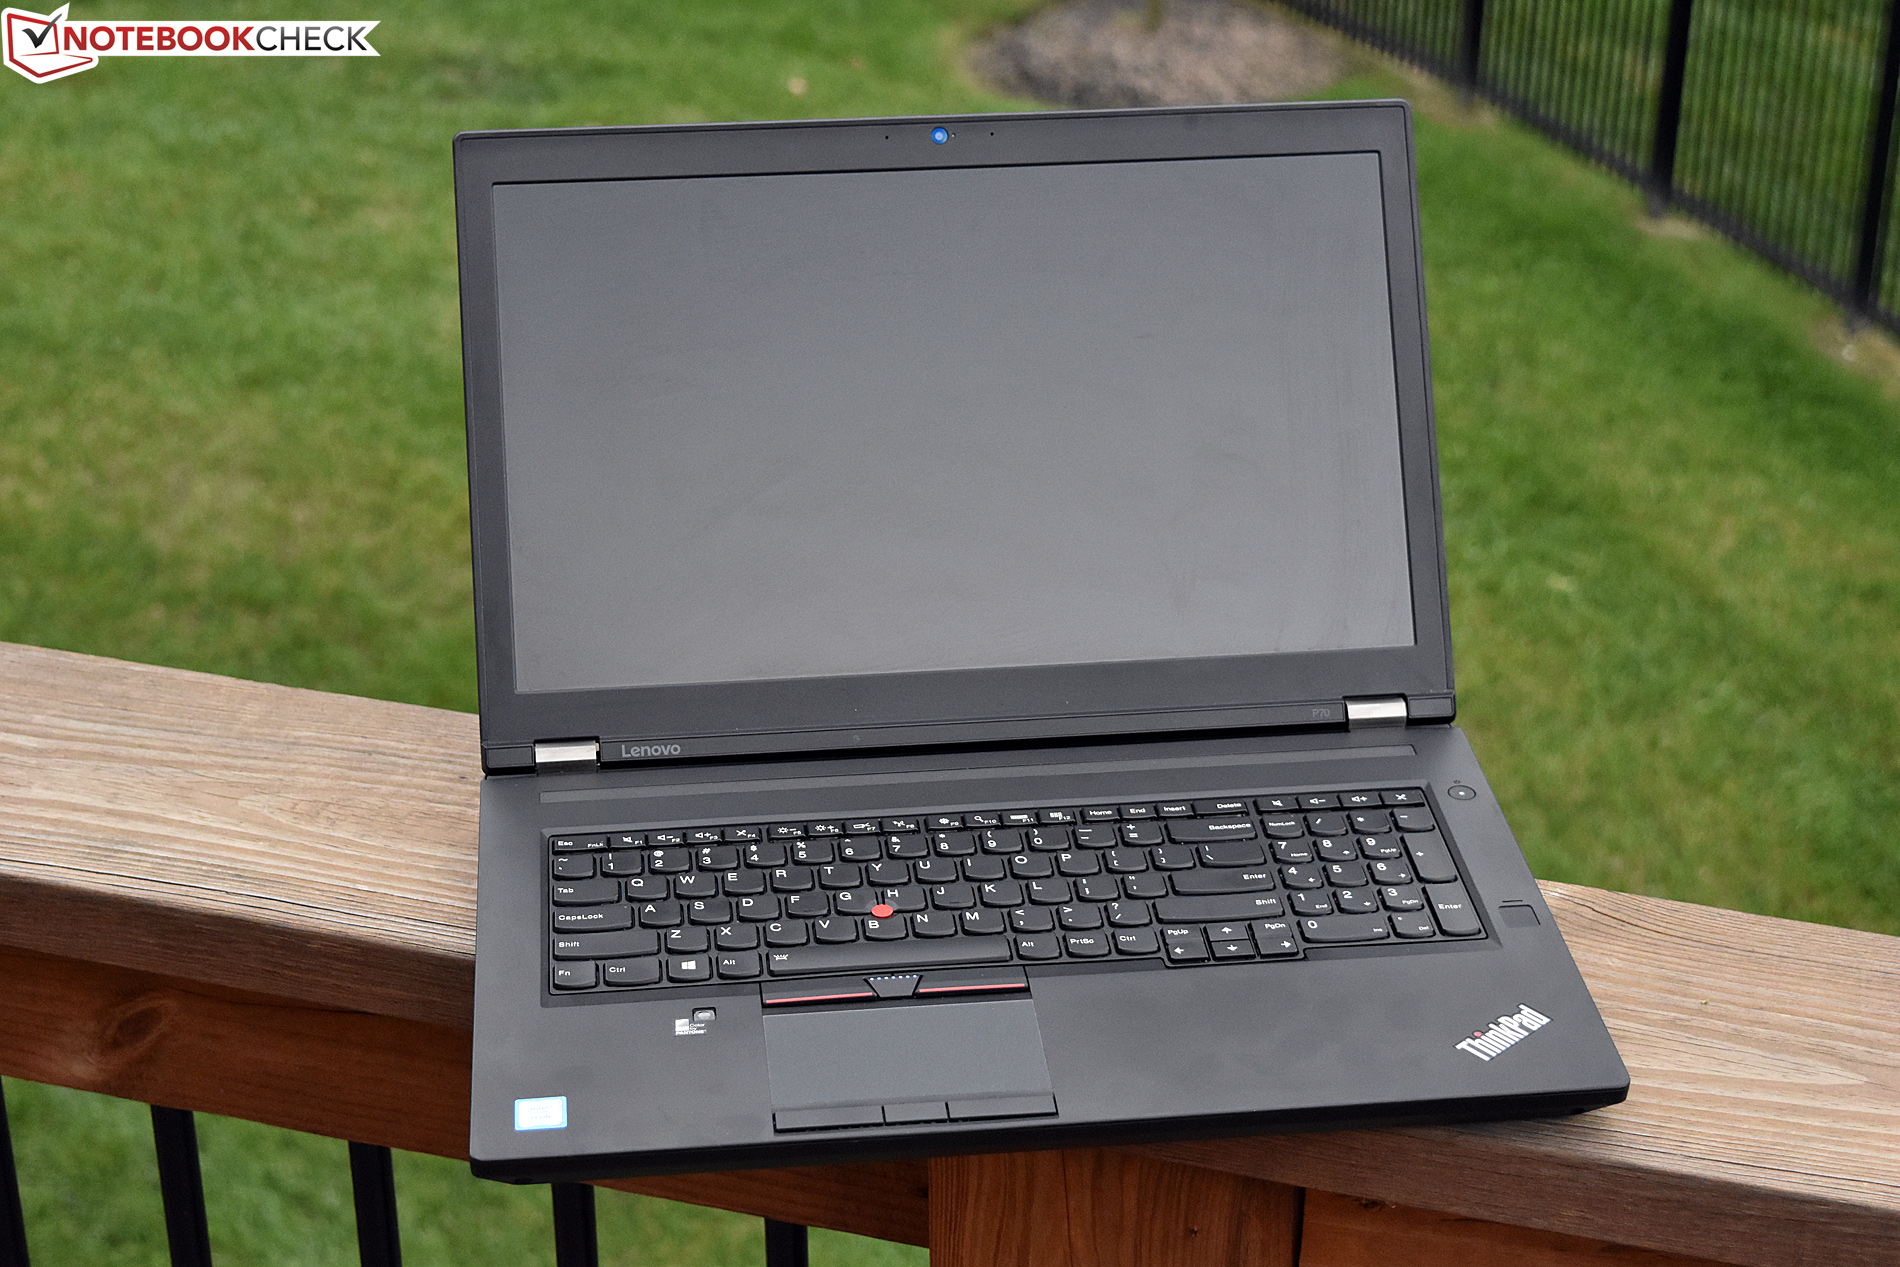
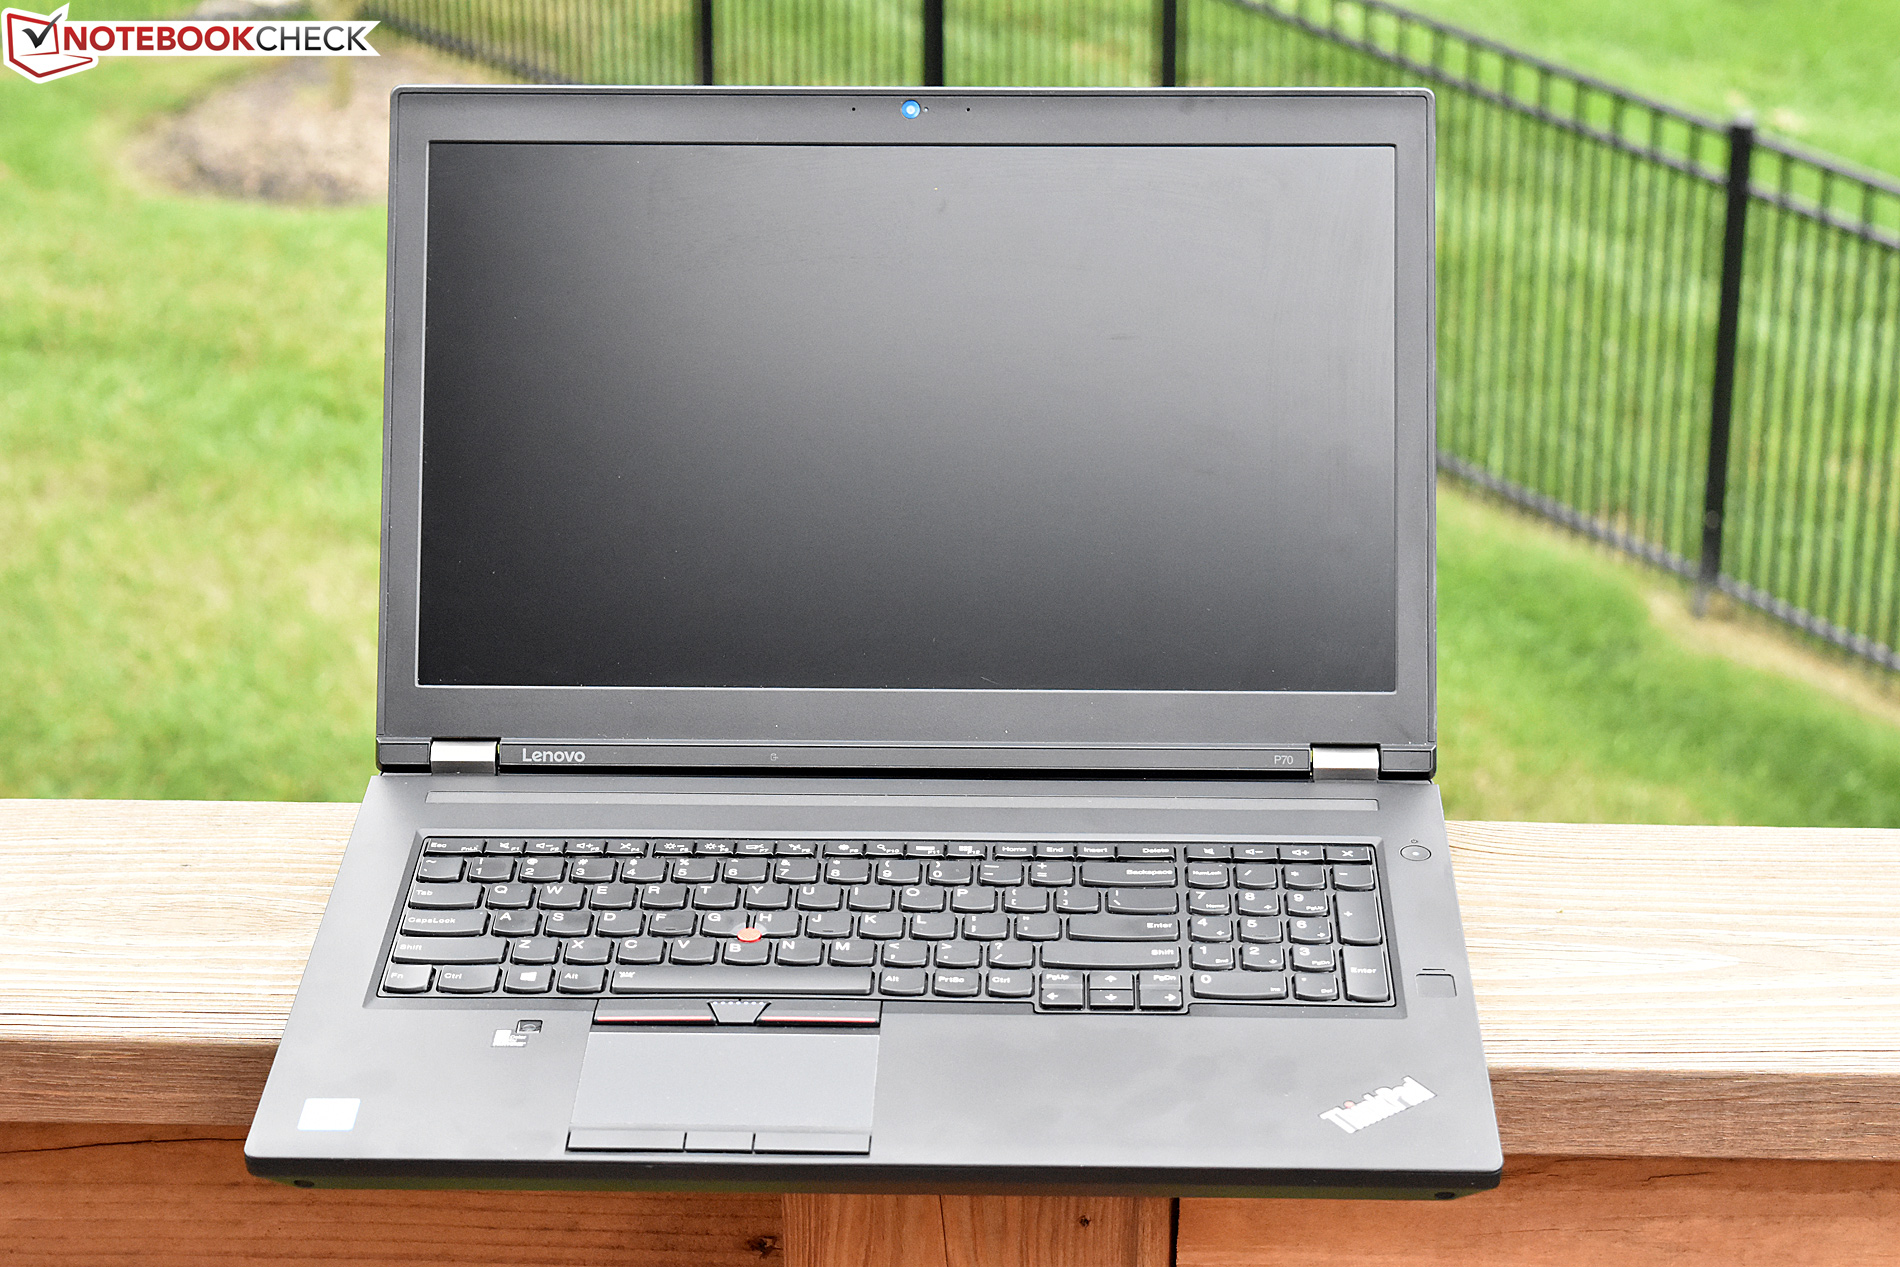
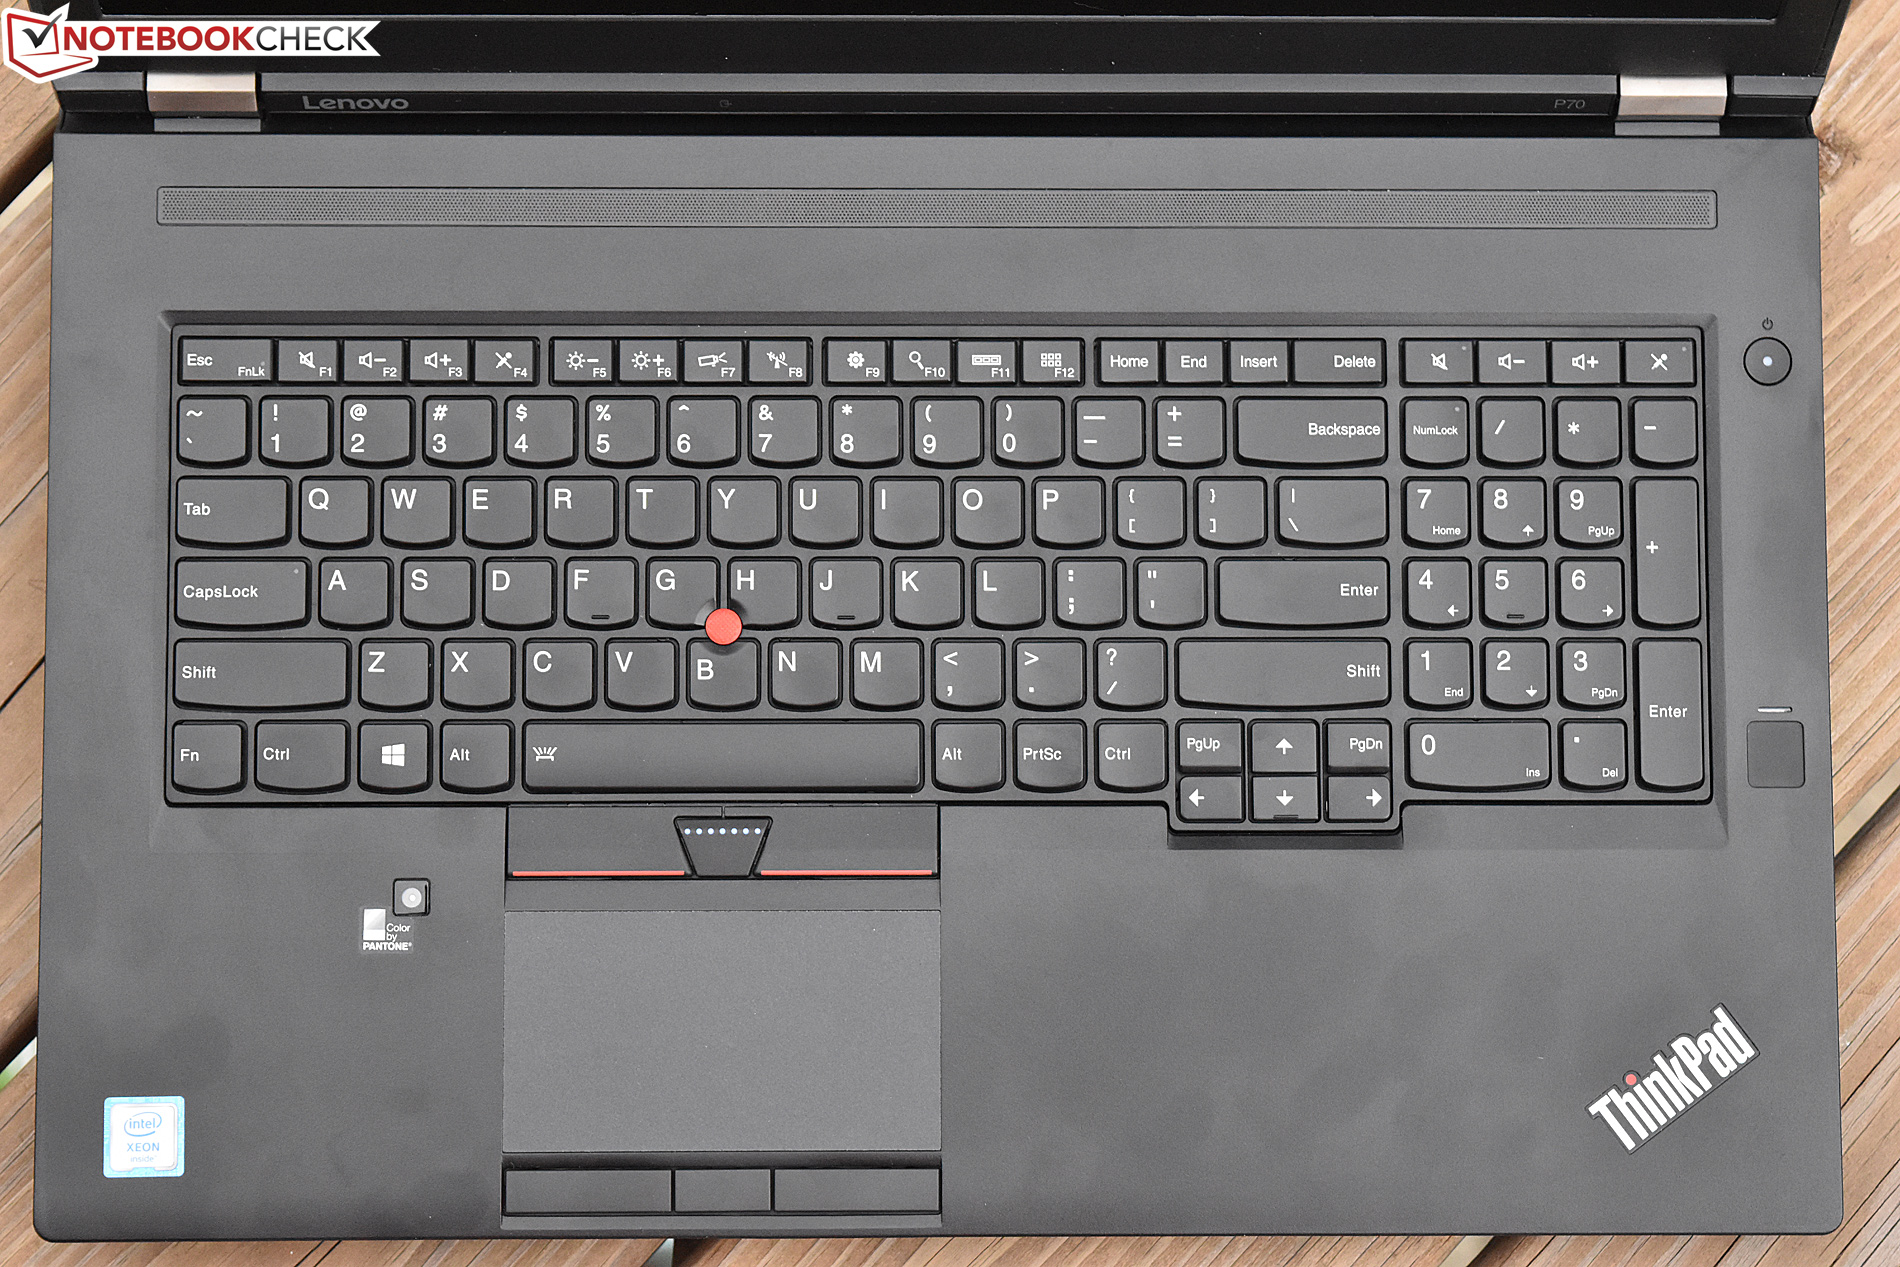
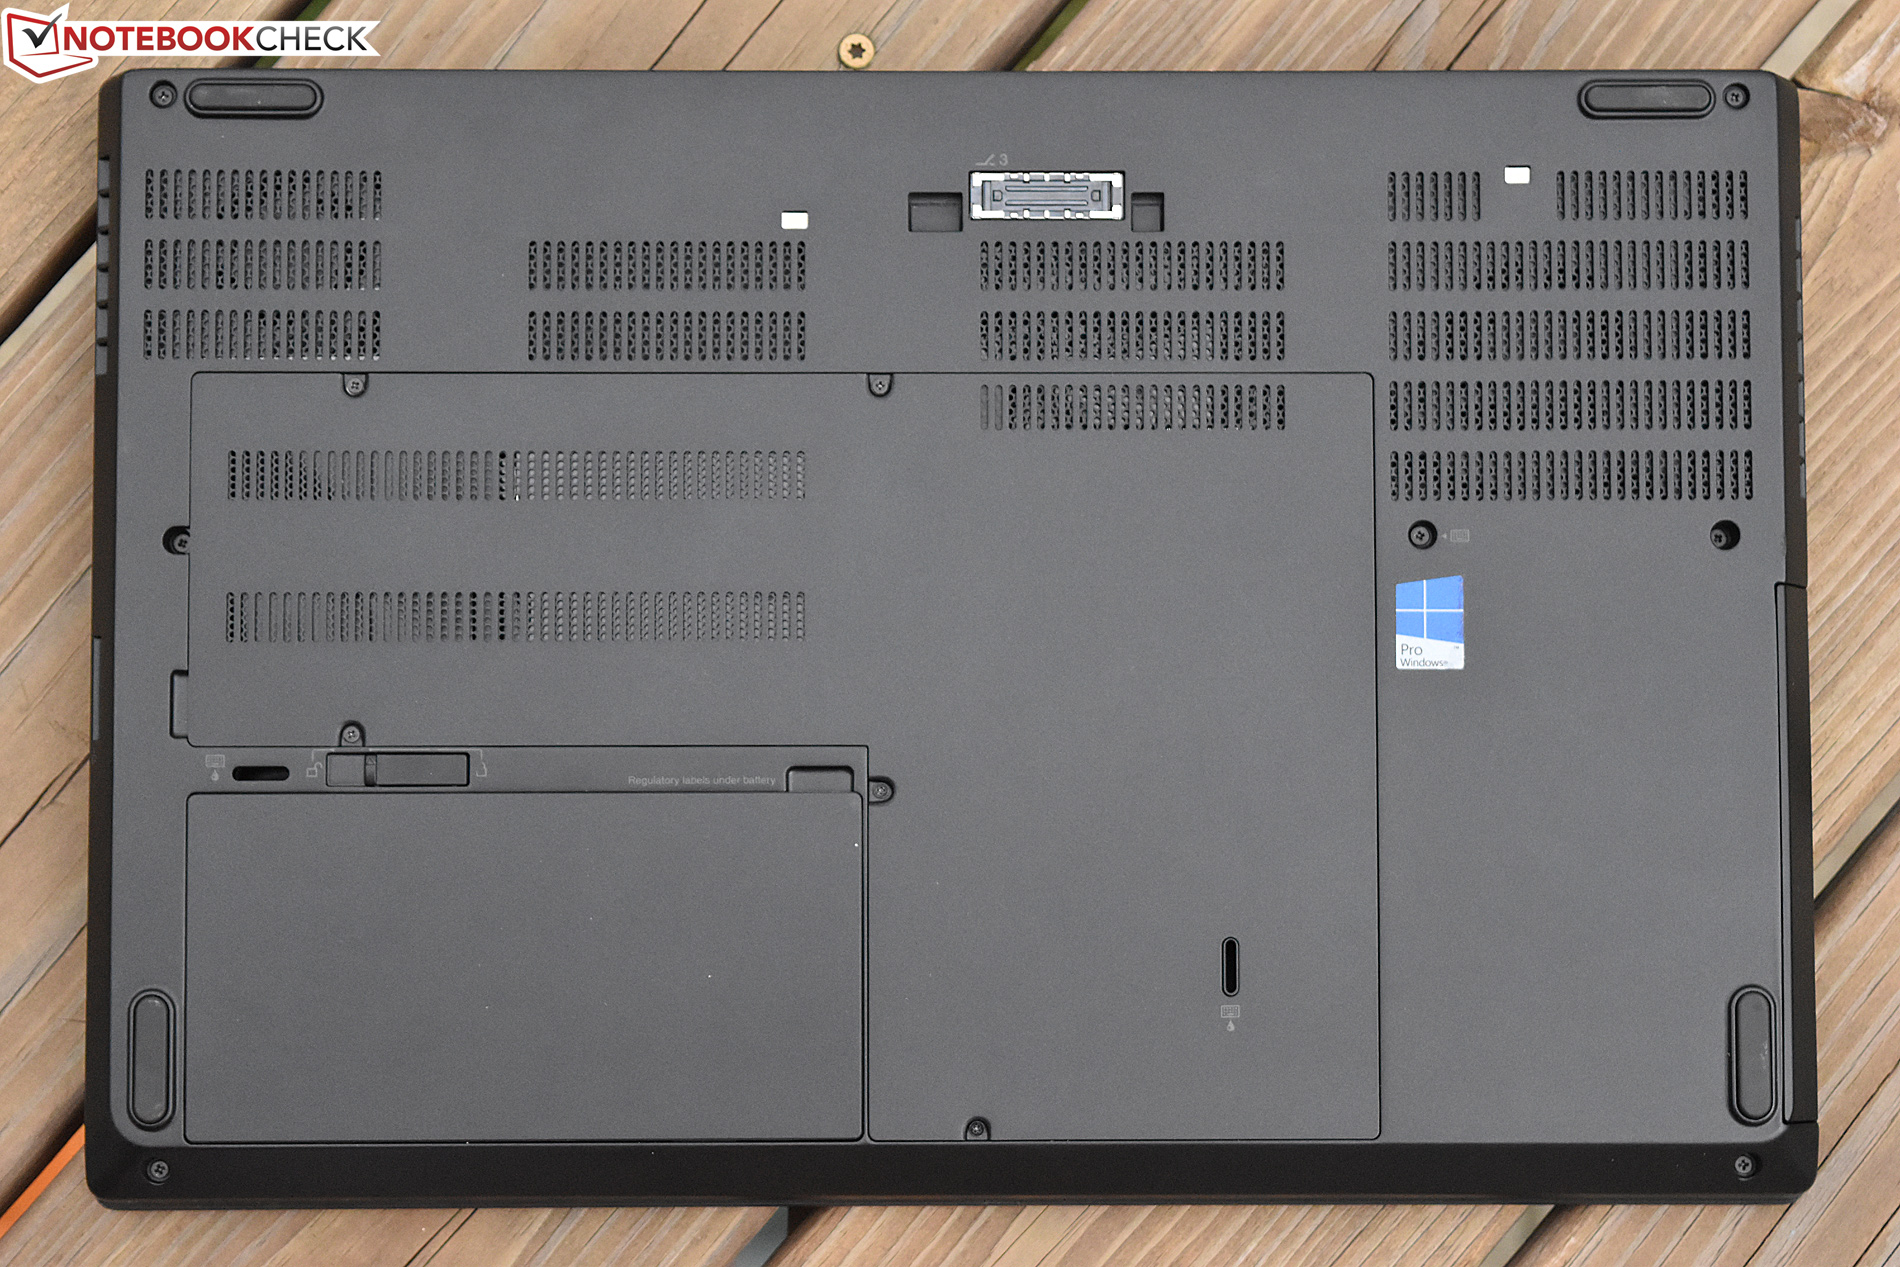
The P70’s case, port selection, and input devices have not changed from the previous version we reviewed back in January. For plenty more detail about each of these items, please see that article.
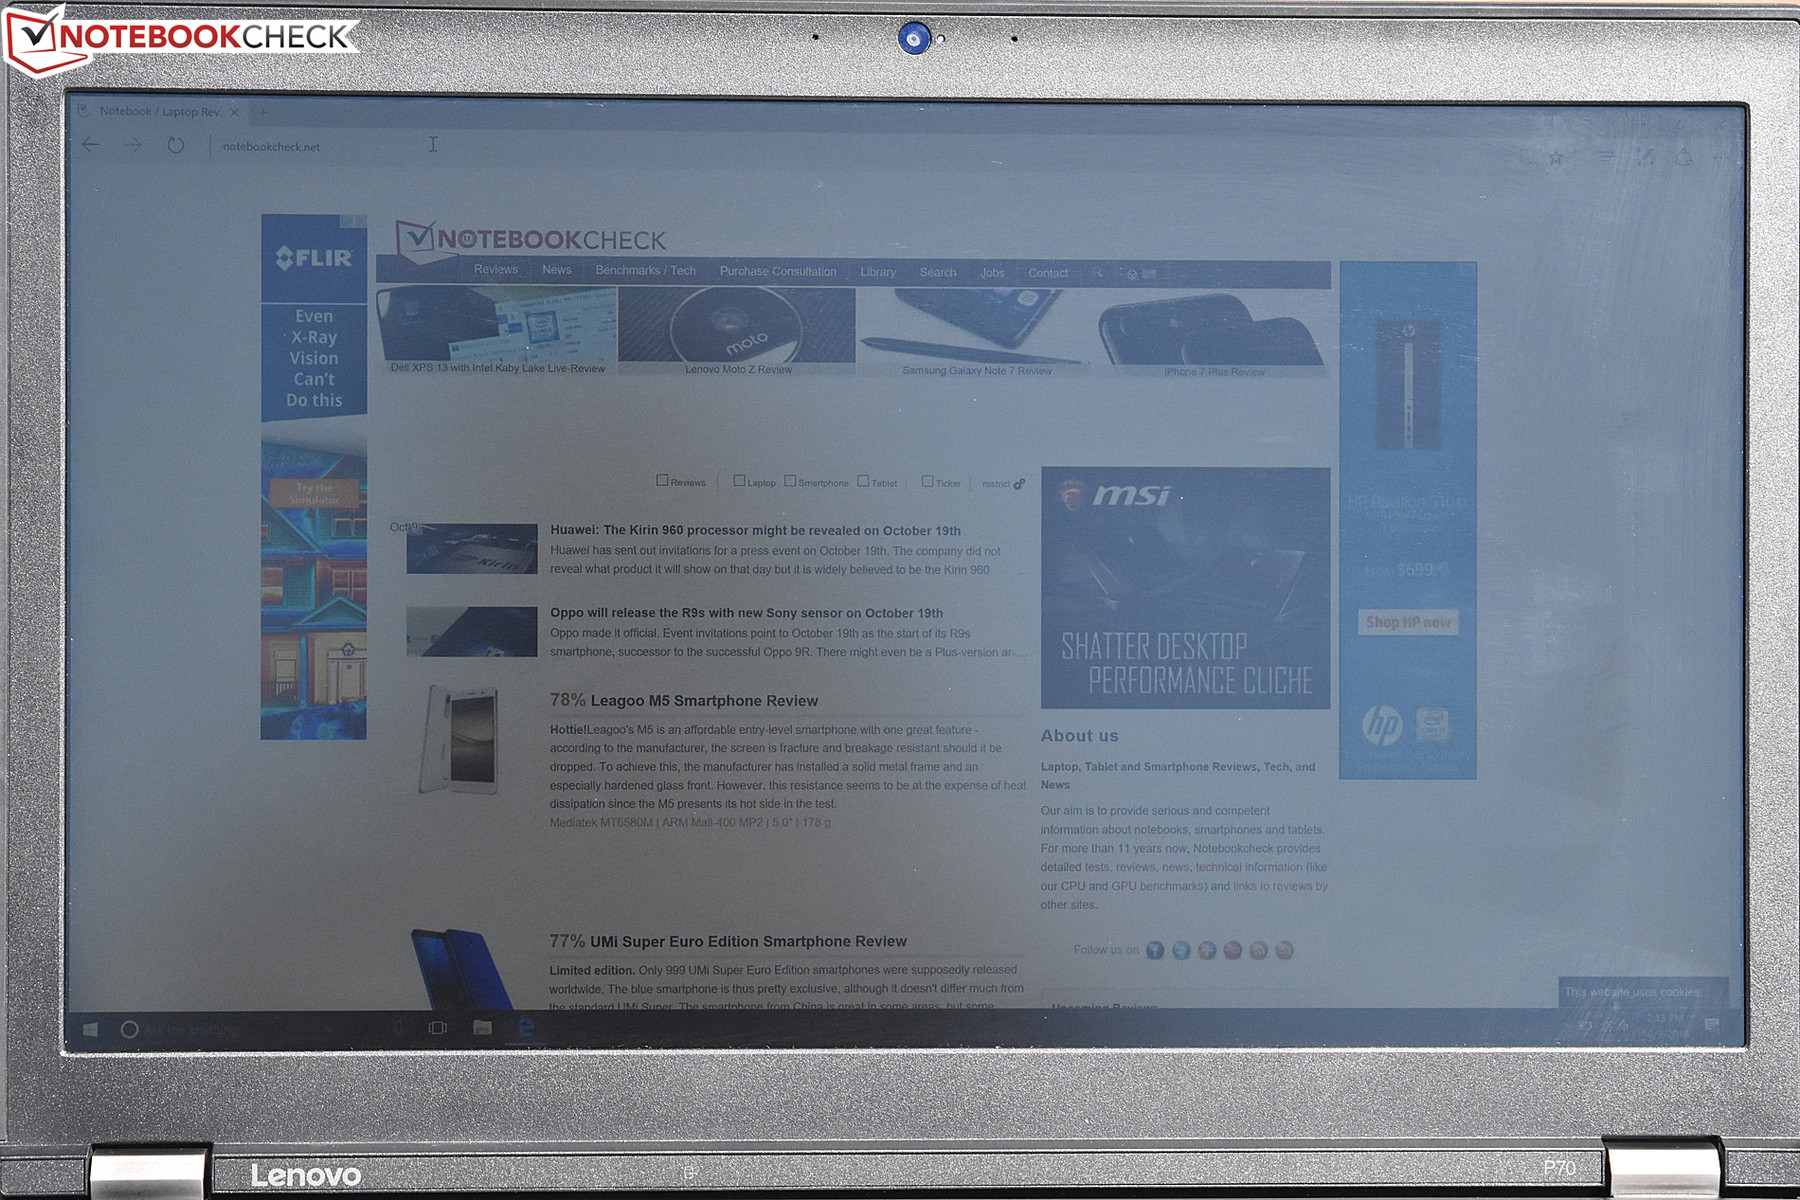
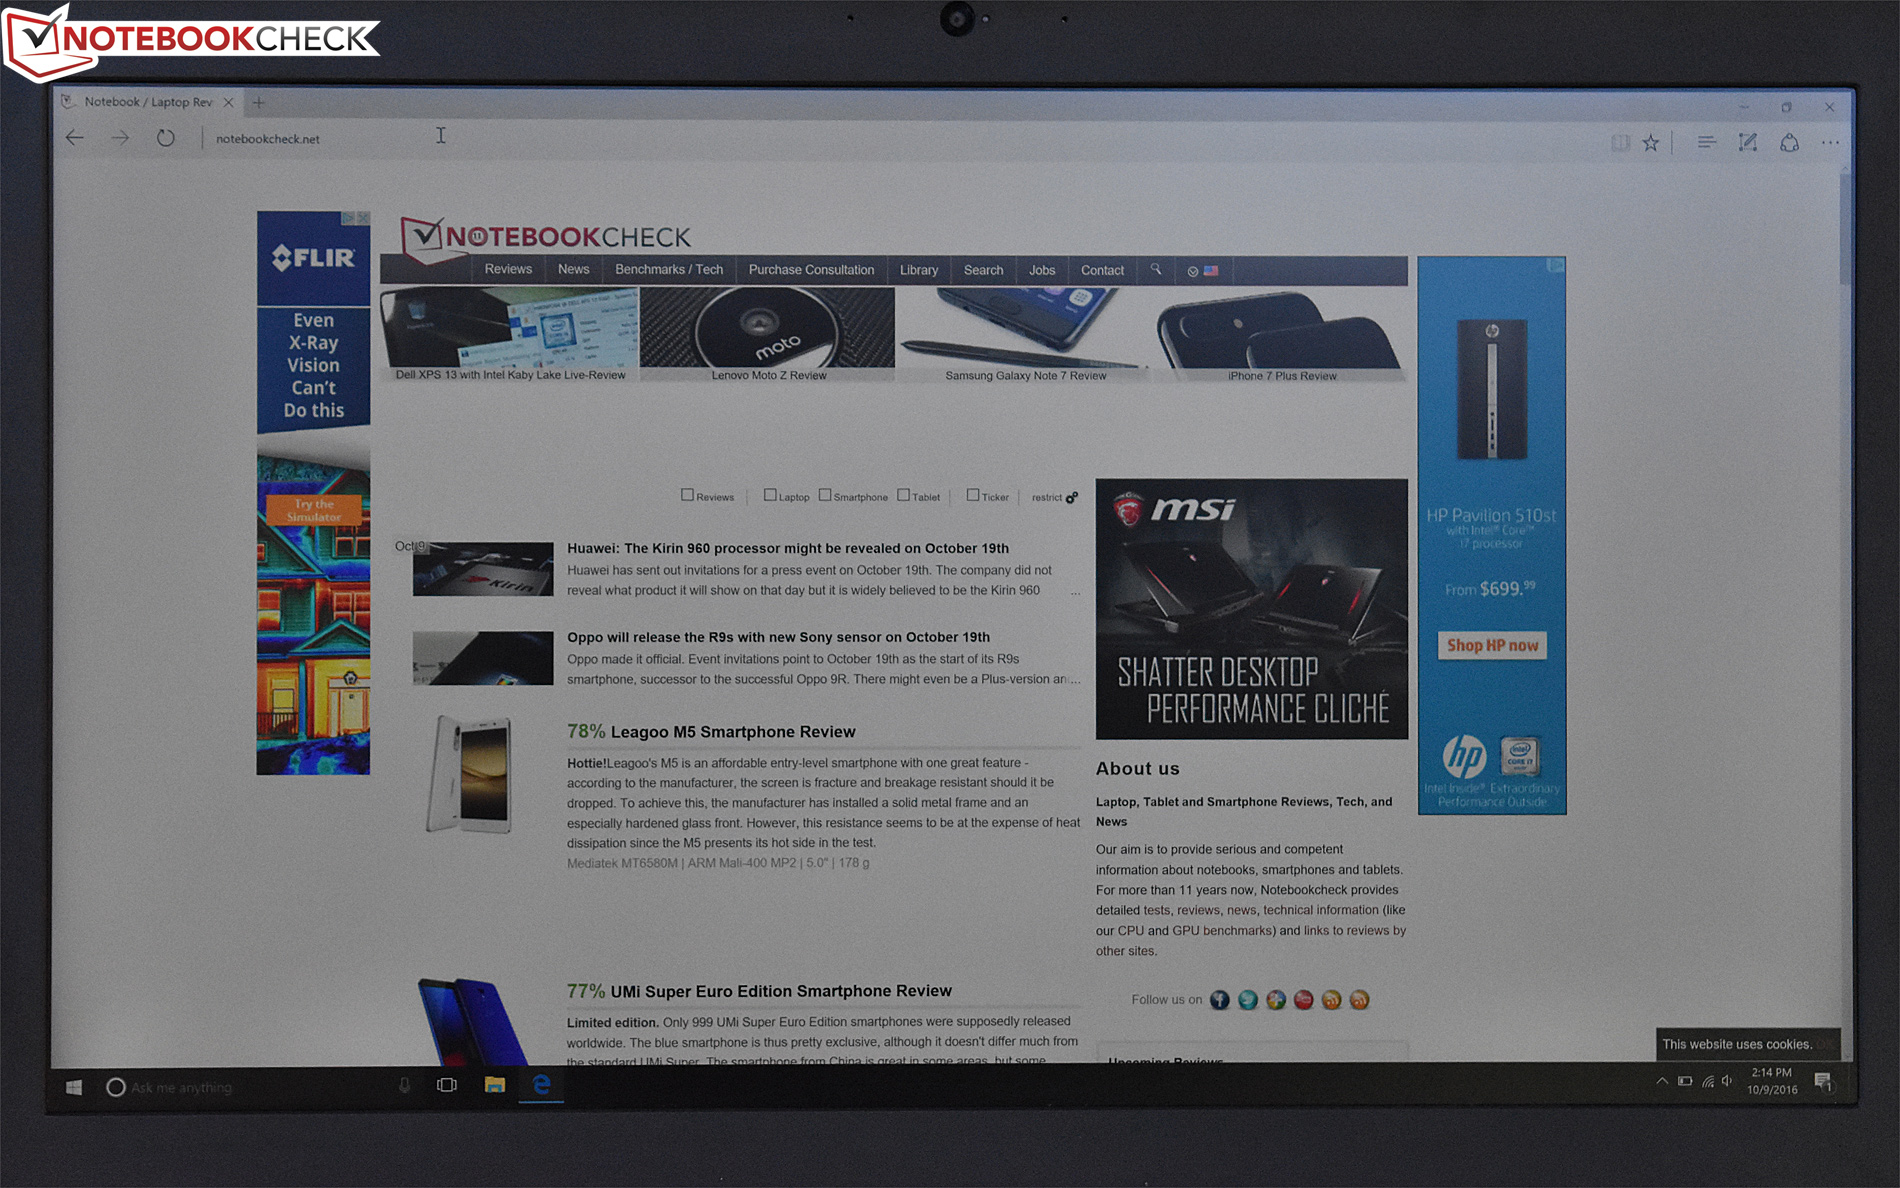
Display

The display panel model (Panasonic VVX17P051J00 / LEN4123) also has not changed; however, we have performed a subsequent analysis on its attributes thanks to possible differences in calibration or other parameters. The 17.3-inch anti-glare panel carries a 4K (3840x2160) resolution for a PPI of 255. Subjectively, it seems relatively rich in color and appears to carry good brightness and contrast values.
| |||||||||||||||||||||||||
Brightness Distribution: 86 %
Center on Battery: 332 cd/m²
Contrast: 836:1 (Black: 0.397 cd/m²)
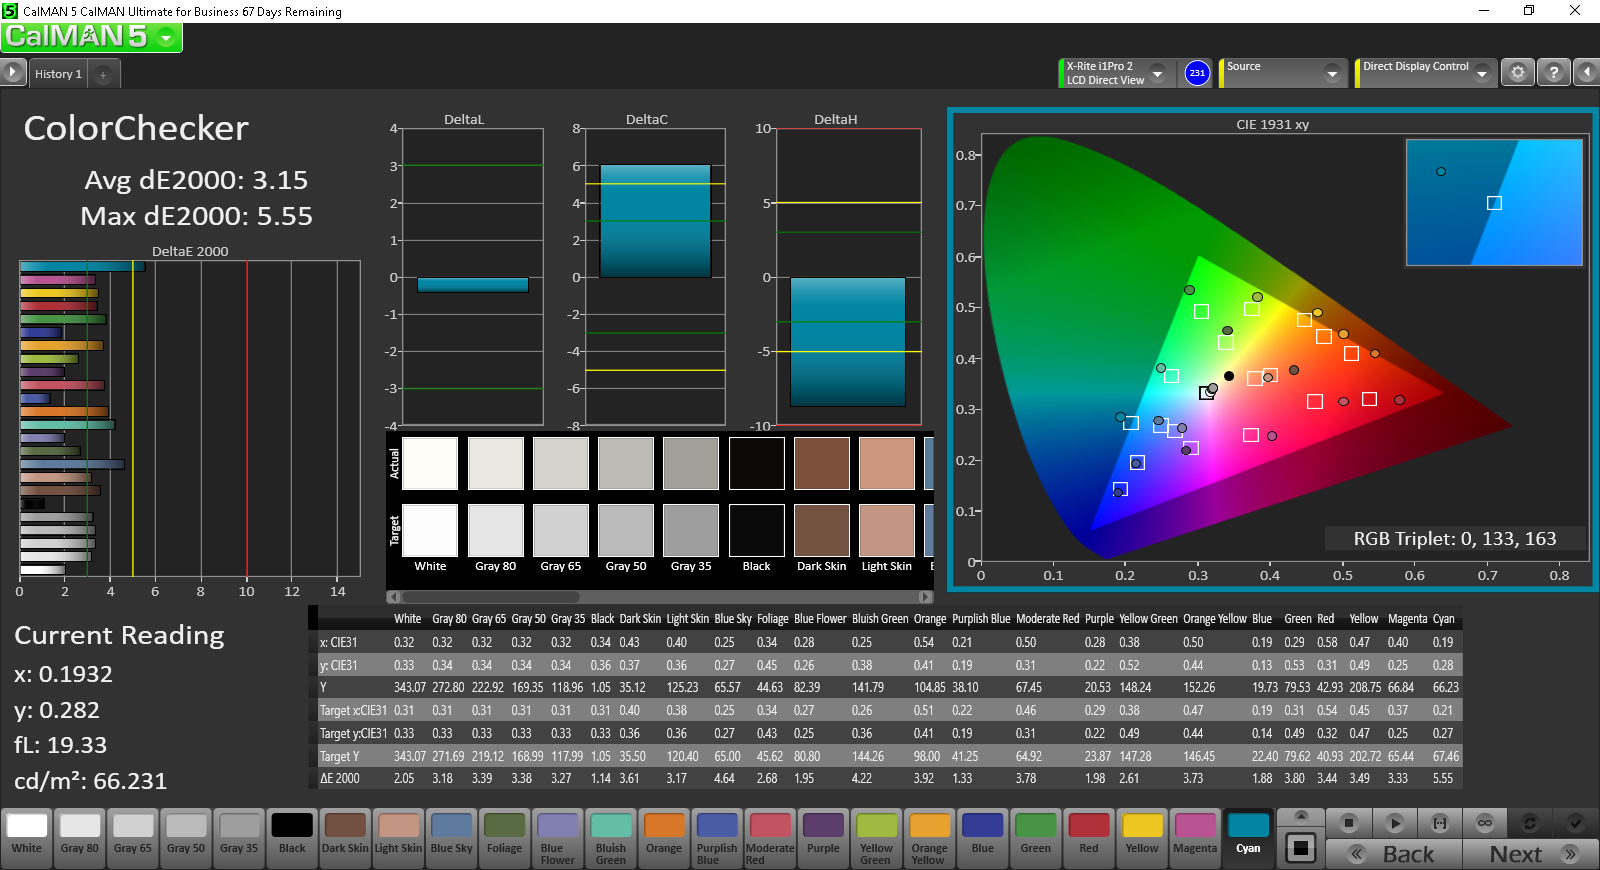
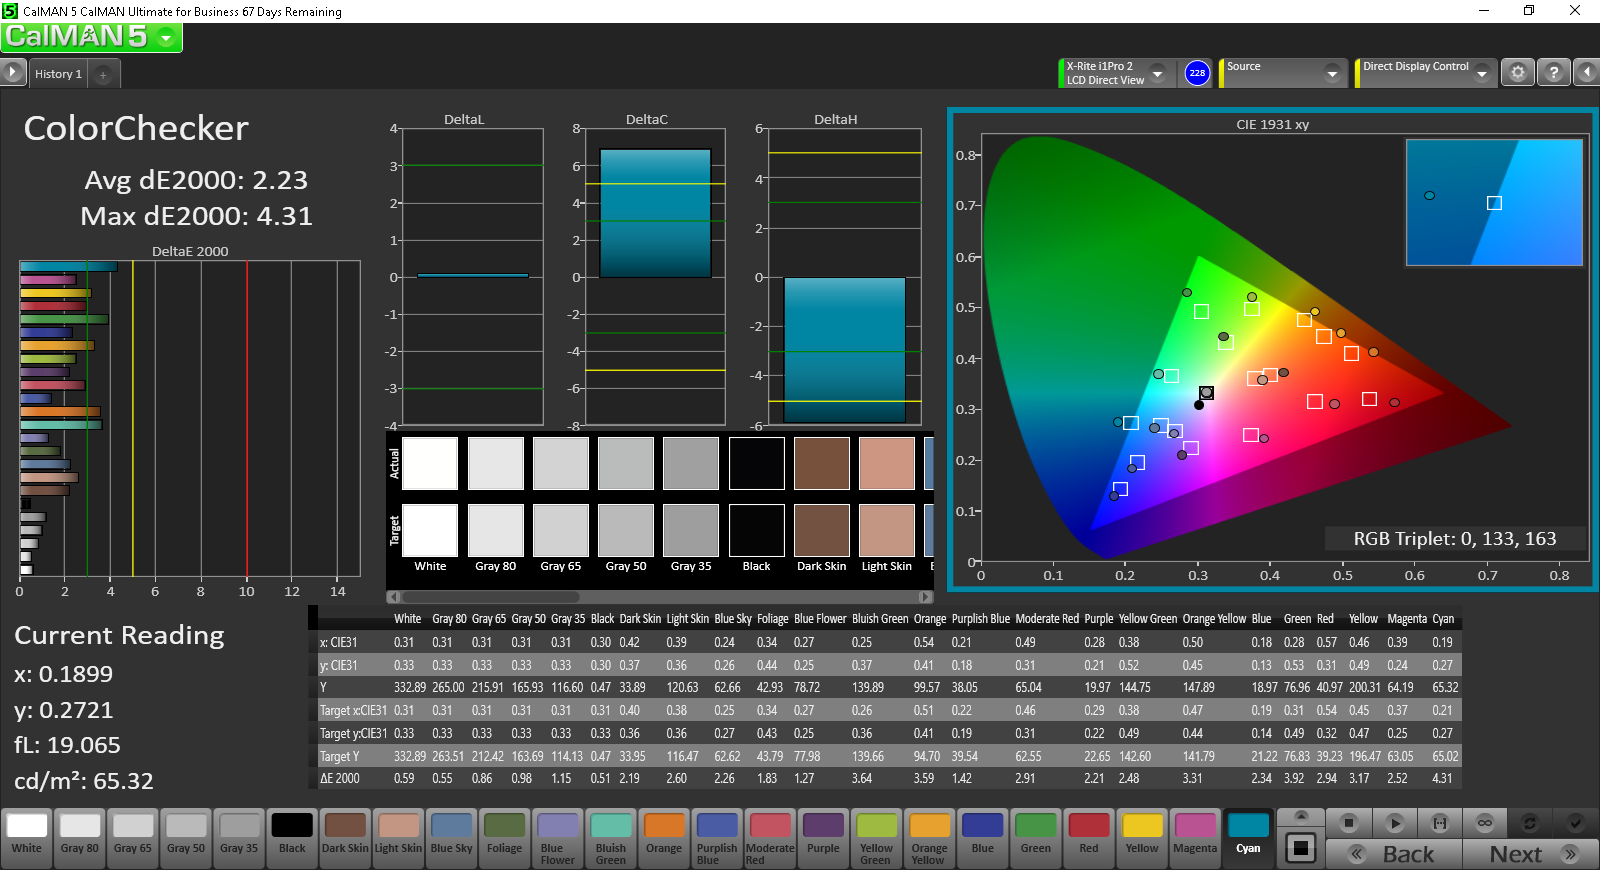
ΔE ColorChecker Calman: 3.15 | ∀{0.5-29.43 Ø4.73}
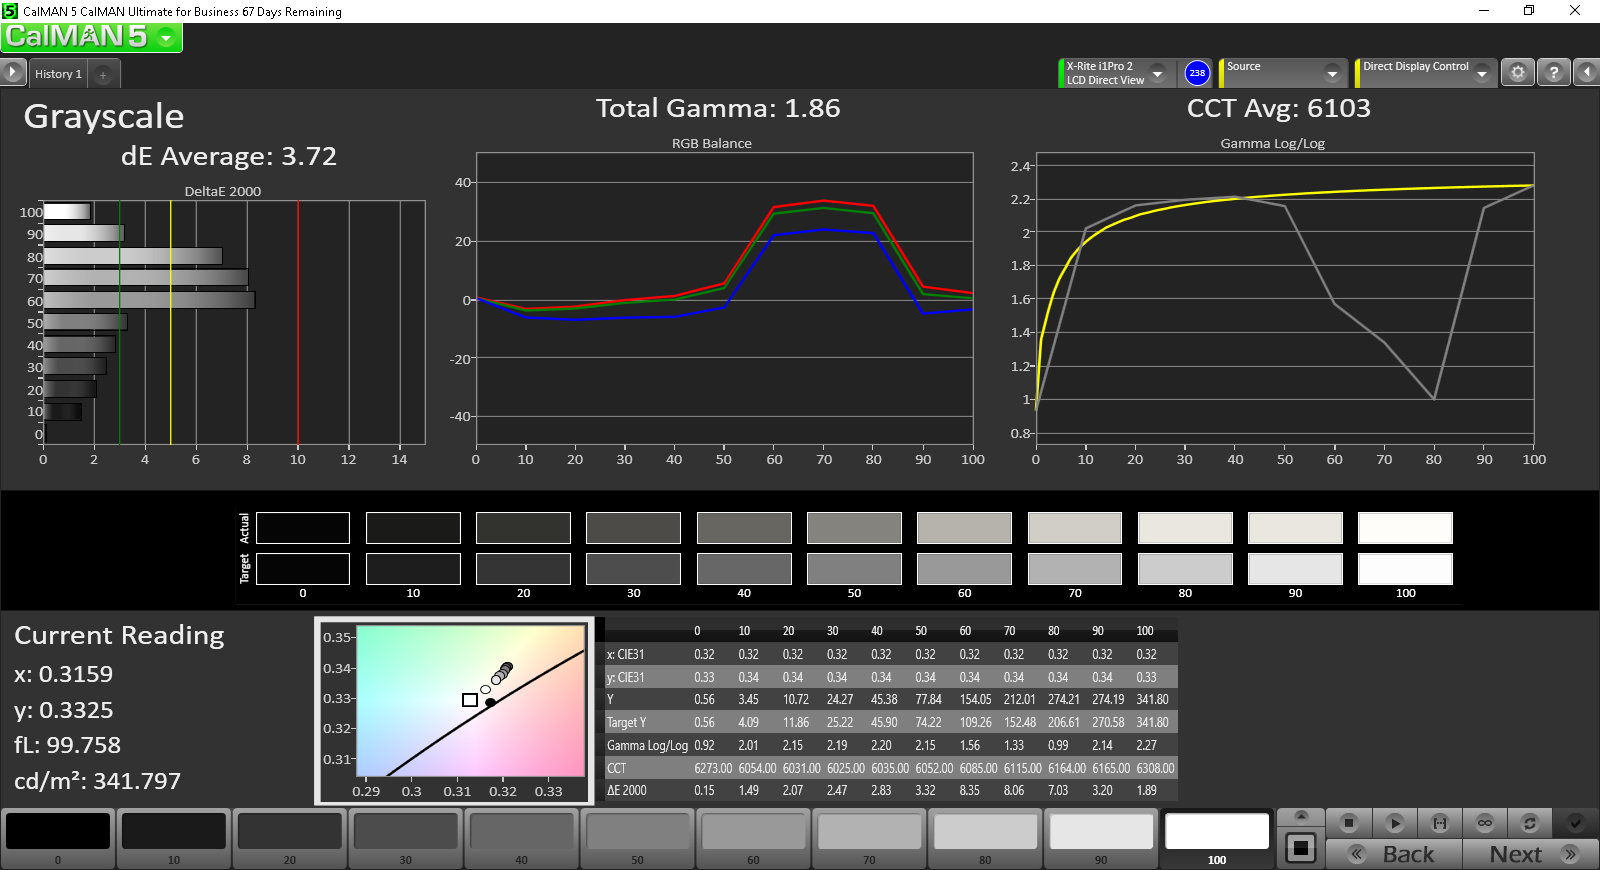
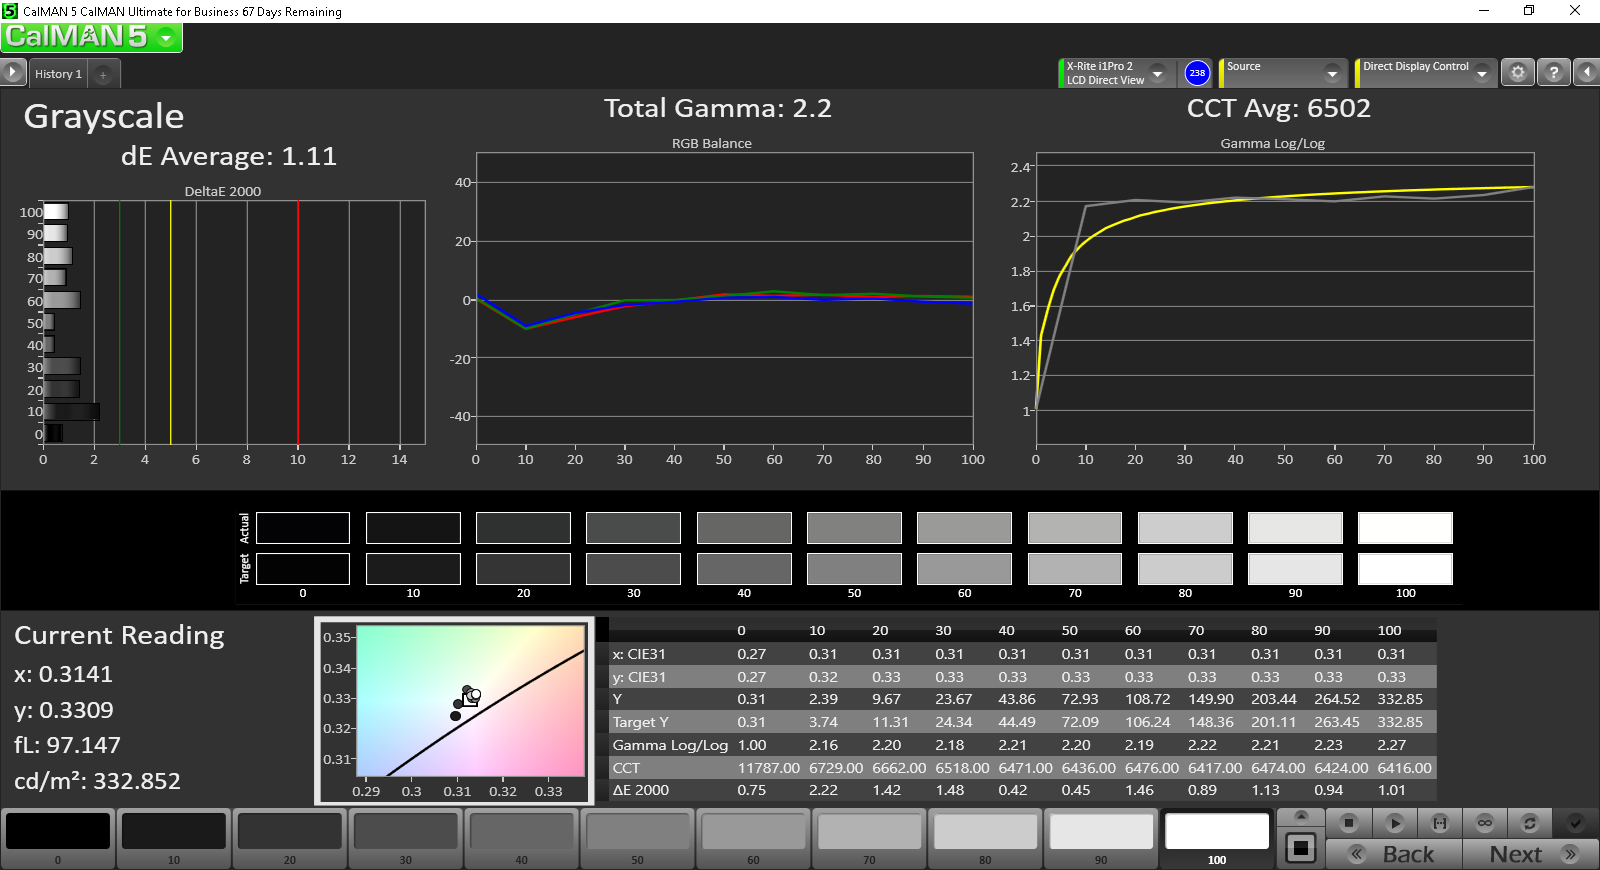
ΔE Greyscale Calman: 3.72 | ∀{0.09-98 Ø4.97}
100% sRGB (Argyll 1.6.3 3D)
74.3% AdobeRGB 1998 (Argyll 1.6.3 3D)
Gamma: 1.86
CCT: 6103 K
| Lenovo ThinkPad P70-20ER000XUS Panasonic VVX17P051J00 / LEN4123, IPS, 17.3", 3840x2160 | HP ZBook 17 G3 TZV66eA SDC3854, IPS, 17.3", 1920x1080 | Dell Precision 7710 SDC8151, VHN17_173HL, IPS LED, 17.3", 1920x1080 | Lenovo ThinkPad P70 LEN4123, IPS, 17.3", 3840x2160 | MSI WT72-6QM LG Philips LP173WF4-SPF1, IPS, 17.3", 1920x1080 | |
|---|---|---|---|---|---|
| Display | |||||
| Display P3 Coverage (%) | 67.3 | 66.6 | 90.8 | 67.3 | |
| sRGB Coverage (%) | 95.9 | 96.9 | 100 | 85.4 | |
| AdobeRGB 1998 Coverage (%) | 69 | 68.6 | 85.4 | 62.5 | |
| Response Times | -26% | -39% | -15% | -9% | |
| Response Time Grey 50% / Grey 80% * (ms) | 34.8 ? | 50.4 ? -45% | 50 ? -44% | 44 ? -26% | 42 ? -21% |
| Response Time Black / White * (ms) | 26.8 ? | 28.4 ? -6% | 36 ? -34% | 27.6 ? -3% | 26 ? 3% |
| PWM Frequency (Hz) | 219.3 ? | 200 ? | 198 ? | 228 ? | 86 ? |
| Screen | 11% | 1% | -6% | -22% | |
| Brightness middle (cd/m²) | 332 | 252 -24% | 332 0% | 365 10% | 303 -9% |
| Brightness (cd/m²) | 317 | 243 -23% | 307 -3% | 341 8% | 298 -6% |
| Brightness Distribution (%) | 86 | 86 0% | 83 -3% | 85 -1% | 94 9% |
| Black Level * (cd/m²) | 0.397 | 0.21 47% | 0.33 17% | 0.4 -1% | 0.46 -16% |
| Contrast (:1) | 836 | 1200 44% | 1006 20% | 913 9% | 659 -21% |
| Colorchecker dE 2000 * | 3.15 | 2.2 30% | 3 5% | 3.8 -21% | 5.77 -83% |
| Colorchecker dE 2000 max. * | 5.55 | 3.8 32% | |||
| Greyscale dE 2000 * | 3.72 | 2.7 27% | 4 -8% | 6.09 -64% | 4.87 -31% |
| Gamma | 1.86 118% | 2.28 96% | 2 110% | 2.3 96% | 1.99 111% |
| CCT | 6103 107% | 6686 97% | 7089 92% | 6332 103% | 7363 88% |
| Color Space (Percent of AdobeRGB 1998) (%) | 74.3 | 62 -17% | 62 -17% | 76.01 2% | 56.04 -25% |
| Color Space (Percent of sRGB) (%) | 100 | 96 -4% | 97 -3% | 99.97 0% | 85.27 -15% |
| Total Average (Program / Settings) | -8% /
5% | -19% /
-6% | -11% /
-8% | -16% /
-20% |
* ... smaller is better
Measurements of 836:1 for contrast and 316.5 cd/m² for brightness reinforce our impressions. These values don’t deviate much from those of our previous measurements, which is expected. Brightness distribution of 86% again is practically unchanged, as is the black level of 0.397 cd/m² (which contributes to the good contrast values).
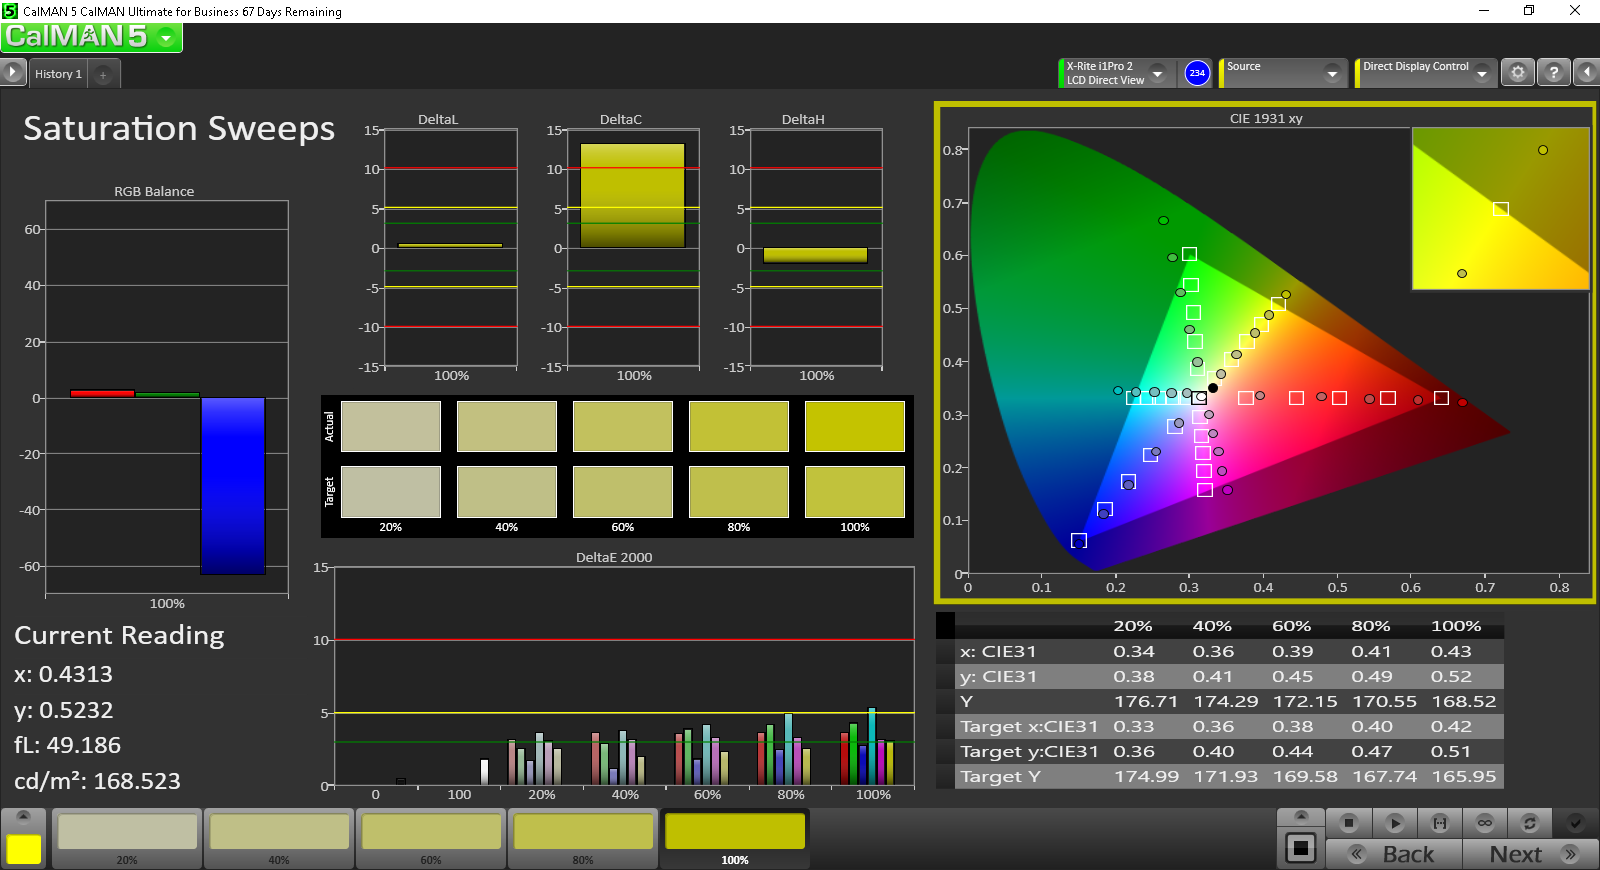
CalMAN 5 provides somewhat different measurements this time around, however, due to differences in calibration. DeltaE2000 values have dropped across the board, indicating greater color accuracy (ColorChecker DE2000: 3.15 vs. 3.8 on the previous P70; Grayscale DE2000: 3.72 vs. 6.09 previously). Total Gamma, on the other hand, is further from its ideal value of 2.2 (1.86 versus 2.3 previously). The same goes for CCT Average, which at 6103 indicates a warmer than ideal color temperature (6332 before). Color space measurements at least have not changed materially—we measured nearly identical values to our previous review in both AdobeRGB 1998 and sRGB comparisons (74.3% and 99.95%, respectively).

Display Response Times
| ↔ Response Time Black to White | ||
|---|---|---|
| 26.8 ms ... rise ↗ and fall ↘ combined | ↗ 4 ms rise | 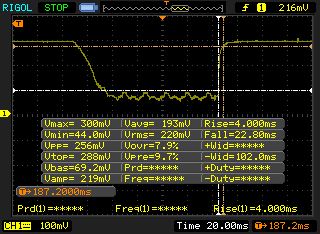 |
| ↘ 22.8 ms fall | ||
| The screen shows relatively slow response rates in our tests and may be too slow for gamers. In comparison, all tested devices range from 0.1 (minimum) to 240 (maximum) ms. » 67 % of all devices are better. This means that the measured response time is worse than the average of all tested devices (19.9 ms). | ||
| ↔ Response Time 50% Grey to 80% Grey | ||
| 34.8 ms ... rise ↗ and fall ↘ combined | ↗ 15.2 ms rise | 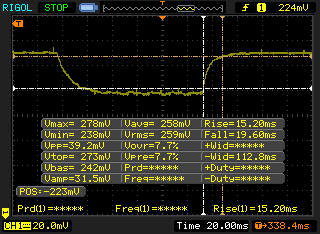 |
| ↘ 19.6 ms fall | ||
| The screen shows slow response rates in our tests and will be unsatisfactory for gamers. In comparison, all tested devices range from 0.165 (minimum) to 636 (maximum) ms. » 48 % of all devices are better. This means that the measured response time is worse than the average of all tested devices (31.1 ms). | ||
Screen Flickering / PWM (Pulse-Width Modulation)
| Screen flickering / PWM detected | 219.3 Hz | ≤ 99 % brightness setting | 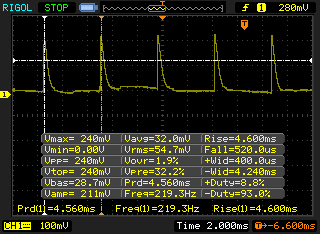 |
The display backlight flickers at 219.3 Hz (worst case, e.g., utilizing PWM) Flickering detected at a brightness setting of 99 % and below. There should be no flickering or PWM above this brightness setting. The frequency of 219.3 Hz is relatively low, so sensitive users will likely notice flickering and experience eyestrain at the stated brightness setting and below. In comparison: 52 % of all tested devices do not use PWM to dim the display. If PWM was detected, an average of 7798 (minimum: 5 - maximum: 343500) Hz was measured. | |||
Outdoors, the panel is easy to read in the shade and is still functional in sunlight. Viewing angles are very good, as is always the case for IPS panels.
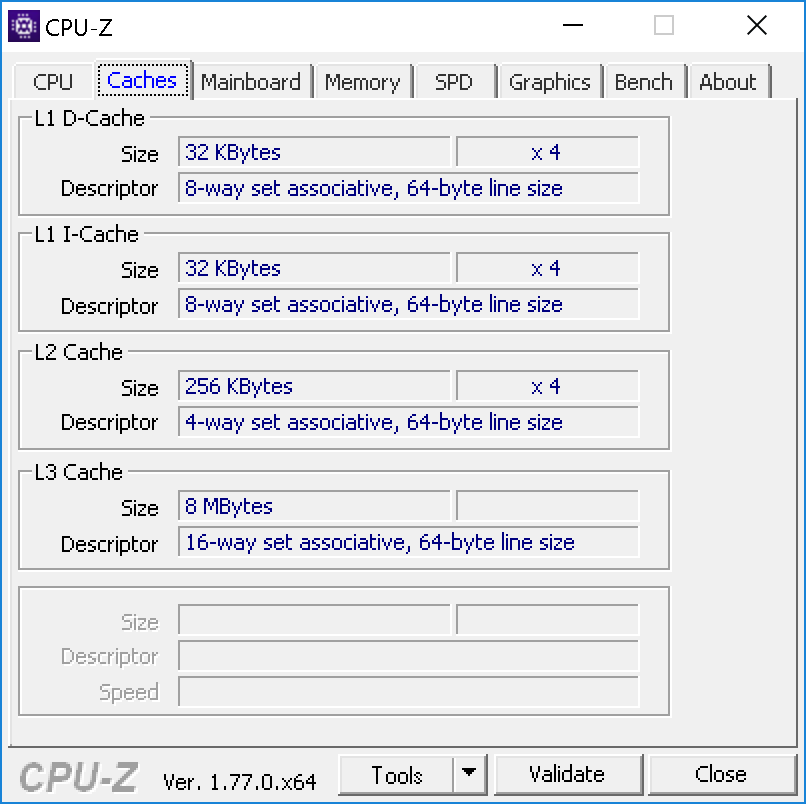
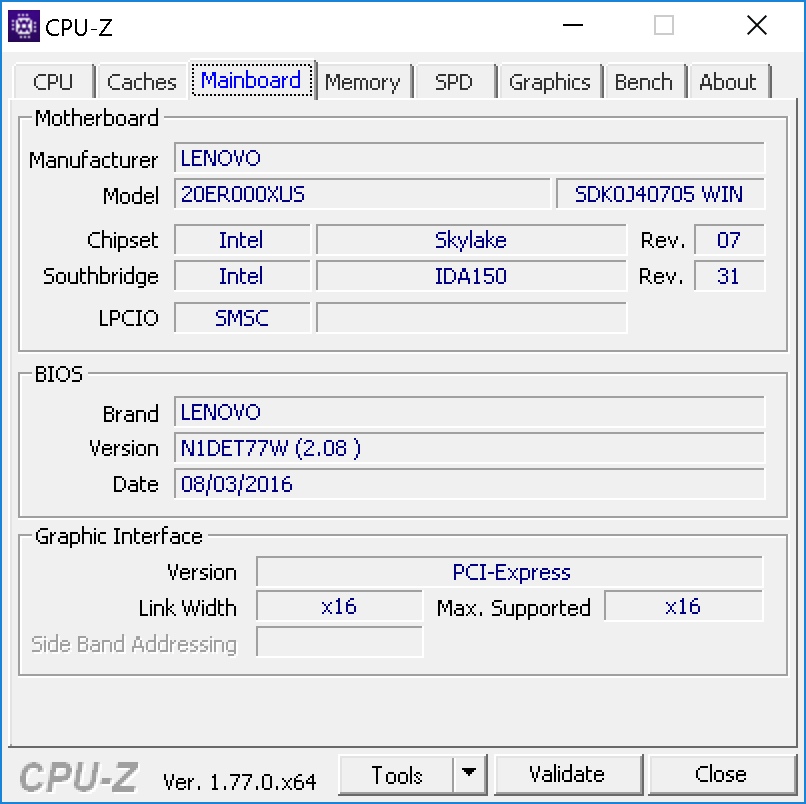
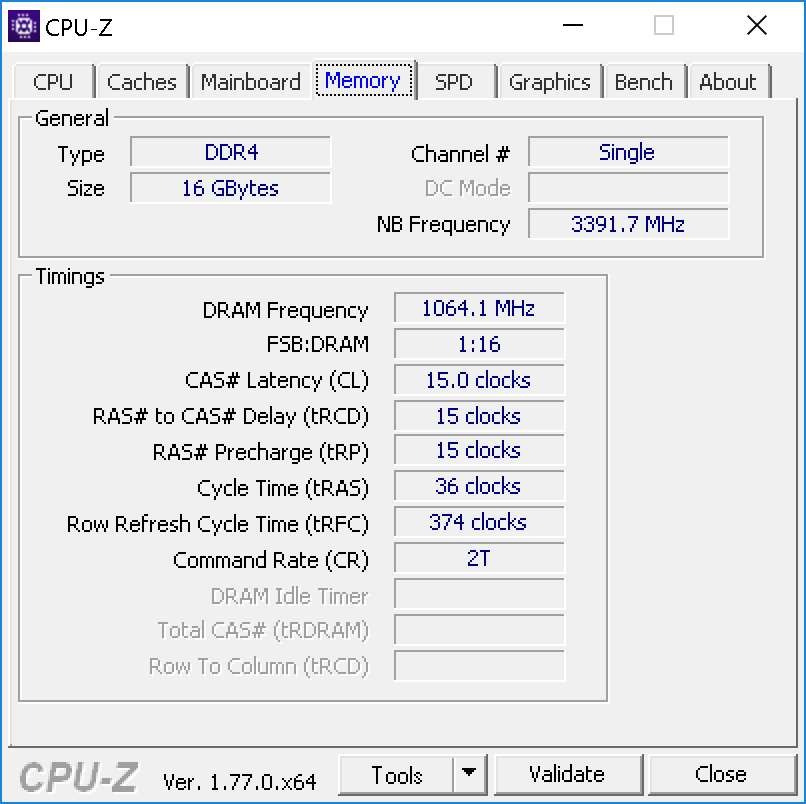
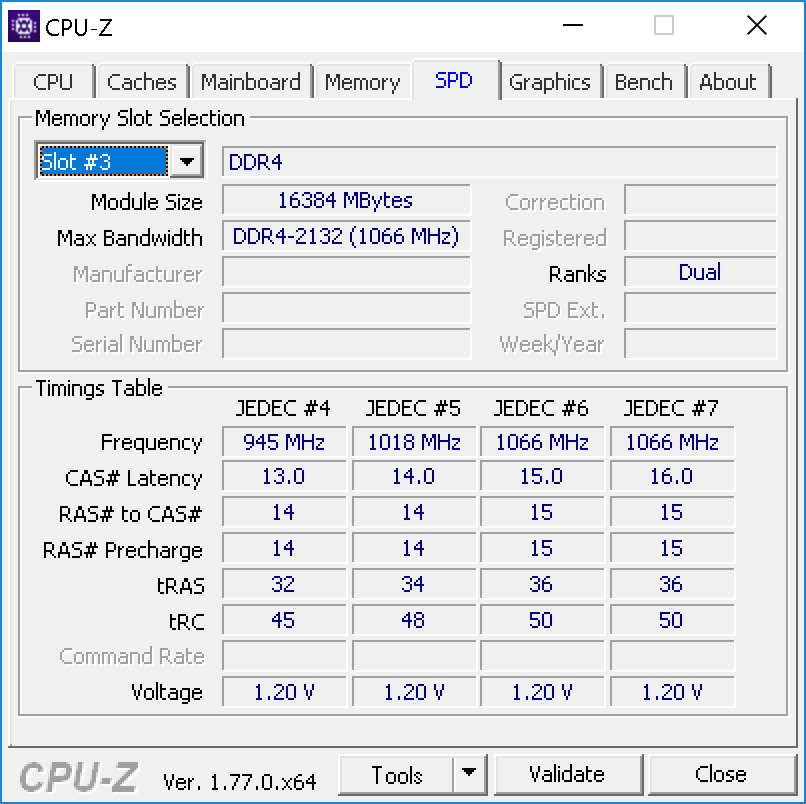
Performance
Apart from the significantly more powerful GPU and much faster NVMe solid-state drive, not much else has changed in terms of the internal specifications of the P70, either. The CPU has been swapped from the previous Intel Core i7-6820HQ for an Intel Xeon E3-1505M v5—not really an upgrade in terms of raw performance apart from the Xeon’s support for ECC memory and security management features. RAM capacity and speed remains the same at 16 GB of DDR4-2133 MHz, though now, the RAM is ECC (thanks to the upgrade to the Xeon CPU), which provides greater stability during intensive computational activities. The configuration is also single-channel (1x16 GB SODIMM) versus the previous dual-channel setup. This actually means slower memory performance unless a second 16 GB DDR4 stick is added aftermarket; however, on the bright side, the machine is ready and waiting for that upgrade—whereas the previous P70 would have required replacement of both SODIMMs to achieve the same performance at 32 GB capacity.
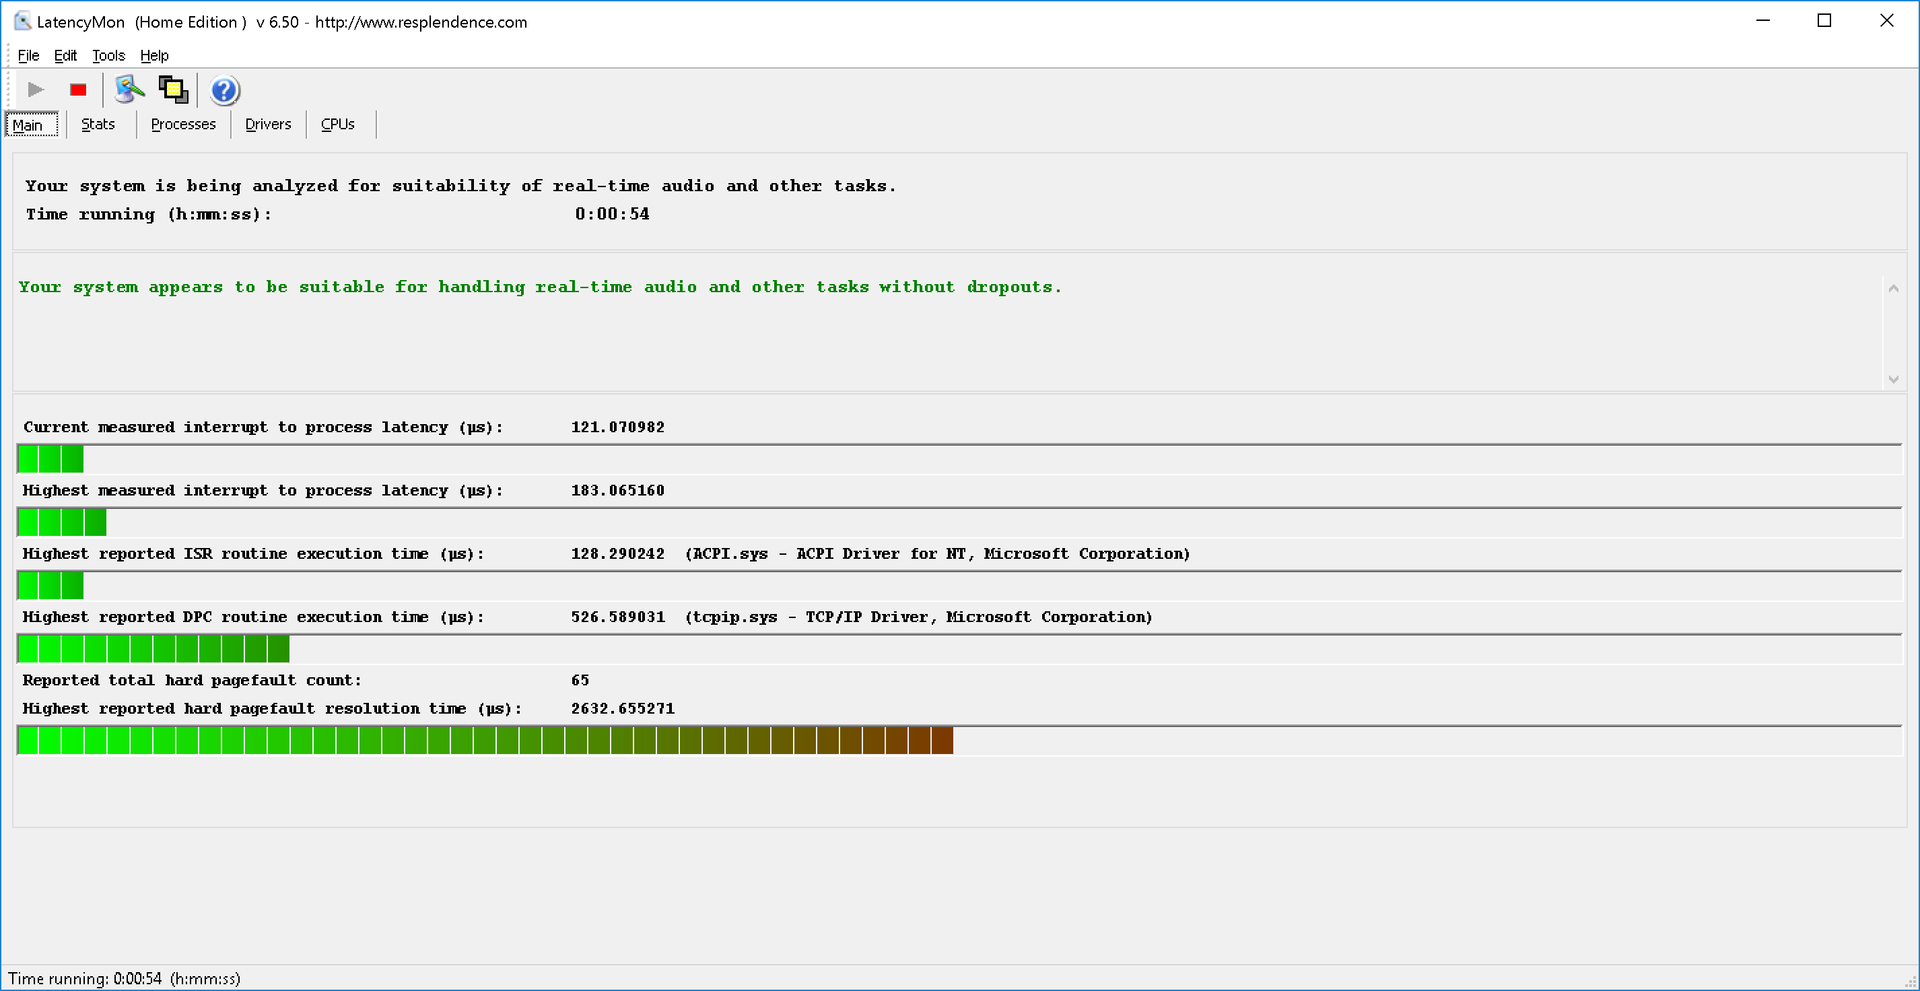
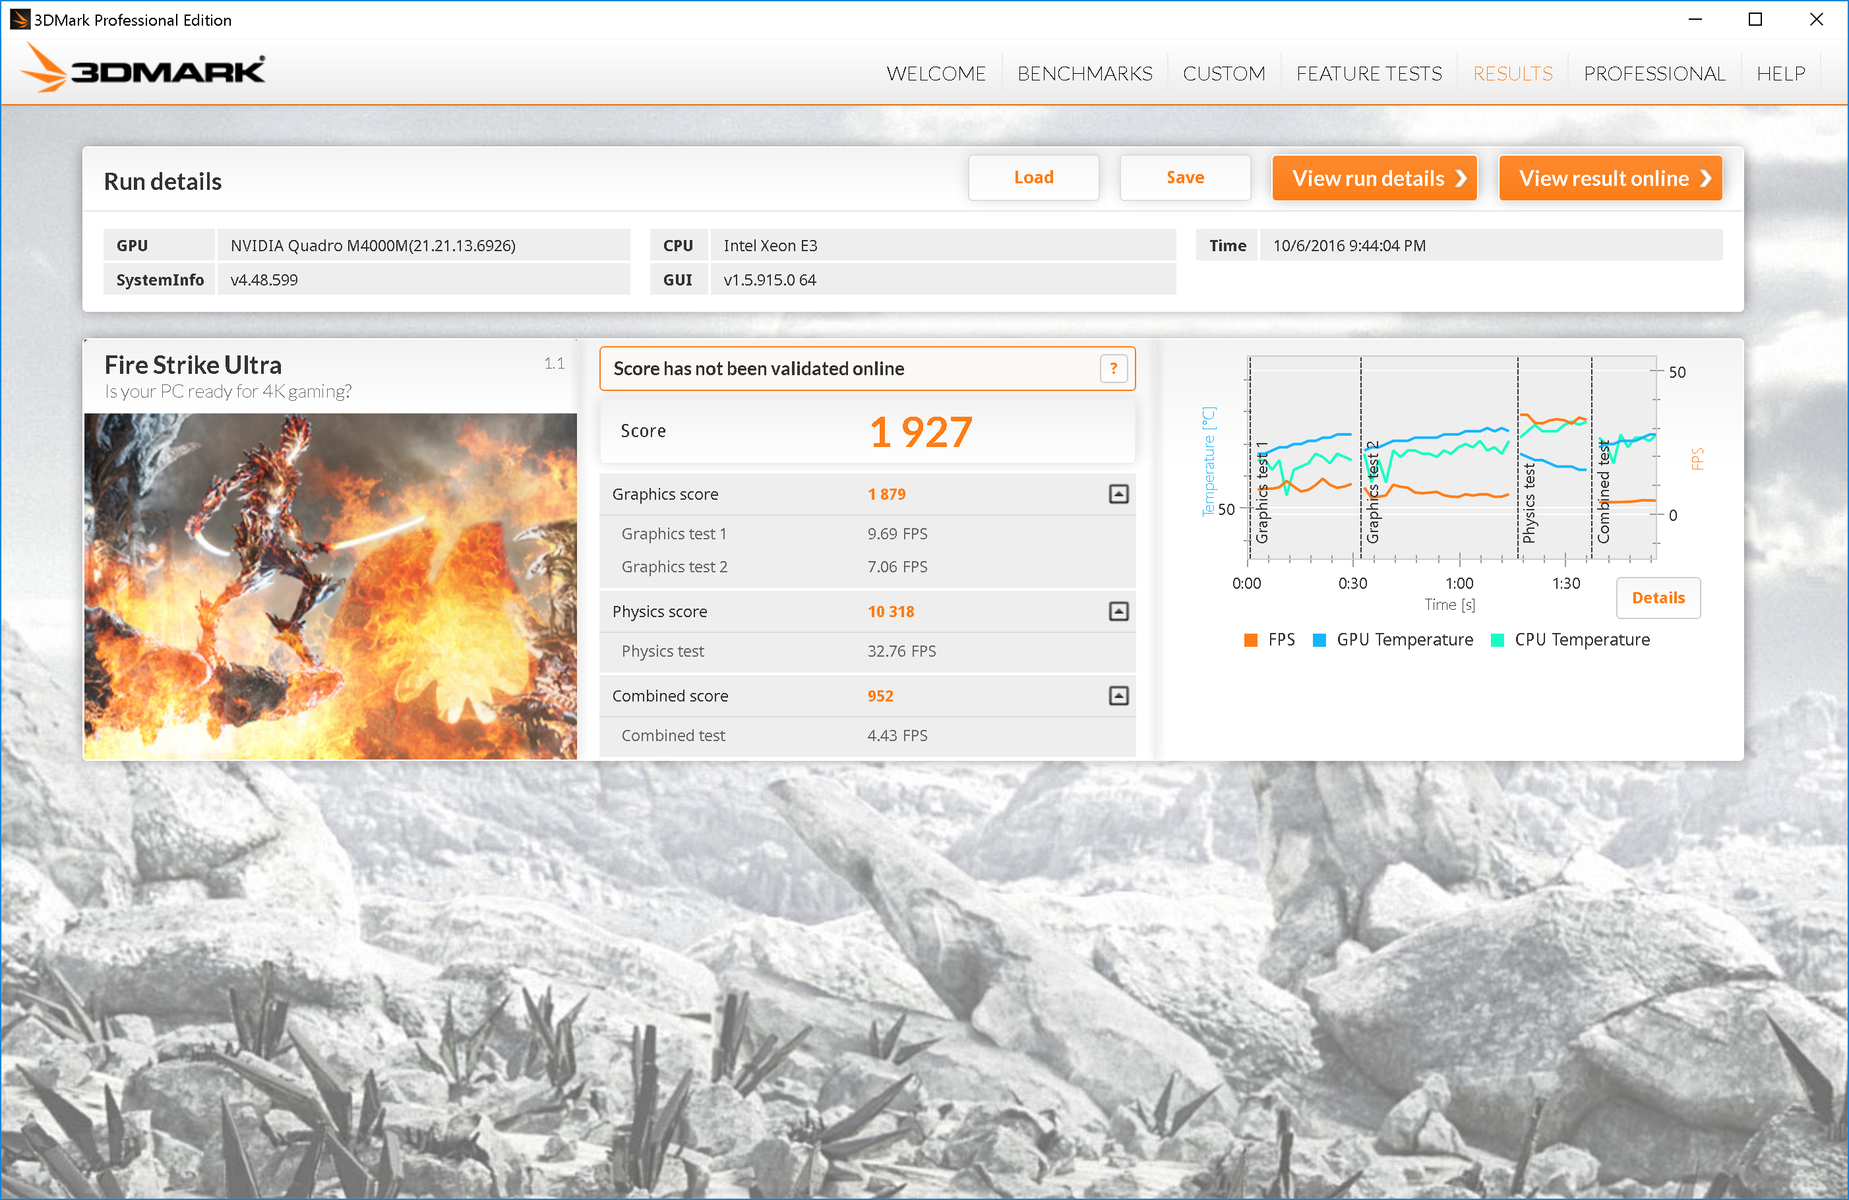
A couple more preliminary notes before we dive into performance analysis: LatencyMon provides no reason for concern as to the P70’s ability to stream real-time audio and video, and—as expected—performance suffers while operating unplugged (we measured 1394 in 3DMark Fire Strike Ultra versus 1927 while plugged in).
We will cover GPU and storage upgrades in later sections of this review, which is where most of the differences lie. For now, let’s take a closer look at the CPU and how it performs in comparison to its peers.
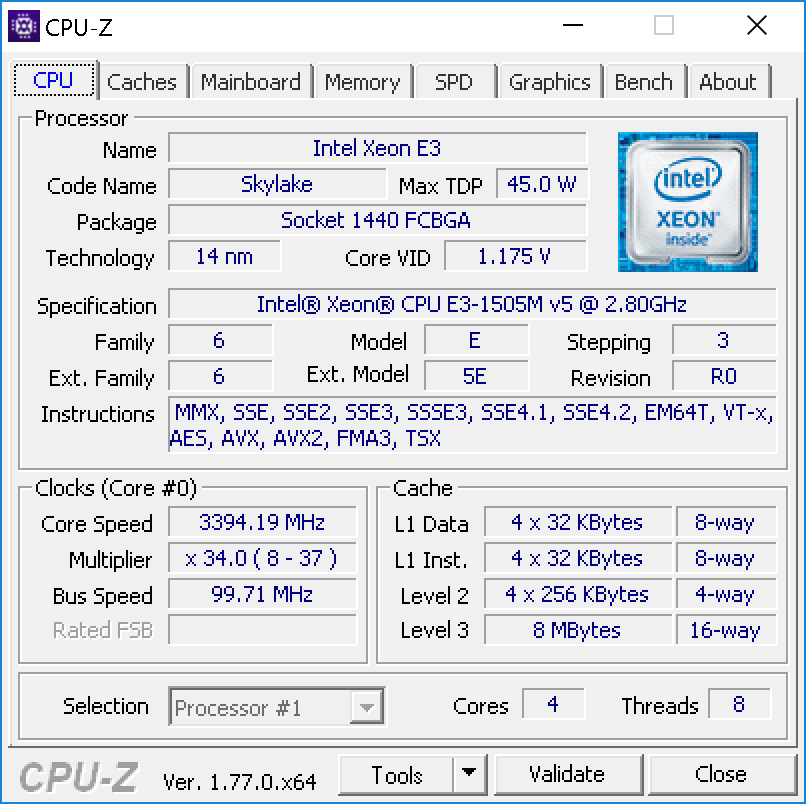
Processor
The Intel Xeon E3-1505M v5 is a high-end quad-core CPU designated for mobile workstations. Like the CPU in the previous P70 (Intel Core i7-6820HQ), it is a member of the Skylake series of CPUs, and it remains a quad-core processor. Clock rates are virtually identical (100 MHz higher, to be exact) at 2.8 – 3.7 GHz single-core and 3.3 GHz quad-core. We should expect few if any major performance deviations from the i7.
Since the Xeon supports ECC memory for greater system stability, the RAM (as previously mentioned) has been swapped for 16 GB ECC memory to take advantage of this capability. Apart from that, no major differences exist versus the Core i7—and exploring performance differences is likely to be a matter of splitting hairs.
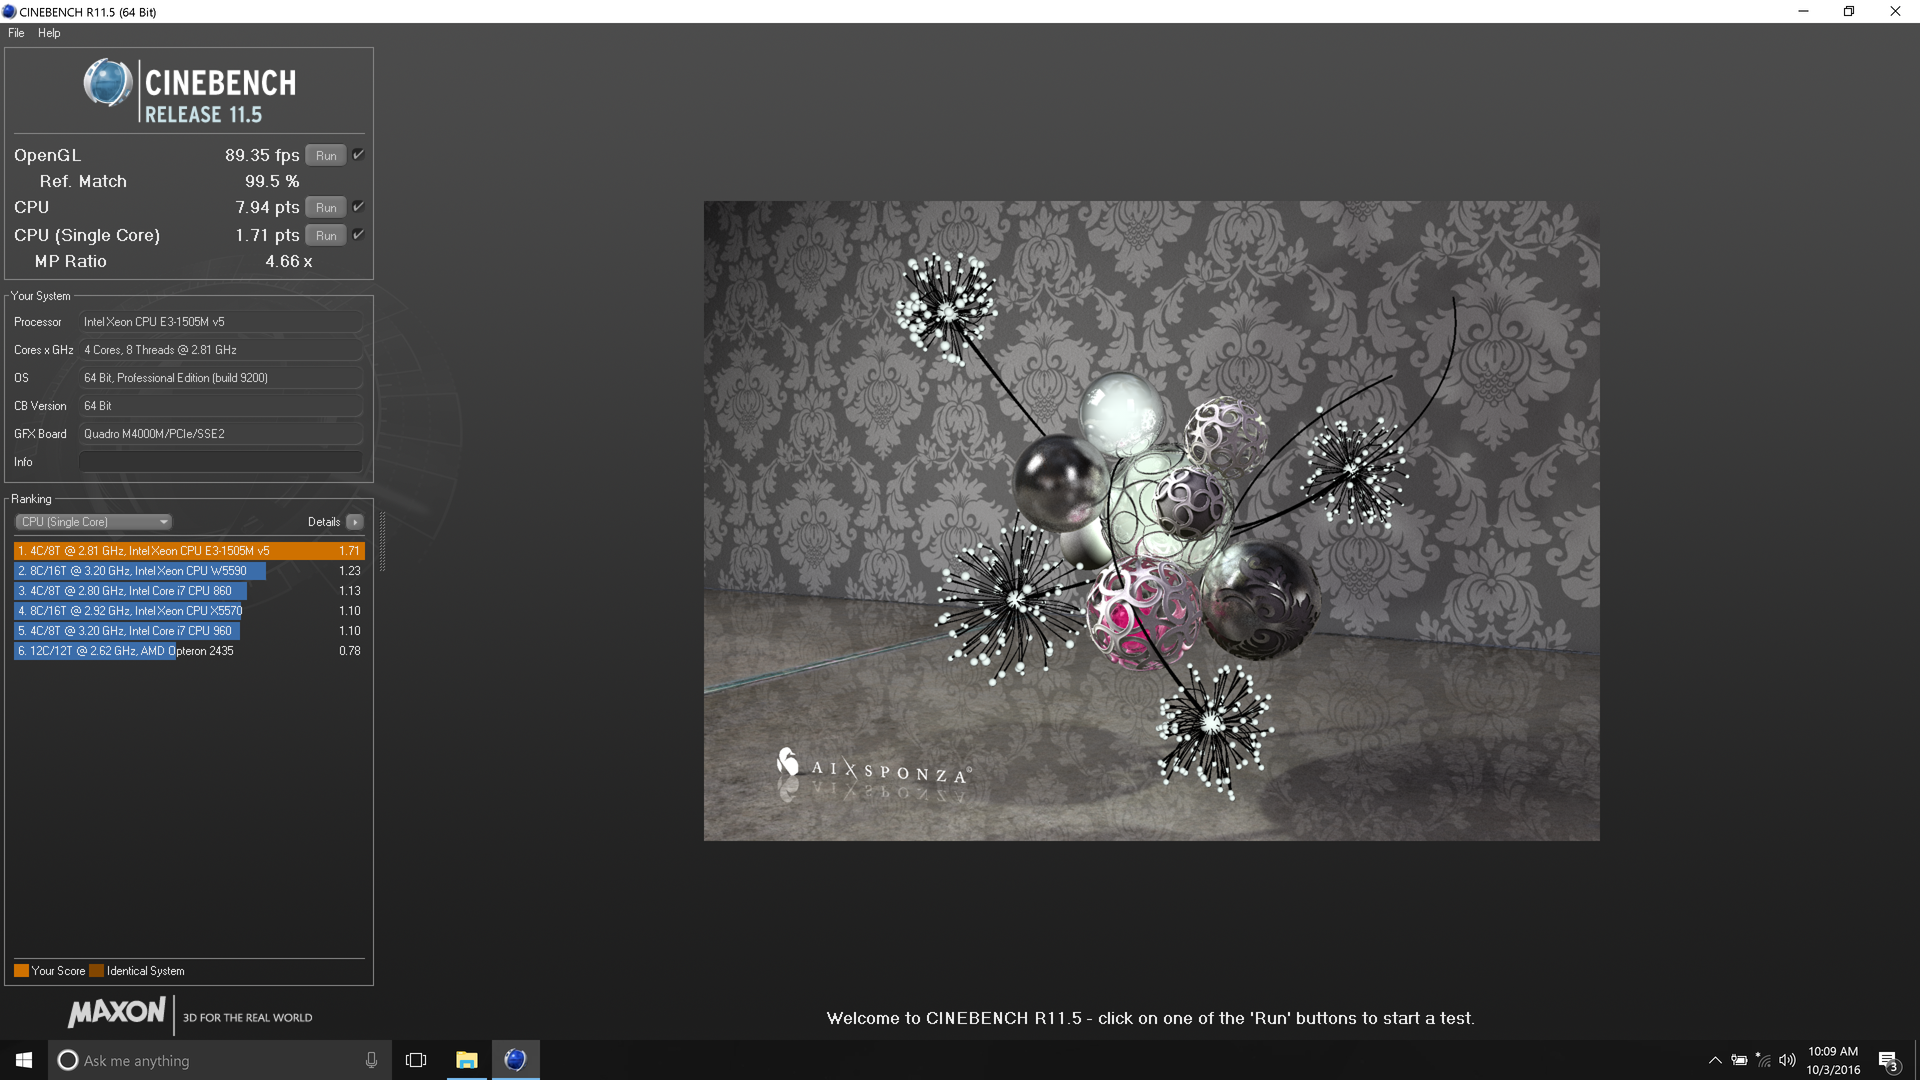
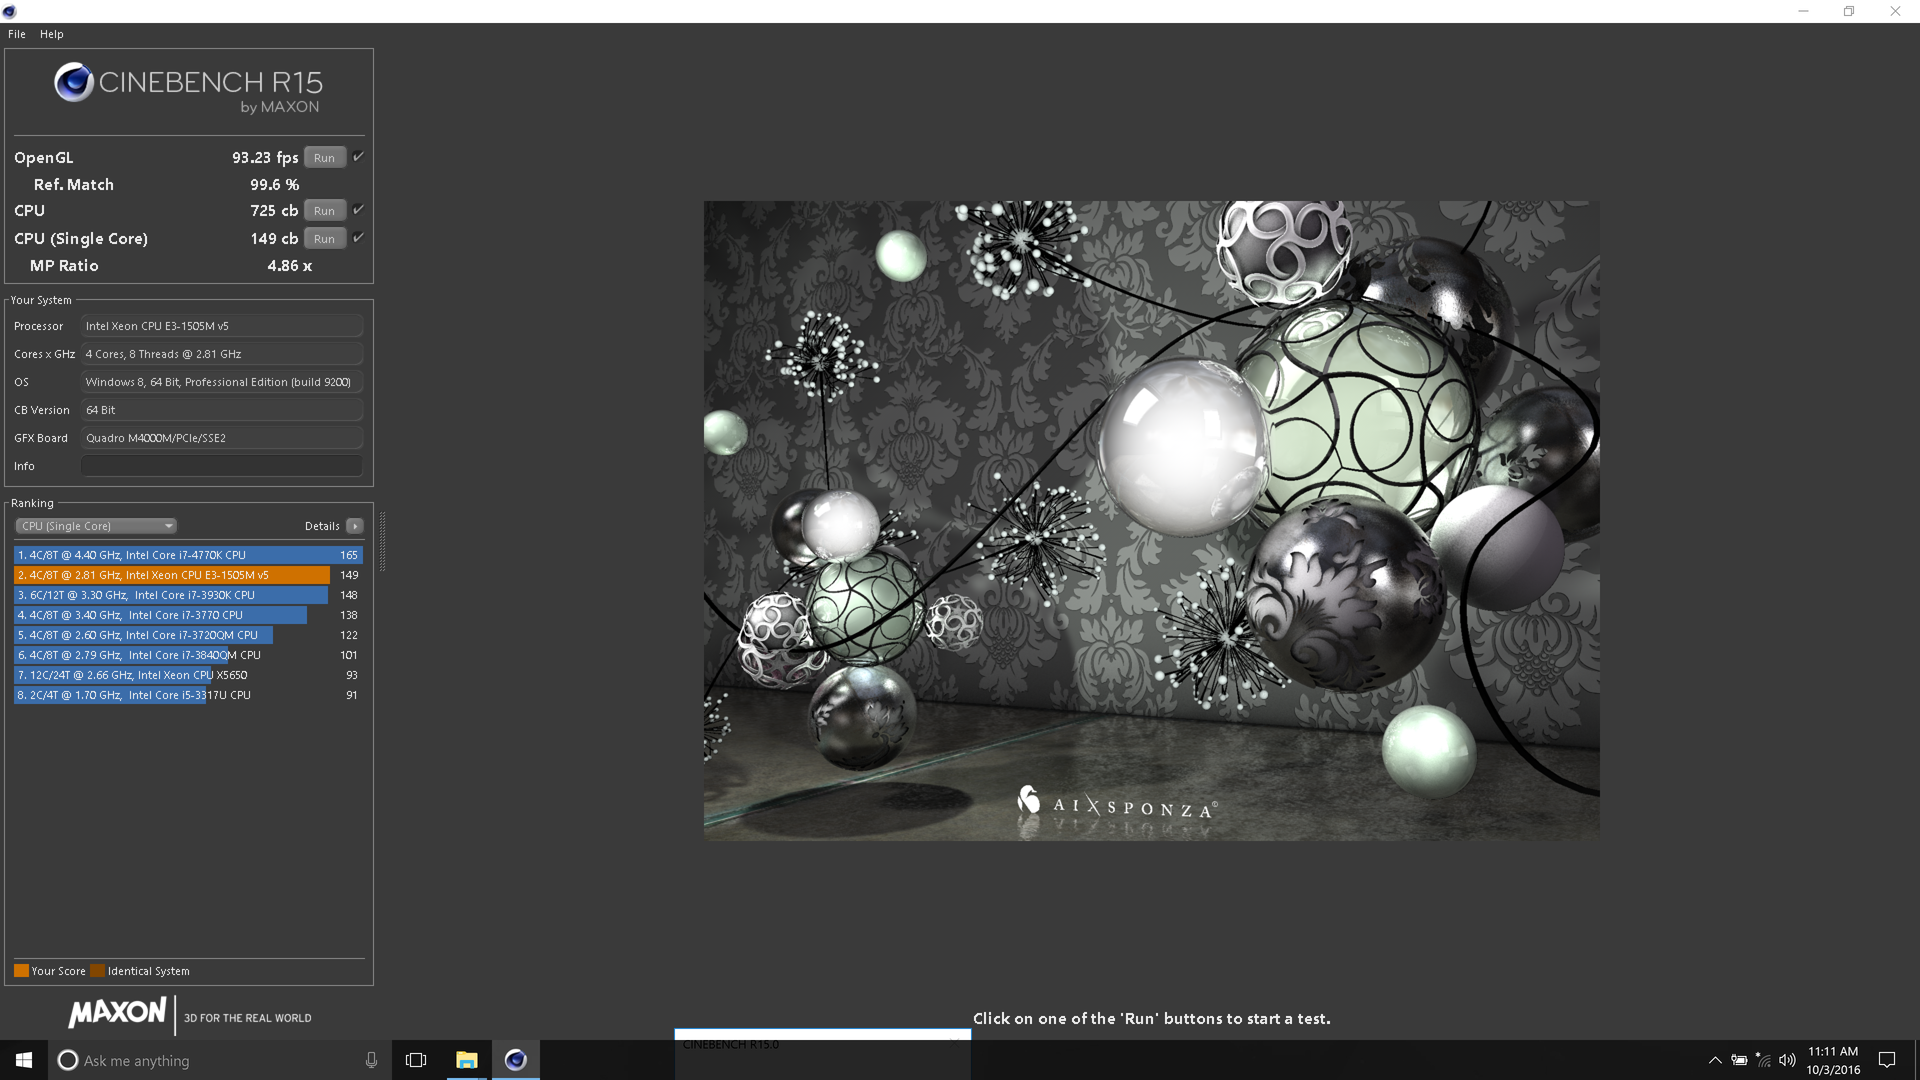
Our benchmarks provide few substantial deviances between the previous P70 (equipped with the i7) and the current one. For starters, performance in Cinebench R15 is strong enough, with scores of 149 and 725 (single and multi-threaded, respectively). These values are within a few percentage points (3-6% lower) than the highest scores posted by competing machines, both of which hail from the Dell Precision 7710. The older P70 in this test is either roughly on par or slightly behind today’s configuration. Mostly the same observations apply to the Cinebench R11.5 results, which present a slightly wider gap (up to 8% advantage for the Precision 7710 in single-core performance and 7% lower scores for the older P70 in multi-core) but which otherwise are no different.
| wPrime 2.10 - 1024m | |
| Lenovo ThinkPad P70-20ER000XUS | |
| Lenovo ThinkPad P70 | |
| Dell Precision 7710 | |
| Super Pi Mod 1.5 XS 32M - 32M | |
| Lenovo ThinkPad P70 | |
| Lenovo ThinkPad P70-20ER000XUS | |
| MSI WT72-6QM | |
| Dell Precision 7710 | |
* ... smaller is better
Workstation Performance
Of most interest here, of course, is workstation performance—and in this category, the P70-20ER flexes its muscle. We use SPECviewperf to synthetically evaluate the performance of mobile workstations, and in both versions 11 and 12 the P70 proves its worth.
In SPECviewperf 12, the ThinkPad P70-20ER generally lands near the top of the chart—and in the couple of instances where it does not (Medical -20%, Energy -14%), it’s still well above the original P70—which is nearly always in last (or second-to-last) place. The difference between January’s model, which featured the M3000M, and this month’s P70 is dramatic—and only the MSI WT72-6QM (translated), with its M5000M GPU, can claim absolute dominance over it. Results from SPECviewperf 11 line up similarly.
Obviously, this is a factor of GPU performance more so than anything else, and the additional power provided by the ~25W TDP heavier M4000M clearly makes a substantial difference. When you are within throwing distance of the MSI WT72-6QM—a $4,500 heavyweight in the workstation segment—you have little to be ashamed about.
System Performance
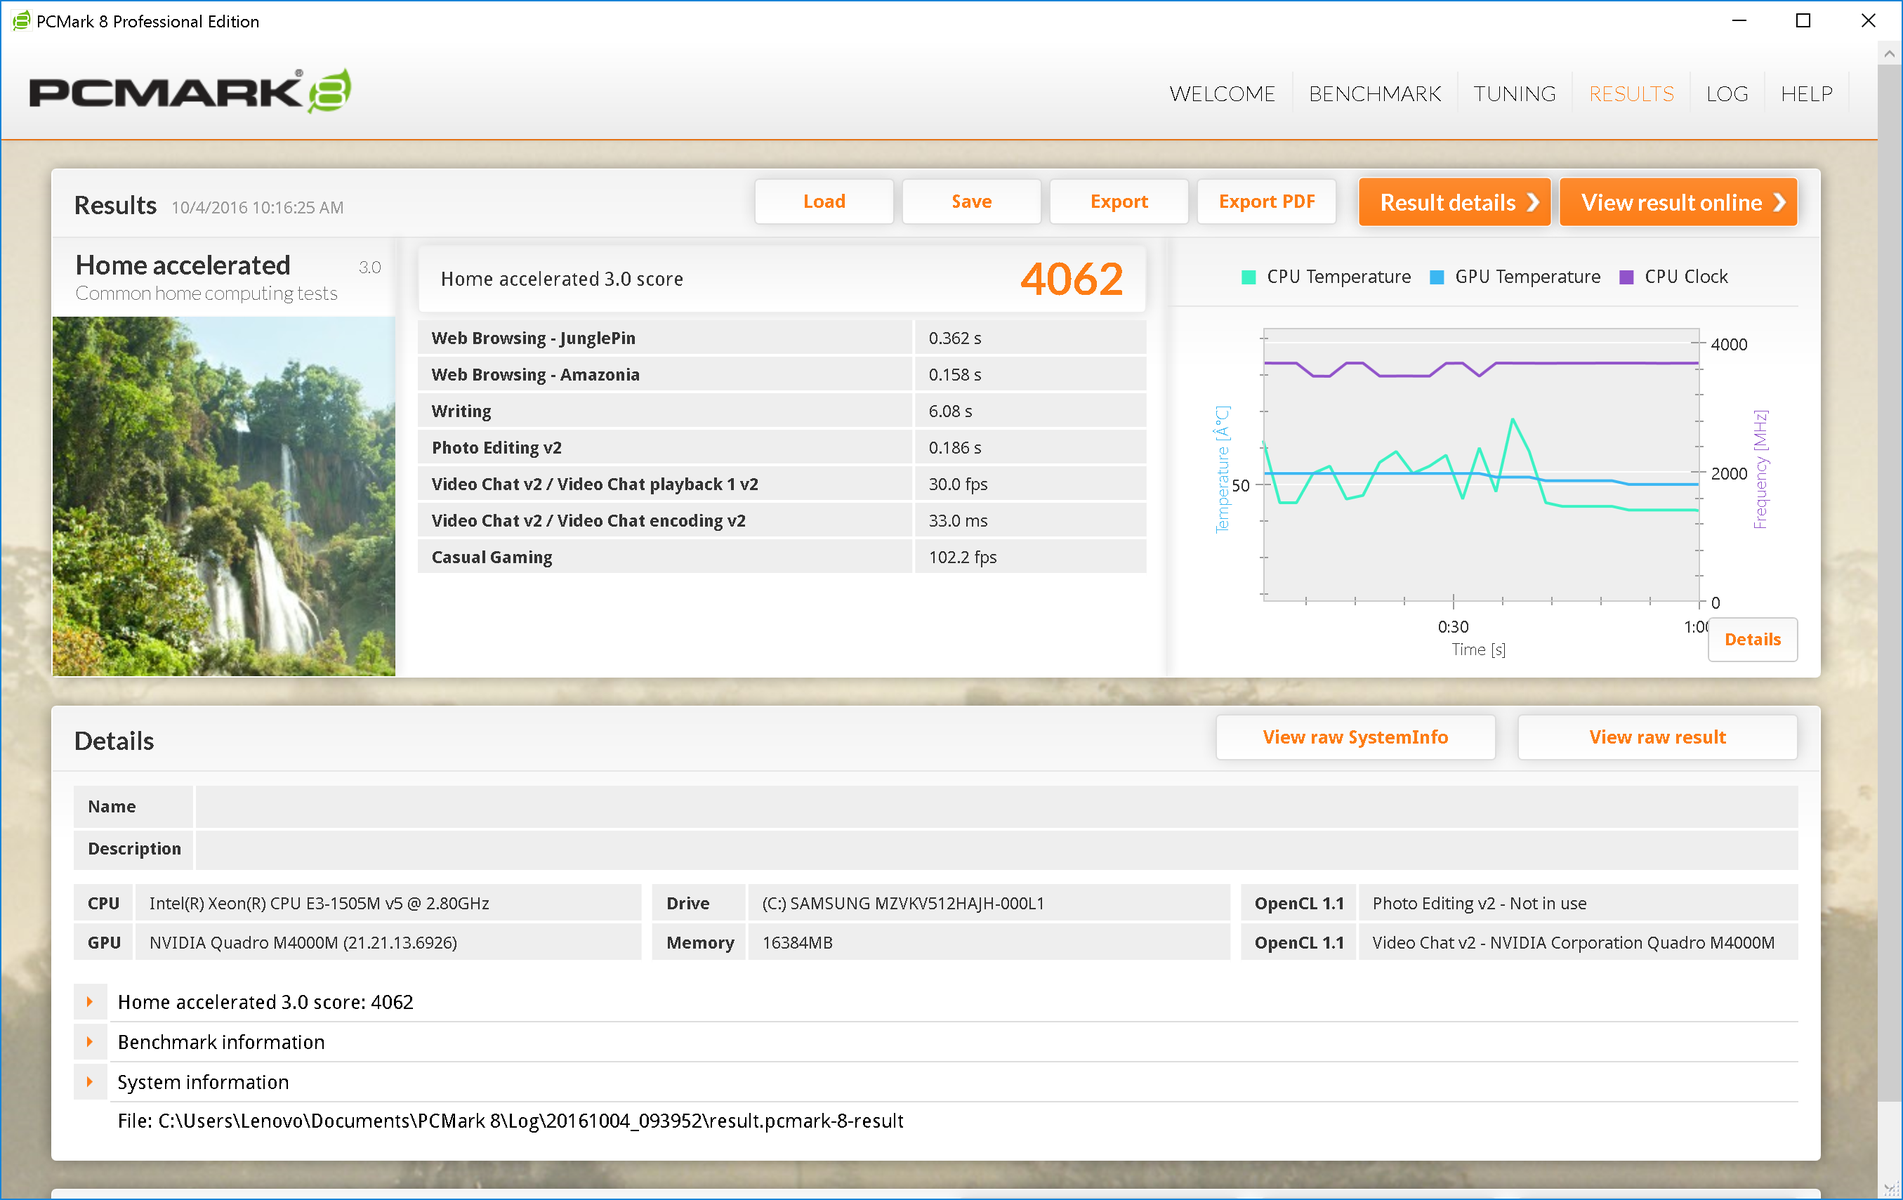
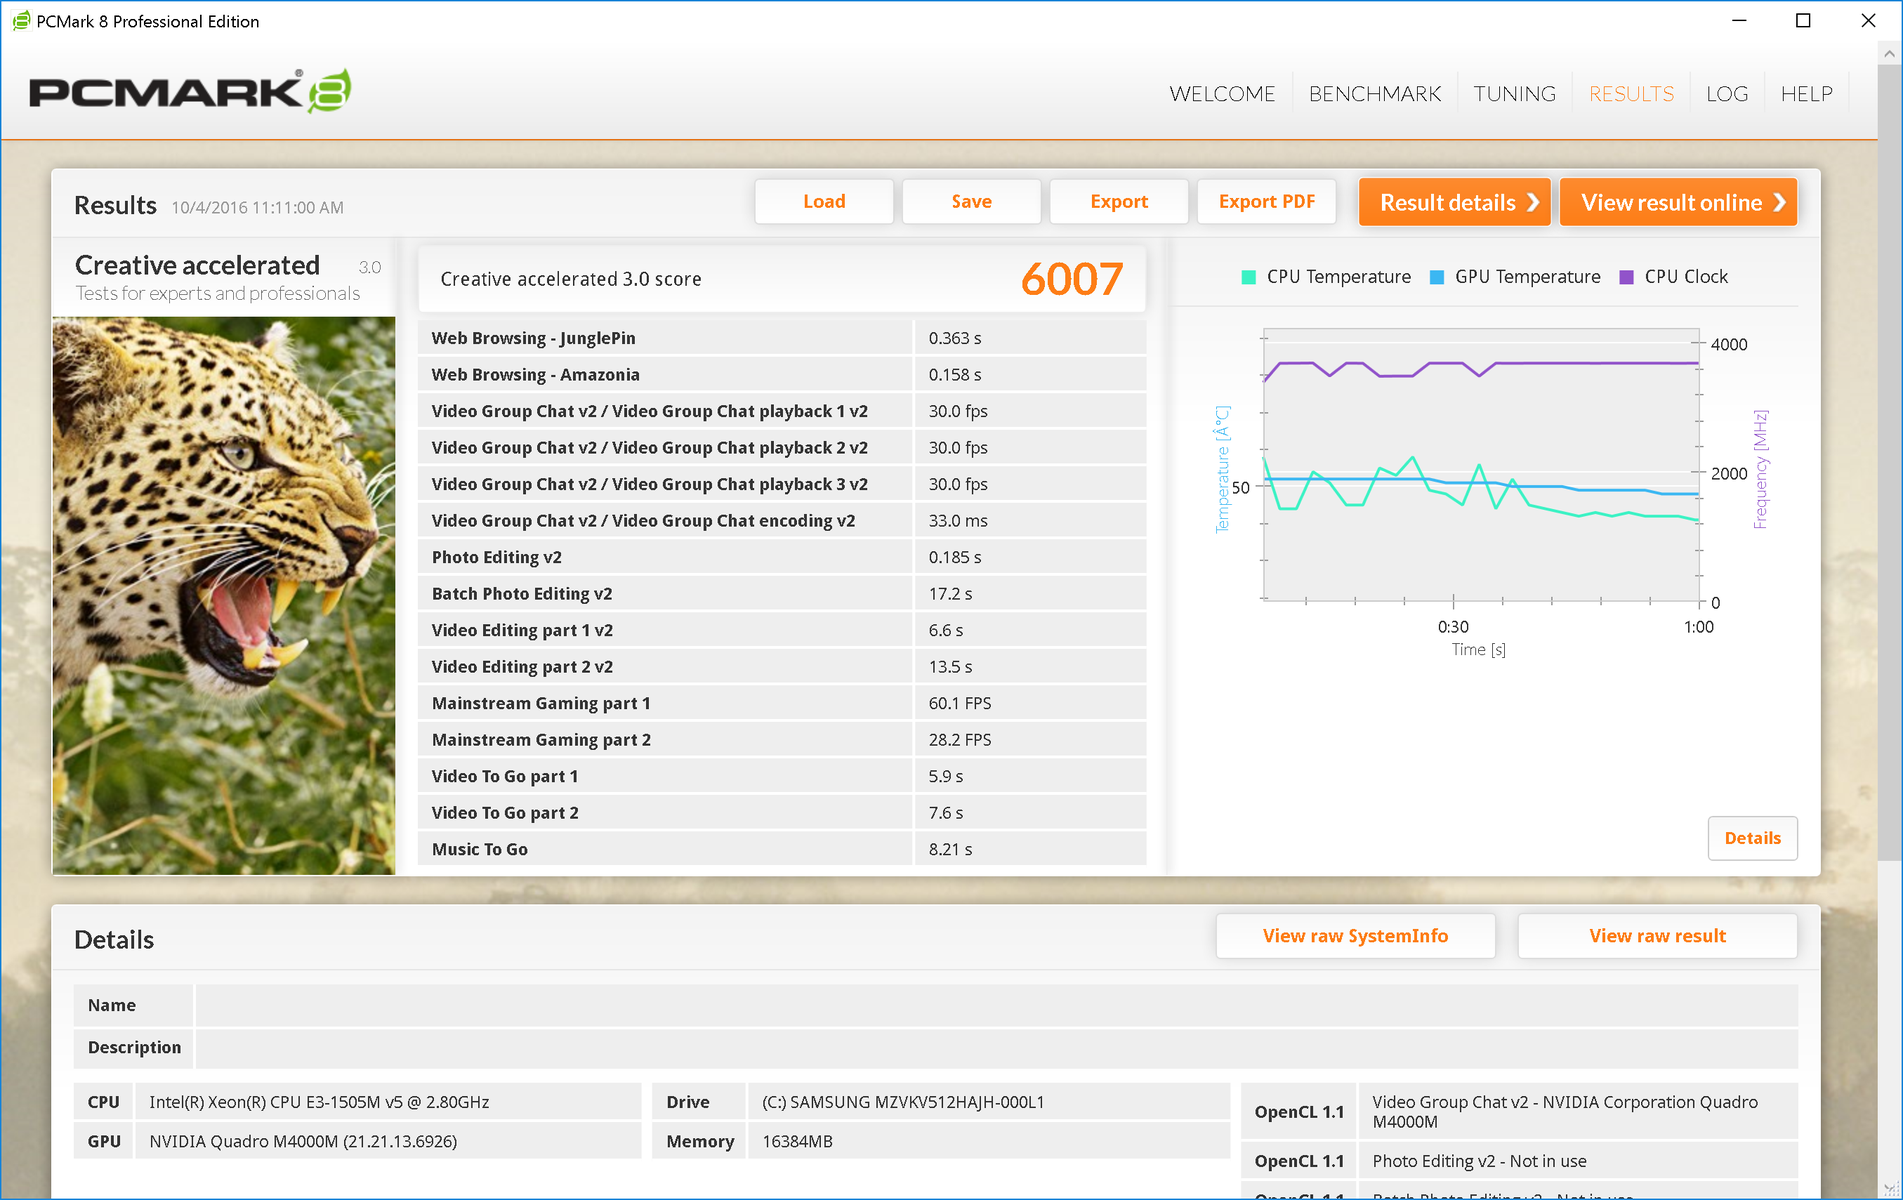
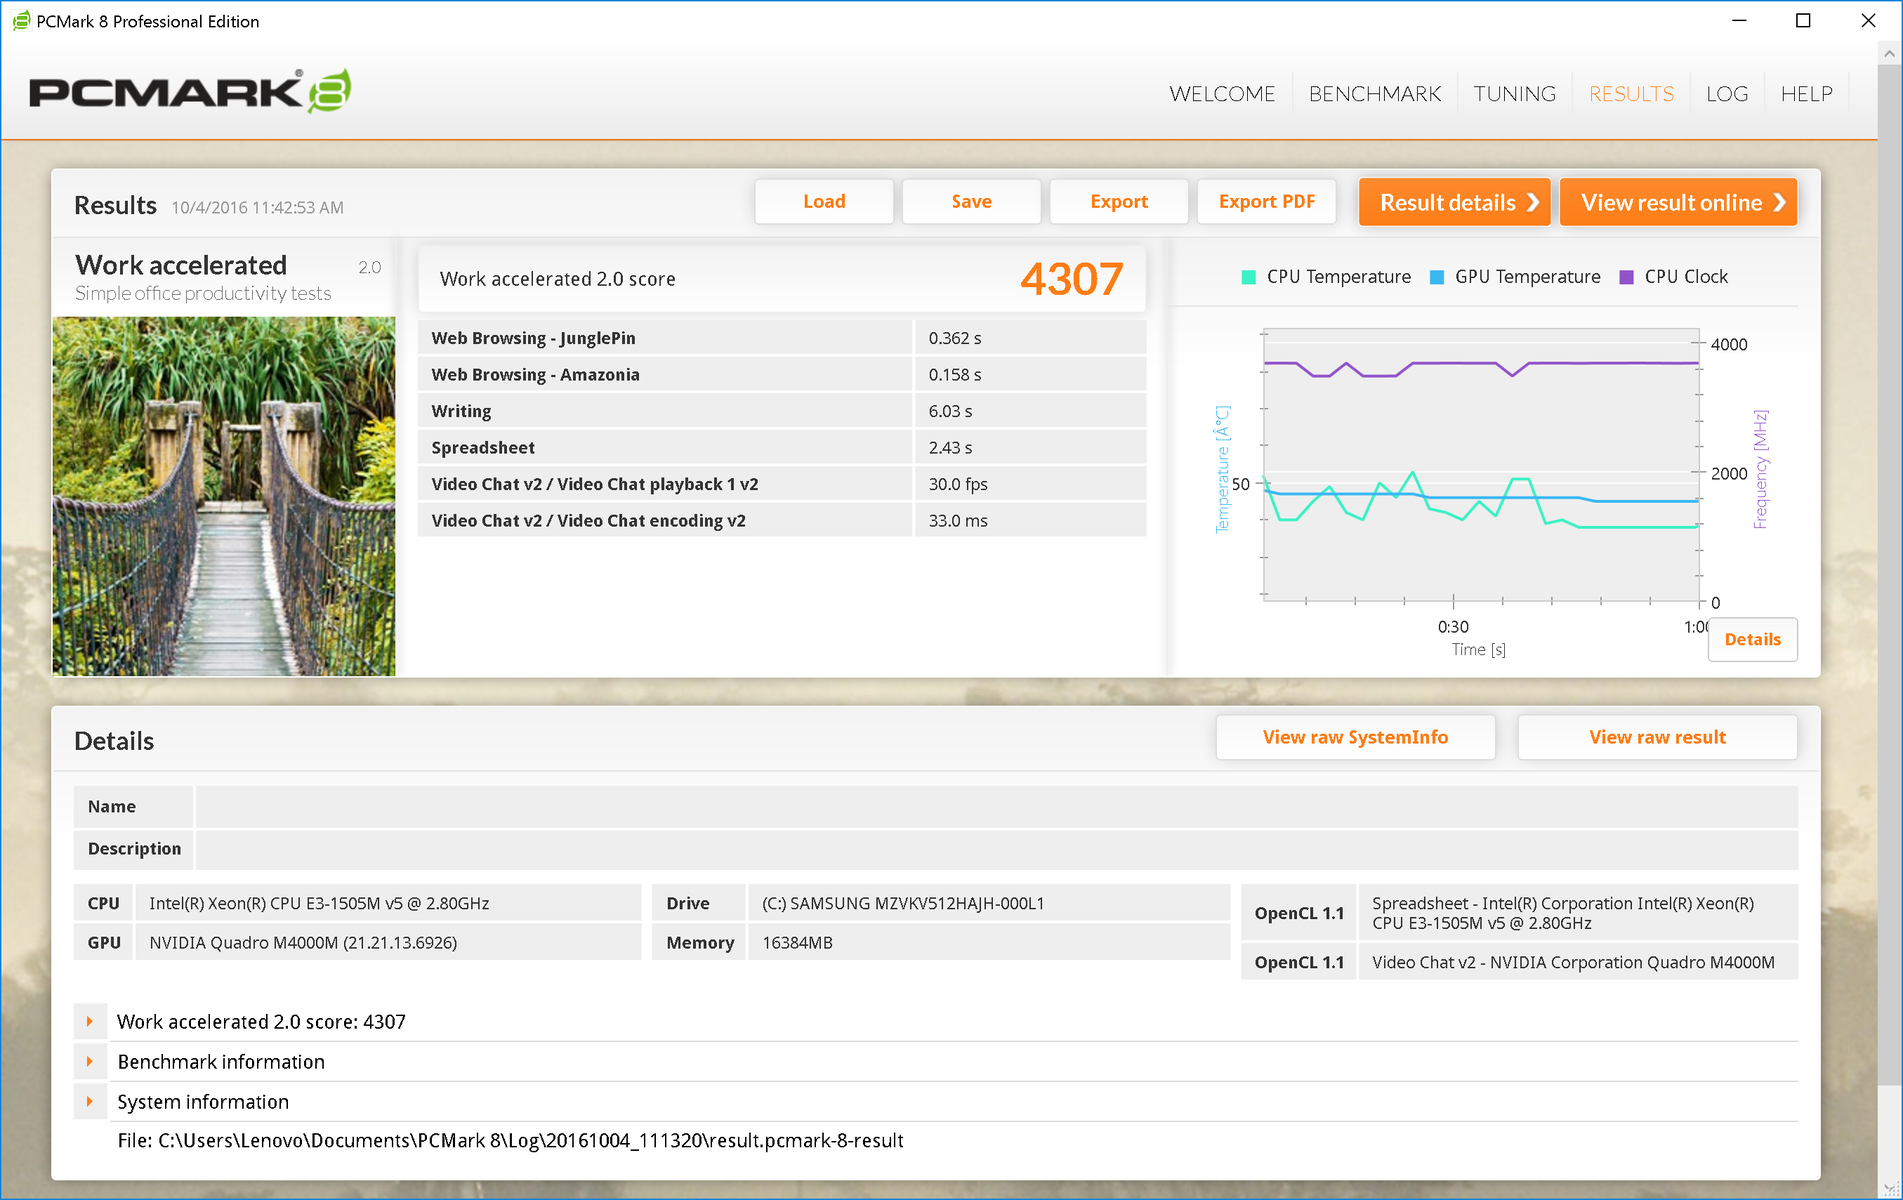
PCMark 8’s benchmarks are not particularly kind to the P70-20ER, which, in spite of its acceptable scores, can’t achieve comparable results with most of the other candidates in the Work and Home Accelerated tests. That’s primarily due to the notebook’s 4K screen, which inherently produces lower results in these benchmarks. Creative Score Accelerated, meanwhile, places the P70 at the top of the rankings, though the MSI WT72 is conspicuously absent from this test.
Regardless of synthetic results, we found the P70-20ER’s operation to be smooth and snappy throughout our time with it.
| PCMark 8 | |
| Home Score Accelerated v2 | |
| Dell Precision 7710 | |
| MSI WT72-6QM | |
| HP ZBook 17 G3 TZV66eA | |
| Lenovo ThinkPad P70-20ER000XUS | |
| Lenovo ThinkPad P70 | |
| Work Score Accelerated v2 | |
| MSI WT72-6QM | |
| Dell Precision 7710 | |
| HP ZBook 17 G3 TZV66eA | |
| Lenovo ThinkPad P70 | |
| Lenovo ThinkPad P70-20ER000XUS | |
| Creative Score Accelerated v2 | |
| Lenovo ThinkPad P70-20ER000XUS | |
| Dell Precision 7710 | |
| HP ZBook 17 G3 TZV66eA | |
| PCMark 8 Home Score Accelerated v2 | 4062 points | |
| PCMark 8 Creative Score Accelerated v2 | 6007 points | |
| PCMark 8 Work Score Accelerated v2 | 4307 points | |
Help | ||
Storage Devices
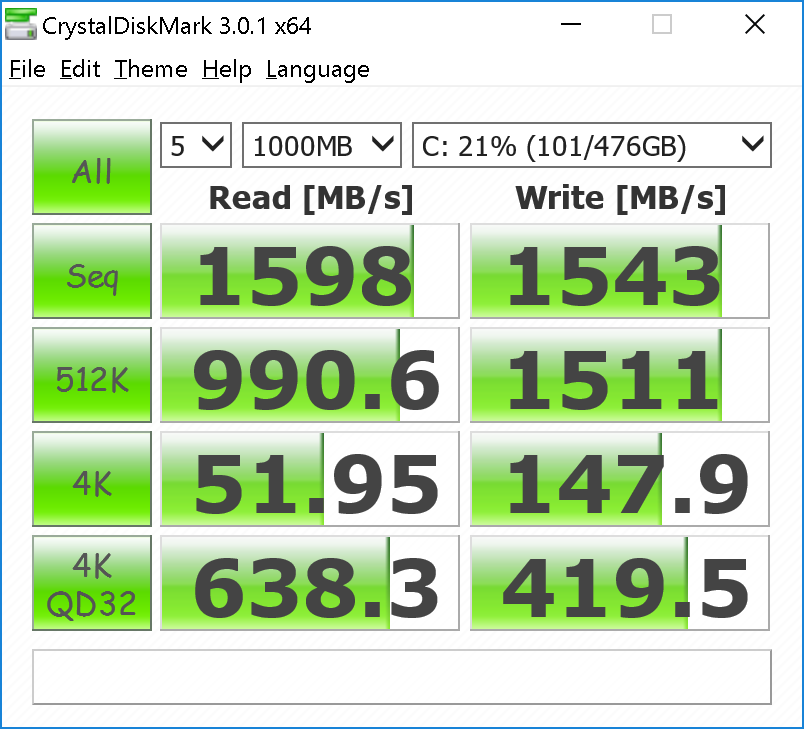
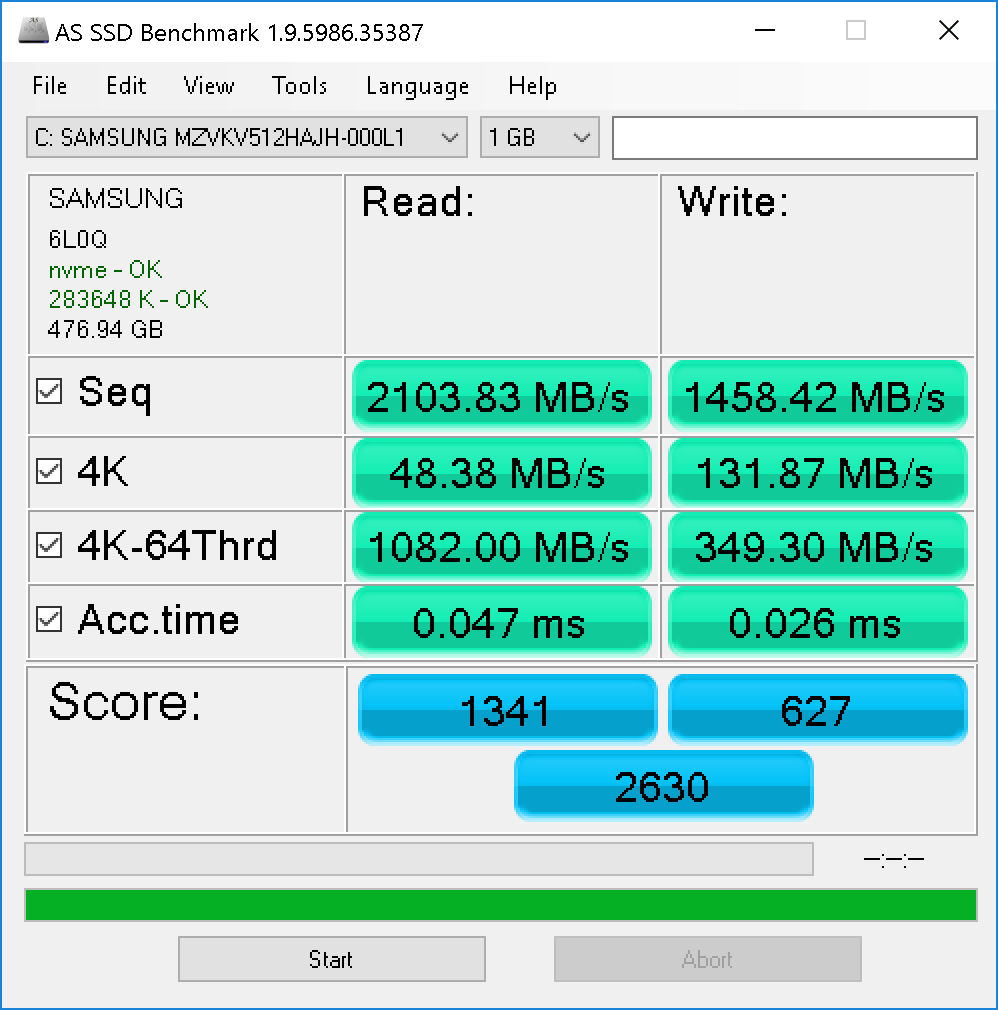
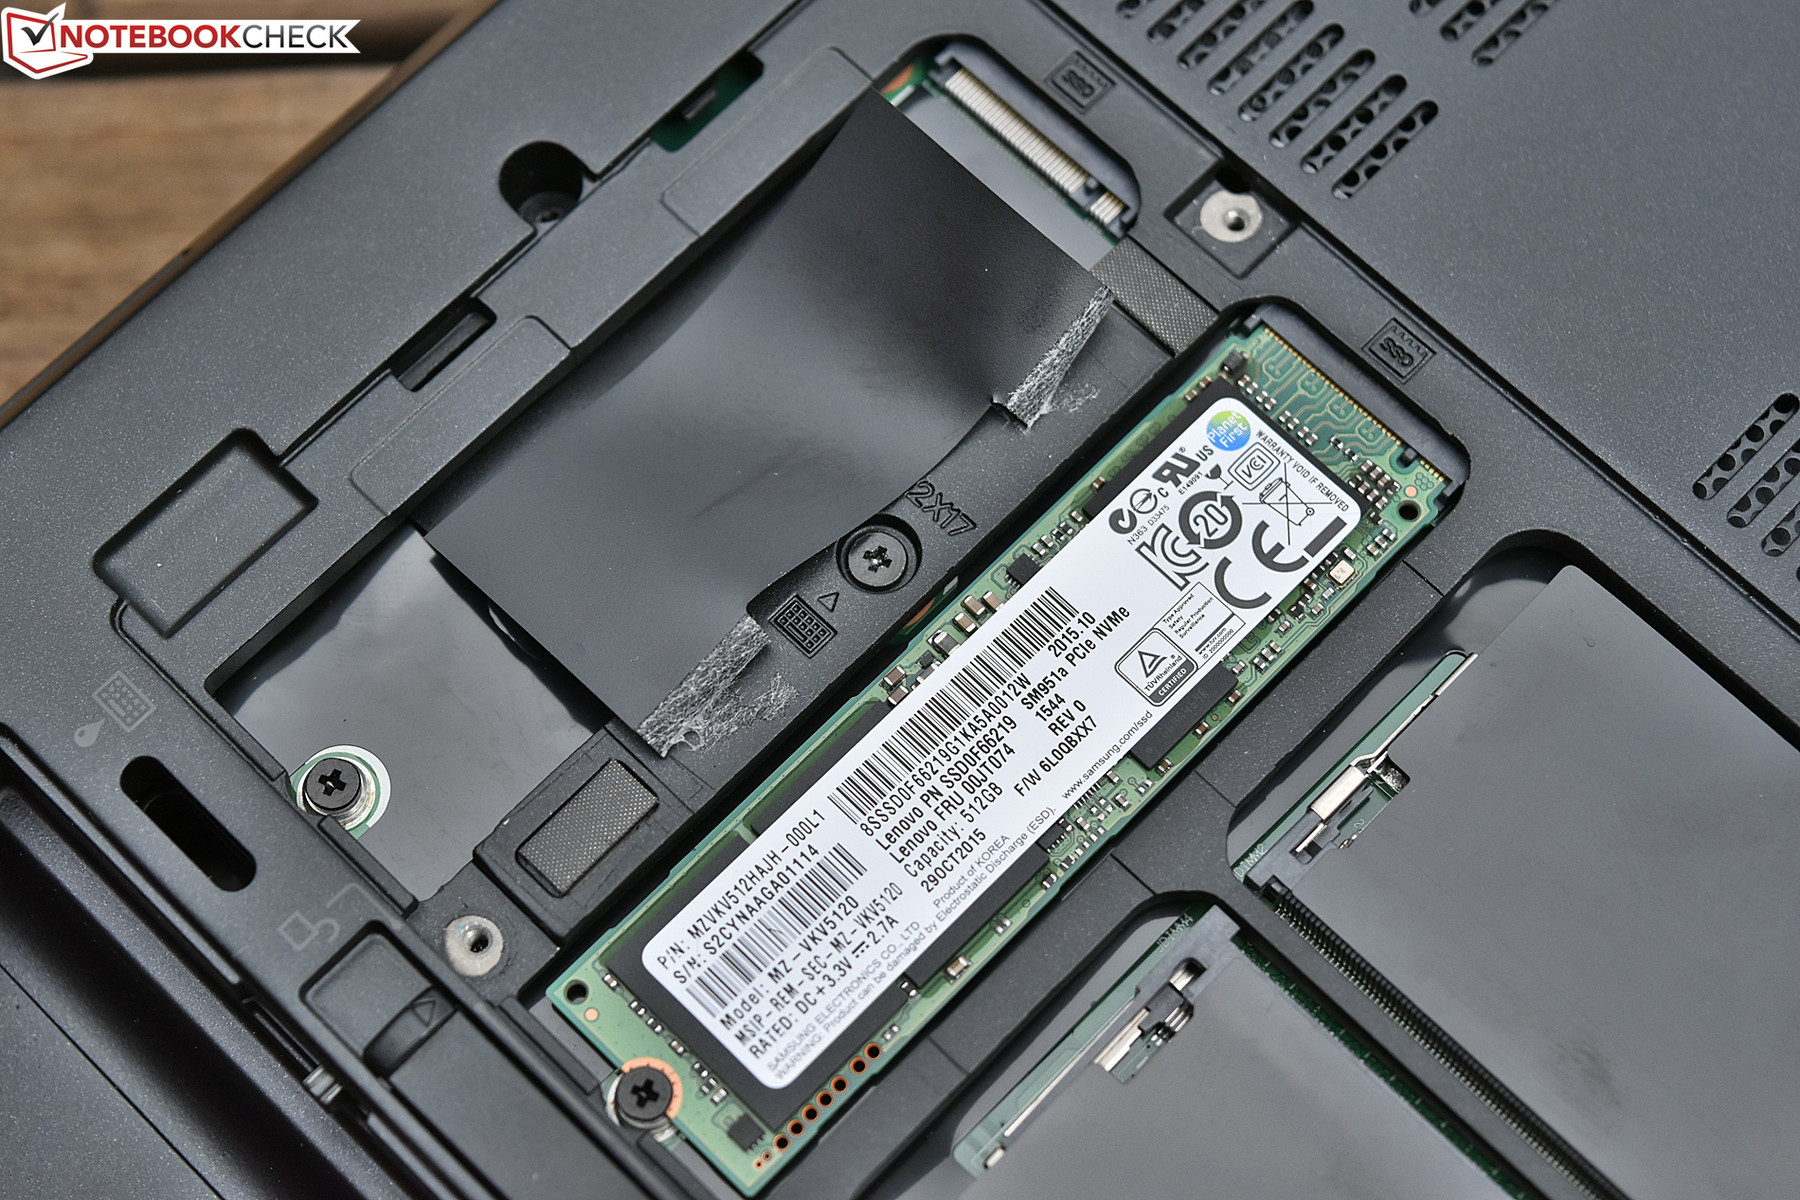
The ThinkPad P70 manages blistering storage speeds thanks to its incredibly fast Samsung PCIe 3.0 x4 NVMe SSD. It absolutely dominated the field practically across the board, with AS SSD sequential read/write speeds of 2104 MB/s and 1458 MB/s contributing to scores of 1341/627 and an overall score of 2630. That’s 10% faster than our second-place candidate, the Dell Precision 7710. Much of the victory here is attributable to greatly enhanced sequential write speeds over other NVMe drives. CrystalDiskMark yields agreeable results, with sequential read/write speeds of 1598 MB/s and 1543 MB/s, again, beating most other notebooks in its class.
The single NVMe drive installed in the P70-20ER leaves room for still a second NVMe drive in an adjacent slot, which can also be configured for RAID (0 or 1) functionality within the system’s BIOS. The most compatible drives for such configurations (as reported by the community) are Samsung SM951 and Samsung 950 Pro drives. In addition to this, there’s also an empty SATA drive bay waiting to be populated with either a conventional 2.5-inch SSD or mechanical storage drive.

| Lenovo ThinkPad P70-20ER000XUS Quadro M4000M, E3-1505M v5, Samsung SSD SM951a 512GB M.2 PCIe 3.0 x4 NVMe (MZVKV512) | HP ZBook 17 G3 TZV66eA Quadro M3000M, E3-1535M v5, Samsung SM951 MZVPV256HDGL m.2 PCI-e | Dell Precision 7710 FirePro W7170M, E3-1535M v5, Samsung SM951 MZVPV256HDGL m.2 PCI-e | Lenovo ThinkPad P70 Quadro M3000M, 6820HQ, Samsung SSD PM871 MZNLN512HCJH | MSI WT72-6QM Quadro M5000M, E3-1505M v5, Toshiba NVMe THNSN5256GPU7 | |
|---|---|---|---|---|---|
| AS SSD | -11% | -10% | -60% | -19% | |
| Seq Read (MB/s) | 2104 | 1596 -24% | 1886 -10% | 477.8 -77% | 2638 25% |
| Seq Write (MB/s) | 1458 | 703 -52% | 626 -57% | 458.1 -69% | 810 -44% |
| 4K Read (MB/s) | 48.38 | 51.1 6% | 51 5% | 22.61 -53% | 37.5 -22% |
| 4K Write (MB/s) | 131.9 | 148.2 12% | 179 36% | 82.7 -37% | 96.4 -27% |
| 4K-64 Read (MB/s) | 1082 | 1037 -4% | 1064 -2% | 341.7 -68% | 935 -14% |
| 4K-64 Write (MB/s) | 349.3 | 230.4 -34% | 275 -21% | 255.5 -27% | 473.5 36% |
| Access Time Read * (ms) | 0.047 | 0.041 13% | 0.069 -47% | 0.069 -47% | 0.092 -96% |
| Access Time Write * (ms) | 0.026 | 0.025 4% | 0.022 15% | 0.056 -115% | 0.04 -54% |
| Score Read (Points) | 1341 | 1248 -7% | 1304 -3% | 412 -69% | 1237 -8% |
| Score Write (Points) | 627 | 449 -28% | 517 -18% | 384 -39% | 651 4% |
| Score Total (Points) | 2630 | 2302 -12% | 2435 -7% | 1012 -62% | 2433 -7% |
* ... smaller is better

GPU Performance
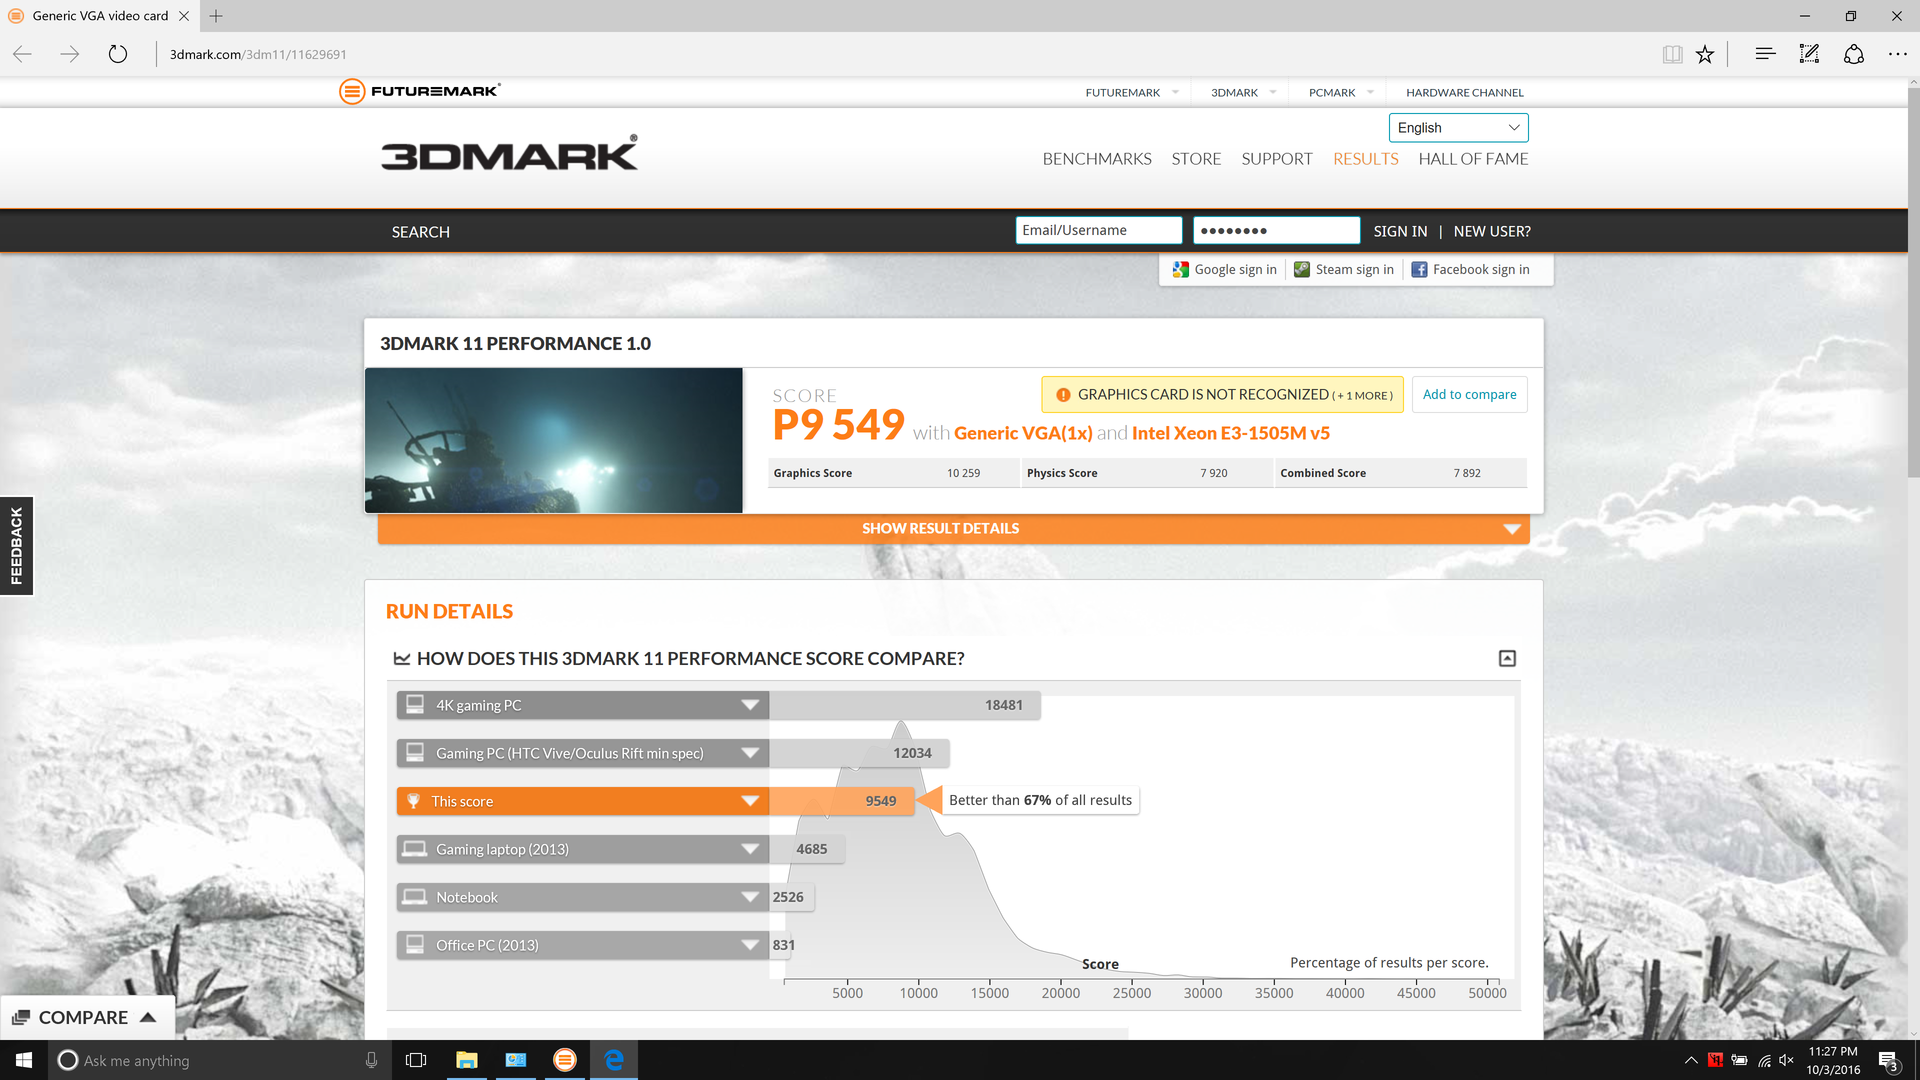
Workstation-class GPUs are not optimized for the sort of benchmarks that are typically used to judge gaming machines; as such, we don’t expect to see the same sorts of numbers that we would from an equivalent NVIDIA GTX GPU. Still, the results we see from the P70’s M4000M demonstrate a more than capable package. In 3DMark 11, we recorded a performance GPU score of 10259, a mere 15% below the M5000M in the MSI WT72-6QM, and besting the rest of the field (including the previous P70, which fell in last place, 19% behind the M4000M-equipped model).
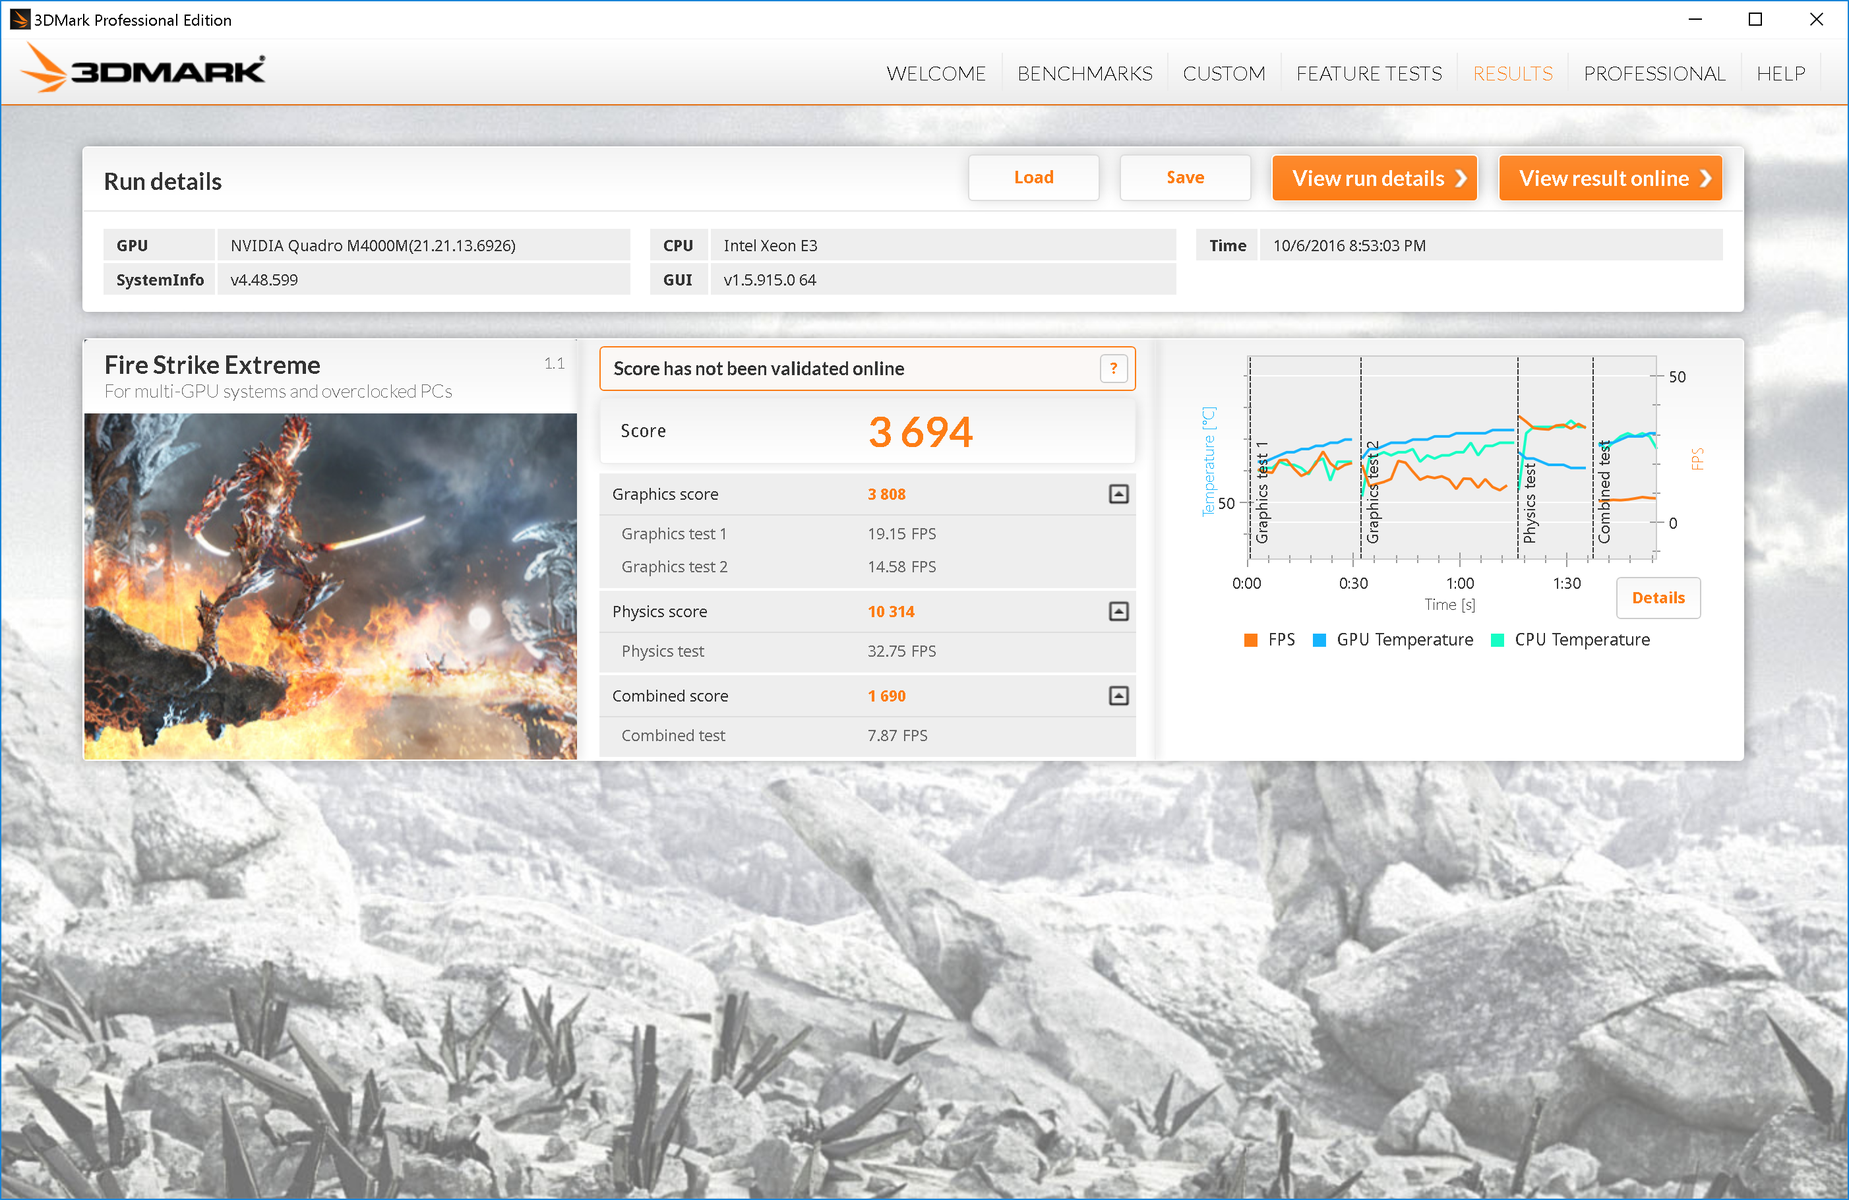
3DMark Fire Strike Graphics provides nearly identical relationships between the contestants, with the MSI WT72 once again predictably taking first place by an 18% margin and the M3000M P70 yet again placing last, off by a 17% discrepancy as compared to today’s P70-20ER. The latter’s score of 7723 is a respectable result, slightly above what we might expect to see from a typical GTX 970M.
| 3DMark 11 | |
| 1280x720 Performance GPU | |
| MSI WT72-6QM | |
| Lenovo ThinkPad P70-20ER000XUS | |
| Dell Precision 7710 | |
| HP ZBook 17 G3 TZV66eA | |
| Lenovo ThinkPad P70 | |
| 1280x720 Performance Combined | |
| MSI WT72-6QM | |
| HP ZBook 17 G3 TZV66eA | |
| Lenovo ThinkPad P70 | |
| Dell Precision 7710 | |
| Lenovo ThinkPad P70-20ER000XUS | |
| 3DMark | |
| 1280x720 Cloud Gate Standard Graphics | |
| MSI WT72-6QM | |
| HP ZBook 17 G3 TZV66eA | |
| Lenovo ThinkPad P70-20ER000XUS | |
| Dell Precision 7710 | |
| Lenovo ThinkPad P70 | |
| 1920x1080 Fire Strike Graphics | |
| MSI WT72-6QM | |
| Lenovo ThinkPad P70-20ER000XUS | |
| Dell Precision 7710 | |
| HP ZBook 17 G3 TZV66eA | |
| Lenovo ThinkPad P70 | |
| 1920x1080 Ice Storm Extreme Graphics | |
| MSI WT72-6QM | |
| Lenovo ThinkPad P70-20ER000XUS | |
| 3DMark 11 Performance | 9549 points | |
| 3DMark Ice Storm Standard Score | 121354 points | |
| 3DMark Cloud Gate Standard Score | 21920 points | |
| 3DMark Fire Strike Score | 6937 points | |
| 3DMark Fire Strike Extreme Score | 3694 points | |
Help | ||
| BioShock Infinite | |
| 1366x768 Medium Preset (sort by value) | |
| Lenovo ThinkPad P70-20ER000XUS | |
| HP ZBook 17 G3 TZV66eA | |
| Dell Precision 7710 | |
| Lenovo ThinkPad P70 | |
| 1366x768 High Preset (sort by value) | |
| Lenovo ThinkPad P70-20ER000XUS | |
| HP ZBook 17 G3 TZV66eA | |
| Dell Precision 7710 | |
| Lenovo ThinkPad P70 | |
| 1920x1080 Ultra Preset, DX11 (DDOF) (sort by value) | |
| Lenovo ThinkPad P70-20ER000XUS | |
| HP ZBook 17 G3 TZV66eA | |
| Dell Precision 7710 | |
| Lenovo ThinkPad P70 | |
| Rise of the Tomb Raider | |
| 1366x768 Medium Preset AF:2x (sort by value) | |
| Lenovo ThinkPad P70-20ER000XUS | |
| HP ZBook 17 G3 TZV66eA | |
| 1920x1080 High Preset AA:FX AF:4x (sort by value) | |
| Lenovo ThinkPad P70-20ER000XUS | |
| HP ZBook 17 G3 TZV66eA | |
| 1920x1080 Very High Preset AA:FX AF:16x (sort by value) | |
| Lenovo ThinkPad P70-20ER000XUS | |
| HP ZBook 17 G3 TZV66eA | |
| 3840x2160 High Preset AA:FX AF:4x (sort by value) | |
| Lenovo ThinkPad P70-20ER000XUS | |
| low | med. | high | ultra | 4K | |
|---|---|---|---|---|---|
| BioShock Infinite (2013) | 196 | 181 | 85 | ||
| Rise of the Tomb Raider (2016) | 90 | 55 | 48 | 20 |
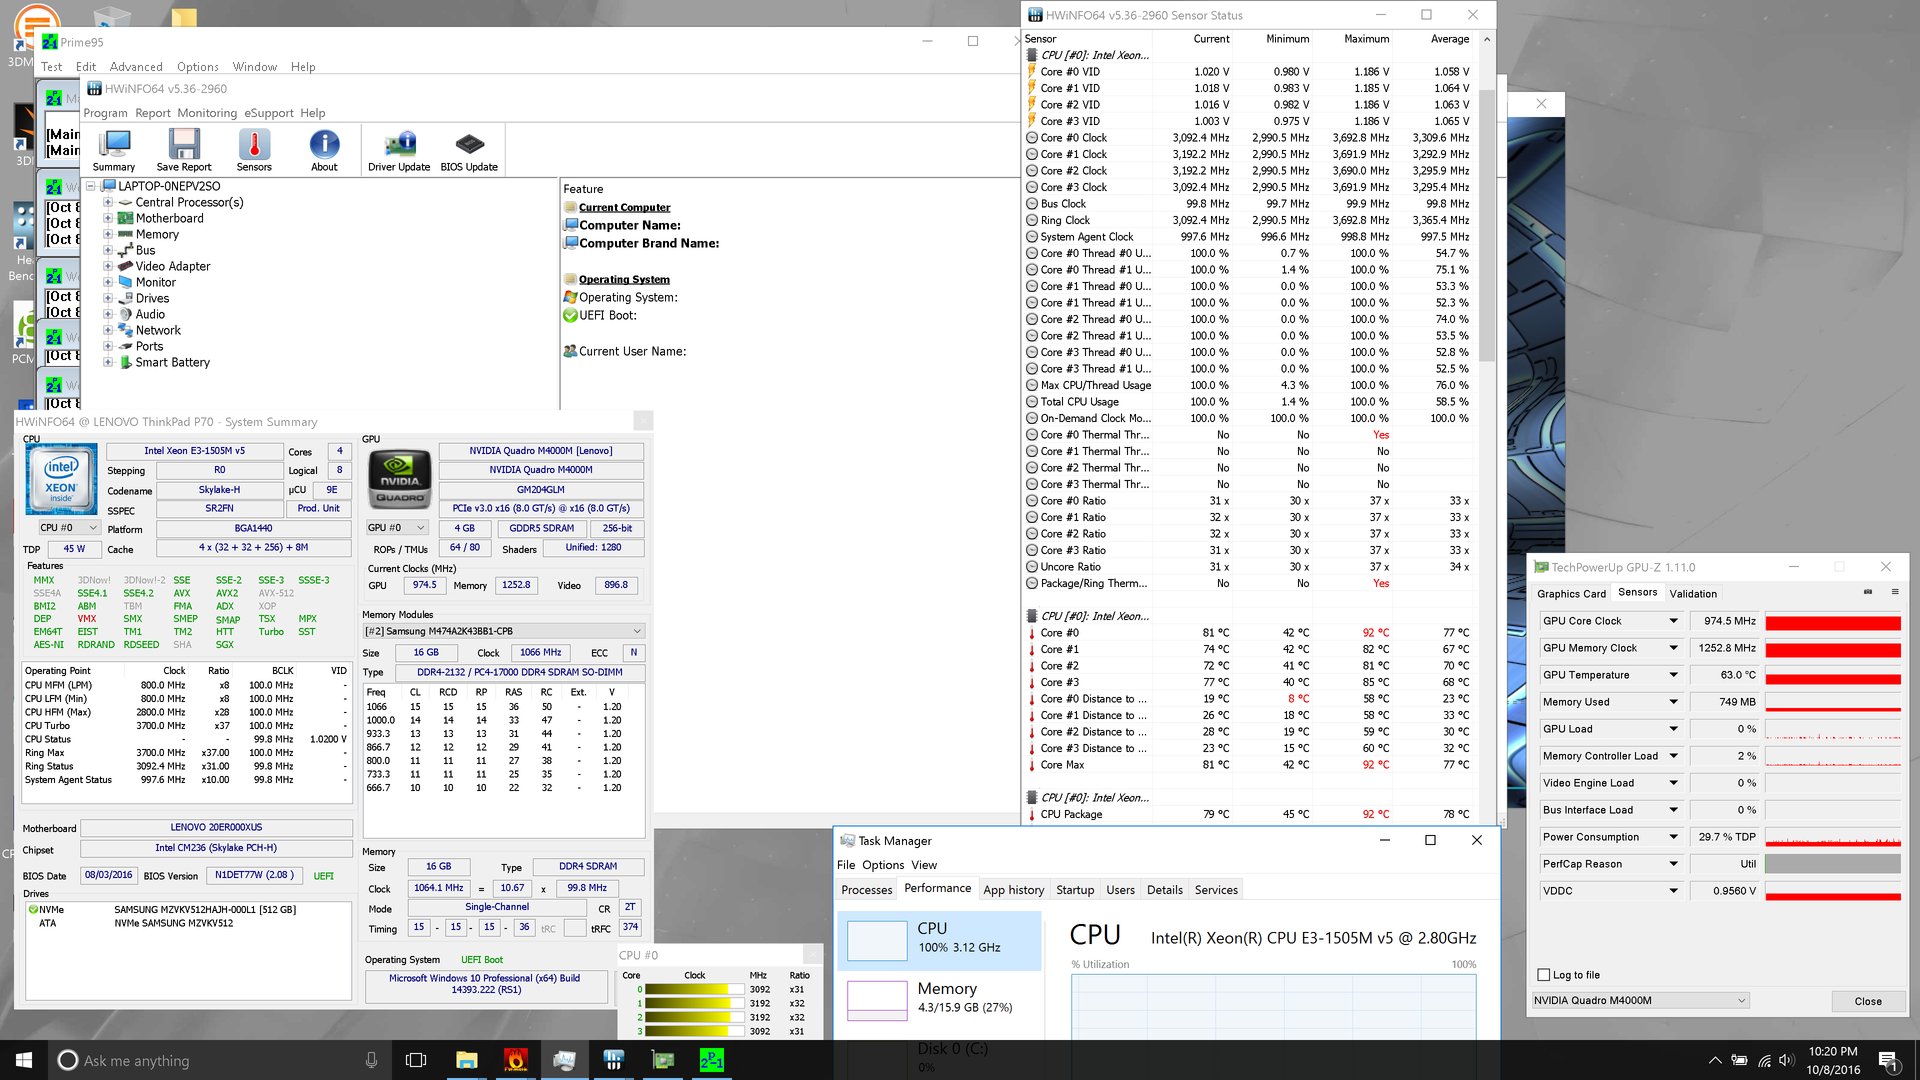
Stress Test
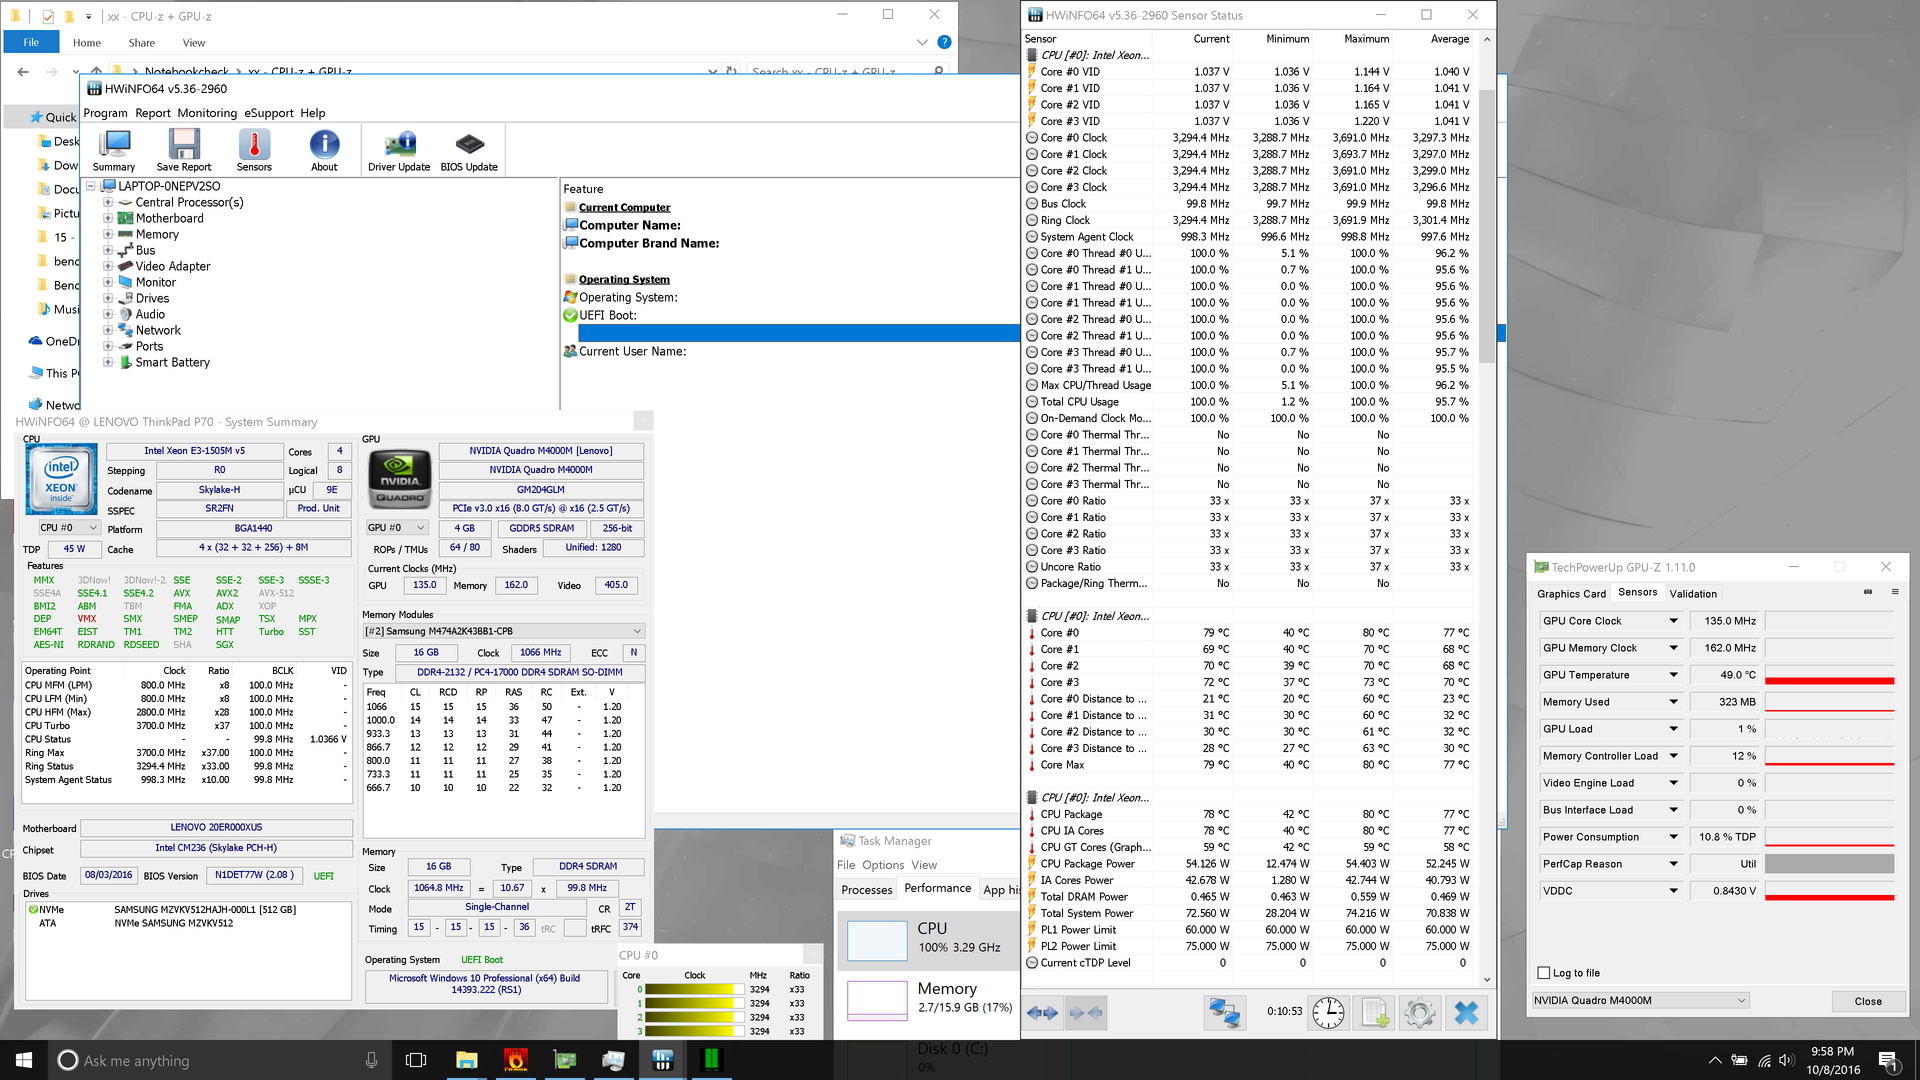
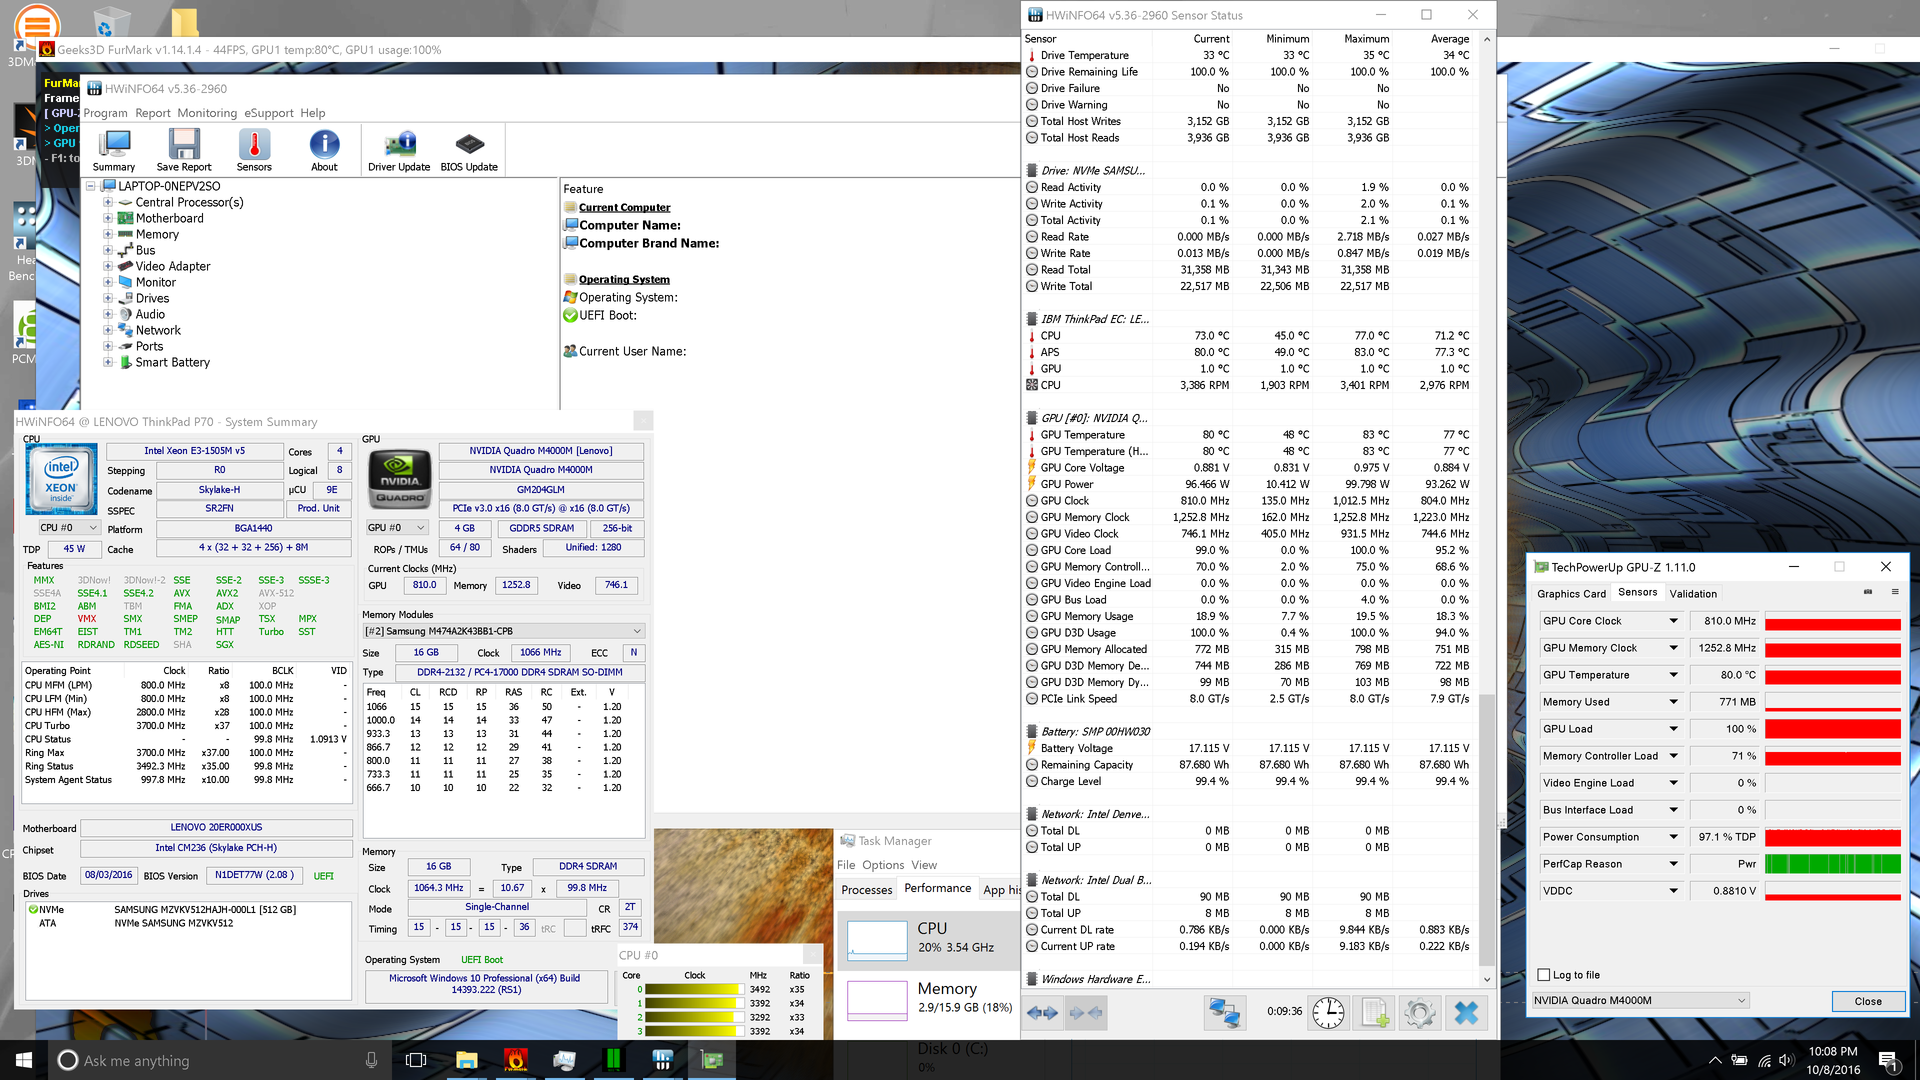
CPU and GPU stress tests independently prove unproblematic for the ThinkPad P70, which aces the CPU stress tests with maximum clock rates of 3.3 GHz across four cores and—in the GPU test—whose GPU TDP limitations come into play long prior to any sort of temperature throttling becoming a concern. Combined stress is a bit more interesting of a scenario, as we were unable to provoke the GPU to work at its full potential any time considerable CPU load was applied (see our screenshot for more detail). However, this does not appear to affect the machine materially in real-world situations, as benchmarks are right in line with what we’d expect to see from similarly-equipped machines. Furthermore, a subsequent 3DMark 11 run provided nearly identical scores after GPU and CPU stress was applied, thus confirming that temperature development should have no bearing on practical performance.
Emissions
System Noise
The P70-20ER is also not a terribly noisy workstation. While idle, the fan is completely inactive and inaudible, and we measured absolutely no noise above our baseline for environmental background levels. Under load, the machine gets a bit noisier, averaging 40.5 dB(A) and maxing out at 45.7 dB(A). These values are not horribly intrusive, however (though they are, of course, noticeable)—and the frequency of the fan noise is fairly low, meaning that there isn’t a lot of high-pitched whining to deal with that some other laptops produce.
The P70-20ER compares favorably to the rest of the field, taking into account discrepancies in environmental noise levels. Having said that, the MSI WT72 is quite a bit subtler in its operation under load even in spite of its more powerful GPU, and the previous P70 is significantly quieter also.
Noise level
| Idle |
| 28.8 / 28.8 / 28.8 dB(A) |
| Load |
| 40.5 / 45.7 dB(A) |
 | ||
30 dB silent 40 dB(A) audible 50 dB(A) loud |
||
min: | ||
| Lenovo ThinkPad P70-20ER000XUS Quadro M4000M, E3-1505M v5, Samsung SSD SM951a 512GB M.2 PCIe 3.0 x4 NVMe (MZVKV512) | HP ZBook 17 G3 TZV66eA Quadro M3000M, E3-1535M v5, Samsung SM951 MZVPV256HDGL m.2 PCI-e | Dell Precision 7710 FirePro W7170M, E3-1535M v5, Samsung SM951 MZVPV256HDGL m.2 PCI-e | Lenovo ThinkPad P70 Quadro M3000M, 6820HQ, Samsung SSD PM871 MZNLN512HCJH | MSI WT72-6QM Quadro M5000M, E3-1505M v5, Toshiba NVMe THNSN5256GPU7 | |
|---|---|---|---|---|---|
| Noise | -7% | -4% | 1% | -6% | |
| off / environment * (dB) | 28.8 | 30 -4% | 30 -4% | 30 -4% | |
| Idle Minimum * (dB) | 28.8 | 30 -4% | 30 -4% | 30 -4% | 33.3 -16% |
| Idle Average * (dB) | 28.8 | 30 -4% | 30 -4% | 30 -4% | 33.4 -16% |
| Idle Maximum * (dB) | 28.8 | 30 -4% | 30 -4% | 30 -4% | 33.5 -16% |
| Load Average * (dB) | 40.5 | 48.9 -21% | 43.2 -7% | 36.5 10% | 38.8 4% |
| Load Maximum * (dB) | 45.7 | 48.9 -7% | 47.13 -3% | 40.8 11% | 40.2 12% |
* ... smaller is better
Temperature
Although the temperatures we recorded here might at first seem abnormally high, in fact, environmental temperature must be considered—and at 25 °C, it was roughly 5 °C above the rest of the candidates when the measurements were taken. Even after taking that into account, however, the P70-20ER still suffers higher-than-average temperatures as compared to its peers—with the exception of the HP ZBook 17, which (temperature adjusted) seems to grow quite a bit hotter under load. Idle temperatures in the P70-20ER are the biggest inconsistency—most certainly thanks to the fact that the cooling fan seems to be completely disabled under these conditions. To avoid confusion about the influence of environmental temperature here, we have omitted the temperature comparison table.
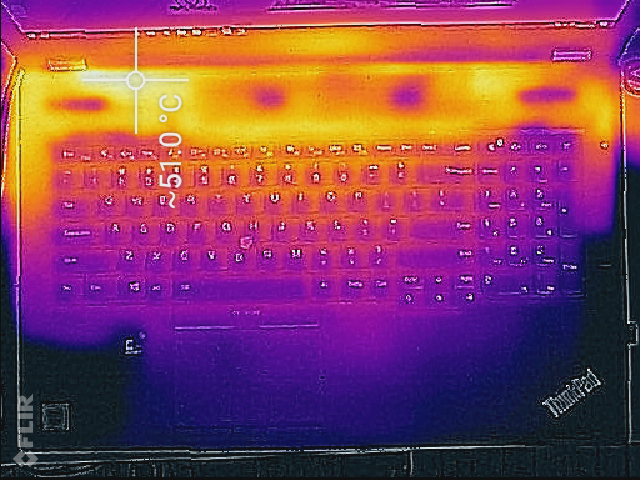
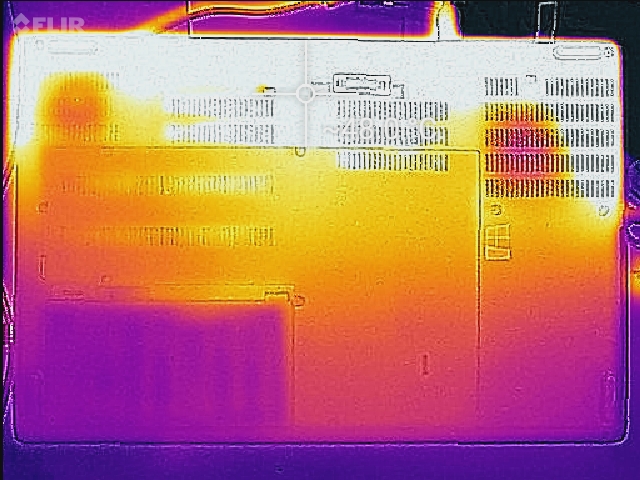
(-) The maximum temperature on the upper side is 52 °C / 126 F, compared to the average of 38.2 °C / 101 F, ranging from 22.2 to 69.8 °C for the class Workstation.
(-) The bottom heats up to a maximum of 51 °C / 124 F, compared to the average of 41.1 °C / 106 F
(±) In idle usage, the average temperature for the upper side is 33.9 °C / 93 F, compared to the device average of 32 °C / 90 F.
(+) The palmrests and touchpad are reaching skin temperature as a maximum (35.6 °C / 96.1 F) and are therefore not hot.
(-) The average temperature of the palmrest area of similar devices was 27.8 °C / 82 F (-7.8 °C / -14.1 F).
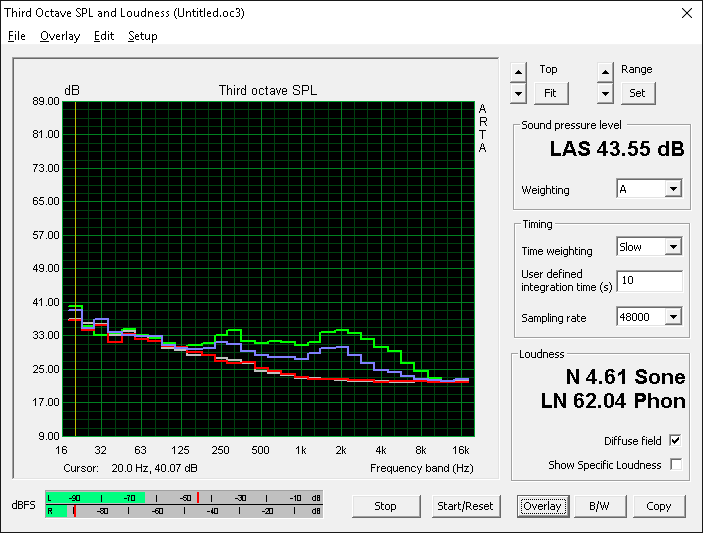
Speakers
The P70 features a very rudimentary set of stereo speakers augmented by a questionable set of presets from the Dolby Audio app. Overall, the sound is dominated by the midrange frequencies when left at default settings. Playing with (or otherwise disabling) the post-processing software improves this somewhat, opening up the high frequencies and perceptibly balancing out the profile a bit more. However, ultimately, the results are quite poor for a notebook of this size; volume level is also merely passable.

Lenovo ThinkPad P70-20ER000XUS audio analysis
(±) | speaker loudness is average but good (72.1 dB)
Bass 100 - 315 Hz
(±) | reduced bass - on average 12.9% lower than median
(±) | linearity of bass is average (14.5% delta to prev. frequency)
Mids 400 - 2000 Hz
(±) | higher mids - on average 5.1% higher than median
(+) | mids are linear (6.1% delta to prev. frequency)
Highs 2 - 16 kHz
(+) | balanced highs - only 4.6% away from median
(±) | linearity of highs is average (14.5% delta to prev. frequency)
Overall 100 - 16.000 Hz
(±) | linearity of overall sound is average (28.1% difference to median)
Compared to same class
» 94% of all tested devices in this class were better, 2% similar, 4% worse
» The best had a delta of 7%, average was 17%, worst was 35%
Compared to all devices tested
» 85% of all tested devices were better, 3% similar, 12% worse
» The best had a delta of 4%, average was 24%, worst was 134%
Apple MacBook 12 (Early 2016) 1.1 GHz audio analysis
(+) | speakers can play relatively loud (83.6 dB)
Bass 100 - 315 Hz
(±) | reduced bass - on average 11.3% lower than median
(±) | linearity of bass is average (14.2% delta to prev. frequency)
Mids 400 - 2000 Hz
(+) | balanced mids - only 2.4% away from median
(+) | mids are linear (5.5% delta to prev. frequency)
Highs 2 - 16 kHz
(+) | balanced highs - only 2% away from median
(+) | highs are linear (4.5% delta to prev. frequency)
Overall 100 - 16.000 Hz
(+) | overall sound is linear (10.2% difference to median)
Compared to same class
» 7% of all tested devices in this class were better, 2% similar, 91% worse
» The best had a delta of 5%, average was 18%, worst was 53%
Compared to all devices tested
» 5% of all tested devices were better, 1% similar, 94% worse
» The best had a delta of 4%, average was 24%, worst was 134%
Frequency Comparison (Checkbox selectable!)
Graph 1: Pink Noise 100% Vol.; Graph 2: Audio off
Energy Management
Power Consumption
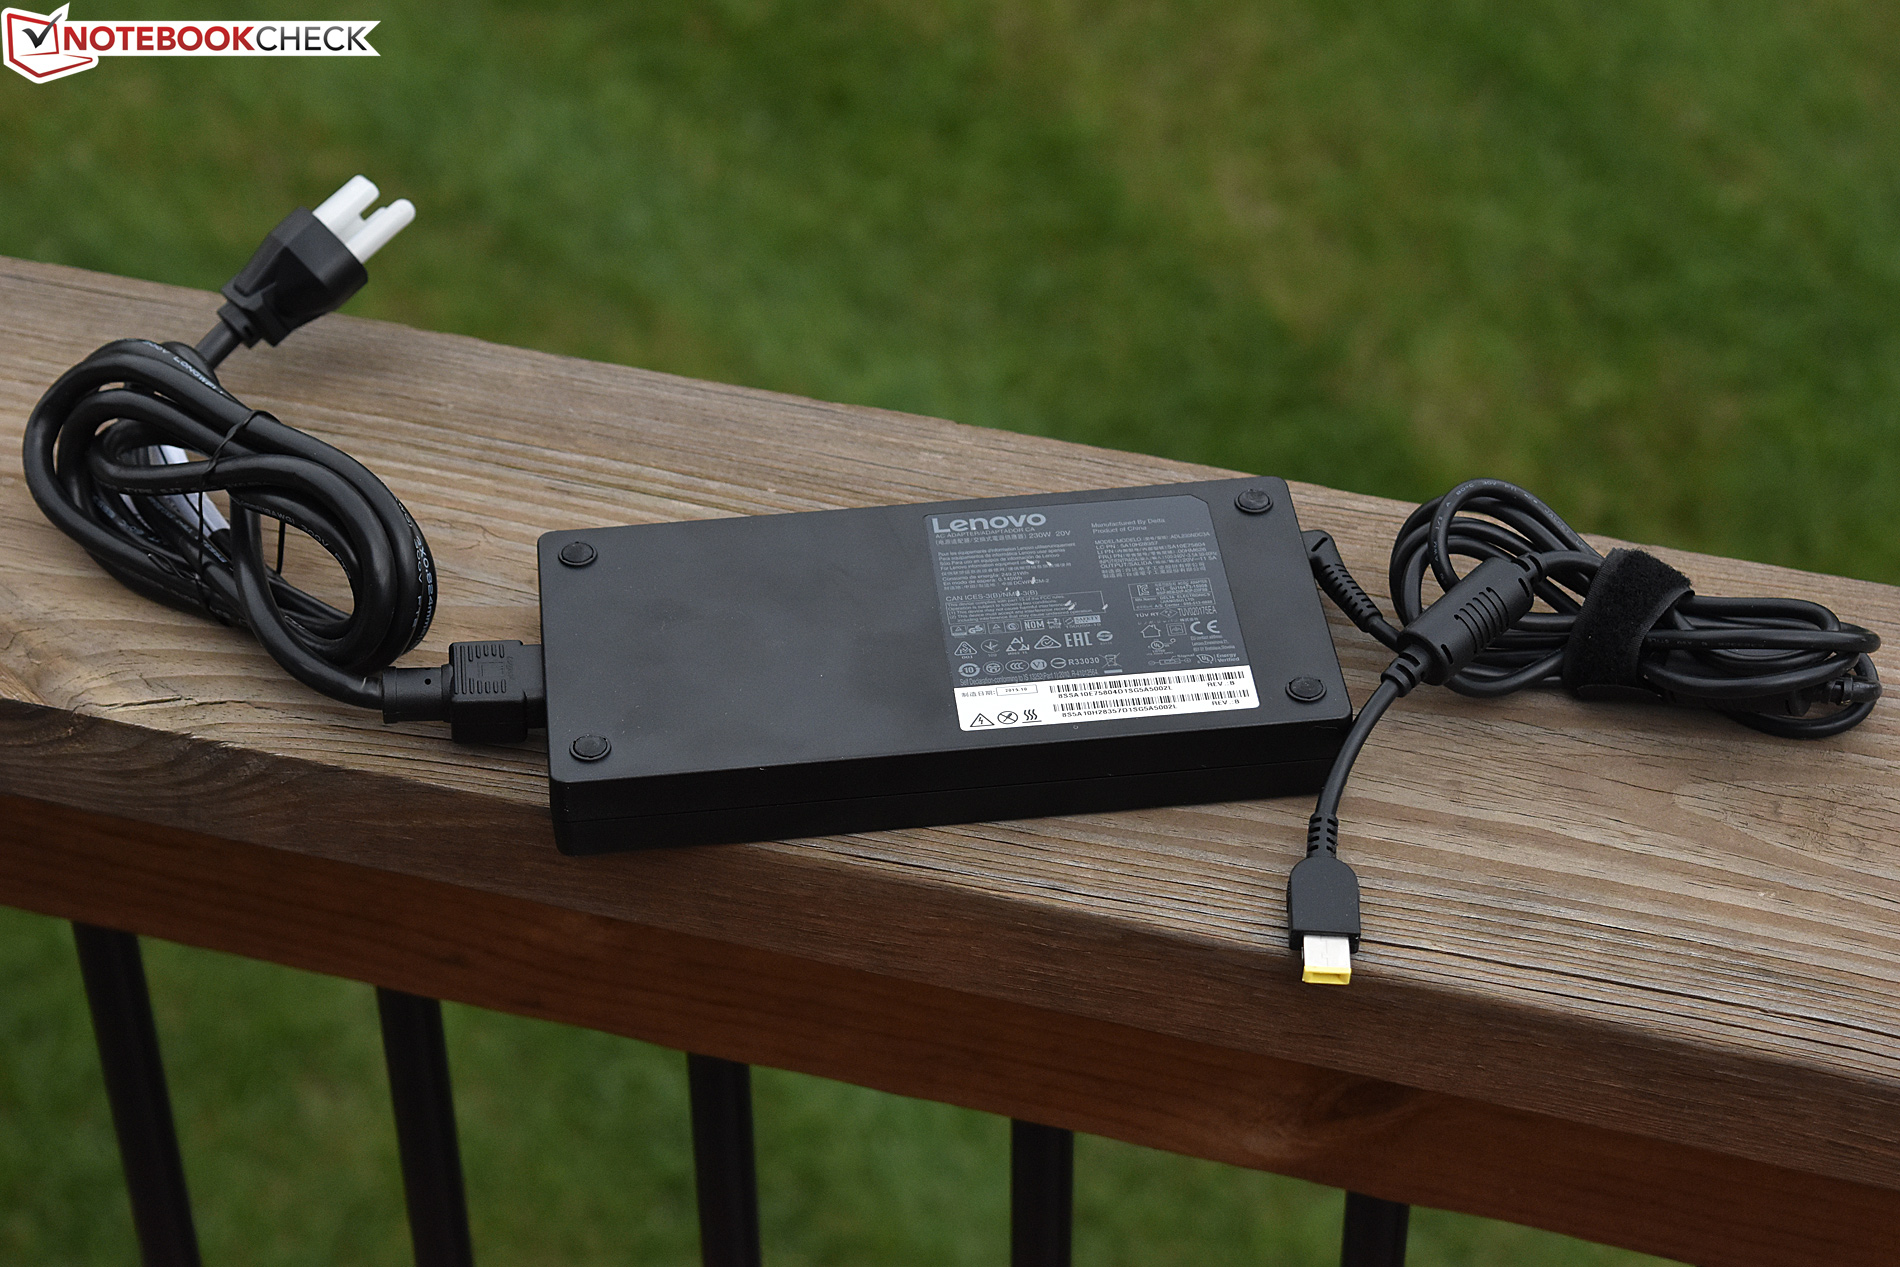
Predictably, the P70-20ER is a power-hungry device; after all, the combined TDP of its Xeon CPU and the M4000M GPU is approximately 145 W. The previous P70’s M3000M manages roughly 30 W lower consumption under load average, which is right along the lines of what we’d expect to see, considering the GPU’s 25W lower TDP. The rest of the field—excepting the ZBook—does a better job under load most of the time. Idle values were measured to be oddly high, roughly on par with the MSI WT72.
| Off / Standby | |
| Idle | |
| Load |
|
Key:
min: | |
| Lenovo ThinkPad P70-20ER000XUS E3-1505M v5, Quadro M4000M, Samsung SSD SM951a 512GB M.2 PCIe 3.0 x4 NVMe (MZVKV512), IPS, 3840x2160, 17.3" | HP ZBook 17 G3 TZV66eA E3-1535M v5, Quadro M3000M, Samsung SM951 MZVPV256HDGL m.2 PCI-e, IPS, 1920x1080, 17.3" | Dell Precision 7710 E3-1535M v5, FirePro W7170M, Samsung SM951 MZVPV256HDGL m.2 PCI-e, IPS LED, 1920x1080, 17.3" | Lenovo ThinkPad P70 6820HQ, Quadro M3000M, Samsung SSD PM871 MZNLN512HCJH, IPS, 3840x2160, 17.3" | MSI WT72-6QM E3-1505M v5, Quadro M5000M, Toshiba NVMe THNSN5256GPU7, IPS, 1920x1080, 17.3" | |
|---|---|---|---|---|---|
| Power Consumption | 39% | 19% | 32% | 0% | |
| Idle Minimum * (Watt) | 22.8 | 6.7 71% | 6.04 74% | 12.1 47% | 24.8 -9% |
| Idle Average * (Watt) | 29.7 | 12.5 58% | 15.2 49% | 19.7 34% | 29.7 -0% |
| Idle Maximum * (Watt) | 31.1 | 13.2 58% | 42.3 -36% | 20.5 34% | 30.1 3% |
| Load Average * (Watt) | 124.2 | 128.2 -3% | 112.8 9% | 94.3 24% | 105.2 15% |
| Load Maximum * (Watt) | 177.4 | 158.9 10% | 182.2 -3% | 139.6 21% | 192.2 -8% |
* ... smaller is better
Battery Life
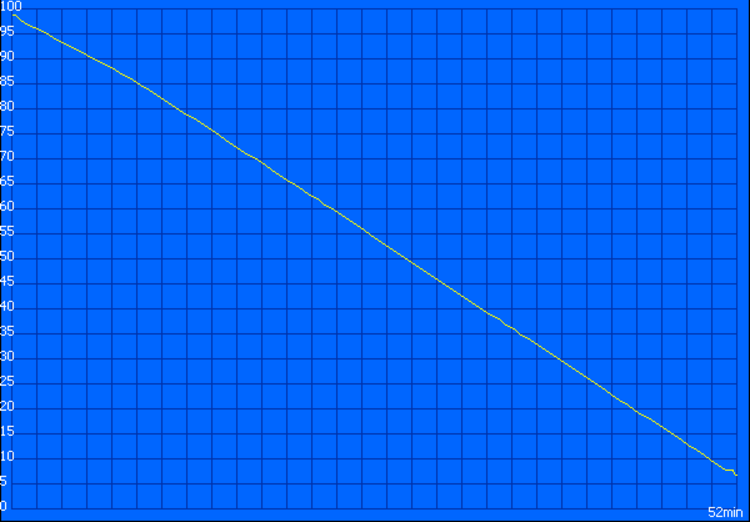
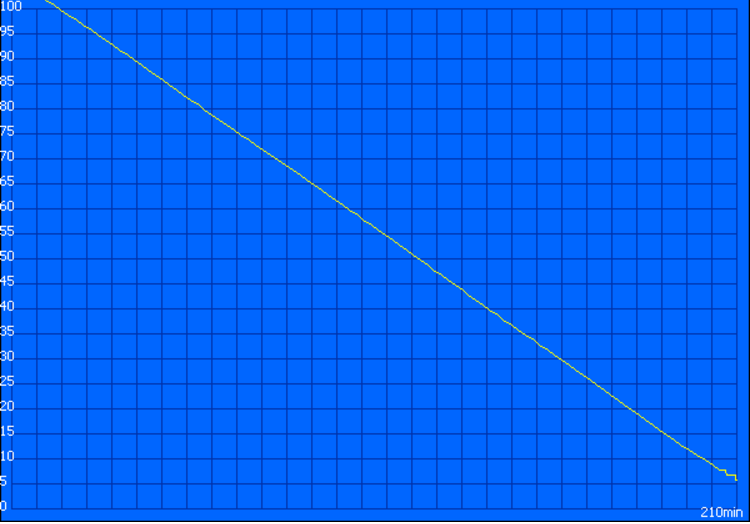
All that power surely means brief battery runtimes, and unsurprisingly, that’s what we get. Just 3 hours and 11 minutes of web surfing activity isn’t going to buy you a lot of productivity unplugged, and if you decide to load the machine down a bit, expect to scramble for an outlet in under an hour—just 52 minutes. The fact that this is so far below the results of the M3000M-equipped P70 would be shocking if we hadn’t already measured such higher power consumption while idle. The reasons for the discrepancy here are not immediately obvious, but just to be sure nothing was amiss, we ran our battery benchmarks multiple times in their entirety to ensure the results did not change significantly—and they did not. If any additional light is shed on this situation, we’ll be sure to update our article.
Fortunately, in spite of the fact that literally every competitor in our selection embarrasses the P70-20ER with its far more favorable battery performance, battery life is arguably among the least important qualities of a workstation.
| Lenovo ThinkPad P70-20ER000XUS E3-1505M v5, Quadro M4000M, 96 Wh | HP ZBook 17 G3 TZV66eA E3-1535M v5, Quadro M3000M, 96 Wh | Dell Precision 7710 E3-1535M v5, FirePro W7170M, 72 Wh | Lenovo ThinkPad P70 6820HQ, Quadro M3000M, 96 Wh | MSI WT72-6QM E3-1505M v5, Quadro M5000M, Wh | |
|---|---|---|---|---|---|
| Battery runtime | 125% | 103% | 56% | 38% | |
| Reader / Idle (h) | 4.9 | 15.9 224% | 12.9 163% | 7.7 57% | 6.9 41% |
| WiFi v1.3 (h) | 3.2 | 4.8 50% | 6.1 91% | 6 88% | 4.1 28% |
| Load (h) | 0.9 | 1.8 100% | 1.4 56% | 1.1 22% | 1.3 44% |
Pros
Cons
Verdict
A lot of variables combine to create a strong mobile workstation, but when you boil it all down, the most critical of all aspects are generally stability, CPU/GPU performance, and storage speed. The Lenovo P70-20ER000XUS reveals itself as more than capable in all of these categories, justifying its hefty $3,849 price tag with its strong benchmark numbers and reliable operation. As compared to the previous P70 configuration we reviewed several months ago, this one features greatly improved storage performance with a new NVMe SSD, a more powerful (and power-hungry) NVIDIA Quadro M4000M GPU, and a somewhat lateral shift to a Xeon CPU which paves the way for ECC RAM for enhanced stability (16 GB of which is preinstalled).
Is it worth considering when viewed alongside the competition? In short, yes—provided the unique benefits it brings (and the various shortcomings) line up with the specific needs of the buyer. Workstations, while often championed as no-compromise devices, are certainly not that: rather, they are devices which refuse to compromise performance—but elsewhere, there are always trade-offs. If the M4000M will get the job done, ECC RAM is a desirable trait, and battery life isn’t of paramount concern, the P70 is a prime candidate and is priced accordingly.
Lenovo ThinkPad P70-20ER000XUS
- 10/17/2016 v5.1 (old)
Steve Schardein
Price comparison
