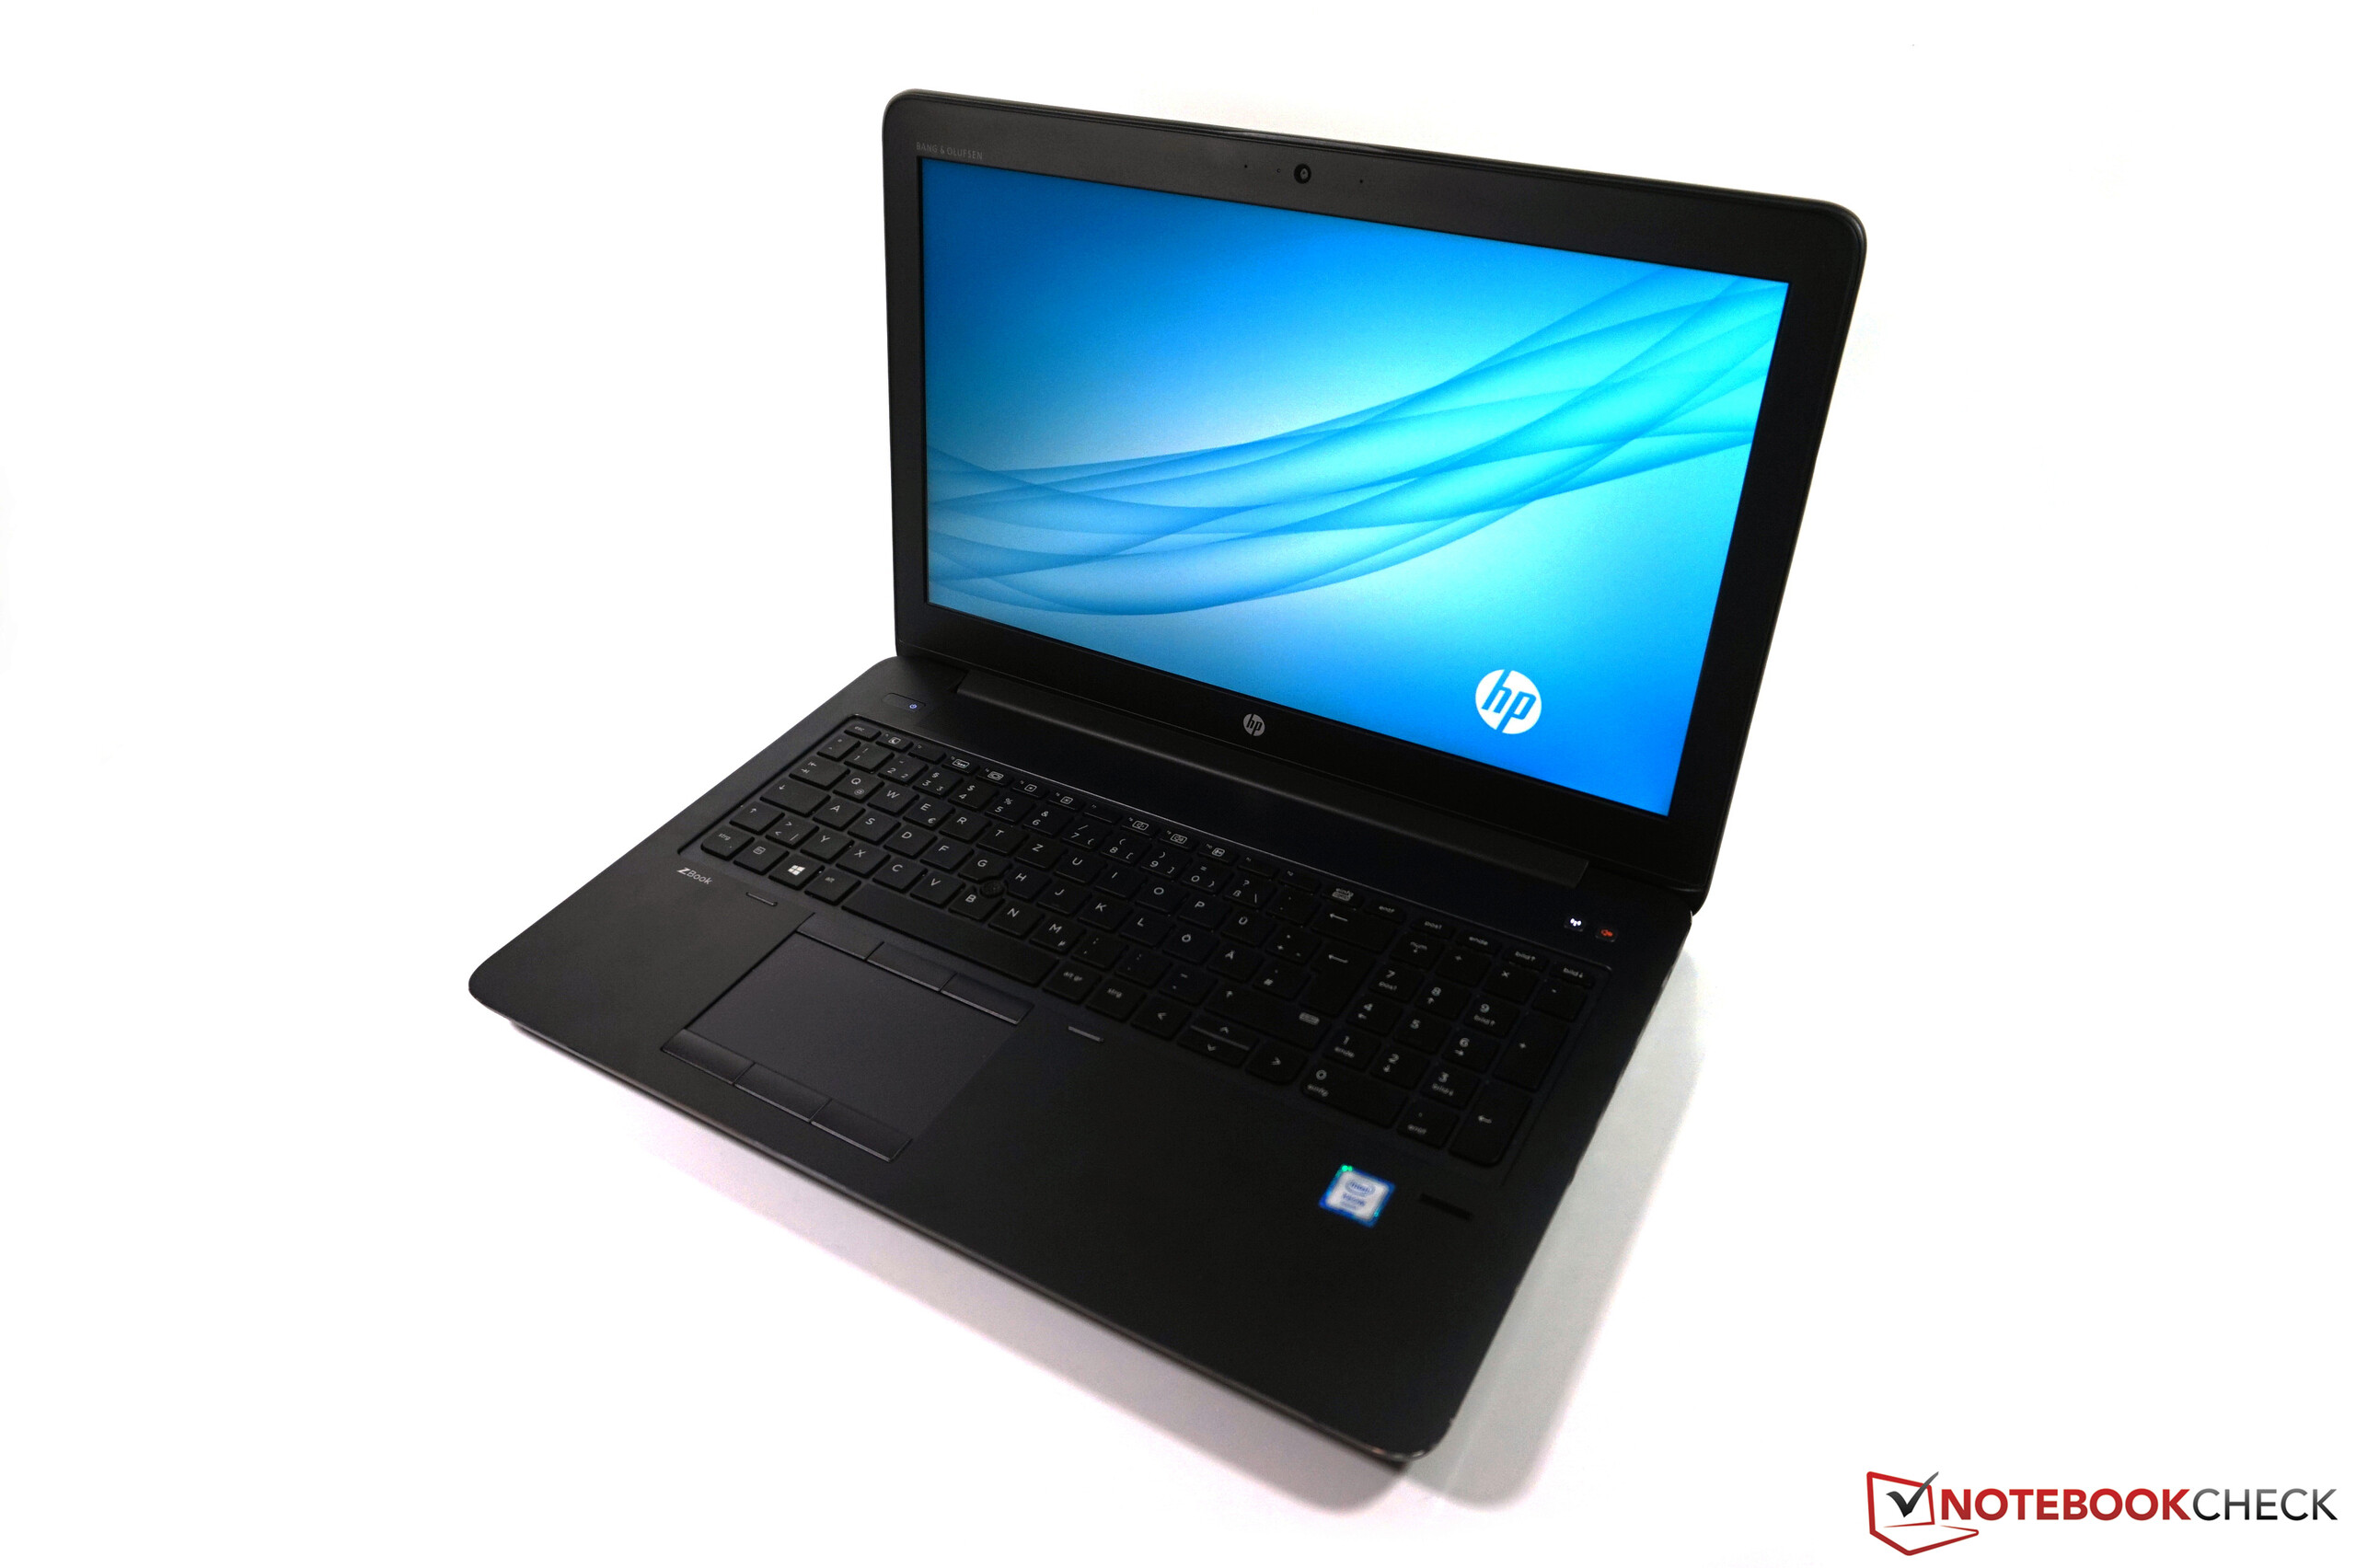
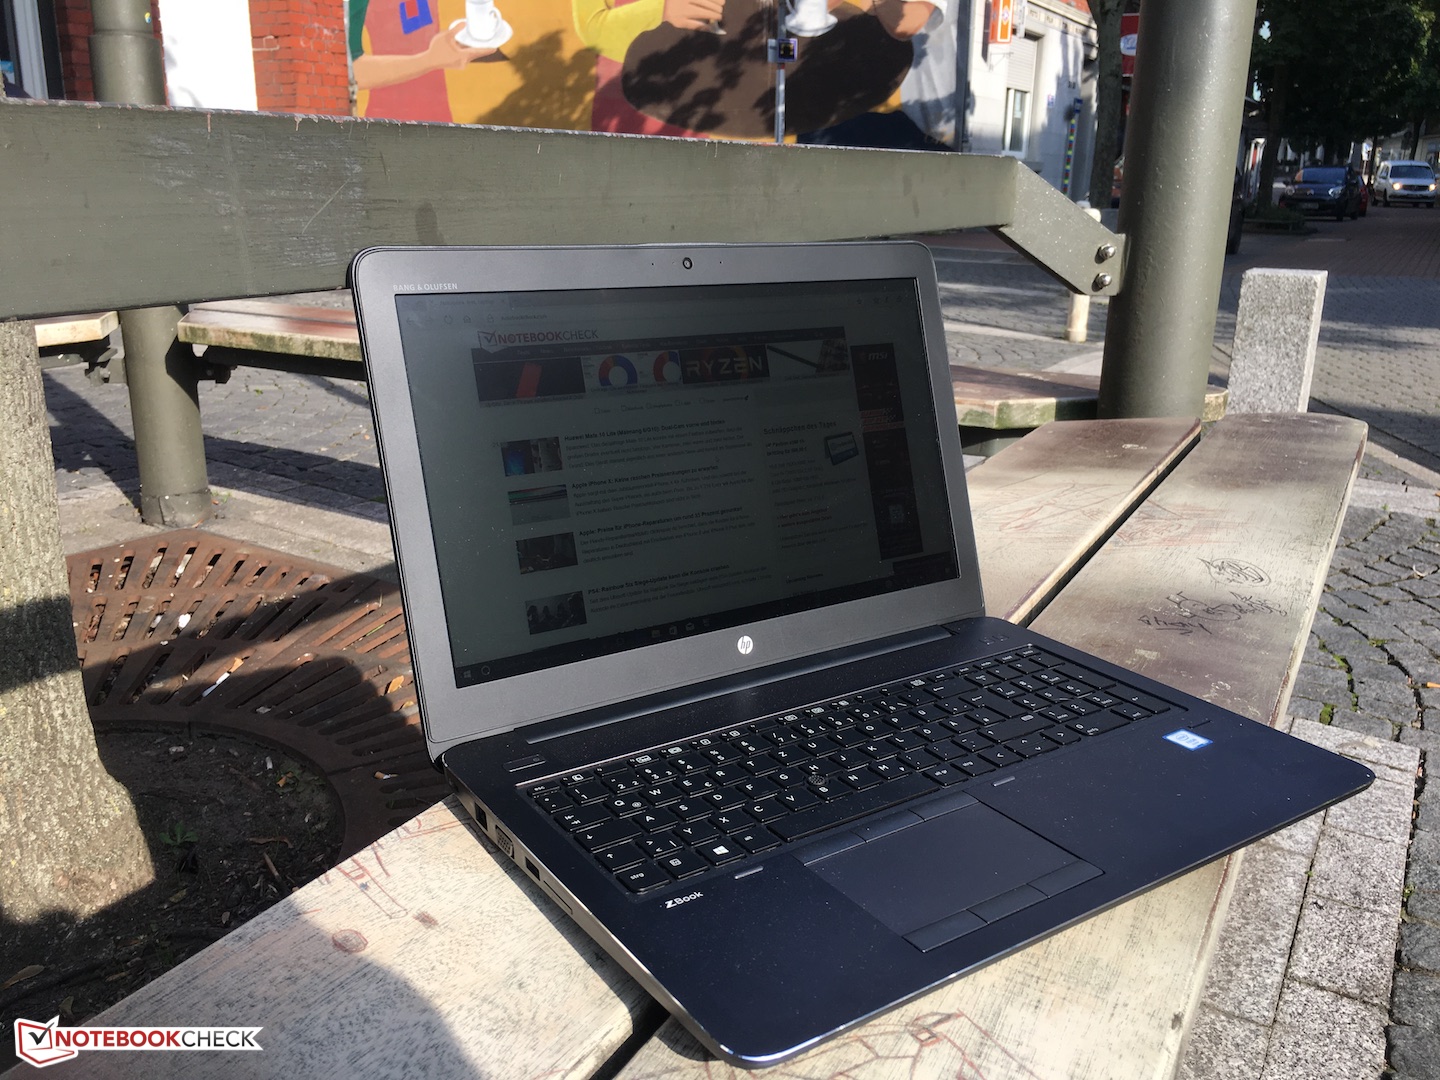
HP ZBook 15 G4 (Xeon, Quadro M2200, Full-HD) Workstation Review
This is not the first time we have had the HP ZBook in our test laboratory. Last year, we had the pleasure of thoroughly inspecting the G3 version. As a mobile workstation, the laptop is built for one main purpose: Performance. The configuration that lies before us is equipped with an Intel Xeon processor, 32 GB of DDR4 RAM, a Nvidia Quadro M2200, and a 1 TB SSD. In the German online store, currently we only find a variety of preconfigured versions with price tags between 2150 and 3500 Euros (~$2550-4100), none of which match our configuration. Our test device is available in the German online store as a custom configuration for around 4650 Euros (~$5500; similar version available in the US for $3630).
In this review, we will dedicate ourselves to the discussion of new features. For further details, please see our comprehensive review of the third generation ZBook. The ZBook G3 will accompany us throughout this review, as will a worthy opponent of the latest HP workstation: the Lenovo ThinkPad P51. For 3300 Euros (~$3900), the ThinkPad offers an Intel Xeon E3-1505M v6, 16 GB of RAM, 512 GB of storage, and a high-resolution 4K display.
SD Card Reader
By means of a Toshiba Exceria Pro SDCX 64 GB UHS-II reference memory card, we measured the SD card reader's data transfer rates. Our test device proves to be quite speedy here, surpassing its predecessor by a margin of over 50% in the copying of JPEG image files (each around 5 MB).
| SD Card Reader | |
| average JPG Copy Test (av. of 3 runs) | |
| HP ZBook 15 G4-Y4E80AV (Toshiba Exceria Pro SDXC 64 GB UHS-II) | |
| Lenovo ThinkPad P51 20HH0016GE (Toshiba Exceria Pro SDXC 64 GB UHS-II) | |
| HP ZBook 15 G3 (Toshiba Exceria Pro SDXC 64 GB UHS-II) | |
| Lenovo ThinkPad P50 (Toshiba Exceria Pro SDXC 64 GB UHS-II) | |
| MSI WE72 7RJ (Toshiba Exceria Pro SDXC 64 GB UHS-II) | |
| maximum AS SSD Seq Read Test (1GB) | |
| Lenovo ThinkPad P51 20HH0016GE (Toshiba Exceria Pro SDXC 64 GB UHS-II) | |
| HP ZBook 15 G4-Y4E80AV (Toshiba Exceria Pro SDXC 64 GB UHS-II) | |
| HP ZBook 15 G3 (Toshiba Exceria Pro SDXC 64 GB UHS-II) | |
| Lenovo ThinkPad P50 (Toshiba Exceria Pro SDXC 64 GB UHS-II) | |
| MSI WE72 7RJ (Toshiba Exceria Pro SDXC 64 GB UHS-II) | |
Communication
In our tests, the integrated Intel 8265 AC module reached transfer rates of 475 MBit/s (receive) and 559 MBit/s (transmit). Those results leave our test device up to 13% behind the Lenovo ThinkPad P51.
| Networking | |
| iperf3 transmit AX12 | |
| Lenovo ThinkPad P51 20HH0016GE | |
| HP ZBook 15 G4-Y4E80AV | |
| MSI WE72 7RJ | |
| iperf3 receive AX12 | |
| Lenovo ThinkPad P51 20HH0016GE | |
| HP ZBook 15 G4-Y4E80AV | |
| MSI WE72 7RJ | |
Display

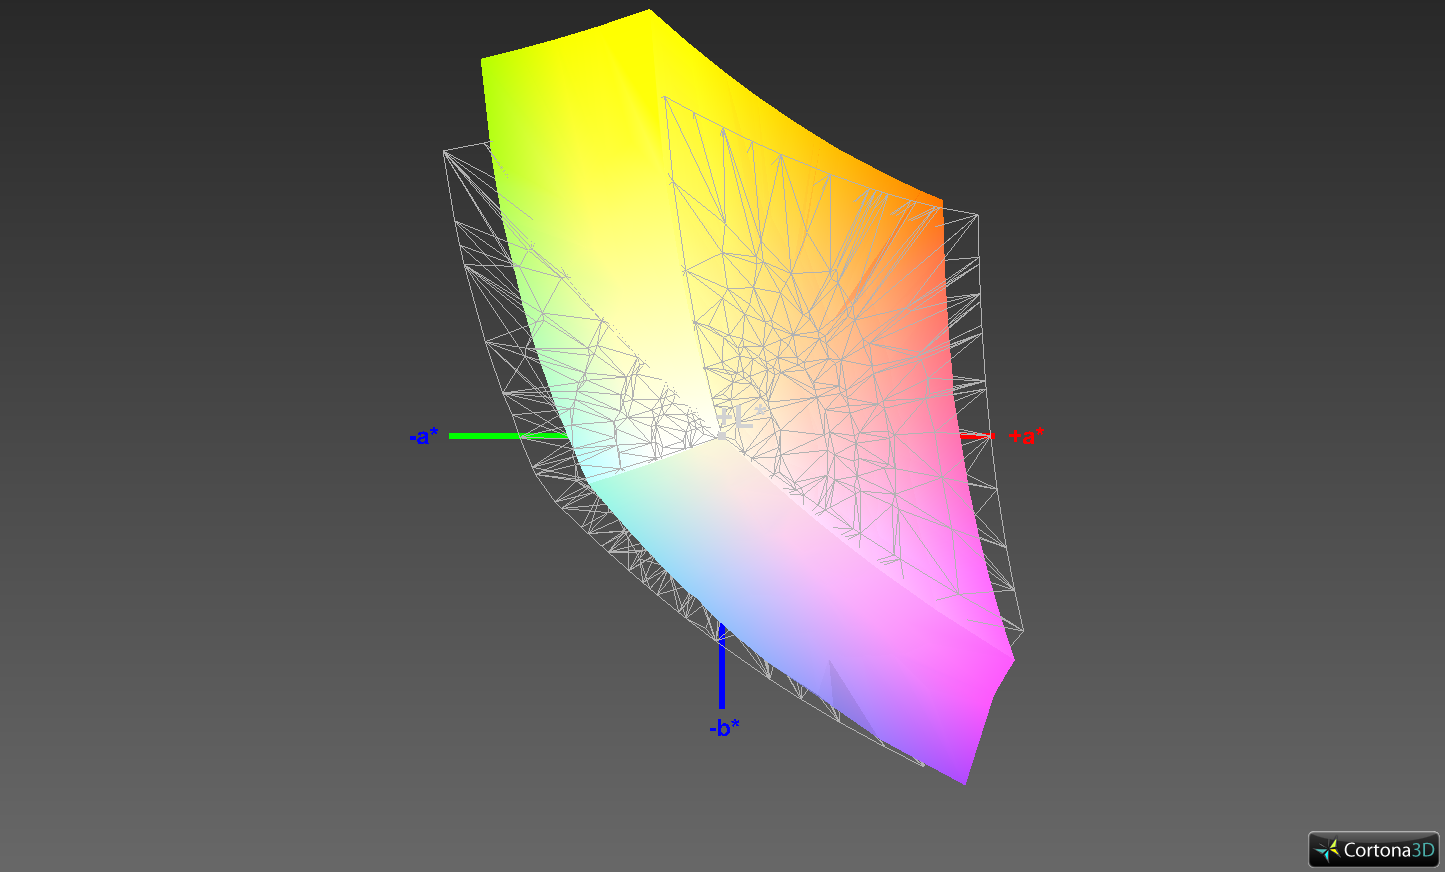
As with the 3rd generation ZBook, HP is offering potential buyers a choice between four different kinds of displays. Details regarding the individual display varieties are available in our previous ZBook review. HP equipped our current test device with an anti-glare non-touch IPS display. The screen is about 10% brighter than its predecessor's screen: The new ZBook G4's brightness level averages 320 cd/m². The brightness distribution is 89% similar across the screen. We did not observe any screen bleeding or clouding. The black value amounts to 0.29 cd/m² – enough to produce a deep, rich black.
| |||||||||||||||||||||||||
Brightness Distribution: 89 %
Center on Battery: 319 cd/m²
Contrast: 1107:1 (Black: 0.29 cd/m²)
ΔE ColorChecker Calman: 4.5 | ∀{0.5-29.43 Ø4.71}
ΔE Greyscale Calman: 2.9 | ∀{0.09-98 Ø4.96}
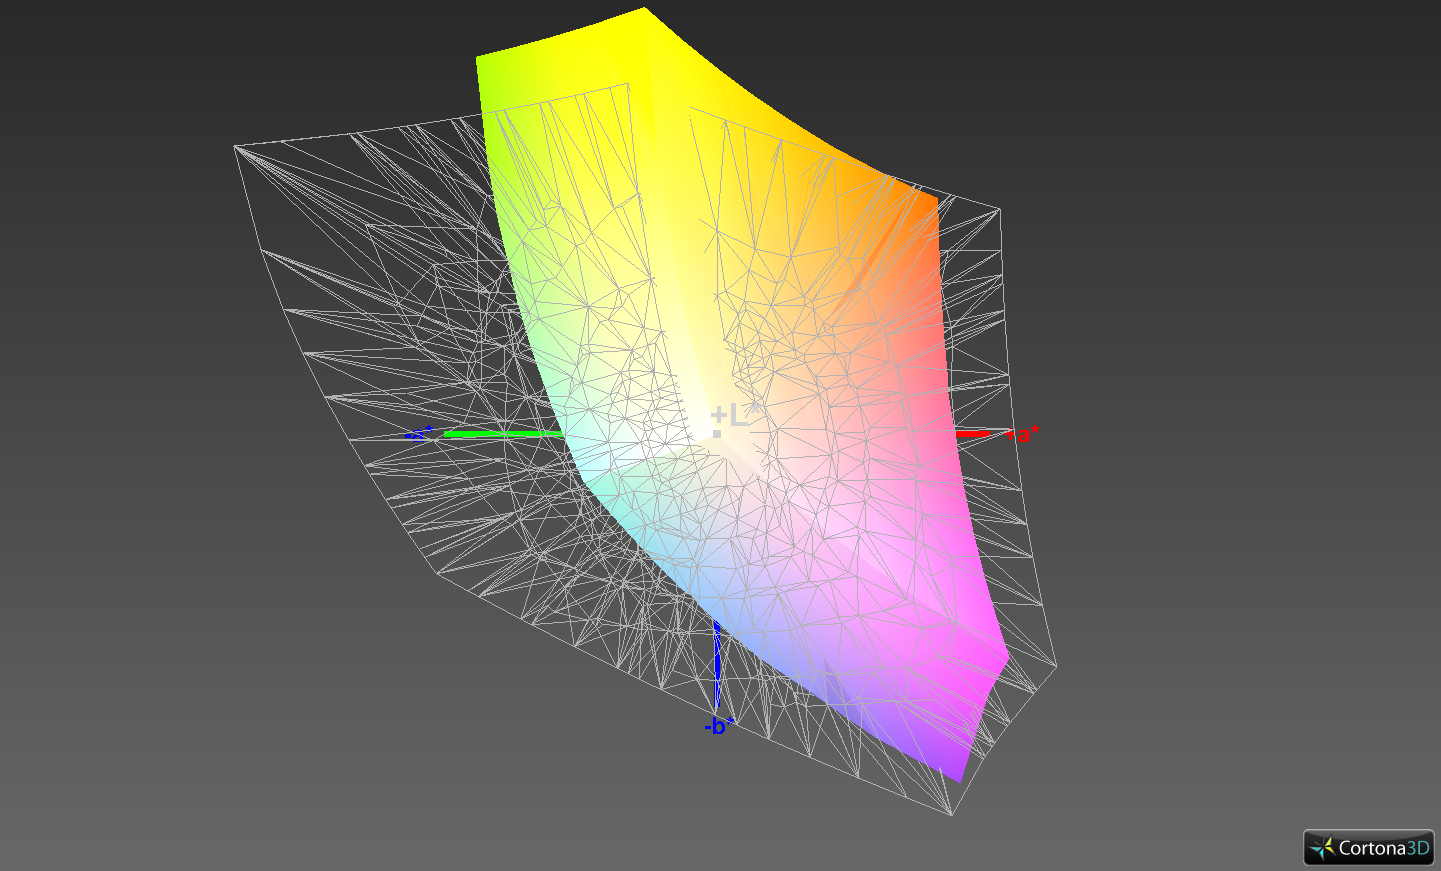
82.6% sRGB (Argyll 1.6.3 3D)
54.2% AdobeRGB 1998 (Argyll 1.6.3 3D)
60.4% AdobeRGB 1998 (Argyll 3D)
82.7% sRGB (Argyll 3D)
64% Display P3 (Argyll 3D)
Gamma: 2.27
CCT: 6519 K
| HP ZBook 15 G4-Y4E80AV LG Philips LGD057E, , 1920x1080, 15.6" | Lenovo ThinkPad P51 20HH0016GE LEN40BD, B156ZAN02.1, , 3840x2160, 15.6" | MSI WE72 7RJ LP173WF4-SPF1, , 1920x1080, 17.3" | HP ZBook 15 G3 Samsung SDC5344, , 1920x1080, 15.6" | |
|---|---|---|---|---|
| Display | 40% | 4% | 11% | |
| Display P3 Coverage (%) | 64 | 86.3 35% | 67.4 5% | 66.8 4% |
| sRGB Coverage (%) | 82.7 | 99.5 20% | 85.3 3% | 95.5 15% |
| AdobeRGB 1998 Coverage (%) | 60.4 | 99.3 64% | 62.4 3% | 69 14% |
| Response Times | -1% | -9% | -39% | |
| Response Time Grey 50% / Grey 80% * (ms) | 39.2 ? | 40.8 ? -4% | 45.2 ? -15% | 54 ? -38% |
| Response Time Black / White * (ms) | 25.6 ? | 25.2 ? 2% | 26.4 ? -3% | 35.6 ? -39% |
| PWM Frequency (Hz) | 20830 ? | 198 ? | ||
| Screen | 13% | -22% | -20% | |
| Brightness middle (cd/m²) | 321 | 317 -1% | 302 -6% | 306 -5% |
| Brightness (cd/m²) | 320 | 309 -3% | 306 -4% | 289 -10% |
| Brightness Distribution (%) | 89 | 89 0% | 93 4% | 85 -4% |
| Black Level * (cd/m²) | 0.29 | 0.36 -24% | 0.31 -7% | 0.34 -17% |
| Contrast (:1) | 1107 | 881 -20% | 974 -12% | 900 -19% |
| Colorchecker dE 2000 * | 4.5 | 2.7 40% | 6.2 -38% | 5.1 -13% |
| Colorchecker dE 2000 max. * | 9.5 | 4.1 57% | 10.6 -12% | 9.9 -4% |
| Greyscale dE 2000 * | 2.9 | 3 -3% | 7.3 -152% | 7.4 -155% |
| Gamma | 2.27 97% | 2.27 97% | 2.08 106% | 2.37 93% |
| CCT | 6519 100% | 6077 107% | 7020 93% | 7263 89% |
| Color Space (Percent of AdobeRGB 1998) (%) | 54.2 | 87.6 62% | 56 3% | 63 16% |
| Color Space (Percent of sRGB) (%) | 82.6 | 99.5 20% | 85.2 3% | 95 15% |
| Total Average (Program / Settings) | 17% /
16% | -9% /
-15% | -16% /
-16% |
* ... smaller is better
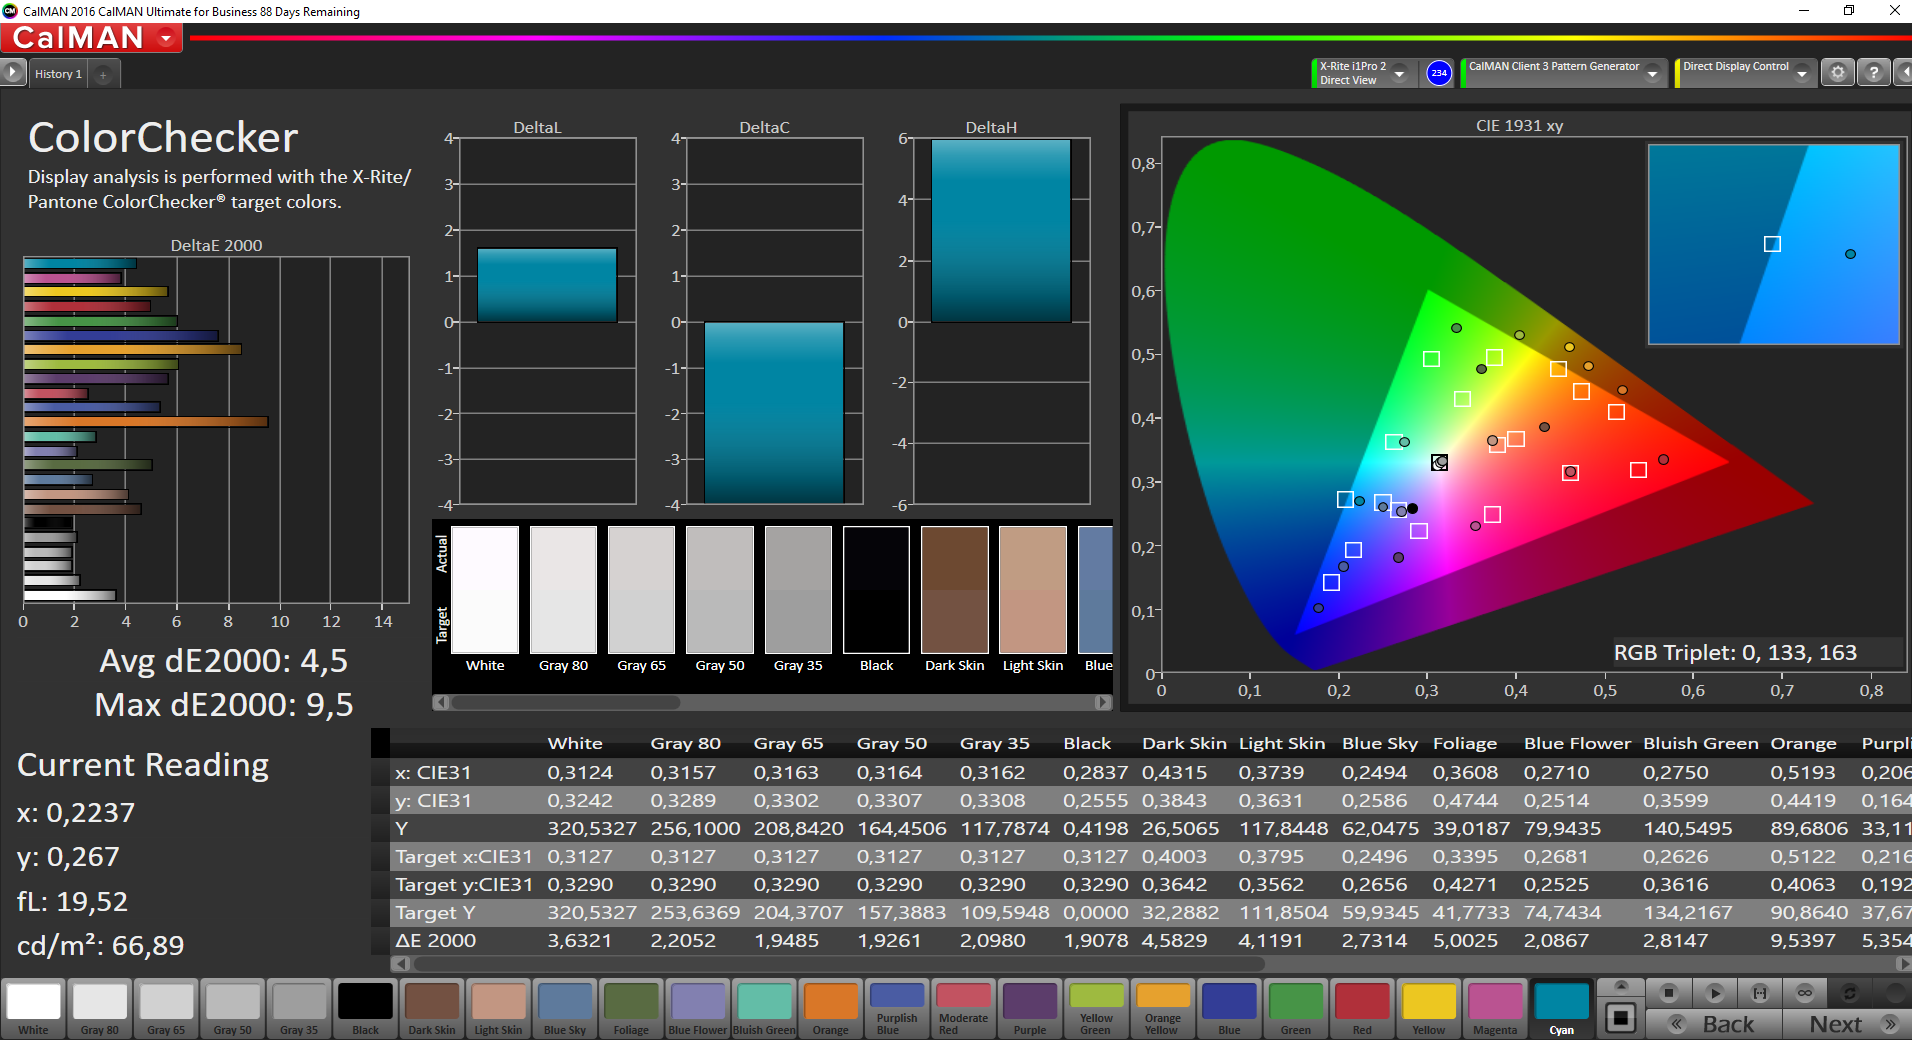
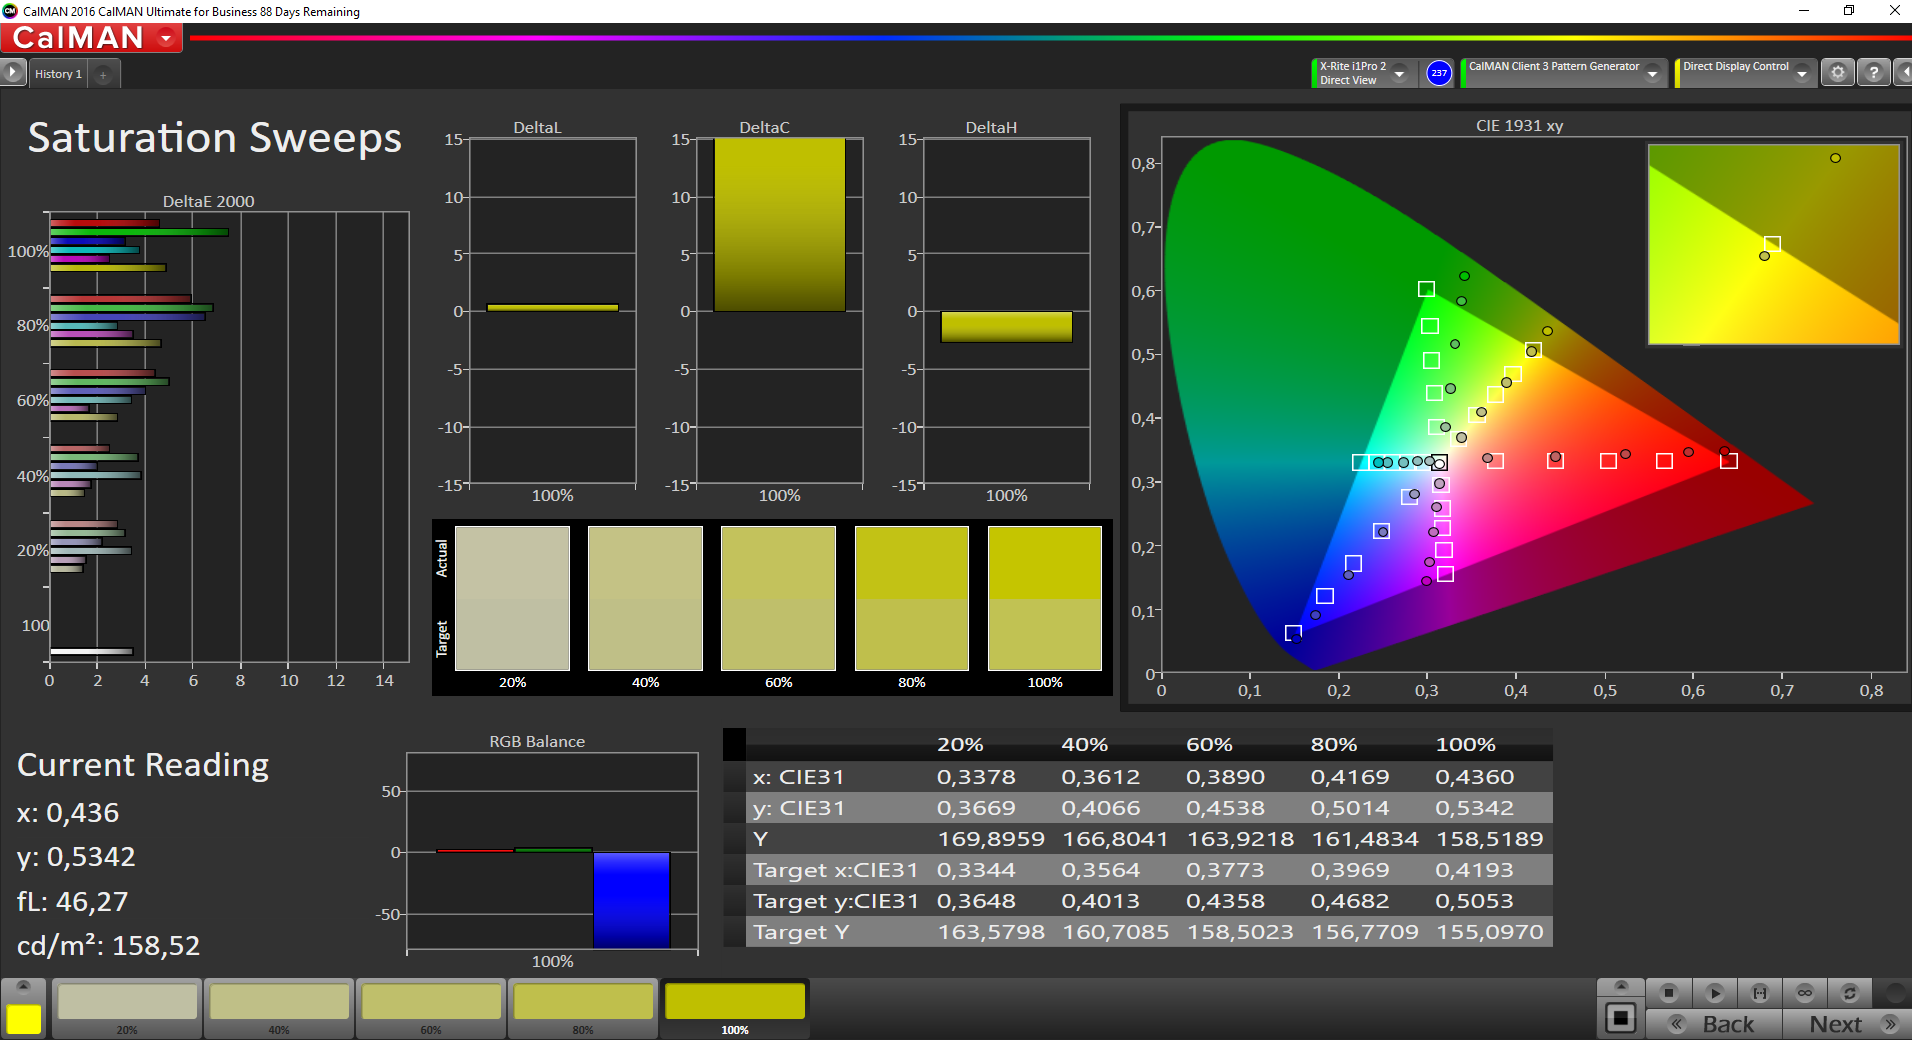
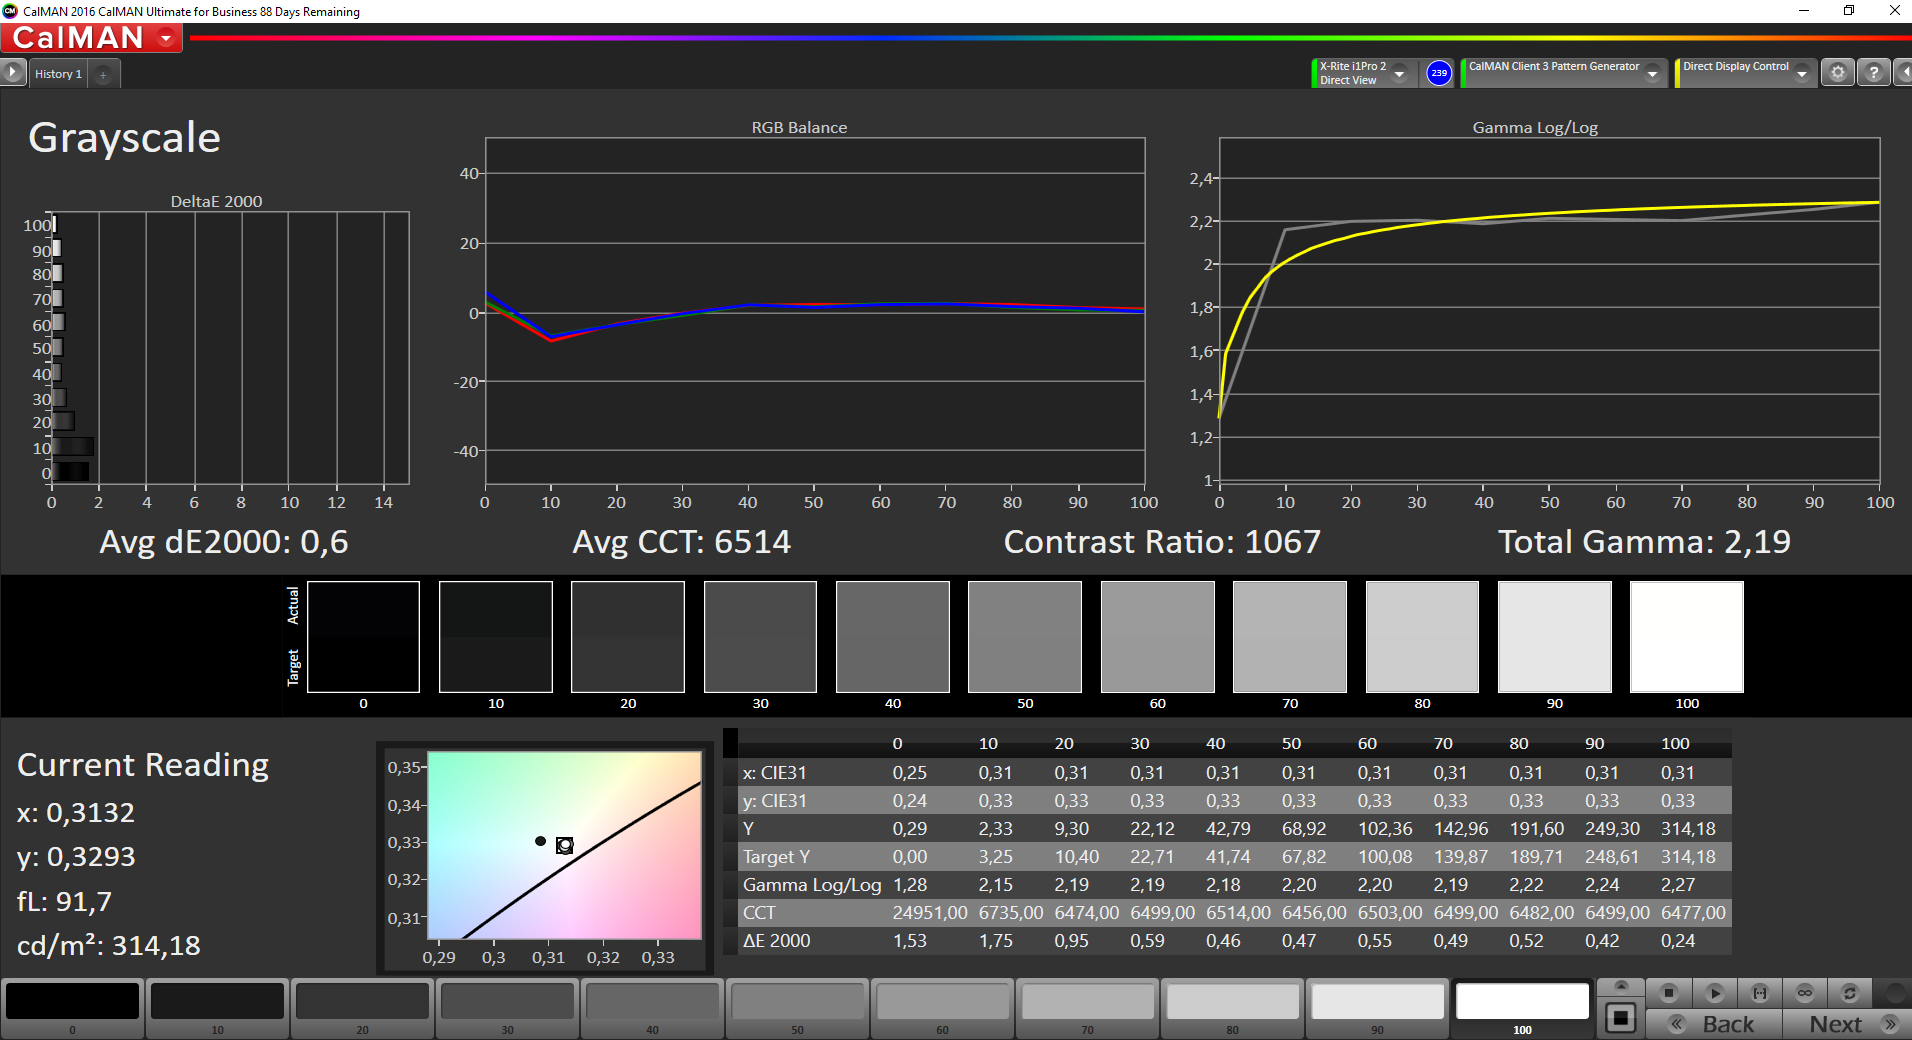
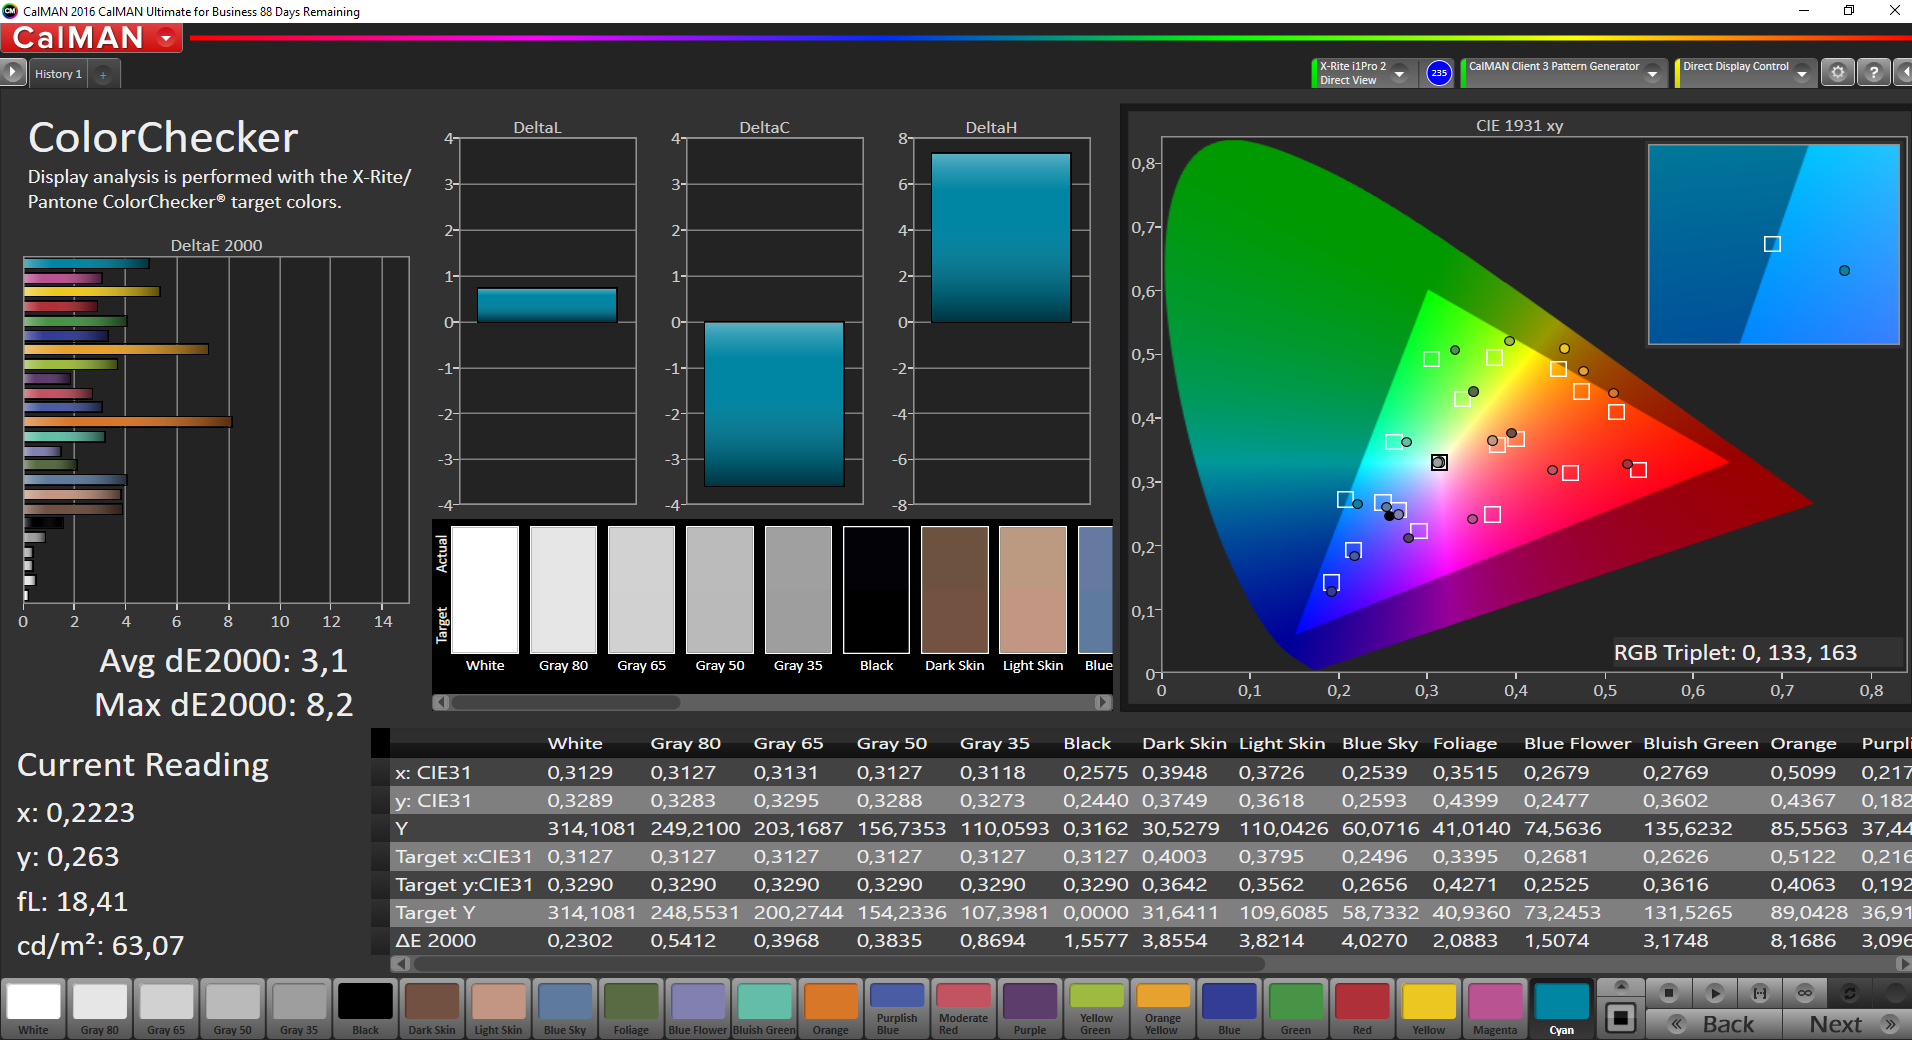
The CalMAN program analyzes color and grayscale deviations. The DeltaE color deviation is 4.5, while the grayscale deviation comes to 2.9. These are typical results for an IPS panel. At 6519 K, the color temperature is optimal. On a negative note, the panel now covers only 82.6% of the small sRGB color space, compared to the previous ZBook's 95%.
HP uses pulse width modulation to control the dynamic display brightness. At a brightness level of 80%, we measured a frequency of over 20 kHz. Even users with sensitive eyes should not have problems here.


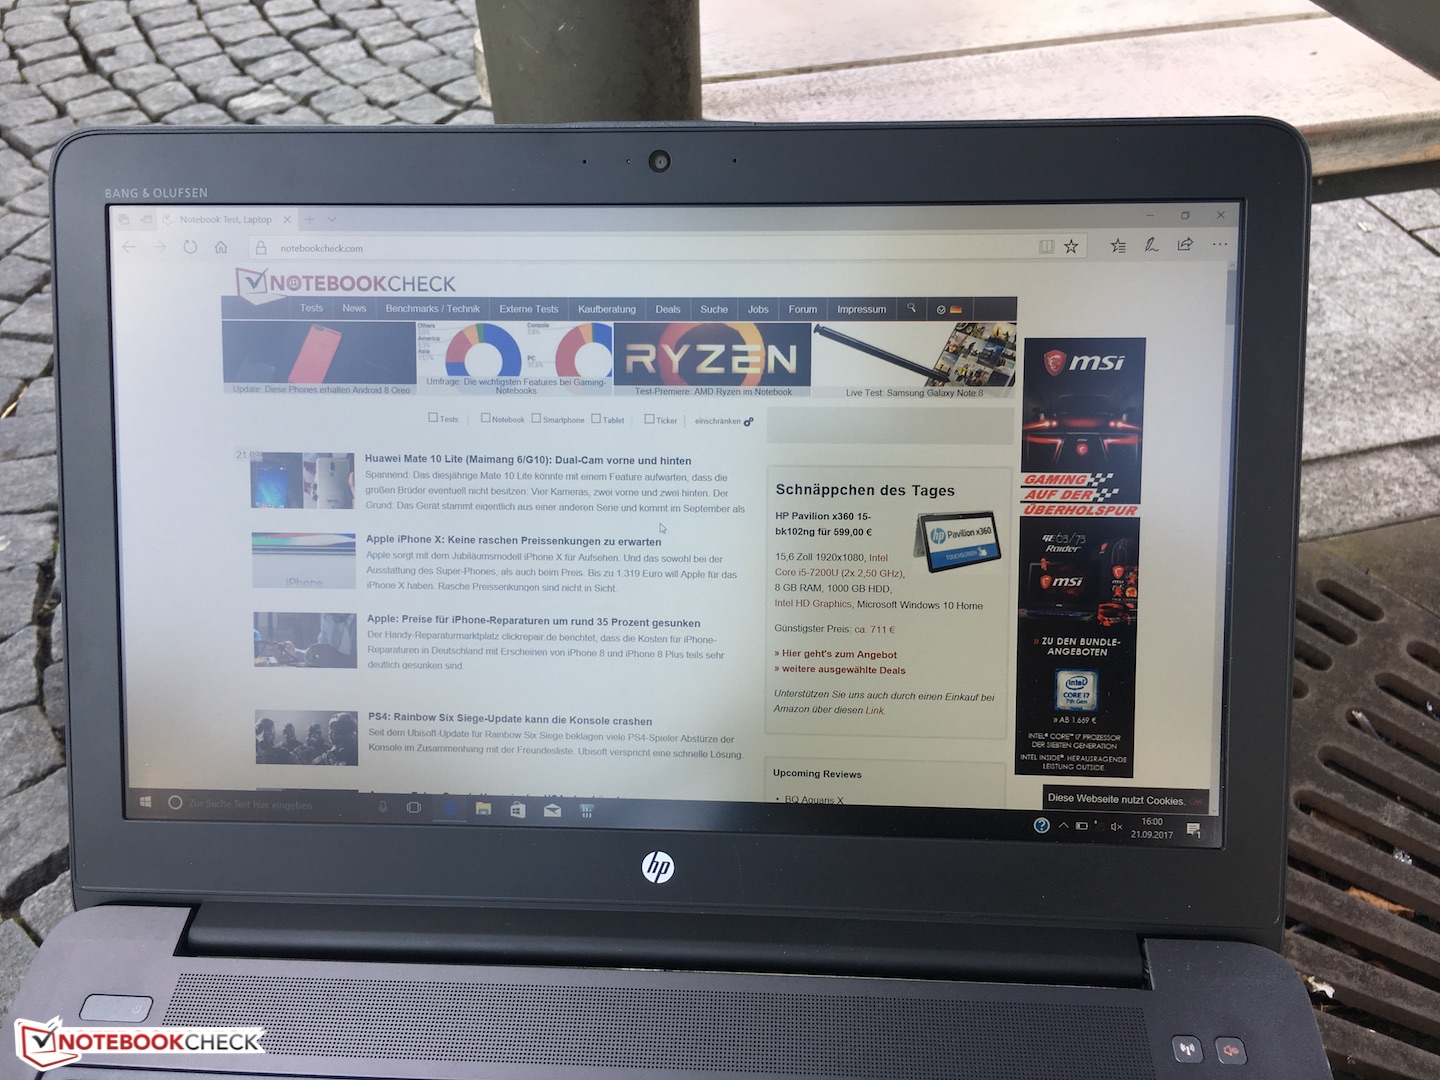
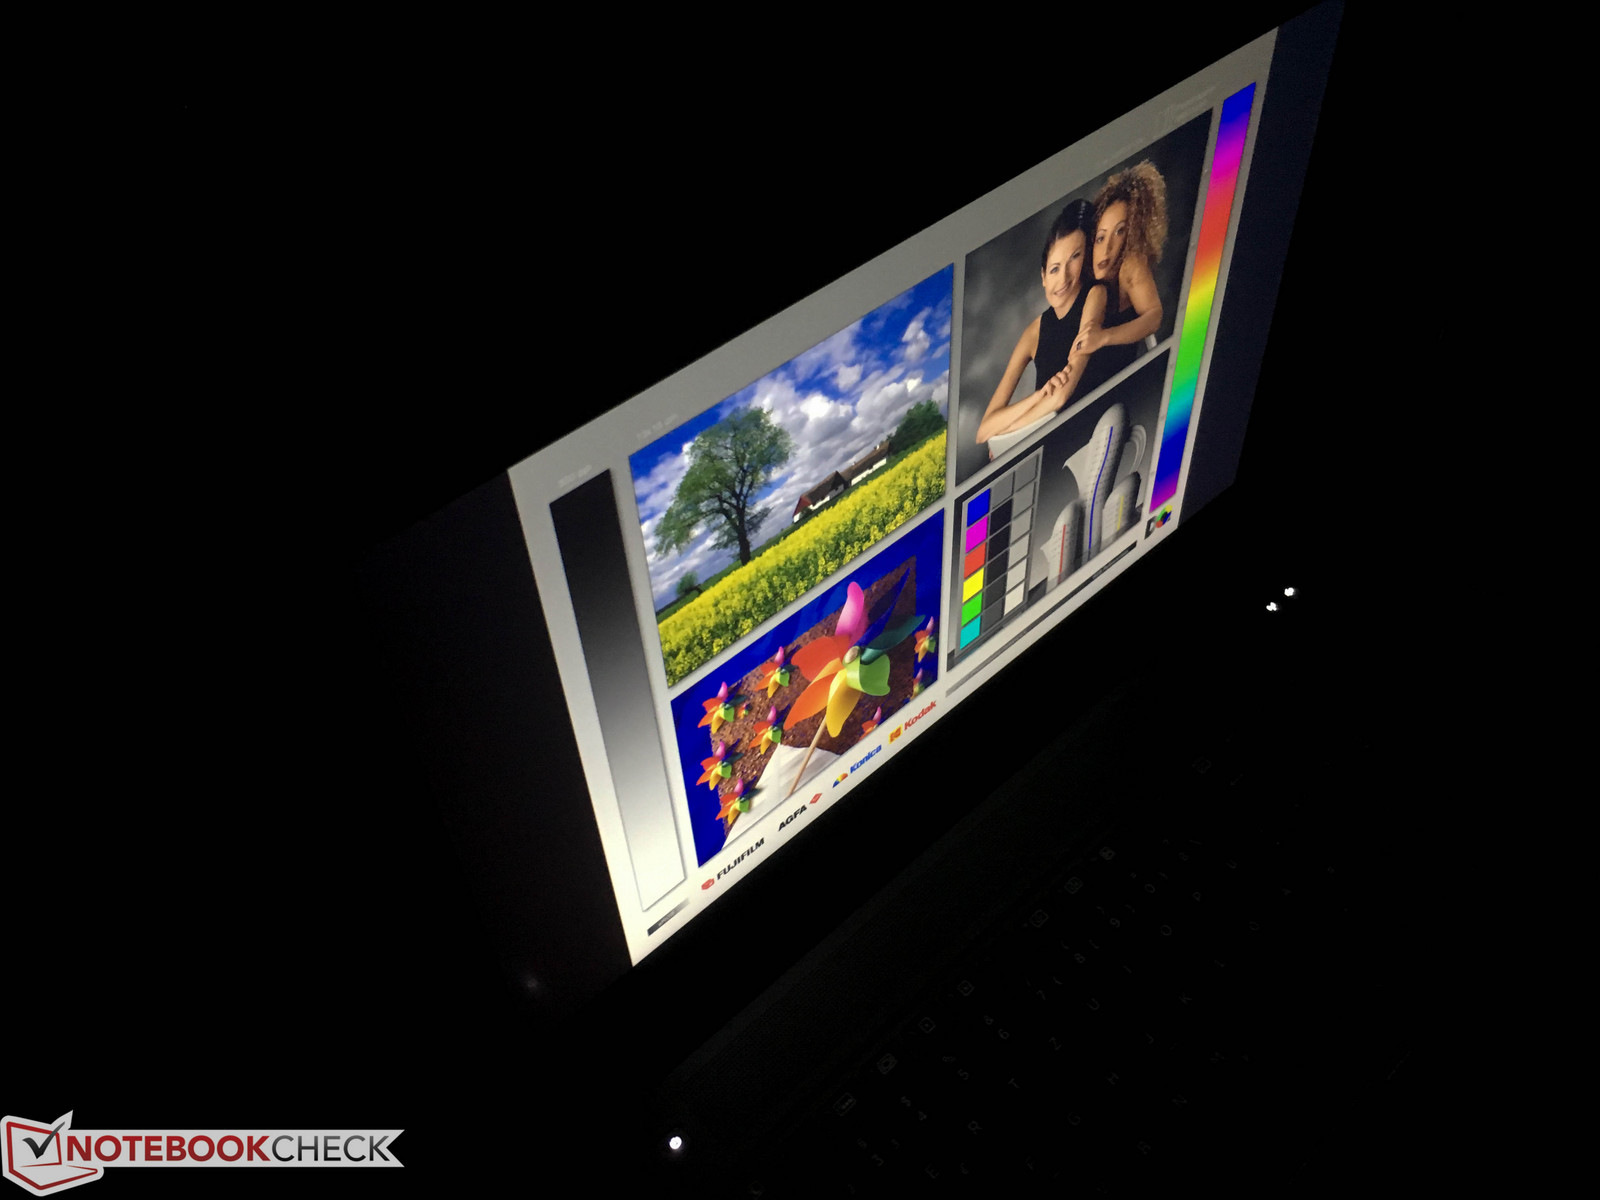
In combination with the matte screen, the display is sufficiently bright to make the screen content easily visible anywhere in the office – even under most direct light sources. For a passable view outdoors, the user must seek a shady area.
Display Response Times
| ↔ Response Time Black to White | ||
|---|---|---|
| 25.6 ms ... rise ↗ and fall ↘ combined | ↗ 14.8 ms rise | 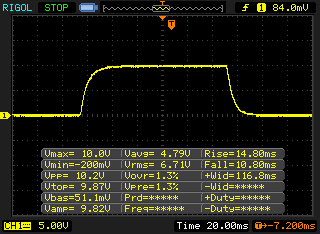 |
| ↘ 10.8 ms fall | ||
| The screen shows relatively slow response rates in our tests and may be too slow for gamers. In comparison, all tested devices range from 0.1 (minimum) to 240 (maximum) ms. » 61 % of all devices are better. This means that the measured response time is worse than the average of all tested devices (19.8 ms). | ||
| ↔ Response Time 50% Grey to 80% Grey | ||
| 39.2 ms ... rise ↗ and fall ↘ combined | ↗ 20.4 ms rise | 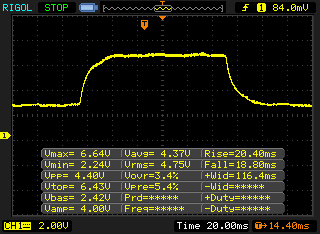 |
| ↘ 18.8 ms fall | ||
| The screen shows slow response rates in our tests and will be unsatisfactory for gamers. In comparison, all tested devices range from 0.165 (minimum) to 636 (maximum) ms. » 60 % of all devices are better. This means that the measured response time is worse than the average of all tested devices (30.9 ms). | ||
Screen Flickering / PWM (Pulse-Width Modulation)
| Screen flickering / PWM detected | 20830 Hz | ≤ 80 % brightness setting | 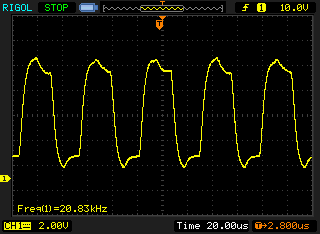 |
The display backlight flickers at 20830 Hz (worst case, e.g., utilizing PWM) Flickering detected at a brightness setting of 80 % and below. There should be no flickering or PWM above this brightness setting. The frequency of 20830 Hz is quite high, so most users sensitive to PWM should not notice any flickering. In comparison: 52 % of all tested devices do not use PWM to dim the display. If PWM was detected, an average of 7748 (minimum: 5 - maximum: 343500) Hz was measured. | |||
Performance
As with the previous version of the ZBook, HP is offering the laptop with numerous configuration options. With an Intel Xeon processor, 32 GB of RAM, a 1 TB SSD, and a dedicated Nvidia graphics card, our test device represents the top model in the new ZBook G4 line. Together, these components form a mobile desktop replacement for professionals. The base configuration contains an Intel Core i5-7300HQ, an internal Intel HD Graphics 630, a 256 GB SSD, and 8 GB of RAM – a combination with a price point of 2200 Euros (~$2600; US version available for $1929).
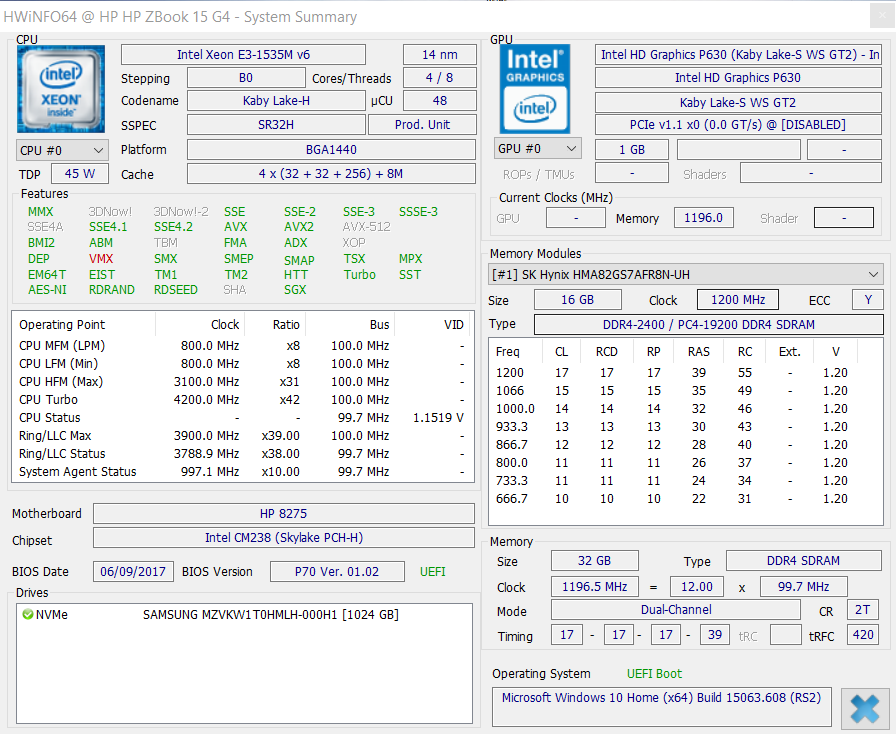
Processor
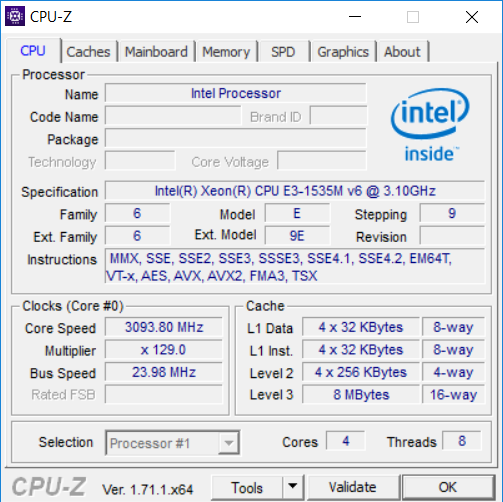
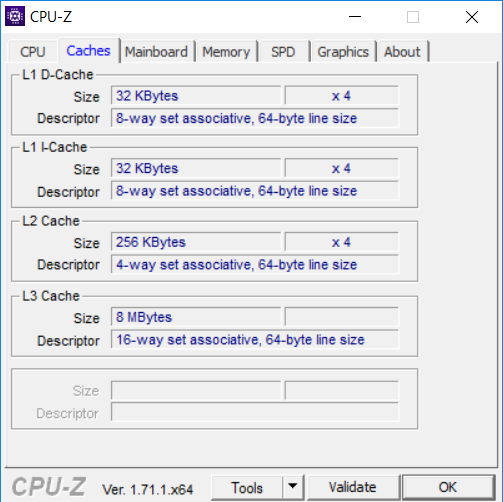
Alongside a line of Intel Core i processors, HP is also offering a choice from two powerful Xeon CPUs. We became acquainted with the strongest model in our test device. The Intel Xeon E3-1535M v6 counts among today's fastest laptop CPUs. More performance is only available for desktops. The quad-core processor has a core clock rate of 3.1 to 4.2 GHz (4 cores: max. 3.9 GHz, 2 cores: max. 4.1 GHz), and 8 MB of L3 cache. At these speeds, the CPU is prepared for tasks that require a lot of performance power.
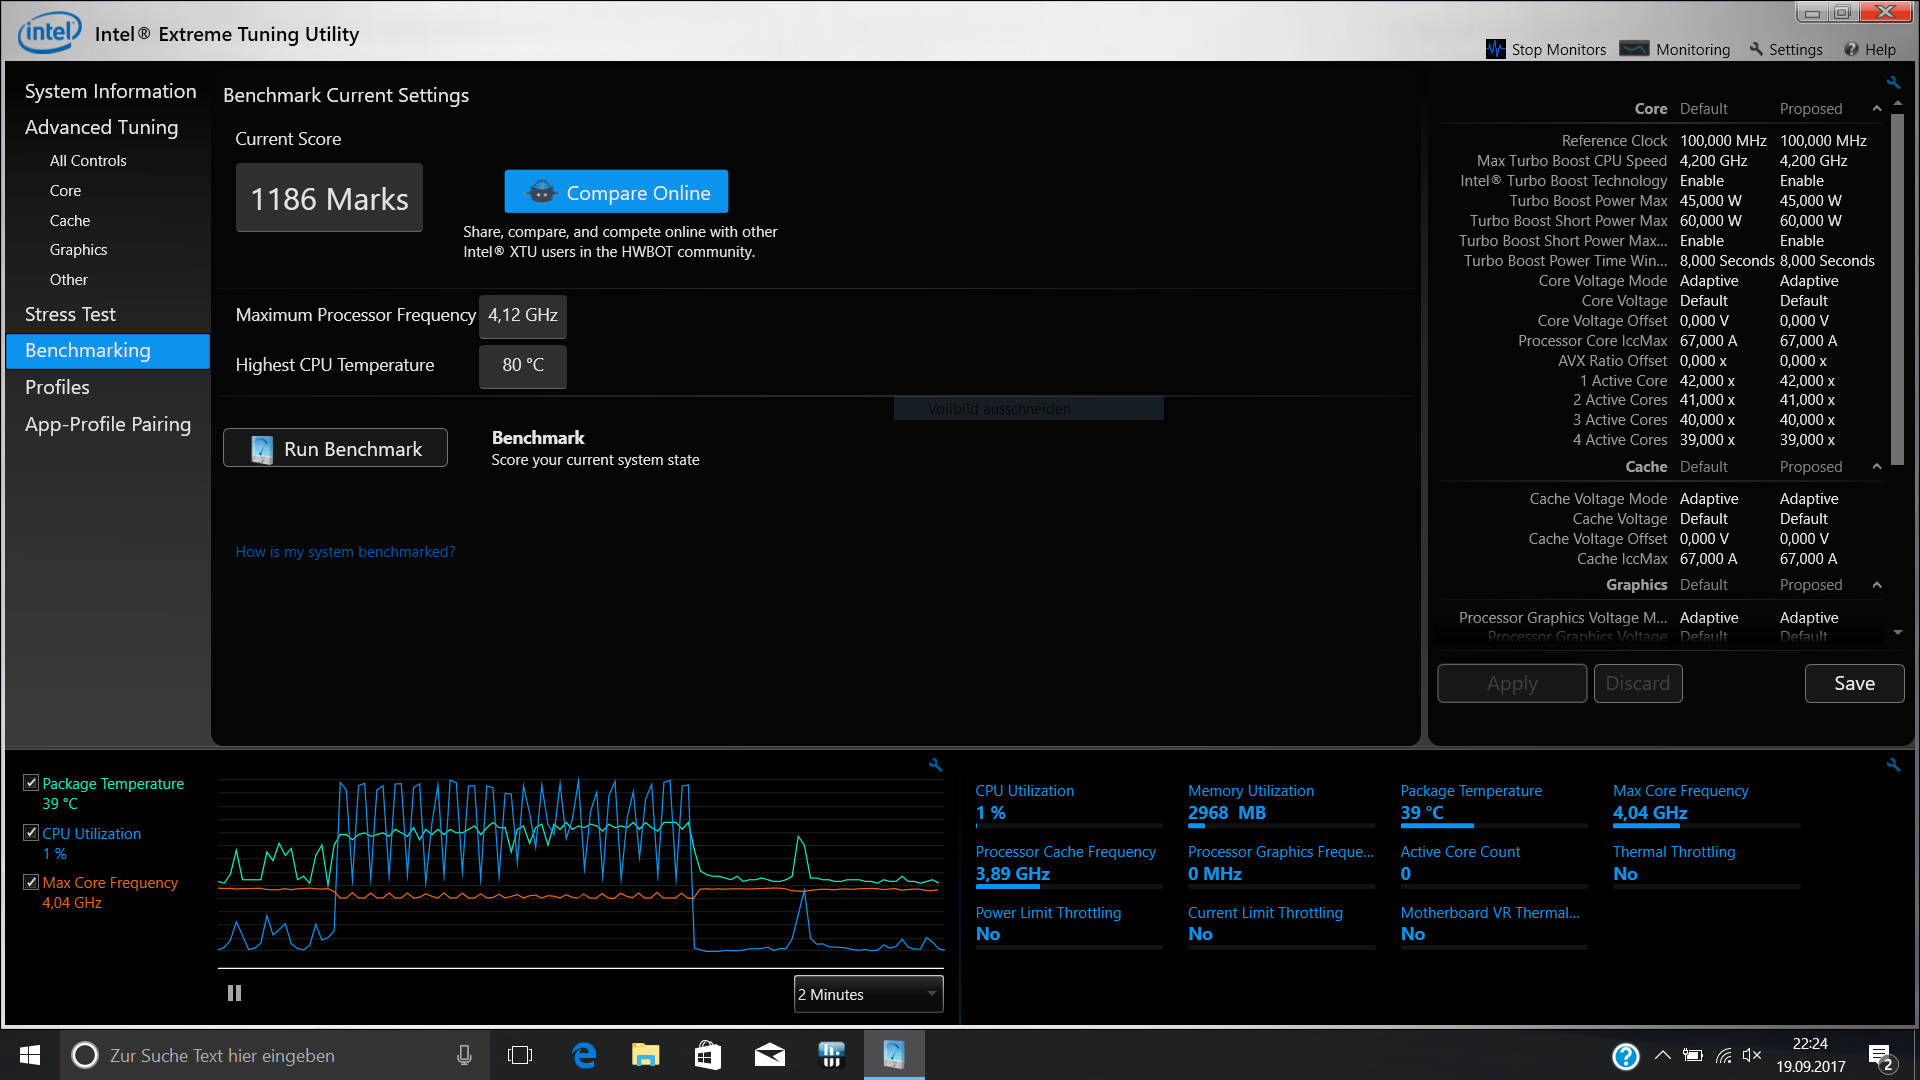
In the Cinebench R15 benchmark, the mobile workstation impressed with a score of over 800. That represents a 10% increase in performance compared to the previous ZBook. The Lenovo ThinkPad P51 we tested achieved nearly equivalent results, even though it is equipped with a cheaper Intel Xeon E3-1505M v6. The reason: Our test device has a limited power draw of 45 W (temporarily 55 W). The ThinkPad's standard limit is 55 W (temporarily even up to 75 W). In this scenario, it makes little sense to shell out the extra cash for the more expensive Intel Xeon E3-1535M v6.
Lastly, we analyzed the processor performance over a longer period, starting with a Cinebench R15 loop. Even after running the benchmark multiple times, the HP ZBook maintains its performance power.
For further comparisons, please see our benchmark list of the newest laptop processors.

| Cinebench R15 | |
| CPU Single 64Bit | |
| HP ZBook 15 G4-Y4E80AV | |
| Lenovo ThinkPad P51 20HH0016GE | |
| Fujitsu Celsius H970 | |
| MSI WE72 7RJ | |
| HP ZBook 15 G3 | |
| Lenovo ThinkPad P50 | |
| Lenovo ThinkPad P50 20ENV509PB | |
| CPU Multi 64Bit | |
| HP ZBook 15 G4-Y4E80AV | |
| Lenovo ThinkPad P51 20HH0016GE | |
| Lenovo ThinkPad P50 20ENV509PB | |
| MSI WE72 7RJ | |
| HP ZBook 15 G3 | |
| Lenovo ThinkPad P50 | |
| Fujitsu Celsius H970 | |
System Performance
Since everyone knows time is money – and this is especially important for a mobile workstation – we wanted to analyze the ZBook's system performance using PCMark 8. Purely from a subjective perspective, the ZBook feels exceptionally fast. This impressive speed results from the pairing of a fast CPU with a quick PCIe mass storage device. Our subjective impression was substantiated by the PCMark scores. In the Home benchmark, the system performs 10% faster than its predecessor. In the Creative test, the climb was even greater: The score rose from 4392 points to 5663 points. The new ZBook G4 even has 4% lead over the G3 version in the Work benchmark. The Lenovo ThinkPad P51 lags significantly behind in both the Home and Work tests. However, it reveals its strength in the Creative portion, scoring a full 638 points above our test device (for a total of 6301 points).
| PCMark 8 | |
| Home Score Accelerated v2 | |
| HP ZBook 15 G4-Y4E80AV | |
| MSI WE72 7RJ | |
| Lenovo ThinkPad P50 | |
| HP ZBook 15 G3 | |
| Lenovo ThinkPad P51 20HH0016GE | |
| Work Score Accelerated v2 | |
| HP ZBook 15 G4-Y4E80AV | |
| HP ZBook 15 G3 | |
| MSI WE72 7RJ | |
| Lenovo ThinkPad P50 | |
| Lenovo ThinkPad P51 20HH0016GE | |
| PCMark 10 | |
| Score | |
| HP ZBook 15 G4-Y4E80AV | |
| Essentials | |
| HP ZBook 15 G4-Y4E80AV | |
| Productivity | |
| HP ZBook 15 G4-Y4E80AV | |
| Digital Content Creation | |
| HP ZBook 15 G4-Y4E80AV | |
| PCMark 8 Home Score Accelerated v2 | 4375 points | |
| PCMark 8 Creative Score Accelerated v2 | 5663 points | |
| PCMark 8 Work Score Accelerated v2 | 5423 points | |
| PCMark 10 Score | 4834 points | |
Help | ||
Mass Storage
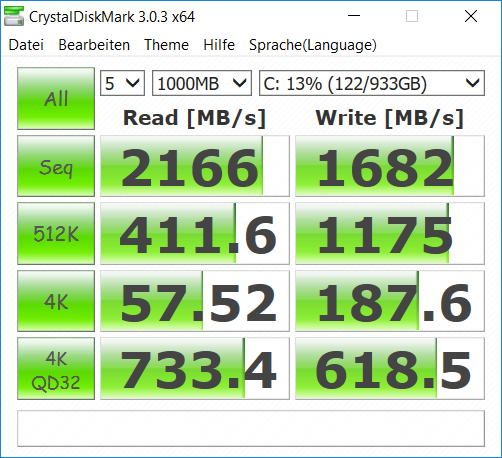
The configuration that lies before us has a 1 TB Samsung SSD at its command. During the configuration process in the HP Store, the buyer may choose up to two separate mass storage devices. The device in our machine is of the M.2 variety.
Thanks to its PCIe connection, this SSD struts its stuff with sequential read rates of 2166 MB/s and write rates of 1682 MB/s – surpassing both its predecessor and the Lenovo ThinkPad P51.
| HP ZBook 15 G4-Y4E80AV Samsung SSD SM961 1TB M.2 MZVKW1T0HMLH | Lenovo ThinkPad P51 20HH0016GE Samsung PM961 NVMe MZVLW512HMJP | HP ZBook 15 G3 Samsung SM951 MZVPV512HDGL m.2 PCI-e | MSI WE72 7RJ Samsung SM961 MZVPW256 m.2 PCI-e | Lenovo ThinkPad P50 Samsung SM951 MZVPV256HDGL m.2 PCI-e | |
|---|---|---|---|---|---|
| CrystalDiskMark 3.0 | 13% | 19% | -6% | 30% | |
| Read Seq (MB/s) | 2166 | 1705 -21% | 1502 -31% | 1492 -31% | 1771 -18% |
| Write Seq (MB/s) | 1682 | 1541 -8% | 1538 -9% | 1512 -10% | 1304 -22% |
| Read 512 (MB/s) | 411.6 | 1038 152% | 1164 183% | 312.6 -24% | 1364 231% |
| Write 512 (MB/s) | 1175 | 1157 -2% | 1432 22% | 1483 26% | 1291 10% |
| Read 4k (MB/s) | 57.5 | 61.3 7% | 59.1 3% | 59.9 4% | 60.2 5% |
| Write 4k (MB/s) | 187.6 | 176 -6% | 207.3 11% | 184.2 -2% | 256.7 37% |
| Read 4k QD32 (MB/s) | 733 | 664 -9% | 798 9% | 681 -7% | 953 30% |
| Write 4k QD32 (MB/s) | 619 | 560 -10% | 393.8 -36% | 590 -5% | 389.6 -37% |

Graphics Card
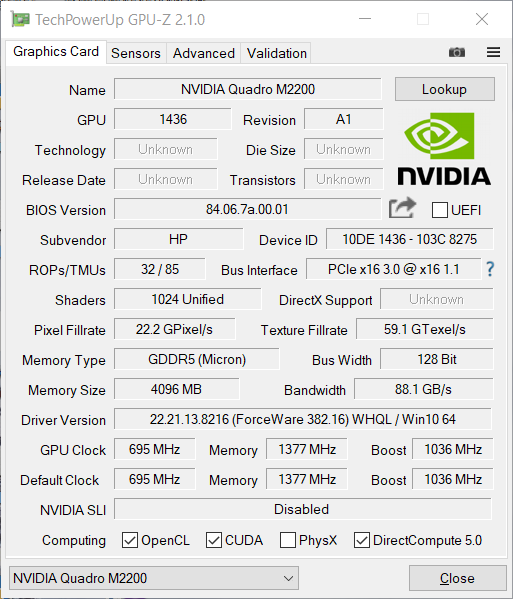
In order to outfit our configuration of the ZBook for professional graphics applications, HP installed an Nvidia Quadro M2200 graphics card. The G3 we reviewed used an Nvidia Quadro M2000M. Thanks to the increased number of pipelines and a higher memory clock frequency, the new version should perform around 20-40% better.
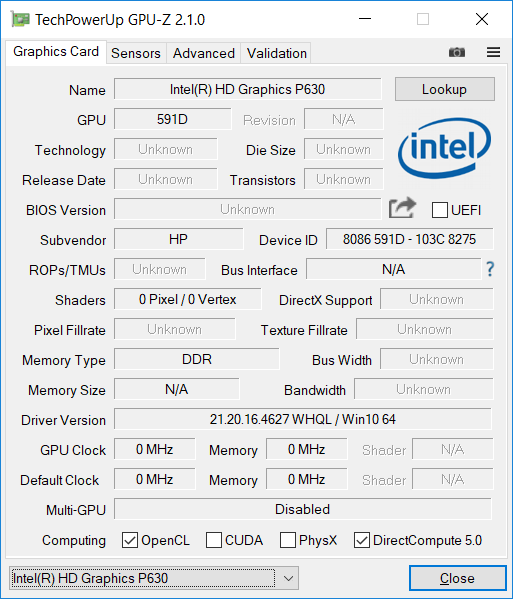
In addition to this dedicated Nvidia GPU, the system uses a built-in graphics unit when modest graphics performance is required. The ZBook G4 contains an Intel HD Graphics P630, based on Kaby Lake architecture.
All in all, HP offers five distinct graphics solutions. Those who can do without a dedicated unit will save 100 Euros (~$120), but they will have to make do with the graphics card integrated into Intel's processor. The HP ZBook's base price includes an Nvidia Quadro M620, which is an entry-level workstation GPU. For an additional 80 or 100 Euros (~$95 or $120), the HP Store offers an AMD Radeon Pro WX 4150 or Nvidia Quadro M1200, respectively. Both units are mid-range cards. We examined the top model more closely (+270 Euros; ~$320).
The advantages of an Nvidia Quadro M2200 over a conventional consumer graphics card are a modified BIOS and special drivers for professional applications. The SPECviewperf benchmark speaks to some of these usage scenarios. Here we observe a 10-25% increase in performance compared to the laptop's predecessor. In some tests, the two devices are actually more or less on par with each other. A look at the diagram below clearly reveals that the Nvidia GeForce GTX 1050 Ti, which is faster in the DirectX domain, is markedly slower in professional use.
| SPECviewperf 11 | |
| 1920x1080 Siemens NX | |
| HP ZBook 15 G4-Y4E80AV | |
| MSI WE72 7RJ | |
| HP ZBook 15 G3 | |
| Saelic Veni G422 G7TPK4 | |
| 1920x1080 Tcvis | |
| HP ZBook 15 G4-Y4E80AV | |
| MSI WE72 7RJ | |
| HP ZBook 15 G3 | |
| Saelic Veni G422 G7TPK4 | |
| 1920x1080 SolidWorks | |
| HP ZBook 15 G4-Y4E80AV | |
| HP ZBook 15 G3 | |
| MSI WE72 7RJ | |
| Saelic Veni G422 G7TPK4 | |
| 1920x1080 Pro/ENGINEER | |
| HP ZBook 15 G4-Y4E80AV | |
| HP ZBook 15 G3 | |
| MSI WE72 7RJ | |
| Saelic Veni G422 G7TPK4 | |
| 1920x1080 Maya | |
| HP ZBook 15 G3 | |
| HP ZBook 15 G4-Y4E80AV | |
| MSI WE72 7RJ | |
| Saelic Veni G422 G7TPK4 | |
| 1920x1080 Lightwave | |
| HP ZBook 15 G4-Y4E80AV | |
| HP ZBook 15 G3 | |
| MSI WE72 7RJ | |
| Saelic Veni G422 G7TPK4 | |
| 1920x1080 Ensight | |
| HP ZBook 15 G4-Y4E80AV | |
| MSI WE72 7RJ | |
| Saelic Veni G422 G7TPK4 | |
| HP ZBook 15 G3 | |
| 1920x1080 Catia | |
| HP ZBook 15 G3 | |
| HP ZBook 15 G4-Y4E80AV | |
| MSI WE72 7RJ | |
| Saelic Veni G422 G7TPK4 | |
| SPECviewperf 12 | |
| 1900x1060 Solidworks (sw-03) | |
| HP ZBook 15 G4-Y4E80AV | |
| MSI WE72 7RJ | |
| HP ZBook 15 G3 | |
| 1900x1060 Siemens NX (snx-02) | |
| HP ZBook 15 G4-Y4E80AV | |
| MSI WE72 7RJ | |
| HP ZBook 15 G3 | |
| 1900x1060 Showcase (showcase-01) | |
| MSI WE72 7RJ | |
| HP ZBook 15 G4-Y4E80AV | |
| HP ZBook 15 G3 | |
| 1900x1060 Medical (medical-01) | |
| HP ZBook 15 G4-Y4E80AV | |
| MSI WE72 7RJ | |
| HP ZBook 15 G3 | |
| 1900x1060 Maya (maya-04) | |
| HP ZBook 15 G4-Y4E80AV | |
| MSI WE72 7RJ | |
| HP ZBook 15 G3 | |
| 1900x1060 Energy (energy-01) | |
| HP ZBook 15 G4-Y4E80AV | |
| MSI WE72 7RJ | |
| HP ZBook 15 G3 | |
| 1900x1060 Creo (creo-01) | |
| HP ZBook 15 G4-Y4E80AV | |
| MSI WE72 7RJ | |
| HP ZBook 15 G3 | |
| 1900x1060 Catia (catia-04) | |
| MSI WE72 7RJ | |
| HP ZBook 15 G4-Y4E80AV | |
| HP ZBook 15 G3 | |
In the second section, we will examine the results in the LuxMark and SiSoft Sandra benchmarks. Both use the OpenGL port to perform calculations on the graphics card. Here too, the new G4 proves up to 20% quicker than the G3 version.
| SiSoft Sandra 2016 | |
| GP Financial Analysis (FP High/Double Precision) | |
| Lenovo ThinkPad P51 20HH0016GE | |
| HP ZBook 15 G4-Y4E80AV | |
| HP ZBook 15 G3 | |
| Lenovo ThinkPad P50 | |
| GP Cryptography (Higher Security AES256+SHA2-512) | |
| HP ZBook 15 G4-Y4E80AV | |
| Lenovo ThinkPad P51 20HH0016GE | |
| HP ZBook 15 G3 | |
| Lenovo ThinkPad P50 | |
| Image Processing | |
| Lenovo ThinkPad P51 20HH0016GE | |
| HP ZBook 15 G4-Y4E80AV | |
| HP ZBook 15 G3 | |
| Lenovo ThinkPad P50 | |
We measured DirectX performance with the 3DMark benchmark, which attested to a 40% increase compared to the predecessor model. The Unigine Valley 1.0 test compares DirectX and OpenGL performance. Once again, we find our test device performs 30-40% better than the ZBook G3.
Further comparisons and benchmark results are available in our separate article on current laptop graphics cards.
| 3DMark | |
| 1280x720 Cloud Gate Standard Graphics | |
| Saelic Veni G422 G7TPK4 | |
| MSI WE72 7RJ | |
| HP ZBook 15 G4-Y4E80AV | |
| Lenovo ThinkPad P51 20HH0016GE | |
| HP ZBook 15 G3 | |
| Asus G752VL-T7023T | |
| 1920x1080 Fire Strike Graphics | |
| Saelic Veni G422 G7TPK4 | |
| MSI WE72 7RJ | |
| Lenovo ThinkPad P51 20HH0016GE | |
| HP ZBook 15 G4-Y4E80AV | |
| Asus G752VL-T7023T | |
| HP ZBook 15 G3 | |
| Unigine Valley 1.0 | |
| 1920x1080 Extreme HD Preset OpenGL AA:x8 | |
| Lenovo ThinkPad P51 20HH0016GE | |
| HP ZBook 15 G4-Y4E80AV | |
| MSI WE72 7RJ | |
| HP ZBook 15 G3 | |
| 1920x1080 Extreme HD DirectX AA:x8 | |
| MSI WE72 7RJ | |
| HP ZBook 15 G4-Y4E80AV | |
| Lenovo ThinkPad P51 20HH0016GE | |
| HP ZBook 15 G3 | |
| Unigine Heaven 4.0 | |
| Extreme Preset DX11 | |
| MSI WE72 7RJ | |
| Lenovo ThinkPad P51 20HH0016GE | |
| HP ZBook 15 G4-Y4E80AV | |
| Extreme Preset OpenGL | |
| Lenovo ThinkPad P51 20HH0016GE | |
| HP ZBook 15 G4-Y4E80AV | |
| MSI WE72 7RJ | |
| 3DMark Ice Storm Standard Score | 144957 points | |
| 3DMark Cloud Gate Standard Score | 22003 points | |
| 3DMark Fire Strike Score | 5232 points | |
| 3DMark Time Spy Score | 1903 points | |
Help | ||
Gaming Performance
This mobile workstation can boldly enter the gaming world, too. Those who enjoy older games – or can do without maximum graphics settings for new games – will find themselves well equipped to dive into various gaming adventures. The G4's performance level lies between the Nvidia GeForce GTX 965m and Nvidia GeForce GTX 1050.
To find out which games run fluidly on this GPU, see our article, "Which games run fluidly on laptop graphics cards?"
| The Witcher 3 | |
| 1366x768 Medium Graphics & Postprocessing | |
| Lenovo ThinkPad P51 20HH0016GE | |
| MSI GE72 965M Ti | |
| HP ZBook 15 G4-Y4E80AV | |
| Lenovo ThinkPad P50 | |
| HP ZBook 15 G3 | |
| 1920x1080 High Graphics & Postprocessing (Nvidia HairWorks Off) | |
| Gigabyte Sabre 15G | |
| Lenovo ThinkPad P51 20HH0016GE | |
| MSI GE72 965M Ti | |
| HP ZBook 15 G4-Y4E80AV | |
| Lenovo ThinkPad P50 | |
| HP ZBook 15 G3 | |
| low | med. | high | ultra | |
|---|---|---|---|---|
| BioShock Infinite (2013) | 270.9 | 174.1 | 149.1 | 56.8 |
| The Witcher 3 (2015) | 104.6 | 63.4 | 30.3 | 18 |
| Rise of the Tomb Raider (2016) | 123 | 68.5 | 37.4 | 33 |
Emissions
In idle mode, the HP ZBook G4 hardly makes a peep. Only upon close listening does the user hear the occasional electronic noise from one of the components. However, these sounds were not within detectable ranges (at least for our measuring devices). As soon as we started the benchmarks like 3DMark, we registered a gradual increase in fan speed to up to 39 dB(A). Under load, the volume settled at around 36 dB(A). We recorded similar behavior in our tests of the Lenovo ThinkPad P51. Compared to the ZBook G3, this number represents an enormous improvement. The predecessor model reached nearly 50 dB(A).
Under load, the system generates an irritating and inconsistent chirping sound. We experienced this as exceptionally unpleasant, especially when there is no other background noise.
Noise level
| Idle |
| 29.5 / 29.5 / 30 dB(A) |
| Load |
| 39.5 / 36 dB(A) |
 | ||
30 dB silent 40 dB(A) audible 50 dB(A) loud |
||
min: | ||
Temperature
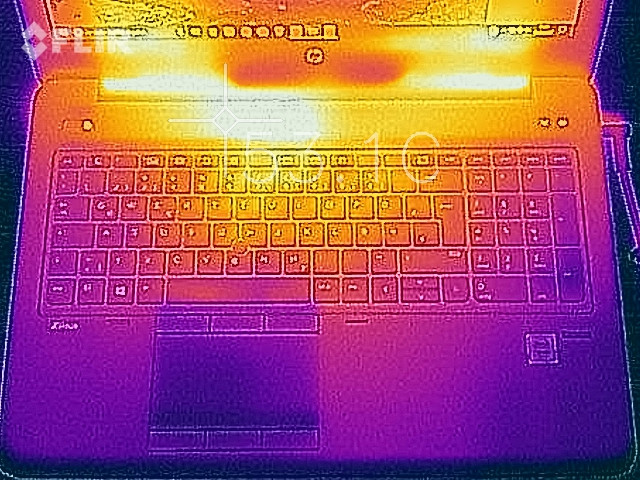
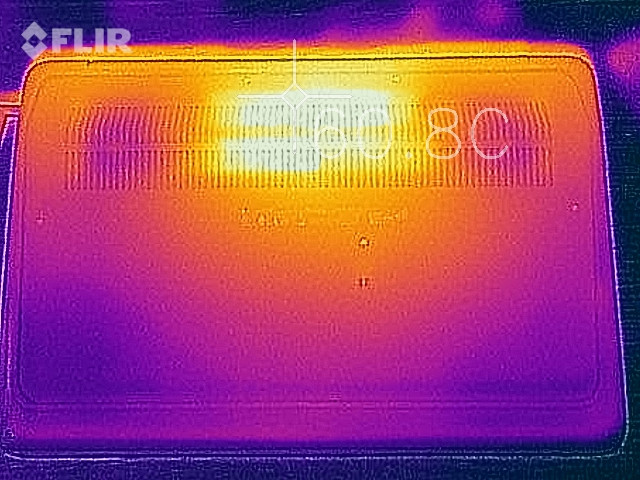
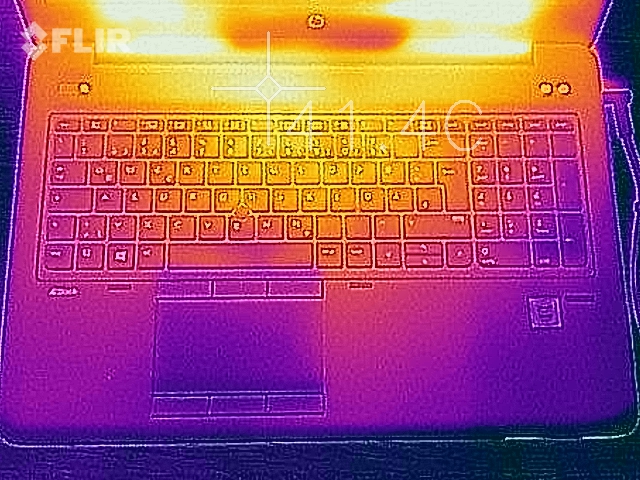
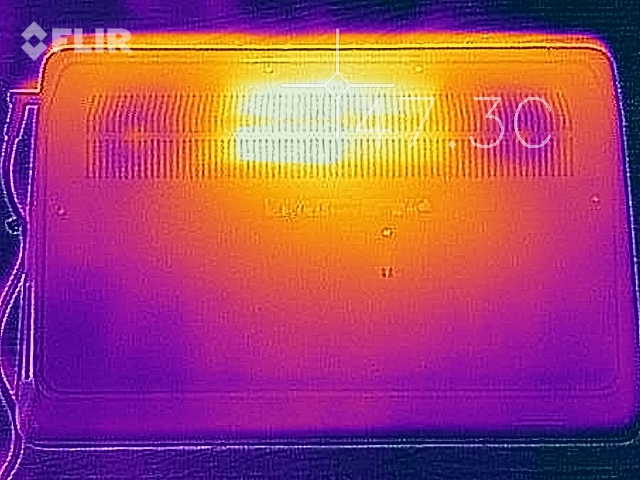
In idle mode, the G4's case temperatures hardly rise at all. Only under load did we measure an enormous increase in temperature. As in the third generation, the hotspot is located in the center of the case. Our current version's maximum temperature measured nearly 57 °C (134.6 °F) on the underside. This number is only marginally better than the predecessor's 60.8 °C (141.4 °F). As a result, it is not advisable to place the device on your lap when it is under load. On the top of the base unit, the hotspot measures 51 °C (123.8 °F). This is only slightly cooler than the G3 model. 41 °C (105.8 °F) in the keyboard area is also palpable while typing. The Lenovo ThinkPad P51 proves cooler overall. Even under load, the ThinkPad's temperatures mostly remain around 40 °C (104 °F).
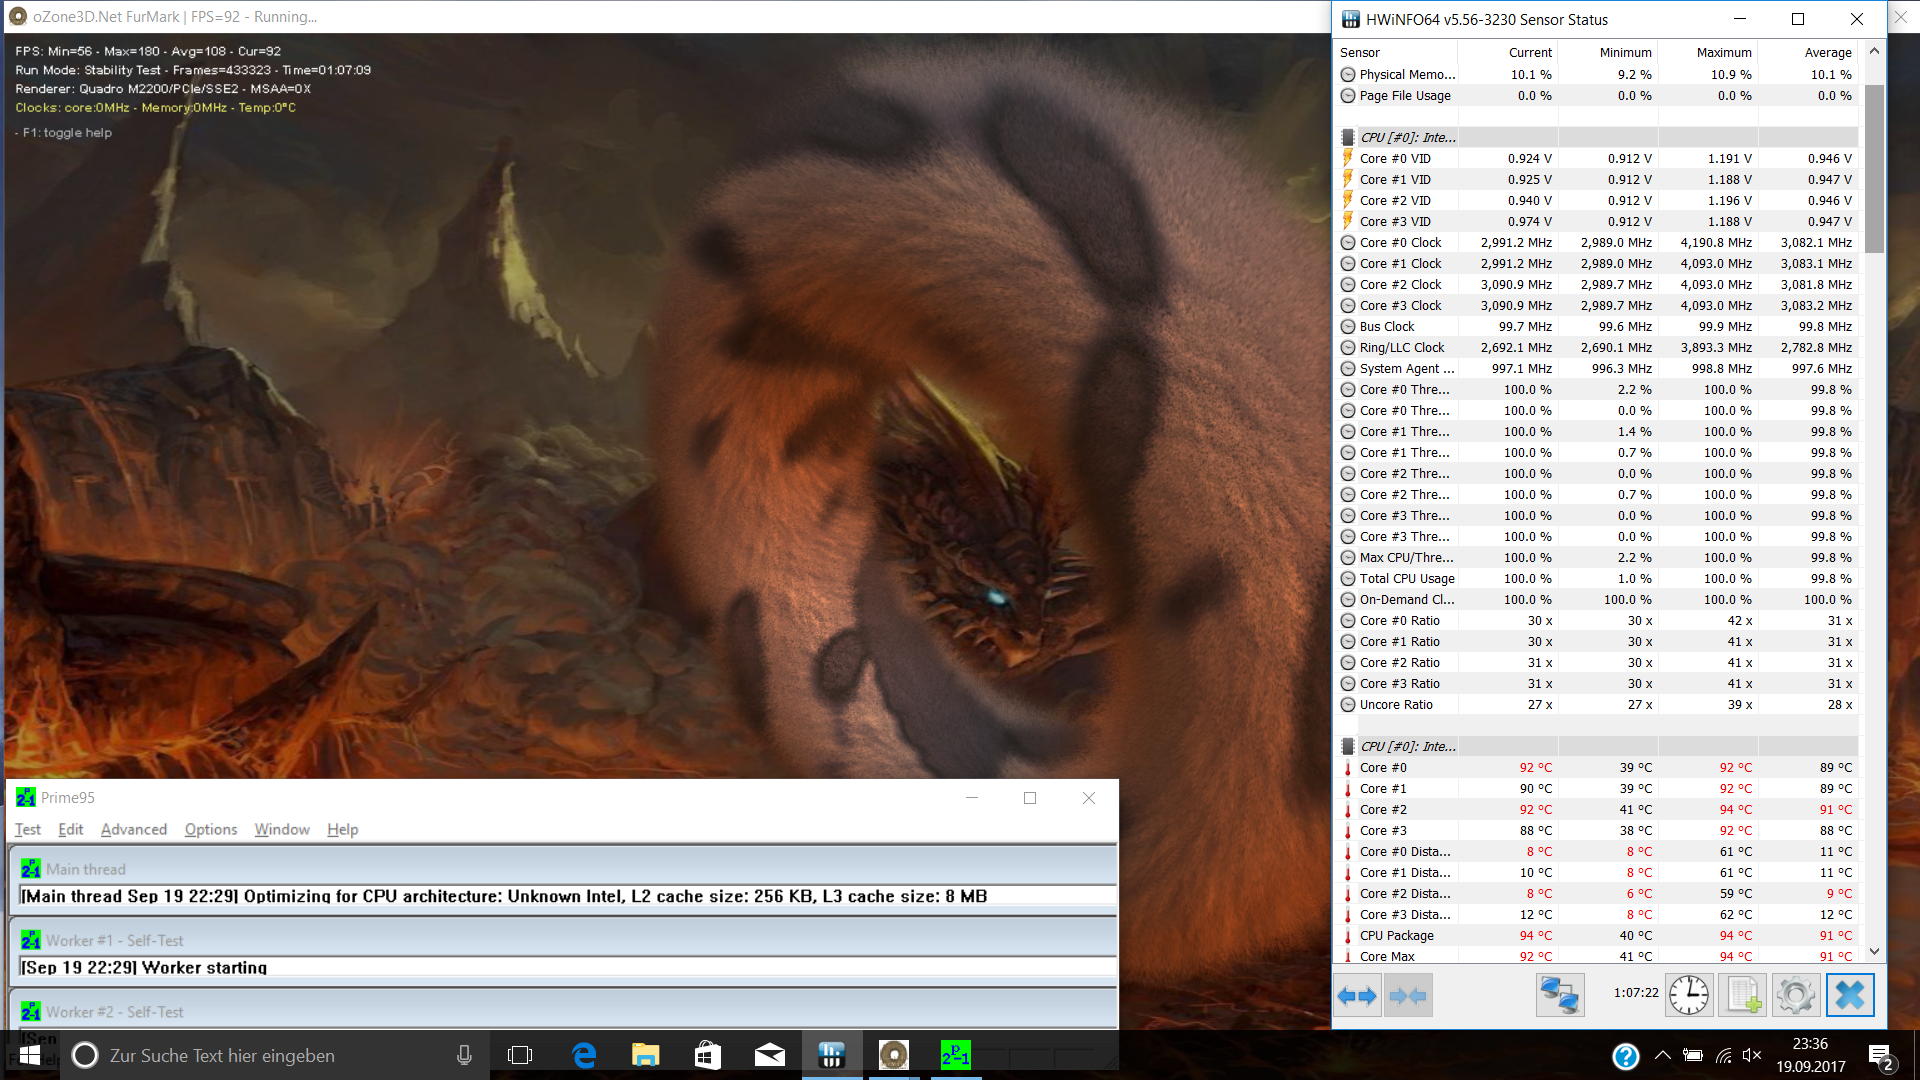
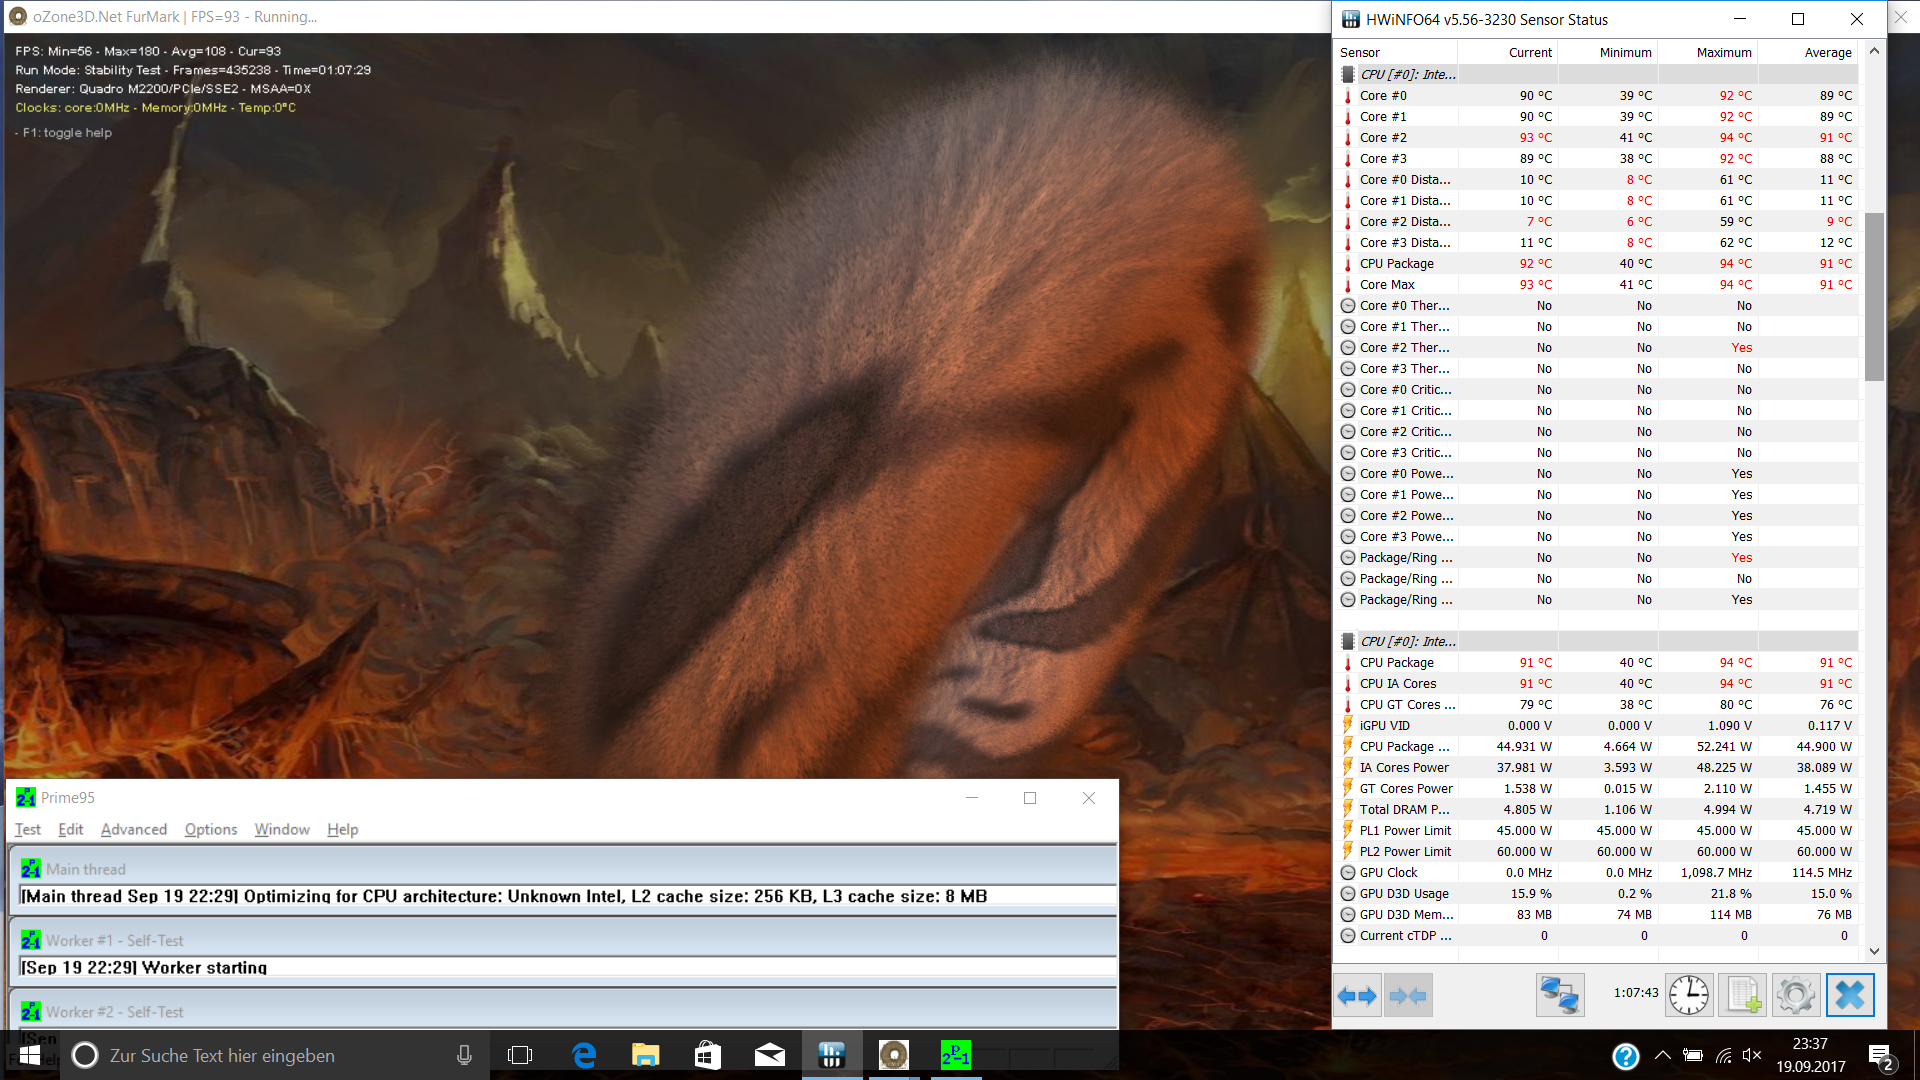
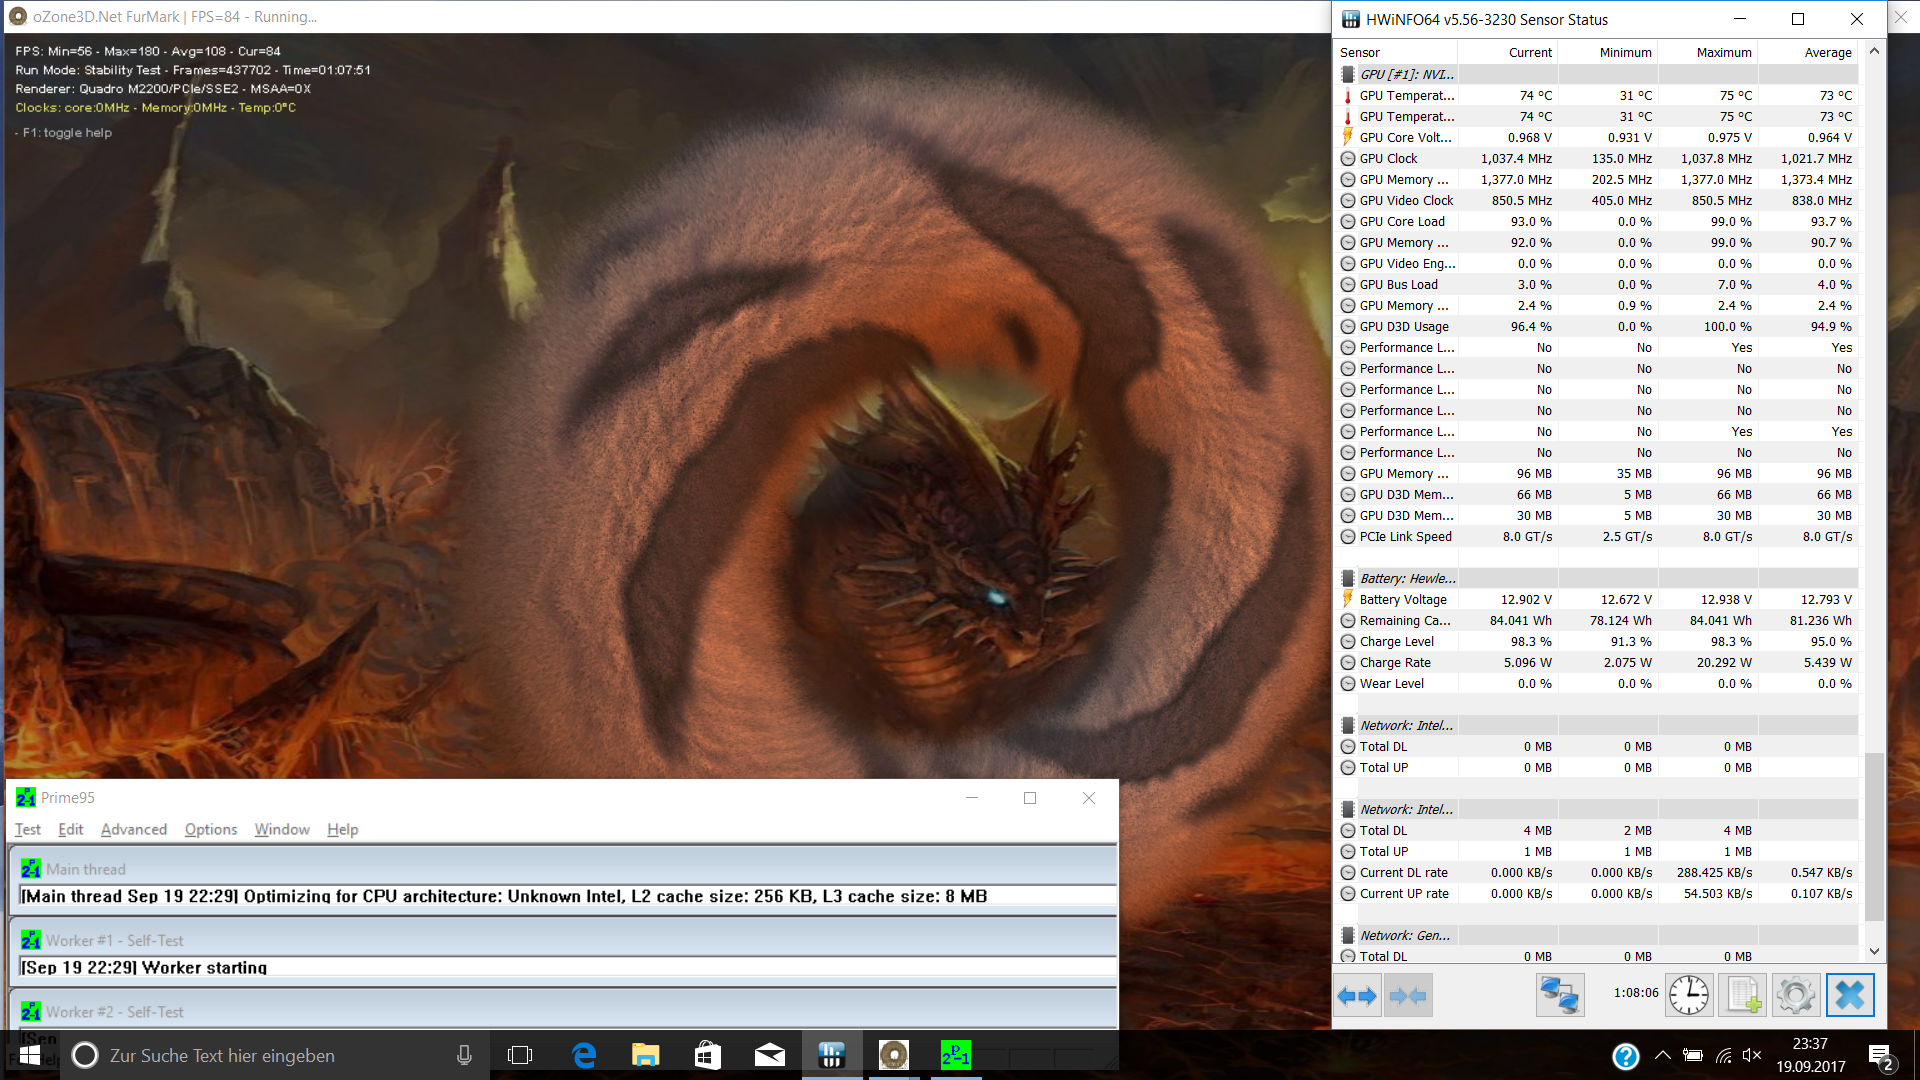
In the stress test, we run Prime95 and FurMark to simulate a situation of maximum load. A laptop will generally only experience this level of load in exceptional circumstances, like rendering and gaming. During the test, the CPU briefly throttled due to excessive heat. In this situation, the clock frequency fell below the base rate of 3.1 GHz to around 3 GHz. After more than an hour in the test, the average clock rate came to almost exactly 3.1 GHz. All told, we expected the cooling system in a full-fledged mobile workstation to be able to handle a CPU that uses more than the standard 45 watts. Because the cooling system clearly is not up to the task, it is questionable whether the expensive processor is worth the extra cost.
On a positive note: When we ended the stress test and immediately started 3DMark again, the laptop achieved the same scores as after a cold boot.
(-) The maximum temperature on the upper side is 50.8 °C / 123 F, compared to the average of 38.2 °C / 101 F, ranging from 22.2 to 69.8 °C for the class Workstation.
(-) The bottom heats up to a maximum of 57.4 °C / 135 F, compared to the average of 41.1 °C / 106 F
(+) In idle usage, the average temperature for the upper side is 25.5 °C / 78 F, compared to the device average of 32 °C / 90 F.
(±) Playing The Witcher 3, the average temperature for the upper side is 33.5 °C / 92 F, compared to the device average of 32 °C / 90 F.
(+) The palmrests and touchpad are cooler than skin temperature with a maximum of 29 °C / 84.2 F and are therefore cool to the touch.
(±) The average temperature of the palmrest area of similar devices was 27.8 °C / 82 F (-1.2 °C / -2.2 F).
Speakers
Quiet and thin. Users who want a great listening experience will need to plug in external devices. The ZBook's speakers are extremely quiet – not even loud enough for Skype calls in noisy environments.
HP ZBook 15 G4-Y4E80AV audio analysis
(±) | speaker loudness is average but good (77.1 dB)
Bass 100 - 315 Hz
(±) | reduced bass - on average 13.6% lower than median
(±) | linearity of bass is average (9.7% delta to prev. frequency)
Mids 400 - 2000 Hz
(+) | balanced mids - only 3.8% away from median
(+) | mids are linear (5.8% delta to prev. frequency)
Highs 2 - 16 kHz
(±) | higher highs - on average 7% higher than median
(+) | highs are linear (5.8% delta to prev. frequency)
Overall 100 - 16.000 Hz
(±) | linearity of overall sound is average (19.2% difference to median)
Compared to same class
» 67% of all tested devices in this class were better, 5% similar, 28% worse
» The best had a delta of 7%, average was 17%, worst was 35%
Compared to all devices tested
» 46% of all tested devices were better, 7% similar, 46% worse
» The best had a delta of 4%, average was 23%, worst was 134%
Lenovo ThinkPad P51 20HH0016GE audio analysis
(-) | not very loud speakers (64.5 dB)
Bass 100 - 315 Hz
(±) | reduced bass - on average 12.3% lower than median
(±) | linearity of bass is average (10.4% delta to prev. frequency)
Mids 400 - 2000 Hz
(+) | balanced mids - only 3.9% away from median
(+) | mids are linear (6.4% delta to prev. frequency)
Highs 2 - 16 kHz
(+) | balanced highs - only 2.7% away from median
(±) | linearity of highs is average (13.3% delta to prev. frequency)
Overall 100 - 16.000 Hz
(±) | linearity of overall sound is average (24.7% difference to median)
Compared to same class
» 86% of all tested devices in this class were better, 2% similar, 12% worse
» The best had a delta of 7%, average was 17%, worst was 35%
Compared to all devices tested
» 75% of all tested devices were better, 5% similar, 19% worse
» The best had a delta of 4%, average was 23%, worst was 134%
frequency diagram in comparison (checkboxes above selectable/deselectable!)
Energy Management
Our test device's energy usage in idle mode is similar to that of the ZBook G3. At a maximum of 12.7 watts, the laptop proves less thirsty than the Lenovo ThinkPad P51, which needs up to 22 watts. Only under load does the ZBook G4's new hardware make its presence known. The power consumption rate rises to up to 154 watts, though it falls back to 143 watts in a matter of seconds. In comparison, the similarly equipped Lenovo mobile workstation uses just 130 watts.
| Off / Standby | |
| Idle | |
| Load |
|
Key:
min: | |
| HP ZBook 15 G4-Y4E80AV E3-1535M v6, Quadro M2200, Samsung SSD SM961 1TB M.2 MZVKW1T0HMLH, IPS, 1920x1080, 15.6" | Lenovo ThinkPad P51 20HH0016GE E3-1505M v6, Quadro M2200, Samsung PM961 NVMe MZVLW512HMJP, IPS, 3840x2160, 15.6" | MSI WE72 7RJ i7-7700HQ, Quadro M2200, Samsung SM961 MZVPW256 m.2 PCI-e, IPS, 1920x1080, 17.3" | HP ZBook 15 G3 E3-1505M v5, Quadro M2000M, Samsung SM951 MZVPV512HDGL m.2 PCI-e, UWVA-IPS, 1920x1080, 15.6" | |
|---|---|---|---|---|
| Power Consumption | -35% | -68% | -2% | |
| Idle Minimum * (Watt) | 5.9 | 8.6 -46% | 15 -154% | 5.7 3% |
| Idle Average * (Watt) | 8.9 | 15.9 -79% | 20.1 -126% | 12.2 -37% |
| Idle Maximum * (Watt) | 12.7 | 22.1 -74% | 23.8 -87% | 12.6 1% |
| Load Average * (Watt) | 95.2 | 84.4 11% | 85.6 10% | 83.1 13% |
| Witcher 3 ultra * (Watt) | 87.7 | |||
| Load Maximum * (Watt) | 154 | 130.6 15% | 128 17% | 138.2 10% |
* ... smaller is better
Battery Life
HP continues to supply their ZBook with a 90 Wh battery. Curiously, the HW Info diagnostic tool registers a capacity of just 84 Wh. Exact size aside, we wanted to take a closer look at the 9-cell battery.
To test a laptop's maximum endurance, we utilize the Battery Eater test, which simulates system use while reading texts. At the lowest brightness setting and with the communications modules turned off, the HP mobile workstation runs for over 18 hours. The rest of the competition cannot hold a candle to that run time. The Lenovo ThinkPad P51 gives up the ghost two hours earlier. The G3 version runs out of steam well before its successor too (14 hours).
Our WLAN test simulates practical, everyday use. With the brightness level set to 150 cd/m², we run a script to imitate web surfing. At around 9 hours, here too our test device proves to be of an athletic build. The competitor from Lenovo reaches nearly seven hours.
Lastly, we look at the device's minimum expected run time using the Battery Eater Classic test. The ZBook retires after less than two hours here. The laptop's predecessor reached a similar run time. The ThinkPad P51 only managed 1.5 hours.
The G4's battery life was even shorter when we started SPECviewperf 12. After just one hour and 26 minutes, the laptop cut out.
On the subject of charge time: The ZBook needs around an hour to charge to 80%. Another 45 minutes are required to reach the 99% mark. The device needs a good two hours for the full 100%.
| HP ZBook 15 G4-Y4E80AV E3-1535M v6, Quadro M2200, 90 Wh | Lenovo ThinkPad P51 20HH0016GE E3-1505M v6, Quadro M2200, 90 Wh | MSI WE72 7RJ i7-7700HQ, Quadro M2200, 51 Wh | HP ZBook 15 G3 E3-1505M v5, Quadro M2000M, 90 Wh | Lenovo ThinkPad P50 E3-1505M v5, Quadro M2000M, 90 Wh | |
|---|---|---|---|---|---|
| Battery runtime | -20% | -69% | -22% | -41% | |
| Reader / Idle (h) | 18.3 | 16.4 -10% | 4.5 -75% | 13.7 -25% | 9 -51% |
| H.264 (h) | 10.5 | 7.6 -28% | 3 -71% | 7.5 -29% | 5.5 -48% |
| WiFi v1.3 (h) | 9.1 | 6.9 -24% | 3 -67% | 6.4 -30% | 4.8 -47% |
| Load (h) | 1.9 | 1.6 -16% | 0.7 -63% | 1.8 -5% | 1.6 -16% |
Pros
Cons
Verdict
The ZBook enters the next round with a persuasive increase in performance power. In our review of the last generation, all we had were words of praise for the design and stability of the case. We were also impressed with the comprehensive choice of ports and good upgradability. The current ZBook G4 is once again available in a number of different configurations. We had the pleasure of testing the top model. Only in the realm of the display did we see a lot of room for improvement. We were particularly disappointed that the display's color space coverage is smaller than the previous generation's coverage. However, in every other respect, the G4 is better than its predecessor, especially given the great power that lies dormant inside. The potent Xeon processor and the GPU upgrade together produce a marked upsurge in computing and graphics performance. Despite this increase in performance, the laptop's temperatures remain somewhat cooler, and its energy management is better balanced. But, as if that were not enough, the battery life is now strong enough for even a somewhat prolonged work day. Unfortunately, the overall picture is a little tarnished by the weak and quiet speakers. We hope to see improvements here in coming generations.
All in all, HP's newest ZBook proves once again to be a very good mobile workstation.
The ZBook is available in Germany starting at 2200 Euros (~$2600; US version available for $1929). Our test device costs a steep 4650 Euros (~$5500; similar version available in the US for $3630). However, a configuration with a slightly weaker and cheaper processor may be more sensible. Before making a decision, a look at the competition – like the Lenovo ThinkPad P51 – is certainly worthwhile.
HP ZBook 15 G4-Y4E80AV
- 09/27/2017 v6 (old)
Nino Ricchizzi
Price comparison
