HP ZBook 15u G4 (7500U, FirePro W4190M) Workstation Review
For the original German article, see here.
When imagining a mobile workstation, images of bulky notebooks with top-of-the-line components come to mind. However, the thinner-and-lighter trend has crept up and invaded this segment as well, and OEMs are more than happy to abide.
The current review unit, the ZBook 15u G4, is one of those “ultrabook workstations”. In 2016, we’ve already had last year’s Skylake-based G3 in review. This year’s G4 is equipped with Kaby Lake processors, and we don’t expect to see Kaby Lake-Refresh CPUs in workstations for another six months.
Unlike the ZBook Studio, the ZBook 15u not only shares its footprint with ultrabooks but also shares its processor. Instead of powerful HQ-class quad-core CPUs you’ll find U-class dual-core processors promising longer battery life, lower temperatures, and a lower price. The main downside is their lower performance. Its main competitor is Lenovo’s ThinkPad P51s – a notebook that is based around the exact same idea and concept as the ZBook 15u G4. Other noteworthy competitors are the Dell Precision 5520, the Apple MacBook Pro 15, and the ZBook Studio G4, every single one of which is equipped with an Intel HQ-class quad-core microprocessor.
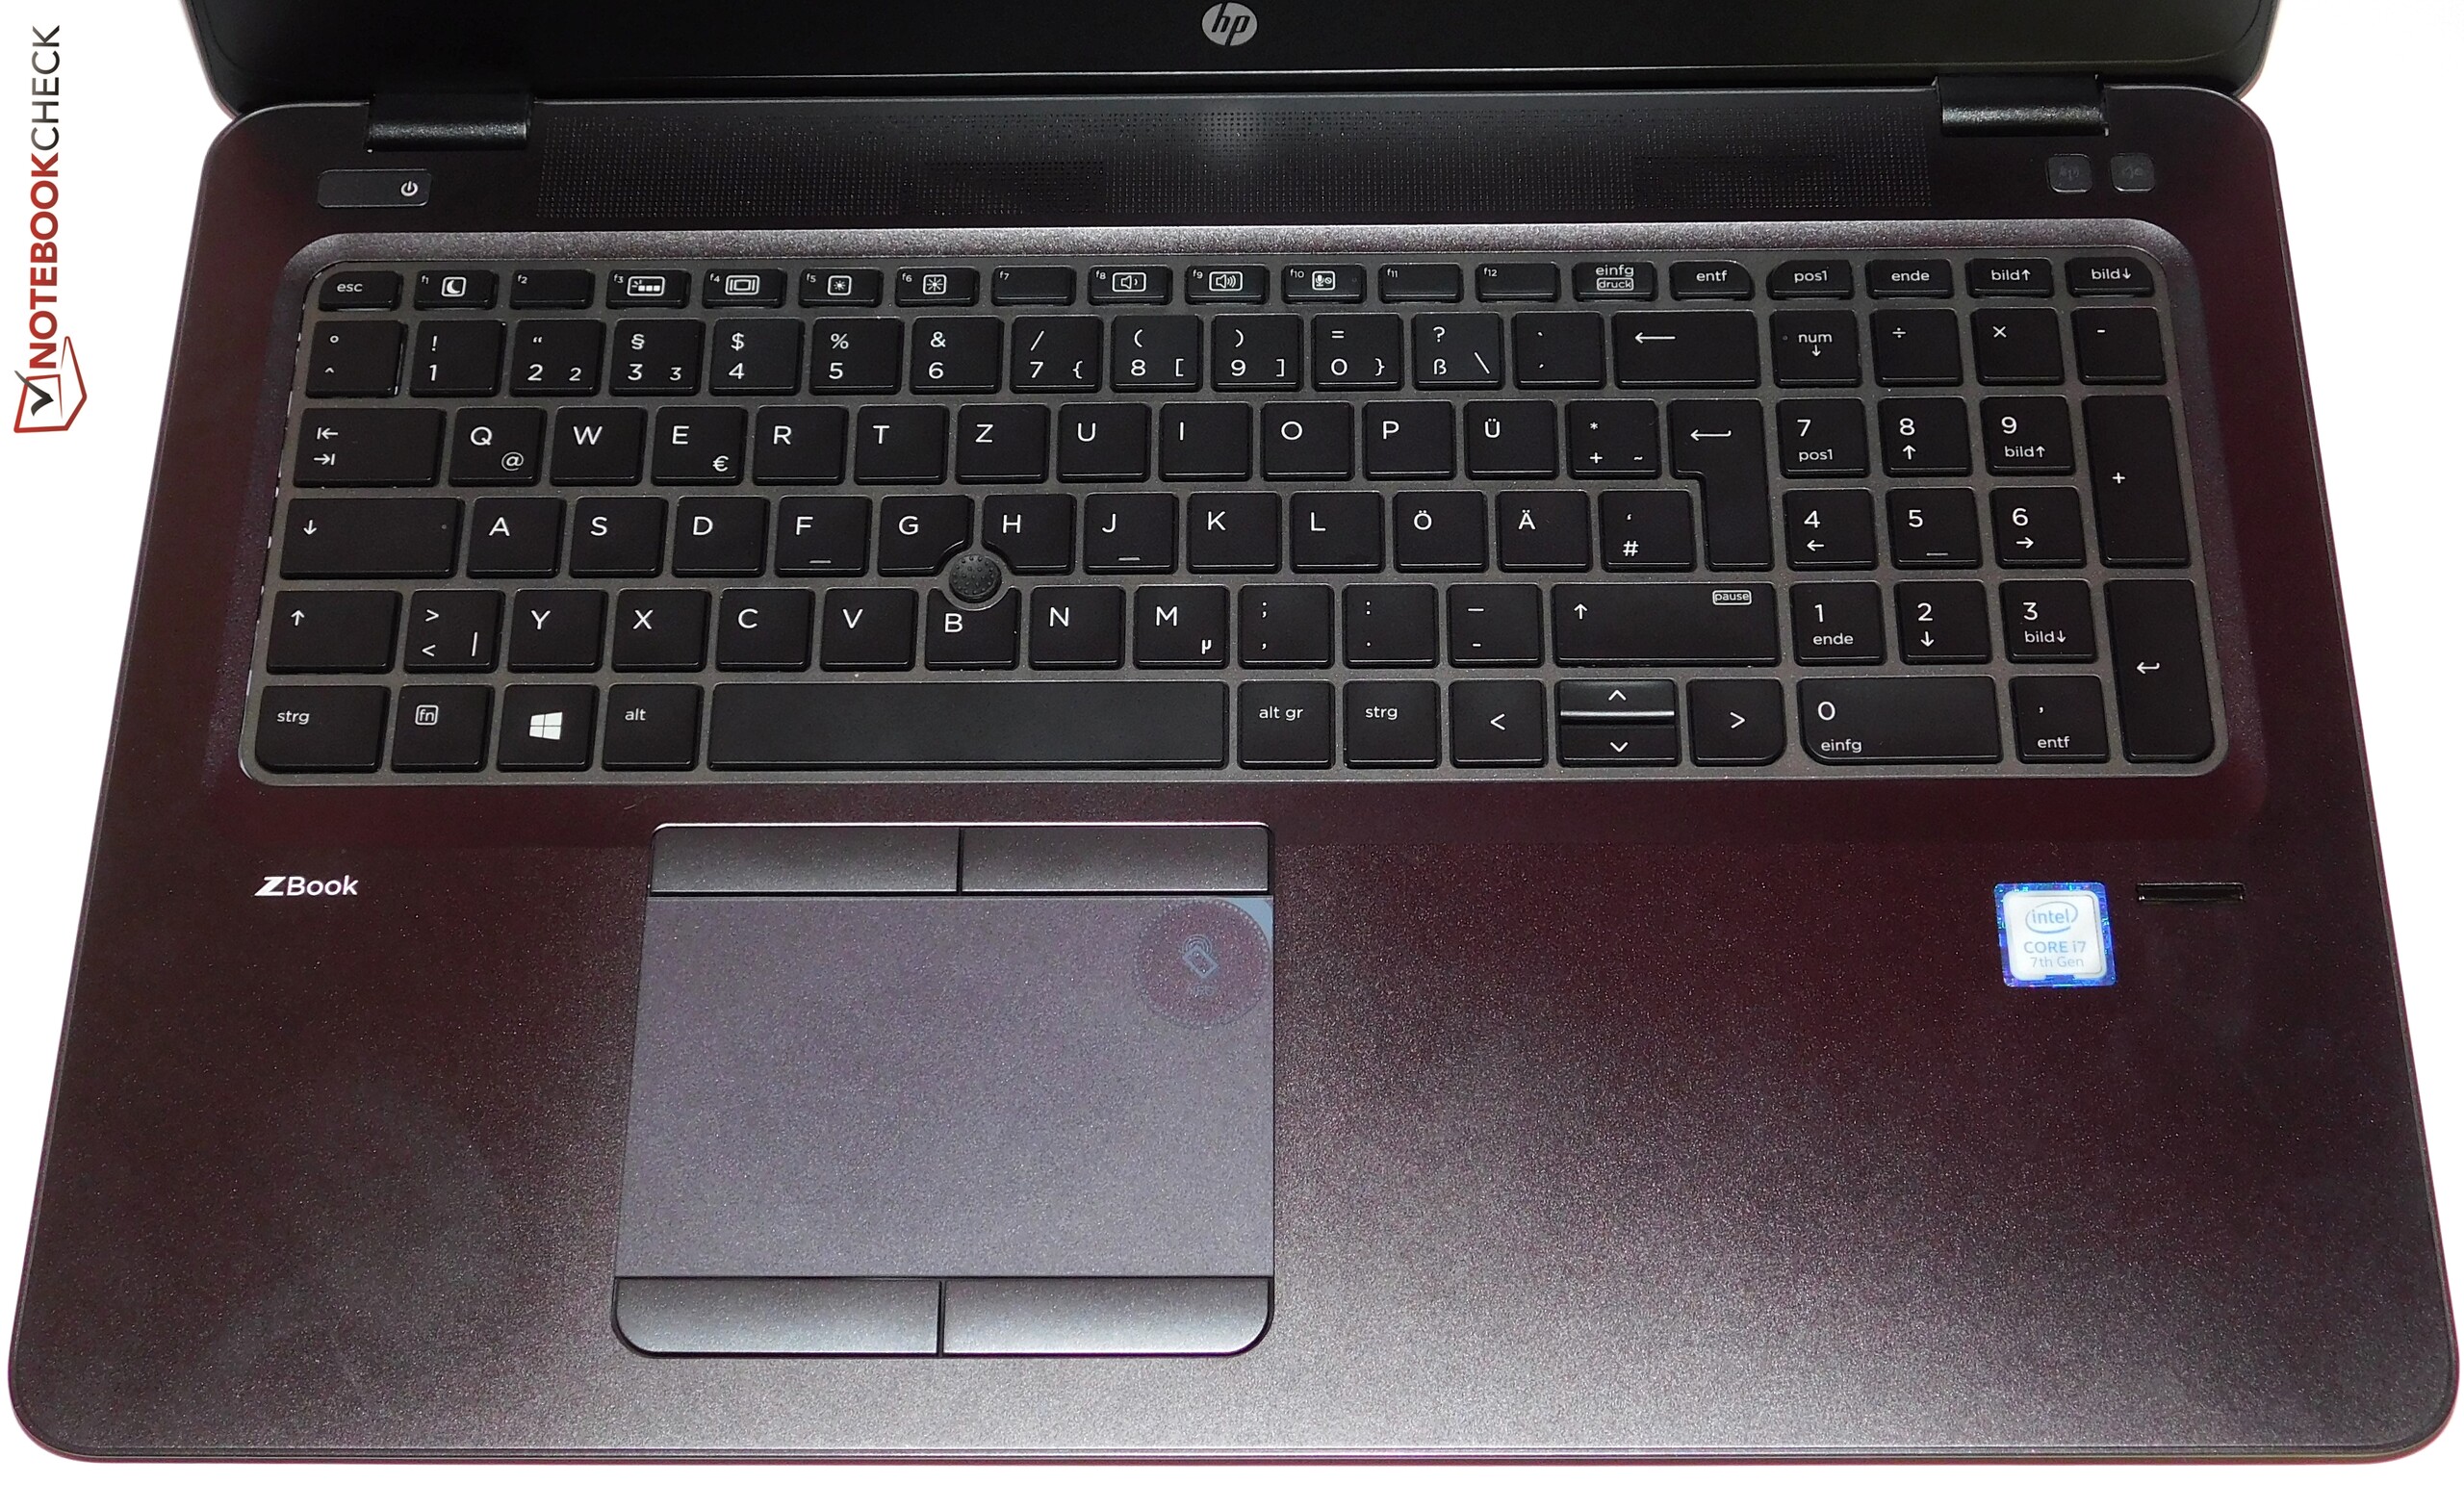
Given that HP has refrained from modifying the case compared to the G4’s direct predecessor we’ll skip over reviewing connectivity, case, and input devices. If you’re interested in these aspects we would like to refer you to last year’s review of the ZBook 15u G3.
Connectivity
SD-Card Reader
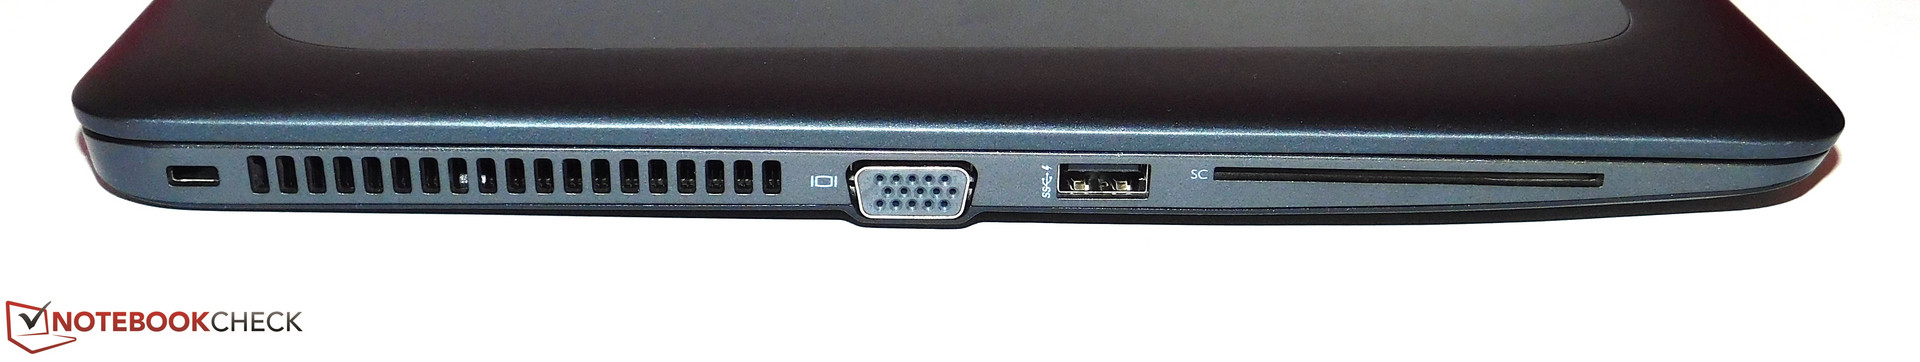
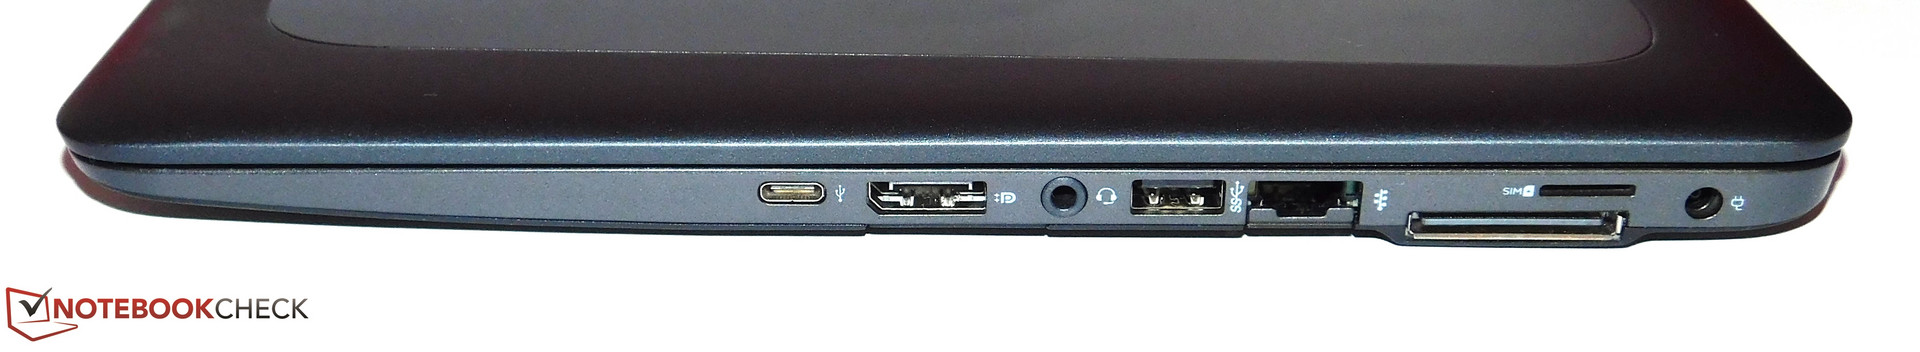
The SD-card reader is located somewhat hidden on the right-hand side. Benchmarked with our usual 64 GB Toshiba Exceria Pro SDXC UHS-II reference card it performed very similar to the ThinkPad's SD-card reader: mediocre at best. The other two competitors, the Dell Precision 5520 and the ZBook Studio G4, were much faster.
| SD Card Reader | |
| average JPG Copy Test (av. of 3 runs) | |
| HP ZBook Studio G4-Y6K17EA (Toshiba Exceria Pro SDXC 64 GB UHS-II) | |
| Dell Precision 5520 UHD (Toshiba Exceria Pro SDXC 64 GB UHS-II) | |
| HP ZBook 15u G4 (Toshiba Exceria Pro SDXC 64 GB UHS-II) | |
| Lenovo ThinkPad P51s 20HB000SGE (Toshiba Exceria Pro SDXC 64 GB UHS-II) | |
| maximum AS SSD Seq Read Test (1GB) | |
| Dell Precision 5520 UHD (Toshiba Exceria Pro SDXC 64 GB UHS-II) | |
| HP ZBook Studio G4-Y6K17EA (Toshiba Exceria Pro SDXC 64 GB UHS-II) | |
| Lenovo ThinkPad P51s 20HB000SGE (Toshiba Exceria Pro SDXC 64 GB UHS-II) | |
| HP ZBook 15u G4 (Toshiba Exceria Pro SDXC 64 GB UHS-II) | |
Communication
One of the updates compared to last year’s model is the Wi-Fi chip. Instead of Intel’s Wireless 8260 the G4 is now equipped with the Intel Wireless 8265, a very frequently used 2x2 AC Wi-Fi modem. While the ZBook performed worse than expected, especially when receiving data, this remained unnoticeable in everyday use.
Display
Four different display options are available for the ZBook 15u, three of which are different FHD panels (1920x1080): two are matte, one is reflective. The latter is equipped with a touch-sensitive surface. Only one of these three is an IPS panel (referred to as UWVA in HP terminology) while the other two are TN panels (SVA). Our review unit was equipped with a matte FHD IPS panel without touch. The fourth display option is a UHD / 4K IPS panel (3840x2160) which is currently not available in all countries.
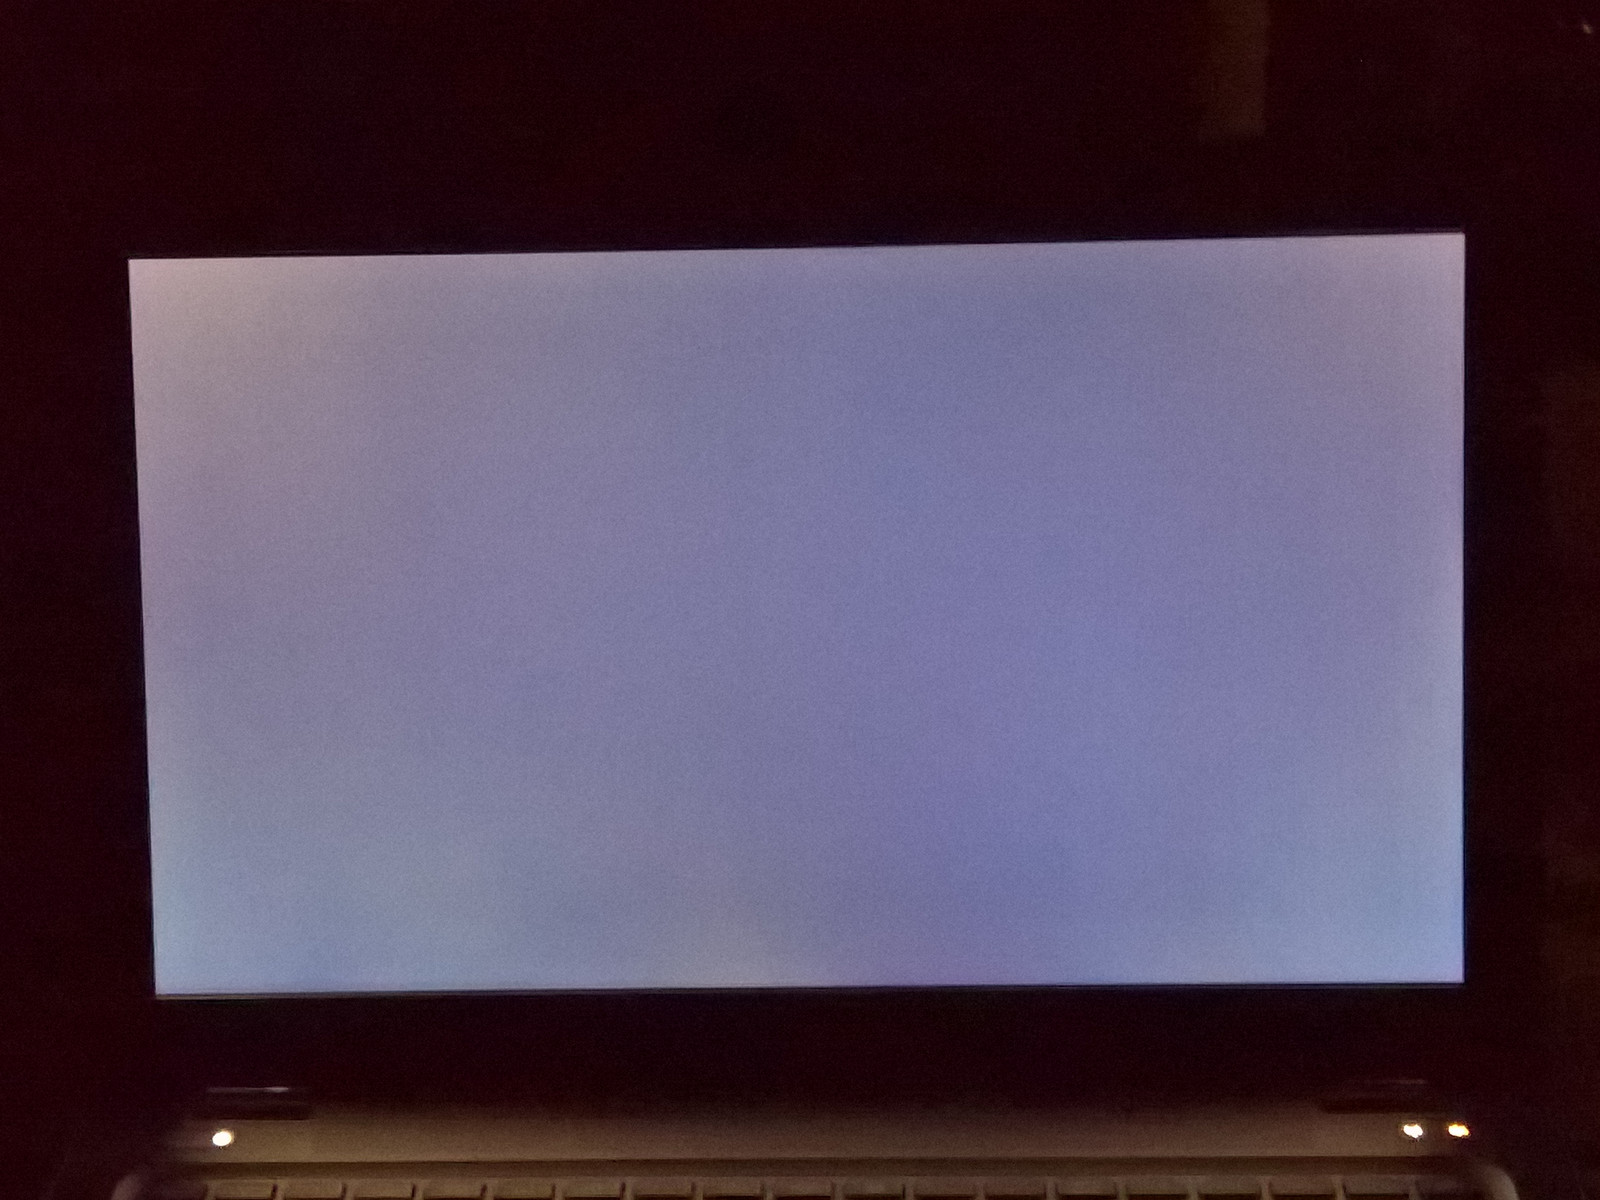
Fortunately, our review unit’s panel was very decent overall. Its brightness of 309 nits on average was okay; the P51s' UHD panel is 20 nits darker, the Precision 5520's and ZBook Studio G4's UHD panels are 30 and 60 nits darker, respectively. Only the MacBook Pro 15's excellent display outshines the entire competition by a huge margin. Unfortunately, the ZBook’s contrast ratio of only 711:1 is less than adequate.
We found almost no traces of backlight-bleeding, and while the display does use PWM for brightness regulation the frequency was very high and should thus not be a problem for anyone.
| |||||||||||||||||||||||||
Brightness Distribution: 92 %
Center on Battery: 318 cd/m²
Contrast: 711:1 (Black: 0.45 cd/m²)
ΔE ColorChecker Calman: 5.5 | ∀{0.5-29.43 Ø4.72}
ΔE Greyscale Calman: 4.8 | ∀{0.09-98 Ø4.97}
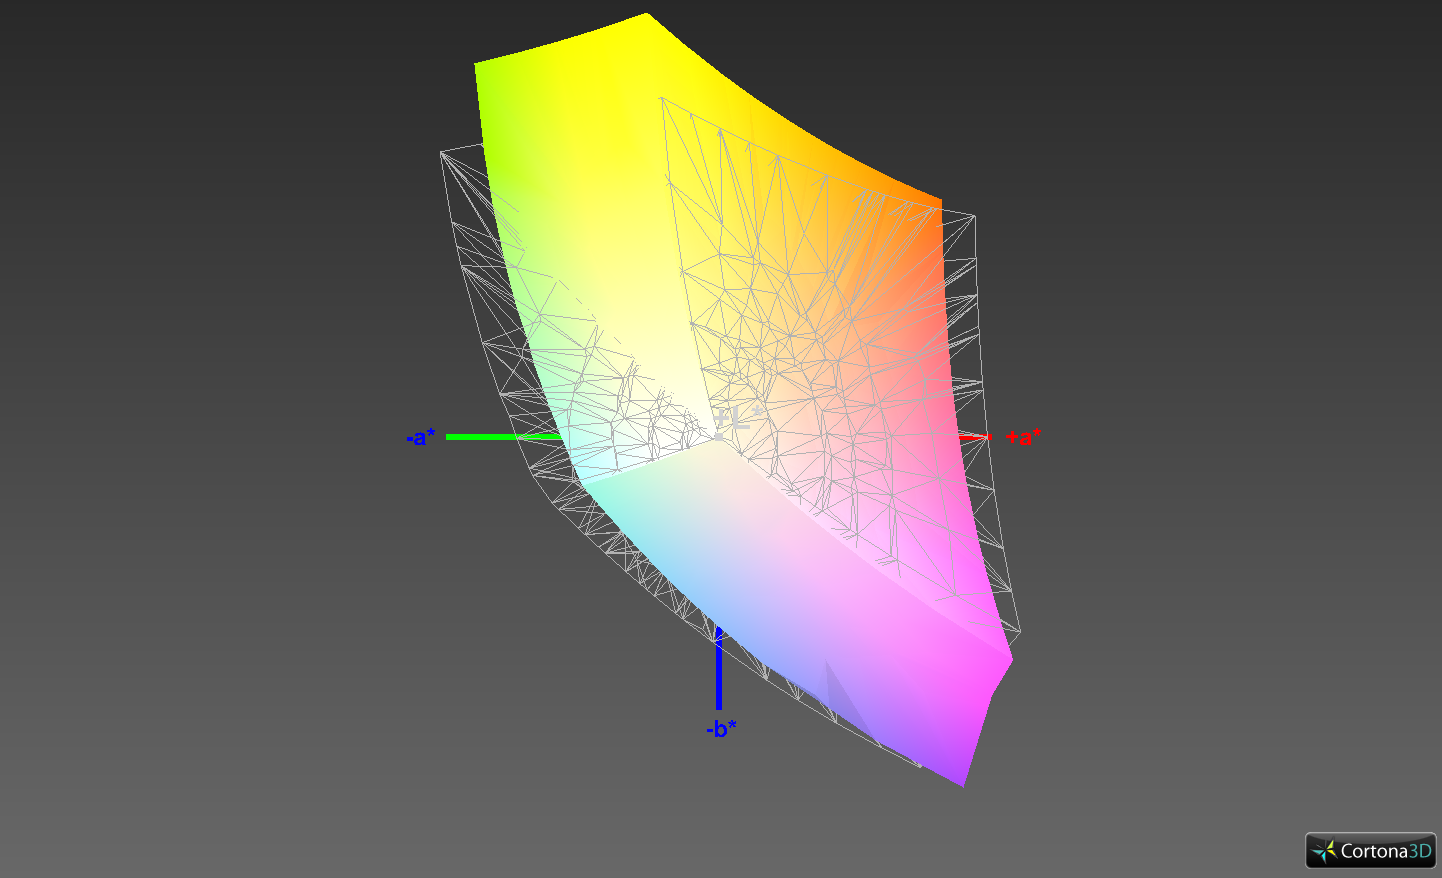
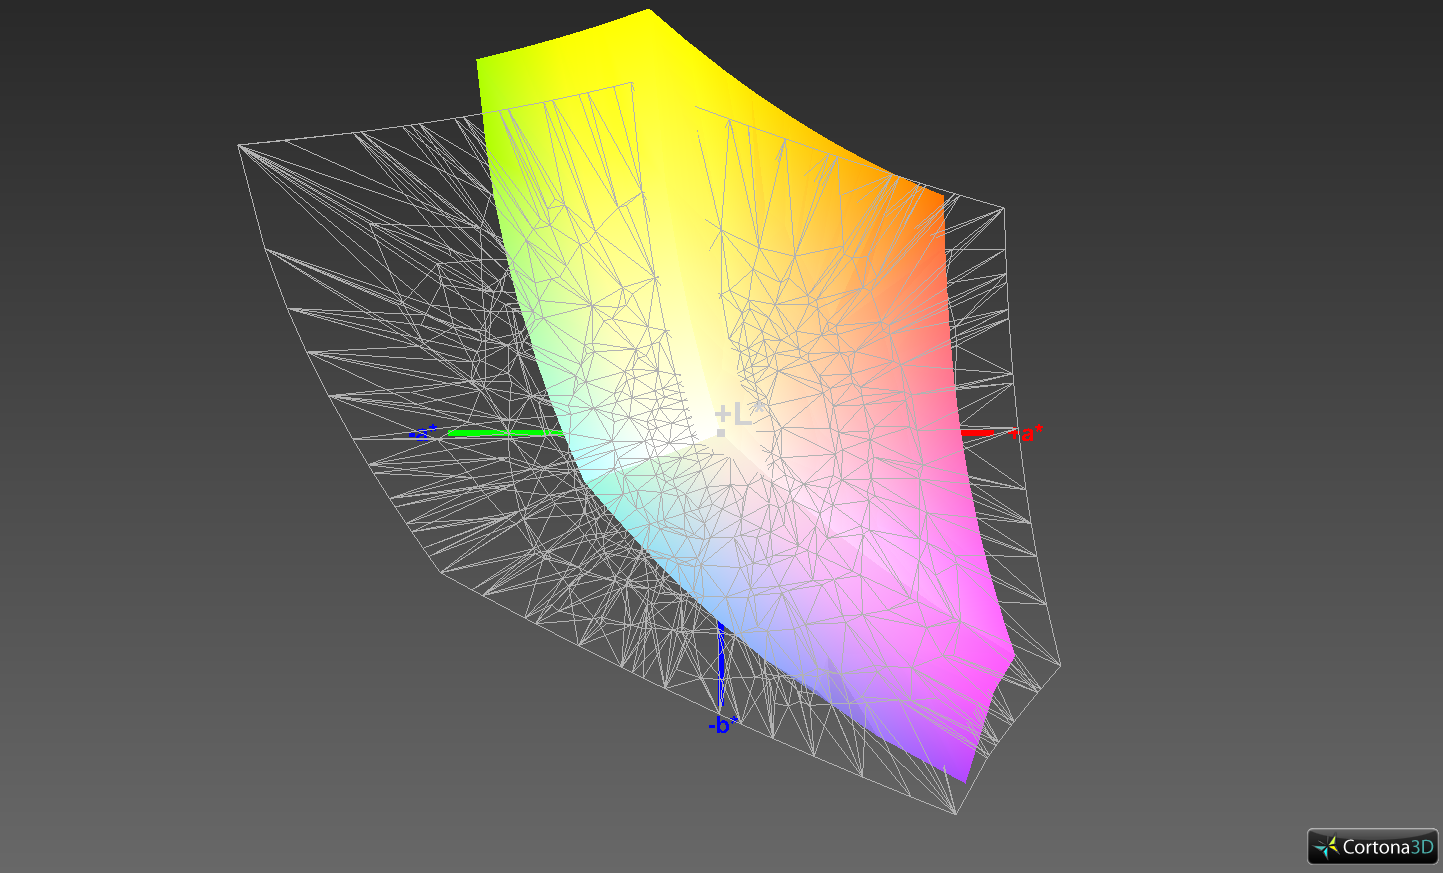
83.8% sRGB (Argyll 1.6.3 3D)
55% AdobeRGB 1998 (Argyll 1.6.3 3D)
61.3% AdobeRGB 1998 (Argyll 3D)
83.9% sRGB (Argyll 3D)
64.8% Display P3 (Argyll 3D)
Gamma: 2.28
CCT: 6987 K
| HP ZBook 15u G4 LP156WF6, , 1920x1080, 15.6" | Lenovo ThinkPad P51s 20HB000SGE BOE NV156QUM-N44, , 3840x2160, 15.6" | Dell Precision 5520 UHD SHP1476, , 3840x2160, 15.6" | Apple MacBook Pro 15 2017 (2.8 GHz, 555) APPA031, , 2880x1800, 15.4" | HP ZBook Studio G4-Y6K17EA SHP1445, , 3840x2160, 15.6" | HP ZBook 15u G3 CMN15C3, , 1920x1080, 15.6" | |
|---|---|---|---|---|---|---|
| Display | 9% | 11% | 37% | 35% | -11% | |
| Display P3 Coverage (%) | 64.8 | 69.7 8% | 67.4 4% | 97.9 51% | 82.6 27% | 53.2 -18% |
| sRGB Coverage (%) | 83.9 | 91.2 9% | 98.5 17% | 99.9 19% | 98.9 18% | 80.1 -5% |
| AdobeRGB 1998 Coverage (%) | 61.3 | 66.8 9% | 68.9 12% | 85.9 40% | 98 60% | 54.9 -10% |
| Response Times | -5% | -69% | -38% | -25% | -36% | |
| Response Time Grey 50% / Grey 80% * (ms) | 39.6 ? | 38.4 ? 3% | 59.2 ? -49% | 48 ? -21% | 44.8 ? -13% | 45.6 ? -15% |
| Response Time Black / White * (ms) | 22 ? | 24.8 ? -13% | 41.6 ? -89% | 33.8 ? -54% | 30 ? -36% | 34.4 ? -56% |
| PWM Frequency (Hz) | 20830 ? | 980 ? | 119000 ? | 1497 ? | 198.4 ? | |
| Screen | 14% | 18% | 50% | 32% | -39% | |
| Brightness middle (cd/m²) | 320 | 317 -1% | 372.4 16% | 545 70% | 324 1% | 297.8 -7% |
| Brightness (cd/m²) | 310 | 290 -6% | 368 19% | 523 69% | 338 9% | 284 -8% |
| Brightness Distribution (%) | 92 | 85 -8% | 90 -2% | 86 -7% | 78 -15% | 89 -3% |
| Black Level * (cd/m²) | 0.45 | 0.32 29% | 0.48 -7% | 0.44 2% | 0.3 33% | 0.849 -89% |
| Contrast (:1) | 711 | 991 39% | 776 9% | 1239 74% | 1080 52% | 351 -51% |
| Colorchecker dE 2000 * | 5.5 | 3.6 35% | 2.6 53% | 1.6 71% | 1.6 71% | 8.68 -58% |
| Colorchecker dE 2000 max. * | 9 | 6.6 27% | 5.6 38% | 3.8 58% | 4.6 49% | 14.98 -66% |
| Greyscale dE 2000 * | 4.8 | 4.2 12% | 3.7 23% | 1.9 60% | 2.5 48% | 9.3 -94% |
| Gamma | 2.28 96% | 2.24 98% | 2.14 103% | 2.26 97% | 2.21 100% | 2.27 97% |
| CCT | 6987 93% | 6740 96% | 7096 92% | 6834 95% | 6273 104% | 10585 61% |
| Color Space (Percent of AdobeRGB 1998) (%) | 55 | 59.5 8% | 63 15% | 85.7 56% | 50.99 -7% | |
| Color Space (Percent of sRGB) (%) | 83.8 | 91.1 9% | 99 18% | 98.9 18% | 80.42 -4% | |
| Total Average (Program / Settings) | 6% /
11% | -13% /
5% | 16% /
33% | 14% /
25% | -29% /
-33% |
* ... smaller is better
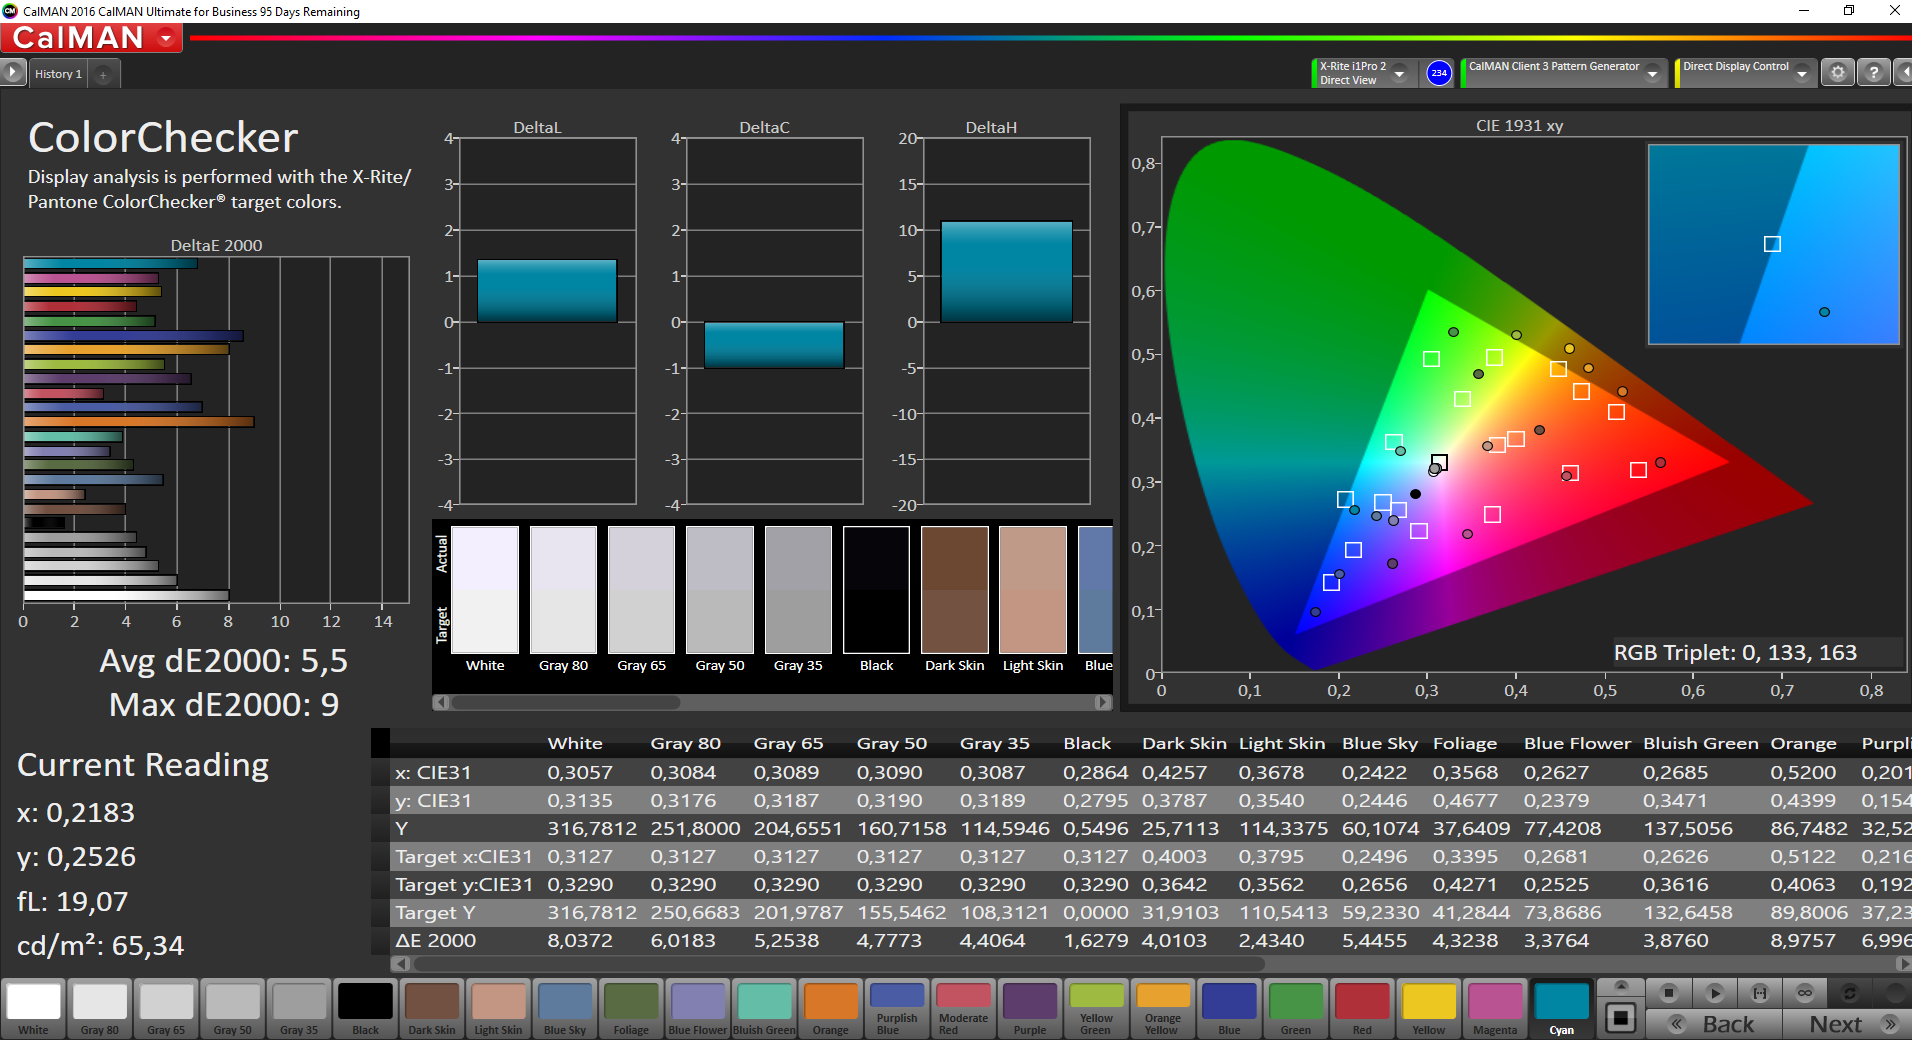
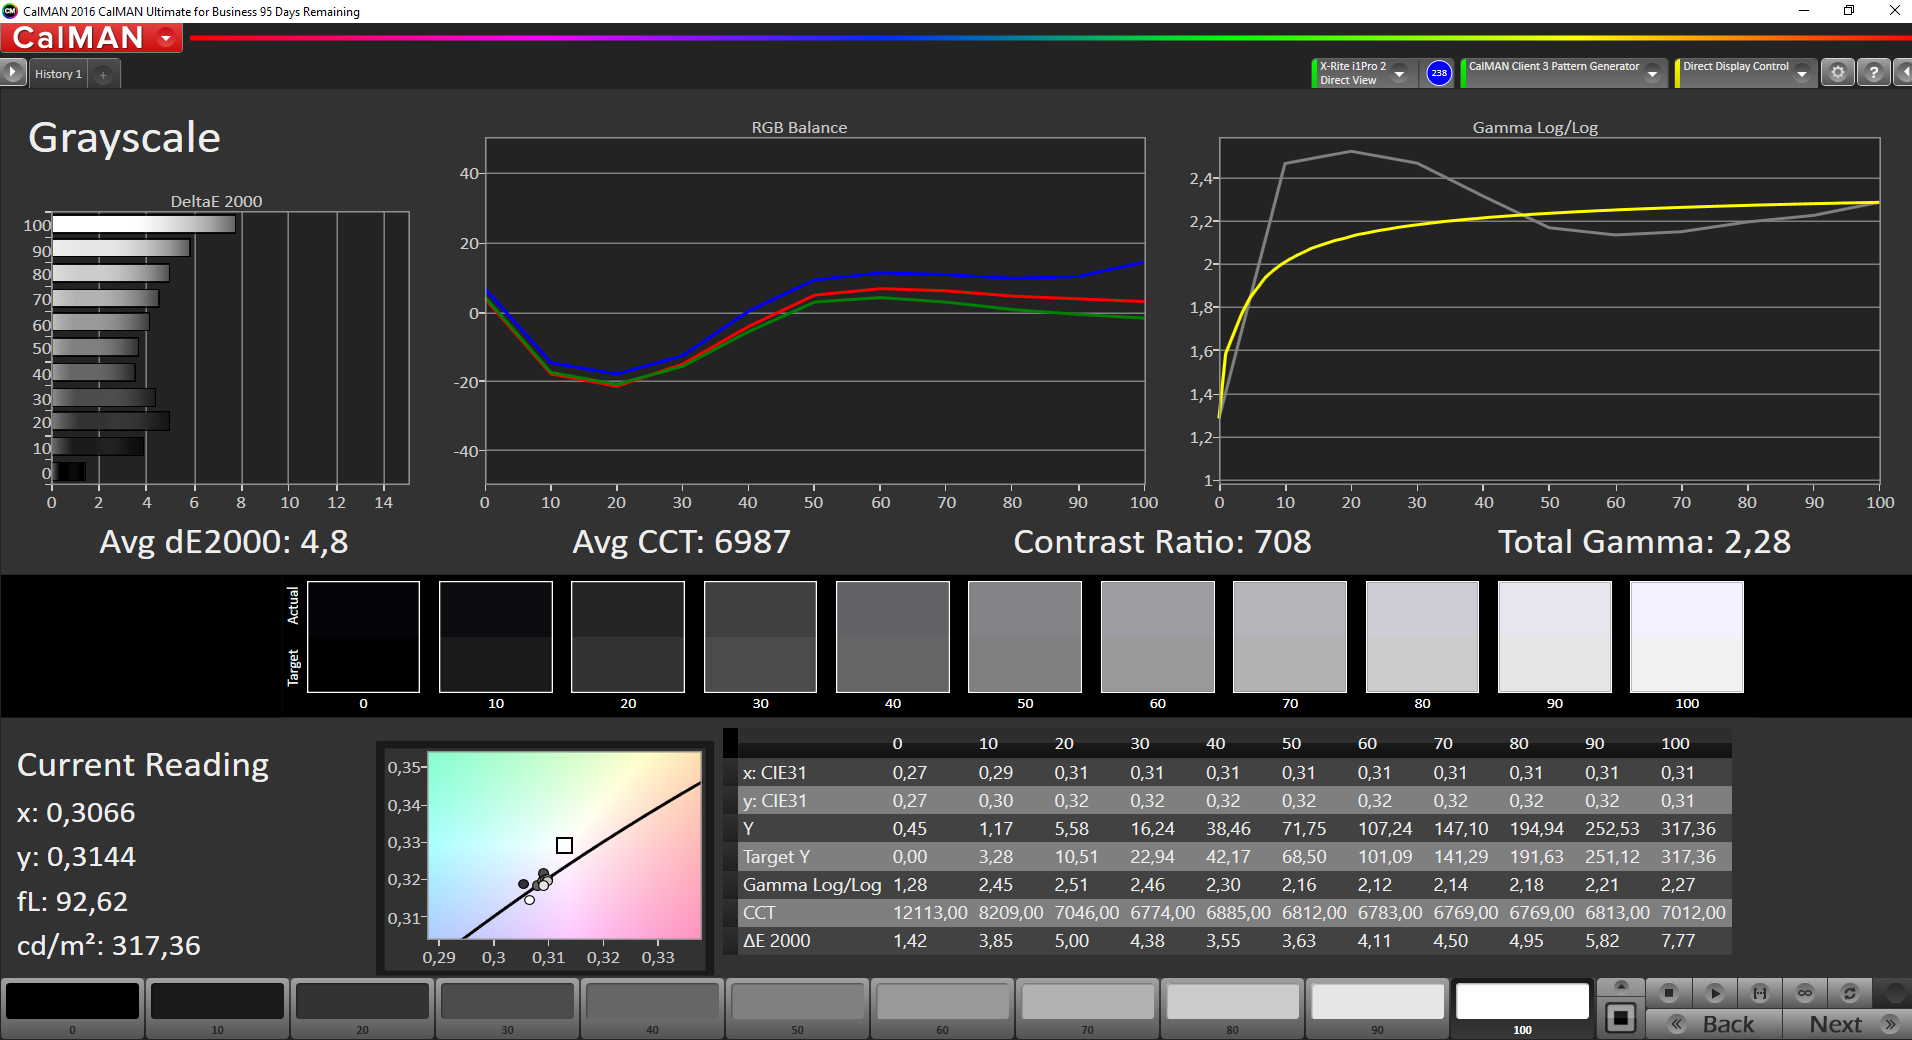
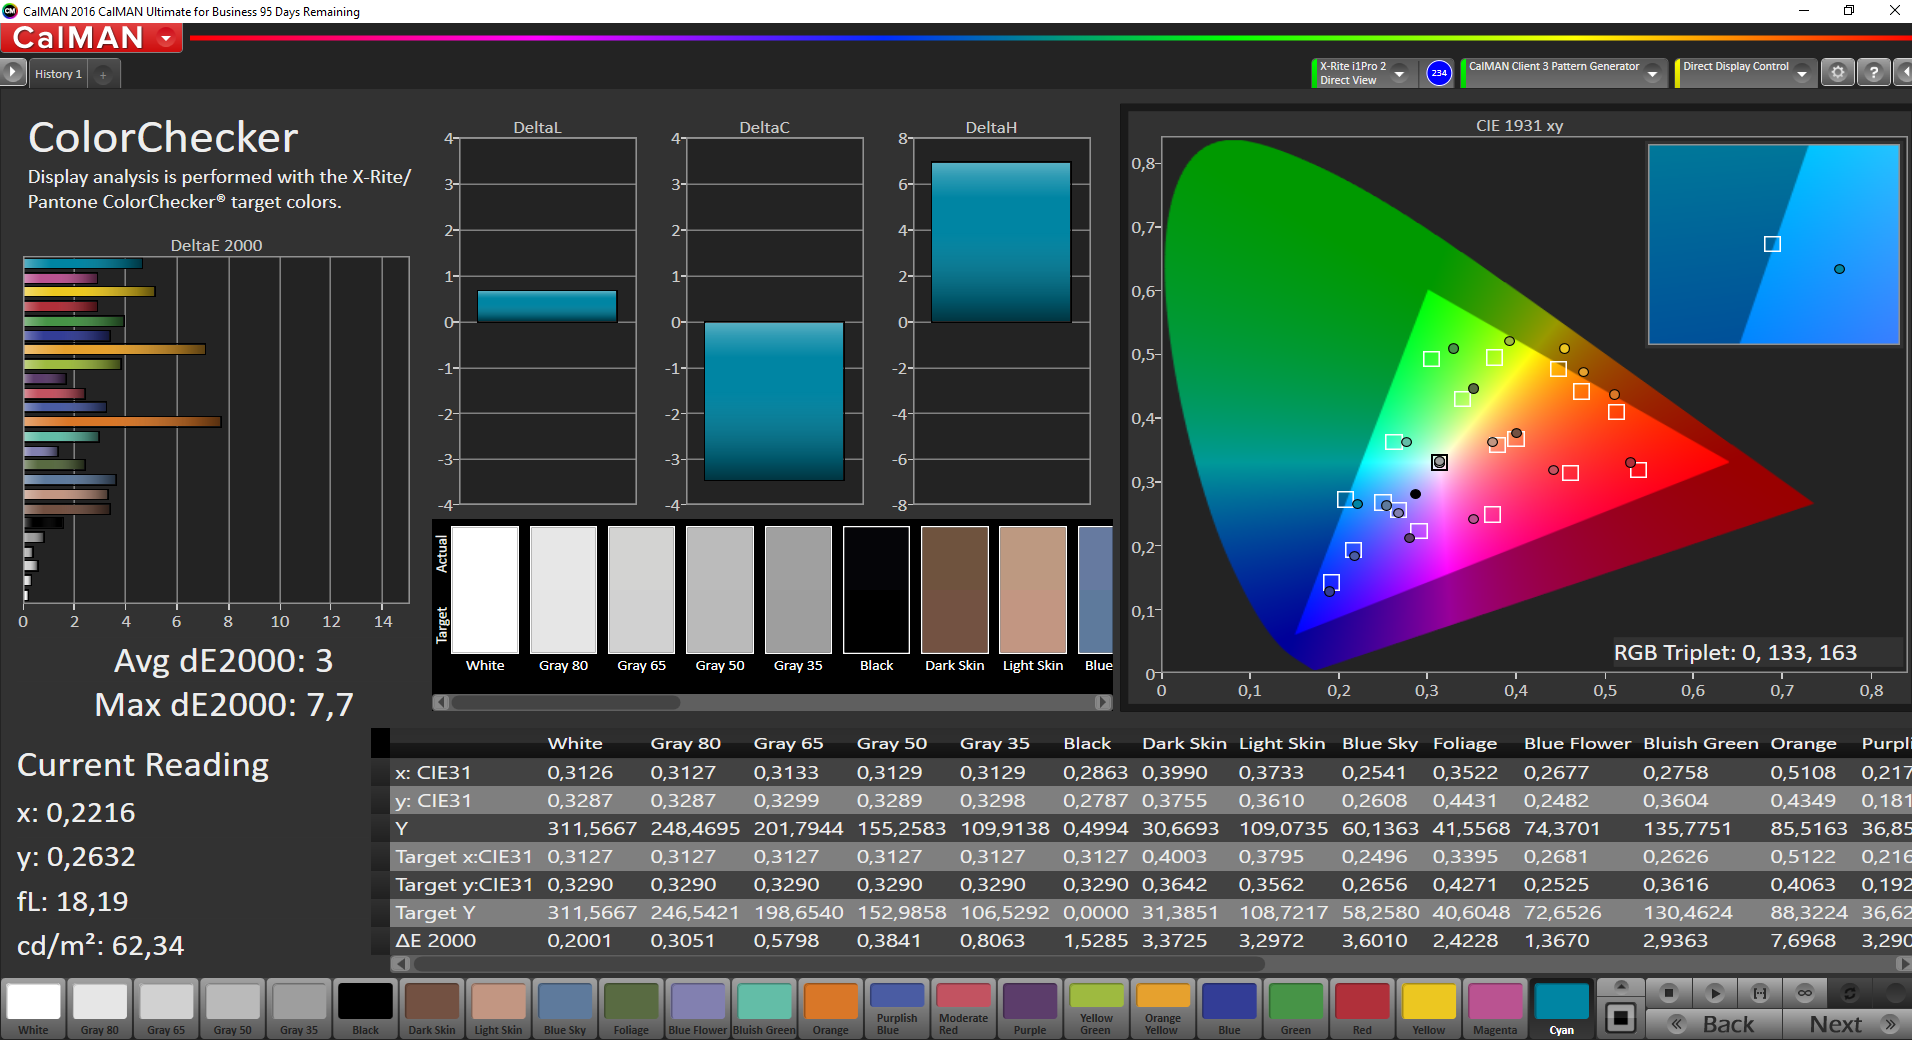
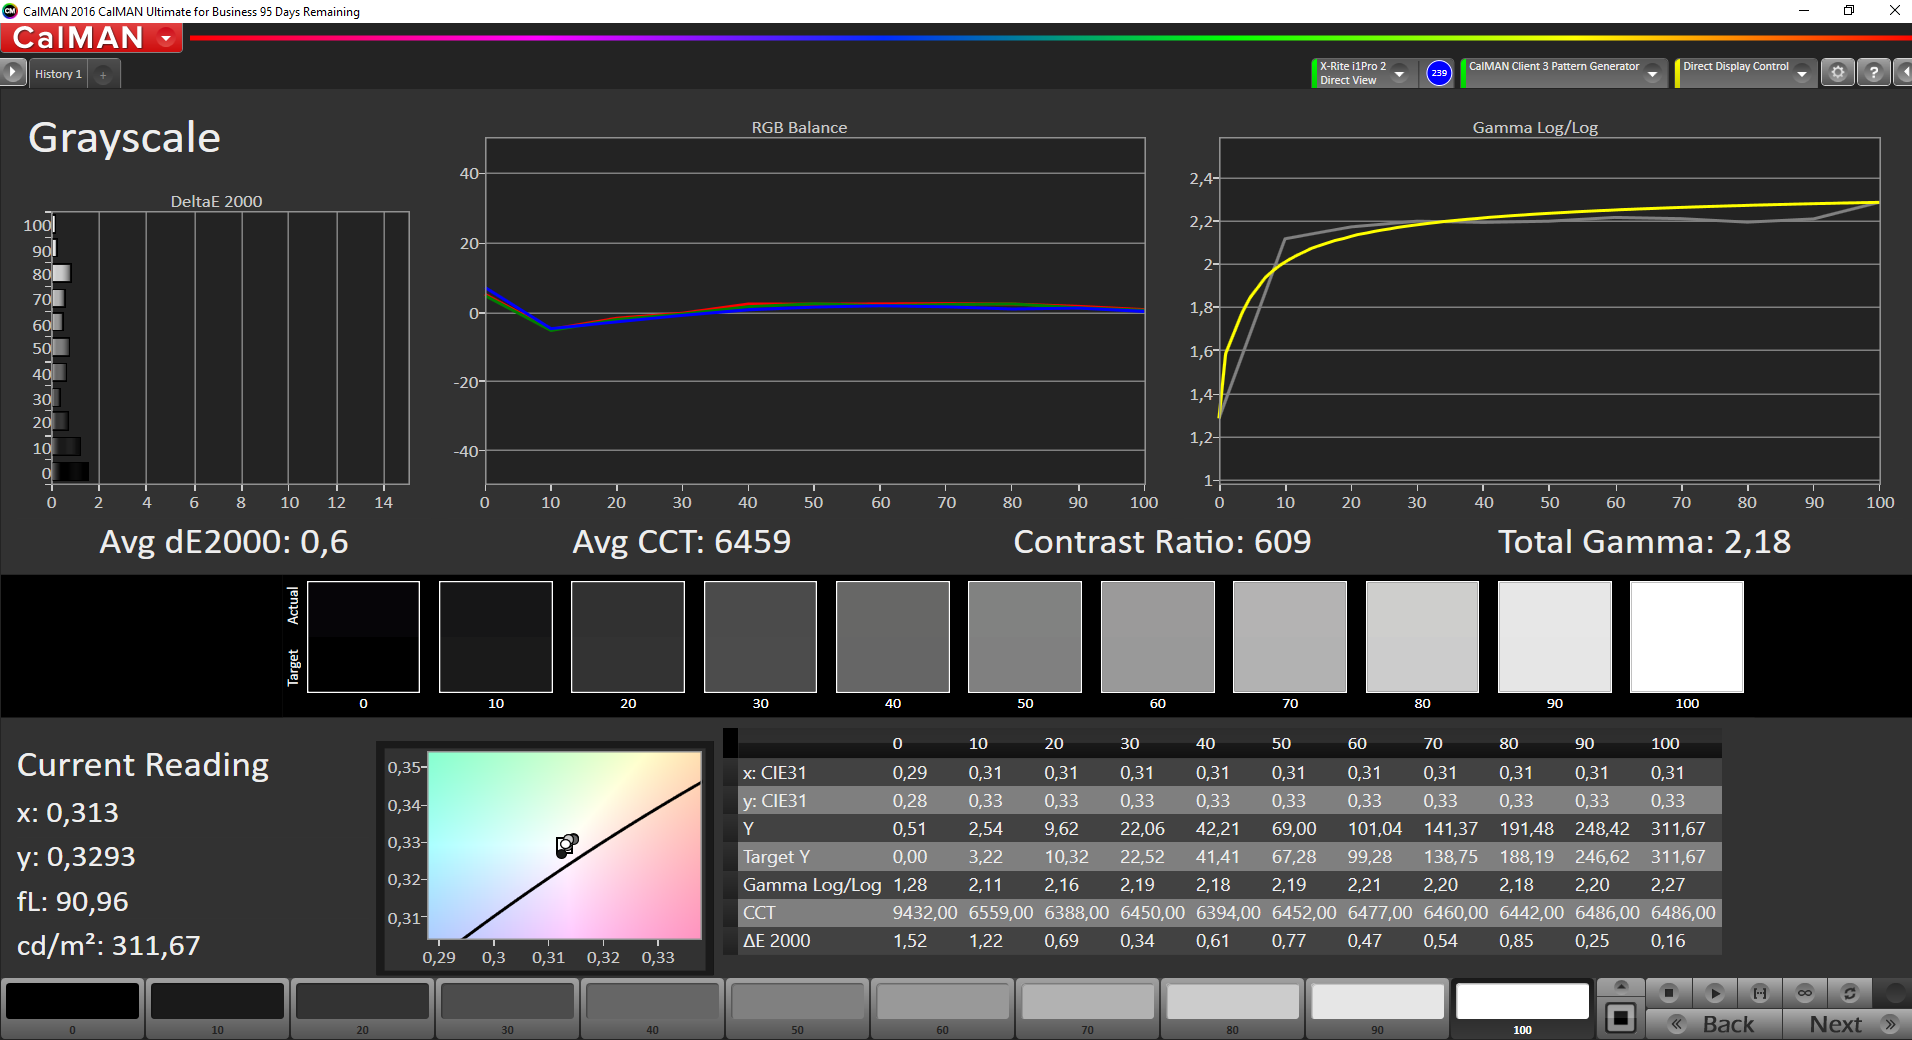
The reason for the comparatively low contrast ratio (for an IPS panel, that is) can be traced back to the comparatively high black level of 0.45. Accordingly, blacks look more like dark grays but we must add that there are panels worse than this one. This issue aside we found no faults with image quality overall – the panel was very sharp and color representation was even somewhat accurate after calibration. As always, the resulting ICC profile can be found for downloading in the box above.
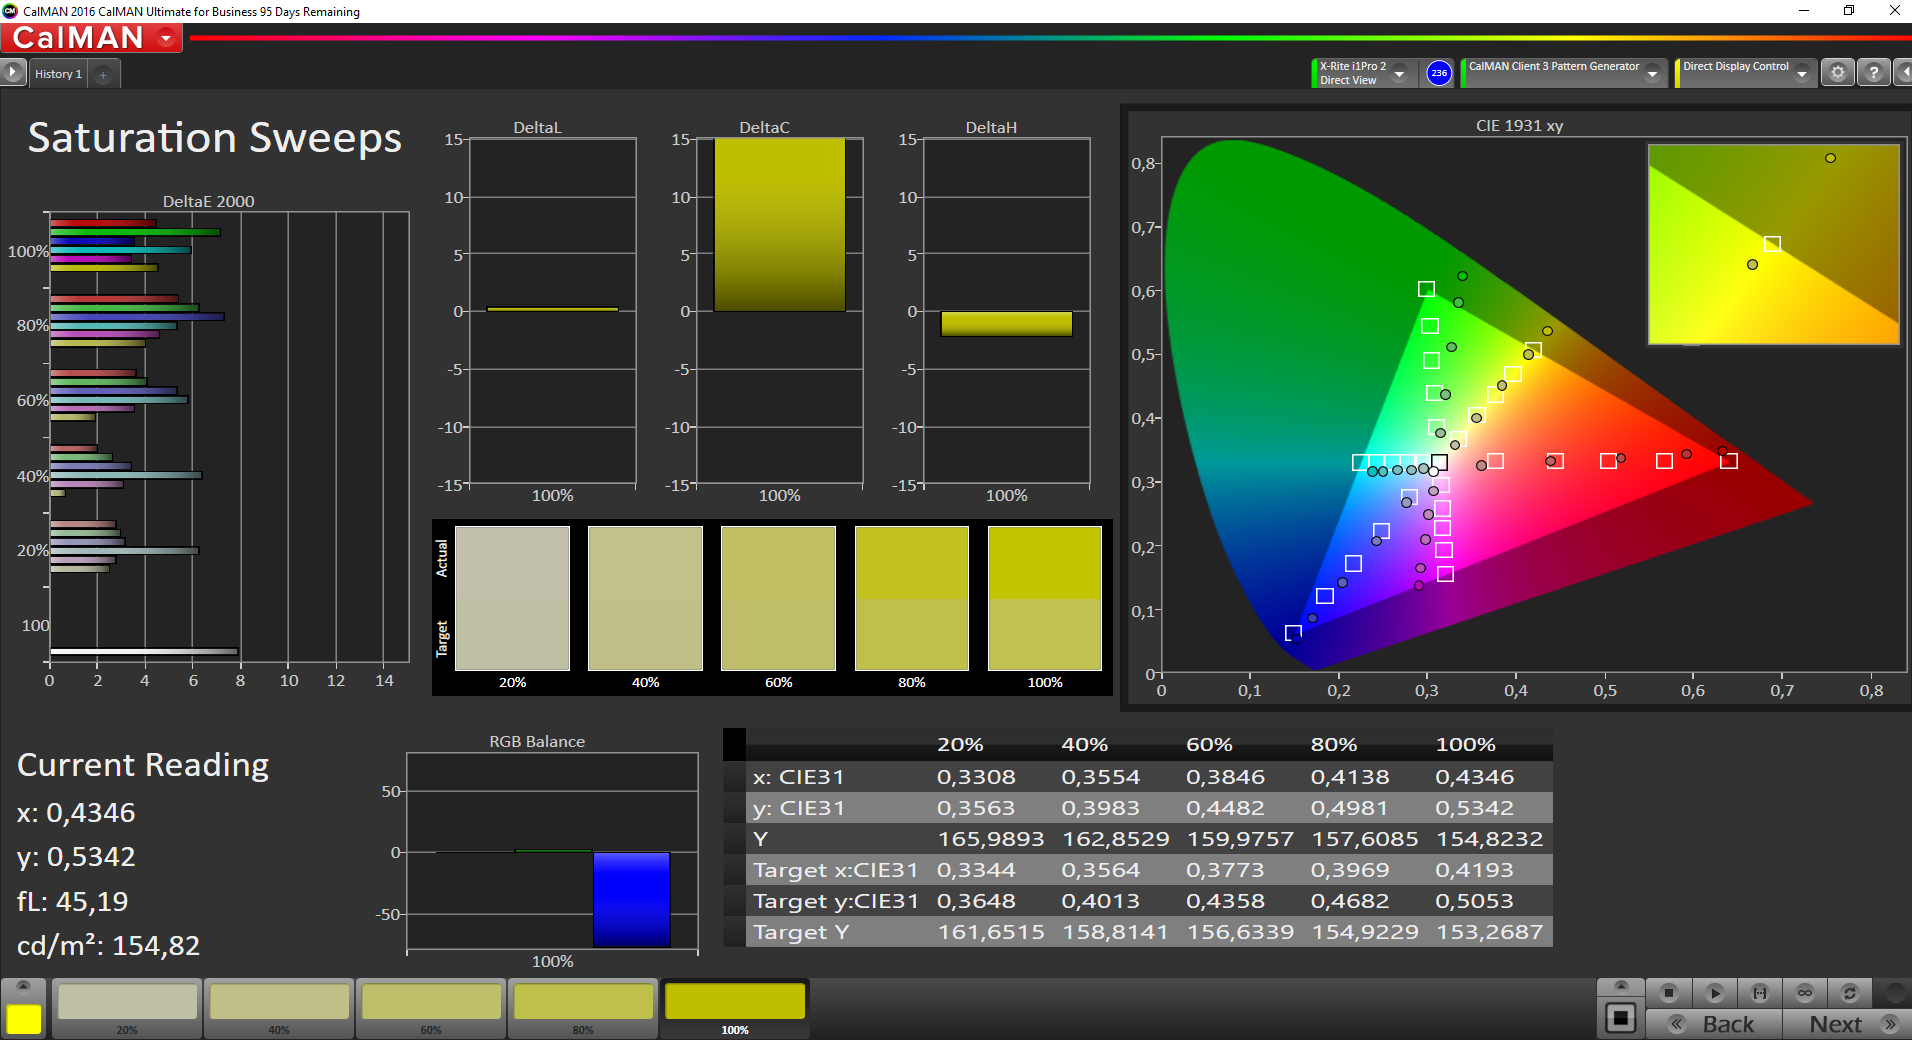
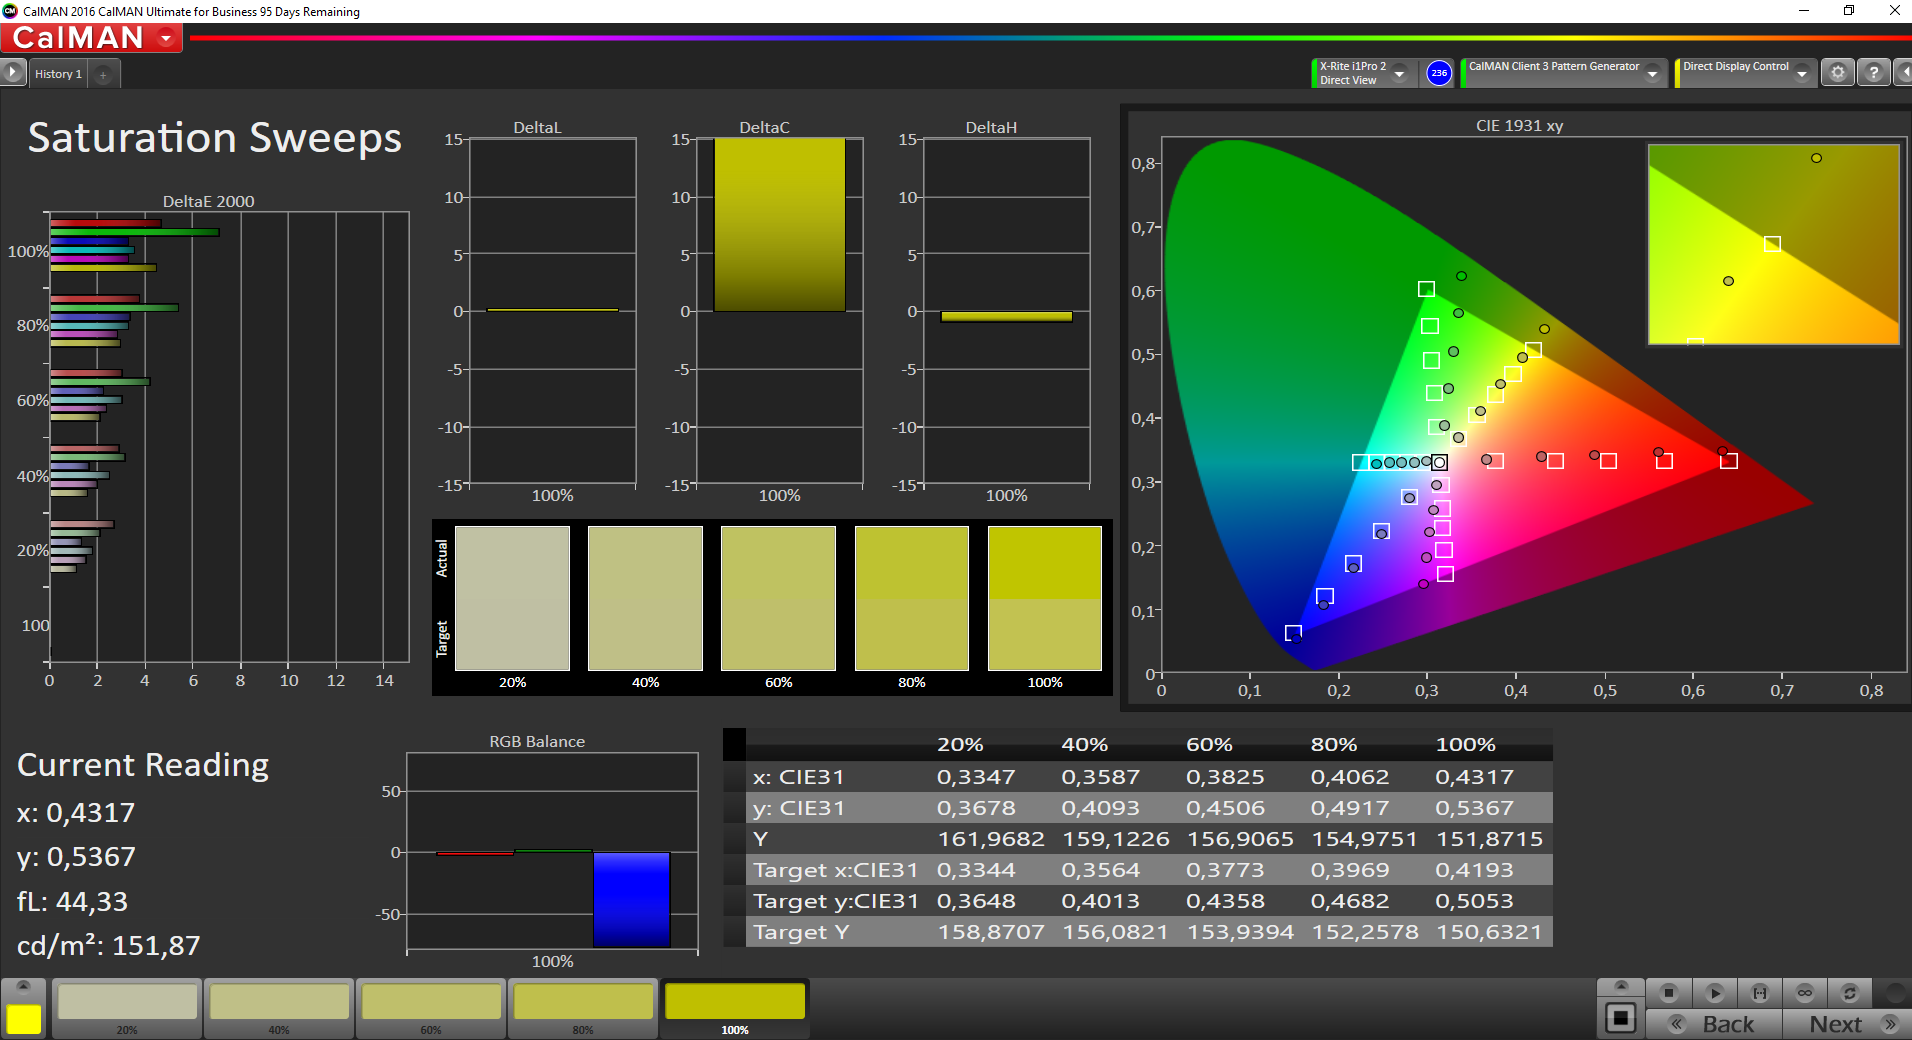
Color-space coverage was decent but far from perfect. At 83.3% sRGB coverage colors pop when compared to cheaper IPS panels that often only manage to reach 60% color coverage at best. However, photo-editing professionals will require an sRGB coverage higher than 90%, and accordingly the display is neither really good nor is it really bad – it’s mediocre.
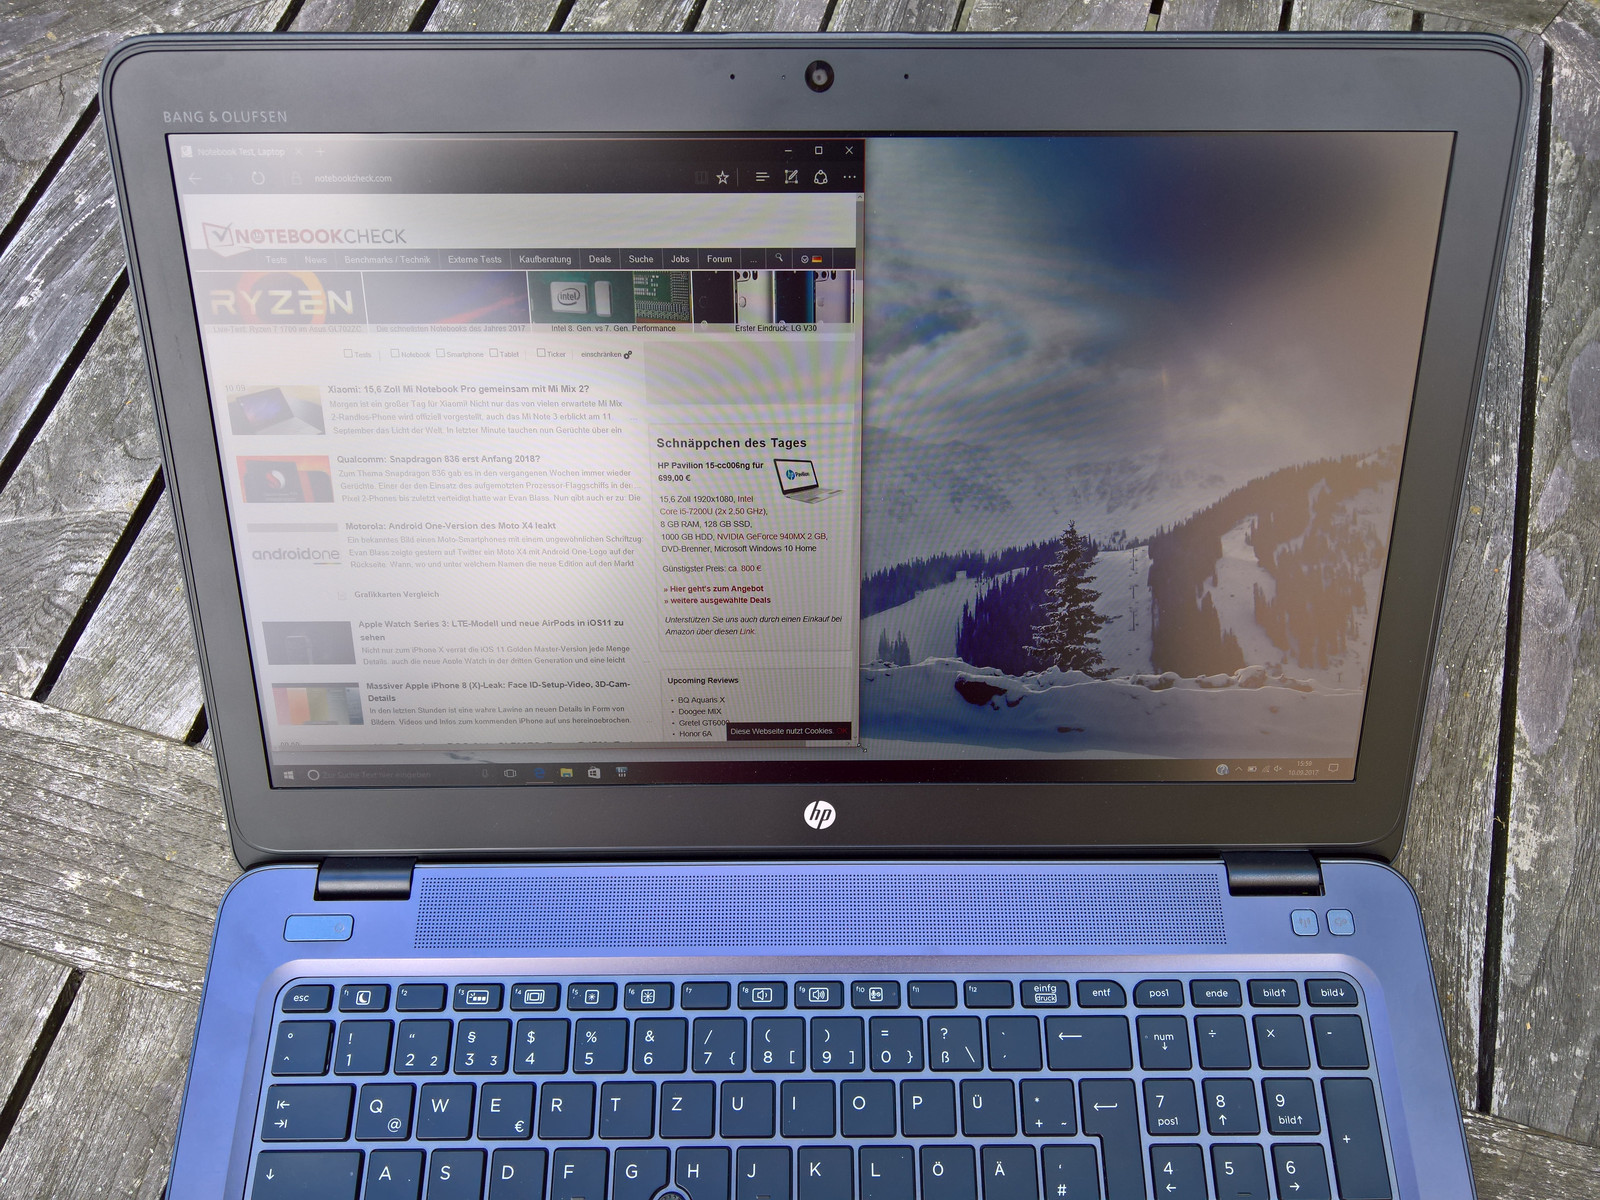
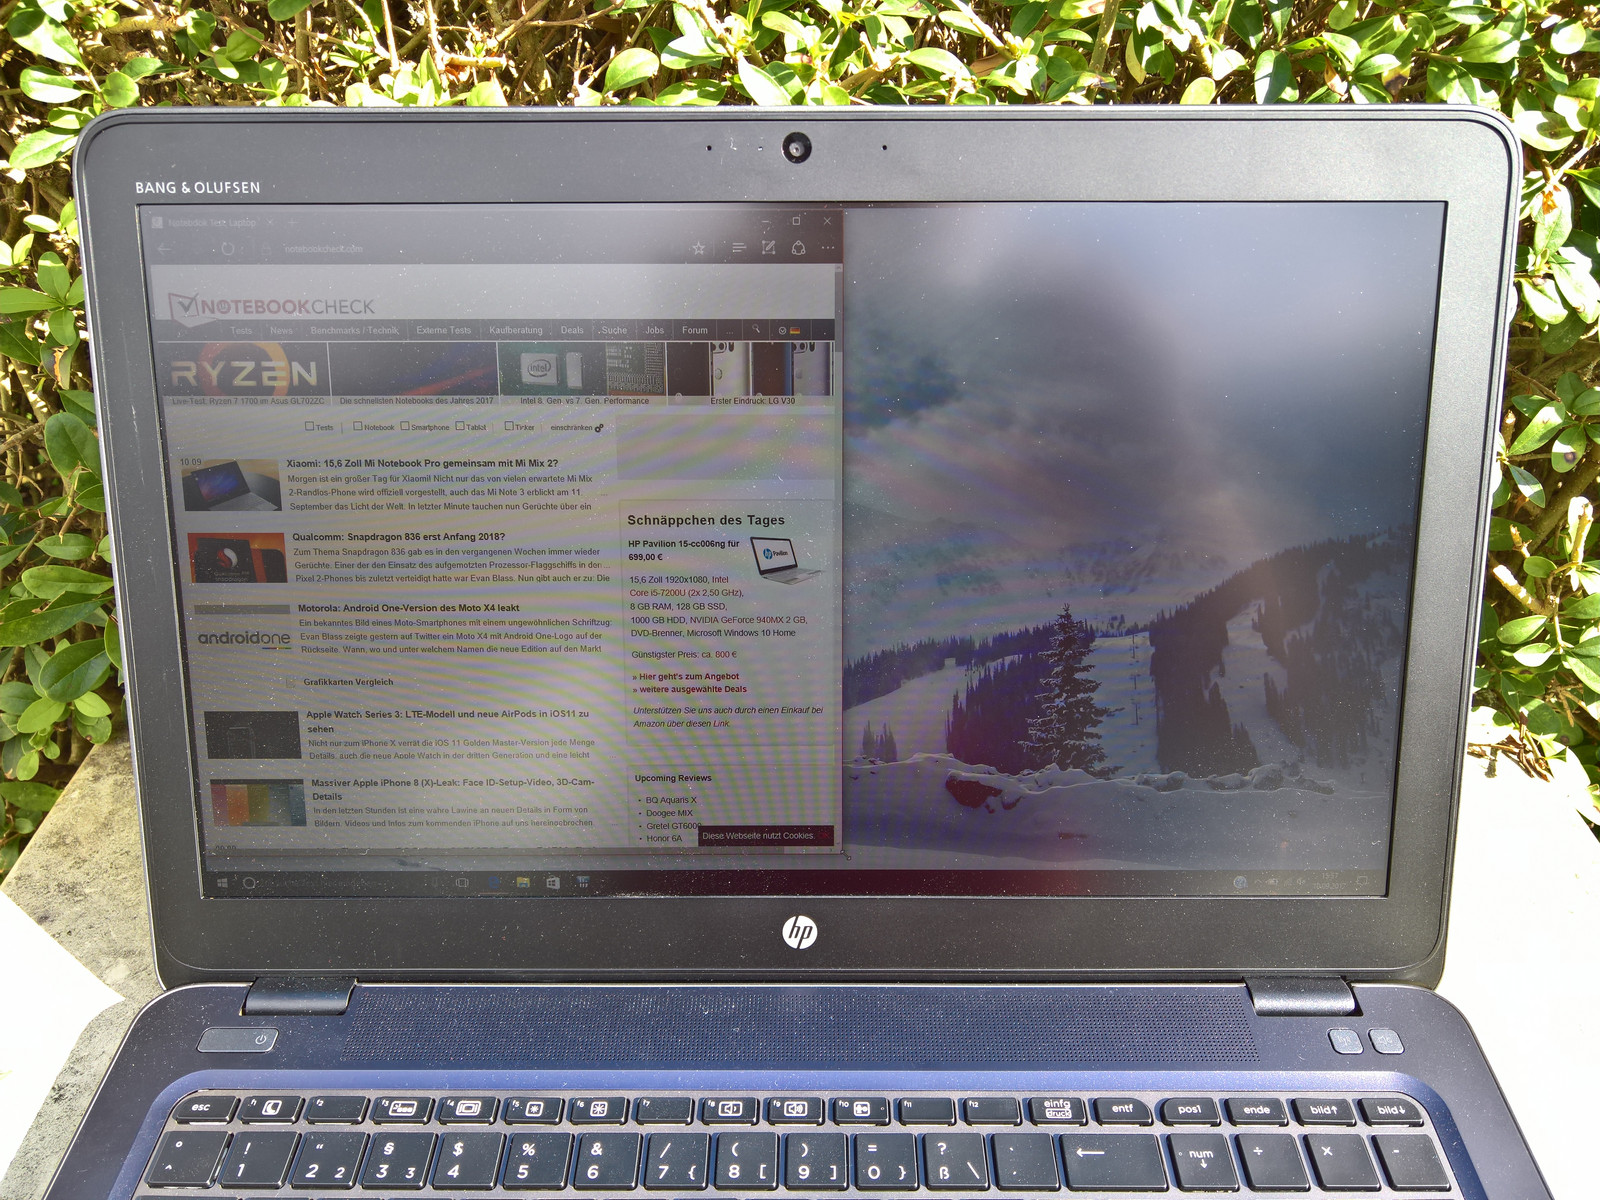
200 nits is the minimum for a matte display to be usable outdoors in the shadows, and our review unit’s 300 nits render the device usable in sunlight as well. At least, as long as it is not exposed to direct sunlight shining right onto the display.
Display Response Times
| ↔ Response Time Black to White | ||
|---|---|---|
| 22 ms ... rise ↗ and fall ↘ combined | ↗ 12 ms rise | 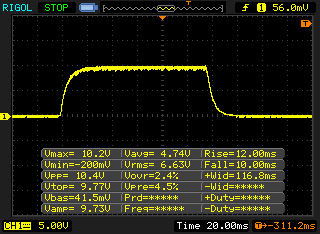 |
| ↘ 10 ms fall | ||
| The screen shows good response rates in our tests, but may be too slow for competitive gamers. In comparison, all tested devices range from 0.1 (minimum) to 240 (maximum) ms. » 49 % of all devices are better. This means that the measured response time is worse than the average of all tested devices (19.8 ms). | ||
| ↔ Response Time 50% Grey to 80% Grey | ||
| 39.6 ms ... rise ↗ and fall ↘ combined | ↗ 22.4 ms rise | 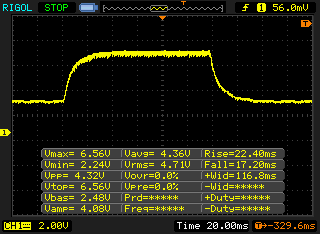 |
| ↘ 17.2 ms fall | ||
| The screen shows slow response rates in our tests and will be unsatisfactory for gamers. In comparison, all tested devices range from 0.165 (minimum) to 636 (maximum) ms. » 61 % of all devices are better. This means that the measured response time is worse than the average of all tested devices (31 ms). | ||
Screen Flickering / PWM (Pulse-Width Modulation)
| Screen flickering / PWM detected | 20830 Hz | ≤ 90 % brightness setting | 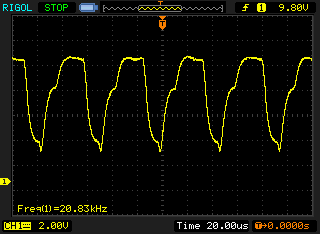 |
The display backlight flickers at 20830 Hz (worst case, e.g., utilizing PWM) Flickering detected at a brightness setting of 90 % and below. There should be no flickering or PWM above this brightness setting. The frequency of 20830 Hz is quite high, so most users sensitive to PWM should not notice any flickering. In comparison: 52 % of all tested devices do not use PWM to dim the display. If PWM was detected, an average of 7763 (minimum: 5 - maximum: 343500) Hz was measured. | |||
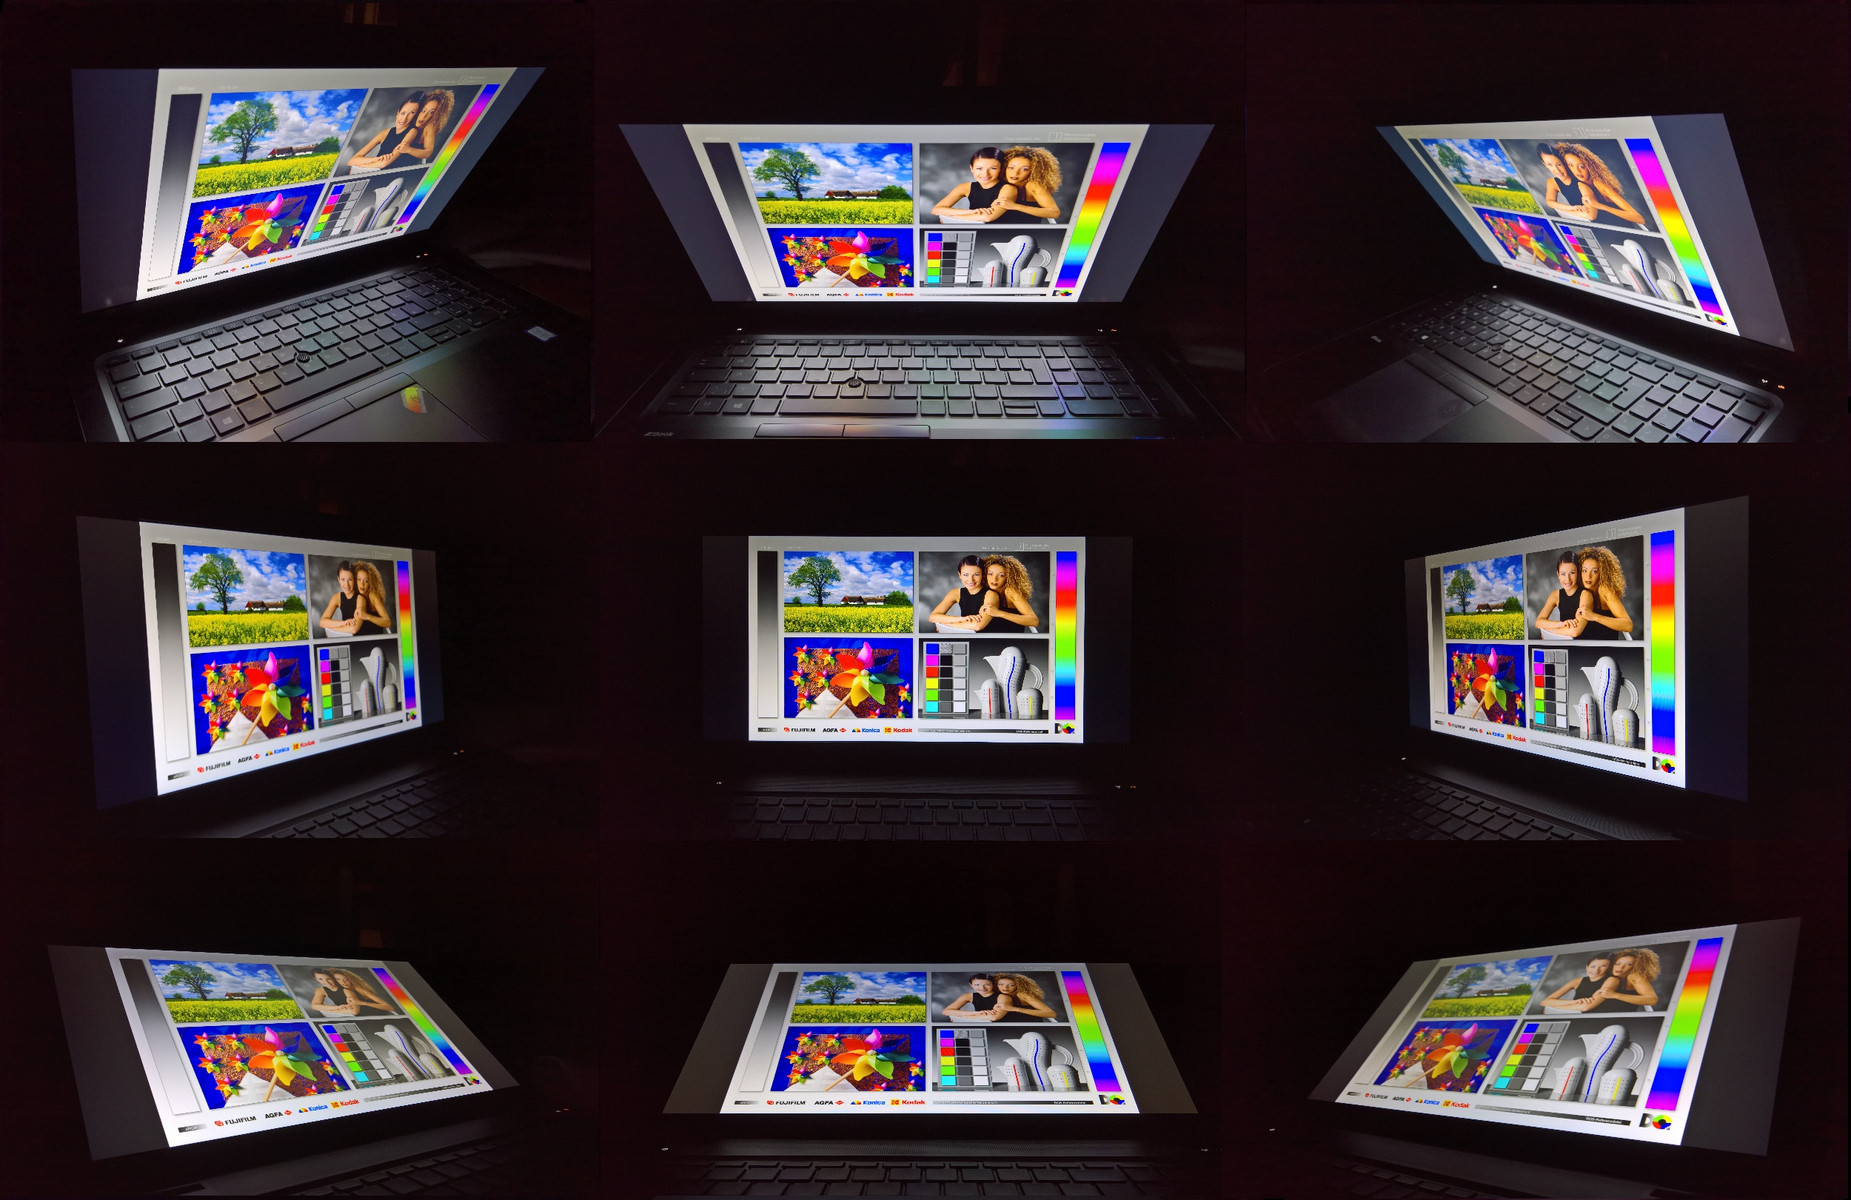
As expected of an IPS panel the ZBook 15u’s viewing angles are superb. Even at acute angles we found no traces of decreased brightness or IPS glow that is so common for cheap IPS displays.
Performance
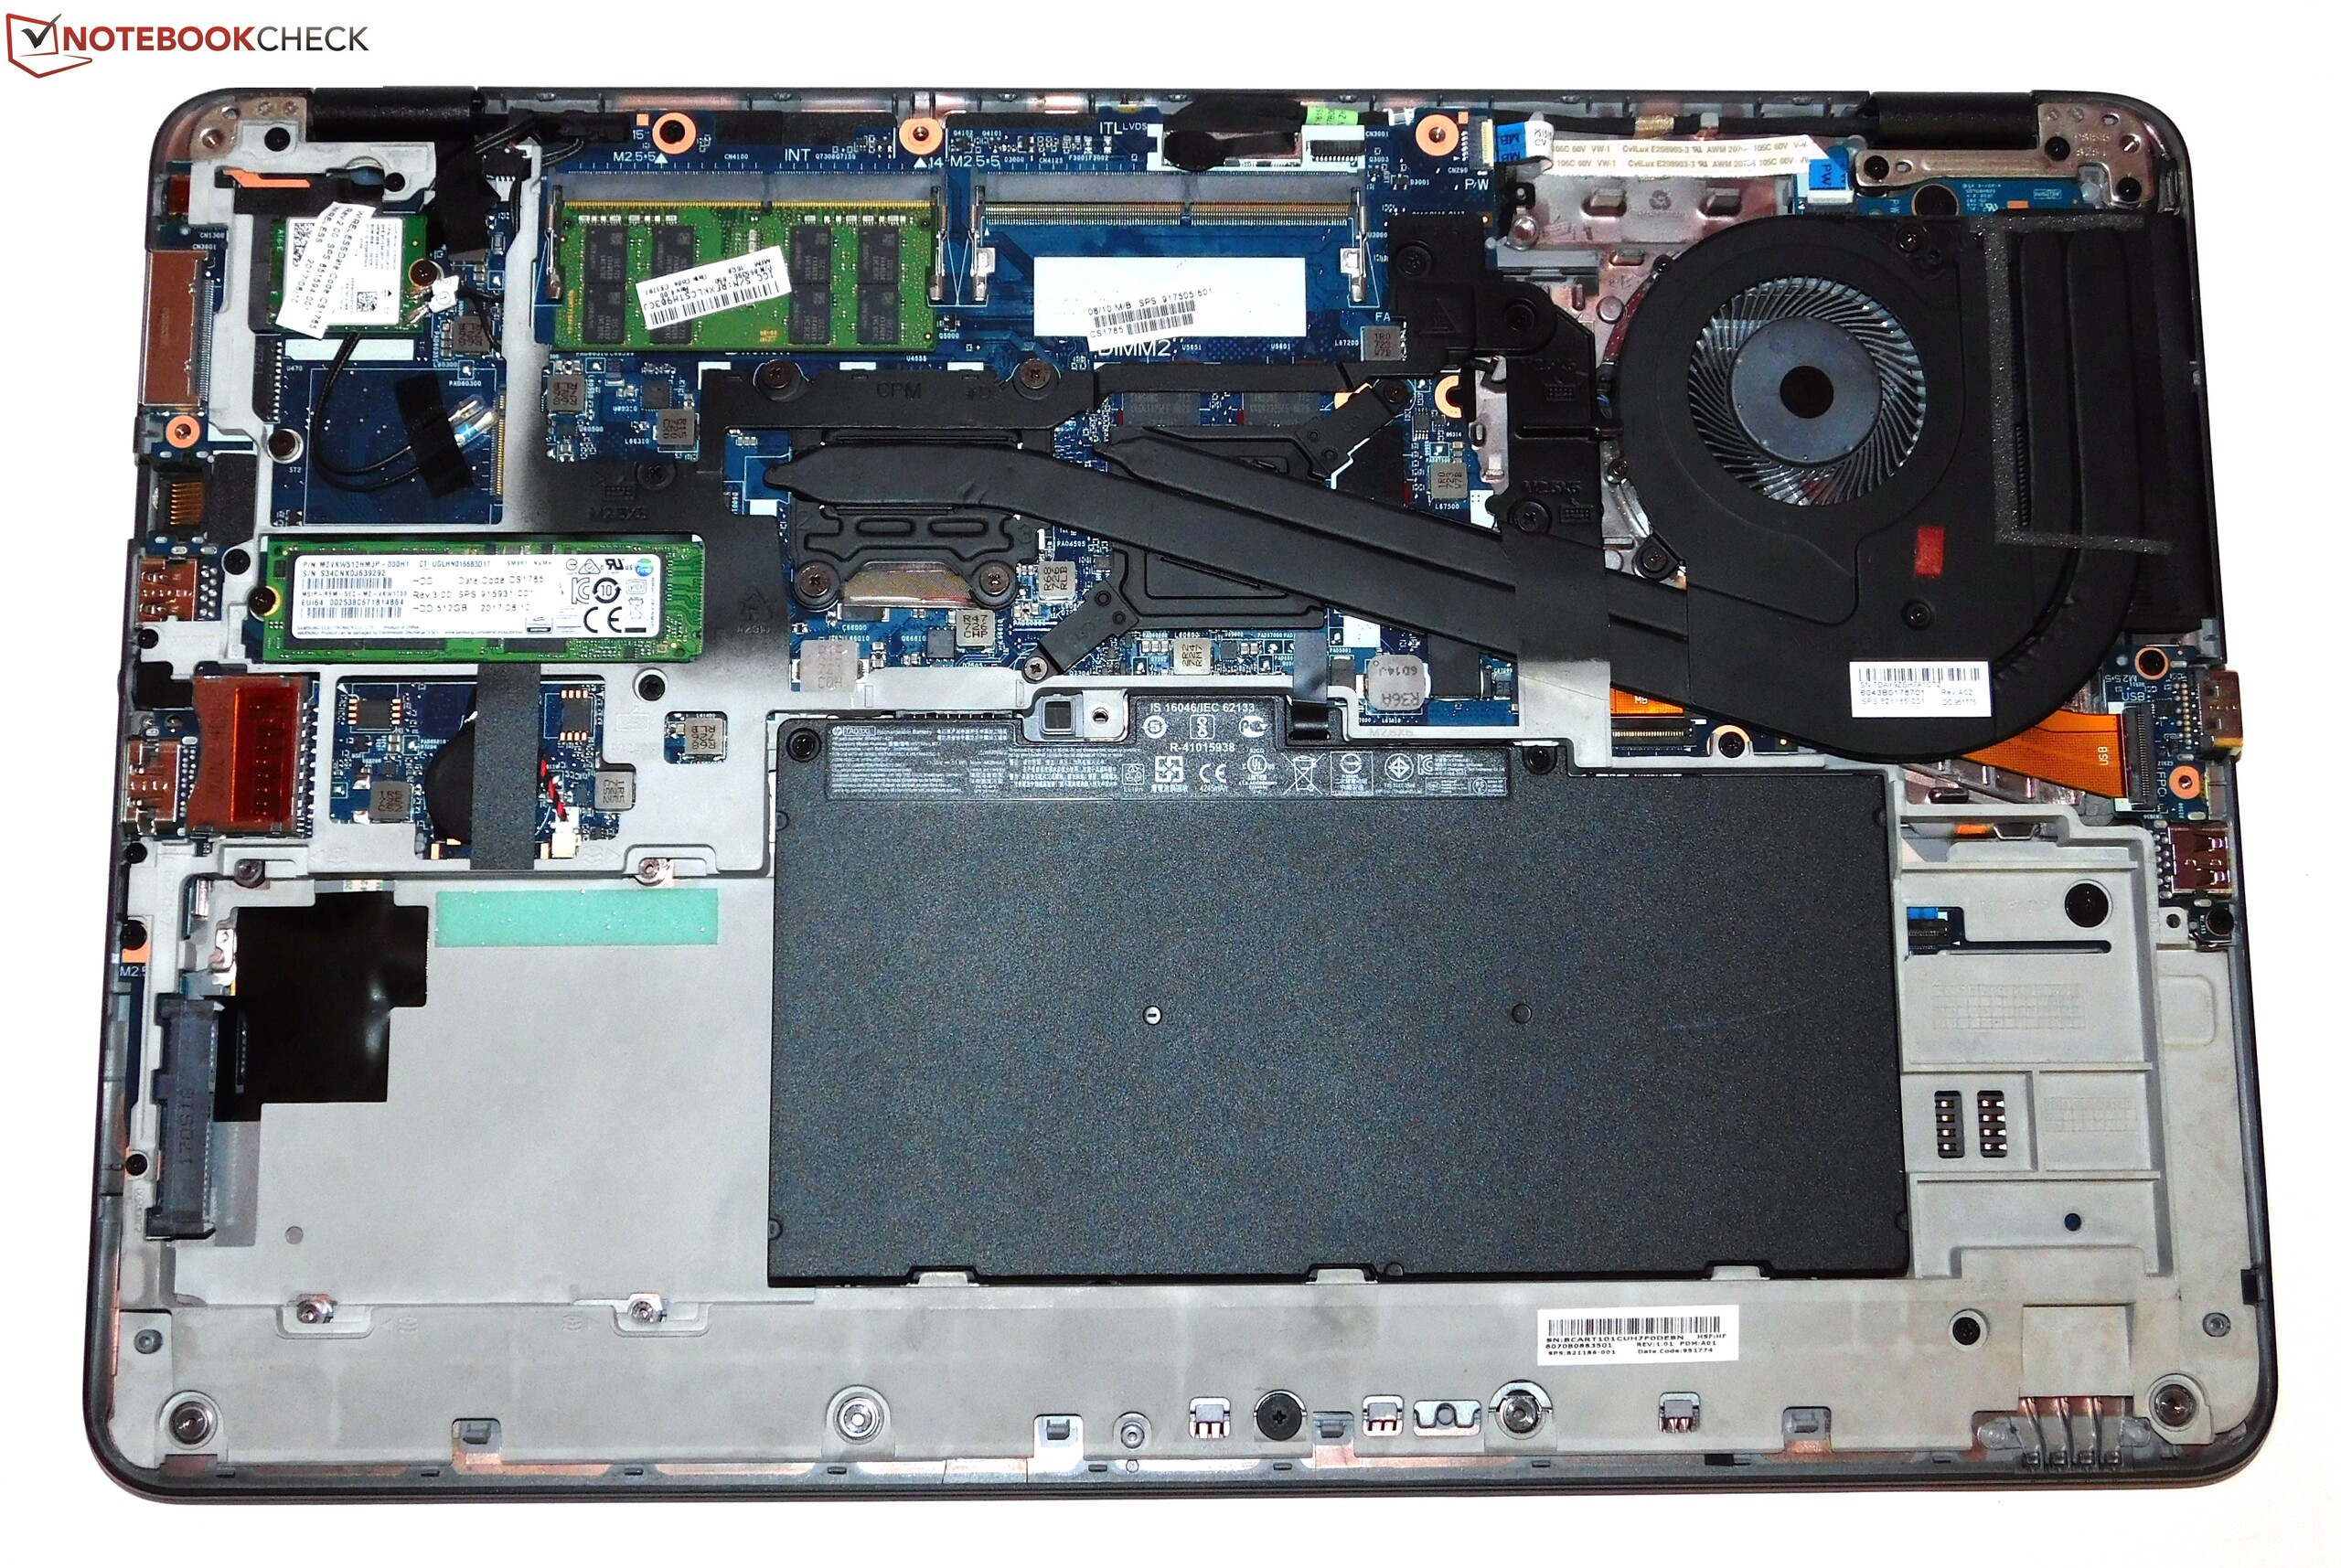
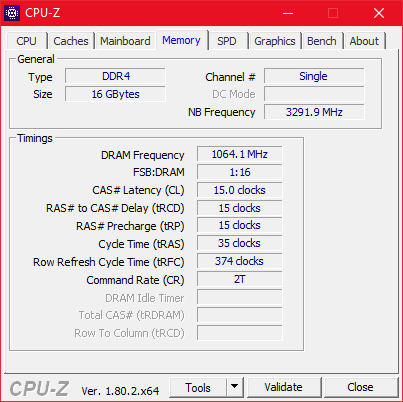
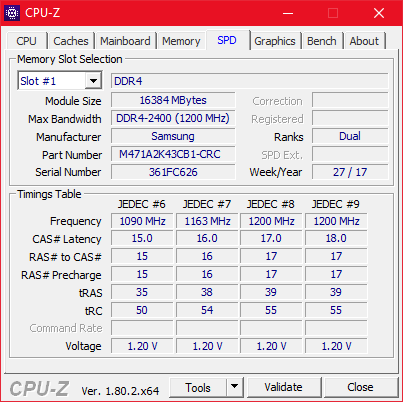
Five different SKUs are currently available through various channels but the overall differences are fairly small. You can choose between 8 and 16 GB of RAM (one module, one free slot), a 256 or 512 GB SSD, and a Core i5-7300U or i7-7500U (the former is only available for the most expensive SKU). The GPU, on the other hand, is a constant throughout the entire line: AMD's FirePro W4190M. Prices range from slightly under $1,100 to around $2,000.
Processor
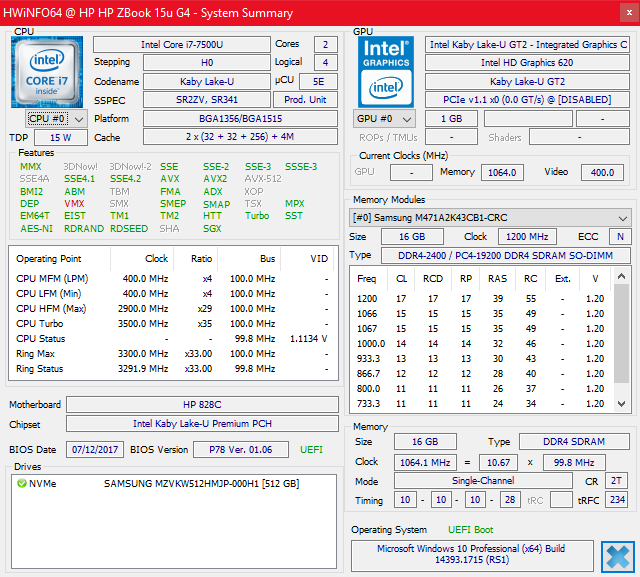
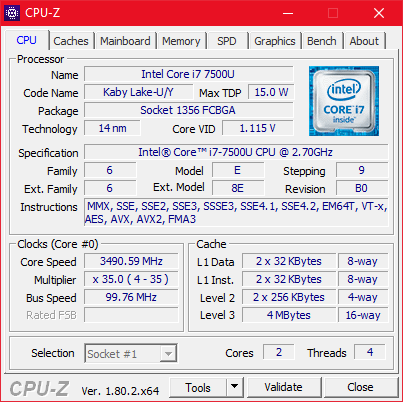
Our review unit was equipped with the frequently used Core i7-7500U processor – the second-fastest currently available U-series CPU with a 15 W TDP. The dual-core CPU supports four threads thanks to Hyper-Threading, and it offers a maximum turbo boost of 3.5 GHz (base frequency: 2.7 GHz). For further comparisons with other CPUs see our CPU benchmark list.
The 30-minute Cinebench R15 multi-core loop is used to determine whether or not the CPU throttles under long-lasting intense load, and we found no evidence of this in our review unit. Even though the first iteration scores a little bit higher than the second the scores leveled out at around 350 points throughout the rest of the test.
This slightly higher initial score can be explained by taking a closer look at Intel’s thermal specifications: a U-class CPU is allowed a TDP of up to 19 W for up to 30 seconds, after which the power limit is reduced to 15 W. Consequently, the CPU runs at its full 3.5 GHz turbo boost frequency for the first 30 seconds of this test until the 15 W TDP limit hits, reducing the turbo boost frequency to 3.2 GHz. All things considered, performance is nothing to write home about, especially when compared to workstations equipped with quad-core processors that are around 50% faster.
Since turbo boost on battery is disabled in BIOS setup out-of-the-box, CPU performance on battery is limited. In order to attain maximum performance on battery as well you have to change this setting accordingly.
System Performance
All workstations in our test group performed very quickly, whether in everyday use or synthetic benchmarks such as PCMark 8. The latter was the ZBook 15u G4’s strong point as it outperformed the entire competition. In everyday use the system was fast and responsive at all times, and we found no evidence of lag whatsoever.
| PCMark 8 Home Score Accelerated v2 | 4169 points | |
| PCMark 8 Creative Score Accelerated v2 | 5127 points | |
| PCMark 8 Work Score Accelerated v2 | 5100 points | |
| PCMark 10 Score | 3818 points | |
Help | ||
Storage Devices
The 512 GB PCIe NVMe SM961 SSD is made by Samsung. As its SM name indicates, this is an OEM version of a fast NVMe SSD. The cheaper PM-series SSDs, such as for example the PM961 in Lenovo’s ThinkPad P51s, are unable to keep up in sequential read/write performance but otherwise the difference between these two is negligible. Since notebooks at this price point are almost always equipped with fast PCIe-SSDs this is also true for all other devices in our test group.
Further details and SM961 performance comparisons can be found in our extensive SSD benchmark list.
| HP ZBook 15u G4 Samsung SM961 MZVKW512HMJP m.2 PCI-e | Lenovo ThinkPad P51s 20HB000SGE Samsung SSD PM961 1TB M.2 PCIe 3.0 x4 NVMe (MZVLW1T0) | Dell Precision 5520 UHD Samsung SM961 MZVKW512HMJP m.2 PCI-e | Apple MacBook Pro 15 2017 (2.8 GHz, 555) Apple SSD SM0256L | HP ZBook Studio G4-Y6K17EA Samsung SM961 MZVKW512HMJP m.2 PCI-e | HP ZBook 15u G3 Samsung SM951 MZVPV256HDGL m.2 PCI-e | |
|---|---|---|---|---|---|---|
| CrystalDiskMark 3.0 | 3% | 9% | -10% | 7% | 13% | |
| Write 4k QD32 (MB/s) | 478.3 | 549 15% | 506 6% | 468.4 -2% | 595 24% | 382.2 -20% |
| Read 4k QD32 (MB/s) | 552 | 642 16% | 633 15% | 631 14% | 645 17% | 585 6% |
| Write 4k (MB/s) | 152.7 | 161.4 6% | 169.4 11% | 12.87 -92% | 182 19% | 136.9 -10% |
| Read 4k (MB/s) | 53.3 | 54.8 3% | 56.1 5% | 10.76 -80% | 56.5 6% | 51.9 -3% |
| Write 512 (MB/s) | 1535 | 959 -38% | 1611 5% | 1124 -27% | 1279 -17% | 1240 -19% |
| Read 512 (MB/s) | 413.4 | 782 89% | 459.1 11% | 968 134% | 391.4 -5% | 1216 194% |
| Write Seq (MB/s) | 1580 | 1138 -28% | 1662 5% | 1505 -5% | 1562 -1% | 1247 -21% |
| Read Seq (MB/s) | 2042 | 1189 -42% | 2253 10% | 1557 -24% | 2229 9% | 1617 -21% |

GPU Performance
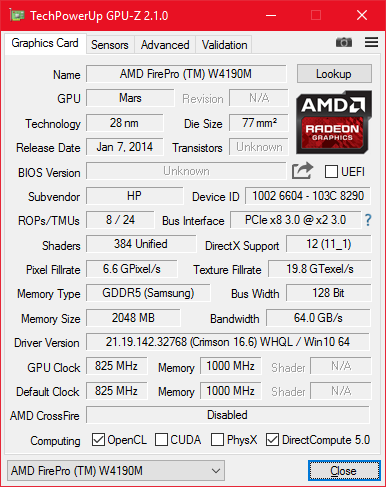
If you’re familiar with the G4’s predecessor then the graphics card will be very familiar: like many other things, the AMD FirePro W4190M has also remained unchanged. This GPU, first introduced in 2015, comes with 2 GB of GDDR5 memory and 384 shader units running at up to 900 MHz. Further details for this outdated GPU can be found in our GPU benchmark list.
The only thing we can really say about this GPU is that it should have been discontinued a long time ago. A quick look at our GPU benchmark list reveals that even the slowest Quadro GPU, the Quadro M520 that the ThinkPad P51s is equipped with, is noticeably faster in all benchmarks. Sometimes by a bit, sometimes by a lot. For example, the difference between these two in 3DMark FireStrike is a whopping 30 %, and in some SPECviewperf12 sub-categories it is even larger than that.
Unlike CPU performance, the GPU does not run at reduced speed on battery.
| 3DMark 11 - 1280x720 Performance GPU | |
| HP ZBook Studio G4-Y6K17EA | |
| Apple MacBook Pro 15 2017 (2.8 GHz, 555) | |
| Dell Precision 5520 UHD | |
| Lenovo ThinkPad P51s 20HB000SGE | |
| HP ZBook 15u G4 | |
| HP ZBook 15u G3 | |
| SiSoft Sandra 2016 | |
| Image Processing | |
| HP ZBook 15u G4 | |
| Lenovo ThinkPad P51s 20HB000SGE | |
| HP ZBook Studio G4-Y6K17EA | |
| GP Cryptography (Higher Security AES256+SHA2-512) | |
| HP ZBook Studio G4-Y6K17EA | |
| Lenovo ThinkPad P51s 20HB000SGE | |
| HP ZBook 15u G4 | |
| GP Financial Analysis (FP High/Double Precision) | |
| HP ZBook 15u G4 | |
| HP ZBook Studio G4-Y6K17EA | |
| Lenovo ThinkPad P51s 20HB000SGE | |
| Unigine Valley 1.0 | |
| 1920x1080 Extreme HD DirectX AA:x8 | |
| HP ZBook Studio G4-Y6K17EA | |
| Apple MacBook Pro 15 2017 (2.8 GHz, 555) | |
| Lenovo ThinkPad P51s 20HB000SGE | |
| HP ZBook 15u G4 | |
| 1920x1080 Extreme HD Preset OpenGL AA:x8 | |
| HP ZBook Studio G4-Y6K17EA | |
| Apple MacBook Pro 15 2017 (2.8 GHz, 555) (OS X) | |
| Lenovo ThinkPad P51s 20HB000SGE | |
| HP ZBook 15u G4 | |
| Unigine Heaven 4.0 | |
| Extreme Preset OpenGL | |
| Lenovo ThinkPad P51s 20HB000SGE | |
| HP ZBook 15u G4 | |
| Extreme Preset DX11 | |
| Apple MacBook Pro 15 2017 (2.8 GHz, 555) (Win 10) | |
| Lenovo ThinkPad P51s 20HB000SGE | |
| HP ZBook 15u G4 | |
| 3DMark 11 Performance | 2611 points | |
| 3DMark Cloud Gate Standard Score | 7894 points | |
| 3DMark Fire Strike Score | 1711 points | |
Help | ||
Gaming Performance
Given that workstation GPUs are not really made for gaming, their somewhat limited gaming performance should be no surprise to anyone. Nevertheless, it is an important benchmark with real-world implications.
In our The Witcher 3 benchmark loop simulating consistent long-term high GPU load, the graphics card almost managed to hold its own. The frame rate dropped from 7 to 6 FPS after a few minutes but remained at that level afterwards. We do not consider this to constitute a significant amount of throttling.
Our expectations were crushed almost instantly by the fact that the GPU turned out to be even slower than the almost ancient GeForce 940MX. Consequently, the FirePro is not really usable for gaming purposes and will only be able to run older or very simple games smoothly.
| BioShock Infinite - 1920x1080 Ultra Preset, DX11 (DDOF) | |
| Dell Precision 5520 UHD | |
| Apple MacBook Pro 15 2017 (2.8 GHz, 555) | |
| Lenovo ThinkPad P51s 20HB000SGE | |
| Lenovo ThinkPad T570-20HAS01E00 | |
| HP ZBook 15u G4 | |
| HP ZBook 15u G3 | |
| low | med. | high | ultra | |
|---|---|---|---|---|
| BioShock Infinite (2013) | 101.9 | 53.9 | 46.86 | 15.45 |
| Company of Heroes 2 (2013) | 39.32 | 30.51 | 17.17 | |
| The Witcher 3 (2015) | 28.5 | 17.39 | 9.69 | 6 |
Emissions
System Noise
By using ultrabook components HP has sacrificed performance somewhat, but there are some notable advantages, too. For one, the fan is almost always completely off when idle, and while it was obviously spinning during our stress-test scenario it remained unobtrusive overall. Its sound characteristics were reminiscent of a gentle low-frequency hum with no high frequencies or fluctuations.
Unfortunately, the ZBook 15u G4 suffers from coil-whining. It was barely noticeable during regular use but very clear and irritating when we put our ear directly on top of the device. It will thus very likely be more or less disturbing for more sensitive users.
Noise level
| Idle |
| 29.5 / 29.5 / 30.5 dB(A) |
| Load |
| 35 / 37.4 dB(A) |
 | ||
30 dB silent 40 dB(A) audible 50 dB(A) loud |
||
min: | ||
Temperature
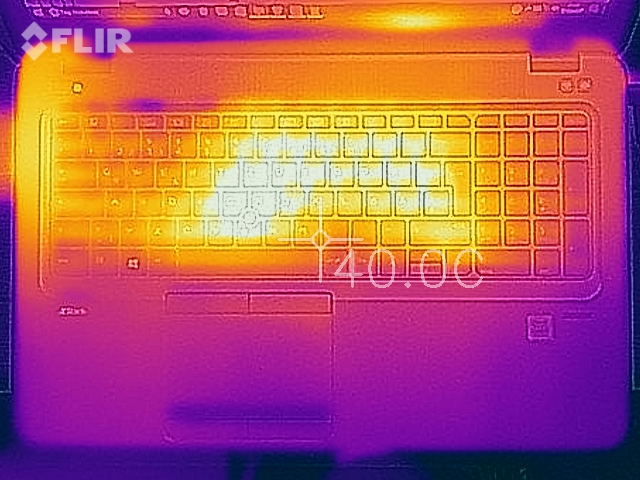
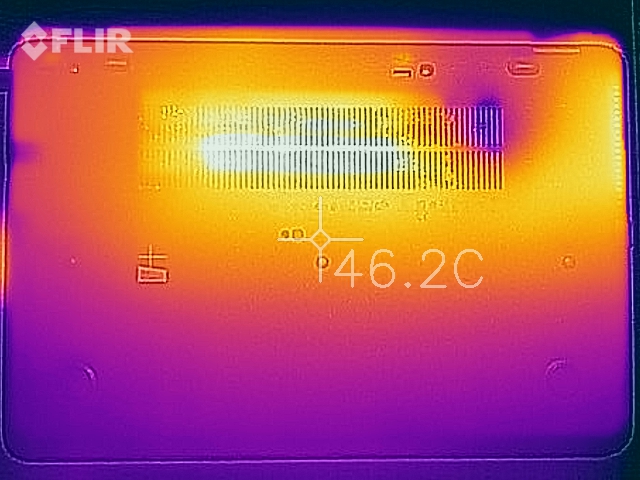
When idle, temperatures were consistent and low. Under load, the ZBook 15u turned out to be quite a hothead indeed. 54 °C at the bottom and 50 °C at the top are definitely too high. At least the palm rests remained somewhat cool but using the device on your lap can turn out to become quite uncomfortable. The notebook remained a little bit cooler during the The Witcher 3 benchmark loop but only slightly so. The case still got uncomfortably warm.
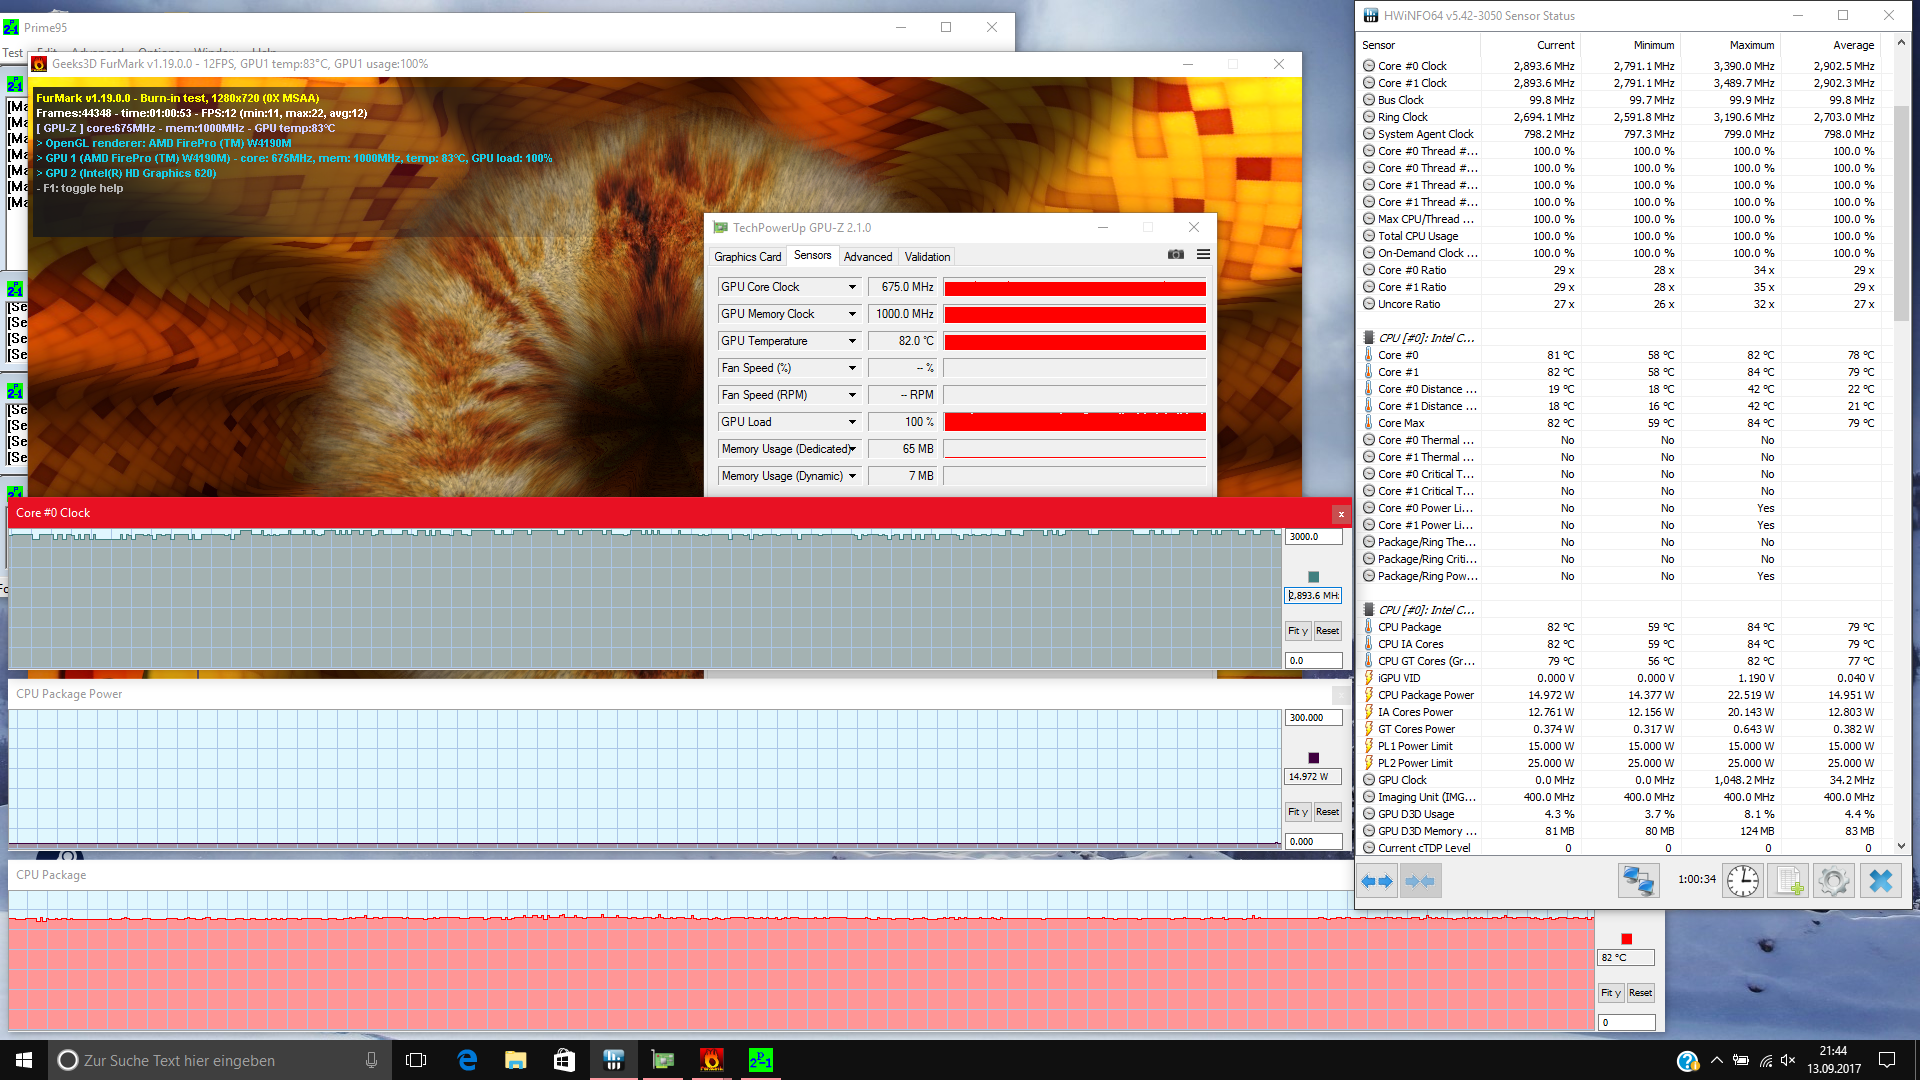
The good news is that internal temperatures remained fairly low overall. Under load (FurMark + Prime95 simultaneously running) both CPU and GPU reached a maximum temperature of 82 °C. We have to add though that while running our stress test the ZBook ran at reduced speeds from the very beginning. The CPU and GPU clocked at 2.9 GHz and 650 MHz throughout the entire test, respectively. In other words: while the CPU did not throttle, it also didn’t run at peak turbo boost performance levels. The GPU, on the other hand, was significantly slower than it could and should have been.
Running 3DMark 11 immediately after performing the stress test yielded exactly the same score as before the test.
(-) The maximum temperature on the upper side is 53.2 °C / 128 F, compared to the average of 38.2 °C / 101 F, ranging from 22.2 to 69.8 °C for the class Workstation.
(-) The bottom heats up to a maximum of 54 °C / 129 F, compared to the average of 41.1 °C / 106 F
(+) In idle usage, the average temperature for the upper side is 23.5 °C / 74 F, compared to the device average of 32 °C / 90 F.
(-) Playing The Witcher 3, the average temperature for the upper side is 39 °C / 102 F, compared to the device average of 32 °C / 90 F.
(+) The palmrests and touchpad are cooler than skin temperature with a maximum of 31.4 °C / 88.5 F and are therefore cool to the touch.
(-) The average temperature of the palmrest area of similar devices was 27.8 °C / 82 F (-3.6 °C / -6.5 F).
Speakers
The massive speaker grill housing a set of stereo speakers is located between the keyboard, the display, and the hinges. Despite the Bang & Olufsen software equalizer the speakers are equipped with, they were only mediocre at best, which is quite common for notebooks these days: they were neither very loud nor were they very good.
The headphone jack works as expected and offers a more than decent alternative to the built-in speakers.
HP ZBook 15u G4 audio analysis
(-) | not very loud speakers (71.9 dB)
Bass 100 - 315 Hz
(±) | reduced bass - on average 13.4% lower than median
(±) | linearity of bass is average (10.2% delta to prev. frequency)
Mids 400 - 2000 Hz
(+) | balanced mids - only 1.8% away from median
(±) | linearity of mids is average (7.1% delta to prev. frequency)
Highs 2 - 16 kHz
(+) | balanced highs - only 2.8% away from median
(+) | highs are linear (5.8% delta to prev. frequency)
Overall 100 - 16.000 Hz
(±) | linearity of overall sound is average (16.5% difference to median)
Compared to same class
» 46% of all tested devices in this class were better, 7% similar, 47% worse
» The best had a delta of 7%, average was 17%, worst was 35%
Compared to all devices tested
» 28% of all tested devices were better, 6% similar, 66% worse
» The best had a delta of 4%, average was 23%, worst was 134%
Lenovo ThinkPad P51s 20HB000SGE audio analysis
(±) | speaker loudness is average but good (75.2 dB)
Bass 100 - 315 Hz
(±) | reduced bass - on average 10.7% lower than median
(±) | linearity of bass is average (11% delta to prev. frequency)
Mids 400 - 2000 Hz
(+) | balanced mids - only 3.9% away from median
(±) | linearity of mids is average (10.5% delta to prev. frequency)
Highs 2 - 16 kHz
(+) | balanced highs - only 3.1% away from median
(±) | linearity of highs is average (7.1% delta to prev. frequency)
Overall 100 - 16.000 Hz
(±) | linearity of overall sound is average (15.6% difference to median)
Compared to same class
» 35% of all tested devices in this class were better, 11% similar, 54% worse
» The best had a delta of 7%, average was 17%, worst was 35%
Compared to all devices tested
» 23% of all tested devices were better, 5% similar, 72% worse
» The best had a delta of 4%, average was 23%, worst was 134%
Frequency diagram in comparison (checkboxes are selectable!)
Energy Management
Power Consumption
Due to the ULV processor and the FHD display, idle power consumption was fairly low. The ThinkPad P51s drew more power but was also equipped with a more power hungry higher resolution 4K display in return. The maximum idle power consumption of 11.8 W was reached with the keyboard backlight activated at its highest possible brightness level.
The included 65 W charger is too weak for the ZBook 15u G4’s maximum power consumption of around 90 W. That said, this high level was only held for around 10 seconds after which it dropped to 62 W.
| Off / Standby | |
| Idle | |
| Load |
|
Key:
min: | |
| HP ZBook 15u G4 i7-7500U, FirePro W4190M, Samsung SM961 MZVKW512HMJP m.2 PCI-e, IPS LED, 1920x1080, 15.6" | Lenovo ThinkPad P51s 20HB000SGE i7-7600U, Quadro M520, Samsung SSD PM961 1TB M.2 PCIe 3.0 x4 NVMe (MZVLW1T0), IPS, 3840x2160, 15.6" | Dell Precision 5520 UHD E3-1505M v6, Quadro M1200, Samsung SM961 MZVKW512HMJP m.2 PCI-e, IPS, 3840x2160, 15.6" | Apple MacBook Pro 15 2017 (2.8 GHz, 555) i7-7700HQ, Radeon Pro 555, Apple SSD SM0256L, IPS, 2880x1800, 15.4" | HP ZBook Studio G4-Y6K17EA E3-1505M v6, Quadro M1200, Samsung SM961 MZVKW512HMJP m.2 PCI-e, IPS, 3840x2160, 15.6" | HP ZBook 15u G3 6600U, FirePro W4190M, Samsung SM951 MZVPV256HDGL m.2 PCI-e, TN LED, 1920x1080, 15.6" | |
|---|---|---|---|---|---|---|
| Power Consumption | -23% | -83% | -32% | -105% | 3% | |
| Idle Minimum * (Watt) | 3.85 | 5.8 -51% | 8.9 -131% | 3.4 12% | 12.6 -227% | 4.3 -12% |
| Idle Average * (Watt) | 7.5 | 10.4 -39% | 13.6 -81% | 13.9 -85% | 17.1 -128% | 7.9 -5% |
| Idle Maximum * (Watt) | 11.8 | 13.5 -14% | 14.1 -19% | 17.6 -49% | 19.3 -64% | 11.5 3% |
| Load Average * (Watt) | 47.7 | 62.4 -31% | 100.3 -110% | 71.1 -49% | 88.3 -85% | 43.3 9% |
| Witcher 3 ultra * (Watt) | 46.7 | 100.2 -115% | 57.9 -24% | 74.8 -60% | ||
| Load Maximum * (Watt) | 90.2 | 73.1 19% | 126.3 -40% | 88.5 2% | 147.3 -63% | 72.3 20% |
* ... smaller is better
Battery Life
The ZBook’s 51 Wh lithium-polymer battery is on the small side and is one of the smallest in our test group.
Compared to its own predecessor, battery life has been improved somewhat. For example, the G4 outlasted the G3 by more than two hours in our Wi-Fi battery test. However, compared to its main rival – the P51s – the G4 doesn’t stand a chance. The ThinkPad was equipped with an add-on battery increasing its initial battery capacity to an impressive 104 Wh. Despite its quad-core CPU the MacBook Pro 15 also easily outlasted the G4 in our Wi-Fi test.
When reviewing workstations we perform an additional battery test by running SPECviewperf in a loop. The ZBook 15u G4 lasted for 64 minutes in this test and therefore almost exactly as long as it lasted in our usual battery eater load test.
With Fast-Charging enabled it took 130 minutes to fully charge the ZBook’s battery. This isn’t half bad, especially considering that the battery hits the 80% threshold after around an hour. As is quite common, the final 20% takes just as long. Thus, the ZBook can be topped up quickly during the day if necessary.
| HP ZBook 15u G4 i7-7500U, FirePro W4190M, 51 Wh | Lenovo ThinkPad P51s 20HB000SGE i7-7600U, Quadro M520, 104 Wh | Dell Precision 5520 UHD E3-1505M v6, Quadro M1200, 97 Wh | Apple MacBook Pro 15 2017 (2.8 GHz, 555) i7-7700HQ, Radeon Pro 555, 76 Wh | HP ZBook Studio G4-Y6K17EA E3-1505M v6, Quadro M1200, 64 Wh | HP ZBook 15u G3 6600U, FirePro W4190M, 90 Wh | |
|---|---|---|---|---|---|---|
| Battery runtime | 139% | -26% | 12% | -47% | 21% | |
| Reader / Idle (h) | 16.1 | 26.4 64% | 12.1 -25% | 6.8 -58% | 12.6 -22% | |
| H.264 (h) | 8.1 | 11.7 44% | 8.5 5% | |||
| WiFi v1.3 (h) | 7.6 | 11.9 57% | 4.2 -45% | 10.7 41% | 3.4 -55% | 5.2 -32% |
| Load (h) | 1.1 | 5.4 391% | 1 -9% | 1 -9% | 0.8 -27% | 2.4 118% |
| Witcher 3 ultra (h) | 1.5 |
Verdict
Pros
Cons

U-class ULV CPUs and mobile workstations – two things that don't really fit together well. This might change with the upcoming Kaby Lake-R ULV quad-core processors in early 2018. However, these are not yet available and we are not reviewing a hypothetical ZBook 15u G5 but the Kaby Lake dual-core equipped ZBook 15u G4 instead.
The G4 has got the basics covered. A rigid and high-quality all-metal case with input devices that, while not top of their class, are suitable for a workhorse such as this. The wide variety of ports includes VGA and a full-size DisplayPort, and unlike the HP EliteBook 850 G4 business model’s display the ZBook 15u G4’s display was decent overall: IPS instead of TN, wide viewing angles, and a maximum brightness north of 300 nits.
Our only nitpick with the display is its substandard color coverage that might be okay for a business device but doesn’t meet the high standards of a workstation. In addition, we would have loved to see a Thunderbolt 3 port on the device – in fact, we’ve come to expect it on a notebook at this price point. Our biggest concern is the two processing units, the CPU and GPU. Both are exactly as fast as you would expect, and they operate at very low sound levels (coil-whining aside). However, they are not nearly powerful enough for a modern workstation. This becomes particularly obvious when looking at the obsolete AMD FirePro GPU that should have been discontinued and retired a long time ago. Instead, an entry-level Quadro GPU like the M520 or M620 would have been a much better match. Last but not least, we were taken aghast by the G4’s high surface temperatures and the inadequately dimensioned charger.
Mixed feelings: the ZBook 15u G4’s high potential is ruined by the ancient, obsolete, and slow GPU.
The question is: what kind of user does HP aim at with the ZBook 15u G4? Workstation users with exceptional performance requirements will find better alternatives, such as the Dell Precision 5520, the Apple MacBook Pro 15, or even HP’s own ZBook Studio G4 (currently in review). Since they come with higher capacity batteries these alternatives even offer a longer battery life. The G4 also isn’t the best choice if you’re looking for an affordable yet energy-efficient workstation for not too-intensive tasks – Lenovo’s ThinkPad P51s may lack the G4’s fancy metal case but it can be equipped with an optional 6-cell battery boosting battery life significantly. In addition, it also features Thunderbolt 3 and the faster Quadro M520 GPU.
All things considered, we can only conclude that the ZBook 15u G4 may be a decent laptop, but it cannot keep up with other mobile workstations. Maybe next year’s model built around the same chassis equipped with newer and faster CPUs and GPUs will be able to change that.
HP ZBook 15u G4
- 09/21/2017 v6 (old)
Benjamin Herzig
Price comparison

