Fujitsu Celsius H980 (Core i7-8750H, NVIDIA Quadro P3200) Workstation Review

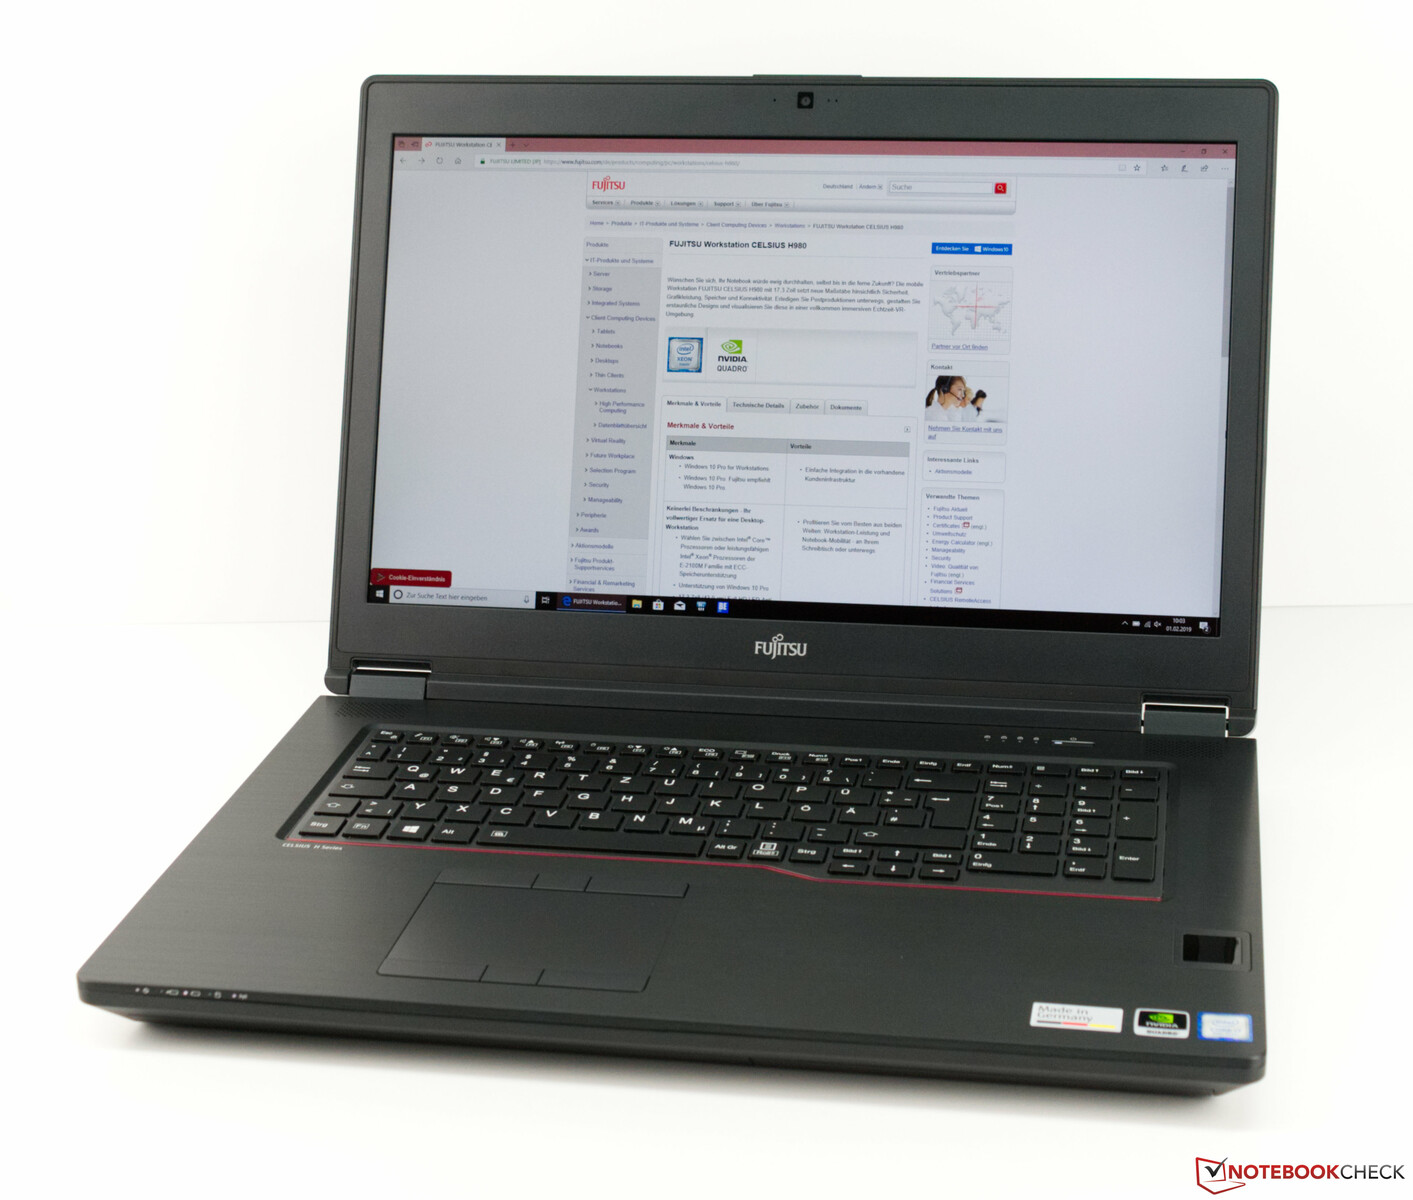
The Fujitsu Celsius H980 is a 17-inch workstation that succeeds the Celsius H970, which we reviewed around 18 months ago. Fujitsu is not leaving the workstation market without a fight, but Dell, HP and Lenovo have become serious opponents and sell decent workstations.
There are numerous configurations of the H980, but our review unit is one of the cheaper models, which the Japanese manufacturer has equipped with an Intel Core i7-8750H processor, an NVIDIA Quadro P3200 GPU, 16 GB of RAM and a 512 GB SSD. This configuration officially retails for €3,899 (~$4,427), but we found that prices have already dropped to around €3,500 (~$3,974) online. Fujitsu also sells variants with just 8 GB of RAM and a 5,400 RPM SATA III HDD, but we would recommend avoiding these models. The limited RAM and slow drive will make the device feel slow, and it may struggle with resource-intensive tasks too.
The company also sells more powerful configurations should you need more performance than our review unit offers. The H980 can also be configured with either an Intel Xeon E-2186M or a Core i7-8850H processor and a Quadro P4200 or Quadro P5200 GPU. Moreover, please see the Fujitsu datasheet for a full list of the optional components with which the H980 can be configured. The most expensive configuration currently costs around €6,700 (~$7,608), which comes with an Xeon E-2186M CPU, a Quadro P5200 GPU, 64 GB of ECC RAM and a 1 TB SSD.
We have chosen to compare the H980 against other comparably priced workstations. Our comparison devices will include the Dell Precision 7720, the HP ZBook 17 G5, the Lenovo ThinkPad P72 and the Fujitsu Celsius H970.
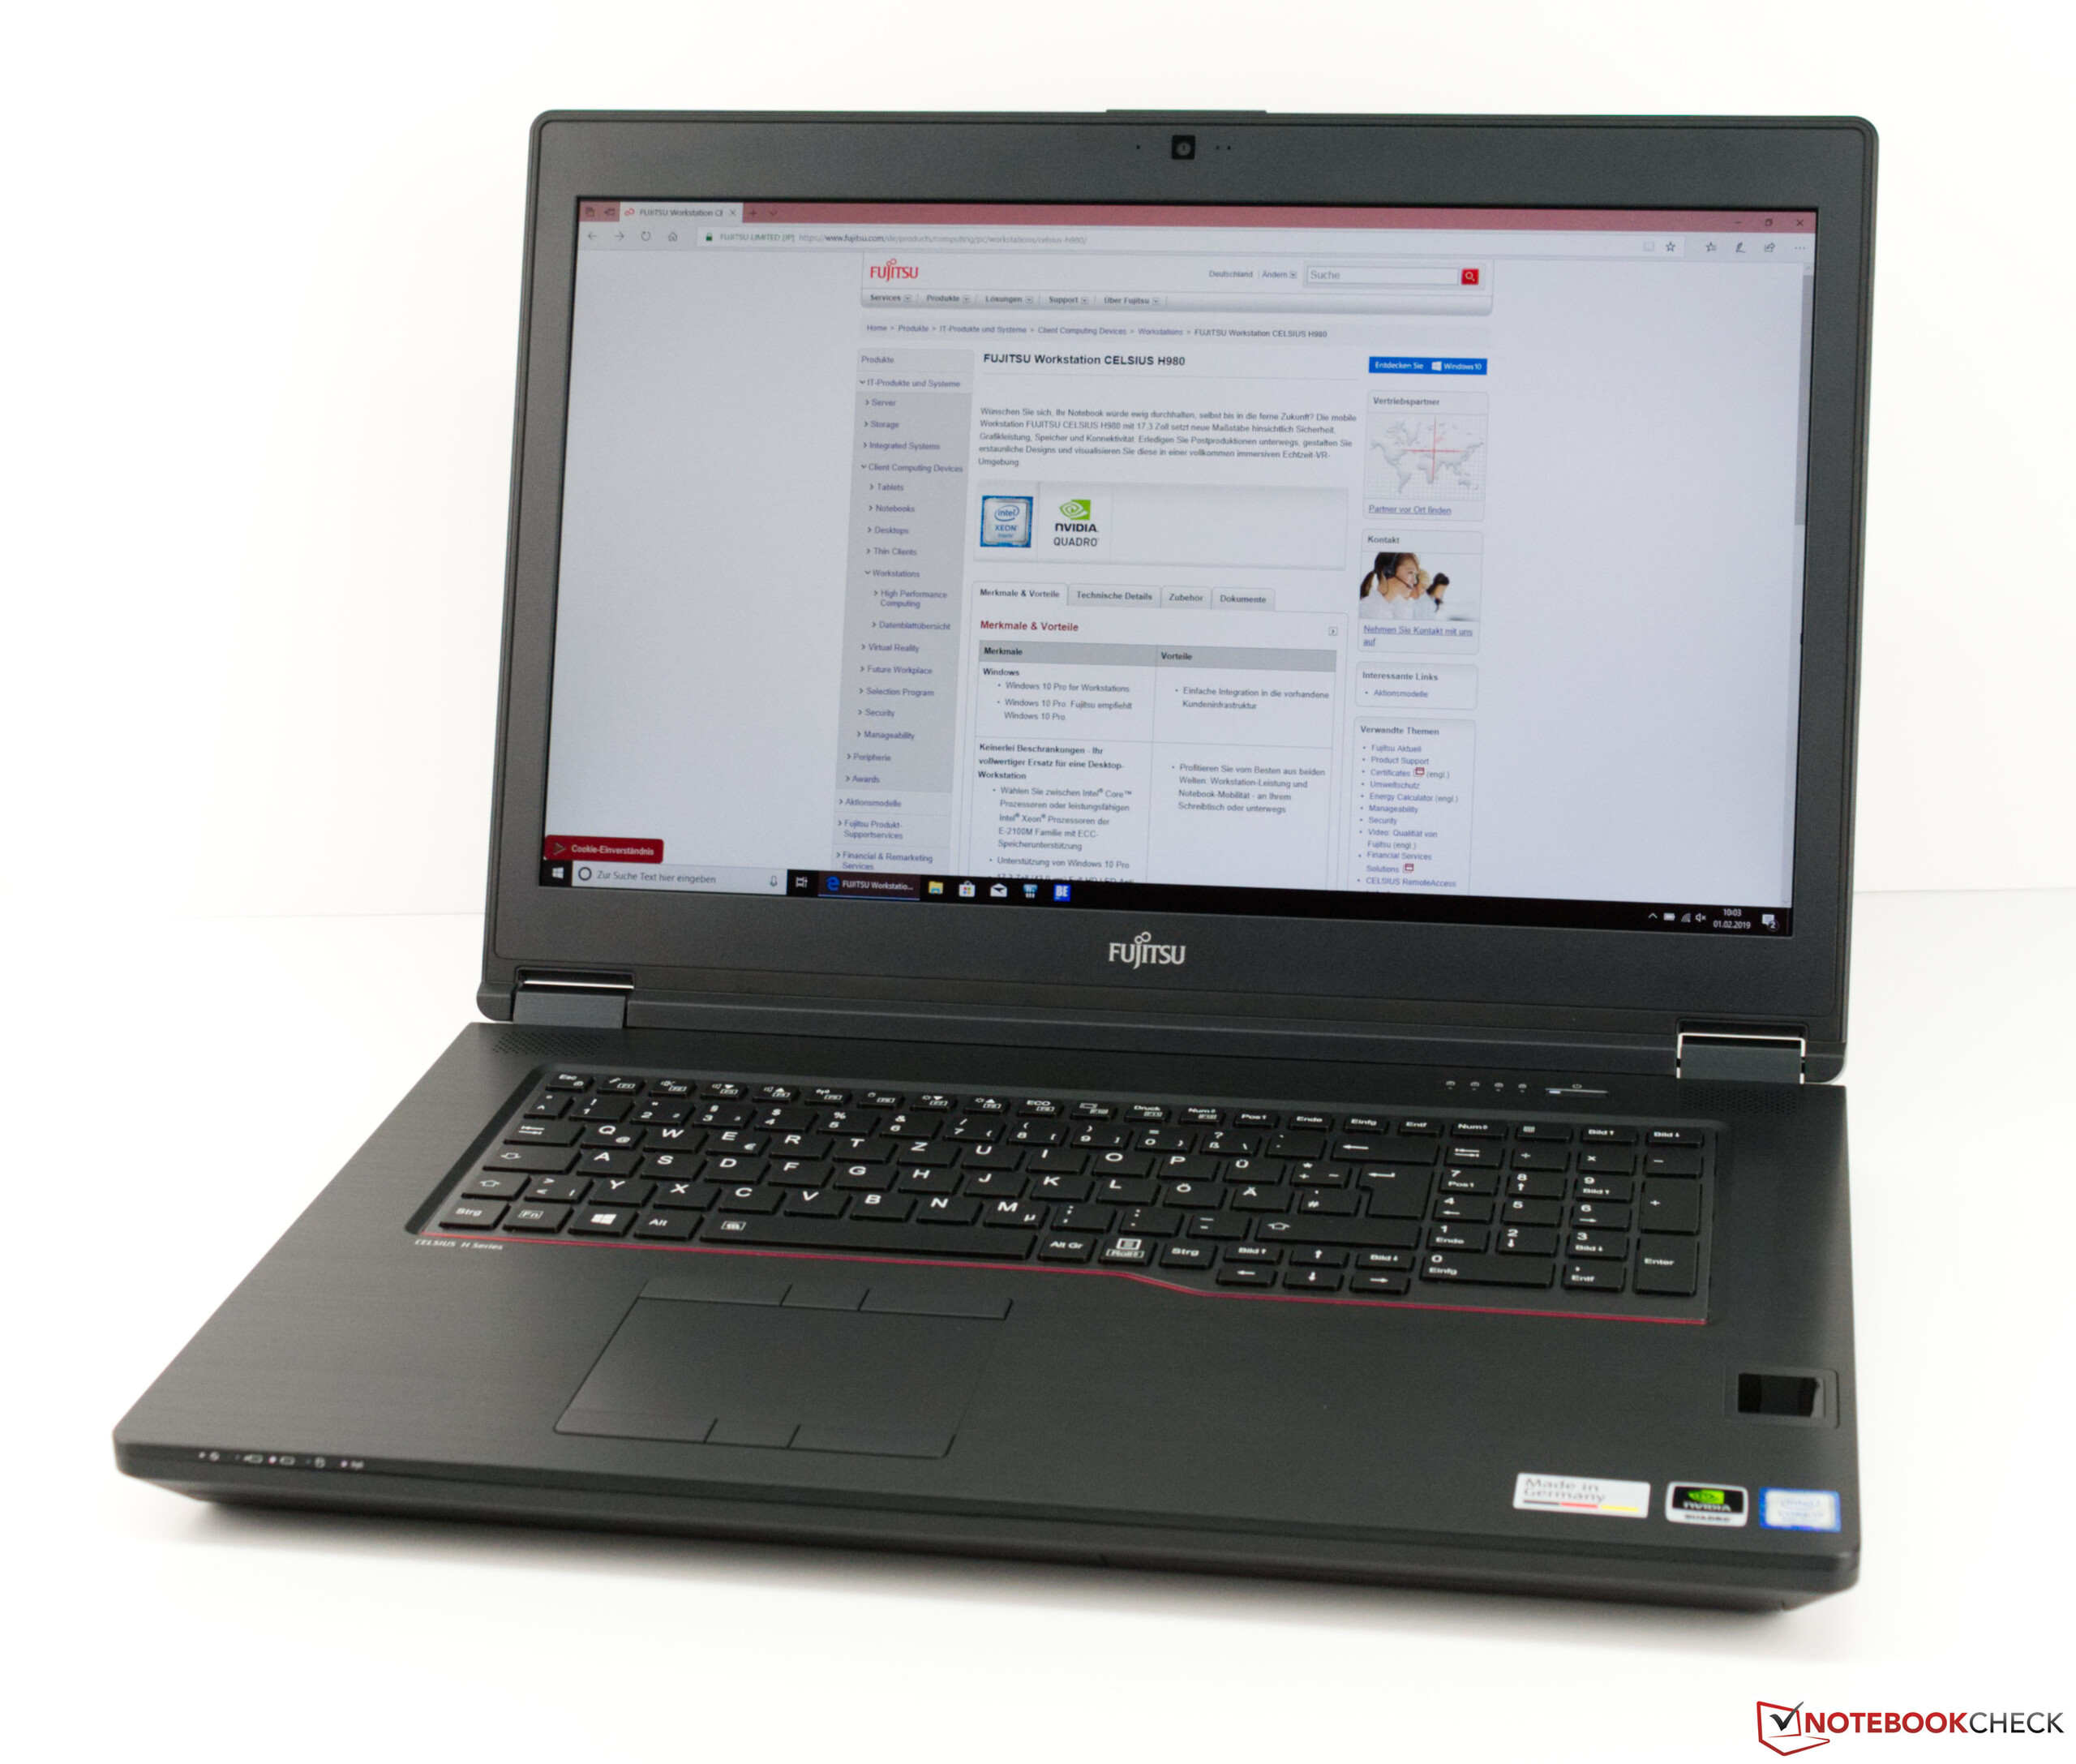
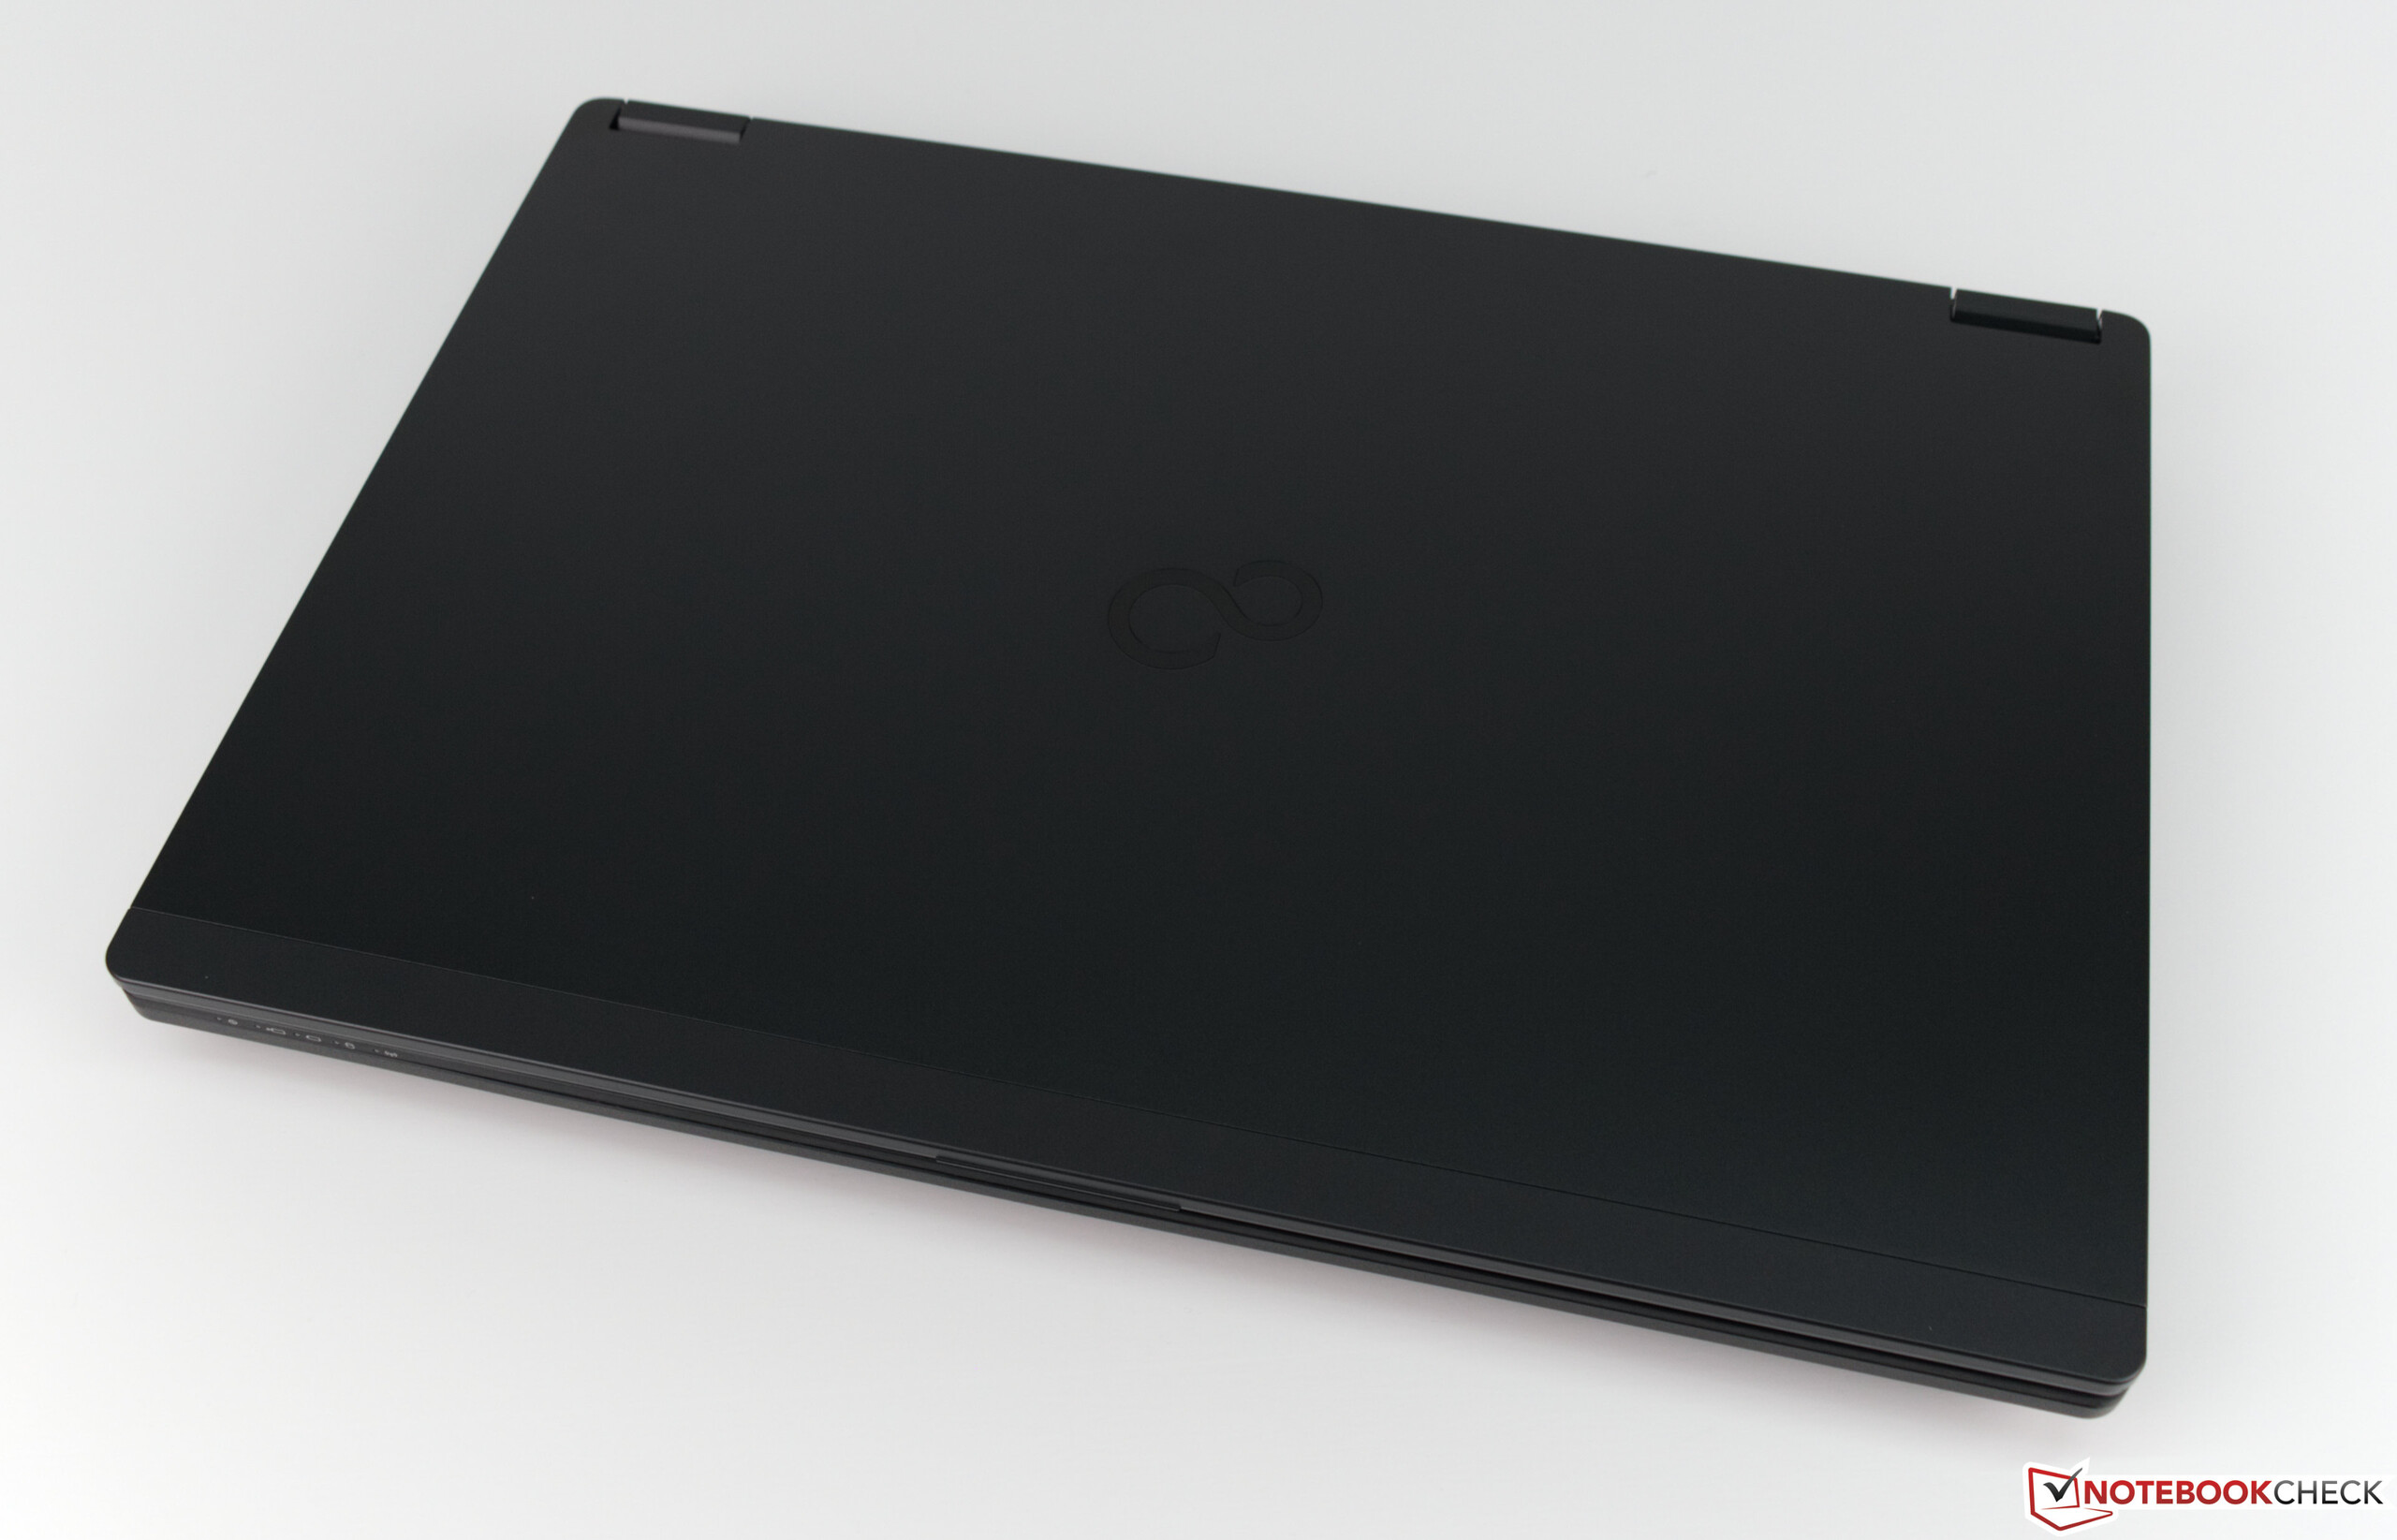
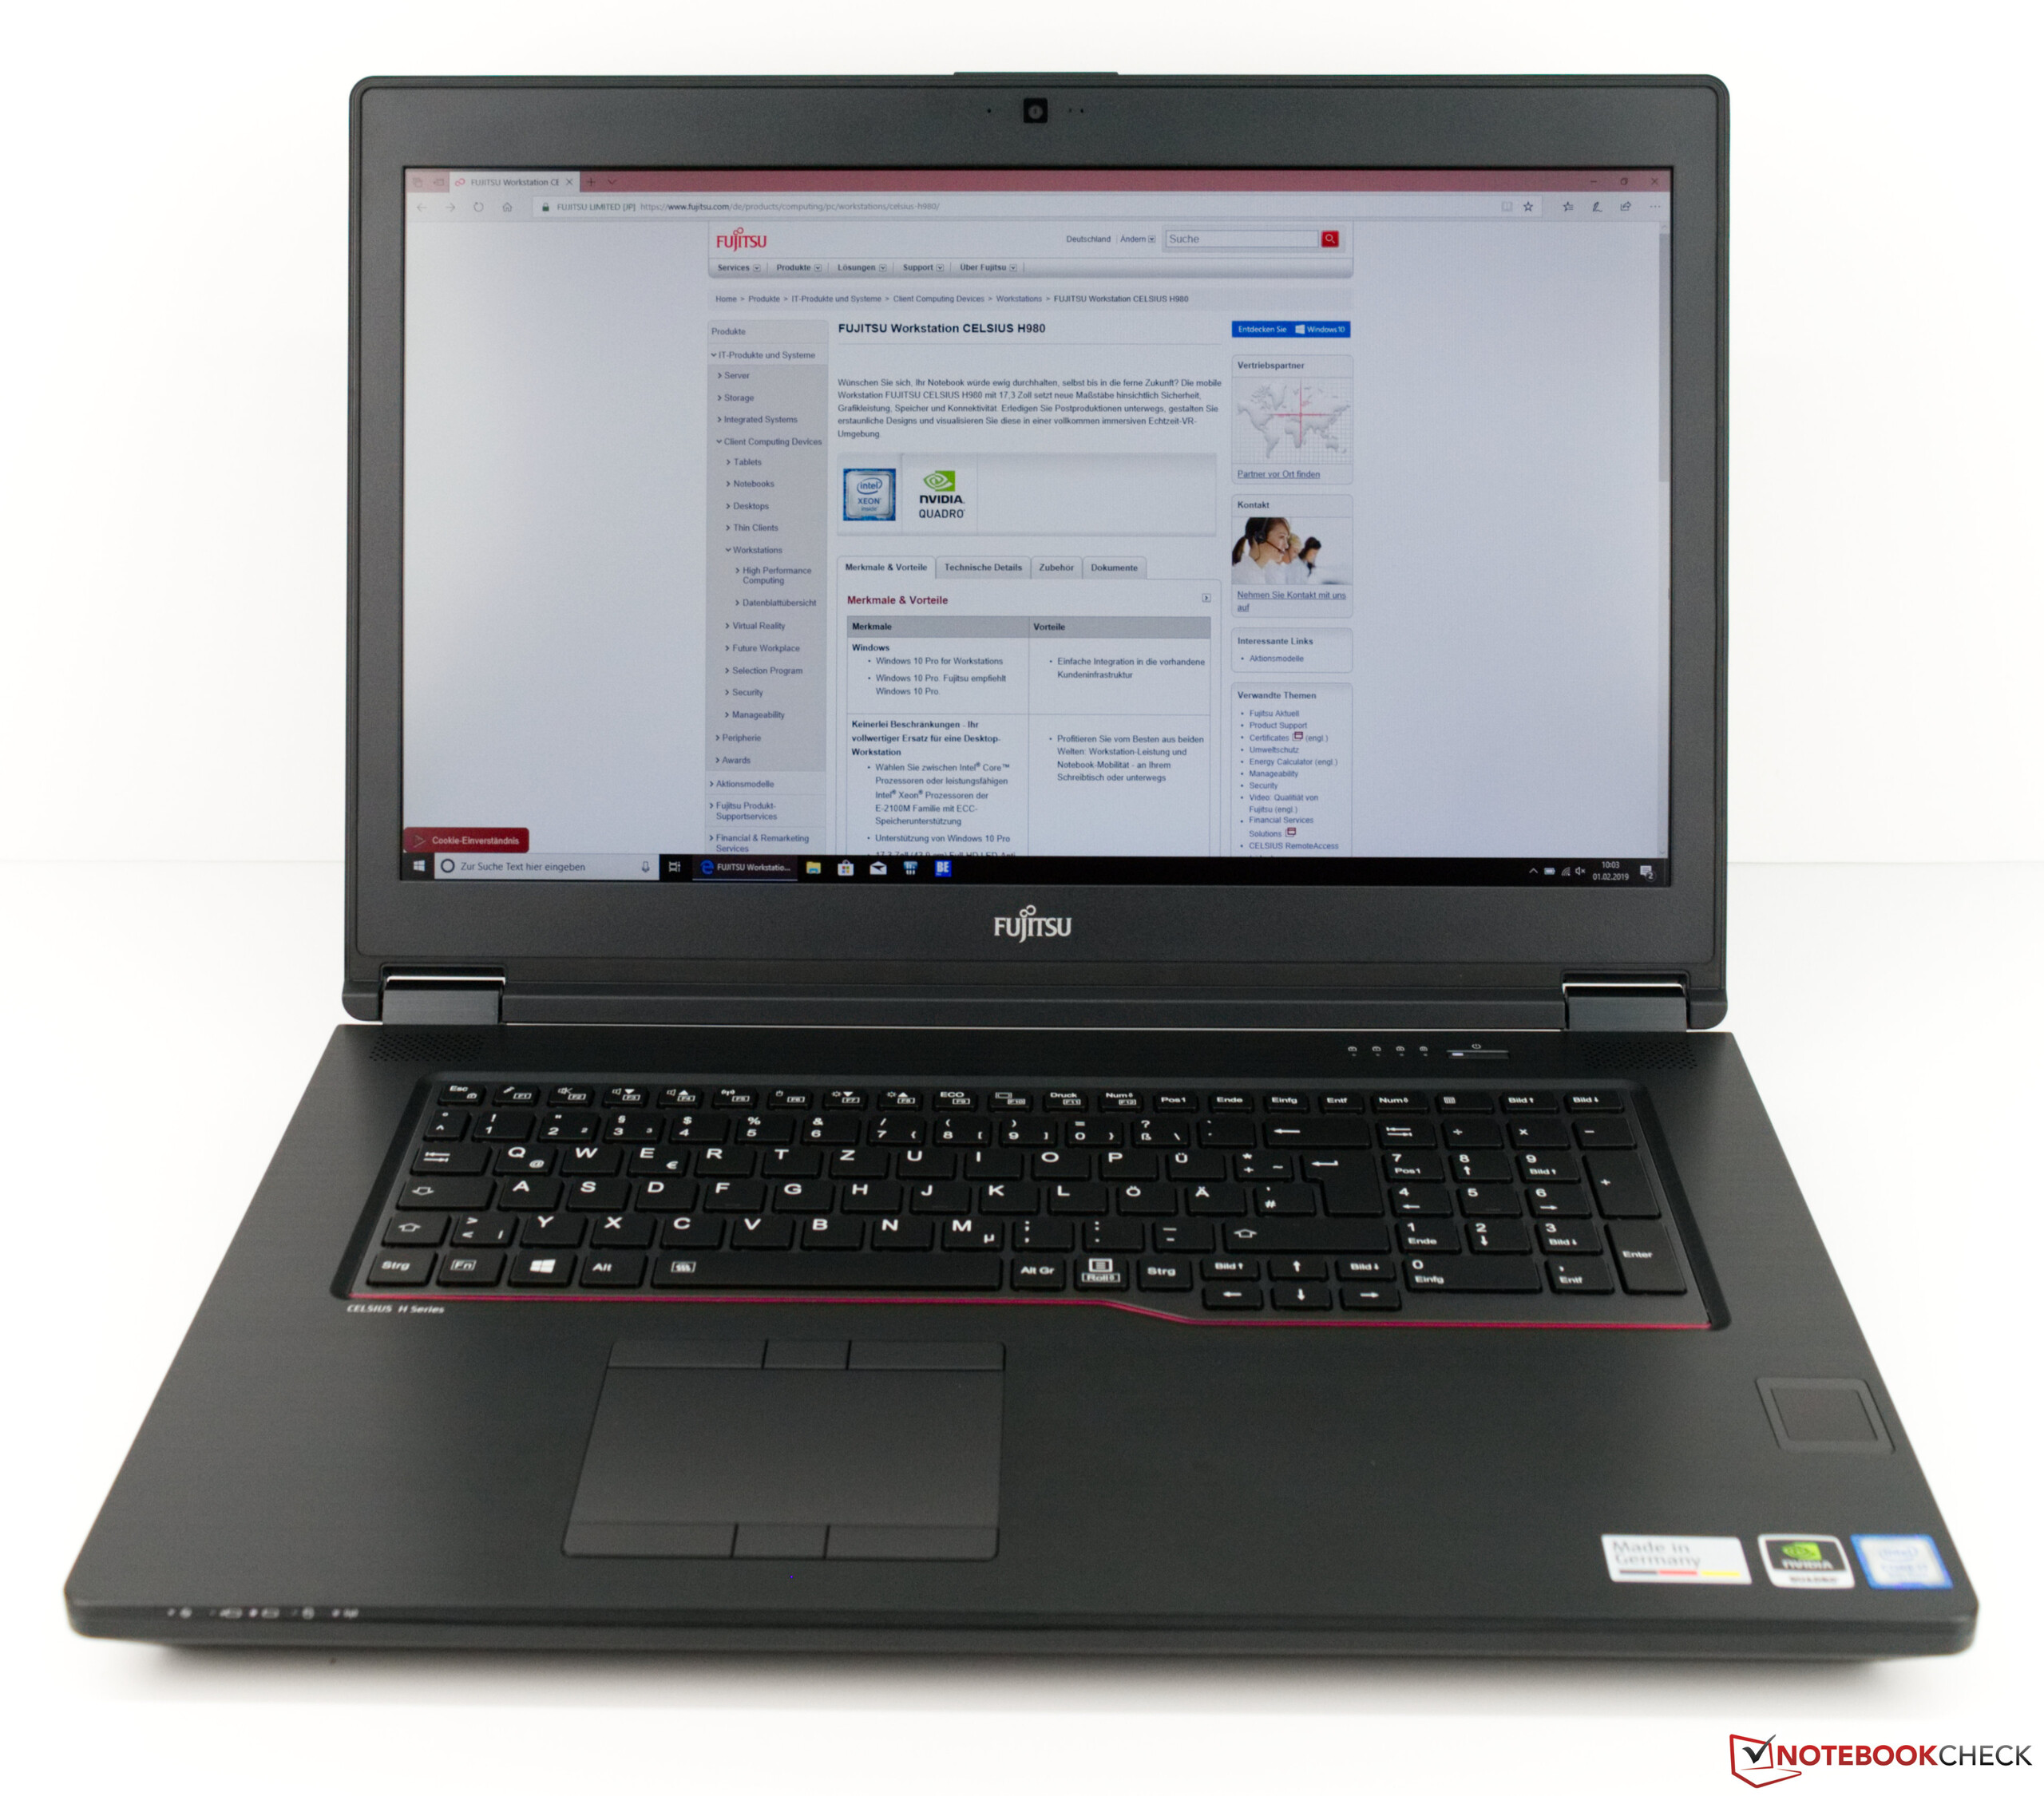
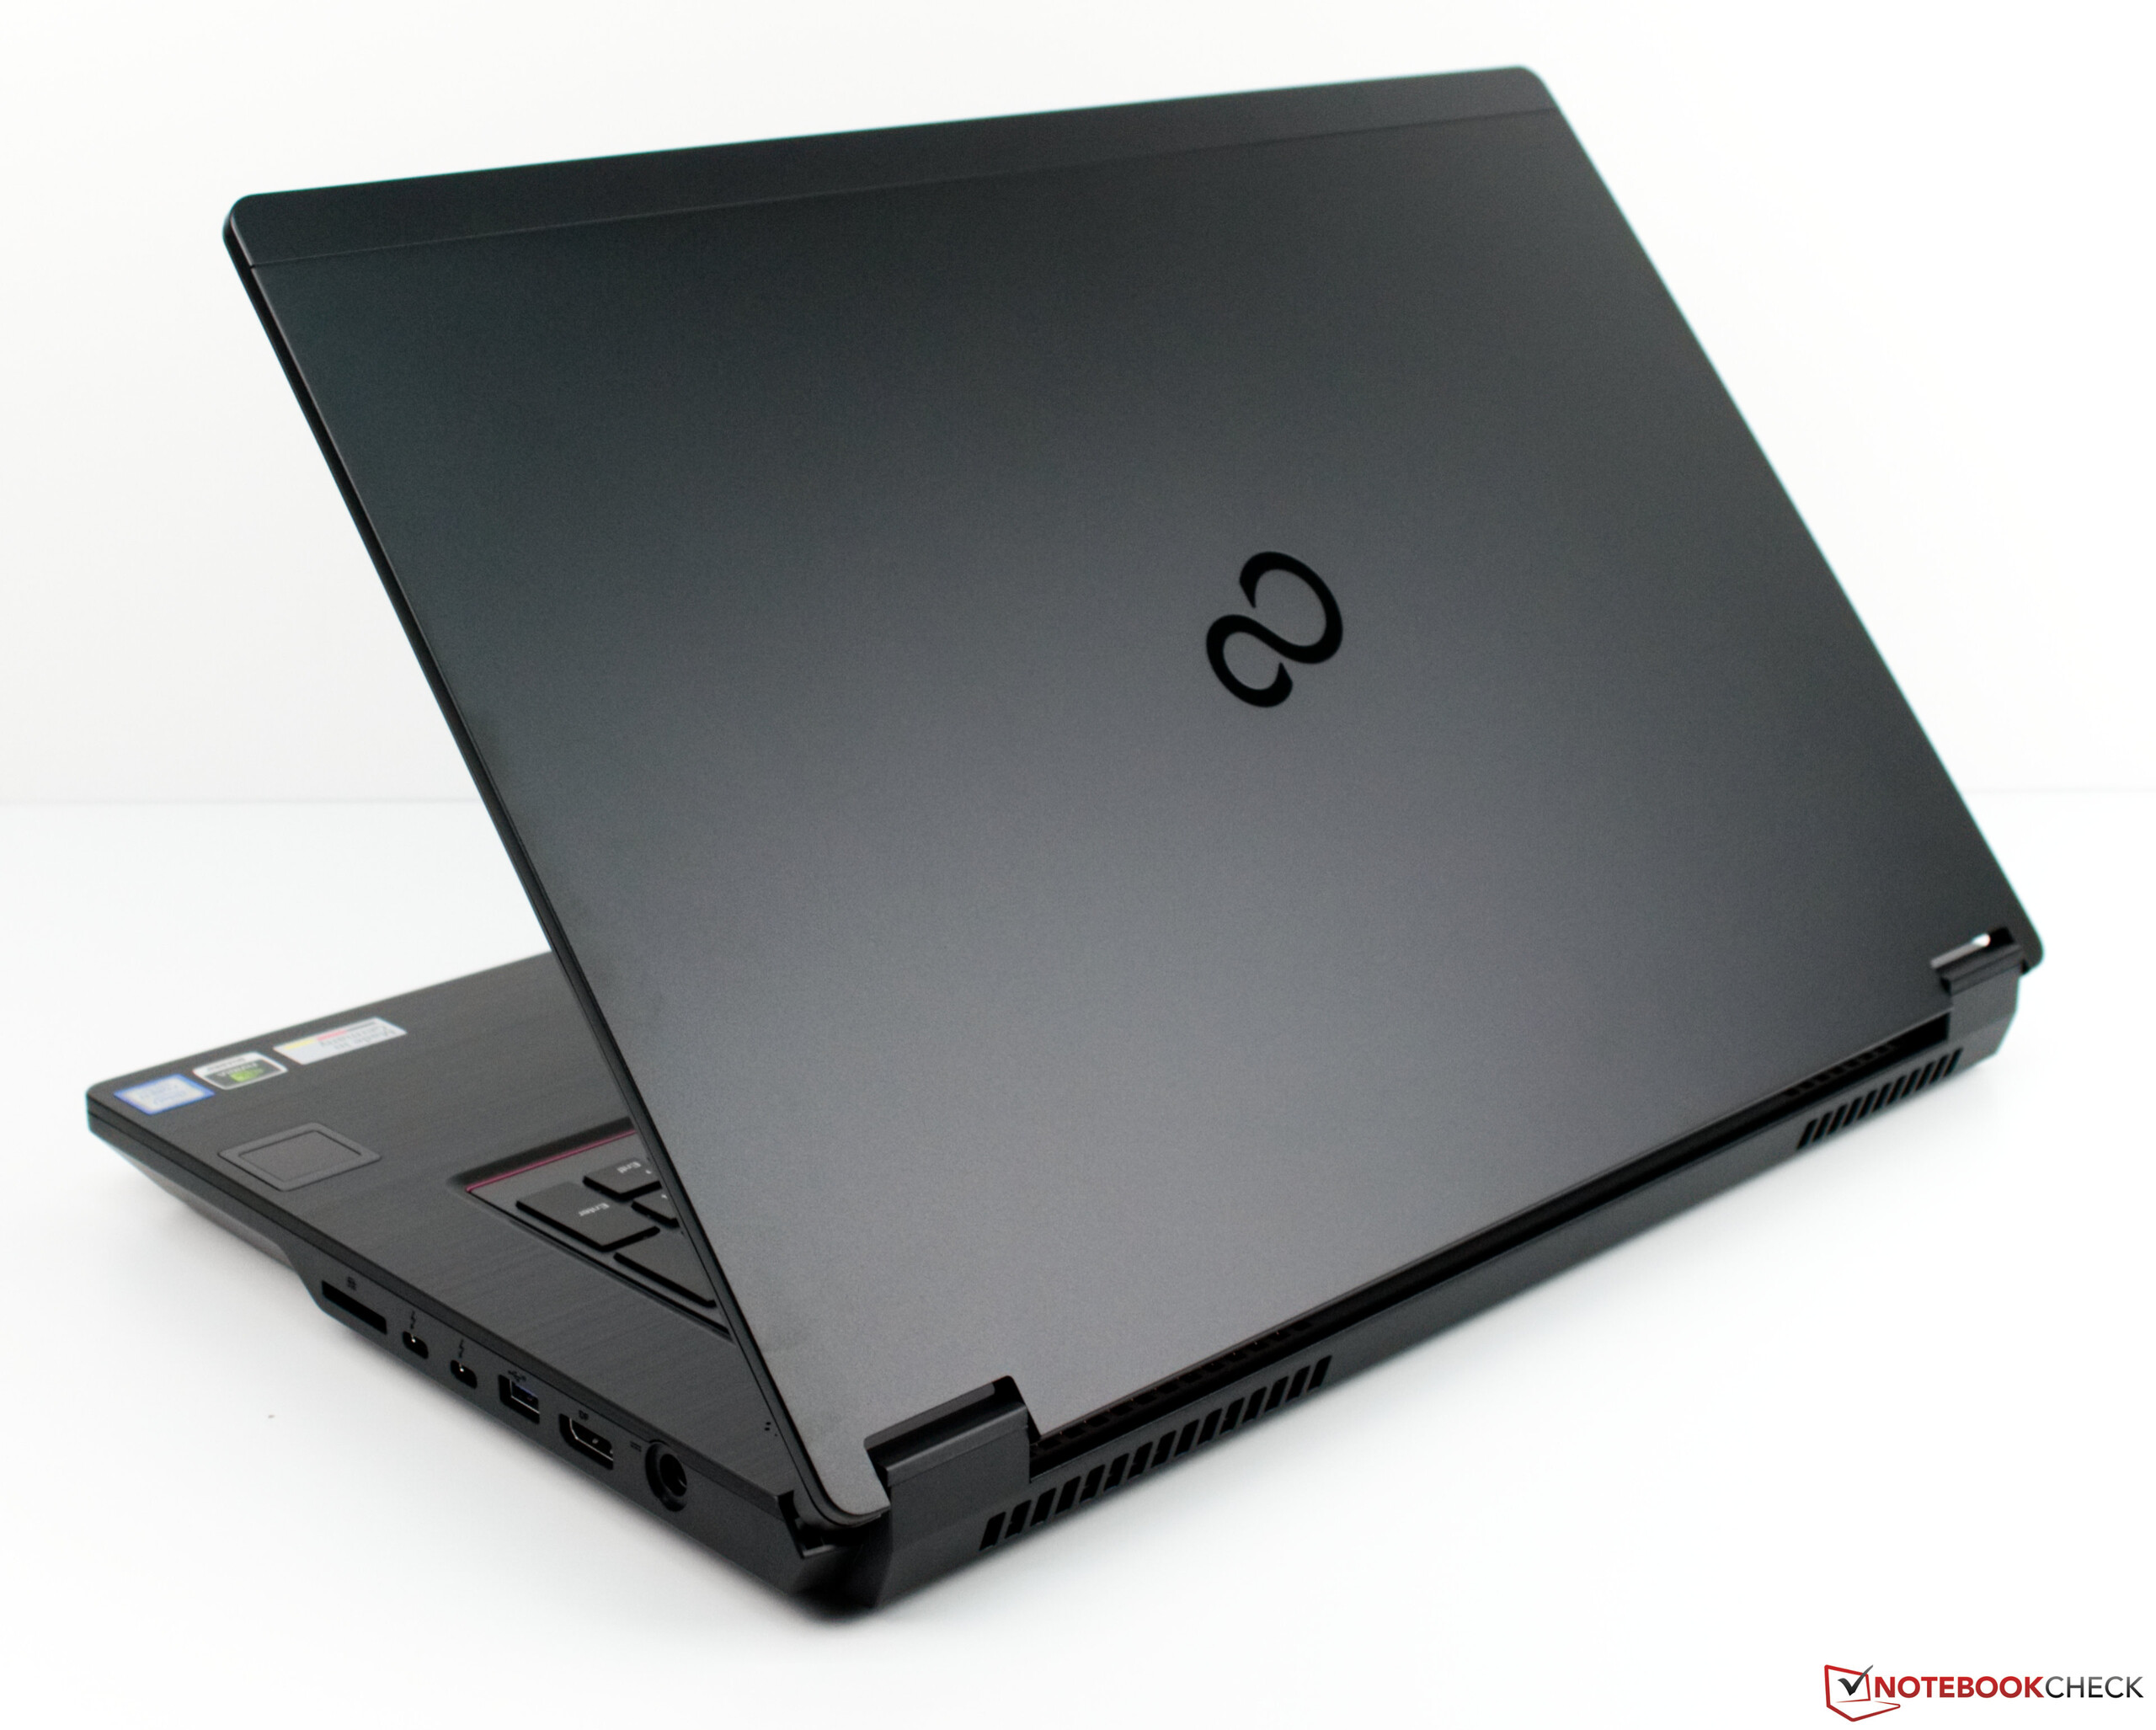
Case
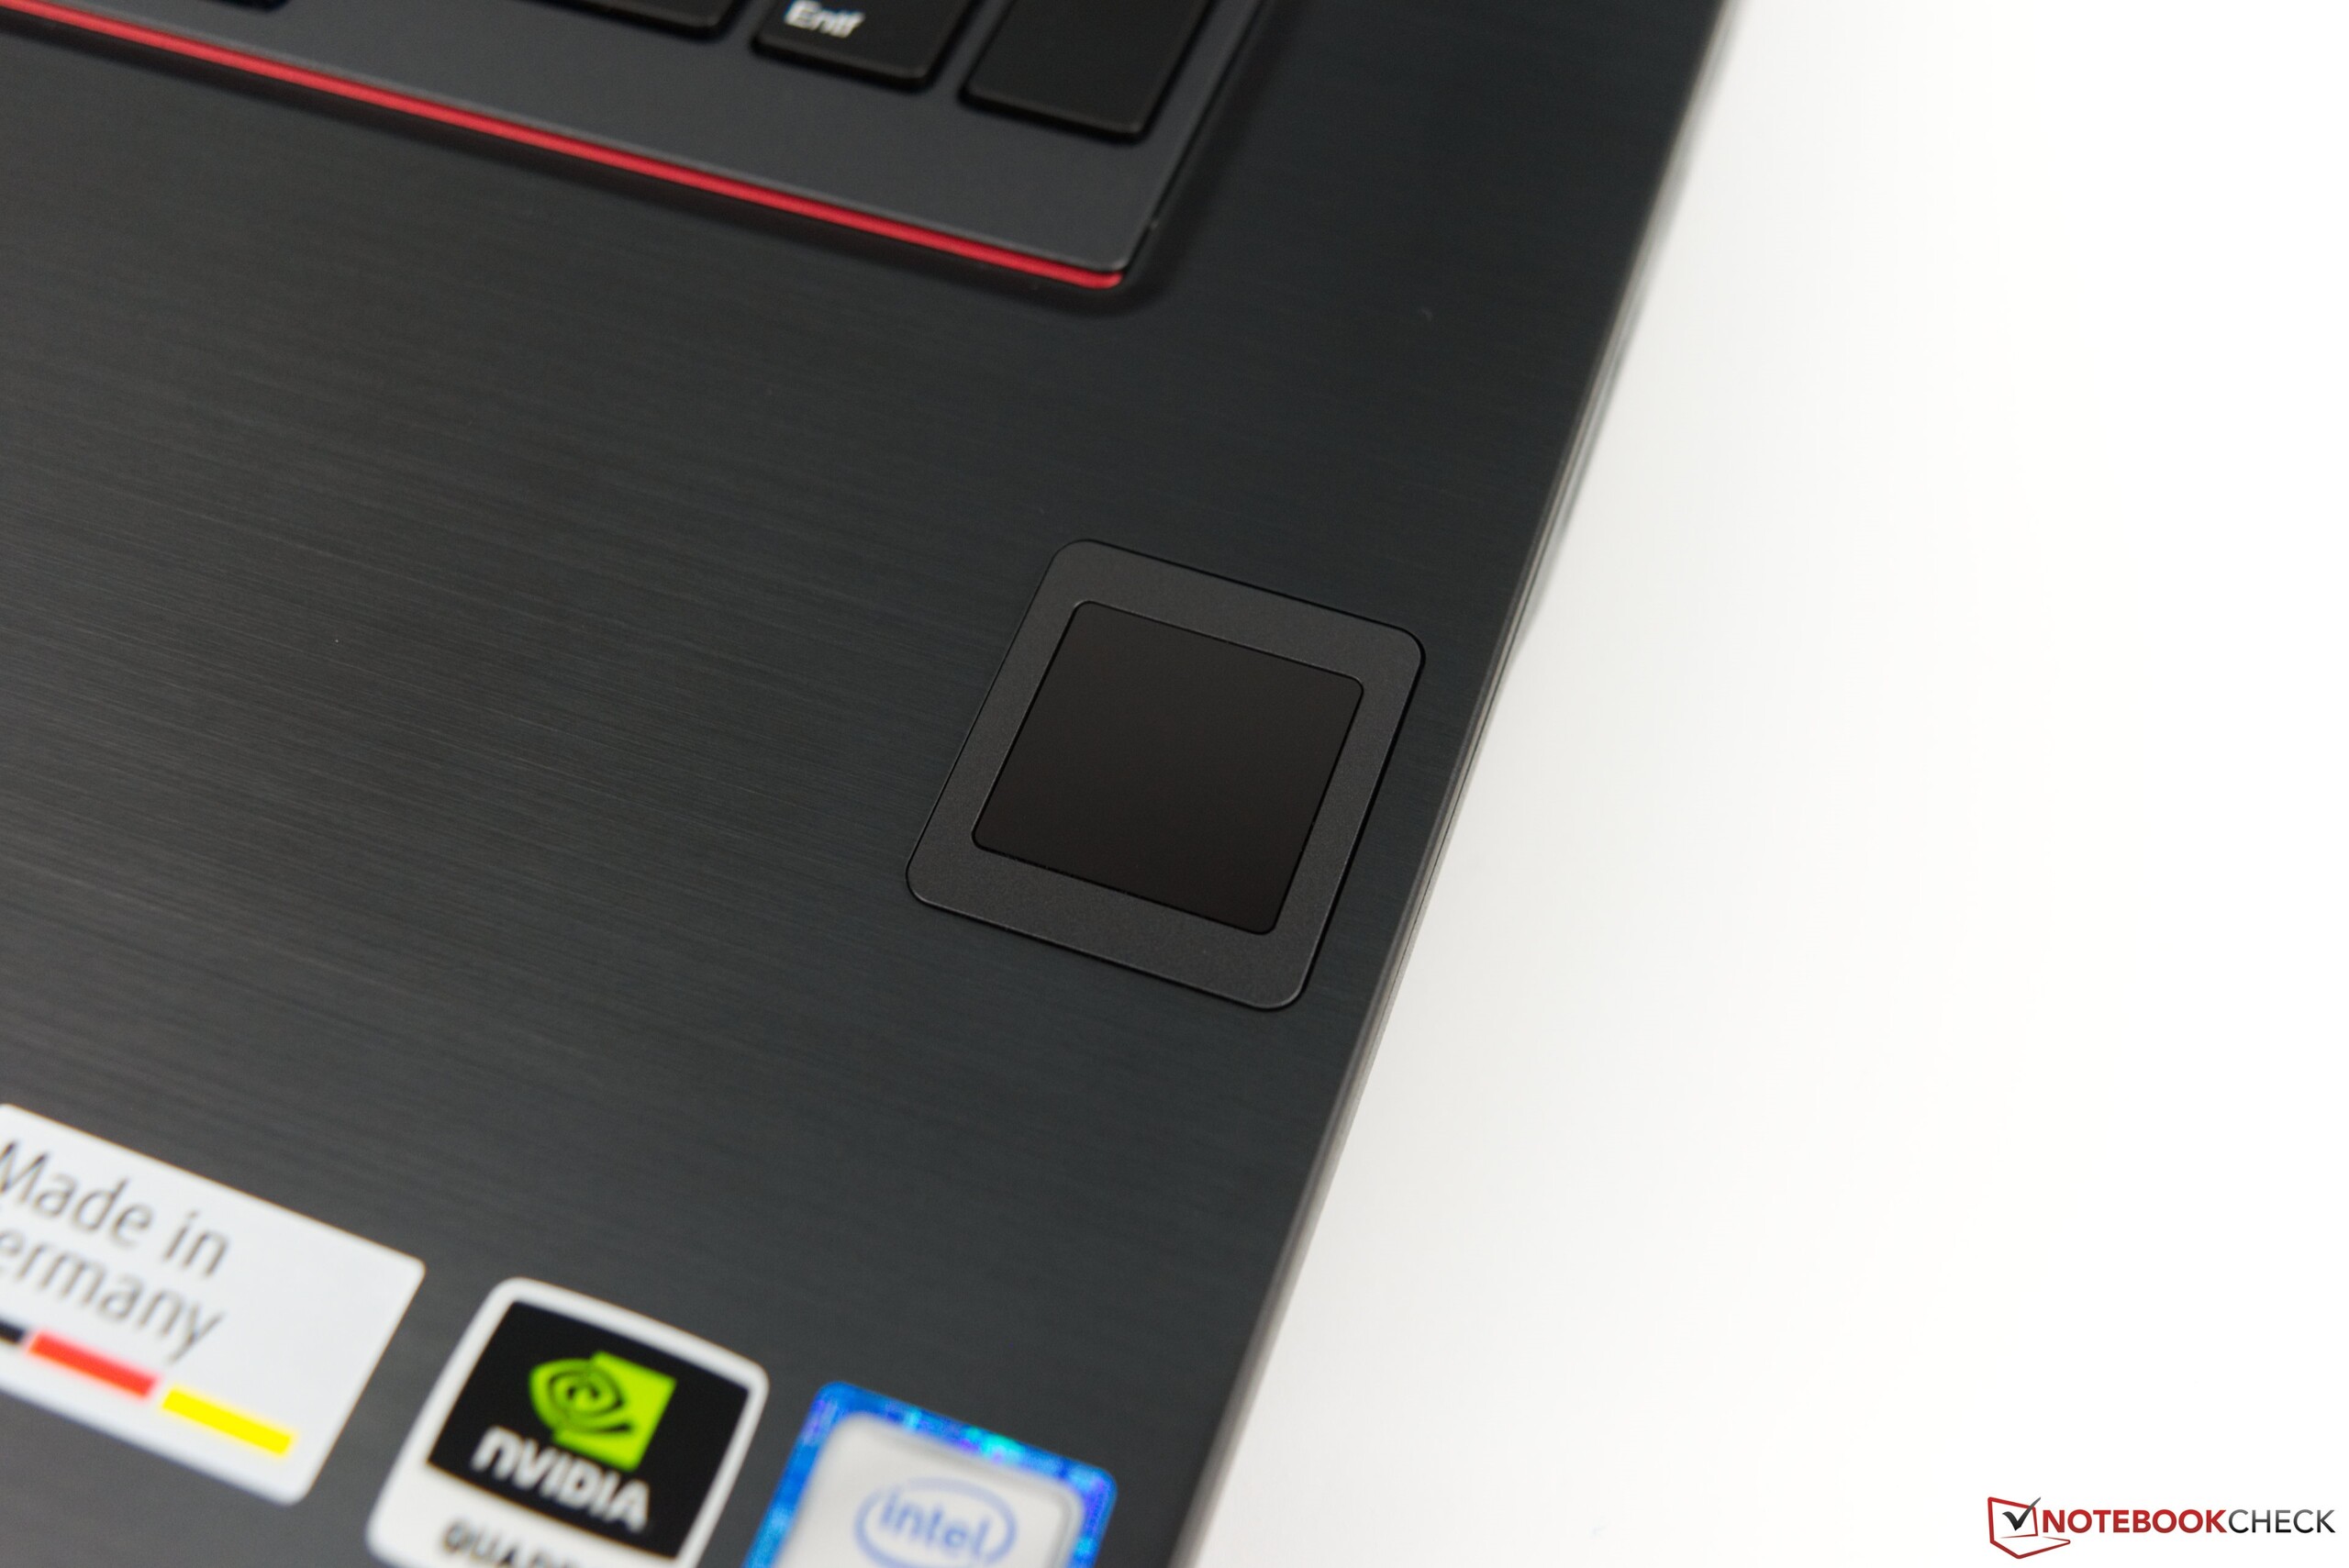
The H980 has the same case as its predecessor, so we point you to our Celsius H970 review for our views on this area. Fujitsu has made changes internally though, which we will cover in the Maintenance section of this review.

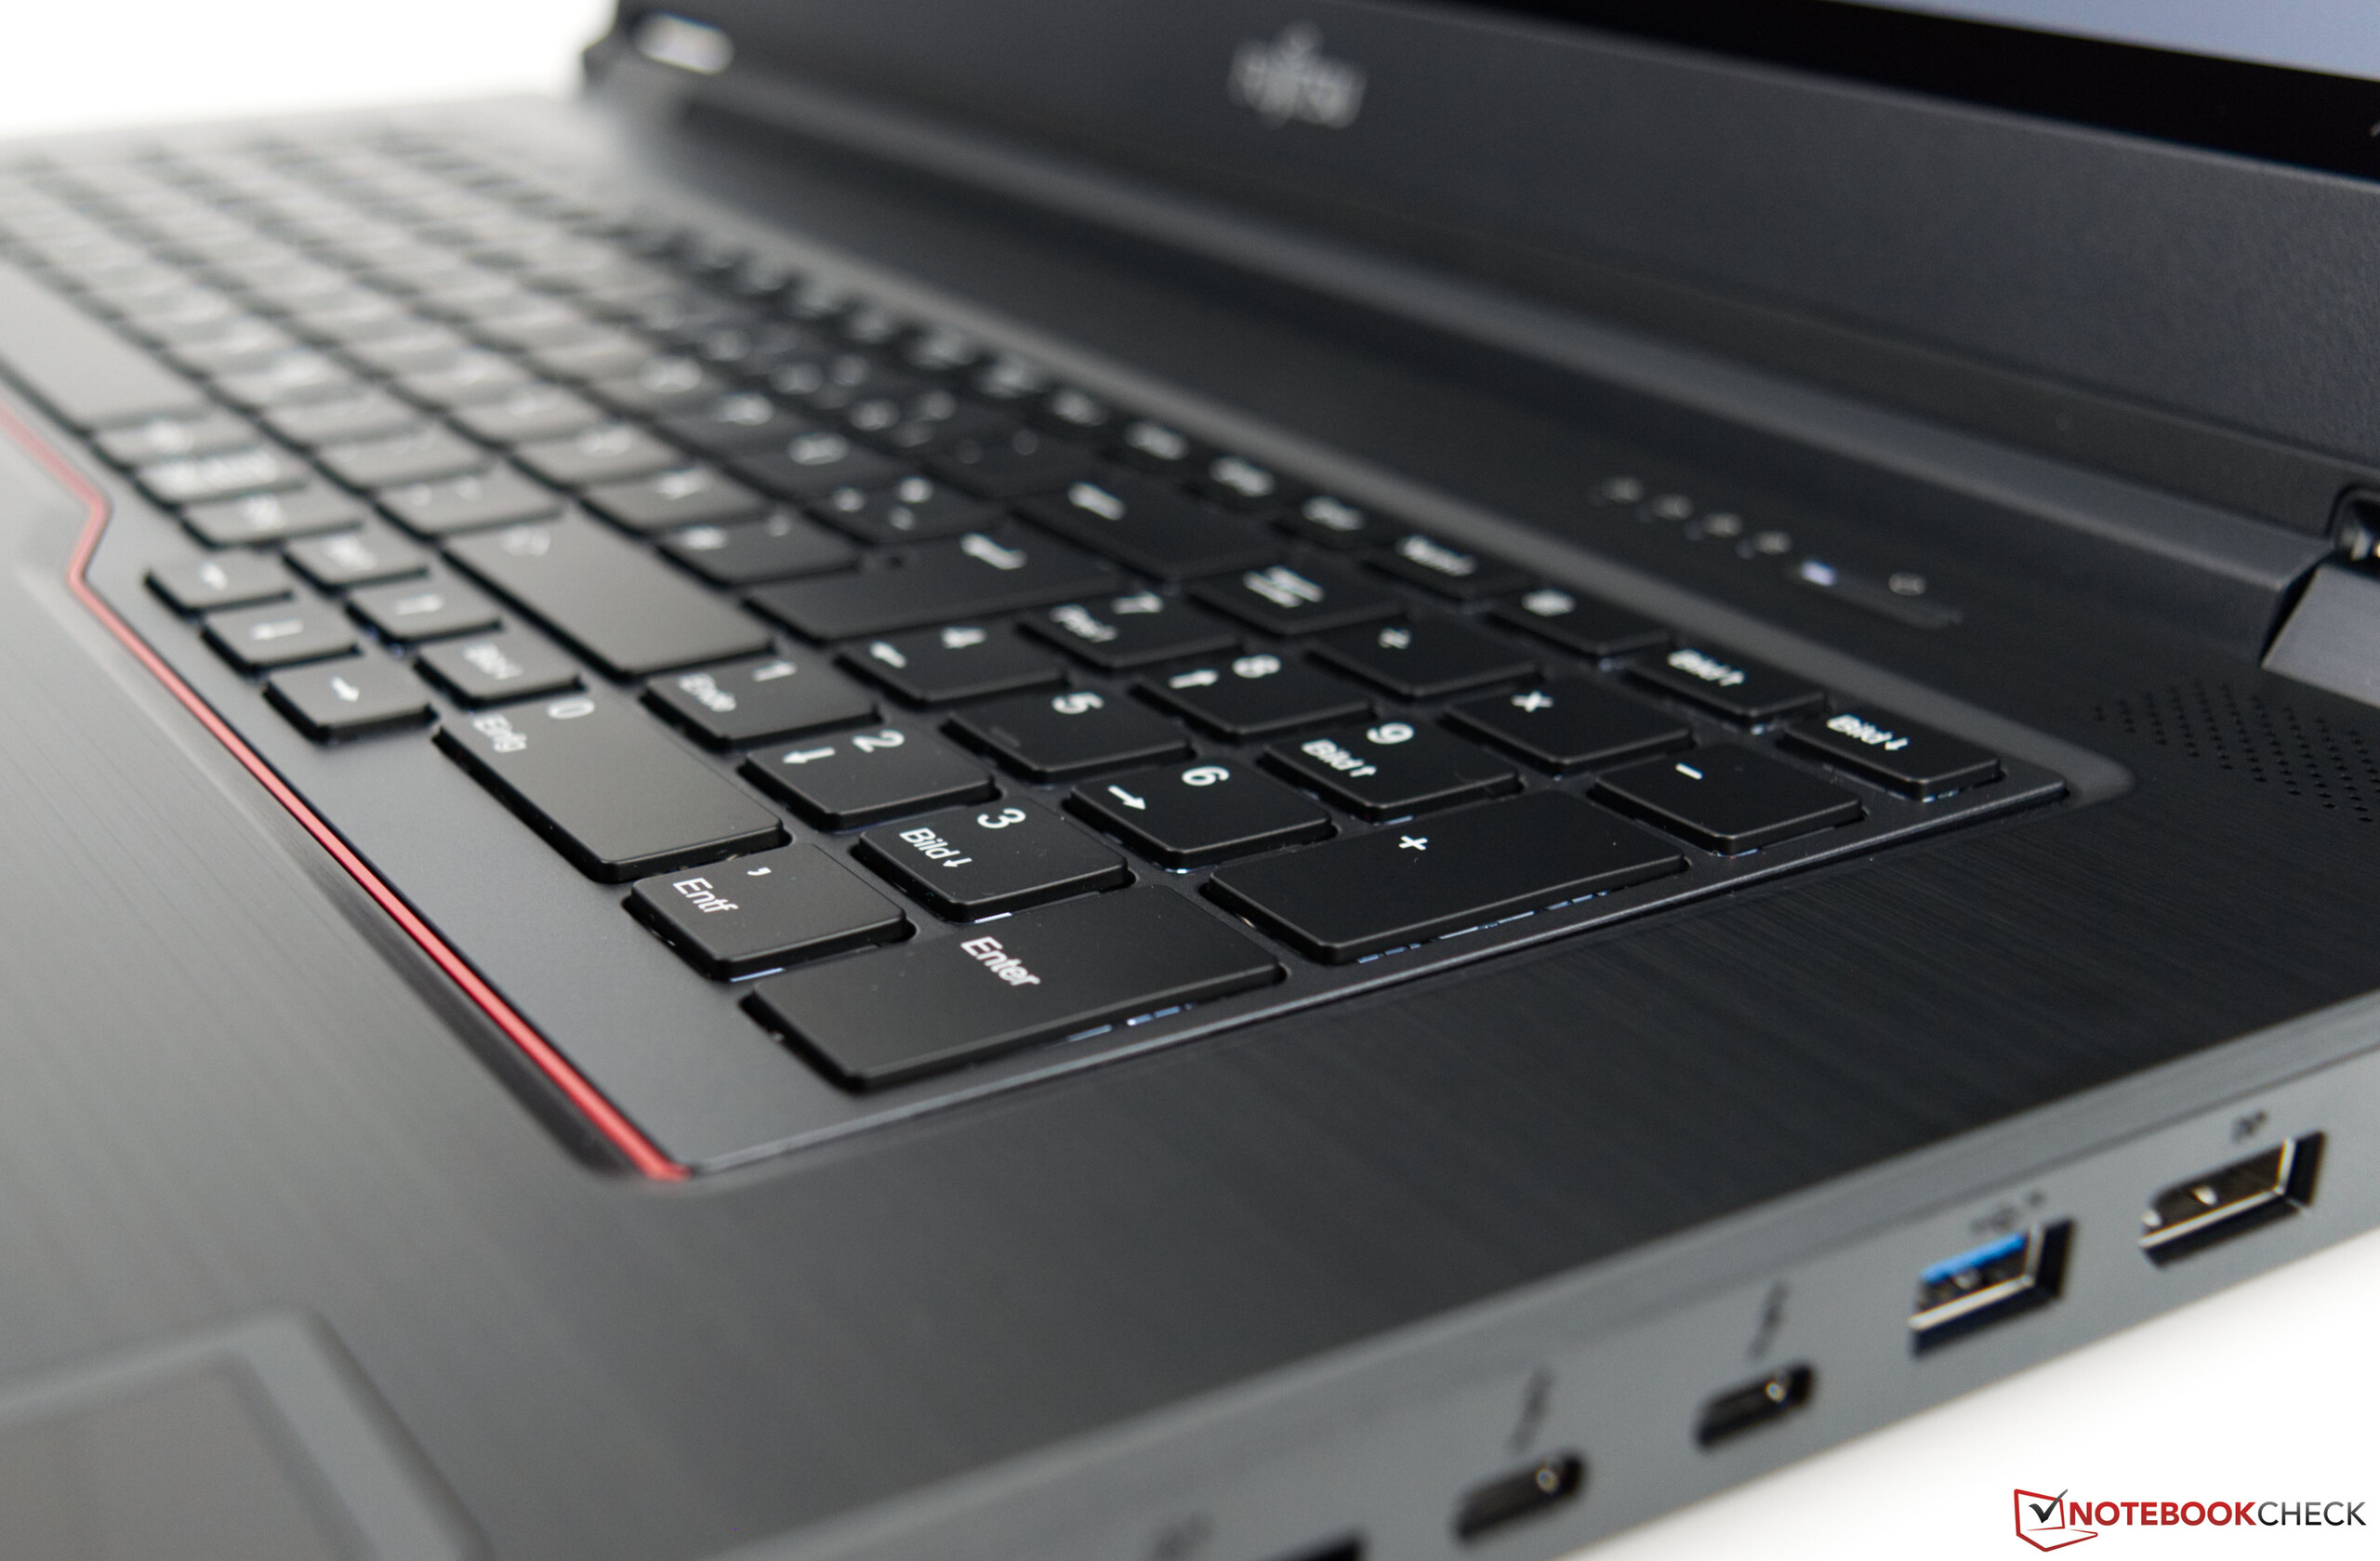
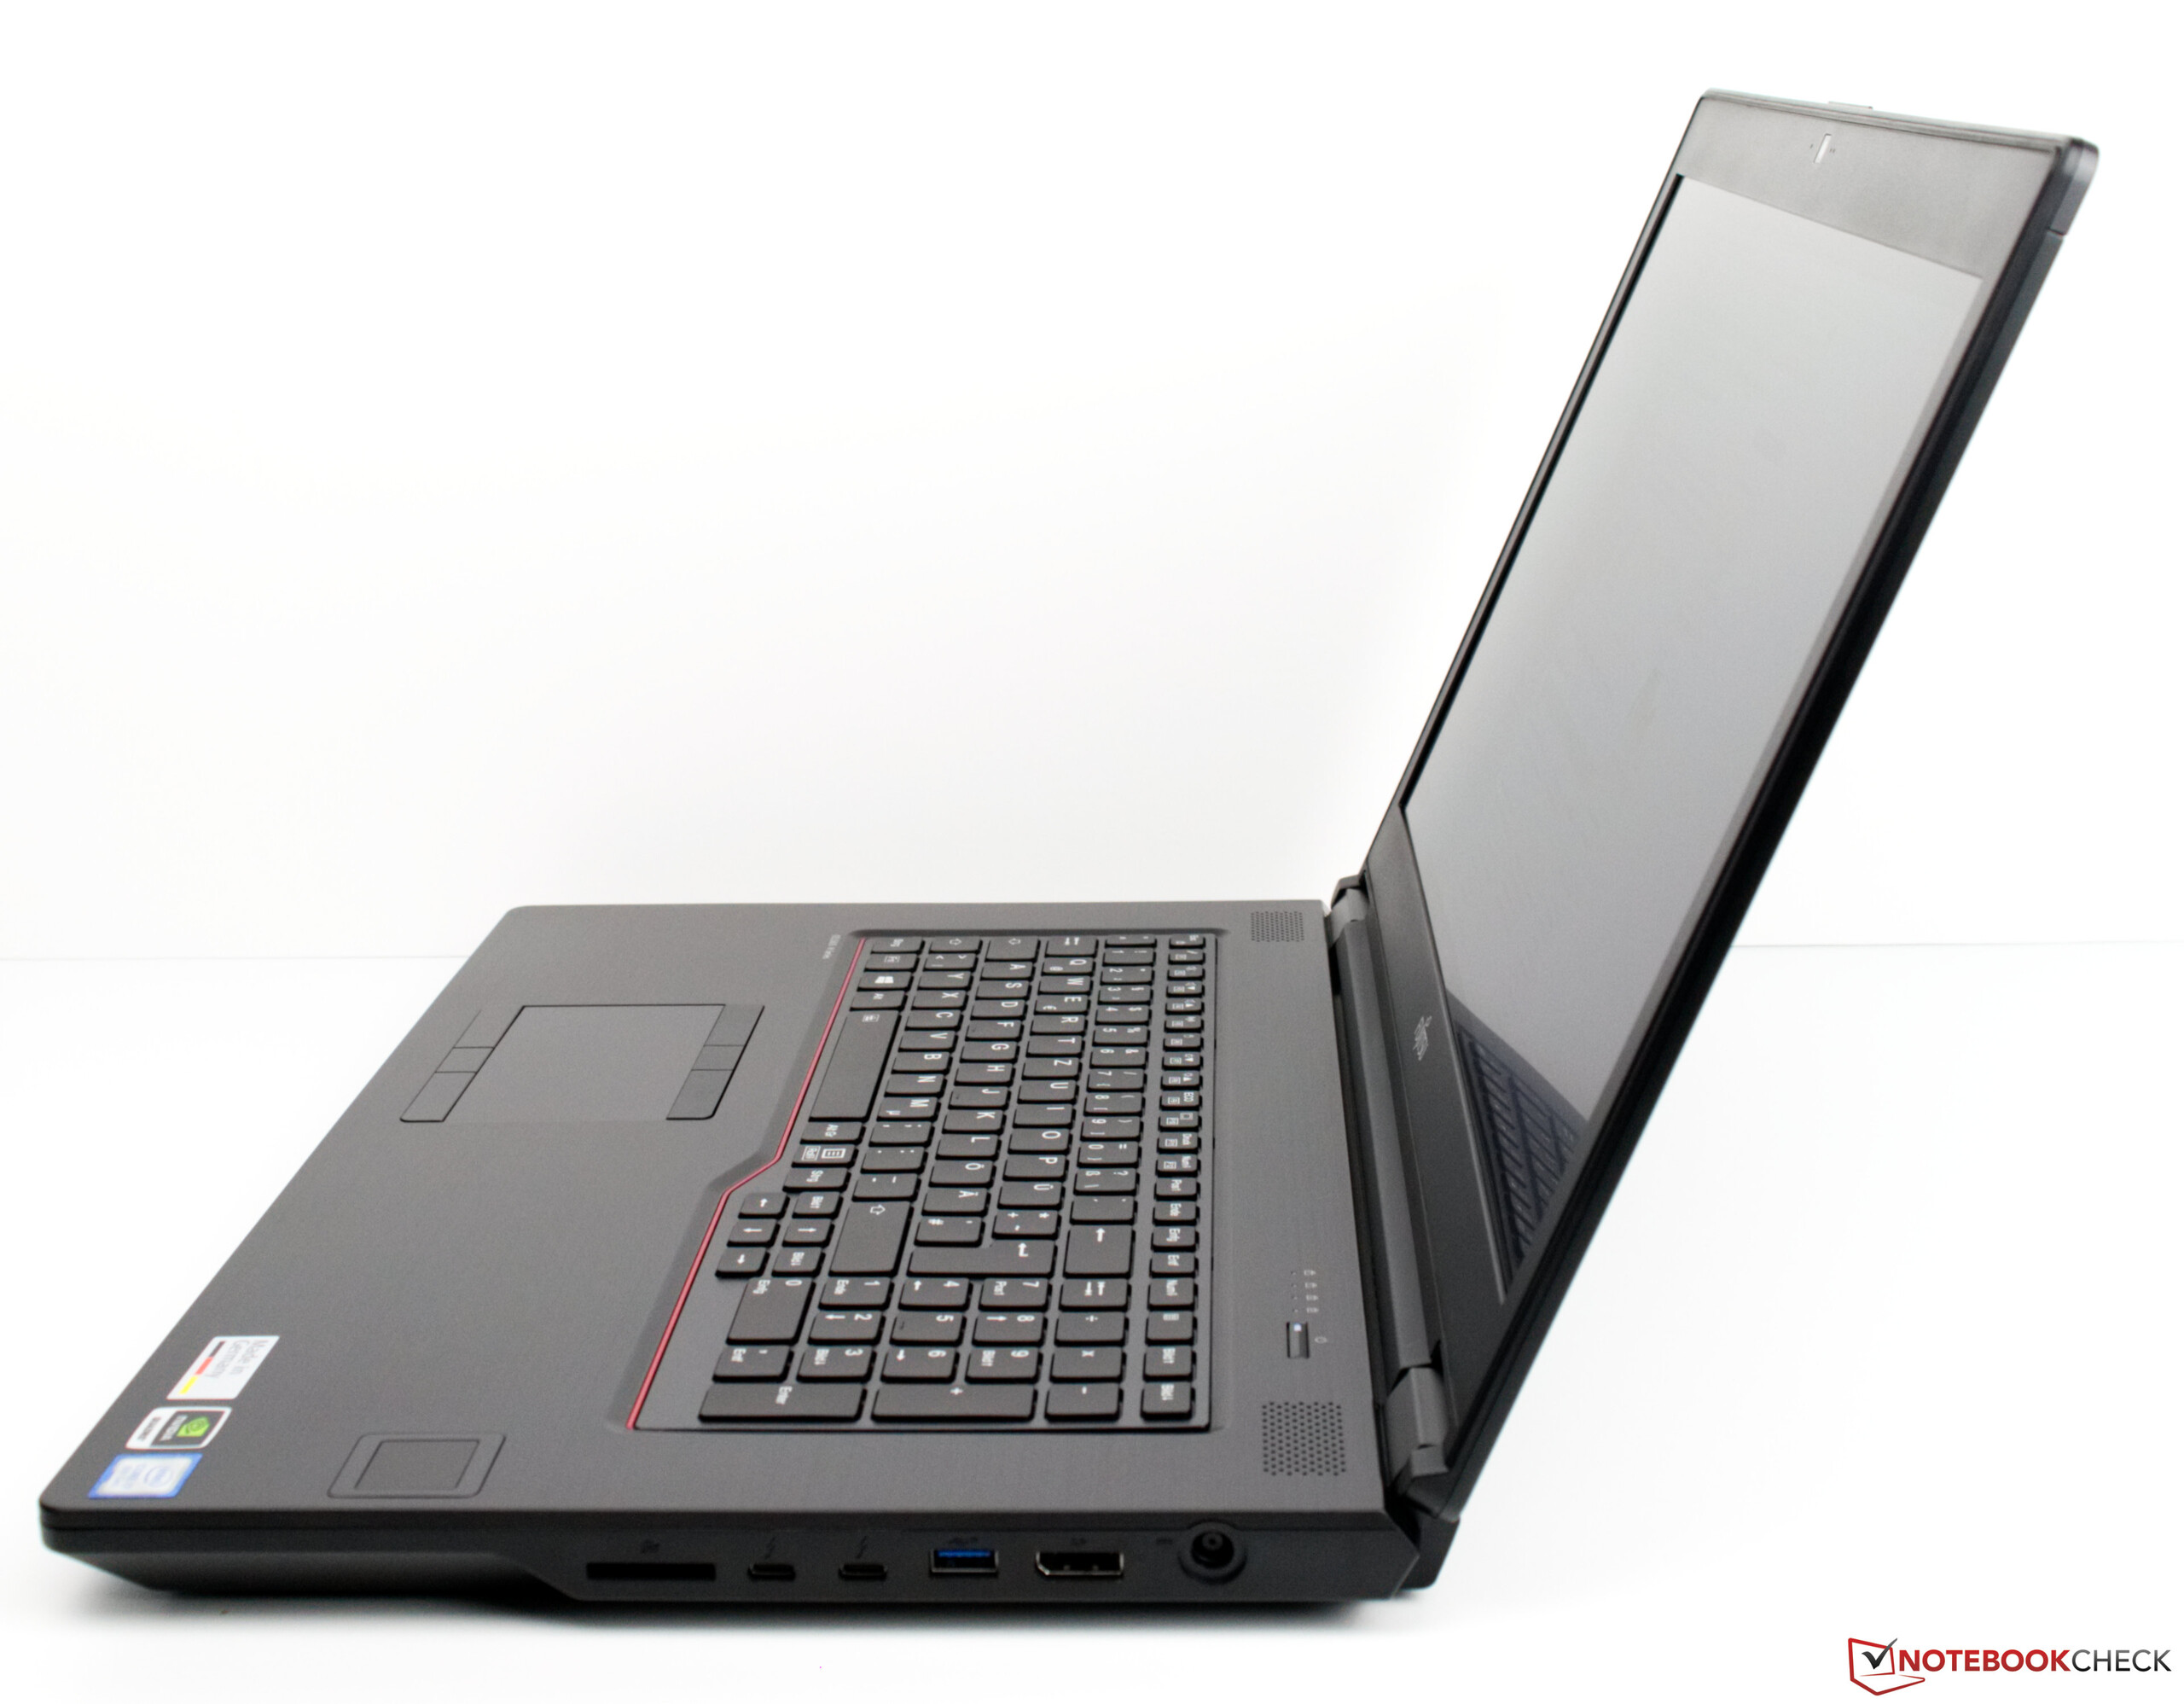
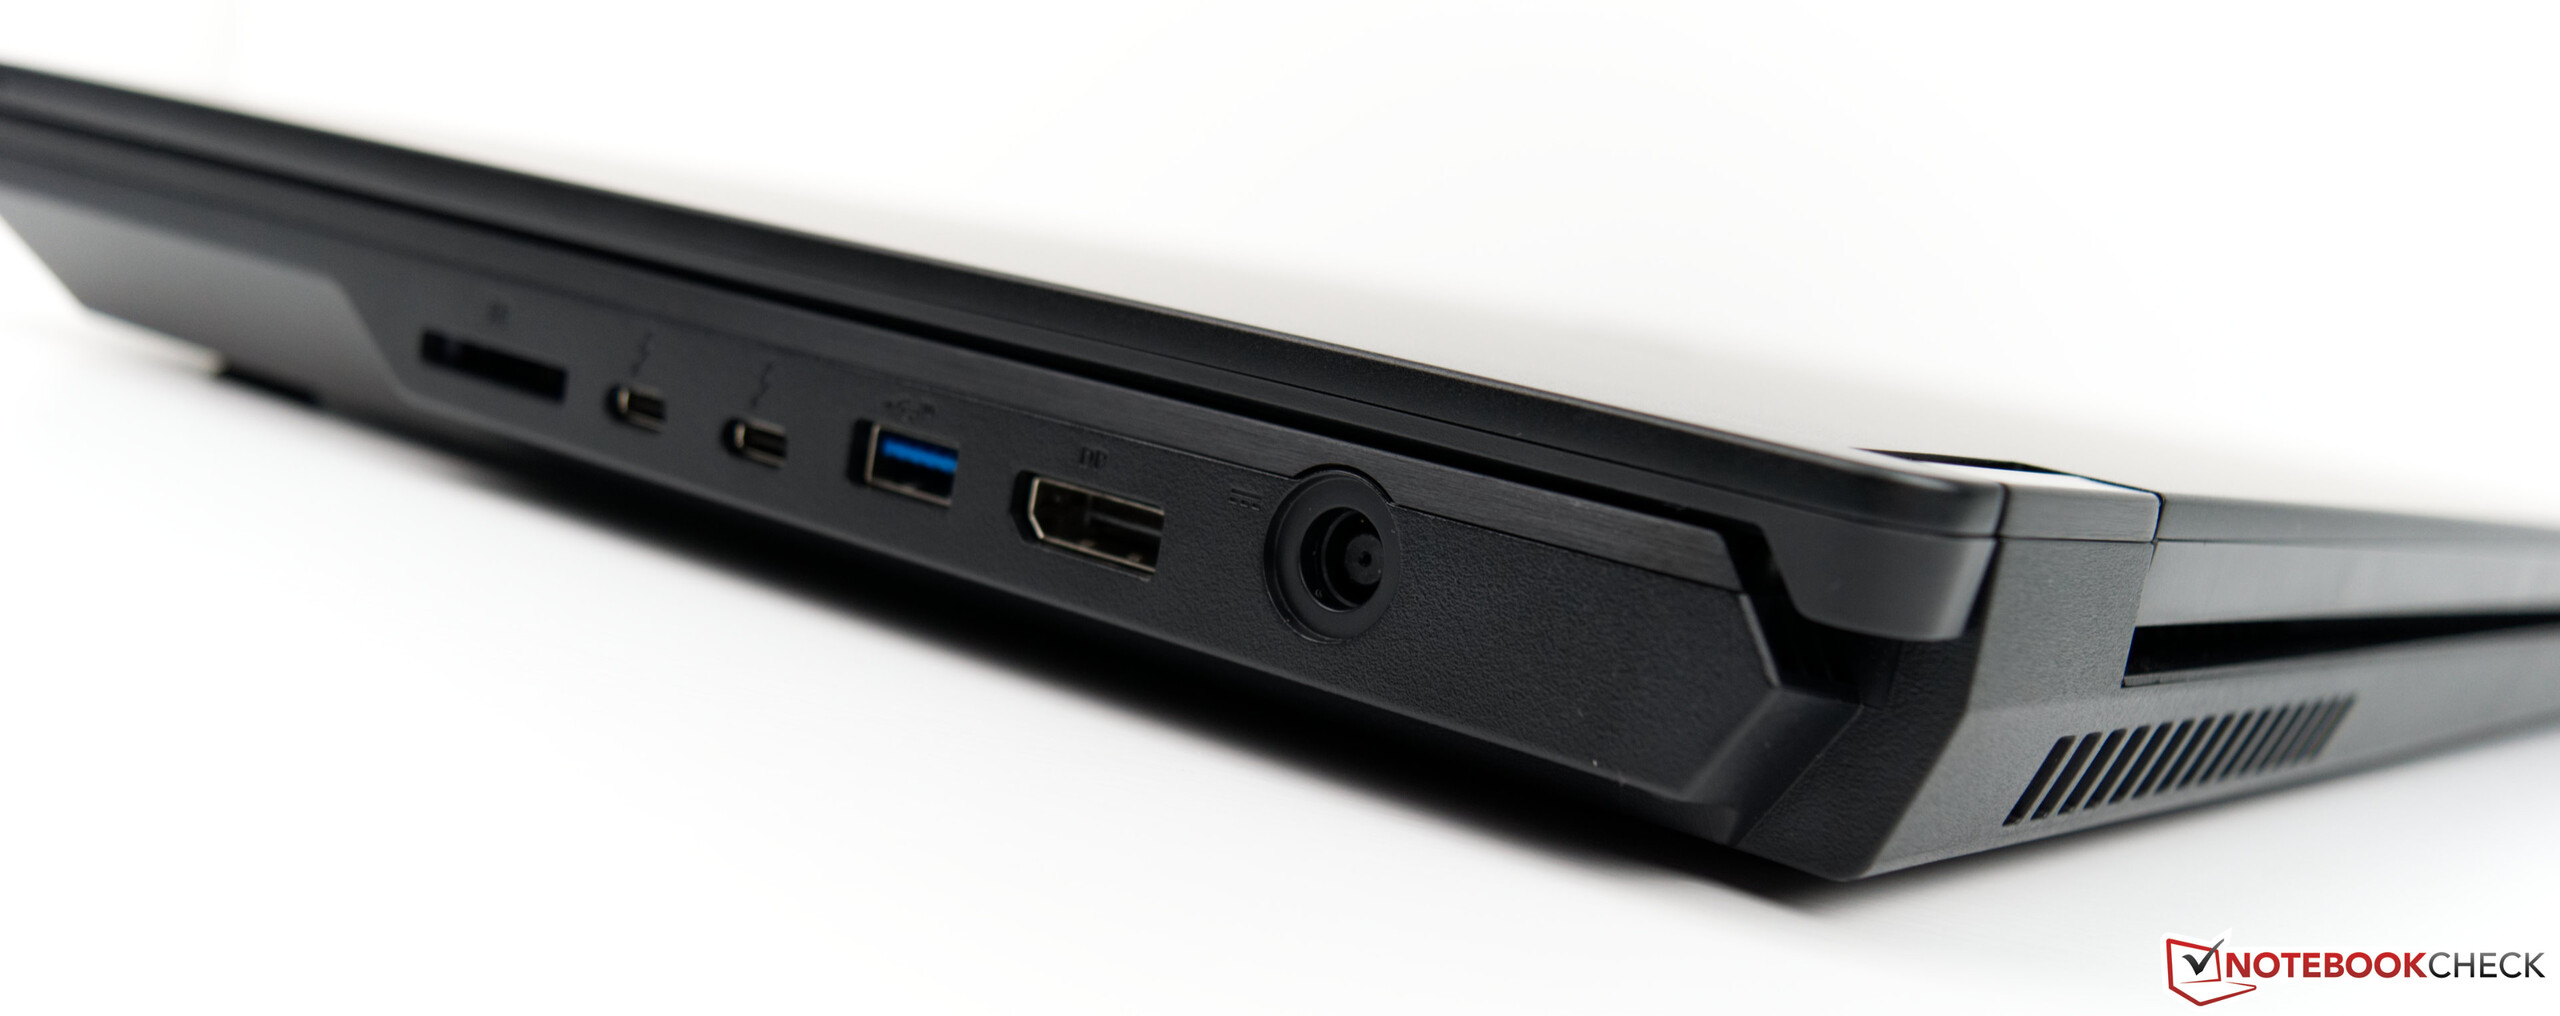
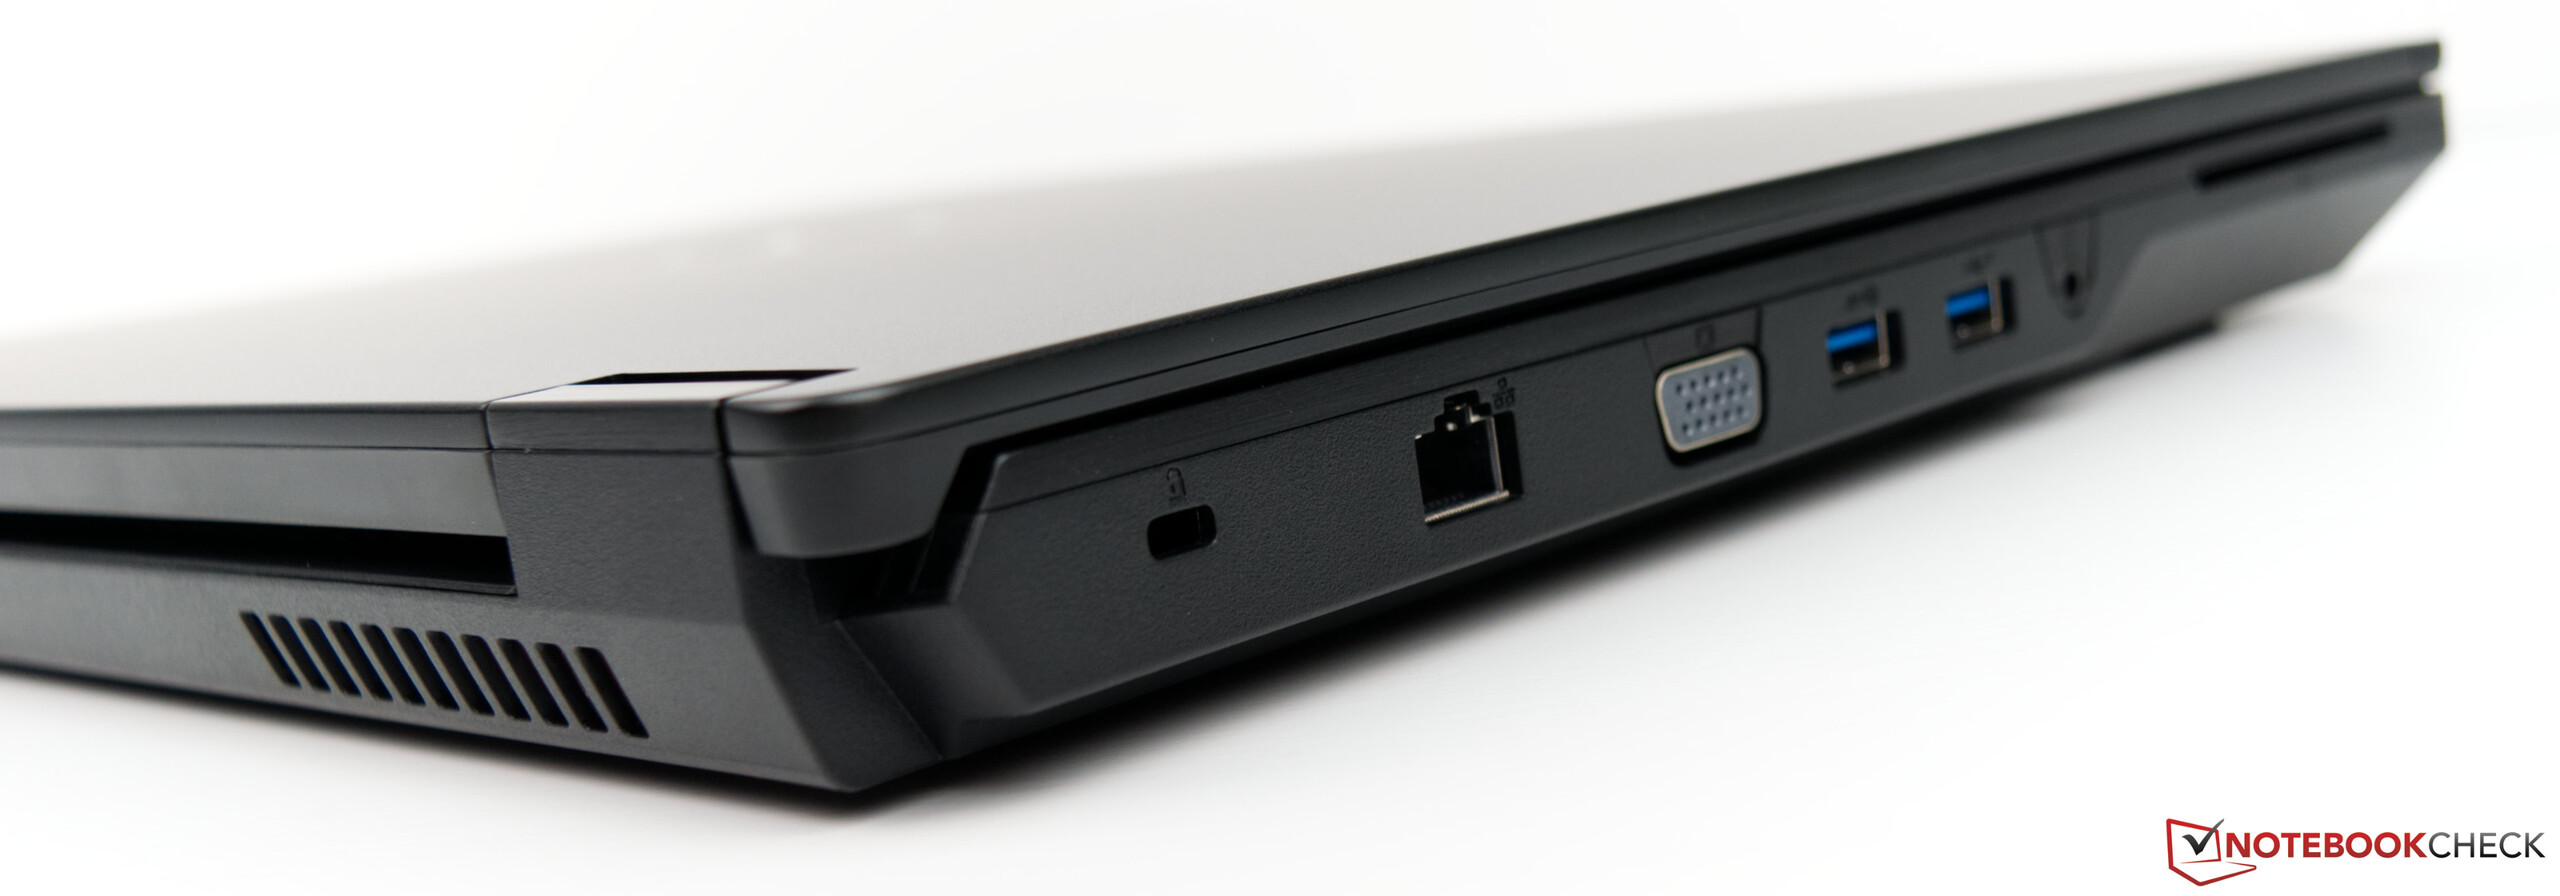
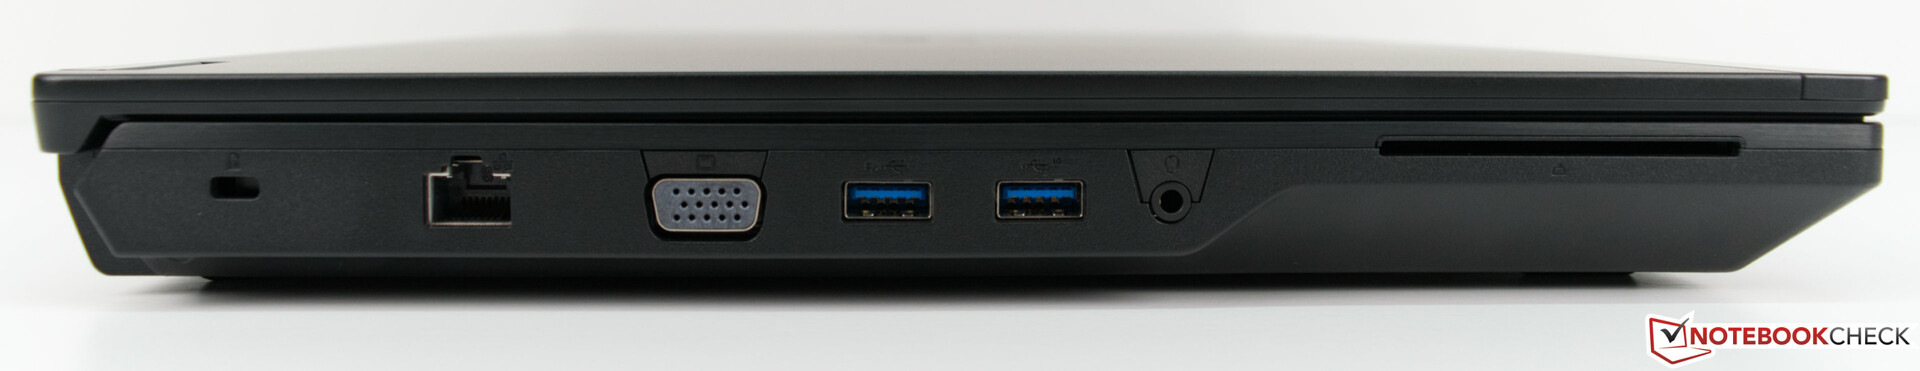
Connectivity
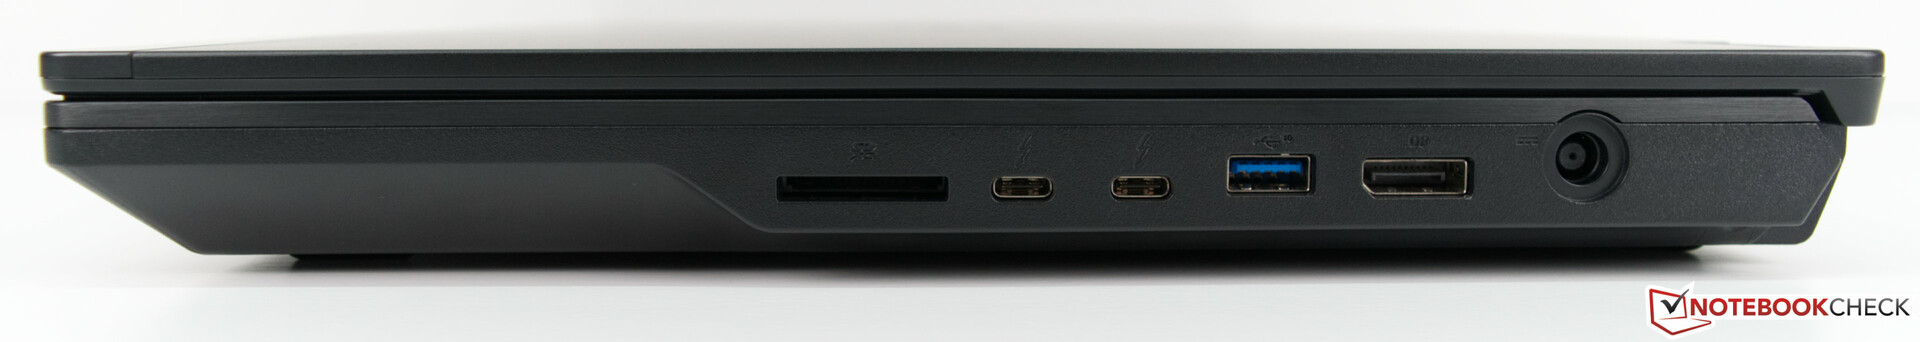
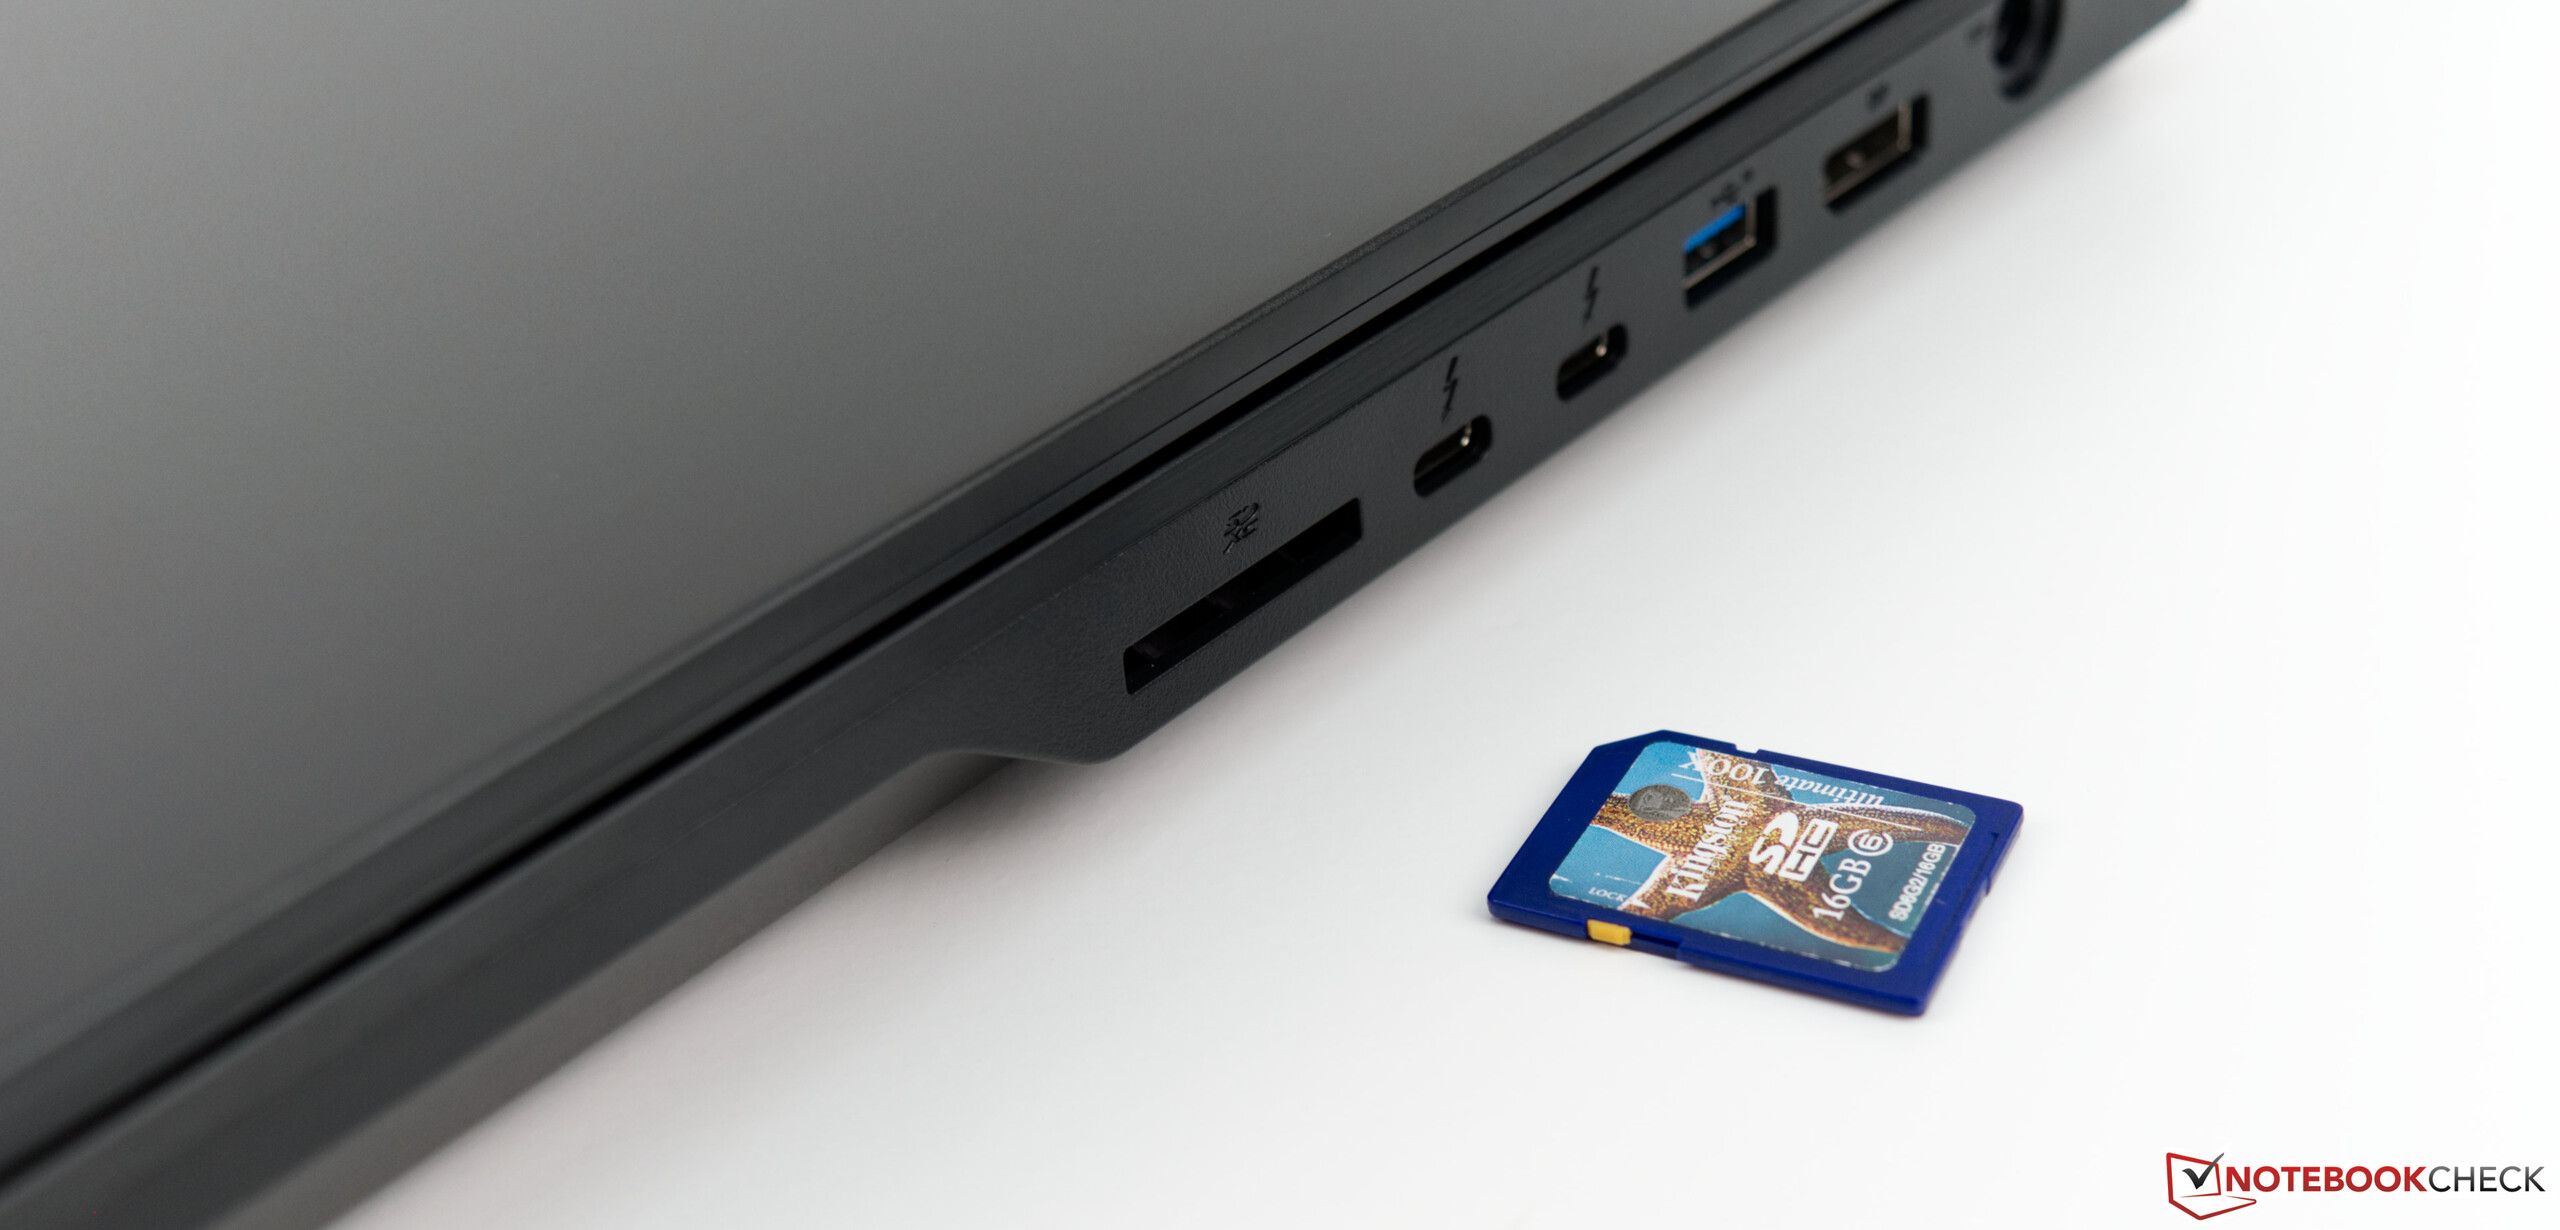
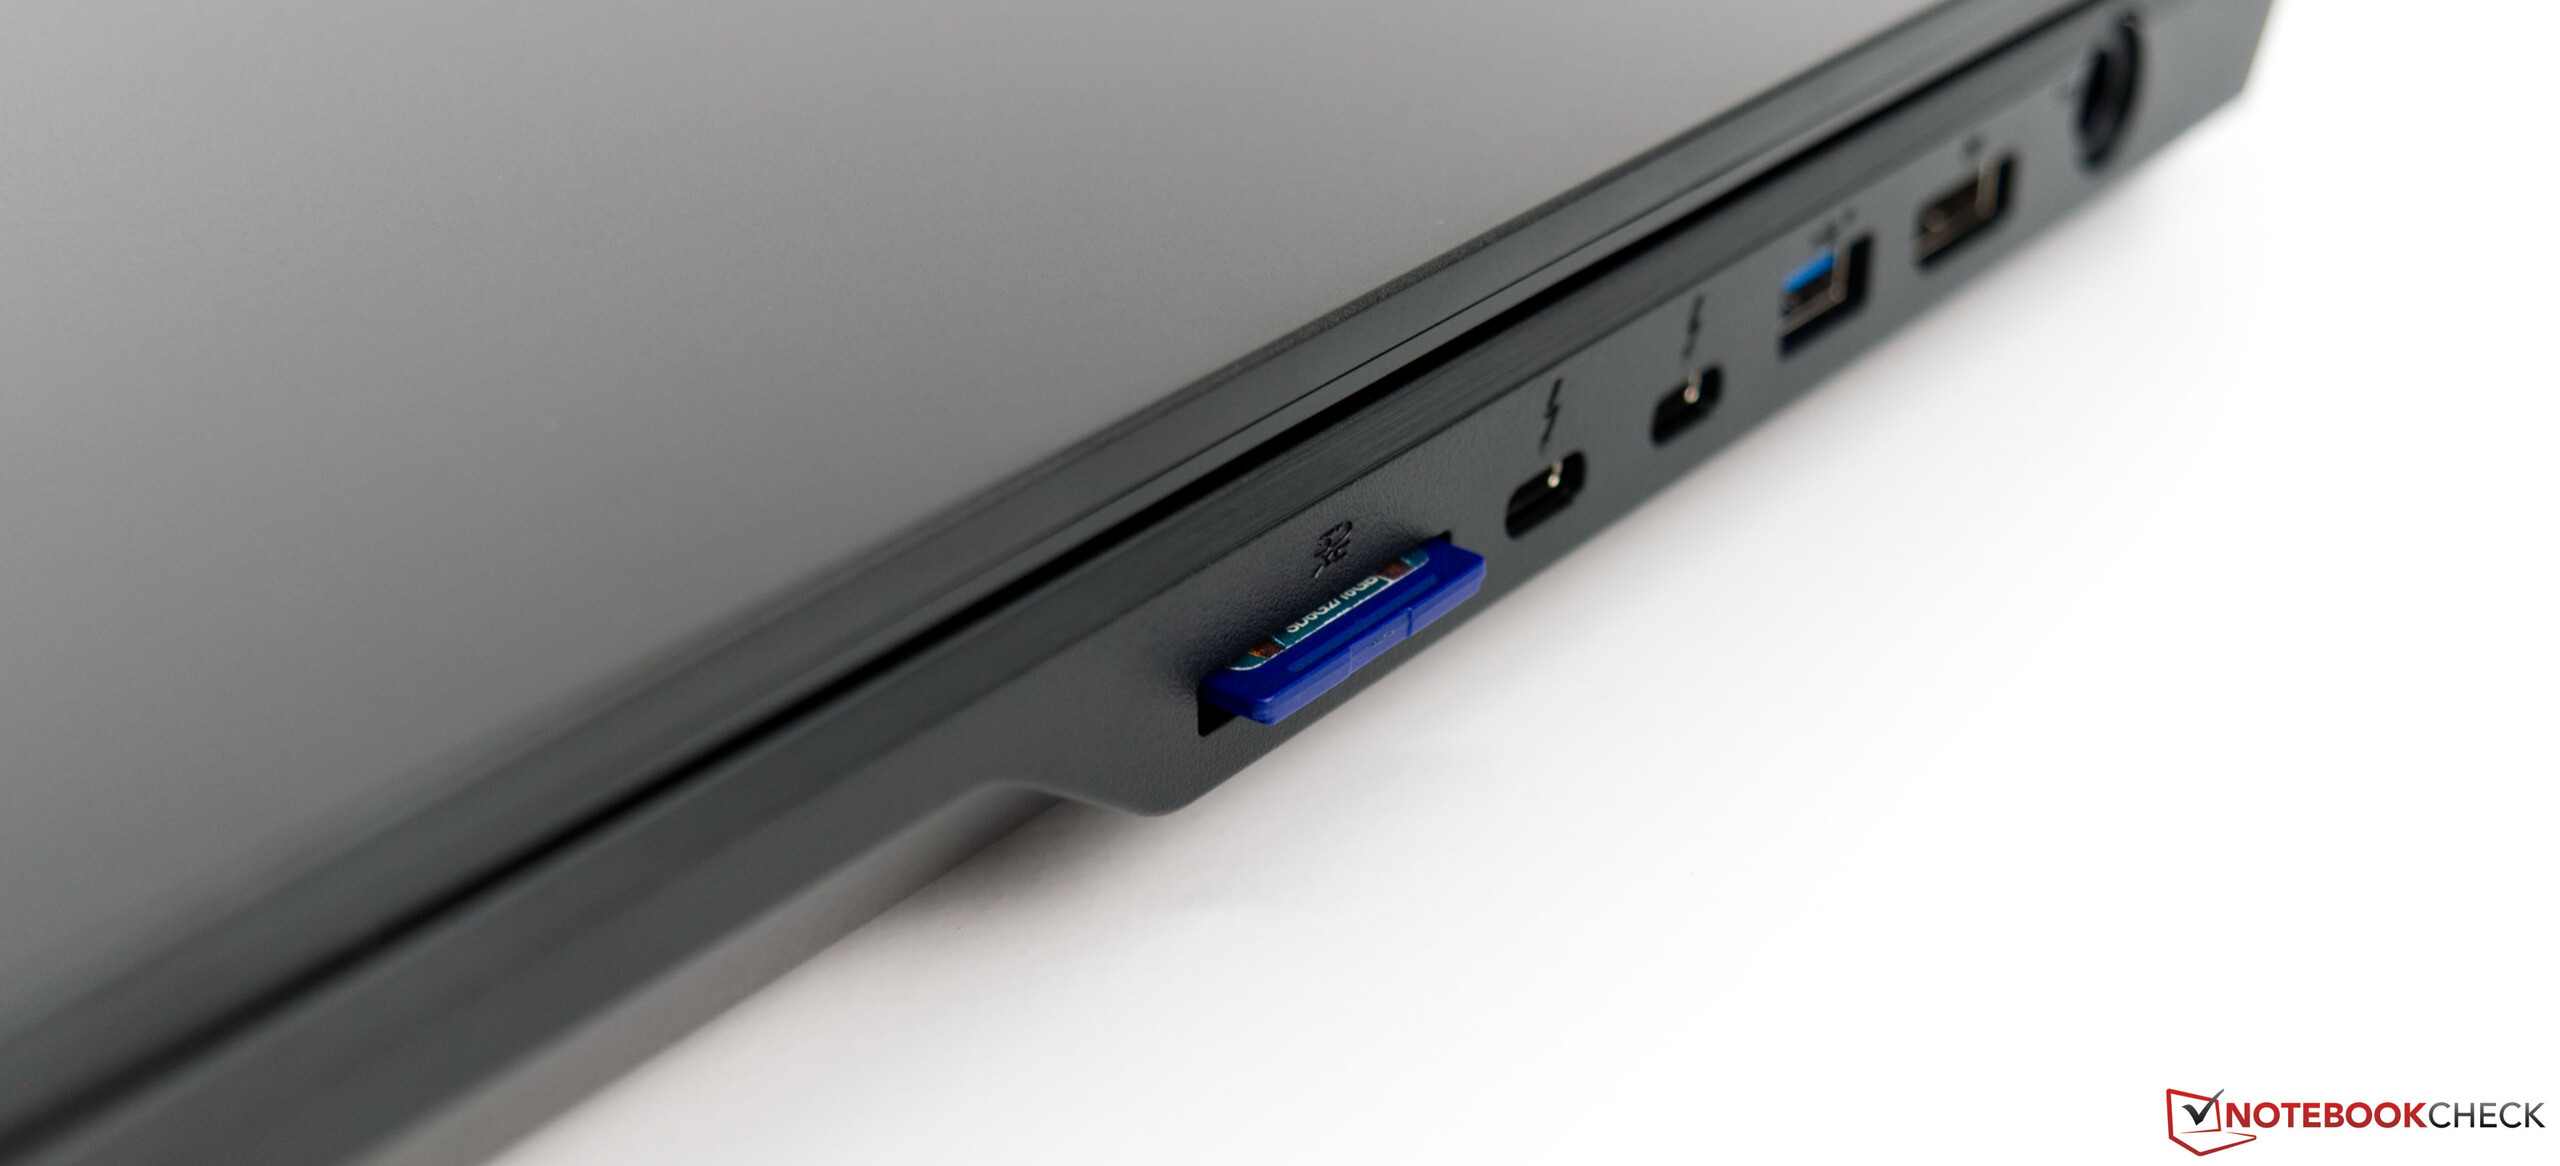
SD Card Reader
| SD Card Reader | |
| average JPG Copy Test (av. of 3 runs) | |
| HP ZBook 17 G5-2ZC48EA (Toshiba Exceria Pro SDXC 64 GB UHS-II) | |
| Lenovo ThinkPad P72-20MB000EGE (Toshiba Exceria Pro SDXC 64 GB UHS-II) | |
| Fujitsu Celsius H980 (Toshiba Exceria Pro SDXC 64 GB UHS-II) | |
| Average of class Workstation (49.6 - 681, n=14, last 2 years) | |
| Fujitsu Celsius H970 (Toshiba Exceria Pro SDXC 64 GB UHS-II) | |
| maximum AS SSD Seq Read Test (1GB) | |
| Average of class Workstation (87.6 - 1455, n=14, last 2 years) | |
| Lenovo ThinkPad P72-20MB000EGE (Toshiba Exceria Pro SDXC 64 GB UHS-II) | |
| HP ZBook 17 G5-2ZC48EA (Toshiba Exceria Pro SDXC 64 GB UHS-II) | |
| Fujitsu Celsius H980 (Toshiba Exceria Pro SDXC 64 GB UHS-II) | |
| Fujitsu Celsius H970 (Toshiba Exceria Pro SDXC 64 GB UHS-II) | |
Communication
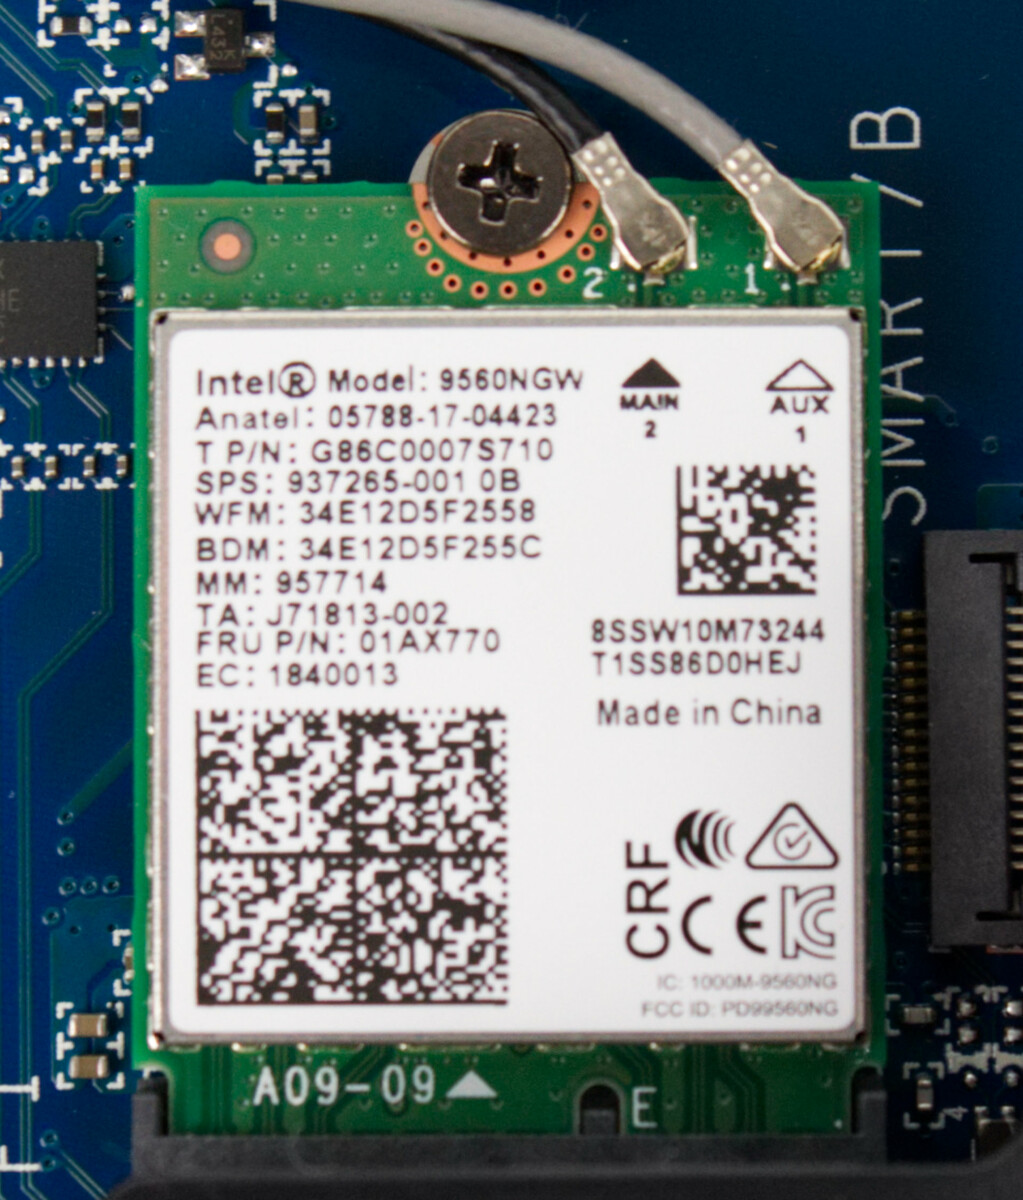

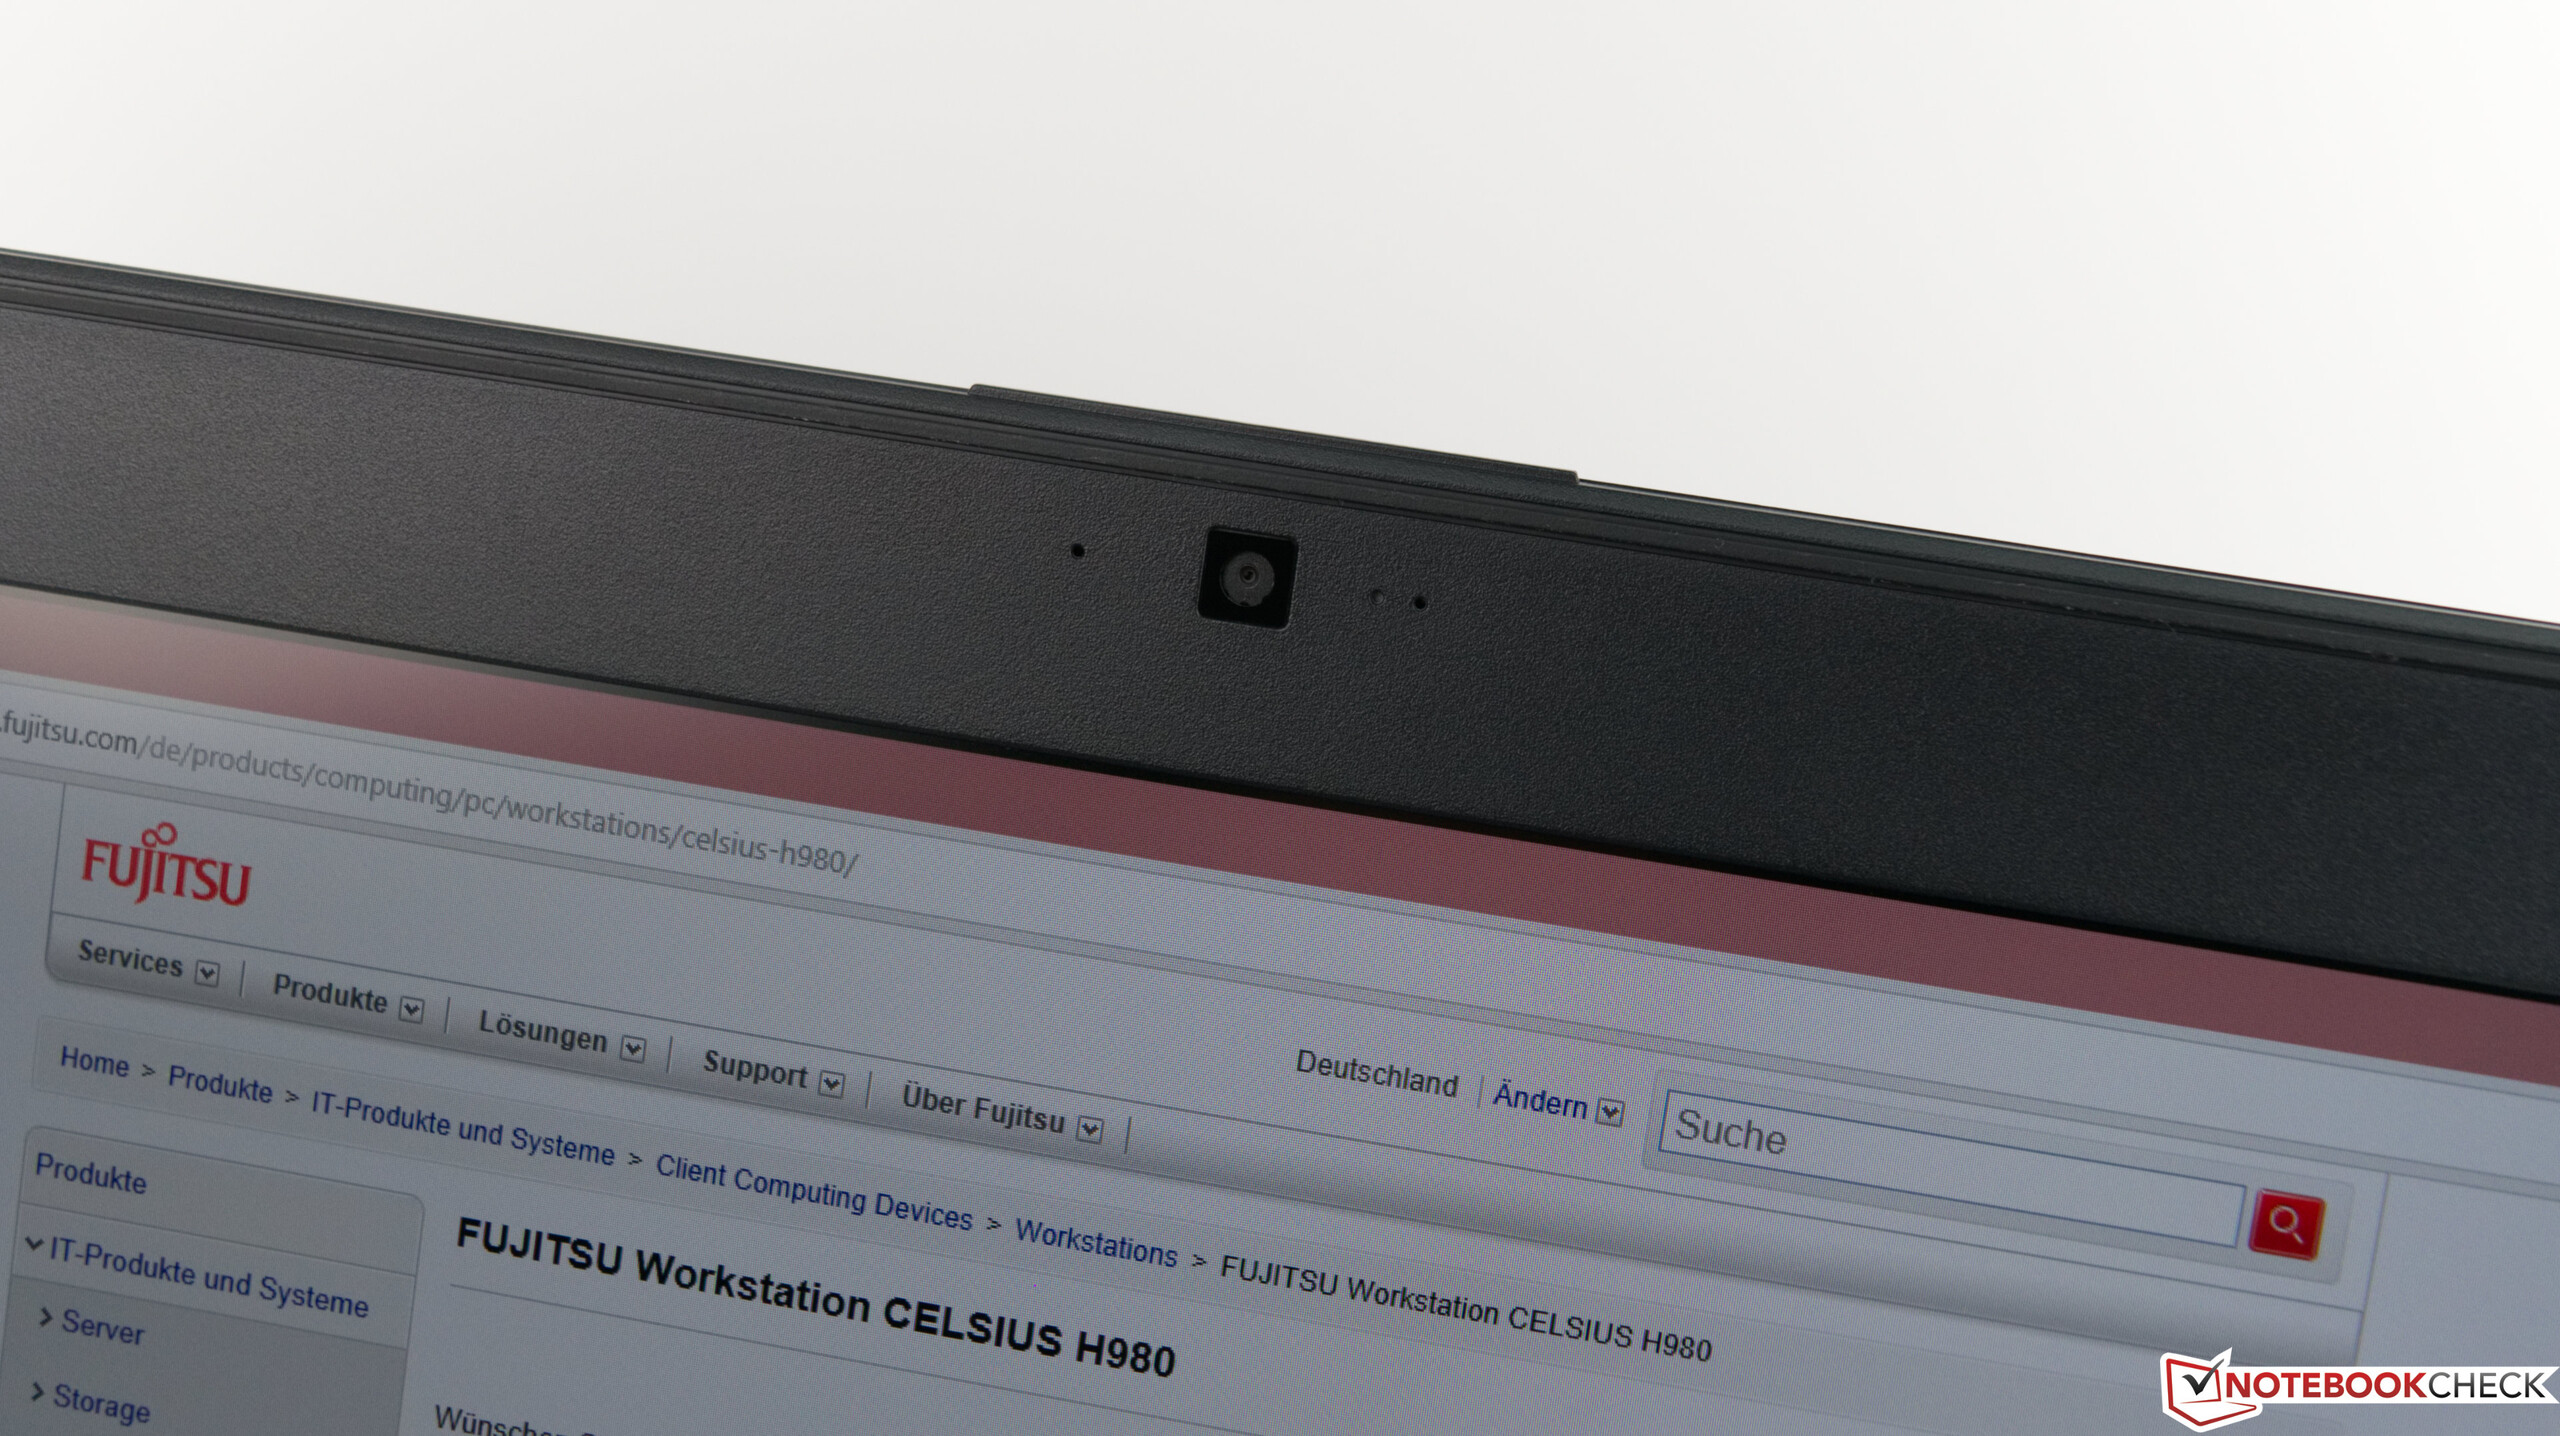
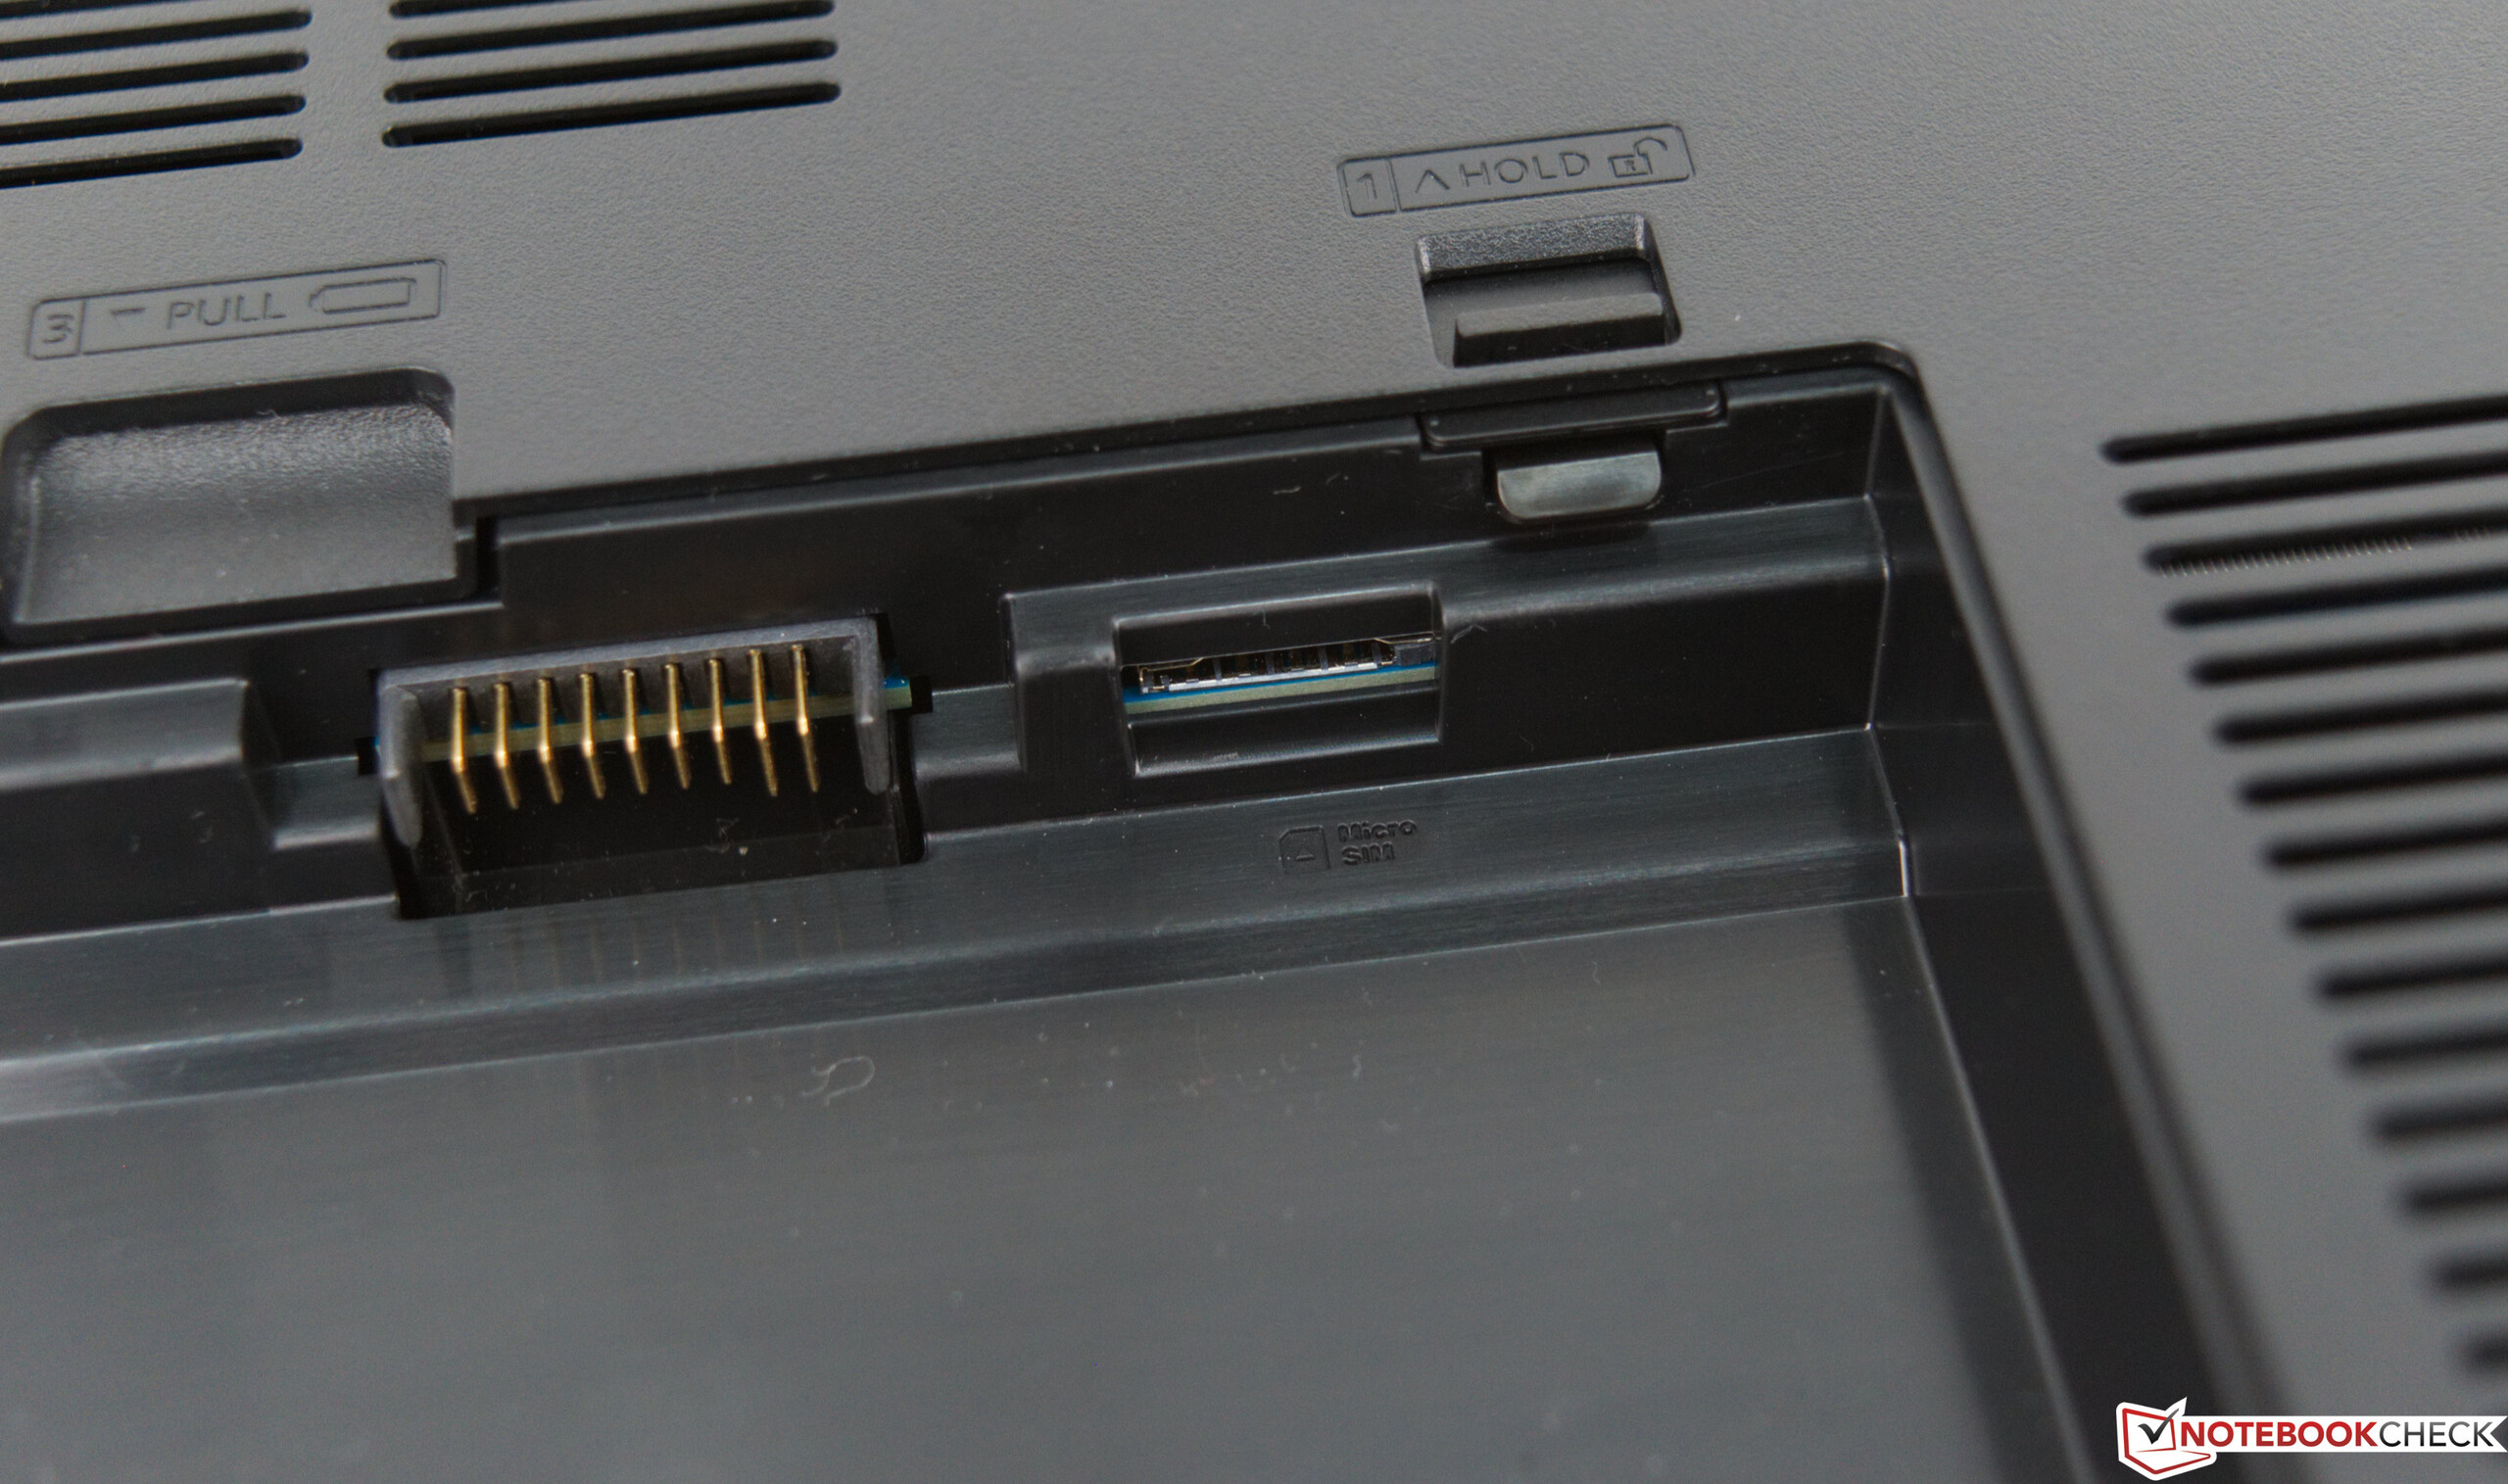
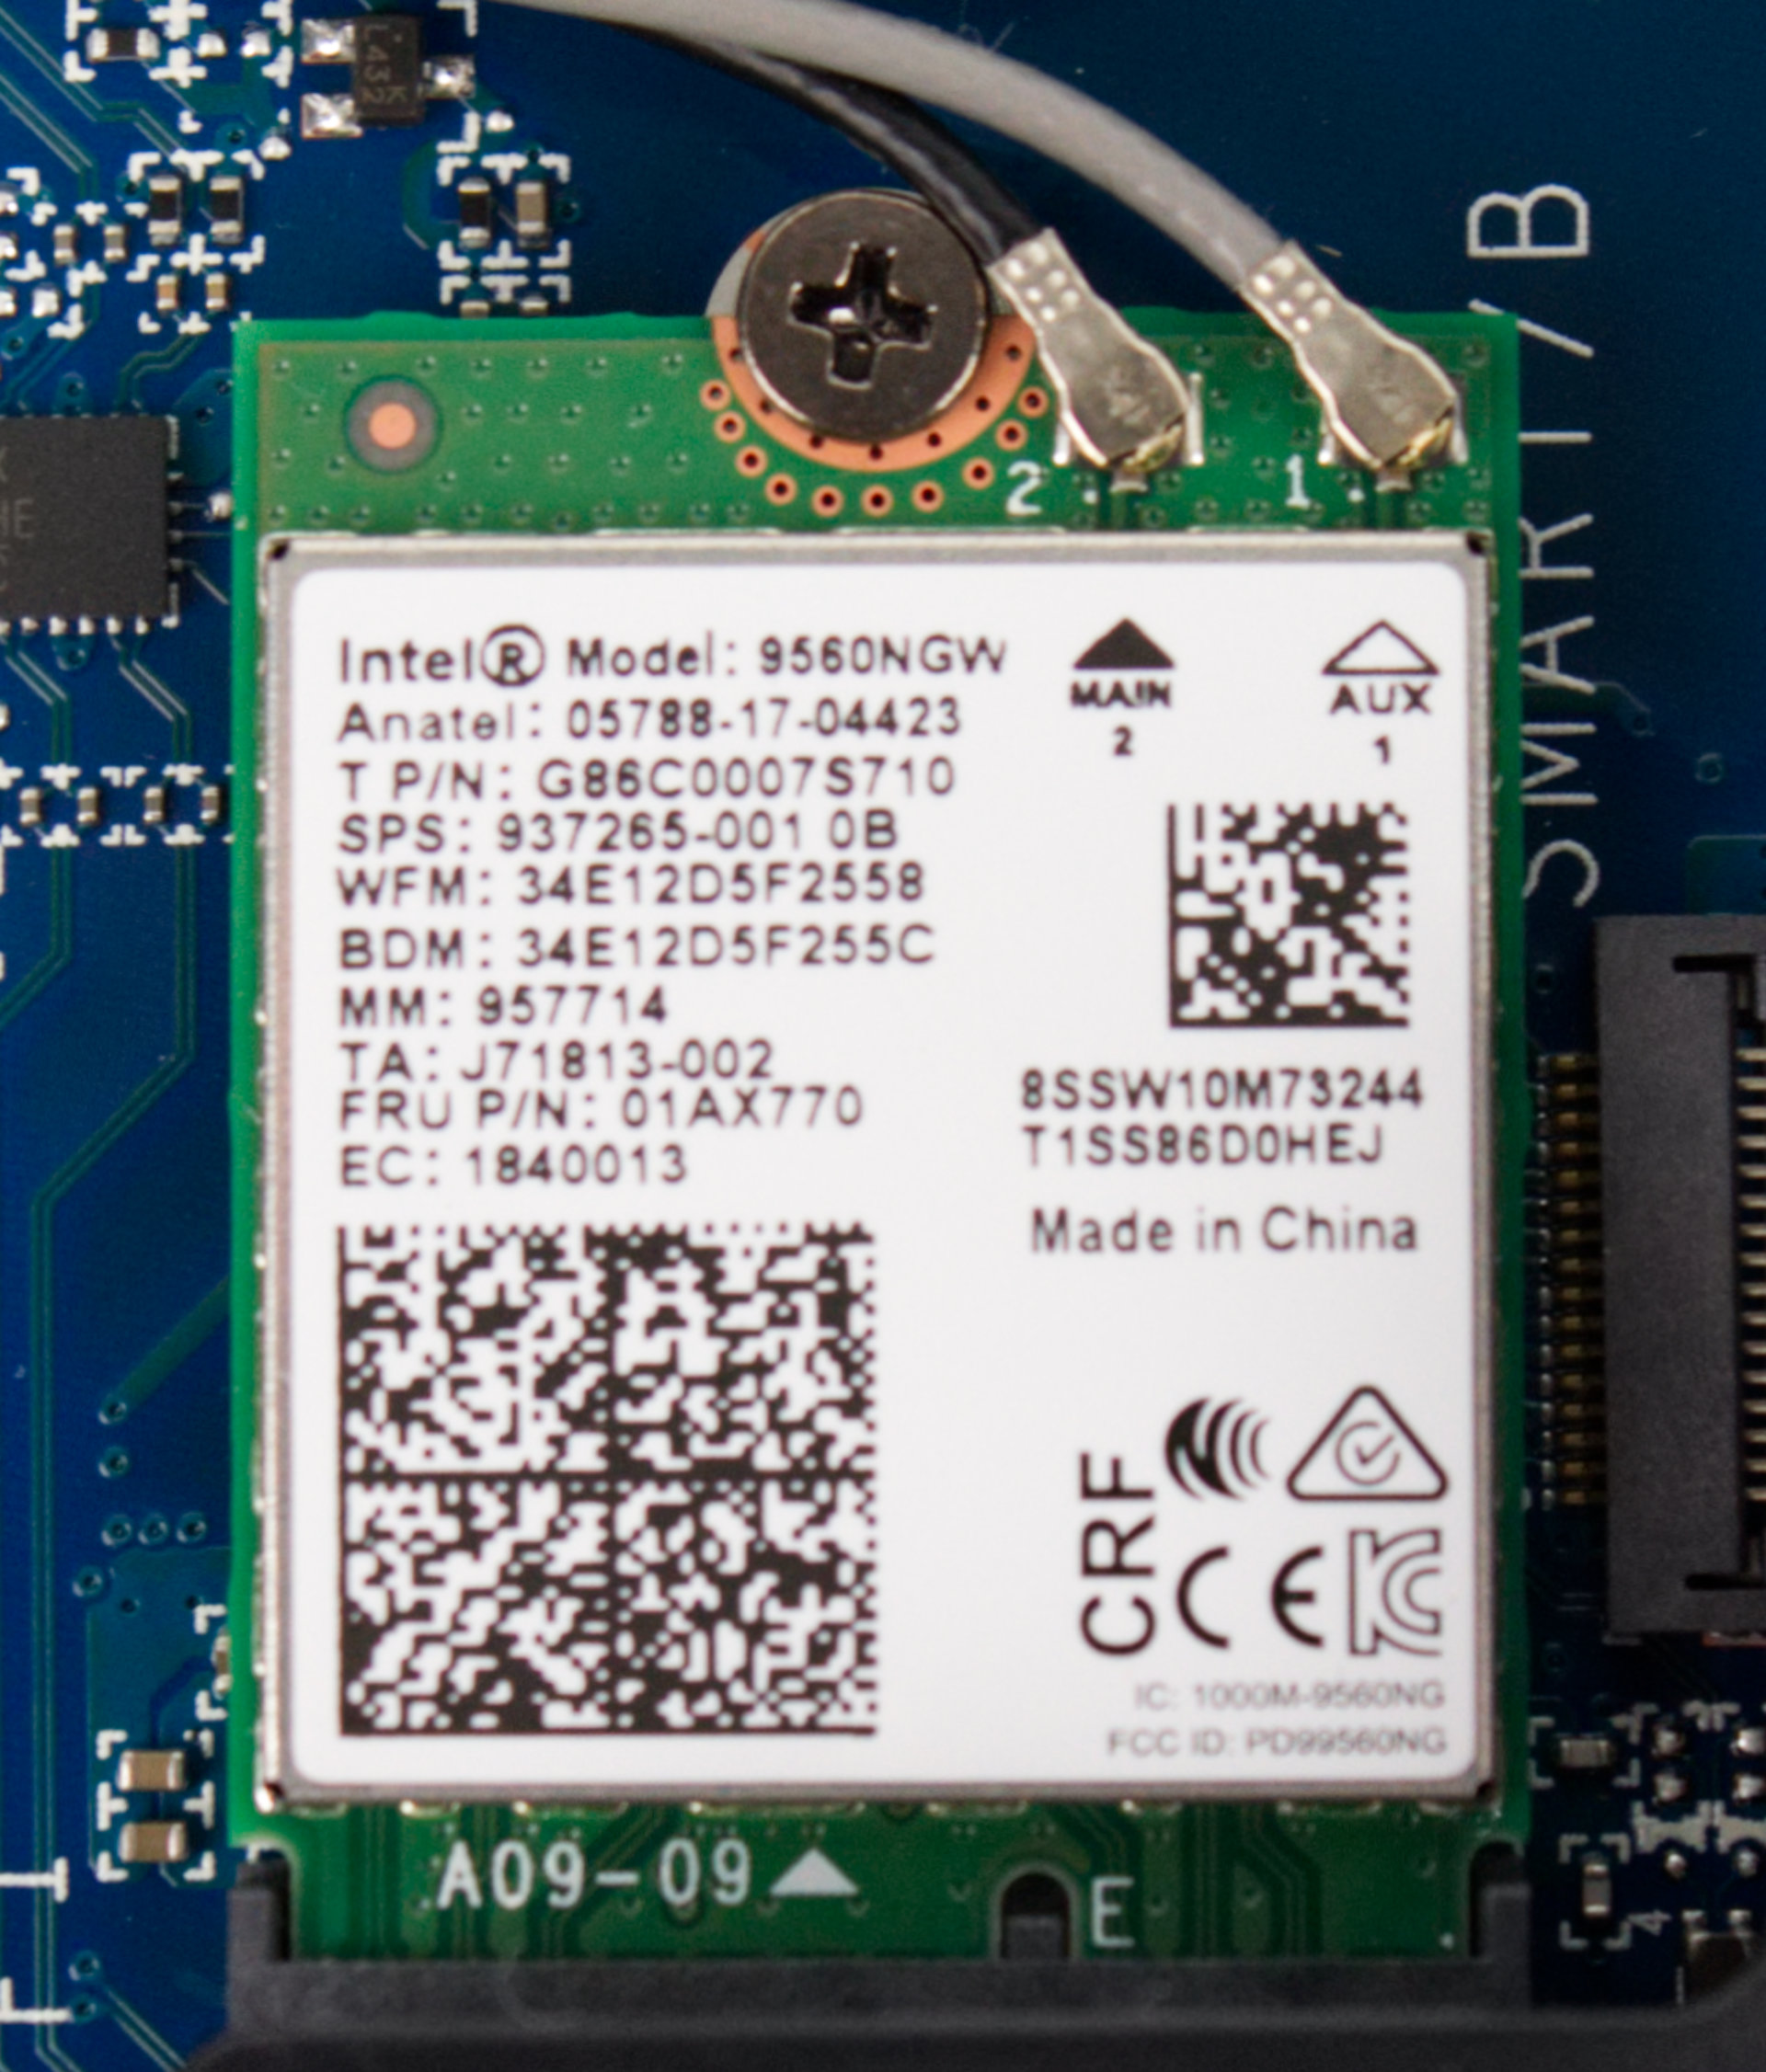
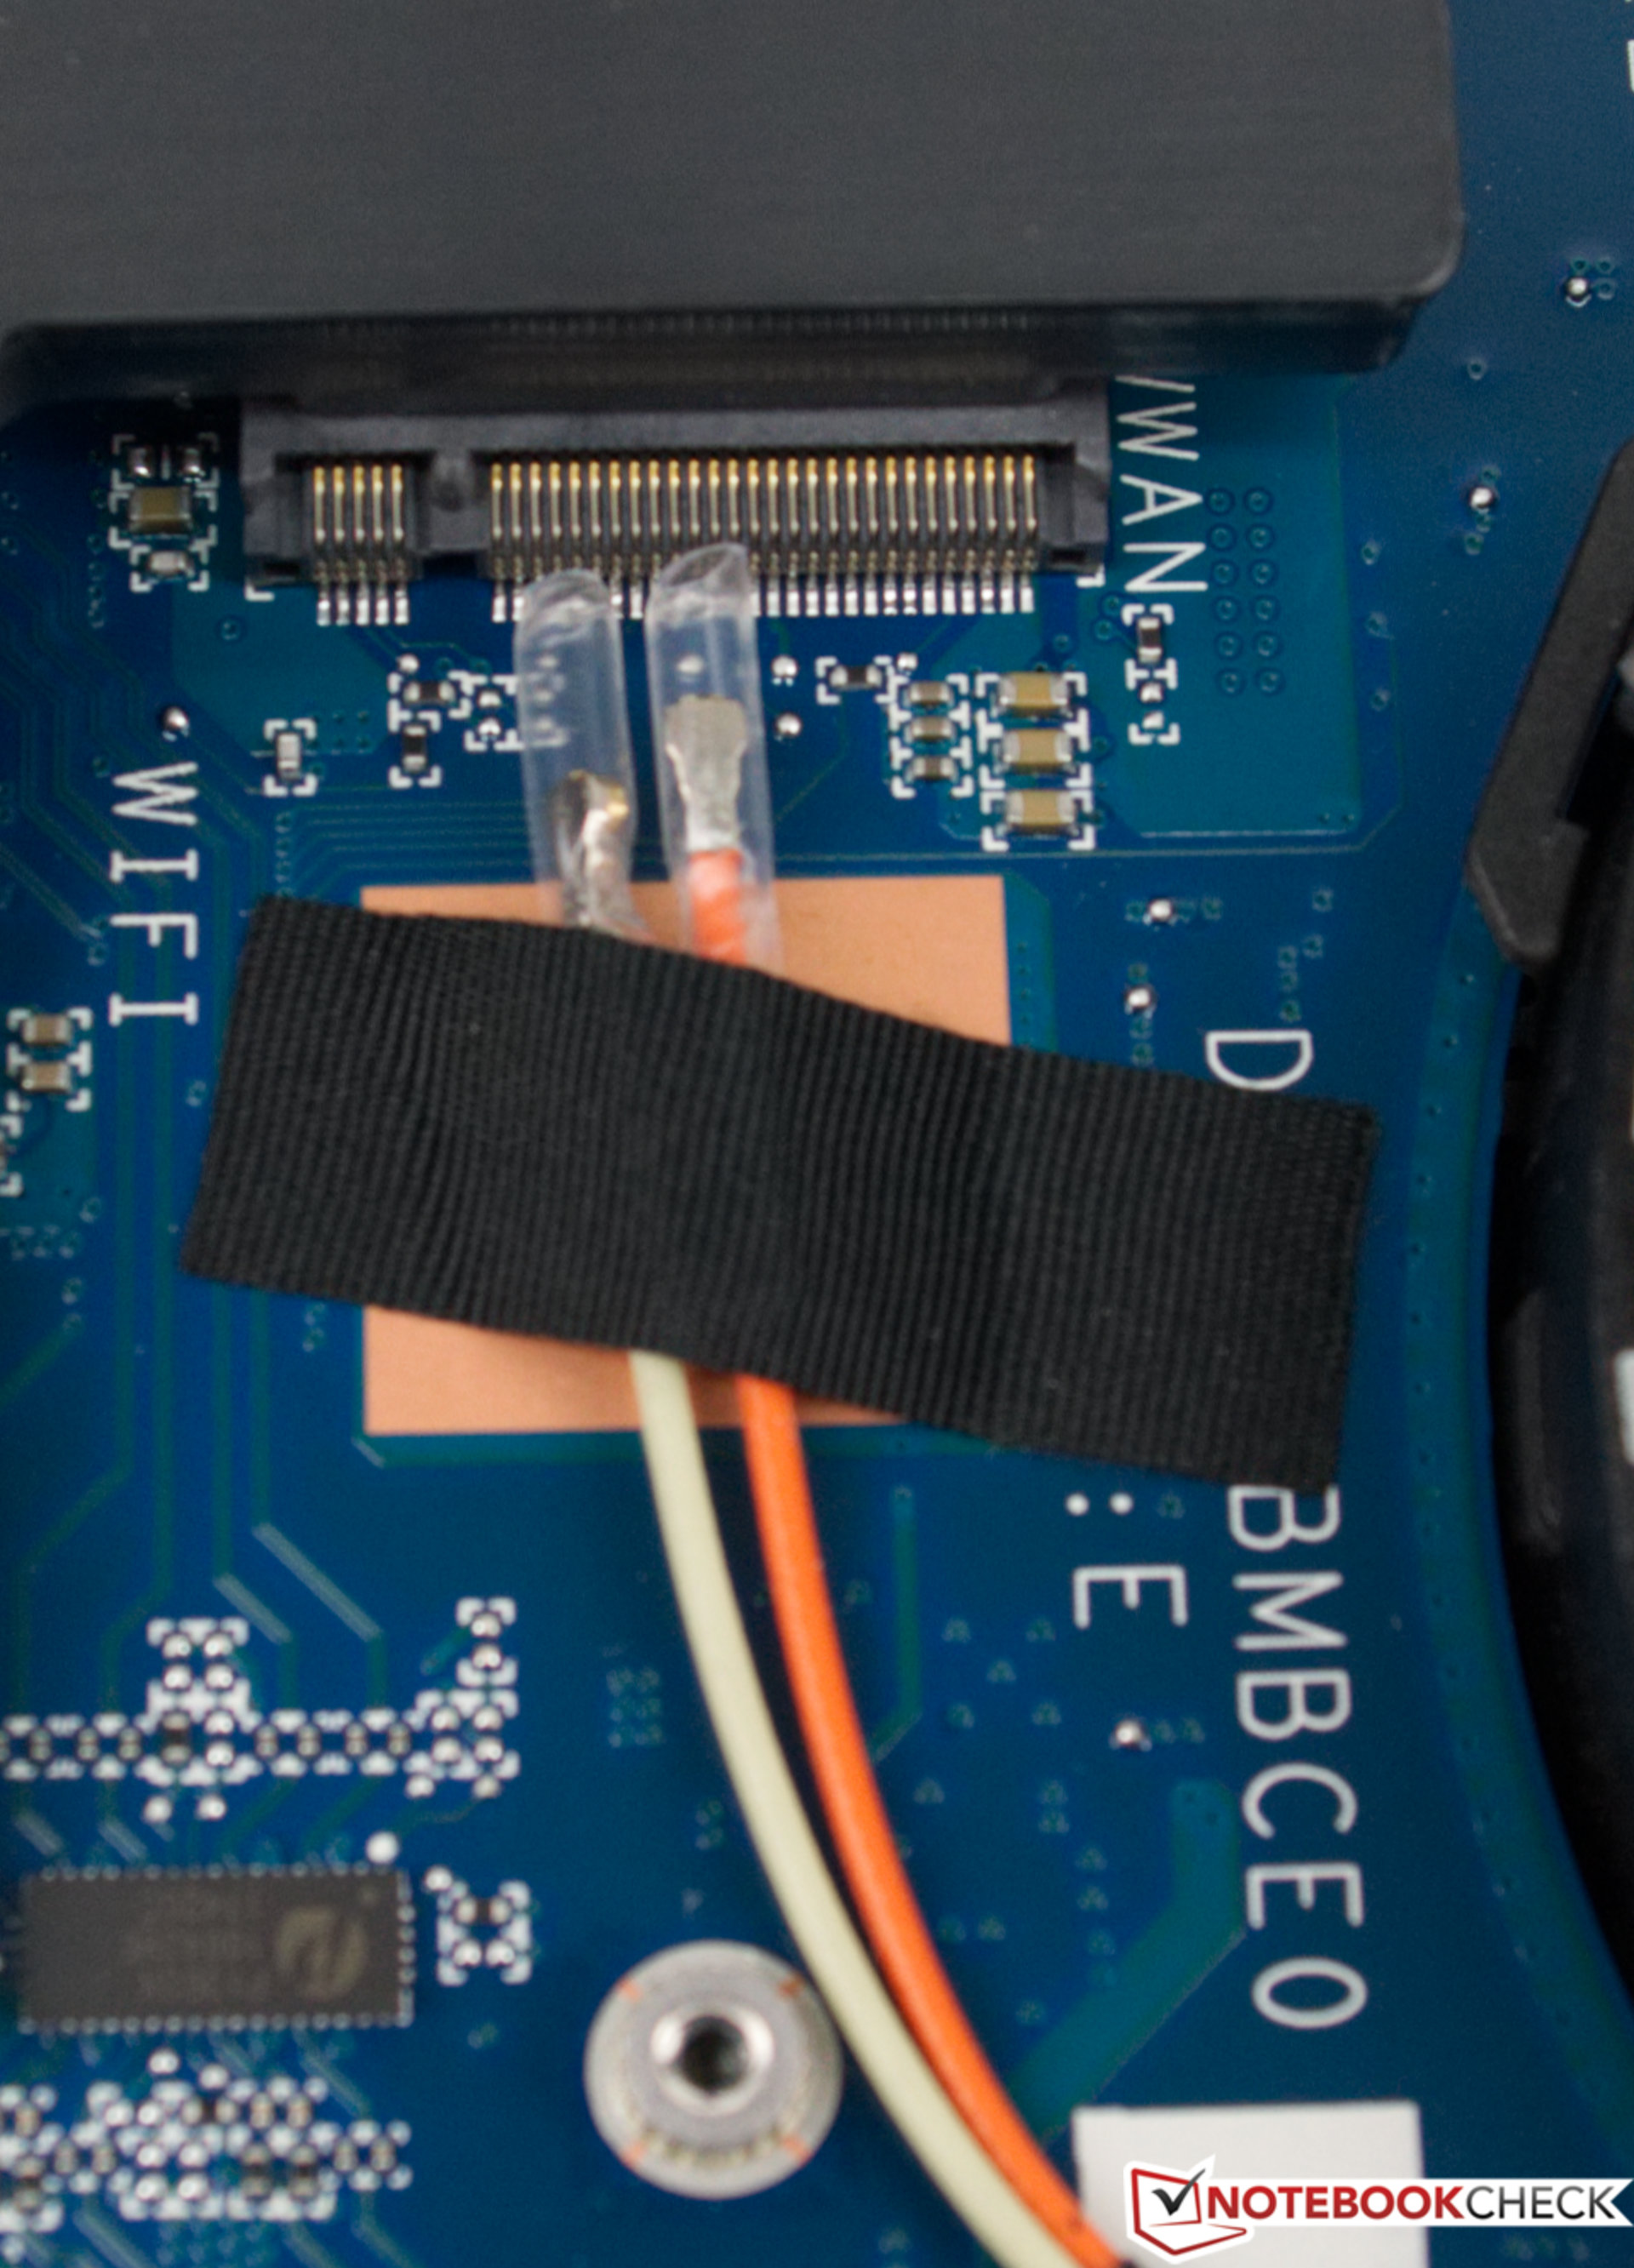
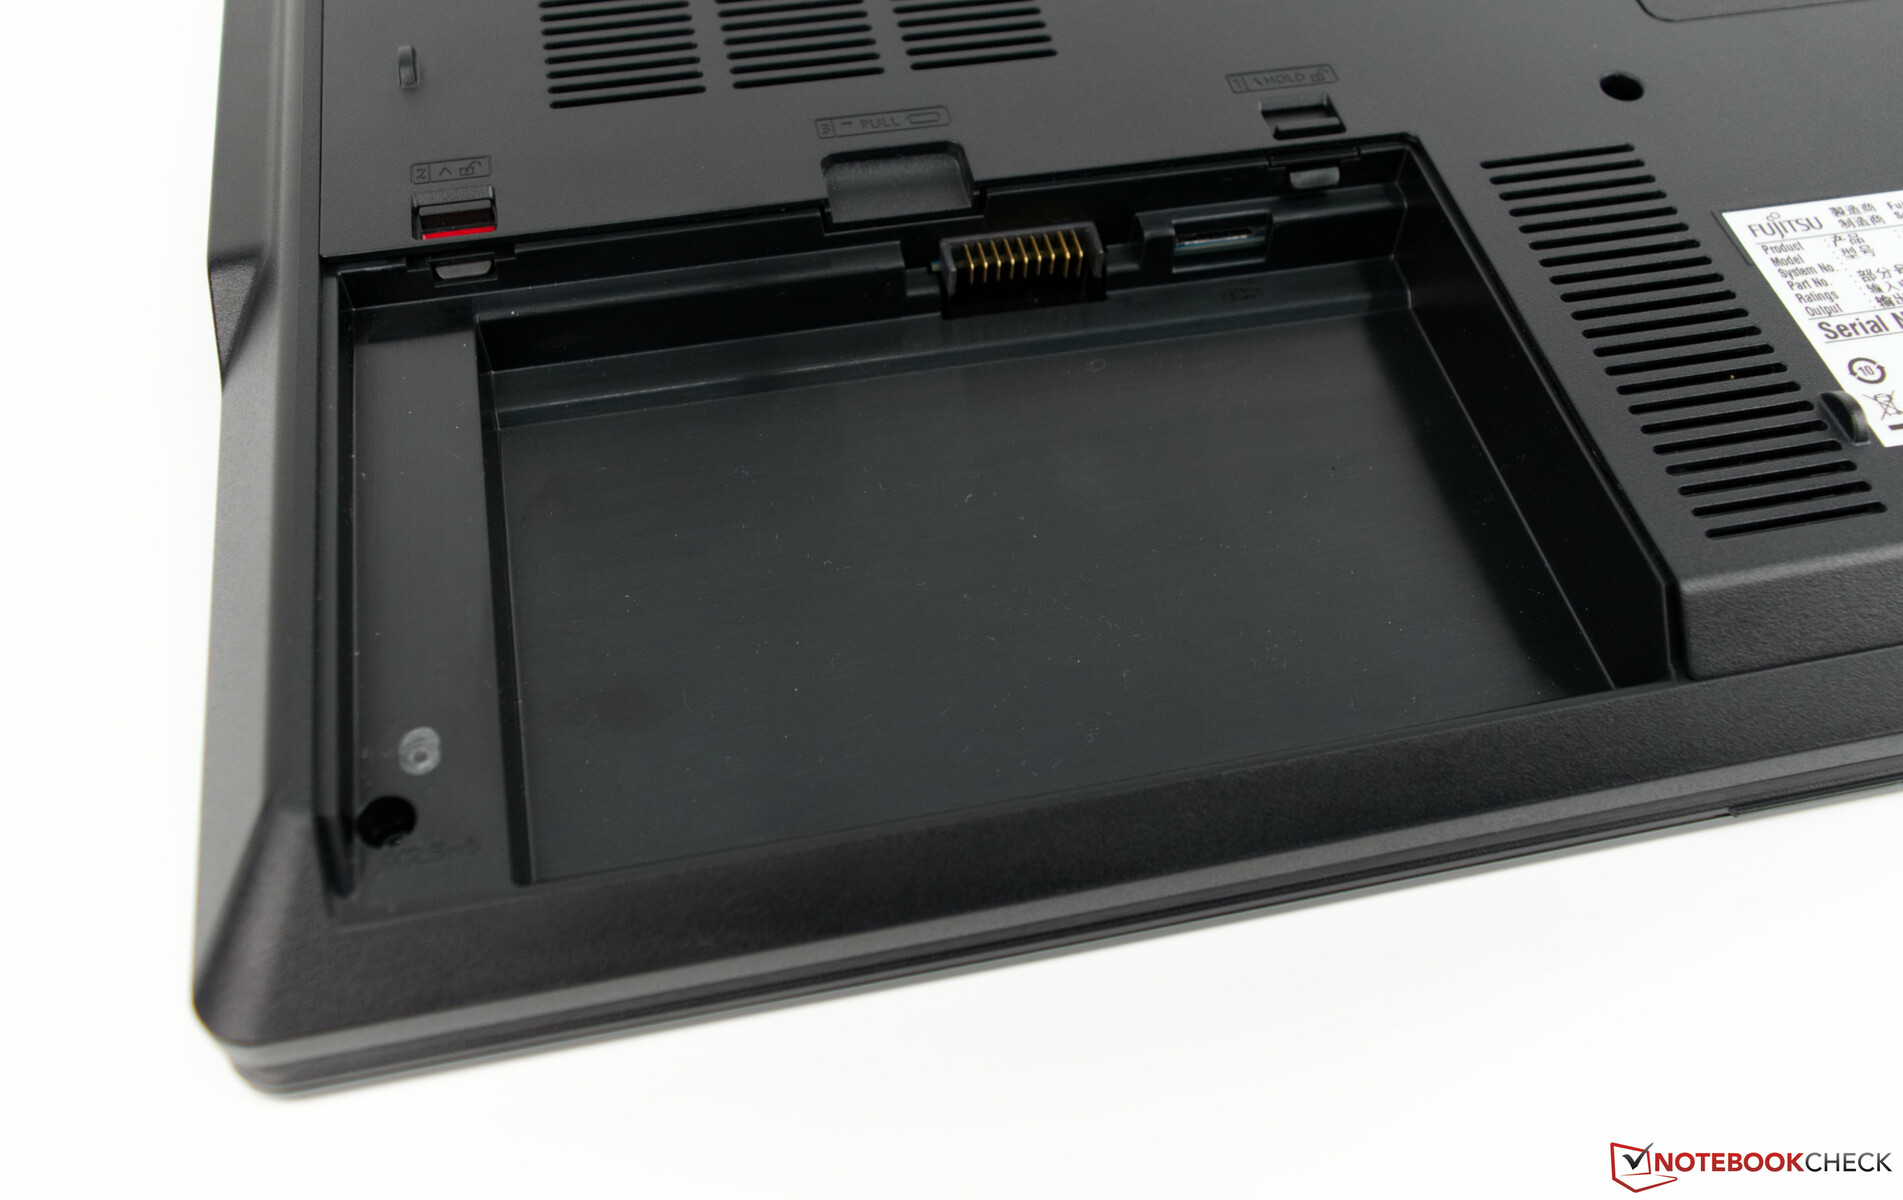
Fujitsu has equipped our review unit with an Intel Dual Band Wireless-AC 9560 modem, which supports all modern Wi-Fi standards and Bluetooth 5.0. There is also an RJ45 LAN port should you need a wired internet connection, but we would have liked to test its WWAN connectivity. Unfortunately, the company did not include a WWAN modem in our test device, so we cannot comment on the H980’s WWAN capabilities. The antennas are pre-installed though, so you could easily add WWAN capabilities should you need it. The corresponding SIM slot is located underneath the removable battery, for reference.
Our test device performed well in our iperf3 Client Wi-Fi tests and averaged over 650 MBit/s in both tests that we conducted. The H980 finished top of our receive comparison table and second in the transmission comparison table, but it is well ahead of the class average in both tests.
| Networking | |
| iperf3 transmit AX12 | |
| HP ZBook 17 G5-2ZC48EA | |
| Fujitsu Celsius H980 | |
| Lenovo ThinkPad P72-20MB000EGE | |
| Dell Precision 7720 | |
| Fujitsu Celsius H970 | |
| iperf3 receive AX12 | |
| Fujitsu Celsius H980 | |
| Lenovo ThinkPad P72-20MB000EGE | |
| Fujitsu Celsius H970 | |
| HP ZBook 17 G5-2ZC48EA | |
| Dell Precision 7720 | |
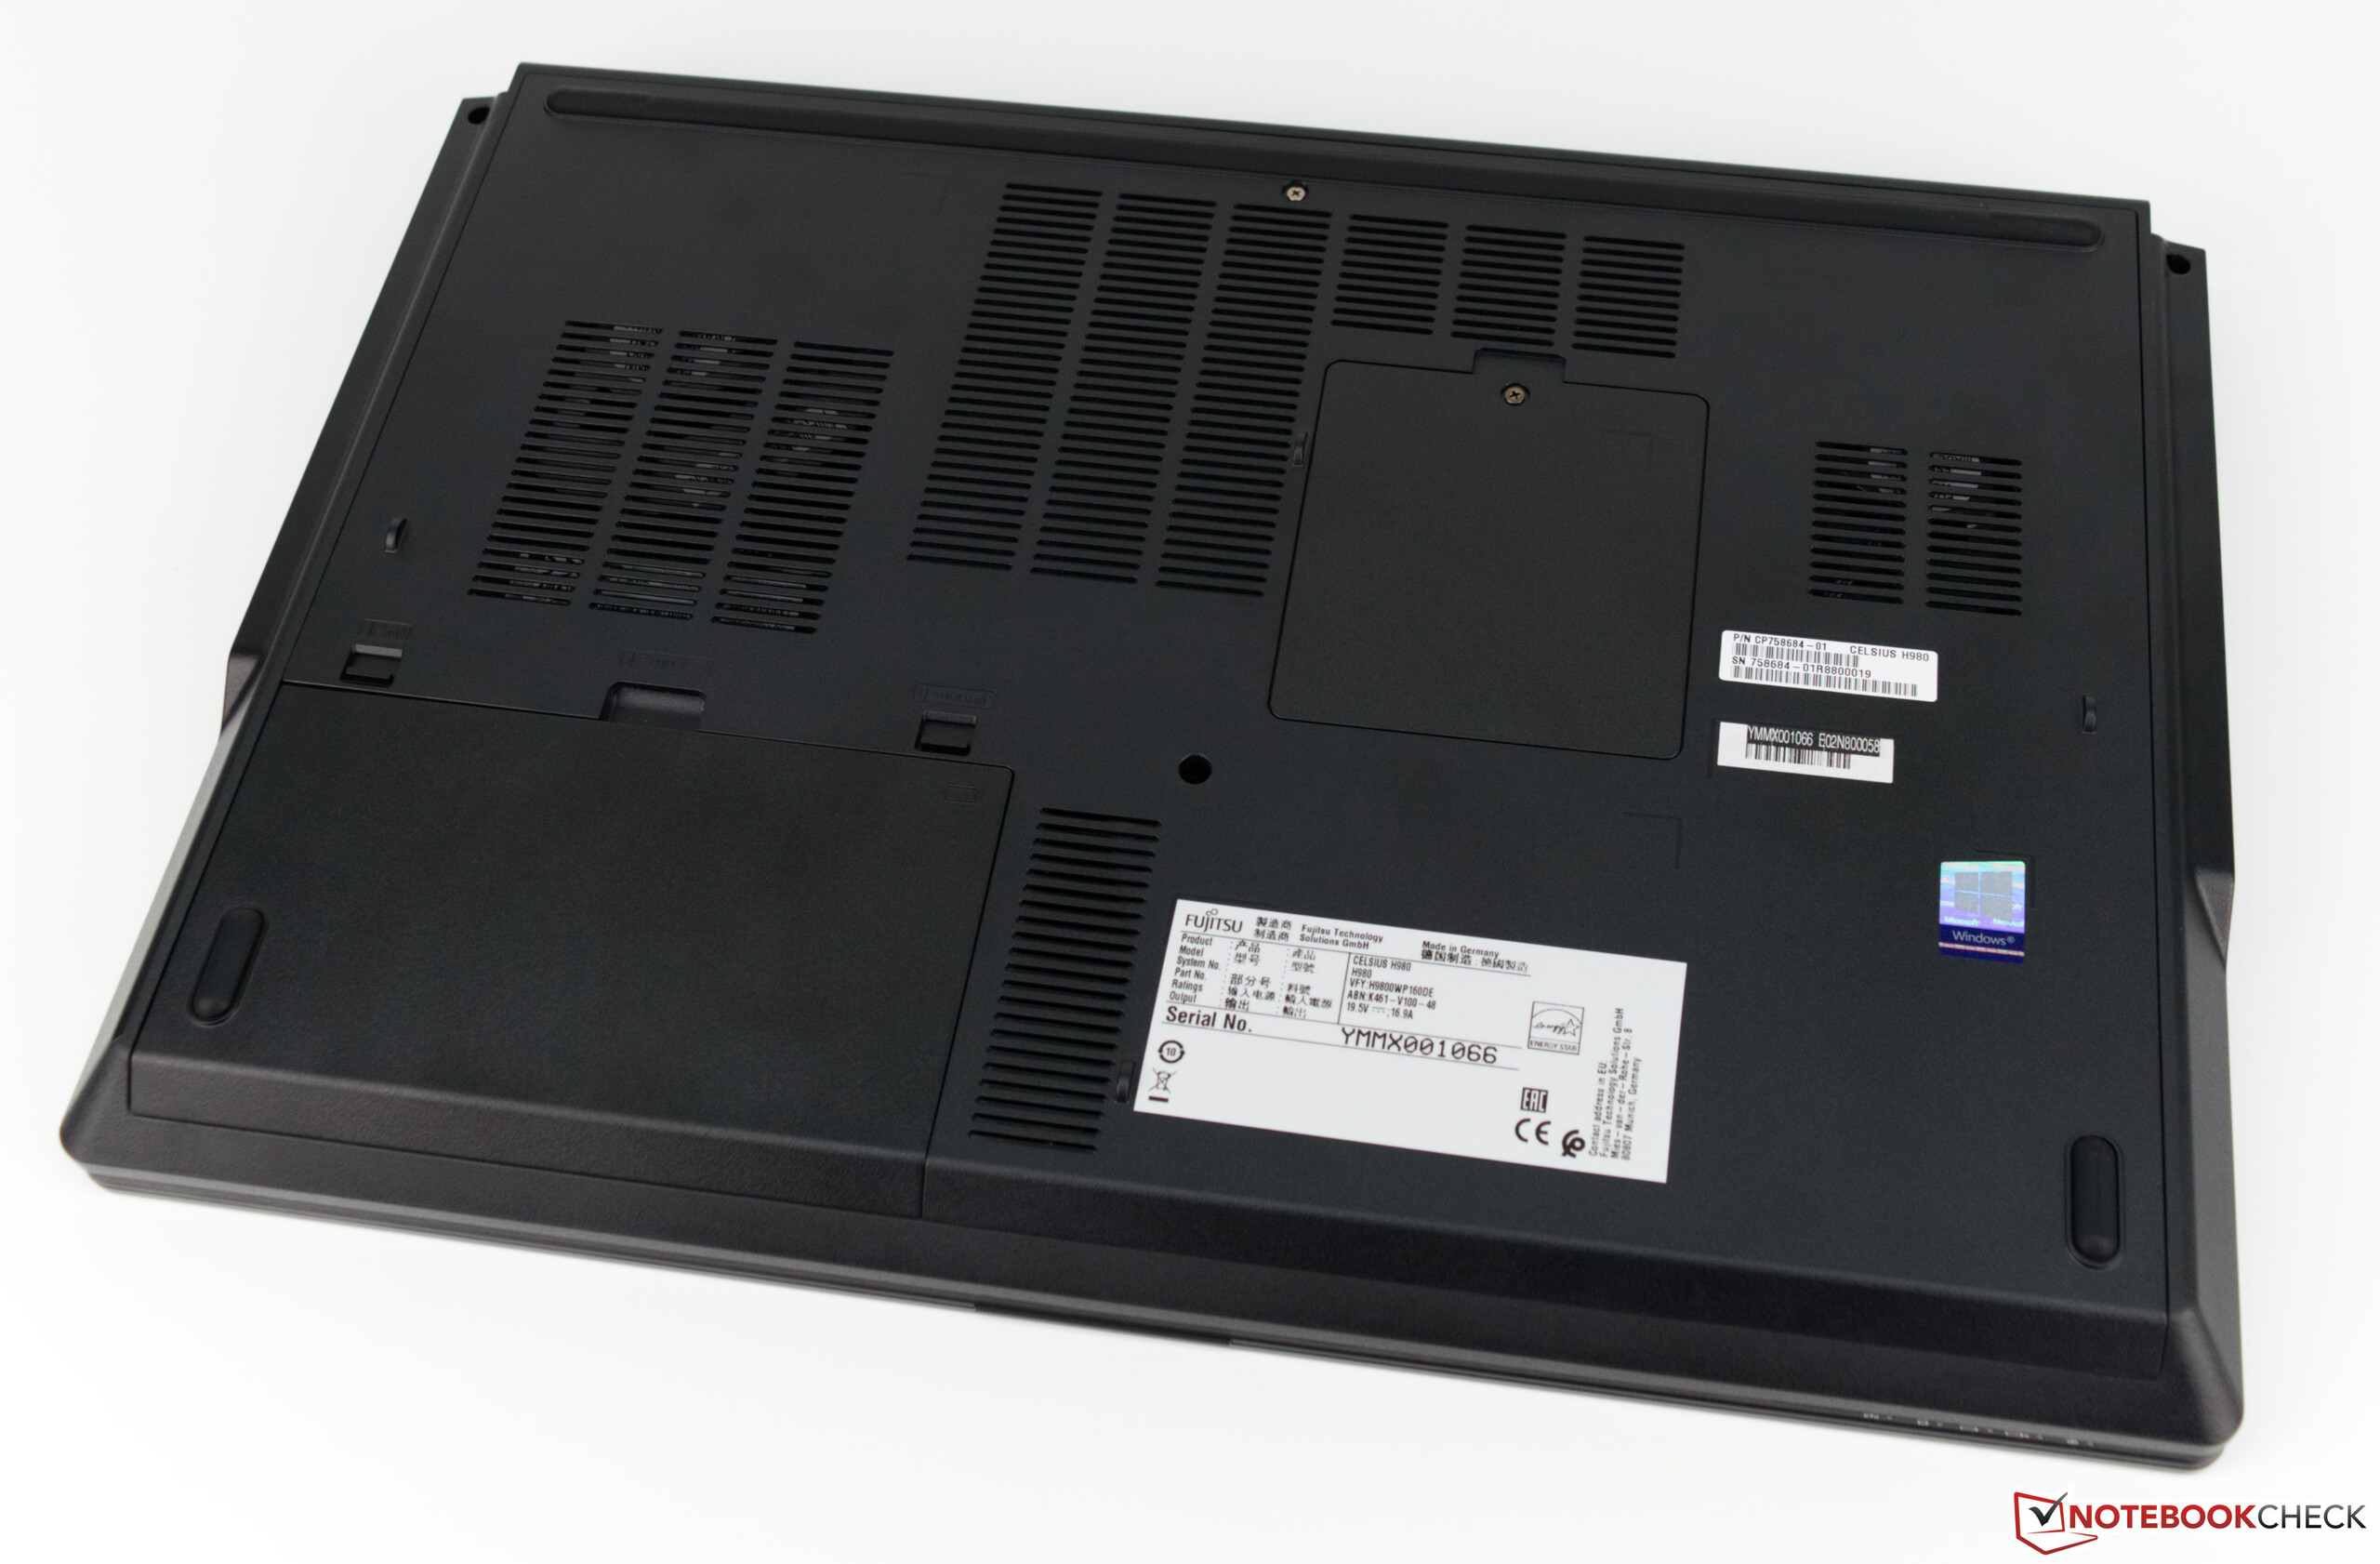
Maintenance
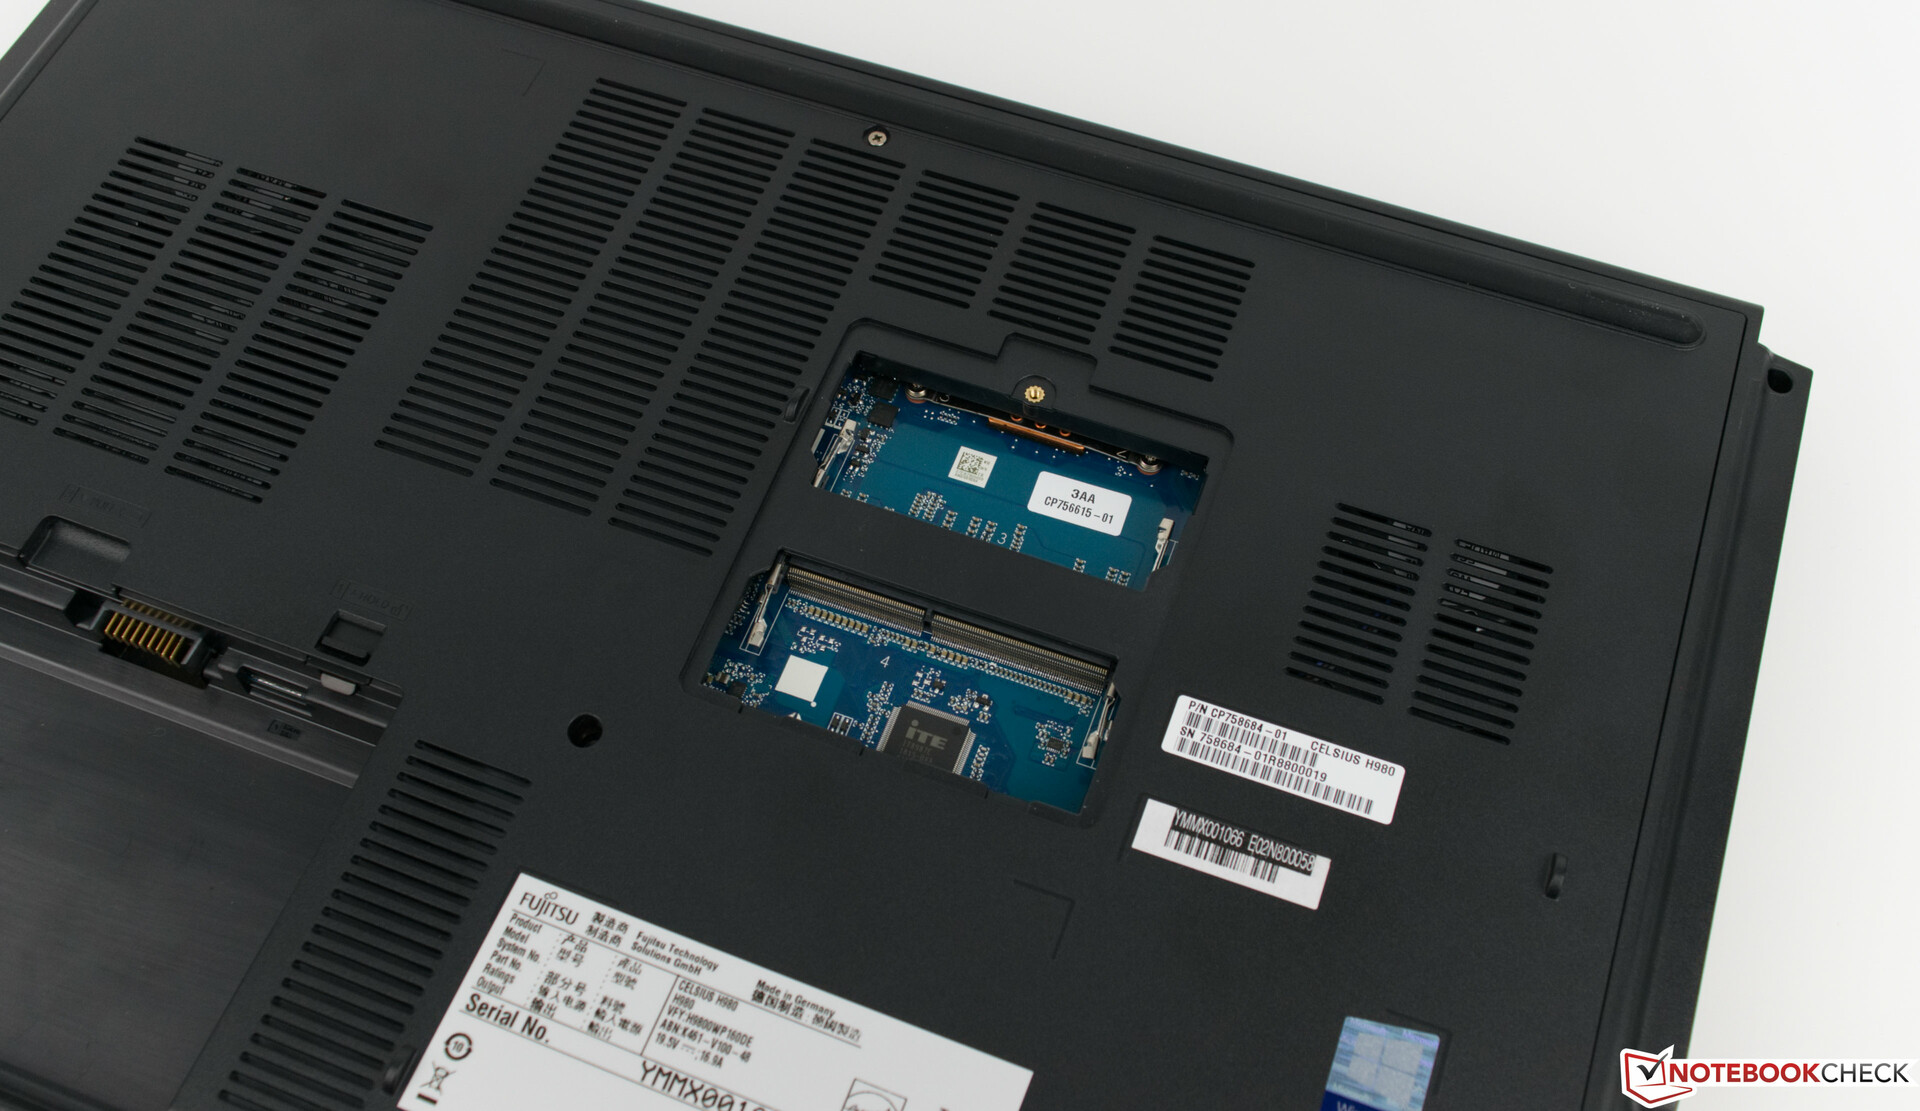
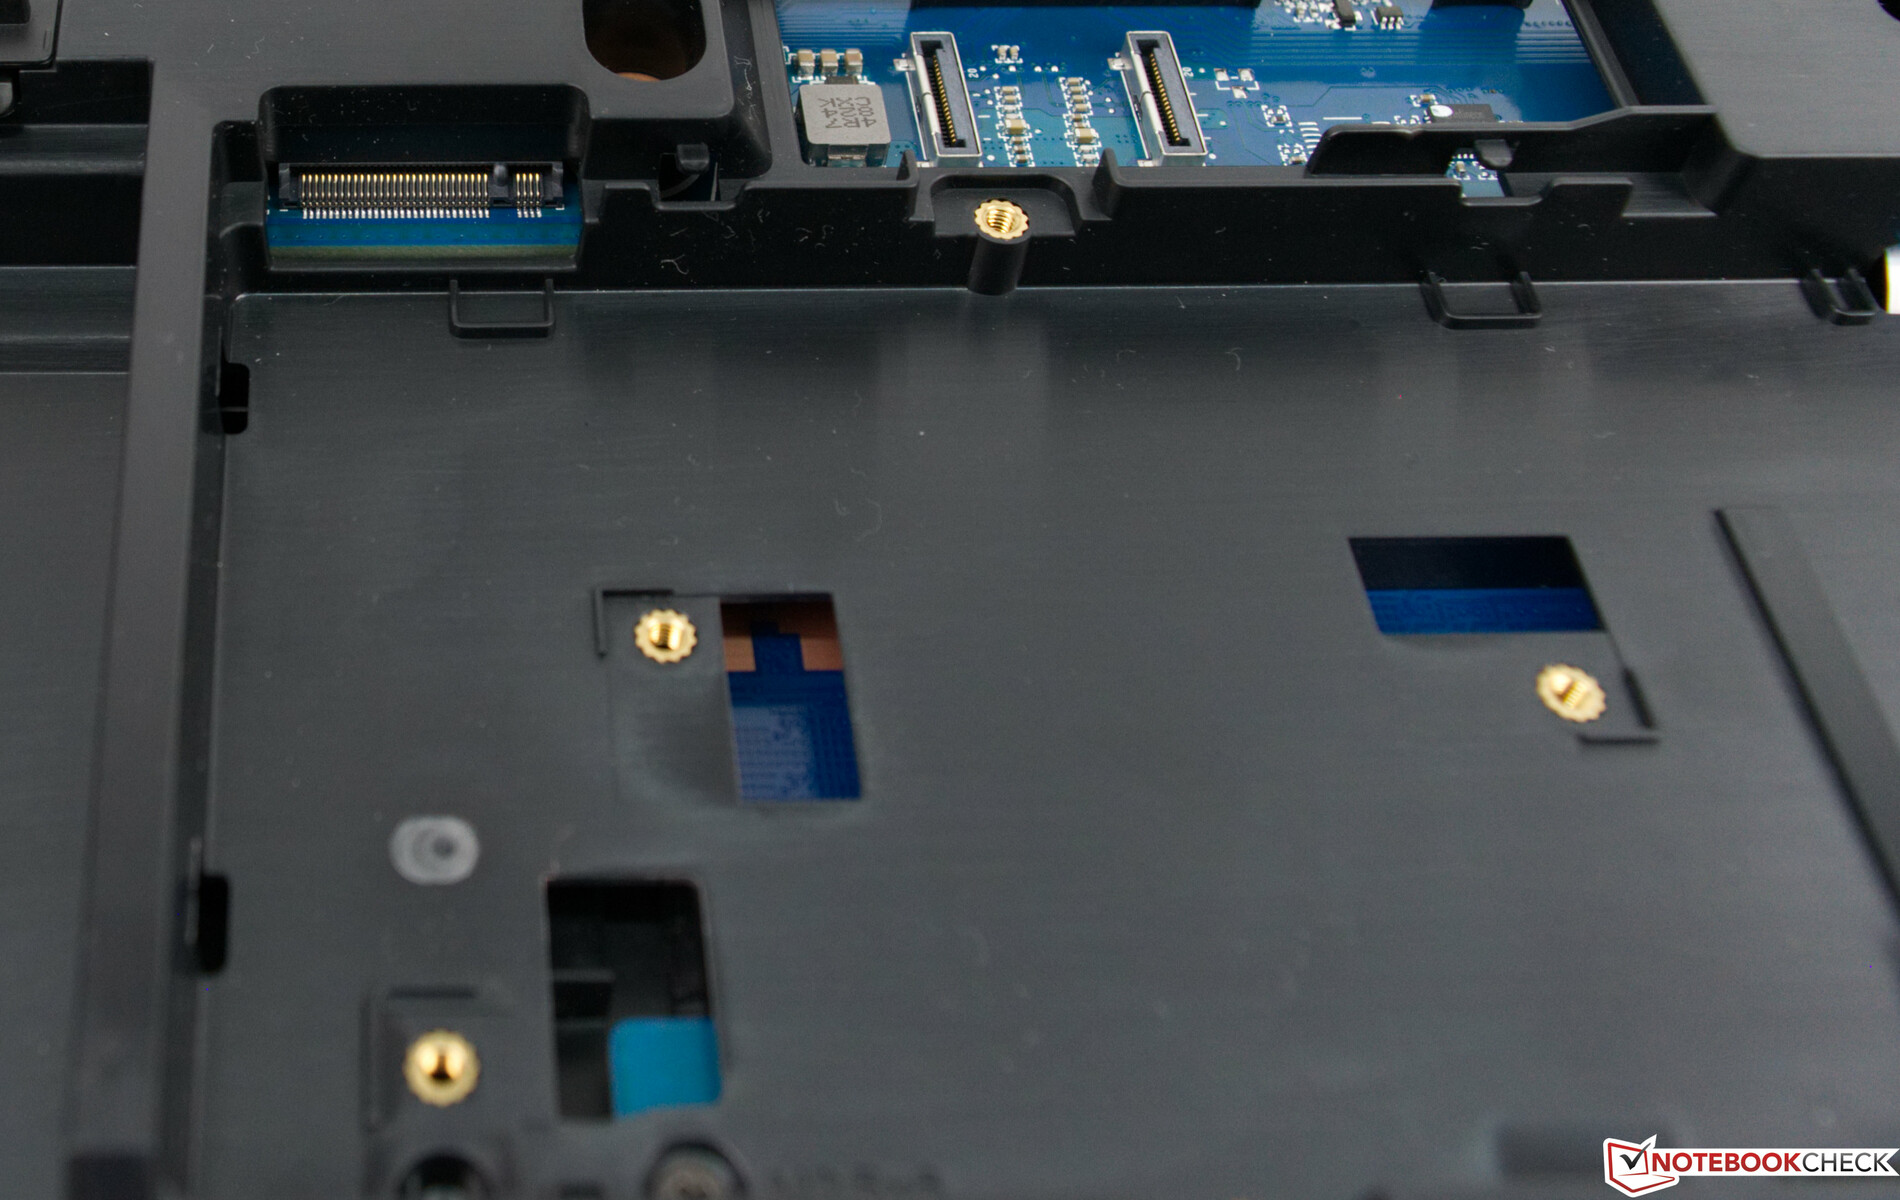
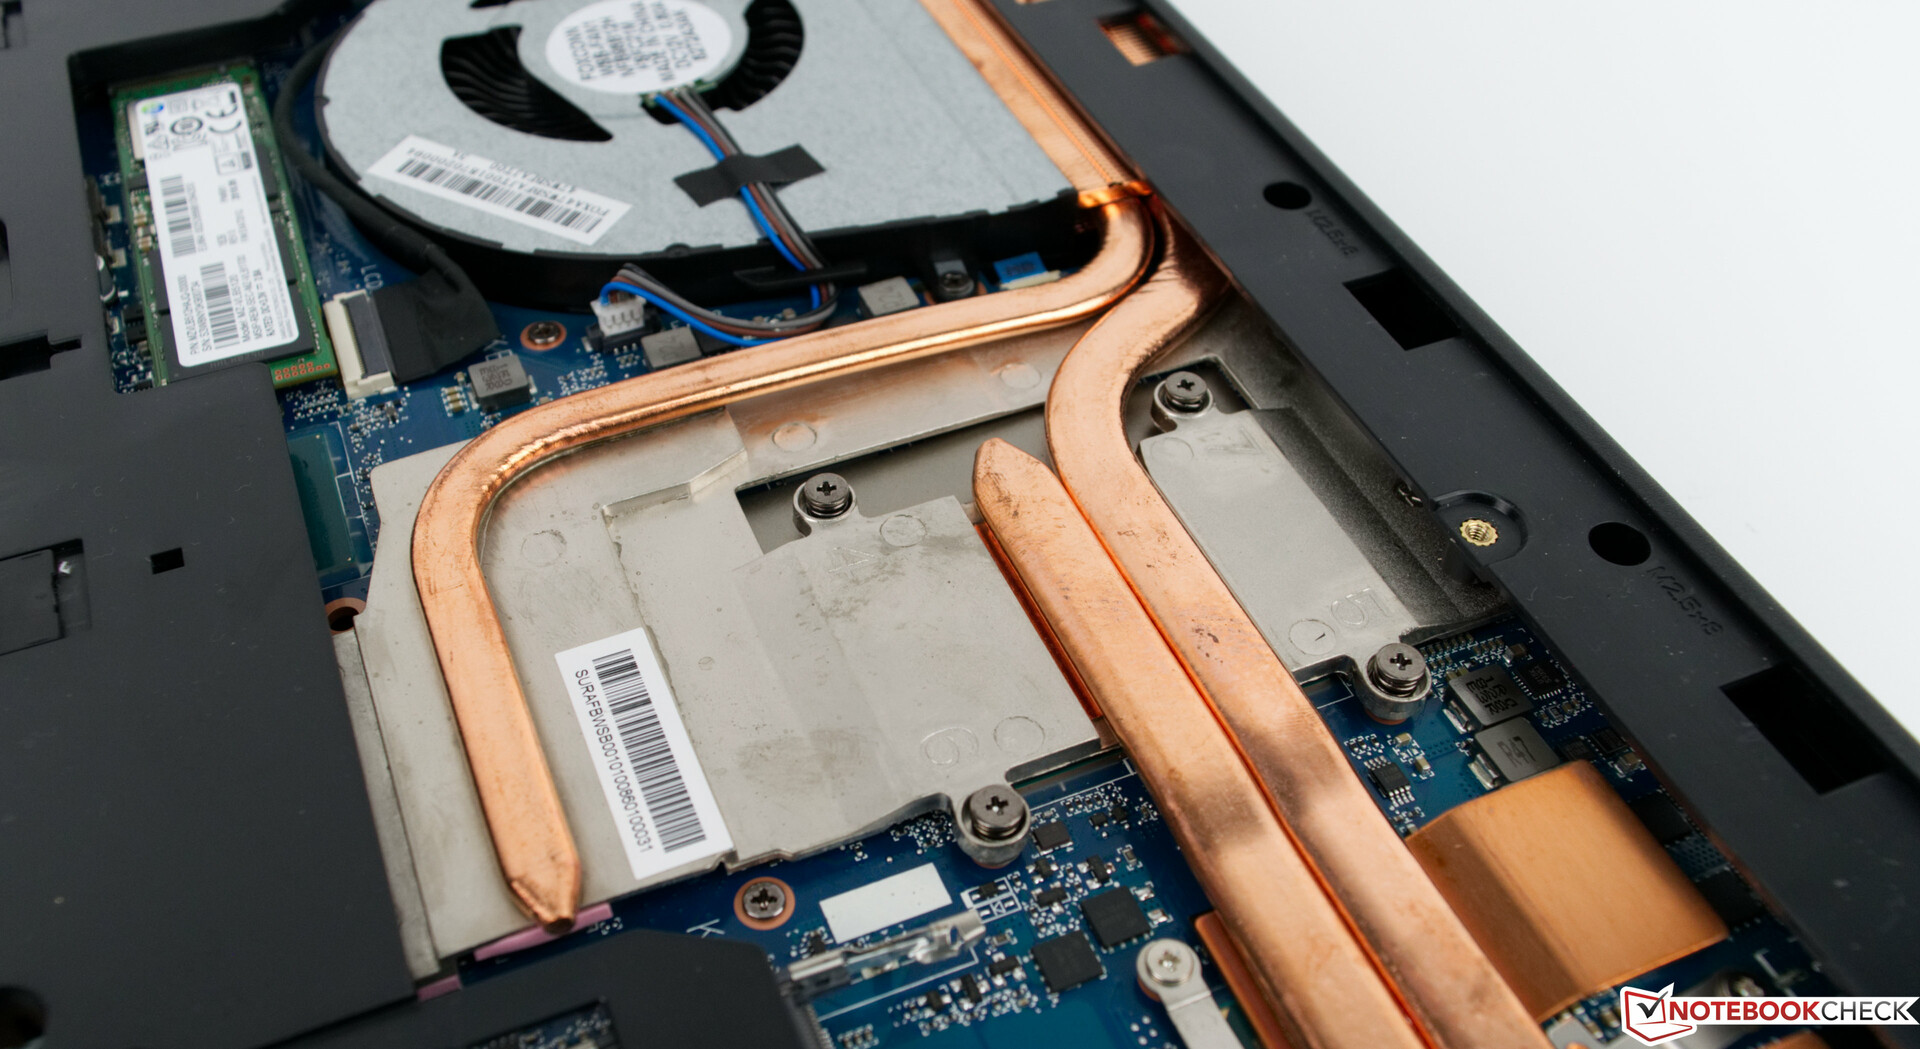
The H980 is trickier to repair and maintain than it initially looks. The battery is removable, and Fujitsu has included a maintenance cover, which is good to see, but it only provides access to two SO-DIMM slots. Accessing any other components requires removing the bottom plate, but thankfully this is simple to do.
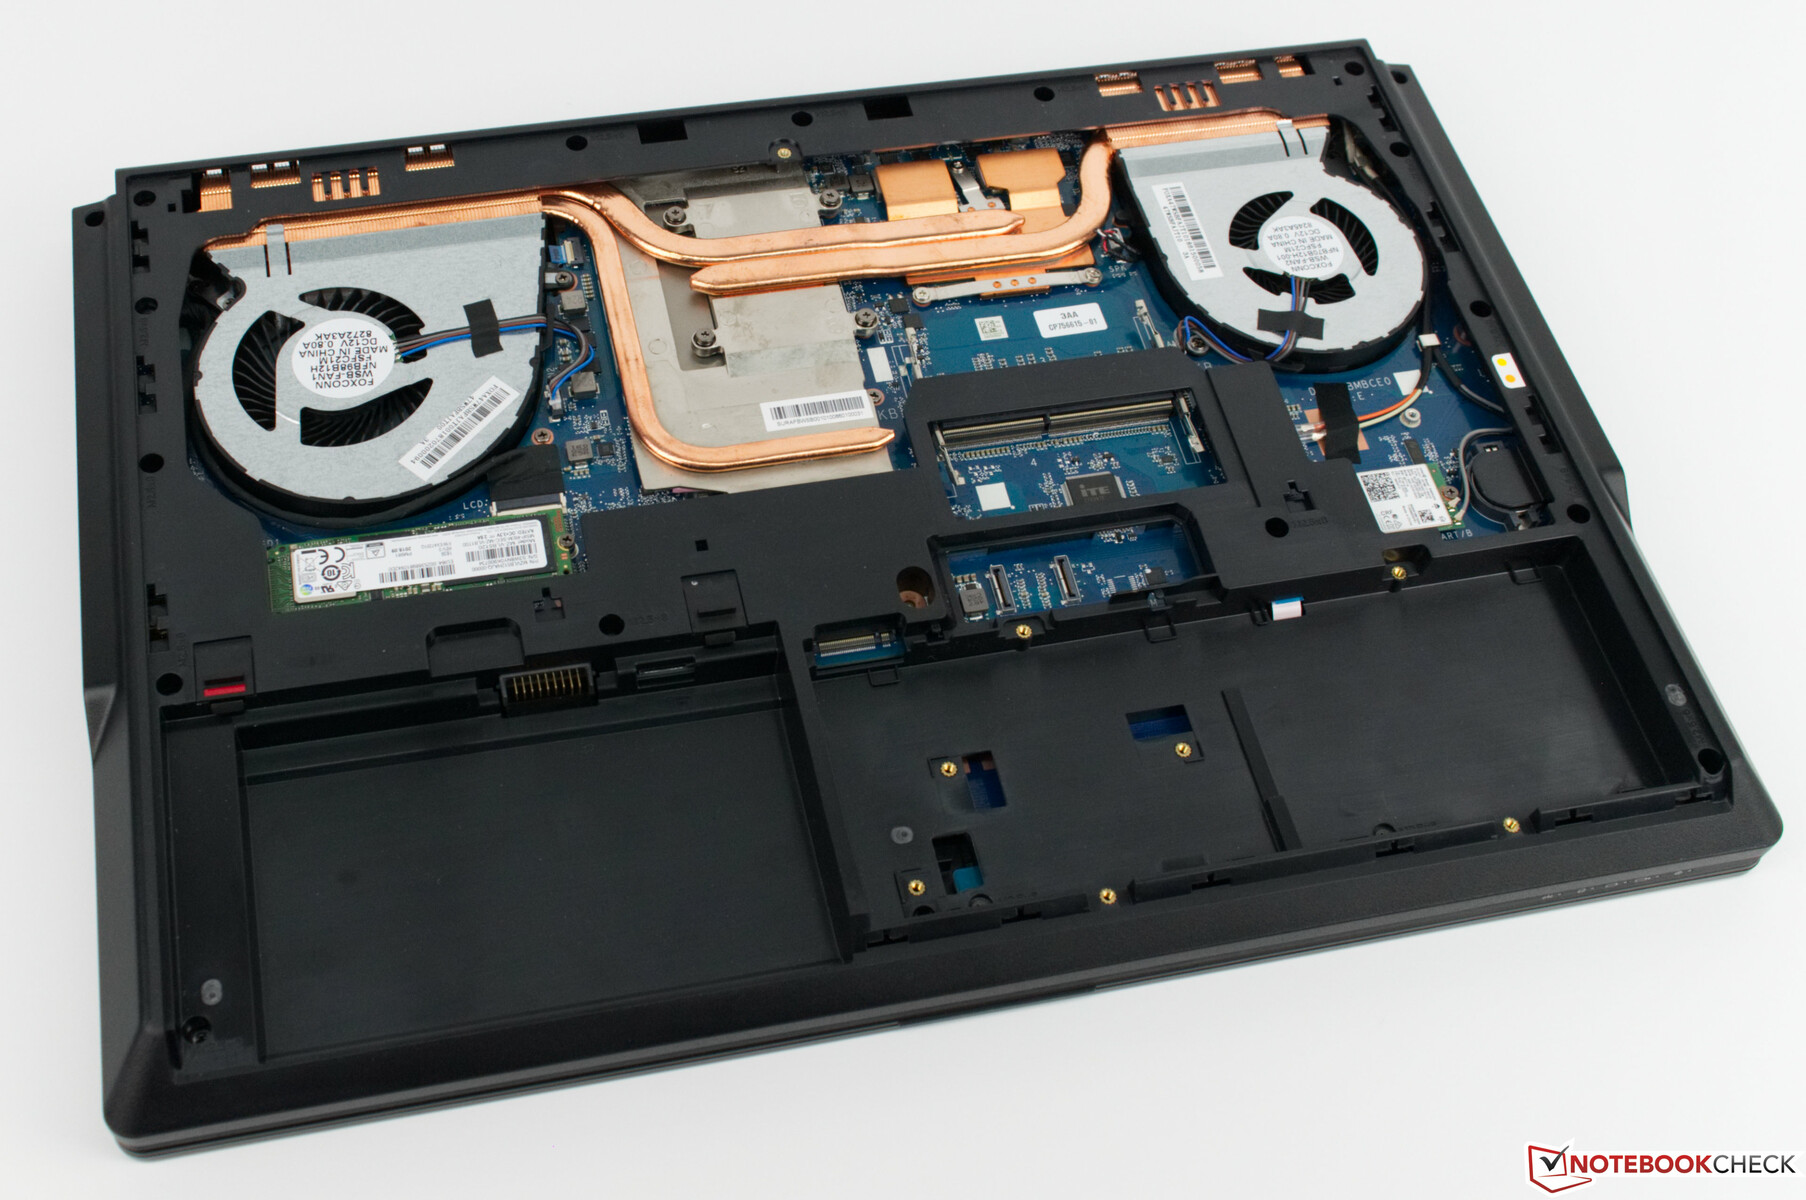
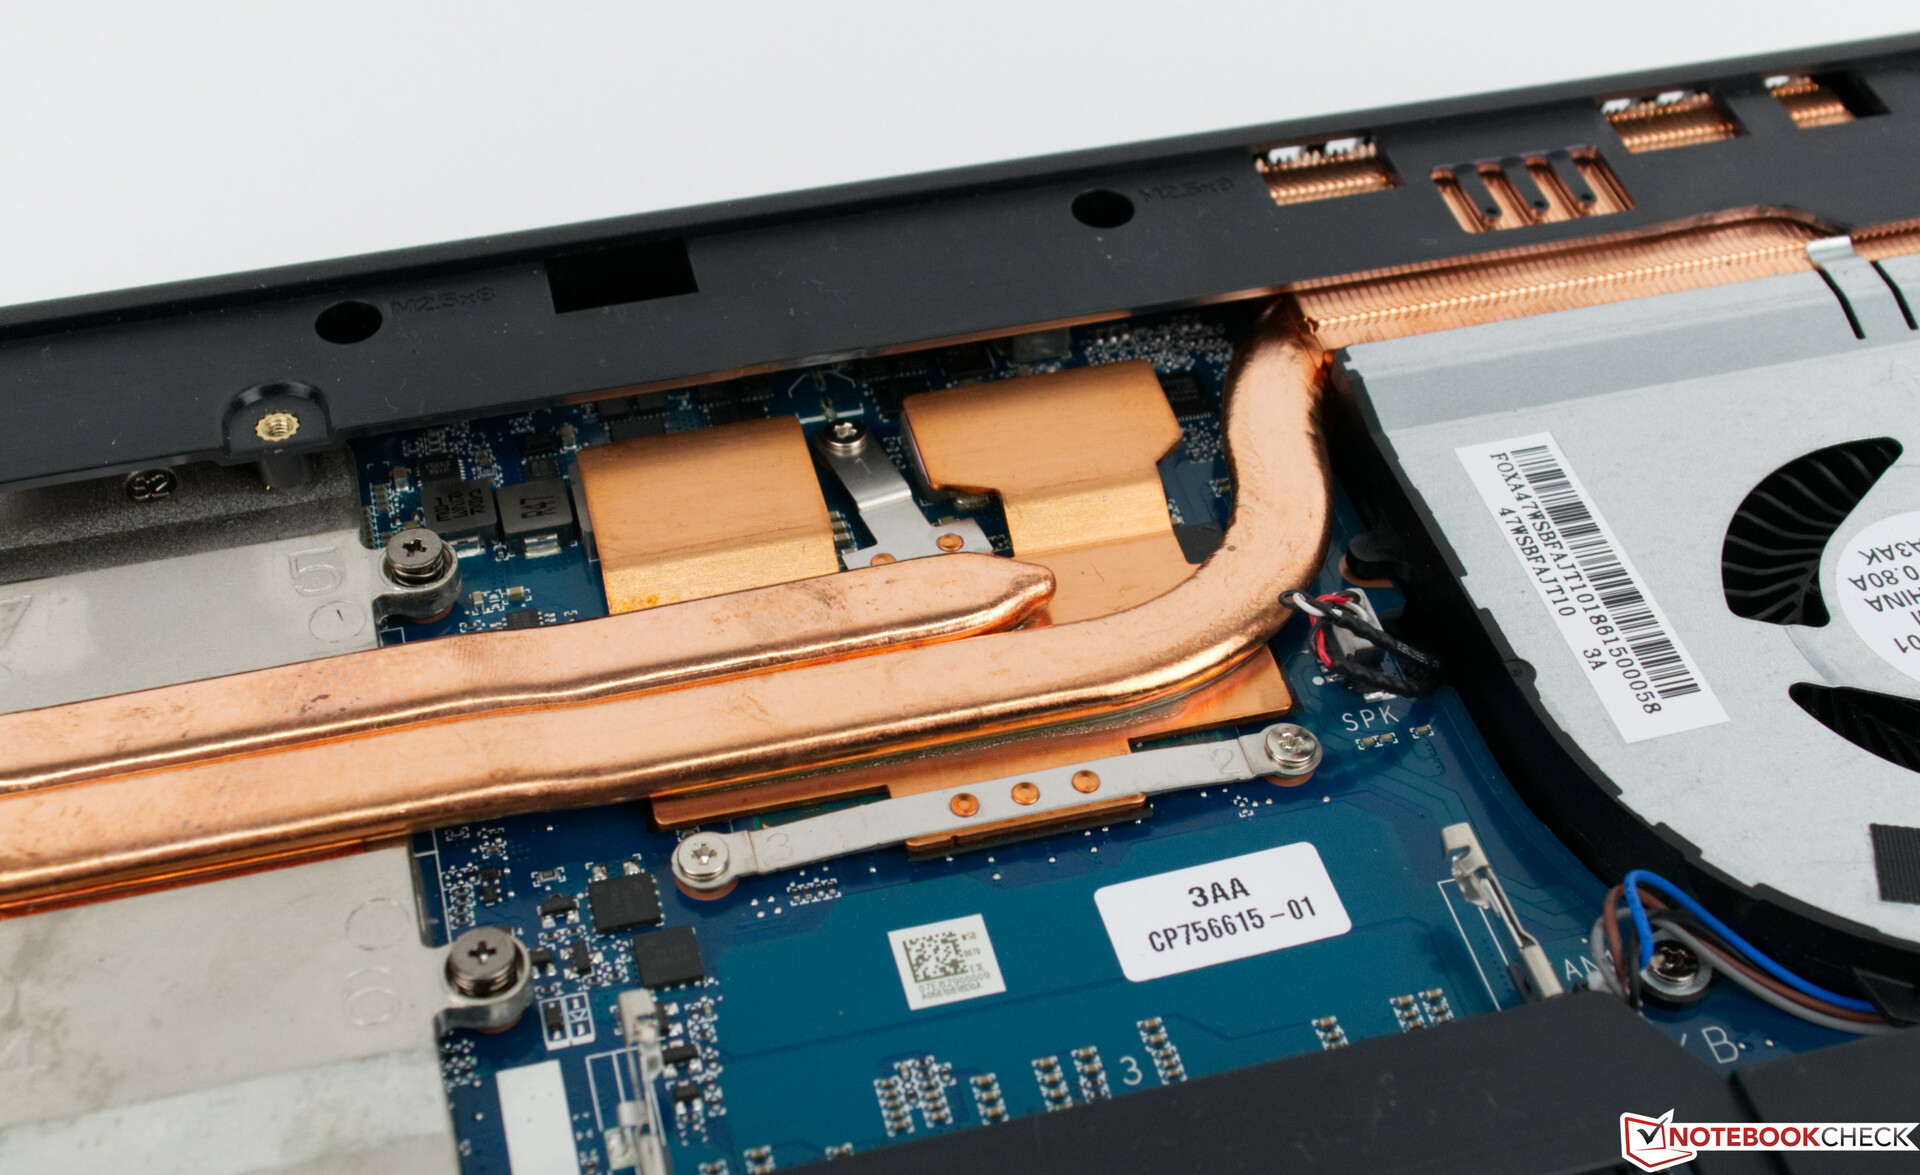
The motherboard has two M.2 2280 and 2.5-inch drive bays, which are easily accessible, as are the WWAN slot, the fans and the heatsinks. However, Fujitsu hides two other SO-DIMM slots on the reverse side of the motherboard, which means that you must remove, flip it over before you can access them. This is an arduous task as it requires removing all the components, which increases the risk of breaking something. Switching RAM modules should not be this difficult or time-consuming.
Display
The H980 and H970 are both equipped with 17.3-inch IPS displays that operate natively at 1,080p and have a pixel density of 127 PPI. Fujitsu has equipped the latter with an older LG Phillips panel, and so their values differ. The display model number for our review unit is LP173WF4-SPF5, for reference, while the H970 has the older LP173WF4-SPF3. There are no alternative displays, which is disappointing as other OEMs have 4K options, as Dell does with its Precision 7720.
Our test device achieves an average maximum brightness of 394 cd/m², which is around 9% brighter than the display in the H970 and puts the H980 in the midfield of our comparison table. The Precision 7720 gets even brighter, but it is less evenly lit so large blocks of colour will look more homogenous on the H980 than they will on the Precision 7720. However, our review unit has a comparatively high black value, which we measure at 0.51 cd/m². By contrast, the H970 has a 0.3 cd/m² black value, while the ThinkPad P72 and ZBook 17 G5 are better still at 0.28 cd/m² and 0.22 cd/m² respectively. This means that black tones will look deeper on our comparison devices than they will on the H980, and it also impacts the contrast ratio, which we measure at 784:1 on our test device. This is poor for such an expensive workstation, and all our comparison devices have considerably more vibrant displays.
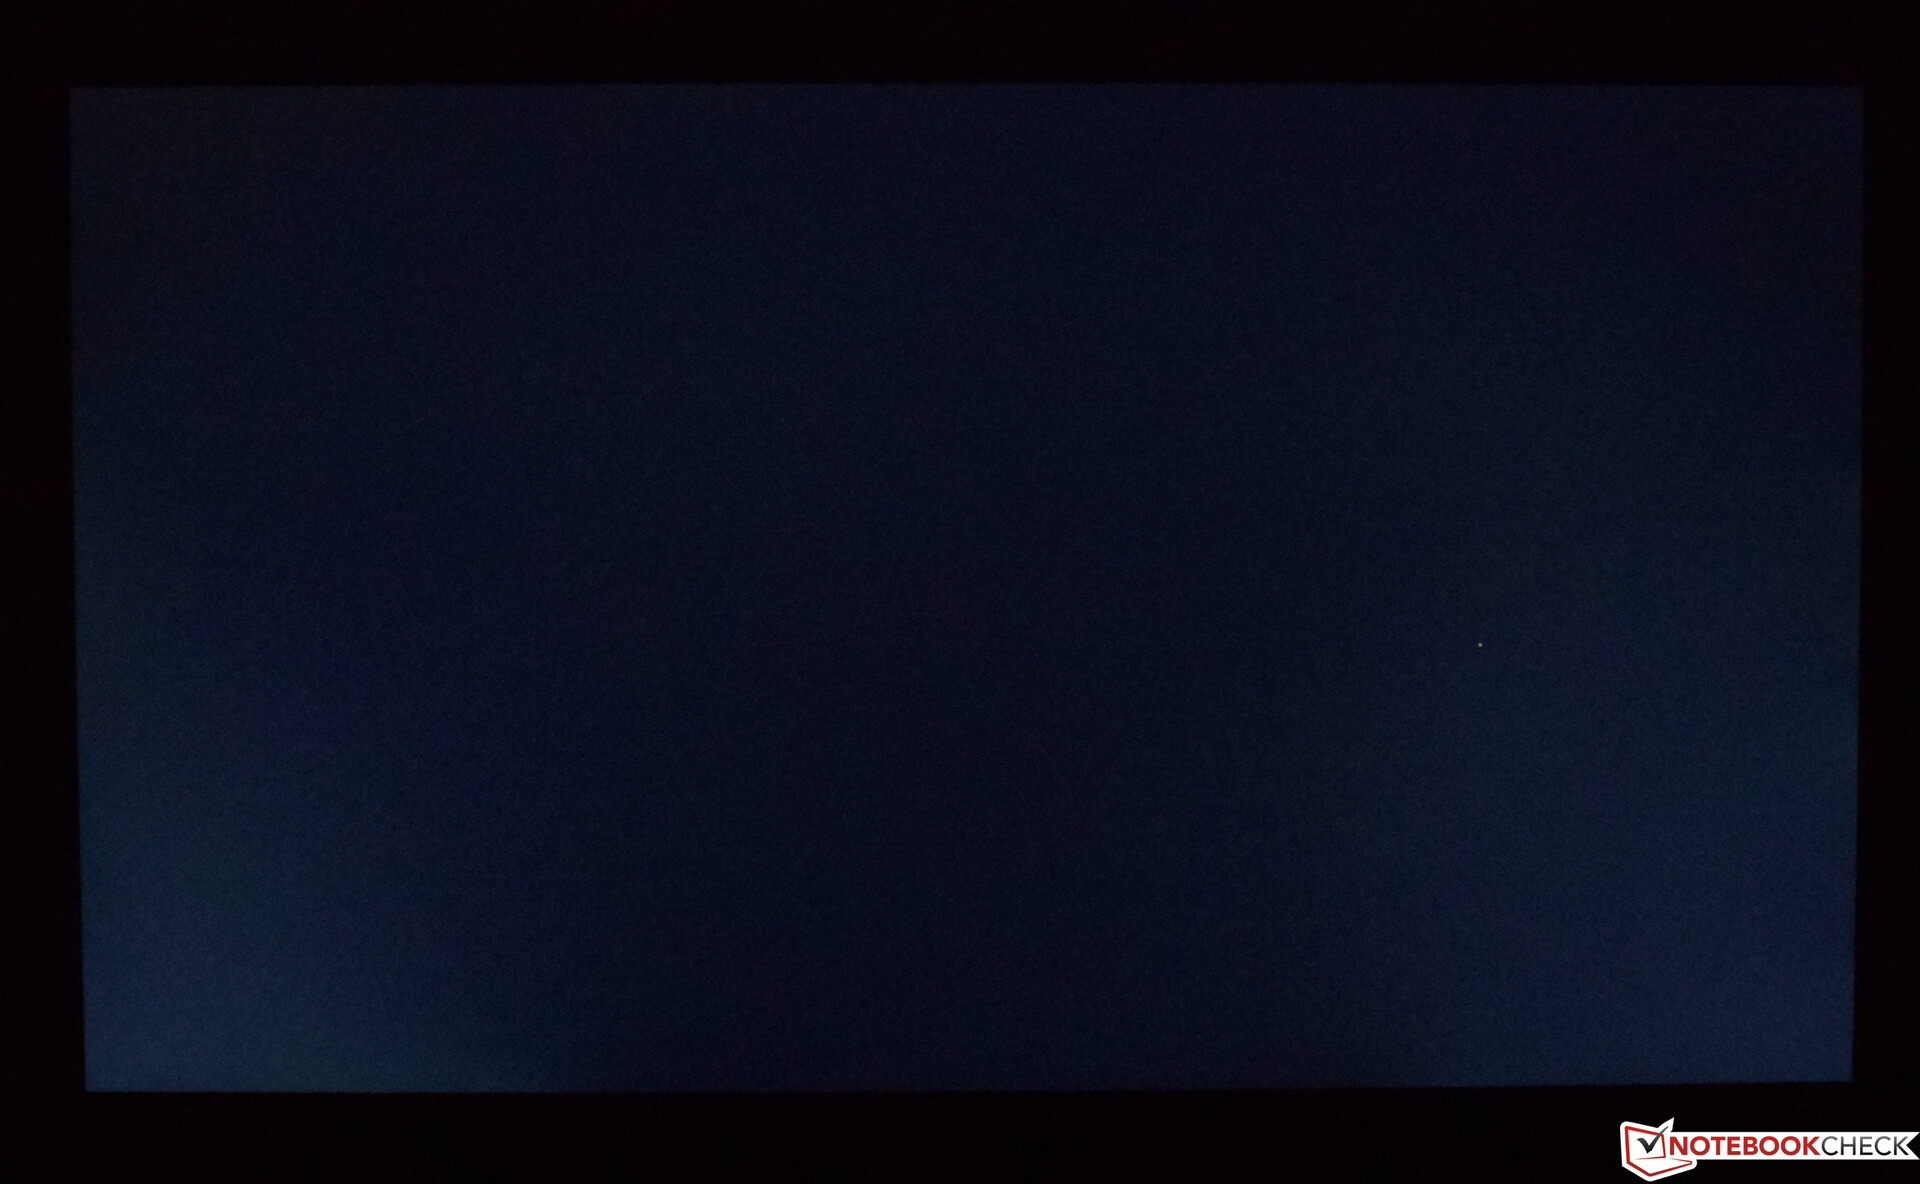
On the positive side, our review unit suffers from practically no backlight bleeding. Moreover, while it uses pulse-width modulation (PWM) to regulate its screen brightness, the frequency at which it does so is so high that it should not affect most people even if they are PWM sensitive.
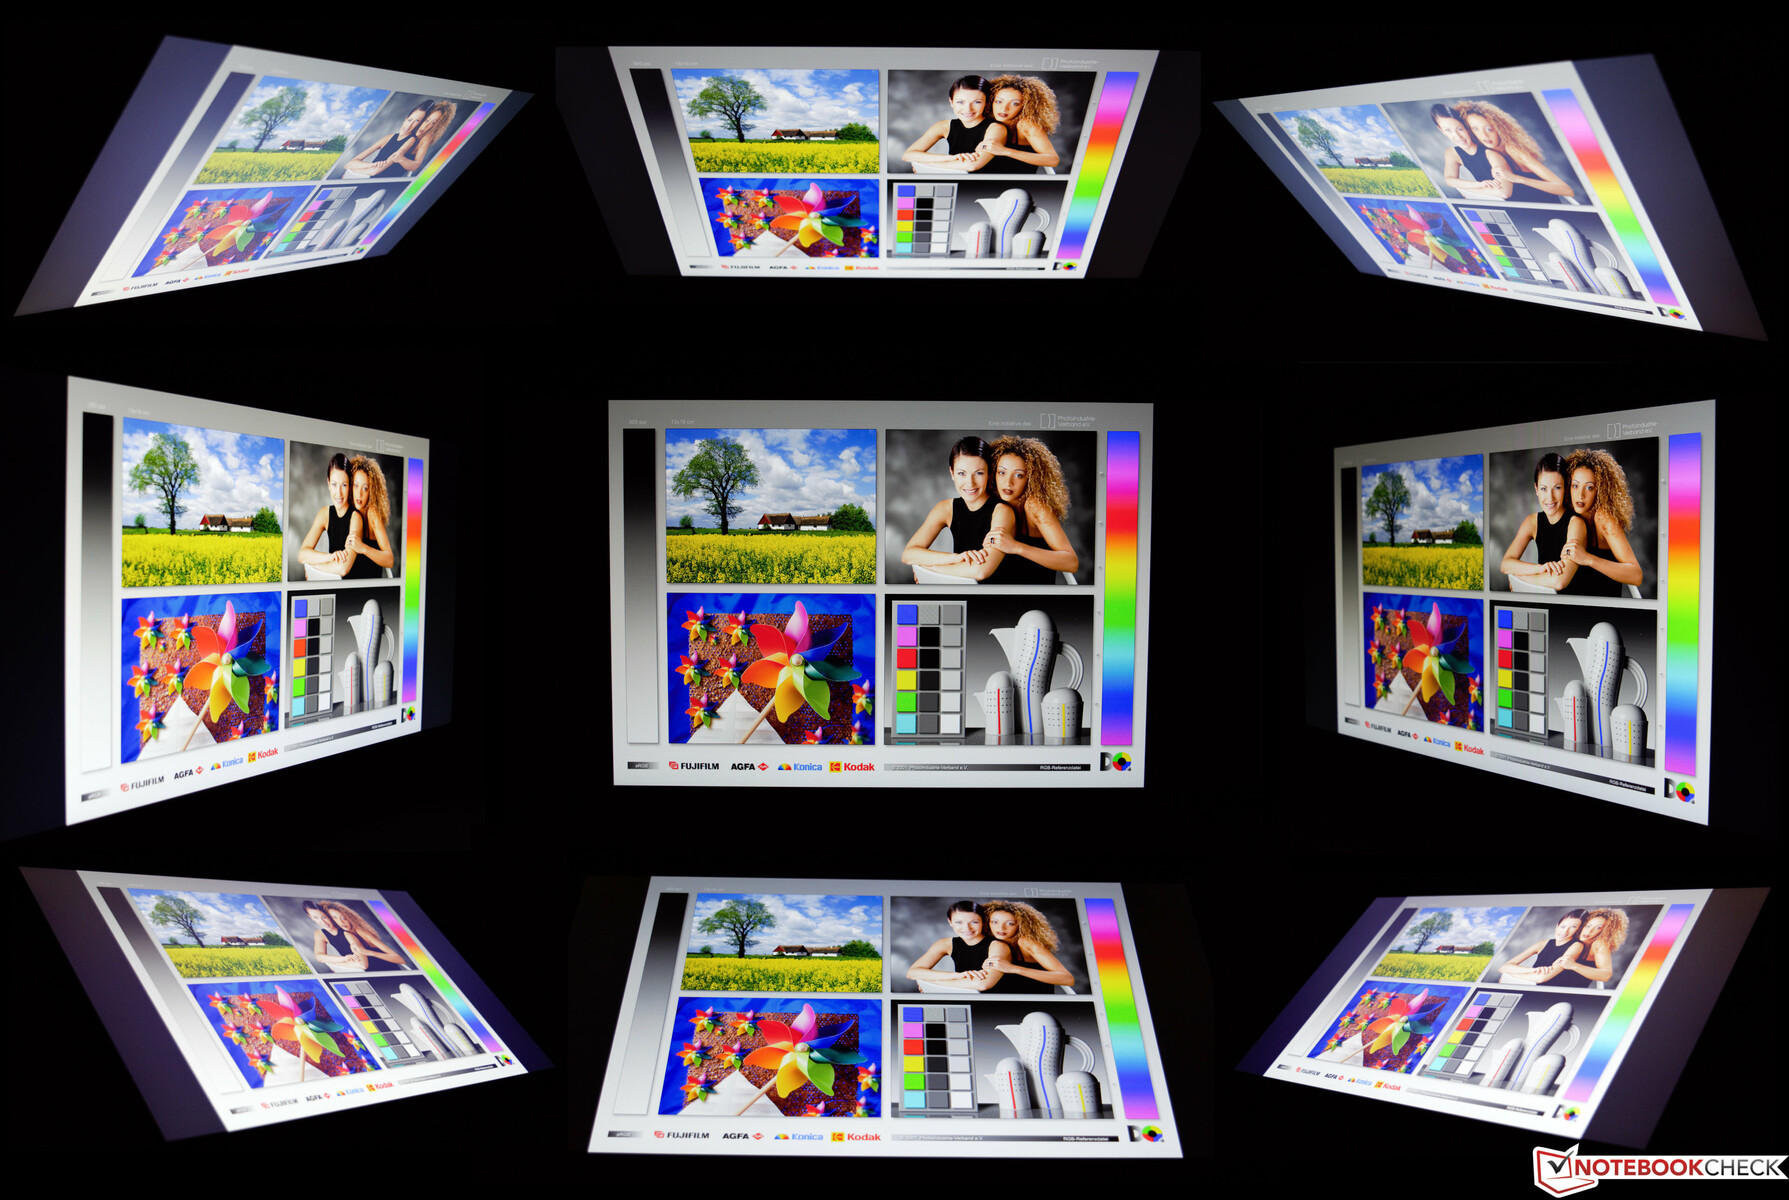
We should point out that our test device does have a stuck pixel, which is visible in our backlight bleed photo. We hardly noticed it in daily use though and we suspect that it is an isolated issue with this device. Hence, we have not factored the matter into our scores for the H980’s display.
| |||||||||||||||||||||||||
Brightness Distribution: 92 %
Center on Battery: 401 cd/m²
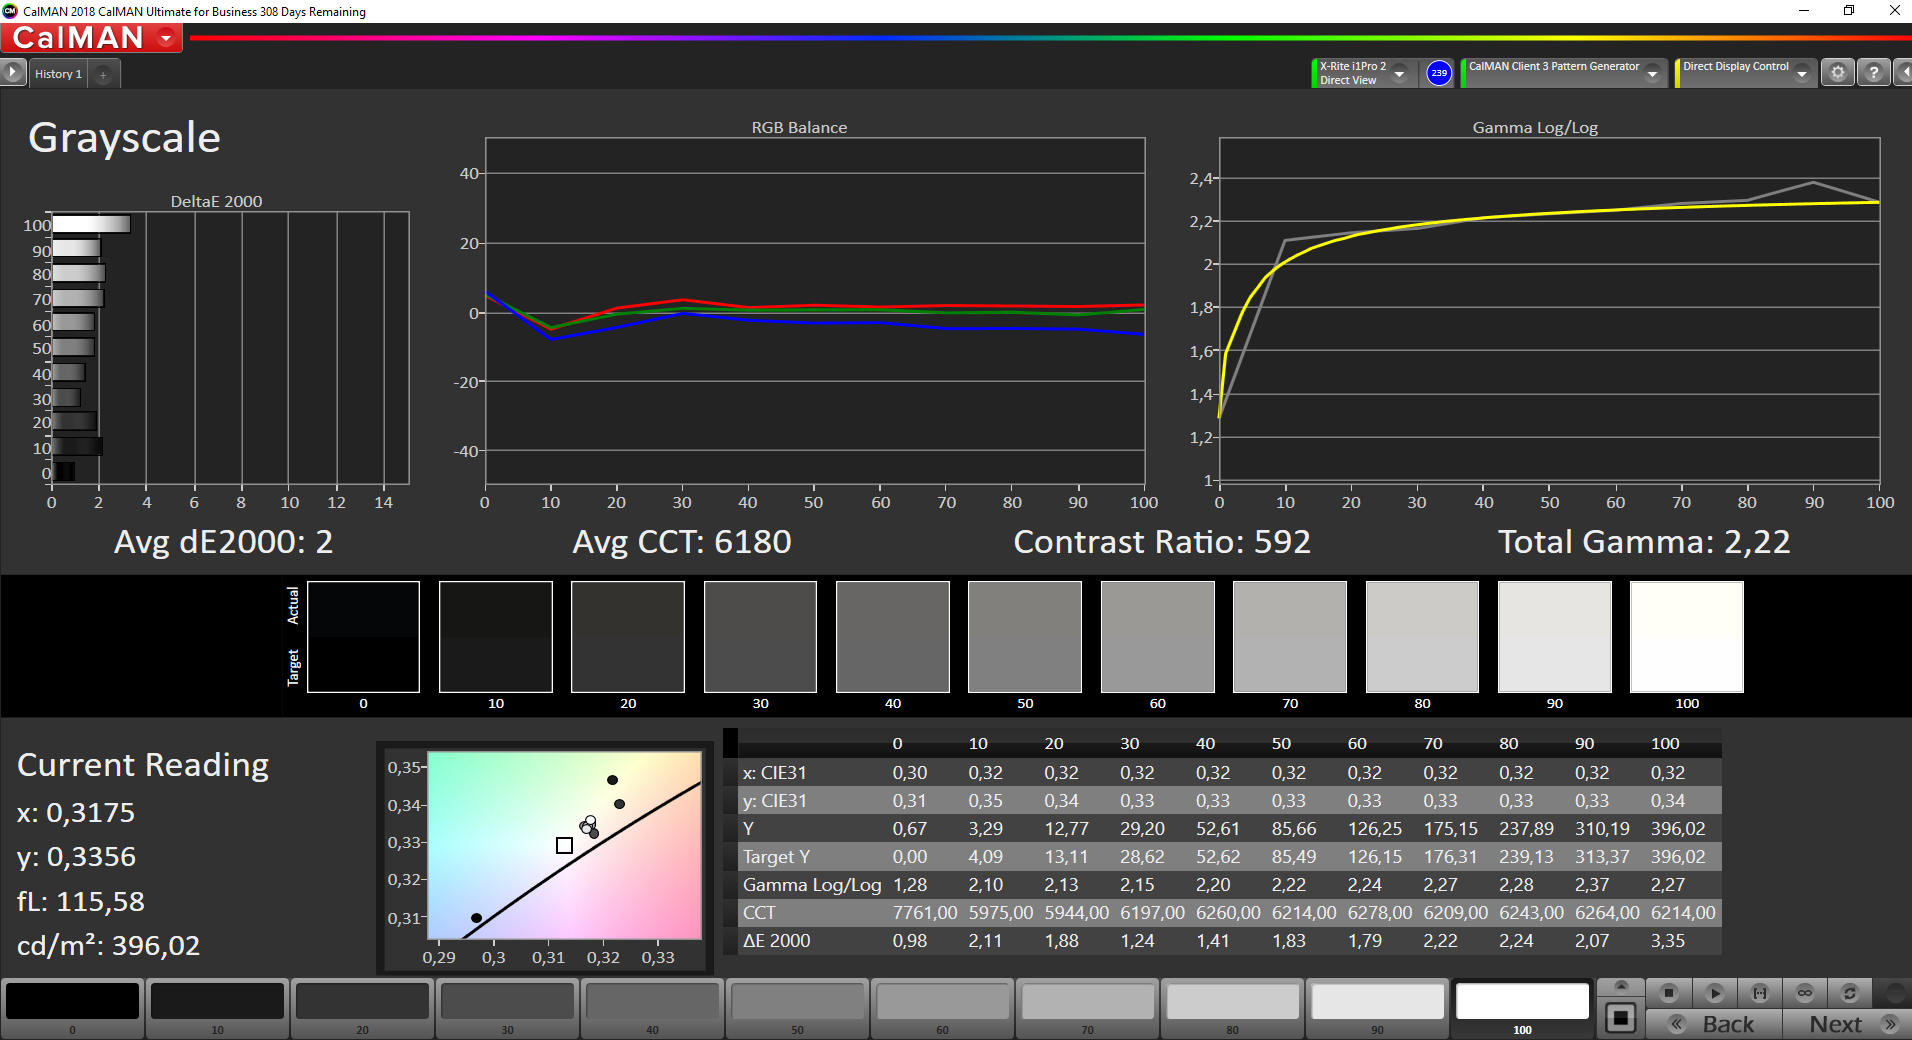
Contrast: 784:1 (Black: 0.51 cd/m²)
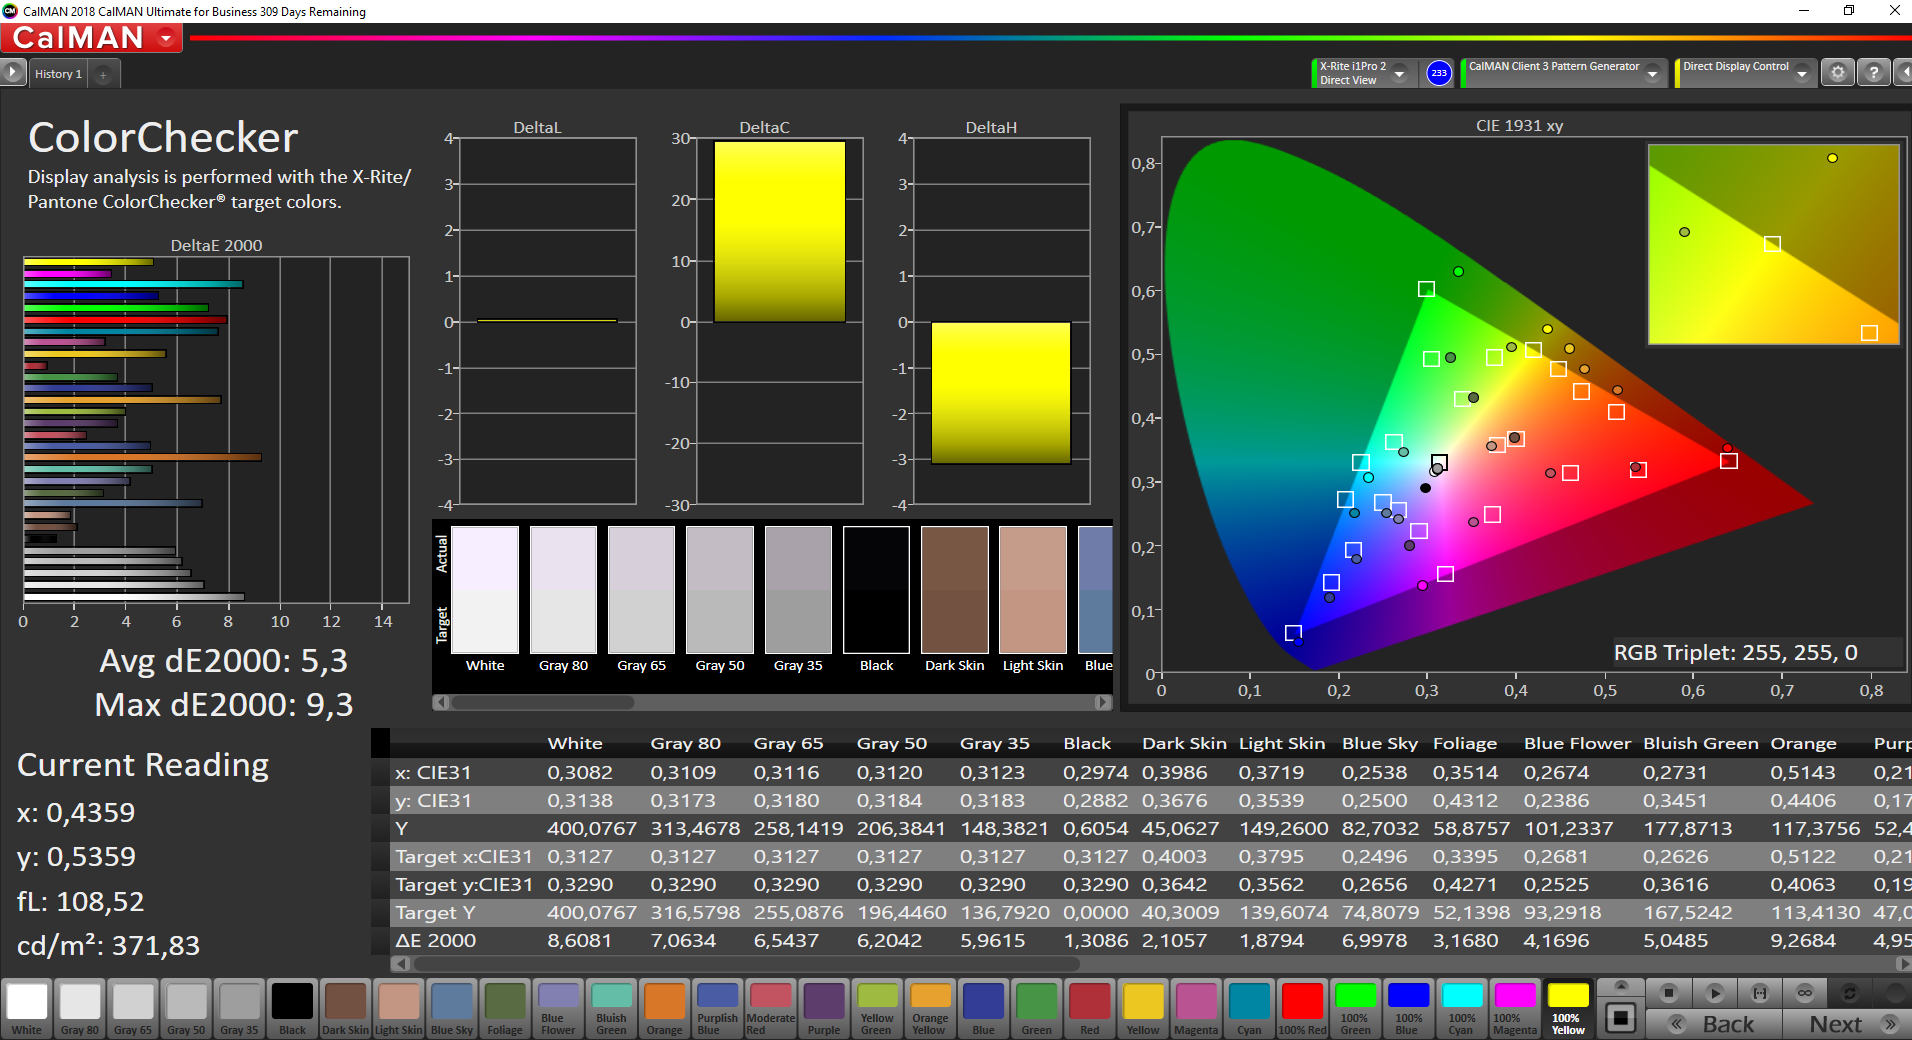
ΔE ColorChecker Calman: 5.3 | ∀{0.5-29.43 Ø4.71}
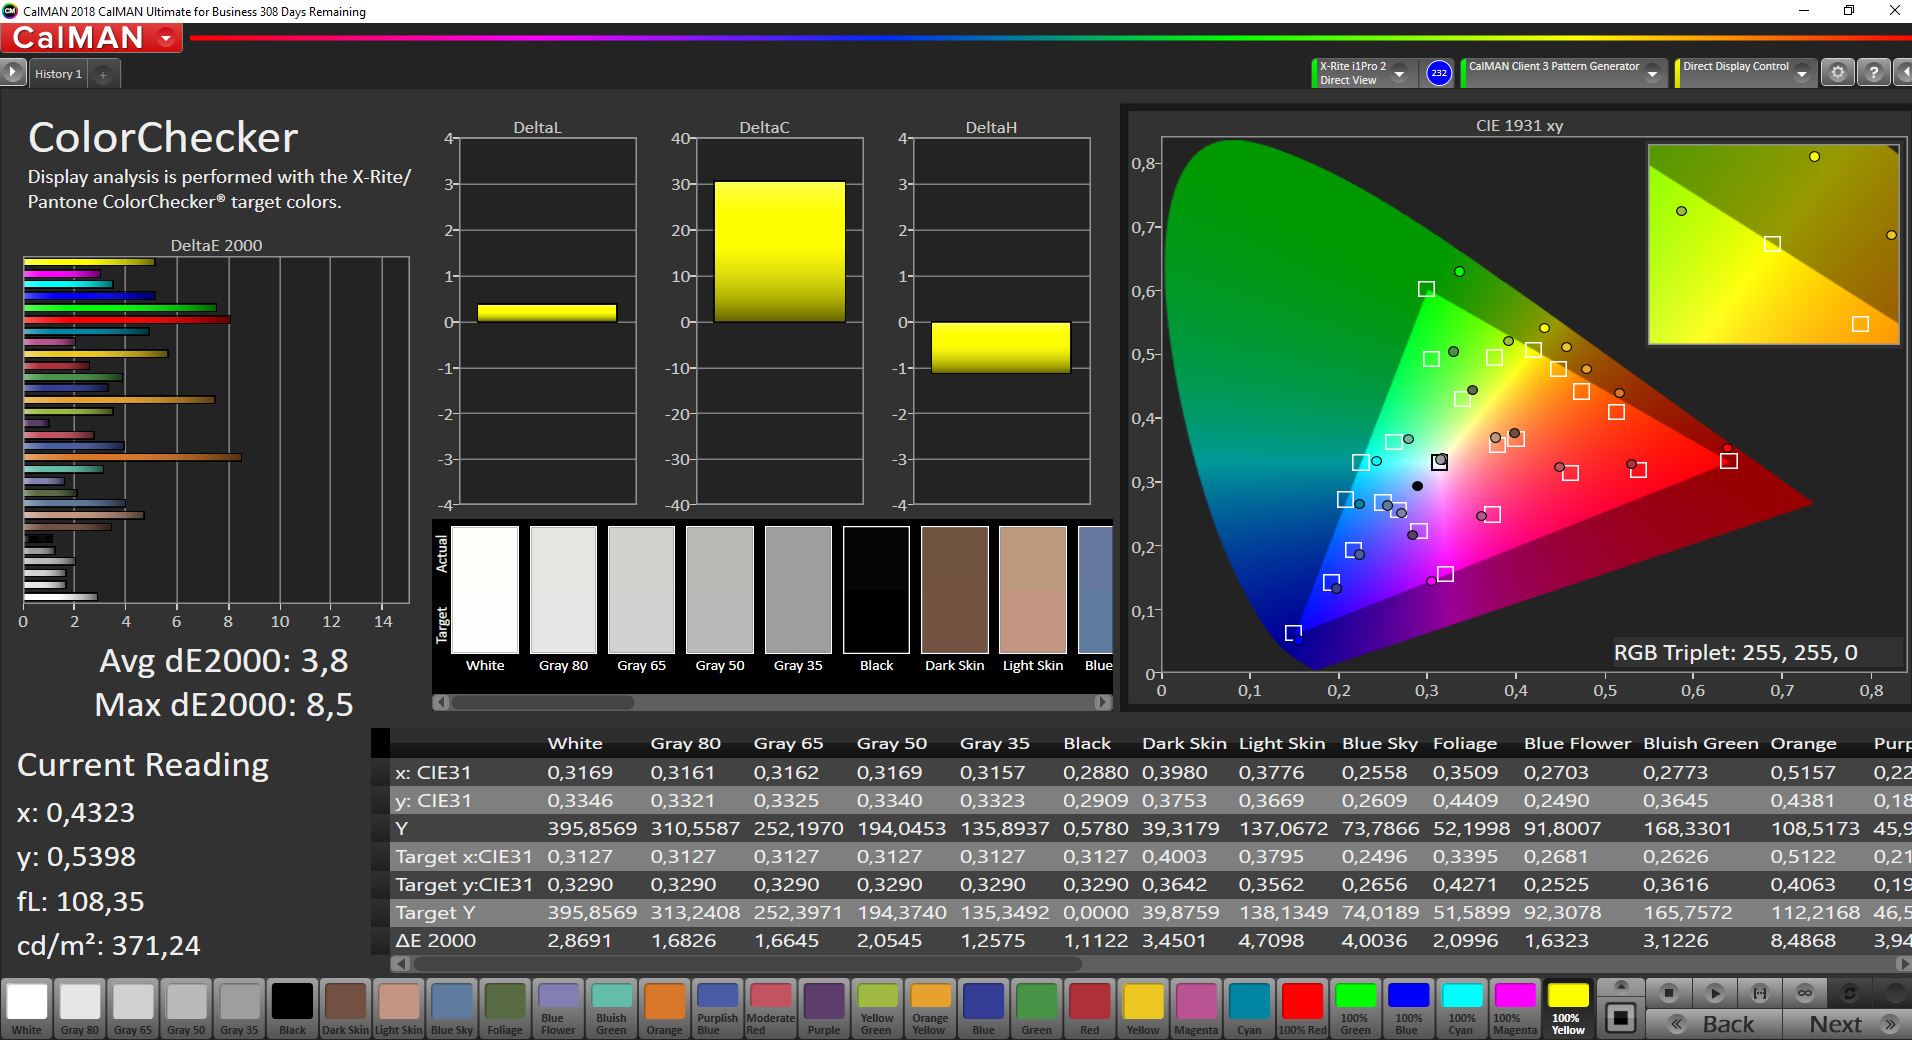
calibrated: 3.8
ΔE Greyscale Calman: 5.5 | ∀{0.09-98 Ø4.96}
84.9% sRGB (Argyll 1.6.3 3D)
55.8% AdobeRGB 1998 (Argyll 1.6.3 3D)
62.2% AdobeRGB 1998 (Argyll 3D)
85% sRGB (Argyll 3D)
67.3% Display P3 (Argyll 3D)
Gamma: 2.17
CCT: 6686 K
| Fujitsu Celsius H980 LG Philips, LP173WF4-SPF5, IPS, 1920x1080, 17.3" | Fujitsu Celsius H970 LP173WF4-SPF3, IPS LED, 1920x1080, 17.3" | Dell Precision 7720 SHP1446 (LQ173D1), IGZO, 3840x2160, 17.3" | Lenovo ThinkPad P72-20MB000EGE LP173WF4_SPF7, IPS, 1920x1080, 17.3" | HP ZBook 17 G5-2ZC48EA AUO B173HW01 V0, , 1920x1080, 17.3" | |
|---|---|---|---|---|---|
| Display | -1% | 36% | 0% | 3% | |
| Display P3 Coverage (%) | 67.3 | 66.8 -1% | 87.6 30% | 67.4 0% | 66.3 -1% |
| sRGB Coverage (%) | 85 | 84.6 0% | 100 18% | 85 0% | 89.9 6% |
| AdobeRGB 1998 Coverage (%) | 62.2 | 61.8 -1% | 99.2 59% | 62.2 0% | |
| Response Times | 1% | -79% | -16% | -17% | |
| Response Time Grey 50% / Grey 80% * (ms) | 38 ? | 32 ? 16% | 60 ? -58% | 40.8 ? -7% | 42.4 ? -12% |
| Response Time Black / White * (ms) | 23.2 ? | 26.4 ? -14% | 46.4 ? -100% | 28.8 ? -24% | 28.4 ? -22% |
| PWM Frequency (Hz) | 120500 ? | 1020 ? | |||
| Screen | 2% | 24% | 12% | 14% | |
| Brightness middle (cd/m²) | 400 | 368 -8% | 464 16% | 338 -15% | 335 -16% |
| Brightness (cd/m²) | 394 | 360 -9% | 441 12% | 317 -20% | 326 -17% |
| Brightness Distribution (%) | 92 | 91 -1% | 89 -3% | 86 -7% | 92 0% |
| Black Level * (cd/m²) | 0.51 | 0.3 41% | 0.45 12% | 0.28 45% | 0.22 57% |
| Contrast (:1) | 784 | 1227 57% | 1031 32% | 1207 54% | 1523 94% |
| Colorchecker dE 2000 * | 5.3 | 6.4 -21% | 3.2 40% | 4.3 19% | 4.7 11% |
| Colorchecker dE 2000 max. * | 9.3 | 10.1 -9% | 6.1 34% | 10.2 -10% | 8.7 6% |
| Colorchecker dE 2000 calibrated * | 3.8 | 3.7 3% | 2.7 29% | ||
| Greyscale dE 2000 * | 5.5 | 7.2 -31% | 4.2 24% | 2.2 60% | 6.5 -18% |
| Gamma | 2.17 101% | 2.02 109% | 2.01 109% | 2.17 101% | 2.23 99% |
| CCT | 6686 97% | 6882 94% | 6736 96% | 6621 98% | 6108 106% |
| Color Space (Percent of AdobeRGB 1998) (%) | 55.8 | 55.5 -1% | 88.1 58% | 55.8 0% | 58.7 5% |
| Color Space (Percent of sRGB) (%) | 84.9 | 84.4 -1% | 100 18% | 84.7 0% | 89.7 6% |
| Total Average (Program / Settings) | 1% /
1% | -6% /
13% | -1% /
6% | 0% /
9% |
* ... smaller is better
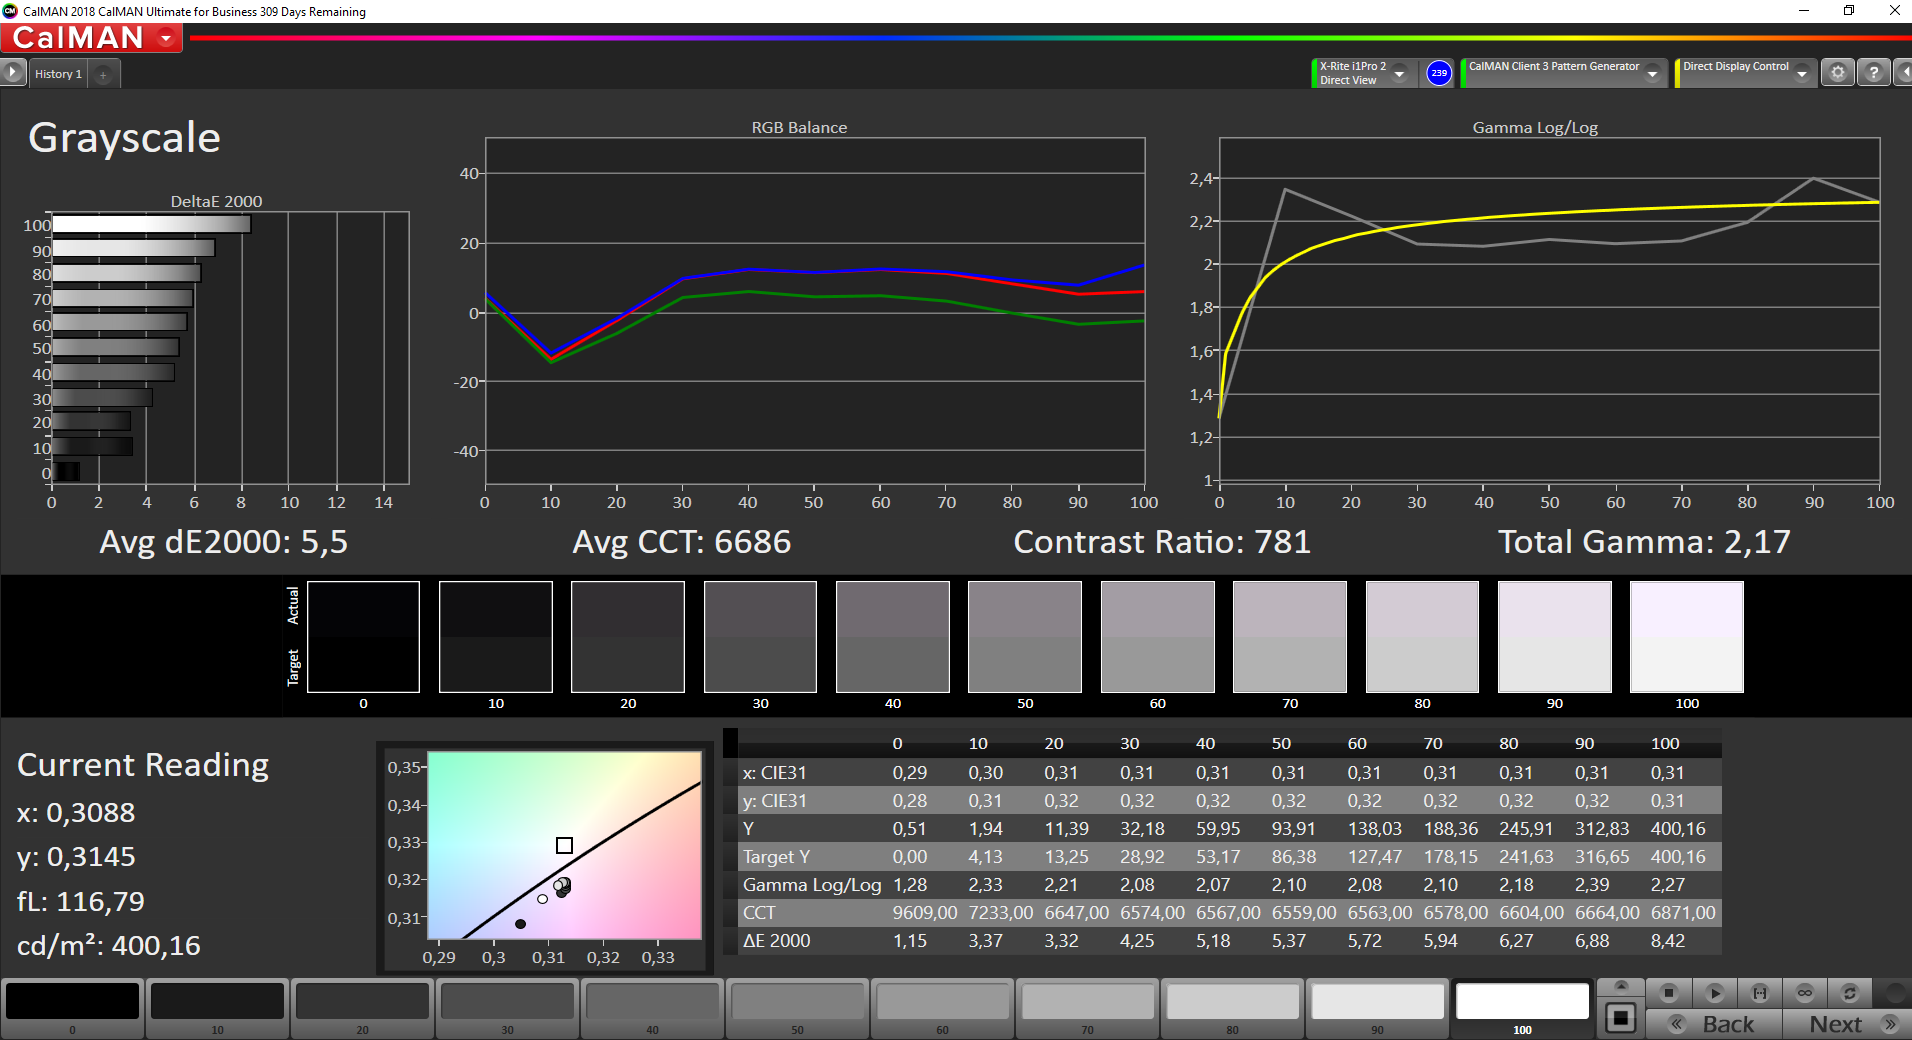
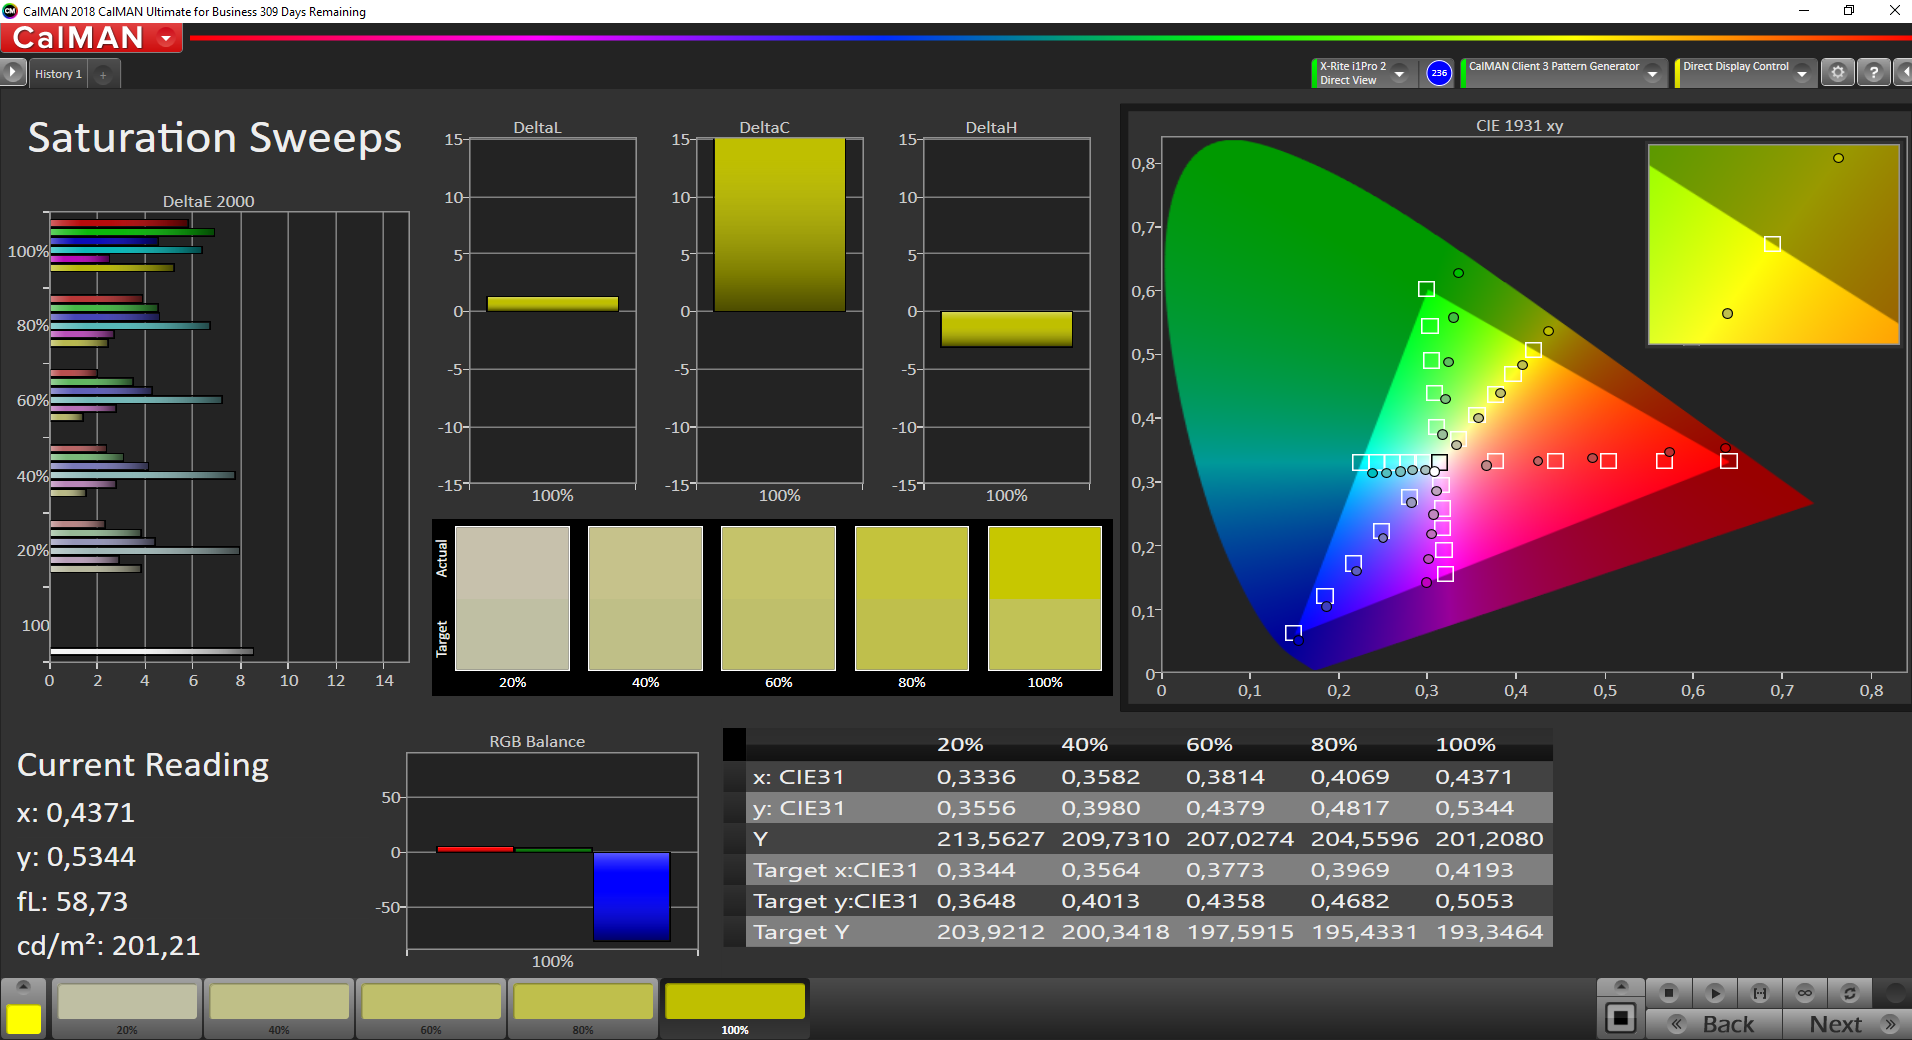
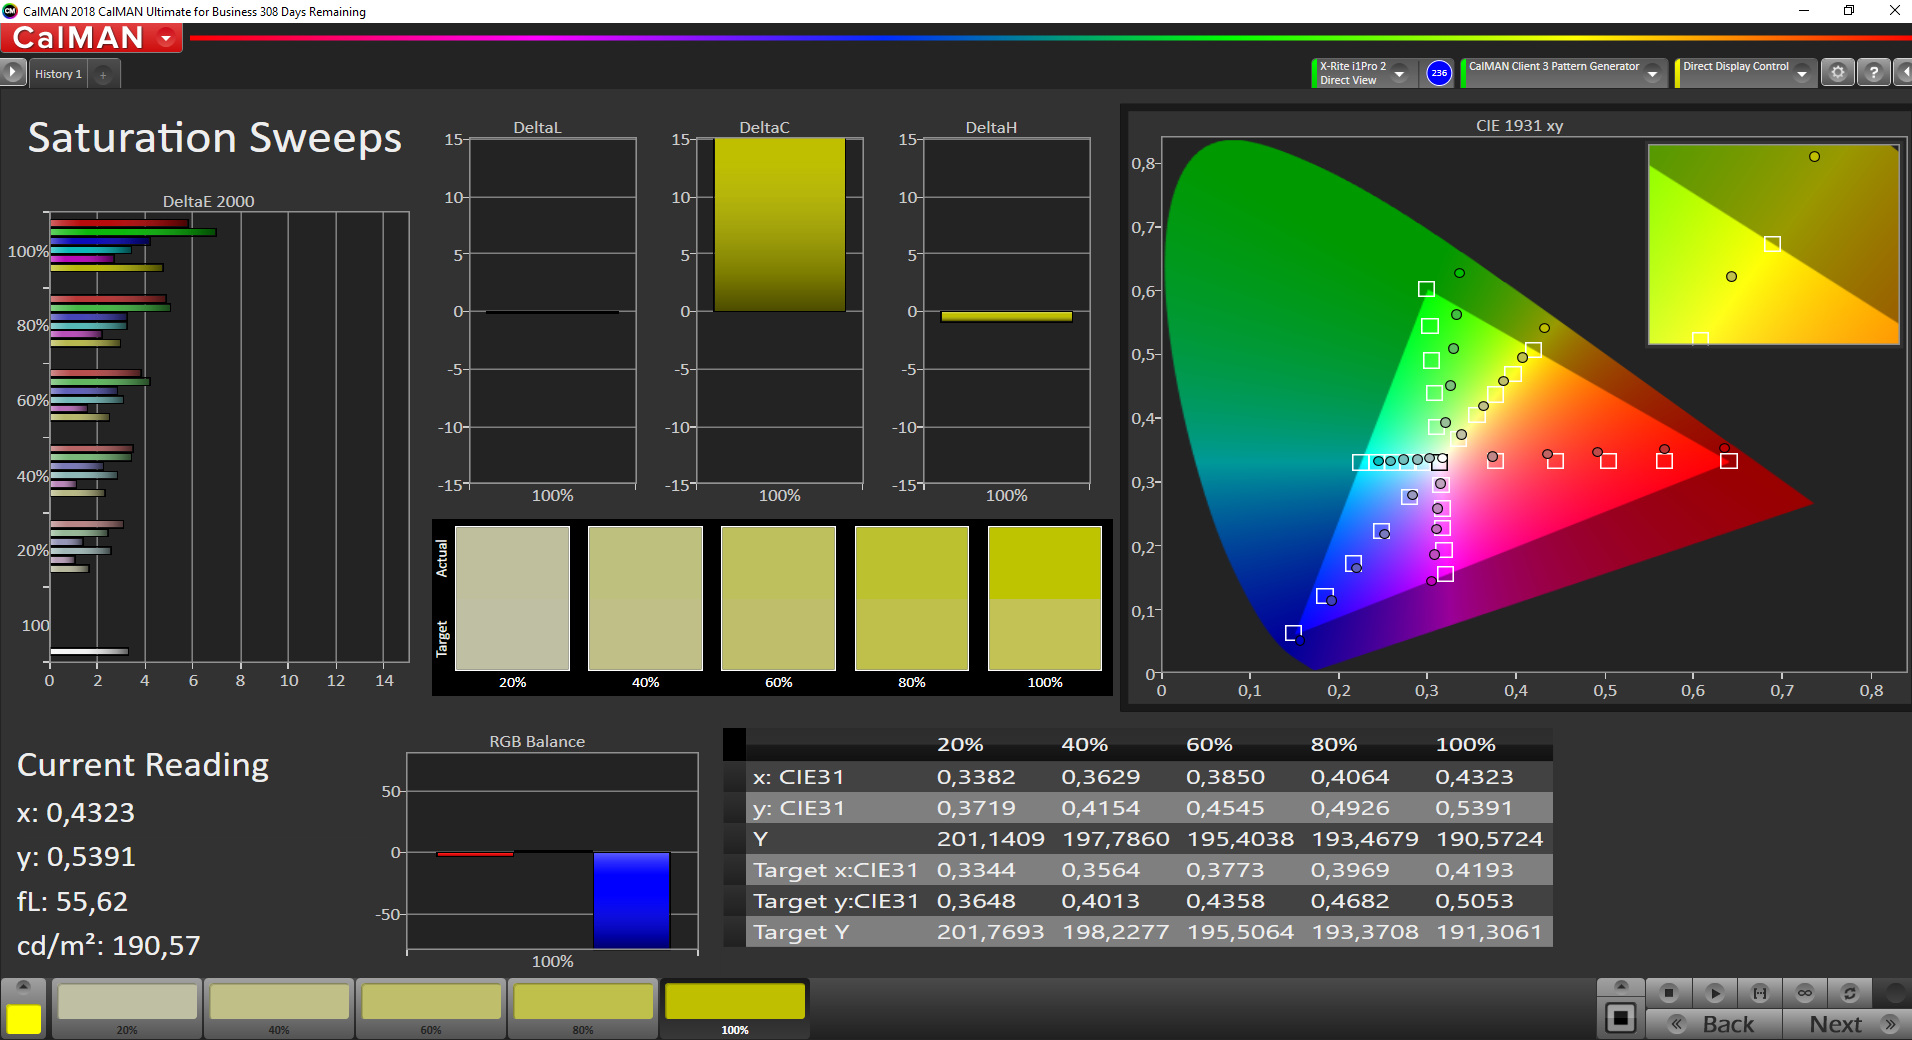
Colours look comparatively pale because of the screen’s low contrast ratio, but it did not look washed out in our view. We would have expected Fujitsu to have equipped the H980 with a higher quality display though, which should have also been pre-calibrated.
Our review unit had too high Delta E 2000 deviations upon delivery for a workstation, but we were able to improve these by calibrating the display noticeably. We have included our calibrated ICC profile in the box above our comparison table should you wish to apply it, but please only use it with a display matching the model number of the one in our device. Otherwise, our ICC profile may worsen colour accuracy rather than improve it.
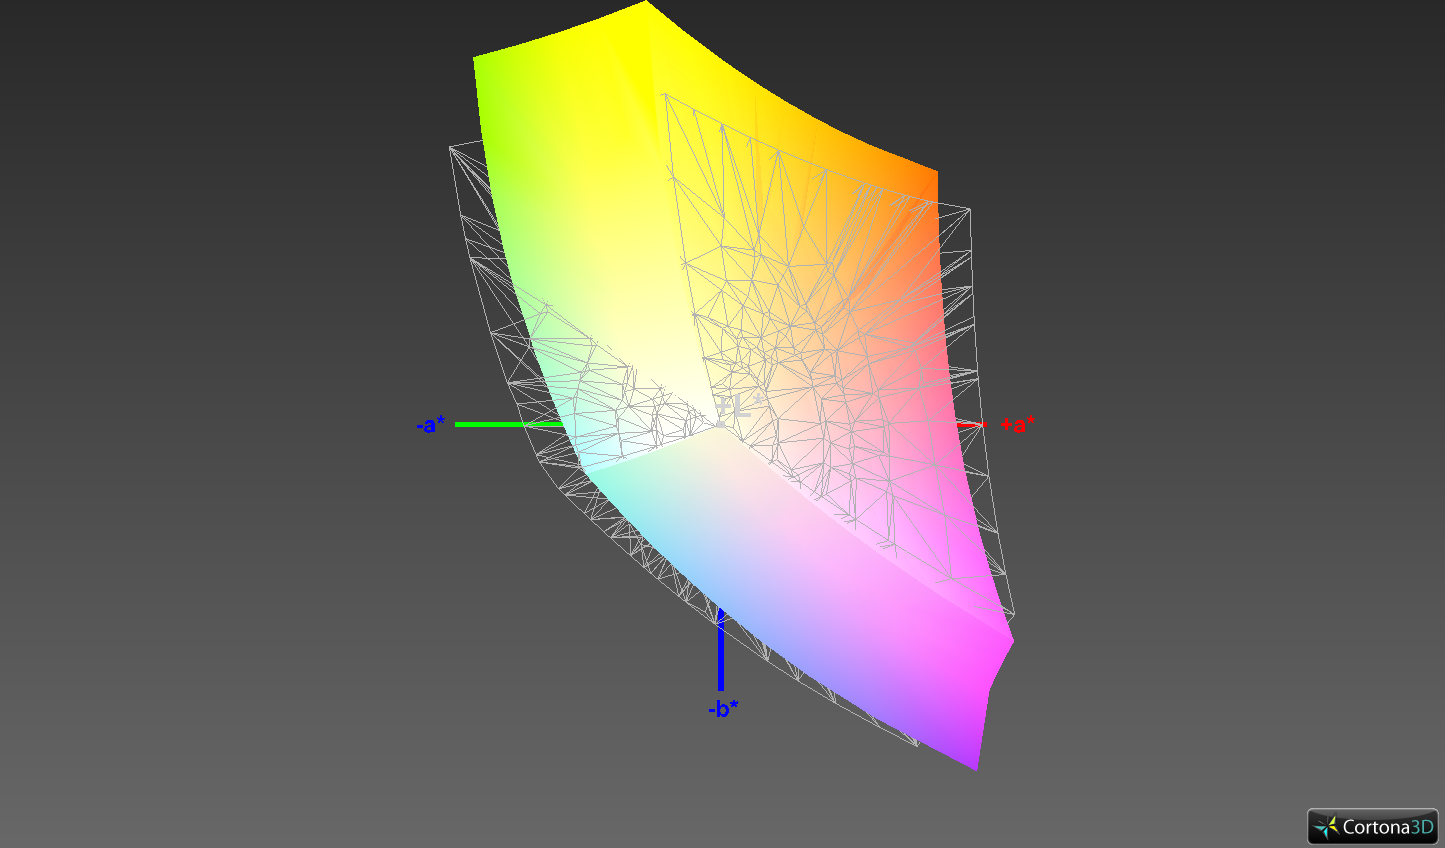
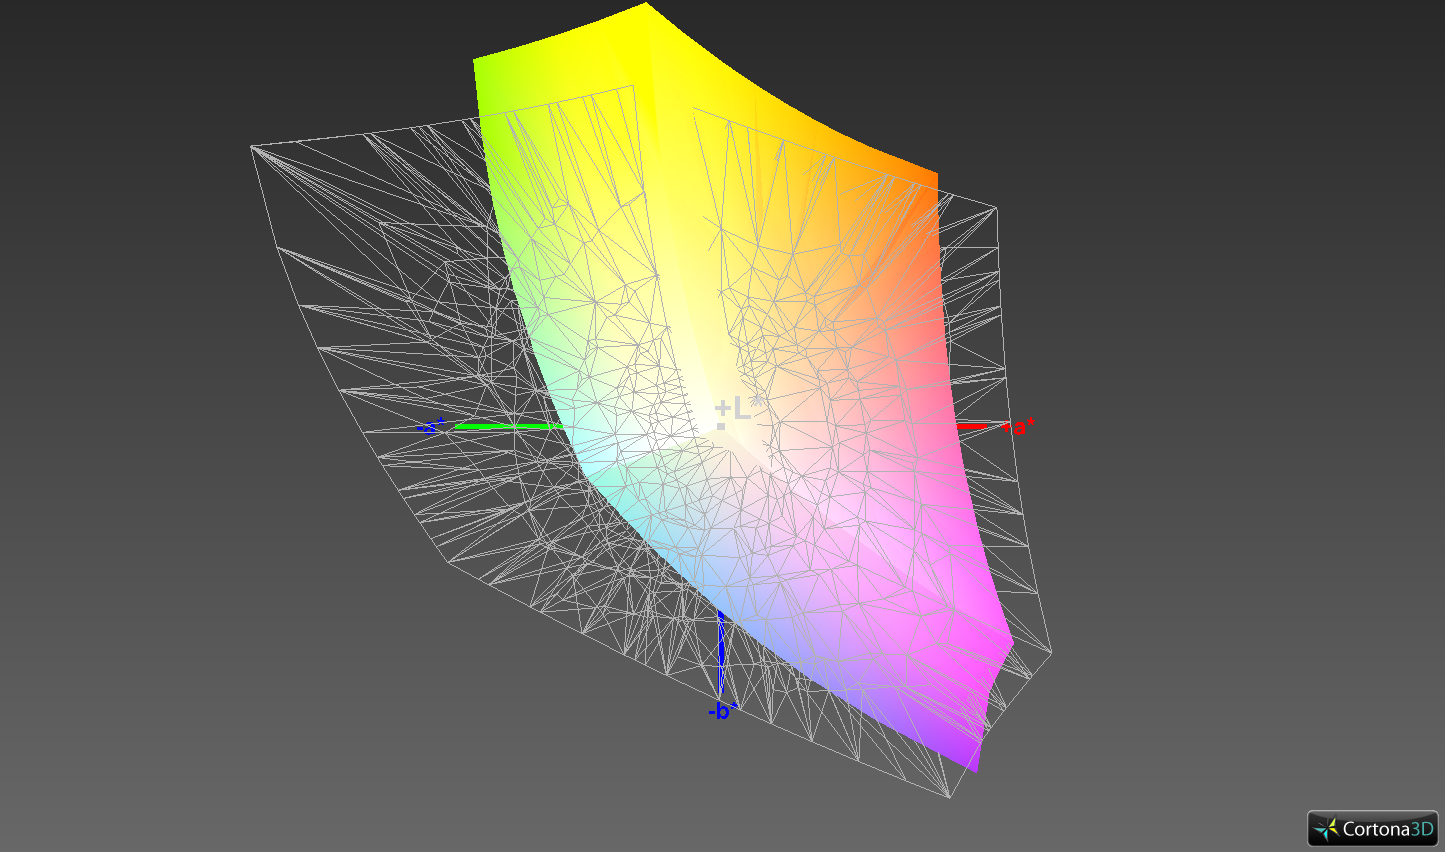
The H980 also has poor colour space coverage for a workstation, with just 84.9% sRGB and 55.8% AdobeRGB coverage. We also criticised the H970 for the same shortcomings that make both devices unsuitable for professional image or video editing unless you use an external monitor.
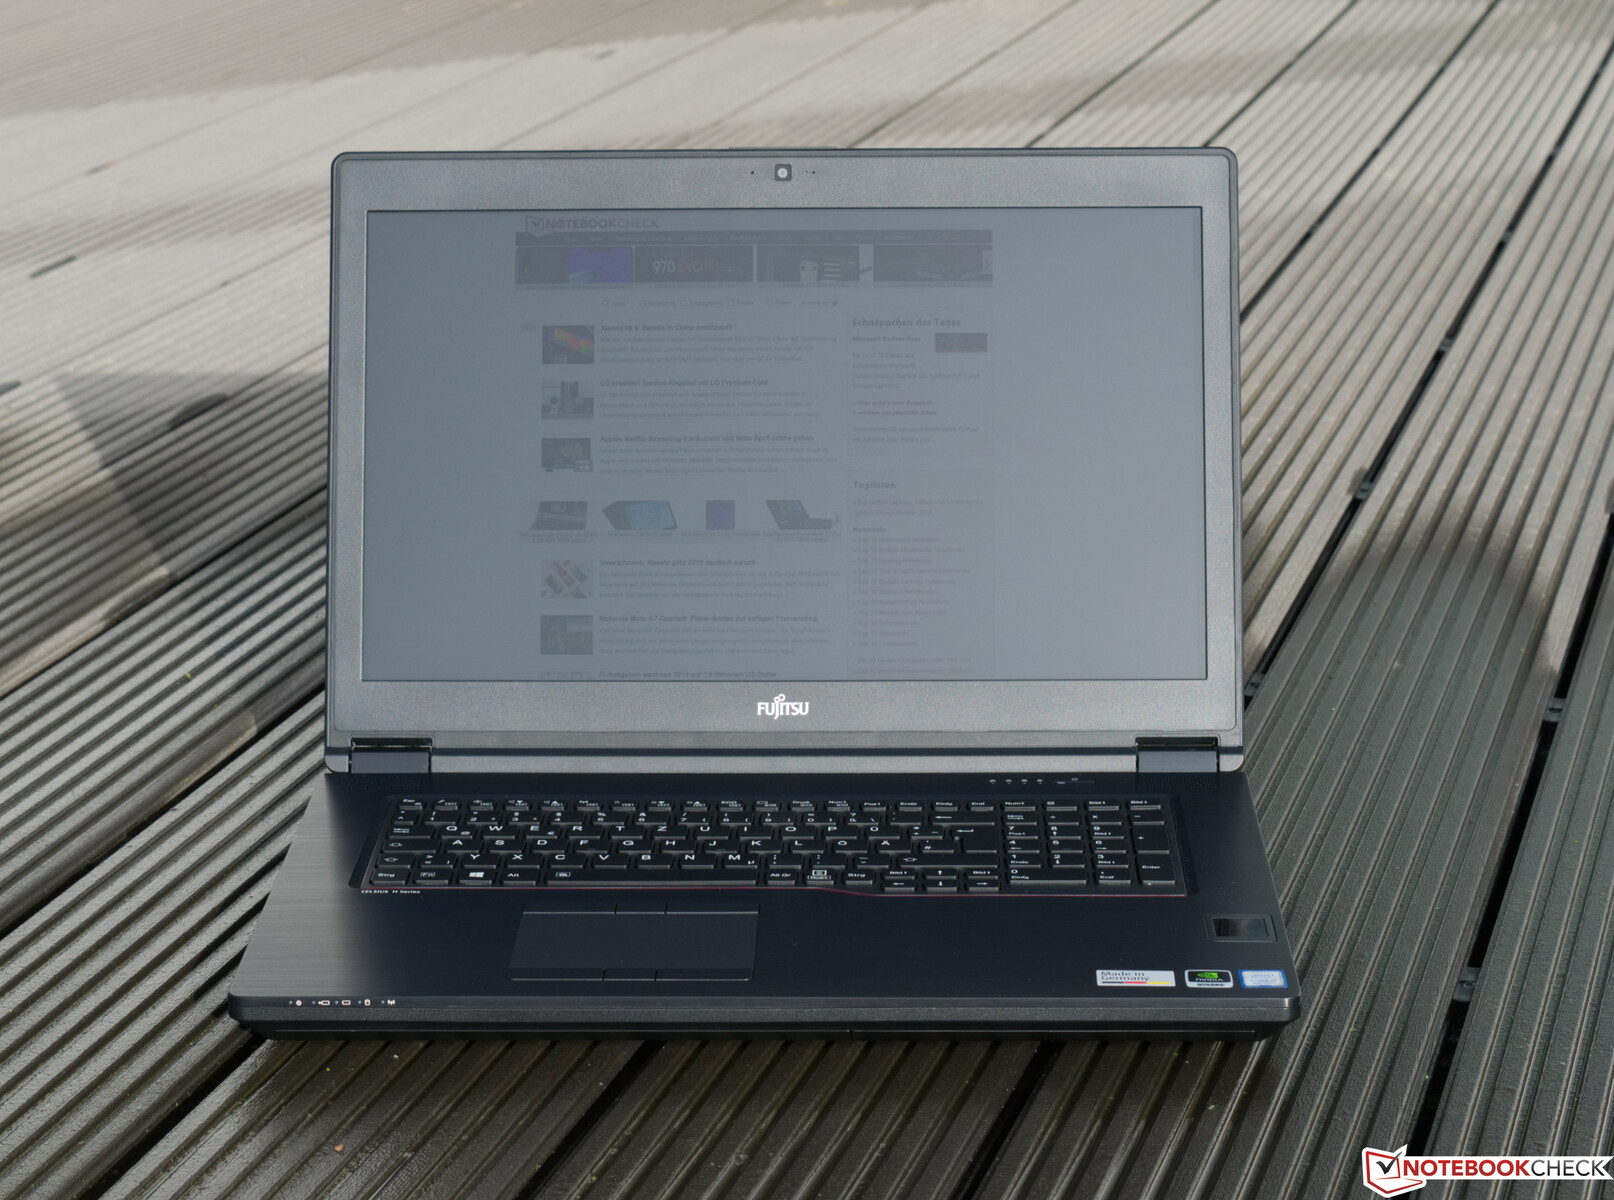
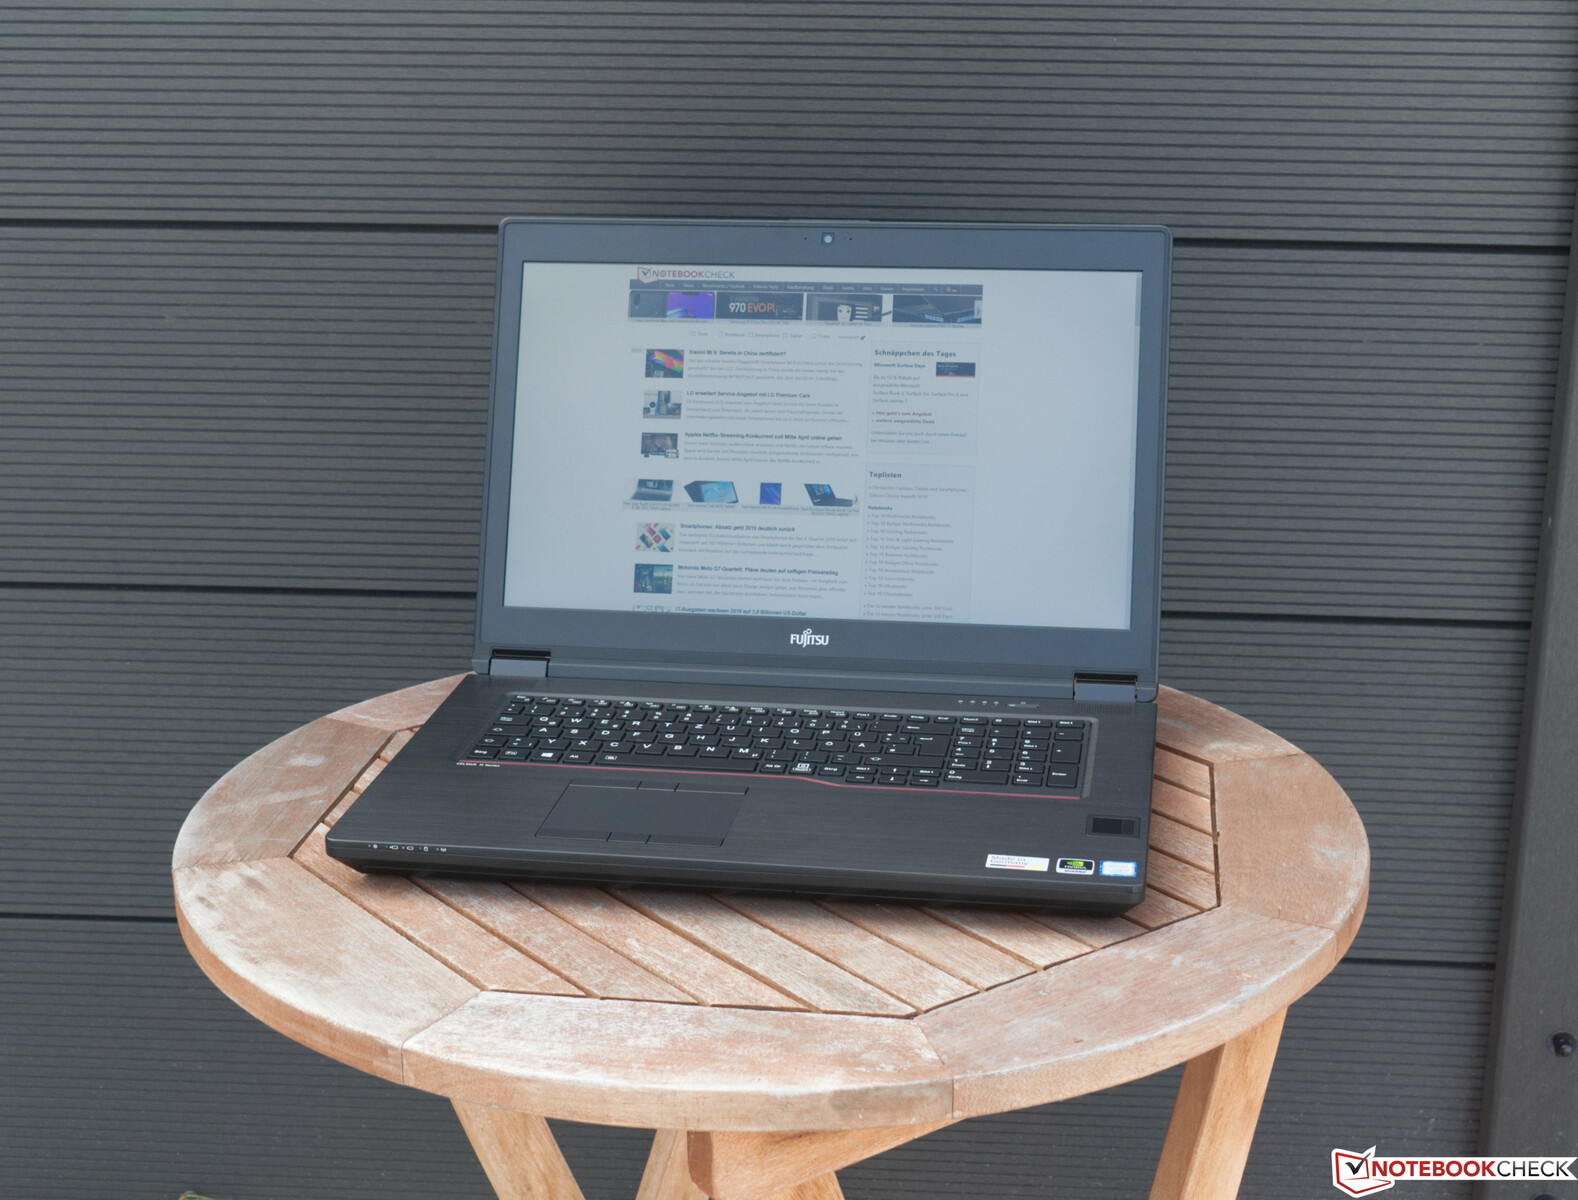
The H980 is easy to use outdoors thanks to its bright matte display. We found that the screen remained readable in sunlight, but you may struggle in the summer under direct sunlight, so we would recommend finding a shady spot where possible.
Display Response Times
| ↔ Response Time Black to White | ||
|---|---|---|
| 23.2 ms ... rise ↗ and fall ↘ combined | ↗ 10 ms rise | 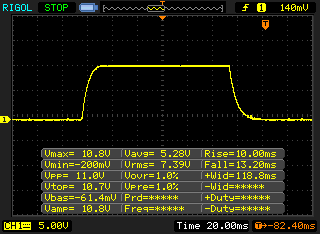 |
| ↘ 13.2 ms fall | ||
| The screen shows good response rates in our tests, but may be too slow for competitive gamers. In comparison, all tested devices range from 0.1 (minimum) to 240 (maximum) ms. » 53 % of all devices are better. This means that the measured response time is worse than the average of all tested devices (19.8 ms). | ||
| ↔ Response Time 50% Grey to 80% Grey | ||
| 38 ms ... rise ↗ and fall ↘ combined | ↗ 19.2 ms rise | 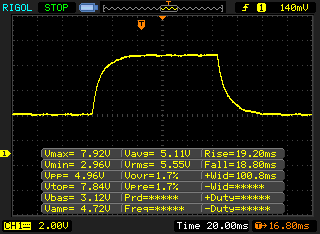 |
| ↘ 18.8 ms fall | ||
| The screen shows slow response rates in our tests and will be unsatisfactory for gamers. In comparison, all tested devices range from 0.165 (minimum) to 636 (maximum) ms. » 55 % of all devices are better. This means that the measured response time is worse than the average of all tested devices (30.9 ms). | ||
Screen Flickering / PWM (Pulse-Width Modulation)
| Screen flickering / PWM detected | 120500 Hz | ≤ 99 % brightness setting | 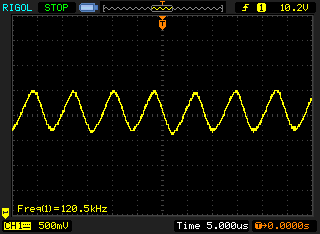 |
The display backlight flickers at 120500 Hz (worst case, e.g., utilizing PWM) Flickering detected at a brightness setting of 99 % and below. There should be no flickering or PWM above this brightness setting. The frequency of 120500 Hz is quite high, so most users sensitive to PWM should not notice any flickering. In comparison: 52 % of all tested devices do not use PWM to dim the display. If PWM was detected, an average of 7748 (minimum: 5 - maximum: 343500) Hz was measured. | |||
Our test device has good viewing angles too. Our test image remains readable from practically every angle, although the top left- and right-hand images show that the contrast levels drop off at certain angles. Overall, you should have no issues with being able to read the H980’s display in daily use.
Performance
The H980 has three CPU and GPU options, as mentioned at the start of this review. The Xeon E-2186M is a true workstation processor, but the Core i7-8750H and Core i7-8850H should still comfortably handle professional applications. Equally, Fujitsu only equips the H980 with workstation GPUs, which can be complemented with up to 64 GB of RAM and a 1 TB SSD. Our test device’s configuration should be powerful enough for most tasks though, while its RAM and storage are upgradable, which we have covered in greater detail in our Maintenance section.


Processor
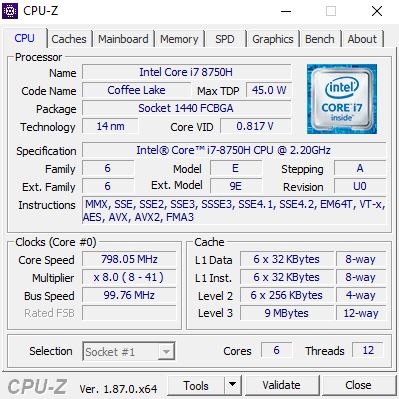
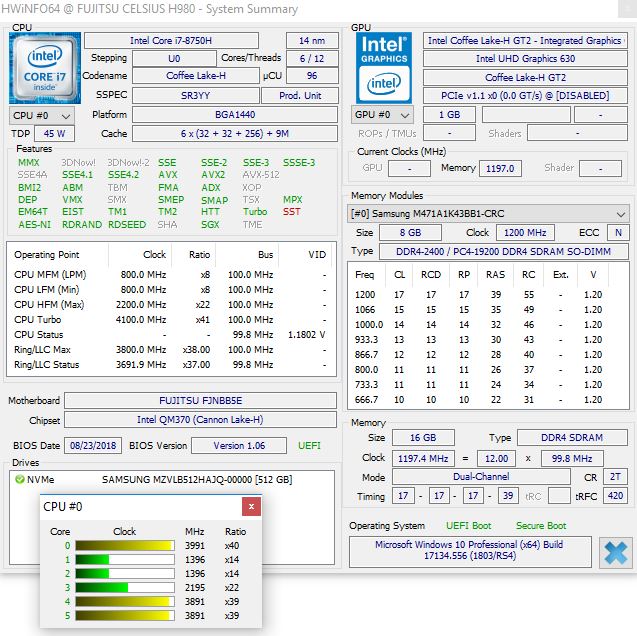
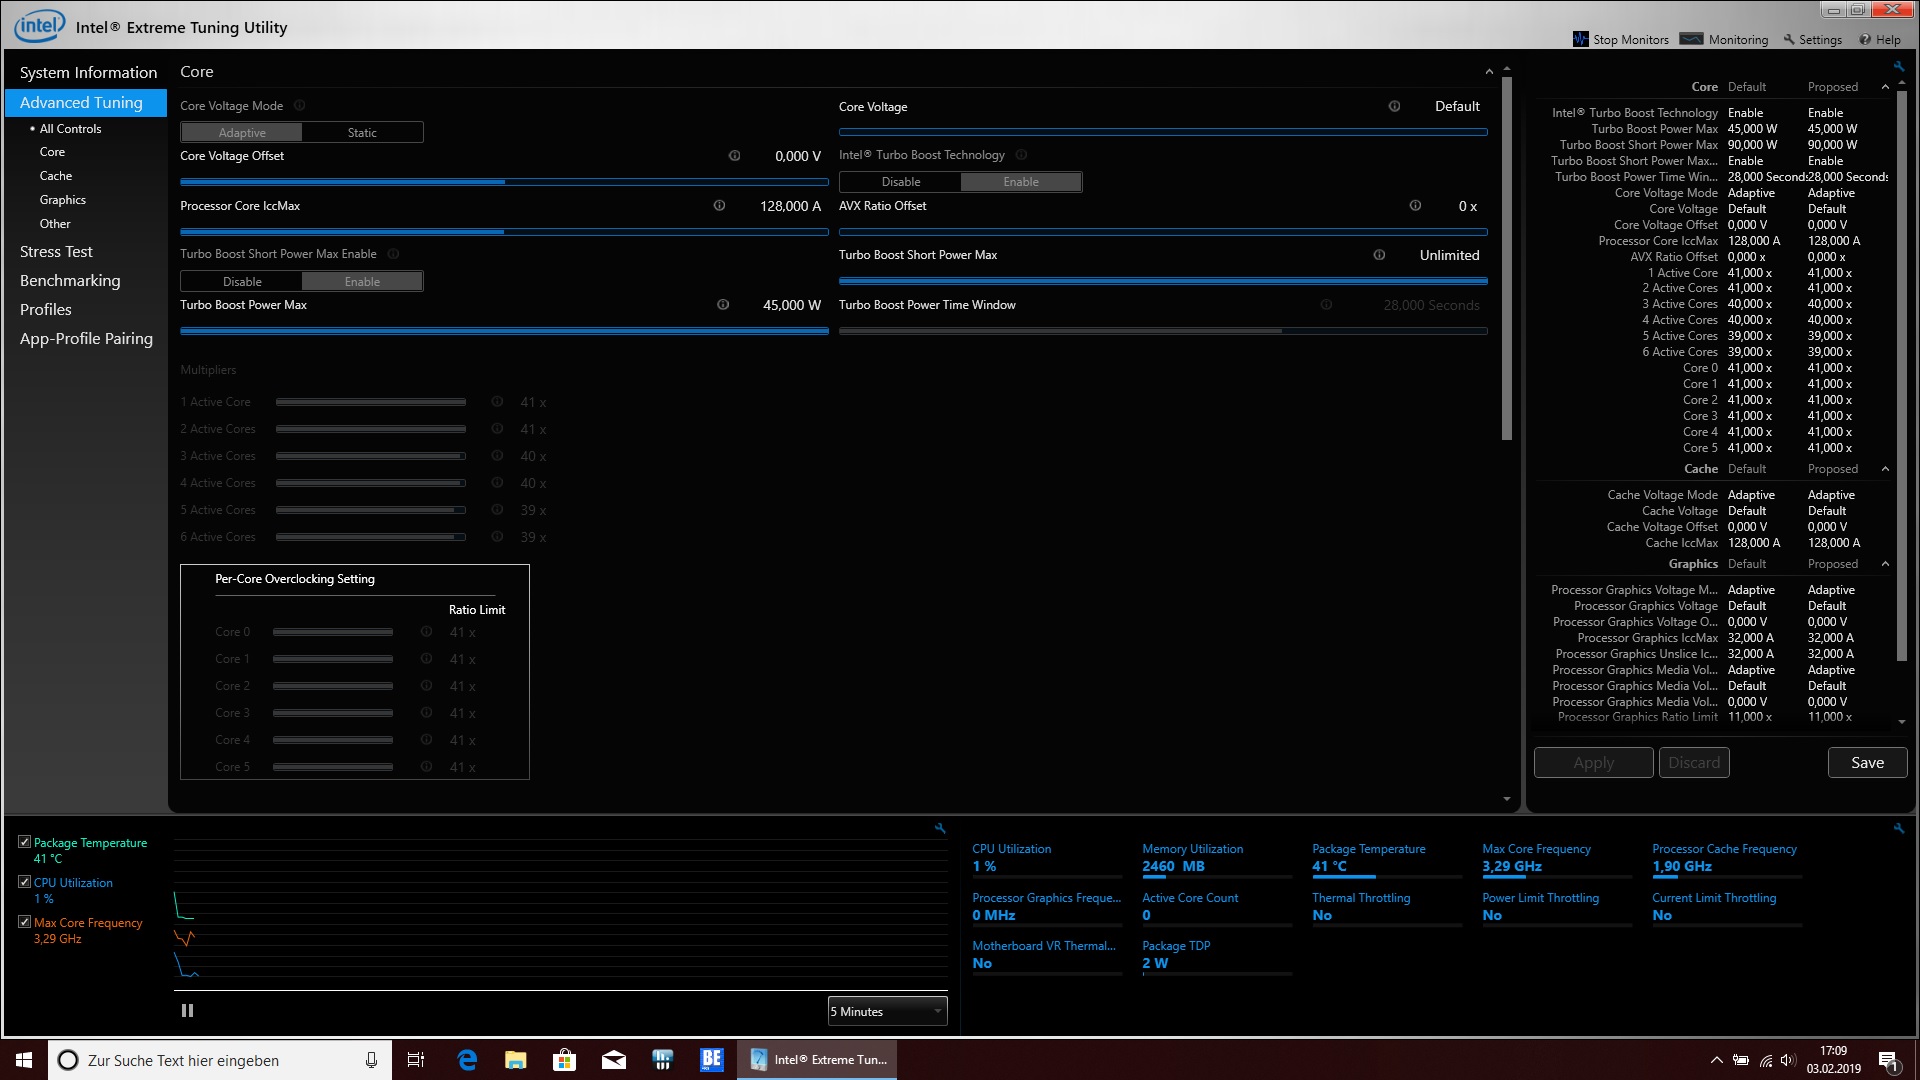
The Core i7-8750H is a hexa-core processor that has a 2.2 GHz base clock, which it can increase up to 4.1 GHz across two cores and 3.9 GHz across all cores thanks to Intel Turbo Boost technology. The CPU has a 45-W thermal design power (TDP) that the system can increase to 90 W for up to 28 seconds to achieve peak boost clock speeds. The Core i7-8750H also supports Intel Hyper-Threading, which allows the CPU to execute up to 12 threads simultaneously.
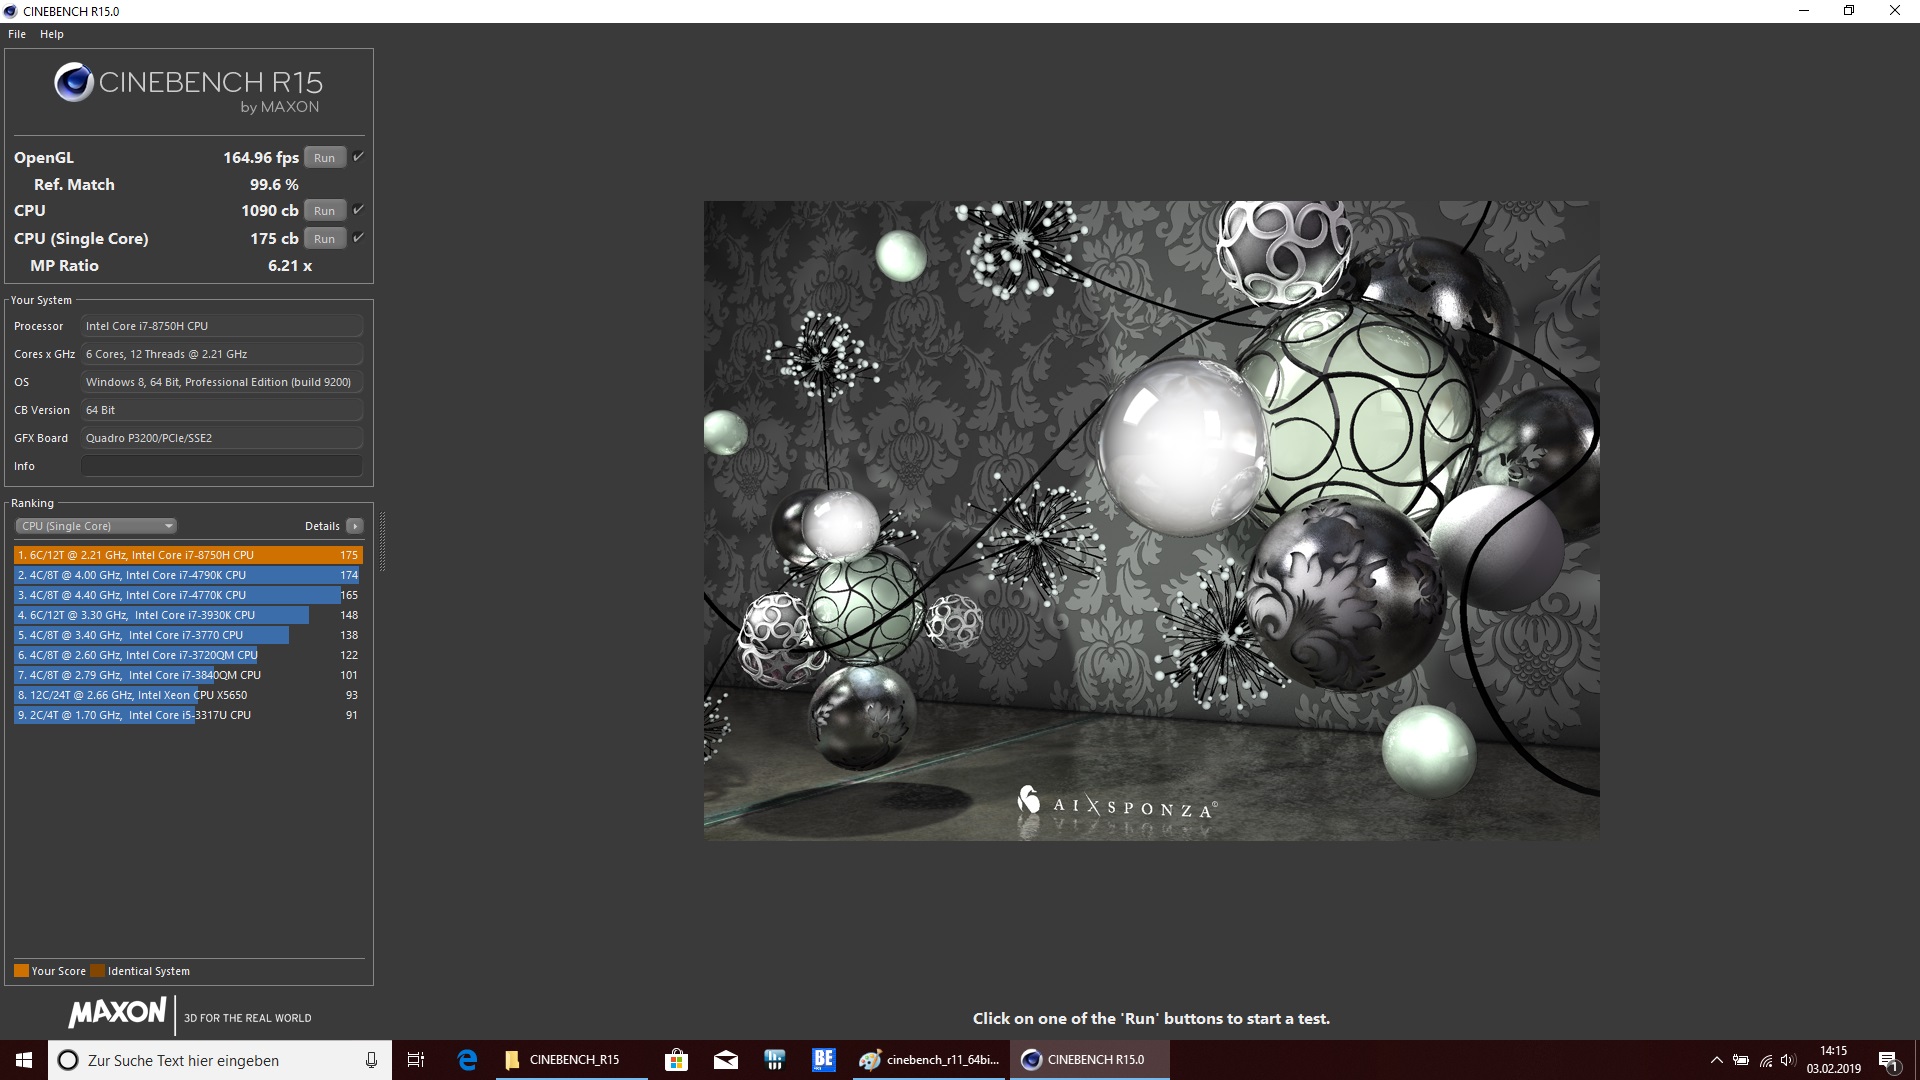
The CPU in our test device performed on par with what we have come to expect from the Core i7-8750H. The H980 scored 1,090 points in the Cinebench R15 Multi 64Bit benchmark, which is 1% below average for its CPU, but is over 20% more than our Xeon E3-1535M v6 powered comparison devices and 33% more than the class average. The Core i7-8750H scores approximately 33% lower than the Core i9-9900K, while it is between 8% and 13% slower than the Core i7-8850H.
Our comparison table is much tighter in the CB R15 Single 64Bit benchmark though, with there being only a 7% gap between the Core i7-8850H and the Xeon E3-1535M v6. However, the Core i9-9900K opens an 18% lead over the Core i7-8750H, but the H980 and H970 only finished 2% apart.
We also subjected our review unit to a looped CB R15 Multi 64Bit benchmark to determine how it manages its CPU performance under sustained load. In short, we were pleasantly surprised, particularly compared to the erratic performance of the H970. The H980 initially scored 1,058 points, which dropped to a minimum of 1,026 points by around the 20th benchmark pass through. Our test device then averaged around 1,034 points for the remainder of the loop. Overall, the CB R15 scores fluctuated by just over 1% after the first benchmark run through, which does not represent thermal throttling. The slight reduction in scores that the H980 initially scored correspond to the system only being able to utilise the CPU’s 90-W peak TDP for 28 seconds.
Please see our CPU benchmarks page for more information on the Core i7-8750H and other CPUs.
| Cinebench R15 | |
| CPU Single 64Bit | |
| Average of class Workstation (191.4 - 328, n=23, last 2 years) | |
| Eurocom Tornado F7W | |
| Lenovo ThinkPad P72-20MB000EGE | |
| HP ZBook 17 G5-2ZC48EA | |
| Dell Precision 7720 | |
| Fujitsu Celsius H980 | |
| Average Intel Core i7-8750H (163 - 177, n=86) | |
| Fujitsu Celsius H970 | |
| CPU Multi 64Bit | |
| Average of class Workstation (2489 - 5810, n=23, last 2 years) | |
| Eurocom Tornado F7W | |
| Lenovo ThinkPad P72-20MB000EGE | |
| Lenovo ThinkPad P72-20MB000EGE | |
| HP ZBook 17 G5-2ZC48EA | |
| Average Intel Core i7-8750H (863 - 1251, n=93) | |
| Fujitsu Celsius H980 | |
| Dell Precision 7720 | |
| Fujitsu Celsius H970 | |
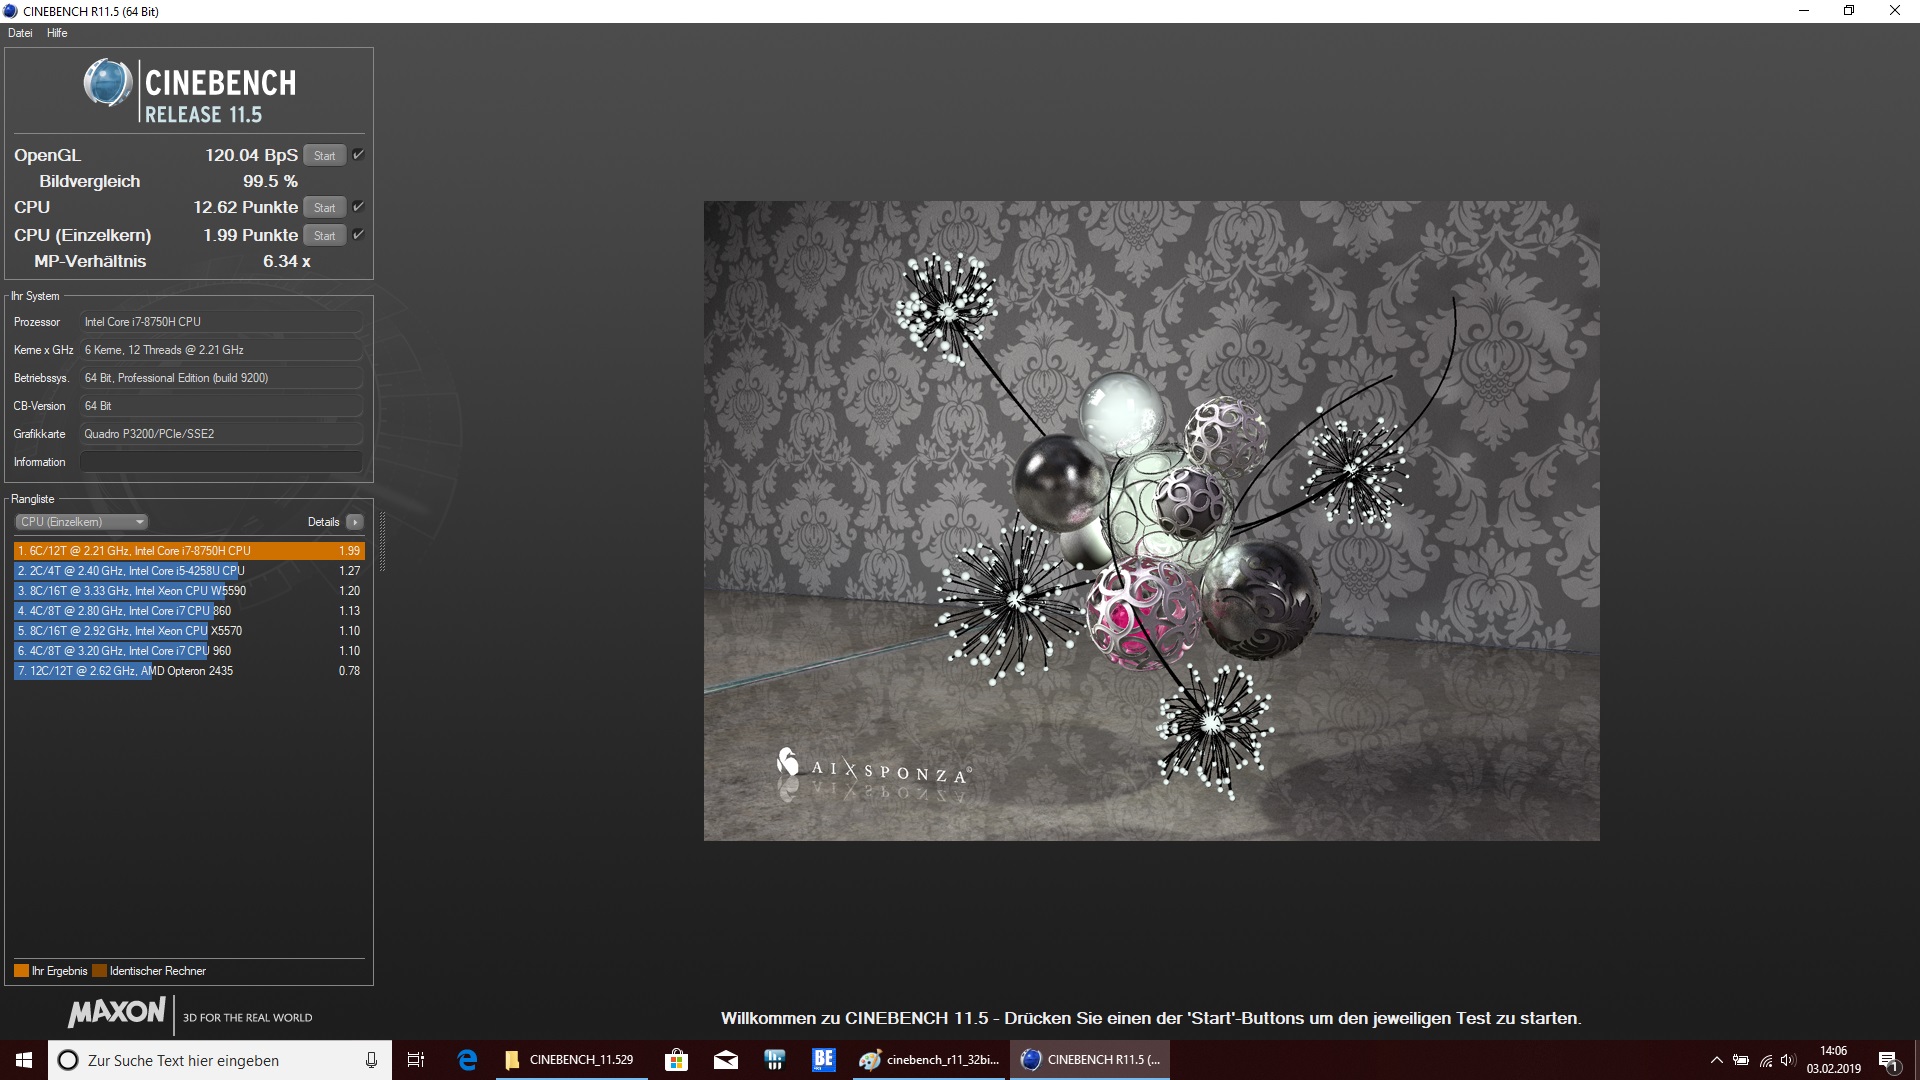
| Cinebench R11.5 | |
| CPU Single 64Bit | |
| Average of class Workstation (n=1last 2 years) | |
| Eurocom Tornado F7W | |
| Fujitsu Celsius H980 | |
| Average Intel Core i7-8750H (1.89 - 2, n=40) | |
| Fujitsu Celsius H970 | |
| CPU Multi 64Bit | |
| Average of class Workstation (n=1last 2 years) | |
| Eurocom Tornado F7W | |
| Lenovo ThinkPad P72-20MB000EGE | |
| Fujitsu Celsius H980 | |
| Average Intel Core i7-8750H (9.54 - 13.5, n=41) | |
| Fujitsu Celsius H970 | |
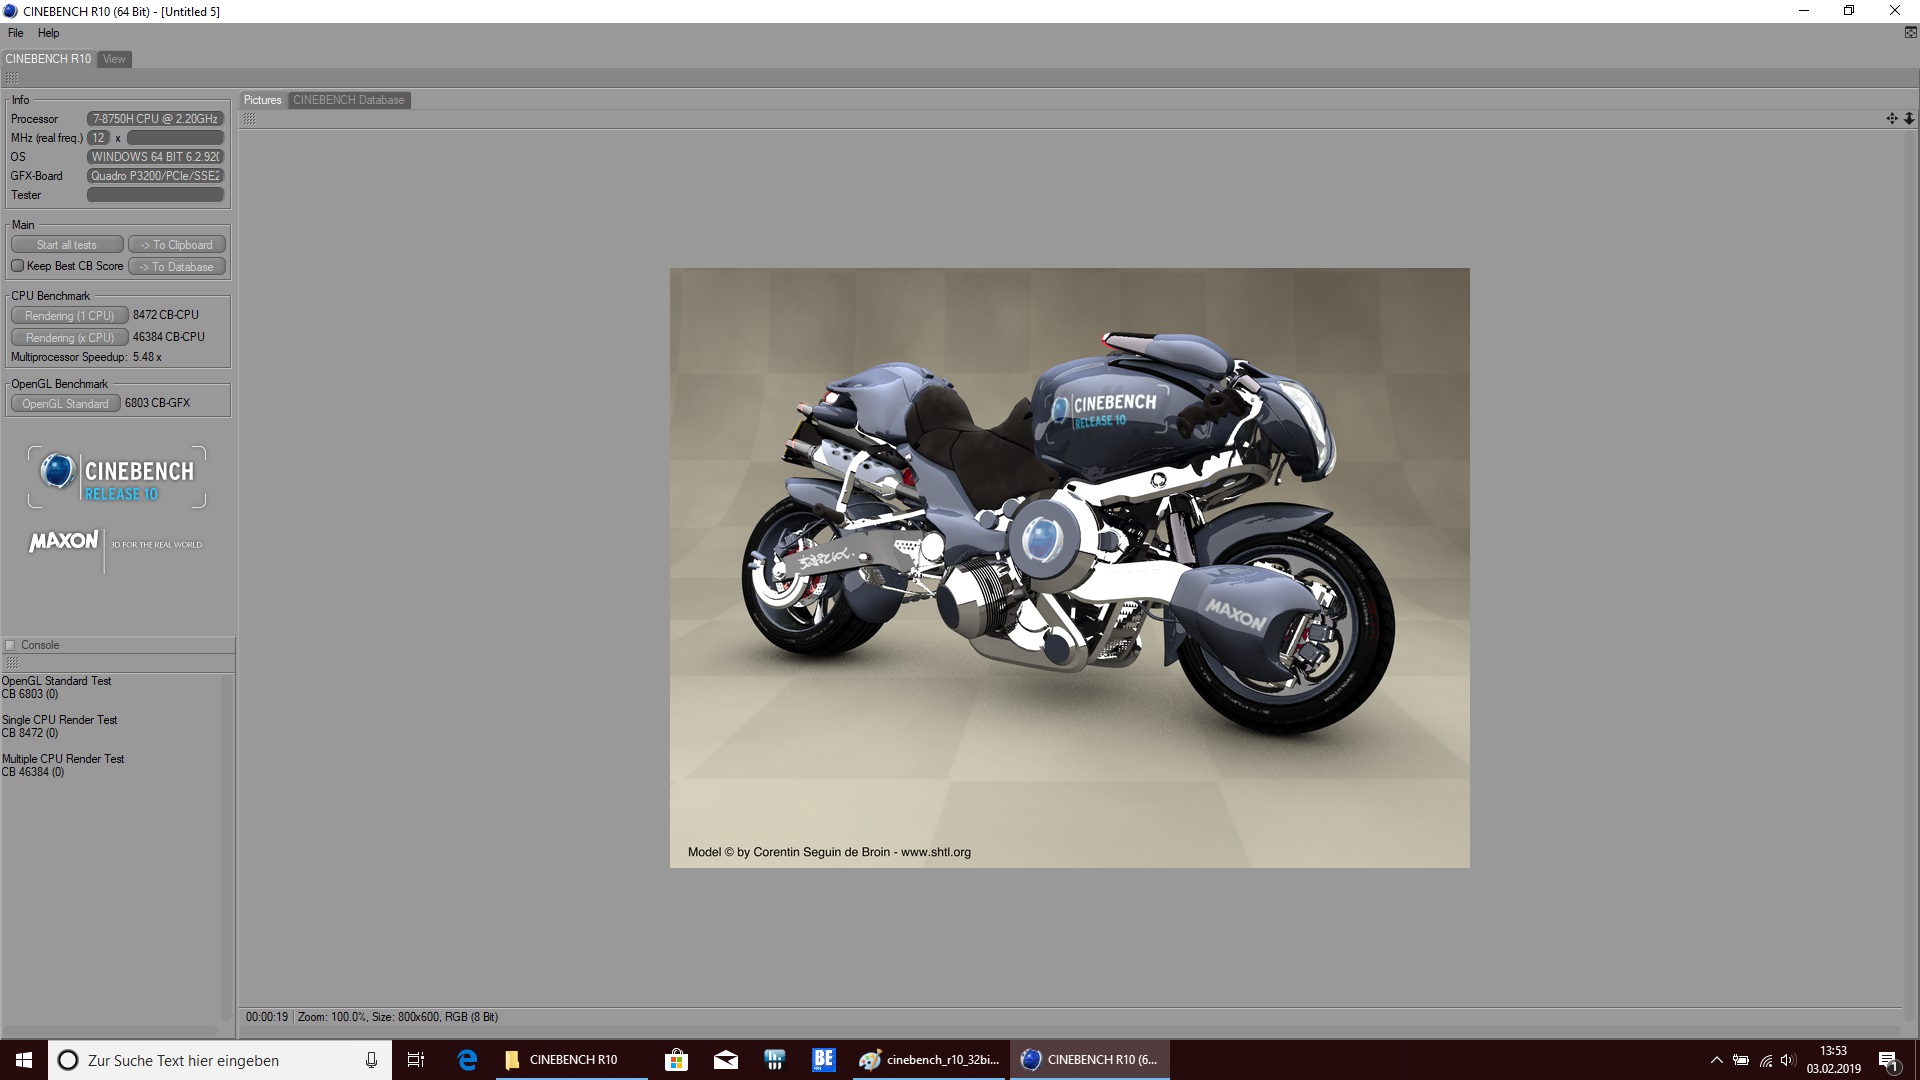
| Cinebench R10 | |
| Rendering Single CPUs 64Bit | |
| Average of class Workstation (n=1last 2 years) | |
| Average Intel Core i7-8750H (8472 - 8665, n=5) | |
| Fujitsu Celsius H980 | |
| Fujitsu Celsius H970 | |
| Rendering Multiple CPUs 64Bit | |
| Average of class Workstation (n=1last 2 years) | |
| Fujitsu Celsius H980 | |
| Average Intel Core i7-8750H (33944 - 46384, n=5) | |
| Fujitsu Celsius H970 | |
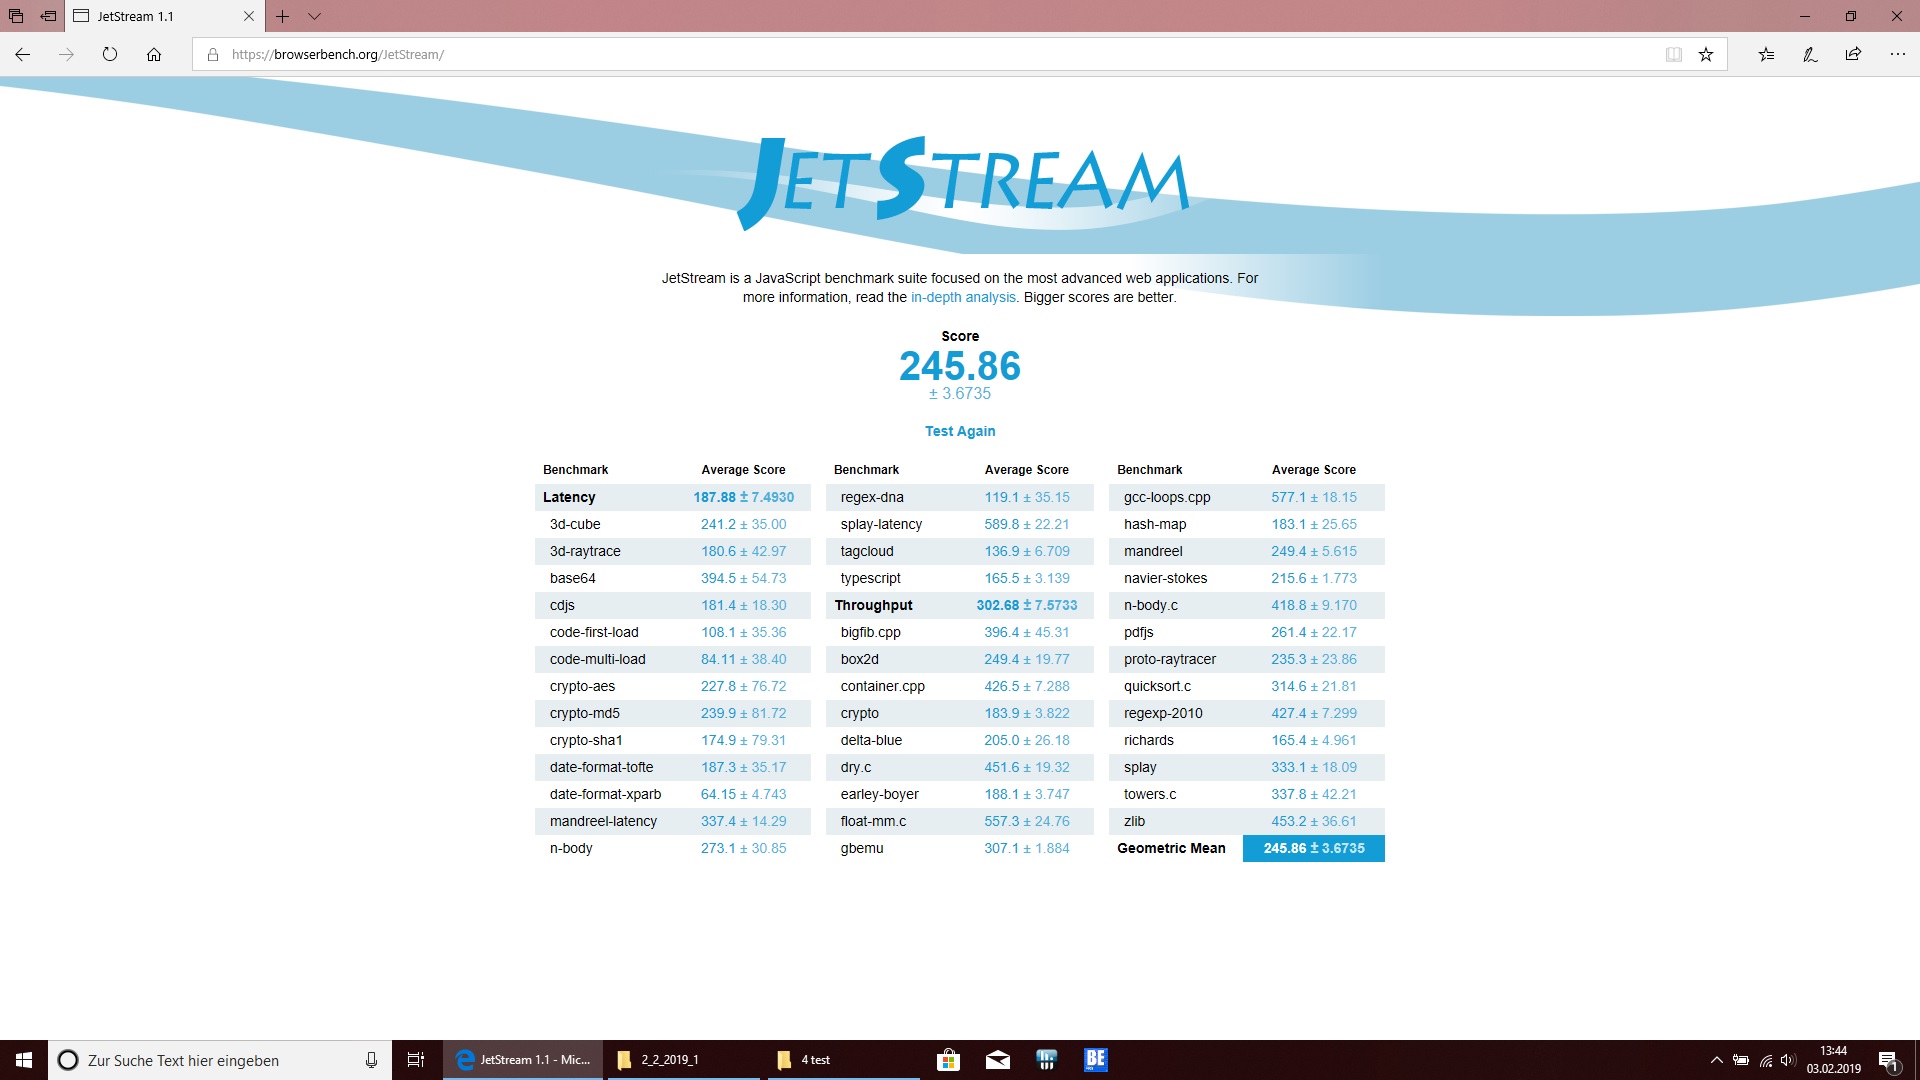
| JetStream 1.1 - 1.1 Total | |
| Eurocom Tornado F7W | |
| Dell Precision 7720 | |
| Fujitsu Celsius H970 | |
| HP ZBook 17 G5-2ZC48EA | |
| Lenovo ThinkPad P72-20MB000EGE | |
| Average Intel Core i7-8750H (205 - 299, n=49) | |
| Fujitsu Celsius H980 | |
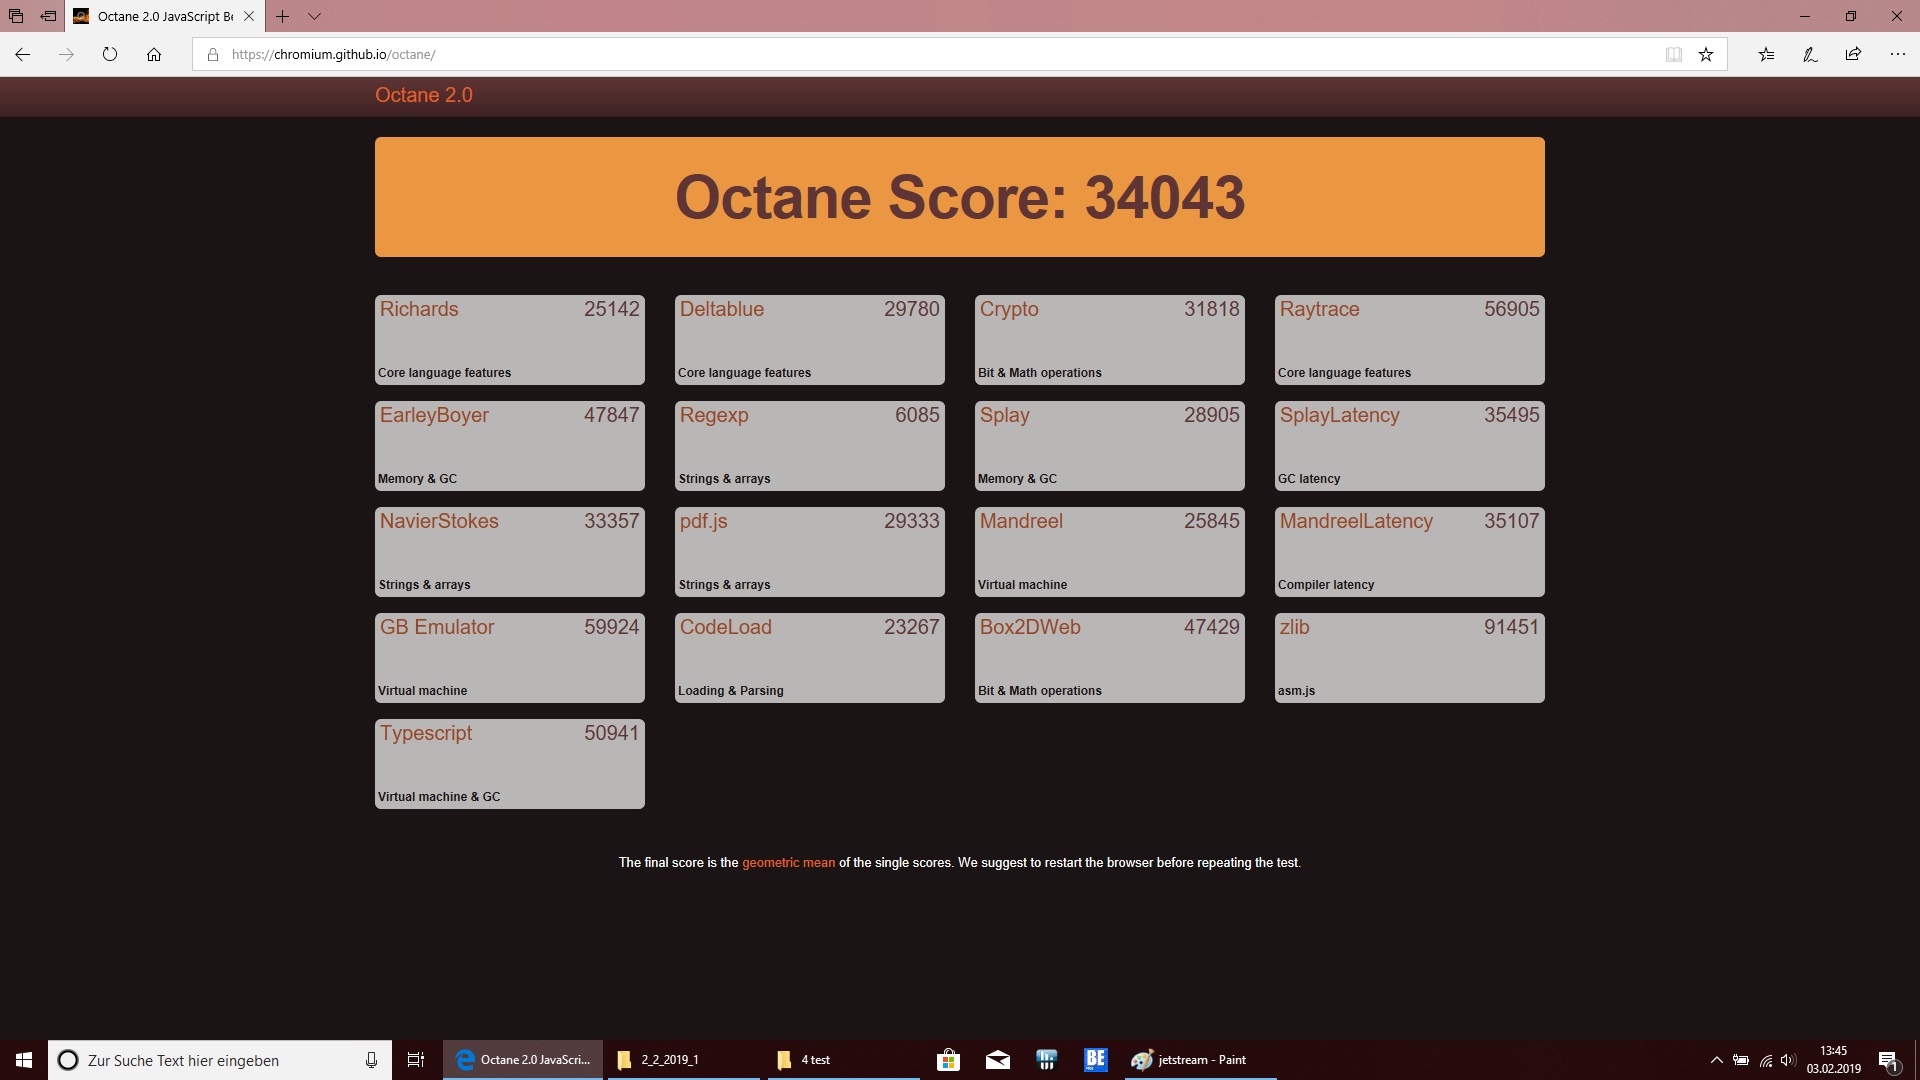
| Octane V2 - Total Score | |
| Average of class Workstation (112382 - 129420, n=3, last 2 years) | |
| Fujitsu Celsius H970 | |
| Dell Precision 7720 | |
| HP ZBook 17 G5-2ZC48EA | |
| Lenovo ThinkPad P72-20MB000EGE | |
| Average Intel Core i7-8750H (27460 - 44549, n=47) | |
| Fujitsu Celsius H980 | |
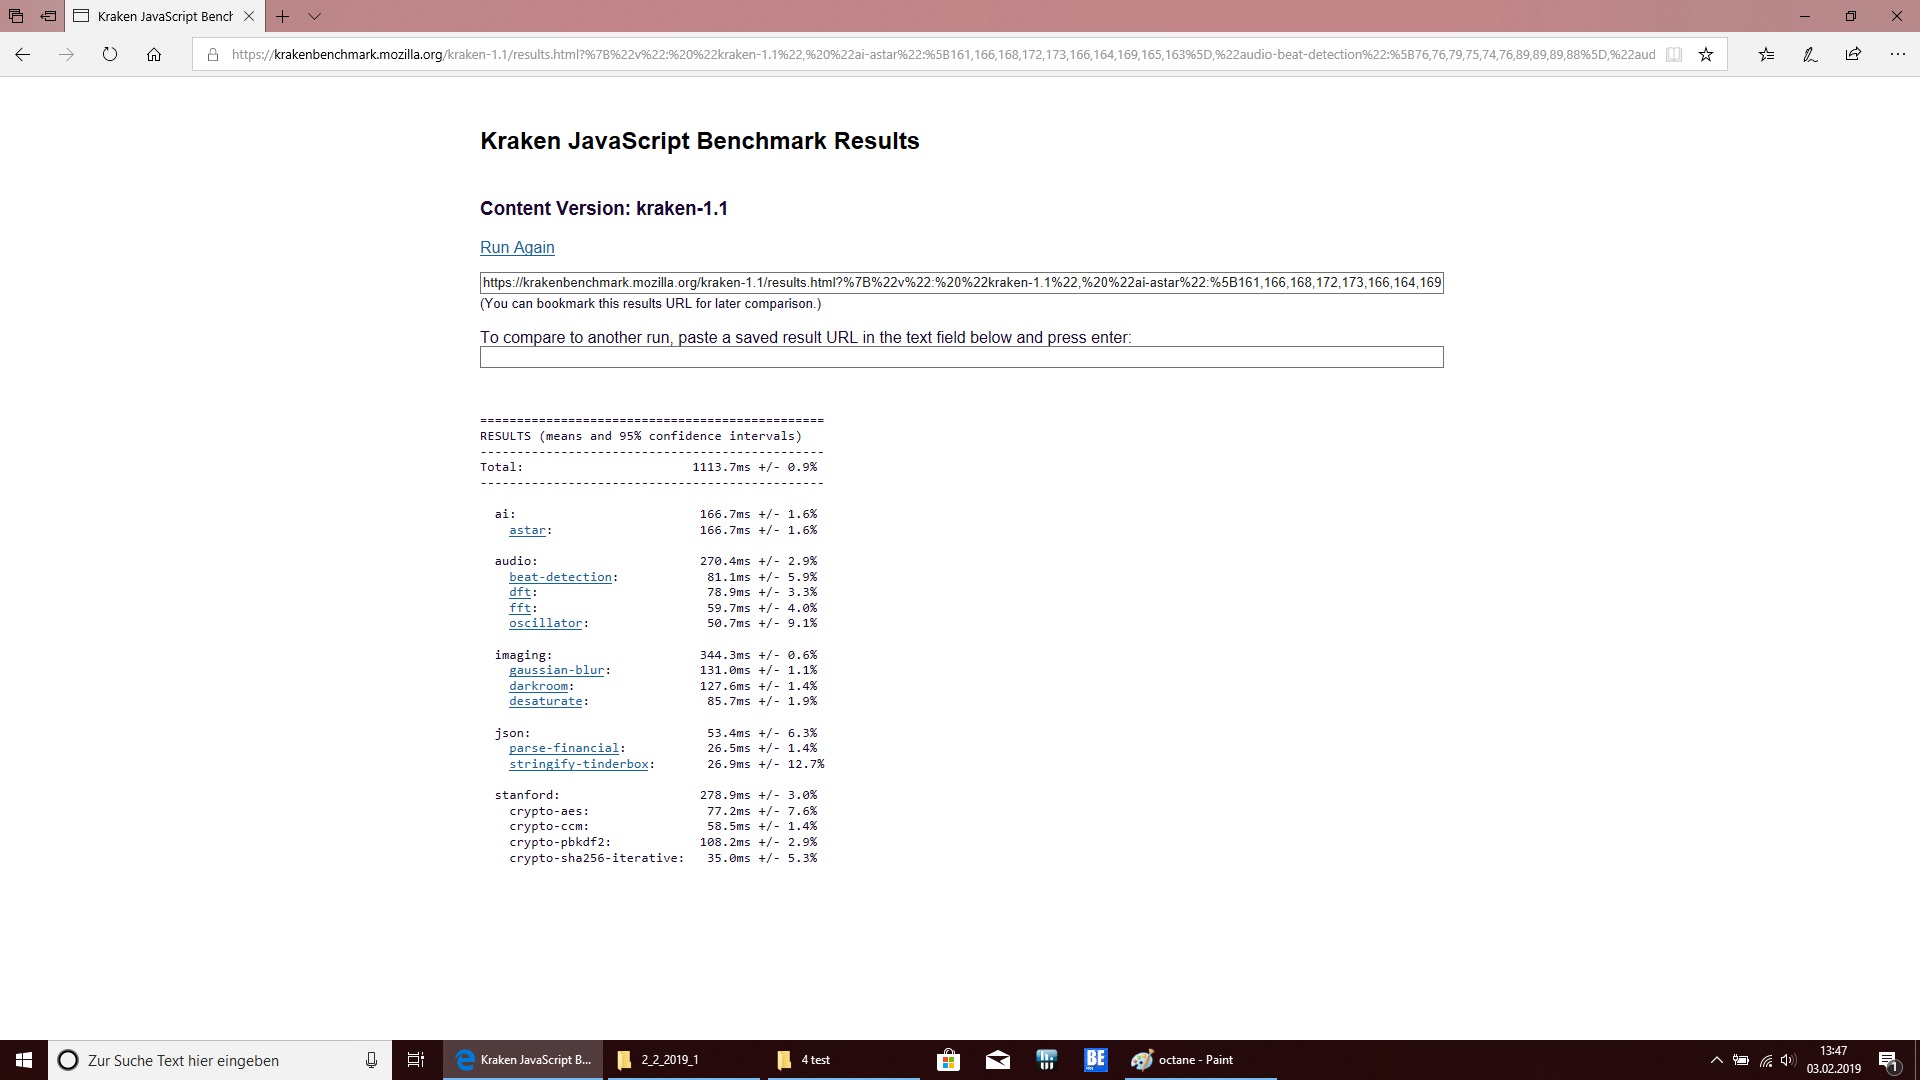
| Mozilla Kraken 1.1 - Total | |
| Lenovo ThinkPad P72-20MB000EGE | |
| Fujitsu Celsius H980 | |
| Average Intel Core i7-8750H (695 - 1272, n=50) | |
| HP ZBook 17 G5-2ZC48EA | |
| Fujitsu Celsius H970 | |
| Dell Precision 7720 | |
| Average of class Workstation (411 - 538, n=23, last 2 years) | |
| Blender - v2.79 BMW27 CPU | |
| Average Intel Core i7-8750H (396 - 486, n=6) | |
| Fujitsu Celsius H980 | |
| Eurocom Tornado F7W | |
| Average of class Workstation (91 - 222, n=23, last 2 years) | |
* ... smaller is better
System Performance
The H980 performed well in PCMark benchmarks too, and demonstrated that good system performance is more than just CPU power. Our review unit occasionally finished up to 7% behind its predecessor, but this is probably because of the latter’s more powerful GPU. Overall, the H980 performed on par with the average of Core i7-8750H and Quadro P3200 equipped devices that we have already tested. Moreover, the gap between our test device and our other comparison devices is generally small, although the Eurocom Tornado F7W flexes its muscles with its more powerful CPU and GPU.
We should also point out that we noticed no performance dips or any abnormalities during our tests. The system remained stable and felt fast throughout, which is also partially because of the NVMe SSD with which Fujitsu has equipped our review unit.
| PCMark 10 | |
| Score | |
| Average of class Workstation (6563 - 10409, n=19, last 2 years) | |
| Eurocom Tornado F7W | |
| Lenovo ThinkPad P72-20MB000EGE | |
| HP ZBook 17 G5-2ZC48EA | |
| Dell Precision 7720 | |
| Fujitsu Celsius H980 | |
| Average Intel Core i7-8750H, NVIDIA Quadro P3200 (n=1) | |
| Fujitsu Celsius H970 | |
| Essentials | |
| Average of class Workstation (9622 - 11157, n=19, last 2 years) | |
| Eurocom Tornado F7W | |
| Lenovo ThinkPad P72-20MB000EGE | |
| Fujitsu Celsius H970 | |
| Dell Precision 7720 | |
| Fujitsu Celsius H980 | |
| Average Intel Core i7-8750H, NVIDIA Quadro P3200 (n=1) | |
| Productivity | |
| Average of class Workstation (8789 - 20616, n=19, last 2 years) | |
| Eurocom Tornado F7W | |
| Fujitsu Celsius H970 | |
| Dell Precision 7720 | |
| Lenovo ThinkPad P72-20MB000EGE | |
| Fujitsu Celsius H980 | |
| Average Intel Core i7-8750H, NVIDIA Quadro P3200 (n=1) | |
| Digital Content Creation | |
| Average of class Workstation (8108 - 15631, n=19, last 2 years) | |
| Eurocom Tornado F7W | |
| Fujitsu Celsius H980 | |
| Average Intel Core i7-8750H, NVIDIA Quadro P3200 (n=1) | |
| Dell Precision 7720 | |
| Lenovo ThinkPad P72-20MB000EGE | |
| Fujitsu Celsius H970 | |
| PCMark 8 | |
| Home Score Accelerated v2 | |
| Eurocom Tornado F7W | |
| Lenovo ThinkPad P72-20MB000EGE | |
| Fujitsu Celsius H980 | |
| Average Intel Core i7-8750H, NVIDIA Quadro P3200 (n=1) | |
| HP ZBook 17 G5-2ZC48EA | |
| Dell Precision 7720 | |
| Work Score Accelerated v2 | |
| Lenovo ThinkPad P72-20MB000EGE | |
| Fujitsu Celsius H970 | |
| HP ZBook 17 G5-2ZC48EA | |
| Fujitsu Celsius H980 | |
| Average Intel Core i7-8750H, NVIDIA Quadro P3200 (n=1) | |
| Dell Precision 7720 | |
| PCMark 8 Home Score Accelerated v2 | 4376 points | |
| PCMark 8 Work Score Accelerated v2 | 5132 points | |
| PCMark 10 Score | 5206 points | |
Help | ||
Storage Devices
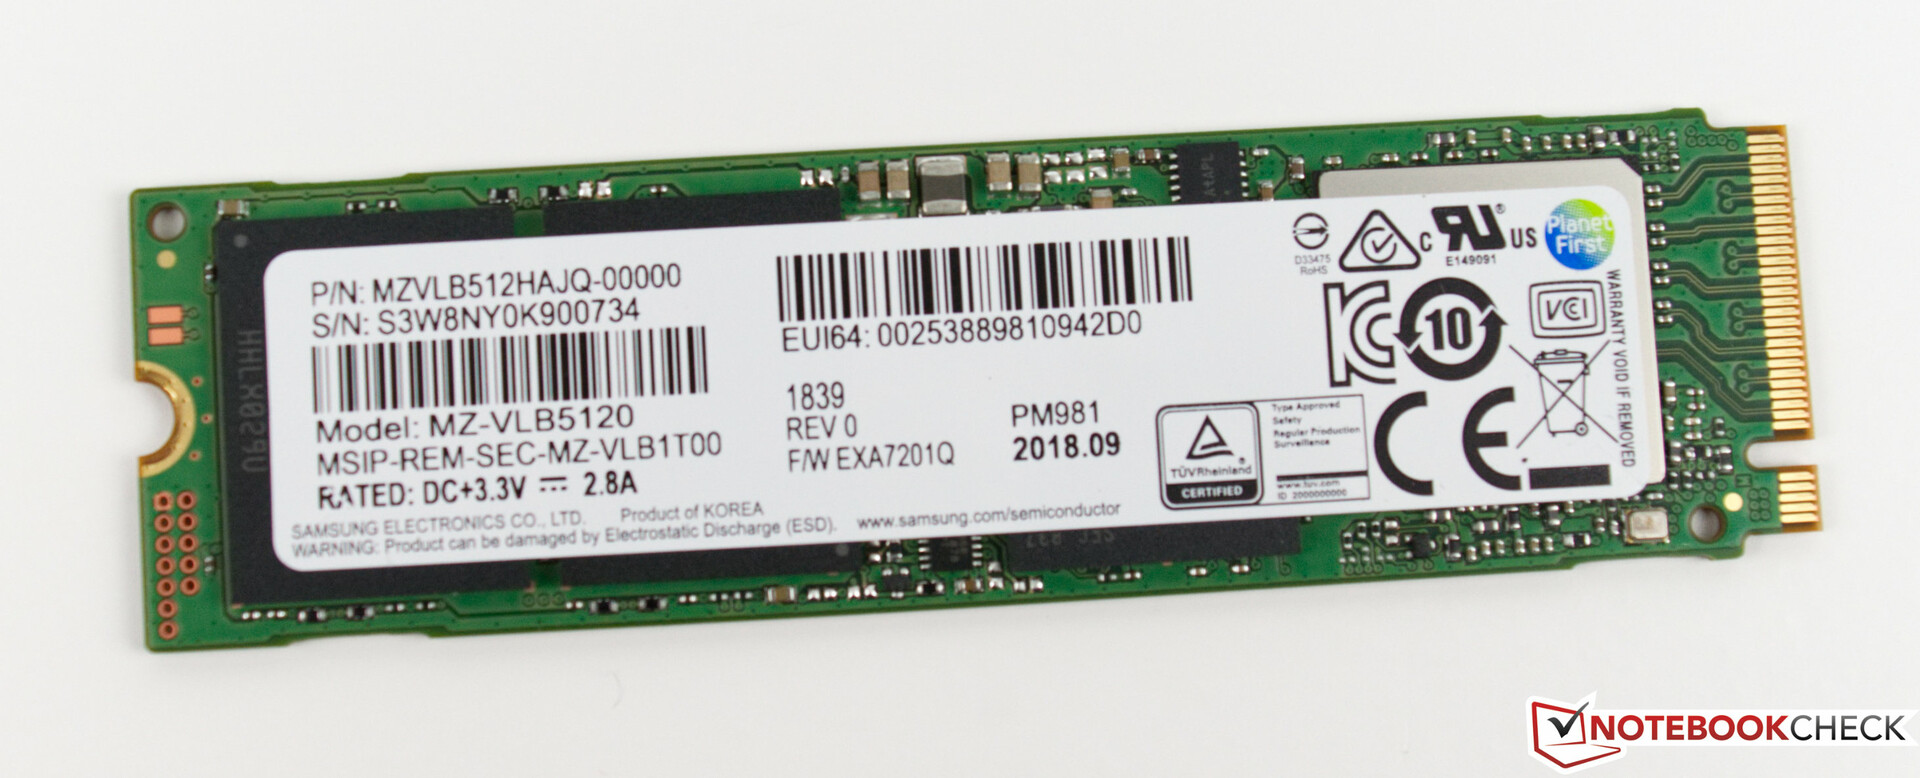
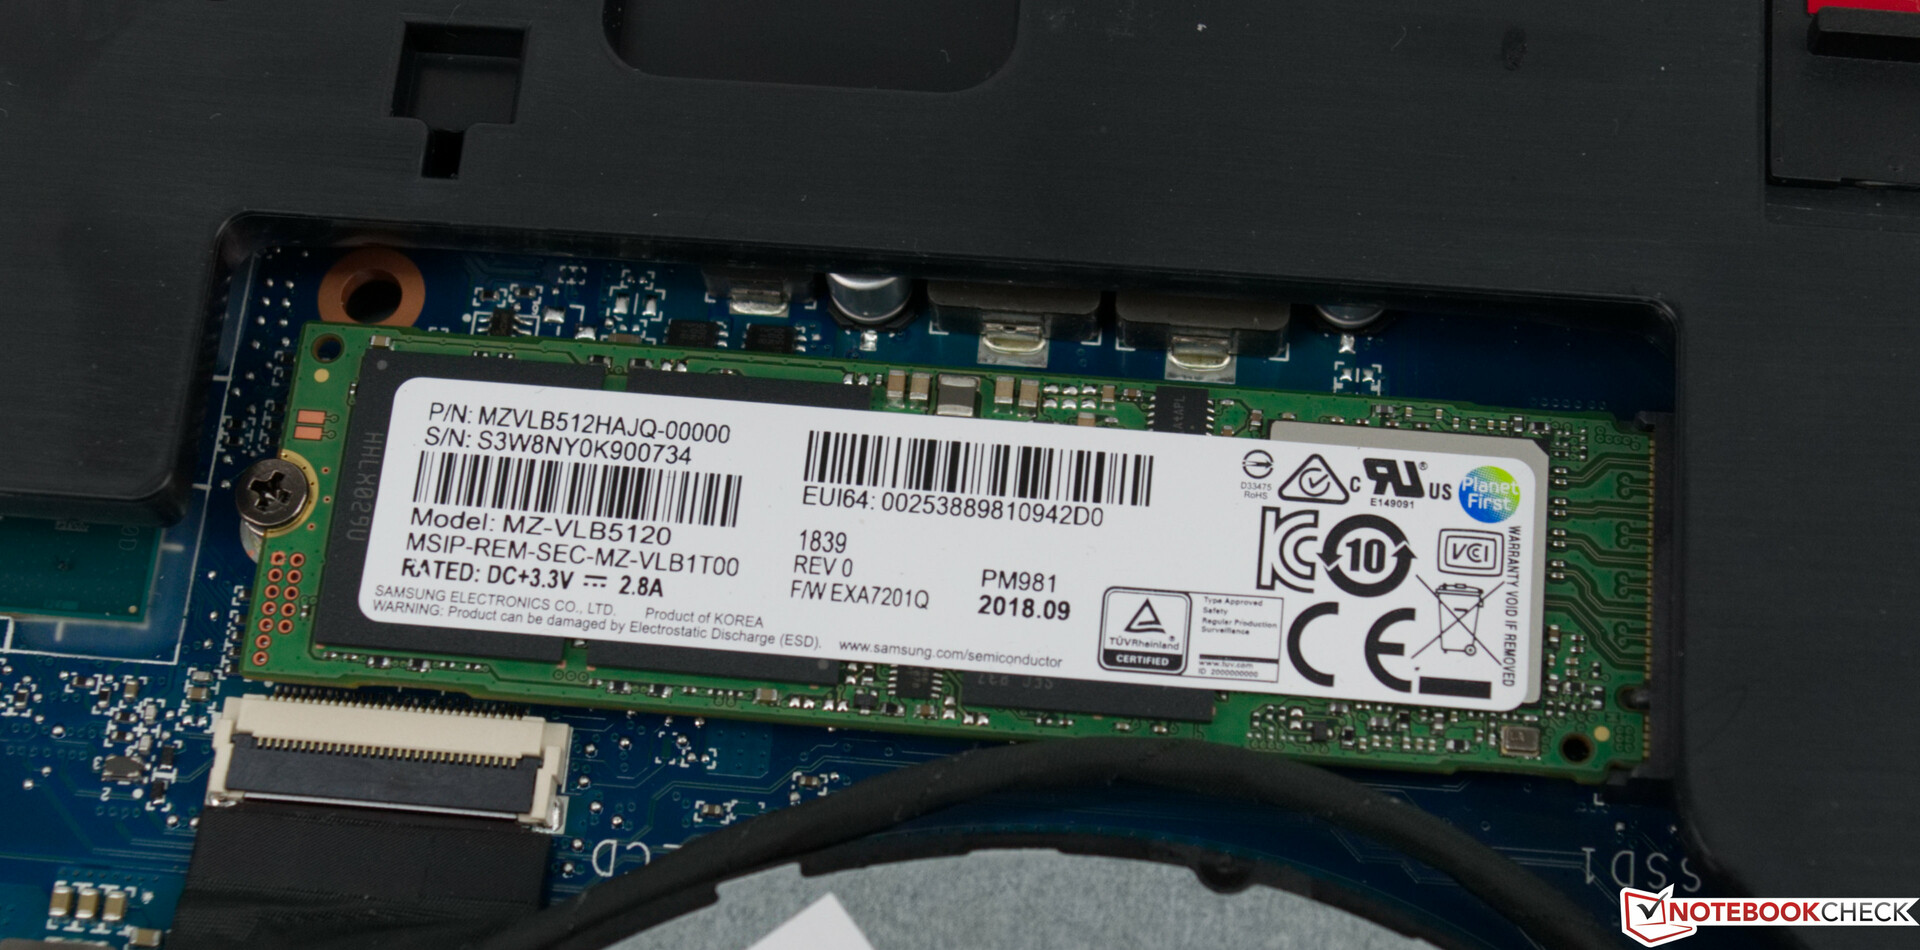
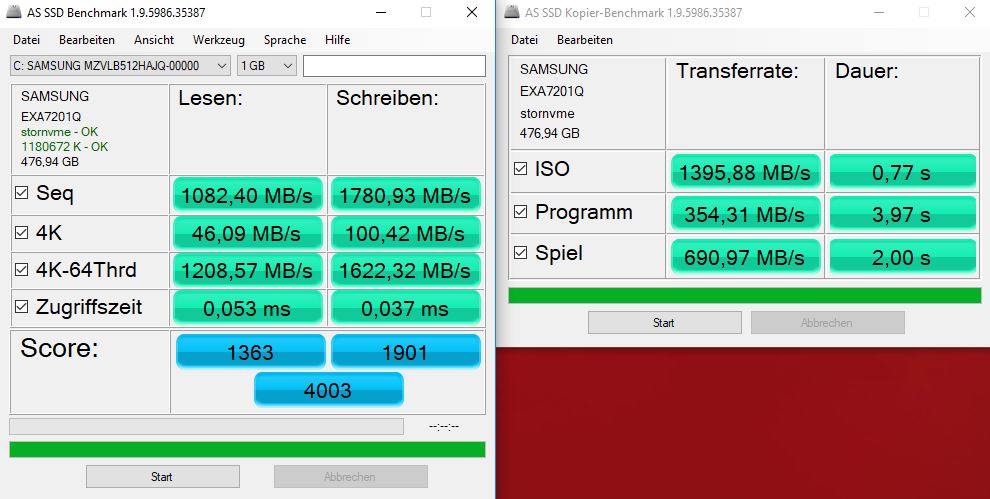
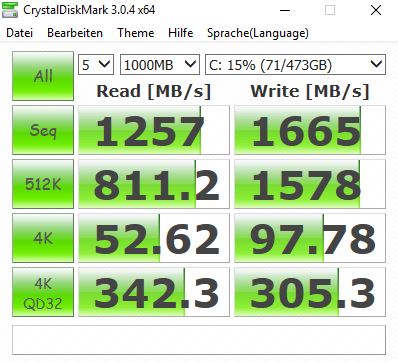
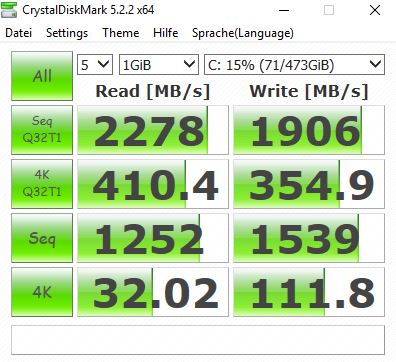
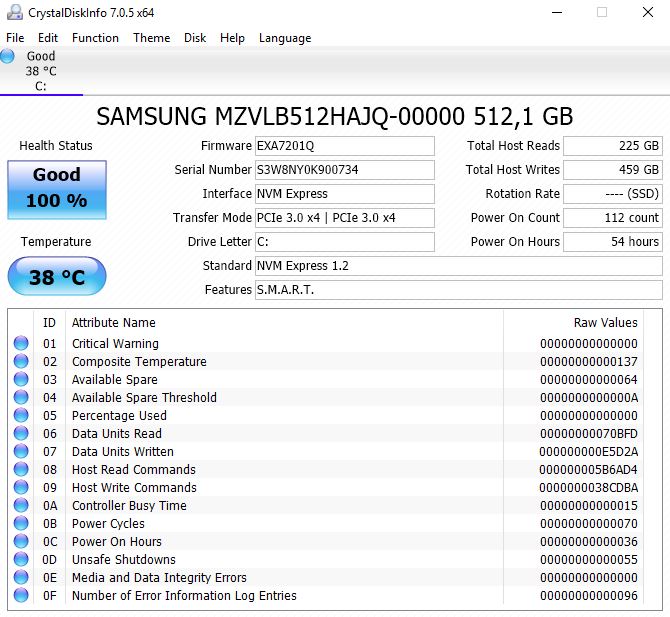
The Japanese manufacturer has equipped our review unit with a 512 GB Samsung PM981 SSD, which is one of the fastest NVMe drives on the market. The drive has excellent write speeds, albeit it is beaten by the Samsung SM961 in the H970. The PM981 also achieved impressive 4K read speeds in our AS SSD and CrystalDiskMark 5.2/6 tests, which indicate that the SSD should launch programs quickly.
The H980 has a spare M.2 drive bay and two 2.5-inch drive bays, as we have mentioned earlier in this review. Please note that Fujitsu does not supply a 2.5-inch drive bay cable, so you must source one separately.
Please see our SSD and HDD benchmarks page for more comparison and information about various drives.
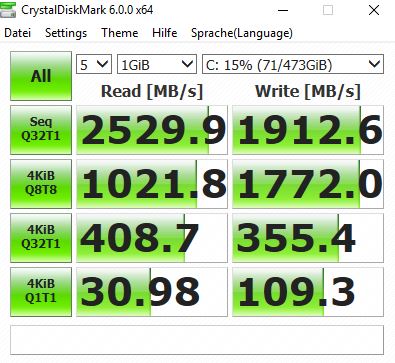
| Fujitsu Celsius H980 Samsung SSD PM981 MZVLB512HAJQ | Fujitsu Celsius H970 Samsung SM961 MZVKW512HMJP m.2 PCI-e | Dell Precision 7720 Toshiba NVMe THNSN5512GPU7 | Lenovo ThinkPad P72-20MB000EGE Lenovo LENSE20256GMSP34MEAT2TA | HP ZBook 17 G5-2ZC48EA Toshiba XG5 KXG50ZNV256G | Average Samsung SSD PM981 MZVLB512HAJQ | |
|---|---|---|---|---|---|---|
| CrystalDiskMark 5.2 / 6 | 33% | 15% | 8% | 13% | ||
| Write 4K (MB/s) | 111.8 | 176.1 58% | 169.2 51% | 101 -10% | 126.7 ? 13% | |
| Read 4K (MB/s) | 32.02 | 44.53 39% | 46.03 44% | 45.37 42% | 44 ? 37% | |
| Write Seq (MB/s) | 1539 | 1637 6% | 1234 -20% | 1409 -8% | 1617 ? 5% | |
| Read Seq (MB/s) | 1252 | 1714 37% | 1854 48% | 2129 70% | 1716 ? 37% | |
| Write 4K Q32T1 (MB/s) | 355.4 | 534 50% | 364.8 3% | 320.3 -10% | 413 ? 16% | |
| Read 4K Q32T1 (MB/s) | 408.7 | 635 55% | 552 35% | 348.3 -15% | 420 ? 3% | |
| Write Seq Q32T1 (MB/s) | 1913 | 1632 -15% | 1088 -43% | 1529 -20% | 2076 ? 9% | |
| Read Seq Q32T1 (MB/s) | 2530 | 3310 31% | 2582 2% | 2957 17% | 3130 ? 24% | |
| Write 4K Q8T8 (MB/s) | 1772 | 1264 ? -29% | ||||
| Read 4K Q8T8 (MB/s) | 1022 | 1193 ? 17% | ||||
| AS SSD | 3% | 2% | 5% | |||
| Seq Read (MB/s) | 1082 | 2726 152% | 2935 171% | 1976 ? 83% | ||
| Seq Write (MB/s) | 1781 | 1609 -10% | 1451 -19% | 1637 ? -8% | ||
| 4K Read (MB/s) | 46.09 | 38.88 -16% | 46.64 1% | 50.5 ? 10% | ||
| 4K Write (MB/s) | 100.4 | 78.1 -22% | 105.8 5% | 112 ? 12% | ||
| 4K-64 Read (MB/s) | 1209 | 1246 3% | 704 -42% | 1203 ? 0% | ||
| 4K-64 Write (MB/s) | 1622 | 971 -40% | 540 -67% | 1504 ? -7% | ||
| Access Time Read * (ms) | 0.053 | 0.05 6% | 0.044 17% | 0.05092 ? 4% | ||
| Access Time Write * (ms) | 0.037 | 0.048 -30% | 0.037 -0% | 0.08337 ? -125% | ||
| Score Read (Points) | 1363 | 1557 14% | 1044 -23% | 1451 ? 6% | ||
| Score Write (Points) | 1901 | 1210 -36% | 791 -58% | 1780 ? -6% | ||
| Score Total (Points) | 4003 | 3509 -12% | 2305 -42% | 3966 ? -1% | ||
| Copy ISO MB/s (MB/s) | 1396 | 1722 23% | 1545 11% | 1755 ? 26% | ||
| Copy Program MB/s (MB/s) | 354.3 | 297.5 -16% | 520 47% | 454 ? 28% | ||
| Copy Game MB/s (MB/s) | 691 | 839 21% | 909 32% | 1057 ? 53% | ||
| Total Average (Program / Settings) | 18% /
14% | 15% /
15% | 5% /
5% | 9% /
9% |
* ... smaller is better

Graphics Card
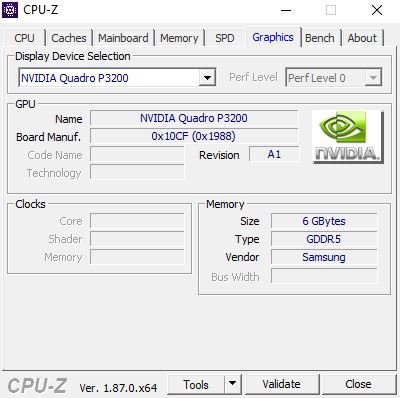
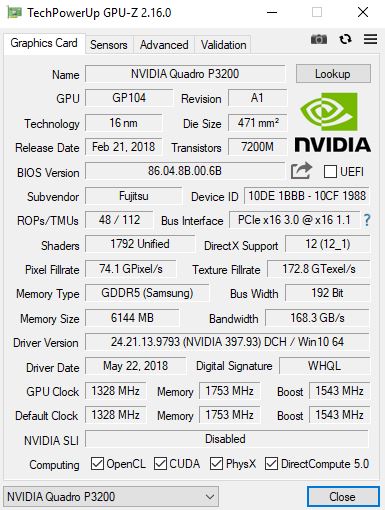
As befits a real workstation, Fujitsu has equipped our review unit with an NVIDIA Quadro P3200, which is a Pascal generation GPU. The P3200 has a 1,328 MHz base clock speed and can boost up to 1,543 MHz when required. The GPU also has 6 GB of GDDR5 VRAM that operates at 7,000 MHz. Our test device performed on par with the ThinkPad P72 in synthetic GPU benchmarks, which also has a Quadro P3200. It is also equipped with the slightly more powerful Core i7-8850H processor. The H980 almost always performed above the GPU average for the Quadro P3200 in synthetic benchmarks too.
The Quadro P3200 has a 75 W TDP, but there is also Intel UHD Graphics 630, which handles 2D graphics and helps improve battery life. The UHD Graphics 630 is integrated within the Core i7-8750H and supports modern codecs such as H.265/HEVC and VP9, which allows the iGPU to decode high-resolution video and relieve pressure on the GPU natively. The H980 also supports NVIDIA Optimus, which allows the workstation to switch seamlessly between GPUs when required.
Please see our GPU benchmarks page for more information on the UHD Graphics 630 and how it compares against other GPUs.
| 3DMark 11 - 1280x720 Performance GPU | |
| Average of class Workstation (12535 - 69594, n=23, last 2 years) | |
| Dell Precision 7720 | |
| Lenovo ThinkPad P72-20MB000EGE | |
| Fujitsu Celsius H980 | |
| Average NVIDIA Quadro P3200 (14673 - 17021, n=4) | |
| Fujitsu Celsius H970 | |
| 3DMark | |
| 1280x720 Cloud Gate Standard Graphics | |
| Average of class Workstation (58392 - 152418, n=14, last 2 years) | |
| Dell Precision 7720 | |
| Lenovo ThinkPad P72-20MB000EGE | |
| Fujitsu Celsius H980 | |
| Average NVIDIA Quadro P3200 (57501 - 84059, n=4) | |
| Fujitsu Celsius H970 | |
| 1920x1080 Fire Strike Graphics | |
| Average of class Workstation (8293 - 52560, n=23, last 2 years) | |
| Dell Precision 7720 | |
| Lenovo ThinkPad P72-20MB000EGE | |
| Fujitsu Celsius H980 | |
| Fujitsu Celsius H970 | |
| Average NVIDIA Quadro P3200 (11316 - 12558, n=4) | |
| 2560x1440 Time Spy Graphics | |
| Average of class Workstation (2725 - 24806, n=23, last 2 years) | |
| Lenovo ThinkPad P72-20MB000EGE | |
| Fujitsu Celsius H980 | |
| Average NVIDIA Quadro P3200 (3732 - 4378, n=3) | |
| Fujitsu Celsius H970 | |
| Dell Precision 7720 | |
| LuxMark v2.0 64Bit | |
| Room GPUs-only | |
| Average of class Workstation (2952 - 6990, n=3, last 2 years) | |
| Dell Precision 7720 | |
| Fujitsu Celsius H980 | |
| Average NVIDIA Quadro P3200 (1842 - 2206, n=5) | |
| Lenovo ThinkPad P72-20MB000EGE | |
| Fujitsu Celsius H970 | |
| HP ZBook 17 G5-2ZC48EA | |
| Sala GPUs-only | |
| Average of class Workstation (6574 - 13967, n=3, last 2 years) | |
| Fujitsu Celsius H980 | |
| Dell Precision 7720 | |
| Average NVIDIA Quadro P3200 (3612 - 4383, n=5) | |
| Lenovo ThinkPad P72-20MB000EGE | |
| HP ZBook 17 G5-2ZC48EA | |
| Fujitsu Celsius H970 | |
| Unigine Heaven 4.0 | |
| Extreme Preset OpenGL | |
| Average of class Workstation (87 - 185.3, n=3, last 2 years) | |
| Dell Precision 7720 | |
| Fujitsu Celsius H980 | |
| Average NVIDIA Quadro P3200 (70.3 - 73, n=3) | |
| Lenovo ThinkPad P72-20MB000EGE | |
| HP ZBook 17 G5-2ZC48EA | |
| Extreme Preset DX11 | |
| Average of class Workstation (92.7 - 222, n=3, last 2 years) | |
| Dell Precision 7720 | |
| Fujitsu Celsius H980 | |
| HP ZBook 17 G5-2ZC48EA | |
| Lenovo ThinkPad P72-20MB000EGE | |
| Average NVIDIA Quadro P3200 (71.4 - 77.2, n=4) | |
| Unigine Valley 1.0 | |
| 1920x1080 Extreme HD DirectX AA:x8 | |
| Dell Precision 7720 | |
| Lenovo ThinkPad P72-20MB000EGE | |
| Average NVIDIA Quadro P3200 (57.1 - 63, n=3) | |
| Fujitsu Celsius H980 | |
| HP ZBook 17 G5-2ZC48EA | |
| 1920x1080 Extreme HD Preset OpenGL AA:x8 | |
| Dell Precision 7720 | |
| Fujitsu Celsius H980 | |
| HP ZBook 17 G5-2ZC48EA | |
| Average NVIDIA Quadro P3200 (49.3 - 50.2, n=3) | |
| Lenovo ThinkPad P72-20MB000EGE | |
| SiSoft Sandra 2016 | |
| Image Processing | |
| Fujitsu Celsius H980 | |
| Lenovo ThinkPad P72-20MB000EGE | |
| Average NVIDIA Quadro P3200 (691 - 830, n=4) | |
| Dell Precision 7720 | |
| HP ZBook 17 G5-2ZC48EA | |
| GP Cryptography (Higher Security AES256+SHA2-512) | |
| Dell Precision 7720 | |
| Lenovo ThinkPad P72-20MB000EGE | |
| Fujitsu Celsius H980 | |
| Average NVIDIA Quadro P3200 (28.1 - 30.2, n=4) | |
| HP ZBook 17 G5-2ZC48EA | |
| GP Financial Analysis (FP High/Double Precision) | |
| Dell Precision 7720 | |
| Fujitsu Celsius H980 | |
| Lenovo ThinkPad P72-20MB000EGE | |
| Average NVIDIA Quadro P3200 (84.5 - 86.6, n=4) | |
| HP ZBook 17 G5-2ZC48EA | |
| 3DMark 11 Performance | 15178 points | |
| 3DMark Ice Storm Standard Score | 90781 points | |
| 3DMark Cloud Gate Standard Score | 34178 points | |
| 3DMark Fire Strike Score | 11114 points | |
| 3DMark Fire Strike Extreme Score | 5856 points | |
| 3DMark Time Spy Score | 4593 points | |
Help | ||
Gaming Performance
Historically, workstations have been poor gaming machines, but the advent of modern drivers mean that you can play most modern triple-A games on the H980 even at maximum graphics settings.
Almost $4,500 would also get you an excellent gaming laptop, but we tested some games on our review unit anyway just to prove its gaming capabilities. The H980 handled all the games we tested with ease, while the Quadro P3200 sits directly between a GeForce GTX 1060 and a GeForce GTX 1070. Please note that the framerates table below were at 1080p; the H980 will struggle to play games in 4K at high graphics though.
| low | med. | high | ultra | |
|---|---|---|---|---|
| BioShock Infinite (2013) | 284.9 | 246.5 | 231.5 | 112.3 |
| Dota 2 Reborn (2015) | 129.6 | 121.2 | 114.7 | 107.8 |
| Rise of the Tomb Raider (2016) | 182 | 144 | 86 | 73 |
| X-Plane 11.11 (2018) | 100 | 86 | 72 | |
| Far Cry 5 (2018) | 120 | 79 | 74 | 70 |
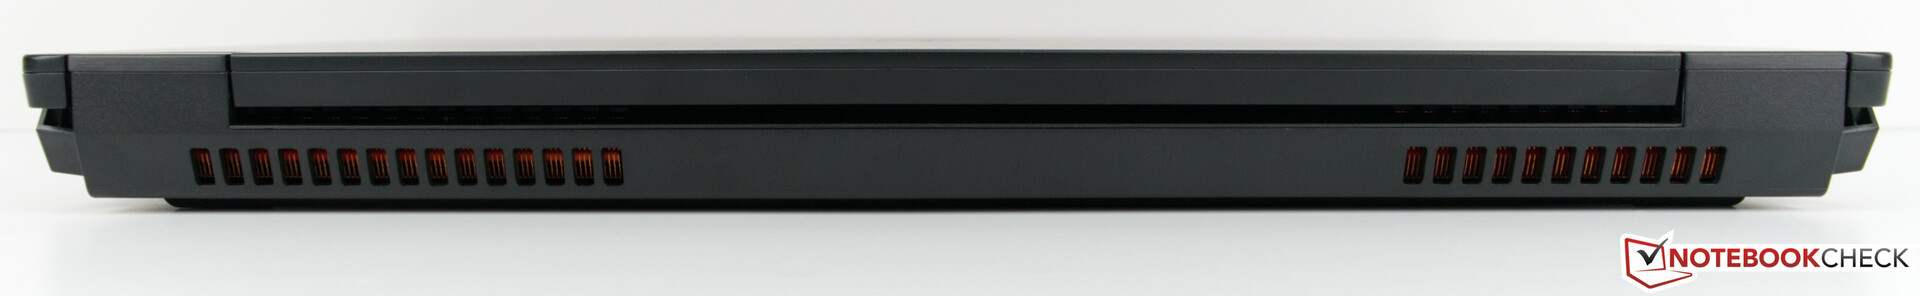
Emissions
Fan Noise
The H980 appears to have a better cooling system than its predecessor, which we have already seen during our CPU tests. Unfortunately, while our review unit can prevent its components from thermal throttling, the fans seem to run if the system is just idling. The fans tend to operate at around 34.9 dB(A) under load, but they did reach 49.1 dB(A) during our stress tests, which is louder than the maximum volume of the fans in the H970. By contrast, the fans in the ThinkPad P72 only reach 31.9 dB(A), which we found pleasantly quiet. The P72 is a rarity for workstations though, as few run as quietly as it does.
Noise level
| Idle |
| 29.6 / 32.5 / 32.5 dB(A) |
| Load |
| 34.9 / 49.1 dB(A) |
 | ||
30 dB silent 40 dB(A) audible 50 dB(A) loud |
||
min: | ||
| Fujitsu Celsius H980 Quadro P3200, i7-8750H, Samsung SSD PM981 MZVLB512HAJQ | Fujitsu Celsius H970 Quadro P4000, E3-1535M v6, Samsung SM961 MZVKW512HMJP m.2 PCI-e | Dell Precision 7720 Quadro P5000, E3-1535M v6, Toshiba NVMe THNSN5512GPU7 | Lenovo ThinkPad P72-20MB000EGE Quadro P3200, i7-8850H, Lenovo LENSE20256GMSP34MEAT2TA | HP ZBook 17 G5-2ZC48EA Quadro P3200, i7-8850H, Toshiba XG5 KXG50ZNV256G | |
|---|---|---|---|---|---|
| Noise | -6% | 4% | 10% | 5% | |
| off / environment * (dB) | 29.6 | 30.2 -2% | 29.5 -0% | 28.6 3% | 28.7 3% |
| Idle Minimum * (dB) | 29.6 | 30.2 -2% | 29.5 -0% | 28.6 3% | 28.7 3% |
| Idle Average * (dB) | 32.5 | 32.8 -1% | 29.5 9% | 28.6 12% | 28.7 12% |
| Idle Maximum * (dB) | 32.5 | 32.8 -1% | 29.5 9% | 28.6 12% | 30.9 5% |
| Load Average * (dB) | 34.9 | 47.3 -36% | 35 -0% | 31.9 9% | 37.3 -7% |
| Load Maximum * (dB) | 49.1 | 47.3 4% | 47.8 3% | 37.7 23% | 41.4 16% |
| Witcher 3 ultra * (dB) | 41 | 35.7 | 41.1 |
* ... smaller is better
Temperature
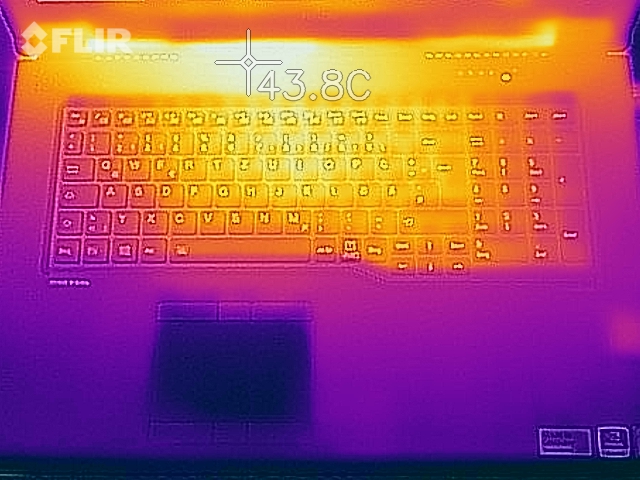
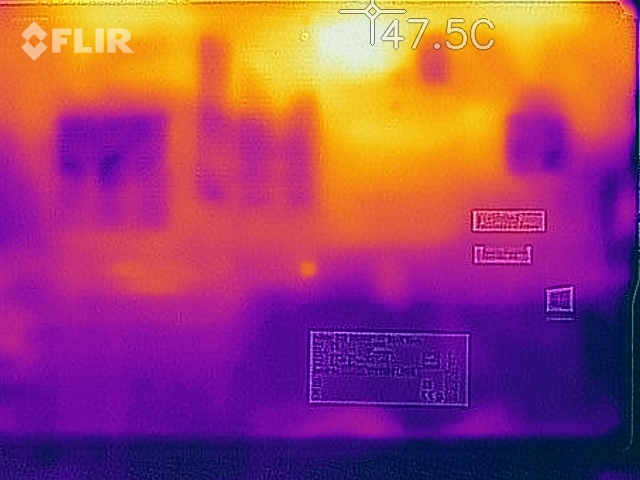
The H980 gets just as hot as its predecessor, which is not surprising considering that they largely have identical cases. Surface temperatures on our review unit reach a maximum of 46.2 °C (~115 °F), which is rather hot. However, the palm rest remains below 24 °C (~75 °F) under load and the whole device averages 24.3 °C (~76 °F) at idle, which is comparatively cool.
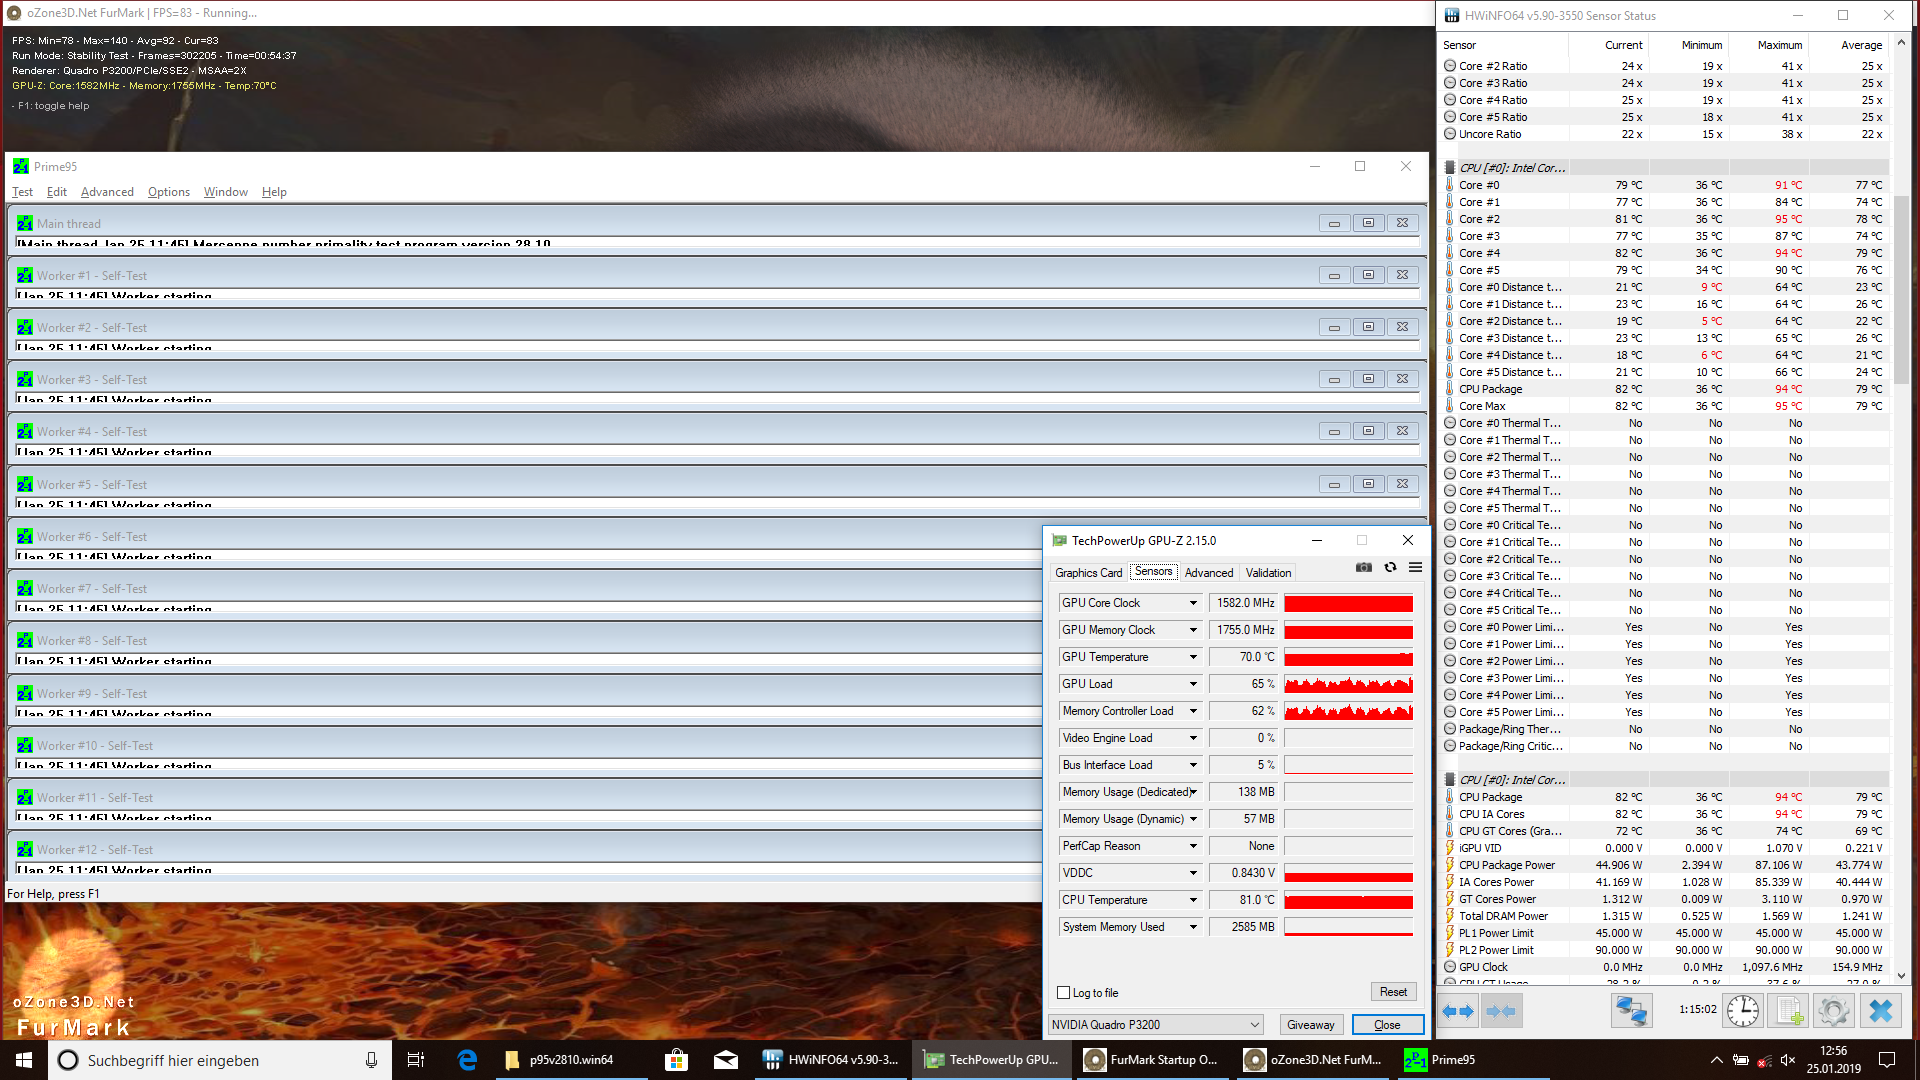
We also subjected our test device to several FurMark and Prime95 stress tests to determine how it manages its internal temperatures under sustained load. We recorded CPU core temperatures reaching 95 °C (~203 °F), but the Core i7-8750H maintained at least its 2.2 GHz base clock speed. Moreover, the GPU operated stably at its 1,582 MHz boost clock speed, while its core temperatures never exceeded 70 °C (158 °F). In short, the H980 appears to cool its GPU more effectively than its CPU and we are unsure whether a more powerful processor would thermal throttle as the Core i7-8750H almost reached its critical core temperatures. Neither the CPU or GPU throttled during our stress tests, so the Core i7-8750H and Quadro P3200 appear to be a good combination for the H980 if you are looking for a workstation that can exploit its hardware fully.
(±) The maximum temperature on the upper side is 41.8 °C / 107 F, compared to the average of 38.2 °C / 101 F, ranging from 22.2 to 69.8 °C for the class Workstation.
(-) The bottom heats up to a maximum of 46.2 °C / 115 F, compared to the average of 41.1 °C / 106 F
(+) In idle usage, the average temperature for the upper side is 24.1 °C / 75 F, compared to the device average of 32 °C / 90 F.
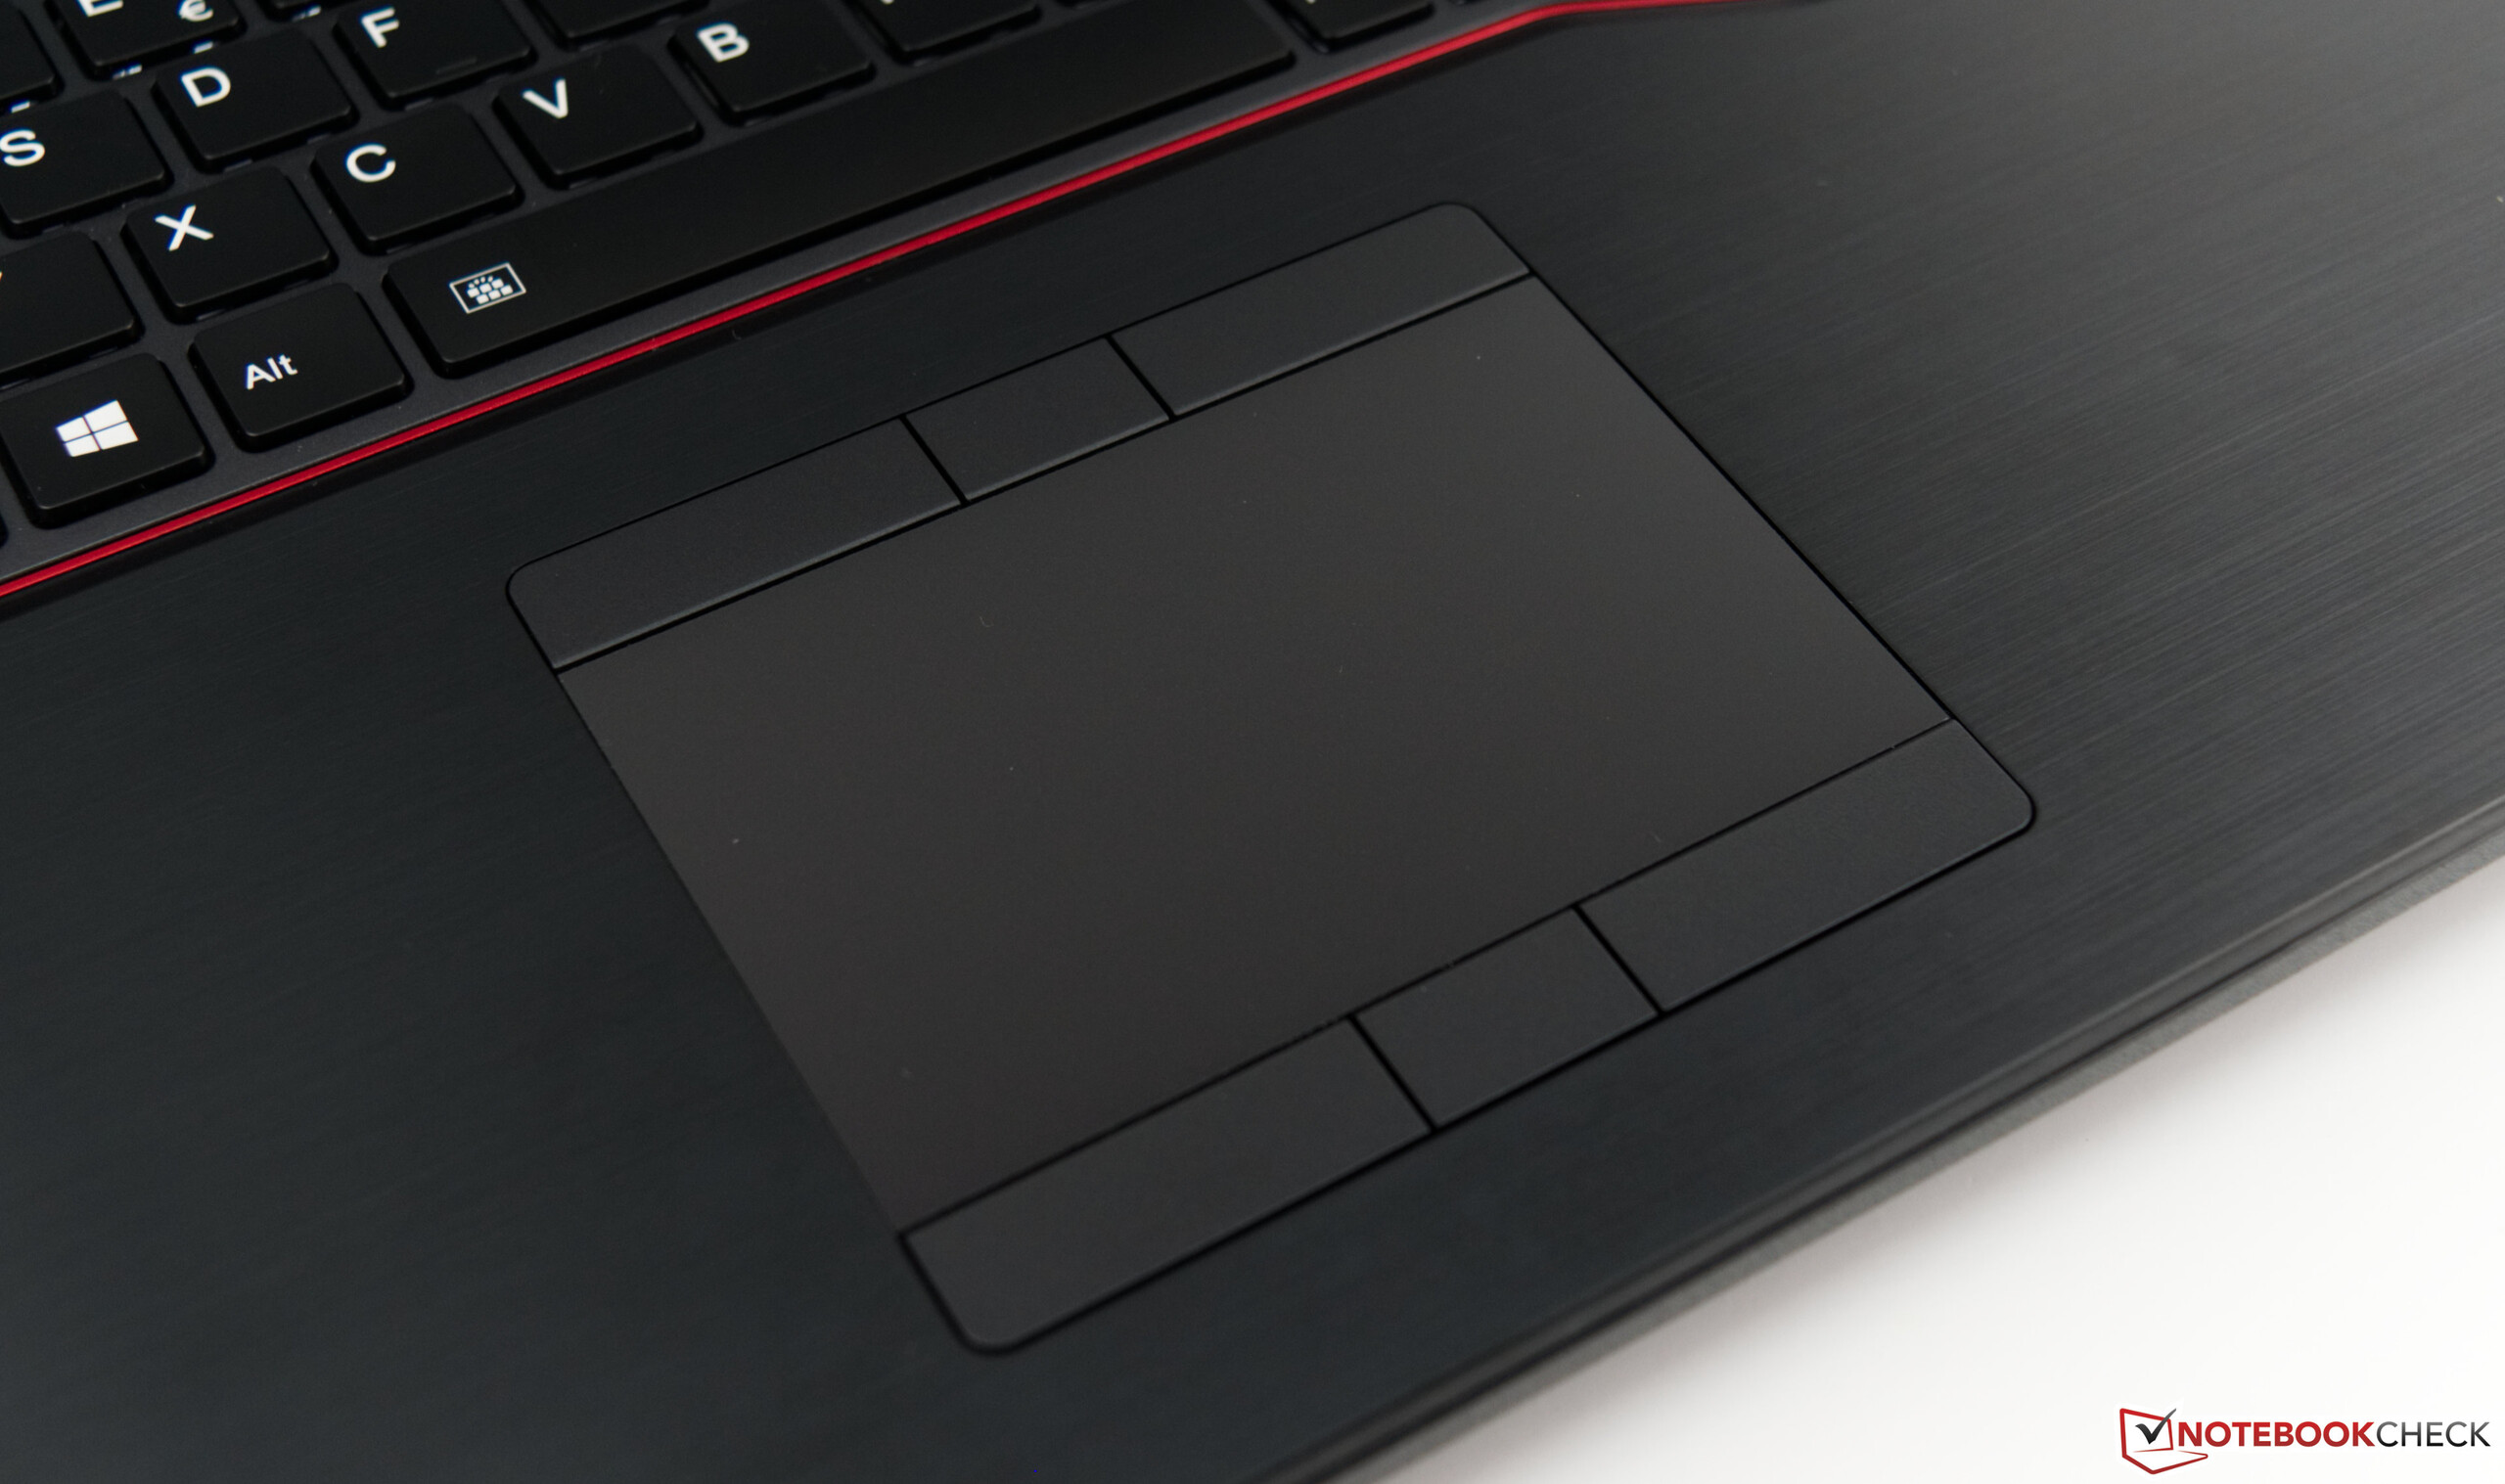
(+) The palmrests and touchpad are cooler than skin temperature with a maximum of 23.8 °C / 74.8 F and are therefore cool to the touch.
(+) The average temperature of the palmrest area of similar devices was 27.8 °C / 82 F (+4 °C / 7.2 F).
| Fujitsu Celsius H980 Quadro P3200, i7-8750H, Samsung SSD PM981 MZVLB512HAJQ | Fujitsu Celsius H970 Quadro P4000, E3-1535M v6, Samsung SM961 MZVKW512HMJP m.2 PCI-e | Dell Precision 7720 Quadro P5000, E3-1535M v6, Toshiba NVMe THNSN5512GPU7 | Lenovo ThinkPad P72-20MB000EGE Quadro P3200, i7-8850H, Lenovo LENSE20256GMSP34MEAT2TA | HP ZBook 17 G5-2ZC48EA Quadro P3200, i7-8850H, Toshiba XG5 KXG50ZNV256G | |
|---|---|---|---|---|---|
| Heat | -1% | -1% | 9% | 2% | |
| Maximum Upper Side * (°C) | 41.8 | 41.4 1% | 42.3 -1% | 42.8 -2% | 42.9 -3% |
| Maximum Bottom * (°C) | 46.2 | 48.7 -5% | 44.9 3% | 39.5 15% | 46.3 -0% |
| Idle Upper Side * (°C) | 25.6 | 26.2 -2% | 26.1 -2% | 23.1 10% | 24.8 3% |
| Idle Bottom * (°C) | 26.6 | 26.4 1% | 27.9 -5% | 23.5 12% | 24.9 6% |
* ... smaller is better
Speakers
The speakers on our test device appear to be the same as those that Fujitsu used in the H970. The stereo speakers are still front-firing, which tend to produce a fuller sound than downward firing speakers, but this is not the case with the H980. The speakers lack any bass and over-reproduce high tones, which makes music sound shrill and irritating, especially at maximum volume.
We would recommend connecting external speakers or headphones using the headphone jack or Bluetooth as these both provide a better listening experience than the speakers do. We had no issues with Bluetooth or the headphone jack throughout our tests.
Fujitsu Celsius H980 audio analysis
(-) | not very loud speakers (69.8 dB)
Bass 100 - 315 Hz
(-) | nearly no bass - on average 26.5% lower than median
(+) | bass is linear (4.7% delta to prev. frequency)
Mids 400 - 2000 Hz
(±) | reduced mids - on average 6.2% lower than median
(±) | linearity of mids is average (10.8% delta to prev. frequency)
Highs 2 - 16 kHz
(+) | balanced highs - only 3.7% away from median
(±) | linearity of highs is average (10% delta to prev. frequency)
Overall 100 - 16.000 Hz
(-) | overall sound is not linear (32.2% difference to median)
Compared to same class
» 99% of all tested devices in this class were better, 1% similar, 1% worse
» The best had a delta of 7%, average was 17%, worst was 35%
Compared to all devices tested
» 91% of all tested devices were better, 2% similar, 7% worse
» The best had a delta of 4%, average was 23%, worst was 134%
Lenovo ThinkPad P72-20MB000EGE audio analysis
(-) | not very loud speakers (69.6 dB)
Bass 100 - 315 Hz
(-) | nearly no bass - on average 17.4% lower than median
(±) | linearity of bass is average (13.5% delta to prev. frequency)
Mids 400 - 2000 Hz
(±) | higher mids - on average 7.2% higher than median
(±) | linearity of mids is average (8.7% delta to prev. frequency)
Highs 2 - 16 kHz
(+) | balanced highs - only 4.4% away from median
(±) | linearity of highs is average (12.7% delta to prev. frequency)
Overall 100 - 16.000 Hz
(-) | overall sound is not linear (30.7% difference to median)
Compared to same class
» 97% of all tested devices in this class were better, 1% similar, 1% worse
» The best had a delta of 7%, average was 17%, worst was 35%
Compared to all devices tested
» 89% of all tested devices were better, 3% similar, 8% worse
» The best had a delta of 4%, average was 23%, worst was 134%
Power Management
Power Consumption
Workstations are all about performance and hardly run on battery, so poor power consumption should not be a deal breaker for most people. The H980 consumes between 14.8 W and 21.5 W at idle, which is around 25% higher than what the H970 consumes. Of our comparison devices, only the Precision 7720 consumes more than the H980 when idling, but even the former is more efficient under sustained load. Our review unit consumes between 98.4 W and 213.5 W under load, which is more than all our comparison devices and the class average. Additionally, the H970 consumes up to 36% more under load than its successor, which is a significant gap between the two devices.
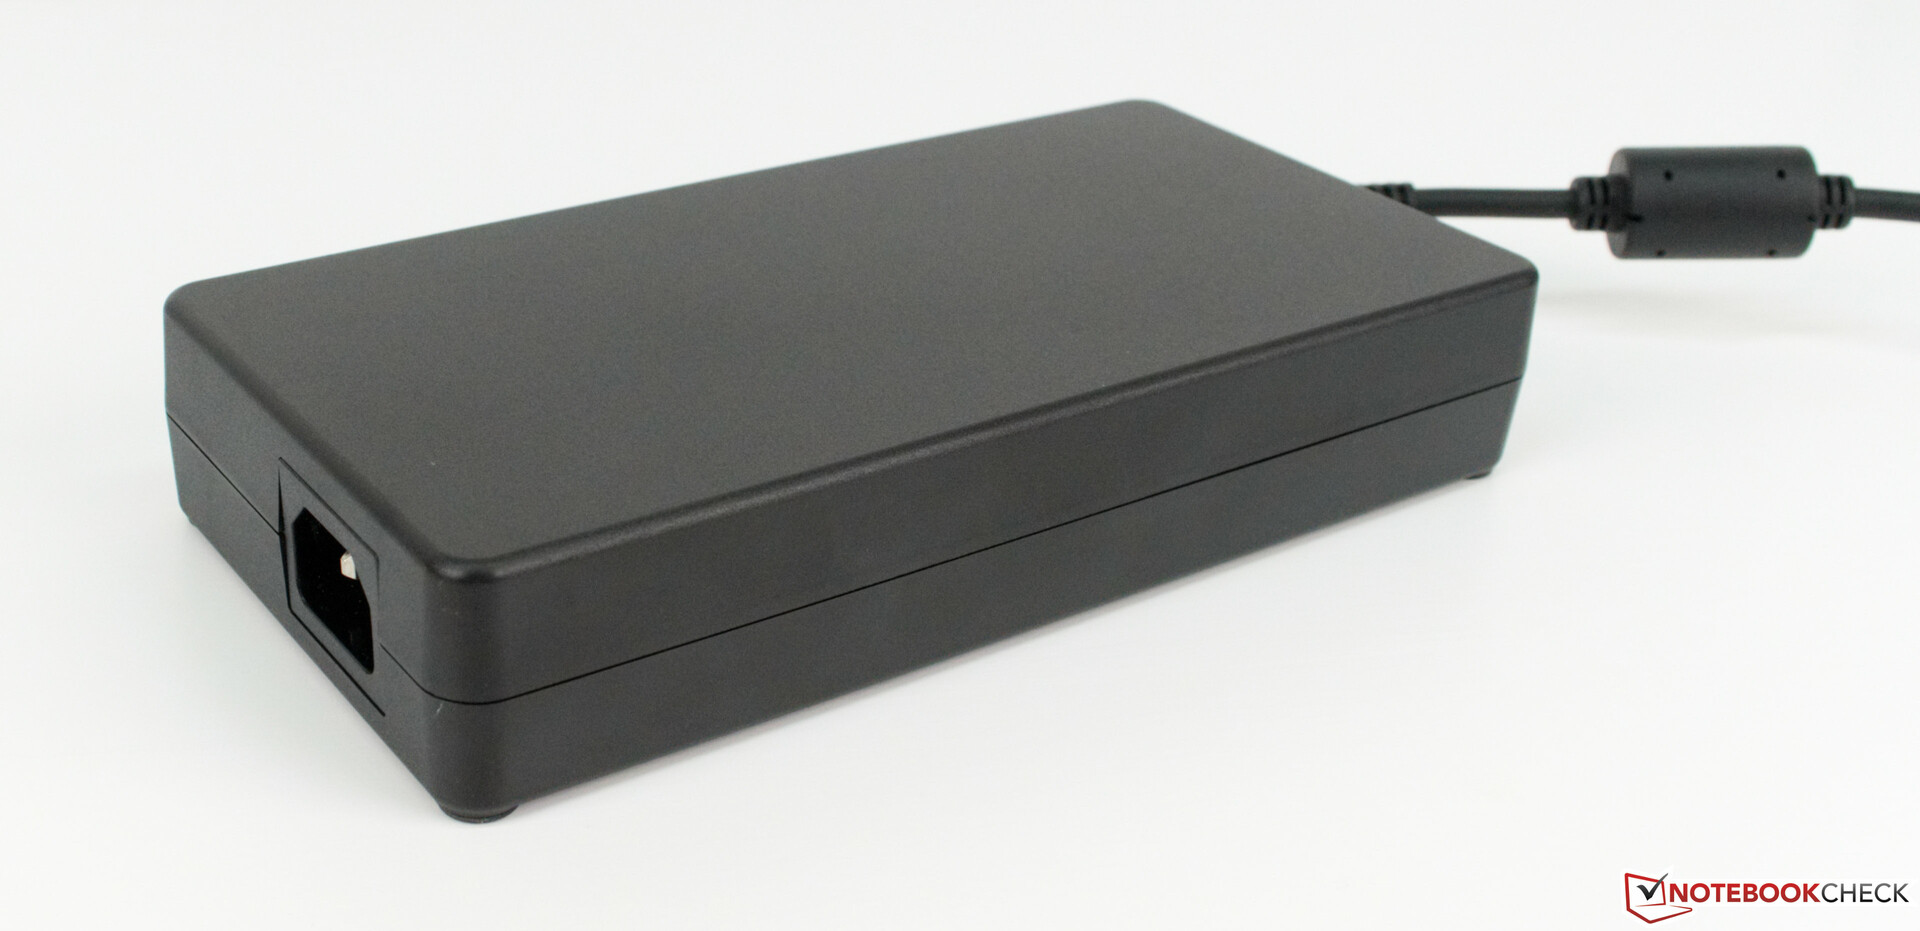
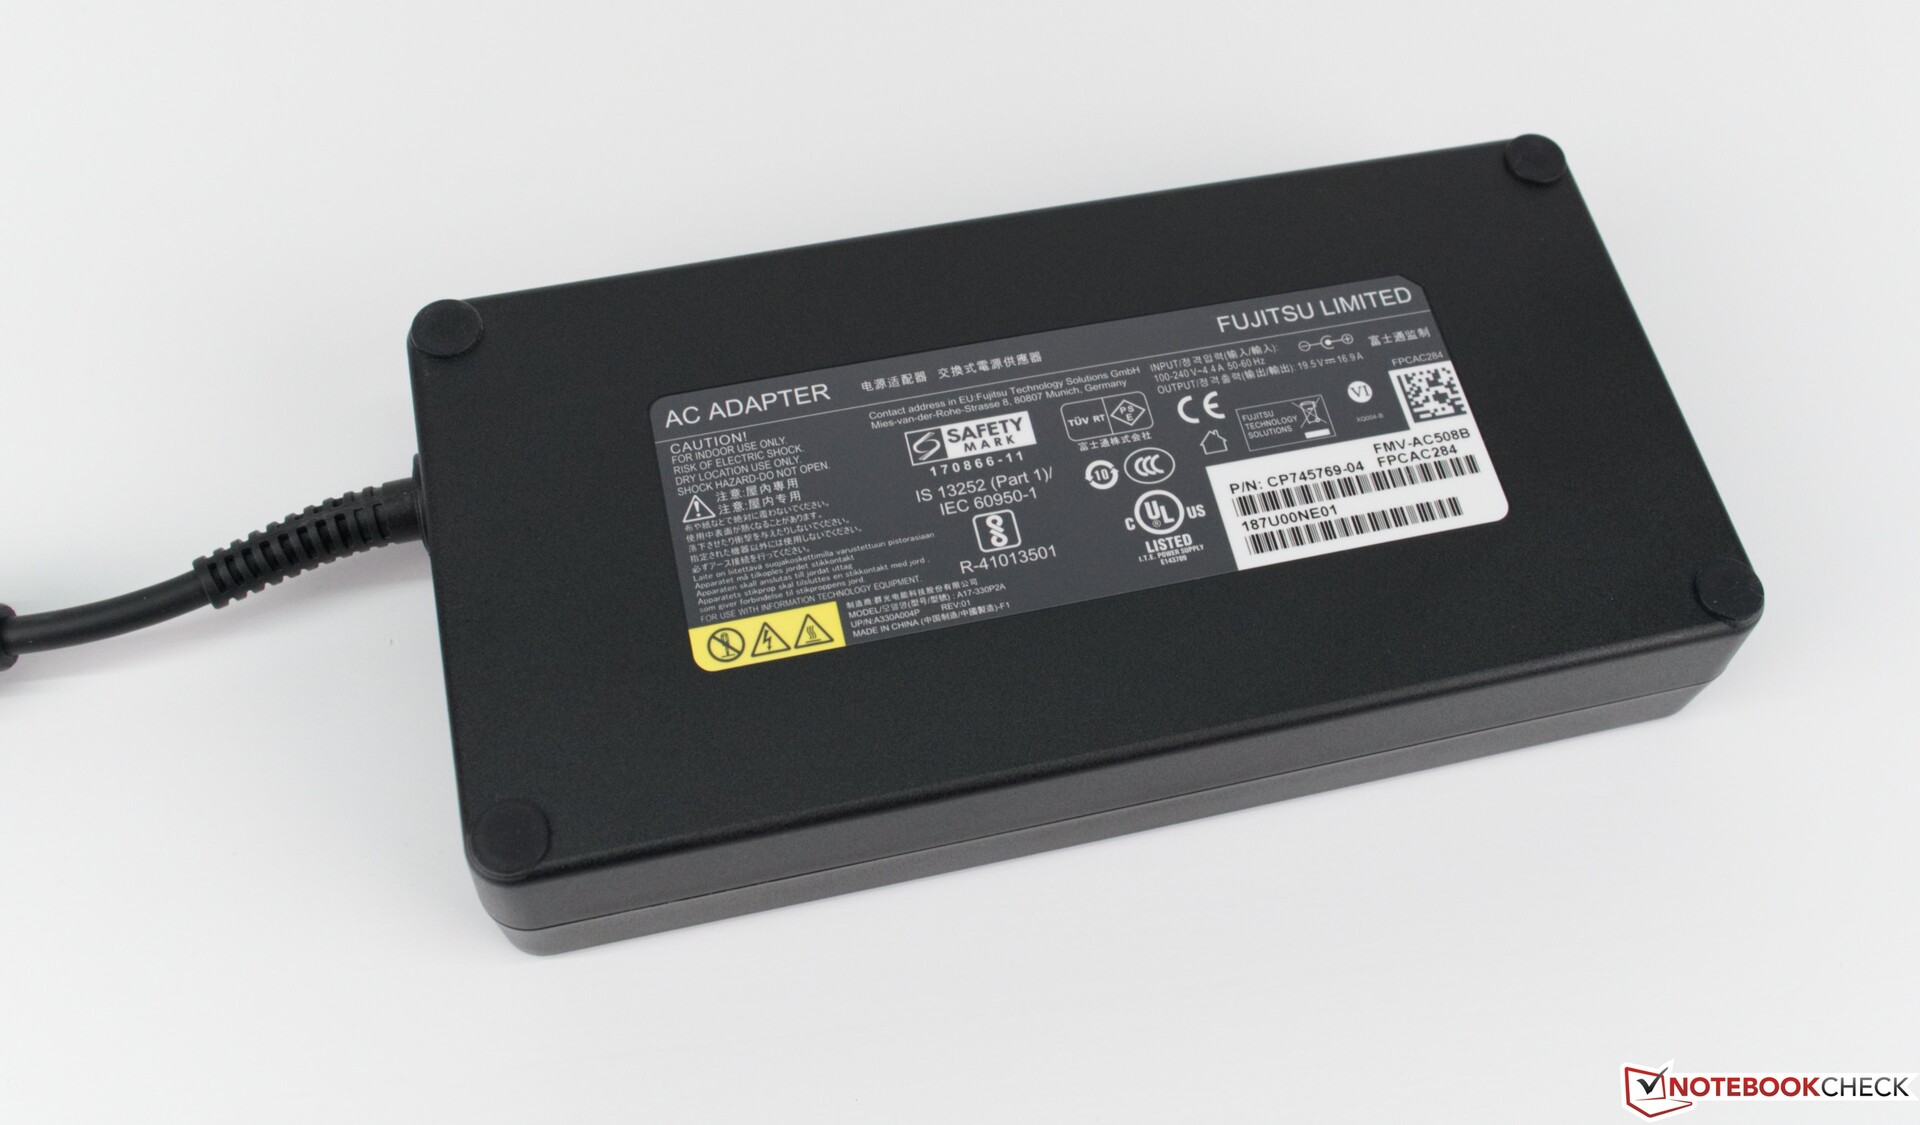
Fujitsu includes a 330-W power supply with the H980, which is powerful enough to charge our test device even when we push it hard. The power supply may seem oversized considering the power consumption of our review unit, but the company also includes it with more powerful H980 configurations, which presumably also consume more watts than our test device.
| Off / Standby | |
| Idle | |
| Load |
|
Key:
min: | |
| Fujitsu Celsius H980 i7-8750H, Quadro P3200, Samsung SSD PM981 MZVLB512HAJQ, IPS, 1920x1080, 17.3" | Fujitsu Celsius H970 E3-1535M v6, Quadro P4000, Samsung SM961 MZVKW512HMJP m.2 PCI-e, IPS LED, 1920x1080, 17.3" | Dell Precision 7720 E3-1535M v6, Quadro P5000, Toshiba NVMe THNSN5512GPU7, IGZO, 3840x2160, 17.3" | Lenovo ThinkPad P72-20MB000EGE i7-8850H, Quadro P3200, Lenovo LENSE20256GMSP34MEAT2TA, IPS, 1920x1080, 17.3" | HP ZBook 17 G5-2ZC48EA i7-8850H, Quadro P3200, Toshiba XG5 KXG50ZNV256G, , 1920x1080, 17.3" | Average NVIDIA Quadro P3200 | Average of class Workstation | |
|---|---|---|---|---|---|---|---|
| Power Consumption | 22% | 7% | 35% | 23% | 13% | 21% | |
| Idle Minimum * (Watt) | 14.8 | 10.7 28% | 9.6 35% | 4.6 69% | 9.3 37% | 10.9 ? 26% | 9.11 ? 38% |
| Idle Average * (Watt) | 20.4 | 15.8 23% | 20.5 -0% | 12.2 40% | 14.4 29% | 17.1 ? 16% | 13.8 ? 32% |
| Idle Maximum * (Watt) | 21.5 | 17.8 17% | 22.9 -7% | 15.4 28% | 15.8 27% | 19.6 ? 9% | 17.9 ? 17% |
| Load Average * (Watt) | 98.4 | 92 7% | 96.8 2% | 79.6 19% | 89.2 9% | 95.1 ? 3% | 96 ? 2% |
| Load Maximum * (Watt) | 213.5 | 137 36% | 202.1 5% | 176 18% | 189 11% | 191.3 ? 10% | 180.3 ? 16% |
| Witcher 3 ultra * (Watt) | 86 | 123 |
* ... smaller is better
Battery Life
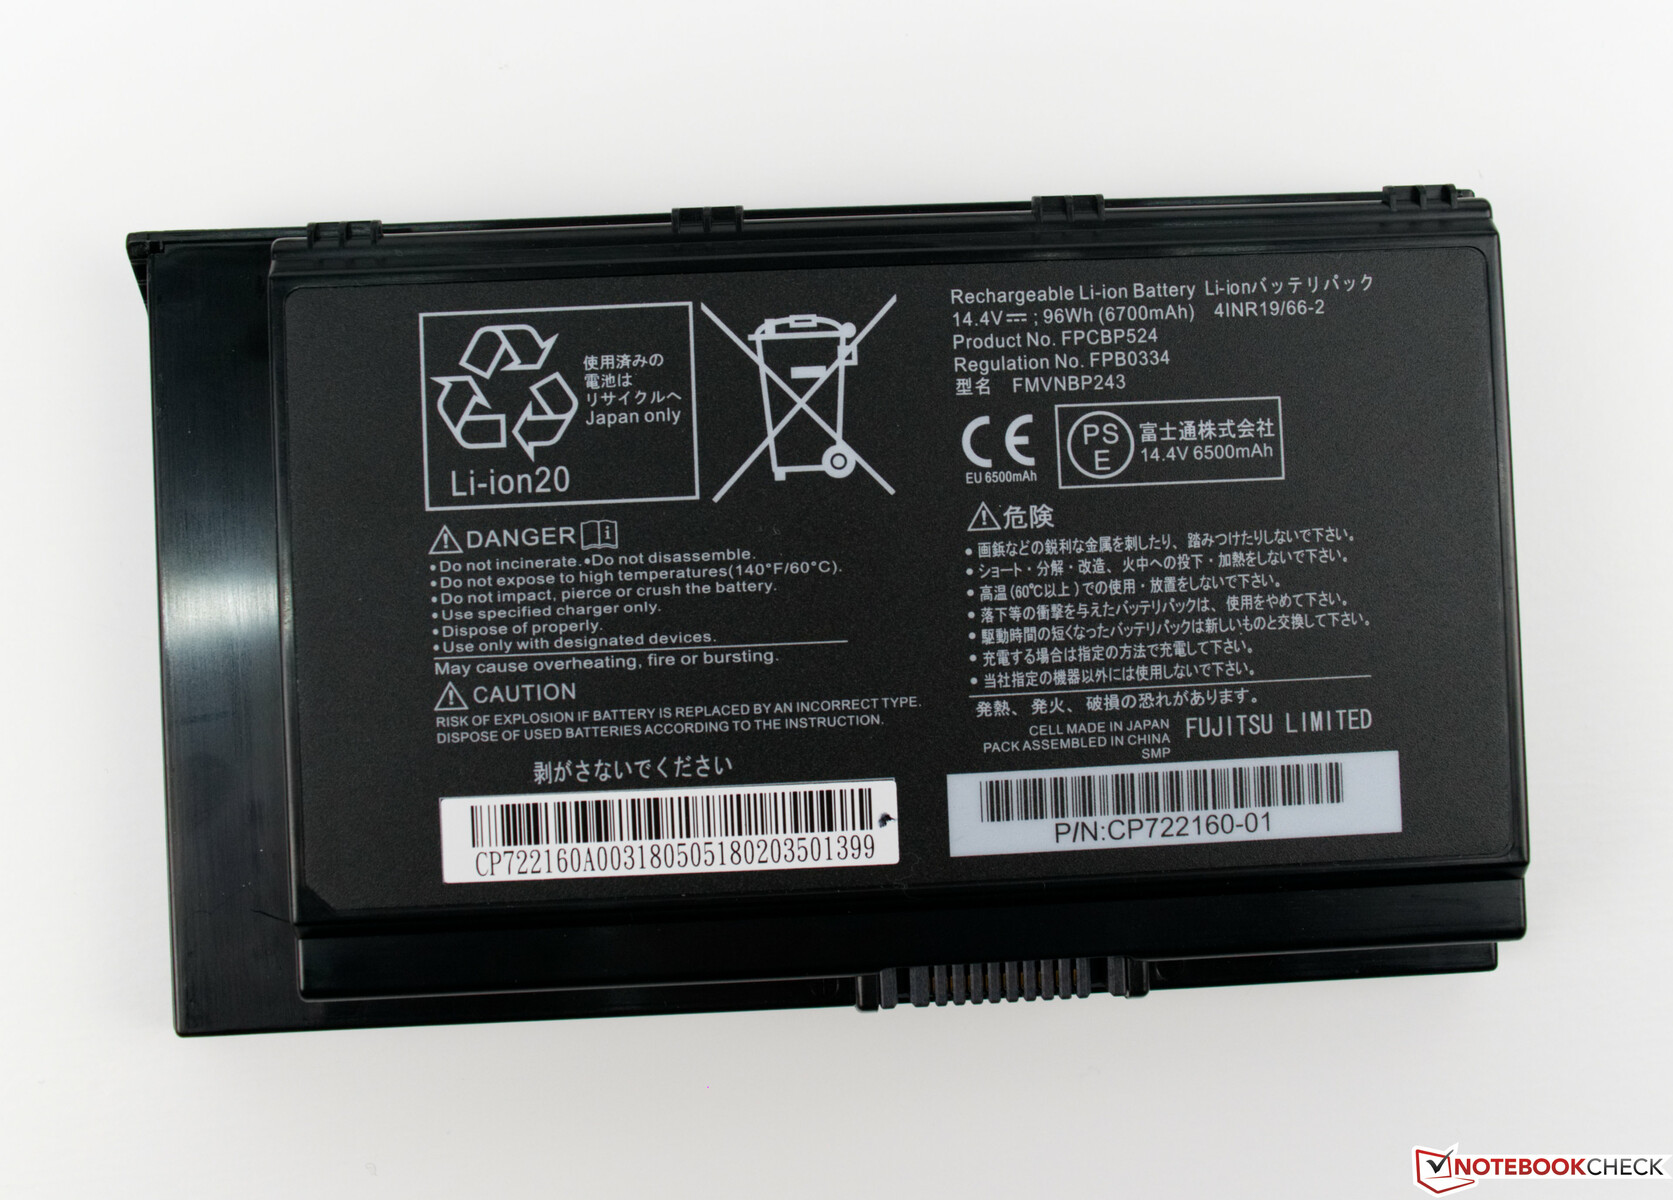
The Celsius H980 has a 96 Wh battery, but we did not expect it to last long considering our review unit’s comparatively high power consumption. While the H980 generally has shorter battery life than its predecessor, it managed to outlast the class average in half of our battery life tests, and only finished around 10% below average in our other tests.
The ThinkPad P72 achieves significantly longer runtimes thanks to its lower power consumption and its 3 Wh larger battery, although the Precision 7720 only beat our test device in one battery life test and needed recharging 24% sooner during our Wi-Fi battery life test. We conducted the latter by setting display luminosity to around 150 cd/m², which corresponds to 38% brightness on the H980. We also set the Windows 10 Power mode to Balanced and disabled all other power saving features. Our test device lasted for 8:16 hours in our practical Wi-Fi battery life test, which puts the device third in our comparison table and 20% ahead of the class average. The H980 finished second to the ThinkPad P72 in our battery life under sustained load test, but it finished bottom of our other two tests.
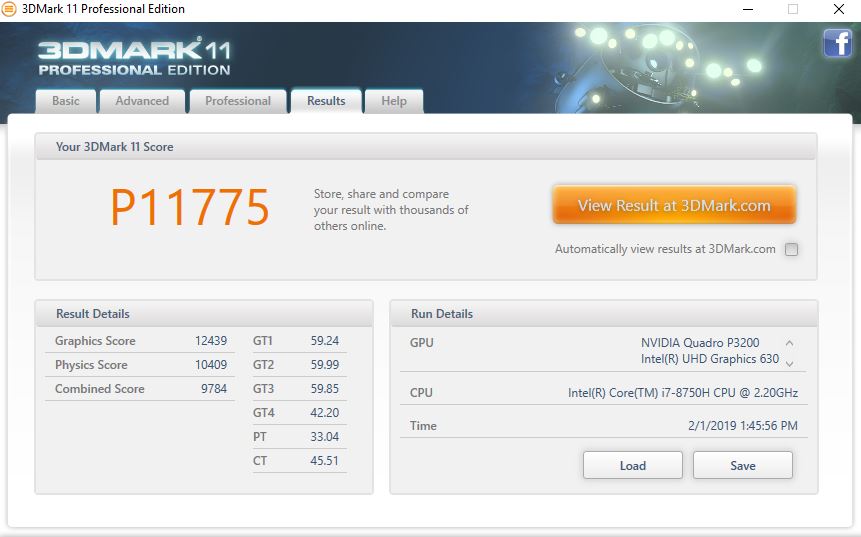
We also looked at CPU and GPU performance on battery and found that the system throttles the Quadro P3200 compared to how it performs when the device is running from mains power. Our review unit scored 3,403 points lower in 3DMark 11 on battery power than when we had it on charge, which represents almost a 30% drop in GPU performance. By contrast, we saw no such behaviour with the processor, so that is worth keeping in mind if you find that your H980 performs poorly in GPU-heavy tasks when running on battery.
| Fujitsu Celsius H980 i7-8750H, Quadro P3200, 96 Wh | Fujitsu Celsius H970 E3-1535M v6, Quadro P4000, 96 Wh | Dell Precision 7720 E3-1535M v6, Quadro P5000, 91 Wh | Lenovo ThinkPad P72-20MB000EGE i7-8850H, Quadro P3200, 99 Wh | HP ZBook 17 G5-2ZC48EA i7-8850H, Quadro P3200, Wh | Average of class Workstation | |
|---|---|---|---|---|---|---|
| Battery runtime | 20% | -10% | 62% | 56% | 43% | |
| Reader / Idle (h) | 13.5 | 16.7 24% | 11.4 -16% | 28.3 110% | 21.9 62% | 26.1 ? 93% |
| H.264 (h) | 5.9 | 9.6 63% | 6.8 15% | 12.3 108% | 9.2 56% | 10.1 ? 71% |
| WiFi v1.3 (h) | 8.3 | 9 8% | 6.3 -24% | 11.2 35% | 8.55 ? 3% | |
| Load (h) | 1.4 | 1.2 -14% | 1.2 -14% | 1.3 -7% | 2.1 50% | 1.441 ? 3% |
Verdict
Pros
Cons
The workstation market is small with only a few OEMs currently producing devices that meet the needs of a workstation. Fujitsu is such a manufacturer that knows what makes a good workstation thanks to its years of experience. The Celsius can exploit the potential of its hexa-core processor, particularly in multi-threaded applications, without thermal throttling, which is outstanding. However, the Core i7-8750H in on our review unit is the least powerful CPU that Fujitsu offers for the Celsius H980, so we would be interested to see whether it can get the best from the Intel Xeon E-2186M without overheating.
The Celsius H970 had effective GPU cooling, and thankfully that has remained unchanged with the H980. In short, the NVIDIA Quadro P3200 performed well in our tests and is a good pairing with the Core i7-8750H.
The Fujitsu Celsius H980 has better CPU cooling and system performance than its predecessor, but its 1080p display cannot compete with the resolution or colour accuracy of competitors such as the Dell Precision 7720.
The Celsius H980 is a bulky and power-hungry device, but as are many other workstations. The device succeeded in delivering excellent system performance and handled our workstation benchmarks with ease. Moreover, while the 17.3-inch display is bright and has a matte finish, which will both prove useful when using the Celsius H980 outdoors, it lacks the colour accuracy of its competitors. Our review unit achieved too low colour space coverages and too high DeltaE deviations for our liking. Worse still, Fujitsu offers the Celsius H980 with only a 1080p display, which puts the device at a disadvantage to its competitors that have optional 4K panels such as the Dell Precision 7720.
These drawbacks will make the Celsius H980 a tough sell despite its good CPU and GPU performance, particularly as it faces strong competition from the Dell Precision 7720, the HP ZBook 17 G5 and the Lenovo ThinkPad P72.
It is also worth keeping in mind that the Celsius H980 also has a worse battery life than its predecessor, but we suspect that this will matter little to most people who use workstations, as the machines tend to be used at a desk rather than on the move. Overall, the Fujitsu Celsius H980 is an excellent workstation that is only held back by its colour inaccurate screen.
Fujitsu Celsius H980
- 01/08/2020 v7 (old)
Sebastian Bade
Price comparison

