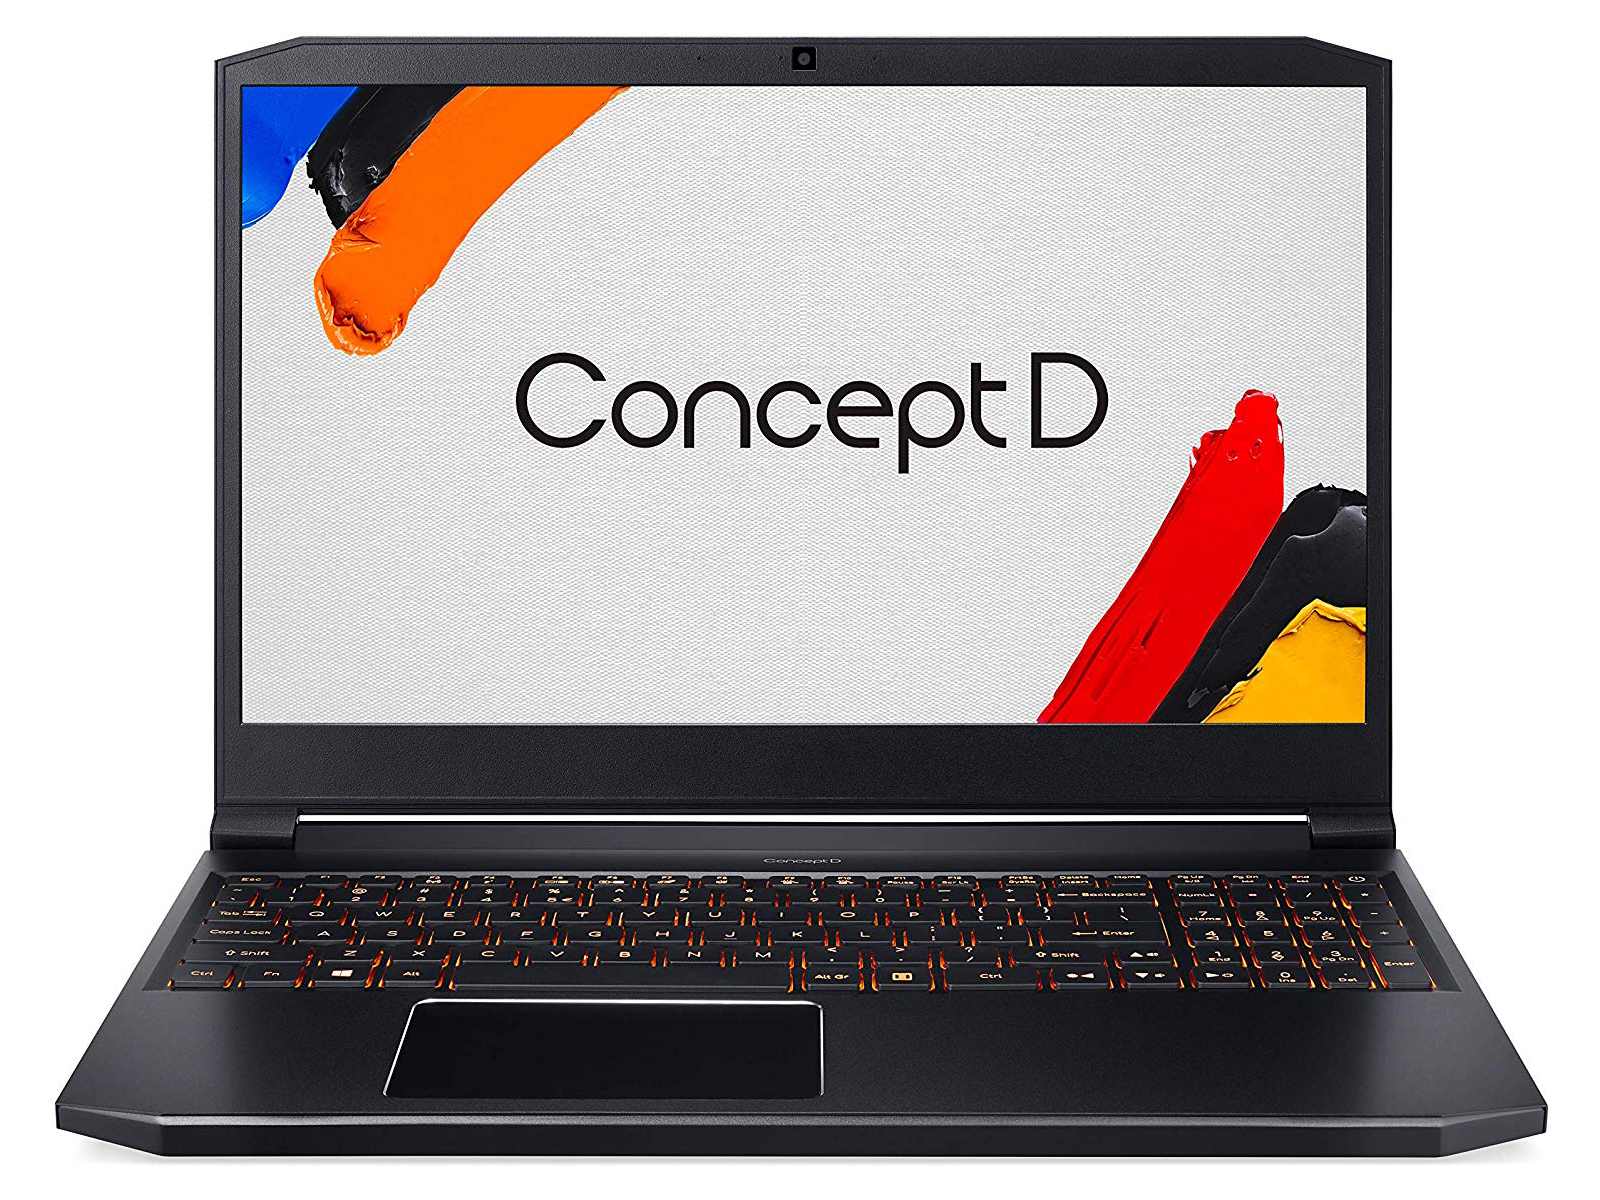
Acer ConceptD 5 17 inch Review: Creativity in large format

Portable, powerful, and precise – this is how Acer presents its ConceptD series for creative professionals. The ConceptD 3 models represent the entry-level with integrated graphics cards. The ConceptD 9 models are the cutting edge with a technically demanding hinge solution and a Core i9-9980HK processor with a free multiplier. The hinge allows using it as a standing tablet.
The 17-inch ConceptD 5 model is far from such technical wizardry as in the D 9. The hefty standard notebook contains an RTX 2060 graphics card, a Core i7-9750H hexa-core processor, and a 4K panel with 100% AdobeRGB coverage – at least on paper. The colors are Pantone validated, which is supposed to attract image processing professionals who prepare for printing.
As competitors of the 17-inch ConceptD 5, the market also offers the Apple MacBook Pro 15 2019 as well as the Dell XPS 15 7590 (both of them 15 inches) with powerful equipment. 17-inch notebooks are rare in the same price and value range. While the Apple and Dell notebooks are even available with the Core i9 9980HK, they have a weaker graphics card. The MSI P65 Creator 9SF-657 with 4K, a Core i9-9880H, and an RTX 2070 Max-Q, which is also a 15-inch notebook, is similarly equipped.
Rating | Date | Model | Weight | Height | Size | Resolution | Price |
|---|---|---|---|---|---|---|---|
| 84.7 % v7 (old) | 04 / 2020 | Acer ConceptD 5 CN517-71-74YA i7-9750H, GeForce RTX 2060 Mobile | 2.8 kg | 24 mm | 17.30" | 3840x2160 | |
| 87.8 % v7 (old) | 08 / 2019 | Dell XPS 15 7590 9980HK GTX 1650 i9-9980HK, GeForce GTX 1650 Mobile | 2 kg | 17 mm | 15.60" | 3840x2160 | |
| 87.1 % v7 (old) | 02 / 2020 | Lenovo ThinkPad X1 Extreme 2019 20QV000WGE i7-9750H, GeForce GTX 1650 Mobile | 1.7 kg | 18.7 mm | 15.60" | 3840x2160 | |
| 89.4 % v7 (old) | 01 / 2020 | Apple MacBook Pro 15 2019 i9 Vega 20 i9-9980HK, Radeon Pro Vega 20 | 1.8 kg | 15.5 mm | 15.40" | 2880x1800 | |
| 85 % v7 (old) | 06 / 2019 | MSI P65 Creator 9SF-657 i9-9880H, GeForce RTX 2070 Max-Q | 1.9 kg | 18 mm | 15.60" | 3840x2160 |
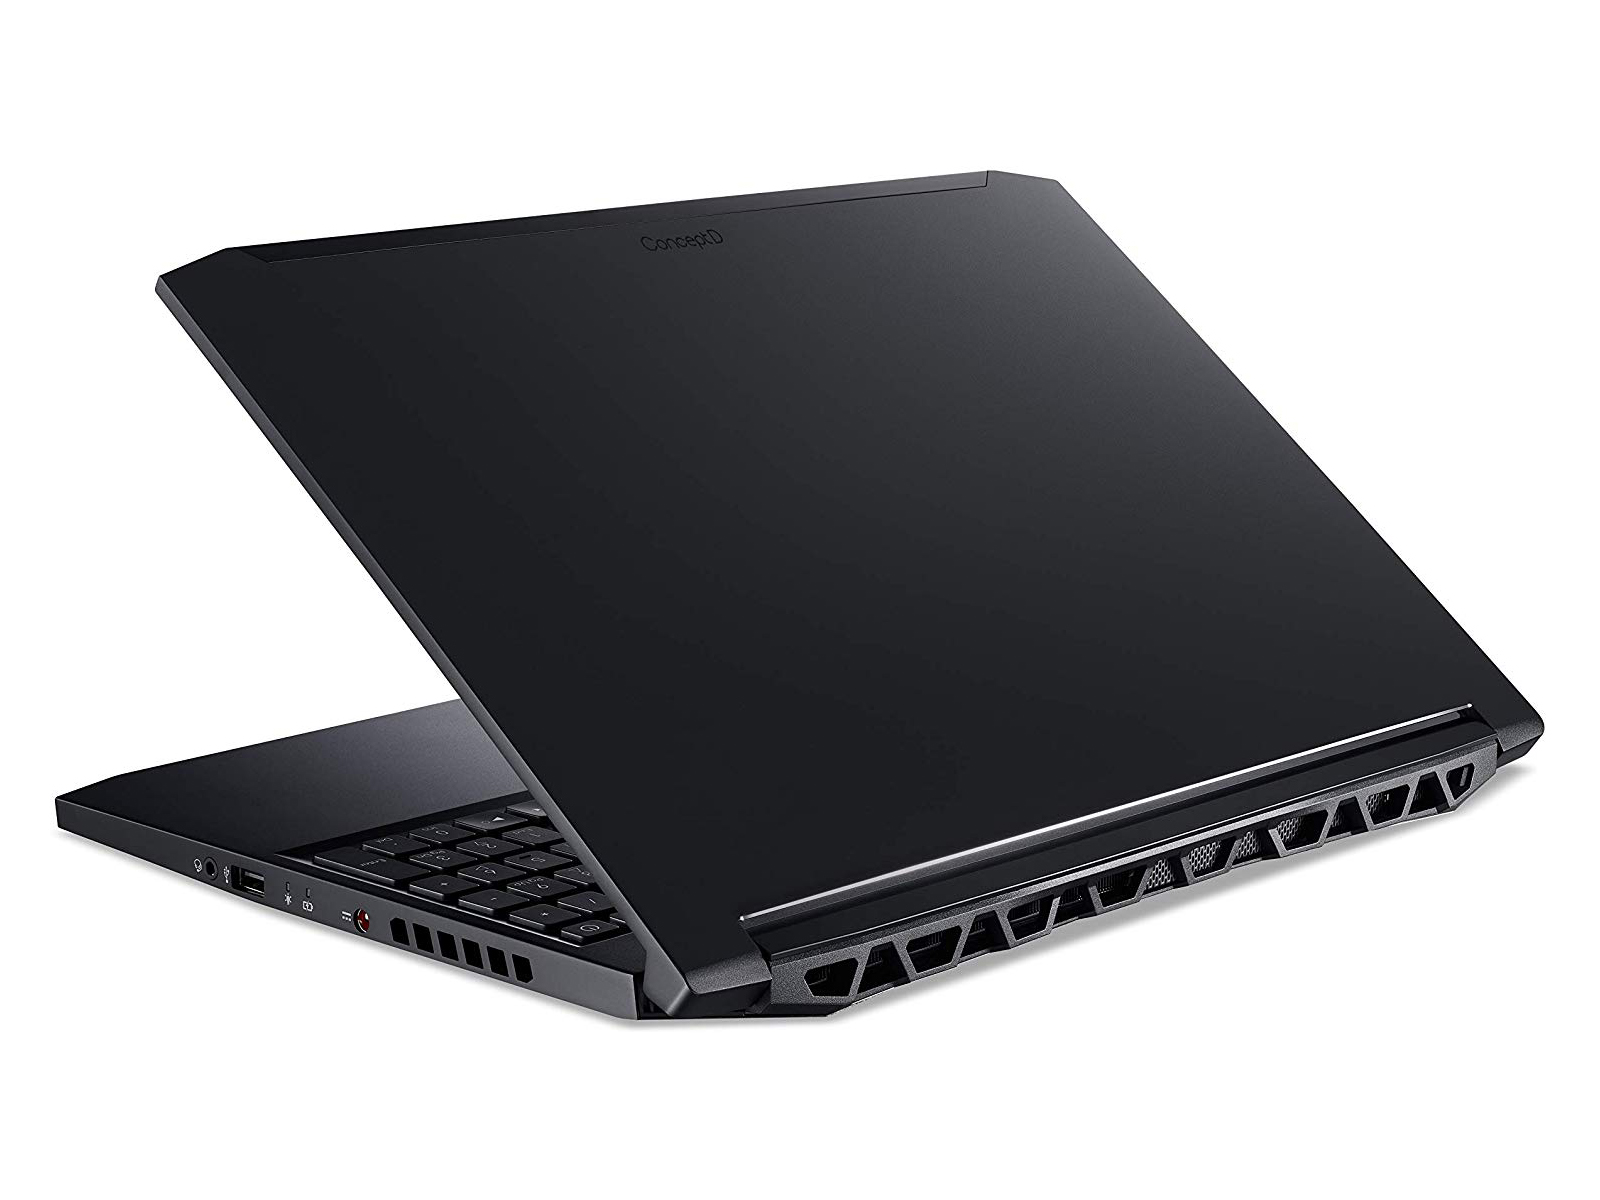
Case and Equipment - A hefty 2.8 kg (~6.2 lb)
With 2.8 kg (~6.2 lb), the heavy device brings a lot of weight to the scale, and the 600-gram (~1.3 lb) power supply does not improve things. The case offers a decent stiffness overall, but it is still some ways from perfection. It is an aluminum unibody case that is closed up by a plate on the bottom. The keyboard and ports stick out from the case. The lid is also made from this metal, and there is a plastic band on top for the WiFi antenna.
The smooth, metal surface feels comfortably cool, particularly during idle operation. The bottom plate can be removed, giving access to the two RAM slots, the WiFi module, and the SSD.
Acer uses Killer network cards: while the E2500 Gigabit Ethernet and the WiFi 6 AX1650x offer strong connection speeds, the test unit still does not place at the top for WiFi. Here, the Lenovo ThinkPad X1 Extreme is able to achieve more data throughput under equal test conditions, particularly during sending.
Real HDMI 2.0 and Mini DisplayPort 1.4 confirm the (limited) workstation ambitions of the ConceptD 5. Unfortunately, there is only a single USB Type-C connection (with DisplayPort 1.4), but on the other hand, two of the four USB ports support the Gen-3.2 standard. The lack of Thunderbolt 3 is incomprehensible for this price range, and the XPS 15, the MSI P65, and the Macbook Pro 15 naturally have it on board.
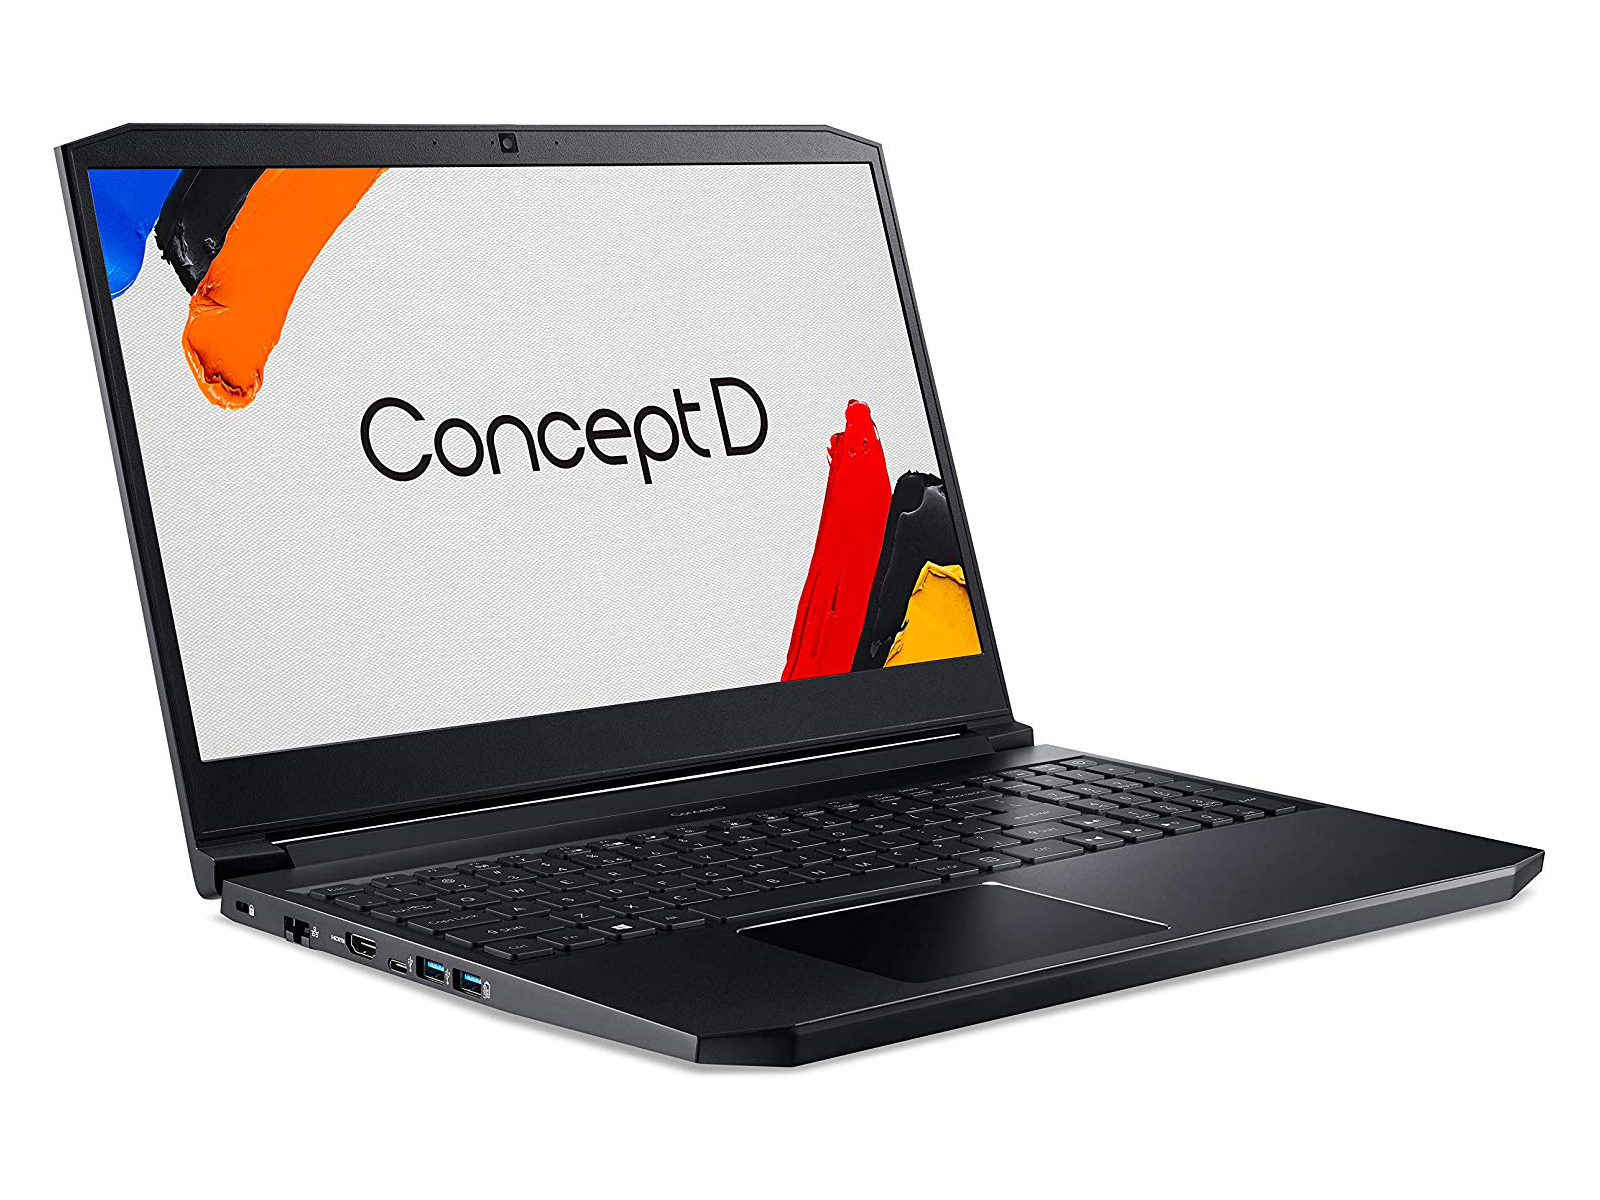
Connection Equipment


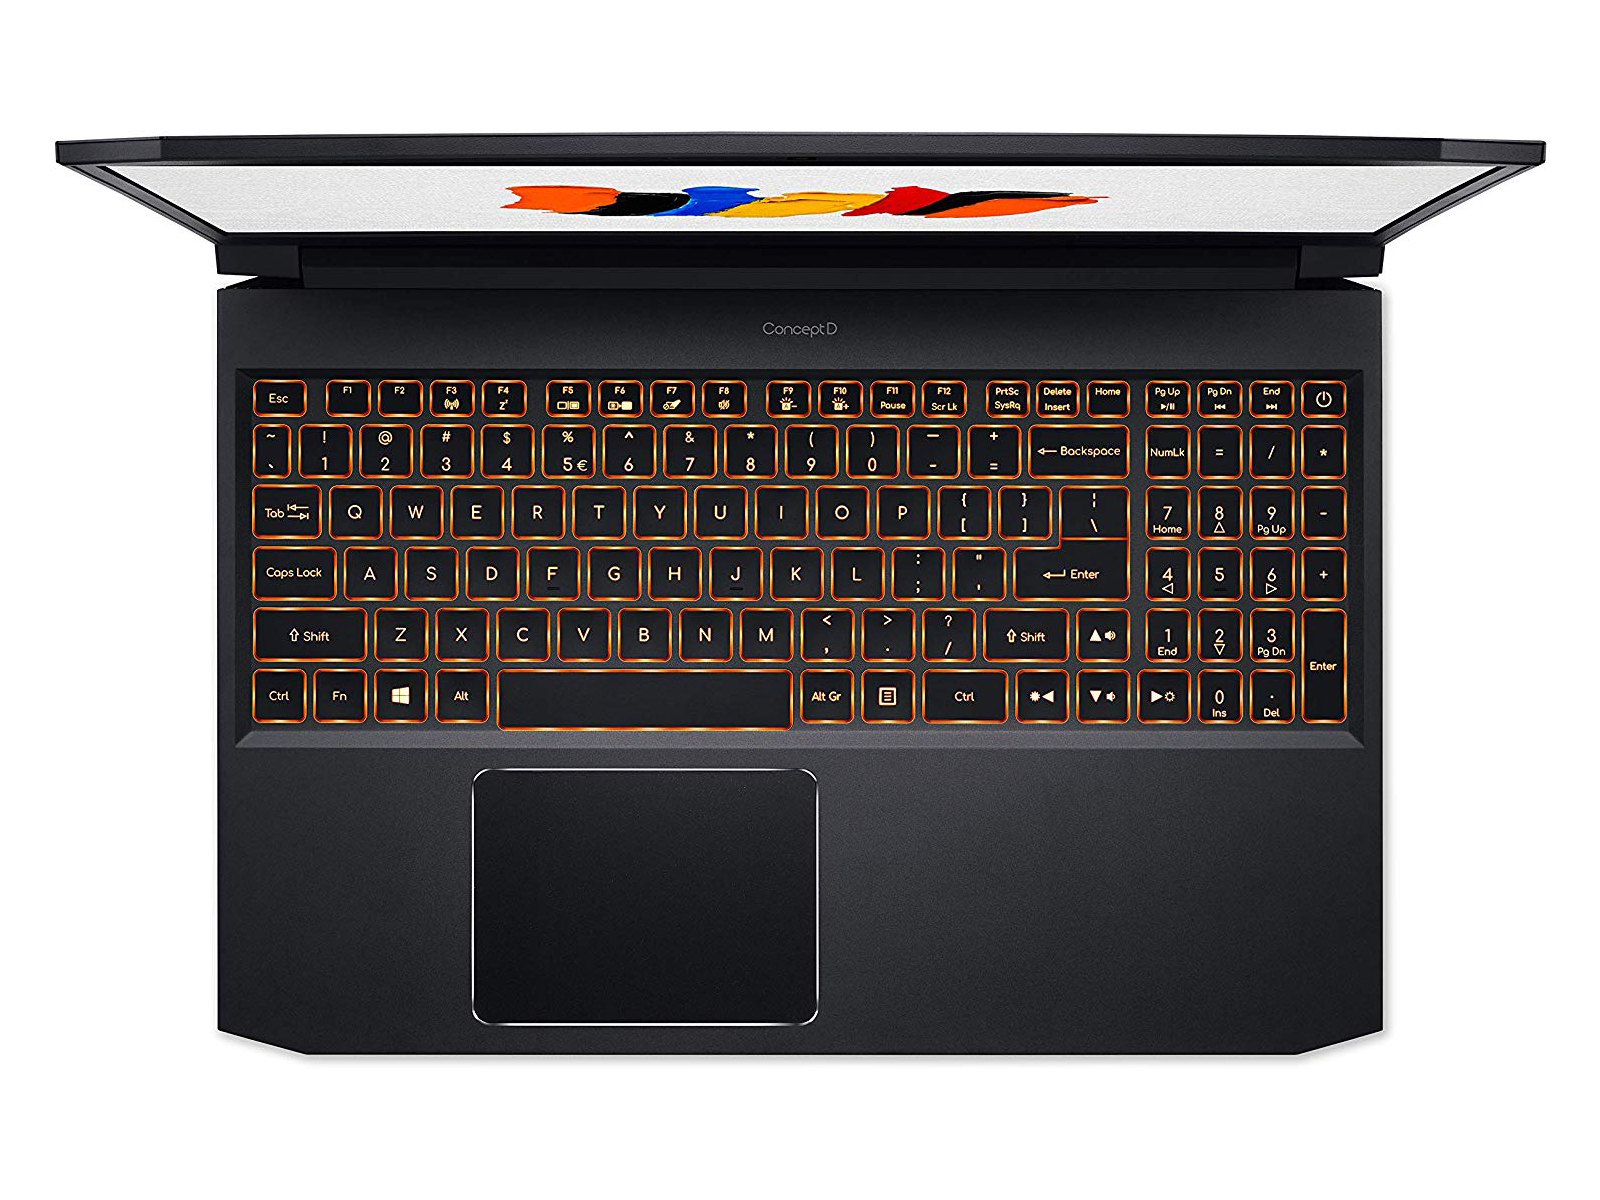
Input Devices - The ConceptD has small keys
The smooth keys with the rubber dome base impress with a crisp pressure point and a clear and solid stroke. The keys are easy to type on, and due to the large distances between the keys, typing tasks succeed easily. There is also a number block with smaller keys. Unfortunately, Acer does not make use of the full case width for a keyboard with larger keys. The way it is, the arrow keys seem to be squished between the Ctrl and Shift keys and the number block. Other keys such as the Enter and right Shift and Ctrl keys, could have been larger for more typing comfort.
While the 13 cm (5.1 in) wide ClickPad offers a smooth surface for sliding, moist fingers might stumble and not slide easily. There is a clear pressure point, but the stroke is very short and there is hardly any at all in the top third of the pad. The pad can be deactivated via function keys.
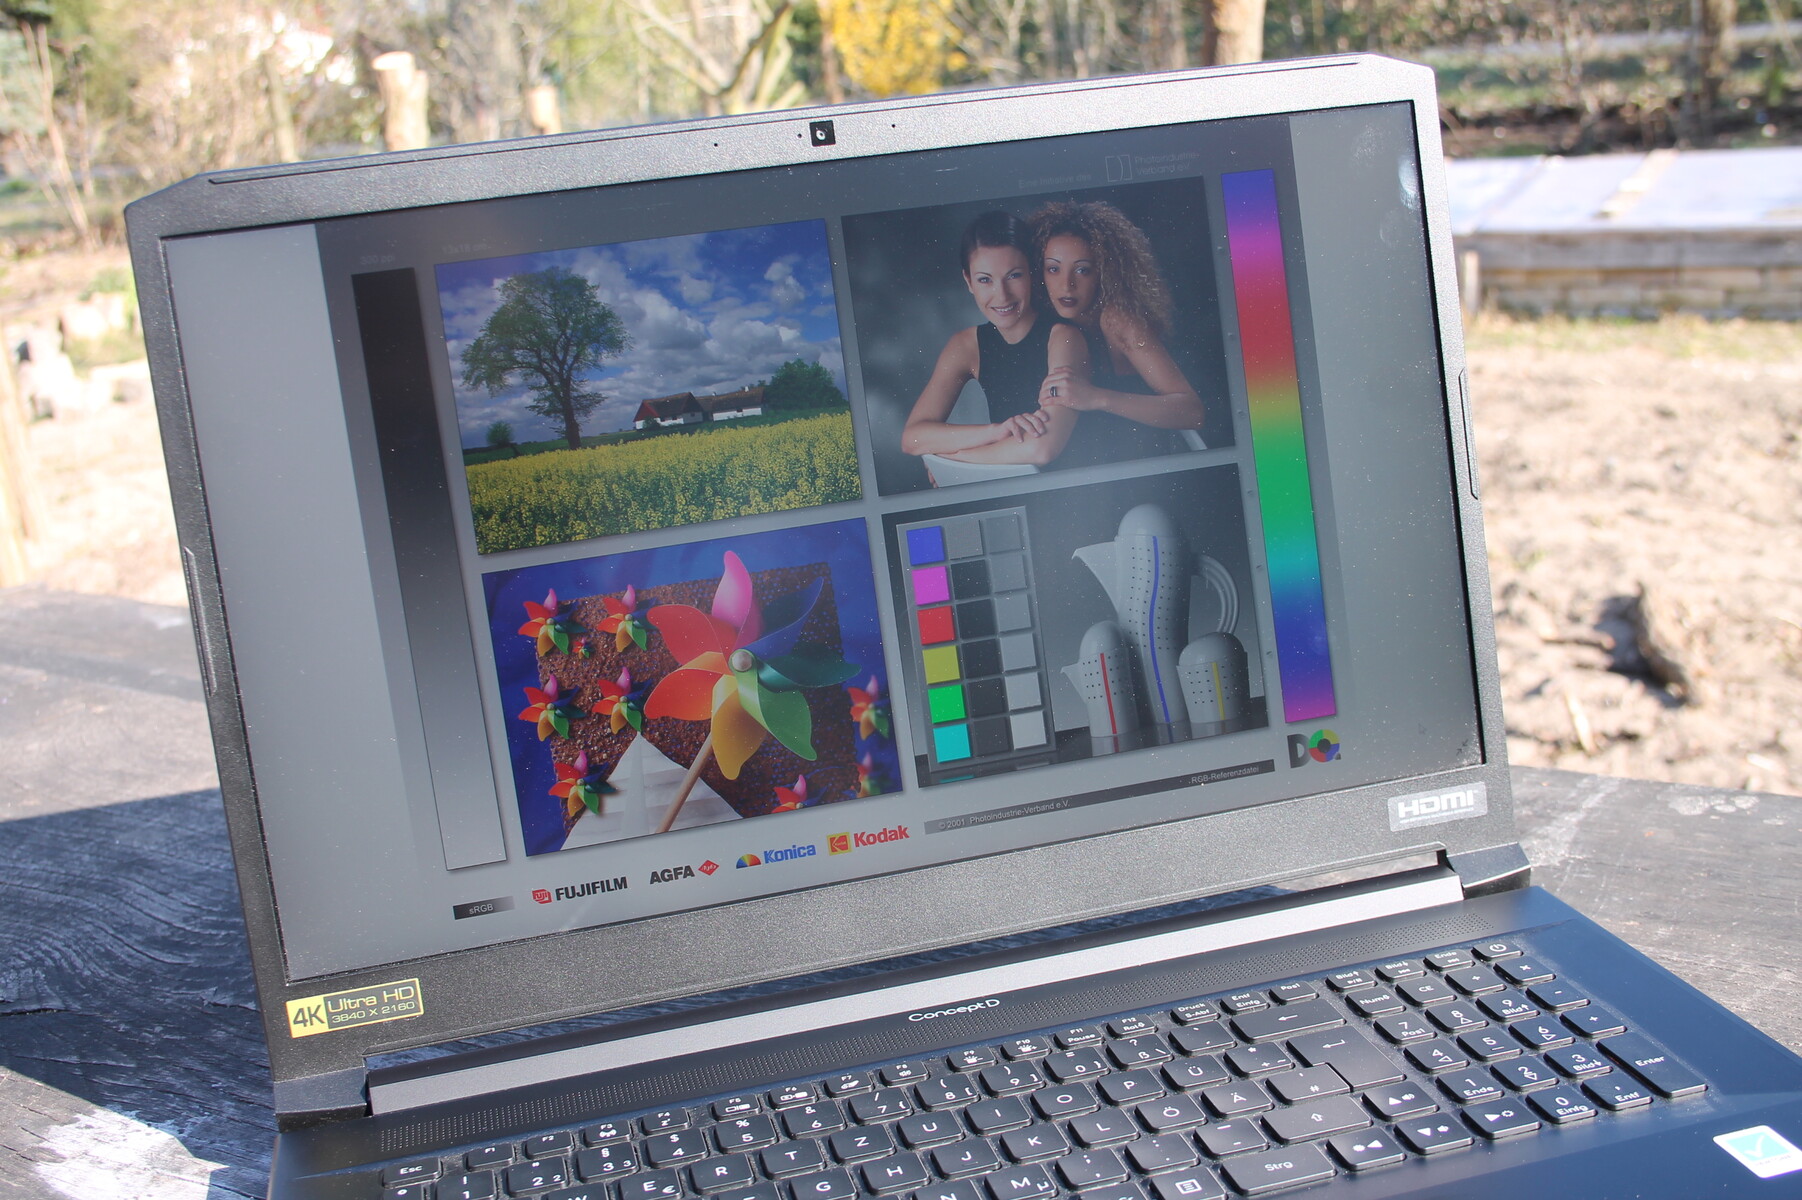
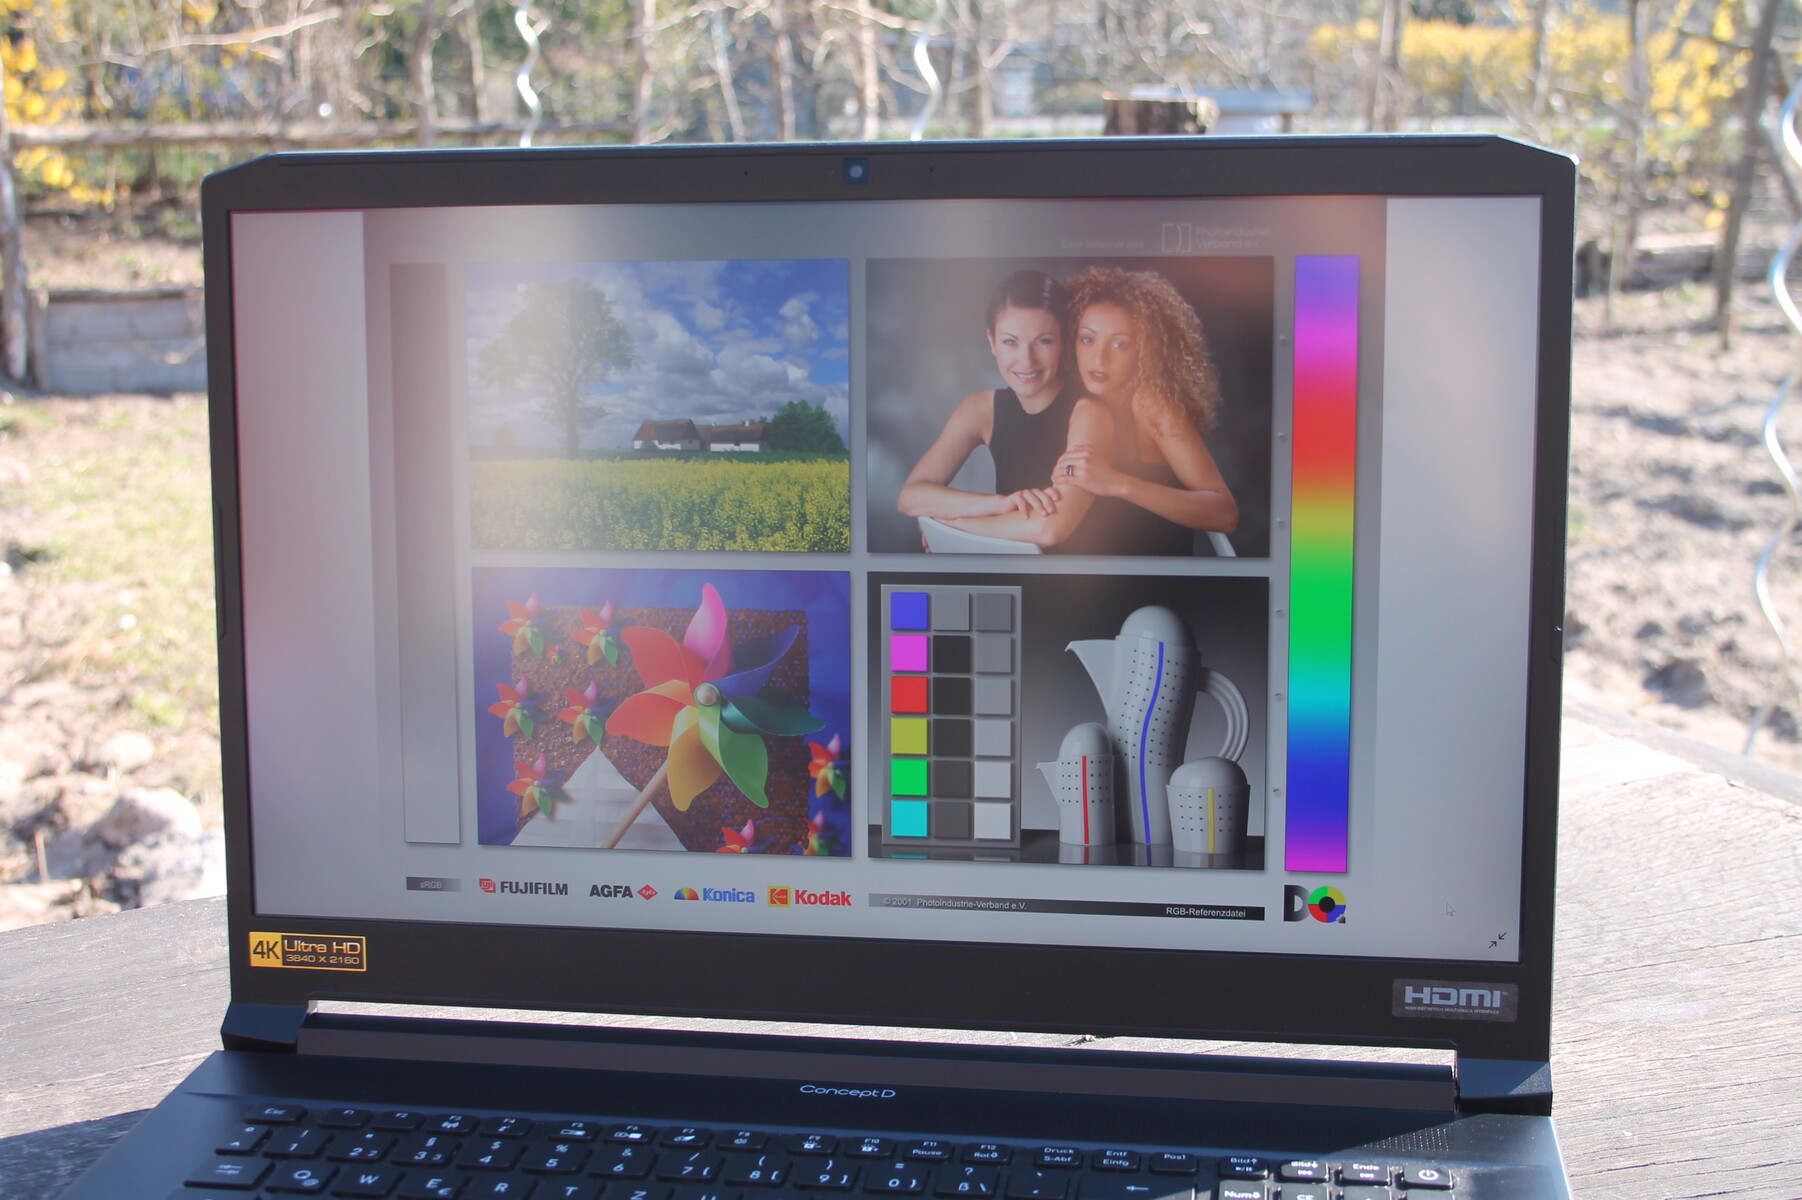
Display - A creative PC with 100% sRGB

The 17.3-inch display is a high-end 4K panel with 3840 x 2160 pixels. Although the frame rate is only 60 Hz, it has a non-reflective surface, its viewing angles are stable (IPS), and it covers 100% of the sRGB color space.
At 88%, the brightness distribution is fairly even, and we do not detect any halos or lighter spots in a black image. At 707:1, the contrast is not top of the line, but we have to give some credit for its high brightness. The response times of the AUO panel turn out very slow.
By the way, this is the same panel that is also used for the ConceptD 9, but there it is a touchscreen version that can also be operated with a Wacom pen.
| |||||||||||||||||||||||||
Brightness Distribution: 88 %
Center on Battery: 417 cd/m²
Contrast: 707:1 (Black: 0.58 cd/m²)
ΔE ColorChecker Calman: 1.91 | ∀{0.5-29.43 Ø4.71}
calibrated: 1.09
ΔE Greyscale Calman: 3 | ∀{0.09-98 Ø4.96}
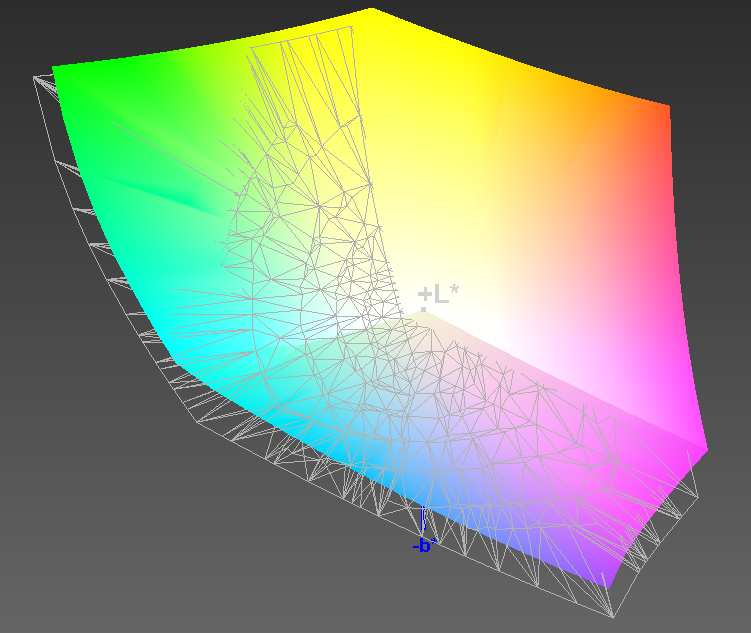
100% sRGB (Argyll 1.6.3 3D)
87% AdobeRGB 1998 (Argyll 1.6.3 3D)
99.1% AdobeRGB 1998 (Argyll 3D)
100% sRGB (Argyll 3D)
86.2% Display P3 (Argyll 3D)
Gamma: 2.18
CCT: 6338 K
| Acer ConceptD 5 CN517-71-74YA AUO B173ZAN03, IPS, 3840x2160, 17.3" | Dell XPS 15 7590 9980HK GTX 1650 Samsung 156WR04, SDCA029, OLED, 3840x2160, 15.6" | Lenovo ThinkPad X1 Extreme 2019 20QV000WGE NE156QUM-N66, IPS, 3840x2160, 15.6" | Apple MacBook Pro 15 2018 (2.6 GHz, 560X) APPA040, IPS, 2880x1800, 15.4" | MSI P65 Creator 9SF-657 AU Optronics AUO41EB, IPS, 3840x2160, 15.6" | |
|---|---|---|---|---|---|
| Display | -2% | -3% | 1% | -1% | |
| Display P3 Coverage (%) | 86.2 | 88.1 2% | 82 -5% | 98.7 15% | 84.4 -2% |
| sRGB Coverage (%) | 100 | 99.6 0% | 99.1 -1% | 99.9 0% | 100 0% |
| AdobeRGB 1998 Coverage (%) | 99.1 | 91.8 -7% | 96.9 -2% | 86.6 -13% | 98.5 -1% |
| Response Times | 95% | 18% | 20% | 13% | |
| Response Time Grey 50% / Grey 80% * (ms) | 55 ? | 2.3 ? 96% | 46.4 ? 16% | 43.2 ? 21% | 51 ? 7% |
| Response Time Black / White * (ms) | 38 ? | 2.4 ? 94% | 30.4 ? 20% | 31.2 ? 18% | 31 ? 18% |
| PWM Frequency (Hz) | 59.5 ? | 117000 ? | |||
| Screen | -44% | -21% | 40% | -20% | |
| Brightness middle (cd/m²) | 410 | 421.2 3% | 464 13% | 520 27% | 445 9% |
| Brightness (cd/m²) | 383 | 417 9% | 448 17% | 492 28% | 462 21% |
| Brightness Distribution (%) | 88 | 94 7% | 90 2% | 88 0% | 83 -6% |
| Black Level * (cd/m²) | 0.58 | 0.36 38% | 0.39 33% | 0.5 14% | |
| Contrast (:1) | 707 | 1289 82% | 1333 89% | 890 26% | |
| Colorchecker dE 2000 * | 1.91 | 6.06 -217% | 4.2 -120% | 1.2 37% | 4.75 -149% |
| Colorchecker dE 2000 max. * | 4.67 | 11.89 -155% | 11.4 -144% | 2.3 51% | 7.79 -67% |
| Colorchecker dE 2000 calibrated * | 1.09 | 0.8 27% | |||
| Greyscale dE 2000 * | 3 | 2.8 7% | 7.2 -140% | 1.3 57% | 4.49 -50% |
| Gamma | 2.18 101% | 2.15 102% | 2.17 101% | 2.18 101% | 2.49 88% |
| CCT | 6338 103% | 6235 104% | 6345 102% | 6738 96% | 7374 88% |
| Color Space (Percent of AdobeRGB 1998) (%) | 87 | 81 -7% | 85.2 -2% | 87 0% | |
| Color Space (Percent of sRGB) (%) | 100 | 99.6 0% | 99 -1% | 100 0% | |
| Total Average (Program / Settings) | 16% /
-13% | -2% /
-13% | 20% /
28% | -3% /
-12% |
* ... smaller is better
Display Response Times
| ↔ Response Time Black to White | ||
|---|---|---|
| 38 ms ... rise ↗ and fall ↘ combined | ↗ 22 ms rise | 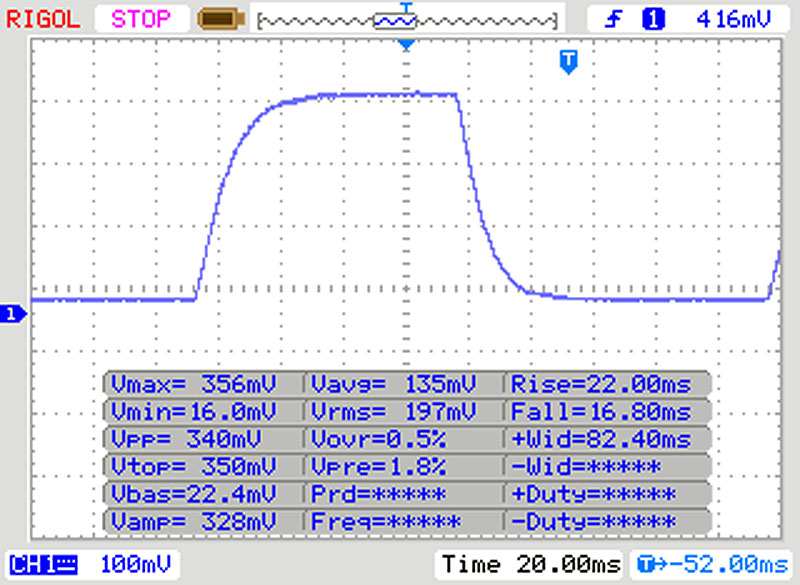 |
| ↘ 16 ms fall | ||
| The screen shows slow response rates in our tests and will be unsatisfactory for gamers. In comparison, all tested devices range from 0.1 (minimum) to 240 (maximum) ms. » 96 % of all devices are better. This means that the measured response time is worse than the average of all tested devices (19.8 ms). | ||
| ↔ Response Time 50% Grey to 80% Grey | ||
| 55 ms ... rise ↗ and fall ↘ combined | ↗ 29 ms rise | 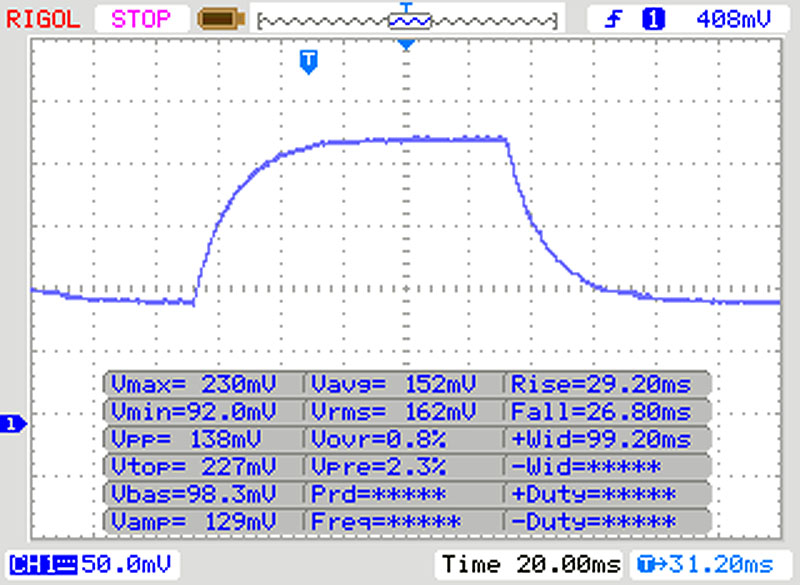 |
| ↘ 26 ms fall | ||
| The screen shows slow response rates in our tests and will be unsatisfactory for gamers. In comparison, all tested devices range from 0.165 (minimum) to 636 (maximum) ms. » 92 % of all devices are better. This means that the measured response time is worse than the average of all tested devices (30.9 ms). | ||
Screen Flickering / PWM (Pulse-Width Modulation)
| Screen flickering / PWM not detected | 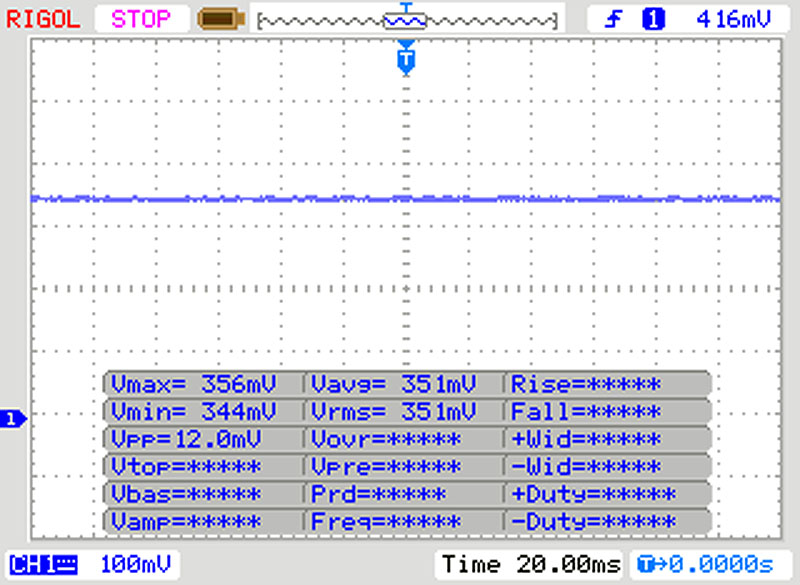 | ||
In comparison: 52 % of all tested devices do not use PWM to dim the display. If PWM was detected, an average of 7744 (minimum: 5 - maximum: 343500) Hz was measured. | |||
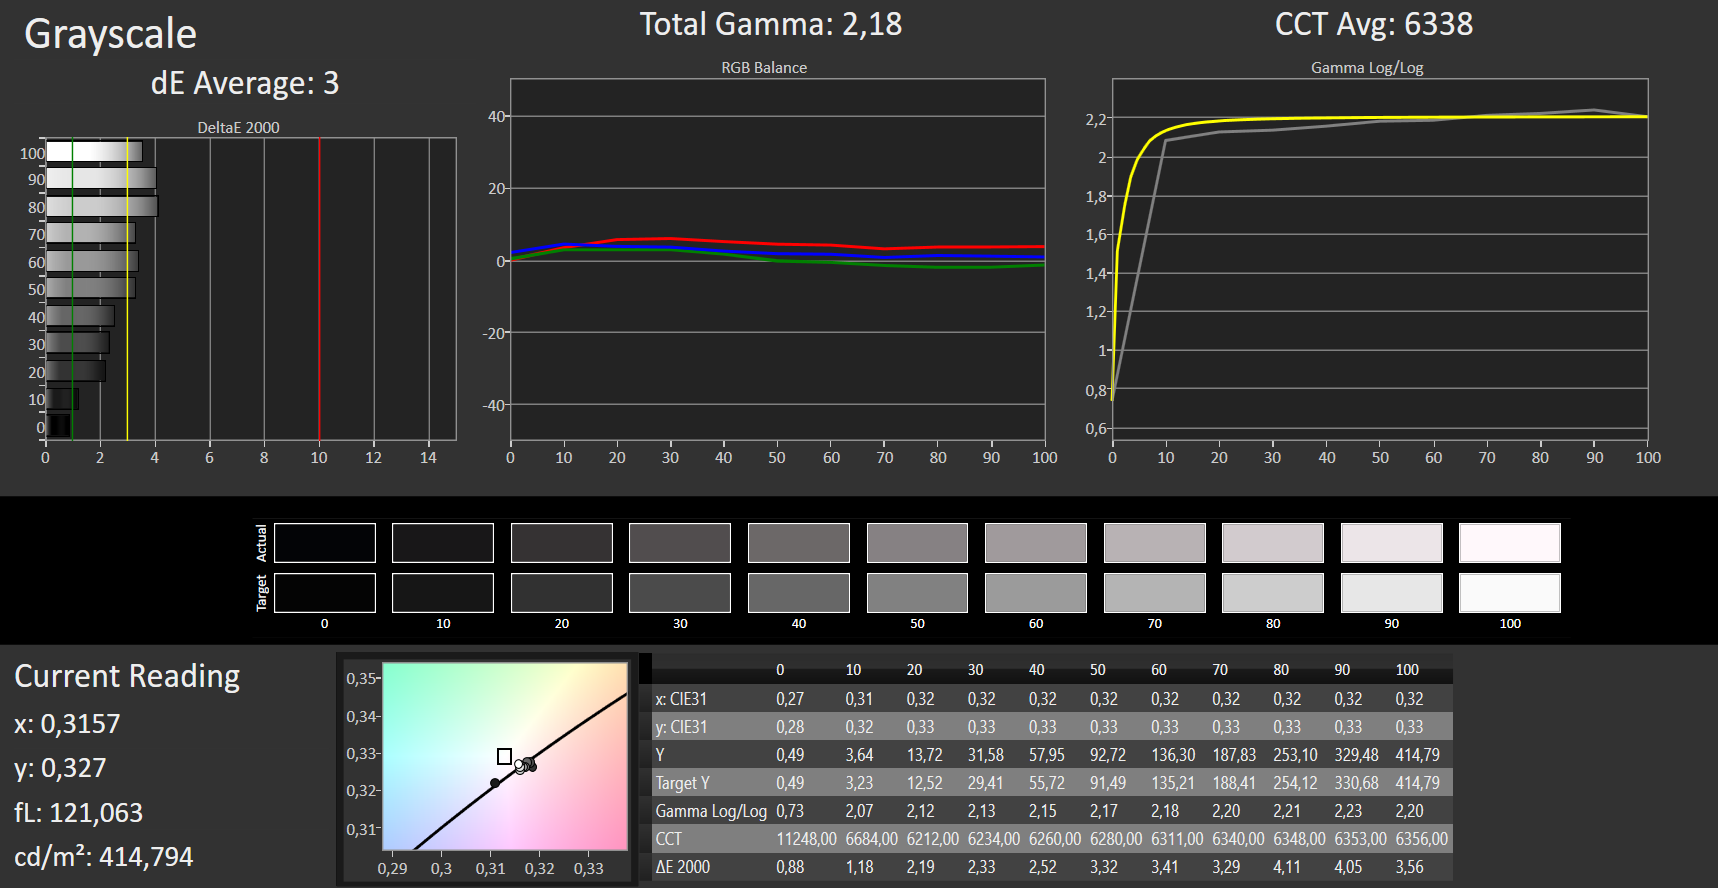

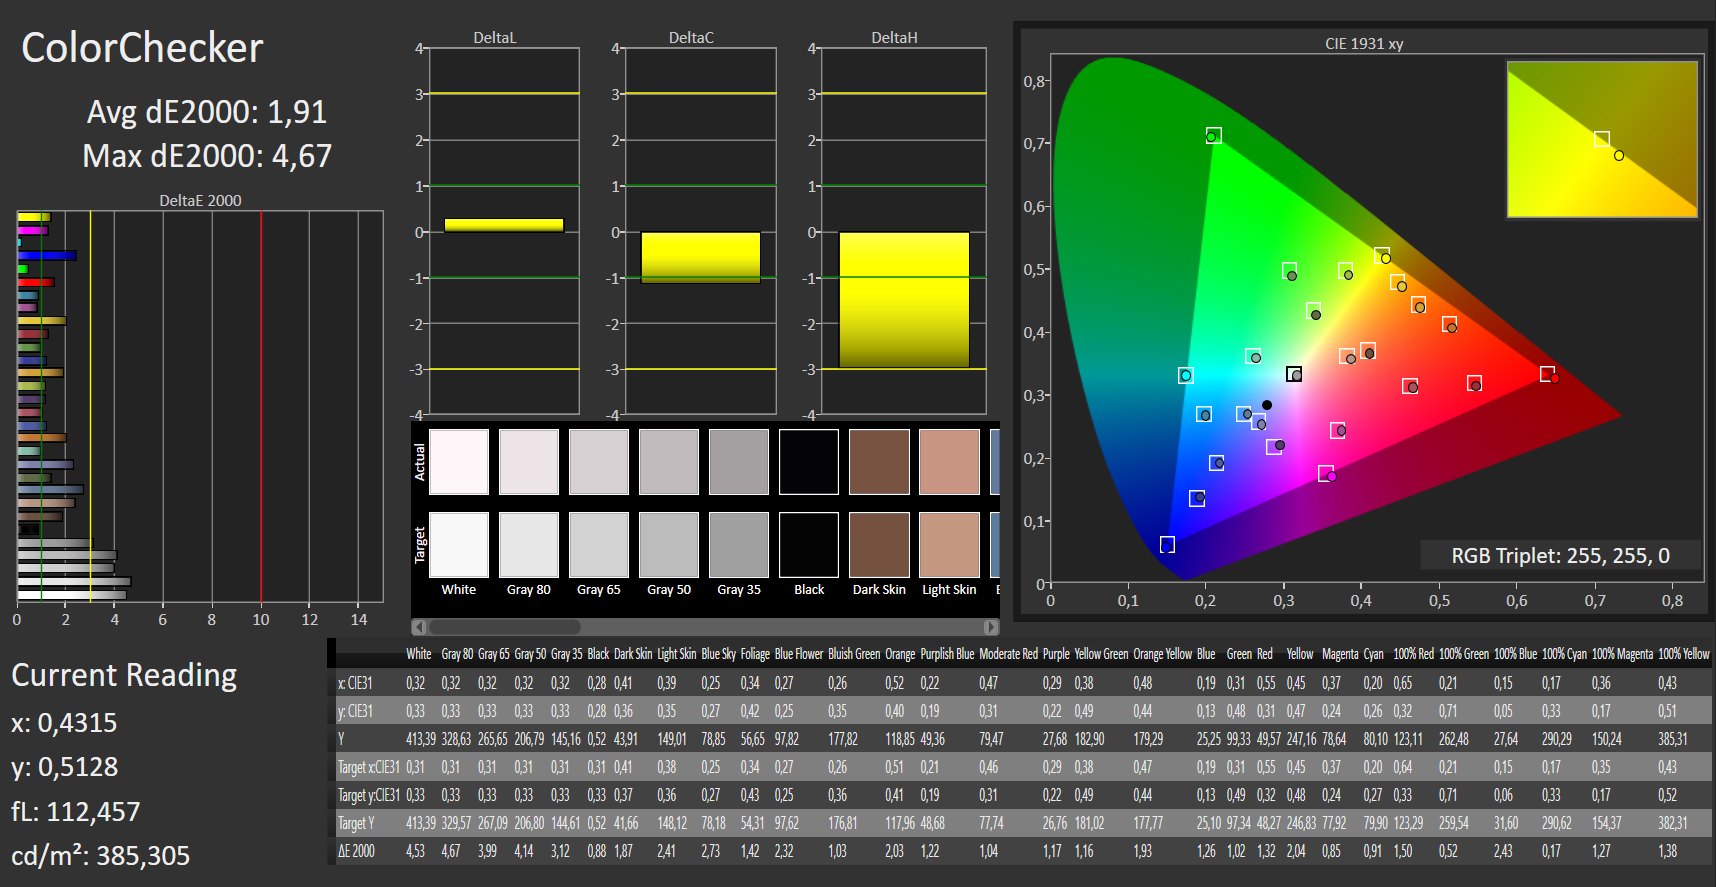
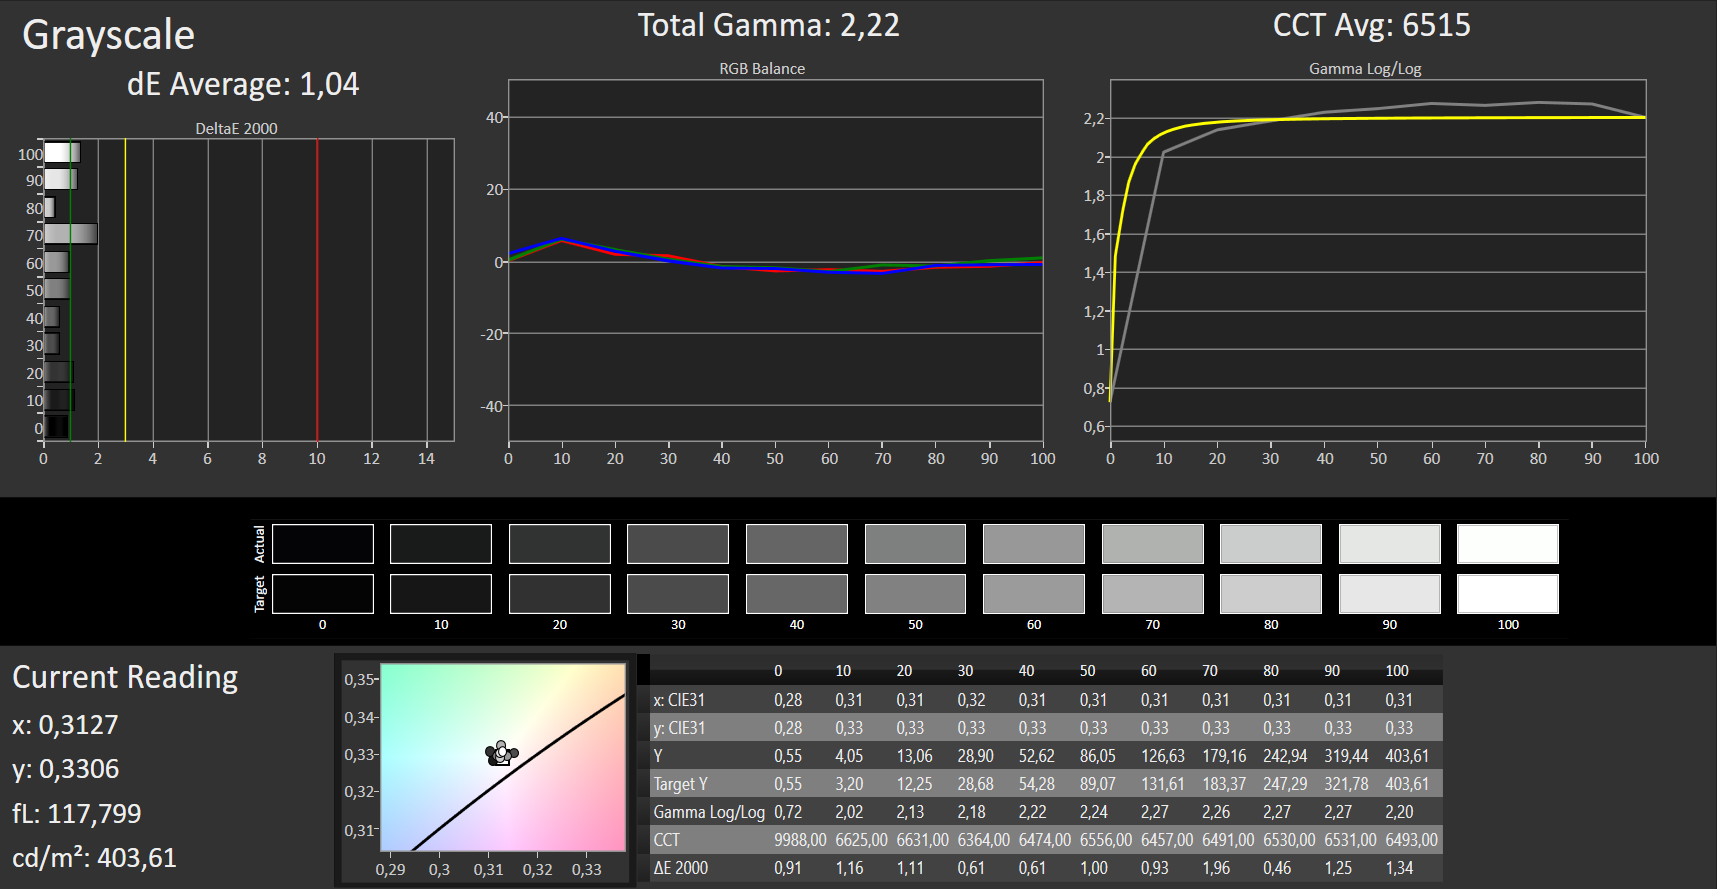
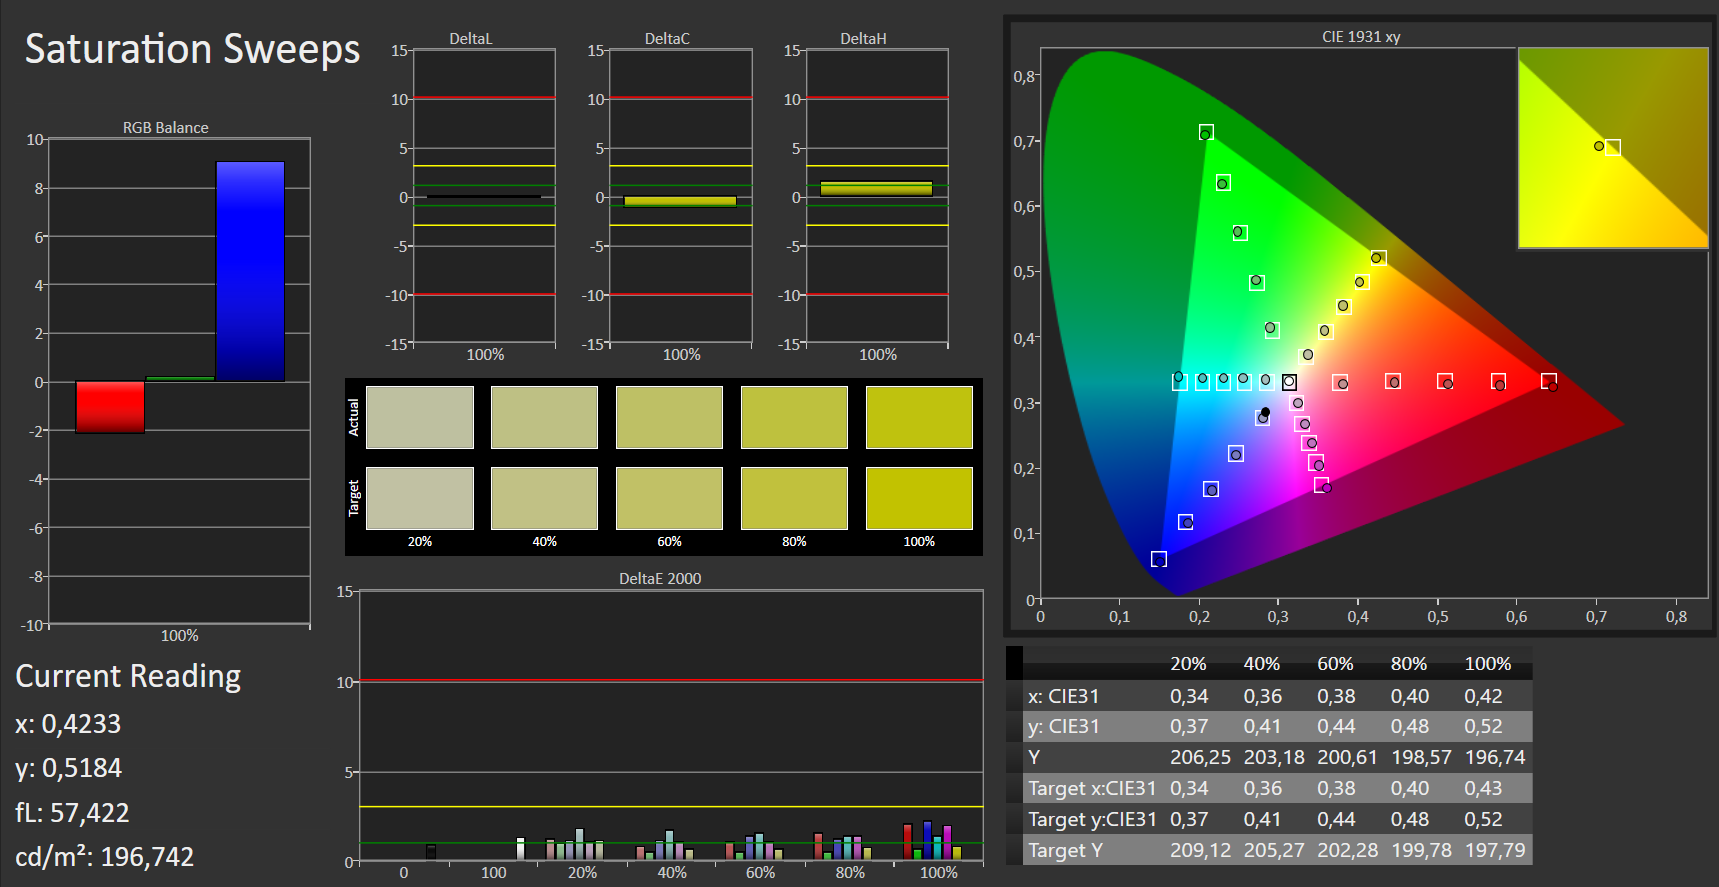


Using the AdobeRGB profile in the state of delivery, the Acer produces a Delta-E of 3 for the Grayscale, and of 1.9 for colors. While this is not a bad result, particularly since there is also no blue tint, it can be further improved via calibration. With this, the Delta-E drops to 1.0 for the colors and Grayscale similarly. This is therefore a panel with a high color accuracy, which corresponds to the Pantone validated (Delta-E <2) manufacturer specification – even though this is only after the calibration.
However, we do not see the advertised 100% AdobeRGB, but "only" 87%. The 17-incher is delivered with a color profile, and users can choose between Normal and AdobeRGB in the ConceptD color palette. We measured the colors under AdobeRGB in the state of delivery before the calibration.
Performance - An Acer with a hexa-core Turbo

Acer offers two models of its ConceptD 5 17-inch notebook: one with a GTX 1660Ti and one with an RTX 2060 (6GB GDDR6). The Intel Core i7-9750H (6x 2.60GHz) hexa-core processor is always included. With 32 GB of DDR4 RAM (2x 16 GB), our test unit has the maximum amount of RAM. There are two differences between the 17-inch and the 15-inch ConceptD: The 15-incher offers only 16 GB RAM and a GTX 1660Ti at most.
The Acer 17-inch notebook is targeted at creative professionals who want to be productive with powerful software such as Adobe Premiere and Photoshop. For this reason, the manufacturer also offers configurations with an ISV certification (Independent Software Vendors).
Processor
The Intel Core i7-9750H has a basic clock speed of 2.6 GHz, and all six cores should also be able to run at Turbo speed, which is even up to 4.5 GHz for the single or dual-core Turbo. Under the single-core load in Cinebench, we are seeing up to 4.4 GHz, but the average is around 3.7 GHz. When all the cores are running simultaneously, the clock speed is 6x 2.6 GHz.
The R15 loop shows the enormous performance difference between the i9-9980HK (Dell XPS, Lenovo TP X1 Extreme, Macbook Pro 15) and our Core i7-9750H. Even though the performance only drops by 3% under constant load, the amount of points are between 20 and 40% below those of the HK processors. However, the reason for this is not any limitation of the CPU (TDPc), and the power limit of our test unit is 45 watts. It never goes below the basic clock speed, so there is no throttling.
A glance at the competitors shows that the hexa-core processor is almost at the same level as the i9-9880H and i9-9980HK in the single-core comparison, and the differences are only marginal here. However, the Core i9-9980HK octa-core SoC uses its full advantage in the multi-core comparison, where it moves ahead by 20 to 40%. Eight cores also means sixteen virtual cores who can compute a Cinebench run blazingly fast.
System Performance
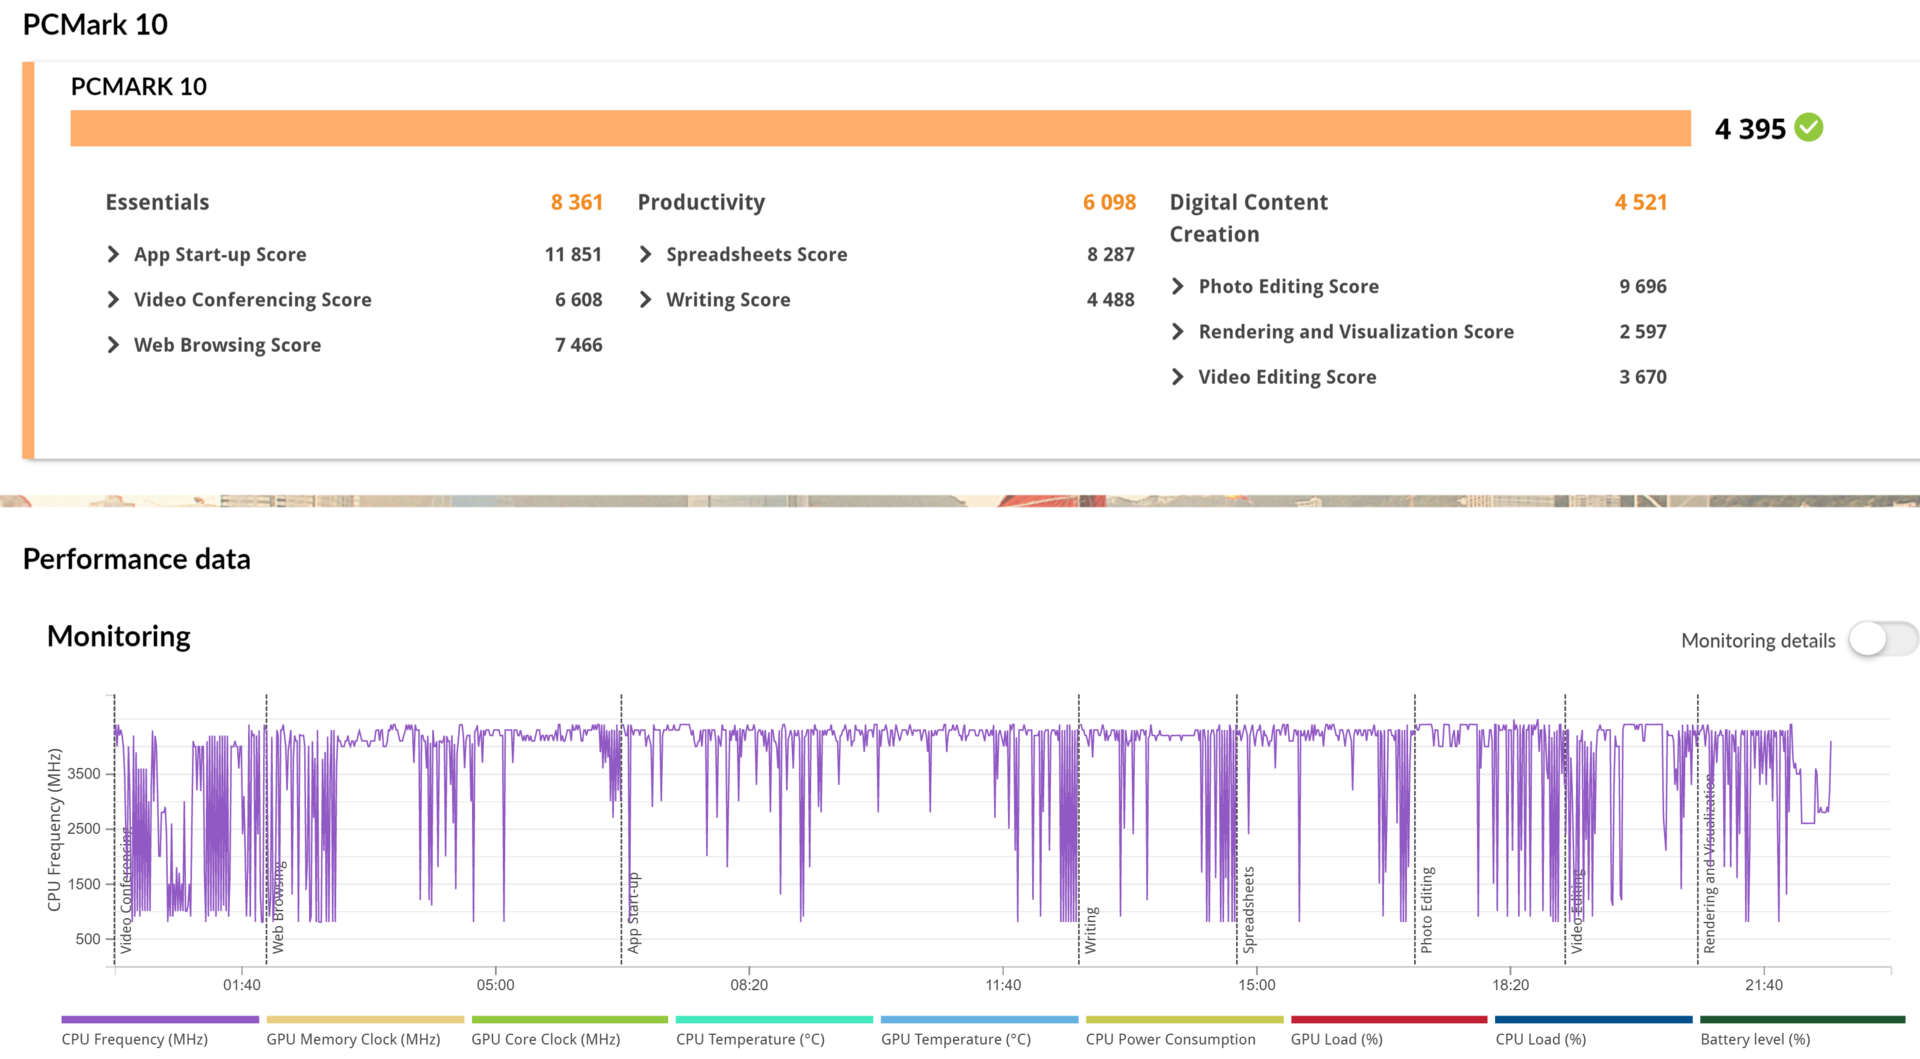
In the PCMark 10 scores, the competitors are 15, 30, or even 60% ahead of the Acer. For example, in the Digital Content Creation test, the MSI P65 Creator 9SF-657 moves ahead, which might be due to its combination of two SSDs, and the Dell XPS 15 7590 9980HK also does not need to hide with its advantage of 35%. Apparently, the PCMark rewards the multi-core capabilities of the octa-core competitors in all the sub scores.
Storage Solution
Although the 1-Terrabyte Western Digital storage is by no means slow, its speed is leisurely compared to the competitors. While it is among the top for sequential writes, it places last during 4K read and writes. Overall, the Samsung SSDs from the Lenovo and Dell 15 offer an up to 18% better performance. On the other hand, the Toshiba XG6 in the Dell XPS has to be content with being left behind.
| Acer ConceptD 5 CN517-71-74YA WDC PC SN720 SDAQNTW-1T00 | Dell XPS 15 7590 9980HK GTX 1650 Toshiba XG6 KXG60ZNV1T02 | Lenovo ThinkPad X1 Extreme 2019 20QV000WGE Samsung SSD PM981 MZVLB512HAJQ | MSI P65 Creator 9SF-657 2x Samsung SSD PM981 MZVLB512HAJQ (RAID 0) | Average WDC PC SN720 SDAQNTW-1T00 | Average of class Multimedia | |
|---|---|---|---|---|---|---|
| CrystalDiskMark 5.2 / 6 | 11% | 21% | 37% | 25% | 64% | |
| Write 4K (MB/s) | 92.3 | 104.3 13% | 148.1 60% | 105.6 14% | 168.6 ? 83% | 166.3 ? 80% |
| Read 4K (MB/s) | 40.12 | 45.23 13% | 47.31 18% | 46.32 15% | 47.6 ? 19% | 68.5 ? 71% |
| Write Seq (MB/s) | 2466 | 1729 -30% | 1414 -43% | 2910 18% | 2602 ? 6% | 2667 ? 8% |
| Read Seq (MB/s) | 1983 | 1861 -6% | 1320 -33% | 2820 42% | 2084 ? 5% | 3134 ? 58% |
| Write 4K Q32T1 (MB/s) | 249.9 | 509 104% | 493.6 98% | 545 118% | 391 ? 56% | 468 ? 87% |
| Read 4K Q32T1 (MB/s) | 375.6 | 388.5 3% | 594 58% | 632 68% | 481 ? 28% | 587 ? 56% |
| Write Seq Q32T1 (MB/s) | 2791 | 2813 1% | 2970 6% | 3349 20% | 2792 ? 0% | 4667 ? 67% |
| Read Seq Q32T1 (MB/s) | 3253 | 2906 -11% | 3472 7% | 3333 2% | 3377 ? 4% | 5884 ? 81% |
| AS SSD | -18% | 9% | -1% | 4% | 19% | |
| Seq Read (MB/s) | 2827 | 1723 -39% | 2352 -17% | 2860 1% | 2873 ? 2% | 4507 ? 59% |
| Seq Write (MB/s) | 2224 | 1386 -38% | 2106 -5% | 2604 17% | 2463 ? 11% | 3049 ? 37% |
| 4K Read (MB/s) | 40.67 | 43.25 6% | 55 35% | 45.15 11% | 38 ? -7% | 62.1 ? 53% |
| 4K Write (MB/s) | 99.6 | 98.3 -1% | 138.1 39% | 100.2 1% | 138.2 ? 39% | 184.7 ? 85% |
| 4K-64 Read (MB/s) | 1603 | 1078 -33% | 1265 -21% | 1428 -11% | 1559 ? -3% | 1094 ? -32% |
| 4K-64 Write (MB/s) | 1515 | 1456 -4% | 1952 29% | 1401 -8% | 1335 ? -12% | 2218 ? 46% |
| Access Time Read * (ms) | 0.05 | 0.053 | 0.049 | 0.081 ? | 0.06235 ? | |
| Access Time Write * (ms) | 0.037 | 0.039 -5% | 0.027 27% | 0.037 -0% | 0.03067 ? 17% | 0.07359 ? -99% |
| Score Read (Points) | 1926 | 1294 -33% | 1556 -19% | 1759 -9% | 1884 ? -2% | 1607 ? -17% |
| Score Write (Points) | 1837 | 1693 -8% | 2301 25% | 1762 -4% | 1719 ? -6% | 2707 ? 47% |
| Score Total (Points) | 4716 | 3638 -23% | 4650 -1% | 4411 -6% | 4544 ? -4% | 5075 ? 8% |
| Copy ISO MB/s (MB/s) | 3182 | 2212 ? | 2850 ? | |||
| Copy Program MB/s (MB/s) | 984 | 537 ? | 839 ? | |||
| Copy Game MB/s (MB/s) | 1824 | 1335 ? | 1669 ? | |||
| Total Average (Program / Settings) | -4% /
-5% | 15% /
15% | 18% /
16% | 15% /
13% | 42% /
39% |
* ... smaller is better

Graphics Card
The GeForce RTX 2060 rocks in the 3DMark. In the Fire Strike Graphics, it almost reaches the RTX 2070 Max-Q of the MSI P65 Creator. However, this should be expected, since the average Nvidia GeForce RTX 2060 is still 3% faster. Anyways, the GeForce GTX 1650 competitors are left in the dust, only reaching about half the amount of points.
| 3DMark Fire Strike Score | 13933 points | |
Help | ||
Gaming Performance
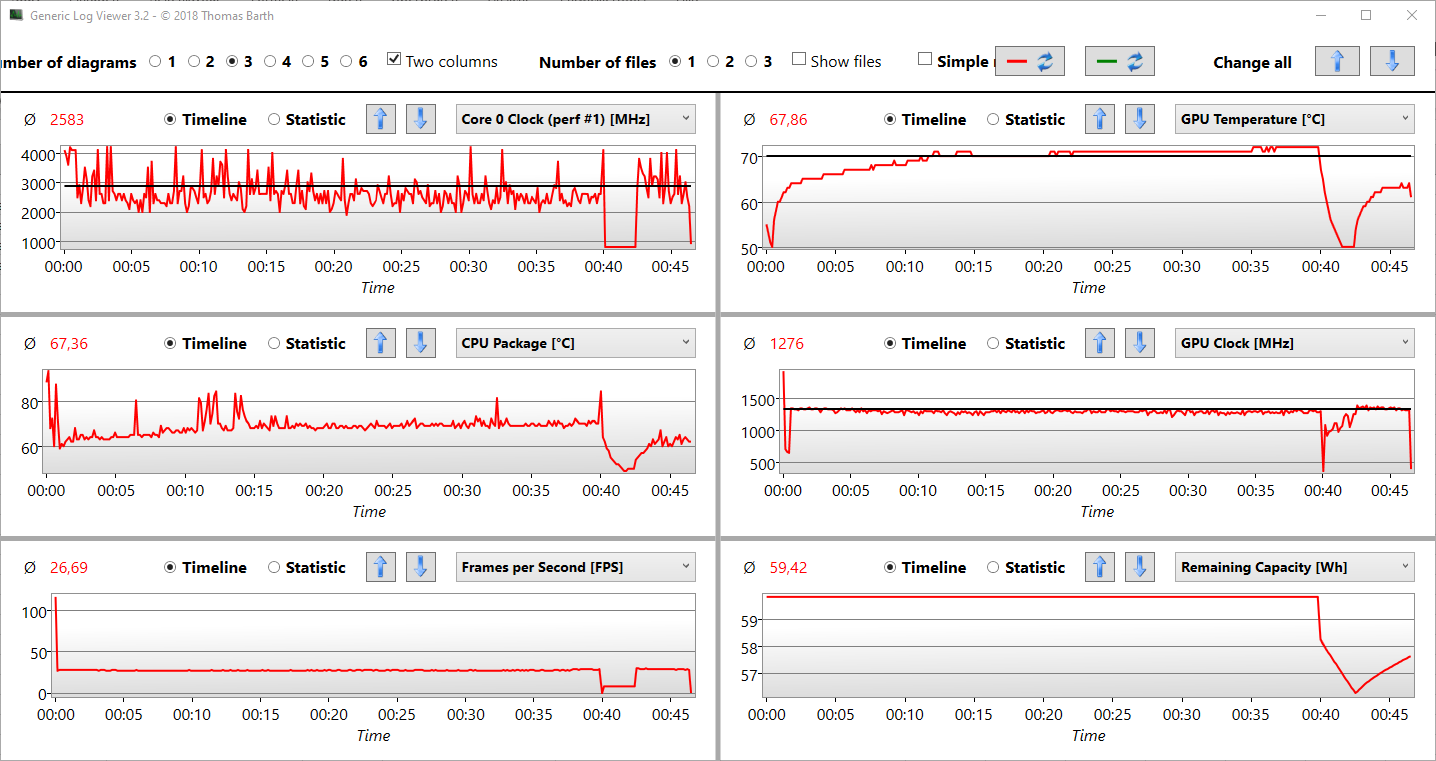
The current games pose no problem for the GeForce RTX 2060, as long as you forgo the 4K resolutions. The slightly aged "Witcher 3 (2015)" runs at a steady 28 fps in this maximum setting with HBAO+ and Hairworks activated. The chart below shows "Witcher 3 Ultra" in Full HD resolution.
The analysis shows stable GPU clock speeds at almost 1300 MHz. At around 40 minutes, they briefly dropped, since we pulled the plug and the game ran in battery operation. However, after several minutes, the clock speed stabilizes at its previous level, offering 28 fps again ("Witcher 3," 4K Ultra settings).
Among the competitors, only the MSI P65 Creator with the more powerful RTX 2070 Max-Q is able to keep up here, reaching 40 to 50% higher fps ("Witcher 3"). The GeForce GTX 1650 models remain significantly behind, and their limit of fps that are still playable are at Full HD resolution.
So while the Acer ConceptD 5 CN517 surely is a notebook that should also make gamers happy, you will only rarely be able to play current games at 4K settings. Which games will run on the GeForce RTX 2060? Our games list will show you the answer.
| The Witcher 3 | |
| 1920x1080 High Graphics & Postprocessing (Nvidia HairWorks Off) | |
| MSI P65 Creator 9SF-657 | |
| Average NVIDIA GeForce RTX 2060 Mobile (74.4 - 131, n=33) | |
| Acer ConceptD 5 CN517-71-74YA | |
| Average of class Multimedia (22 - 157, n=5, last 2 years) | |
| Dell XPS 15 7590 9980HK GTX 1650 | |
| Lenovo ThinkPad X1 Extreme 2019 20QV000WGE | |
| 1920x1080 Ultra Graphics & Postprocessing (HBAO+) | |
| MSI P65 Creator 9SF-657 | |
| Average NVIDIA GeForce RTX 2060 Mobile (50.6 - 74, n=40) | |
| Acer ConceptD 5 CN517-71-74YA | |
| Average of class Multimedia (11 - 107, n=5, last 2 years) | |
| Dell XPS 15 7590 9980HK GTX 1650 | |
| Lenovo ThinkPad X1 Extreme 2019 20QV000WGE | |
| Apple MacBook Pro 15 2019 i9 Vega 20 | |
| low | med. | high | ultra | 4K | |
|---|---|---|---|---|---|
| The Witcher 3 (2015) | 74.4 | 57.3 | 30.4 | ||
| Dota 2 Reborn (2015) | 145 | 134 | 128 | 109 | |
| X-Plane 11.11 (2018) | 107 | 87 | 75.6 |
Emissions and Power Management
Noise Emissions
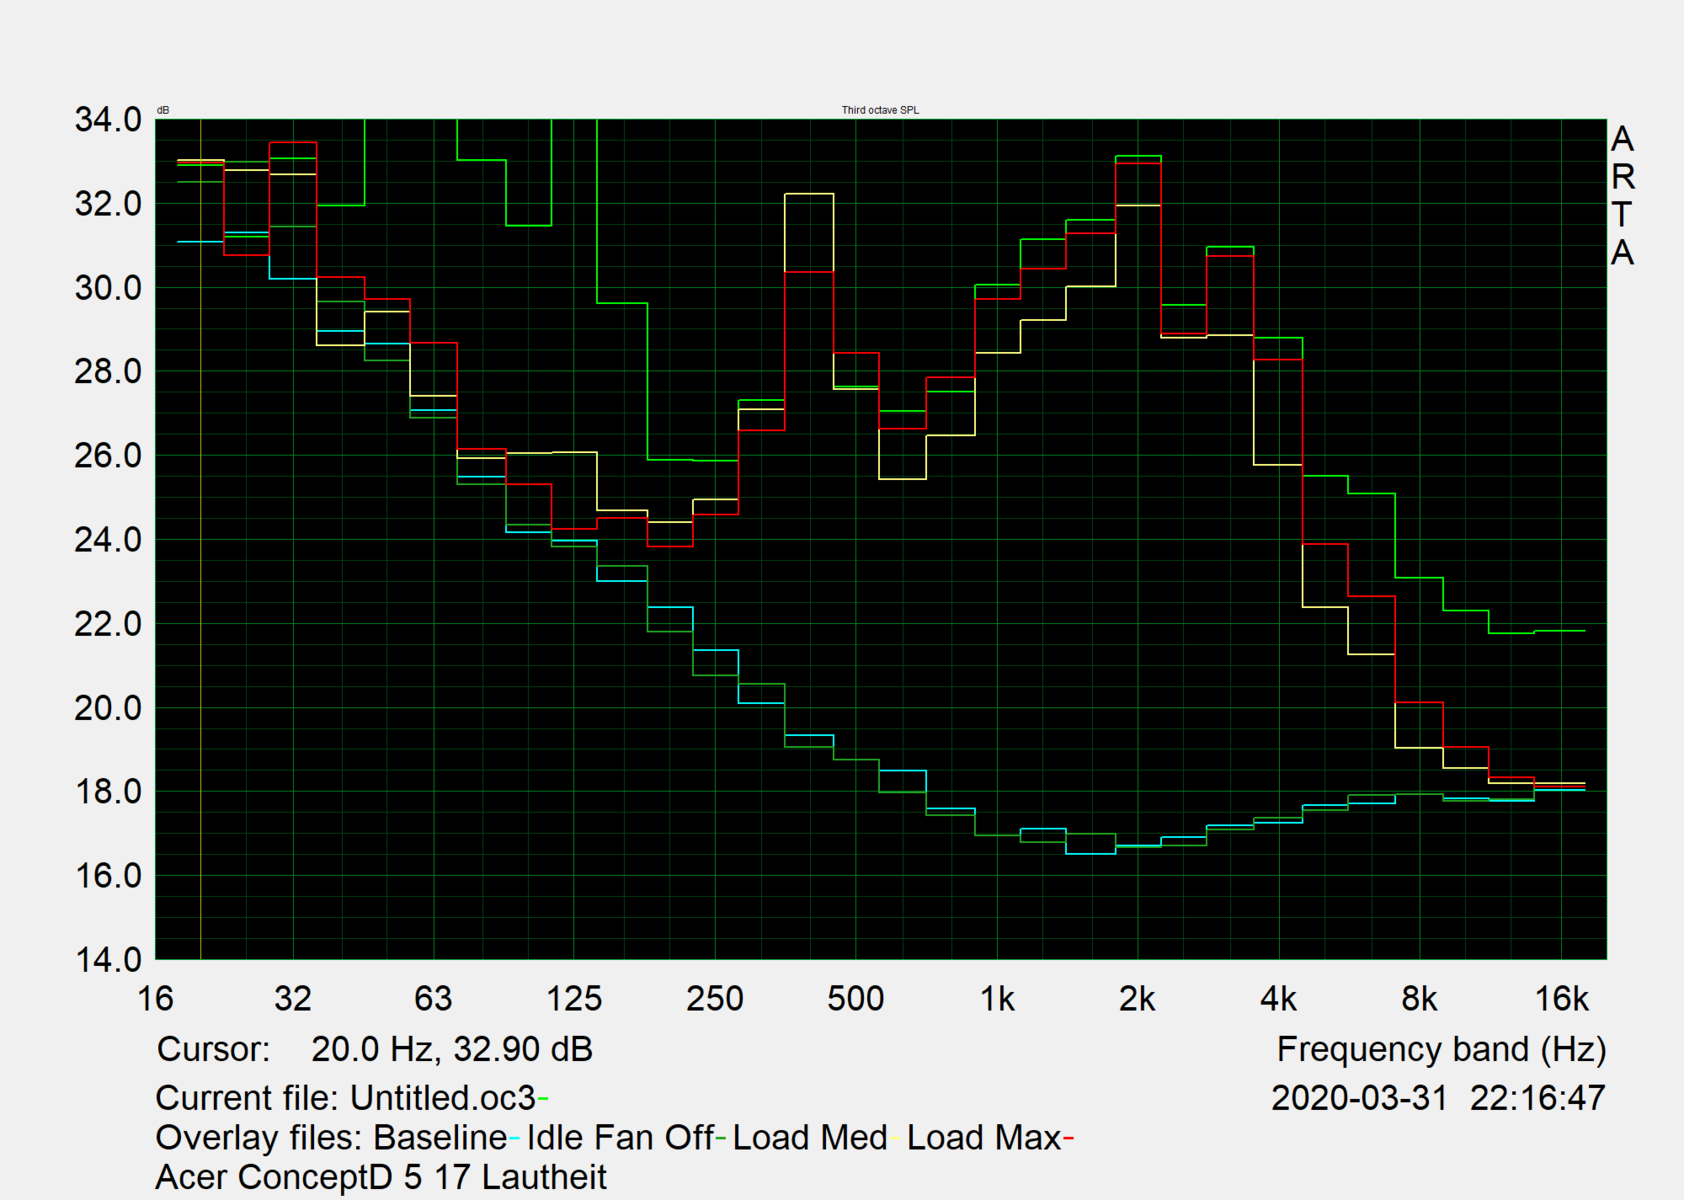
We are experiencing a notebook that is extremely quiet during idle operation, with the fans remaining turned off consistently. But this changes when playing YouTube videos, for example, and the running fans become very noticeable.
However, while rendering or gaming, this becomes a loud racket, with the double fans revving up to a maximum of 41 dB(A). It will then hardly matter whether you are running 3DMark or playing a current game, since 40 to 41 dB(A) are the standard noise level when running the ConceptD 5.
Noise level
| Idle |
| 29.7 / 29.7 / 29.7 dB(A) |
| Load |
| 39.9 / 41 dB(A) |
 | ||
30 dB silent 40 dB(A) audible 50 dB(A) loud |
||
min: | ||
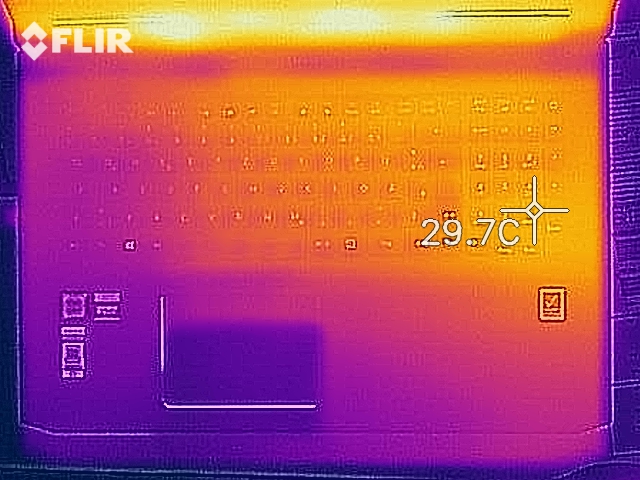
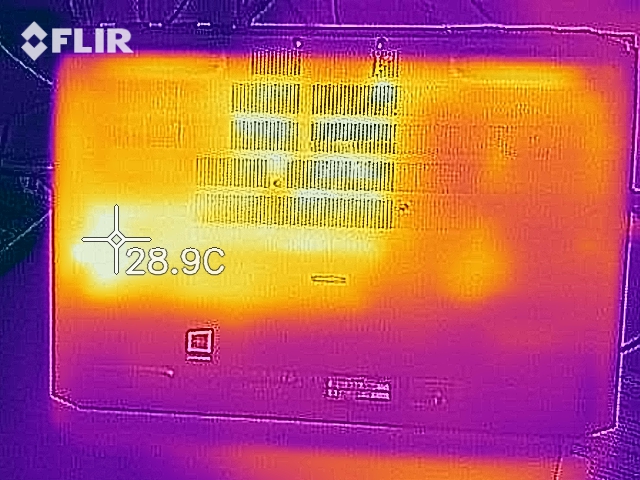
Temperature
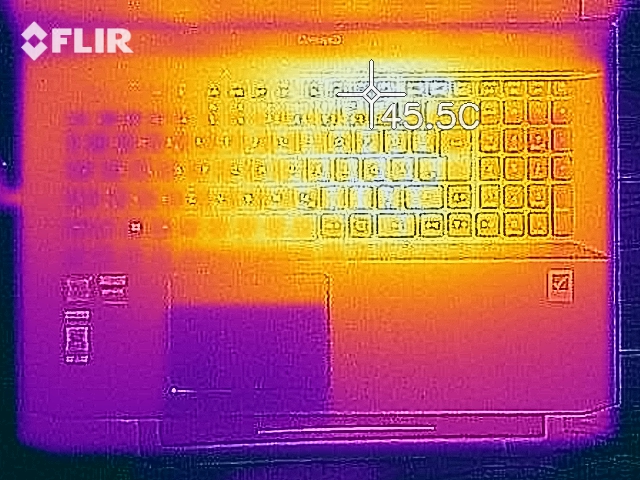
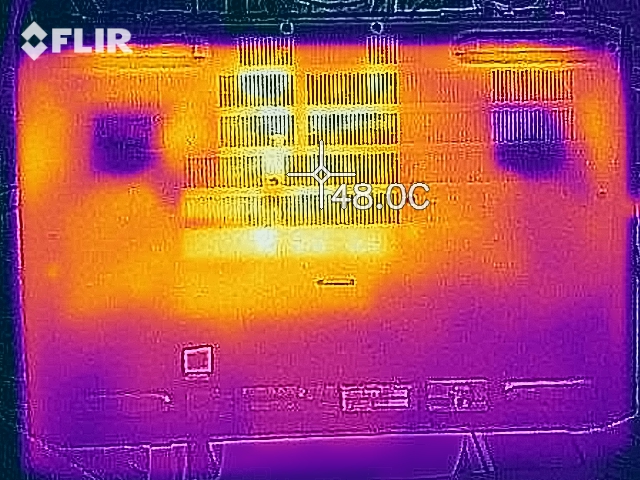
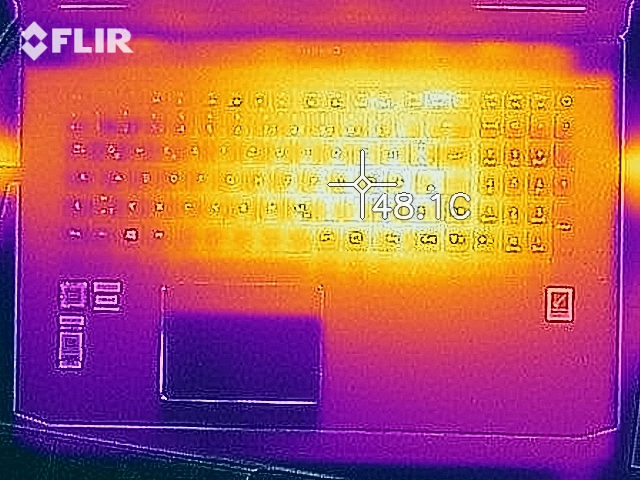
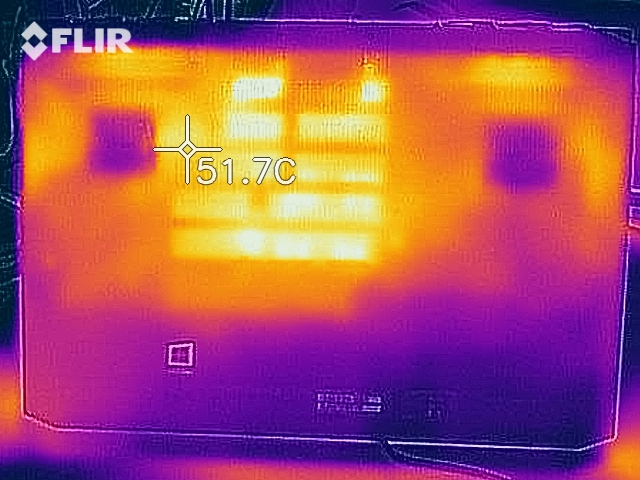
In the meantime, the case is cooled adequately, and there is no place where it gets warmer than 50 °C (122 °F). During the "Witcher 3" test, the temperature increases slightly on the bottom. The device runs through the stress test with Prime95 and Furmark with the same numbers as during maximum load. The palm rest succeeds in remaining constantly cool, never getting warmer than 30 °C (86 °F).
(-) The maximum temperature on the upper side is 46.4 °C / 116 F, compared to the average of 36.8 °C / 98 F, ranging from 21 to 71 °C for the class Multimedia.
(-) The bottom heats up to a maximum of 46.3 °C / 115 F, compared to the average of 39.1 °C / 102 F
(+) In idle usage, the average temperature for the upper side is 25.1 °C / 77 F, compared to the device average of 31.3 °C / 88 F.
(±) Playing The Witcher 3, the average temperature for the upper side is 36.9 °C / 98 F, compared to the device average of 31.3 °C / 88 F.
(+) The palmrests and touchpad are cooler than skin temperature with a maximum of 31.3 °C / 88.3 F and are therefore cool to the touch.
(-) The average temperature of the palmrest area of similar devices was 28.7 °C / 83.7 F (-2.6 °C / -4.6 F).
Speaker
The two speakers are not positioned above the keyboard, as you might think because of the perforations, but at the bottom in front, below the palm rests. The sound spectrum could use a little more bass, and the maximum volume also seems a bit weak for a 17-inch notebook. But at least there are no distortions or speaker noises with maximum volume. While the Pink Noise diagram shows the XPS 15 as having a wider sound spectrum, the bass of the XPS is weaker.
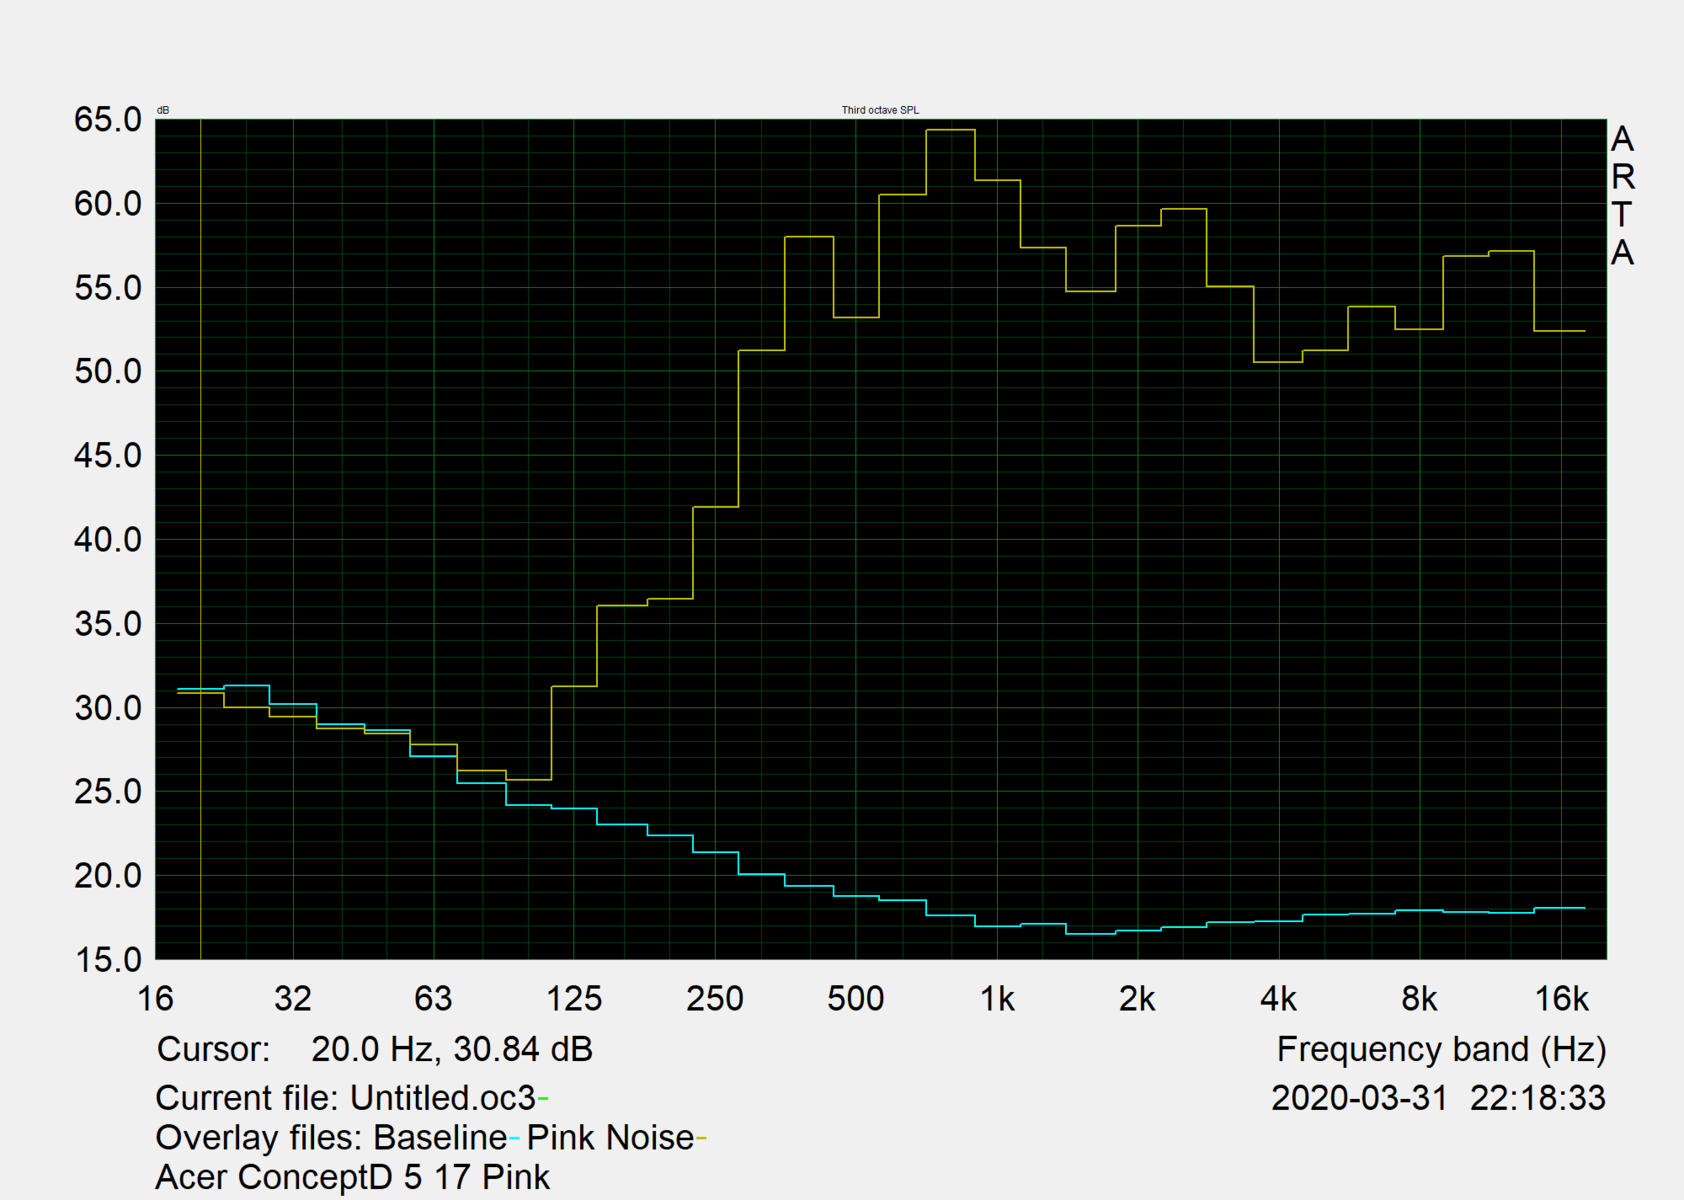
Acer ConceptD 5 CN517-71-74YA audio analysis
(-) | not very loud speakers (64 dB)
Bass 100 - 315 Hz
(-) | nearly no bass - on average 16.7% lower than median
(±) | linearity of bass is average (12.1% delta to prev. frequency)
Mids 400 - 2000 Hz
(+) | balanced mids - only 4.9% away from median
(±) | linearity of mids is average (12.6% delta to prev. frequency)
Highs 2 - 16 kHz
(+) | balanced highs - only 2.5% away from median
(±) | linearity of highs is average (7.6% delta to prev. frequency)
Overall 100 - 16.000 Hz
(±) | linearity of overall sound is average (22.9% difference to median)
Compared to same class
» 81% of all tested devices in this class were better, 5% similar, 14% worse
» The best had a delta of 5%, average was 17%, worst was 45%
Compared to all devices tested
» 68% of all tested devices were better, 6% similar, 26% worse
» The best had a delta of 4%, average was 23%, worst was 134%
Dell XPS 15 7590 9980HK GTX 1650 audio analysis
(+) | speakers can play relatively loud (88.4 dB)
Bass 100 - 315 Hz
(-) | nearly no bass - on average 24.9% lower than median
(±) | linearity of bass is average (14.4% delta to prev. frequency)
Mids 400 - 2000 Hz
(+) | balanced mids - only 2.8% away from median
(±) | linearity of mids is average (7.8% delta to prev. frequency)
Highs 2 - 16 kHz
(+) | balanced highs - only 1.9% away from median
(+) | highs are linear (5.3% delta to prev. frequency)
Overall 100 - 16.000 Hz
(±) | linearity of overall sound is average (17.8% difference to median)
Compared to same class
» 52% of all tested devices in this class were better, 7% similar, 41% worse
» The best had a delta of 5%, average was 17%, worst was 45%
Compared to all devices tested
» 36% of all tested devices were better, 8% similar, 56% worse
» The best had a delta of 4%, average was 23%, worst was 134%
Power Consumption
The power consumption is moderate and on a level that is typical for a 17-inch notebook with a 45-watt processor. The dedicated GPU can be turned off via Optimus, so the minimum power consumption lies between 6 and 15 watts, depending on the brightness, keyboard illumination, and WiFi activity. The 15-inch competitors cannot serve as a comparison in this discipline. Under load, the power consumption increases up to 145 watts, so the 180-watt power supply is sufficiently large.
| Off / Standby | |
| Idle | |
| Load |
|
Key:
min: | |
Battery Life
A long battery life is surely not a priority for heavy 17-inch notebooks. With its 55-Wh capacity, Acer's 17-incher manages 333 minutes in the WiFi test at a brightness of 150 cd/m². The more powerful Dell XPS 15 does better here, but it also has to carry 97 Wh around to achieve its 467 minutes. Compared to that, the ConceptD 5 17-inch notebook is not so bad with its 5:30 hours.
Pros
Cons
Verdict

As a 17-inch notebook, Acer's ConceptD 5 takes a different path than the 15-inch model. Indications of this are the stronger graphics and more working memory (up to 32 GB, two storage slots). The 4K panel with 100% sRGB was also available for the 15-inch model. The accurate color reproduction in form of a very low Delta-E is a characteristic of both the 15 and the 17-inch model.
Within its hefty and heavy aluminum case, the 17-inch notebook holds a powerful cooling solution for the 45-watt hexa-core processor. This probably contains a lot of copper, since the double fans do not even turn on during idle operation.
While the processor is powerful, it does not come near the power of the Core i9 octa-core processors during multi-core computing tasks. The system performance turns out correspondingly lower in the comparison.
The graphics performance of the GeForce RTX 2060 is impressive, easily surpassing that of the GTX 1660. For gamers this means that playing in 4K resolution will only work in a few games, but any current game will run beautifully in Full HD resolution.
The ConceptD 5 CN517 is also some kind of small workstation for creative professionals. We then wonder, why neither a card reader, nor Thunderbolt have found their way into the case, as the price range beyond 2000 Euros (~$2229) would demand.
All the competitors have Thunderbolt on board, so why not the ConceptD 5 17-incher?
Each of the competitors offer such a port, whether the Lenovo, Dell, MSI, or Apple. Does this mean that this is a deal breaker for Acer's 17-inch notebook? Perhaps, but let's take a look at the display: The AUO 4K is no match for Dell's 4K UHD OLED in the XPS 15. And neither for Apple's 3K panel, which is brighter, offers more contrast and also 100% sRGB. The panels in the MSI P65 Creator and in the Lenovo ThinkPad X1 Extreme 2019 with their strong colors and 100% sRGB are at the same level.
This means that the competitors in the same price class also offer very good panels that are even better in some criteria. This leaves the fact that this is a 17-inch notebook as the only thing speaking for Acer's ConceptD 5. Our top list of multimedia notebooks currently includes no other 17-inch model with an overall rating that is similarly high.
Acer ConceptD 5 CN517-71-74YA
- 05/14/2020 v7 (old)
Sebastian Jentsch
Price comparison

