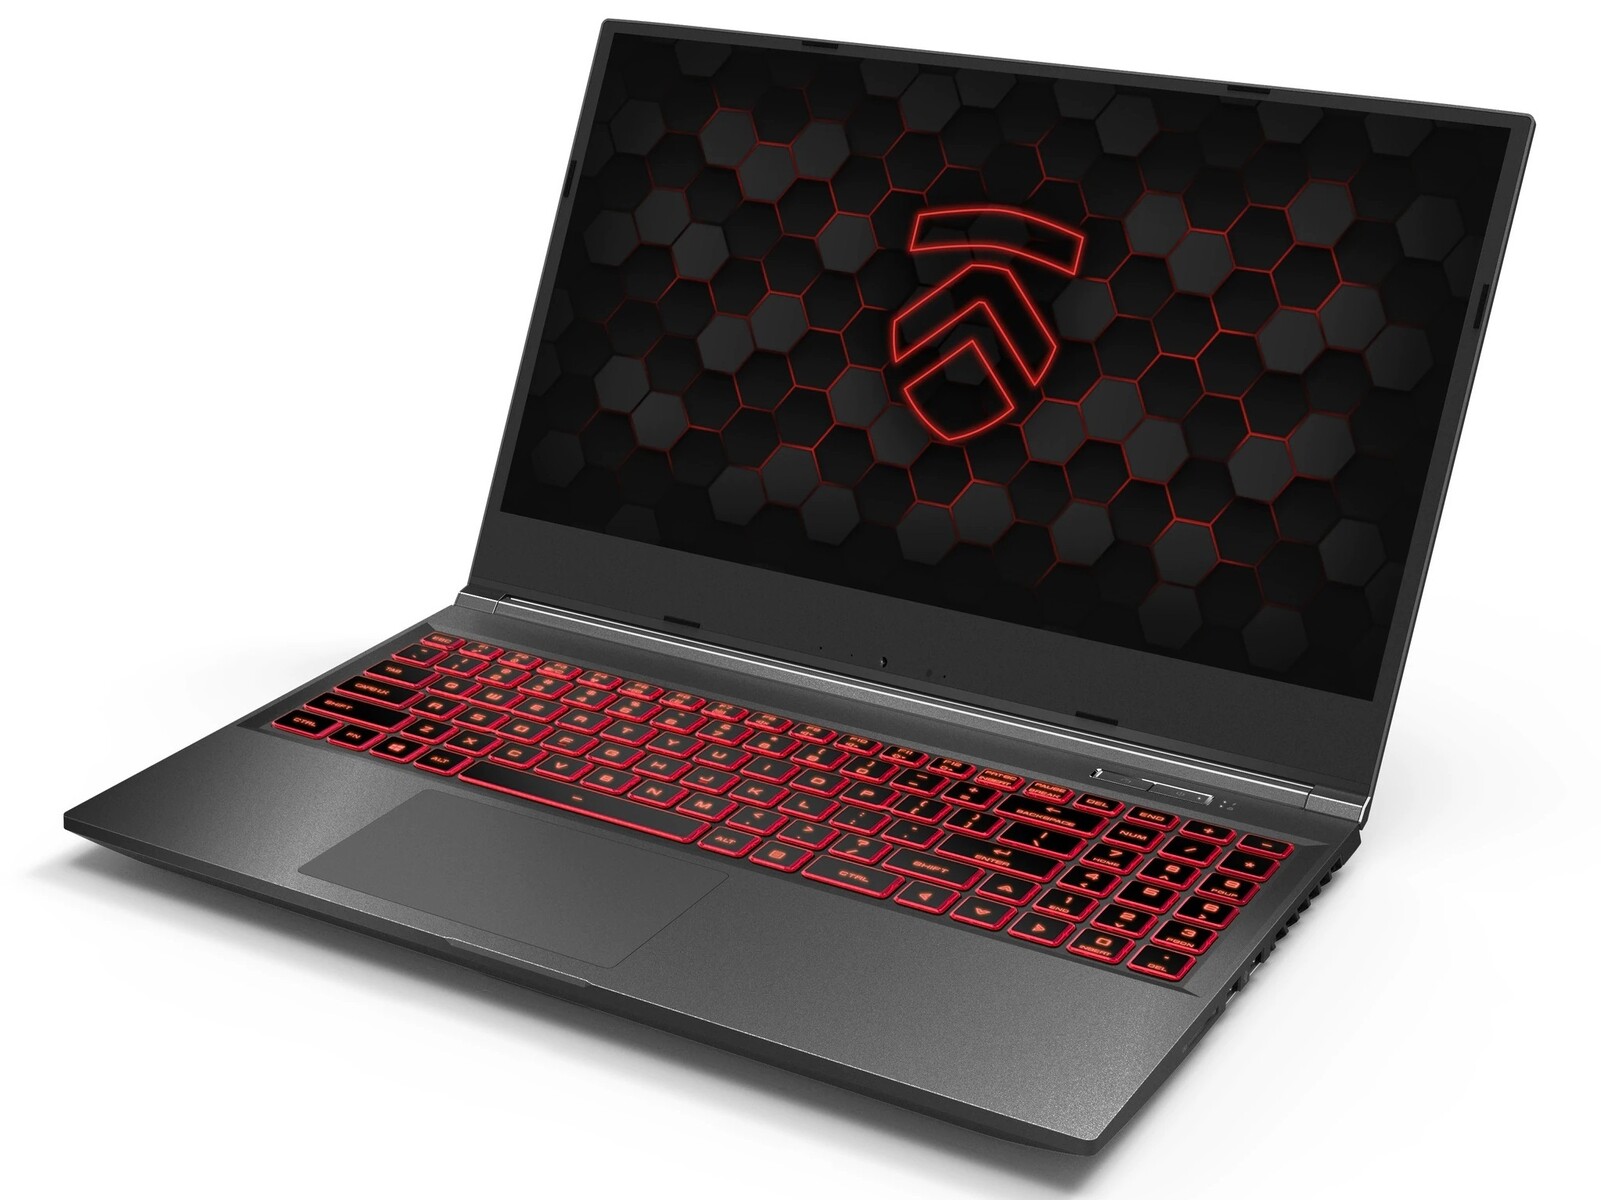
Eluktronics RP-15 Laptop Review: The Ryzen 7 4800H Impresses Yet Again

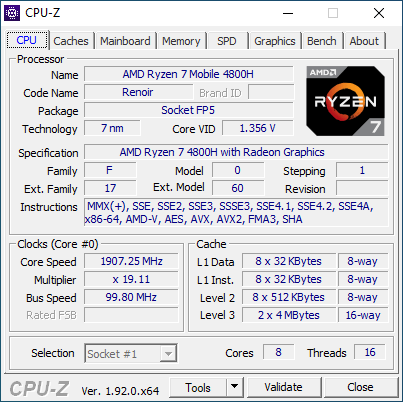
Both OEMs and resellers are beginning to embrace AMD hardware much more than before all thanks to the promising 7 nm Renoir series. Eluktronics is one such reseller who is expected to ship its first 15.6-inch Ryzen 7 RP-15 gaming laptop by the end of July. The system is set to be fixed at the octa-core Ryzen 7 4800H CPU with GeForce RTX 2060 graphics and a 144 Hz 1080p matte display. More specifications and options on the RP-15 can be found on its product page here.
Direct competitors to the RP-15 include other thin-and-light 15.6-inch gaming laptops like the MSI GS66, Razer Blade 15, Asus Zephyrus S GX502, Lenovo Legion Y740-15, or the Acer Predator Triton series.
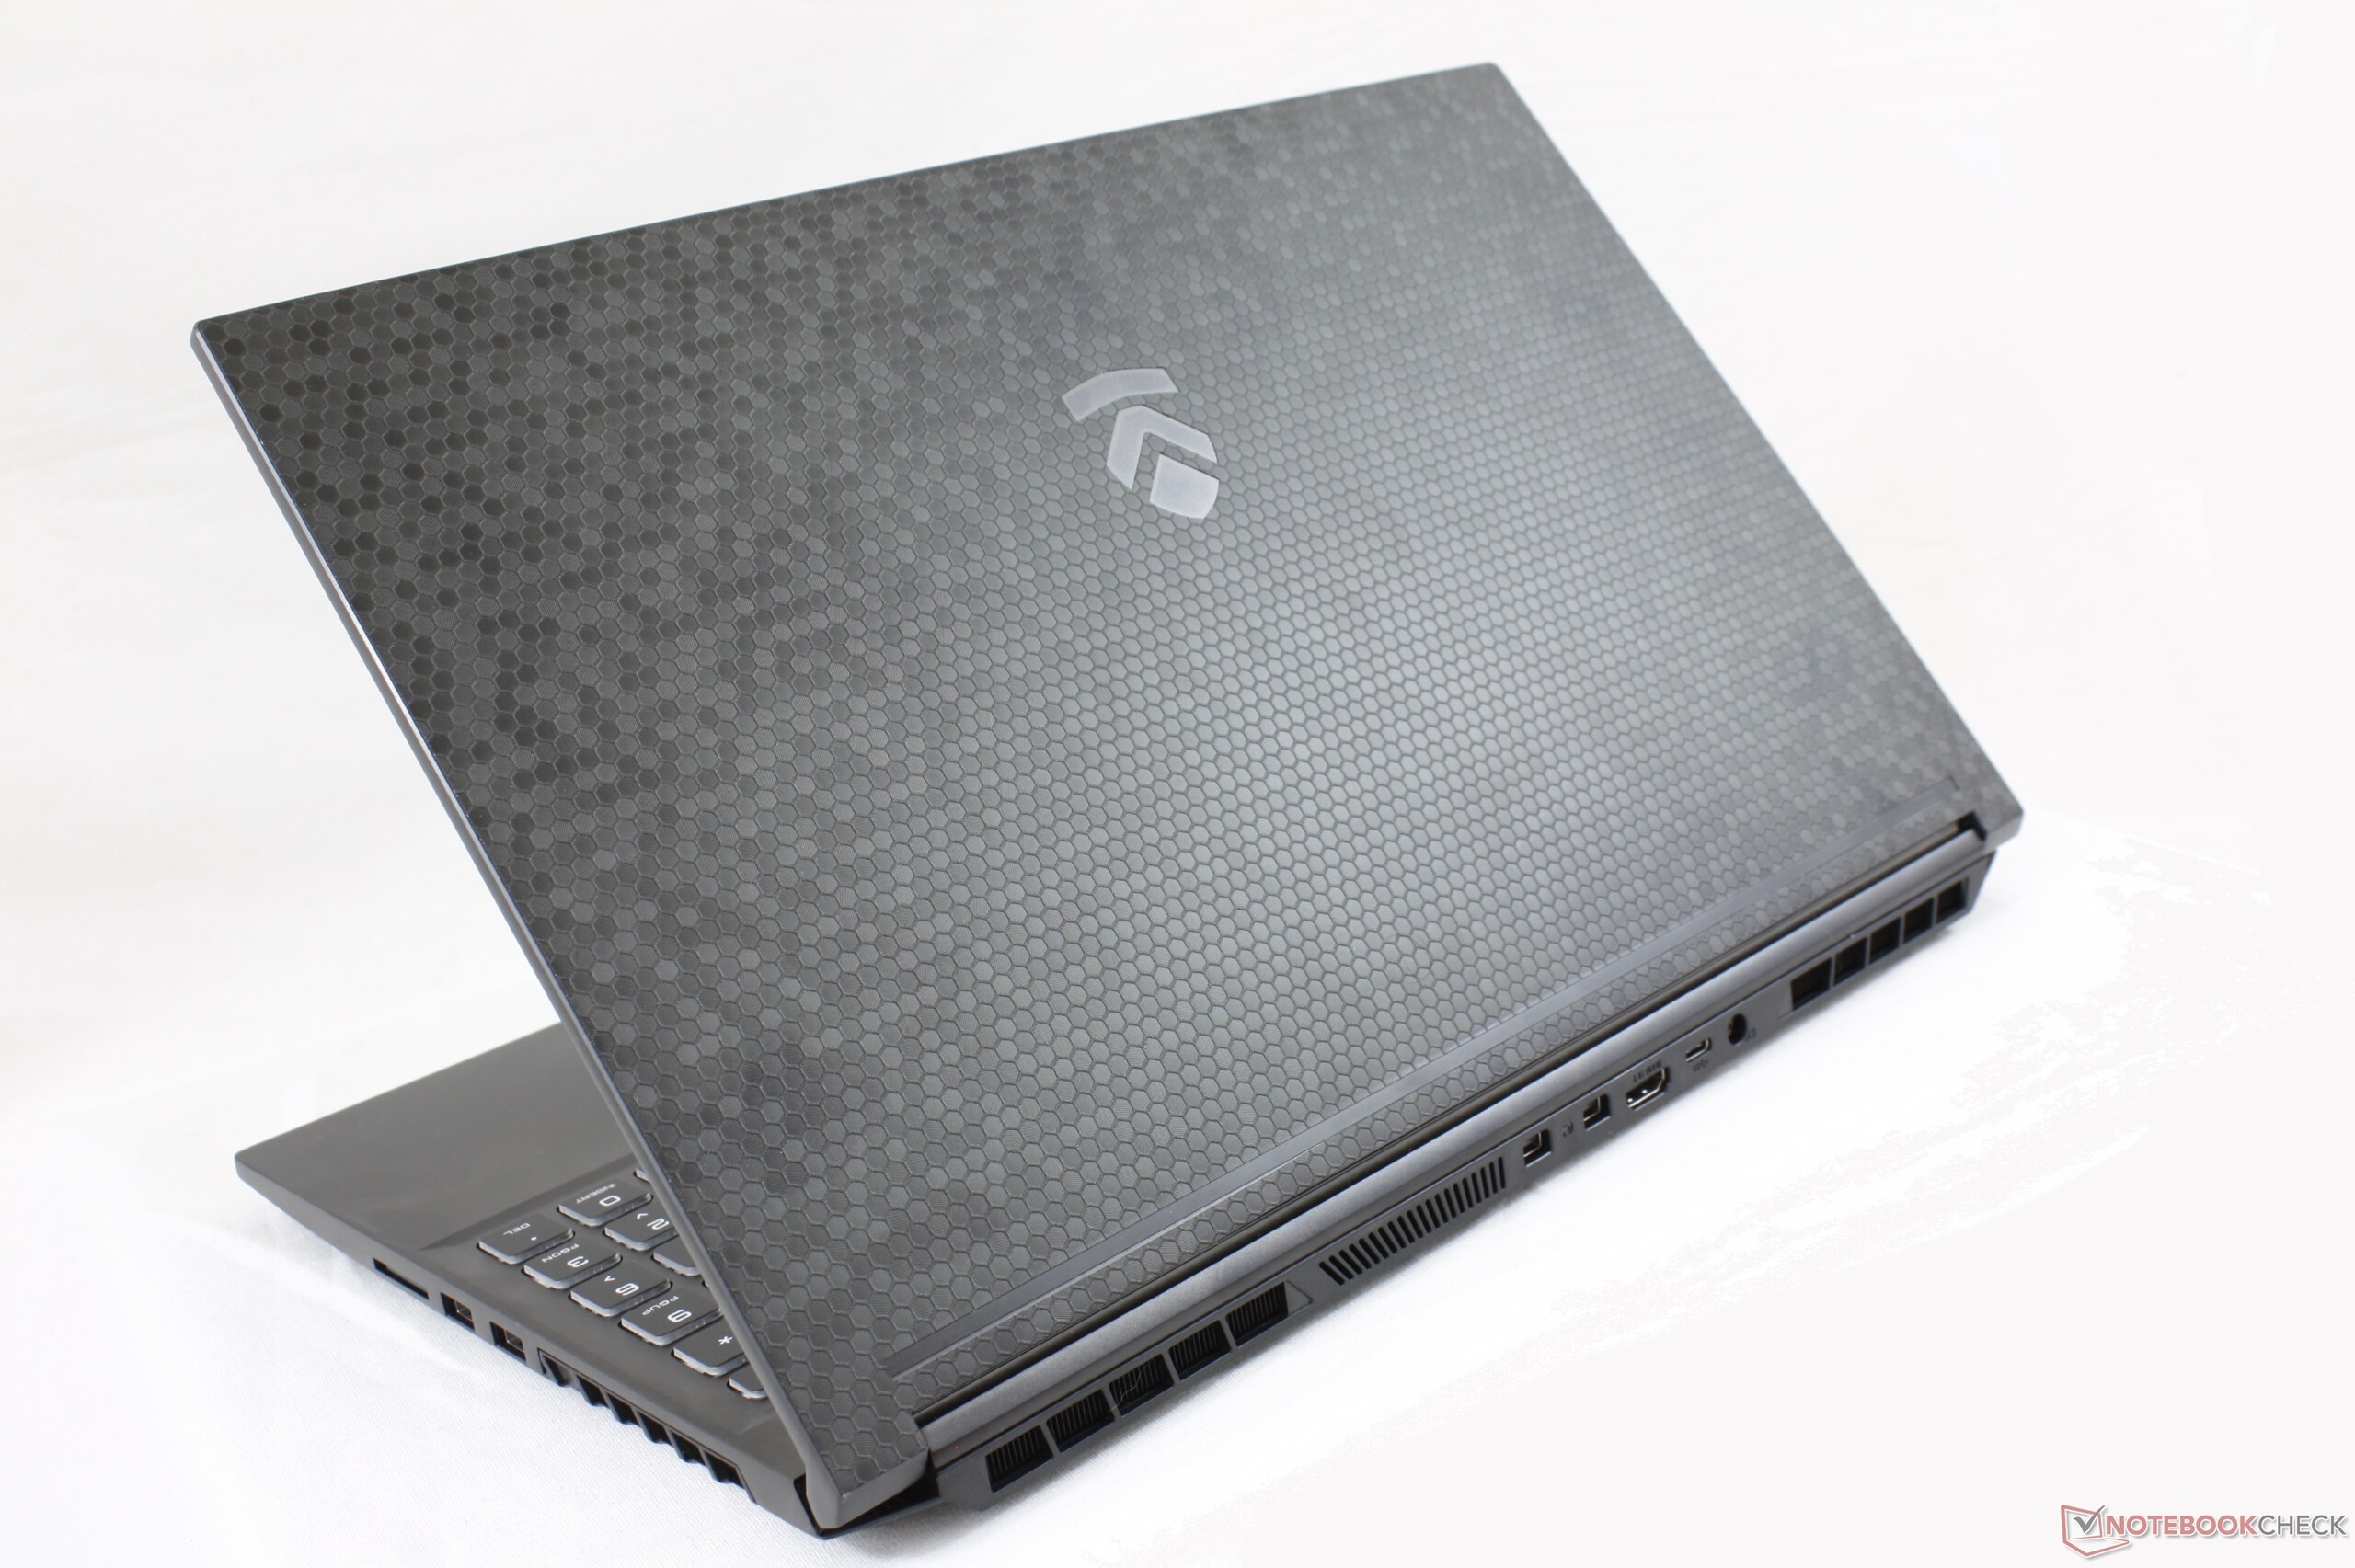
The RP-15 is derived from a white label chassis design meaning it's possible to find this exact model from other resellers under different brand names.
Rating | Date | Model | Weight | Height | Size | Resolution | Price |
|---|---|---|---|---|---|---|---|
| 82.6 % v7 (old) | 05 / 2020 | Eluktronics RP-15 R7 4800H, GeForce RTX 2060 Mobile | 1.9 kg | 20 mm | 15.60" | 1920x1080 | |
| 84 % v7 (old) | 05 / 2020 | MSI GS66 10SGS i7-10750H, GeForce RTX 2080 Super Max-Q | 2.2 kg | 20 mm | 15.60" | 1920x1080 | |
| 86 % v7 (old) | 05 / 2020 | Razer Blade 15 RZ09-0328 i7-10750H, GeForce RTX 2070 Max-Q | 2.1 kg | 19.9 mm | 15.60" | 3840x2160 | |
| 84.4 % v7 (old) | 08 / 2019 | Asus Strix GL531GV-PB74 i7-9750H, GeForce RTX 2060 Mobile | 2.4 kg | 25.9 mm | 15.60" | 1920x1080 | |
| 85.1 % v7 (old) | 03 / 2019 | Lenovo Legion Y740-15ICHg i7-8750H, GeForce RTX 2070 Max-Q | 2.3 kg | 25 mm | 15.60" | 1920x1080 | |
| 83 % v7 (old) | 09 / 2019 | Alienware m15 R2 P87F i7-9750H, GeForce RTX 2080 Max-Q | 2.2 kg | 18.3 mm | 15.60" | 1920x1080 |
Case
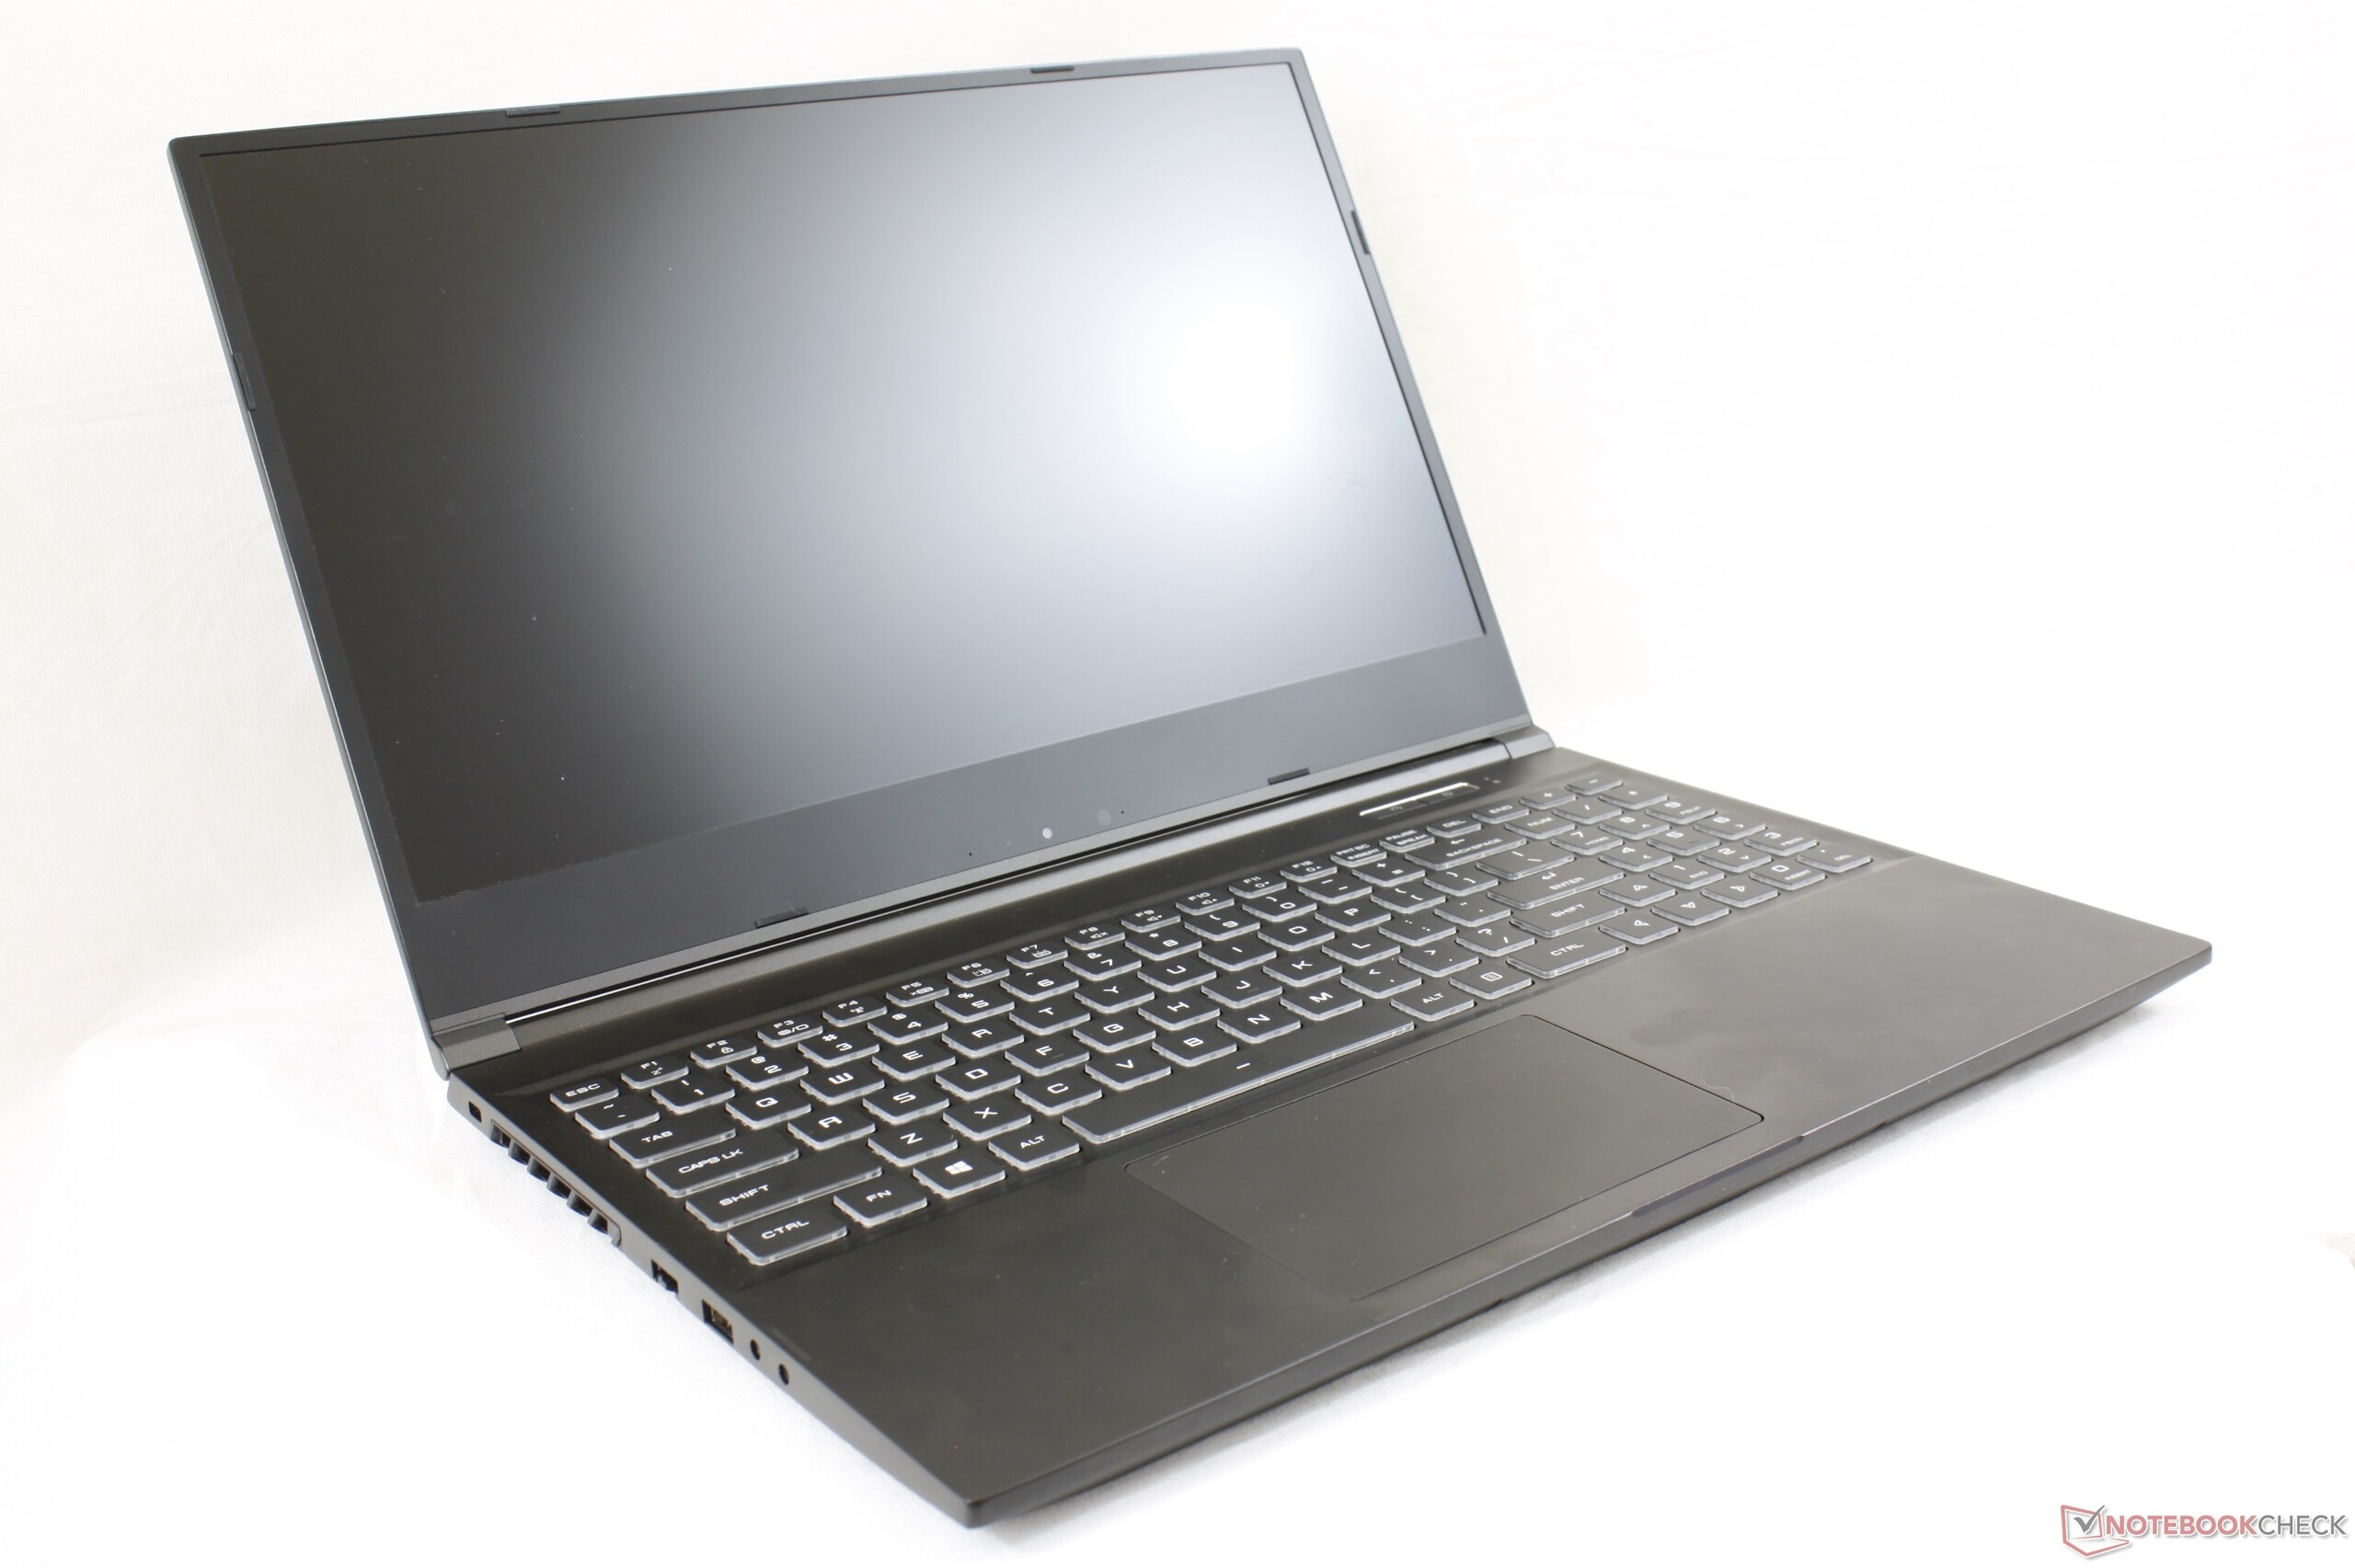
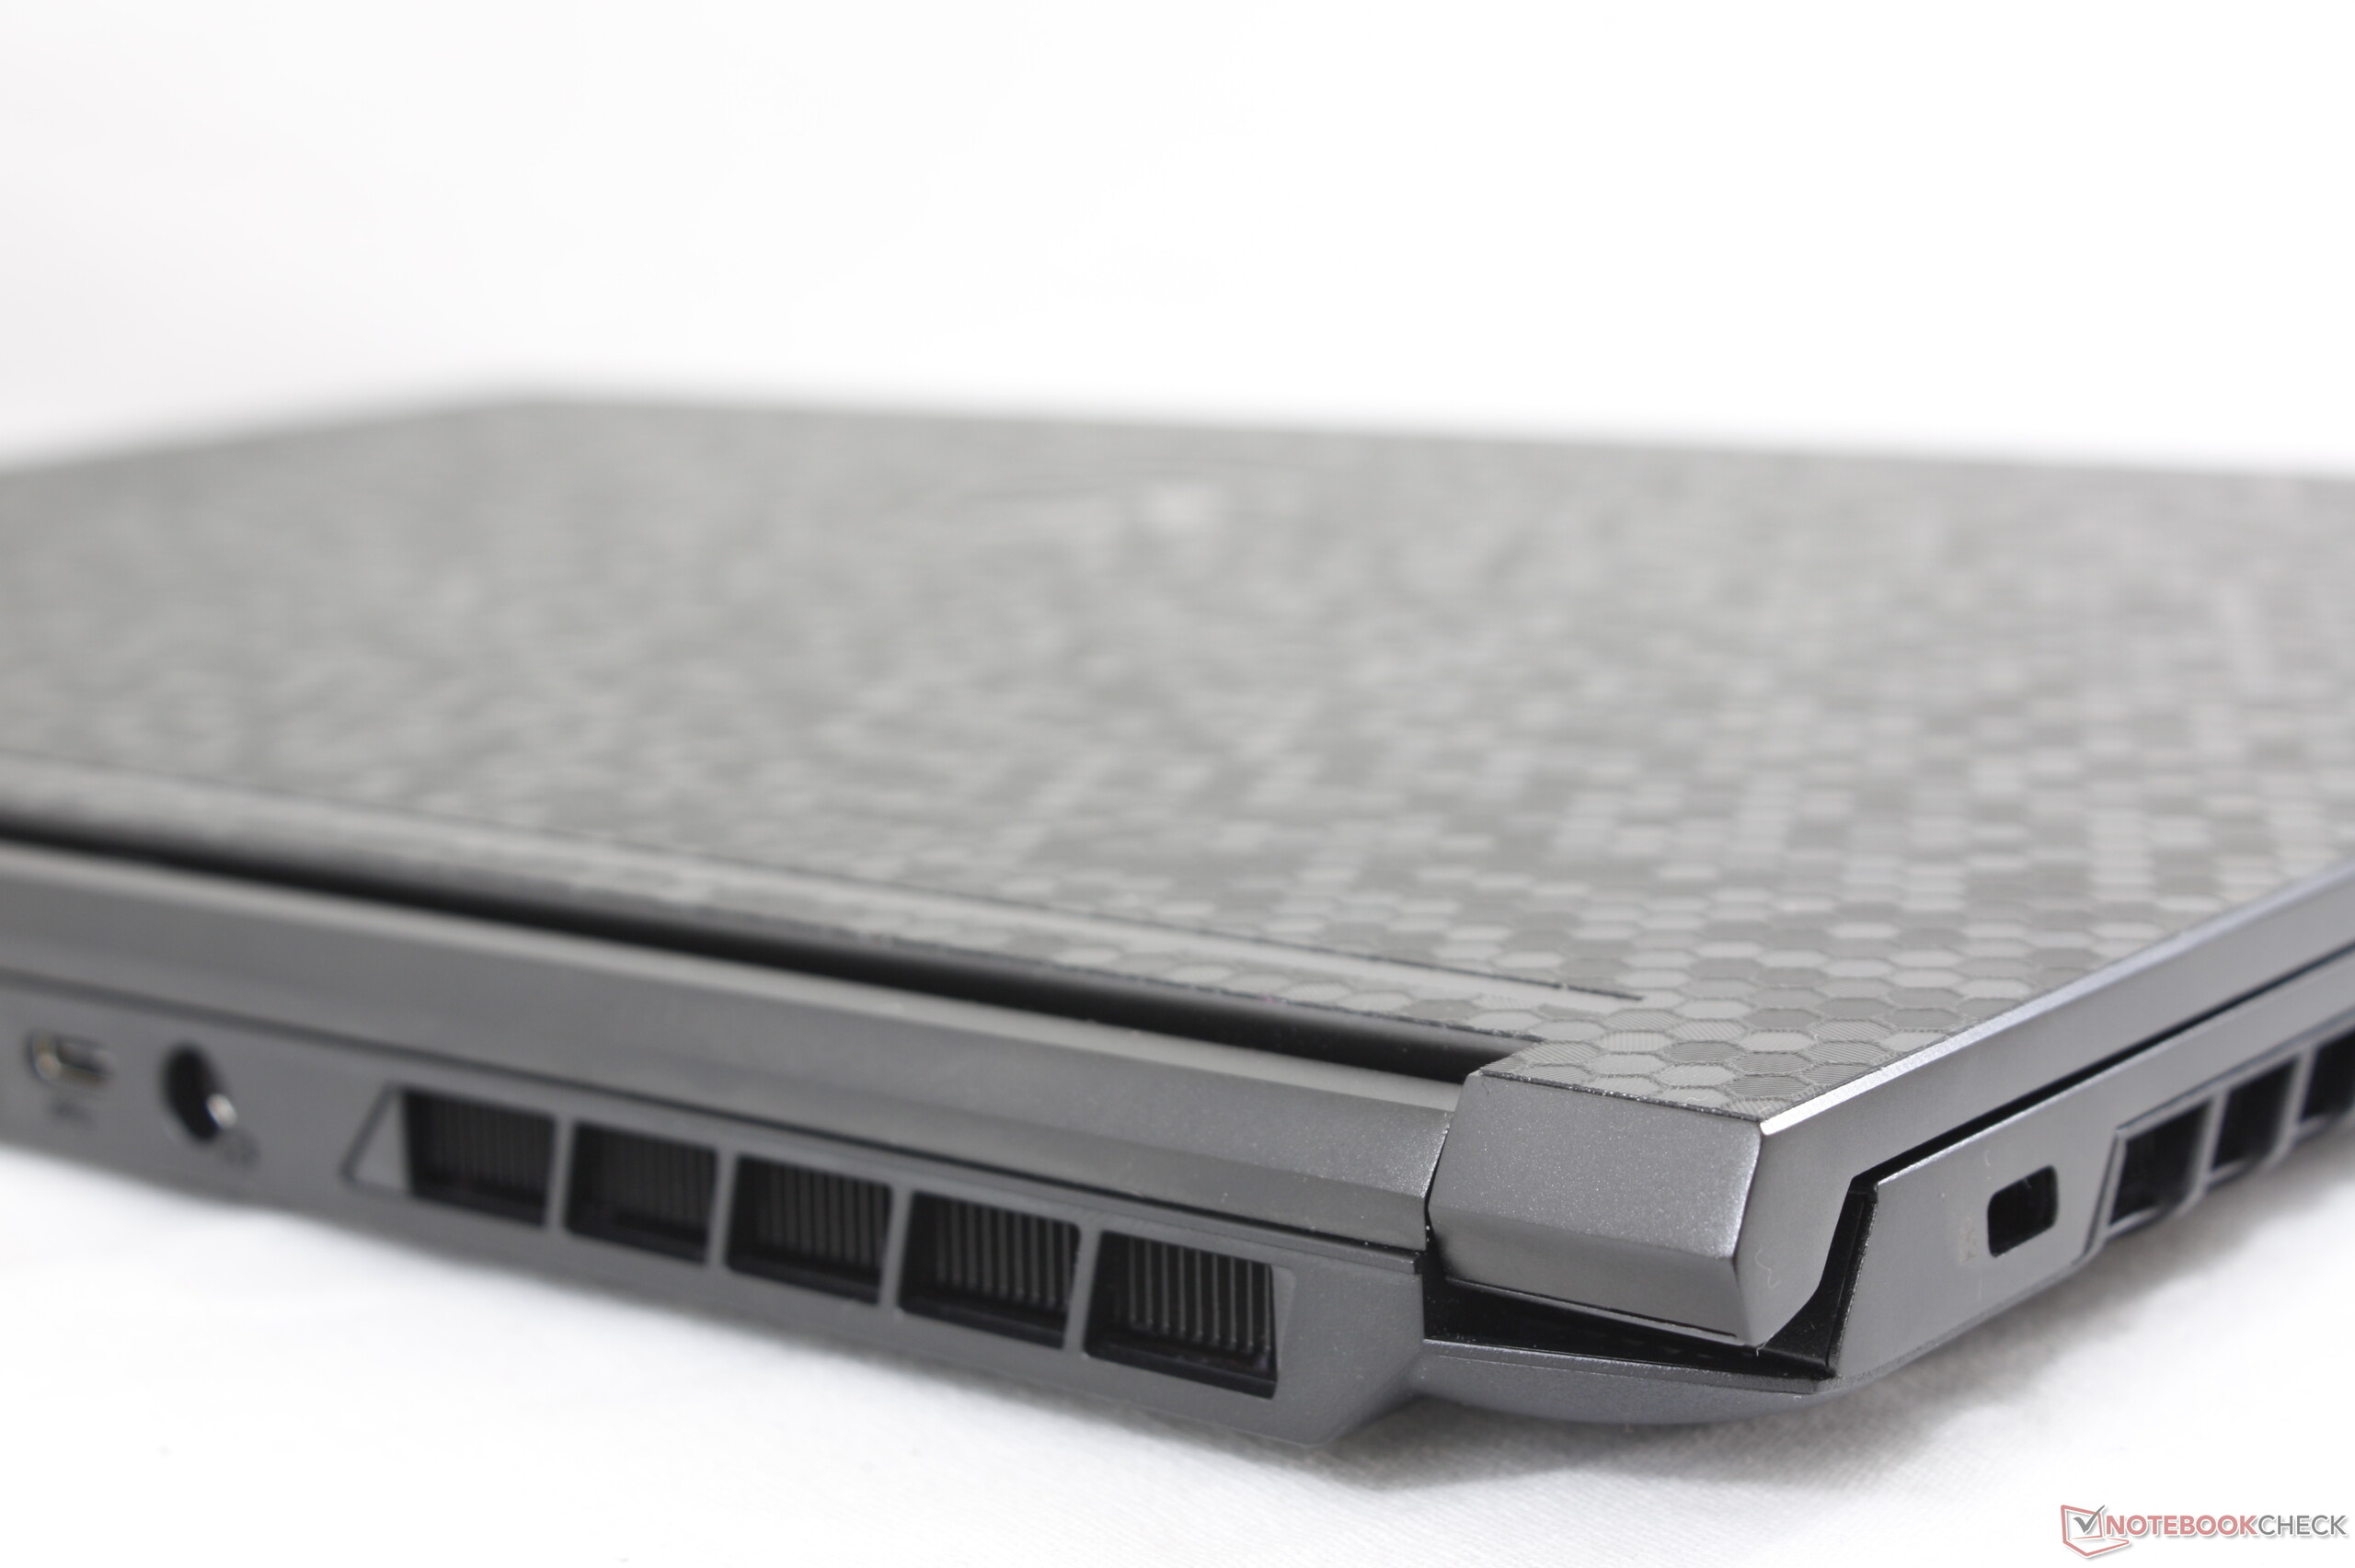
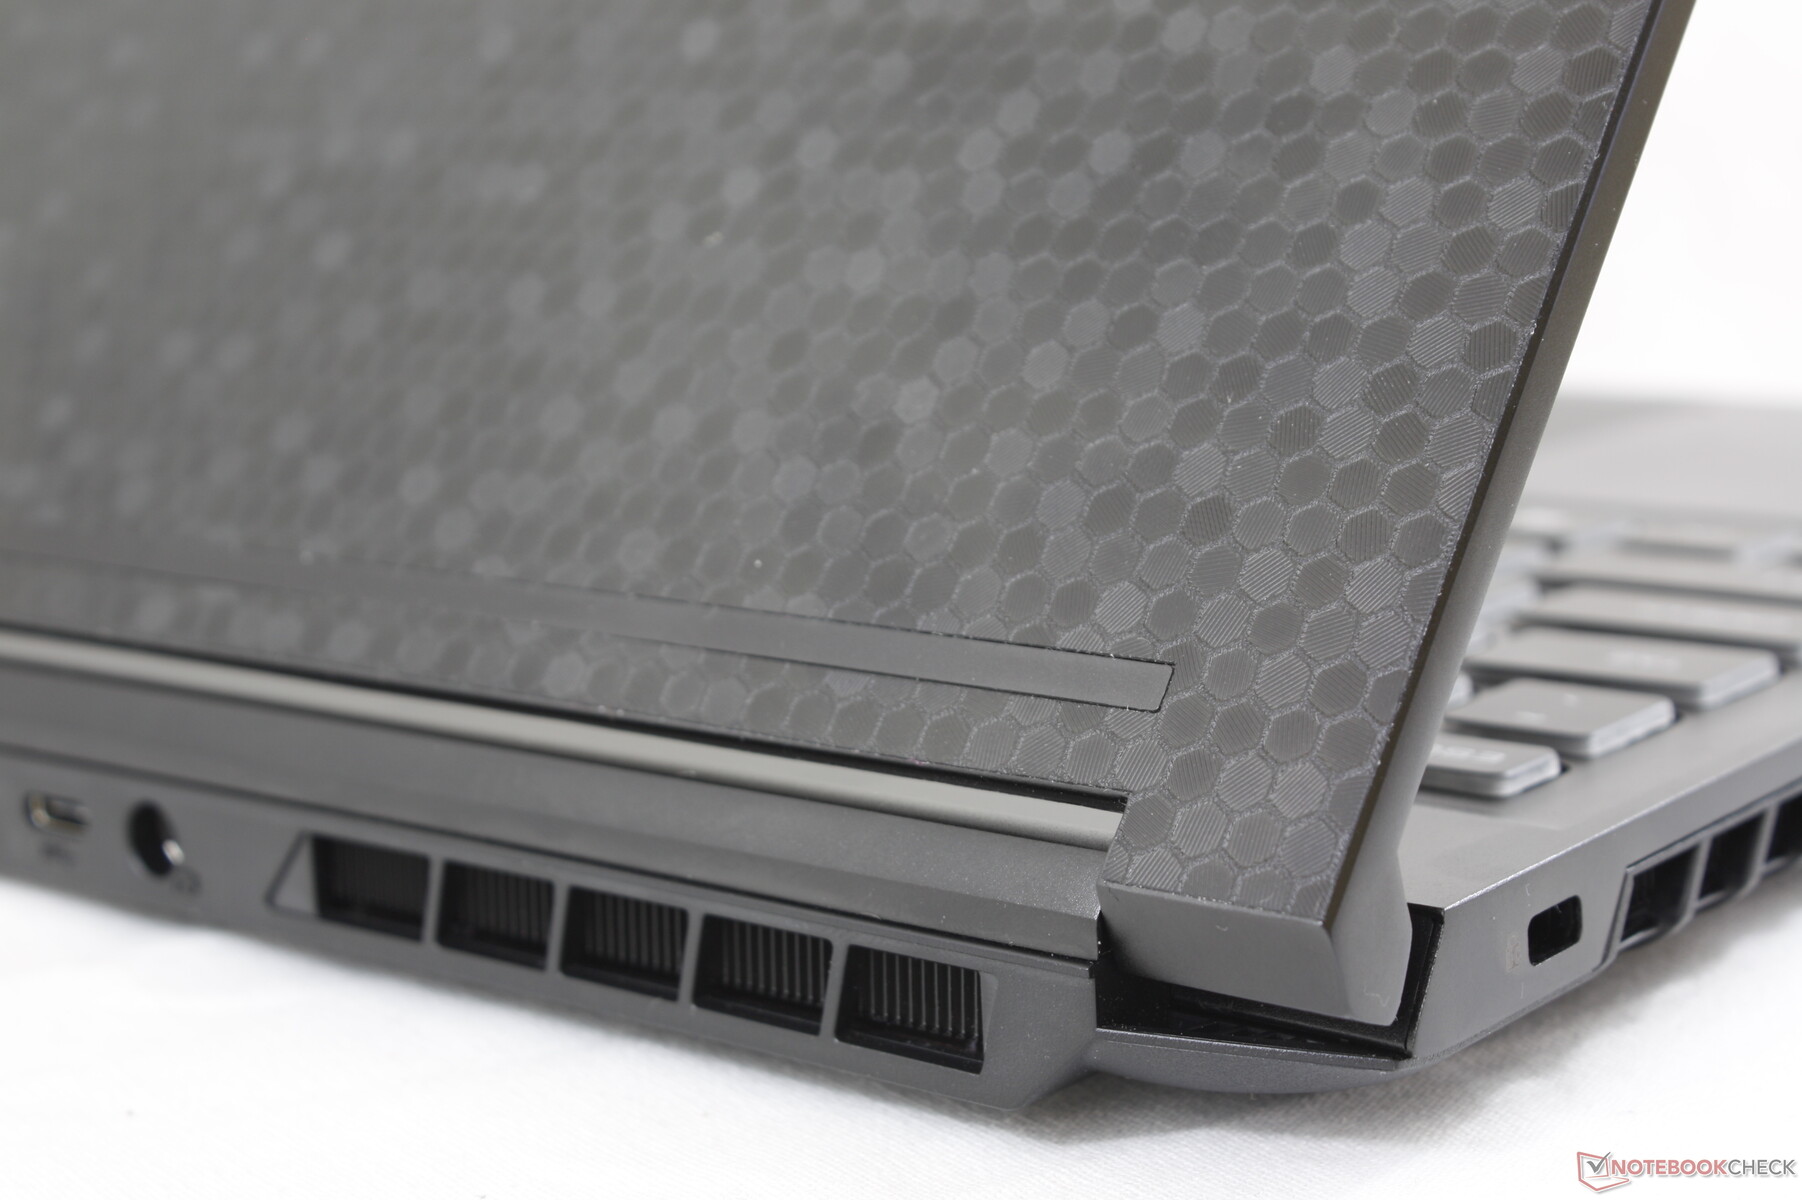
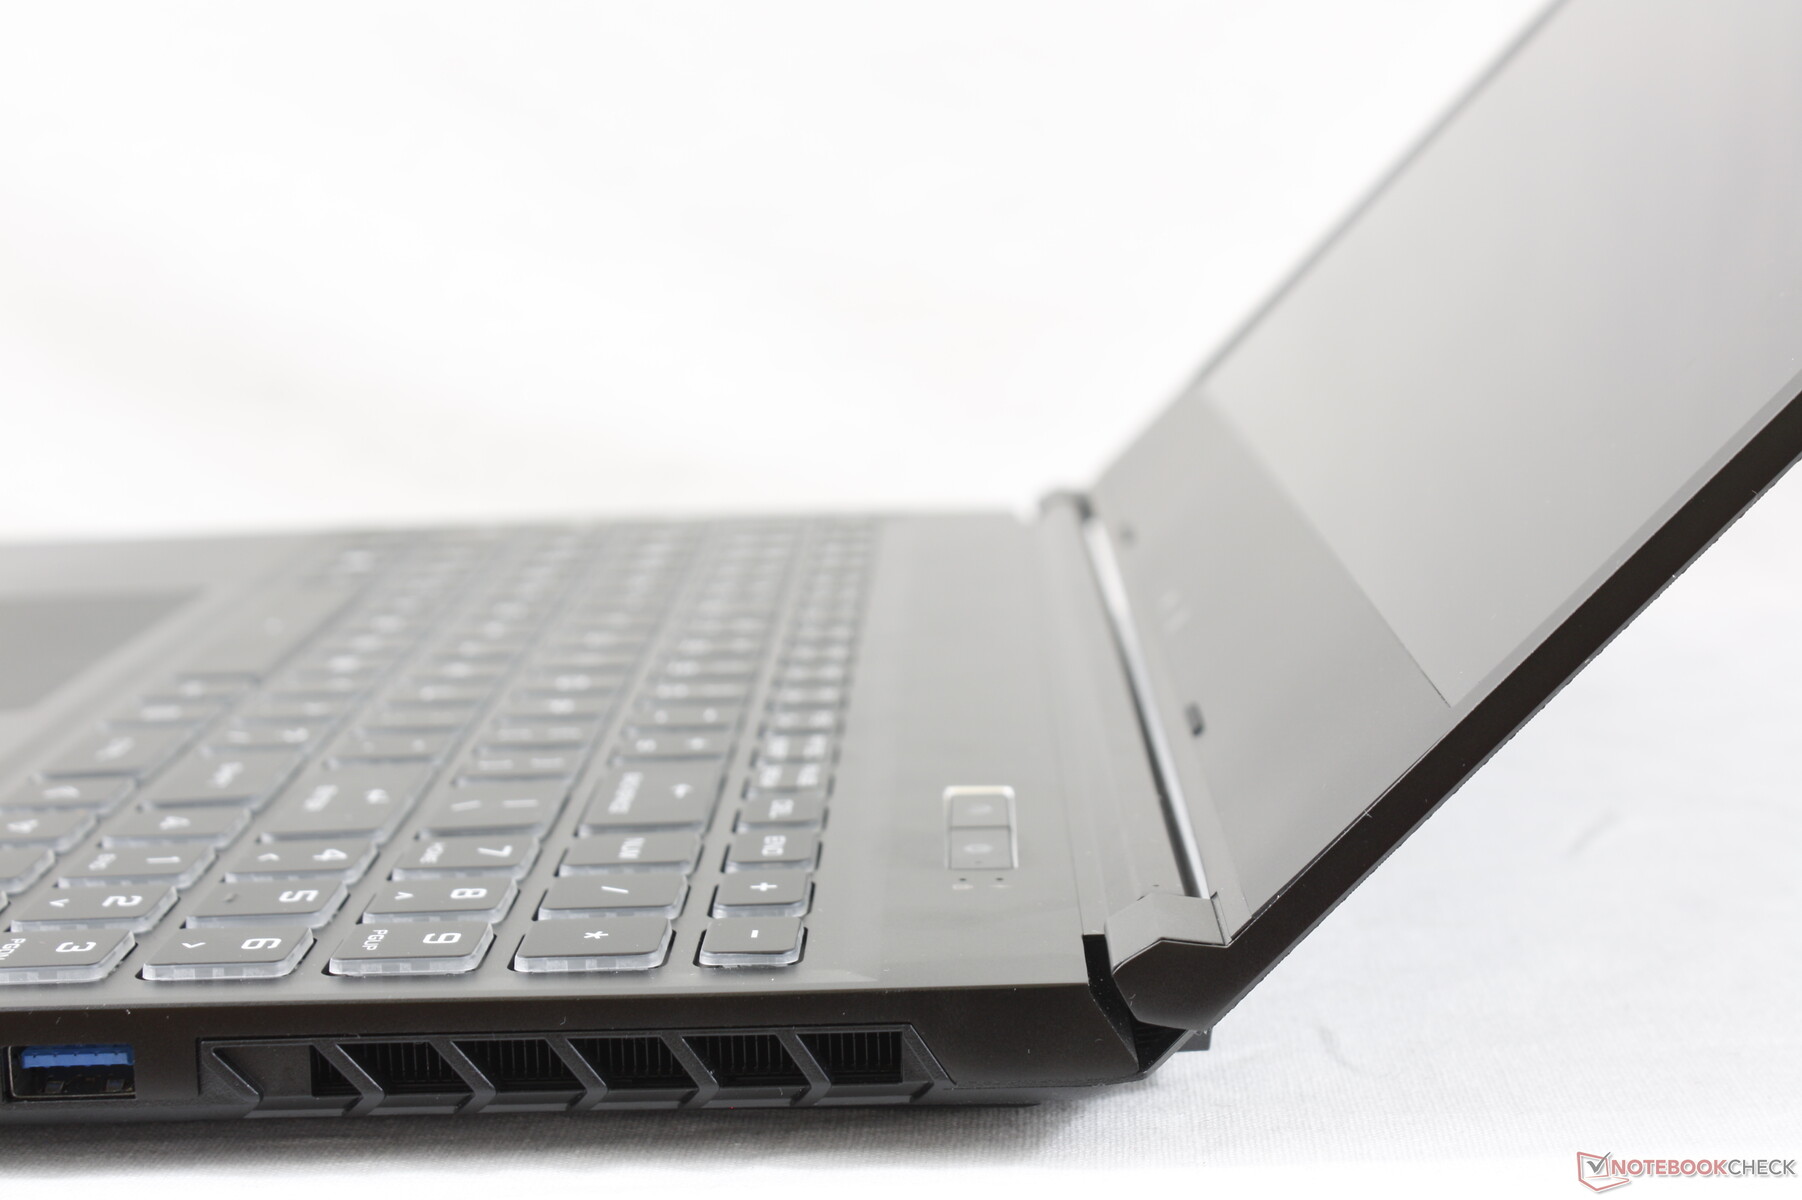
Our first impression of the RP-15 is how surprisingly lightweight the system is. At just 1.9 kg, it's a few hundred grams lighter than competing systems like the Razer Blade 15 Base Model while being slightly lighter than the Asus Zephyrus GX502. It's closest in weight and size to the last generation MSI GS65.
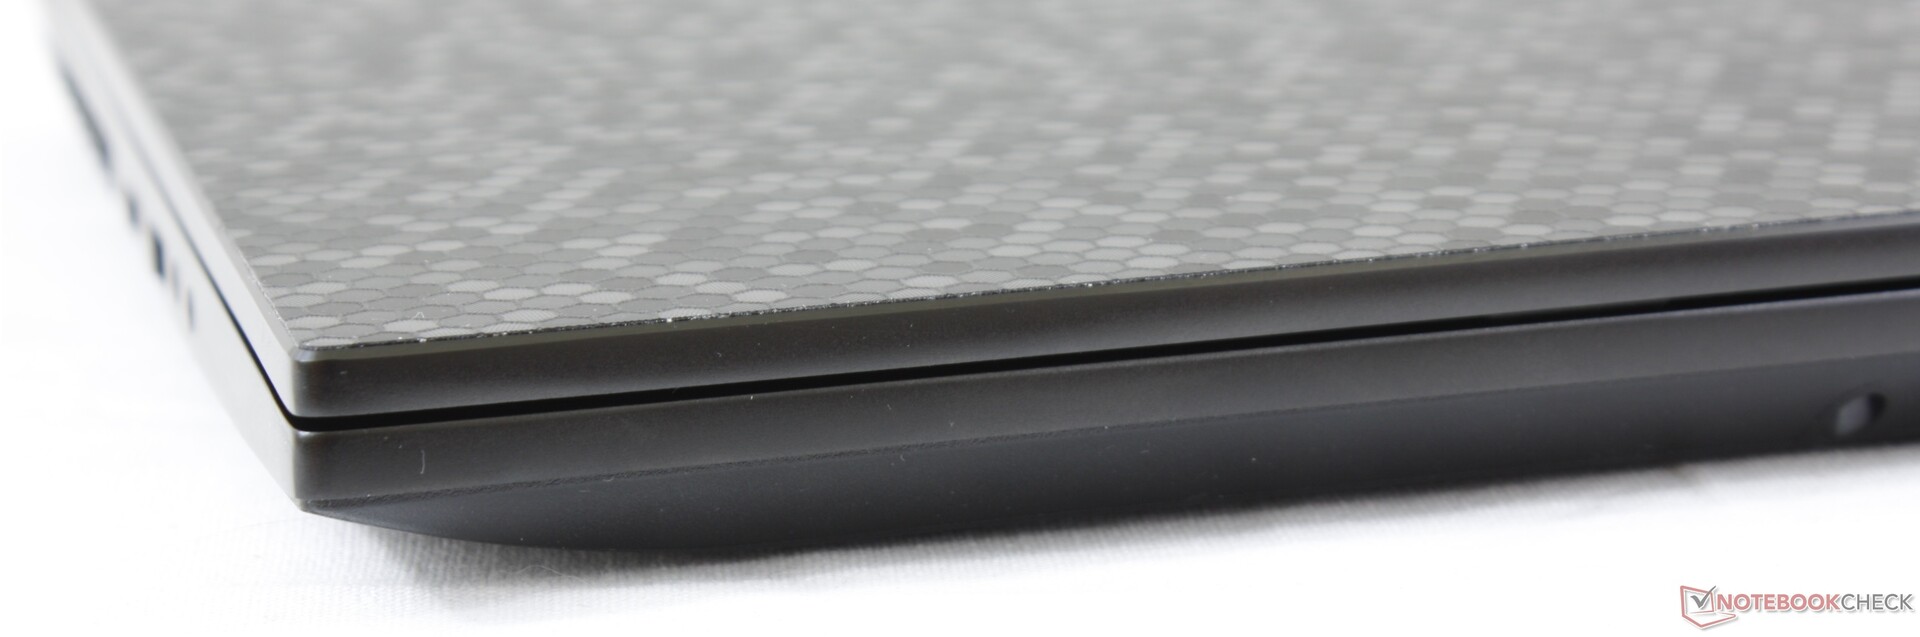
On the flip side, chassis rigidity takes a hit as the lid and base are more flexible than the latest systems from Razer, MSI, and others where metal alloy skeletons have become common. Expect some minor creaking when attempting to twist its base. This isn't to say that the system is weak or poorly built, but it's certainly not as sound as some of the heavier alternatives.

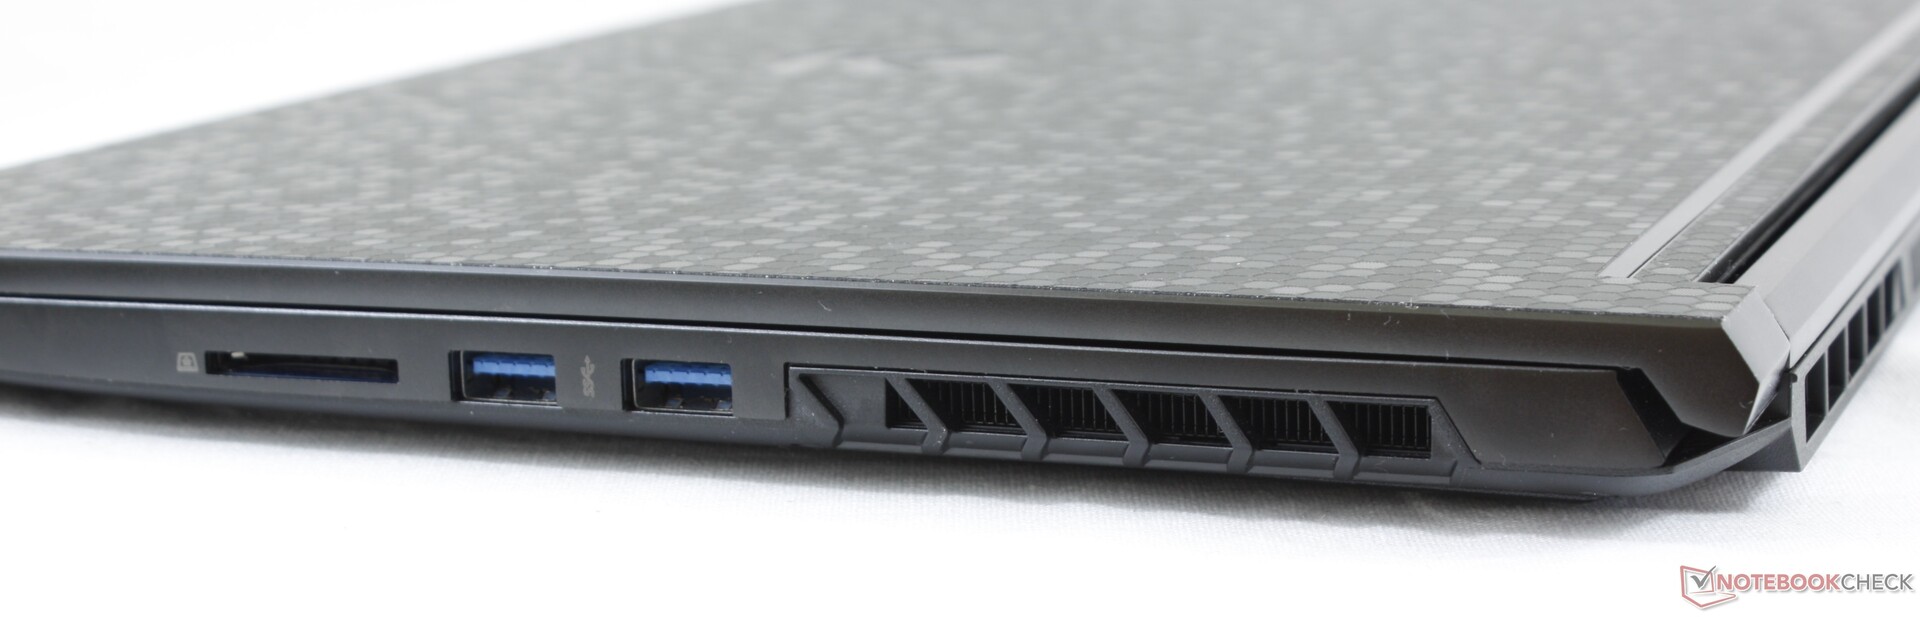
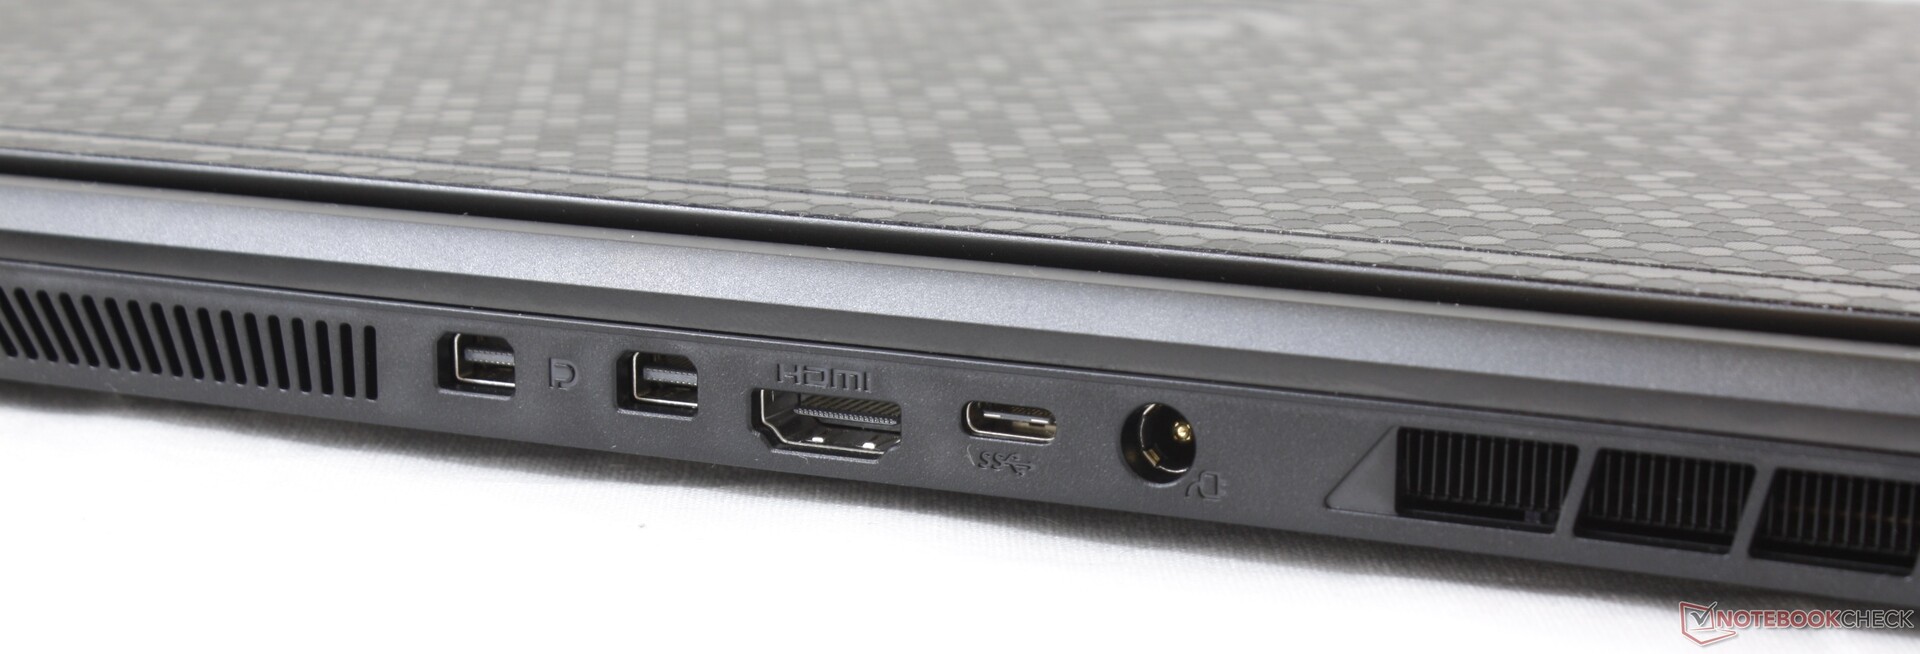
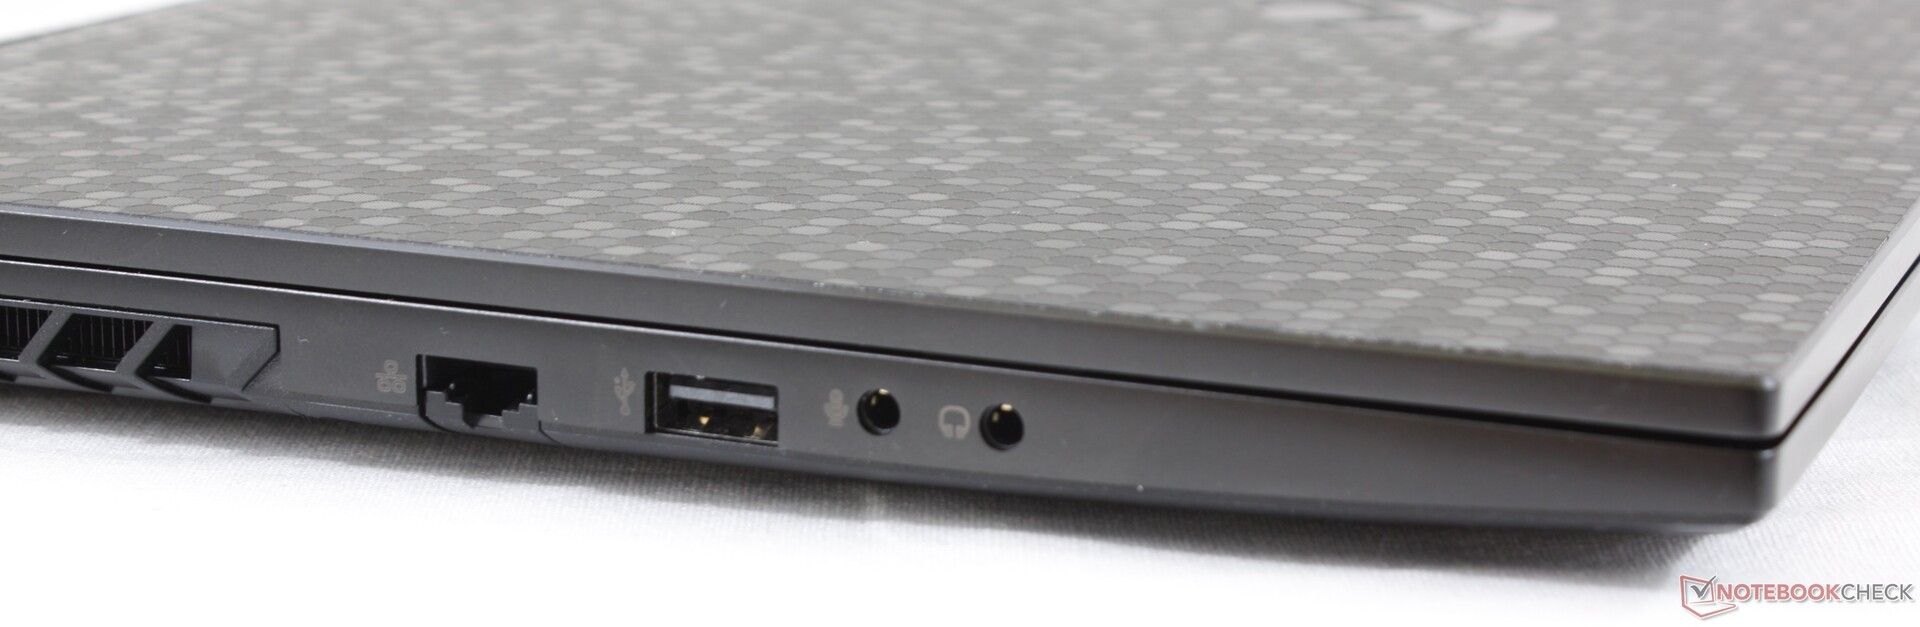
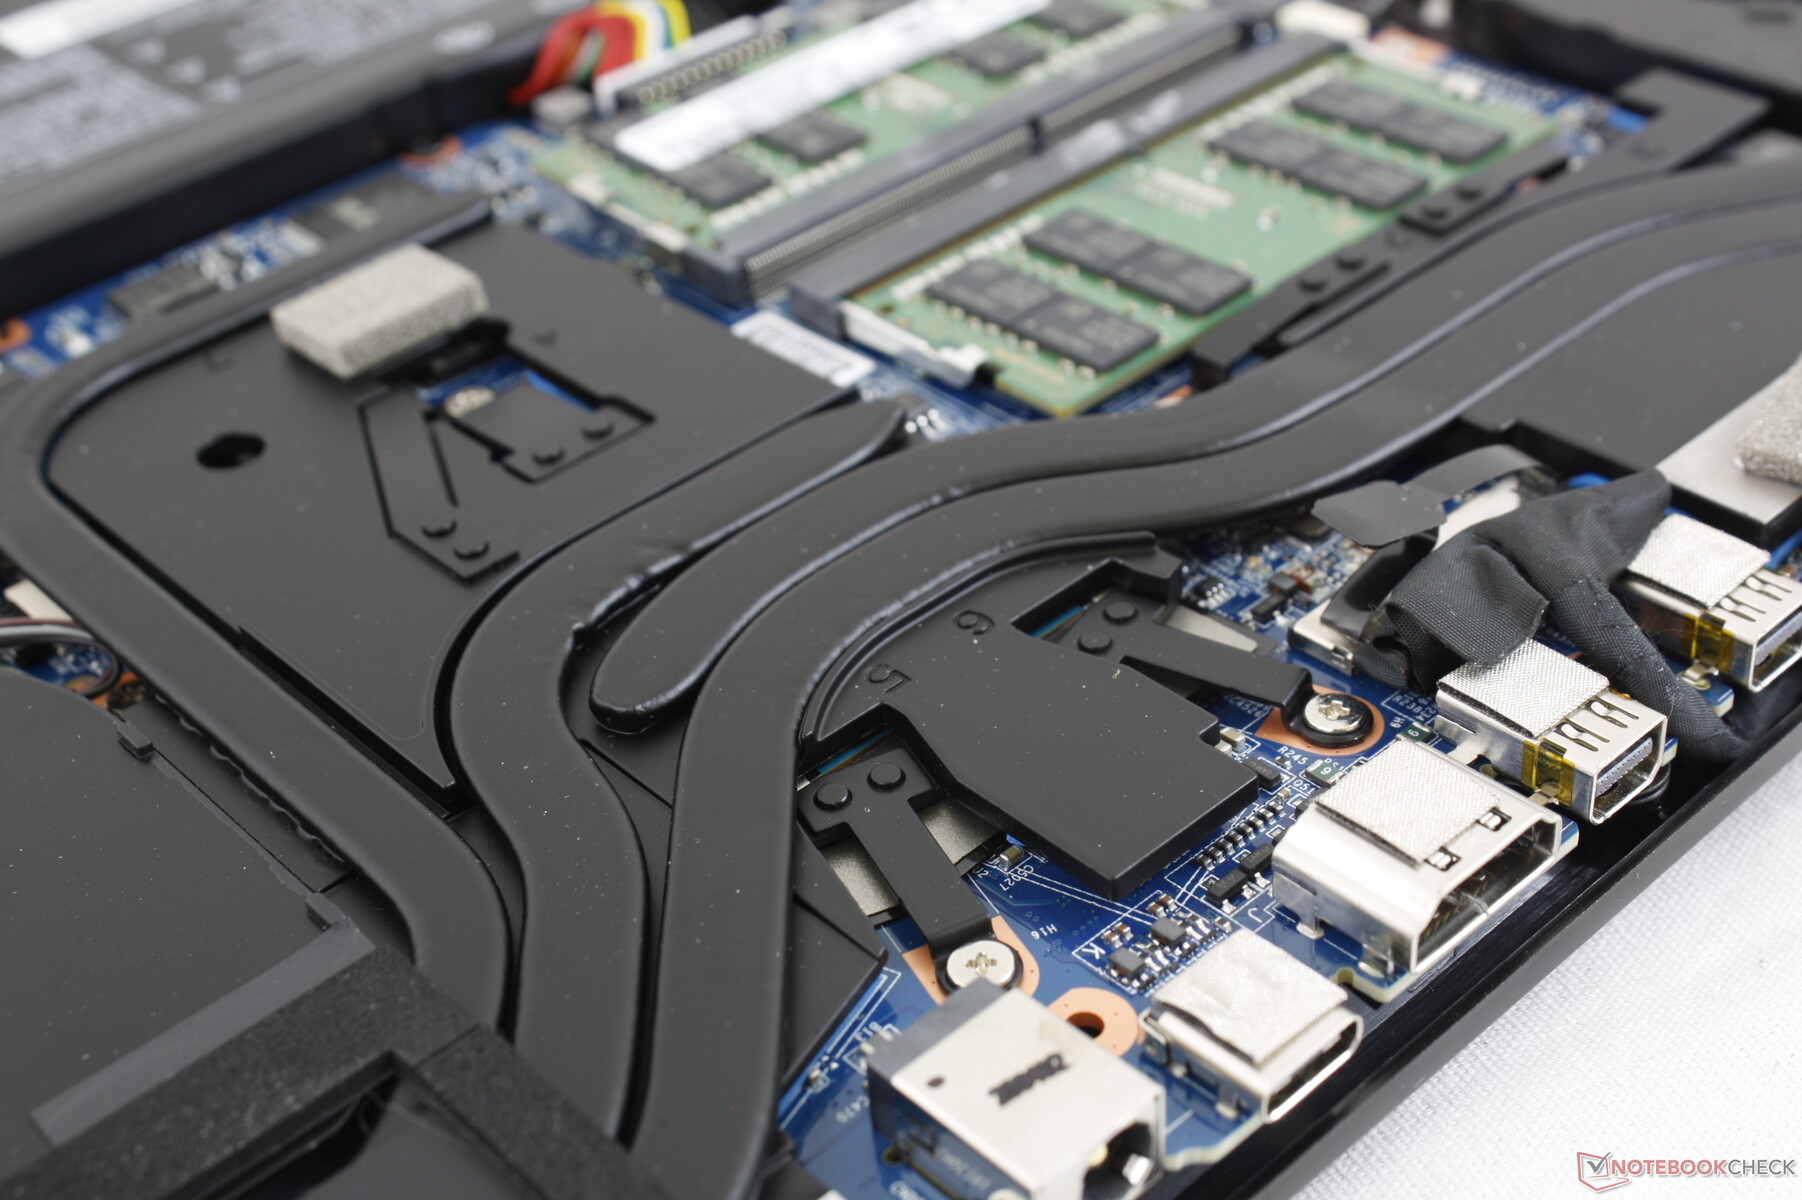
Connectivity
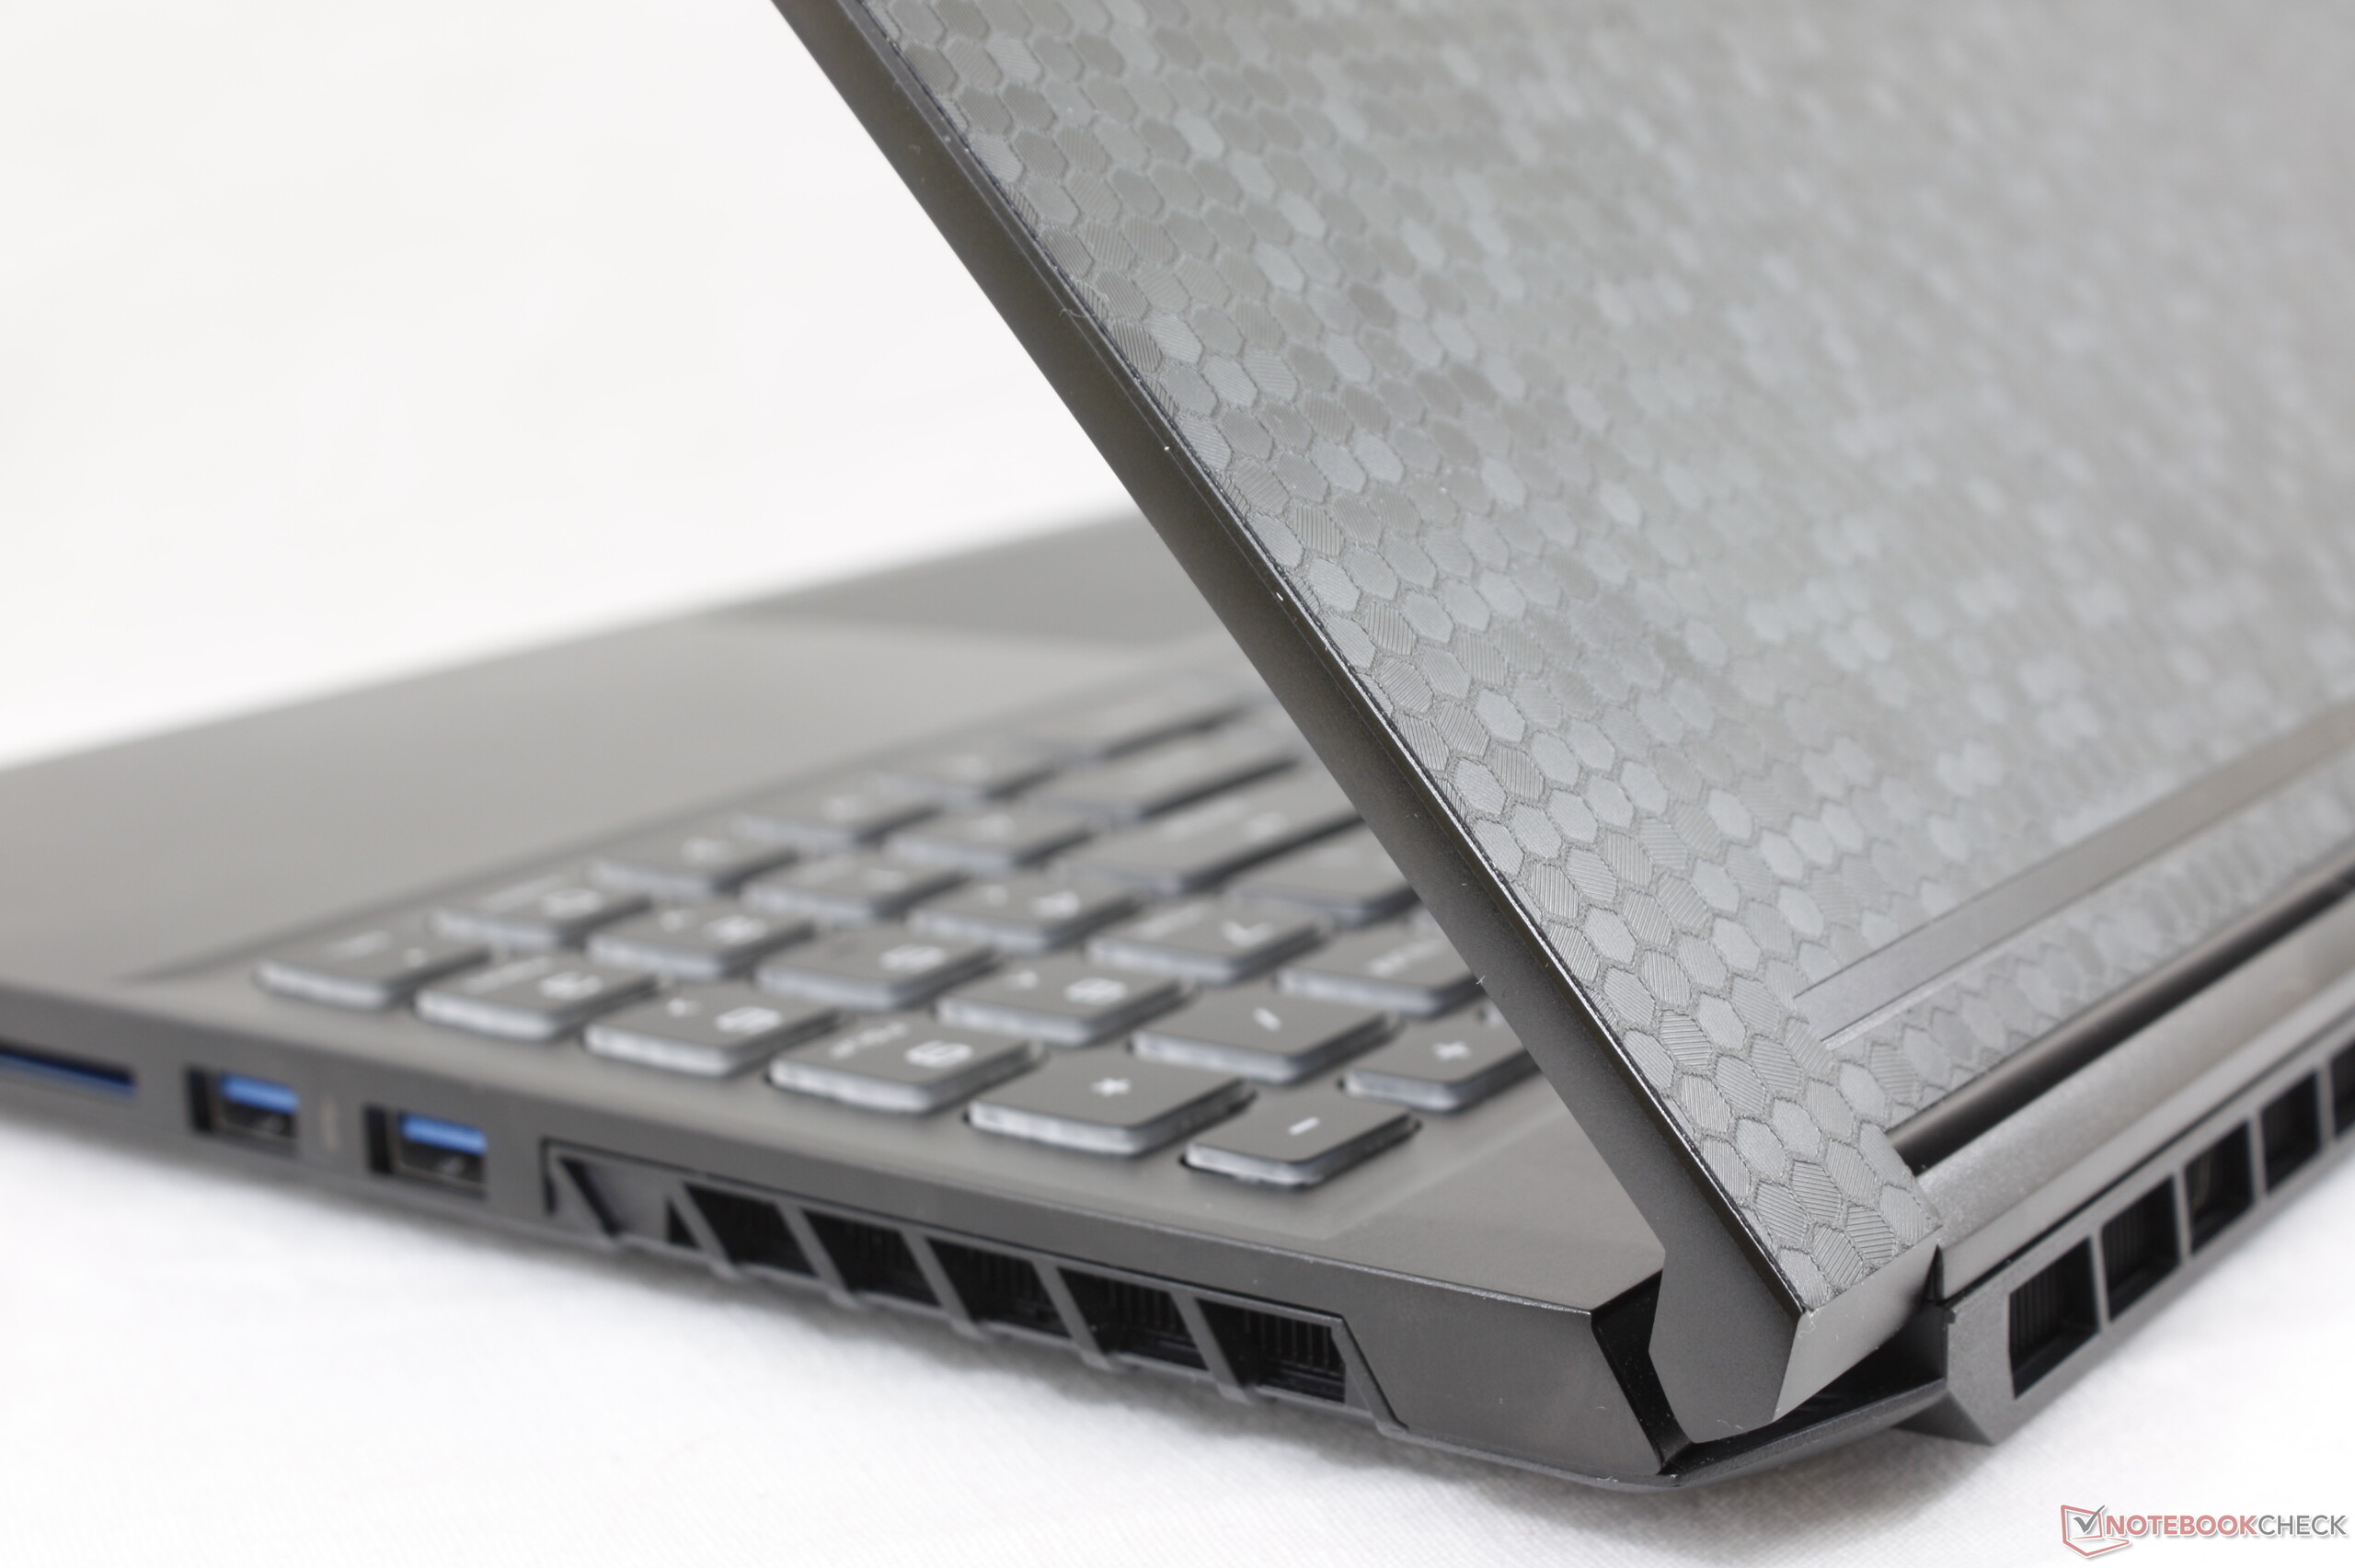
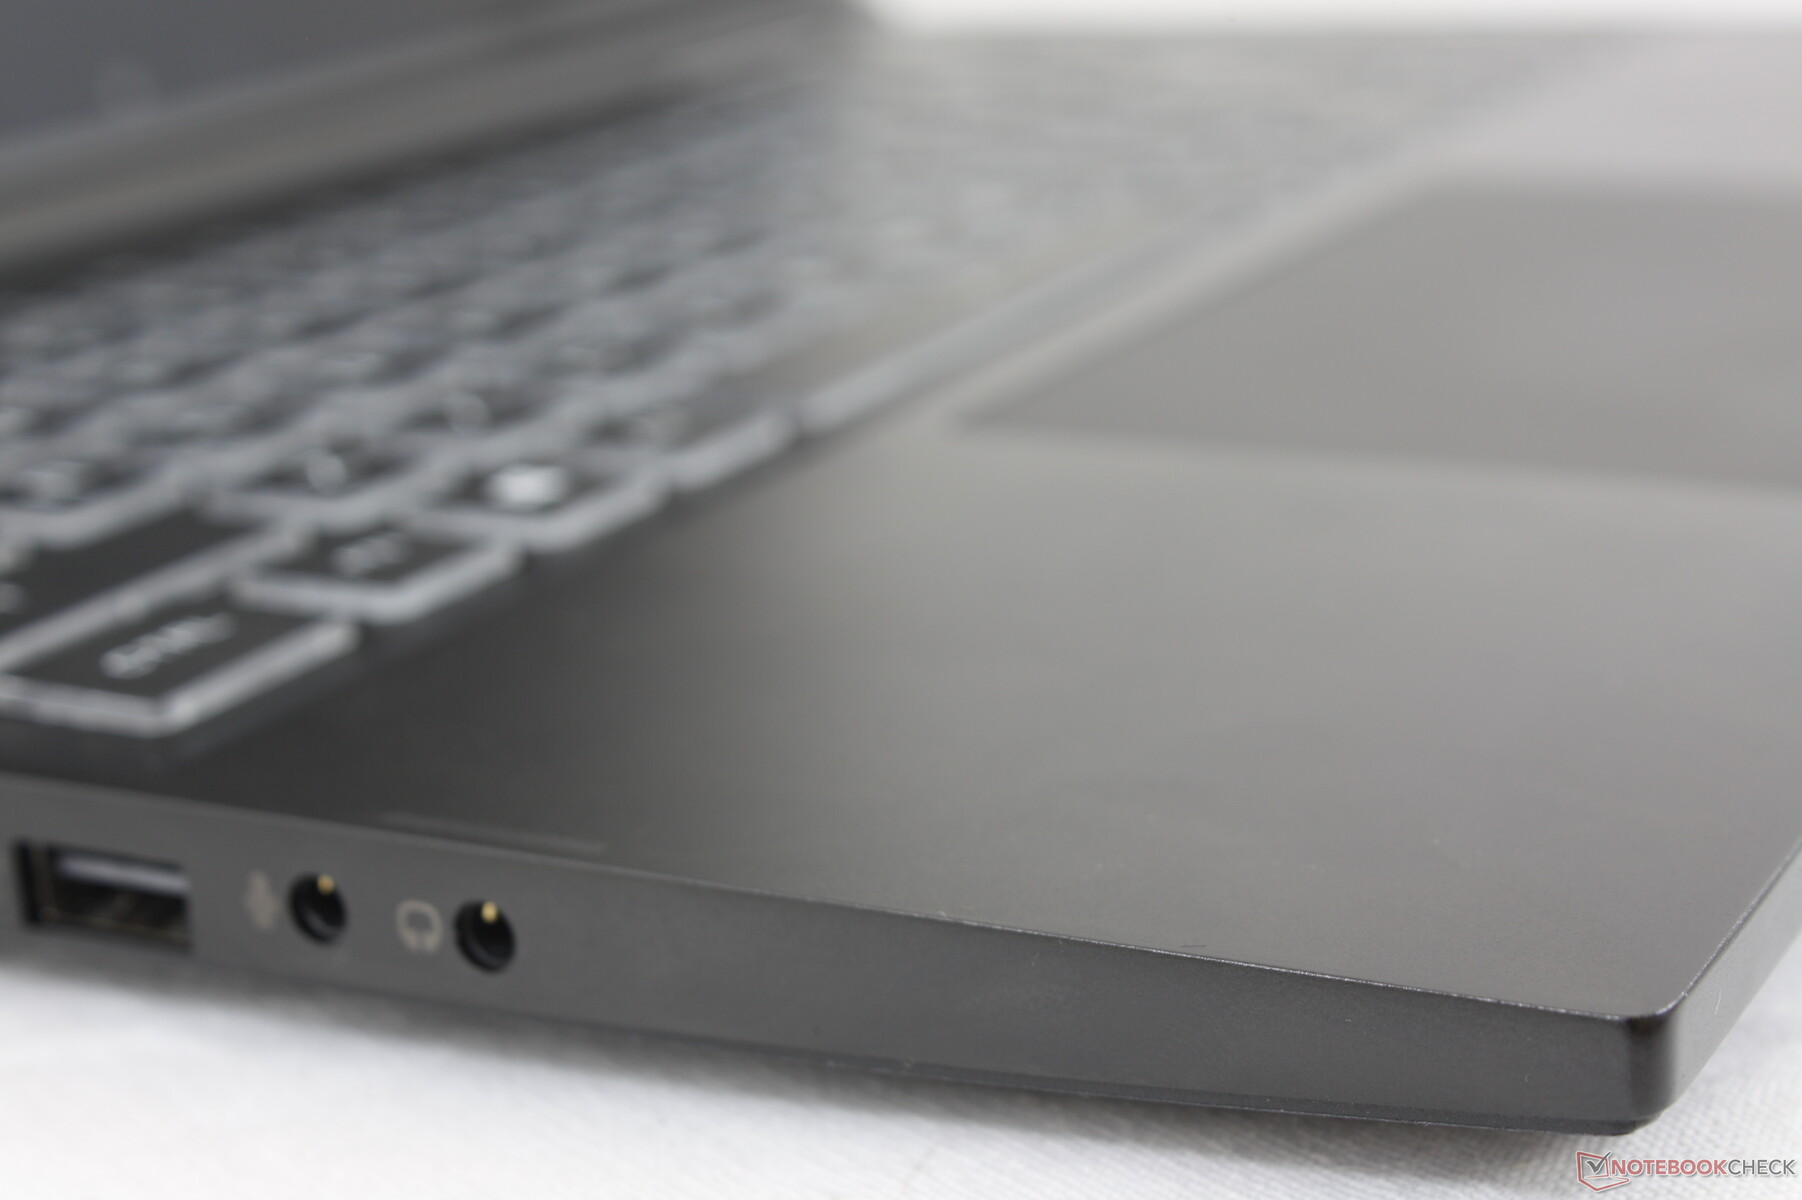
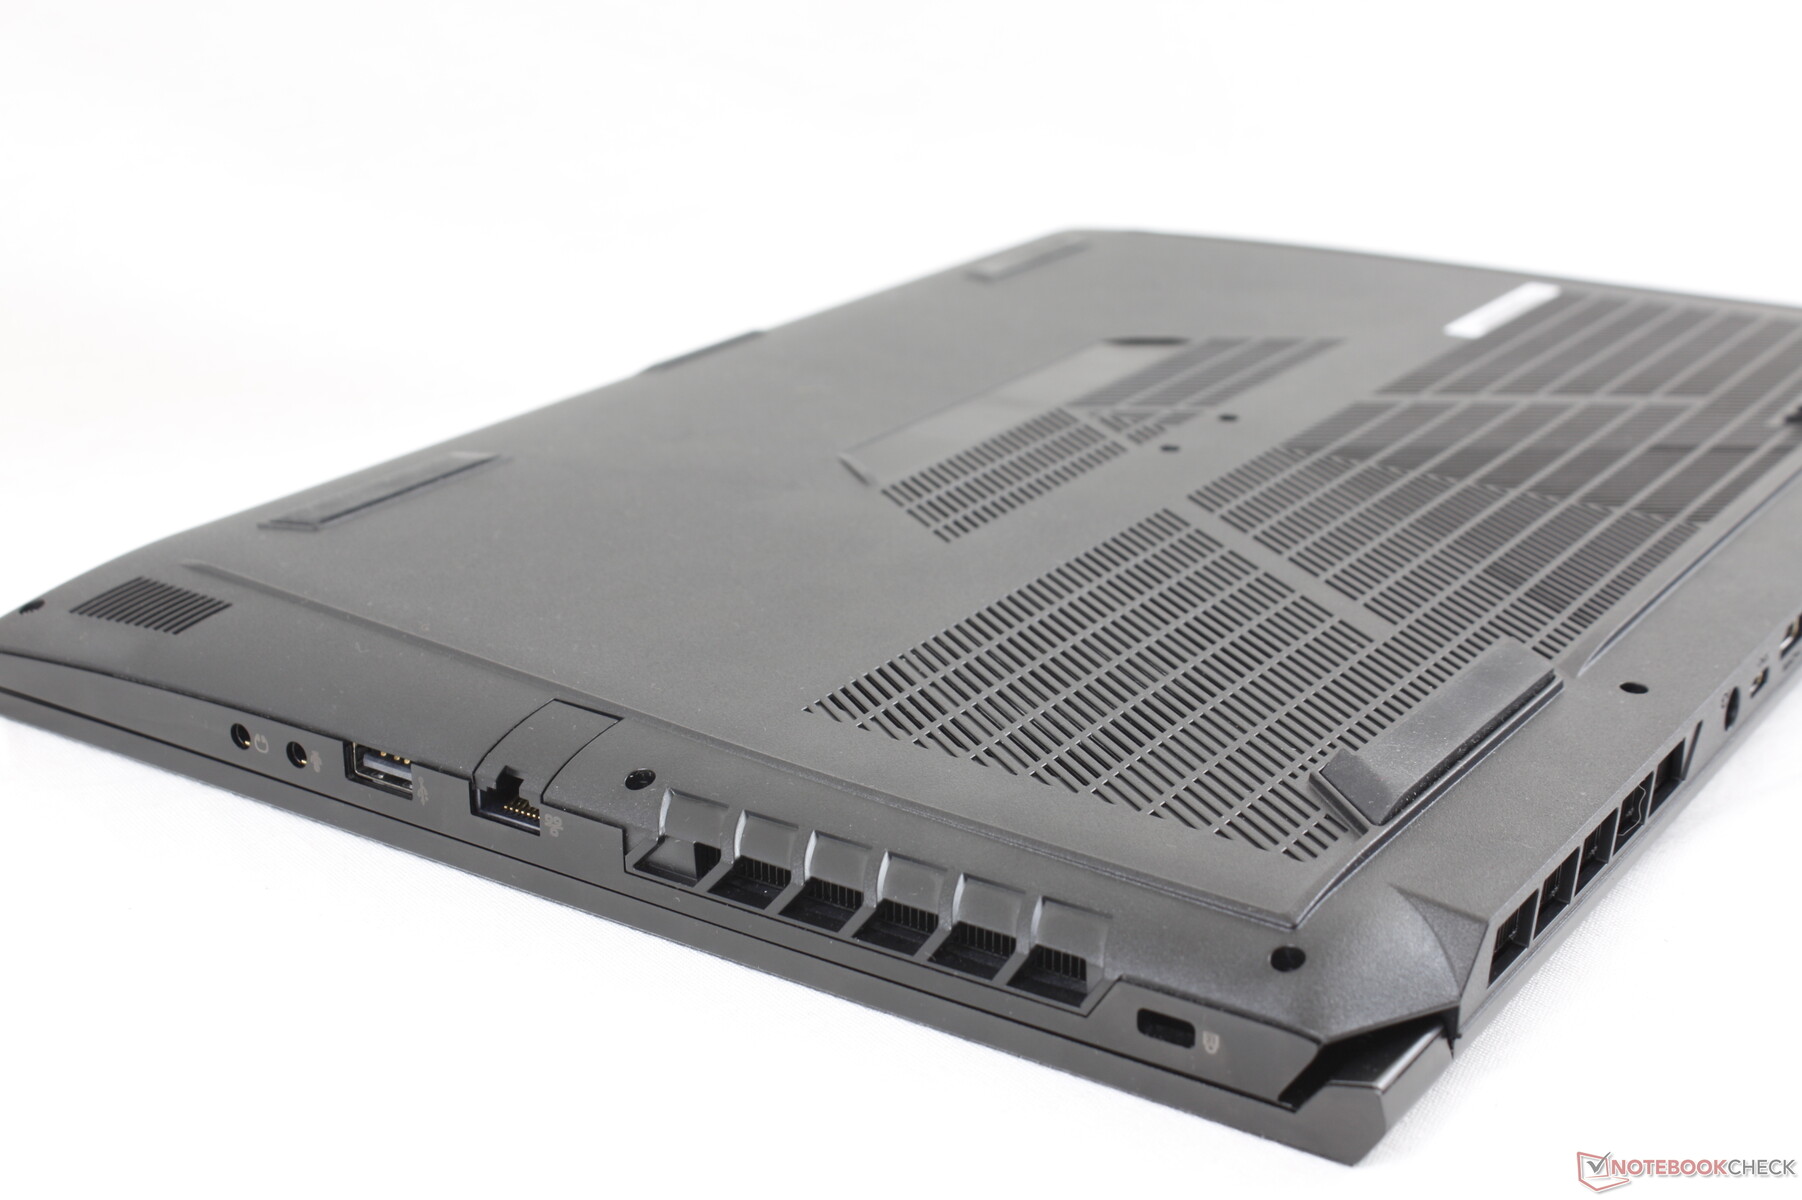
Port options are unique in that the RP-15 offers two mini-DisplayPort ports whereas most other gaming laptops have dropped them completely for DisplayPort-over-USB. Thunderbolt 3 is not supported, either.
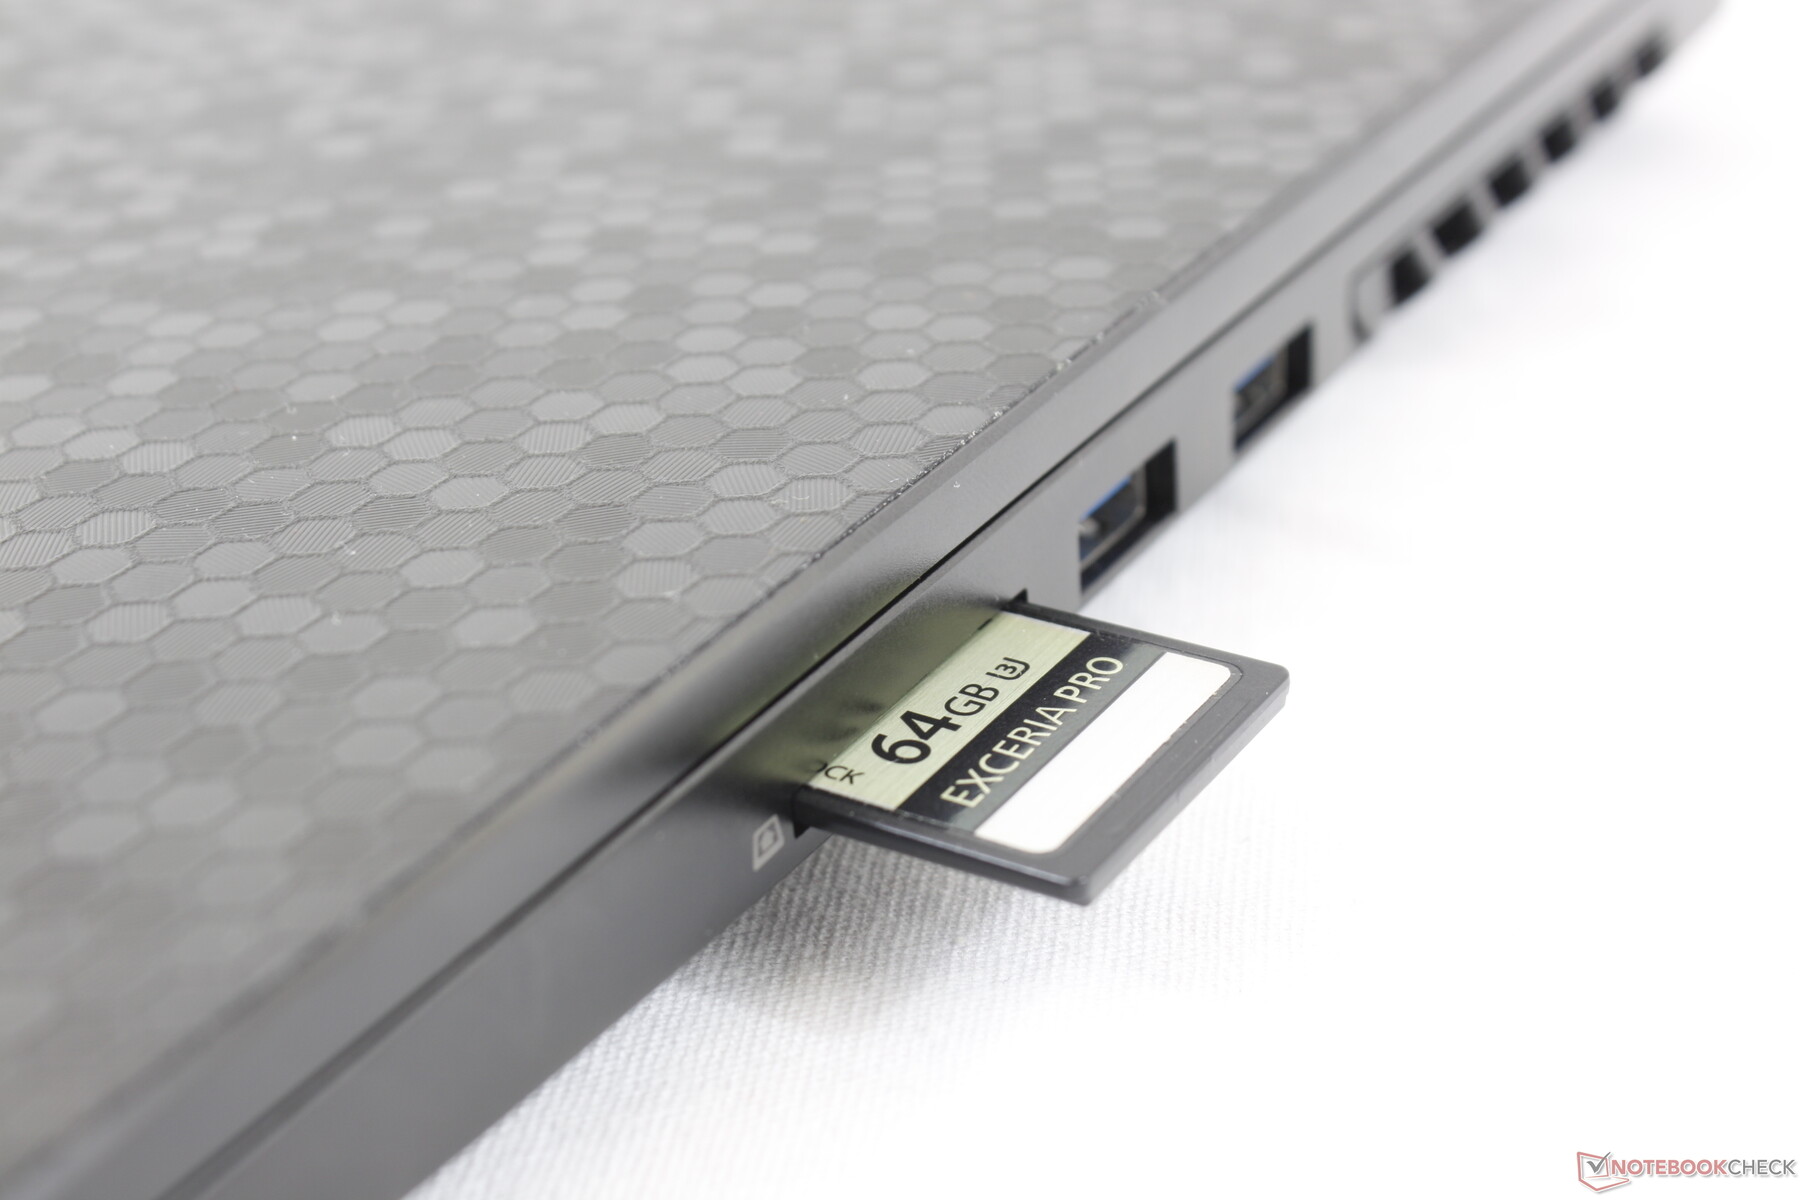
SD Card Reader
Transfer rates from the integrated SD reader are slow. Moving 1 GB of images from our UHS-II test card to desktop takes about 28 seconds compared to just under 7 seconds on the Dell XPS 15 9500.
| SD Card Reader | |
| average JPG Copy Test (av. of 3 runs) | |
| Razer Blade Pro 17 4K UHD 120 Hz (Toshiba Exceria Pro SDXC 64 GB UHS-II) | |
| Dell XPS 15 7590 9980HK GTX 1650 (Toshiba Exceria Pro SDXC 64 GB UHS-II) | |
| MSI GT75 8RG-090 Titan (Toshiba Exceria Pro SDXC 64 GB UHS-II) | |
| Asus ZenBook 15 UX534FTC-A8190T (Toshiba Exceria Pro SDXC 64 GB UHS-II) | |
| Eluktronics RP-15 (Toshiba Exceria Pro SDXC 64 GB UHS-II) | |
| maximum AS SSD Seq Read Test (1GB) | |
| Razer Blade Pro 17 4K UHD 120 Hz (Toshiba Exceria Pro SDXC 64 GB UHS-II) | |
| Dell XPS 15 7590 9980HK GTX 1650 (Toshiba Exceria Pro SDXC 64 GB UHS-II) | |
| MSI GT75 8RG-090 Titan (Toshiba Exceria Pro SDXC 64 GB UHS-II) | |
| Eluktronics RP-15 (Toshiba Exceria Pro SDXC 64 GB UHS-II) | |
Communication
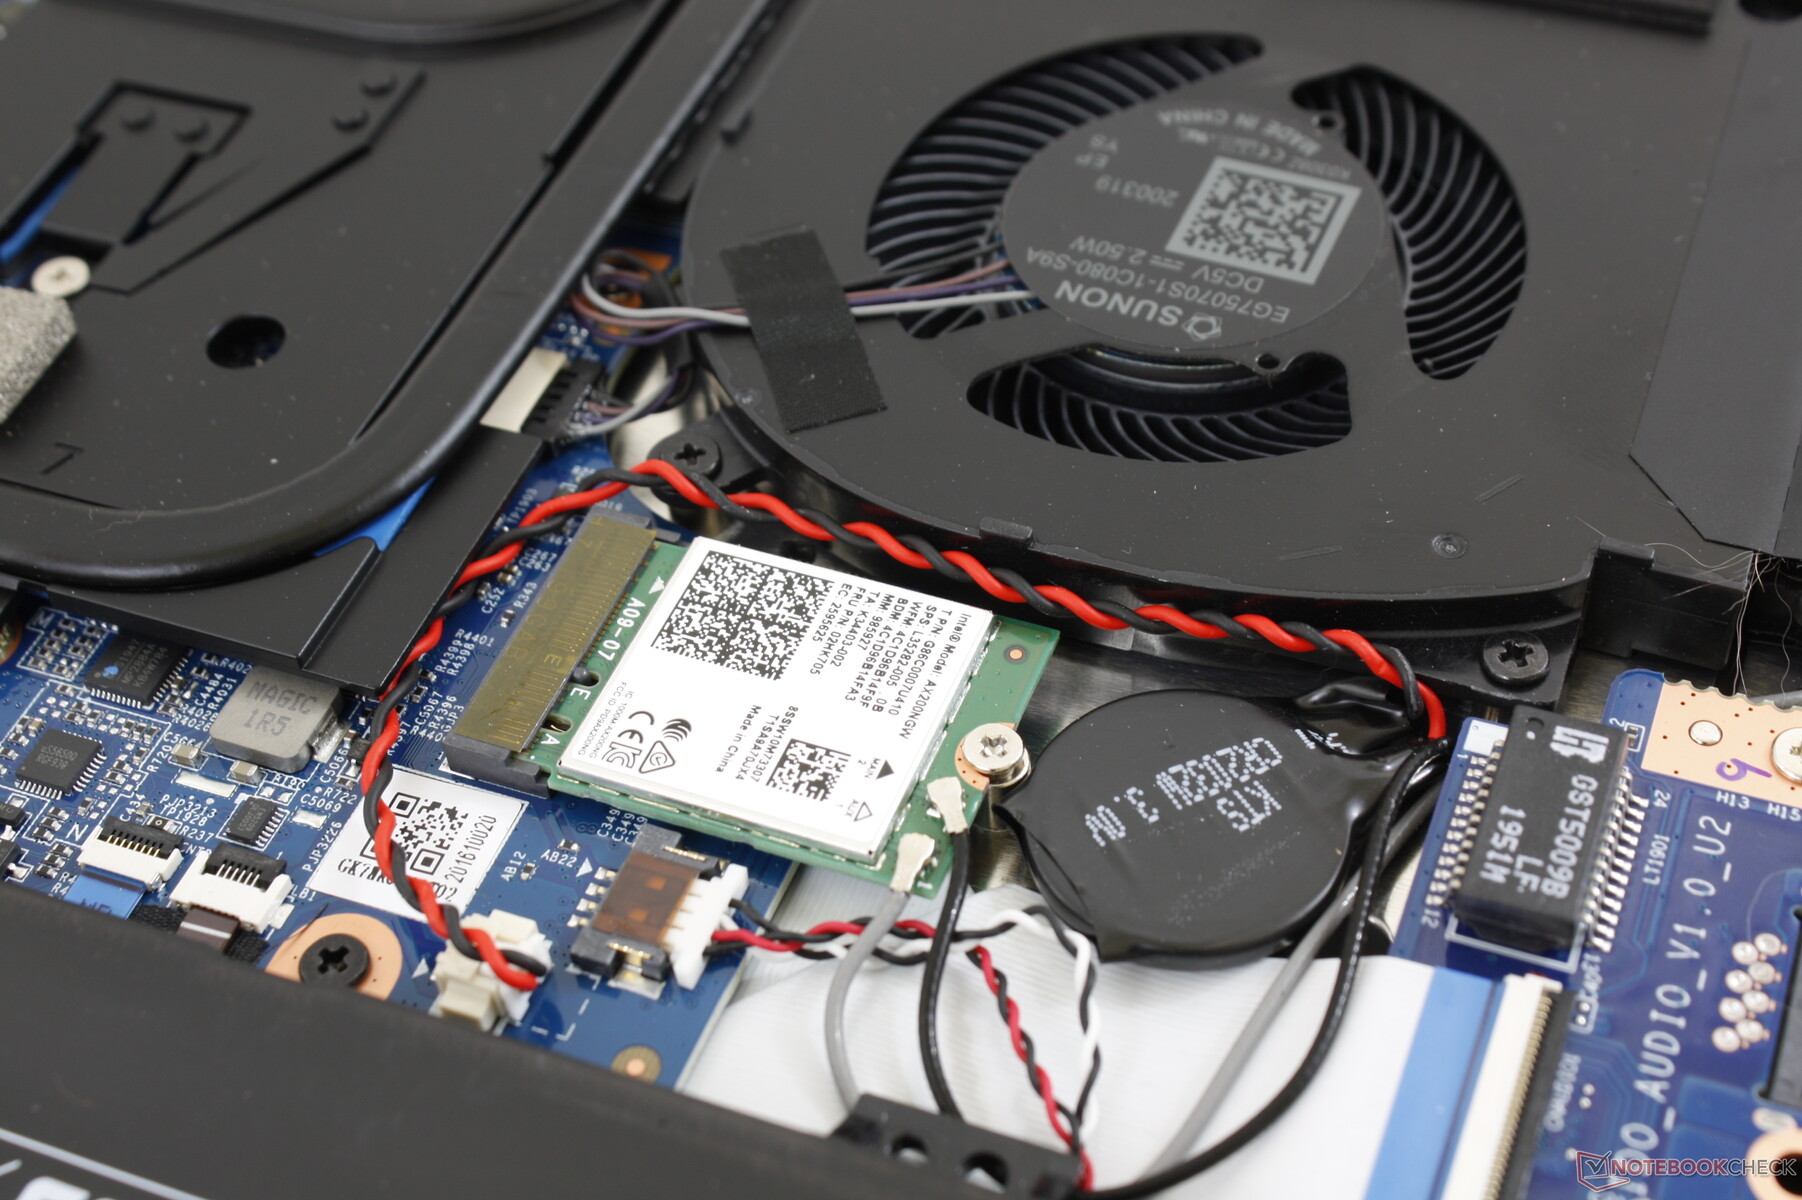
The Intel AX200 comes standard for Bluetooth 5.1 and Wi-Fi 6 connectivity. We experienced no connectivity issues when paired with our Netgear RAX200 router.
| Networking | |
| iperf3 transmit AX12 | |
| Asus Zephyrus G14 GA401IV | |
| Razer Blade 15 RZ09-0328 | |
| Eluktronics RP-15 | |
| MSI GS66 10SGS | |
| iperf3 receive AX12 | |
| Razer Blade 15 RZ09-0328 | |
| Eluktronics RP-15 | |
| MSI GS66 10SGS | |
| Asus Zephyrus G14 GA401IV | |
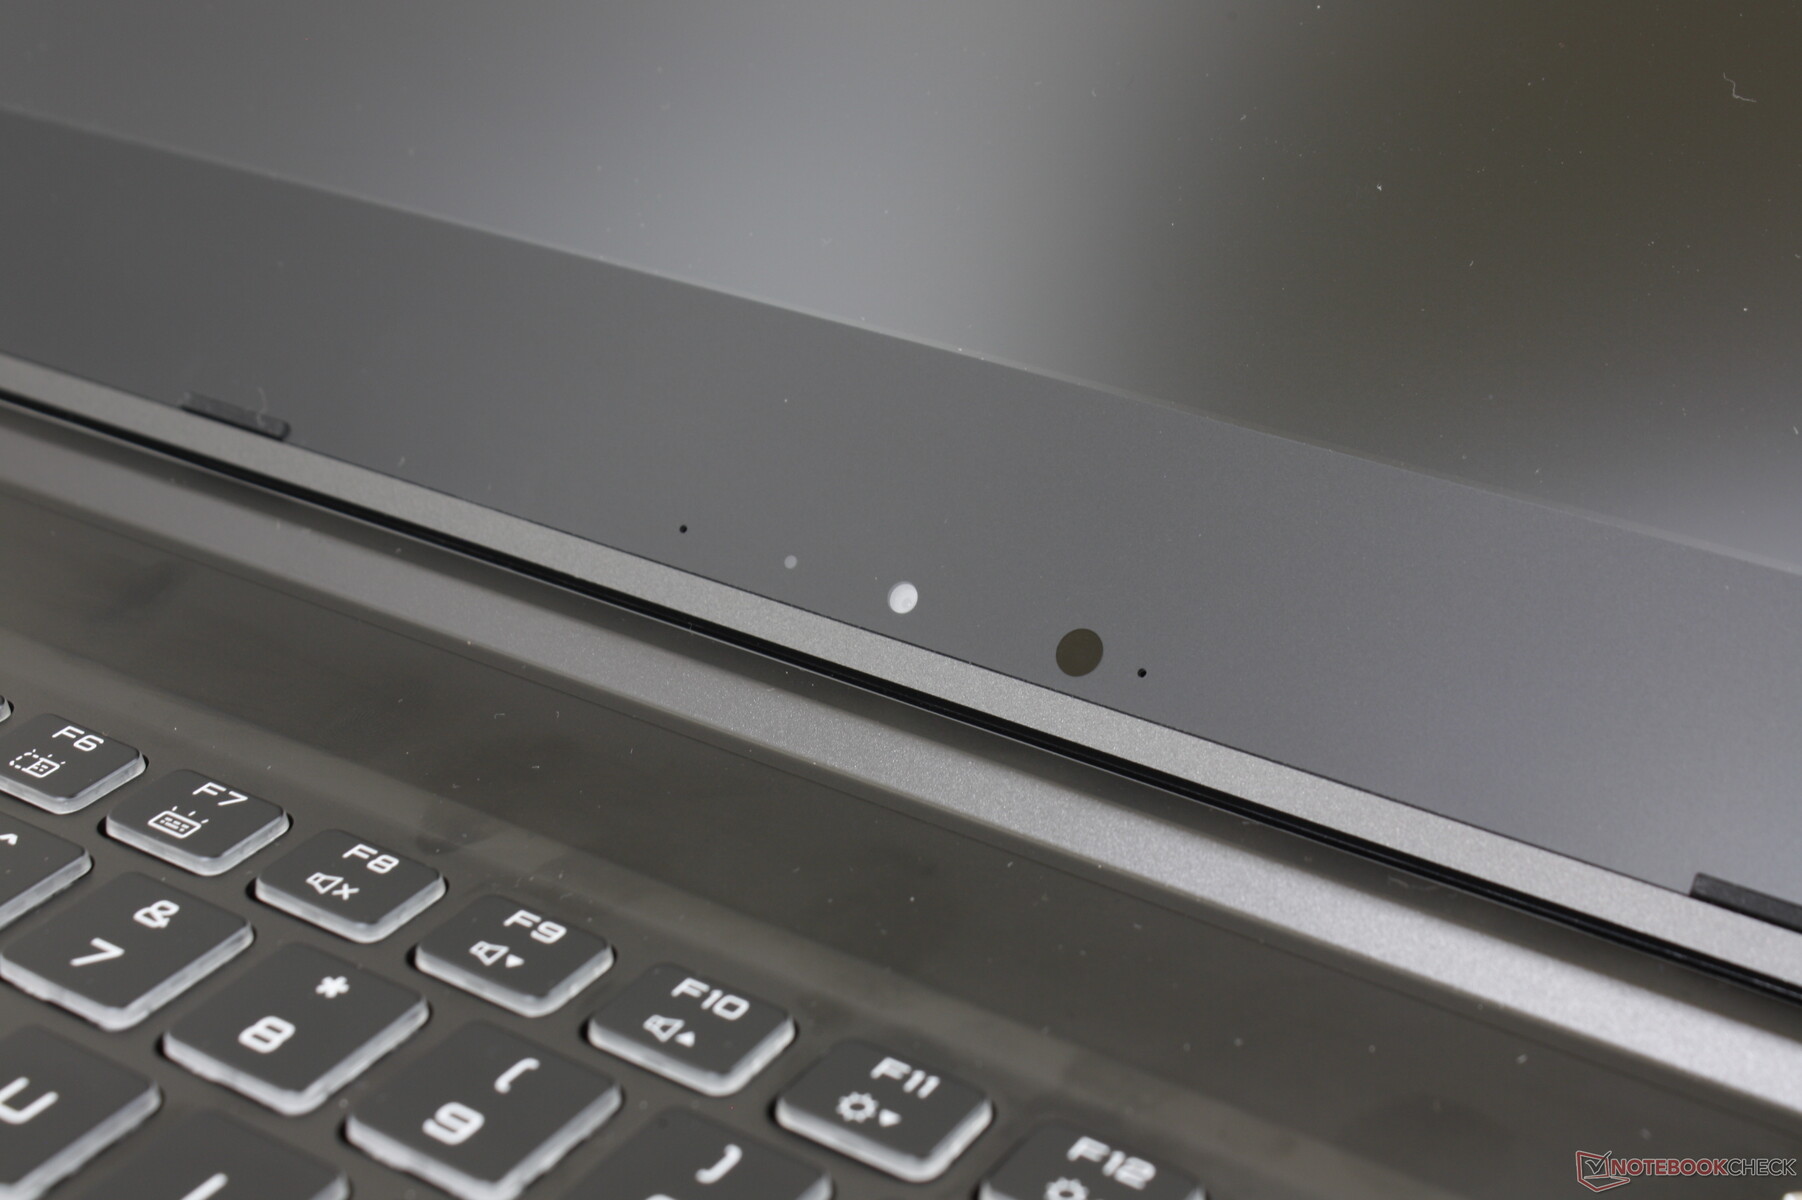
Webcam


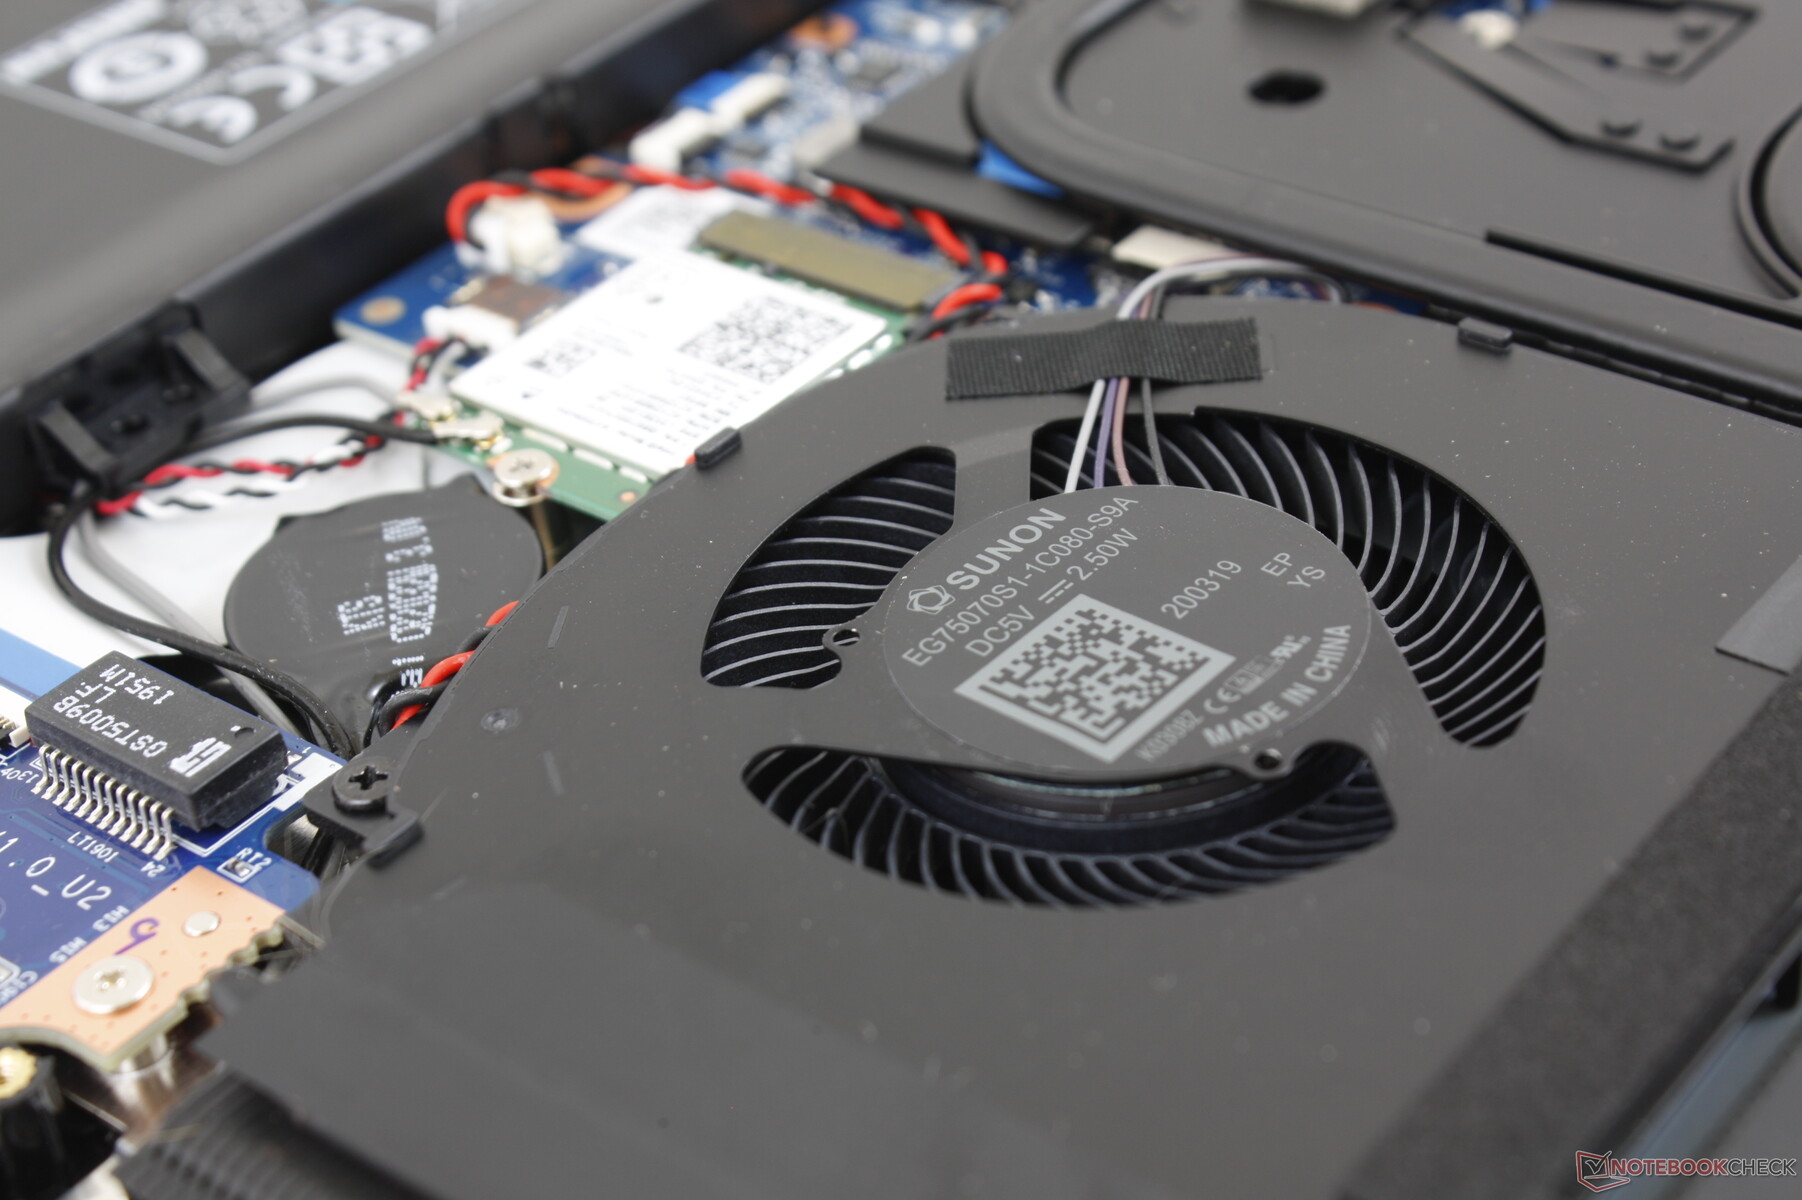
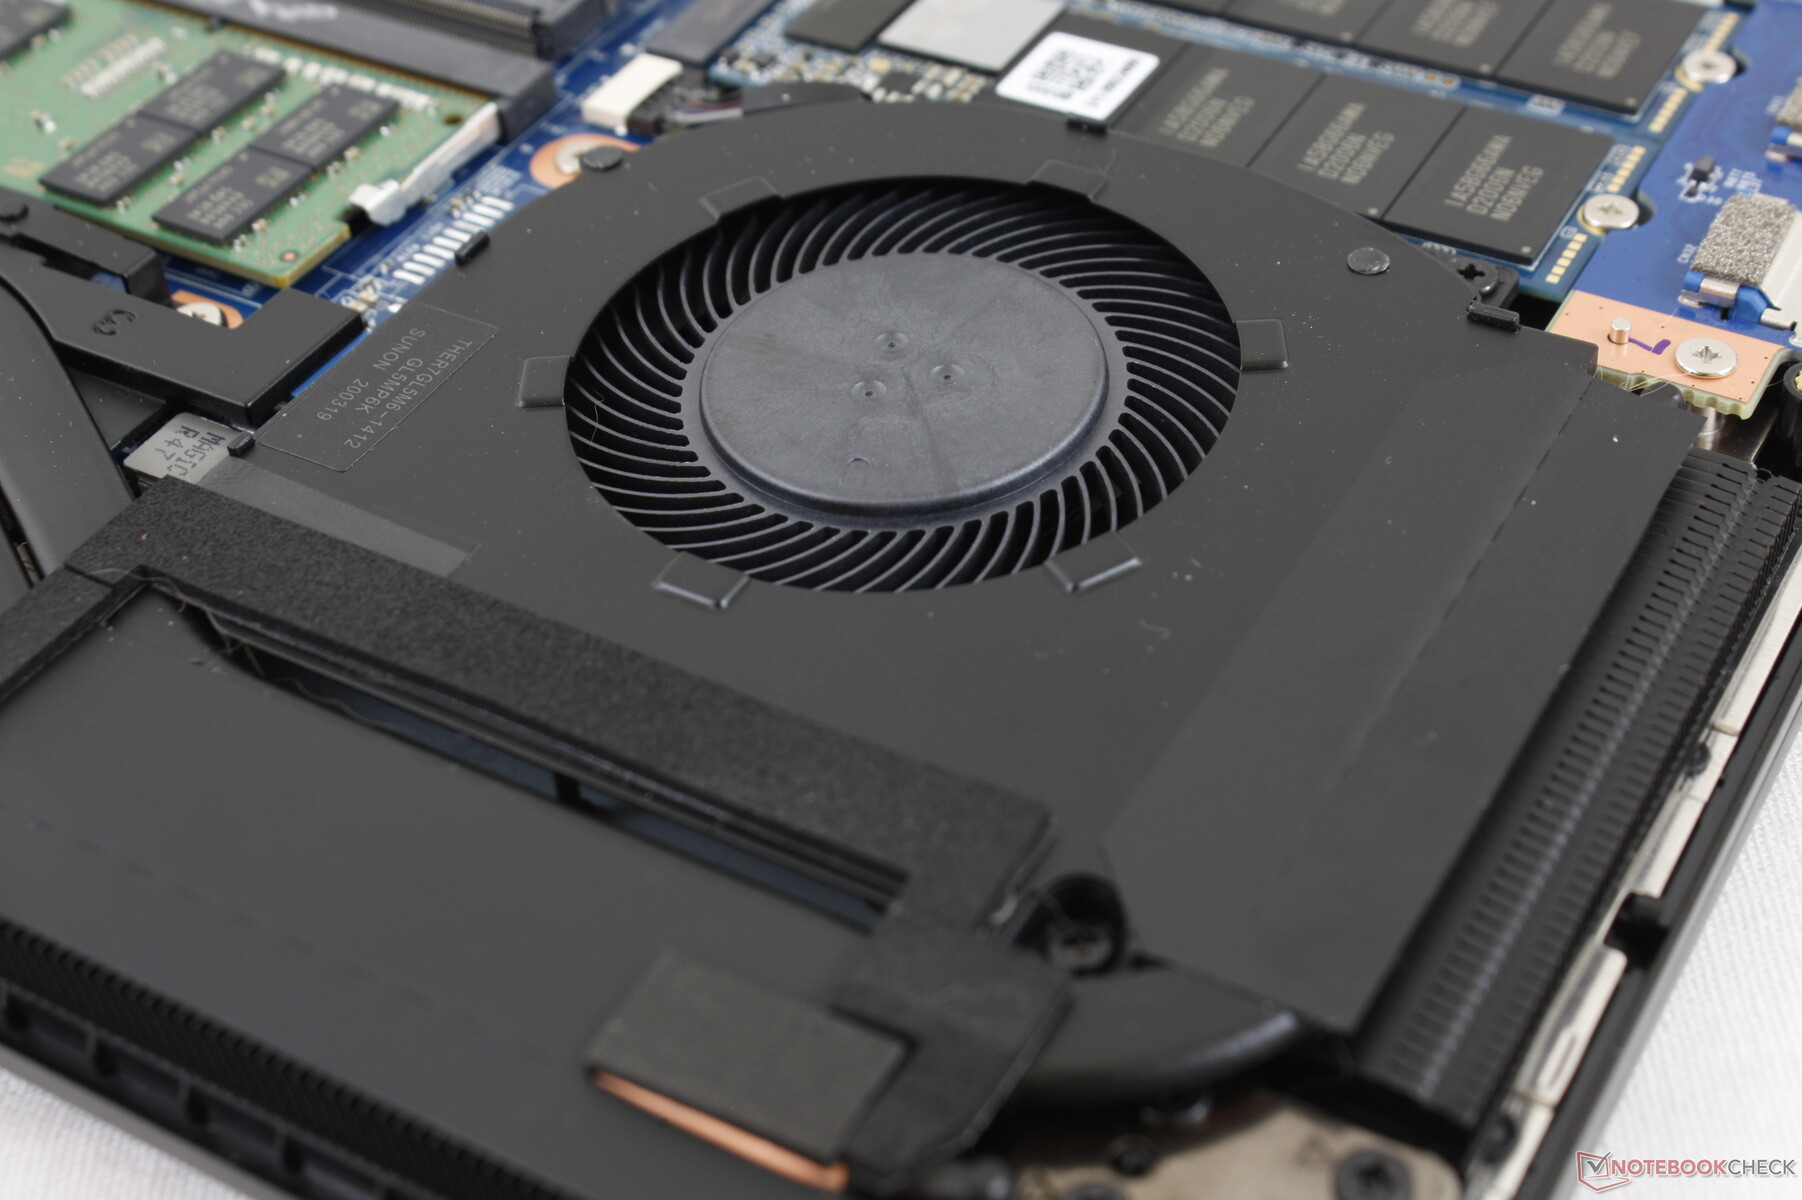
Maintenance
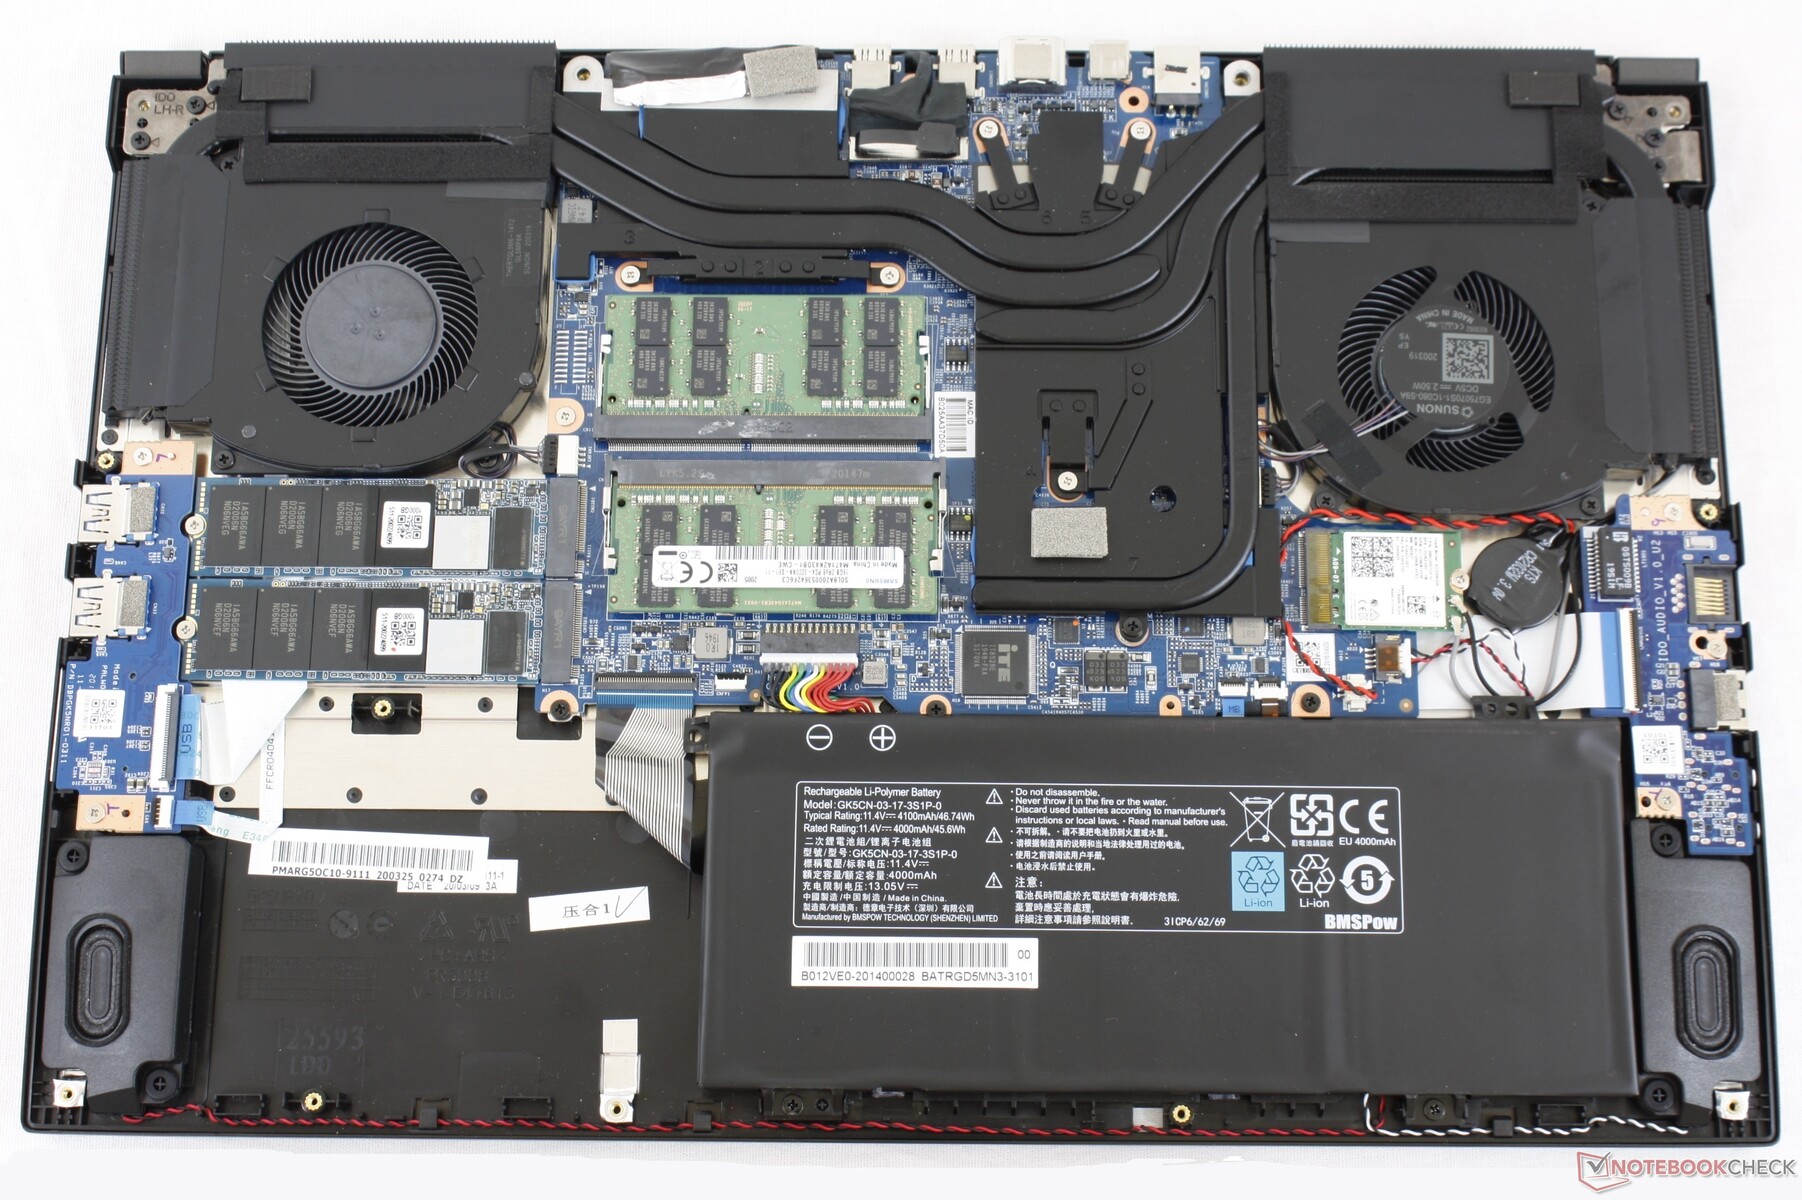
The bottom panel pops off easily after removing the 10 Philips screws. Owners get direct access to both SODIMM slots, both storage slots, WLAN module, and the internal battery.
Input Devices
Keyboard
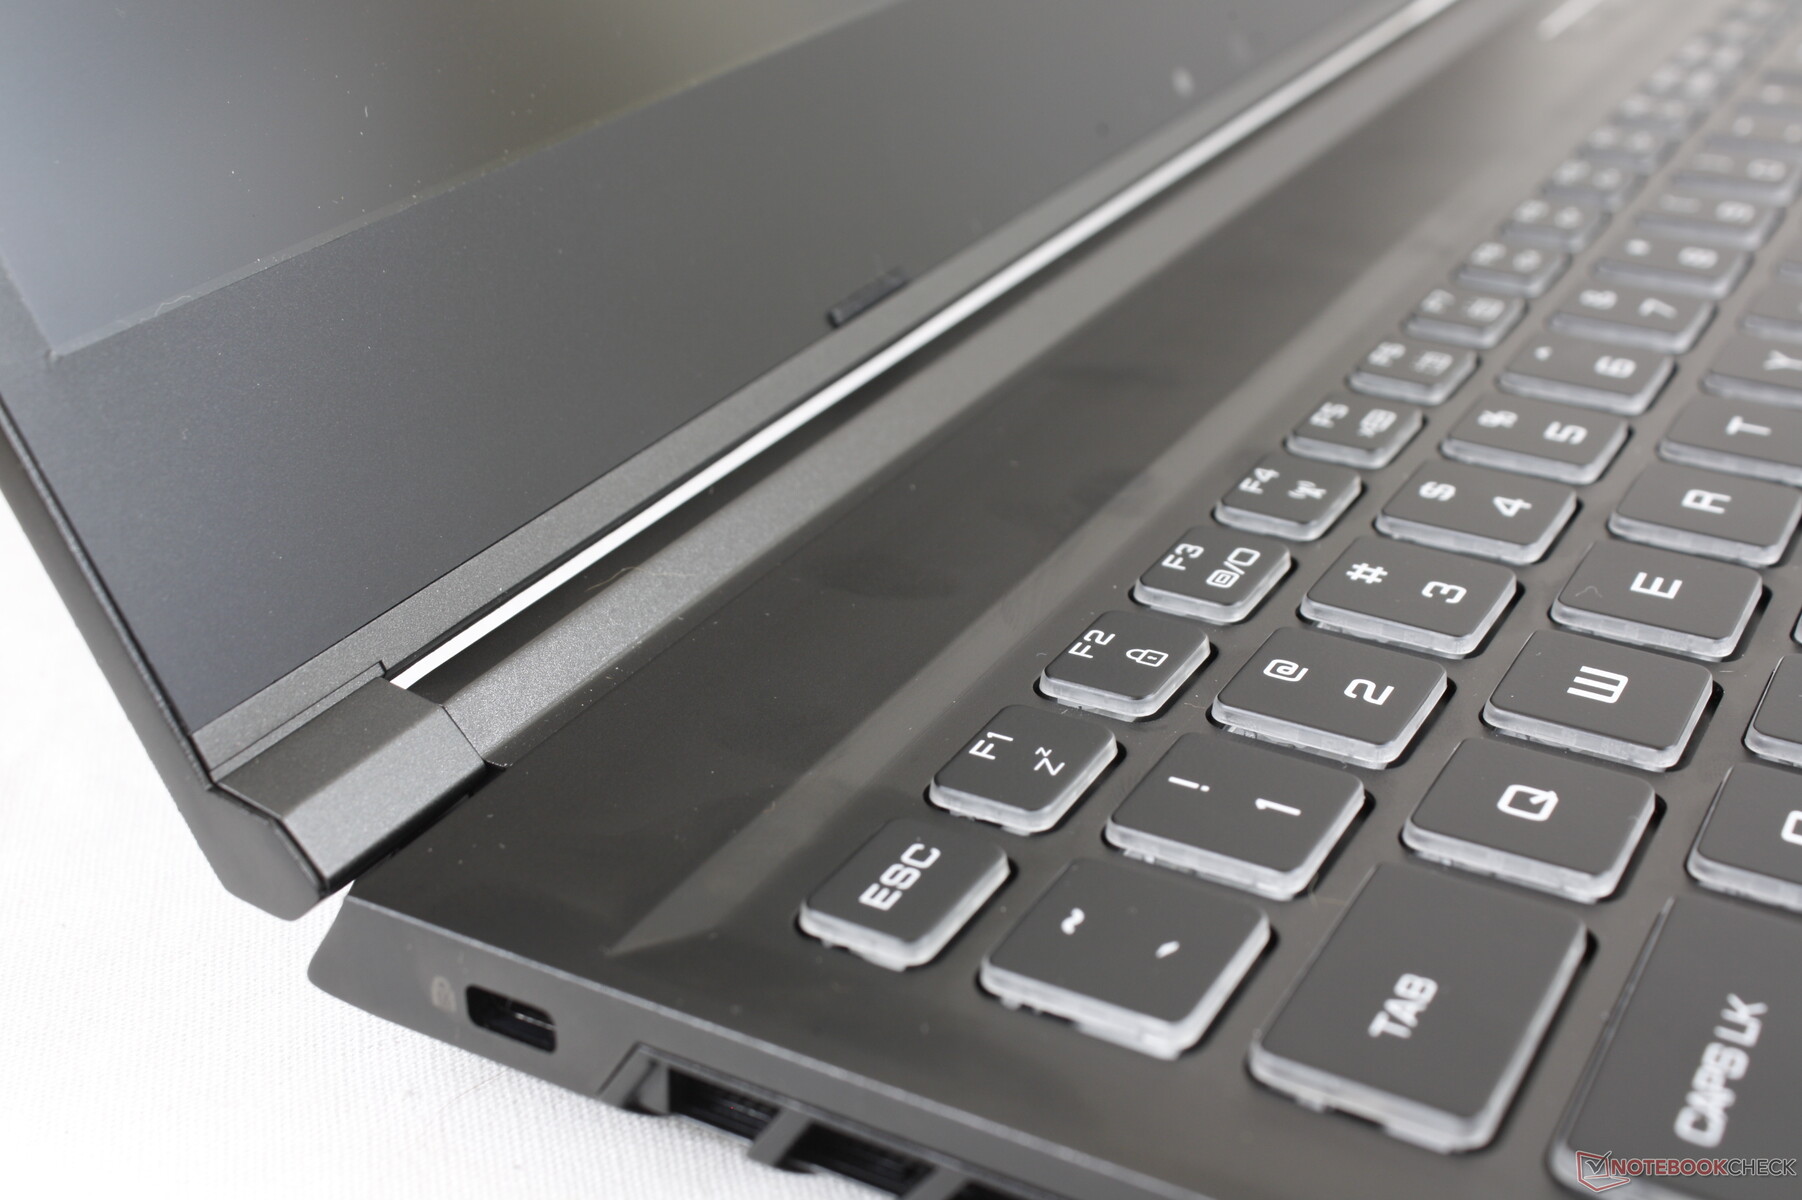
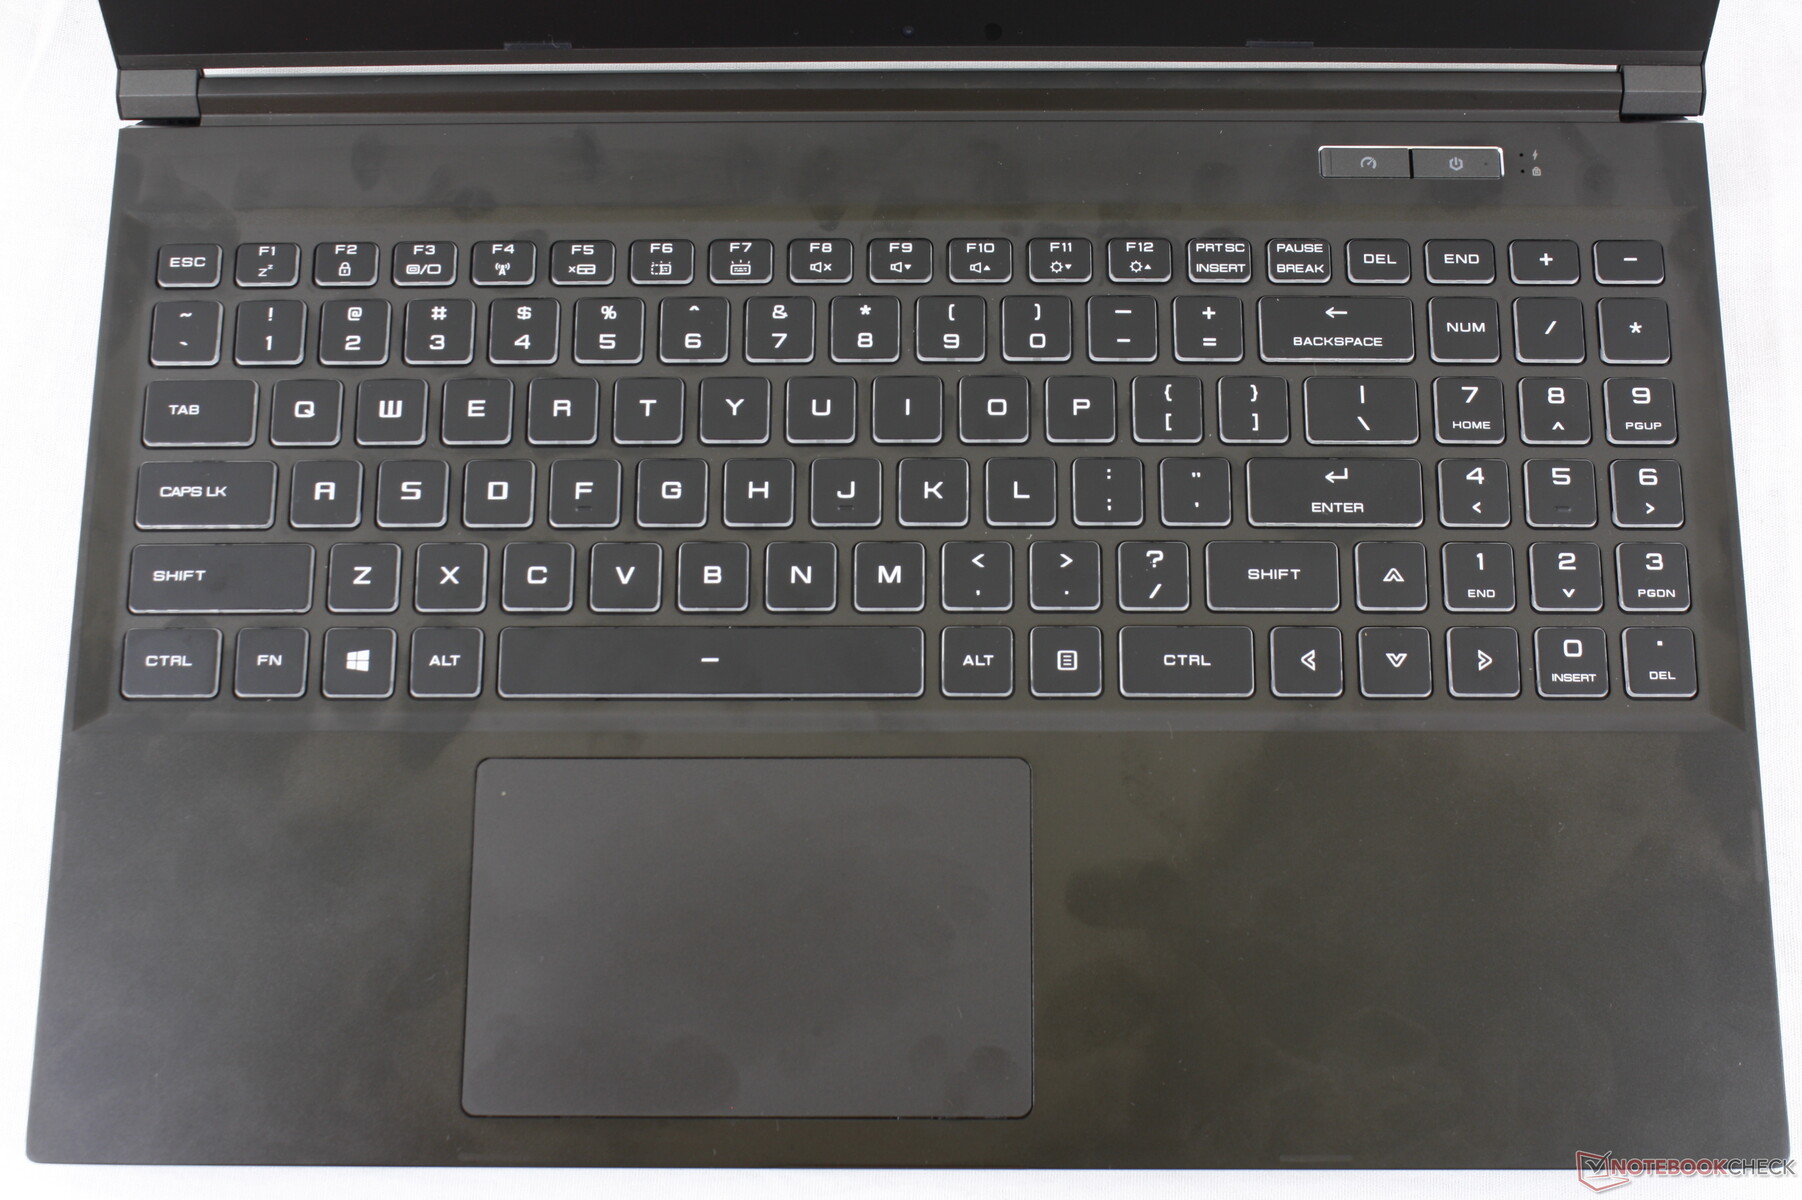
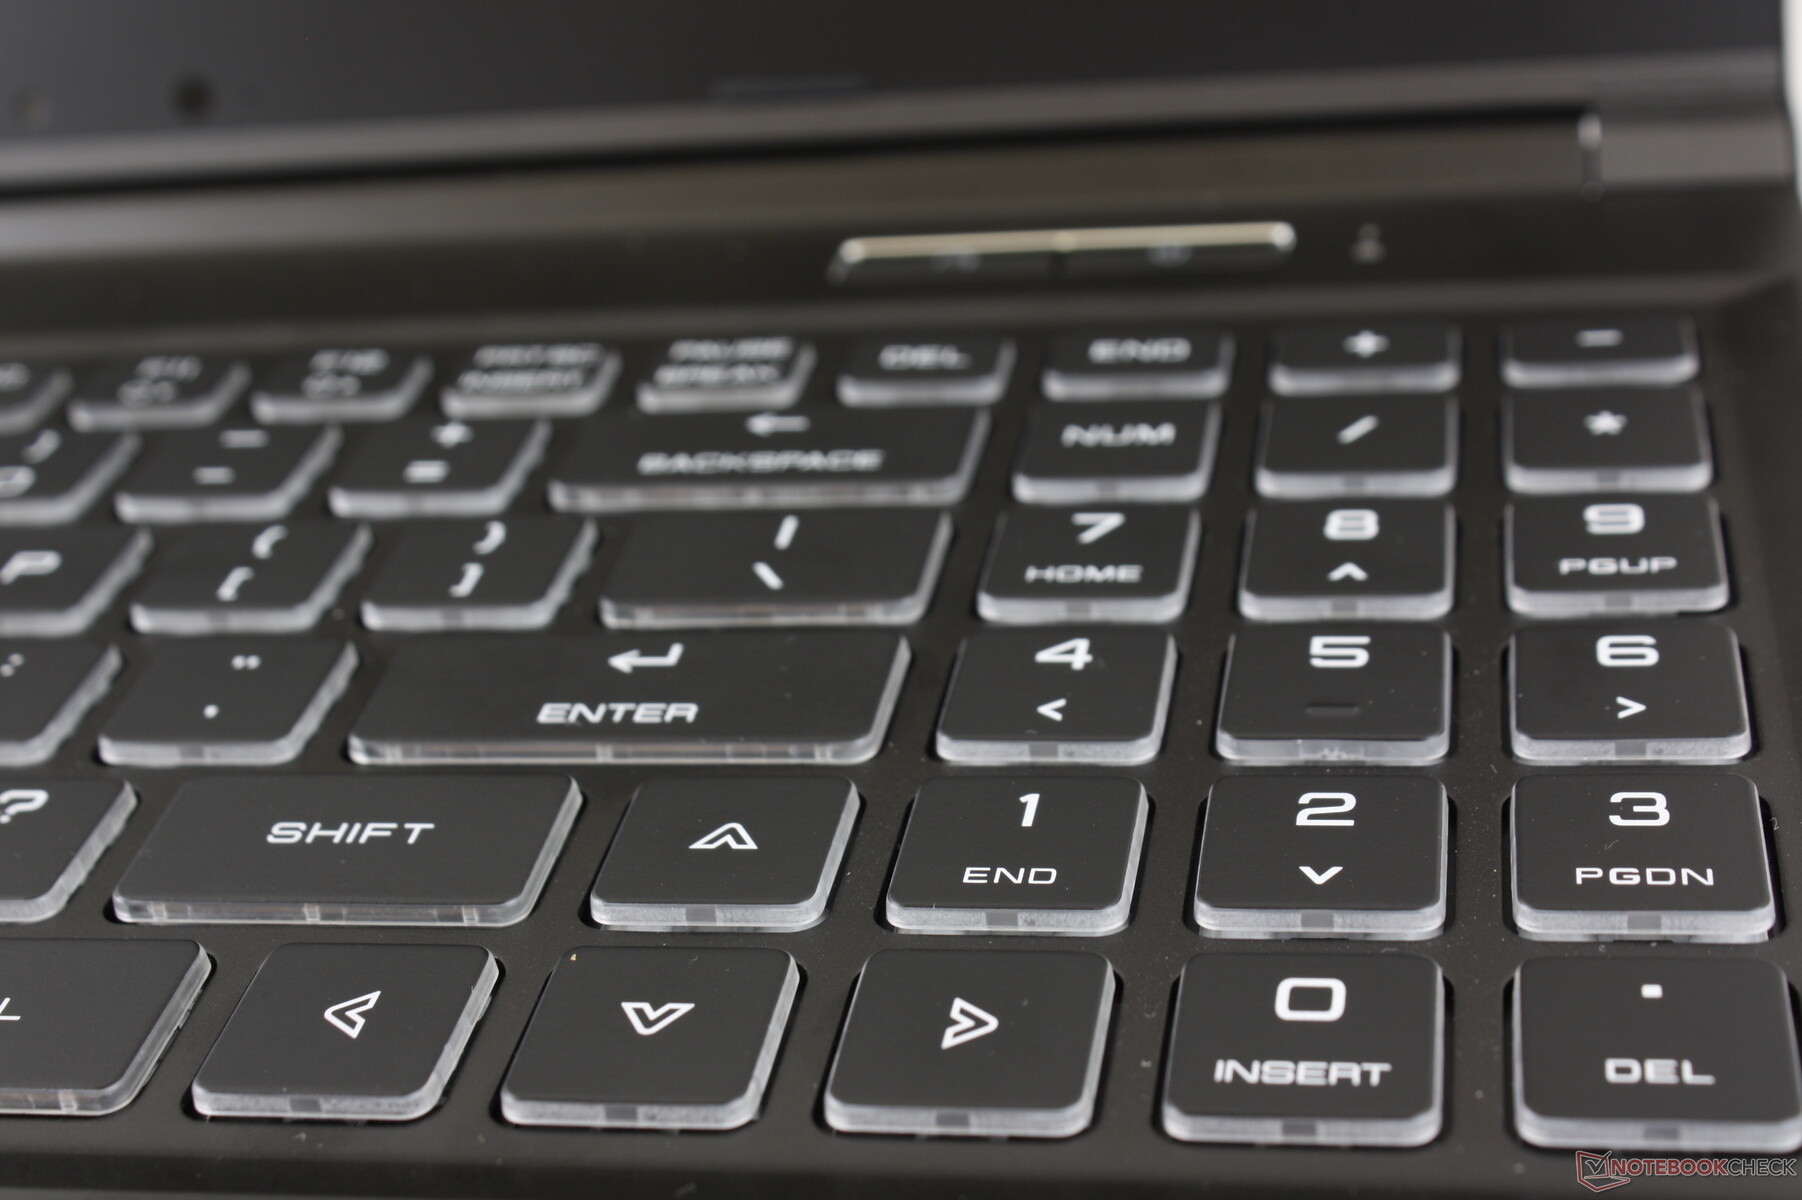
The keys are light in feedback with moderate clatter when compared to the deeper and quieter keys of the MSI GS65. We still prefer it over the Blade 15 keyboard which we find to be too shallow. The NumPad and arrow keys are the same size as the main QWERTY keys unlike on most other gaming laptops.
Touchpad
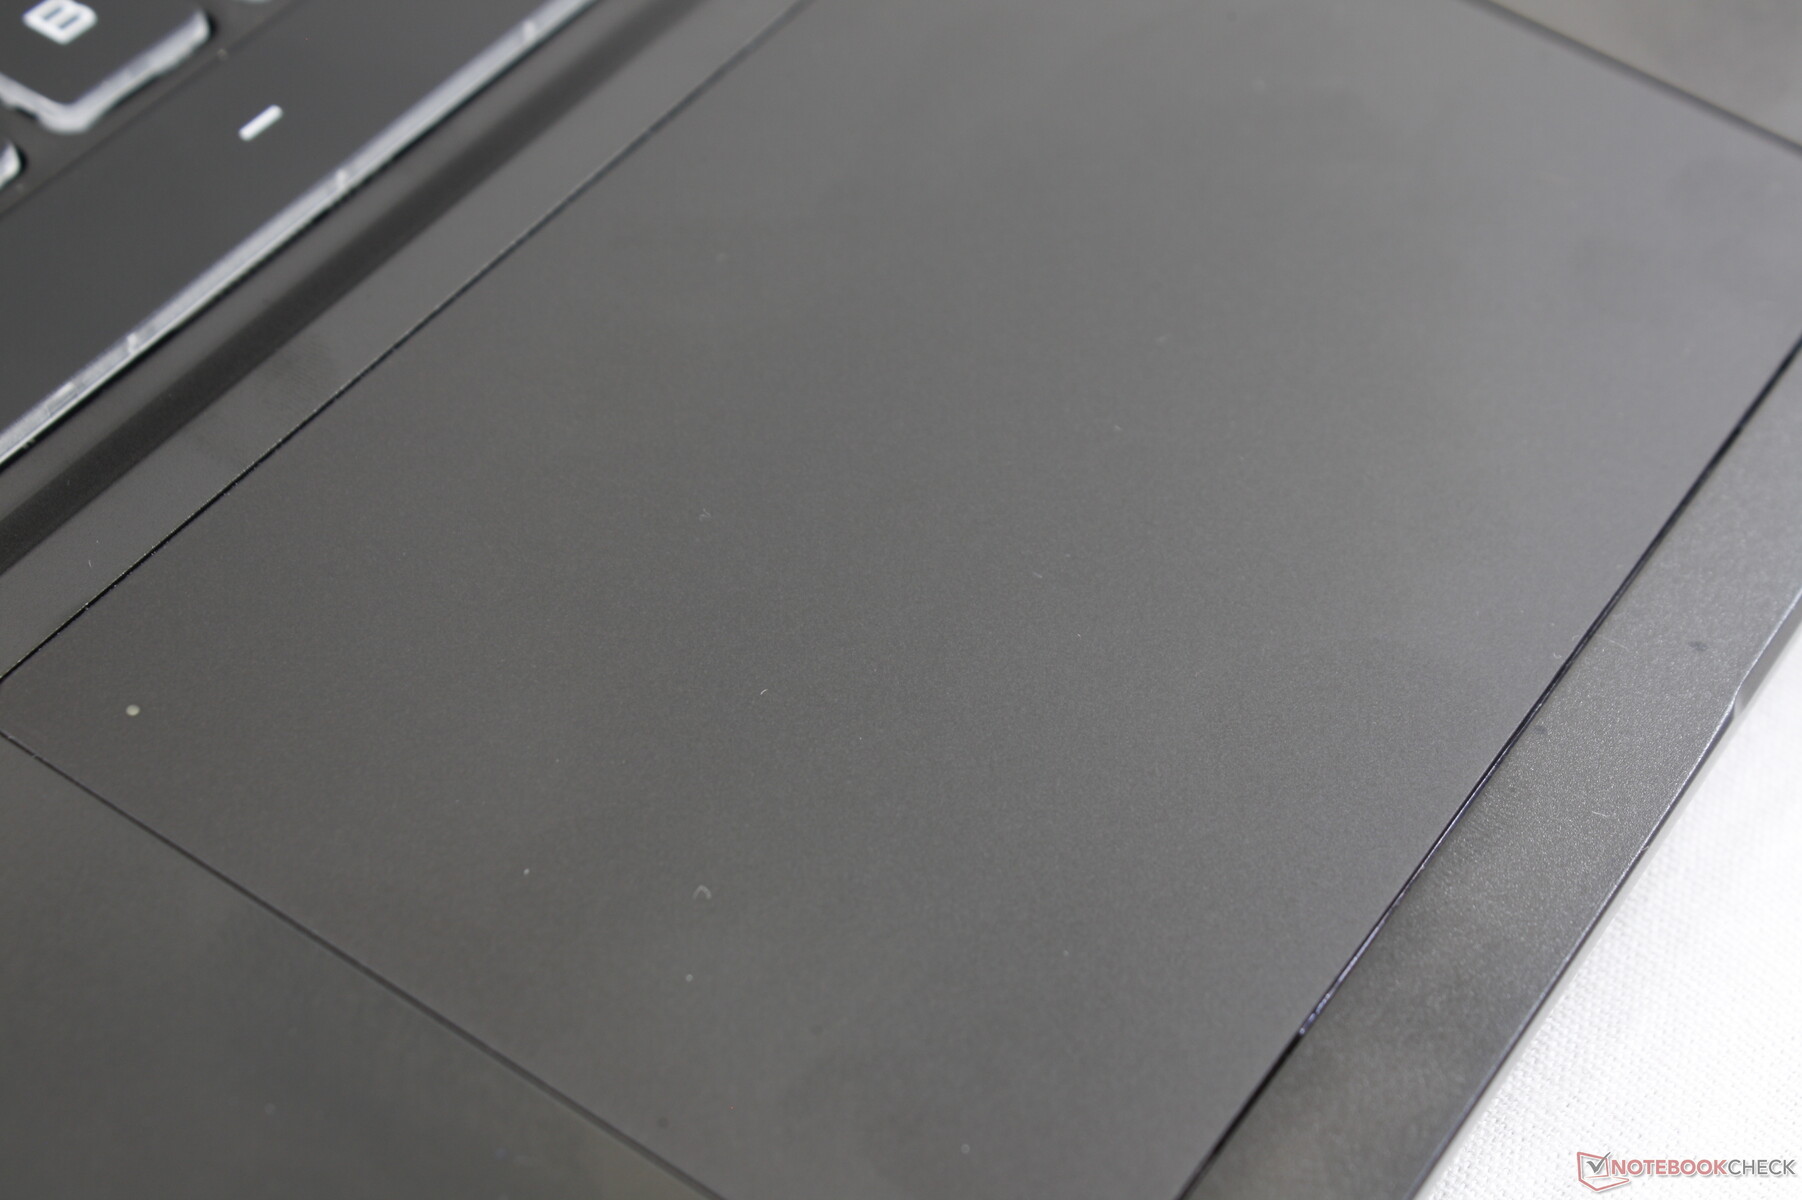
The clickpad is decent in size (11.5 x 7.5 cm) but still smaller than the ones on the MSI GS66 (14 x 6.5 cm) or Razer Blade 15 (13 x 8.0 cm). Cursor control is otherwise reliable and silky smooth especially on a 144 Hz display. Gliding slowly across the surface results in some sticking which is normal for more precise clicks.
The integrated mouse keys have a loud and satisfying "click" when pressed. Feedback, however, is a bit on the spongy side. You're going to want an external mouse if you plan on doing a lot of dragging and dropping.

Display
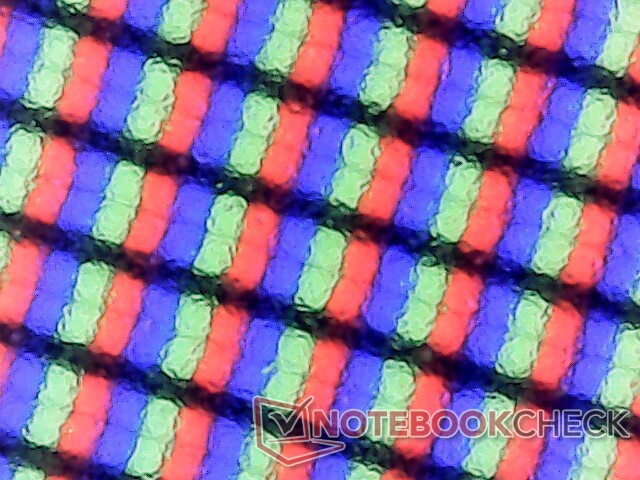
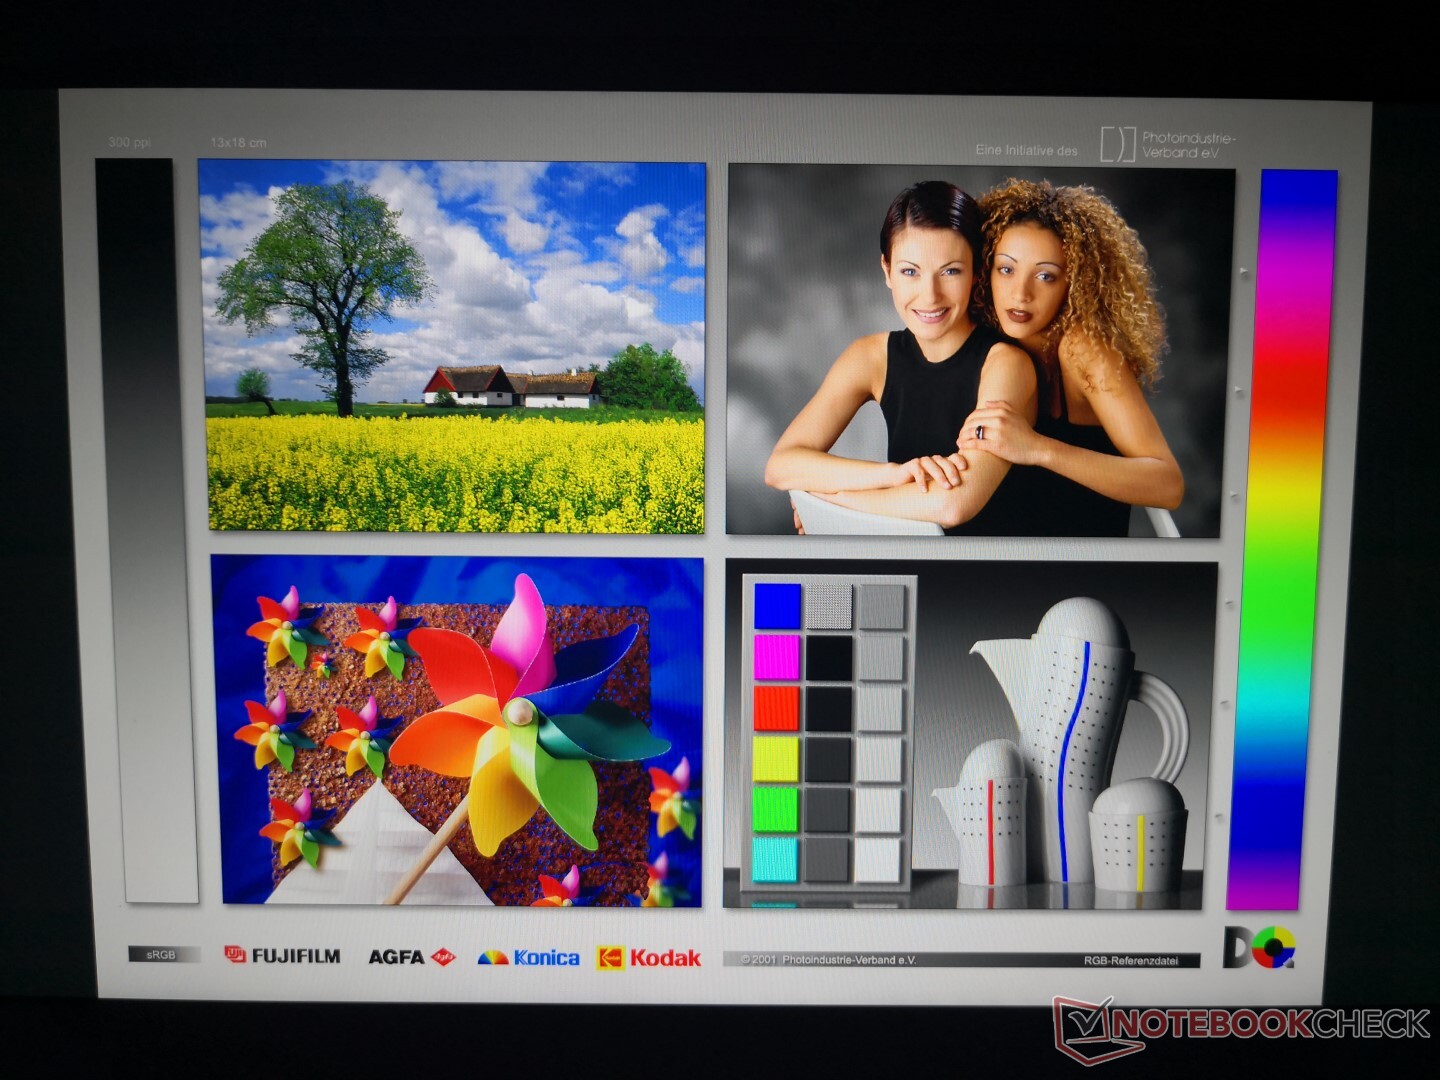
The RP-15 uses the same 144 Hz BOE NV156FHM-N4G IPS panel as found on the Lenovo Legion Y540-15, Xiaomi Mi Gaming 15, and some Schenker laptops like the XMG Neo 15. Thus, these systems share similar characteristics including the fast black-white response times and good contrast ratio of nearly 900:1.

| |||||||||||||||||||||||||
Brightness Distribution: 90 %
Center on Battery: 298.6 cd/m²
Contrast: 853:1 (Black: 0.35 cd/m²)
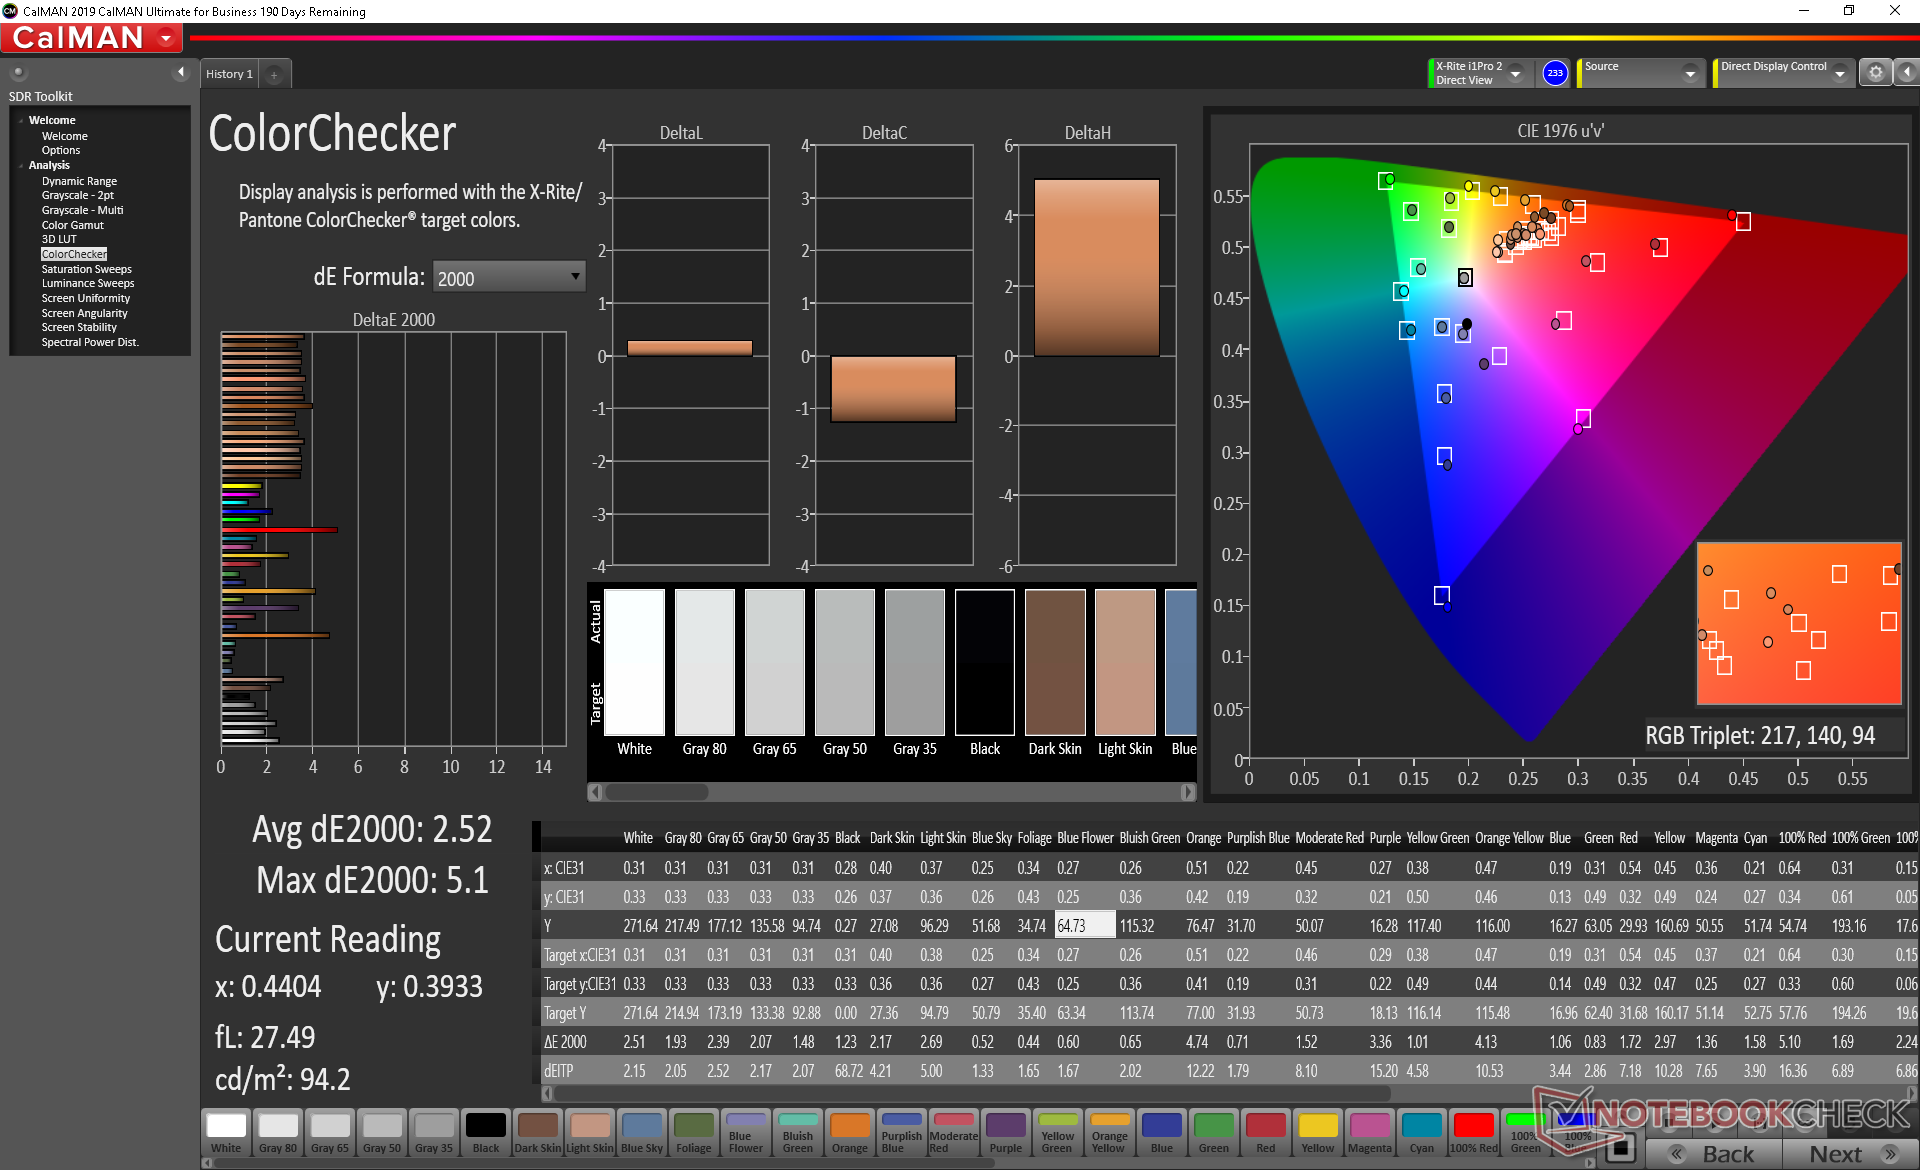
ΔE ColorChecker Calman: 5.01 | ∀{0.5-29.43 Ø4.71}
calibrated: 2.52
ΔE Greyscale Calman: 5.4 | ∀{0.09-98 Ø4.96}
91.6% sRGB (Argyll 1.6.3 3D)
59.1% AdobeRGB 1998 (Argyll 1.6.3 3D)
65.2% AdobeRGB 1998 (Argyll 3D)
92% sRGB (Argyll 3D)
63.7% Display P3 (Argyll 3D)
Gamma: 2.54
CCT: 7461 K
| Eluktronics RP-15 BOE NV156FHM-N4G, IPS, 15.6", 1920x1080 | MSI GS66 10SGS AU Optronics B156HAN12.0, IPS, 15.6", 1920x1080 | Razer Blade 15 RZ09-0328 Samsung SDCA029, AMOLED, 15.6", 3840x2160 | Asus Strix GL531GV-PB74 Panda LM156LF-GL02, IPS, 15.6", 1920x1080 | Lenovo Legion Y740-15ICHg LP156WFG-SPB2, IPS, 15.6", 1920x1080 | Alienware m15 R2 P87F Sharp LQ156M1, IPS, 15.6", 1920x1080 | |
|---|---|---|---|---|---|---|
| Display | 9% | 38% | -36% | -0% | 2% | |
| Display P3 Coverage (%) | 63.7 | 69.9 10% | 99.9 57% | 40.13 -37% | 63.5 0% | 65.3 3% |
| sRGB Coverage (%) | 92 | 99.1 8% | 100 9% | 60.3 -34% | 92.4 0% | 95.1 3% |
| AdobeRGB 1998 Coverage (%) | 65.2 | 71.1 9% | 97.4 49% | 41.48 -36% | 64.7 -1% | 65.9 1% |
| Response Times | 20% | 80% | -99% | -18% | 10% | |
| Response Time Grey 50% / Grey 80% * (ms) | 17.2 ? | 11.2 ? 35% | 2.7 ? 84% | 26 ? -51% | 18.8 ? -9% | 16.4 ? 5% |
| Response Time Black / White * (ms) | 10.4 ? | 10 ? 4% | 2.6 ? 75% | 25.6 ? -146% | 13.2 ? -27% | 8.8 ? 15% |
| PWM Frequency (Hz) | 59.5 ? | 23810 ? | ||||
| Screen | 33% | 19% | -35% | 6% | -7% | |
| Brightness middle (cd/m²) | 298.6 | 339.4 14% | 366.7 23% | 290.1 -3% | 320.4 7% | 324.2 9% |
| Brightness (cd/m²) | 289 | 331 15% | 371 28% | 274 -5% | 298 3% | 304 5% |
| Brightness Distribution (%) | 90 | 92 2% | 91 1% | 86 -4% | 85 -6% | 90 0% |
| Black Level * (cd/m²) | 0.35 | 0.24 31% | 0.54 -54% | 0.42 -20% | 0.38 -9% | |
| Contrast (:1) | 853 | 1414 66% | 537 -37% | 763 -11% | 853 0% | |
| Colorchecker dE 2000 * | 5.01 | 1.58 68% | 5.21 -4% | 5.16 -3% | 3.21 36% | 5.01 -0% |
| Colorchecker dE 2000 max. * | 7.06 | 3.8 46% | 7.92 -12% | 18.09 -156% | 5.54 22% | 12.7 -80% |
| Colorchecker dE 2000 calibrated * | 2.52 | 1.47 42% | 4.35 -73% | 2.36 6% | 1.64 35% | |
| Greyscale dE 2000 * | 5.4 | 2.3 57% | 2 63% | 4.4 19% | 3.6 33% | 7.9 -46% |
| Gamma | 2.54 87% | 2.24 98% | 2.17 101% | 2.1 105% | 2.27 97% | 2.35 94% |
| CCT | 7461 87% | 6952 93% | 6514 100% | 7362 88% | 6503 100% | 8455 77% |
| Color Space (Percent of AdobeRGB 1998) (%) | 59.1 | 64.8 10% | 86.6 47% | 38.1 -36% | 59 0% | 60.8 3% |
| Color Space (Percent of sRGB) (%) | 91.6 | 99.4 9% | 100 9% | 60 -34% | 92 0% | 95.5 4% |
| Total Average (Program / Settings) | 21% /
27% | 46% /
33% | -57% /
-43% | -4% /
2% | 2% /
-3% |
* ... smaller is better
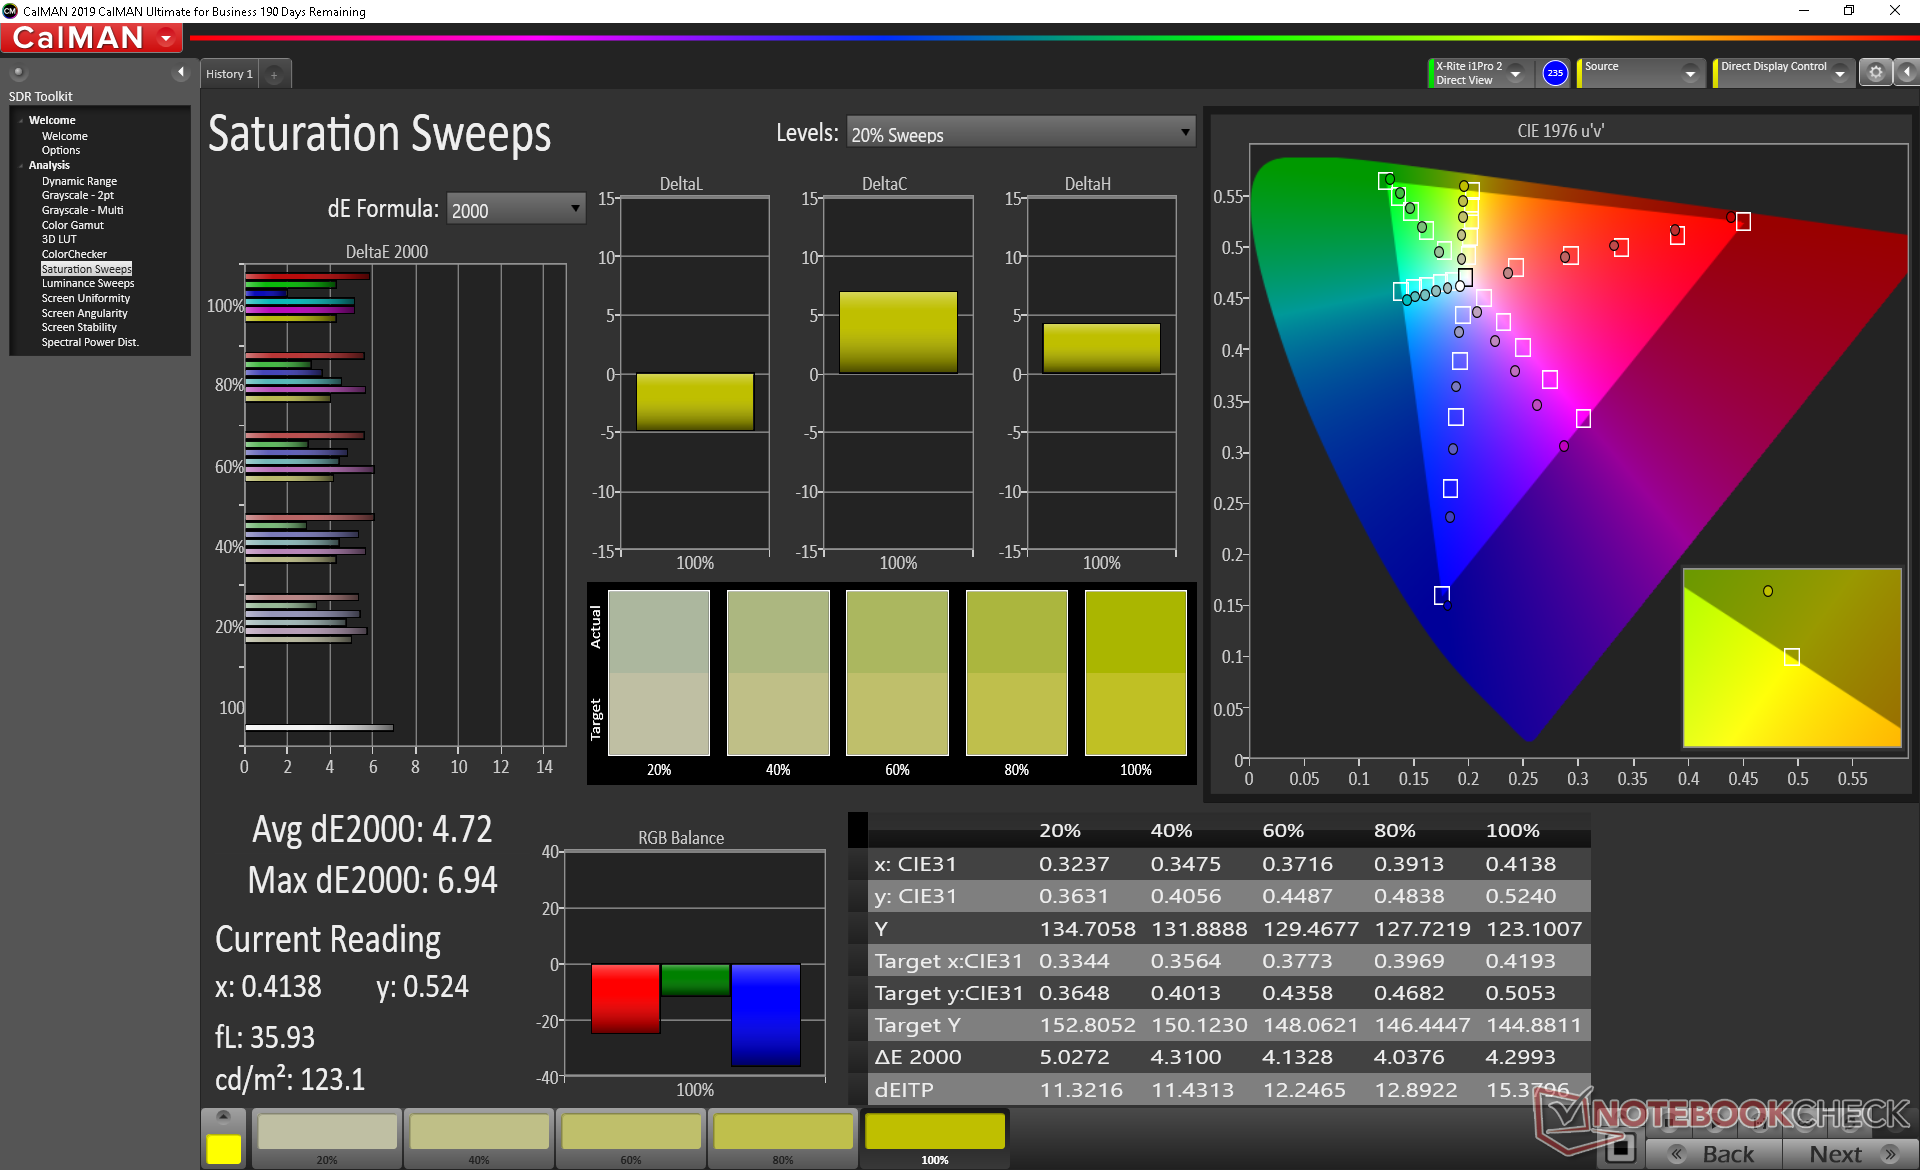
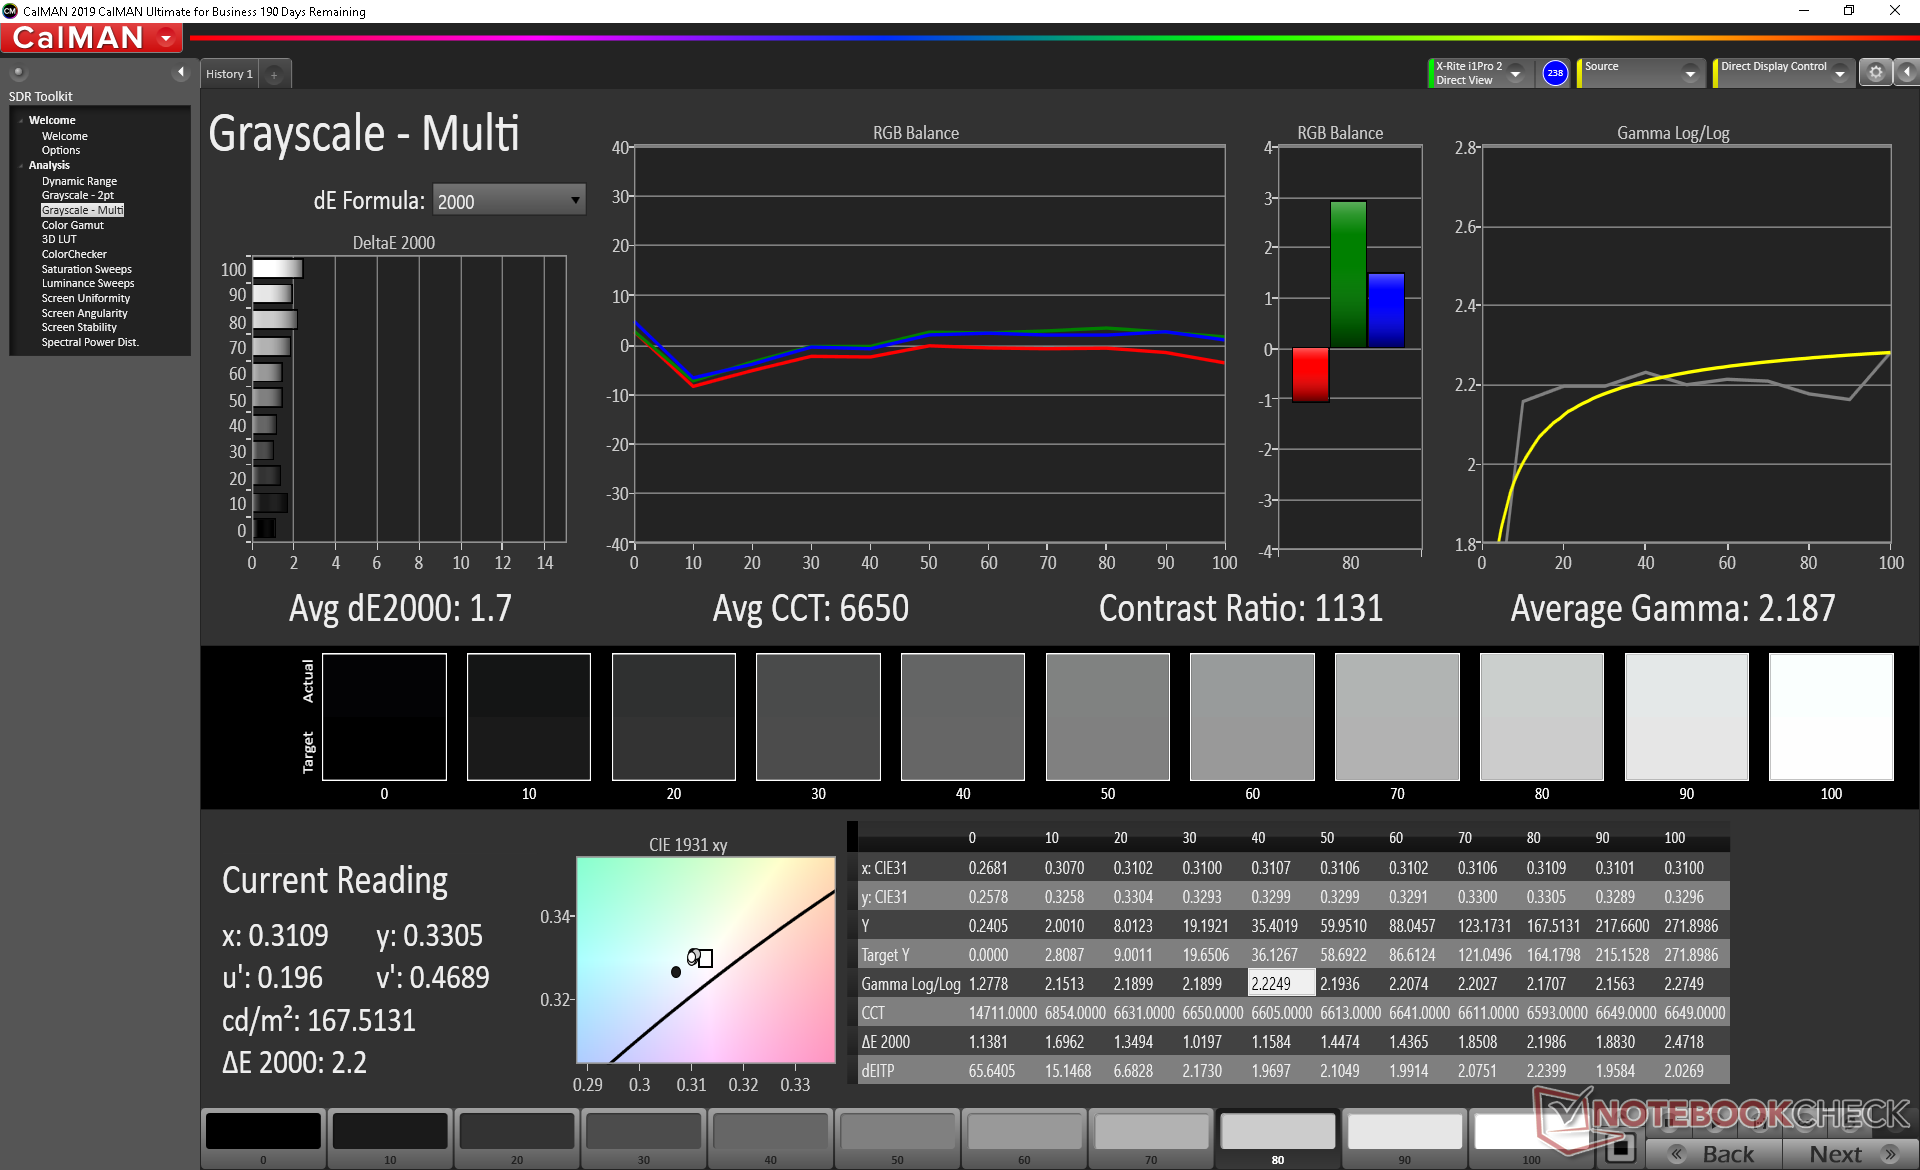
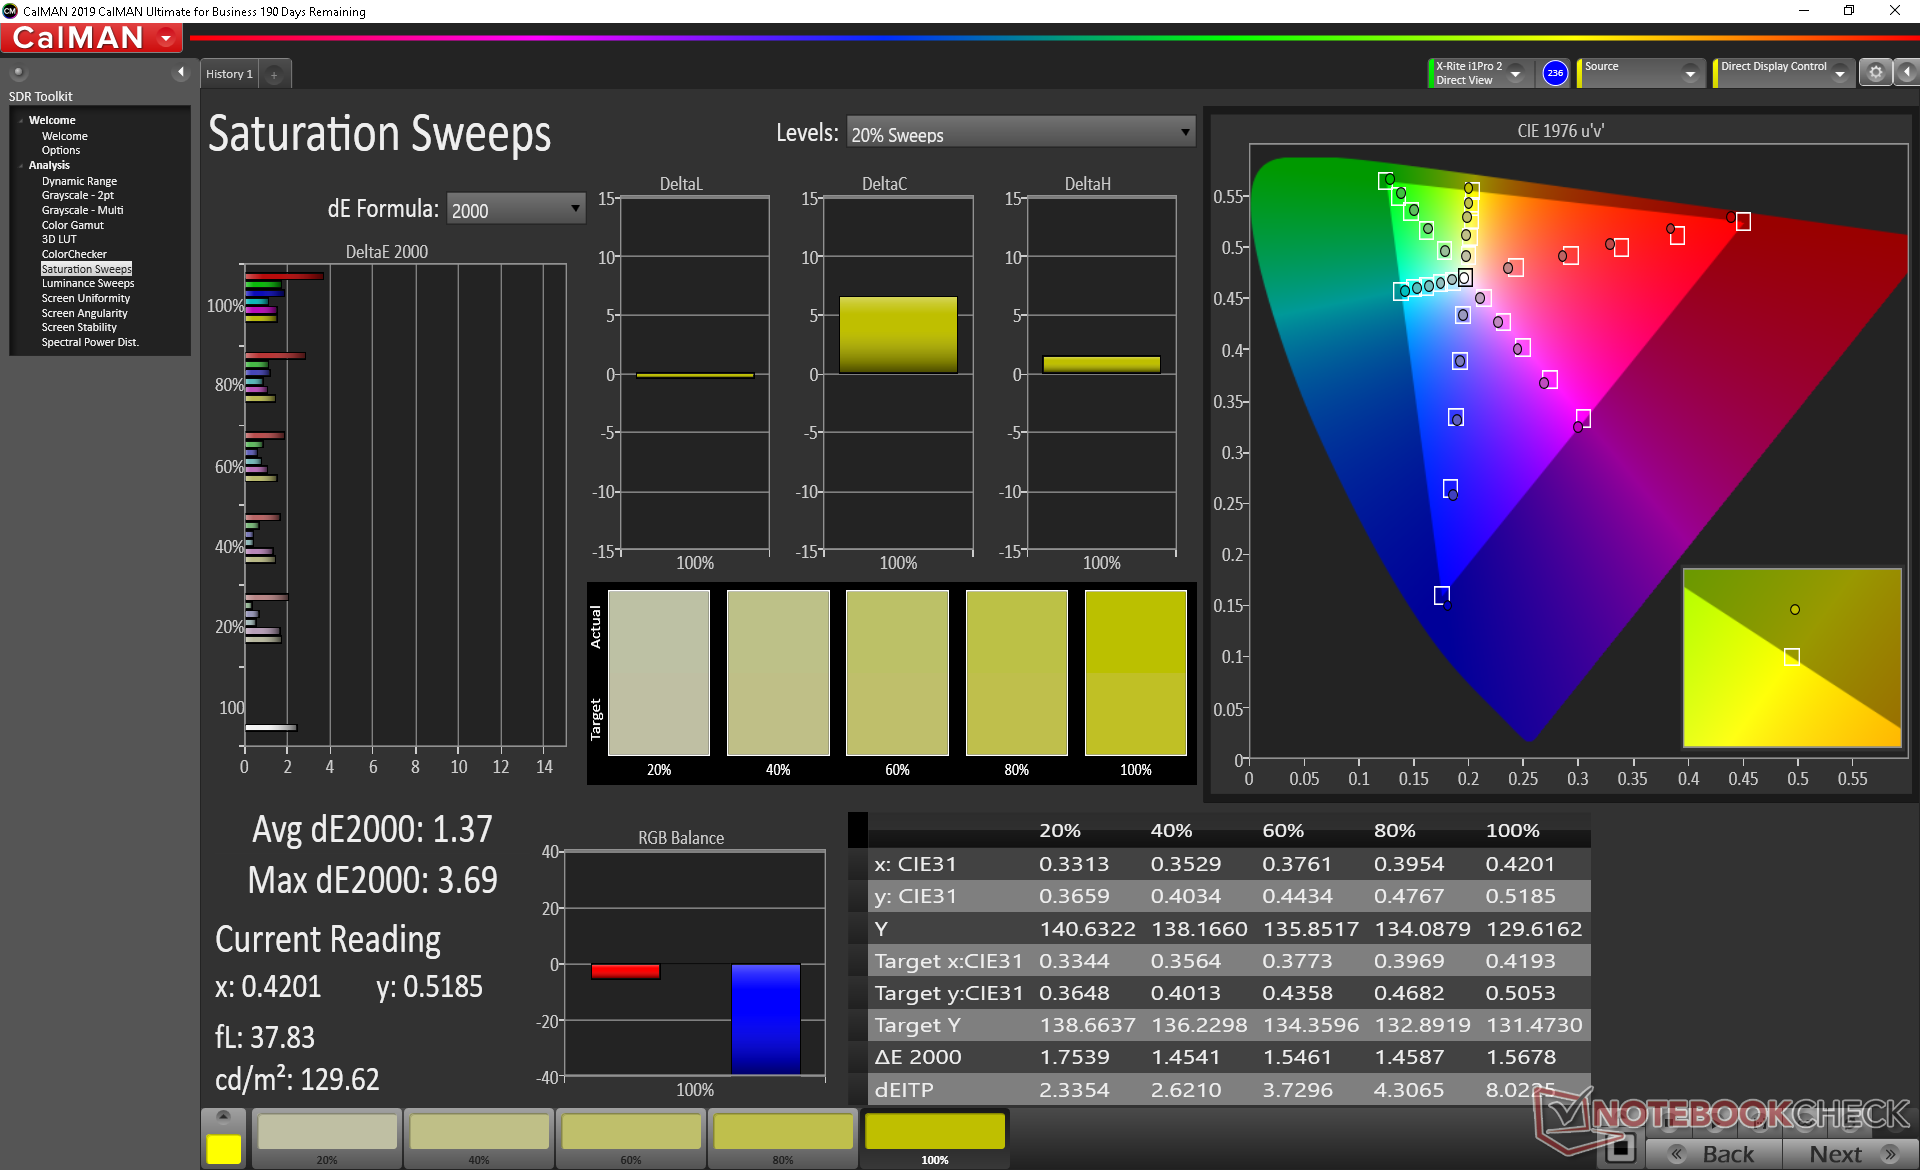
Color space is approximately 59 percent and 92 percent of the AdobeRGB and sRGB standards, respectively, to be similar to most other high-end gaming laptops. Users looking for deeper colors may want to consider other gaming laptops with OLED options or professional models like the Asus ProArt series.
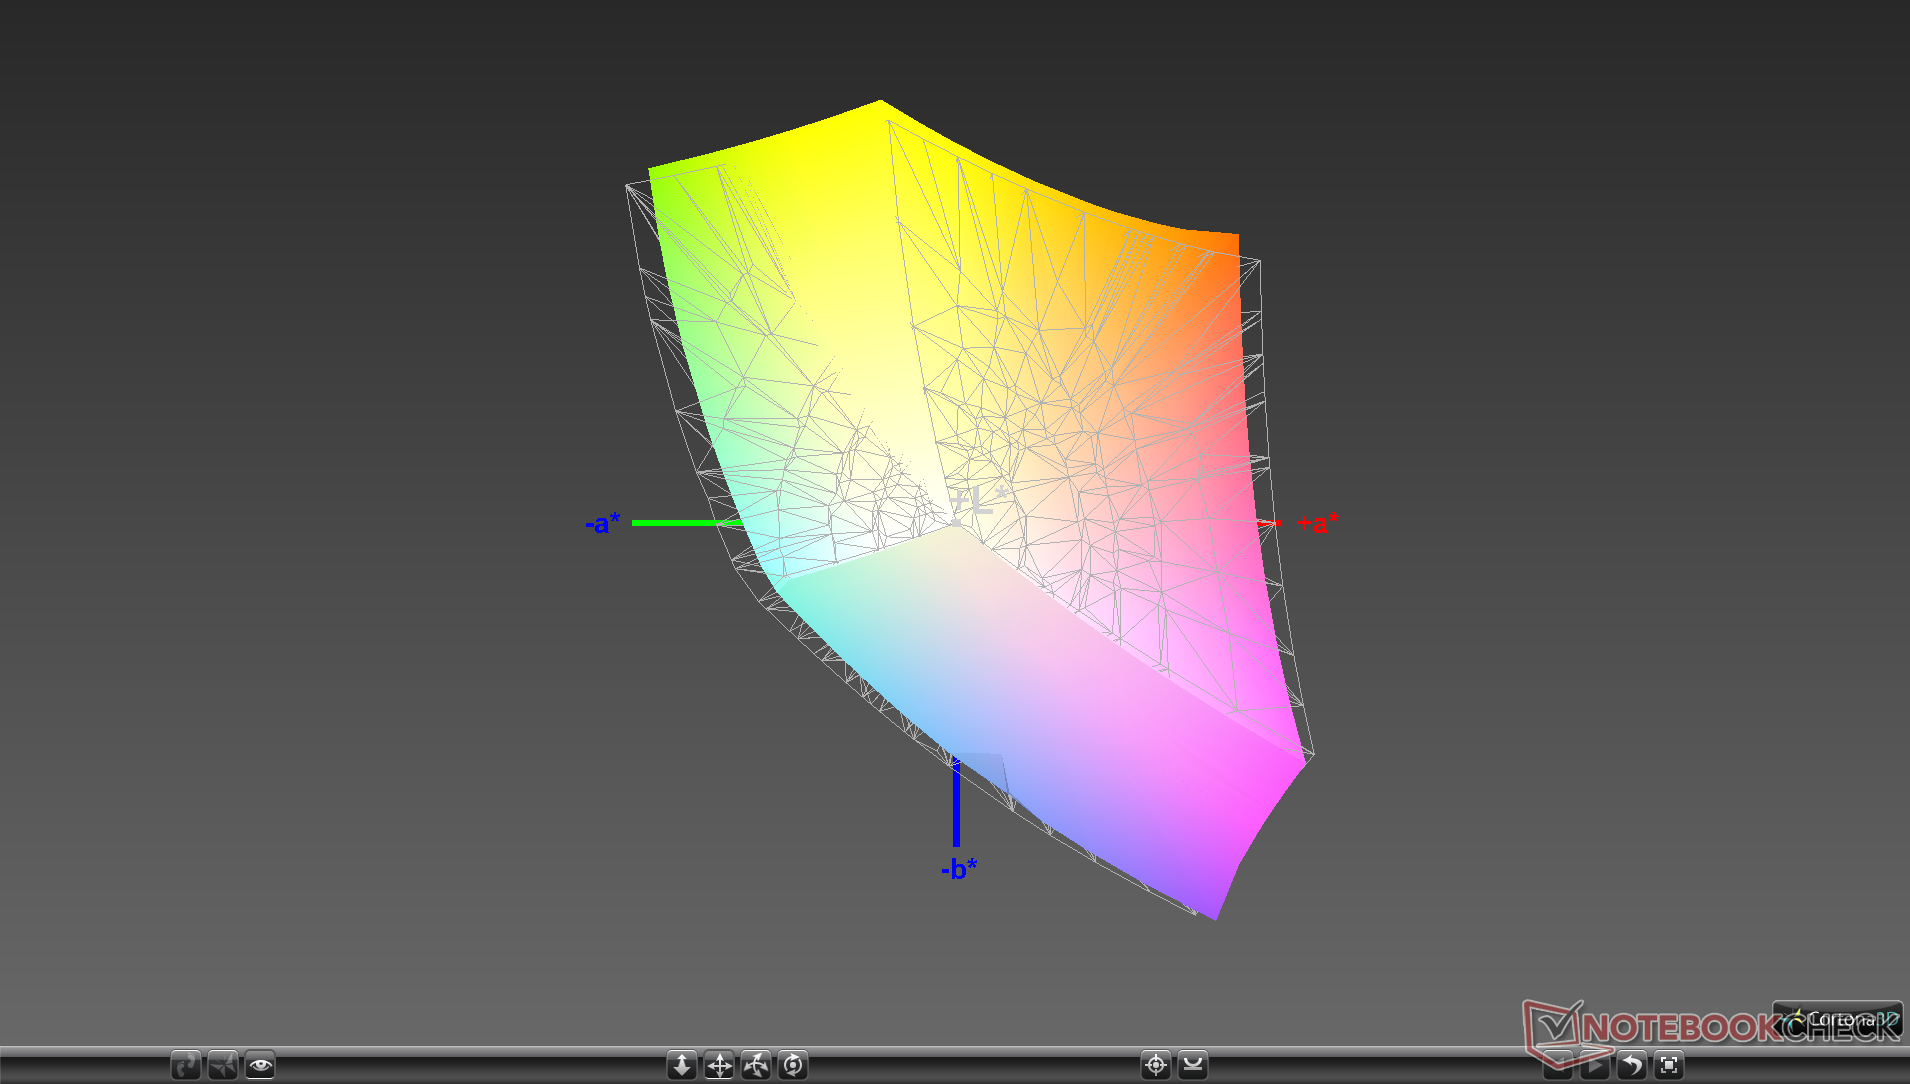

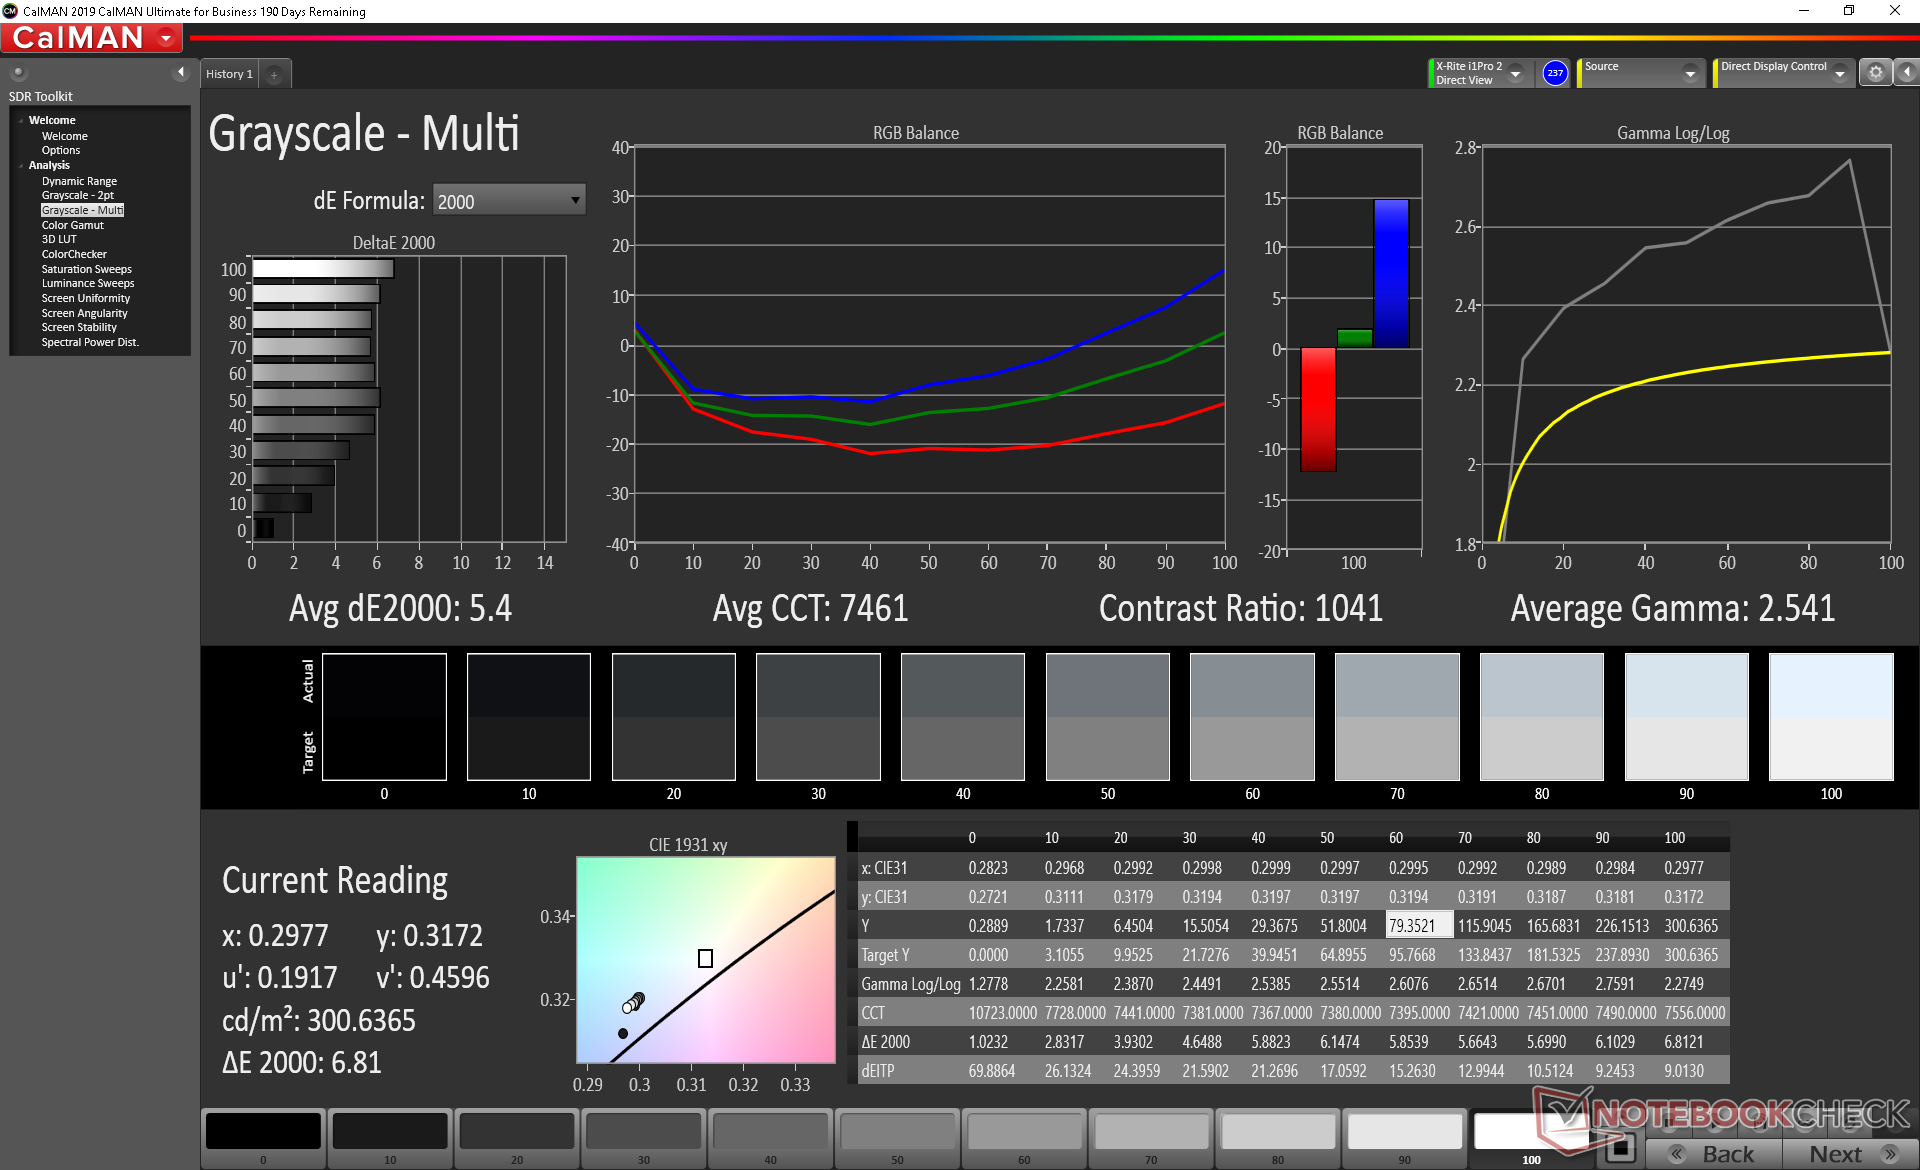
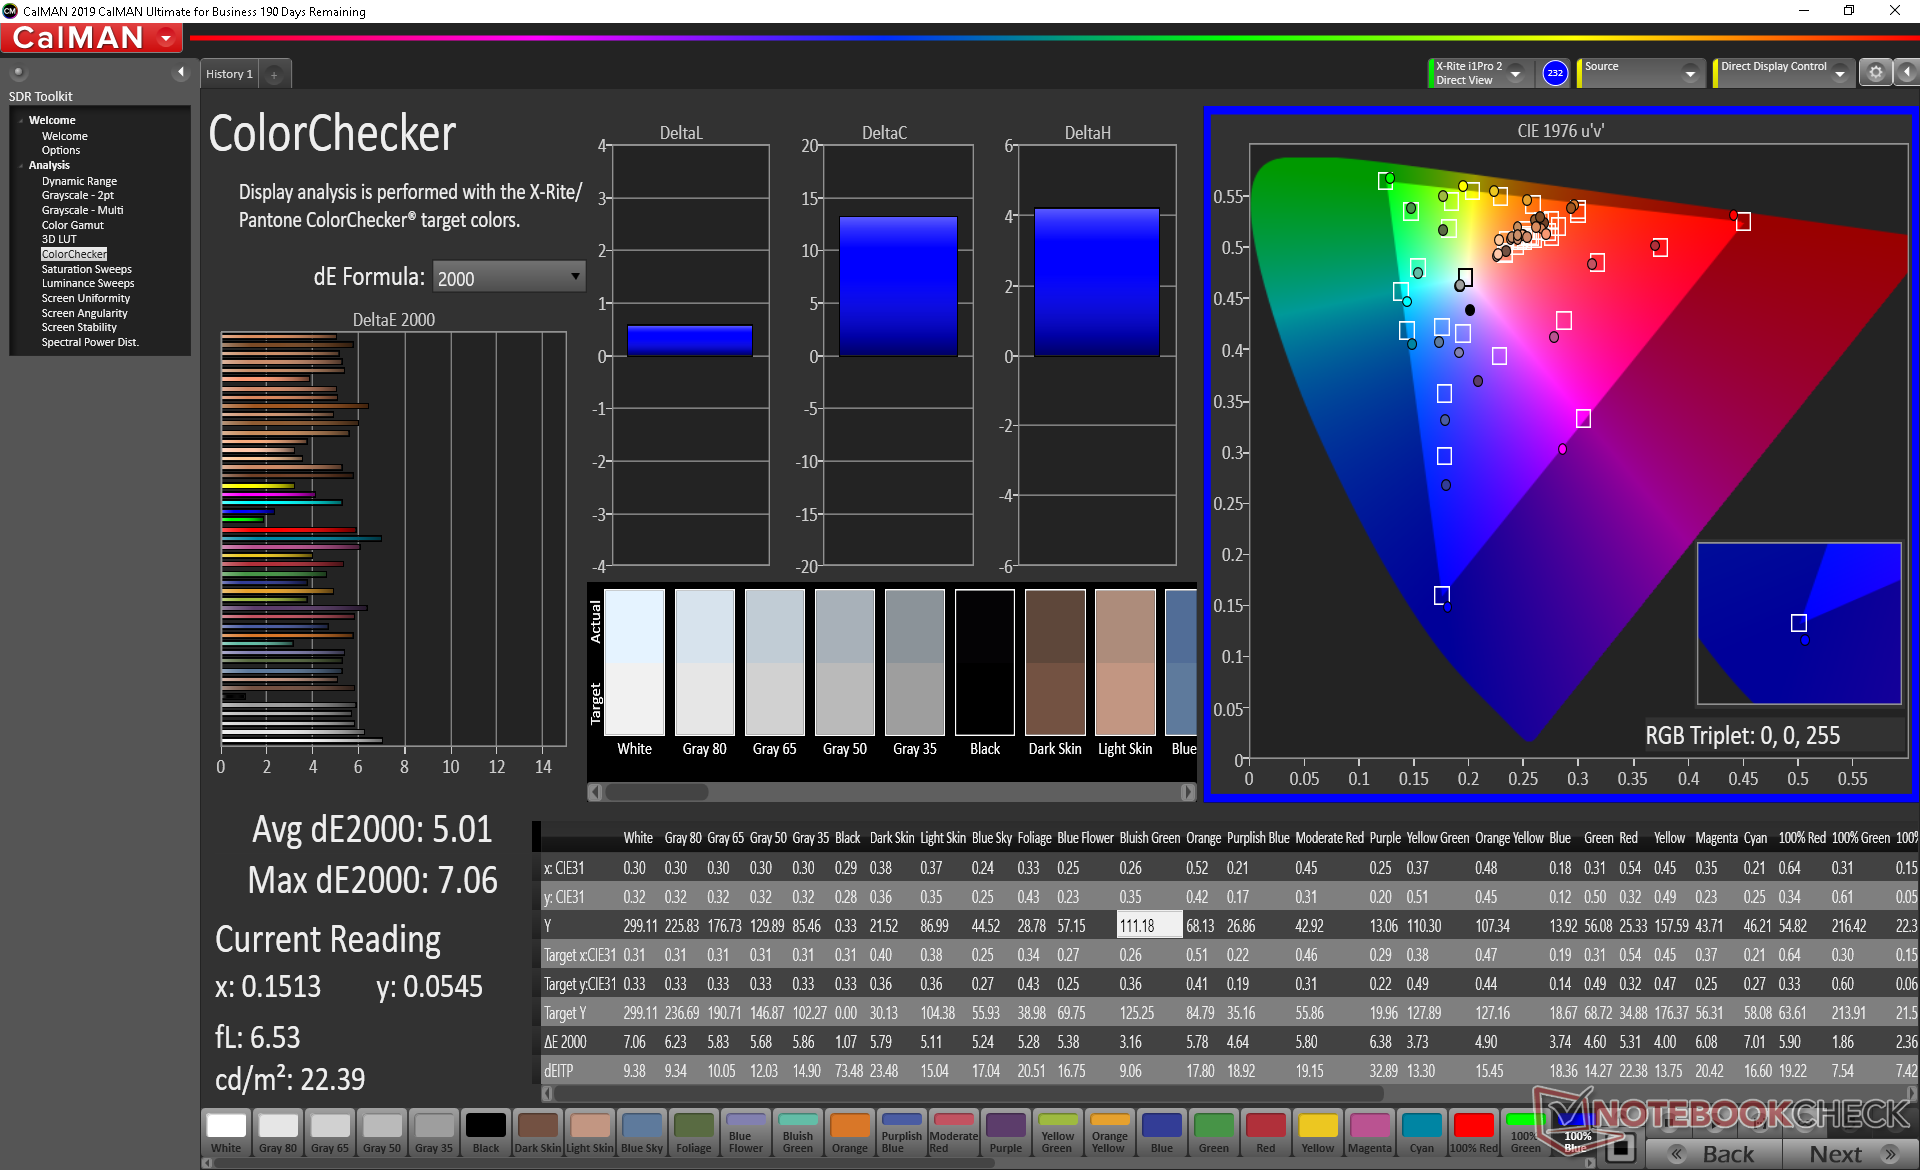
X-Rite measurements reveal a display in need of calibration and an overly cool color temperature. After calibrating the panel ourselves, grayscale and color DeltaE values would improve from 5.4 to 1.7 and 5.01 to 2.52, respectively. Apply our calibrated ICM profile above to get the most out of the display since it is capable of reproducing almost all of sRGB.
Display Response Times
| ↔ Response Time Black to White | ||
|---|---|---|
| 10.4 ms ... rise ↗ and fall ↘ combined | ↗ 6 ms rise | 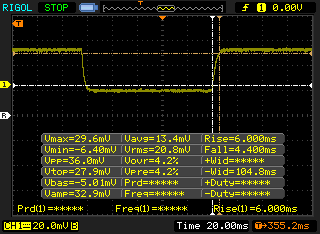 |
| ↘ 4.4 ms fall | ||
| The screen shows good response rates in our tests, but may be too slow for competitive gamers. In comparison, all tested devices range from 0.1 (minimum) to 240 (maximum) ms. » 28 % of all devices are better. This means that the measured response time is better than the average of all tested devices (19.8 ms). | ||
| ↔ Response Time 50% Grey to 80% Grey | ||
| 17.2 ms ... rise ↗ and fall ↘ combined | ↗ 6 ms rise | 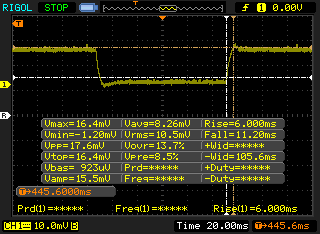 |
| ↘ 11.2 ms fall | ||
| The screen shows good response rates in our tests, but may be too slow for competitive gamers. In comparison, all tested devices range from 0.165 (minimum) to 636 (maximum) ms. » 31 % of all devices are better. This means that the measured response time is better than the average of all tested devices (30.9 ms). | ||
Screen Flickering / PWM (Pulse-Width Modulation)
| Screen flickering / PWM not detected | 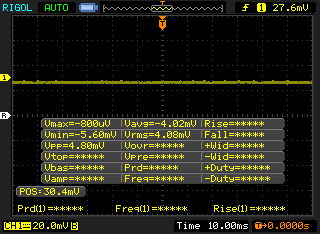 | ||
In comparison: 52 % of all tested devices do not use PWM to dim the display. If PWM was detected, an average of 7744 (minimum: 5 - maximum: 343500) Hz was measured. | |||
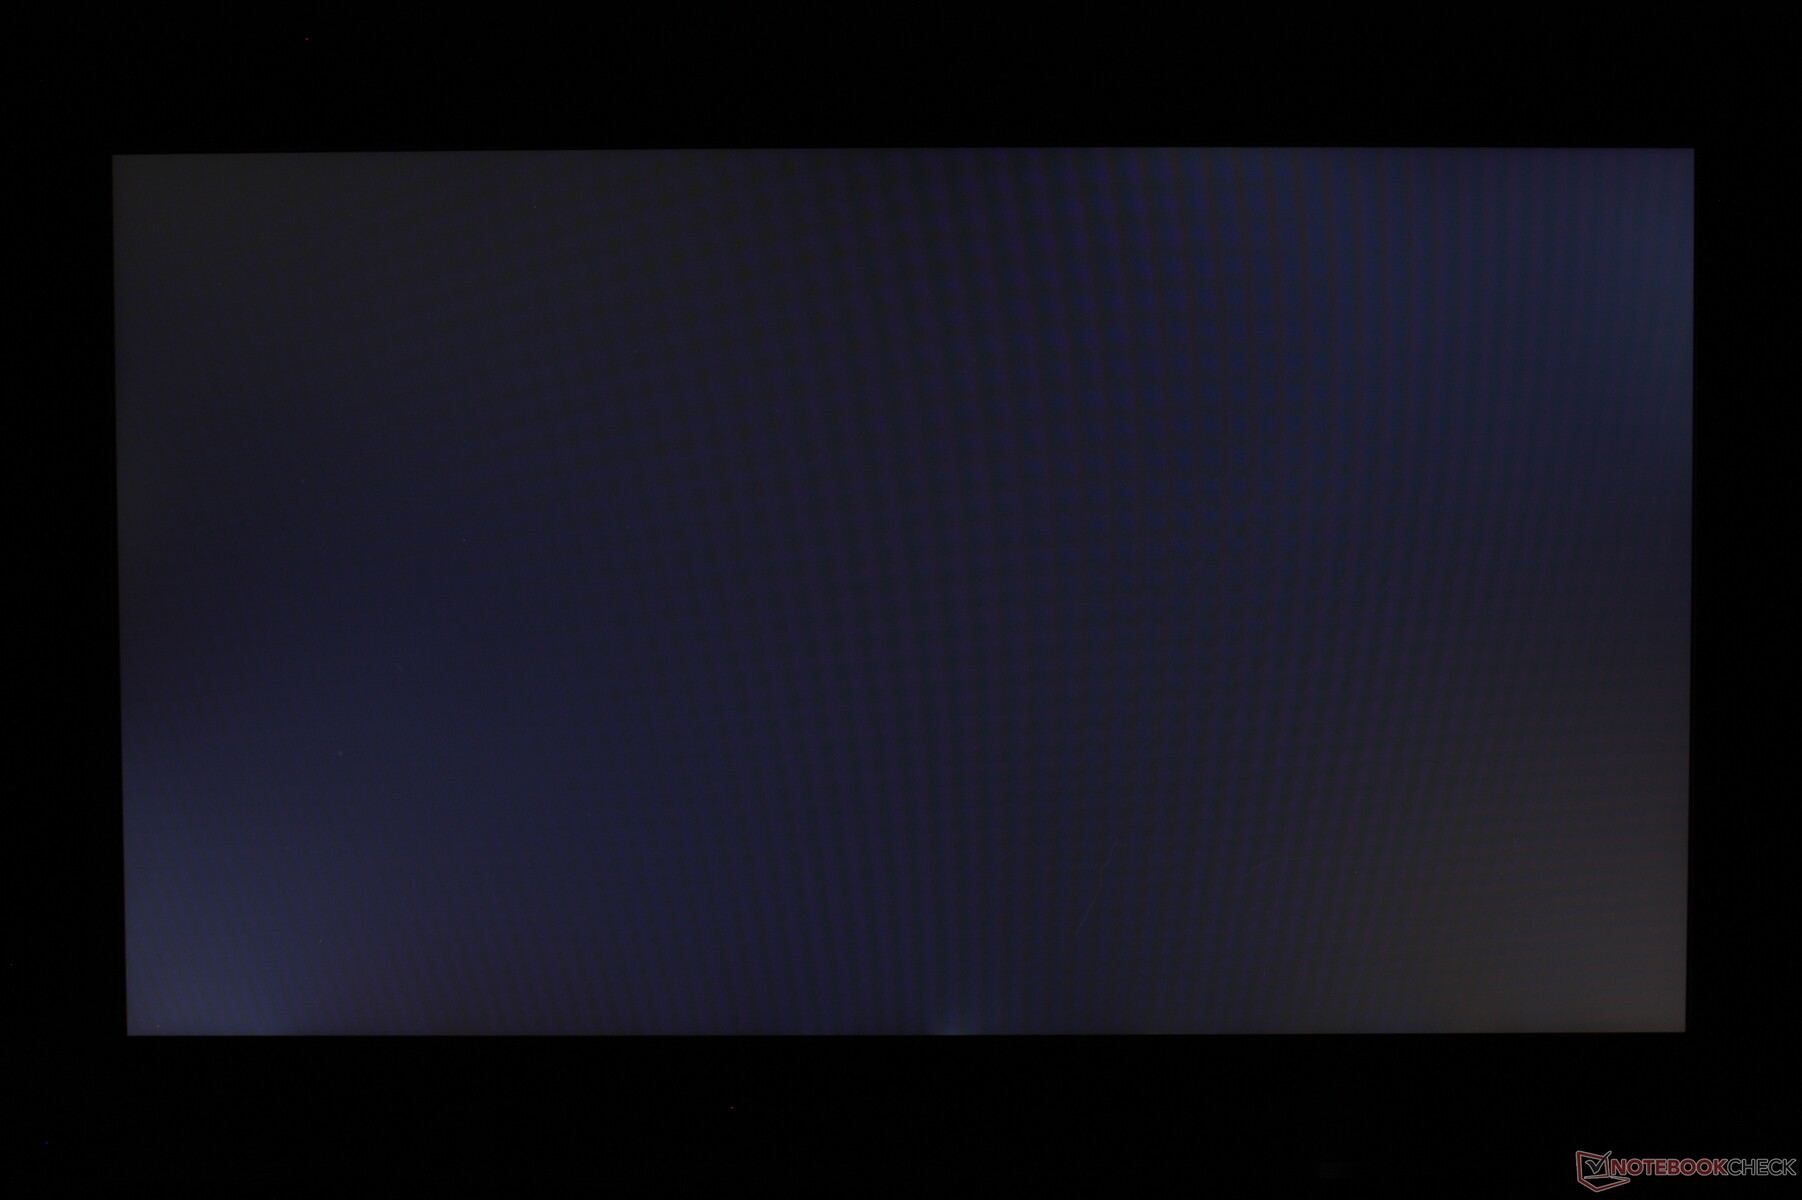
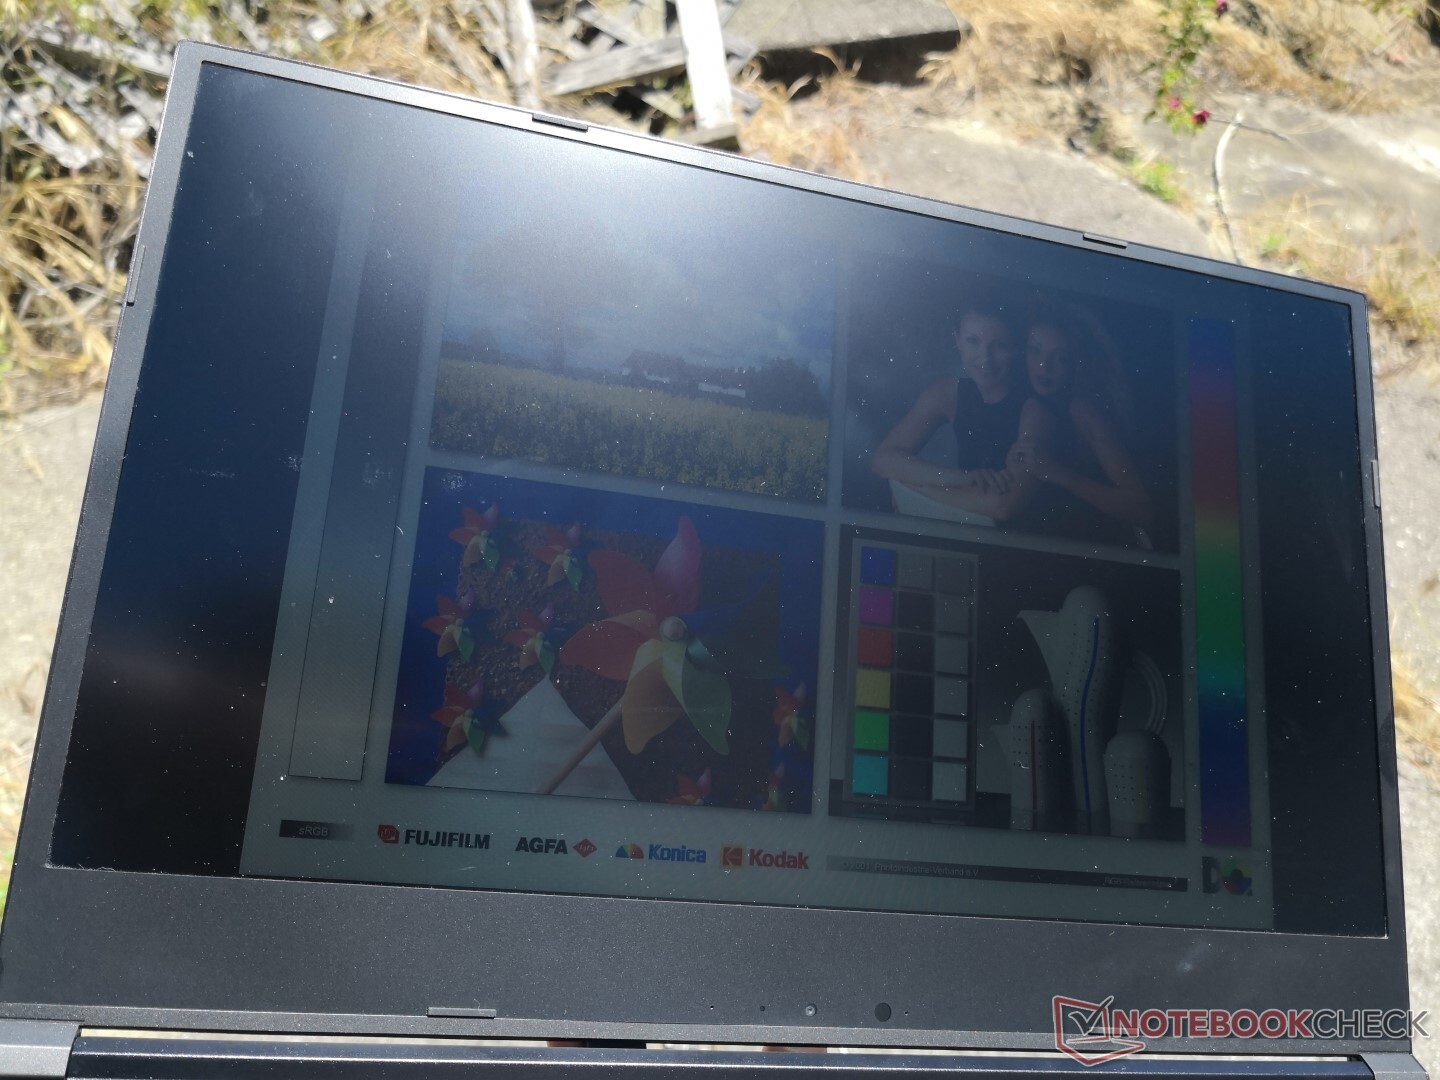
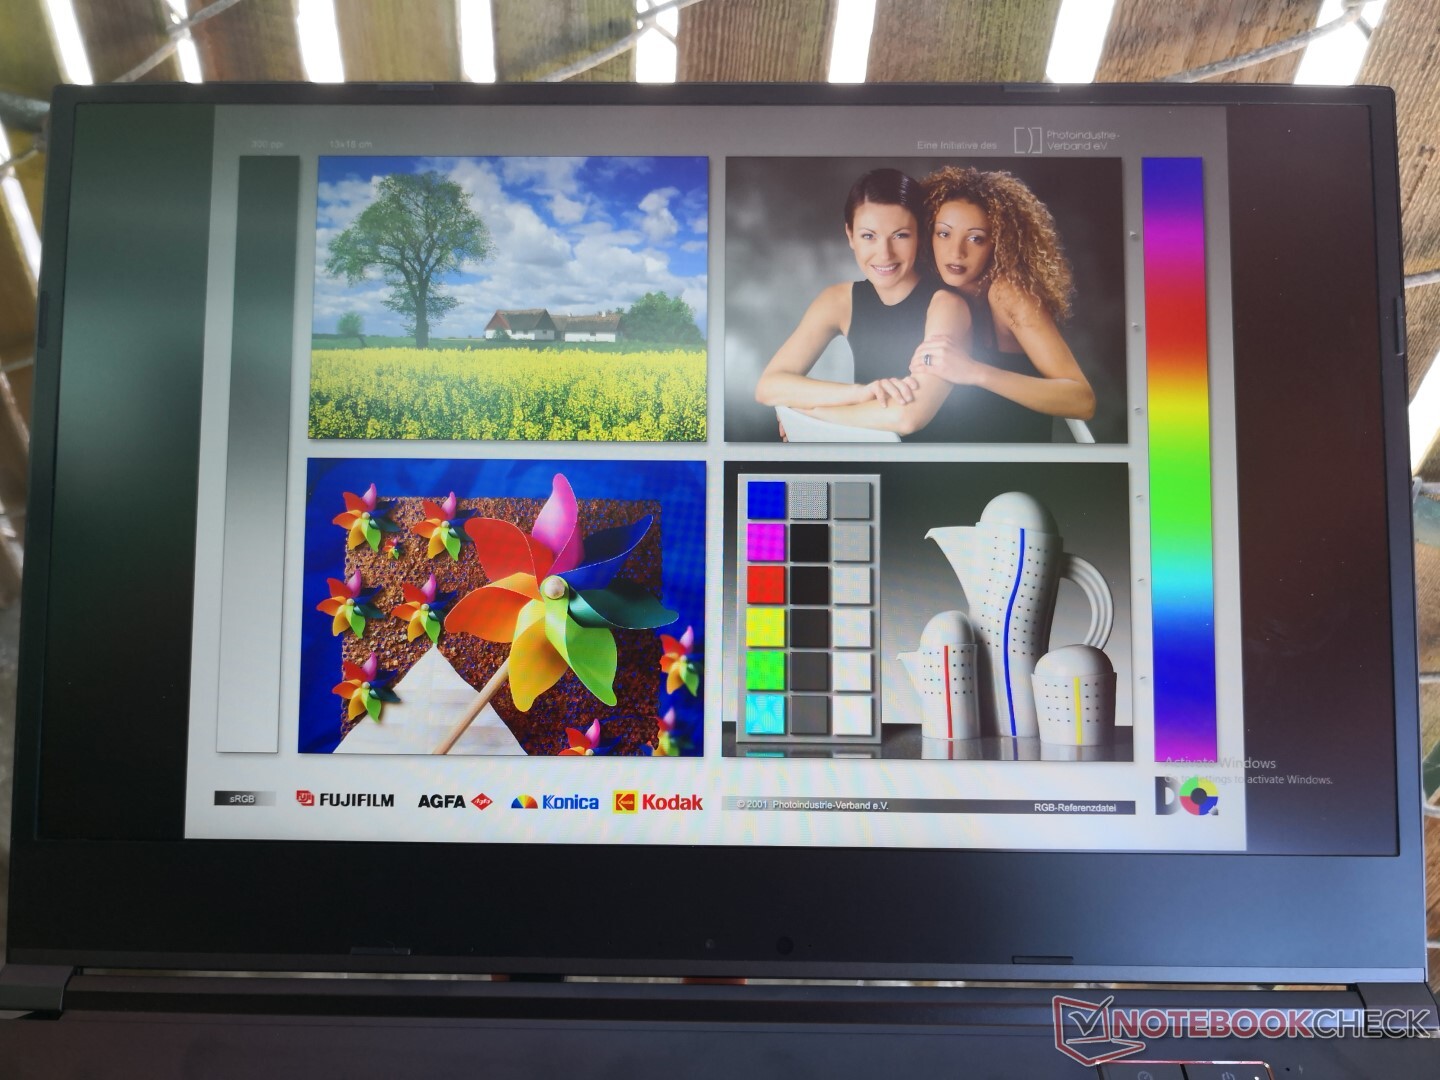
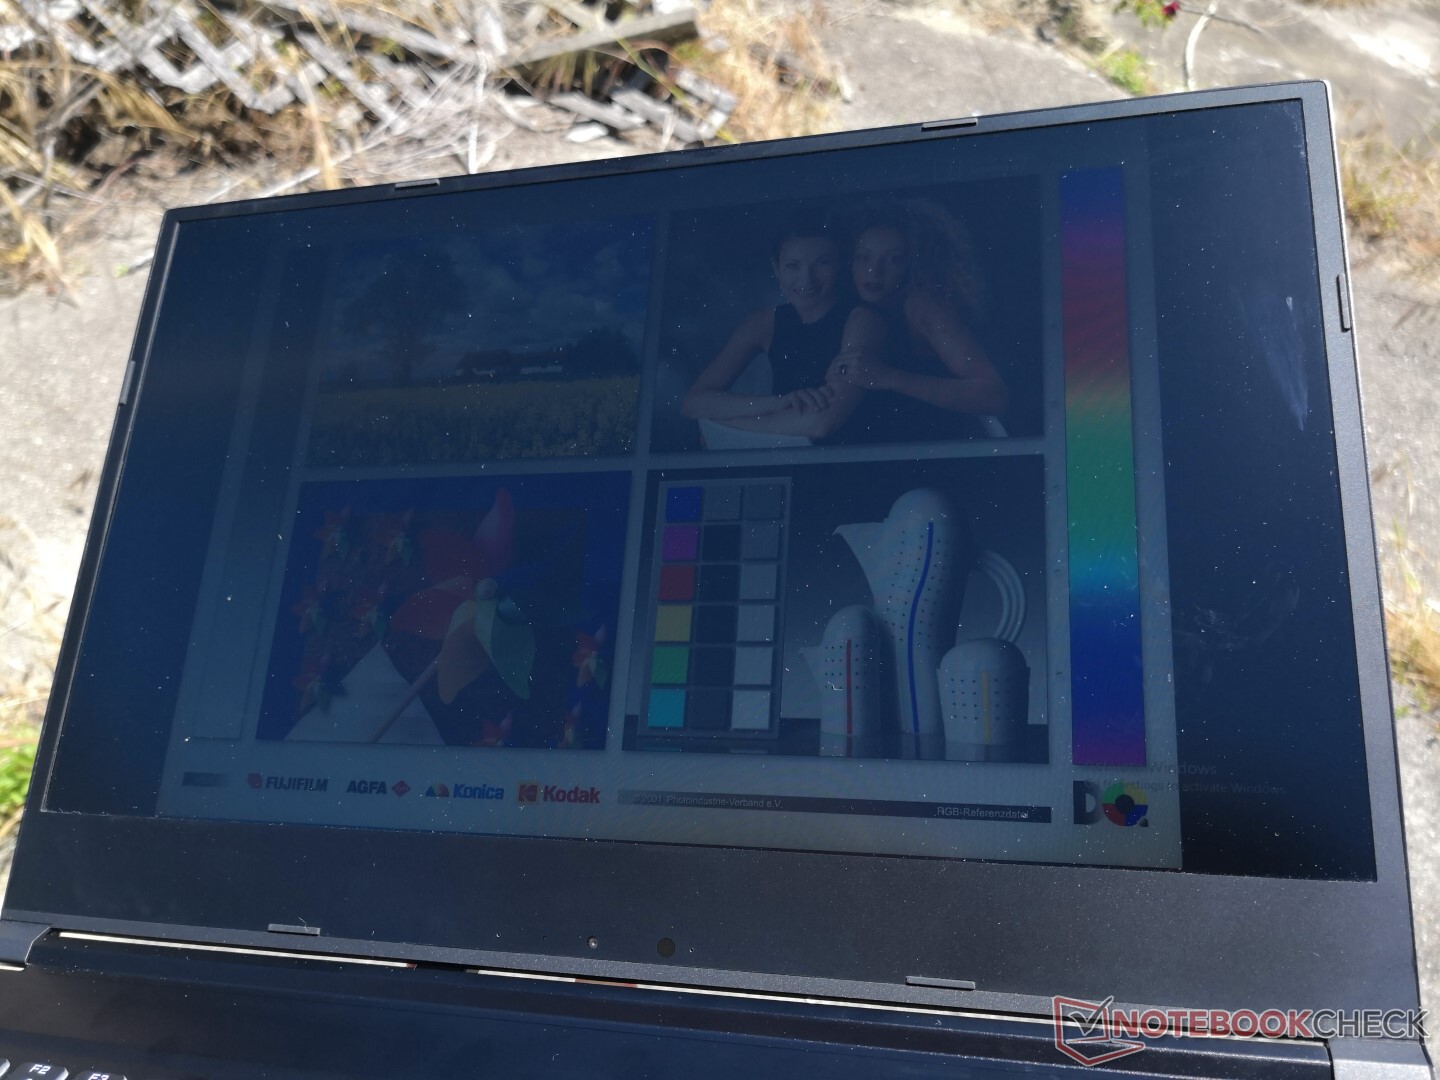
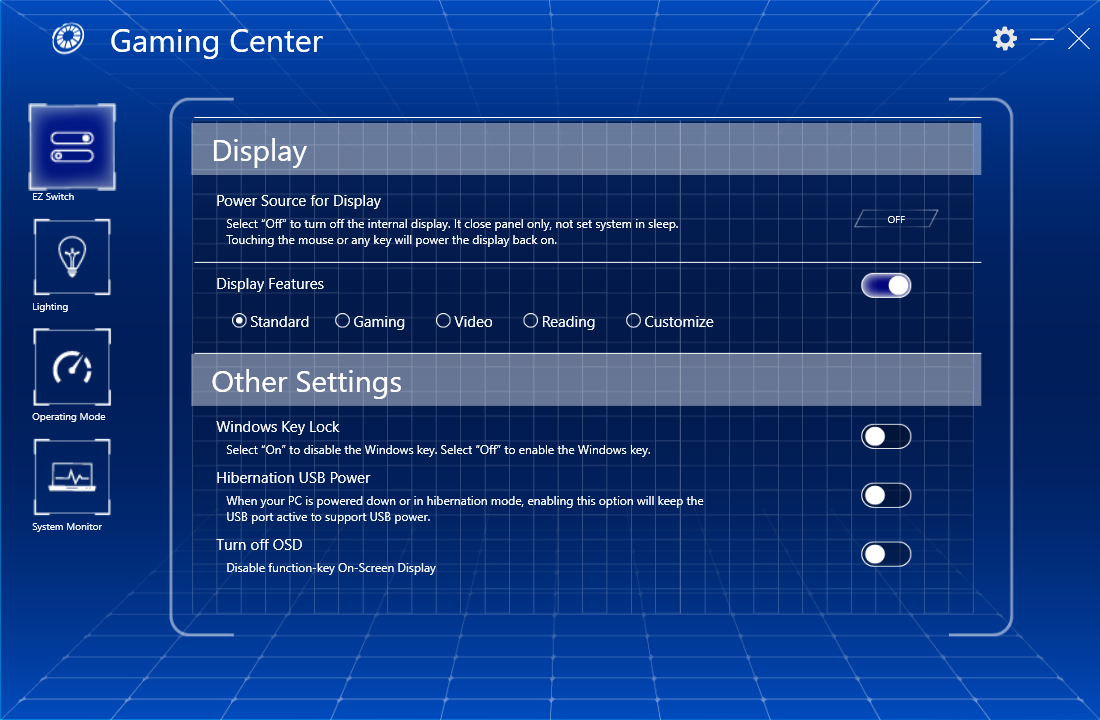
Outdoor visibility is poor but otherwise average for its category since gaming laptop displays are not designed to overcome such bright ambient lighting. Remember to disable AMD Vari-Bright or else the maximum brightness of the display will drop to 263 nits.
Performance


Processor
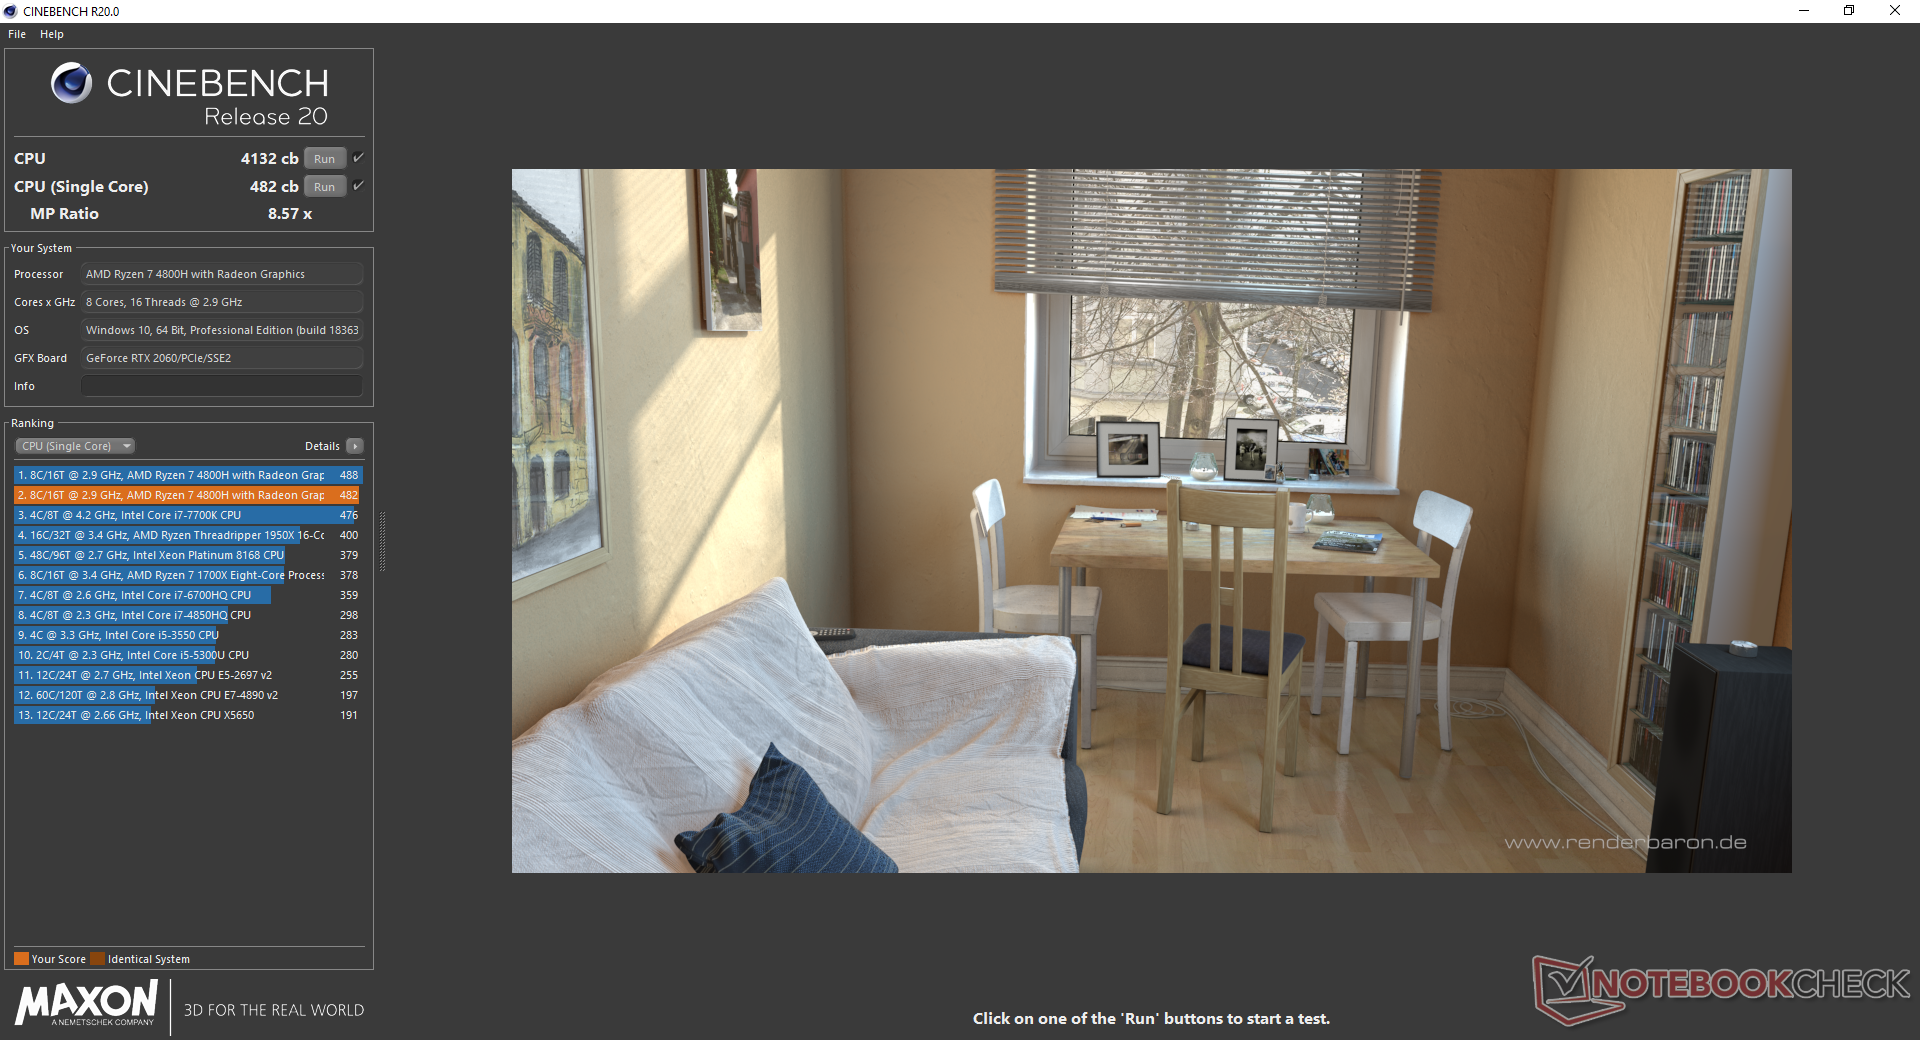
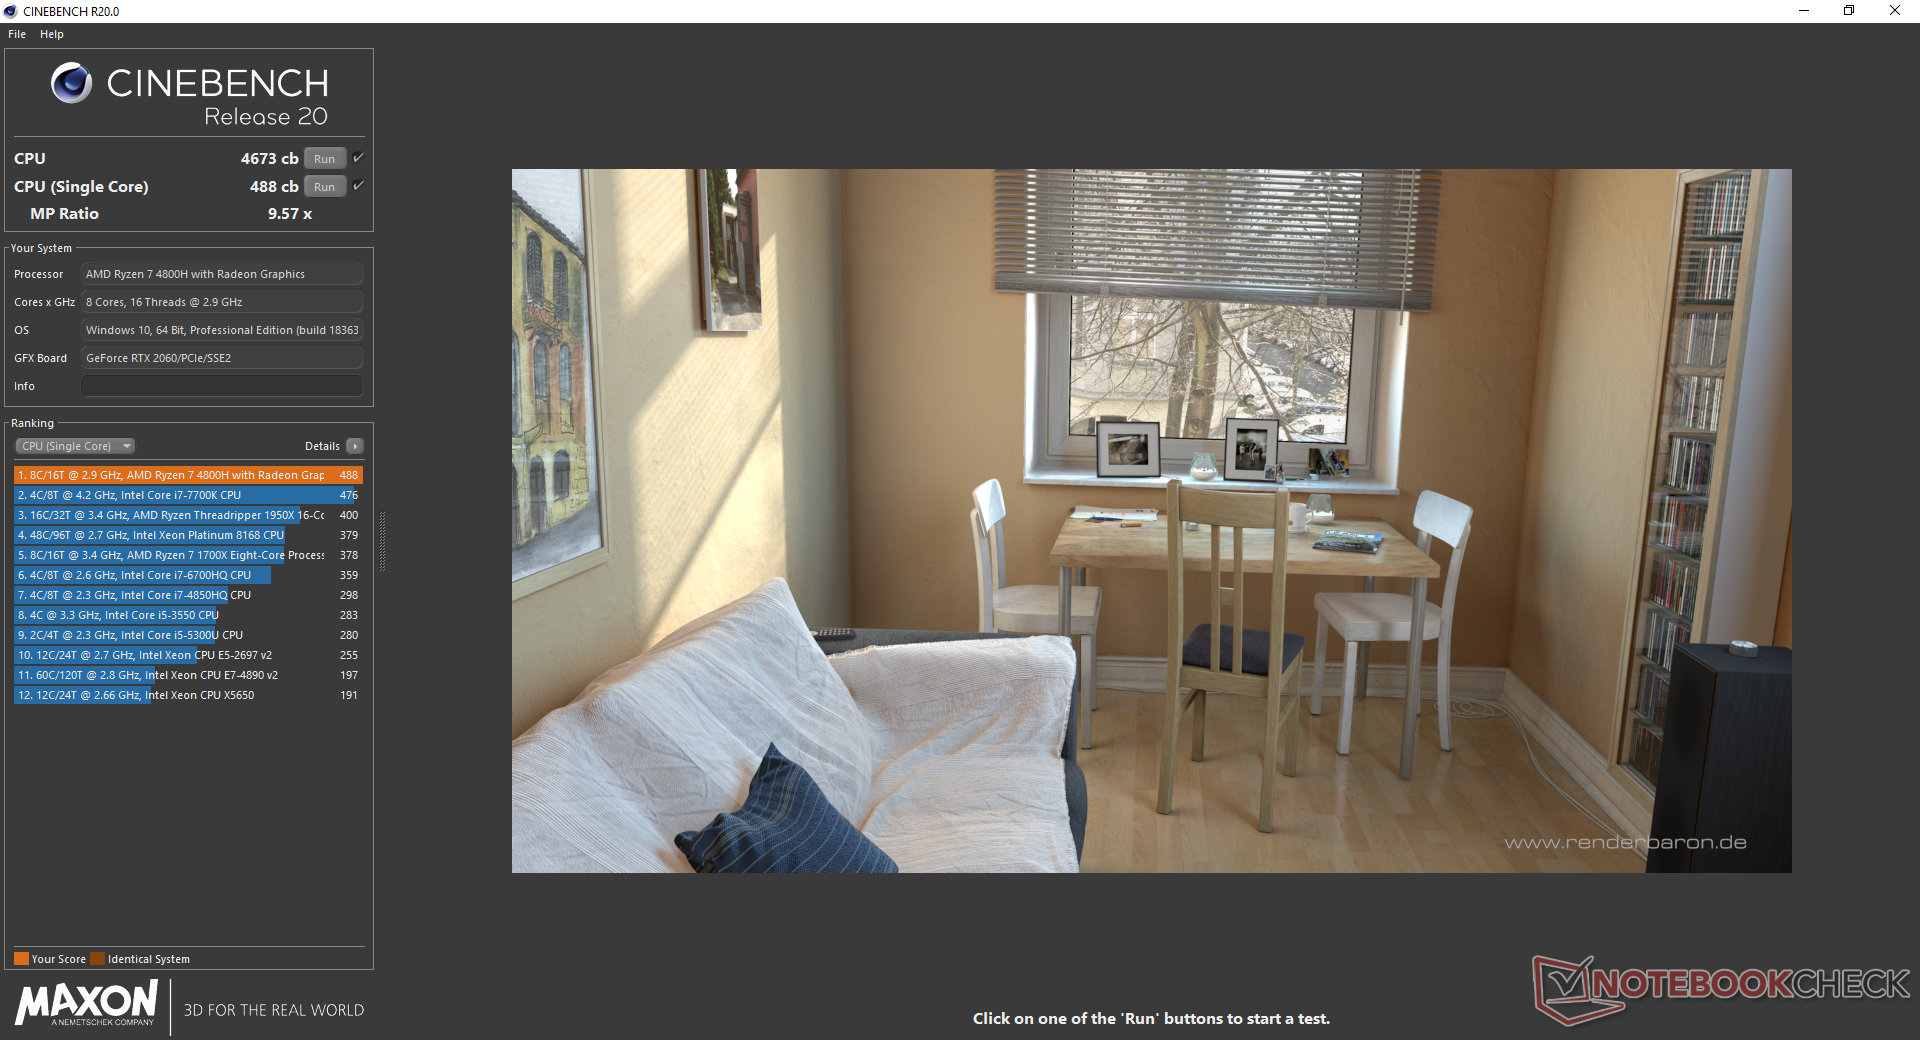
Raw CPU performance is where the RP-15 really shines. When Fan Boost mode (i.e., maximum fan mode) is active, the system returns a CineBench R20 multi-thread score of 4663 points to be noticeably faster than most - if not all - mobile Intel octa-core CPUs at the moment. Performance sustainability is also excellent when running CineBench R15 in a loop as scores remain relatively consistent throughout.
The major downside is that the laptop must be set to Fan Boost mode in order to get the most out of the CPU. When the feature is disabled, performance would drop by almost 12 percent to be slower than the Ryzen 9 4900HS but still faster than the Core i7-10875H.
See our dedicated page on the Ryzen 7 4800H for more technical information and benchmark comparisons.
Cinebench R15: CPU Multi 64Bit | CPU Single 64Bit
Blender: v2.79 BMW27 CPU
7-Zip 18.03: 7z b 4 -mmt1 | 7z b 4
Geekbench 5.5: Single-Core | Multi-Core
HWBOT x265 Benchmark v2.2: 4k Preset
LibreOffice : 20 Documents To PDF
R Benchmark 2.5: Overall mean
| Cinebench R20 / CPU (Single Core) | |
| Gigabyte Aero 15 OLED XB-8DE51B0SP | |
| Eurocom Sky X4C i9-9900KS | |
| Asus Zephyrus G14 GA401IV | |
| Eluktronics RP-15 | |
| Average AMD Ryzen 7 4800H (462 - 491, n=17) | |
| Eurocom Nightsky RX15 | |
| MSI GE65 Raider 9SF-049US | |
| MSI GS66 10SGS | |
| Schenker XMG Pro 15 | |
| MSI GE63 Raider 8SG | |
| Asus ROG Zephyrus G15 GA502DU | |
| Cinebench R15 / CPU Single 64Bit | |
| Eurocom Sky X4C i9-9900KS | |
| Gigabyte Aero 15 OLED XB-8DE51B0SP | |
| Eurocom Nightsky RX15 | |
| MSI GE65 Raider 9SF-049US | |
| Asus Zephyrus G14 GA401IV | |
| Eluktronics RP-15 | |
| MSI GS66 10SGS | |
| Average AMD Ryzen 7 4800H (186 - 191, n=15) | |
| Schenker XMG Pro 15 | |
| MSI GE63 Raider 8SG | |
| Asus ROG Zephyrus G15 GA502DU | |
| Blender / v2.79 BMW27 CPU | |
| Asus ROG Zephyrus G15 GA502DU | |
| Eurocom Nightsky RX15 | |
| Schenker XMG Pro 15 | |
| MSI GS66 10SGS | |
| Asus Zephyrus G14 GA401IV | |
| Gigabyte Aero 15 OLED XB-8DE51B0SP | |
| Average AMD Ryzen 7 4800H (248 - 299, n=15) | |
| Eluktronics RP-15 | |
| Eurocom Sky X4C i9-9900KS | |
| 7-Zip 18.03 / 7z b 4 -mmt1 | |
| Eurocom Sky X4C i9-9900KS | |
| Gigabyte Aero 15 OLED XB-8DE51B0SP | |
| Eurocom Nightsky RX15 | |
| MSI GS66 10SGS | |
| Eluktronics RP-15 | |
| Average AMD Ryzen 7 4800H (4575 - 4743, n=15) | |
| Asus Zephyrus G14 GA401IV | |
| Schenker XMG Pro 15 | |
| Asus ROG Zephyrus G15 GA502DU | |
| Geekbench 5.5 / Single-Core | |
| Eurocom Sky X4C i9-9900KS | |
| Gigabyte Aero 15 OLED XB-8DE51B0SP | |
| Asus Zephyrus G14 GA401IV | |
| MSI GS66 10SGS | |
| Eluktronics RP-15 | |
| Average AMD Ryzen 7 4800H (1154 - 1207, n=17) | |
| Schenker XMG Pro 15 | |
| Geekbench 5.5 / Multi-Core | |
| Eurocom Sky X4C i9-9900KS | |
| Eluktronics RP-15 | |
| Gigabyte Aero 15 OLED XB-8DE51B0SP | |
| Average AMD Ryzen 7 4800H (5920 - 8672, n=17) | |
| Asus Zephyrus G14 GA401IV | |
| MSI GS66 10SGS | |
| Schenker XMG Pro 15 | |
| HWBOT x265 Benchmark v2.2 / 4k Preset | |
| Eurocom Sky X4C i9-9900KS | |
| Eluktronics RP-15 | |
| Gigabyte Aero 15 OLED XB-8DE51B0SP | |
| Average AMD Ryzen 7 4800H (10.8 - 14.1, n=16) | |
| Eurocom Nightsky RX15 | |
| Asus Zephyrus G14 GA401IV | |
| MSI GS66 10SGS | |
| Schenker XMG Pro 15 | |
| Asus ROG Zephyrus G15 GA502DU | |
| LibreOffice / 20 Documents To PDF | |
| Average AMD Ryzen 7 4800H (28.6 - 95.8, n=14) | |
| Eluktronics RP-15 | |
| MSI GS66 10SGS | |
| Gigabyte Aero 15 OLED XB-8DE51B0SP | |
| R Benchmark 2.5 / Overall mean | |
| Schenker XMG Pro 15 | |
| MSI GS66 10SGS | |
| Average AMD Ryzen 7 4800H (0.562 - 0.603, n=15) | |
| Eluktronics RP-15 | |
| Gigabyte Aero 15 OLED XB-8DE51B0SP | |
* ... smaller is better
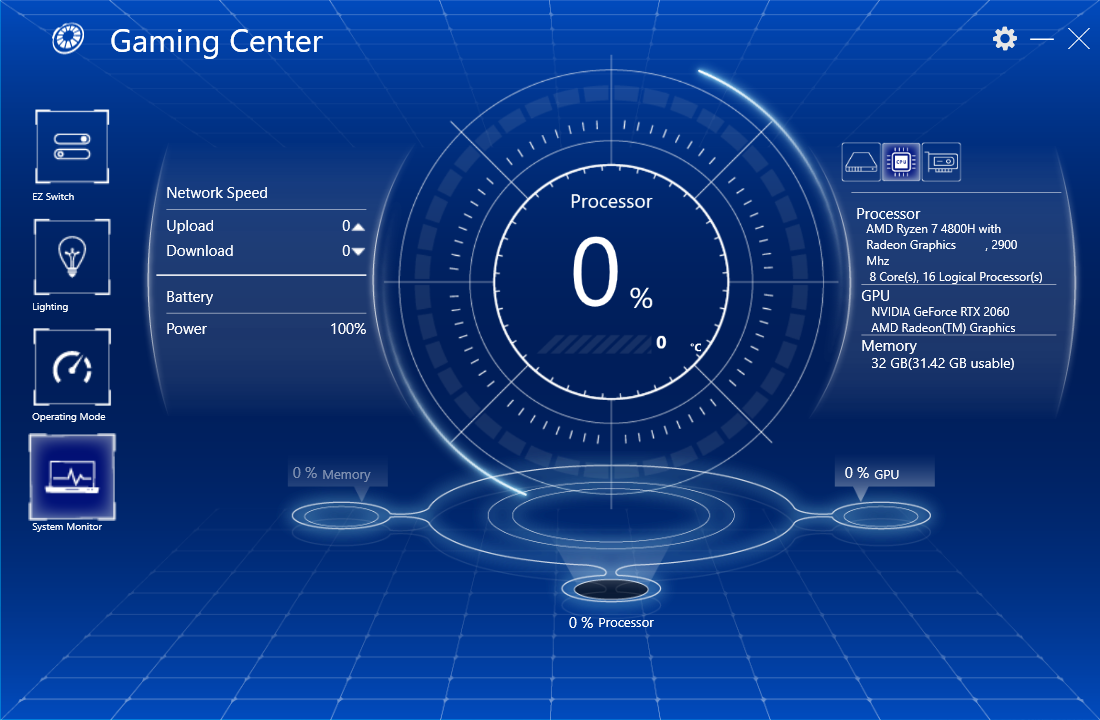
System Performance
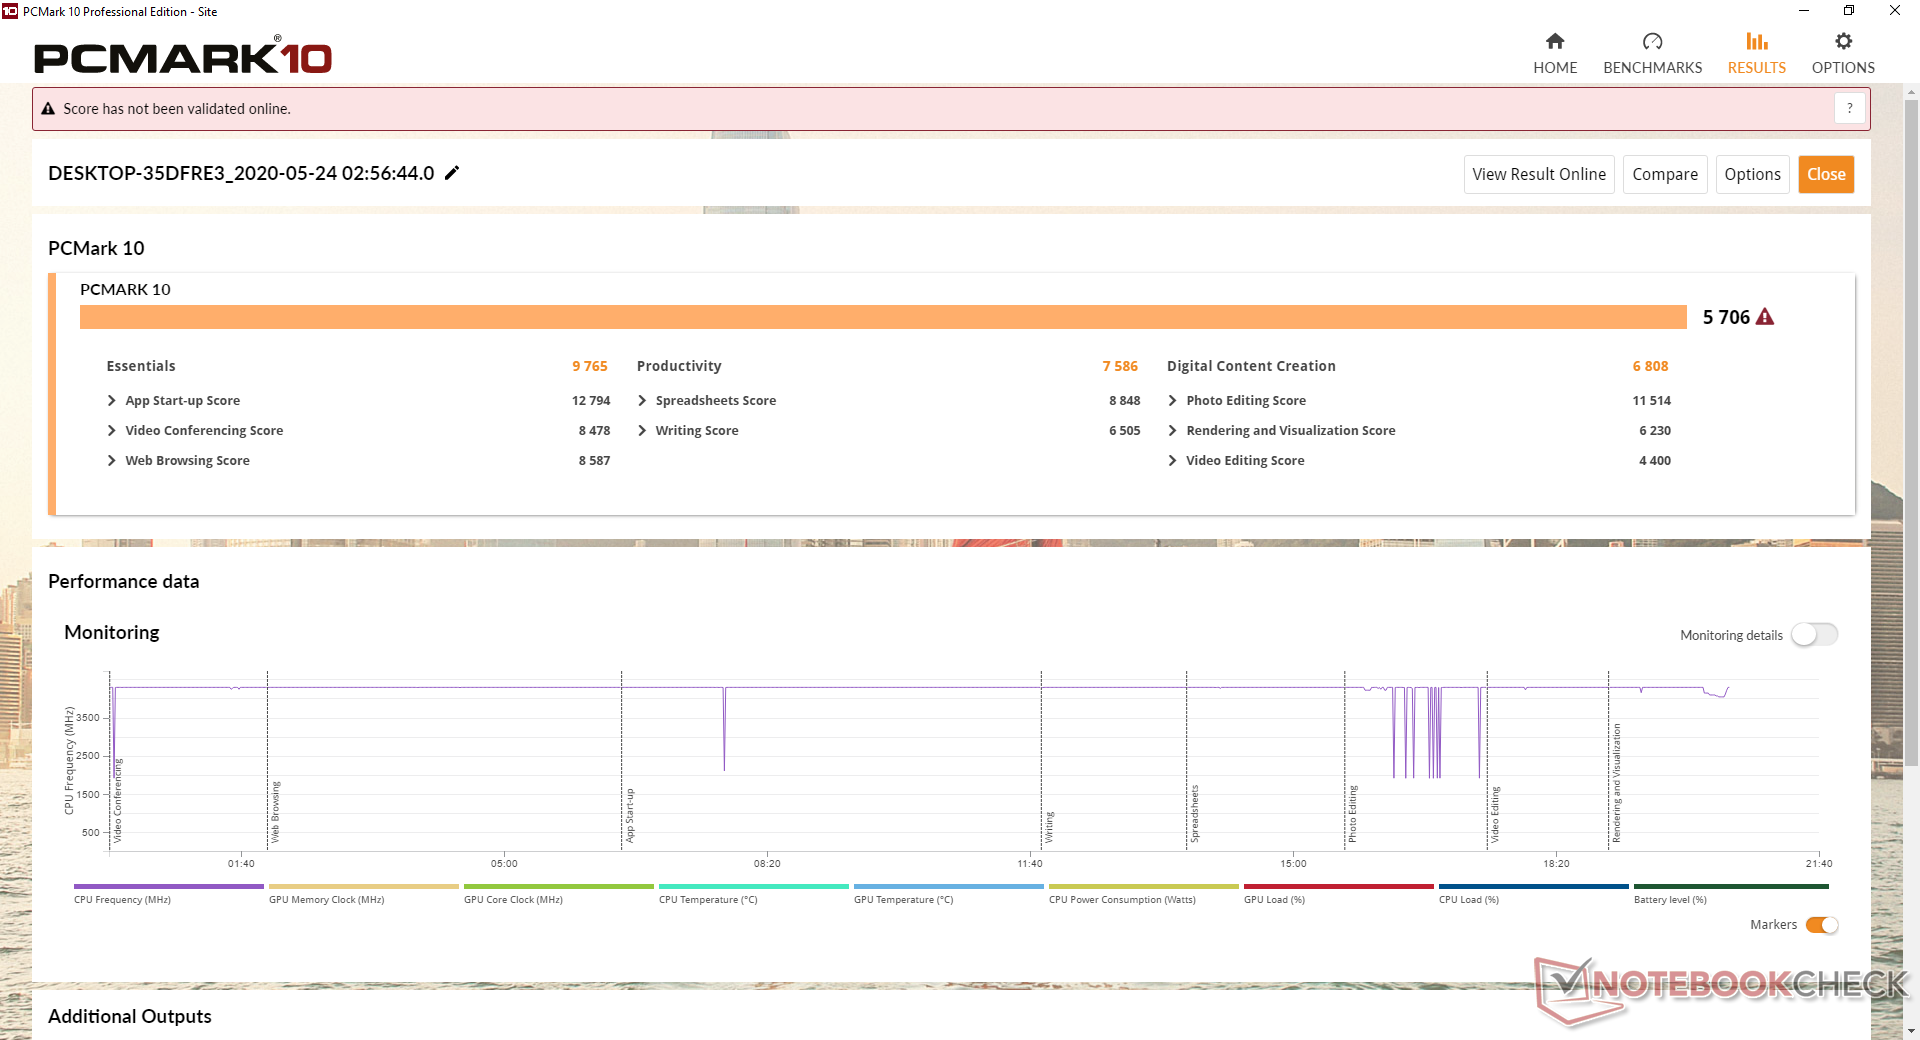
PCMark benchmarks are where we expect them to be relative to other Core H-class gaming laptops with GeForce RTX graphics. We experenced no software or hardware issues during our time with the test unit.
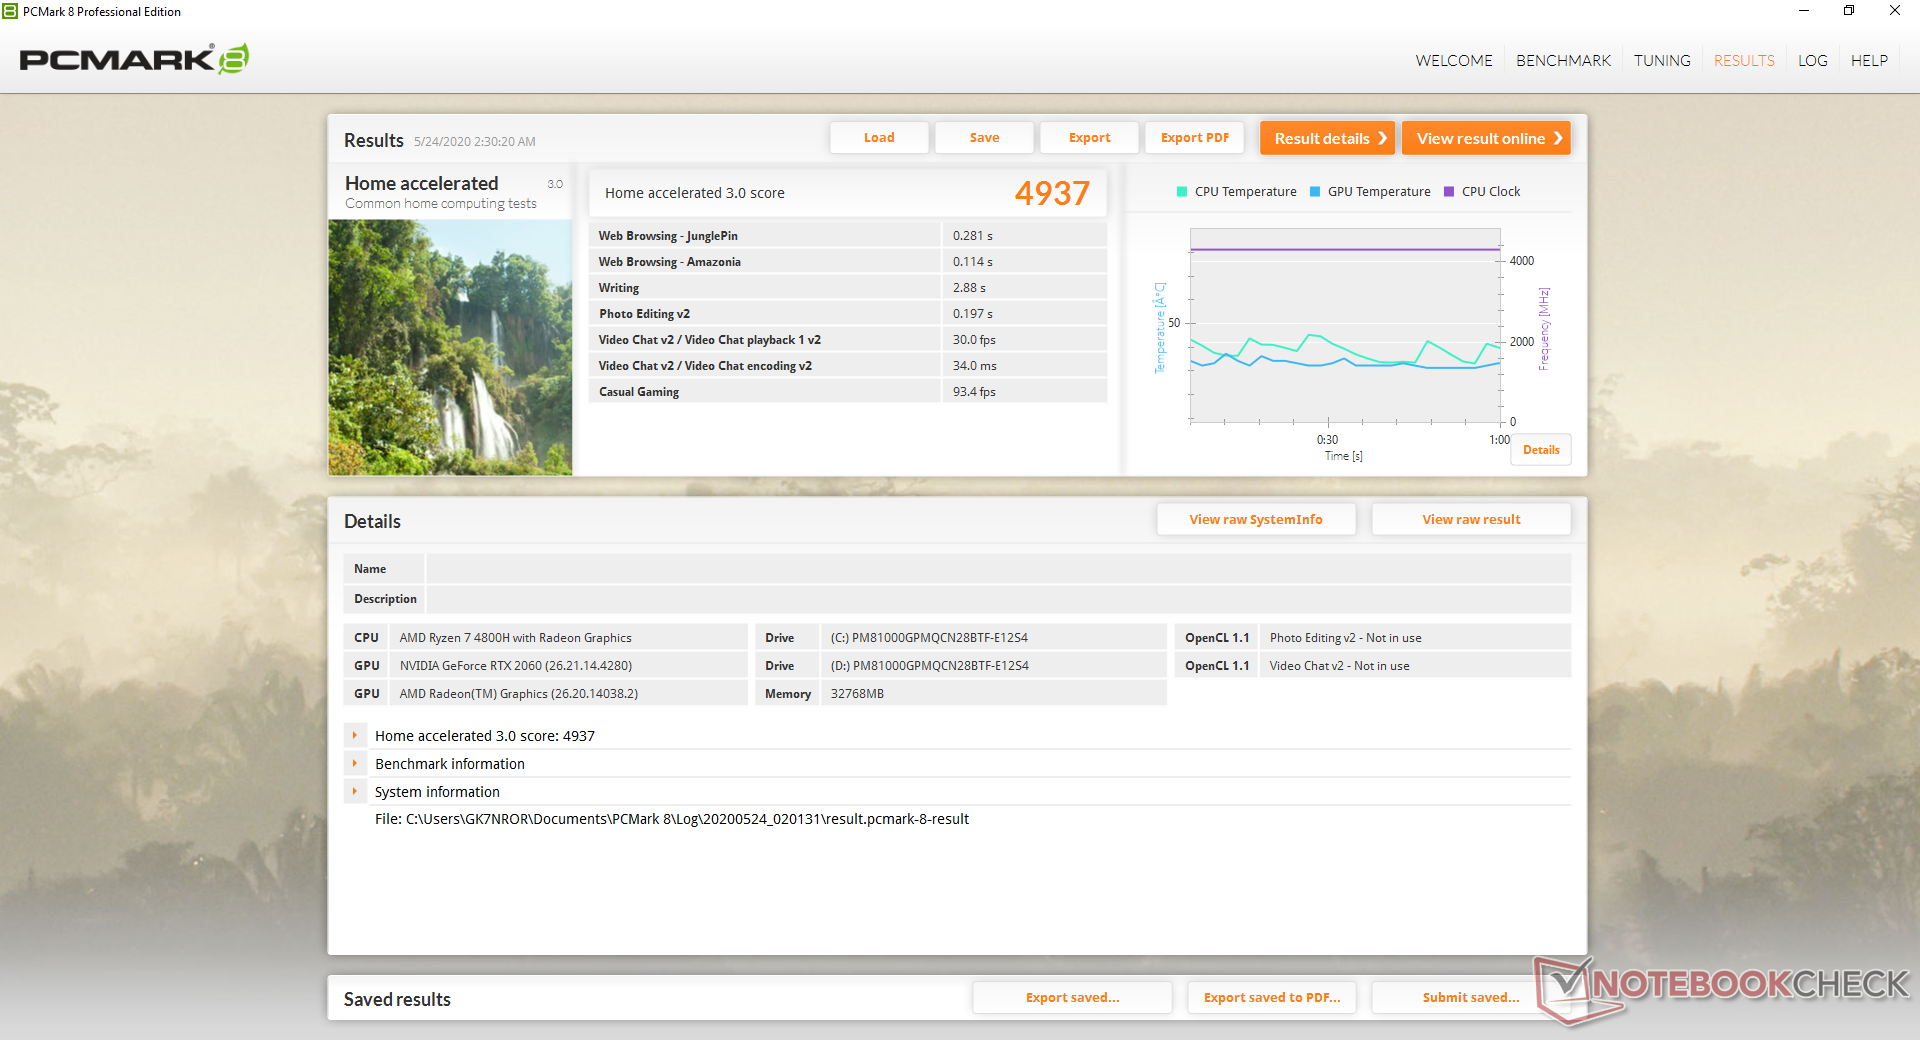
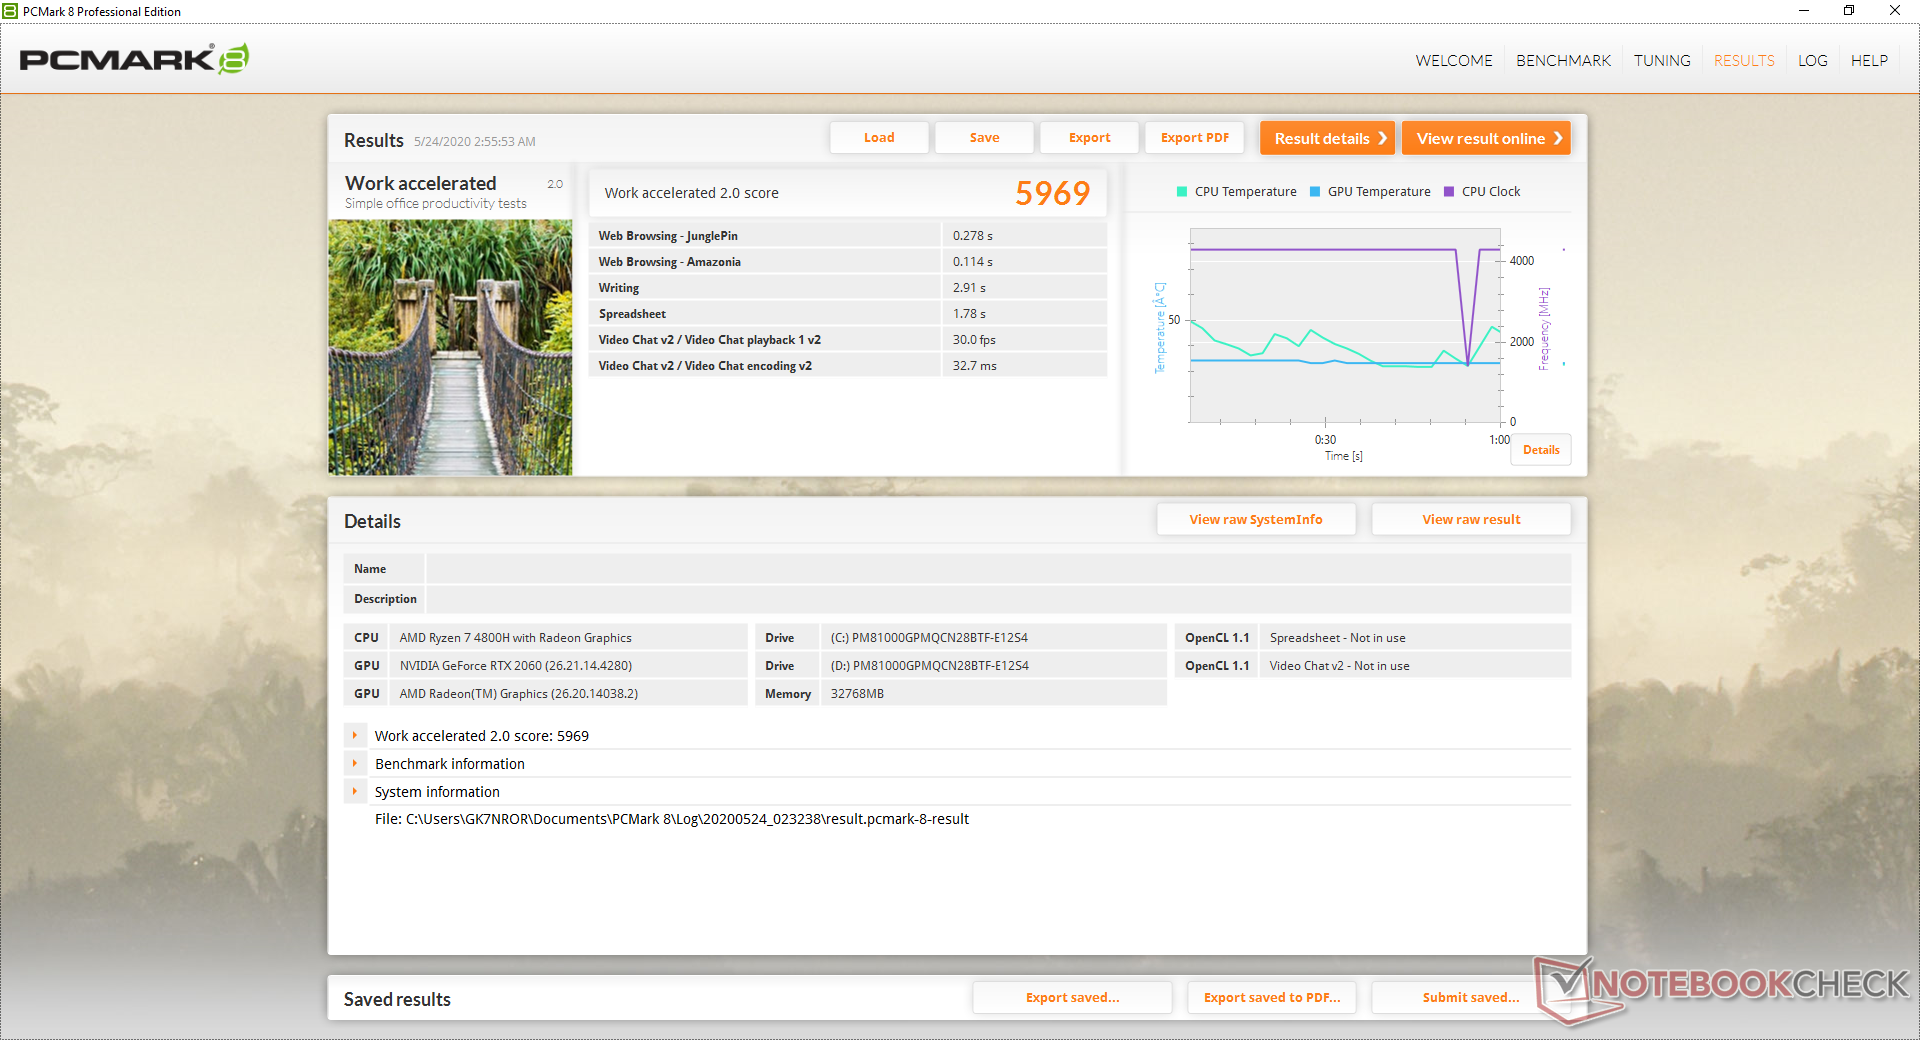
| PCMark 8 Home Score Accelerated v2 | 4937 points | |
| PCMark 8 Work Score Accelerated v2 | 5969 points | |
| PCMark 10 Score | 5706 points | |
Help | ||
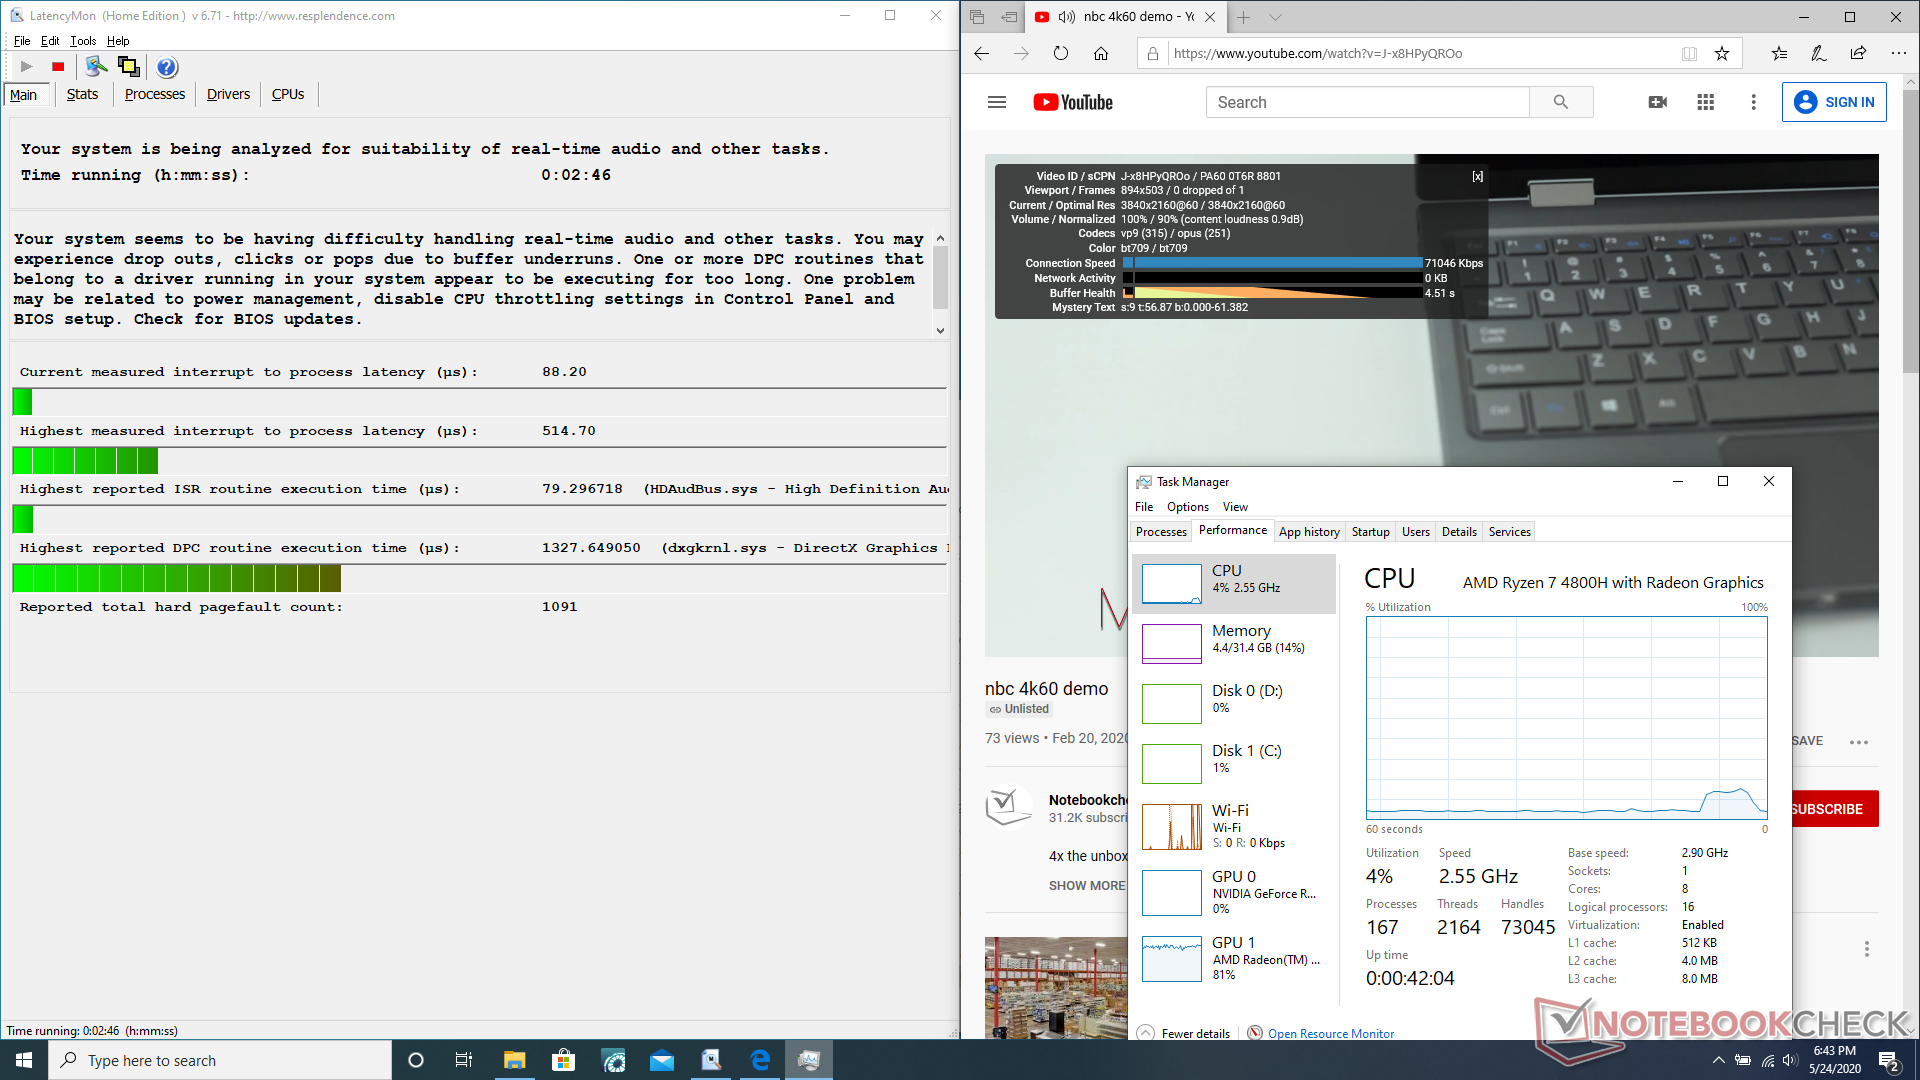
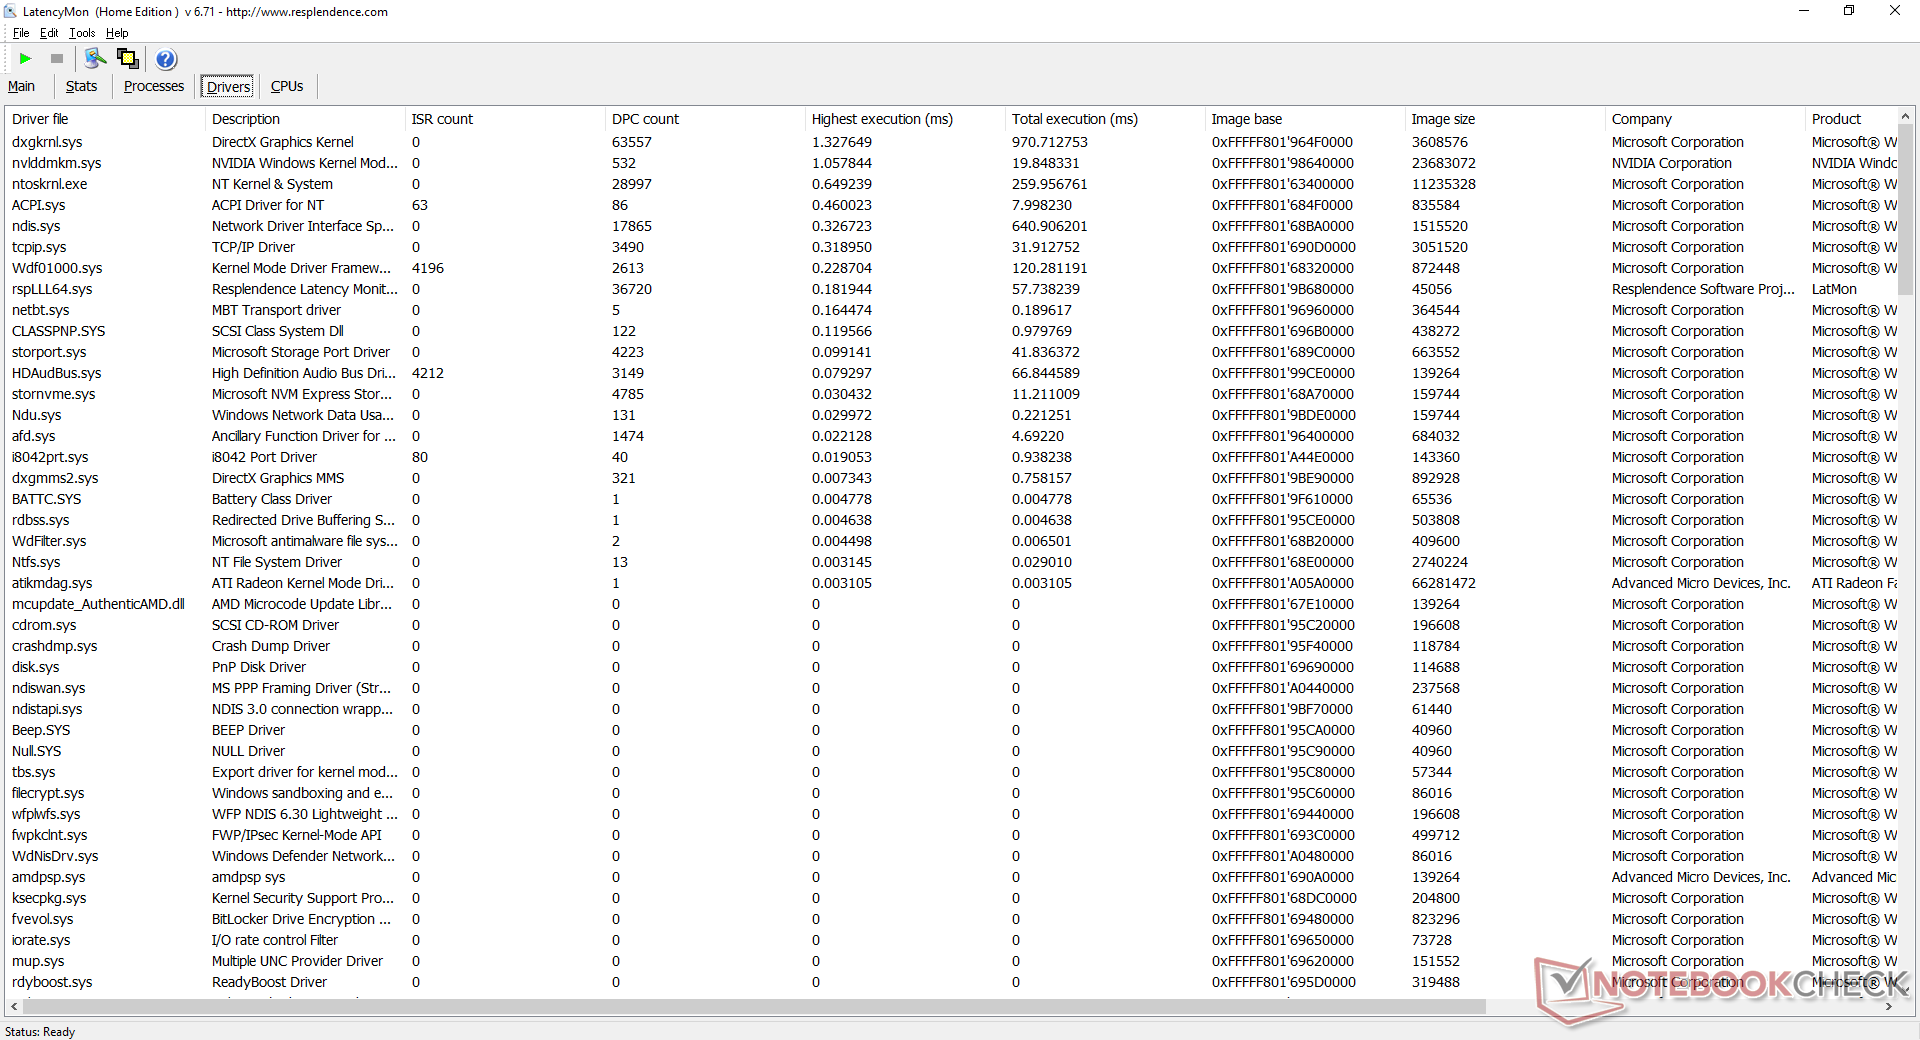
DPC Latency
LatencyMon shows DPC latency issues when opening multiple browser tabs on our homepage. 4K video playback on YouTube is otherwise smooth with no dropped frames.
| DPC Latencies / LatencyMon - interrupt to process latency (max), Web, Youtube, Prime95 | |
| Asus Zephyrus G14 GA401IV | |
| MSI GS66 10SGS | |
| Razer Blade 15 RZ09-0328 | |
| Eluktronics RP-15 | |
* ... smaller is better
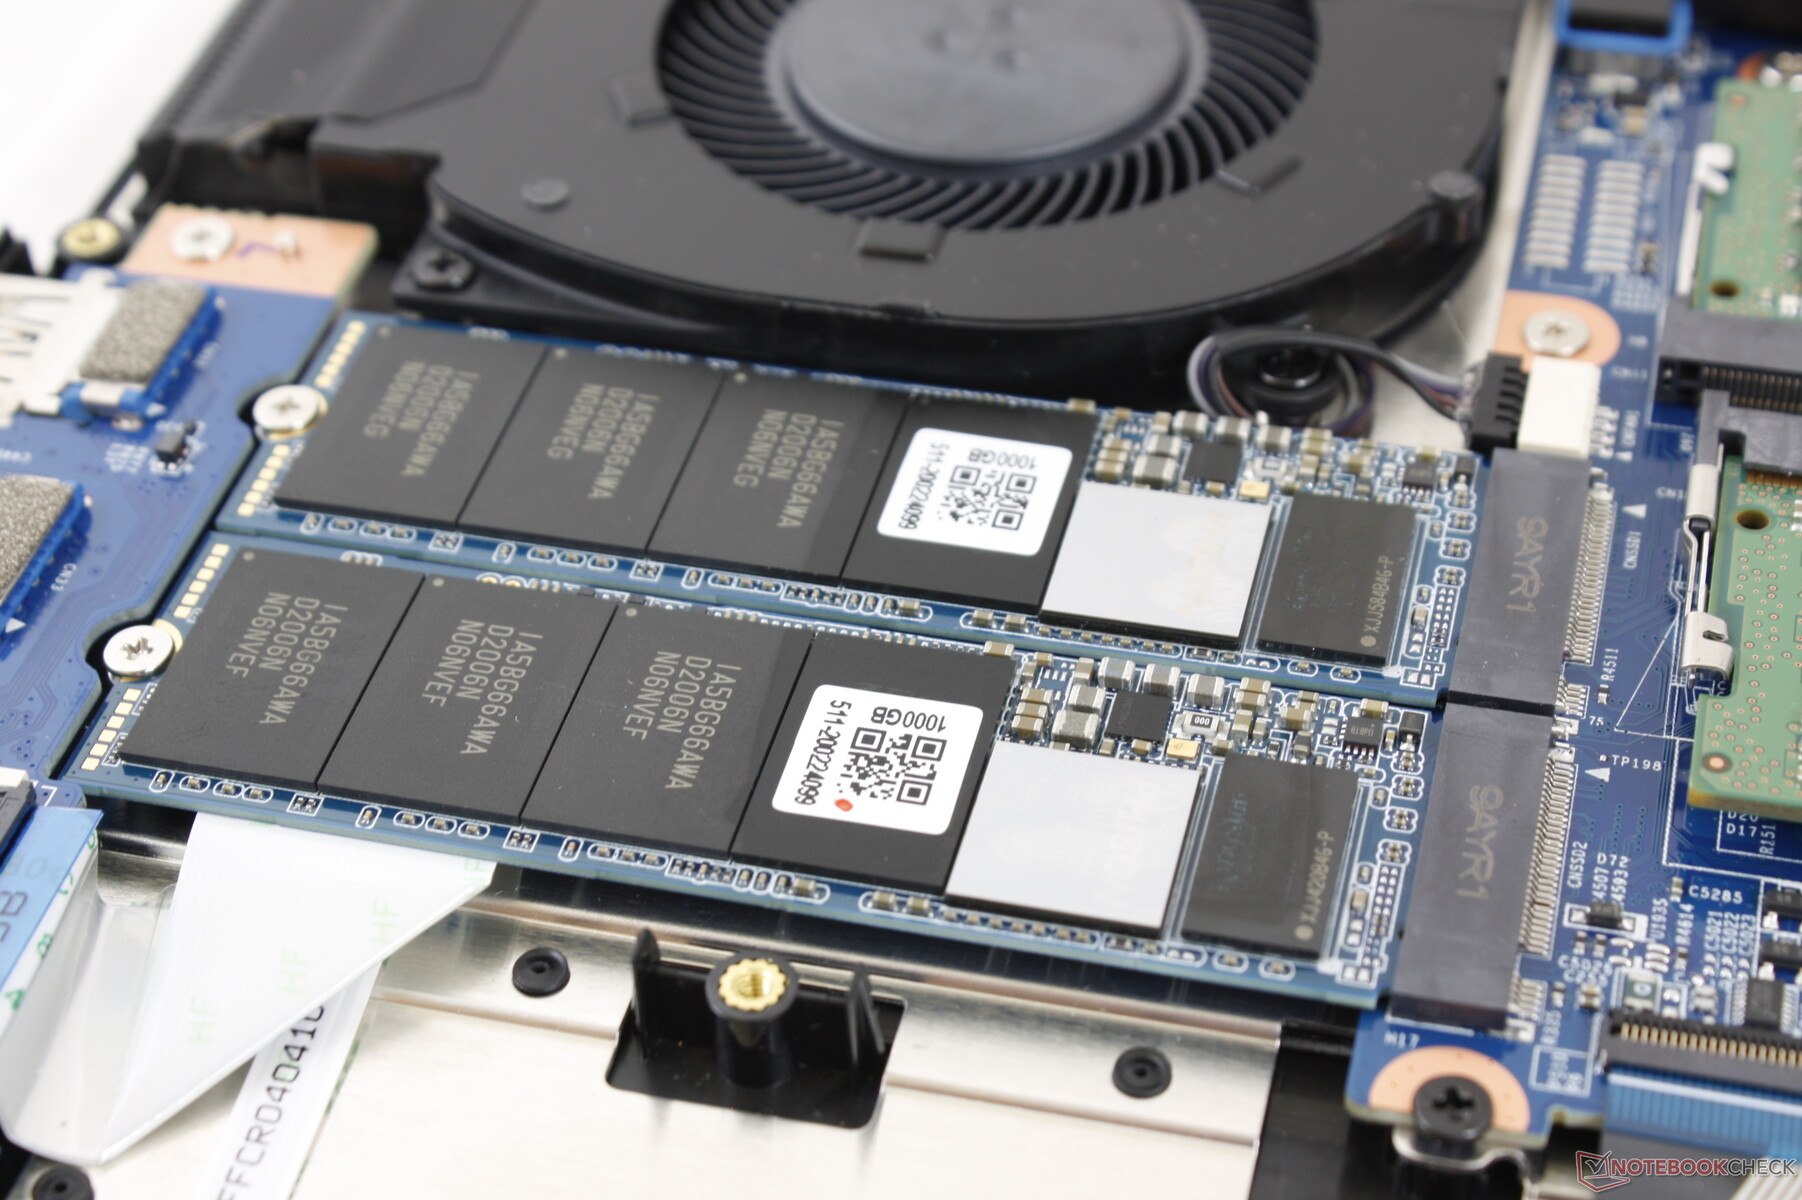
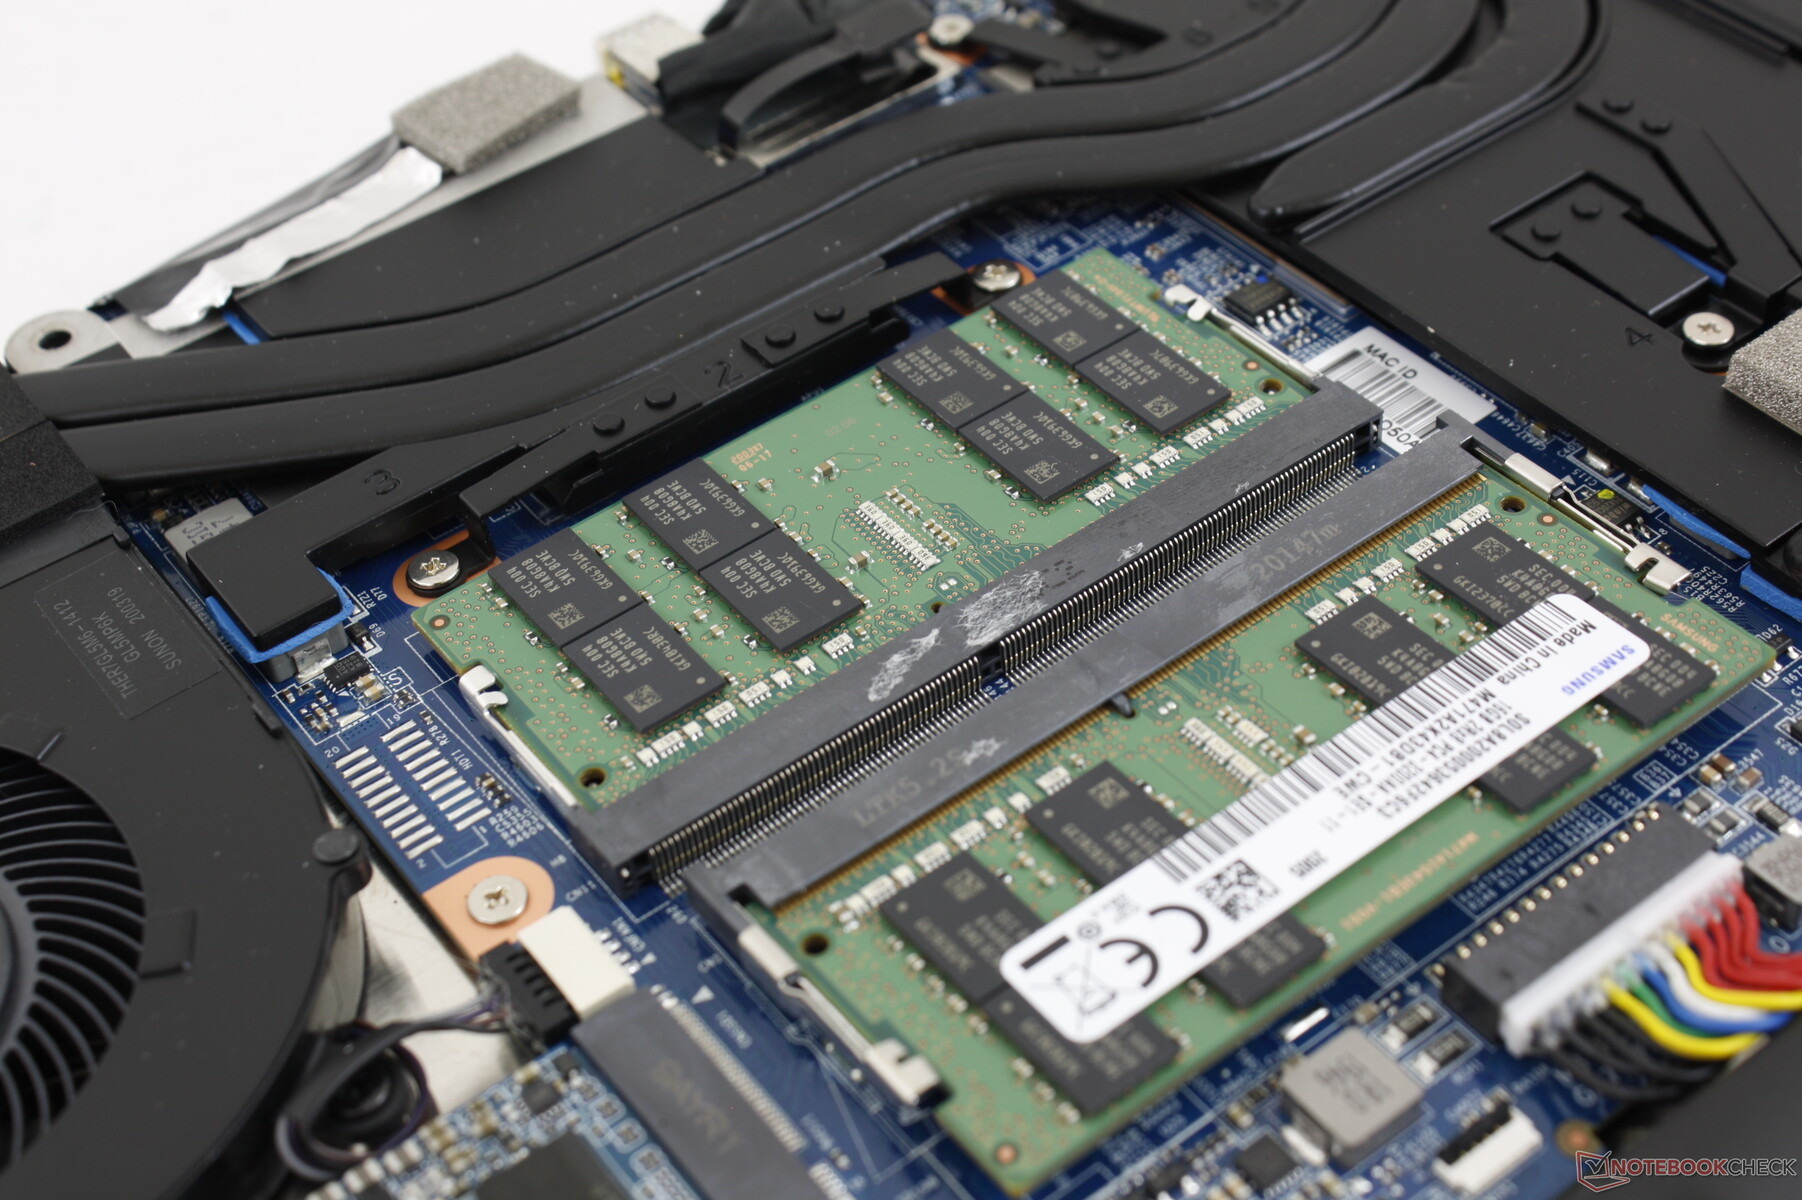
Storage Devices
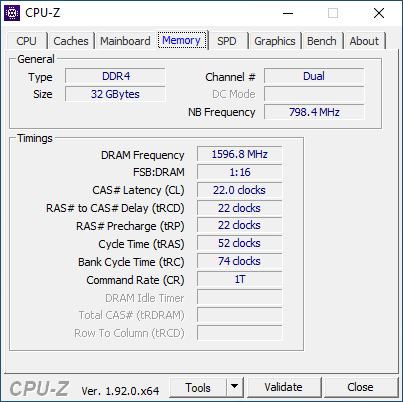
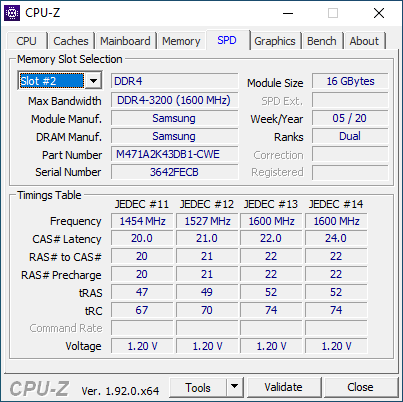
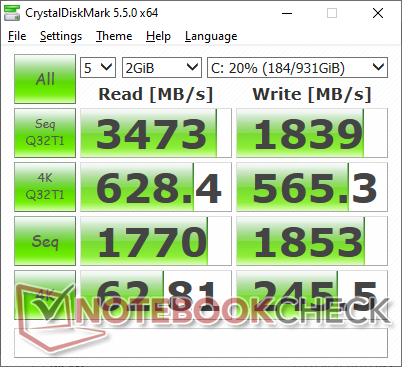
Two M.2 PCIe x4 bays are available for RAID configuration if desired. Our test unit comes with two 1 TB Phison PS5012 NVMe SSDs, but users can configure anywhere from none at all to 8 TB total.
We applaud the inclusion of a heat spreader for the M.2 SSDs which is uncommon for most laptops.
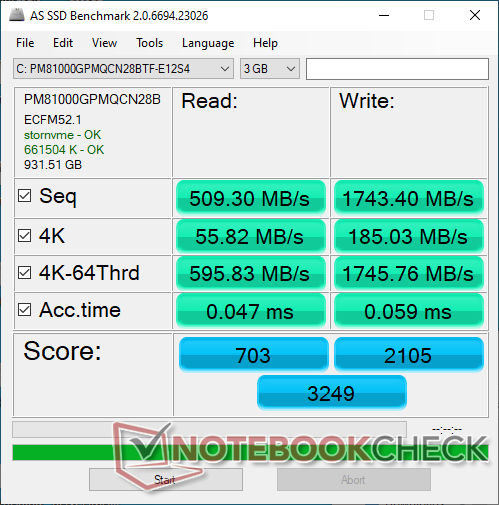
| Eluktronics RP-15 Phison PM81000GPMQCN28BTF-E12S4 M.2 NVM SSD | MSI GS66 10SGS Samsung SSD PM981 MZVLB512HAJQ | Razer Blade 15 RZ09-0328 Lite-On CA5-8D512 | Asus Strix GL531GV-PB74 Intel SSD 660p SSDPEKNW512G8 | Alienware m15 R2 P87F 2x Toshiba XG6 KXG60ZNV512G (RAID 0) | |
|---|---|---|---|---|---|
| AS SSD | 24% | 13% | -16% | 18% | |
| Seq Read (MB/s) | 509 | 1086 113% | 2021 297% | 1280 151% | 1925 278% |
| Seq Write (MB/s) | 1743 | 1901 9% | 2090 20% | 905 -48% | 2371 36% |
| 4K Read (MB/s) | 55.8 | 51 -9% | 47.71 -14% | 48.73 -13% | 37.2 -33% |
| 4K Write (MB/s) | 185 | 117.3 -37% | 101.1 -45% | 107 -42% | 108.9 -41% |
| 4K-64 Read (MB/s) | 596 | 1503 152% | 856 44% | 321.1 -46% | 1177 97% |
| 4K-64 Write (MB/s) | 1746 | 1721 -1% | 1041 -40% | 761 -56% | 1135 -35% |
| Access Time Read * (ms) | 0.047 | 0.059 -26% | 0.052 -11% | 0.058 -23% | 0.065 -38% |
| Access Time Write * (ms) | 0.059 | 0.1 -69% | 0.111 -88% | 0.046 22% | 0.108 -83% |
| Score Read (Points) | 703 | 1662 136% | 1105 57% | 498 -29% | 1407 100% |
| Score Write (Points) | 2105 | 2029 -4% | 1351 -36% | 958 -54% | 1481 -30% |
| Score Total (Points) | 3249 | 4588 41% | 3037 -7% | 1711 -47% | 3633 12% |
| Copy ISO MB/s (MB/s) | 2413 | 2155 -11% | 2474 3% | 1519 -37% | 2073 -14% |
| Copy Program MB/s (MB/s) | 580 | 715 23% | 679 17% | 749 29% | 576 -1% |
| Copy Game MB/s (MB/s) | 1311 | 1506 15% | 1037 -21% | 943 -28% | 1426 9% |
| CrystalDiskMark 5.2 / 6 | -14% | -3% | -37% | 2% | |
| Write 4K (MB/s) | 245.5 | 132.5 -46% | 118.7 -52% | 121.9 -50% | 108.8 -56% |
| Read 4K (MB/s) | 62.8 | 45.03 -28% | 52.4 -17% | 53.6 -15% | 45.41 -28% |
| Write Seq (MB/s) | 1853 | 1987 7% | 2247 21% | 967 -48% | 2467 33% |
| Read Seq (MB/s) | 1770 | 1434 -19% | 2234 26% | 1461 -17% | 2456 39% |
| Write 4K Q32T1 (MB/s) | 565 | 467.5 -17% | 515 -9% | 431.4 -24% | 532 -6% |
| Read 4K Q32T1 (MB/s) | 628 | 536 -15% | 584 -7% | 337.3 -46% | 590 -6% |
| Write Seq Q32T1 (MB/s) | 1839 | 2003 9% | 2235 22% | 972 -47% | 2801 52% |
| Read Seq Q32T1 (MB/s) | 3473 | 3306 -5% | 3171 -9% | 1727 -50% | 3172 -9% |
| Total Average (Program / Settings) | 5% /
10% | 5% /
7% | -27% /
-24% | 10% /
13% |
* ... smaller is better

Disk Throttling: DiskSpd Read Loop, Queue Depth 8
GPU Performance
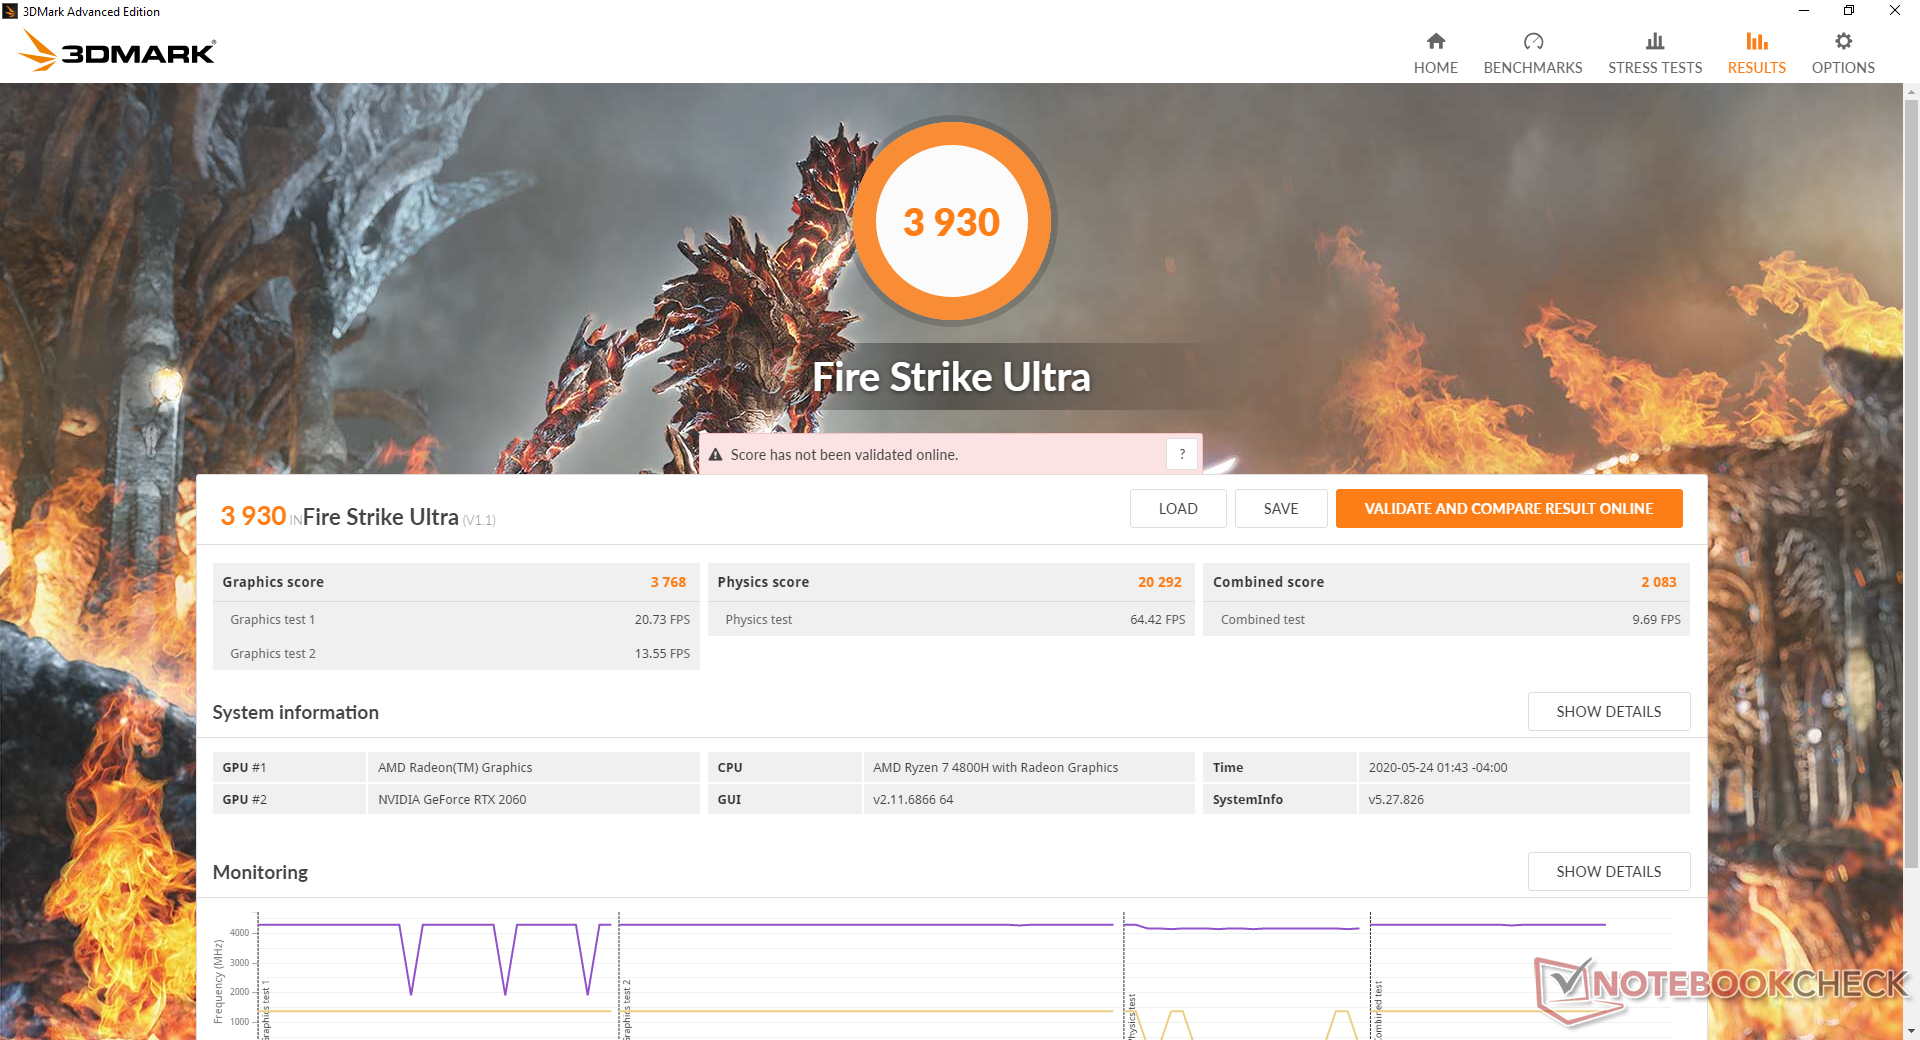
The GeForce RTX 2060 performs where we expect it to be relative to other laptops equipped with the same GPU. When compared to a "proper" desktop RTX 2060, raw performance is about 15 to 20 percent slower.
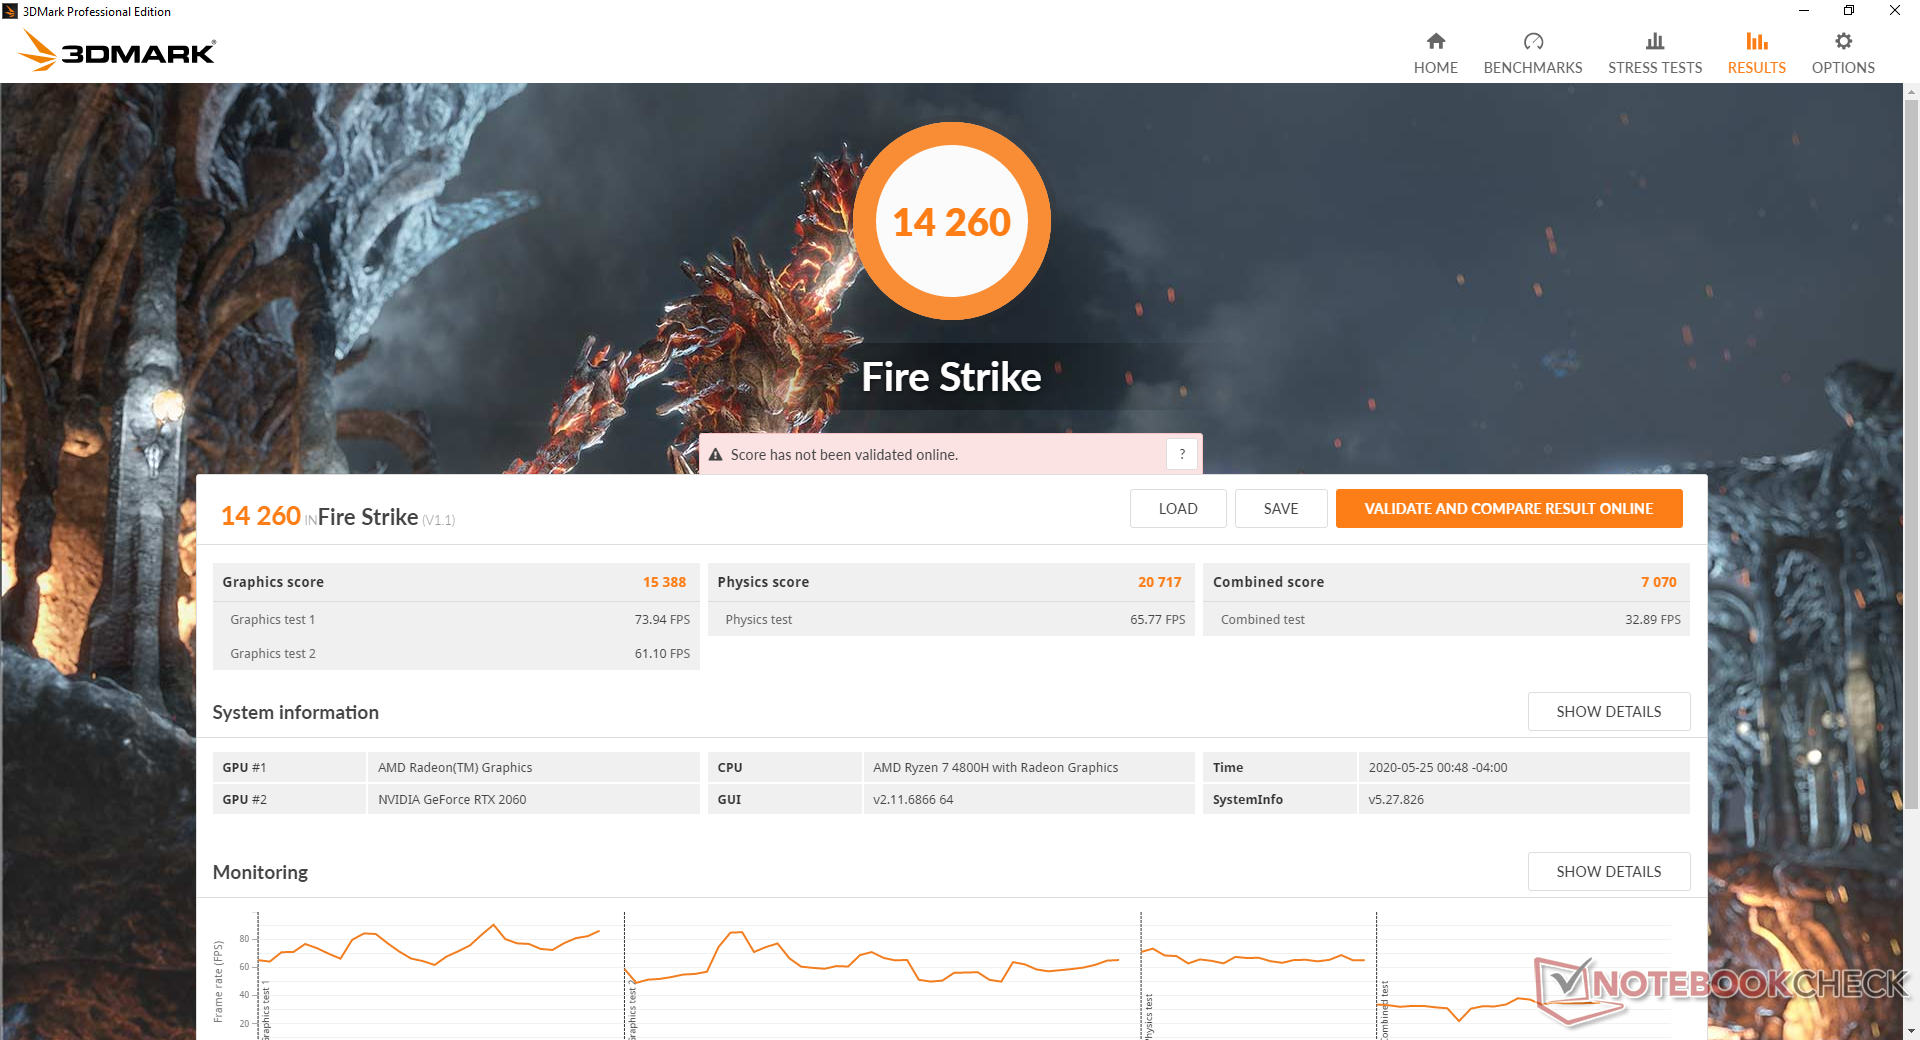
Enabling Fan Boost mode will increase GPU performance by about 9 percent according to 3DMark Fire Strike (15388 points to 16808 points).
See our dedicated page on the mobile GeForce RTX 2060 for more technical information and benchmark comparisons. This particular GPU pairs very well with a 144 Hz panel since it tends to run most newer games in the 40 to 60 FPS range.
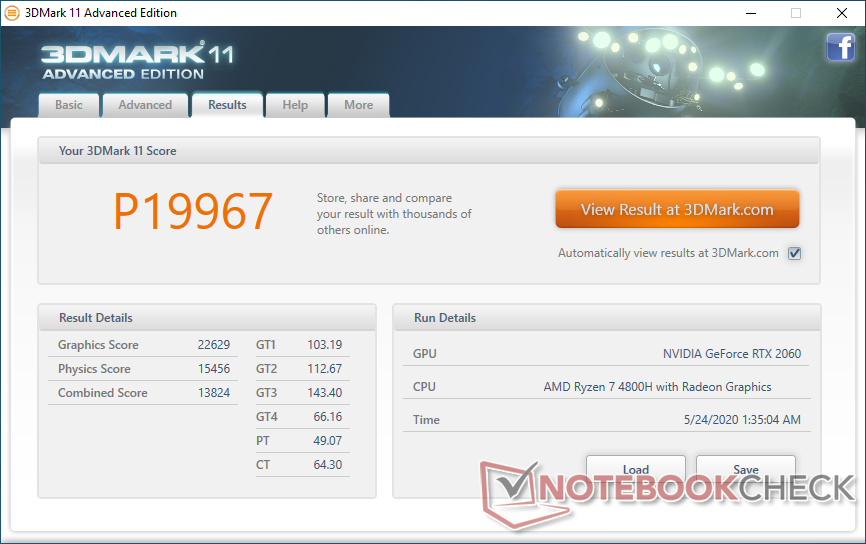
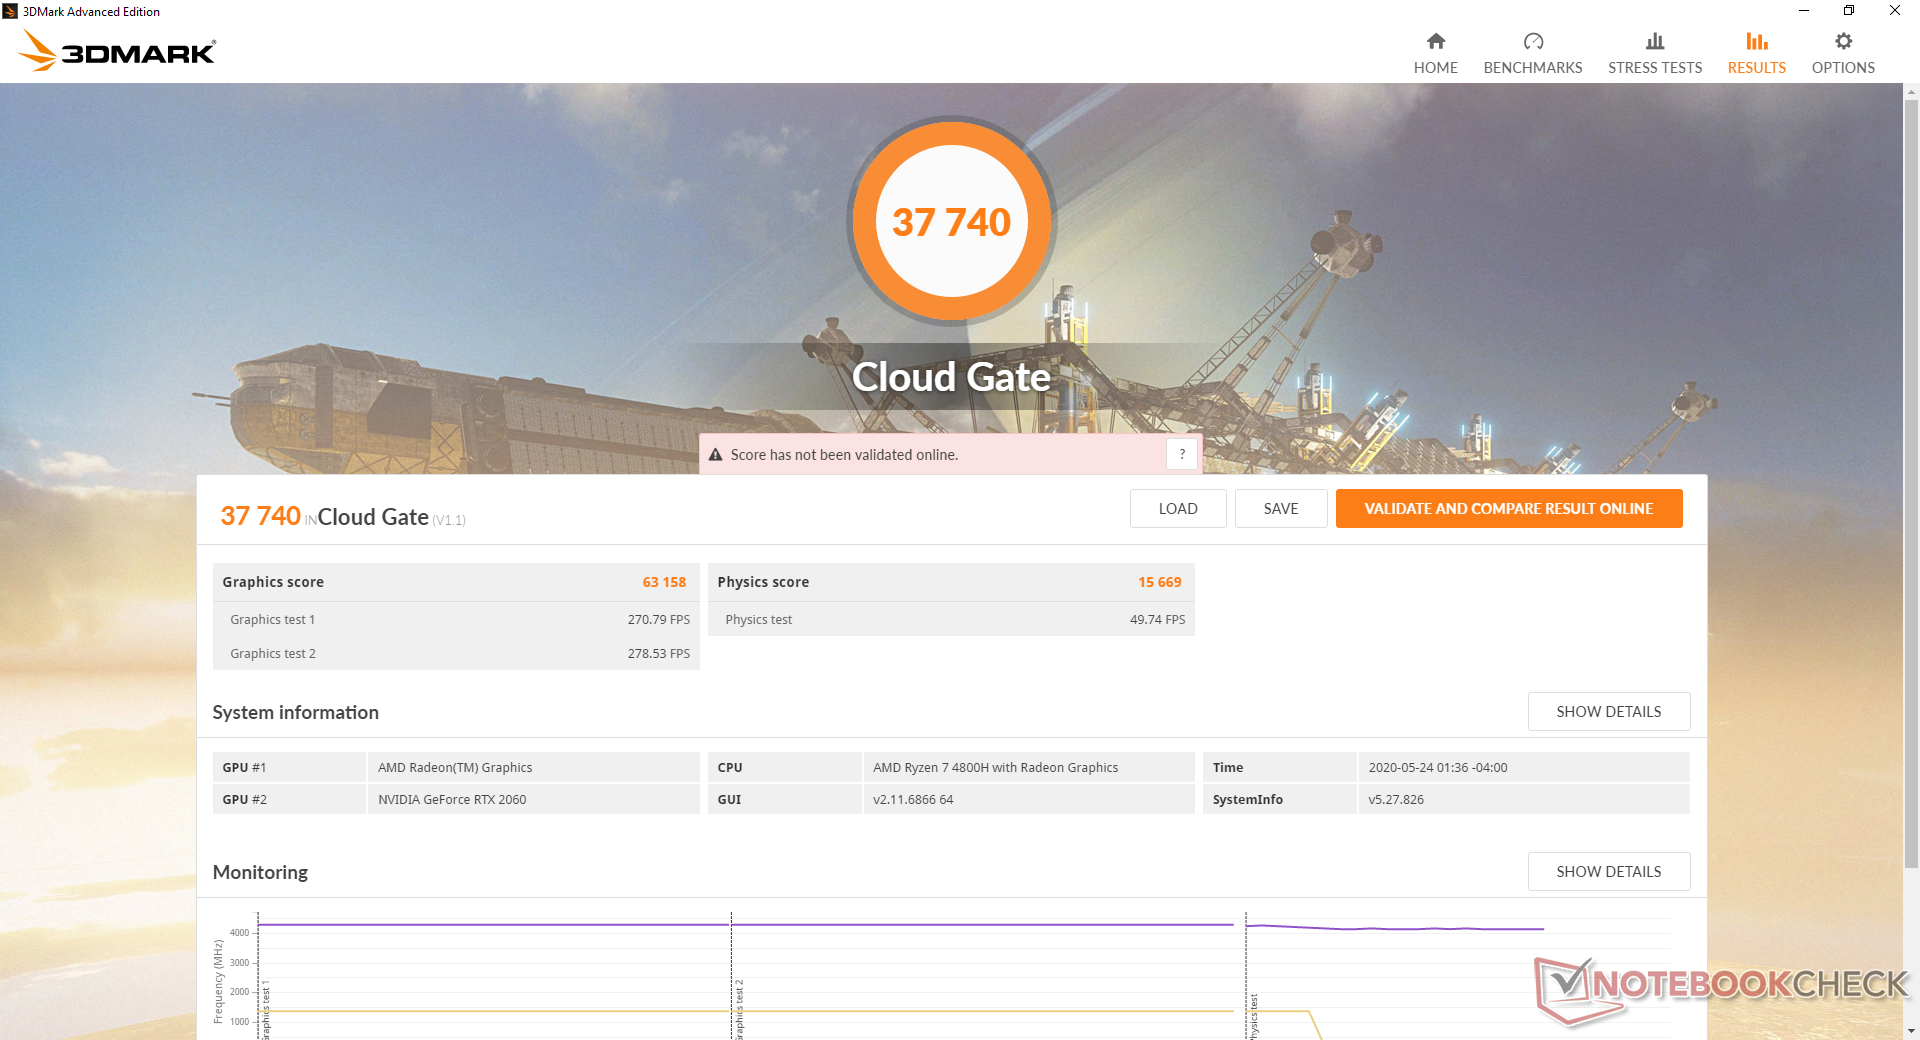

| 3DMark 11 Performance | 19967 points | |
| 3DMark Cloud Gate Standard Score | 37740 points | |
| 3DMark Fire Strike Score | 15476 points | |
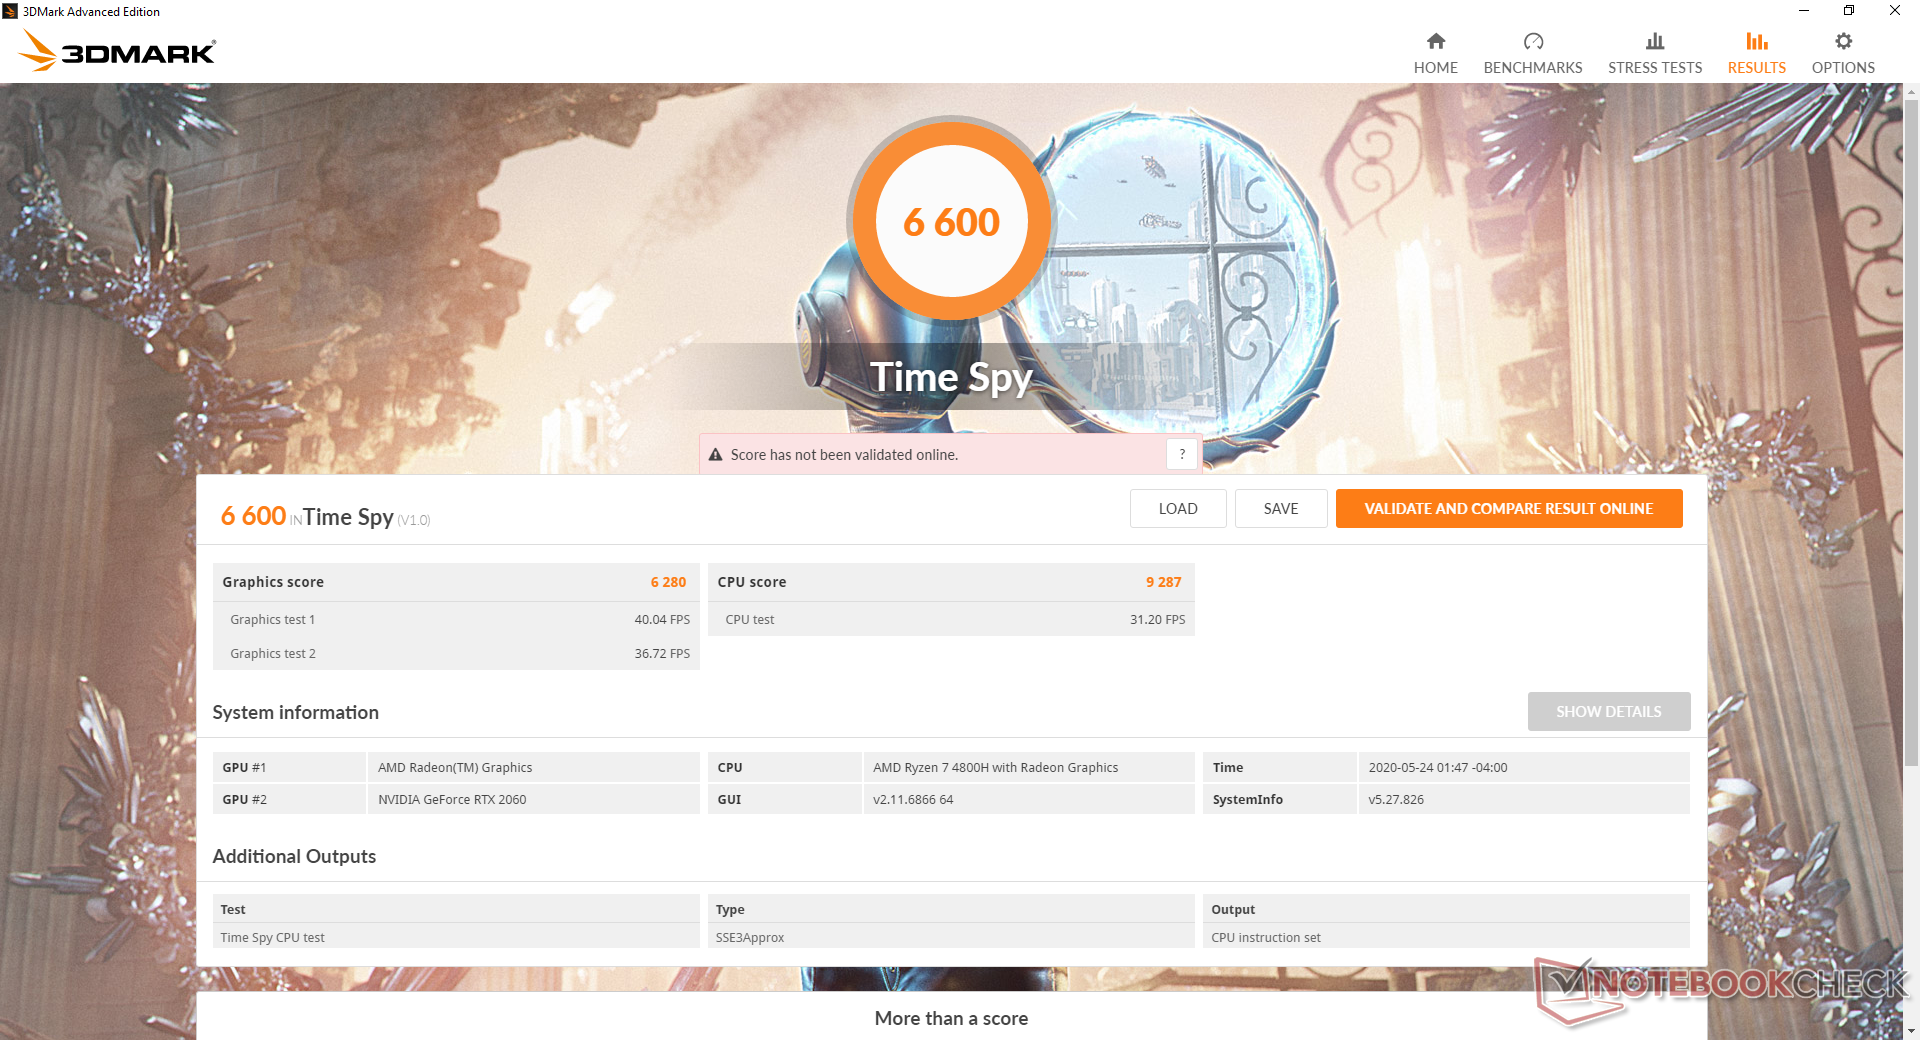
| 3DMark Time Spy Score | 6600 points | |
Help | ||
| The Witcher 3 | |
| 1024x768 Low Graphics & Postprocessing | |
| MSI GS66 10SGS | |
| Razer Blade 15 RZ09-0328 | |
| MSI GF65 9SD | |
| MSI RTX 2060 Gaming Z 6G | |
| Eluktronics RP-15 | |
| Average NVIDIA GeForce RTX 2060 Mobile (188.7 - 295, n=27) | |
| HP Omen 15-dc0015ng | |
| Lenovo Yoga C940-15IRH | |
| 1920x1080 Ultra Graphics & Postprocessing (HBAO+) | |
| Schenker XMG Apex 15 NH57AF1 | |
| MSI GS66 10SGS | |
| MSI RTX 2060 Gaming Z 6G | |
| Eluktronics RP-15 | |
| Razer Blade 15 RZ09-0328 | |
| Average NVIDIA GeForce RTX 2060 Mobile (50.6 - 74, n=40) | |
| MSI GF65 9SD | |
| HP Omen 15-dc0015ng | |
| Medion Erazer X6805-MD61085 | |
| Lenovo Yoga C940-15IRH | |
| low | med. | high | ultra | |
|---|---|---|---|---|
| The Witcher 3 (2015) | 275.4 | 113.6 | 62.4 | |
| Dota 2 Reborn (2015) | 122 | 116 | 107 | 104 |
| X-Plane 11.11 (2018) | 95.7 | 84.9 | 71.1 | |
| Shadow of the Tomb Raider (2018) | 118 | 91 | 84 | 75 |
| Metro Exodus (2019) | 132.8 | 71.8 | 54.3 | 43 |
| Borderlands 3 (2019) | 118.1 | 88.1 | 61 | 47.5 |
Emissions
System Noise
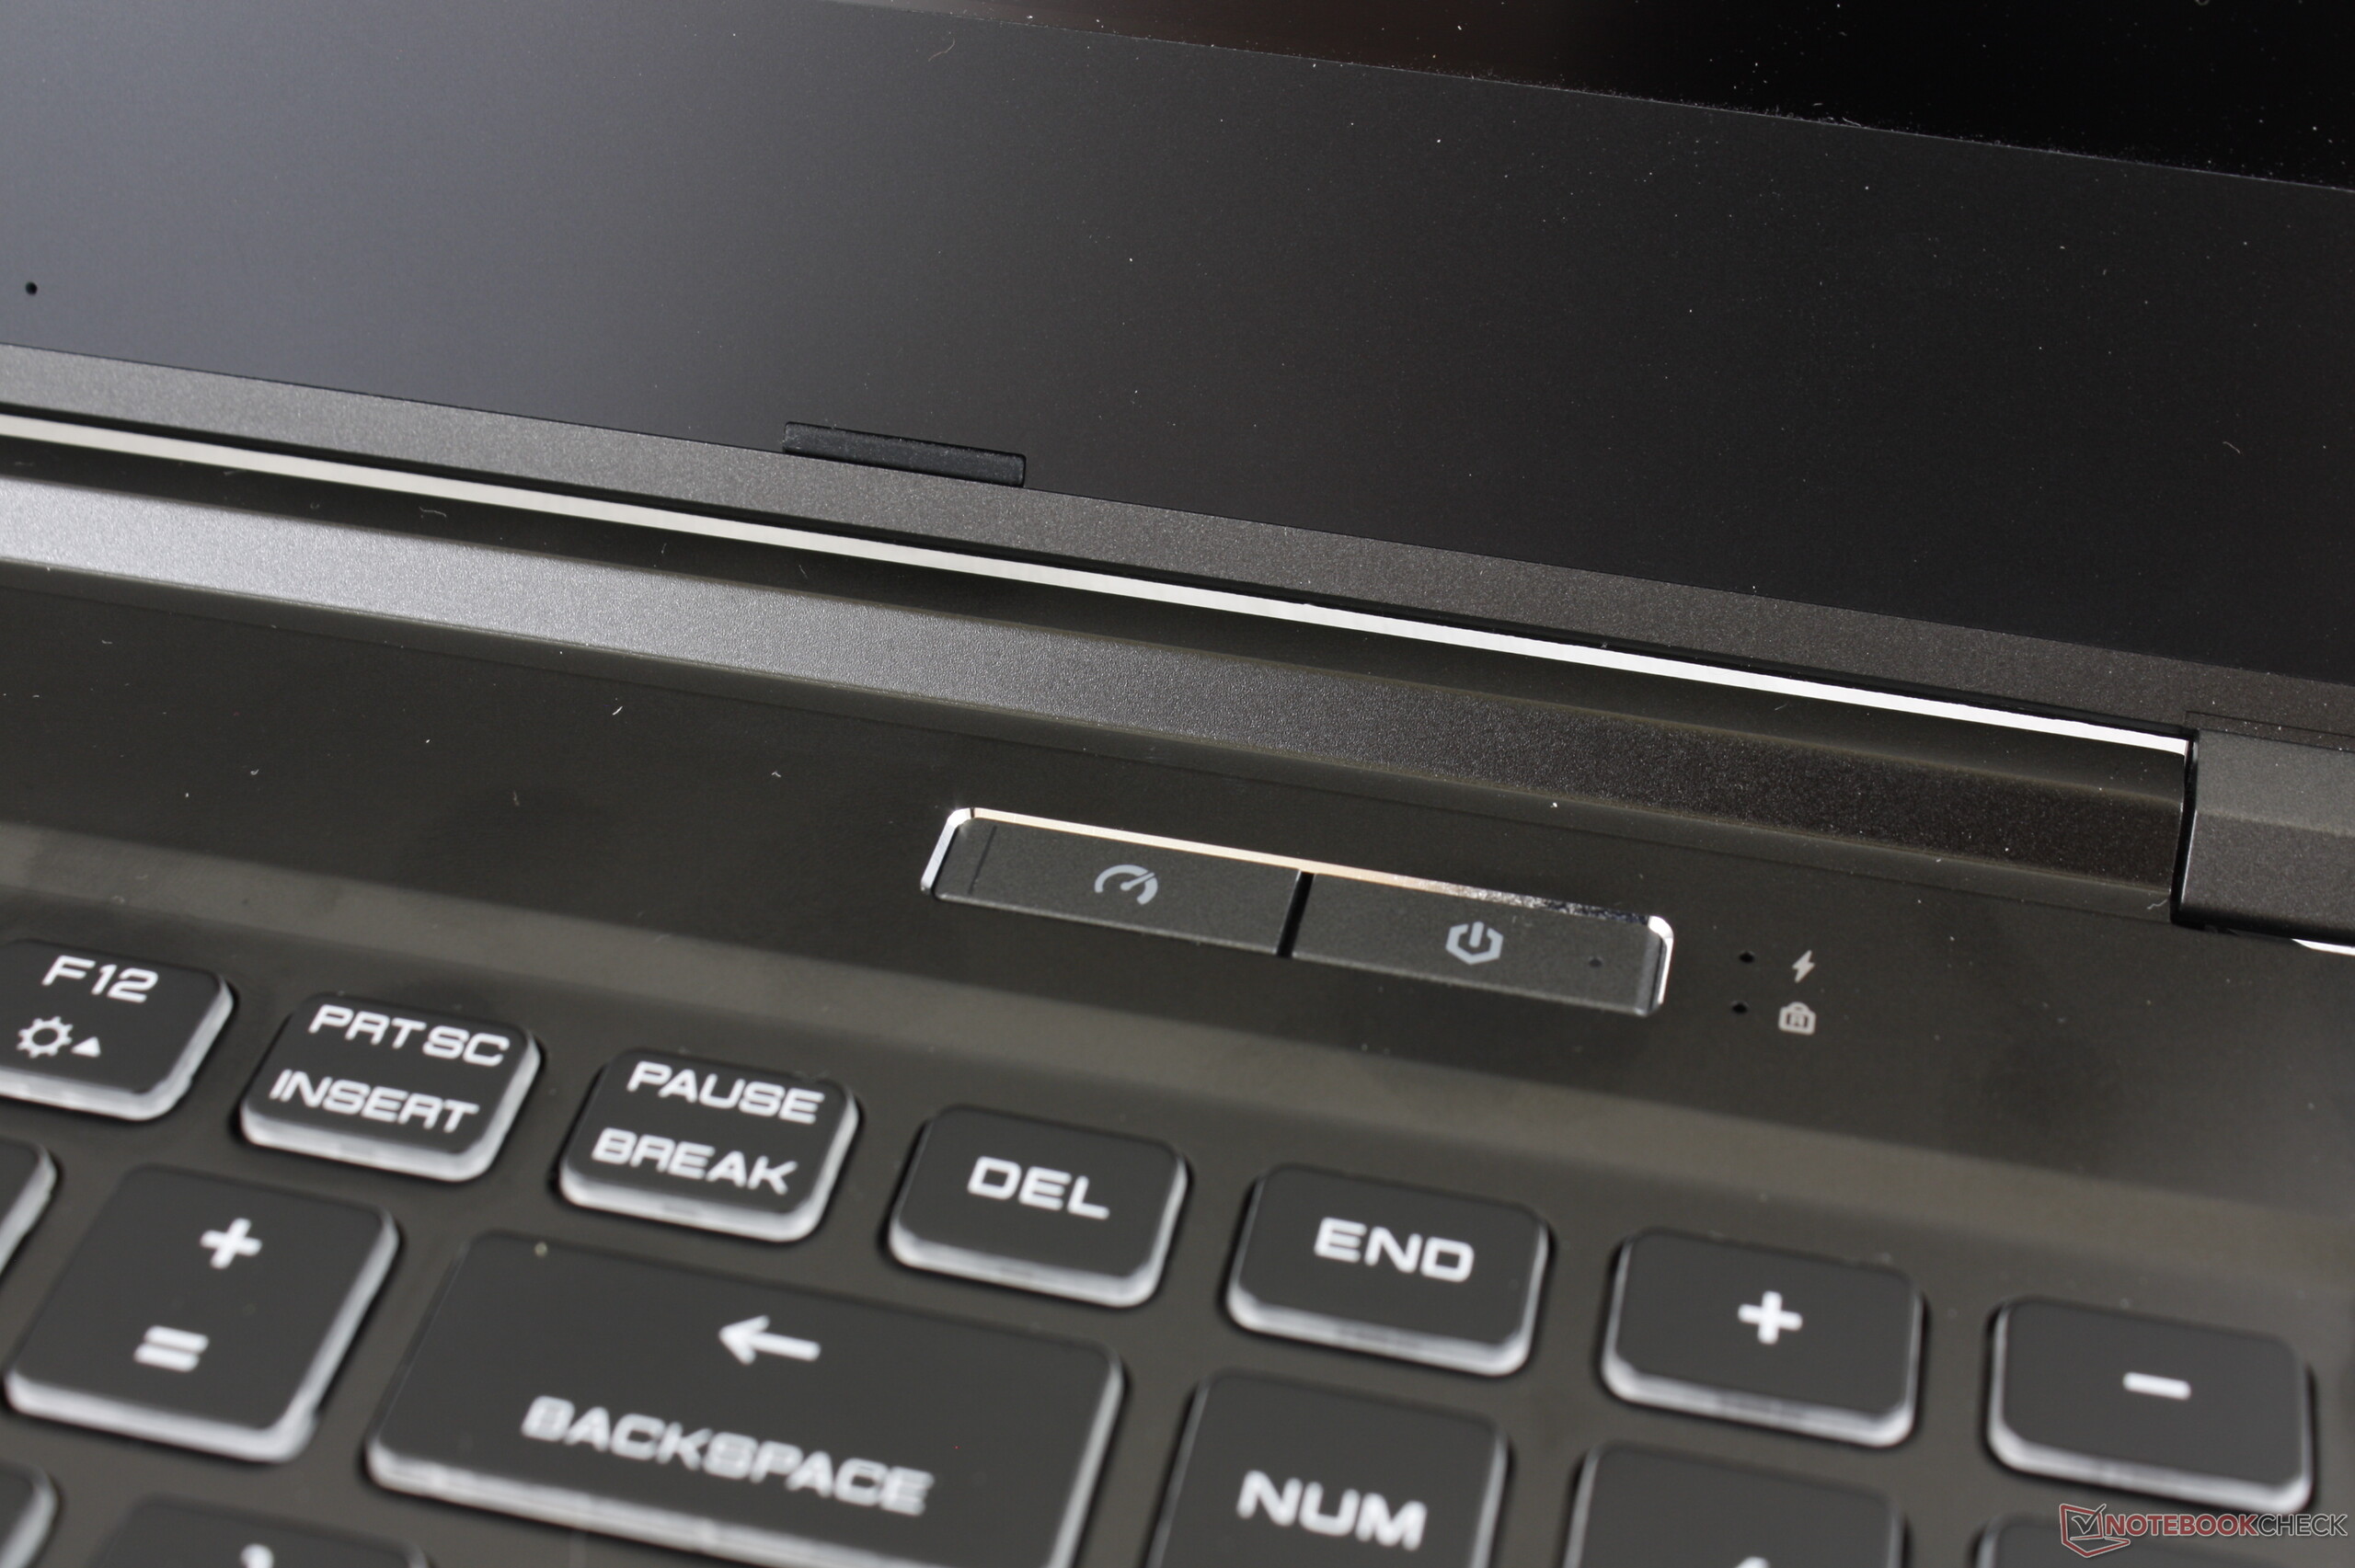
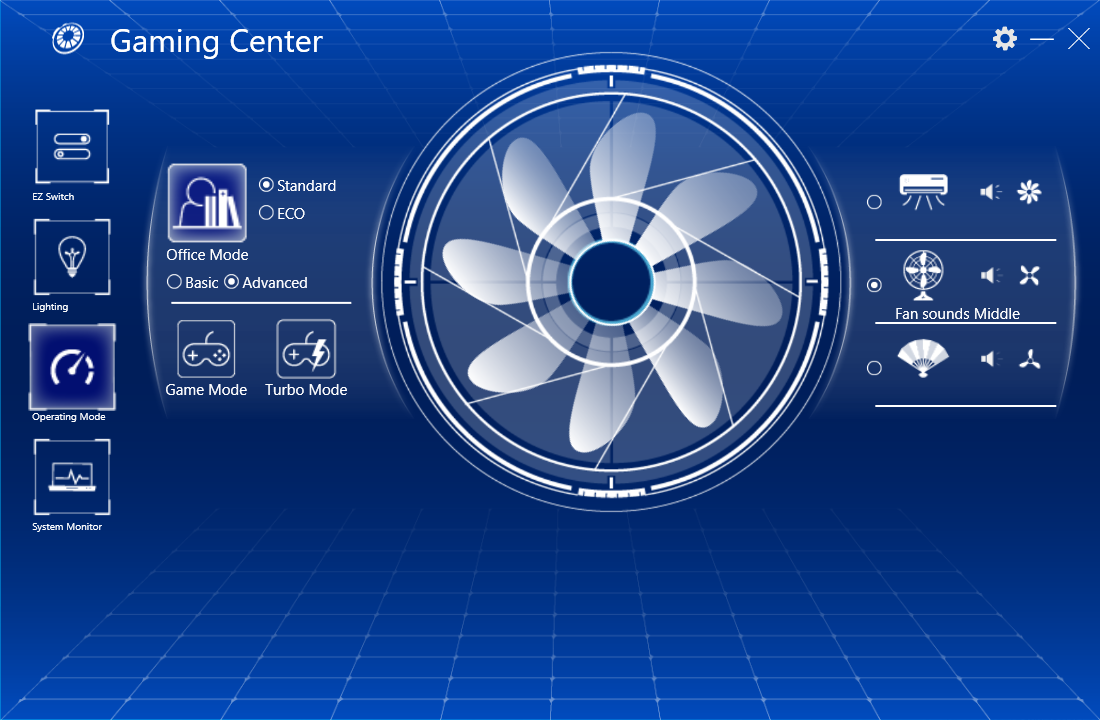
Fan noise is tied very closely to the preset Office, Gaming, and Fan Boost modes. If on Office mode, the system tends to hover around 32 dB(A) or lower when video streaming or browsing to be unobtrusive. If on Gaming or Fan Boost mode, however, fan noise would pulse higher and more frequently. Running Witcher 3 in Gaming mode and Fan Boost mode will cause a fan noise of 48.8 dB(A) and 54.1 dB(A), respectively, to be almost as loud as an Alienware m15 R2.
| Eluktronics RP-15 GeForce RTX 2060 Mobile, R7 4800H, Phison PM81000GPMQCN28BTF-E12S4 M.2 NVM SSD | MSI GS66 10SGS GeForce RTX 2080 Super Max-Q, i7-10750H, Samsung SSD PM981 MZVLB512HAJQ | Razer Blade 15 RZ09-0328 GeForce RTX 2070 Max-Q, i7-10750H, Lite-On CA5-8D512 | Asus Strix GL531GV-PB74 GeForce RTX 2060 Mobile, i7-9750H, Intel SSD 660p SSDPEKNW512G8 | Lenovo Legion Y740-15ICHg GeForce RTX 2070 Max-Q, i7-8750H, Samsung SSD PM981 MZVLB256HAHQ | Alienware m15 R2 P87F GeForce RTX 2080 Max-Q, i7-9750H, 2x Toshiba XG6 KXG60ZNV512G (RAID 0) | |
|---|---|---|---|---|---|---|
| Noise | -2% | 0% | -4% | 3% | -11% | |
| off / environment * (dB) | 28 | 28.5 -2% | 28.4 -1% | 28.2 -1% | 28 -0% | 28.3 -1% |
| Idle Minimum * (dB) | 28 | 30 -7% | 28.4 -1% | 28.8 -3% | 32.6 -16% | 28.5 -2% |
| Idle Average * (dB) | 28 | 30 -7% | 28.4 -1% | 31.4 -12% | 32.7 -17% | 28.5 -2% |
| Idle Maximum * (dB) | 31.5 | 30.9 2% | 31.7 -1% | 33.3 -6% | 32.7 -4% | 49 -56% |
| Load Average * (dB) | 44 | 39.5 10% | 47.7 -8% | 46.2 -5% | 33.3 24% | 49 -11% |
| Witcher 3 ultra * (dB) | 48.8 | 48 2% | 47.5 3% | 50.5 -3% | 41.6 15% | 49 -0% |
| Load Maximum * (dB) | 54.1 | 59.4 -10% | 49.5 9% | 51.3 5% | 45.2 16% | 55 -2% |
* ... smaller is better
Noise level
| Idle |
| 28 / 28 / 31.5 dB(A) |
| Load |
| 44 / 54.1 dB(A) |
 | ||
30 dB silent 40 dB(A) audible 50 dB(A) loud |
||
min: | ||
Temperature
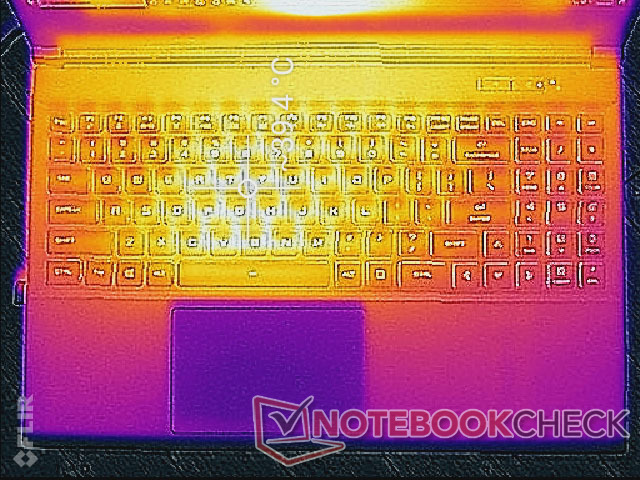
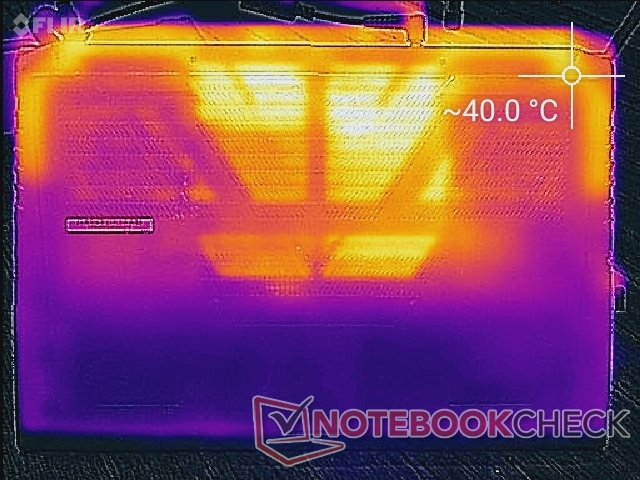
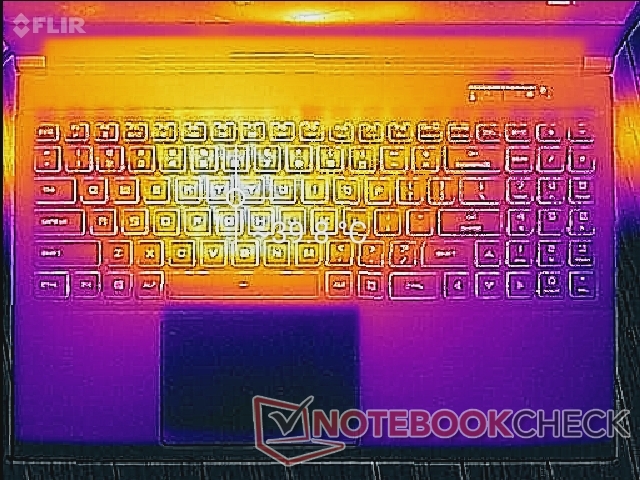
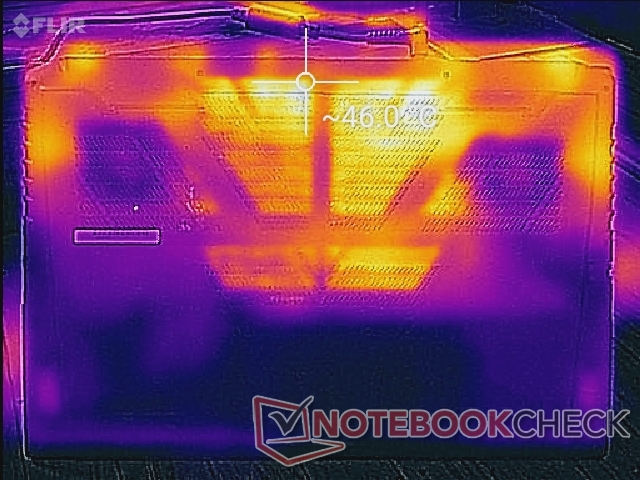
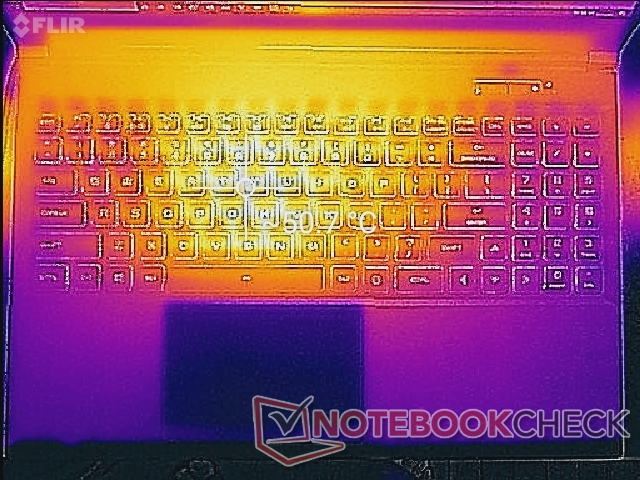
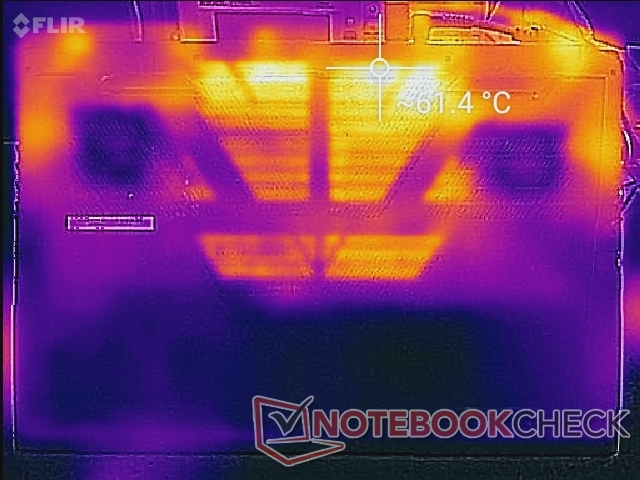
Surface temperatures are very warm even when idling on desktop on Office mode since the fans will be doing their best to remain as quiet as possible. Meanwhile, the keyboard hot spot can reach over 50 C if running extreme processing loads even if set to Fan Boost mode. Combine this with the crammed ventilation grilles and the RP-15 is definitely a laptop you'll want to use on a flat desk for more demanding applications.
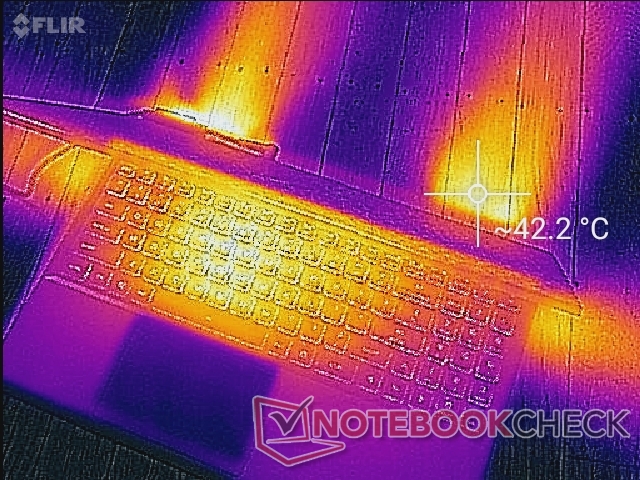
(-) The maximum temperature on the upper side is 50 °C / 122 F, compared to the average of 40.4 °C / 105 F, ranging from 21.2 to 68.8 °C for the class Gaming.
(-) The bottom heats up to a maximum of 58 °C / 136 F, compared to the average of 43.2 °C / 110 F
(±) In idle usage, the average temperature for the upper side is 34.4 °C / 94 F, compared to the device average of 33.9 °C / 93 F.
(+) Playing The Witcher 3, the average temperature for the upper side is 31 °C / 88 F, compared to the device average of 33.9 °C / 93 F.
(+) The palmrests and touchpad are cooler than skin temperature with a maximum of 31.4 °C / 88.5 F and are therefore cool to the touch.
(-) The average temperature of the palmrest area of similar devices was 28.8 °C / 83.8 F (-2.6 °C / -4.7 F).
Stress Test
We stress the system with synthetic loads to identify for any potential throttling or stability issues. When running Prime95, the CPU can be observed boosting to 4.2 GHz for a few seconds until eventually stabilizing at 90 C and the 4.0 to 4.1 GHz range. These results mirror the relatively steady results during our CineBench loop test above.
Running Witcher 3 is Fan Boost mode would result in CPU and GPU temperatures of 70 C and 59 C, respectively, compared to 72 C and 62 C with Fan Boost off. In comparison, the Core i7-10750H CPU and RTX 2070 Max-Q GPU in the 2020 Razer Blade 15 Base Model would stabilize at 76 C and 72 C, respectively, when under similar conditions.
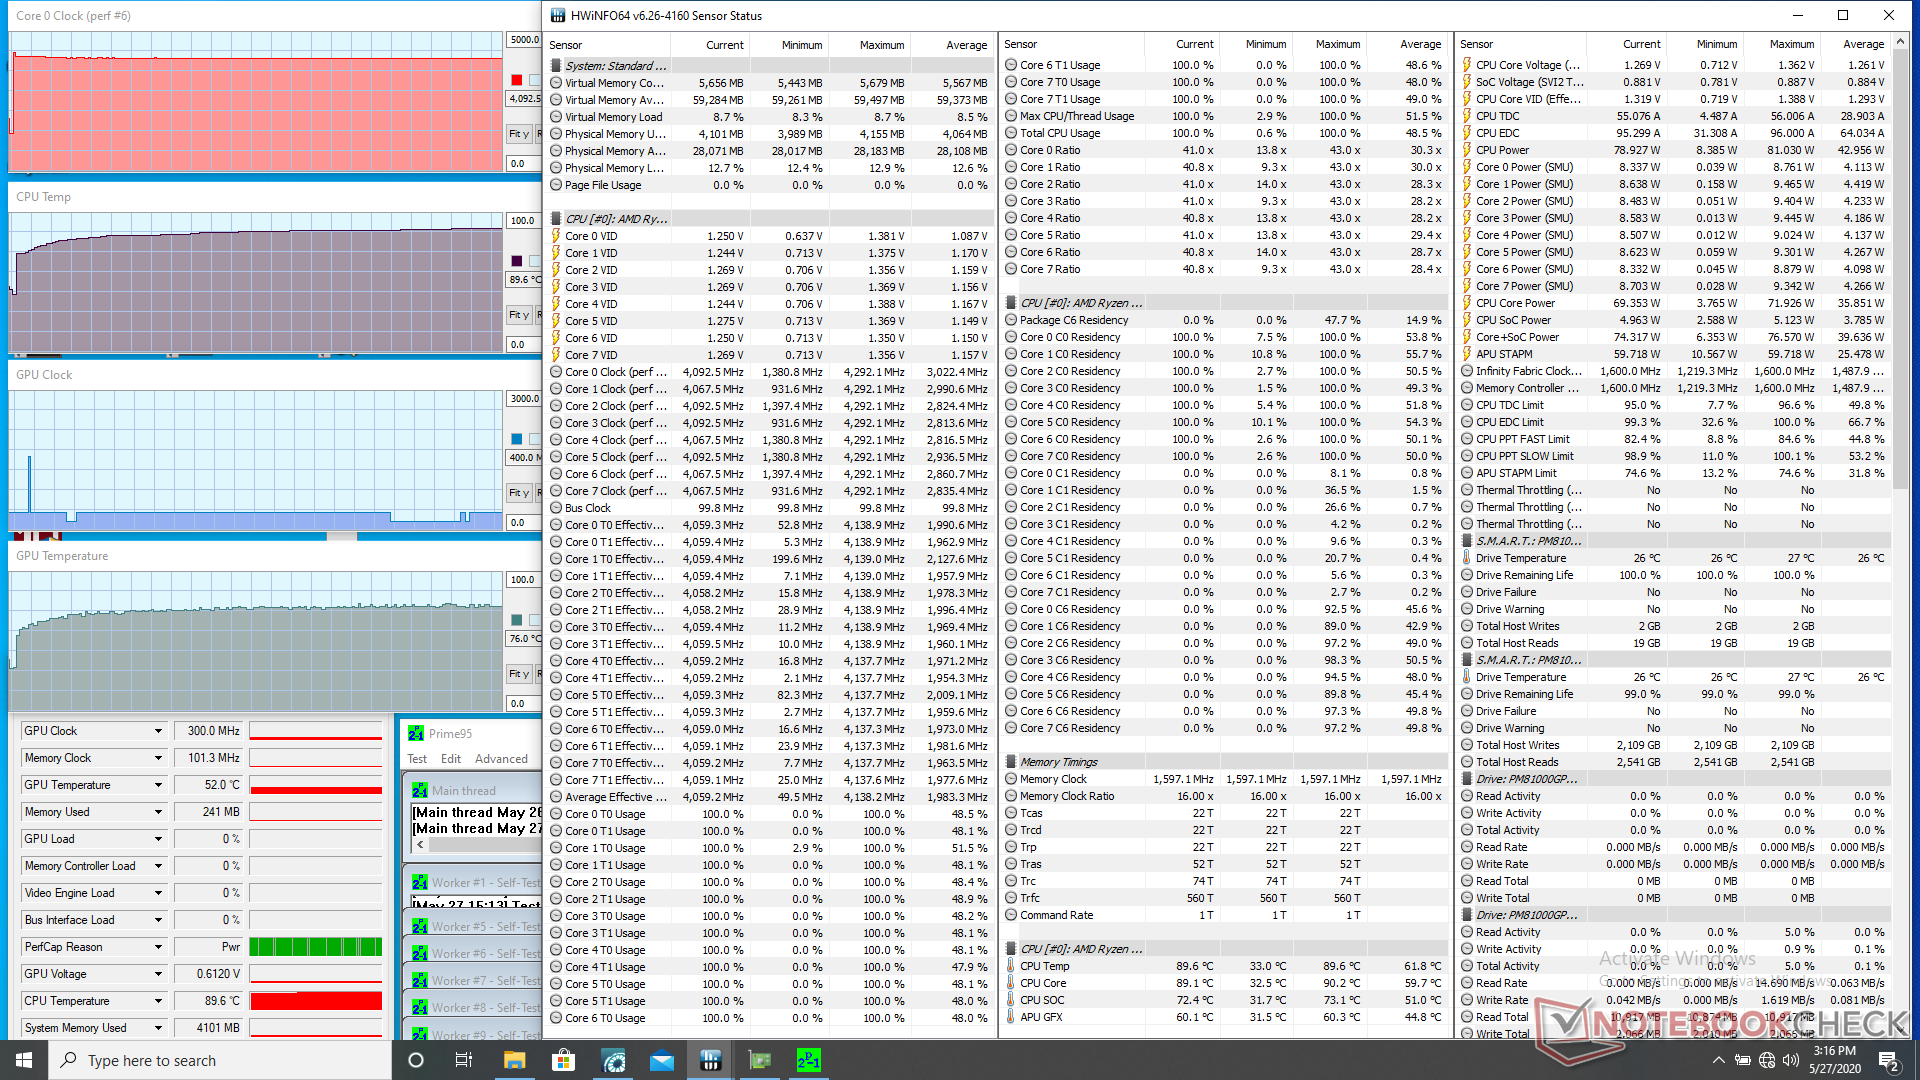
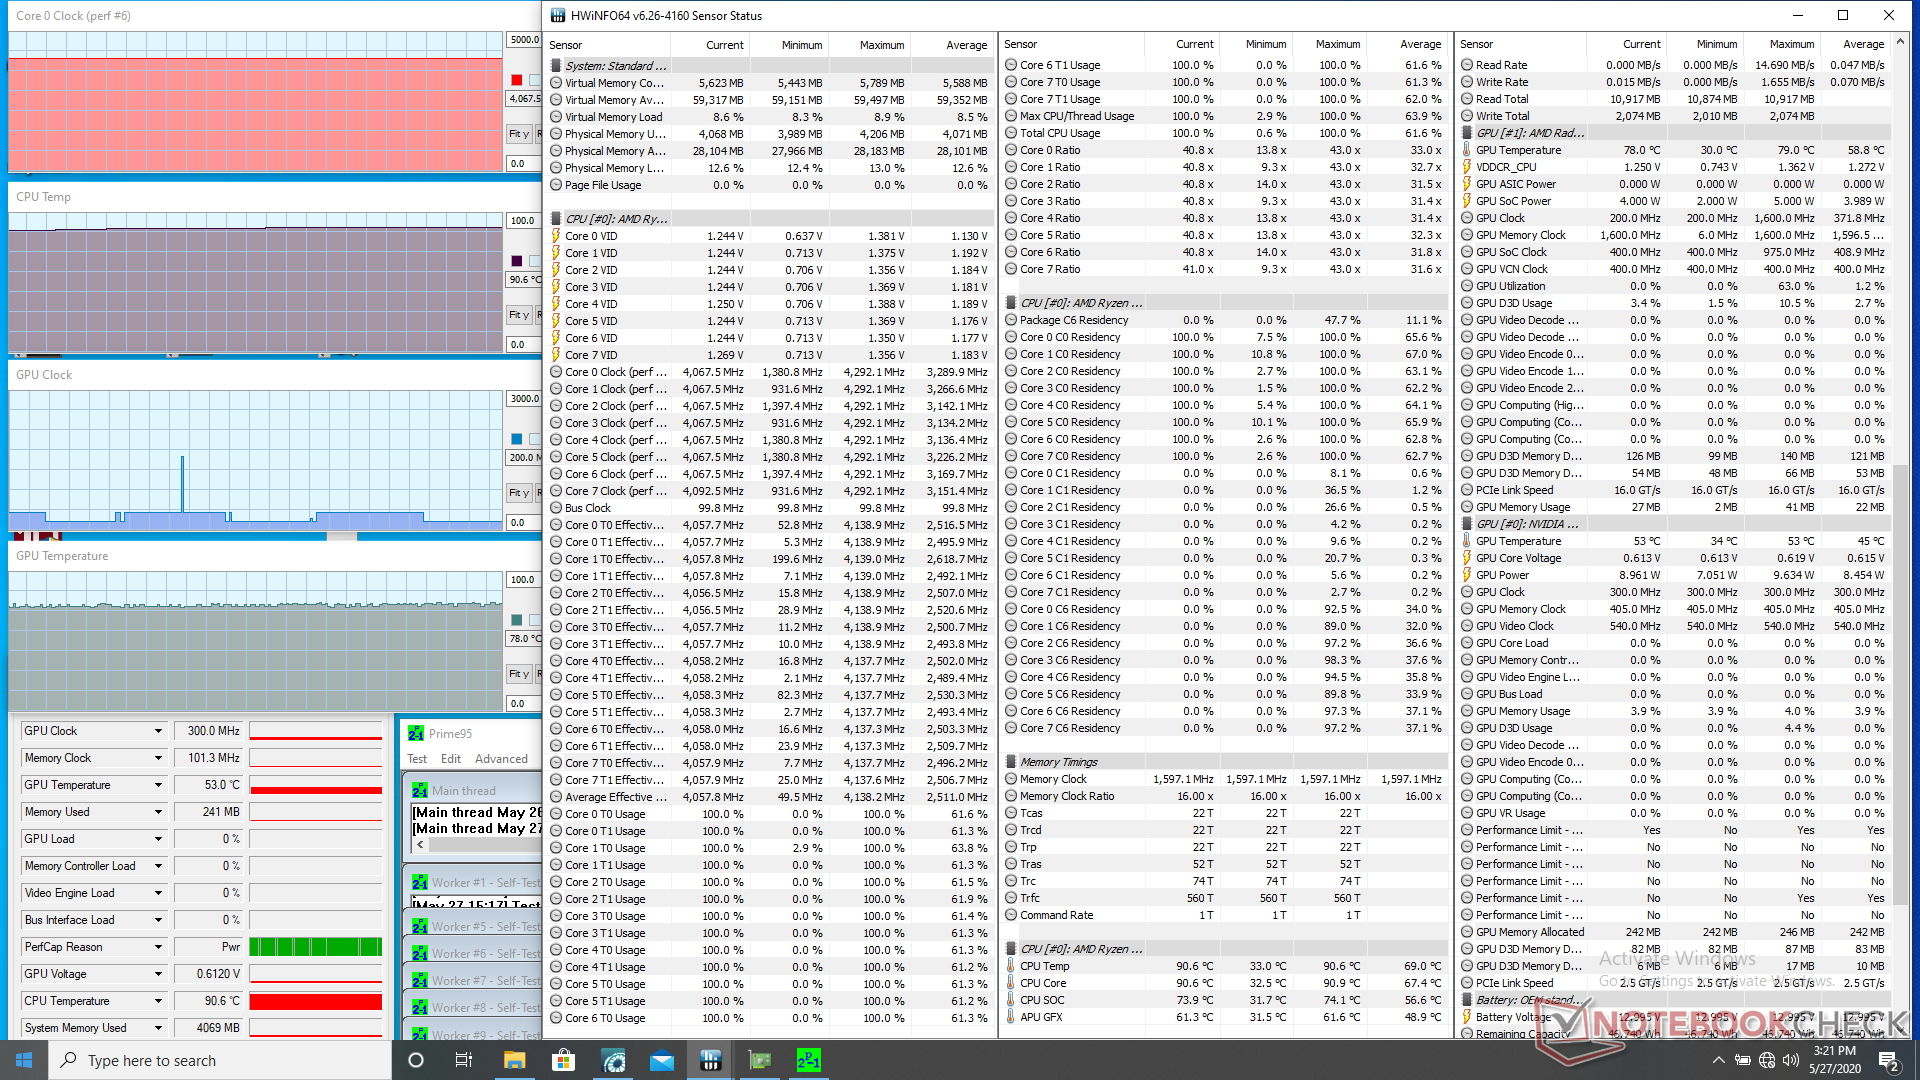
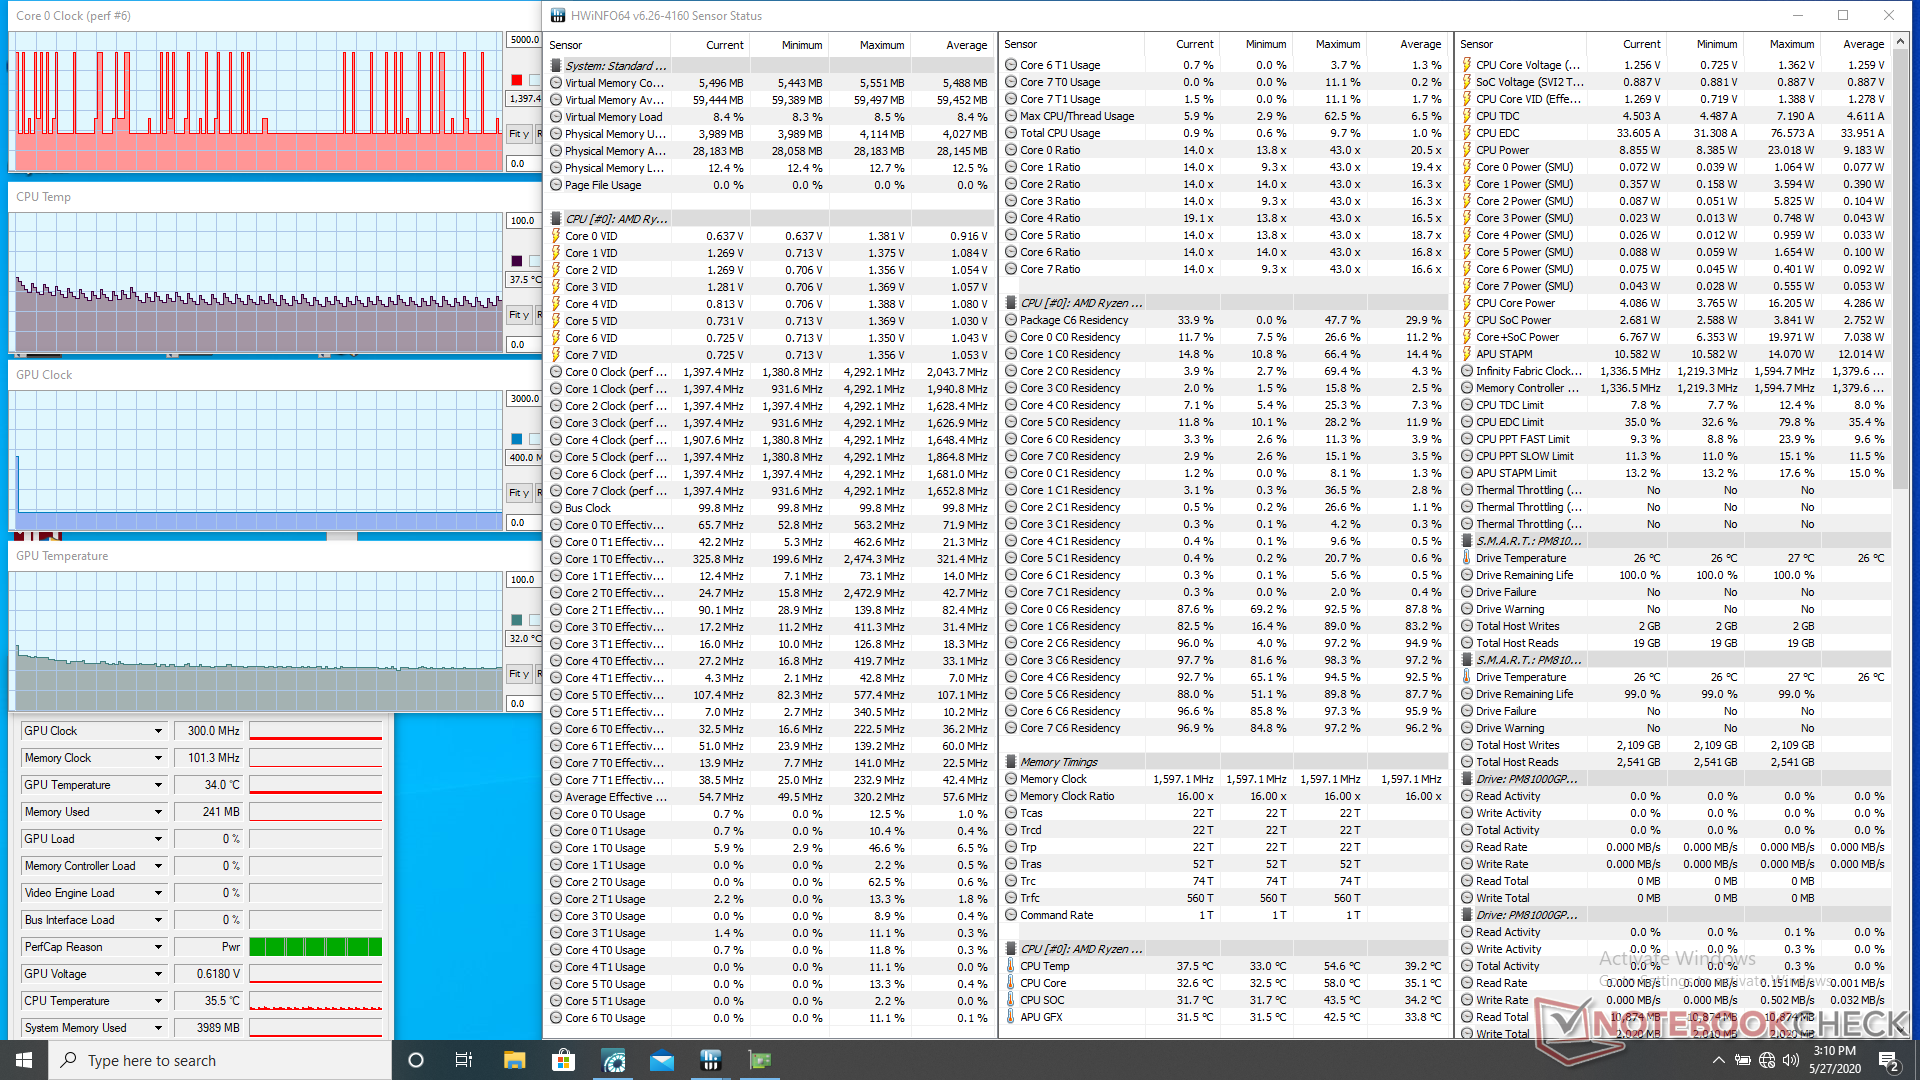
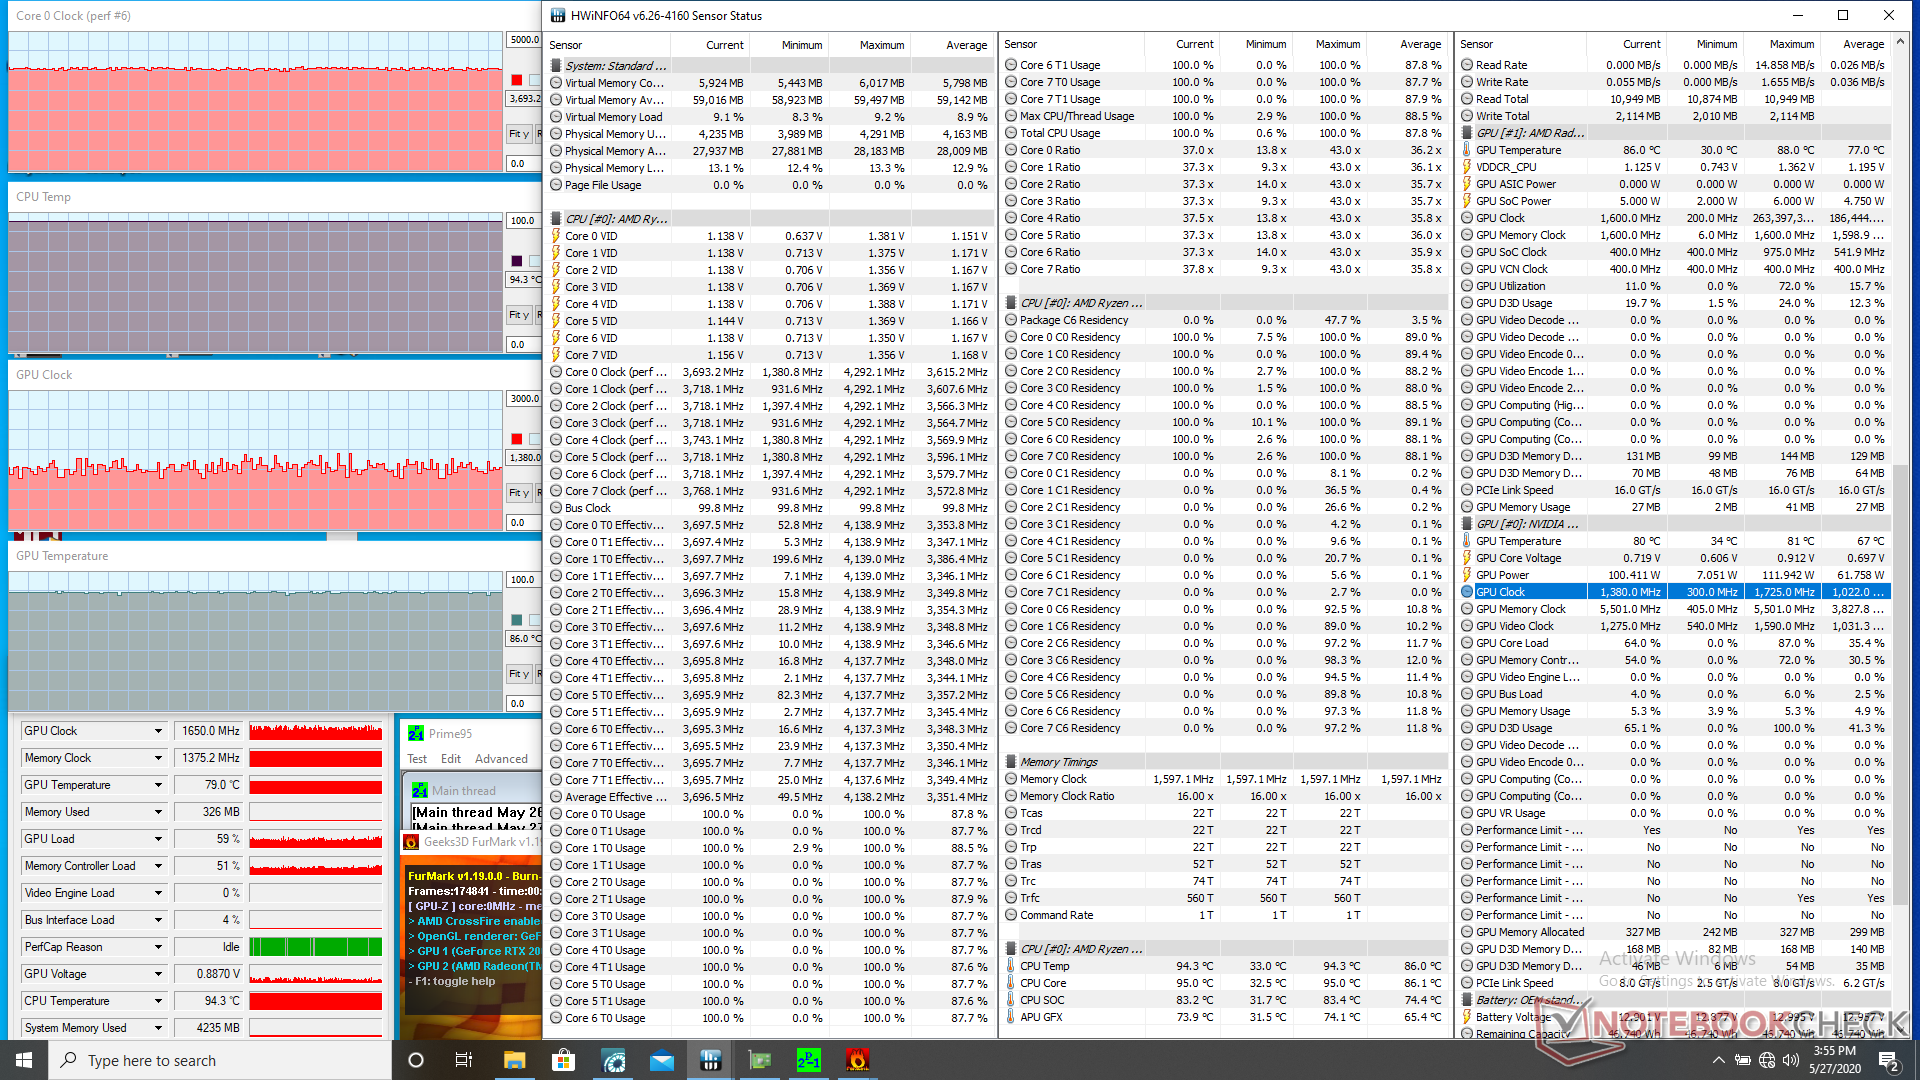
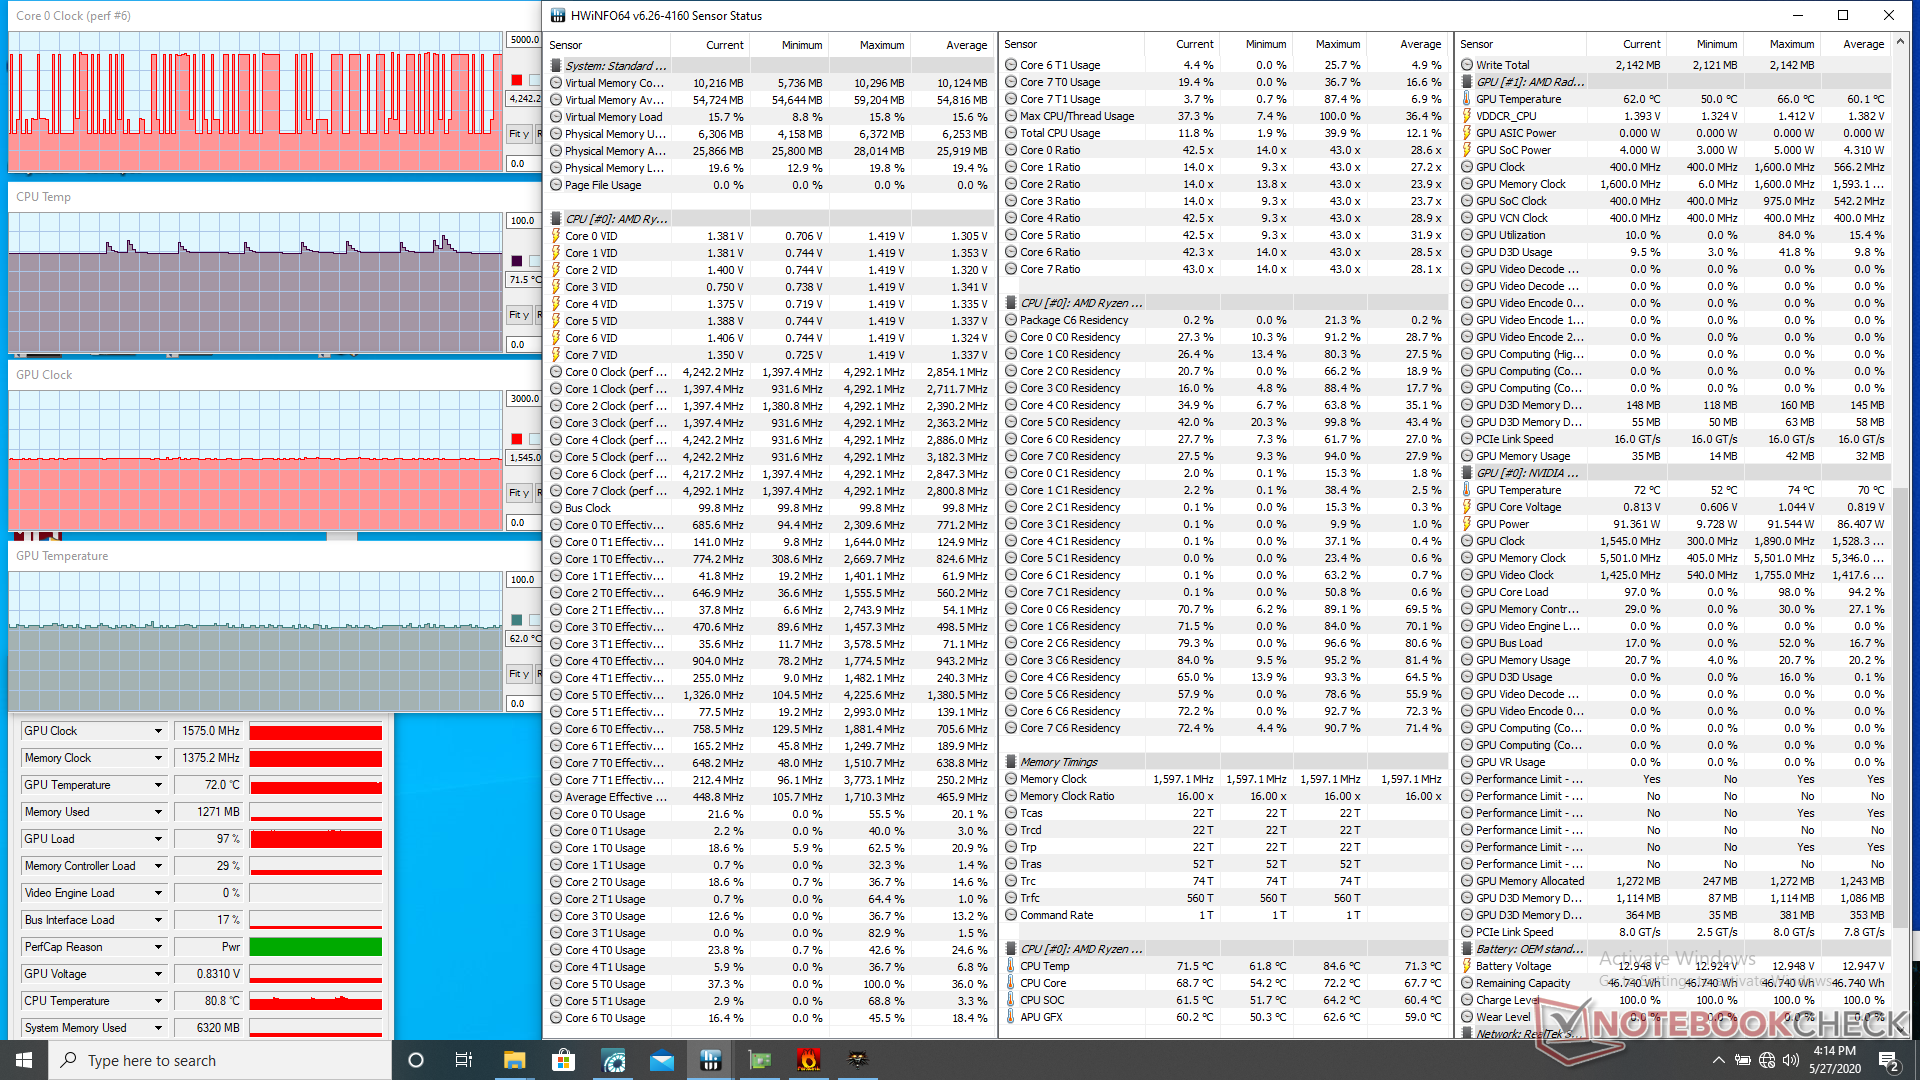
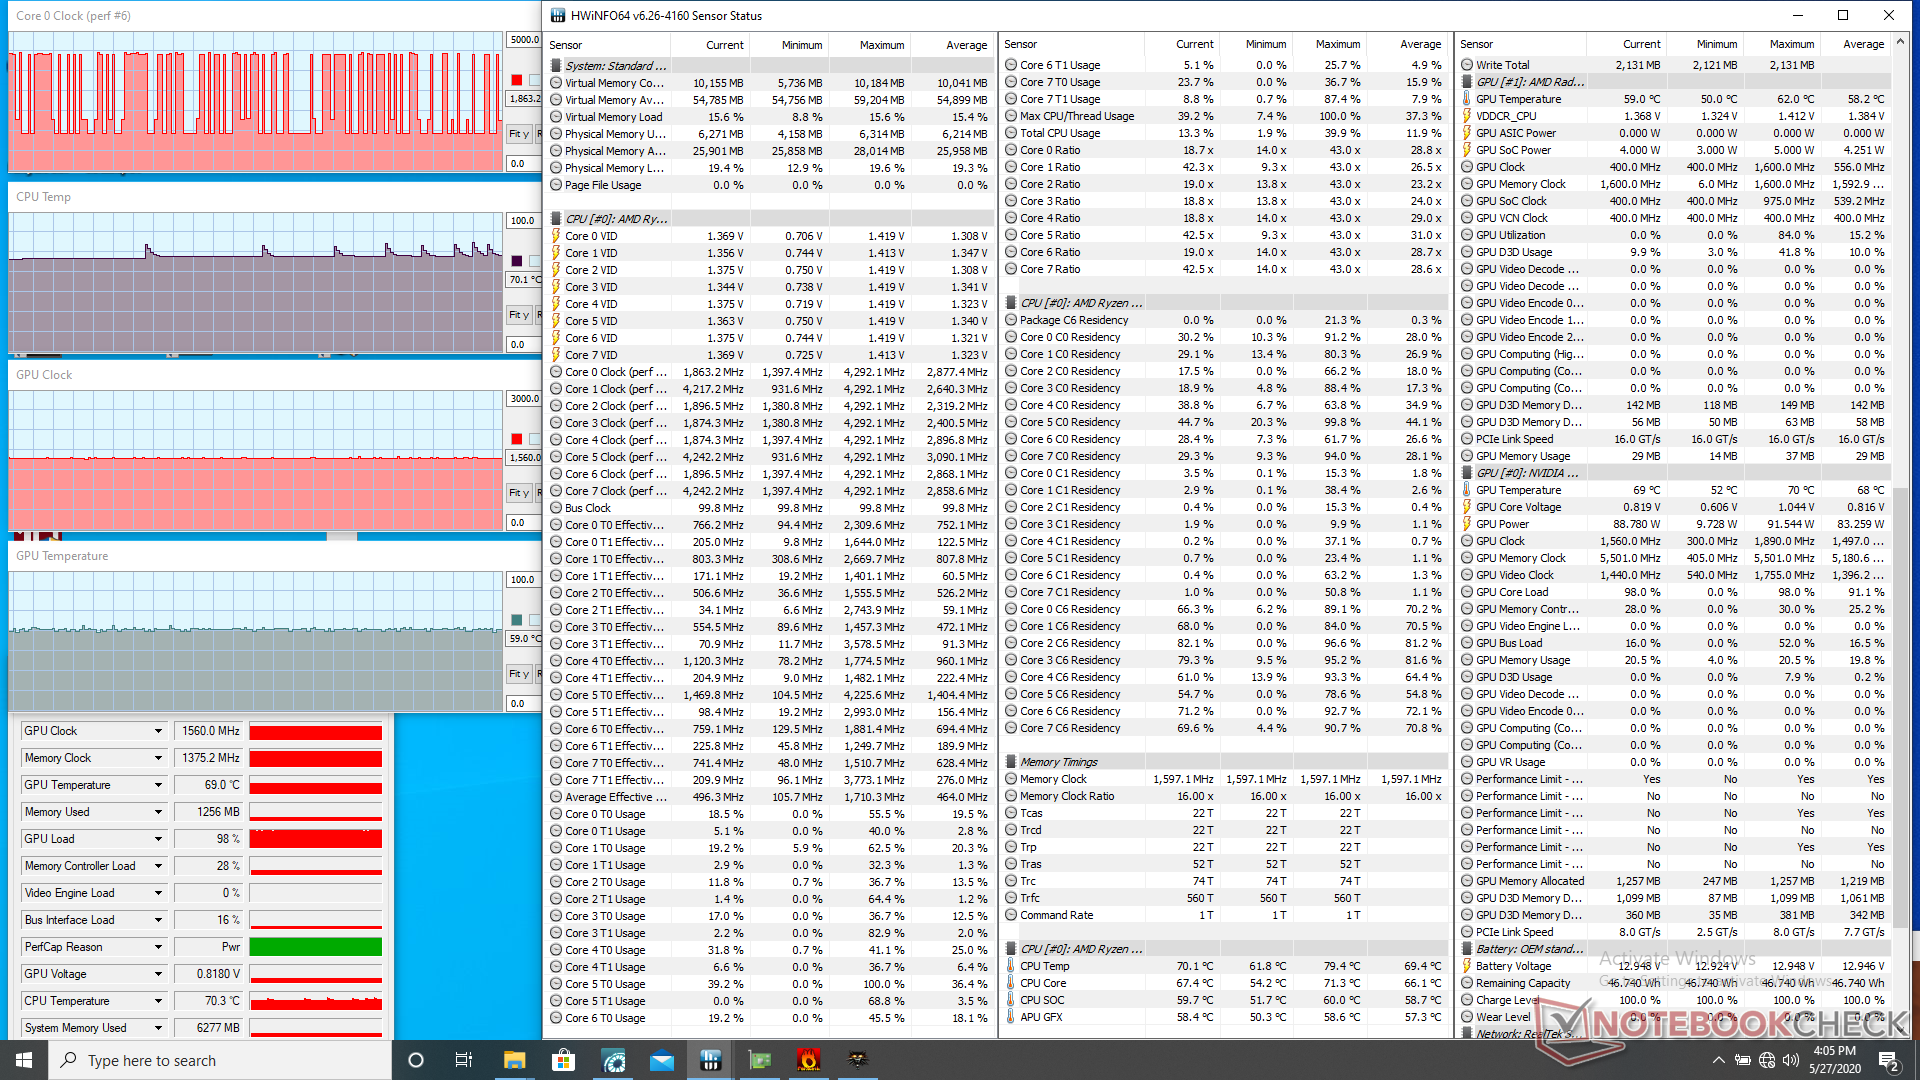
| CPU Clock (GHz) | GPU Clock (MHz) | Average CPU Temperature (°C) | Average GPU Temperature (°C) | |
| System Idle (Fan Boost on) | -- | -- | ~37 | 32 |
| Prime95 Stress (Fan Boost on) | 4.0 - 4.1 | -- | 91 | 78 |
| Prime95 + FurMark Stress (Fan Boost on) | 3.7 | ~1650 | 94 | 86 |
| Witcher 3 Stress (Fan Boost on) | ~4.2 | 1560 | 70 | 59 |
| Witcher 3 Stress (Fan Boost off) | ~4.2 | 1575 | 72 | 62 |
Speakers


Eluktronics RP-15 audio analysis
(±) | speaker loudness is average but good (78.8 dB)
Bass 100 - 315 Hz
(-) | nearly no bass - on average 18.2% lower than median
(±) | linearity of bass is average (10.8% delta to prev. frequency)
Mids 400 - 2000 Hz
(+) | balanced mids - only 3.8% away from median
(±) | linearity of mids is average (8.1% delta to prev. frequency)
Highs 2 - 16 kHz
(+) | balanced highs - only 3% away from median
(+) | highs are linear (4.6% delta to prev. frequency)
Overall 100 - 16.000 Hz
(±) | linearity of overall sound is average (20% difference to median)
Compared to same class
» 70% of all tested devices in this class were better, 7% similar, 23% worse
» The best had a delta of 6%, average was 18%, worst was 132%
Compared to all devices tested
» 51% of all tested devices were better, 8% similar, 40% worse
» The best had a delta of 4%, average was 23%, worst was 134%
Apple MacBook 12 (Early 2016) 1.1 GHz audio analysis
(+) | speakers can play relatively loud (83.6 dB)
Bass 100 - 315 Hz
(±) | reduced bass - on average 11.3% lower than median
(±) | linearity of bass is average (14.2% delta to prev. frequency)
Mids 400 - 2000 Hz
(+) | balanced mids - only 2.4% away from median
(+) | mids are linear (5.5% delta to prev. frequency)
Highs 2 - 16 kHz
(+) | balanced highs - only 2% away from median
(+) | highs are linear (4.5% delta to prev. frequency)
Overall 100 - 16.000 Hz
(+) | overall sound is linear (10.2% difference to median)
Compared to same class
» 7% of all tested devices in this class were better, 2% similar, 90% worse
» The best had a delta of 5%, average was 18%, worst was 53%
Compared to all devices tested
» 5% of all tested devices were better, 1% similar, 94% worse
» The best had a delta of 4%, average was 23%, worst was 134%
Energy Management
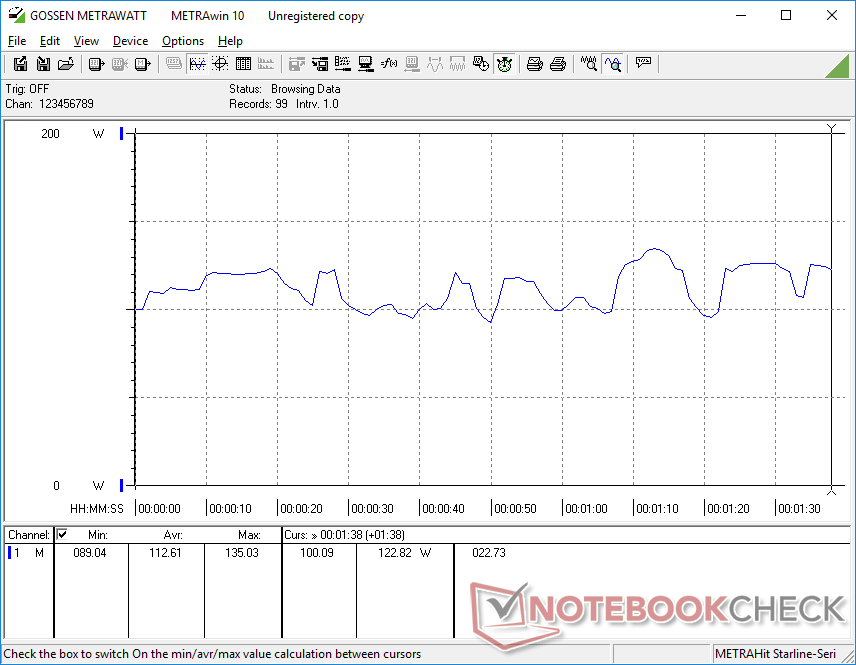
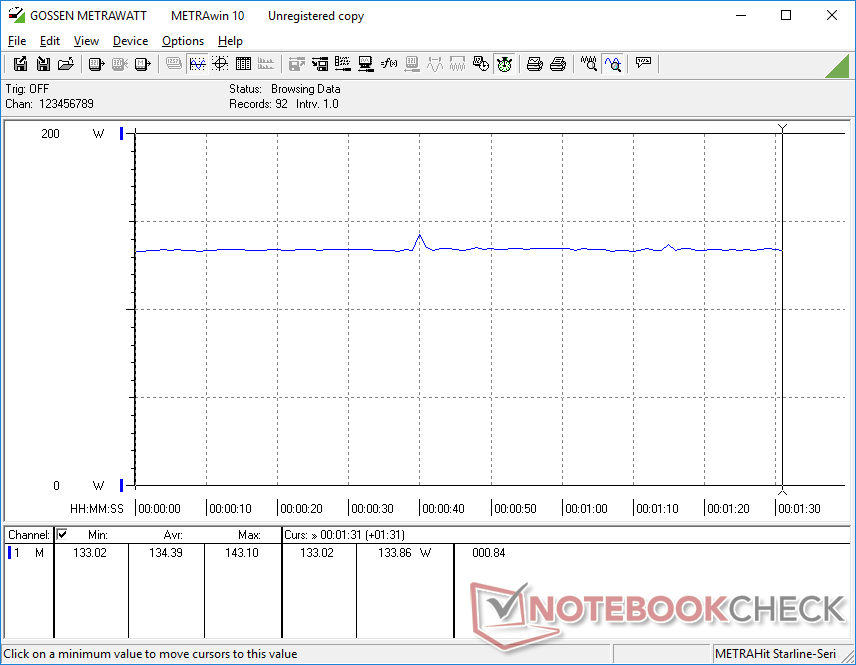
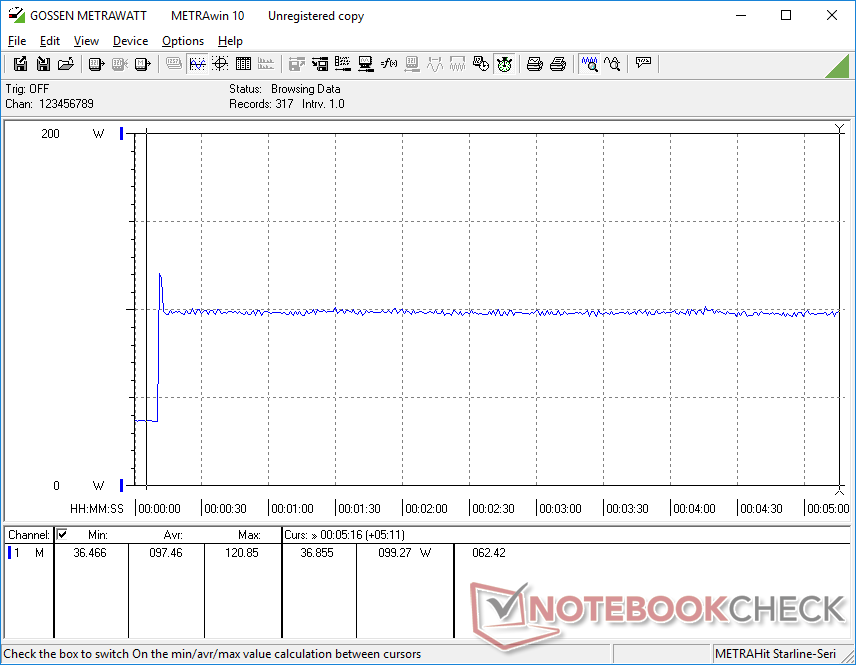
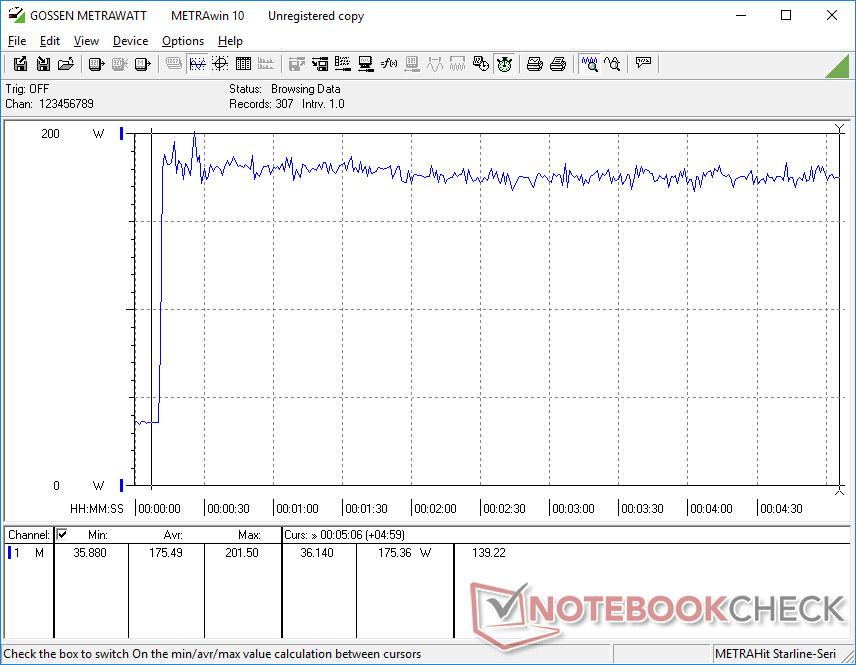
Power Consumption
Power consumption is high at 21 W to 35 W even when idling on Office mode. When gaming, the system draws between 112 W and 135 W to be very similar to what we recorded on the Dell G7 7590 or Asus Strix GL531GV each equipped with the same RTX 2060 GPU.
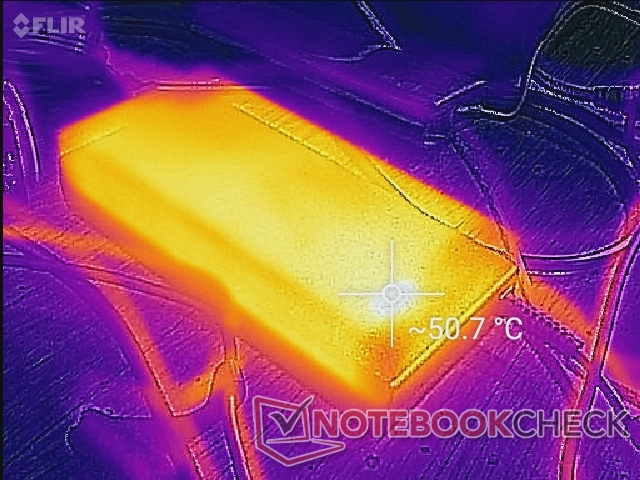
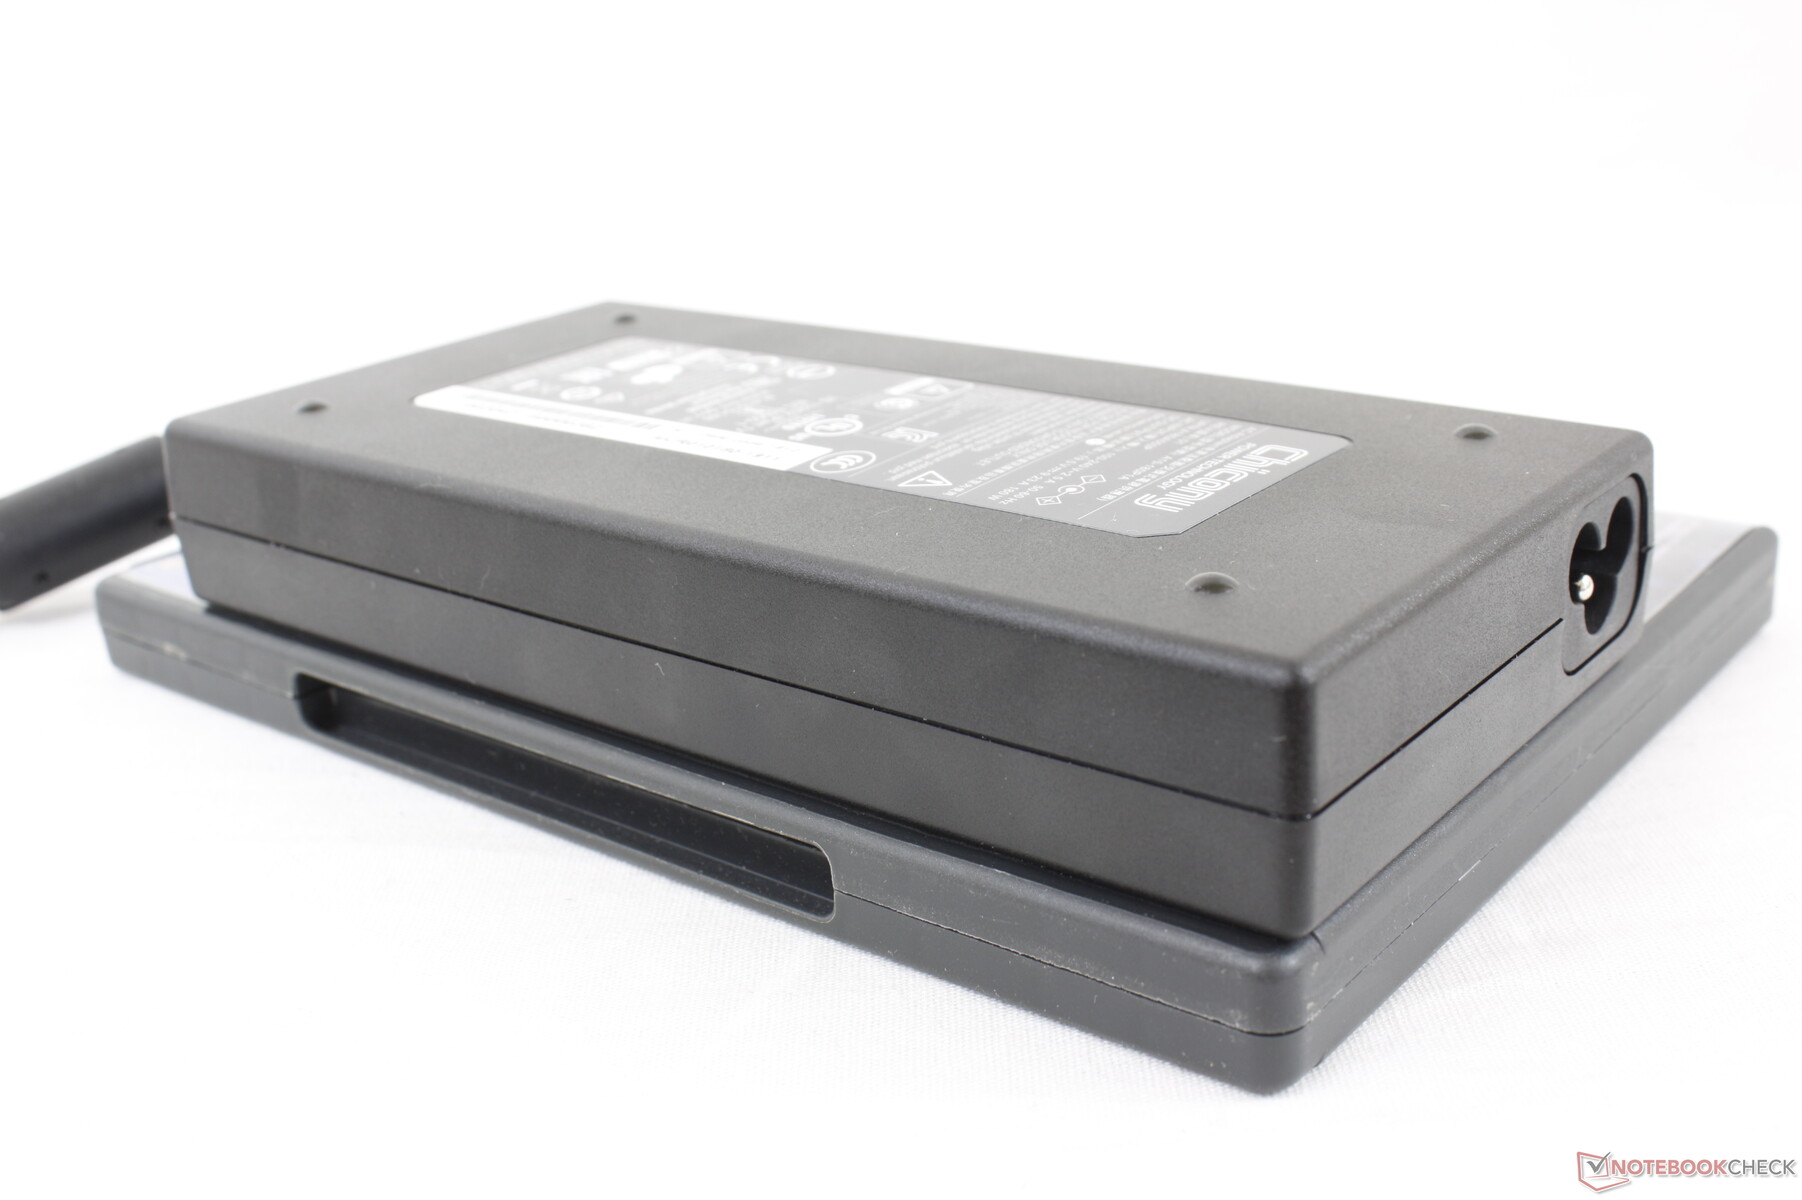
We're able to record a maximum of 201.5 W from the medium-sized (~16.7 x 8 x 2.6 cm) 180 W Chicony AC adapter when running both Prime95 and FurMark simultaneously. The system is able to maintain a relatively steady consumption rate of 175 W when fully stressed.
| Off / Standby | |
| Idle | |
| Load |
|
Key:
min: | |
| Eluktronics RP-15 R7 4800H, GeForce RTX 2060 Mobile, Phison PM81000GPMQCN28BTF-E12S4 M.2 NVM SSD, IPS, 1920x1080, 15.6" | MSI GS66 10SGS i7-10750H, GeForce RTX 2080 Super Max-Q, Samsung SSD PM981 MZVLB512HAJQ, IPS, 1920x1080, 15.6" | Razer Blade 15 RZ09-0328 i7-10750H, GeForce RTX 2070 Max-Q, Lite-On CA5-8D512, AMOLED, 3840x2160, 15.6" | Asus Strix GL531GV-PB74 i7-9750H, GeForce RTX 2060 Mobile, Intel SSD 660p SSDPEKNW512G8, IPS, 1920x1080, 15.6" | Lenovo Legion Y740-15ICHg i7-8750H, GeForce RTX 2070 Max-Q, Samsung SSD PM981 MZVLB256HAHQ, IPS, 1920x1080, 15.6" | Maingear Vector 15 i7-9750H, GeForce GTX 1660 Ti Mobile, , IPS, 1920x1080, 15.6" | |
|---|---|---|---|---|---|---|
| Power Consumption | 15% | 16% | 15% | 11% | 16% | |
| Idle Minimum * (Watt) | 21.7 | 14.9 31% | 11.1 49% | 10.9 50% | 22.9 -6% | 16.2 25% |
| Idle Average * (Watt) | 30.1 | 17.5 42% | 13.7 54% | 14.7 51% | 27.2 10% | 21.1 30% |
| Idle Maximum * (Watt) | 35 | 29.5 16% | 33.4 5% | 32.4 7% | 27.5 21% | 26.4 25% |
| Load Average * (Watt) | 112.6 | 94.8 16% | 104.4 7% | 121.9 -8% | 83.4 26% | 85.1 24% |
| Witcher 3 ultra * (Watt) | 134.4 | 146.1 -9% | 159.9 -19% | 143.5 -7% | 143.6 -7% | 158.2 -18% |
| Load Maximum * (Watt) | 201.5 | 210.9 -5% | 203.8 -1% | 209.6 -4% | 160.5 20% | 188 7% |
* ... smaller is better
Battery Life
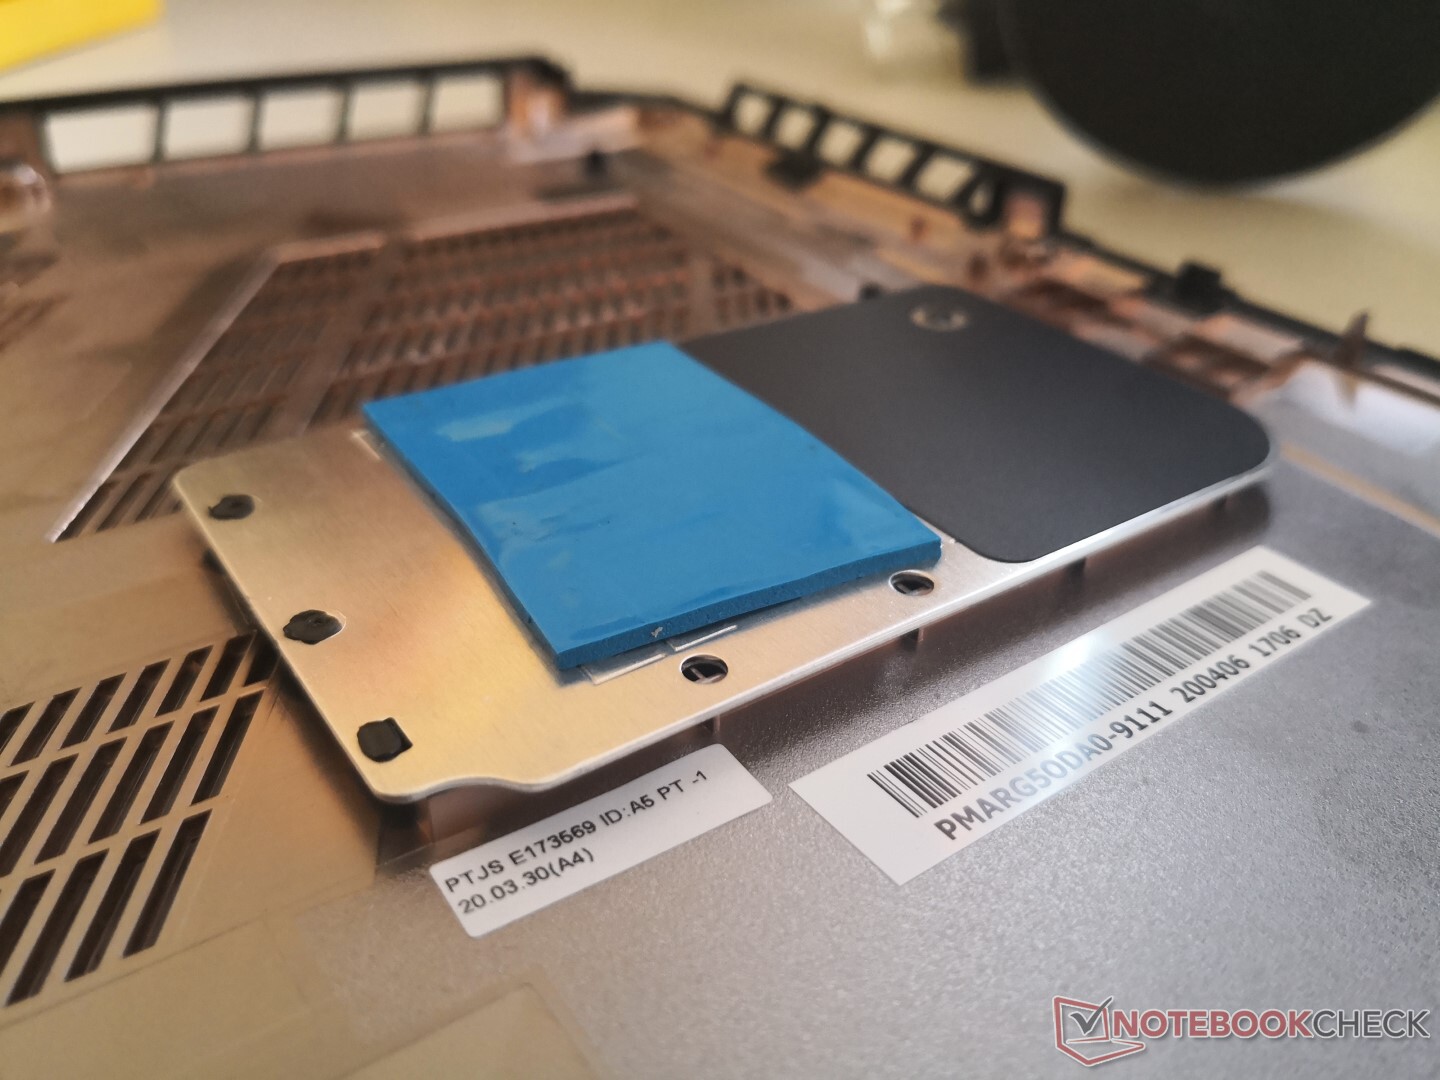
With such powerful internals packed in a thin and light chassis, something has to give. In this case, battery capacity is small at just 46 Wh whereas most other 15.6-inch gaming laptops have batteries larger than 60 Wh up to even 80+ Wh like on the Razer Bade 15 or MSI GS66. Expect just over 3.5 hours of real-world WLAN use when set to Office mode with the iGPU active.
Eluktronics is now shipping SKUs with 62 Wh batteries instead of 46 Wh for increased battery life. The larger battery occupies more of the unused empty space under the right palm rest.
Charging from empty to full capacity takes about 2 hours. It is not possible to recharge the laptop with USB Type-C unlike on the Asus Zephyrus M.
| Eluktronics RP-15 R7 4800H, GeForce RTX 2060 Mobile, 46.7 Wh | MSI GS66 10SGS i7-10750H, GeForce RTX 2080 Super Max-Q, 99.99 Wh | Razer Blade 15 RZ09-0328 i7-10750H, GeForce RTX 2070 Max-Q, 65 Wh | Asus Strix GL531GV-PB74 i7-9750H, GeForce RTX 2060 Mobile, 66 Wh | Lenovo Legion Y740-15ICHg i7-8750H, GeForce RTX 2070 Max-Q, 57 Wh | Alienware m15 R2 P87F i7-9750H, GeForce RTX 2080 Max-Q, 76 Wh | |
|---|---|---|---|---|---|---|
| Battery runtime | 92% | 11% | -47% | -22% | 53% | |
| WiFi v1.3 (h) | 3.6 | 6.9 92% | 4 11% | 1.9 -47% | 2.8 -22% | 5.5 53% |
| Reader / Idle (h) | 10.2 | 3.9 | 9.2 | |||
| Load (h) | 1.6 | 0.8 | 0.7 |
Pros
Cons
Verdict
The 15.6-inch Eluktronics RP-15 shares a lot of pros and cons with the 14-inch Asus Zephyrus G14. Both are very compact for their respective class sizes with extreme performance-per-volume thanks largely to their 7 nm Ryzen CPUs. For now, you're not going to find another 15.6-inch gaming laptop with faster processor performance than the Eluktronics at under 2 kg.
The main disadvantages are what you would expect: loud fans and high temperatures when running demanding loads. If you want to squeeze out everything the system has to offer, then you'll have to endure Fan Boost mode and its unavoidable 54 dB(A) fan noise.
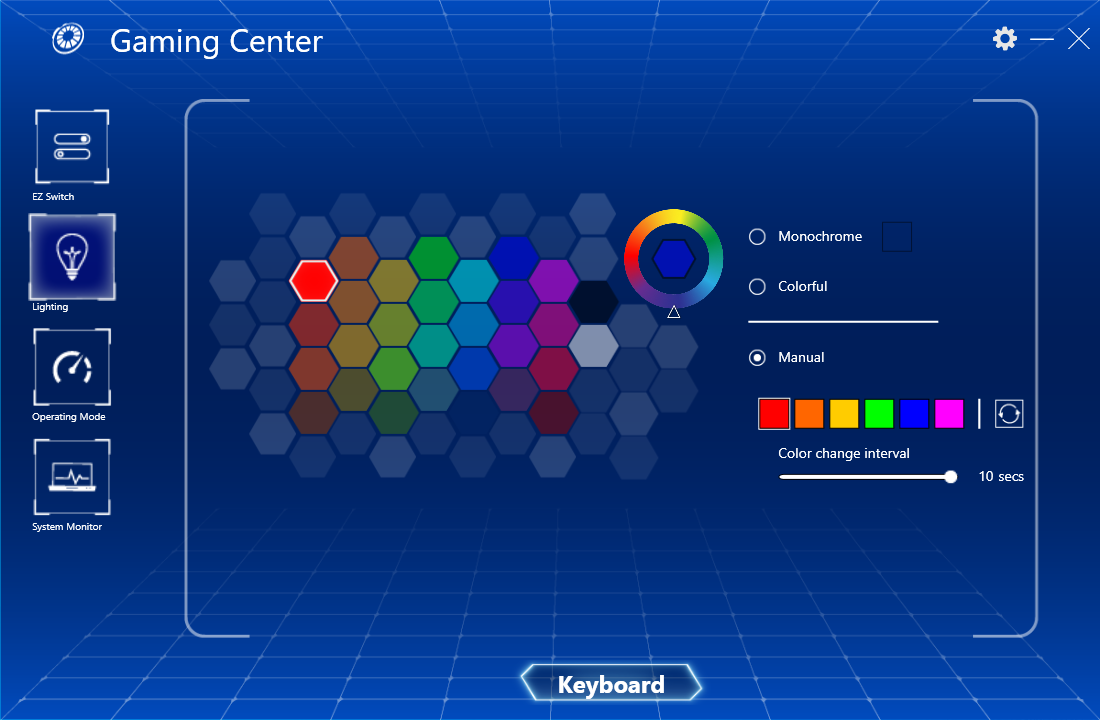
High-end performance for a mid-range price. You'll miss out on some luxury features like Thunderbolt 3, per-key RGB lighting, and adaptive sync while the suboptimal webcam positioning and slow SD card reader are a bummer. However, the very high performance-per-weight, easy serviceability, and comfortable keyboard keys make up for most of the drawbacks.
Eluktronics RP-15
- 05/28/2020 v7 (old)
Allen Ngo
Price comparison
