Acer Aspire 7 A715-72G (i7-8750H, GTX 1050 Ti, SSD, FHD) Laptop Review
The Aspire 7 comes with a hexa-core Coffee Lake CPU and Nvidia’s GeForce GTX 1050 Ti GPU. Therefore, it is faster than the predecessor model (Aspire 7 A715-71G) that we previously reviewed. Our current review device has good hardware: IPS screen, SSD, HDD, and 8 GB of dual-channel RAM. The competing devices include: The HP Pavilion Gaming 15, the Dell G3 15 3579 and the Lenovo Legion Y730-15ICH.
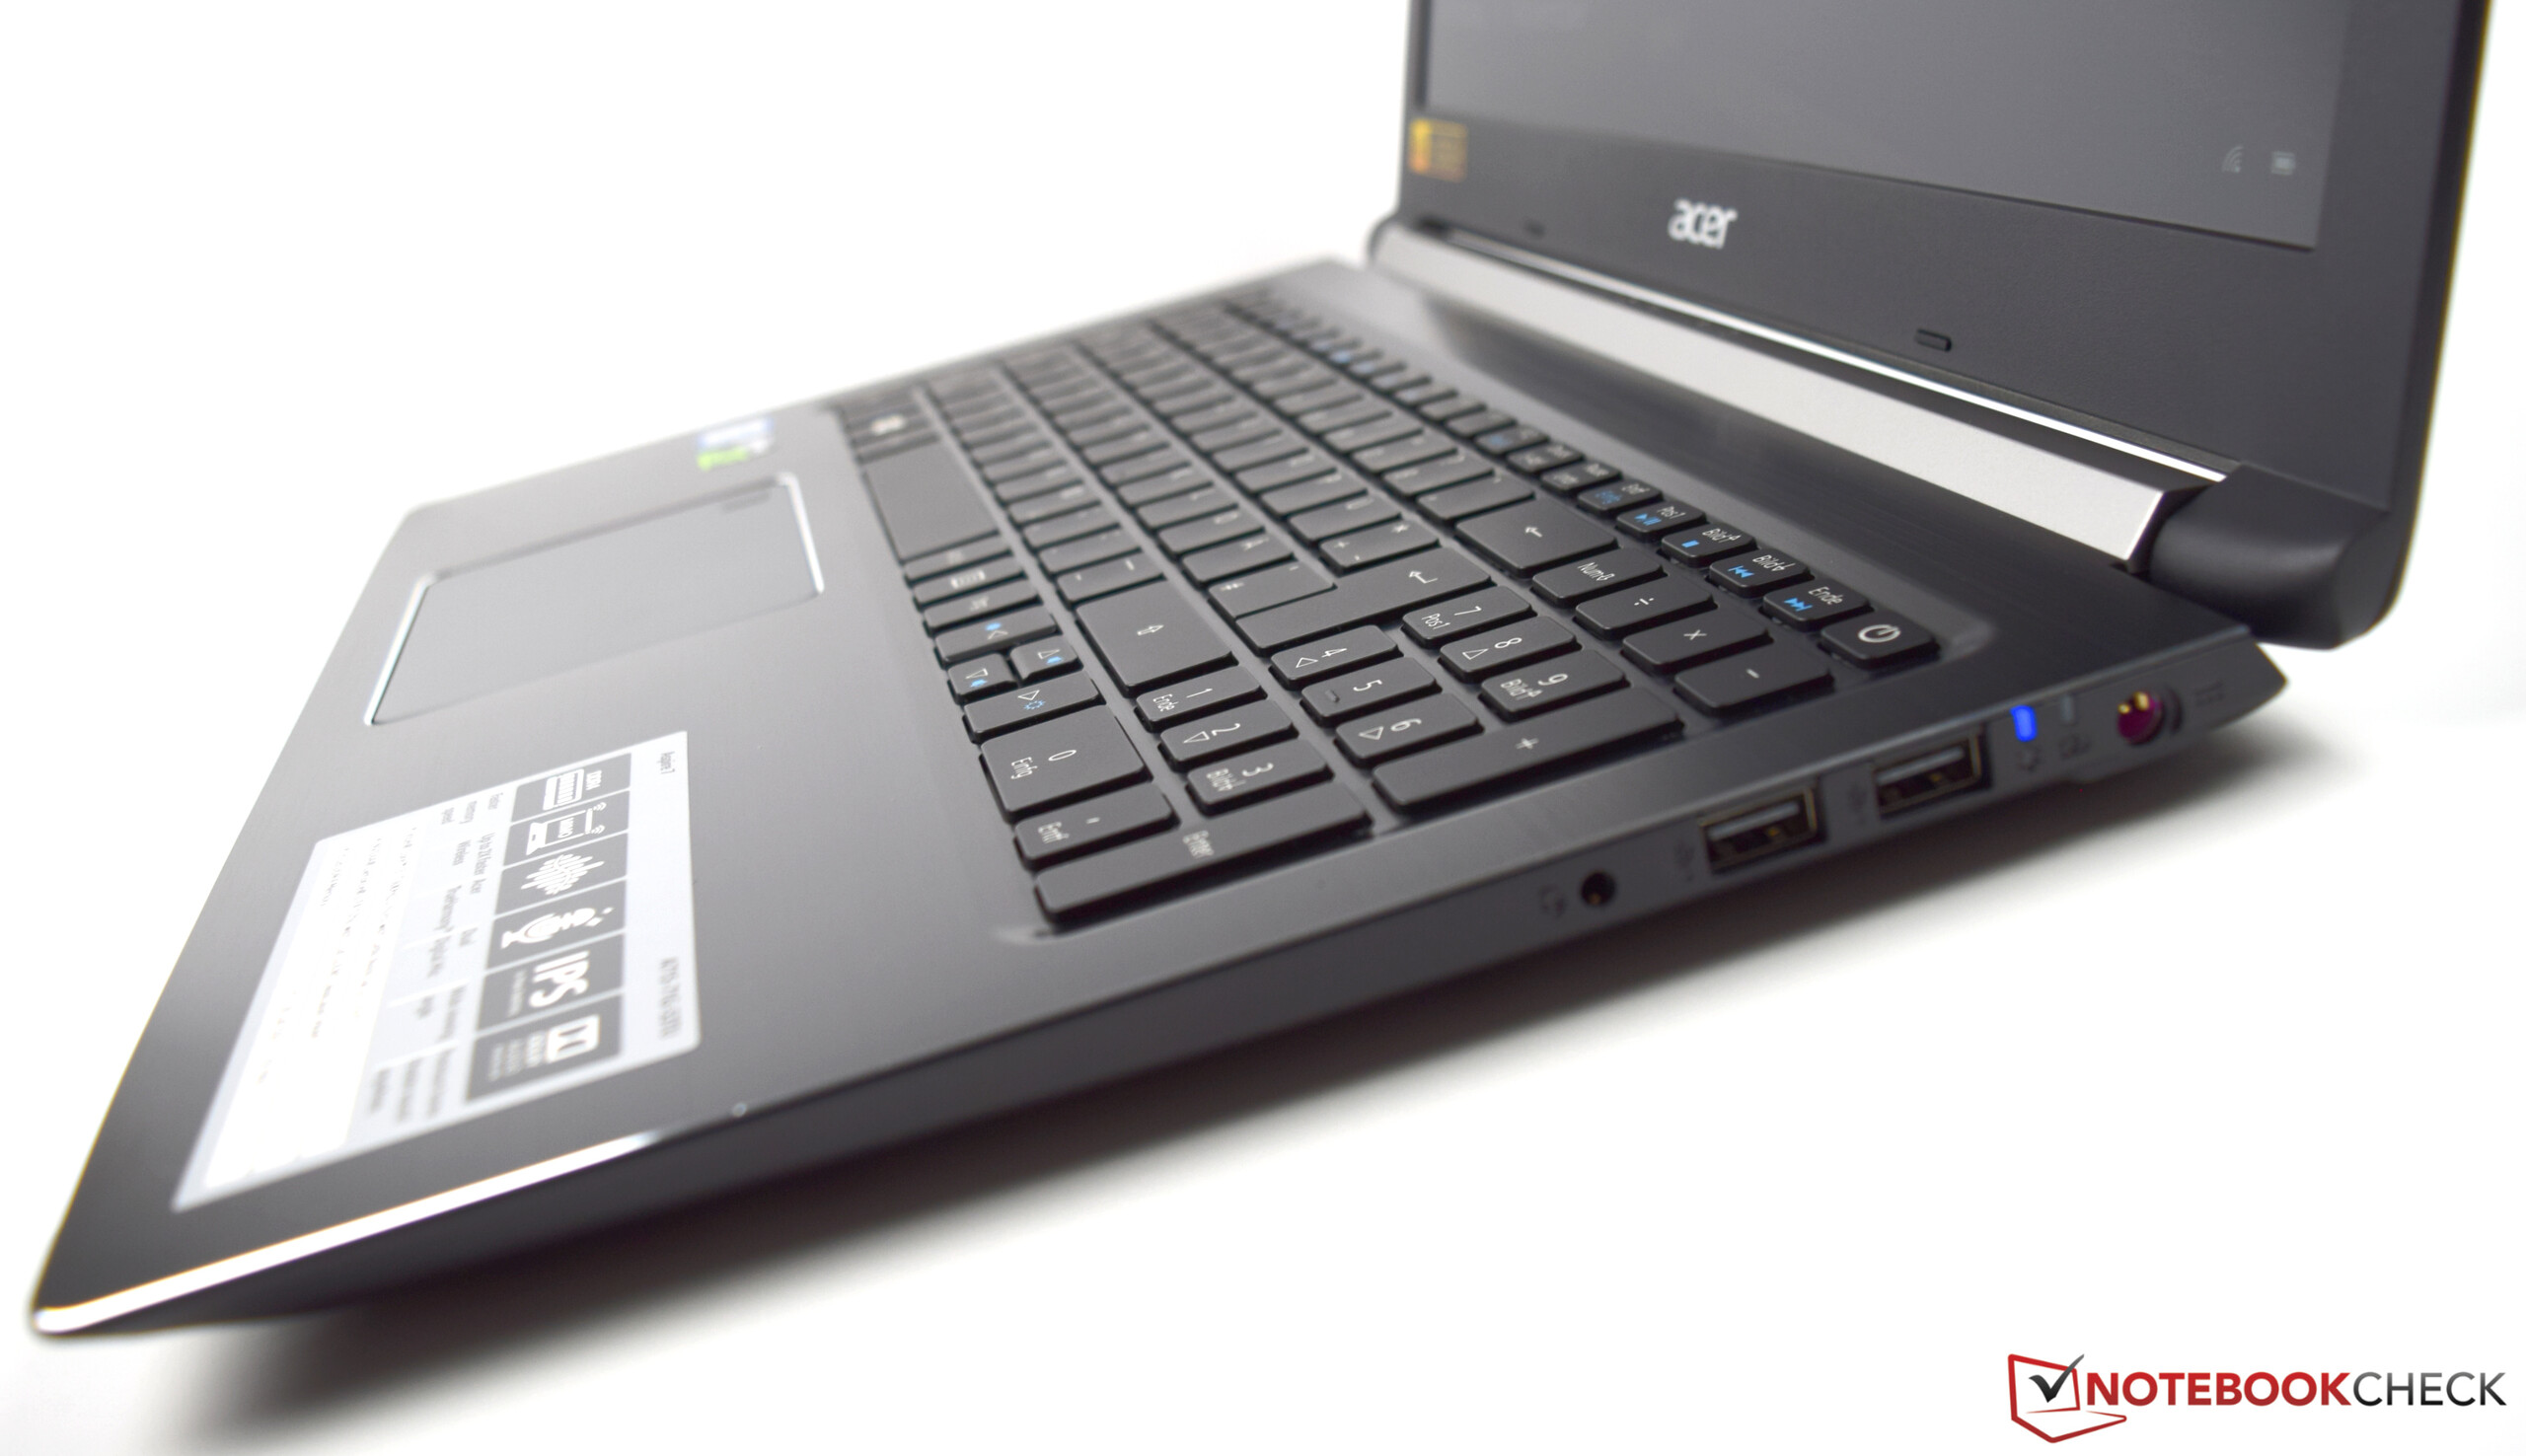
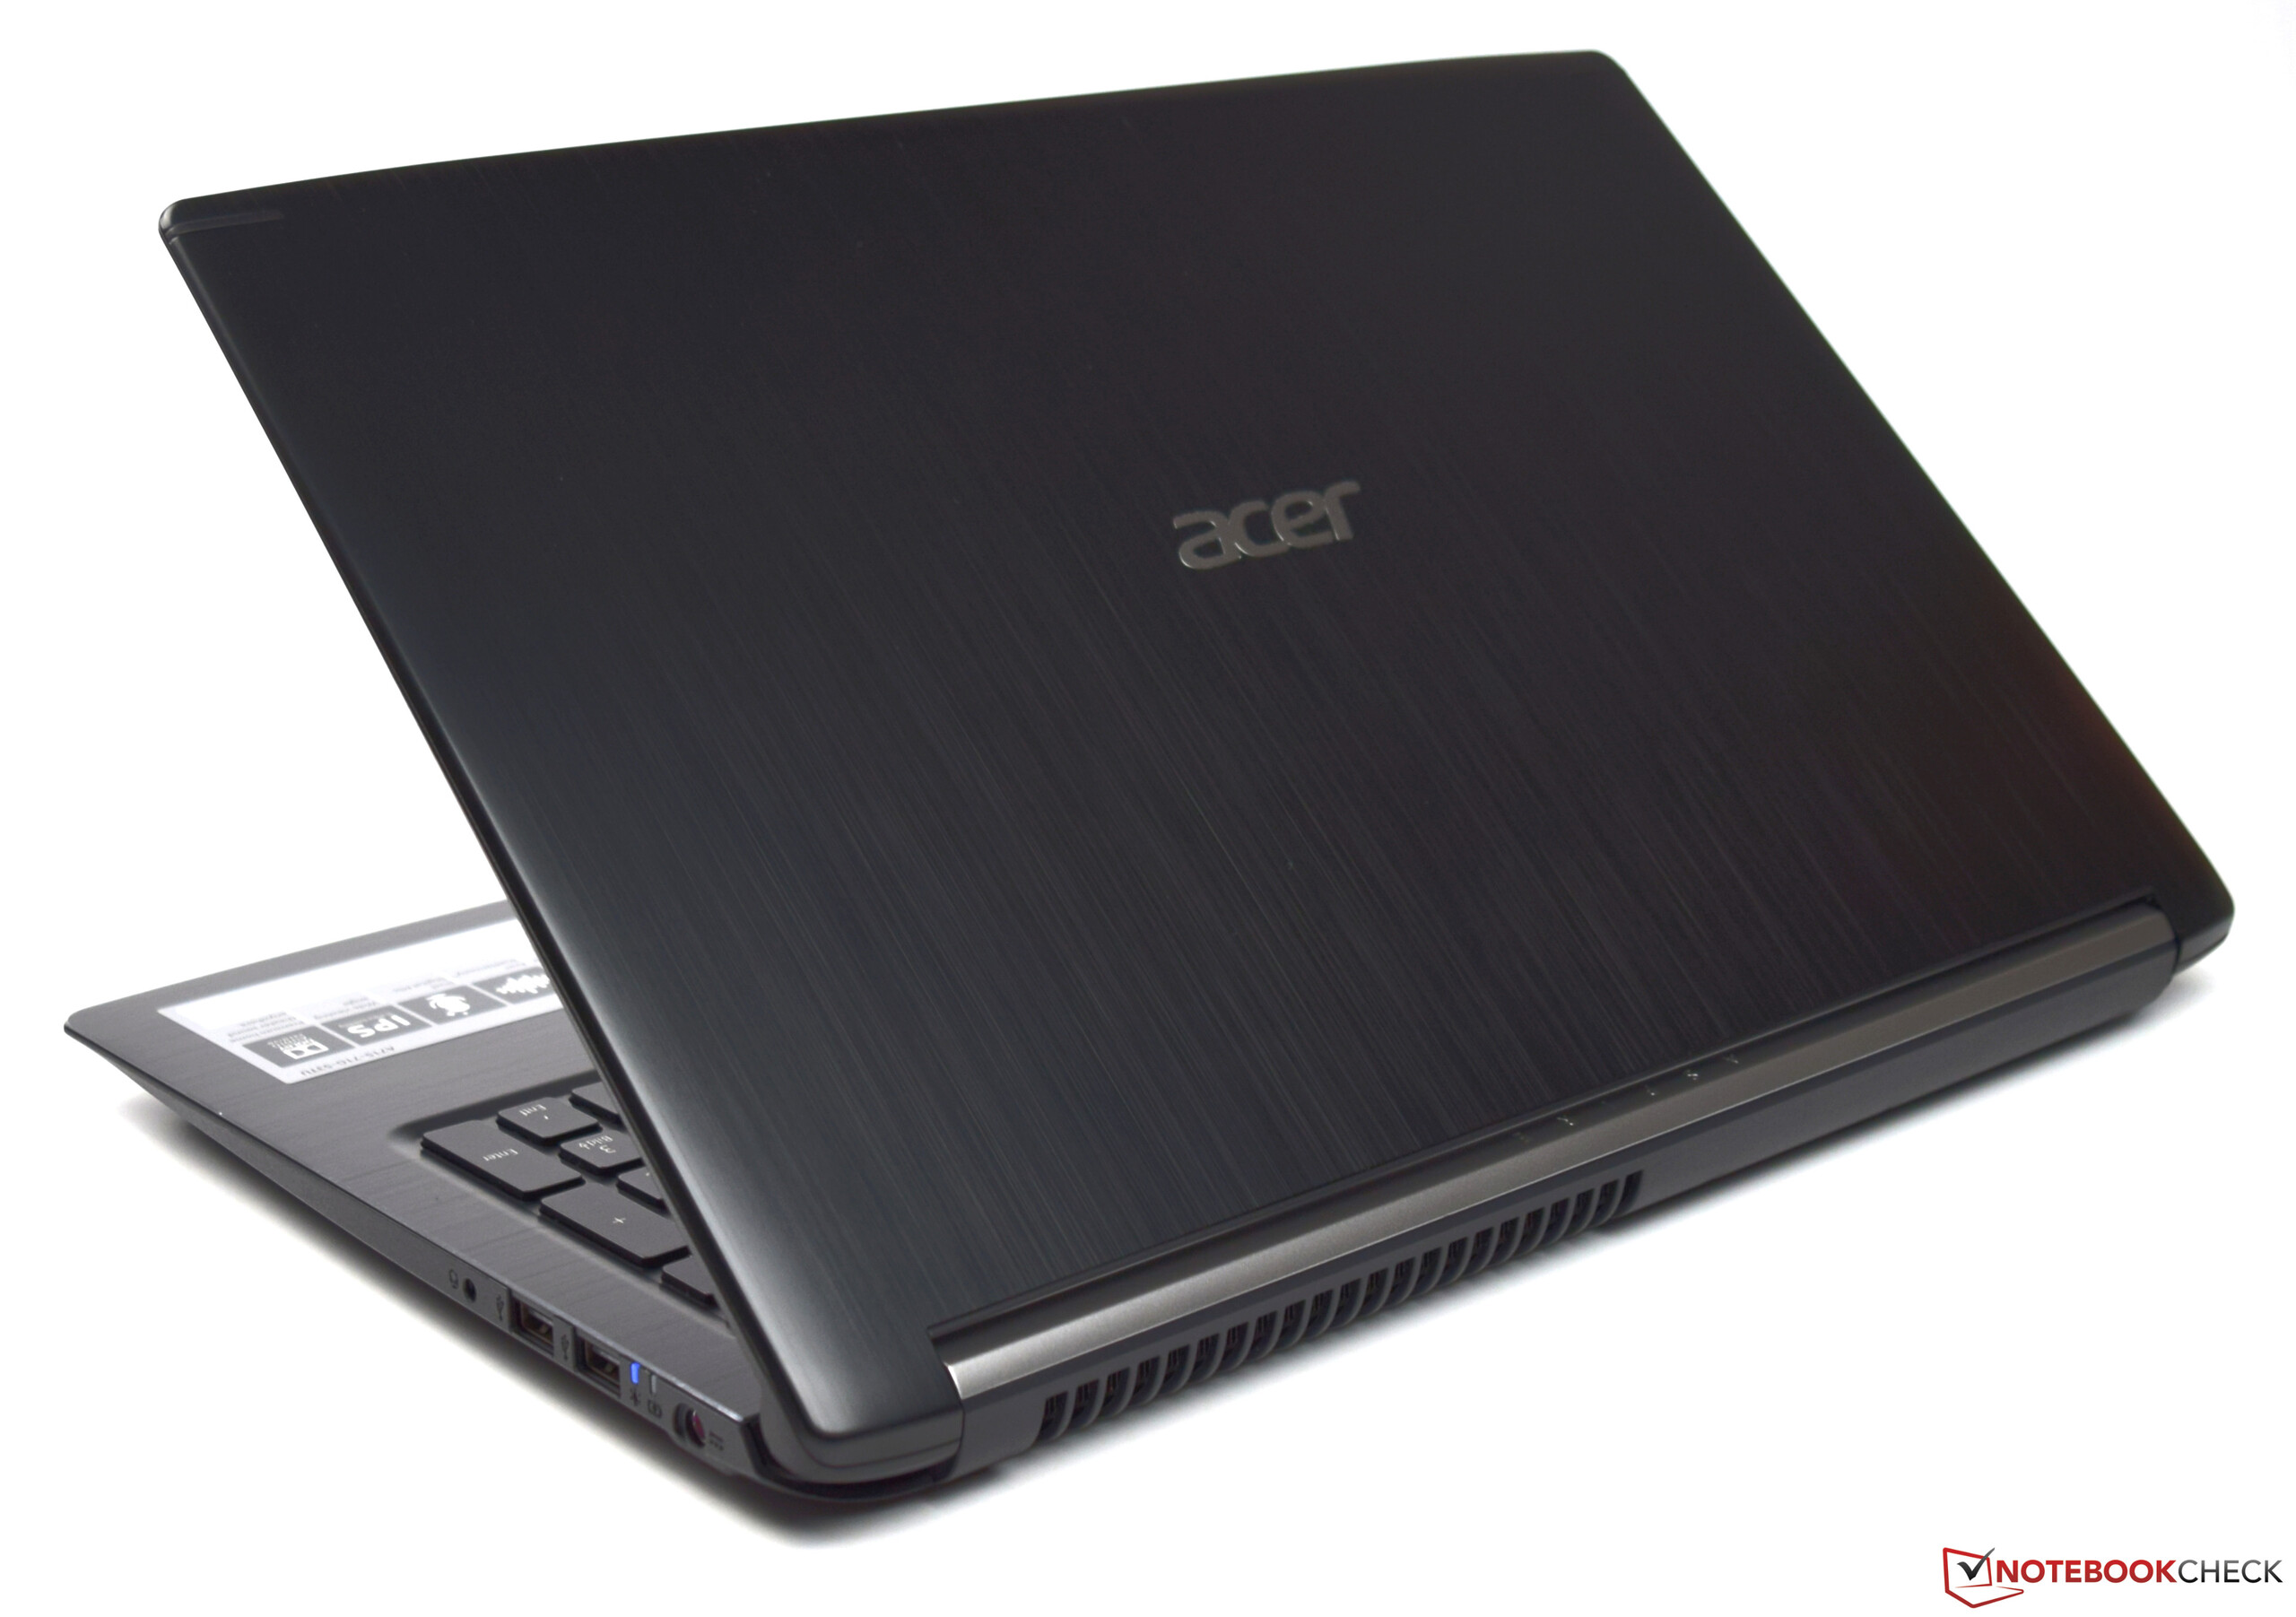
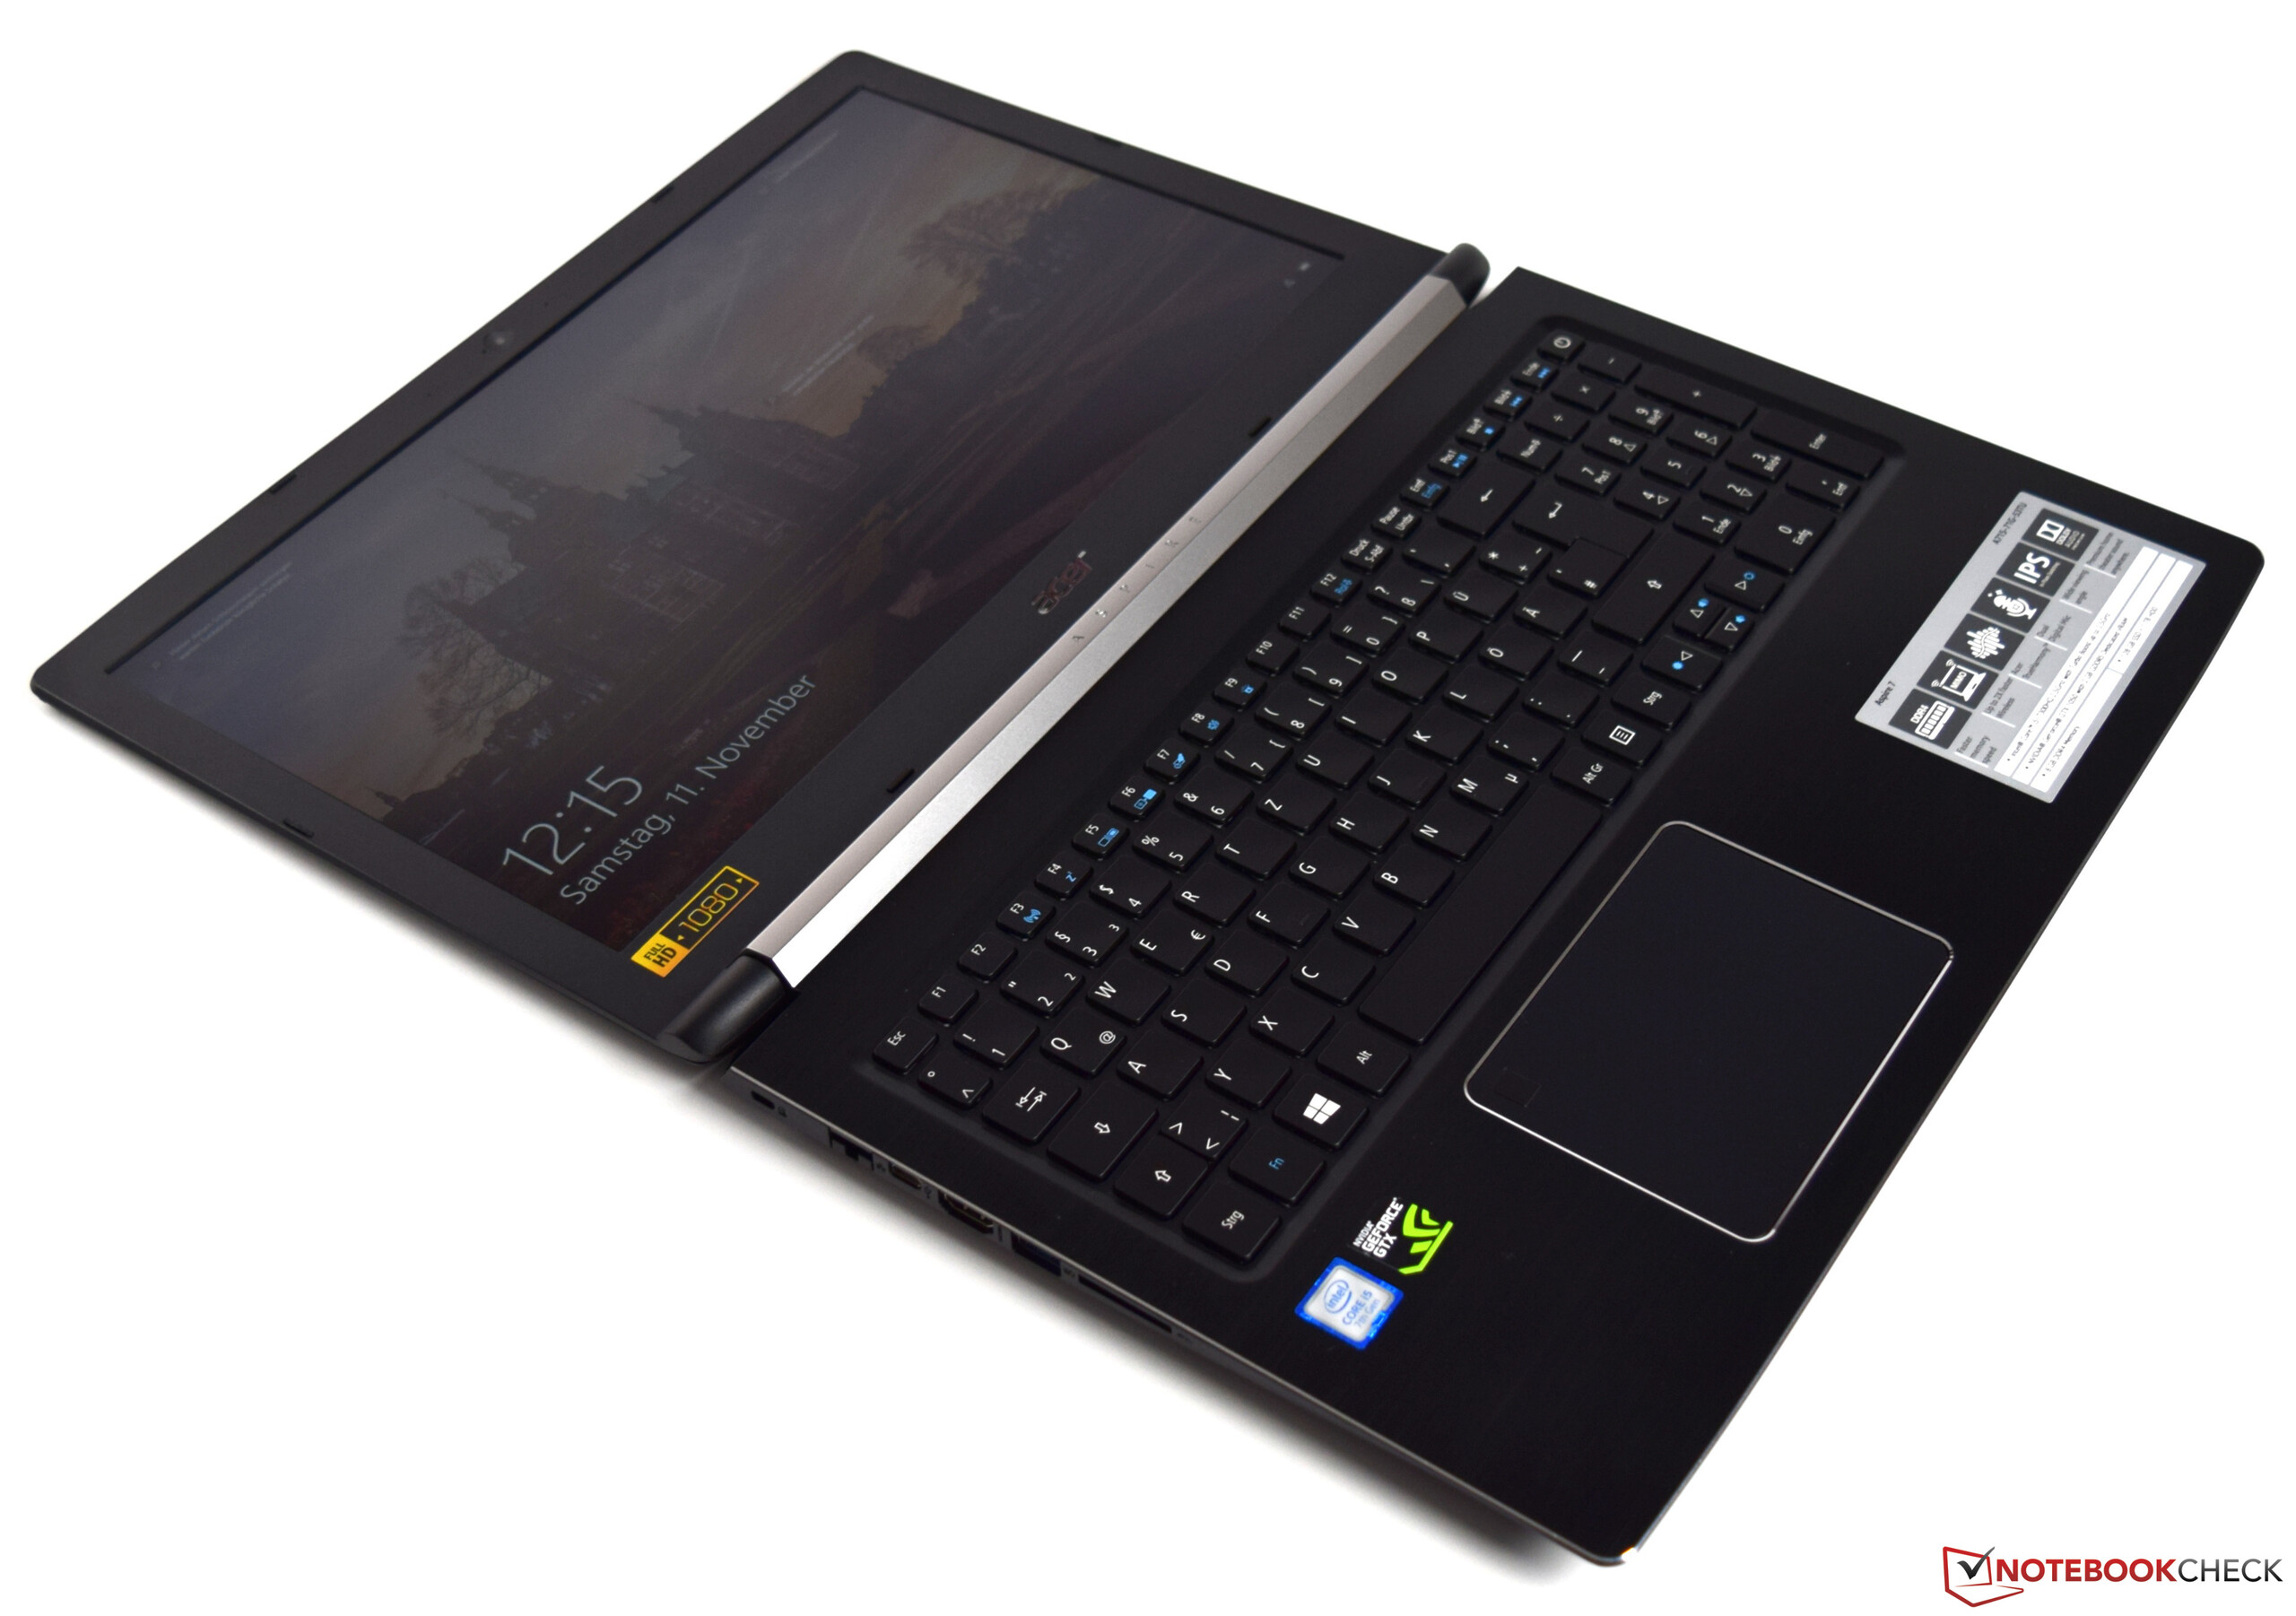
Because both the A715-72G and the A715-71G are identically built, we shall skip the sections that deal with the case, connectivity, input devices and the speakers. You can find all the appropriate information in our review of the Aspire 7 A715-71G.

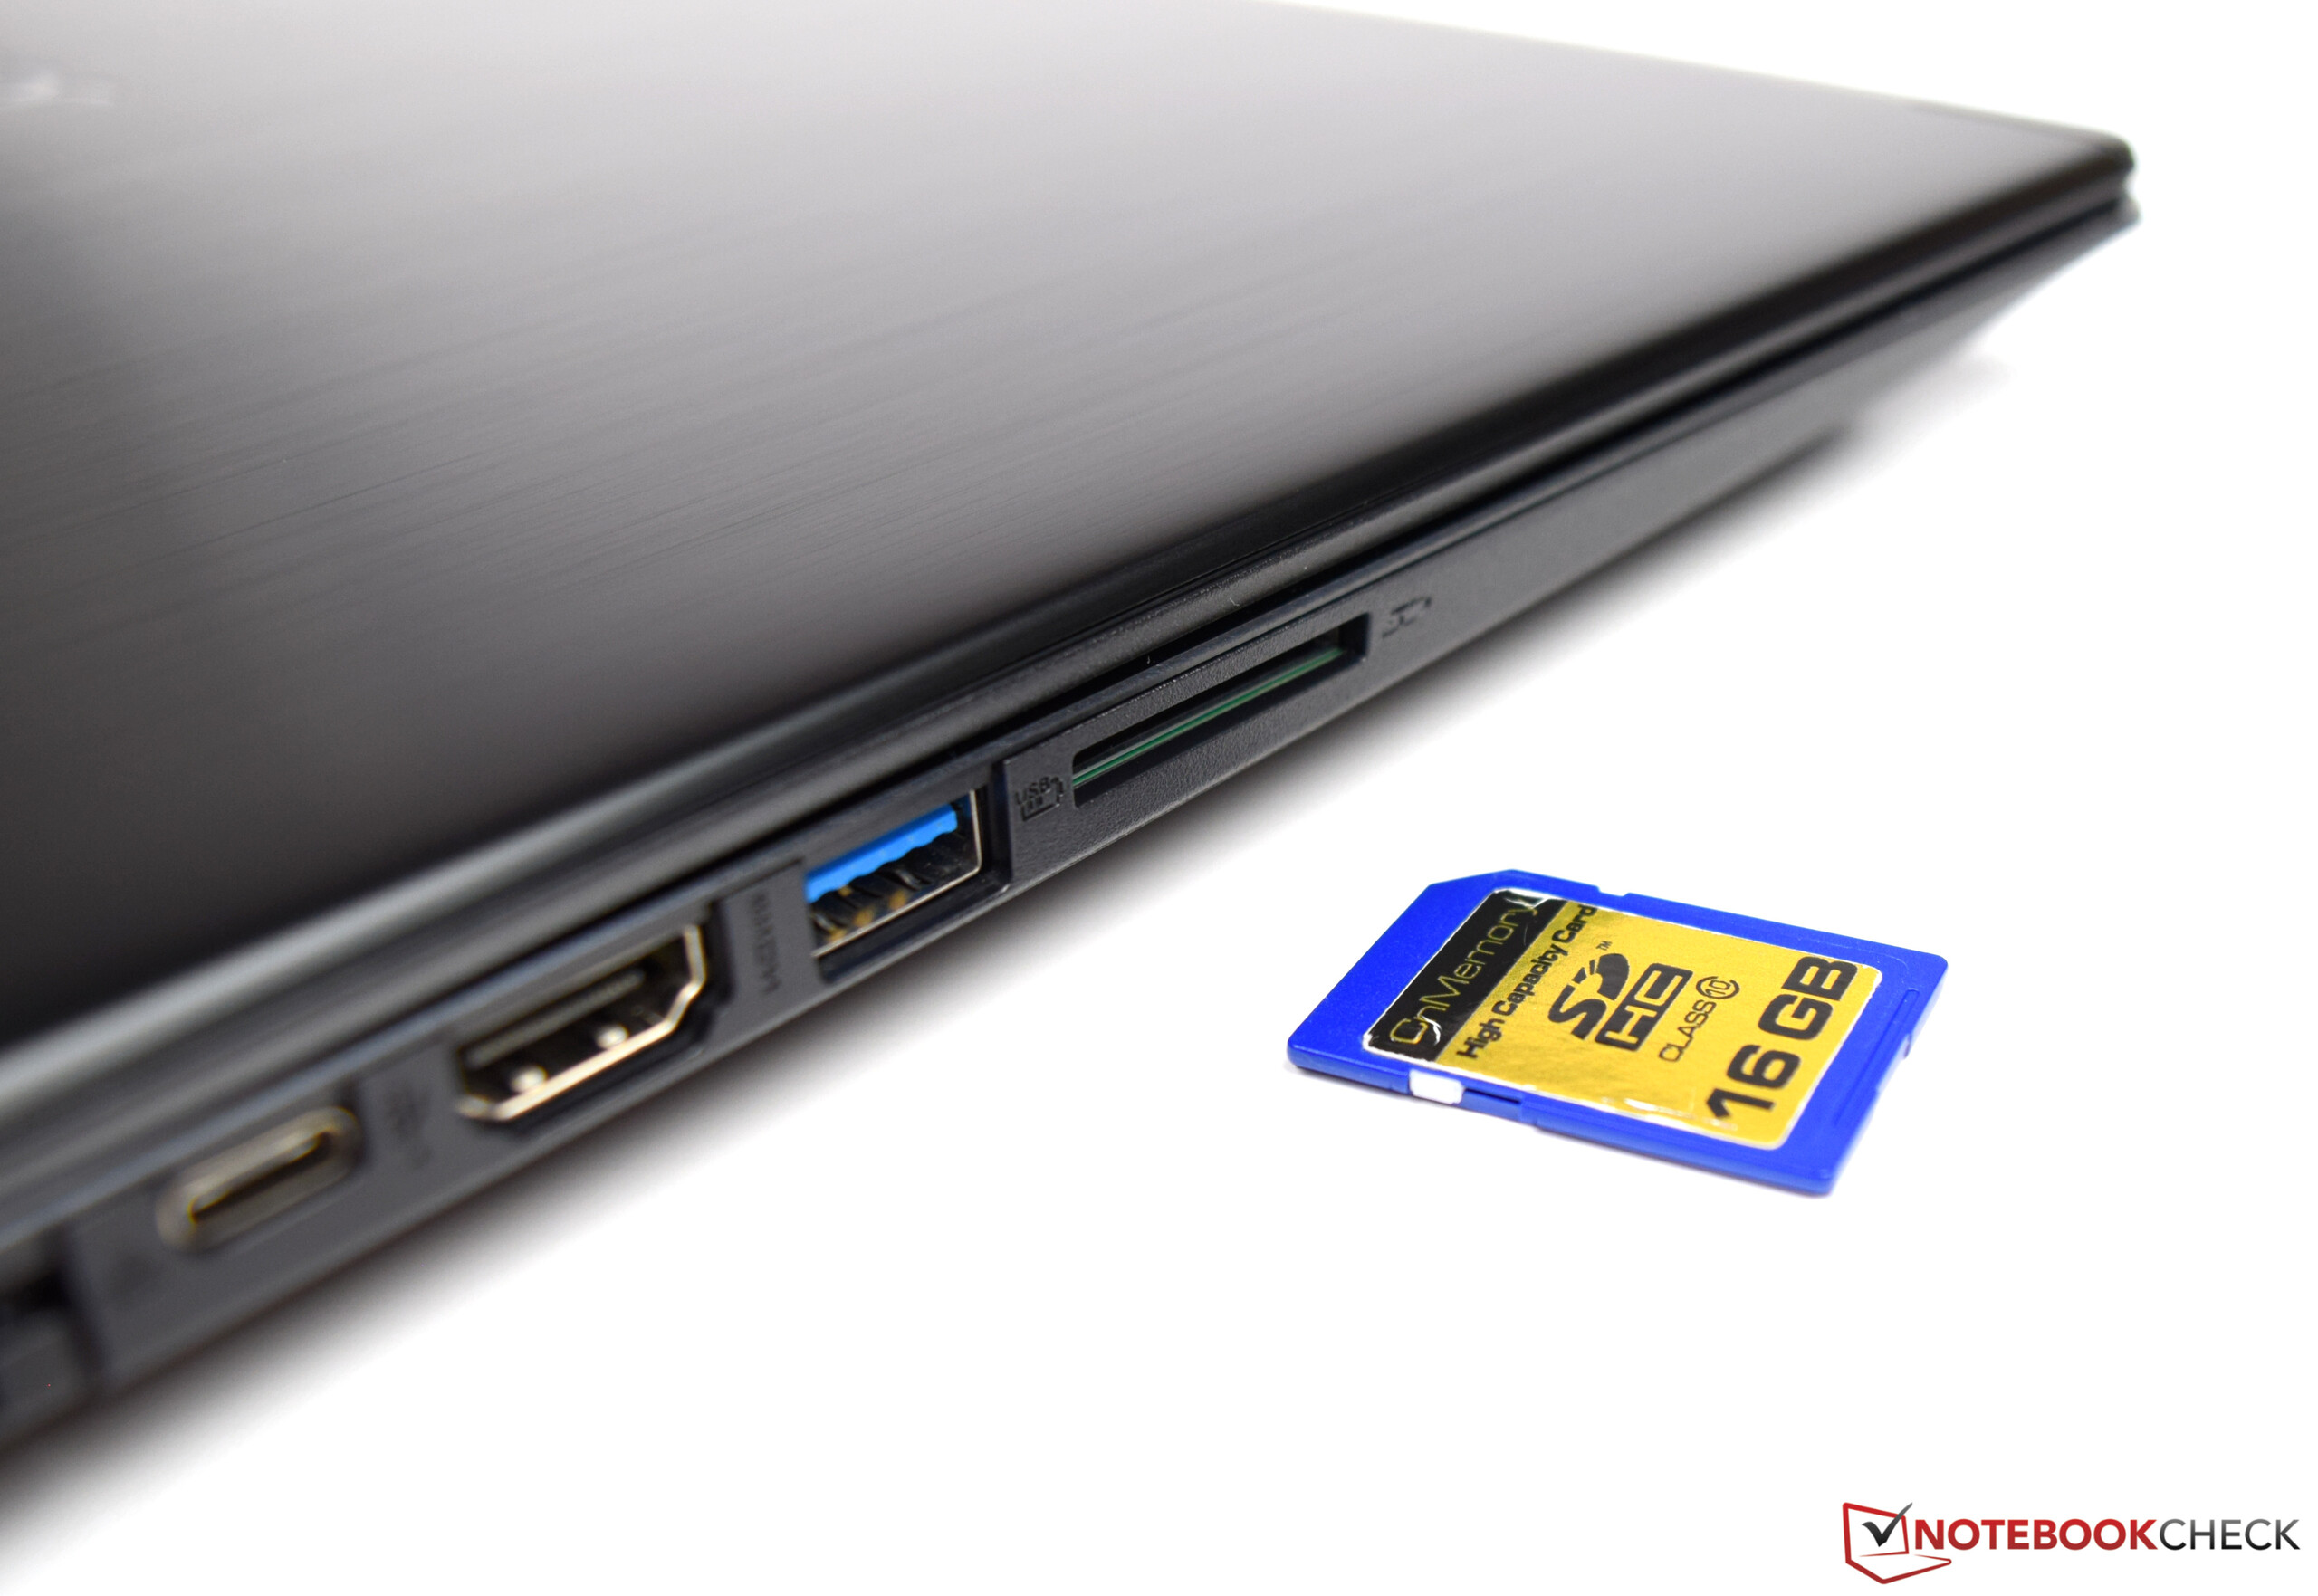
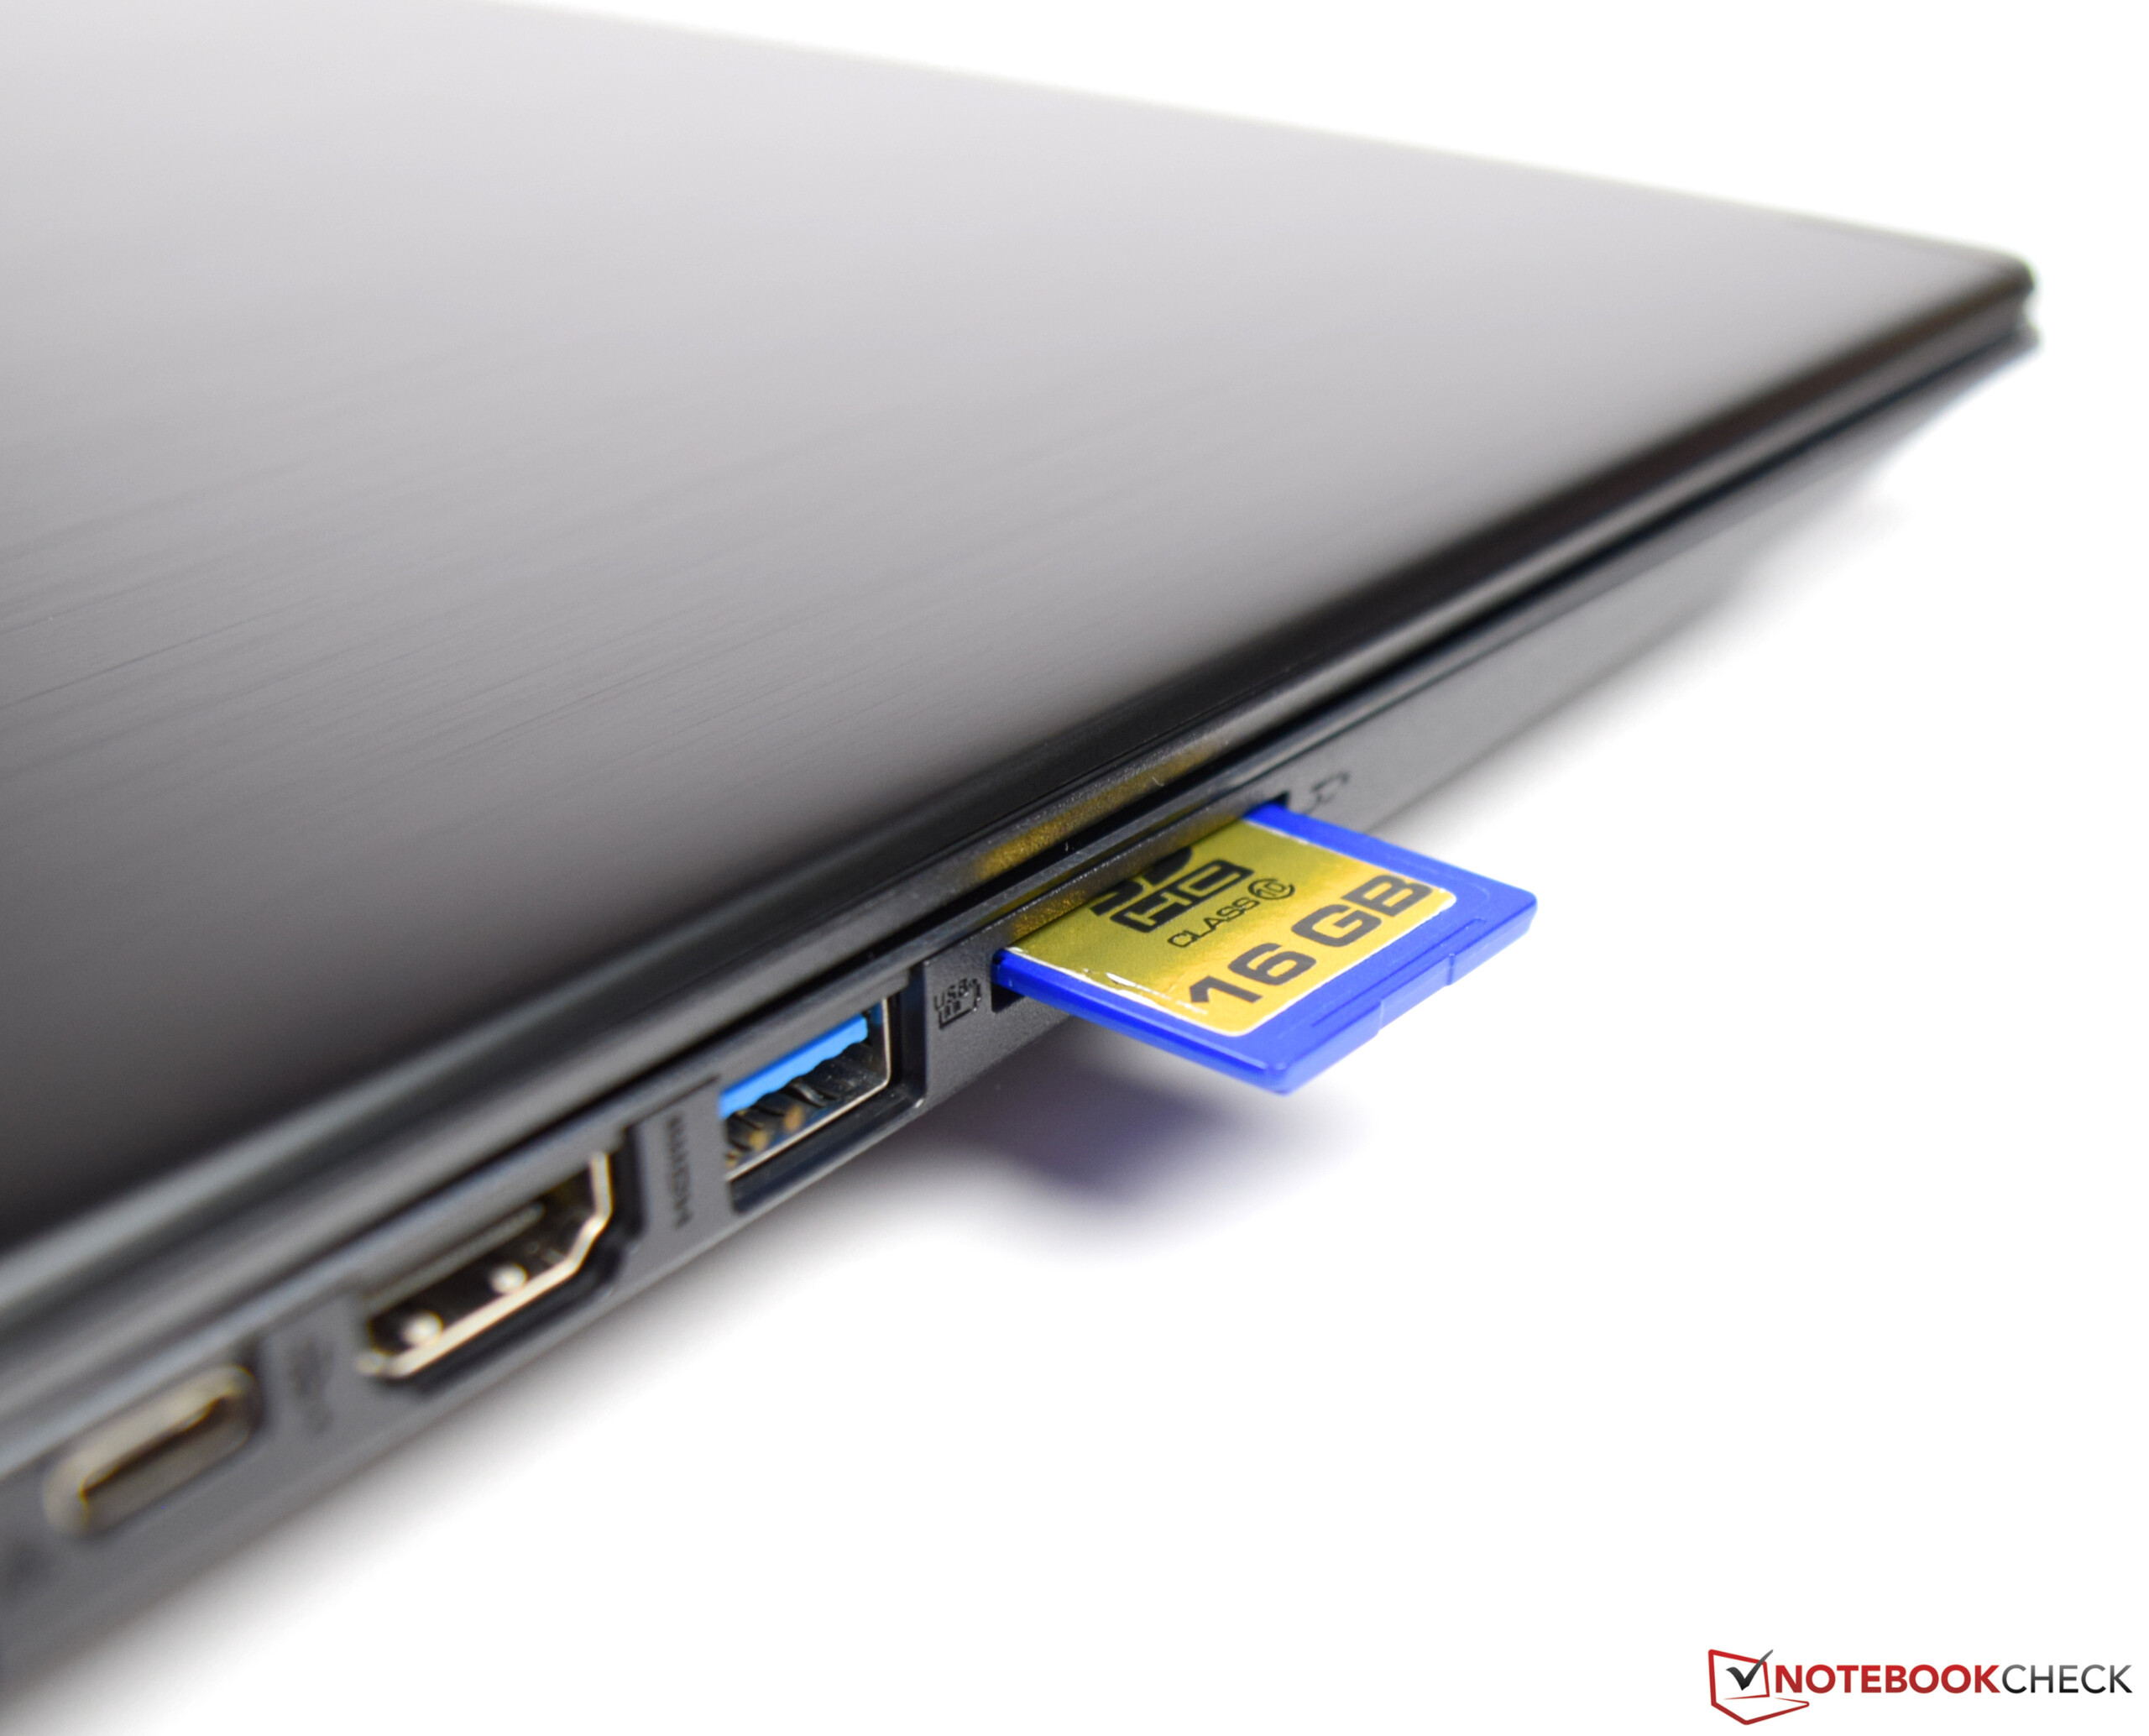
| SD Card Reader | |
| average JPG Copy Test (av. of 3 runs) | |
| Average of class Multimedia (23 - 531, n=43, last 2 years) | |
| Acer Aspire 7 A715-71G-53TU (Toshiba Exceria Pro SDXC 64 GB UHS-II) | |
| HP Pavilion Gaming 15-cx0003ng (Toshiba Exceria Pro SDXC 64 GB UHS-II) | |
| Acer Aspire 7 A715-72G-704Q (Toshiba Exceria Pro SDXC 64 GB UHS-II) | |
| Dell G3 15 3579 (Toshiba Exceria Pro SDXC 64 GB UHS-II) | |
| maximum AS SSD Seq Read Test (1GB) | |
| Average of class Multimedia (27.9 - 1455, n=42, last 2 years) | |
| Acer Aspire 7 A715-71G-53TU (Toshiba Exceria Pro SDXC 64 GB UHS-II) | |
| HP Pavilion Gaming 15-cx0003ng (Toshiba Exceria Pro SDXC 64 GB UHS-II) | |
| Acer Aspire 7 A715-72G-704Q (Toshiba Exceria Pro SDXC 64 GB UHS-II) | |
| Dell G3 15 3579 (Toshiba Exceria Pro SDXC 64 GB UHS-II) | |
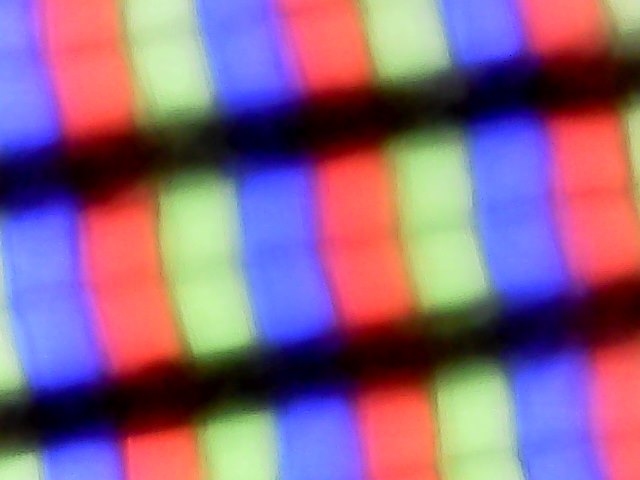
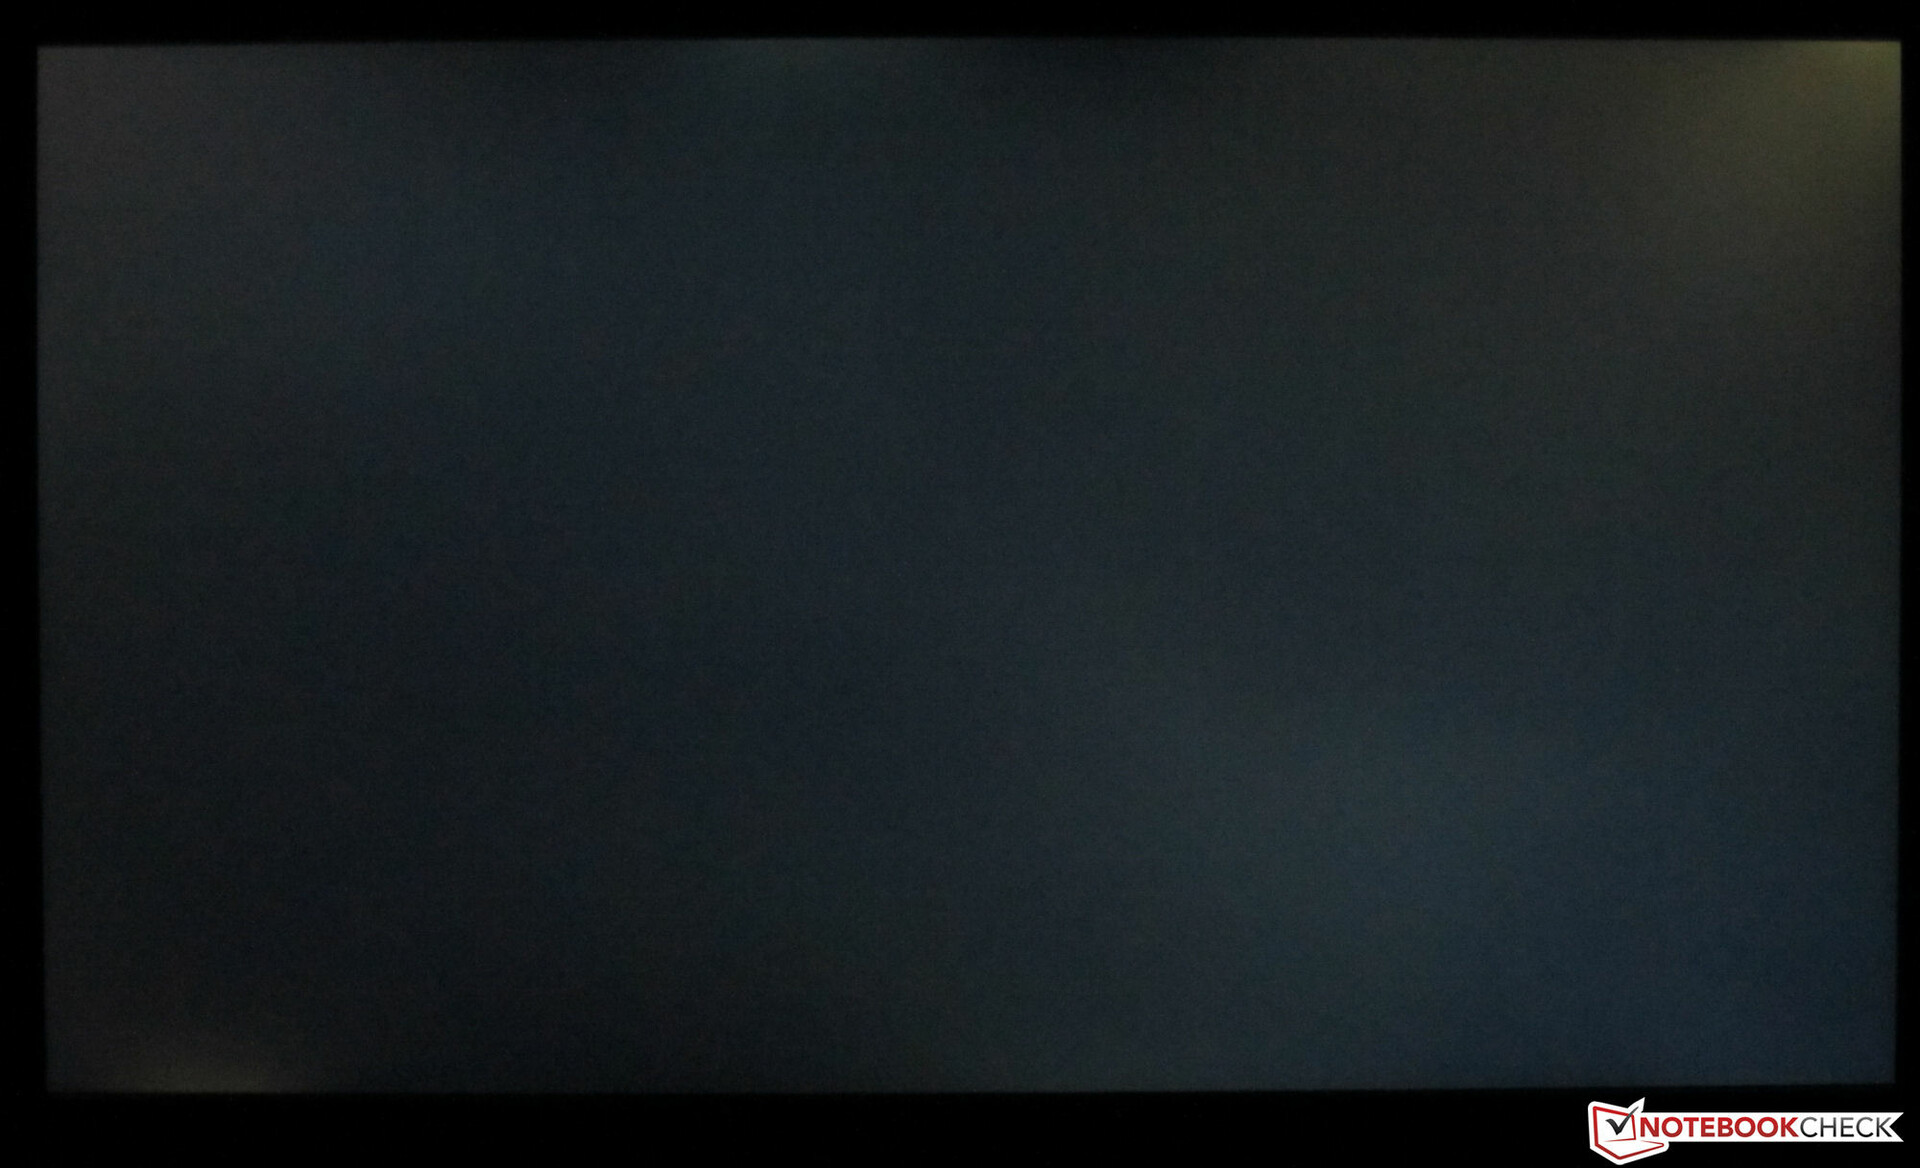
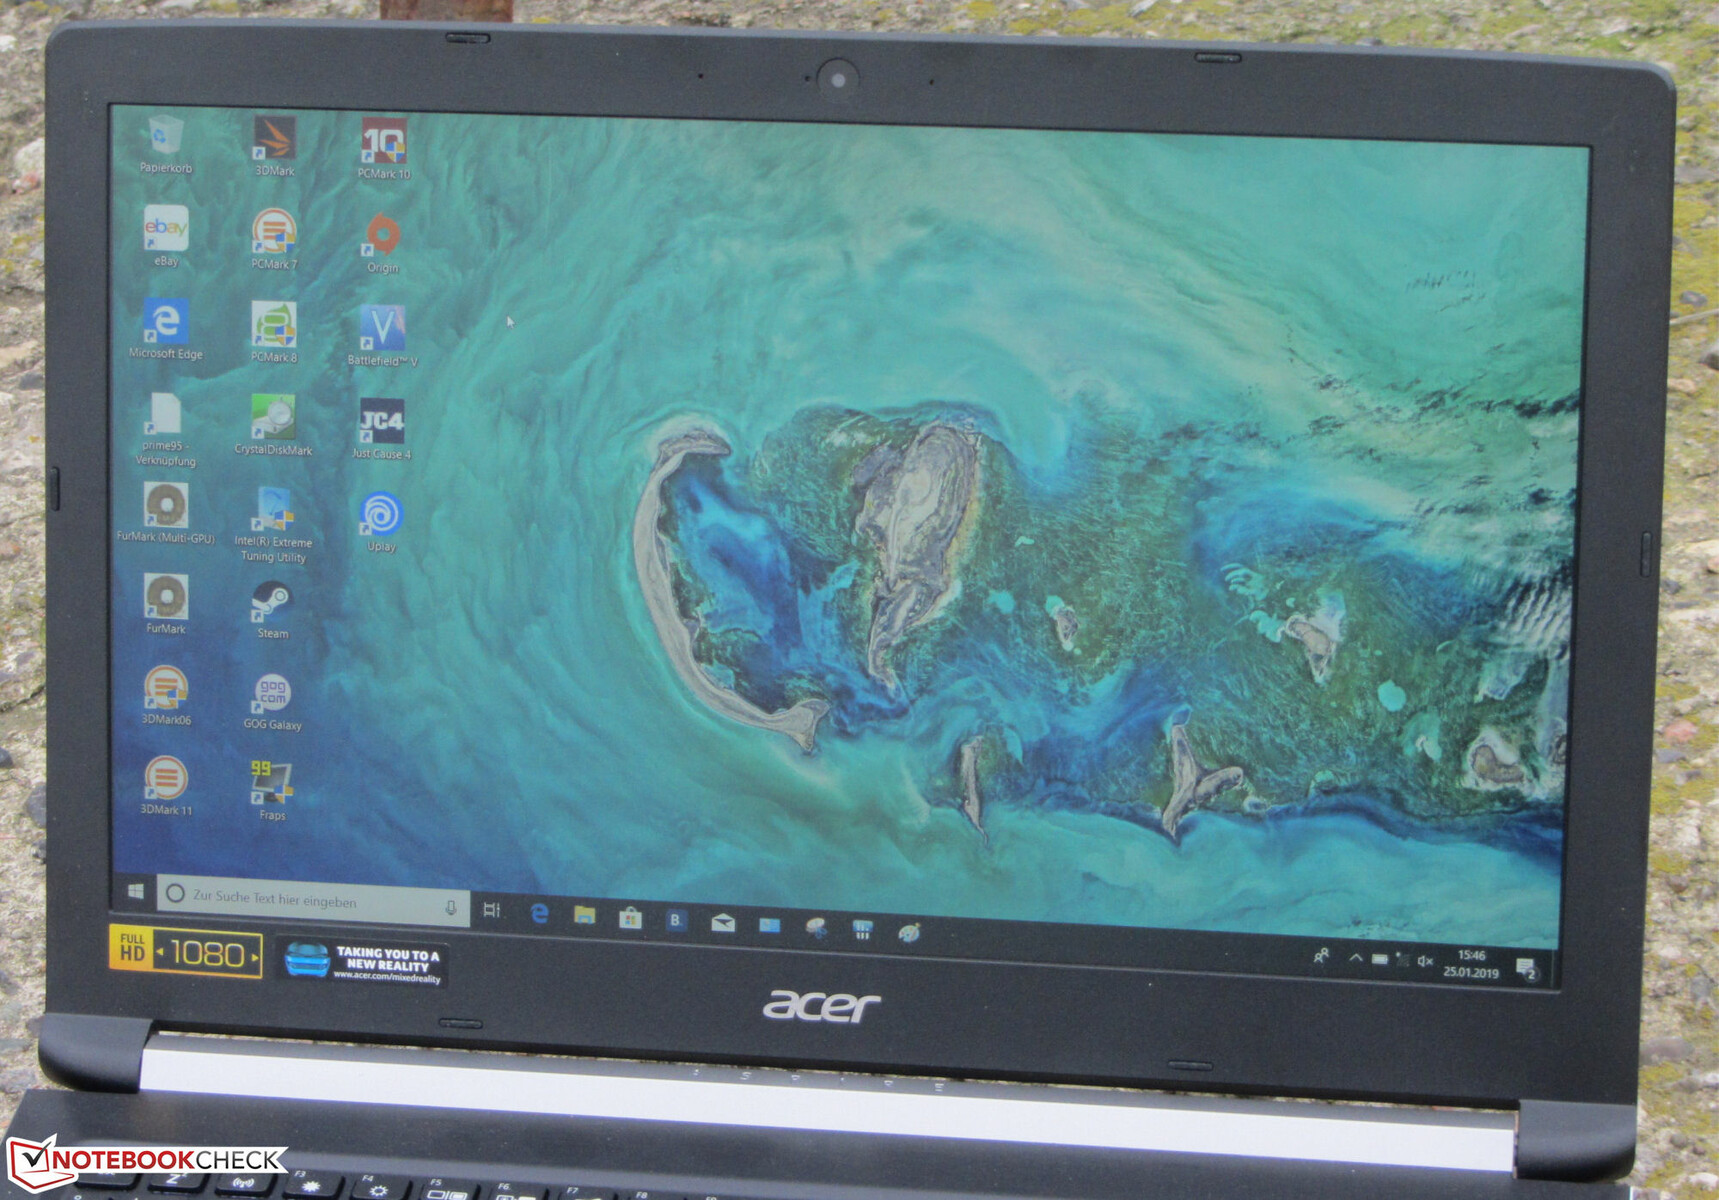
Display - IPS screen with a poor contrast ratio
The 15.6-inch display of the Aspire 7 has a native resolution of 1920x1080. Both the brightness (247.7 cd/m²) and the contrast ratio (500:1) are too low for a device in this price range. Here, we expected to see a contrast ratio of more than 1000:1 and a screen brightness of at least 300 cd/m². Things do not look any better when it comes to the rest of the competition. Positive: The screen does not suffer from PWM flickering.
| |||||||||||||||||||||||||
Brightness Distribution: 81 %
Center on Battery: 276 cd/m²
Contrast: 500:1 (Black: 0.56 cd/m²)
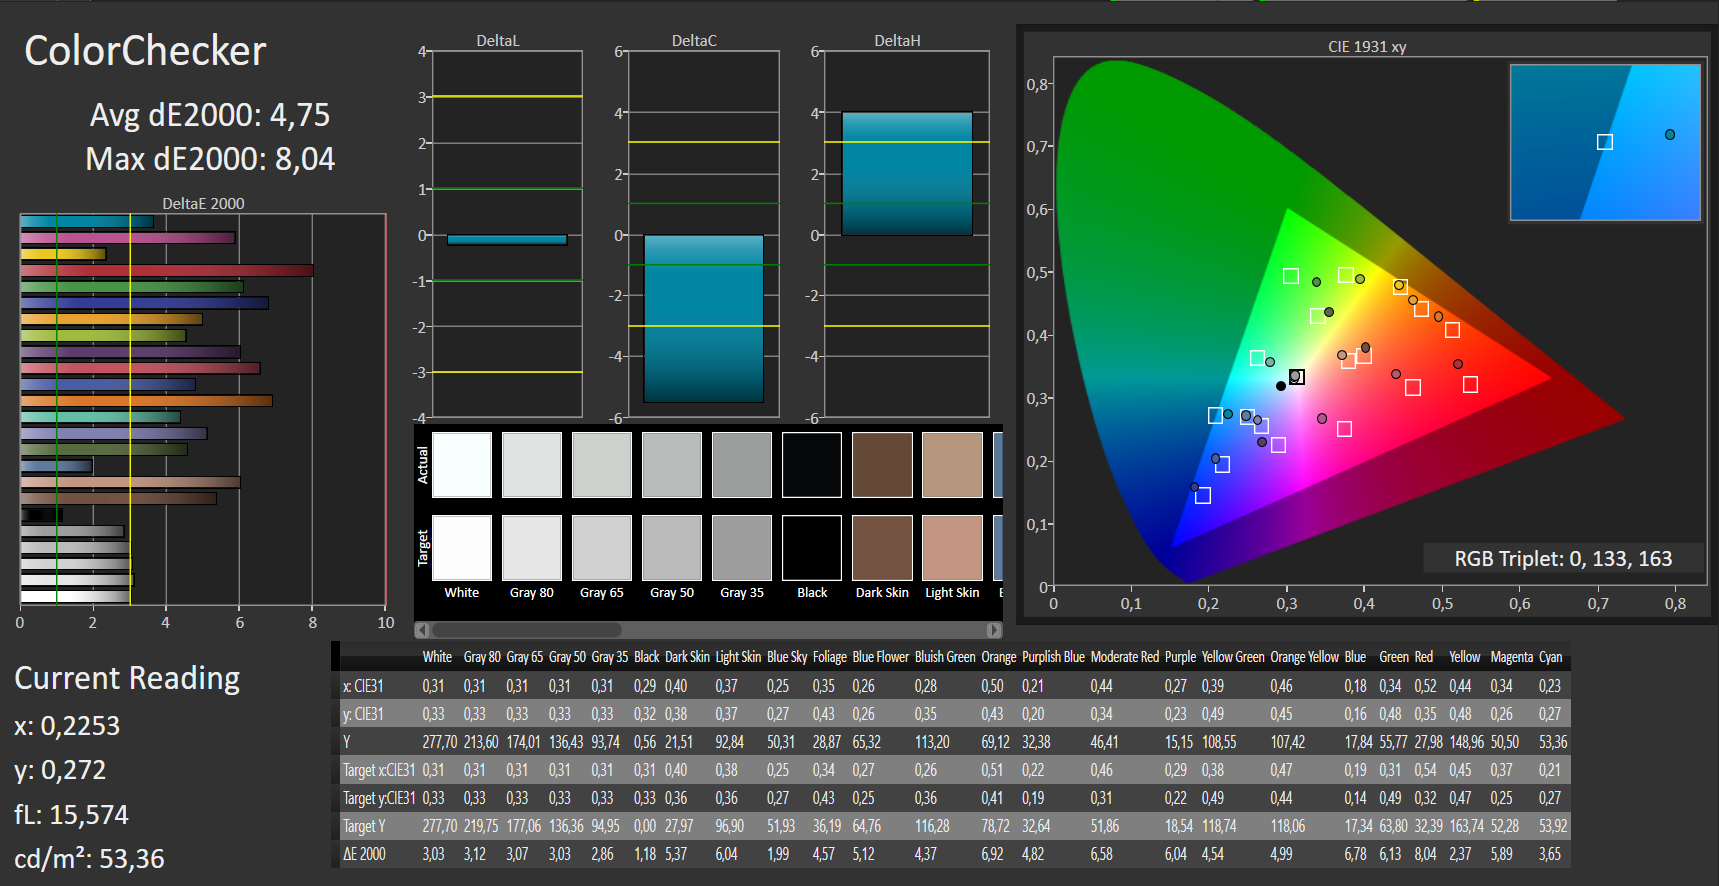
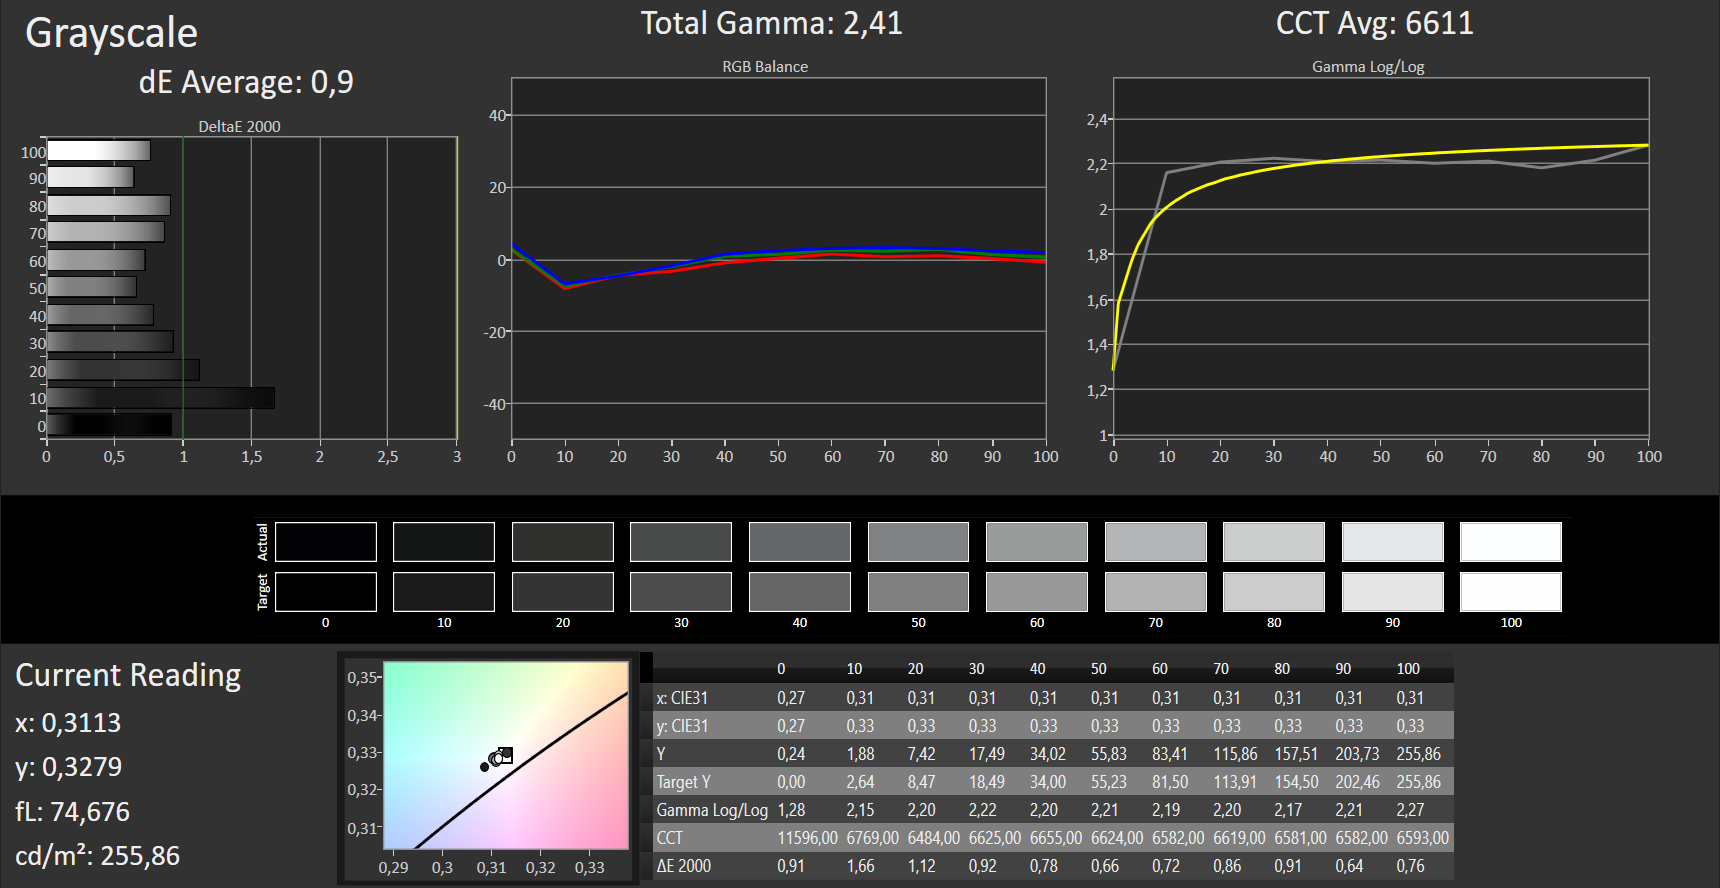
ΔE ColorChecker Calman: 4.75 | ∀{0.5-29.43 Ø4.73}
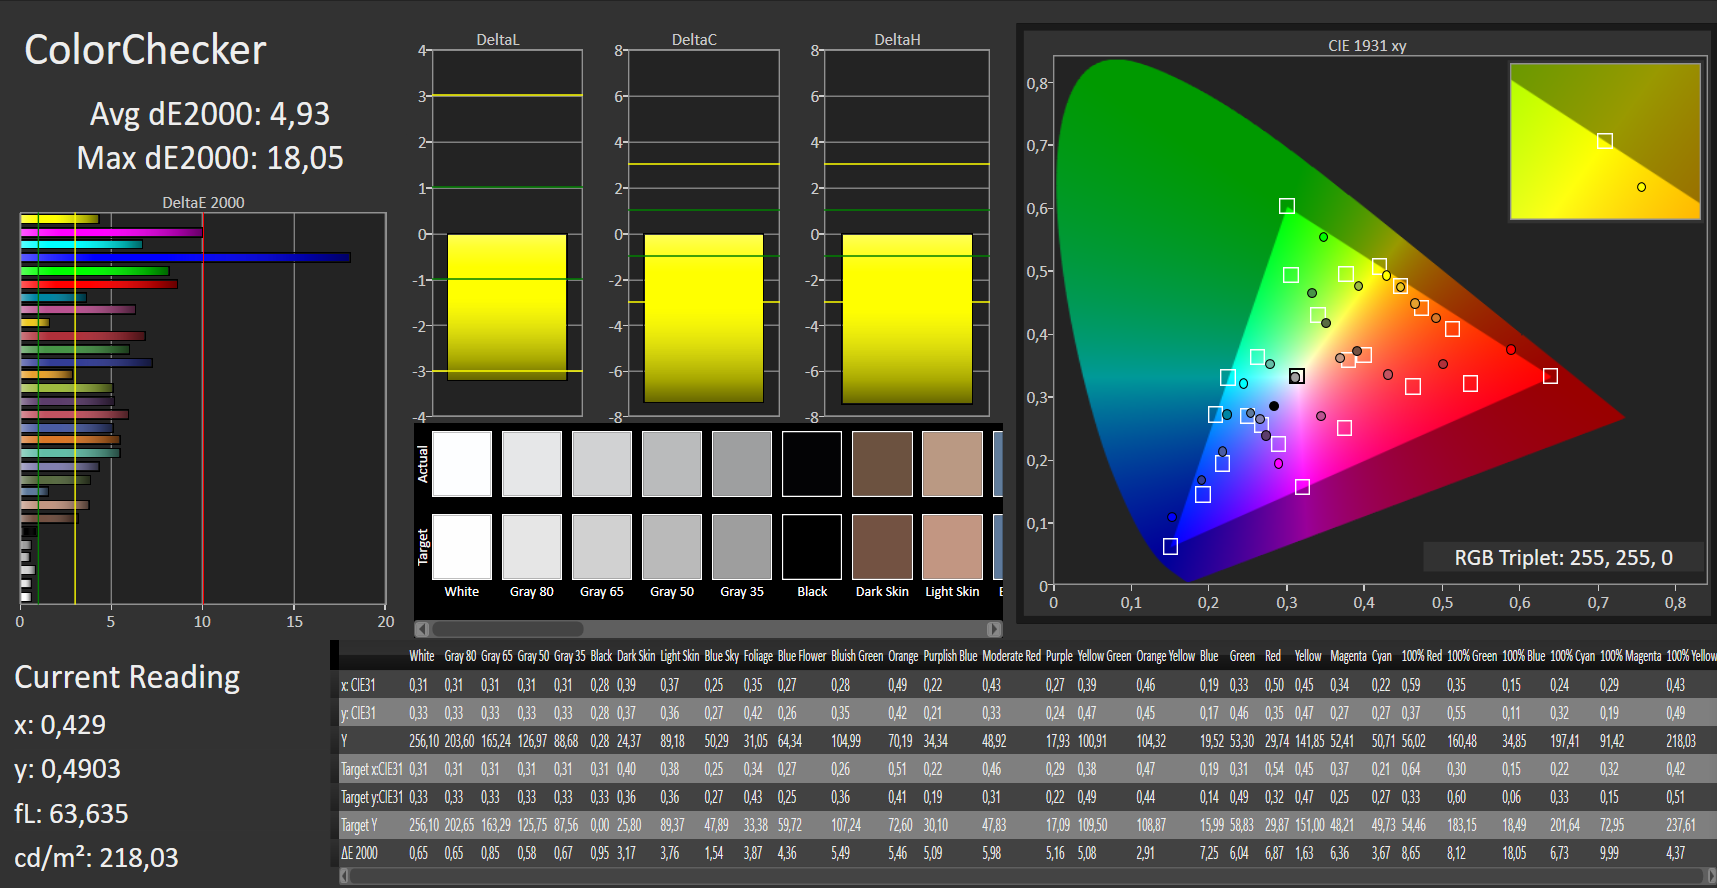
calibrated: 4.93
ΔE Greyscale Calman: 3.21 | ∀{0.09-98 Ø4.97}
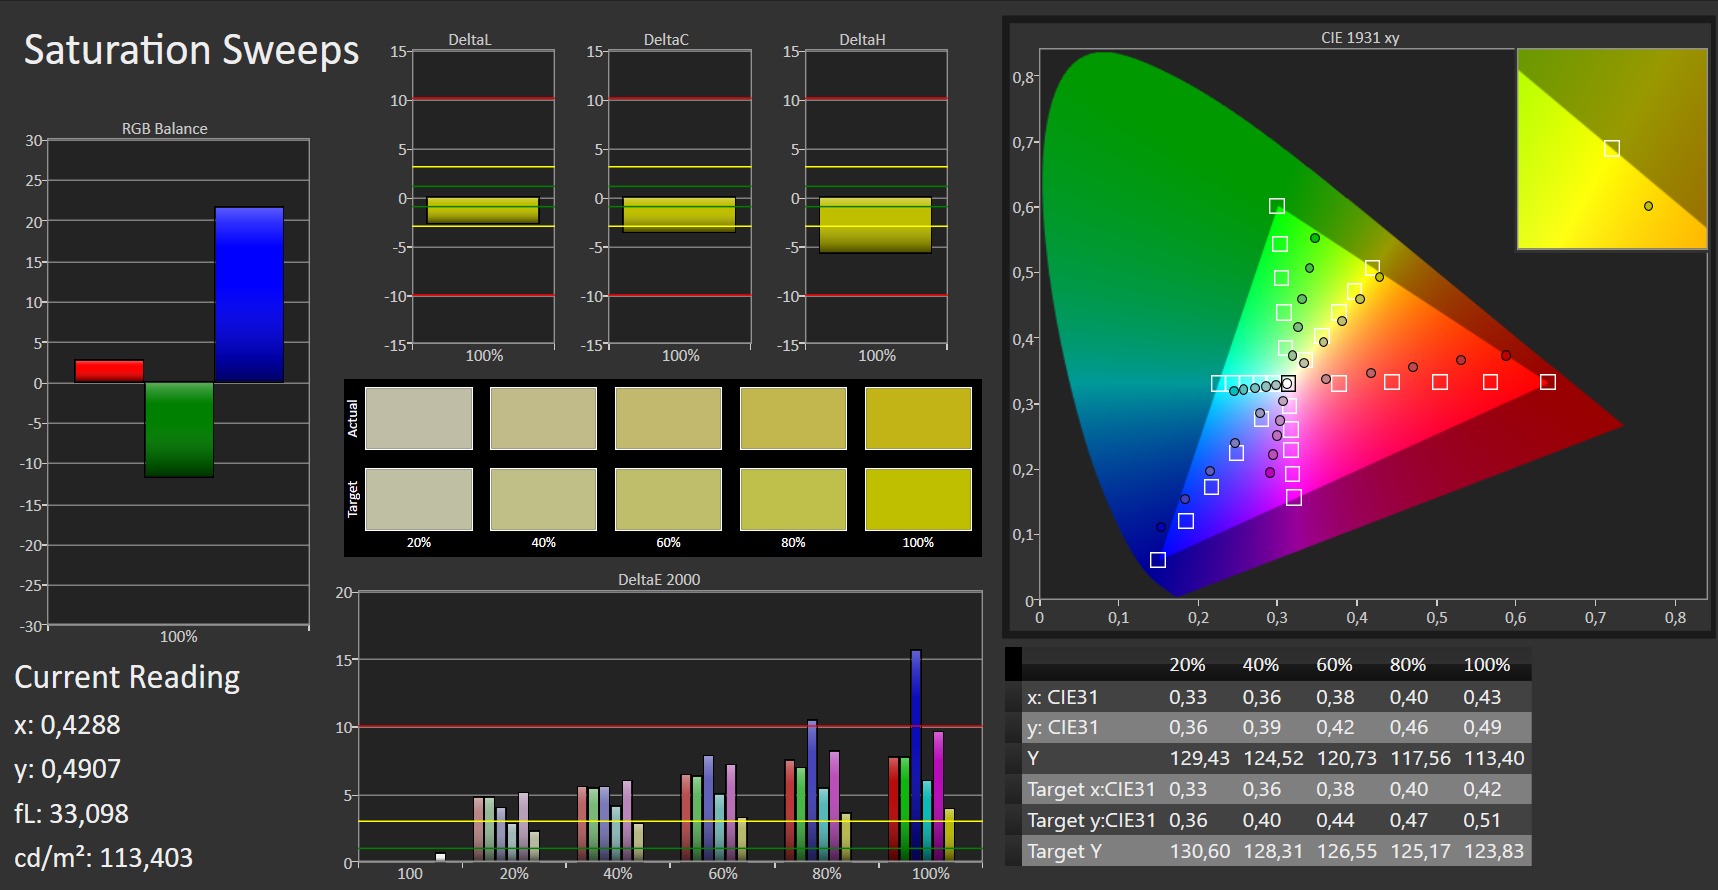
57% sRGB (Argyll 1.6.3 3D)
36% AdobeRGB 1998 (Argyll 1.6.3 3D)
39.65% AdobeRGB 1998 (Argyll 3D)
57.5% sRGB (Argyll 3D)
38.34% Display P3 (Argyll 3D)
Gamma: 2.59
CCT: 6601 K
| Acer Aspire 7 A715-72G-704Q IPS, 1920x1080, 15.6" | Acer Aspire 7 A715-71G-53TU a-Si TFT-LCD, IPS, 1920x1080, 15.6" | HP Pavilion Gaming 15-cx0003ng IPS, 1920x1080, 15.6" | Dell G3 15 3579 IPS, 1920x1080, 15.6" | Lenovo Legion Y730-15ICH i5-8300H IPS, 1920x1080, 15.6" | |
|---|---|---|---|---|---|
| Display | 5% | 4% | 0% | 60% | |
| Display P3 Coverage (%) | 38.34 | 40.53 6% | 39.72 4% | 38.48 0% | 65.9 72% |
| sRGB Coverage (%) | 57.5 | 59.9 4% | 59.3 3% | 57.9 1% | 85.5 49% |
| AdobeRGB 1998 Coverage (%) | 39.65 | 41.87 6% | 41.04 4% | 39.75 0% | 62.5 58% |
| Response Times | -45% | -32% | 5% | -45% | |
| Response Time Grey 50% / Grey 80% * (ms) | 35 ? | 49 ? -40% | 47 ? -34% | 32.4 ? 7% | 43.2 ? -23% |
| Response Time Black / White * (ms) | 24 ? | 36 ? -50% | 31 ? -29% | 23.2 ? 3% | 40 ? -67% |
| PWM Frequency (Hz) | 20000 ? | 208 ? | 21740 ? | ||
| Screen | 14% | 21% | -7% | 11% | |
| Brightness middle (cd/m²) | 280 | 267 -5% | 241 -14% | 208.2 -26% | 286.5 2% |
| Brightness (cd/m²) | 248 | 250 1% | 236 -5% | 203 -18% | 269 8% |
| Brightness Distribution (%) | 81 | 82 1% | 75 -7% | 81 0% | 84 4% |
| Black Level * (cd/m²) | 0.56 | 0.31 45% | 0.15 73% | 0.34 39% | 0.33 41% |
| Contrast (:1) | 500 | 861 72% | 1607 221% | 612 22% | 868 74% |
| Colorchecker dE 2000 * | 4.75 | 4.65 2% | 4.85 -2% | 4.65 2% | 6.3 -33% |
| Colorchecker dE 2000 max. * | 8.04 | 8.2 -2% | 8.82 -10% | 15.99 -99% | 10.01 -25% |
| Colorchecker dE 2000 calibrated * | 4.93 | 3.84 22% | 4.17 15% | ||
| Greyscale dE 2000 * | 3.21 | 2.65 17% | 5.15 -60% | 4.1 -28% | 5.6 -74% |
| Gamma | 2.59 85% | 2.44 90% | 2.49 88% | 2.3 96% | 2.23 99% |
| CCT | 6601 98% | 6820 95% | 7042 92% | 7352 88% | 6822 95% |
| Color Space (Percent of AdobeRGB 1998) (%) | 36 | 38 6% | 38 6% | 36.7 2% | 55.7 55% |
| Color Space (Percent of sRGB) (%) | 57 | 59 4% | 59 4% | 57.9 2% | 85.1 49% |
| Total Average (Program / Settings) | -9% /
4% | -2% /
10% | -1% /
-4% | 9% /
13% |
* ... smaller is better
Screen Flickering / PWM (Pulse-Width Modulation)
| Screen flickering / PWM not detected | 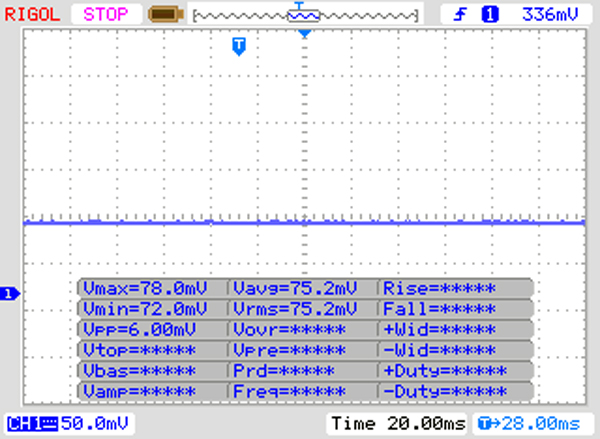 | ||
In comparison: 52 % of all tested devices do not use PWM to dim the display. If PWM was detected, an average of 7801 (minimum: 5 - maximum: 343500) Hz was measured. | |||
Right out of the box, the DeltaE 2000 color deviation of the display is 4.75. Therefore, it is not very far from the desired value (DeltaE less than 3). The display does not suffer from a bluish cast. The screen cannot fully cover both the AdobeRGB color space and the sRGB color space. It can only cover 36% of AdobeRGB and 57% of sRGB.
By means of our color profile, the color reproduction can be improved. However before downloading it, you should make sure that your laptop has the same display model (manufacturer + model number) as our review device, because otherwise our color profile can result in worse color reproduction. Displays from different manufacturers can often be found within notebooks from the same model range.


Display Response Times
| ↔ Response Time Black to White | ||
|---|---|---|
| 24 ms ... rise ↗ and fall ↘ combined | ↗ 14 ms rise | 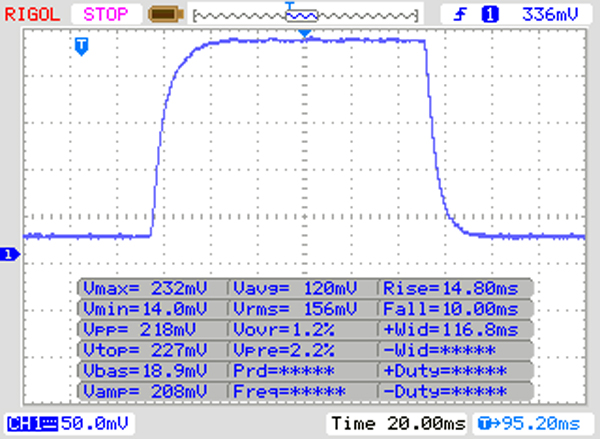 |
| ↘ 10 ms fall | ||
| The screen shows good response rates in our tests, but may be too slow for competitive gamers. In comparison, all tested devices range from 0.1 (minimum) to 240 (maximum) ms. » 54 % of all devices are better. This means that the measured response time is worse than the average of all tested devices (19.9 ms). | ||
| ↔ Response Time 50% Grey to 80% Grey | ||
| 35 ms ... rise ↗ and fall ↘ combined | ↗ 17 ms rise | 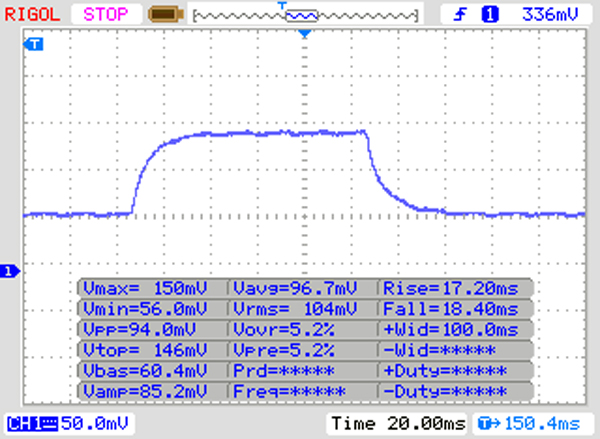 |
| ↘ 18 ms fall | ||
| The screen shows slow response rates in our tests and will be unsatisfactory for gamers. In comparison, all tested devices range from 0.165 (minimum) to 636 (maximum) ms. » 49 % of all devices are better. This means that the measured response time is worse than the average of all tested devices (31.1 ms). | ||
Acer has equipped the A715-72G with an IPS panel with stable viewing angles. Therefore, the screen content can be read from any position. The display brightness is only sufficient for indoor use. Outside, the screen is readable only when the sun does not shine too brightly.

Performance - Good enough for years to come
The Aspire 7 A715-72G is a 15.6-inch multimedia notebook. It is powerful enough for such usage scenarios as playing 3D video games and consuming media content. Our review device can be had for about 1200 Euros (~$1374). Other hardware configurations are also available. The prices start at 900 Euros (~$1031).
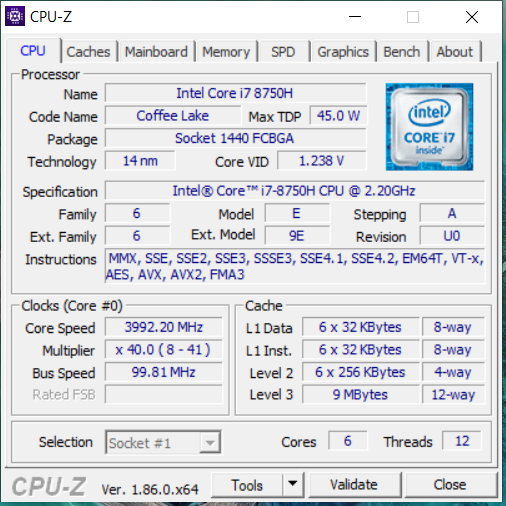
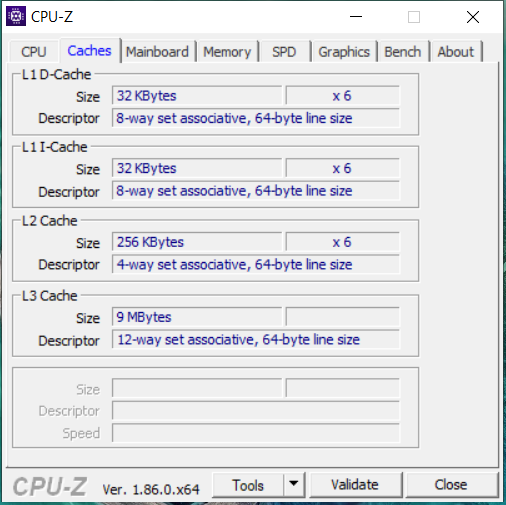


Processor
The Aspire A715 comes with a Core i7-8750H. It is a hexa-care (Coffee Lake) CPU from Intel with a TDP of 45 watts. The CPU represents the best compromise of energy efficiency and performance and therefore is a good choice for the Aspire 7. The processor has a base clock of 2.2 GHz and a boost clock of 3.9 GHz for six cores, 4 GHz for four cores and 4.1 GHz for one/two cores.
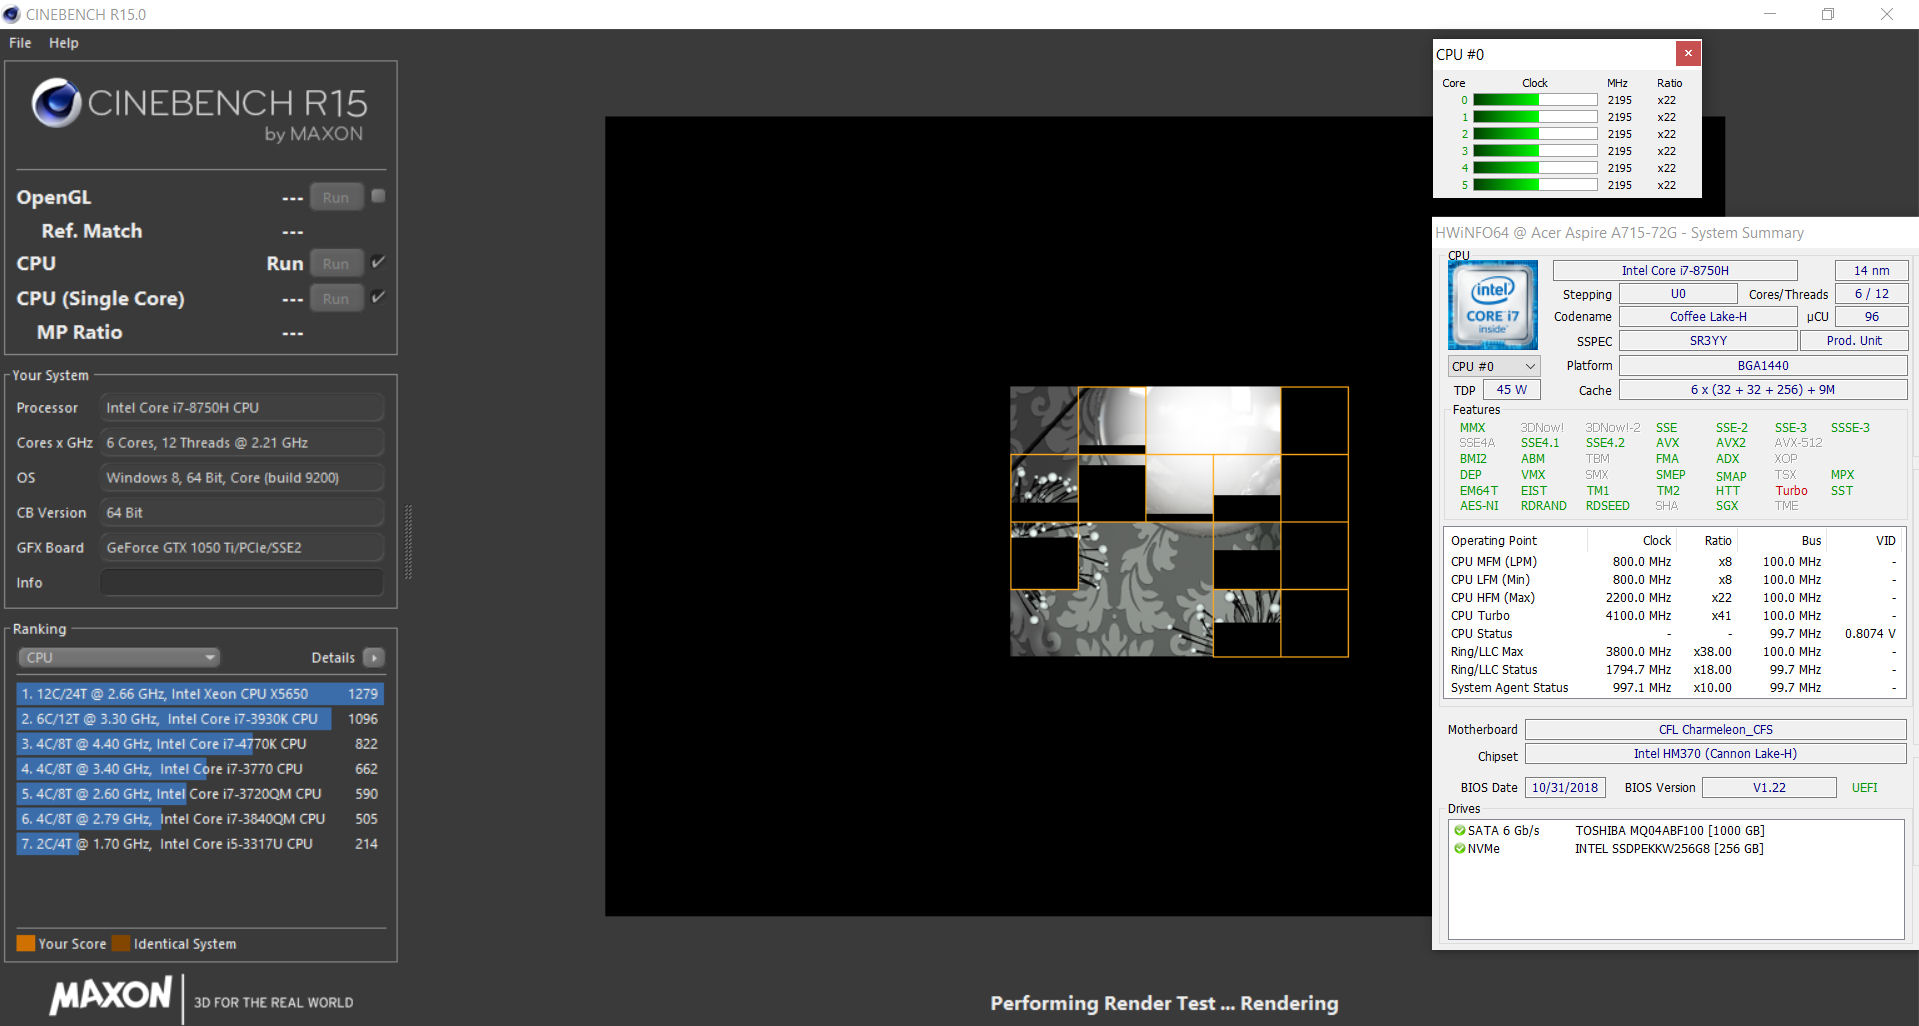
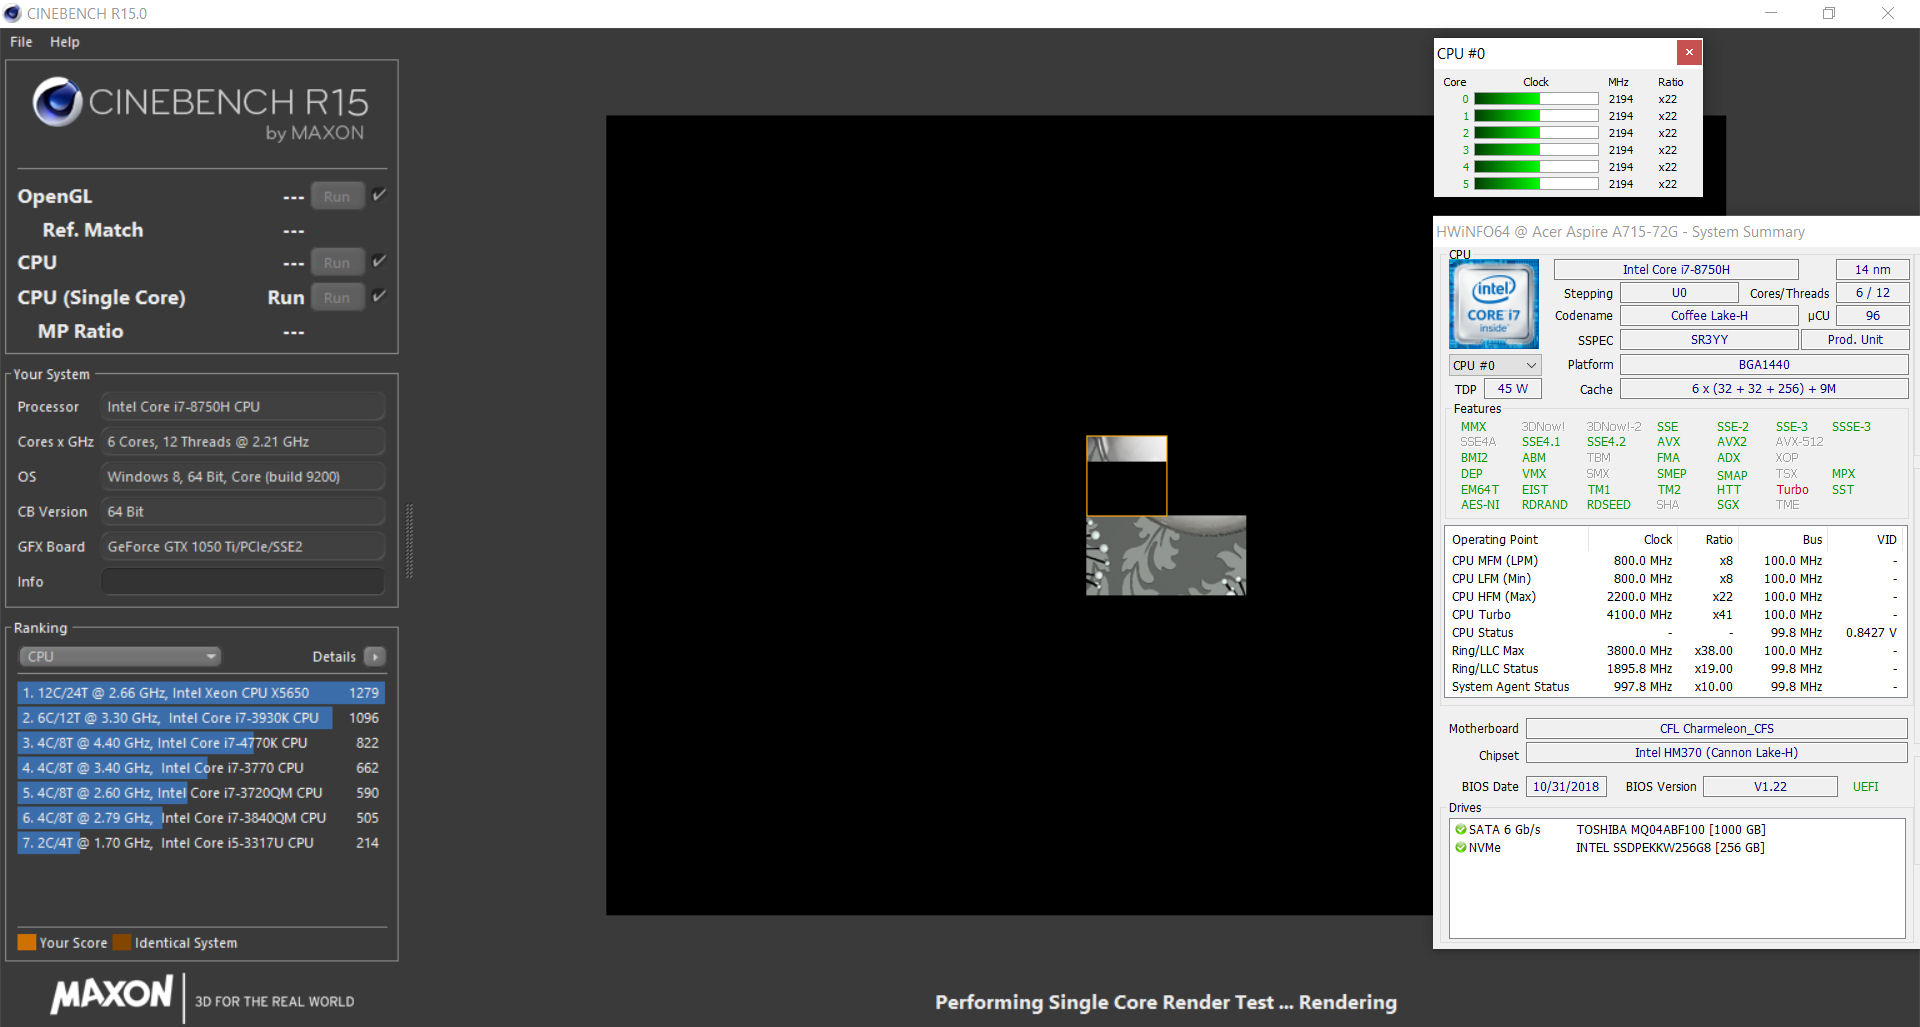
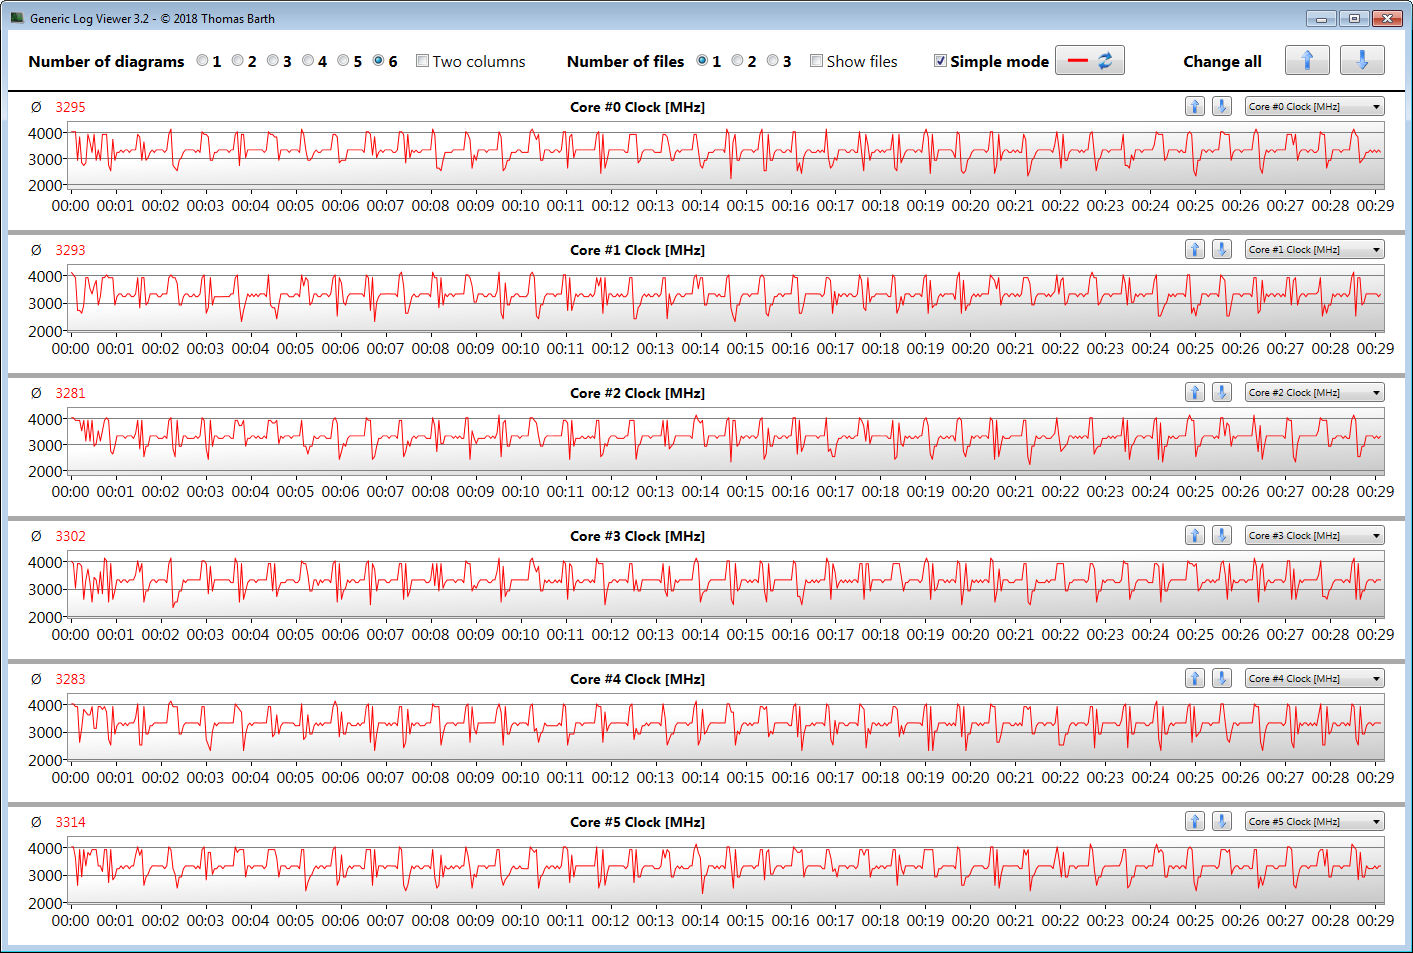
In the multi-core section of the Cinebench R15 benchmarks, the processor operates at 2.8 to 3.9 GHz. In the single-core benchmarks, the CPU runs at 3.9 to 4.1 GHz. This is the level of performance that we see when the laptop is plugged in. When it is running on battery power, the clock rates sink to 2.2 GHz.
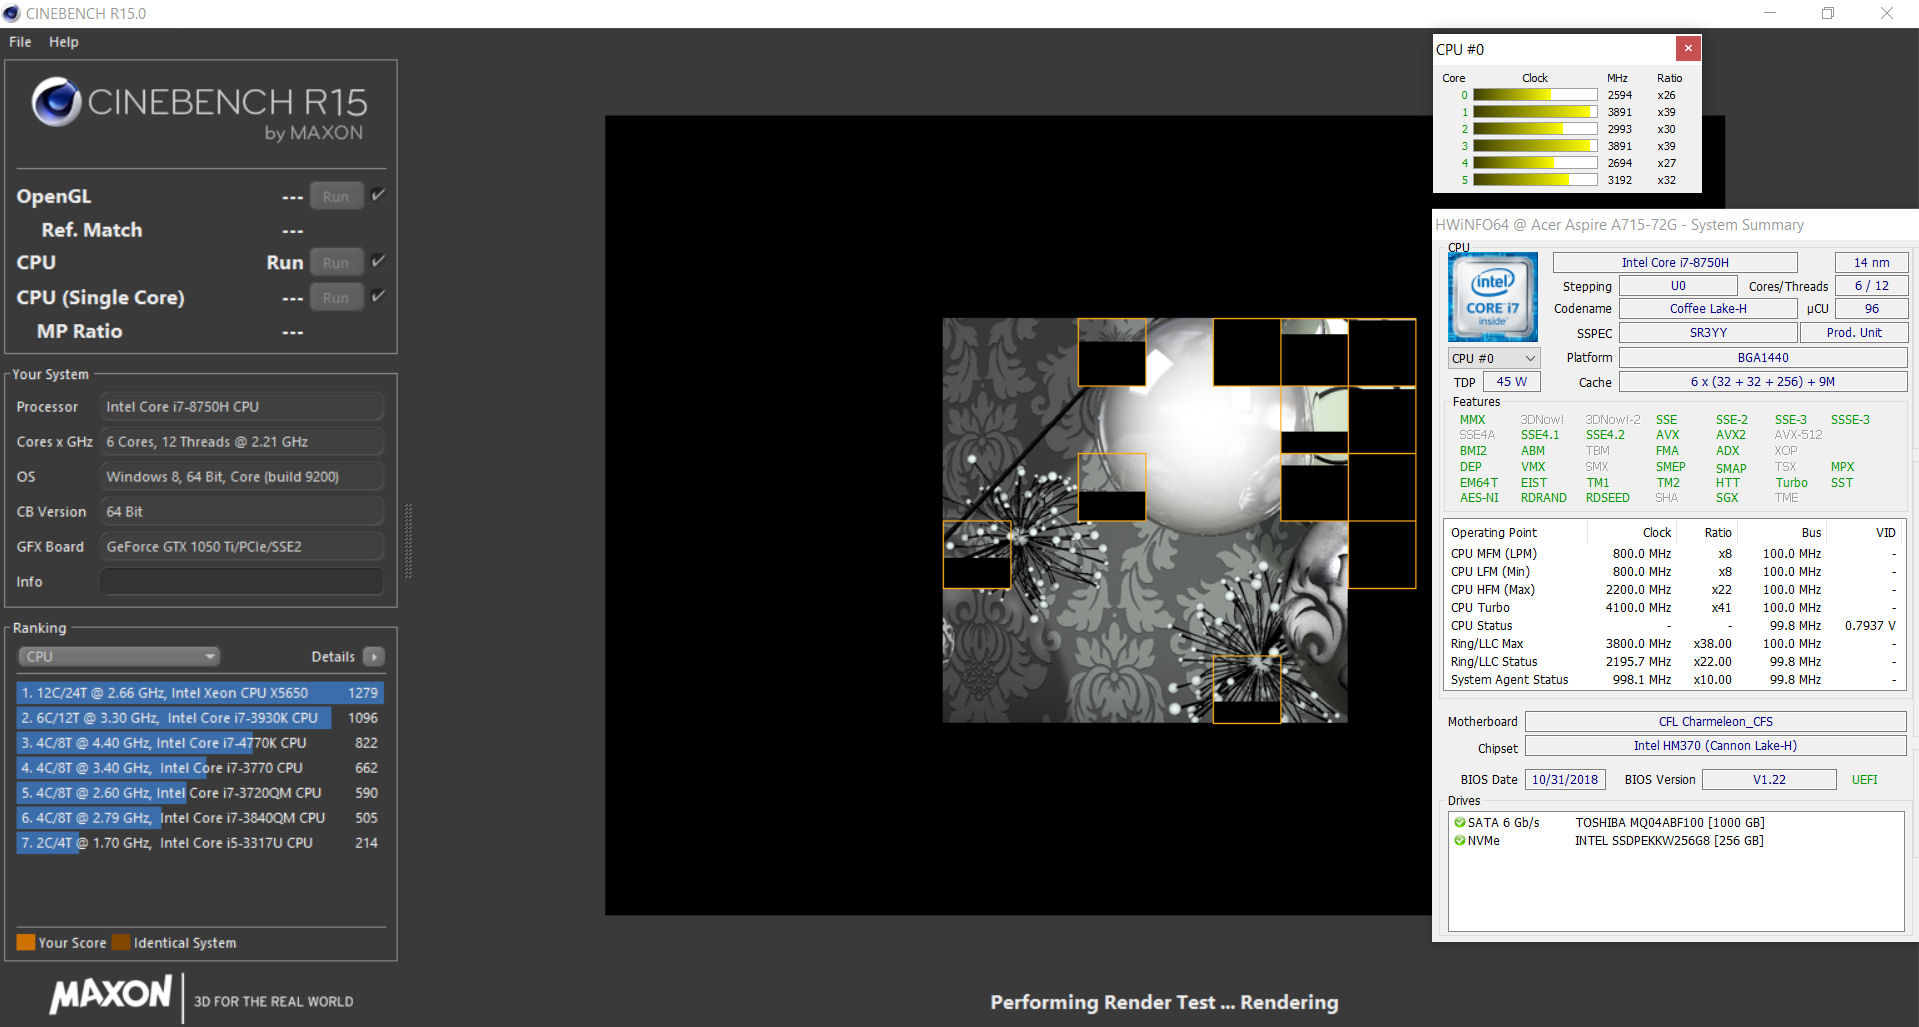
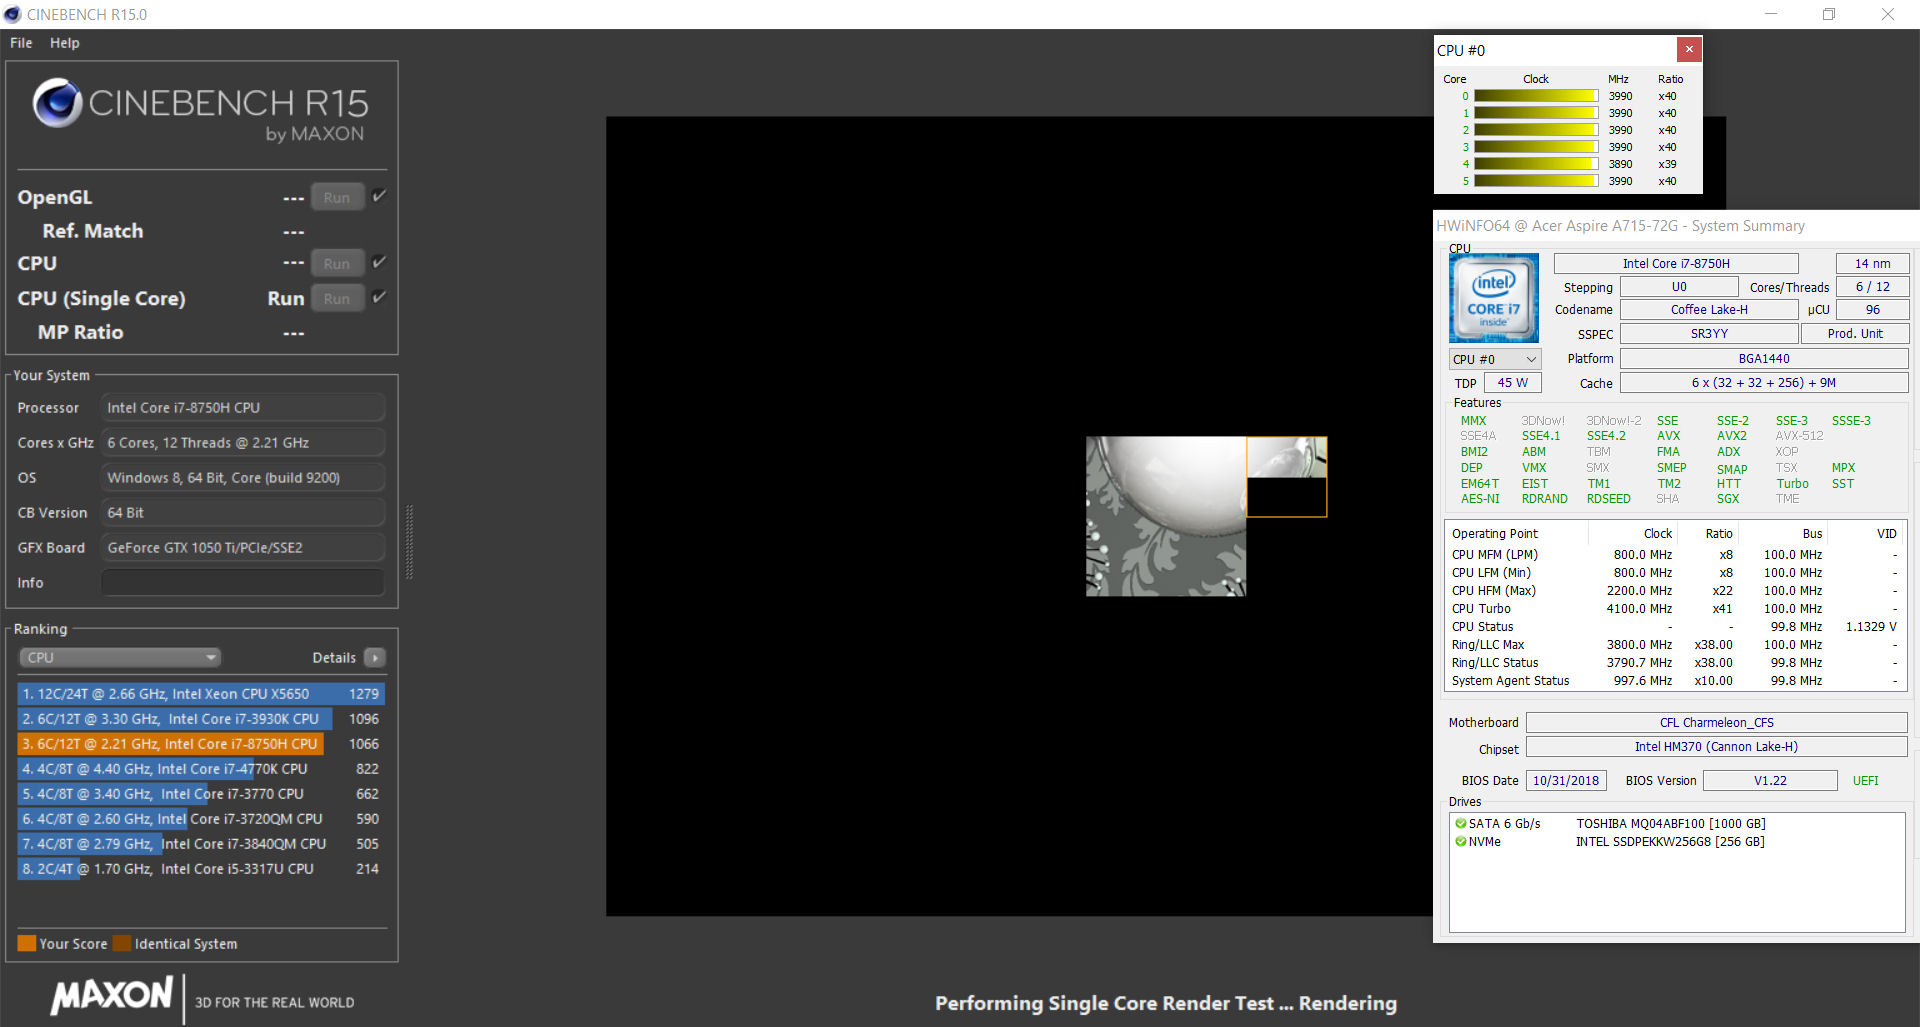
We check if the Turbo boost can be used over an extended period of time by running the Cinebench R15 multi-core benchmark in a continuous loop for 30 minutes. The results drop by less than 10% after the first benchmark run and then stay consistently on the same level. The Turbo boost is utilized.
| Geekbench 3 | |
| 32 Bit Multi-Core Score | |
| Average Intel Core i7-8750H (20725 - 22665, n=13) | |
| HP Pavilion Gaming 15-cx0003ng | |
| Acer Aspire 7 A715-72G-704Q | |
| 32 Bit Single-Core Score | |
| Average Intel Core i7-8750H (3734 - 4163, n=13) | |
| HP Pavilion Gaming 15-cx0003ng | |
| Acer Aspire 7 A715-72G-704Q | |
| Geekbench 4.0 | |
| 64 Bit Multi-Core Score | |
| Average of class Multimedia (n=1last 2 years) | |
| Average Intel Core i7-8750H (17048 - 22006, n=8) | |
| HP Pavilion Gaming 15-cx0003ng | |
| Acer Aspire 7 A715-72G-704Q | |
| 64 Bit Single-Core Score | |
| Average of class Multimedia (n=1last 2 years) | |
| HP Pavilion Gaming 15-cx0003ng | |
| Average Intel Core i7-8750H (4548 - 4997, n=8) | |
| Acer Aspire 7 A715-72G-704Q | |
| Geekbench 4.4 | |
| 64 Bit Multi-Core Score | |
| Average of class Multimedia (n=1last 2 years) | |
| Average Intel Core i7-8750H (17709 - 23313, n=17) | |
| HP Pavilion Gaming 15-cx0003ng | |
| Acer Aspire 7 A715-72G-704Q | |
| 64 Bit Single-Core Score | |
| Average of class Multimedia (n=1last 2 years) | |
| HP Pavilion Gaming 15-cx0003ng | |
| Average Intel Core i7-8750H (4669 - 5146, n=17) | |
| Acer Aspire 7 A715-72G-704Q | |
| Mozilla Kraken 1.1 - Total | |
| Dell G3 15 3579 (Edge 42.17134.1.0) | |
| Acer Aspire 7 A715-72G-704Q (Edge 44) | |
| Lenovo Legion Y730-15ICH i5-8300H (Edge 42.17134.1.0) | |
| Average Intel Core i7-8750H (695 - 1272, n=50) | |
| HP Pavilion Gaming 15-cx0003ng | |
| Acer Aspire 7 A715-71G-53TU (EDGE: 41.16299.15.0) | |
| Average of class Multimedia (228 - 835, n=74, last 2 years) | |
| Octane V2 - Total Score | |
| Average of class Multimedia (64079 - 153175, n=35, last 2 years) | |
| Acer Aspire 7 A715-71G-53TU (EDGE: 41.16299.15.0) | |
| Acer Aspire 7 A715-72G-704Q (Edge 44) | |
| HP Pavilion Gaming 15-cx0003ng | |
| Average Intel Core i7-8750H (27460 - 44549, n=47) | |
| Lenovo Legion Y730-15ICH i5-8300H (Edge 42.17134.1.0) | |
| Dell G3 15 3579 (Edge 42.17134.1.0) | |
| JetStream 1.1 - 1.1 Total | |
| Average of class Multimedia (482 - 711, n=2, last 2 years) | |
| Acer Aspire 7 A715-71G-53TU (EDGE: 41.16299.15.0) | |
| Acer Aspire 7 A715-72G-704Q (Edge 44) | |
| HP Pavilion Gaming 15-cx0003ng (Edge 44) | |
| Average Intel Core i7-8750H (205 - 299, n=49) | |
| Dell G3 15 3579 (Edge 42.17134.1.0) | |
| Lenovo Legion Y730-15ICH i5-8300H (Edge 42.17134.1.0) | |
* ... smaller is better
System Performance
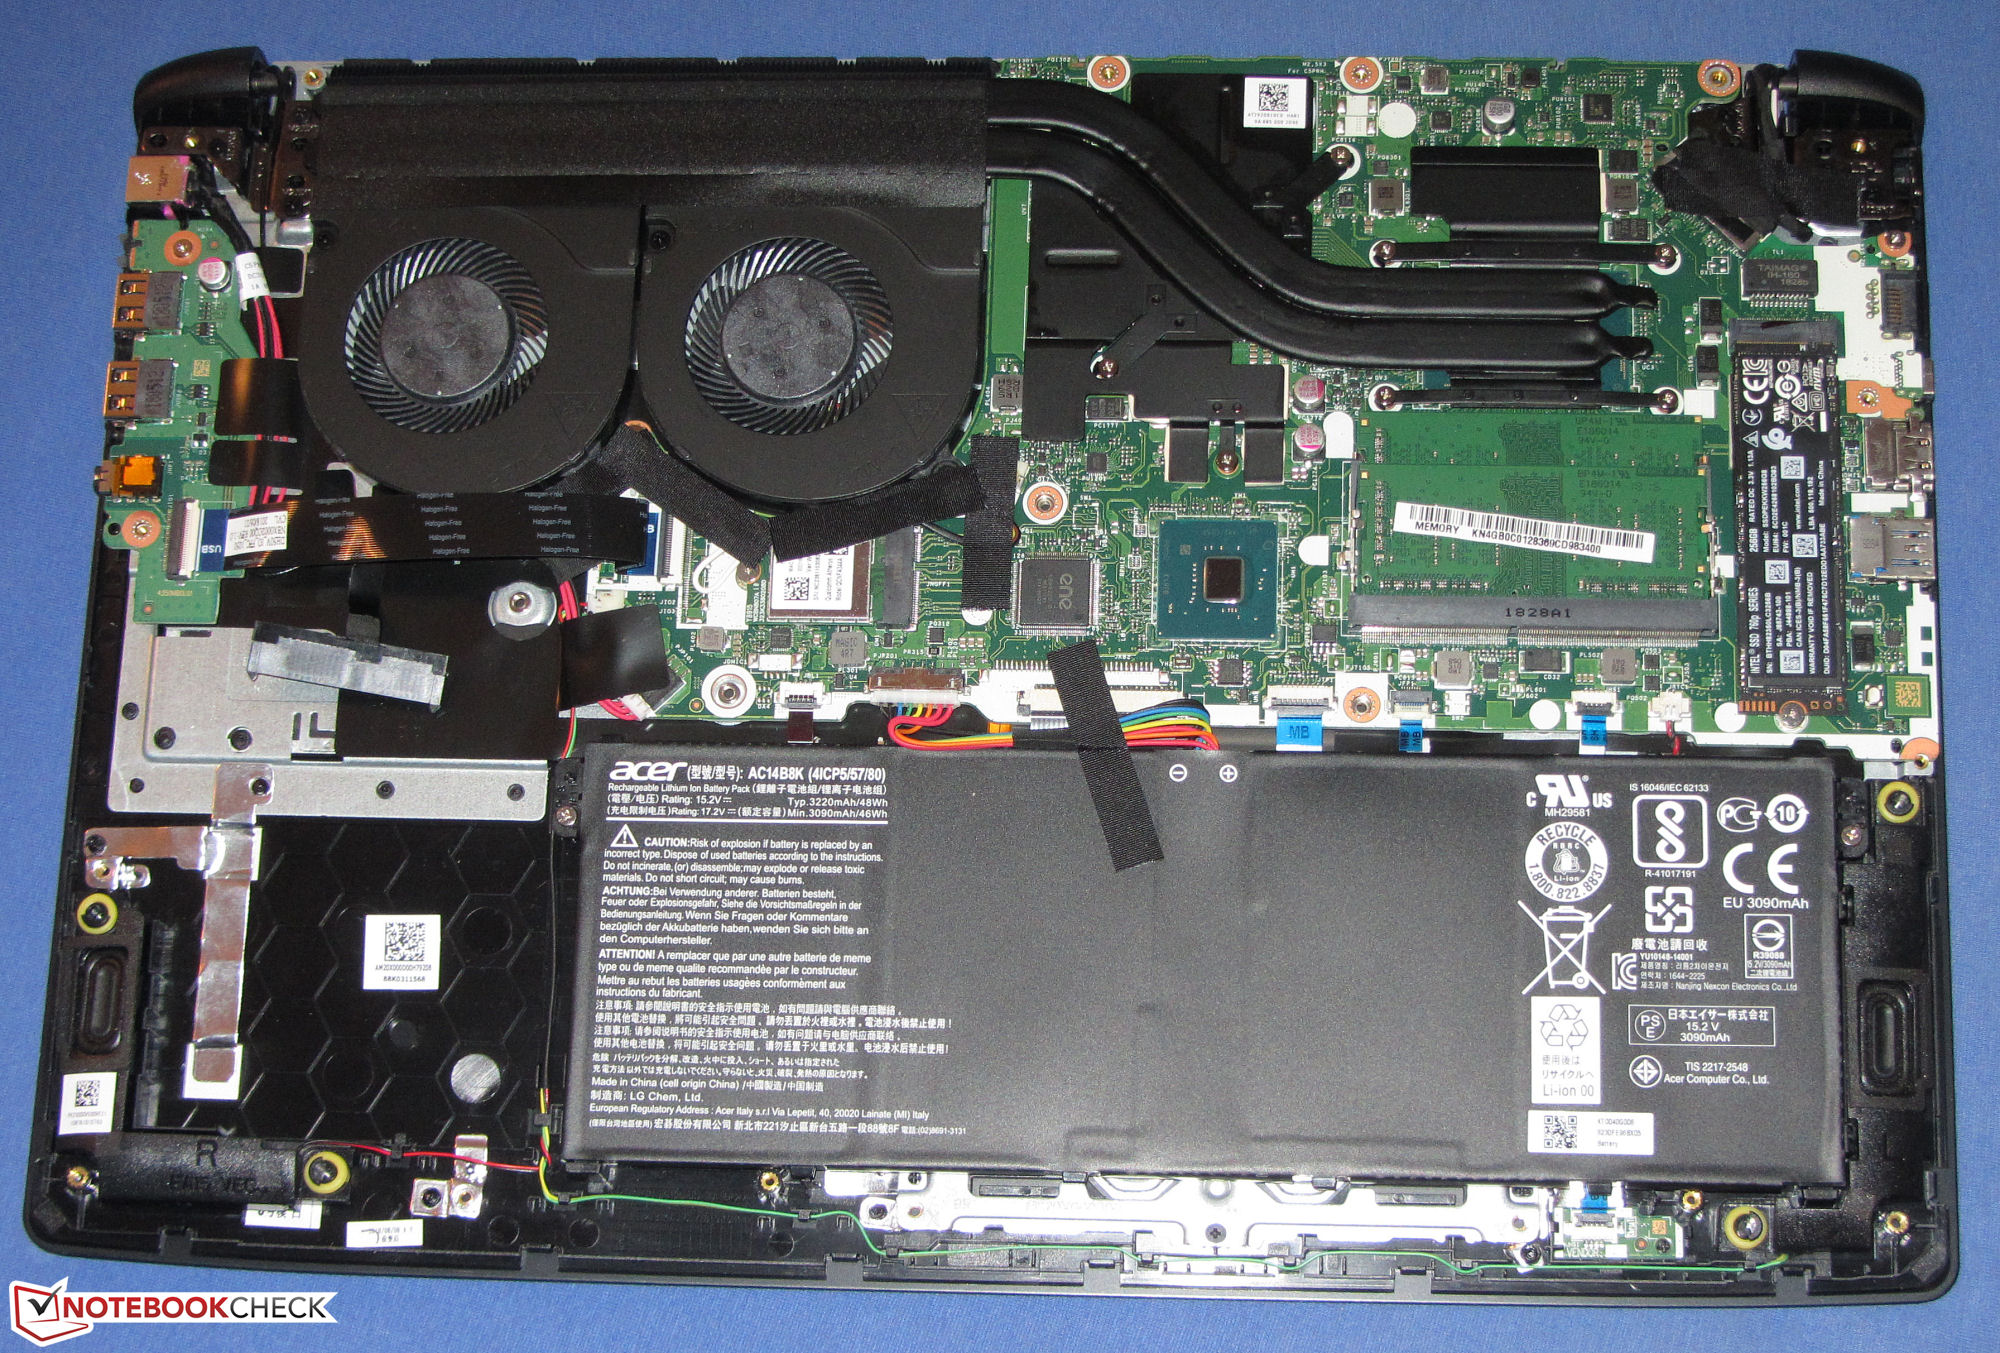
The combination of the Core i7-8750H, 8 GB of dual-channel-enabled RAM and an NVMe SSD creates a very responsive system. We did not encounter any problems. The hexa-core CPU will not become obsolete for years to come. The dedicated graphics card is powerful enough to be able to run the latest games smoothly. The PCMark results show the system to be quite well-rounded.

| PCMark 7 Score | 6380 points | |
| PCMark 8 Home Score Accelerated v2 | 4125 points | |
| PCMark 8 Creative Score Accelerated v2 | 5255 points | |
| PCMark 8 Work Score Accelerated v2 | 5310 points | |
| PCMark 10 Score | 5162 points | |
Help | ||
Storage Devices
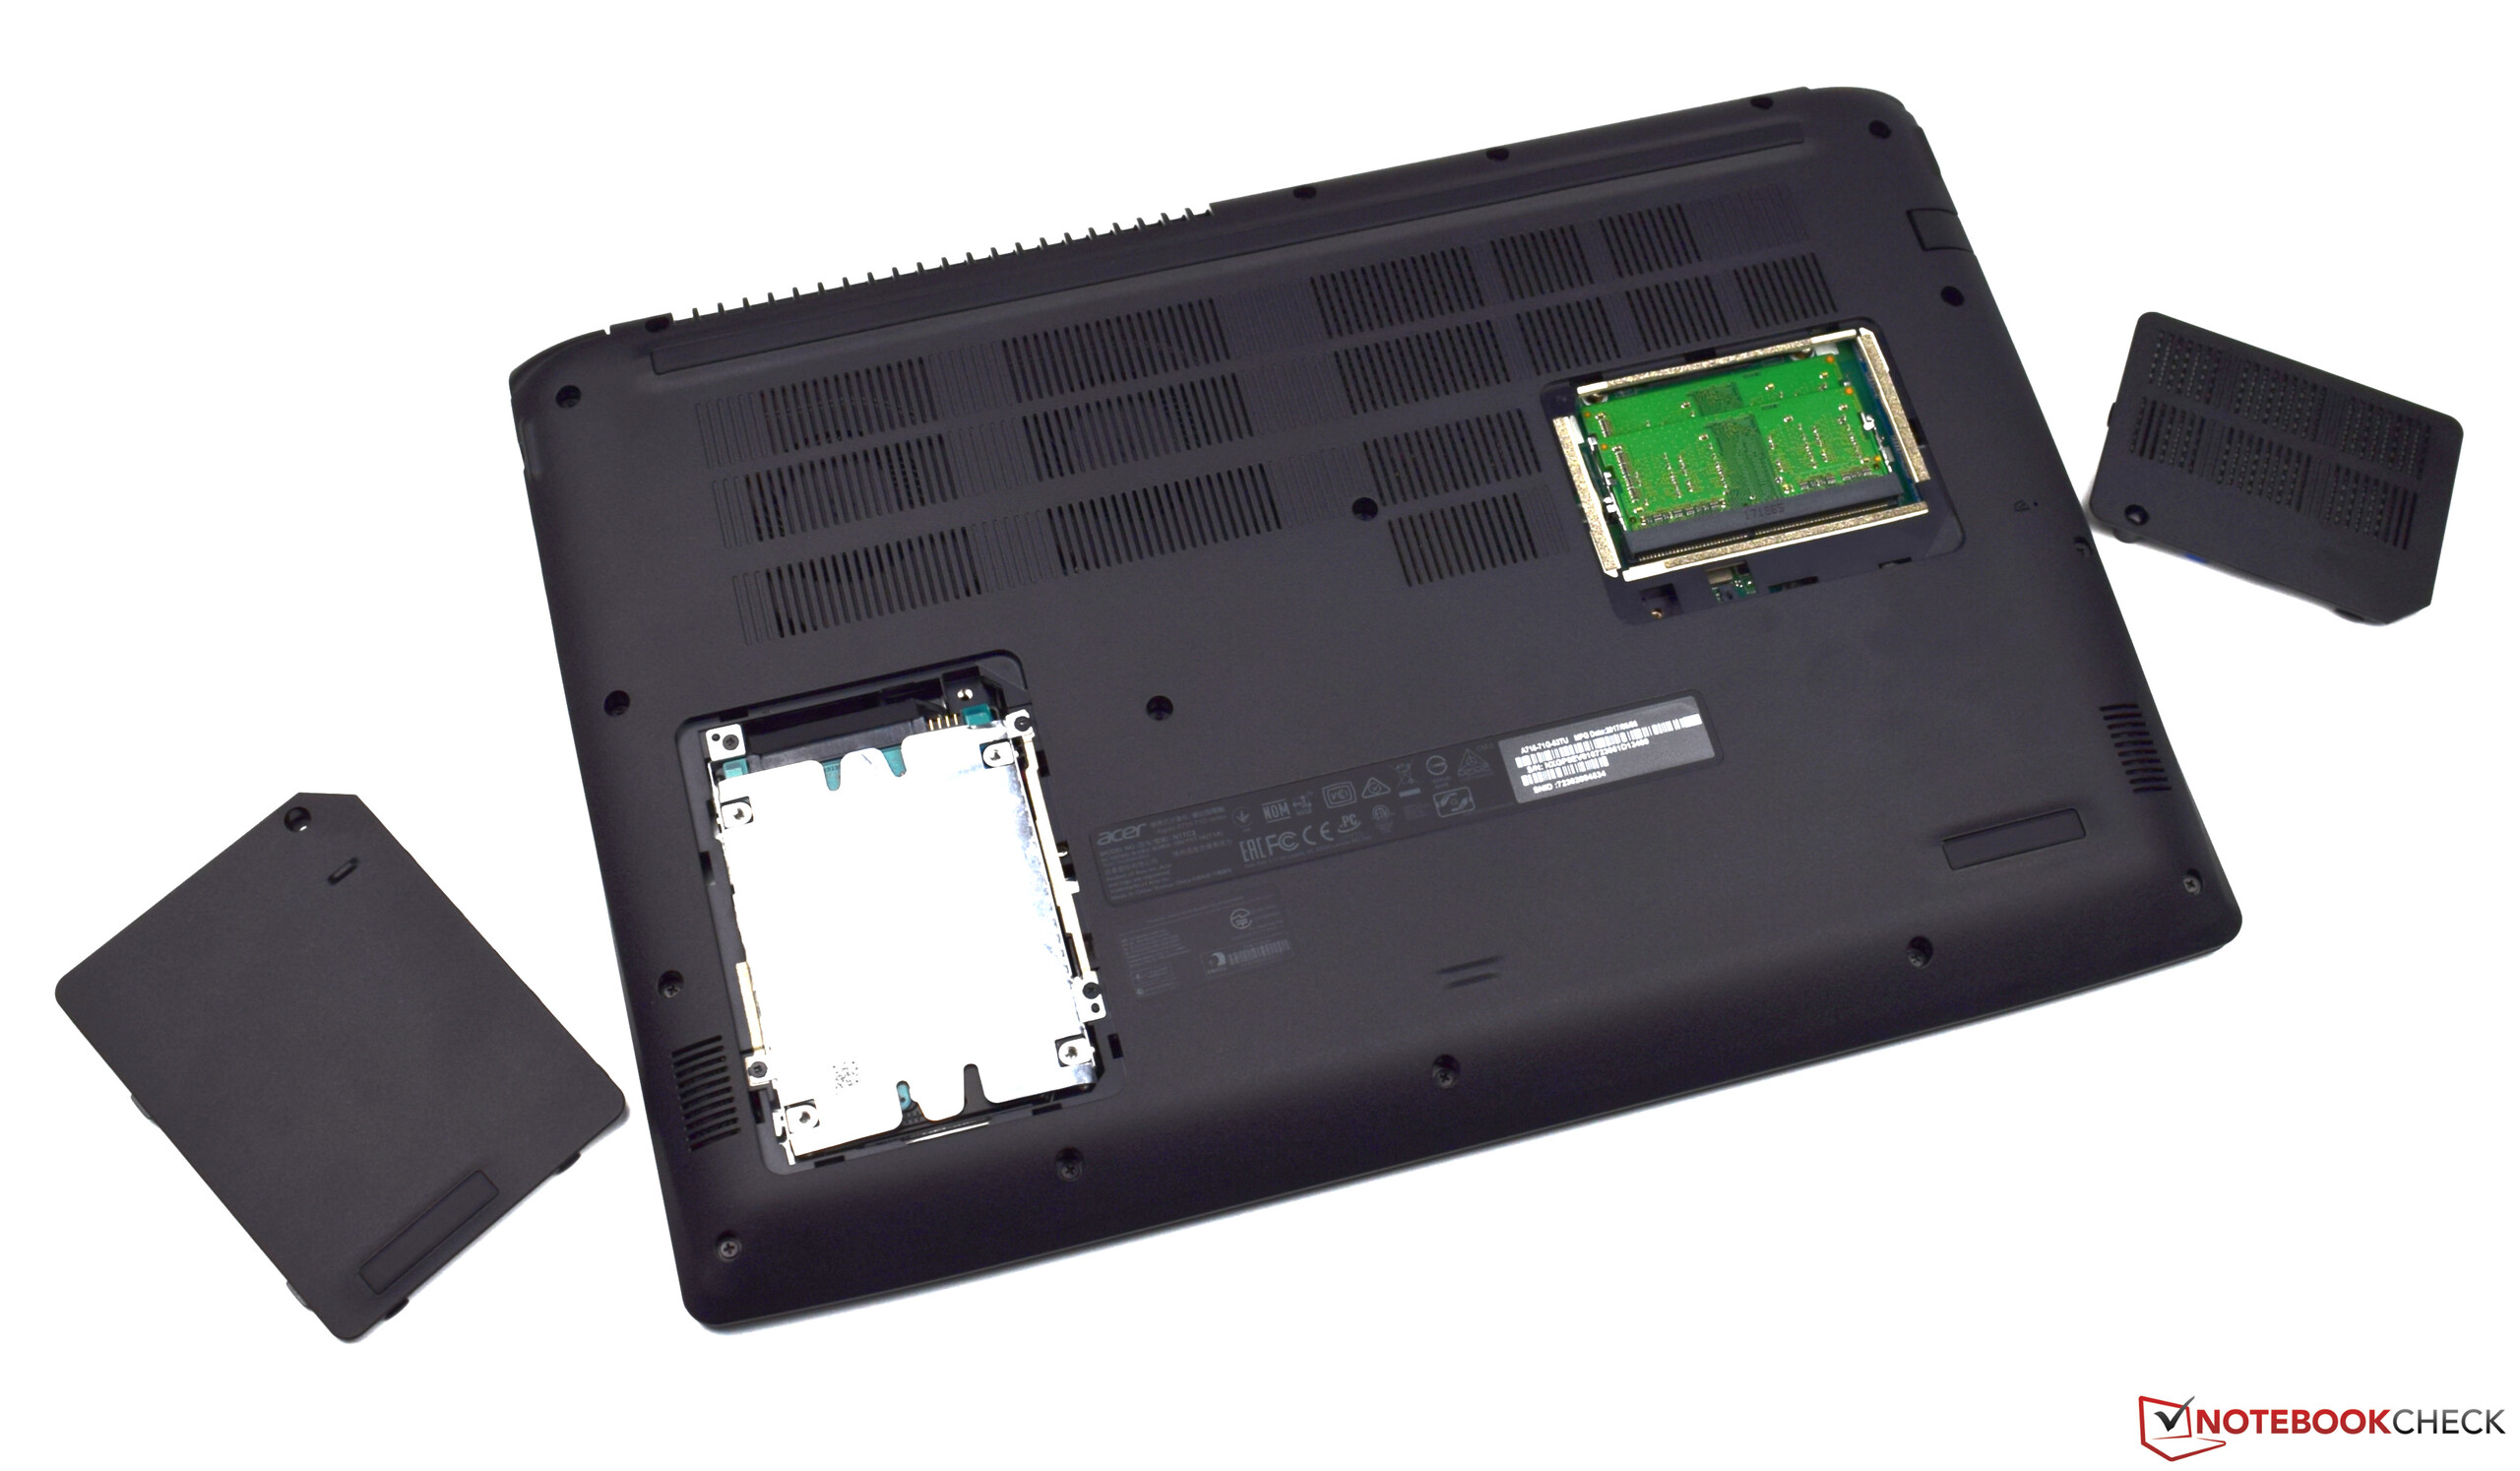
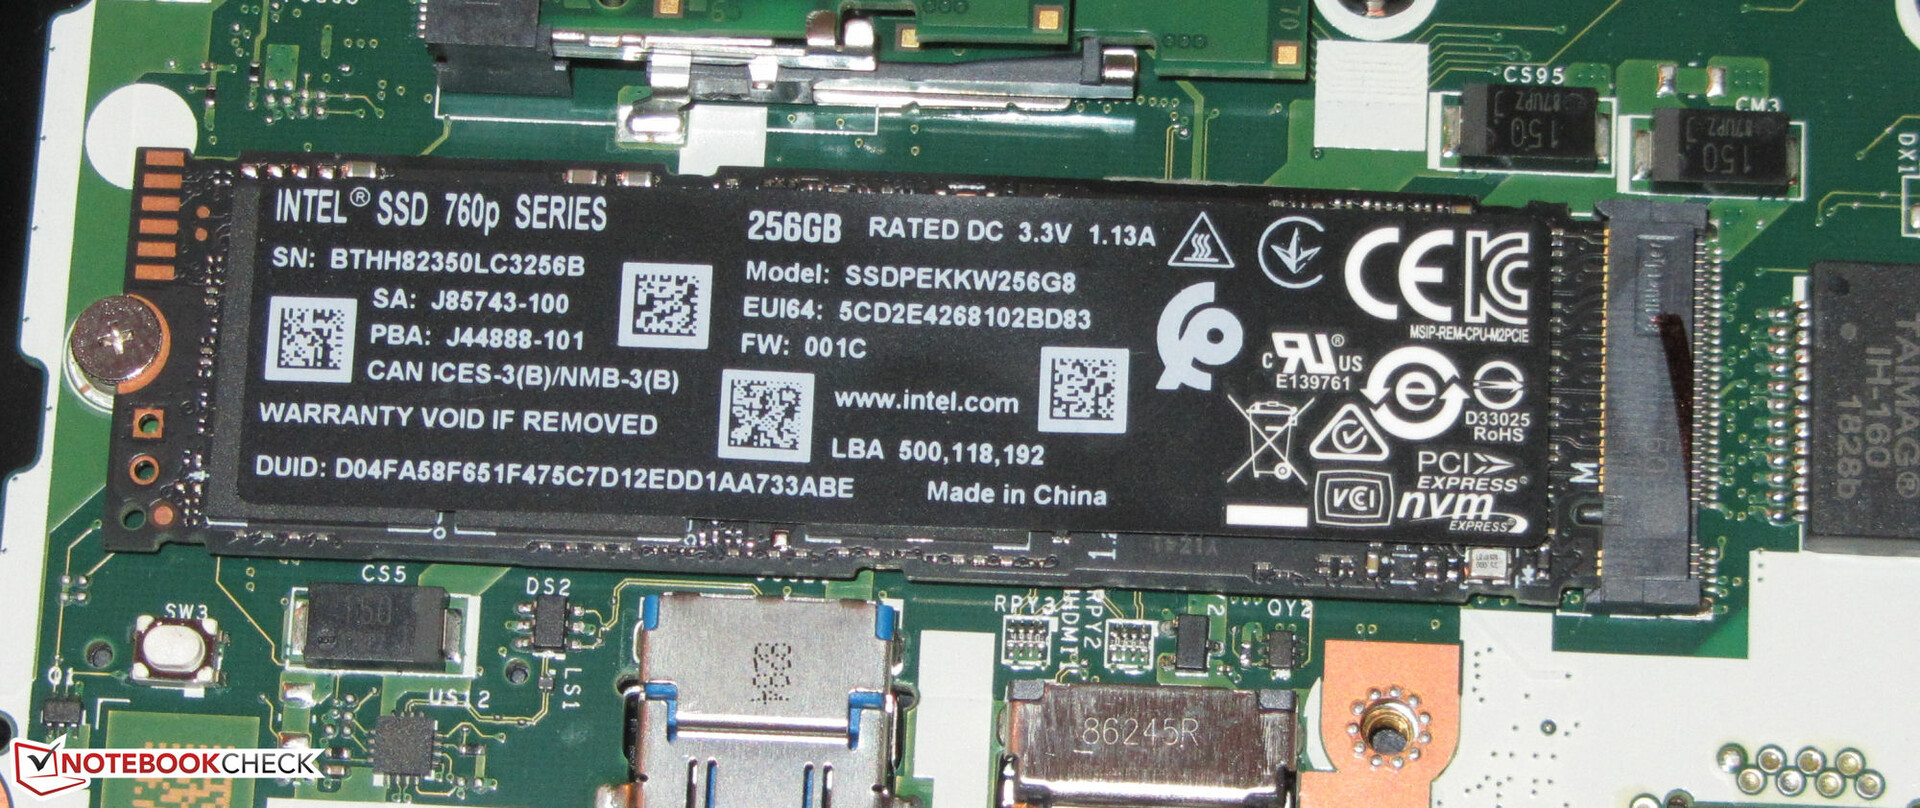
The Aspire 7 features an NVMe SSD from Intel. It comes in the M.2-2280 form-factor and has a capacity of 256 GB. Only 203 GB thereof is available to the user. The rest of the storage space is occupied by the recovery partition and the Windows installation files. NVMe SSDs achieve significantly faster transfer speeds than SATA-III models, because they are connected via PCI Express 3.0 x4.
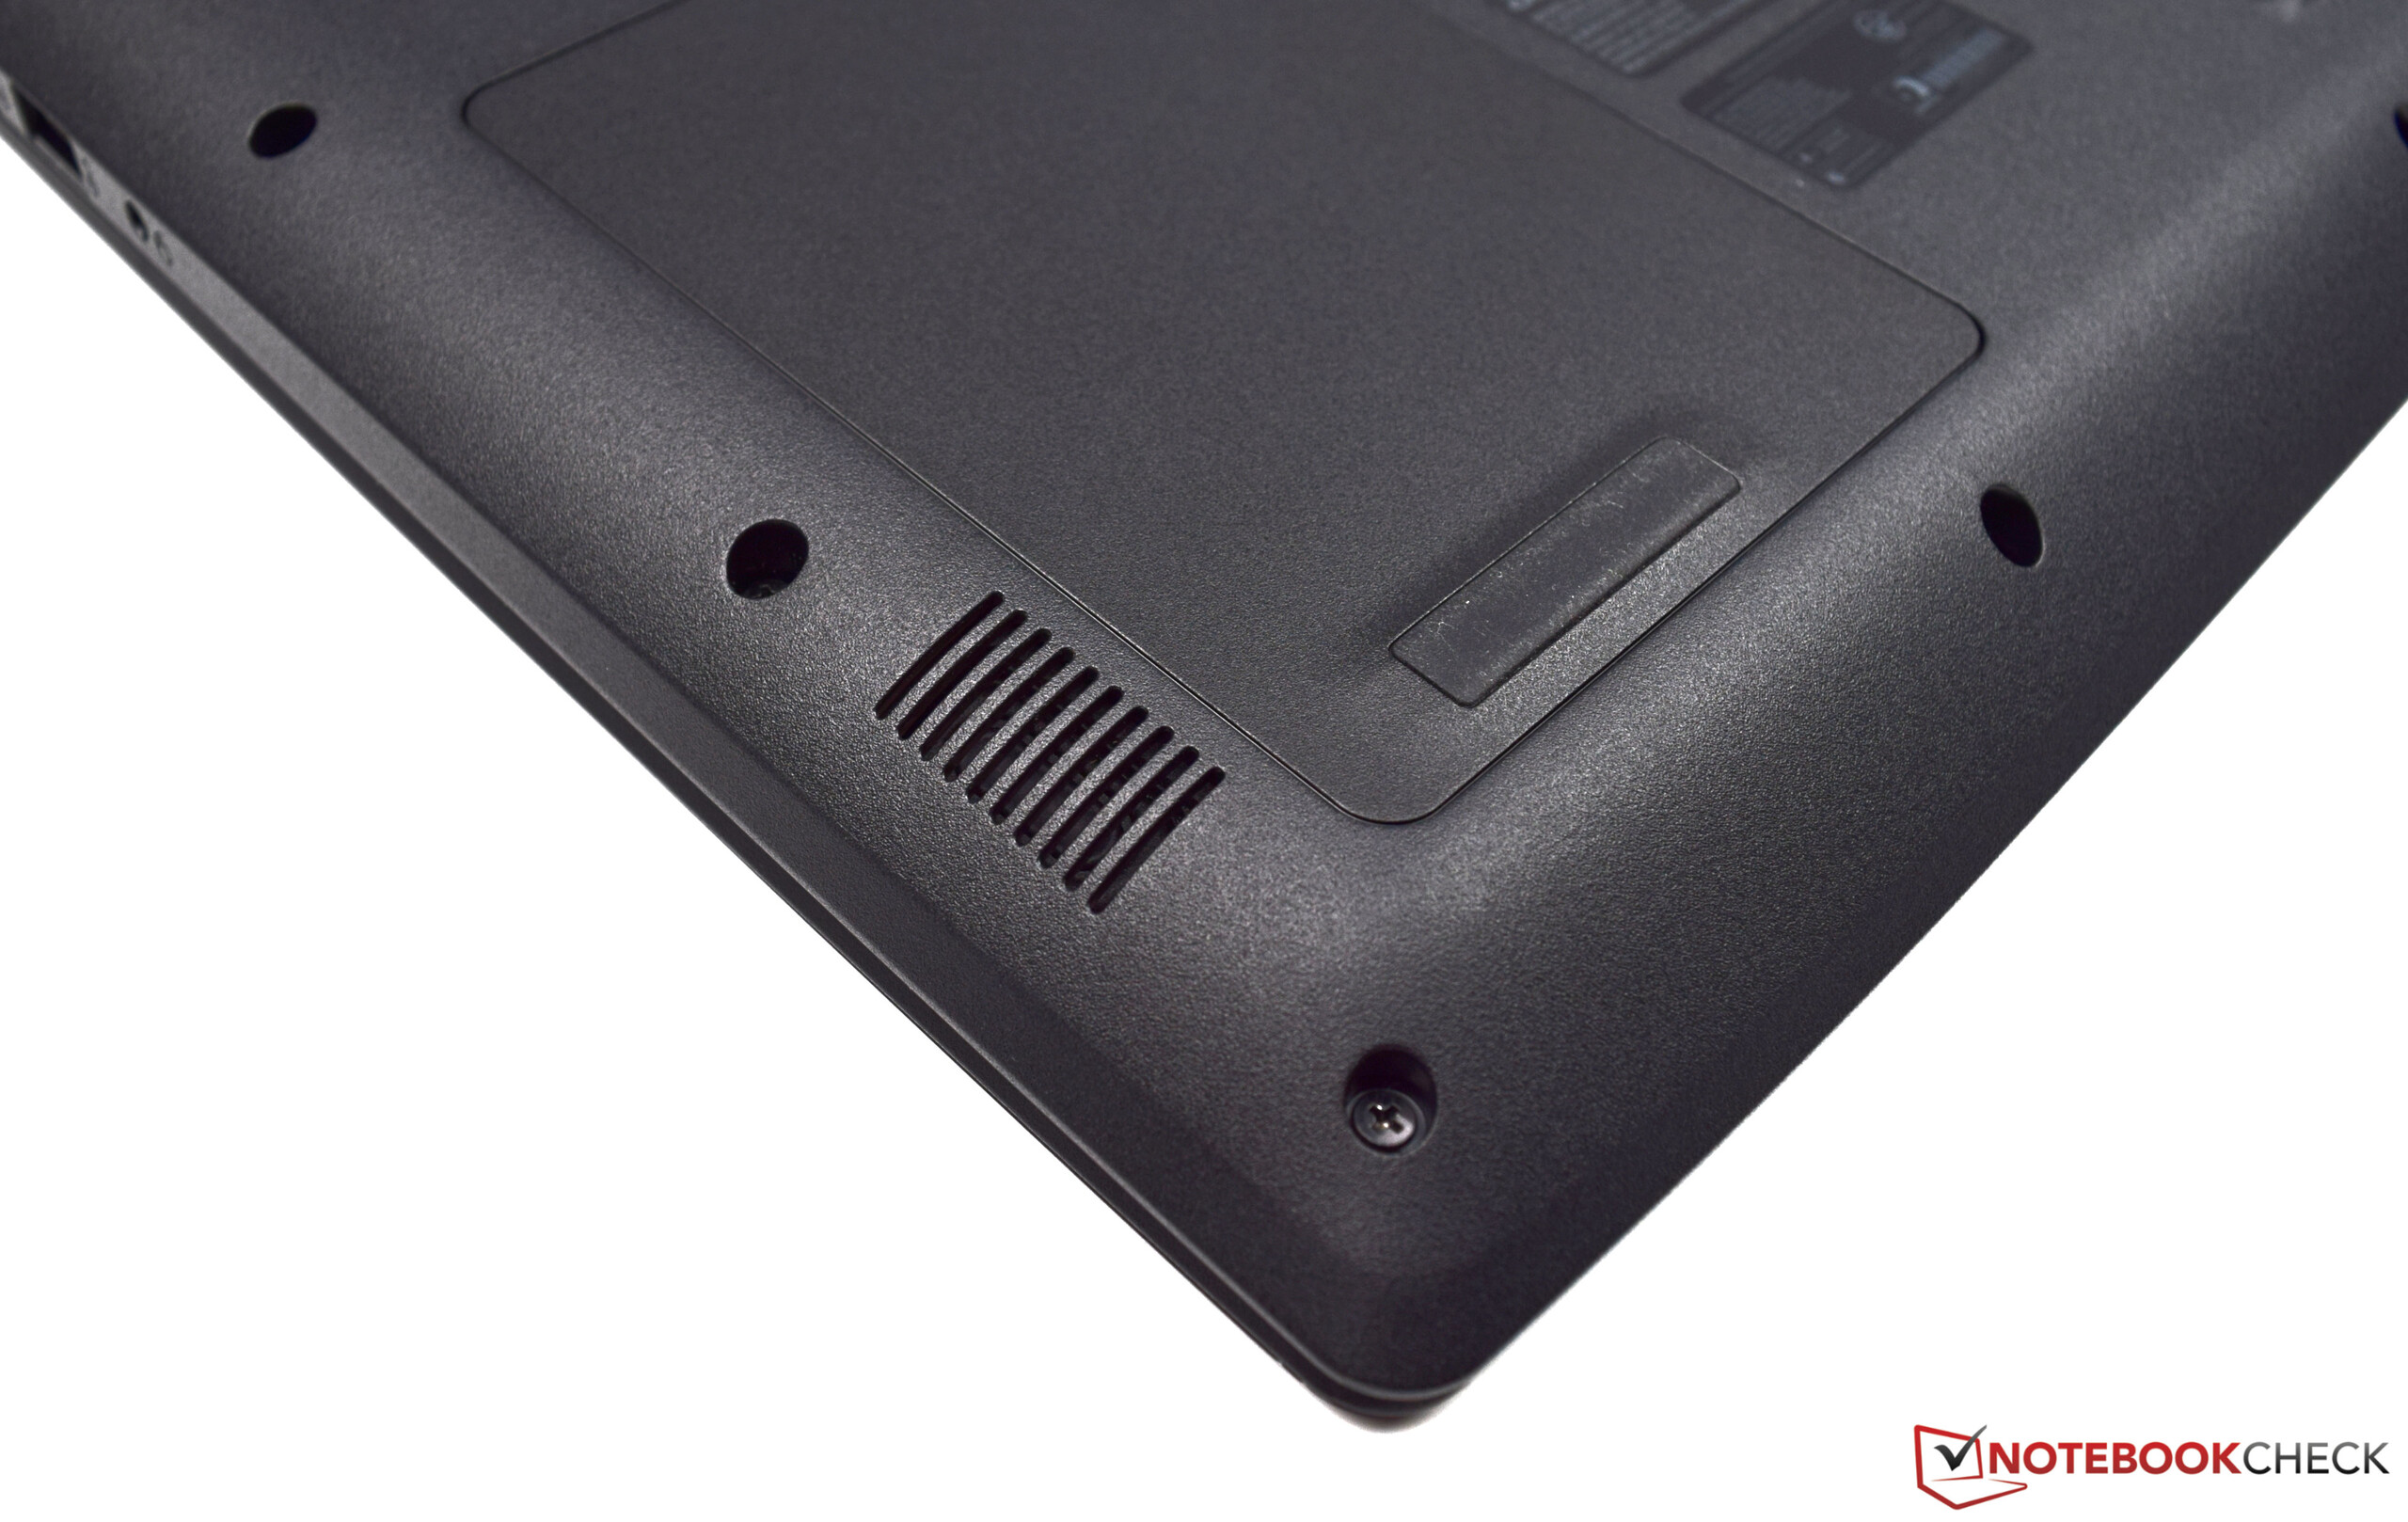
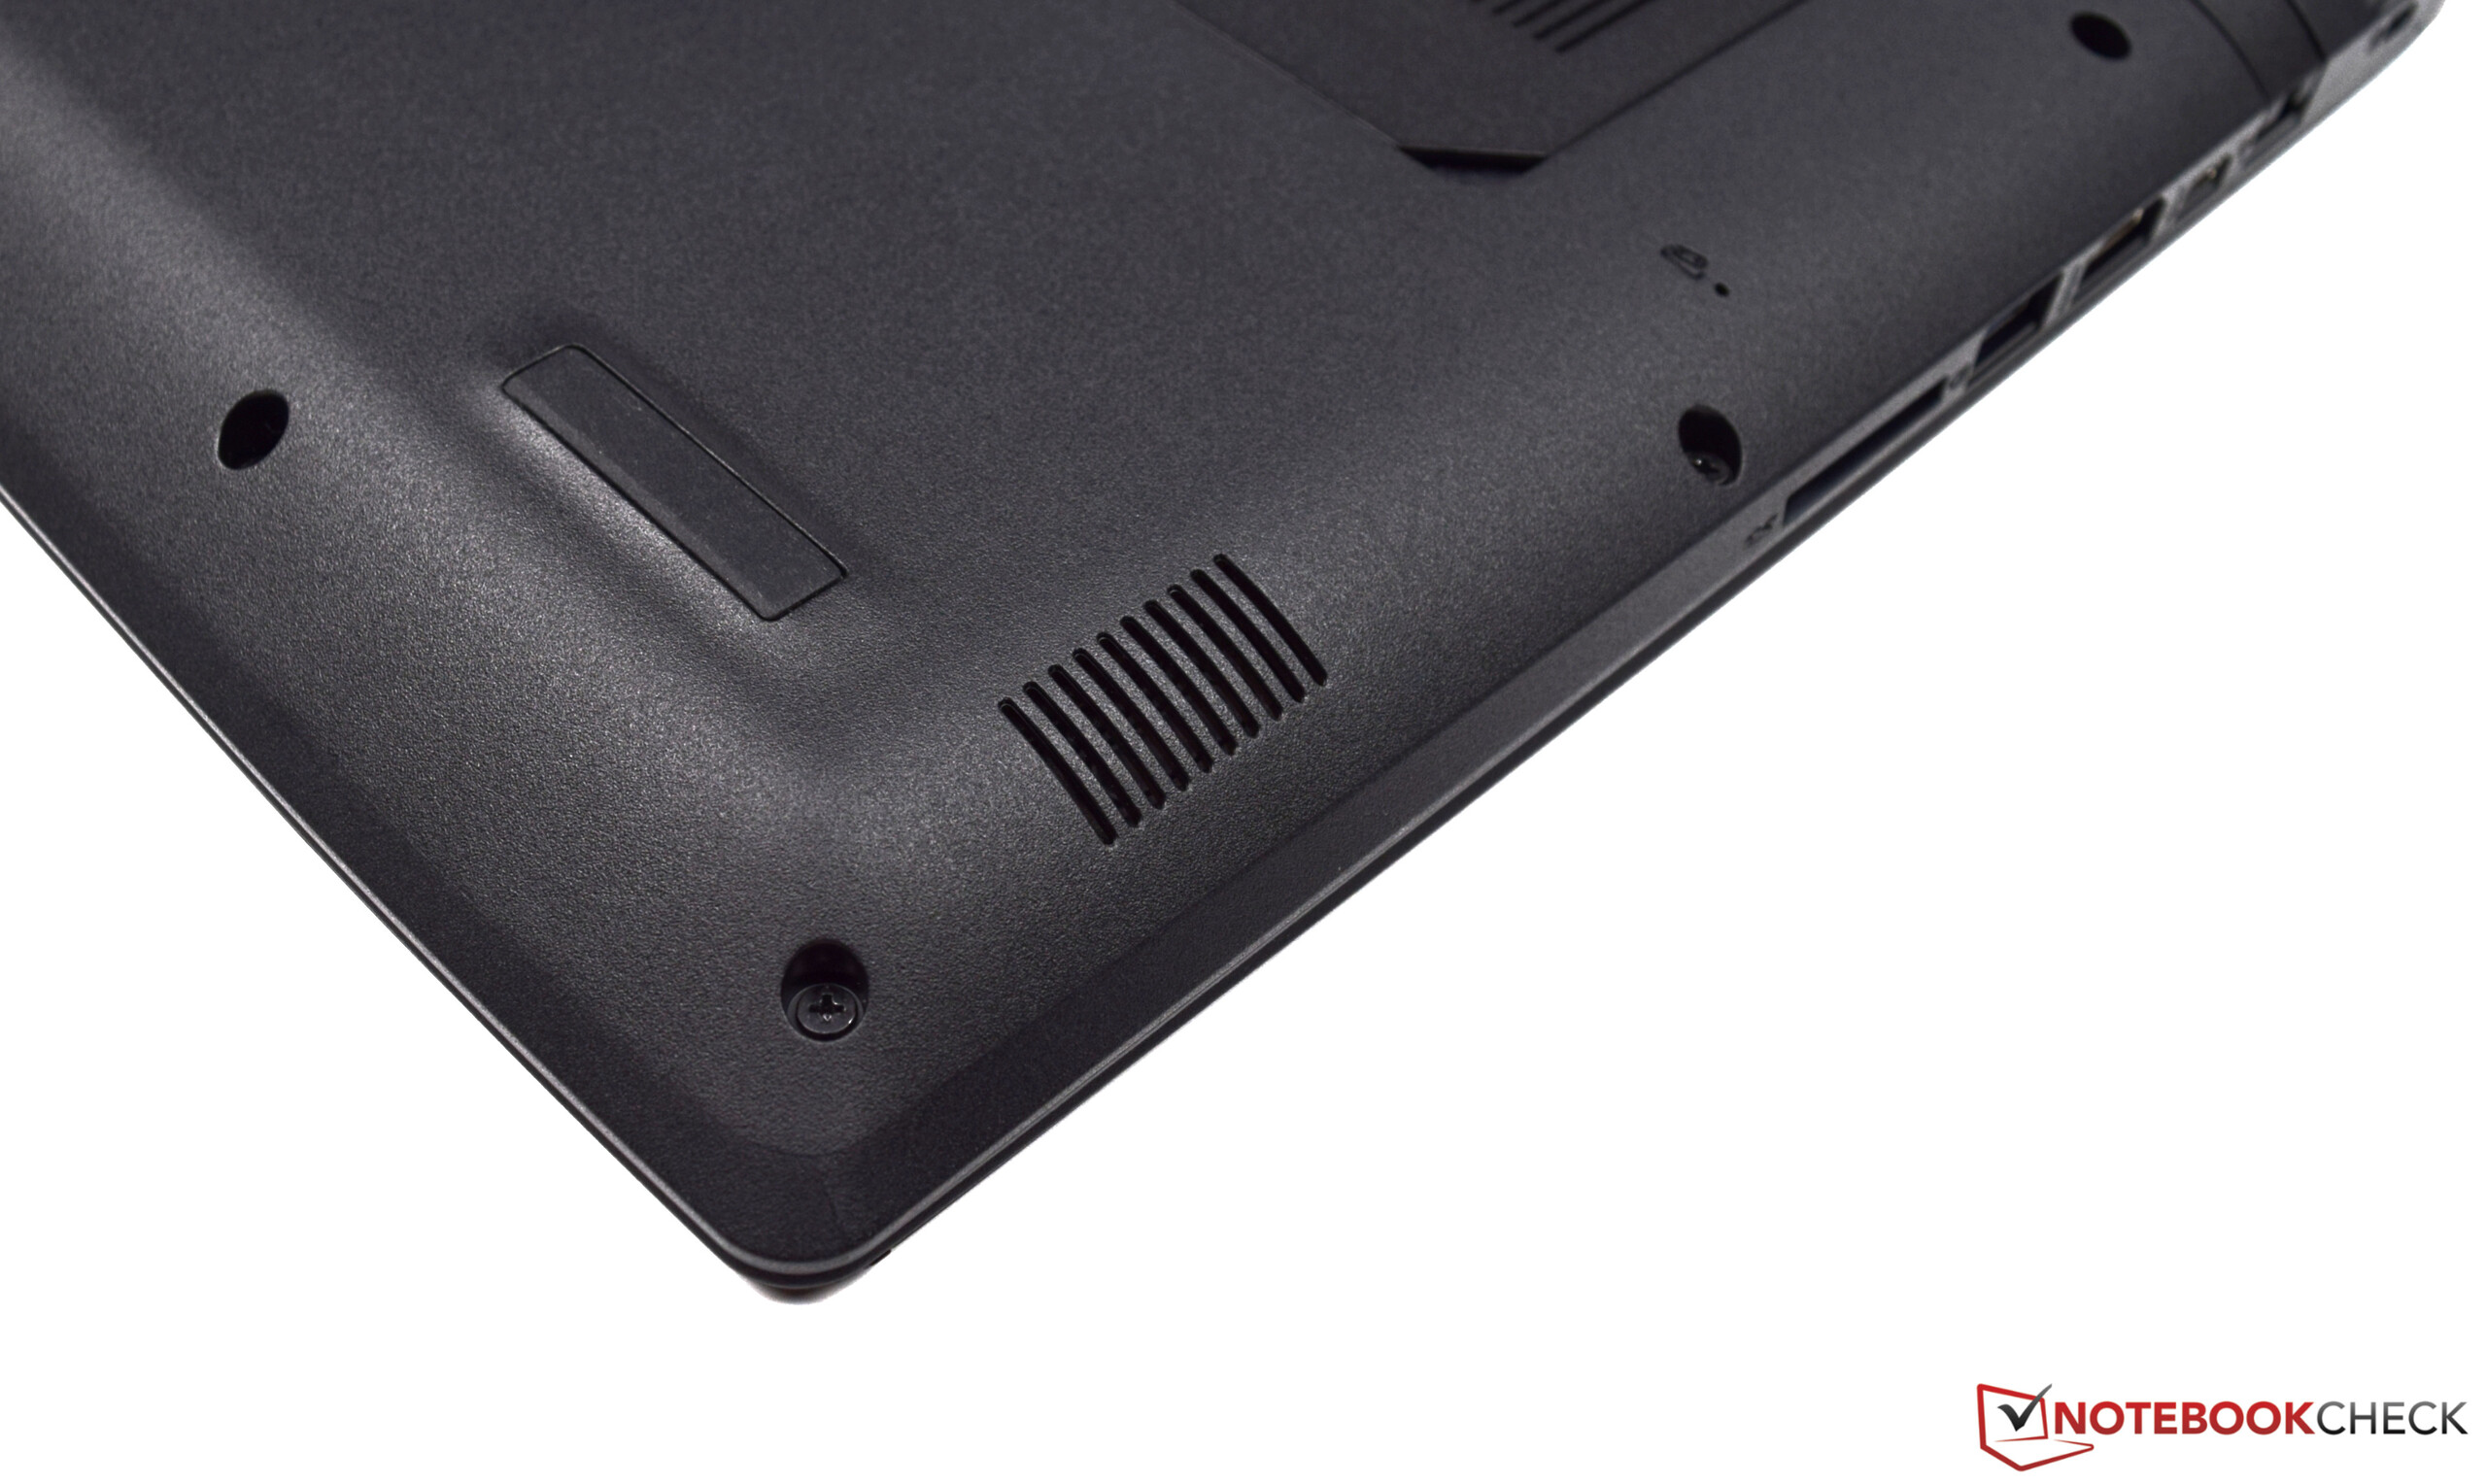
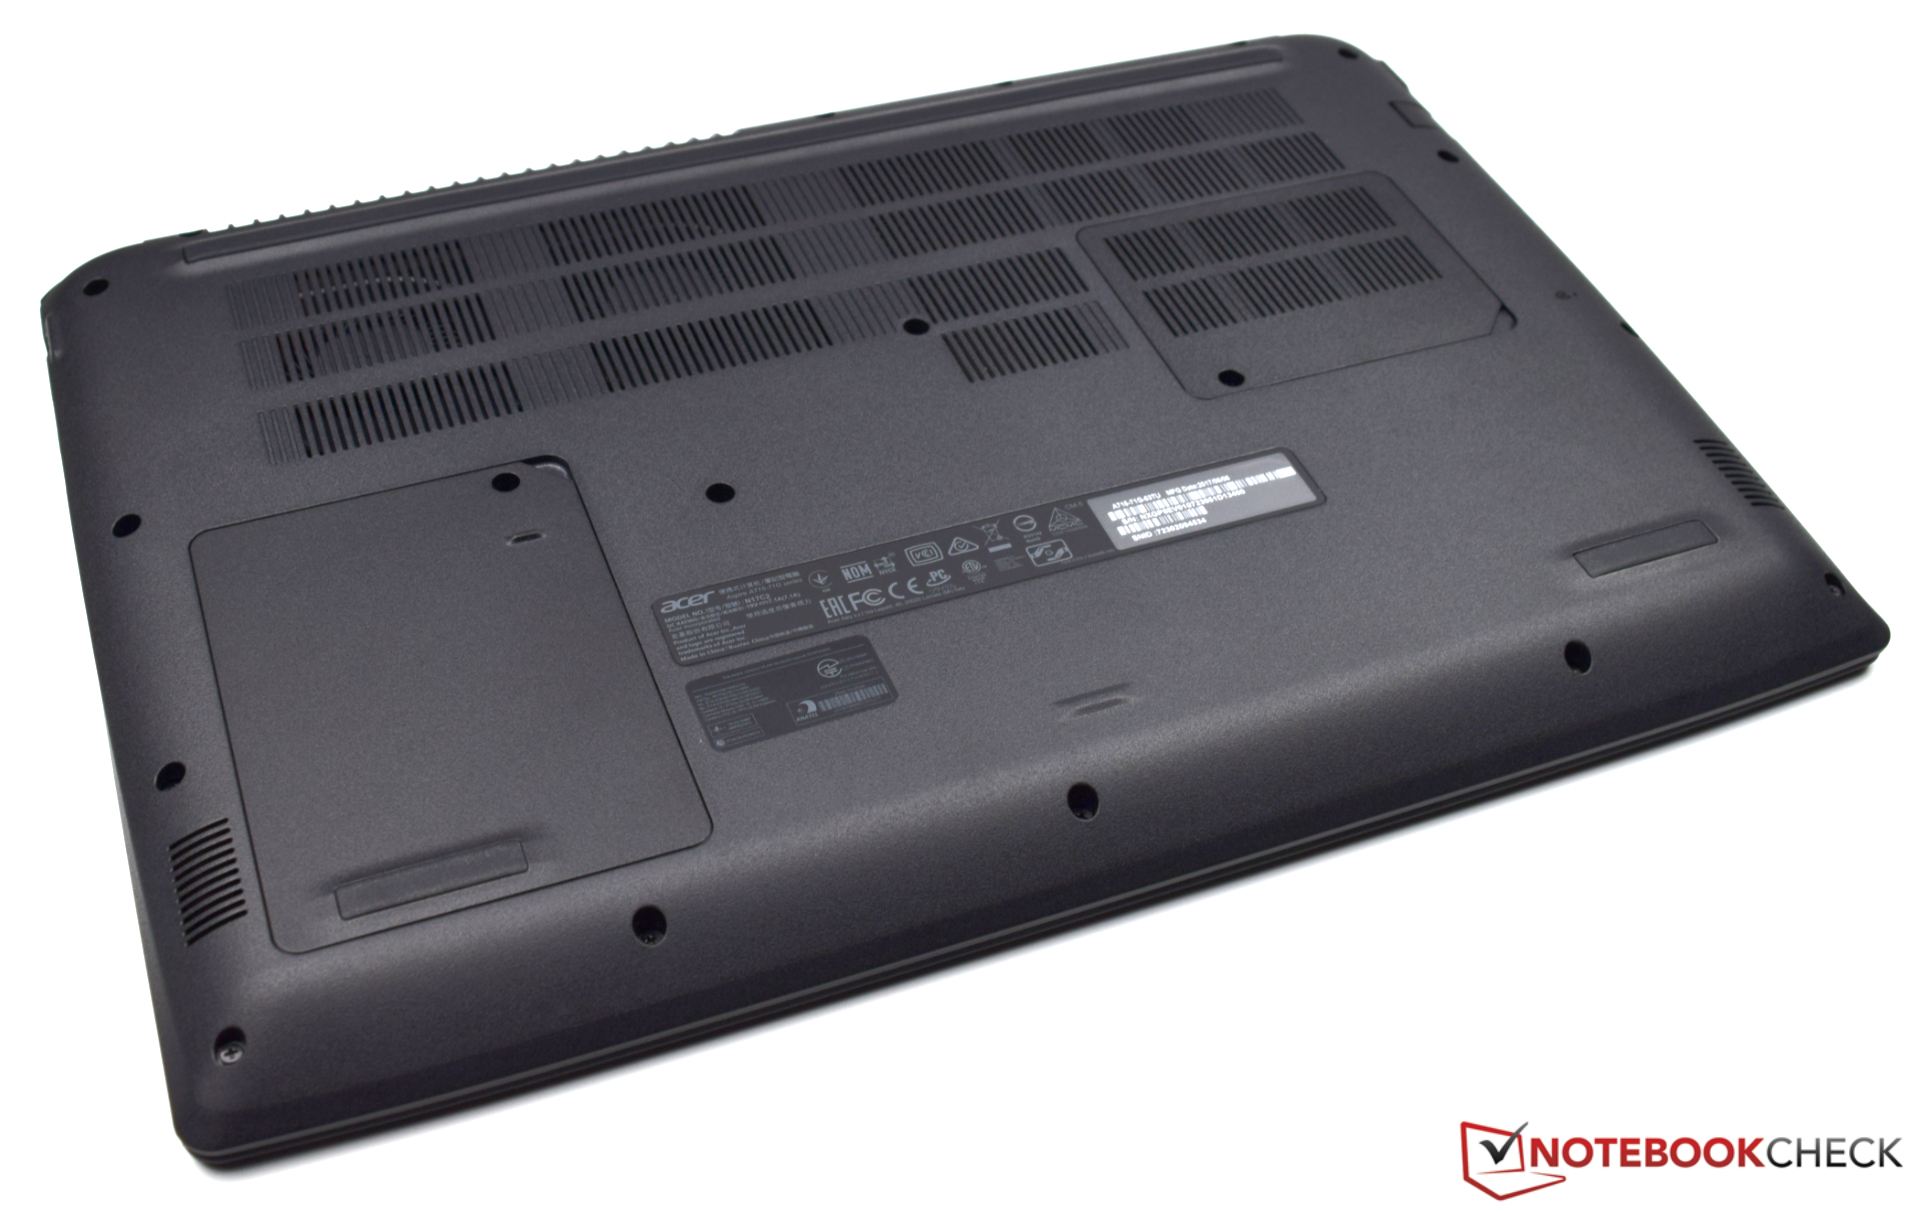
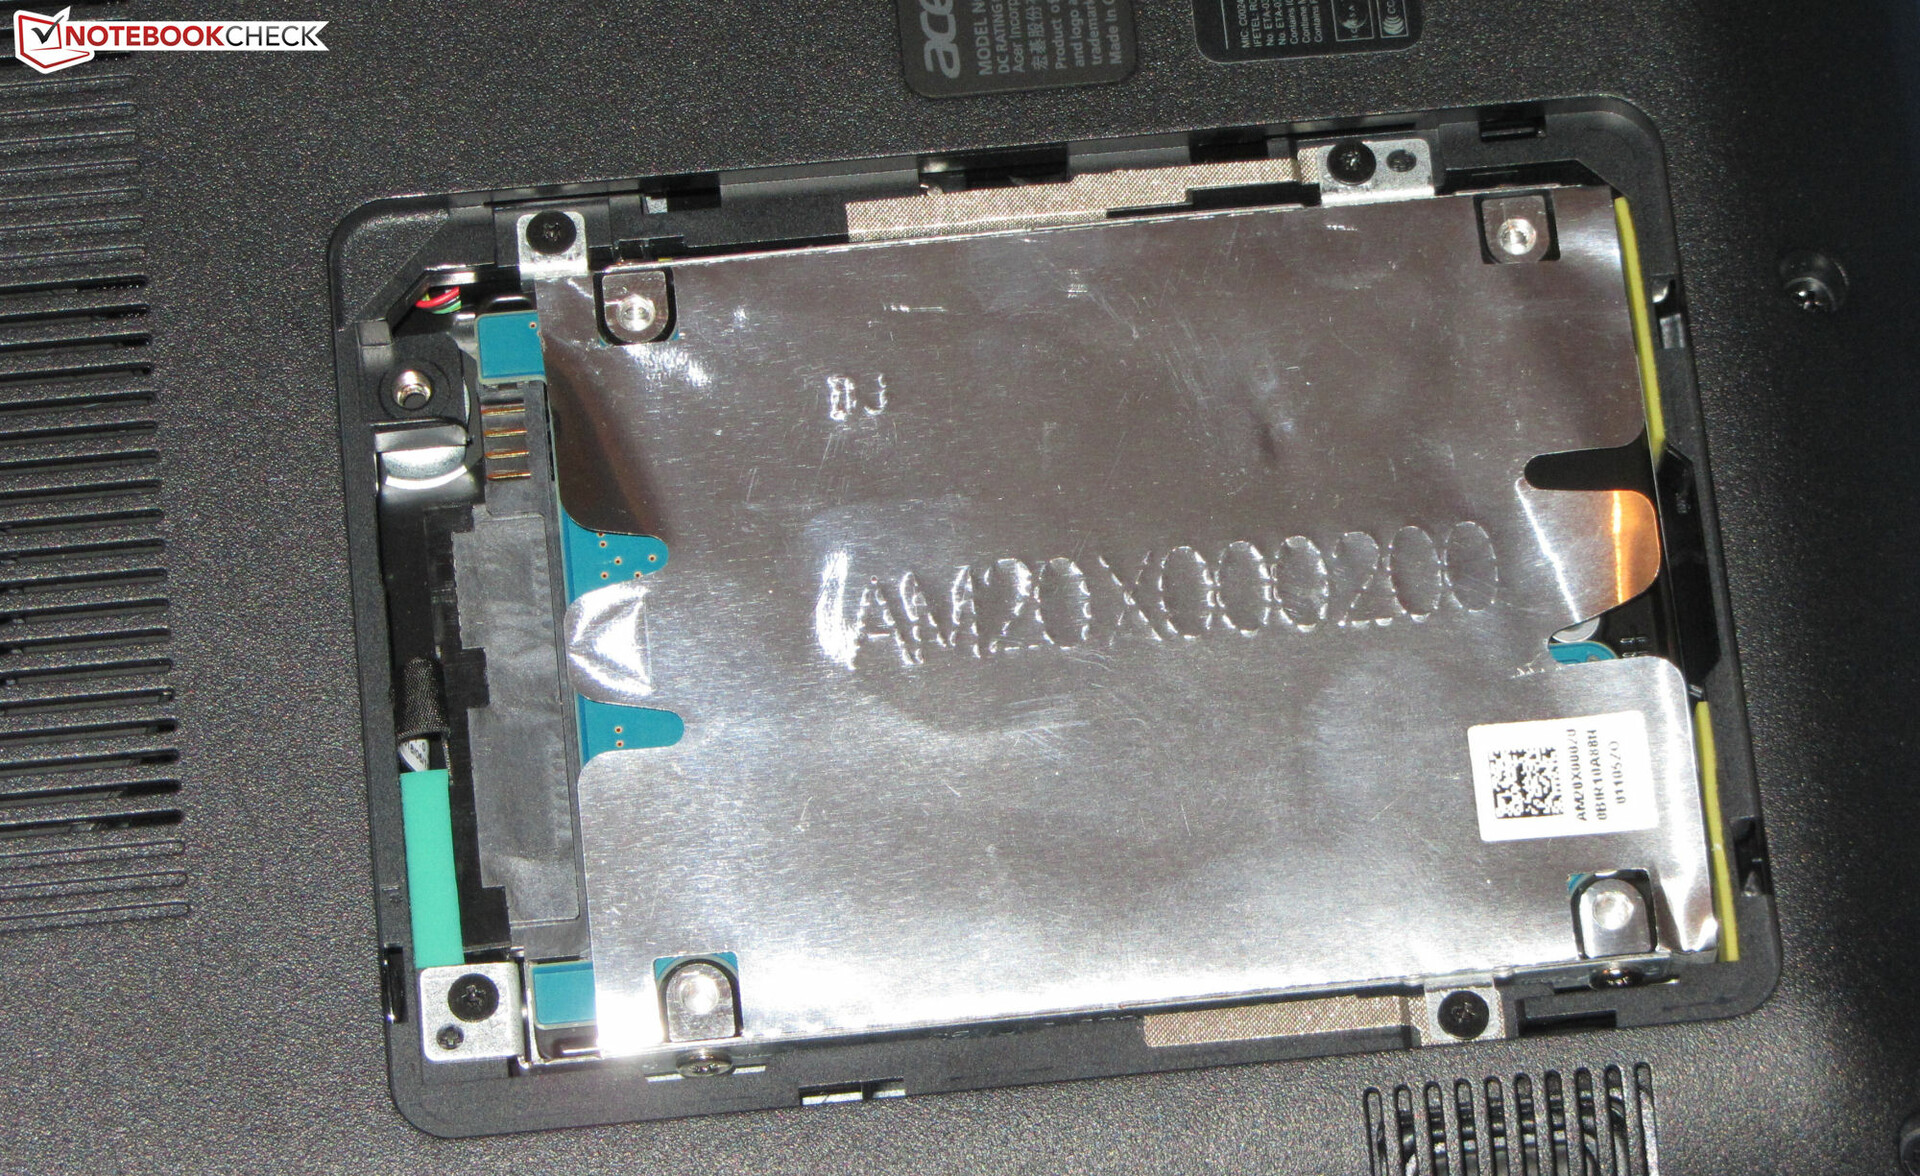
In addition to the SSD, there is also a 2.5-inch hard drive (1 TB, 5400 rpm) inside the Aspire 7. Therefore, users of the Acer notebook should not run out of storage space. While the HDD can be accessed via a maintenance hatch, to replace the SSD you will have to open up the case.

| Acer Aspire 7 A715-72G-704Q Intel SSD 760p SSDPEKKW256G8 | Acer Aspire 7 A715-71G-53TU Kingston RBUSNS8180DS3128GH | HP Pavilion Gaming 15-cx0003ng Intel Optane 16 GB MEMPEK1J016GAH + HGST HTS721010A9E630 1 TB HDD | Dell G3 15 3579 Seagate Mobile HDD 1TB ST1000LX015-1U7172 | Lenovo Legion Y730-15ICH i5-8300H Intel Optane 16 GB MEMPEK1J016GAL + HGST ST1000LM049 1 TB HDD | Average Intel SSD 760p SSDPEKKW256G8 | |
|---|---|---|---|---|---|---|
| CrystalDiskMark 5.2 / 6 | -41% | -38% | -96% | -28% | 35% | |
| Write 4K (MB/s) | 103.4 | 74.3 -28% | 59.2 -43% | 0.202 -100% | 66.9 -35% | 148.8 ? 44% |
| Read 4K (MB/s) | 56 | 18.65 -67% | 91.3 63% | 0.461 -99% | 118.5 112% | 64.8 ? 16% |
| Write Seq (MB/s) | 808 | 405.8 -50% | 158.3 -80% | 53.5 -93% | 157.7 -80% | 956 ? 18% |
| Read Seq (MB/s) | 1939 | 480.7 -75% | 880 -55% | 107.2 -94% | 886 -54% | 2325 ? 20% |
| Write 4K Q32T1 (MB/s) | 281.3 | 235.7 -16% | 161.8 -42% | 0.882 -100% | 162.4 -42% | 381 ? 35% |
| Read 4K Q32T1 (MB/s) | 326.5 | 307.2 -6% | 286.5 -12% | 1.057 -100% | 353 8% | 462 ? 42% |
| Write Seq Q32T1 (MB/s) | 474.1 | 451.6 -5% | 159.8 -66% | 63.7 -87% | 159.8 -66% | 954 ? 101% |
| Read Seq Q32T1 (MB/s) | 2735 | 520 -81% | 929 -66% | 77.1 -97% | 926 -66% | 2848 ? 4% |
Graphics Card
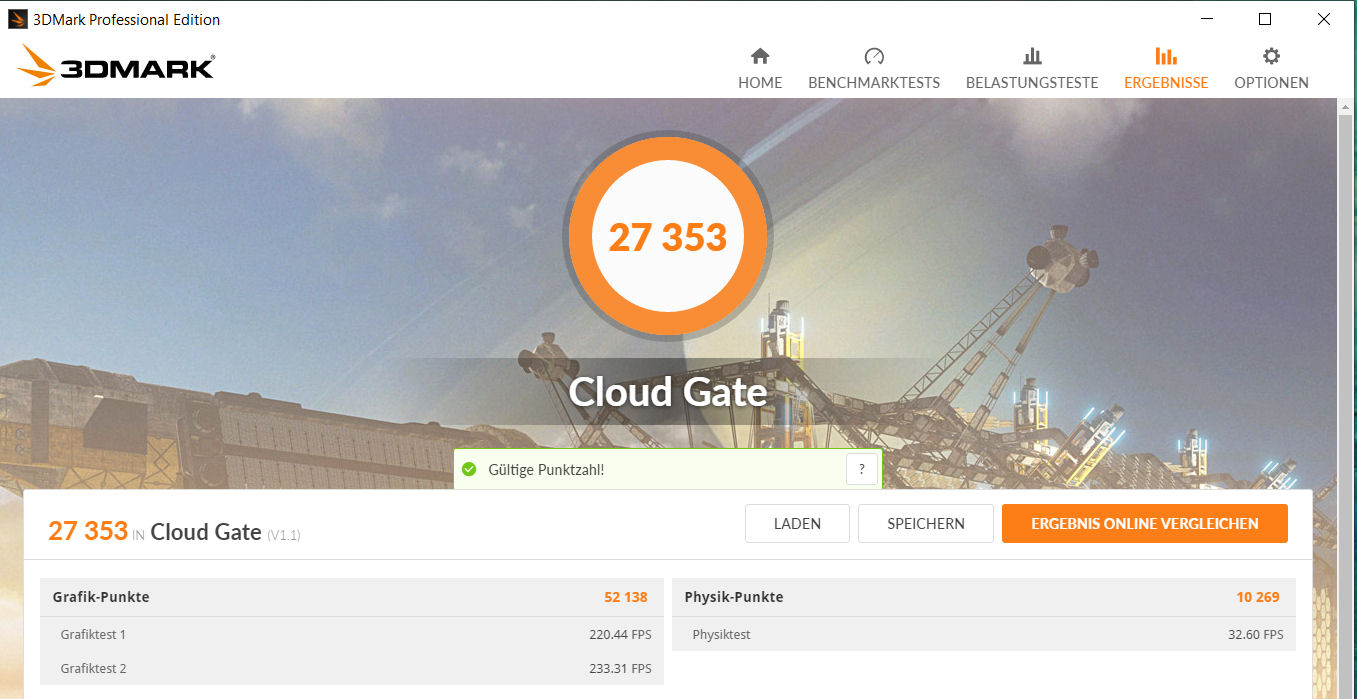
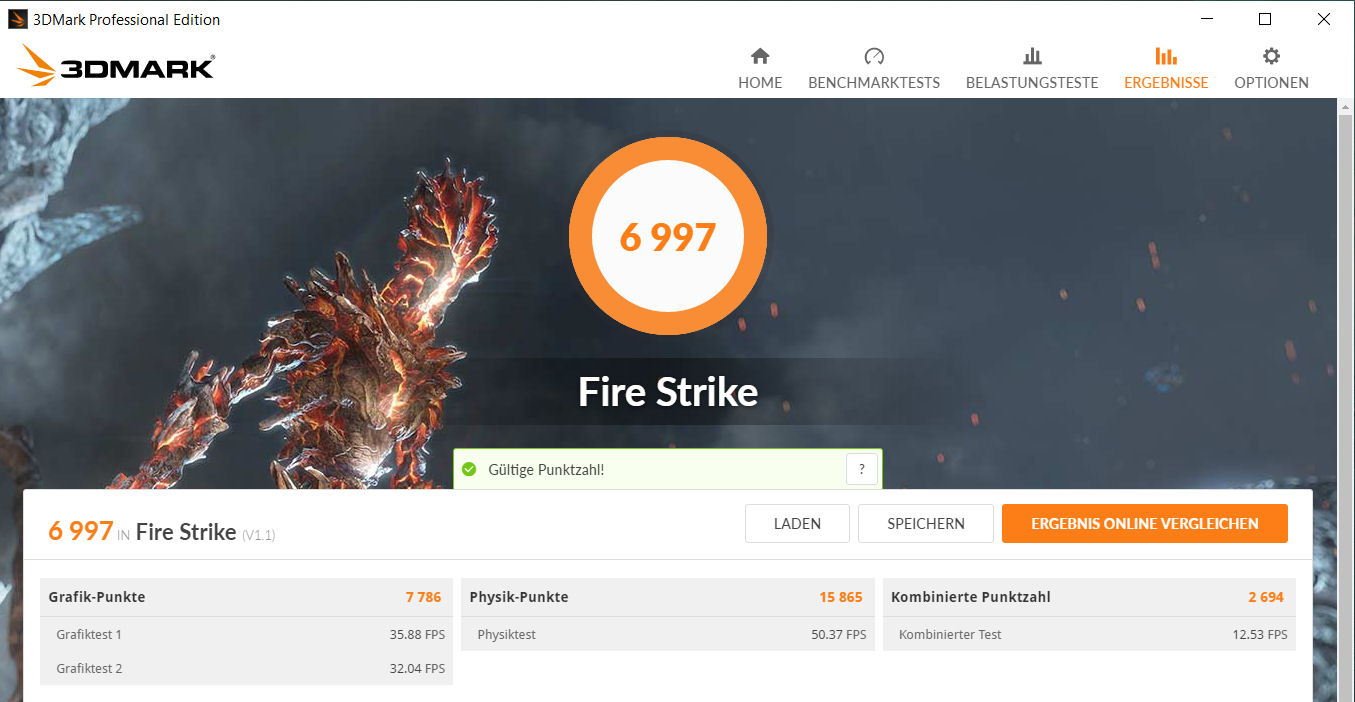
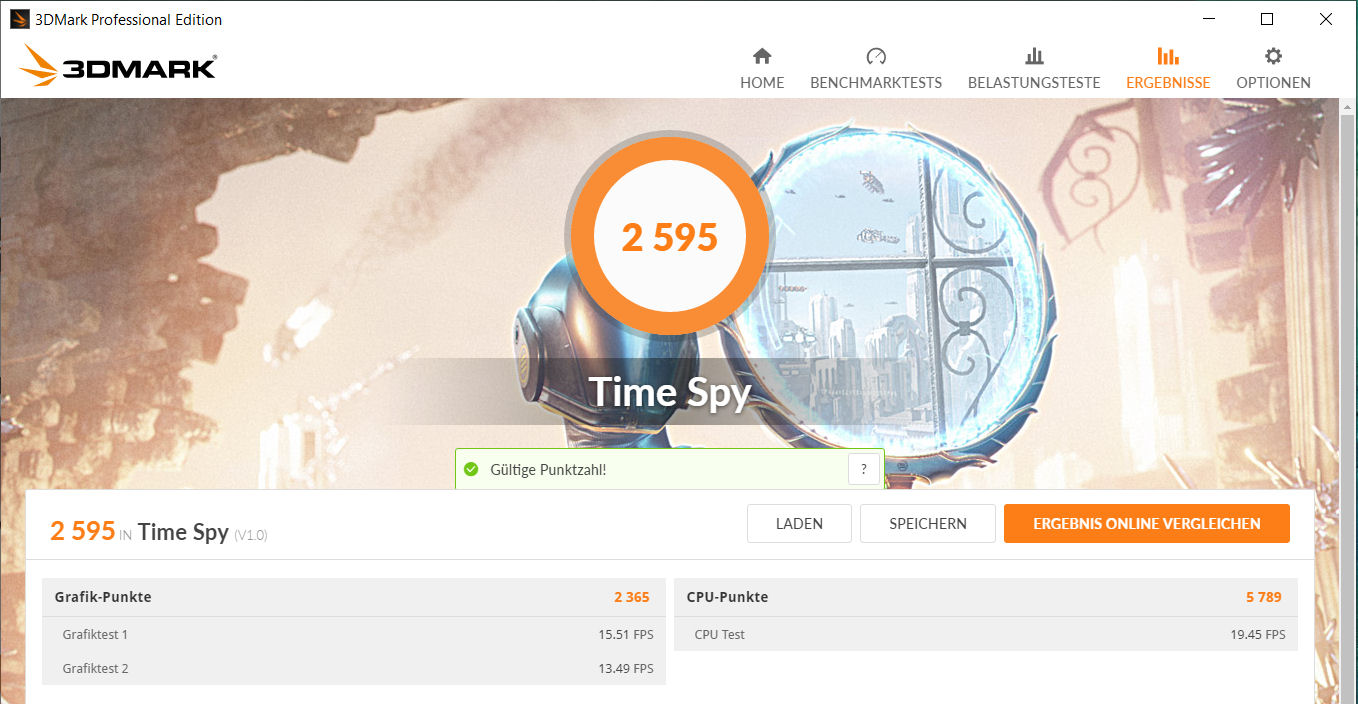
The Aspire 7 comes with Nvidia’s dedicated GeForce GTX 1050 Ti. It is a Pascal-based mid-range GPU. It features 4 GB of GDDR5 memory, supports DirectX 12 and it has a core clock of up to 1620 MHz. The results in the 3DMark benchmarks are on the normal level for this kind of GPU.
Nvidia’s Optimus technology is supported. In everyday use and when running on battery power, the UHD Graphics 630 is utilized. Nvidia’s GPU is used when gaming.
| 3DMark 06 Standard Score | 34938 points | |
| 3DMark 11 Performance | 9518 points | |
| 3DMark Ice Storm Standard Score | 108541 points | |
| 3DMark Cloud Gate Standard Score | 27353 points | |
| 3DMark Fire Strike Score | 6997 points | |
| 3DMark Fire Strike Extreme Score | 3647 points | |
| 3DMark Time Spy Score | 2595 points | |
Help | ||
Gaming Performance
The Acer laptop is powerful enough to be able to run all current games smoothly at 1080p and on medium to high settings, and in some case even on the highest settings. Quality settings/resolution will have to be reduced in very graphically demanding titles to achieve high frame rates.
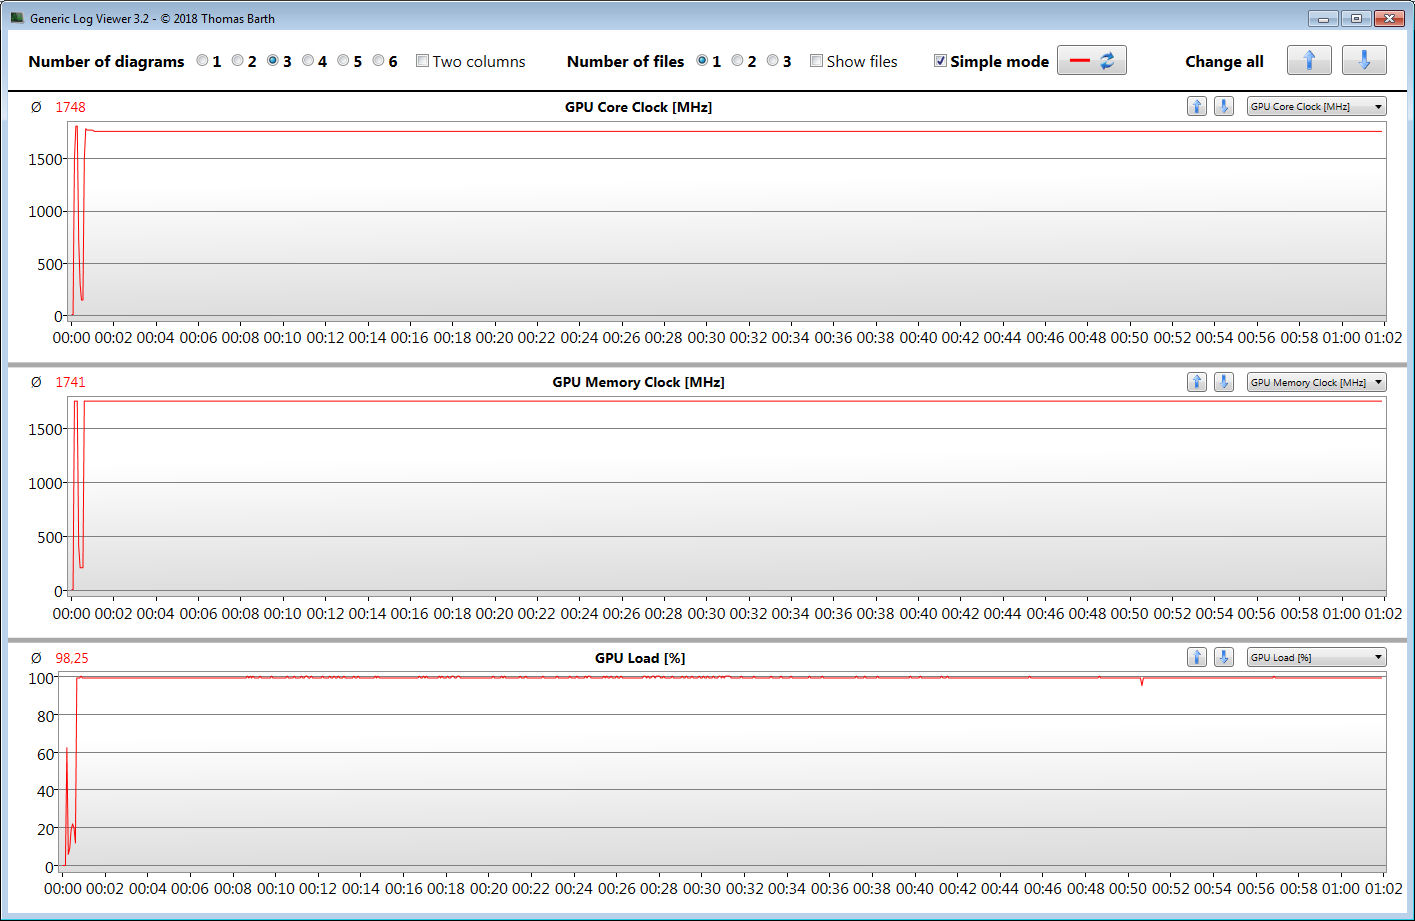
We use the video game The Witcher 3 to check if the frame rates can be maintained consistently over an extended period of time. For this, we run the game on the highest graphics settings at Full HD resolution (1920x1080) for one hour. Over the entire run of gameplay, the player-controlled character stands still. We did not observe any frame rate drops.
| low | med. | high | ultra | |
|---|---|---|---|---|
| Tomb Raider (2013) | 433 | 306.7 | 201.5 | 94.5 |
| BioShock Infinite (2013) | 270.6 | 216.5 | 195.4 | 76.7 |
| GTA V (2015) | 150.1 | 141 | 84.3 | 37.4 |
| The Witcher 3 (2015) | 145.5 | 86.5 | 50 | 29.7 |
| Dota 2 Reborn (2015) | 113 | 104 | 94 | 88 |
| World of Warships (2015) | 179.8 | 152.8 | 127.5 | 111.4 |
| The Division (2016) | 147 | 60.3 | 47.3 | 36.4 |
| Civilization 6 (2016) | 127.2 | 102.2 | 58.6 | 48 |
| X-Plane 11.11 (2018) | 87.8 | 78.2 | 65.9 | |
| F1 2018 (2018) | 146 | 86 | 63 | 39 |
| Shadow of the Tomb Raider (2018) | 95 | 42 | 37 | 31 |
| Assassin´s Creed Odyssey (2018) | 75 | 51 | 45 | 34 |
| Call of Duty Black Ops 4 (2018) | 114.7 | 52.9 | 52.3 | 47.7 |
| Hitman 2 (2018) | 71.6 | 49.4 | 44.9 | 42.3 |
| Battlefield V (2018) | 118.6 | 64.4 | 53.3 | 52 |
| Darksiders III (2018) | 167.3 | 70.4 | 55.3 | 46.3 |
| Just Cause 4 (2018) | 83.1 | 54 | 42.5 | 39.9 |
| BioShock Infinite - 1920x1080 Ultra Preset, DX11 (DDOF) | |
| Acer Aspire 7 A715-72G-704Q | |
| Lenovo Legion Y730-15ICH i5-8300H | |
| Average NVIDIA GeForce GTX 1050 Ti Mobile (61 - 97, n=23) | |
| HP Pavilion Gaming 15-cx0003ng | |
| Dell G3 15 3579 | |
| Acer Aspire 7 A715-71G-53TU | |
| Shadow of the Tomb Raider - 1920x1080 Medium Preset | |
| Average of class Multimedia (28 - 167, n=8, last 2 years) | |
| Acer Aspire 7 A715-72G-704Q | |
| Average NVIDIA GeForce GTX 1050 Ti Mobile (38 - 42, n=4) | |
| Battlefield V - 1920x1080 Medium Preset | |
| Acer Aspire 7 A715-72G-704Q | |
| Average NVIDIA GeForce GTX 1050 Ti Mobile (53.2 - 64.4, n=2) | |
| HP Pavilion Gaming 15-cx0003ng | |
Emissions - Coil whine
System Noise
The Aspire 7 does not produce too much noise for a device with such powerful hardware. When idle, the fan often stands still, which leads to silent operation - except when the 2.5-inch hard drive is being accessed. Under full load, the fans spin up. During the stress test, we measured a sound pressure level of 43.8 dB(A).
Unfortunately, our review device suffers from permanent coil whine.
Noise level
| Idle |
| 30.4 / 30.4 / 30.4 dB(A) |
| HDD |
| 32.2 dB(A) |
| Load |
| 36.2 / 43.8 dB(A) |
 | ||
30 dB silent 40 dB(A) audible 50 dB(A) loud |
||
min: | ||
| Acer Aspire 7 A715-72G-704Q i7-8750H, GeForce GTX 1050 Ti Mobile | Acer Aspire 7 A715-71G-53TU i5-7300HQ, GeForce GTX 1050 Mobile | HP Pavilion Gaming 15-cx0003ng i7-8750H, GeForce GTX 1050 Ti Mobile | Dell G3 15 3579 i5-8300H, GeForce GTX 1050 Mobile | Lenovo Legion Y730-15ICH i5-8300H i5-8300H, GeForce GTX 1050 Ti Mobile | Average NVIDIA GeForce GTX 1050 Ti Mobile | Average of class Multimedia | |
|---|---|---|---|---|---|---|---|
| Noise | 1% | -5% | -1% | -2% | -6% | 10% | |
| off / environment * (dB) | 30.4 | 30.4 -0% | 30.6 -1% | 28 8% | 28.9 5% | 29.4 ? 3% | 24.2 ? 20% |
| Idle Minimum * (dB) | 30.4 | 30.4 -0% | 30.6 -1% | 29.8 2% | 32.2 -6% | 30.7 ? -1% | 24.4 ? 20% |
| Idle Average * (dB) | 30.4 | 30.8 -1% | 30.6 -1% | 29.8 2% | 32.5 -7% | 31.7 ? -4% | 24.8 ? 18% |
| Idle Maximum * (dB) | 30.4 | 30.8 -1% | 33.2 -9% | 30 1% | 32.7 -8% | 33.8 ? -11% | 26.5 ? 13% |
| Load Average * (dB) | 36.2 | 33.6 7% | 42.8 -18% | 38.6 -7% | 33.2 8% | 41.3 ? -14% | 37.6 ? -4% |
| Load Maximum * (dB) | 43.8 | 43.4 1% | 43 2% | 49.4 -13% | 45 -3% | 47.2 ? -8% | 45.9 ? -5% |
| Witcher 3 ultra * (dB) | 42.1 | 46.9 | 43.1 |
* ... smaller is better
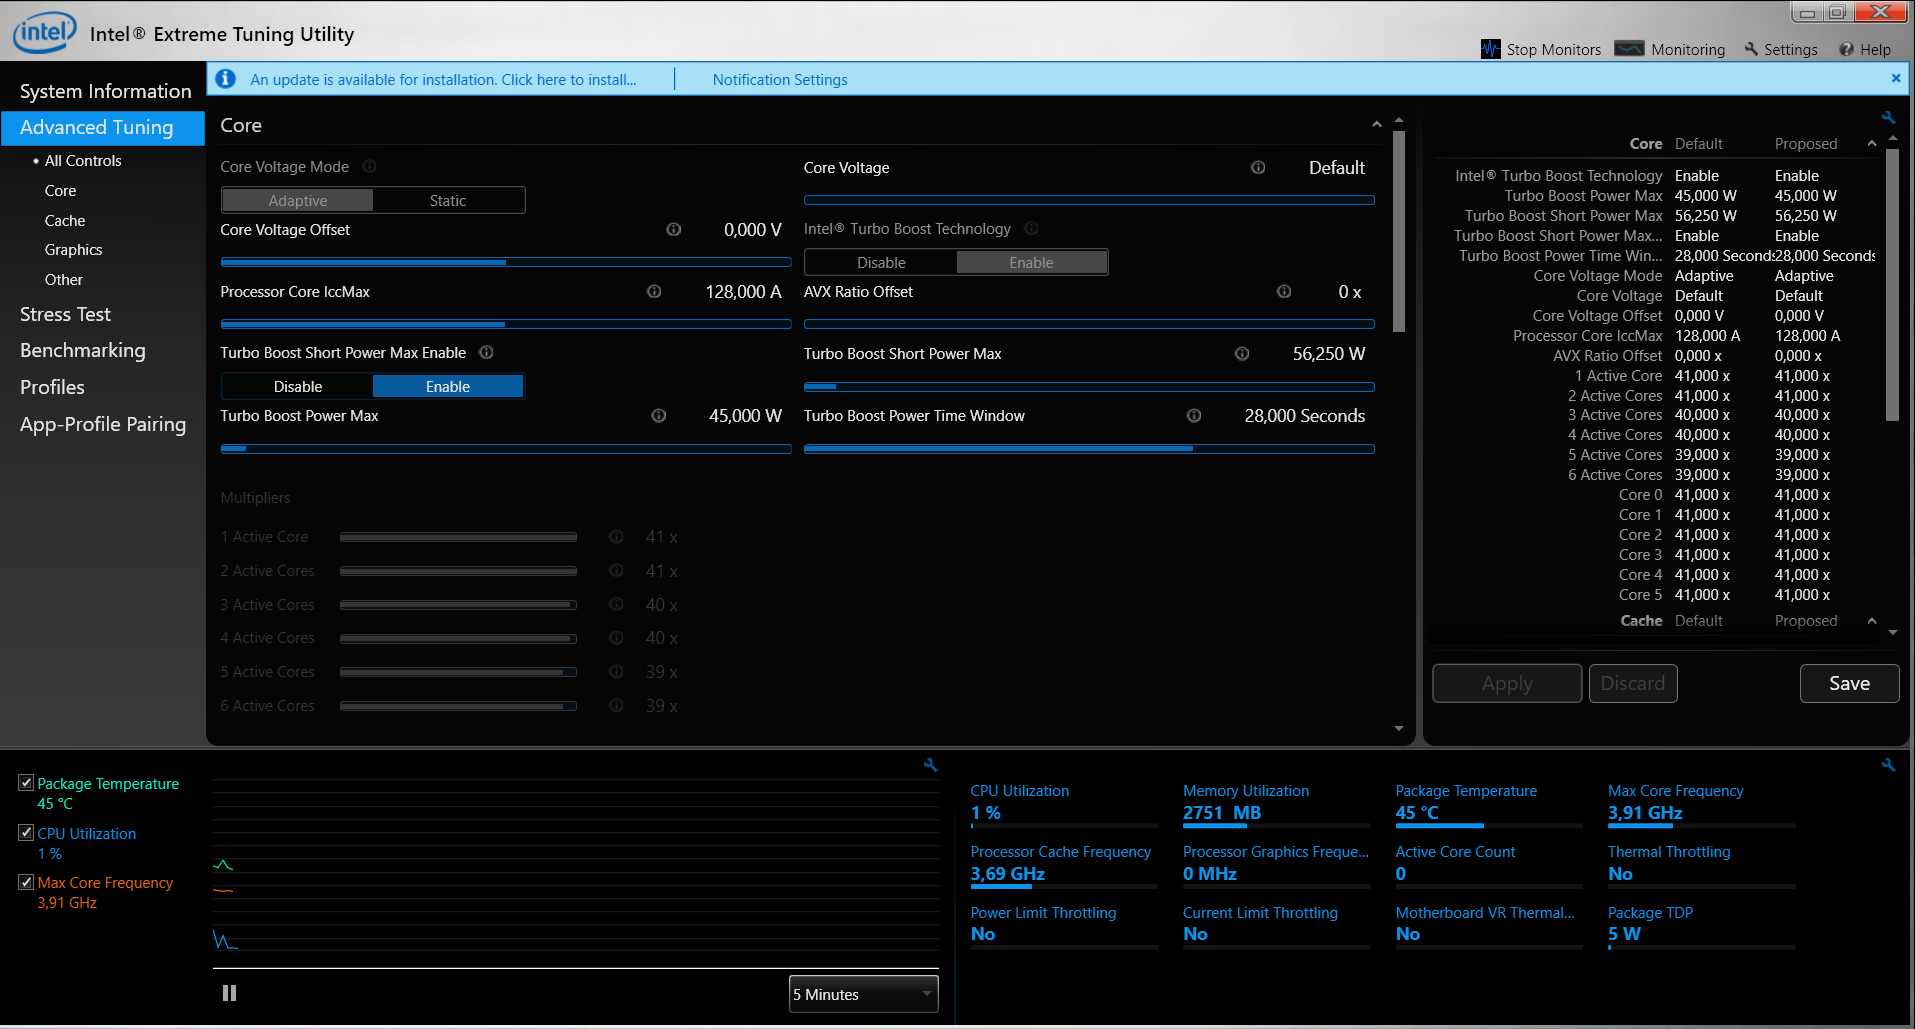
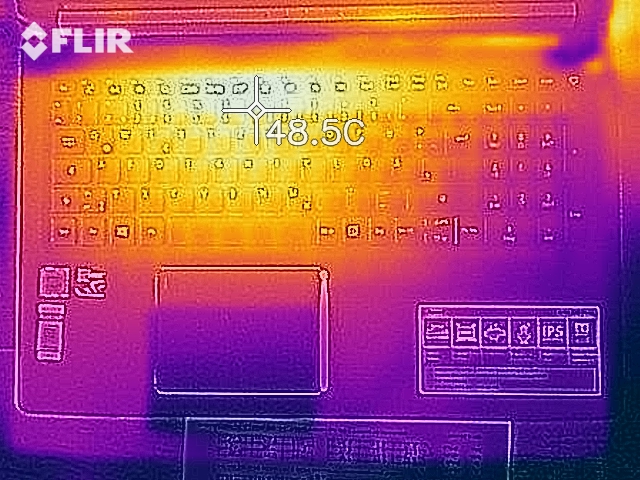
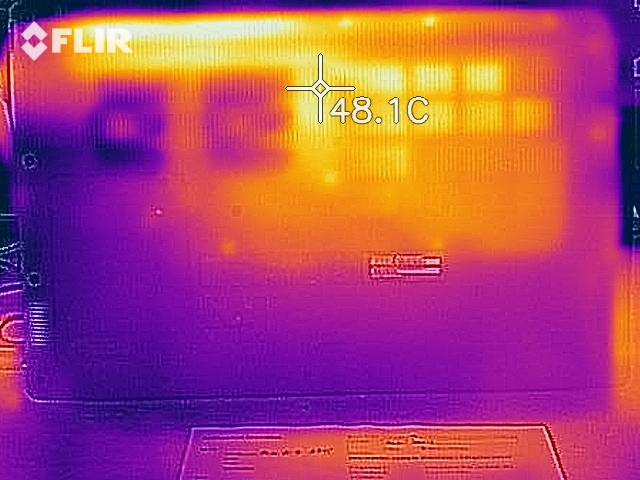
Temperature
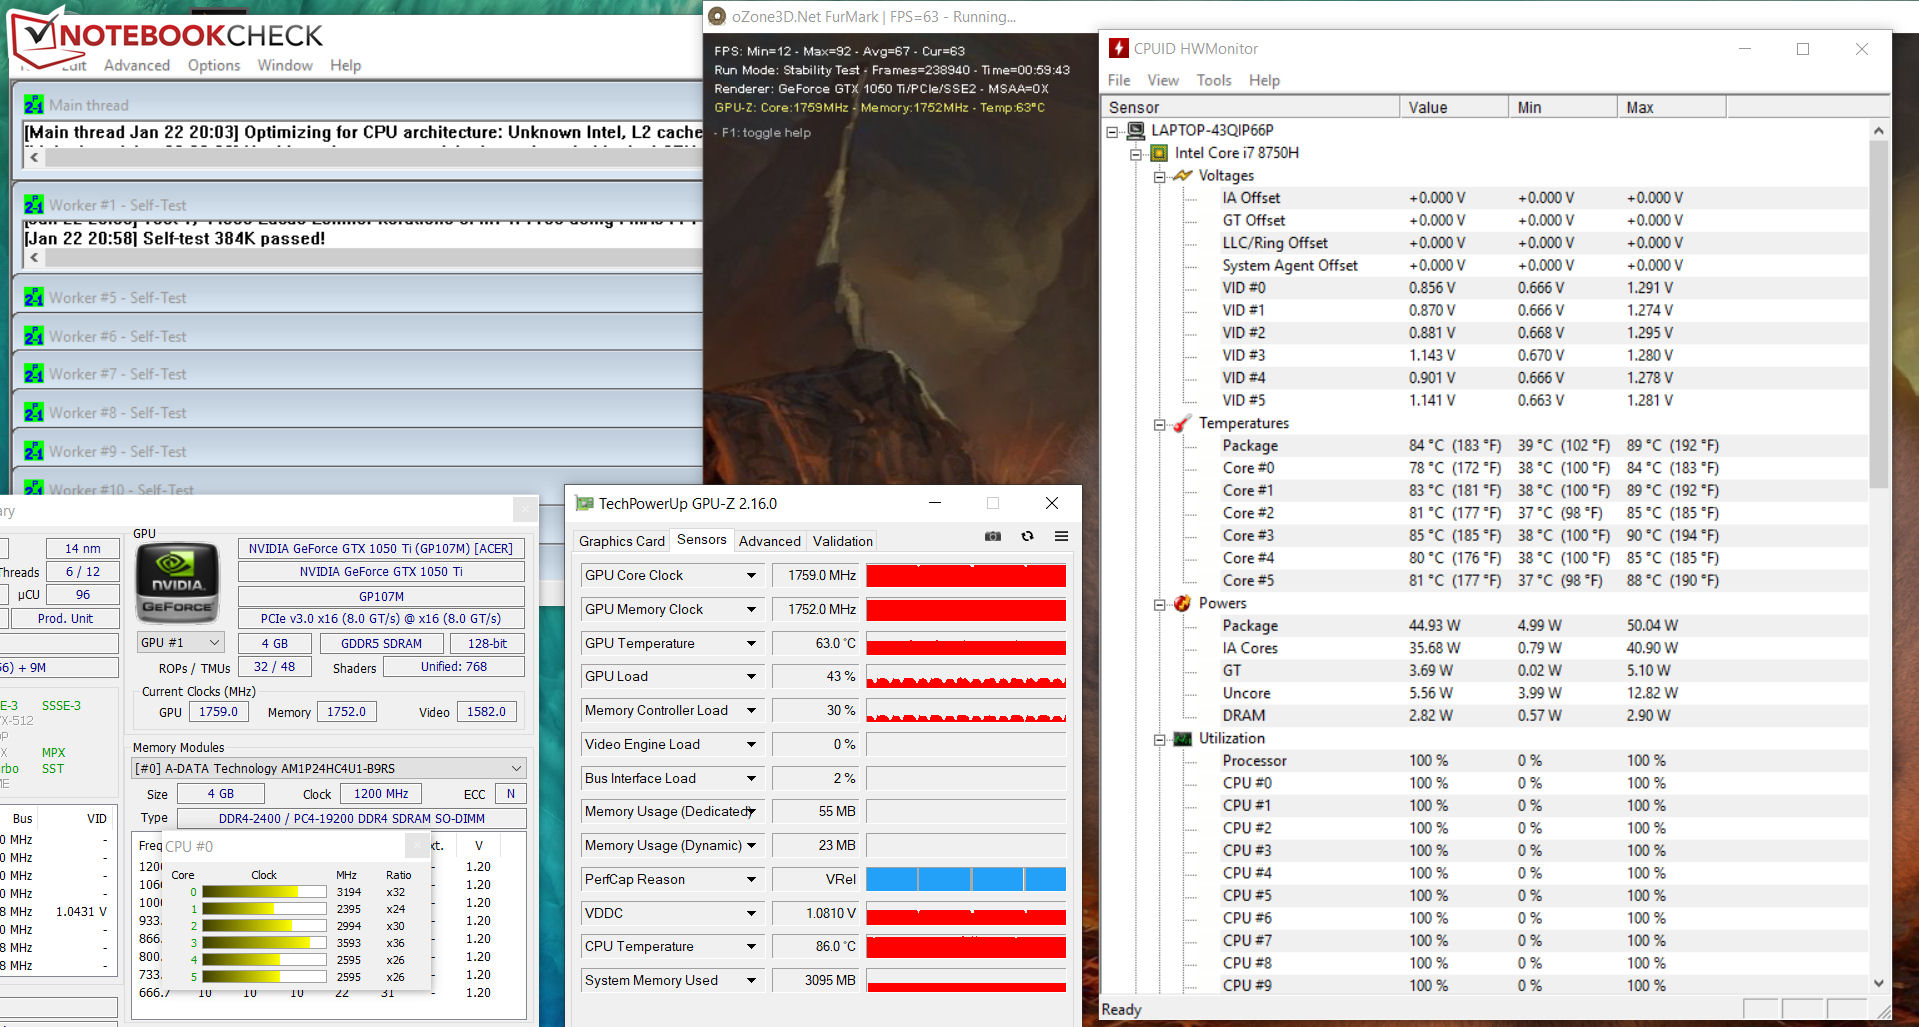
The Acer laptop completes our stress test (Prime95 and FurMark running continuously for at least one hour) with different results. When plugged in, the CPU runs at 2.4 to 3.9 GHz. Here it spends most of the time at 3.2 GHz. The GPU runs at full power. However, when running on battery power, the CPU is throttled down to 800 MHz and the core clock of the GPU fluctuates between 800 MHz and 1.6 GHz.
The notebook does not become excessively hot. During the stress test, the 40 °C (104 °F) mark is exceeded at several measurement points. In everyday use, the temperatures always stay well within reasonable bounds. The stress test is an extreme case scenario, which is very unlikely to occur in real life. We use it to test system stability.
(-) The maximum temperature on the upper side is 45.2 °C / 113 F, compared to the average of 36.8 °C / 98 F, ranging from 21 to 71 °C for the class Multimedia.
(±) The bottom heats up to a maximum of 43.8 °C / 111 F, compared to the average of 39.1 °C / 102 F
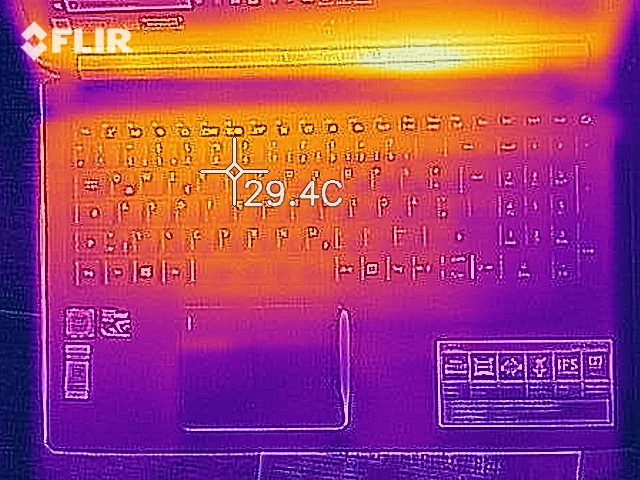
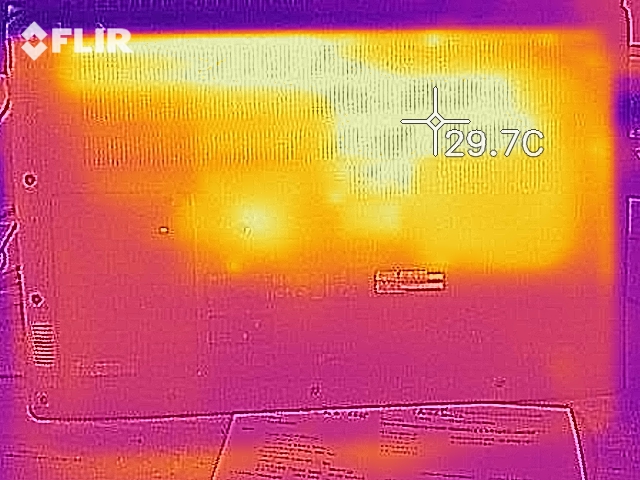
(+) In idle usage, the average temperature for the upper side is 23.2 °C / 74 F, compared to the device average of 31.3 °C / 88 F.
(+) The palmrests and touchpad are cooler than skin temperature with a maximum of 25.1 °C / 77.2 F and are therefore cool to the touch.
(+) The average temperature of the palmrest area of similar devices was 28.7 °C / 83.7 F (+3.6 °C / 6.5 F).
| Acer Aspire 7 A715-72G-704Q i7-8750H, GeForce GTX 1050 Ti Mobile | Acer Aspire 7 A715-71G-53TU i5-7300HQ, GeForce GTX 1050 Mobile | HP Pavilion Gaming 15-cx0003ng i7-8750H, GeForce GTX 1050 Ti Mobile | Dell G3 15 3579 i5-8300H, GeForce GTX 1050 Mobile | Lenovo Legion Y730-15ICH i5-8300H i5-8300H, GeForce GTX 1050 Ti Mobile | Average NVIDIA GeForce GTX 1050 Ti Mobile | Average of class Multimedia | |
|---|---|---|---|---|---|---|---|
| Heat | -5% | -5% | -29% | 11% | -10% | -2% | |
| Maximum Upper Side * (°C) | 45.2 | 41.6 8% | 44.1 2% | 47 -4% | 30 34% | 46.5 ? -3% | 41.5 ? 8% |
| Maximum Bottom * (°C) | 43.8 | 42.5 3% | 53.8 -23% | 61.2 -40% | 40.8 7% | 48.4 ? -11% | 44.1 ? -1% |
| Idle Upper Side * (°C) | 24.8 | 29.7 -20% | 24.6 1% | 34 -37% | 23.4 6% | 28.6 ? -15% | 27.1 ? -9% |
| Idle Bottom * (°C) | 26.4 | 29.4 -11% | 26.7 -1% | 35.8 -36% | 27.8 -5% | 28.9 ? -9% | 28 ? -6% |
* ... smaller is better
Speakers
Acer Aspire 7 A715-72G-704Q audio analysis
(-) | not very loud speakers (65.1 dB)
Bass 100 - 315 Hz
(±) | reduced bass - on average 12% lower than median
(±) | linearity of bass is average (14.5% delta to prev. frequency)
Mids 400 - 2000 Hz
(+) | balanced mids - only 4.6% away from median
(±) | linearity of mids is average (7.6% delta to prev. frequency)
Highs 2 - 16 kHz
(+) | balanced highs - only 2.6% away from median
(+) | highs are linear (4.6% delta to prev. frequency)
Overall 100 - 16.000 Hz
(±) | linearity of overall sound is average (19.1% difference to median)
Compared to same class
» 61% of all tested devices in this class were better, 7% similar, 32% worse
» The best had a delta of 5%, average was 17%, worst was 45%
Compared to all devices tested
» 46% of all tested devices were better, 7% similar, 47% worse
» The best had a delta of 4%, average was 24%, worst was 134%
HP Pavilion Gaming 15-cx0003ng audio analysis
(-) | not very loud speakers (70.4 dB)
Bass 100 - 315 Hz
(-) | nearly no bass - on average 25.4% lower than median
(±) | linearity of bass is average (10.3% delta to prev. frequency)
Mids 400 - 2000 Hz
(+) | balanced mids - only 2.3% away from median
(+) | mids are linear (6.9% delta to prev. frequency)
Highs 2 - 16 kHz
(+) | balanced highs - only 1.8% away from median
(+) | highs are linear (4.7% delta to prev. frequency)
Overall 100 - 16.000 Hz
(±) | linearity of overall sound is average (21.1% difference to median)
Compared to same class
» 76% of all tested devices in this class were better, 4% similar, 20% worse
» The best had a delta of 6%, average was 18%, worst was 132%
Compared to all devices tested
» 58% of all tested devices were better, 7% similar, 35% worse
» The best had a delta of 4%, average was 24%, worst was 134%
Energy Management - Nothing unusual
Energy Consumption
We did not encounter any issues in terms of energy consumption. When idle, we measured a maximum power draw of 8.5 watts - a good result. During the stress test, the energy consumption peaked at 134 watts. The 135-watt AC adapter should provide enough energy to charge the device. There should not be any problems with stability.
| Off / Standby | |
| Idle | |
| Load |
|
Key:
min: | |
| Acer Aspire 7 A715-72G-704Q i7-8750H, GeForce GTX 1050 Ti Mobile | Acer Aspire 7 A715-71G-53TU i5-7300HQ, GeForce GTX 1050 Mobile | HP Pavilion Gaming 15-cx0003ng i7-8750H, GeForce GTX 1050 Ti Mobile | Dell G3 15 3579 i5-8300H, GeForce GTX 1050 Mobile | Lenovo Legion Y730-15ICH i5-8300H i5-8300H, GeForce GTX 1050 Ti Mobile | Average NVIDIA GeForce GTX 1050 Ti Mobile | Average of class Multimedia | |
|---|---|---|---|---|---|---|---|
| Power Consumption | 2% | -25% | -41% | -48% | -51% | -20% | |
| Idle Minimum * (Watt) | 3.9 | 4 -3% | 5.5 -41% | 7.9 -103% | 8 -105% | 7.92 ? -103% | 5.71 ? -46% |
| Idle Average * (Watt) | 6.6 | 6.9 -5% | 8.5 -29% | 9.6 -45% | 11.8 -79% | 11.9 ? -80% | 10.1 ? -53% |
| Idle Maximum * (Watt) | 8.5 | 9.4 -11% | 11.9 -40% | 13 -53% | 13.1 -54% | 15.4 ? -81% | 12.4 ? -46% |
| Load Average * (Watt) | 89 | 72.6 18% | 94 -6% | 93 -4% | 90.2 -1% | 85.1 ? 4% | 65 ? 27% |
| Load Maximum * (Watt) | 134 | 122 9% | 144 -7% | 132.7 1% | 136.2 -2% | 130.5 ? 3% | 112.2 ? 16% |
| Witcher 3 ultra * (Watt) | 86 | 100.6 | 107.8 |
* ... smaller is better
Battery Life
In our practically oriented Wi-Fi test, the Aspire 7 achieves a battery runtime of 6 h 23 m. In this test, we simulate loads that are consistent with surfing the Internet. The “balanced” power plan is selected, the display brightness is set to 150 cd/m² and the energy-saving functions are switched off. In our video test, the Acer laptop lasts for 6 h 1 m. We conduct this test using the short film titled Big Buck Bunny (H.264; 1920x1080). The communications modules are disabled, the energy-saving functions are turned on and the display brightness is set to 150 cd/m².
The A715-72G offers somewhat longer battery runtimes than the identically built predecessor model.
| Acer Aspire 7 A715-72G-704Q i7-8750H, GeForce GTX 1050 Ti Mobile, 48.9 Wh | Acer Aspire 7 A715-71G-53TU i5-7300HQ, GeForce GTX 1050 Mobile, 48 Wh | HP Pavilion Gaming 15-cx0003ng i7-8750H, GeForce GTX 1050 Ti Mobile, 52.5 Wh | Dell G3 15 3579 i5-8300H, GeForce GTX 1050 Mobile, 56 Wh | Lenovo Legion Y730-15ICH i5-8300H i5-8300H, GeForce GTX 1050 Ti Mobile, 57 Wh | Average of class Multimedia | |
|---|---|---|---|---|---|---|
| Battery runtime | -4% | -9% | 43% | -19% | 102% | |
| Reader / Idle (h) | 12.3 | 9.9 -20% | 10.8 -12% | 9.6 -22% | 25.2 ? 105% | |
| H.264 (h) | 6 | 5.1 -15% | 4.6 -23% | 16.4 ? 173% | ||
| WiFi v1.3 (h) | 6.4 | 5.6 -13% | 5.3 -17% | 6.5 2% | 5.3 -17% | 12 ? 88% |
| Load (h) | 1.2 | 1.6 33% | 1.4 17% | 2.2 83% | 1 -17% | 1.675 ? 40% |
Verdict
Pros
Cons
The Aspire 7 A715-72G is a 15.6-inch multimedia notebook that is suitable for gaming. The built-in Core i7-8750H will not become obsolete for quite a long time. The GeForce GTX 1050 Ti is capable of running all the latest video games smoothly.
Acer’s all-rounder left a good impression, but it is not free from flaws.
Despite powerful hardware, the notebook is basically silent when using office applications and browsing the Internet. The Acer laptop does not get very hot. An NVMe SSD creates a very responsive system. The A715 offers plenty of storage space. In addition to the SSD, the Aspire 7 also features a 1 TB hard drive. The battery runtimes are more than okay for a notebook with this much power. Moreover, Acer’s notebook also has a good keyboard with a backlight.
The IPS display is nothing to write home about. Its main advantages include a matte screen surface and good viewing angles. Both the brightness and the contrast ratio are too low for a 1200-Euro (~$1374) notebook. Coil whine is another drawback. It is quite audible and proves to be annoying in quiet environments.
Acer Aspire 7 A715-72G-704Q
- 01/30/2019 v6 (old)
Sascha Mölck
Price comparison
