HP Pavilion Gaming 15 (i7-8750H, GTX 1050 Ti, Optane Memory, FHD) Laptop Review
The Pavilion Gaming 15 series consists of gaming notebooks that are positioned underneath the HP Omen series. HP has equipped its Pavilion models with upper mid-range graphics cards while the Omen models contain high-end GPUs. We tested the Pavilion Gaming 15t-cx0000, one of the better configurations of the series that was equipped with a GeForce GTX 1060 (3 GB), a few months ago. Our current test unit comes with a hexa-core Core i7-8750H and a GeForce GTX 1050 Ti graphics card. The Acer Nitro 5 AN515-52, Medion Erazer P6705, Lenovo Legion Y530-15ICH and Acer Nitro 5 AN515-42 are among our test unit's comparison devices.
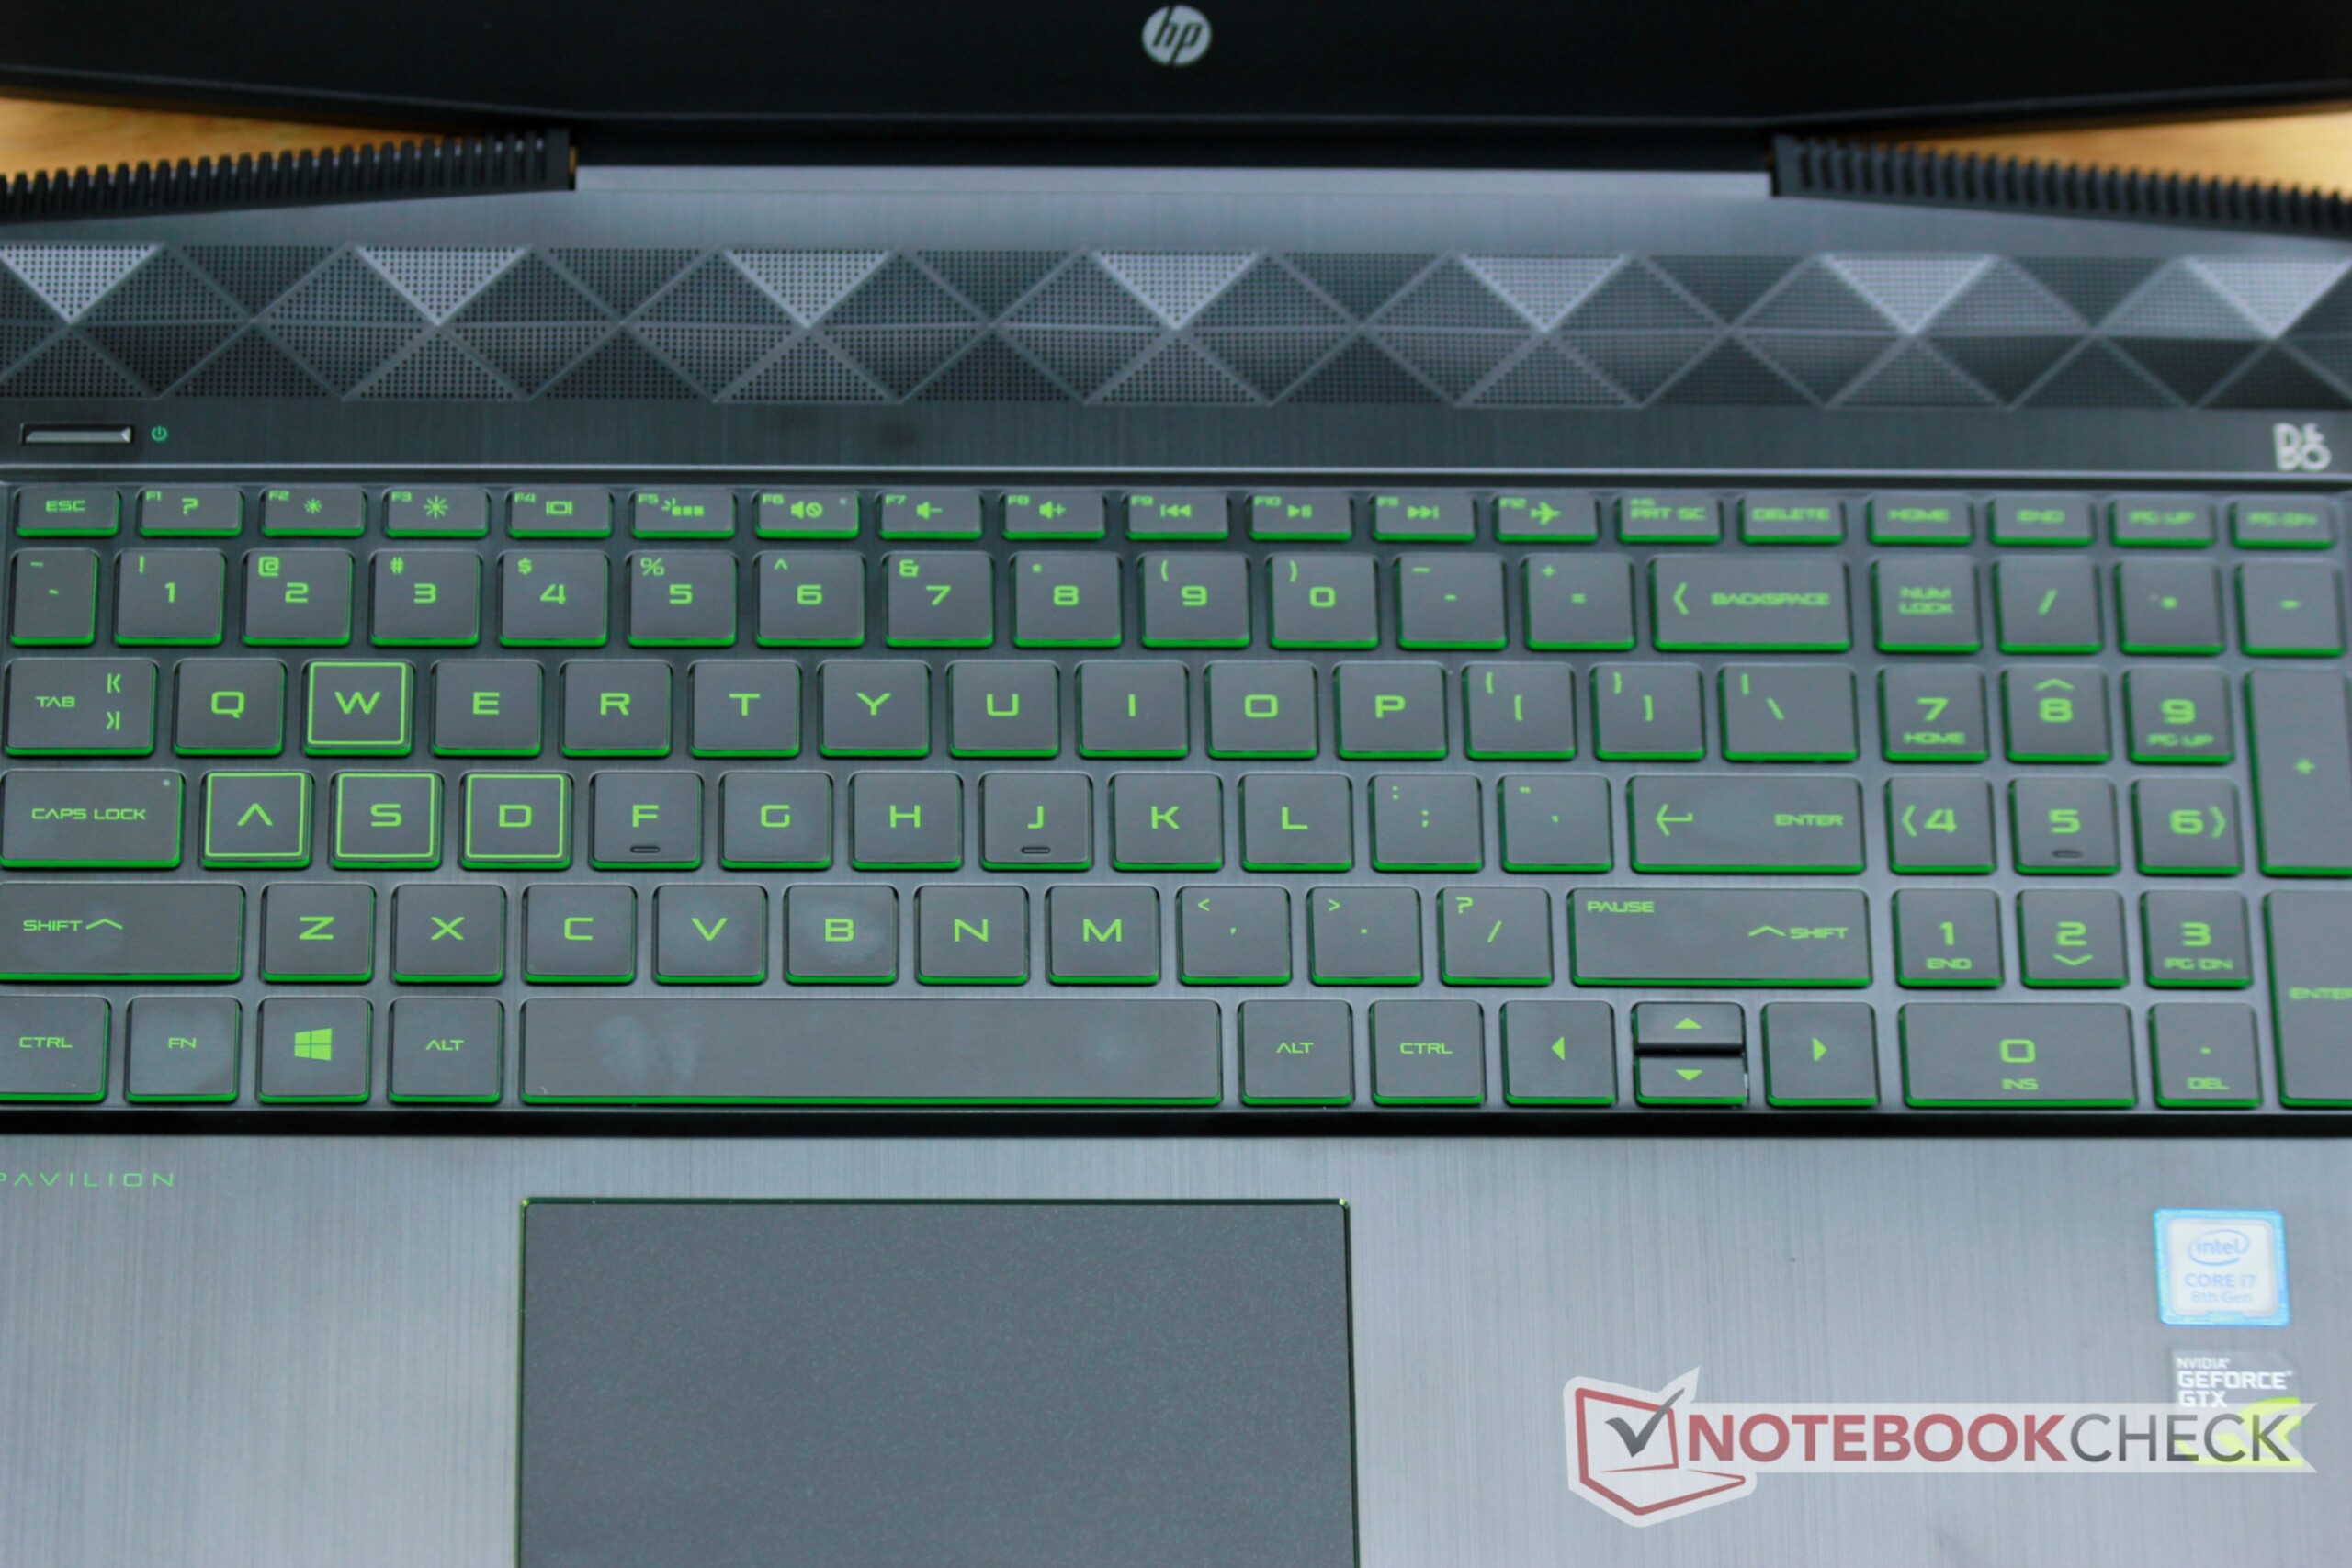
As both Pavilion models have the same build, we will not go into details about the case, connectivity, input devices and speakers. For further information on these aspects, please take a look at our review of the Pavilion Gaming 15t-cx0000.
Connectivity - DisplayPort via USB-C
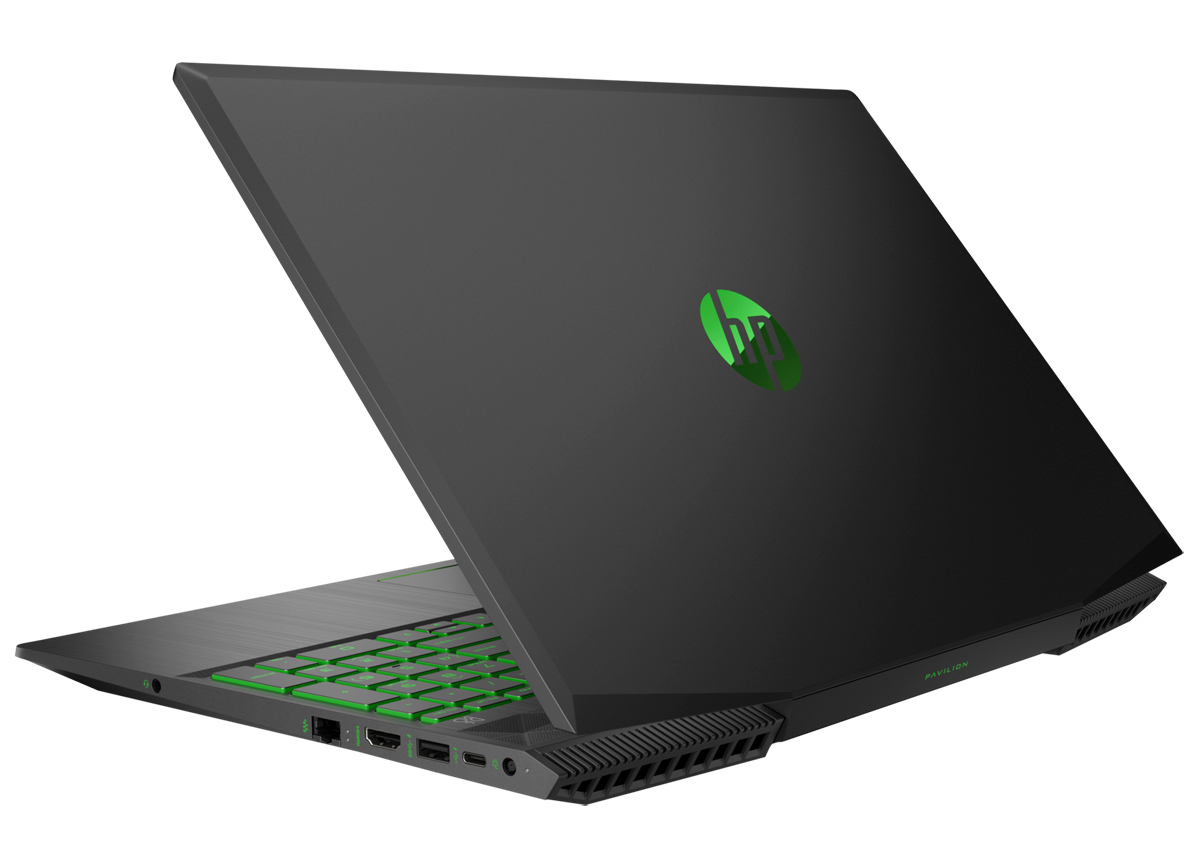
While the Pavilion Gaming 15 model we already tested was equipped with a Thunderbolt 3 port, our current test unit only offers USB Type-C 3.1 Gen 1. This can be used to transfer data and also to connect external screens. We tried it (please note: You need a separate adapter for DisplayPort via USB-C). According to the maintenance manual, the Type-C port supports DisplayPort 1.2 (resolutions of up to 4096x2304 pixels at 60 Hz). In total, the laptop has two video outputs.
| SD Card Reader | |
| average JPG Copy Test (av. of 3 runs) | |
| Average of class Gaming (20.9 - 210, n=54, last 2 years) | |
| Acer Nitro 5 AN515-52-74DR (Toshiba Exceria Pro SDXC 64 GB UHS-II) | |
| HP Pavilion Gaming 15t-cx0000 (Toshiba Exceria Pro SDXC 64 GB UHS-II) | |
| Medion Erazer P6705-MD61131 (Toshiba Exceria Pro SDXC 64 GB UHS-II) | |
| HP Pavilion Gaming 15-cx0003ng (Toshiba Exceria Pro SDXC 64 GB UHS-II) | |
| Acer Nitro 5 AN515-42-R6V0 (Toshiba Exceria Pro SDXC 64 GB UHS-II) | |
| maximum AS SSD Seq Read Test (1GB) | |
| Average of class Gaming (25.5 - 261, n=51, last 2 years) | |
| Medion Erazer P6705-MD61131 (Toshiba Exceria Pro SDXC 64 GB UHS-II) | |
| Acer Nitro 5 AN515-52-74DR (Toshiba Exceria Pro SDXC 64 GB UHS-II) | |
| Acer Nitro 5 AN515-42-R6V0 (Toshiba Exceria Pro SDXC 64 GB UHS-II) | |
| HP Pavilion Gaming 15t-cx0000 (Toshiba Exceria Pro SDXC 64 GB UHS-II) | |
| HP Pavilion Gaming 15-cx0003ng (Toshiba Exceria Pro SDXC 64 GB UHS-II) | |
| Networking | |
| iperf3 transmit AX12 | |
| Acer Nitro 5 AN515-52-74DR | |
| HP Pavilion Gaming 15-cx0003ng | |
| Medion Erazer P6705-MD61131 | |
| Lenovo Legion Y530-15ICH | |
| HP Pavilion Gaming 15t-cx0000 | |
| Acer Nitro 5 AN515-42-R6V0 | |
| iperf3 receive AX12 | |
| Medion Erazer P6705-MD61131 | |
| Acer Nitro 5 AN515-42-R6V0 | |
| HP Pavilion Gaming 15t-cx0000 | |
| Acer Nitro 5 AN515-52-74DR | |
| Lenovo Legion Y530-15ICH | |
| HP Pavilion Gaming 15-cx0003ng | |
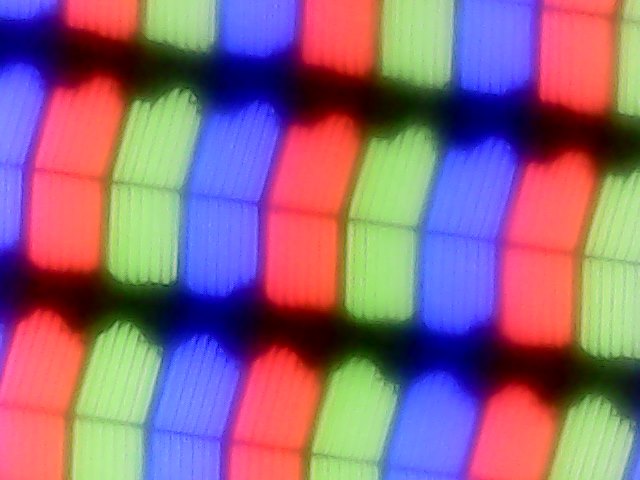
Display - IPS has low brightness
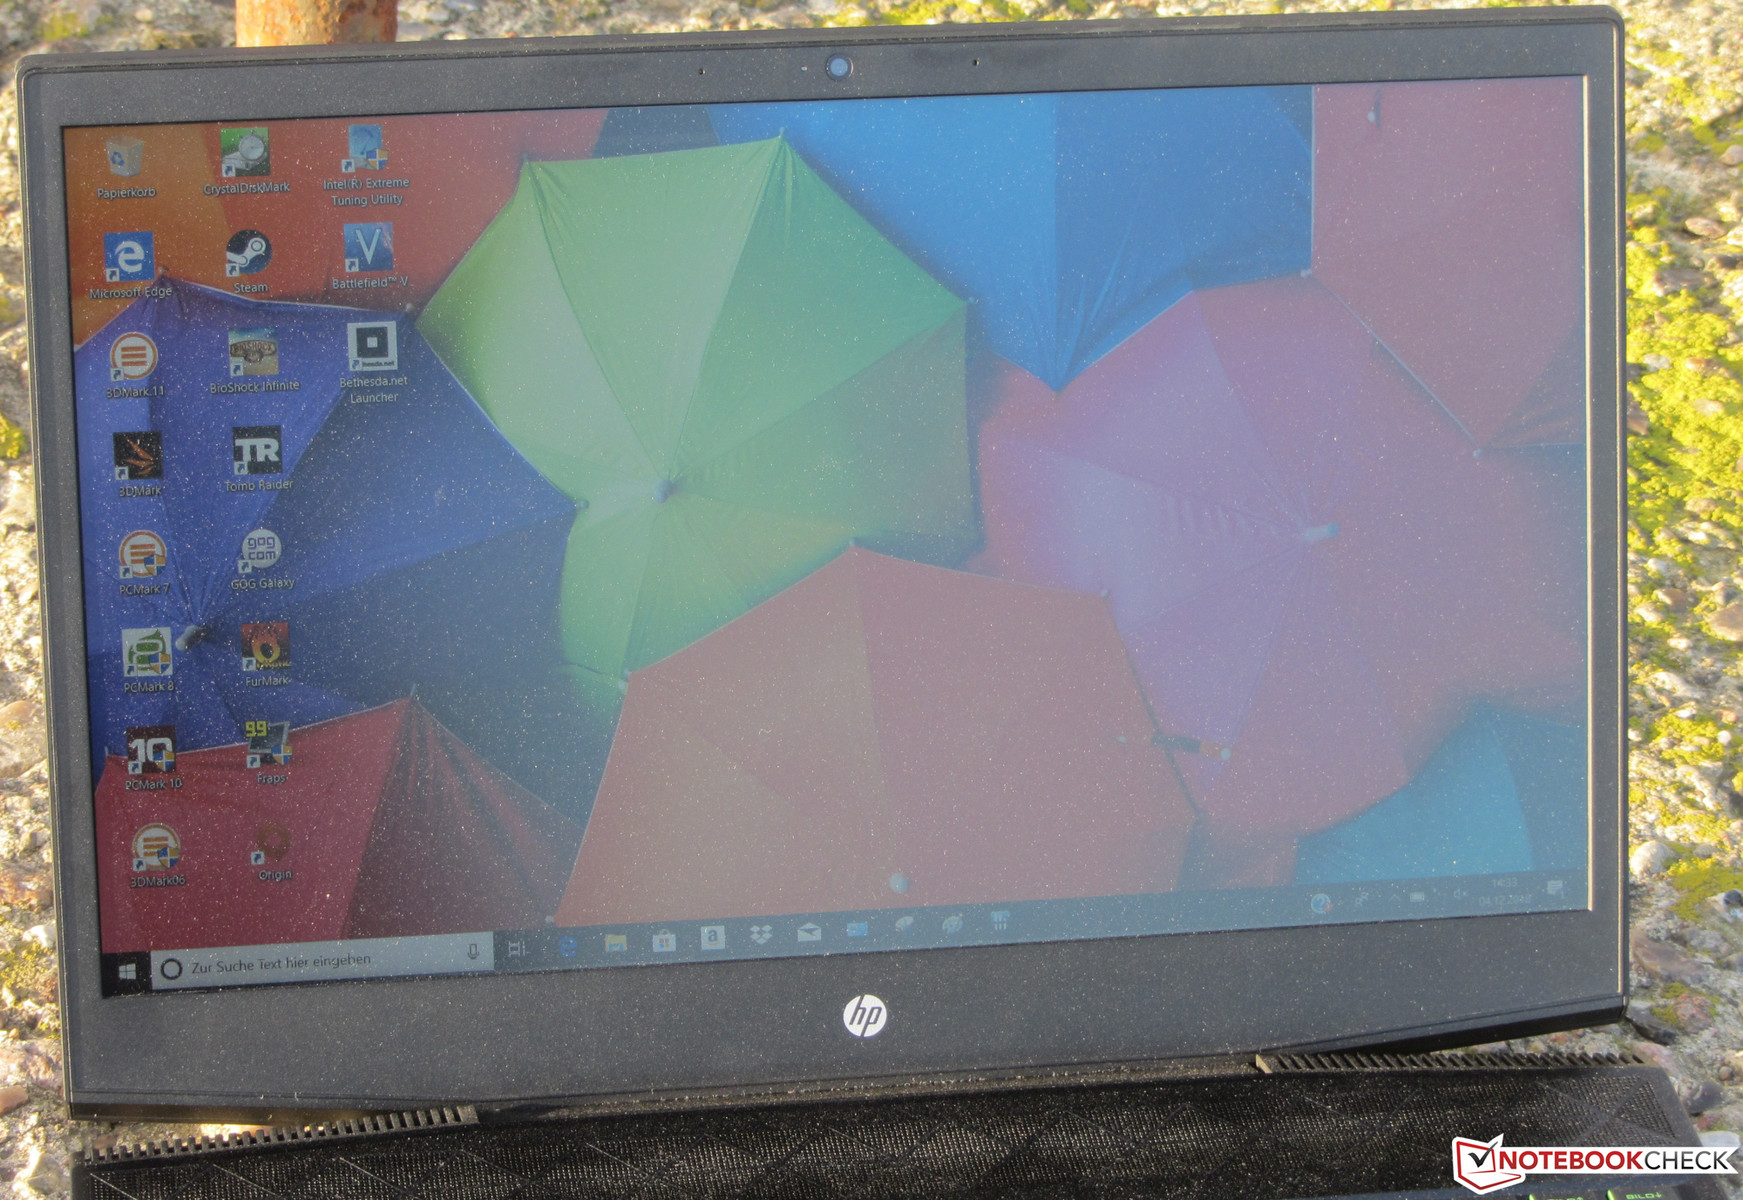
While the Pavilion Gaming 15 model we already tested was equipped with a 144-Hz display, our current test unit contains a 60-Hz model. The display has a native resolution of 1920x1080 pixels. The contrast (1607:1) is good, but brightness could be better at 235.8 cd/m², particularly considering the price of the Pavilion. We generally consider values above 300 cd/m² and 1000:1 as good. At least the screen is bright enough for indoor use.
The screen uses PWM at brightness levels up to 90%. Its frequency is quite low at 208 Hz and could cause headaches and/or eye problems for sensitive users.

| |||||||||||||||||||||||||
Brightness Distribution: 75 %
Center on Battery: 208 cd/m²
Contrast: 1607:1 (Black: 0.15 cd/m²)
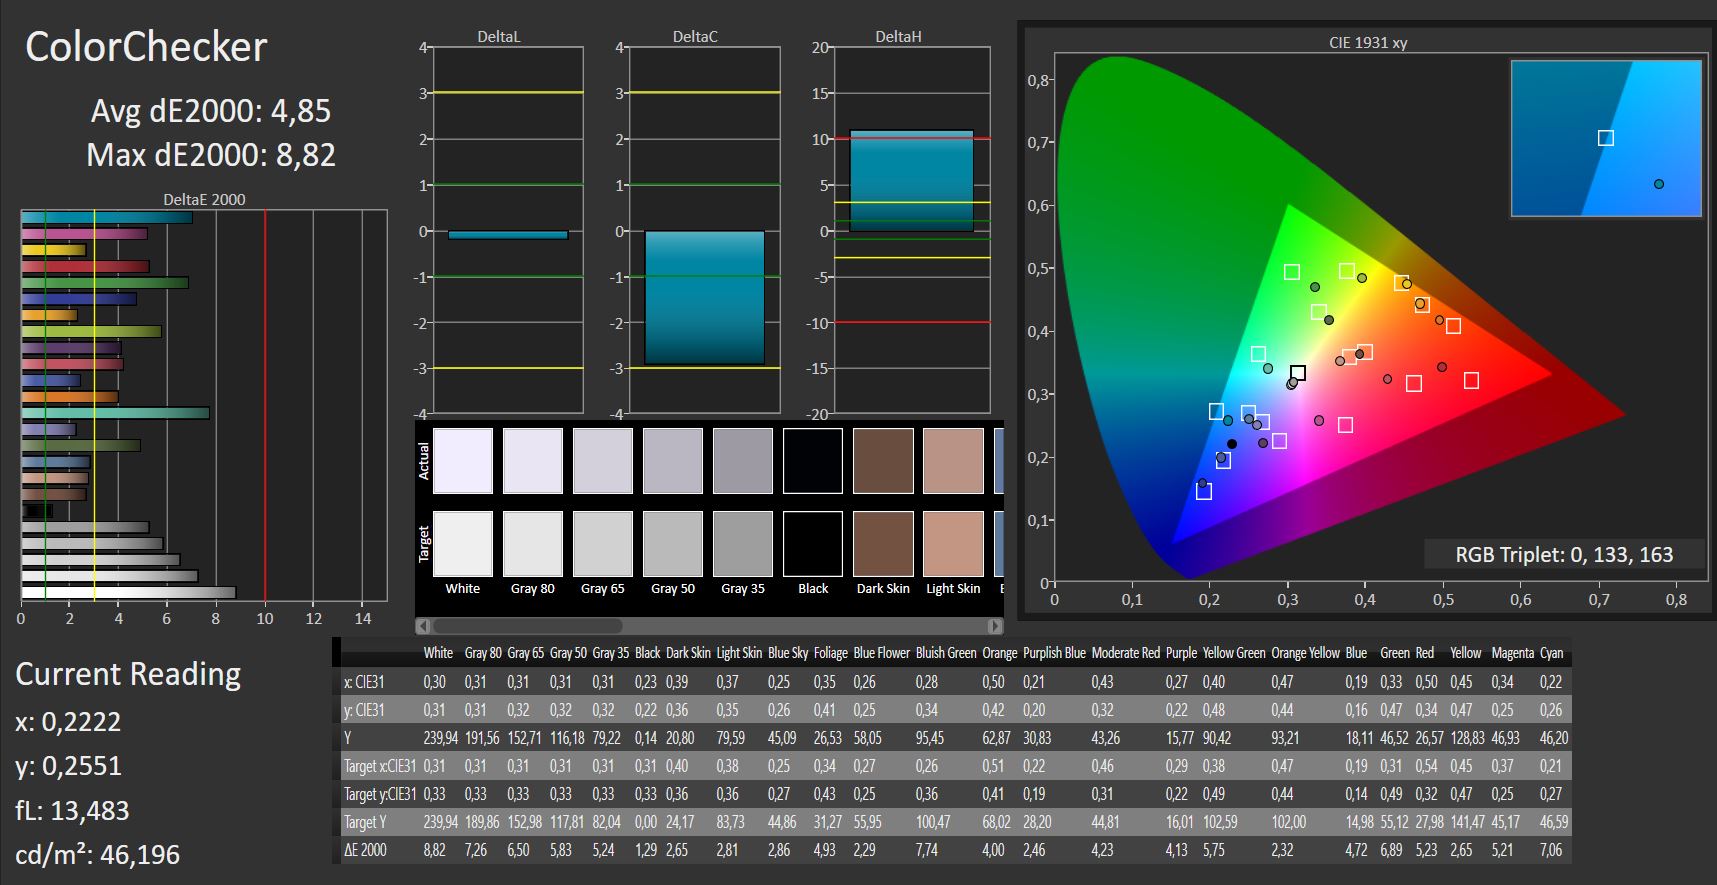
ΔE ColorChecker Calman: 4.85 | ∀{0.5-29.43 Ø4.73}
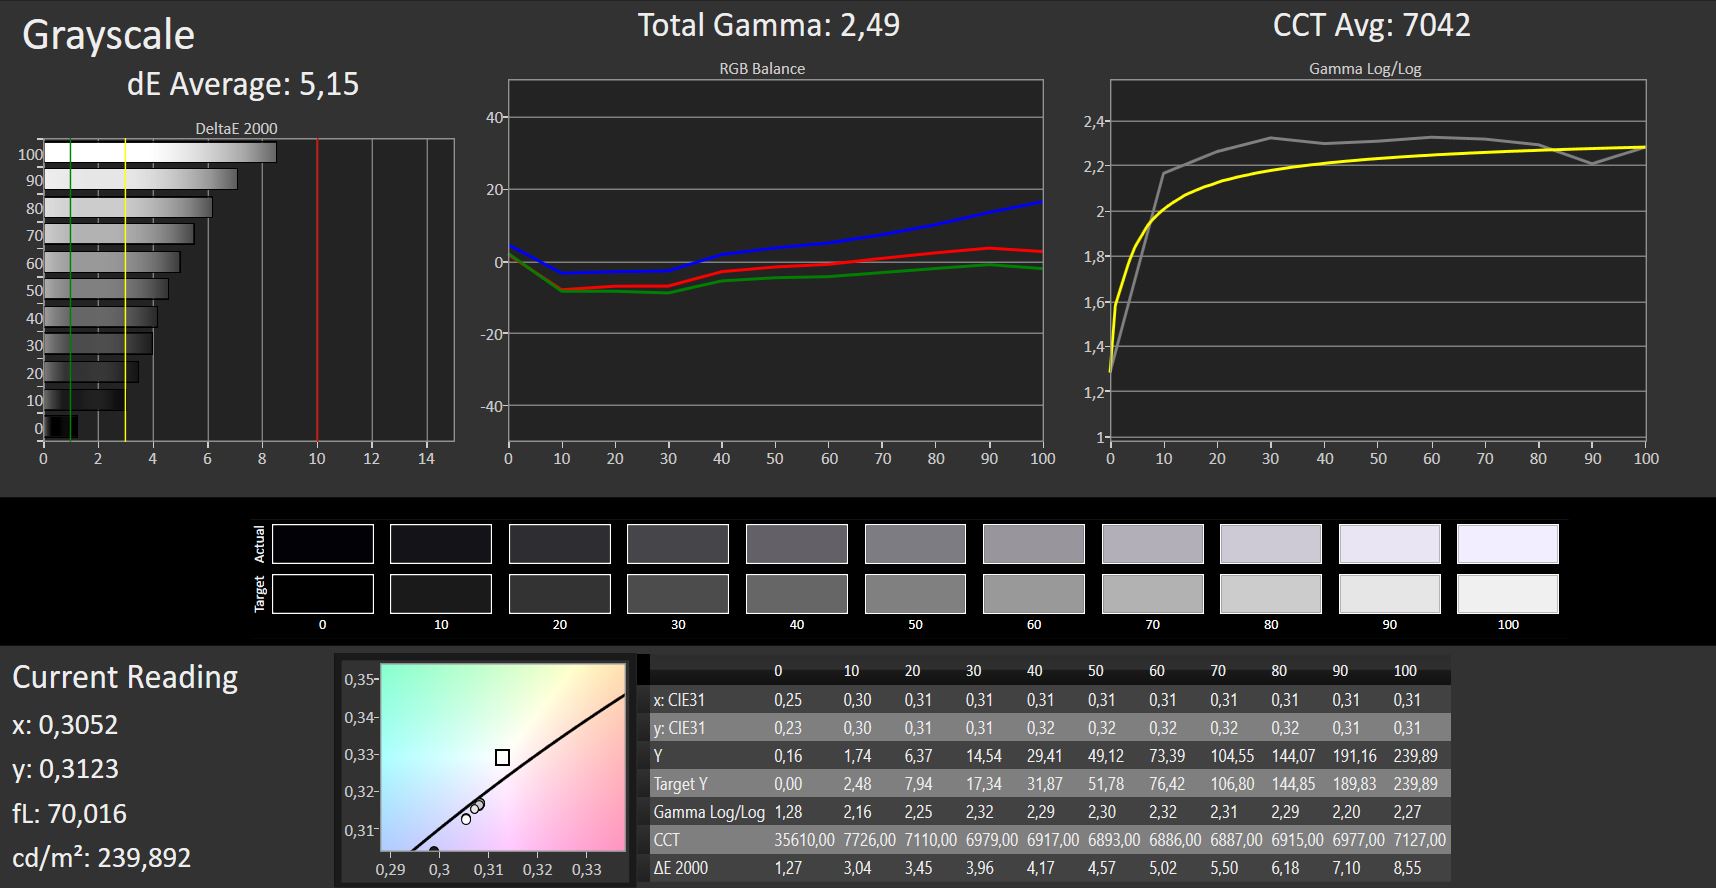
ΔE Greyscale Calman: 5.15 | ∀{0.09-98 Ø4.97}
59% sRGB (Argyll 1.6.3 3D)
38% AdobeRGB 1998 (Argyll 1.6.3 3D)
41.04% AdobeRGB 1998 (Argyll 3D)
59.3% sRGB (Argyll 3D)
39.72% Display P3 (Argyll 3D)
Gamma: 2.49
CCT: 7042 K
| HP Pavilion Gaming 15-cx0003ng IPS, 1920x1080, 15.6" | Acer Nitro 5 AN515-42-R6V0 IPS, 1920x1080, 15.6" | Acer Nitro 5 AN515-52-74DR IPS, 1920x1080, 15.6" | HP Pavilion Gaming 15t-cx0000 IPS, 1920x1080, 15.6" | Medion Erazer P6705-MD61131 TN, 1920x1080, 15.6" | Lenovo Legion Y530-15ICH IPS, 1920x1080, 15.6" | |
|---|---|---|---|---|---|---|
| Display | 54% | 0% | 62% | -8% | -4% | |
| Display P3 Coverage (%) | 39.72 | 63.4 60% | 39.59 0% | 66.5 67% | 36.4 -8% | 38.31 -4% |
| sRGB Coverage (%) | 59.3 | 87.4 47% | 59.5 0% | 91.7 55% | 54.8 -8% | 57.3 -3% |
| AdobeRGB 1998 Coverage (%) | 41.04 | 64 56% | 40.92 0% | 67.1 63% | 37.61 -8% | 39.58 -4% |
| Response Times | -5% | 24% | 64% | 27% | 1% | |
| Response Time Grey 50% / Grey 80% * (ms) | 47 ? | 48.4 ? -3% | 38 ? 19% | 17.6 ? 63% | 44.8 ? 5% | 43.6 ? 7% |
| Response Time Black / White * (ms) | 31 ? | 32.8 ? -6% | 22 ? 29% | 11.2 ? 64% | 16 ? 48% | 32.4 ? -5% |
| PWM Frequency (Hz) | 208 ? | |||||
| Screen | 10% | 1% | 11% | -68% | -28% | |
| Brightness middle (cd/m²) | 241 | 299 24% | 252 5% | 357.5 48% | 200 -17% | 282.8 17% |
| Brightness (cd/m²) | 236 | 284 20% | 237 0% | 351 49% | 186 -21% | 264 12% |
| Brightness Distribution (%) | 75 | 88 17% | 86 15% | 85 13% | 85 13% | 88 17% |
| Black Level * (cd/m²) | 0.15 | 0.24 -60% | 0.21 -40% | 0.36 -140% | 0.43 -187% | 0.42 -180% |
| Contrast (:1) | 1607 | 1246 -22% | 1200 -25% | 993 -38% | 465 -71% | 673 -58% |
| Colorchecker dE 2000 * | 4.85 | 4.98 -3% | 4.42 9% | 4.19 14% | 11.39 -135% | 4.93 -2% |
| Colorchecker dE 2000 max. * | 8.82 | 7.67 13% | 7.21 18% | 6.97 21% | 19.36 -120% | 17.65 -100% |
| Greyscale dE 2000 * | 5.15 | 4.58 11% | 3.74 27% | 3.5 32% | 11.73 -128% | 3.8 26% |
| Gamma | 2.49 88% | 2.55 86% | 2.34 94% | 2.324 95% | 1.97 112% | 2.449 90% |
| CCT | 7042 92% | 6397 102% | 7291 89% | 7028 92% | 12614 52% | 6112 106% |
| Color Space (Percent of AdobeRGB 1998) (%) | 38 | 57 50% | 38 0% | 60 58% | 35 -8% | 36 -5% |
| Color Space (Percent of sRGB) (%) | 59 | 87 47% | 59 0% | 91 54% | 55 -7% | 57 -3% |
| Colorchecker dE 2000 calibrated * | 3.7 | 3.08 | 3.2 | 3.05 | 4.07 | |
| Total Average (Program / Settings) | 20% /
17% | 8% /
4% | 46% /
28% | -16% /
-43% | -10% /
-19% |
* ... smaller is better
Screen Flickering / PWM (Pulse-Width Modulation)
| Screen flickering / PWM detected | 208 Hz | ≤ 90 % brightness setting | 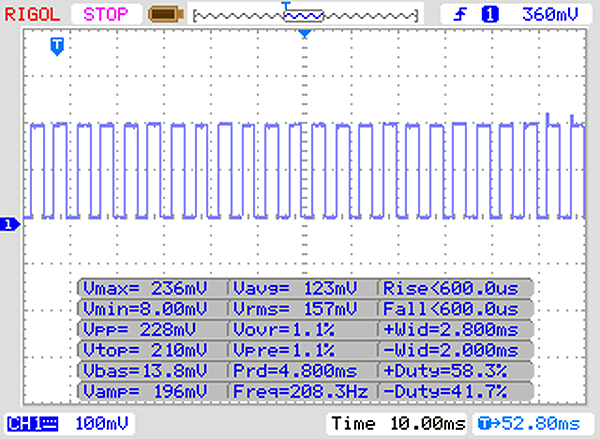 |
The display backlight flickers at 208 Hz (worst case, e.g., utilizing PWM) Flickering detected at a brightness setting of 90 % and below. There should be no flickering or PWM above this brightness setting. The frequency of 208 Hz is relatively low, so sensitive users will likely notice flickering and experience eyestrain at the stated brightness setting and below. In comparison: 52 % of all tested devices do not use PWM to dim the display. If PWM was detected, an average of 7798 (minimum: 5 - maximum: 343500) Hz was measured. | |||
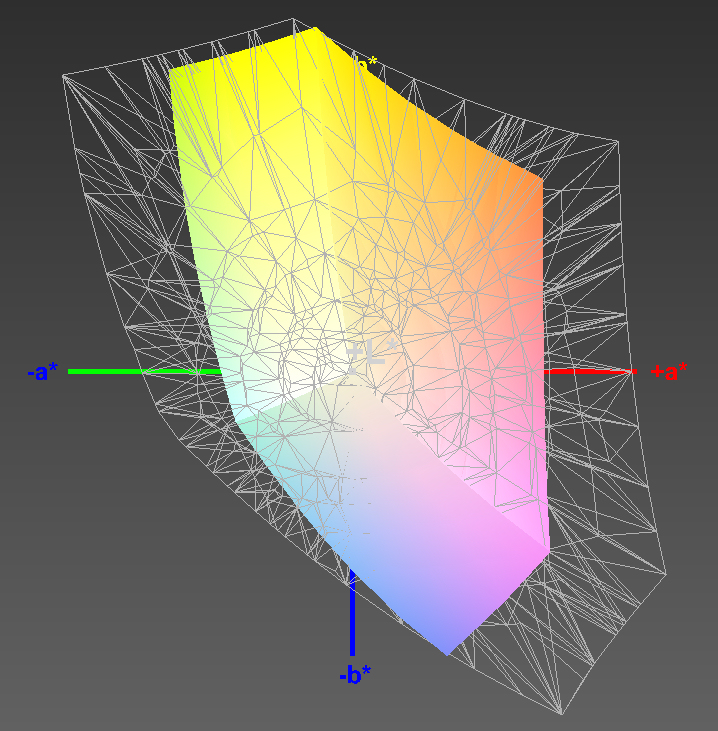
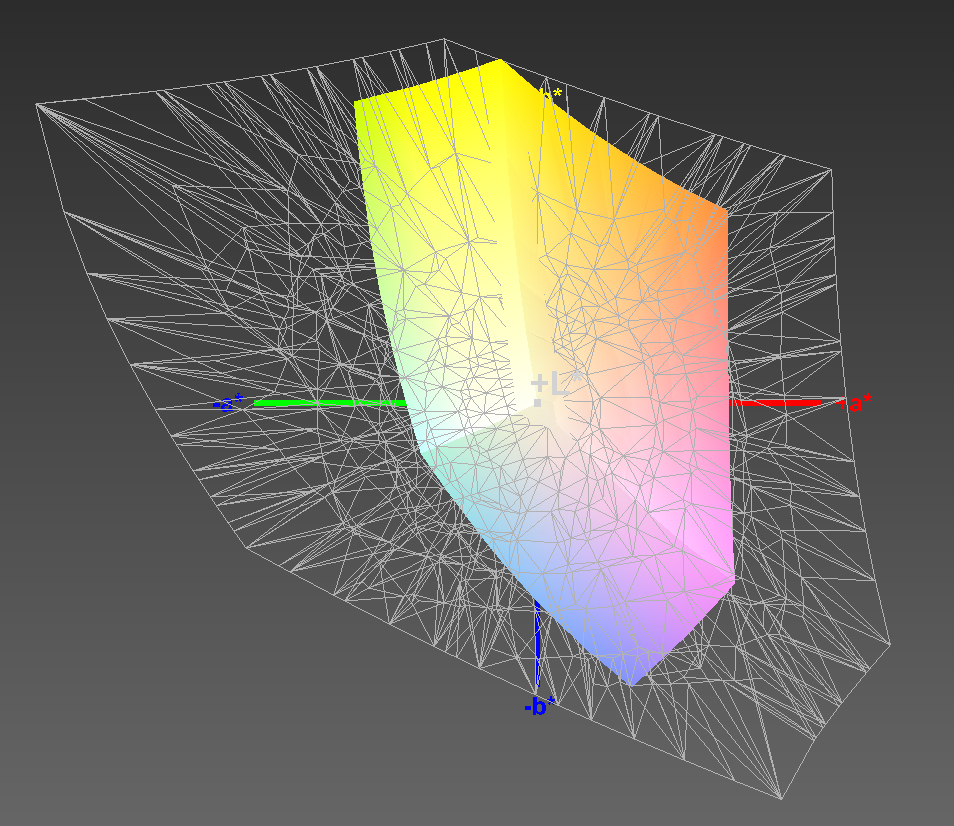
We measured a relatively decent DeltaE 2000 deviation of 4.85 ex-works. This is not too far off from the target range of DeltaE below 3. The display does not have a blue cast. The color spaces AdobeRGB and sRGB are not displayed fully - we measured color-space coverage of 38% (AdobeRGB) and 59% (sRGB).
The color profile provided by us (see above) can be used to improve the color accuracy of the screen. However, please make sure that your device is equipped with exactly the same display model (manufacturer + model number) as the one in our test unit. Otherwise, colors could actually worsen rather than improve. Manufacturers often use different displays from various manufacturers within the same notebook model.
Display Response Times
| ↔ Response Time Black to White | ||
|---|---|---|
| 31 ms ... rise ↗ and fall ↘ combined | ↗ 17 ms rise | 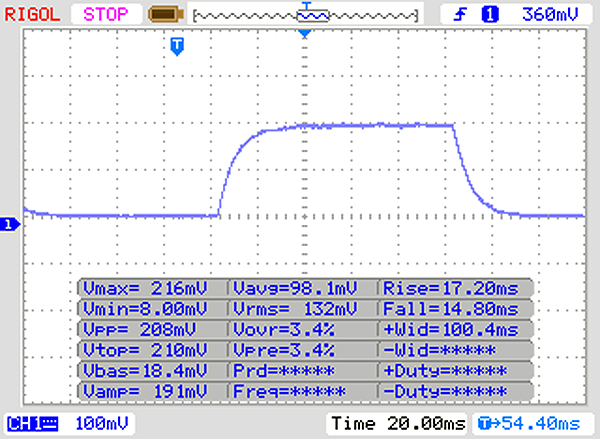 |
| ↘ 14 ms fall | ||
| The screen shows slow response rates in our tests and will be unsatisfactory for gamers. In comparison, all tested devices range from 0.1 (minimum) to 240 (maximum) ms. » 84 % of all devices are better. This means that the measured response time is worse than the average of all tested devices (19.9 ms). | ||
| ↔ Response Time 50% Grey to 80% Grey | ||
| 47 ms ... rise ↗ and fall ↘ combined | ↗ 23 ms rise | 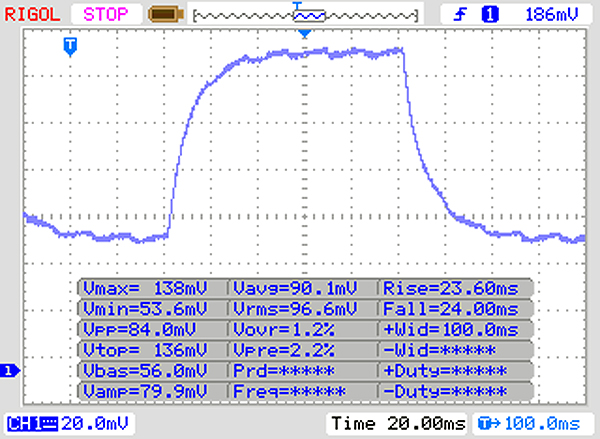 |
| ↘ 24 ms fall | ||
| The screen shows slow response rates in our tests and will be unsatisfactory for gamers. In comparison, all tested devices range from 0.165 (minimum) to 636 (maximum) ms. » 81 % of all devices are better. This means that the measured response time is worse than the average of all tested devices (31.1 ms). | ||
HP has equipped the Pavilion with an IPS panel with stable viewing angles. This means that the screen can be read from any position. The display brightness is sufficient for indoor use but will make using the device out of doors difficult or rather impossible, particularly as the maximum brightness is even lower when the device is running on battery (208 cd/m²).

Performance - sufficient for the next few years
The Pavilion Gaming 15 from Hewlett-Packard is a mid-range gaming notebook. The device has sufficient processing power for all normal applications and can display all current games smoothly. Our test unit is available for around $1,000. The starting price for other configurations is $900.
Processor
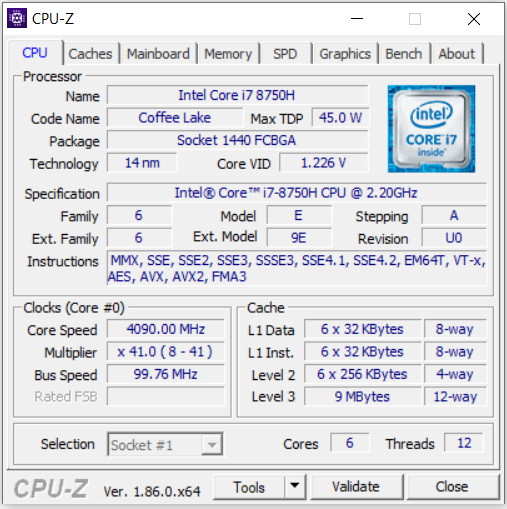
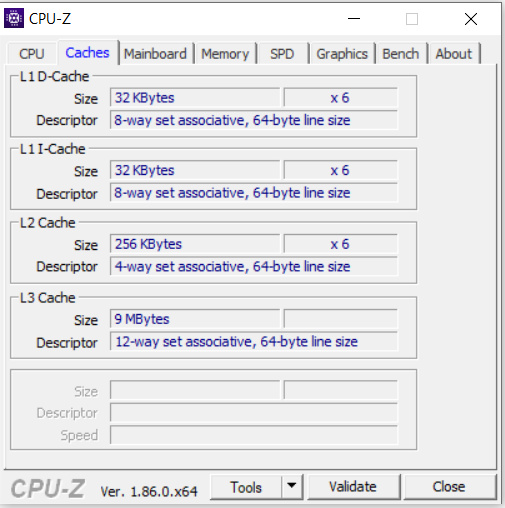
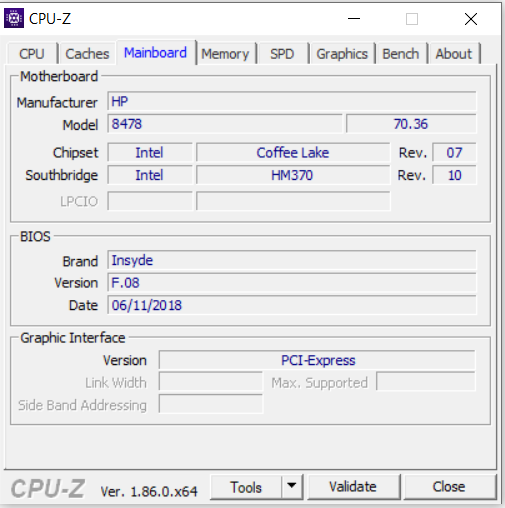
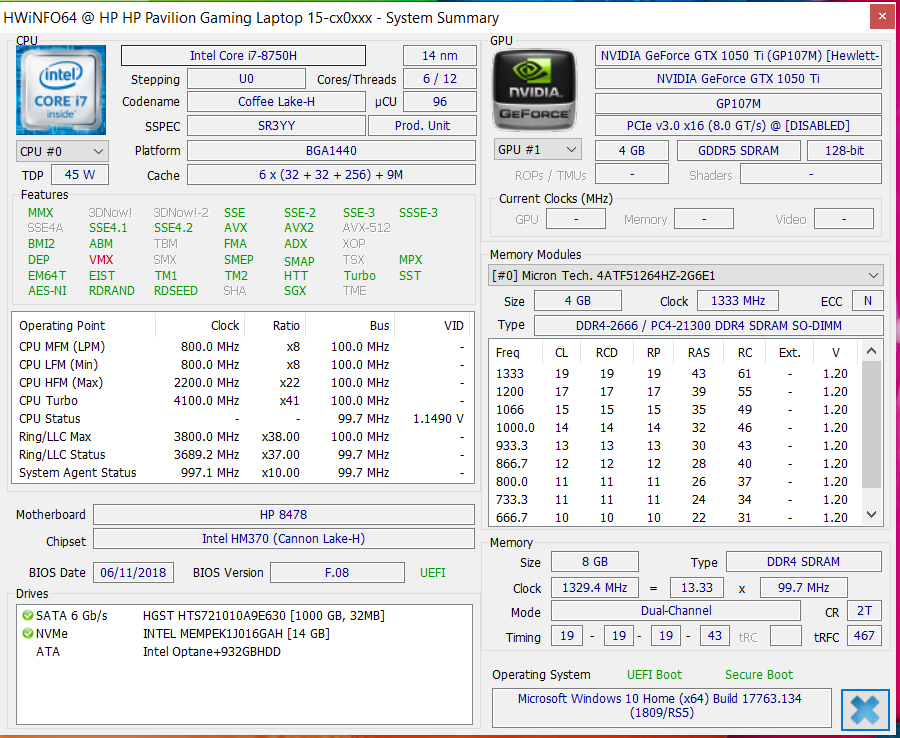
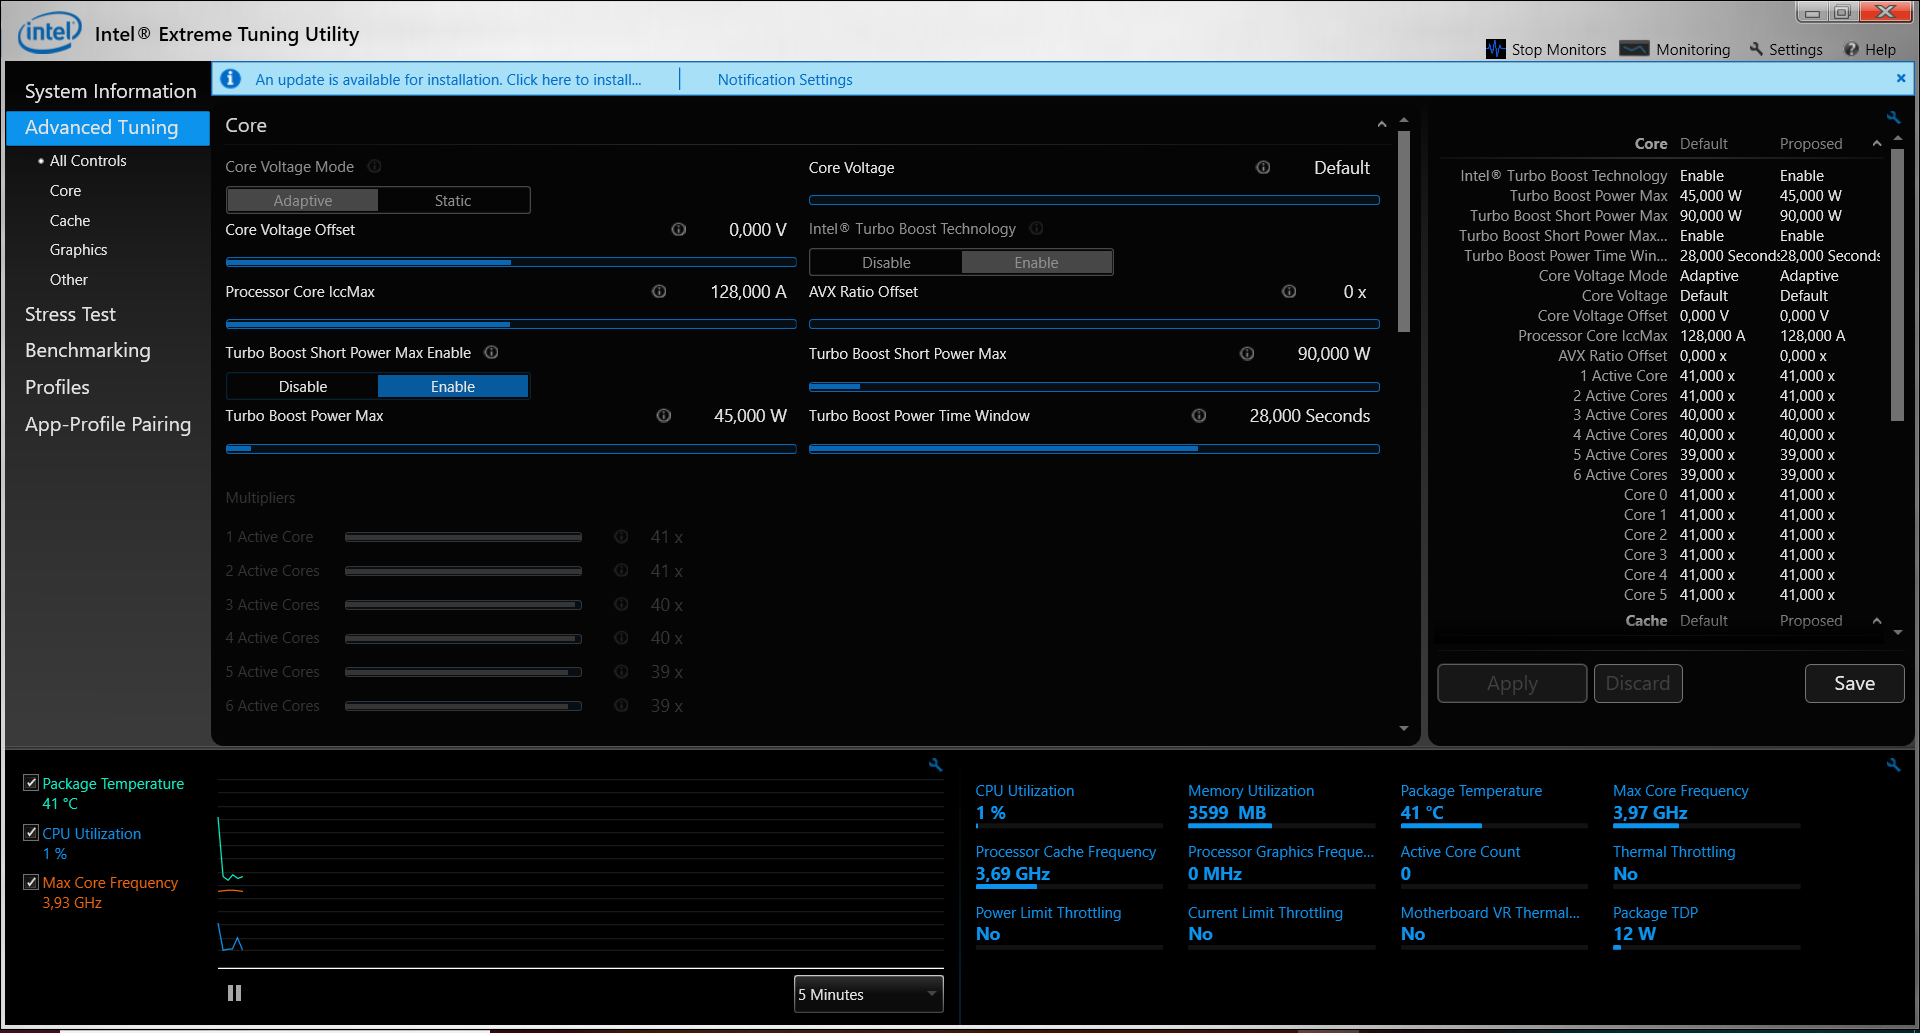
The Pavilion is equipped with a hexa-core Intel Core i7-8750H (Coffee Lake). This is a mobile CPU with a TDP of 45 watts. Hewlett-Packard allows users to increase the TDP to 90 watts for a short time. The processor clocks at 2.2 GHz (base rate) but can be increased to 3.9 GHz (six cores), 4 GHz (four cores) or 4.1 GHz (one or two cores) in turbo mode.
There is basically no difference between Coffee Lake and Kaby Lake architecture. Therefore, the performance per MHz has remained the same. The higher performance of the Core i7-8750H compared to its predecessors is based mainly on the additional cores. The improved production process also enables Coffee Lake chips to have higher clock rates.
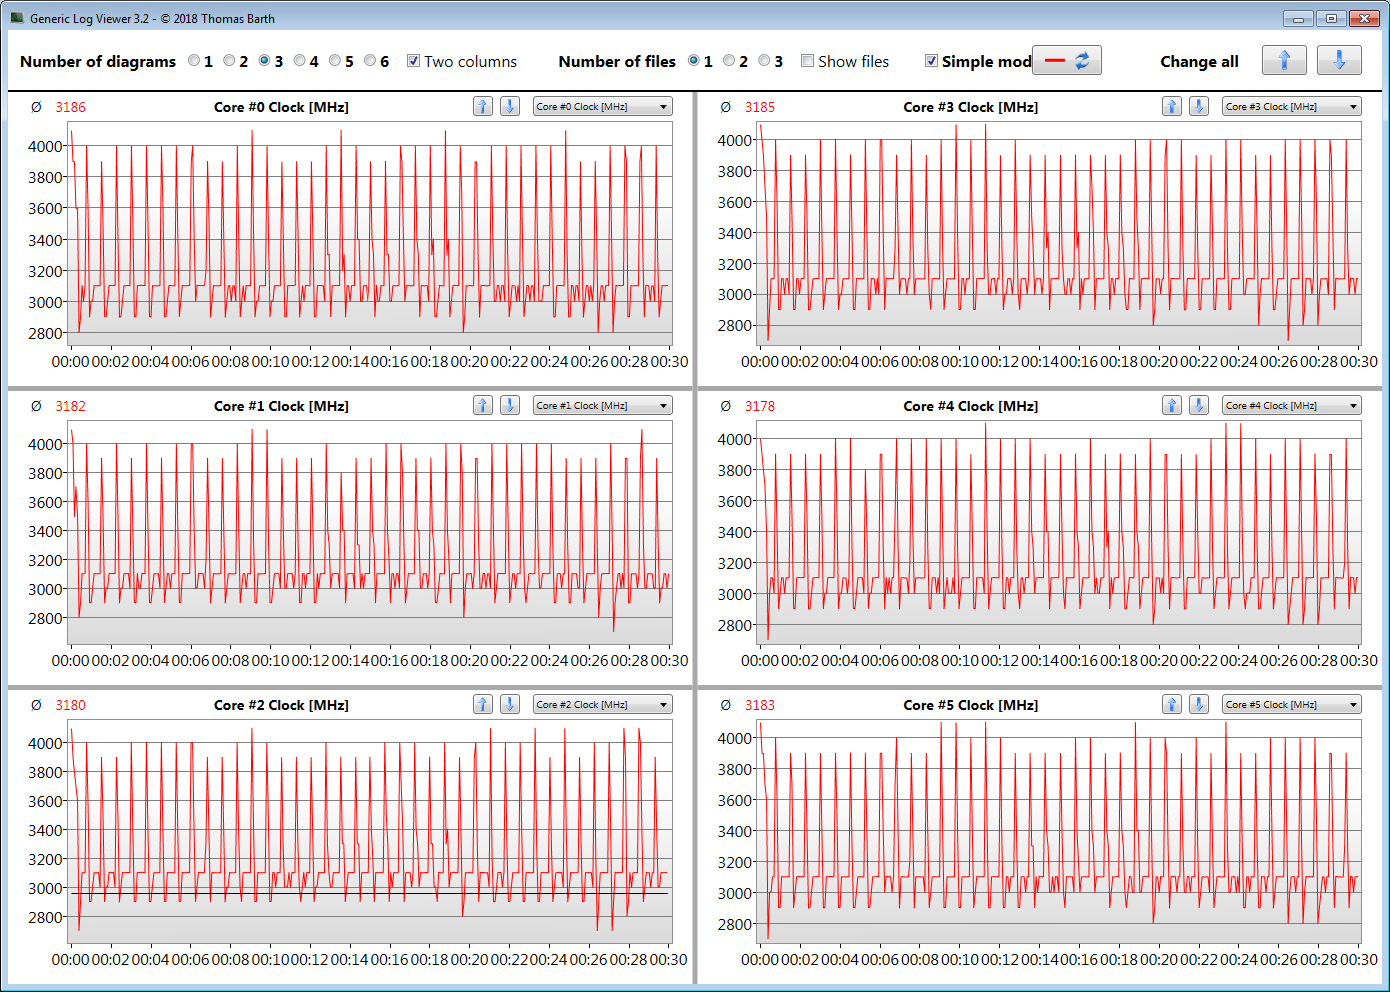
The processor clocks at 3.5 - 4 GHz during the first few seconds of our Cinebench multithread test. After that, the clock rate drops to 2.8 GHz - 3.1 GHz. The single-thread benchmark is completed at 3.9 - 4.1 GHz. These are the results when running on power supply. On battery, the processor clocks at 2.2 - 2.7 GHz (multithread) and 2.4 - 4.1 GHz (single-thread).
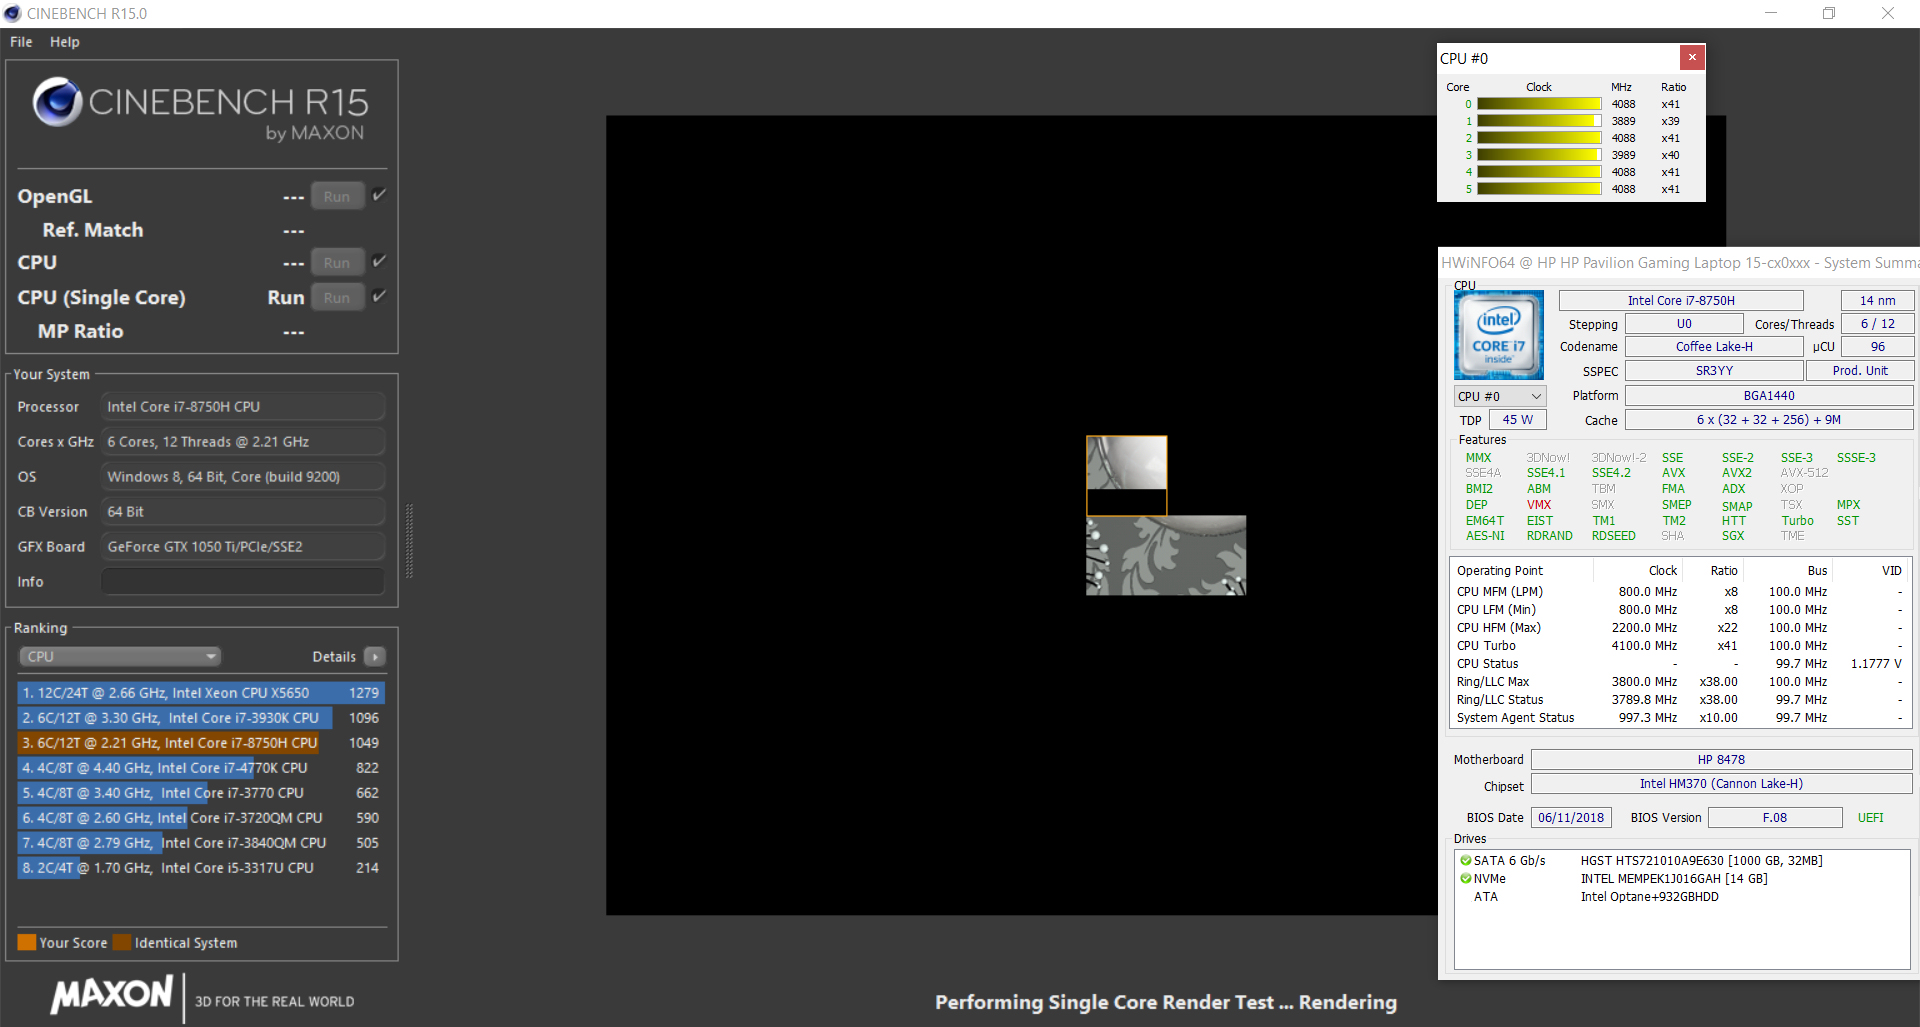
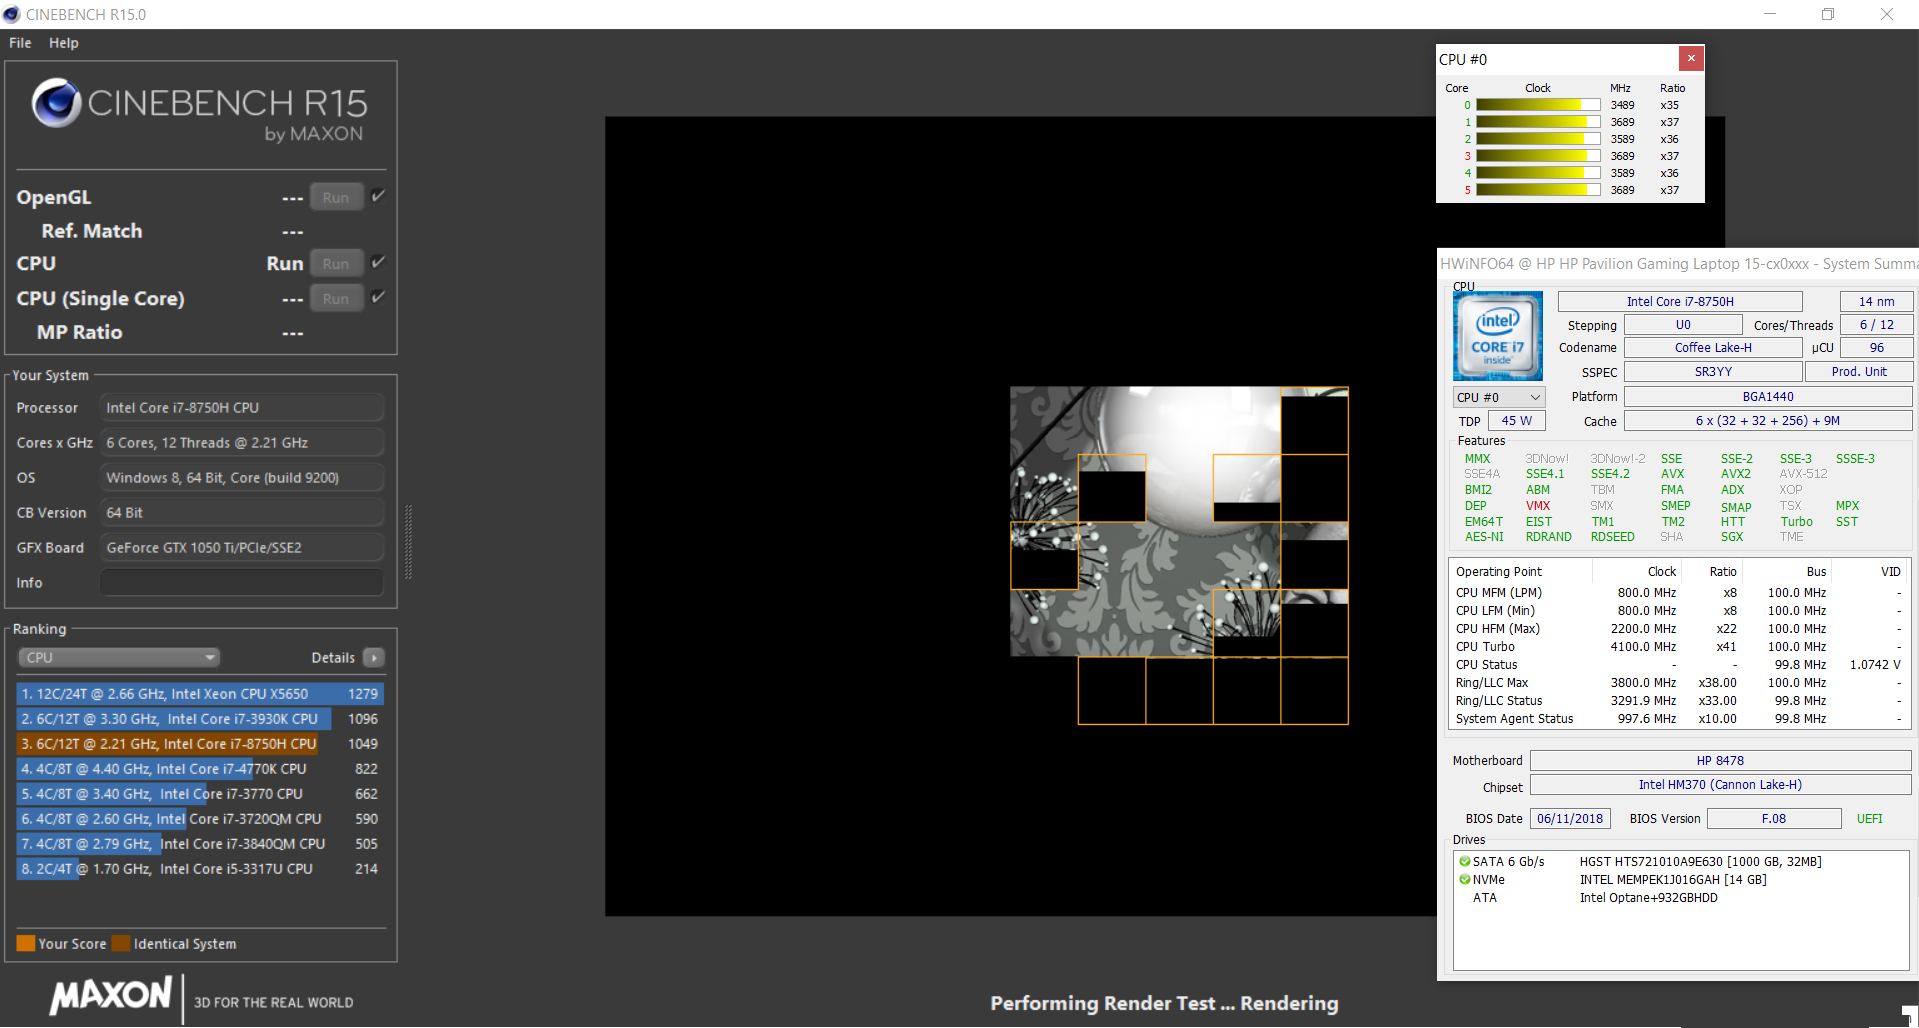
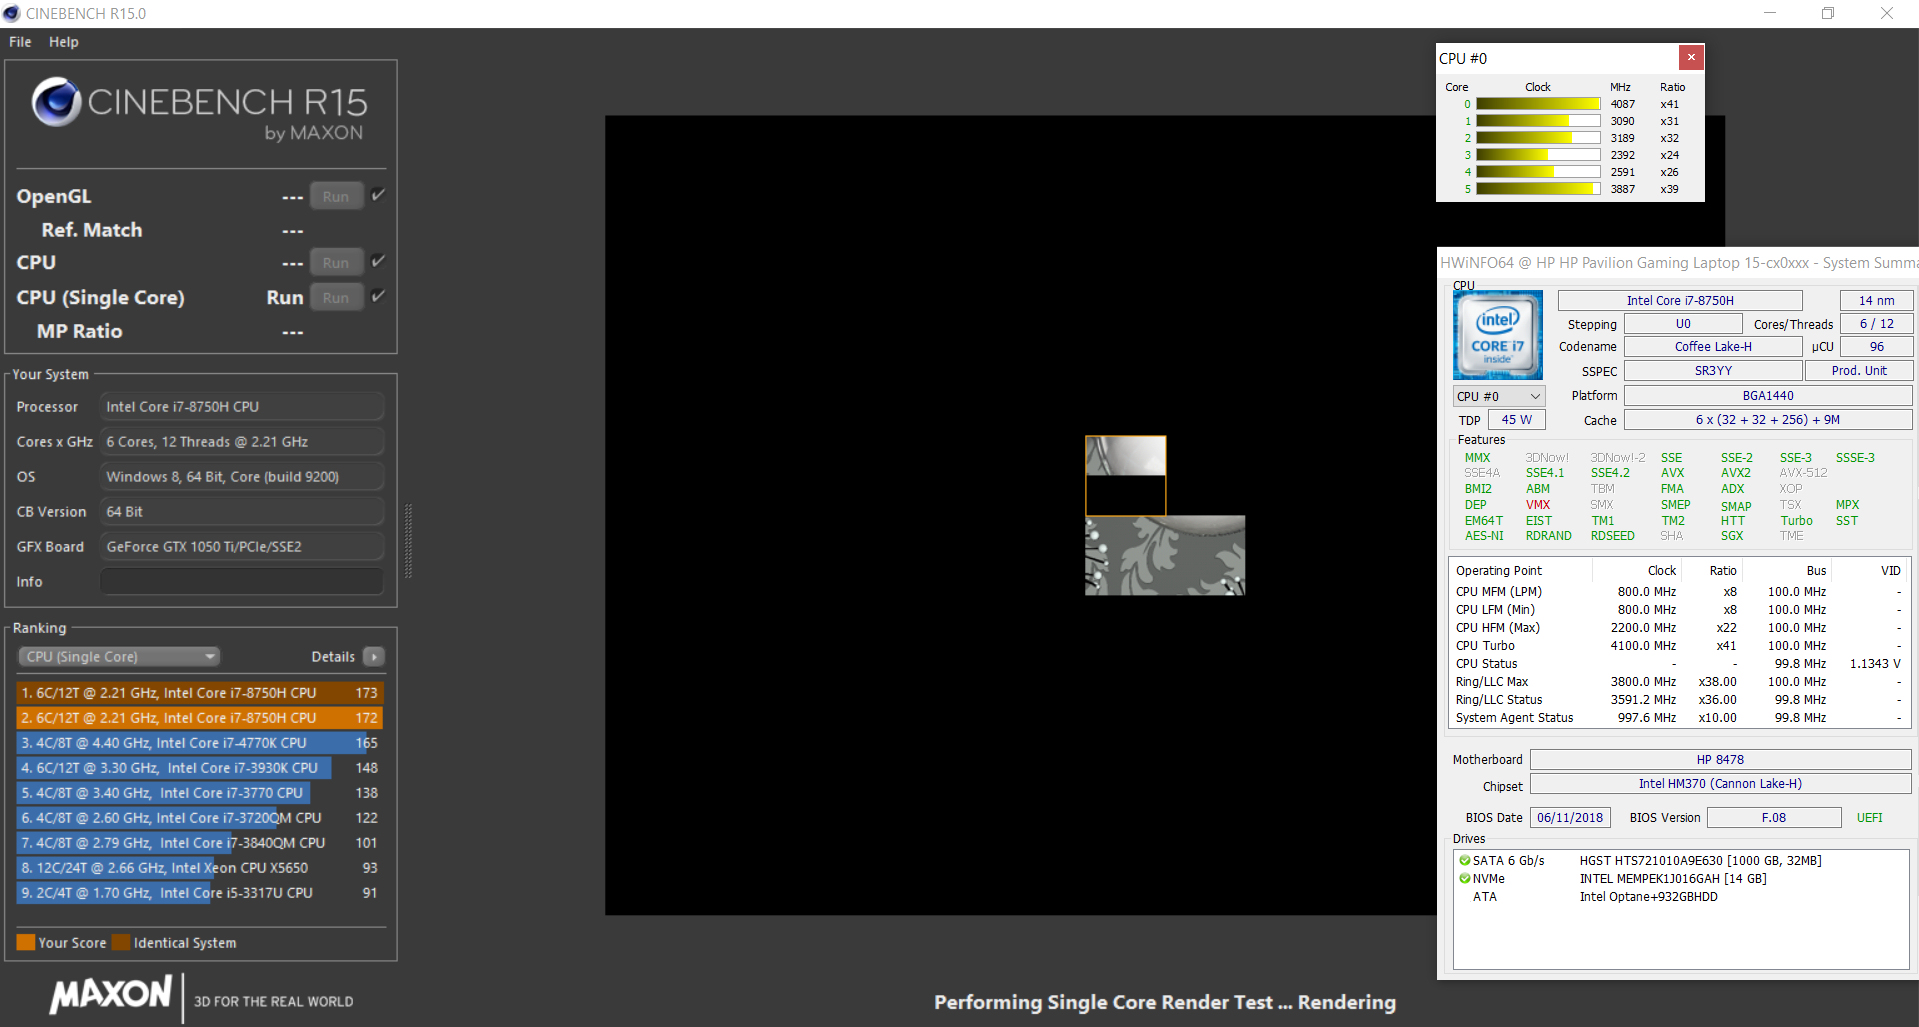
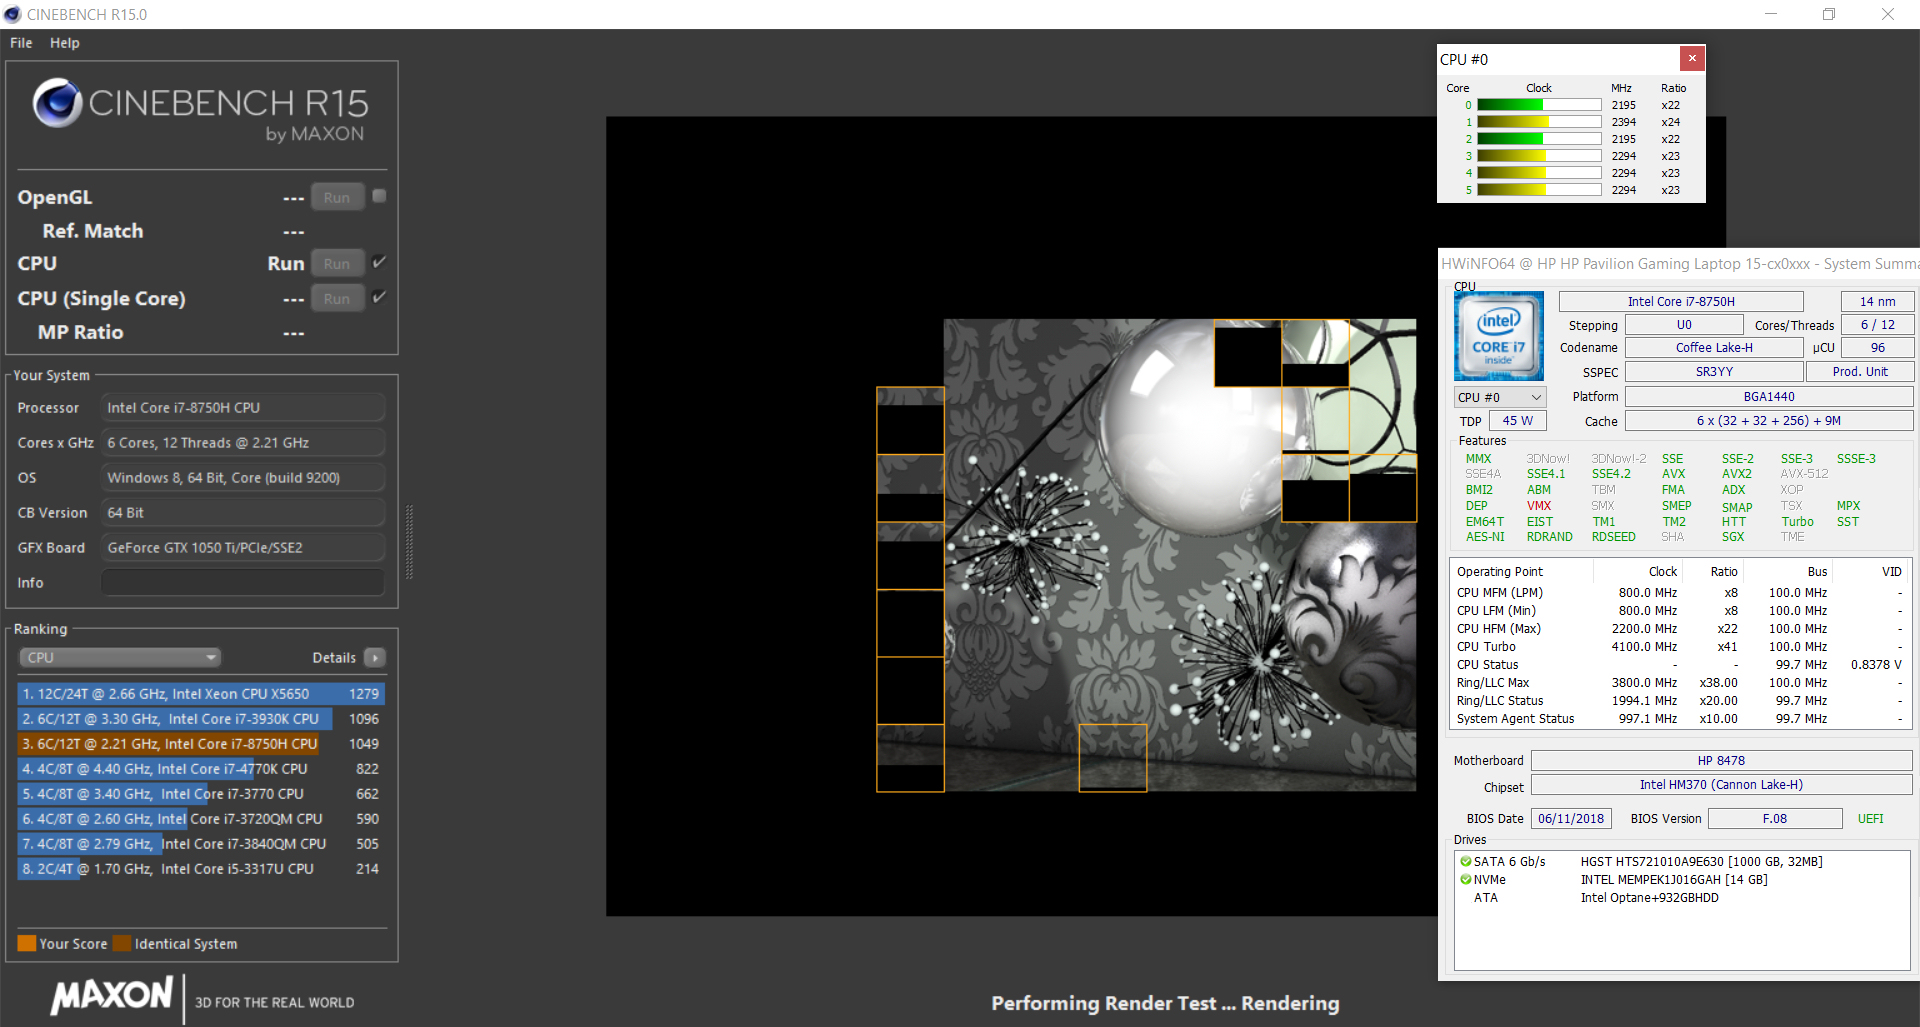
We can find out whether the turbo is used continuously by running the multithread Cinebench R15 benchmark in a loop for about 30 minutes. The results drop slightly between the first and second round but then remain constant for the remainder of the test. This means that the turbo is used. However, the Pavilion cannot keep up with the Acer Nitro 5, which is equipped with the same CPU/GPU combination. The latter offers results above 1000 points throughout the entire test.
| Cinebench R11.5 | |
| CPU Multi 64Bit | |
| Average of class Gaming (29.8 - 70.7, n=8, last 2 years) | |
| Acer Nitro 5 AN515-52-74DR | |
| Average Intel Core i7-8750H (9.54 - 13.5, n=41) | |
| Medion Erazer P6705-MD61131 | |
| HP Pavilion Gaming 15-cx0003ng | |
| HP Pavilion Gaming 15t-cx0000 | |
| Acer Nitro 5 AN515-42-R6V0 | |
| CPU Single 64Bit | |
| Average of class Gaming (3.3 - 3.98, n=8, last 2 years) | |
| Acer Nitro 5 AN515-52-74DR | |
| HP Pavilion Gaming 15t-cx0000 | |
| HP Pavilion Gaming 15-cx0003ng | |
| Average Intel Core i7-8750H (1.89 - 2, n=40) | |
| Medion Erazer P6705-MD61131 | |
| Acer Nitro 5 AN515-42-R6V0 | |
| Cinebench R10 | |
| Rendering Multiple CPUs 32Bit | |
| Average of class Gaming (42932 - 81339, n=8, last 2 years) | |
| Average Intel Core i7-8750H (29664 - 35307, n=25) | |
| HP Pavilion Gaming 15-cx0003ng | |
| Rendering Single 32Bit | |
| Average of class Gaming (7457 - 11779, n=8, last 2 years) | |
| HP Pavilion Gaming 15-cx0003ng | |
| Average Intel Core i7-8750H (6236 - 6645, n=25) | |
| Geekbench 3 | |
| 32 Bit Multi-Core Score | |
| Average Intel Core i7-8750H (20725 - 22665, n=13) | |
| HP Pavilion Gaming 15-cx0003ng | |
| 32 Bit Single-Core Score | |
| Average Intel Core i7-8750H (3734 - 4163, n=13) | |
| HP Pavilion Gaming 15-cx0003ng | |
| Geekbench 4.0 | |
| 64 Bit Multi-Core Score | |
| Average of class Gaming (40469 - 76142, n=4, last 2 years) | |
| Average Intel Core i7-8750H (17048 - 22006, n=8) | |
| HP Pavilion Gaming 15-cx0003ng | |
| 64 Bit Single-Core Score | |
| Average of class Gaming (7589 - 9053, n=4, last 2 years) | |
| HP Pavilion Gaming 15-cx0003ng | |
| Average Intel Core i7-8750H (4548 - 4997, n=8) | |
| Geekbench 4.4 | |
| 64 Bit Multi-Core Score | |
| Average of class Gaming (89200 - 97490, n=2, last 2 years) | |
| Average Intel Core i7-8750H (17709 - 23313, n=17) | |
| HP Pavilion Gaming 15-cx0003ng | |
| 64 Bit Single-Core Score | |
| Average of class Gaming (9335 - 9492, n=2, last 2 years) | |
| HP Pavilion Gaming 15-cx0003ng | |
| Average Intel Core i7-8750H (4669 - 5146, n=17) | |
| Mozilla Kraken 1.1 - Total | |
| Average Intel Core i7-8750H (695 - 1272, n=50) | |
| HP Pavilion Gaming 15-cx0003ng | |
| Lenovo Legion Y530-15ICH (Microsoft Edge 42.17134.1.0) | |
| Average of class Gaming (391 - 590, n=105, last 2 years) | |
| Octane V2 - Total Score | |
| Average of class Gaming (87588 - 139447, n=30, last 2 years) | |
| HP Pavilion Gaming 15-cx0003ng | |
| Lenovo Legion Y530-15ICH (Microsoft Edge 42.17134.1.0) | |
| Average Intel Core i7-8750H (27460 - 44549, n=47) | |
| JetStream 1.1 - 1.1 Total | |
| Average of class Gaming (518 - 647, n=5, last 2 years) | |
| Lenovo Legion Y530-15ICH (Microsoft Edge 42.17134.1.0) | |
| HP Pavilion Gaming 15-cx0003ng (Edge 44) | |
| Average Intel Core i7-8750H (205 - 299, n=49) | |
* ... smaller is better
System Performance
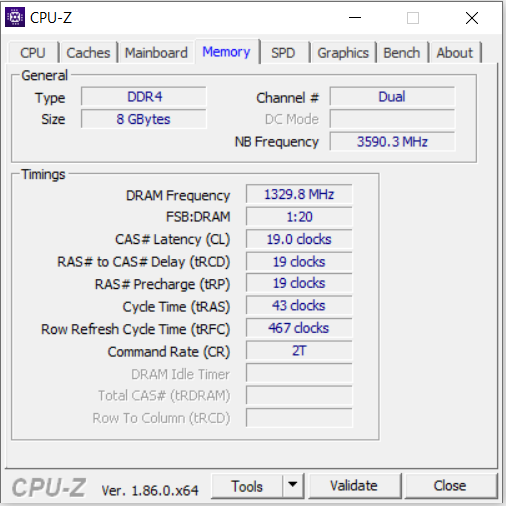
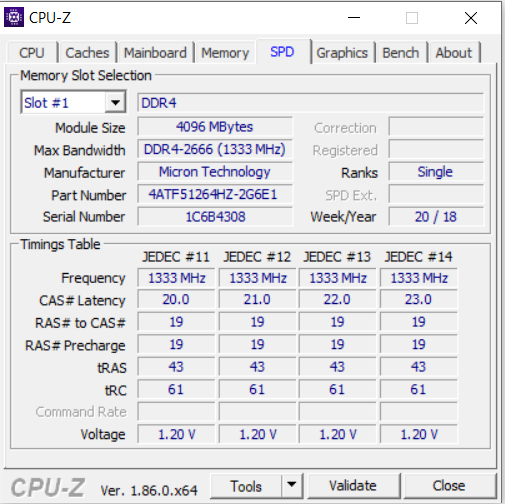
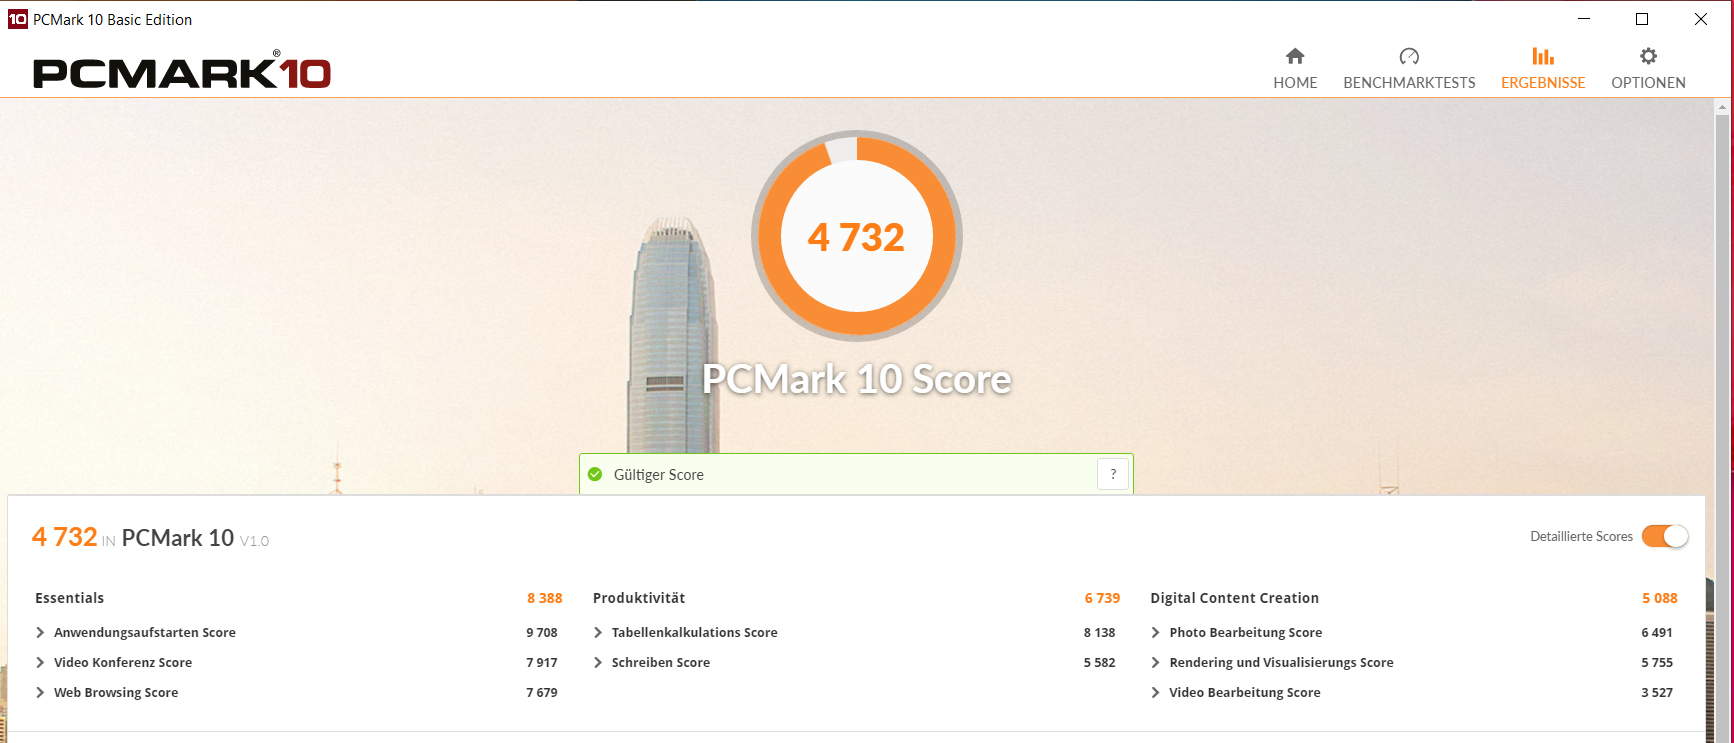
The Pavilion does not lack performance power. The hexa-core processor performs well in all the usual areas of use and offers sufficient reserves for the next few years. The dedicated graphics card also enables gaming. In addition, the combination of a hexa-core processor, RAM in dual-channel mode and Intel Optane Memory ensures a smooth-running system. The results of the PCMark benchmarks confirm our very good impression. We did not encounter any issues here.
| PCMark 7 Score | 6418 points | |
| PCMark 8 Home Score Accelerated v2 | 4259 points | |
| PCMark 8 Creative Score Accelerated v2 | 4820 points | |
| PCMark 8 Work Score Accelerated v2 | 5249 points | |
| PCMark 10 Score | 4732 points | |
Help | ||
| PCMark 8 | |
| Home Score Accelerated v2 | |
| Average of class Gaming (n=1last 2 years) | |
| HP Pavilion Gaming 15t-cx0000 | |
| Acer Nitro 5 AN515-52-74DR | |
| HP Pavilion Gaming 15-cx0003ng | |
| Average Intel Core i7-8750H, NVIDIA GeForce GTX 1050 Ti Mobile (3894 - 4371, n=10) | |
| Lenovo Legion Y530-15ICH | |
| Medion Erazer P6705-MD61131 | |
| Acer Nitro 5 AN515-42-R6V0 | |
| Work Score Accelerated v2 | |
| Acer Nitro 5 AN515-52-74DR | |
| Lenovo Legion Y530-15ICH | |
| Medion Erazer P6705-MD61131 | |
| Average Intel Core i7-8750H, NVIDIA GeForce GTX 1050 Ti Mobile (4973 - 5461, n=10) | |
| HP Pavilion Gaming 15t-cx0000 | |
| HP Pavilion Gaming 15-cx0003ng | |
| Acer Nitro 5 AN515-42-R6V0 | |
| Average of class Gaming (n=1last 2 years) | |
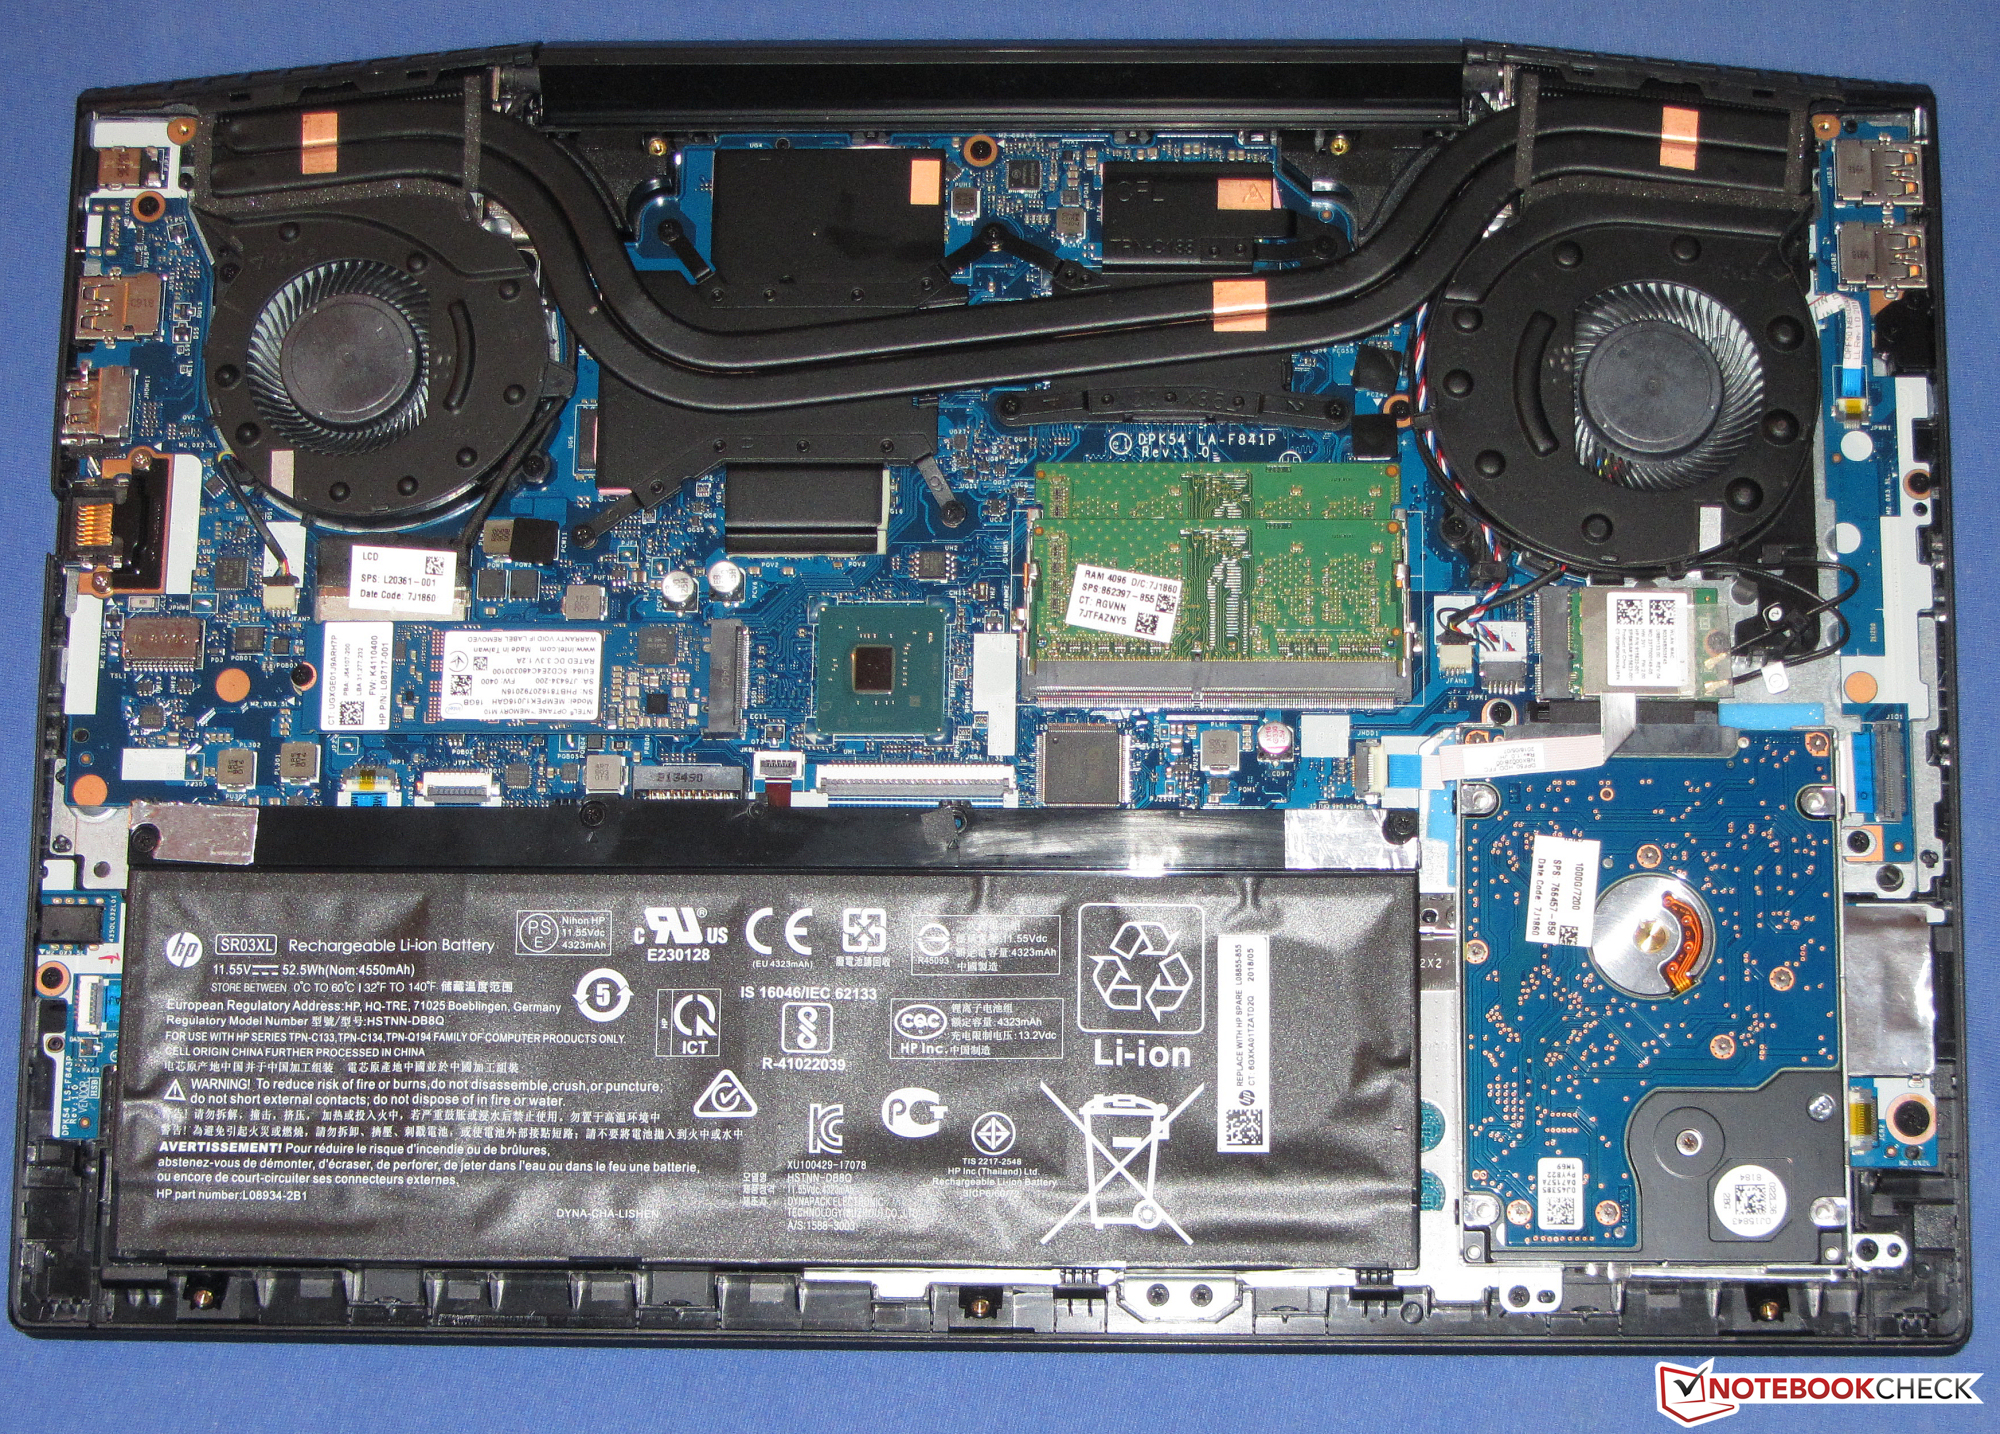
Storage Devices
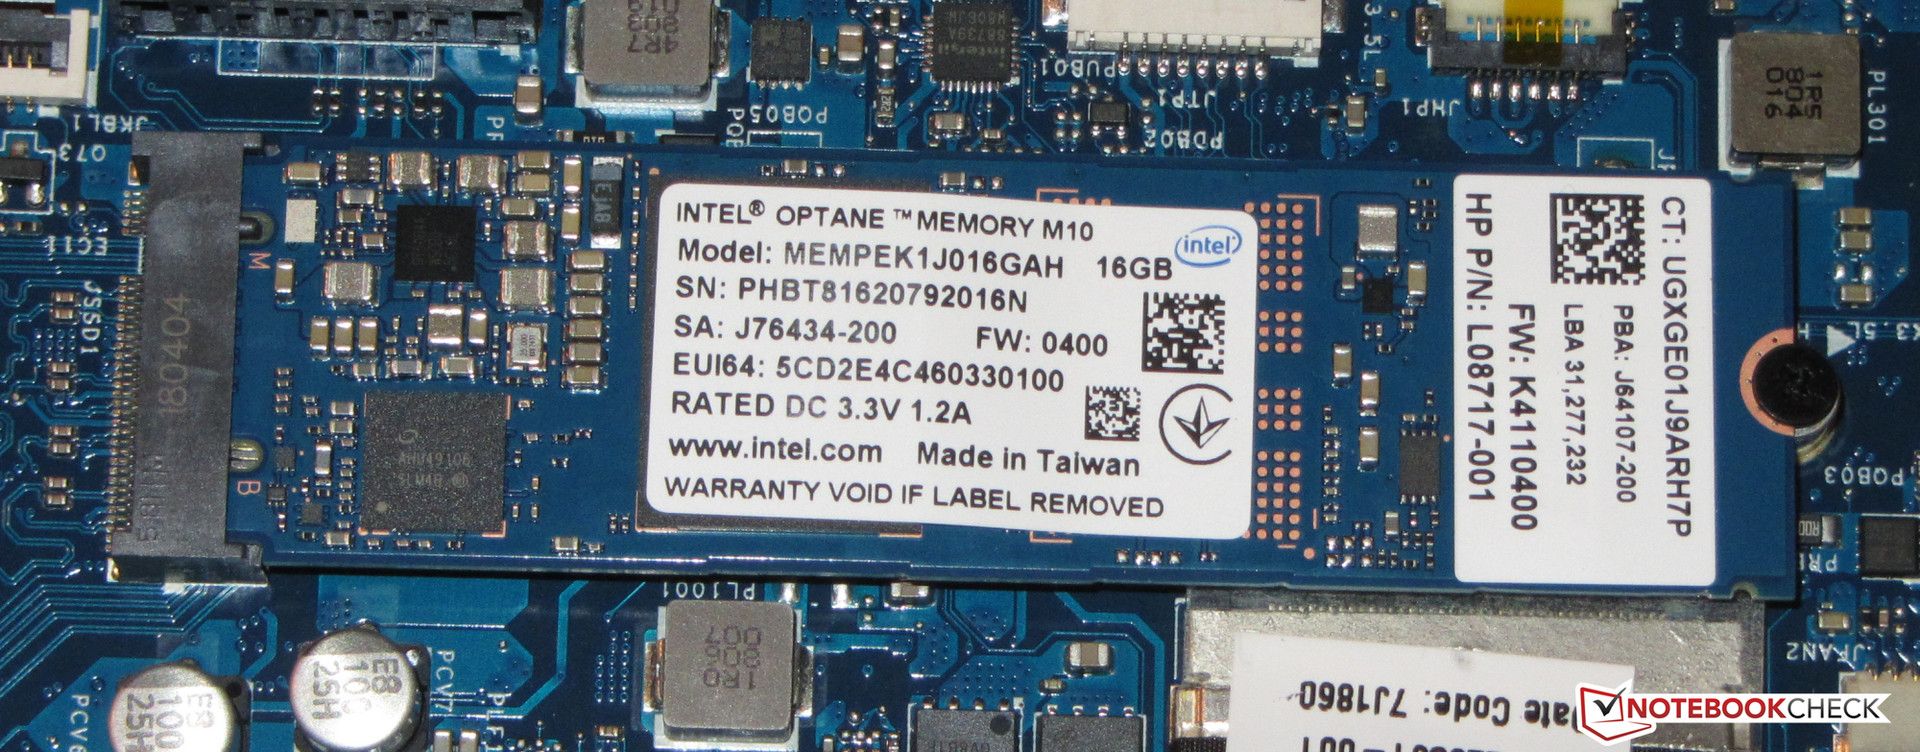
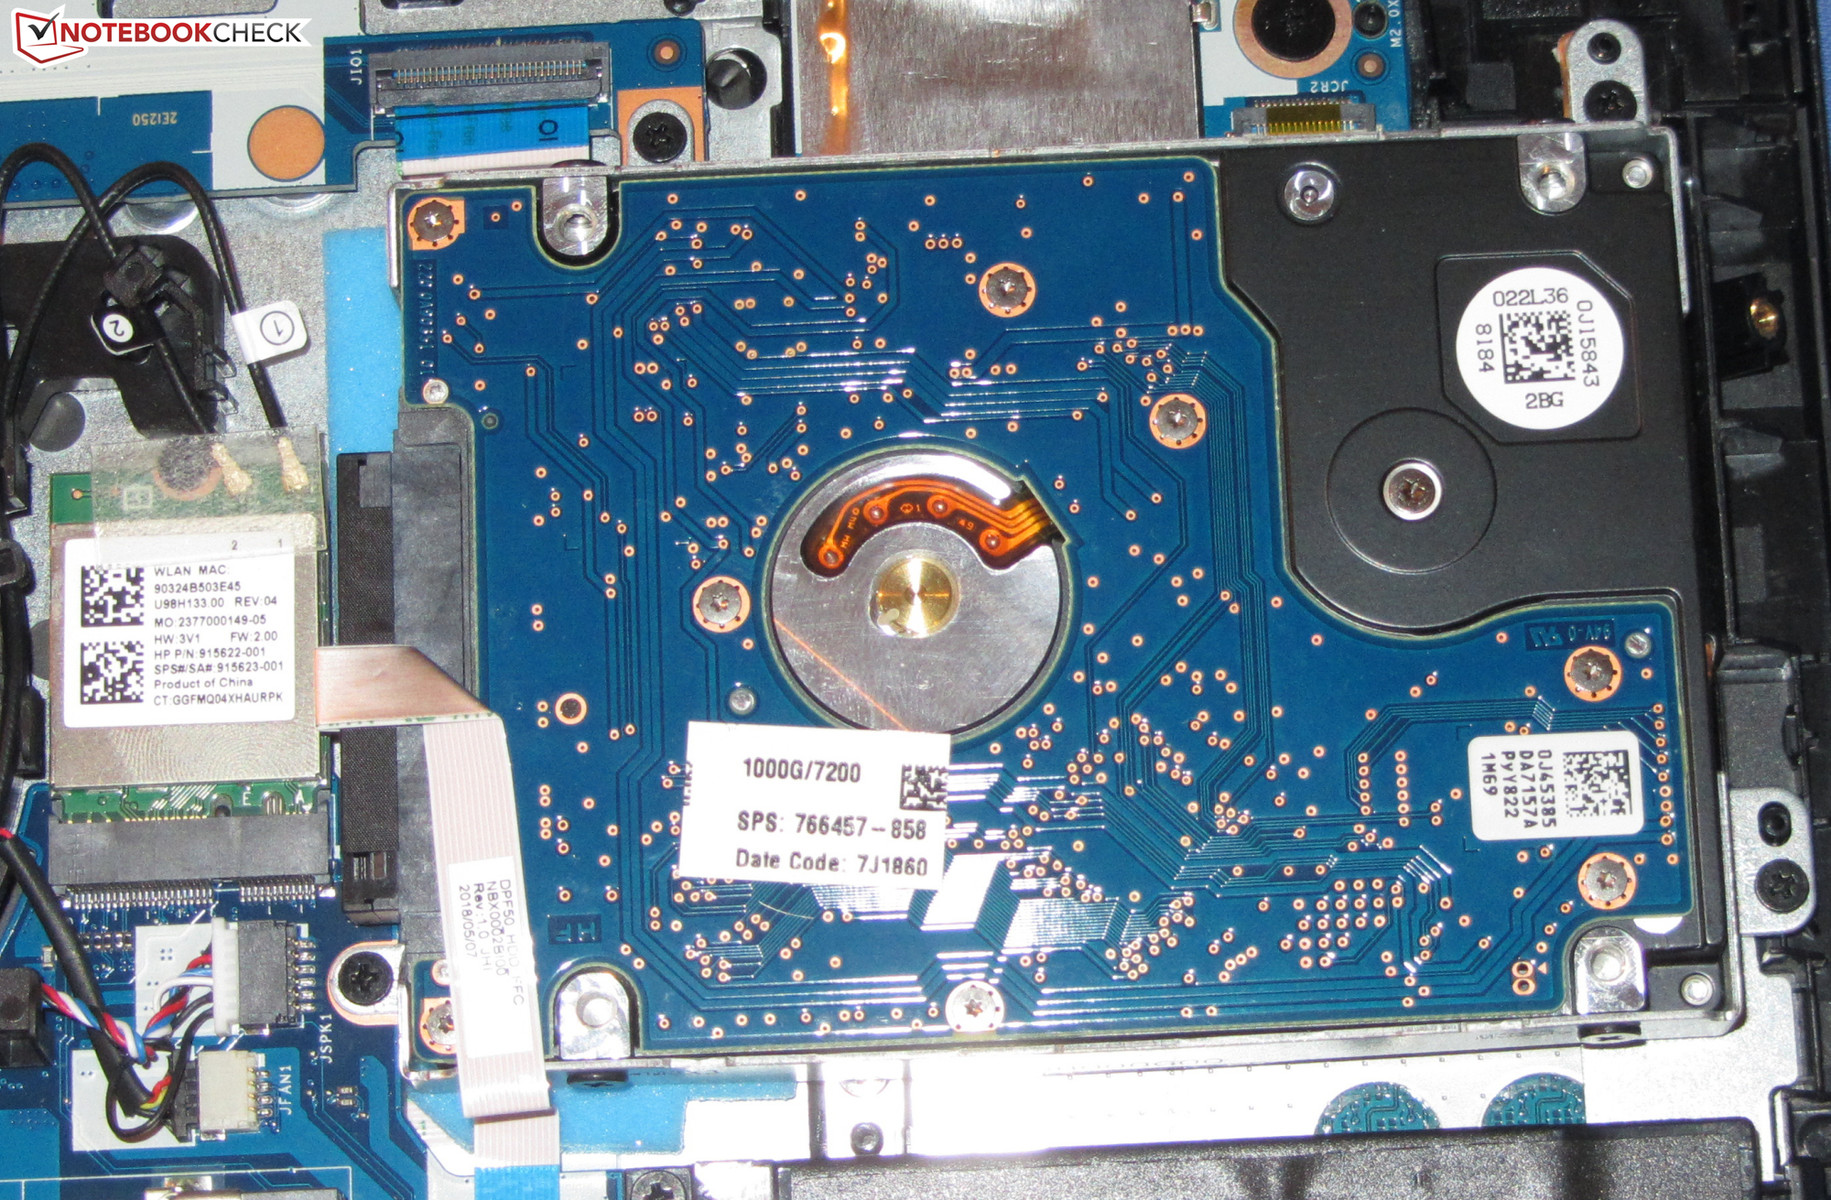
HP has equipped the Pavilion with Intel Optane Memory that consists of a 2.5-inch hard drive (1 TB of storage, 7200 rpm) and a 16-GB NVMe SSD from Intel. The SSD is used as a fast cache for the hard drive. This should speed up start-ups, searching for files and storing large sets of data significantly.
Overall, the transfer rates are good. Optane is used primarily to increase the read rates and the test unit's write rates are accordingly low in comparison. The random read rates are particularly high. The Optane transfer rates can be positioned between those of SATA III SSDs and NVMe SSDs.
Users do not have to use Optane. Alternatively, they could also go for a combination of an SSD as system drive and an HDD for storage, or simply just use one of the two storage devices.

| HP Pavilion Gaming 15-cx0003ng Intel Optane 16 GB MEMPEK1J016GAH + HGST HTS721010A9E630 1 TB HDD | Acer Nitro 5 AN515-42-R6V0 SK Hynix HFS128G39TND | Acer Nitro 5 AN515-52-74DR Intel SSD 600p SSDPEKKW512G7 | HP Pavilion Gaming 15t-cx0000 Samsung SSD PM981 MZVLB512HAJQ | Medion Erazer P6705-MD61131 Samsung SSD PM981 MZVLB256HAHQ | Lenovo Legion Y530-15ICH Toshiba KBG30ZMT128G | Average Intel Optane 16 GB MEMPEK1J016GAH + HGST HTS721010A9E630 1 TB HDD | |
|---|---|---|---|---|---|---|---|
| CrystalDiskMark 5.2 / 6 | -25% | 80% | 298% | 266% | 9% | 0% | |
| Write 4K (MB/s) | 59.2 | 73 23% | 78.8 33% | 129.5 119% | 107 81% | 71.8 21% | 59.2 ? 0% |
| Read 4K (MB/s) | 91.3 | 29.16 -68% | 29.51 -68% | 44.61 -51% | 39.91 -56% | 41.03 -55% | 91.3 ? 0% |
| Write Seq (MB/s) | 158.3 | 135.9 -14% | 581 267% | 1268 701% | 1439 809% | 349 120% | 158.3 ? 0% |
| Read Seq (MB/s) | 880 | 498.5 -43% | 934 6% | 992 13% | 2011 129% | 736 -16% | 880 ? 0% |
| Write 4K Q32T1 (MB/s) | 161.8 | 135.4 -16% | 280.8 74% | 535 231% | 282.1 74% | 105.3 -35% | 161.8 ? 0% |
| Read 4K Q32T1 (MB/s) | 286.5 | 215.6 -25% | 335.6 17% | 601 110% | 326.6 14% | 308 8% | 287 ? 0% |
| Write Seq Q32T1 (MB/s) | 159.8 | 135.7 -15% | 571 257% | 1938 1113% | 1441 802% | 151.4 -5% | 159.8 ? 0% |
| Read Seq Q32T1 (MB/s) | 929 | 512 -45% | 1389 50% | 2306 148% | 3516 278% | 1262 36% | 929 ? 0% |
| AS SSD | -17% | 217% | 649% | 310% | 21% | 0% | |
| Seq Read (MB/s) | 854 | 470.8 -45% | 1321 55% | 1235 45% | 2724 219% | 1231 44% | 854 ? 0% |
| Seq Write (MB/s) | 147 | 126.8 -14% | 554 277% | 1829 1144% | 1365 829% | 131.6 -10% | 147 ? 0% |
| 4K Read (MB/s) | 105.1 | 23.64 -78% | 32.38 -69% | 35.03 -67% | 46.14 -56% | 38.71 -63% | 105.1 ? 0% |
| 4K Write (MB/s) | 59.5 | 54.5 -8% | 94.5 59% | 95.9 61% | 102.6 72% | 35.74 -40% | 59.5 ? 0% |
| 4K-64 Read (MB/s) | 42.09 | 203.1 383% | 505 1100% | 1160 2656% | 567 1247% | 335.3 697% | 42.1 ? 0% |
| 4K-64 Write (MB/s) | 137.3 | 127.1 -7% | 511 272% | 1808 1217% | 459.8 235% | 78.9 -43% | 137.3 ? 0% |
| Access Time Read * (ms) | 14.99 | 0.121 99% | 0.12 99% | 0.051 100% | 0.08 99% | 0.626 96% | 15 ? -0% |
| Access Time Write * (ms) | 0.043 | 0.269 -526% | 0.039 9% | 0.038 12% | 0.037 14% | 0.287 -567% | 0.043 ? -0% |
| Score Read (Points) | 233 | 274 18% | 670 188% | 1319 466% | 886 280% | 497 113% | 233 ? 0% |
| Score Write (Points) | 211 | 194 -8% | 661 213% | 2087 889% | 699 231% | 128 -39% | 211 ? 0% |
| Score Total (Points) | 577 | 600 4% | 1643 185% | 4113 613% | 1983 244% | 838 45% | 577 ? 0% |
| Copy ISO MB/s (MB/s) | 110.1 | 110.1 ? 0% | |||||
| Copy Program MB/s (MB/s) | 94.1 | 94.1 ? 0% | |||||
| Copy Game MB/s (MB/s) | 81.7 | 81.7 ? 0% | |||||
| Total Average (Program / Settings) | -21% /
-20% | 149% /
159% | 474% /
501% | 288% /
292% | 15% /
16% | 0% /
0% |
* ... smaller is better
GPU Performance
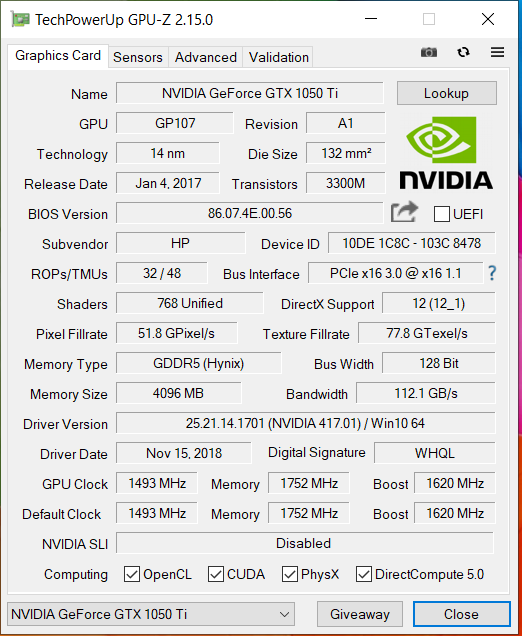
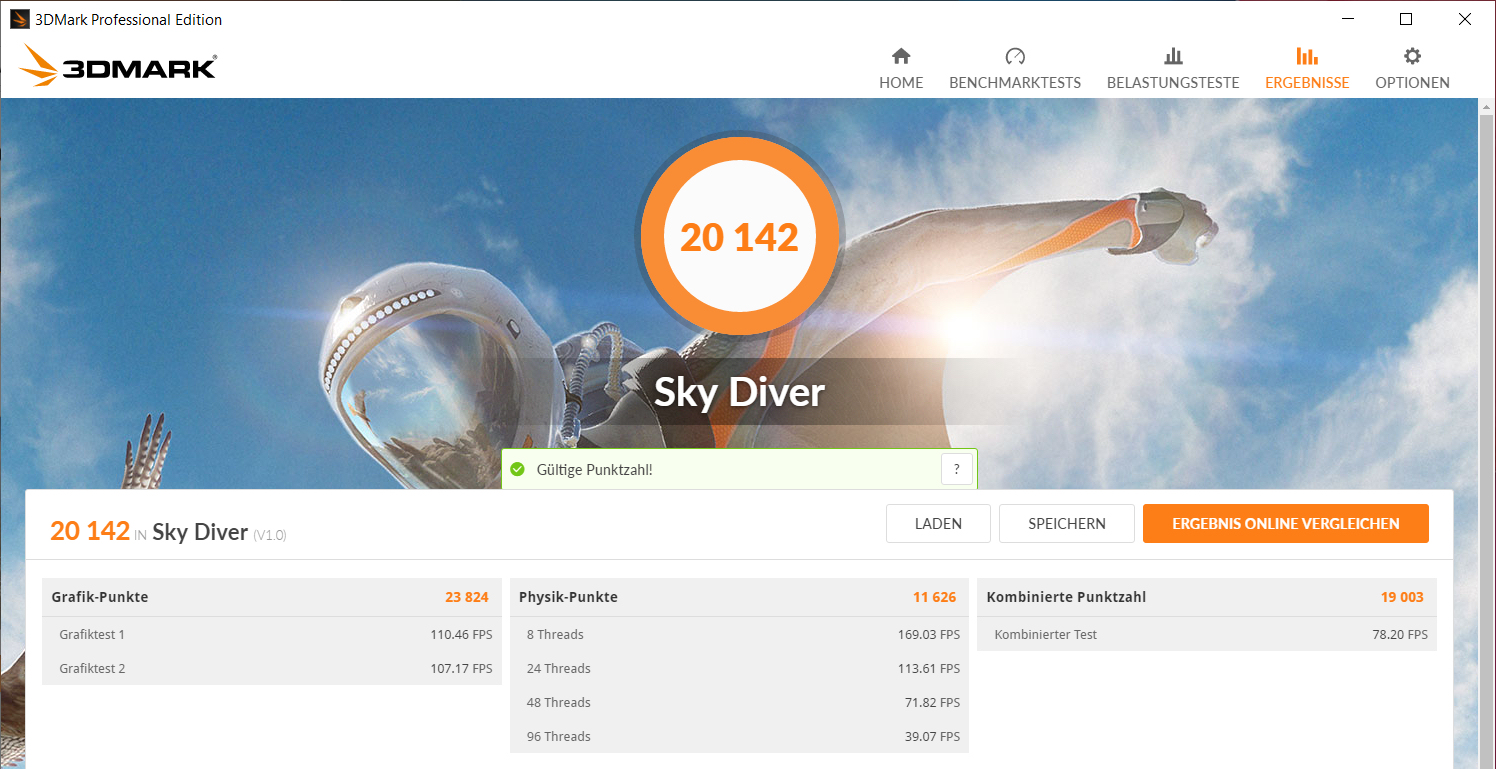
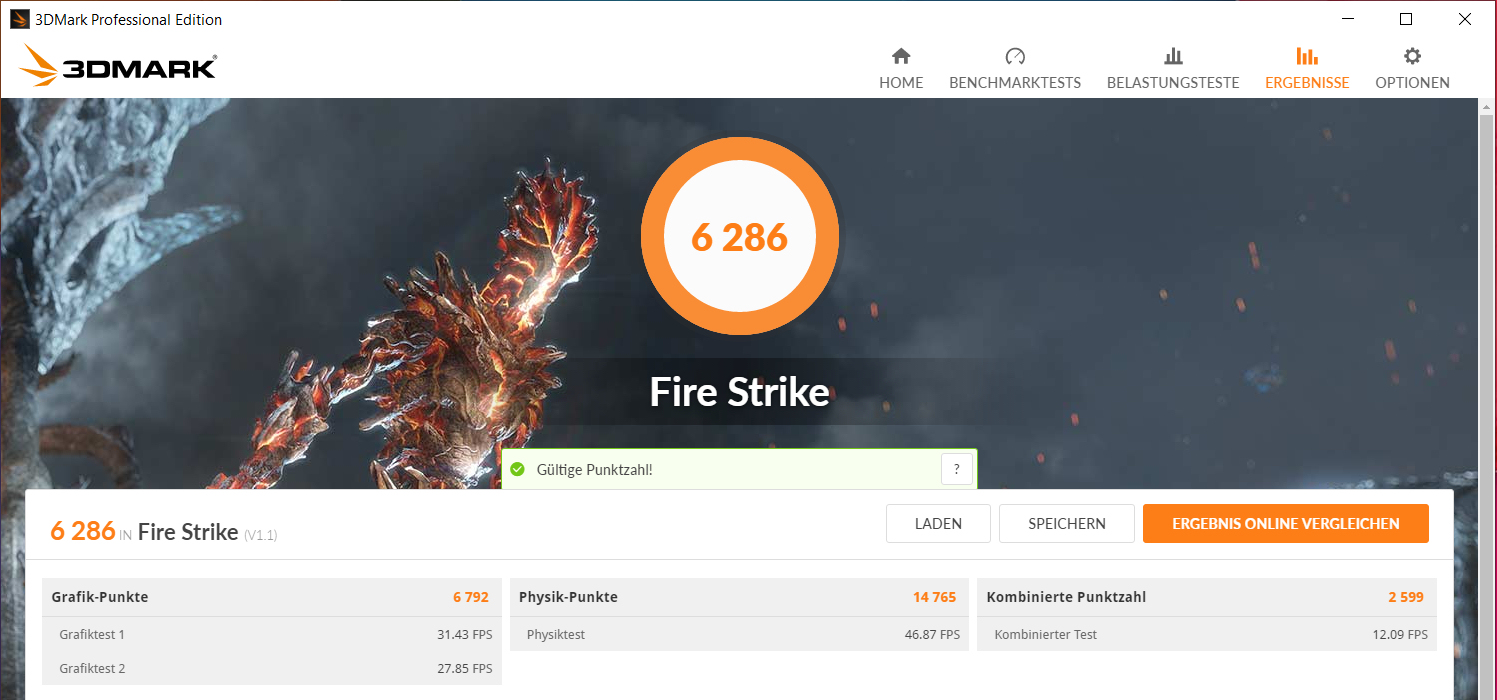
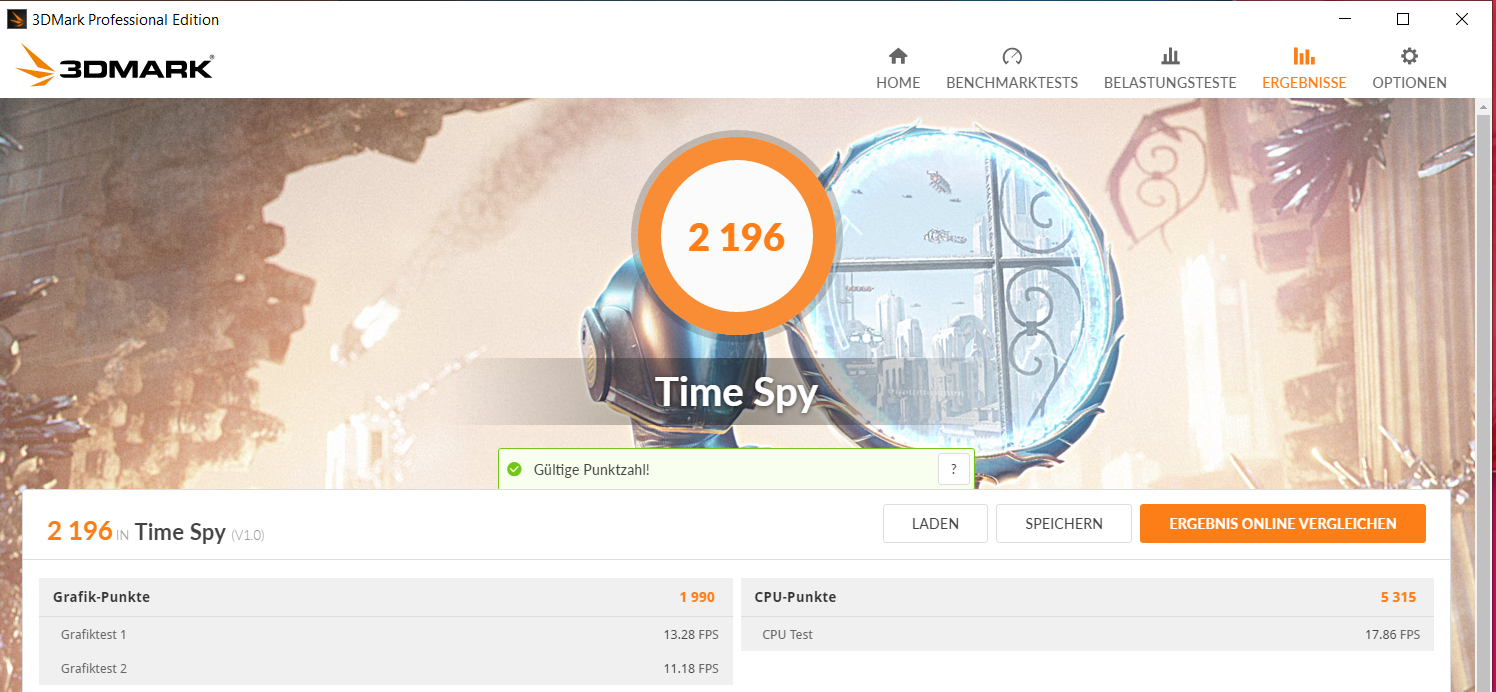
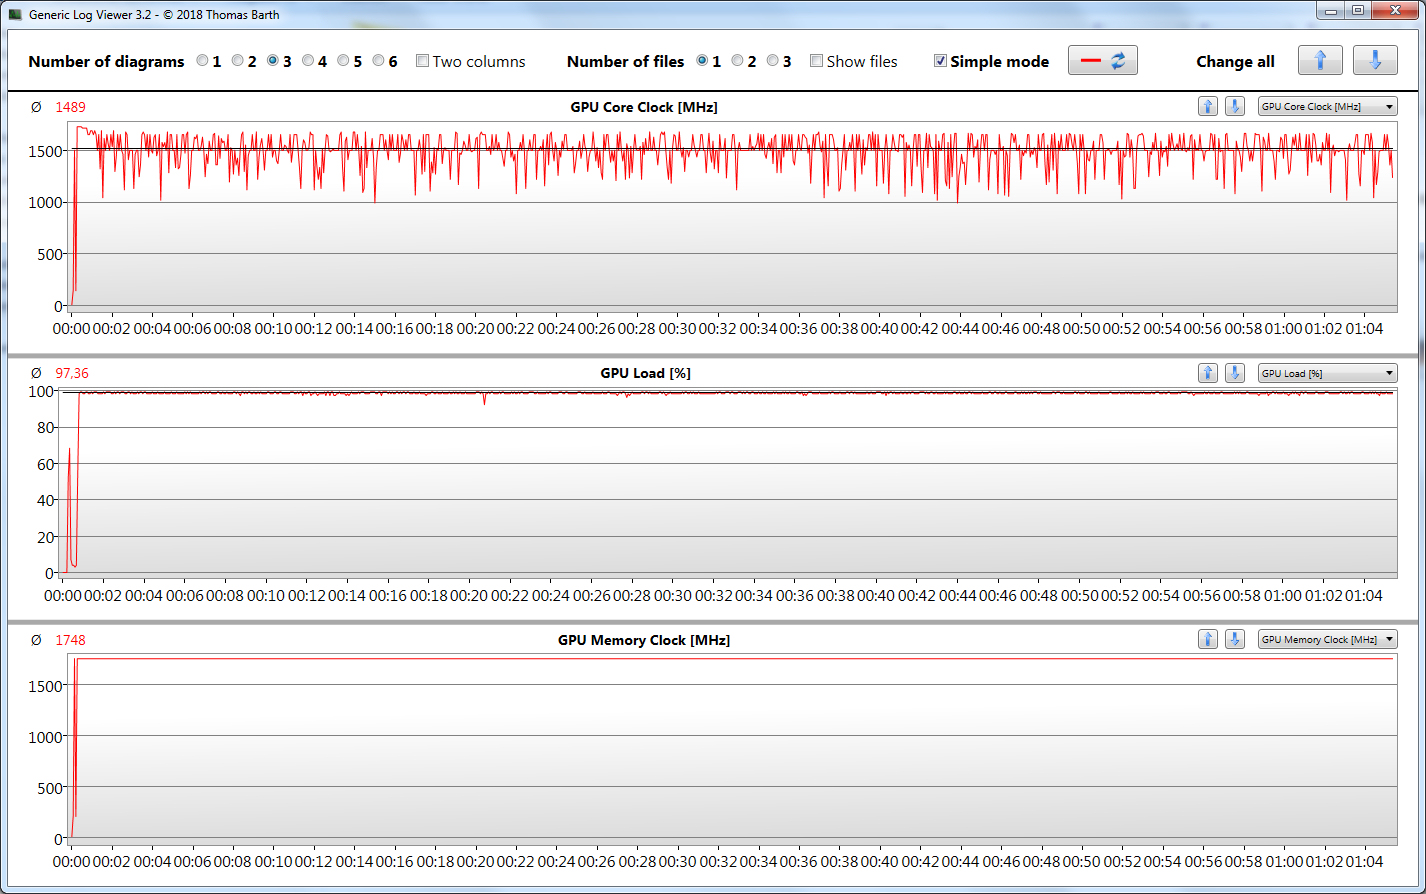
Nvidia's dedicated GeForce GTX 1050 Ti belongs to the upper mid-range of graphics cards. The Pascal model supports DirectX 12 and reaches speeds of up to 1620 MHz. The GPU has 4096 MB of GDDR5 VRAM available. The results of the 3DMark benchmarks show that the GPU cannot quite reach its full potential in this device. Again, the Acer Nitro 5, equipped with the same CPU/GPU combination, reaches results that are 10 - 15% higher. The average clock rate of the GPU in the HP device was slightly lower than that of the Nitro 5 GPU.
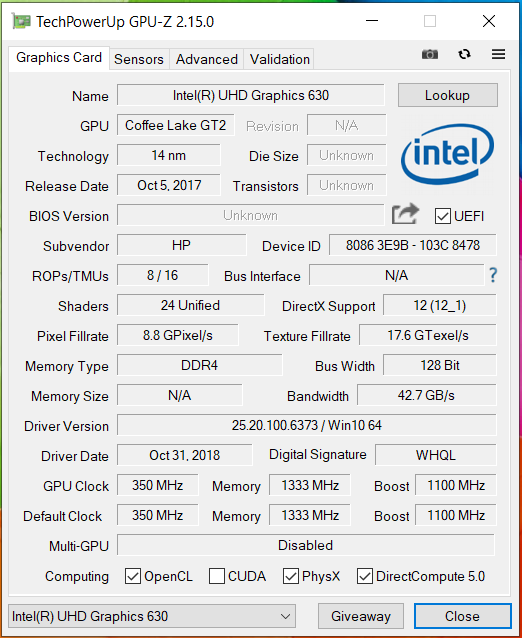
HP's 15.6-inch Pavilion is equipped with the graphics-switching technology Optimus. This means that the device uses Intel's integrated UHD Graphics 630 for simpler, everyday workloads and when running on battery, and it switches to the Nvidia core for graphically demanding scenarios such as gaming.
| 3DMark 06 Standard Score | 33957 points | |
| 3DMark 11 Performance | 8501 points | |
| 3DMark Ice Storm Standard Score | 87964 points | |
| 3DMark Cloud Gate Standard Score | 25570 points | |
| 3DMark Fire Strike Score | 6286 points | |
| 3DMark Time Spy Score | 2196 points | |
Help | ||
| 3DMark 11 - 1280x720 Performance GPU | |
| Average of class Gaming (21841 - 80022, n=108, last 2 years) | |
| HP Pavilion Gaming 15t-cx0000 | |
| Lenovo Legion Y530-15ICH | |
| Average NVIDIA GeForce GTX 1050 Ti Mobile (8304 - 10402, n=36) | |
| Acer Nitro 5 AN515-52-74DR | |
| Medion Erazer P6705-MD61131 | |
| Acer Nitro 5 AN515-42-R6V0 | |
| HP Pavilion Gaming 15-cx0003ng | |
| 3DMark | |
| 1280x720 Cloud Gate Standard Graphics | |
| Average of class Gaming (86886 - 223650, n=61, last 2 years) | |
| HP Pavilion Gaming 15t-cx0000 | |
| Acer Nitro 5 AN515-52-74DR | |
| Lenovo Legion Y530-15ICH | |
| Average NVIDIA GeForce GTX 1050 Ti Mobile (43721 - 53978, n=37) | |
| Medion Erazer P6705-MD61131 | |
| HP Pavilion Gaming 15-cx0003ng | |
| Acer Nitro 5 AN515-42-R6V0 | |
| 1920x1080 Fire Strike Graphics | |
| Average of class Gaming (12242 - 62849, n=120, last 2 years) | |
| HP Pavilion Gaming 15t-cx0000 | |
| Average NVIDIA GeForce GTX 1050 Ti Mobile (6792 - 8376, n=38) | |
| Lenovo Legion Y530-15ICH | |
| Acer Nitro 5 AN515-52-74DR | |
| Medion Erazer P6705-MD61131 | |
| HP Pavilion Gaming 15-cx0003ng | |
| Acer Nitro 5 AN515-42-R6V0 | |
| 2560x1440 Time Spy Graphics | |
| Average of class Gaming (5012 - 26212, n=119, last 2 years) | |
| Average NVIDIA GeForce GTX 1050 Ti Mobile (1990 - 2536, n=16) | |
| HP Pavilion Gaming 15-cx0003ng | |
Gaming Performance
The hardware of the Pavilion is able to display all current games smoothly. Most of the games in our database can even be displayed at maximum resolution. Current games allow average to high quality settings. Older games that are less demanding on the hardware can be displayed with higher details.
| low | med. | high | ultra | |
|---|---|---|---|---|
| Tomb Raider (2013) | 326.3 | 237.1 | 174.7 | 80 |
| BioShock Infinite (2013) | 259.7 | 200.5 | 180.5 | 71.9 |
| The Witcher 3 (2015) | 116 | 69.7 | 40 | 23.1 |
| Rainbow Six Siege (2015) | 95.9 | 92 | 74.9 | 69.3 |
| Call of Duty Black Ops 4 (2018) | 107.8 | 47.6 | 47.5 | 44 |
| Hitman 2 (2018) | 60.8 | 43.1 | 37.8 | 33.4 |
| Fallout 76 (2018) | 60 | 50.3 | 44.1 | 43.1 |
| Battlefield V (2018) | 65.8 | 53.2 | 44.5 | 39.5 |
| Farming Simulator 19 (2018) | 163.1 | 124.8 | 79.1 | 60.1 |
| Darksiders III (2018) | 116.6 | 60.2 | 44.7 | 38.9 |
| Just Cause 4 (2018) | 65.6 | 40.9 | 34.6 | 33.2 |
| BioShock Infinite - 1920x1080 Ultra Preset, DX11 (DDOF) | |
| HP Pavilion Gaming 15t-cx0000 | |
| Average NVIDIA GeForce GTX 1050 Ti Mobile (61 - 97, n=23) | |
| HP Pavilion Gaming 15-cx0003ng | |
| Lenovo Legion Y530-15ICH | |
| The Witcher 3 - 1920x1080 High Graphics & Postprocessing (Nvidia HairWorks Off) | |
| Average of class Gaming (181 - 341, n=3, last 2 years) | |
| HP Pavilion Gaming 15t-cx0000 | |
| MSI GE72 7RE-046 | |
| Acer Nitro 5 AN515-52-74DR | |
| Average NVIDIA GeForce GTX 1050 Ti Mobile (21.3 - 51.9, n=26) | |
| Medion Erazer P6705-MD61131 | |
| HP Pavilion Gaming 15-cx0003ng | |
| Acer Nitro 5 AN515-42-R6V0 | |
| Farming Simulator 19 - 1920x1080 Very High Preset | |
| HP Pavilion Gaming 15-cx0003ng | |
| Average NVIDIA GeForce GTX 1050 Ti Mobile (59.3 - 60.1, n=2) | |
| MSI GE72 7RE | |
| Acer Nitro 5 AN515-42-R6V0 | |
| Just Cause 4 - 1920x1080 Medium / Off AF:4x | |
| MSI GE72 7RE | |
| Average NVIDIA GeForce GTX 1050 Ti Mobile (40.9 - 54, n=3) | |
| HP Pavilion Gaming 15-cx0003ng | |
| Call of Duty Black Ops 4 - 1920x1080 Very High / On | |
| HP Pavilion Gaming 15-cx0003ng | |
| Average NVIDIA GeForce GTX 1050 Ti Mobile (35.5 - 47.7, n=4) | |
| Medion Erazer P6705-MD61131 | |
| MSI GE72 7RE-046 | |
| Acer Nitro 5 AN515-42-R6V0 | |
We ran the game The Witcher 3 for about 60 minutes in Full HD resolution and high quality settings to find out whether the device can keep up the frame rate over a long period of time. The in-game character remains stationary during this entire period. We did not record a drop in the frame rate.
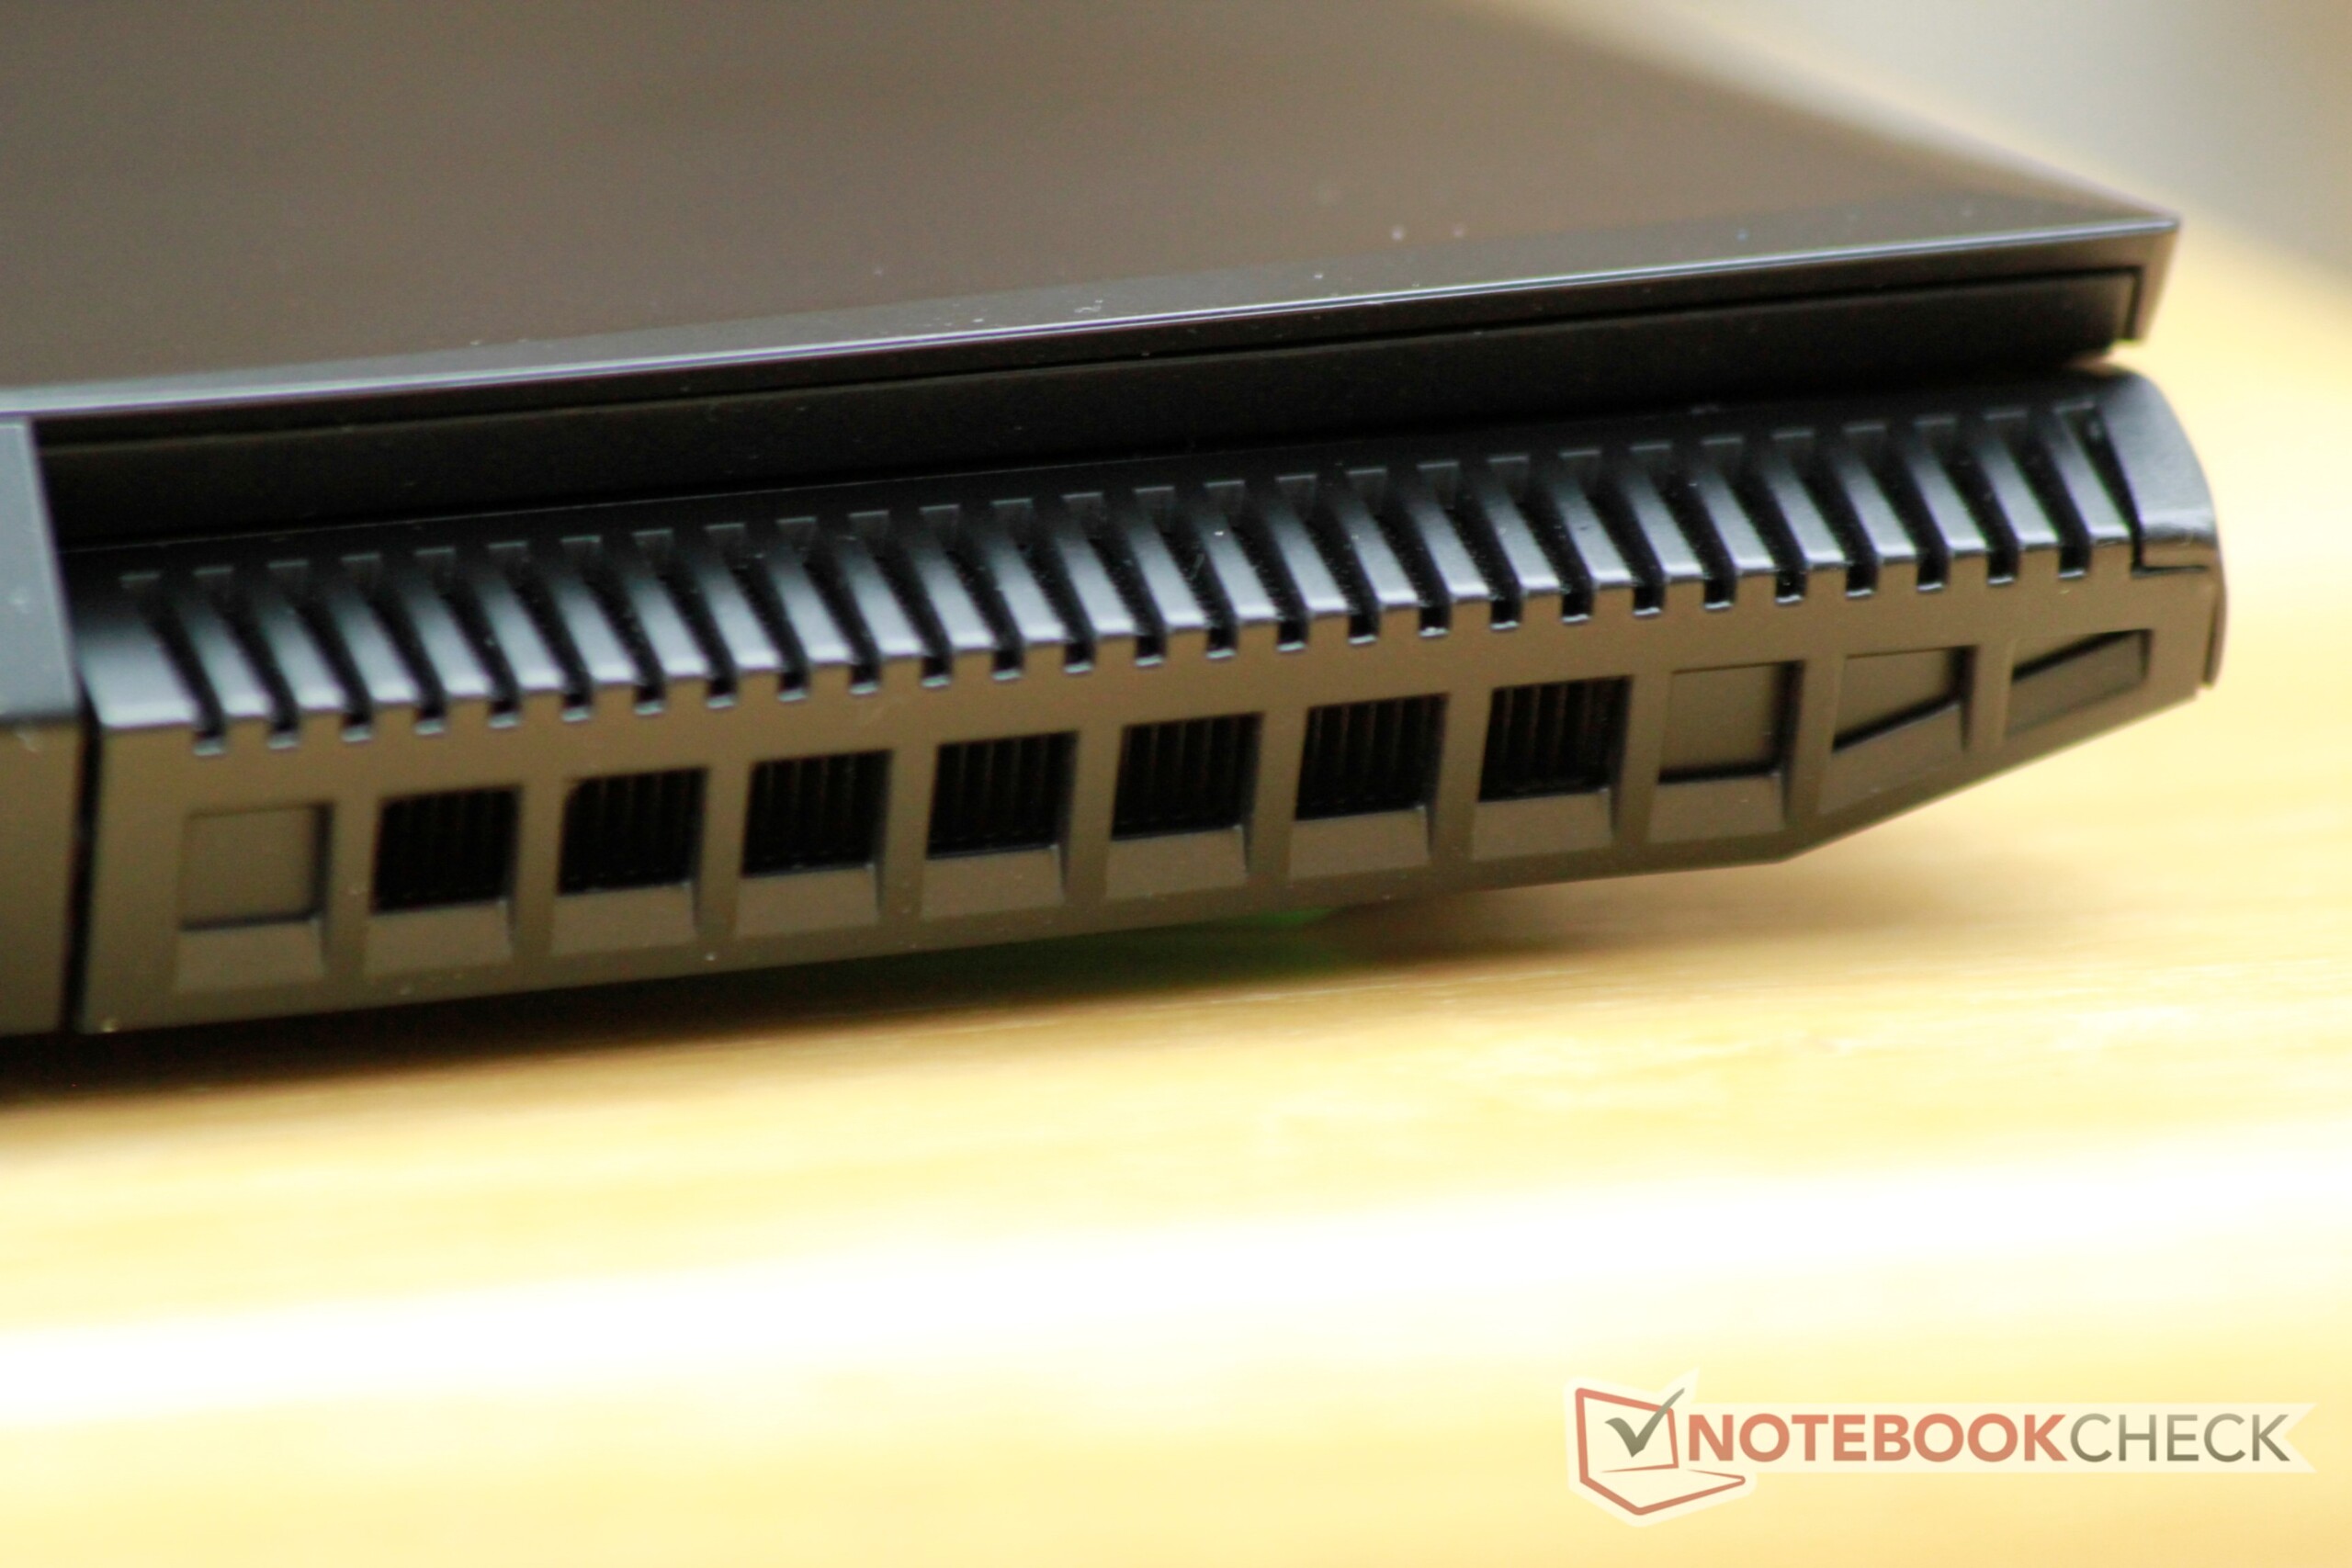
Emissions - relatively high temperatures
System Noise
The two fans in the Pavilion run at low speed constantly while the device is idling. This is due to HP's own BIOS function "Fan always on". If this is disabled, the cooling fans can occasionally stand still while the laptop is idling. There is a noticeable difference between when the fans are running during idle and when they are turned off. However, even then the device is not silent as the hard drive emits audible noise. This can only be avoided by exchanging the HDD for an SSD. The device becomes quite loud under load as the cooling fans turn up significantly. We measured 43 dB(A) during the stress test. The results are very similar at average load with a system noise of 42.8 dB(A).
Noise level
| Idle |
| 30.6 / 30.6 / 33.2 dB(A) |
| DVD |
| 0 / dB(A) |
| Load |
| 42.8 / 43 dB(A) |
 | ||
30 dB silent 40 dB(A) audible 50 dB(A) loud |
||
min: | ||
| HP Pavilion Gaming 15-cx0003ng i7-8750H, GeForce GTX 1050 Ti Mobile | Acer Nitro 5 AN515-42-R6V0 R7 2700U, Radeon RX 560X (Laptop) | Acer Nitro 5 AN515-52-74DR i7-8750H, GeForce GTX 1050 Ti Mobile | HP Pavilion Gaming 15t-cx0000 i7-8750H, GeForce GTX 1060 Max-Q | Medion Erazer P6705-MD61131 i7-8750H, GeForce GTX 1050 Ti Mobile | Lenovo Legion Y530-15ICH i5-8300H, GeForce GTX 1050 Ti Mobile | Average NVIDIA GeForce GTX 1050 Ti Mobile | Average of class Gaming | |
|---|---|---|---|---|---|---|---|---|
| Noise | 2% | -3% | -2% | -7% | 7% | -1% | 5% | |
| off / environment * (dB) | 30.6 | 29 5% | 30 2% | 28.3 8% | 29 5% | 28 8% | 29.4 ? 4% | 24.1 ? 21% |
| Idle Minimum * (dB) | 30.6 | 29 5% | 30 2% | 32.2 -5% | 29 5% | 28 8% | 30.7 ? -0% | 25.8 ? 16% |
| Idle Average * (dB) | 30.6 | 31 -1% | 32 -5% | 32.4 -6% | 34 -11% | 28 8% | 31.7 ? -4% | 27.4 ? 10% |
| Idle Maximum * (dB) | 33.2 | 32 4% | 33 1% | 32.4 2% | 43 -30% | 28.5 14% | 33.8 ? -2% | 30 ? 10% |
| Load Average * (dB) | 42.8 | 36 16% | 42 2% | 40.2 6% | 44 -3% | 34.9 18% | 41.3 ? 4% | 43 ? -0% |
| Witcher 3 ultra * (dB) | 42.1 | 44 -5% | 46 -9% | 45 -7% | 44 -5% | 40 5% | ||
| Load Maximum * (dB) | 43 | 46 -7% | 49 -14% | 47.2 -10% | 48 -12% | 49.6 -15% | 47.2 ? -10% | 54 ? -26% |
* ... smaller is better
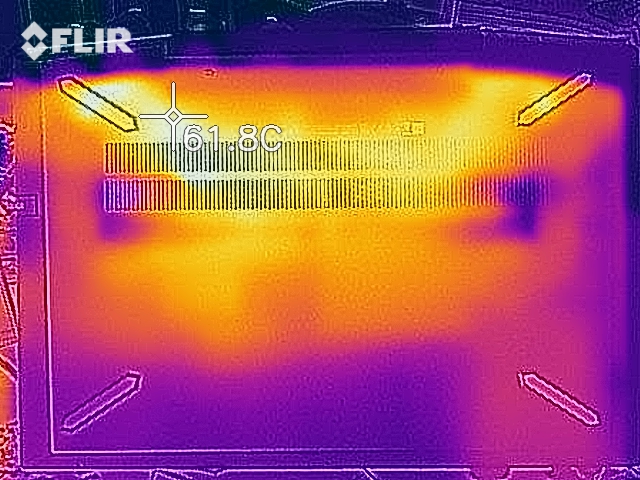
Temperature
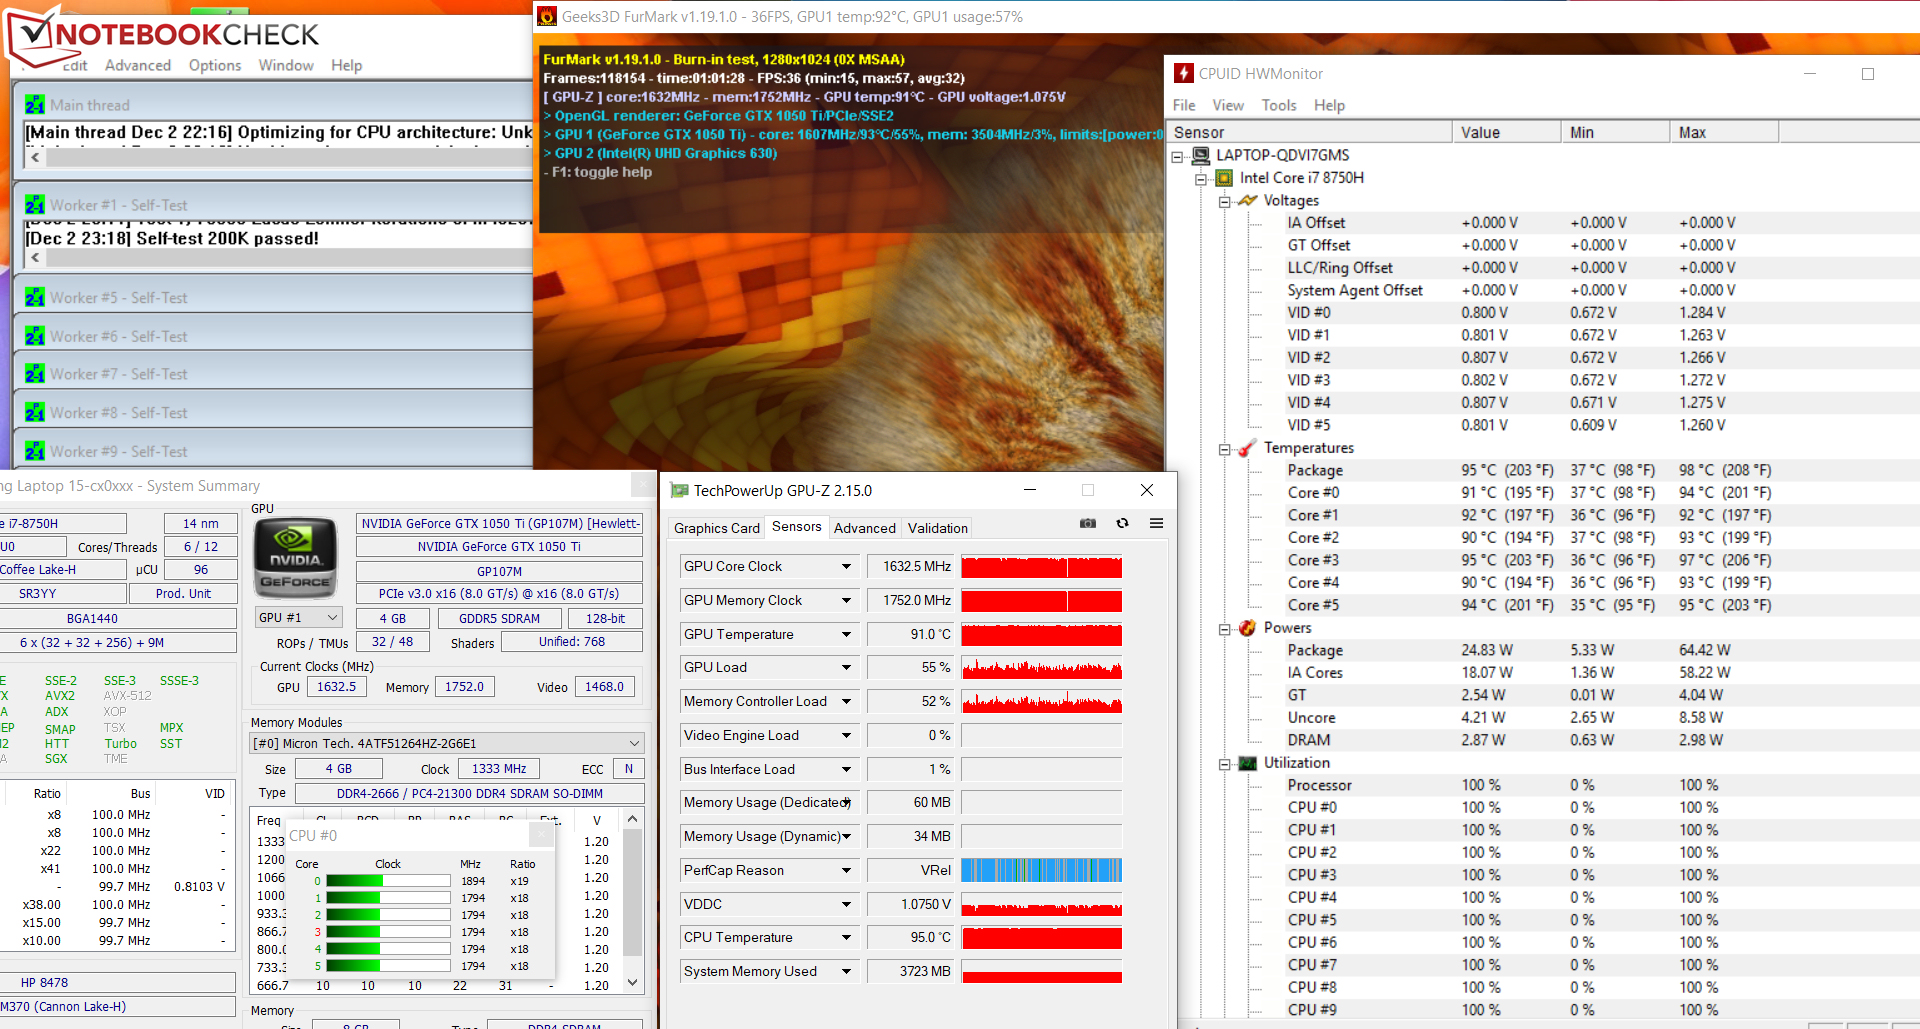
Our stress test (Prime95 and FurMark running for at least an hour) is completed differently depending on whether the Pavilion is running on power supply or in battery mode. When connected to the grid, the processor clocks at 1.8 - 2 GHz while the graphics core reaches speeds of around 1600 MHz. On battery, the CPU throttles to 800 MHz and the GPU clocks at between 1300 and 1400 MHz.
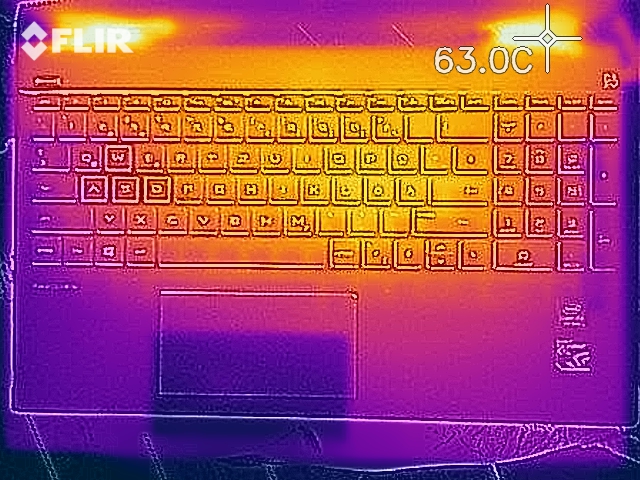
The notebook heats up a little too much during our stress test. We registered temperatures above 50 °C in some areas. However, this is not too worrisome as the stress test represents an extreme scenario that will not occur during everyday use. We simply use this test to find out whether the system remains stable even at maximum load. The temperature development was even more significant during our The Witcher 3 test (with the game running at Full HD resolution and high quality settings for an hour). The temperatures are fine during everyday use.
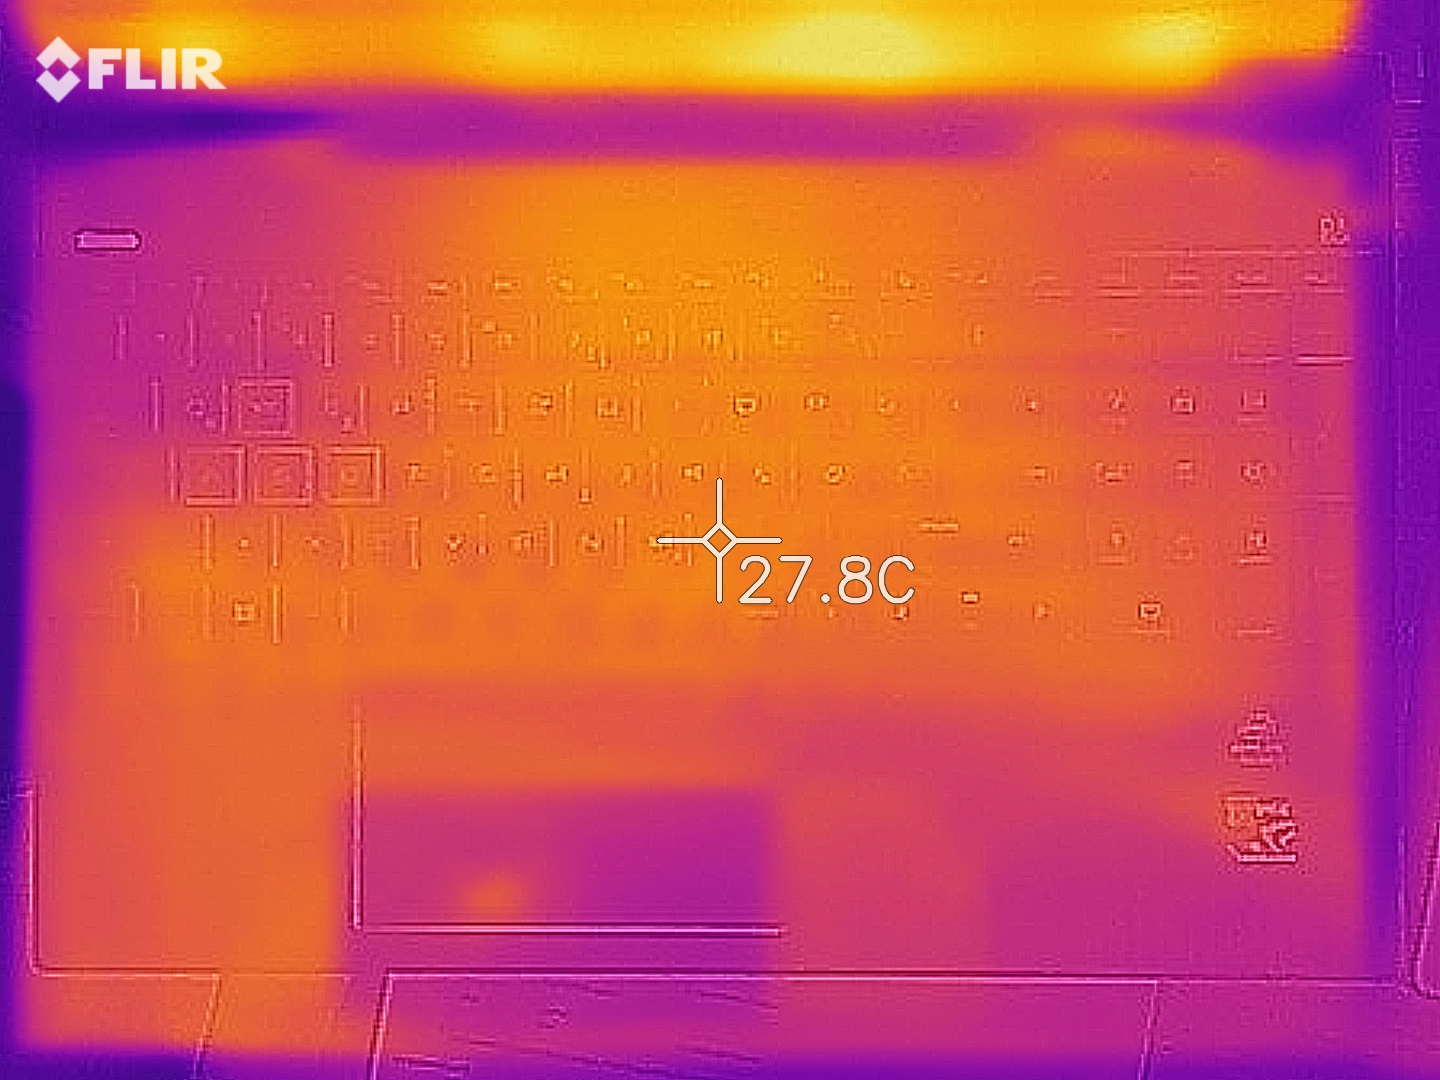
(±) The maximum temperature on the upper side is 44.1 °C / 111 F, compared to the average of 40.4 °C / 105 F, ranging from 21.2 to 68.8 °C for the class Gaming.
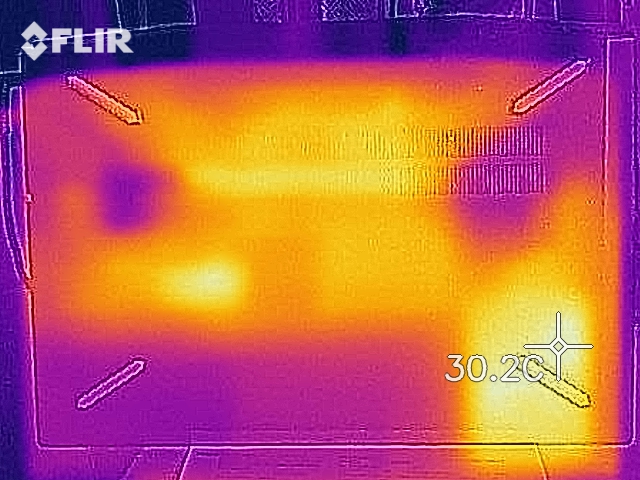
(-) The bottom heats up to a maximum of 53.8 °C / 129 F, compared to the average of 43.2 °C / 110 F
(+) In idle usage, the average temperature for the upper side is 24.1 °C / 75 F, compared to the device average of 33.9 °C / 93 F.
(±) Playing The Witcher 3, the average temperature for the upper side is 35.2 °C / 95 F, compared to the device average of 33.9 °C / 93 F.
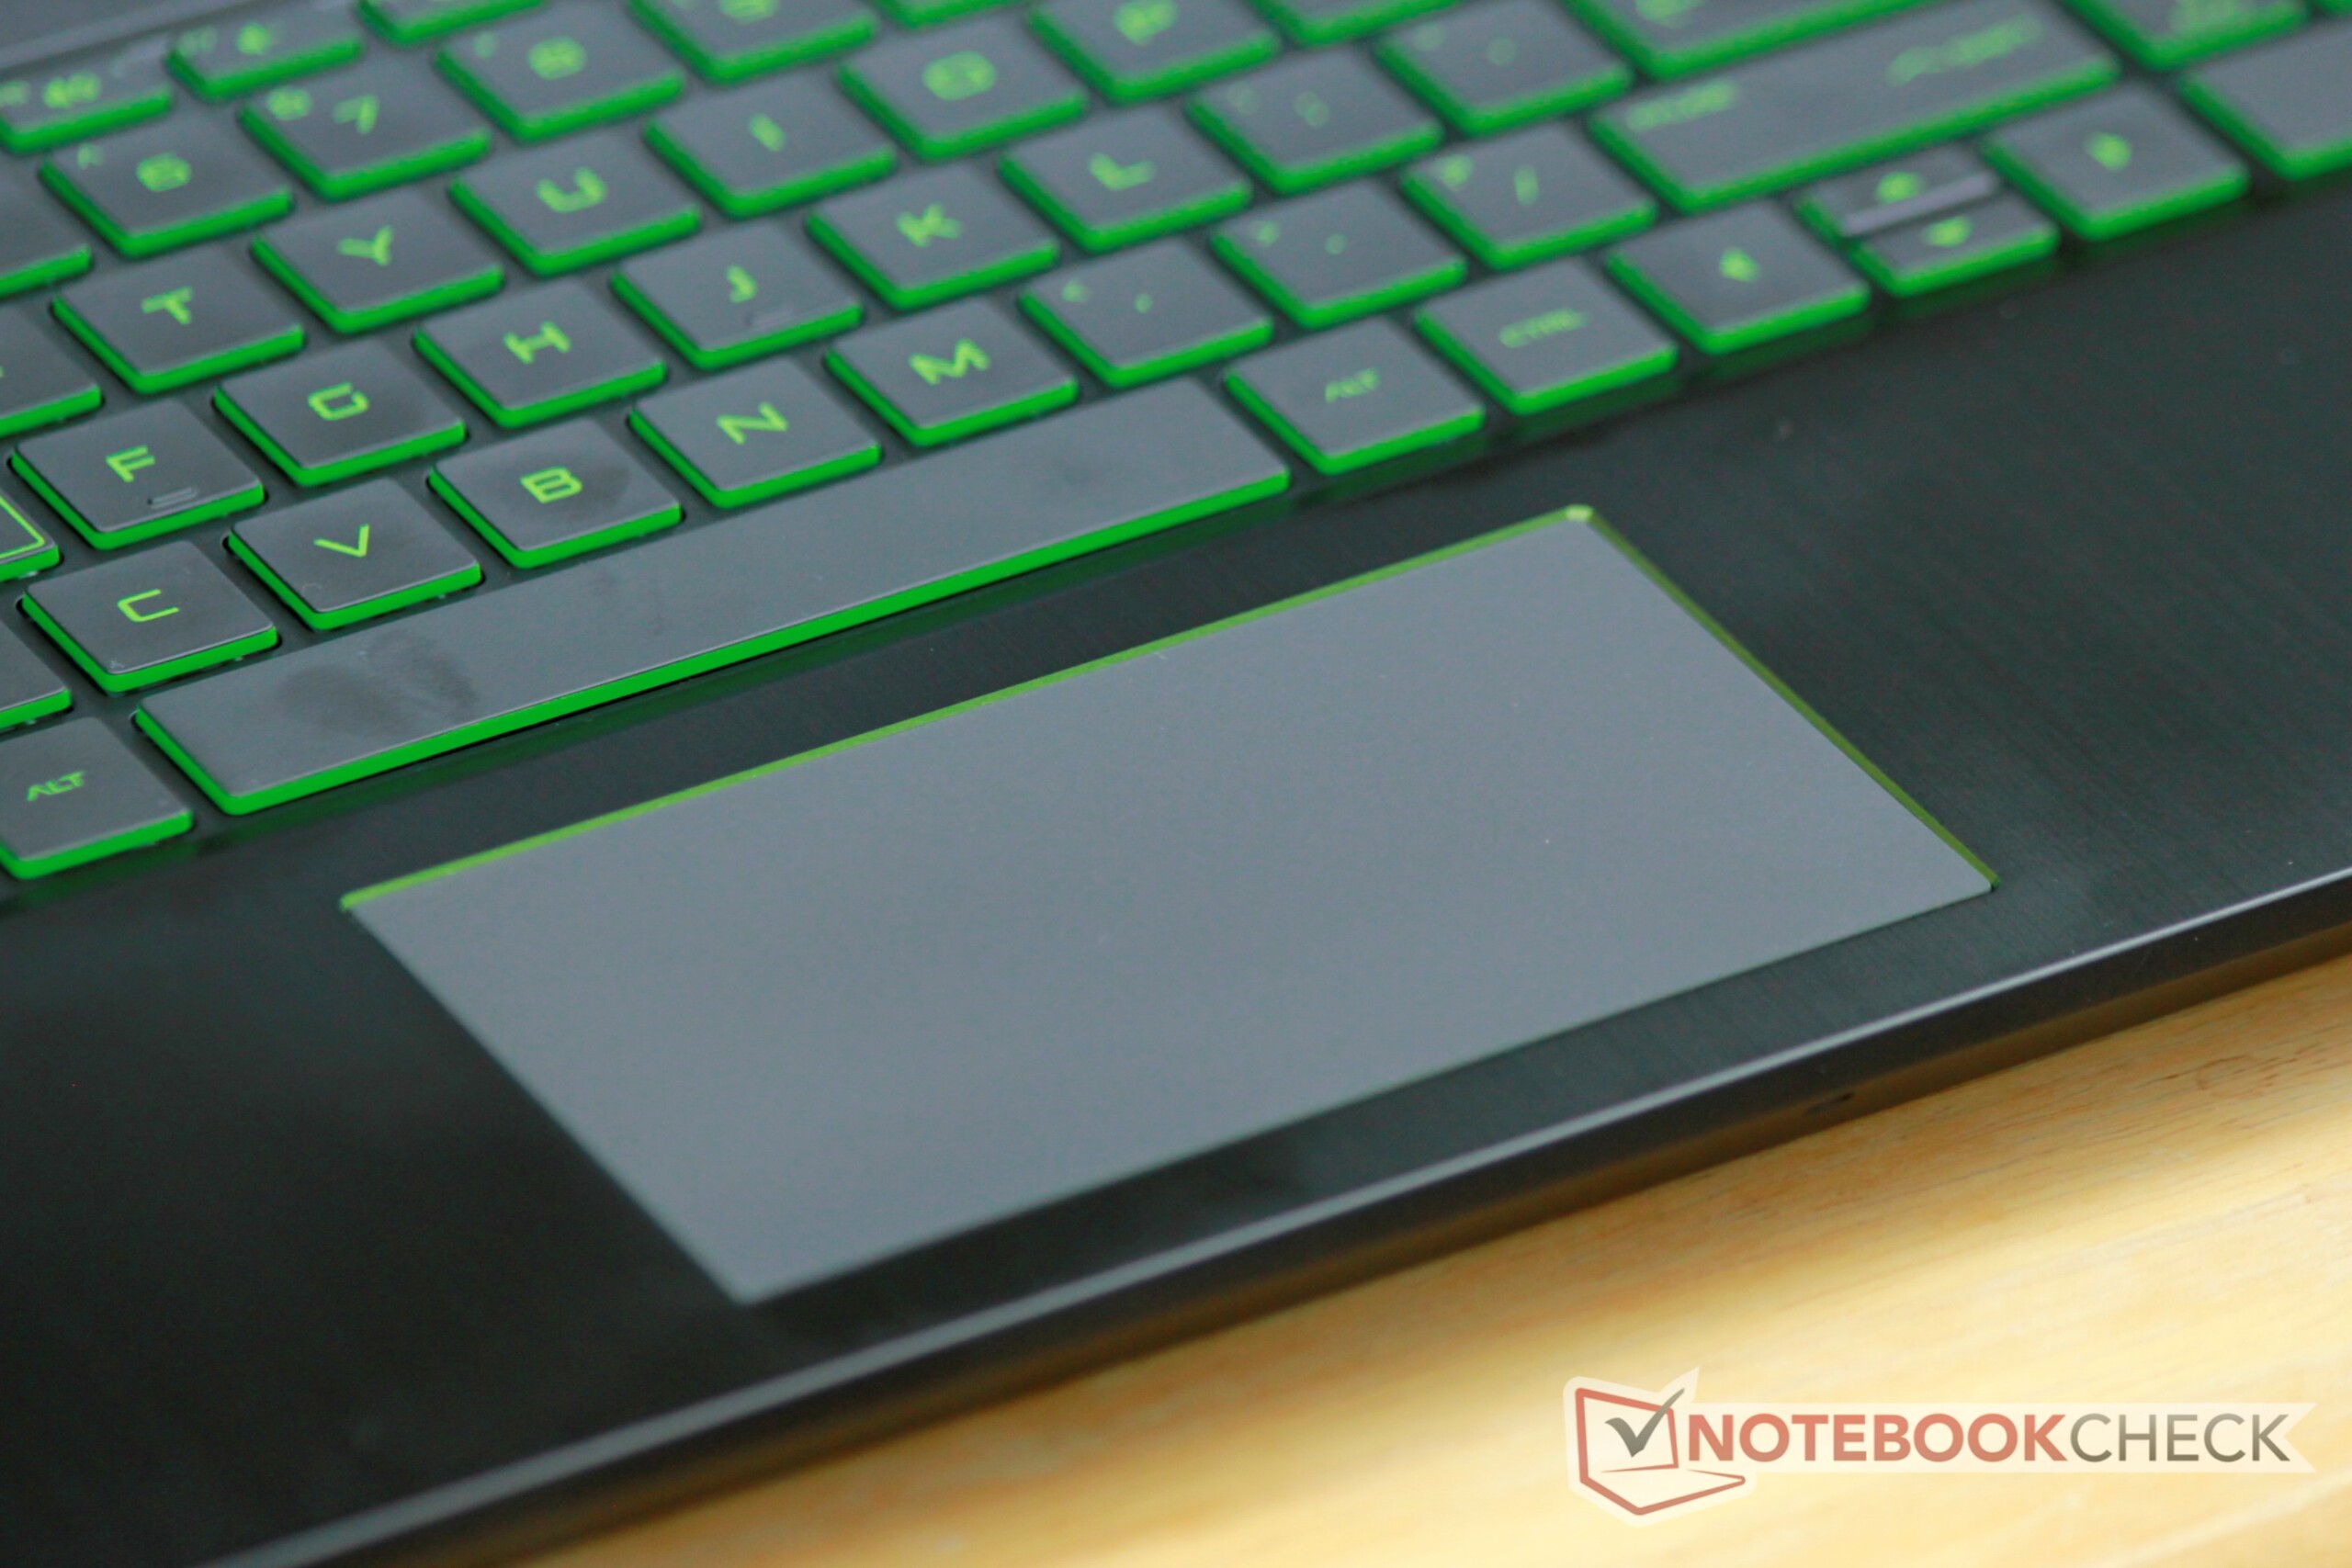
(+) The palmrests and touchpad are cooler than skin temperature with a maximum of 30.6 °C / 87.1 F and are therefore cool to the touch.
(±) The average temperature of the palmrest area of similar devices was 28.8 °C / 83.8 F (-1.8 °C / -3.3 F).
| HP Pavilion Gaming 15-cx0003ng i7-8750H, GeForce GTX 1050 Ti Mobile | Acer Nitro 5 AN515-42-R6V0 R7 2700U, Radeon RX 560X (Laptop) | Acer Nitro 5 AN515-52-74DR i7-8750H, GeForce GTX 1050 Ti Mobile | HP Pavilion Gaming 15t-cx0000 i7-8750H, GeForce GTX 1060 Max-Q | Medion Erazer P6705-MD61131 i7-8750H, GeForce GTX 1050 Ti Mobile | Lenovo Legion Y530-15ICH i5-8300H, GeForce GTX 1050 Ti Mobile | Average NVIDIA GeForce GTX 1050 Ti Mobile | Average of class Gaming | |
|---|---|---|---|---|---|---|---|---|
| Heat | -4% | -22% | -11% | 5% | -18% | -5% | -11% | |
| Maximum Upper Side * (°C) | 44.1 | 47 -7% | 52 -18% | 46 -4% | 45 -2% | 42.8 3% | 46.5 ? -5% | 45.2 ? -2% |
| Maximum Bottom * (°C) | 53.8 | 44 18% | 55 -2% | 52 3% | 43 20% | 52 3% | 48.4 ? 10% | 48 ? 11% |
| Idle Upper Side * (°C) | 24.6 | 30 -22% | 36 -46% | 29 -18% | 25 -2% | 32 -30% | 28.6 ? -16% | 31.1 ? -26% |
| Idle Bottom * (°C) | 26.7 | 28 -5% | 32 -20% | 33 -24% | 26 3% | 39.4 -48% | 28.9 ? -8% | 34.2 ? -28% |
* ... smaller is better
Speakers
HP Pavilion Gaming 15-cx0003ng audio analysis
(-) | not very loud speakers (70.4 dB)
Bass 100 - 315 Hz
(-) | nearly no bass - on average 25.4% lower than median
(±) | linearity of bass is average (10.3% delta to prev. frequency)
Mids 400 - 2000 Hz
(+) | balanced mids - only 2.3% away from median
(+) | mids are linear (6.9% delta to prev. frequency)
Highs 2 - 16 kHz
(+) | balanced highs - only 1.8% away from median
(+) | highs are linear (4.7% delta to prev. frequency)
Overall 100 - 16.000 Hz
(±) | linearity of overall sound is average (21.1% difference to median)
Compared to same class
» 76% of all tested devices in this class were better, 4% similar, 20% worse
» The best had a delta of 6%, average was 18%, worst was 132%
Compared to all devices tested
» 58% of all tested devices were better, 7% similar, 35% worse
» The best had a delta of 4%, average was 24%, worst was 134%
Apple MacBook 12 (Early 2016) 1.1 GHz audio analysis
(+) | speakers can play relatively loud (83.6 dB)
Bass 100 - 315 Hz
(±) | reduced bass - on average 11.3% lower than median
(±) | linearity of bass is average (14.2% delta to prev. frequency)
Mids 400 - 2000 Hz
(+) | balanced mids - only 2.4% away from median
(+) | mids are linear (5.5% delta to prev. frequency)
Highs 2 - 16 kHz
(+) | balanced highs - only 2% away from median
(+) | highs are linear (4.5% delta to prev. frequency)
Overall 100 - 16.000 Hz
(+) | overall sound is linear (10.2% difference to median)
Compared to same class
» 7% of all tested devices in this class were better, 2% similar, 91% worse
» The best had a delta of 5%, average was 18%, worst was 53%
Compared to all devices tested
» 5% of all tested devices were better, 1% similar, 94% worse
» The best had a delta of 4%, average was 24%, worst was 134%
Energy Management - not a lot of stamina
Power Consumption
The power consumption is normal on every level for this combination of hardware. We measured a maximum consumption of 11.9 watts while idling. This increased to up to 144 watts during our stress test. Users can expect around 94 watts (+/- 20 watts) during everyday gaming use. The rated output of the power supply is 150 watts.
| Off / Standby | |
| Idle | |
| Load |
|
Key:
min: | |
| HP Pavilion Gaming 15-cx0003ng i7-8750H, GeForce GTX 1050 Ti Mobile | Acer Nitro 5 AN515-42-R6V0 R7 2700U, Radeon RX 560X (Laptop) | Acer Nitro 5 AN515-52-74DR i7-8750H, GeForce GTX 1050 Ti Mobile | HP Pavilion Gaming 15t-cx0000 i7-8750H, GeForce GTX 1060 Max-Q | Medion Erazer P6705-MD61131 i7-8750H, GeForce GTX 1050 Ti Mobile | Lenovo Legion Y530-15ICH i5-8300H, GeForce GTX 1050 Ti Mobile | Average NVIDIA GeForce GTX 1050 Ti Mobile | Average of class Gaming | |
|---|---|---|---|---|---|---|---|---|
| Power Consumption | -14% | 5% | -10% | 12% | -4% | -19% | -91% | |
| Idle Minimum * (Watt) | 5.5 | 7 -27% | 5 9% | 6 -9% | 4 27% | 4.5 18% | 7.92 ? -44% | 13.2 ? -140% |
| Idle Average * (Watt) | 8.5 | 10 -18% | 7 18% | 11.2 -32% | 7 18% | 10 -18% | 11.9 ? -40% | 18.9 ? -122% |
| Idle Maximum * (Watt) | 11.9 | 18 -51% | 11 8% | 13.3 -12% | 11 8% | 13.8 -16% | 15.4 ? -29% | 24.3 ? -104% |
| Load Average * (Watt) | 94 | 79 16% | 91 3% | 89.2 5% | 72 23% | 92.5 2% | 85.1 ? 9% | 108 ? -15% |
| Witcher 3 ultra * (Watt) | 86 | 98 -14% | 97 -13% | 101.9 -18% | 79 8% | 108.1 -26% | ||
| Load Maximum * (Watt) | 144 | 128 11% | 137 5% | 134.5 7% | 158 -10% | 123.2 14% | 130.5 ? 9% | 254 ? -76% |
* ... smaller is better
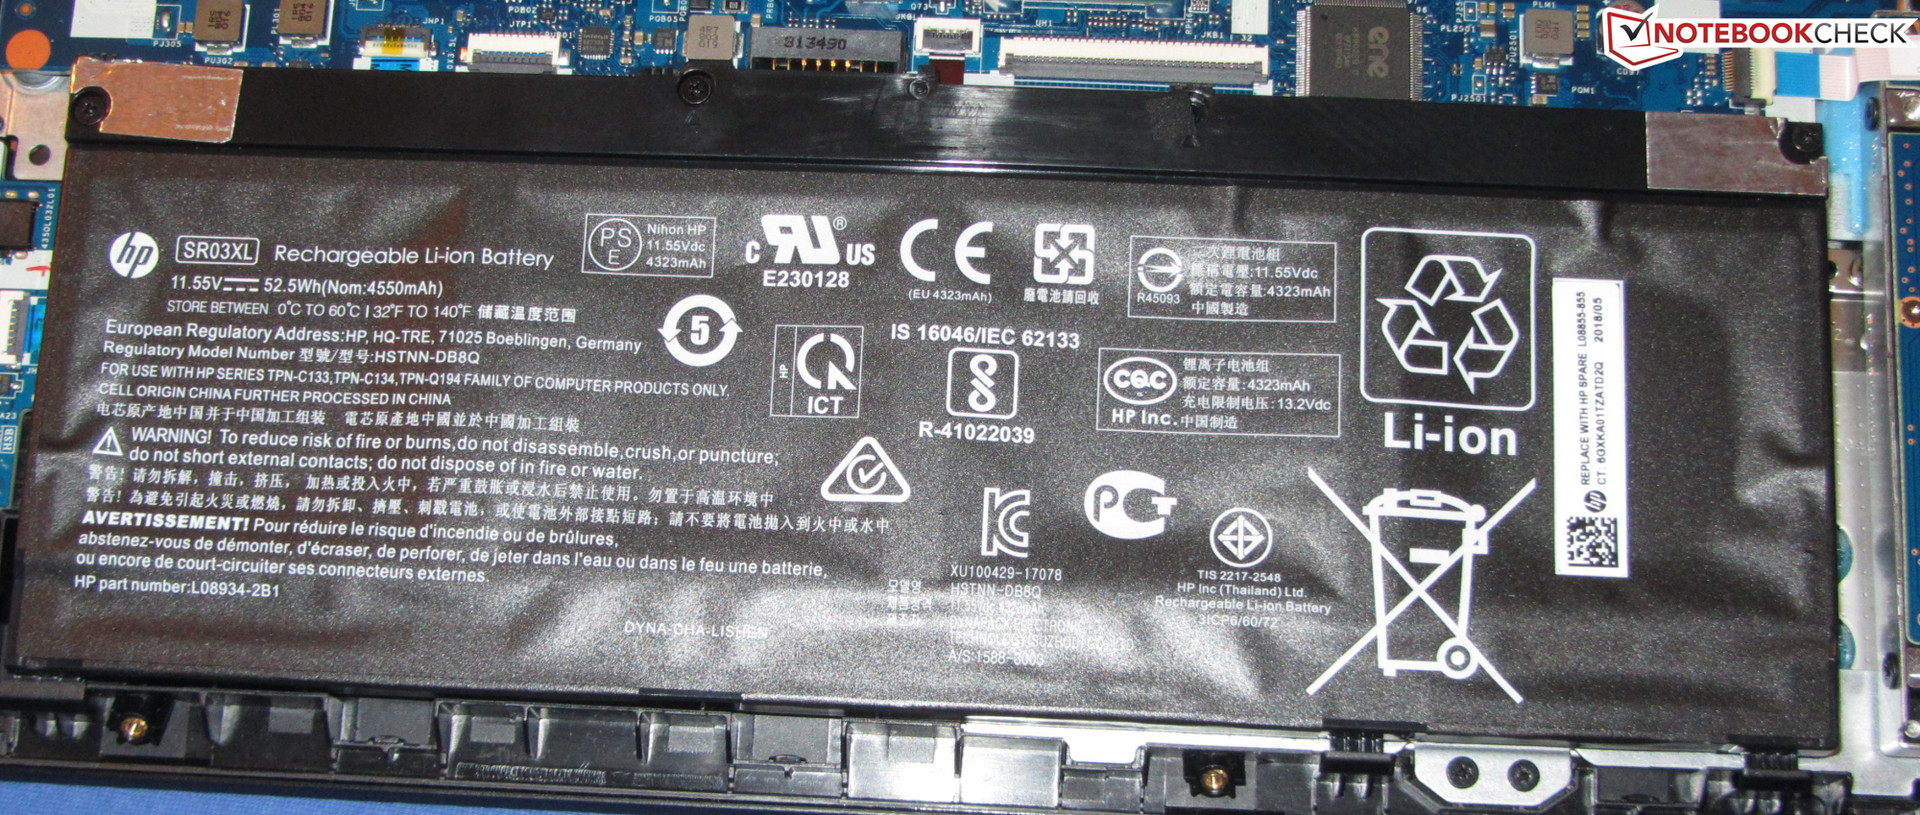
Battery Runtimes
The Pavilion reaches a runtime of 5:18 hours during our realistic Wi-Fi test. We use this test to simulate the load of browsing the Internet with the energy profile set to "balanced" and display brightness at around 150 cd/m². The HP Pavilion managed to keep going for 4:38 hours during our video test, for which we used the short film Big Buck Bunny (H.264 coding, 1920x1080 pixels) in a loop. The wireless modules are disabled and the energy-saving profile is turned on during this test with the display brightness set to 150 cd/m² again.
This positions the Pavilion far below its sister model in terms of battery runtimes - although that is equipped with a stronger GPU. Why? The battery in our current test unit has a significantly lower capacity (52.2 Wh vs. 70 Wh). On top of that, the battery has a rate of wear of 8%. The Acer Nitro 5, which is equipped with the same CPU/GPU combination, proves that it does not have to be this way. It manages to get a longer runtime out of its 48-Wh battery than both of the Pavilion Gaming 15 models we have tested.
| HP Pavilion Gaming 15-cx0003ng i7-8750H, GeForce GTX 1050 Ti Mobile, 52.5 Wh | Acer Nitro 5 AN515-42-R6V0 R7 2700U, Radeon RX 560X (Laptop), 48 Wh | Acer Nitro 5 AN515-52-74DR i7-8750H, GeForce GTX 1050 Ti Mobile, 48 Wh | HP Pavilion Gaming 15t-cx0000 i7-8750H, GeForce GTX 1060 Max-Q, 70 Wh | Medion Erazer P6705-MD61131 i7-8750H, GeForce GTX 1050 Ti Mobile, 62 Wh | Lenovo Legion Y530-15ICH i5-8300H, GeForce GTX 1050 Ti Mobile, 52.5 Wh | Average of class Gaming | |
|---|---|---|---|---|---|---|---|
| Battery runtime | 8% | 27% | 2% | 29% | -23% | 25% | |
| Reader / Idle (h) | 10.8 | 12.5 16% | 8 -26% | 8.9 -18% | 8.71 ? -19% | ||
| H.264 (h) | 4.6 | 7.1 54% | 8.26 ? 80% | ||||
| WiFi v1.3 (h) | 5.3 | 5.7 8% | 7 32% | 6.3 19% | 6.7 26% | 4.1 -23% | 7.02 ? 32% |
| Load (h) | 1.4 | 1.5 7% | 1.6 14% | 2.5 79% | 1.47 ? 5% |
Verdict
Pros
Cons
The Pavilion Gaming 15 is a 15.6-inch mid-range gaming notebook. The combination of a Core i7-8750H processor and a GeForce GTX 1050 Ti graphics card can display all games that are currently in our database smoothly. However, the most-demanding modern games should be played at lower settings. The hexa-core processor also offers sufficient processing power for applications beyond gaming loads. If you do not need a hexa-core processor and/or would like to save some money, you should take a look at a Pavilion model that is equipped with a quad-core Core i5-8300H.
The Intel Optane Memory combination consists of a 1-TB HDD and a 16-GB NVMe SSD and ensures a fast-running system. The use of Optane is optional. The cache SSD could be replaced by a larger NVMe device from a different manufacturer, which could then be used as the system drive while the HDD would be used for data storage only.
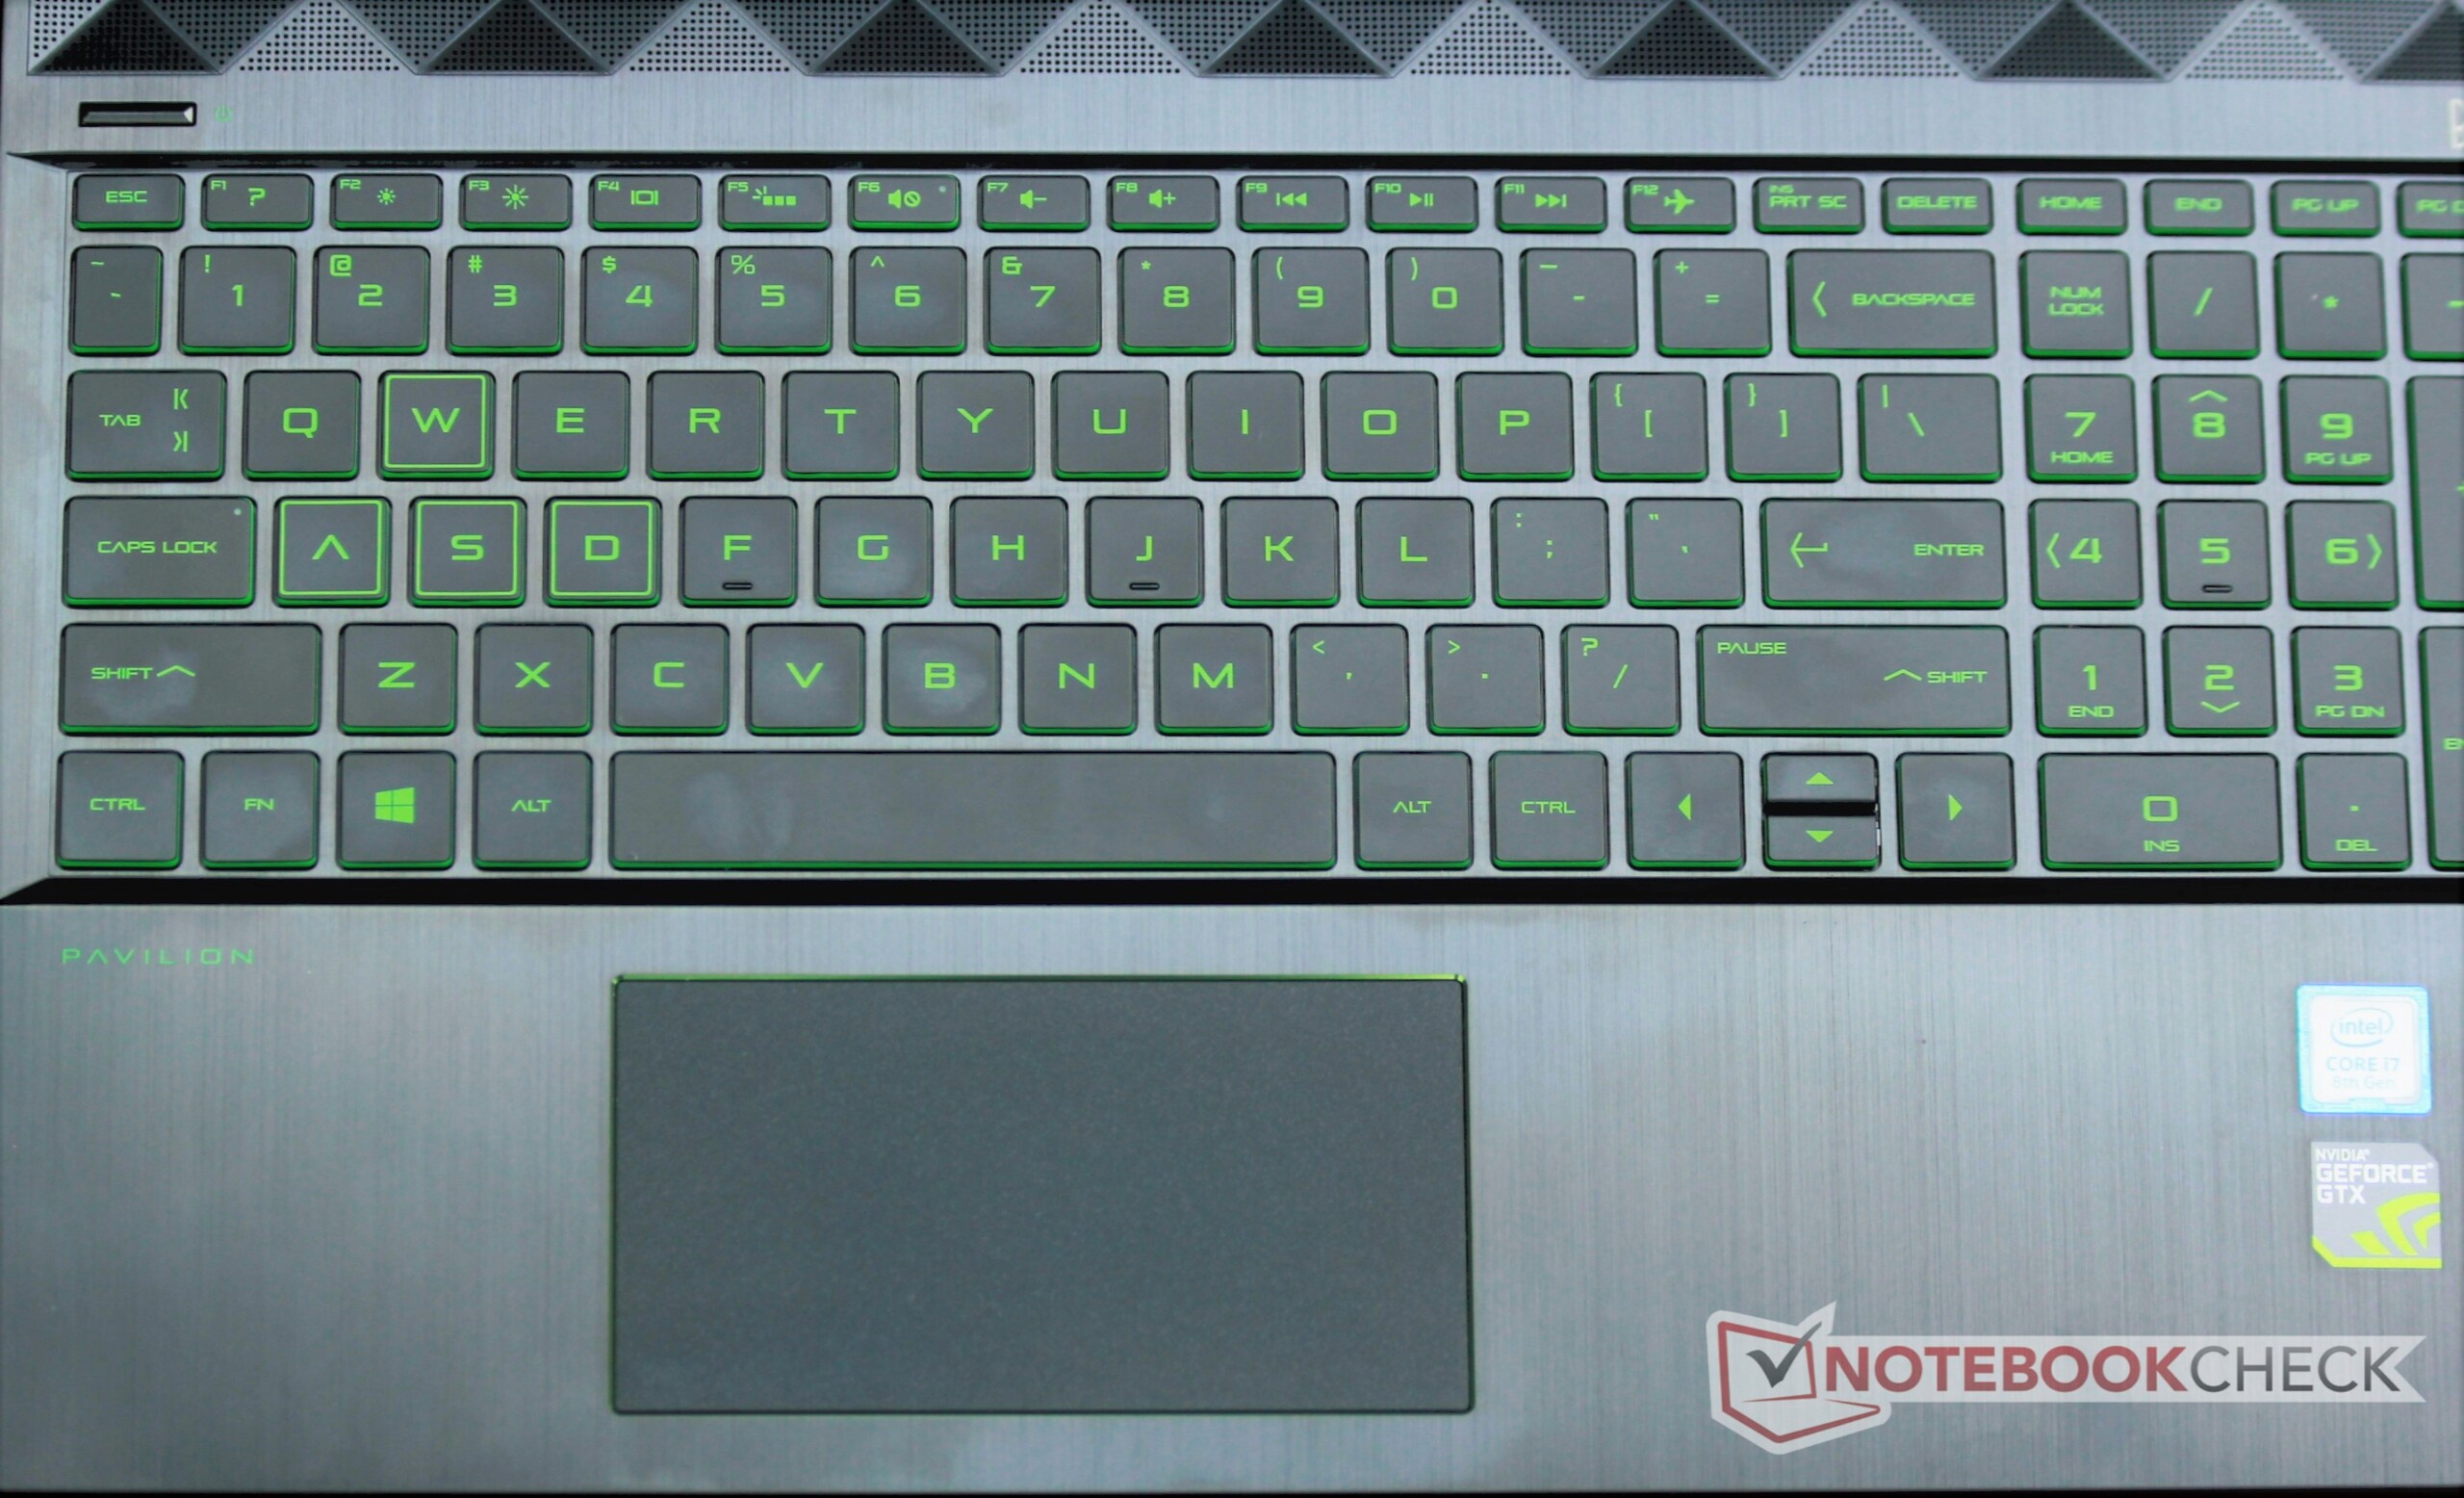
The Full HD IPS display in the Pavilion offers stable viewing angles and good contrast. The brightness is too low for a device in this price range. Its battery runtimes are fine for a gaming notebook, although some comparable competitors have more to offer. The keyboard is quite good, particularly for a gaming notebook.
HP has created a series of gaming notebooks that is positioned below the Omen series. These devices are supposed to offer as much gaming performance as possible for a comparatively low price. While the device fulfills this goal, it does not unleash waves of enthusiasm.
The cooling fans in our test unit could also be better, as these produce a lot of noise. On top of that, the case itself is not quite as stable as we would have hoped for. For example, the relatively unstable display cover shows that a large part of the budget was spent on the device's insides rather than its outside. The Acer Nitro 5 is equipped with the same CPU/GPU combination but manages to get more performance out of these components while simultaneously offering significantly better battery runtimes.
HP Pavilion Gaming 15-cx0003ng
- 12/12/2018 v6 (old)
Sascha Mölck
Price comparison

