Bristol Ridge in Review: AMDs A10-9600P Against the Competition
For the original German article, see here.
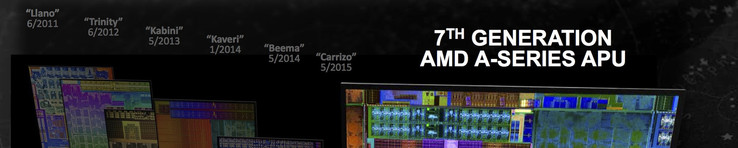
The AMD Raven Ridge APU has a release date in mid-2017 and promises a lot of impressive features: a modern 14 nm process with FinFET transistors, a greatly improved CPU performance thanks to the Zen microarchitecture and a faster HBM2 memory directly on the interposer. Until then, AMD is keeping the interest of consumers with the 7th generation of AMD APUs: Bristol Ridge.
Although the name implies a new chip, Bristol Ridge is essentially a rework of the 2016 Carrizo design. The APU uses the well-known 28 nm process and offers minor modifications on the previous design. As such, the technical details have stayed mostly the same: the APU still has up to 4 "Excavator" CPU cores, 512 shaders (GCN, 3rd Gen) and a Southbridge with 12 PCIe 3.0 lanes. The DDR4 support of the memory controller is new. Although this feature was already available in the Carrizo design, it was never officially unlocked. Furthermore, AMD has optimized the finish and boost behavior of the chip. This allows it to perform at higher clock speeds while keeping to the same power consumption levels.
Additional details about the improvements made to the Bristol Ridge architecture can be found in the following articles:
Model Overview
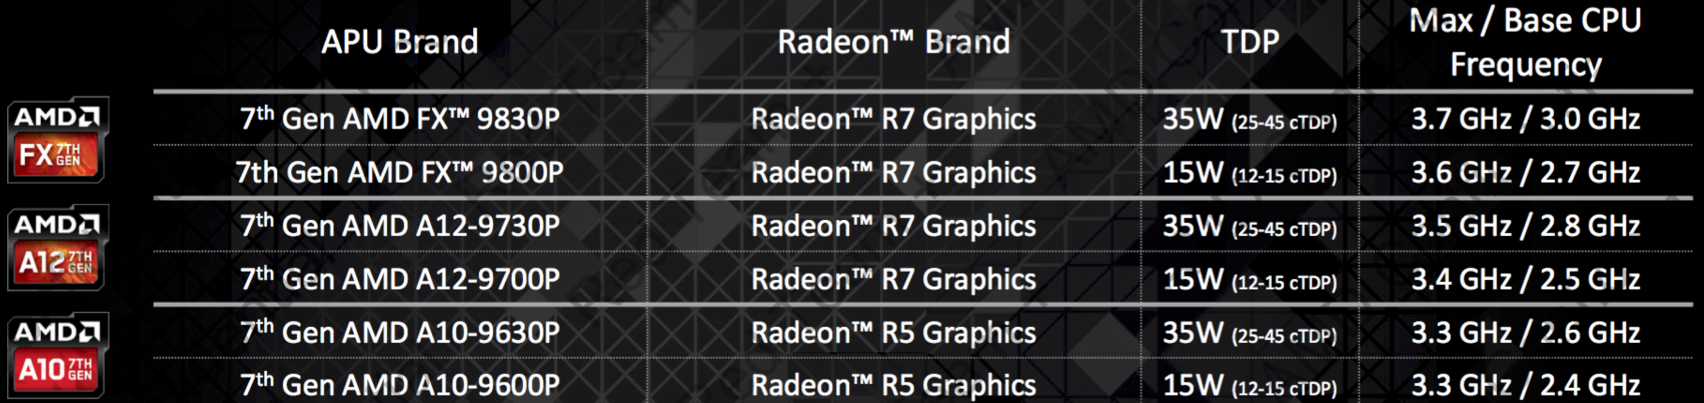
Unlike Intel, AMD offers a smaller line-up of APUs, which consists of 6 models: 3 in 15-watt and 3 in 35-watt APUs. All APUs have 4 CPU cores, an IGP (Integrated Graphics Processor) with either 384 (A10 and A12 series) or 512 shaders (FX series). The max clock speed of the IGP varies between 720 (A10-9600P) and 900 MHz (FX-9830P). Additional differences can be noticed in the memory controllers. The 35-watt series can support RAM up to DDR4-2400, whereas the 15-watt APUs can only support RAM up to DDR4-1866.
The Test Model
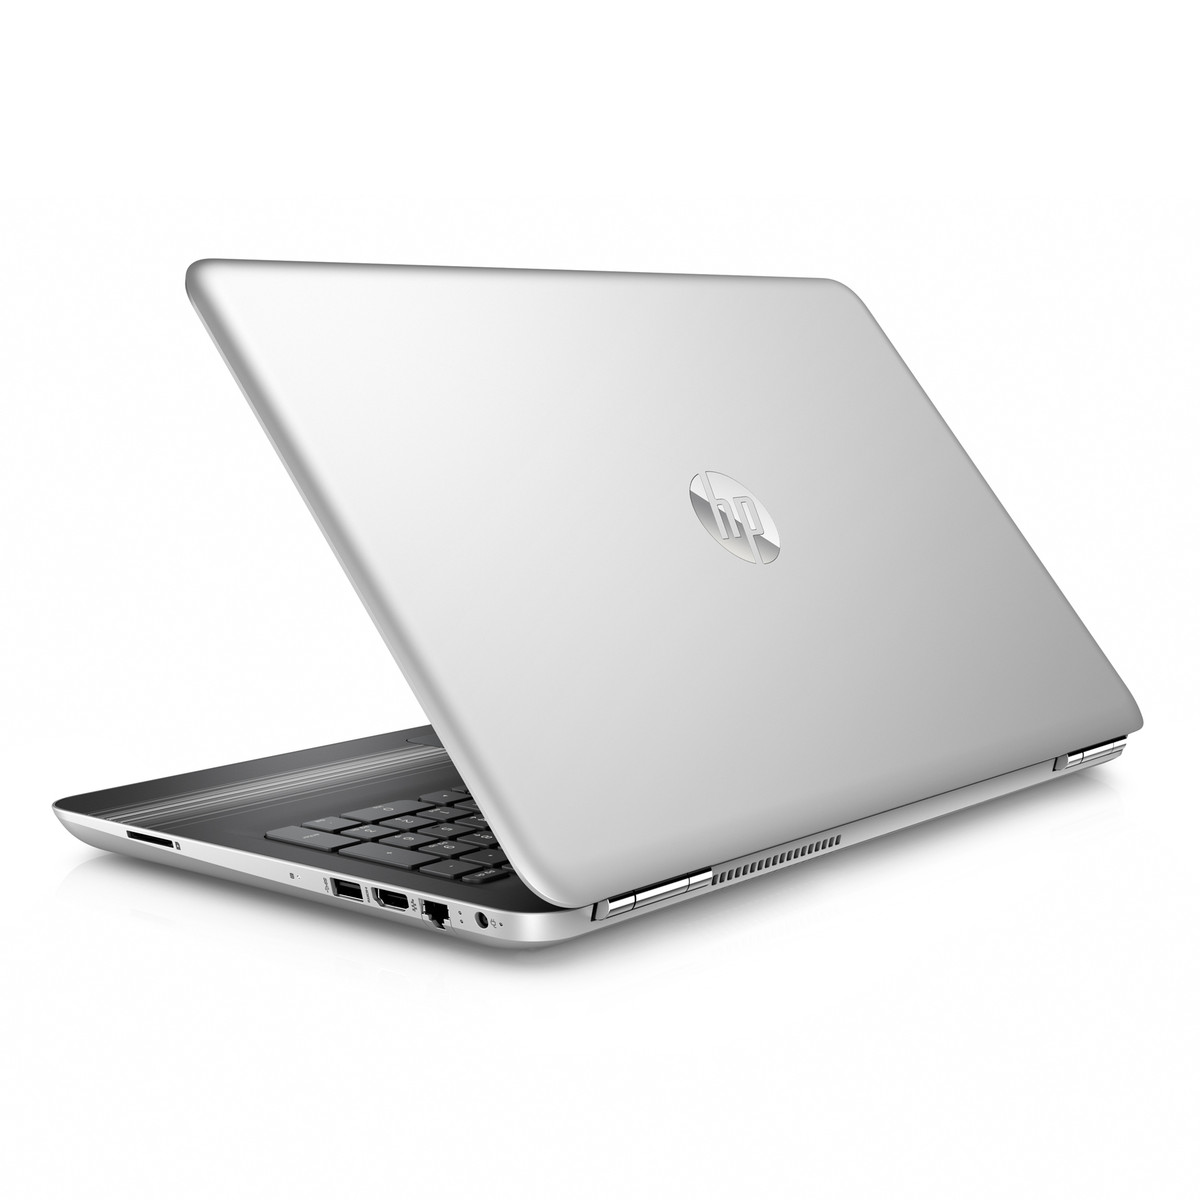
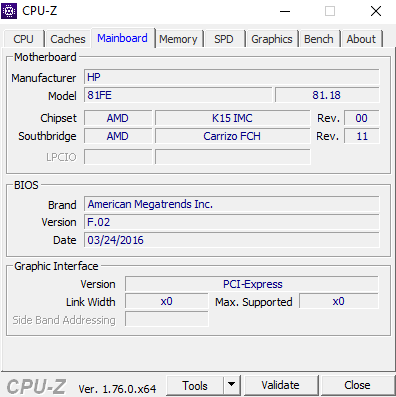
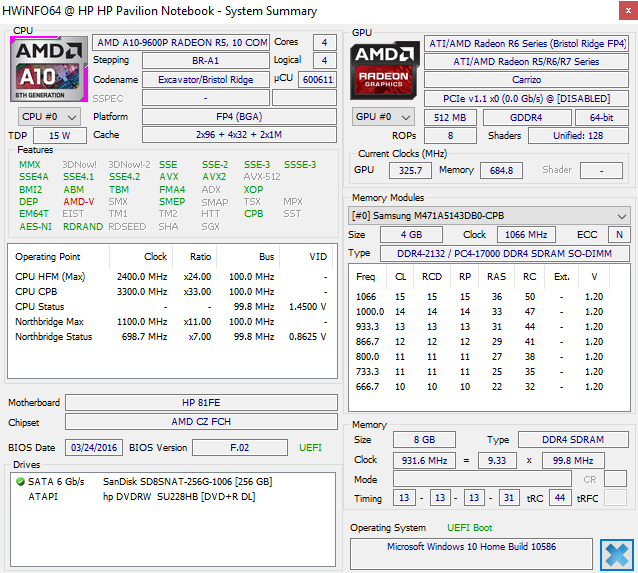
For the following measurements, we used an HP Pavilion 15-aw004ng. The laptop was provided by Notebooksbilliger.de. With a price tag of 600 Euros (~$669), the 15-inch model offers the following components:
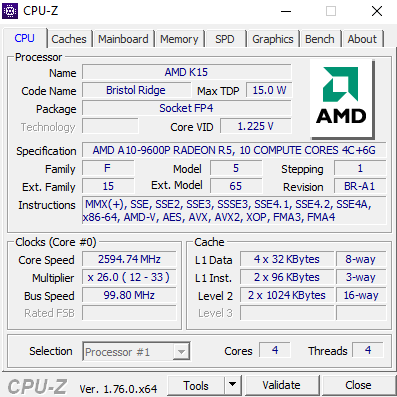
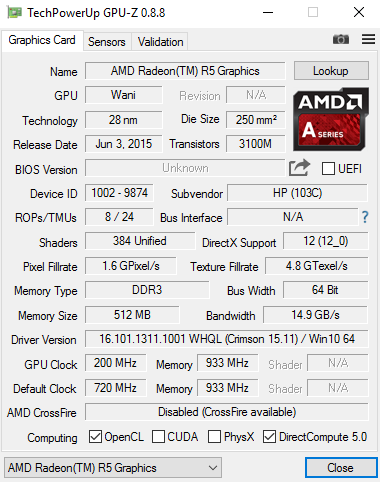
- AMD A10-9600P
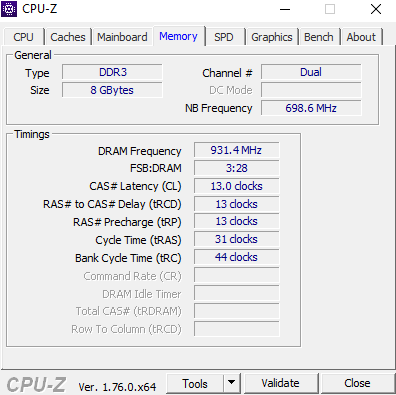
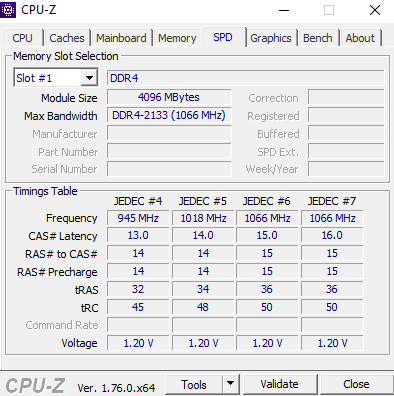
- 2x 4 GB DDR4-1866
- Radeon R5 (integrated) + Radeon R7 M440 (dedicated), Driver 16.101.1311.1001
- 256 GB SSD (SanDisk Z400s, M.2 2280)
- 15.6 inch Full HD Display (1920 x 1080 pixels), TN Panel, matte
- Windows 10 64-Bit
The laptop offers good components for its price range: a 256 GB SSD and an FHD display. However, the latter is a relatively disappointing TN panel (see review of predecessor). We want to praise HP for their decision to install two DDR4 RAM modules (1866 MHz). Unfortunately, the main beneficiary of such strong RAM is the IGP, which is limited to office work, as the dedicated Radeon R7 M440 GPU takes care of the heavy lifting. We tested both graphics processors individually and together in CrossFire mode (Radeon R8 M445DX) in the following game benchmarks.


Benchmarks
CPU Performance
The 15-watt TDP (Thermal Design Power) of the A10-9600P places it in competition with the Intel ULV models, which use the Skylake architecture. From a price perspective, the direct competition for the APU would be the i3 series.
Due to the stagnating per-MHz ratio, any performance increases achieved by Bristol Ridge is through higher clock speeds. The APU starts the Cinebench single thread test at 3.2 GHz, but the clock speed drops to 3.0 GHz after a short period of time. This places the clock speed of our APU above the similar Carrizo models by a few percent. A Core i3-6100U can distance itself from our test model by 20 to 25% and the older Broadwell processors, i3-5005U and i3-5010U; achieve a lead of 5 to 10%.
The A10-9600P performs better in the Cinebench multithreading test: starting at 2.6 GHz and ending at 2.2 GHz. This suffices to place our model above the A10-8700P by 10% and directly between the i3-5000 and i3-6000 series.
| Cinebench R11.5 | |
| CPU Single 64Bit | |
| Intel Core i5-6200U | |
| Intel Core i5-5200U | |
| Intel Core i3-6100U | |
| Intel Core i3-5010U | |
| Intel Core i3-5005U | |
| AMD A10-9600P | |
| AMD Pro A12-8800B | |
| AMD A10-8700P | |
| AMD FX-7600P | |
| CPU Multi 64Bit | |
| Intel Core i5-6200U | |
| Intel Core i5-5200U | |
| Intel Core i3-6100U | |
| AMD A10-9600P | |
| AMD Pro A12-8800B | |
| AMD FX-7600P | |
| AMD A10-8700P | |
| Intel Core i3-5010U | |
| Intel Core i3-5005U | |
| Cinebench R15 | |
| CPU Single 64Bit | |
| Intel Core i5-6200U | |
| Intel Core i5-5200U | |
| Intel Core i3-6100U | |
| Intel Core i3-5010U | |
| Intel Core i3-5005U | |
| AMD A10-9600P | |
| AMD FX-7600P | |
| AMD Pro A12-8800B | |
| AMD A10-8700P | |
| CPU Multi 64Bit | |
| Intel Core i5-6200U | |
| Intel Core i5-5200U | |
| Intel Core i3-6100U | |
| AMD FX-7600P | |
| Intel Core i3-5010U | |
| AMD A10-9600P | |
| Intel Core i3-5005U | |
| AMD Pro A12-8800B | |
| AMD A10-8700P | |
| TrueCrypt | |
| AES Mean 100MB | |
| AMD FX-7600P | |
| Intel Core i5-6200U | |
| AMD A10-8700P | |
| AMD Pro A12-8800B | |
| AMD A10-9600P | |
| Intel Core i3-6100U | |
| Intel Core i3-5005U | |
| Intel Core i3-5010U | |
| Twofish Mean 100MB | |
| AMD FX-7600P | |
| AMD A10-9600P | |
| AMD Pro A12-8800B | |
| AMD A10-8700P | |
| Intel Core i5-6200U | |
| Intel Core i3-6100U | |
| Intel Core i3-5010U | |
| Intel Core i3-5005U | |
| Serpent Mean 100MB | |
| AMD FX-7600P | |
| AMD A10-9600P | |
| AMD Pro A12-8800B | |
| AMD A10-8700P | |
| Intel Core i5-6200U | |
| Intel Core i3-6100U | |
| Intel Core i3-5010U | |
| Intel Core i3-5005U | |
| WinRAR - Result | |
| Intel Core i5-5200U | |
| Intel Core i5-6200U | |
| Intel Core i3-5010U | |
| Intel Core i3-5005U | |
| Intel Core i3-6100U | |
| AMD FX-7600P | |
| AMD A10-9600P | |
| AMD A10-8700P | |
| AMD Pro A12-8800B | |
| Super Pi Mod 1.5 XS 32M - 32M | |
| AMD FX-7600P | |
| AMD Pro A12-8800B | |
| Intel Core i3-5005U | |
| AMD A10-8700P | |
| AMD A10-9600P | |
| Intel Core i3-5010U | |
| Intel Core i3-6100U | |
| Intel Core i5-5200U | |
| Intel Core i5-6200U | |
| 3DMark 06 - CPU - CPU Score | |
| Intel Core i5-6200U | |
| AMD FX-7600P | |
| Intel Core i5-5200U | |
| AMD A10-9600P | |
| Intel Core i3-6100U | |
| AMD A10-8700P | |
| Intel Core i3-5010U | |
| AMD Pro A12-8800B | |
| Intel Core i3-5005U | |
| Geekbench 3 | |
| 32 Bit Single-Core Score | |
| Intel Core i5-6200U | |
| Intel Core i5-5200U | |
| Intel Core i3-6100U | |
| Intel Core i3-5010U | |
| AMD A10-9600P | |
| AMD A10-8700P | |
| AMD Pro A12-8800B | |
| AMD FX-7600P | |
| Intel Core i3-5005U | |
| 32 Bit Multi-Core Score | |
| Intel Core i5-6200U | |
| AMD A10-9600P | |
| AMD FX-7600P | |
| Intel Core i5-5200U | |
| Intel Core i3-6100U | |
| AMD A10-8700P | |
| AMD Pro A12-8800B | |
| Intel Core i3-5010U | |
| Intel Core i3-5005U | |
| Mozilla Kraken 1.1 - Total | |
| AMD Pro A12-8800B | |
| AMD FX-7600P | |
| AMD FX-7600P | |
| AMD A10-8700P | |
| Intel Core i3-5005U | |
| Intel Core i3-5010U | |
| Intel Core i5-5200U | |
| AMD A10-9600P | |
| Intel Core i3-6100U | |
| Intel Core i5-6200U | |
| Octane V2 - Total Score | |
| Intel Core i5-6200U | |
| Intel Core i3-6100U | |
| AMD A10-9600P | |
| AMD FX-7600P | |
| AMD FX-7600P | |
| Intel Core i5-5200U | |
| Intel Core i3-5010U | |
| Intel Core i3-5005U | |
| AMD A10-8700P | |
| AMD Pro A12-8800B | |
* ... smaller is better
Performance Consistency - Sustaining High CPU Loads
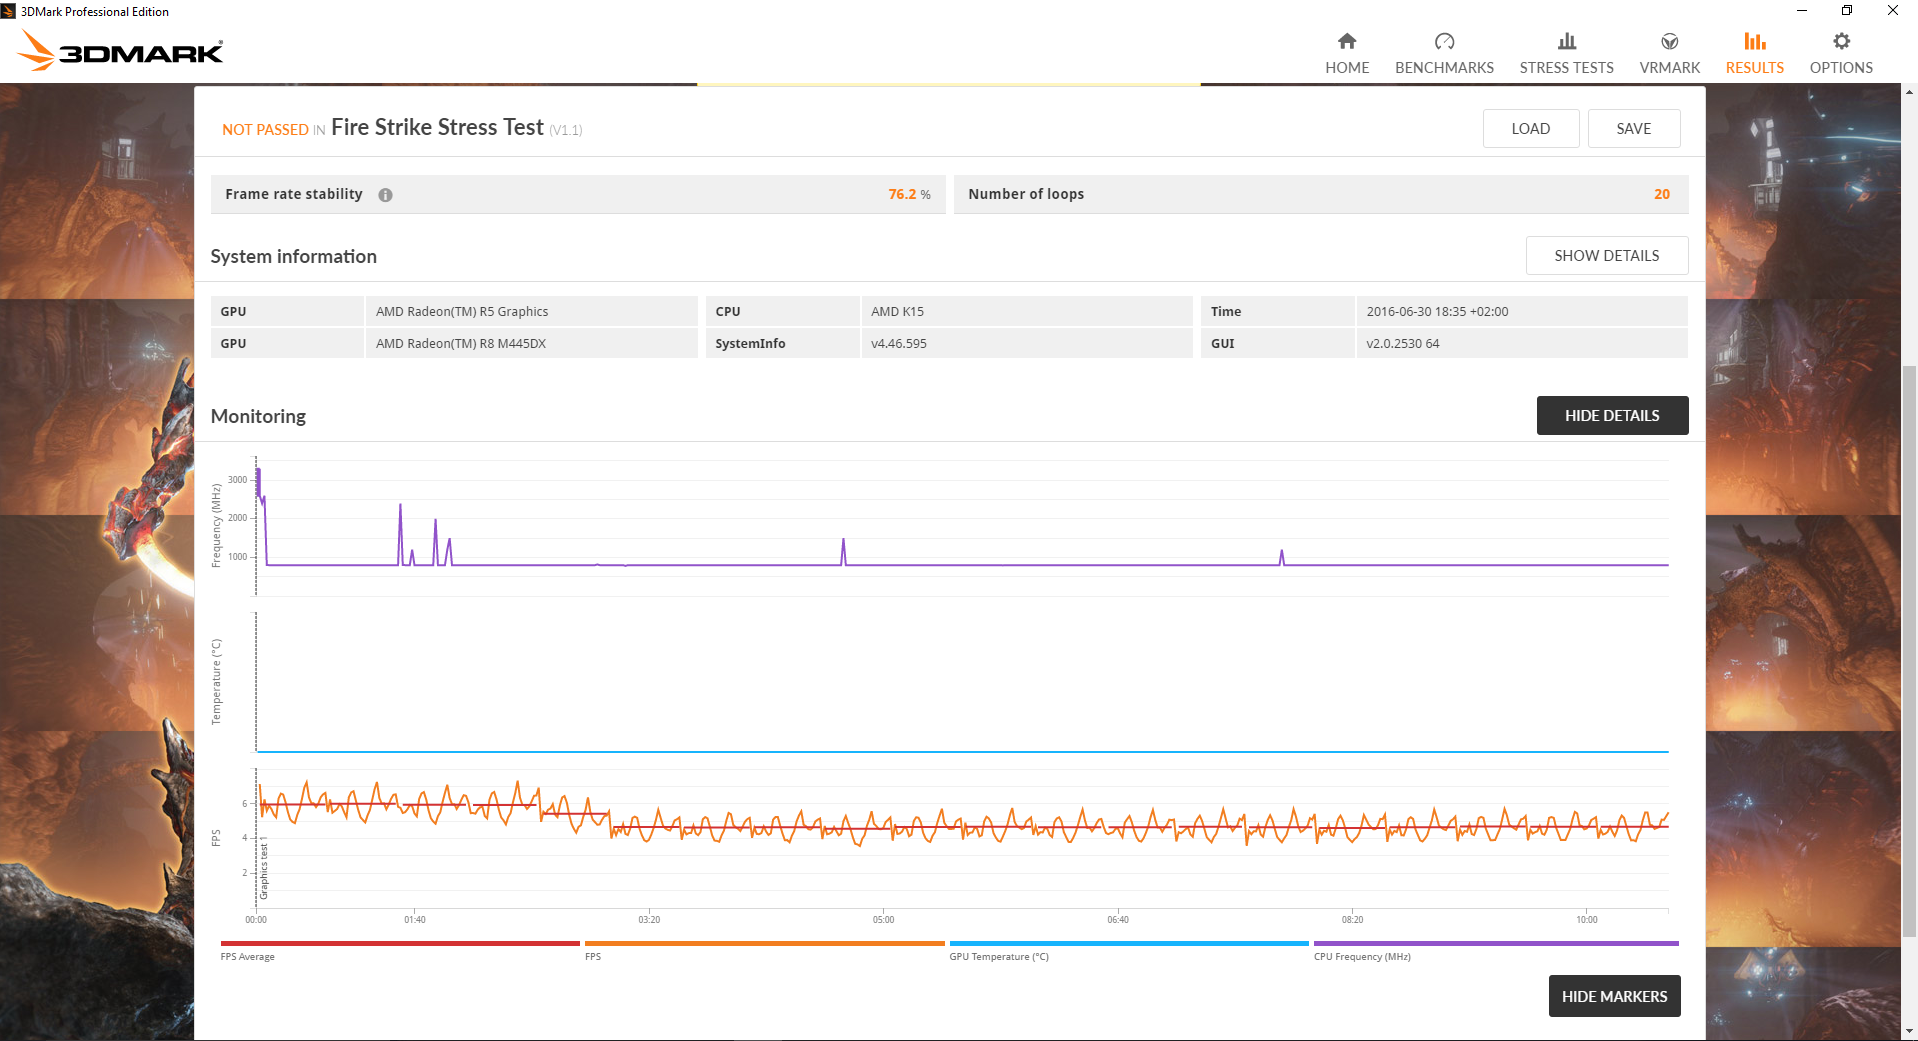
The A10-9600P does not fulfil its potential. AMD specifies a clock speed range of 2.4 to 3.3 GHz. However, the test APU cannot perform at the upper ends of this range continuously due to the limiting TDP value. This behavior exhibited in the Carrizo models as well. The APU often starts the benchmarks at a high clock speed. Sadly, these high clock speeds are reached by surpassing the 15-watt TDP limit, which means that after a short period of time (around a minute), the performance drops by up to 20%. Intel models present a similar pattern, but thankfully, only the fastest i7 processors are (imperceptibly) affected by it.
This scenario of exceeding TDP limits was observed in the smallest Bristol Ridge model. It is doubtful whether the stronger 15-watt APUs will perform faster with continuously high CPU load. If, instead of continuously high CPU load, there are spikes of high CPU load, it is possible for the higher clock speeds of the A12 and FX processors to shine through. The 35-watt series should be able to offer high and stable CPU clock speeds during Turbo.
| Start | after 1 minute | after 5 minutes | |
|---|---|---|---|
Cinebench R15 (Single) |
3.2 GHz (37.5 W) | 3.0 GHz (33.3 W) | 2.9 GHz (30.7 W) |
Cinebench R15 (Multi) |
2.6 GHz (41.4 W) | 2.2 GHz (32.4 W) | 2.1 GHz (30.8 W) |
Prime95 |
2.3 GHz (41.3 W) | 1.8 GHz (32.3 W) | 1.7 GHz (31.1 W) |
GPU Performance
The Radeon R5 IGP of the A10-9600P offers 720 MHz Boost clock speed and 384 shaders, which is identical to the features offered by the older Radeon R6 in the A10-8700P (Carrizo). Curiously, the IGP of the more expensive A12-9700P is named Radeon R7, although that chip also uses 384 ALUs (max. 758 MHz). The full 512 shaders found in the Bristol Ridge chips can only be offered by the FX-9800P (max. 758 MHz) in this TDP class. The IGP of the FX-9800P is also named Radeon R7. As the power consumption is limited to a fixed value, we do not expect great performance differences between the three 15-watt models.
Where does all of this place Bristol Ridge? The APU performs best in a synthetic 3DMark benchmark, where it can achieve a lead of 25% over Carrizo. This lead is due to the optimized boost and faster DDR4 memory support, which offers a 16% larger bandwidth than its predecessor, the DDR3 (L) RAM. The Intel HD Graphics 520 IGP falls behind by 30 to 60%.
Sadly, this gap shrinks quickly in games. On average, Bristol Ridge places itself ahead of Carrizo and the HD Graphics 520 IGP by 10 to 15%. The Intel Skylake IGP performs quite well in games which rely heavily on CPU performance, such as, “Sims 4” or “World of Warships”. The AMD APUs are clearly in the lead in terms of games which have more demanding graphics, such as “BioShock”. The Iris Graphics 540 places itself at the head of all benchmarks, but is also more expensive. It gains a large lead thanks to its eDRAM cache.
We found the dedicated Radeon R7 M440 GPU of our test laptop relatively disappointing. It rarely performed faster than the integrated Radeon R5 and, when it did, the IGP was suffering performance drops due to its limiting TDP. Instead, HP should have installed the higher-performance A10-9630P (35-watt). This would have boosted CPU and GPU performance. This statement is supported by the fact that the CrossFire setup did not produce higher frame rates in none of the games we tested.
| 3DMark | |
| 1280x720 Cloud Gate Standard Graphics | |
| Radeon R8 M445DX (Dual Graphics) | |
| Iris Graphics 540 (i5-6260U; Dual-Channel) | |
| Iris Graphics 540 (i7-6560U; Dual-Channel) | |
| Radeon R5 (A10-9600P; Dual-Channel) | |
| HD Graphics 520 (i5-6200U; Dual-Channel) | |
| HD Graphics 520 (i7-6600U; Dual-Channel) | |
| Radeon R6 Carrizo (A10-8700P; Dual-Channel) | |
| HD Graphics 520 (i7-6500U; Single-Channel) | |
| HD Graphics 520 (i7-6500U; Dual-Channel) | |
| Radeon R7 M440 (dediziert) | |
| HD Graphics 520 (i5-6200U; Single-Channel) | |
| HD Graphics 520 (i7-6600U; Single-Channel) | |
| 1920x1080 Fire Strike Graphics | |
| Radeon R8 M445DX (Dual Graphics) | |
| Iris Graphics 540 (i5-6260U; Dual-Channel) | |
| Radeon R5 (A10-9600P; Dual-Channel) | |
| Radeon R7 M440 (dediziert) | |
| Radeon R6 Carrizo (A10-8700P; Dual-Channel) | |
| HD Graphics 520 (i7-6600U; Dual-Channel) | |
| HD Graphics 520 (i7-6500U; Dual-Channel) | |
| HD Graphics 520 (i7-6500U; Single-Channel) | |
| HD Graphics 520 (i7-6600U; Single-Channel) | |
| HD Graphics 520 (i5-6200U; Single-Channel) | |
| LuxMark v2.0 64Bit | |
| Room GPUs-only | |
| Radeon R8 M445DX (Dual Graphics) | |
| Iris Graphics 540 (i5-6260U; Dual-Channel) | |
| HD Graphics 520 (i7-6600U; Dual-Channel) | |
| Radeon R5 (A10-9600P; Dual-Channel) | |
| Radeon R7 M440 (dediziert) | |
| Radeon R6 Carrizo (A10-8700P; Dual-Channel) | |
| Sala GPUs-only | |
| Iris Graphics 540 (i5-6260U; Dual-Channel) | |
| Radeon R8 M445DX (Dual Graphics) | |
| HD Graphics 520 (i7-6600U; Dual-Channel) | |
| Radeon R5 (A10-9600P; Dual-Channel) | |
| Radeon R6 Carrizo (A10-8700P; Dual-Channel) | |
| Radeon R7 M440 (dediziert) | |
| Sims 4 | |
| 1024x768 Low Preset | |
| HD Graphics 520 (i7-6600U; Dual-Channel) | |
| HD Graphics 520 (i5-6200U; Single-Channel) | |
| Radeon R5 (A10-9600P; Dual-Channel) | |
| Radeon R8 M445DX (Dual Graphics) | |
| Radeon R6 Carrizo (A10-8700P; Dual-Channel) | |
| Radeon R7 M440 (dediziert) | |
| 1366x768 Medium Preset | |
| HD Graphics 520 (i7-6600U; Dual-Channel) | |
| HD Graphics 520 (i5-6200U; Single-Channel) | |
| Radeon R7 M440 (dediziert) | |
| Radeon R8 M445DX (Dual Graphics) | |
| Radeon R5 (A10-9600P; Dual-Channel) | |
| Radeon R6 Carrizo (A10-8700P; Dual-Channel) | |
| 1920x1080 High Preset | |
| HD Graphics 520 (i7-6600U; Dual-Channel) | |
| Radeon R7 M440 (dediziert) | |
| Radeon R5 (A10-9600P; Dual-Channel) | |
| Radeon R8 M445DX (Dual Graphics) | |
| Radeon R6 Carrizo (A10-8700P; Dual-Channel) | |
| HD Graphics 520 (i5-6200U; Single-Channel) | |
| BioShock Infinite | |
| 1280x720 Very Low Preset | |
| Iris Graphics 540 (i5-6260U; Dual-Channel) | |
| Radeon R7 M440 (dediziert) | |
| Radeon R8 M445DX (Dual Graphics) | |
| Iris Graphics 540 (i7-6560U; Dual-Channel) | |
| Radeon R5 (A10-9600P; Dual-Channel) | |
| Radeon R6 Carrizo (A10-8700P; Dual-Channel) | |
| HD Graphics 520 (i7-6600U; Dual-Channel) | |
| HD Graphics 520 (i7-6500U; Dual-Channel) | |
| 1366x768 Medium Preset | |
| Iris Graphics 540 (i5-6260U; Dual-Channel) | |
| Radeon R7 M440 (dediziert) | |
| Radeon R8 M445DX (Dual Graphics) | |
| Iris Graphics 540 (i7-6560U; Dual-Channel) | |
| Radeon R5 (A10-9600P; Dual-Channel) | |
| HD Graphics 520 (i7-6600U; Dual-Channel) | |
| Radeon R6 Carrizo (A10-8700P; Dual-Channel) | |
| HD Graphics 520 (i7-6500U; Dual-Channel) | |
| 1366x768 High Preset | |
| Iris Graphics 540 (i5-6260U; Dual-Channel) | |
| Iris Graphics 540 (i7-6560U; Dual-Channel) | |
| Radeon R8 M445DX (Dual Graphics) | |
| Radeon R7 M440 (dediziert) | |
| Radeon R5 (A10-9600P; Dual-Channel) | |
| HD Graphics 520 (i7-6600U; Dual-Channel) | |
| Radeon R6 Carrizo (A10-8700P; Dual-Channel) | |
| HD Graphics 520 (i7-6500U; Dual-Channel) | |
| Diablo III | |
| 1024x768 Low / off | |
| Radeon R8 M445DX (Dual Graphics) | |
| HD Graphics 520 (i5-6200U; Single-Channel) | |
| Radeon R7 M440 (dediziert) | |
| Radeon R5 (A10-9600P; Dual-Channel) | |
| Radeon R6 Carrizo (A10-8700P; Dual-Channel) | |
| 1366x768 Medium / low | |
| Radeon R8 M445DX (Dual Graphics) | |
| Radeon R7 M440 (dediziert) | |
| HD Graphics 520 (i5-6200U; Single-Channel) | |
| Radeon R5 (A10-9600P; Dual-Channel) | |
| Radeon R6 Carrizo (A10-8700P; Dual-Channel) | |
| 1366x768 High AA:on | |
| Radeon R7 M440 (dediziert) | |
| Radeon R8 M445DX (Dual Graphics) | |
| HD Graphics 520 (i5-6200U; Single-Channel) | |
| Radeon R5 (A10-9600P; Dual-Channel) | |
| Radeon R6 Carrizo (A10-8700P; Dual-Channel) | |
| Crysis 3 | |
| 1024x768 Low Preset | |
| Iris Graphics 540 (i5-6260U; Dual-Channel) | |
| Iris Graphics 540 (i7-6560U; Dual-Channel) | |
| Radeon R7 M440 (dediziert) | |
| Radeon R6 Carrizo (A10-8700P; Dual-Channel) | |
| Radeon R8 M445DX (Dual Graphics) | |
| Radeon R5 (A10-9600P; Dual-Channel) | |
| HD Graphics 520 (i7-6500U; Single-Channel) | |
| 1366x768 Medium Preset AF:16x | |
| Iris Graphics 540 (i5-6260U; Dual-Channel) | |
| Iris Graphics 540 (i7-6560U; Dual-Channel) | |
| Radeon R5 (A10-9600P; Dual-Channel) | |
| Radeon R7 M440 (dediziert) | |
| Radeon R8 M445DX (Dual Graphics) | |
| Radeon R6 Carrizo (A10-8700P; Dual-Channel) | |
| HD Graphics 520 (i7-6500U; Single-Channel) | |
| 1366x768 High Preset AA:FX AF:16x | |
| Iris Graphics 540 (i5-6260U; Dual-Channel) | |
| Iris Graphics 540 (i7-6560U; Dual-Channel) | |
| Radeon R7 M440 (dediziert) | |
| Radeon R8 M445DX (Dual Graphics) | |
| Radeon R5 (A10-9600P; Dual-Channel) | |
| Radeon R6 Carrizo (A10-8700P; Dual-Channel) | |
| Metro: Last Light | |
| 1024x768 Low (DX10) AF:4x | |
| Iris Graphics 540 (i5-6260U; Dual-Channel) | |
| Radeon R7 M440 (dediziert) | |
| Radeon R8 M445DX (Dual Graphics) | |
| HD Graphics 520 (i5-6200U; Dual-Channel) | |
| Radeon R5 (A10-9600P; Dual-Channel) | |
| Radeon R6 Carrizo (A10-8700P; Dual-Channel) | |
| 1366x768 Medium (DX10) AF:4x | |
| Iris Graphics 540 (i5-6260U; Dual-Channel) | |
| Radeon R7 M440 (dediziert) | |
| Radeon R8 M445DX (Dual Graphics) | |
| HD Graphics 520 (i5-6200U; Dual-Channel) | |
| Radeon R5 (A10-9600P; Dual-Channel) | |
| Radeon R6 Carrizo (A10-8700P; Dual-Channel) | |
| 1366x768 High (DX11) AF:16x | |
| Iris Graphics 540 (i5-6260U; Dual-Channel) | |
| Iris Graphics 540 (i7-6560U; Dual-Channel) | |
| Radeon R8 M445DX (Dual Graphics) | |
| HD Graphics 520 (i5-6200U; Dual-Channel) | |
| Radeon R7 M440 (dediziert) | |
| Radeon R5 (A10-9600P; Dual-Channel) | |
| Radeon R6 Carrizo (A10-8700P; Dual-Channel) | |
| Dirt Rally | |
| 1024x768 Ultra Low Preset | |
| Iris Graphics 540 (i5-6260U; Dual-Channel) | |
| Iris Graphics 540 (i7-6560U; Dual-Channel) | |
| Radeon R8 M445DX (Dual Graphics) | |
| Radeon R7 M440 (dediziert) | |
| Radeon R6 Carrizo (A10-8700P; Dual-Channel) | |
| HD Graphics 520 (i5-6200U; Single-Channel) | |
| Radeon R5 (A10-9600P; Dual-Channel) | |
| 1366x768 Medium Preset | |
| Iris Graphics 540 (i5-6260U; Dual-Channel) | |
| Radeon R7 M440 (dediziert) | |
| Radeon R8 M445DX (Dual Graphics) | |
| Iris Graphics 540 (i7-6560U; Dual-Channel) | |
| Radeon R6 Carrizo (A10-8700P; Dual-Channel) | |
| Radeon R5 (A10-9600P; Dual-Channel) | |
| HD Graphics 520 (i5-6200U; Single-Channel) | |
| 1920x1080 High Preset | |
| Radeon R8 M445DX (Dual Graphics) | |
| Radeon R7 M440 (dediziert) | |
| Iris Graphics 540 (i5-6260U; Dual-Channel) | |
| Iris Graphics 540 (i7-6560U; Dual-Channel) | |
| Radeon R5 (A10-9600P; Dual-Channel) | |
| Radeon R6 Carrizo (A10-8700P; Dual-Channel) | |
| HD Graphics 520 (i5-6200U; Single-Channel) | |
| The Witcher 3 | |
| 1024x768 Low Graphics & Postprocessing | |
| Radeon R8 M445DX (Dual Graphics) | |
| Radeon R7 M440 (dediziert) | |
| Radeon R5 (A10-9600P; Dual-Channel) | |
| Iris Graphics 540 (i5-6260U; Dual-Channel) | |
| Iris Graphics 540 (i7-6560U; Dual-Channel) | |
| Radeon R6 Carrizo (A10-8700P; Dual-Channel) | |
| HD Graphics 520 (i5-6200U; Dual-Channel) | |
| 1366x768 Medium Graphics & Postprocessing | |
| Radeon R8 M445DX (Dual Graphics) | |
| Radeon R7 M440 (dediziert) | |
| Iris Graphics 540 (i5-6260U; Dual-Channel) | |
| Iris Graphics 540 (i7-6560U; Dual-Channel) | |
| Radeon R5 (A10-9600P; Dual-Channel) | |
| Radeon R6 Carrizo (A10-8700P; Dual-Channel) | |
| HD Graphics 520 (i5-6200U; Dual-Channel) | |
| 1920x1080 High Graphics & Postprocessing (Nvidia HairWorks Off) | |
| Radeon R8 M445DX (Dual Graphics) | |
| Radeon R7 M440 (dediziert) | |
| Radeon R5 (A10-9600P; Dual-Channel) | |
| Radeon R6 Carrizo (A10-8700P; Dual-Channel) | |
| Iris Graphics 540 (i7-6560U; Dual-Channel) | |
| Mad Max | |
| 1366x768 Normal Preset AF:2x | |
| Iris Graphics 540 (i5-6260U; Dual-Channel) | |
| Iris Graphics 540 (i7-6560U; Dual-Channel) | |
| Radeon R7 M440 (dediziert) | |
| Radeon R8 M445DX (Dual Graphics) | |
| HD Graphics 520 (i5-6200U; Dual-Channel) | |
| Radeon R5 (A10-9600P; Dual-Channel) | |
| 1920x1080 High Preset AF:6x | |
| Iris Graphics 540 (i5-6260U; Dual-Channel) | |
| Iris Graphics 540 (i7-6560U; Dual-Channel) | |
| Radeon R7 M440 (dediziert) | |
| Radeon R8 M445DX (Dual Graphics) | |
| HD Graphics 520 (i5-6200U; Dual-Channel) | |
| Radeon R5 (A10-9600P; Dual-Channel) | |
| World of Warships | |
| 1366x768 Low Preset AF:Trilinear | |
| Iris Graphics 540 (i5-6260U; Dual-Channel) | |
| Radeon R8 M445DX (Dual Graphics) | |
| Radeon R7 M440 (dediziert) | |
| HD Graphics 520 (i5-6200U; Single-Channel) | |
| Radeon R5 (A10-9600P; Dual-Channel) | |
| 1366x768 Medium Preset AF:Trilinear | |
| Iris Graphics 540 (i5-6260U; Dual-Channel) | |
| Radeon R7 M440 (dediziert) | |
| Radeon R8 M445DX (Dual Graphics) | |
| HD Graphics 520 (i5-6200U; Single-Channel) | |
| Radeon R5 (A10-9600P; Dual-Channel) | |
| 1920x1080 High Preset AF:8x | |
| Iris Graphics 540 (i5-6260U; Dual-Channel) | |
| Radeon R8 M445DX (Dual Graphics) | |
| Radeon R7 M440 (dediziert) | |
| Radeon R5 (A10-9600P; Dual-Channel) | |
| HD Graphics 520 (i5-6200U; Single-Channel) | |
| Fallout 4 | |
| 1280x720 Low Preset AA:FX | |
| Radeon R7 M440 (dediziert) | |
| Radeon R8 M445DX (Dual Graphics) | |
| Radeon R5 (A10-9600P; Dual-Channel) | |
| HD Graphics 520 (i5-6200U; Single-Channel) | |
| 1366x768 Medium Preset AA:T AF:16x | |
| Radeon R8 M445DX (Dual Graphics) | |
| Radeon R7 M440 (dediziert) | |
| Radeon R5 (A10-9600P; Dual-Channel) | |
| HD Graphics 520 (i5-6200U; Single-Channel) | |
| 1920x1080 High Preset AA:T AF:16x | |
| Radeon R8 M445DX (Dual Graphics) | |
| Radeon R7 M440 (dediziert) | |
| Radeon R5 (A10-9600P; Dual-Channel) | |
| Star Wars Battlefront | |
| 1024x768 Low Preset | |
| Iris Graphics 540 (i7-6560U; Dual-Channel) | |
| Radeon R8 M445DX (Dual Graphics) | |
| HD Graphics 520 (i7-6600U; Single-Channel) | |
| Radeon R7 M440 (dediziert) | |
| Radeon R5 (A10-9600P; Dual-Channel) | |
| 1366x768 Medium Preset AA:FX | |
| Radeon R8 M445DX (Dual Graphics) | |
| Iris Graphics 540 (i7-6560U; Dual-Channel) | |
| Radeon R7 M440 (dediziert) | |
| HD Graphics 520 (i7-6600U; Single-Channel) | |
| Radeon R5 (A10-9600P; Dual-Channel) | |
| 1920x1080 High Preset AA:FX | |
| Radeon R8 M445DX (Dual Graphics) | |
| Radeon R7 M440 (dediziert) | |
| Radeon R5 (A10-9600P; Dual-Channel) | |
| Iris Graphics 540 (i7-6560U; Dual-Channel) | |
| Just Cause 3 | |
| 1024x768 Low / Off AF:2x | |
| Iris Graphics 540 (i5-6260U; Dual-Channel) | |
| Radeon R7 M440 (dediziert) | |
| HD Graphics 520 (i7-6500U; Dual-Channel) | |
| Radeon R8 M445DX (Dual Graphics) | |
| Radeon R5 (A10-9600P; Dual-Channel) | |
| 1366x768 Medium / Off AF:4x | |
| Iris Graphics 540 (i5-6260U; Dual-Channel) | |
| Radeon R7 M440 (dediziert) | |
| Radeon R8 M445DX (Dual Graphics) | |
| HD Graphics 520 (i7-6500U; Dual-Channel) | |
| Radeon R5 (A10-9600P; Dual-Channel) | |
| 1920x1080 High / On AA:FX AF:8x | |
| Iris Graphics 540 (i5-6260U; Dual-Channel) | |
| Radeon R7 M440 (dediziert) | |
| Radeon R8 M445DX (Dual Graphics) | |
| Radeon R5 (A10-9600P; Dual-Channel) | |
| HD Graphics 520 (i7-6500U; Dual-Channel) | |
| Rise of the Tomb Raider | |
| 1024x768 Lowest Preset | |
| Iris Graphics 540 (i5-6260U; Dual-Channel) | |
| Radeon R7 M440 (dediziert) | |
| Iris Graphics 540 (i7-6560U; Dual-Channel) | |
| Radeon R5 (A10-9600P; Dual-Channel) | |
| HD Graphics 520 (i7-6600U; Dual-Channel) | |
| 1366x768 Medium Preset AF:2x | |
| Iris Graphics 540 (i5-6260U; Dual-Channel) | |
| Radeon R7 M440 (dediziert) | |
| Radeon R5 (A10-9600P; Dual-Channel) | |
| HD Graphics 520 (i7-6600U; Dual-Channel) | |
| Iris Graphics 540 (i7-6560U; Dual-Channel) | |
| 1920x1080 High Preset AA:FX AF:4x | |
| Radeon R8 M445DX (Dual Graphics) | |
| Radeon R7 M440 (dediziert) | |
| Radeon R5 (A10-9600P; Dual-Channel) | |
| HD Graphics 520 (i7-6600U; Dual-Channel) | |
| Iris Graphics 540 (i7-6560U; Dual-Channel) | |
| low | med. | high | ultra | |
|---|---|---|---|---|
| Diablo III (2012) | 50.7 | 36.6 | 32.9 | 23.6 |
| Crysis 3 (2013) | 25.6 | 20.5 | 11.5 | 4.2 |
| BioShock Infinite (2013) | 66.1 | 40.5 | 32.1 | 10.2 |
| Metro: Last Light (2013) | 26.5 | 18.2 | 12.4 | 6.9 |
| Battlefield 4 (2013) | 35.8 | 24.3 | 18.2 | 7 |
| Sims 4 (2014) | 99.6 | 35.4 | 19.4 | 15.8 |
| Dirt Rally (2015) | 65.3 | 20.6 | 13.1 | |
| The Witcher 3 (2015) | 20.2 | 11 | 5.9 | |
| Mad Max (2015) | 19 | 9.4 | ||
| World of Warships (2015) | 41.2 | 29.1 | 16.9 | 14 |
| Fallout 4 (2015) | 22.1 | 15.2 | 6.5 | |
| Star Wars Battlefront (2015) | 22.9 | 12.7 | 7.8 | |
| Just Cause 3 (2015) | 13.3 | 12.4 | 8.3 | |
| Rise of the Tomb Raider (2016) | 20.6 | 11.2 | 6.2 |
Performance Consistency - Sustaining High CPU and GPU Loads
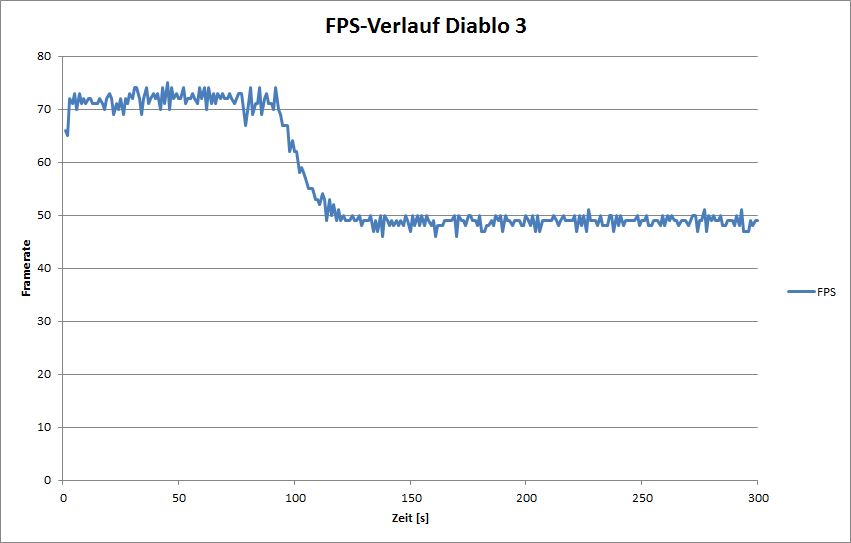
In games, the TDP limit is temporarily exceeded. However, after a maximum of two minutes (depending on the previous load and temperatures of the laptop), the 15-watt limit strikes back, dropping clock speeds. For example, in “Diablo III”, the CPU and GPU clock speeds start at 1800 and 550 MHz respectively. As the game runs, the speeds drop to 1100 to 1200 (CPU) and 380 to 420 MHz (GPU). The frame rates drop in parallel in our static gaming scene from 72 to 49 fps. To some extent, all current Intel ULV chips are also affected by this issue. The game benchmarks above reflect the long-term performance of the test model due to the length of the benchmarks and "hot" state of the laptop.
Power Consumption and Battery Life
While idling, the Pavilion 15-aw004ng runs at 5.7 to 9.3 watts, which is far lower than the Carrizo predecessor, the Pavilion 15-ab052ng (6.9 to 12.1 watts). However, the predecessor uses DDR3 memory and a traditional hard disk, which makes it unclear how much of the reduction in power consumption levels is due to the optimized APU platform. At full load, the 15-inch model consumes a max 37.6 watts, which drops to around 30 watts (typical ULV levels) when the TDP limit kicks in.
With a 41 Wh battery, the Pavilion 15 is able to run a normalized WLAN test for 3.5 hours. This is significantly better than the Carrizo model, but it falls short of similar Skylake models.
| Off / Standby | |
| Idle | |
| Load |
|
Key:
min: | |
Verdict
A little more performance, a little more battery life - AMD Bristol Ridge is a reliable successor to the Carrizo design. This places AMD closer to the Intel competition. In terms of CPU performance, we see that the A10-9600P is placed between the Intel i3 models of the 5000 series (Broadwell) and 6000 series (Skylake), as long as all 4 cores are used. The single thread performance may be a little lower, but the APU compensates by offering strong Boost speeds.
We want to praise the AMD IGP. Once again, the manufacturer steals the performance crown in the 15-watt segment. The only Intel IGP capable of surpassing the AMD competitor is the Iris Graphics 540, which is very expensive. We hope that many manufacturers will install Bristol Ridge without a dedicated graphics card and thus make good use of this strong advantage. Dual Graphics can only create a large lead over the competition in synthetic benchmarks. When running demanding applications, such as games, the setup does not offer much better performance.
In summary, Bristol Ridge revives the fluctuating power dynamic between Broadwell and Carrizo from last year - nothing more and nothing less. AMD needs a new CPU architecture to make a larger dent and this will come in 2017. Raven Ridge will be the next APU generation and uses a cutting-edge 14 nm process.
