Schenker XMG Core 15 (Tongfang GK5CP6V) Laptop Review: Budget Gamer

On the bestware.com home page of the manufacturer, the XMG Core 15 can be configured extensively in order to adjust it to your individual preferences. The graphics calculations can be handled by either a GeForce GTX 1650 or a significantly more powerful GeForce GTX 1660 Ti. The working memory ranges from 8 GB up to a maximum of 64 GB, and as the storage solution, you can choose a 2.5-inch drive and up to two M.2 SSDs. While you can also select the wireless module, the keyboard language, and the operating system, there are currently no configuration options for the display and the processor. The matte 144-Hz IPS panel is accompanied by a Core i7-9750H.
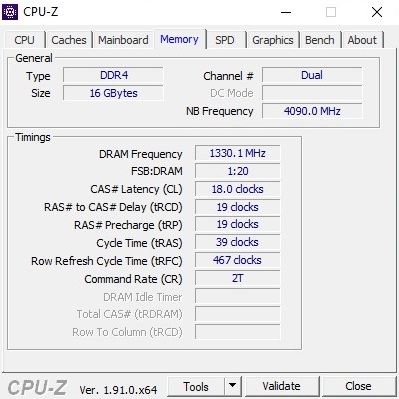
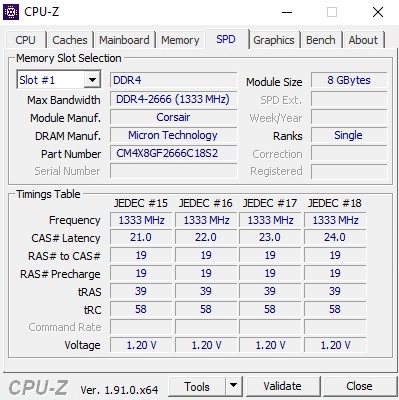
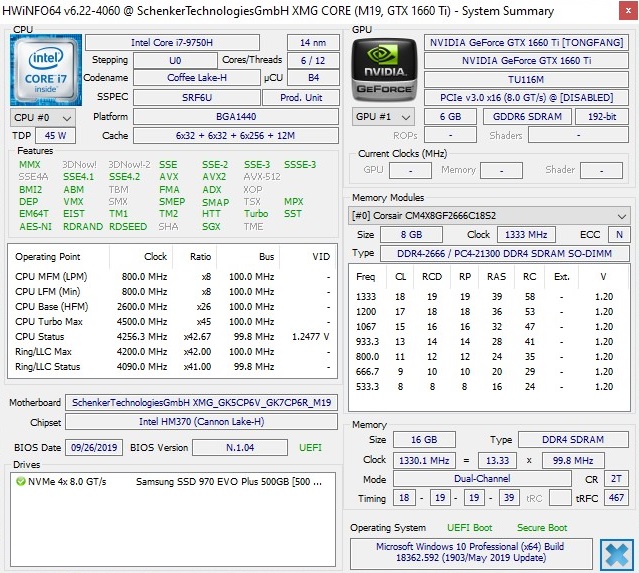
The price of the XMG Core 15 starts at 1149 Euros (~$1254). For our configuration model with a GTX 1660 Ti, 16 GB of DDR4 RAM in the dual-channel mode, and a 500-GB SSD (additional specifications in the data sheet), you would have to pay about 1500 Euros (~$1637).
The competitors of the XMG Core 15 include other 15-inch gaming notebooks based on the GTX 1660-Ti such as the Razer Blade 15, the Asus Zephyrus M GU502GU, the Aorus 15-SA, the Lenovo Legion Y540-15, and the Acer Predator Helios 300 PH315. These notebooks are also listed in our charts as comparison devices.
Rating | Date | Model | Weight | Height | Size | Resolution | Price |
|---|---|---|---|---|---|---|---|
| 81.3 % v7 (old) | 02 / 2020 | Schenker XMG Core 15 GK5CP6V i7-9750H, GeForce GTX 1660 Ti Mobile | 2 kg | 26 mm | 15.60" | 1920x1080 | |
| 84.2 % v7 (old) | 09 / 2019 | Razer Blade 15 GTX 1660 Ti i7-9750H, GeForce GTX 1660 Ti Mobile | 2.1 kg | 19.9 mm | 15.60" | 1920x1080 | |
| 82.9 % v7 (old) | 10 / 2019 | Asus ROG Zephyrus M15 GU502GU-XB74 i7-9750H, GeForce GTX 1660 Ti Mobile | 2 kg | 18.9 mm | 15.60" | 1920x1080 | |
| 85.5 % v6 (old) | 06 / 2019 | Aorus 15-SA i7-9750H, GeForce GTX 1660 Ti Mobile | 2.1 kg | 24.4 mm | 15.60" | 1920x1080 | |
| 82.3 % v7 (old) | 08 / 2019 | Lenovo Legion Y540-15IRH-81SX00B2GE i7-9750H, GeForce GTX 1660 Ti Mobile | 2.2 kg | 26 mm | 15.60" | 1920x1080 | |
| 82.1 % v7 (old) | 11 / 2019 | Acer Predator Helios 300 PH315-52-79TY i7-9750H, GeForce GTX 1660 Ti Mobile | 2.3 kg | 23.2 mm | 15.60" | 1920x1080 |
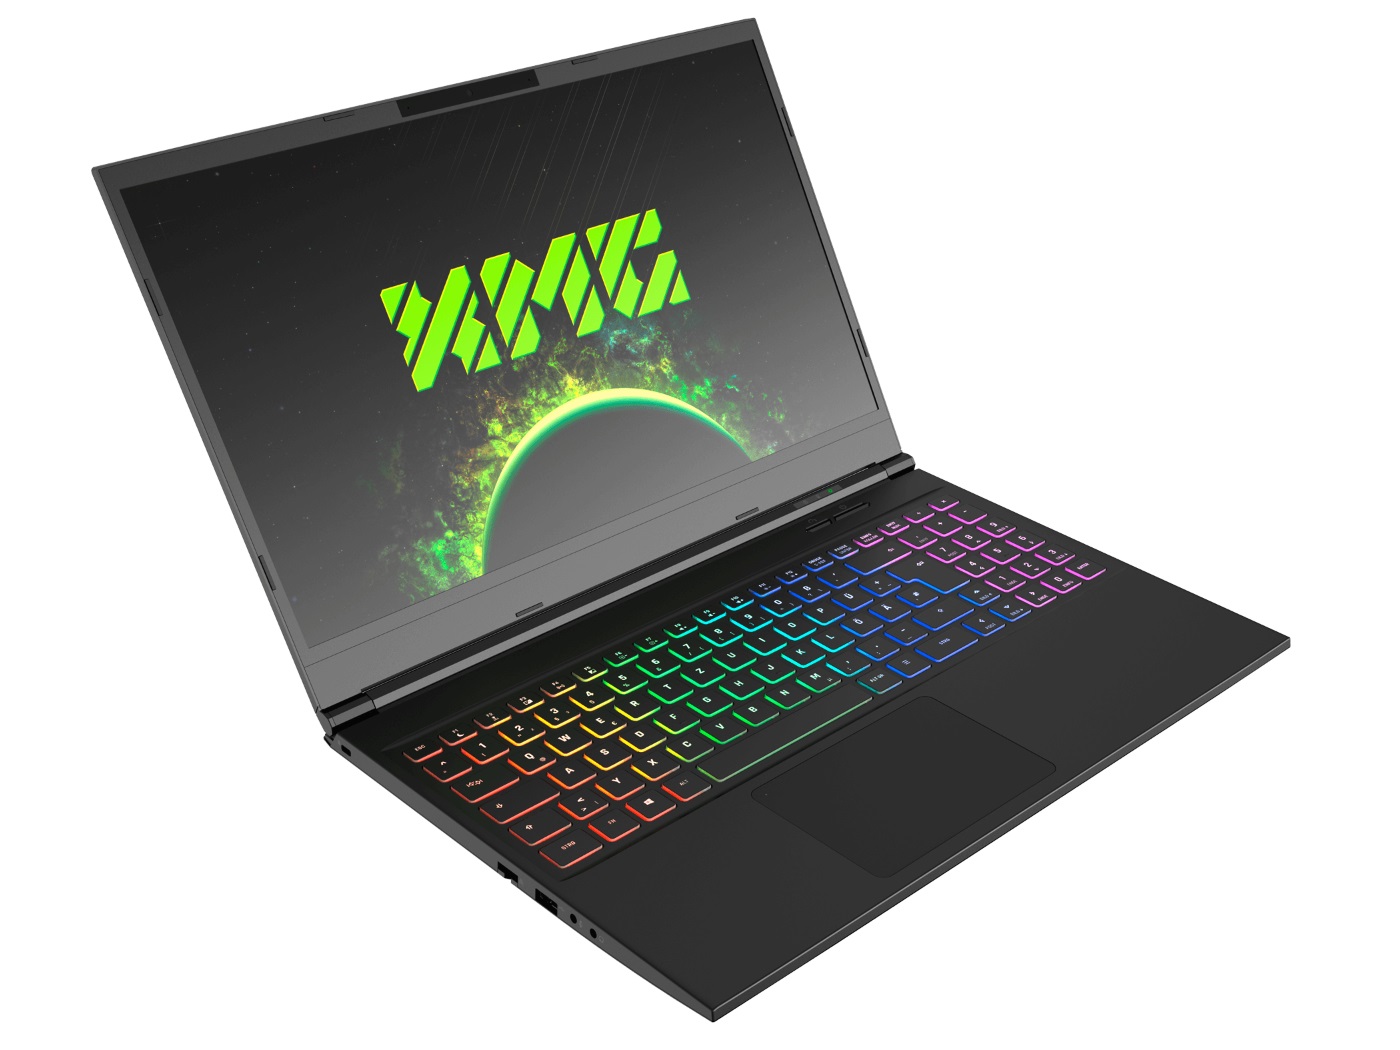
Case
The case of the Core 15 has changed a lot since our test in 2017. Following the current trend, Schenker has implemented a slim-bezel design, which also ensures significantly smaller dimensions, and instead of 38.6 x 26.2 cm (15.2 x 10.3 in), the footprint is now only 36.0 x 24.4 cm (14.2 x 9.6 in). The weight was also reduced, and barely 2 kg (~4.4 lb) are noticeably more comfortable to lug around than 2.6 kg (~5.7 lb).
In terms of quality, the case makes a decent impression. The workmanship as well as the stability offer no reason for complaints. Like in most other laptops, only the display lid could have been slightly more robust and resistant to warping. The fact that most of the case is made from plastic is no negative mark in our opinion, particularly since the look and feel of most of the surfaces (around the keys, cover) remind us of sandblasted aluminum.
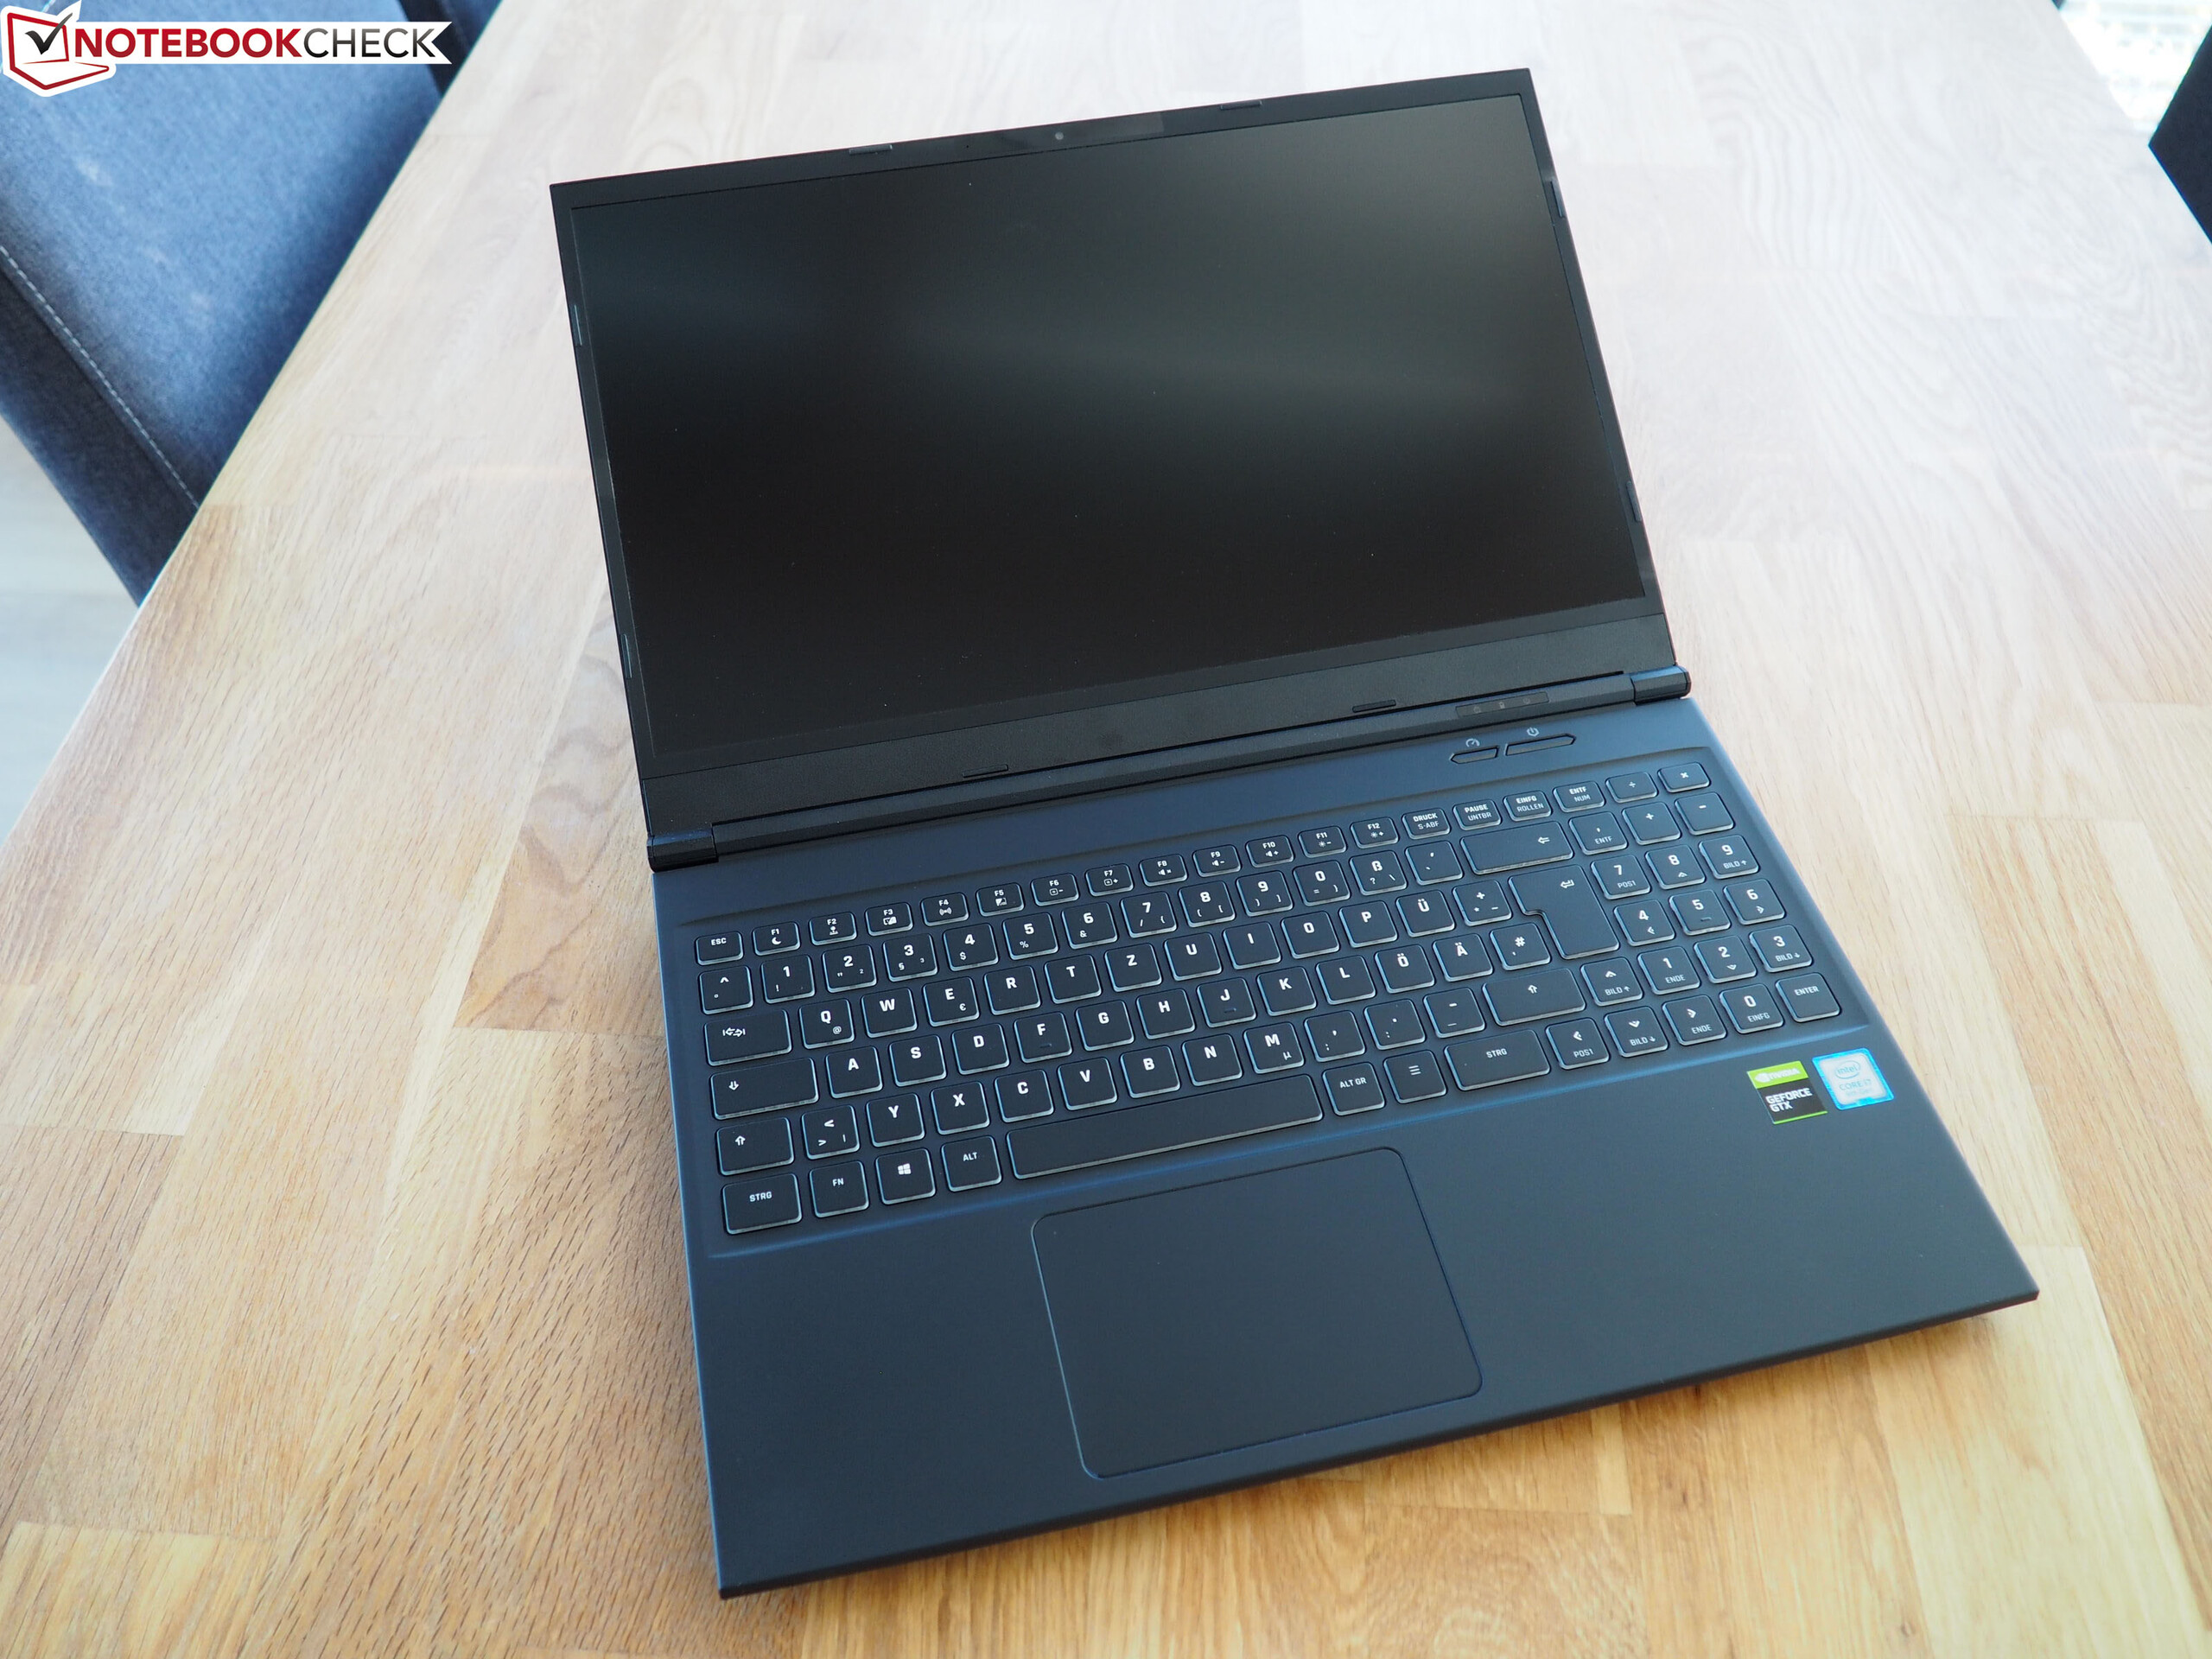
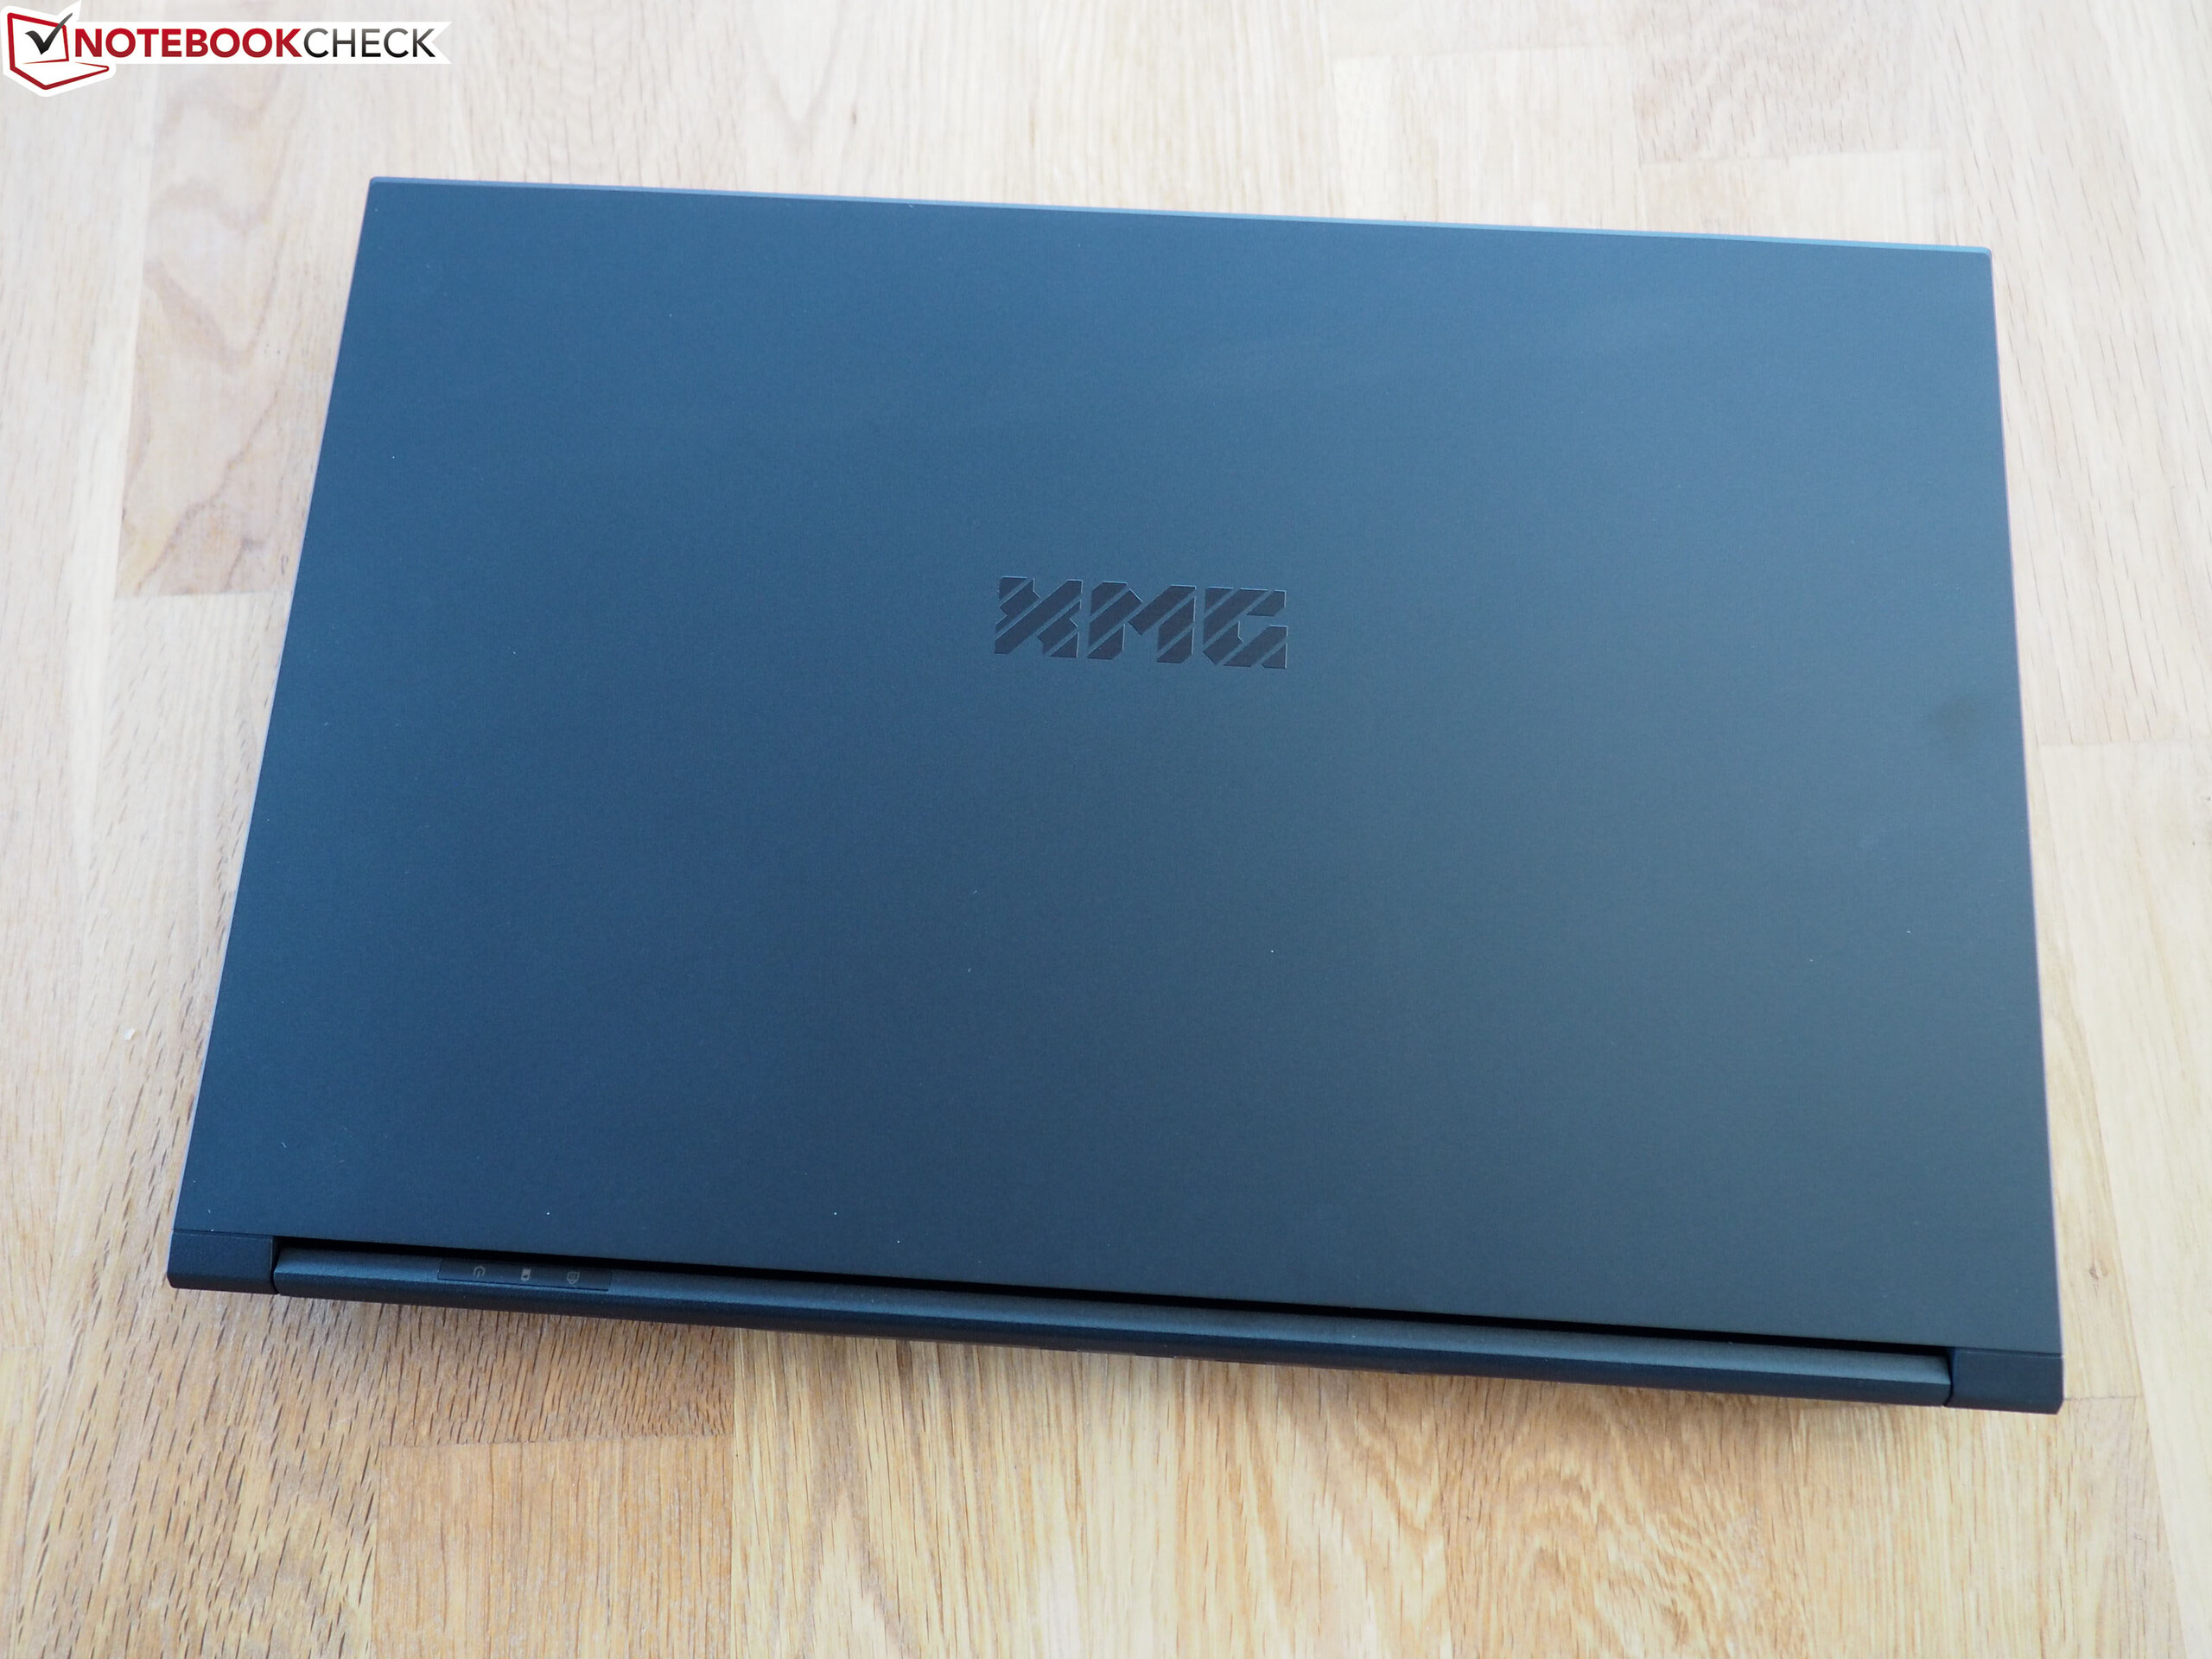
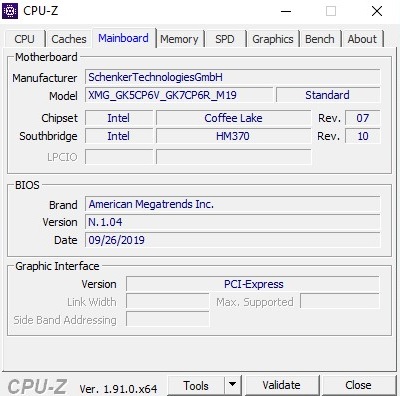
Apropos looks: as with almost all Schenker laptops, the design of the Core 15 is fairly subdued and without frills. The hinges could still need some improvements by the manufacturer: even though the lid can be opened with one hand, the base unit then also moves quite a bit. By the way, the Core 15 is based on the GK5CP6V Barebone from Tongfang.
Equipment
Connections
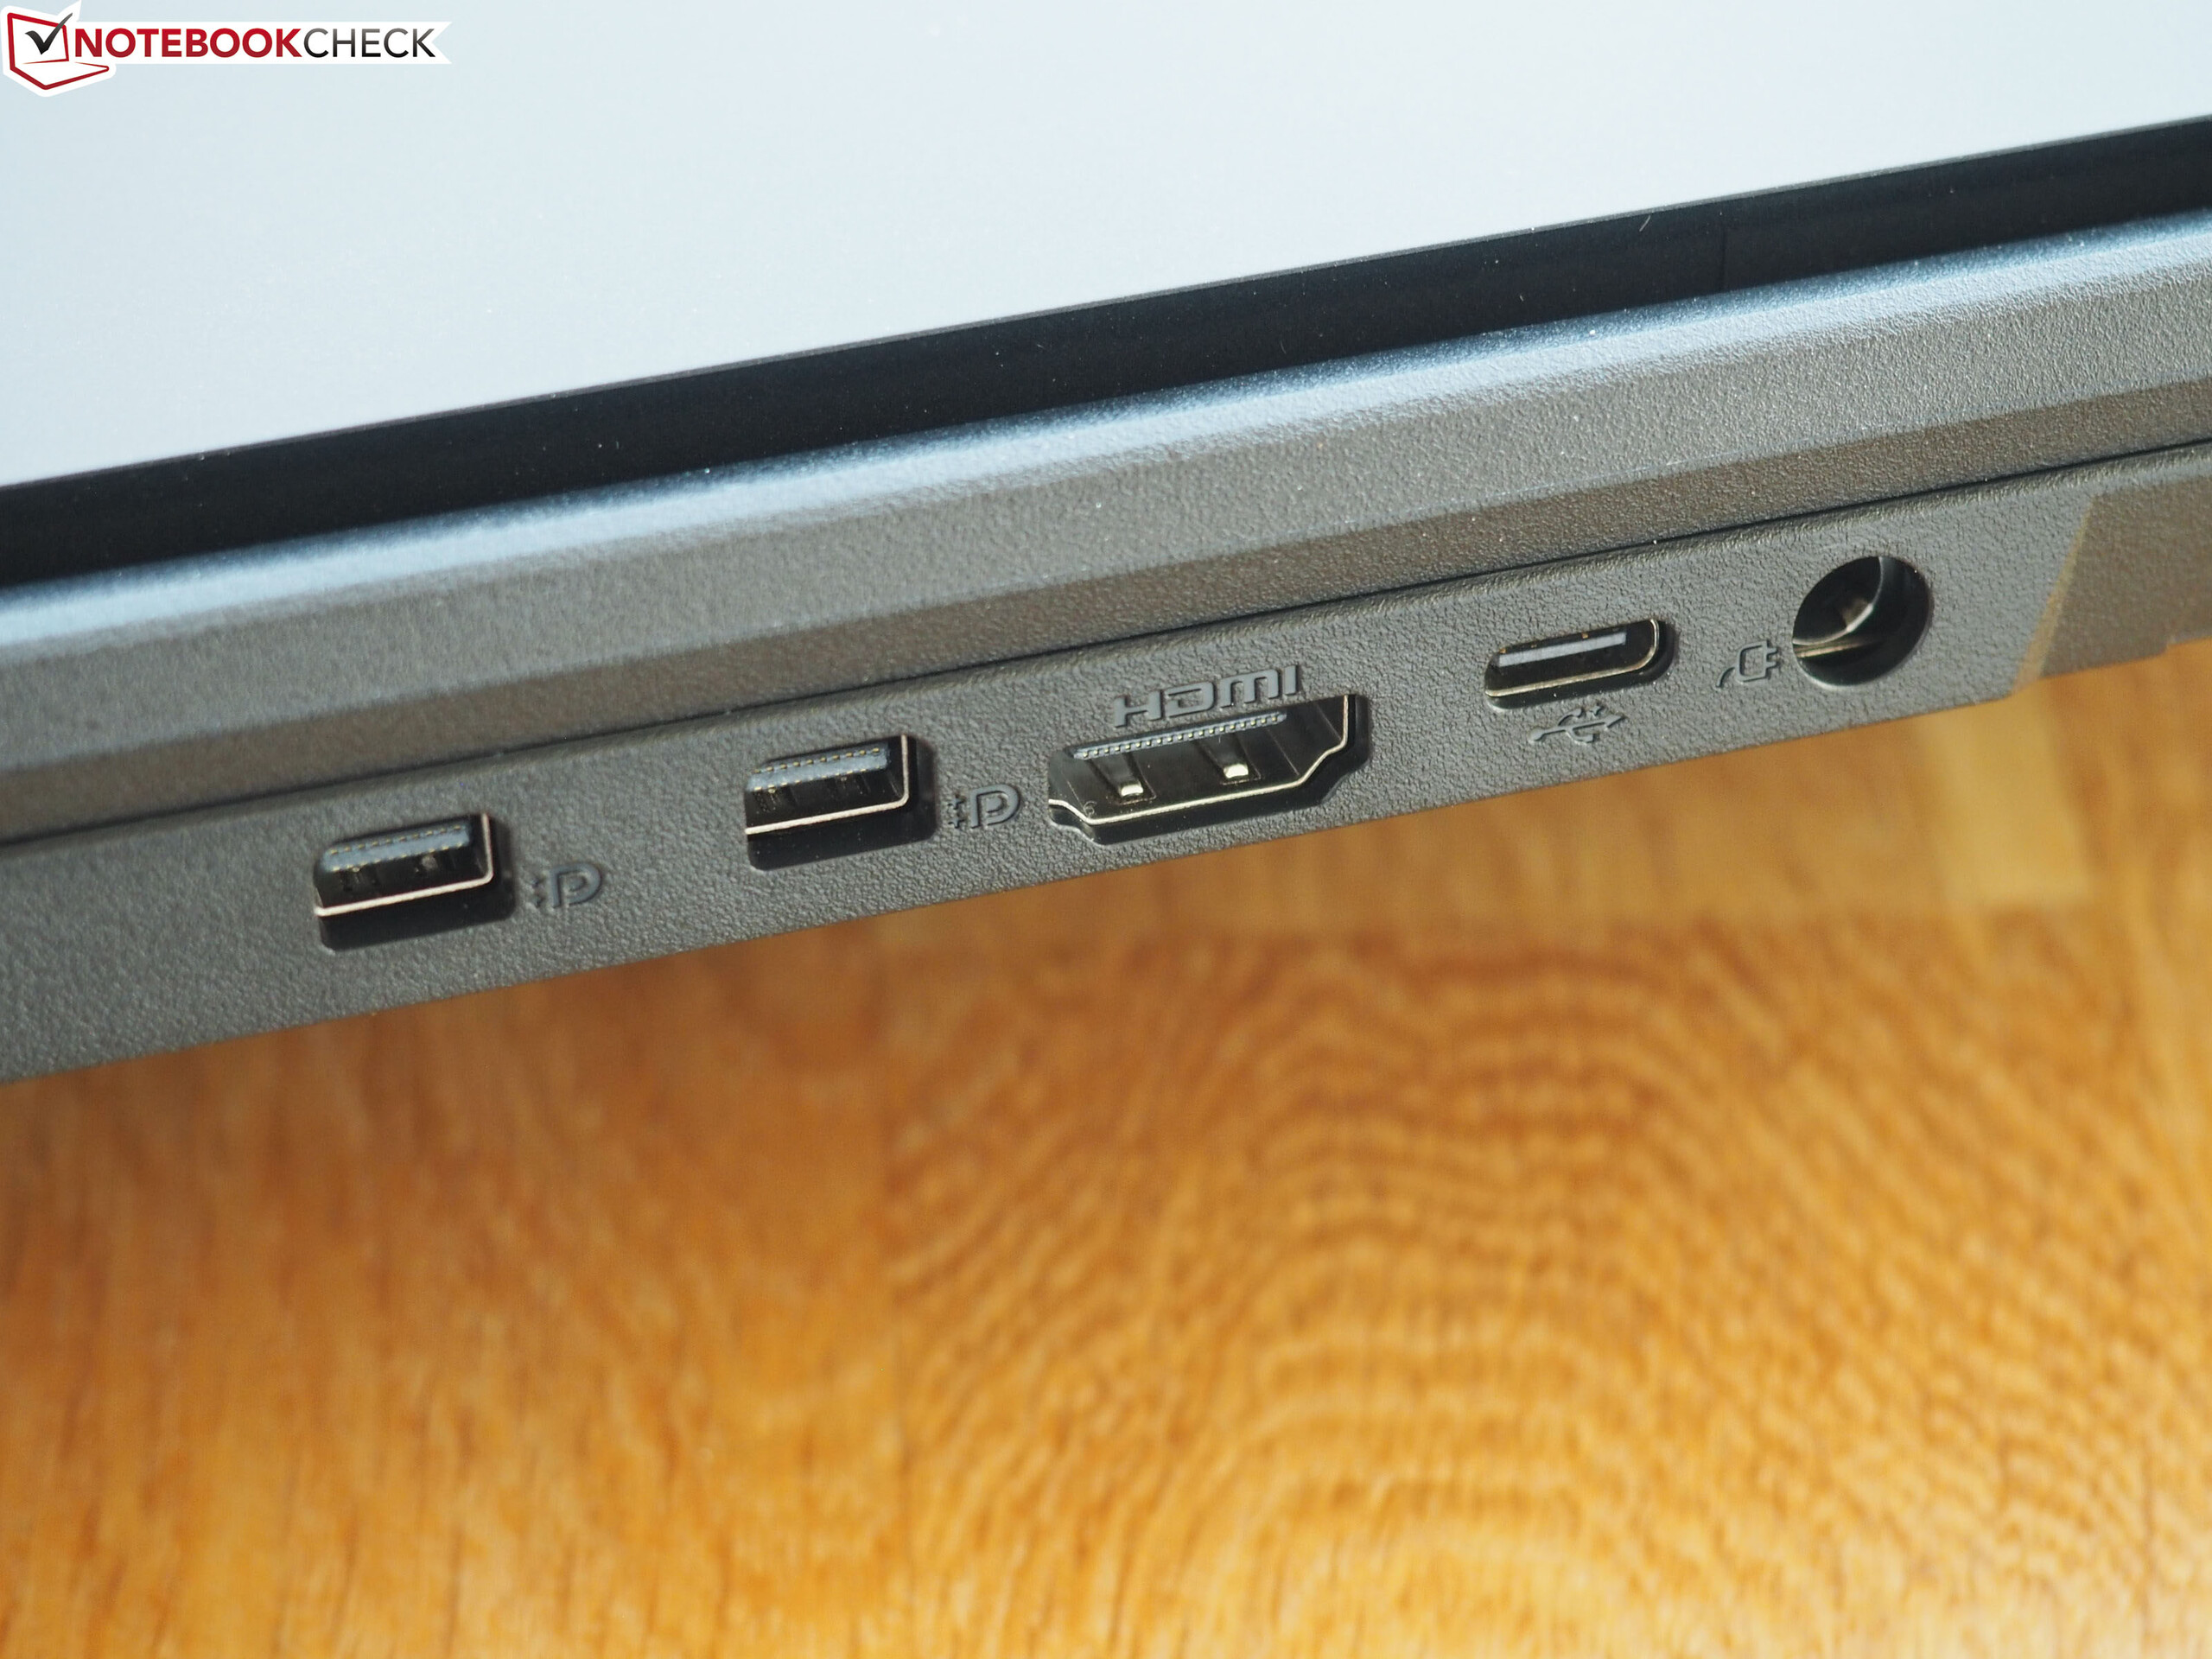
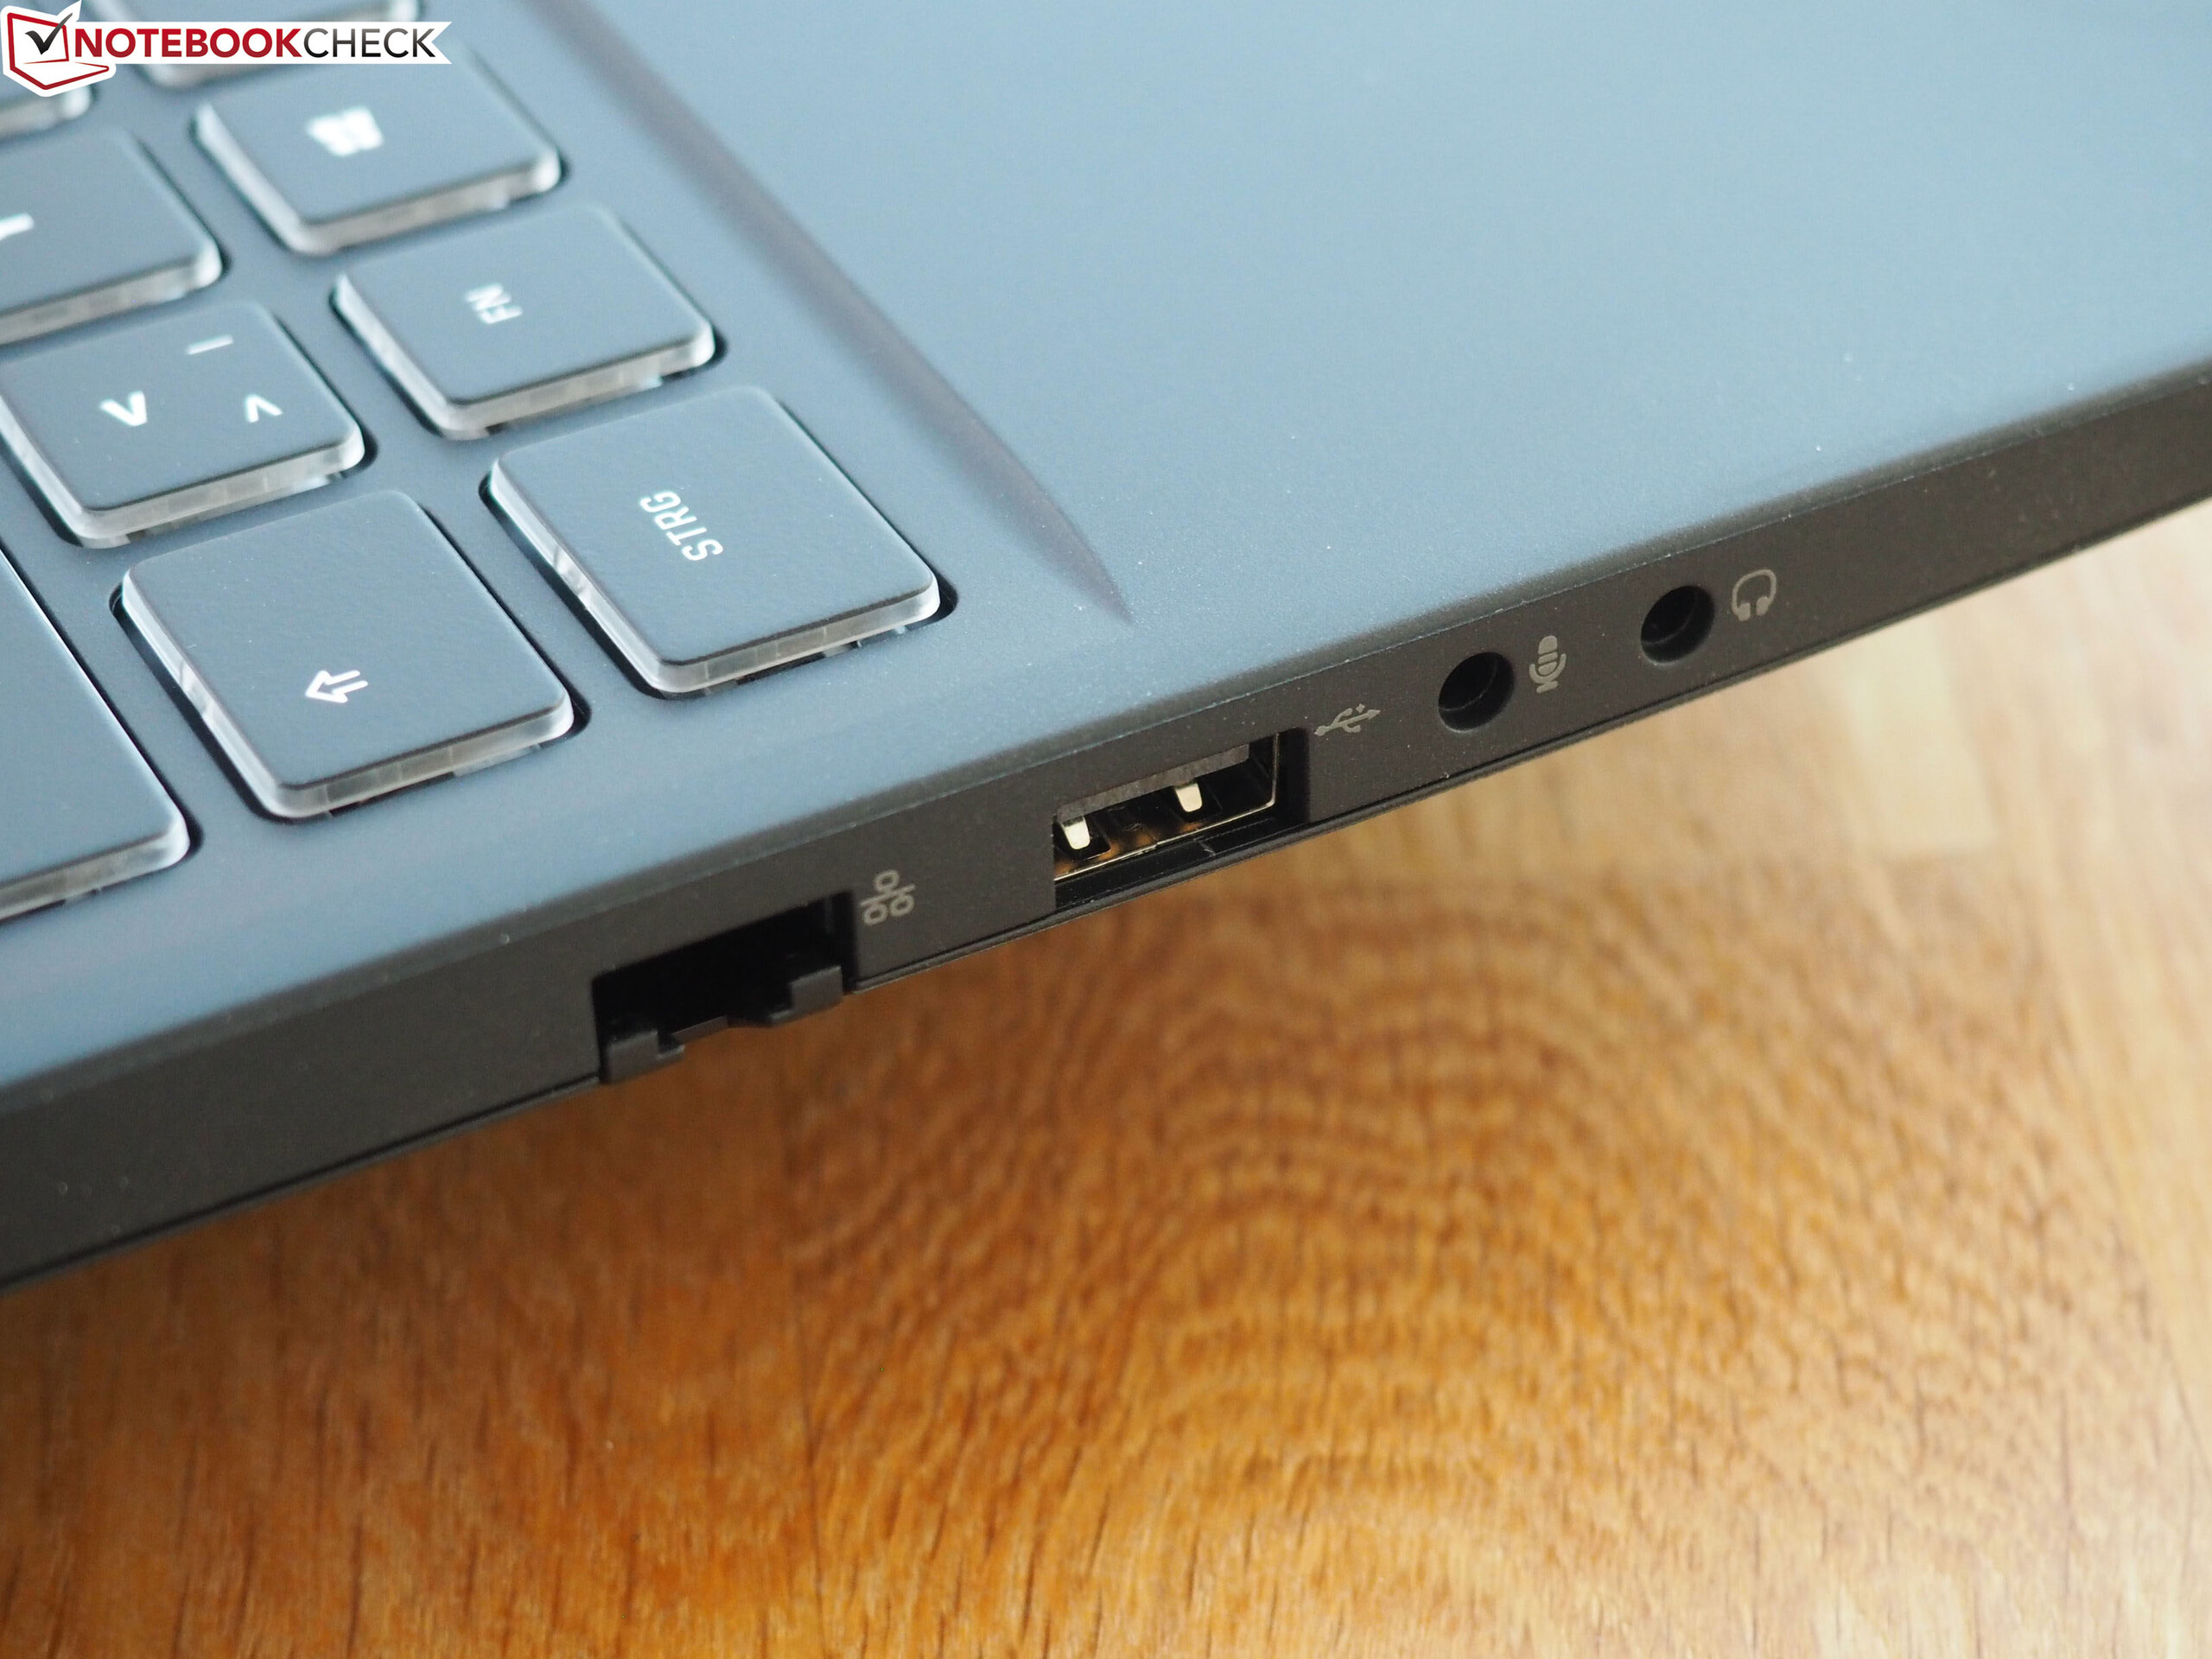
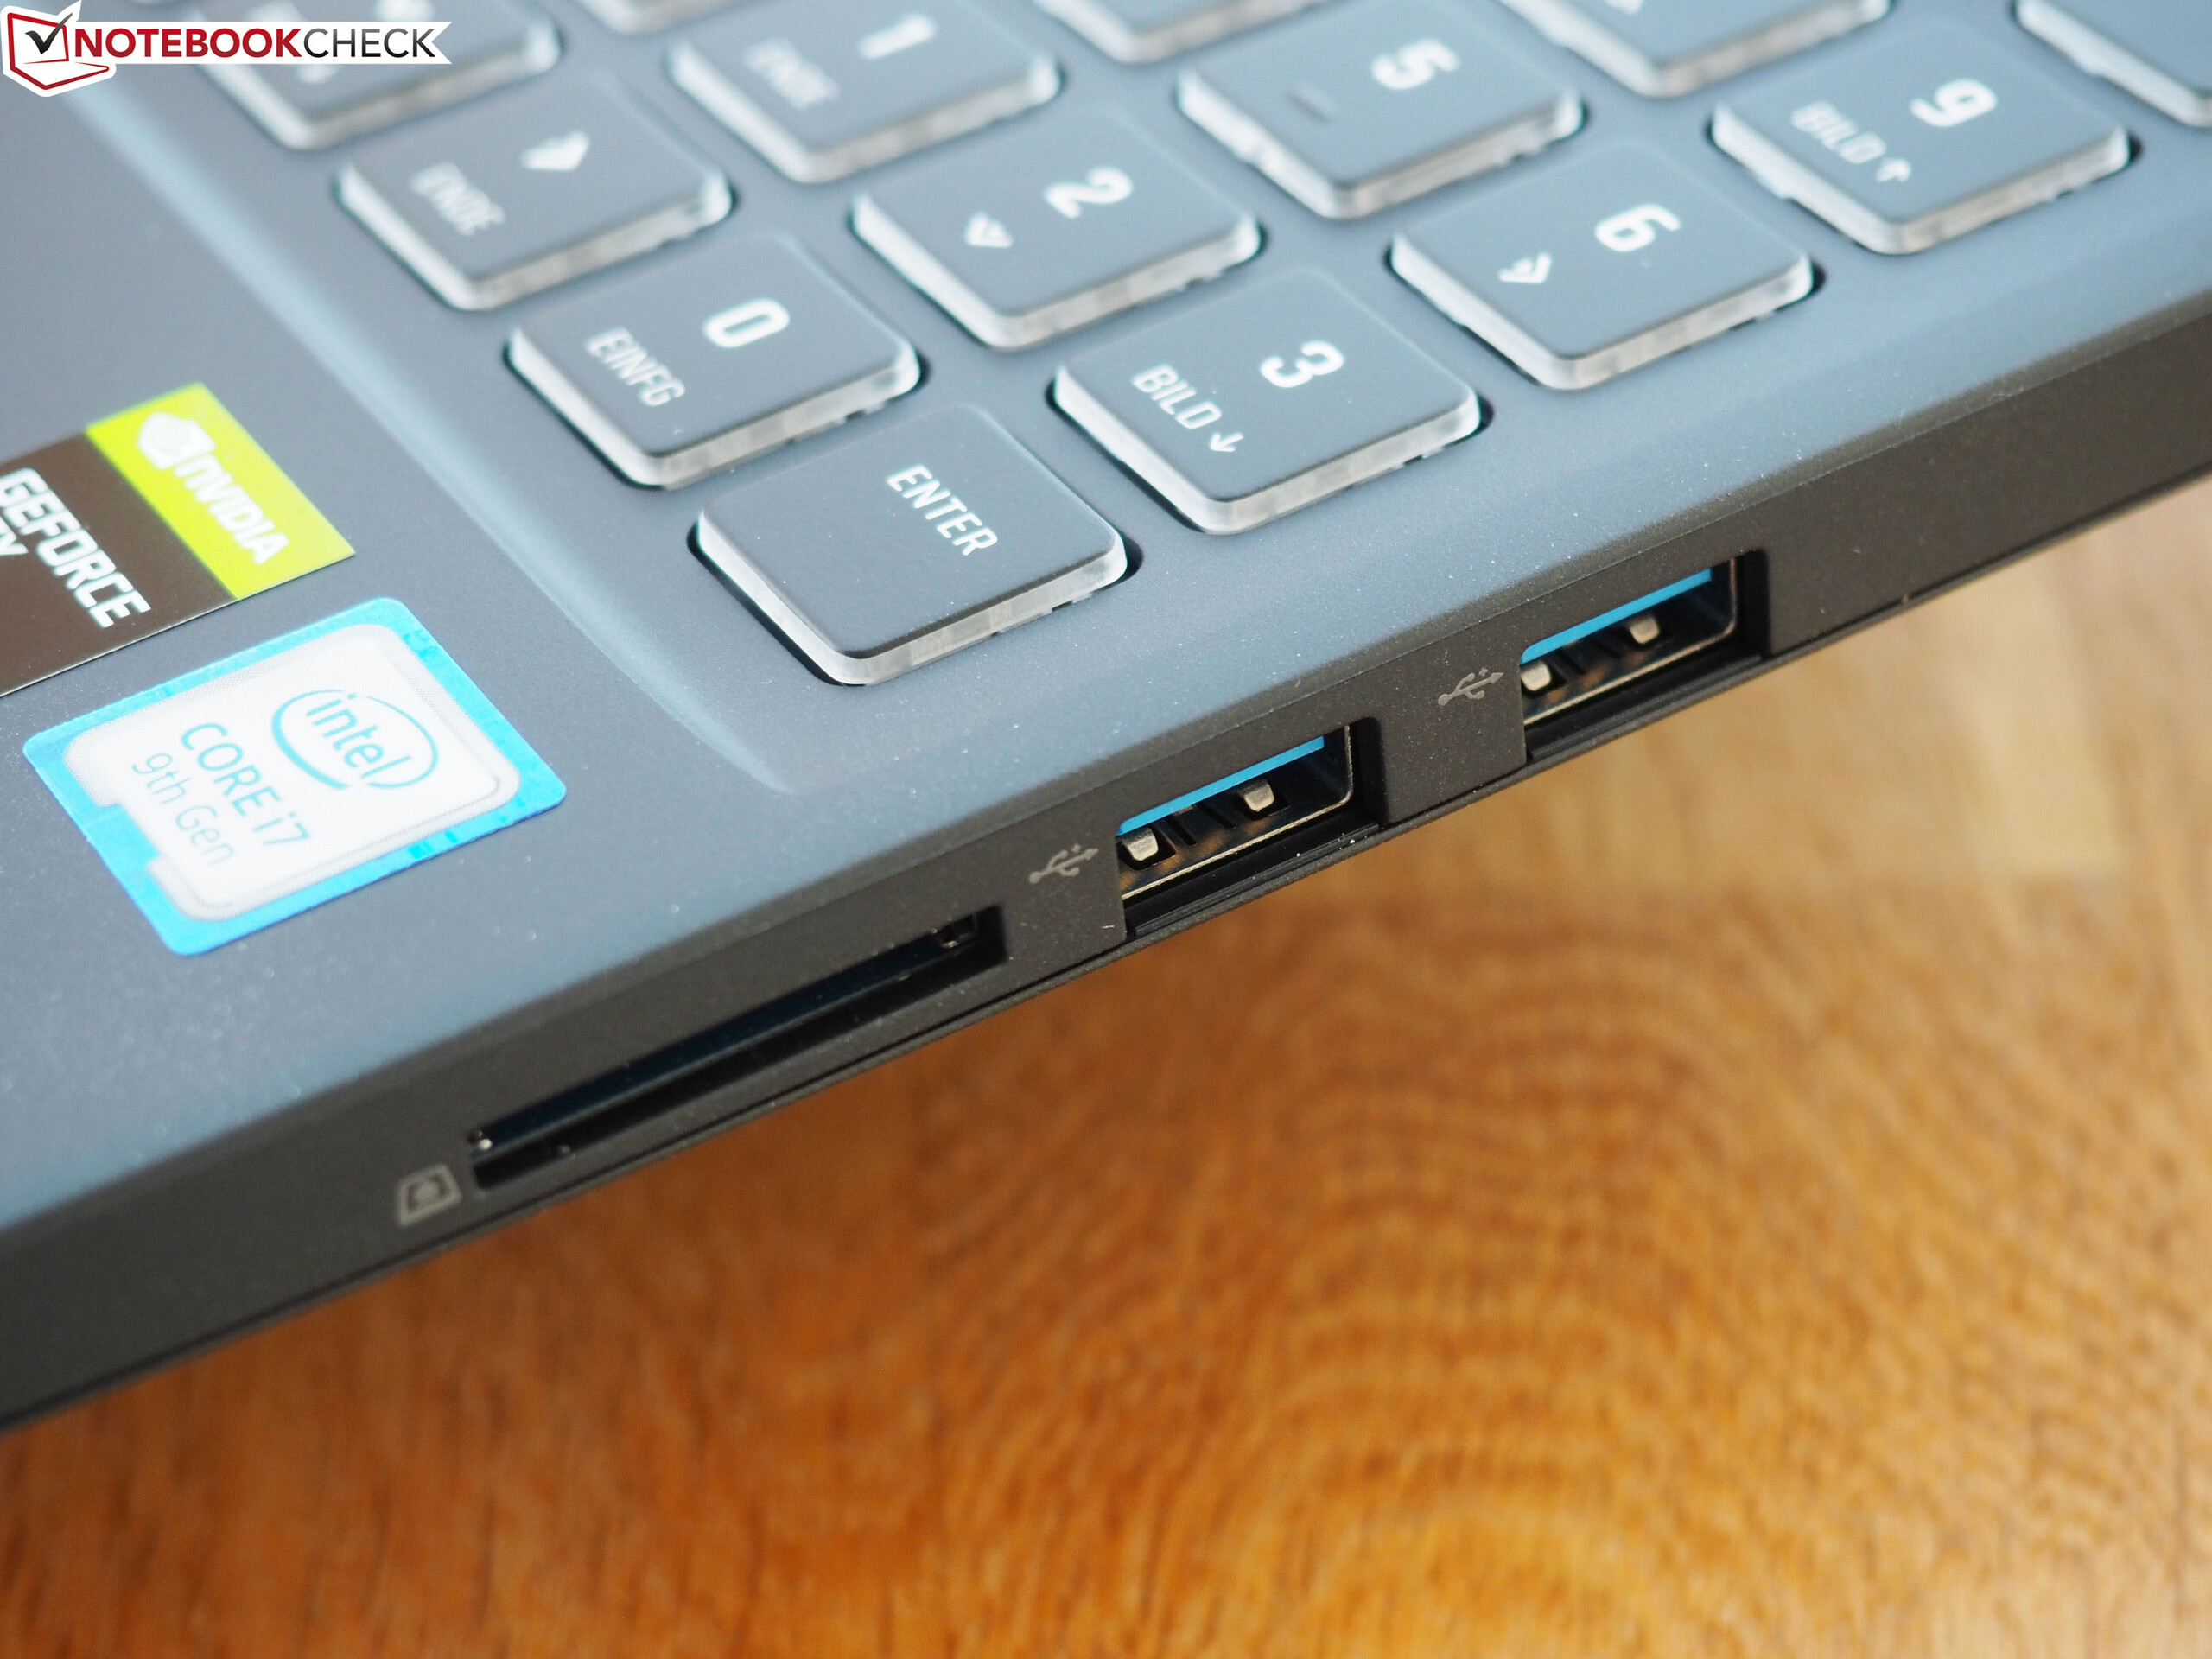
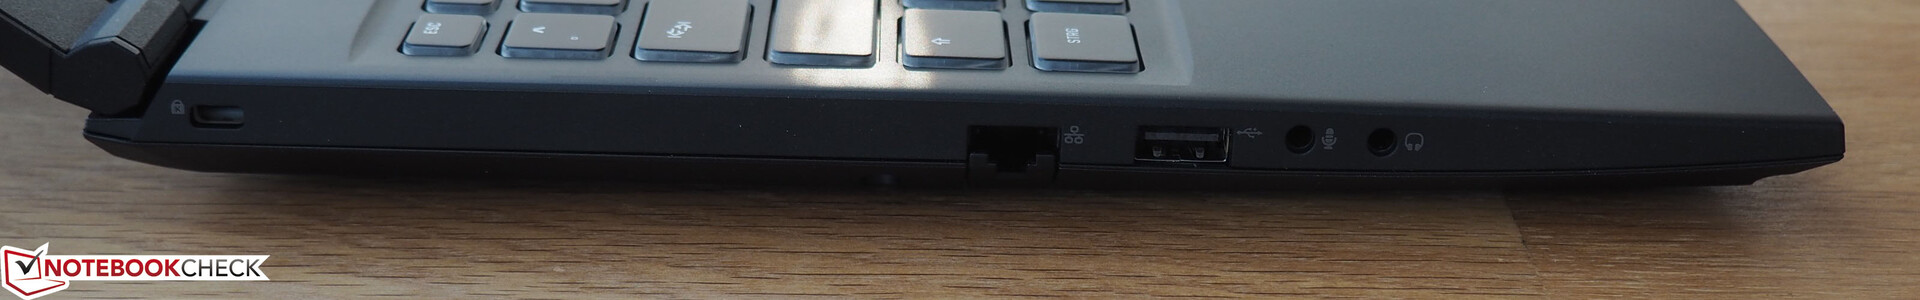
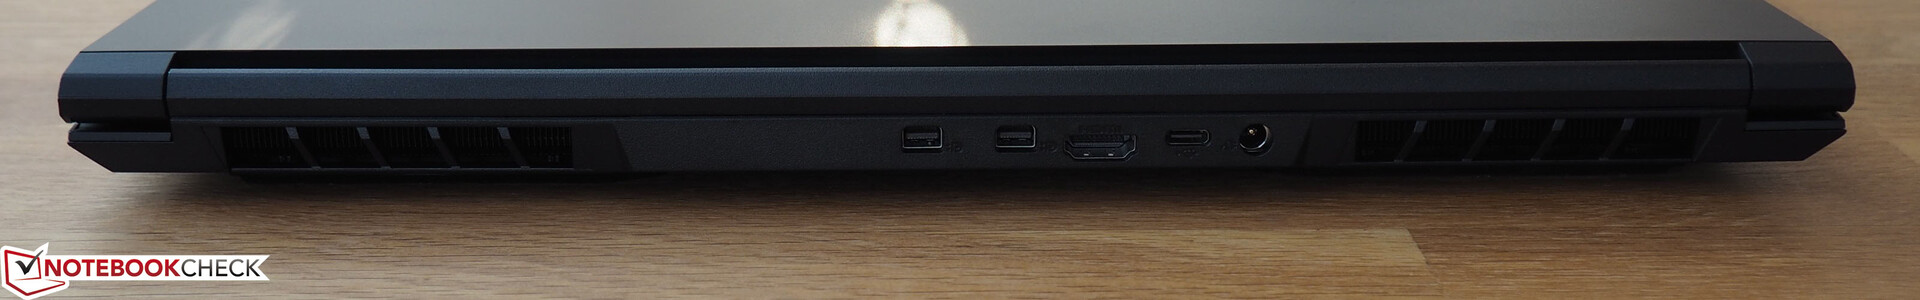
Those users who do not need Thunderbolt 3 or the latest USB technology should be happy with the connection equipment. In contrast to some other gaming laptops from the thin-and-light category, the 15-incher offers a card reader and a RJ45 port. Those are accompanied by an opening for a Kensington Lock, two audio connections, one USB 2.0 port, and the USB 3.0 ports (1x Type C + 2x Type A). External displays can be connected to the HDMI 2.0 port and/or the two Mini DisplayPorts.
The placement of the connections leaves some mixed feelings. Since the ports on the side are placed fairly close toward the front, you can run into some space problems and cable collisions when using a mouse.
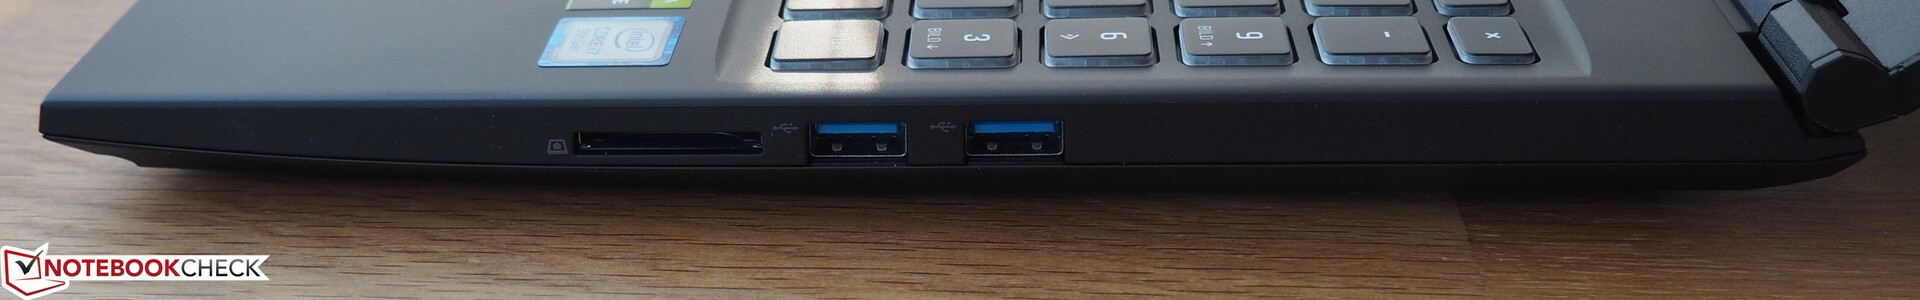
SD Card Reader
You should not expect a fast SD card reader in the Core 15. Between 20 and 30 MB/s are very meager and only correspond to the USB 2.0 level. Theoretically, our Toshiba reference card should be able to reach up to 260 MB/s.
| SD Card Reader | |
| average JPG Copy Test (av. of 3 runs) | |
| Average of class Gaming (20.9 - 210, n=54, last 2 years) | |
| Schenker XMG Core 15 GK5CP6V (Toshiba Exceria Pro SDXC 64 GB UHS-II) | |
| maximum AS SSD Seq Read Test (1GB) | |
| Average of class Gaming (25.5 - 261, n=51, last 2 years) | |
| Schenker XMG Core 15 GK5CP6V (Toshiba Exceria Pro SDXC 64 GB UHS-II) | |
Communication
On the other hand, the WLAN is not slow at all. In ideal conditions, the wireless module of our test configuration (Intel Wireless-AC 9560) is able to crack the 1000-Mbit mark when sending as well as receiving data. Note: Due to our recently changed test setup (ax router instead of ac-router), the results from the competitors are not really comparable.
Webcam
Accessories
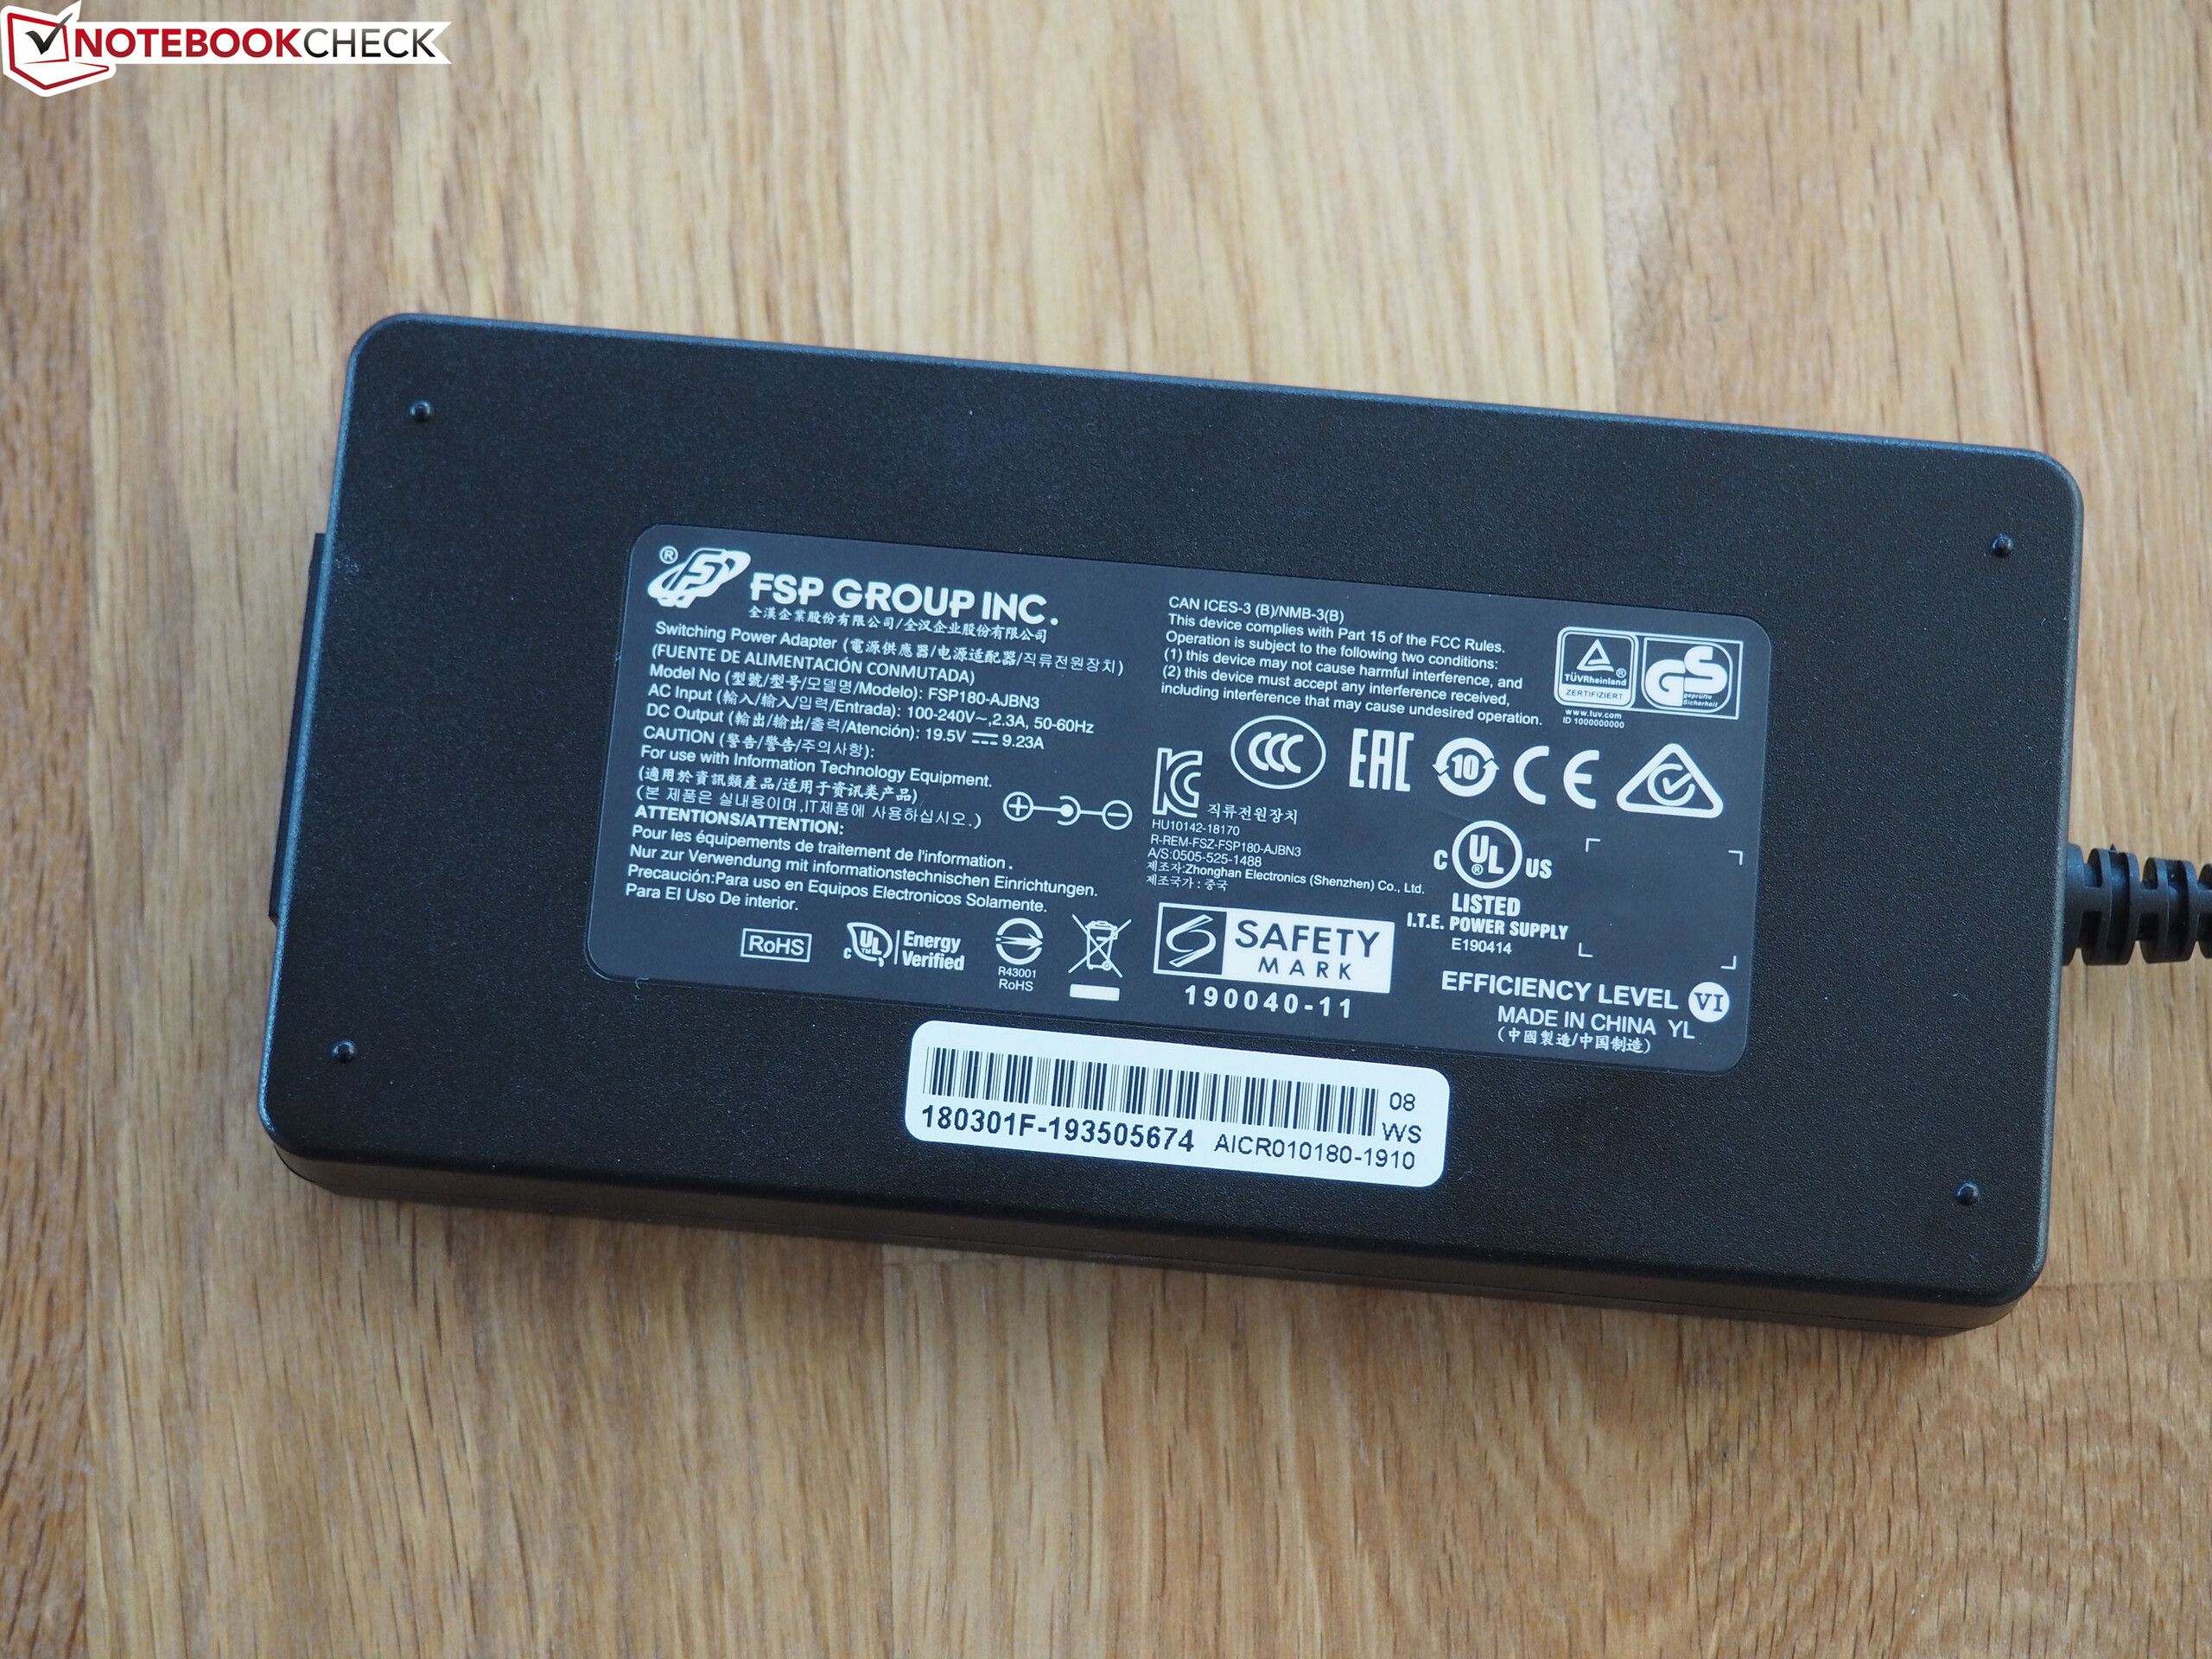
Not only does Schenker include a 420-gram (~14.8 oz), light, 180-Watt power supply (120 Watt @GTX 1650) with the notebook, but also a mouse pad, screws for the 2.5-inch slot, and a USB stick with software and drivers. Additional accessories such as bags are available on the home page.
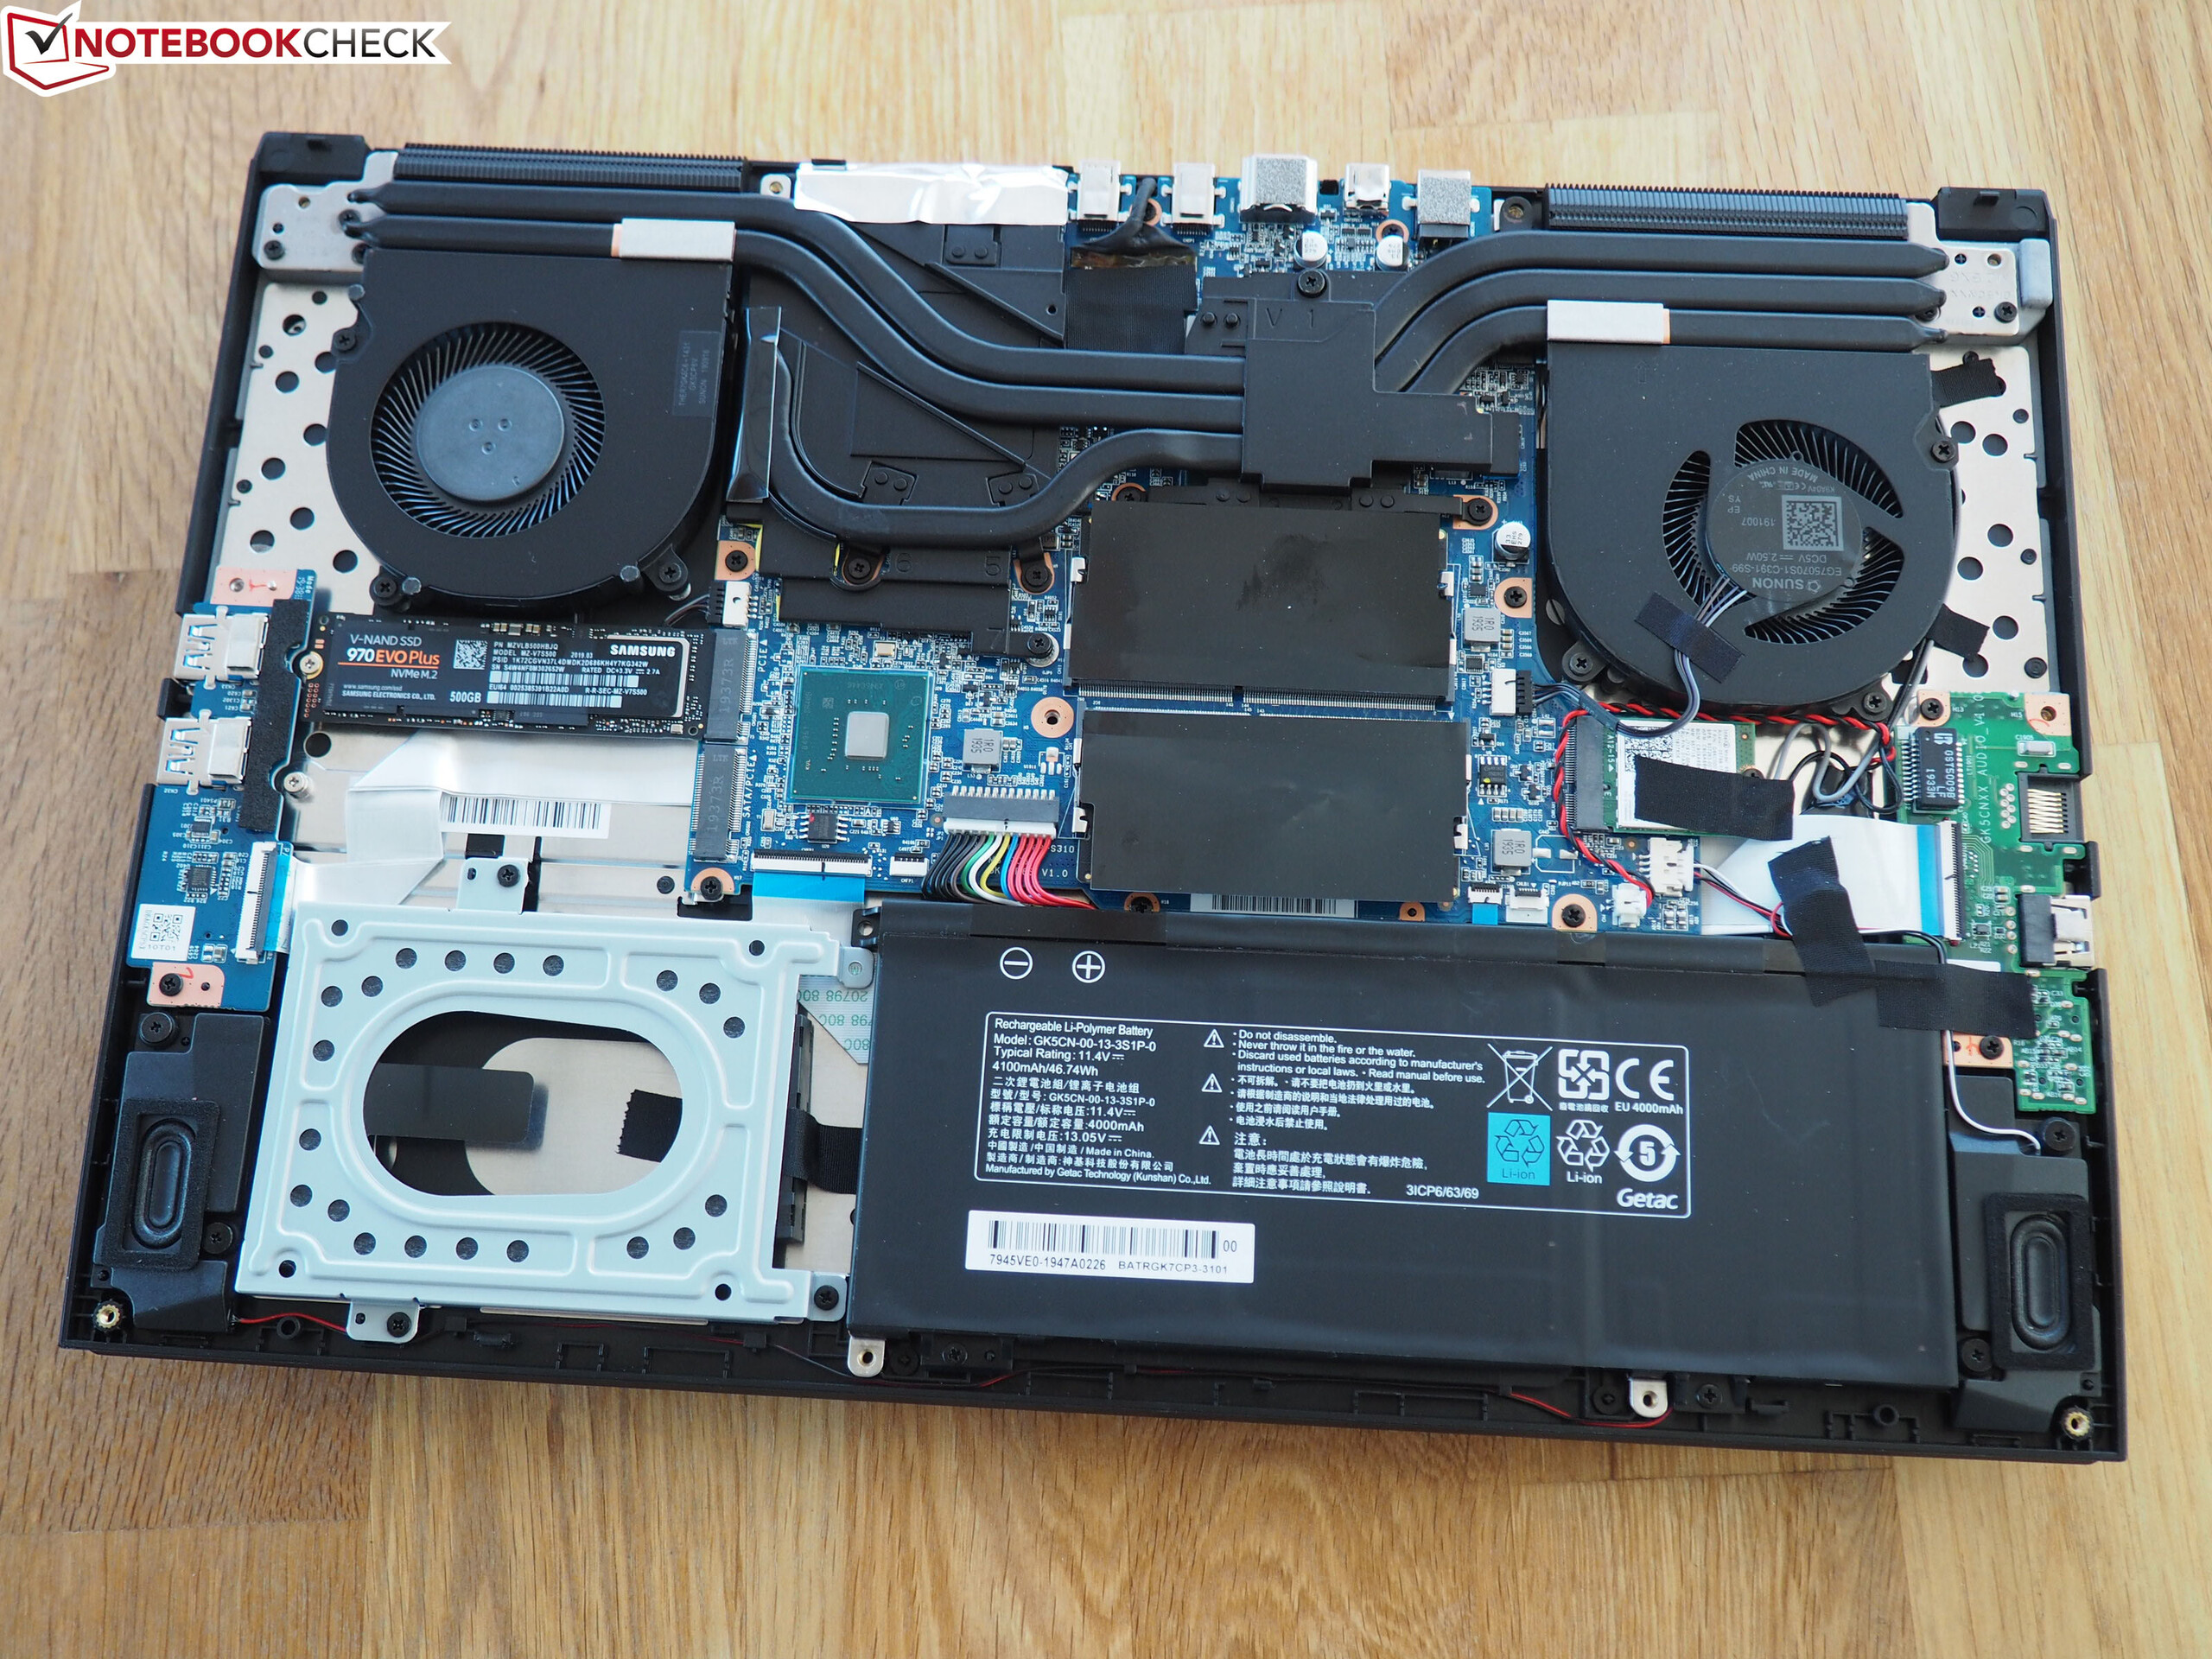
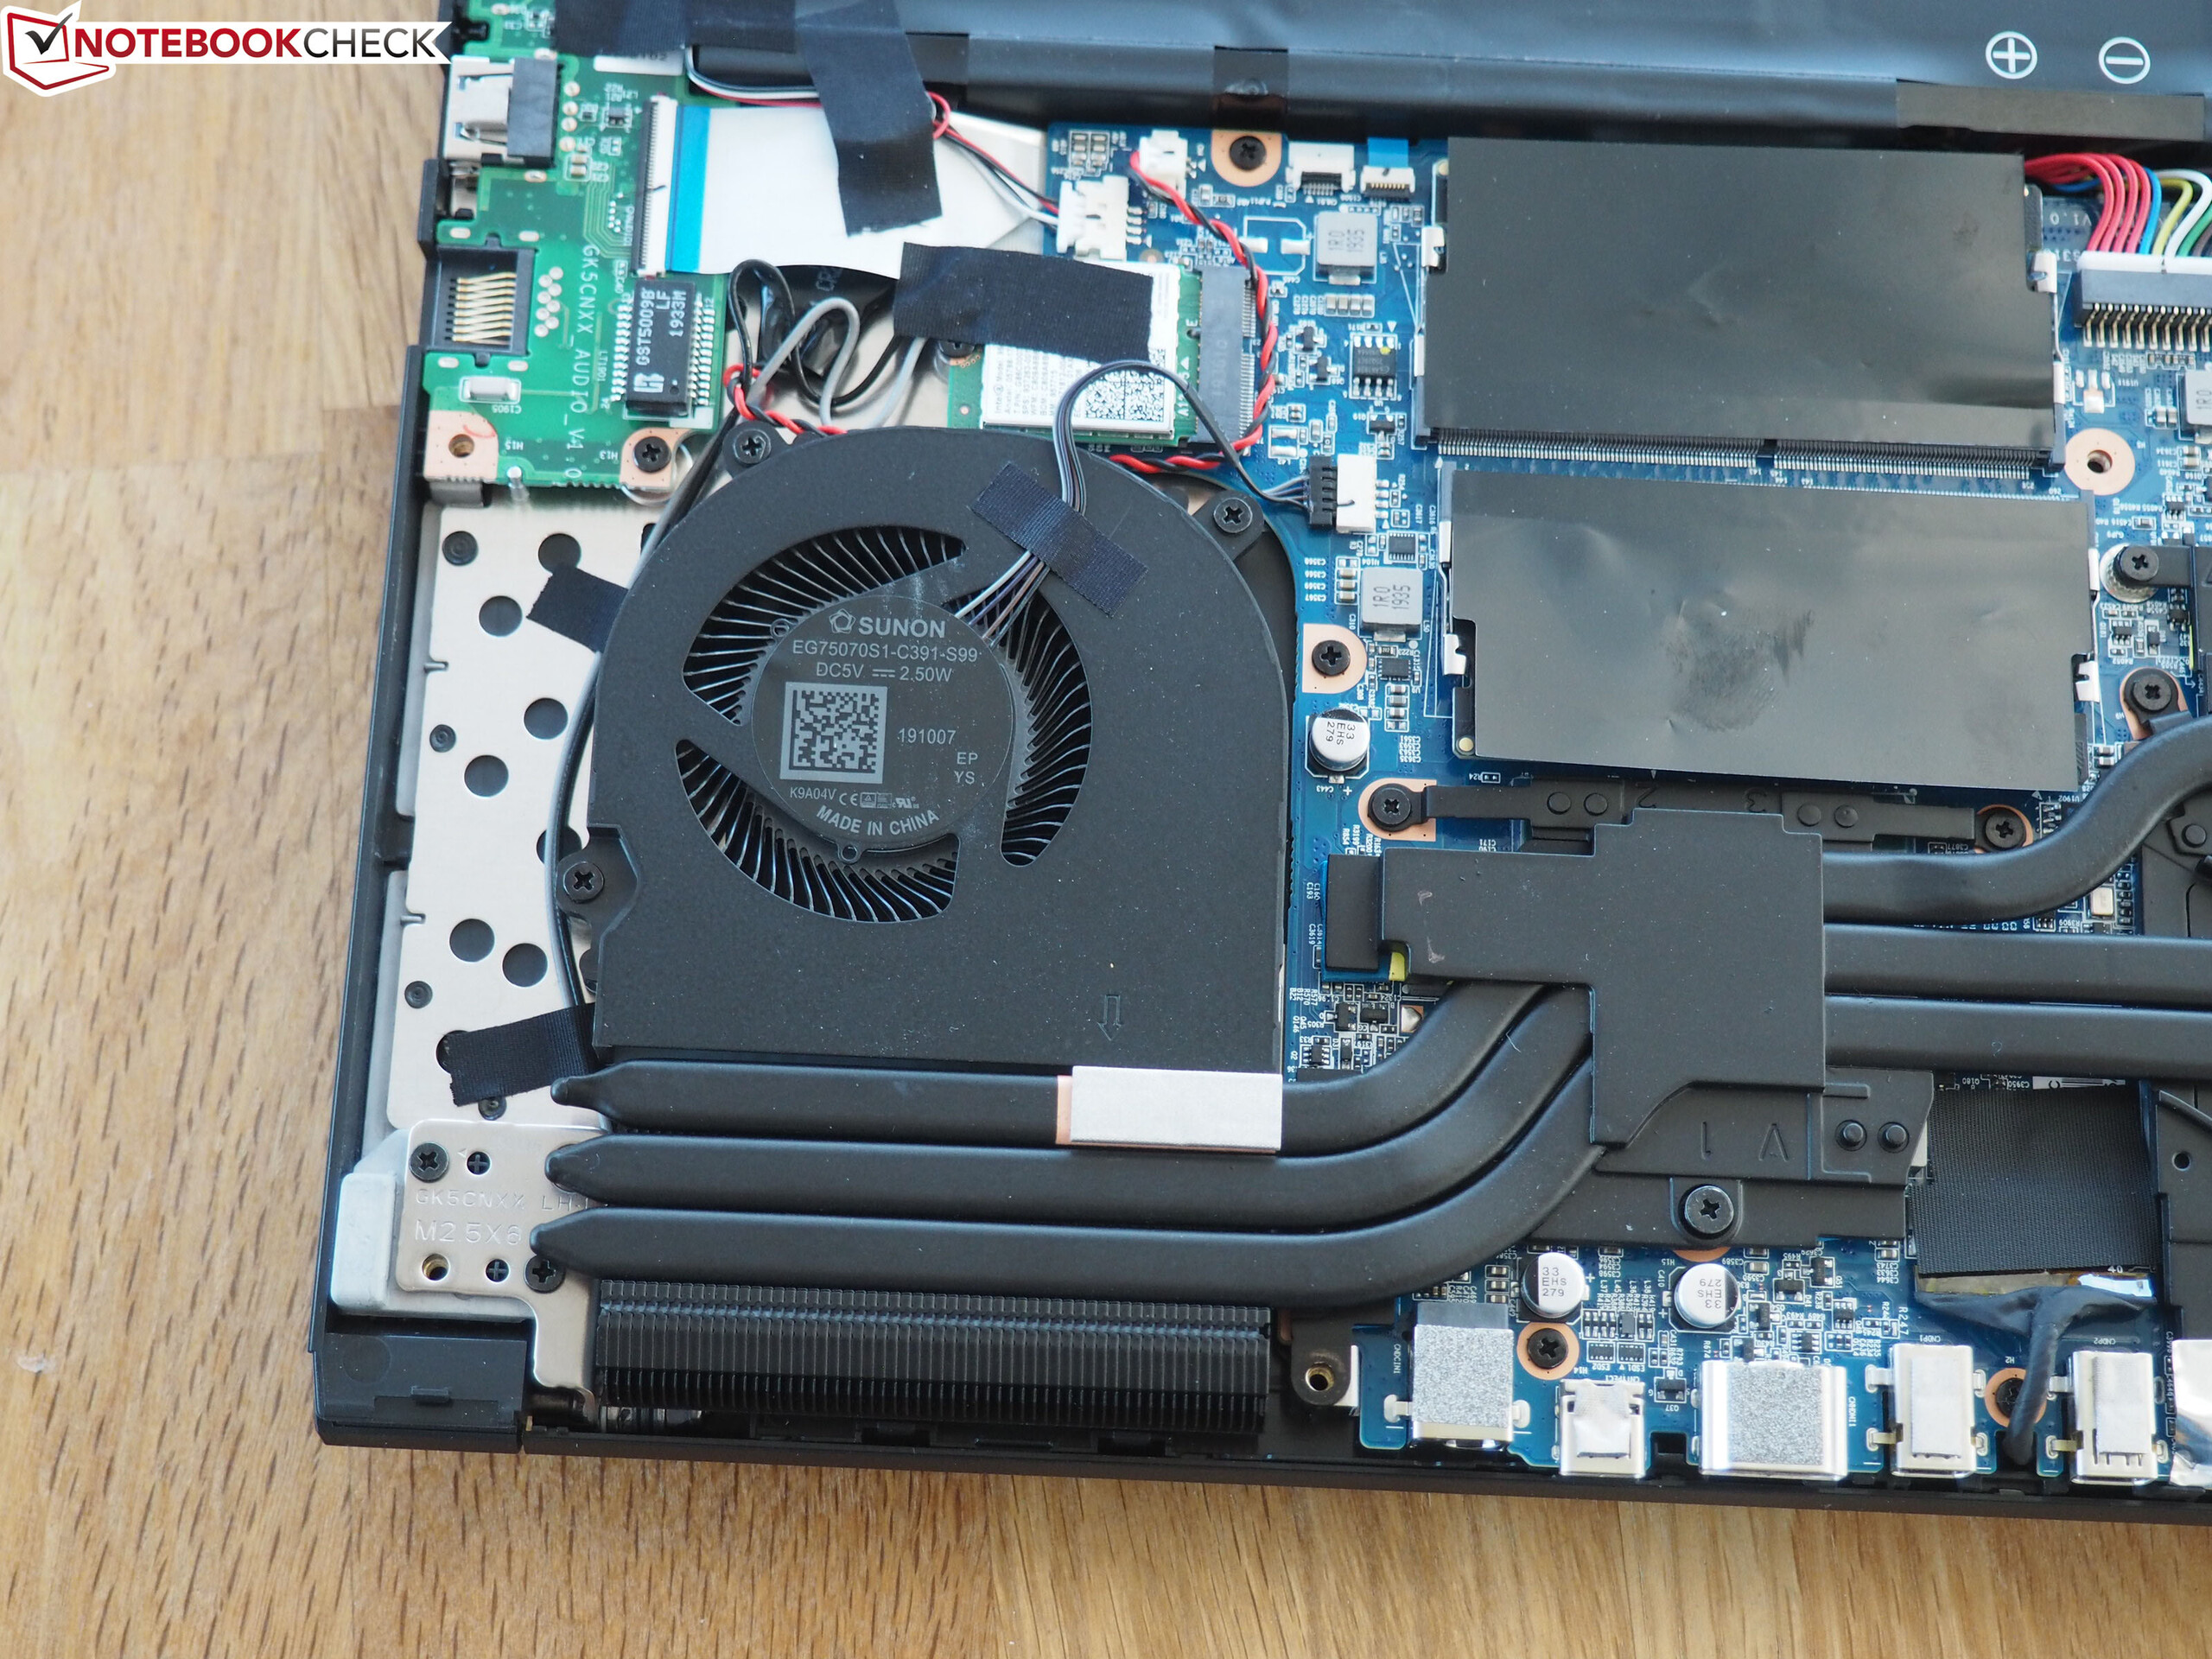
Maintenance
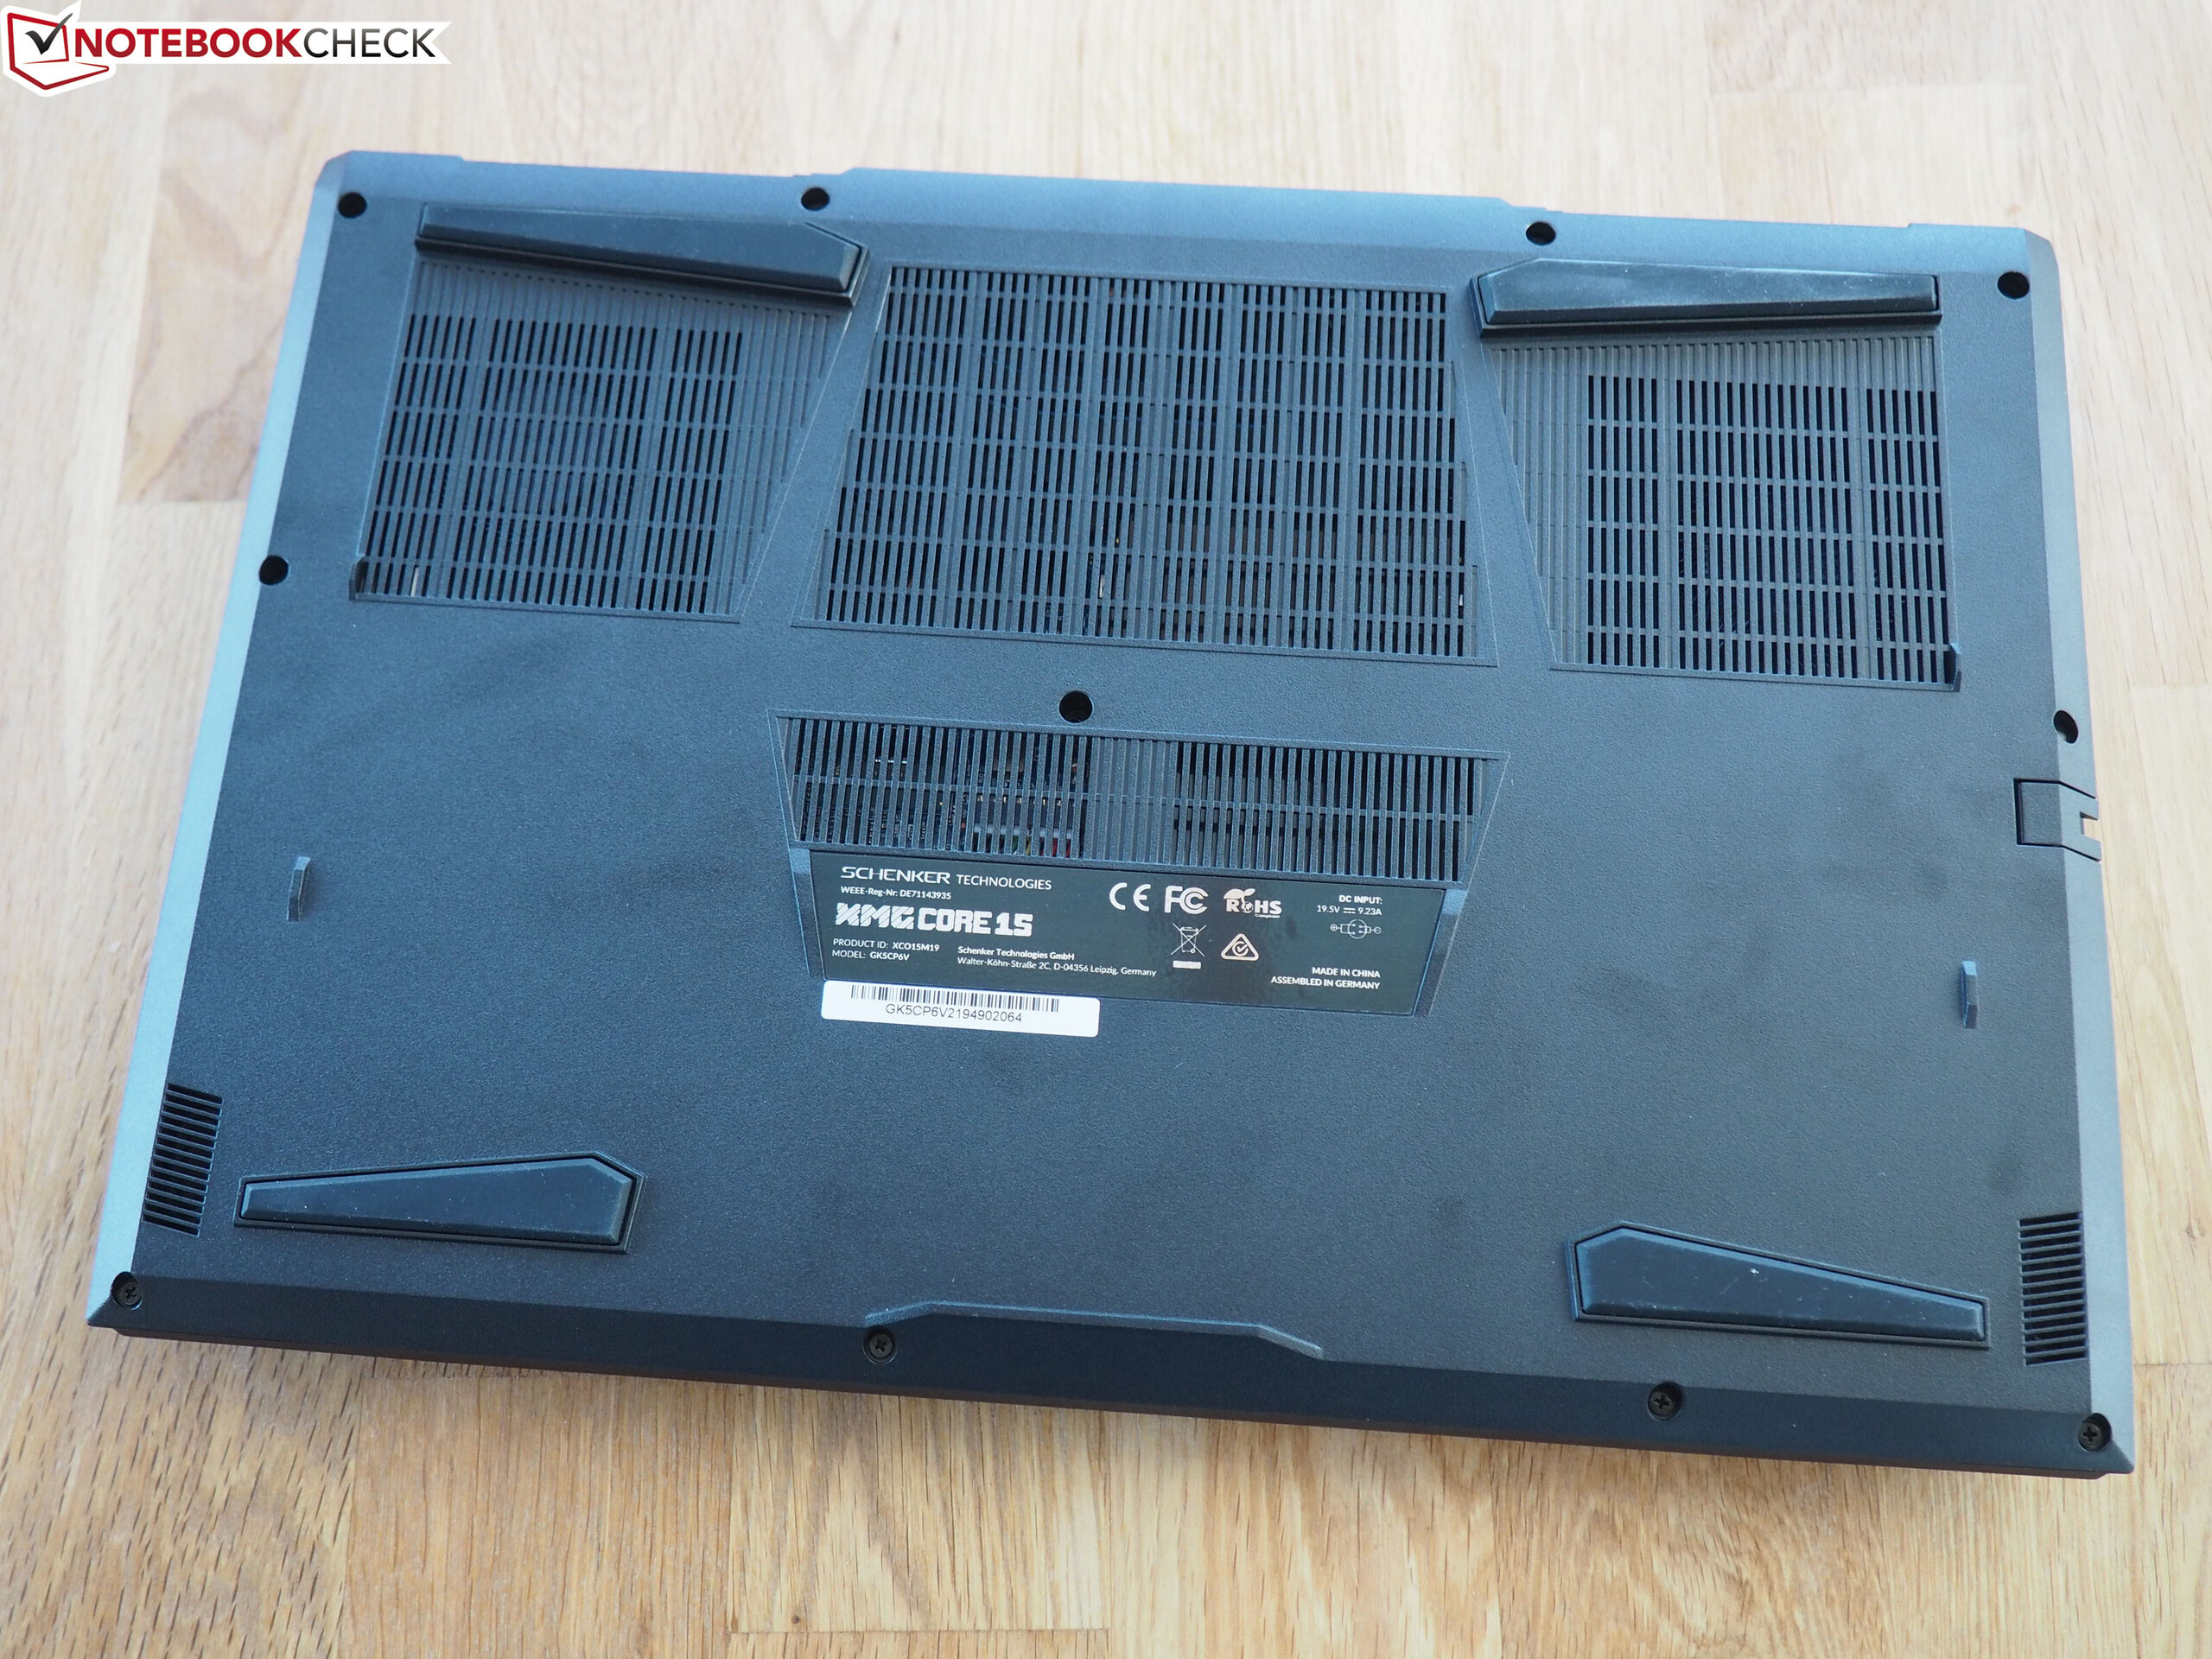
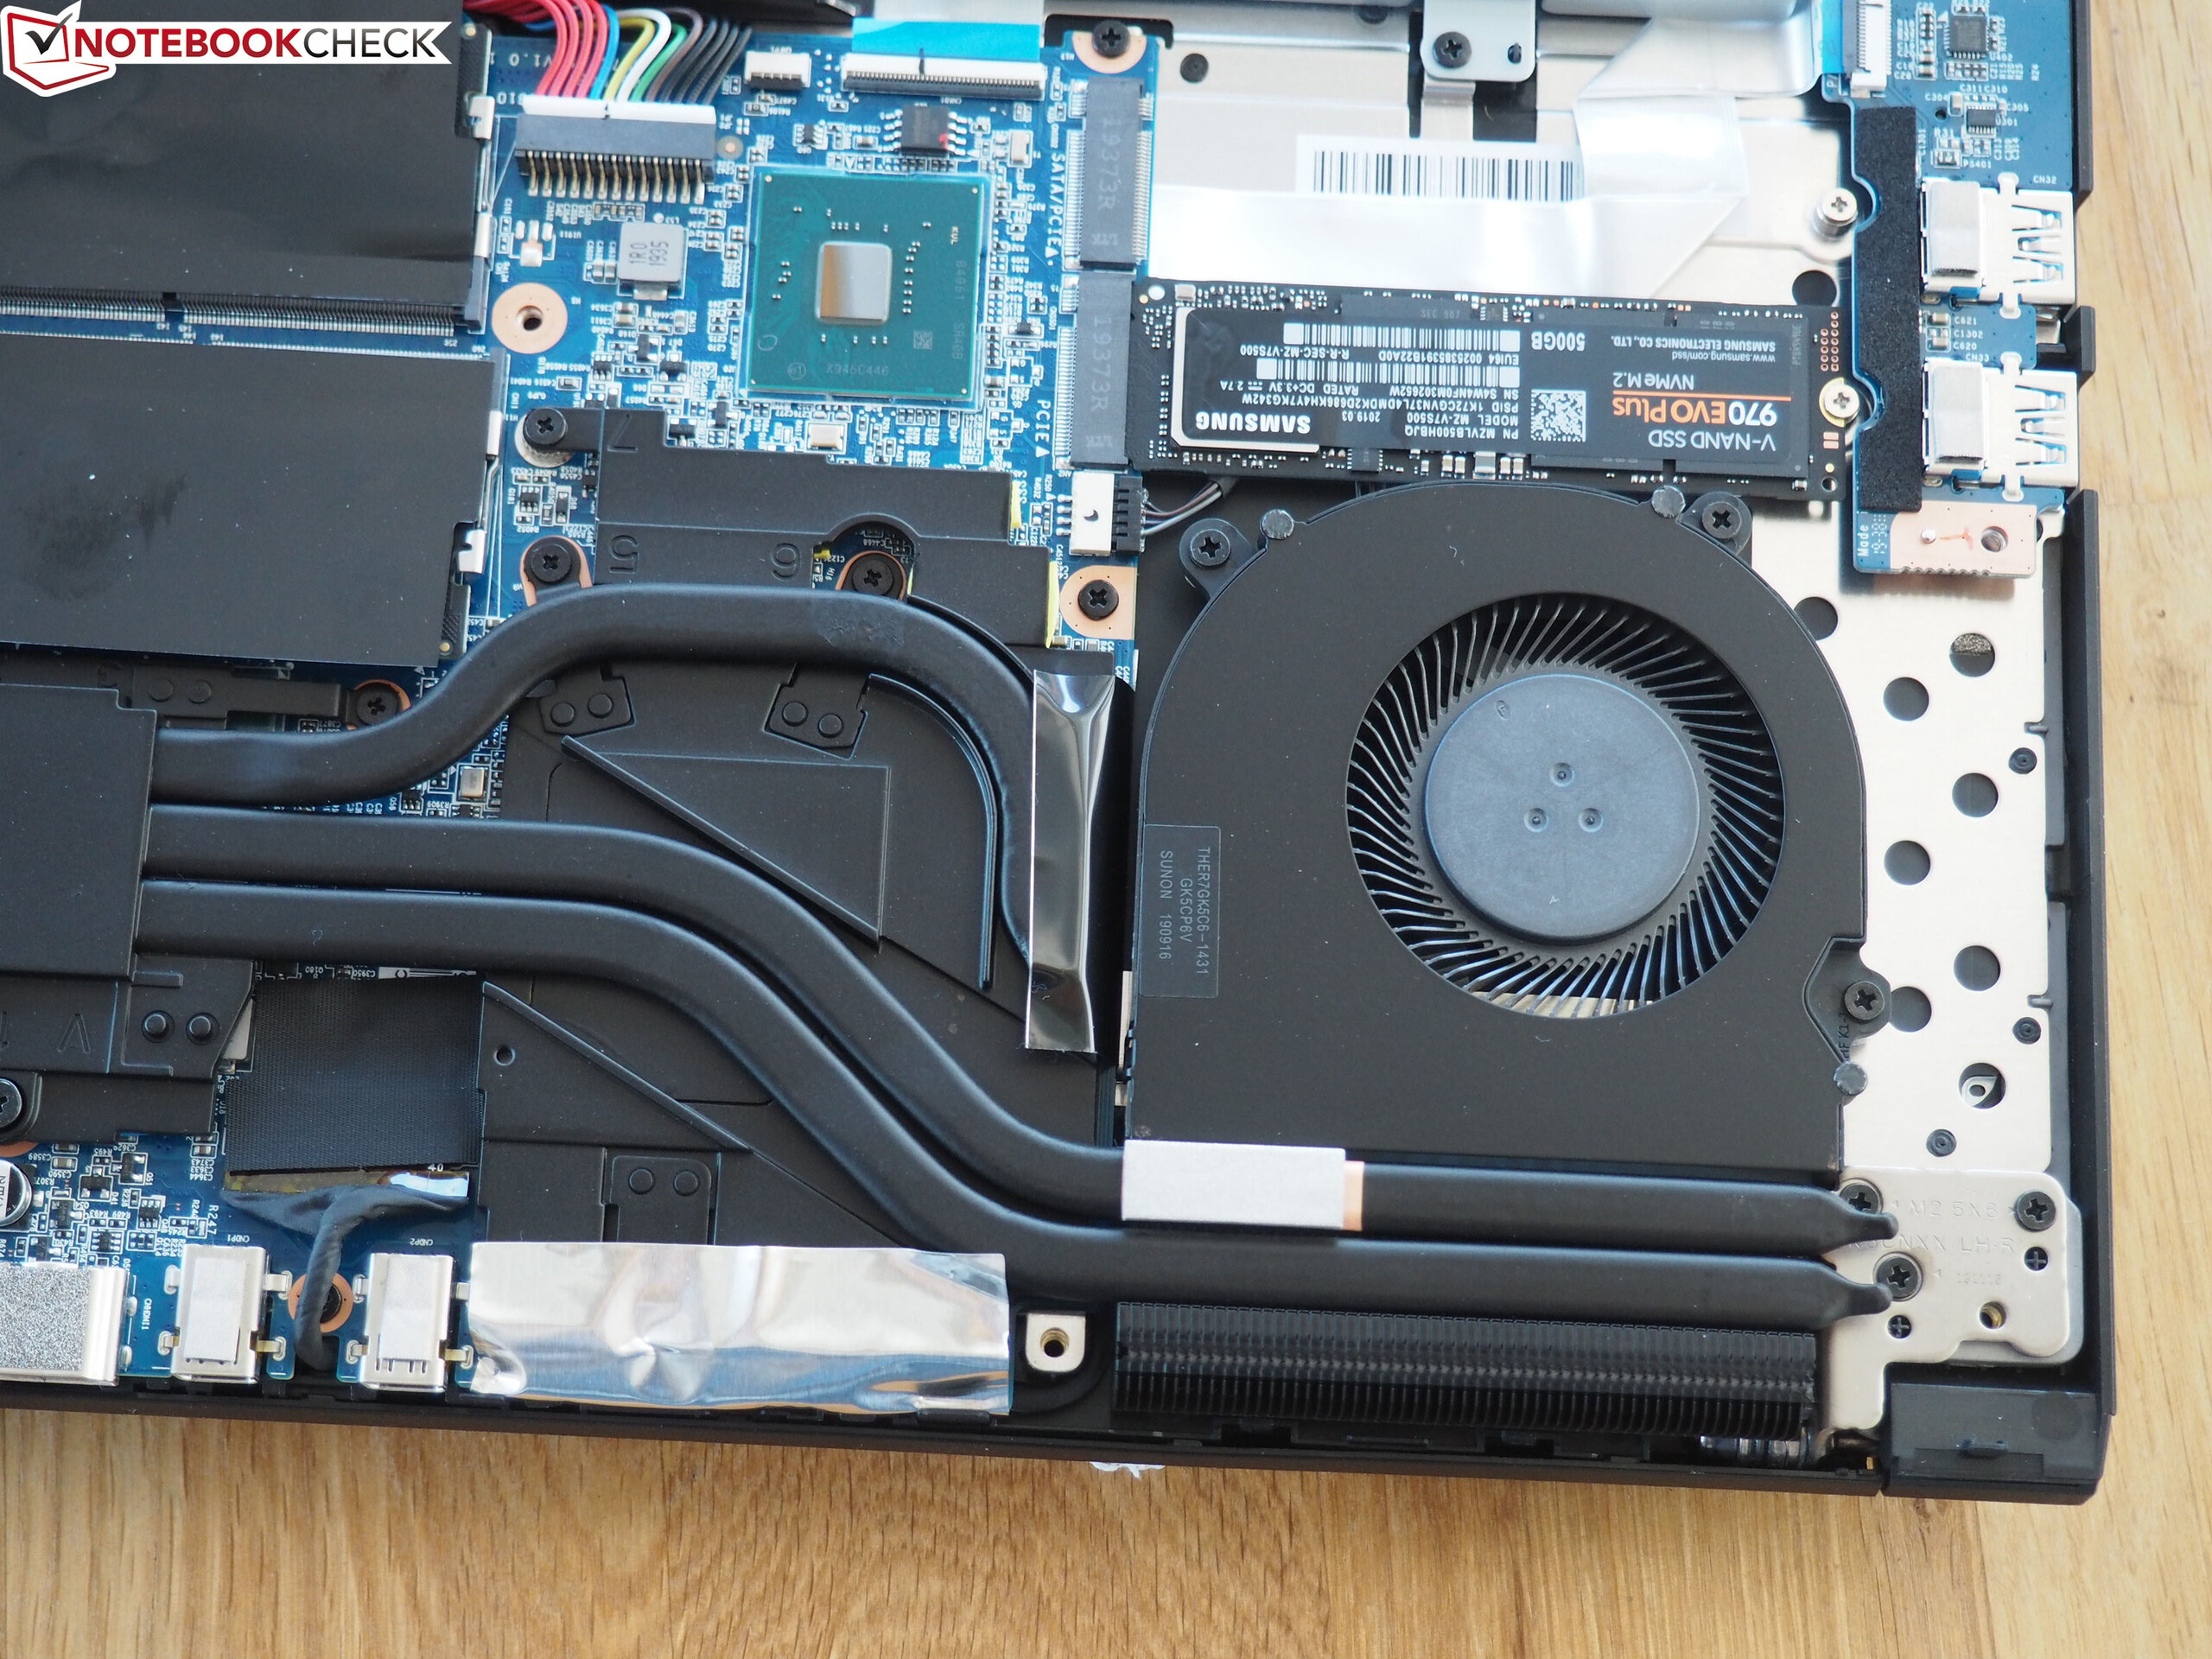
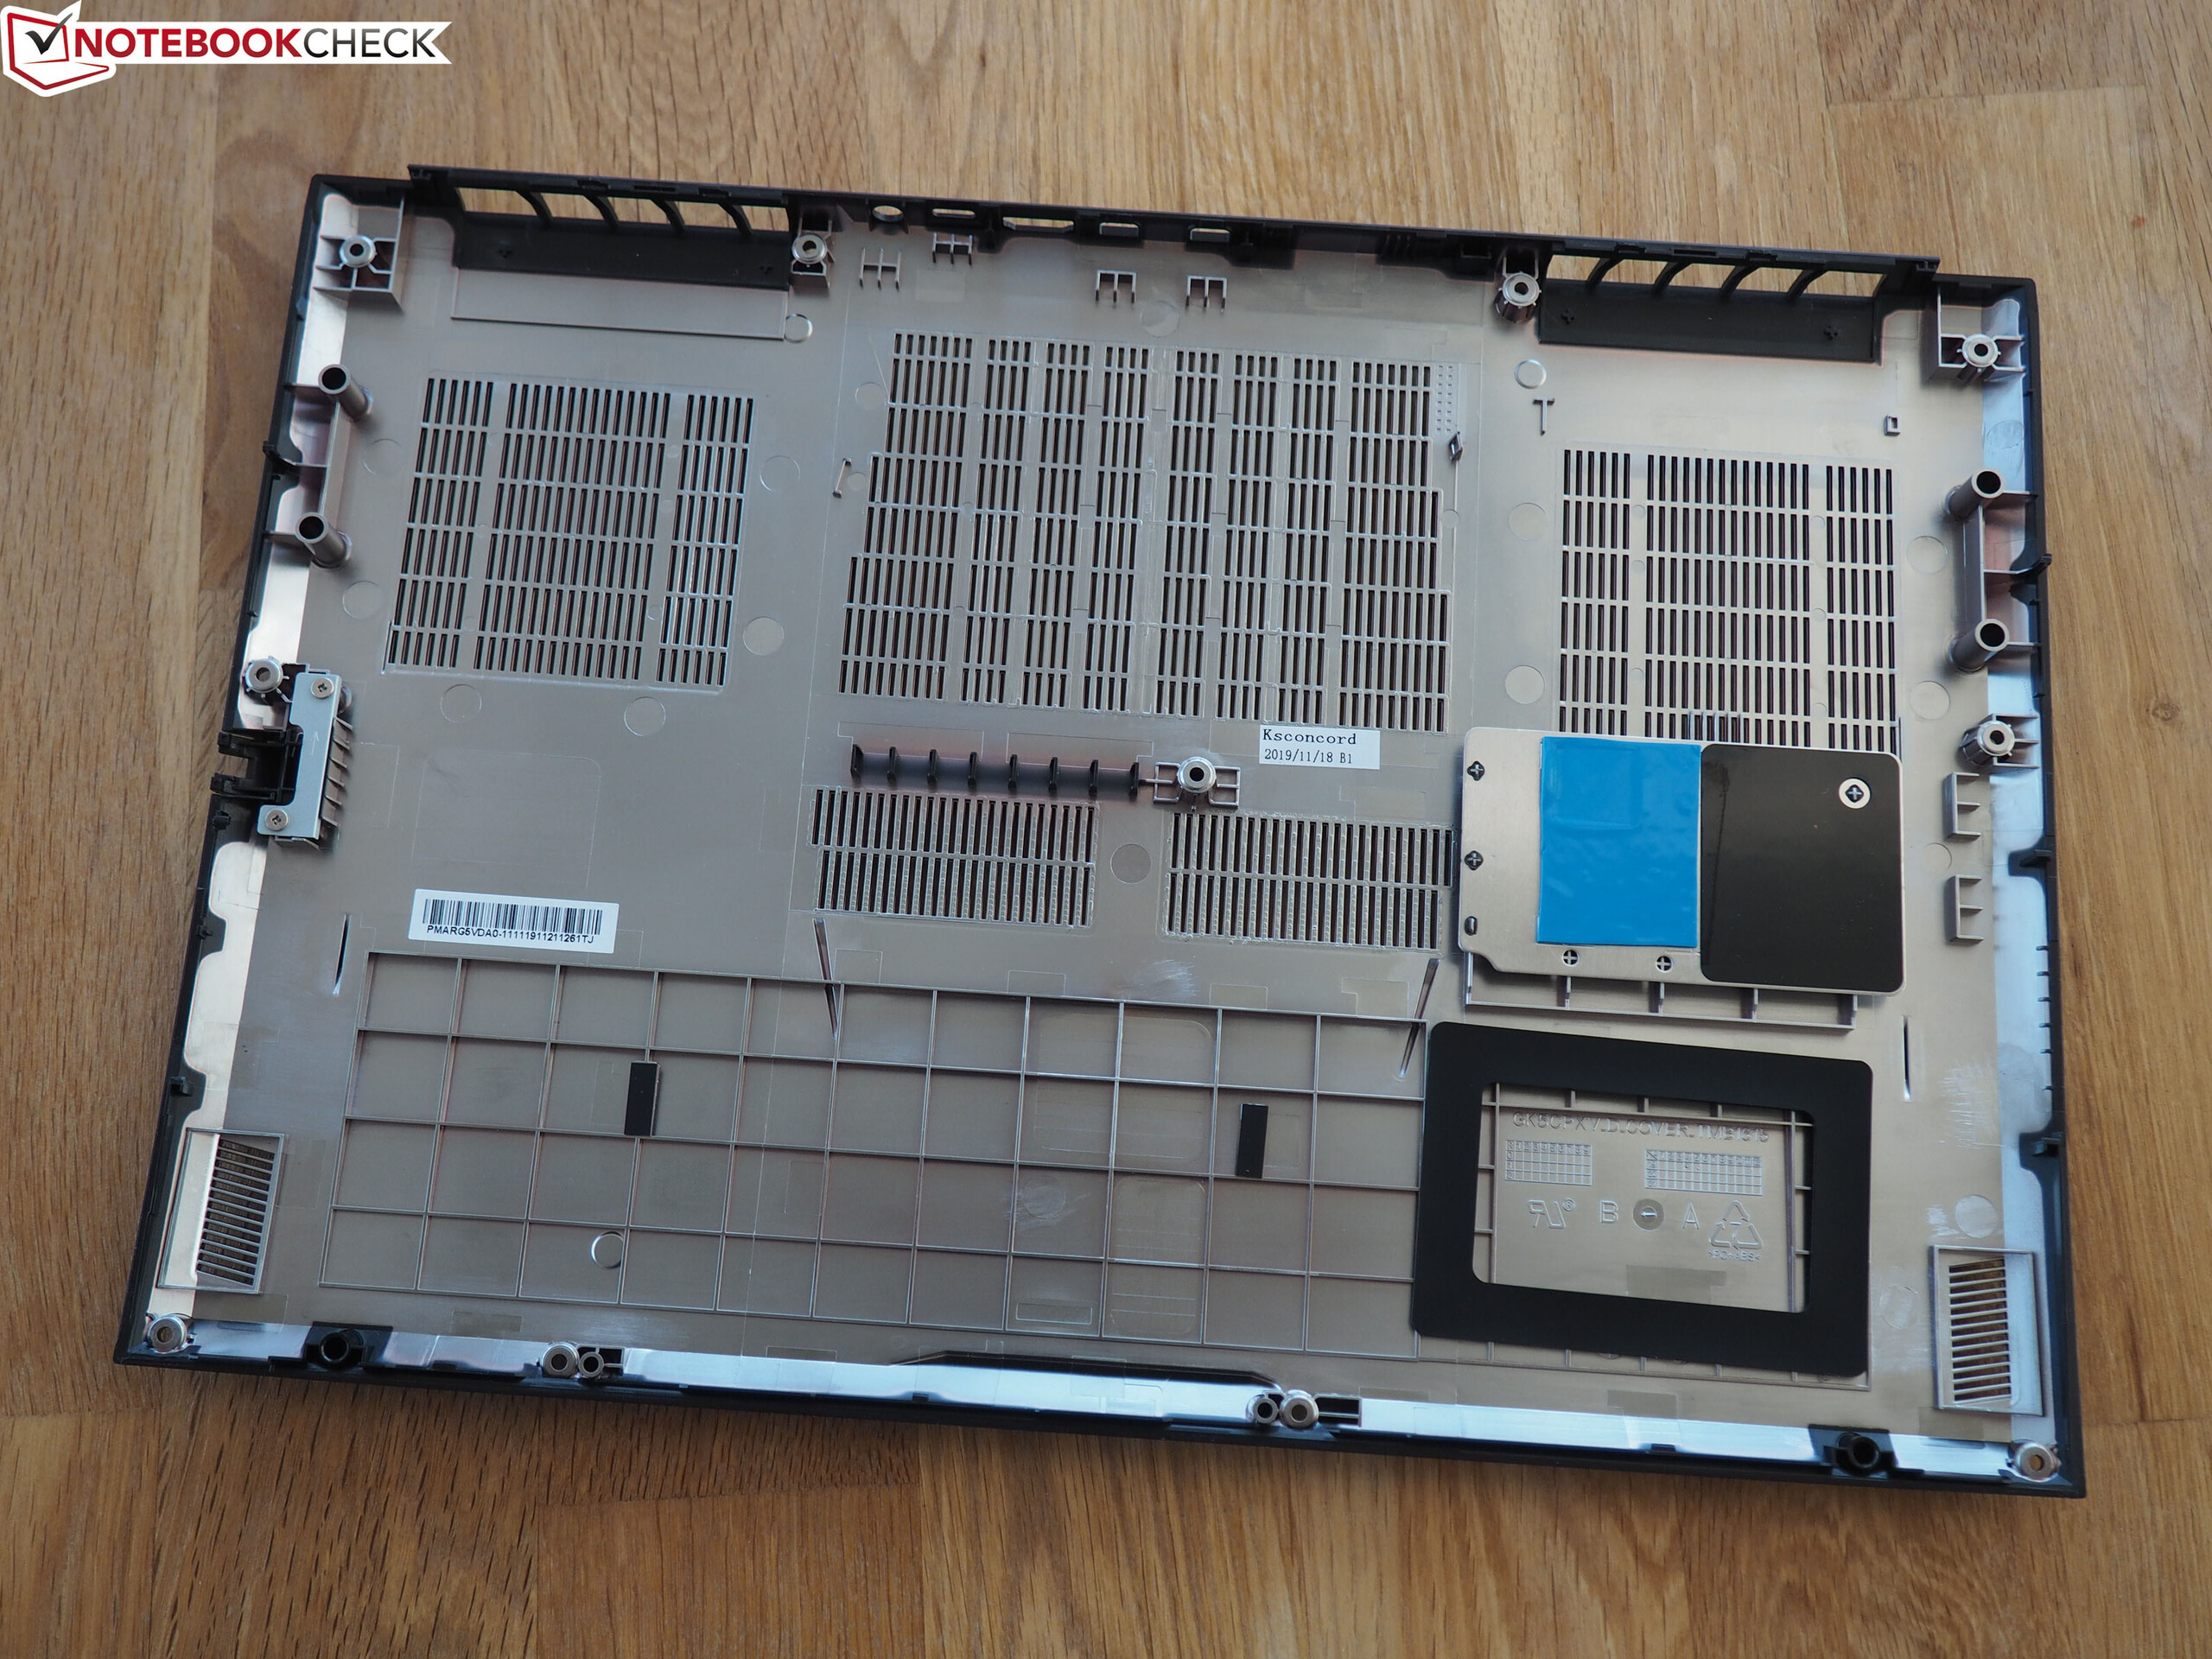
The maintenance options are typical for a notebook of this price class. After you have removed 11 Phillips screws from the bottom, you can remove the whole case bottom. As you can see in the pictures, you then get access to all the components inside, including the RAM slots, storage drive slots, battery, and WLAN module. The cooling system consists of two fans and several heat pipes that run across the CPU and GPU. The latter are soldered-in and therefore cannot be replaced.
Warranty
The basic warranty includes pickup-and-return service and covers 24 months. At an additional cost, the warranty can be expanded to three years. A longer time period for quick-repair is also offered.
Input Devices
Keyboard
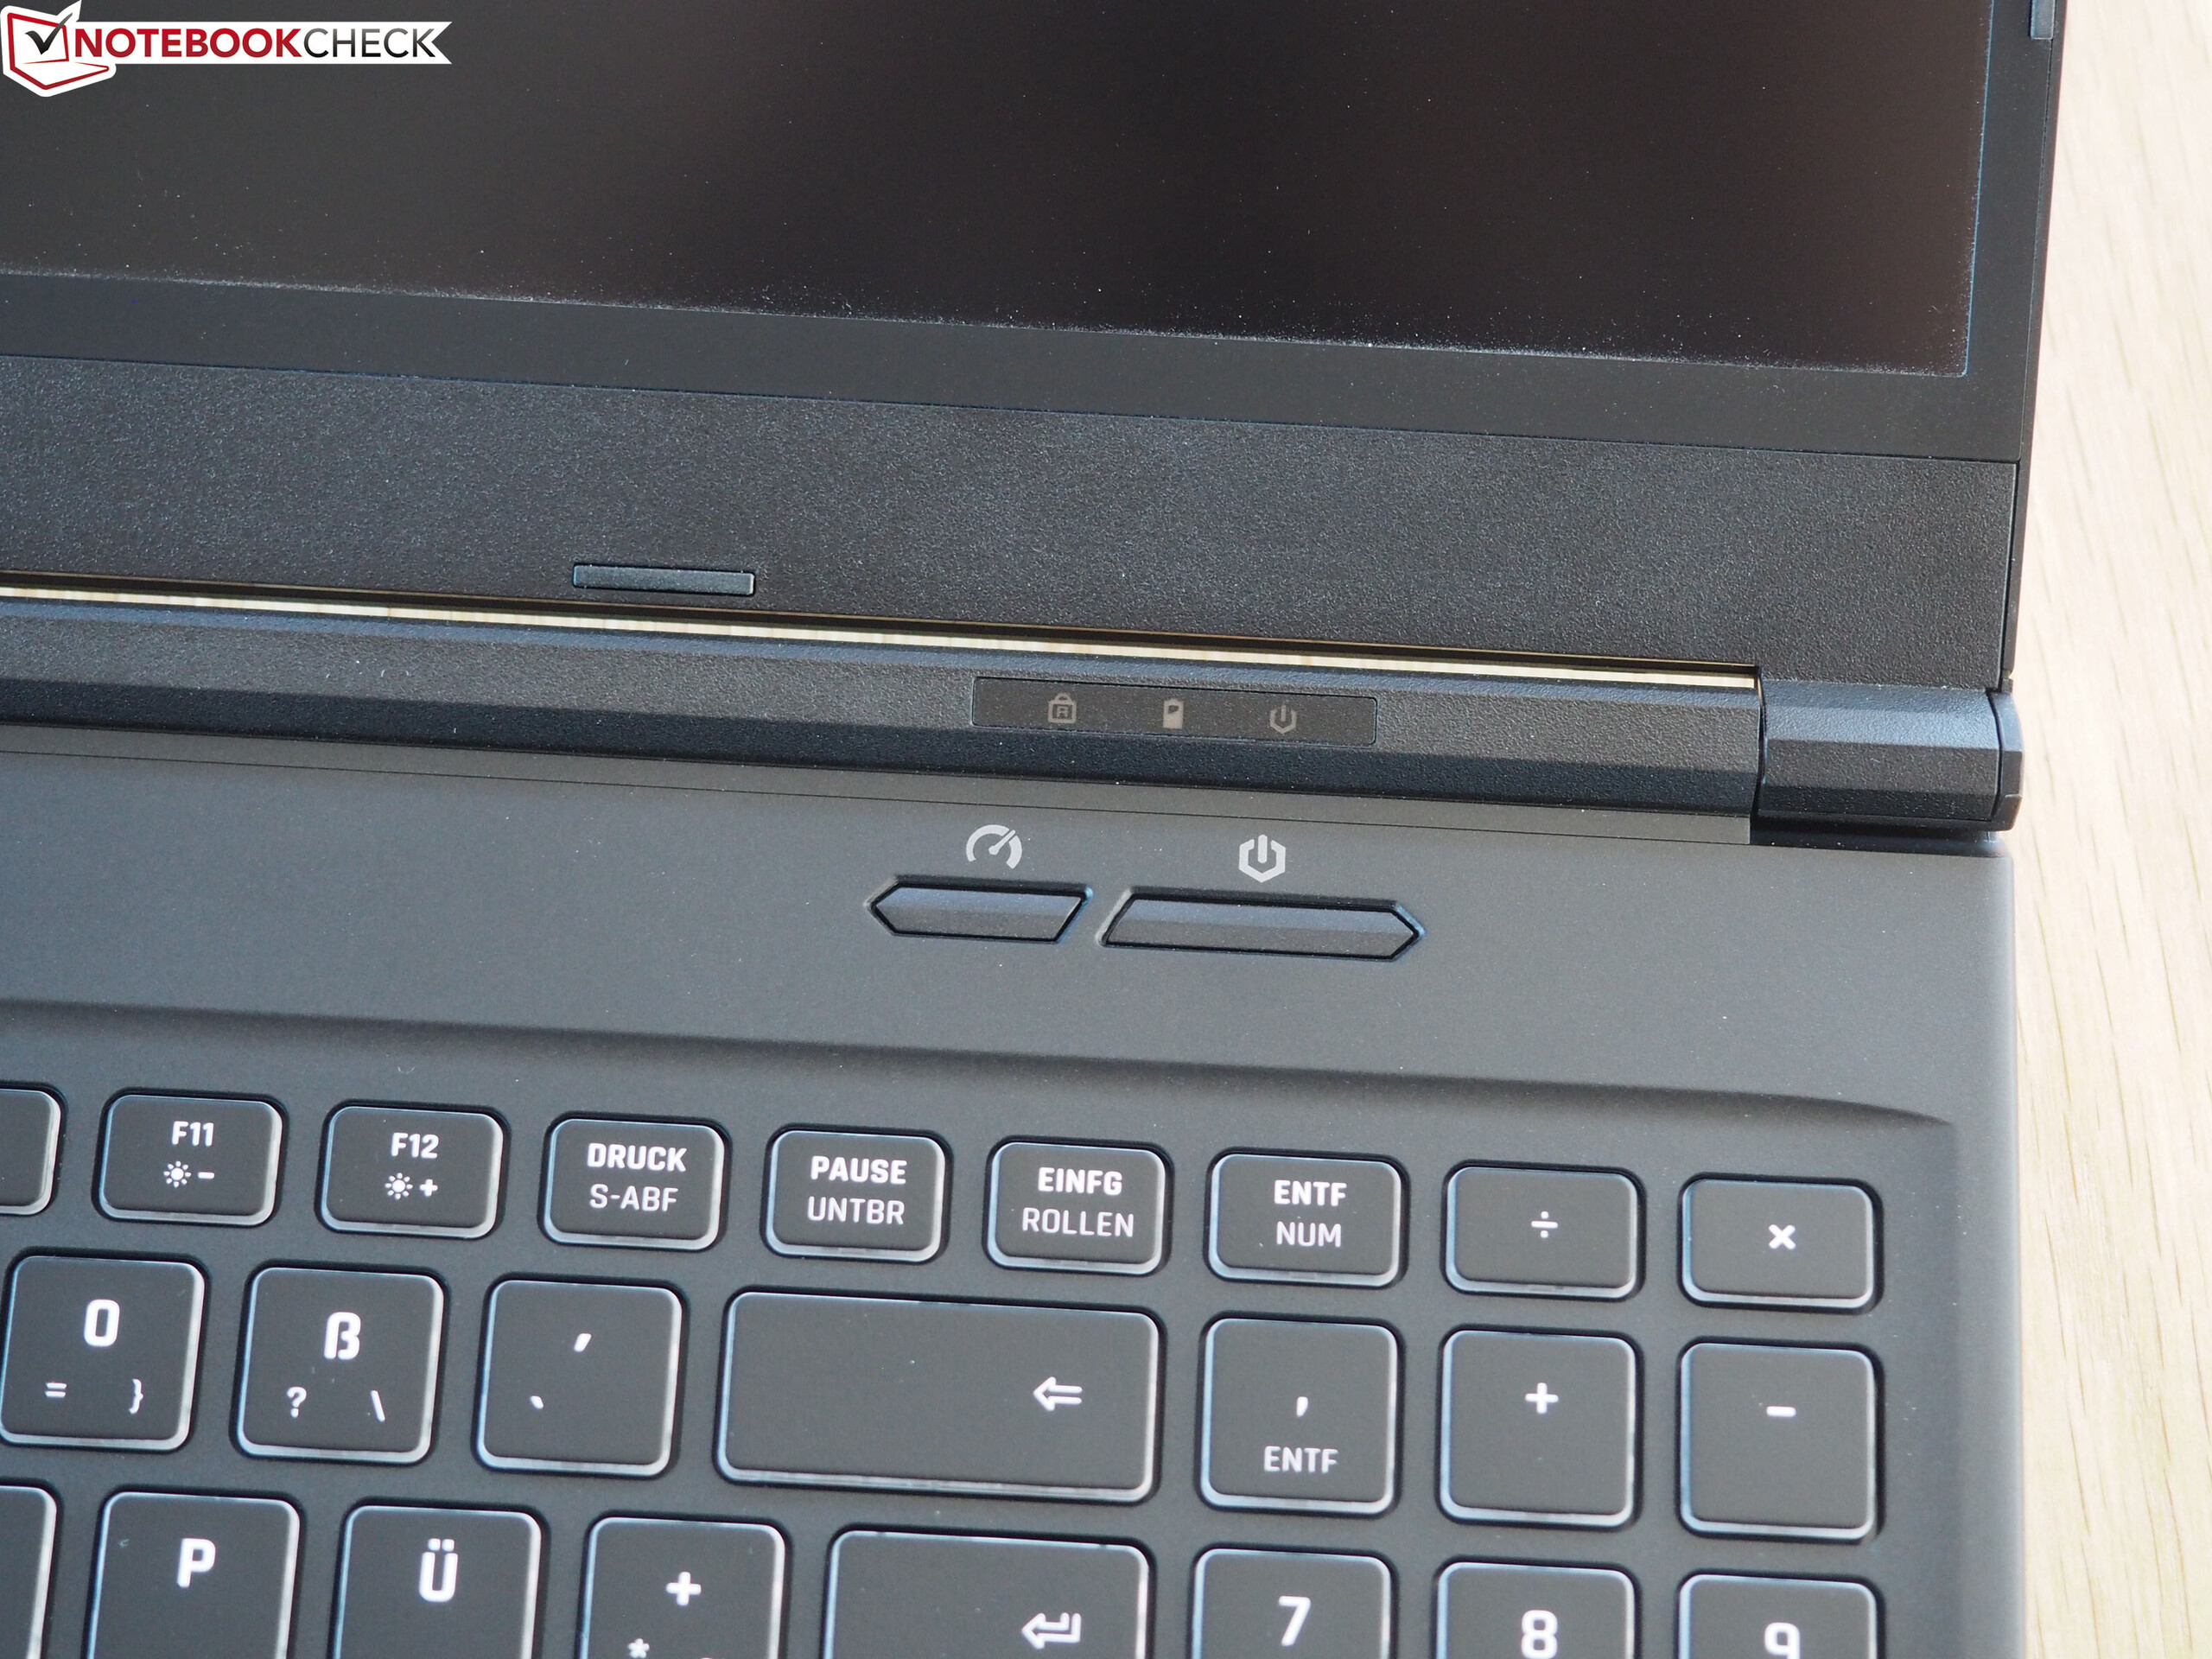
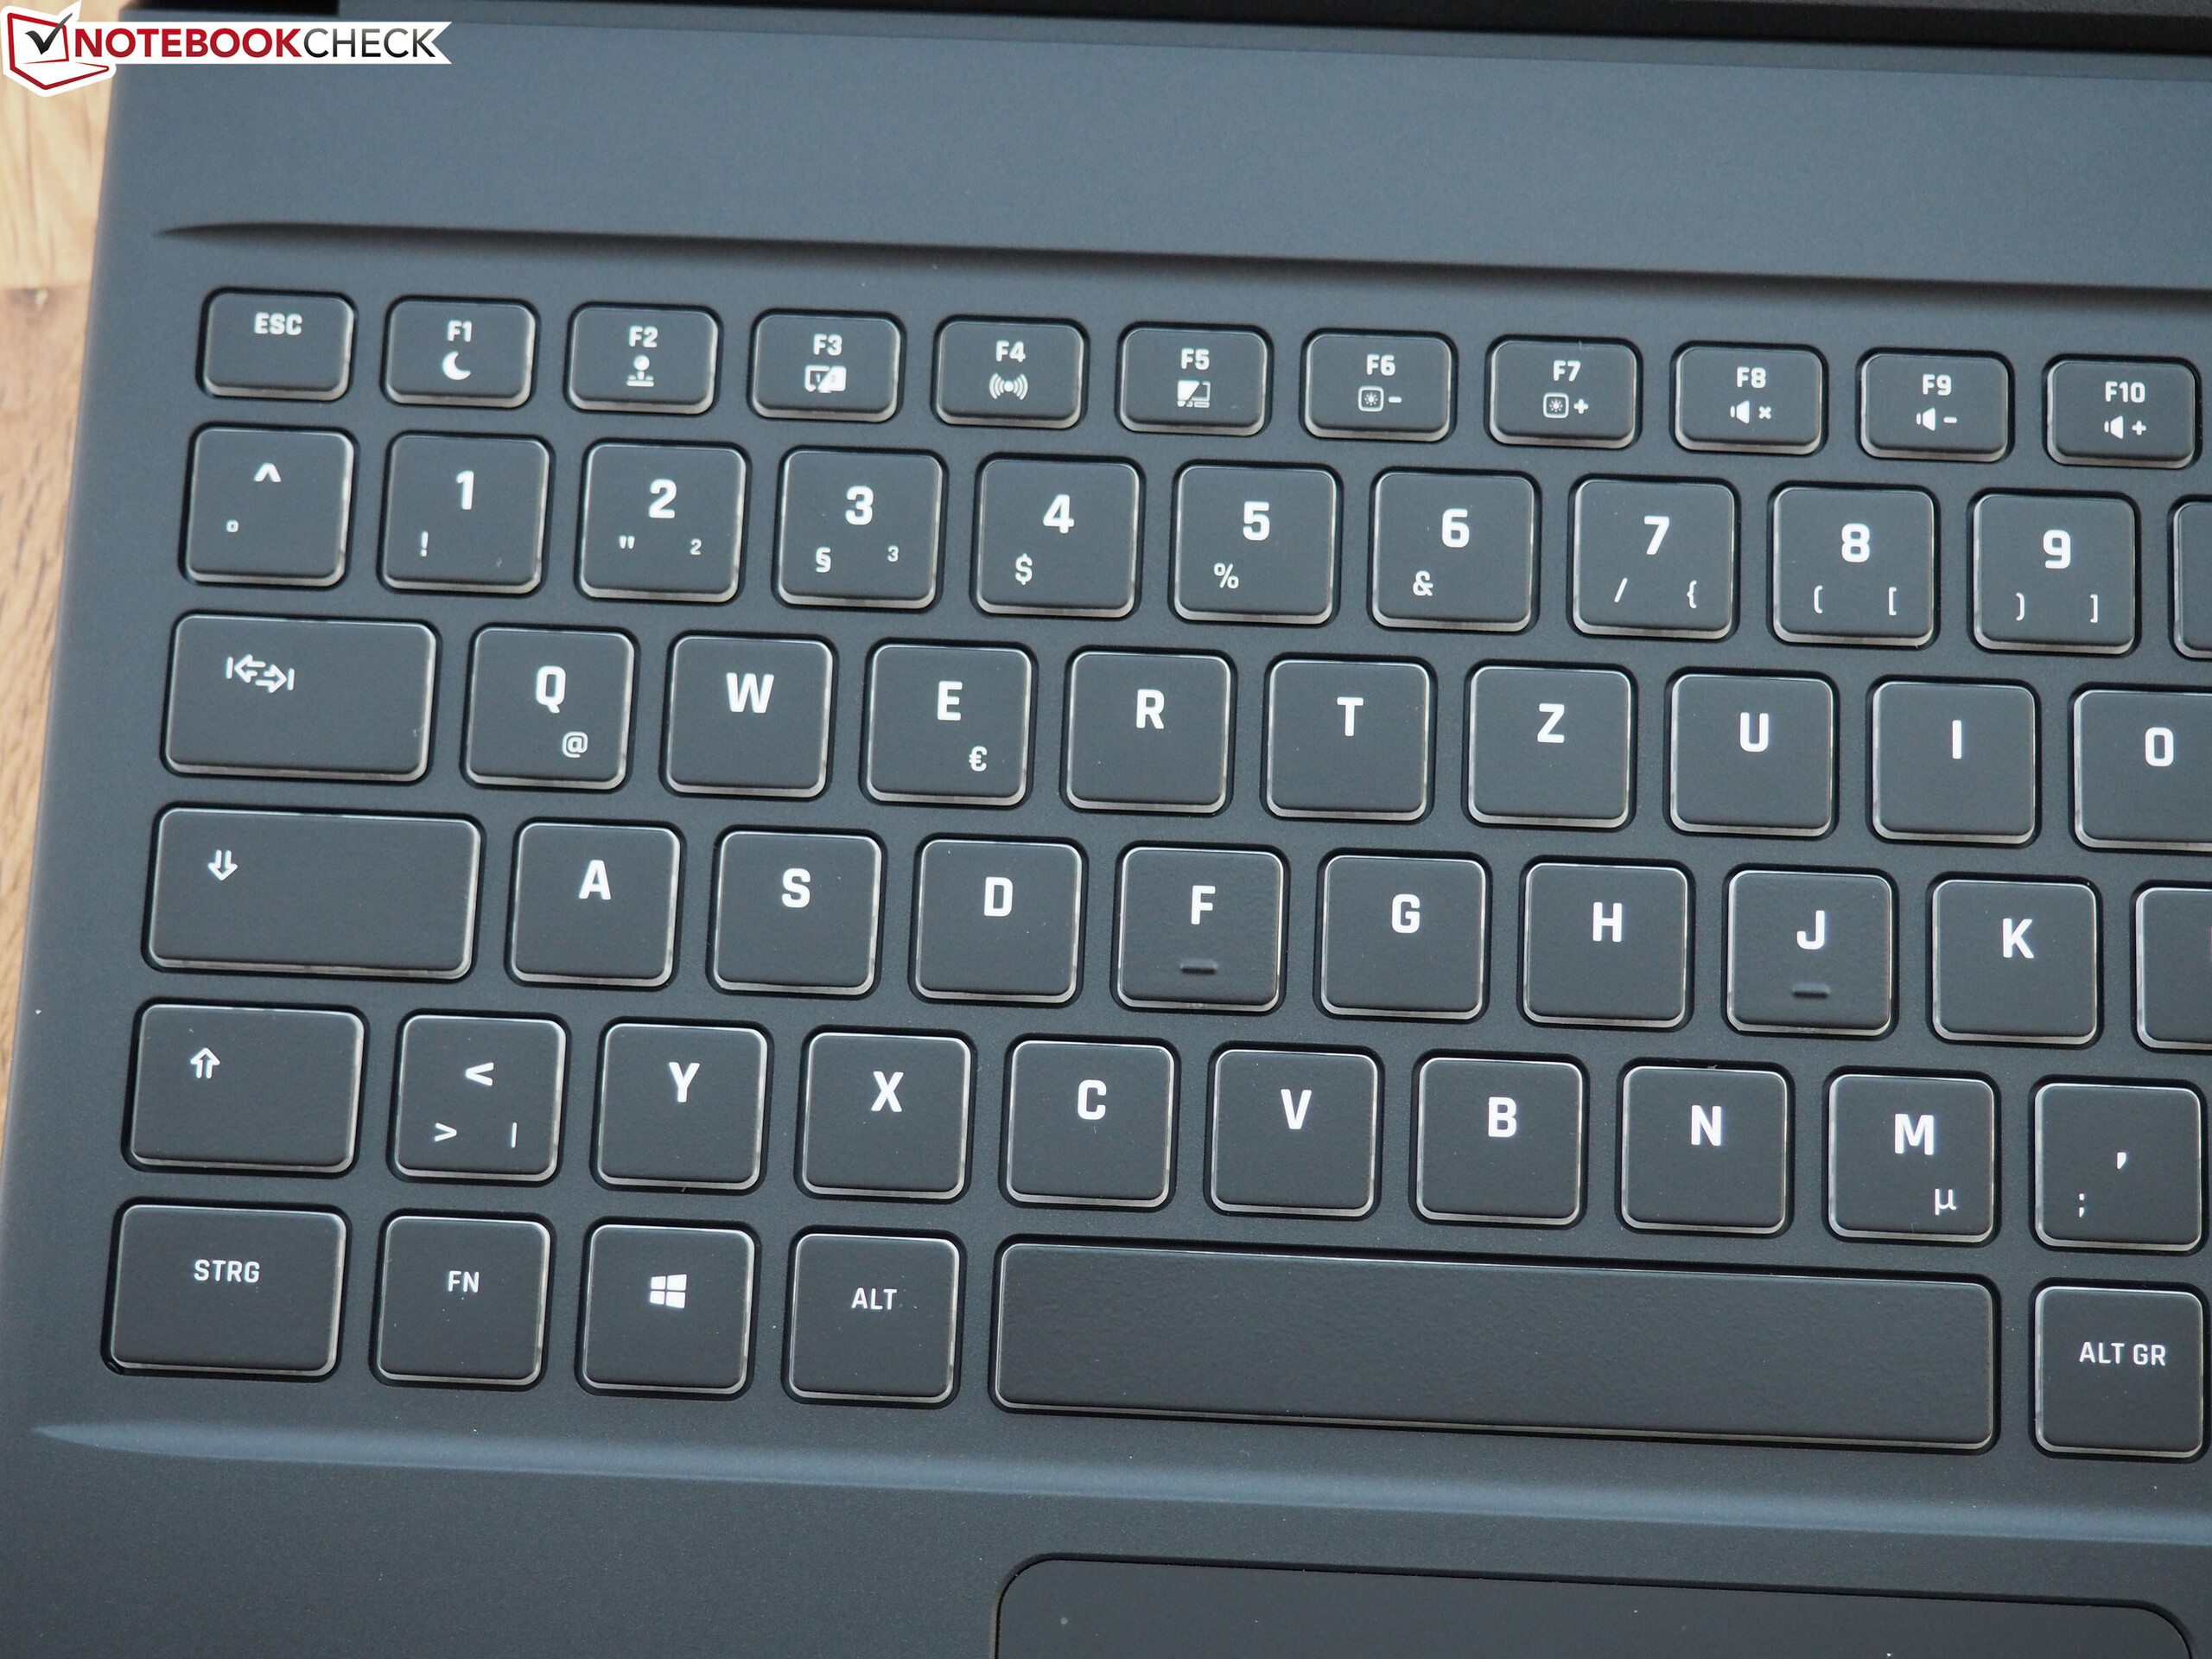
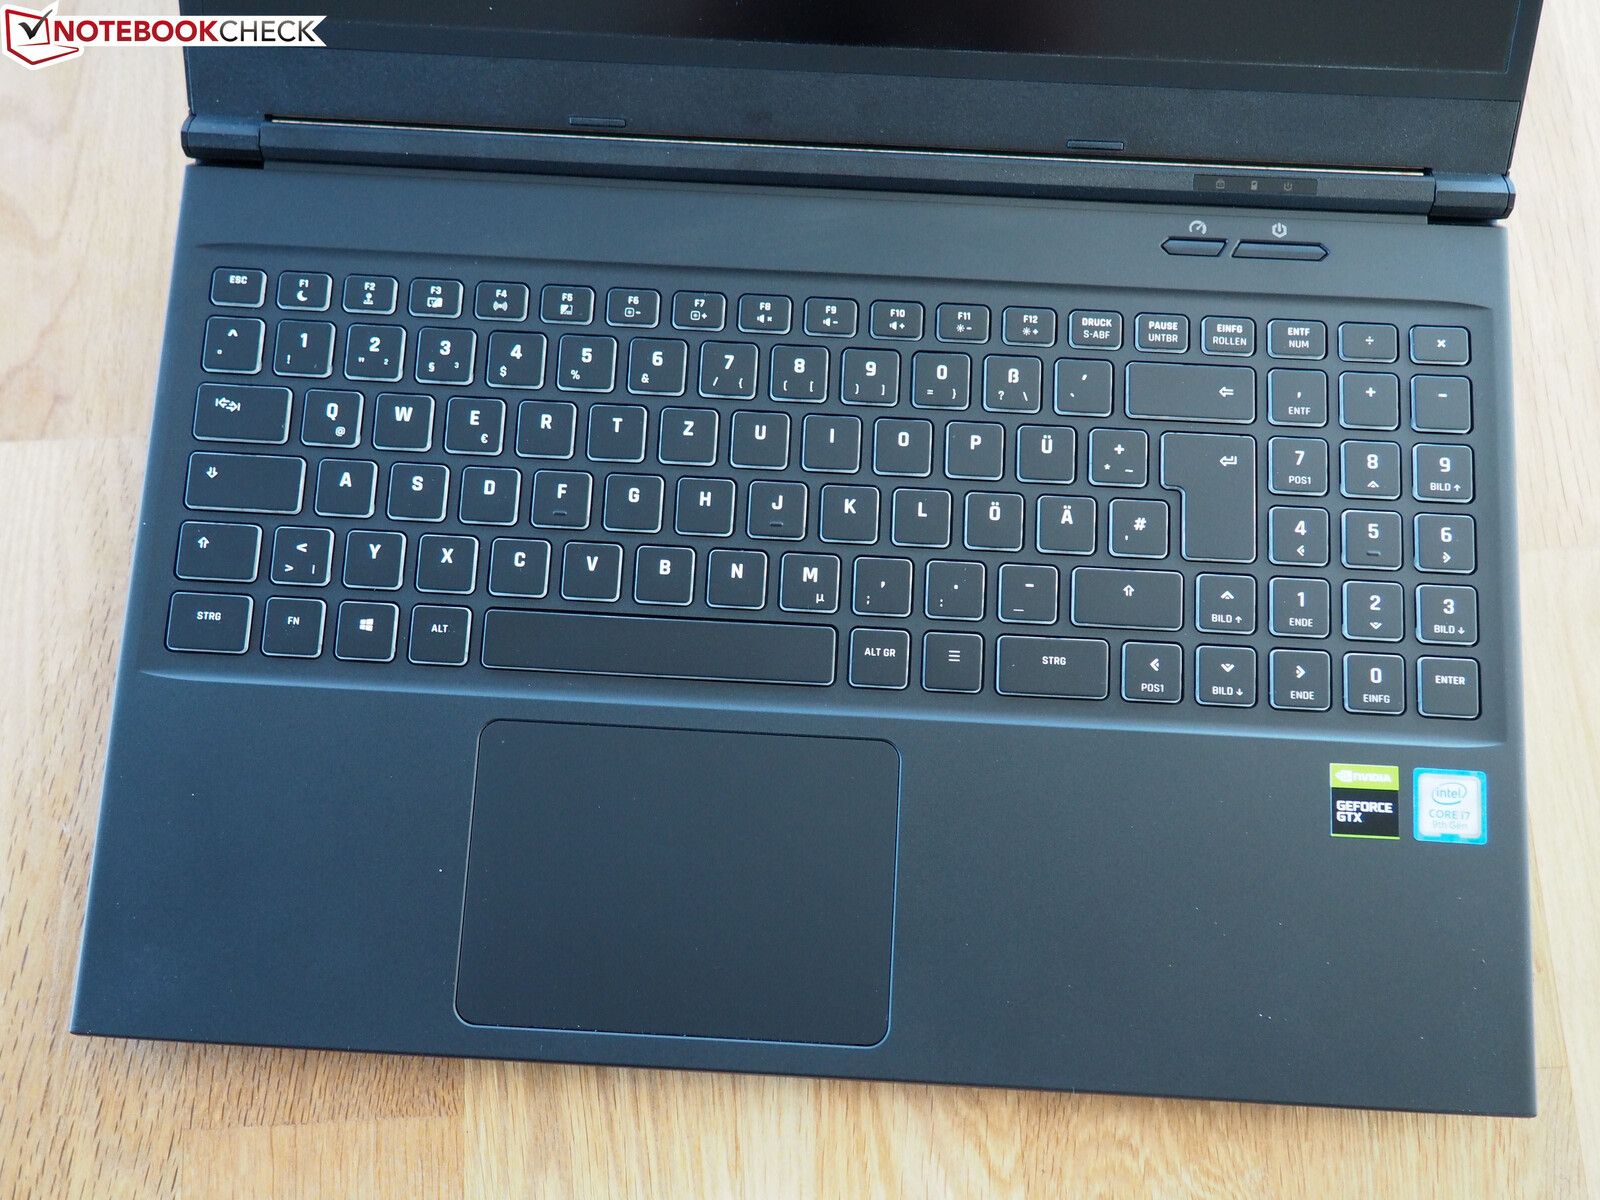
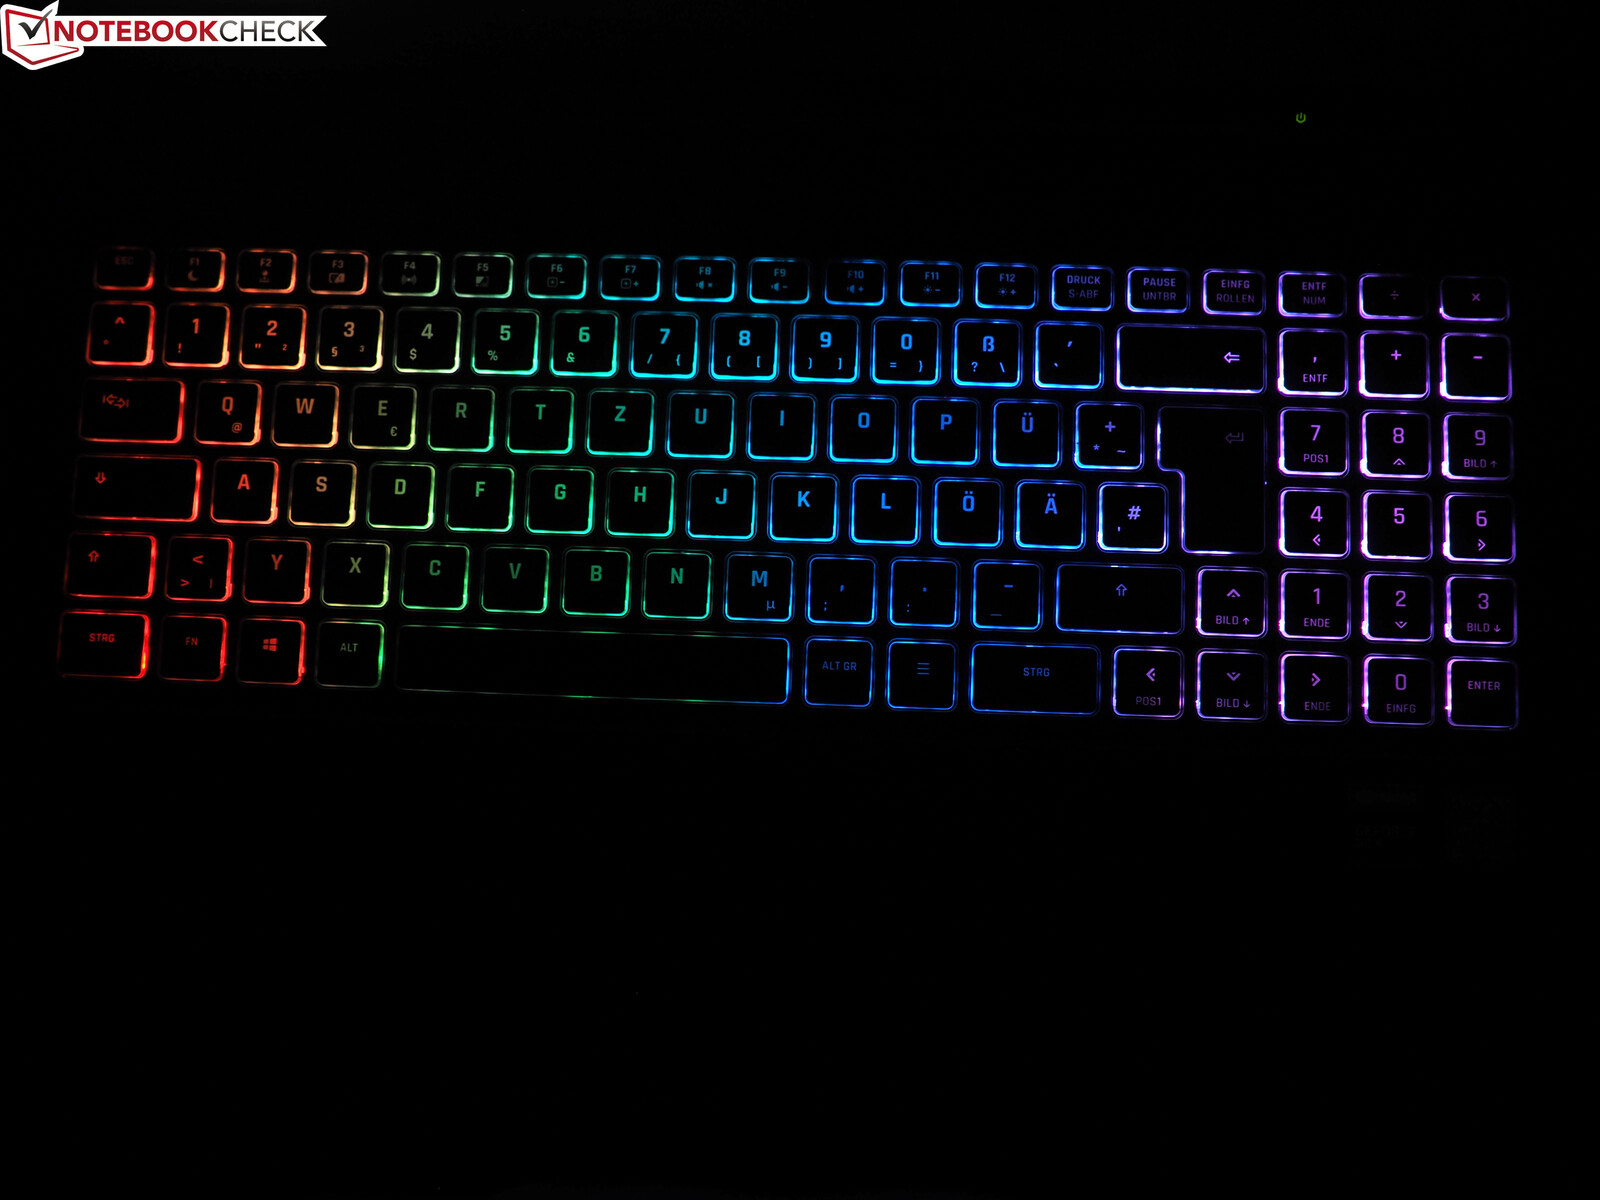
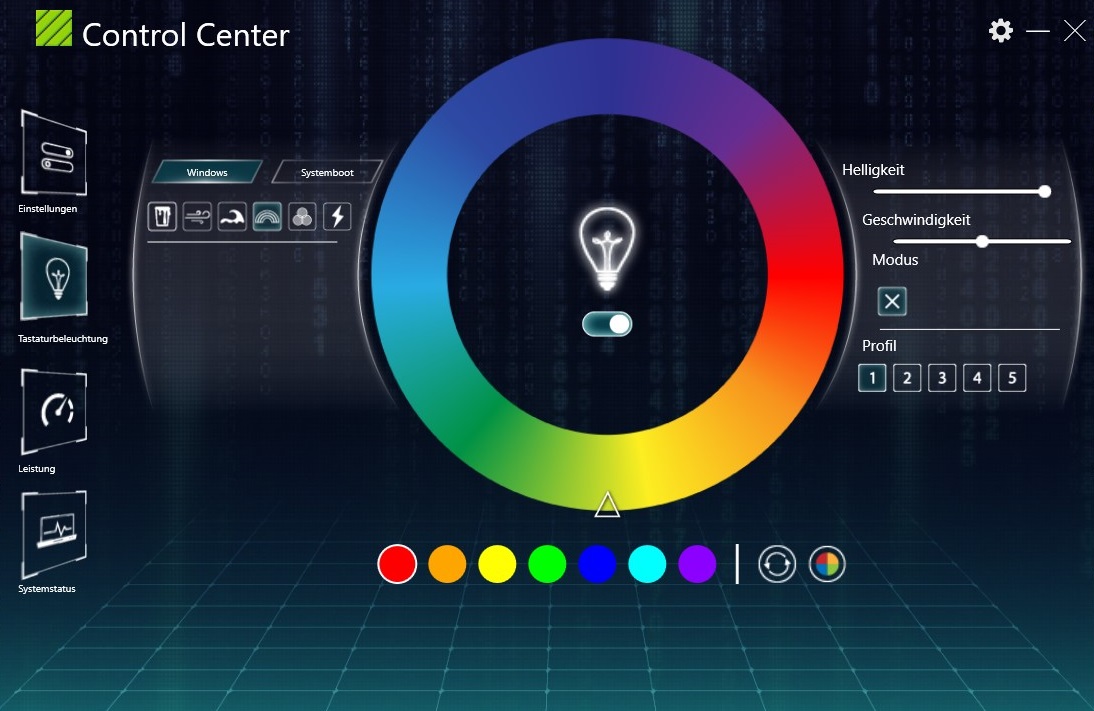
We would call the keyboard "good." The manufacturer has opted for a chiclet model with RGB illumination. The latter can be adjusted in several steps and modified in detail via software (mode, colors, speed, etc.). In combination with the bright labeling, you can always read the keys easily, day and night.
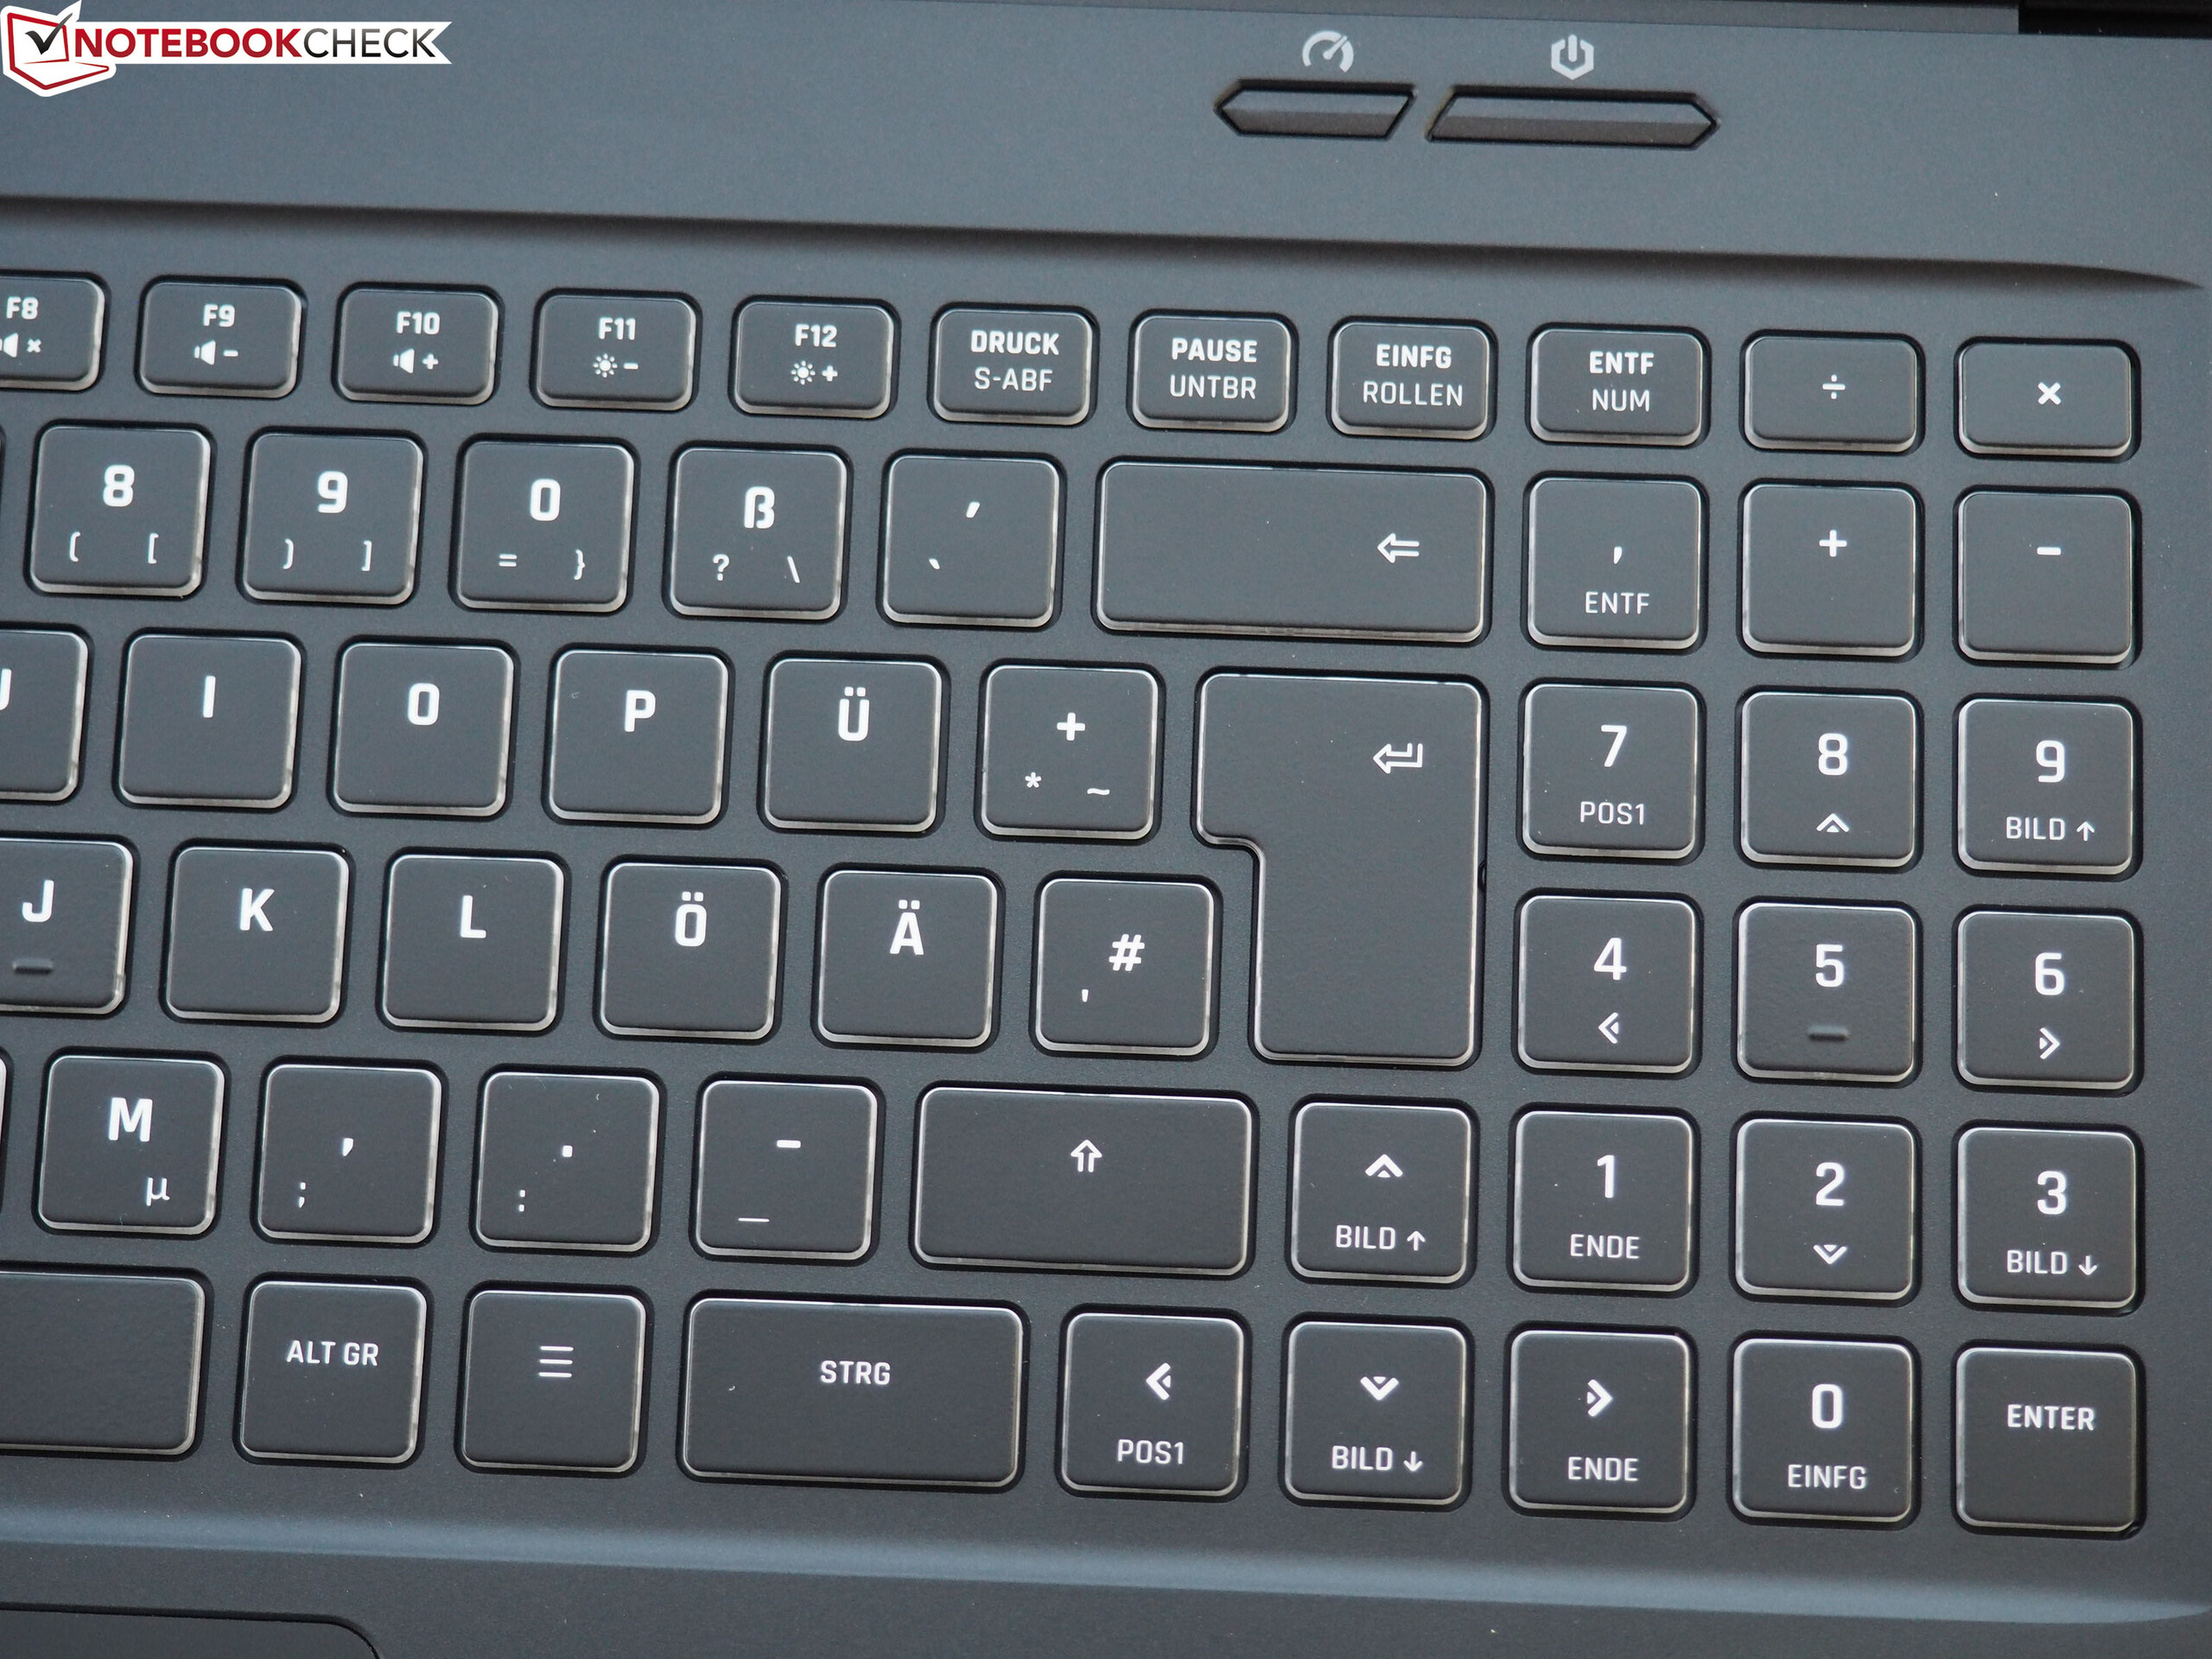
The typing experience is also good and offers a good compromise of soft (comfortable) and hard (accurate feedback). Compared to other gaming laptops, the keyboard is neither particularly loud nor quiet. As usual, the layout is a matter of taste. In order to offer regular-sized arrow keys, the "0" key of the dedicated number block was cut in half and the right Shift and Ctrl keys were moved to the left.
Touchpad
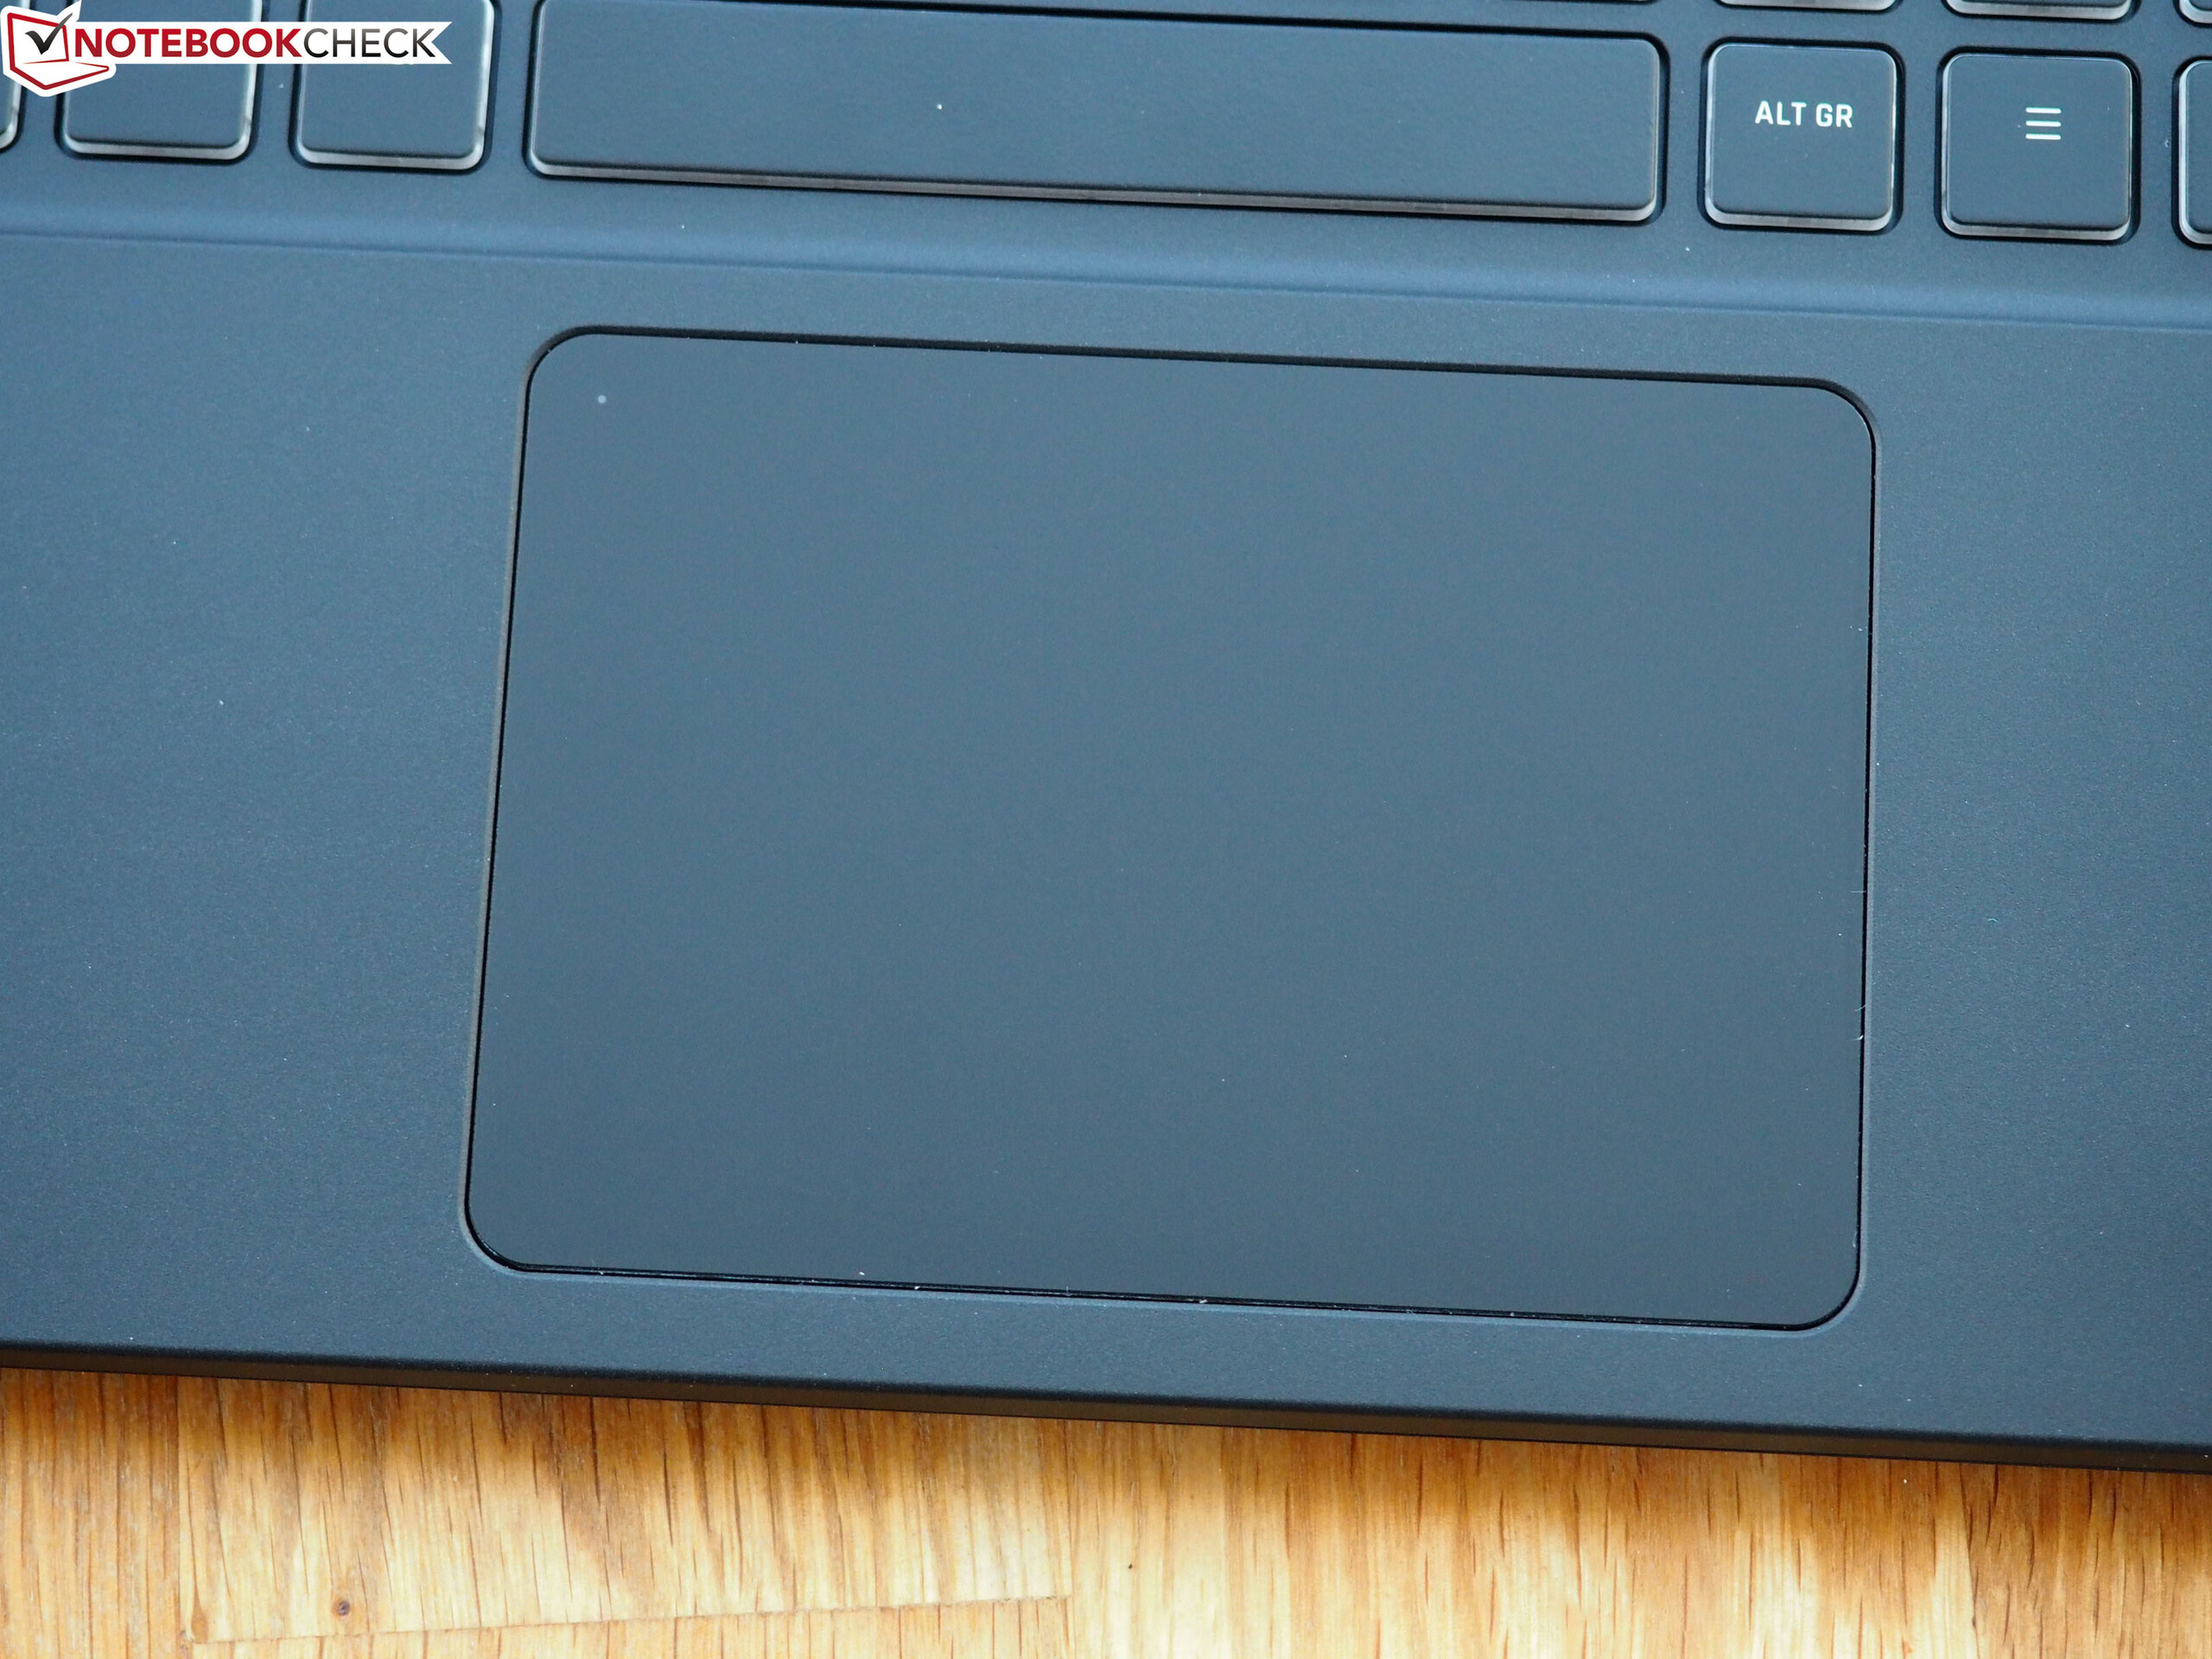
The Touchpad or more accurately, ClickPad, delivers an acceptable performance. At 10.6 x 7.4 cm (~4.2 x 2.9 in) it is sized sufficiently large for a 15-inch device. The surface, which appears slightly rubberized, offers relatively good sliding characteristics. Of course, there is also multi-touch support. Two-finger gestures such as zooming and scrolling worked flawlessly in our test. The accuracy of the mouse replacement turned out to be mediocre. Despite a clear feedback, left and right clicks on the lower edge are not always accepted reliably and produce a loud clattering noise.
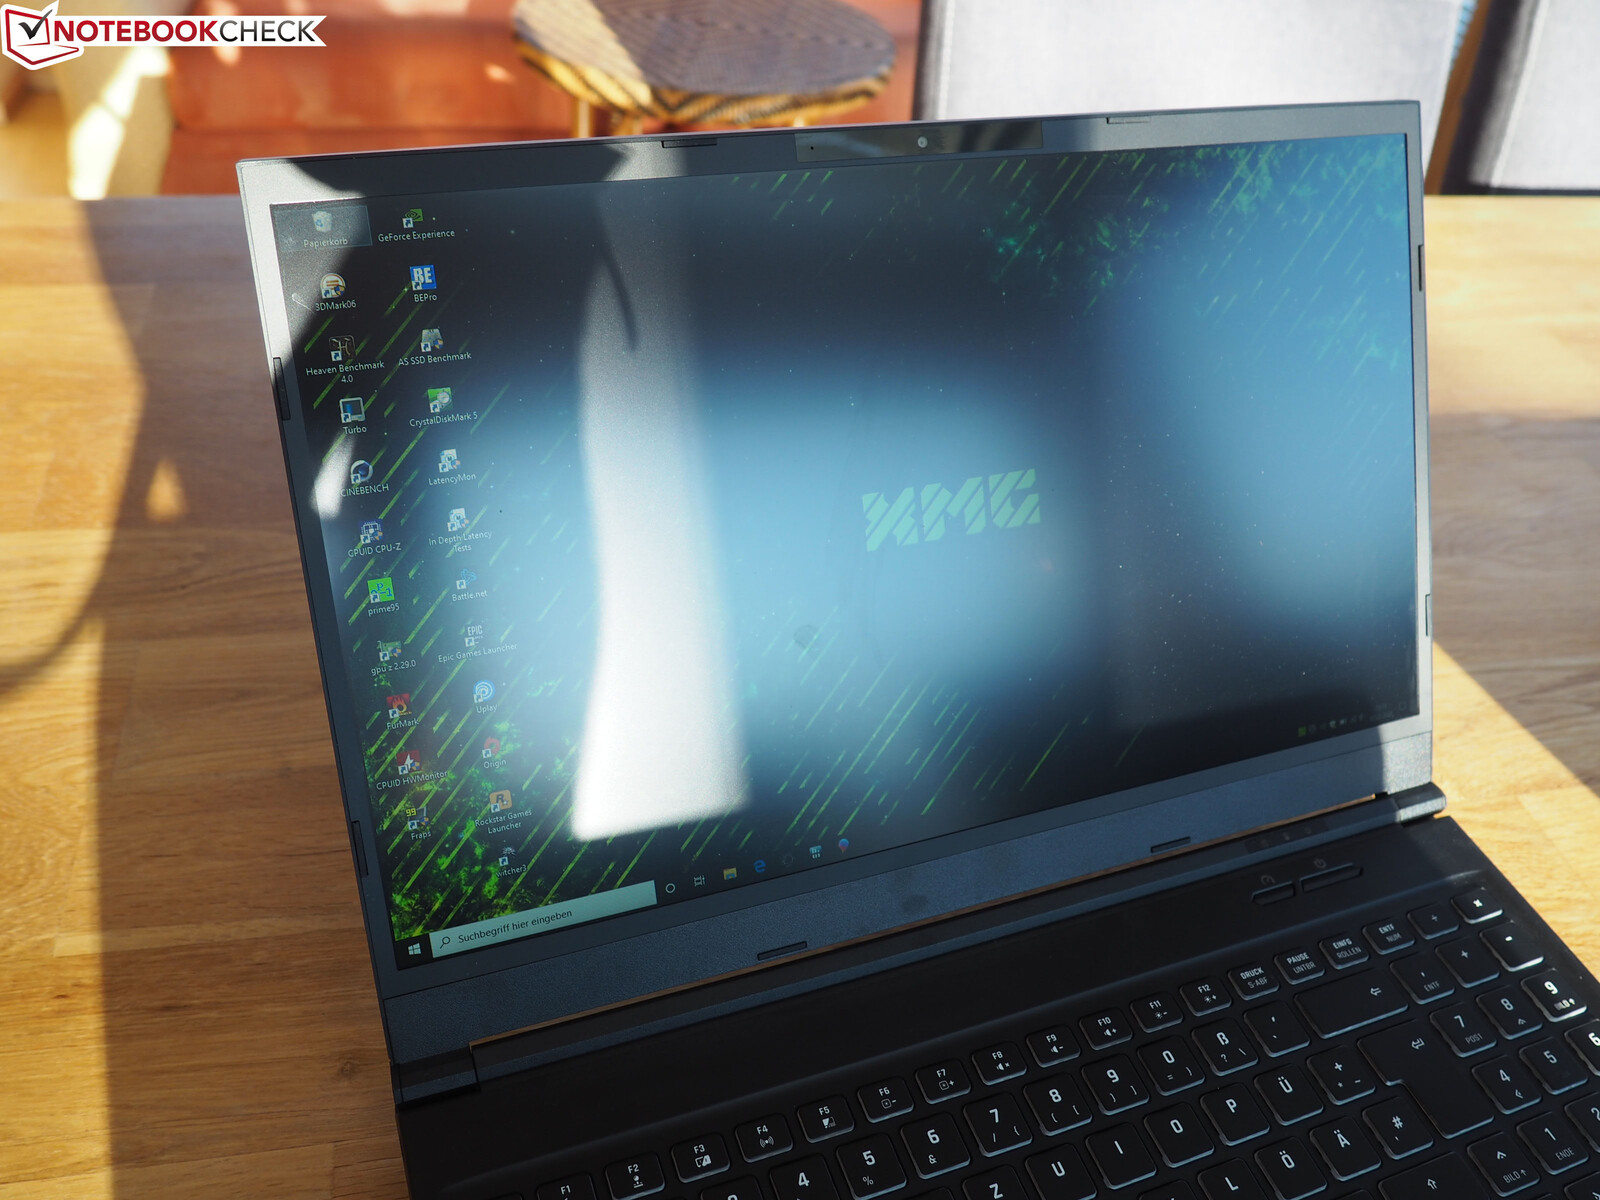
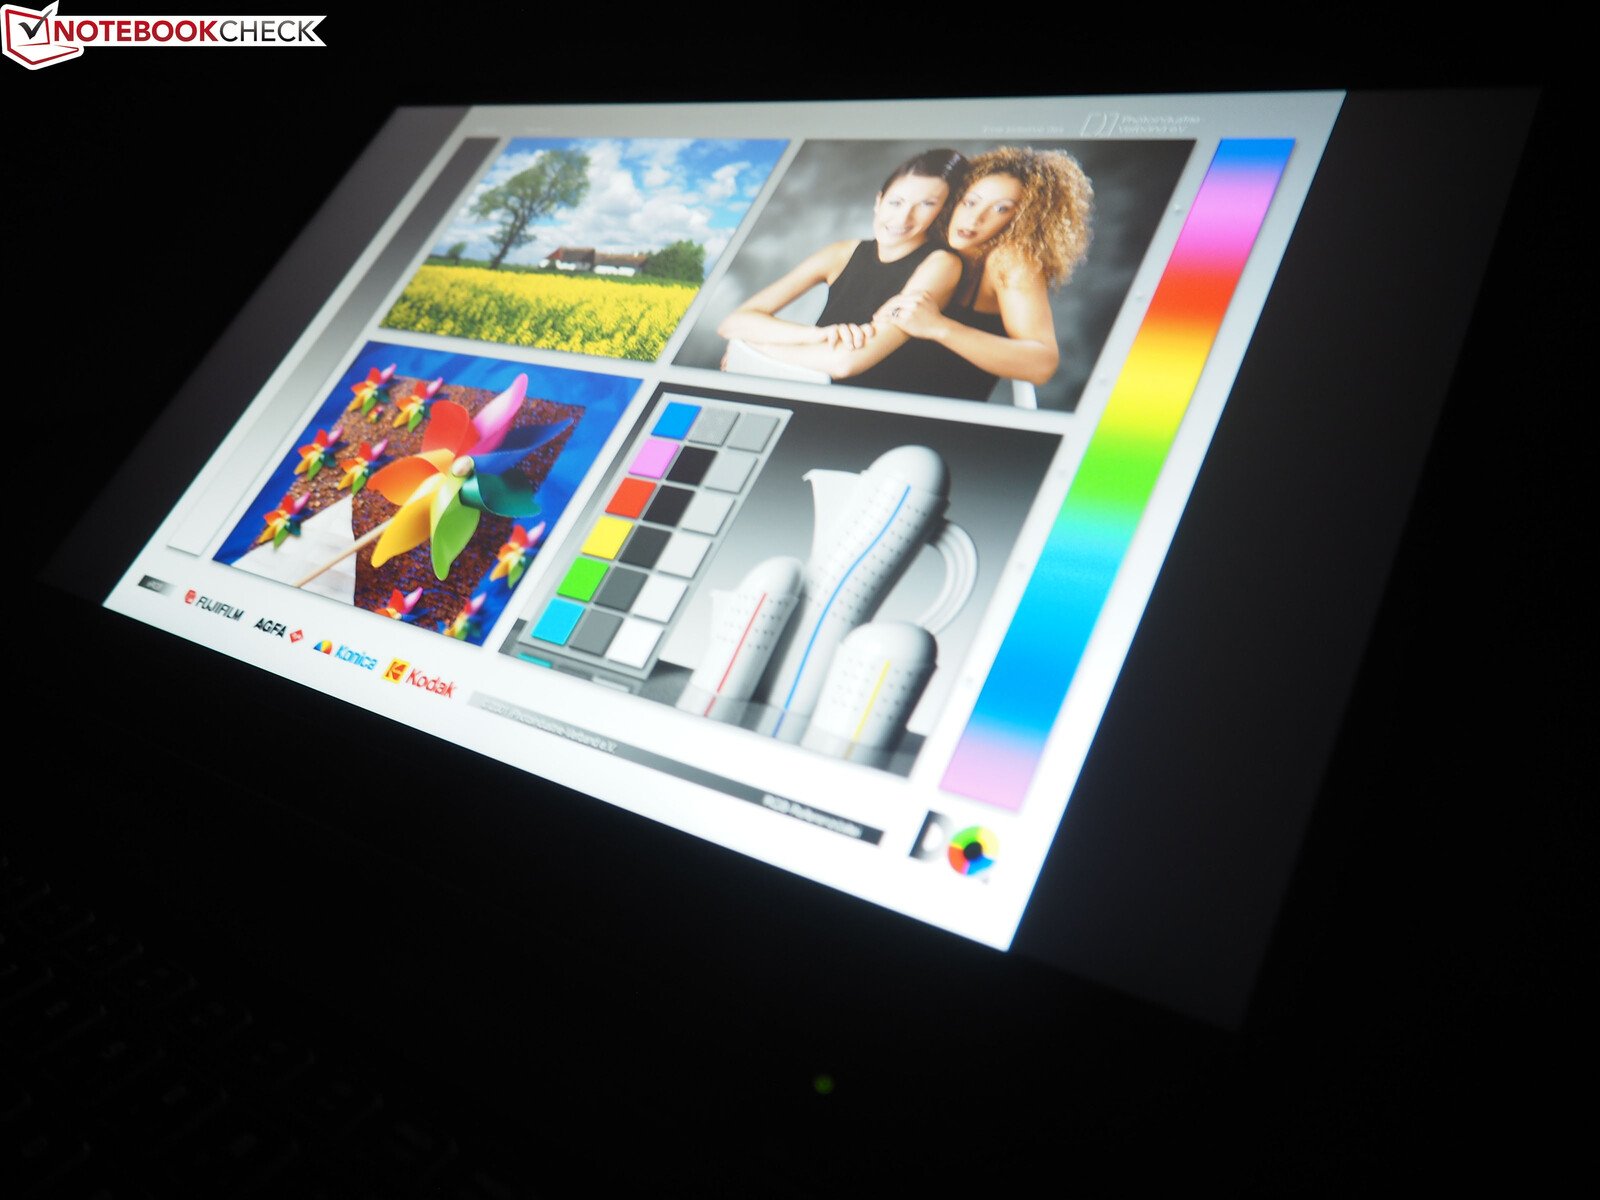
Display
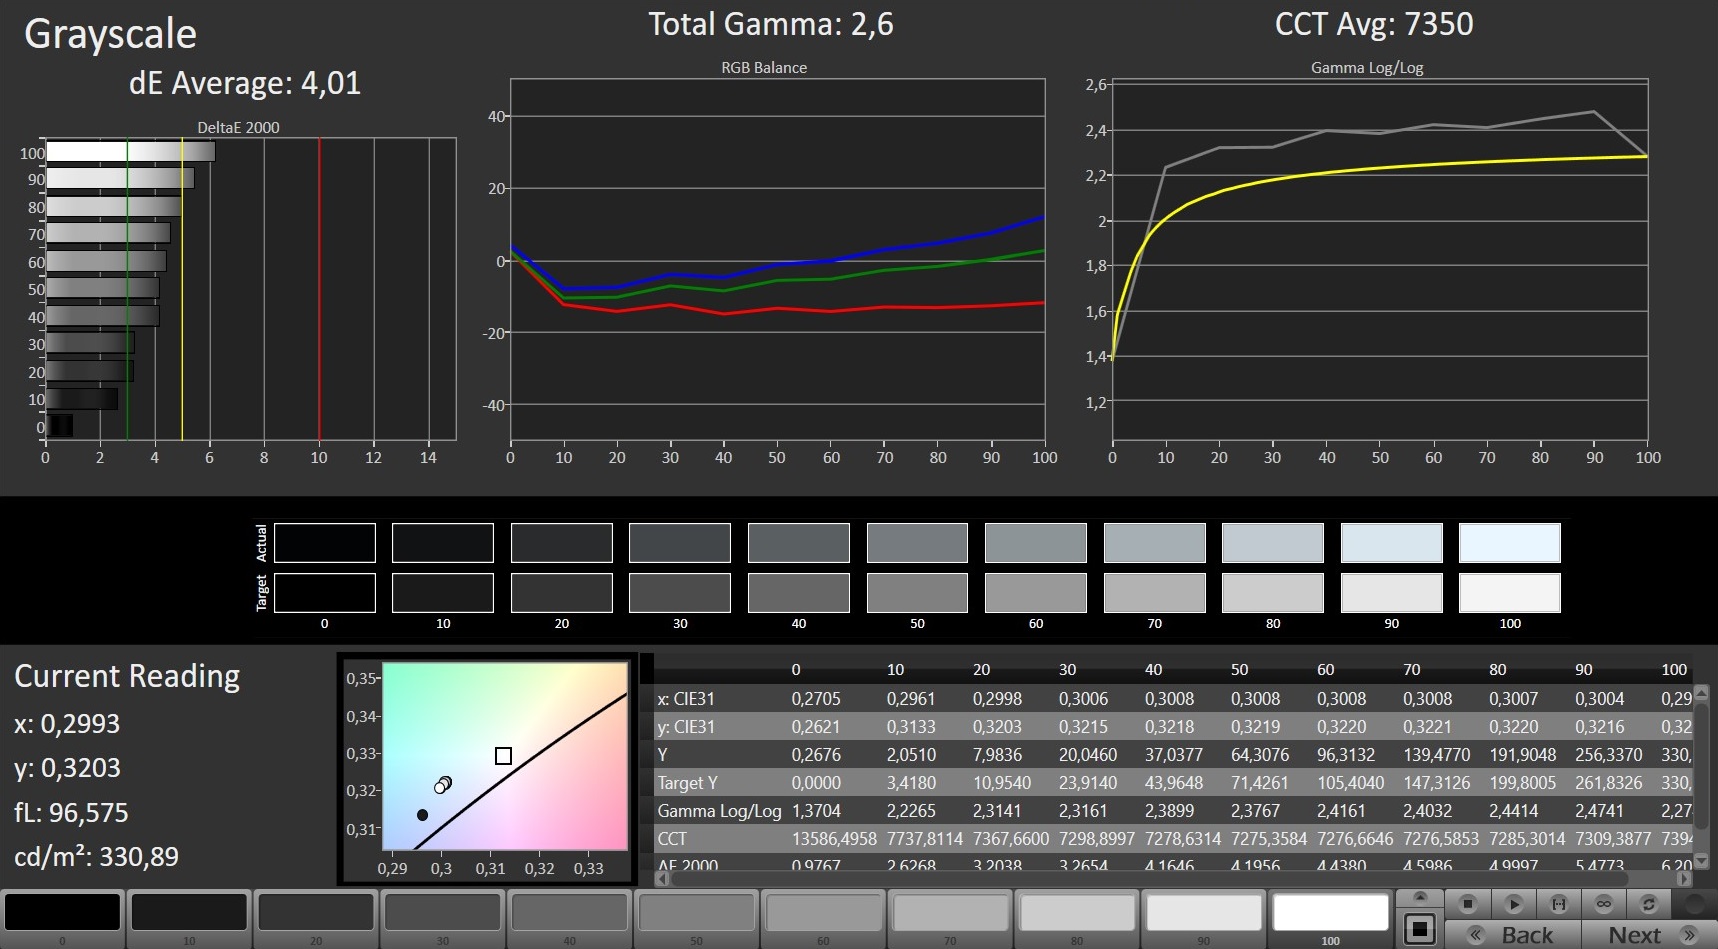
As expected, an IPS panel with 144 Hz is used as the display. The measured values are not particularly spectacular, but this is not meant as a negative. As long as you stay indoors, an average brightness of barely 300 cd/m² is okay. Only if you stay outdoors, the brightness should be higher.
| |||||||||||||||||||||||||
Brightness Distribution: 88 %
Center on Battery: 324 cd/m²
Contrast: 1200:1 (Black: 0.27 cd/m²)
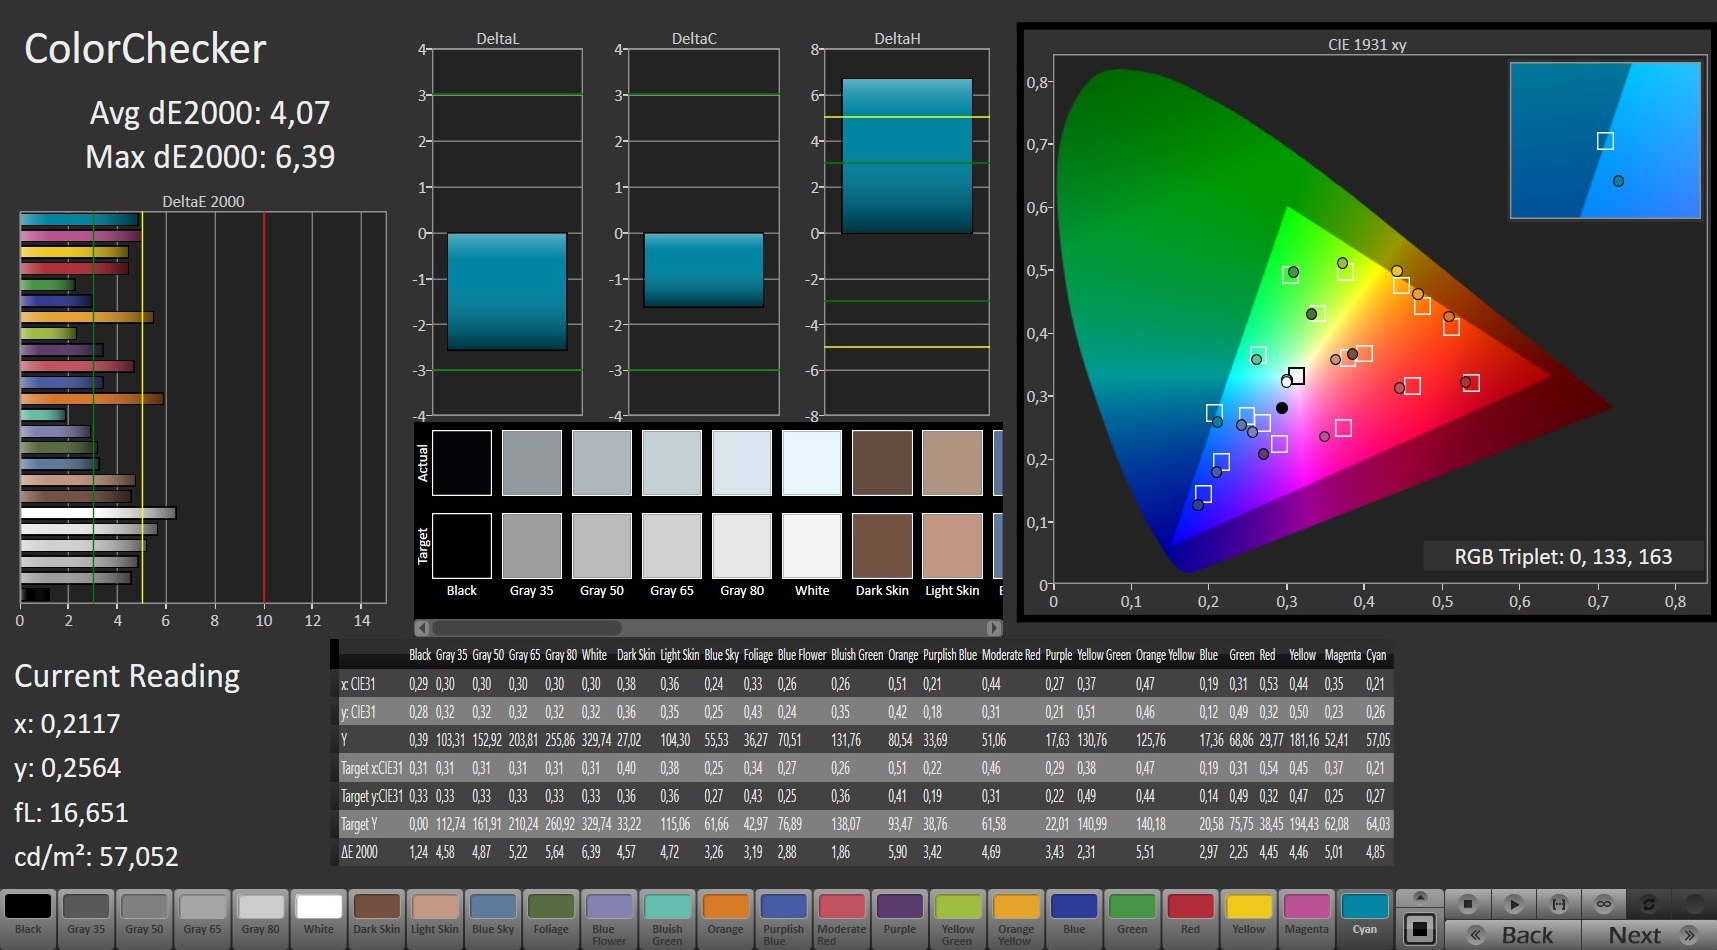
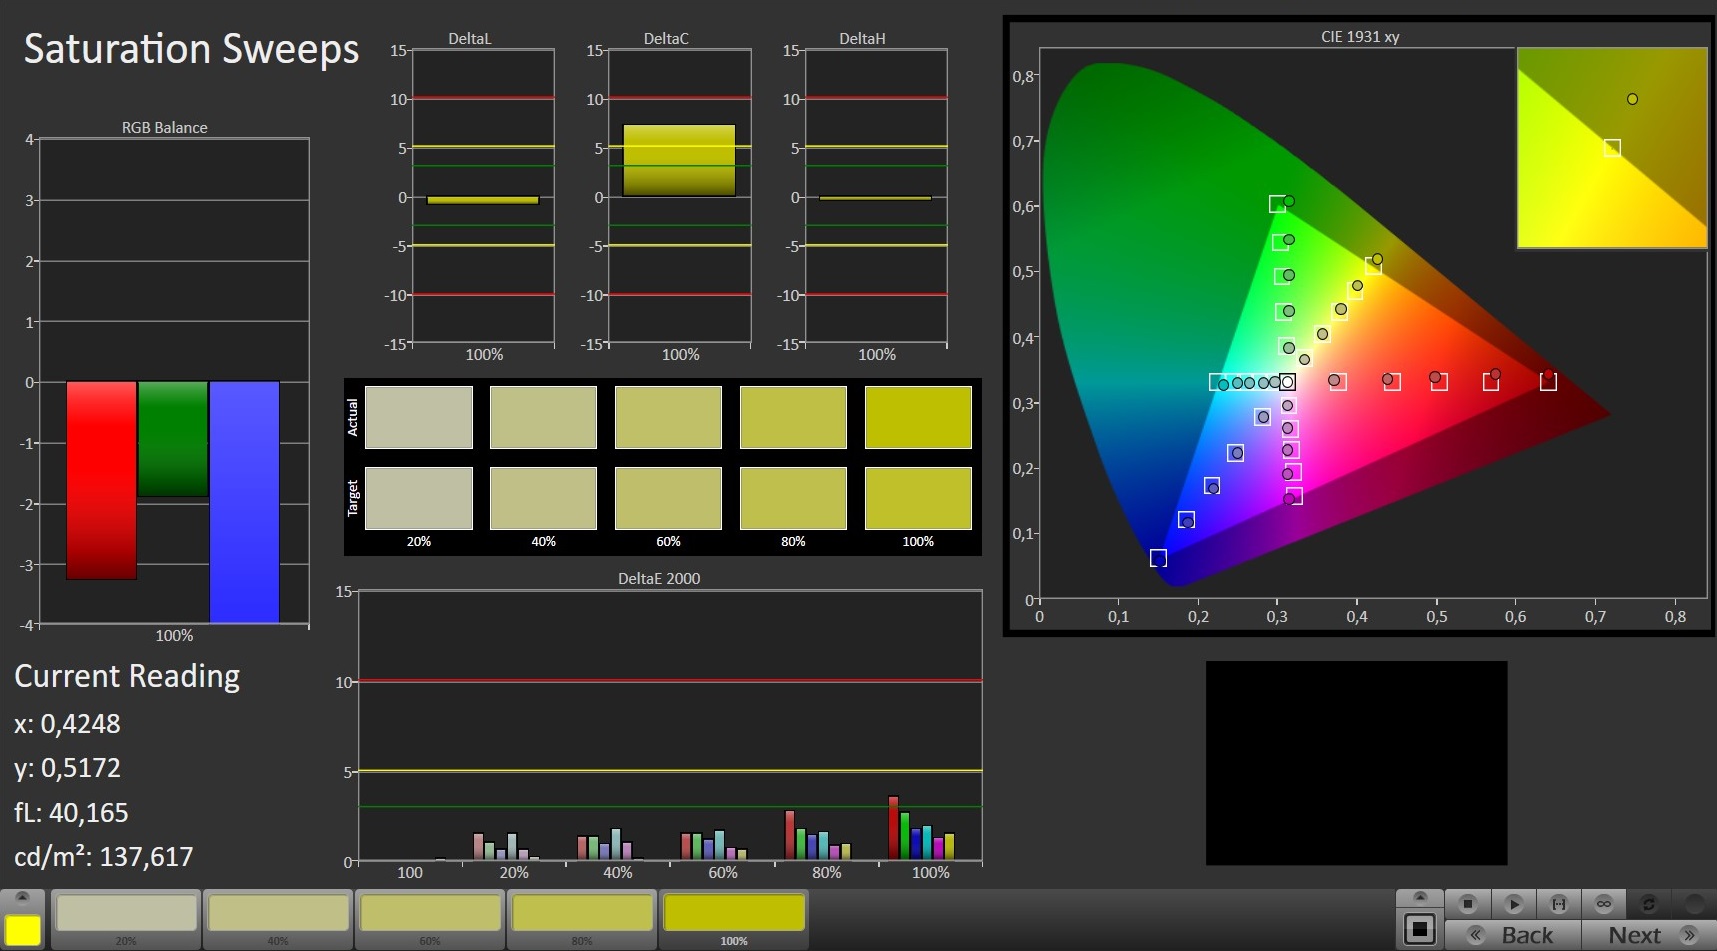
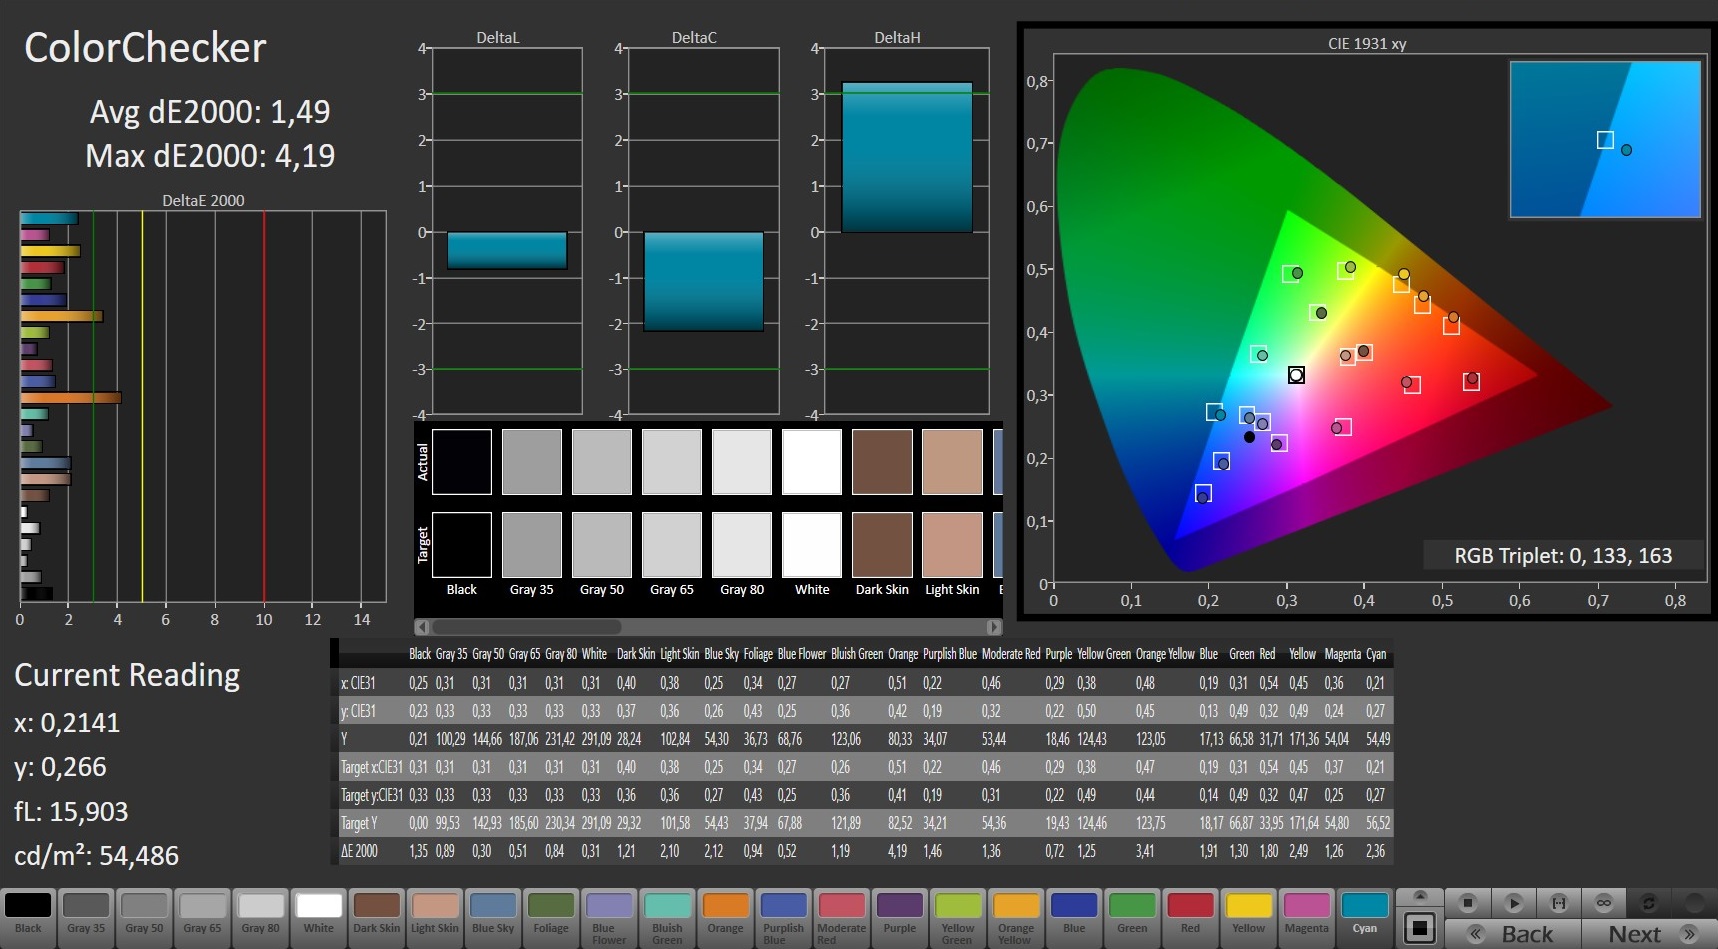
ΔE ColorChecker Calman: 4.07 | ∀{0.5-29.43 Ø4.73}
calibrated: 1.49
ΔE Greyscale Calman: 4.01 | ∀{0.09-98 Ø4.97}
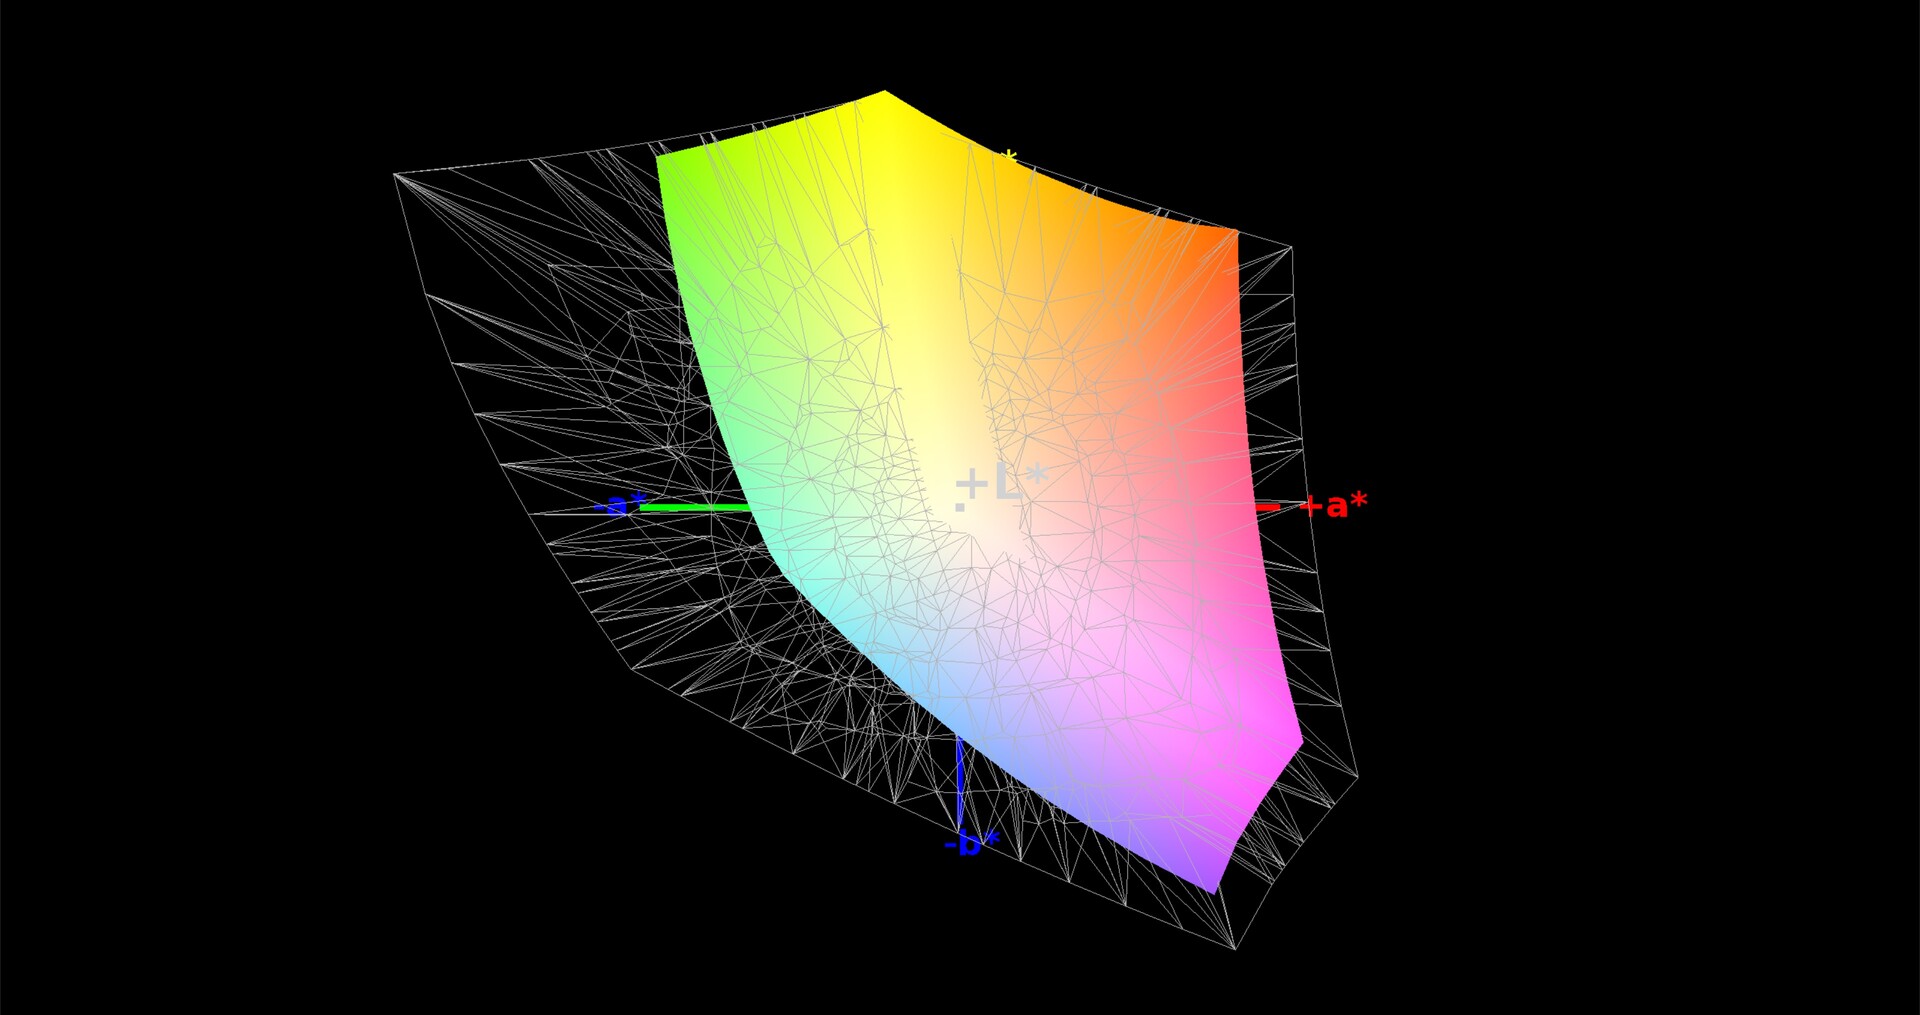
91% sRGB (Argyll 1.6.3 3D)
59% AdobeRGB 1998 (Argyll 1.6.3 3D)
65% AdobeRGB 1998 (Argyll 3D)
91.2% sRGB (Argyll 3D)
63.3% Display P3 (Argyll 3D)
Gamma: 2.6
CCT: 7350 K
| Schenker XMG Core 15 GK5CP6V BOEhydis NV156FHM-N4G (BOE084D), IPS, 1920x1080 | Razer Blade 15 GTX 1660 Ti BOE NV156FHM-N4K, IPS, 1920x1080 | Asus ROG Zephyrus M15 GU502GU-XB74 AU Optronics B156HAN08.2, IPS, 1920x1080 | Aorus 15-SA LG Philips LP156WFG-SPB2 (LGD05E8), IPS, 1920x1080 | Lenovo Legion Y540-15IRH-81SX00B2GE BOE 084D, IPS, 1920x1080 | Acer Predator Helios 300 PH315-52-79TY AUO, B156HAN08.2, IPS, 1920x1080 | |
|---|---|---|---|---|---|---|
| Display | 2% | 2% | 2% | 0% | 1% | |
| Display P3 Coverage (%) | 63.3 | 65.3 3% | 66.5 5% | 64.3 2% | 63.6 0% | 64.1 1% |
| sRGB Coverage (%) | 91.2 | 91.8 1% | 90.8 0% | 93.6 3% | 91.7 1% | 93 2% |
| AdobeRGB 1998 Coverage (%) | 65 | 66.5 2% | 66.5 2% | 65.6 1% | 65.2 0% | 65.7 1% |
| Response Times | -26% | 21% | -50% | -8% | -29% | |
| Response Time Grey 50% / Grey 80% * (ms) | 8.8 ? | 13.6 ? -55% | 6.4 ? 27% | 15.6 ? -77% | 8.8 ? -0% | 15 ? -70% |
| Response Time Black / White * (ms) | 10.4 ? | 10 ? 4% | 8.8 ? 15% | 12.8 ? -23% | 12 ? -15% | 9 ? 13% |
| PWM Frequency (Hz) | 200 ? | |||||
| Screen | -11% | -15% | -1% | -6% | -4% | |
| Brightness middle (cd/m²) | 324 | 312.7 -3% | 297.7 -8% | 266 -18% | 299 -8% | 325 0% |
| Brightness (cd/m²) | 296 | 305 3% | 280 -5% | 254 -14% | 290 -2% | 310 5% |
| Brightness Distribution (%) | 88 | 90 2% | 84 -5% | 90 2% | 89 1% | 82 -7% |
| Black Level * (cd/m²) | 0.27 | 0.27 -0% | 0.43 -59% | 0.28 -4% | 0.29 -7% | 0.255 6% |
| Contrast (:1) | 1200 | 1158 -3% | 692 -42% | 950 -21% | 1031 -14% | 1275 6% |
| Colorchecker dE 2000 * | 4.07 | 4.57 -12% | 3.13 23% | 3.11 24% | 3.7 9% | 4.28 -5% |
| Colorchecker dE 2000 max. * | 6.39 | 6.81 -7% | 7.1 -11% | 5.84 9% | 7 -10% | 8.42 -32% |
| Colorchecker dE 2000 calibrated * | 1.49 | 2.91 -95% | 3.06 -105% | 1.37 8% | 2 -34% | 1.45 3% |
| Greyscale dE 2000 * | 4.01 | 4.3 -7% | 1.9 53% | 3.94 2% | 4.1 -2% | 5.01 -25% |
| Gamma | 2.6 85% | 2.29 96% | 2.23 99% | 2.53 87% | 2.19 100% | 2.6 85% |
| CCT | 7350 88% | 7098 92% | 6325 103% | 6210 105% | 7166 91% | 7678 85% |
| Color Space (Percent of AdobeRGB 1998) (%) | 59 | 59.4 1% | 59.2 0% | 60 2% | 59.3 1% | 60 2% |
| Color Space (Percent of sRGB) (%) | 91 | 91.3 0% | 90.5 -1% | 93 2% | 91.5 1% | 93 2% |
| Total Average (Program / Settings) | -12% /
-10% | 3% /
-7% | -16% /
-6% | -5% /
-5% | -11% /
-6% |
* ... smaller is better
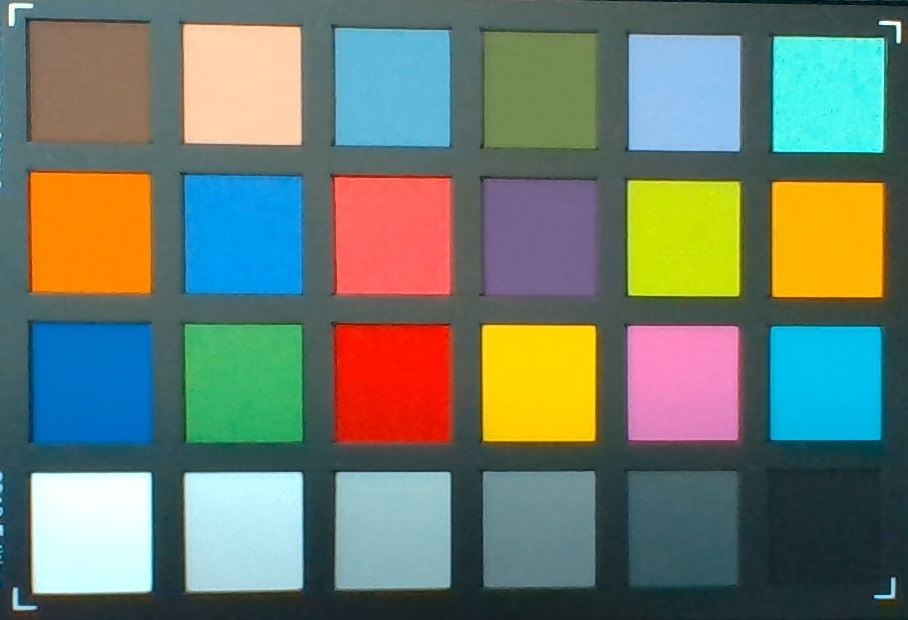
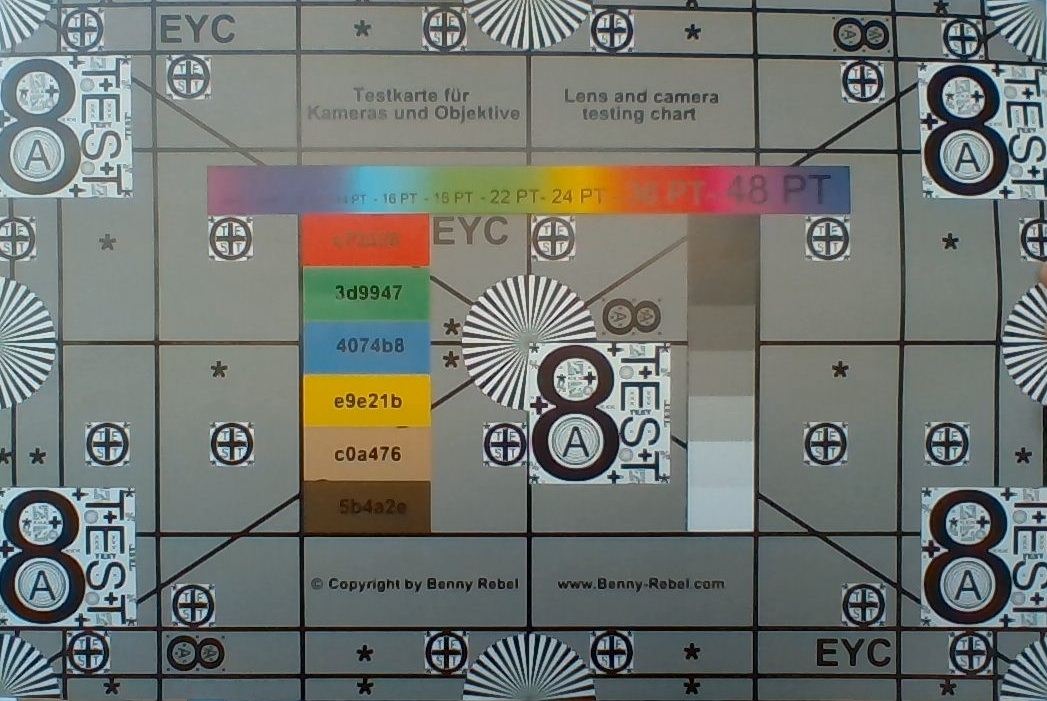
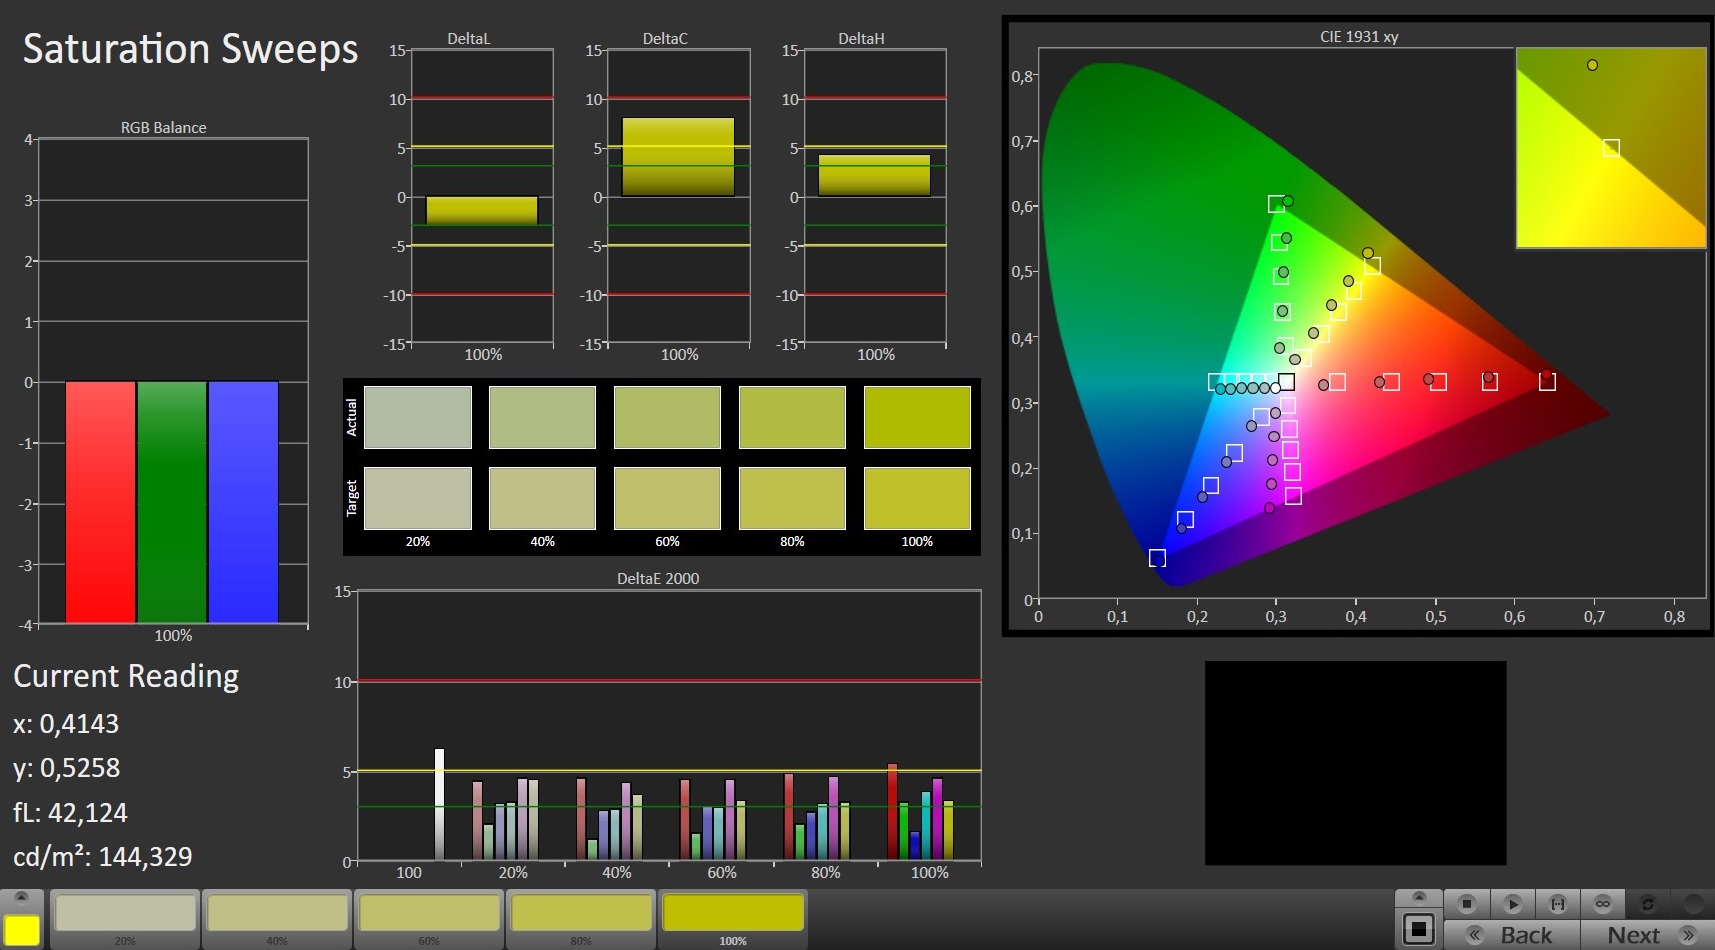
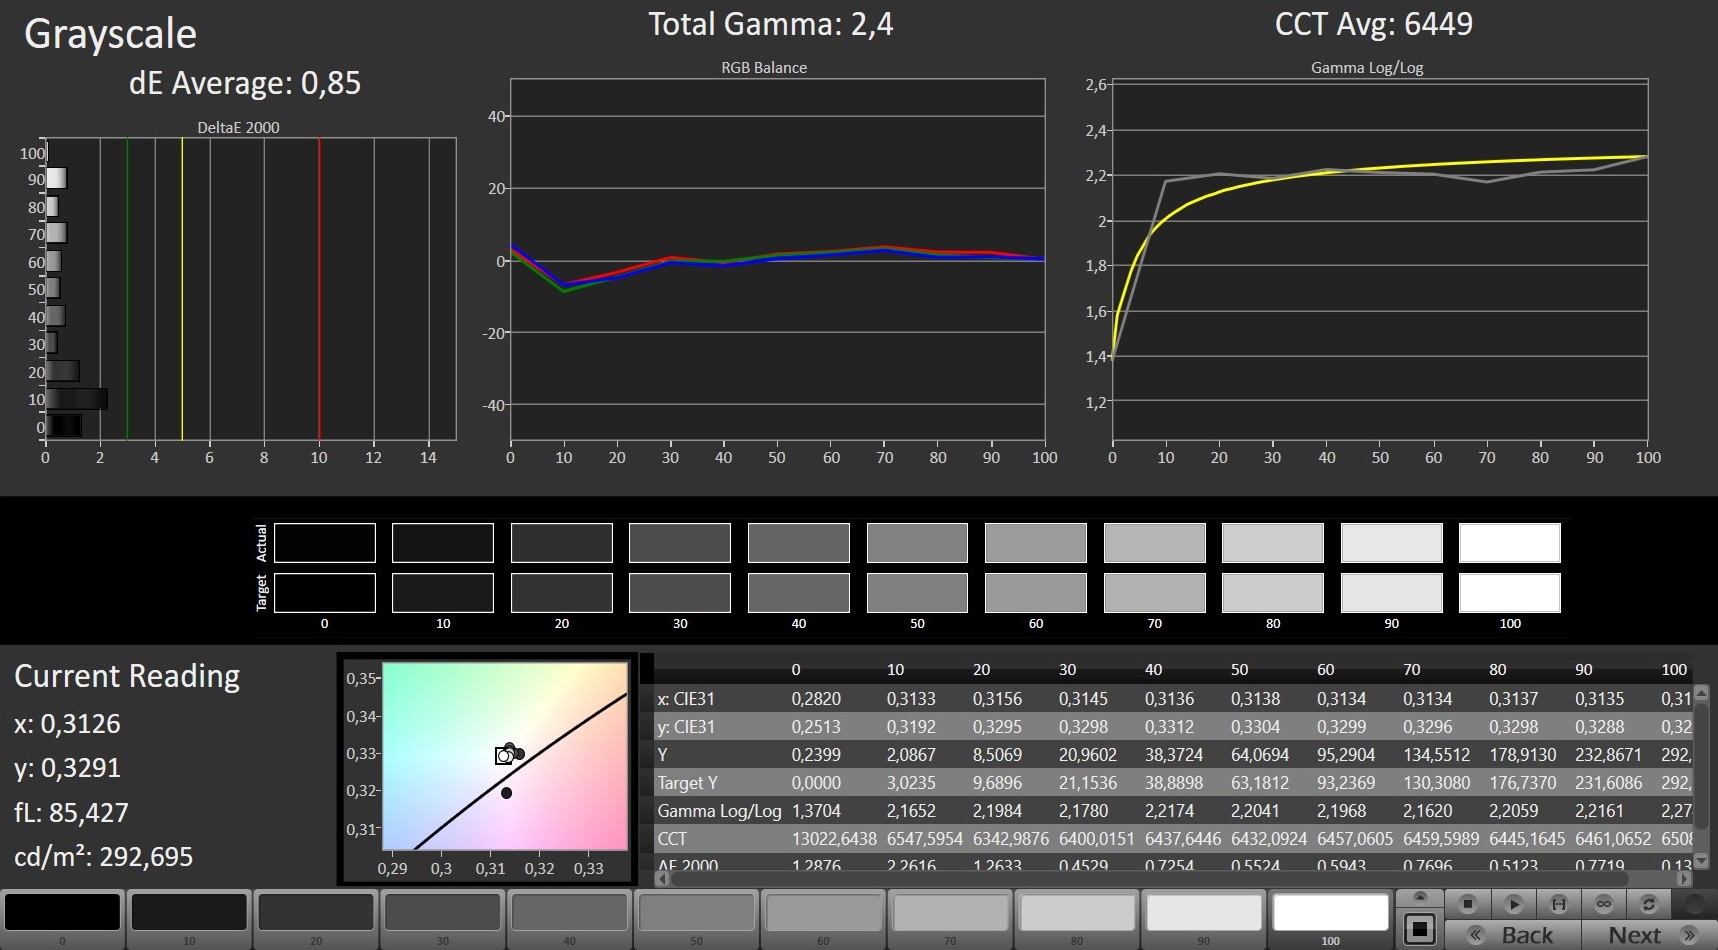
The black value (0.27 cd/m²) and the contrast (1200:1) hardly give any reason for complaint. The same goes for the color space coverage, which at 91% sRGB and 59% AdobeRGB is similar to that of the competitors. Even through the color accuracy barely misses the target range and white color tones have a slight bluish tint, most buyers should be satisfied with the color reproduction. As an option, you can also improve the color reproduction by using our ICC file which is linked above for your download.
One of the biggest strengths of the 144-Hz panel is its fast response time. About 10 ms promises a streak-free image even during fast games (such as ego shooters). As typical for IPS panels, the viewing angles range at a good level.

Unlike many other laptops, our test unit did not have to struggle with any pronounced screen bleeding. In favor of the battery life, Nvidia's G-Sync image improvement is not used.
Display Response Times
| ↔ Response Time Black to White | ||
|---|---|---|
| 10.4 ms ... rise ↗ and fall ↘ combined | ↗ 5.2 ms rise | 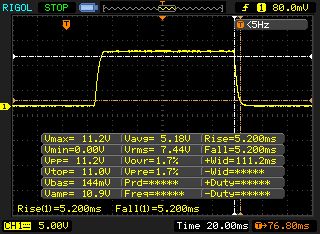 |
| ↘ 5.2 ms fall | ||
| The screen shows good response rates in our tests, but may be too slow for competitive gamers. In comparison, all tested devices range from 0.1 (minimum) to 240 (maximum) ms. » 28 % of all devices are better. This means that the measured response time is better than the average of all tested devices (19.9 ms). | ||
| ↔ Response Time 50% Grey to 80% Grey | ||
| 8.8 ms ... rise ↗ and fall ↘ combined | ↗ 4.4 ms rise | 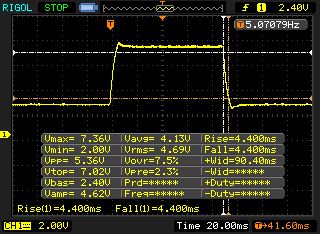 |
| ↘ 4.4 ms fall | ||
| The screen shows fast response rates in our tests and should be suited for gaming. In comparison, all tested devices range from 0.165 (minimum) to 636 (maximum) ms. » 22 % of all devices are better. This means that the measured response time is better than the average of all tested devices (31.1 ms). | ||
Screen Flickering / PWM (Pulse-Width Modulation)
| Screen flickering / PWM not detected | 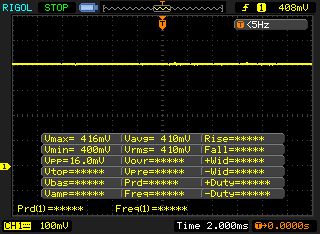 | ||
In comparison: 52 % of all tested devices do not use PWM to dim the display. If PWM was detected, an average of 7797 (minimum: 5 - maximum: 343500) Hz was measured. | |||
Testing Conditions
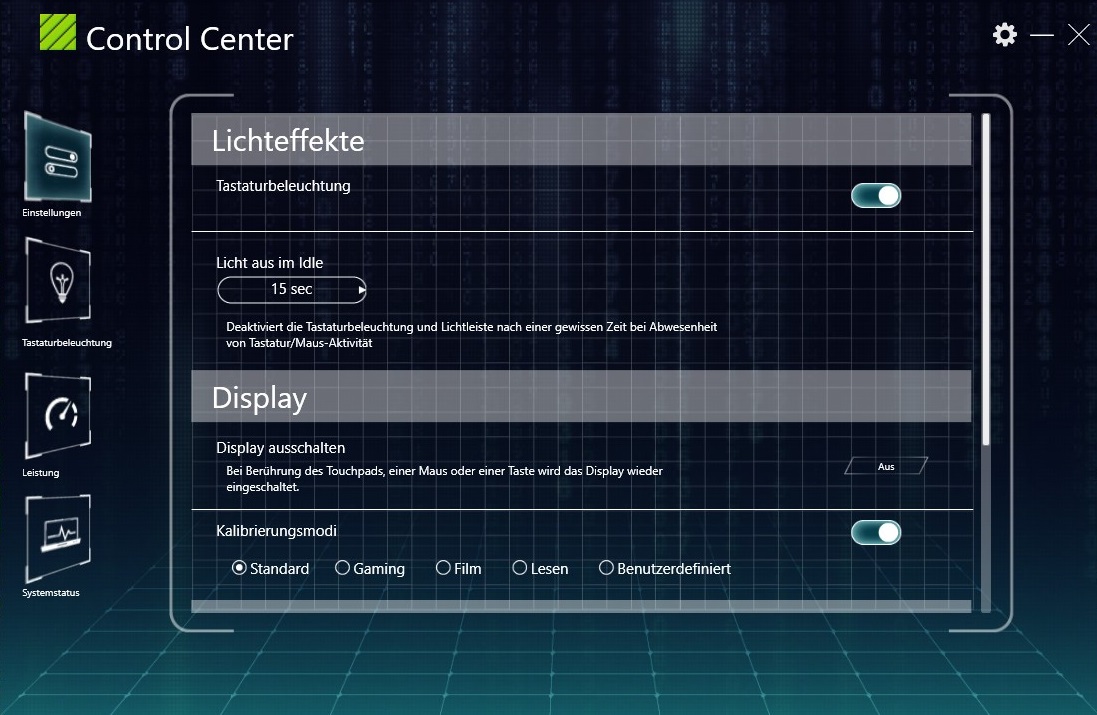
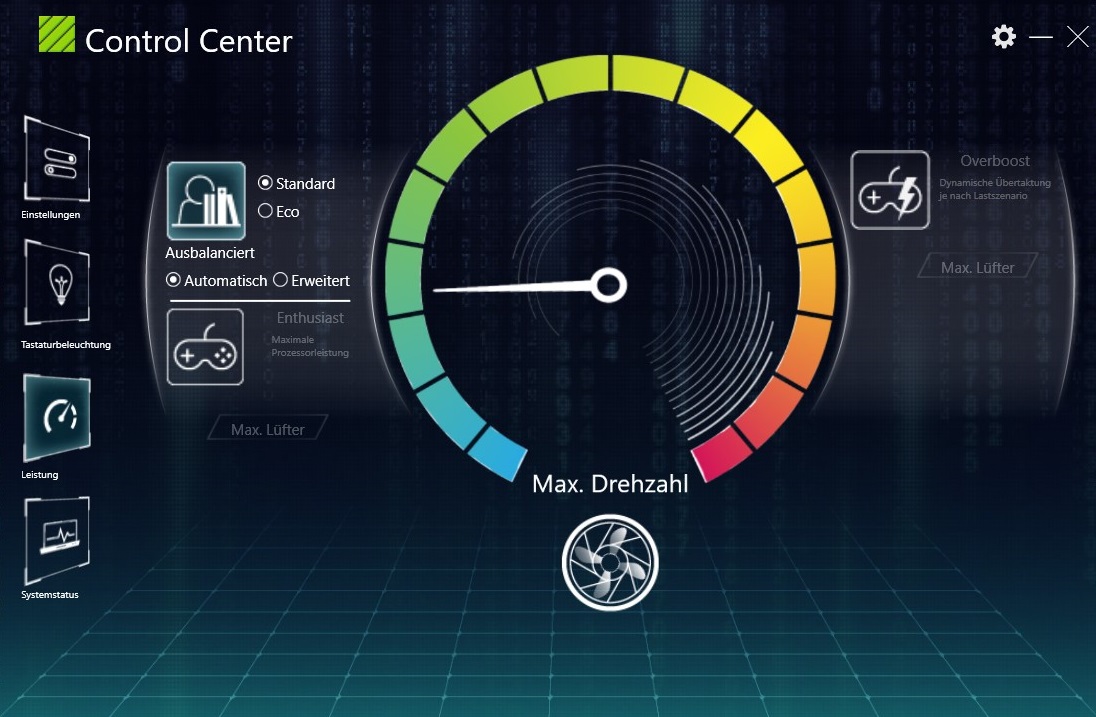
The preinstalled Control Center allows you to adjust several system settings. All of our tests were run using the Balanced or Standard power profiles and the automatic fan control. With other modes, some of the measurements (such as the noise volume) might be completely different.
Performance
Depending on the configuration, the Core 15 positions itself in the upper mid-range (GTX 1650) or the lower high-end (GTX 1660 Ti). In combination with a PCIe/NVMe SSD and at least 16 GB of RAM, the Core i7-9750H should offer sufficient performance reserves also for the coming years.
Processor
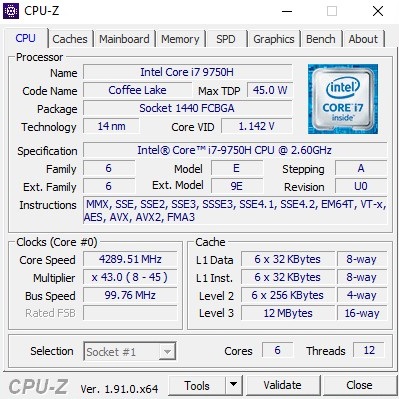
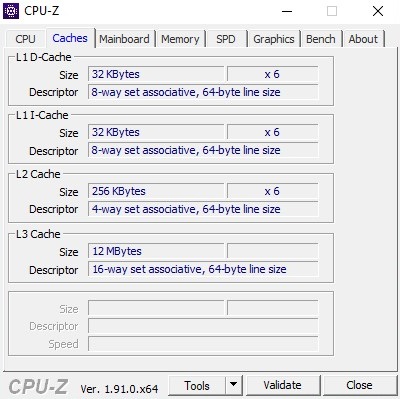
The processor is a six-core model from Intel's Coffee Lake generation, which can operate up to 12 threads simultaneously, thanks to Hyper-Threading. In addition, the Core i7-9750H offers 12 MB of L3 cache and an integrated graphics unit called UHD Graphics 630, which takes over non-demanding tasks in the office, video, or web areas. The dedicated GeForce GPU is only activated for demanding tasks such as 3D programs (Optimus technology).
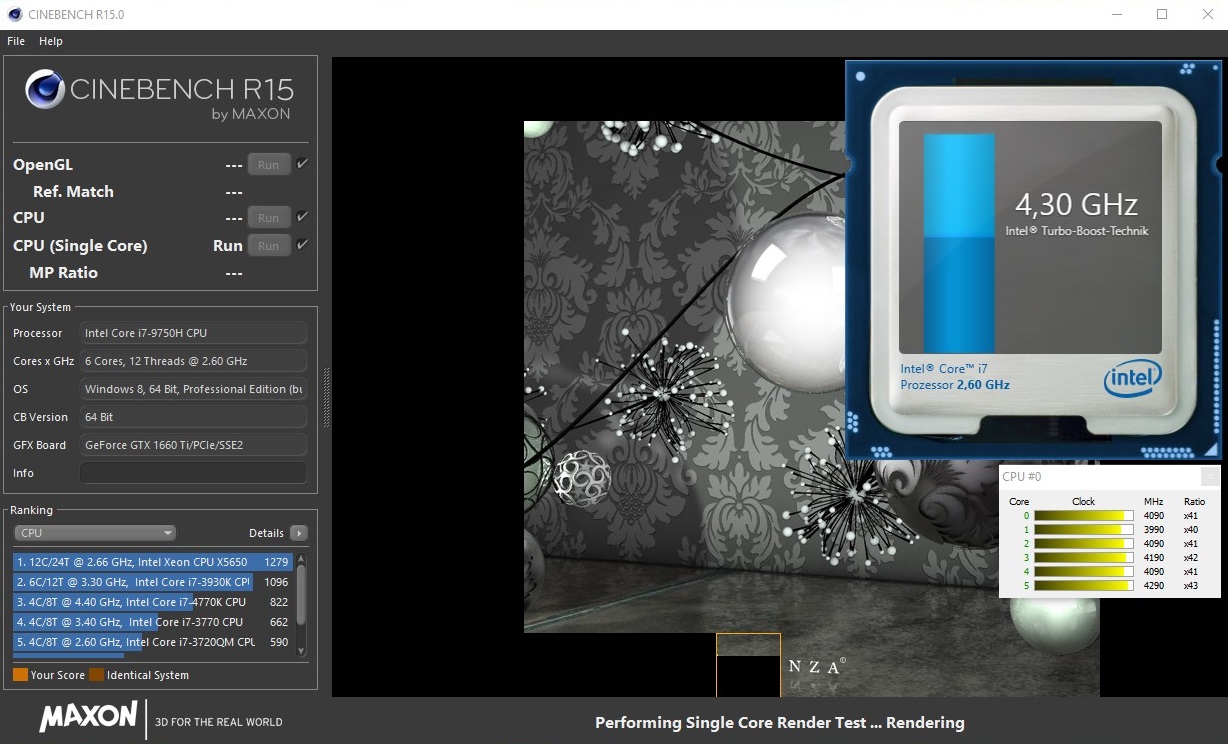
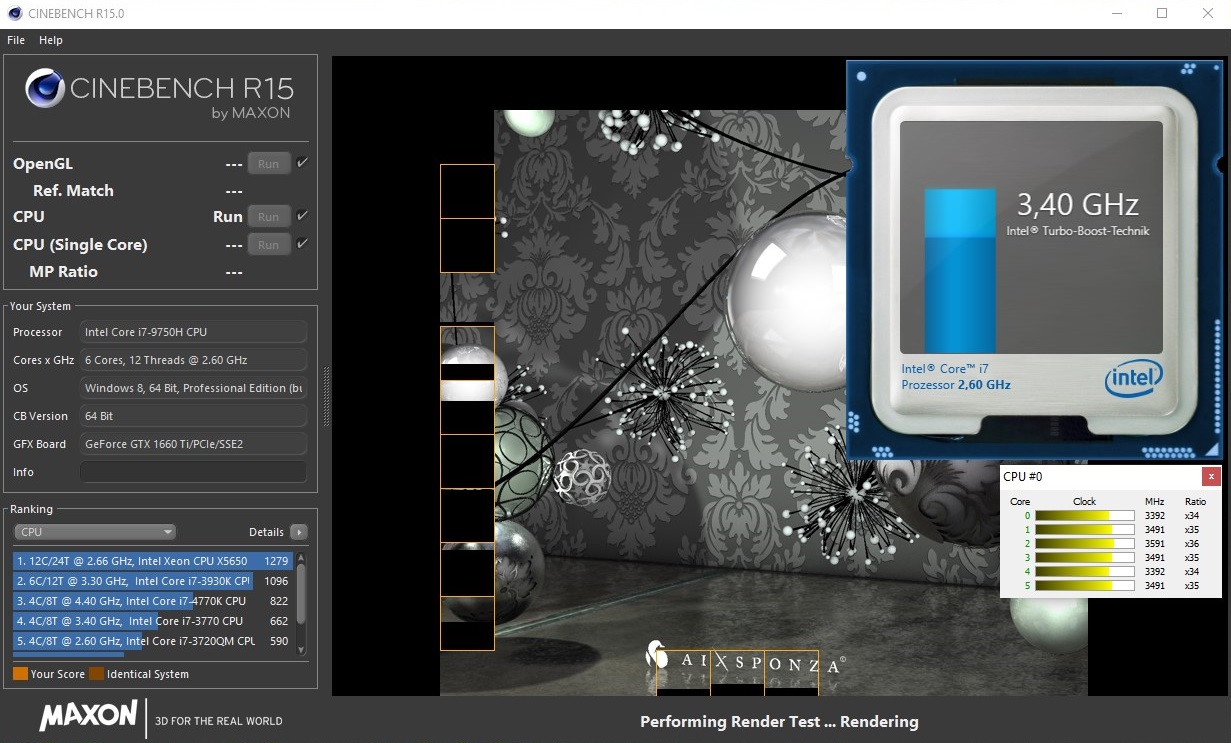
The basic clock speed of the Core i7-9750H is 2.6 GHz, and Turbo Boost (=dynamic overclocking) allows speeds of up to 4.5 GHz. However, during Balanced mode, the Core 15 only uses the CPU Turbo to a limited extent. While we were able to measure good speeds of 4.0 to 4.3 GHz in the single-core tests, 3.1 to 3.7 GHz in the multi-core scenarios was a bit meager.
With this clock speed behavior, the Core 15 positioned second to last in our comparison field during the Cinebench loop. Only the Razer Blade 15 uses its Turbo even less. In computer games, the limited Turbo hardly has any effect due to the GPU-heavy load. If needed, you can also change the power profile in the Control Center to Enthusiast or Overboost, which potentially promises more performance (naturally to the detriment of the noise levels).
System Performance
Although the operating system could boot a little faster for our tastes, the Core 15 scores with a high system performance. This is mainly due to the fast Solid-State Drive, which ensures quick installations, load times, and program starts, among other benefits.
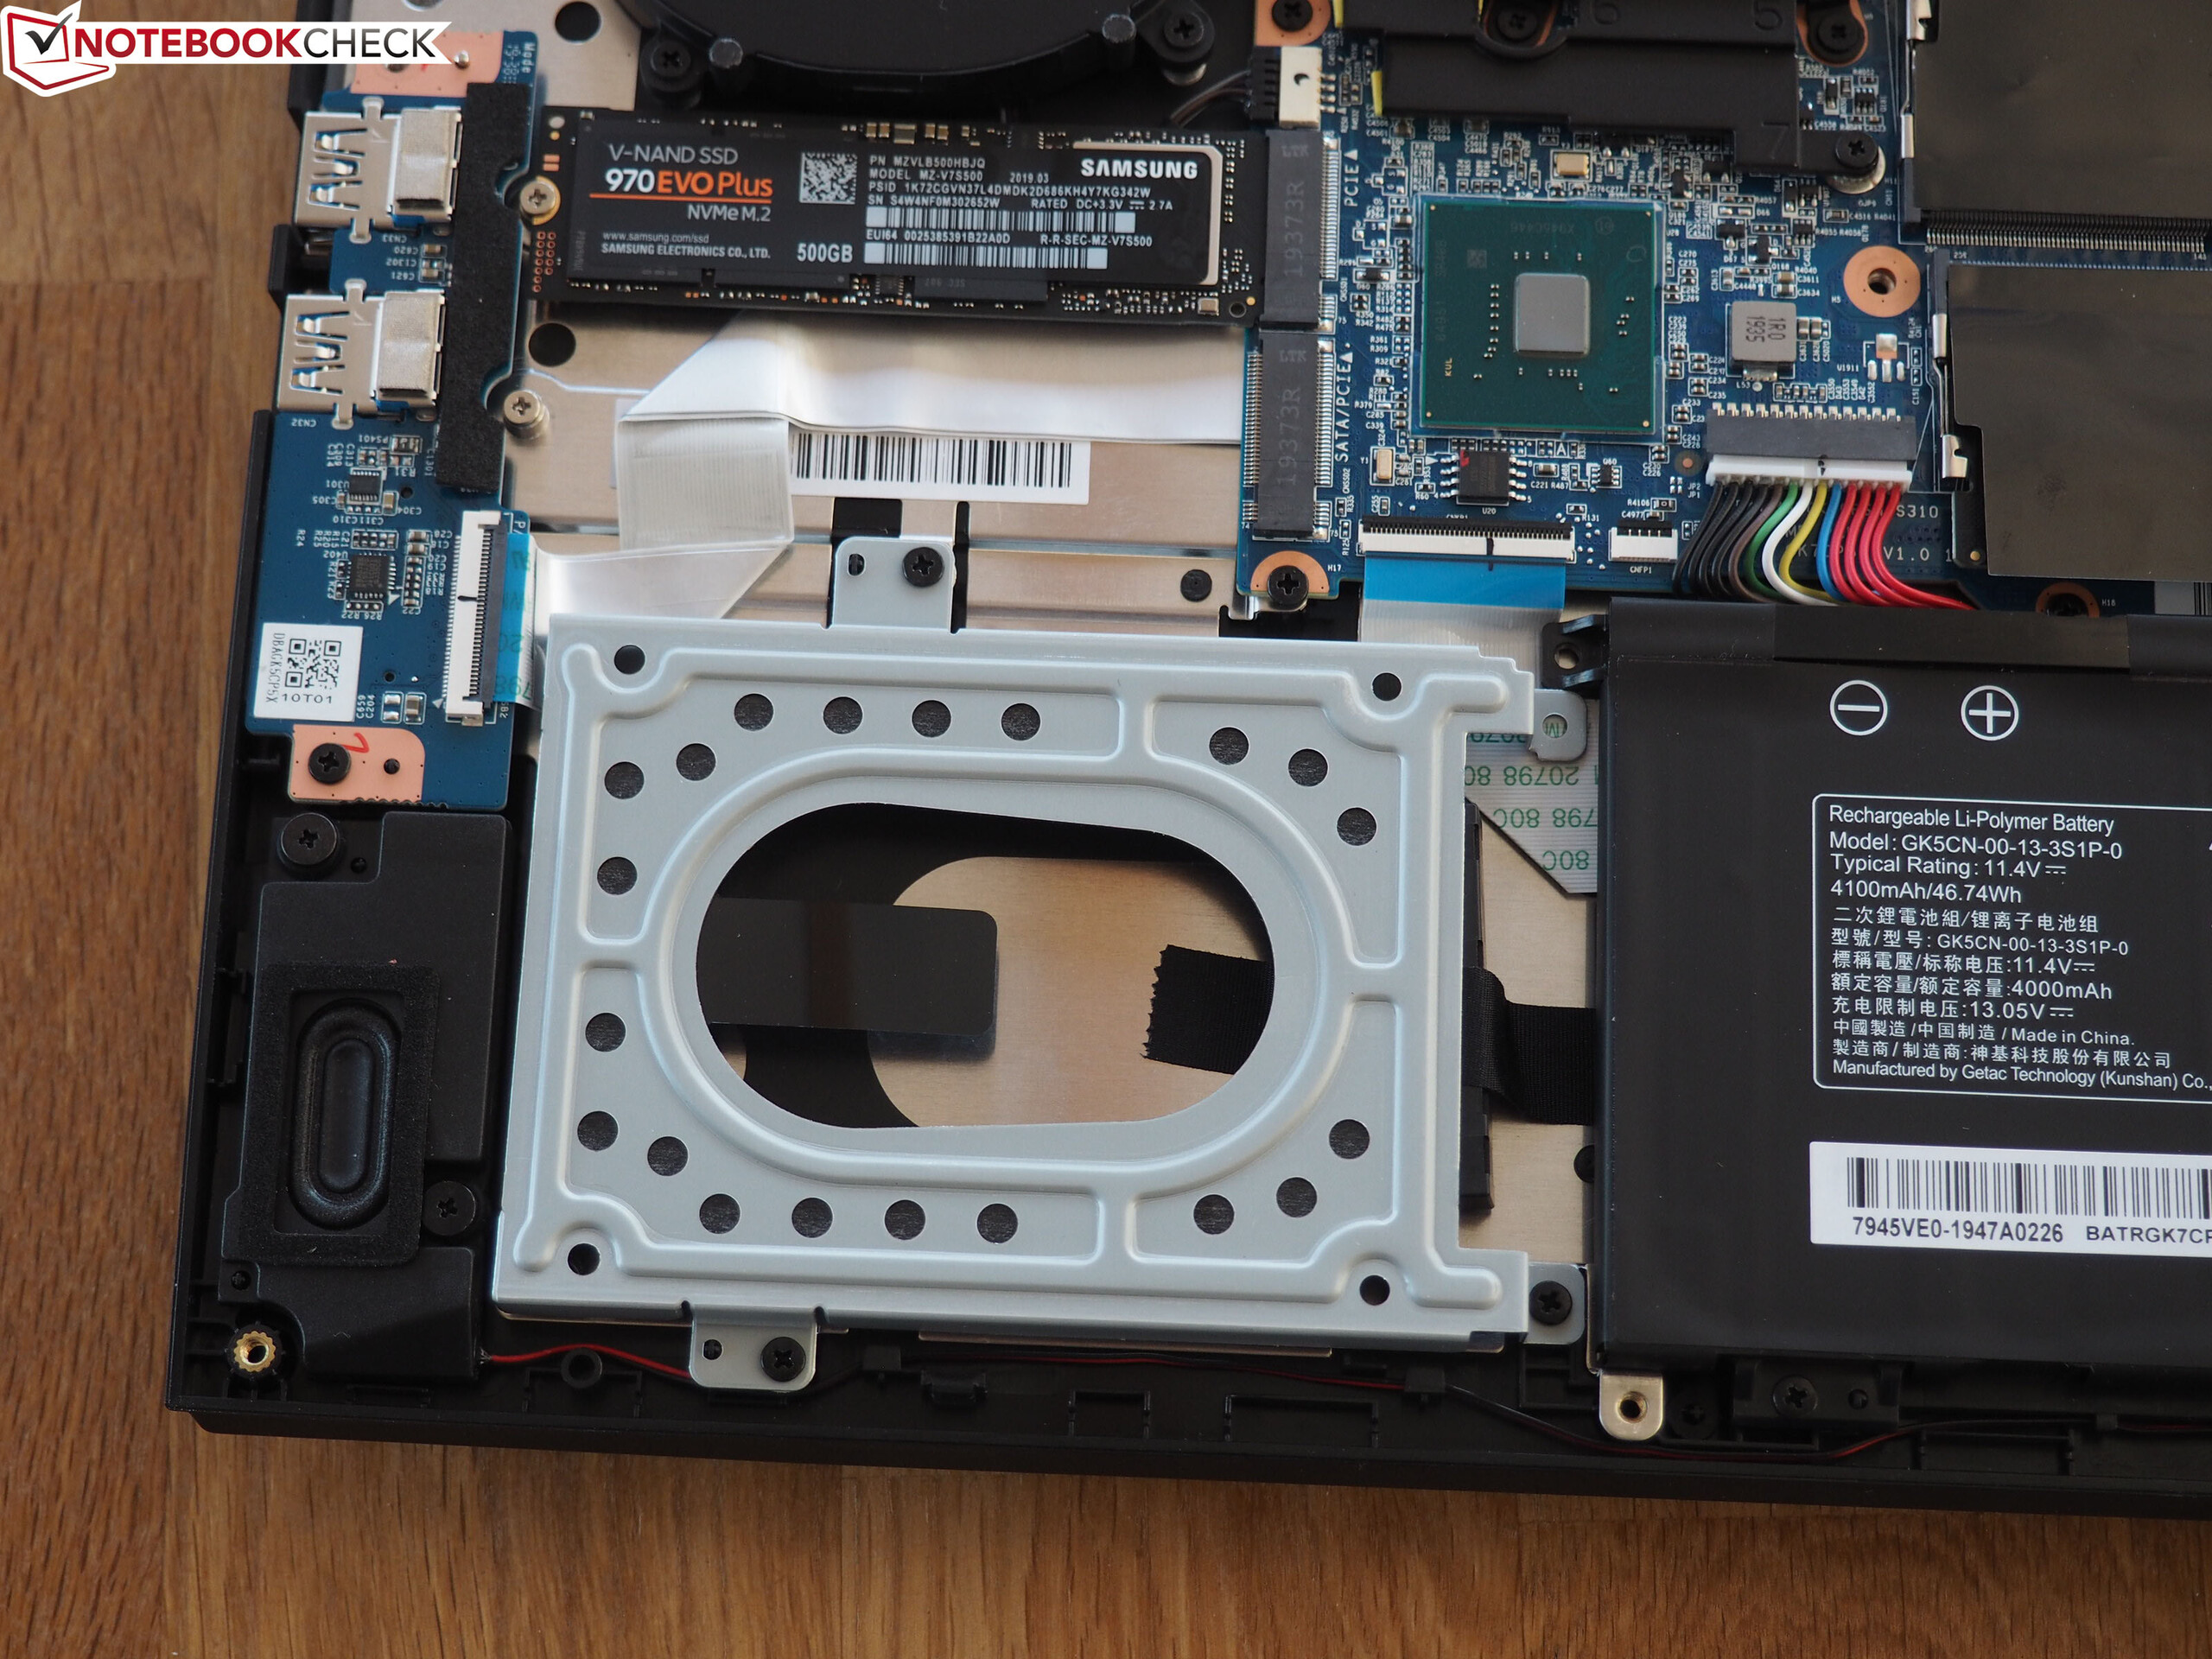
Storage Solution
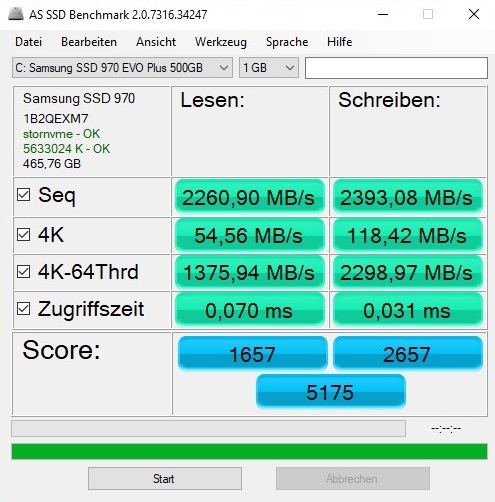
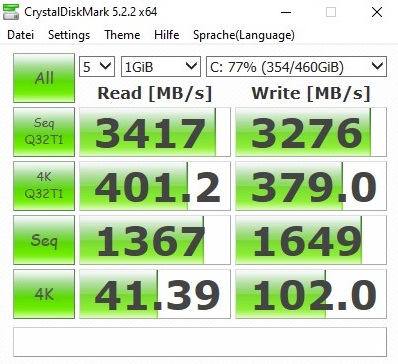
Our test unit was driven by a 500-GB SSD from Samsung. As confirmed by our benchmarks, the 970 Evo Plus NVMe model is easily able to compete with the models from Intel and WDC. Whether during reading or writing, the M.2 drive always delivers a first-rate performance. Thanks to the three slots for storage drives (1x 2.5 inch, 2x M.2), there generally is sufficient space for expansion and a high total storage capacity.
| Schenker XMG Core 15 GK5CP6V Samsung SSD 970 EVO Plus 500GB | Razer Blade 15 GTX 1660 Ti Samsung SSD PM981 MZVLB256HAHQ | Asus ROG Zephyrus M15 GU502GU-XB74 Intel SSD 660p SSDPEKNW512G8 | Aorus 15-SA Intel SSD 760p SSDPEKKW512G8 | Lenovo Legion Y540-15IRH-81SX00B2GE WDC PC SN720 SDAPNTW-512G | Acer Predator Helios 300 PH315-52-79TY WDC PC SN720 SDAPNTW-512G | |
|---|---|---|---|---|---|---|
| CrystalDiskMark 5.2 / 6 | 5% | -4% | 4% | 7% | 11% | |
| Write 4K (MB/s) | 102 | 135 32% | 156 53% | 104 2% | 158.8 56% | 108.7 7% |
| Read 4K (MB/s) | 41.39 | 41.1 -1% | 60.7 47% | 55.1 33% | 29.11 -30% | 44.91 9% |
| Write Seq (MB/s) | 1649 | 1427 -13% | 968 -41% | 1519 -8% | 1584 -4% | 2424 47% |
| Read Seq (MB/s) | 1367 | 1494 9% | 1619 18% | 2486 82% | 1694 24% | 1617 18% |
| Write 4K Q32T1 (MB/s) | 379 | 494.9 31% | 485 28% | 320.5 -15% | 536 41% | 356.9 -6% |
| Read 4K Q32T1 (MB/s) | 401.2 | 578 44% | 337.3 -16% | 431.8 8% | 363.9 -9% | 557 39% |
| Write Seq Q32T1 (MB/s) | 3276 | 1417 -57% | 969 -70% | 1498 -54% | 2536 -23% | 2542 -22% |
| Read Seq Q32T1 (MB/s) | 3417 | 3251 -5% | 1825 -47% | 2868 -16% | 3458 1% | 3218 -6% |

Graphics Card
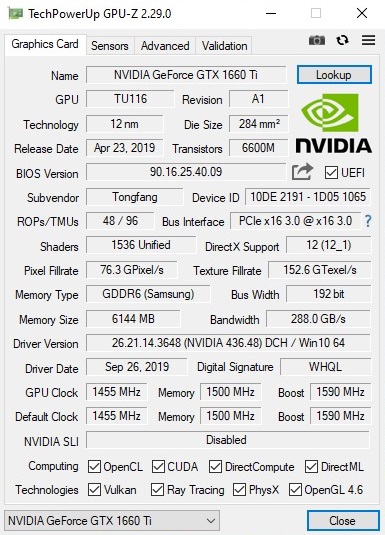
The graphics card comes from Nvidia's Turing generation. Those who also want to play newer games at a (very) high detail level should choose the GeForce GTX 1660 Ti. While the GTX 1650 should also not be underestimated, during computing-intensive games such as "Control," it only offers sufficient performance for medium settings. Some of the coming games should make the situation more difficult. On the other hand, with the GTX 1660 Ti you should be well armed for the future – aside from ray tracing. The DirectX-12 model offers 1536 Shaders and 6 GB of GDDR6 video storage connected via 192-bit.
| 3DMark 11 Performance | 17351 points | |
| 3DMark Cloud Gate Standard Score | 35204 points | |
| 3DMark Fire Strike Score | 13267 points | |
| 3DMark Time Spy Score | 5724 points | |
Help | ||
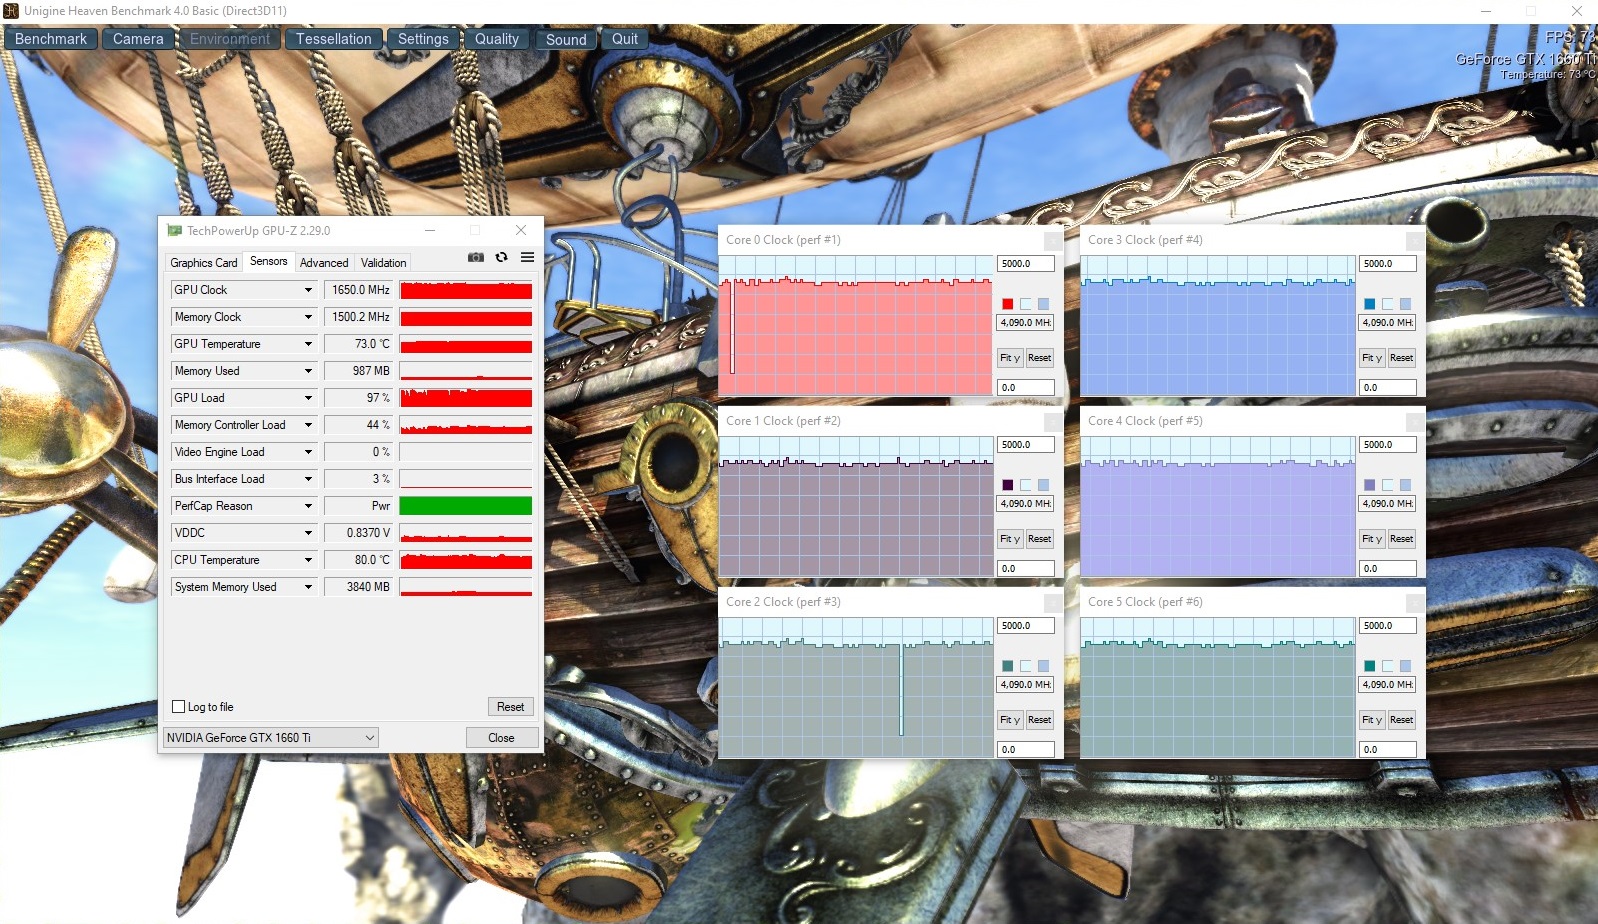
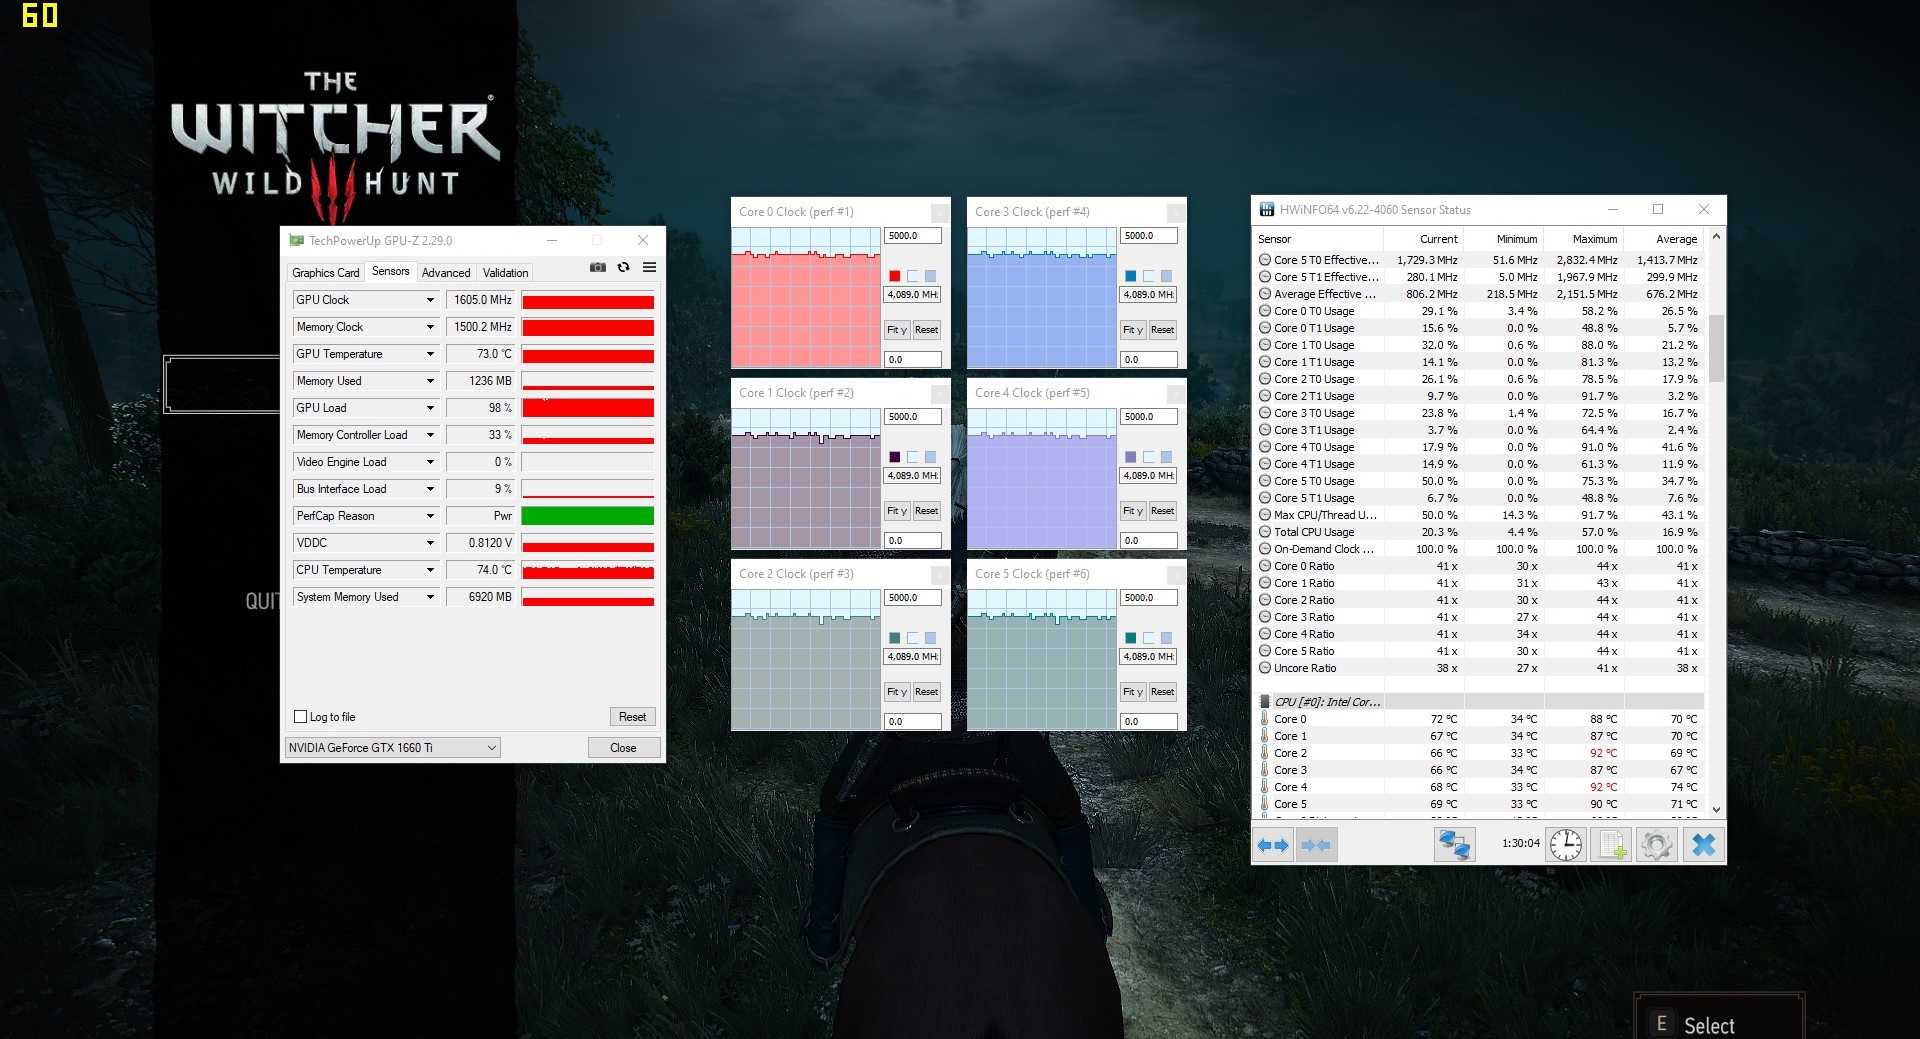
Like the Intel processor, the Nvidia GPU also has automatic overclocking abilities. Under load, the core climbs from its standard 1455 MHz up to 1920 MHz. According to our measurements, you can expect around 1600 MHz during everyday gaming, which is still a good result. It is also good that the clock speed and GPU performance remain constant over longer time periods as well. The 60-minute test with "The Witcher 3" (1920x1080, Ultra) showed very even frame rates over time.
The benchmark tests also did not show any bad surprises. In 3DMark 13 as well as 3DMark 11, the Core 15 placed in the middle of the field of comparison devices.
Gaming Performance
As already mentioned, the GTX 1660 Ti is fast enough to bring all the current games at maximum settings to the Full-HD screen. With the exception of "Red Dead Redemption 2," all the games we tested ran at more than 40 FPS.
| The Witcher 3 | |
| 1920x1080 High Graphics & Postprocessing (Nvidia HairWorks Off) | |
| Aorus 15-SA | |
| Schenker XMG Core 15 GK5CP6V | |
| Razer Blade 15 GTX 1660 Ti | |
| Asus ROG Zephyrus M15 GU502GU-XB74 | |
| Acer Predator Helios 300 PH315-52-79TY | |
| 1920x1080 Ultra Graphics & Postprocessing (HBAO+) | |
| Aorus 15-SA | |
| Asus ROG Zephyrus M15 GU502GU-XB74 | |
| Acer Predator Helios 300 PH315-52-79TY | |
| Schenker XMG Core 15 GK5CP6V | |
| Lenovo Legion Y540-15IRH-81SX00B2GE | |
| Razer Blade 15 GTX 1660 Ti | |
In many games, the GTX 1660 Ti also handles 2560x1440 pixels well. Only in the 4K range (3840x2160 pixels) will it quickly hit its limits.
| low | med. | high | ultra | |
|---|---|---|---|---|
| The Witcher 3 (2015) | 101 | 54.2 | ||
| Dota 2 Reborn (2015) | 144 | 131 | 124 | 118 |
| X-Plane 11.11 (2018) | 107 | 92.7 | 78.6 | |
| Apex Legends (2019) | 131 | 108 | 107 | |
| Anthem (2019) | 75.2 | 73.2 | 71 | |
| Dirt Rally 2.0 (2019) | 144 | 123 | 65.6 | |
| The Division 2 (2019) | 98 | 78 | 57 | |
| Control (2019) | 69.2 | 50.7 | ||
| Borderlands 3 (2019) | 91.7 | 61.7 | 46.6 | |
| FIFA 20 (2019) | 192 | 181 | 179 | |
| Ghost Recon Breakpoint (2019) | 79 | 70 | 51 | |
| GRID 2019 (2019) | 119 | 90.5 | 61.7 | |
| Call of Duty Modern Warfare 2019 (2019) | 99 | 88.1 | 71.9 | |
| Need for Speed Heat (2019) | 87.9 | 79.7 | 67.4 | |
| Star Wars Jedi Fallen Order (2019) | 94.7 | 84.9 | 77.7 | |
| Red Dead Redemption 2 (2019) | 75.3 | 50.5 | 31.2 |
Emissions
Noise Emissions
The verdict on the noise development turns out to be a mixed bag. The Core 15 mostly remains comfortably quiet (31 to 33 dB) or even completely silent during idle operation, only rarely revving up (for example during smaller tasks such as Windows updates). Under load, on the other hand, the fans rev up forcefully.
A noise level of 48 to 51 dB is very noticeable and annoying to many users, so that using headphones might be recommended. However, the same goes for almost all the competitors, and only the Lenovo Legion Y540 remains fairly quiet during 3D operation.
Noise level
| Idle |
| 30 / 31 / 33 dB(A) |
| Load |
| 48 / 51 dB(A) |
 | ||
30 dB silent 40 dB(A) audible 50 dB(A) loud |
||
min: | ||
| Schenker XMG Core 15 GK5CP6V i7-9750H, GeForce GTX 1660 Ti Mobile | Razer Blade 15 GTX 1660 Ti i7-9750H, GeForce GTX 1660 Ti Mobile | Asus ROG Zephyrus M15 GU502GU-XB74 i7-9750H, GeForce GTX 1660 Ti Mobile | Aorus 15-SA i7-9750H, GeForce GTX 1660 Ti Mobile | Lenovo Legion Y540-15IRH-81SX00B2GE i7-9750H, GeForce GTX 1660 Ti Mobile | Acer Predator Helios 300 PH315-52-79TY i7-9750H, GeForce GTX 1660 Ti Mobile | |
|---|---|---|---|---|---|---|
| Noise | 5% | 2% | -9% | 10% | 5% | |
| off / environment * (dB) | 30 | 28.5 5% | 28.2 6% | 29 3% | 29.3 2% | 30.2 -1% |
| Idle Minimum * (dB) | 30 | 30.3 -1% | 28.7 4% | 32 -7% | 29.3 2% | 31 -3% |
| Idle Average * (dB) | 31 | 30.5 2% | 30.5 2% | 35 -13% | 29.3 5% | 31 -0% |
| Idle Maximum * (dB) | 33 | 30.5 8% | 31 6% | 41 -24% | 29.3 11% | 31 6% |
| Load Average * (dB) | 48 | 41 15% | 39 19% | 54 -13% | 35.7 26% | 41.5 14% |
| Witcher 3 ultra * (dB) | 51 | 48 6% | 54.2 -6% | 52 -2% | 44.2 13% | 46.7 8% |
| Load Maximum * (dB) | 51 | 51.9 -2% | 59.6 -17% | 56 -10% | 45.6 11% | 46.9 8% |
* ... smaller is better
Temperature
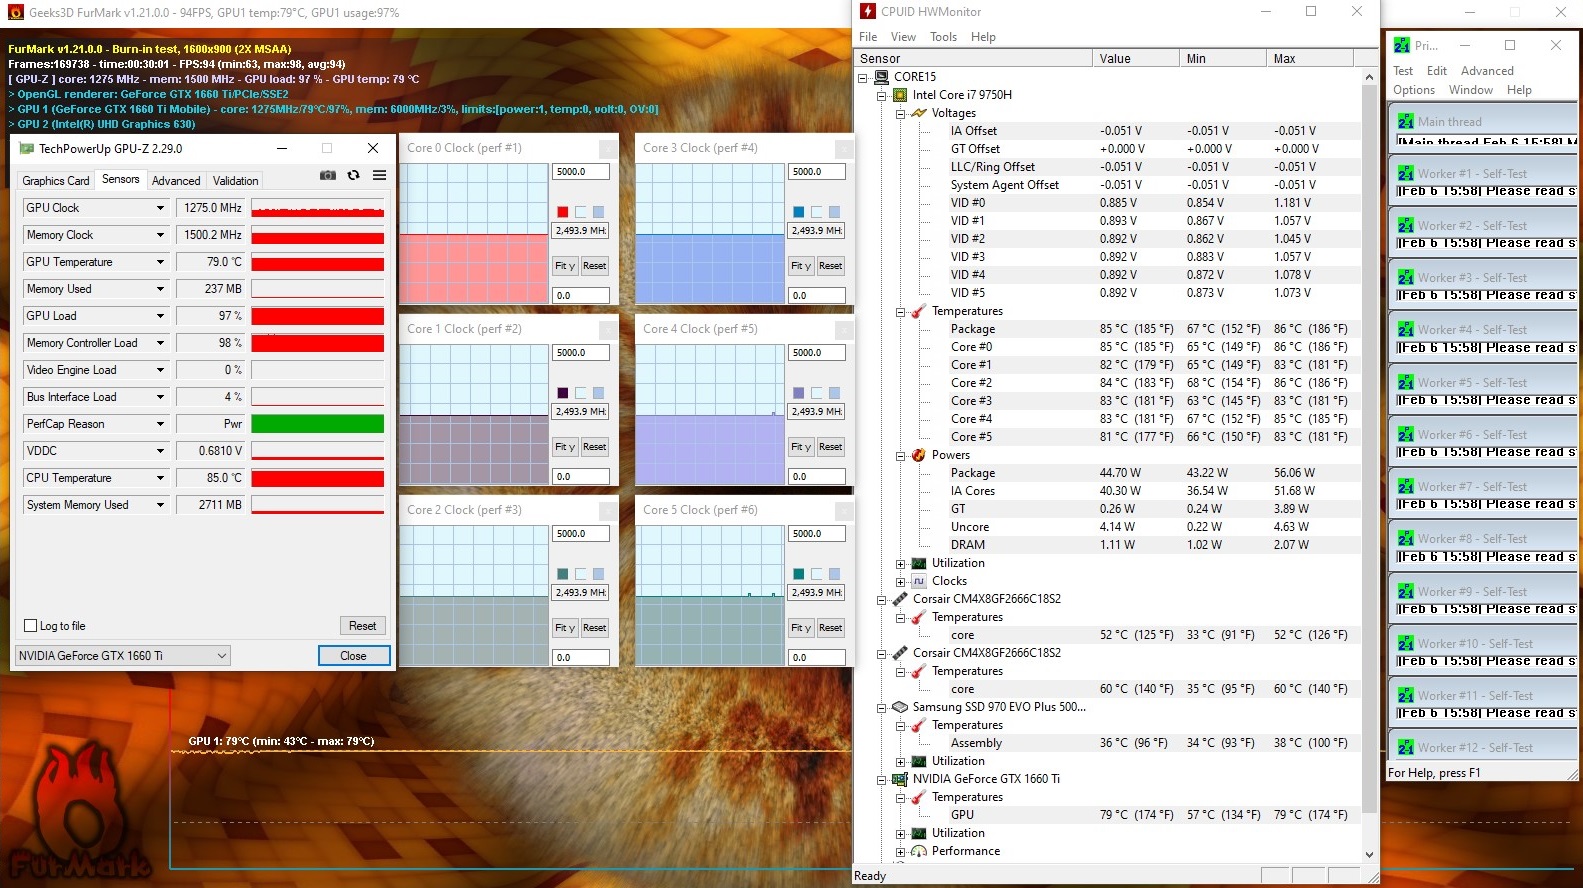
The temperature development of the components is neither good nor particularly bad. During the sixty-minute stress test with the FurMark tools and Prime95, the Core i7-9750H heated up to an average of 80 - 85 °C (176 - 185 °F), while the (slightly throttled) GeForce GTX 1660 Ti reached around 79 °C (174 °F).
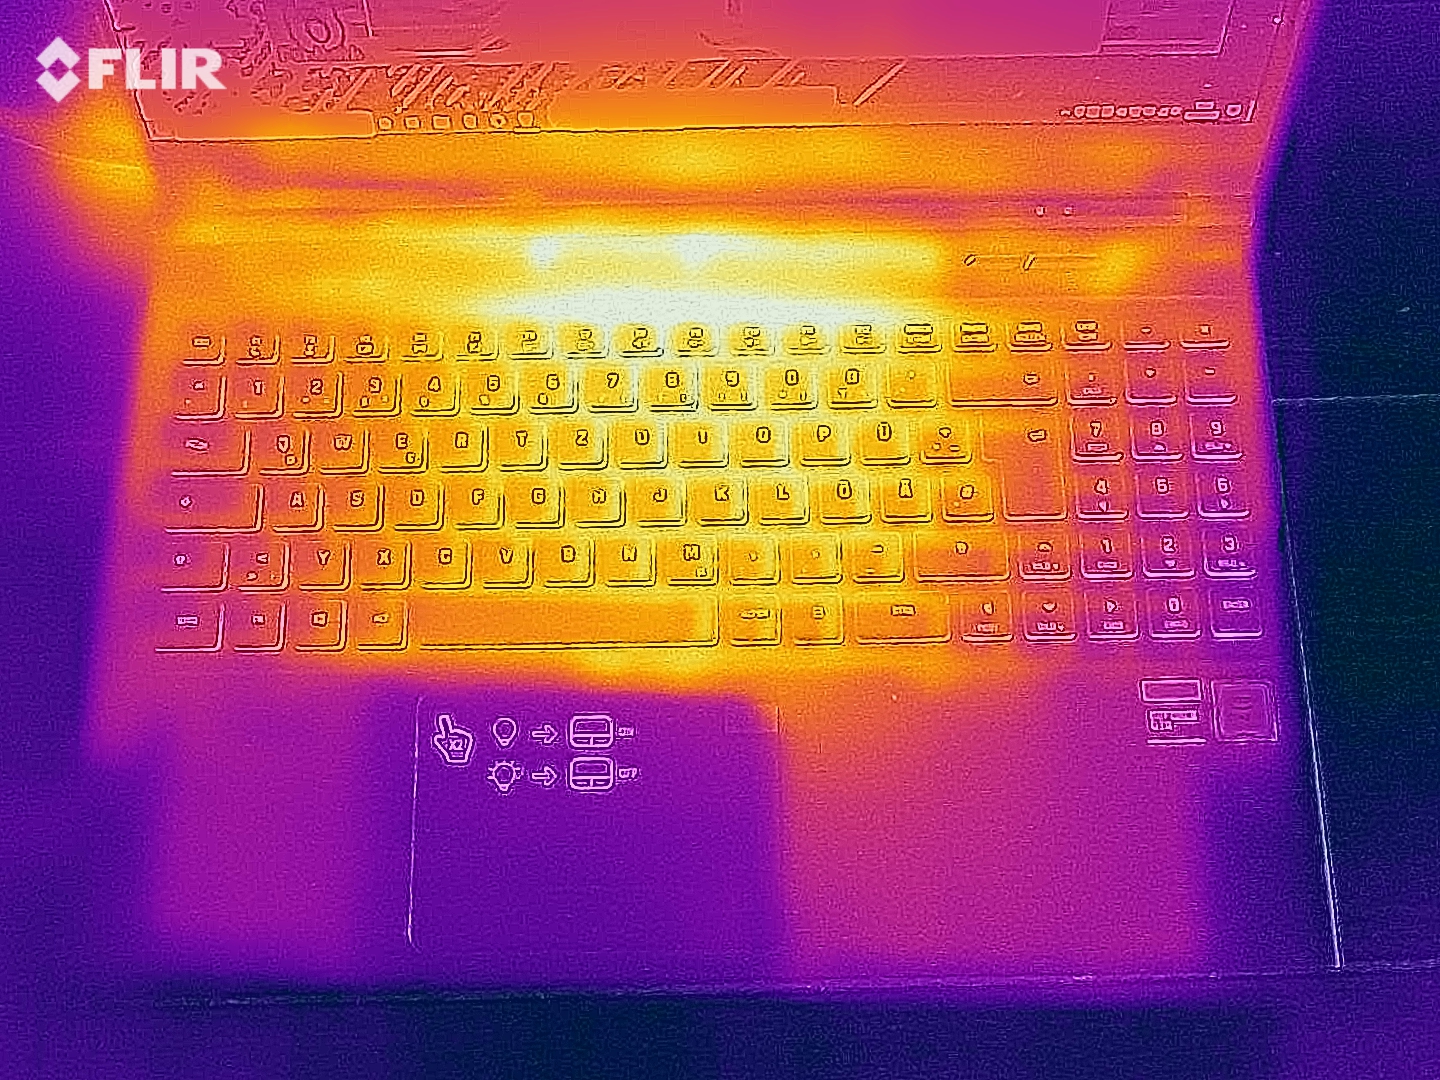
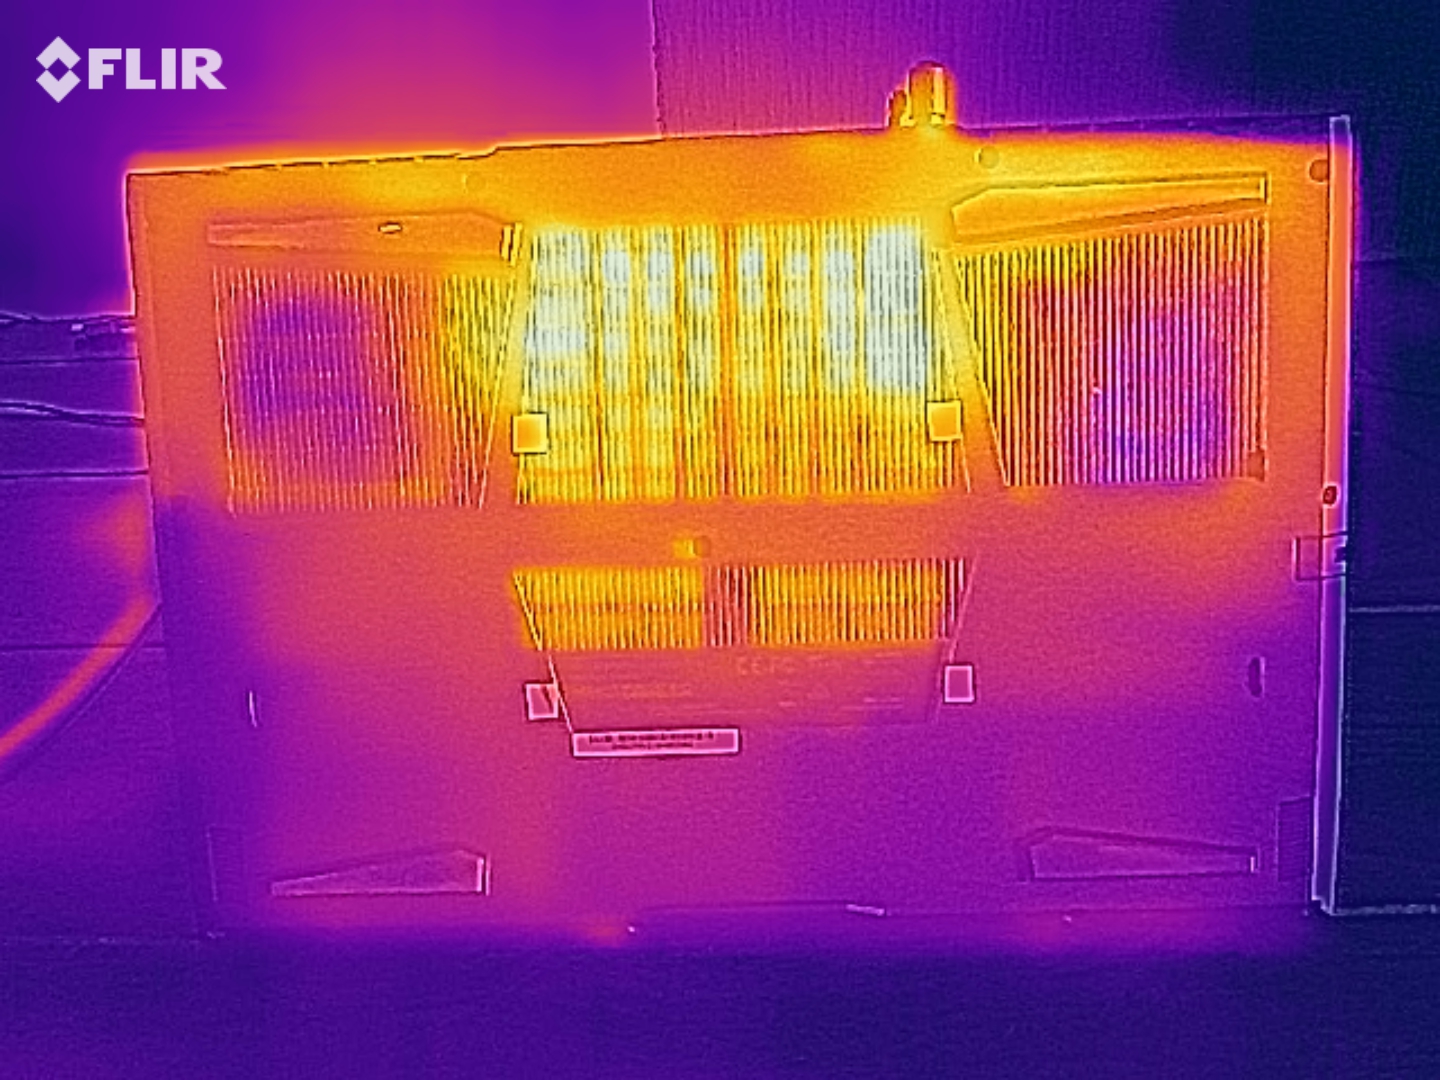
On the surfaces of the case we were able to measure up to 48 °C (118 °F) on top and 59 °C (138 °F) on the bottom during full load operation, which is also a middling result. On the other hand, the whole case remains pleasantly cool without exceeding the 30 °C (86 °F) mark during idle operation.
(-) The maximum temperature on the upper side is 48 °C / 118 F, compared to the average of 40.4 °C / 105 F, ranging from 21.2 to 68.8 °C for the class Gaming.
(-) The bottom heats up to a maximum of 59 °C / 138 F, compared to the average of 43.2 °C / 110 F
(+) In idle usage, the average temperature for the upper side is 25.7 °C / 78 F, compared to the device average of 33.9 °C / 93 F.
(-) Playing The Witcher 3, the average temperature for the upper side is 39.6 °C / 103 F, compared to the device average of 33.9 °C / 93 F.
(±) The palmrests and touchpad can get very hot to the touch with a maximum of 37 °C / 98.6 F.
(-) The average temperature of the palmrest area of similar devices was 28.8 °C / 83.8 F (-8.2 °C / -14.8 F).
| Schenker XMG Core 15 GK5CP6V i7-9750H, GeForce GTX 1660 Ti Mobile | Razer Blade 15 GTX 1660 Ti i7-9750H, GeForce GTX 1660 Ti Mobile | Asus ROG Zephyrus M15 GU502GU-XB74 i7-9750H, GeForce GTX 1660 Ti Mobile | Aorus 15-SA i7-9750H, GeForce GTX 1660 Ti Mobile | Lenovo Legion Y540-15IRH-81SX00B2GE i7-9750H, GeForce GTX 1660 Ti Mobile | Acer Predator Helios 300 PH315-52-79TY i7-9750H, GeForce GTX 1660 Ti Mobile | |
|---|---|---|---|---|---|---|
| Heat | -20% | -15% | -6% | -12% | 8% | |
| Maximum Upper Side * (°C) | 48 | 52 -8% | 49.8 -4% | 44 8% | 42.7 11% | 52 -8% |
| Maximum Bottom * (°C) | 59 | 52.2 12% | 63.2 -7% | 58 2% | 52.7 11% | 46.3 22% |
| Idle Upper Side * (°C) | 27 | 38 -41% | 32 -19% | 30 -11% | 33.1 -23% | 24.8 8% |
| Idle Bottom * (°C) | 28 | 40.4 -44% | 36.2 -29% | 34 -21% | 41 -46% | 25.4 9% |
* ... smaller is better
Speakers
The speakers of the XMG Core 15 should be considered more as a stopgap solution. As typical for notebooks, the 2.0 system built into the front area lacks bass, and at 76 dB, the maximum volume is not very high. More than 70% of all the gaming laptops we have tested scored better in our audio analysis.
Schenker XMG Core 15 GK5CP6V audio analysis
(±) | speaker loudness is average but good (76 dB)
Bass 100 - 315 Hz
(-) | nearly no bass - on average 23.1% lower than median
(±) | linearity of bass is average (11.5% delta to prev. frequency)
Mids 400 - 2000 Hz
(+) | balanced mids - only 4.7% away from median
(±) | linearity of mids is average (9% delta to prev. frequency)
Highs 2 - 16 kHz
(+) | balanced highs - only 1.5% away from median
(+) | highs are linear (4.6% delta to prev. frequency)
Overall 100 - 16.000 Hz
(±) | linearity of overall sound is average (23.1% difference to median)
Compared to same class
» 84% of all tested devices in this class were better, 5% similar, 12% worse
» The best had a delta of 6%, average was 18%, worst was 132%
Compared to all devices tested
» 69% of all tested devices were better, 5% similar, 26% worse
» The best had a delta of 4%, average was 24%, worst was 134%
Razer Blade 15 GTX 1660 Ti audio analysis
(±) | speaker loudness is average but good (80.1 dB)
Bass 100 - 315 Hz
(±) | reduced bass - on average 13.5% lower than median
(±) | linearity of bass is average (13.2% delta to prev. frequency)
Mids 400 - 2000 Hz
(±) | higher mids - on average 5.3% higher than median
(+) | mids are linear (4.7% delta to prev. frequency)
Highs 2 - 16 kHz
(±) | reduced highs - on average 5.1% lower than median
(±) | linearity of highs is average (7.2% delta to prev. frequency)
Overall 100 - 16.000 Hz
(±) | linearity of overall sound is average (25.2% difference to median)
Compared to same class
» 90% of all tested devices in this class were better, 3% similar, 7% worse
» The best had a delta of 6%, average was 18%, worst was 132%
Compared to all devices tested
» 77% of all tested devices were better, 5% similar, 18% worse
» The best had a delta of 4%, average was 24%, worst was 134%
Power Management
Power Consumption
During idle operation, the graphics switching ensures fairly low power needs. Between 9 and 18 watts is lower than the values of the competitors (some of which make do without Optimus) and could also come from a multimedia notebook. Under load, the consumption is also mostly lower than that of the competitors, even though the differences are significantly smaller here.
| Off / Standby | |
| Idle | |
| Load |
|
Key:
min: | |
| Schenker XMG Core 15 GK5CP6V i7-9750H, GeForce GTX 1660 Ti Mobile | Razer Blade 15 GTX 1660 Ti i7-9750H, GeForce GTX 1660 Ti Mobile | Asus ROG Zephyrus M15 GU502GU-XB74 i7-9750H, GeForce GTX 1660 Ti Mobile | Aorus 15-SA i7-9750H, GeForce GTX 1660 Ti Mobile | Lenovo Legion Y540-15IRH-81SX00B2GE i7-9750H, GeForce GTX 1660 Ti Mobile | Acer Predator Helios 300 PH315-52-79TY i7-9750H, GeForce GTX 1660 Ti Mobile | |
|---|---|---|---|---|---|---|
| Power Consumption | -67% | -77% | -47% | -24% | -45% | |
| Idle Minimum * (Watt) | 9 | 18.7 -108% | 17.6 -96% | 20 -122% | 14.5 -61% | 17.2 -91% |
| Idle Average * (Watt) | 12 | 30.7 -156% | 24.7 -106% | 23 -92% | 18.5 -54% | 22.6 -88% |
| Idle Maximum * (Watt) | 18 | 33.9 -88% | 56.3 -213% | 29 -61% | 20 -11% | 25.5 -42% |
| Load Average * (Watt) | 86 | 93.4 -9% | 111.1 -29% | 87 -1% | 81.6 5% | 88 -2% |
| Witcher 3 ultra * (Watt) | 126 | 158.9 -26% | 149 -18% | 136 -8% | 132 -5% | |
| Load Maximum * (Watt) | 173 | 195.3 -13% | 170 2% | 173 -0% | 208.1 -20% | 177 -2% |
* ... smaller is better
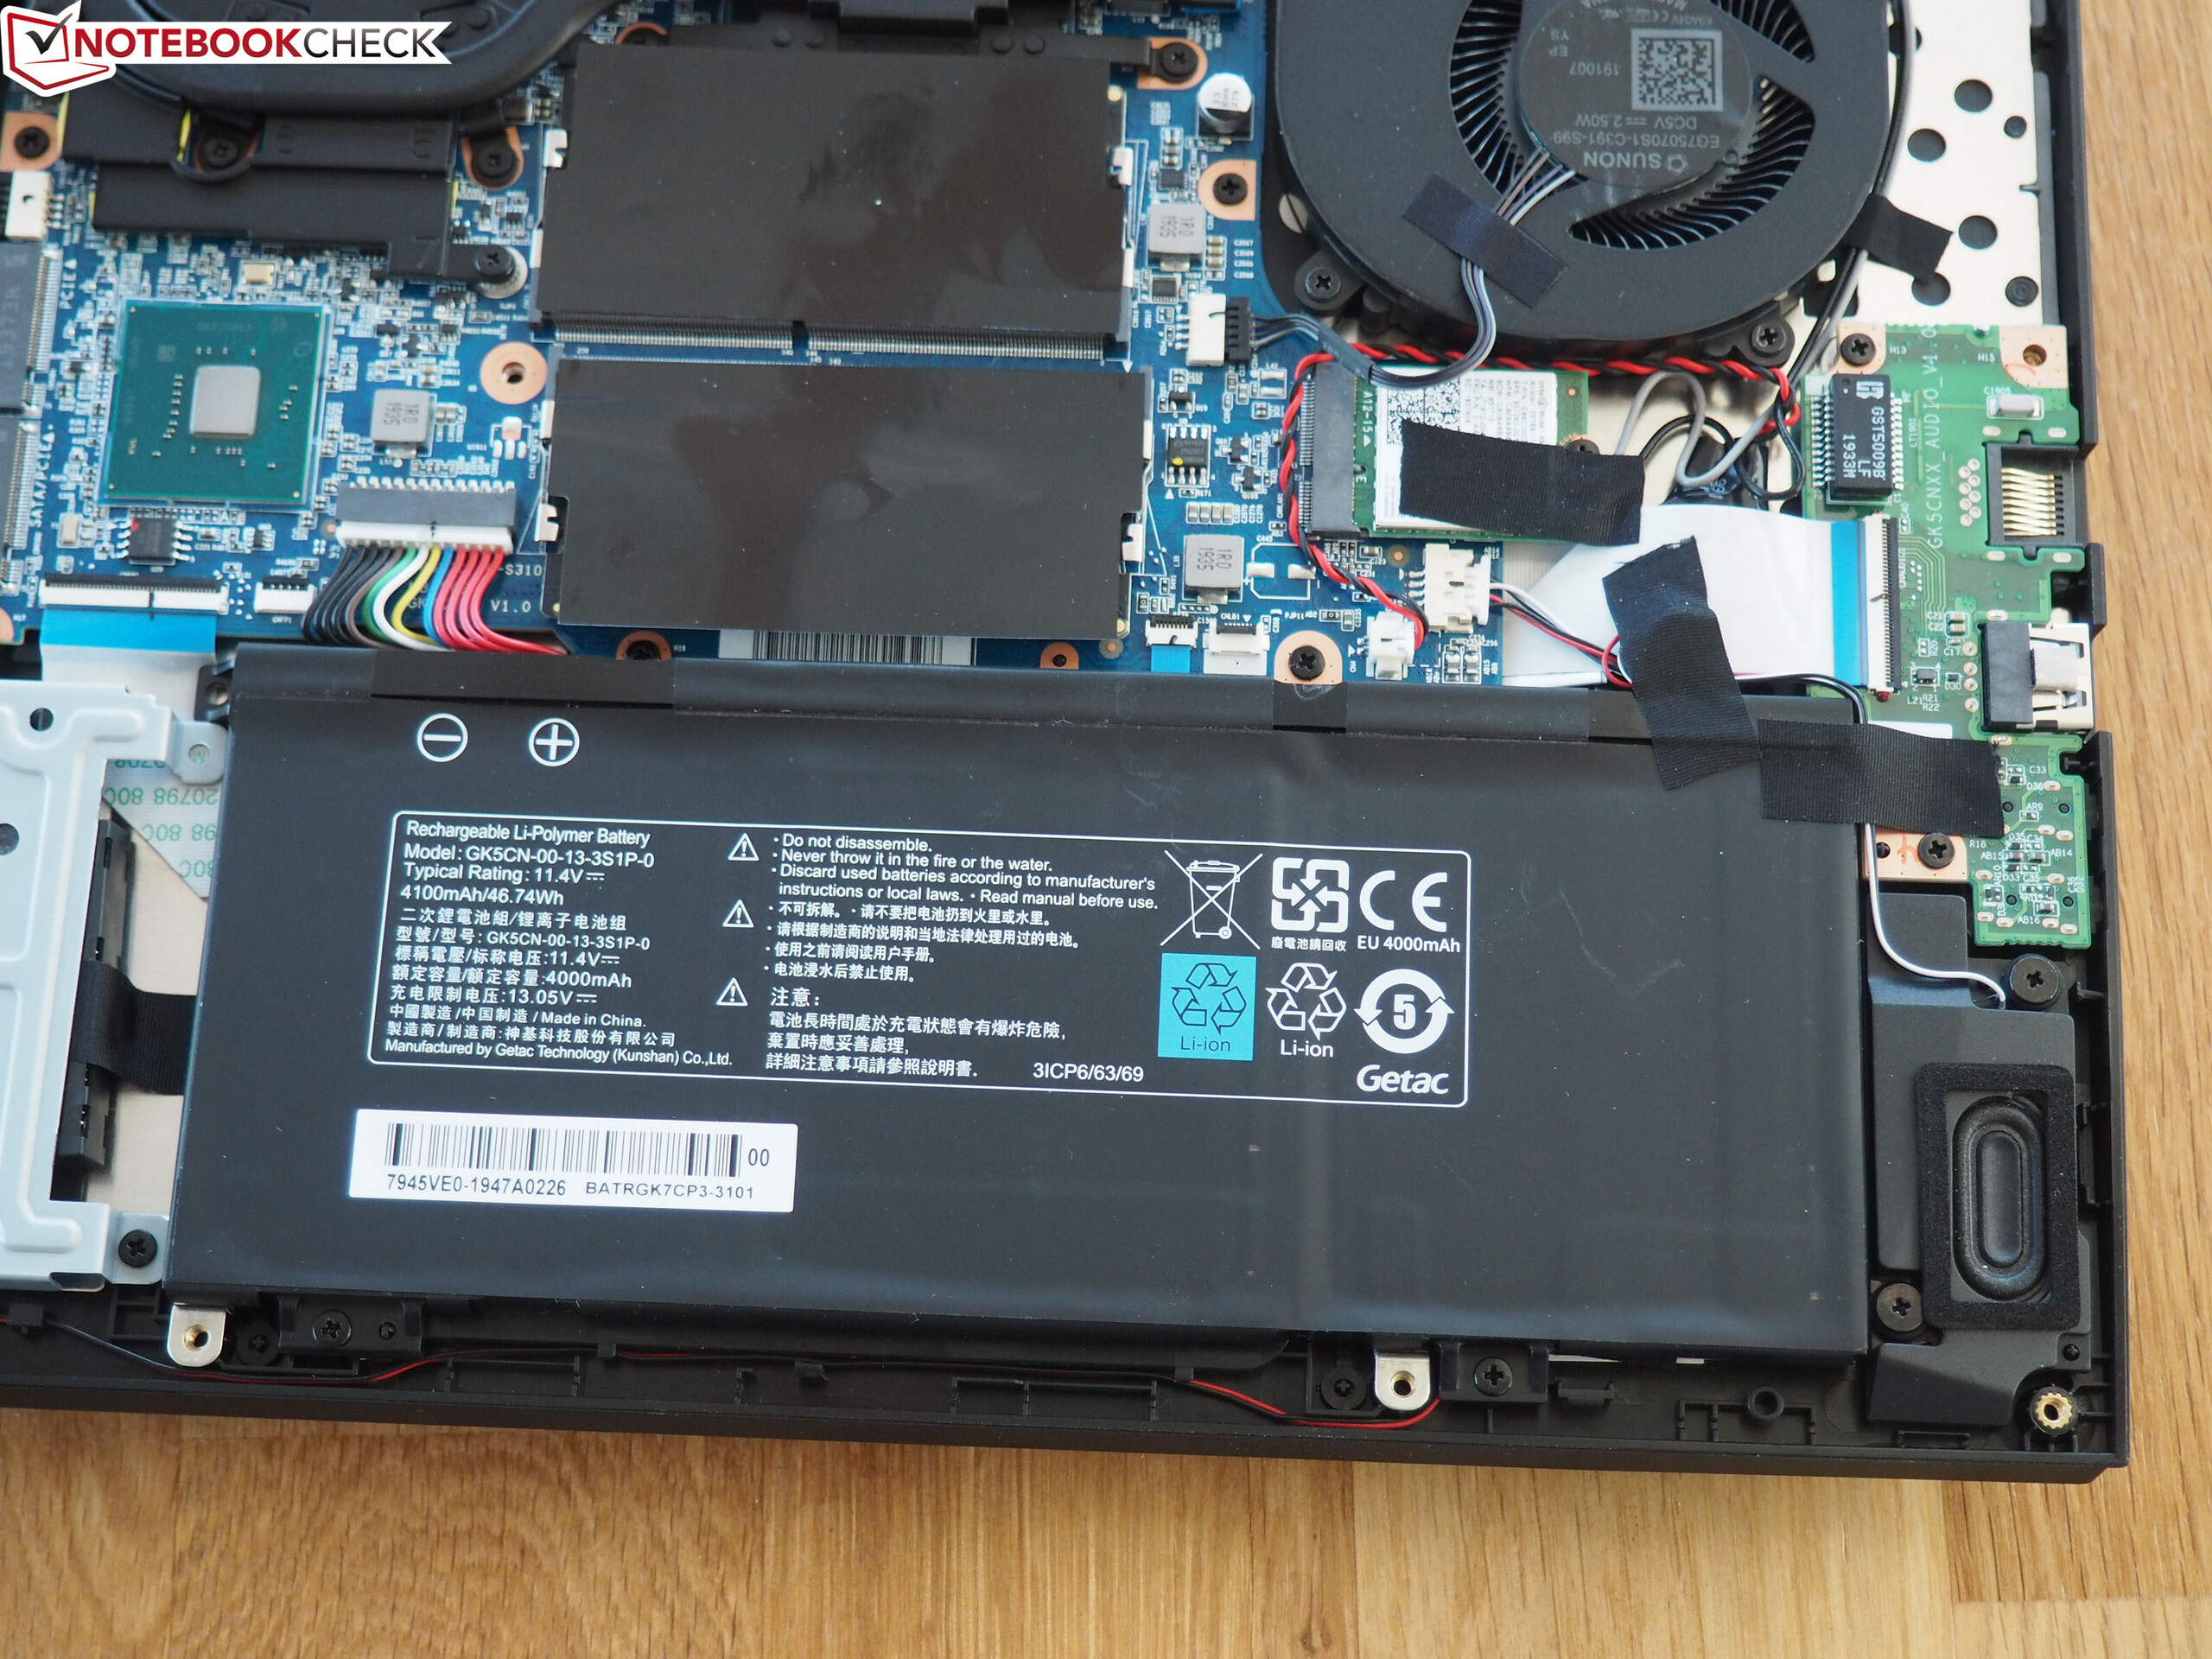
Battery Life
Despite the moderate power consumption, the Core 15 does not achieve a good battery life. With a capacity of 46 Wh, the battery is rather small. For comparison, the competitors offer between 57 and 76 Wh. In our opinion, the 2.5-inch slot, which takes up a lot of space in the case, should have been replaced by a larger battery instead.
Barely 3.5 hours of surfing the Internet at medium display brightness are also unlikely to get anyone excited. Under perfect conditions (no load, minimum brightness), the 15-incher can last up to 6 hours. But be careful: the 3D performance drops by almost 90% in battery operation!
| Schenker XMG Core 15 GK5CP6V i7-9750H, GeForce GTX 1660 Ti Mobile, 46 Wh | Razer Blade 15 GTX 1660 Ti i7-9750H, GeForce GTX 1660 Ti Mobile, 65 Wh | Asus ROG Zephyrus M15 GU502GU-XB74 i7-9750H, GeForce GTX 1660 Ti Mobile, 76 Wh | Aorus 15-SA i7-9750H, GeForce GTX 1660 Ti Mobile, 62 Wh | Lenovo Legion Y540-15IRH-81SX00B2GE i7-9750H, GeForce GTX 1660 Ti Mobile, 57 Wh | Acer Predator Helios 300 PH315-52-79TY i7-9750H, GeForce GTX 1660 Ti Mobile, 58.75 Wh | |
|---|---|---|---|---|---|---|
| Battery runtime | 53% | 61% | 40% | 6% | 17% | |
| Reader / Idle (h) | 6.1 | 7.1 16% | 3.5 -43% | 4 -34% | 5 -18% | |
| WiFi v1.3 (h) | 3.6 | 5.5 53% | 4.5 25% | 2.8 -22% | 2.4 -33% | 3.5 -3% |
| Load (h) | 0.7 | 1.7 143% | 2 186% | 1.3 86% | 1.2 71% | |
| H.264 (h) | 2.8 | 3.4 |
Pros
Cons
Verdict
In our test, the XMG Core 15 has proven itself as a real alternative to the products from larger manufacturers (Acer, Asus, Lenovo, etc.).
At a budget price, Schenker Technologies delivers a 15-inch notebook suitable for gaming that also offers a good, responsive IPS panel. The RGB illumination of the keyboard will also please gamers. Thanks to its low weight and compact dimensions, the Core 15 is also surprisingly mobile, if you disregard the mediocre battery life.
The Barebone producer Tongfang could make some improvements on the connection equipment (since there are neither Thunderbolt 3, nor USB-3.1 Gen2), and – as often in the gaming segment – the noise development under load could also use some improvements.
Schenker XMG Core 15 GK5CP6V
- 02/09/2020 v7 (old)
Florian Glaser
Price comparison

