Schenker XMG Core 15 (Tongfang GK5NR0O) Laptop Review: AMD gamer with a good price-performance ratio
Schenker has updated its whole XMG Core series. The gaming laptop is available in a 15 and a 17-inch version, and for the processor you now have the choice between an Intel CPU of the 10th generation and one of the new and very powerful AMD Ryzen CPUs based on the Zen 2, as in our test unit. In addition to the Ryzen 7 4800H, Schenker also upgraded to RTX options for the graphics. Our 15-inch XMG offers an Nvidia RTX 2060. The case was also slightly updated for this. Although it looks the same at first glance, it is now equipped with additional fan vents for improved heat exchange. The gaming package is available for less than 1500 Euros (~$1745).
The direct competitors include other, relatively affordable gaming laptops, particularly Intel competitors with the same graphics such as the Dell G3 15 3500 or the Lenovo Legion 5 15IMH05H. We are also including the Asus TUF A15 with the same Ryzen 7 CPU in our performance comparison, and last but not least we are also interested how our AMD/Nvidia configuration fares against the pure AMD Dell G5 gaming laptop with the Radeon 5600M.
Rating | Date | Model | Weight | Height | Size | Resolution | Price |
|---|---|---|---|---|---|---|---|
| 82.1 % v7 (old) | 09 / 2020 | Schenker XMG Core 15 GK5NR0O R7 4800H, GeForce RTX 2060 Mobile | 2 kg | 19.9 mm | 15.60" | 1920x1080 | |
| 81.3 % v7 (old) | 02 / 2020 | Schenker XMG Core 15 GK5CP6V i7-9750H, GeForce GTX 1660 Ti Mobile | 2 kg | 26 mm | 15.60" | 1920x1080 | |
| 81.6 % v7 (old) | 09 / 2020 | Dell G3 15 3500-G4DG2 i7-10750H, GeForce RTX 2060 Mobile | 2.3 kg | 22 mm | 15.60" | 1920x1080 | |
| 83.3 % v7 (old) | 07 / 2020 | Lenovo Legion 5 15IMH05H i5-10300H, GeForce RTX 2060 Mobile | 2.5 kg | 26.1 mm | 15.60" | 1920x1080 | |
| 82.7 % v7 (old) | 06 / 2020 | Asus TUF Gaming A15 FA506IV-HN172 R7 4800H, GeForce RTX 2060 Mobile | 2.2 kg | 24.9 mm | 15.60" | 1920x1080 | |
| 83.7 % v7 (old) | 06 / 2020 | Dell G5 15 SE 5505 P89F R7 4800H, Radeon RX 5600M | 2.4 kg | 21.6 mm | 15.60" | 1920x1080 |
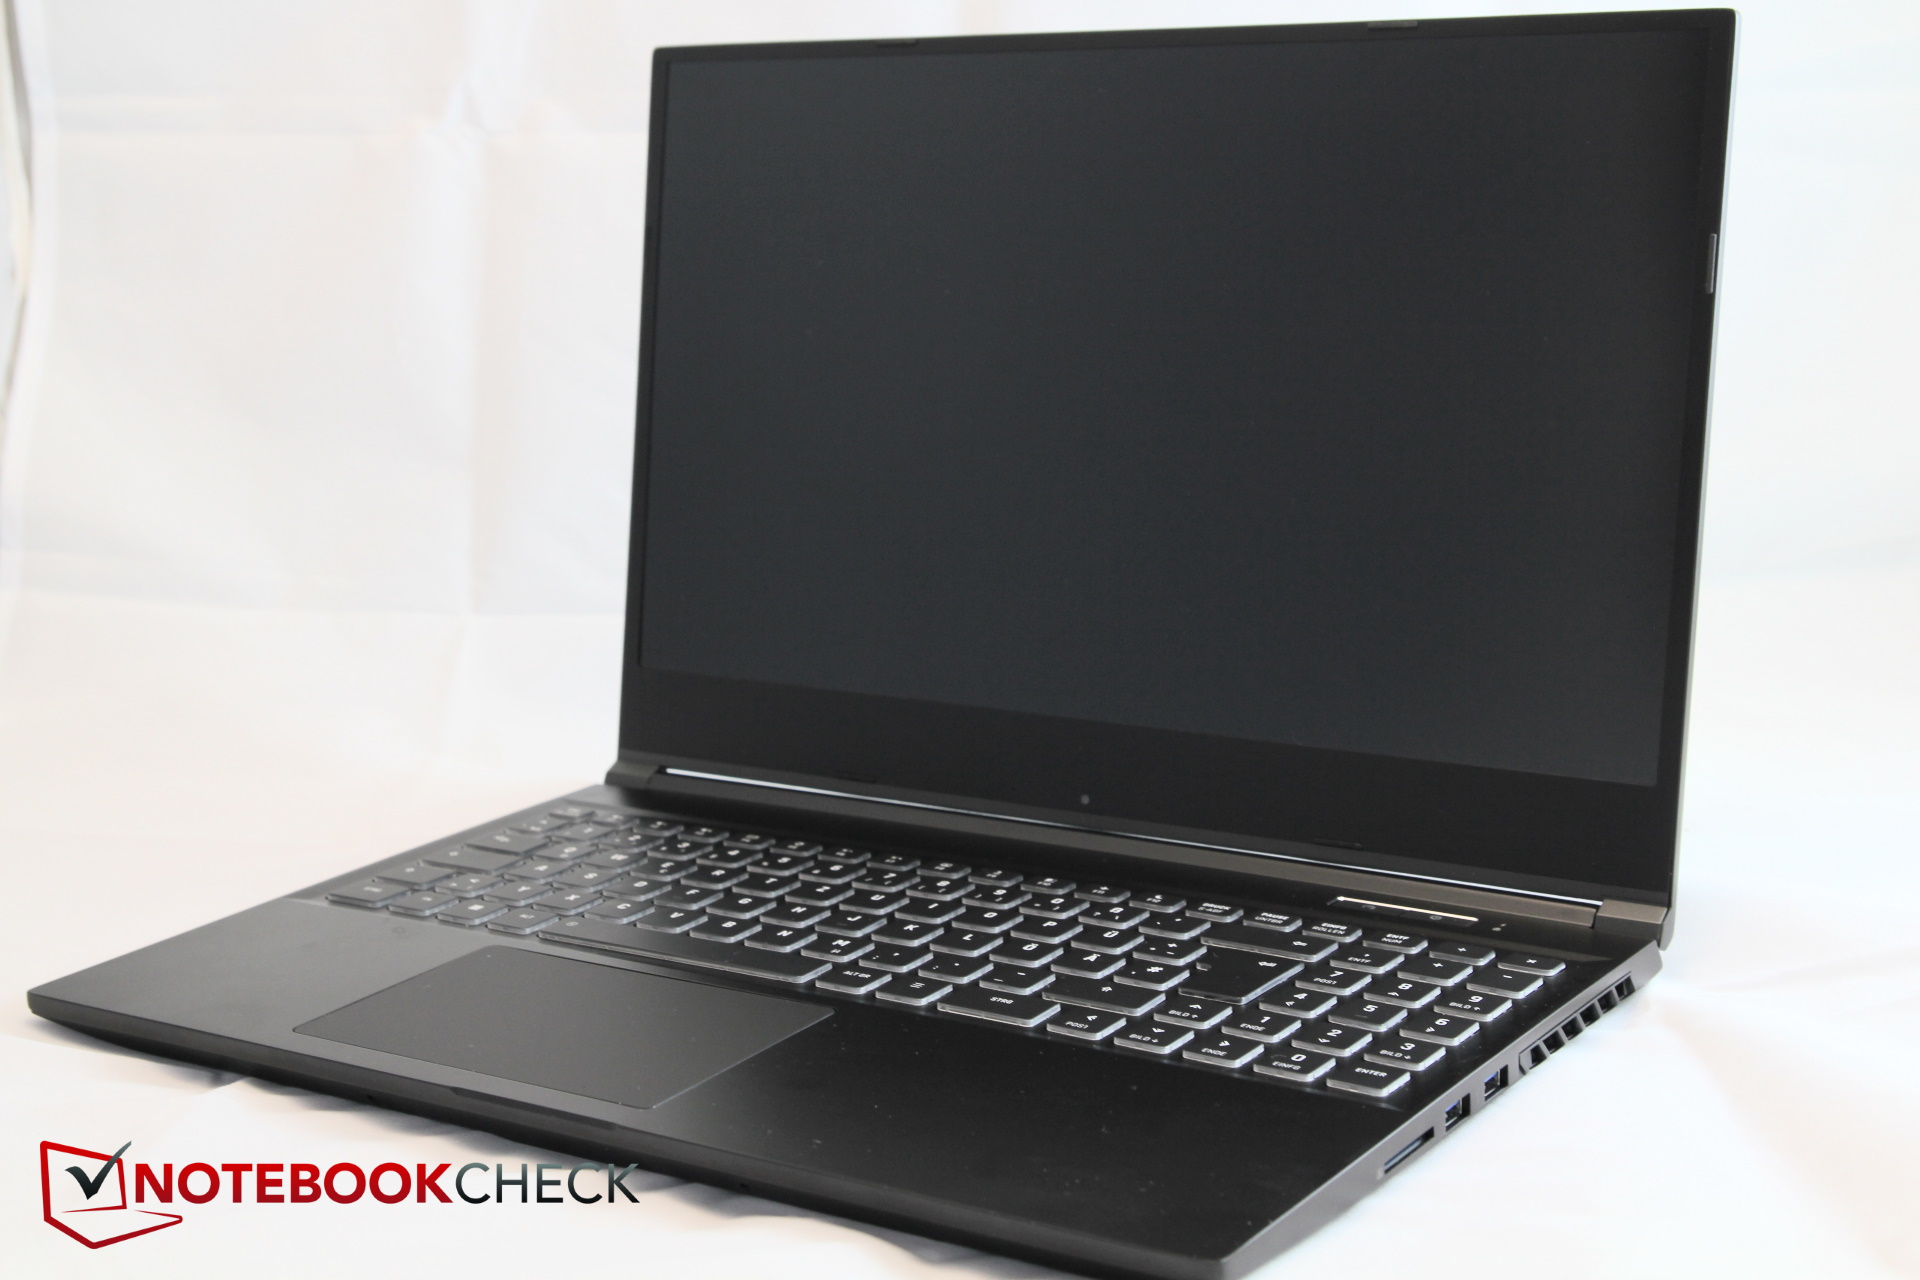
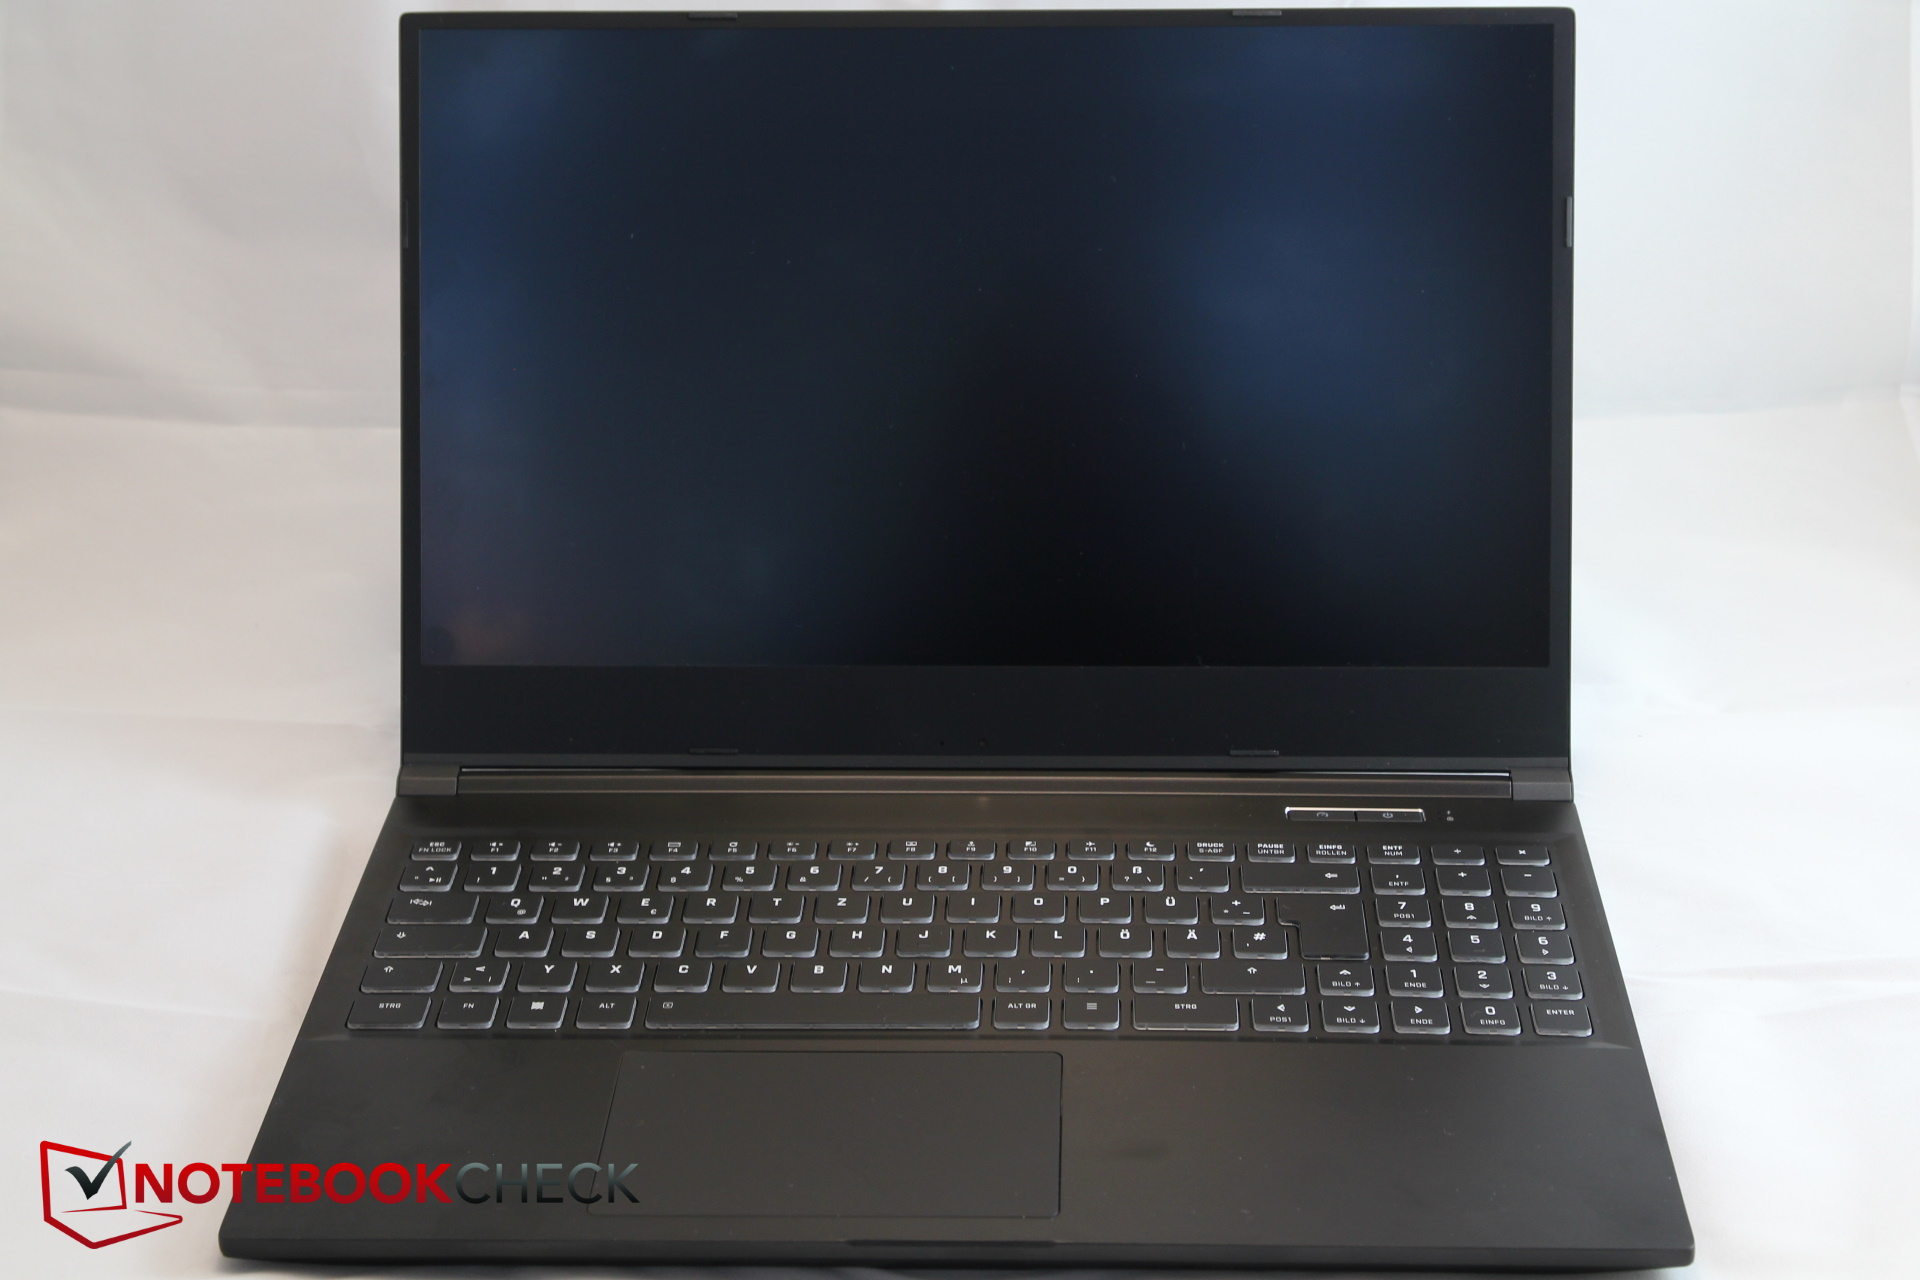
Case - Schenker with a Tongfang case
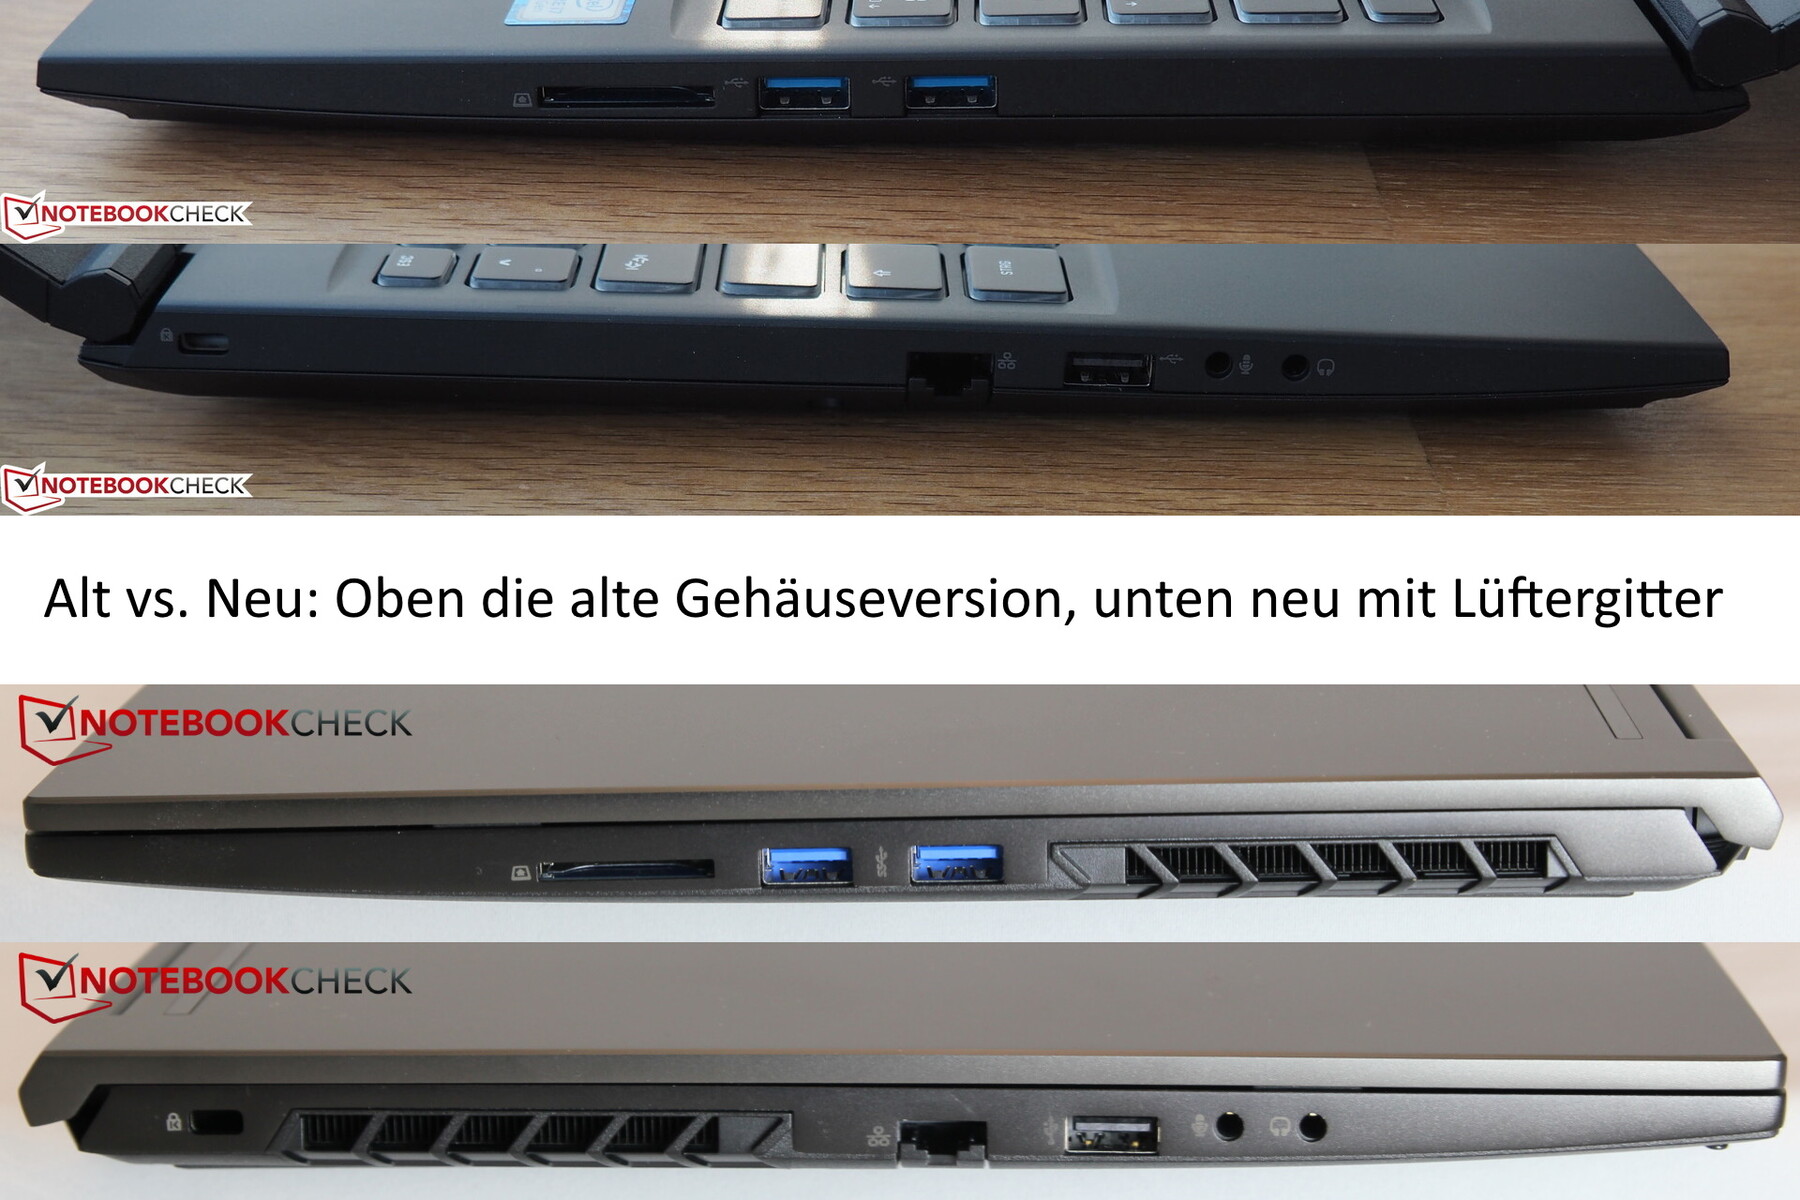
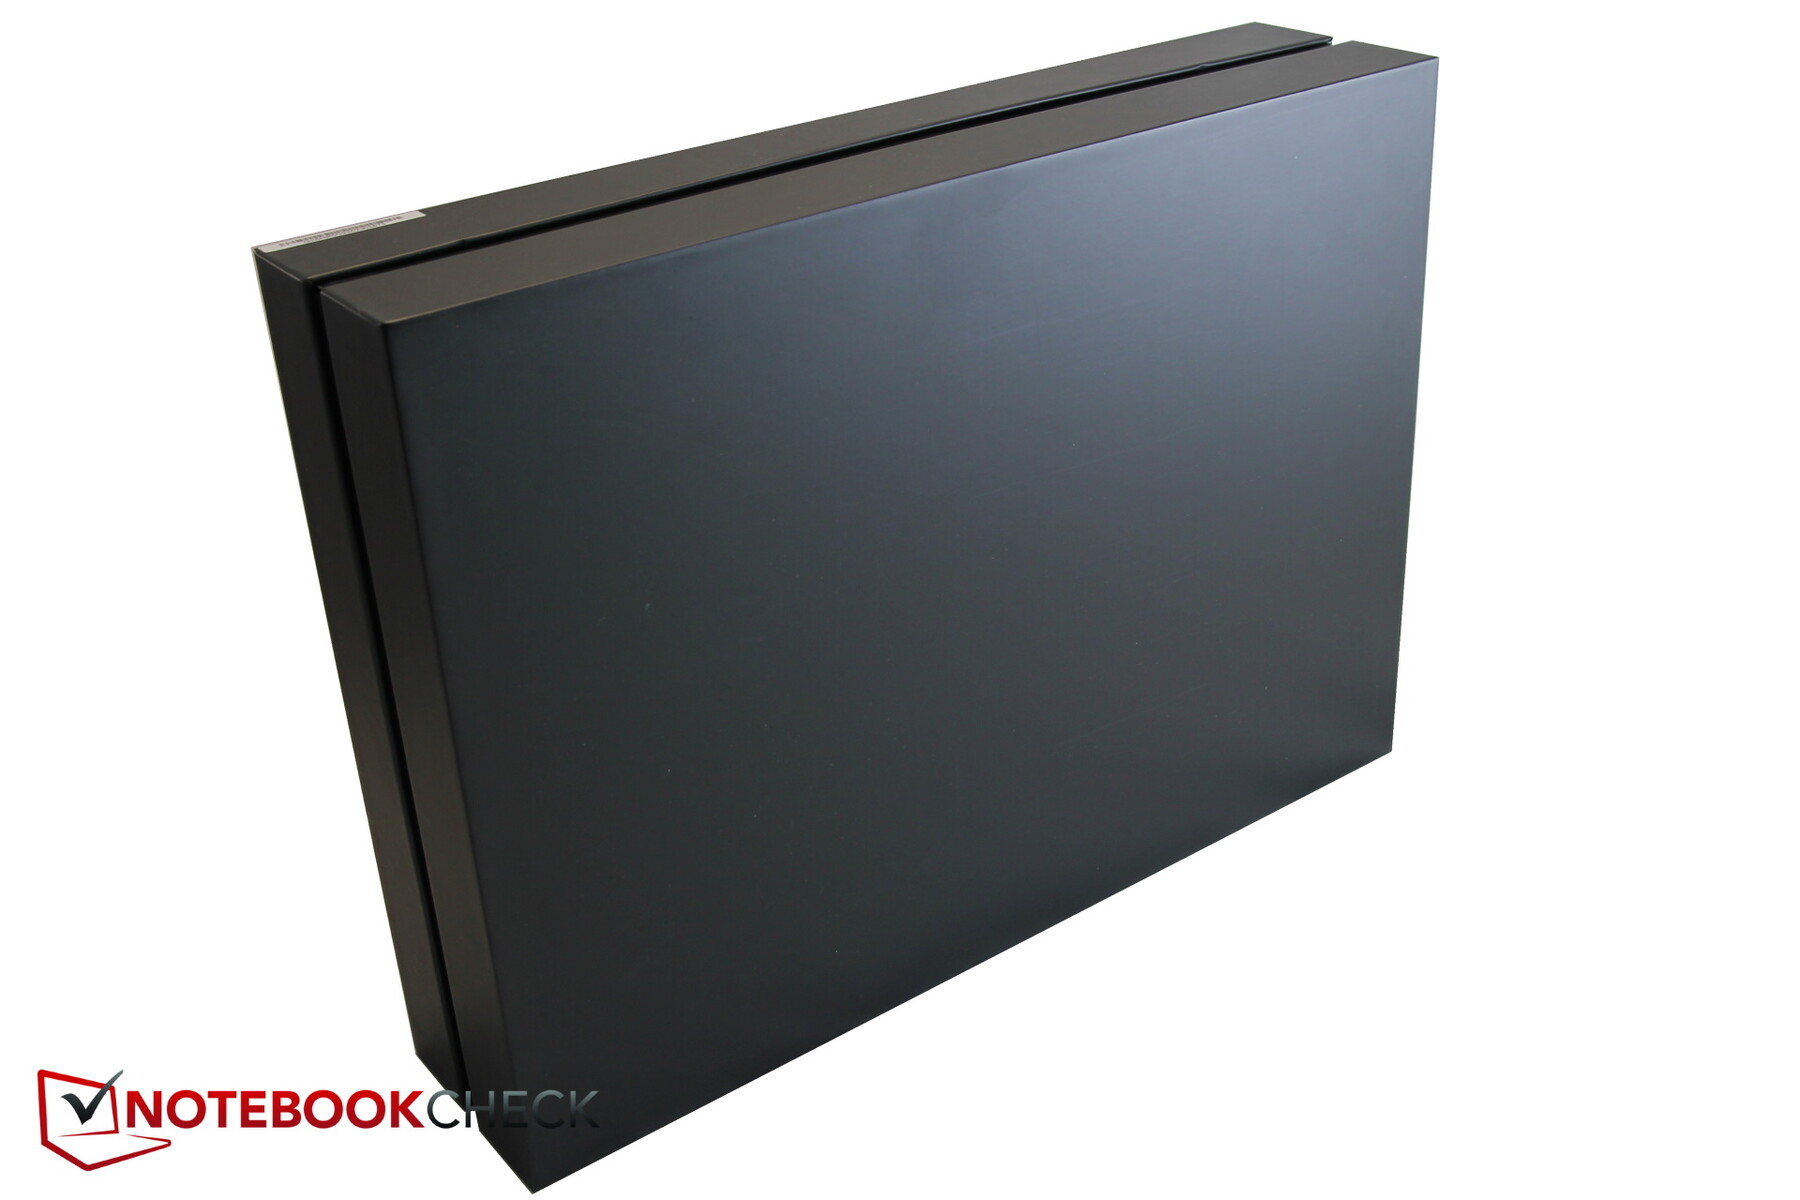
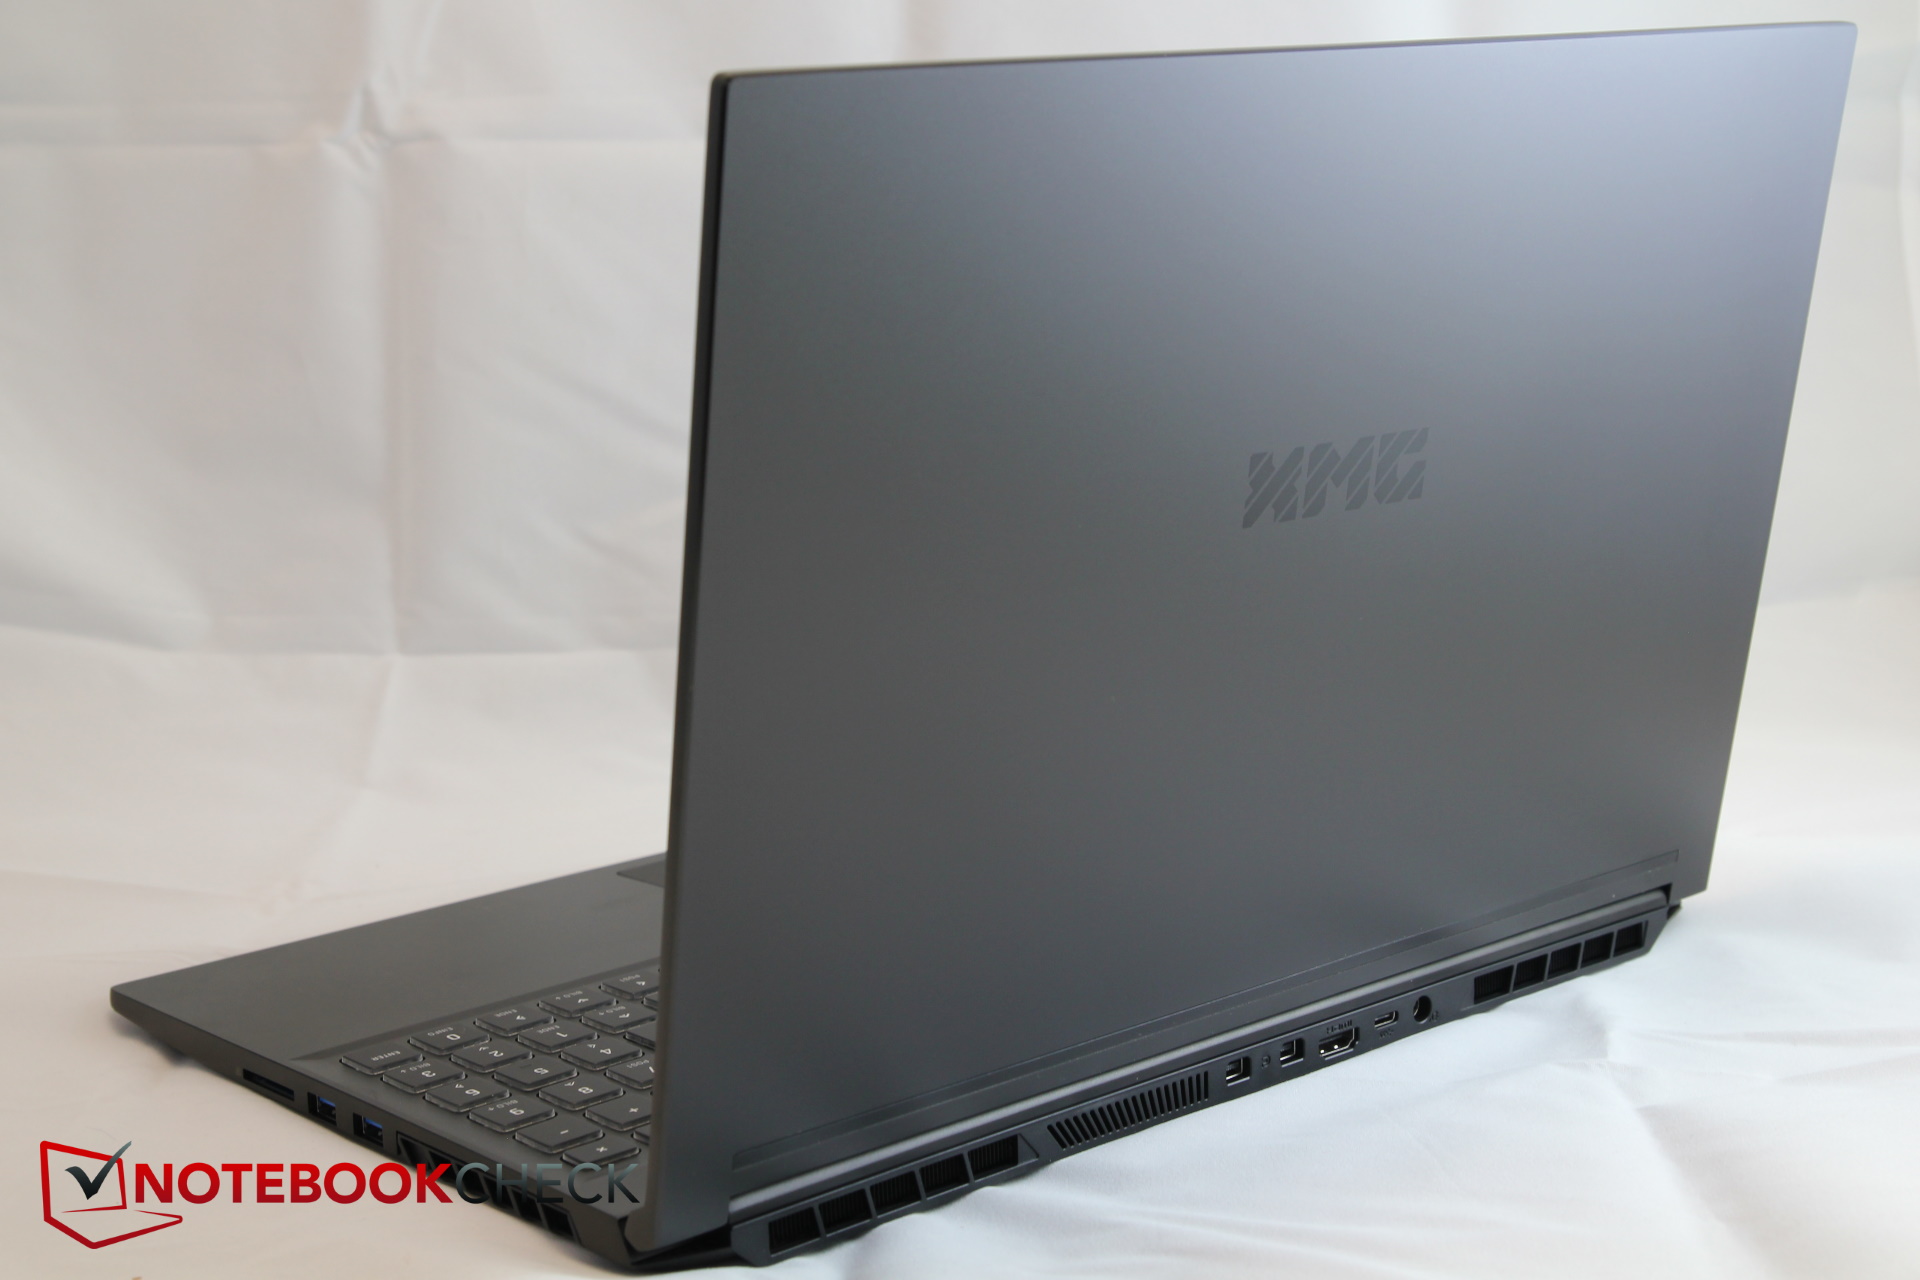
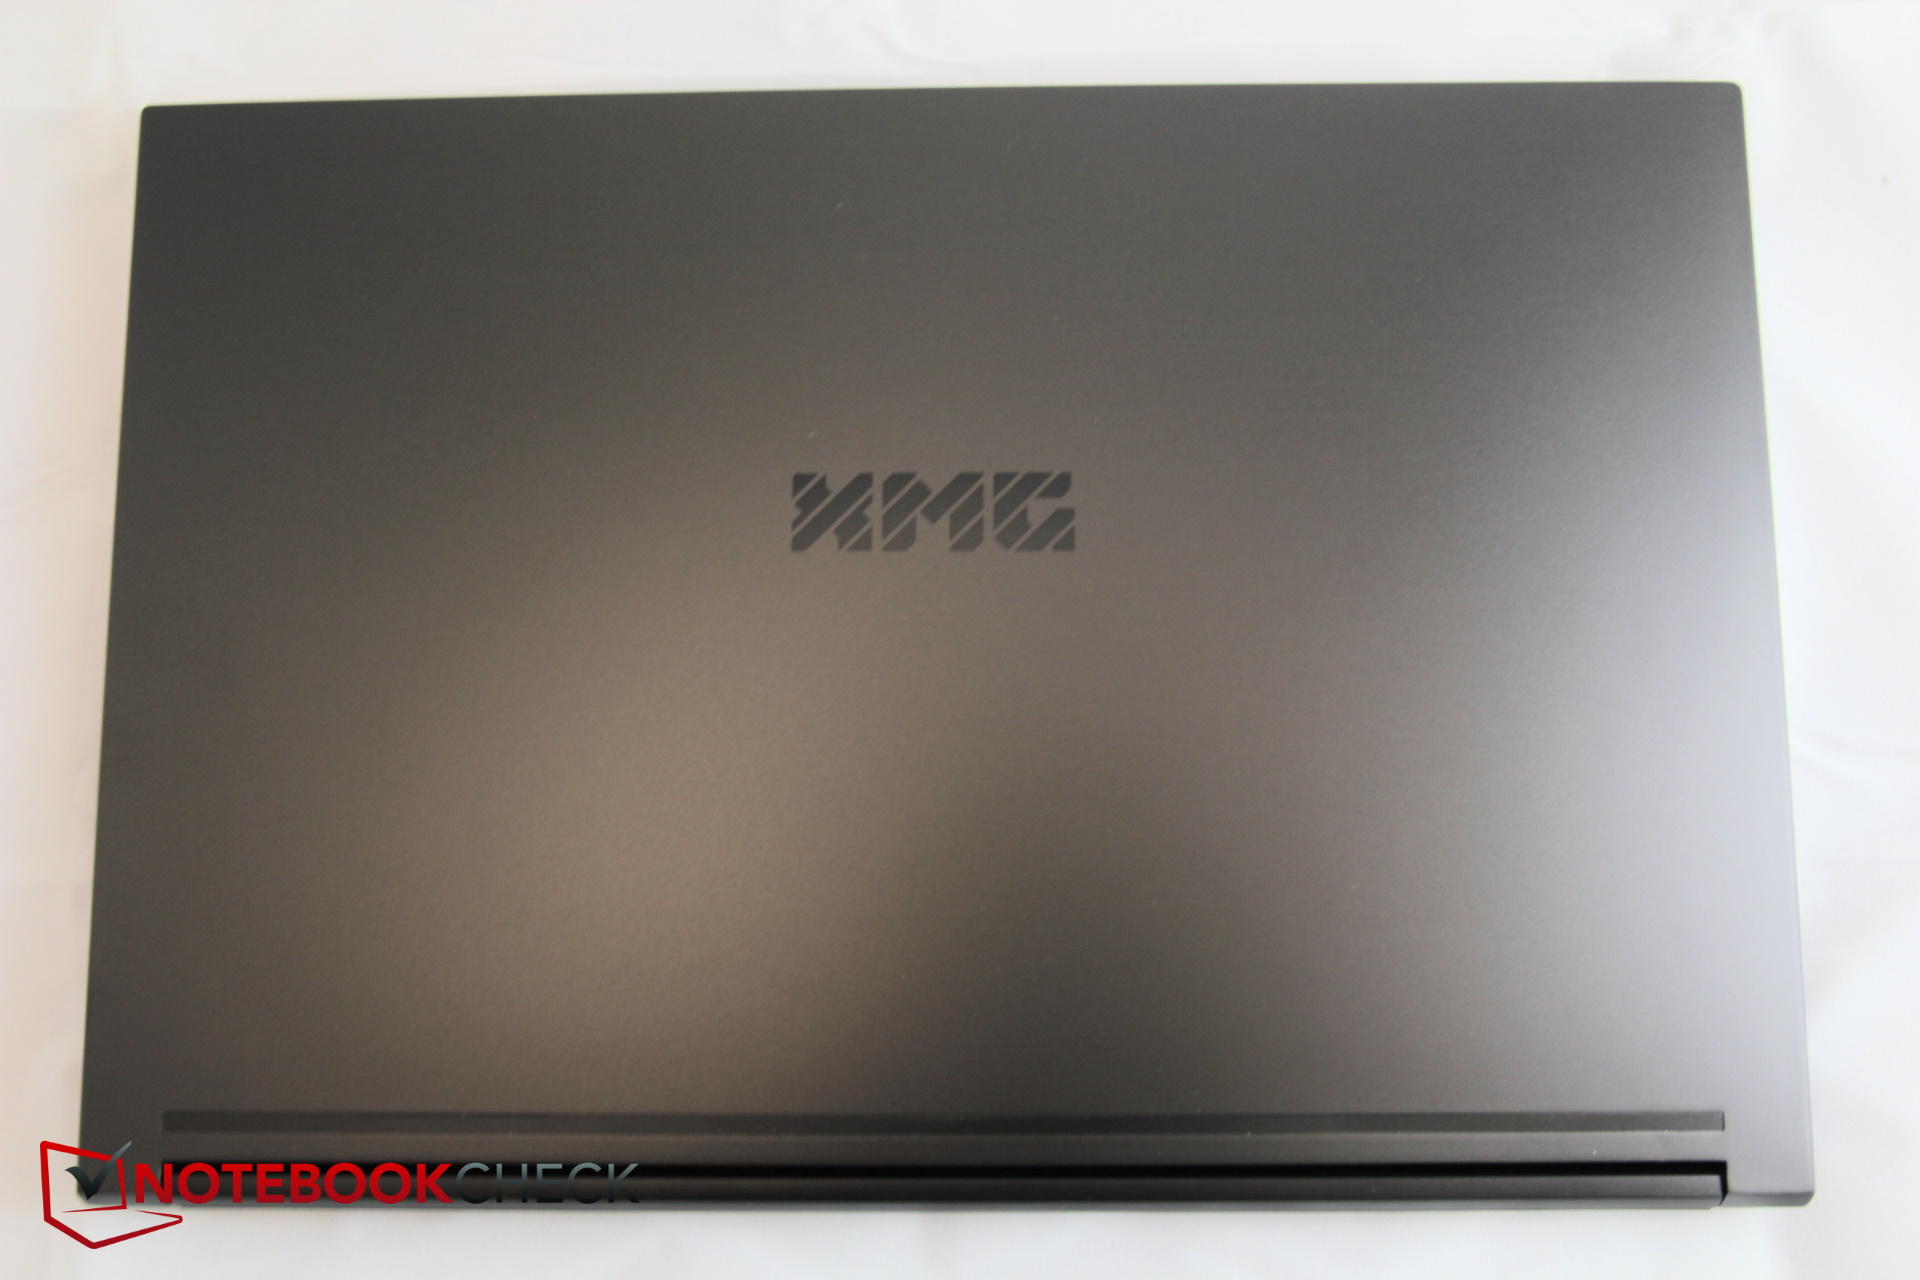
It is only at first glance that the Tongfang GK5NR0O case appears identical to the Tongfang GK5CP6V of the similarly-labeled predecessor that we tested in February. While the connections remained the same, the space behind the connections on the sides that was unused before is now equipped with additional fan vents for better air circulation. The display lid and top of the base are made from aluminum, while the display frame and the bottom continue to be made of plastic. The design remained the same and continues to appear pleasantly modest for a gaming laptop. The compact dimensions of the case are also fitting. Finger prints and smudges leave visible traces next to the dark "XMG" lettering on the display lid surface.
Despite the use of metal, the keyboard backing can be pressed in relatively easily, but this hardly becomes an annoyance while typing. As usual, the display lid is even less resistant to warping. We would have liked the two small hinges to be stiffer, and when the base is wiggled, the display angle also changes along with it quickly. In addition, the base is creaking, particularly in the area of the left palm rest, so that the overall impression is mixed. However, the rest of the workmanship appears to be okay and there are no conspicuous gap clearances.
Compared to the predecessor, the thickness of the case was slimmed down by a whole 6 mm (~0.2 in), but otherwise there are hardly any changes. The Lenovo Legion is larger and thicker. Overall, the new Core 15 is the slimmest and most often also the most compact gaming laptop in the direct comparison within the price class. All the other representatives are also more than 200 grams (7 oz) heavier at least.
Equipment - XMG with a lot of display potential
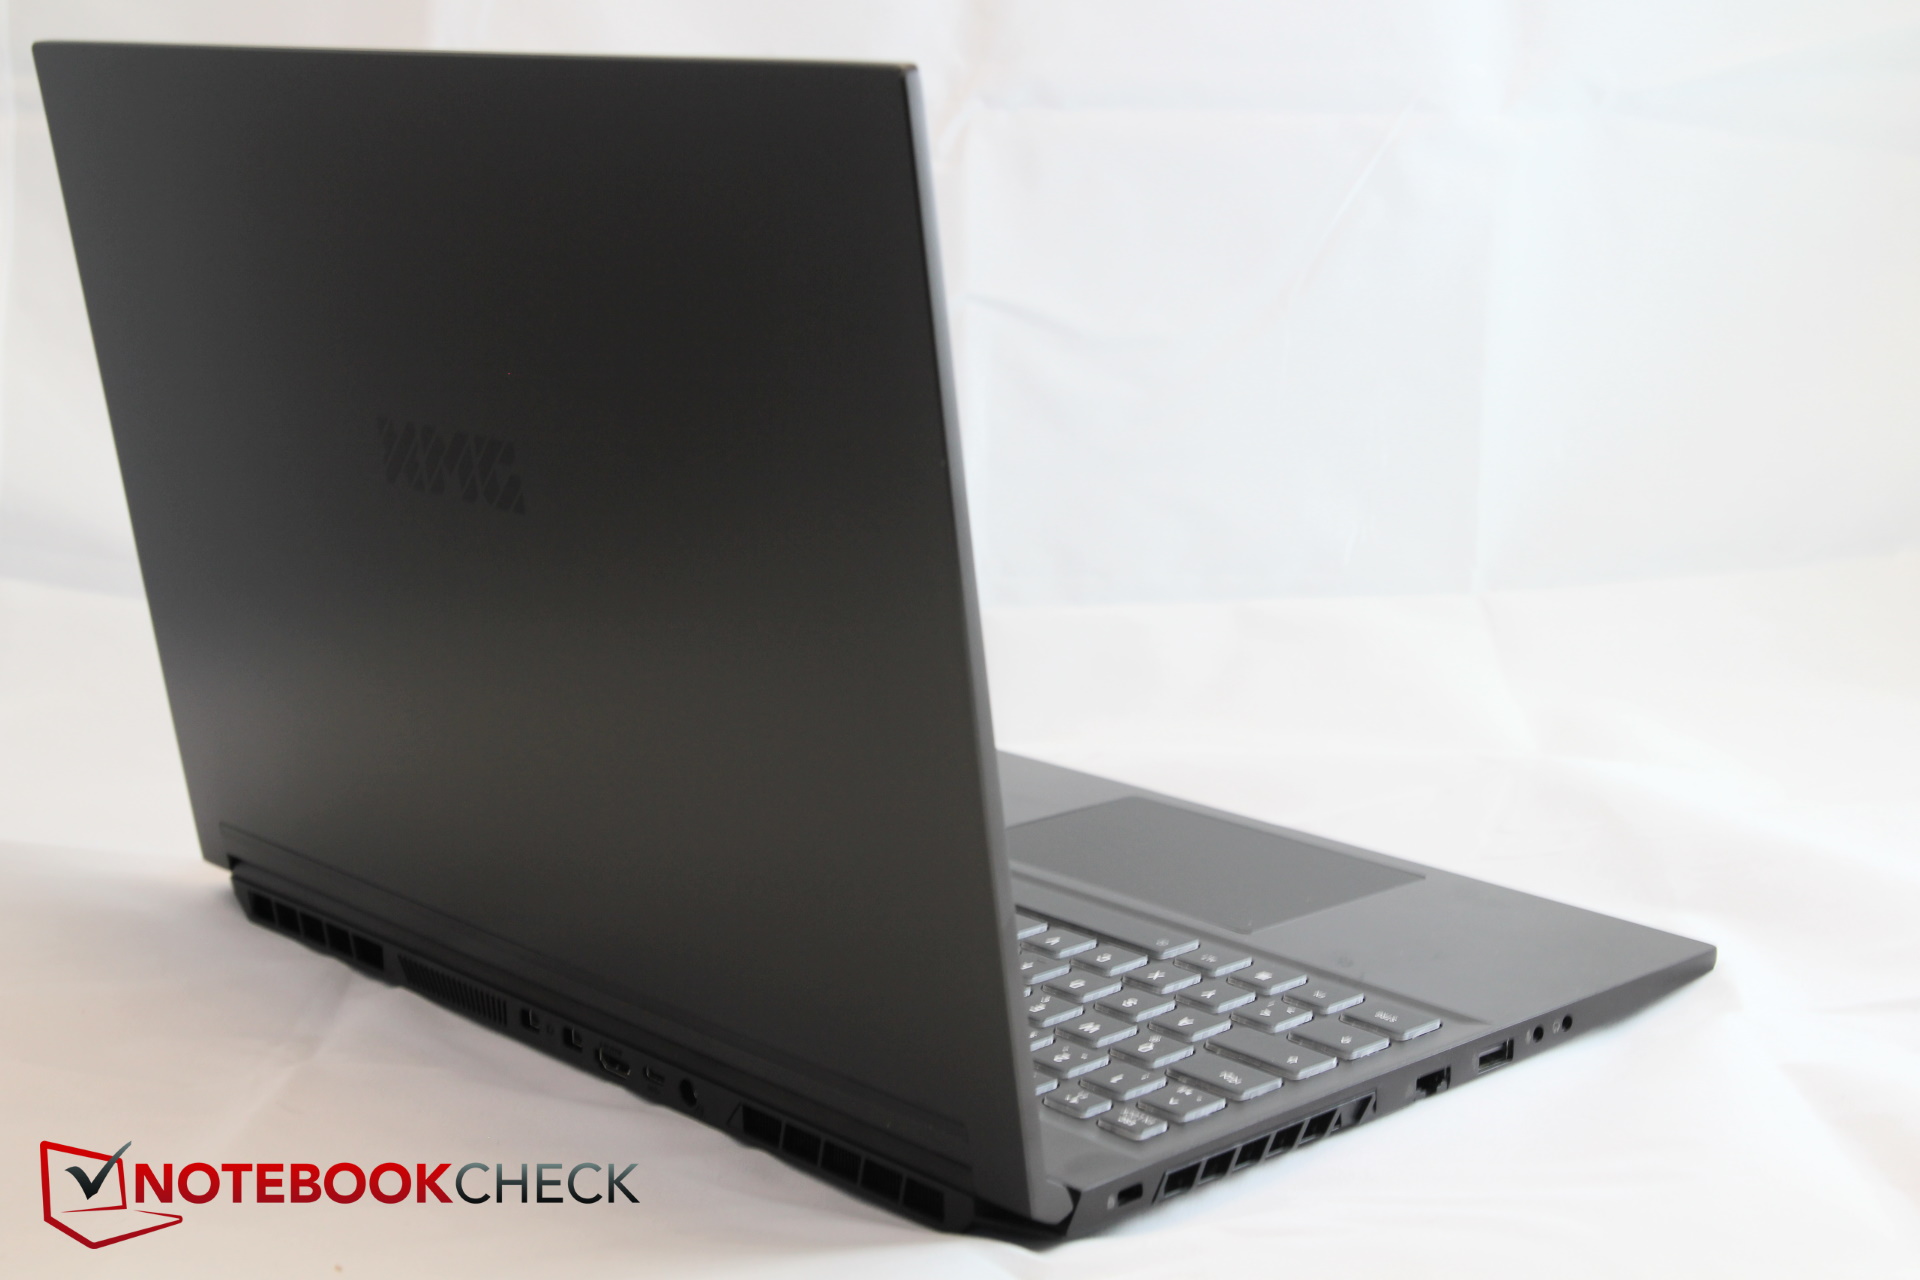
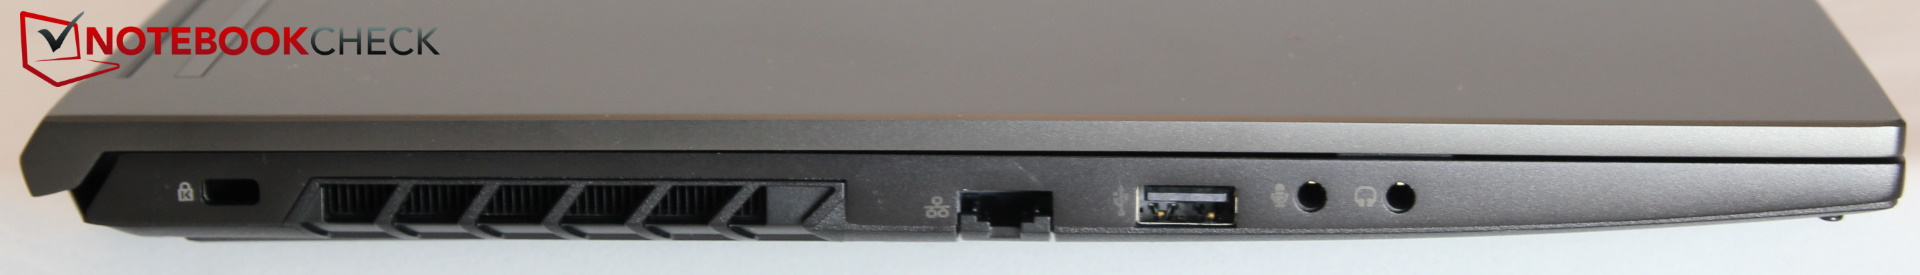
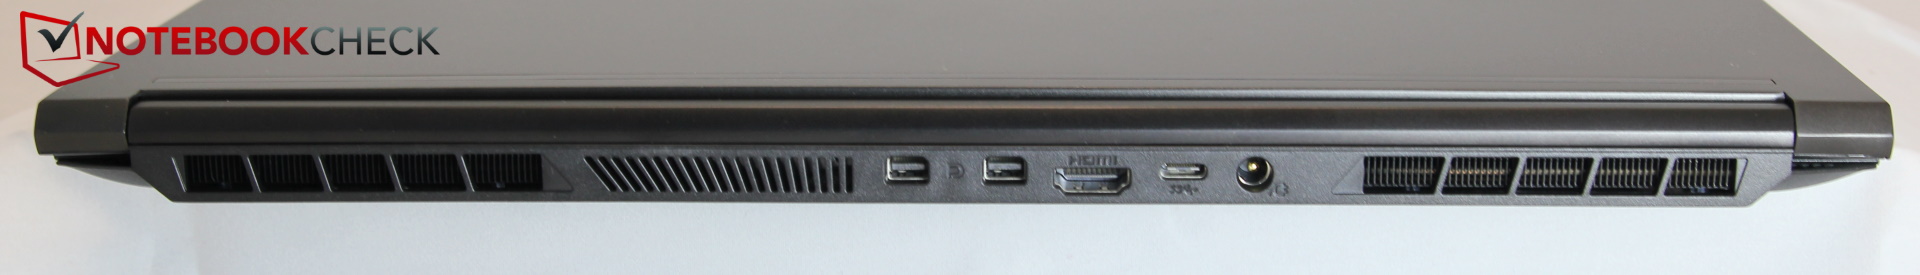
In terms of the connections, everything remains the same, only the USB-C port is now 3.2 Gen 2 instead of 3.0. The separate audio ports for microphone and headphones and the multitude of display connections deserve some praise. Since some of the ports are also on the back, the slots on the sides of the laptop are not too cramped. However, due to the fan vents on the sides, the ports are placed quite far toward the front, which might lead to some annoyances with the mouse operation.
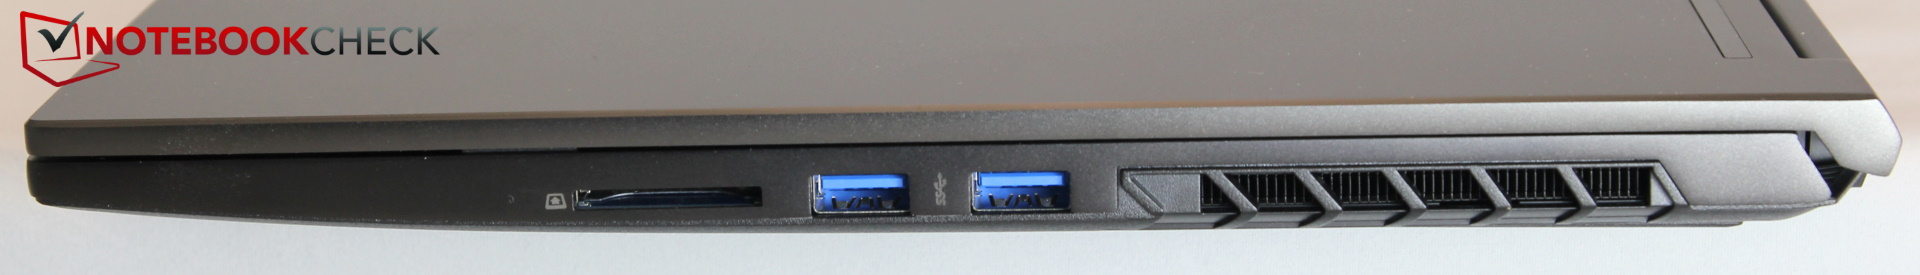
SD Card Reader
The transfer speed of the built-in SD card reader is lame. Like its direct competitors, the Schenker only reaches transfer rates of about 30 MB/s, while the average among gaming laptops is about 100 MB/s.
| SD Card Reader | |
| average JPG Copy Test (av. of 3 runs) | |
| Average of class Gaming (20.9 - 210, n=54, last 2 years) | |
| Dell G5 15 SE 5505 P89F (Toshiba Exceria Pro SDXC 64 GB UHS-II) | |
| Schenker XMG Core 15 GK5NR0O (Toshiba Exceria Pro SDXC 64 GB UHS-II) | |
| Dell G3 15 3500-G4DG2 (Toshiba Exceria Pro SDXC 64 GB UHS-II) | |
| Schenker XMG Core 15 GK5CP6V (Toshiba Exceria Pro SDXC 64 GB UHS-II) | |
| maximum AS SSD Seq Read Test (1GB) | |
| Average of class Gaming (25.5 - 261, n=51, last 2 years) | |
| Dell G5 15 SE 5505 P89F (Toshiba Exceria Pro SDXC 64 GB UHS-II) | |
| Schenker XMG Core 15 GK5NR0O (Toshiba Exceria Pro SDXC 64 GB UHS-II) | |
| Dell G3 15 3500-G4DG2 (Toshiba Exceria Pro SDXC 64 GB UHS-II) | |
| Schenker XMG Core 15 GK5CP6V (Toshiba Exceria Pro SDXC 64 GB UHS-II) | |
Communication
In terms of the WLAN transfer speeds, the XMG Core 15 does very well, ending up even significantly above the values we expect from the Intel AX200 module. In our comparison, it achieves one of the top values while sending as well as receiving.
Webcam
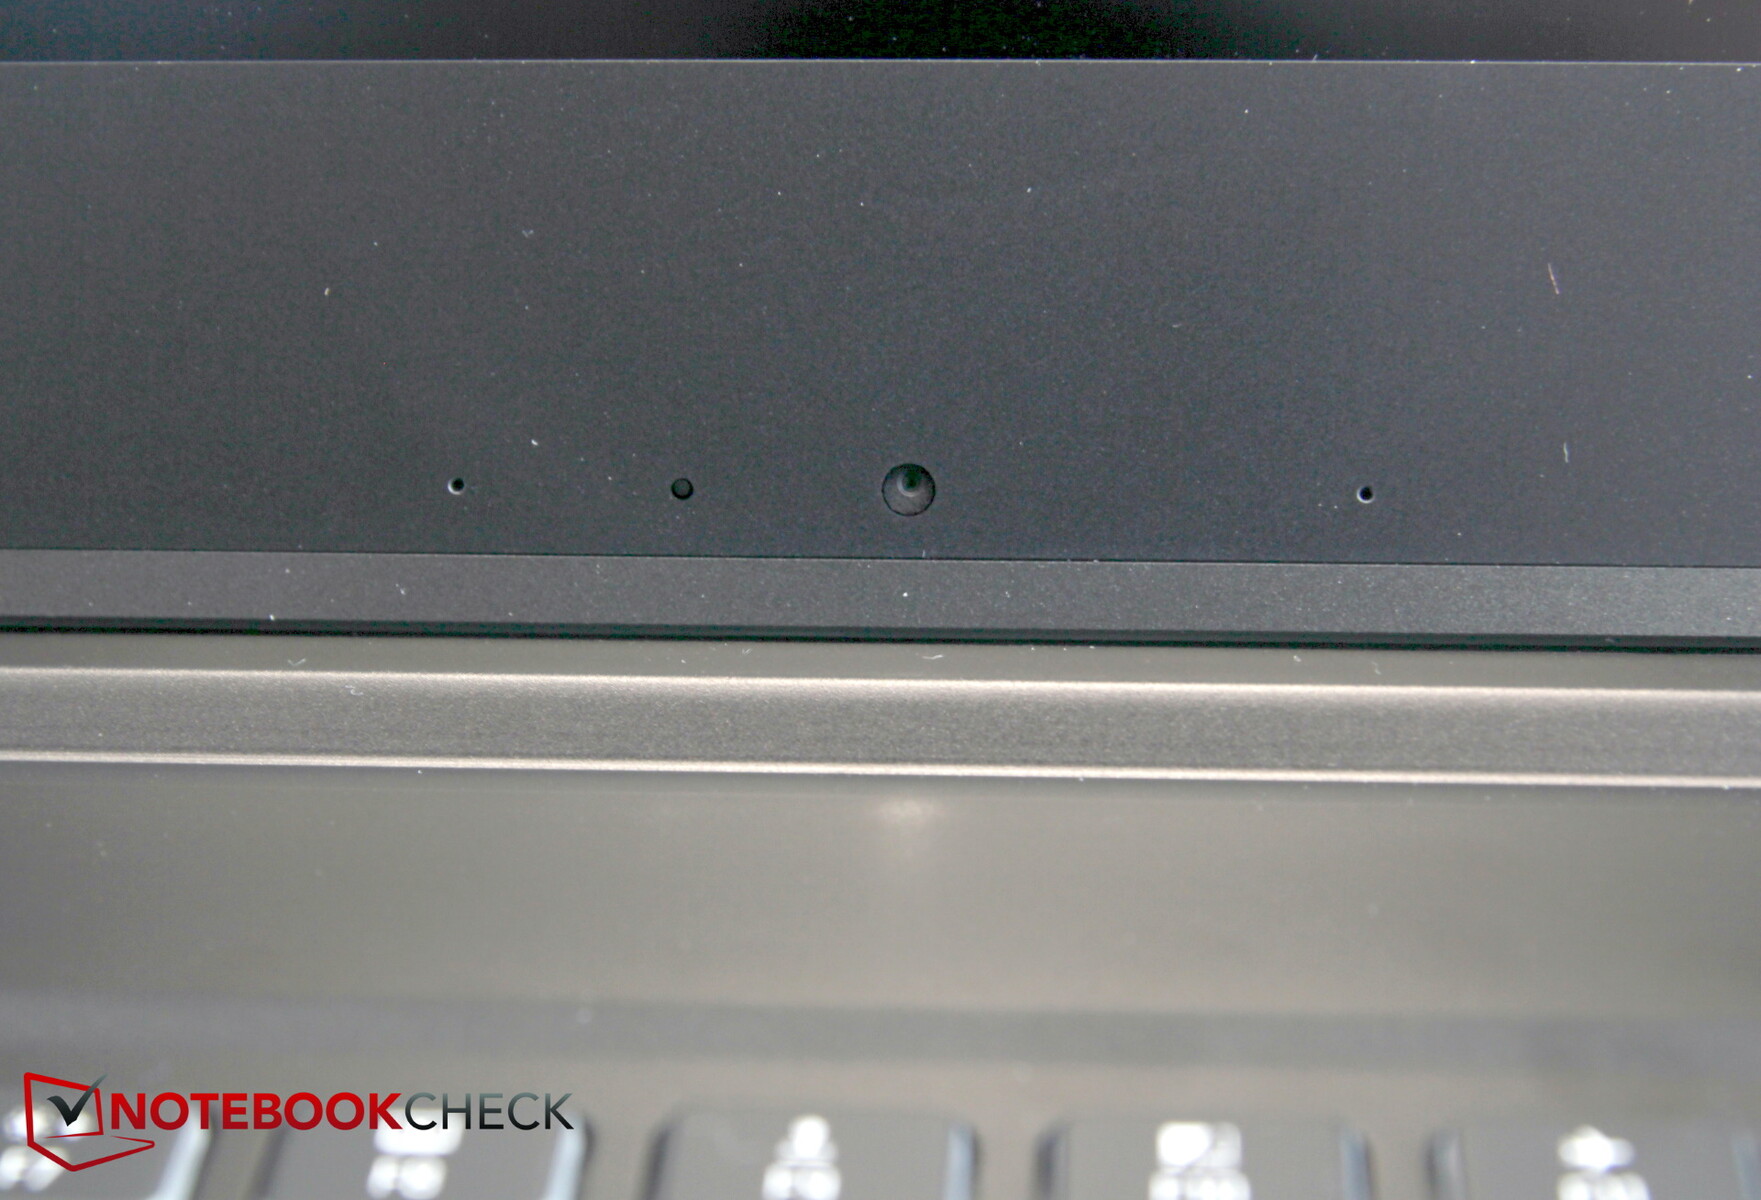
The webcam with its microphone is placed at the bottom edge of the display. There is no shutter. As you can see in the color deviations and especially also the writing using our X-Rite color measurement device, the images of the webcam have a blue tint that is more than clearly noticeable.


Security
The Schenker XMG Core 15 offers a slot for a Kensington Lock, and TPM 2.0 (via Intel PTT) is also onboard.
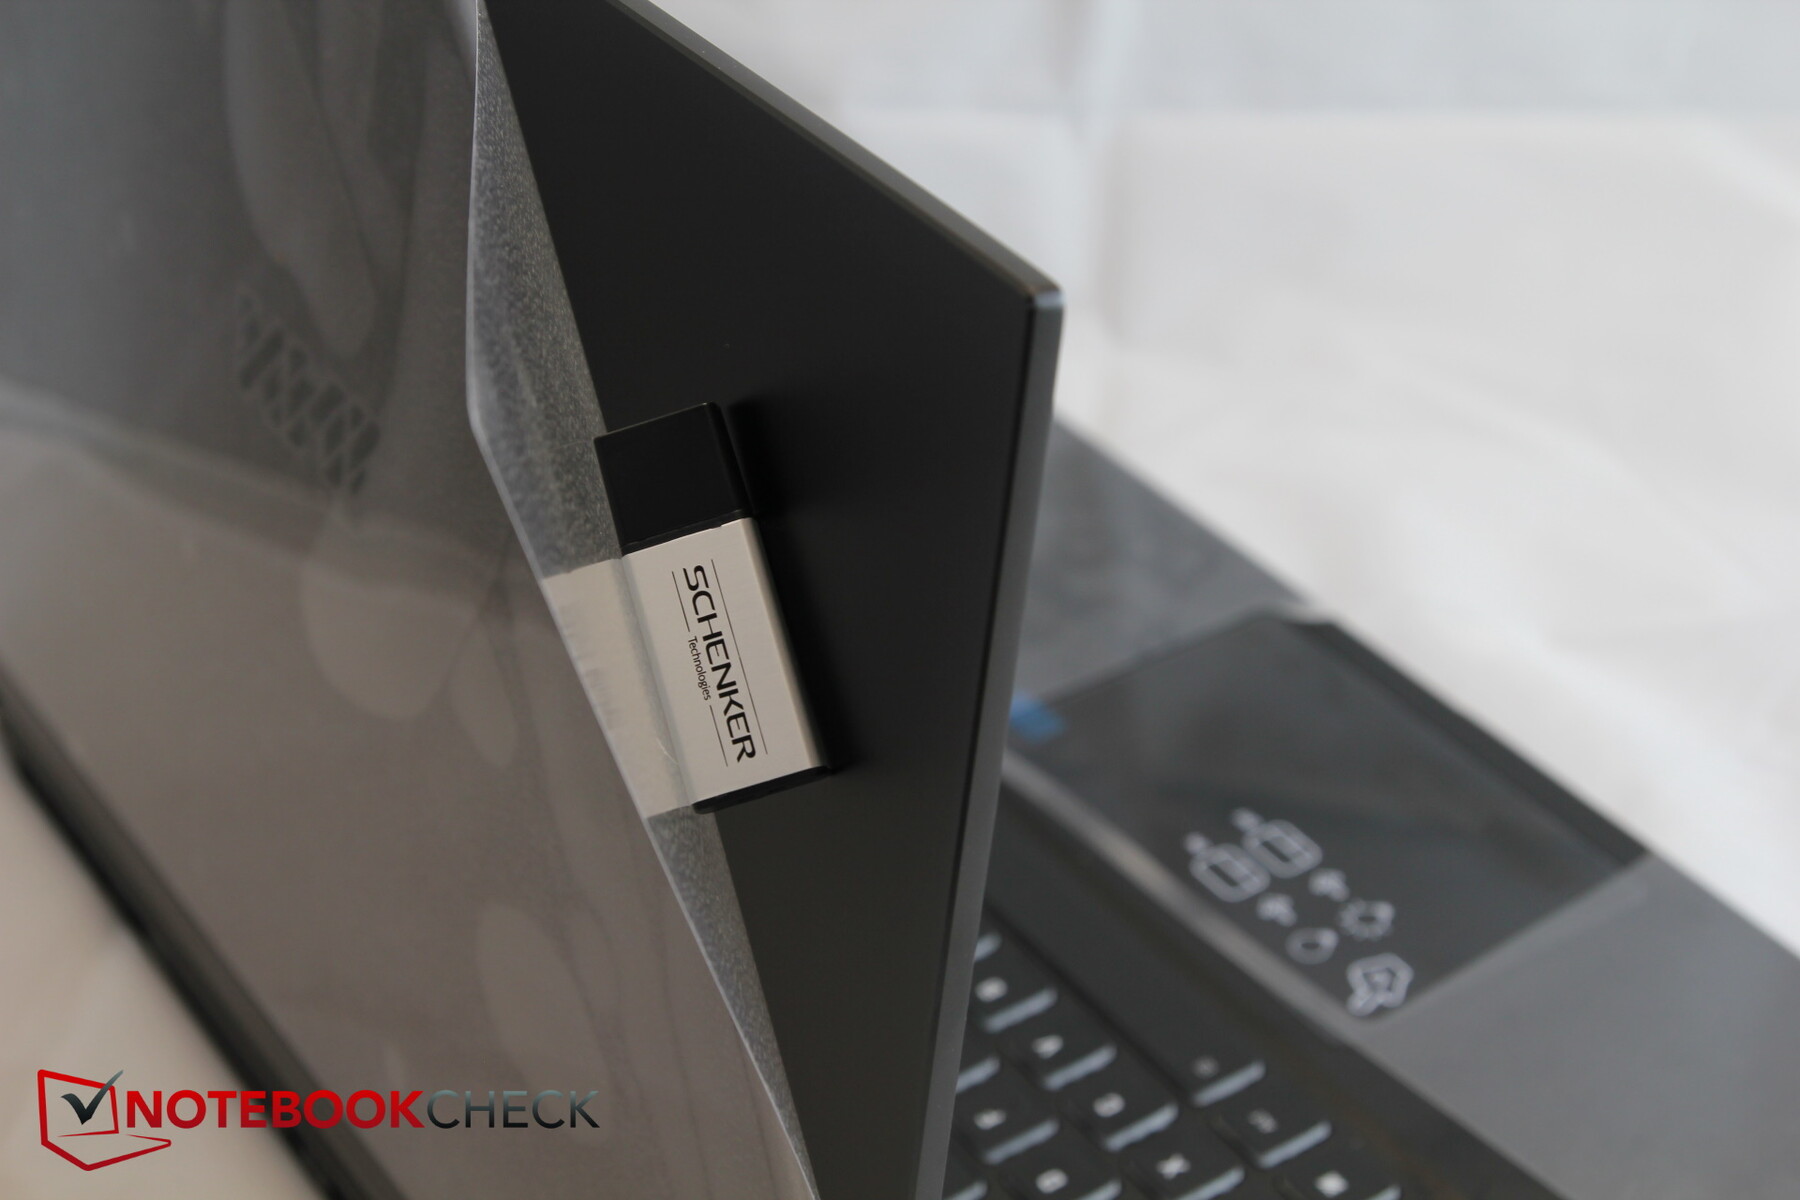
Accessories
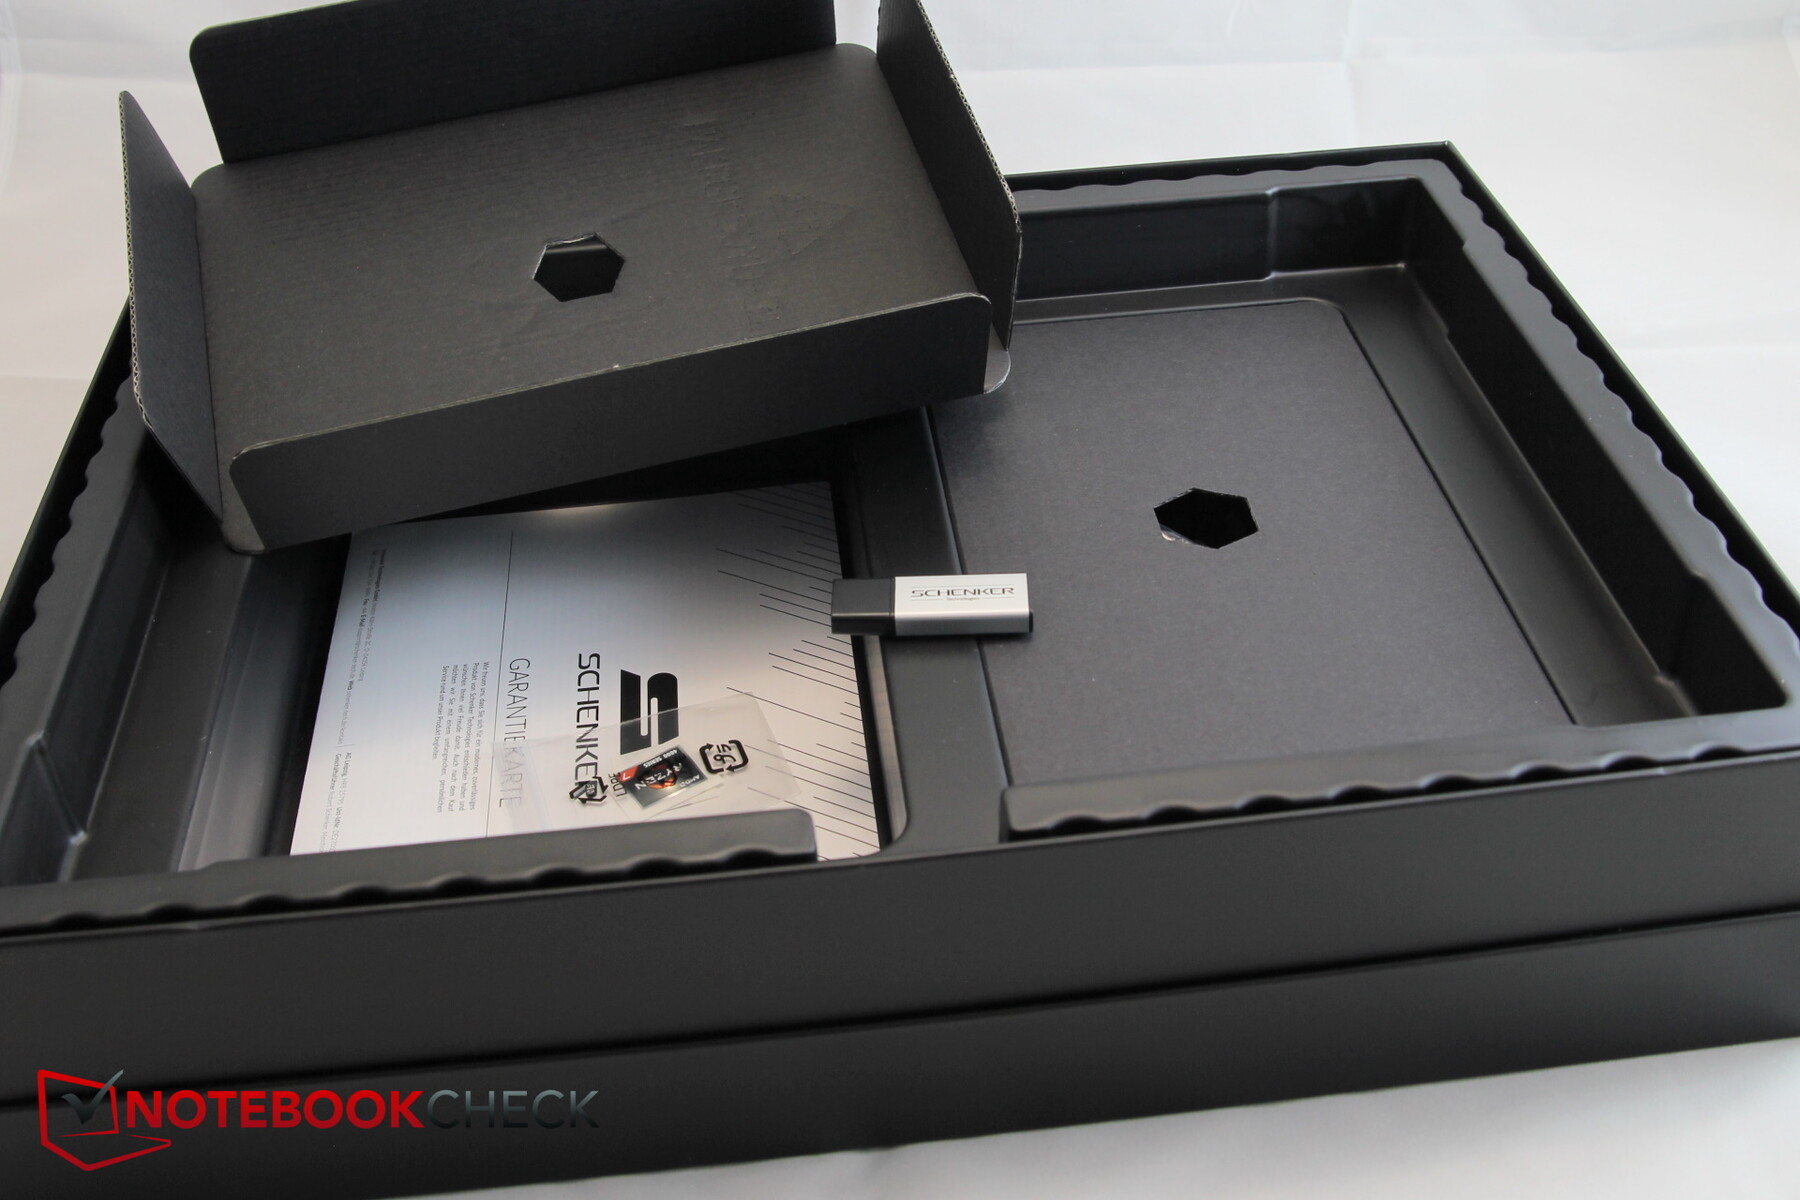
Our unit comes with Windows 10 Pro (64 bit) preinstalled, but that still has to be activated, because a license is not included. In the Bestware.com Schenker shop, you can add a Pro license for 97.49 Euros (~$113) or a Home license for 58.49 Euros (~$68) to your configuration. In addition to the power supply and quick start manual, our box also includes a 16-GB USB stick with the device drivers, which is a nice bonus.
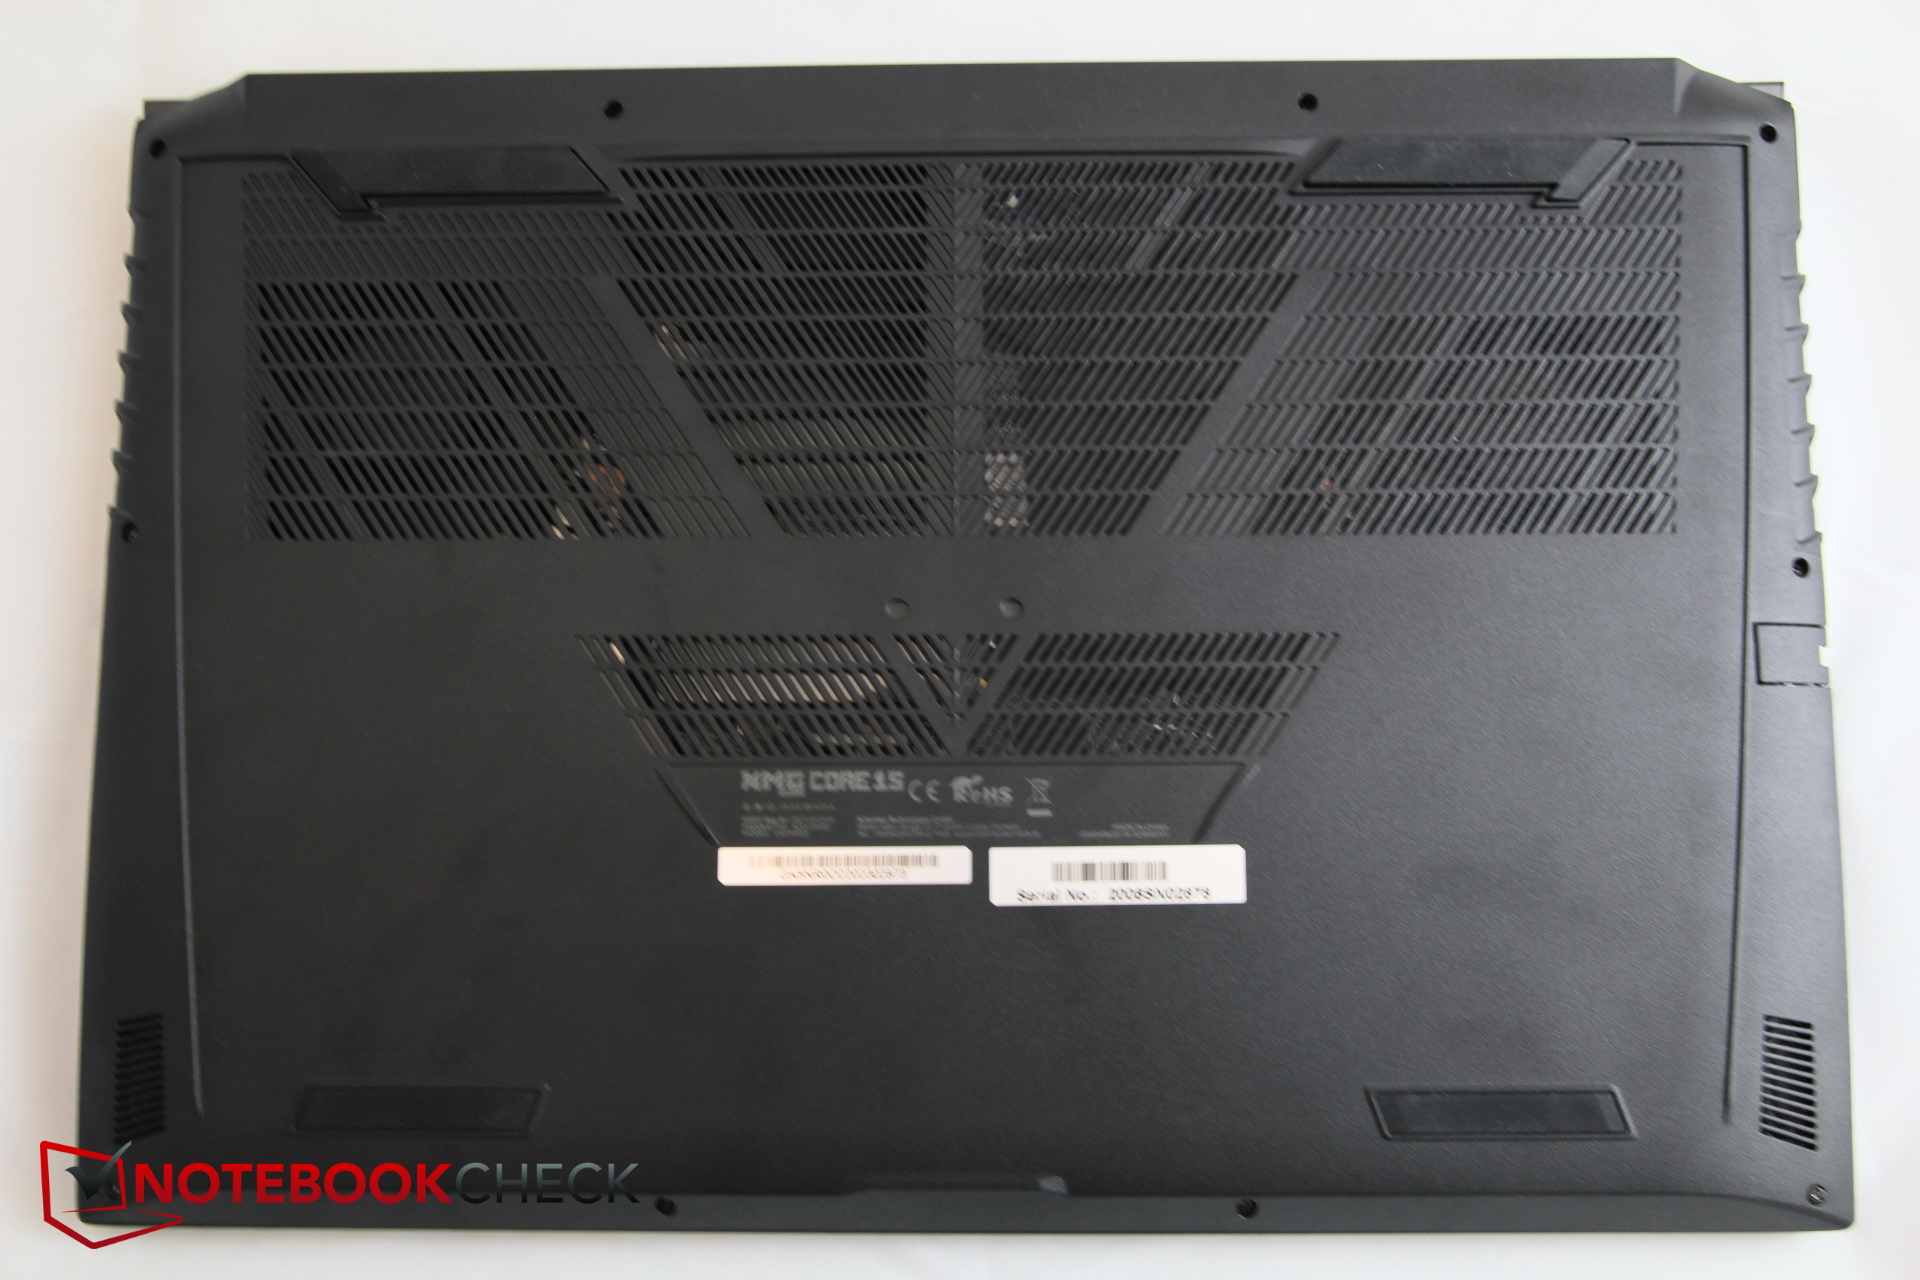
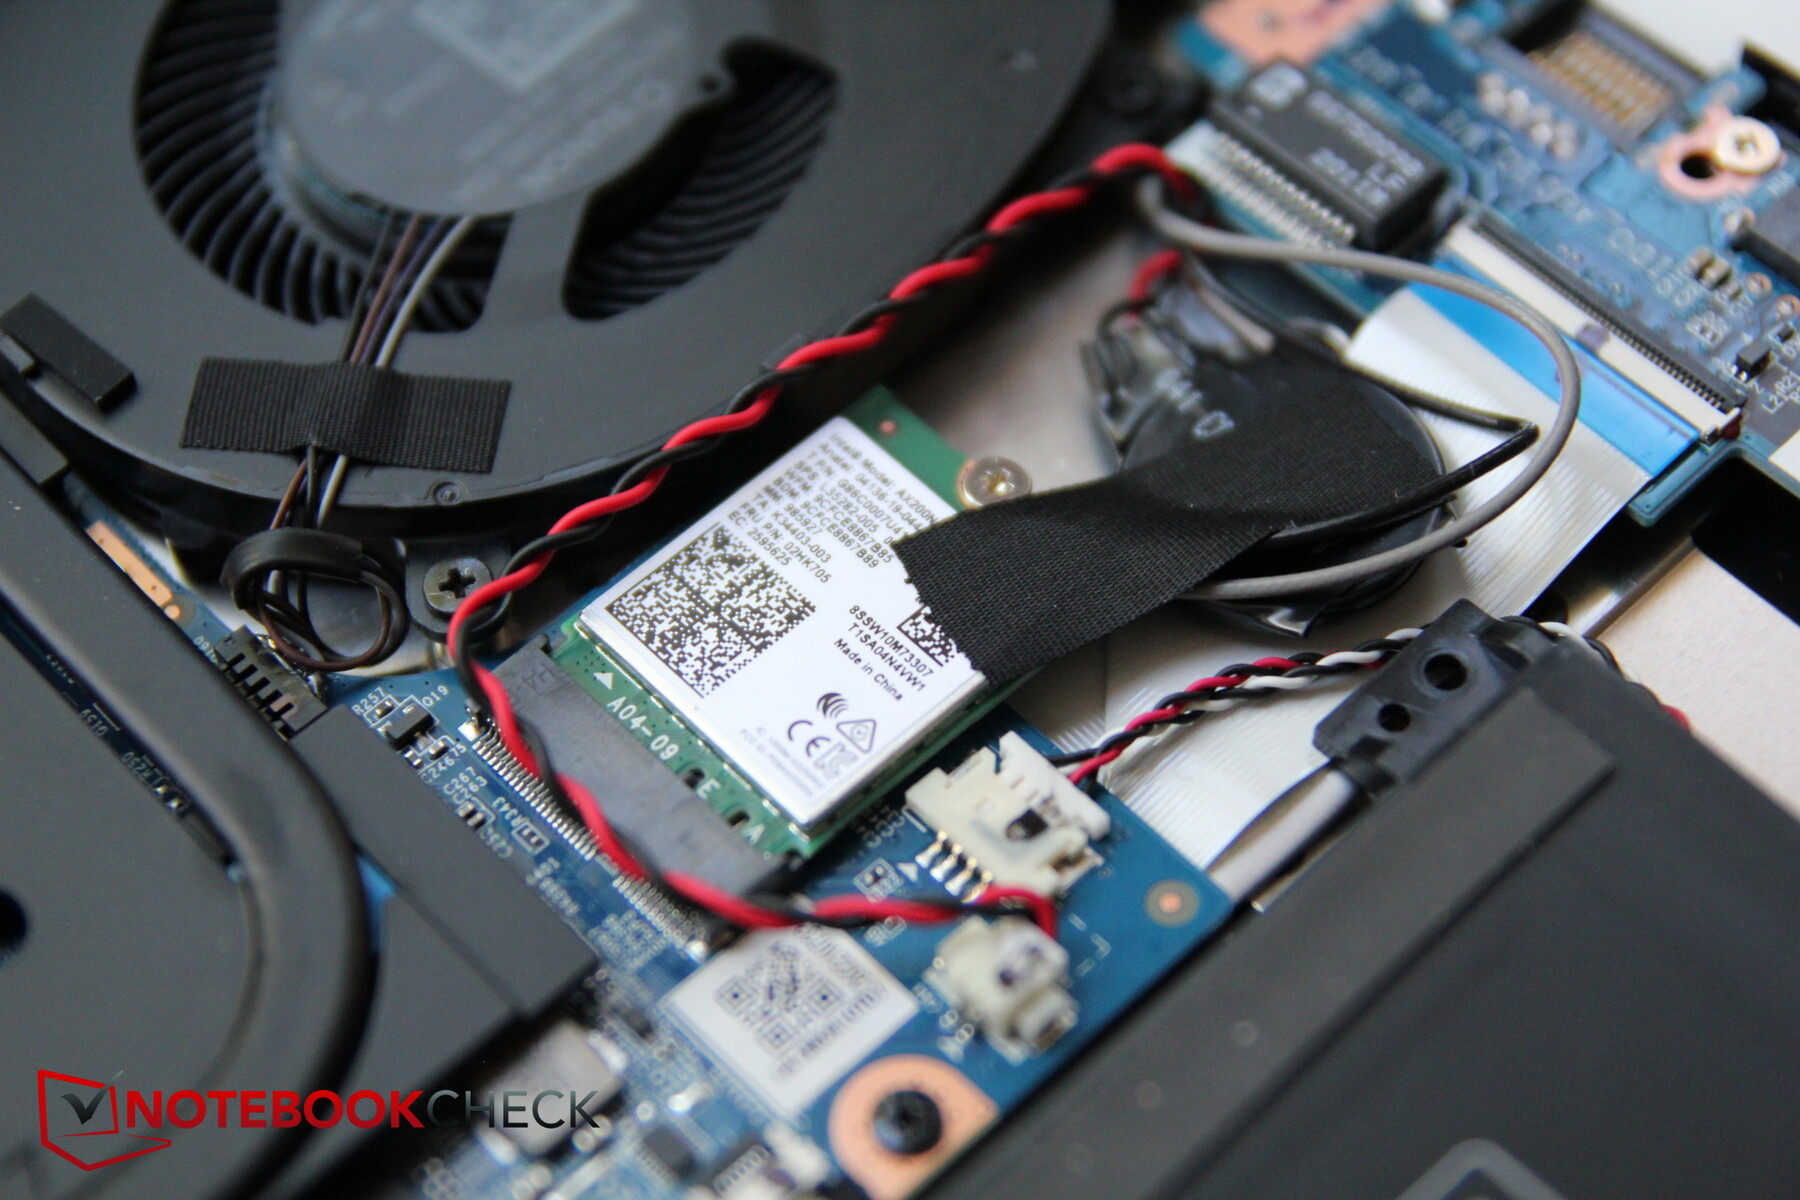
Maintenance
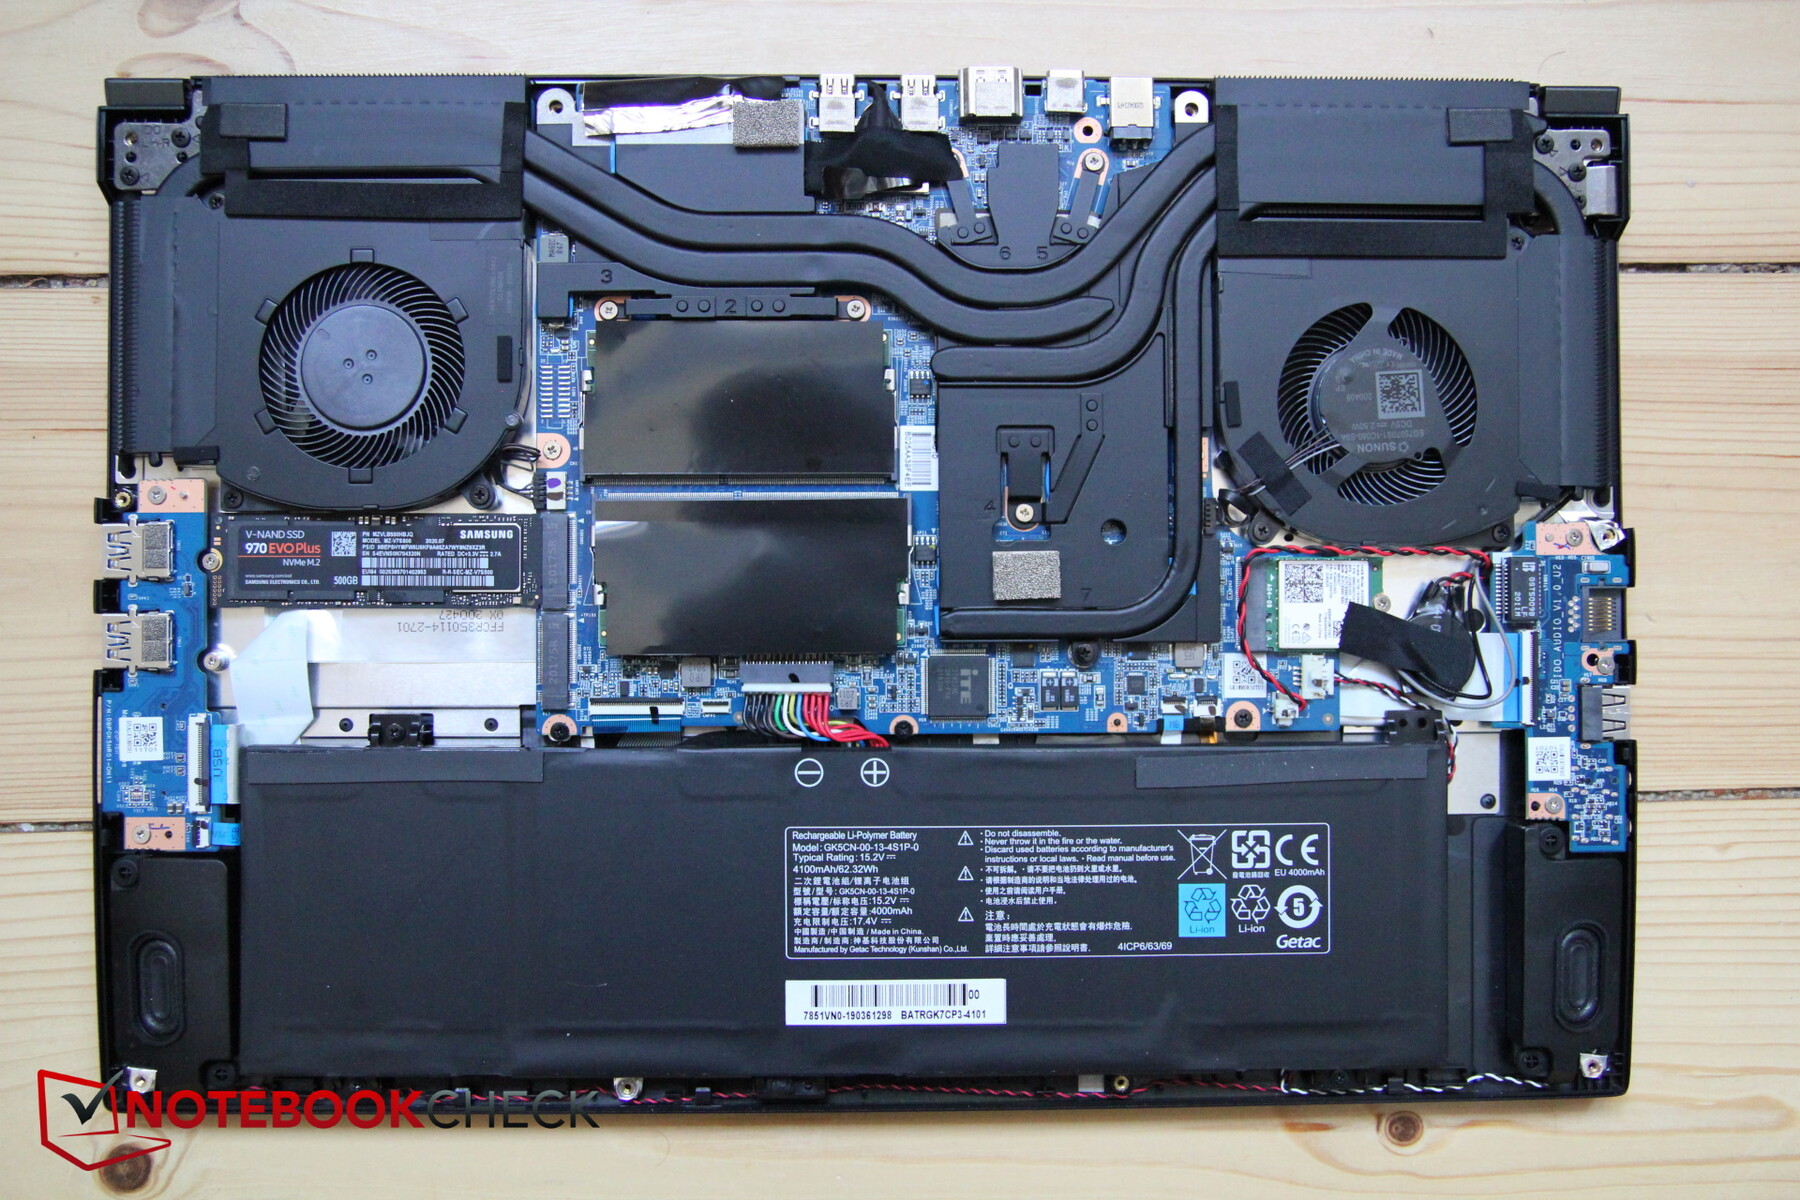
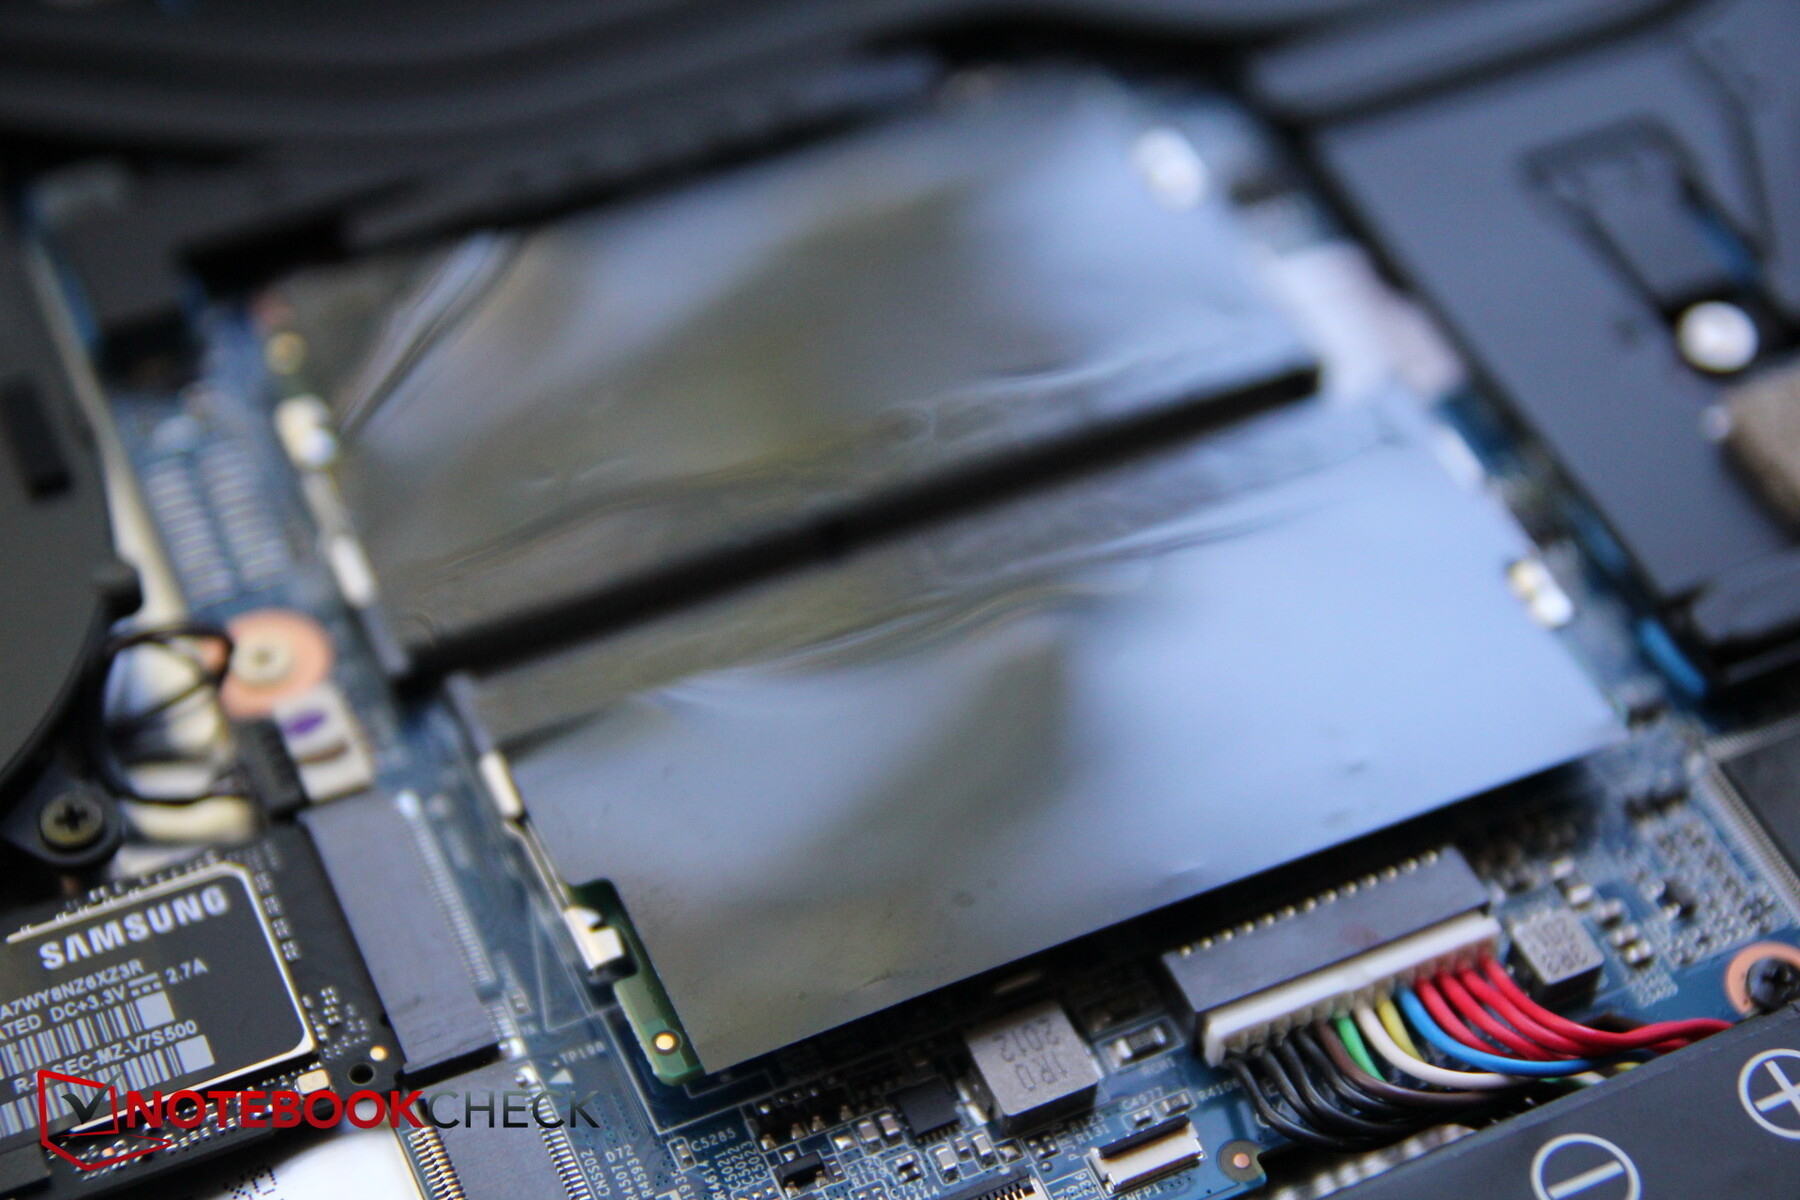
Performing maintenance should be relatively easy. After removing the 10 Philips screws, the bottom of the case can be removed fairly easily without needing any prying effort. You then get access to all the important components such as the two fans, the battery, the two RAM slots, and the two M.2 storage slots, one of which is still empty.

Warranty
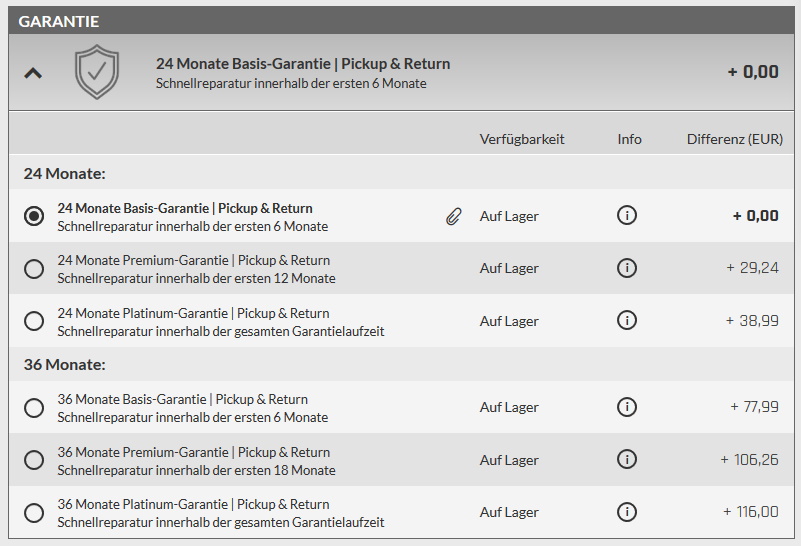
While Schenker offers a 24-month warranty, you can only get the "fast repair" for 6 months. If you want to extend this to 12 months or the whole warranty period, you have to pay extra, as shown in the screenshot below.
Input Devices - Good for a gaming laptop
Keyboard
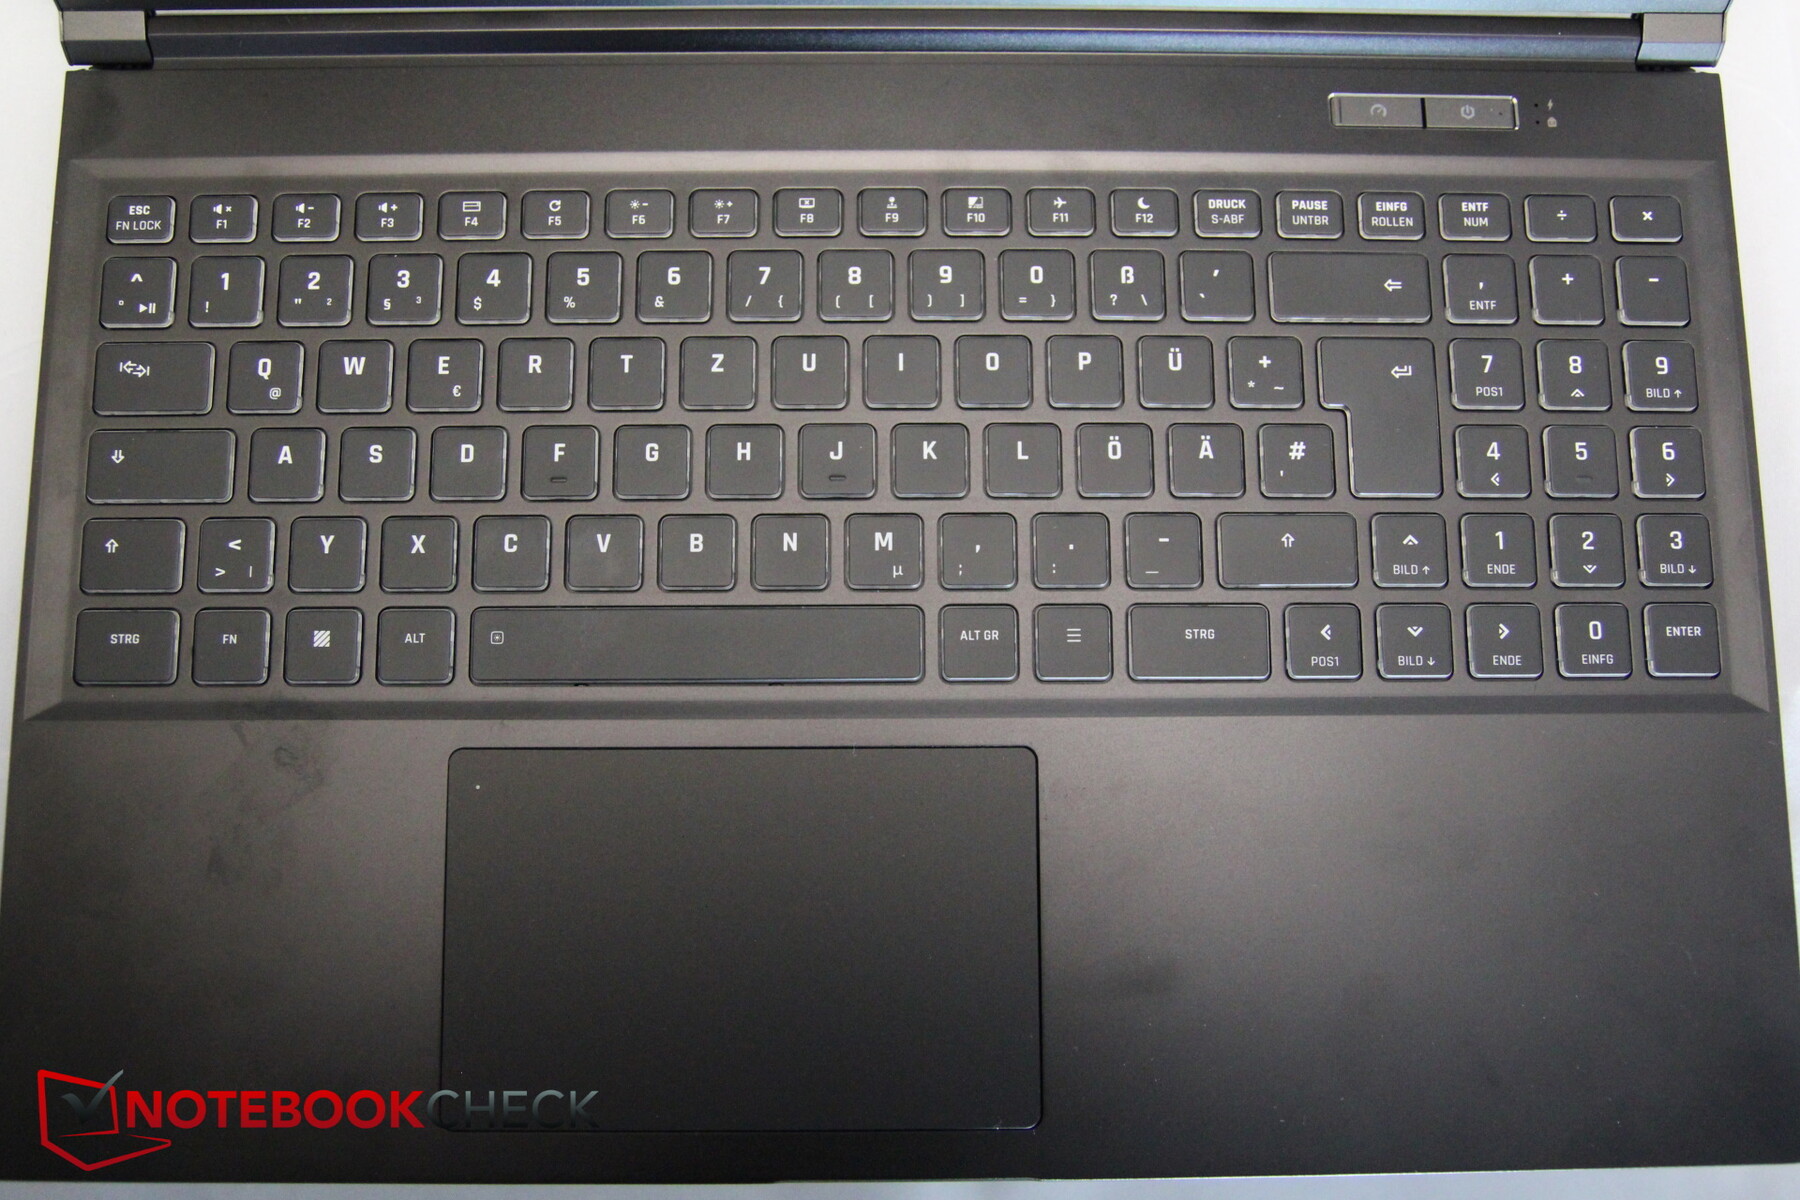
In the keyboard, we like the fairly comfortable stroke with the feedback that is still clear, and typing tasks succeed easily this way. The lettering of the keys is okay, but looks a little fat and chunky, instead of clearly defined. Overall, the layout is very well arranged. Another positive point is the continued existence of a number pad. In exchange, the keys appear slightly small (14-15 mm; 0.55-0.59 in), the right arrow key reaches into the number pad, and the +/- keys that are usually elongated, as well as the additional Enter key on the right, had to be implemented smaller and not quite positioned in their usual places. However, this is hardly any annoyance.
The typing noise is fairly inconspicuous but not extremely quiet either. The keyboard offers RGB background illumination that can be freely configured using a piece of software.
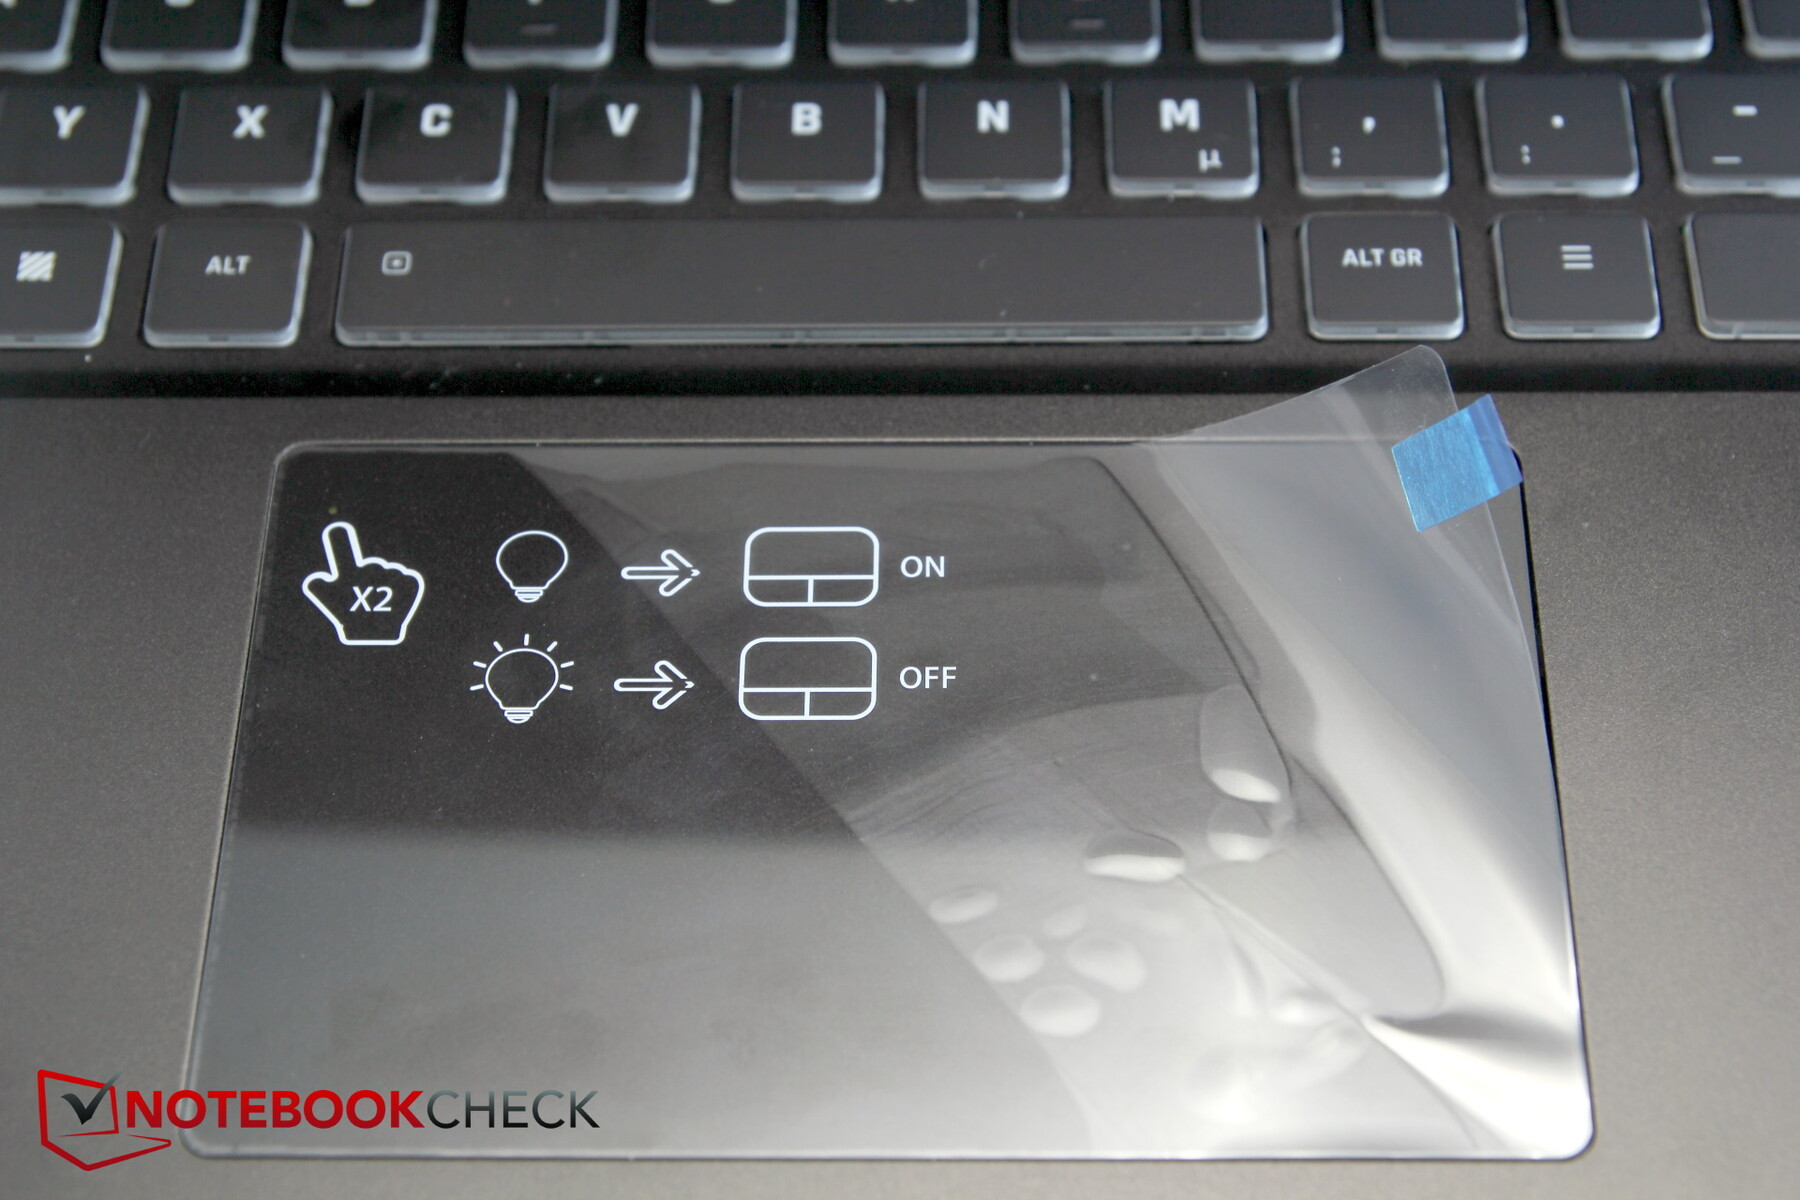
Touchpad
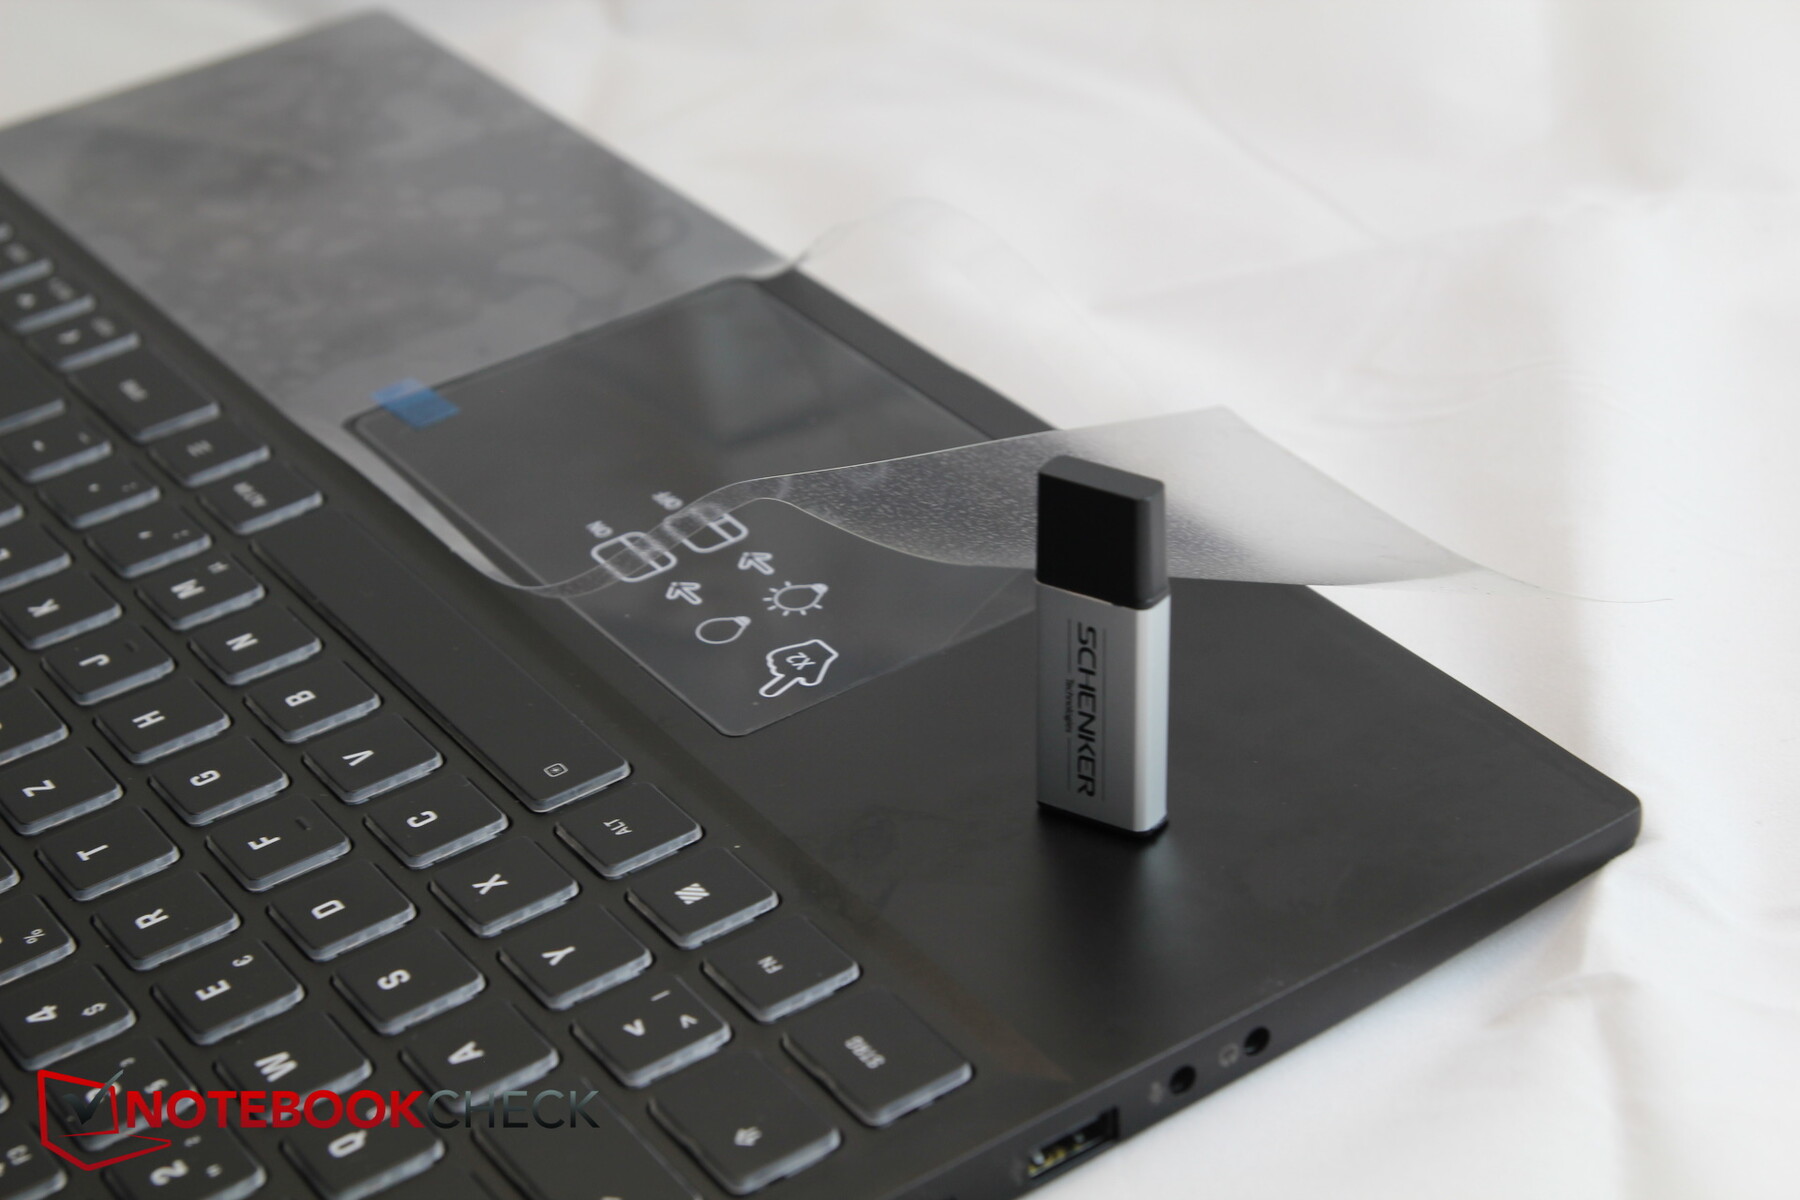
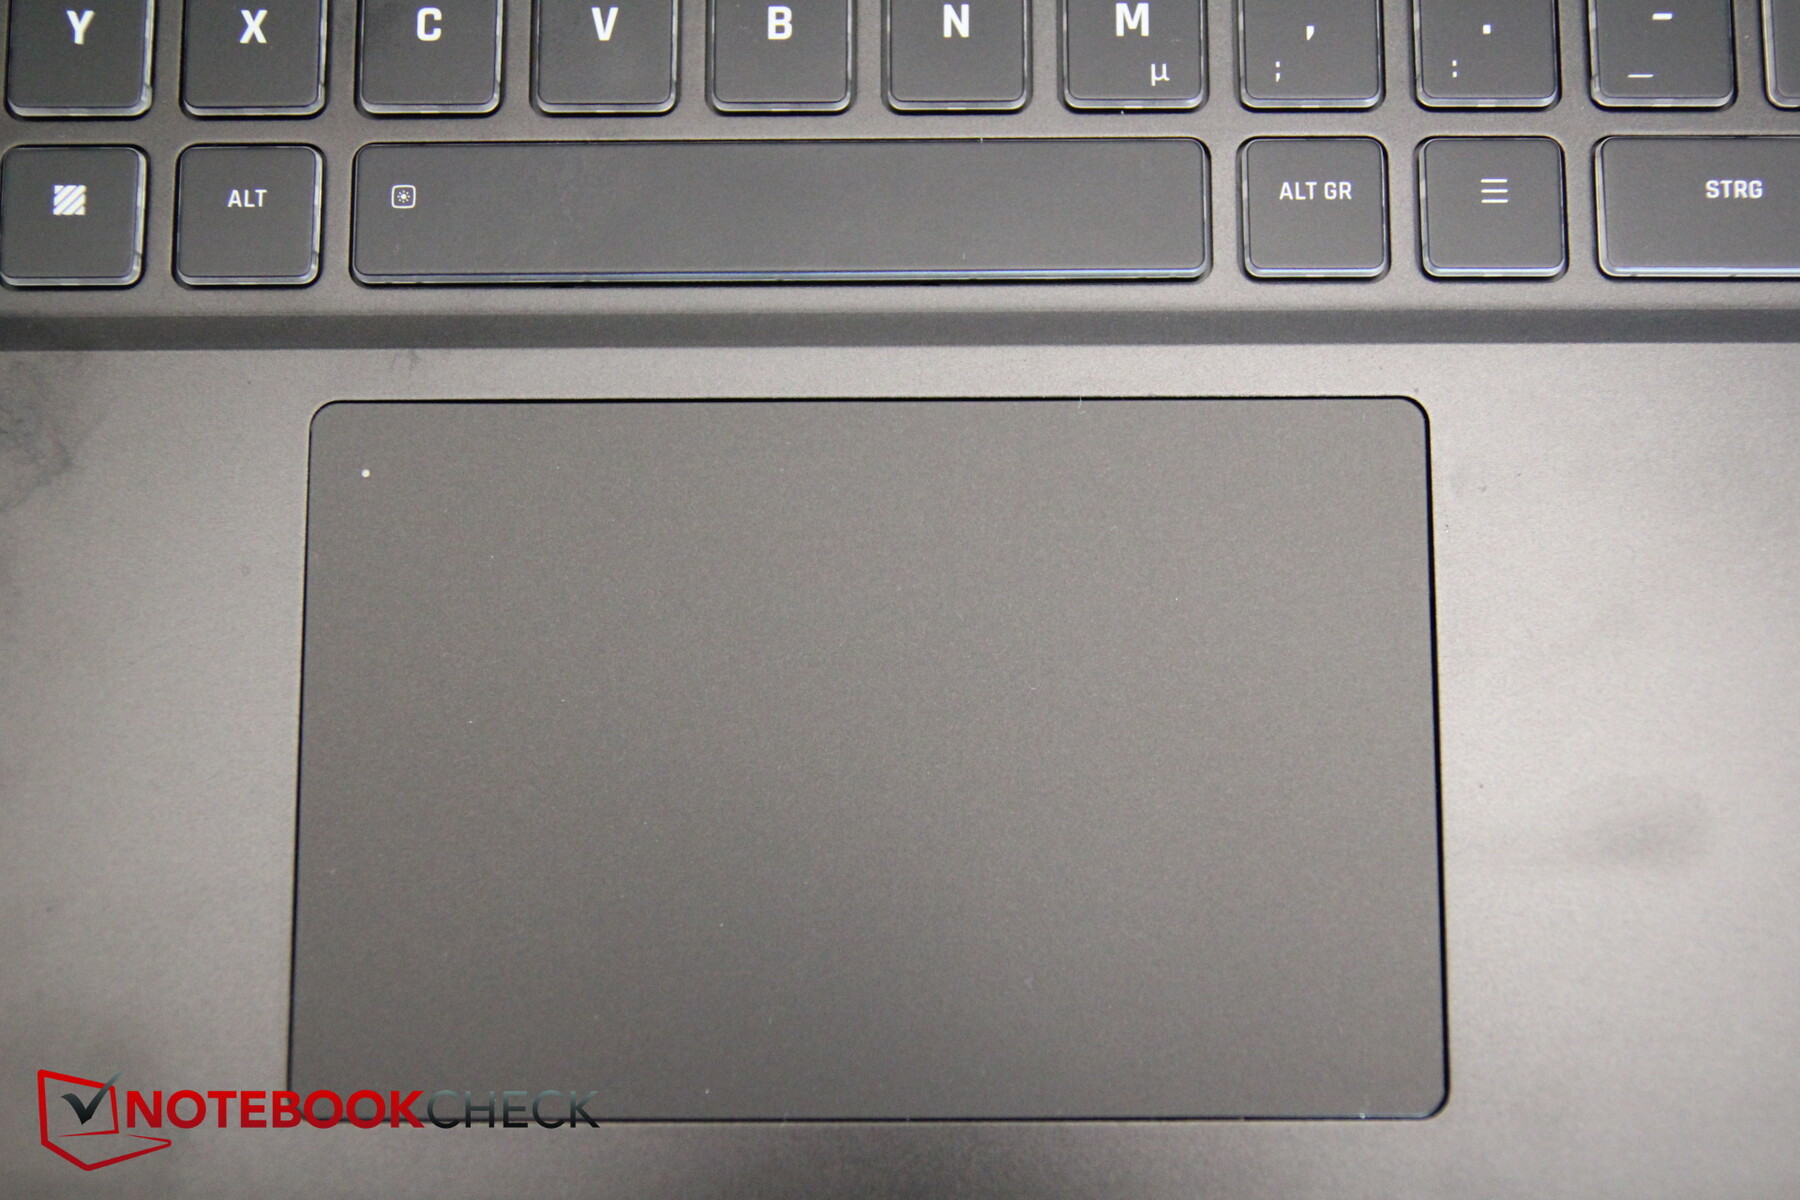
The large touchpad (11.7 cm x 7.4 cm; ~4.6 x 2.9 in) offers good sliding characteristics for regular finger movements, but at only very slow speeds it can slightly hinder the movement. The integrated keys only offer a very short stroke and like the keyboard, they are neither particularly loud nor particularly quiet. Tapping twice in the left top corner of the touchpad will activate or deactivate it. When the pad is deactivated, a small, white LED in the corner will light up. The instructions on that, pictured on a sticky foil, were a bit confusing at first.
Display - 144 Hz to please a gamer's heart
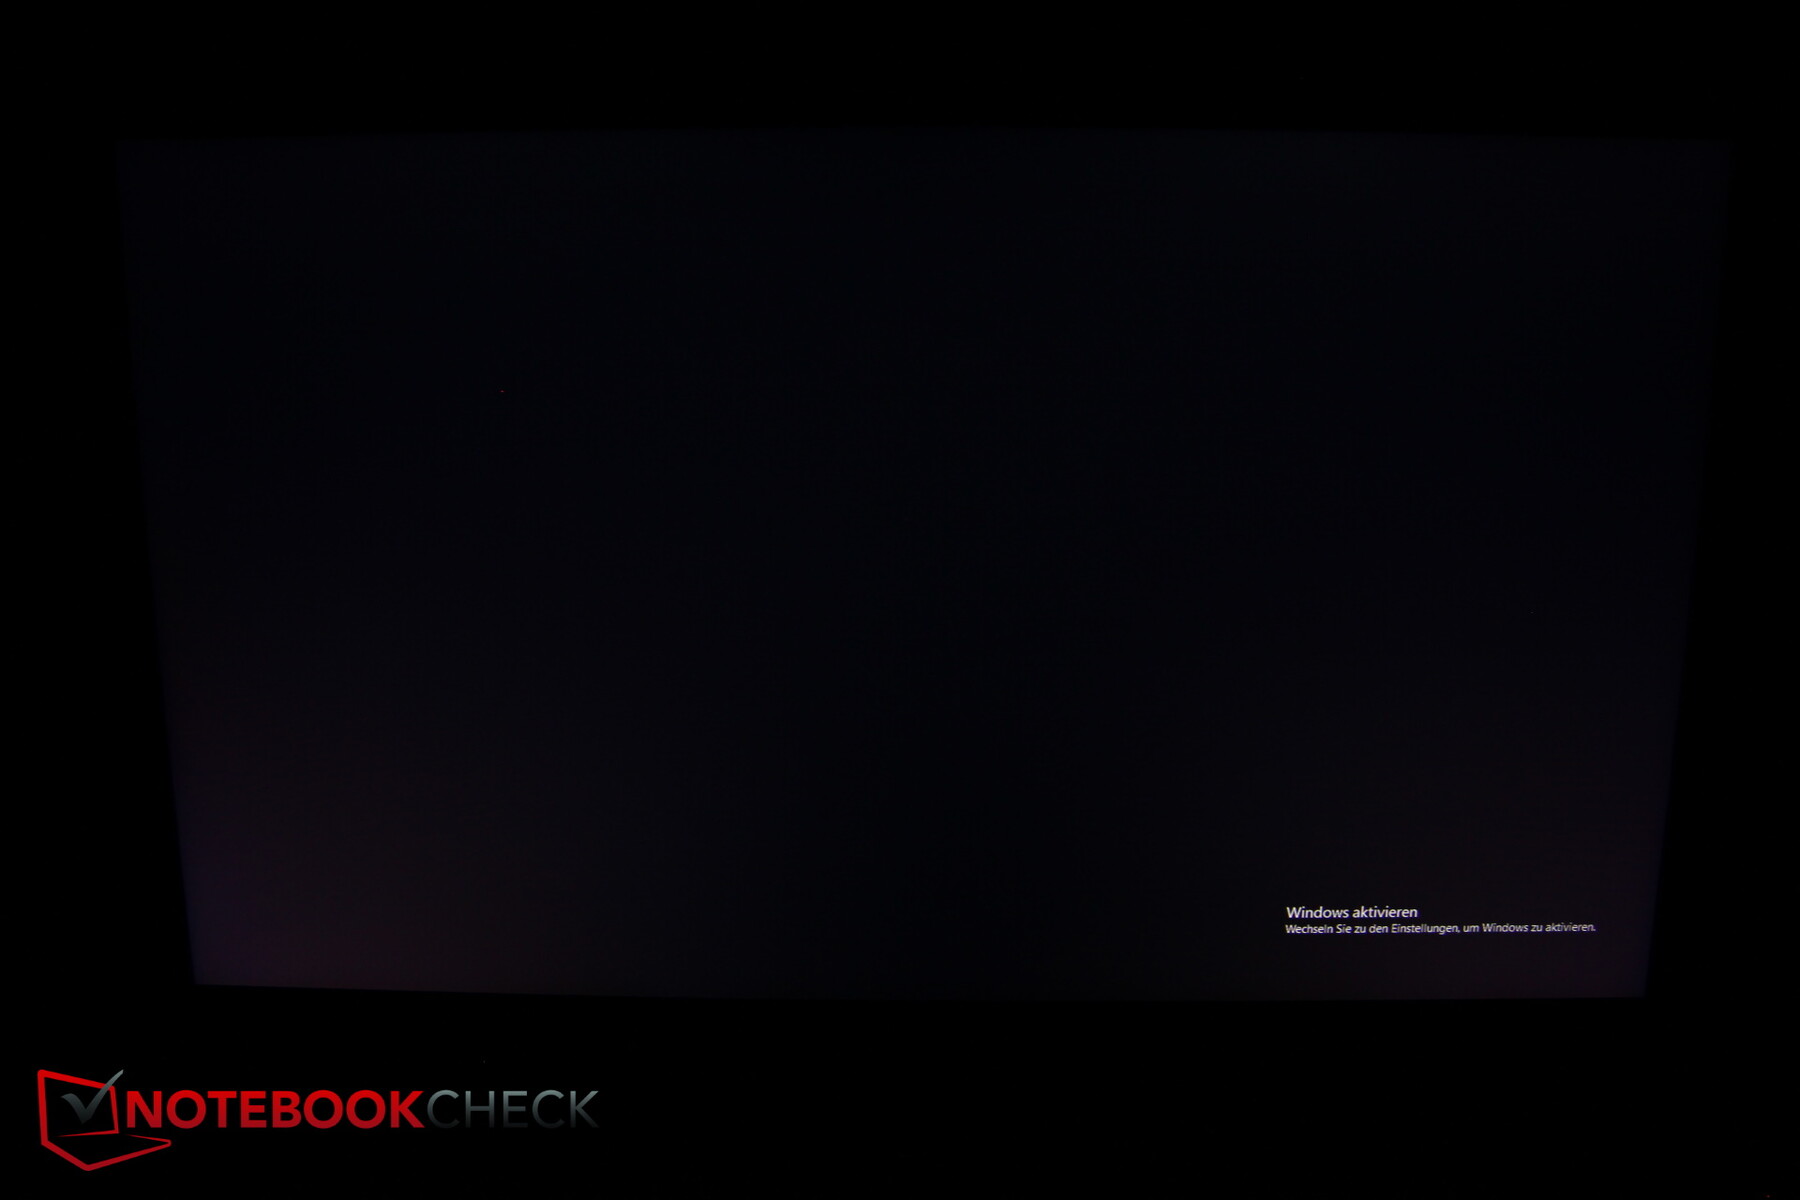
A Full-HD IPS panel that now supports a refresh rate of 144 Hz is used as the display. Schenker does not offer any 4K options for the Core 15. The average brightness is a satisfactory 290 Nits, and the brightness distribution of 87% is also decent.
The subpixel structure is slightly more grainy than in a reflective display, but all the contents are displayed sharp in everyday usage. Fortunately we did not notice any screen bleeding.
| |||||||||||||||||||||||||
Brightness Distribution: 87 %
Center on Battery: 312 cd/m²
Contrast: 1560:1 (Black: 0.2 cd/m²)
ΔE ColorChecker Calman: 4.84 | ∀{0.5-29.43 Ø4.71}
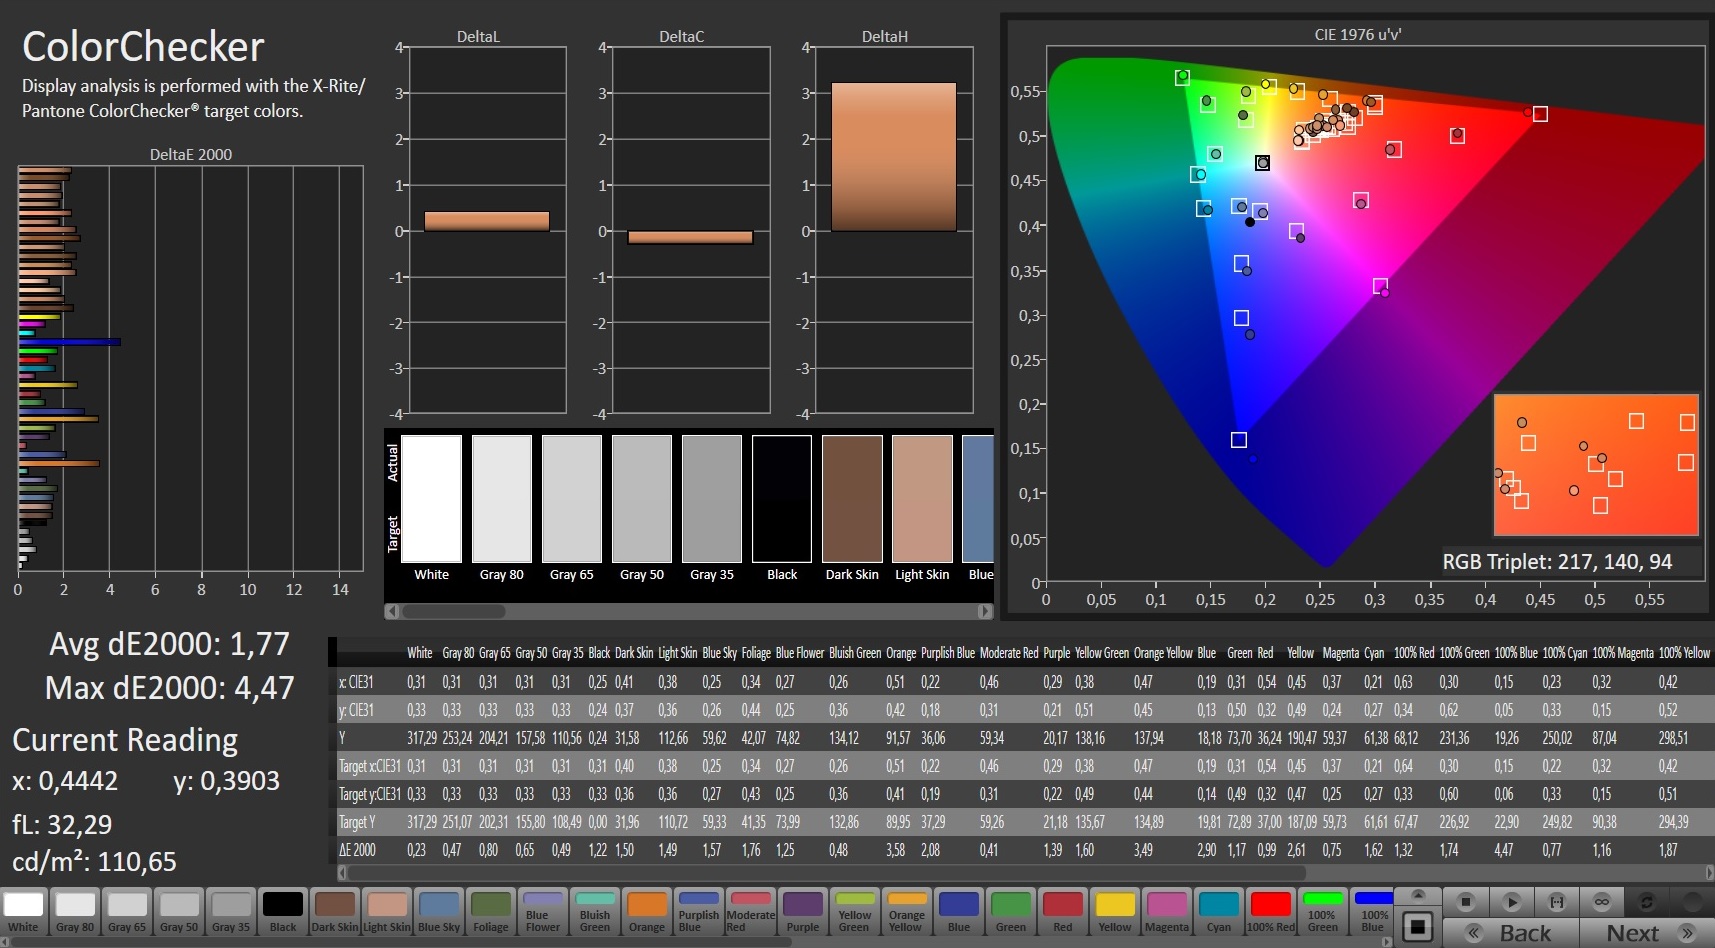
calibrated: 1.77
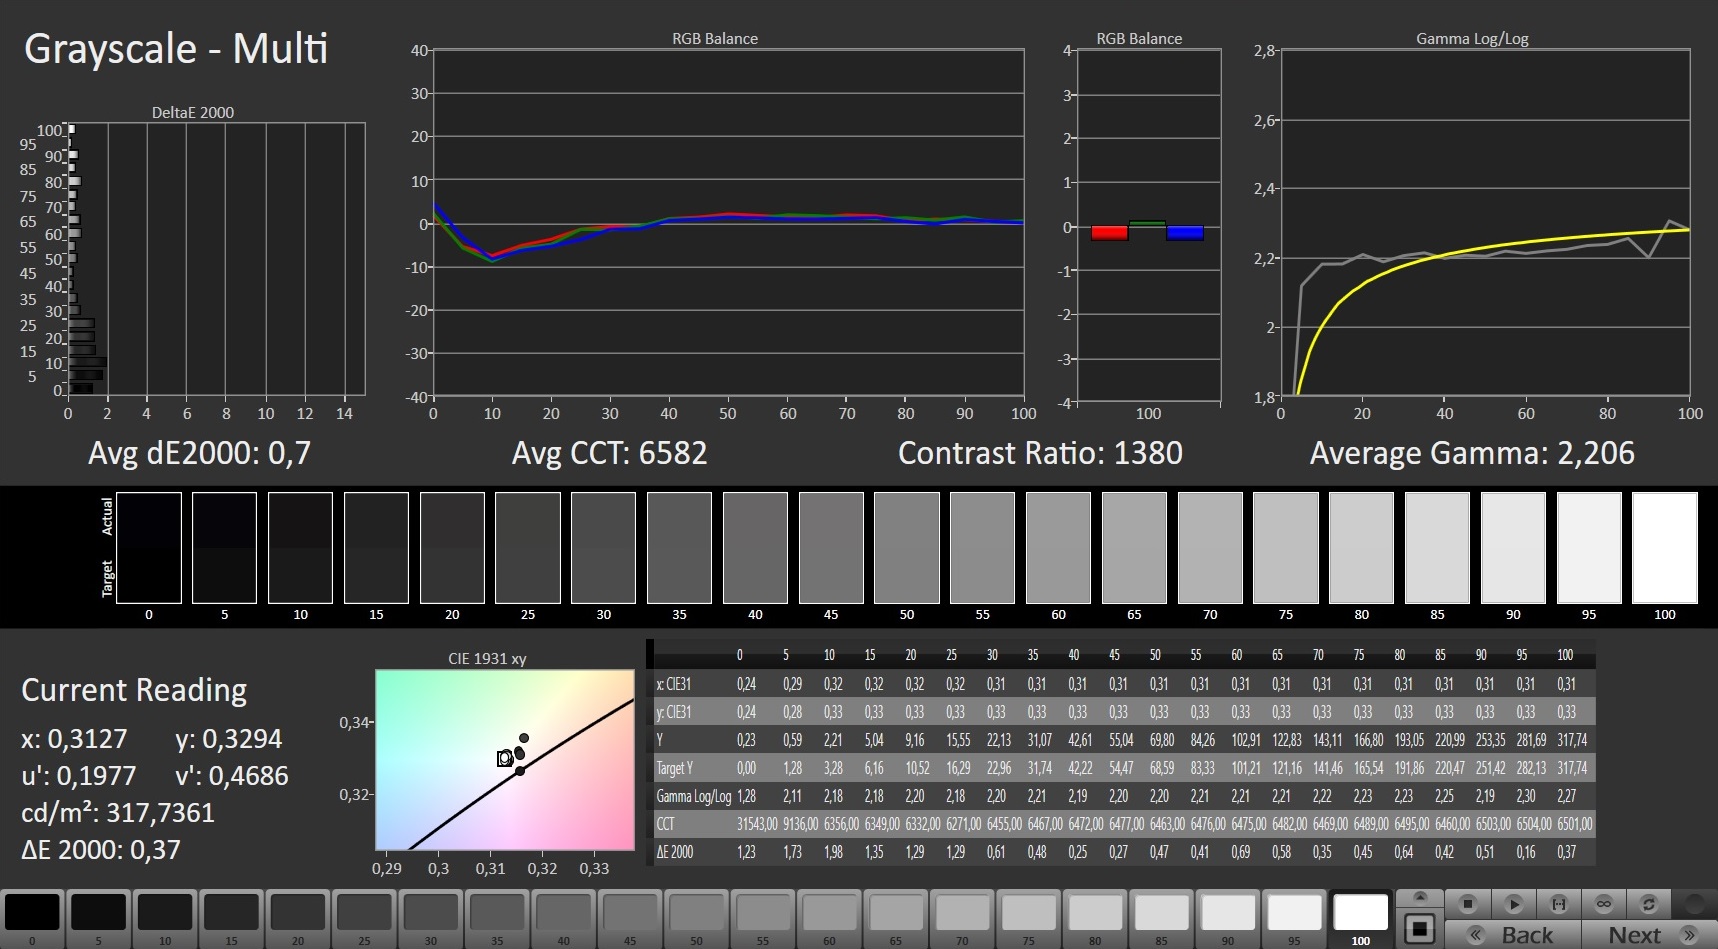
ΔE Greyscale Calman: 9 | ∀{0.09-98 Ø4.96}
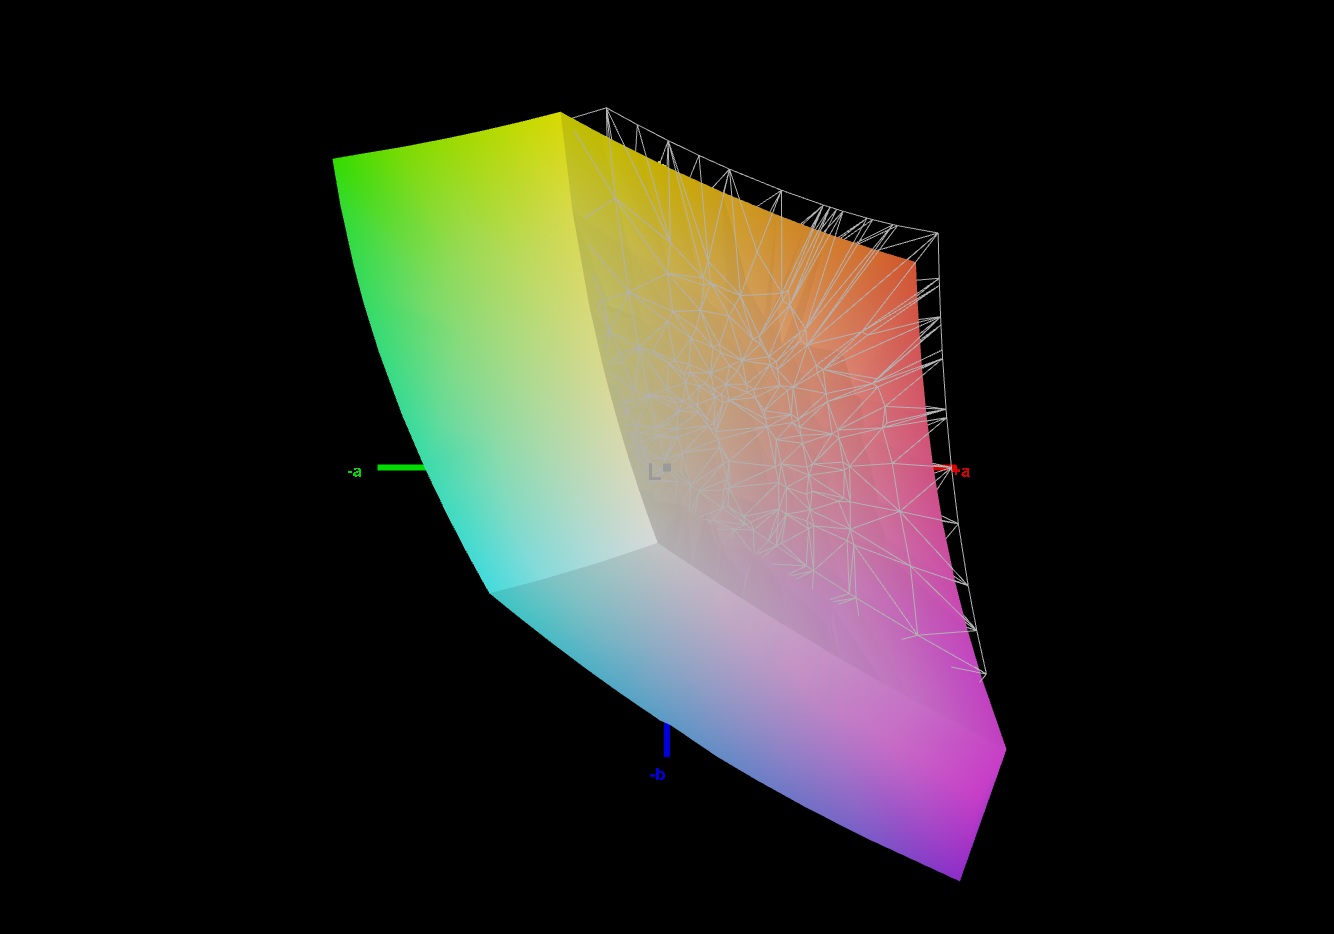
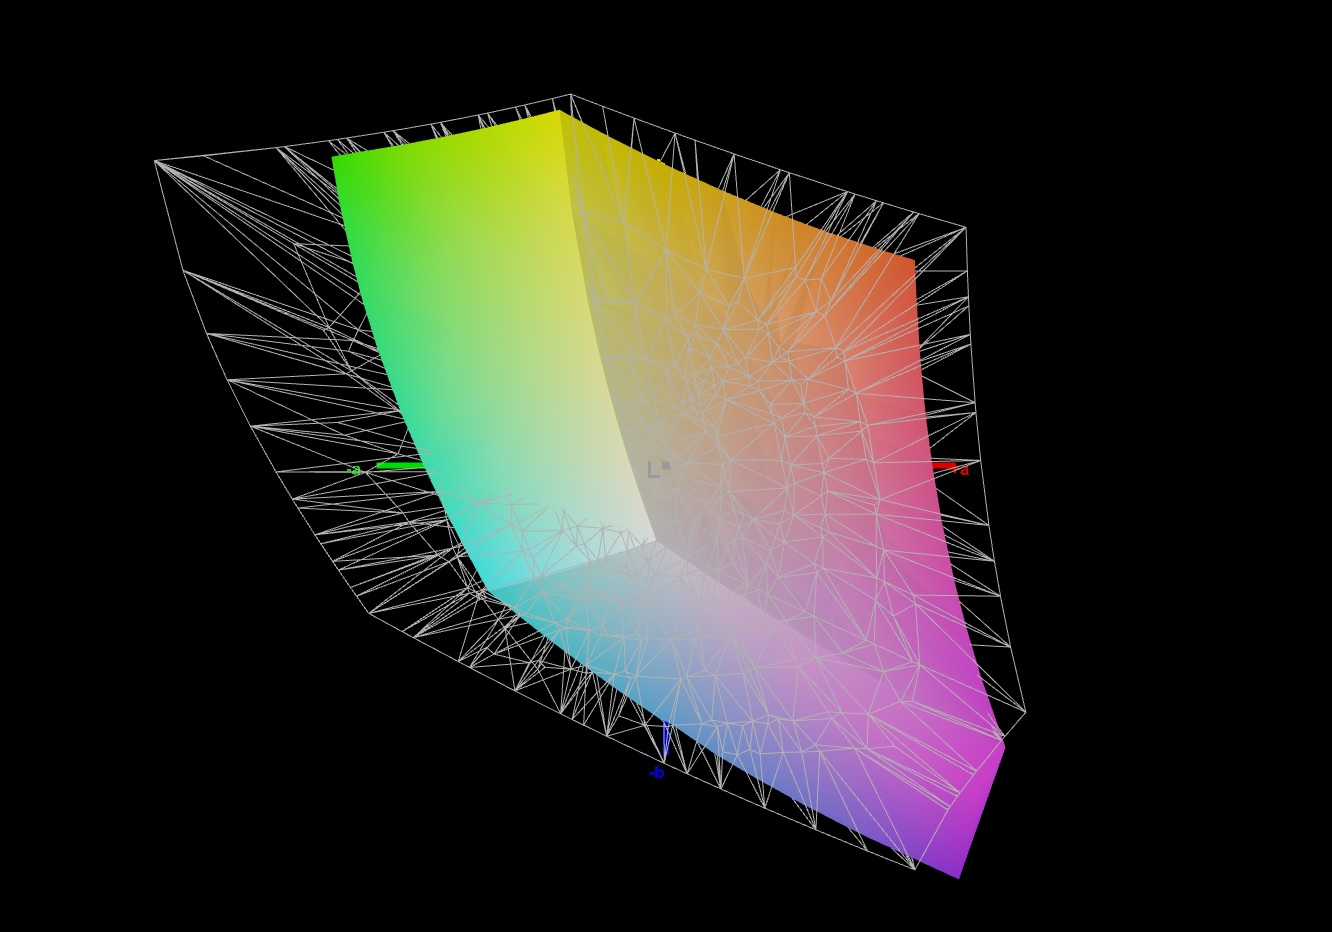
92% sRGB (Argyll 1.6.3 3D)
68% AdobeRGB 1998 (Argyll 1.6.3 3D)
68.5% AdobeRGB 1998 (Argyll 3D)
95.9% sRGB (Argyll 3D)
67.2% Display P3 (Argyll 3D)
Gamma: 2.105
CCT: 8099 K
| Schenker XMG Core 15 GK5NR0O LM156LF-1F02, IPS, 1920x1080, 15.6" | Schenker XMG Core 15 GK5CP6V BOEhydis NV156FHM-N4G (BOE084D), IPS, 1920x1080, 15.6" | Dell G3 15 3500-G4DG2 AU Optronics AUO80ED, IPS, 1920x1080, 15.6" | Lenovo Legion 5 15IMH05H BOE CQ NV156FHM-NX1, IPS, 1920x1080, 15.6" | Asus TUF Gaming A15 FA506IV-HN172 LM156LF-2F01, IPS, 1920x1080, 15.6" | Dell G5 15 SE 5505 P89F BOE NV156FH, WVA, 1920x1080, 15.6" | |
|---|---|---|---|---|---|---|
| Display | -5% | -3% | -41% | -41% | -6% | |
| Display P3 Coverage (%) | 67.2 | 63.3 -6% | 64.6 -4% | 38.8 -42% | 38.92 -42% | 63 -6% |
| sRGB Coverage (%) | 95.9 | 91.2 -5% | 93.9 -2% | 57.8 -40% | 58.5 -39% | 90.1 -6% |
| AdobeRGB 1998 Coverage (%) | 68.5 | 65 -5% | 66.4 -3% | 40.09 -41% | 40.22 -41% | 64.1 -6% |
| Response Times | 0% | -15% | -124% | -202% | -63% | |
| Response Time Grey 50% / Grey 80% * (ms) | 9.6 ? | 8.8 ? 8% | 14 ? -46% | 26 ? -171% | 34 ? -254% | 20.4 ? -113% |
| Response Time Black / White * (ms) | 9.6 ? | 10.4 ? -8% | 8 ? 17% | 17 ? -77% | 24 ? -150% | 10.8 ? -13% |
| PWM Frequency (Hz) | 198.4 ? | |||||
| Screen | 7% | -1% | -22% | -21% | -3% | |
| Brightness middle (cd/m²) | 312 | 324 4% | 301 -4% | 301 -4% | 280 -10% | 292 -6% |
| Brightness (cd/m²) | 290 | 296 2% | 298 3% | 277 -4% | 254 -12% | 290 0% |
| Brightness Distribution (%) | 87 | 88 1% | 81 -7% | 77 -11% | 88 1% | 77 -11% |
| Black Level * (cd/m²) | 0.2 | 0.27 -35% | 0.23 -15% | 0.26 -30% | 0.15 25% | 0.27 -35% |
| Contrast (:1) | 1560 | 1200 -23% | 1309 -16% | 1158 -26% | 1867 20% | 1081 -31% |
| Colorchecker dE 2000 * | 4.84 | 4.07 16% | 4.68 3% | 5.12 -6% | 5.89 -22% | 3.99 18% |
| Colorchecker dE 2000 max. * | 13.85 | 6.39 54% | 8.86 36% | 19 -37% | 6.11 56% | |
| Colorchecker dE 2000 calibrated * | 1.77 | 1.49 16% | 1.87 -6% | 4.88 -176% | 4.79 -171% | 3.02 -71% |
| Greyscale dE 2000 * | 9 | 4.01 55% | 5.79 36% | 3.47 61% | 4.08 55% | 3.3 63% |
| Gamma | 2.105 105% | 2.6 85% | 2.46 89% | 2.37 93% | 2.33 94% | 2.25 98% |
| CCT | 8099 80% | 7350 88% | 7706 84% | 7062 92% | 7303 89% | 7047 92% |
| Color Space (Percent of AdobeRGB 1998) (%) | 68 | 59 -13% | 61 -10% | 37 -46% | 37 -46% | 58.1 -15% |
| Color Space (Percent of sRGB) (%) | 92 | 91 -1% | 94 2% | 57 -38% | 58 -37% | 89.7 -2% |
| Total Average (Program / Settings) | 1% /
4% | -6% /
-3% | -62% /
-38% | -88% /
-48% | -24% /
-11% |
* ... smaller is better
Compared to the predecessor that already offered decent values, the contrast and black value were even slightly improved, and only the Asus TUF turns out even better here. On the other hand, the display seems to be badly calibrated in the state of delivery. Particularly the deviations in the grayscale are unusually high, and the display also shows a significant blue tint.
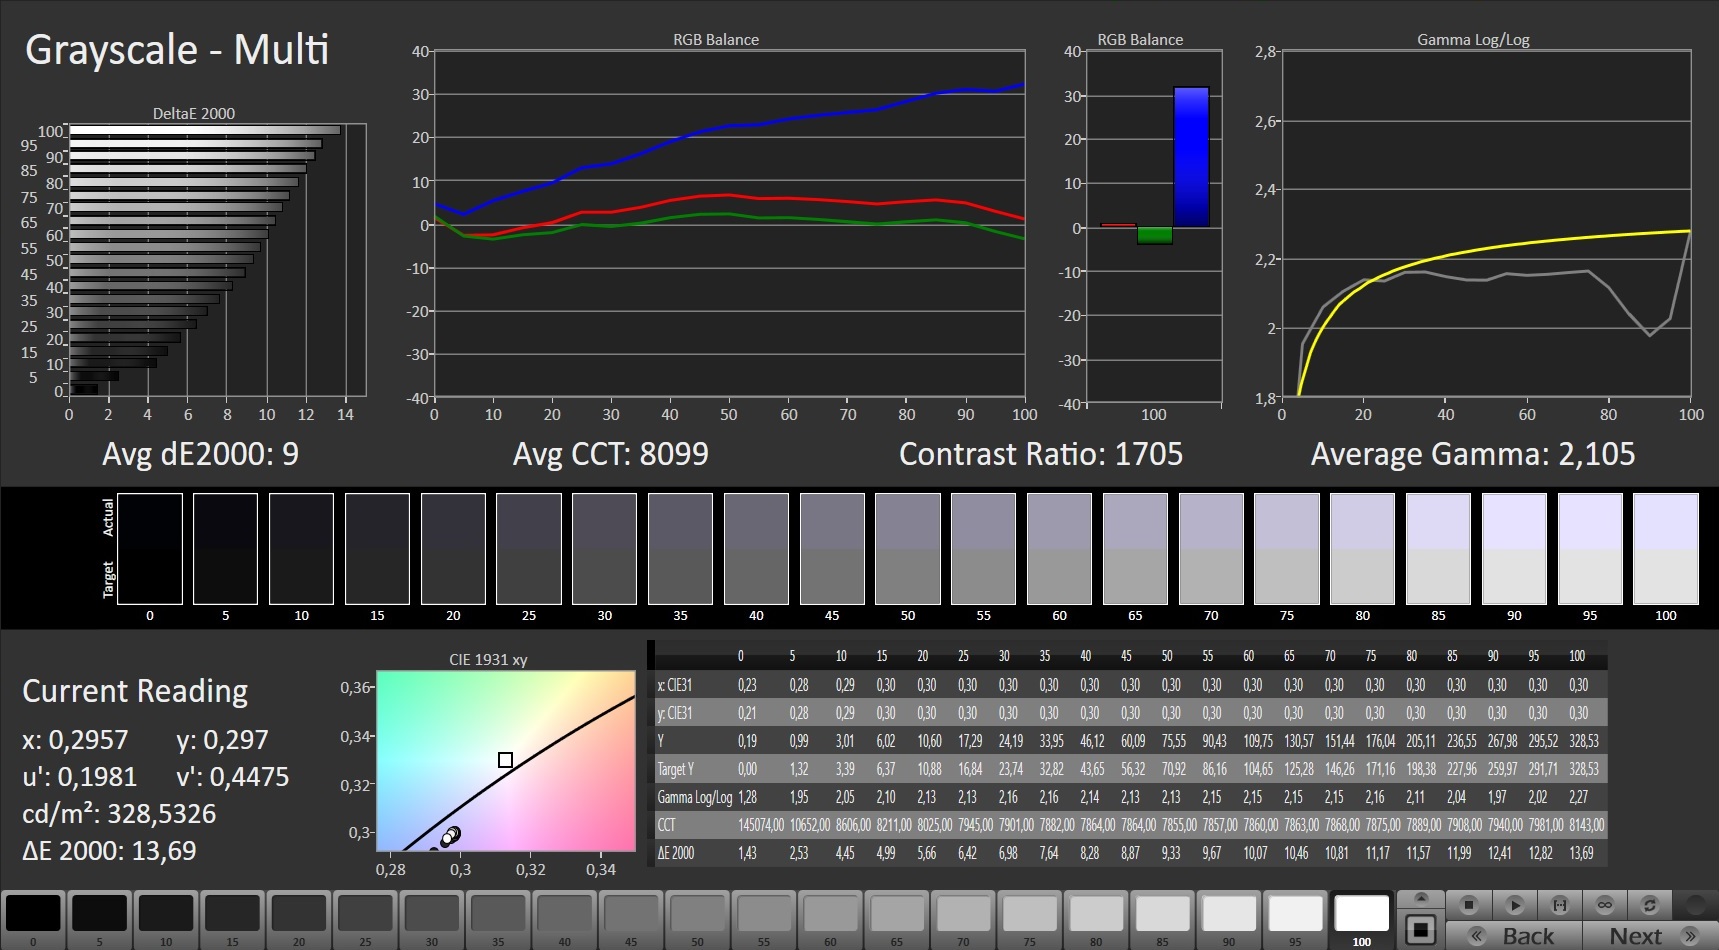
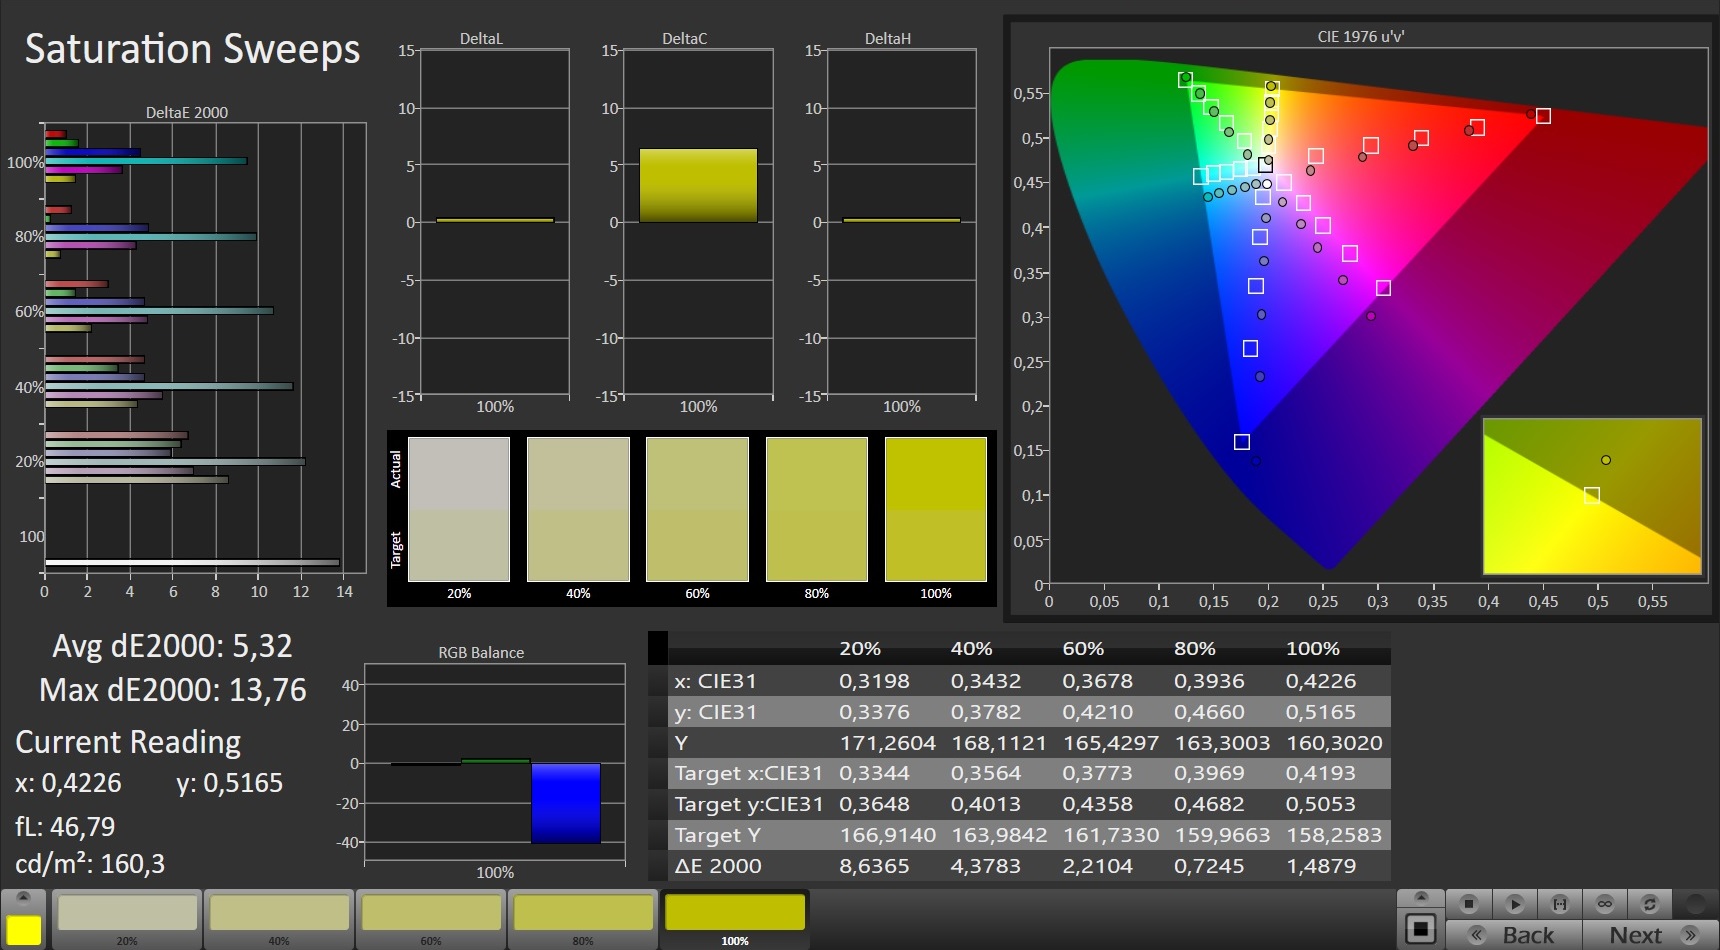
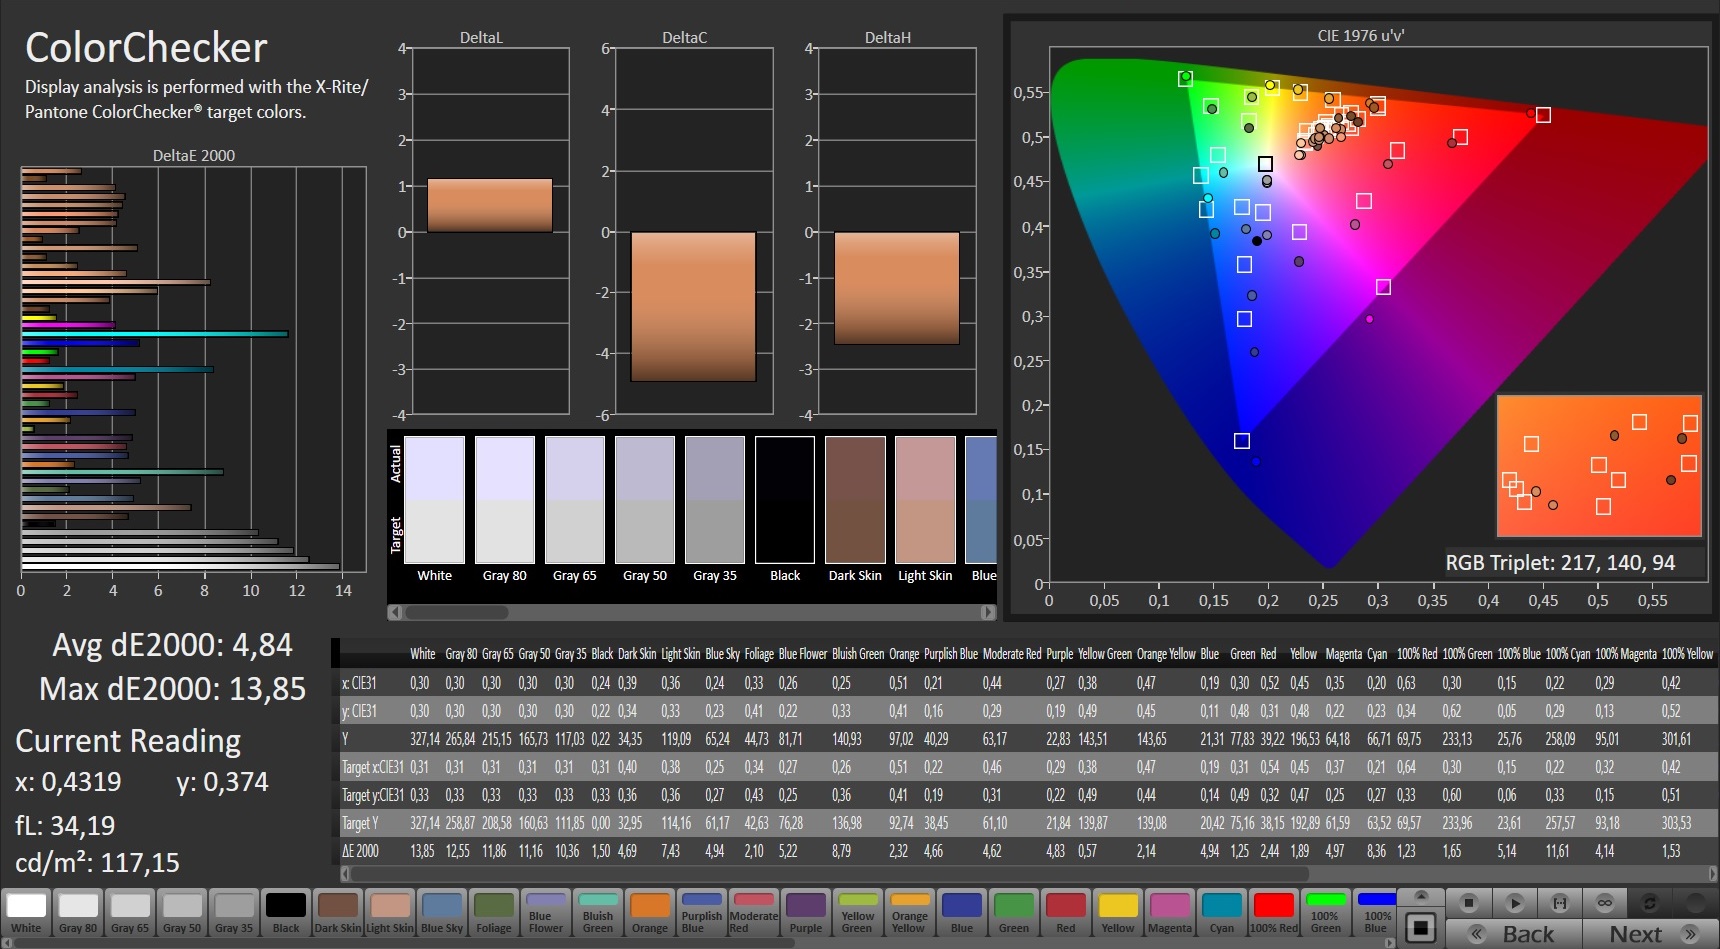
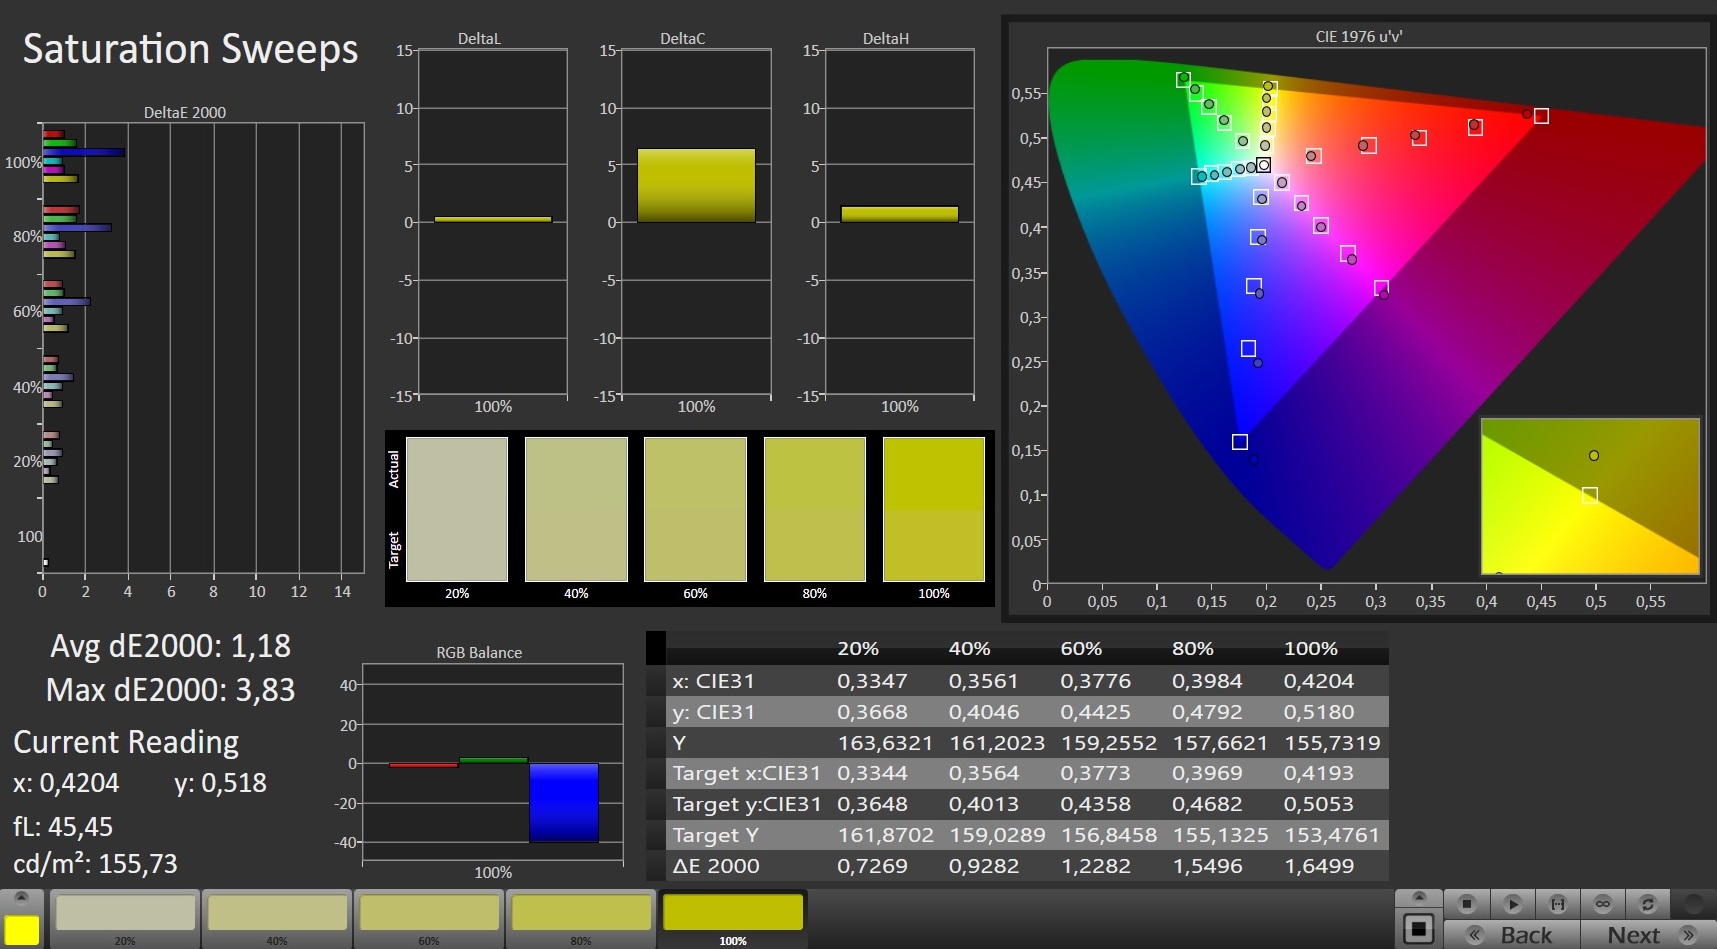
At 92% sRGB and 68% AdobeRGB, the color space coverage turns out quite good for this price class. At less than 10 ms, the response times also need to be pointed out positively. G-Sync is supported, at least via the two Mini DisplayPorts.
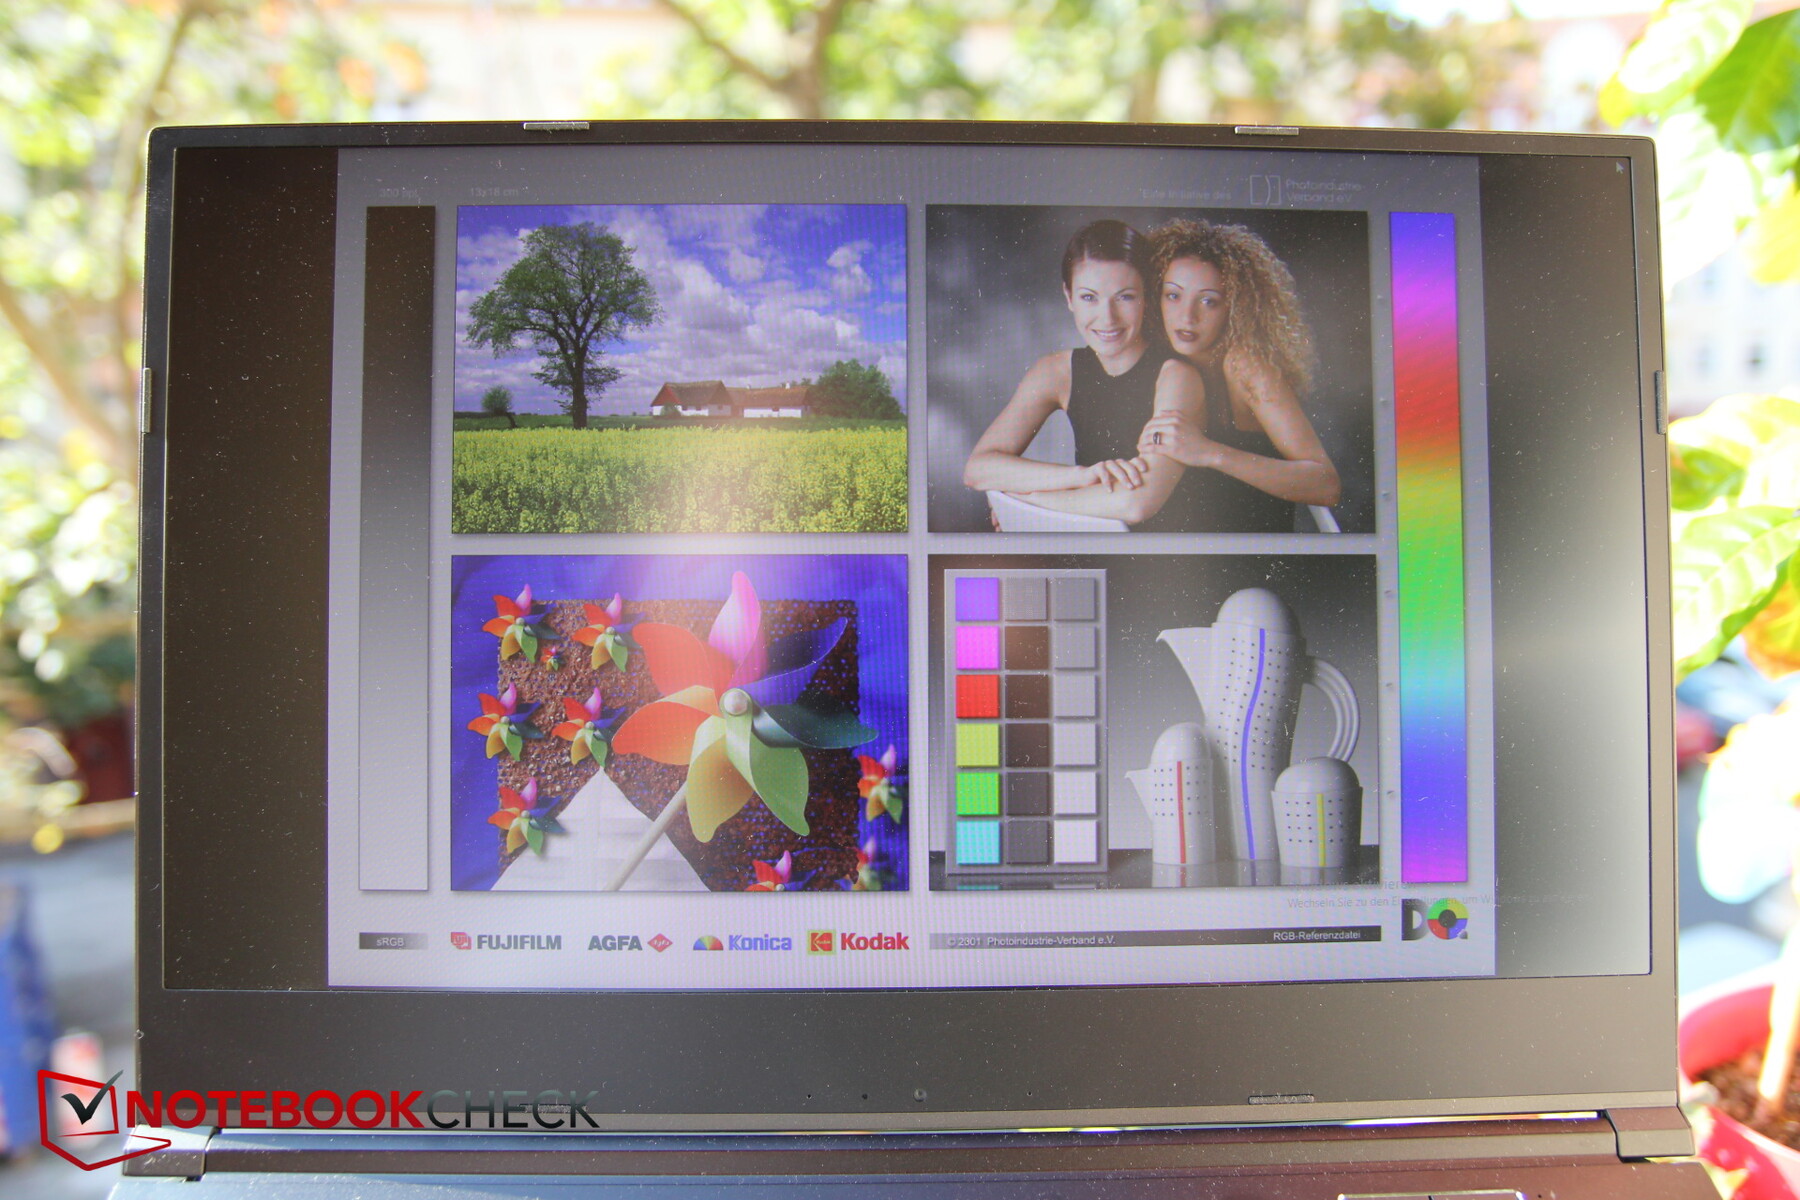
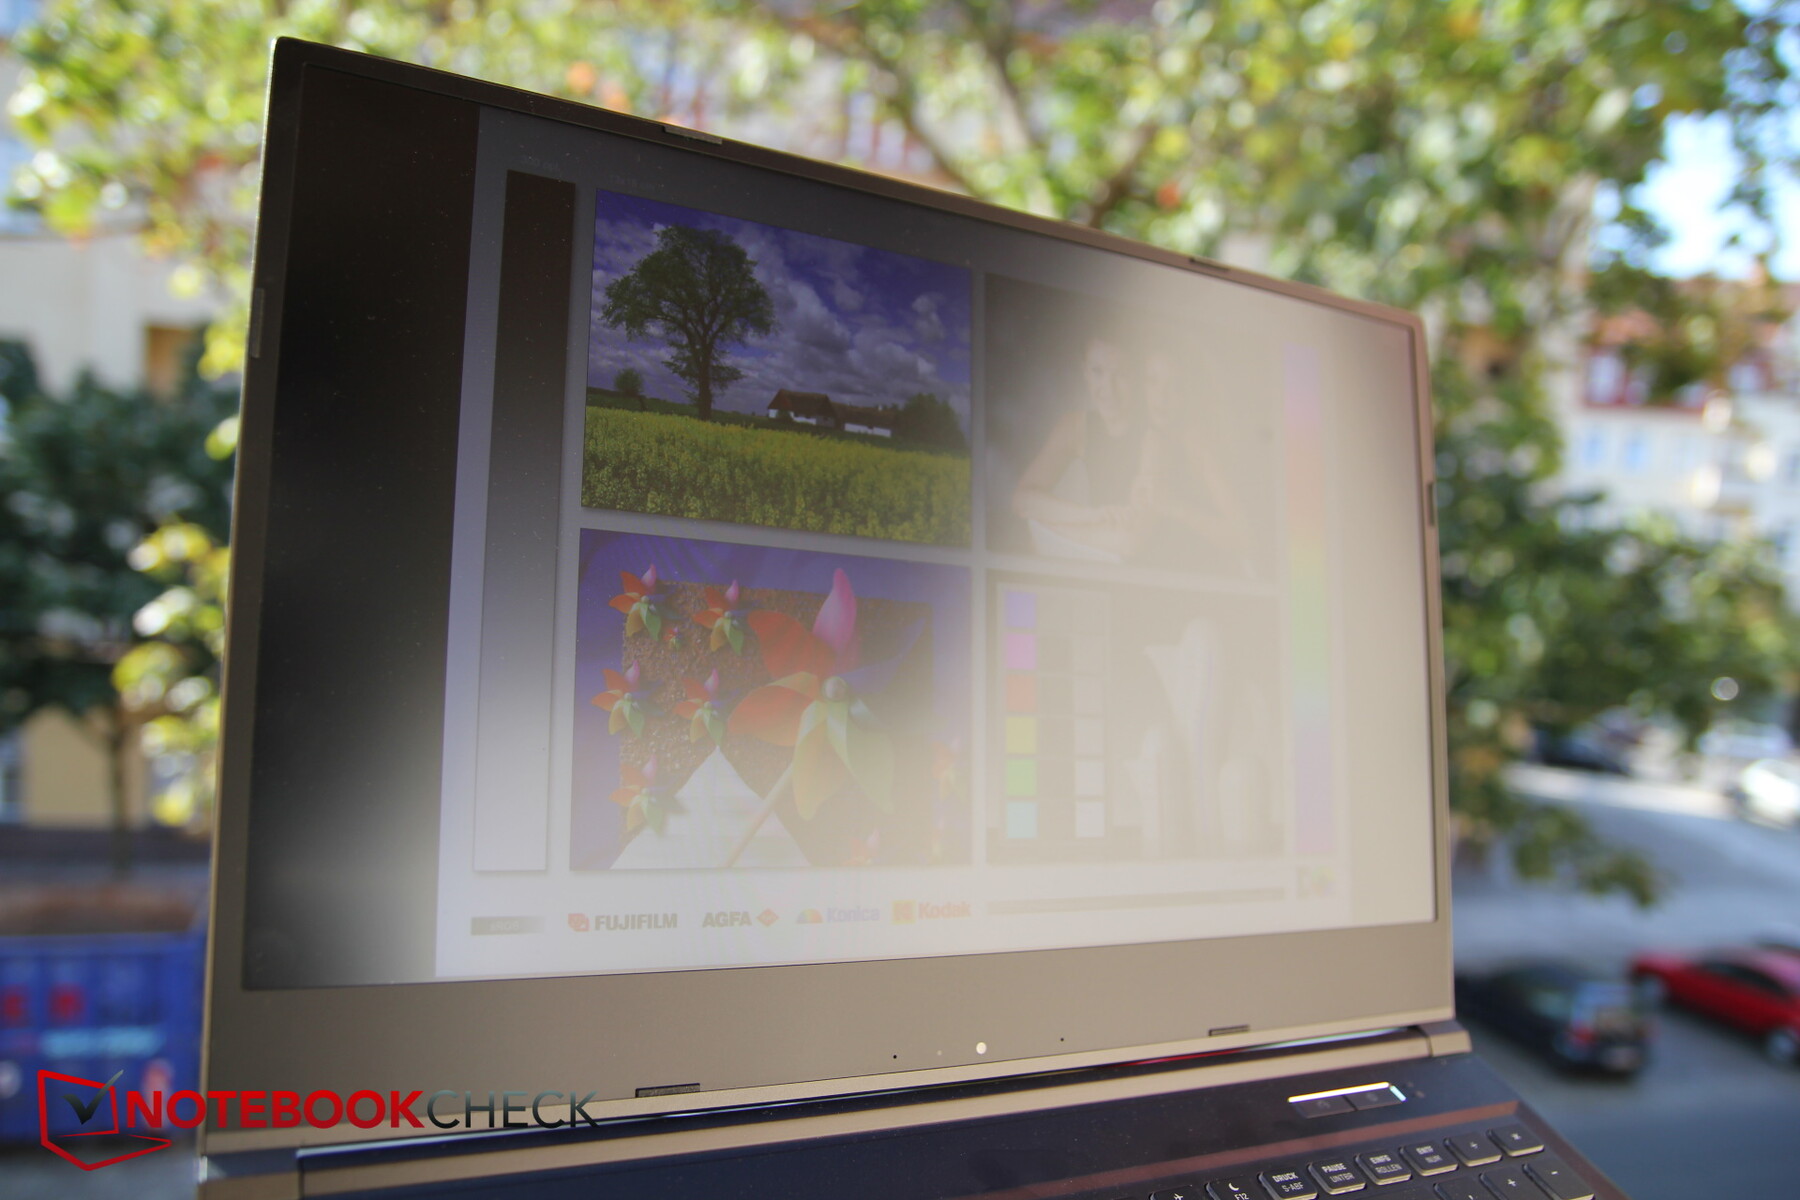
The matte surface that prevents reflections fairly well helps during outdoor usage. While the brightness of less than 300 Nits is not quite optimal, it does not create any problems, at least when using it in the shade.
Display Response Times
| ↔ Response Time Black to White | ||
|---|---|---|
| 9.6 ms ... rise ↗ and fall ↘ combined | ↗ 4.4 ms rise | 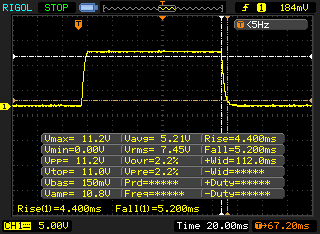 |
| ↘ 5.2 ms fall | ||
| The screen shows fast response rates in our tests and should be suited for gaming. In comparison, all tested devices range from 0.1 (minimum) to 240 (maximum) ms. » 26 % of all devices are better. This means that the measured response time is better than the average of all tested devices (19.8 ms). | ||
| ↔ Response Time 50% Grey to 80% Grey | ||
| 9.6 ms ... rise ↗ and fall ↘ combined | ↗ 5.2 ms rise | 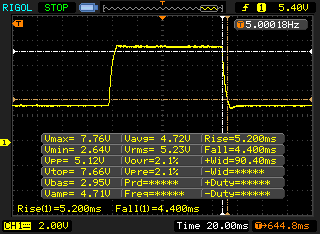 |
| ↘ 4.4 ms fall | ||
| The screen shows fast response rates in our tests and should be suited for gaming. In comparison, all tested devices range from 0.165 (minimum) to 636 (maximum) ms. » 23 % of all devices are better. This means that the measured response time is better than the average of all tested devices (30.9 ms). | ||
Screen Flickering / PWM (Pulse-Width Modulation)
| Screen flickering / PWM not detected | 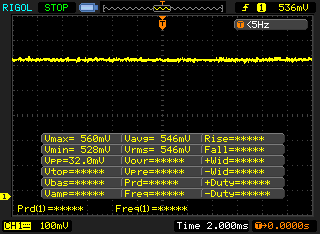 | ||
In comparison: 52 % of all tested devices do not use PWM to dim the display. If PWM was detected, an average of 7741 (minimum: 5 - maximum: 343500) Hz was measured. | |||
As typical for IPS panels, the viewing angle stability is good, and even from the steepest viewing angles, the image only suffers minimally.

Performance - Great CPU, but the GPU is so so.
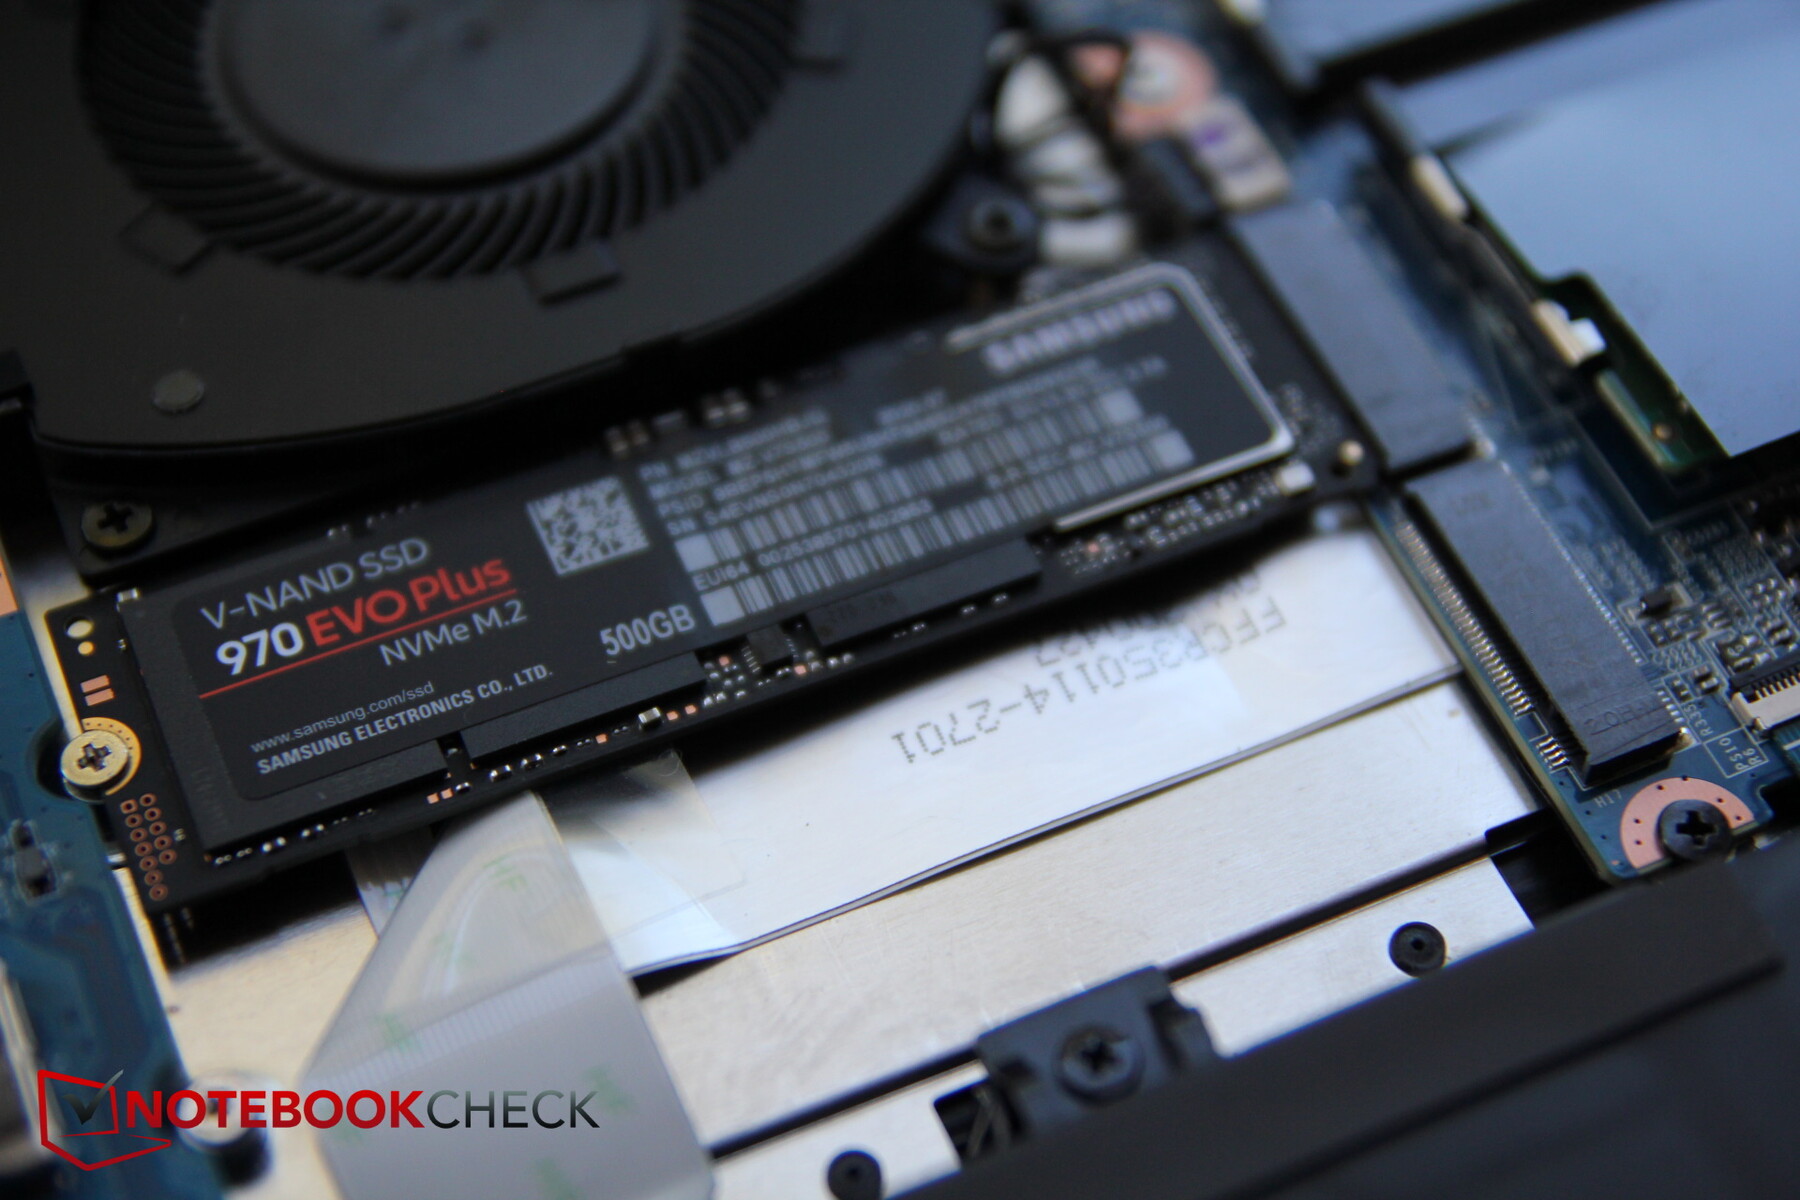
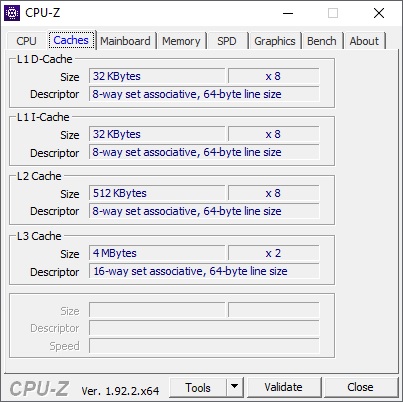
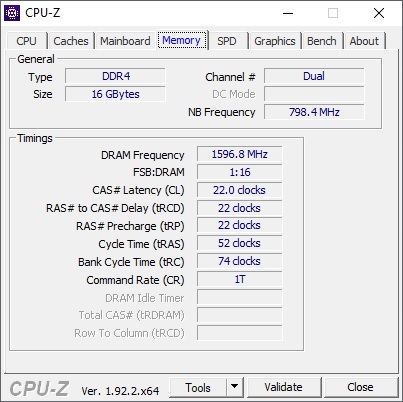
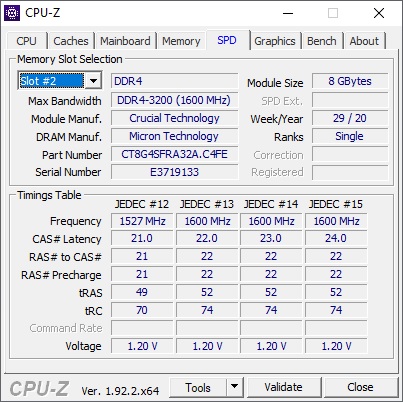
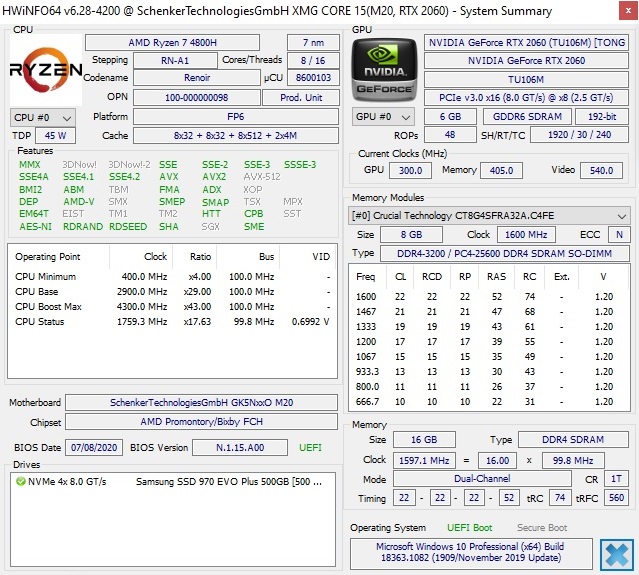
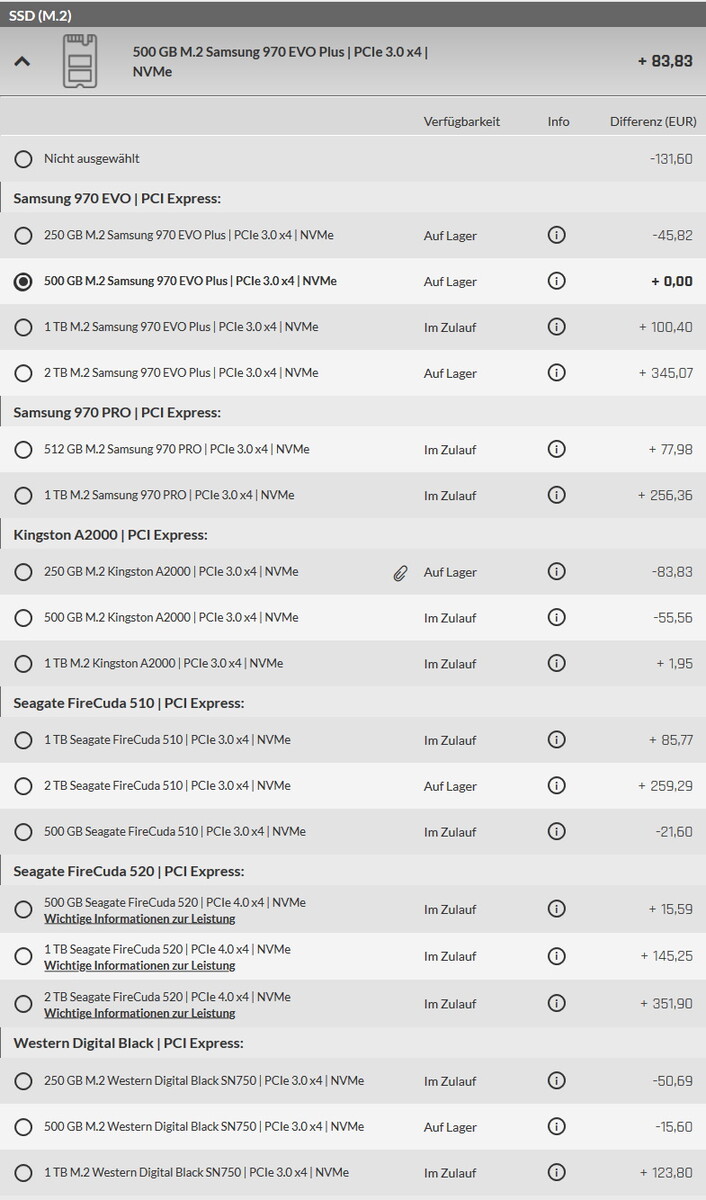
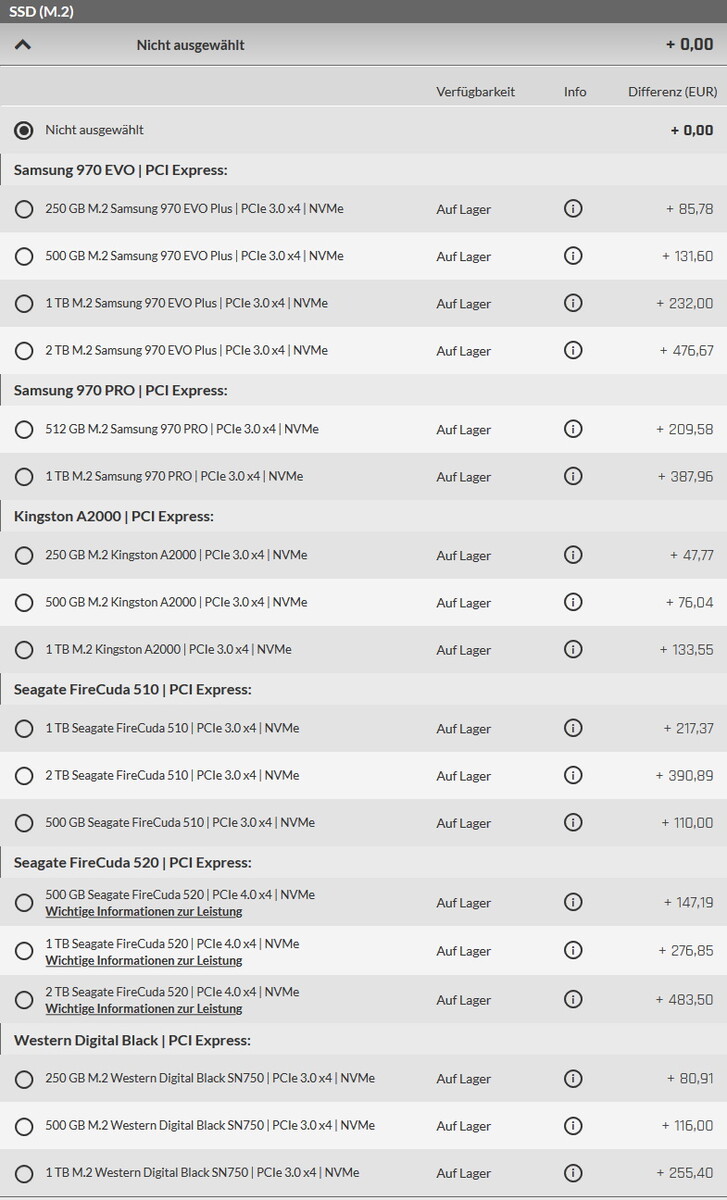
The Core 15 is equipped with a Ryzen 7-4800H, accompanied by 16 GB of RAM and an Nvidia GeForce RTX 2060. In addition, there is a Samsung SSD 970 Evo Plus with 500 GB of storage. While the laptop is quite clearly designed for gaming, theoretically it is also suited for video editing or image processing. Due to its compact dimensions, it is also fairly mobile for a 15-inch gaming laptop. The storage space is slightly limited considering current games, but can be expanded easily via the empty M.2 slot.
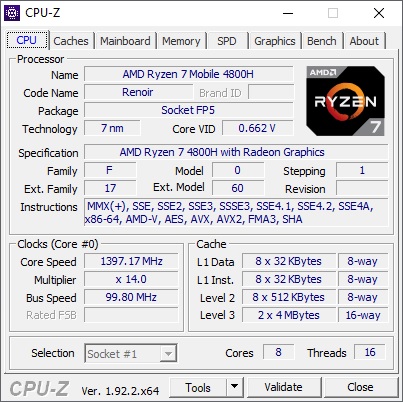
Processor
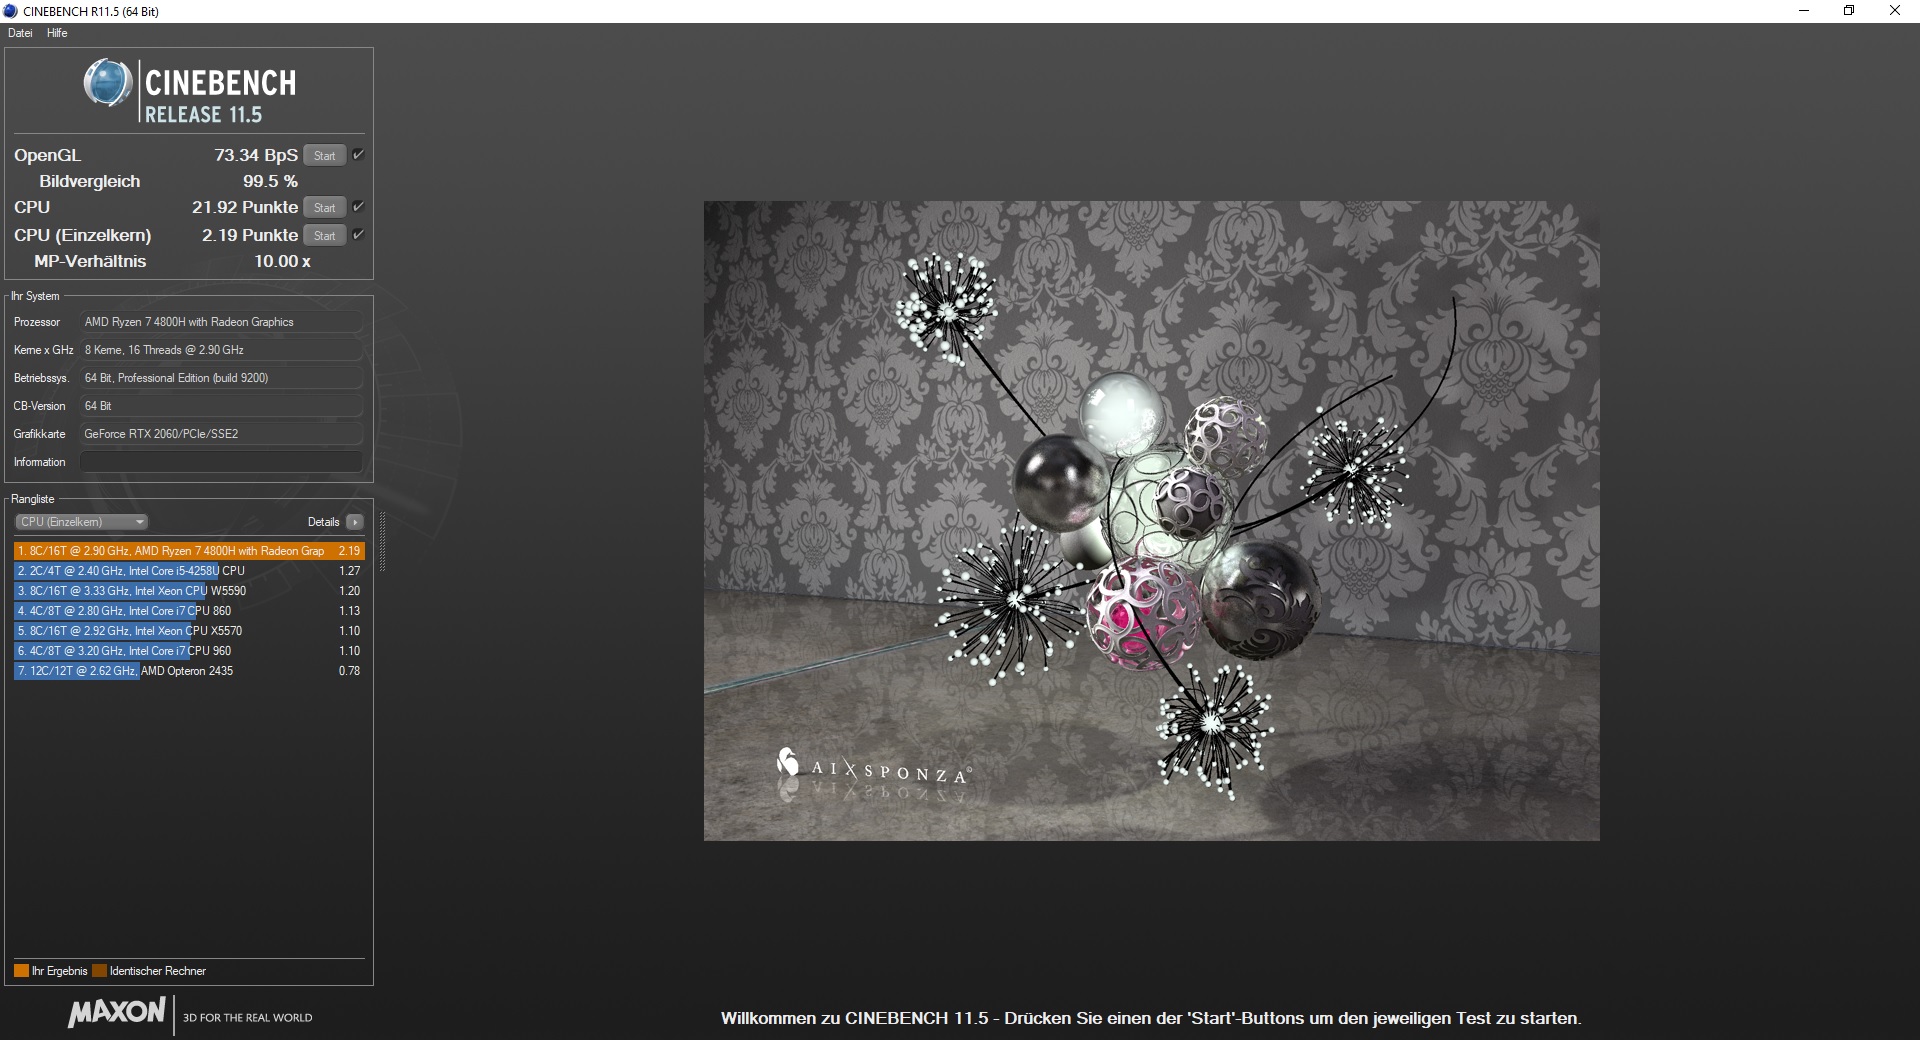
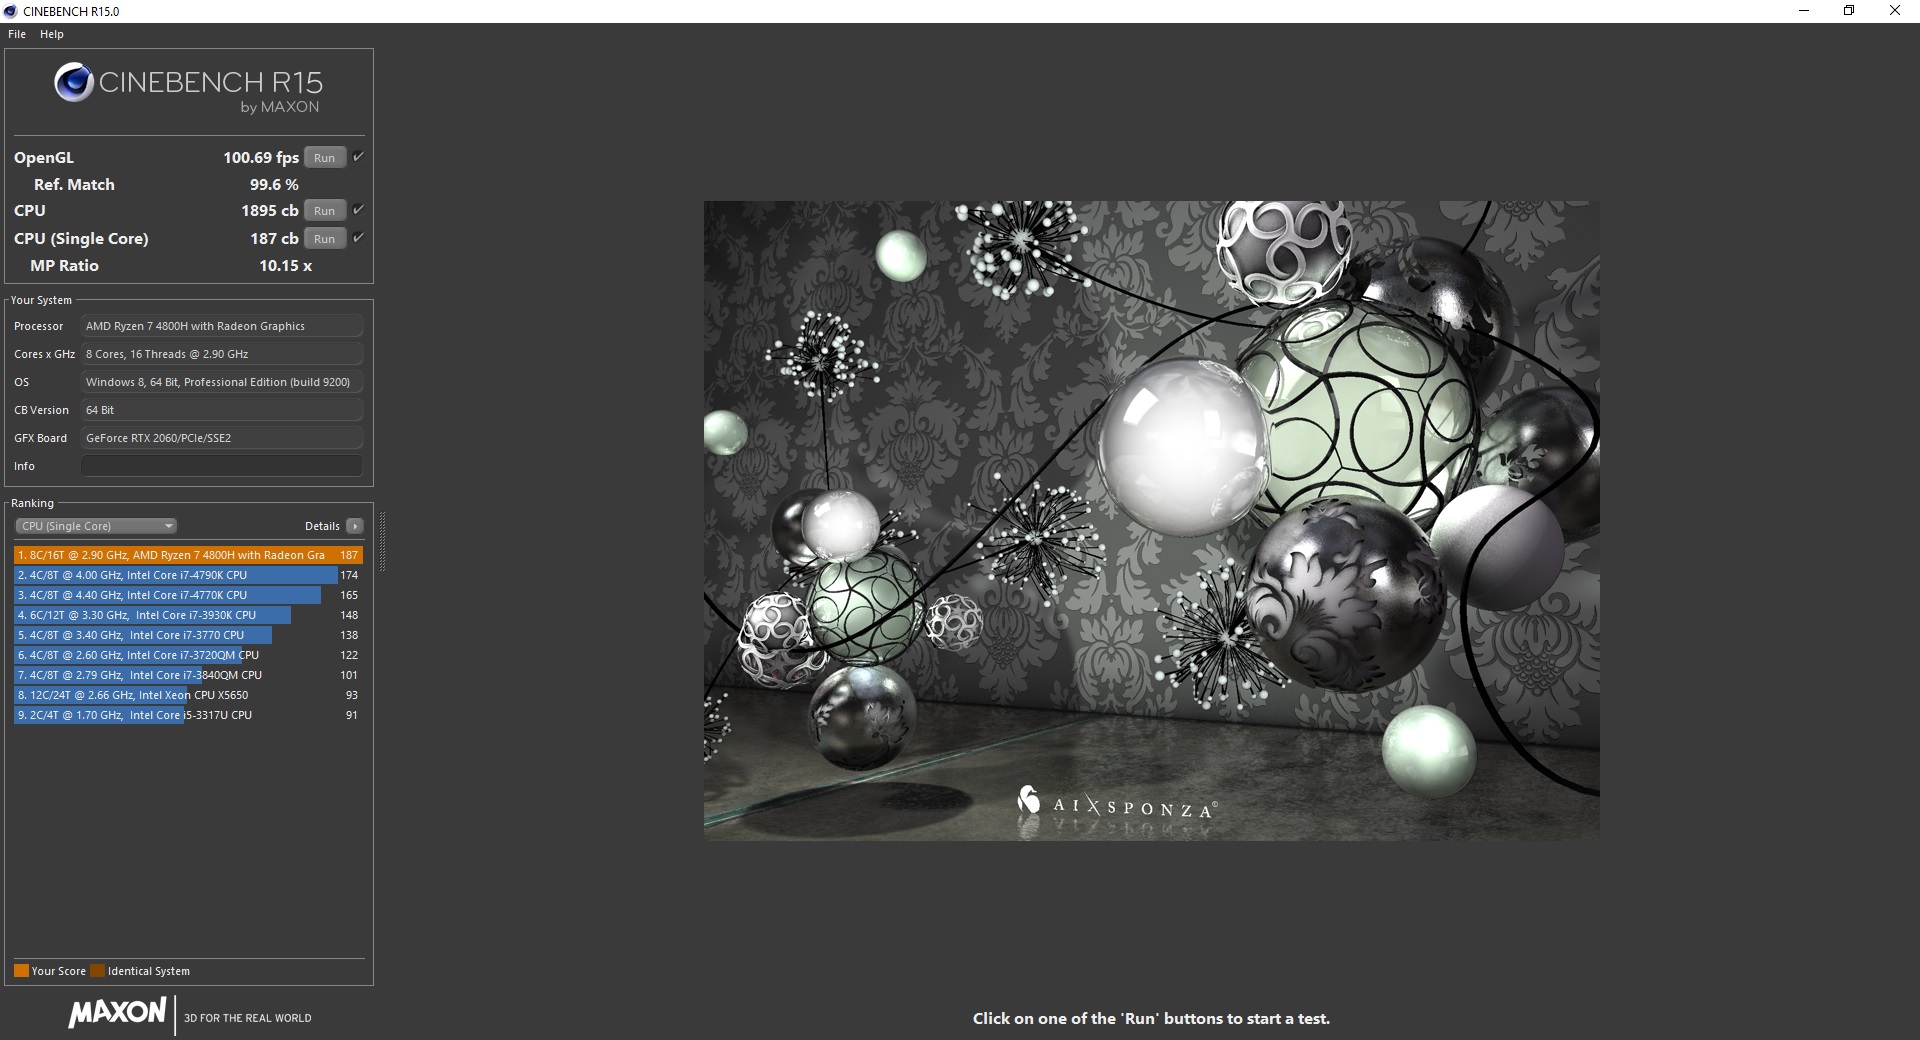
The Ryzen 7-4800H has 8 cores and is able to process 16 threads simultaneously. In Turbo mode, the cores can offer a speed of up to 4.2 GHz. Schenker has installed its Control Center software on the XMG Core 15, allowing you to select the "Overboost" mode that minimally overclocks the CPU. Despite that, we are running all our benchmarks in the mode called "Enthusiast," which is supposed to set the performance at 100% without any overclocking.
In the Cinebench R15 loop, we are presented with the usual, strong Zen-2 performance. Over time, the high starting performance hardly decreases, in contrast to many of its Intel counter parts.
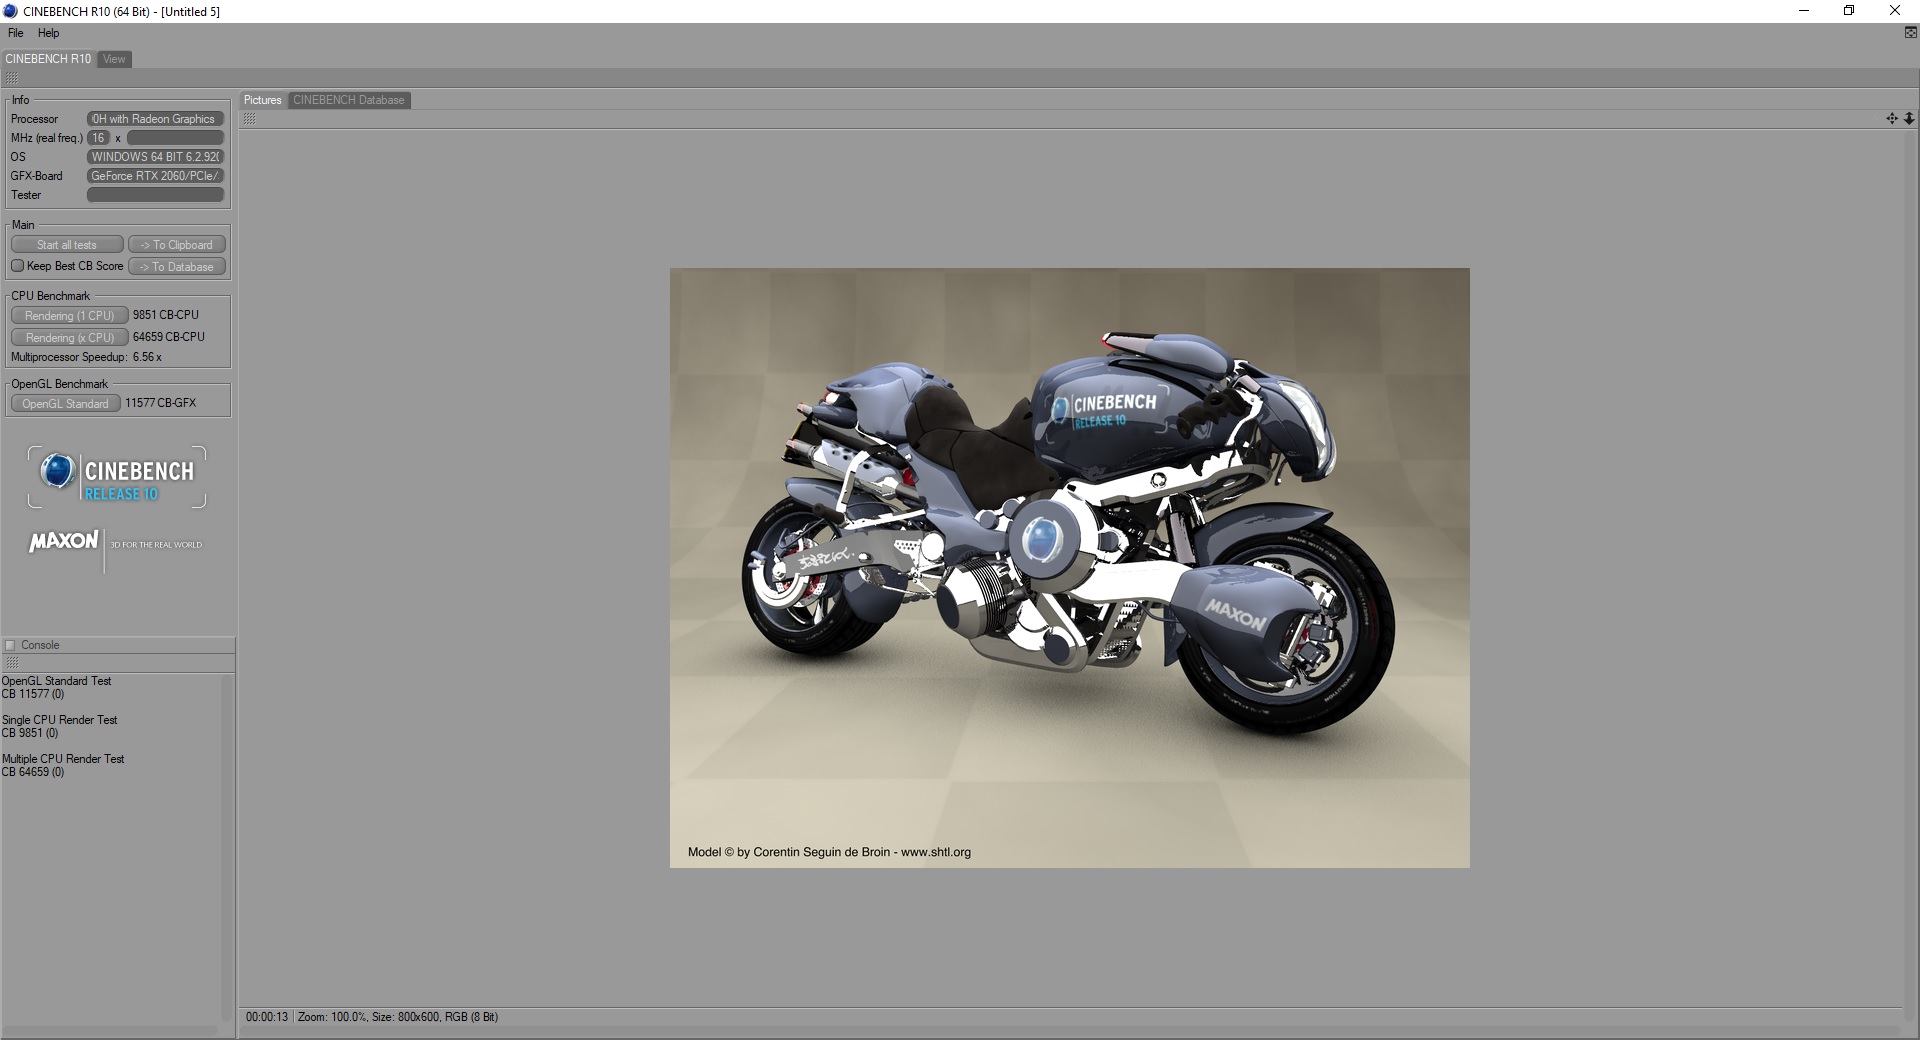
In the multi-core benchmark from Cinebench R15, the Ryzen 7 is a whole 57% faster than the Intel Core i7-10750H in the Dell G3 (2 cores less, Turbo up to 5 GHz). It is able to beat the predecessor with the Intel Core i7-9750H by even 75%. In the test, the core clock speeds are at about 4 GHz.
Away from the outlet, the laptop loses about 25% of its CPU performance in Cinebench R15.
* ... smaller is better
System Performance
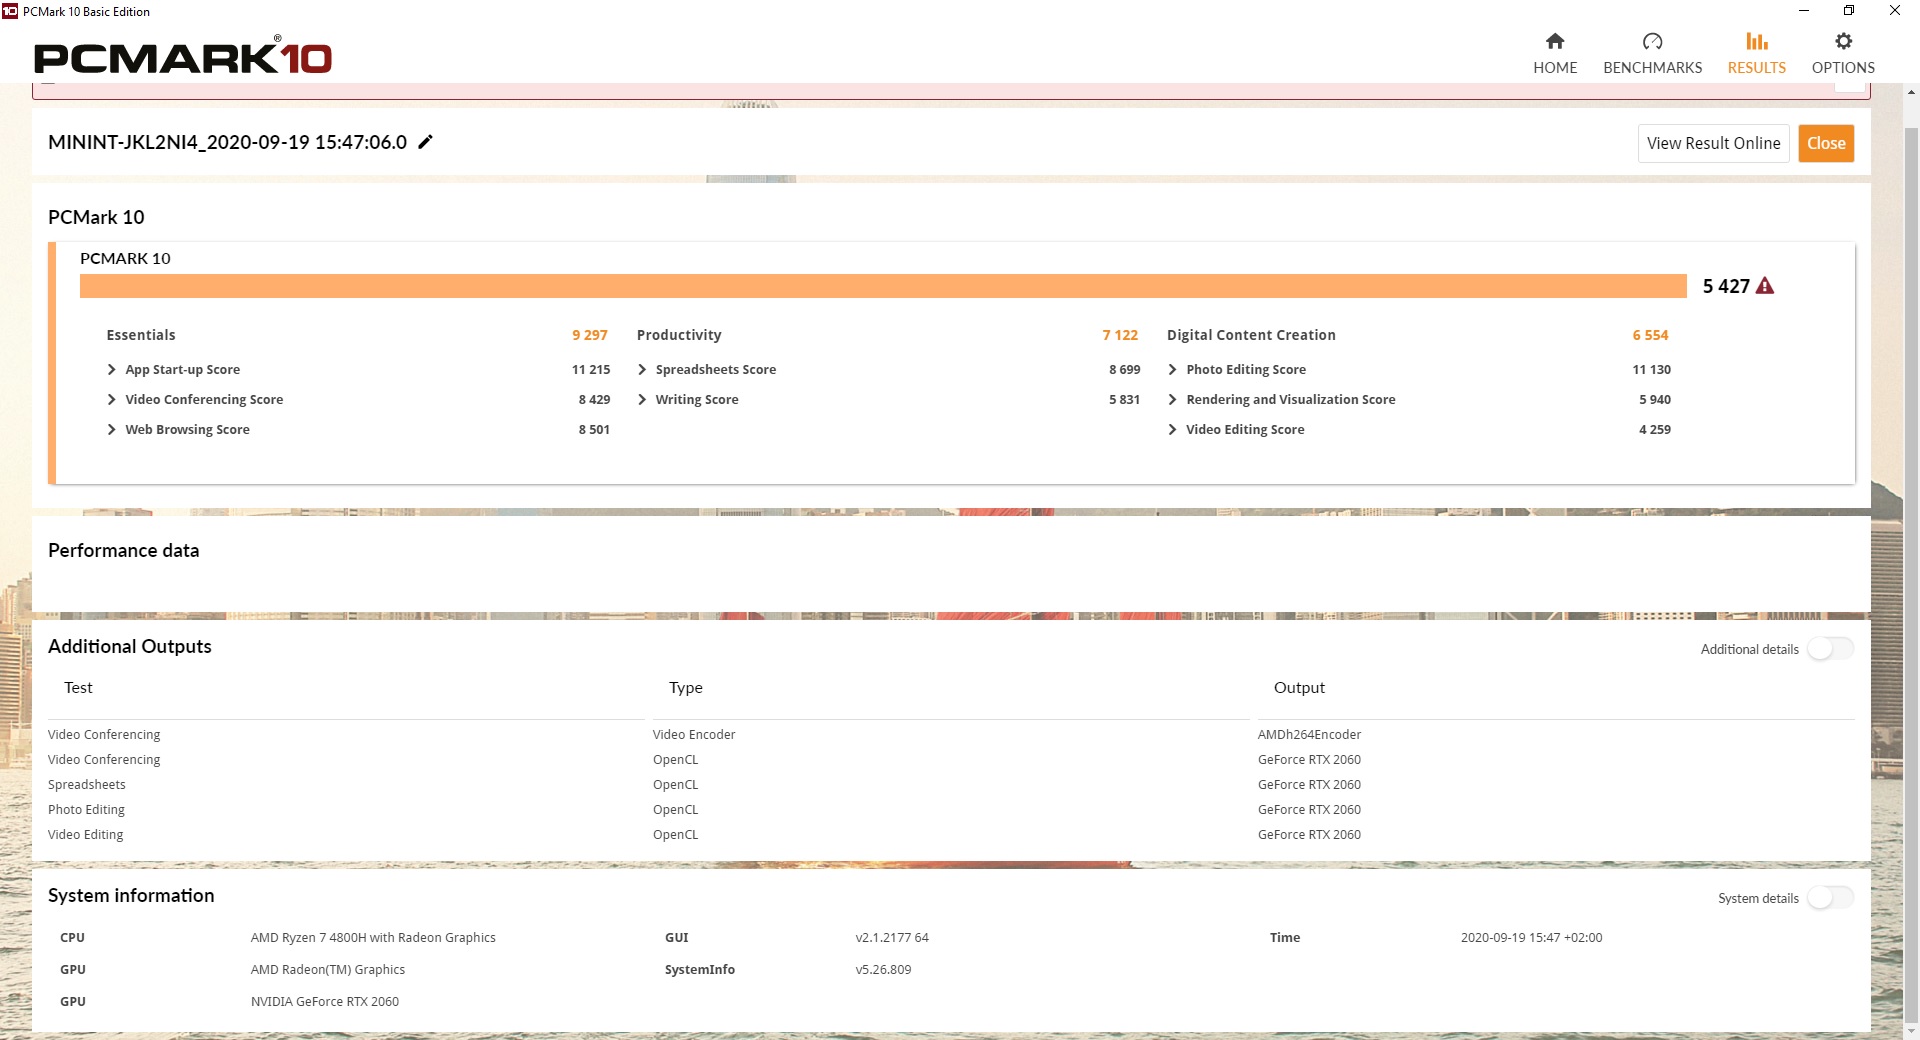
Here, the performance of the XMG Core 15 conforms closely to the expectations, corresponding to the average of the Ryzen 7-4800H/RTX-2060 combinations. In PCMark 8, the Schenker holds the top position in both tests, but in PCMark 10 the two Dell models are often slightly faster. The system performance during everyday operation is smooth.
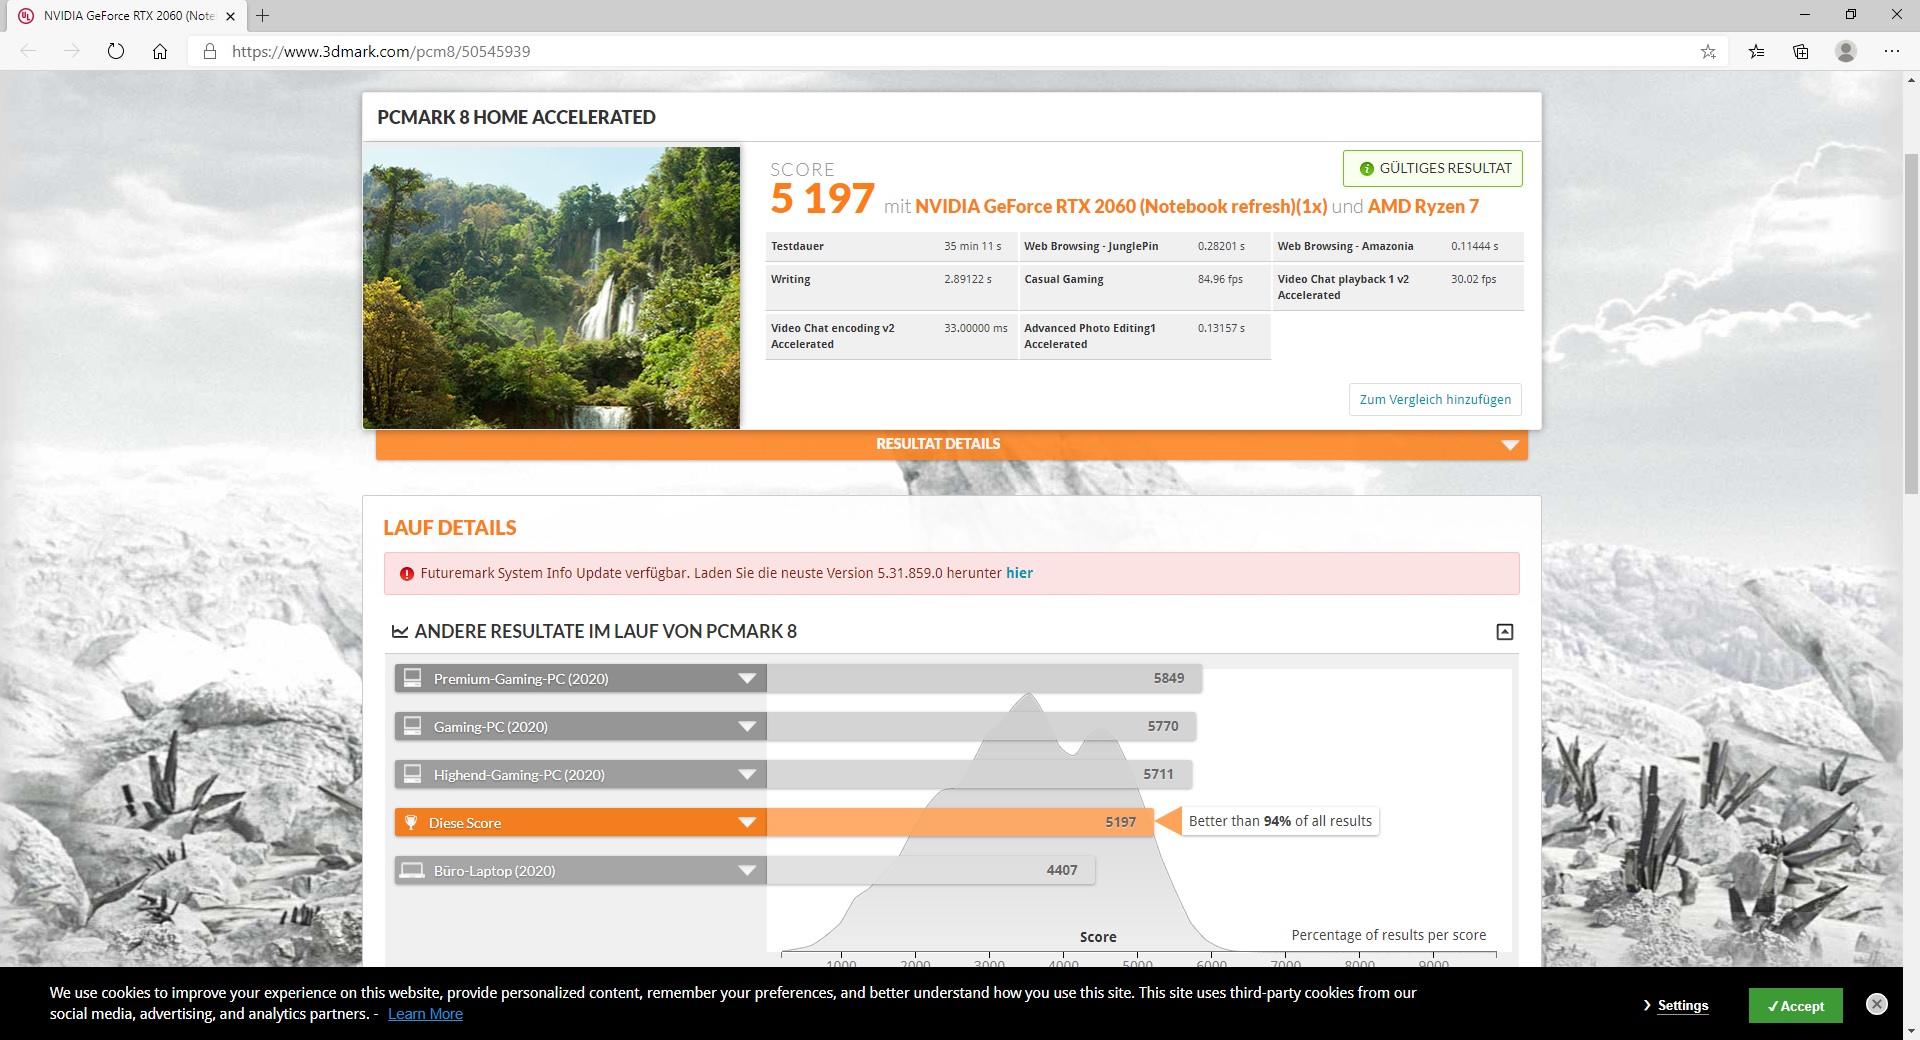
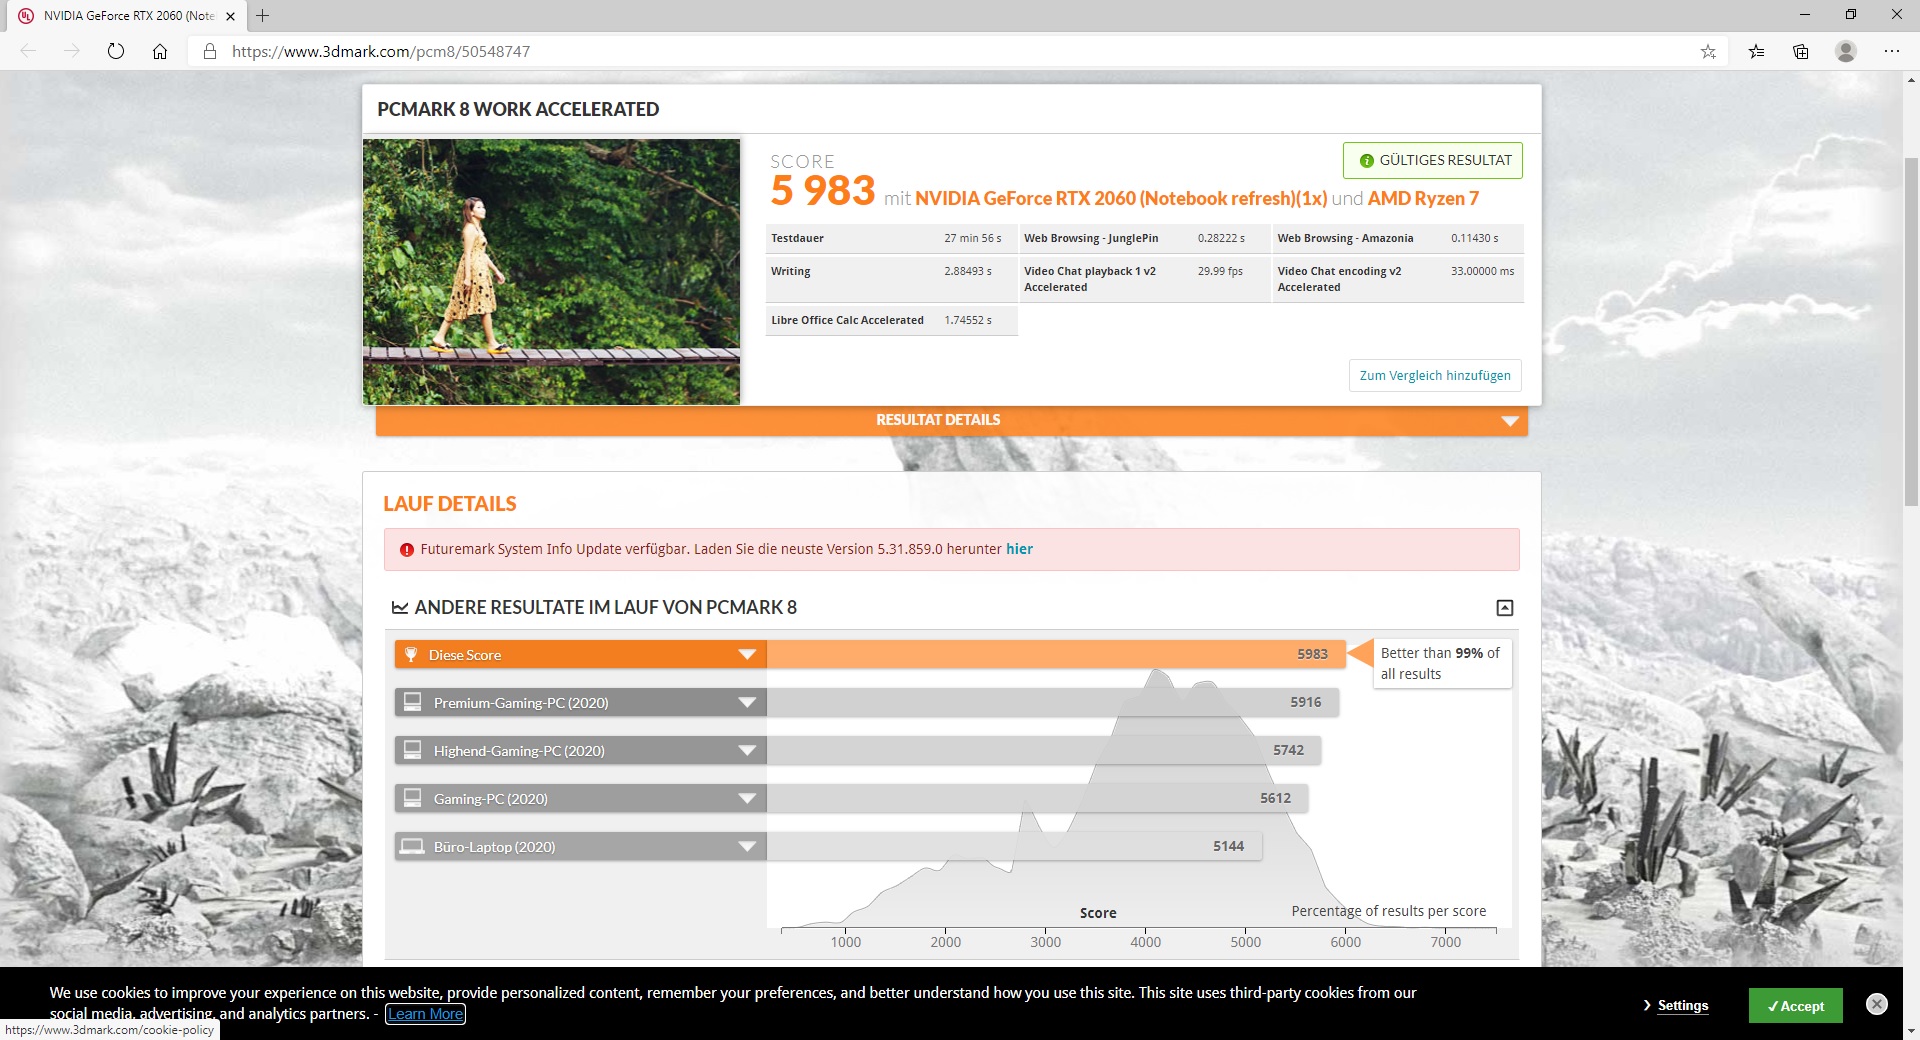
| PCMark 8 Home Score Accelerated v2 | 5197 points | |
| PCMark 8 Work Score Accelerated v2 | 5983 points | |
| PCMark 10 Score | 5427 points | |
Help | ||
DPC Latencies
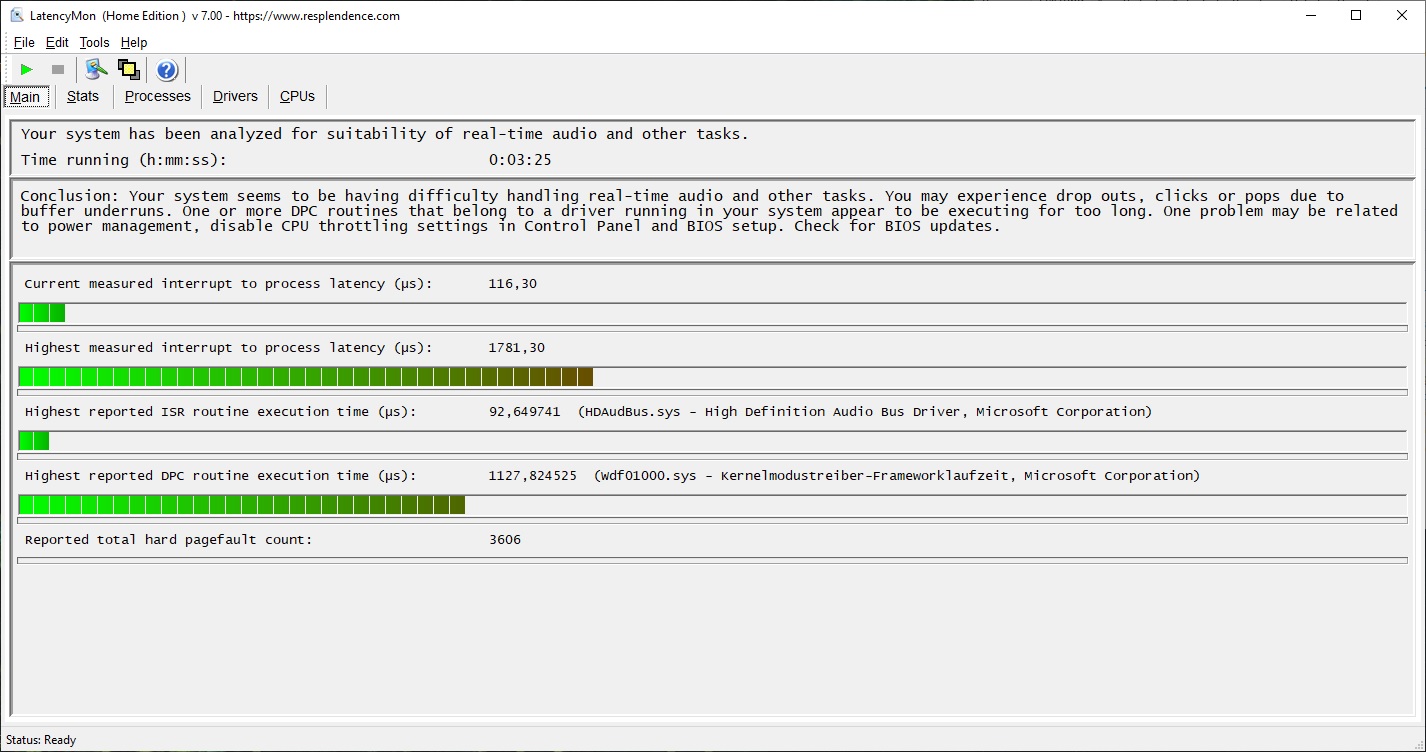
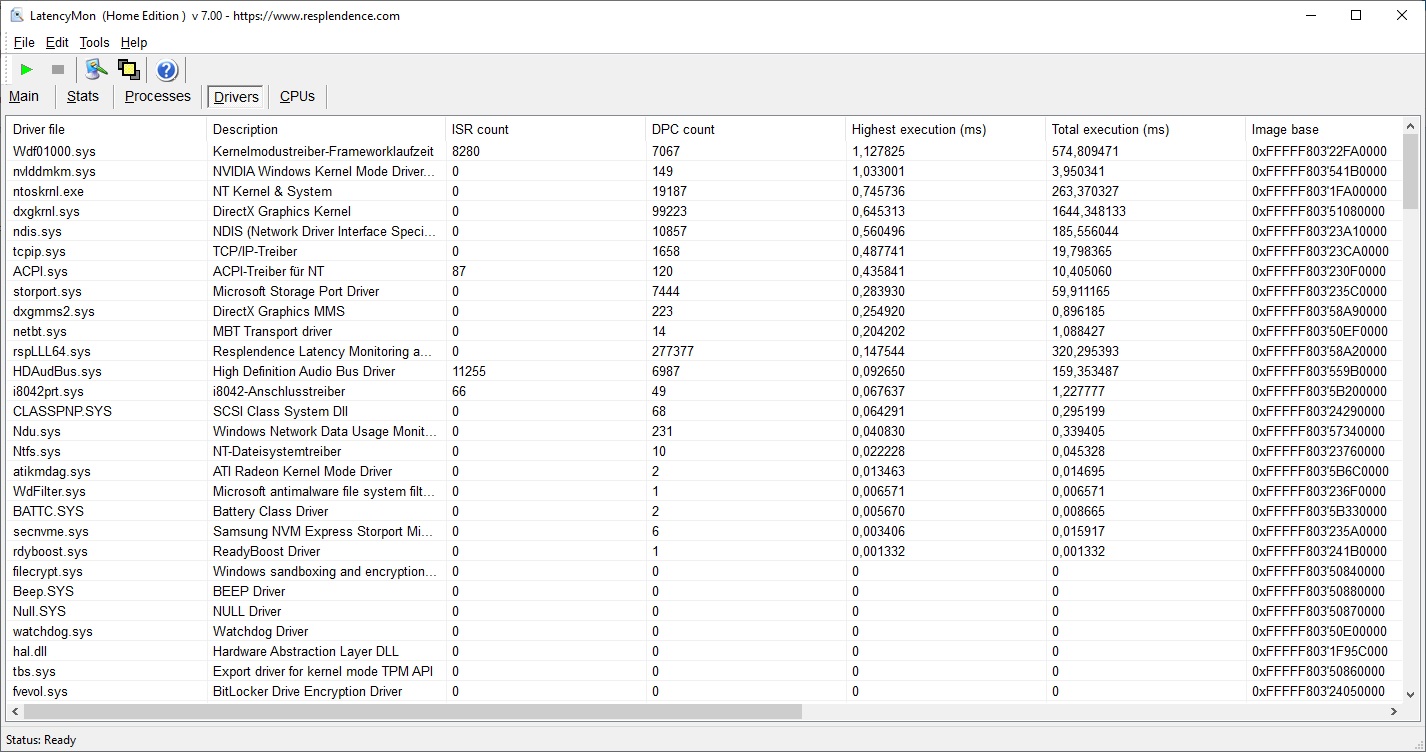
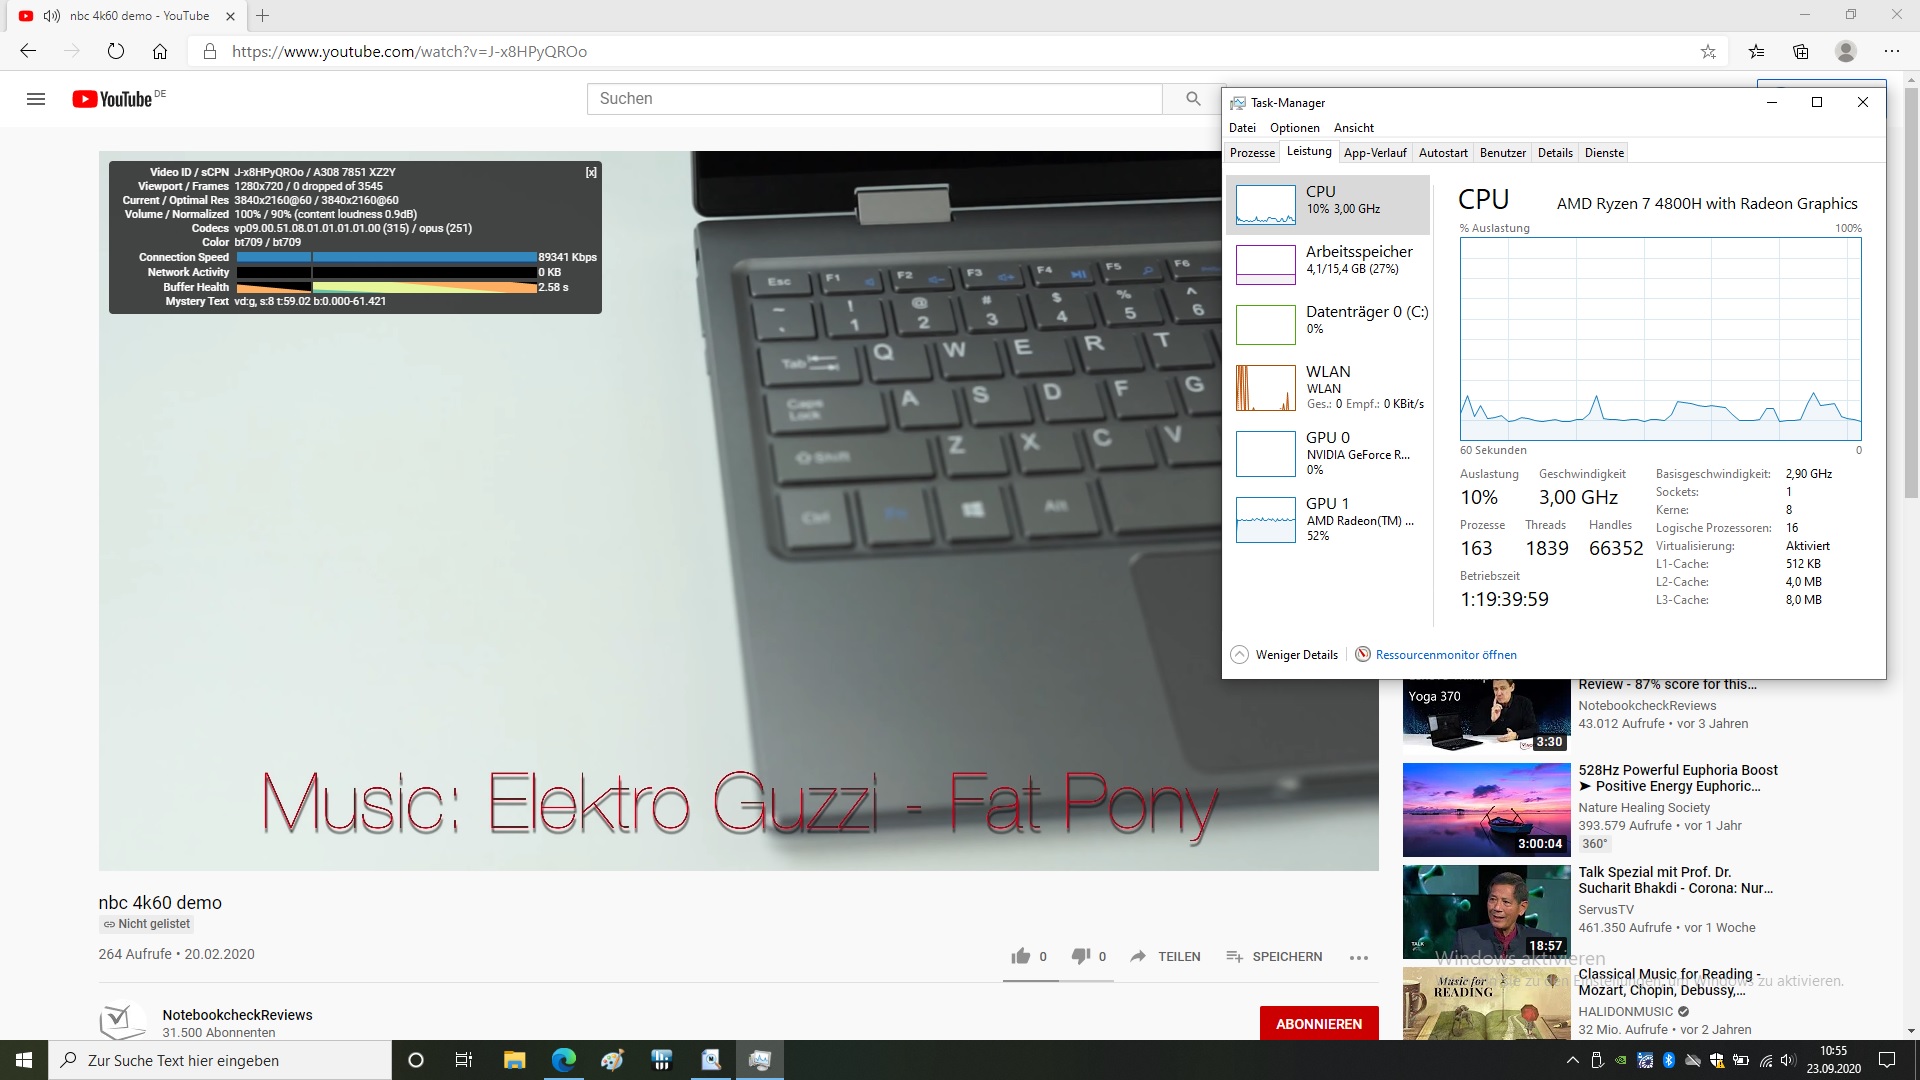
The LatencyMon test revealed some driver problems that originate from a Microsoft kernel mode driver for the framework runtime. However, during our YouTube test with a 4K60 video everything went smoothly and there were also no dropped frames.
| DPC Latencies / LatencyMon - interrupt to process latency (max), Web, Youtube, Prime95 | |
| Dell G3 15 3500-G4DG2 | |
| Dell G5 15 SE 5505 P89F | |
| Schenker XMG Core 15 GK5NR0O | |
| Asus TUF Gaming A15 FA506IV-HN172 | |
| Lenovo Legion 5 15IMH05H | |
* ... smaller is better
Storage Solution
Our test unit is equipped with a Samsung SSD 970 Evo Plus with 500 GB, which occupies 14th place in our HDD/SSD benchmark chart, so it is quite fast. However, you can chose among a lot of different SSDs in the configurator, so it depends on the configuration. The model in our test unit is completely convincing in our synthetic benchmarks, beating all the competitors including the predecessor, even though that was equipped with the same model.
| Schenker XMG Core 15 GK5NR0O Samsung SSD 970 EVO Plus 500GB | Schenker XMG Core 15 GK5CP6V Samsung SSD 970 EVO Plus 500GB | Dell G3 15 3500-G4DG2 SK Hynix BC511 HFM512GDJTNI | Lenovo Legion 5 15IMH05H Samsung PM991 MZALQ512HALU | Asus TUF Gaming A15 FA506IV-HN172 Kingston OM8PCP3512F-AB | Dell G5 15 SE 5505 P89F Samsung PM991 MZ9LQ512HALU | Average Samsung SSD 970 EVO Plus 500GB | |
|---|---|---|---|---|---|---|---|
| CrystalDiskMark 5.2 / 6 | -30% | -46% | -35% | -35% | -35% | -16% | |
| Write 4K (MB/s) | 233 | 102 -56% | 99.6 -57% | 145.4 -38% | 219.8 -6% | 142.1 -39% | 159.2 ? -32% |
| Read 4K (MB/s) | 54.5 | 41.39 -24% | 38.8 -29% | 51.6 -5% | 50.2 -8% | 46.43 -15% | 48.5 ? -11% |
| Write Seq (MB/s) | 3050 | 1649 -46% | 1117 -63% | 1007 -67% | 979 -68% | 1108 -64% | 2114 ? -31% |
| Read Seq (MB/s) | 3042 | 1367 -55% | 1030 -66% | 1145 -62% | 1990 -35% | 1622 -47% | 2044 ? -33% |
| Write 4K Q32T1 (MB/s) | 520 | 379 -27% | 445.2 -14% | 468.4 -10% | 516 -1% | 467 -10% | 435 ? -16% |
| Read 4K Q32T1 (MB/s) | 546 | 401.2 -27% | 331.8 -39% | 528 -3% | 298.3 -45% | 525 -4% | 508 ? -7% |
| Write Seq Q32T1 (MB/s) | 3241 | 3276 1% | 1102 -66% | 1381 -57% | 982 -70% | 1203 -63% | 3238 ? 0% |
| Read Seq Q32T1 (MB/s) | 3538 | 3417 -3% | 2227 -37% | 2291 -35% | 1907 -46% | 2288 -35% | 3499 ? -1% |
| Write 4K Q8T8 (MB/s) | 981 | 2067 ? | |||||
| Read 4K Q8T8 (MB/s) | 300.9 | 1064 ? | |||||
| AS SSD | -20% | -68% | -55% | -53% | -74% | -10% | |
| Seq Read (MB/s) | 2836 | 2261 -20% | 1305 -54% | 2012 -29% | 1682 -41% | 1386 -51% | 2640 ? -7% |
| Seq Write (MB/s) | 2452 | 2393 -2% | 767 -69% | 1261 -49% | 904 -63% | 1234 -50% | 2500 ? 2% |
| 4K Read (MB/s) | 60.4 | 54.6 -10% | 41.84 -31% | 43.66 -28% | 60.2 0% | 41.32 -32% | 54.8 ? -9% |
| 4K Write (MB/s) | 190.5 | 118.4 -38% | 90.1 -53% | 109.3 -43% | 164.8 -13% | 128 -33% | 141.2 ? -26% |
| 4K-64 Read (MB/s) | 1283 | 1376 7% | 773 -40% | 851 -34% | 472.5 -63% | 854 -33% | 1345 ? 5% |
| 4K-64 Write (MB/s) | 2298 | 2299 0% | 711 -69% | 780 -66% | 845 -63% | 721 -69% | 2116 ? -8% |
| Access Time Read * (ms) | 0.034 | 0.07 -106% | 0.09 -165% | 0.117 -244% | 0.087 -156% | 0.098 -188% | 0.0475 ? -40% |
| Access Time Write * (ms) | 0.02 | 0.031 -55% | 0.04 -100% | 0.036 -80% | 0.02 -0% | 0.095 -375% | 0.02775 ? -39% |
| Score Read (Points) | 1627 | 1657 2% | 945 -42% | 1096 -33% | 701 -57% | 1034 -36% | 1664 ? 2% |
| Score Write (Points) | 2734 | 2657 -3% | 878 -68% | 1016 -63% | 1101 -60% | 973 -64% | 2507 ? -8% |
| Score Total (Points) | 5184 | 5175 0% | 2290 -56% | 2643 -49% | 2143 -59% | 2536 -51% | 5023 ? -3% |
| Copy ISO MB/s (MB/s) | 2039 | 1481 -27% | 675 -67% | 1284 -37% | 1989 ? -2% | ||
| Copy Program MB/s (MB/s) | 438 | 467.5 7% | 248.4 -43% | 401.9 -8% | 442 ? 1% | ||
| Copy Game MB/s (MB/s) | 1137 | 734 -35% | 535 -53% | 1013 -11% | 1121 ? -1% | ||
| Total Average (Program / Settings) | -25% /
-24% | -57% /
-59% | -45% /
-48% | -44% /
-46% | -55% /
-60% | -13% /
-12% |
* ... smaller is better

Constant Performance Read: DiskSpd Read Loop, Queue Depth 8
Graphics Card
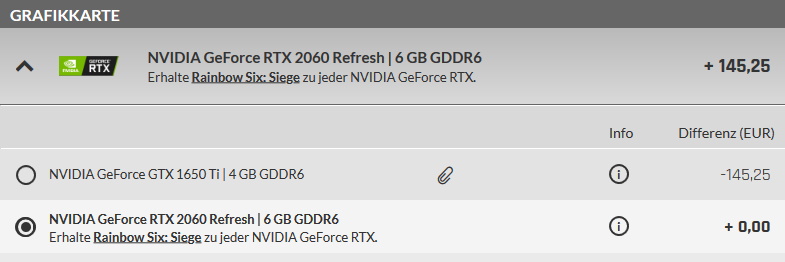
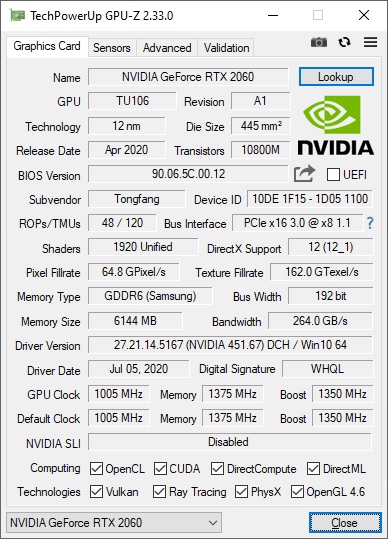
In addition to the Vega 7 GPU that is integrated into the processor, there is also a powerful Nvidia GeForce RTX 2060, which represents Nvidia's entry into the high-end gaming segment and also supports ray tracing functions. Alternatively, you can also select the significantly weaker GTX 1650 Ti.
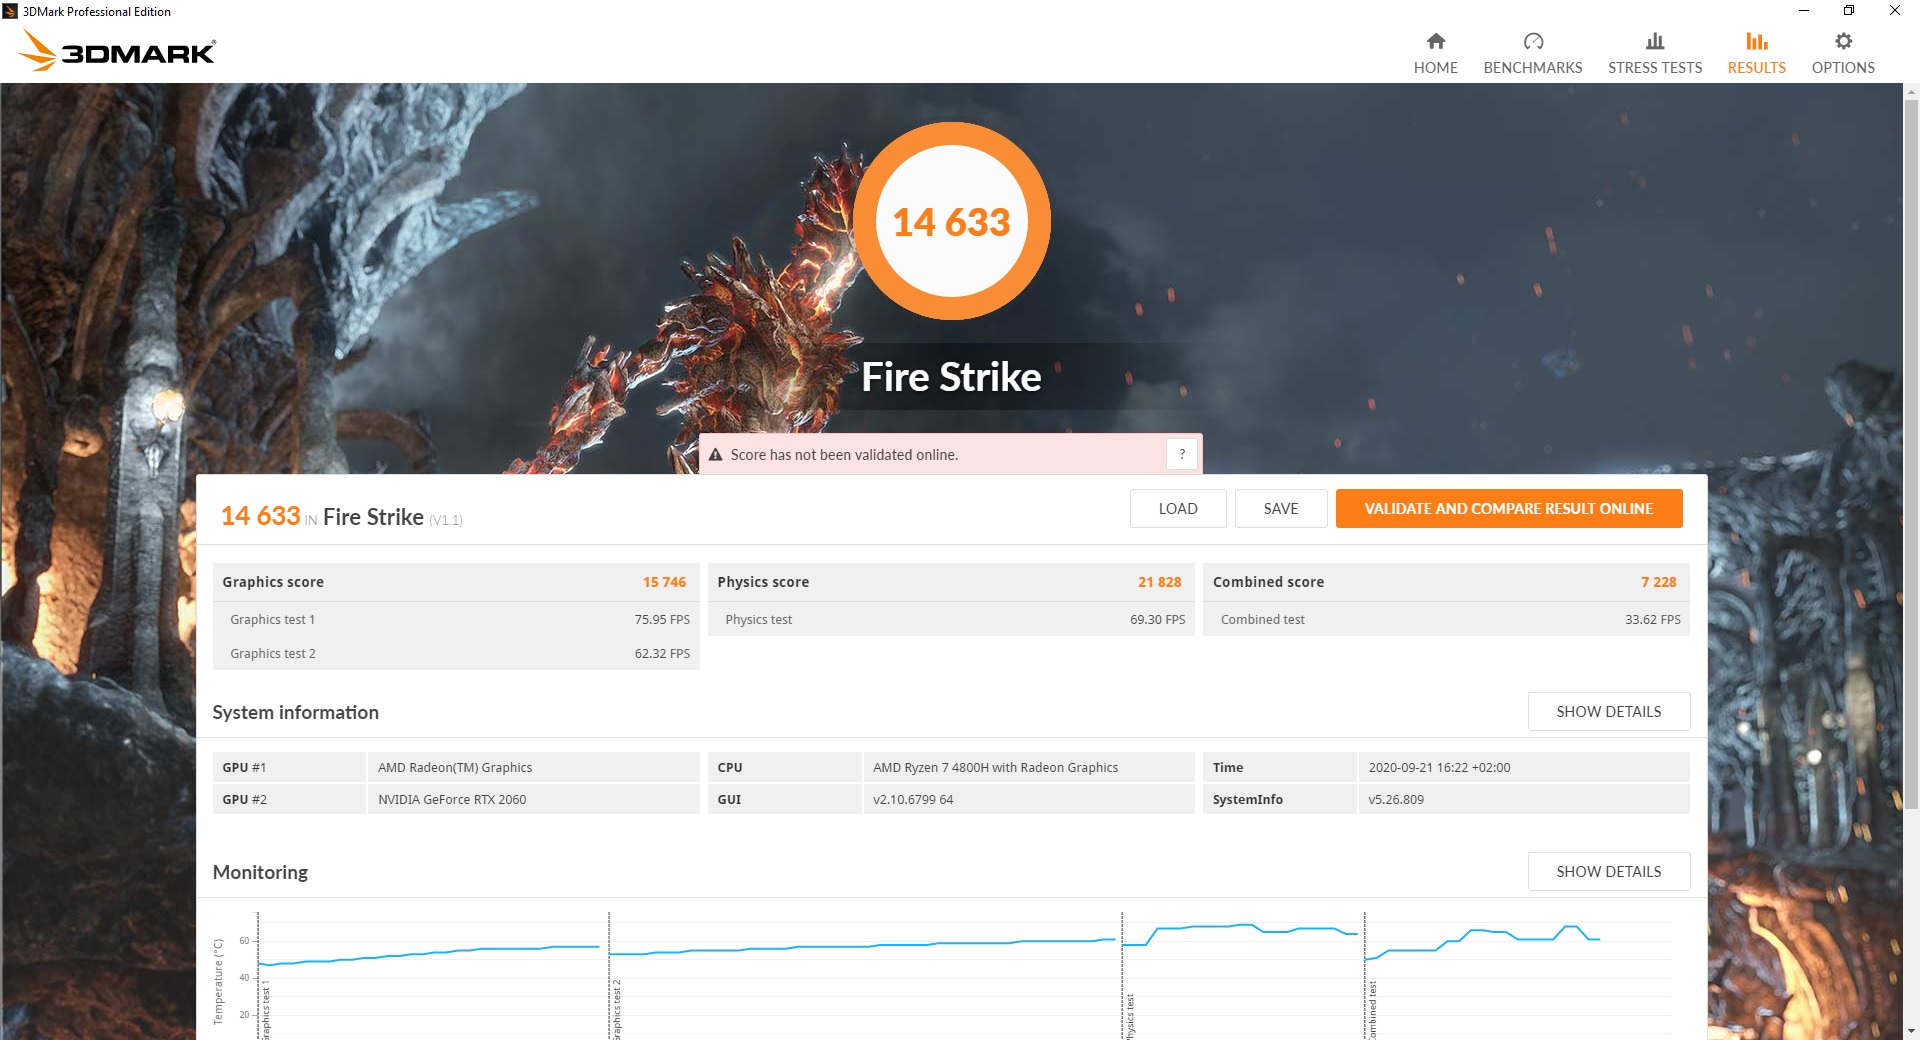
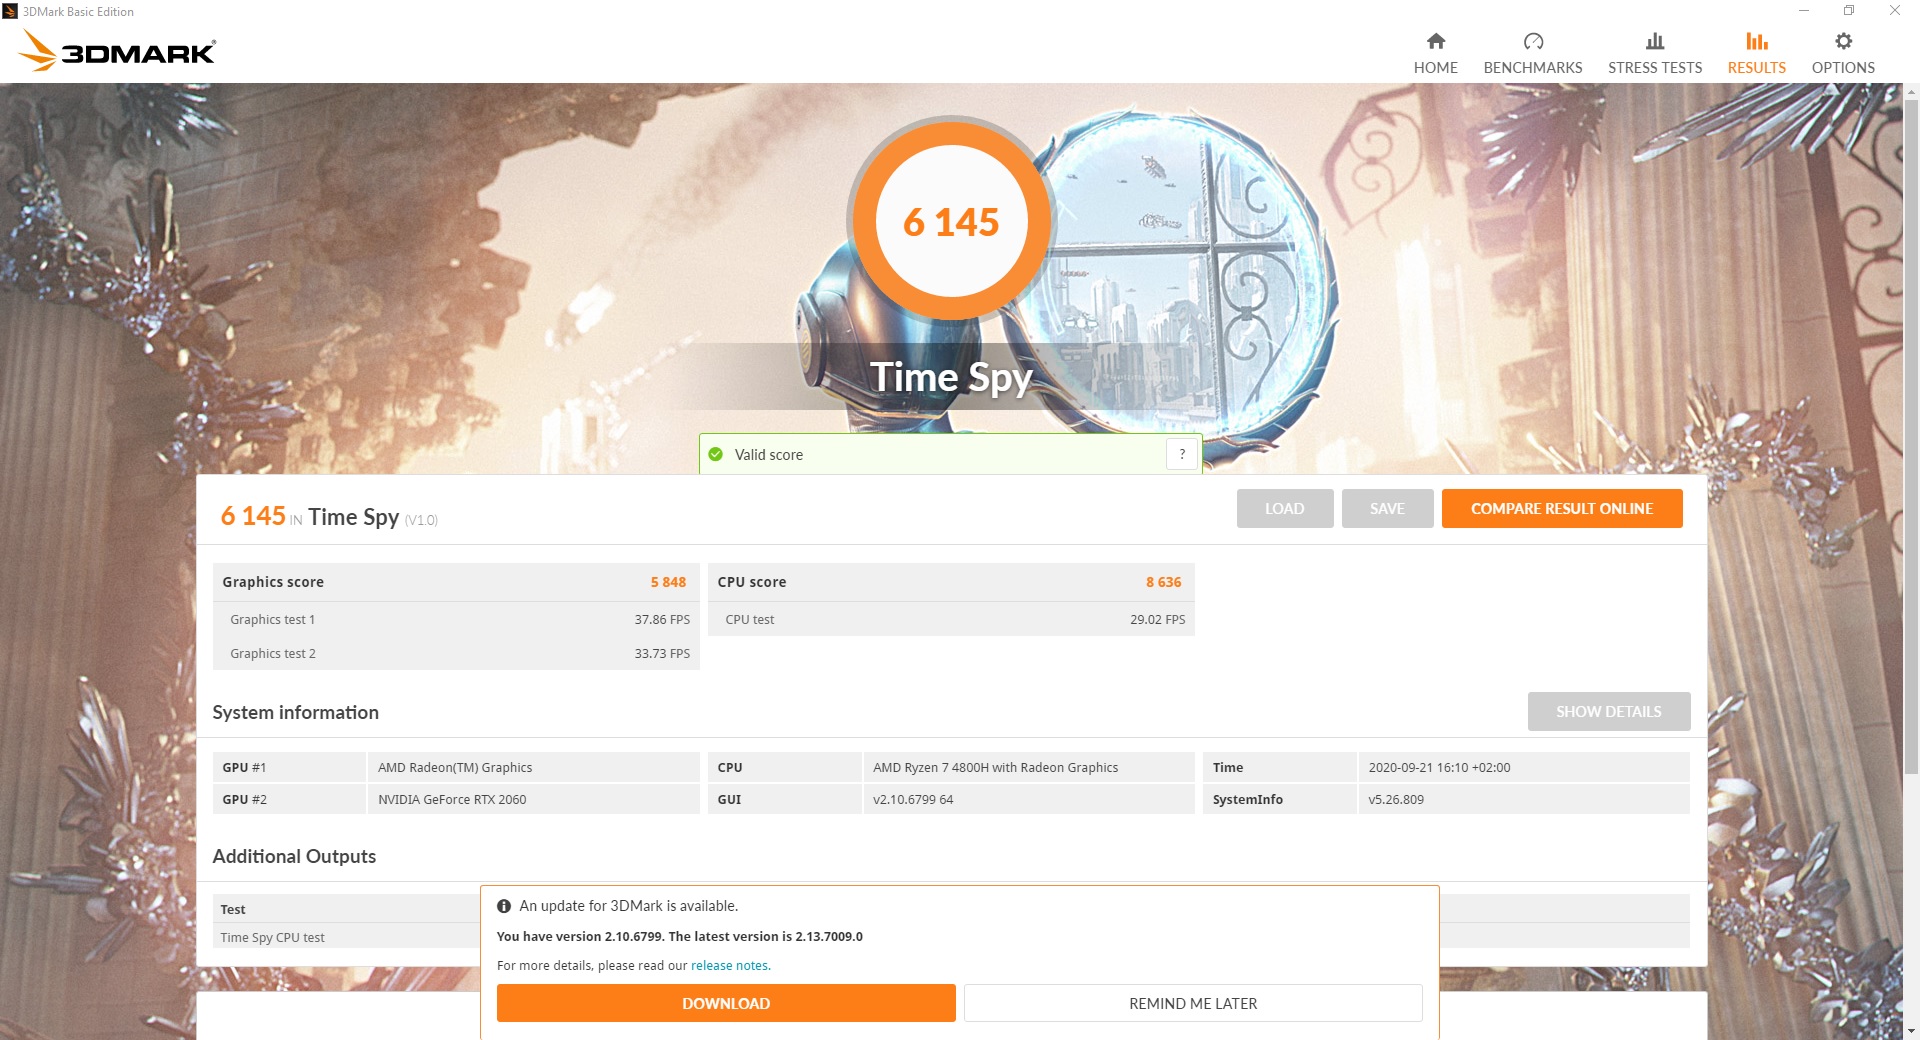
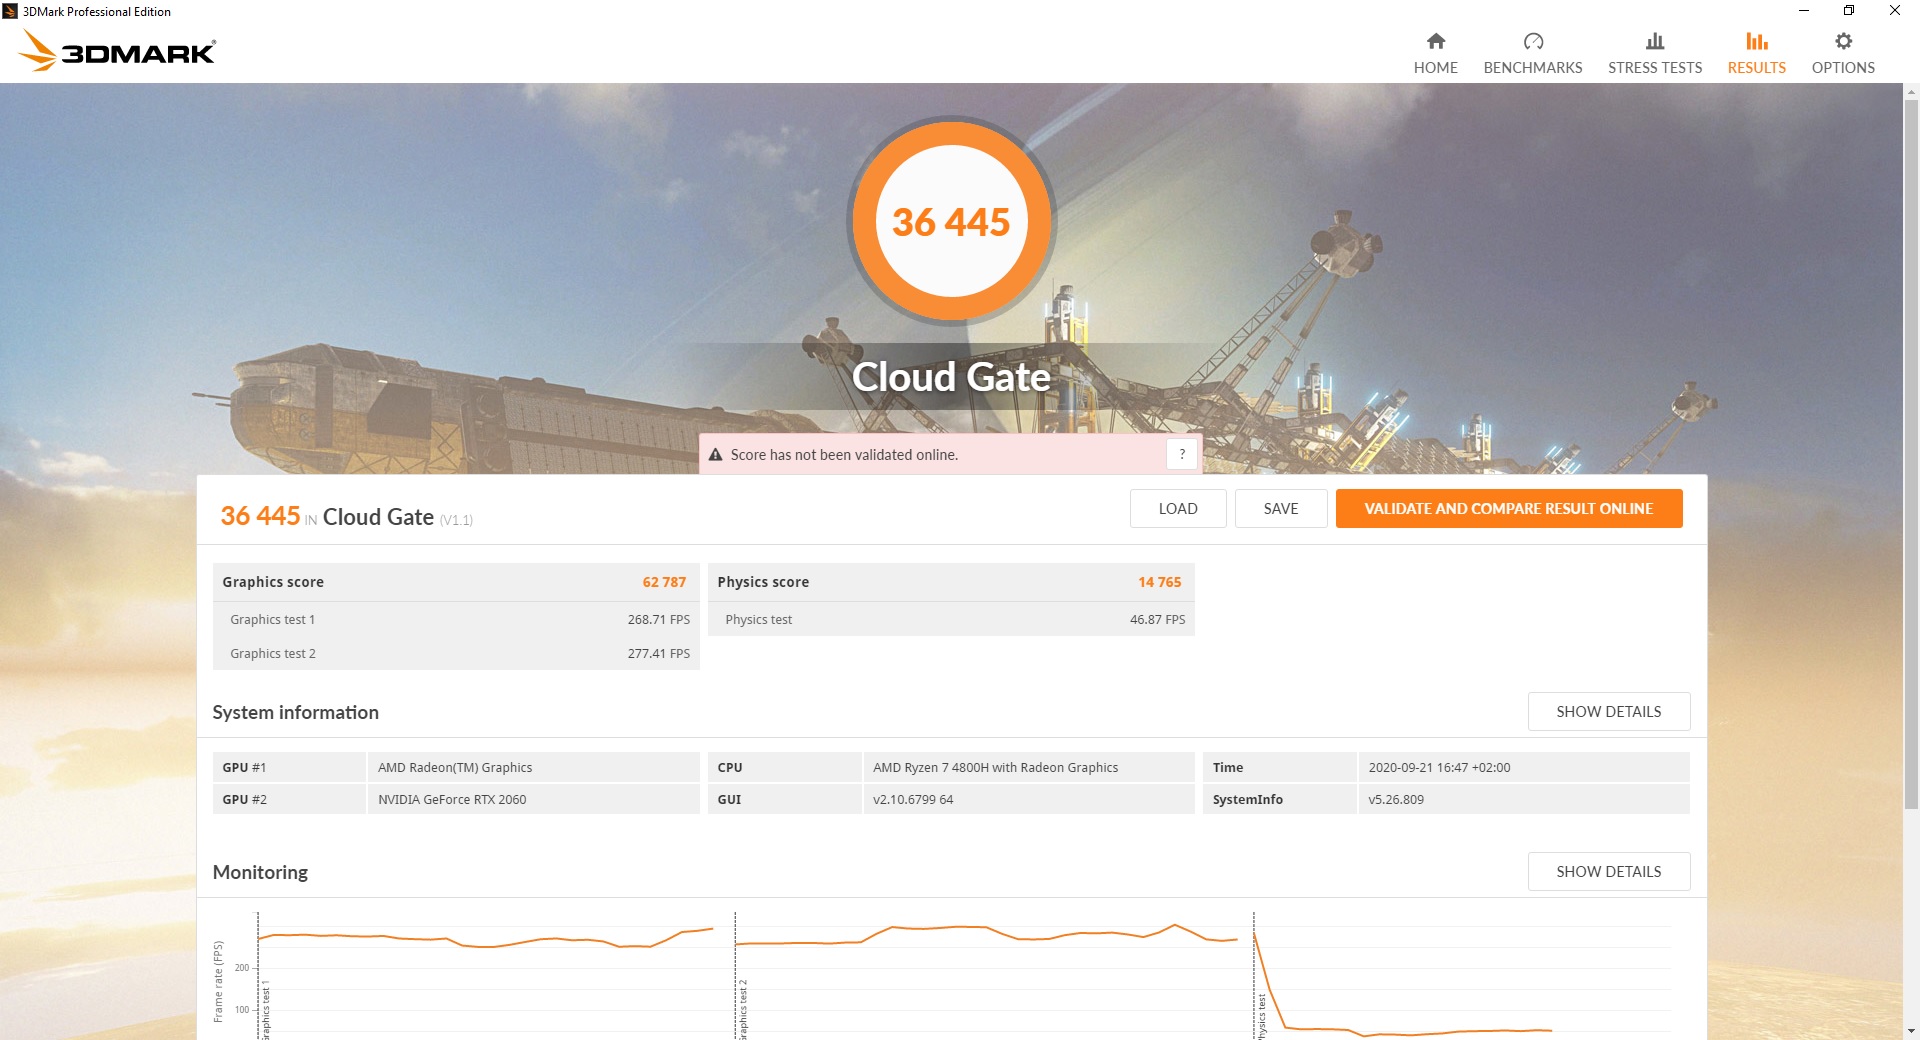
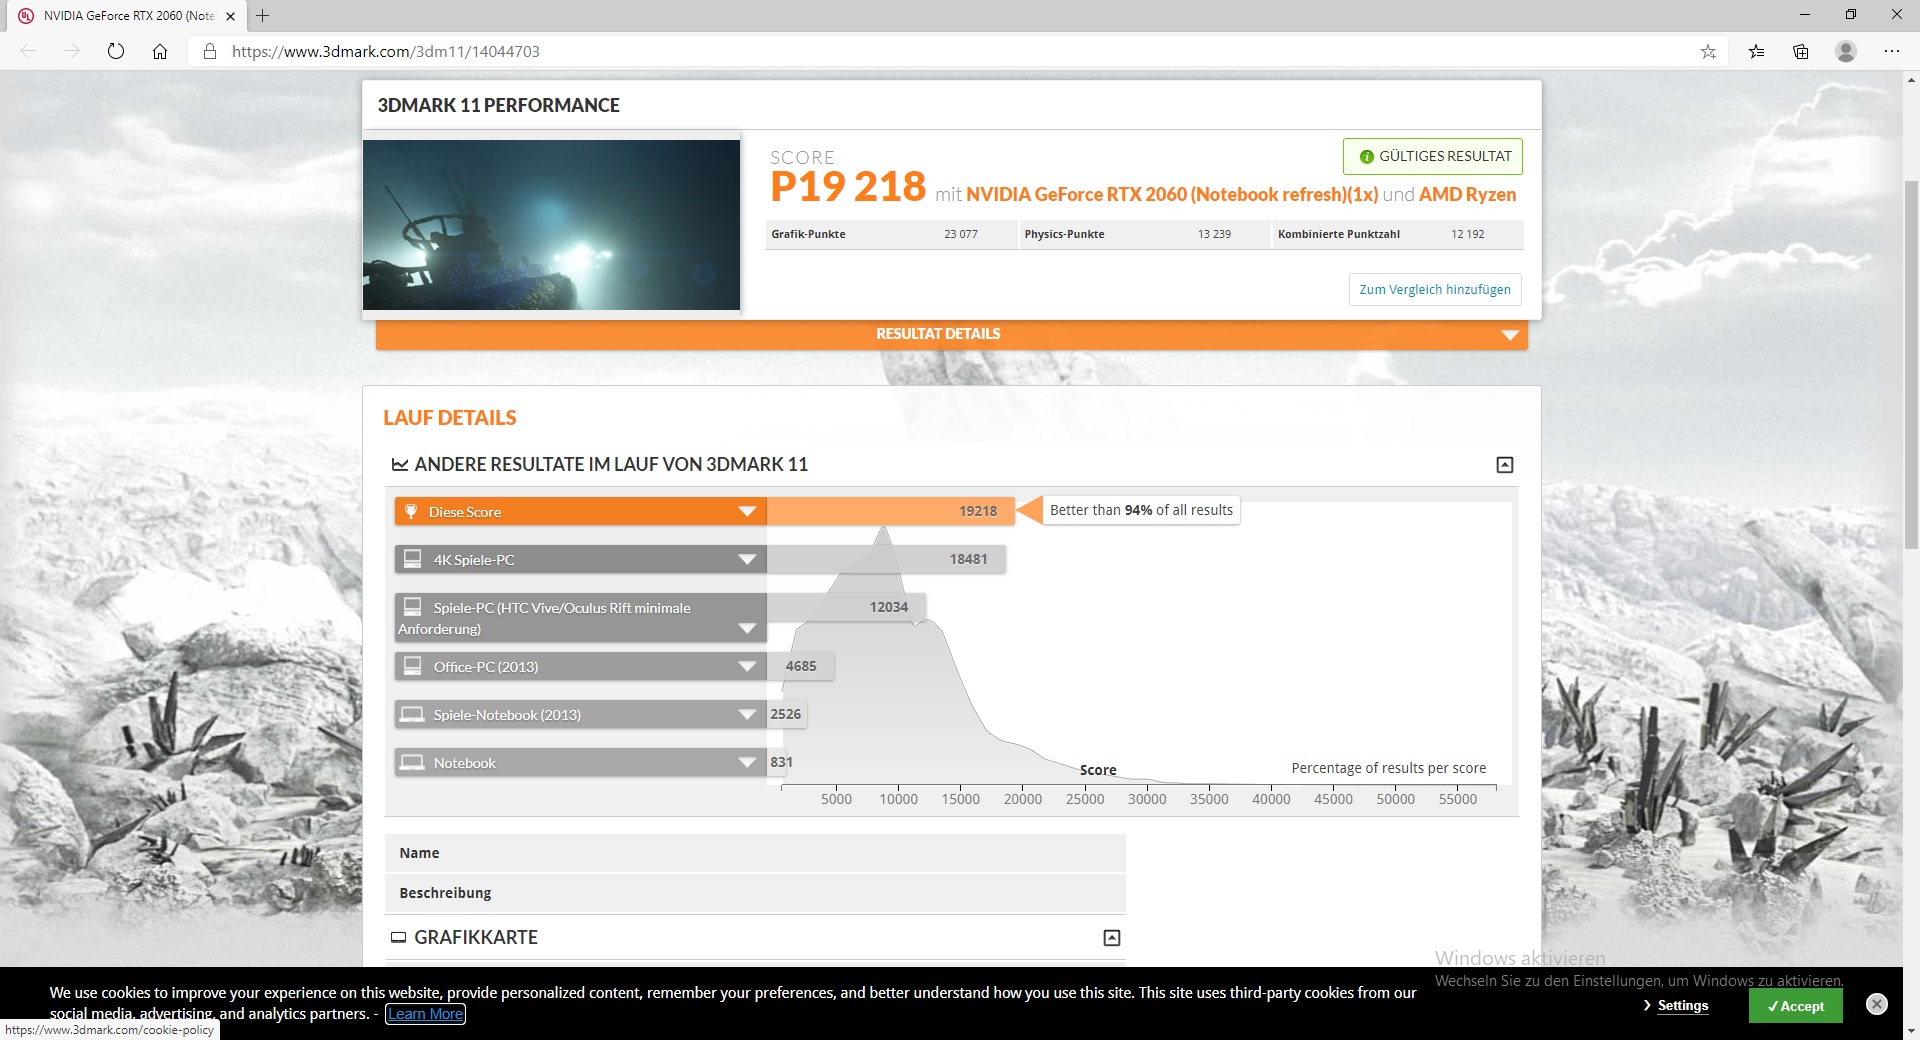
In the synthetic 3DMark tests, the RTX 2060 delivers a performance minimally below what we expect from an average RTX 2060. However, the low deviations (3-8%) are within the tolerance range. In 3DMark 11, our test unit places second, in 3DMark 2013 it fares worse, and there is a significant, reproducible downward outlier in Cloud Gate. Here, the Dell G5 with the Radeon RX 5600M always seems to be ahead of the rest of the competitors with an advantage of about 18%. Using the Overboost mode gains about 4% in performance.
If you unplug the Schenker from the outlet, the 3D performance is massively throttled. Of 21478 points in 3DMark 11, only 3598 points remain, which is a shocking difference!
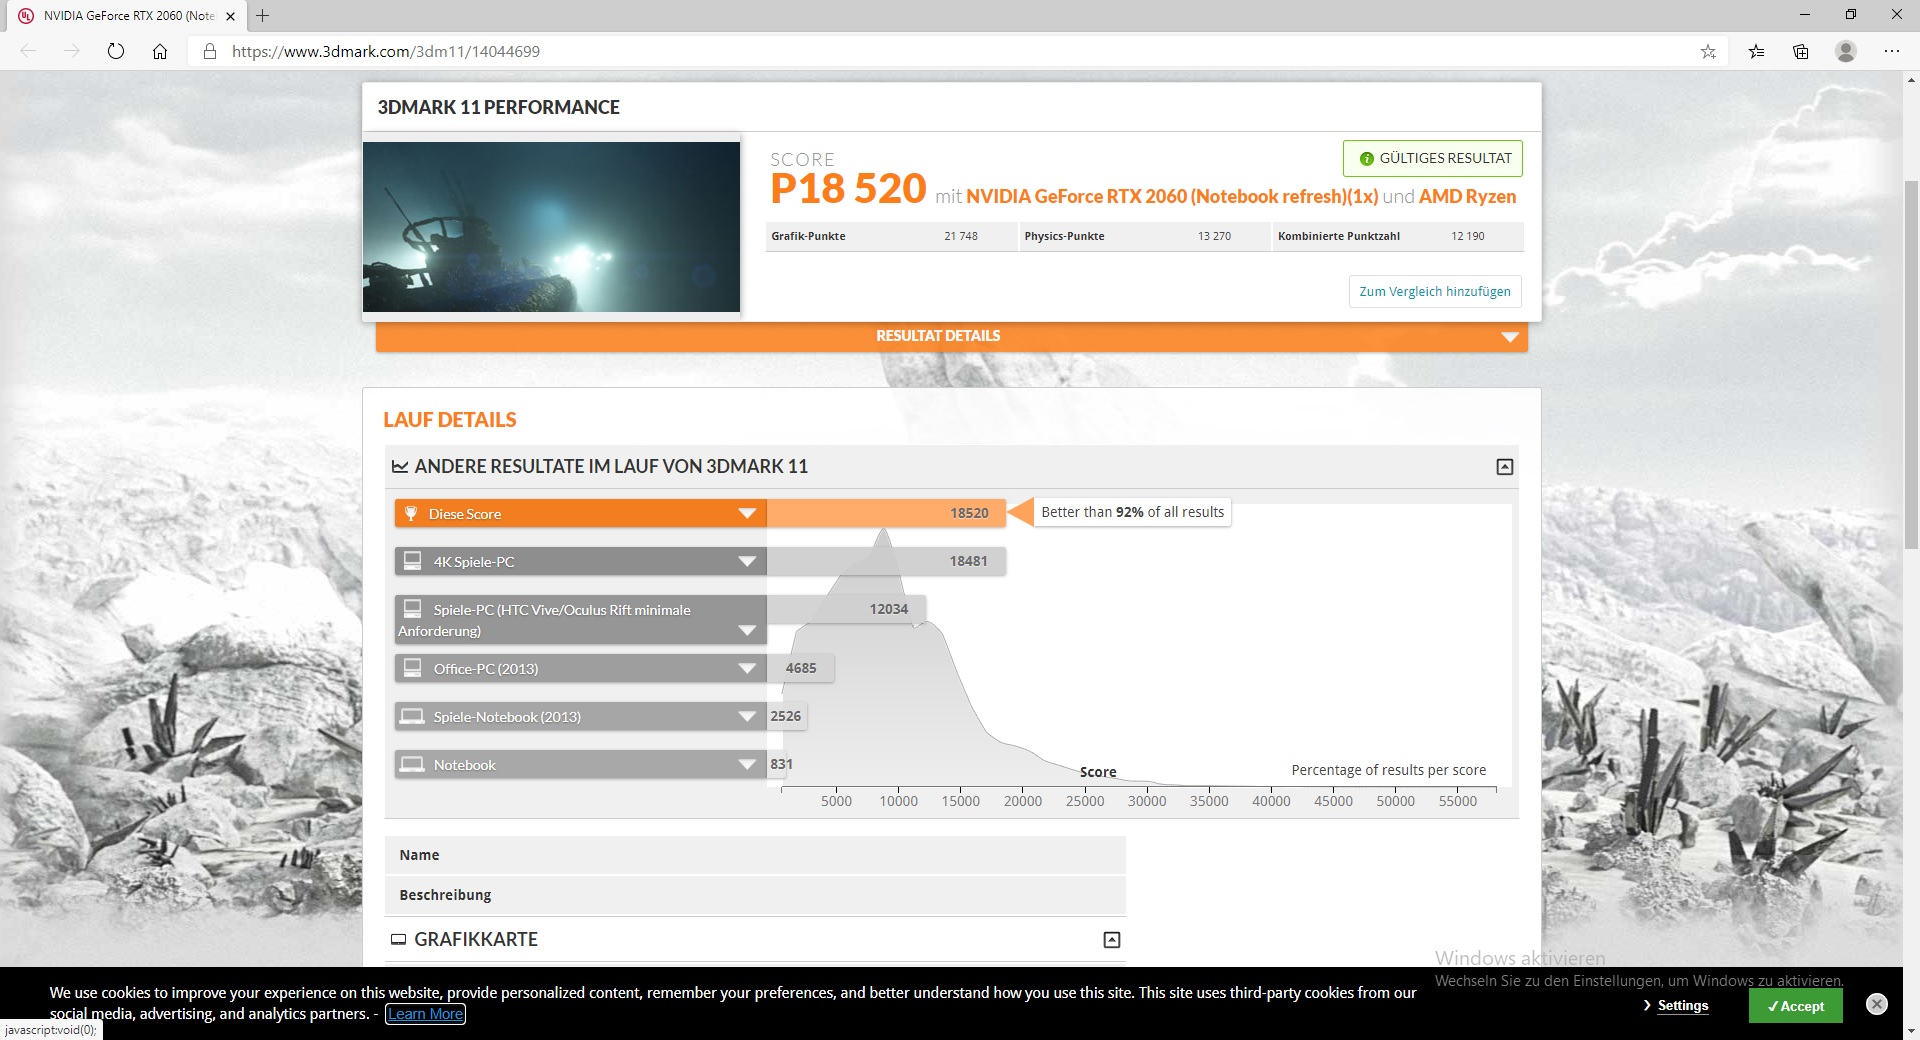
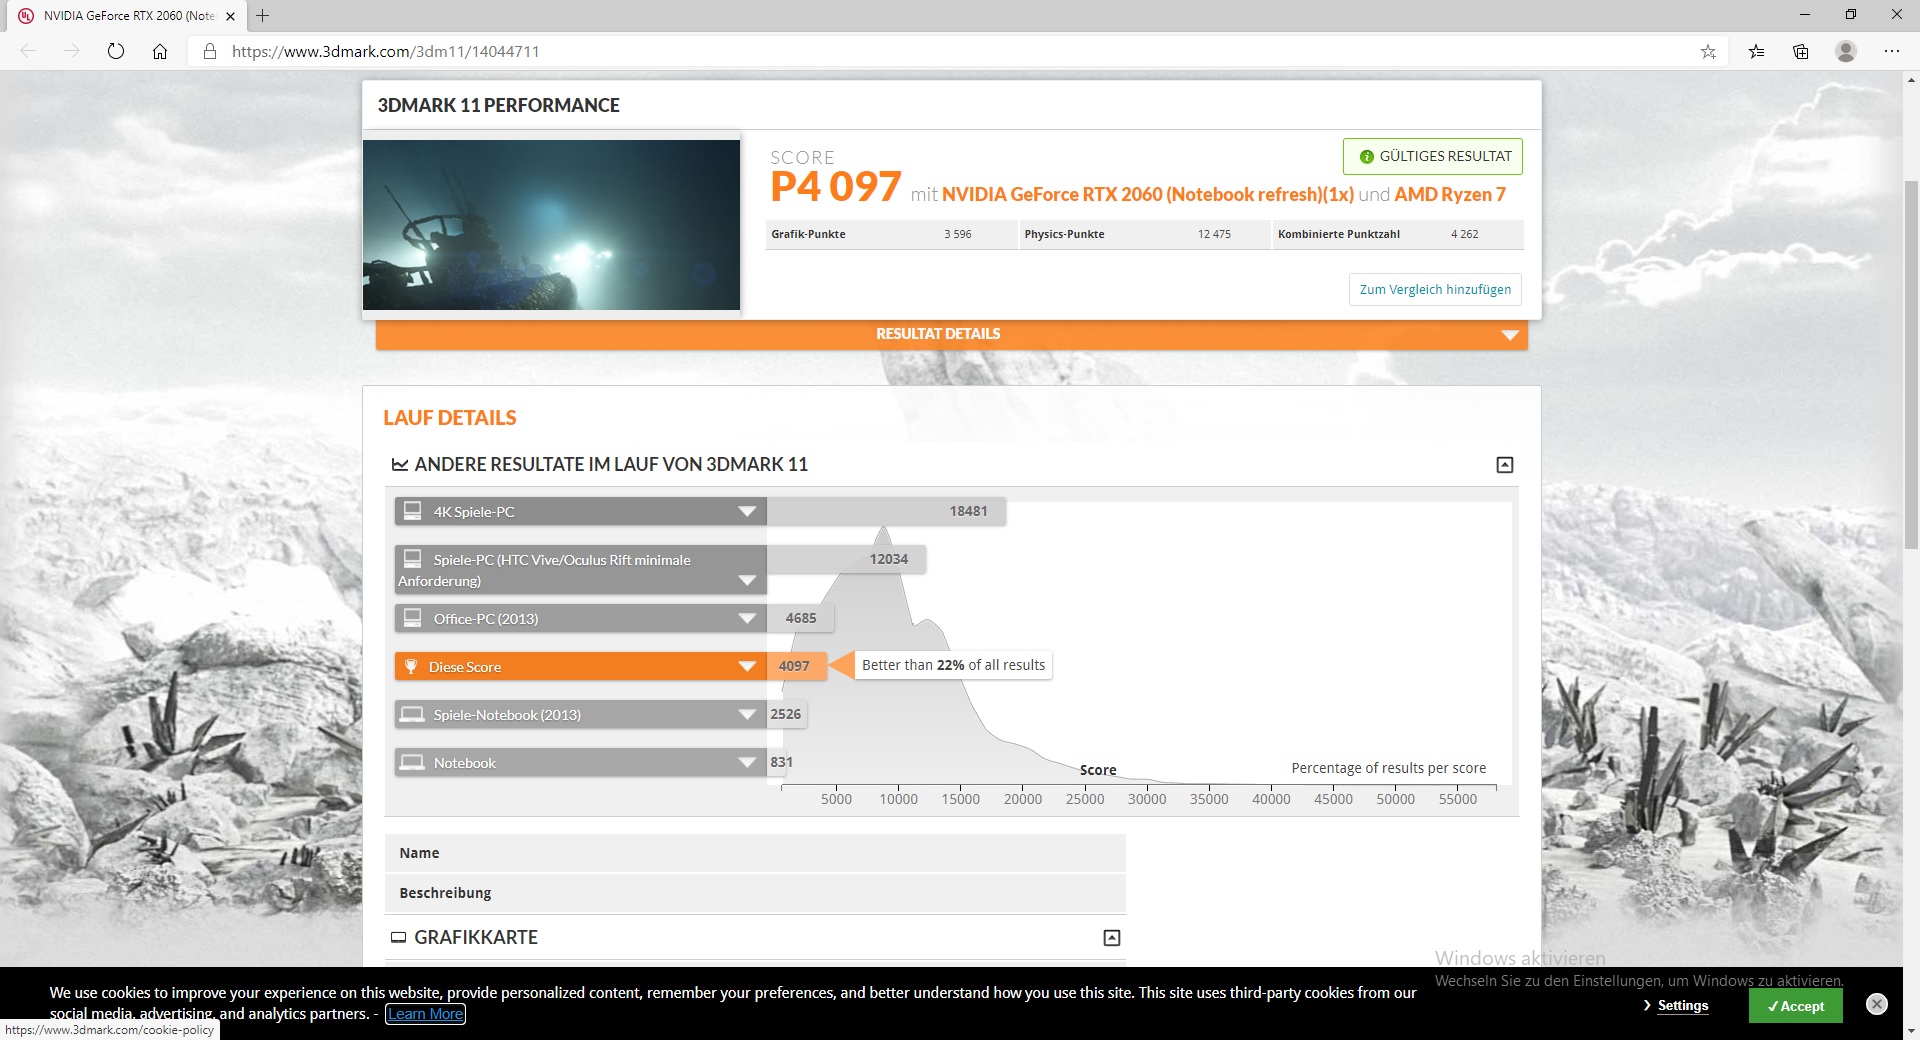
| 3DMark 11 Performance | 18520 points | |
| 3DMark Cloud Gate Standard Score | 36445 points | |
| 3DMark Fire Strike Score | 14633 points | |
| 3DMark Time Spy Score | 6145 points | |
Help | ||
Gaming Performance
While gaming, our suspicion from before is confirmed: The Schenker always performs a few percent behind an average RTX 2060. Particularly the Lenovo Legion with the same GPU but weaker processor is always 10 to 15% faster here. The Dell G5 also strikes a slightly better figure most of the time. Especially the comparison with the predecessor with a GTX 1660 Ti is a bit disappointing. In The Witcher 3, the new model is only 4 to 8% faster, despite its more powerful graphics.
However, in practice, those fairly small advantages of some competitors should be hardly noticeable. All the games we tested always ran smoothly, at least in the native Full-HD resolution. Our page specifically on the mobile GeForce RTX 2060 shows more benchmark comparisons. You should deduct about 5% of the performance for the Schenker.
| The Witcher 3 | |
| 1920x1080 High Graphics & Postprocessing (Nvidia HairWorks Off) | |
| Average of class Gaming (341 - 404, n=2, last 2 years) | |
| Lenovo Legion 5 15IMH05H | |
| Average NVIDIA GeForce RTX 2060 Mobile (74.4 - 131, n=33) | |
| Asus TUF Gaming A15 FA506IV-HN172 | |
| Schenker XMG Core 15 GK5NR0O | |
| Dell G5 15 SE 5505 P89F | |
| Schenker XMG Core 15 GK5CP6V | |
| 1920x1080 Ultra Graphics & Postprocessing (HBAO+) | |
| Average of class Gaming (104.7 - 240, n=7, last 2 years) | |
| Lenovo Legion 5 15IMH05H | |
| Dell G5 15 SE 5505 P89F | |
| Average NVIDIA GeForce RTX 2060 Mobile (50.6 - 74, n=40) | |
| Asus TUF Gaming A15 FA506IV-HN172 | |
| Schenker XMG Core 15 GK5NR0O | |
| Schenker XMG Core 15 GK5CP6V | |
| Dell G3 15 3500-G4DG2 | |
Our stress test with The Witcher 3 shows a relatively stable performance curve. During the hour-long test, the XMG Core loses about 12% of the gaming performance.
| low | med. | high | ultra | |
|---|---|---|---|---|
| GTA V (2015) | 156 | 143 | 112 | 62 |
| The Witcher 3 (2015) | 219.5 | 105 | 58.8 | |
| Dota 2 Reborn (2015) | 110.9 | 109.6 | 94 | 90.8 |
| X-Plane 11.11 (2018) | 89.1 | 75.9 | 64.7 | |
| Far Cry 5 (2018) | 95 | 87 | 81 | 76 |
| Battlefield V (2018) | 111.1 | 77.9 | 68.5 | 63.2 |
Emissions - Slim means hot
Noise Emissions
The fan volume depends strongly on the selected performance profile. Here the Windows performance profiles overlap with those of the Control Center. Ideally, the fans even remain silent under low load, but during regular office usage or under average load, the Core 15 gets minimally louder than the competitors. On the other hand, under maximum load it is slightly quieter than some of its rivals. However, the differences are not particularly pronounced overall. If you activate the Overboost mode, it again becomes louder during heavy load, which hardly seems worthwhile with a performance gain of only about 4%. We did not notice any annoying coil whine or such.
Noise level
| Idle |
| 26 / 30 / 32 dB(A) |
| Load |
| 46 / 48 dB(A) |
 | ||
30 dB silent 40 dB(A) audible 50 dB(A) loud |
||
min: | ||
| Schenker XMG Core 15 GK5NR0O R7 4800H, GeForce RTX 2060 Mobile | Schenker XMG Core 15 GK5CP6V i7-9750H, GeForce GTX 1660 Ti Mobile | Dell G3 15 3500-G4DG2 i7-10750H, GeForce RTX 2060 Mobile | Lenovo Legion 5 15IMH05H i5-10300H, GeForce RTX 2060 Mobile | Asus TUF Gaming A15 FA506IV-HN172 R7 4800H, GeForce RTX 2060 Mobile | Dell G5 15 SE 5505 P89F R7 4800H, Radeon RX 5600M | |
|---|---|---|---|---|---|---|
| Noise | -8% | 0% | -3% | -3% | 4% | |
| off / environment * (dB) | 25 | 30 -20% | 26.7 -7% | 30.7 -23% | 30.2 -21% | 28 -12% |
| Idle Minimum * (dB) | 26 | 30 -15% | 27.1 -4% | 30.7 -18% | 30.2 -16% | 28 -8% |
| Idle Average * (dB) | 30 | 31 -3% | 27.1 10% | 30.7 -2% | 30.2 -1% | 28 7% |
| Idle Maximum * (dB) | 32 | 33 -3% | 30.8 4% | 30.7 4% | 30.2 6% | 28 12% |
| Load Average * (dB) | 46 | 48 -4% | 45.3 2% | 36.6 20% | 40 13% | 28 39% |
| Witcher 3 ultra * (dB) | 48 | 51 -6% | 48.7 -1% | 47 2% | 49 -2% | 50.6 -5% |
| Load Maximum * (dB) | 48 | 51 -6% | 48.7 -1% | 50.9 -6% | 49 -2% | 50.6 -5% |
* ... smaller is better
Temperature
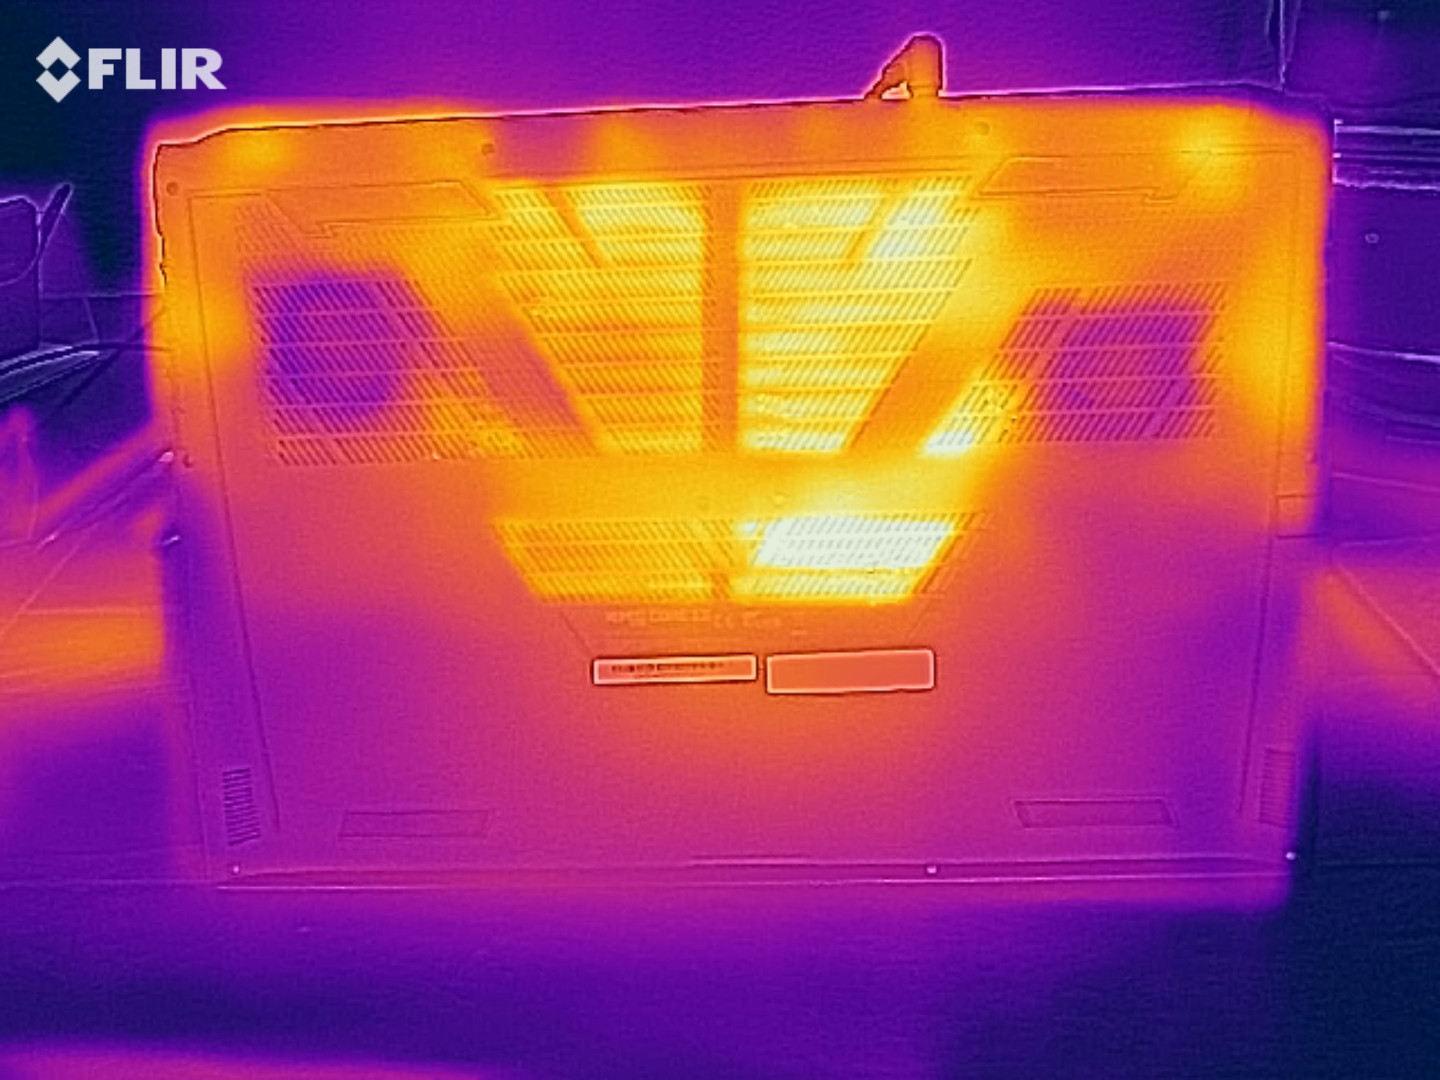
Under maximum load, the XMG heats up slightly more than the competitors, and we measure hot spots of up to 64 °C (147 °F). The central area of the keyboard, particularly on the bottom, becomes the hottest. The WSAD keys important for gamers can also become quite hot at 50 °C (122 °F). In contrast, the palm rests remain relatively cool, and during idle operation everything remains within the green range anyway.
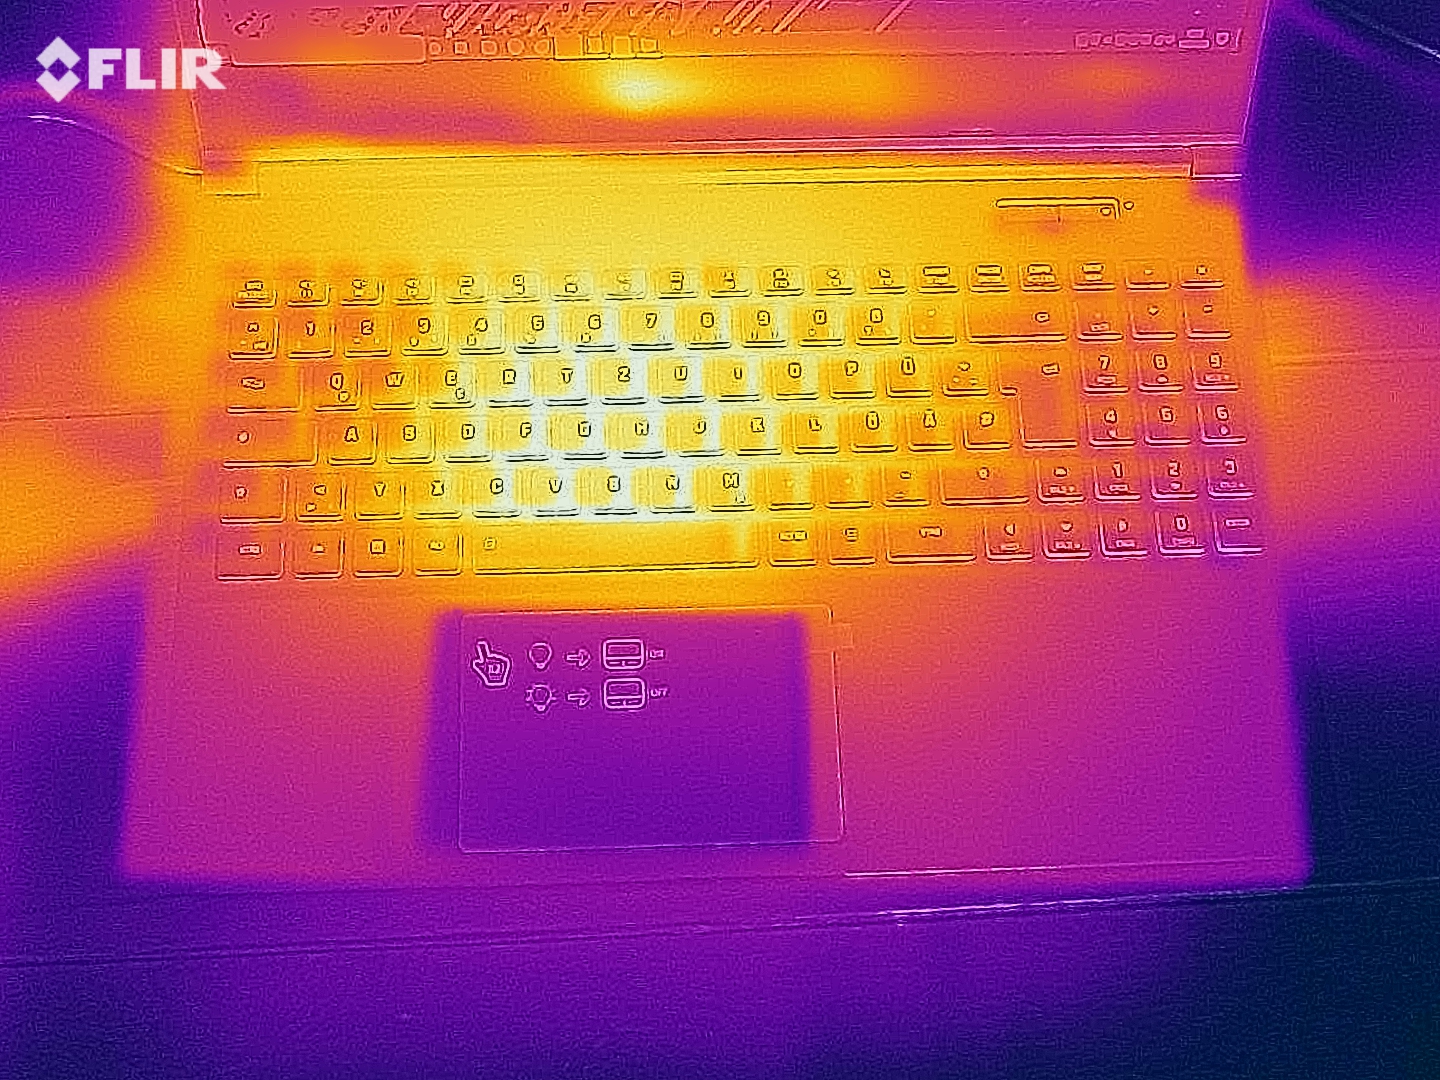
(-) The maximum temperature on the upper side is 51 °C / 124 F, compared to the average of 40.4 °C / 105 F, ranging from 21.2 to 68.8 °C for the class Gaming.
(-) The bottom heats up to a maximum of 64 °C / 147 F, compared to the average of 43.2 °C / 110 F
(+) In idle usage, the average temperature for the upper side is 28.3 °C / 83 F, compared to the device average of 33.9 °C / 93 F.
(-) Playing The Witcher 3, the average temperature for the upper side is 42.6 °C / 109 F, compared to the device average of 33.9 °C / 93 F.
(±) The palmrests and touchpad can get very hot to the touch with a maximum of 36 °C / 96.8 F.
(-) The average temperature of the palmrest area of similar devices was 28.8 °C / 83.8 F (-7.2 °C / -13 F).
| Schenker XMG Core 15 GK5NR0O R7 4800H, GeForce RTX 2060 Mobile | Schenker XMG Core 15 GK5CP6V i7-9750H, GeForce GTX 1660 Ti Mobile | Dell G3 15 3500-G4DG2 i7-10750H, GeForce RTX 2060 Mobile | Lenovo Legion 5 15IMH05H i5-10300H, GeForce RTX 2060 Mobile | Asus TUF Gaming A15 FA506IV-HN172 R7 4800H, GeForce RTX 2060 Mobile | Dell G5 15 SE 5505 P89F R7 4800H, Radeon RX 5600M | |
|---|---|---|---|---|---|---|
| Heat | 8% | -5% | 13% | 15% | 4% | |
| Maximum Upper Side * (°C) | 51 | 48 6% | 50.3 1% | 46.3 9% | 42.9 16% | 53 -4% |
| Maximum Bottom * (°C) | 64 | 59 8% | 58.6 8% | 44.4 31% | 49.9 22% | 57.6 10% |
| Idle Upper Side * (°C) | 29 | 27 7% | 33.9 -17% | 28.1 3% | 27.8 4% | 27.4 6% |
| Idle Bottom * (°C) | 32 | 28 12% | 36.3 -13% | 29.4 8% | 27 16% | 31 3% |
* ... smaller is better
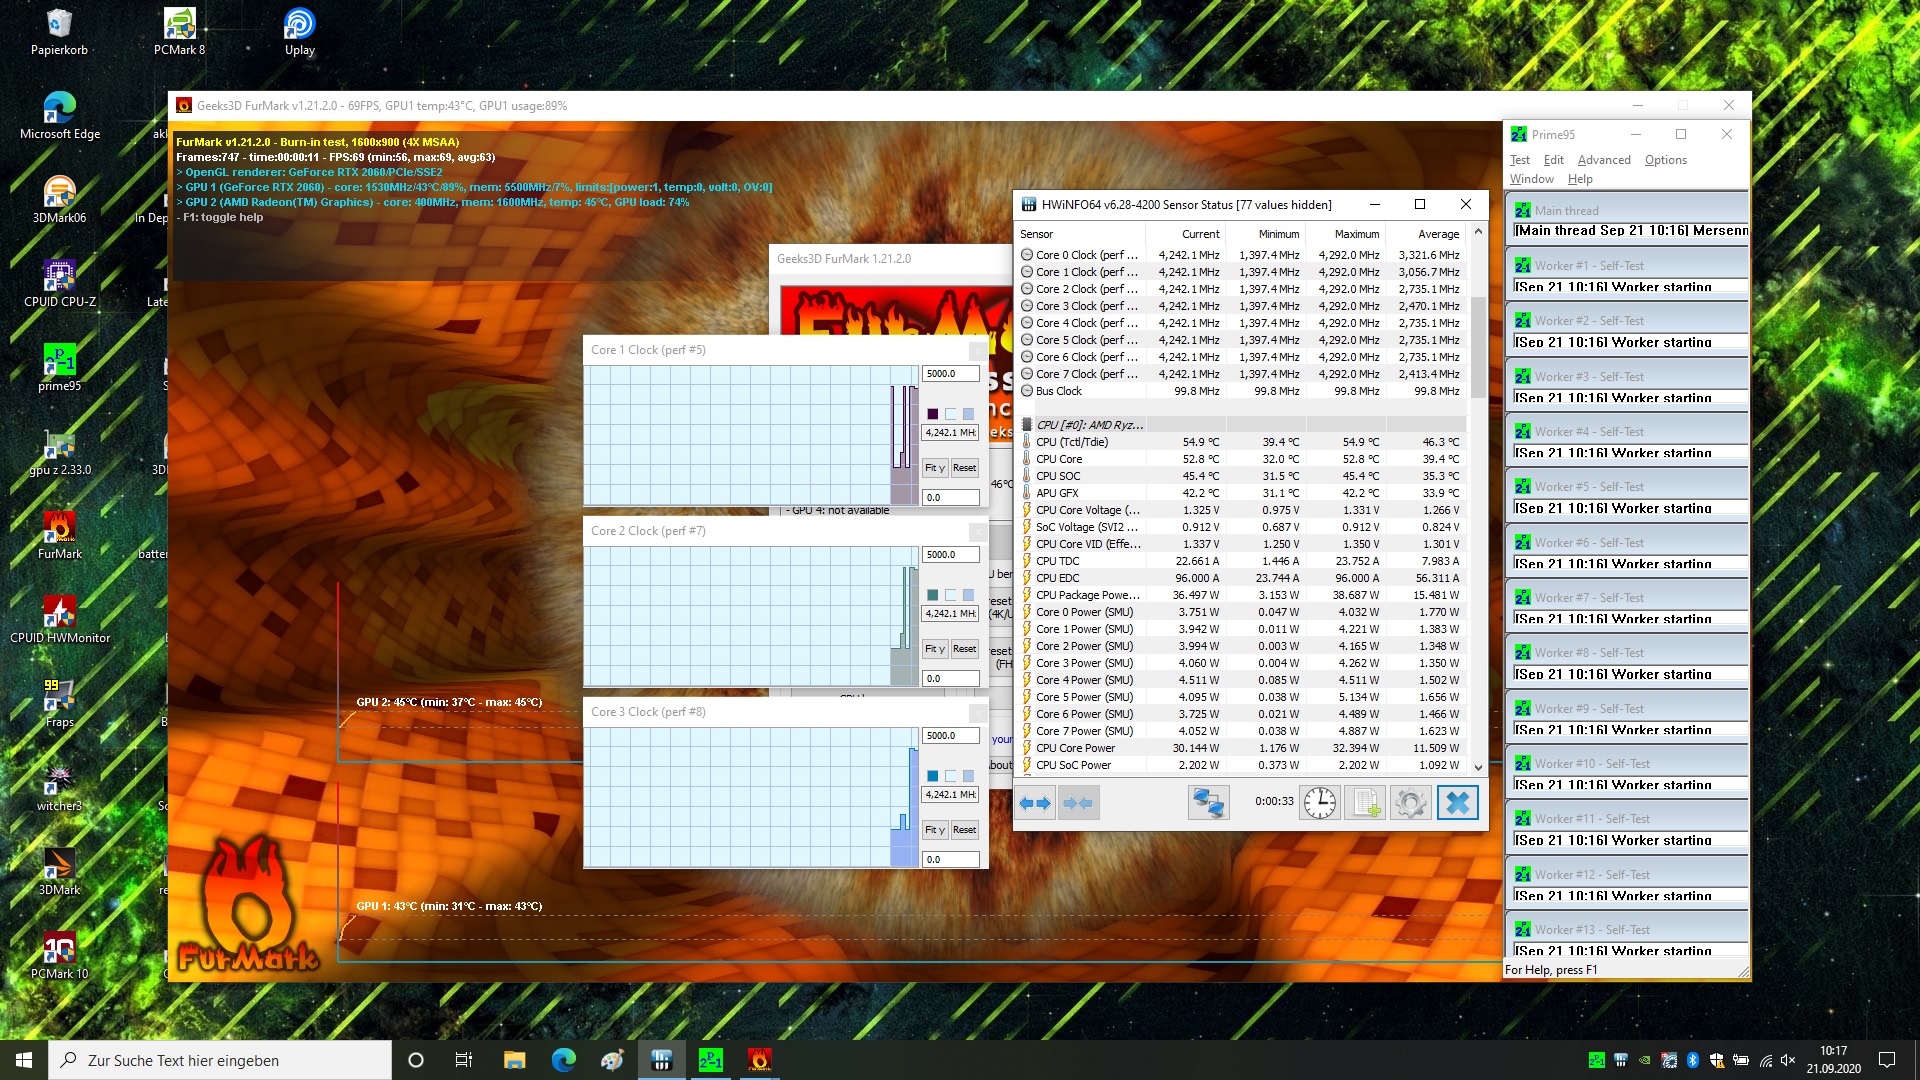
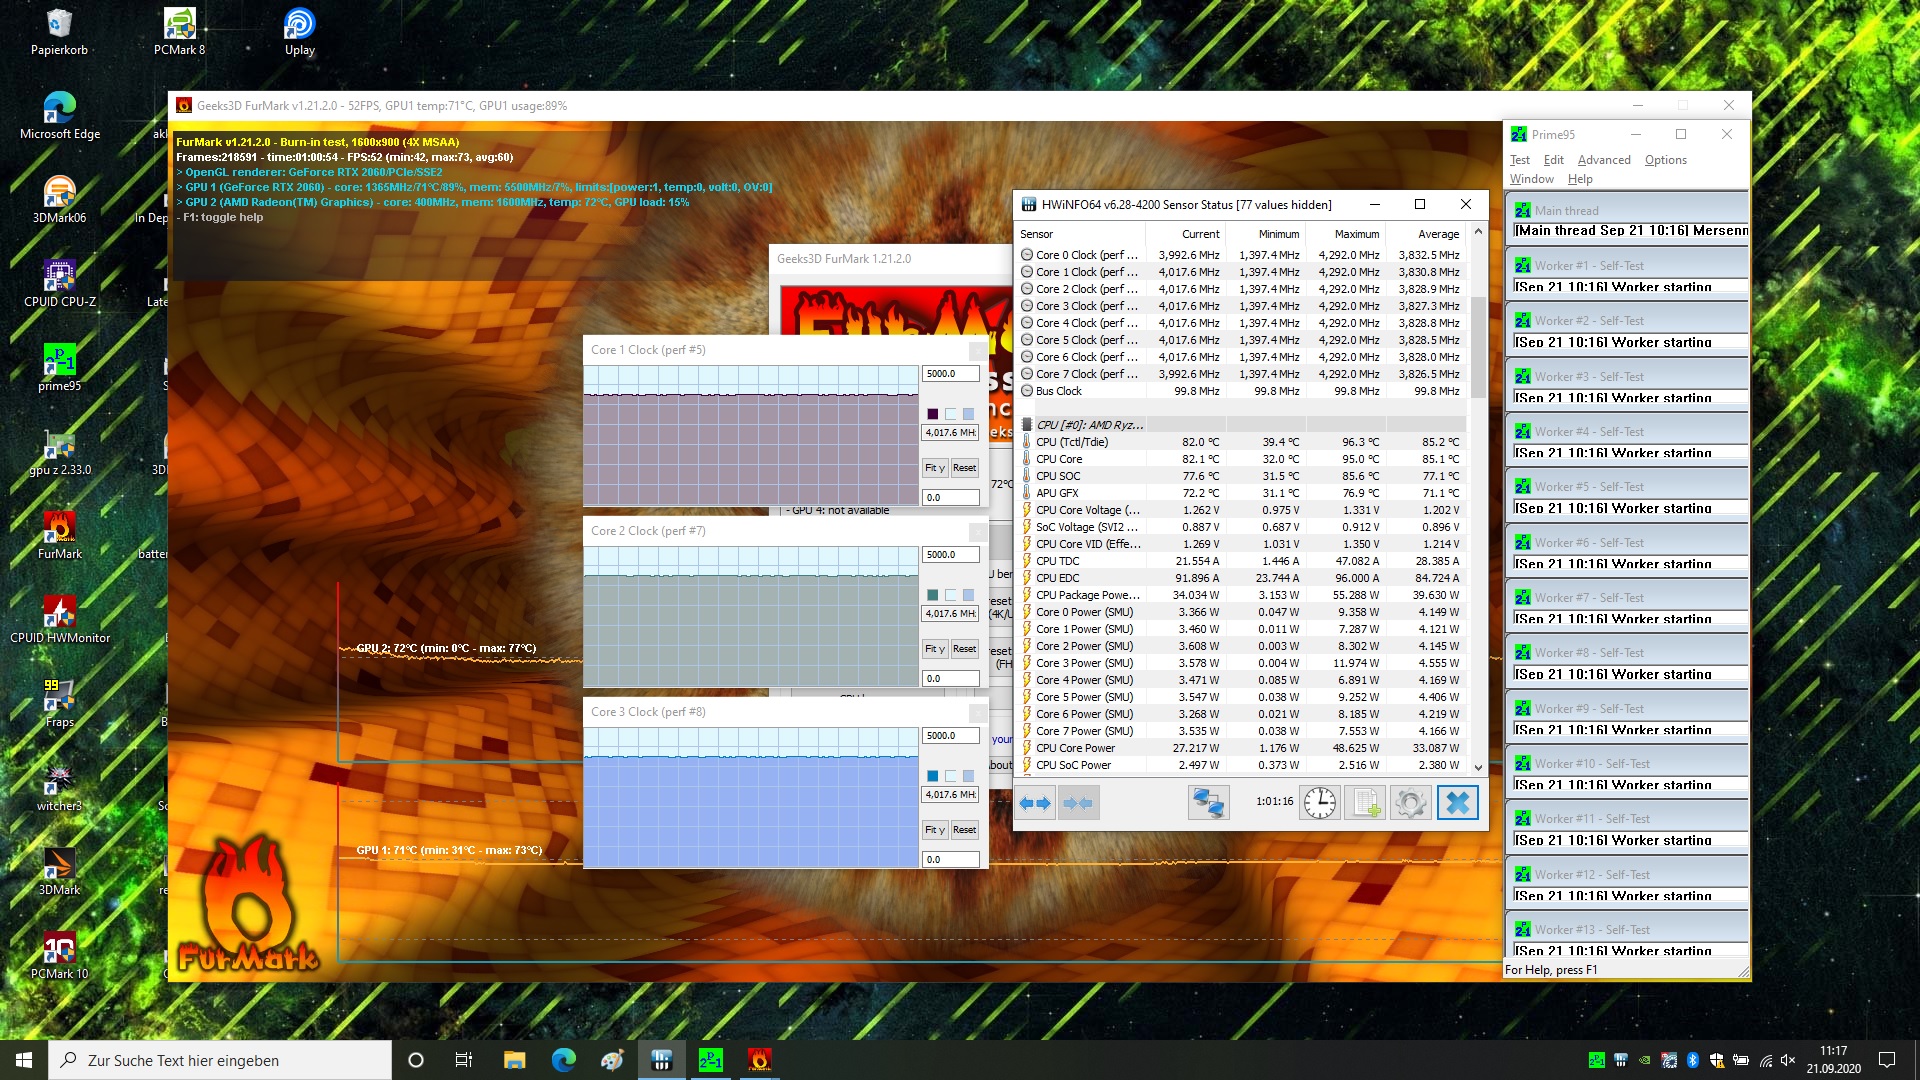
We put maximum stress on the system by running Prime95 and FurMark simultaneously for about one hour. The core clock speeds start out at 4.3 GHz and after one hour, they still are at a very good 4.0 GHz. During this time, the CPU warms up to 80 °C (176 °F), which is no reason for concern. At the end, the GPU temperature lies at 71 °C (160 °F) and its clock speed drops by about 11% from 1530 MHz down to 1365 MHz. Afterwards, the system recovers fairly quickly, and a subsequent run of 3DMark 11 shows only a performance drop of 3 to 4%.
Speakers
The stereo speakers are placed in the front area and play significantly louder now than in the predecessor. The mids also sound better, but the highs are now too sharp, and the sound lacks any kind of bass as usual. Next to HDMI, there is a microphone/line-in and a headphone port for external devices.
Schenker XMG Core 15 GK5NR0O audio analysis
(+) | speakers can play relatively loud (85 dB)
Bass 100 - 315 Hz
(-) | nearly no bass - on average 24.2% lower than median
(±) | linearity of bass is average (14.8% delta to prev. frequency)
Mids 400 - 2000 Hz
(+) | balanced mids - only 2% away from median
(+) | mids are linear (3.8% delta to prev. frequency)
Highs 2 - 16 kHz
(±) | higher highs - on average 7.1% higher than median
(±) | linearity of highs is average (9% delta to prev. frequency)
Overall 100 - 16.000 Hz
(±) | linearity of overall sound is average (18.8% difference to median)
Compared to same class
» 62% of all tested devices in this class were better, 8% similar, 30% worse
» The best had a delta of 6%, average was 18%, worst was 132%
Compared to all devices tested
» 44% of all tested devices were better, 8% similar, 49% worse
» The best had a delta of 4%, average was 23%, worst was 134%
Schenker XMG Core 15 GK5CP6V audio analysis
(±) | speaker loudness is average but good (76 dB)
Bass 100 - 315 Hz
(-) | nearly no bass - on average 23.1% lower than median
(±) | linearity of bass is average (11.5% delta to prev. frequency)
Mids 400 - 2000 Hz
(+) | balanced mids - only 4.7% away from median
(±) | linearity of mids is average (9% delta to prev. frequency)
Highs 2 - 16 kHz
(+) | balanced highs - only 1.5% away from median
(+) | highs are linear (4.6% delta to prev. frequency)
Overall 100 - 16.000 Hz
(±) | linearity of overall sound is average (23.1% difference to median)
Compared to same class
» 84% of all tested devices in this class were better, 4% similar, 12% worse
» The best had a delta of 6%, average was 18%, worst was 132%
Compared to all devices tested
» 69% of all tested devices were better, 5% similar, 26% worse
» The best had a delta of 4%, average was 23%, worst was 134%
Power Management - Optimus or not?
Power Consumption
Surprisingly, the Schenker XMG consumes slightly more power during idle operation than the competitors, which has a very bad negative effect on the overall consumption. Perhaps the automatic switching to the integrated graphics does not work properly here. On the other hand, during our The Witcher 3 test, it even is the most efficient gaming laptop of our comparison, with the predecessor having the same consumption. Then again, under extreme load, it is the laptop with the highest peak consumption (193 watts).
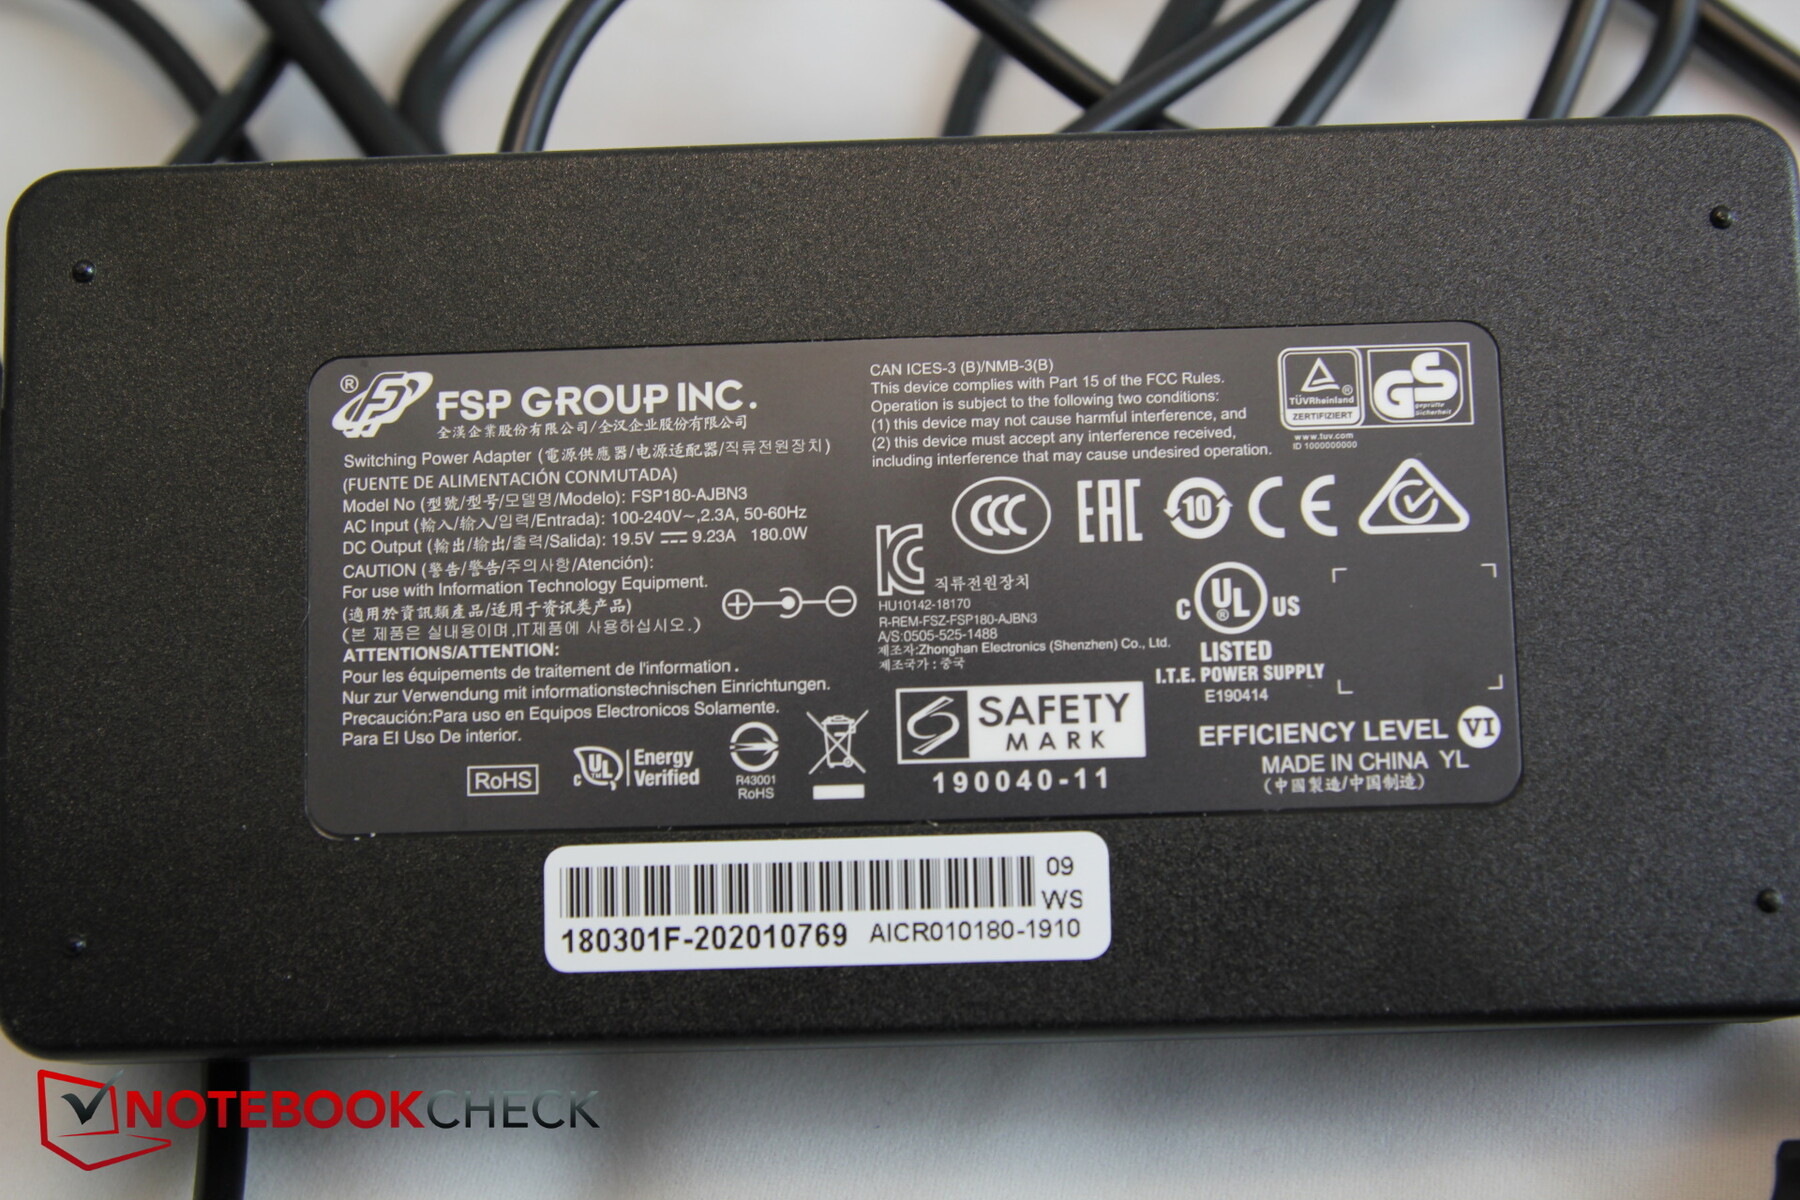
The 15 x 7.3 cm (5.9 x 2.9 in) power supply is rated at 180 watts. Under normal gaming conditions this value will hardly be reached (125 watts), and the high peak values are only temporary and quickly level out significantly lower.

| Off / Standby | |
| Idle | |
| Load |
|
Key:
min: | |
| Schenker XMG Core 15 GK5NR0O R7 4800H, GeForce RTX 2060 Mobile | Schenker XMG Core 15 GK5CP6V i7-9750H, GeForce GTX 1660 Ti Mobile | Dell G3 15 3500-G4DG2 i7-10750H, GeForce RTX 2060 Mobile | Lenovo Legion 5 15IMH05H i5-10300H, GeForce RTX 2060 Mobile | Asus TUF Gaming A15 FA506IV-HN172 R7 4800H, GeForce RTX 2060 Mobile | Dell G5 15 SE 5505 P89F R7 4800H, Radeon RX 5600M | Average of class Gaming | |
|---|---|---|---|---|---|---|---|
| Power Consumption | 13% | 7% | 28% | 18% | 20% | -22% | |
| Idle Minimum * (Watt) | 12 | 9 25% | 7 42% | 3.2 73% | 5.4 55% | 6.5 46% | 13.1 ? -9% |
| Idle Average * (Watt) | 14 | 12 14% | 10.2 27% | 8.3 41% | 10 29% | 10.6 24% | 19 ? -36% |
| Idle Maximum * (Watt) | 20 | 18 10% | 15 25% | 8.7 57% | 10.5 47% | 11 45% | 24.6 ? -23% |
| Load Average * (Watt) | 103 | 86 17% | 147 -43% | 82 20% | 135 -31% | 84.1 18% | 111.3 ? -8% |
| Witcher 3 ultra * (Watt) | 125 | 126 -1% | 131 -5% | 151 -21% | 144 -15% | 152.9 -22% | |
| Load Maximum * (Watt) | 193 | 173 10% | 197 -2% | 195 -1% | 147 24% | 180.4 7% | 260 ? -35% |
* ... smaller is better
Battery Life


The XMG Core 15 brings a 62-Wh battery. Alternatively, it is also available with a smaller battery with only a 46-Wh capacity, but strangely you don't pay less for this than for the larger model in the configurator. It should be well known that gaming laptops are not endurance champions. But at least the battery life is increased significantly compared to the predecessor due to the larger battery. However, except for the Dell G3, the rest of the competitors still last a bit longer, even those with a smaller battery. Here, particularly the higher consumption in idle operation plays a role.
A movie evening at reduced brightness can be planned to last slightly more than 6 hours. With the realistic WLAN surf test, it will last slightly less than 6 hours. Those runtimes are acceptable for this kind of device.
| Schenker XMG Core 15 GK5NR0O R7 4800H, GeForce RTX 2060 Mobile, 62 Wh | Schenker XMG Core 15 GK5CP6V i7-9750H, GeForce GTX 1660 Ti Mobile, 46 Wh | Dell G3 15 3500-G4DG2 i7-10750H, GeForce RTX 2060 Mobile, 68 Wh | Lenovo Legion 5 15IMH05H i5-10300H, GeForce RTX 2060 Mobile, 60 Wh | Asus TUF Gaming A15 FA506IV-HN172 R7 4800H, GeForce RTX 2060 Mobile, 48 Wh | Dell G5 15 SE 5505 P89F R7 4800H, Radeon RX 5600M, 51 Wh | Average of class Gaming | |
|---|---|---|---|---|---|---|---|
| Battery runtime | -38% | -3% | 36% | 11% | 16% | 14% | |
| Reader / Idle (h) | 7.8 | 6.1 -22% | 7.5 -4% | 14.1 81% | 9.8 26% | 11.2 44% | 7.84 ? 1% |
| H.264 (h) | 6.2 | 9.2 48% | 5.4 -13% | 8.27 ? 33% | |||
| WiFi v1.3 (h) | 5.9 | 3.6 -39% | 5.2 -12% | 7.2 22% | 6.2 5% | 6.2 5% | 7.08 ? 20% |
| Load (h) | 1.5 | 0.7 -53% | 1.6 7% | 1.4 -7% | 1.9 27% | 1.5 0% | 1.496 ? 0% |
Pros
Cons
Verdict - Budget Schenker with powerful hardware

Currently, a hardware update makes more sense than ever before. The new Zen 2 processors from AMD have raised laptop performance into new realms at this point, and a RTX 2060 instead of the GTX 1660 Ti as the Ryzen 7 companion is only consequent. However, the performance increase from the 1660 Ti turns out lower than expected. On the other hand, the CPU performance is beyond any doubt and the WLAN and the display are also able to convince.
But those who think that the relatively compact size and comparatively low weight make the XMG into the perfect mobile gaming machine will be disappointed by the massive throttling of the graphics performance in battery mode. In addition, the Schenker consumes more power during idle operation than would really be necessary with Optimus, and it also becomes quite hot under high load.
While the Schenker XMG Core 15 offers powerful hardware in a fairly slim case at a low price of less than 1500 Euros (~$1745), it spoils its potential for mobility with strong throttling in battery mode. Plugged in, particularly the CPU performance is exciting, but the RTX 2060 is a tad faster in most of the competitors.
Schenker XMG Core 15 GK5NR0O
- 09/25/2020 v7 (old)
Christian Hintze
Price comparison

