Schenker XMG Core 17 (Core i7-9750H, GeForce GTX 1660 Ti, 144-Hz Display) Tongfang GK7CP6R Laptop Review

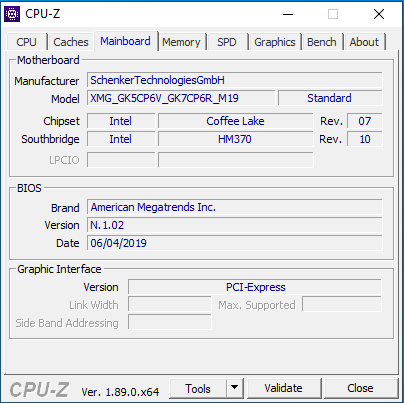
With the XMG Core 17, Schenker includes a 17.3-inch mid-range gaming notebook in its offerings. The device is targeted toward users who value a sober exterior. The notebook does not offer any visual flourishes. It is based on a barebone (GK7CP6R) from Tongfang. Regular visitors on our website might notice some familiarity with the Core 17, which is unable to hide its kinship with the Schenker XMG Neo 17 that is also based on a Tongfang barebone.
The test unit that was made available to us is run by a Core-i7 9750H processor and a GeForce GTX 1660 Ti GPU. Alternatively you can also get the notebook with a GeForce GTX 1650 graphics core. Competitors include devices such as the MSI GP75 Leopard 9SD, the Dell G7 17 7790, the Lenovo Legion Y730-17ICH, and the Gigabyte Sabre 17-W8.
Case - Unobtrusive
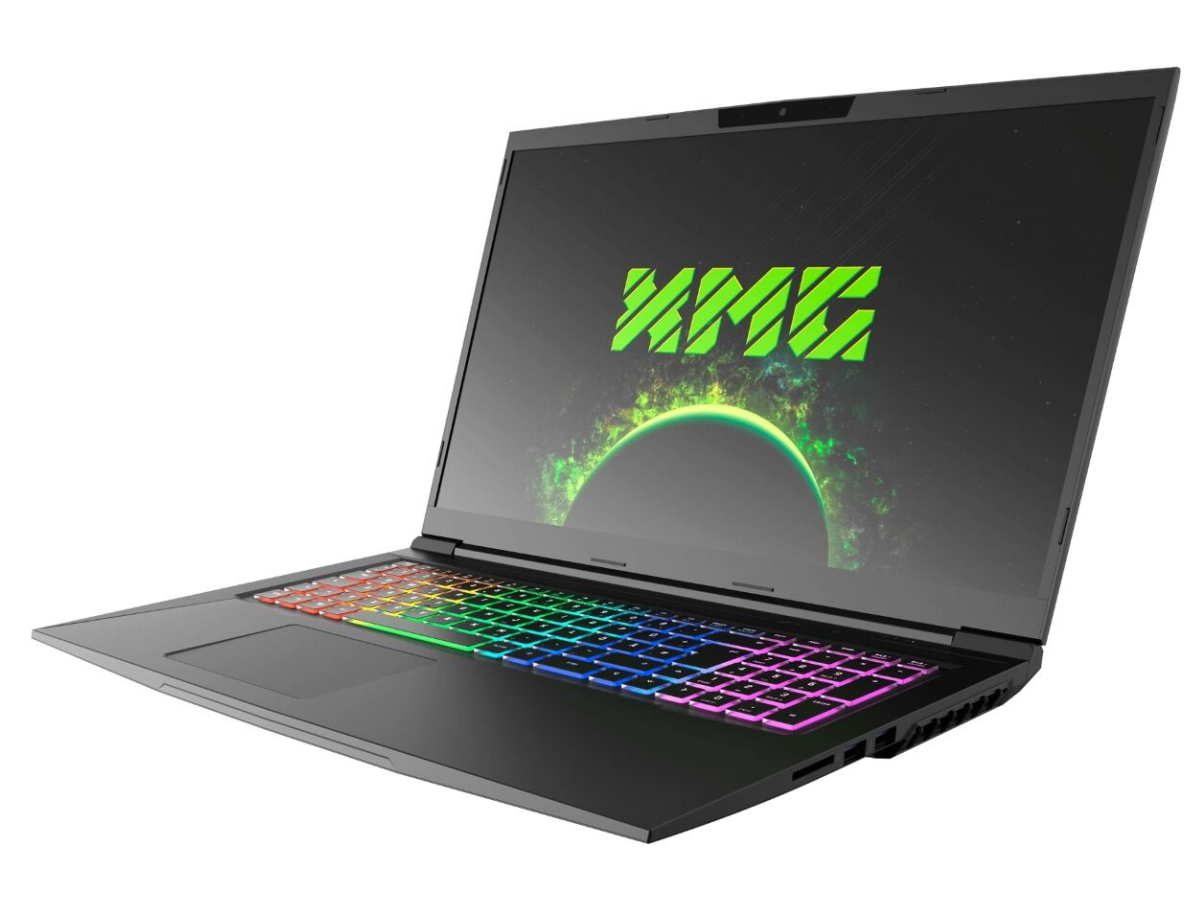
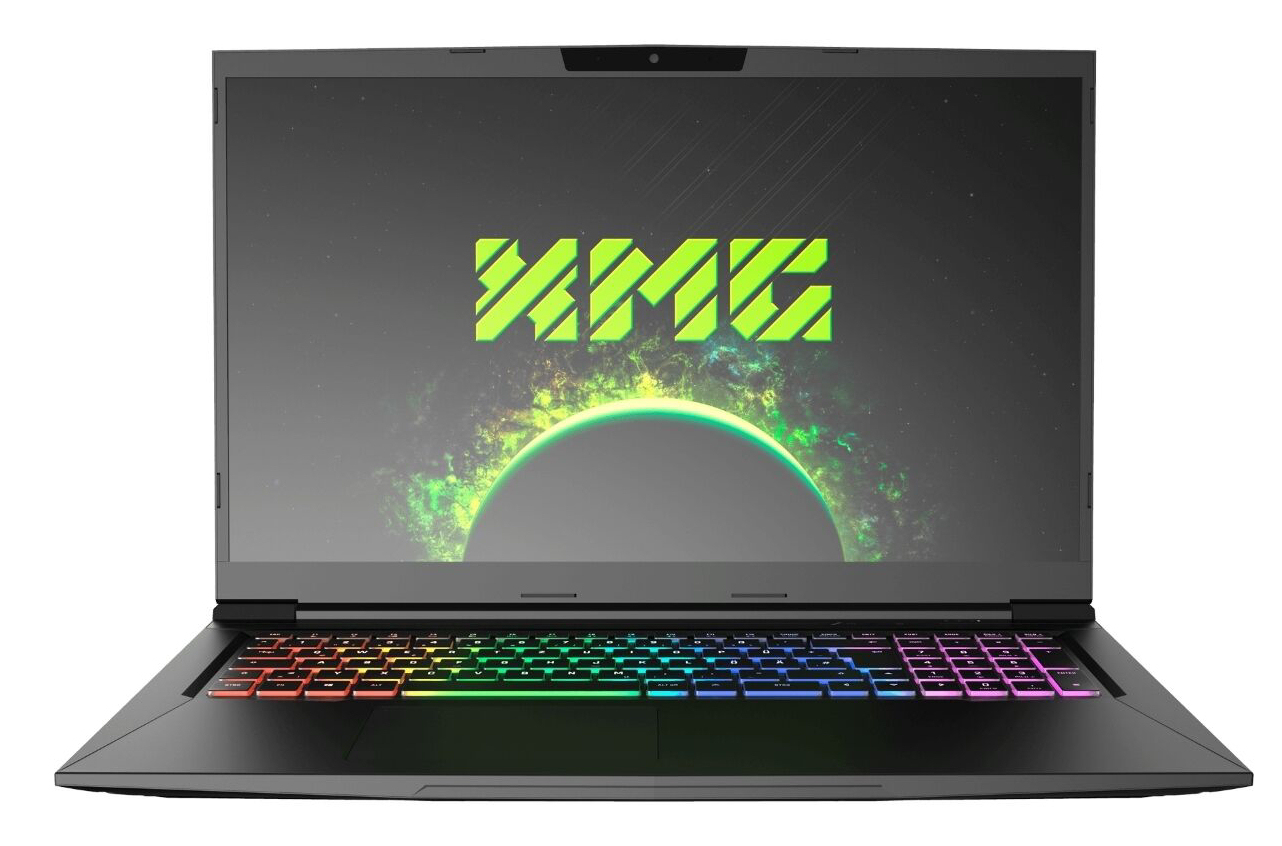
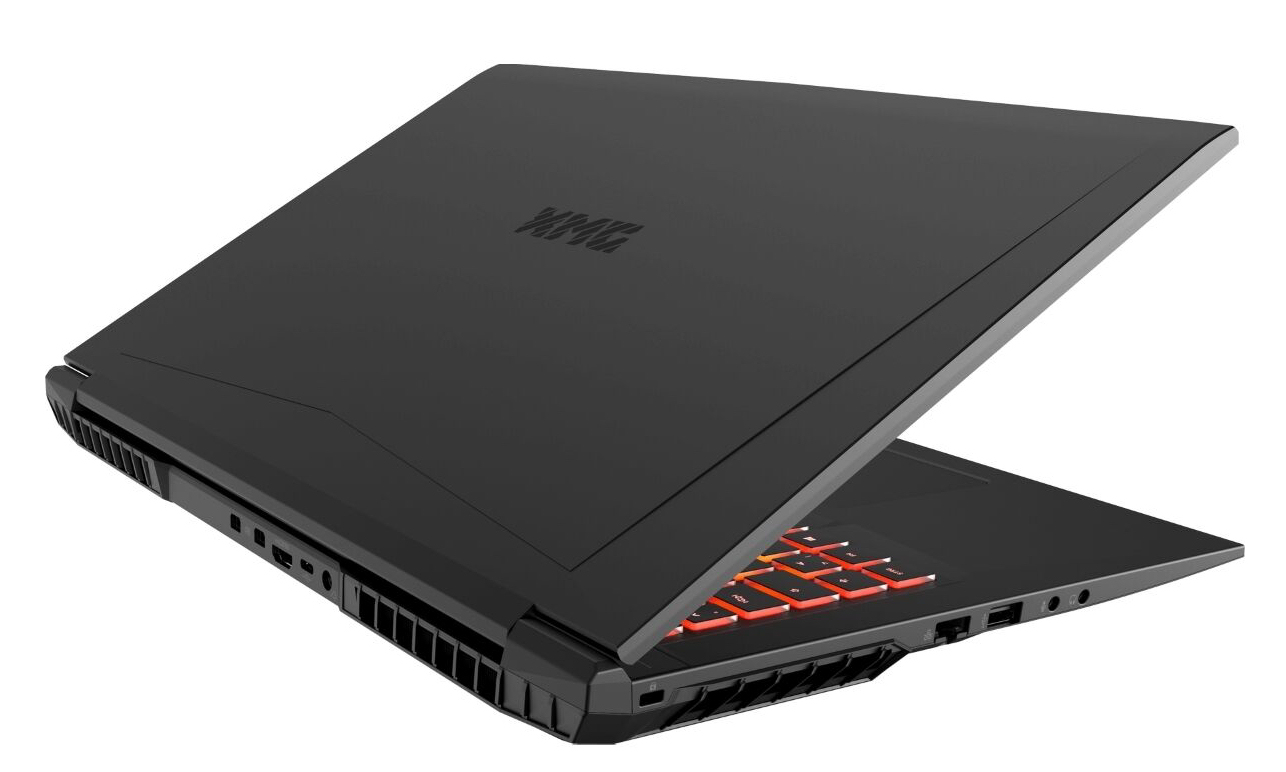
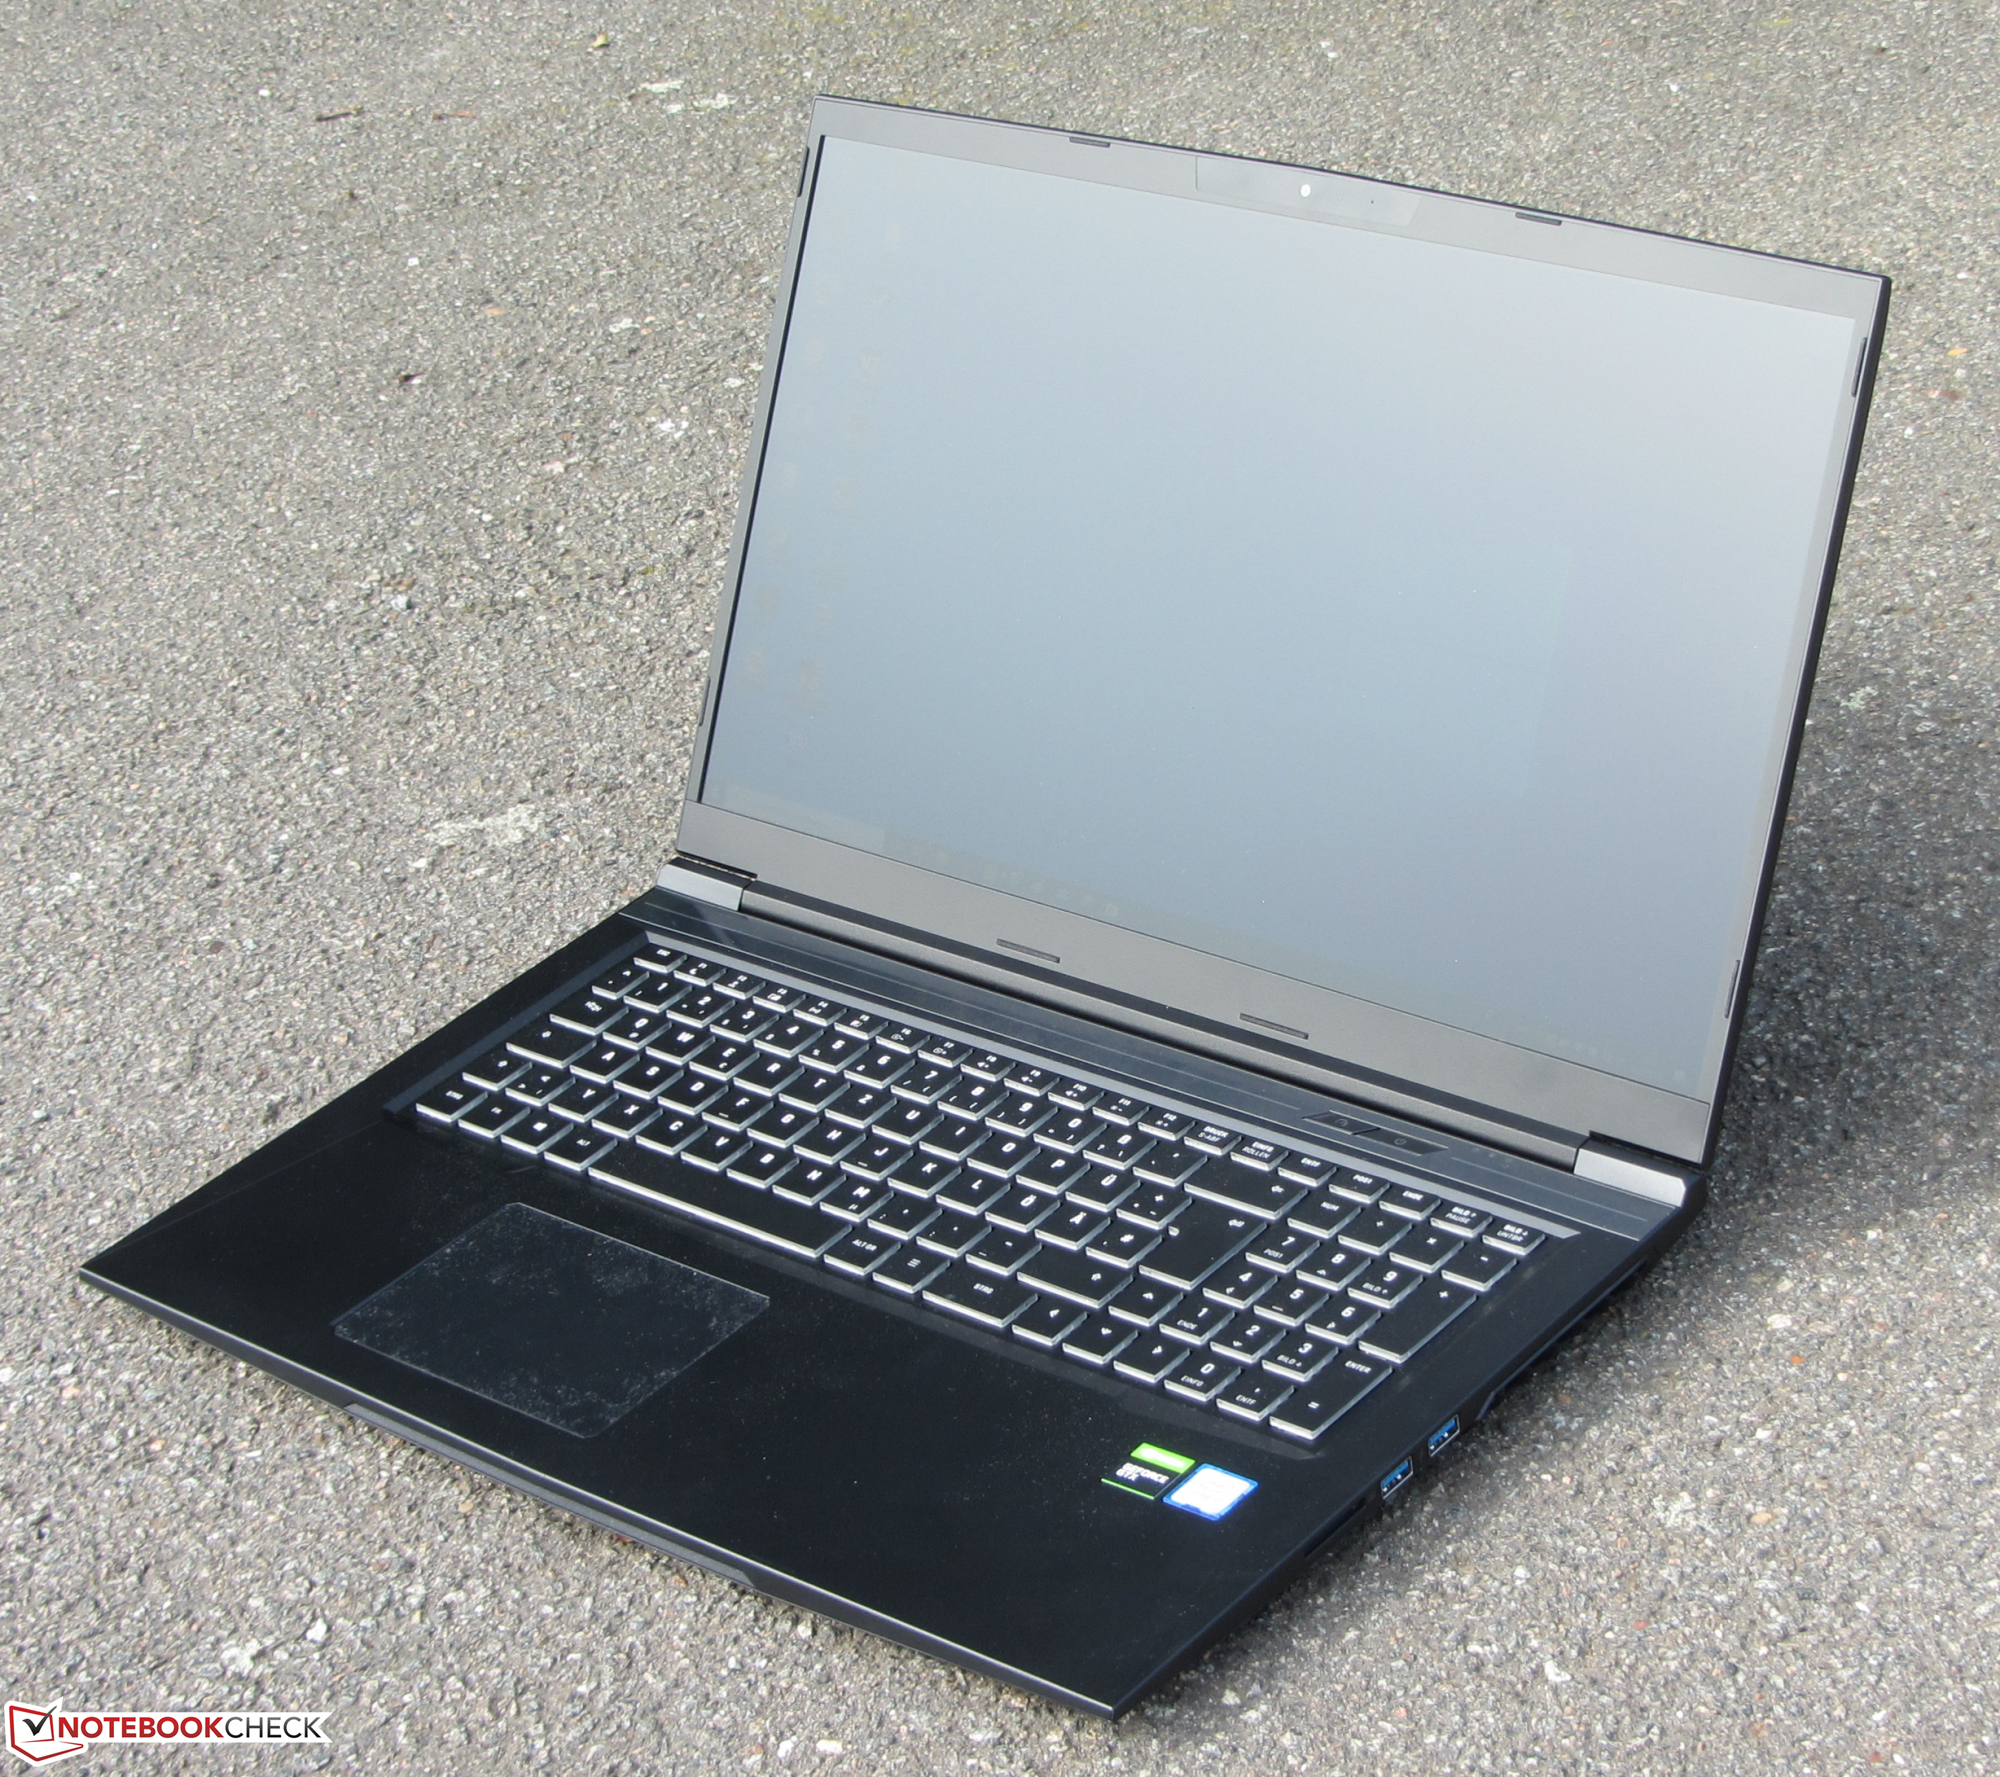
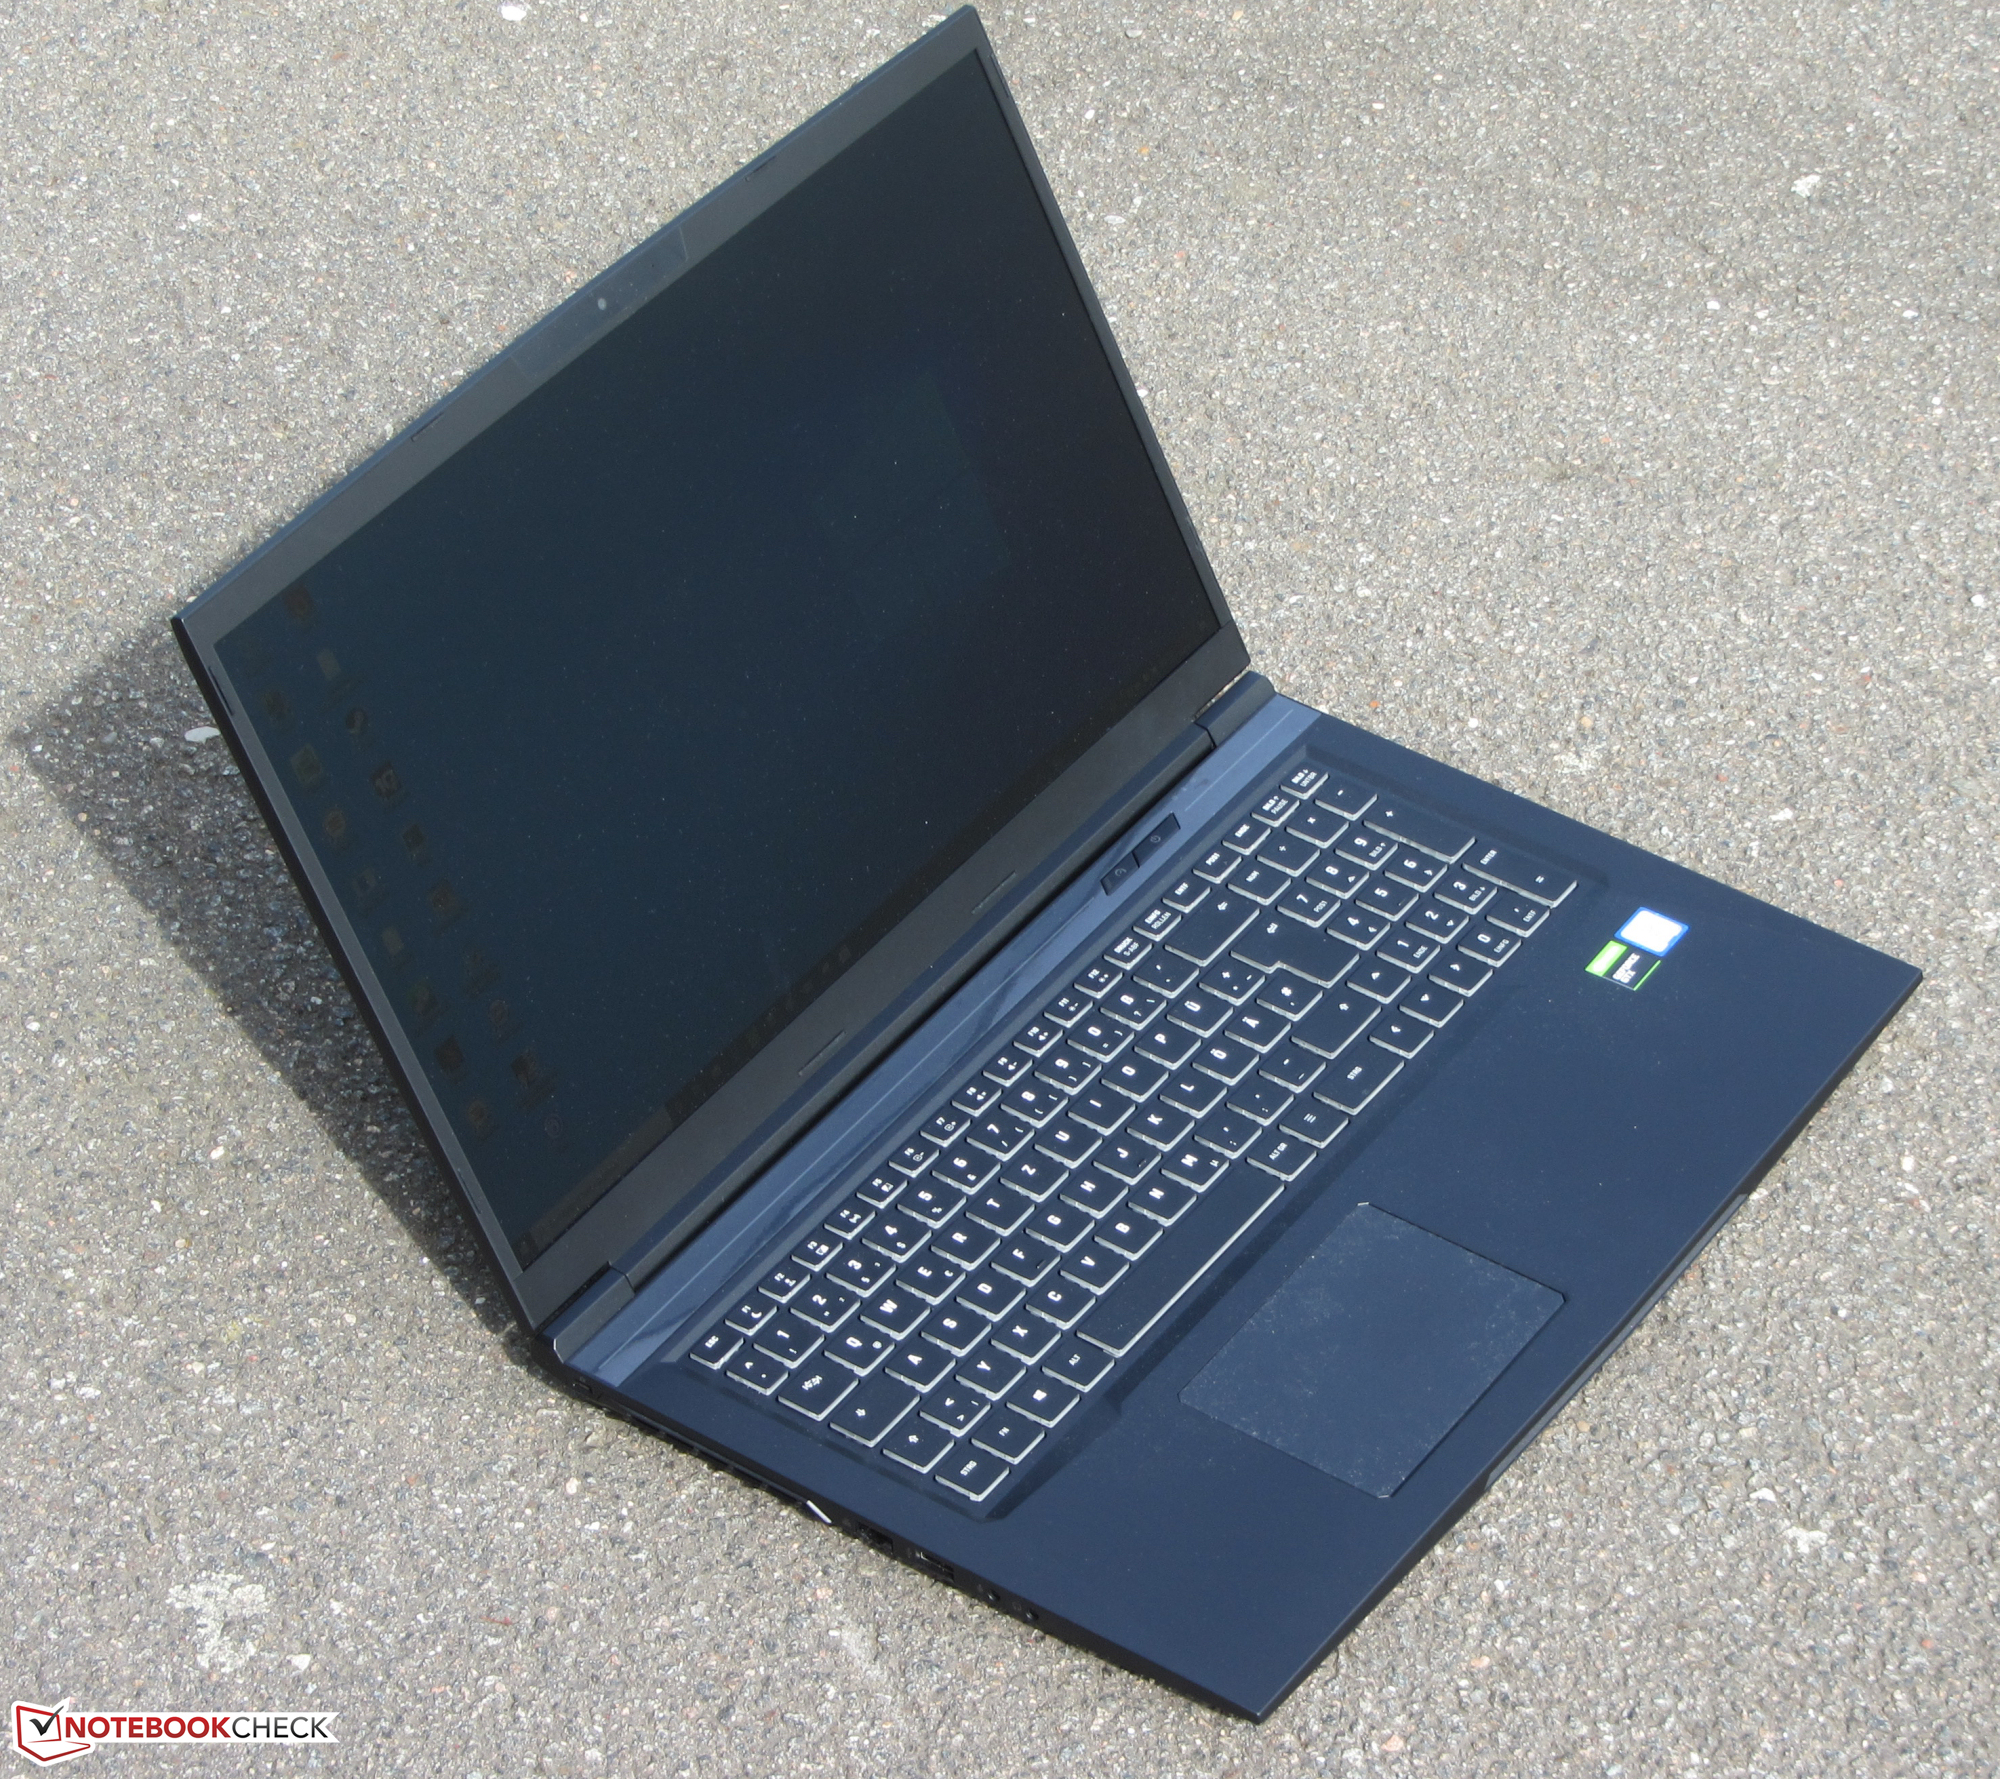
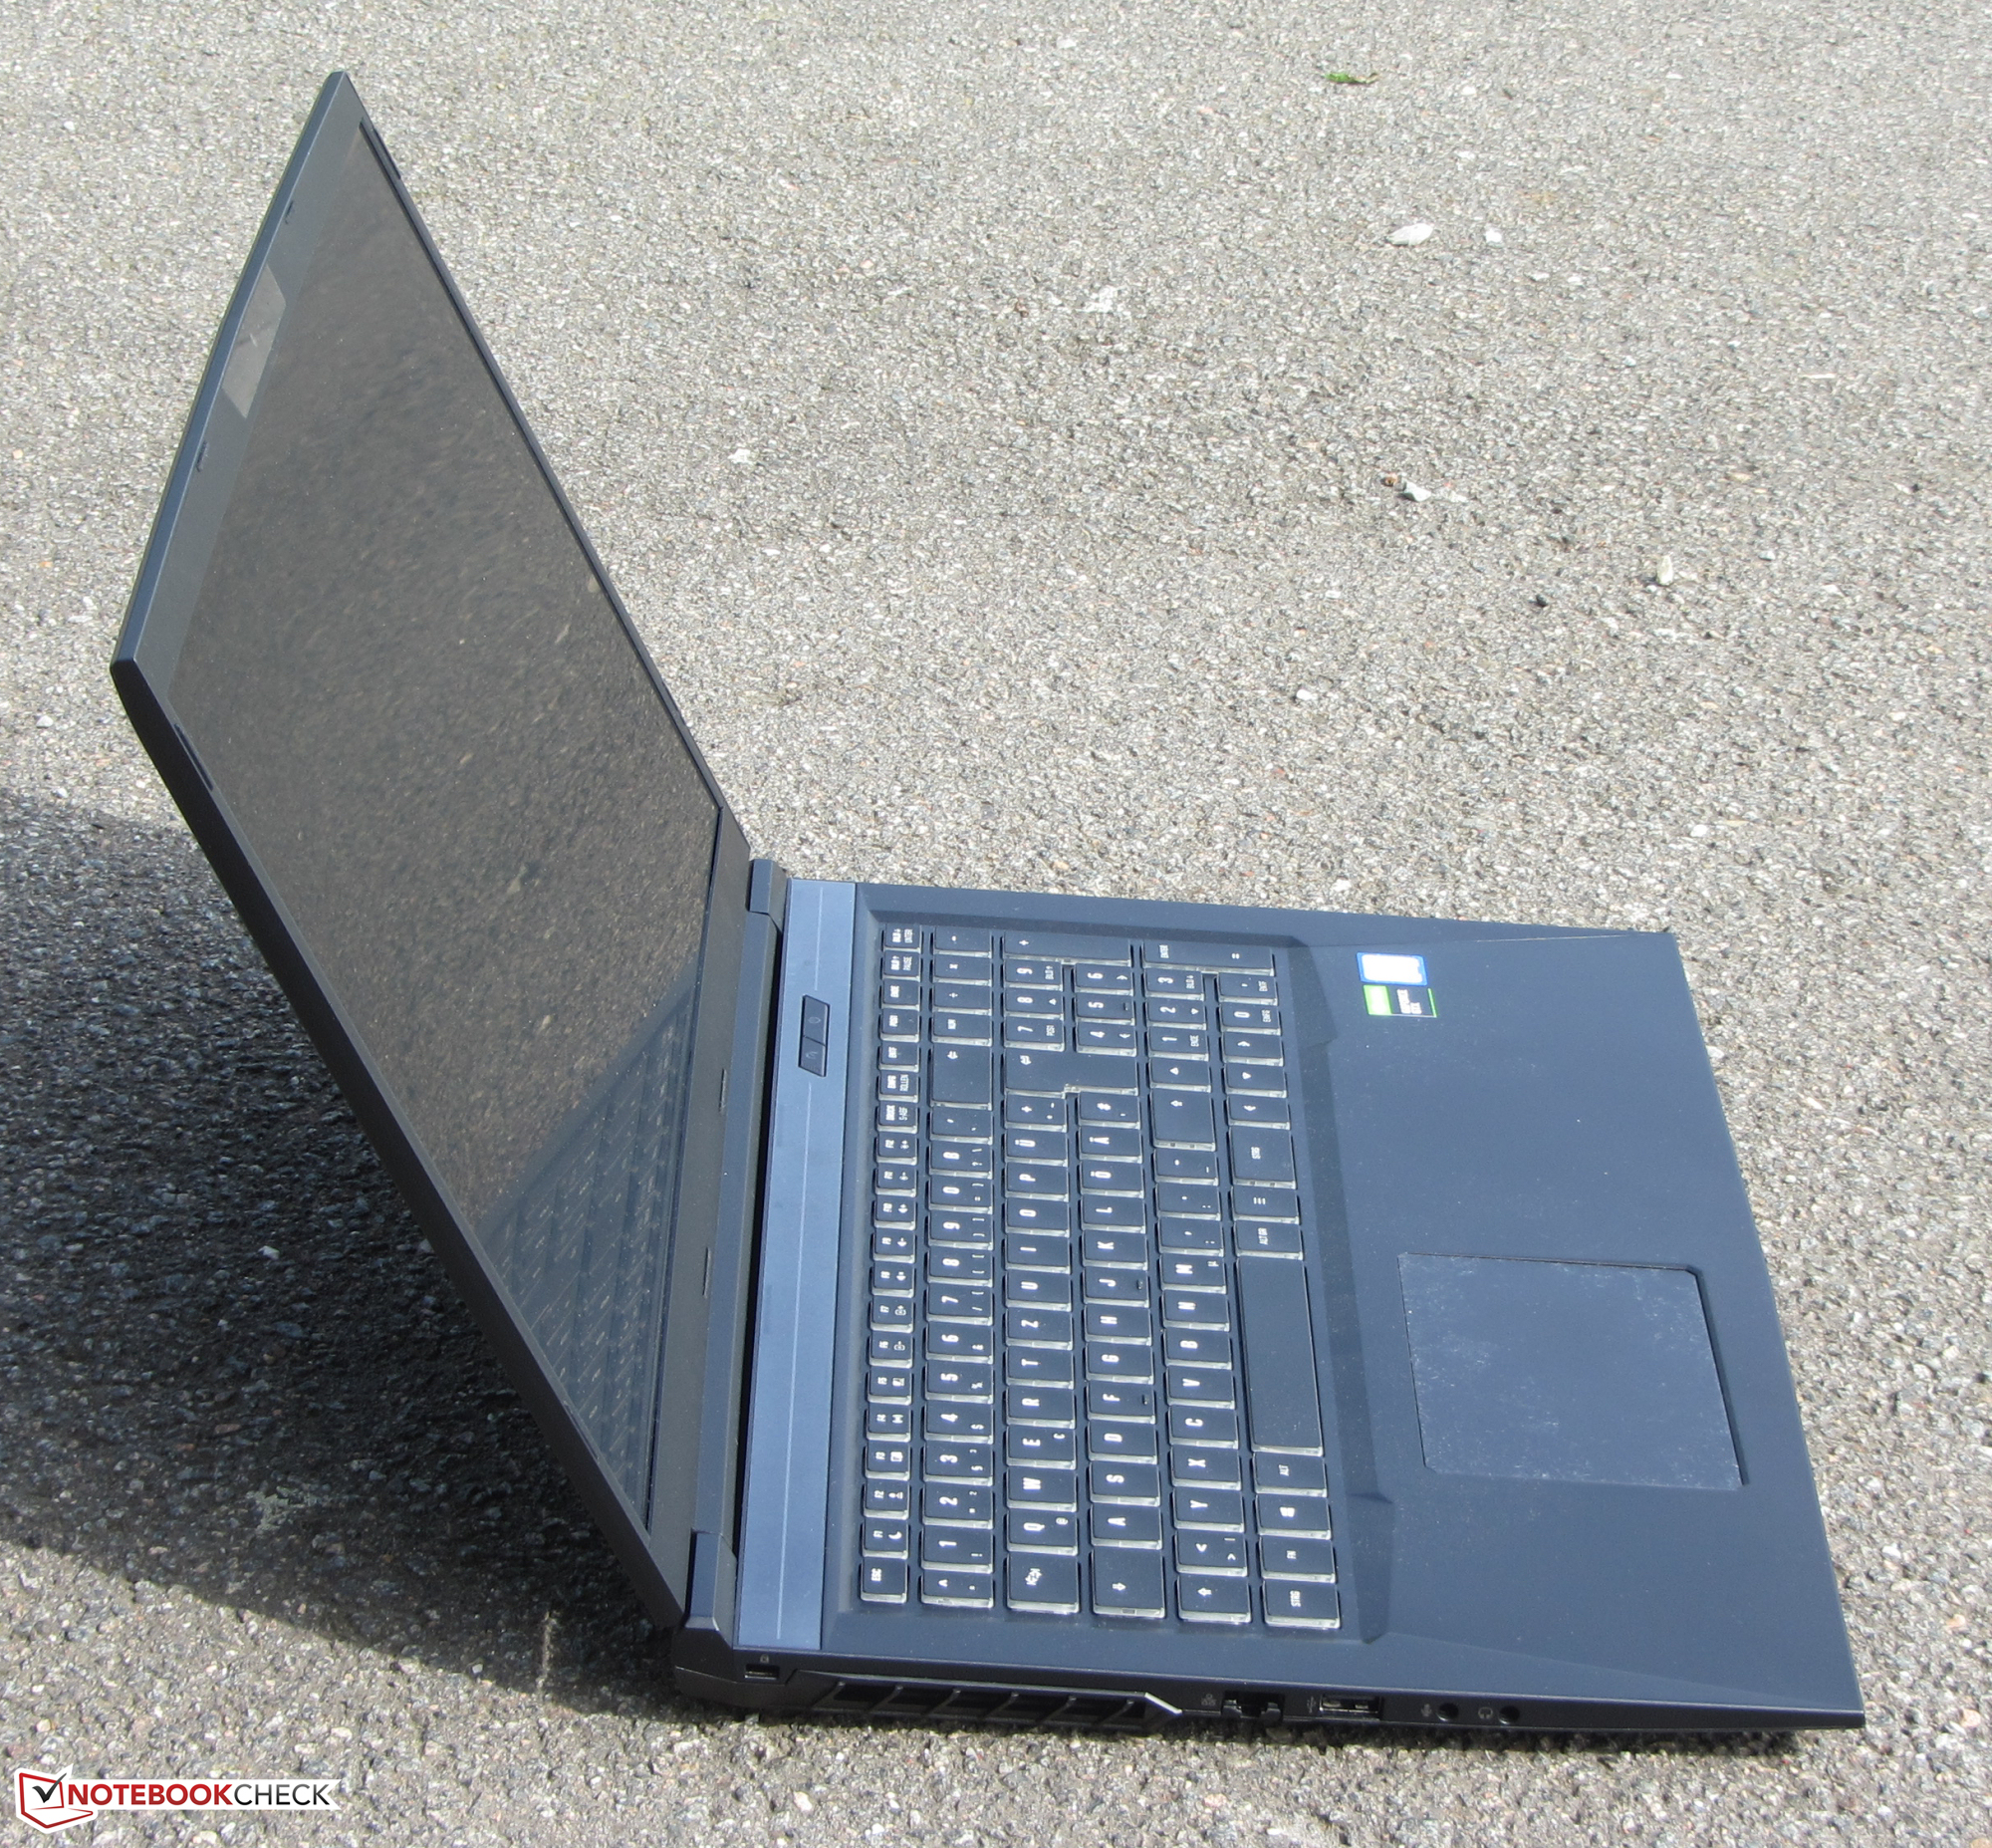
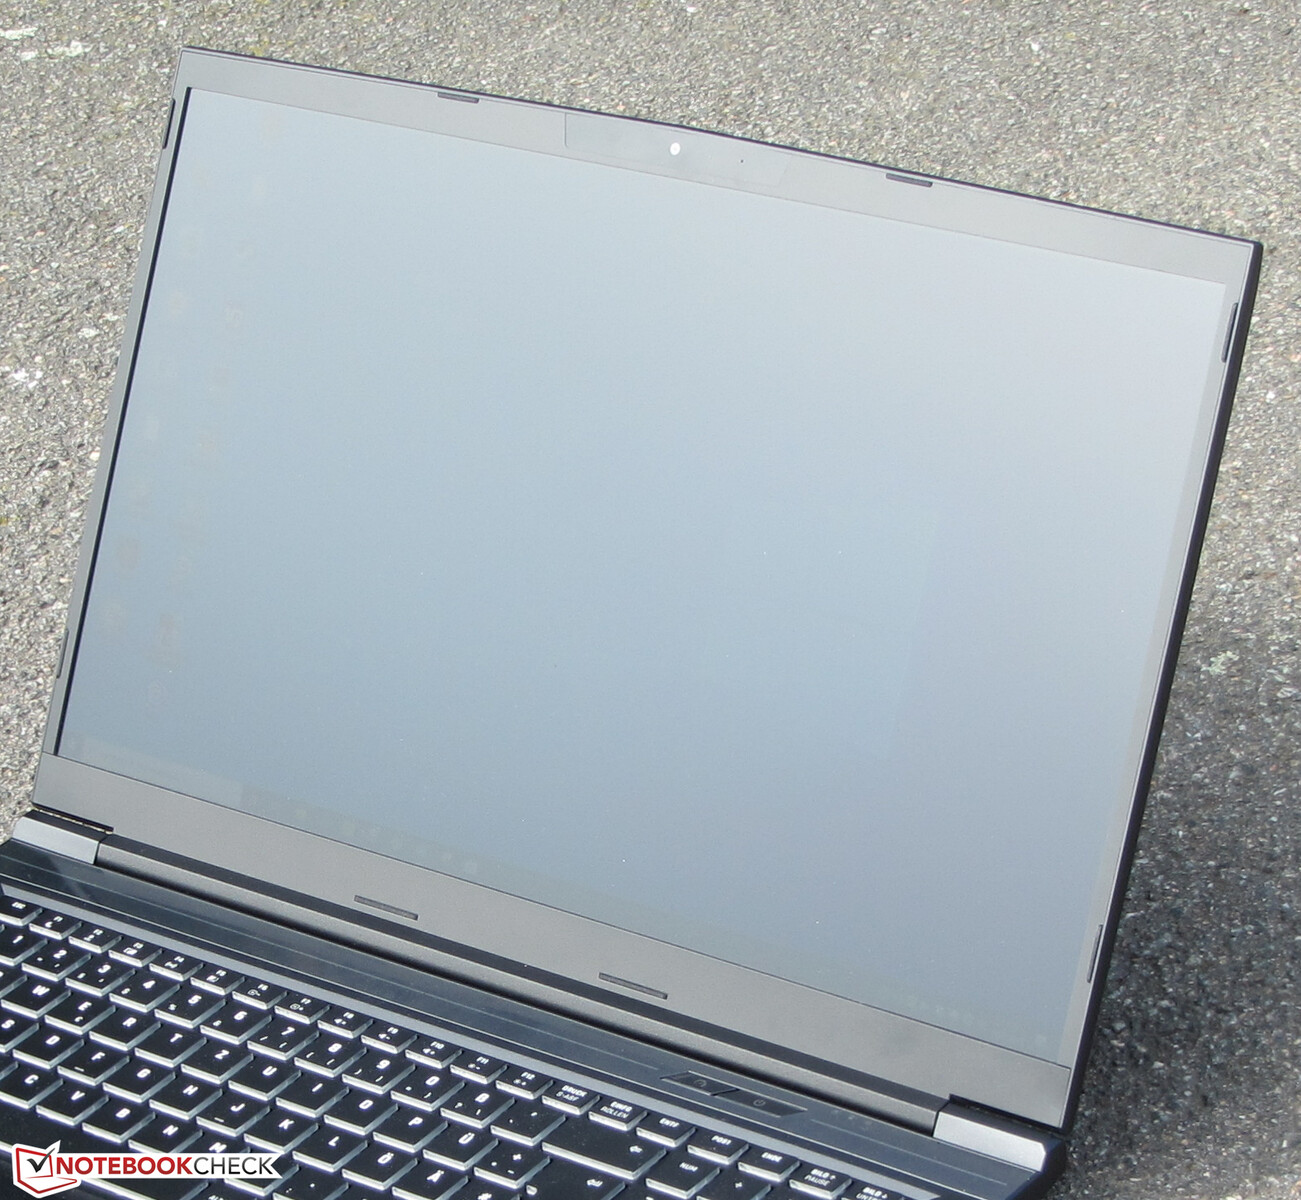
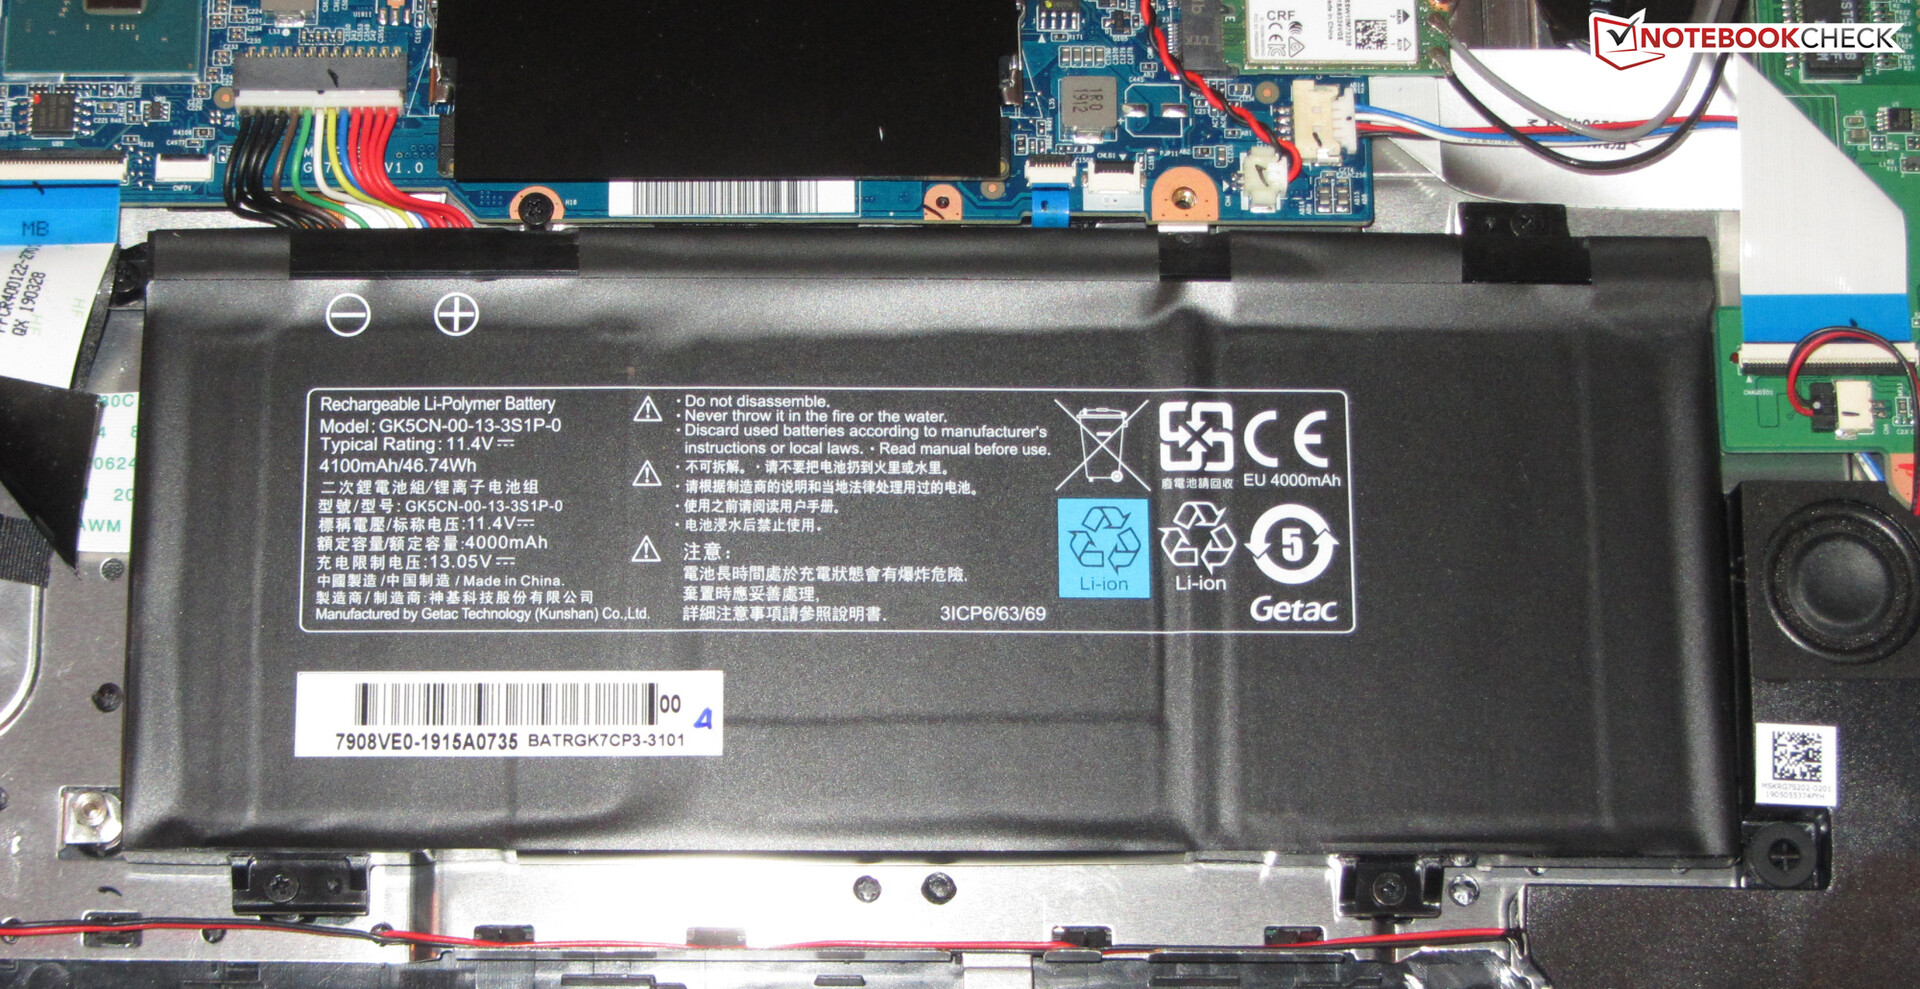
The XMG Core 17 is not a gaming notebook that visually stands out. While Schenker bets on a sober, angular exterior, the slim display bezels still make the notebook look elegant. You will not find any colorful accents on the case, which is kept completely in black. The case is made completely from plastic that is covered by a soft-touch surface layer. The notebook does not offer a maintenance flap, and the battery is built-in.
The notebook shows good workmanship. The gap measurements are tight and we do not notice any ridges in the materials. Things also look quite good in terms of stability. The base unit hardly reacts to pressure. Although it can still be warped slightly, this remains within limits. The same goes for the cover, and pressure on the display lid does not lead to any changes in the displayed image. The hinges keep the lid tightly in place but wobble slightly. It is possible to open the lid with one hand.
Within our comparison field, the Core 17 is one of the most compact and light devices. While it has the smallest footprint, at about 30 mm (~1.2 in) it is also the thickest notebook. This constitutes a clear difference to the XMG Neo 17, which is several millimeters slimmer.
Connections - Thunderbolt 3 is lacking
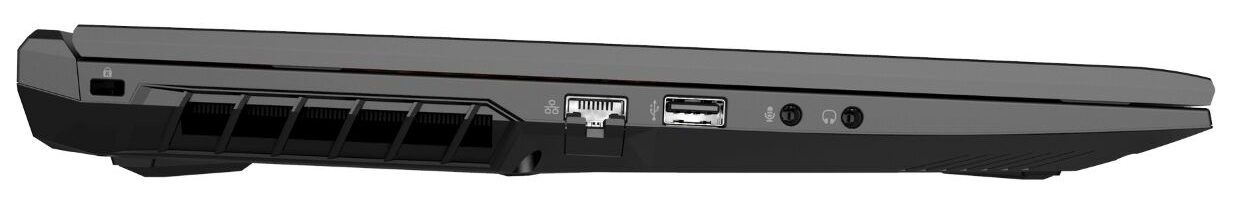
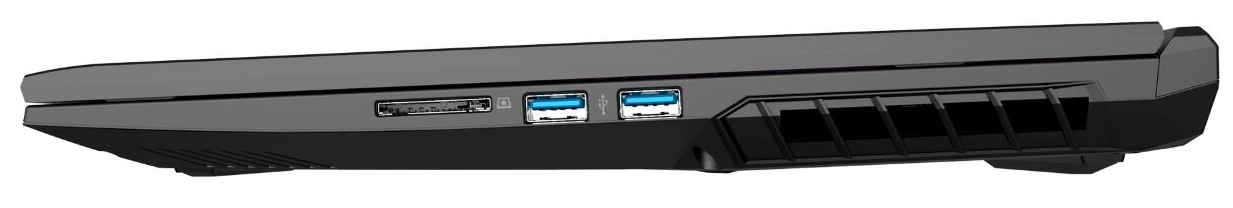
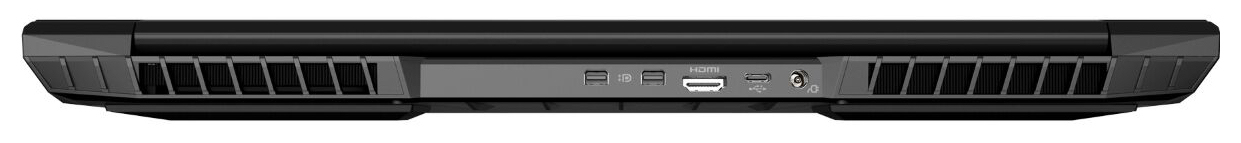
Overall, the Core 17 offers an ample selection of connections. The notebook brings three Type-A USB ports (2x USB 3.1 Gen 1, 1x USB 2.0) and one Type-C USB port (USB 3.1 Gen 1). Those are accompanied by one HDMI-2.0 port and two Mini DisplayPorts (Version 1.4) that support G-Sync. The whole set is completed by two audio ports (headphones, microphone), one Gigabit Ethernet port, and a provision for a cable lock.
However, we are missing a Thunderbolt-3 connection. This should be included in the standard repertoire for a gaming notebook in this price range. It would allow, for example, connection to a more powerful, external GPU, if needed. A simple Type-C connection is not up-to-date anymore.
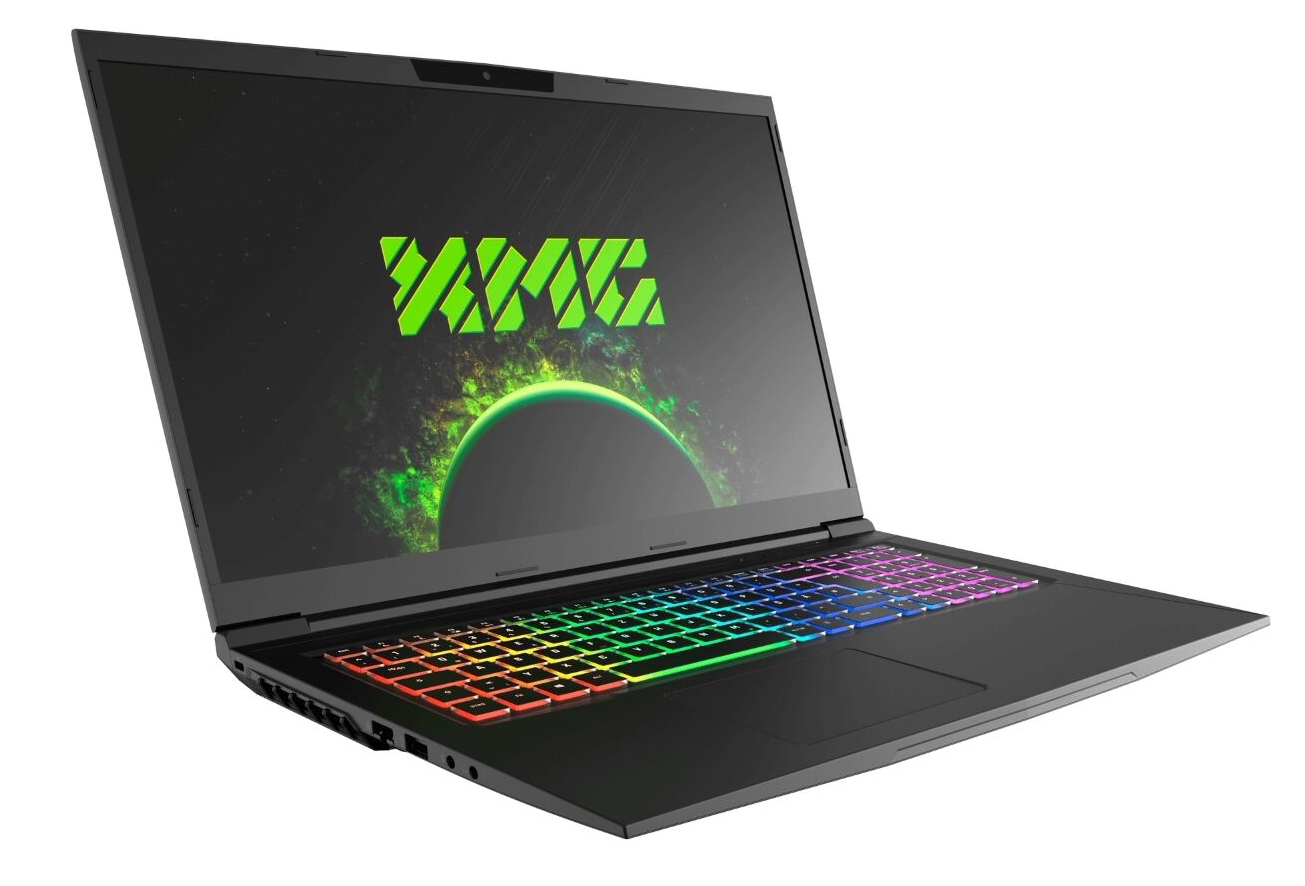
The connections are distributed over three of the sides. The connections on the left and right sides are placed relatively far towards the front, where the cables might hinder usage of a mouse.
SD Card Reader
The built-in storage card reader runs at a leisurely pace. When copying large data blocks, a maximum transfer rate of 27 MB/s is achieved, and 250 jpg image files (about 5 MB each) are transferred at a speed of 25 MB/s. This means that the speeds remain significantly behind those of the model built into the XMG Neo 17. We test storage card readers using a reference card (Toshiba Exceria Pro SDXC 64 GB UHS-II).
The storage cards cannot be completely inserted into the card reader, and about 17 mm (~0.7 in) still sticks out, and they are not locked in place.
| SD Card Reader | |
| average JPG Copy Test (av. of 3 runs) | |
| Average of class Gaming (20.9 - 210, n=54, last 2 years) | |
| Schenker XMG Core 15 (Toshiba Exceria Pro SDXC 64 GB UHS-II) | |
| Schenker XMG Neo 17 (Toshiba Exceria Pro SDXC 64 GB UHS-II) | |
| Gigabyte Sabre 17-W8 (Toshiba Exceria Pro SDXC 64 GB UHS-II) | |
| Dell G7 17 7790 (Toshiba Exceria Pro SDXC 64 GB UHS-II) | |
| MSI GP75 Leopard 9SD (Toshiba Exceria Pro SDXC 64 GB UHS-II) | |
| Schenker XMG Core 17 (Toshiba Exceria Pro SDXC 64 GB UHS-II) | |
| maximum AS SSD Seq Read Test (1GB) | |
| Average of class Gaming (25.5 - 261, n=51, last 2 years) | |
| Schenker XMG Neo 17 (Toshiba Exceria Pro SDXC 64 GB UHS-II) | |
| Schenker XMG Core 15 (Toshiba Exceria Pro SDXC 64 GB UHS-II) | |
| Gigabyte Sabre 17-W8 (Toshiba Exceria Pro SDXC 64 GB UHS-II) | |
| Dell G7 17 7790 (Toshiba Exceria Pro SDXC 64 GB UHS-II) | |
| MSI GP75 Leopard 9SD (Toshiba Exceria Pro SDXC 64 GB UHS-II) | |
| Schenker XMG Core 17 (Toshiba Exceria Pro SDXC 64 GB UHS-II) | |
Communication
The WLAN module contains an Intel chip (Wireless AC 9560), which in addition to the 802.11a/b/g/n WLAN standards also supports the fast ac standard. The transfer speeds we measured under optimal conditions (no other WLAN devices in close proximity, small distance between the notebook and the server PC) turn out good. Wired network connections are handled by a Gigabit Ethernet controller from Realtek's well-known RTL8168/8111 family, which handles all its tasks without any trouble.
Accessories
As customary for Schenker, the notebook includes various accessories. The box includes a mouse pad, a recovery DVD, a frame for a 2.5-inch hard drive, a key ring, and a USB stick (16 GB) on which the device drivers and a pdf file of the manual are stored.
Maintenance
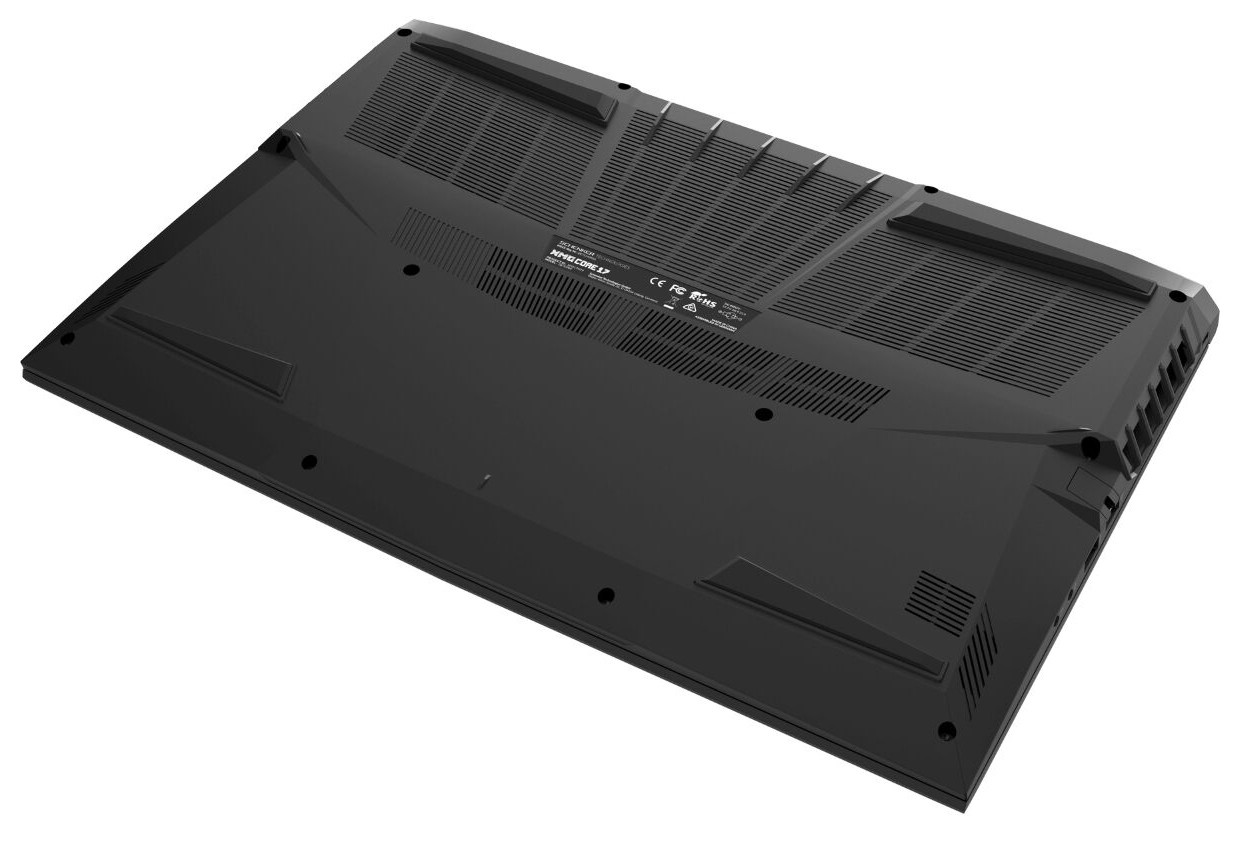
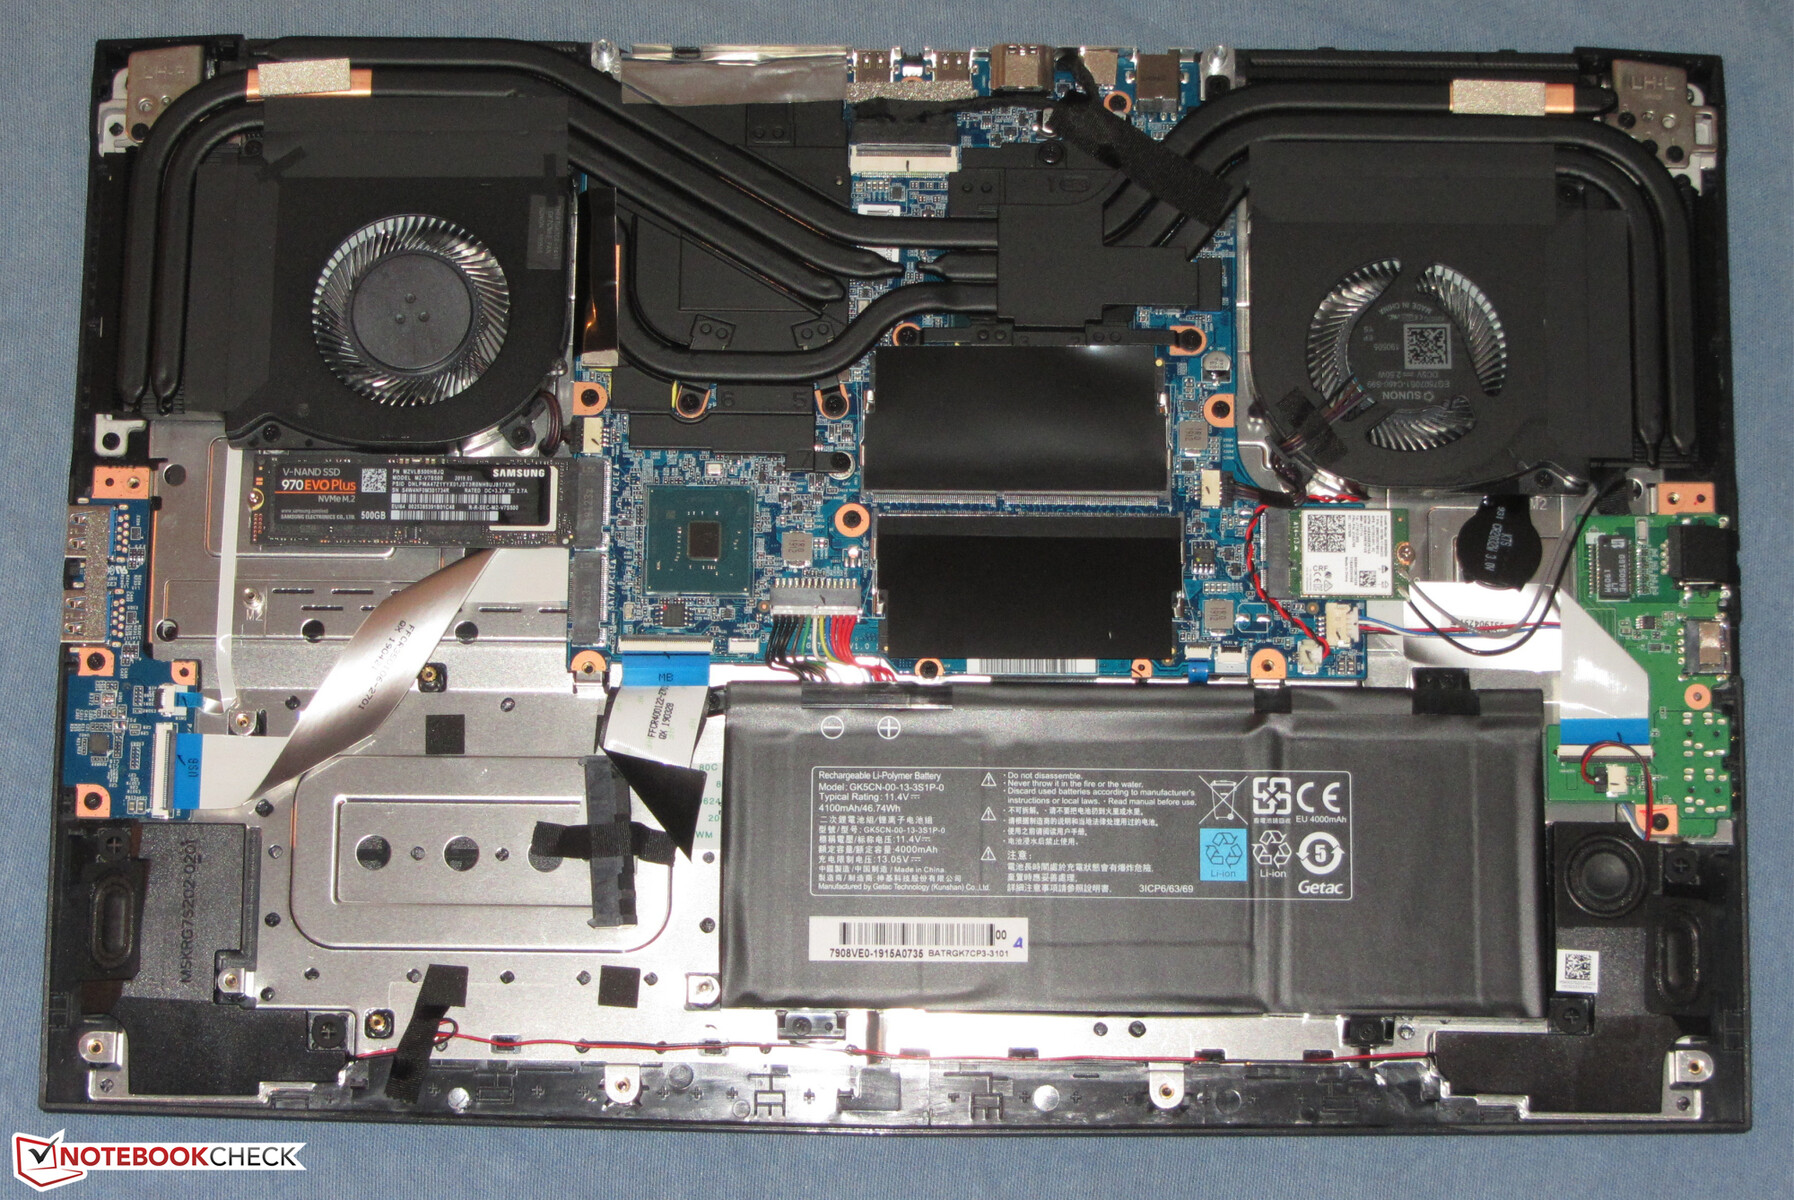
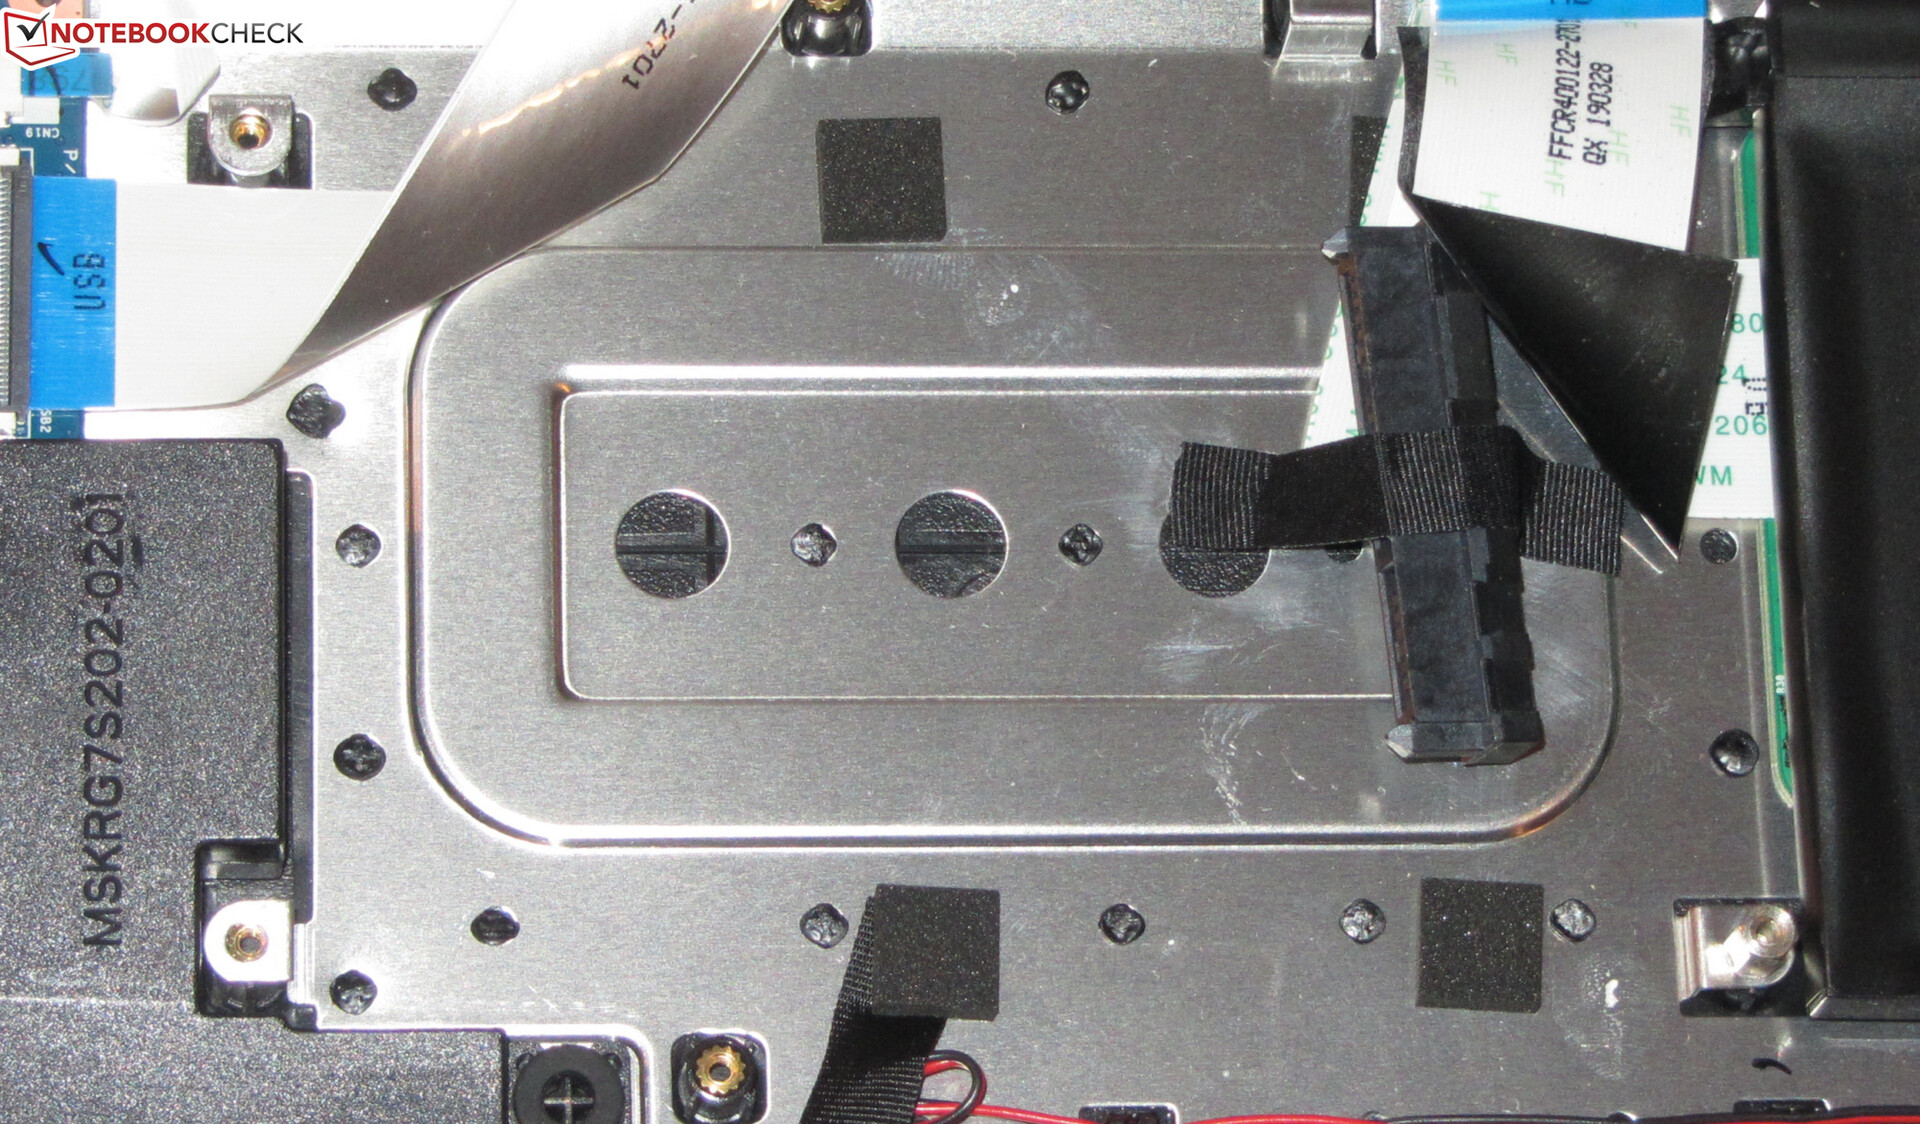
The maintenance and upgrades of the notebook turn out fairly simple. After removing all the screws from the bottom of the case, you can take off the bottom plate. In order to loosen the plastic clips, you can use a thin spatula. After opening the case, you can see two working-memory banks (both slots occupied), two M.2-2280 slots (one slot occupied), the WLAN module, the BIOS battery, one 2.5-inch slot, and the battery, which you could replace, since it is screwed in and not glued.
Warranty
The base warranty covers two years, including pick-up service and fast repair (within 48 hours) for up to six months. A 36-month warranty costs between 80 and 119 Euros (~$90-134), depending on the selected fast repair period.
Input Devices - Chiclet keyboard with RGB illumination
Keyboard
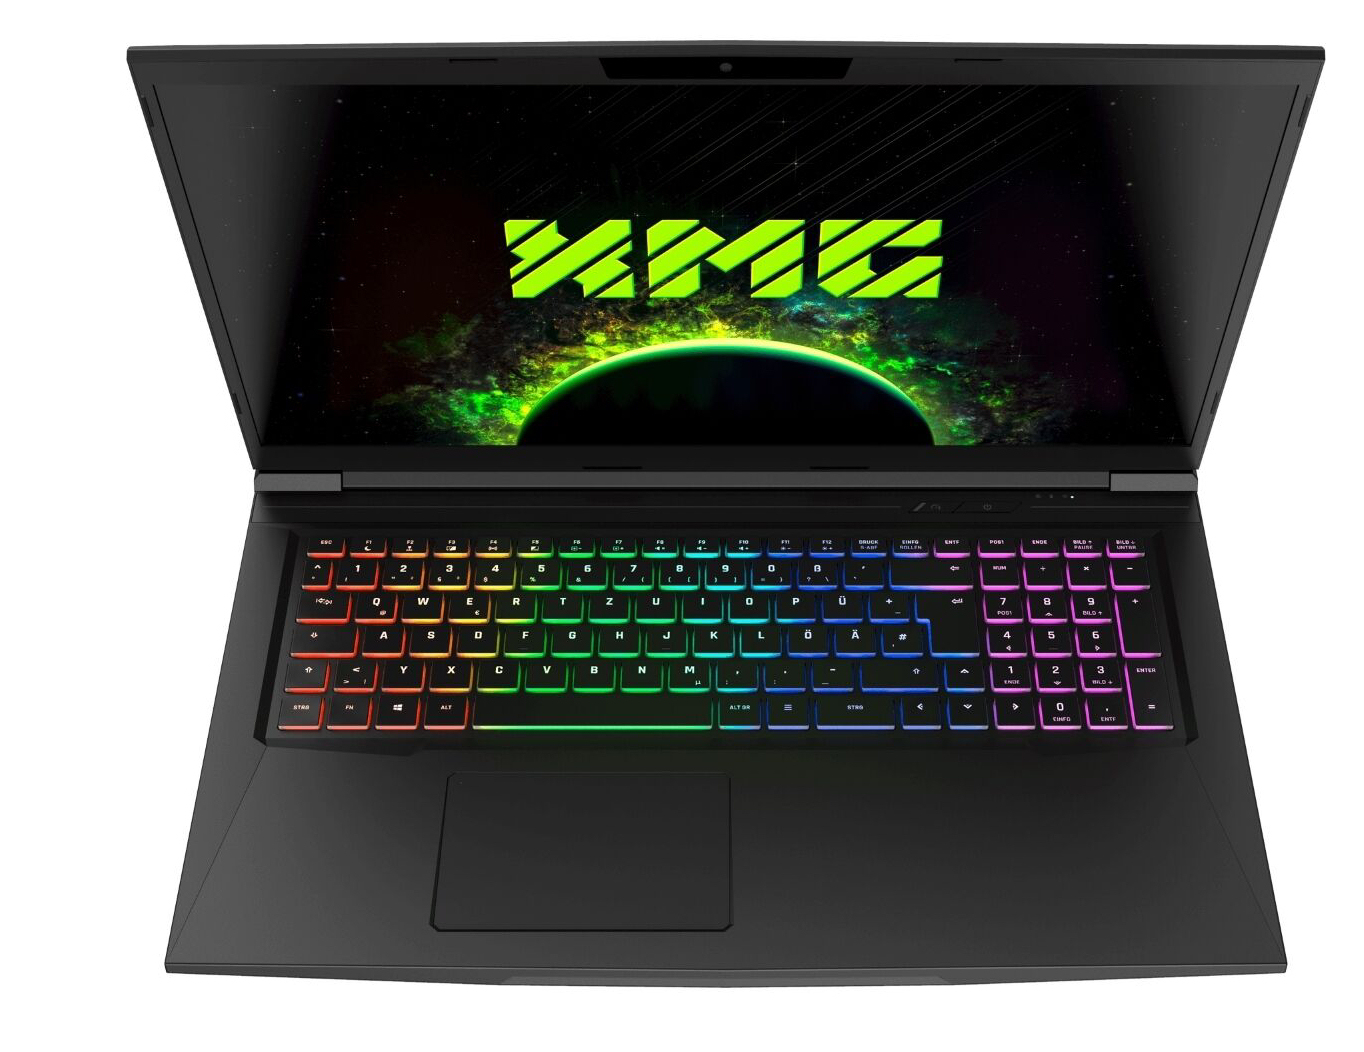
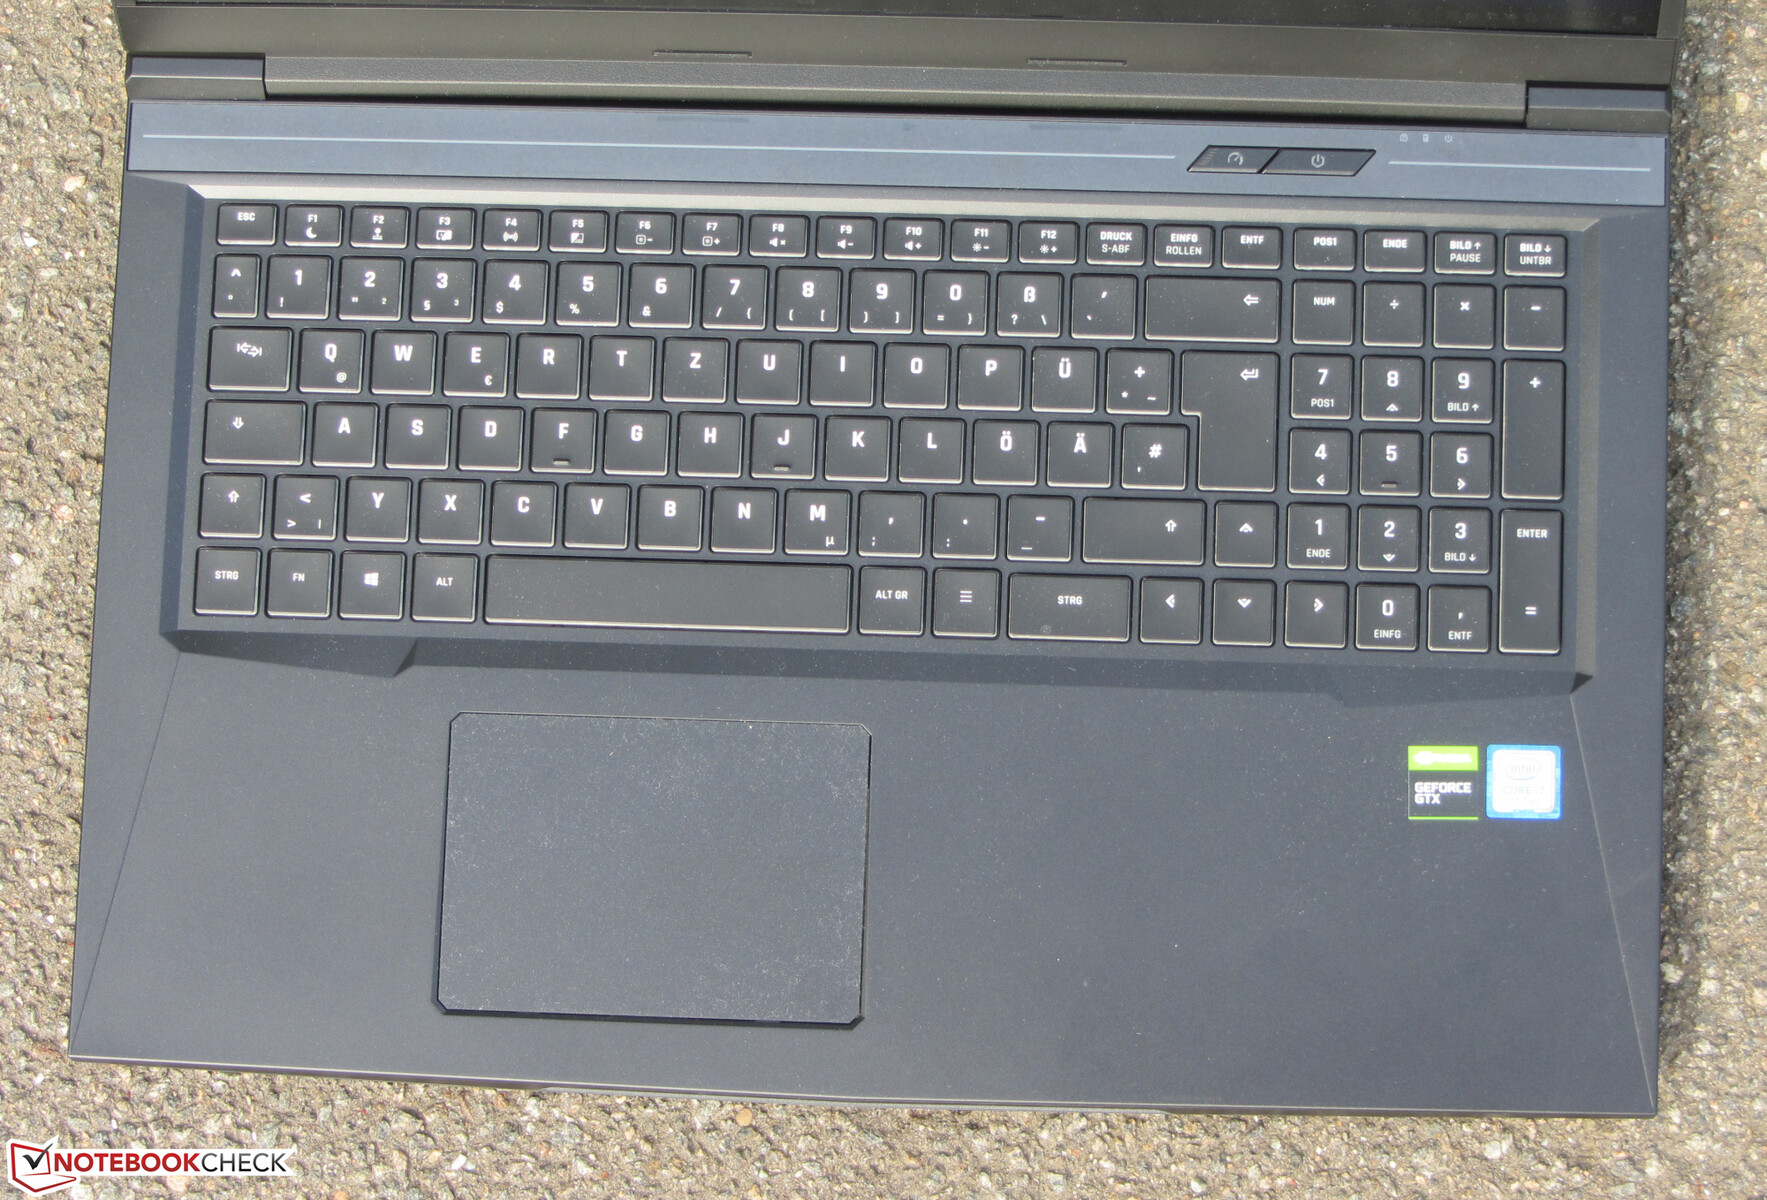
While the XMG Neo 17 can offer a mechanical keyboard, a classic chiclet keyboard is used in the Core 17. The main keys have a size of 15 x 15 mm (~0.6 x 0.6 in) and can be easily distinguished. Overall, the built-in keys offer a medium stroke and a clear pressure point. However, in our opinion, the resistance could have been crisper. While typing, the keyboard has a little give in the center, but this did not turn out to be annoying. The RGB illumination offers four brightness levels that are controlled via two function keys. All in all, the Schenker offers a keyboard that is suitable for everyday tasks.
Touchpad
With its footprint of 10.6 x 7.4 cm (~4.2 x 2.9 in), the multi-touch-capable ClickPad offers sufficient space for using gesture controls. The smooth surface provides no resistance to sliding fingers. The pad responds quickly to inputs - also in the corners. The pad has a short stroke for mechanical clicks and offers a clearly noticeable and audible pressure point.
Display - 144-Hz IPS
The 17.3-inch display of the XMG Core 17 has a native resolution of 1920x1080 pixels. While the display delivers a good contrast value (1097:1), the brightness (286 cd/m²) turns out slightly low - the price level of the notebook would demand more. We consider a value beyond 300 cd/m² as good. In addition, the brightness distribution turns out slightly too uneven.
The 144-Hz panel used here shows good response times overall. However, the 144-Hz models used in the MSI GP75 Leopard 9SD and in the Gigabyte Sabre 17-W8 can offer even better values. A positive point is that the display does not produce any PWM flickering.
| |||||||||||||||||||||||||
Brightness Distribution: 79 %
Center on Battery: 329 cd/m²
Contrast: 1097:1 (Black: 0.3 cd/m²)
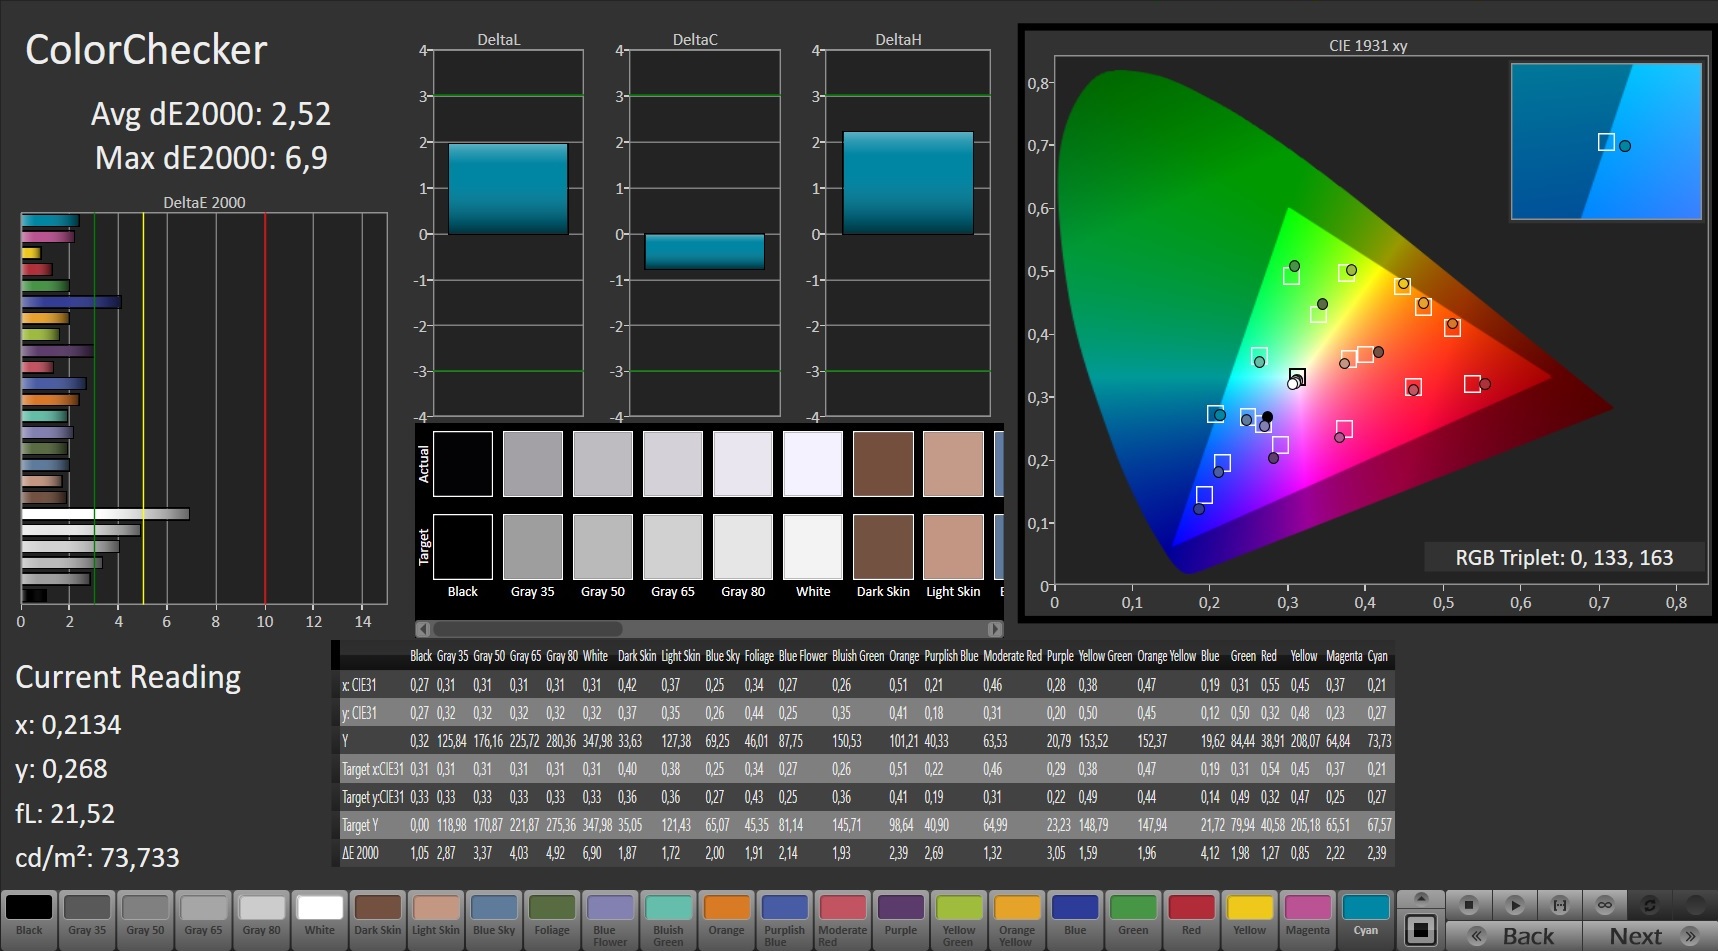
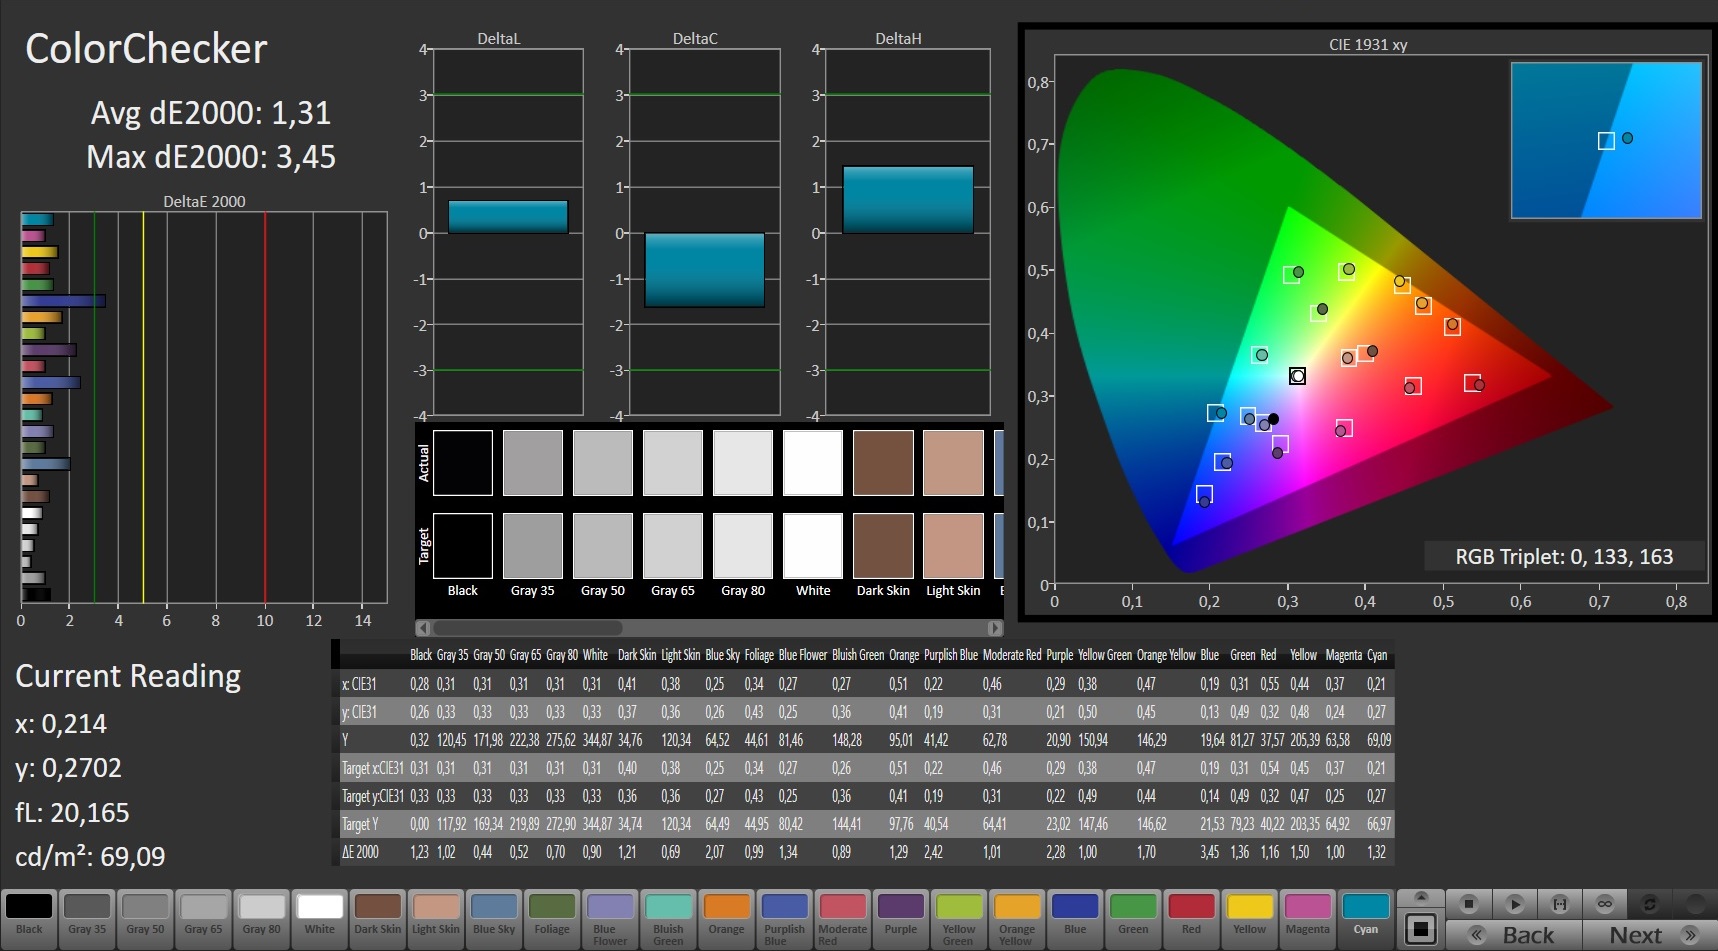
ΔE ColorChecker Calman: 2.52 | ∀{0.5-29.43 Ø4.72}
calibrated: 1.31
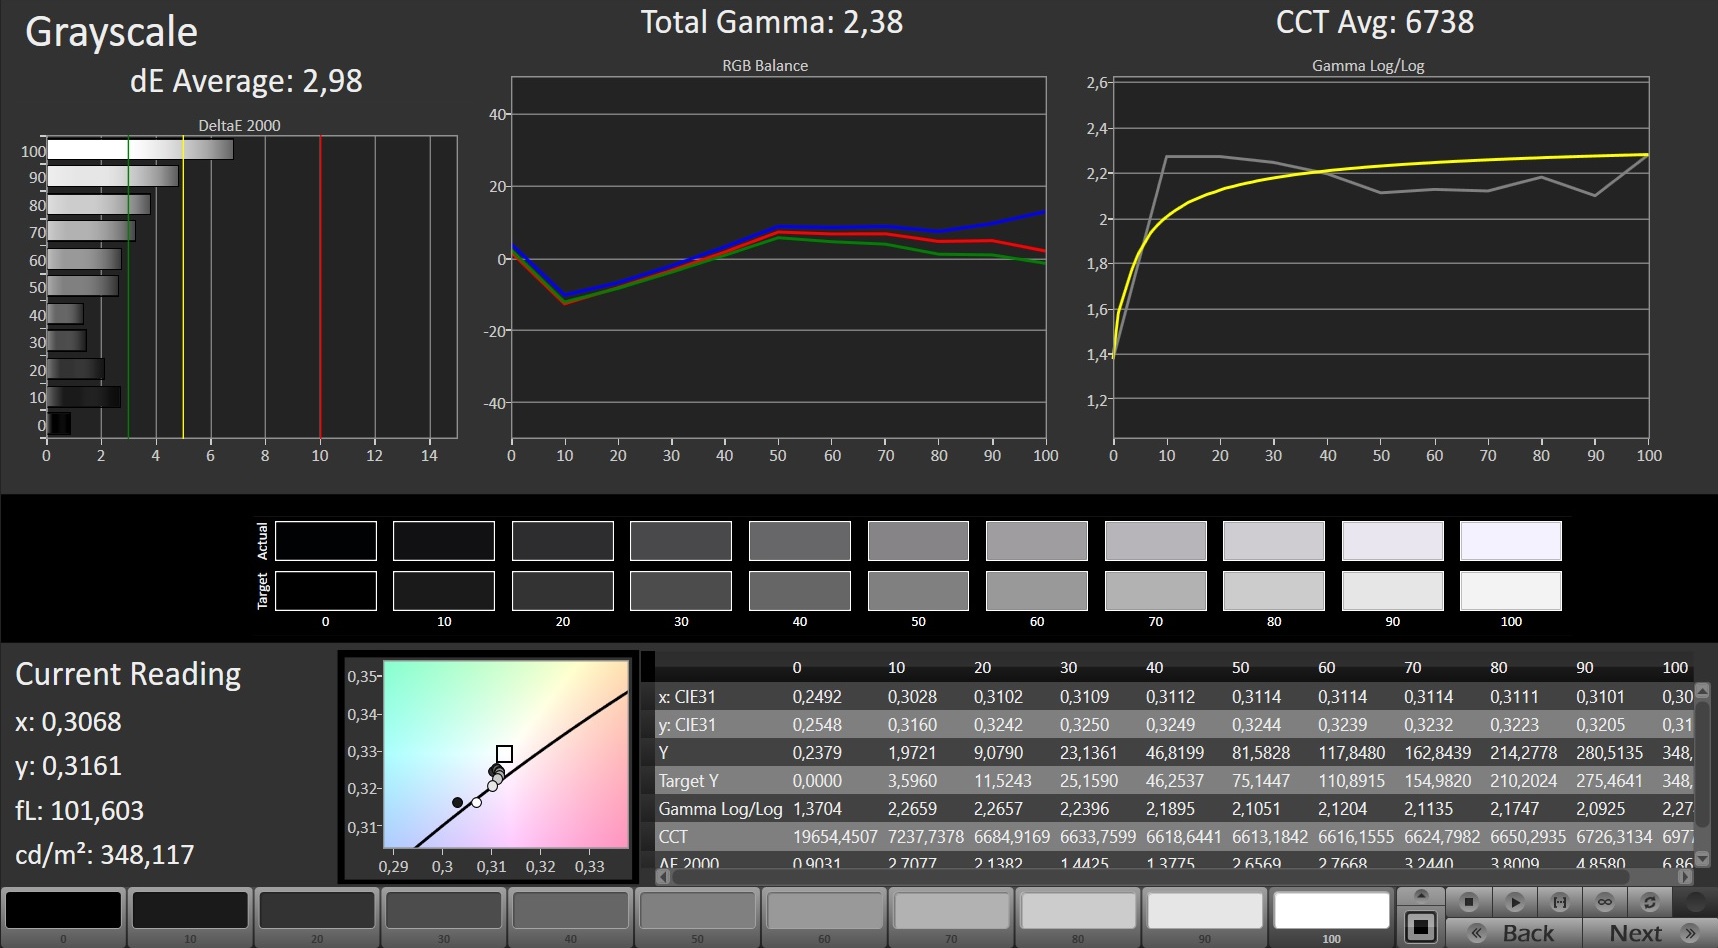
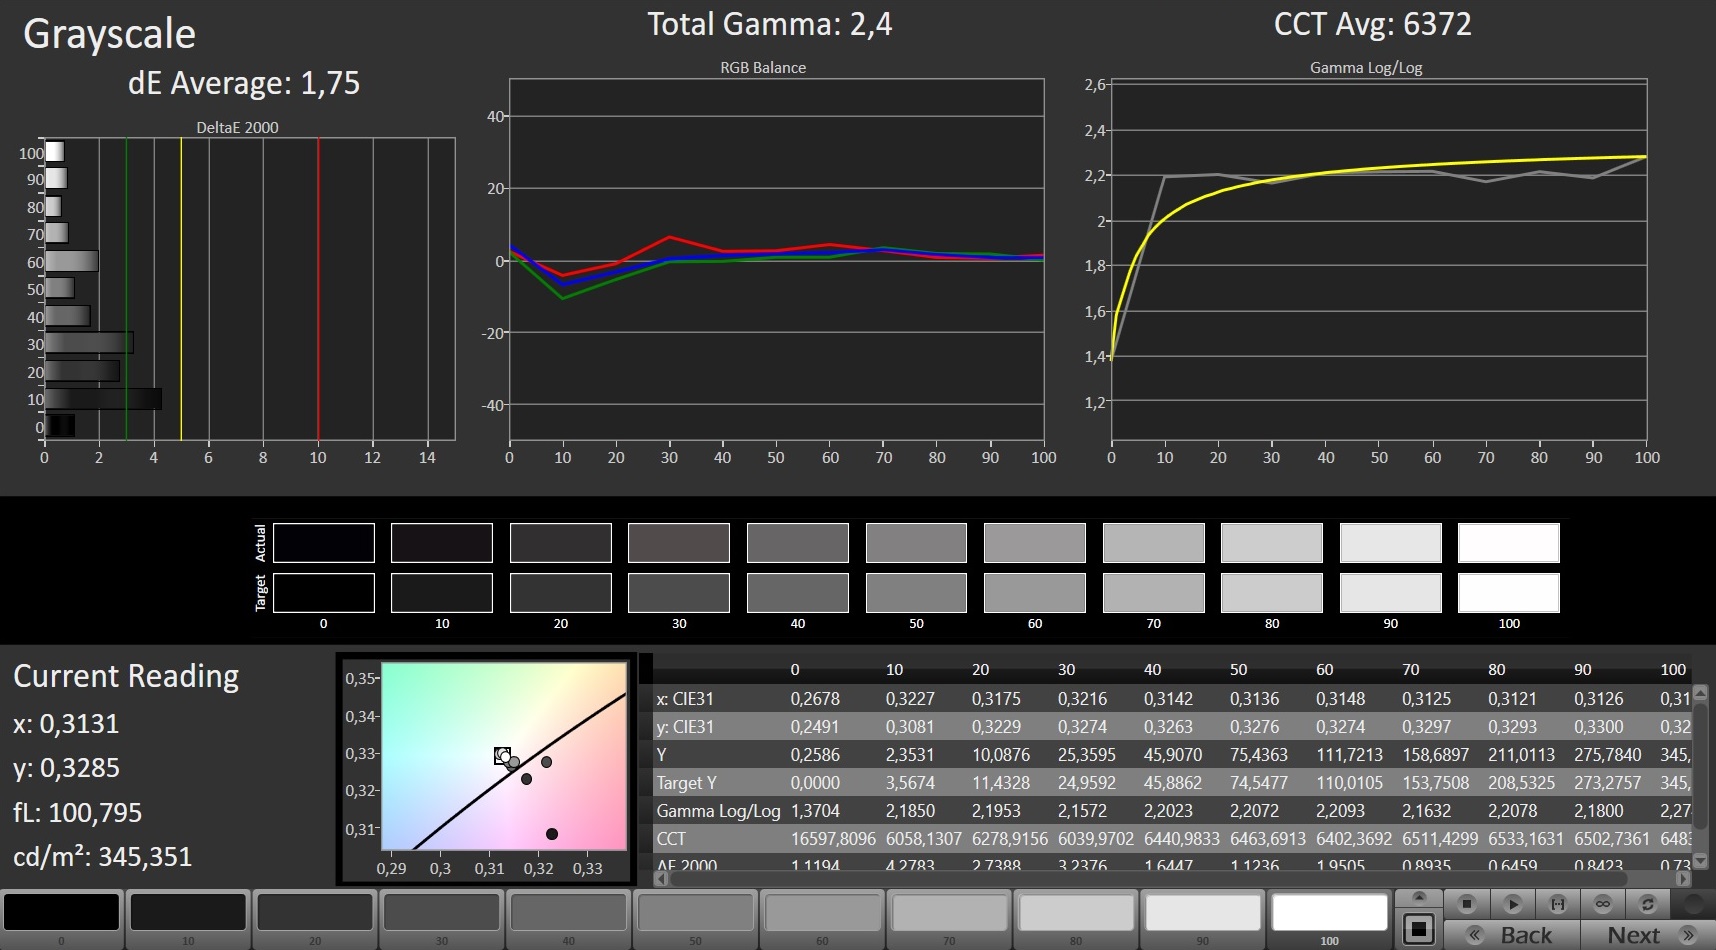
ΔE Greyscale Calman: 2.98 | ∀{0.09-98 Ø4.97}
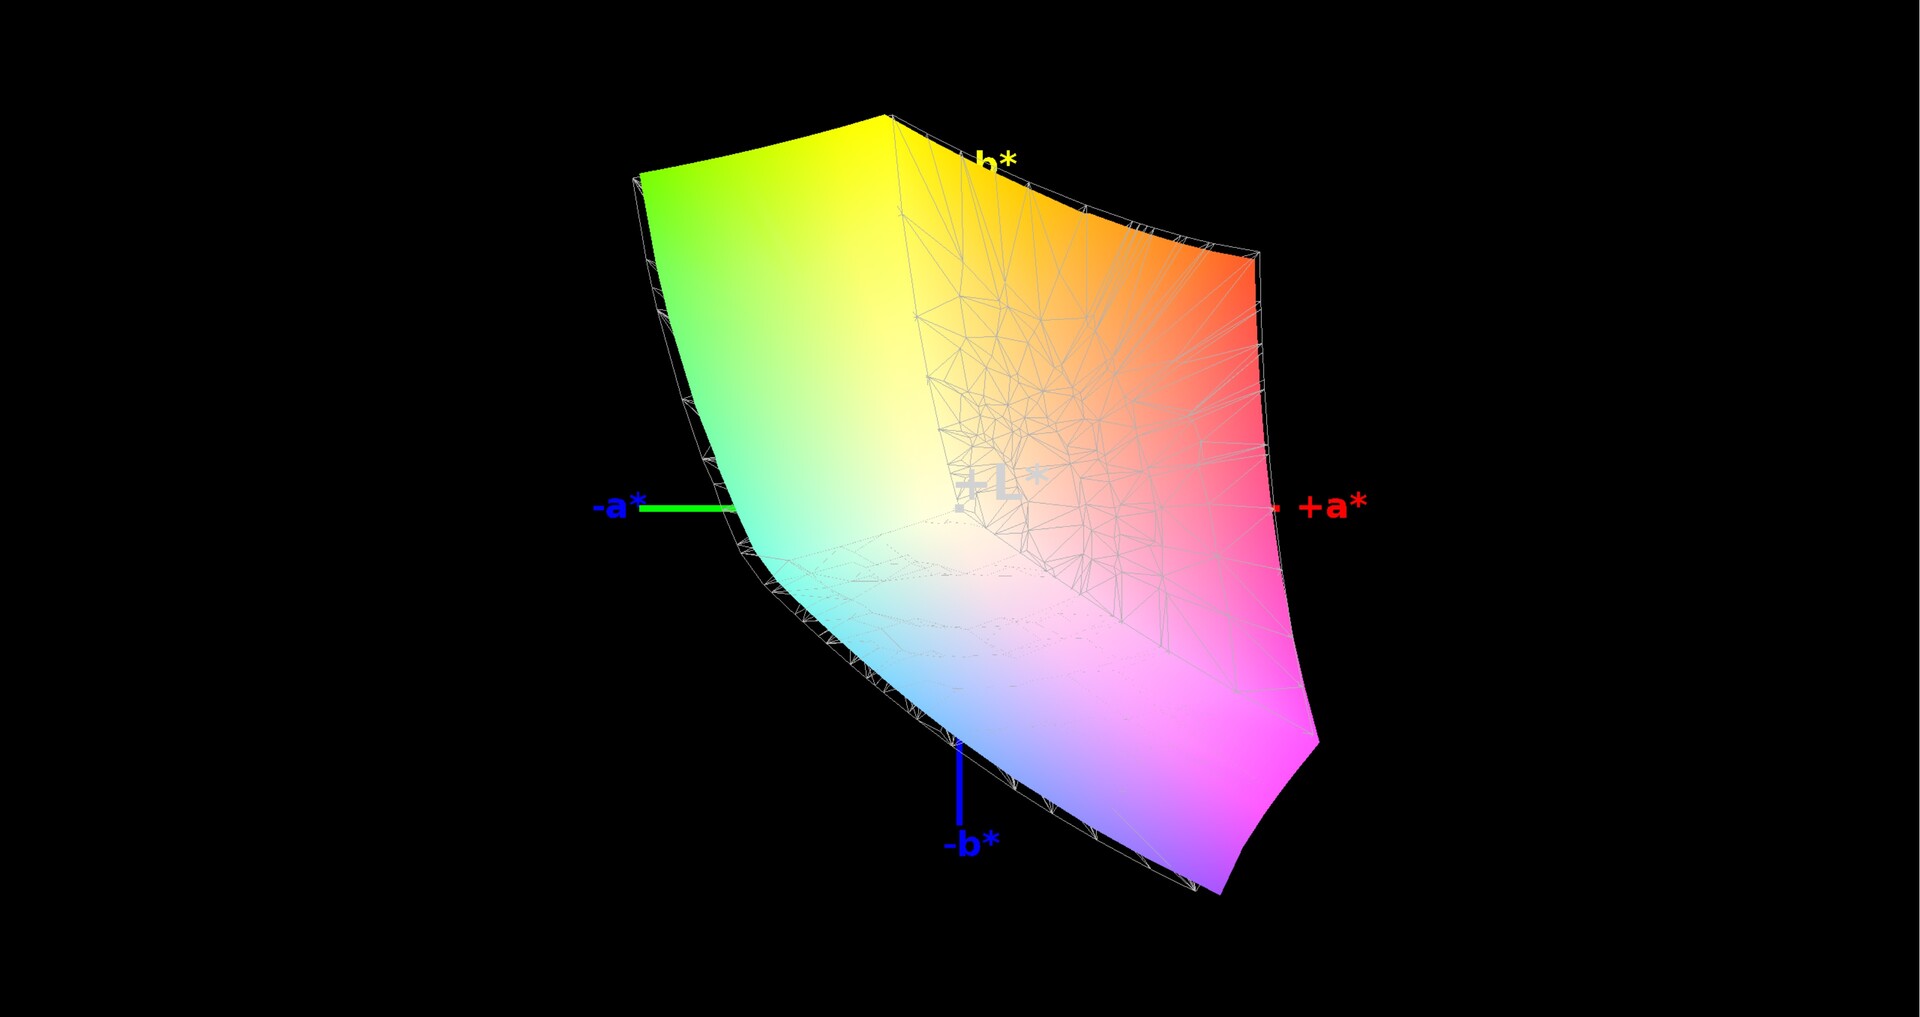
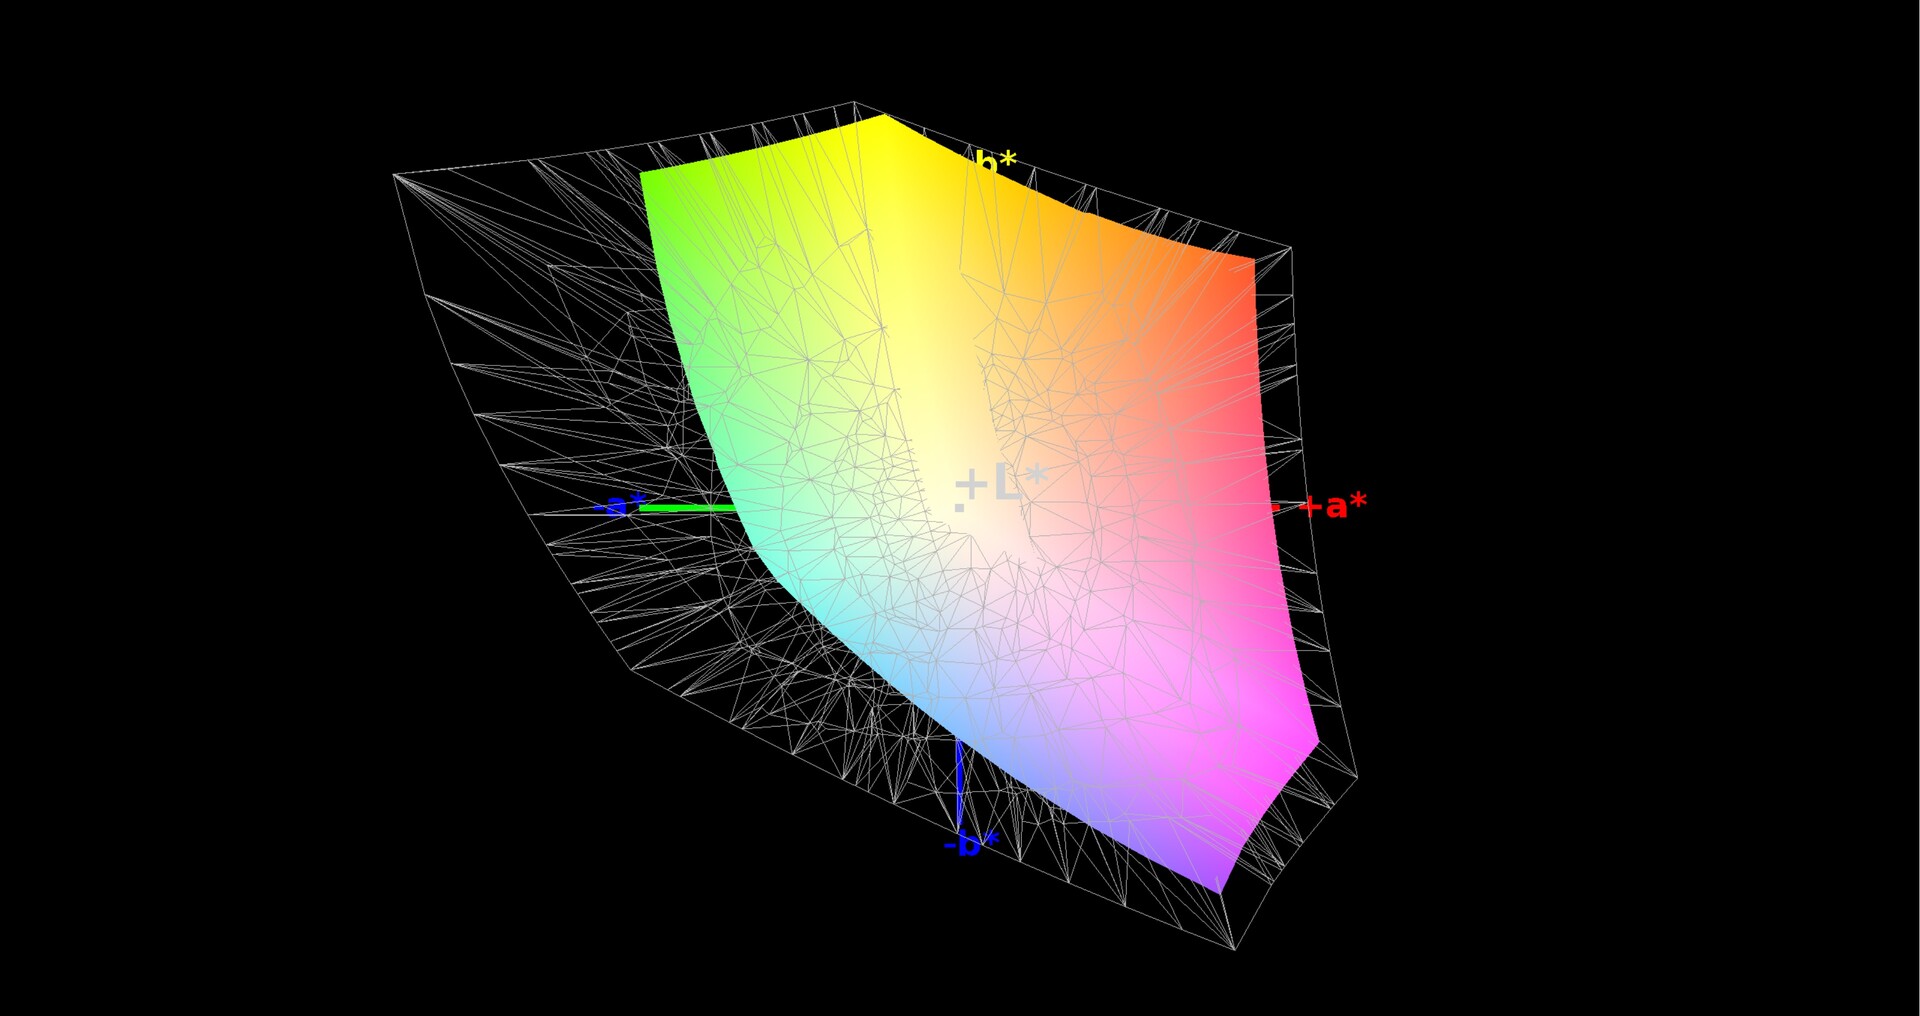
95% sRGB (Argyll 1.6.3 3D)
60% AdobeRGB 1998 (Argyll 1.6.3 3D)
65.6% AdobeRGB 1998 (Argyll 3D)
95.6% sRGB (Argyll 3D)
64.4% Display P3 (Argyll 3D)
Gamma: 2.38
CCT: 6738 K
| Schenker XMG Core 17 LG Philips LP173WFG-SPB1 (LGD0615), IPS, 1920x1080 | Schenker XMG Neo 17 BOEhydis NV173FHM-N44 (BOE07B6), IPS, 1920x1080 | Dell G7 17 7790 AU Optronics AUO409D, B173HAN, IPS, 1920x1080 | MSI GP75 Leopard 9SD Chi Mei N173HCE-G33 (CMN175C), IPS, 1920x1080 | Gigabyte Sabre 17-W8 Chi Mei CMN1747, TN, 1920x1080 | Lenovo Legion Y730-17ICH, i7-8750H LP173WF4-SPF6, IPS, 1920x1080 | |
|---|---|---|---|---|---|---|
| Display | -1% | -5% | -1% | 25% | -4% | |
| Display P3 Coverage (%) | 64.4 | 65.2 1% | 61.9 -4% | 63.4 -2% | 89.9 40% | 66.4 3% |
| sRGB Coverage (%) | 95.6 | 92.2 -4% | 89.6 -6% | 94.9 -1% | 100 5% | 84.9 -11% |
| AdobeRGB 1998 Coverage (%) | 65.6 | 66.5 1% | 63.2 -4% | 65.1 -1% | 85.1 30% | 62.1 -5% |
| Response Times | -28% | -22% | 26% | 27% | -153% | |
| Response Time Grey 50% / Grey 80% * (ms) | 14.4 ? | 18.8 ? -31% | 17.2 ? -19% | 8 ? 44% | 9 ? 37% | 36.8 ? -156% |
| Response Time Black / White * (ms) | 9.6 ? | 12 ? -25% | 12 ? -25% | 8.8 ? 8% | 8 ? 17% | 24 ? -150% |
| PWM Frequency (Hz) | 971 ? | 25510 ? | 25000 ? | |||
| Screen | 2% | -24% | 6% | -62% | -46% | |
| Brightness middle (cd/m²) | 329 | 304 -8% | 308.6 -6% | 420 28% | 326 -1% | 328.7 0% |
| Brightness (cd/m²) | 286 | 289 1% | 299 5% | 393 37% | 309 8% | 318 11% |
| Brightness Distribution (%) | 79 | 90 14% | 92 16% | 91 15% | 82 4% | 91 15% |
| Black Level * (cd/m²) | 0.3 | 0.26 13% | 0.29 3% | 0.32 -7% | 0.27 10% | 0.51 -70% |
| Contrast (:1) | 1097 | 1169 7% | 1064 -3% | 1313 20% | 1207 10% | 645 -41% |
| Colorchecker dE 2000 * | 2.52 | 2.65 -5% | 4.26 -69% | 3.04 -21% | 9.11 -262% | 4.91 -95% |
| Colorchecker dE 2000 max. * | 6.9 | 6.11 11% | 7.83 -13% | 7.22 -5% | 14.14 -105% | 10.15 -47% |
| Colorchecker dE 2000 calibrated * | 1.31 | 1.5 -15% | 2.93 -124% | 0.89 32% | 2.62 -100% | 4.27 -226% |
| Greyscale dE 2000 * | 2.98 | 2.75 8% | 5 -68% | 3.91 -31% | 11.17 -275% | 3.9 -31% |
| Gamma | 2.38 92% | 2.46 89% | 2.07 106% | 2.26 97% | 2.28 96% | 2.13 103% |
| CCT | 6738 96% | 6763 96% | 7488 87% | 7138 91% | 12475 52% | 6911 94% |
| Color Space (Percent of AdobeRGB 1998) (%) | 60 | 60 0% | 57.8 -4% | 60 0% | 76 27% | 55.6 -7% |
| Color Space (Percent of sRGB) (%) | 95 | 92 -3% | 89.2 -6% | 95 0% | 100 5% | 84.7 -11% |
| Total Average (Program / Settings) | -9% /
-2% | -17% /
-20% | 10% /
7% | -3% /
-34% | -68% /
-51% |
* ... smaller is better
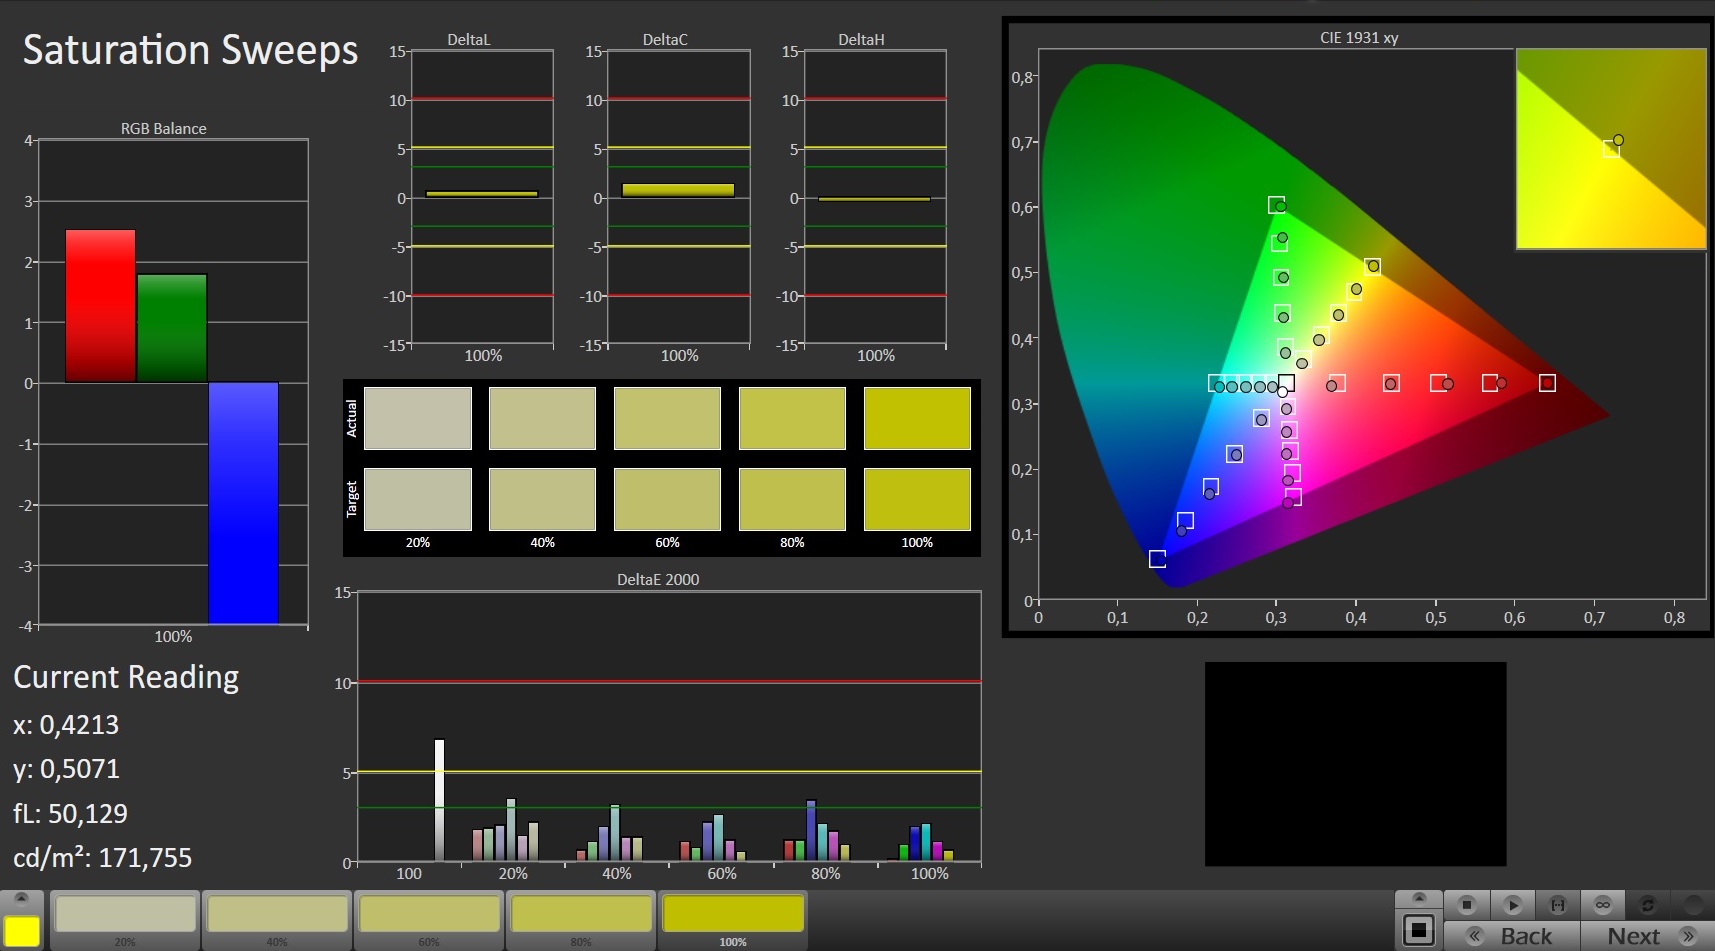
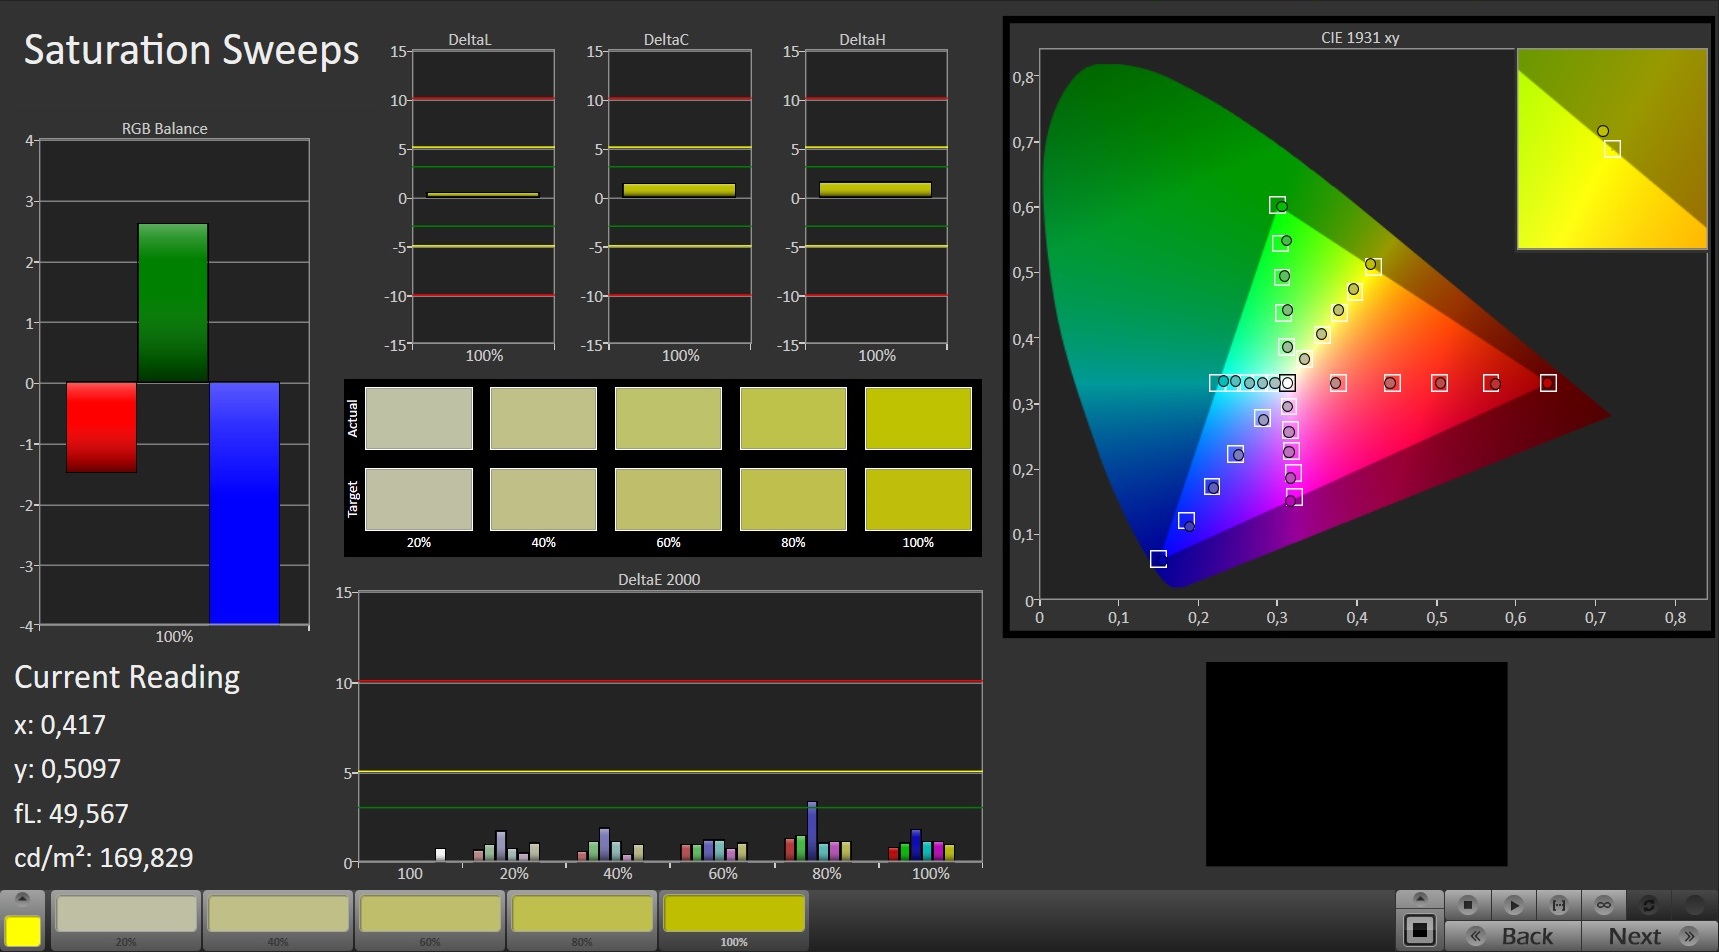
The display offers a good color reproduction already in the state of delivery. With a DeltaE-2000 color deviation of 2.52, it meets the target of DeltaE < 3. The display does not suffer from a blue tint. Via calibration, you can achieve an even better color reproduction. We tried it: The color deviation drops to a value of 1.31 and the grayscales are displayed noticeably more balanced. The AdobeRGB and sRGB color spaces are not reproduced completely. The coverage rates are 60% (AdobeRGB) and 95% (sRGB).
Using the color profile we are offering, you can improve the color reproduction of the display with our calibration. However, you have to make sure that you have the same display model (manufacturer + model number) as our test unit, or otherwise the color reproduction might become worse, instead of improving. Often displays from different manufacturers are used within the same notebook model series.

Display Response Times
| ↔ Response Time Black to White | ||
|---|---|---|
| 9.6 ms ... rise ↗ and fall ↘ combined | ↗ 5.2 ms rise | 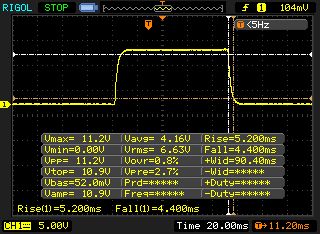 |
| ↘ 4.4 ms fall | ||
| The screen shows fast response rates in our tests and should be suited for gaming. In comparison, all tested devices range from 0.1 (minimum) to 240 (maximum) ms. » 26 % of all devices are better. This means that the measured response time is better than the average of all tested devices (19.8 ms). | ||
| ↔ Response Time 50% Grey to 80% Grey | ||
| 14.4 ms ... rise ↗ and fall ↘ combined | ↗ 7.6 ms rise | 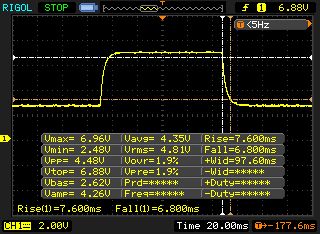 |
| ↘ 6.8 ms fall | ||
| The screen shows good response rates in our tests, but may be too slow for competitive gamers. In comparison, all tested devices range from 0.165 (minimum) to 636 (maximum) ms. » 28 % of all devices are better. This means that the measured response time is better than the average of all tested devices (31 ms). | ||
Screen Flickering / PWM (Pulse-Width Modulation)
| Screen flickering / PWM not detected | 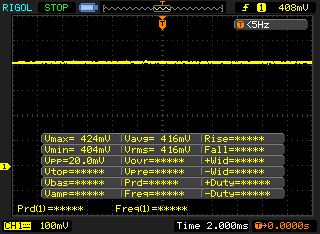 | ||
In comparison: 52 % of all tested devices do not use PWM to dim the display. If PWM was detected, an average of 7763 (minimum: 5 - maximum: 343500) Hz was measured. | |||
The Core 17 is equipped with an IPS panel with stable viewing angles. This allows the screen to be read from any position. Outdoors, you can only read the display when the sun is not shining.


Performance - Hexa-core power on board
The Schenker XMG Core 17 is a gaming notebook in the 17.3-inch format. It can bring any current game to the screen smoothly and also strikes a good figure in other application areas. You would have to pay about 1600 Euros (~$1798) for our test unit. The most affordable models are available for 1356 Euros (~$1524; GeForce GTX 1660 Ti) or almost 1200 Euros (~$1349; GeForce GTX 1650). Since Schenker offers many individual configuration options, the price of some well-equipped models can surpass 3000 Euros (~$3372).

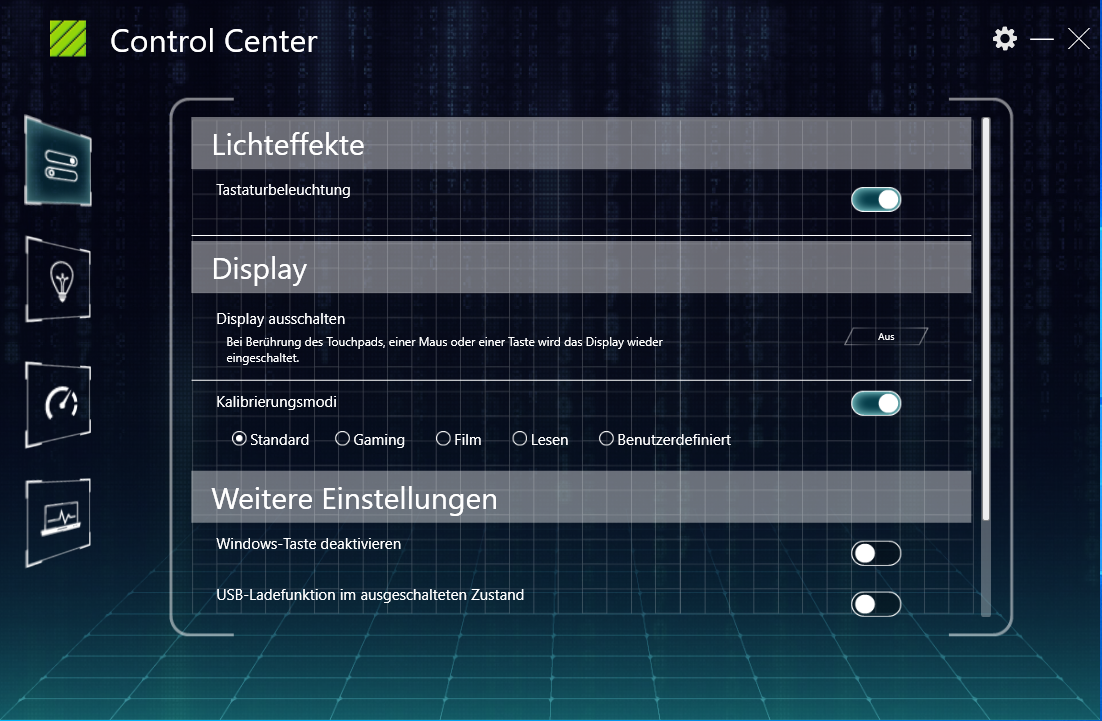
Test Conditions
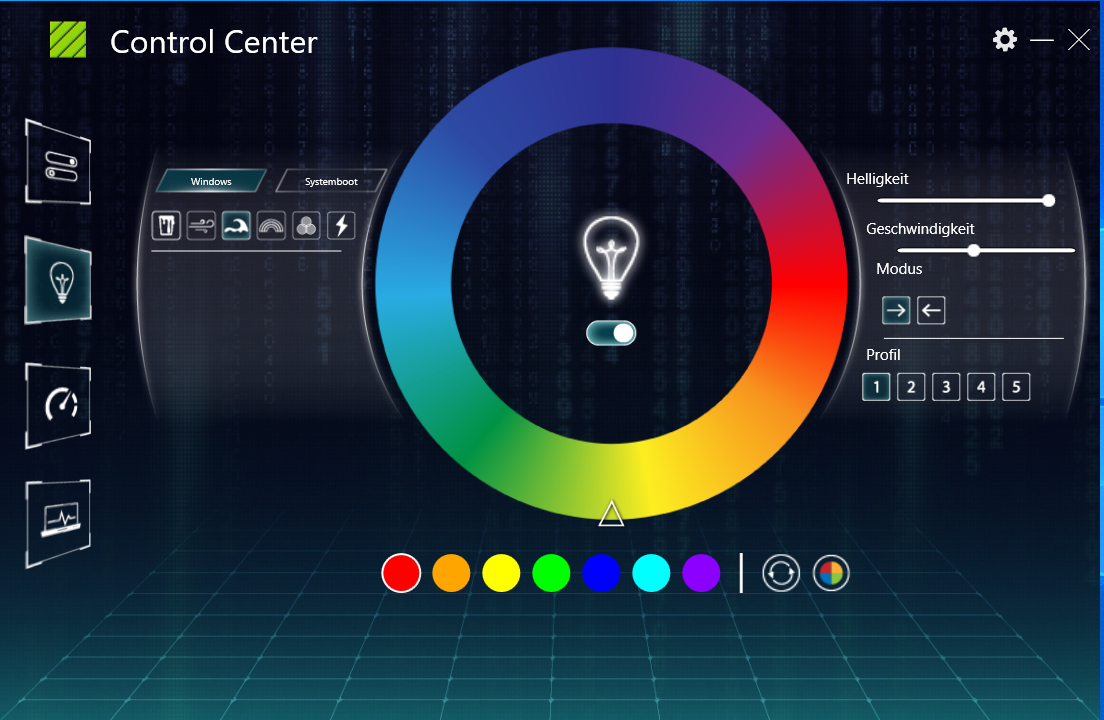
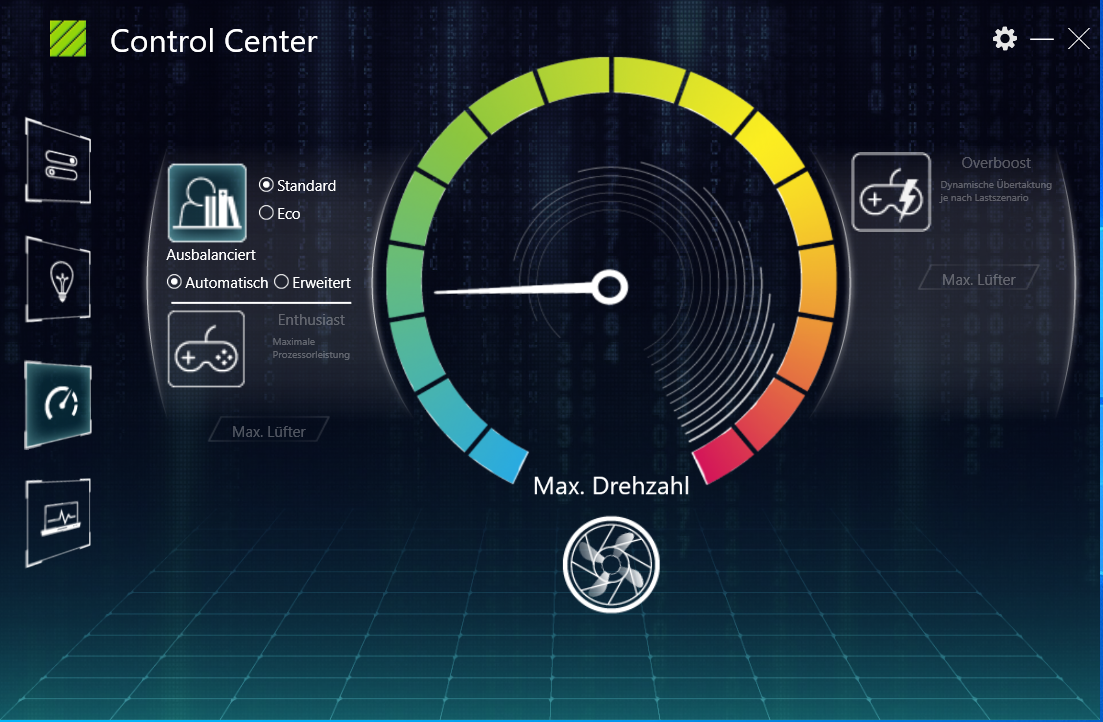
In addition to functions to supervise the system status and adjust the keyboard illumination, the preinstalled Control Center also offers options to set the power profile and influence the fan control. We performed our testing with the Balanced power profile activated and automatic fan control.
The Control Center offers two more profiles that are called "Enthusiast" and "Overboost." If the former is selected, the full processor performance is available. When the Overboost profile is activated, the CPU and GPU are dynamically overclocked. We also ran some of our benchmarks with the Enthusiast and Overboost profiles activated. You can see the results among the comparison diagrams.
The differences between the power profiles lie in the power limits. The Balanced profile offers power limits of 45 watts (PL1) and 56 watts (PL2). With the Enthusiast or Overboost profile activated, the limits increase to 70 watts (PL1) and 85 watts (PL2). The power limit 1 also increases to 85 watts, if the GPU is not used.

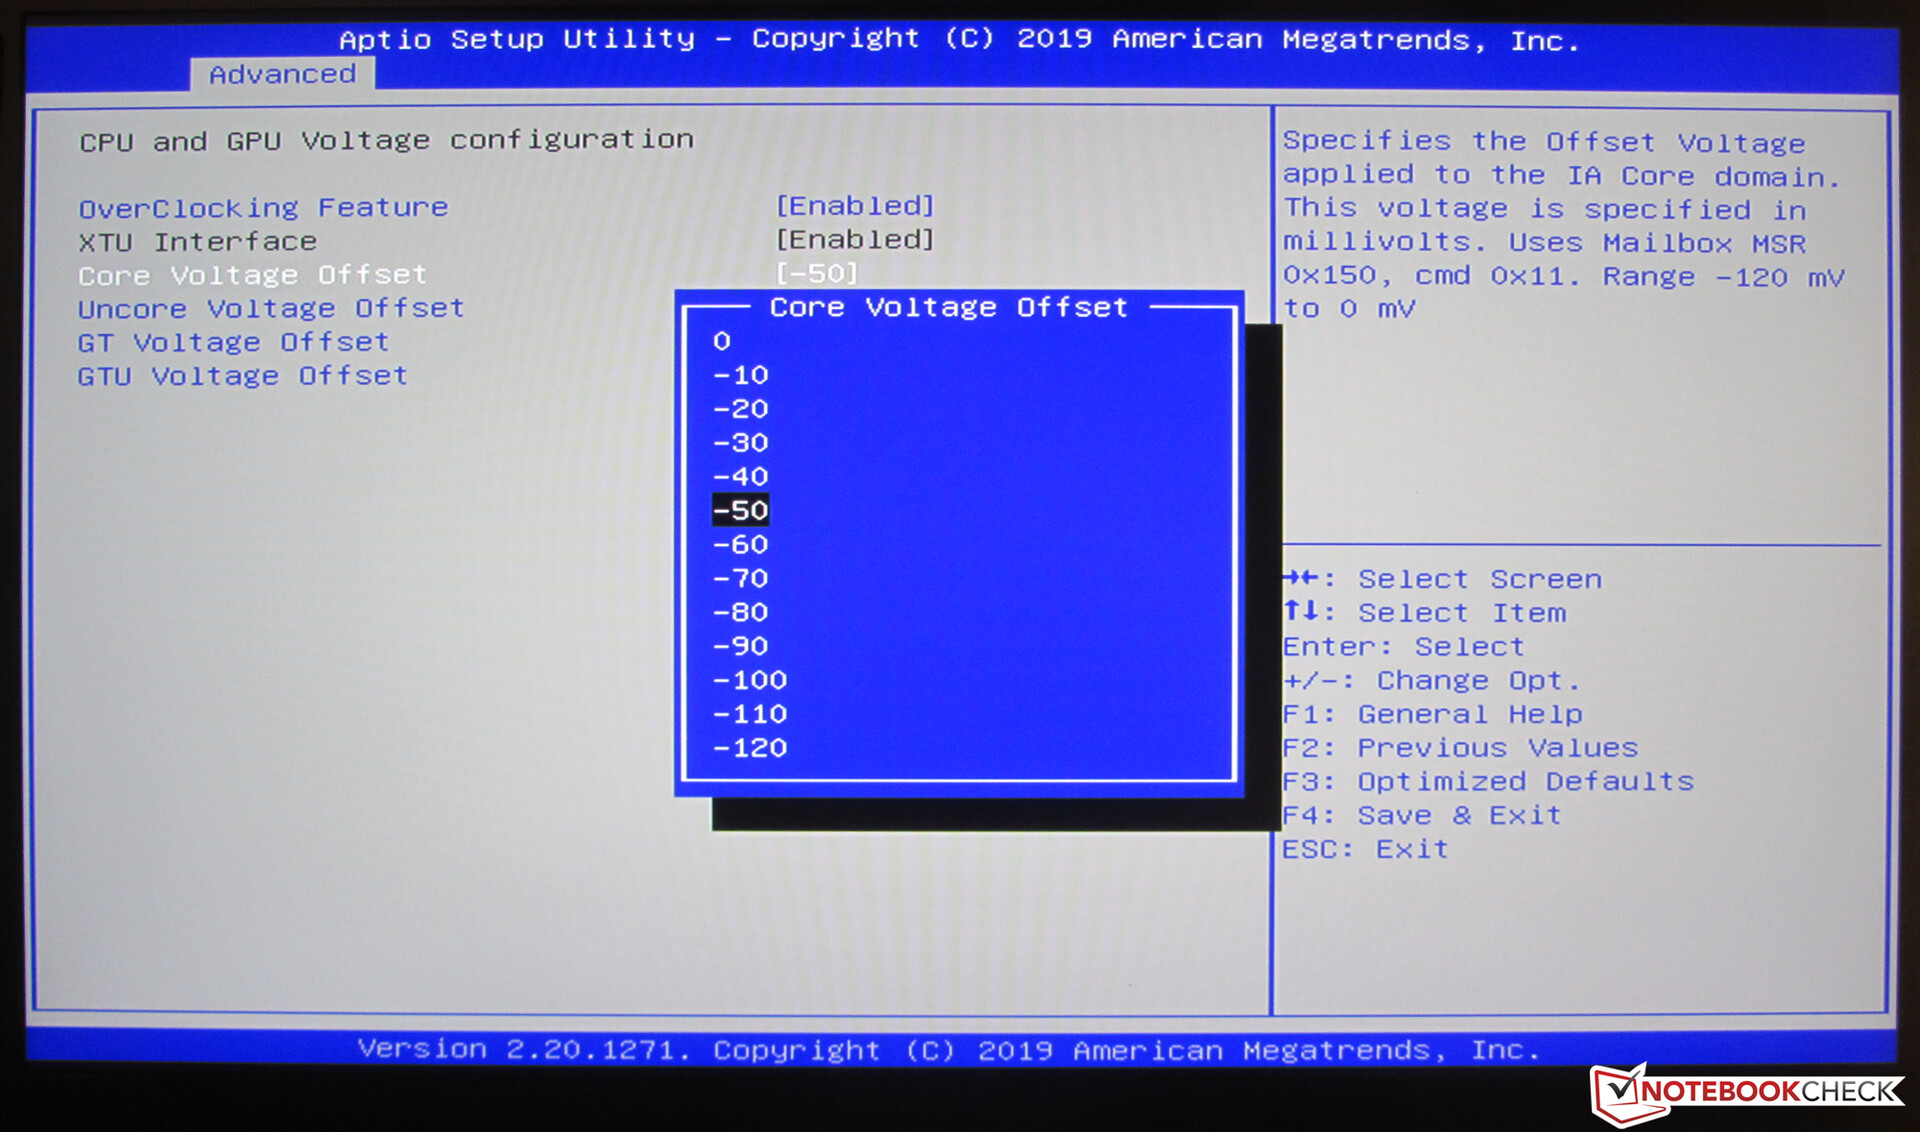
Undervolting via BIOS
The BIOS of the XMG Core 17 allows for so-called "undervolting" of the processor and the integrated GPU. This means that the corresponding components are run at lower voltages than specified by the manufacturer. As a result, the power consumption and heat development turn out lower. If the voltage is dropped too low, there is a danger of an unstable or faulty system. Schenker has therefore limited the power drop to a maximum of 120 mV, since at that point the hardware operation should still remain stable. The BIOS allows undervolting in steps of 10 mV. If faults or instabilities occur, you should go back to the previous voltage level.


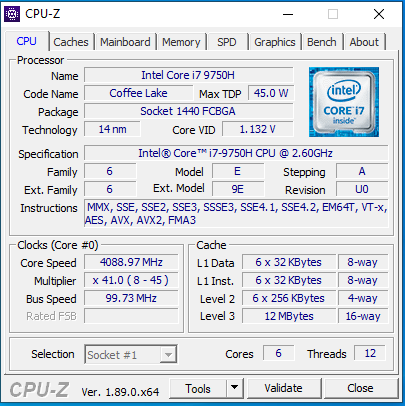
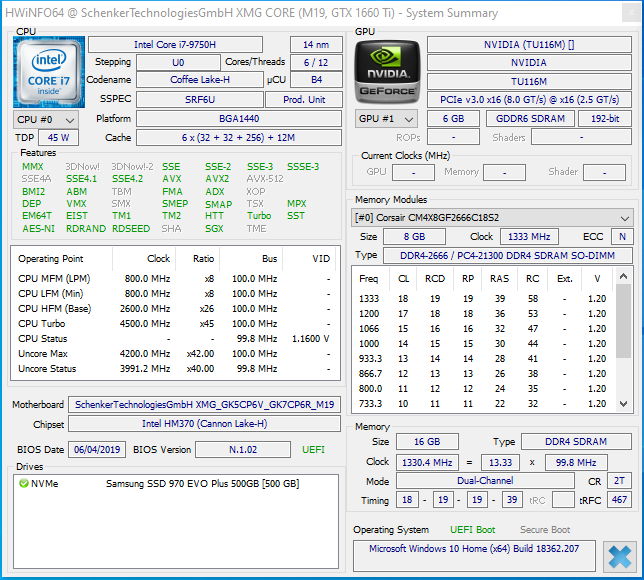
Processor
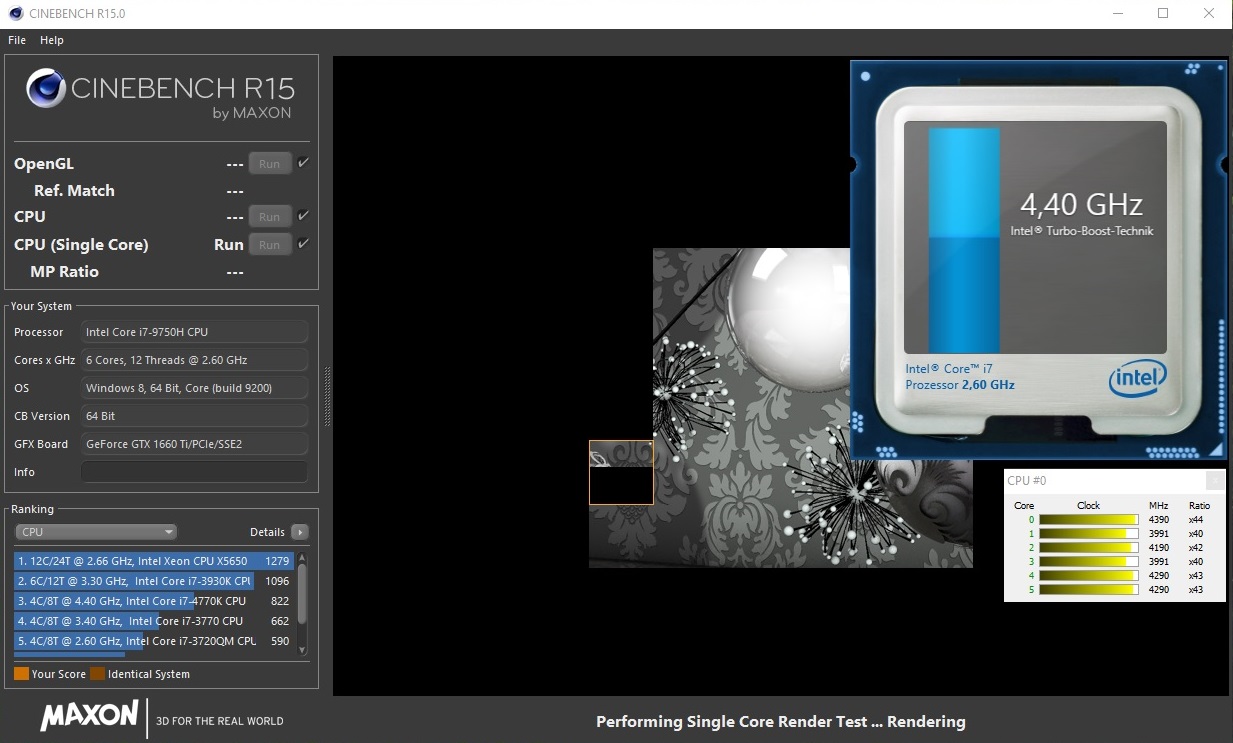
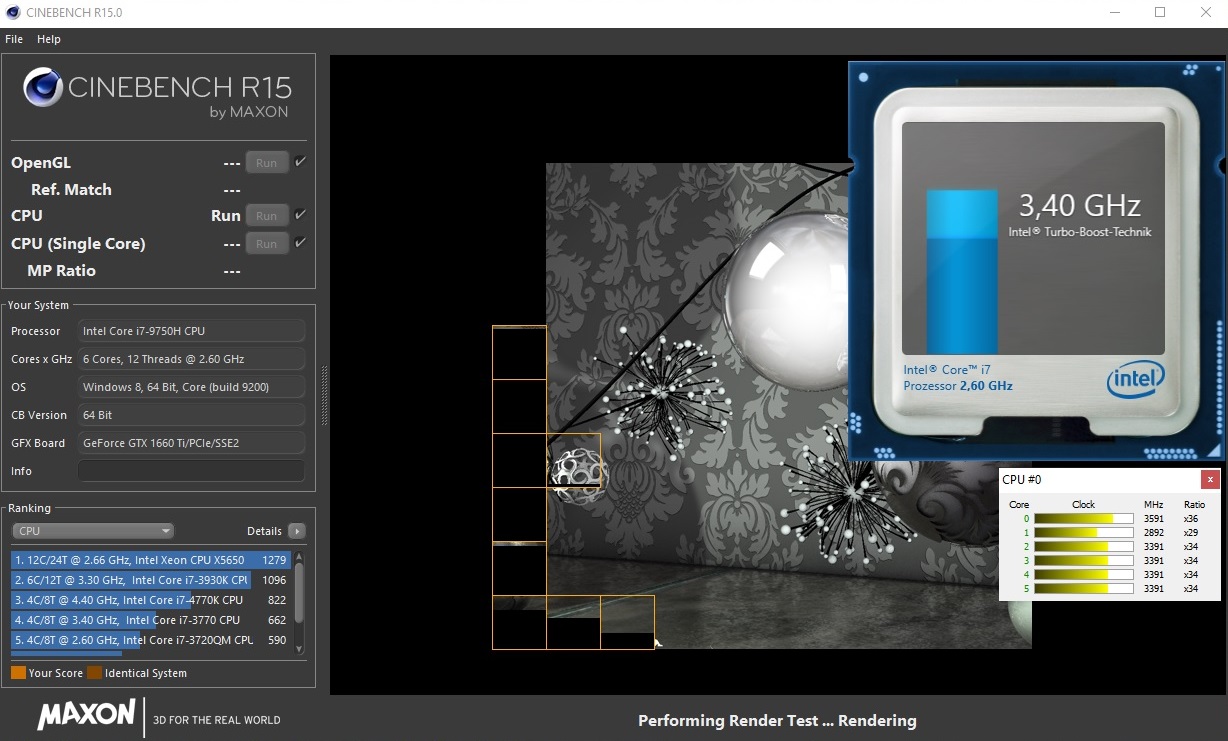
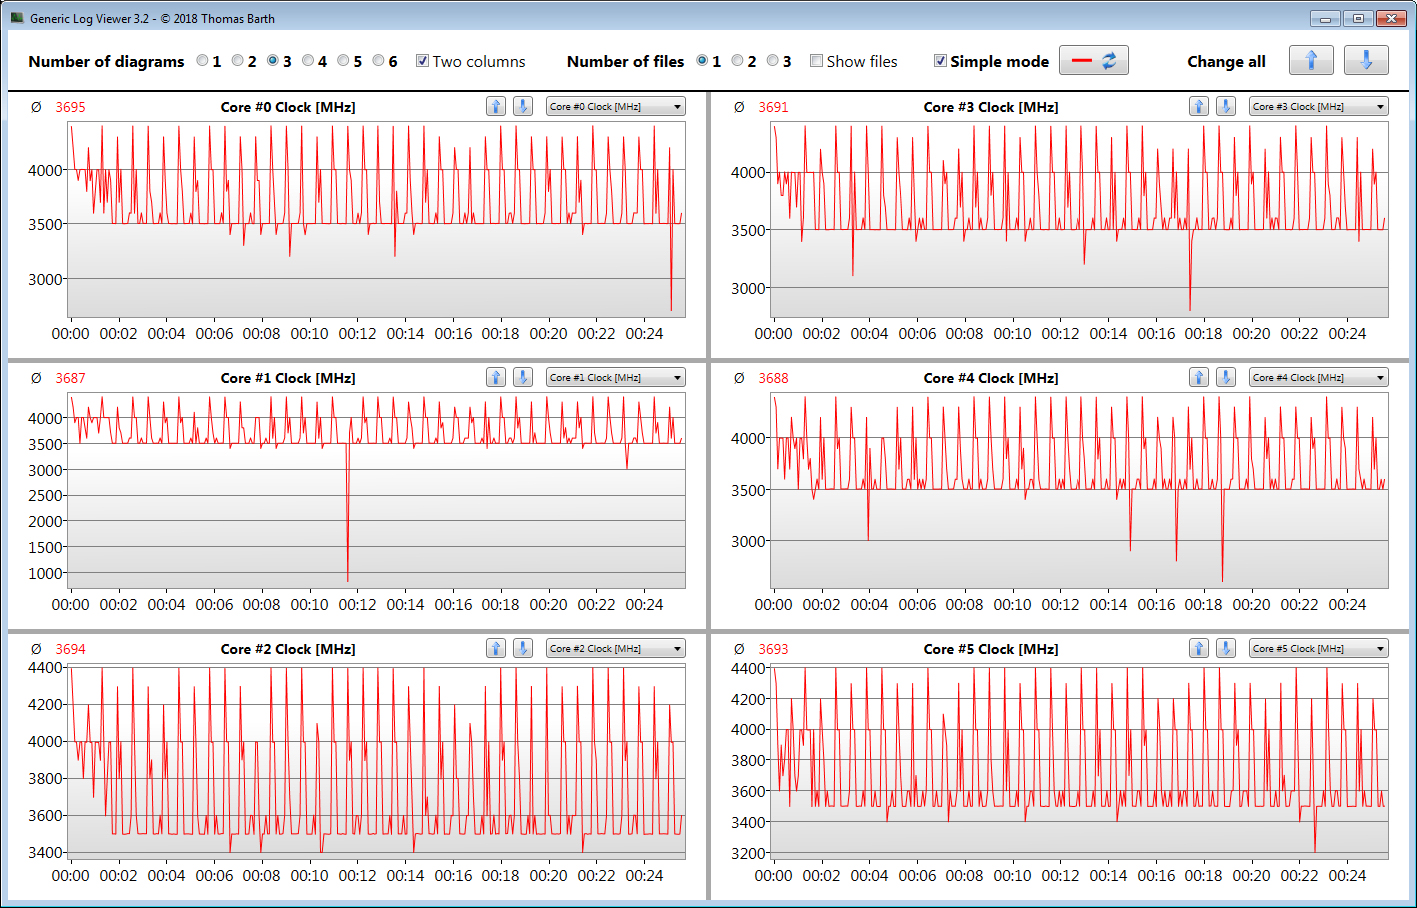
The computing power necessary for a gaming notebook is provided by Intel's Core-i7 9750H hexa-core processor (Coffee Lake Refresh). We see this CPU in many gaming notebooks, since it offers a good compromise of performance, power consumption, and price. The same was also true for its two predecessors: the Core i7-8750H and the Core i7-7700HQ. The 9750H operates at a basic clock speed of 2.6 GHz. Via Turbo, the clock speed can be increased to 4 GHz (six cores), 4.1 GHz (five cores), 4.2 GHz (four cores), 4.3 GHz (three cores), 4.4 GHz (two cores), or 4.5 GHz (one core).
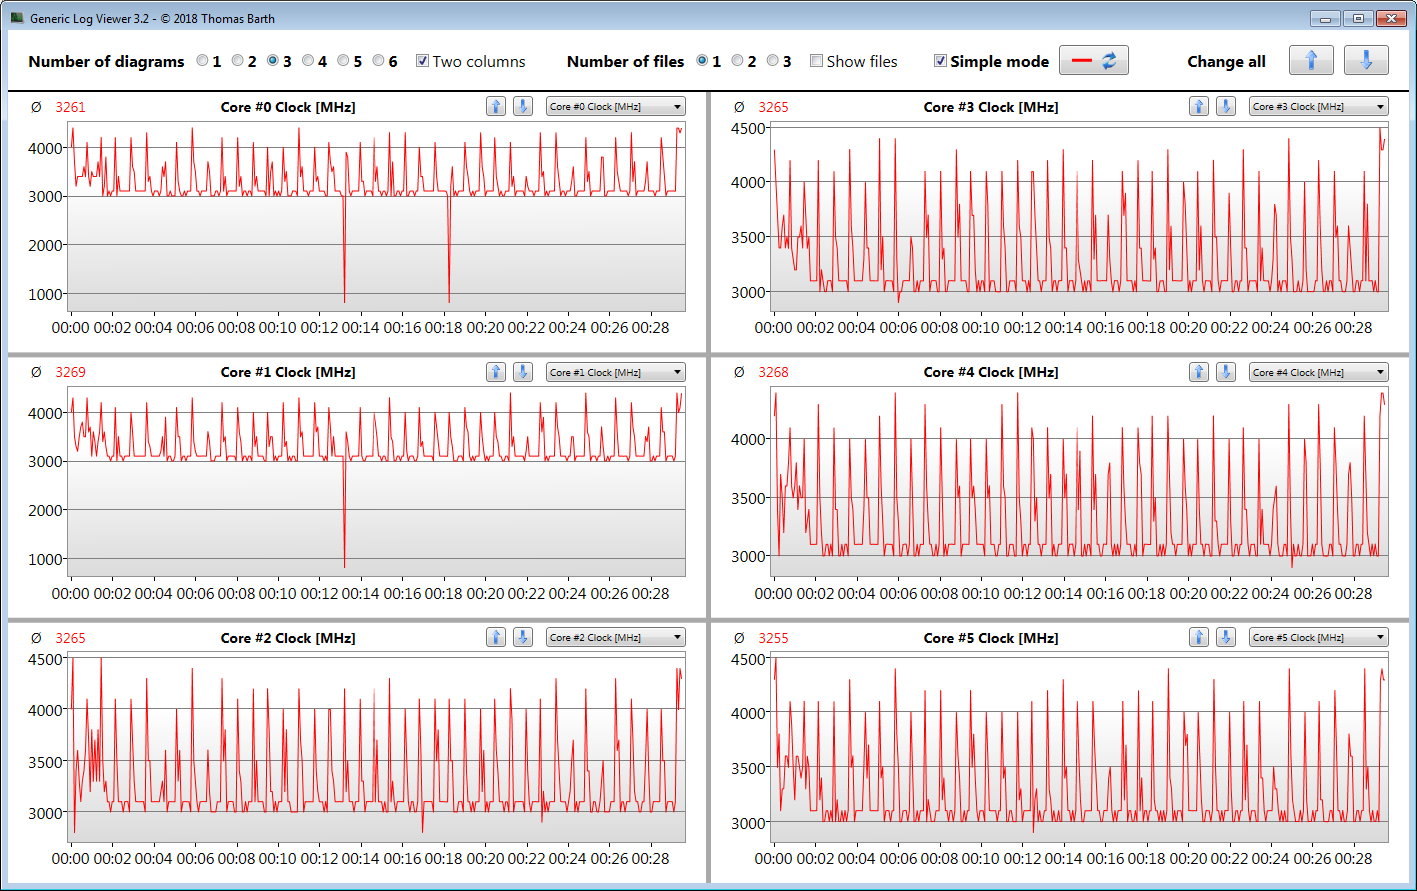
The processor runs through the multithread test of Cinebench R15 at 2.8 to 3.8 GHz. The single-thread test runs at 4.0 to 4.4 GHz. If we activate the Enthusiast or Overboost profile in the Control Center, the clock speeds turn out slightly higher. So far for the behavior in mains operation. In battery operation, the speeds are 2.6 GHz (multithread) and 2 to 4.3 GHz (single-thread).
We evaluate whether the CPU Turbo is also used constantly in mains operation by running the multithread test of Cinebench R15 in a constant loop for at least 30 minutes. From the first to the fourth run, the results drop by about 10% and then remain on a constant level. This places the Core 17 behind the other competitors that are also equipped with hexa-core processor. Only the XMG Neo 17 delivers values that are even worse.
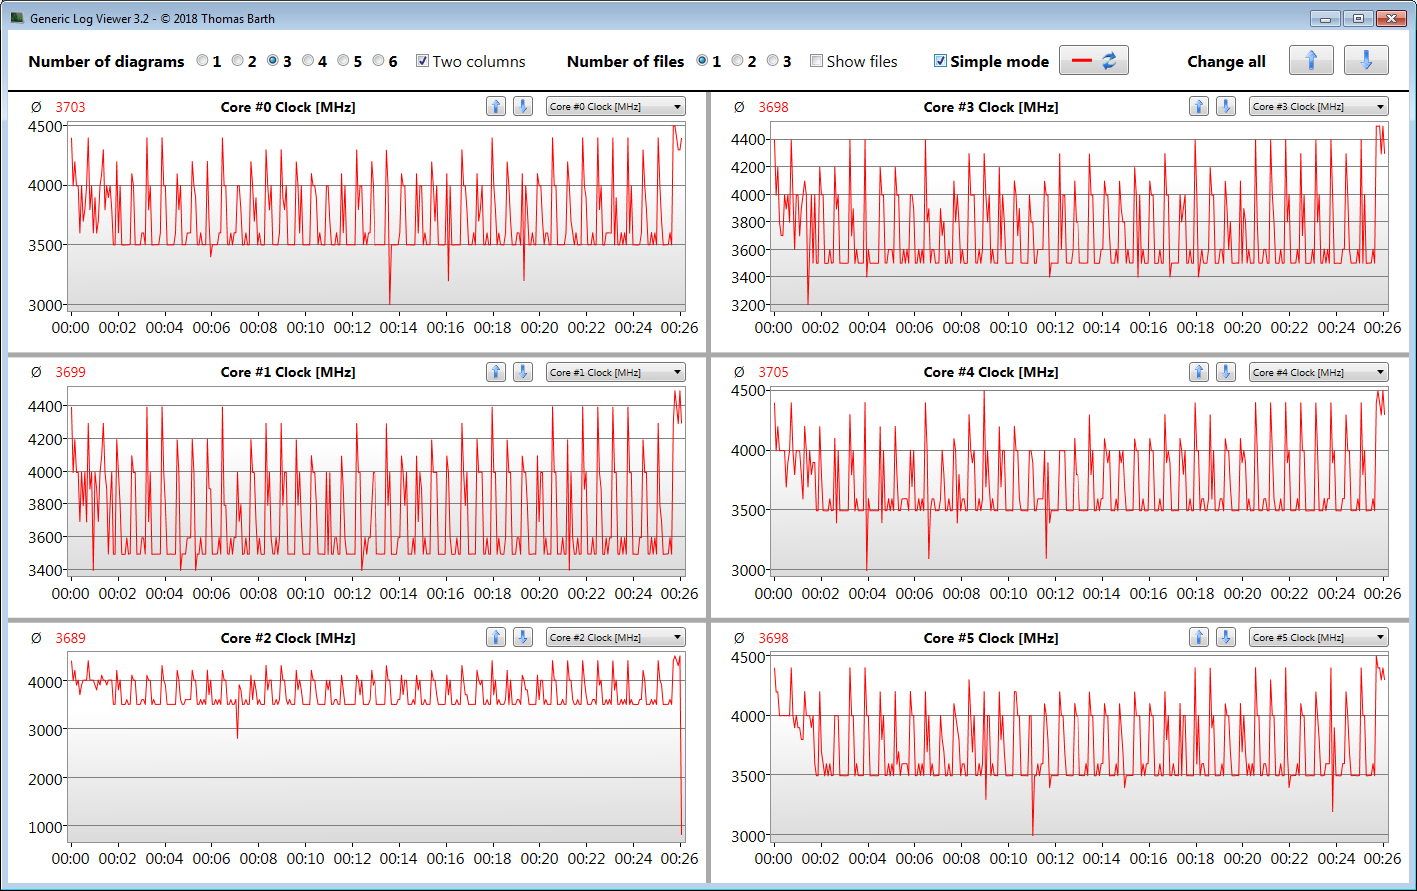
On the other hand, when the Enthusiast or Overboost profiles are activated, the Core 17 is able to jump ahead significantly - and the same also goes for the Neo 17. We were unable to determine a difference between the Overboost and Enthusiast profiles, and the results in the CB15 loop are at the same level.
| Cinebench R15 | |
| CPU Single 64Bit | |
| Average of class Gaming (188.8 - 343, n=109, last 2 years) | |
| MSI GP75 Leopard 9SD | |
| Schenker XMG Core 17 | |
| Schenker XMG Core 17 (Overboost-Profil) | |
| Schenker XMG Core 17 (Enthusiast-Profil) | |
| Schenker XMG Neo 17 | |
| Lenovo Legion Y730-17ICH, i7-8750H | |
| Gigabyte Sabre 17-W8 | |
| Dell G7 17 7790 | |
| CPU Multi 64Bit | |
| Average of class Gaming (1578 - 6271, n=108, last 2 years) | |
| Schenker XMG Core 17 (Enthusiast-Profil) | |
| Schenker XMG Core 17 (Overboost-Profil) | |
| Lenovo Legion Y730-17ICH, i7-8750H | |
| Gigabyte Sabre 17-W8 | |
| MSI GP75 Leopard 9SD | |
| Dell G7 17 7790 | |
| Schenker XMG Core 17 | |
| Schenker XMG Neo 17 | |
| Cinebench R10 | |
| Rendering Single 32Bit | |
| Average of class Gaming (7457 - 11779, n=8, last 2 years) | |
| Schenker XMG Core 17 | |
| Rendering Multiple CPUs 32Bit | |
| Average of class Gaming (42932 - 81339, n=8, last 2 years) | |
| Schenker XMG Core 17 | |
| Cinebench R20 | |
| CPU (Single Core) | |
| Average of class Gaming (442 - 895, n=109, last 2 years) | |
| Schenker XMG Core 17 | |
| CPU (Multi Core) | |
| Average of class Gaming (4029 - 16108, n=109, last 2 years) | |
| Schenker XMG Core 17 | |
| Geekbench 3 | |
| 32 Bit Multi-Core Score | |
| Schenker XMG Core 17 | |
| 32 Bit Single-Core Score | |
| Schenker XMG Core 17 | |
| Geekbench 4.4 | |
| 64 Bit Multi-Core Score | |
| Average of class Gaming (89200 - 97490, n=2, last 2 years) | |
| Schenker XMG Core 17 | |
| 64 Bit Single-Core Score | |
| Average of class Gaming (9335 - 9492, n=2, last 2 years) | |
| Schenker XMG Core 17 | |
| Mozilla Kraken 1.1 - Total | |
| Gigabyte Sabre 17-W8 | |
| MSI GP75 Leopard 9SD | |
| Schenker XMG Core 17 (Edge 44) | |
| Average of class Gaming (391 - 590, n=104, last 2 years) | |
| Octane V2 - Total Score | |
| Average of class Gaming (93292 - 139447, n=27, last 2 years) | |
| MSI GP75 Leopard 9SD | |
| Schenker XMG Core 17 (Edge 44) | |
| Gigabyte Sabre 17-W8 | |
| JetStream 1.1 - 1.1 Total | |
| Average of class Gaming (549 - 647, n=3, last 2 years) | |
| Schenker XMG Core 17 (Edge 44) | |
| MSI GP75 Leopard 9SD | |
| Gigabyte Sabre 17-W8 | |
* ... smaller is better
System Performance
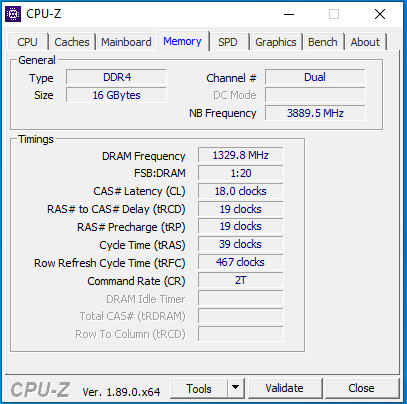
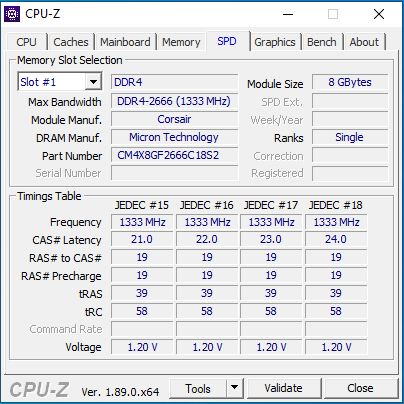
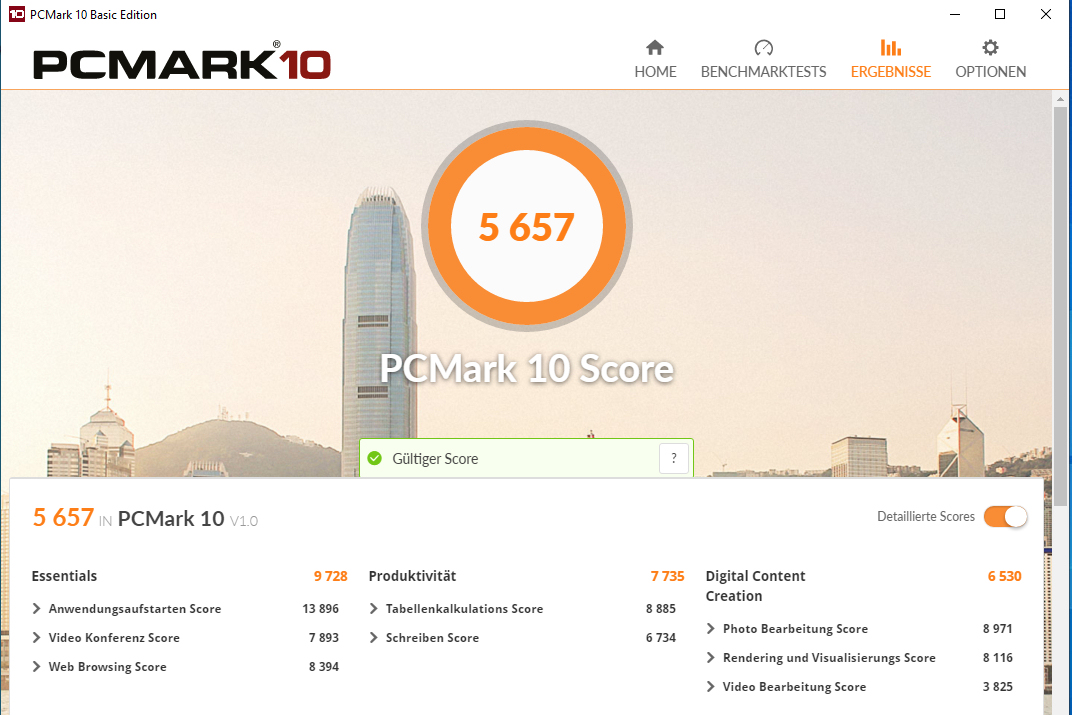
The Schenker notebook does not lack in system performance - and this also includes for the next few years. A powerful hexa-core processor, the working memory running in dual-channel mode, and a fast NVMe SSD ensure a quickly and smoothly running system. The very good results in the PCMark benchmarks attest the laptop with sufficient computing performance also for applications beyond the gaming area.
| PCMark 7 Score | 6946 points | |
| PCMark 8 Home Score Accelerated v2 | 4401 points | |
| PCMark 8 Creative Score Accelerated v2 | 4153 points | |
| PCMark 8 Work Score Accelerated v2 | 5697 points | |
| PCMark 10 Score | 5657 points | |
Help | ||
| PCMark 10 - Score | |
| Average of class Gaming (5828 - 11574, n=95, last 2 years) | |
| Schenker XMG Core 17 (Overboost-Profil) | |
| Schenker XMG Core 17 (Enthusiast-Profil) | |
| Schenker XMG Core 17 | |
| MSI GP75 Leopard 9SD | |
| Schenker XMG Neo 17 | |
| Dell G7 17 7790 | |
| Gigabyte Sabre 17-W8 | |
| Lenovo Legion Y730-17ICH, i7-8750H | |
Storage Solution
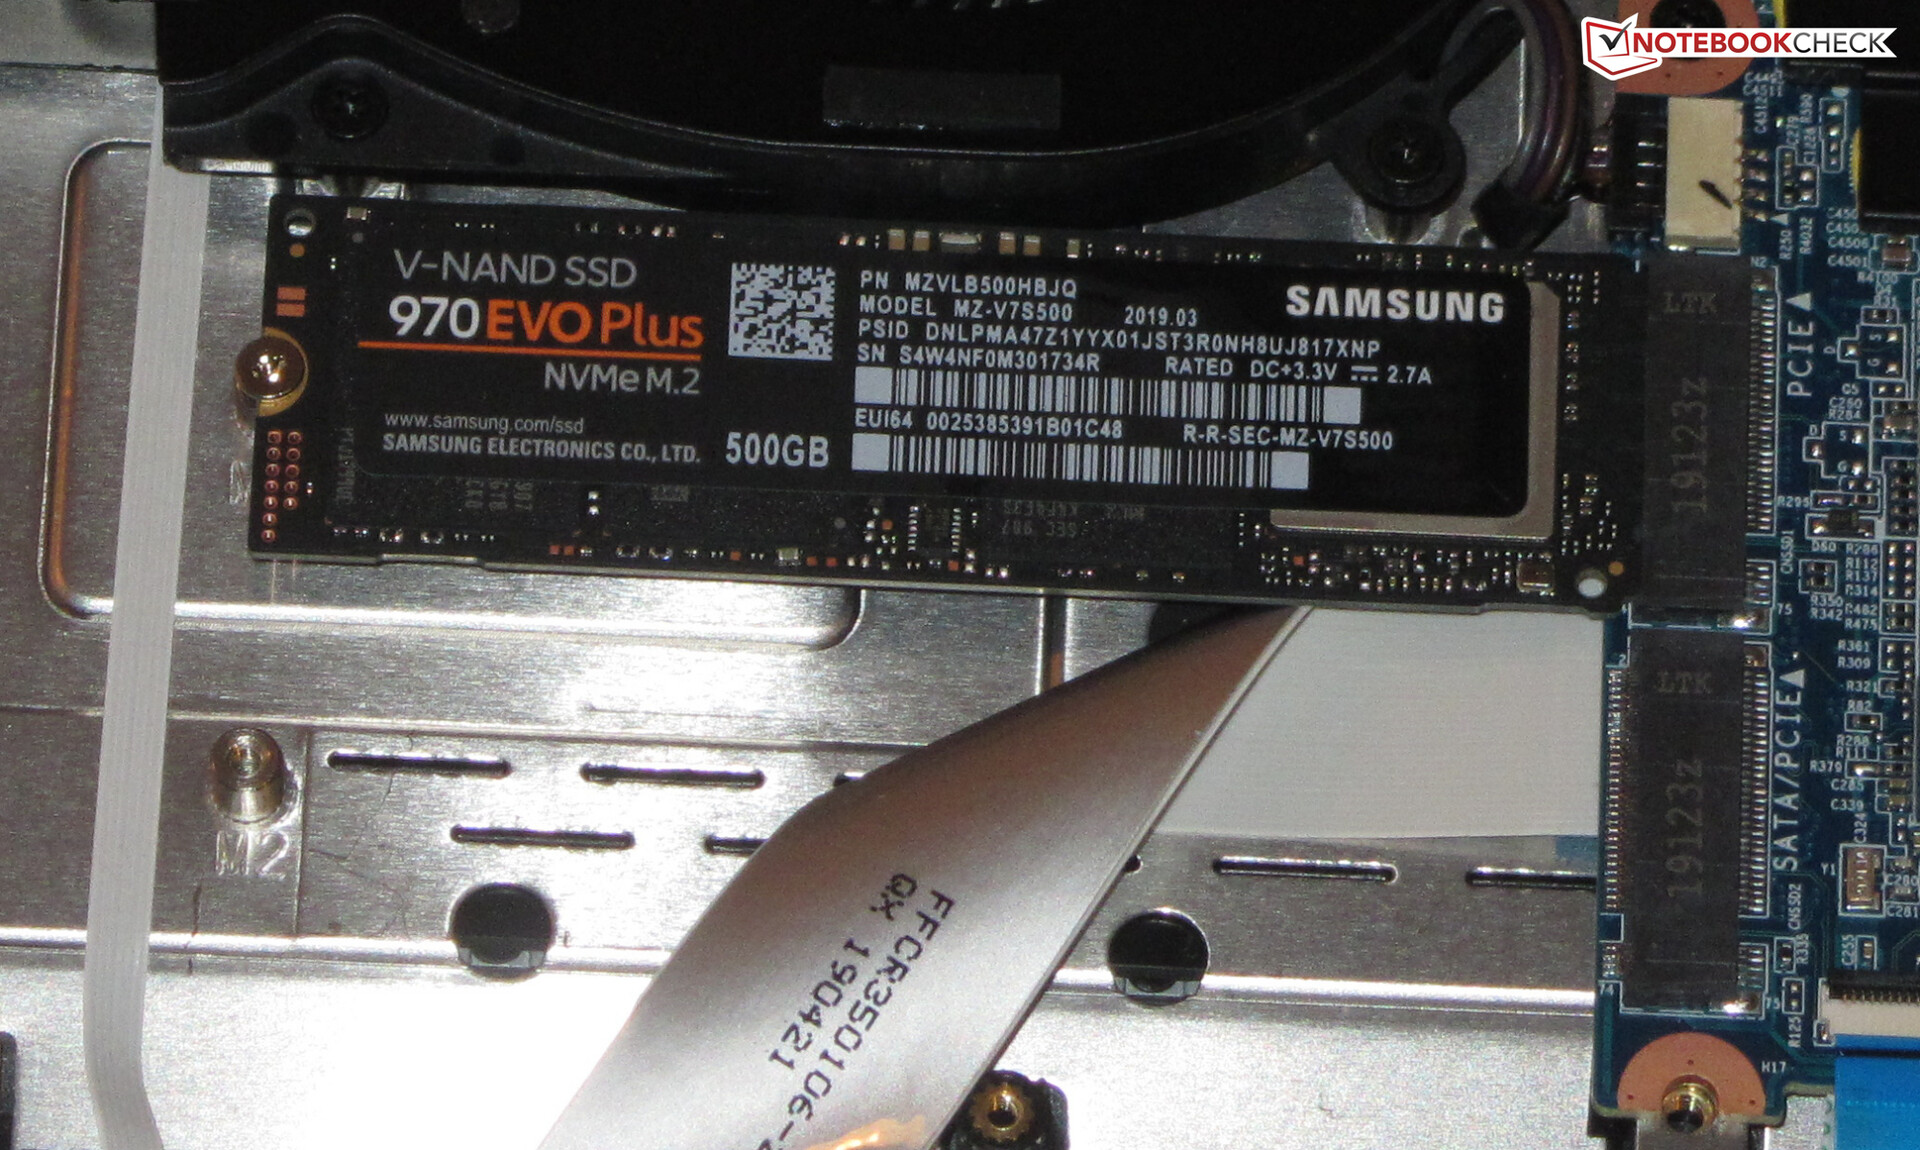
An NVMe SSD from Samsung serves as the system drive. This is a model in the M.2-2280 format that offers 500 GB of storage space. In the state of delivery, about 431 GB of that is still available to the user. The remaining storage space is used up by the recovery partition and the Windows installation. Thanks to its connection via PCI Express, the SSD delivers outstanding transfer rates. In NVMe storage media, the transfer rates turn out significantly higher than in SATA-III models (max. 600 MB/s).
Inside the notebook, there is also a second, unused M.2-2280 slot. While both slots can run NVMe SSDs, the unoccupied slot additionally supports SATA-III models. If two NVMe models are used, you can configure a RAID array (0 or 1). However, this is still not the end of it, and the Core 17 also offers space for a 2.5-inch hard drive.

| Schenker XMG Core 17 Samsung SSD 970 EVO Plus 500GB | Schenker XMG Neo 17 Samsung SSD 970 EVO Plus 1TB | Dell G7 17 7790 Toshiba BG3 KBG30ZMS256G | MSI GP75 Leopard 9SD Kingston RBUSNS8154P3256GJ1 | Gigabyte Sabre 17-W8 Toshiba NVMe THNSN5256GPU7 | Lenovo Legion Y730-17ICH, i7-8750H Toshiba KBG30ZMT128G | |
|---|---|---|---|---|---|---|
| CrystalDiskMark 5.2 / 6 | -5% | -48% | -40% | -23% | -58% | |
| Write 4K (MB/s) | 99.3 | 92.7 -7% | 78.6 -21% | 105.8 7% | 104.7 5% | 71.4 -28% |
| Read 4K (MB/s) | 38.47 | 41.4 8% | 31.89 -17% | 27.89 -28% | 37.39 -3% | 29.98 -22% |
| Write Seq (MB/s) | 1449 | 1363 -6% | 230.4 -84% | 270.8 -81% | 866 -40% | 129.6 -91% |
| Read Seq (MB/s) | 1237 | 1259 2% | 925 -25% | 879 -29% | 944 -24% | 843 -32% |
| Write 4K Q32T1 (MB/s) | 364.4 | 289.7 -20% | 159.1 -56% | 273.3 -25% | 293.3 -20% | 88.9 -76% |
| Read 4K Q32T1 (MB/s) | 421.9 | 337.5 -20% | 315.6 -25% | 361.2 -14% | 374.3 -11% | 196.4 -53% |
| Write Seq Q32T1 (MB/s) | 3276 | 3332 2% | 230.7 -93% | 253 -92% | 1064 -68% | 130.5 -96% |
| Read Seq Q32T1 (MB/s) | 3338 | 3477 4% | 1323 -60% | 1505 -55% | 2616 -22% | 1037 -69% |
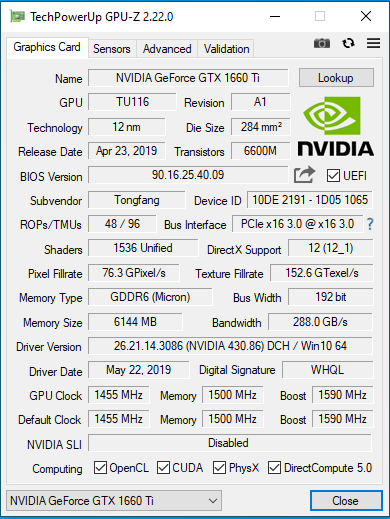
Graphics Card
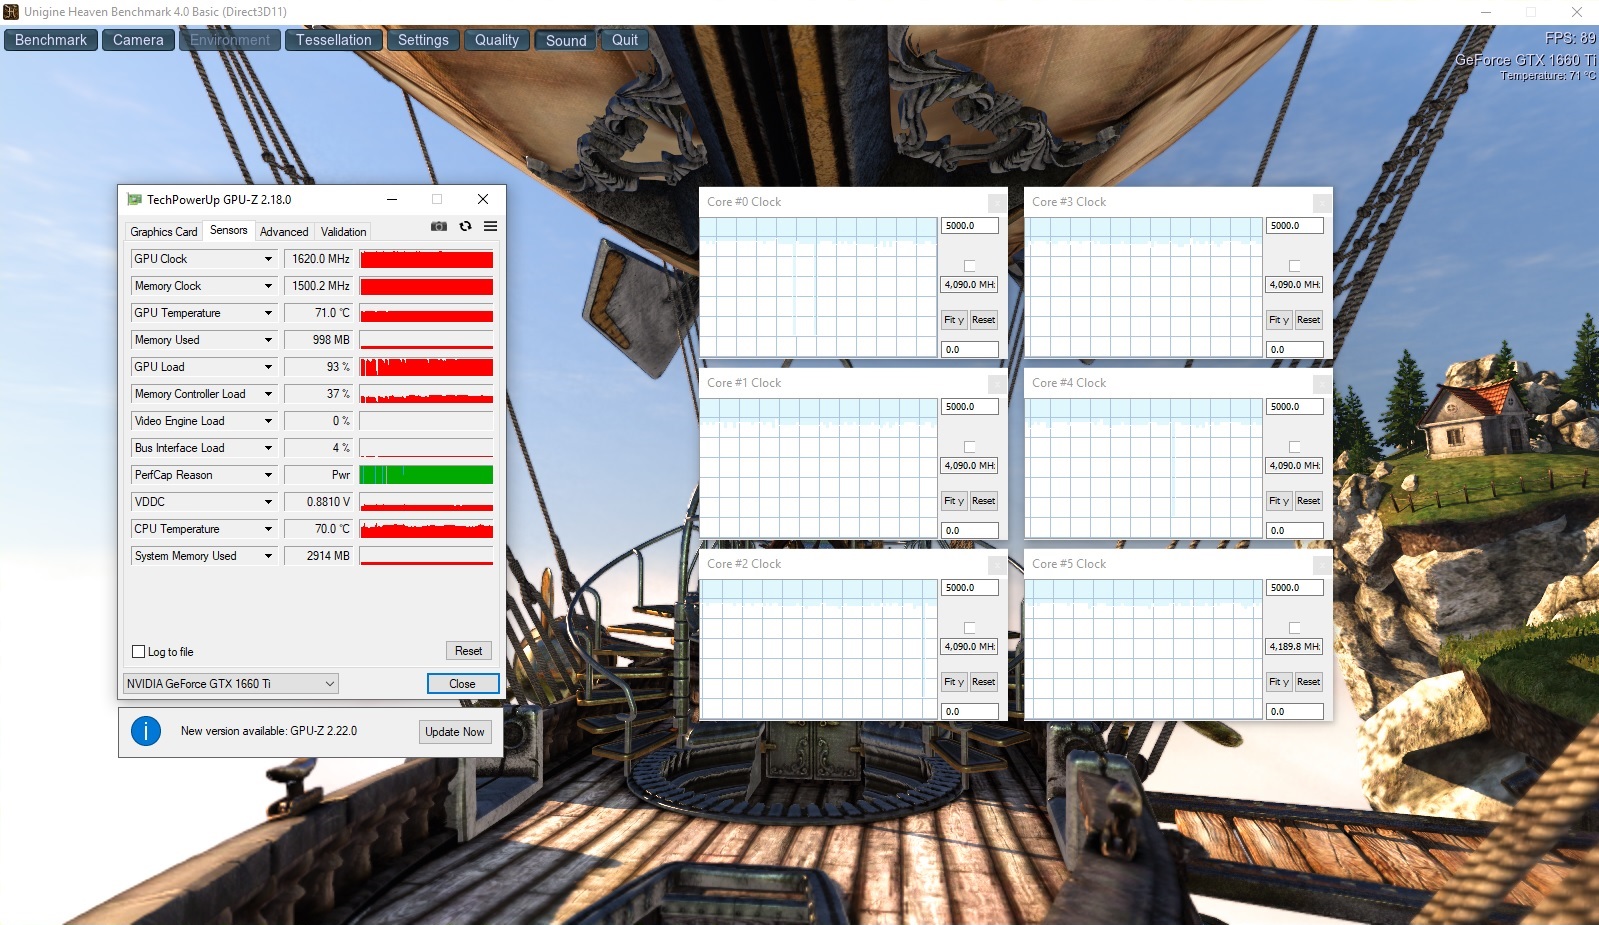
The XMG Core 17 has a GeForce GTX 1660 Ti graphics core from Nvidia on board. Alternatively, you can also get the notebook with a GeForce GTX 1650 GPU. The GTX 1660 Ti is based on the Turing architecture, but in contrast to the Turing GPUs of the RTX-2000 series, it does not offer any ray tracing or any tensor cores. The UHD Graphics 630 GPU integrated into the processor is active, and the notebook uses Nvidia's Optimus switching-graphics solution.
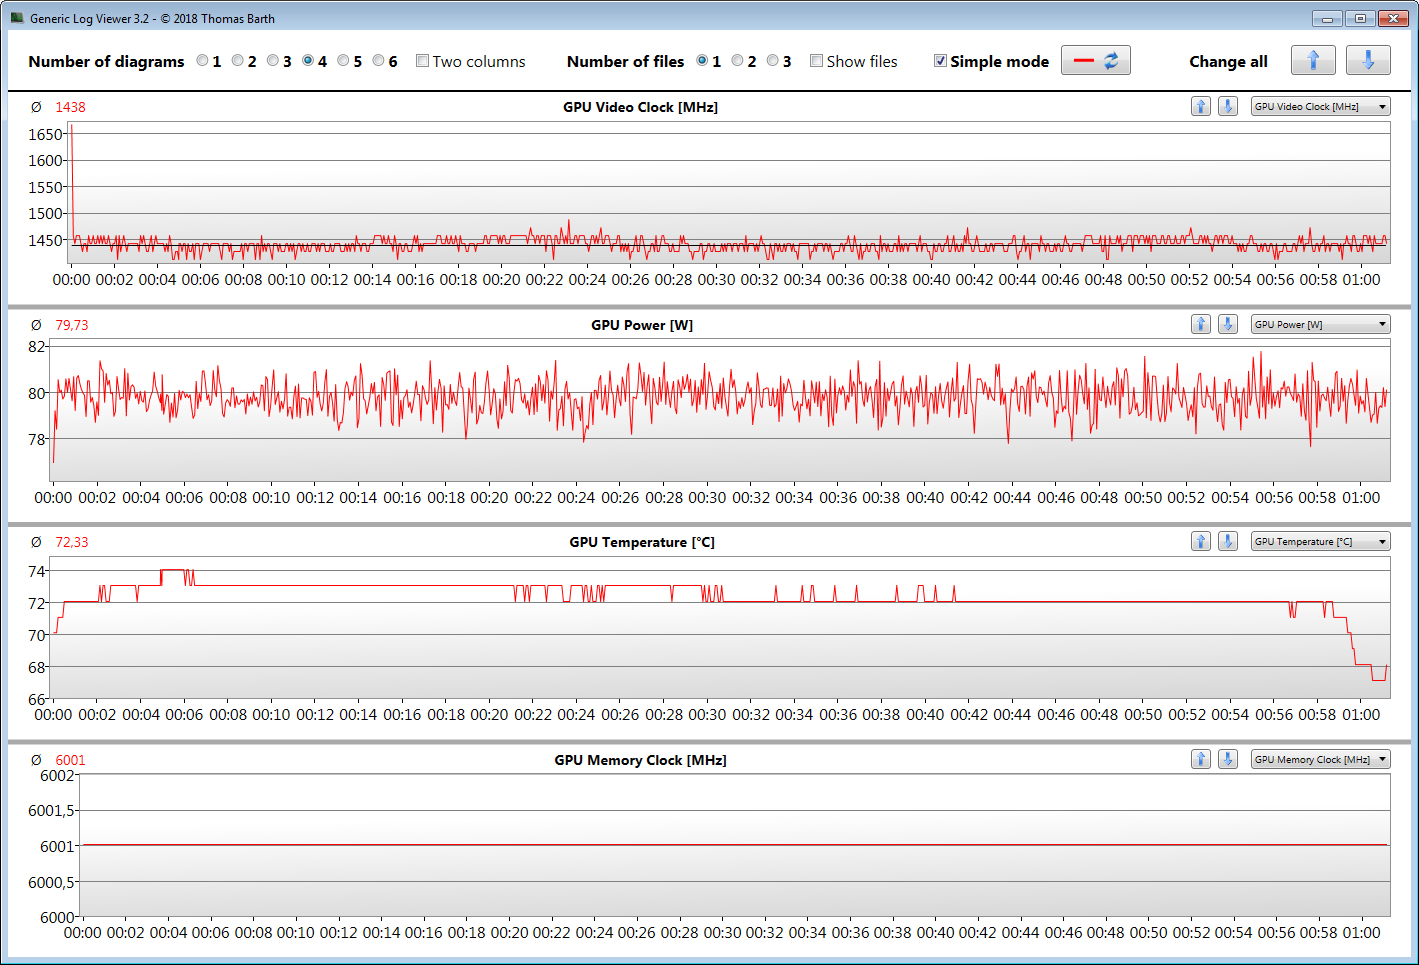
Nvidia's GPU supports DirectX 12 and runs at a basic clock speed of 1455 MHz. Via Boost, this can be increased up to 1590 MHz. But if the GPU does not exceed a set temperature or power limit, even higher speeds can be reached. For example, we measure a maximum of 1845 MHz, but this is only maintained for a short time. During our benchmarks, we measured an average operating speed of 1620 MHz. The GPU is able to use fast GDDR6 graphics storage (6.144 GB).
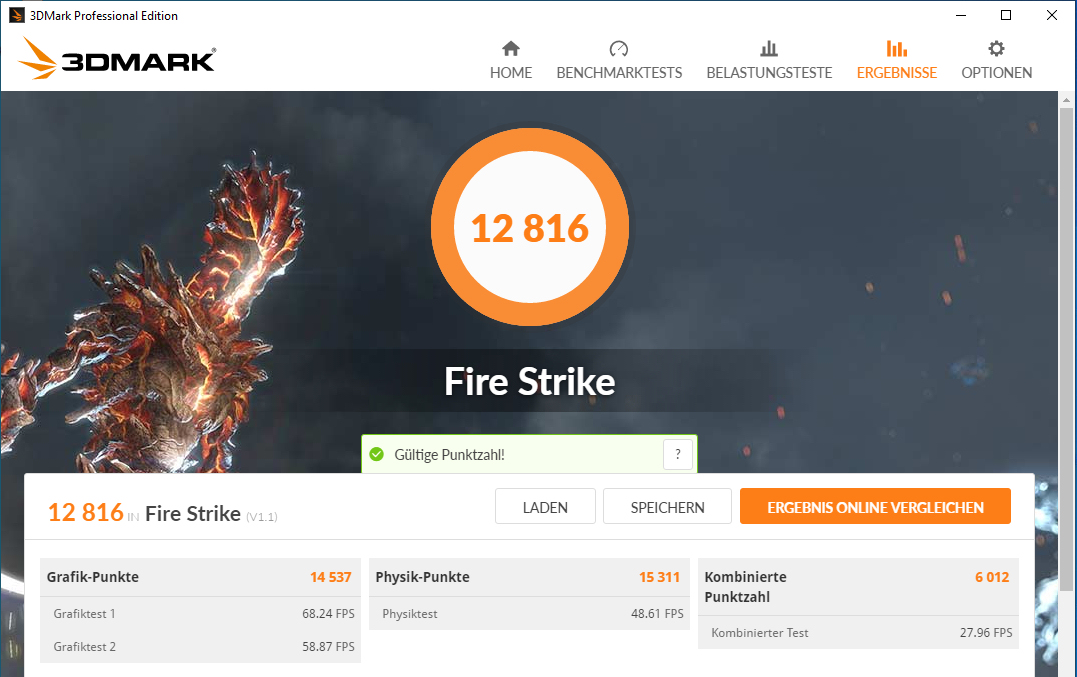
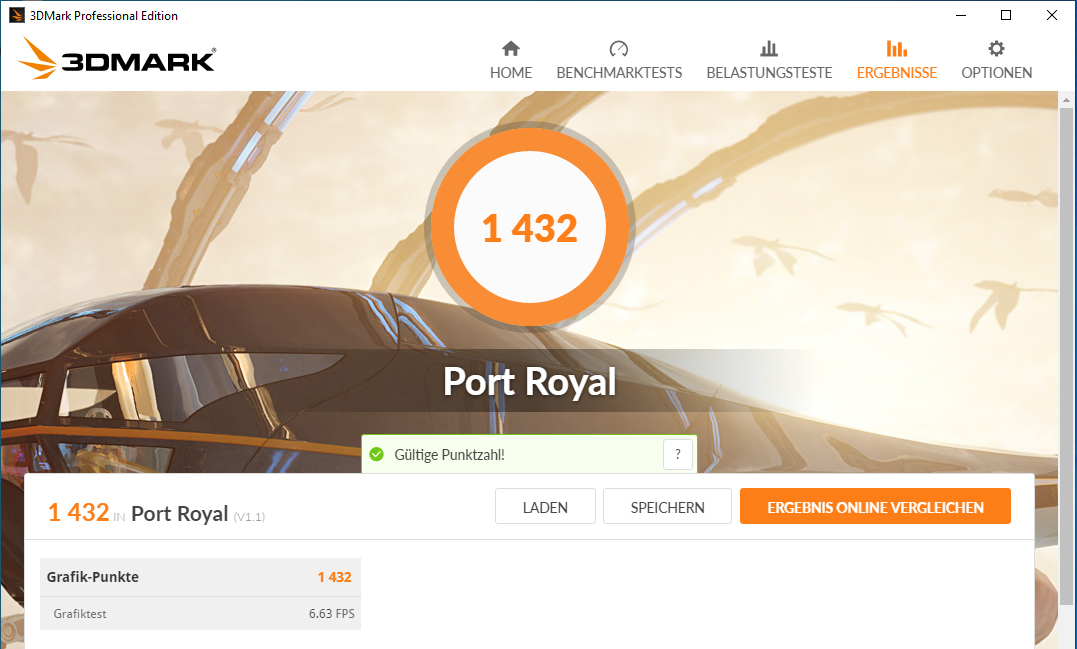
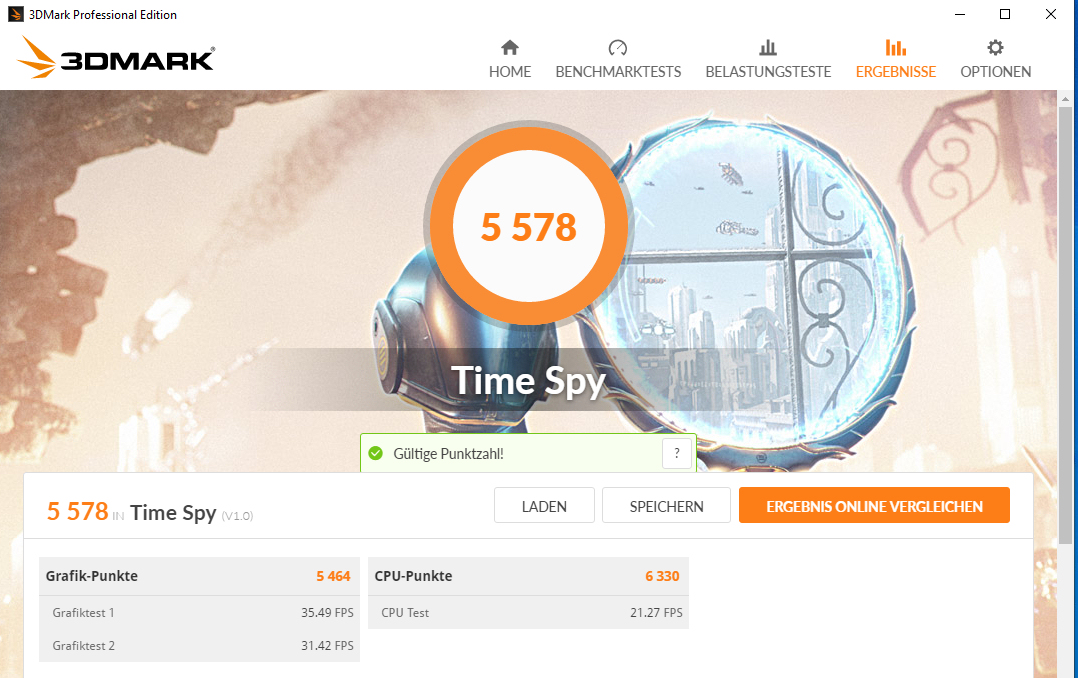
The results in the 3DMark benchmarks range at a normal level for this GPU. The GTX 1660 Ti performs better than the GTX 1060 and places just behind the GTX 1070. If the Enthusiast profile is activated in the Control Center of the notebook, the Physics performance improves. The profile has no influence on the graphics performance. We only register a slight increase in the graphics performance when the Overboost profile is activated. In battery operation, barely a quarter of the graphics performance is available.

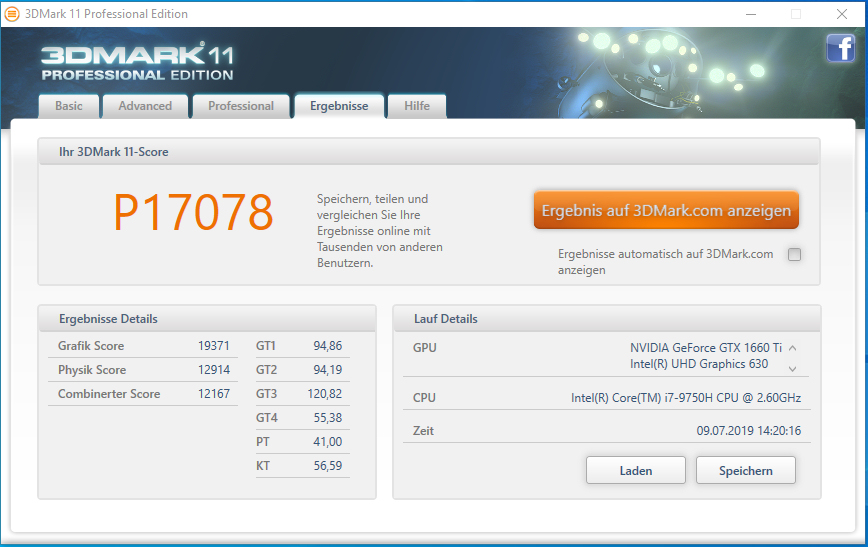

| 3DMark 06 Standard Score | 38141 points | |
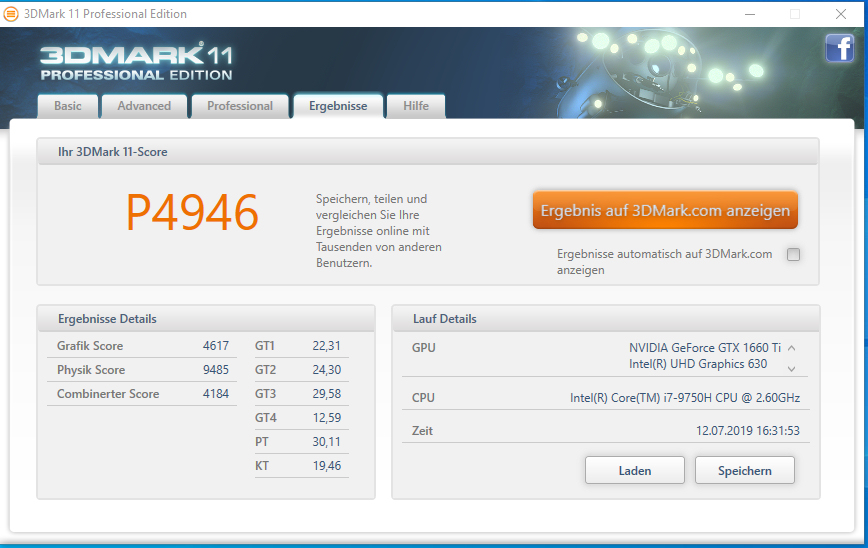
| 3DMark 11 Performance | 16657 points | |
| 3DMark Ice Storm Standard Score | 109442 points | |
| 3DMark Cloud Gate Standard Score | 34040 points | |
| 3DMark Fire Strike Score | 12816 points | |
| 3DMark Time Spy Score | 5578 points | |
Help | ||
| 3DMark 11 - 1280x720 Performance GPU | |
| Average of class Gaming (21841 - 80022, n=106, last 2 years) | |
| Schenker XMG Neo 17 | |
| Dell G7 17 7790 | |
| Schenker XMG Core 17 (Overboost-Profil) | |
| MSI GP75 Leopard 9SD | |
| Schenker XMG Core 17 (Enthusiast-Profil) | |
| Schenker XMG Core 17 | |
| Gigabyte Sabre 17-W8 | |
| 3DMark | |
| 1280x720 Cloud Gate Standard Graphics | |
| Average of class Gaming (86886 - 223650, n=62, last 2 years) | |
| Schenker XMG Neo 17 | |
| MSI GP75 Leopard 9SD | |
| Schenker XMG Core 17 | |
| Dell G7 17 7790 | |
| Gigabyte Sabre 17-W8 | |
| Lenovo Legion Y730-17ICH, i7-8750H | |
| 1920x1080 Fire Strike Graphics | |
| Average of class Gaming (12242 - 62849, n=118, last 2 years) | |
| Schenker XMG Neo 17 | |
| Dell G7 17 7790 | |
| Schenker XMG Core 17 (Overboost-Profil) | |
| MSI GP75 Leopard 9SD | |
| Schenker XMG Core 17 | |
| Schenker XMG Core 17 (Enthusiast-Profil) | |
| Gigabyte Sabre 17-W8 | |
| Lenovo Legion Y730-17ICH, i7-8750H | |
| 2560x1440 Time Spy Graphics | |
| Average of class Gaming (5012 - 26212, n=118, last 2 years) | |
| Dell G7 17 7790 | |
| Schenker XMG Core 17 (Overboost-Profil) | |
| MSI GP75 Leopard 9SD | |
| Schenker XMG Core 17 | |
| Schenker XMG Core 17 (Enthusiast-Profil) | |
Gaming Performance
It is not surprising that as a gaming notebook, the XMG Core 17 is able to bring all the games that are in our database smoothly to the screen. Generally, Full HD resolution and high to maximum quality settings can be used. However, the GPU can only handle resolutions beyond Full HD (an external monitor would also be necessary) to a limited extent. If you use the corresponding resolutions, you should not be too optimistic in the choice of your quality settings.
A brief test of the Overboost profile leaves a mixed impression. While the frame rates of the F1 2019 game are slightly increased in two of the four settings we tried, the frame rates in Far Cry: New Dawn are slightly lower than with the Balanced profile activated.
| The Witcher 3 - 1920x1080 Ultra Graphics & Postprocessing (HBAO+) | |
| Average of class Gaming (95 - 240, n=7, last 2 years) | |
| Dell G7 17 7790 | |
| MSI GP75 Leopard 9SD | |
| Schenker XMG Core 17 | |
| Lenovo Legion Y730-17ICH, i7-8750H | |
| Gigabyte Sabre 17-W8 | |
| BioShock Infinite - 1920x1080 Ultra Preset, DX11 (DDOF) | |
| MSI GP75 Leopard 9SD | |
| Schenker XMG Core 17 | |
| Dell G7 17 7790 | |
| Lenovo Legion Y730-17ICH, i7-8750H | |
| Rage 2 - 1920x1080 Ultra Preset (Resolution Scale Off) | |
| Schenker XMG Core 17 | |
| Far Cry New Dawn - 1920x1080 Ultra Preset | |
| Schenker XMG Core 17 | |
| Schenker XMG Core 17 (Overboost-Profil) | |
| Anno 1800 - 1920x1080 Ultra Graphics Quality (DX11) | |
| Average of class Gaming (n=1last 2 years) | |
| Schenker XMG Core 17 | |
| MSI GP75 Leopard 9SD | |
| For Honor - 1920x1080 Extreme Preset AA:T AF:16x | |
| Schenker XMG Core 17 | |
| F1 2019 - 1920x1080 Ultra High Preset AA:T AF:16x | |
| Schenker XMG Core 17 (Overboost-Profil) | |
| Schenker XMG Core 17 | |
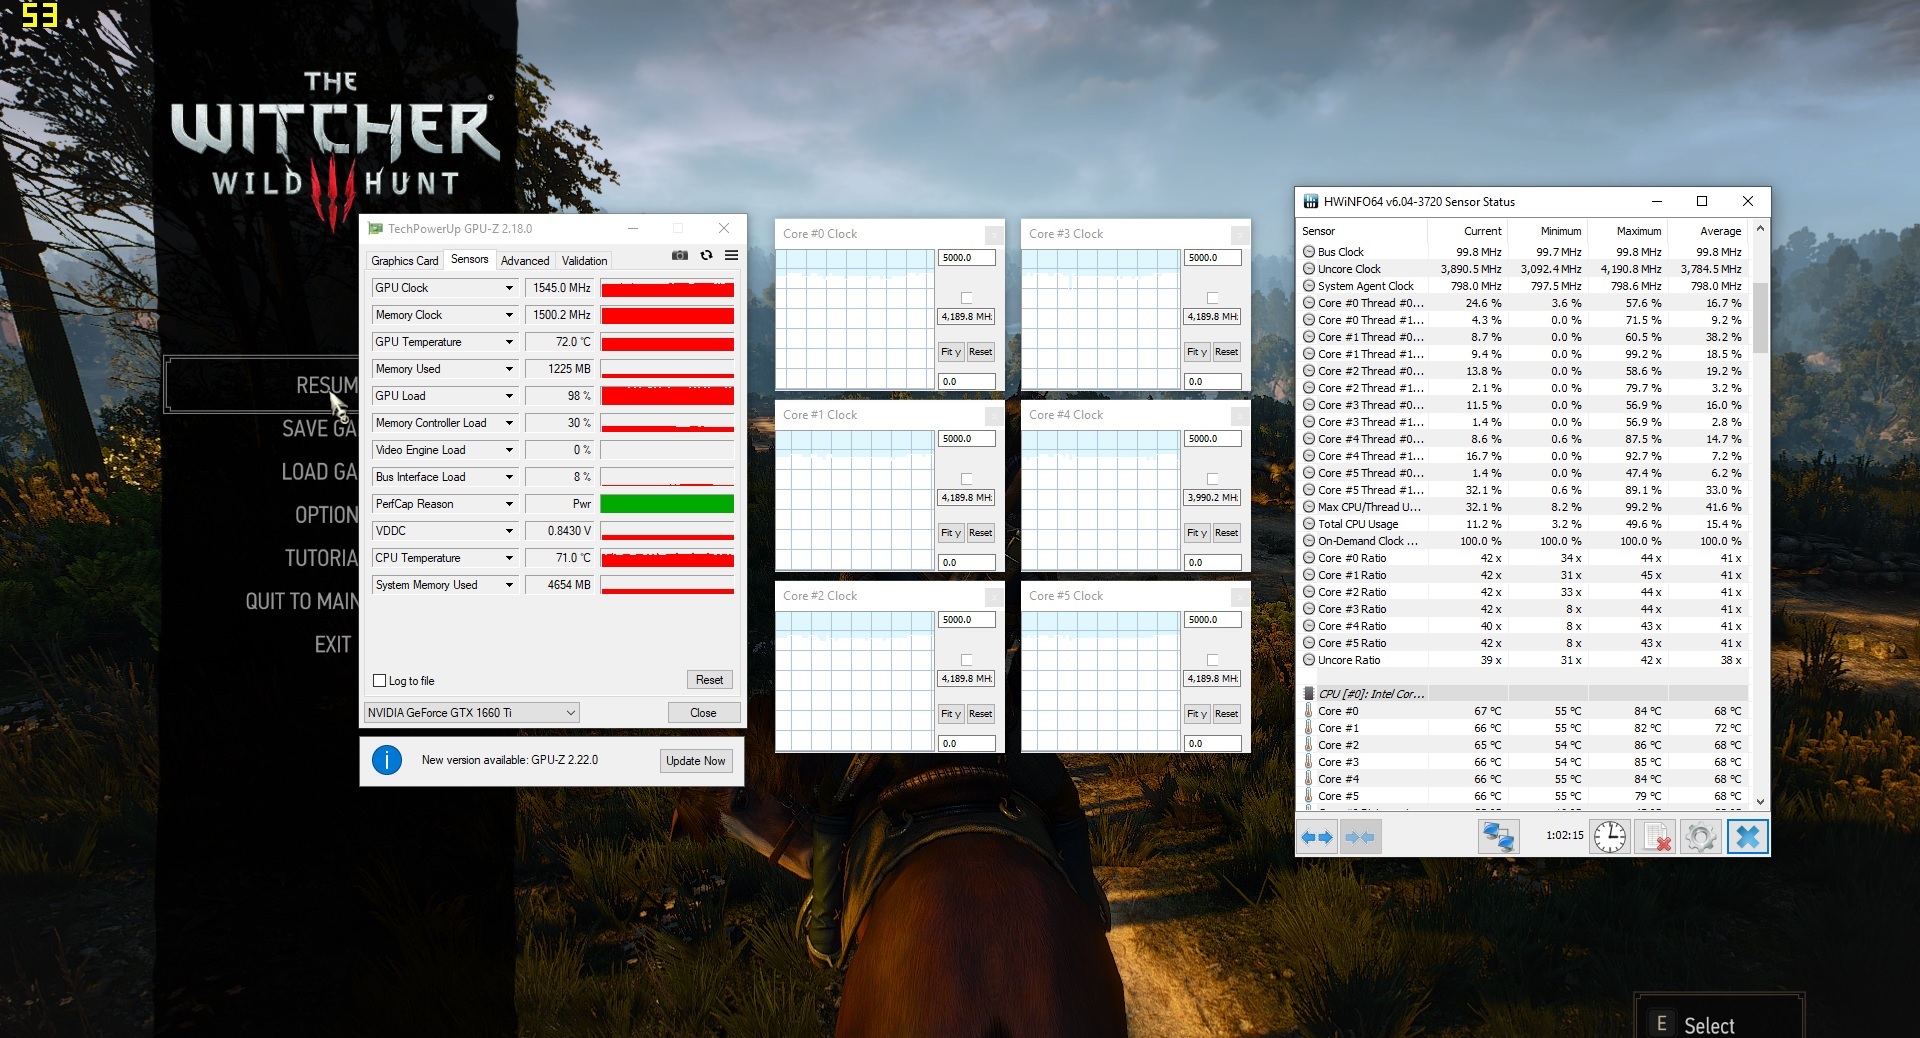
In order to evaluate whether the frame rates also remain to a large extent constant over a longer time period, we run the game The Witcher 3 for about 60 minutes at Full HD resolution and maximum quality settings. During this whole time, the main playable character is not moved. The frame rates consistently remain at a constant level within a range that is clearly playable. We did not notice any drop in the performance.
| low | med. | high | ultra | |
|---|---|---|---|---|
| BioShock Infinite (2013) | 304.3 | 271.6 | 248.7 | 136.2 |
| The Witcher 3 (2015) | 258.9 | 163.9 | 102.6 | 53.3 |
| For Honor (2017) | 237.2 | 128.6 | 121.5 | 93.1 |
| Final Fantasy XV Benchmark (2018) | 120.9 | 79.9 | 57.2 | |
| Far Cry 5 (2018) | 119 | 93 | 88 | 83 |
| Far Cry New Dawn (2019) | 109 | 90 | 86 | 78 |
| Anno 1800 (2019) | 94.6 | 89.6 | 69.2 | 39.6 |
| Rage 2 (2019) | 175.1 | 83.3 | 69.9 | 68.8 |
| F1 2019 (2019) | 181 | 144 | 122 | 92 |
Emissions - The Core 17 warms up only moderately
Noise Emissions
During idle operation, the Core 17 produces only little noise. Most of the time, the fans run at low speeds and are hardly noticeable. Occasionally they rev up slightly more, and from time to time they stop. Understandably, they rev up considerably under load. During the stress test, we measure a noise level of 51 dB(A). During gaming operation it does not get quite as loud, and while running our The Witcher 3 test, the Schenker notebook reaches a noise level of 48 dB(A).
Noise level
| Idle |
| 30 / 32 / 35 dB(A) |
| Load |
| 47 / 51 dB(A) |
 | ||
30 dB silent 40 dB(A) audible 50 dB(A) loud |
||
min: | ||
| Schenker XMG Core 17 i7-9750H, GeForce GTX 1660 Ti Mobile | Schenker XMG Neo 17 i7-8750H, GeForce RTX 2070 Mobile | Dell G7 17 7790 i7-8750H, GeForce RTX 2070 Max-Q | MSI GP75 Leopard 9SD i7-9750H, GeForce GTX 1660 Ti Mobile | Gigabyte Sabre 17-W8 i7-8750H, GeForce GTX 1060 Mobile | Lenovo Legion Y730-17ICH, i7-8750H i7-8750H, GeForce GTX 1050 Ti Mobile | Average of class Gaming | |
|---|---|---|---|---|---|---|---|
| Noise | 4% | 10% | -5% | 2% | 12% | 11% | |
| off / environment * (dB) | 30 | 29 3% | 28.2 6% | 29 3% | 30.5 -2% | 28 7% | 24.1 ? 20% |
| Idle Minimum * (dB) | 30 | 29 3% | 28.6 5% | 29 3% | 32.1 -7% | 28 7% | 25.9 ? 14% |
| Idle Average * (dB) | 32 | 32 -0% | 28.6 11% | 34 -6% | 32.1 -0% | 28 12% | 27.5 ? 14% |
| Idle Maximum * (dB) | 35 | 33 6% | 28.6 18% | 37 -6% | 32.3 8% | 31.3 11% | 30 ? 14% |
| Load Average * (dB) | 47 | 42 11% | 31.8 32% | 53 -13% | 42.9 9% | 33.4 29% | 43 ? 9% |
| Witcher 3 ultra * (dB) | 48 | 49 -2% | 50.6 -5% | 51 -6% | 42.8 11% | ||
| Load Maximum * (dB) | 51 | 49 4% | 50.8 -0% | 55 -8% | 48.8 4% | 46.2 9% | 54.2 ? -6% |
* ... smaller is better
Temperature
The XMG Core 17 runs through our stress test (Prime95 and FurMark running for at least one hour) in different ways in mains and in battery operation. In mains operation, the processor runs at 3 to 3.1 GHz and the graphics core at 1215 MHz. In battery operation, the clock speeds are at 1.8 GHz (CPU) and 300 MHz (GPU). The stress test represents an extreme scenario that does not occur like that in everyday operation. We use this test to evaluate whether the system also remains stable during full loads.
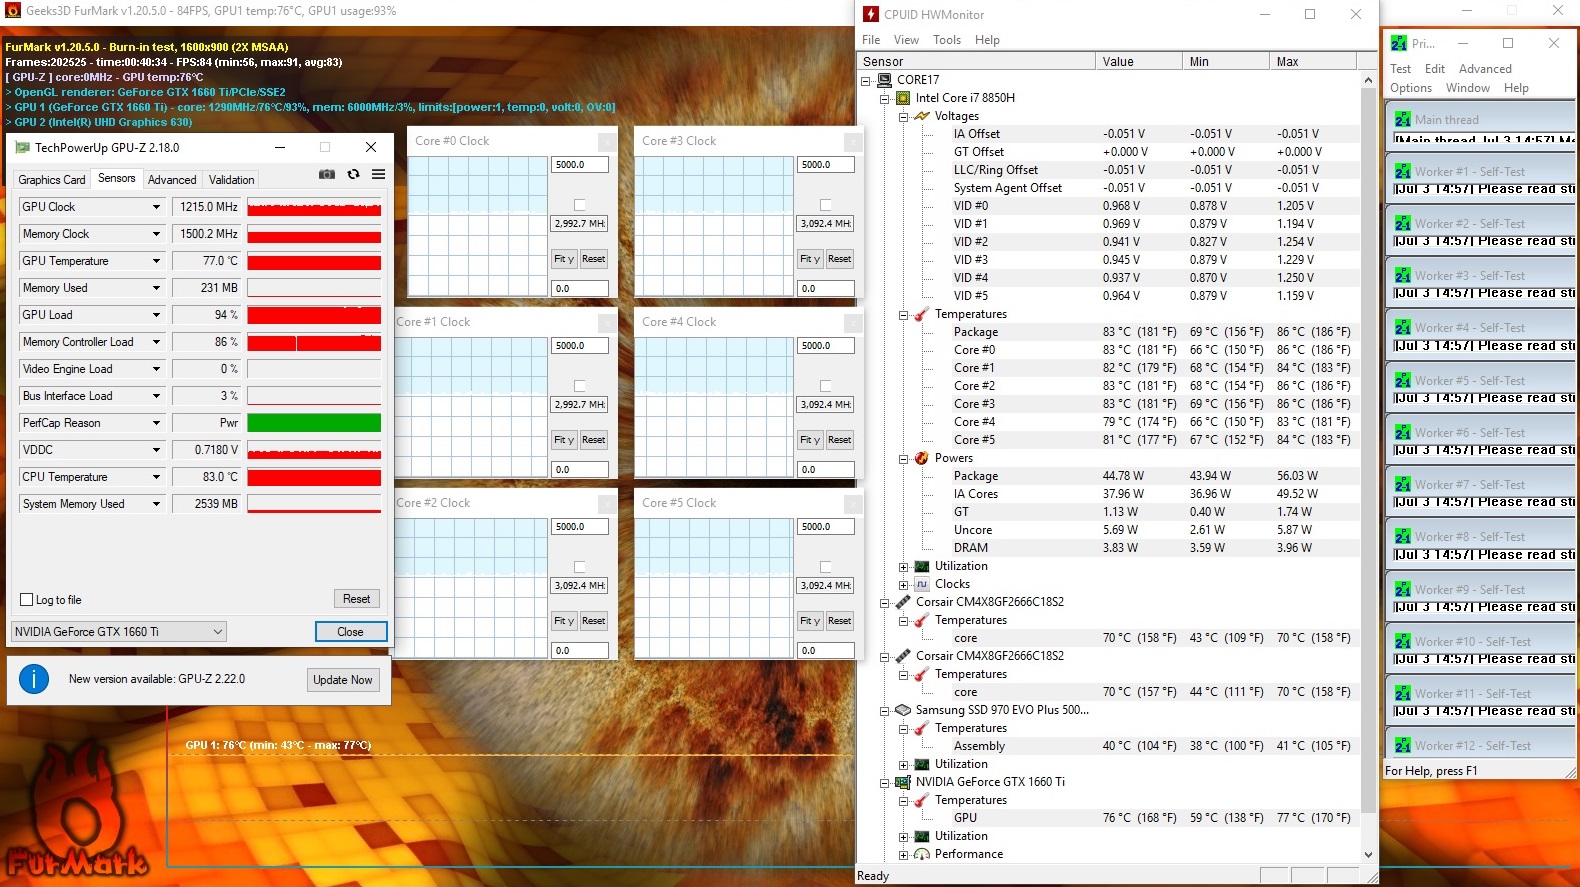
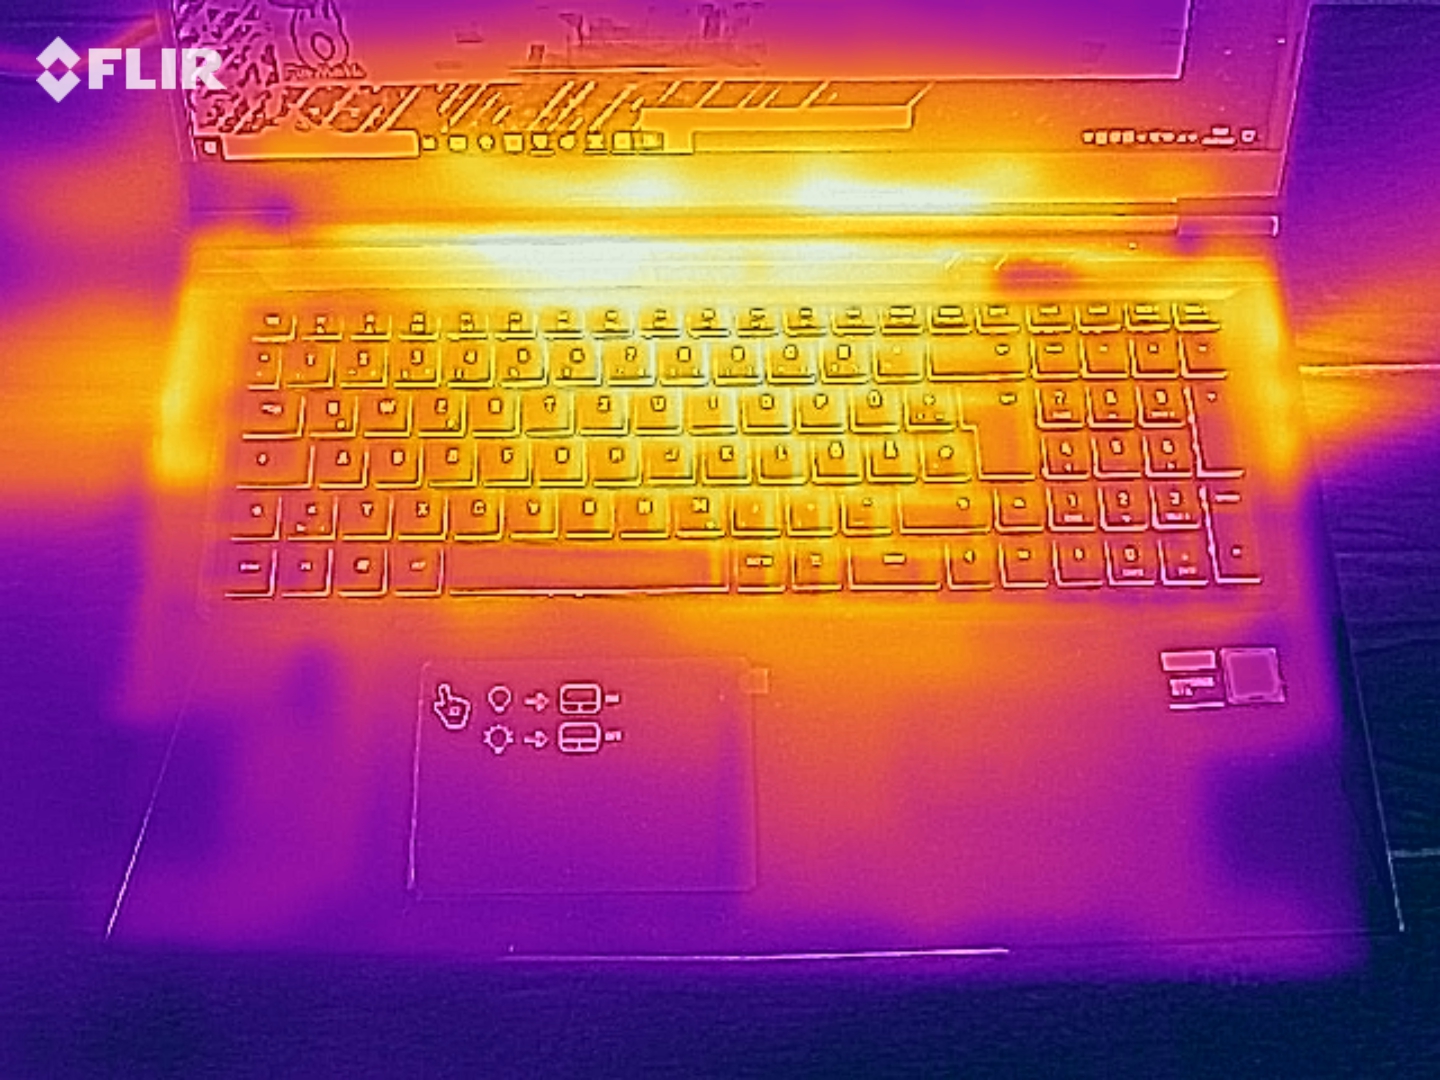
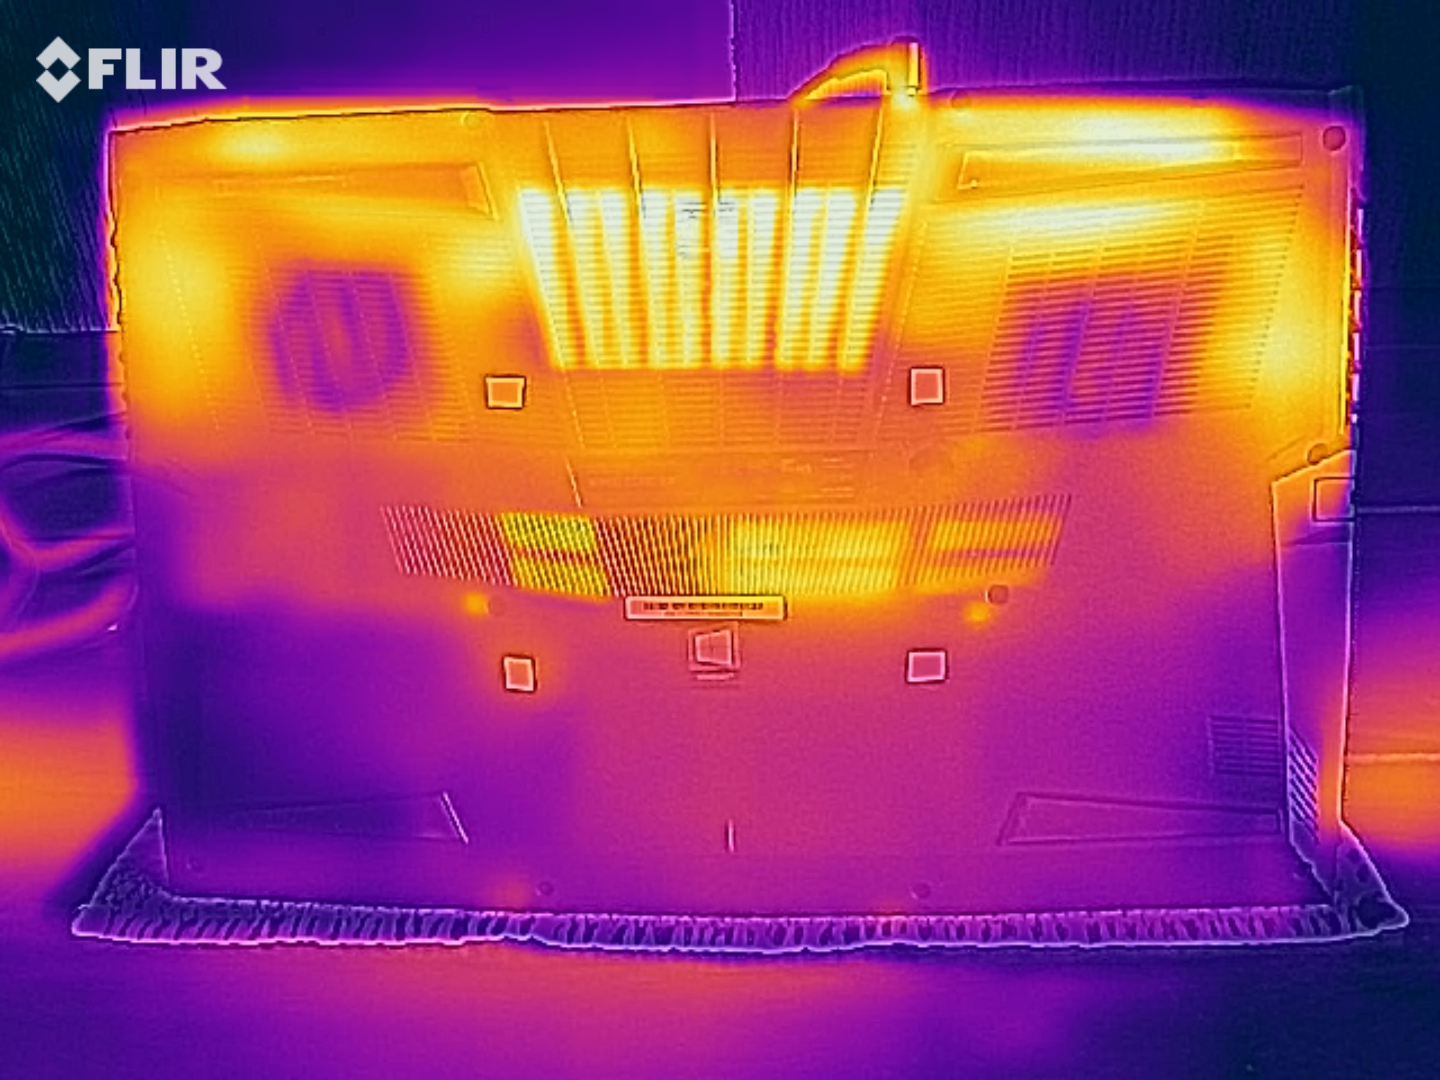
The Core 17 scores with warming that remains moderate overall for a gaming notebook. During the stress test, we measure temperatures between 30 and 50 °C (86-122 °F) at various measurement points. Values beyond 50 or 60 °C (122-140 °F) would not be unusual. The warming turns out even slightly lower while running our The Witcher 3 test (the game runs for one hour in Full HD resolution and at maximum quality settings), where the temperatures always remain significantly below the 50-°C mark (122 °F). However, you still should not place the notebook on your lap. The case temperatures would only allow doing this in everyday operation.
(-) The maximum temperature on the upper side is 47 °C / 117 F, compared to the average of 40.4 °C / 105 F, ranging from 21.2 to 68.8 °C for the class Gaming.
(-) The bottom heats up to a maximum of 50 °C / 122 F, compared to the average of 43.2 °C / 110 F
(+) In idle usage, the average temperature for the upper side is 30.7 °C / 87 F, compared to the device average of 33.9 °C / 93 F.
(-) Playing The Witcher 3, the average temperature for the upper side is 38.7 °C / 102 F, compared to the device average of 33.9 °C / 93 F.
(+) The palmrests and touchpad are reaching skin temperature as a maximum (35 °C / 95 F) and are therefore not hot.
(-) The average temperature of the palmrest area of similar devices was 28.8 °C / 83.8 F (-6.2 °C / -11.2 F).
| Schenker XMG Core 17 i7-9750H, GeForce GTX 1660 Ti Mobile | Schenker XMG Neo 17 i7-8750H, GeForce RTX 2070 Mobile | Dell G7 17 7790 i7-8750H, GeForce RTX 2070 Max-Q | MSI GP75 Leopard 9SD i7-9750H, GeForce GTX 1660 Ti Mobile | Gigabyte Sabre 17-W8 i7-8750H, GeForce GTX 1060 Mobile | Lenovo Legion Y730-17ICH, i7-8750H i7-8750H, GeForce GTX 1050 Ti Mobile | Average of class Gaming | |
|---|---|---|---|---|---|---|---|
| Heat | 3% | -6% | 8% | 18% | 1% | 2% | |
| Maximum Upper Side * (°C) | 47 | 47 -0% | 46.6 1% | 45 4% | 35 26% | 42 11% | 45.2 ? 4% |
| Maximum Bottom * (°C) | 50 | 56 -12% | 57 -14% | 42 16% | 34.3 31% | 51.2 -2% | 48.2 ? 4% |
| Idle Upper Side * (°C) | 34 | 28 18% | 34.4 -1% | 30 12% | 30.1 11% | 31.8 6% | 31 ? 9% |
| Idle Bottom * (°C) | 32 | 30 6% | 34.6 -8% | 32 -0% | 30.5 5% | 35.4 -11% | 34.4 ? -8% |
* ... smaller is better
Speakers
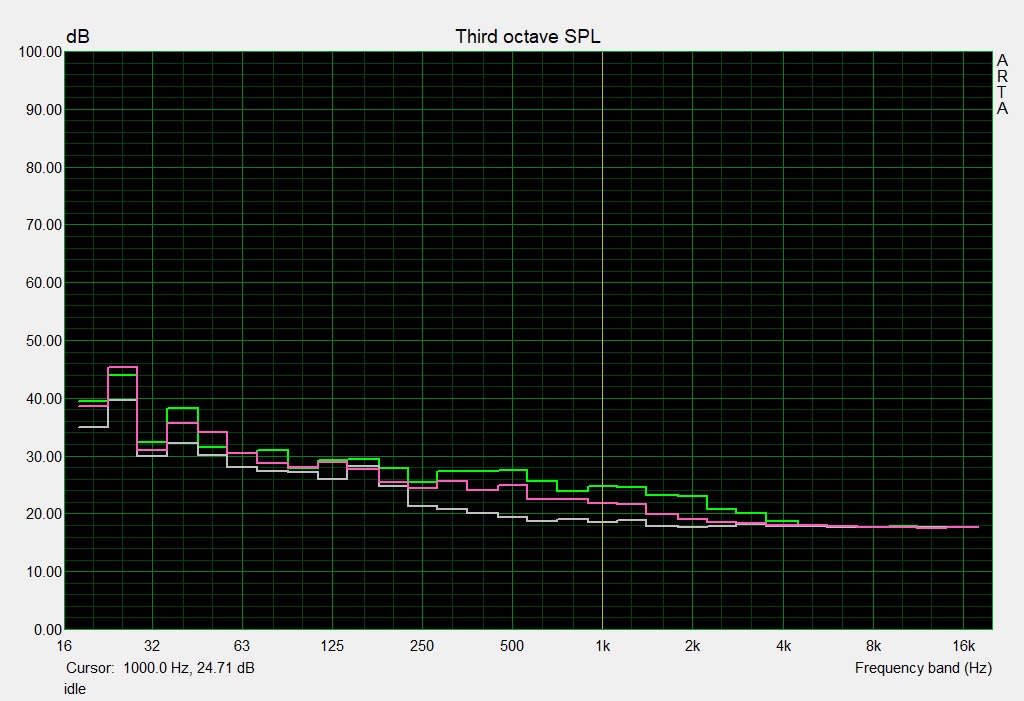
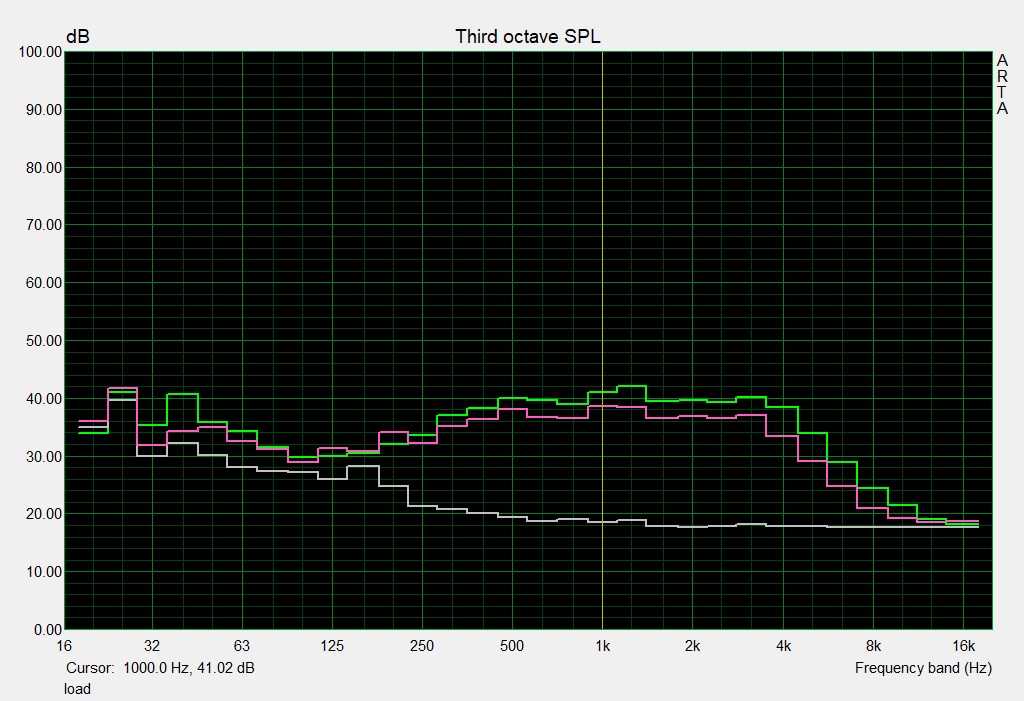
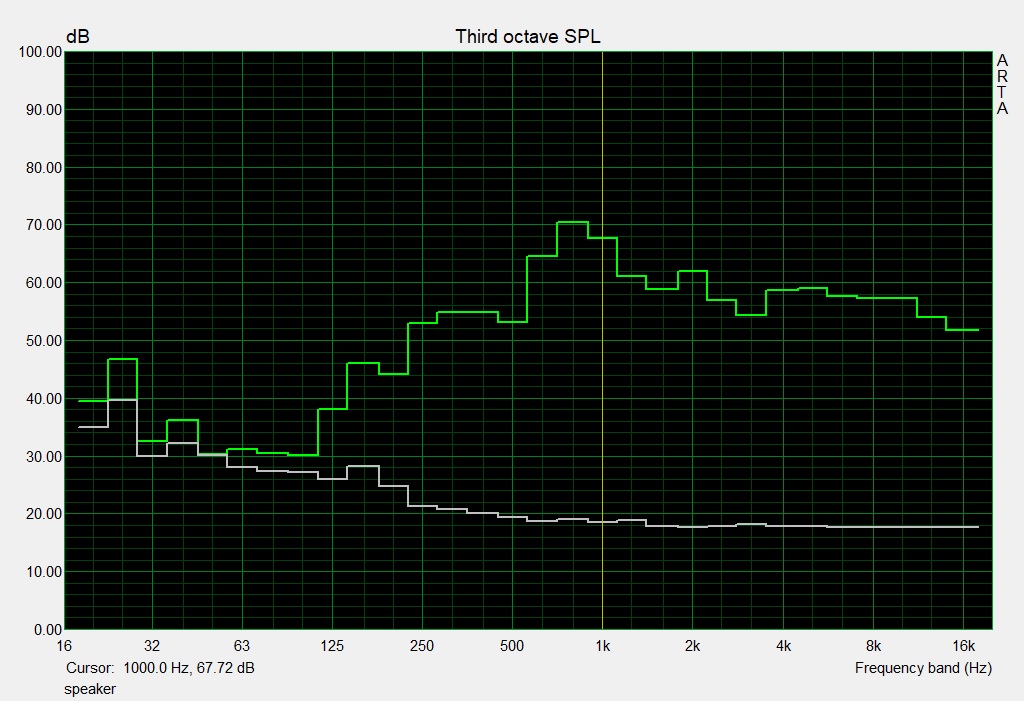
The 17.3-incher offers a 2.1 speaker system that is placed at the bottom of the device. It produces a decent sound that you can also listen to for longer time periods without hurting your ears. It lacks bass, however. For a better sound experience, it is recommended to use headphones or external speakers.
Schenker XMG Core 17 audio analysis
(±) | speaker loudness is average but good (74 dB)
Bass 100 - 315 Hz
(±) | reduced bass - on average 12.5% lower than median
(±) | linearity of bass is average (12.5% delta to prev. frequency)
Mids 400 - 2000 Hz
(±) | higher mids - on average 6.1% higher than median
(±) | linearity of mids is average (10.9% delta to prev. frequency)
Highs 2 - 16 kHz
(+) | balanced highs - only 1.1% away from median
(+) | highs are linear (5.2% delta to prev. frequency)
Overall 100 - 16.000 Hz
(±) | linearity of overall sound is average (18.9% difference to median)
Compared to same class
» 63% of all tested devices in this class were better, 8% similar, 29% worse
» The best had a delta of 6%, average was 18%, worst was 132%
Compared to all devices tested
» 44% of all tested devices were better, 8% similar, 48% worse
» The best had a delta of 4%, average was 24%, worst was 134%
Schenker XMG Core 15 audio analysis
(±) | speaker loudness is average but good (75 dB)
Bass 100 - 315 Hz
(±) | reduced bass - on average 8% lower than median
(±) | linearity of bass is average (11.7% delta to prev. frequency)
Mids 400 - 2000 Hz
(±) | higher mids - on average 10.1% higher than median
(±) | linearity of mids is average (13.2% delta to prev. frequency)
Highs 2 - 16 kHz
(+) | balanced highs - only 1.9% away from median
(±) | linearity of highs is average (7.5% delta to prev. frequency)
Overall 100 - 16.000 Hz
(±) | linearity of overall sound is average (23.6% difference to median)
Compared to same class
» 86% of all tested devices in this class were better, 4% similar, 10% worse
» The best had a delta of 6%, average was 18%, worst was 132%
Compared to all devices tested
» 71% of all tested devices were better, 6% similar, 23% worse
» The best had a delta of 4%, average was 24%, worst was 134%
Power Management - Power consumption at normal levels
Power Consumption
In terms of its power consumption, the XMG Core 17 does not show any conspicuous behavior. In idle operation, we register a maximum power consumption of 21 watts, which is a normal value for a gaming notebook of this performance level. During our stress test, the value increases up to 177 watts. During gaming operation, the consumption is lower, and we measure a value of about 128 watts while running our The Witcher 3 test. The power supply is rated at 180 watts.
| Off / Standby | |
| Idle | |
| Load |
|
Key:
min: | |
| Schenker XMG Core 17 i7-9750H, GeForce GTX 1660 Ti Mobile | Schenker XMG Neo 17 i7-8750H, GeForce RTX 2070 Mobile | Dell G7 17 7790 i7-8750H, GeForce RTX 2070 Max-Q | MSI GP75 Leopard 9SD i7-9750H, GeForce GTX 1660 Ti Mobile | Gigabyte Sabre 17-W8 i7-8750H, GeForce GTX 1060 Mobile | Lenovo Legion Y730-17ICH, i7-8750H i7-8750H, GeForce GTX 1050 Ti Mobile | Average of class Gaming | |
|---|---|---|---|---|---|---|---|
| Power Consumption | -17% | -11% | -11% | 2% | 24% | -32% | |
| Idle Minimum * (Watt) | 10 | 13 -30% | 9.5 5% | 10 -0% | 9.3 7% | 6.3 37% | 13.1 ? -31% |
| Idle Average * (Watt) | 13 | 16 -23% | 16.2 -25% | 15 -15% | 14.8 -14% | 11 15% | 18.8 ? -45% |
| Idle Maximum * (Watt) | 21 | 21 -0% | 23.8 -13% | 22 -5% | 22 -5% | 11.5 45% | 24.4 ? -16% |
| Load Average * (Watt) | 89 | 96 -8% | 101.7 -14% | 92 -3% | 63 29% | 89.8 -1% | 108.6 ? -22% |
| Witcher 3 ultra * (Watt) | 128 | 172 -34% | 155 -21% | 153 -20% | 102 20% | ||
| Load Maximum * (Watt) | 177 | 191 -8% | 172.2 3% | 216 -22% | 187 -6% | 130.7 26% | 255 ? -44% |
* ... smaller is better
Battery Life
In our realistic WLAN test, the Core 17 achieves a runtime of 4:39 hours. Via a script, we simulate the load when calling up websites. The Balanced power profile is active and the display brightness is set at about 150 cd/m². The 17.3-inch notebook lasts for 5:16 hours in our video test, where we run the short movie Big Buck Bunny (H.264 coding, 1920x1080 pixels) in a constant loop. The "Power Saver" profile is active, the Wi-Fi module is deactivated, and the display brightness is lowered to 150 cd/m².
While the battery life does not give any reason to be excited, it is okay for a gaming notebook. If you consider the relatively small battery capacity, it is actually quite good. Even though the Core 17 has the battery with the smallest capacity in our comparison field, it is able to keep up with most competitors and can even surpass some. The XMG Neo 17, which is equipped with the same battery, is unable to keep up with the Core 17.
| Schenker XMG Core 17 i7-9750H, GeForce GTX 1660 Ti Mobile, 46.74 Wh | Schenker XMG Neo 17 i7-8750H, GeForce RTX 2070 Mobile, 46.74 Wh | Dell G7 17 7790 i7-8750H, GeForce RTX 2070 Max-Q, 60 Wh | MSI GP75 Leopard 9SD i7-9750H, GeForce GTX 1660 Ti Mobile, 51 Wh | Gigabyte Sabre 17-W8 i7-8750H, GeForce GTX 1060 Mobile, 62 Wh | Lenovo Legion Y730-17ICH, i7-8750H i7-8750H, GeForce GTX 1050 Ti Mobile, 76 Wh | Average of class Gaming | |
|---|---|---|---|---|---|---|---|
| Battery runtime | -29% | 14% | -42% | 2% | 25% | 35% | |
| Reader / Idle (h) | 8.1 | 5.3 -35% | 8.5 5% | 4.8 -41% | 6.9 -15% | 13.2 63% | 8.71 ? 8% |
| H.264 (h) | 5.3 | 5.3 0% | 8.9 ? 68% | ||||
| WiFi v1.3 (h) | 4.7 | 3.7 -21% | 3.9 -17% | 3.2 -32% | 5.4 15% | 6.7 43% | 7 ? 49% |
| Load (h) | 1.3 | 0.9 -31% | 2 54% | 0.6 -54% | 1.4 8% | 0.9 -31% | 1.51 ? 16% |
Pros
Cons
Verdict
With the XMG Core 17, Schenker delivers a 17.3-inch gaming notebook that is able to bring all the current computer games smoothly to the matte Full HD screen, thanks to the Core i7-9750H processor and GeForce GTX 1660 Ti graphics core. You can always select high to maximum quality settings.
It is also positive that in contrast to many other gaming notebooks the Core 17 does not heat up excessively under load. In addition, it does not produce much noise - at least in idle operation and under low loads. Particularly during idle operation, you often cannot hear the fans. However, under load, it is a different story.
The XMG Core 17 turns out to be a well-rounded gaming notebook with an unassuming exterior.
The 144-Hz IPS display scores with short response times, stable viewing angles, a good contrast, and a great color reproduction. The brightness of the display is okay but could have been better for a notebook in this price range. We should also not forget to mention the small display bezels.
The notebook offers space for two NVMe SSDs in the M.2-2280 format that can also be configured as a RAID array (0 or 1). In addition, you can also add a 2.5-inch hard drive. Upgrade or maintenance tasks can be performed without any problems. After removing the bottom of the case, you get access to all the components.
The battery life will not excite anyone but is fairly decent for a gaming notebook. The chiclet keyboard (RGB illumination) has proven to be suitable for everyday tasks. The amount of connections is fairly large, but we miss a Thunderbolt-3 port.
Schenker XMG Core 17
- 07/16/2019 v6 (old)
Sascha Mölck
Price comparison

