Schenker XMG Core 17 (Tongfang GK7MRFR) in review: Mid-range gaming laptop without hot flashes

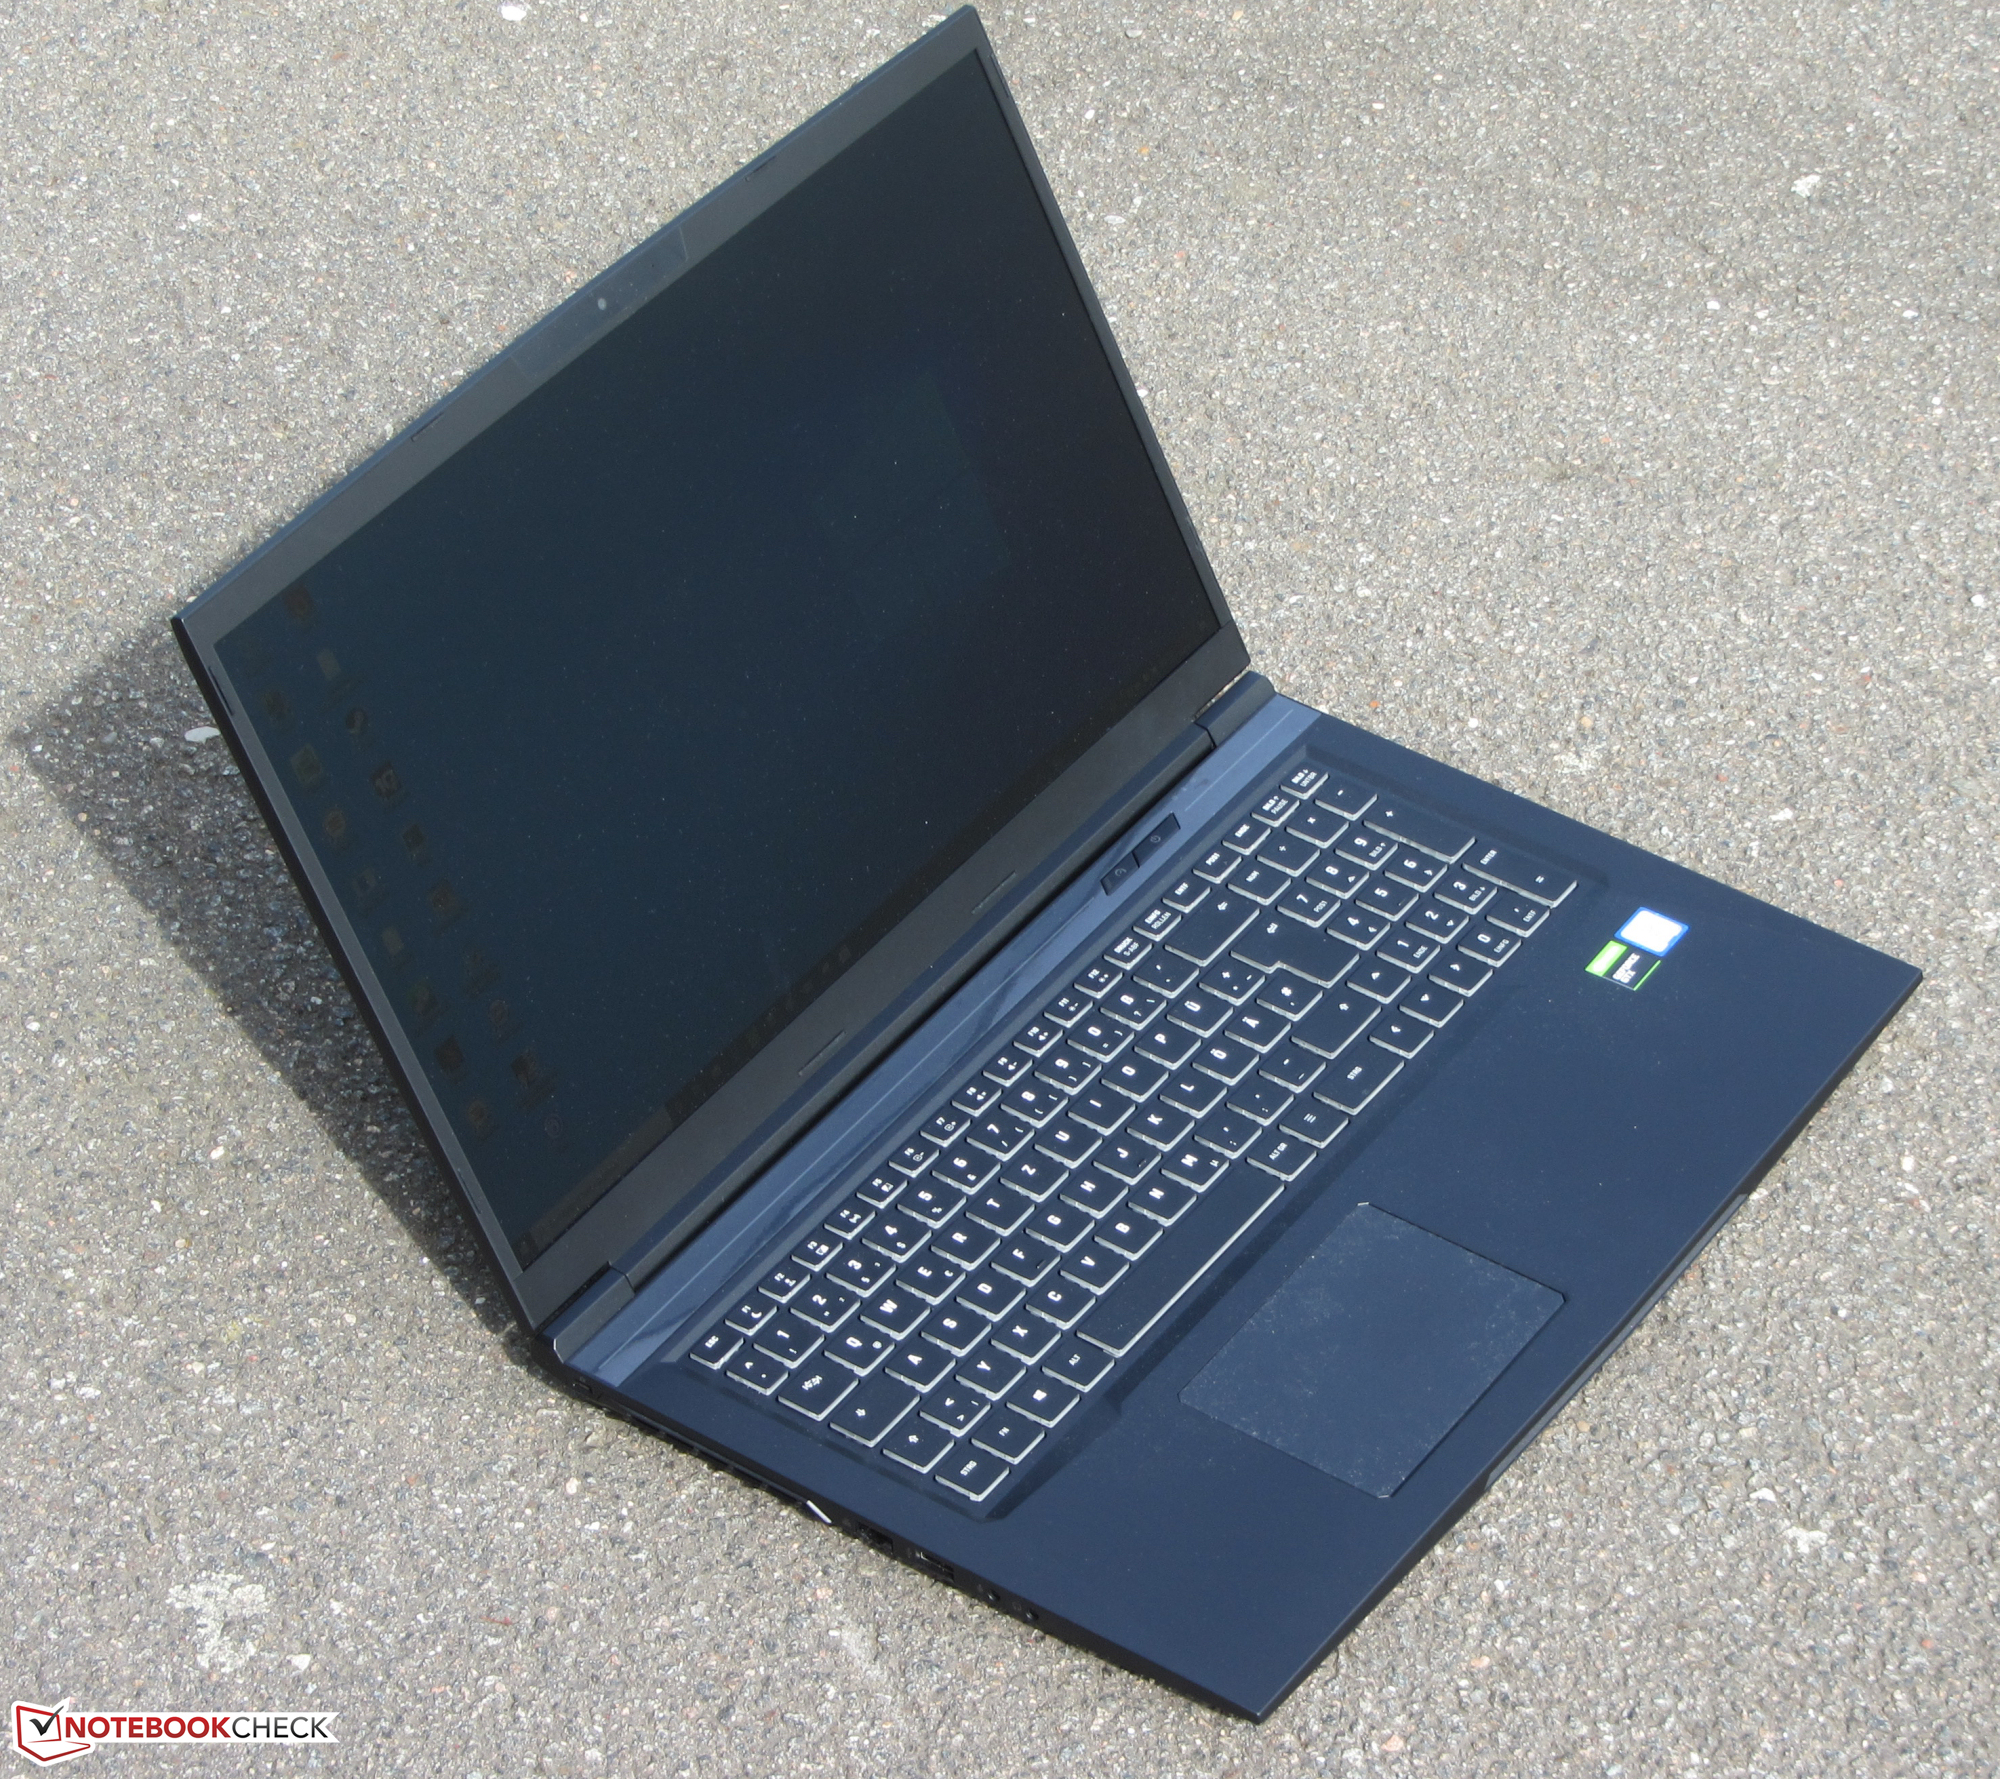
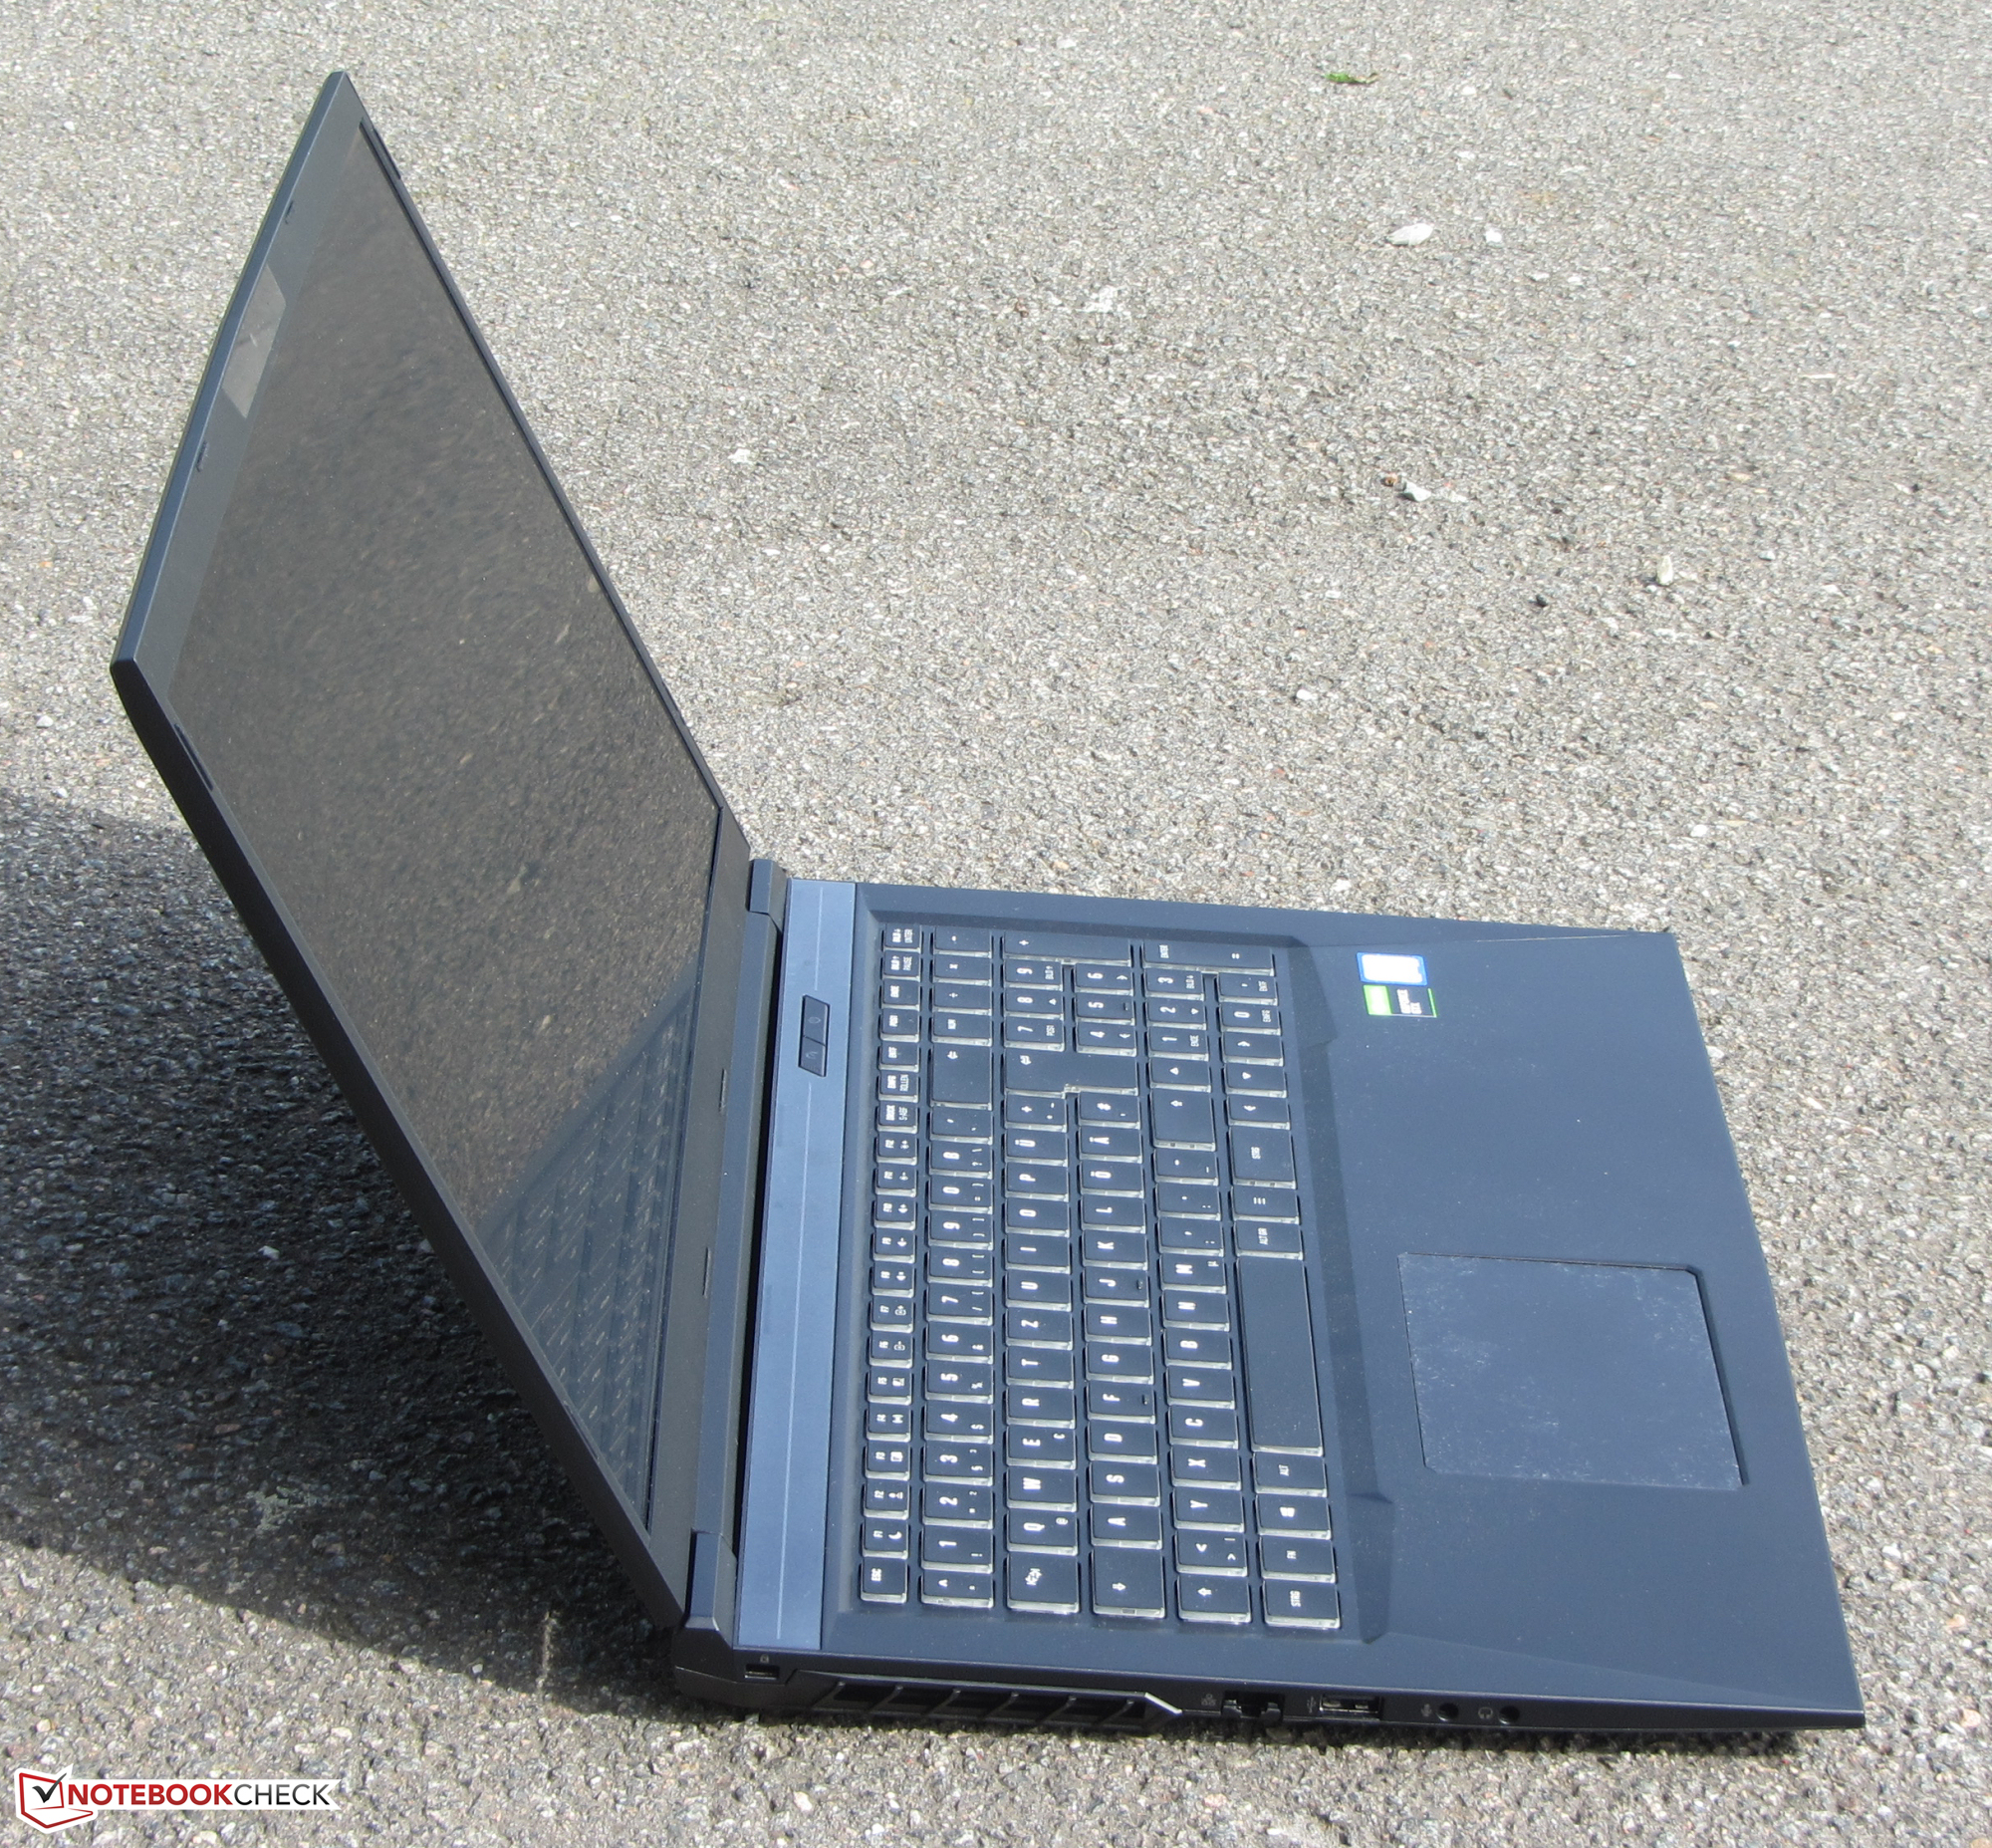
The Schenker XMG Core 17 is a mid-range gaming laptop. The review sample provided to us is powered by a Core i7-10750H processor and a GeForce GTX 1650 Ti graphics core. Alternatively, the laptop is available with a GeForce RTX 2060 Refresh GPU. Competitors include devices like the Lenovo Legion 5 17IMH05, the Acer Predator Helios 300 PH317-54, the MSI GF75 Thin SDR, and the Nexoc GH7 716IG.
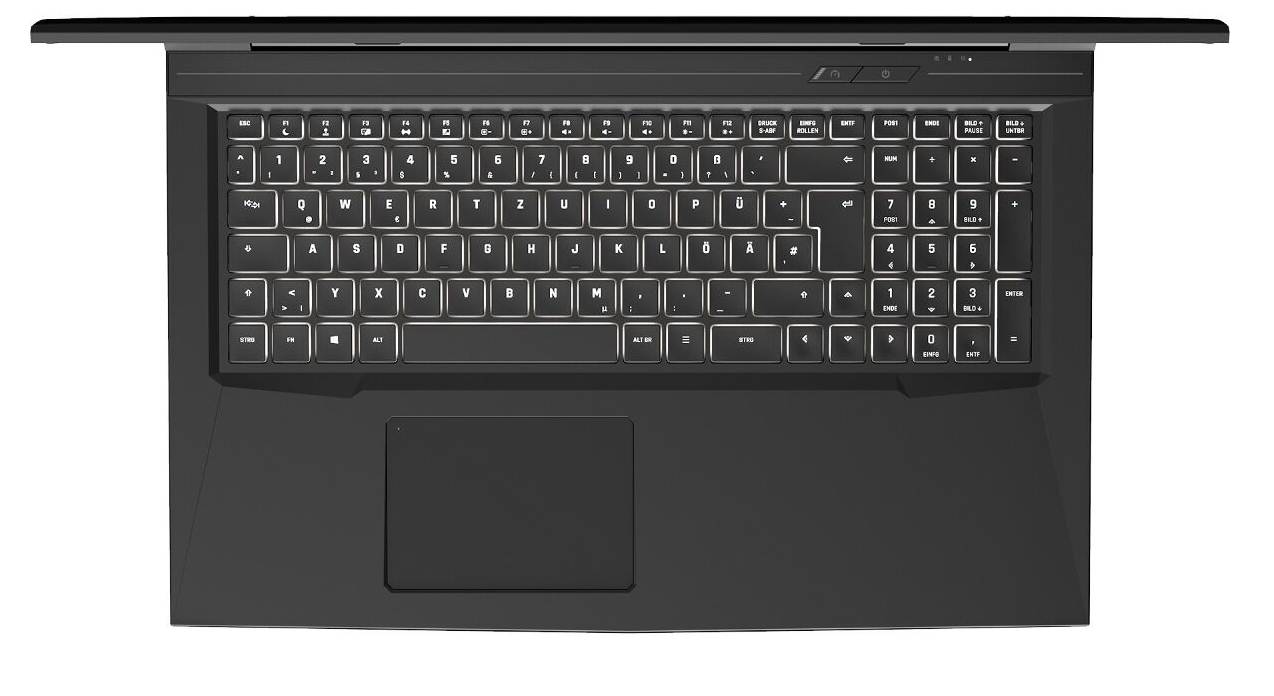
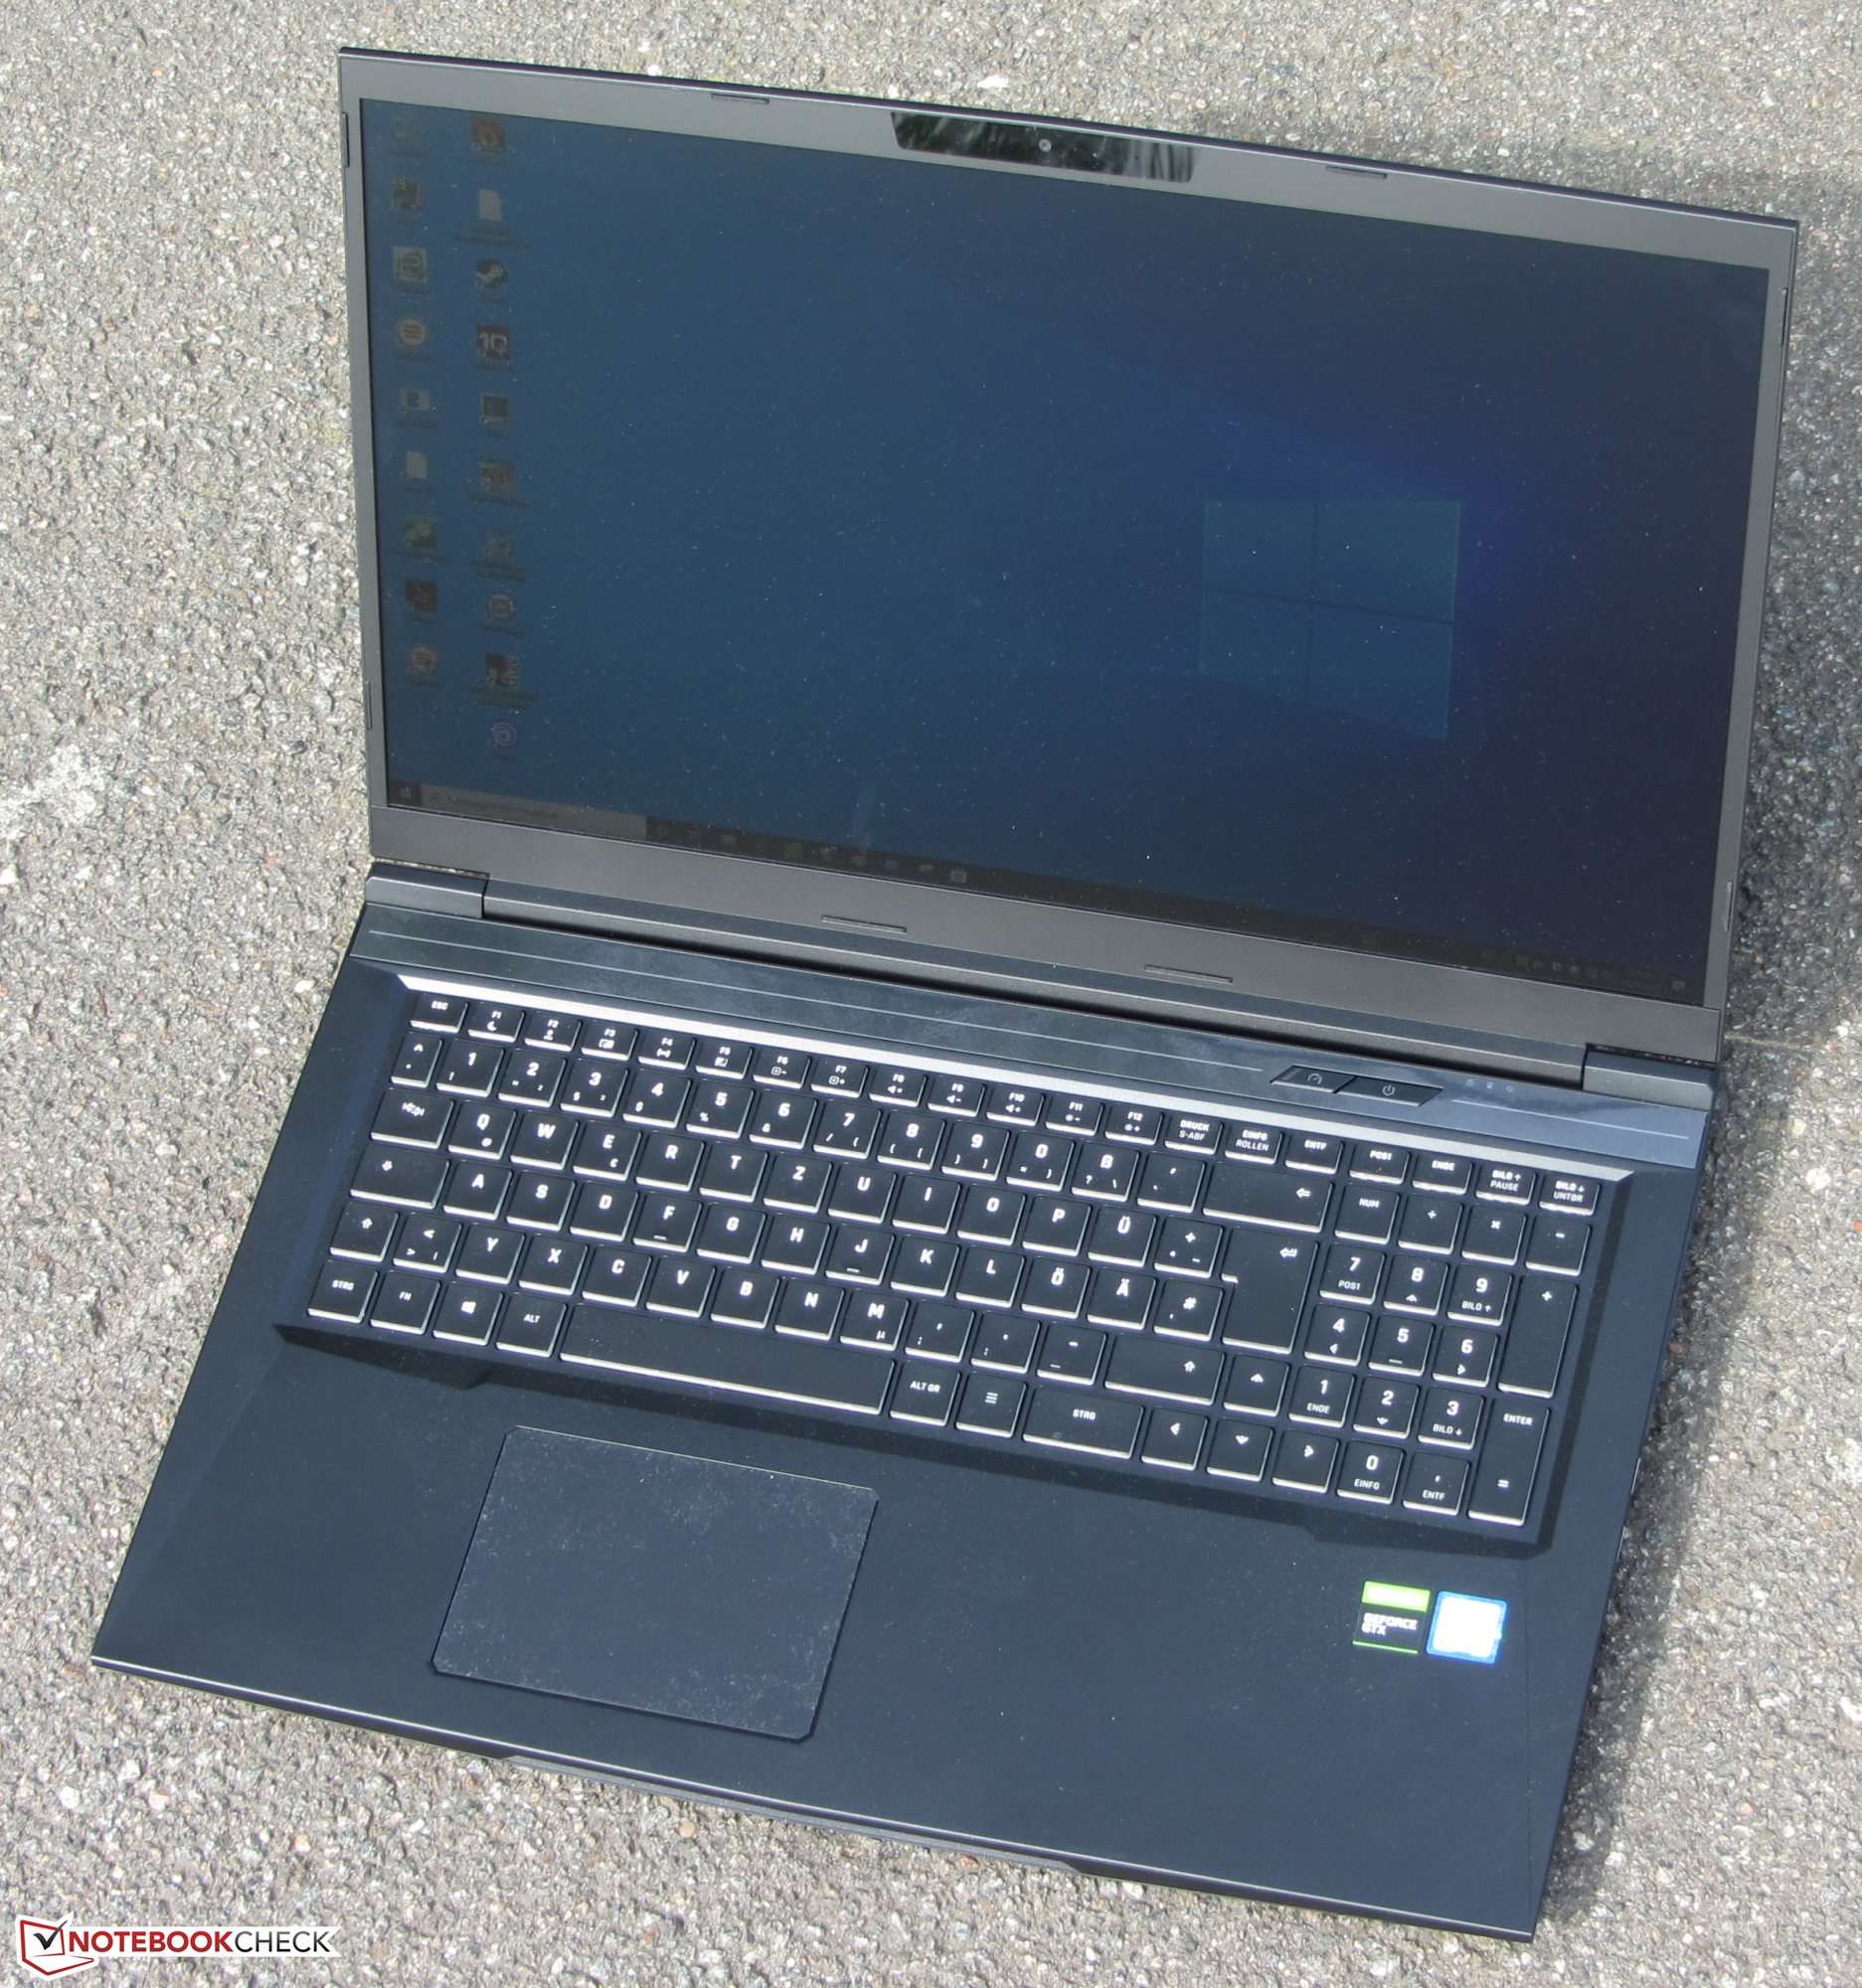
Since the 2020 Core 17 is identical in construction to the 2019 model, we won't go further into the case, the connectivity, the input devices, and the speakers. The corresponding information can be found in the review of the Schenker XMG Core 17 (2019).
Rating | Date | Model | Weight | Height | Size | Resolution | Price |
|---|---|---|---|---|---|---|---|
| 81.4 % v7 (old) | 12 / 2020 | Schenker XMG Core 17 Comet Lake i7-10750H, GeForce GTX 1650 Ti Mobile | 2.5 kg | 30 mm | 17.30" | 1920x1080 | |
| 81.9 % v7 (old) | 10 / 2020 | Lenovo Legion 5 17IMH05 i5-10300H, GeForce GTX 1650 Mobile | 2.9 kg | 26.2 mm | 17.30" | 1920x1080 | |
| 83.6 % v7 (old) | 10 / 2020 | Acer Predator Helios 300 PH317-54-75G8 i7-10750H, GeForce RTX 2060 Mobile | 2.8 kg | 25 mm | 17.30" | 1920x1080 | |
| 79.8 % v7 (old) | 10 / 2020 | MSI GF75 Thin 10SDR i7-10750H, GeForce GTX 1660 Ti Mobile | 2.2 kg | 23 mm | 17.30" | 1920x1080 | |
| 81.5 % v7 (old) | 09 / 2020 | Nexoc GH7 716IG i7-10750H, GeForce GTX 1660 Ti Mobile | 2.5 kg | 29.5 mm | 17.30" | 1920x1080 |
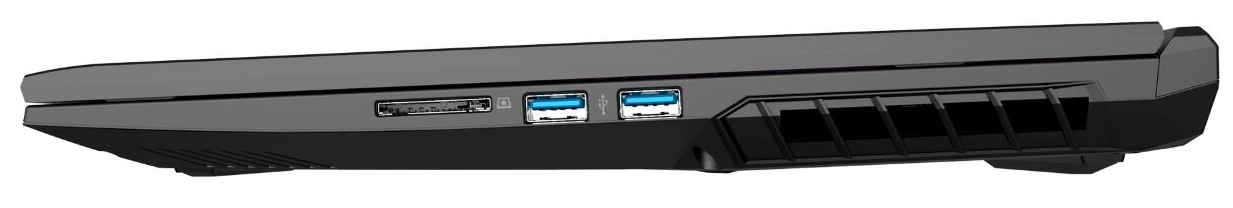
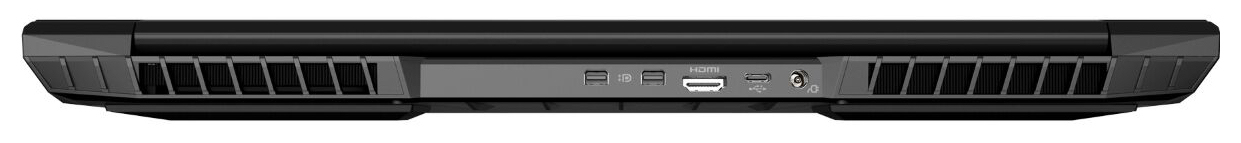
Connectivity
| SD Card Reader | |
| average JPG Copy Test (av. of 3 runs) | |
| Average of class Gaming (20.9 - 210, n=54, last 2 years) | |
| Nexoc GH7 716IG (Toshiba Exceria Pro SDXC 64 GB UHS-II) | |
| Lenovo Legion 5 17IMH05 (Toshiba Exceria Pro SDXC 64 GB UHS-II) | |
| Schenker XMG Core 17 (Toshiba Exceria Pro SDXC 64 GB UHS-II) | |
| Schenker XMG Core 17 Comet Lake (Toshiba Exceria Pro SDXC 64 GB UHS-II) | |
| maximum AS SSD Seq Read Test (1GB) | |
| Average of class Gaming (25.5 - 261, n=51, last 2 years) | |
| Lenovo Legion 5 17IMH05 (Toshiba Exceria Pro SDXC 64 GB UHS-II) | |
| Nexoc GH7 716IG (Toshiba Exceria Pro SDXC 64 GB UHS-II) | |
| Schenker XMG Core 17 (Toshiba Exceria Pro SDXC 64 GB UHS-II) | |
| Schenker XMG Core 17 Comet Lake (Toshiba Exceria Pro SDXC 64 GB UHS-II) | |


Display - 144 Hz IPS
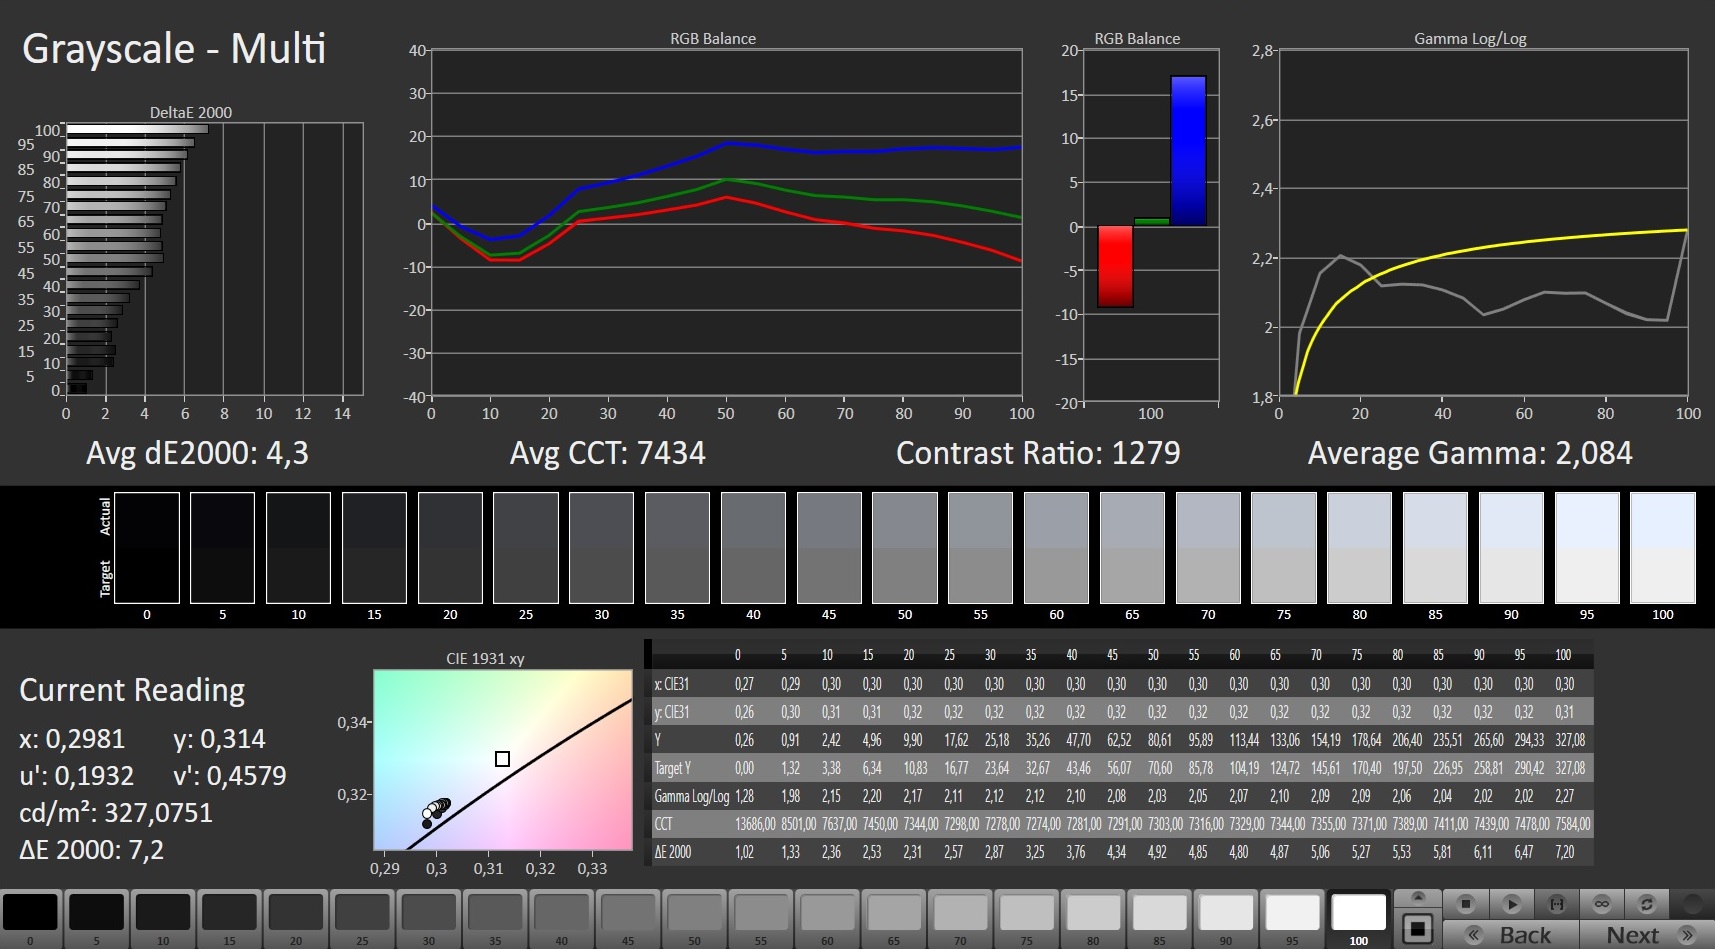
The brightness (297.8 cd/m²) and contrast (1,086:1) of the matte 17.3-inch display (1920x1080 pixels) are okay. Furthermore, the 144 Hz panel has good response times overall. The display flickers at a frequency of 1,000 Hz at brightness levels of 99% and below.
| |||||||||||||||||||||||||
Brightness Distribution: 88 %
Center on Battery: 315 cd/m²
Contrast: 1086:1 (Black: 0.29 cd/m²)
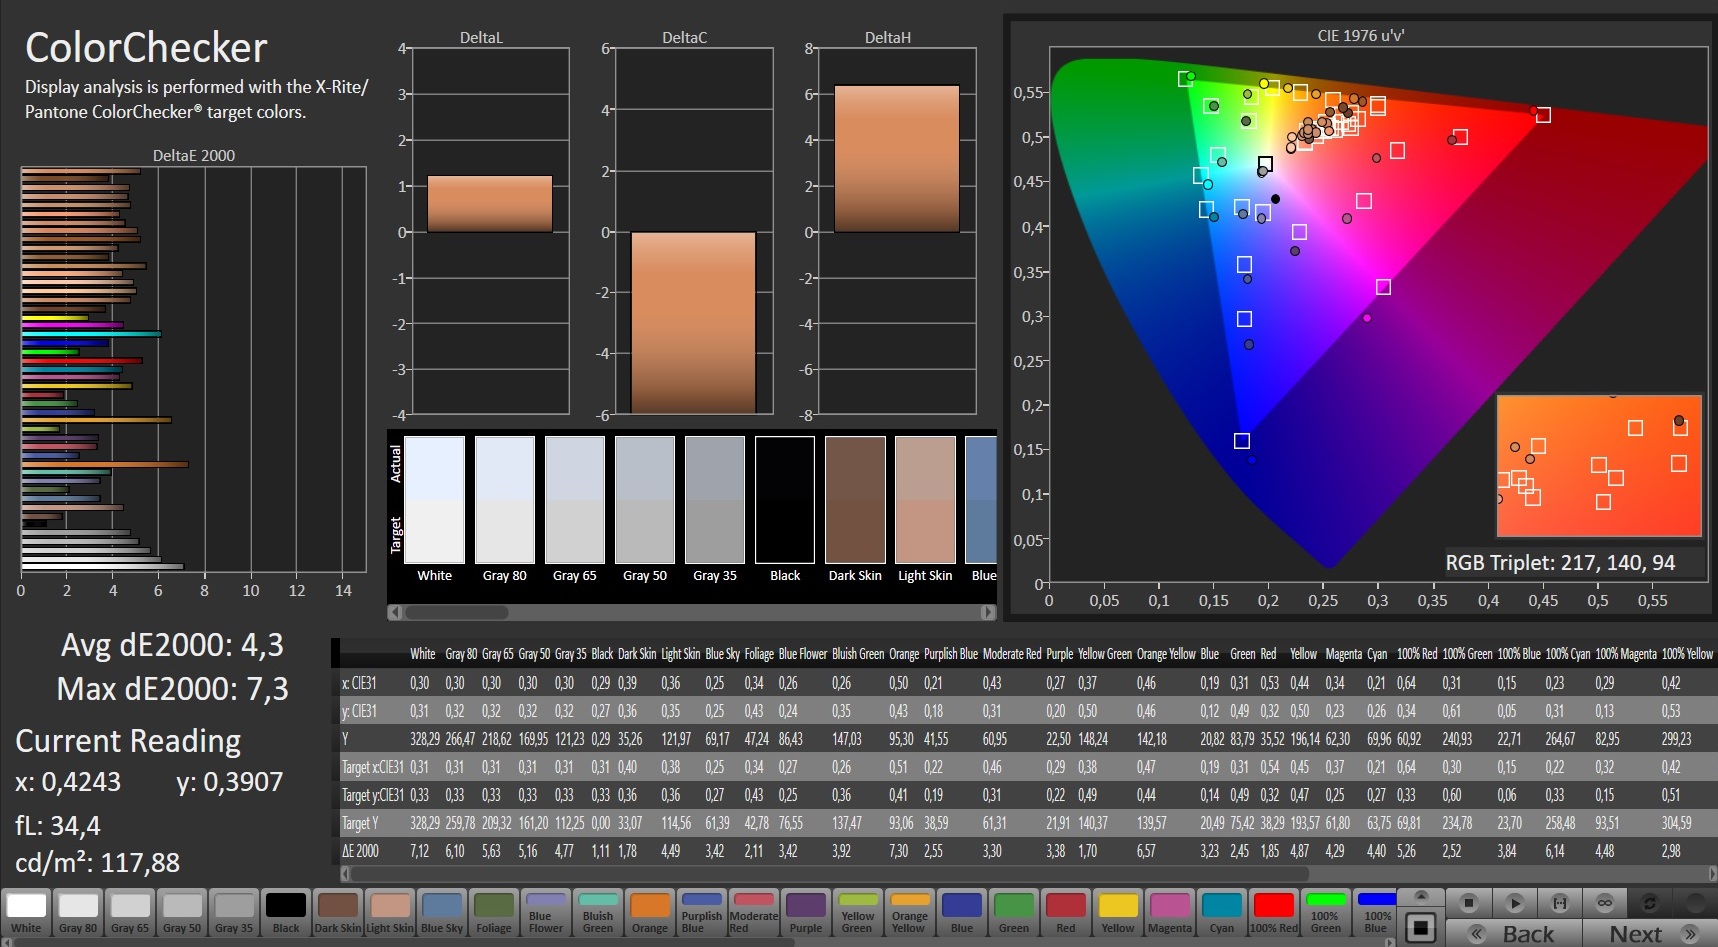
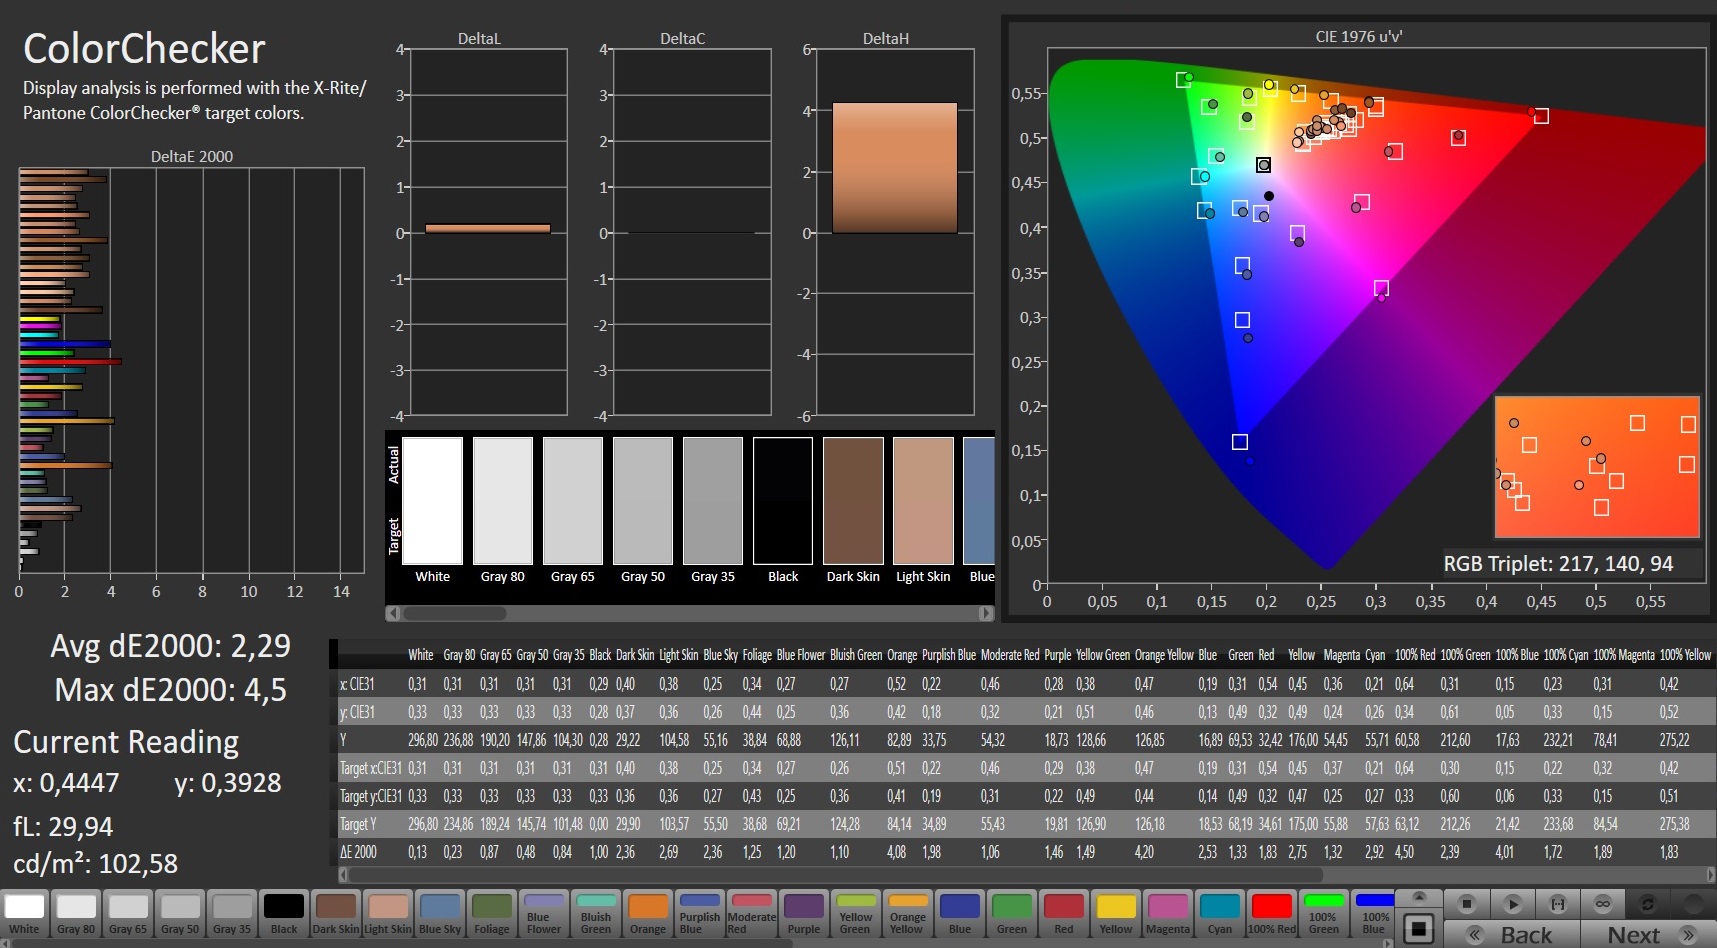
ΔE ColorChecker Calman: 4.3 | ∀{0.5-29.43 Ø4.71}
calibrated: 2.29
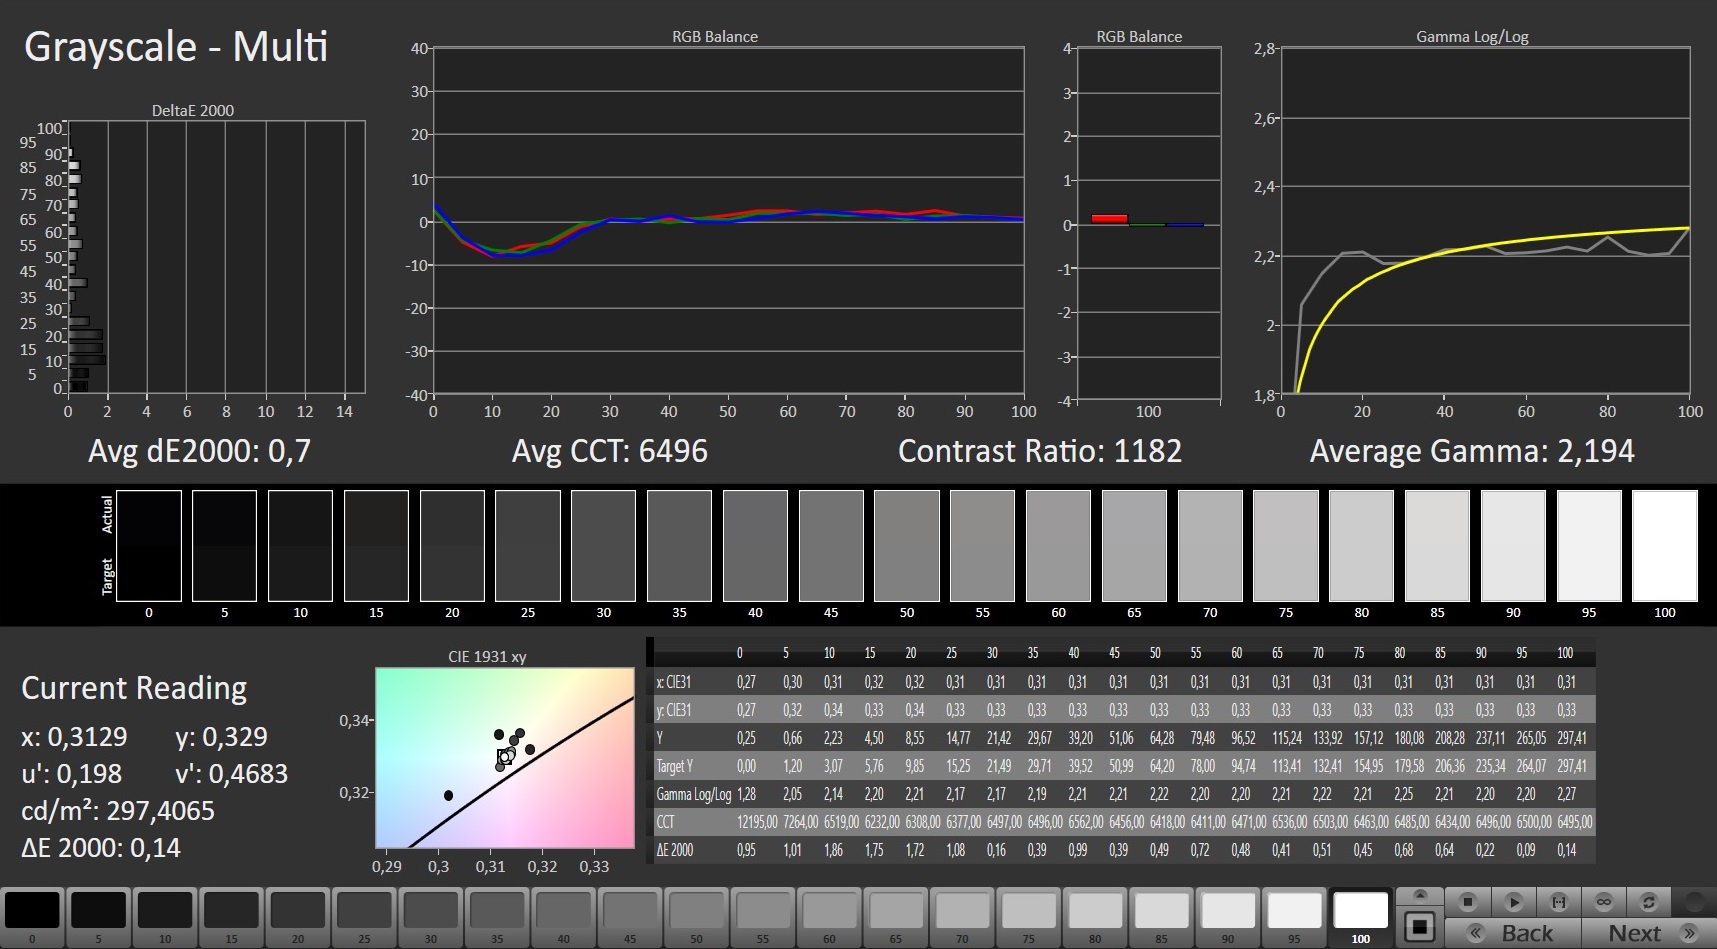
ΔE Greyscale Calman: 4.3 | ∀{0.09-98 Ø4.96}
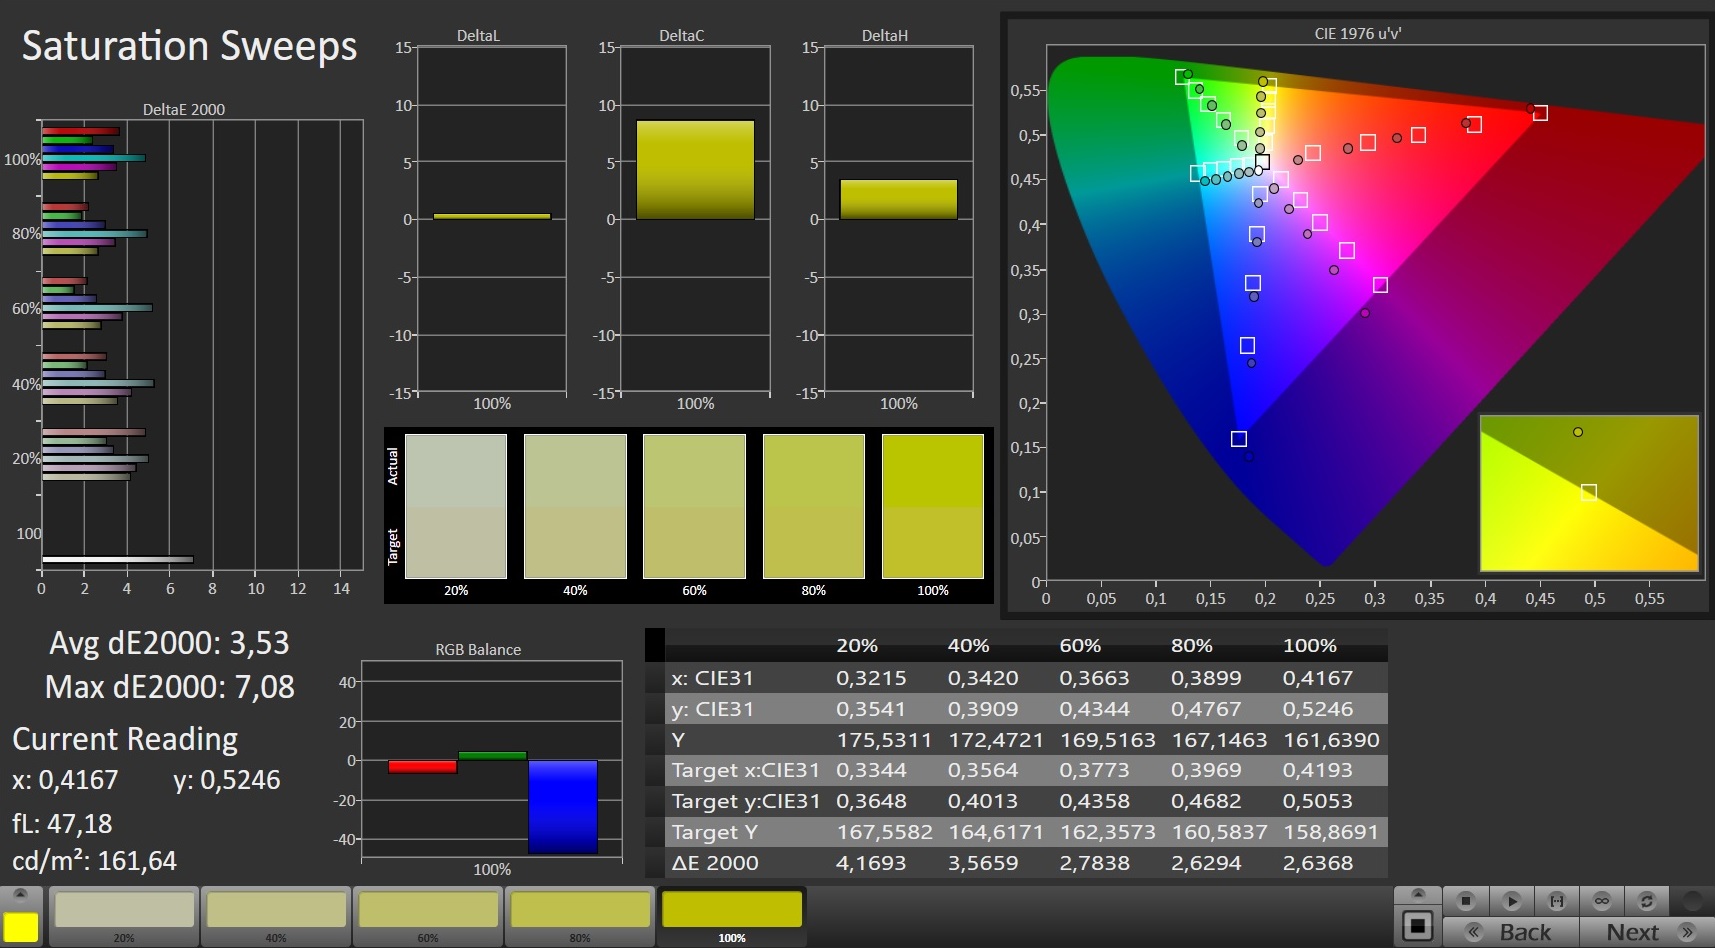
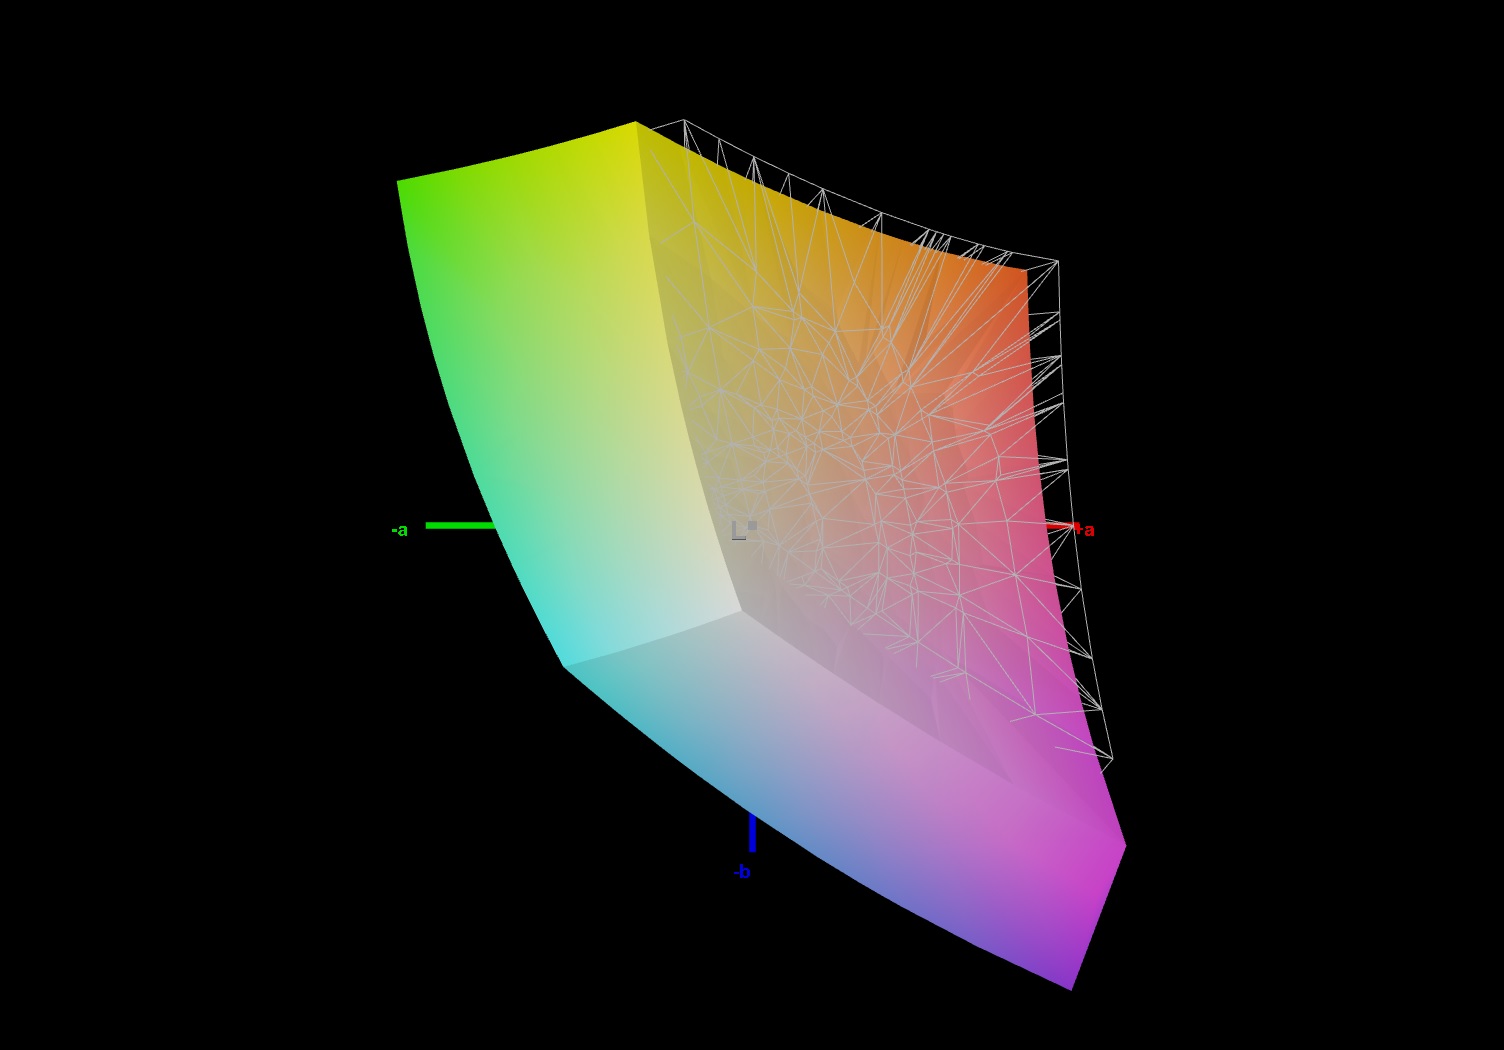
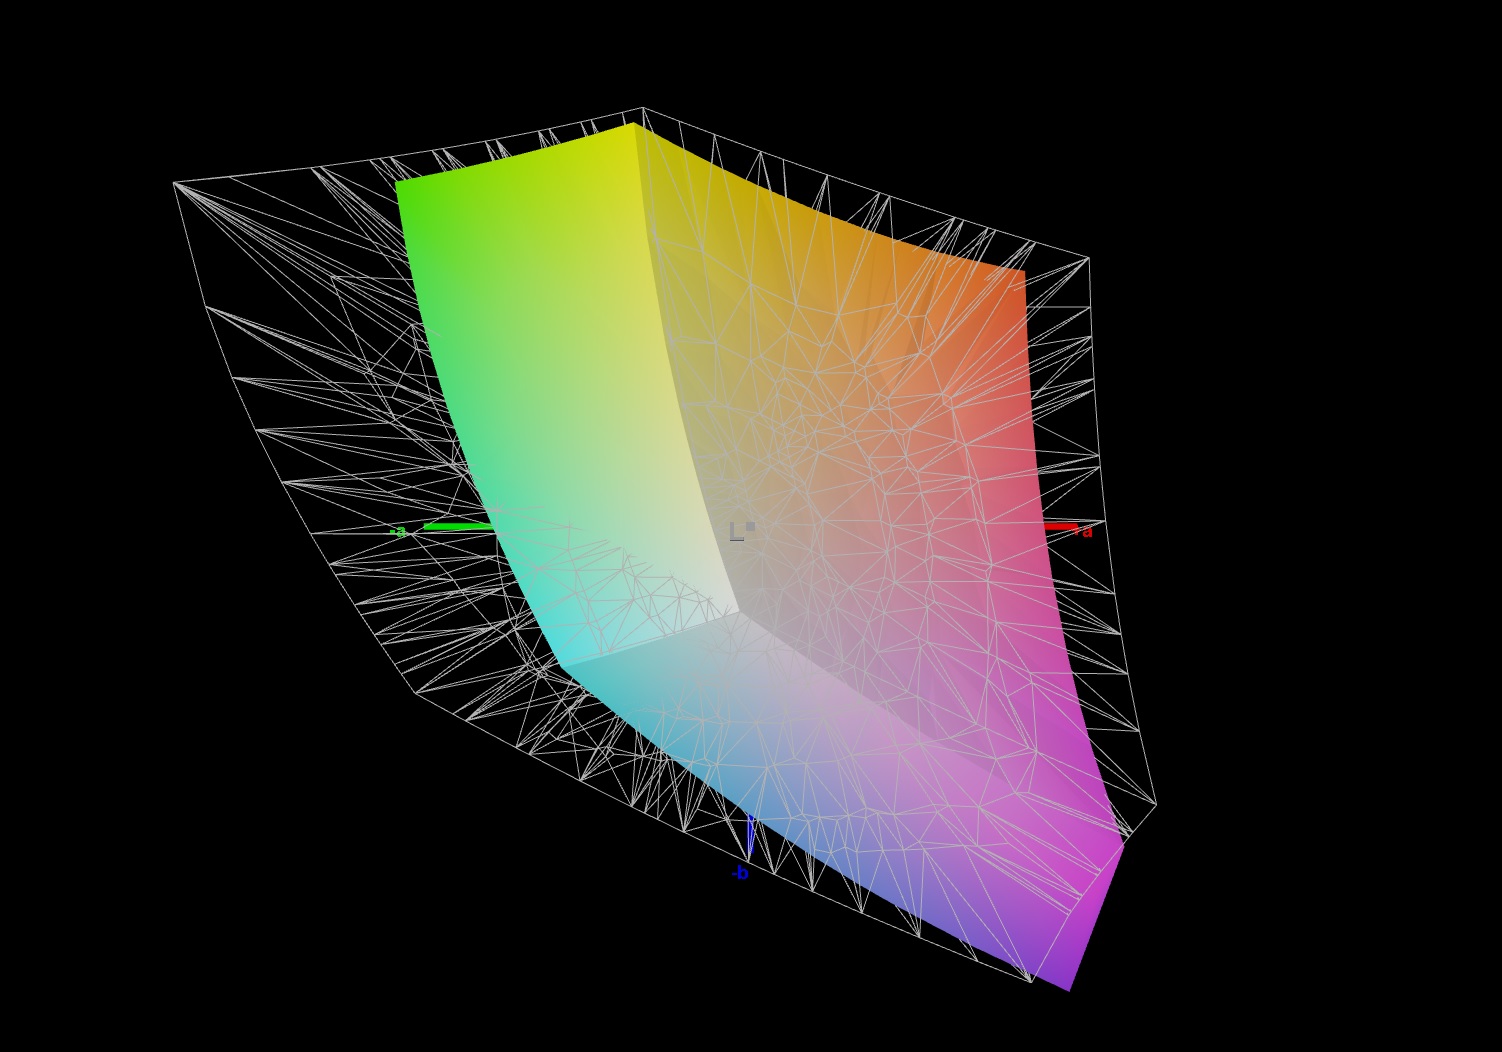
92% sRGB (Argyll 1.6.3 3D)
66% AdobeRGB 1998 (Argyll 1.6.3 3D)
66.5% AdobeRGB 1998 (Argyll 3D)
92.6% sRGB (Argyll 3D)
65.3% Display P3 (Argyll 3D)
Gamma: 2.084
CCT: 7434 K
| Schenker XMG Core 17 Comet Lake BOE HF NV173FHM-N44, IPS, 1920x1080, 17.3" | Schenker XMG Core 17 LG Philips LP173WFG-SPB1 (LGD0615), IPS, 1920x1080, 17.3" | Lenovo Legion 5 17IMH05 AU Optronics B173HAN04.3, IPS, 1920x1080, 17.3" | Acer Predator Helios 300 PH317-54-75G8 Chi Mei N173HCE-G33, IPS, 1920x1080, 17.3" | MSI GF75 Thin 10SDR B173HAN04.9 (AUO978F), IPS, 1920x1080, 17.3" | Nexoc GH7 716IG LG Philips LGD0615, IPS, 1920x1080, 17.3" | |
|---|---|---|---|---|---|---|
| Display | 0% | 6% | -2% | -37% | 0% | |
| Display P3 Coverage (%) | 65.3 | 64.4 -1% | 69.4 6% | 62.6 -4% | 39.98 -39% | 64.6 -1% |
| sRGB Coverage (%) | 92.6 | 95.6 3% | 97.1 5% | 94.3 2% | 59.9 -35% | 95.8 3% |
| AdobeRGB 1998 Coverage (%) | 66.5 | 65.6 -1% | 71.2 7% | 64.7 -3% | 41.31 -38% | 65.7 -1% |
| Response Times | 11% | -149% | -1% | -147% | 14% | |
| Response Time Grey 50% / Grey 80% * (ms) | 17.6 ? | 14.4 ? 18% | 38.4 ? -118% | 16.4 ? 7% | 38.4 ? -118% | 15.2 ? 14% |
| Response Time Black / White * (ms) | 10 ? | 9.6 ? 4% | 28 ? -180% | 10.8 ? -8% | 27.6 ? -176% | 8.6 ? 14% |
| PWM Frequency (Hz) | 1000 ? | 24510 ? | ||||
| Screen | 9% | 1% | 32% | -27% | 0% | |
| Brightness middle (cd/m²) | 315 | 329 4% | 326 3% | 322 2% | 252 -20% | 303 -4% |
| Brightness (cd/m²) | 298 | 286 -4% | 304 2% | 308 3% | 253 -15% | 277 -7% |
| Brightness Distribution (%) | 88 | 79 -10% | 89 1% | 92 5% | 92 5% | 86 -2% |
| Black Level * (cd/m²) | 0.29 | 0.3 -3% | 0.25 14% | 0.18 38% | 0.23 21% | 0.25 14% |
| Contrast (:1) | 1086 | 1097 1% | 1304 20% | 1789 65% | 1096 1% | 1212 12% |
| Colorchecker dE 2000 * | 4.3 | 2.52 41% | 4.42 -3% | 1.53 64% | 4.24 1% | 4.15 3% |
| Colorchecker dE 2000 max. * | 7.3 | 6.9 5% | 9.44 -29% | 3.14 57% | 21.4 -193% | 10.52 -44% |
| Colorchecker dE 2000 calibrated * | 2.29 | 1.31 43% | 1.53 33% | 0.74 68% | 3.64 -59% | 0.9 61% |
| Greyscale dE 2000 * | 4.3 | 2.98 31% | 5.8 -35% | 1.9 56% | 2.8 35% | 5.38 -25% |
| Gamma | 2.084 106% | 2.38 92% | 2.261 97% | 2.144 103% | 2.196 100% | 2.35 94% |
| CCT | 7434 87% | 6738 96% | 6822 95% | 6809 95% | 7027 93% | 7680 85% |
| Color Space (Percent of AdobeRGB 1998) (%) | 66 | 60 -9% | 71 8% | 65 -2% | 41 -38% | 61 -8% |
| Color Space (Percent of sRGB) (%) | 92 | 95 3% | 93 1% | 87 -5% | 59 -36% | 96 4% |
| Total Average (Program / Settings) | 7% /
8% | -47% /
-17% | 10% /
22% | -70% /
-44% | 5% /
2% |
* ... smaller is better
Out of the box, the display shows a decent color reproduction. However, with a color deviation of 4.3, the target (Delta E less than 3) is not met. Moreover, the display doesn't suffer from a blue tint. Calibration reduces the color deviation to 2.29 and provides a more balanced representation of the grayscales. The AdobeRGB (66%) and sRGB (92%) color spaces are not completely reproduced.

Display Response Times
| ↔ Response Time Black to White | ||
|---|---|---|
| 10 ms ... rise ↗ and fall ↘ combined | ↗ 5.2 ms rise | 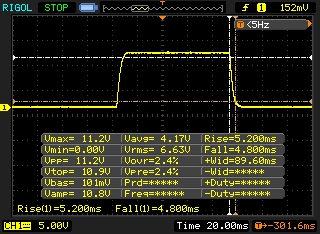 |
| ↘ 4.8 ms fall | ||
| The screen shows good response rates in our tests, but may be too slow for competitive gamers. In comparison, all tested devices range from 0.1 (minimum) to 240 (maximum) ms. » 27 % of all devices are better. This means that the measured response time is better than the average of all tested devices (19.8 ms). | ||
| ↔ Response Time 50% Grey to 80% Grey | ||
| 17.6 ms ... rise ↗ and fall ↘ combined | ↗ 8.4 ms rise | 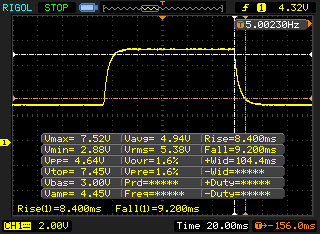 |
| ↘ 9.2 ms fall | ||
| The screen shows good response rates in our tests, but may be too slow for competitive gamers. In comparison, all tested devices range from 0.165 (minimum) to 636 (maximum) ms. » 32 % of all devices are better. This means that the measured response time is better than the average of all tested devices (30.9 ms). | ||
Screen Flickering / PWM (Pulse-Width Modulation)
| Screen flickering / PWM detected | 1000 Hz | ≤ 99 % brightness setting | 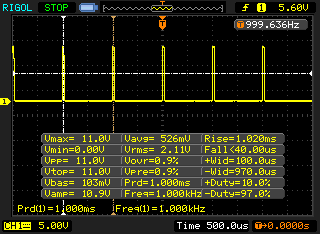 |
The display backlight flickers at 1000 Hz (worst case, e.g., utilizing PWM) Flickering detected at a brightness setting of 99 % and below. There should be no flickering or PWM above this brightness setting. The frequency of 1000 Hz is quite high, so most users sensitive to PWM should not notice any flickering. In comparison: 52 % of all tested devices do not use PWM to dim the display. If PWM was detected, an average of 7741 (minimum: 5 - maximum: 343500) Hz was measured. | |||
The viewing-angle stable IPS panel can be read from any position. Outdoors, reading the display is possible under cloudy skies or in the shade.
Performance - Sufficient for all application areas
Schenker's 17.3-inch gaming laptop brings every modern game smoothly onto the screen and also cuts a fine figure in all other application areas. Our test device costs about 1,500 Euros (~$1,828). The laptop can be customized in Schenker's online store.
Test conditions
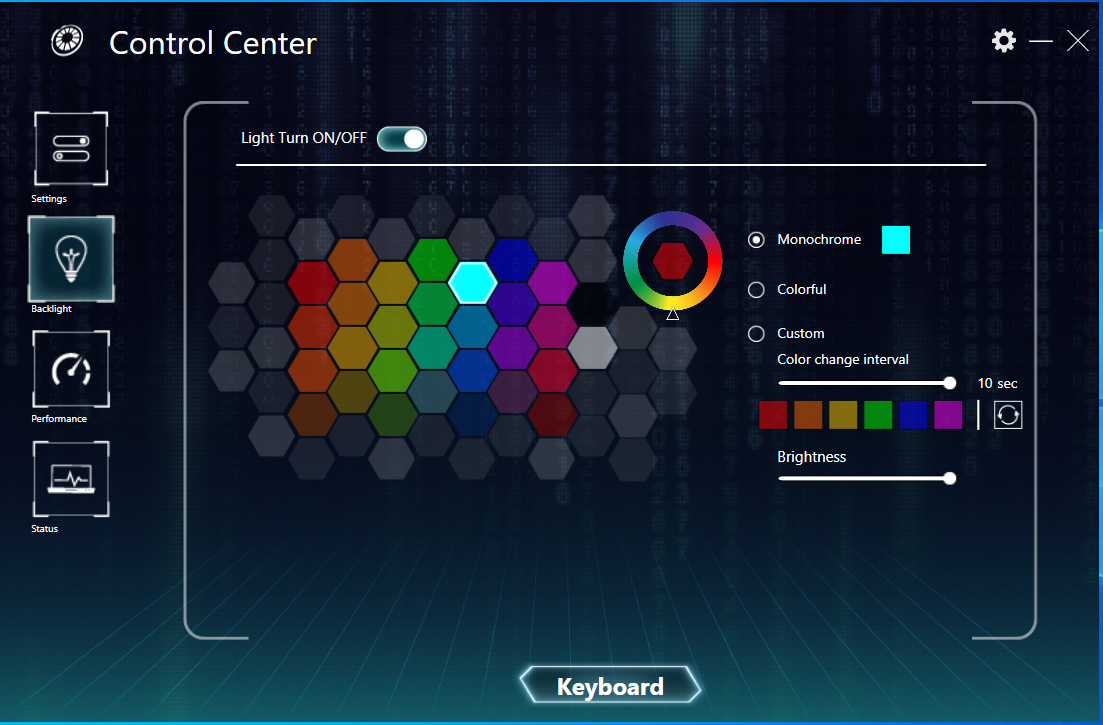
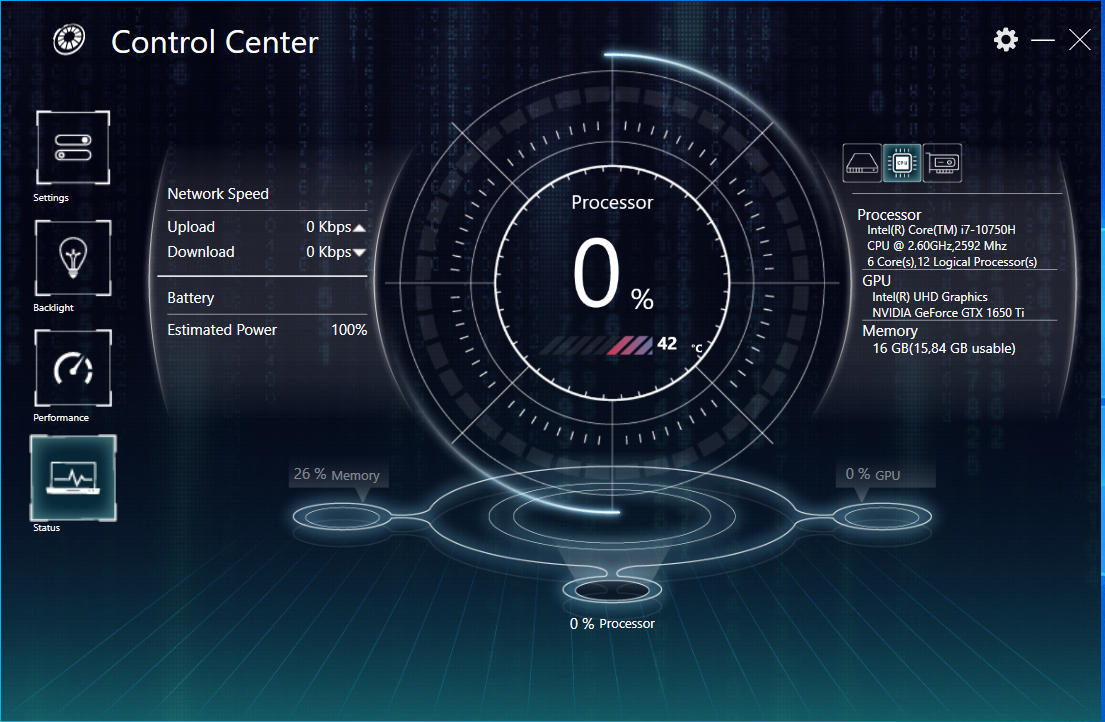
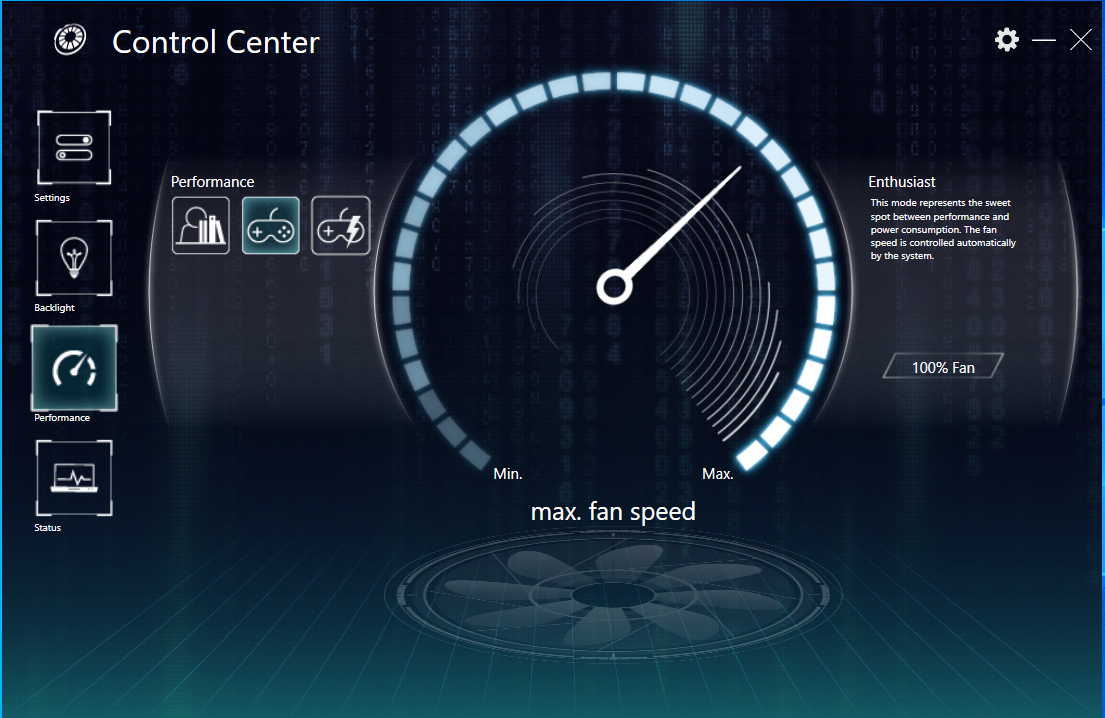
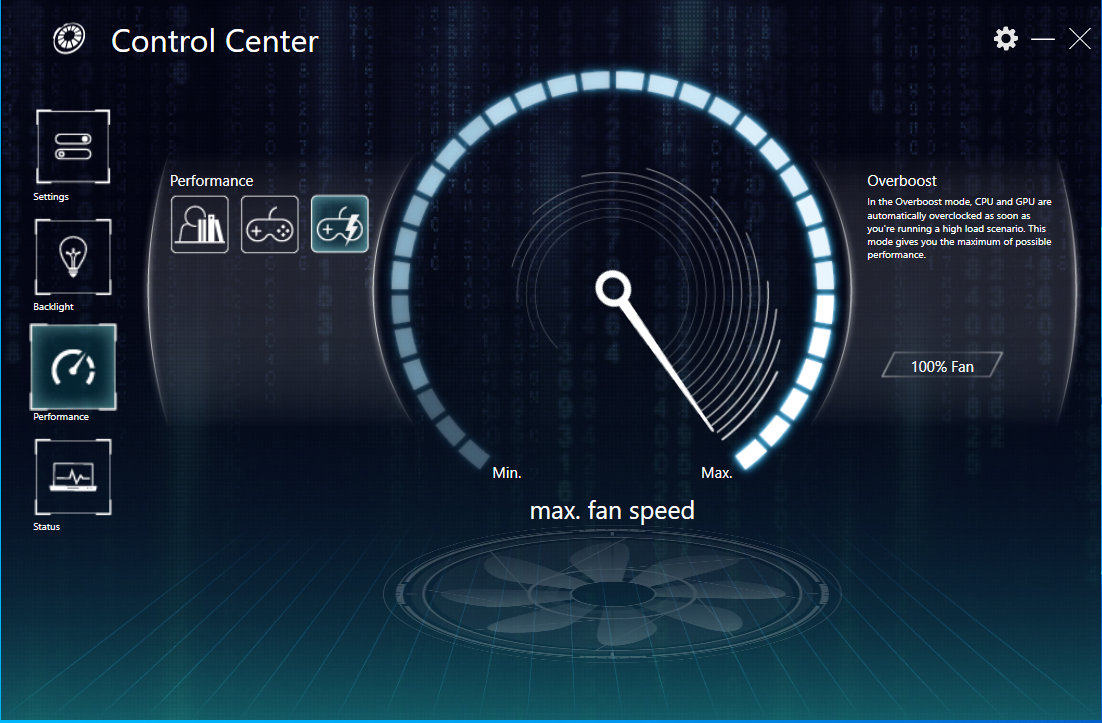
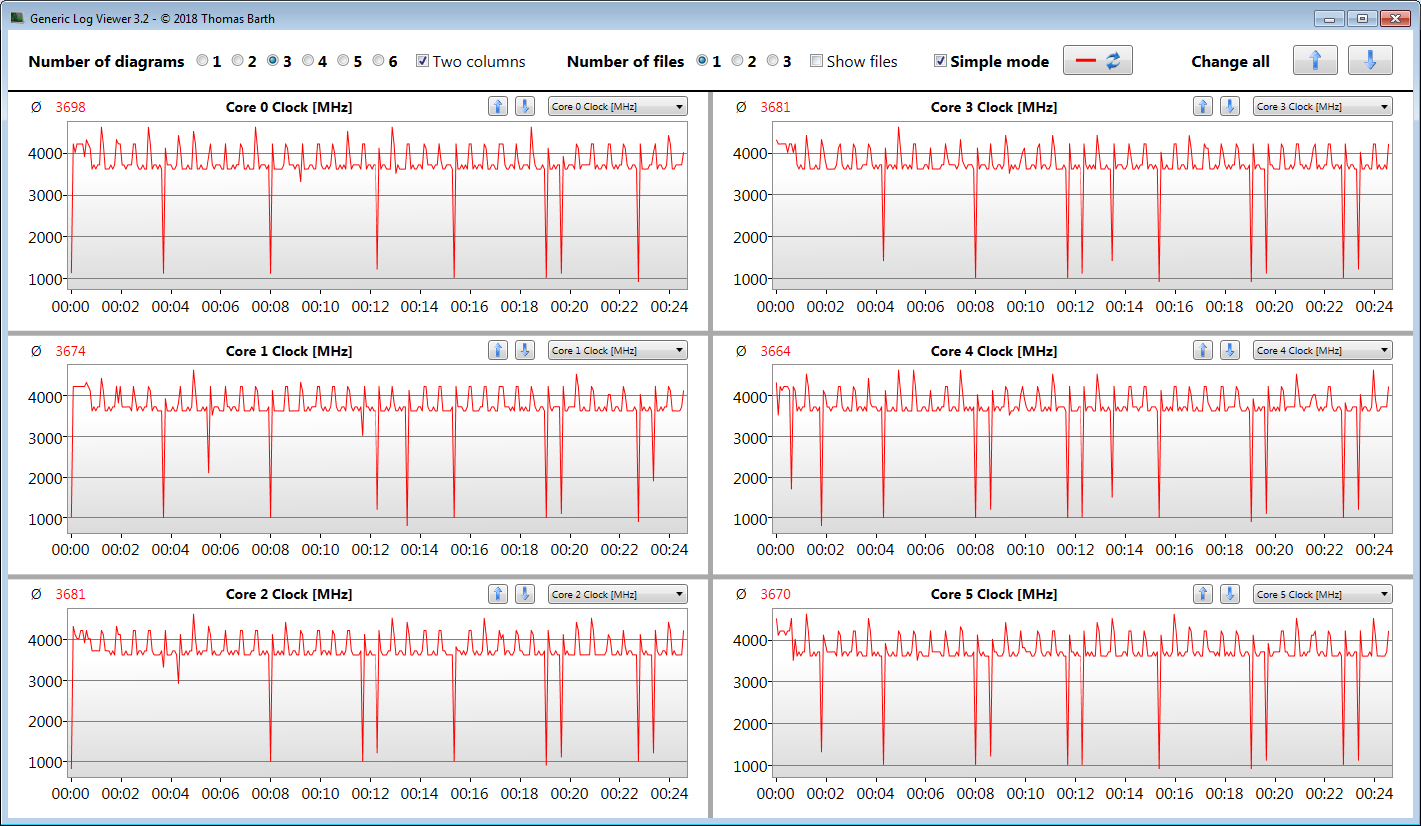
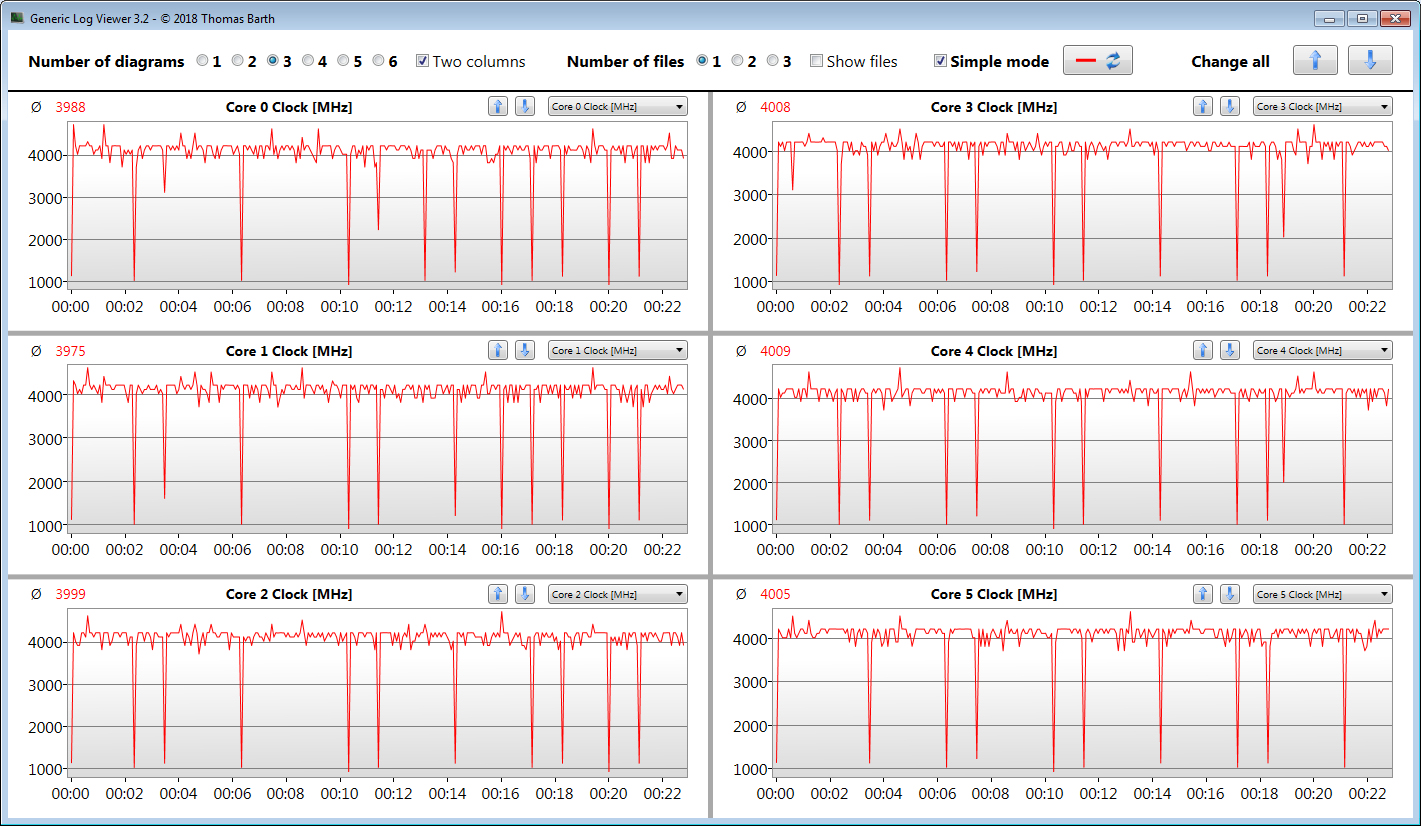
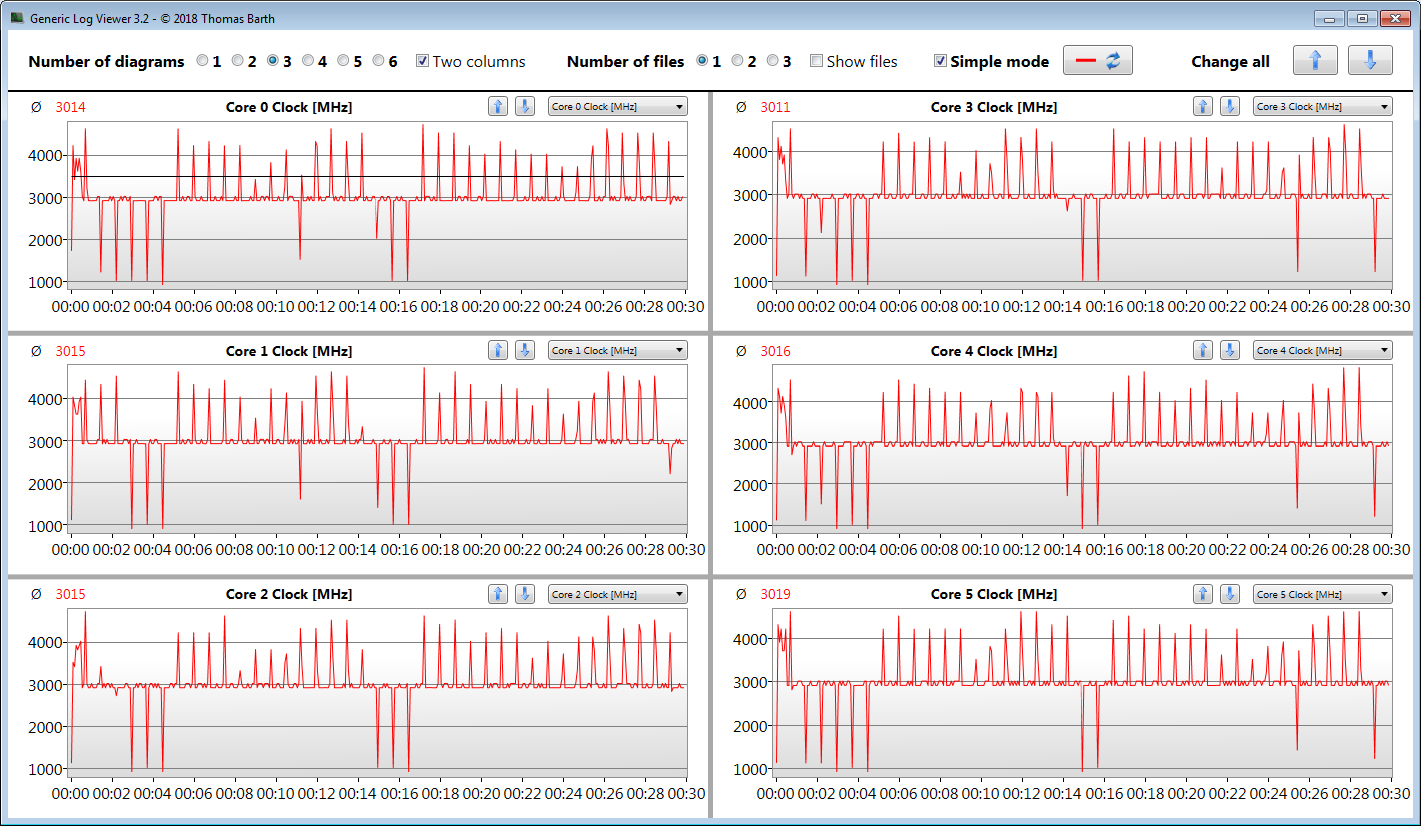
The preinstalled Control Center allows selecting a performance profile ("Balanced", "Enthusiast", "Overboost"). We performed our test under the "Enthusiast" profile and using automatic fan control. We also ran some benchmarks with the "Overboost" and "Balanced" profiles enabled, respectively. The results can be found in the comparison graphs.


Processor
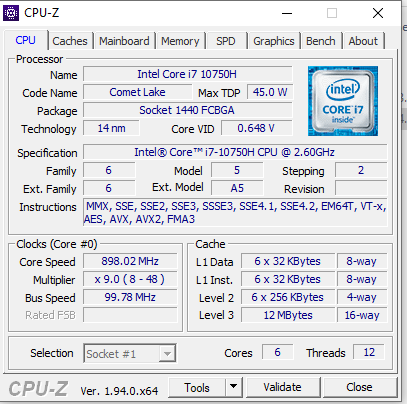
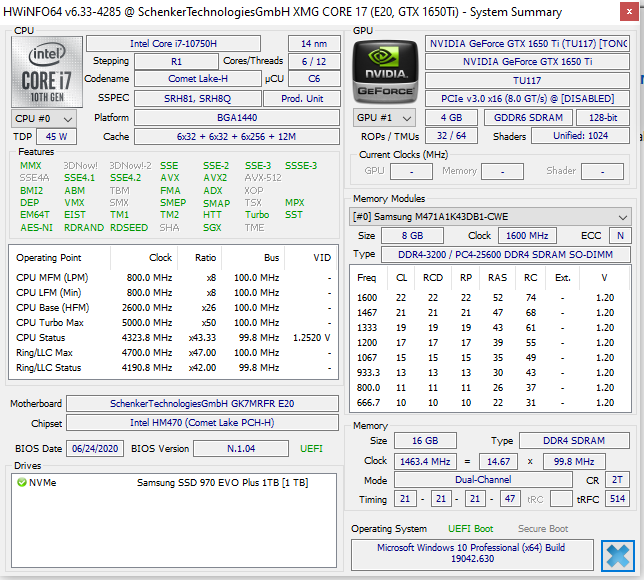
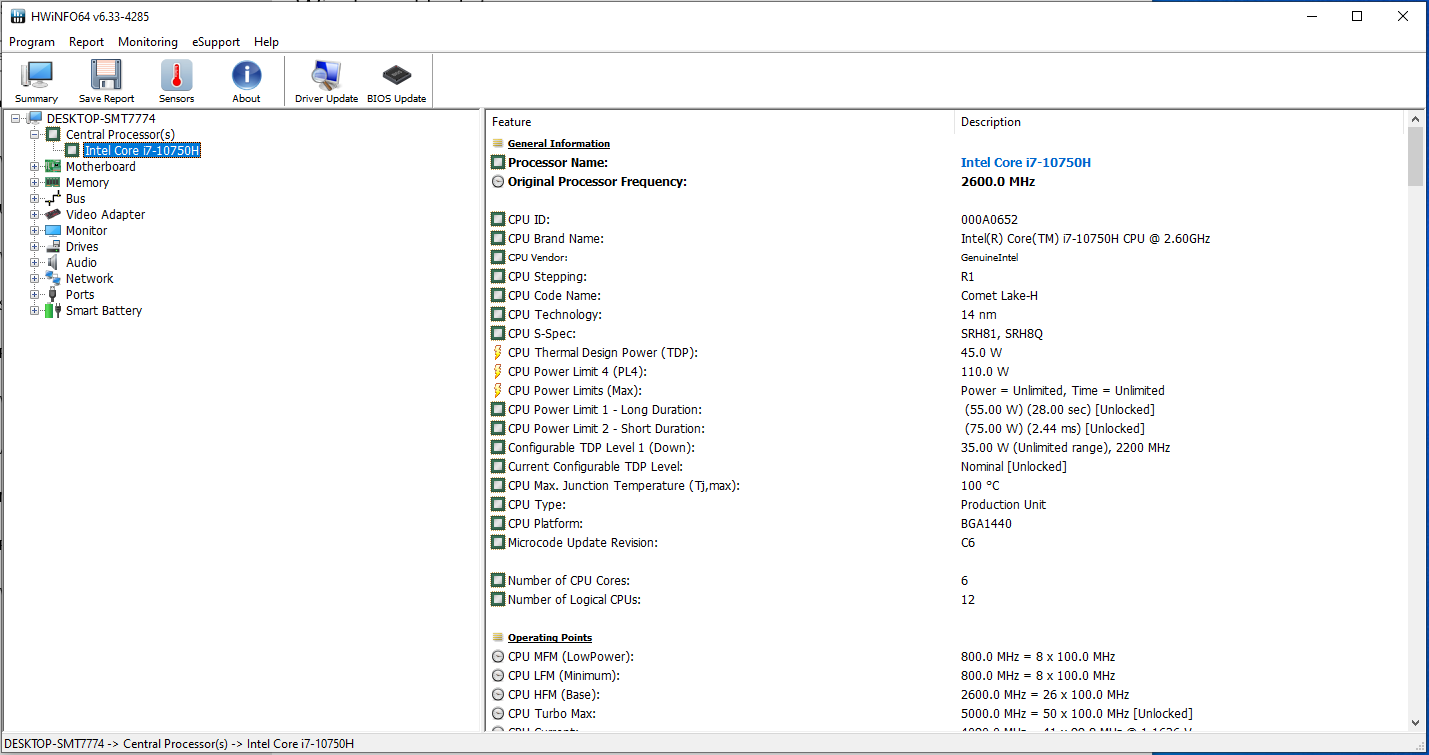
The Core i7-10750H hexa-core processor (Comet Lake) operates at a base speed of 2.6 GHz. Via Turbo, the clock rate can be increased to 4.3 GHz (six cores) and up to 5 GHz (one core). Hyper-Threading (two threads per core) is supported.
The processor executes the CPU tests of the Cinebench R15 benchmark at 3.7 to 4.3 GHz (multithread) and 4.2 to 5 GHz (single-thread). On battery power, the clock rates are 3 to 3.3 GHz (multithread) and 2.5 to 3.9 GHz (single-thread), respectively.
We verify if the CPU Turbo is consistently used when plugged in by running the Cinebench R15 benchmark's multithread test in a continuous loop for at least 30 minutes. Turbo is used. Furthermore, enabling the "Overboost" profile causes an increase in Turbo speeds.
| Cinebench R15 | |
| CPU Single 64Bit | |
| Average of class Gaming (188.8 - 350, n=103, last 2 years) | |
| Schenker XMG Core 17 Comet Lake | |
| Nexoc GH7 716IG | |
| MSI GF75 Thin 10SDR | |
| Average Intel Core i7-10750H (184 - 213, n=45) | |
| Acer Predator Helios 300 PH317-54-75G8 | |
| Schenker XMG Core 17 | |
| Lenovo Legion 5 17IMH05 | |
| CPU Multi 64Bit | |
| Average of class Gaming (1578 - 6330, n=102, last 2 years) | |
| Nexoc GH7 716IG | |
| Acer Predator Helios 300 PH317-54-75G8 | |
| Schenker XMG Core 17 Comet Lake (Overboost) | |
| Schenker XMG Core 17 Comet Lake | |
| Average Intel Core i7-10750H (804 - 1418, n=50) | |
| MSI GF75 Thin 10SDR | |
| Schenker XMG Core 17 Comet Lake (Balanced) | |
| Schenker XMG Core 17 | |
| Lenovo Legion 5 17IMH05 | |
| Blender - v2.79 BMW27 CPU | |
| Lenovo Legion 5 17IMH05 | |
| Schenker XMG Core 17 Comet Lake (Balanced) | |
| Average Intel Core i7-10750H (322 - 587, n=43) | |
| MSI GF75 Thin 10SDR | |
| Schenker XMG Core 17 Comet Lake | |
| Acer Predator Helios 300 PH317-54-75G8 | |
| Schenker XMG Core 17 Comet Lake (Overboost) | |
| Average of class Gaming (79 - 330, n=101, last 2 years) | |
| 7-Zip 18.03 | |
| 7z b 4 -mmt1 | |
| Average of class Gaming (4824 - 7436, n=102, last 2 years) | |
| Schenker XMG Core 17 Comet Lake (Overboost) | |
| Schenker XMG Core 17 Comet Lake | |
| Schenker XMG Core 17 Comet Lake (Balanced) | |
| Acer Predator Helios 300 PH317-54-75G8 | |
| Average Intel Core i7-10750H (4504 - 5470, n=43) | |
| MSI GF75 Thin 10SDR | |
| Lenovo Legion 5 17IMH05 | |
| 7z b 4 | |
| Average of class Gaming (33491 - 148086, n=102, last 2 years) | |
| Schenker XMG Core 17 Comet Lake (Overboost) | |
| Schenker XMG Core 17 Comet Lake | |
| Average Intel Core i7-10750H (26040 - 37345, n=43) | |
| MSI GF75 Thin 10SDR | |
| Acer Predator Helios 300 PH317-54-75G8 | |
| Schenker XMG Core 17 Comet Lake (Balanced) | |
| Lenovo Legion 5 17IMH05 | |
| Cinebench R20 | |
| CPU (Single Core) | |
| Average of class Gaming (622 - 913, n=103, last 2 years) | |
| Schenker XMG Core 17 Comet Lake (Overboost) | |
| Schenker XMG Core 17 Comet Lake | |
| Schenker XMG Core 17 Comet Lake (Balanced) | |
| Average Intel Core i7-10750H (431 - 504, n=43) | |
| MSI GF75 Thin 10SDR | |
| Acer Predator Helios 300 PH317-54-75G8 | |
| Schenker XMG Core 17 | |
| Lenovo Legion 5 17IMH05 | |
| CPU (Multi Core) | |
| Average of class Gaming (4029 - 16433, n=103, last 2 years) | |
| Schenker XMG Core 17 Comet Lake (Overboost) | |
| Acer Predator Helios 300 PH317-54-75G8 | |
| Schenker XMG Core 17 Comet Lake | |
| Average Intel Core i7-10750H (1749 - 3325, n=43) | |
| MSI GF75 Thin 10SDR | |
| Schenker XMG Core 17 | |
| Schenker XMG Core 17 Comet Lake (Balanced) | |
| Lenovo Legion 5 17IMH05 | |
| Geekbench 5.5 | |
| Single-Core | |
| Average of class Gaming (1403 - 2474, n=102, last 2 years) | |
| Schenker XMG Core 17 Comet Lake | |
| Schenker XMG Core 17 Comet Lake (Overboost) | |
| Nexoc GH7 716IG | |
| MSI GF75 Thin 10SDR | |
| Schenker XMG Core 17 Comet Lake (Balanced) | |
| Average Intel Core i7-10750H (1114 - 1333, n=43) | |
| Acer Predator Helios 300 PH317-54-75G8 | |
| Lenovo Legion 5 17IMH05 | |
| Multi-Core | |
| Average of class Gaming (6460 - 28263, n=102, last 2 years) | |
| Schenker XMG Core 17 Comet Lake (Overboost) | |
| Nexoc GH7 716IG | |
| Schenker XMG Core 17 Comet Lake | |
| MSI GF75 Thin 10SDR | |
| Acer Predator Helios 300 PH317-54-75G8 | |
| Average Intel Core i7-10750H (4443 - 6674, n=43) | |
| Schenker XMG Core 17 Comet Lake (Balanced) | |
| Lenovo Legion 5 17IMH05 | |
| HWBOT x265 Benchmark v2.2 - 4k Preset | |
| Average of class Gaming (11.5 - 44.4, n=102, last 2 years) | |
| Schenker XMG Core 17 Comet Lake (Overboost) | |
| Acer Predator Helios 300 PH317-54-75G8 | |
| Schenker XMG Core 17 Comet Lake | |
| Average Intel Core i7-10750H (5.54 - 11.6, n=43) | |
| MSI GF75 Thin 10SDR | |
| Schenker XMG Core 17 Comet Lake (Balanced) | |
| Lenovo Legion 5 17IMH05 | |
| LibreOffice - 20 Documents To PDF | |
| Lenovo Legion 5 17IMH05 | |
| Acer Predator Helios 300 PH317-54-75G8 | |
| MSI GF75 Thin 10SDR | |
| Schenker XMG Core 17 Comet Lake | |
| Average Intel Core i7-10750H (43.1 - 99.2, n=43) | |
| Average of class Gaming (33.2 - 88.8, n=102, last 2 years) | |
| Nexoc GH7 716IG | |
| Schenker XMG Core 17 Comet Lake (Overboost) | |
| R Benchmark 2.5 - Overall mean | |
| Lenovo Legion 5 17IMH05 | |
| MSI GF75 Thin 10SDR | |
| Acer Predator Helios 300 PH317-54-75G8 | |
| Average Intel Core i7-10750H (0.578 - 0.708, n=42) | |
| Schenker XMG Core 17 Comet Lake (Balanced) | |
| Schenker XMG Core 17 Comet Lake (Overboost) | |
| Schenker XMG Core 17 Comet Lake | |
| Average of class Gaming (0.3439 - 0.59, n=102, last 2 years) | |
* ... smaller is better
System performance
The system works well and smoothly. The laptop offers enough computing power for all common application areas - gaming, video-editing, image-processing, office tasks, and Internet usage don't pose any problems for the hardware. This is complemented by good results in the PCMark benchmarks.
| PCMark 8 Home Score Accelerated v2 | 4136 points | |
| PCMark 8 Creative Score Accelerated v2 | 5002 points | |
| PCMark 8 Work Score Accelerated v2 | 5610 points | |
| PCMark 10 Score | 5185 points | |
Help | ||
DPC latencies

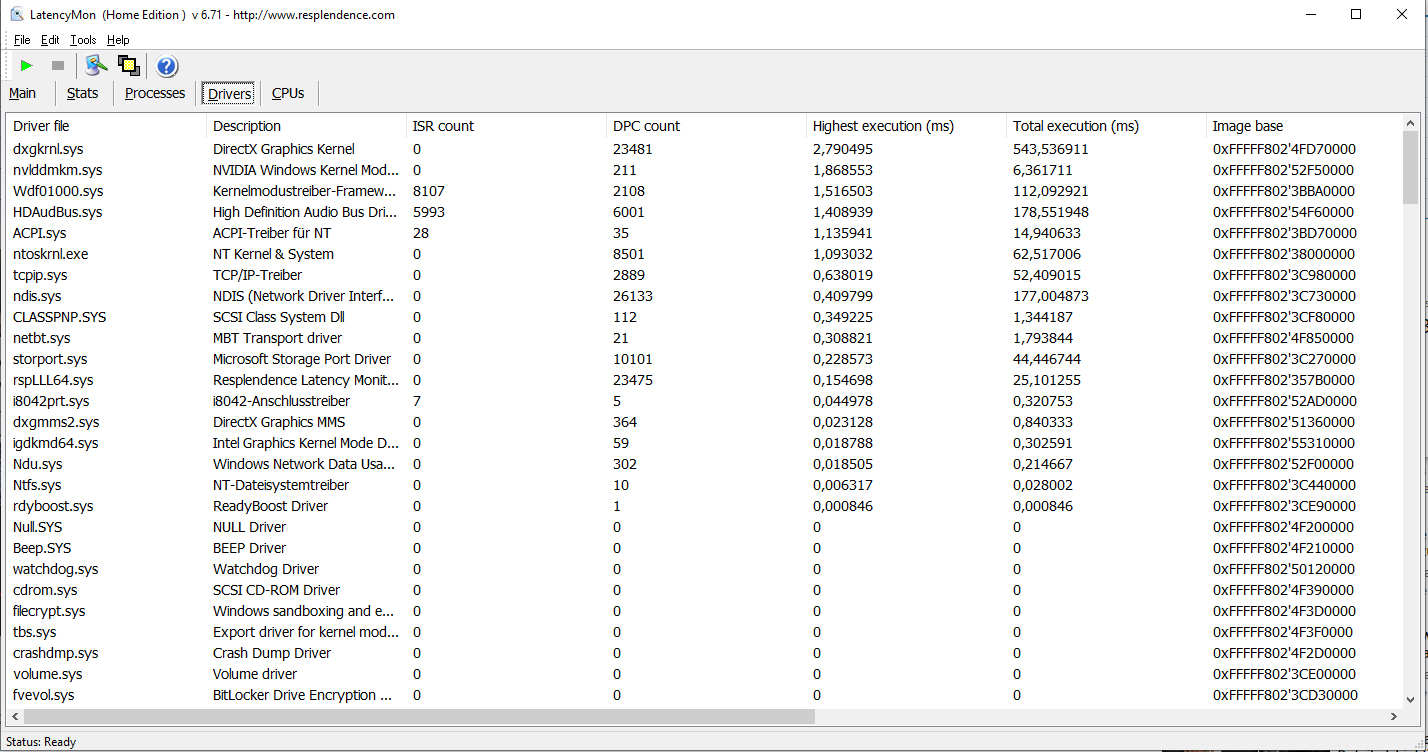
| DPC Latencies / LatencyMon - interrupt to process latency (max), Web, Youtube, Prime95 | |
| Lenovo Legion 5 17IMH05 | |
| MSI GF75 Thin 10SDR | |
| Schenker XMG Core 17 Comet Lake | |
| Nexoc GH7 716IG | |
| Acer Predator Helios 300 PH317-54-75G8 | |
* ... smaller is better
Storage
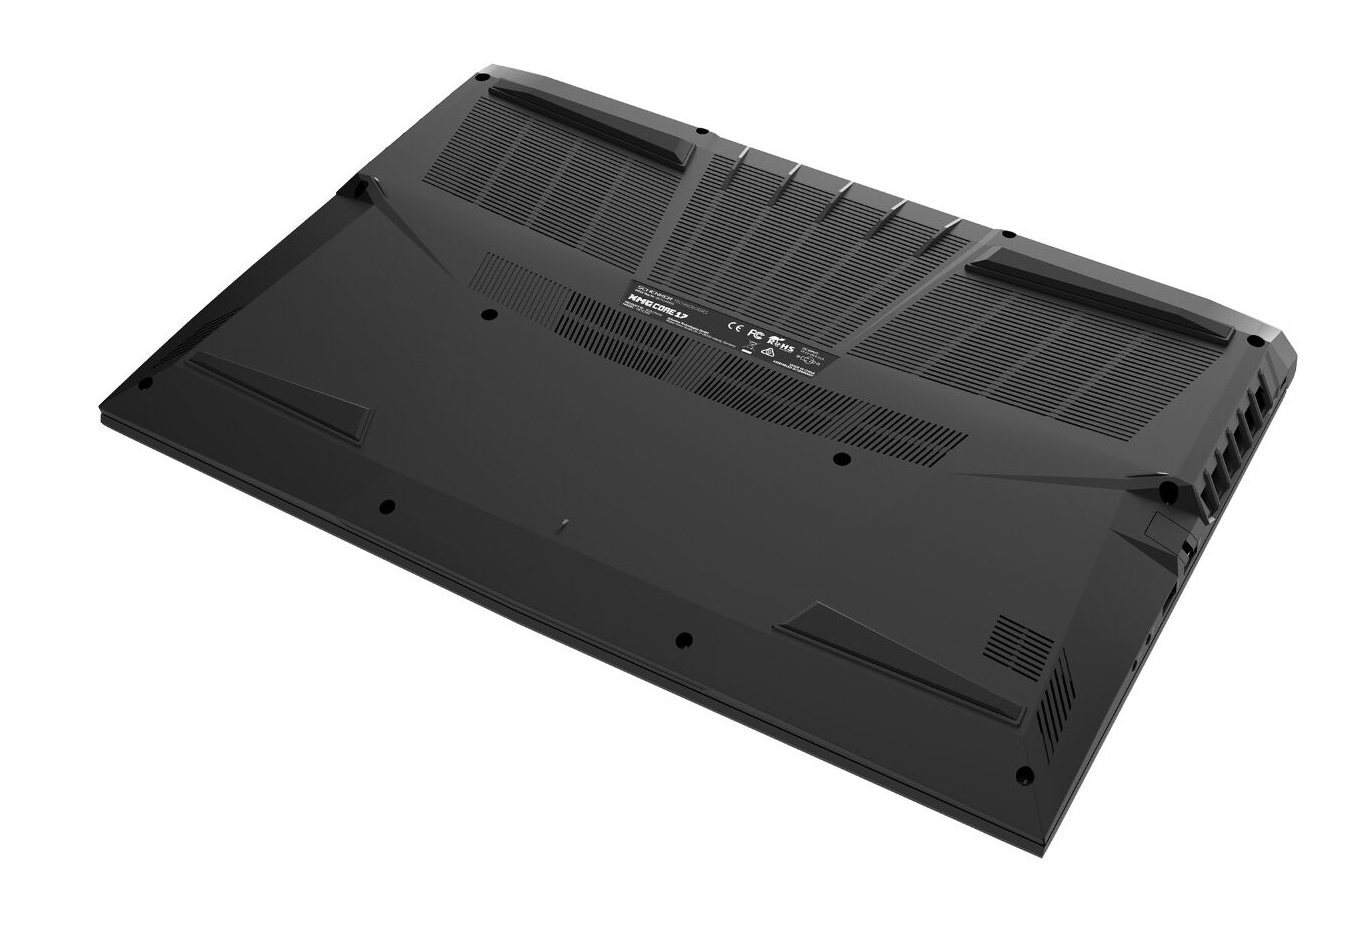
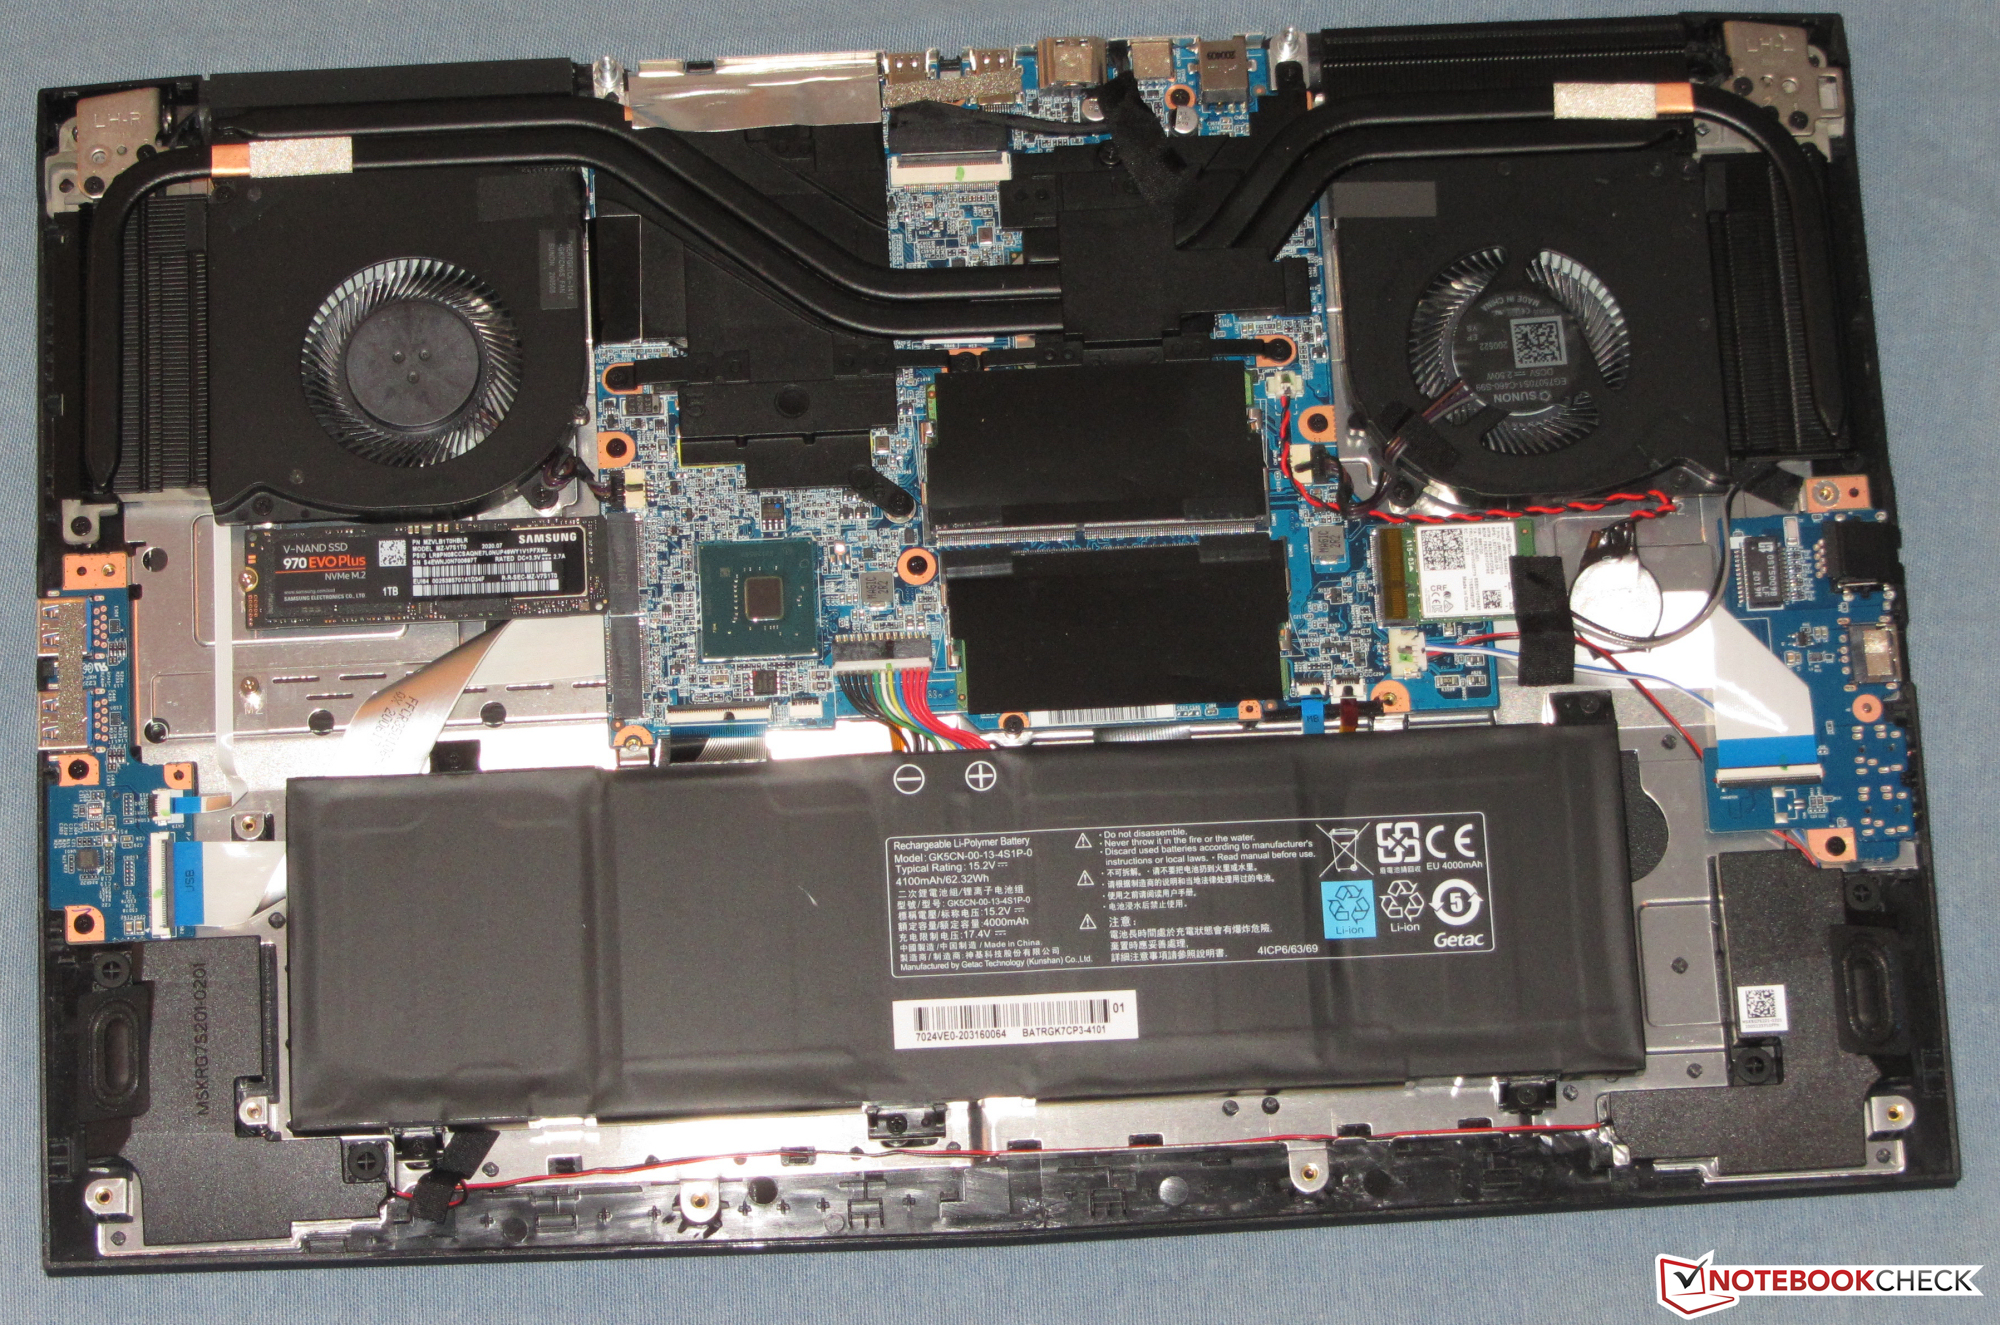
An NVMe SSD (M.2 2280) from Samsung serves as system drive. It provides 1 TB of storage space and delivers very good transfer rates. In total, the laptop can accommodate two M.2 2280 SSDs (1x NVMe, 1x NVMe/SATA; RAID 0/1).
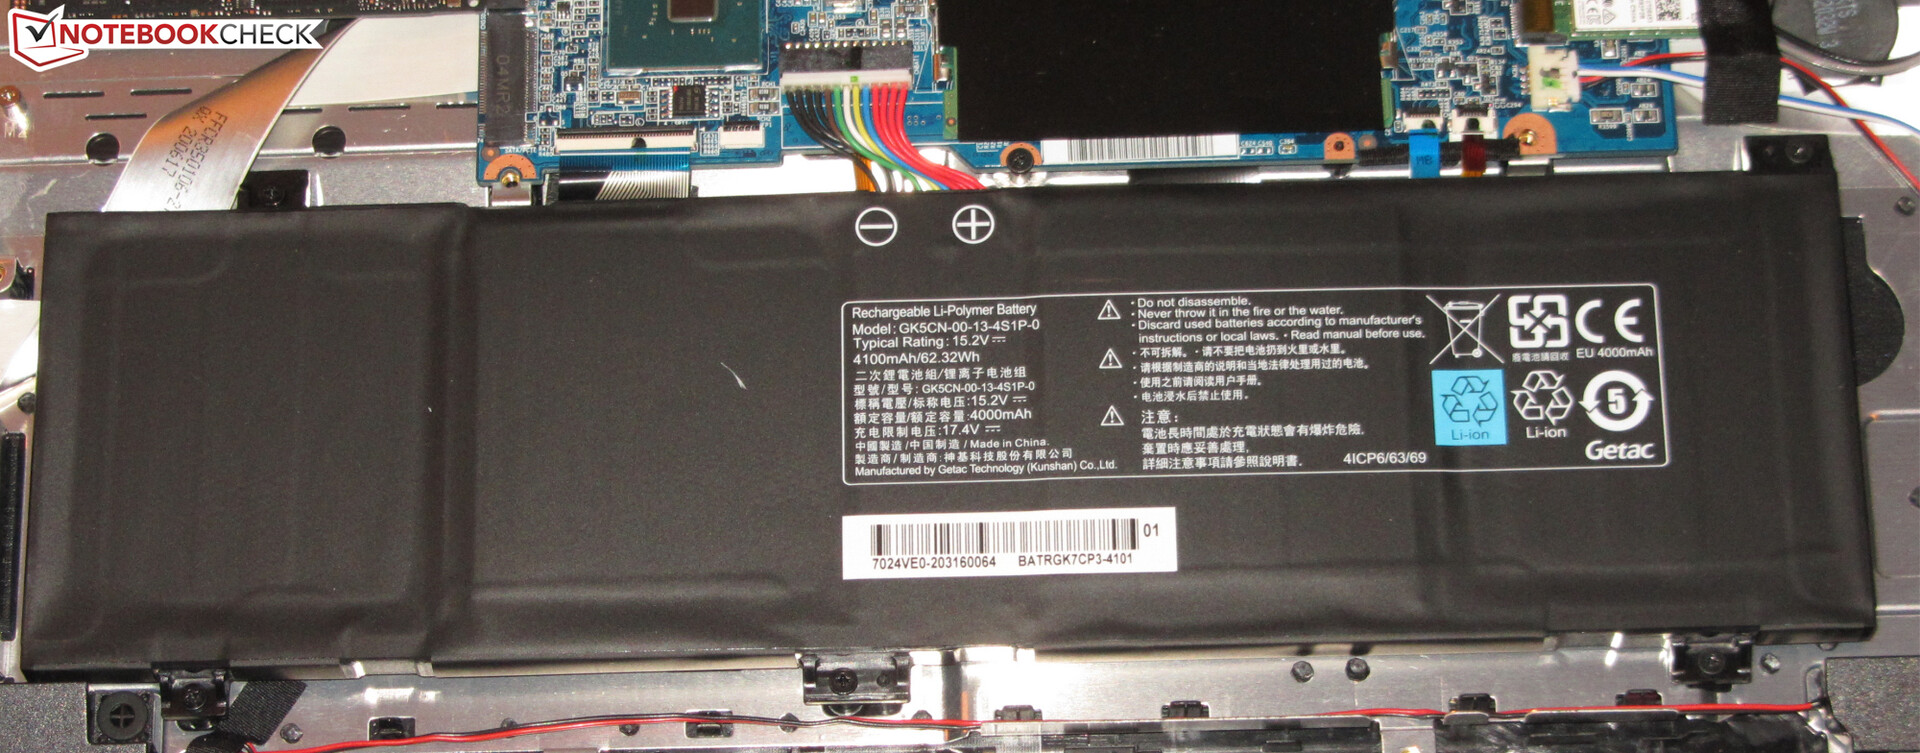
The laptop would still have room for a 2.5-inch storage medium. Since our test device is equipped with the larger of the two available batteries (46 Wh, 62 Wh), the battery takes up the space designated for the storage device.
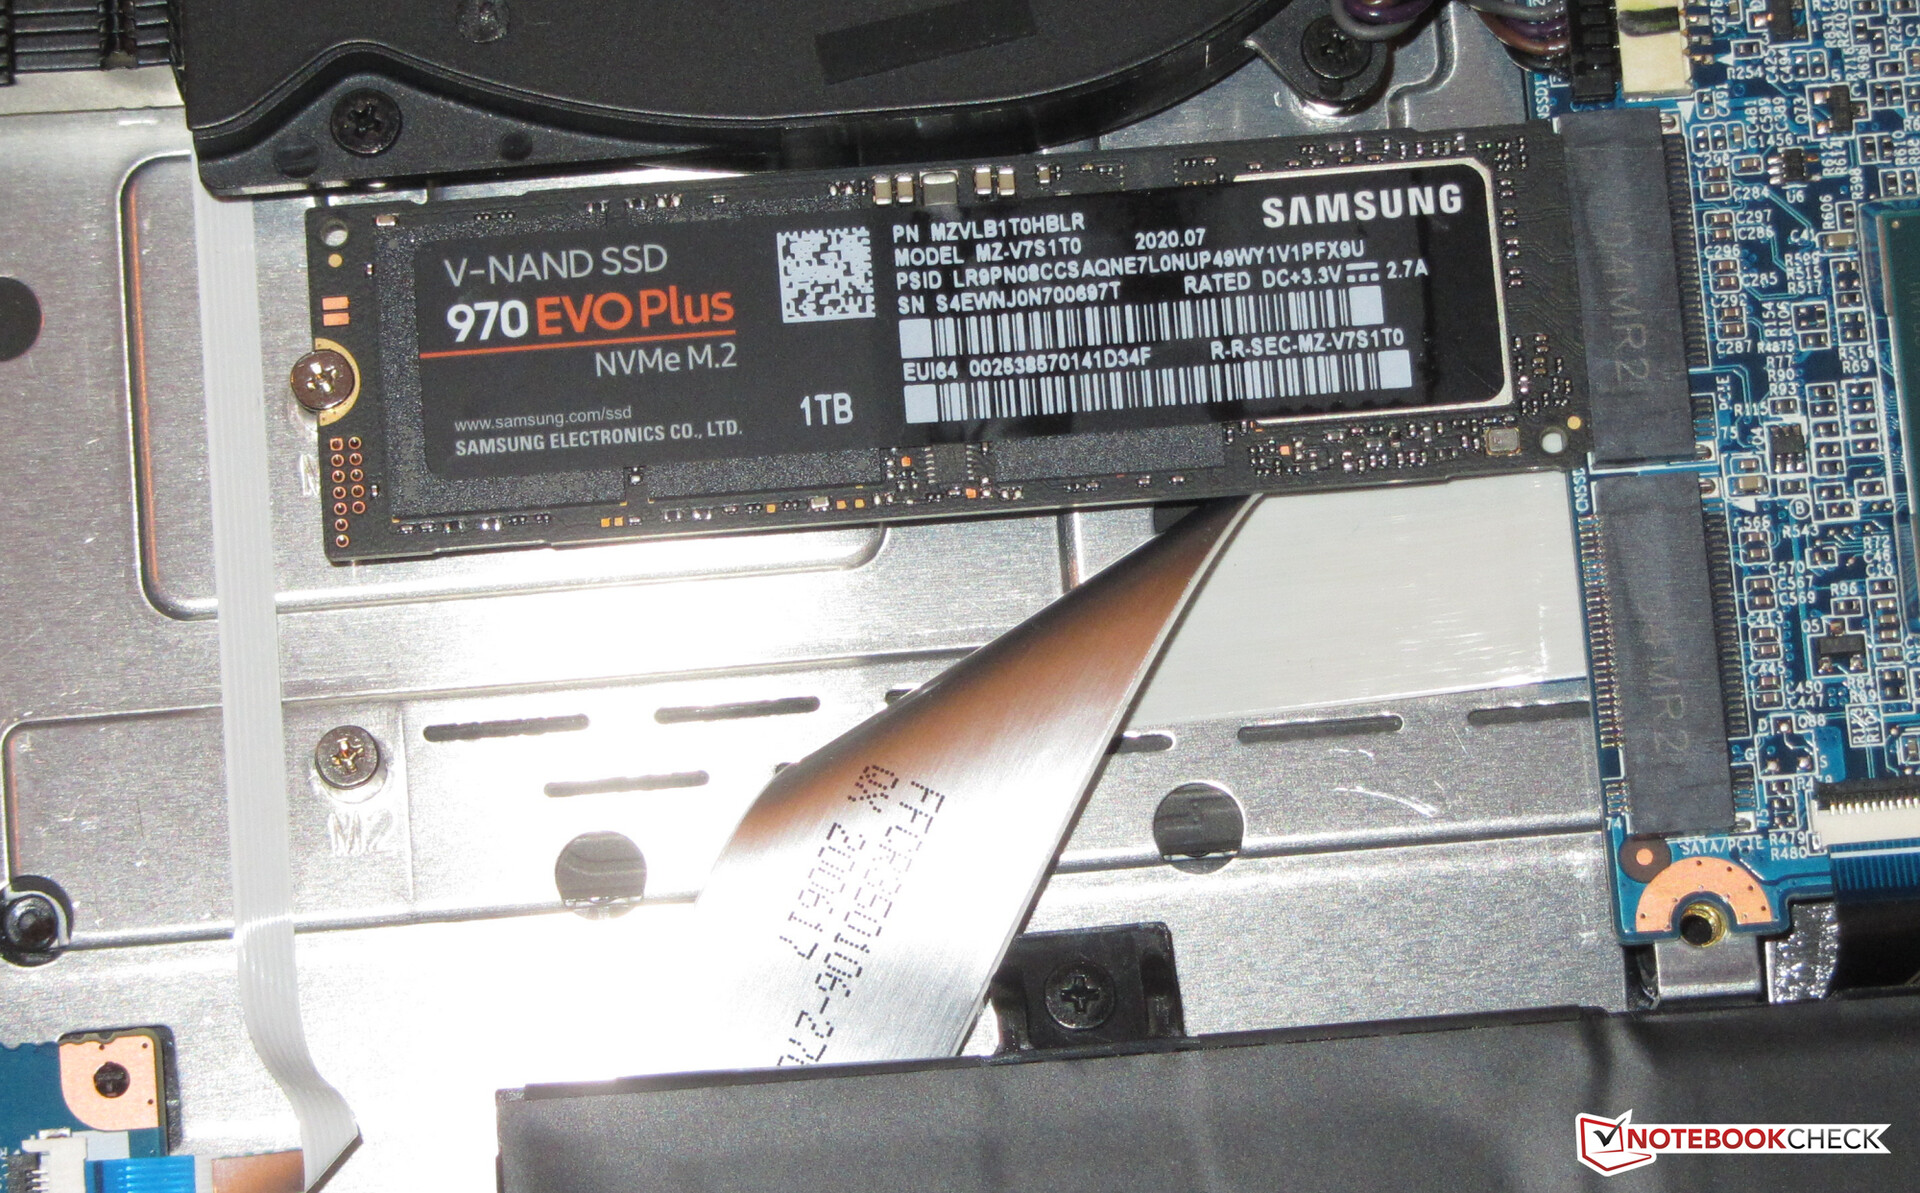

| Schenker XMG Core 17 Comet Lake Samsung SSD 970 EVO Plus 1TB | Lenovo Legion 5 17IMH05 SK hynix BC511 HFM512GDHTNI-87A0B | Acer Predator Helios 300 PH317-54-75G8 WDC PC SN730 SDBQNTY-1T00 | MSI GF75 Thin 10SDR Samsung PM991 MZVLQ512HALU | Nexoc GH7 716IG Samsung SSD 970 EVO Plus 500GB | Schenker XMG Core 17 Samsung SSD 970 EVO Plus 500GB | |
|---|---|---|---|---|---|---|
| CrystalDiskMark 5.2 / 6 | -36% | -15% | -34% | 4% | -31% | |
| Write 4K (MB/s) | 169.5 | 134.7 -21% | 141.9 -16% | 138.8 -18% | 201.6 19% | 99.3 -41% |
| Read 4K (MB/s) | 51.5 | 44.84 -13% | 48.75 -5% | 50.6 -2% | 54.8 6% | 38.47 -25% |
| Write Seq (MB/s) | 3009 | 1053 -65% | 2734 -9% | 1032 -66% | 2999 0% | 1449 -52% |
| Read Seq (MB/s) | 2959 | 1241 -58% | 1921 -35% | 1199 -59% | 3023 2% | 1237 -58% |
| Write 4K Q32T1 (MB/s) | 536 | 499.8 -7% | 422.6 -21% | 464.6 -13% | 545 2% | 364.4 -32% |
| Read 4K Q32T1 (MB/s) | 621 | 518 -17% | 509 -18% | 550 -11% | 636 2% | 421.9 -32% |
| Write Seq Q32T1 (MB/s) | 3339 | 1022 -69% | 3055 -9% | 1216 -64% | 3262 -2% | 3276 -2% |
| Read Seq Q32T1 (MB/s) | 3561 | 2263 -36% | 3257 -9% | 2275 -36% | 3550 0% | 3338 -6% |
| AS SSD | -50% | -18% | -69% | 1% | -34% | |
| Seq Read (MB/s) | 2937 | 1635 -44% | 2828 -4% | 1976 -33% | 3008 2% | 2283 -22% |
| Seq Write (MB/s) | 2858 | 913 -68% | 2677 -6% | 1057 -63% | 2521 -12% | 2779 -3% |
| 4K Read (MB/s) | 50.3 | 46.18 -8% | 39.94 -21% | 45.31 -10% | 64.3 28% | 29.99 -40% |
| 4K Write (MB/s) | 130.6 | 101.7 -22% | 100.9 -23% | 119.1 -9% | 142.5 9% | 99.1 -24% |
| 4K-64 Read (MB/s) | 1710 | 773 -55% | 1562 -9% | 817 -52% | 1664 -3% | 1156 -32% |
| 4K-64 Write (MB/s) | 2355 | 745 -68% | 1867 -21% | 672 -71% | 2447 4% | 2333 -1% |
| Access Time Read * (ms) | 0.037 | 0.05 -35% | 0.156 -322% | 0.047 -27% | 0.092 -149% | |
| Access Time Write * (ms) | 0.028 | 0.037 -32% | 0.037 -32% | 0.034 -21% | 0.026 7% | 0.037 -32% |
| Score Read (Points) | 2054 | 983 -52% | 1885 -8% | 1060 -48% | 2029 -1% | 1414 -31% |
| Score Write (Points) | 2771 | 938 -66% | 2236 -19% | 897 -68% | 2842 3% | 2710 -2% |
| Score Total (Points) | 5873 | 2399 -59% | 5076 -14% | 2464 -58% | 5893 0% | 4871 -17% |
| Copy ISO MB/s (MB/s) | 2225 | 573 -74% | 1870 -16% | 1394 -37% | ||
| Copy Program MB/s (MB/s) | 779 | 344.4 -56% | 545 -30% | 379.8 -51% | ||
| Copy Game MB/s (MB/s) | 1590 | 535 -66% | 1083 -32% | 976 -39% | ||
| Total Average (Program / Settings) | -43% /
-45% | -17% /
-17% | -52% /
-54% | 3% /
2% | -33% /
-33% |
* ... smaller is better
Continuous load read: DiskSpd Read Loop, Queue Depth 8
Graphics card
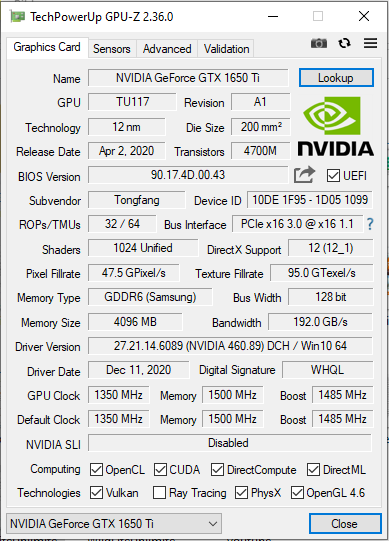
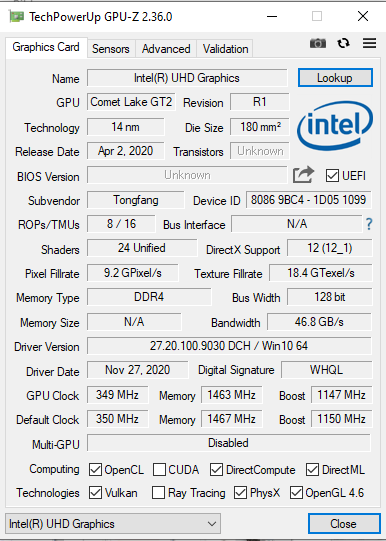
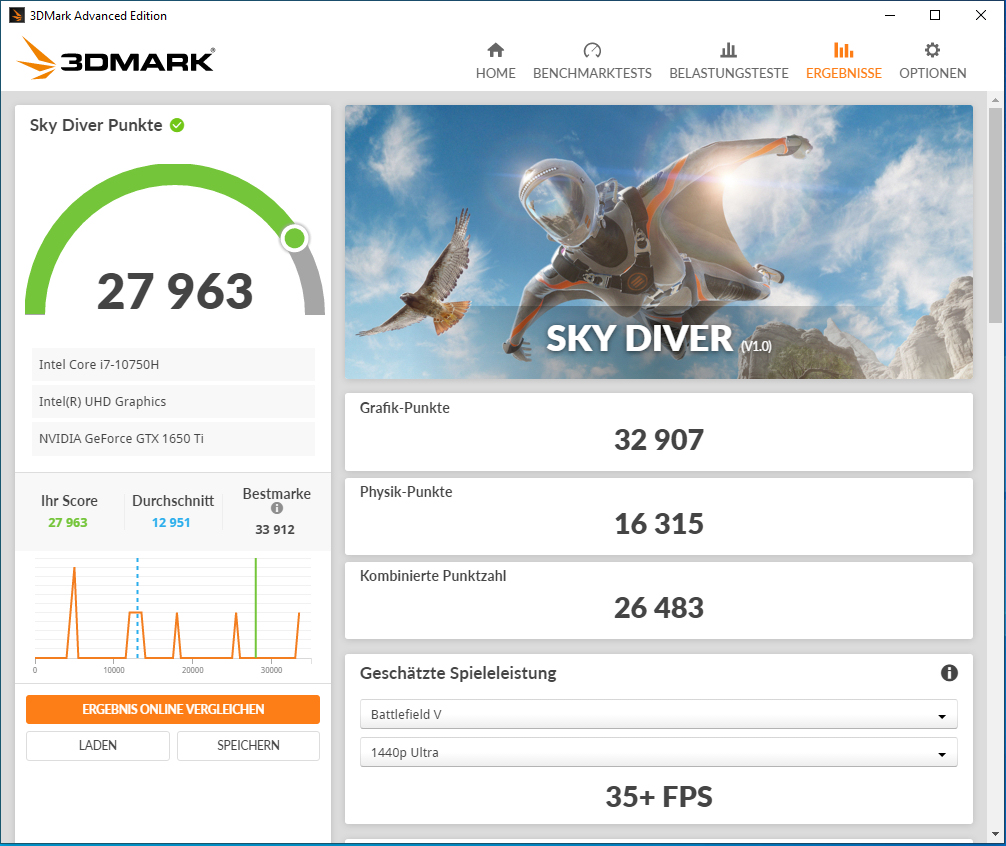
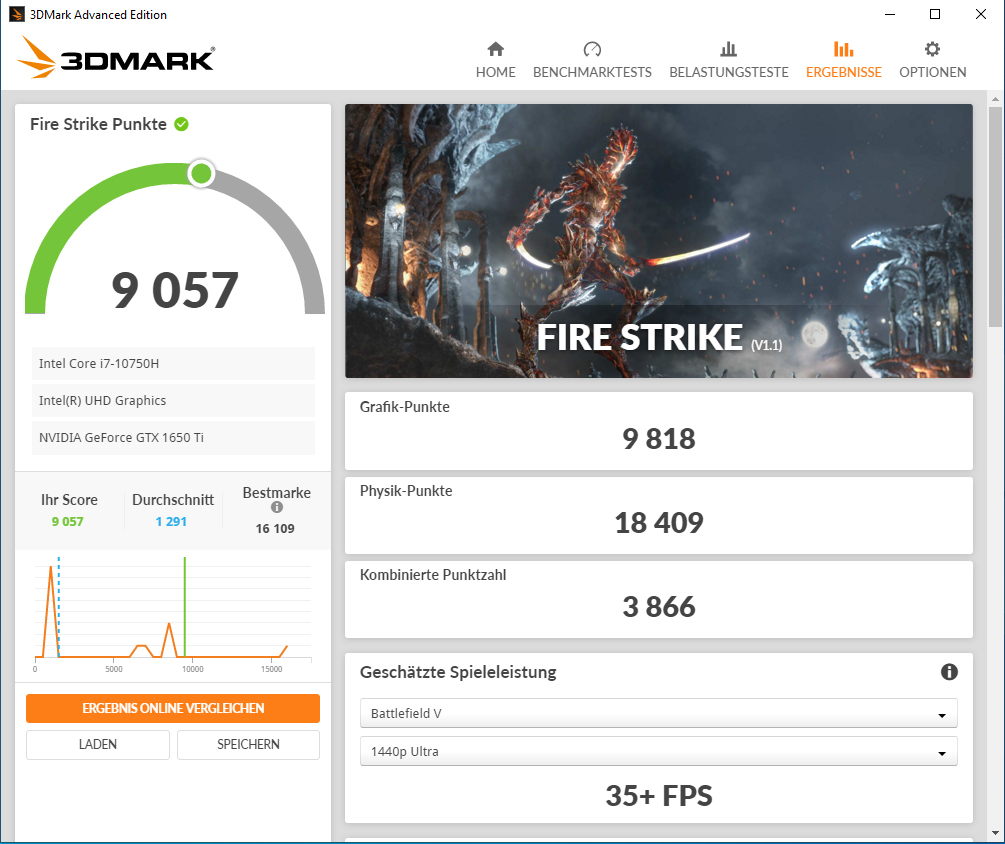
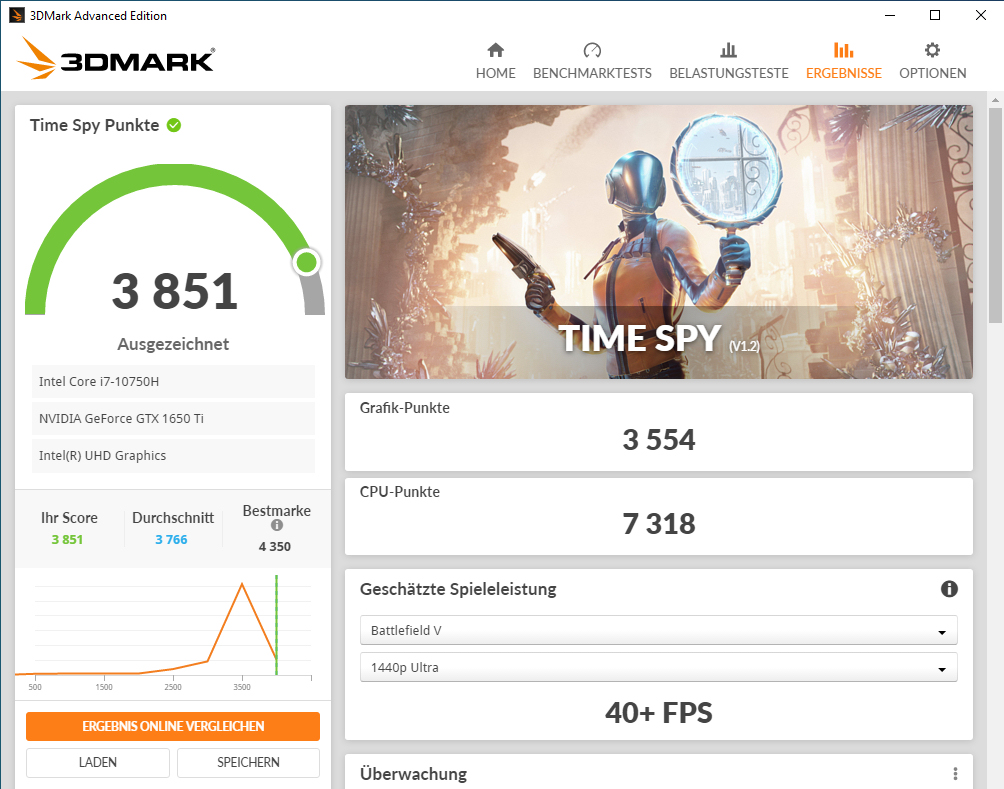
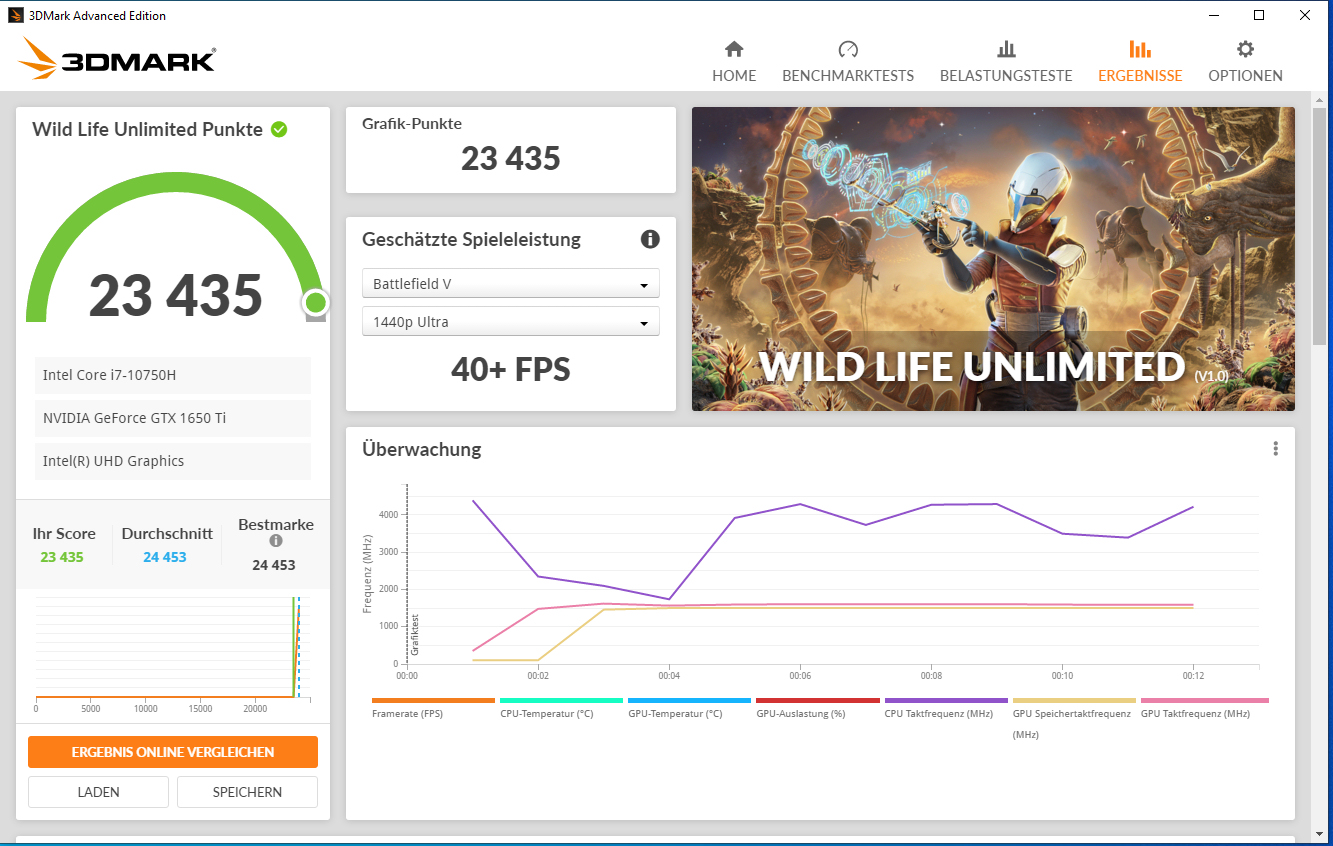
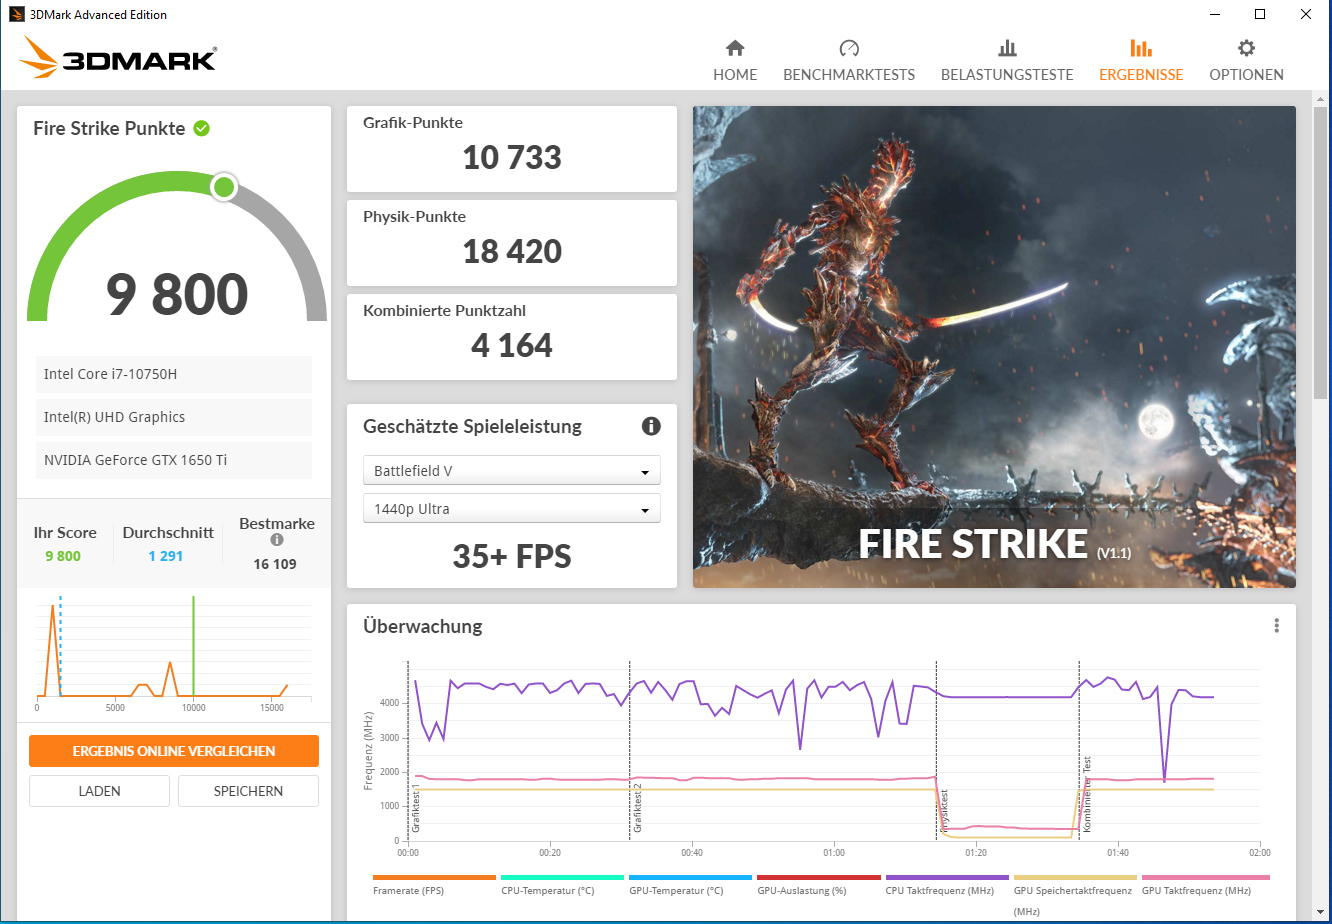
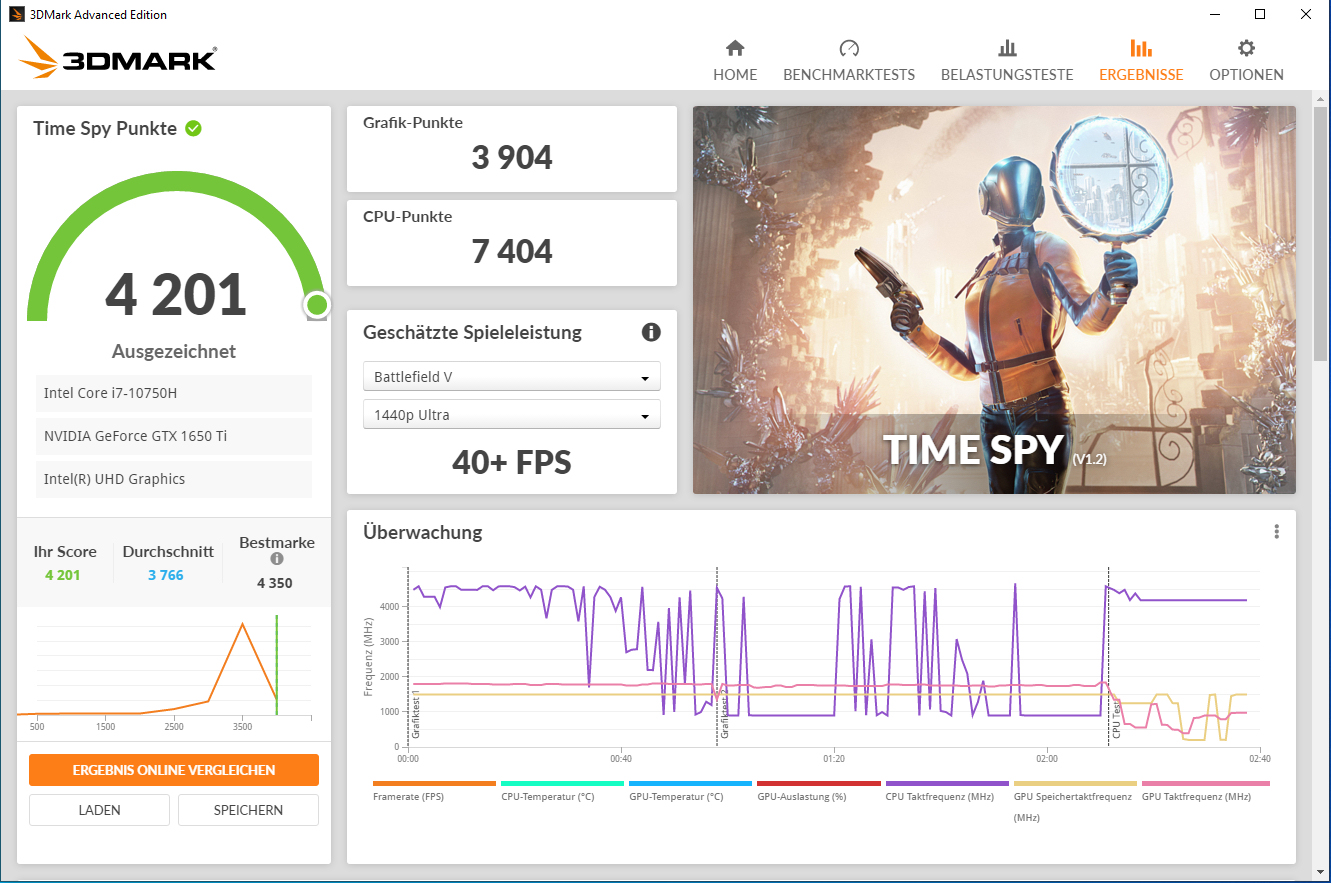
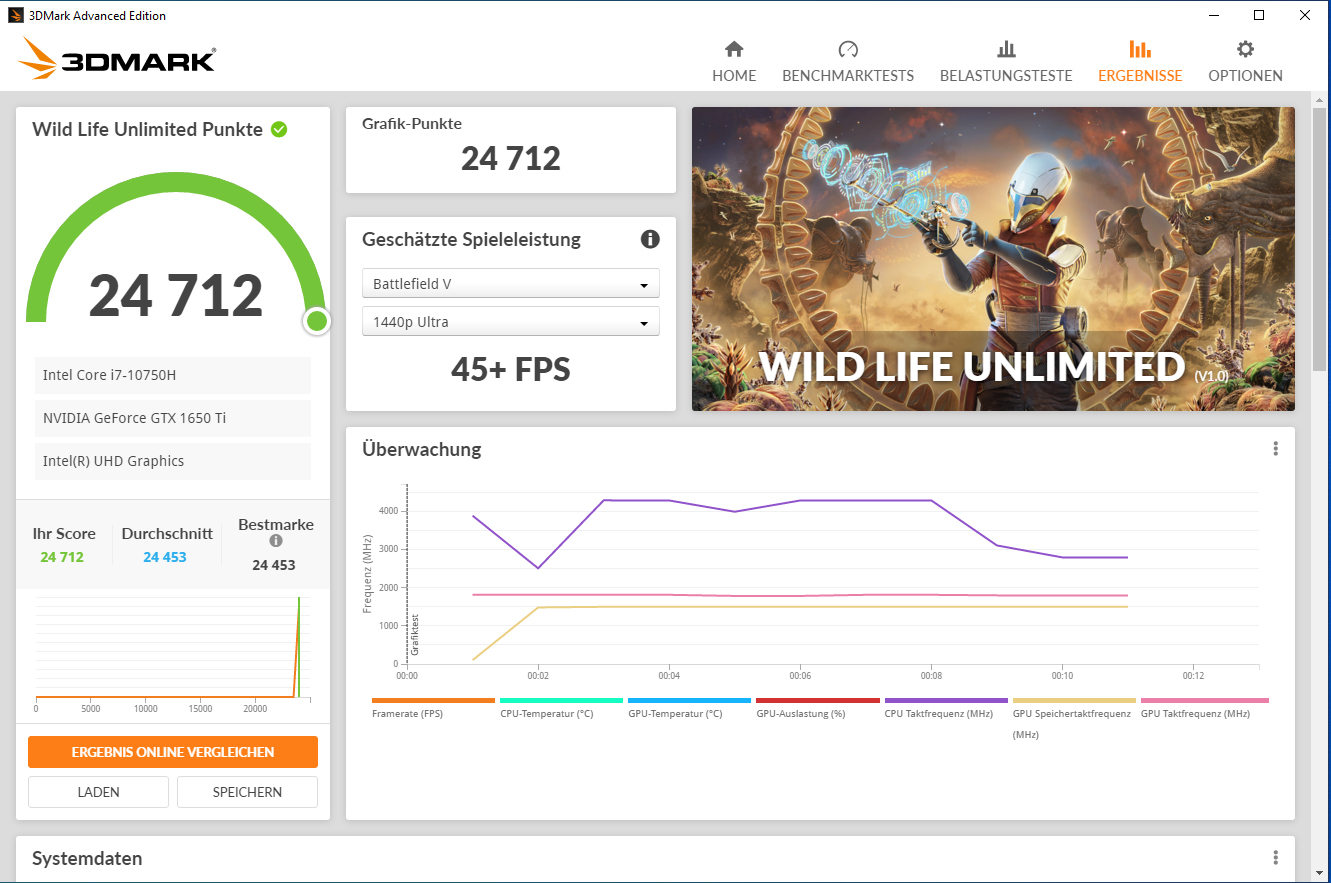
The GeForce GTX 1650 Ti graphics core (Turing) belongs to the upper GPU mid-range. It's supported by fast GDDR6 memory (4,096 MB). The 3DMark results are at a normal level for the GPU installed here. The "Overboost" profile causes a slight increase in graphics performance. Moreover, the UHD Graphics 630 GPU integrated into the processor is active, and the laptop works with Nvidia's Optimus graphics-switching solution.
| 3DMark 11 Performance | 13280 points | |
| 3DMark Cloud Gate Standard Score | 33280 points | |
| 3DMark Fire Strike Score | 9057 points | |
| 3DMark Time Spy Score | 3851 points | |
Help | ||
| 3DMark | |
| 1280x720 Cloud Gate Standard Graphics | |
| Average of class Gaming (86886 - 223650, n=60, last 2 years) | |
| Acer Predator Helios 300 PH317-54-75G8 | |
| Schenker XMG Core 17 | |
| Schenker XMG Core 17 Comet Lake | |
| Lenovo Legion 5 17IMH05 | |
| Average NVIDIA GeForce GTX 1650 Ti Mobile (34971 - 70377, n=7) | |
| 1920x1080 Fire Strike Graphics | |
| Average of class Gaming (18629 - 62849, n=112, last 2 years) | |
| Acer Predator Helios 300 PH317-54-75G8 | |
| MSI GF75 Thin 10SDR | |
| Schenker XMG Core 17 | |
| Schenker XMG Core 17 Comet Lake (Overboost) | |
| Average NVIDIA GeForce GTX 1650 Ti Mobile (9691 - 10733, n=9) | |
| Schenker XMG Core 17 Comet Lake | |
| Lenovo Legion 5 17IMH05 | |
| 2560x1440 Time Spy Graphics | |
| Average of class Gaming (6387 - 26212, n=112, last 2 years) | |
| Acer Predator Helios 300 PH317-54-75G8 | |
| MSI GF75 Thin 10SDR | |
| Schenker XMG Core 17 | |
| Schenker XMG Core 17 Comet Lake (Overboost) | |
| Average NVIDIA GeForce GTX 1650 Ti Mobile (3554 - 3904, n=9) | |
| Schenker XMG Core 17 Comet Lake | |
| Lenovo Legion 5 17IMH05 | |
Gaming performance
The Core 17 brings all games in our database smoothly onto the screen. Full HD resolution and medium to high quality settings can usually be selected. Titles that only have low hardware requirements allow more. A current hit like Cyberpunk 2077 requires a reduction of the resolution and/or quality level. The "Overboost" profile doesn't cause an increase in frame rates.
| The Witcher 3 - 1920x1080 Ultra Graphics & Postprocessing (HBAO+) | |
| Average of class Gaming (104.7 - 240, n=7, last 2 years) | |
| Acer Predator Helios 300 PH317-54-75G8 | |
| MSI GF75 Thin 10SDR | |
| Schenker XMG Core 17 | |
| Nexoc GH7 716IG | |
| Schenker XMG Core 17 Comet Lake | |
| Schenker XMG Core 17 Comet Lake (Overboost) | |
| Lenovo Legion 5 17IMH05 | |
| Average NVIDIA GeForce GTX 1650 Ti Mobile (34.7 - 42.3, n=8) | |
| Dota 2 Reborn - 1920x1080 ultra (3/3) best looking | |
| Average of class Gaming (84.8 - 252, n=104, last 2 years) | |
| Nexoc GH7 716IG | |
| MSI GF75 Thin 10SDR | |
| Schenker XMG Core 17 Comet Lake | |
| Schenker XMG Core 17 Comet Lake (Overboost) | |
| Average NVIDIA GeForce GTX 1650 Ti Mobile (87.1 - 120, n=8) | |
| Schenker XMG Core 17 Comet Lake (Balanced) | |
| X-Plane 11.11 - 1920x1080 high (fps_test=3) | |
| Average of class Gaming (55.5 - 148.5, n=106, last 2 years) | |
| Nexoc GH7 716IG | |
| MSI GF75 Thin 10SDR | |
| Schenker XMG Core 17 Comet Lake (Overboost) | |
| Schenker XMG Core 17 Comet Lake | |
| Schenker XMG Core 17 Comet Lake (Balanced) | |
| Average NVIDIA GeForce GTX 1650 Ti Mobile (59.1 - 75.9, n=8) | |
| Horizon Zero Dawn - 1920x1080 Ultimate Quality | |
| Acer Predator Helios 300 PH317-54-75G8 | |
| MSI GF75 Thin 10SDR | |
| Average NVIDIA GeForce GTX 1650 Ti Mobile (43 - 48, n=4) | |
| Schenker XMG Core 17 Comet Lake | |
| Schenker XMG Core 17 Comet Lake (Overboost) | |
| Watch Dogs Legion - 1920x1080 High Preset (DX12) | |
| Average NVIDIA GeForce GTX 1650 Ti Mobile (50 - 53.1, n=2) | |
| Schenker XMG Core 17 Comet Lake | |
| Immortals Fenyx Rising - 1920x1080 High Preset | |
| Average NVIDIA GeForce GTX 1650 Ti Mobile (38 - 46, n=2) | |
| Schenker XMG Core 17 Comet Lake | |
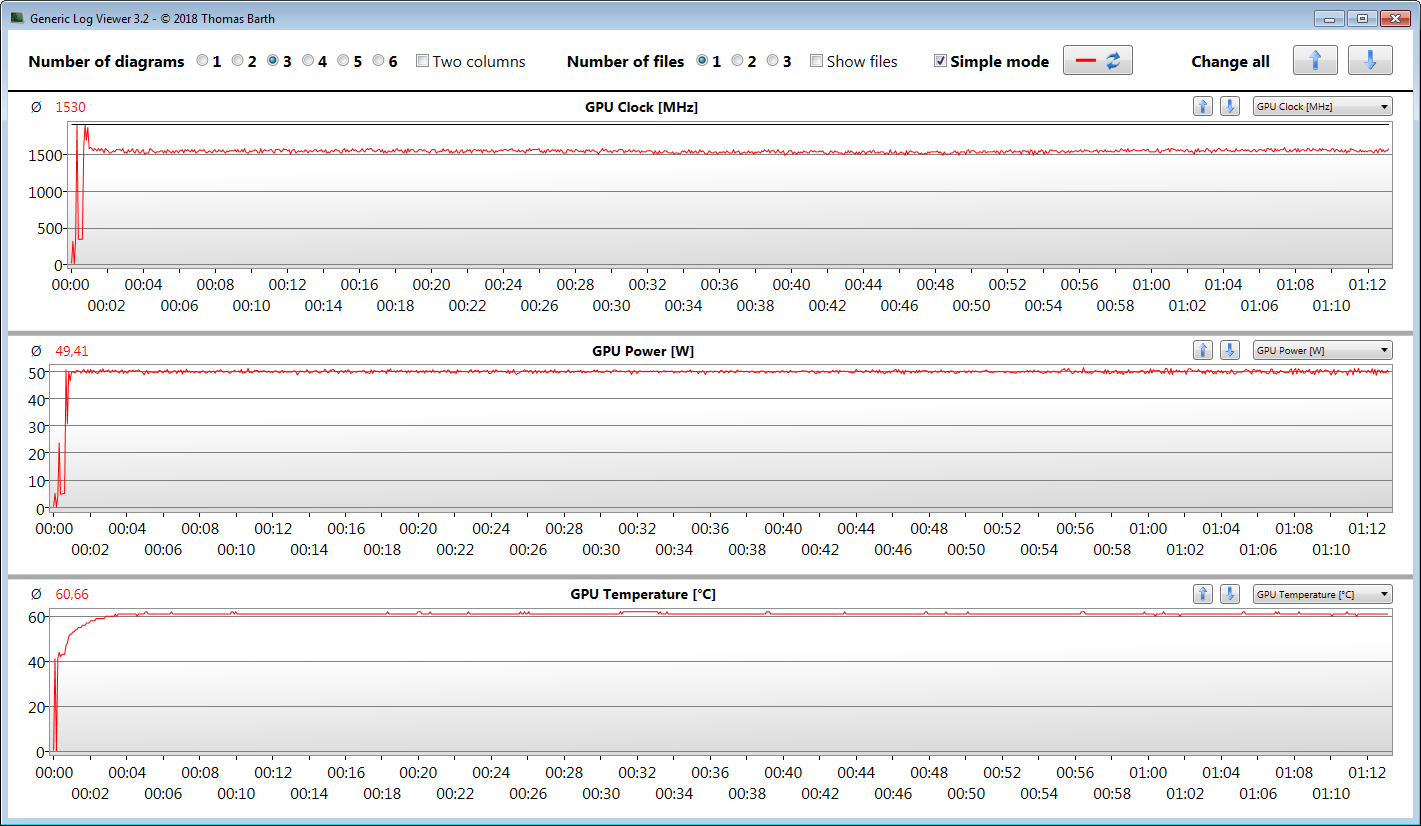
In order to verify whether the frame rates remain largely constant over a prolonged period of time, we let the game The Witcher 3 run for about 60 minutes at Full HD resolution and maximum quality settings. The character is not moved. A drop in frame rates wasn't found.
| low | med. | high | ultra | |
|---|---|---|---|---|
| The Witcher 3 (2015) | 217 | 133.4 | 74.1 | 42.3 |
| Dota 2 Reborn (2015) | 148 | 129 | 120 | 112 |
| X-Plane 11.11 (2018) | 103 | 89.9 | 75.7 | |
| Doom Eternal (2020) | 188.3 | 97.9 | 82.3 | |
| F1 2020 (2020) | 206 | 110 | 87.9 | 61.4 |
| Horizon Zero Dawn (2020) | 110 | 62 | 50 | 43 |
| Serious Sam 4 (2020) | 119 | 55.8 | 43.4 | 32.9 |
| Watch Dogs Legion (2020) | 97 | 57 | 50 | 22 |
| Assassin´s Creed Valhalla (2020) | 85 | 49 | 35 | 15 |
| Yakuza Like a Dragon (2020) | 121.1 | 49.4 | 49 | 42.9 |
| Immortals Fenyx Rising (2020) | 92 | 54 | 38 | 33 |
| Cyberpunk 2077 1.0 (2020) | 69.5 | 34.2 | 27.9 | 23.2 |
Emissions and energy - The Schenker laptop doesn't get particularly warm
Noise emissions
In idle usage, the laptop produces little to no noise. The fans work at low speeds or stand still. However, they turn up under load. In this way, we register a maximum sound pressure level of 51 dB(A) during the stress test. At a level of 44 dB(A), there is less noise during our The Witcher 3 test.
The laptop's noise development can be reduced by using the "Balanced" profile - at the expense of performance.
Noise level
| Idle |
| 25 / 31 / 32 dB(A) |
| Load |
| 48 / 51 dB(A) |
 | ||
30 dB silent 40 dB(A) audible 50 dB(A) loud |
||
min: | ||
Temperature
Our stress test (Prime95 and FurMark run for at least an hour) is processed by the CPU and GPU at 3.1 to 3.2 GHz and 1,125 MHz, respectively. The stress test represents an extreme scenario that doesn't occur in everyday use. We conduct this test to check whether the system remains stable even under full load.
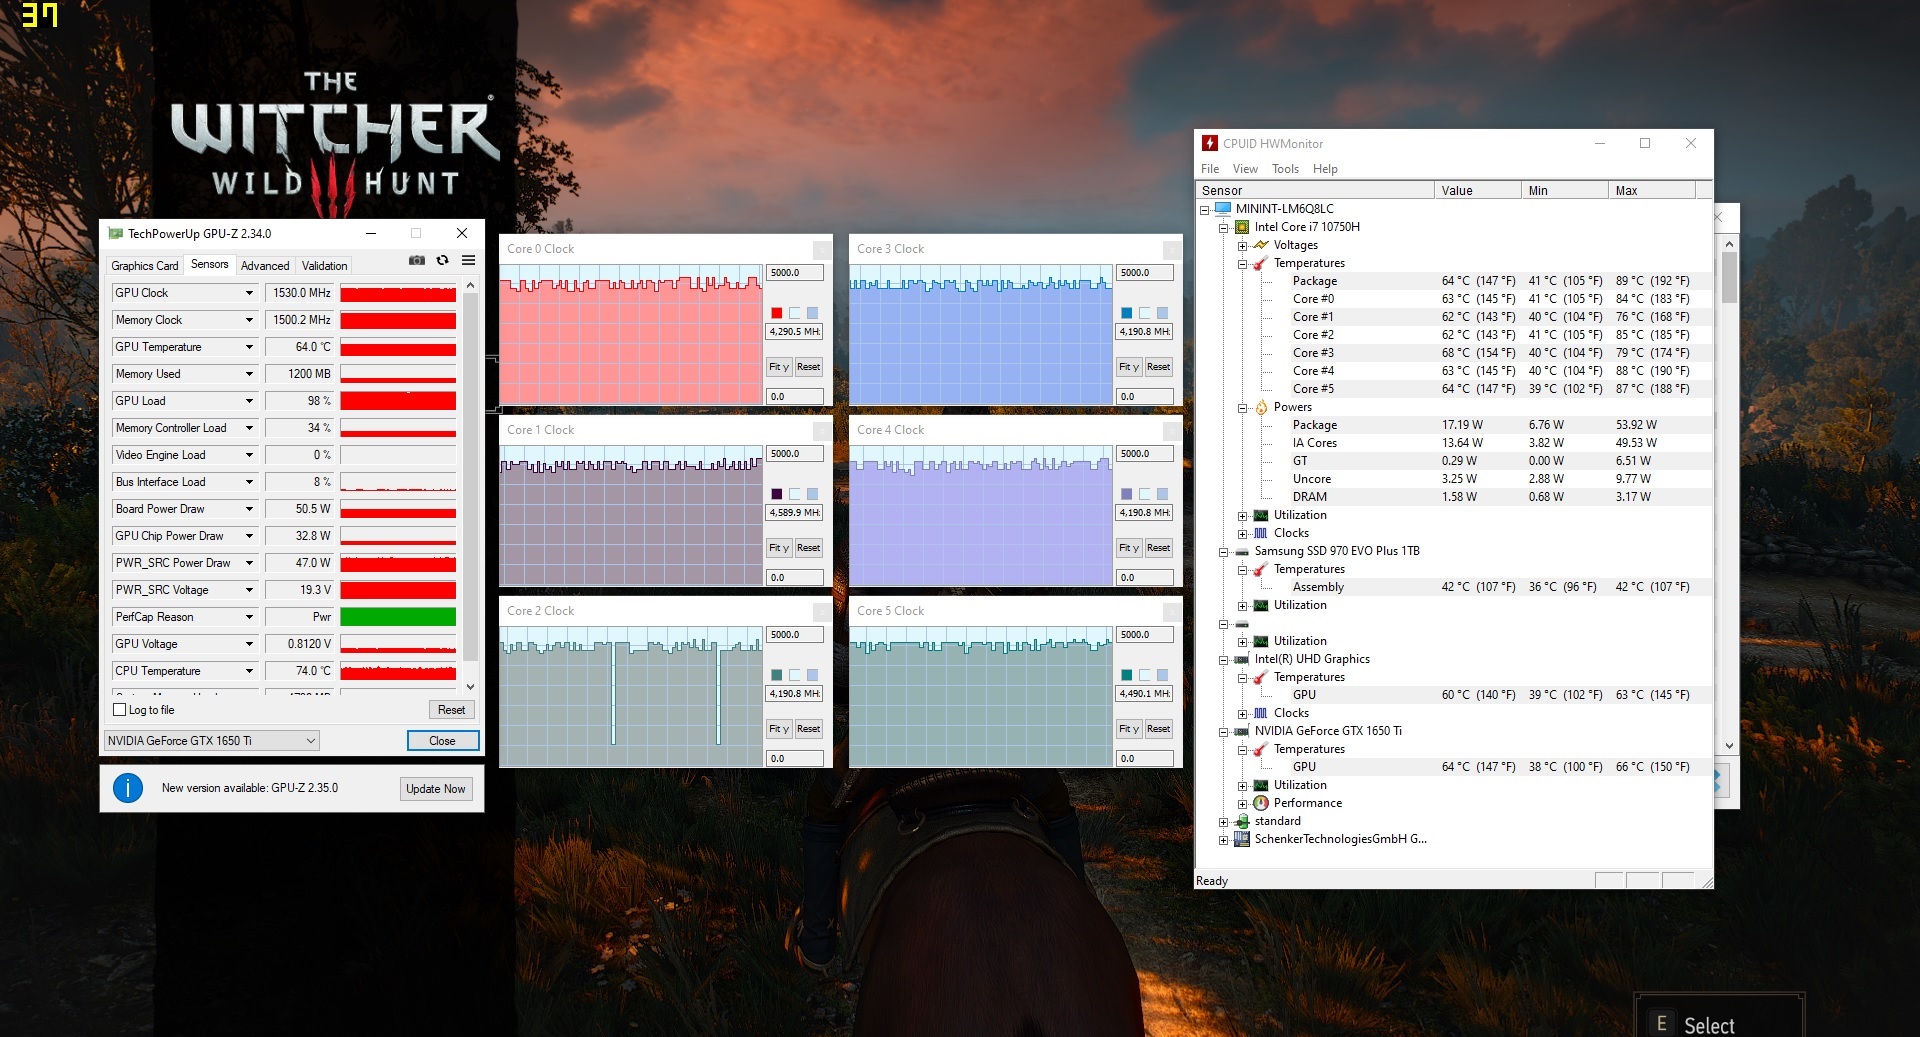
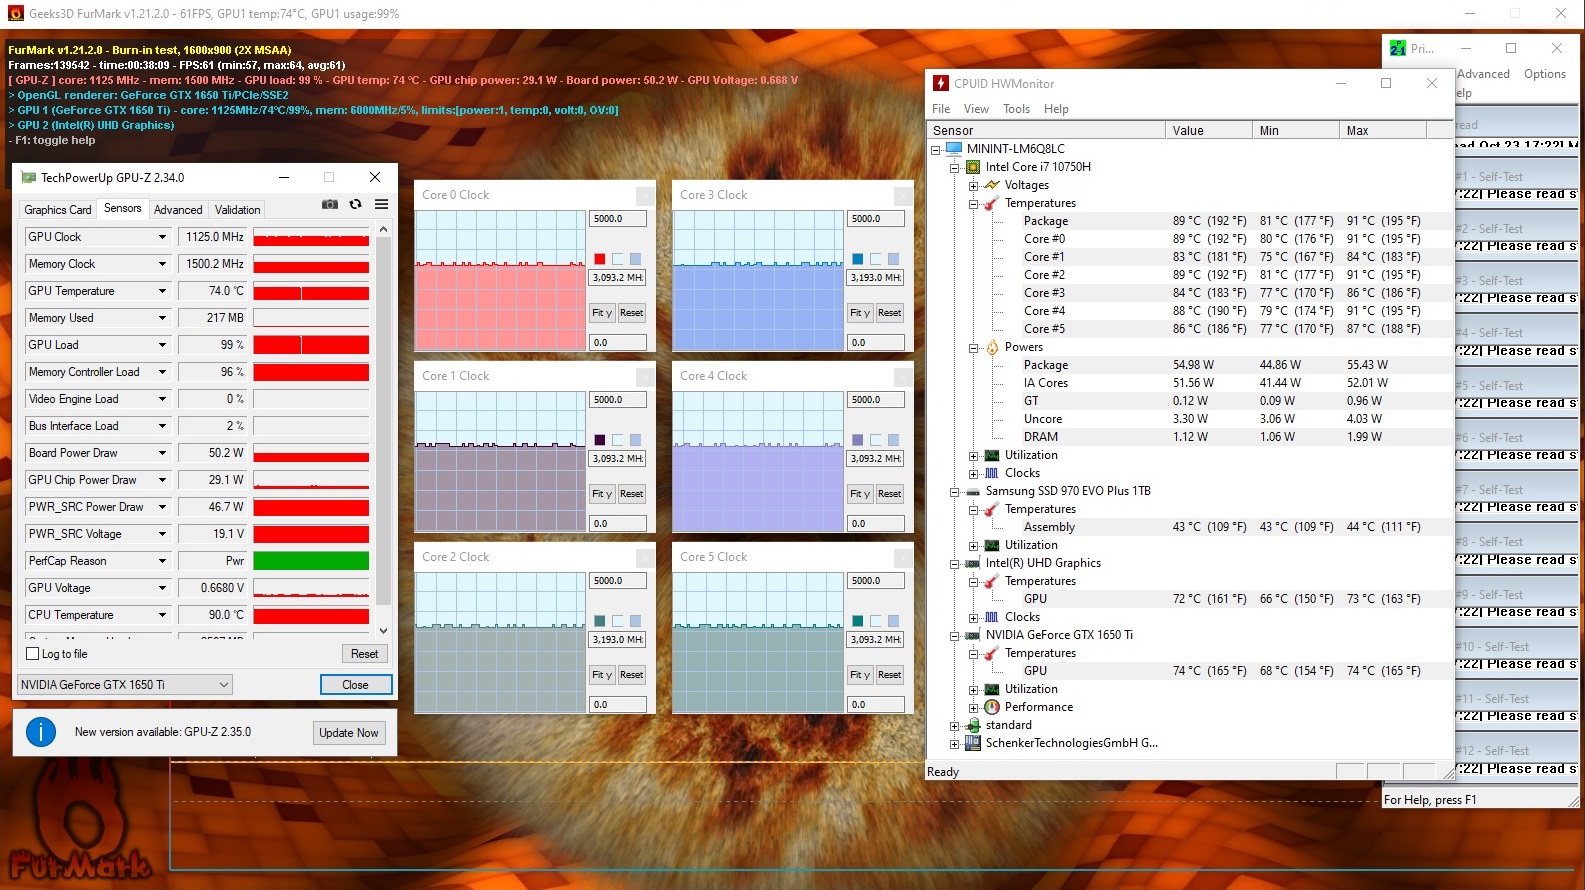
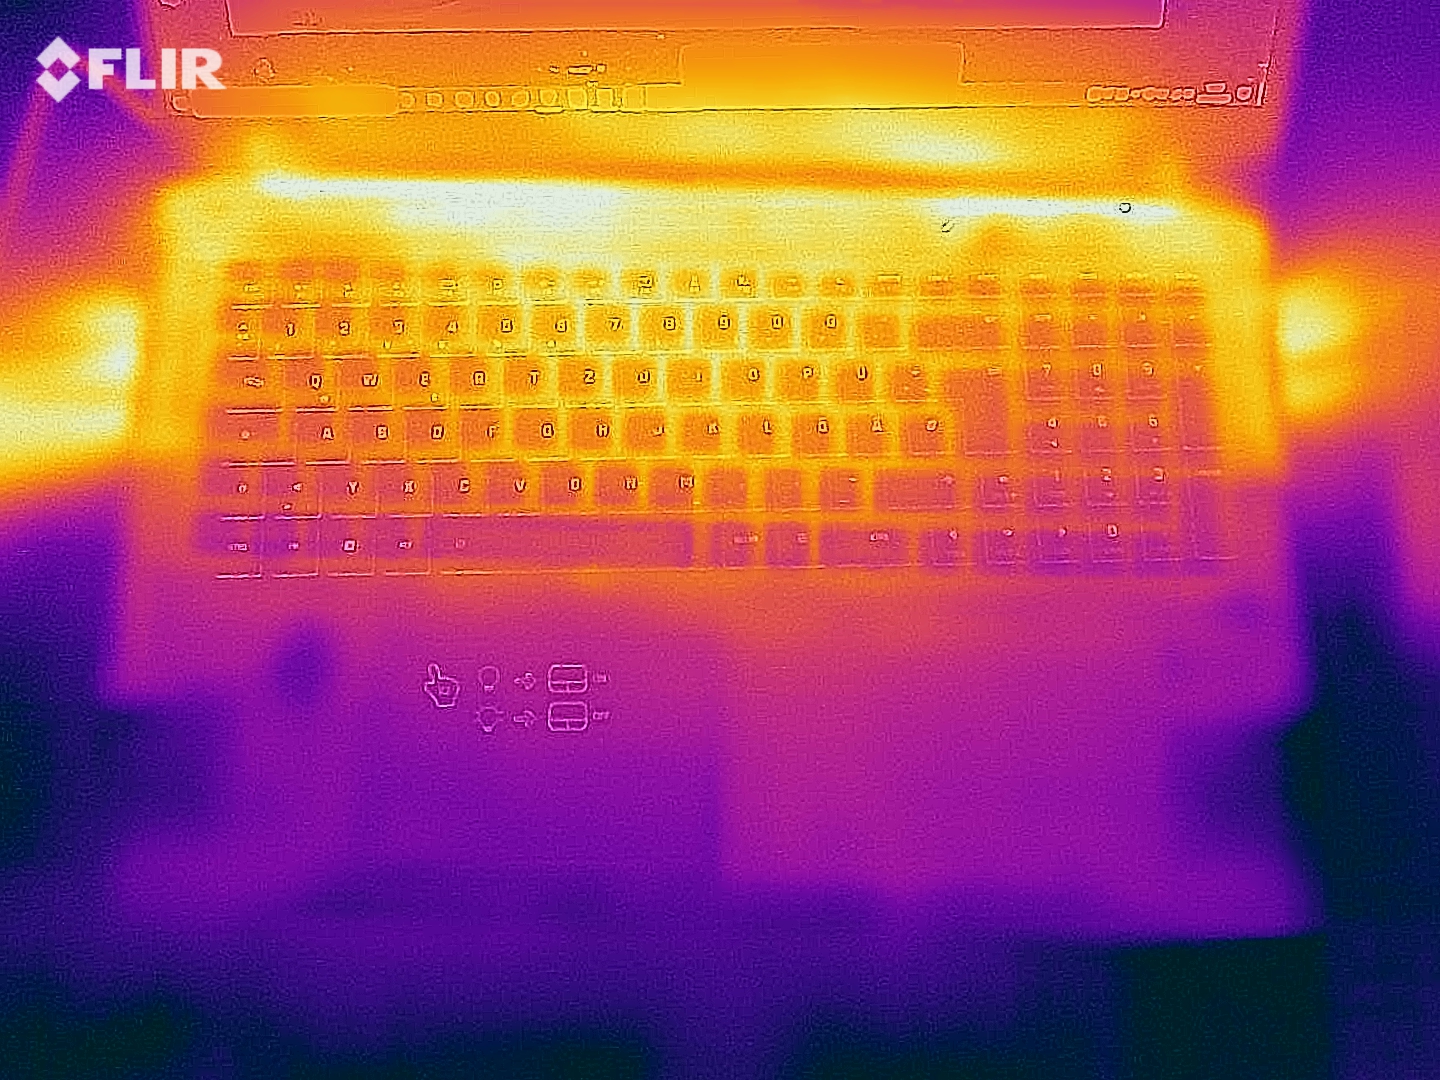
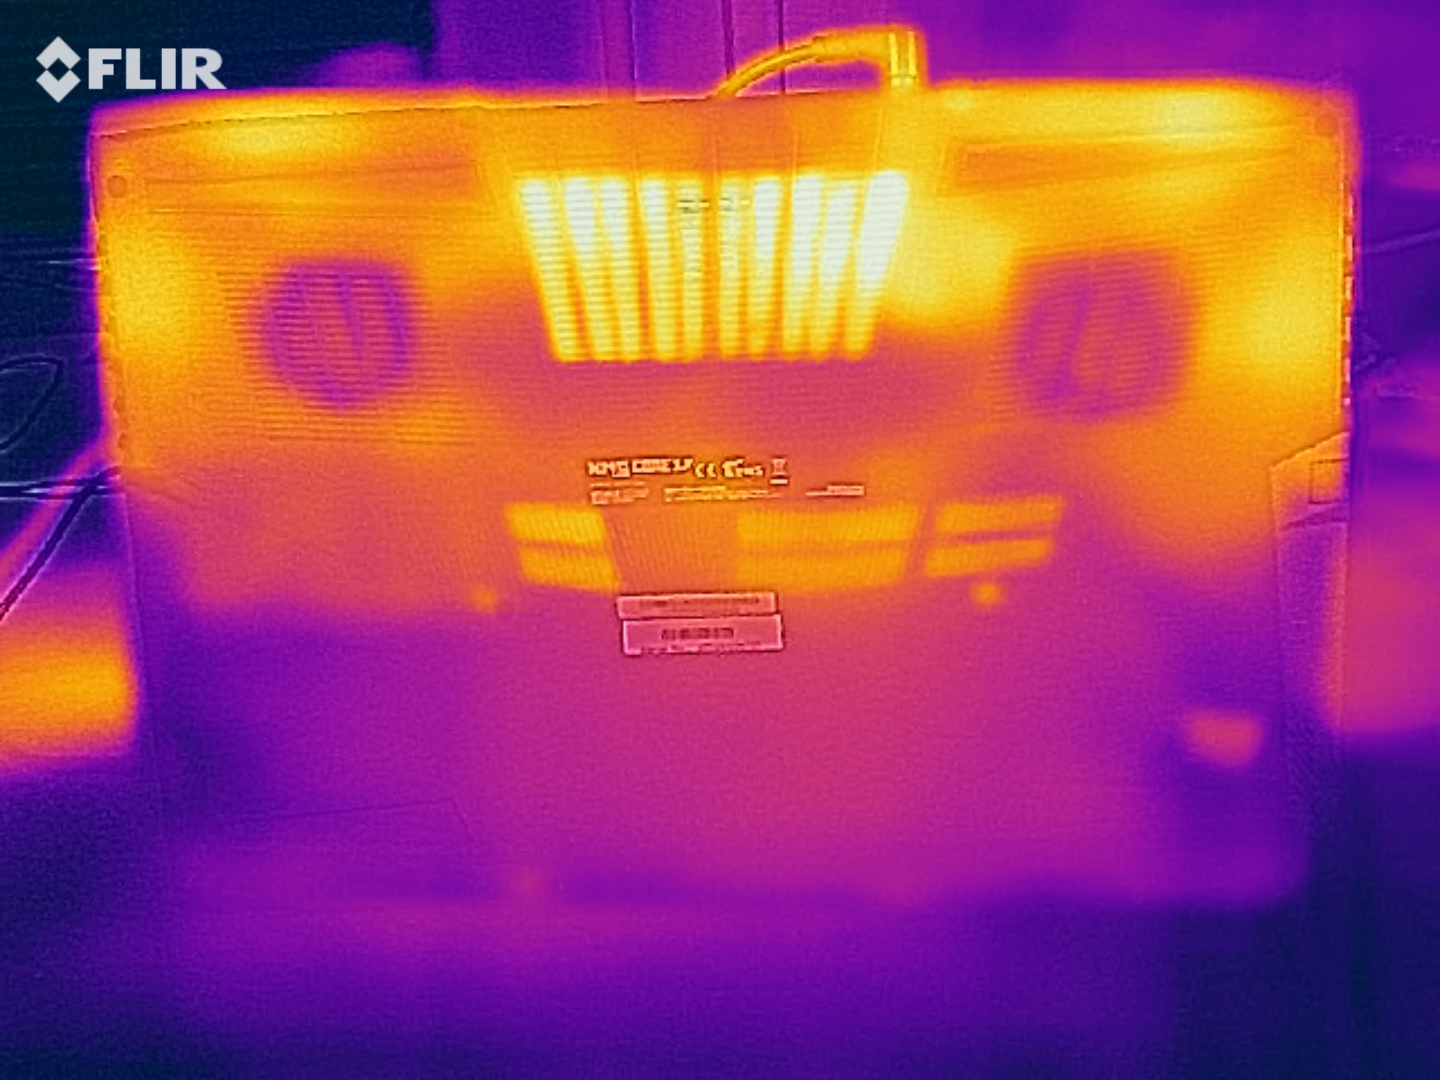
The laptop doesn't warm up excessively. We register temperatures below 50 °C (~122 °F) at all measuring points during the stress test. Heat development is lower when we run our The Witcher 3 test. The temperatures are within the green range in everyday use.
(±) The maximum temperature on the upper side is 45 °C / 113 F, compared to the average of 40.4 °C / 105 F, ranging from 21.2 to 68.8 °C for the class Gaming.
(-) The bottom heats up to a maximum of 48 °C / 118 F, compared to the average of 43.2 °C / 110 F
(+) In idle usage, the average temperature for the upper side is 26.3 °C / 79 F, compared to the device average of 33.9 °C / 93 F.
(±) Playing The Witcher 3, the average temperature for the upper side is 34.7 °C / 94 F, compared to the device average of 33.9 °C / 93 F.
(+) The palmrests and touchpad are cooler than skin temperature with a maximum of 31 °C / 87.8 F and are therefore cool to the touch.
(-) The average temperature of the palmrest area of similar devices was 28.8 °C / 83.8 F (-2.2 °C / -4 F).
Speakers
Schenker XMG Core 17 Comet Lake audio analysis
(-) | not very loud speakers (67 dB)
Bass 100 - 315 Hz
(-) | nearly no bass - on average 20.8% lower than median
(±) | linearity of bass is average (11.1% delta to prev. frequency)
Mids 400 - 2000 Hz
(+) | balanced mids - only 3.2% away from median
(±) | linearity of mids is average (8.5% delta to prev. frequency)
Highs 2 - 16 kHz
(+) | balanced highs - only 3.9% away from median
(±) | linearity of highs is average (7.1% delta to prev. frequency)
Overall 100 - 16.000 Hz
(±) | linearity of overall sound is average (23.6% difference to median)
Compared to same class
» 86% of all tested devices in this class were better, 4% similar, 10% worse
» The best had a delta of 6%, average was 18%, worst was 132%
Compared to all devices tested
» 71% of all tested devices were better, 6% similar, 23% worse
» The best had a delta of 4%, average was 23%, worst was 134%
Energy consumption
There are no problems in terms of energy consumption. The rates are at a normal level for the hardware installed here across the entire load range. Moreover, the power adapter's output is 150 watts.
| Off / Standby | |
| Idle | |
| Load |
|
Key:
min: | |
Battery life
Using a script, our WLAN test simulates the load caused by accessing websites. The laptop's energy-saving features are disabled, and the display brightness is set to about 150 cd/m². The Core 17 achieves a runtime of 5:06 hours.
Pros
Cons
Verdict
Thanks to the Core i7-10750H processor and the GeForce GTX 1650 Ti GPU, the Schenker XMG Core 17 brings all modern computer games smoothly onto the screen. However, the GPU is not designed for maximum quality settings.
Prospective buyers should ask themselves if the model with the GeForce RTX 2060 GPU might be a better choice before buying the laptop. This higher-class GPU is available for a price premium of just under 150 Euros (~$183), and it might pay off in the long run.
Schenker delivers a solid 17.3-inch mid-range gaming laptop with the XMG Core 17.
Externally, nothing has changed compared with the 2019 model, but the hardware has been updated on the inside. Furthermore, the good features of the 2019 model have been inherited: The laptop doesn't heat up excessively under load and produces little noise - at least in idle usage and under low load.
The laptop offers space for two M.2 2280 SSDs (1x NVMe, 1x NVMe/SATA; RAID 0/1). Our test device is equipped with a 1 TB NVMe SSD. The responsive screen (Full HD, IPS, 144 Hz) scores points with a matte surface, decent color reproduction, and acceptable color-space coverage. Moreover, brightness and contrast are acceptable as well.
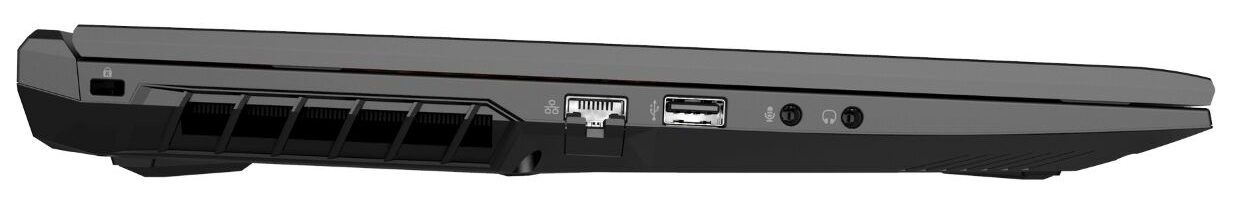
Battery life is at a normal level for a gaming laptop. In addition, the laptop's extensive range of interfaces includes, among other things, three video outputs - two of them support G-Sync. There is no Thunderbolt 3 port.
Note: The scores of the individual categories partly differ from those of the 2019 Core 17, because we have updated the rating system. The scores of both Core 17 models are not comparable.
Schenker XMG Core 17 Comet Lake
- 12/21/2020 v7 (old)
Sascha Mölck
Price comparison

