MSI GF75 Thin 10SDR Laptop Review: For Budget Gamers

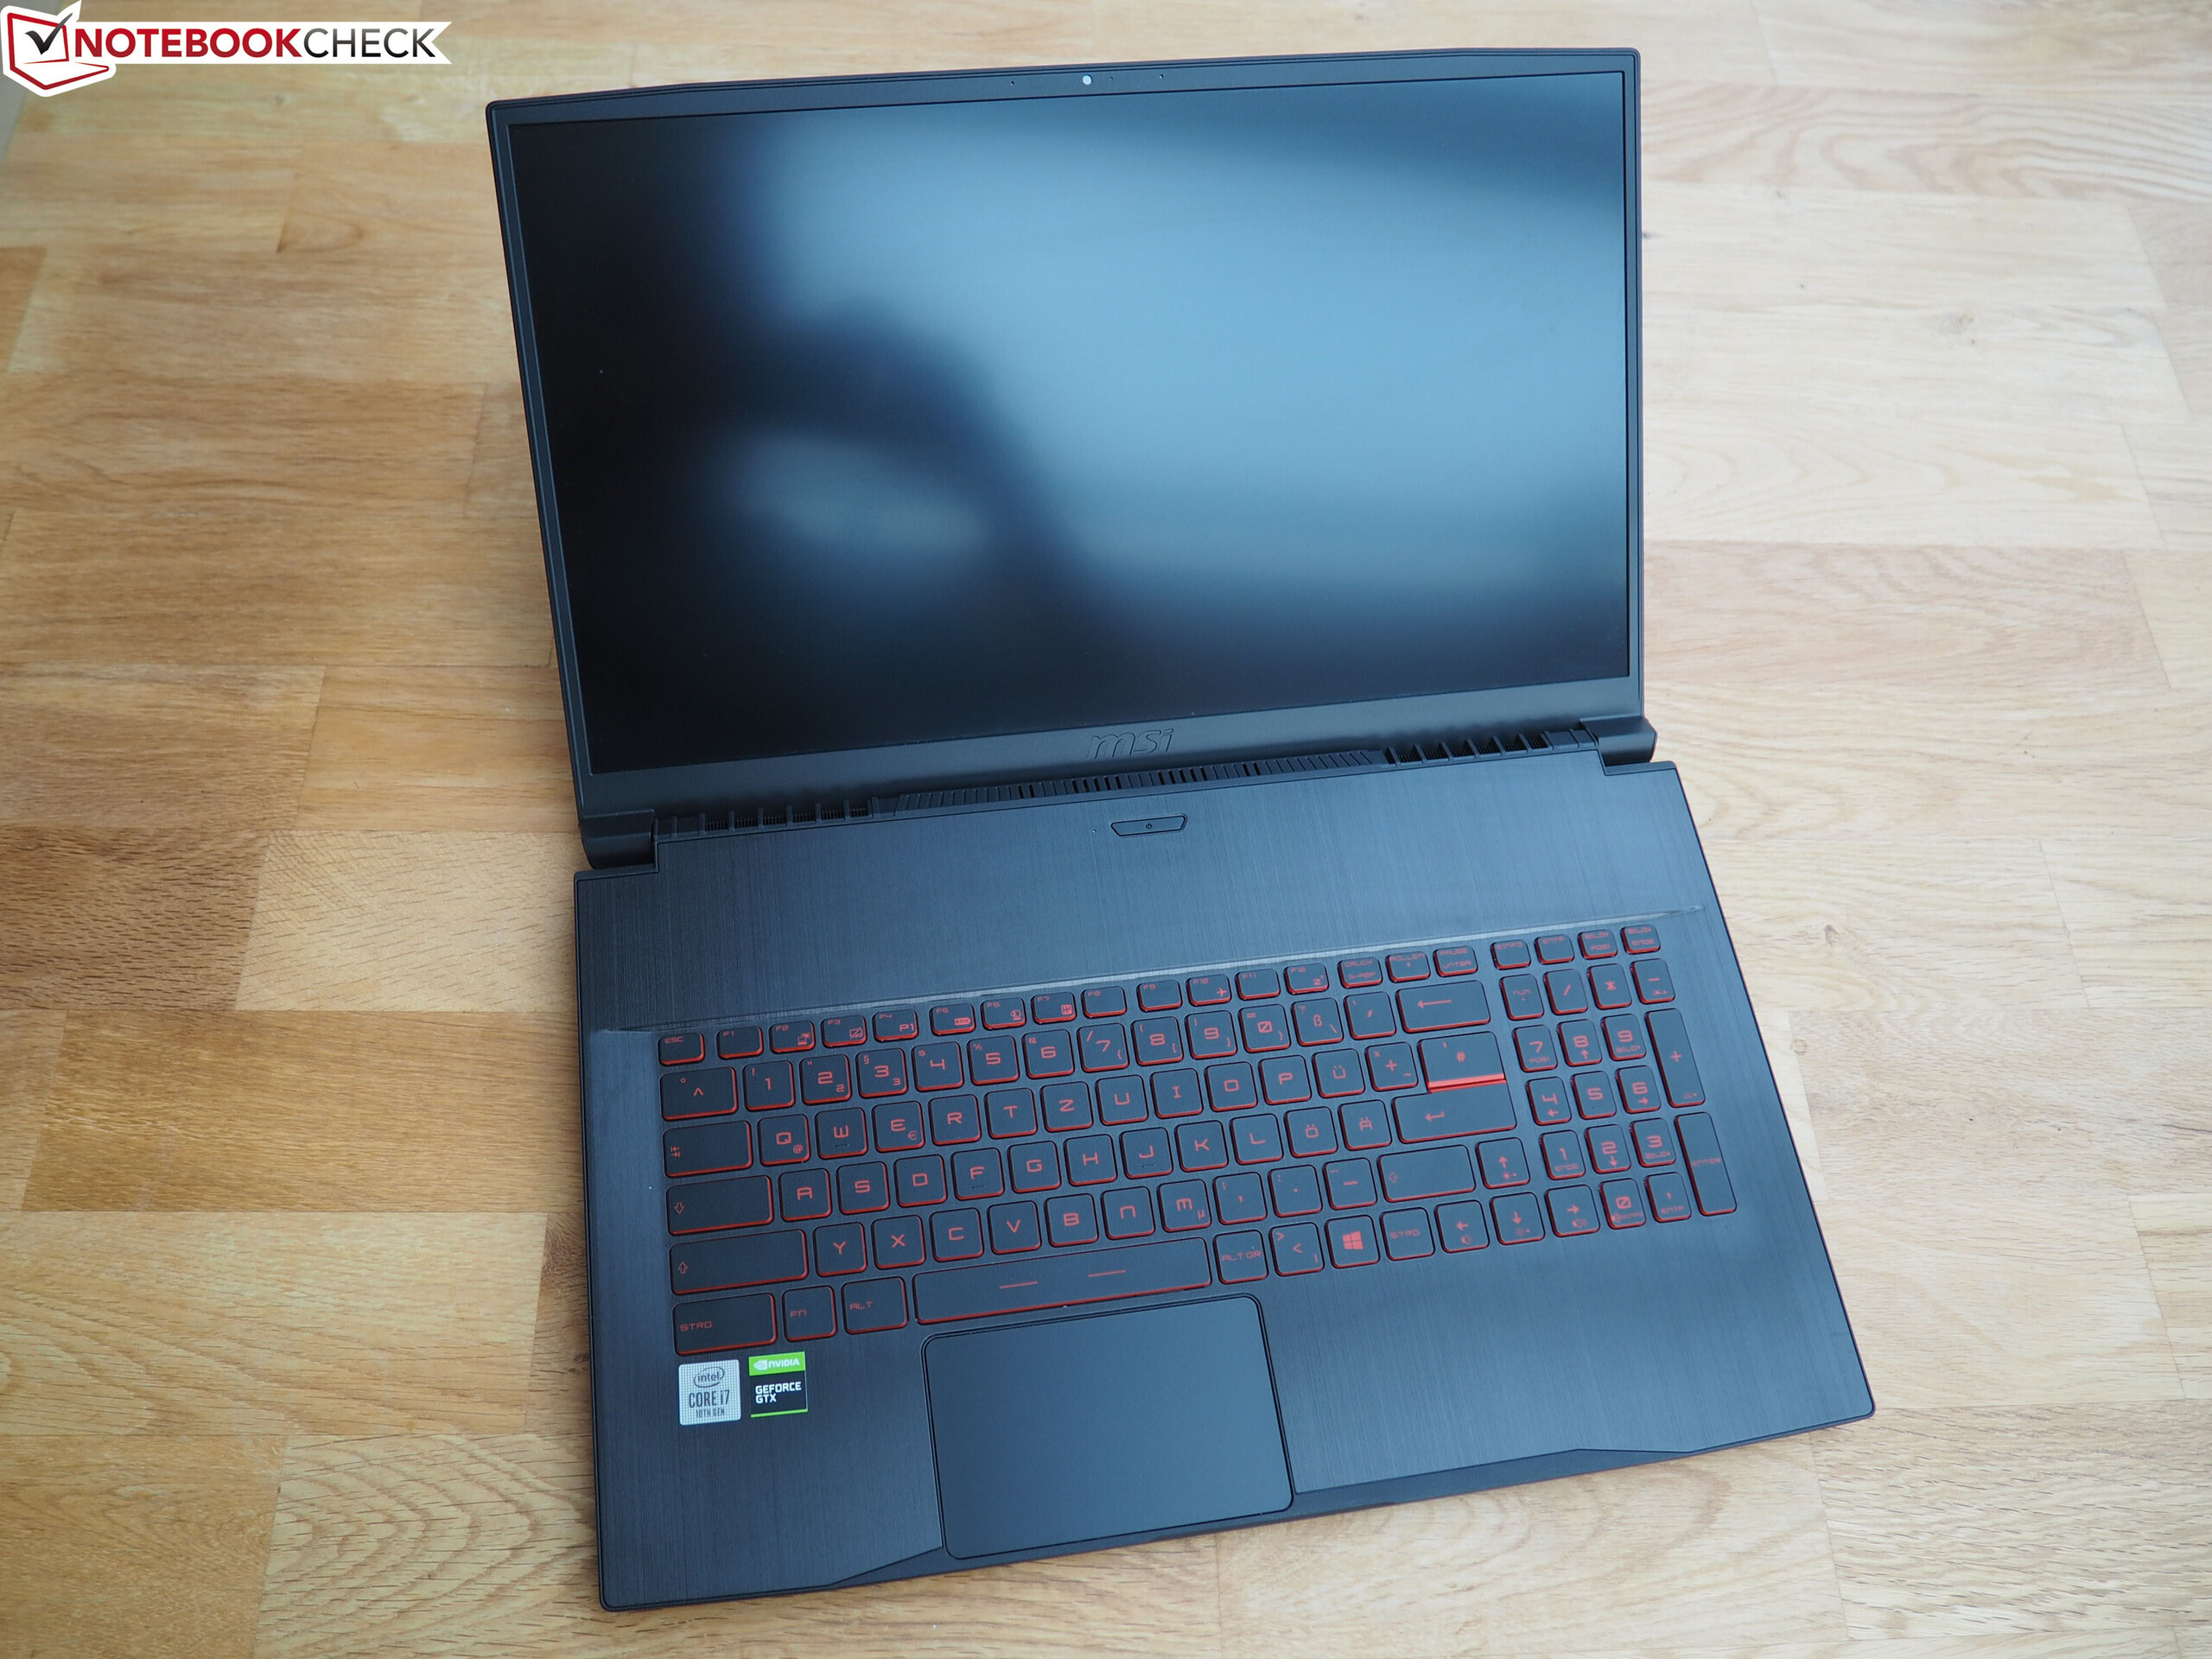
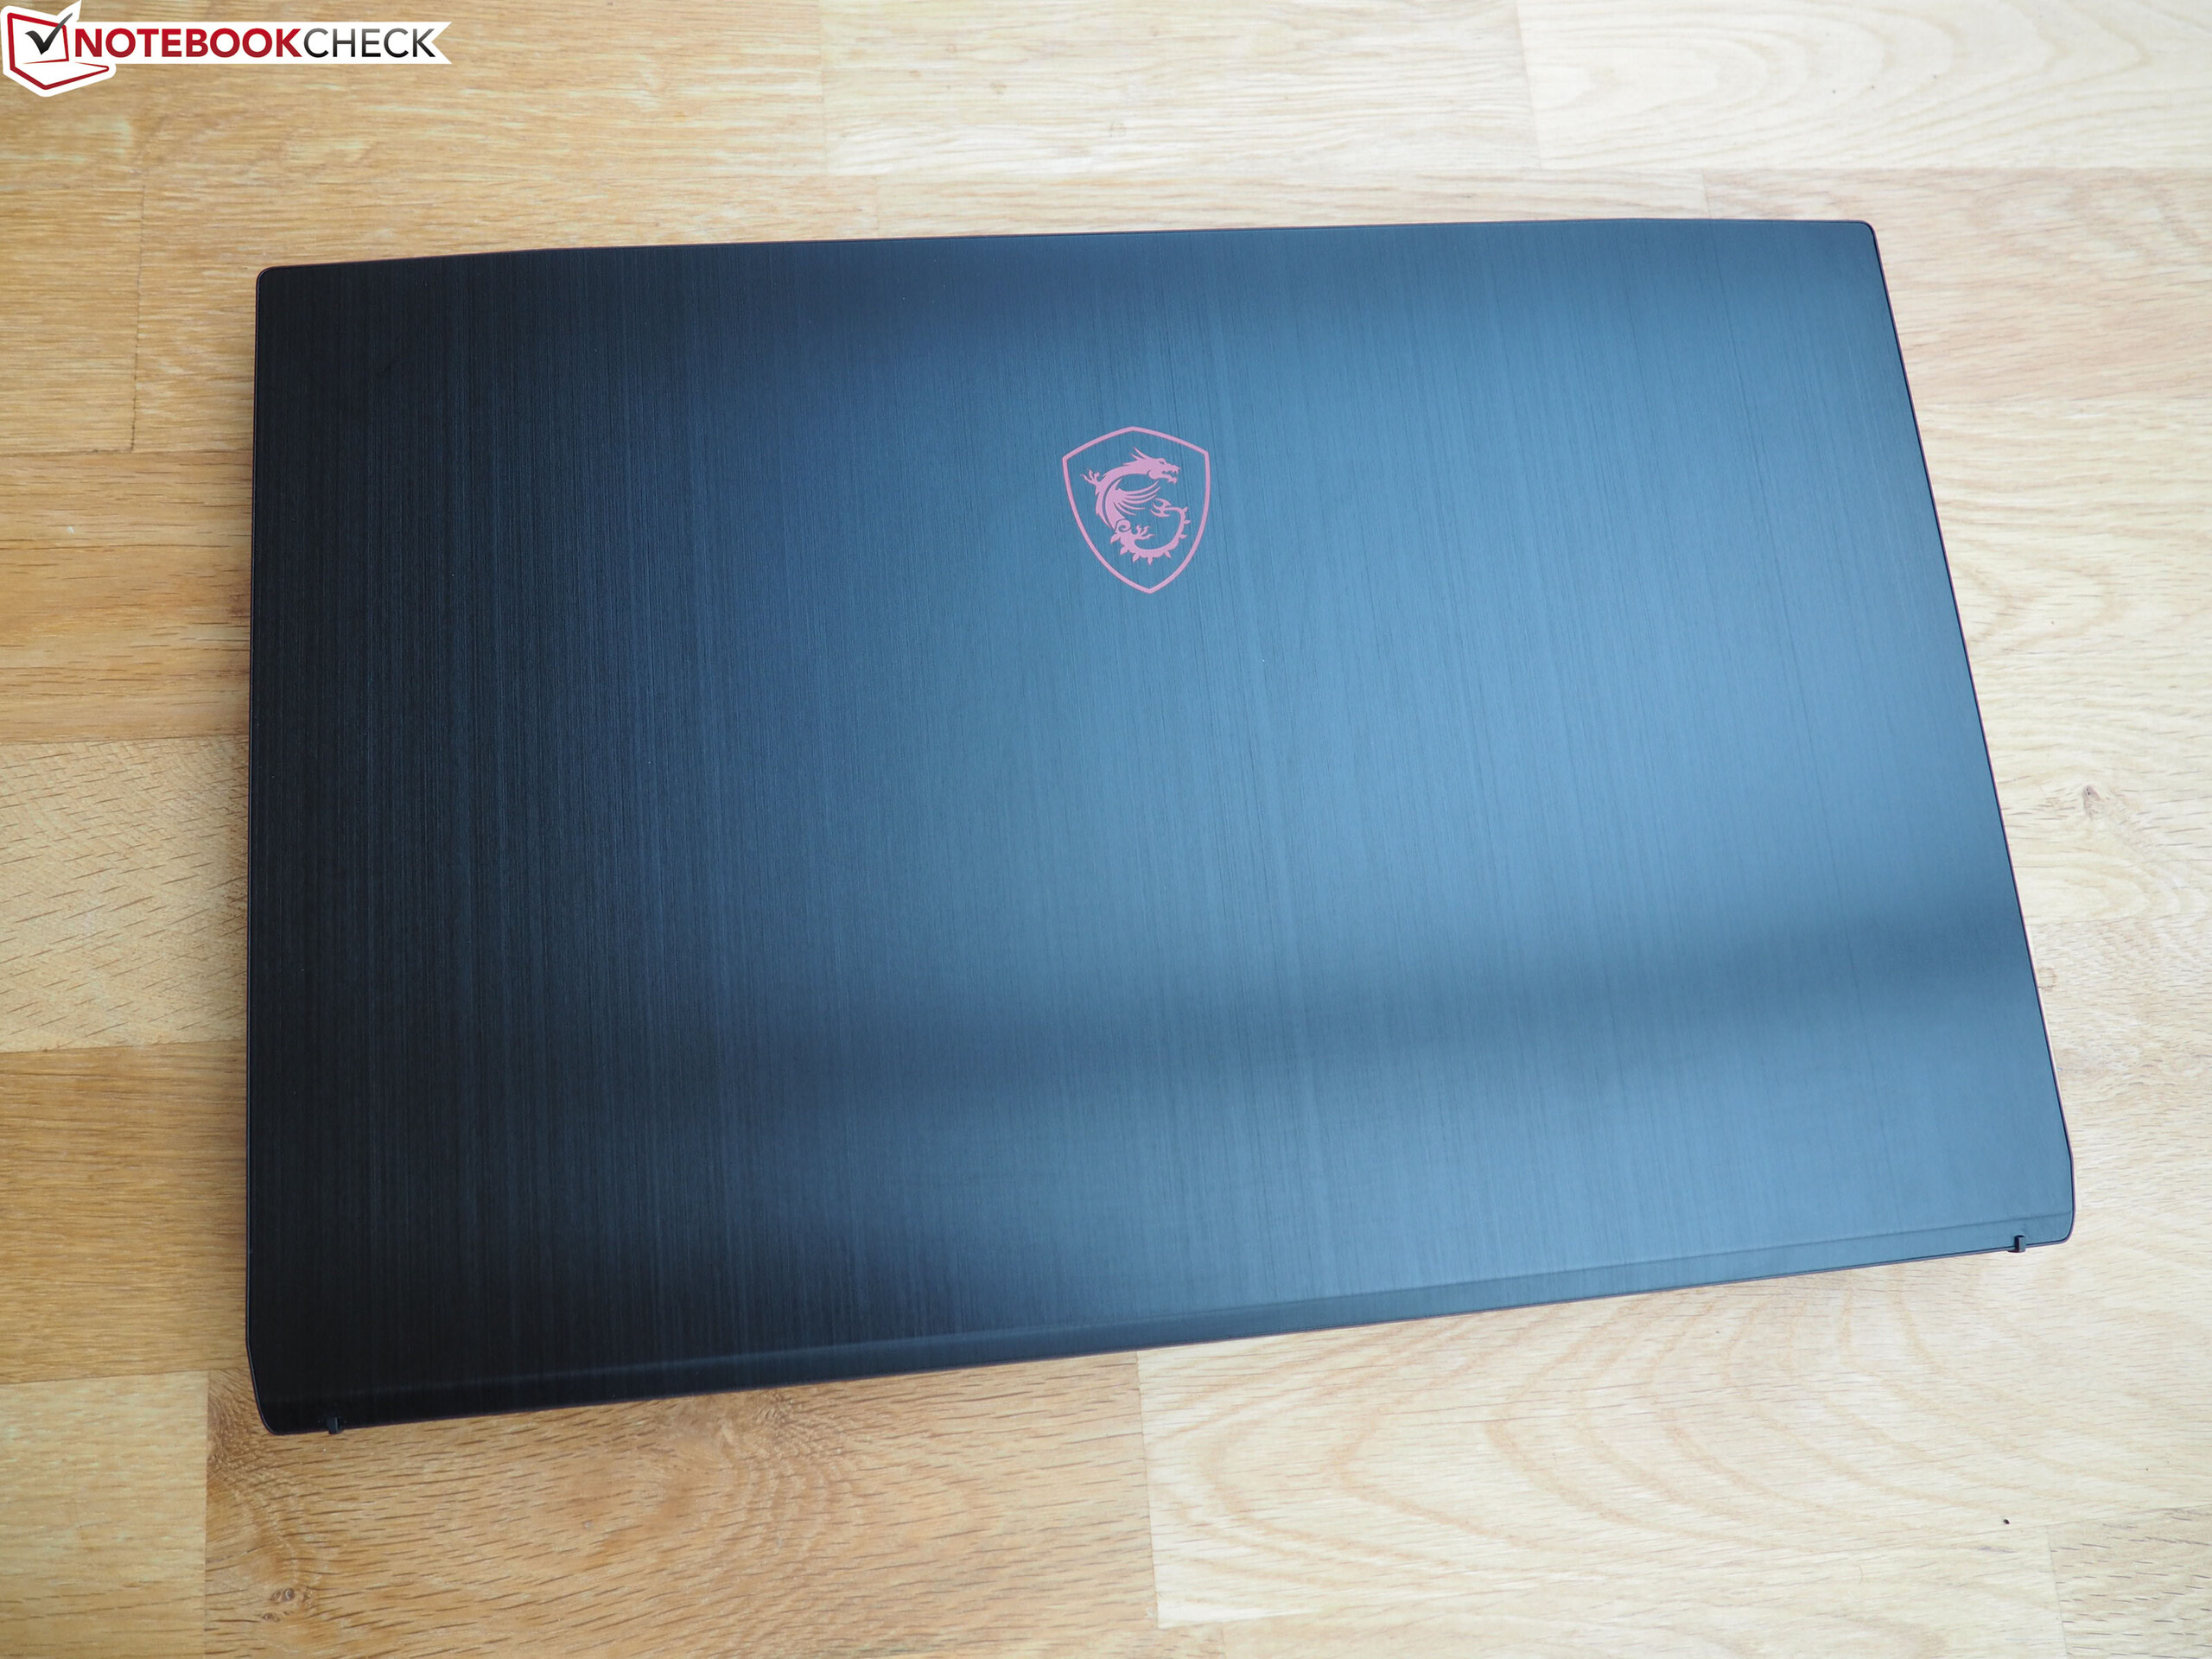
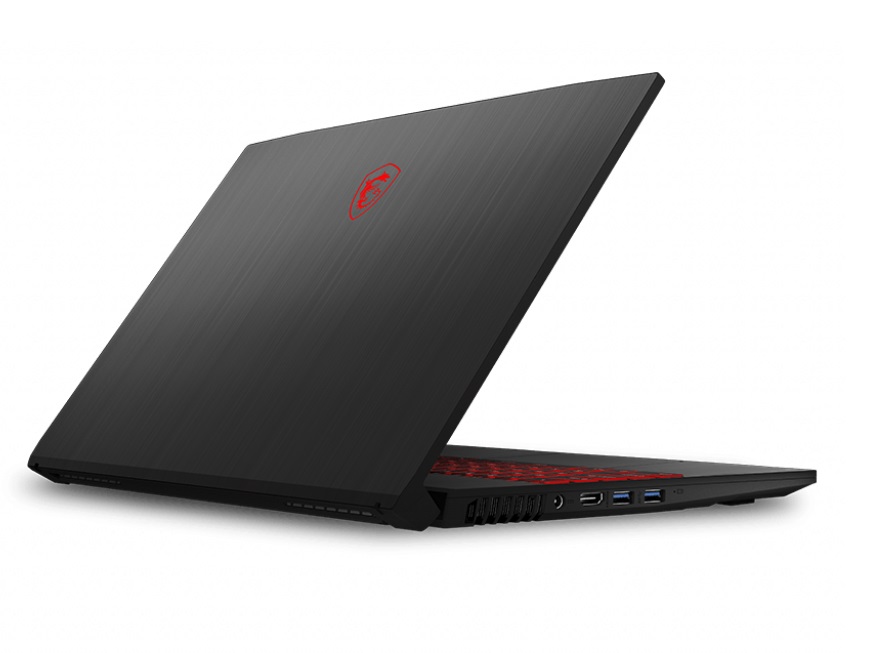
The GF-series is MSI’s series of affordable gaming laptops with an upper mid-range performance rating. At just 2.3 cm (0.9 inches) the GF75, a 17-inch laptop, is not just comparatively thin but of surprisingly high quality (metal surfaces) for a budget gaming laptop.
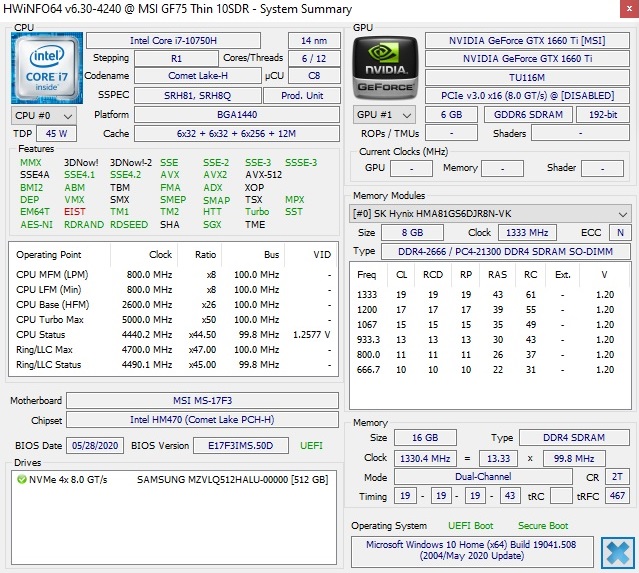
Several months ago, we already had the chance to review the entry-level model 10SCXR, equipped with a Core i5-10300H, 8 GB of RAM, and a GeForce GTX 1650. In this review, we want to take a closer look at the significantly more powerful yet not much more expensive 10DR-253 SKU. It comes with a Core i7-10750H, 16 GB of dual-channel RAM, a GeForce GTX 1660 Ti, and a 512 GB large PCIe SSD. Keep in mind that this particular SKU is only available with FreeDOS in some countries. Thankfully, MSI sent us a review unit with Windows 10 Home preloaded.
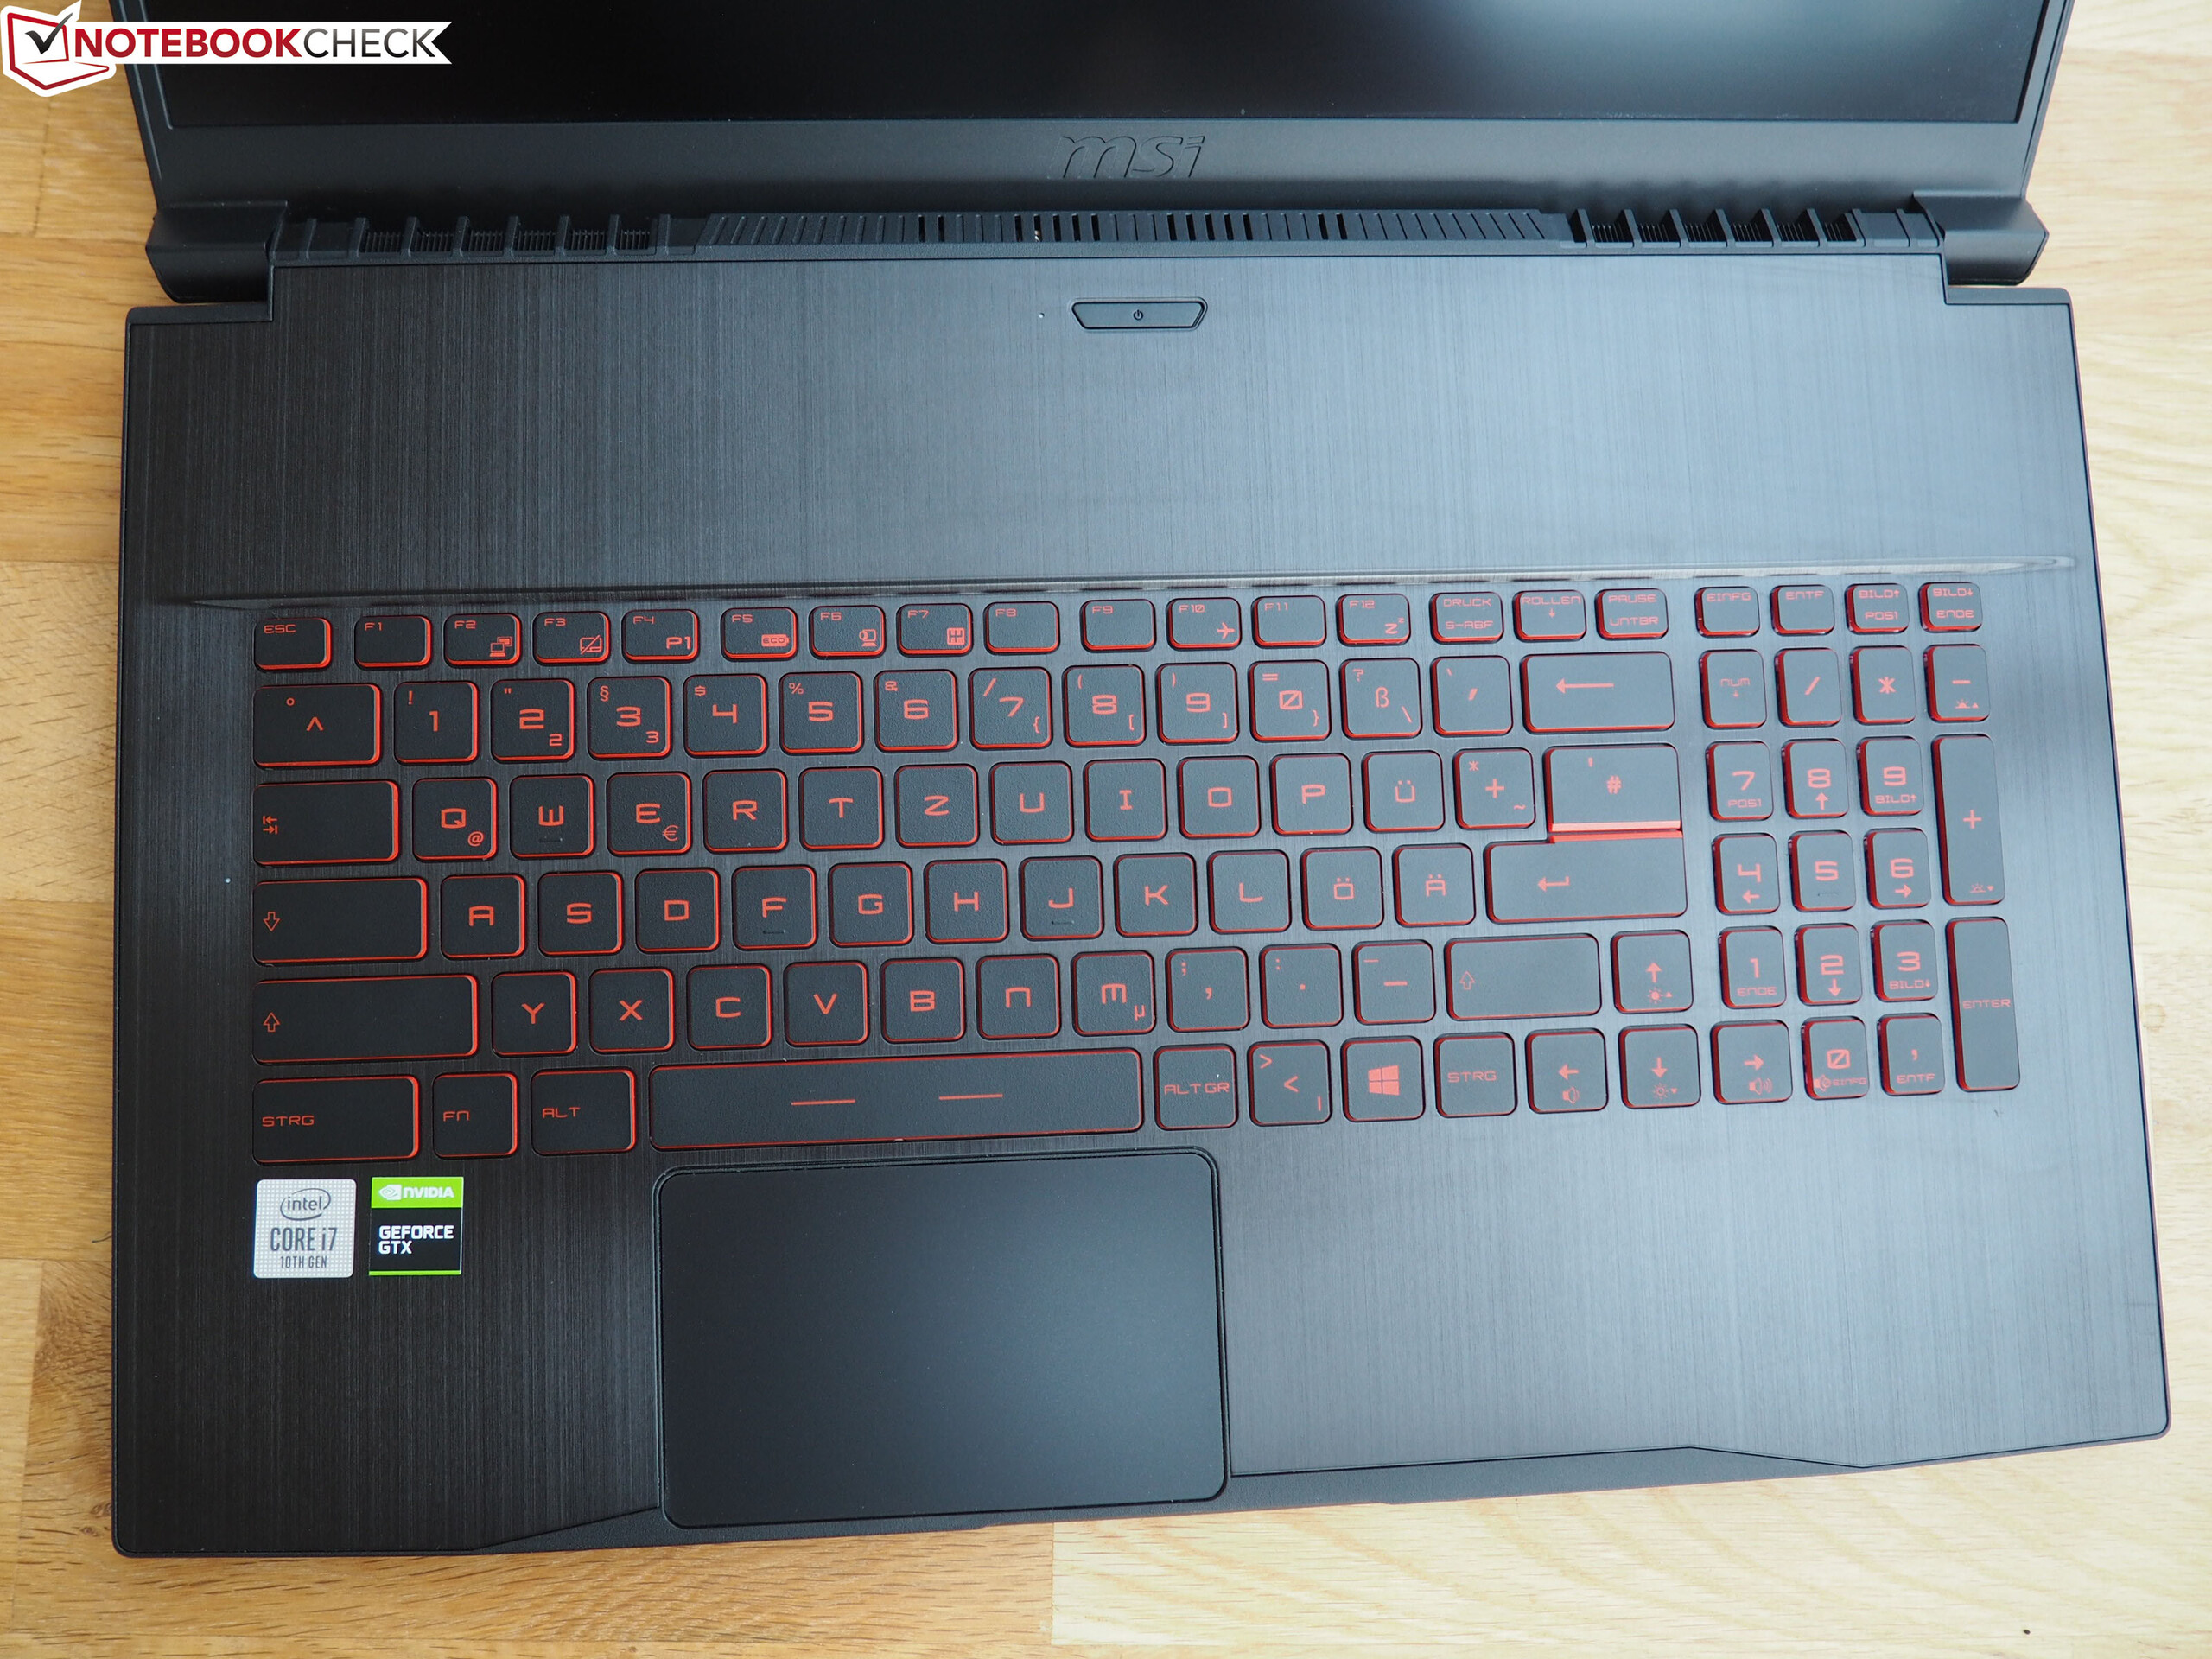
Given that the chassis is identical to the previously reviewed 2019 model we are not going to discuss case, connectivity, and input devices in this review. Please refer to our previous GF75 8RD review should you be interested to find out more.
Rating | Date | Model | Weight | Height | Size | Resolution | Price |
|---|---|---|---|---|---|---|---|
| 79.8 % v7 (old) | 10 / 2020 | MSI GF75 Thin 10SDR i7-10750H, GeForce GTX 1660 Ti Mobile | 2.2 kg | 23 mm | 17.30" | 1920x1080 | |
| 78.5 % v7 (old) | 04 / 2020 | MSI GF75 Thin 10SCXR i5-10300H, GeForce GTX 1650 Mobile | 2.2 kg | 23.1 mm | 17.30" | 1920x1080 | |
| 82.9 % v7 (old) | 05 / 2020 | Asus TUF A17 FA706IU-AS76 R7 4800H, GeForce GTX 1660 Ti Mobile | 2.6 kg | 26 mm | 17.30" | 1920x1080 | |
| 80.6 % v7 (old) | 06 / 2020 | Acer Nitro 5 AN517-52-77DS i7-10750H, GeForce RTX 2060 Mobile | 2.2 kg | 24.9 mm | 17.30" | 1920x1080 | |
| 85.1 % v7 (old) | 07 / 2020 | MSI GE75 Raider 10SE-008US i7-10750H, GeForce RTX 2060 Mobile | 2.6 kg | 27.5 mm | 17.30" | 1920x1080 |
Communication
Webcam


Display
Despite their similar model numbers, the GF75 10SDR-253 comes with a different panel than the GF75 10SCXR. Instead of a 120 Hz display the new device is equipped with a 144 Hz display with similar specs. This means that in addition to comparatively high response times its maximum brightness was also mediocre at best. An average of 250 nits is barely good enough for indoor use and certainly not meant to be used outdoors.
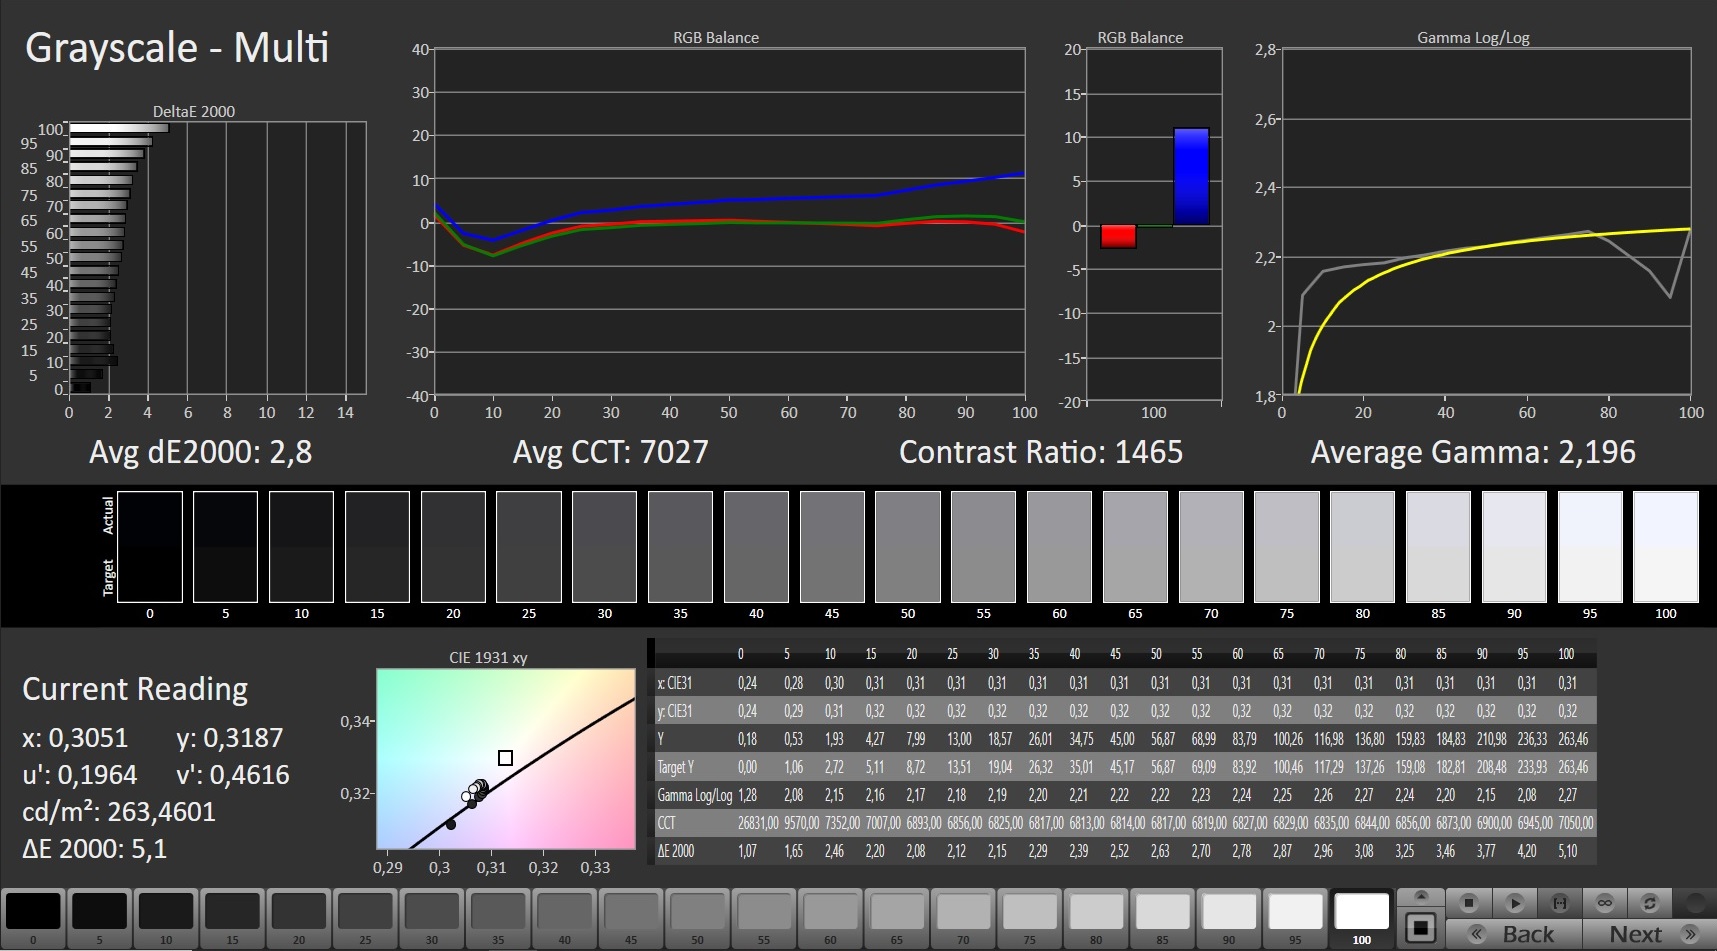
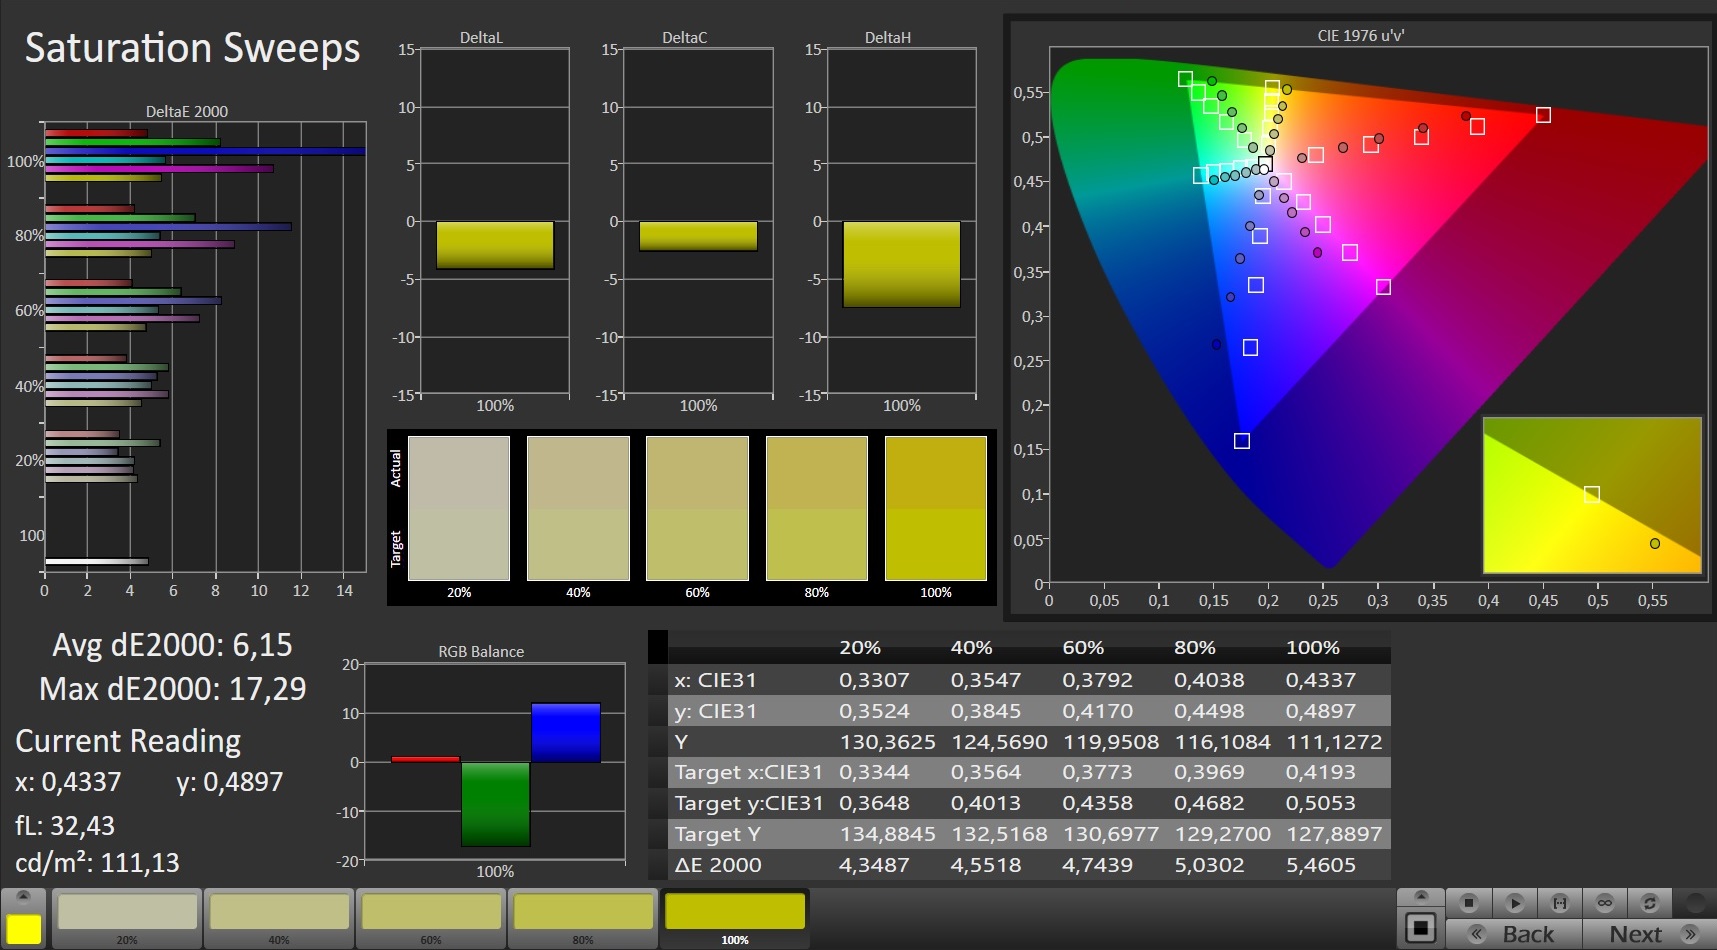
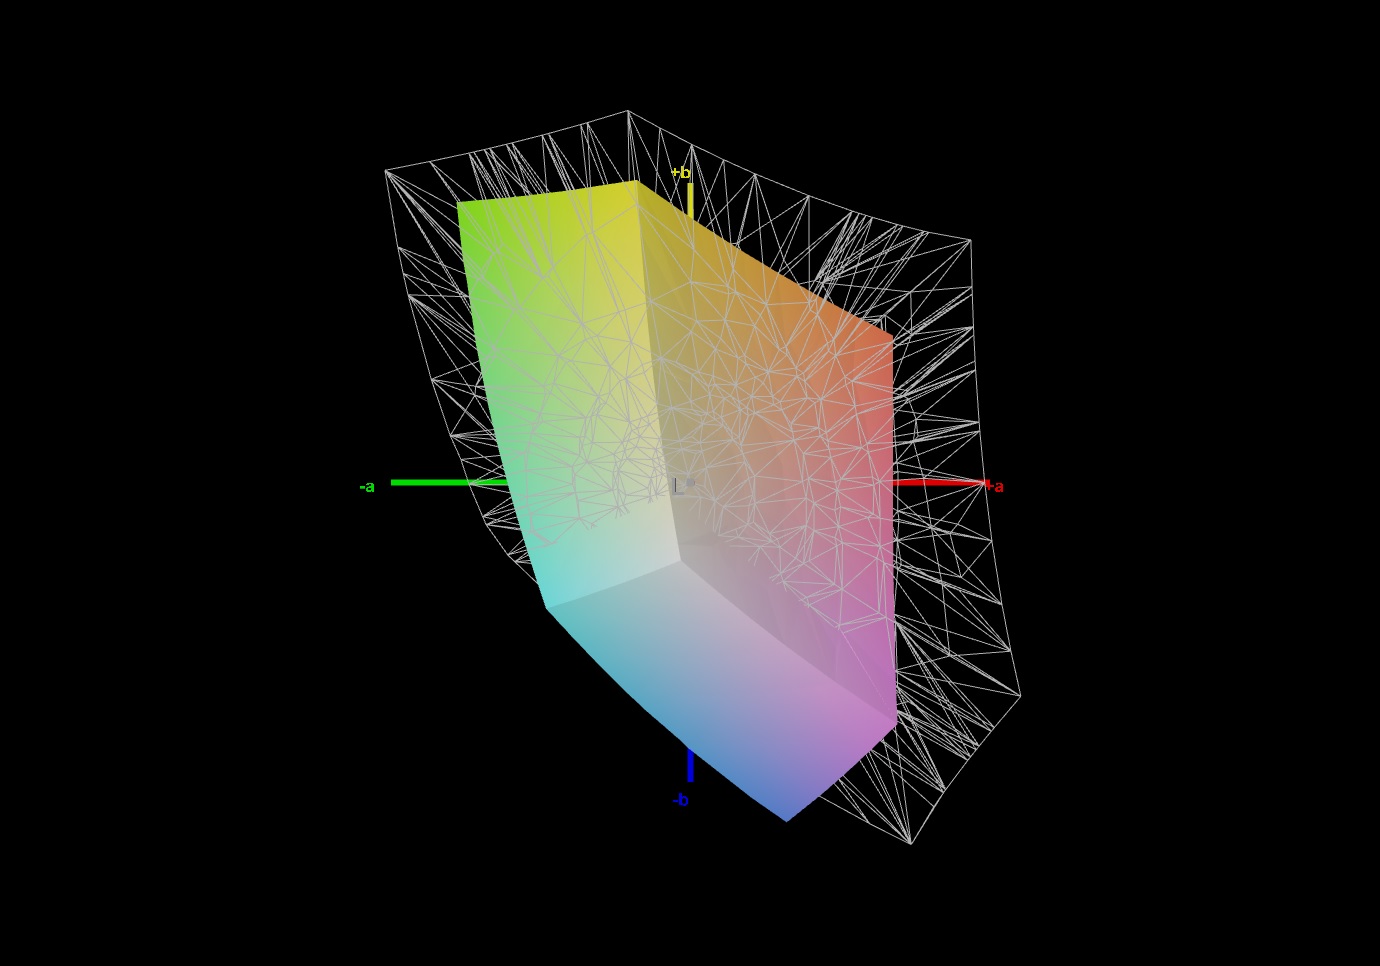
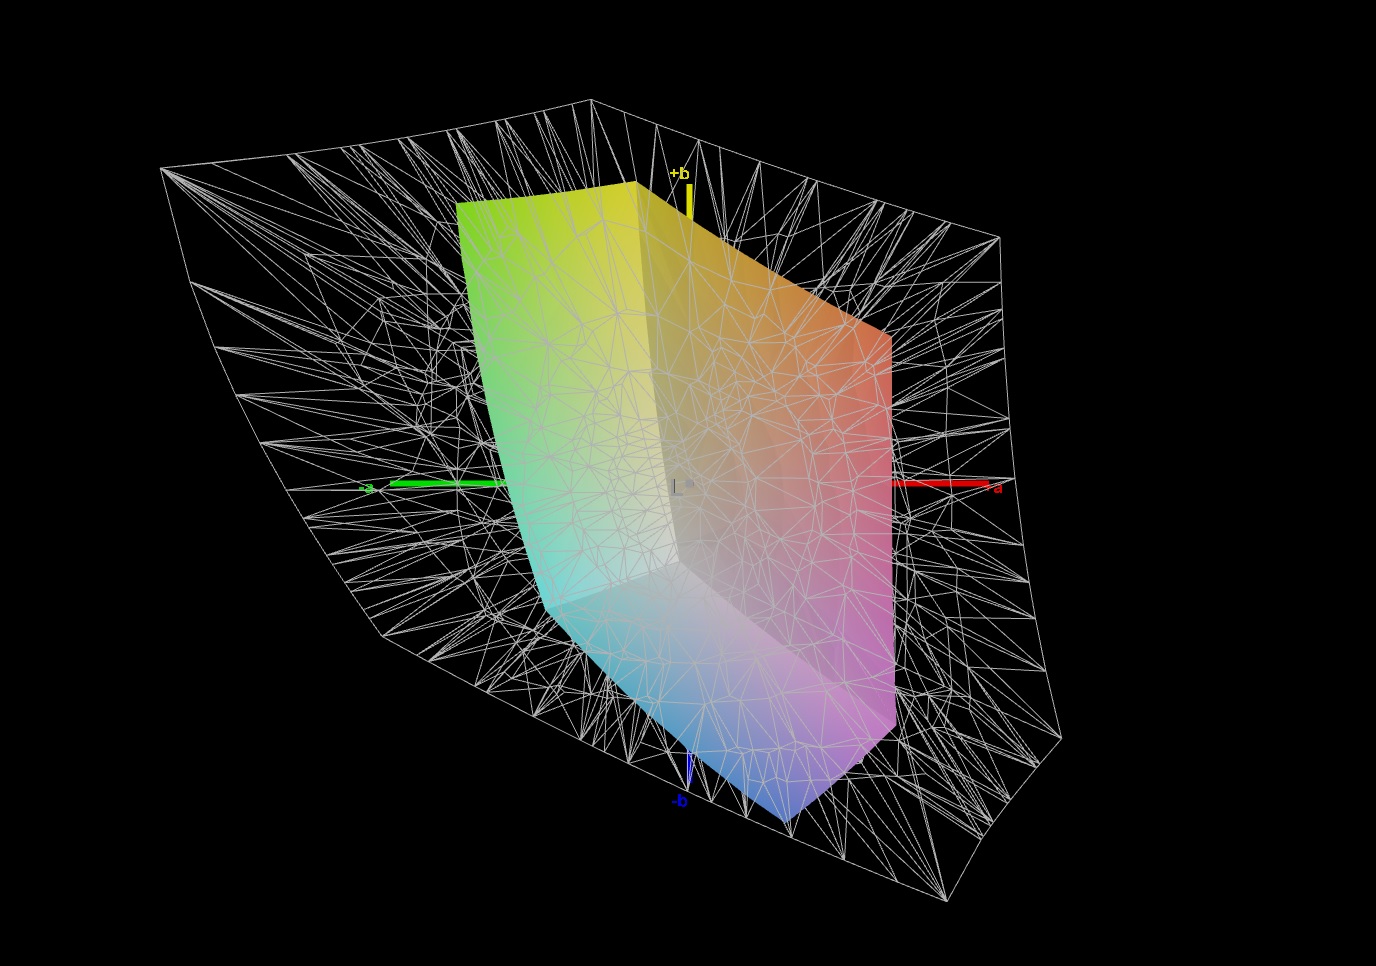
Thanks to its low black level of just 0.23 nits the 17-inch device offers a decent contrast ratio of 1100:1. As is common in budget gaming laptops color space coverage is very low at just 59 and 41 % for sRGB and AdobeRGB, respectively. Compare that to the more expensive 17-inch GE75 Raider 10SE with almost 100 % sRGB coverage. As expected of an IPS panel we found no faults with the display’s viewing angles.
| |||||||||||||||||||||||||
Brightness Distribution: 92 %
Center on Battery: 252 cd/m²
Contrast: 1096:1 (Black: 0.23 cd/m²)
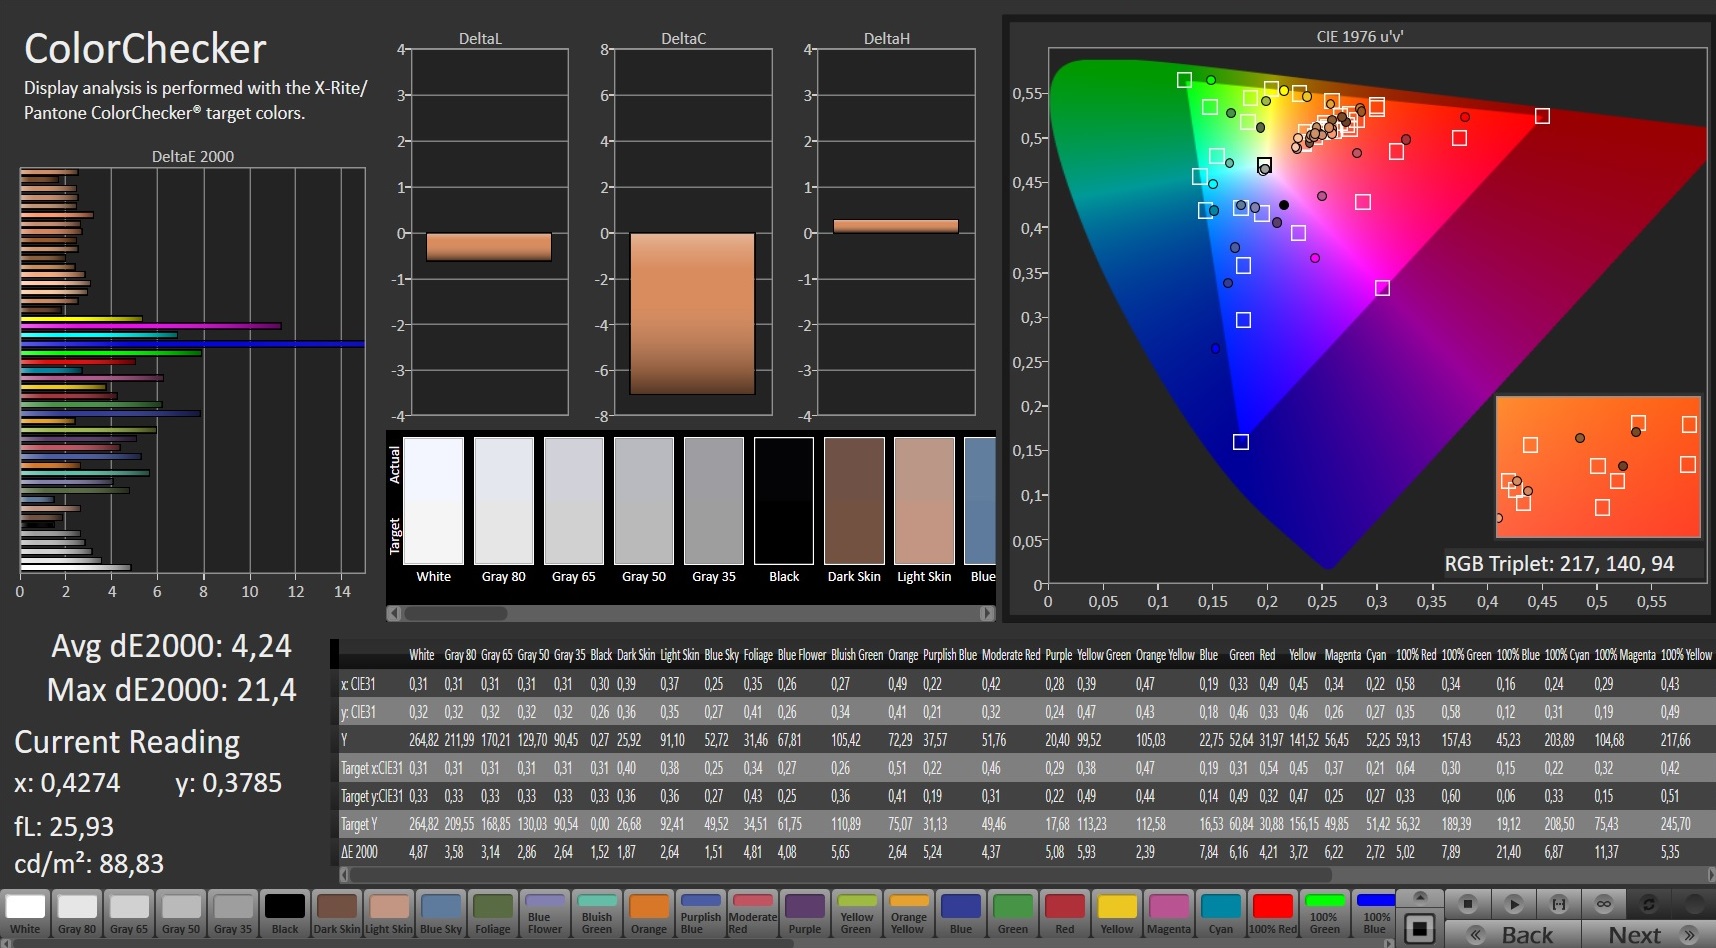
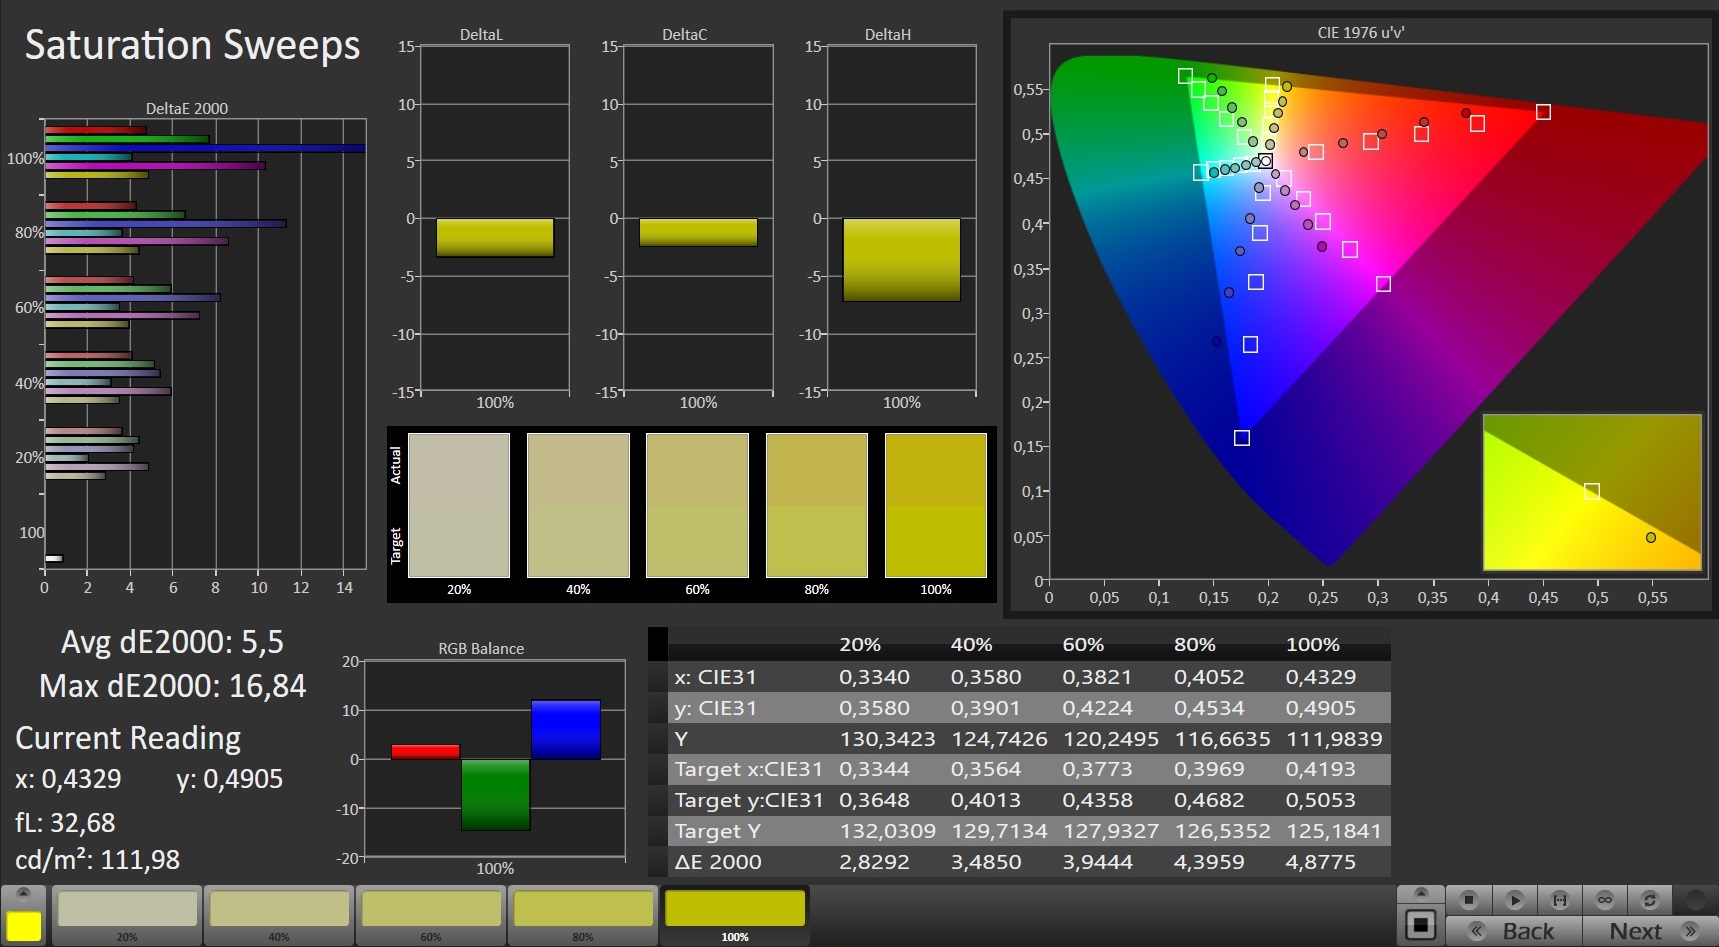
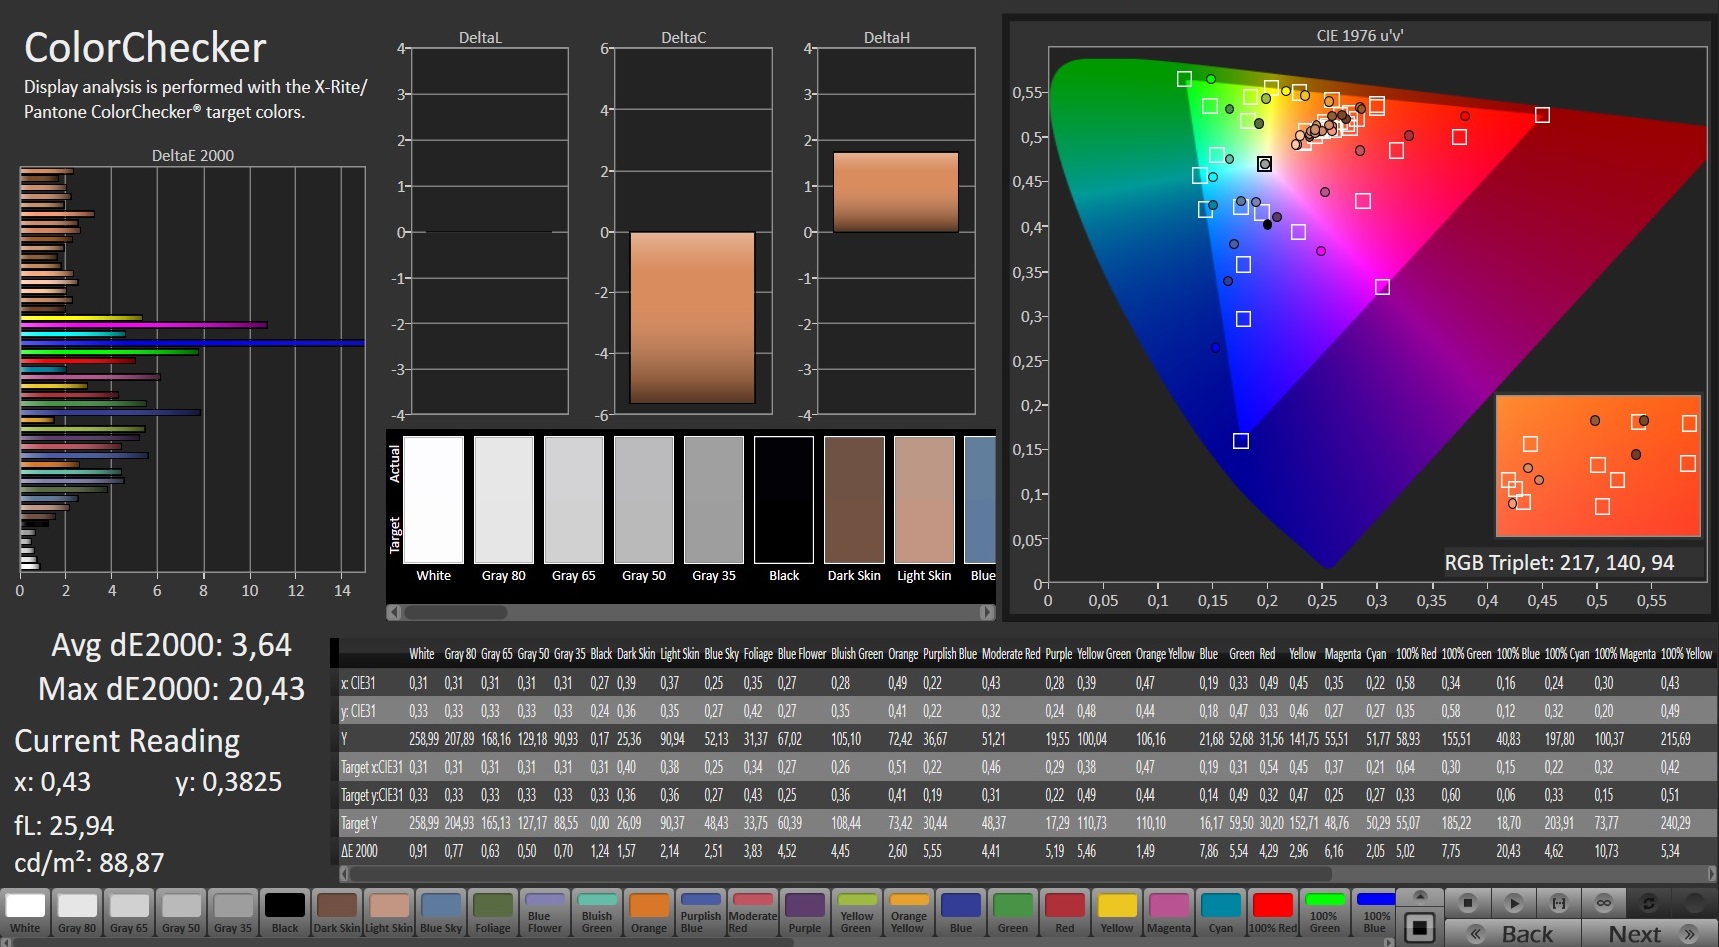
ΔE ColorChecker Calman: 4.24 | ∀{0.5-29.43 Ø4.71}
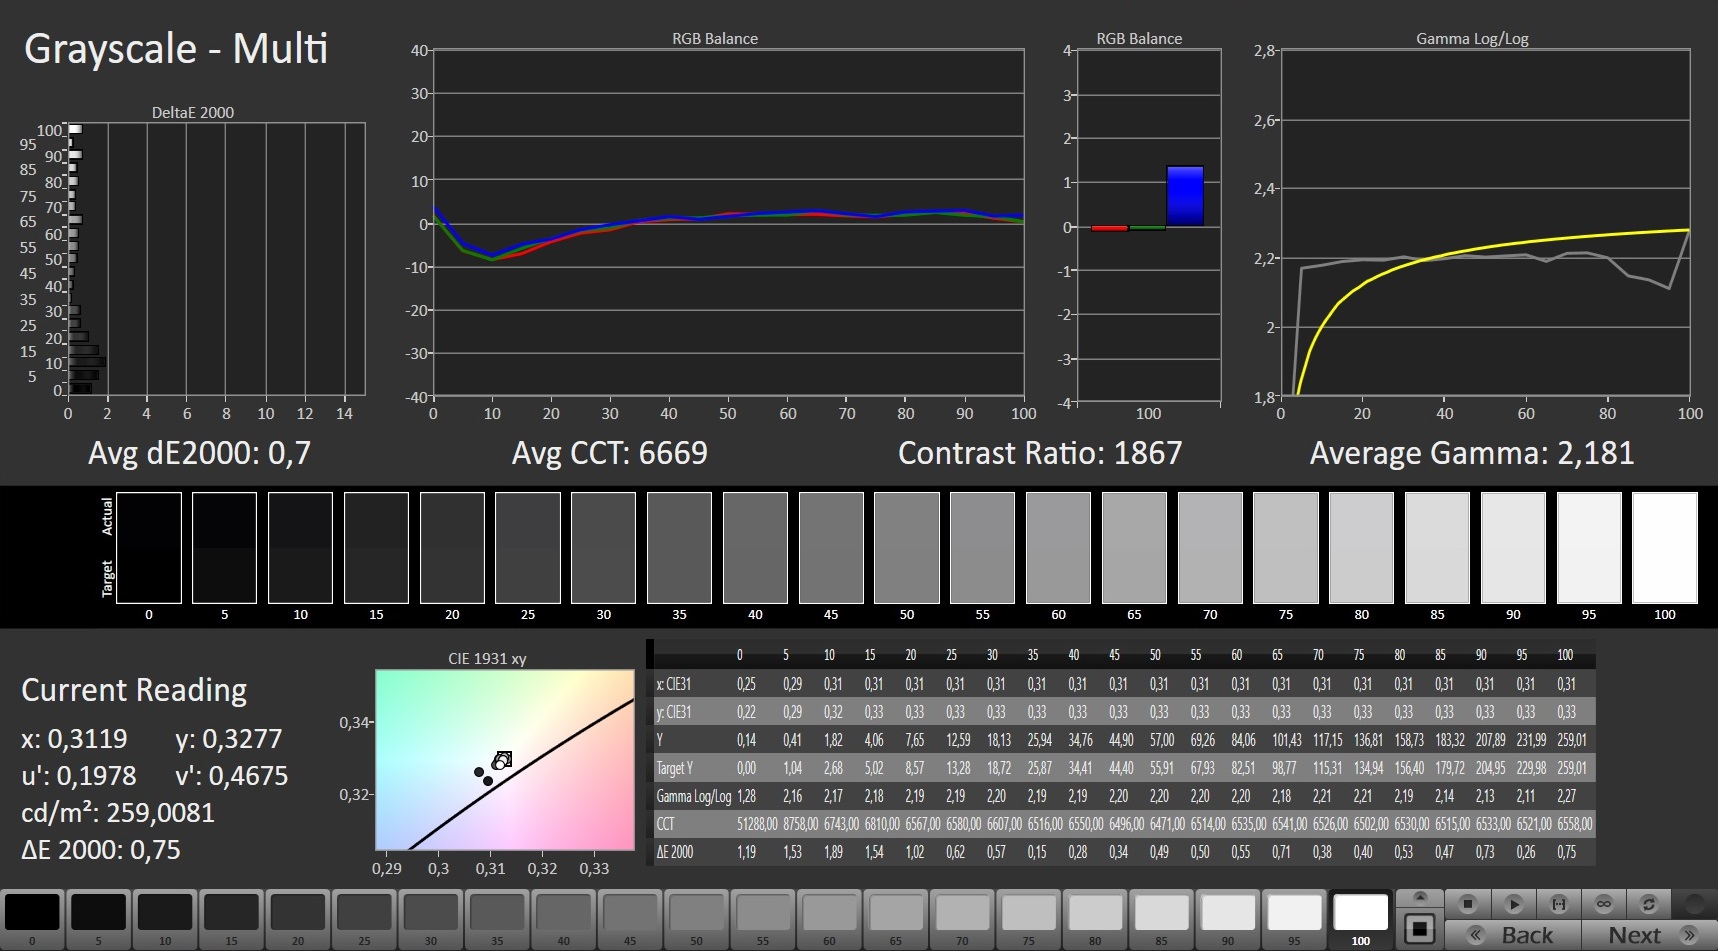
calibrated: 3.64
ΔE Greyscale Calman: 2.8 | ∀{0.09-98 Ø4.96}
59% sRGB (Argyll 1.6.3 3D)
41% AdobeRGB 1998 (Argyll 1.6.3 3D)
41.31% AdobeRGB 1998 (Argyll 3D)
59.9% sRGB (Argyll 3D)
39.98% Display P3 (Argyll 3D)
Gamma: 2.196
CCT: 7027 K
| MSI GF75 Thin 10SDR B173HAN04.9 (AUO978F), IPS, 1920x1080, 17.3" | MSI GF75 Thin 10SCXR AU Optronics B173HAN04.7, IPS, 1920x1080, 17.3" | Asus TUF A17 FA706IU-AS76 BOE NV173FHM-NX1, IPS, 1920x1080, 17.3" | Acer Nitro 5 AN517-52-77DS AU Optronics B173HAN04.7, IPS, 1920x1080, 17.3" | MSI GE75 Raider 10SE-008US Chi Mei N173HCE-G33, IPS, 1920x1080, 17.3" | |
|---|---|---|---|---|---|
| Display | -2% | 1% | -1% | 64% | |
| Display P3 Coverage (%) | 39.98 | 39.46 -1% | 40.55 1% | 39.47 -1% | 65.6 64% |
| sRGB Coverage (%) | 59.9 | 58.4 -3% | 59.7 0% | 58.9 -2% | 98.1 64% |
| AdobeRGB 1998 Coverage (%) | 41.31 | 40.77 -1% | 41.89 1% | 40.77 -1% | 67.8 64% |
| Response Times | 8% | 36% | 8% | 75% | |
| Response Time Grey 50% / Grey 80% * (ms) | 38.4 ? | 34 ? 11% | 22.4 ? 42% | 35 ? 9% | 6.8 ? 82% |
| Response Time Black / White * (ms) | 27.6 ? | 26.4 ? 4% | 19.2 ? 30% | 26 ? 6% | 8.8 ? 68% |
| PWM Frequency (Hz) | 25000 ? | ||||
| Screen | -13% | -3% | -19% | 31% | |
| Brightness middle (cd/m²) | 252 | 251.2 0% | 264.8 5% | 263 4% | 337.9 34% |
| Brightness (cd/m²) | 253 | 242 -4% | 253 0% | 246 -3% | 305 21% |
| Brightness Distribution (%) | 92 | 92 0% | 90 -2% | 85 -8% | 81 -12% |
| Black Level * (cd/m²) | 0.23 | 0.34 -48% | 0.31 -35% | 0.47 -104% | 0.29 -26% |
| Contrast (:1) | 1096 | 739 -33% | 854 -22% | 560 -49% | 1165 6% |
| Colorchecker dE 2000 * | 4.24 | 4.5 -6% | 4.73 -12% | 5.07 -20% | 2.18 49% |
| Colorchecker dE 2000 max. * | 21.4 | 20 7% | 18.89 12% | 20.5 4% | 3.9 82% |
| Colorchecker dE 2000 calibrated * | 3.64 | 3.91 -7% | 4.64 -27% | 4.9 -35% | 0.69 81% |
| Greyscale dE 2000 * | 2.8 | 4 -43% | 1.4 50% | 2.55 9% | 3.1 -11% |
| Gamma | 2.196 100% | 2.25 98% | 2.16 102% | 2.37 93% | 2.07 106% |
| CCT | 7027 93% | 5882 111% | 6641 98% | 6446 101% | 6882 94% |
| Color Space (Percent of AdobeRGB 1998) (%) | 41 | 37.3 -9% | 38.4 -6% | 37 -10% | 62 51% |
| Color Space (Percent of sRGB) (%) | 59 | 58.1 -2% | 59.3 1% | 59 0% | 98.2 66% |
| Total Average (Program / Settings) | -2% /
-8% | 11% /
2% | -4% /
-13% | 57% /
43% |
* ... smaller is better
Display Response Times
| ↔ Response Time Black to White | ||
|---|---|---|
| 27.6 ms ... rise ↗ and fall ↘ combined | ↗ 14.8 ms rise | 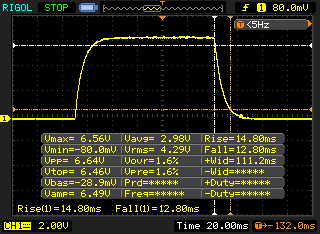 |
| ↘ 12.8 ms fall | ||
| The screen shows relatively slow response rates in our tests and may be too slow for gamers. In comparison, all tested devices range from 0.1 (minimum) to 240 (maximum) ms. » 70 % of all devices are better. This means that the measured response time is worse than the average of all tested devices (19.8 ms). | ||
| ↔ Response Time 50% Grey to 80% Grey | ||
| 38.4 ms ... rise ↗ and fall ↘ combined | ↗ 18 ms rise | 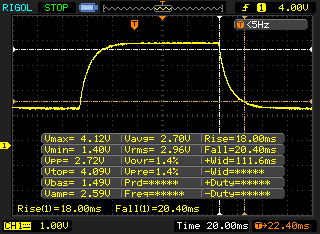 |
| ↘ 20.4 ms fall | ||
| The screen shows slow response rates in our tests and will be unsatisfactory for gamers. In comparison, all tested devices range from 0.165 (minimum) to 636 (maximum) ms. » 58 % of all devices are better. This means that the measured response time is worse than the average of all tested devices (30.9 ms). | ||
Screen Flickering / PWM (Pulse-Width Modulation)
| Screen flickering / PWM not detected | 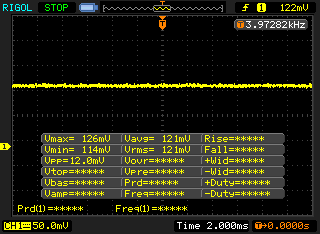 | ||
In comparison: 52 % of all tested devices do not use PWM to dim the display. If PWM was detected, an average of 7744 (minimum: 5 - maximum: 343500) Hz was measured. | |||
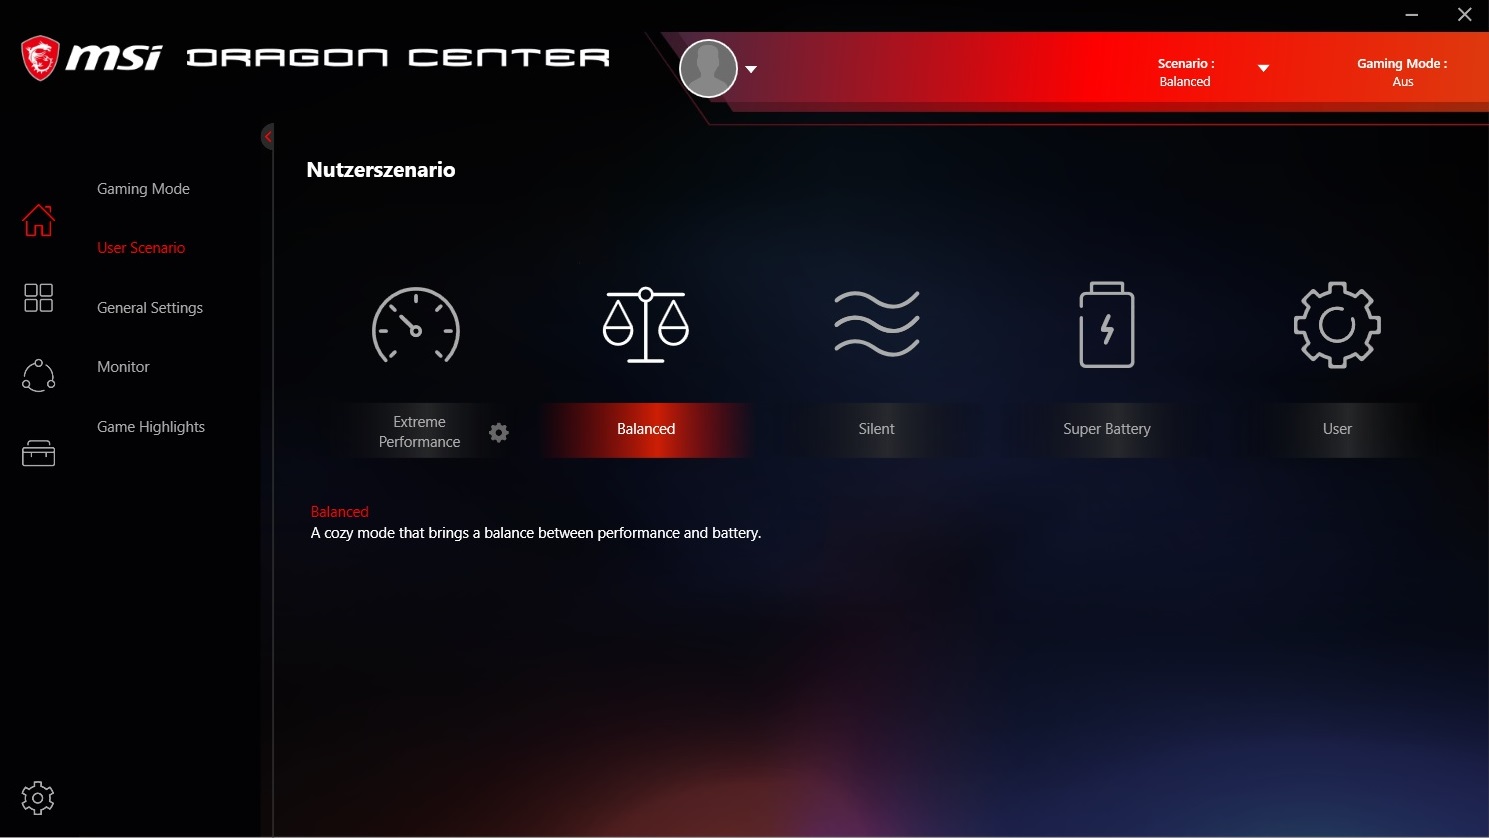
Test Parameters
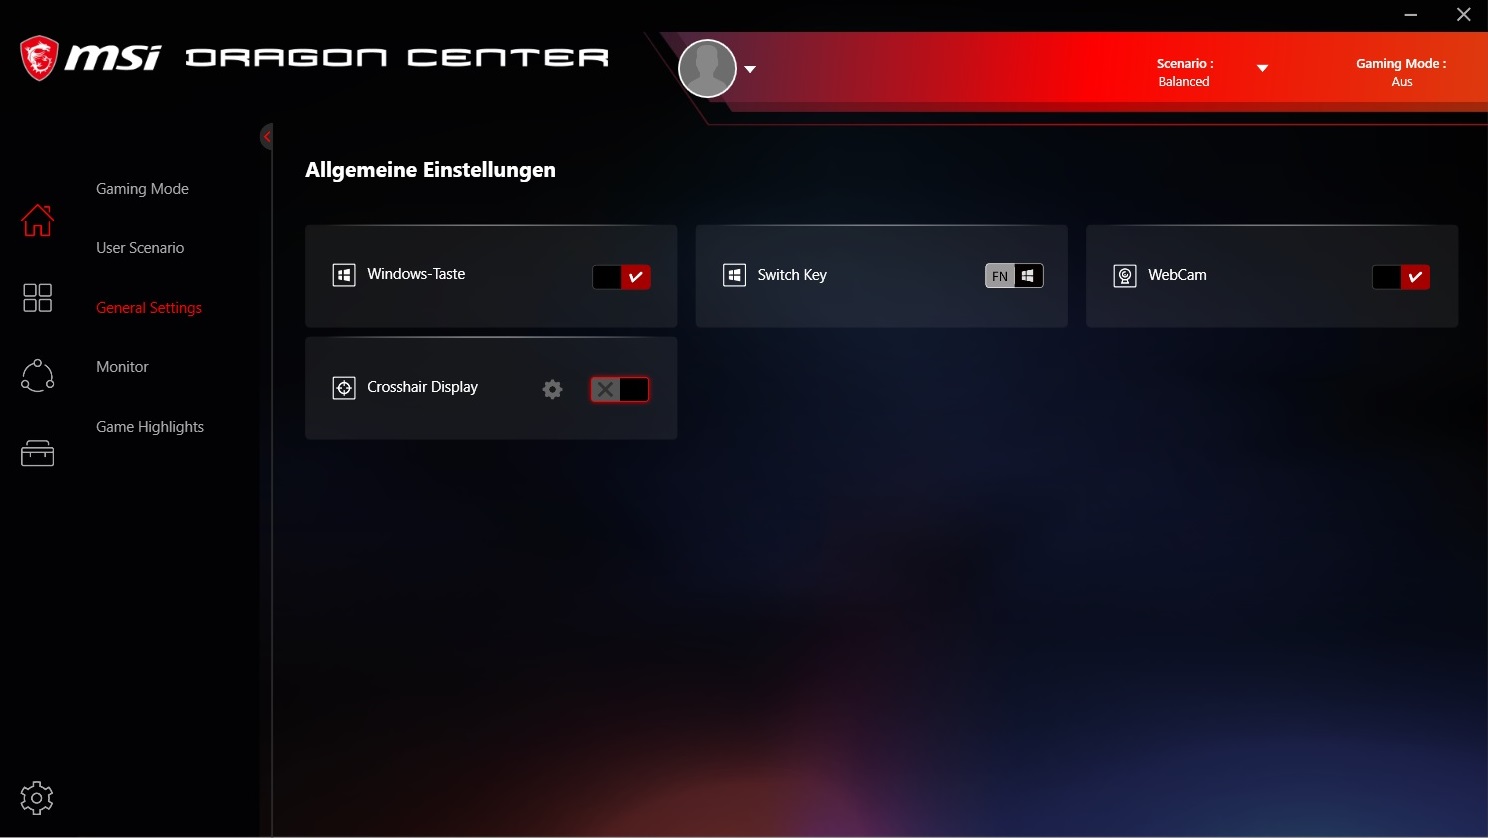
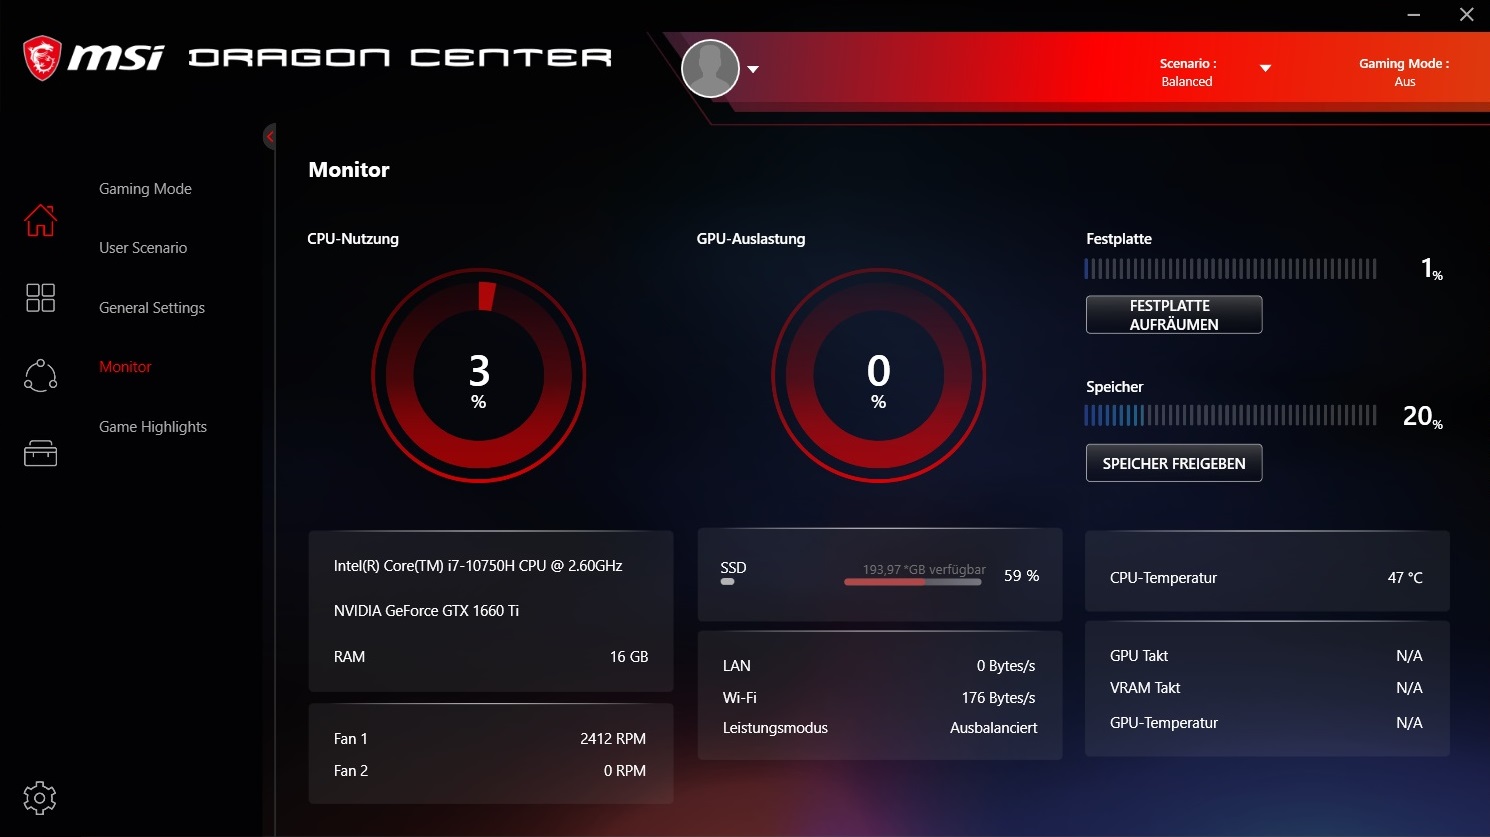
MSI’s Dragon Center allows for a huge variety of system settings adjustments. For the course of this review, we had it set to Balanced (see screenshots).
Performance
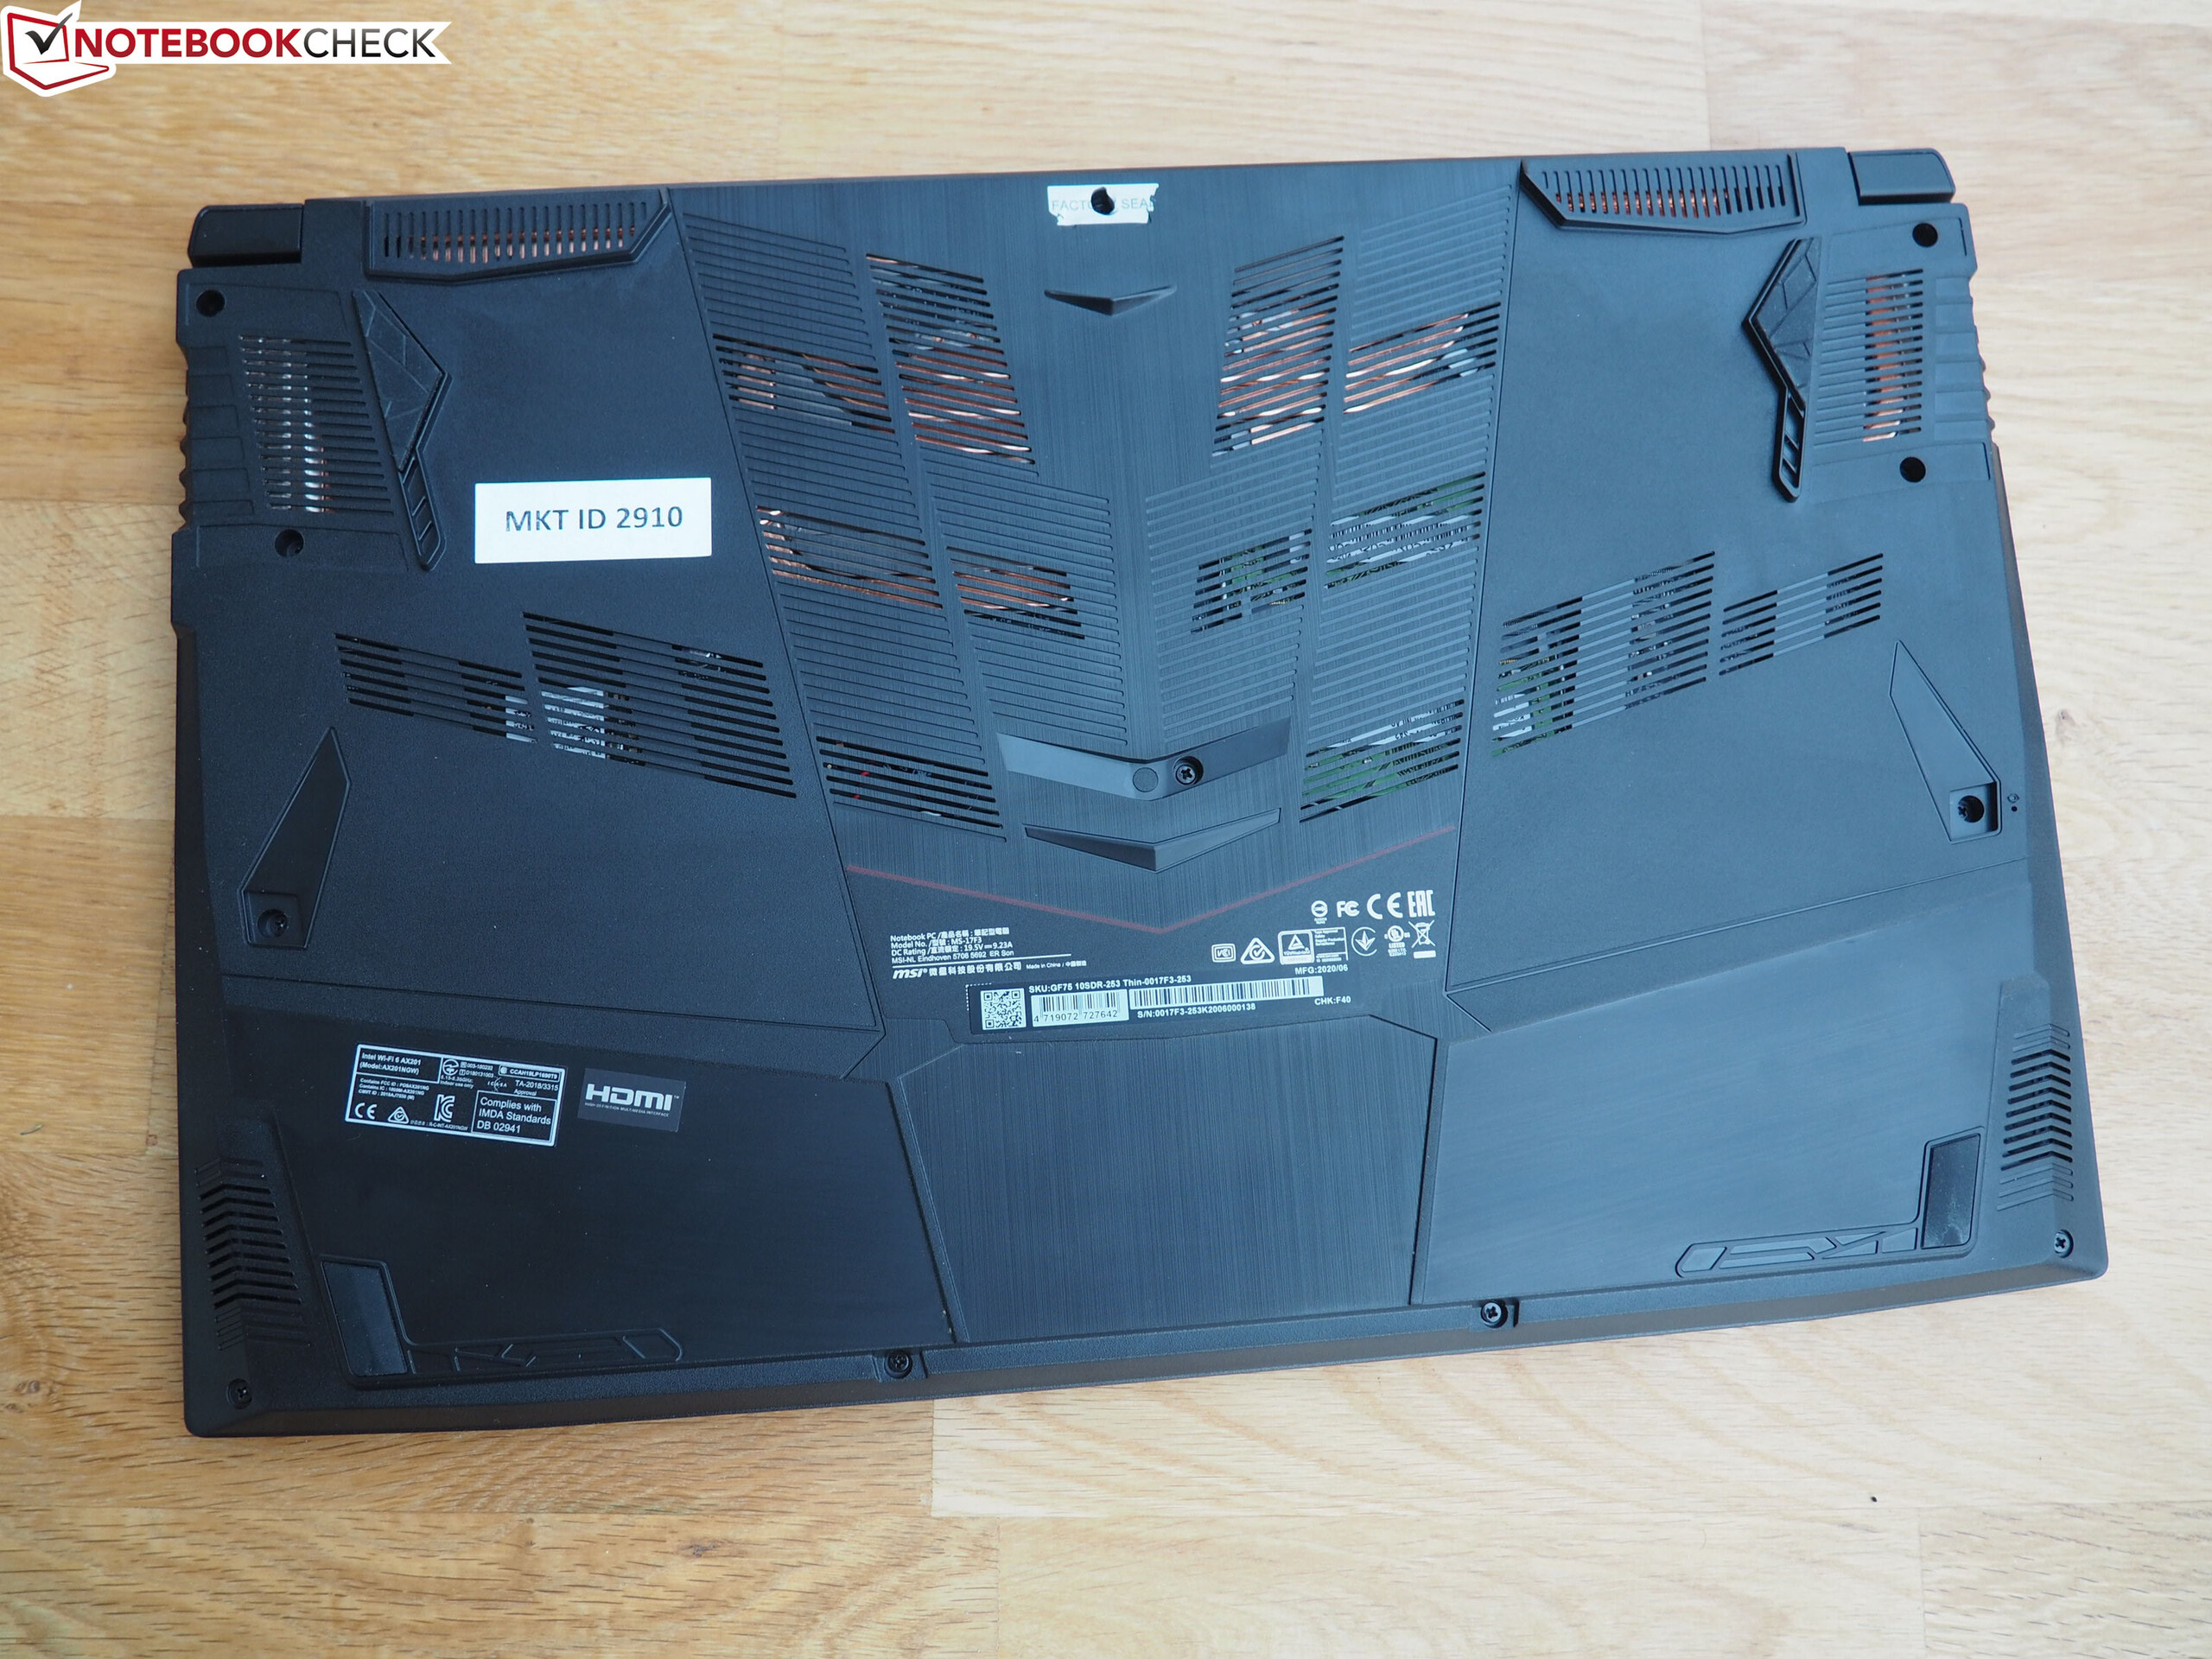
Despite the fact that the GTX 1660 Ti lacks its bigger brother’s hardware ray tracing capabilities the GF75 10SDR is a full-fledged gaming notebook capable of running almost all current games smoothly at the display’s native resolution of 1920 x 1080 and maximum details. Its hexa-core CPU and 16 GB of RAM should be more than plenty for the foreseeable future. Should you require additional storage there is an empty 2.5-inch slot for an extra drive in addition to the M.2 SSD.
Processor
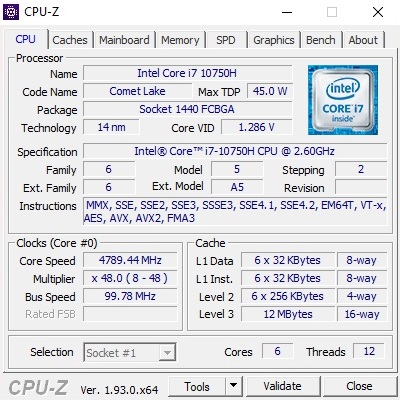
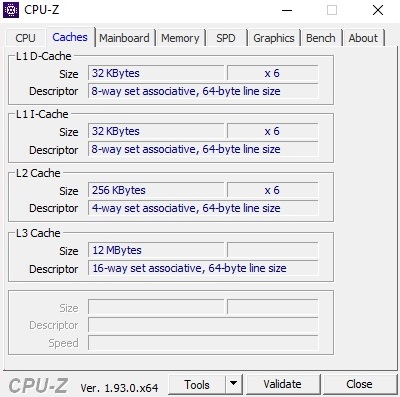
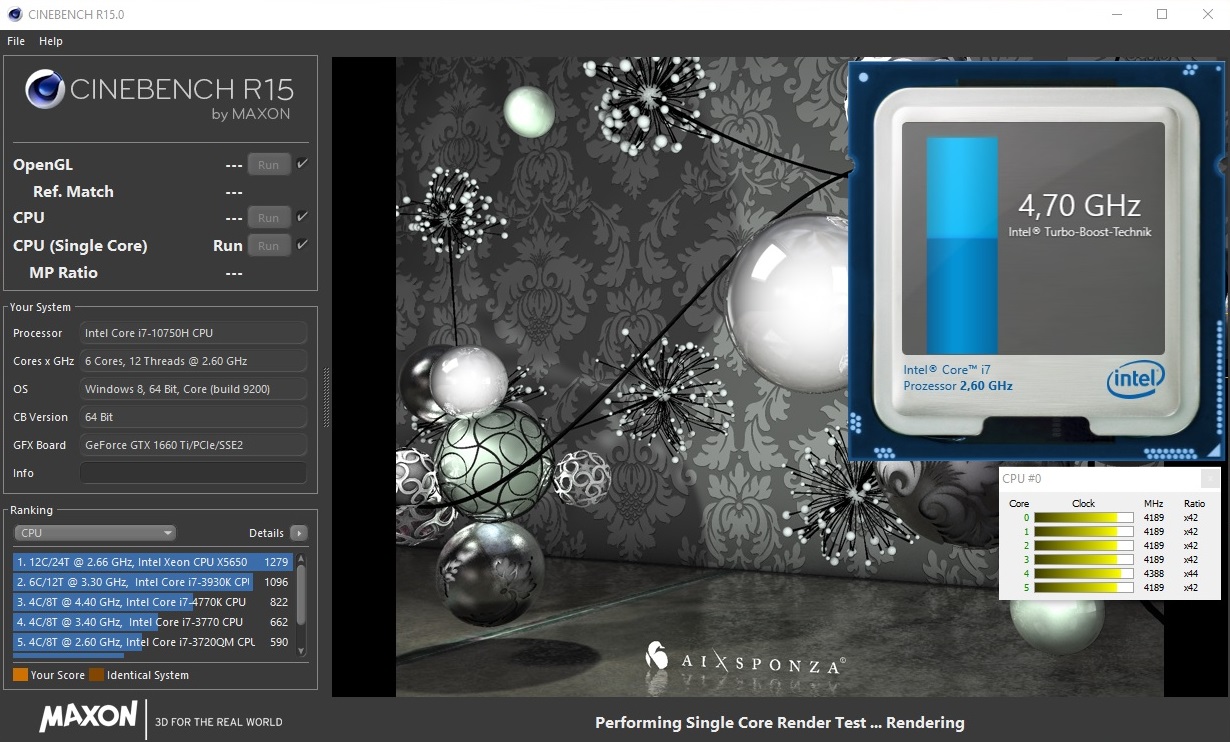
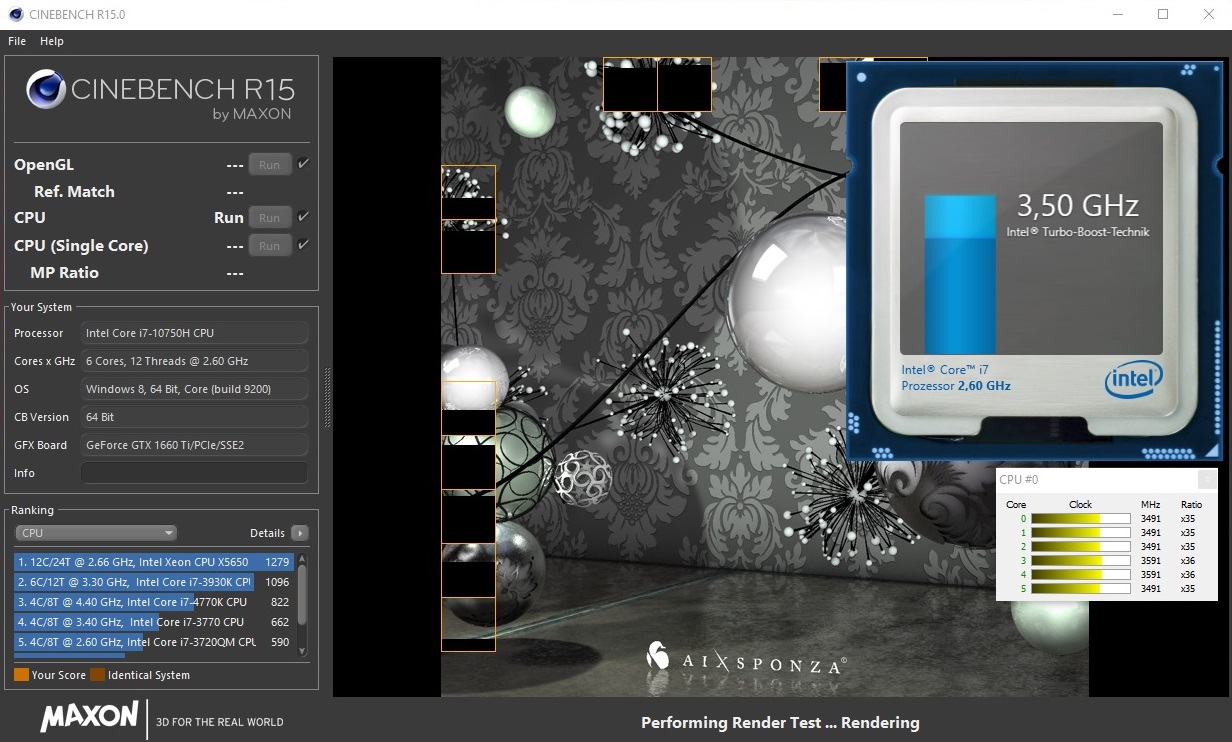
Intel’s Core i7-10750H is a member of the Comet Lake generation of CPUs and supports up to 12 threads simultaneously thanks to Hyperthreading. Its base clock speed of 2.6 GHz can turbo boost up to 5 GHz under load.
As our CineBench results showed the CPU does not fully utilize its turbo boost potential, at least with Balanced mode enabled. In the single-thread test it ran at between 4.2 to 4.7 GHz, and dropped from its initial 4.2 GHz to 3.5 to 3.6 GHz in the multi-thread test. Its scores placed the GF75 10SDR behind its 10750H-equipped competitors, such as the Acer Nitro 5 or the MSI GE75, albeit the differences were so minor they should be negligible, especially when running games.
* ... smaller is better
System Performance
Our system performance benchmarks see the 17-inch device somewhere in the middle of its comparison group. Subjectively, it performed very smoothly and snappy, and should be usable for pretty much any and all use case scenarios.
DPC Latencies
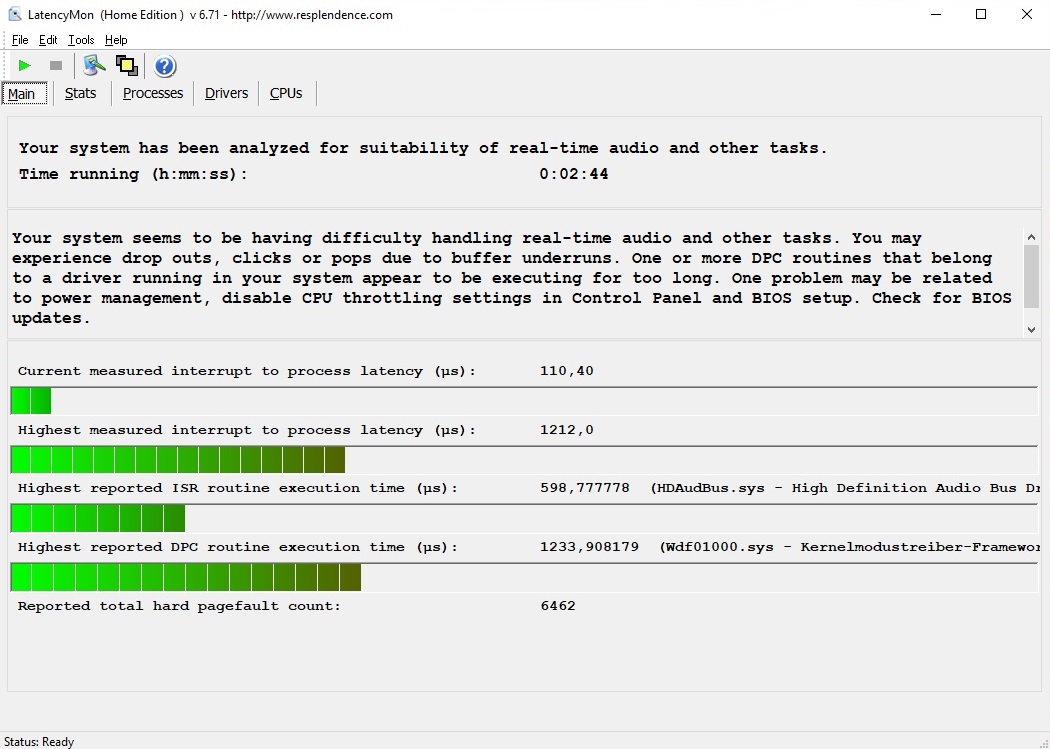
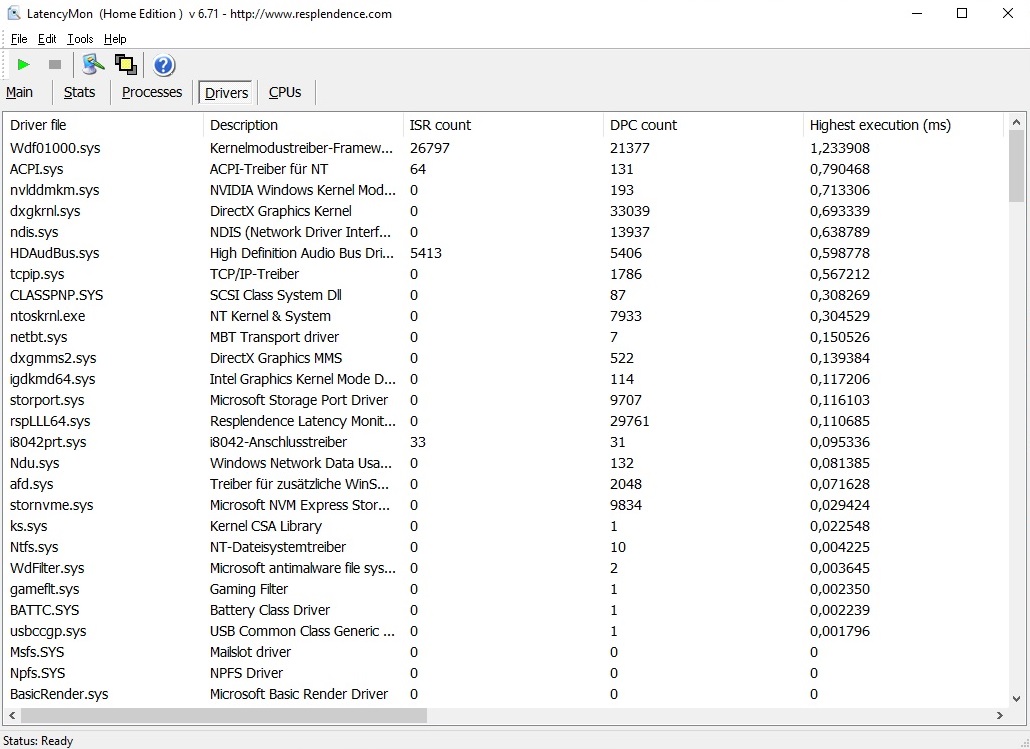
Latencies were certainly not one of the device’s strong suits. According to LatencyMon real-time processing of audio and video content can be troublesome, albeit still less so than on some of its significantly worse performing competitors.
| DPC Latencies / LatencyMon - interrupt to process latency (max), Web, Youtube, Prime95 | |
| Asus TUF A17 FA706IU-AS76 | |
| MSI GF75 Thin 10SCXR | |
| MSI GE75 Raider 10SE-008US | |
| MSI GF75 Thin 10SDR | |
| Acer Nitro 5 AN517-52-77DS | |
* ... smaller is better
Storage Devices
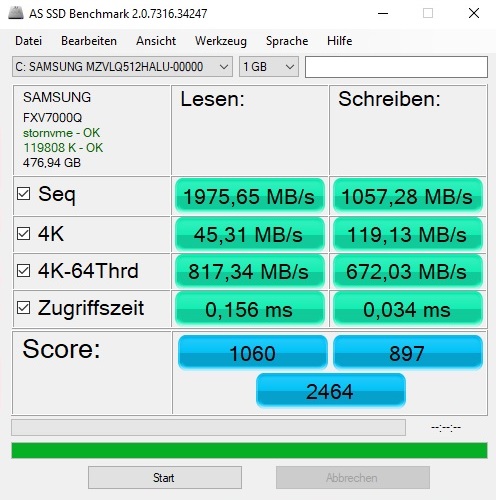
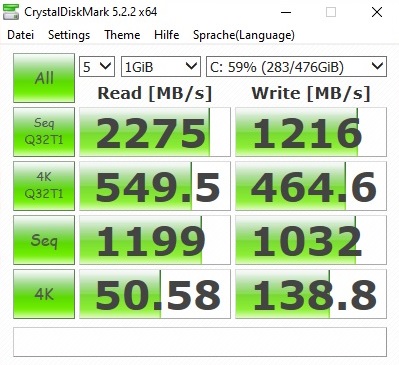
The storage device of MSI’s choosing is a 512 GB large Samsung PM991 M.2 SSD. It offers a decent performance and should be more than fast enough for most users.
| MSI GF75 Thin 10SDR Samsung PM991 MZVLQ512HALU | MSI GF75 Thin 10SCXR WDC PC SN530 SDBPNPZ-512G | Asus TUF A17 FA706IU-AS76 Intel SSD 660p 1TB SSDPEKNW010T8 | Acer Nitro 5 AN517-52-77DS WDC PC SN530 SDBPNPZ-1T00 | MSI GE75 Raider 10SE-008US Samsung SSD PM981 MZVLB512HAJQ | |
|---|---|---|---|---|---|
| CrystalDiskMark 5.2 / 6 | 9% | 23% | 16% | 36% | |
| Write 4K (MB/s) | 138.8 | 140.7 1% | 189.7 37% | 140 1% | 139.2 0% |
| Read 4K (MB/s) | 50.6 | 43.18 -15% | 62.3 23% | 49.04 -3% | 53 5% |
| Write Seq (MB/s) | 1032 | 1829 77% | 1681 63% | 1963 90% | 1950 89% |
| Read Seq (MB/s) | 1199 | 1095 -9% | 1608 34% | 1455 21% | 2328 94% |
| Write 4K Q32T1 (MB/s) | 464.6 | 431.7 -7% | 468.6 1% | 398.2 -14% | 408.9 -12% |
| Read 4K Q32T1 (MB/s) | 550 | 527 -4% | 541 -2% | 461.9 -16% | 551 0% |
| Write Seq Q32T1 (MB/s) | 1216 | 1831 51% | 1770 46% | 1969 62% | 1938 59% |
| Read Seq Q32T1 (MB/s) | 2275 | 1708 -25% | 1898 -17% | 1927 -15% | 3467 52% |

Sustained Read Speed: DiskSpd Read Loop, Queue Depth 8
GPU Performance
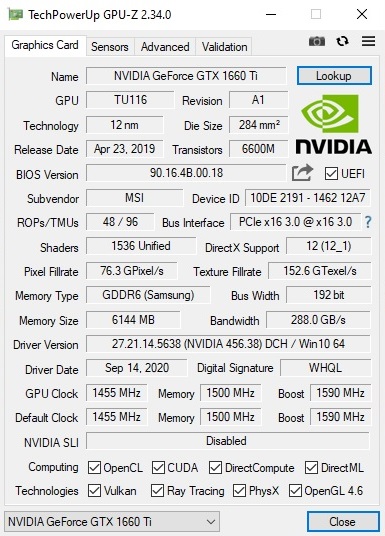
When looking at GPUs purely from a price-performance perspective the Nvidia GeForce GTX 1660 Ti is hard to beat. This particular DirectX 12 Turing-family GPU features 1,536 shaders and 6 GB of GDDR6 video RAM connected via a 192-bit interface.
In our 3DMark benchmarks the GF75 10SDR performed slightly slower than the similarly equipped Asus TUF A17. RTX 2060-equipped notebooks are between 10 to 20 % faster on average while those with GTX 1650 are around 30 % slower.
| 3DMark 11 Performance | 17704 points | |
| 3DMark Fire Strike Score | 13396 points | |
| 3DMark Time Spy Score | 5677 points | |
Help | ||
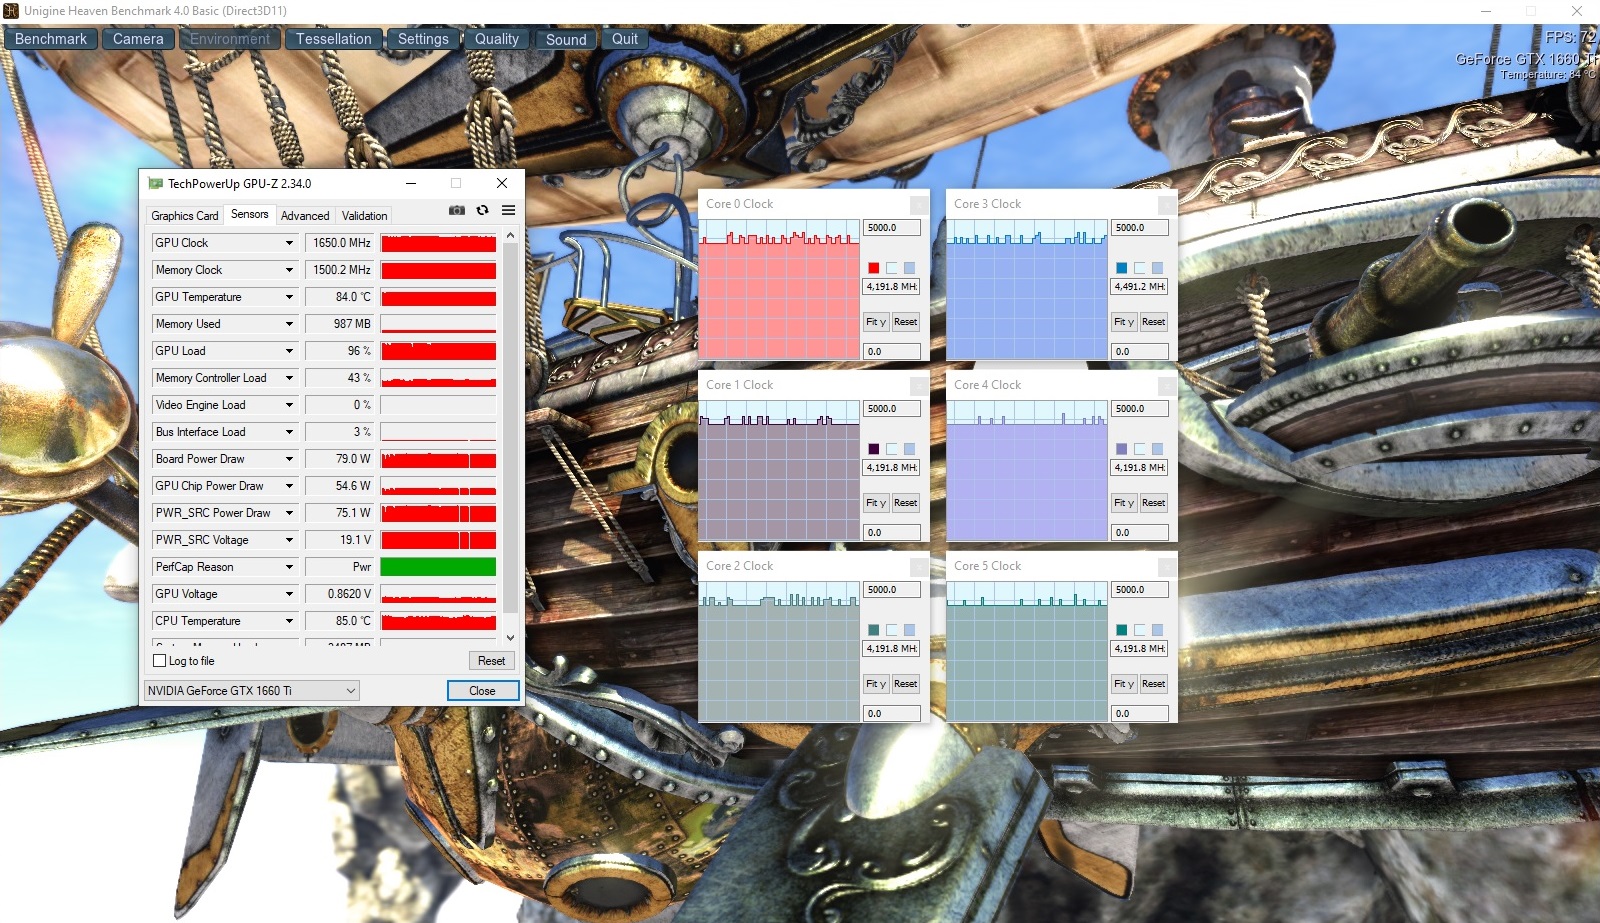
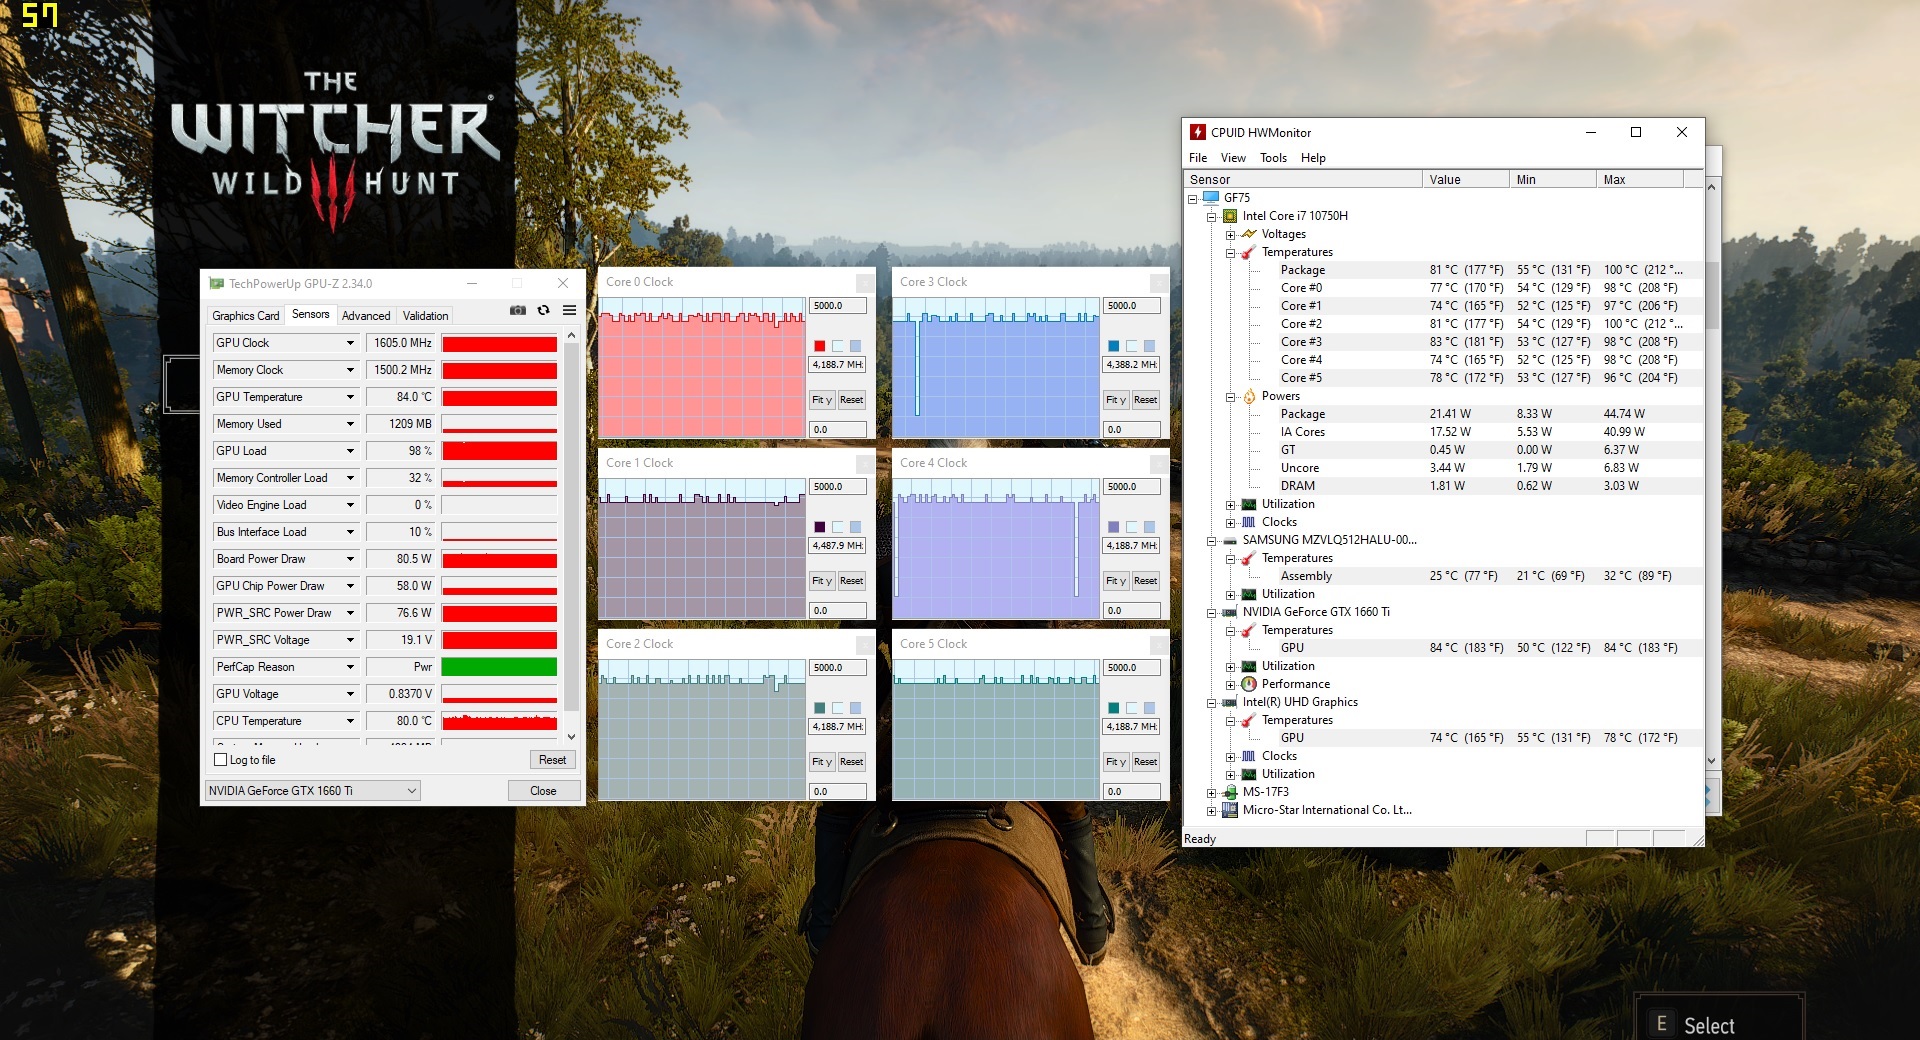
We ran The Witcher 3 in a 60-minute loop in order to determine the GF75’s sustained 3D load capabilities and are able to report that its GPU clock speeds remained fairly consistent at around 1,600 MHz.
Gaming Performance
The GTX 1660 Ti offers more than enough performance to run even demanding games in full details at the panel’s native FHD resolution, extremes such as Microsoft’s Flight Simulator excluded. Given that many games are capable of running at more than 60 FPS the 144 Hz display definitely pays off.
| The Witcher 3 | |
| 1920x1080 High Graphics & Postprocessing (Nvidia HairWorks Off) | |
| Average of class Gaming (341 - 404, n=2, last 2 years) | |
| MSI GE75 Raider 10SE-008US | |
| Acer Nitro 5 AN517-52-77DS | |
| MSI GF75 Thin 10SDR | |
| Average NVIDIA GeForce GTX 1660 Ti Mobile (93 - 120.4, n=17) | |
| Asus TUF A17 FA706IU-AS76 | |
| MSI GF75 Thin 10SCXR | |
| 1920x1080 Ultra Graphics & Postprocessing (HBAO+) | |
| Average of class Gaming (104.7 - 240, n=7, last 2 years) | |
| MSI GE75 Raider 10SE-008US | |
| Acer Nitro 5 AN517-52-77DS | |
| MSI GF75 Thin 10SDR | |
| Average NVIDIA GeForce GTX 1660 Ti Mobile (51.6 - 65.1, n=21) | |
| Asus TUF A17 FA706IU-AS76 | |
| MSI GF75 Thin 10SCXR | |
| low | med. | high | ultra | |
|---|---|---|---|---|
| GTA V (2015) | 178 | 170 | 139 | 73.8 |
| The Witcher 3 (2015) | 106 | 56.6 | ||
| Dota 2 Reborn (2015) | 146 | 133 | 124 | 116 |
| X-Plane 11.11 (2018) | 108 | 92.1 | 78.4 | |
| Shadow of the Tomb Raider (2018) | 83 | 73 | ||
| Battlefield V (2018) | 104 | 95.7 | ||
| Hunt Showdown (2020) | 69.1 | |||
| Gears Tactics (2020) | 90.2 | 63.6 | ||
| F1 2020 (2020) | 122 | 87 | ||
| Death Stranding (2020) | 88.3 | 85.5 | ||
| Horizon Zero Dawn (2020) | 75 | 58 | ||
| Flight Simulator 2020 (2020) | 39.4 | 26.8 | ||
| Serious Sam 4 (2020) | 67.1 | 52.3 | ||
| Mafia Definitive Edition (2020) | 66.8 | |||
| Star Wars Squadrons (2020) | 159 | 156 |
Emissions
Noise Emissions
Truth be told the fans could have used some extra fine tuning. Even when idle the GF75 10SDR produces a rather annoying soundscape at a very audible 35 to 39 dB(A). Most competitors are significantly quieter under similar conditions. Under load the device played by the rules, and its sound pressure level of between 44 and 46 dB(A) was very similar to that produced by the Acer Nitro 5 AN517, and subsequently placed the 17-inch laptop in the middle of the pack. At the very bottom we find devices such as the Asus TUF A17 and the MSI GE75 producing more than 50 dB(A) when subjected to 3D load.
Noise level
| Idle |
| 35 / 37 / 39 dB(A) |
| Load |
| 45 / 46 dB(A) |
 | ||
30 dB silent 40 dB(A) audible 50 dB(A) loud |
||
min: | ||
| MSI GF75 Thin 10SDR i7-10750H, GeForce GTX 1660 Ti Mobile | MSI GF75 Thin 10SCXR i5-10300H, GeForce GTX 1650 Mobile | Asus TUF A17 FA706IU-AS76 R7 4800H, GeForce GTX 1660 Ti Mobile | Acer Nitro 5 AN517-52-77DS i7-10750H, GeForce RTX 2060 Mobile | MSI GE75 Raider 10SE-008US i7-10750H, GeForce RTX 2060 Mobile | Average of class Gaming | |
|---|---|---|---|---|---|---|
| Noise | 6% | 2% | 6% | 2% | 11% | |
| off / environment * (dB) | 25 | 28.4 -14% | 28.7 -15% | 30.2 -21% | 28.4 -14% | 24.1 ? 4% |
| Idle Minimum * (dB) | 35 | 33 6% | 28.7 18% | 30.2 14% | 30.2 14% | 25.9 ? 26% |
| Idle Average * (dB) | 37 | 33 11% | 30.5 18% | 30.2 18% | 30.2 18% | 27.4 ? 26% |
| Idle Maximum * (dB) | 39 | 33.1 15% | 32.5 17% | 30.2 23% | 32 18% | 30.1 ? 23% |
| Load Average * (dB) | 45 | 37.7 16% | 42.5 6% | 41.5 8% | 33.2 26% | 43.7 ? 3% |
| Witcher 3 ultra * (dB) | 44 | 39.2 11% | 50.1 -14% | 44.5 -1% | 55 -25% | |
| Load Maximum * (dB) | 46 | 46 -0% | 53.4 -16% | 44.6 3% | 55 -20% | 54.3 ? -18% |
* ... smaller is better
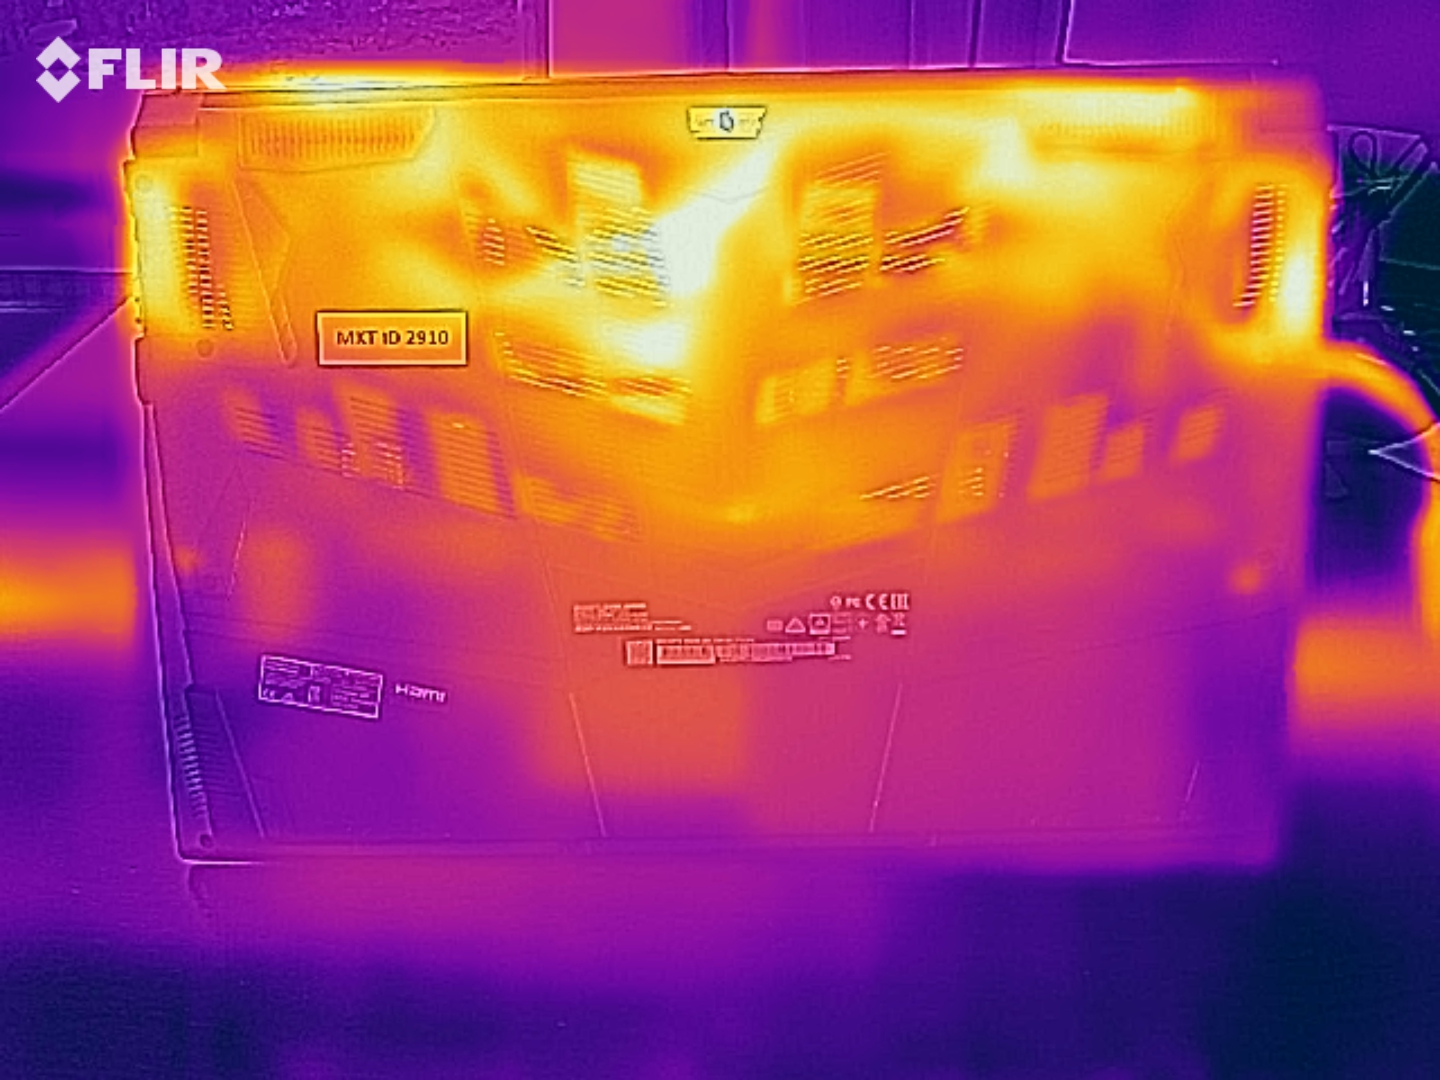
Temperature
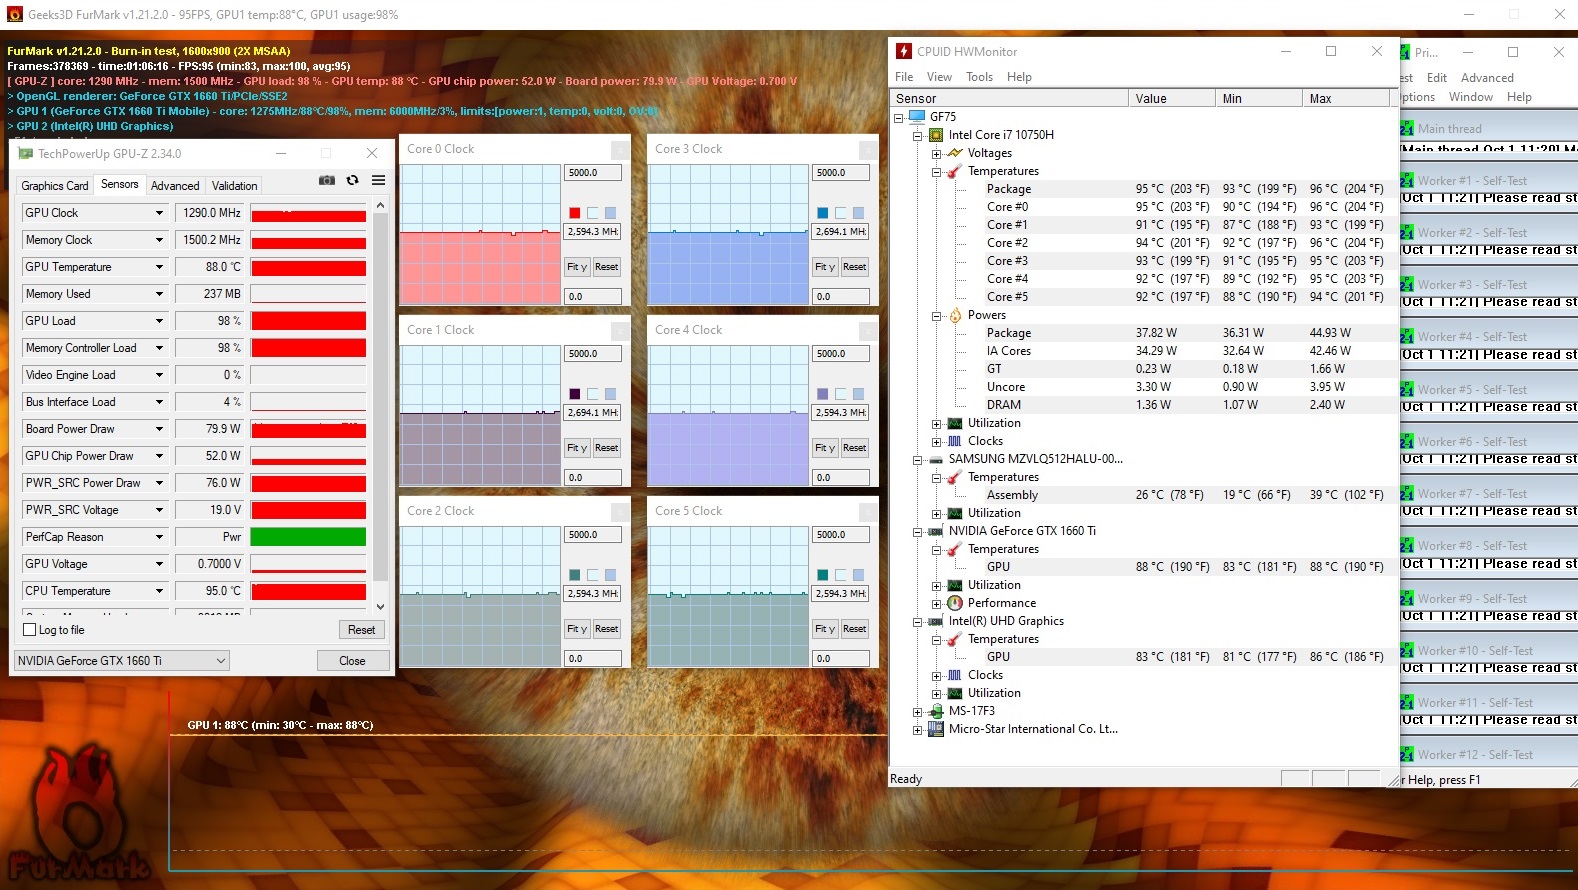
Considering its powerful hardware, we found the laptop’s surface temperatures to be okay overall. After 60 minutes of maximum load running Prime95 and FurMark simultaneously we were able to measure 51 °C at the top and 53 °C at the bottom of the case. When idle, the entire case remained very cool at just around 25 °C. Looking at its internal temperatures we find that the CPU in particular was struggling hard with its thermals. Despite a disabled turbo boost the Core i7-10750H peaked at more than 90 °C in our stress test, with the GPU following suit at a similarly hot 88 °C.
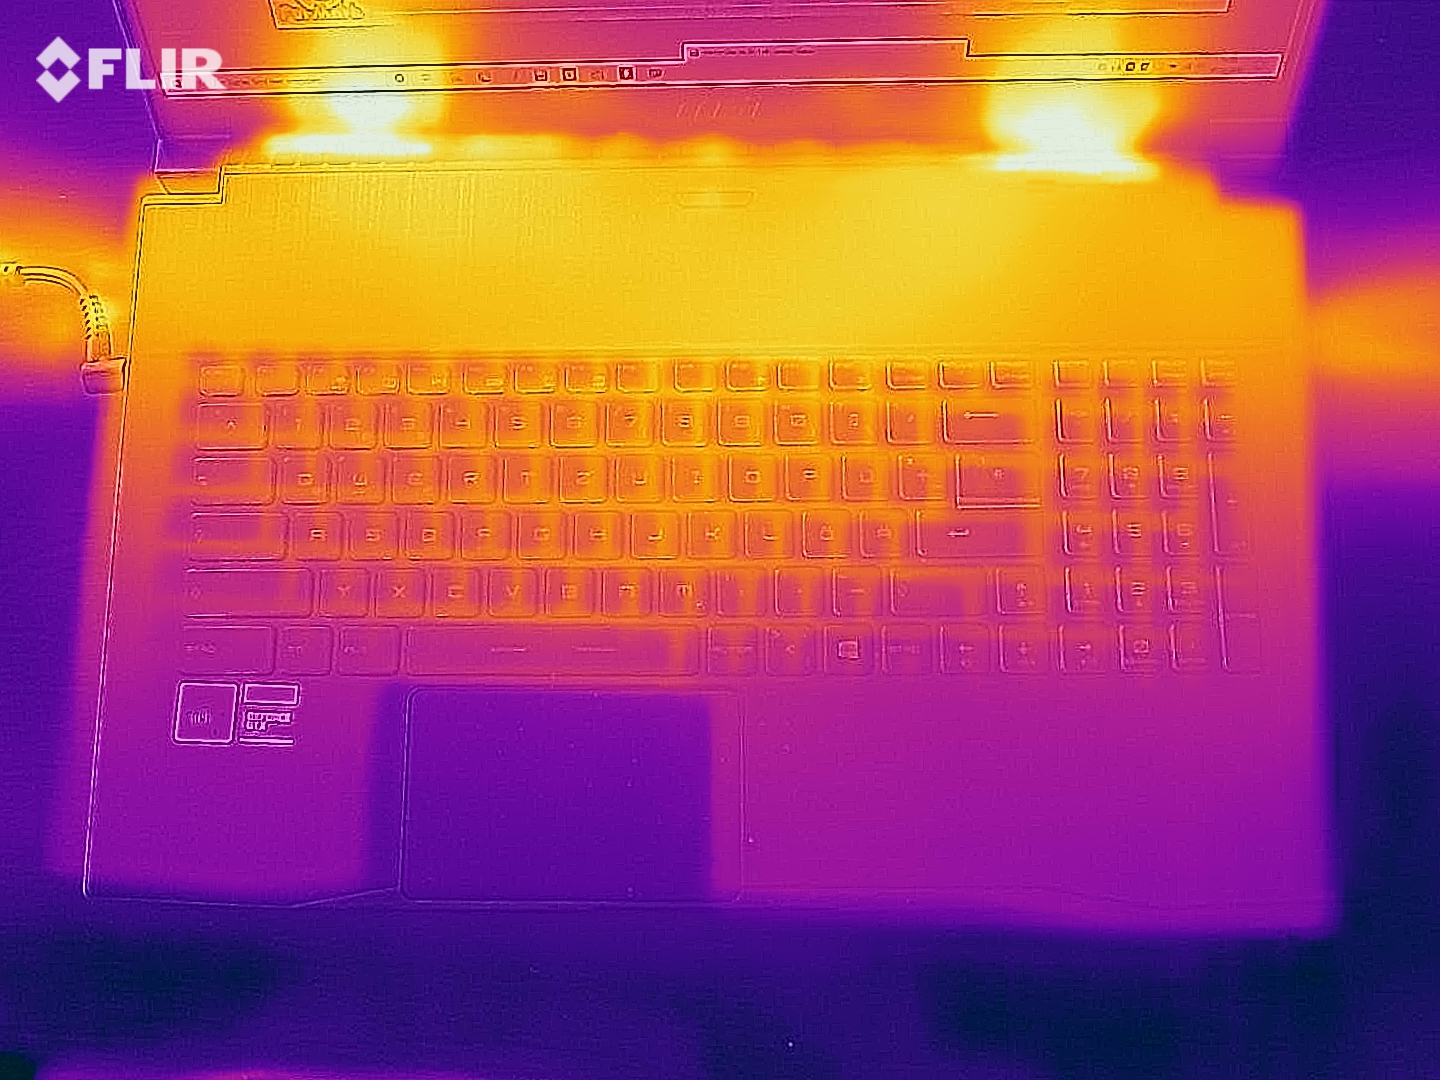
(-) The maximum temperature on the upper side is 51 °C / 124 F, compared to the average of 40.4 °C / 105 F, ranging from 21.2 to 68.8 °C for the class Gaming.
(-) The bottom heats up to a maximum of 53 °C / 127 F, compared to the average of 43.2 °C / 110 F
(+) In idle usage, the average temperature for the upper side is 24.7 °C / 76 F, compared to the device average of 33.9 °C / 93 F.
(-) Playing The Witcher 3, the average temperature for the upper side is 40.2 °C / 104 F, compared to the device average of 33.9 °C / 93 F.
(+) The palmrests and touchpad are reaching skin temperature as a maximum (35 °C / 95 F) and are therefore not hot.
(-) The average temperature of the palmrest area of similar devices was 28.8 °C / 83.8 F (-6.2 °C / -11.2 F).
| MSI GF75 Thin 10SDR i7-10750H, GeForce GTX 1660 Ti Mobile | MSI GF75 Thin 10SCXR i5-10300H, GeForce GTX 1650 Mobile | Asus TUF A17 FA706IU-AS76 R7 4800H, GeForce GTX 1660 Ti Mobile | Acer Nitro 5 AN517-52-77DS i7-10750H, GeForce RTX 2060 Mobile | MSI GE75 Raider 10SE-008US i7-10750H, GeForce RTX 2060 Mobile | Average of class Gaming | |
|---|---|---|---|---|---|---|
| Heat | -18% | -9% | -5% | -18% | -10% | |
| Maximum Upper Side * (°C) | 51 | 42 18% | 47.6 7% | 50.6 1% | 44.2 13% | 45.1 ? 12% |
| Maximum Bottom * (°C) | 53 | 53.4 -1% | 50.8 4% | 53.8 -2% | 49 8% | 48.1 ? 9% |
| Idle Upper Side * (°C) | 25 | 34.2 -37% | 33 -32% | 26.6 -6% | 33.6 -34% | 31 ? -24% |
| Idle Bottom * (°C) | 25 | 37.4 -50% | 29 -16% | 27.8 -11% | 39.6 -58% | 34.2 ? -37% |
* ... smaller is better
Speakers
MSI GF75 Thin 10SDR audio analysis
(±) | speaker loudness is average but good (81 dB)
Bass 100 - 315 Hz
(-) | nearly no bass - on average 16.6% lower than median
(-) | bass is not linear (15.4% delta to prev. frequency)
Mids 400 - 2000 Hz
(+) | balanced mids - only 2.6% away from median
(+) | mids are linear (5.5% delta to prev. frequency)
Highs 2 - 16 kHz
(+) | balanced highs - only 2.2% away from median
(+) | highs are linear (6% delta to prev. frequency)
Overall 100 - 16.000 Hz
(+) | overall sound is linear (12.5% difference to median)
Compared to same class
» 15% of all tested devices in this class were better, 3% similar, 81% worse
» The best had a delta of 6%, average was 18%, worst was 132%
Compared to all devices tested
» 11% of all tested devices were better, 2% similar, 86% worse
» The best had a delta of 4%, average was 23%, worst was 134%
Asus TUF A17 FA706IU-AS76 audio analysis
(±) | speaker loudness is average but good (74 dB)
Bass 100 - 315 Hz
(±) | reduced bass - on average 12.7% lower than median
(±) | linearity of bass is average (11.5% delta to prev. frequency)
Mids 400 - 2000 Hz
(+) | balanced mids - only 4.8% away from median
(±) | linearity of mids is average (9.1% delta to prev. frequency)
Highs 2 - 16 kHz
(+) | balanced highs - only 3.1% away from median
(±) | linearity of highs is average (8.7% delta to prev. frequency)
Overall 100 - 16.000 Hz
(±) | linearity of overall sound is average (23.5% difference to median)
Compared to same class
» 85% of all tested devices in this class were better, 5% similar, 10% worse
» The best had a delta of 6%, average was 18%, worst was 132%
Compared to all devices tested
» 70% of all tested devices were better, 6% similar, 24% worse
» The best had a delta of 4%, average was 23%, worst was 134%
Energy Management
Power Consumption
Thanks to dynamic graphics switching (Nvidia Optimus) the GF75 turned out to be fairly energy efficient when idle. An average of 8 to 15 W is comparatively low for a gaming laptop. With enabled GeForce GTX 1660 Ti under load we were able to record between 95 and 193 W of power consumption, which is fairly similar to the Acer Nitro 5.
| Off / Standby | |
| Idle | |
| Load |
|
Key:
min: | |
| MSI GF75 Thin 10SDR i7-10750H, GeForce GTX 1660 Ti Mobile | MSI GF75 Thin 10SCXR i5-10300H, GeForce GTX 1650 Mobile | Asus TUF A17 FA706IU-AS76 R7 4800H, GeForce GTX 1660 Ti Mobile | Acer Nitro 5 AN517-52-77DS i7-10750H, GeForce RTX 2060 Mobile | MSI GE75 Raider 10SE-008US i7-10750H, GeForce RTX 2060 Mobile | Average of class Gaming | |
|---|---|---|---|---|---|---|
| Power Consumption | -17% | -2% | 9% | -55% | -54% | |
| Idle Minimum * (Watt) | 8 | 13 -63% | 7.4 7% | 5.4 32% | 14.7 -84% | 13.1 ? -64% |
| Idle Average * (Watt) | 10 | 15.7 -57% | 10.5 -5% | 9.8 2% | 20.4 -104% | 19 ? -90% |
| Idle Maximum * (Watt) | 15 | 21 -40% | 17 -13% | 10.9 27% | 26.9 -79% | 24.6 ? -64% |
| Load Average * (Watt) | 95 | 87 8% | 103.7 -9% | 104 -9% | 93.2 2% | 111.3 ? -17% |
| Witcher 3 ultra * (Watt) | 133 | 96.4 28% | 128.1 4% | 134.3 -1% | 185.4 -39% | |
| Load Maximum * (Watt) | 193 | 145.8 24% | 183.2 5% | 193 -0% | 237.8 -23% | 260 ? -35% |
* ... smaller is better
Battery Life
Battery life is neither here nor there. Our Wi-Fi test at medium display brightness saw the GF75 Thin run out of juice after almost exactly four hours. Battery life could have been improved with a more powerful battery, especially considering that 51 Wh are fairly poor compared to its competitors.
| MSI GF75 Thin 10SDR i7-10750H, GeForce GTX 1660 Ti Mobile, 51 Wh | MSI GF75 Thin 10SCXR i5-10300H, GeForce GTX 1650 Mobile, 51 Wh | Asus TUF A17 FA706IU-AS76 R7 4800H, GeForce GTX 1660 Ti Mobile, 90 Wh | Acer Nitro 5 AN517-52-77DS i7-10750H, GeForce RTX 2060 Mobile, 57.48 Wh | MSI GE75 Raider 10SE-008US i7-10750H, GeForce RTX 2060 Mobile, 65 Wh | Average of class Gaming | |
|---|---|---|---|---|---|---|
| Battery runtime | 11% | 123% | 72% | -7% | 45% | |
| Reader / Idle (h) | 7.3 | 7.7 5% | 9.1 25% | 11 51% | 7.84 ? 7% | |
| WiFi v1.3 (h) | 4 | 4.7 18% | 8.5 113% | 6.6 65% | 3.7 -7% | 7.08 ? 77% |
| Load (h) | 1 | 1.1 10% | 3.3 230% | 2 100% | 1.496 ? 50% | |
| H.264 (h) | 7.3 | 8.27 ? |
Pros
Cons
Verdict
The GF75 10SDR-253 is made for gamers looking for ultimate performance at a price point of less than $1,200.
The GeForce GTX 1660 Ti is much faster than the GTX 1650 (Ti) that is usually found in similarly priced notebooks. Its CPU performance is also impressive, although we would have wished for a Ryzen 5 4600H instead of the Core i7-10750H, which would have been not only potentially faster but also more efficient, cooler, and therefore also quieter thanks to its 7 nm (compared to 14 nm) manufacturing process. The rest of the hardware was adequate. 16 GB of RAM, an M.2 PCIe SSD, and a 144 Hz panel are up to date.
A higher rating could have been achieved with better connectivity (no Thunderbolt 3, no card reader, no DisplayPort), better fan management, and a higher-capacity battery. The Scrooge McDucks among us will still find it hard to resist. Considering that a Windows 10 license can be purchased for around $50 already the fact that the device ships without one in some countries is only going to be problematic for inexperienced beginners.
MSI GF75 Thin 10SDR
- 10/06/2020 v7 (old)
Florian Glaser
Price comparison

