Notebookcheck Logo

Star Wars Squadrons Laptop and Desktop Benchmarks

X-Wing vs. TIE Fighter. Only a year after the first-class Jedi Fallen Order, EA sends its next Star Wars epic into the race. Squadrons offers action-filled space fights and turns out to be surprisingly undemanding when it comes to hardware.
Star Wars Squadrons

Technology

Star Wars Squadrons is based on the Frostbite Engine 3 which fuels many titles from EA (Need for Speed Heat, Fifa 20, Battlefield V, ...) and is known for its good quality and moderate hardware requirements at the same time.

Star Wars Squadrons
Star Wars Squadrons
Star Wars Squadrons
Star Wars Squadrons
Star Wars Squadrons
Star Wars Squadrons

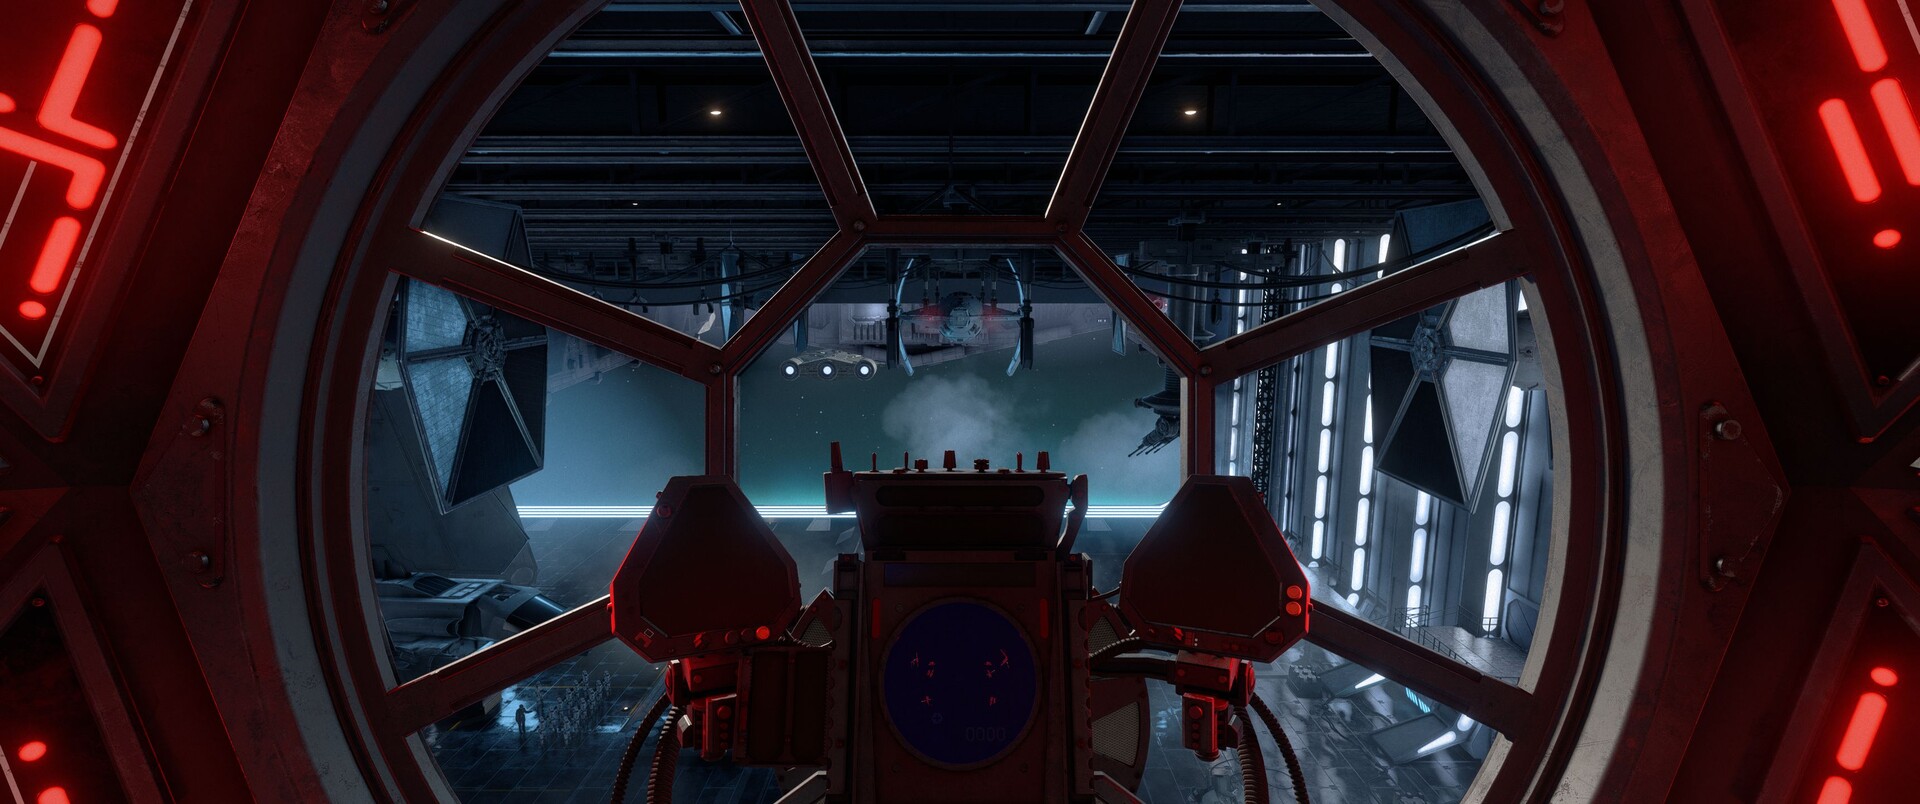
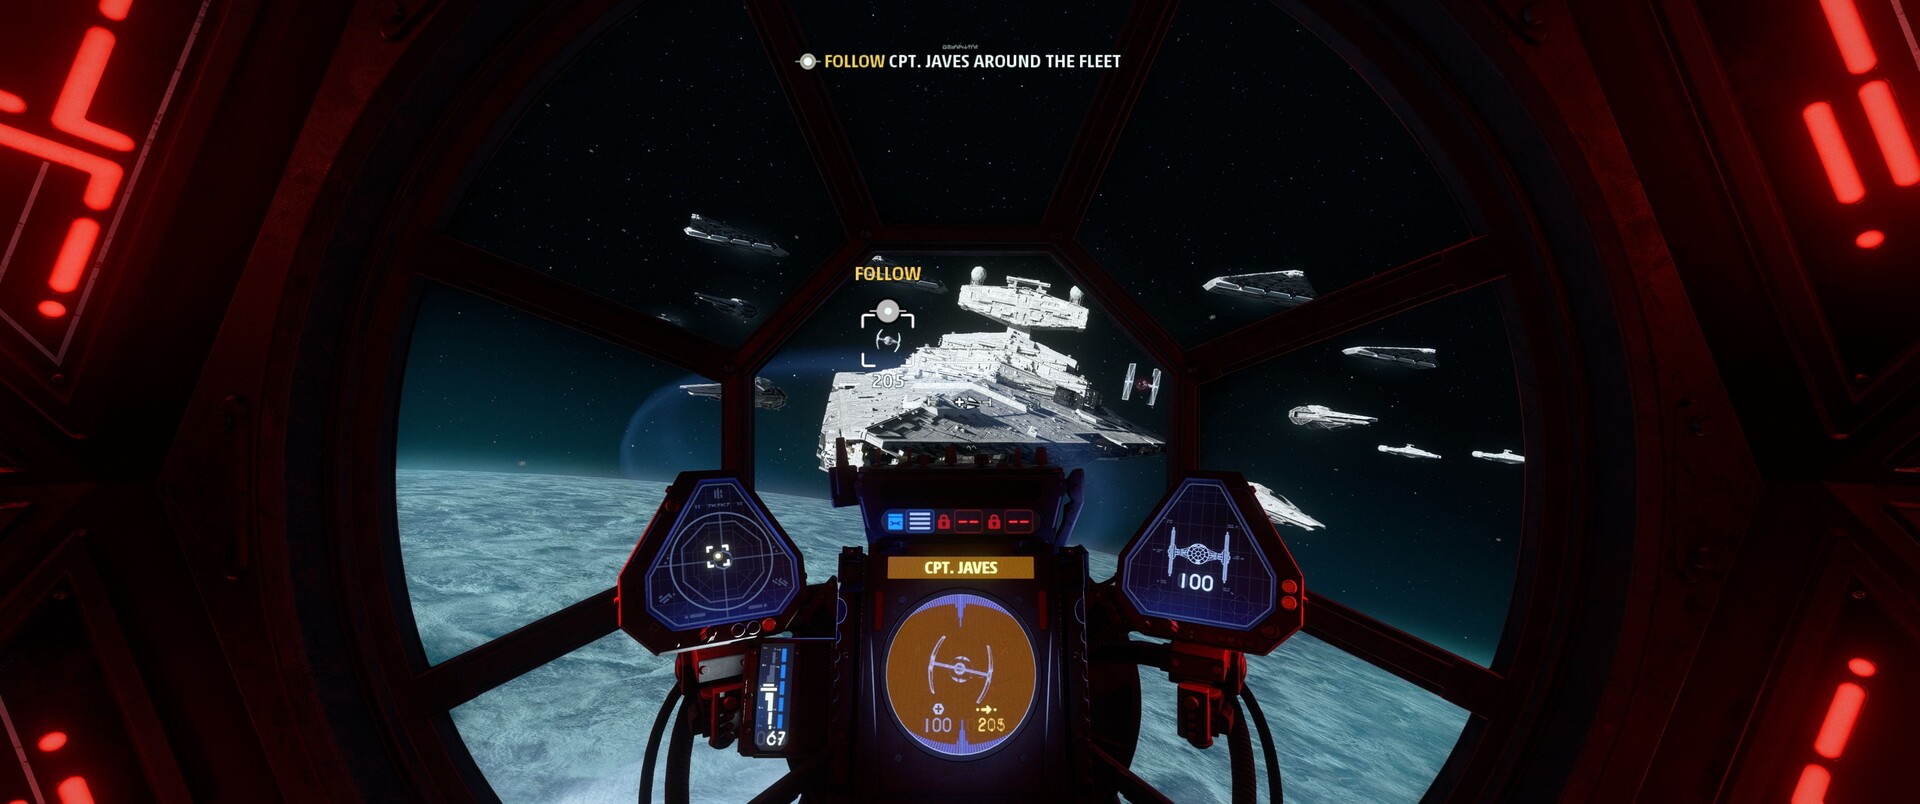
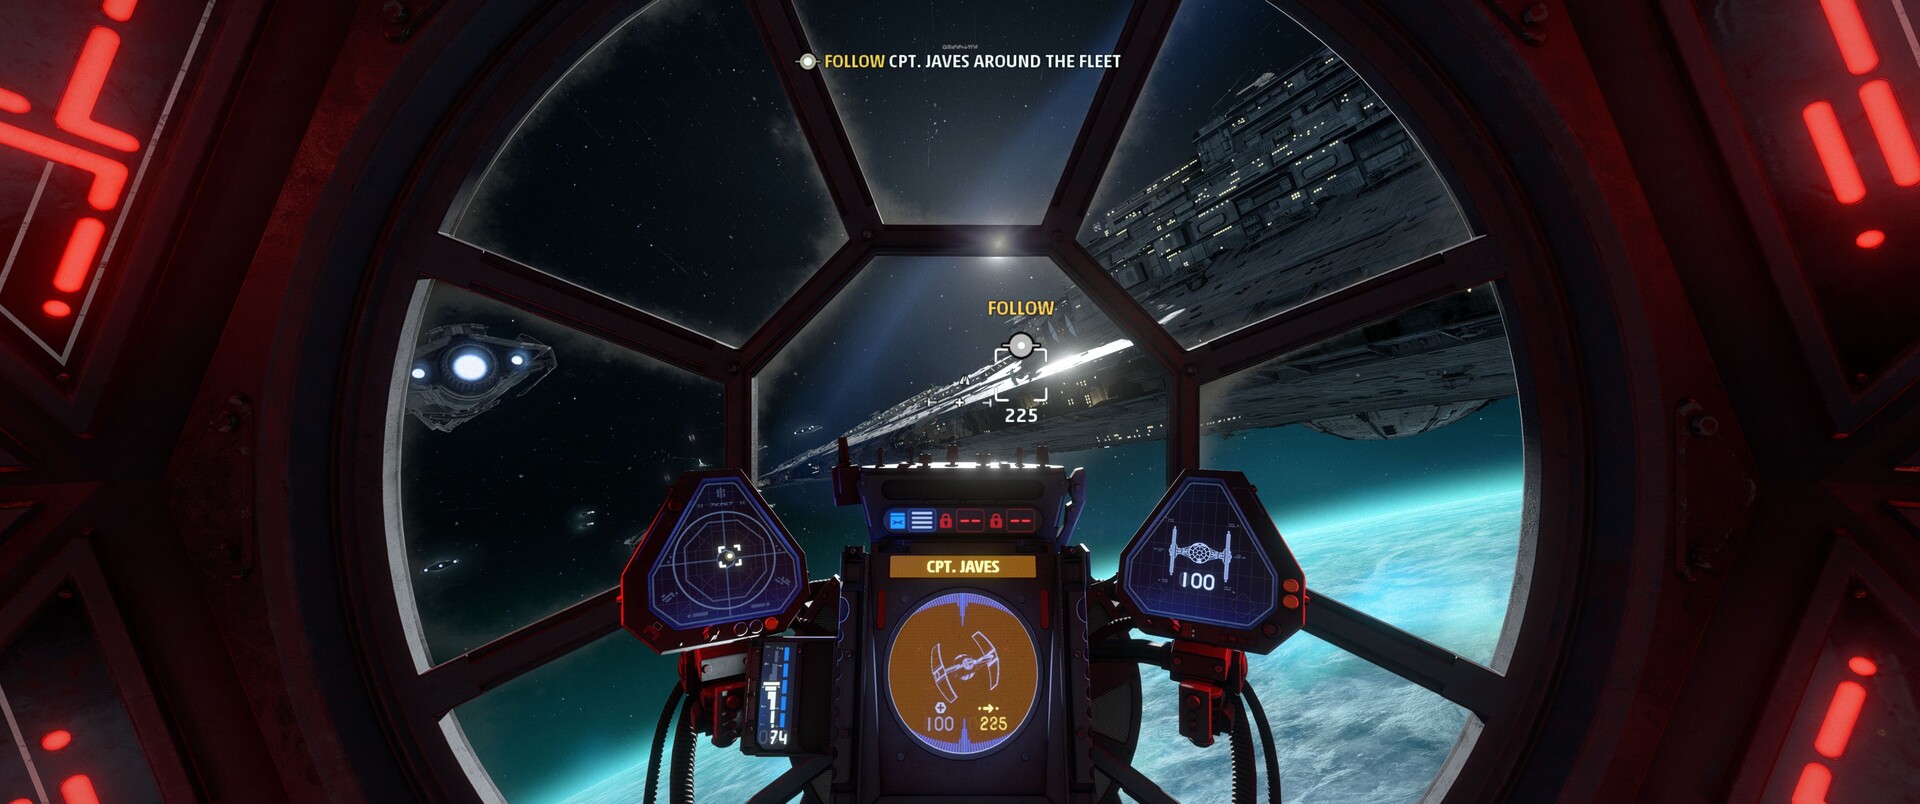
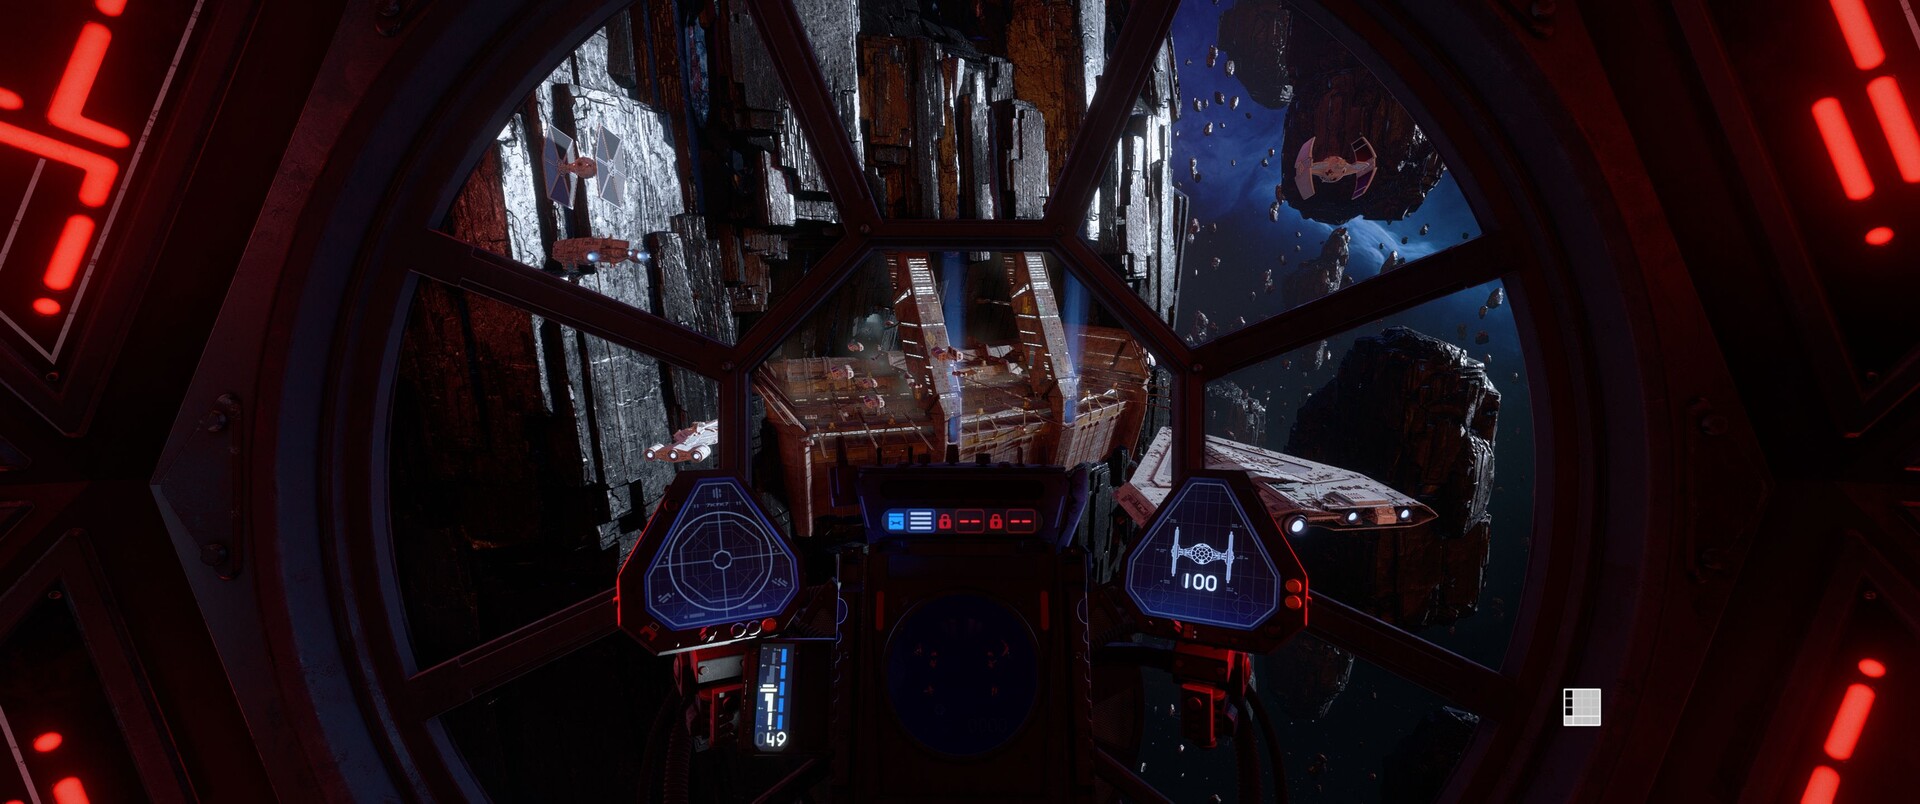
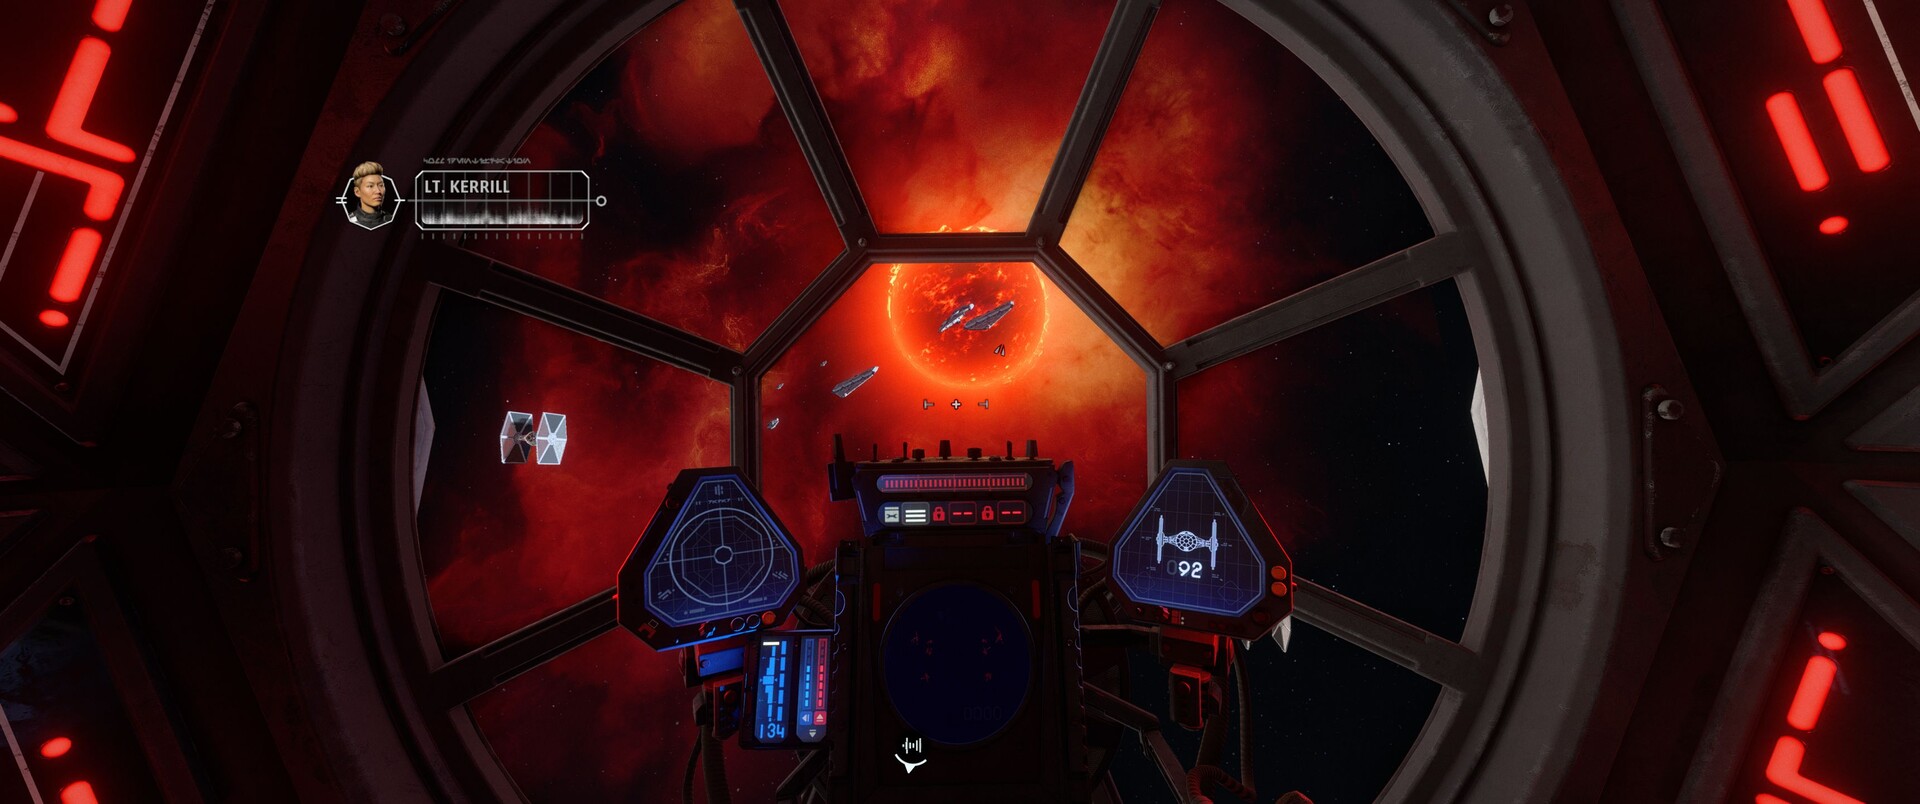
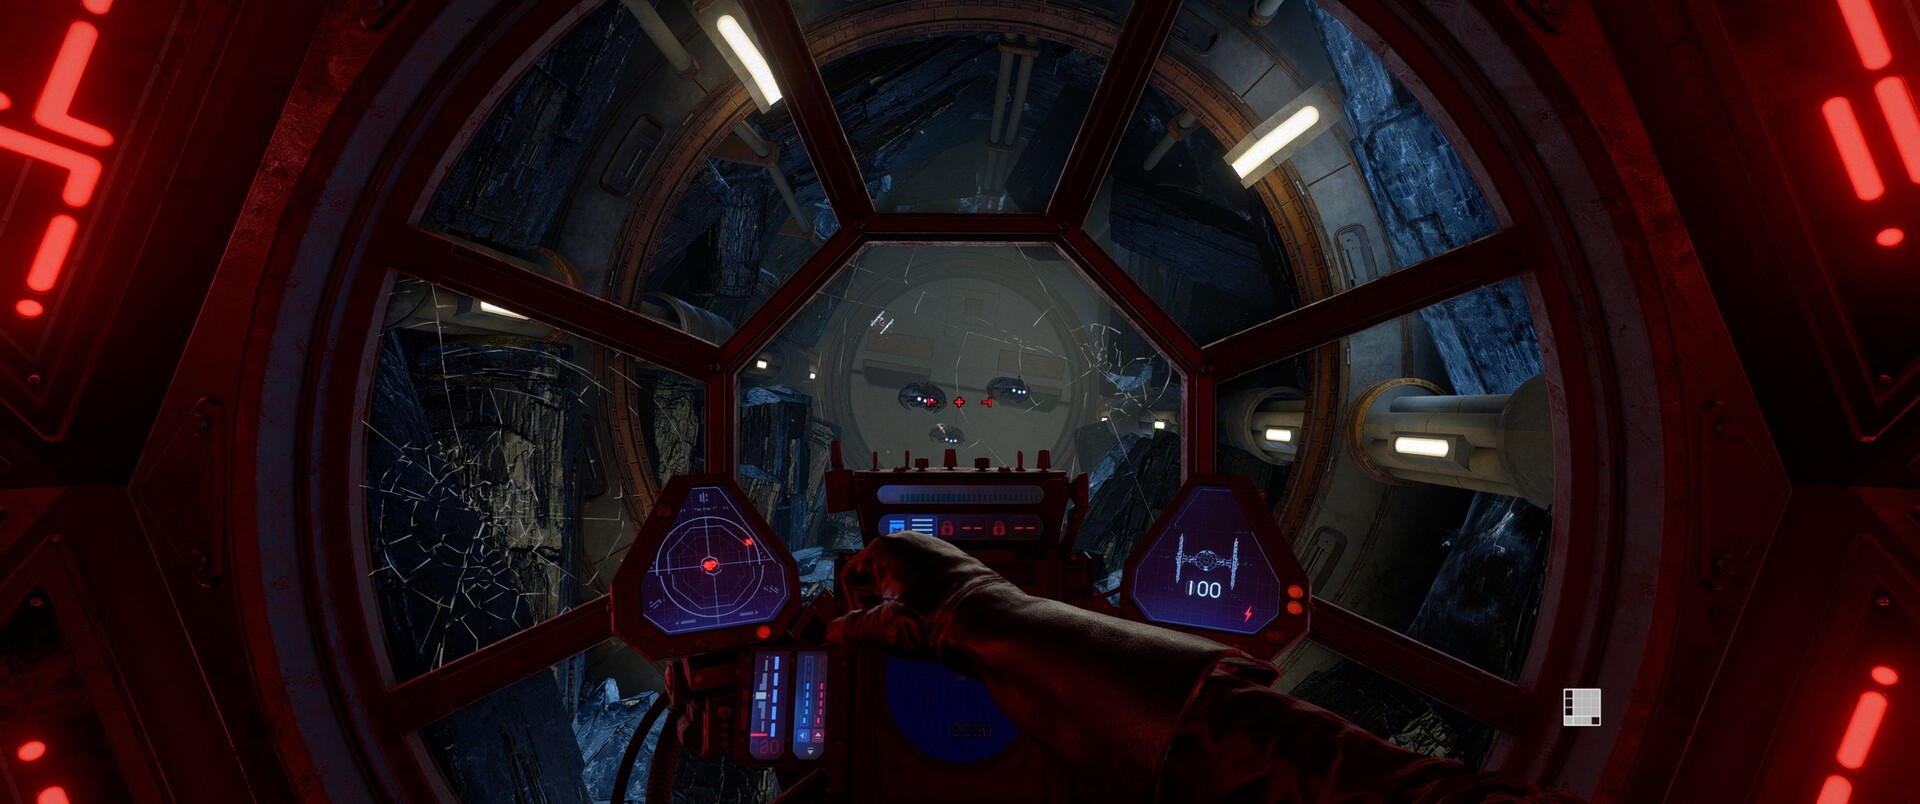
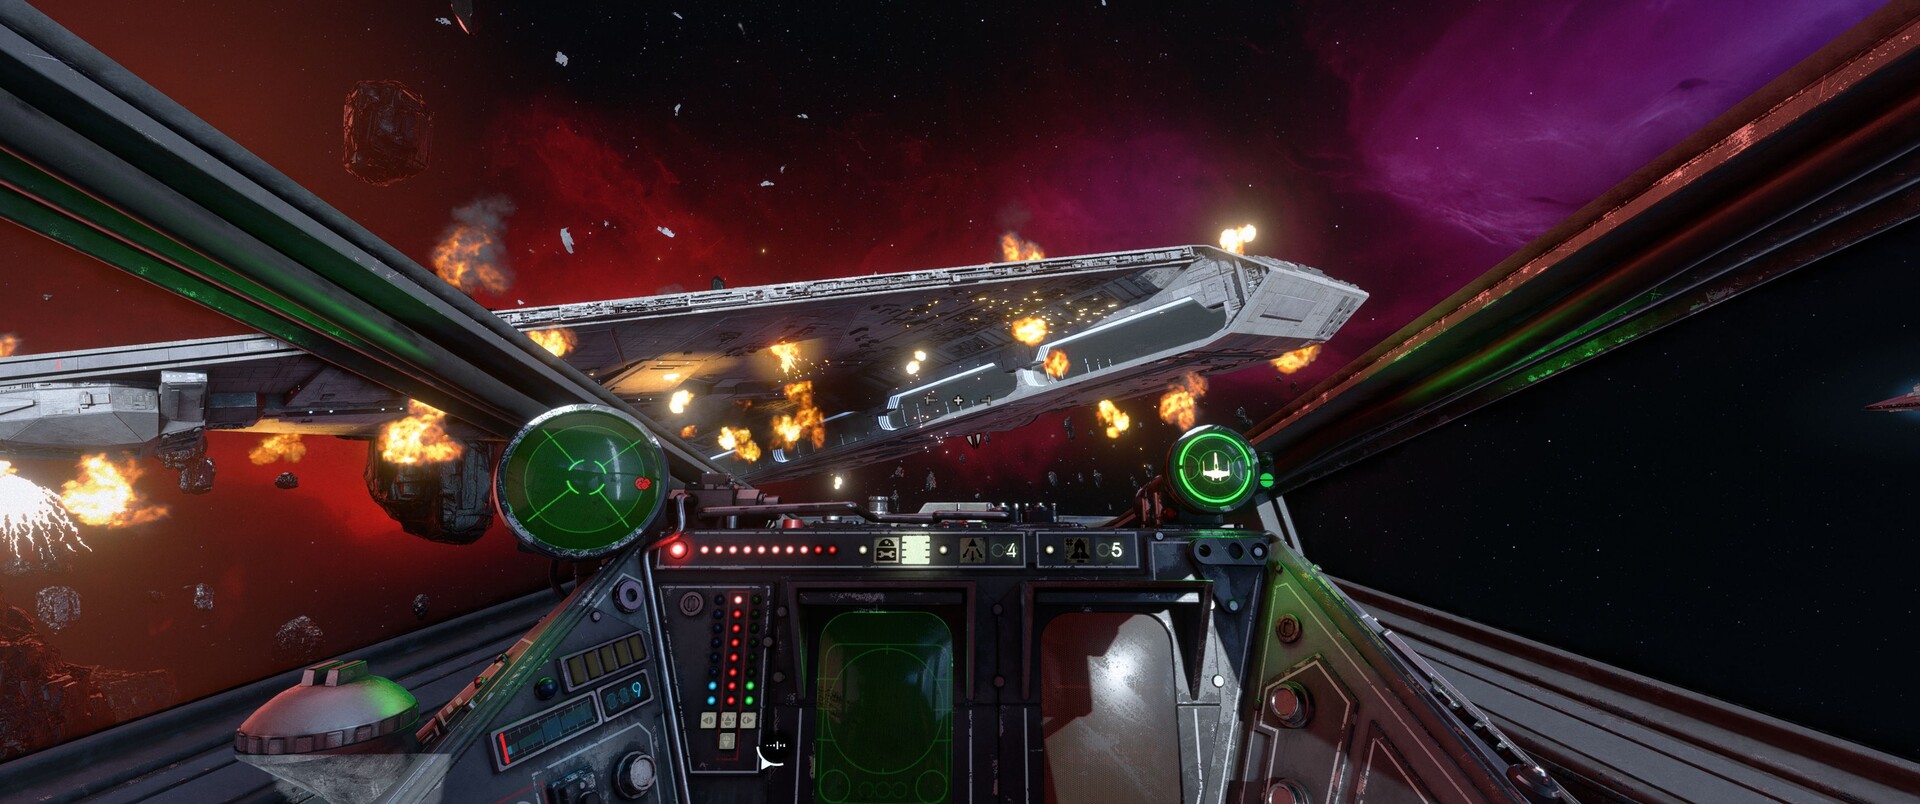
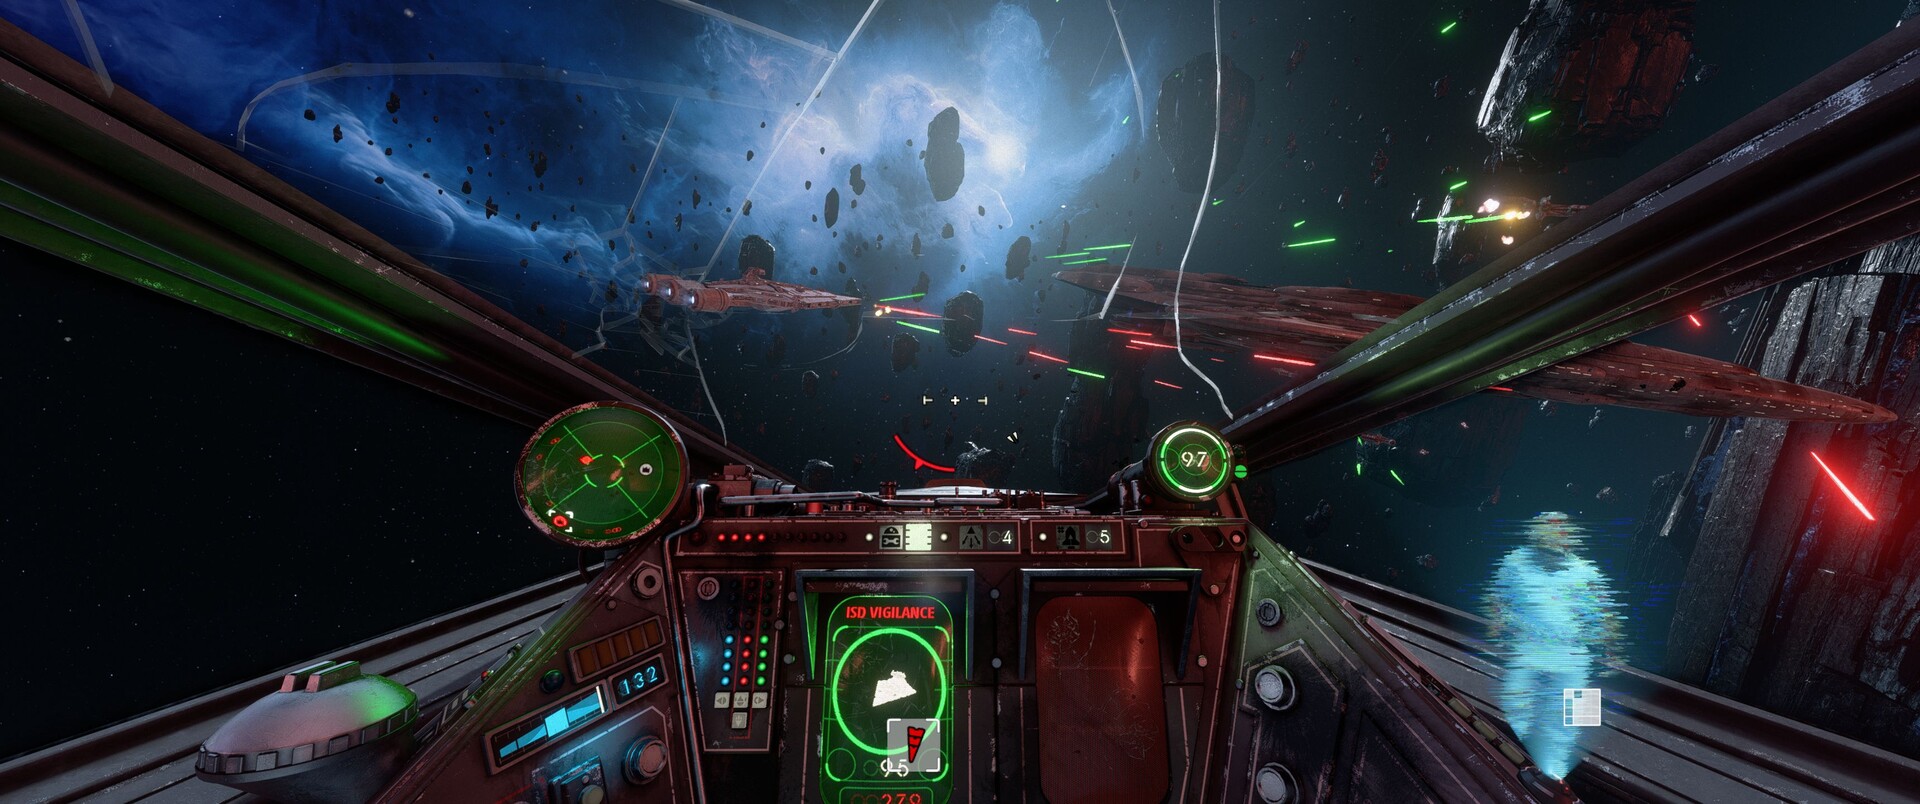
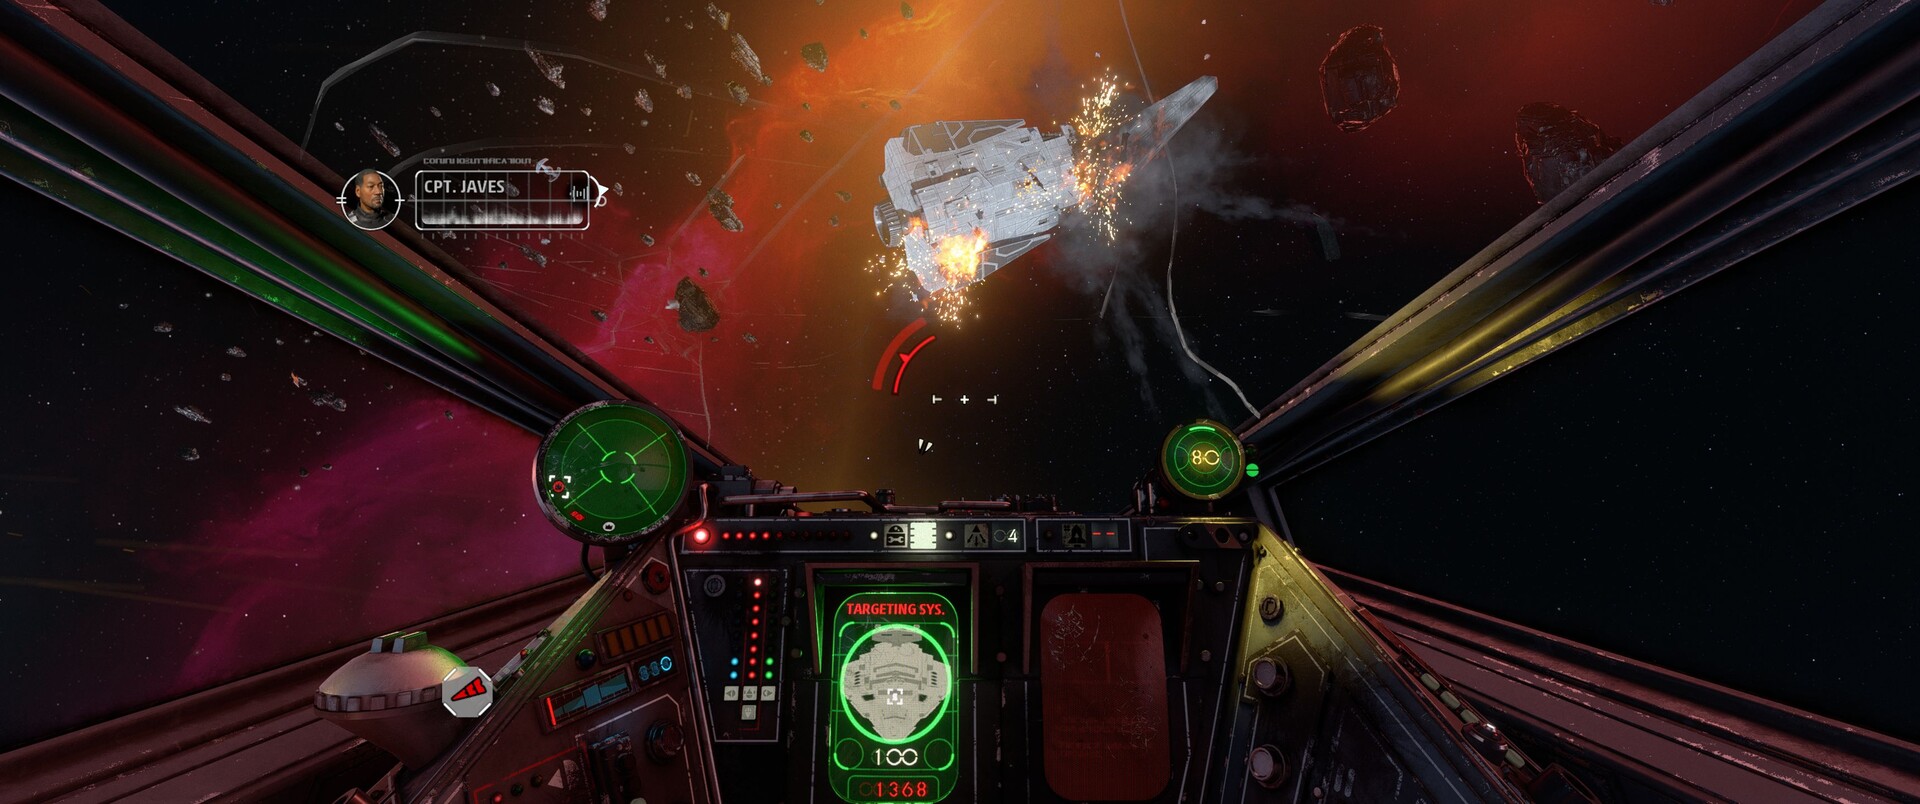
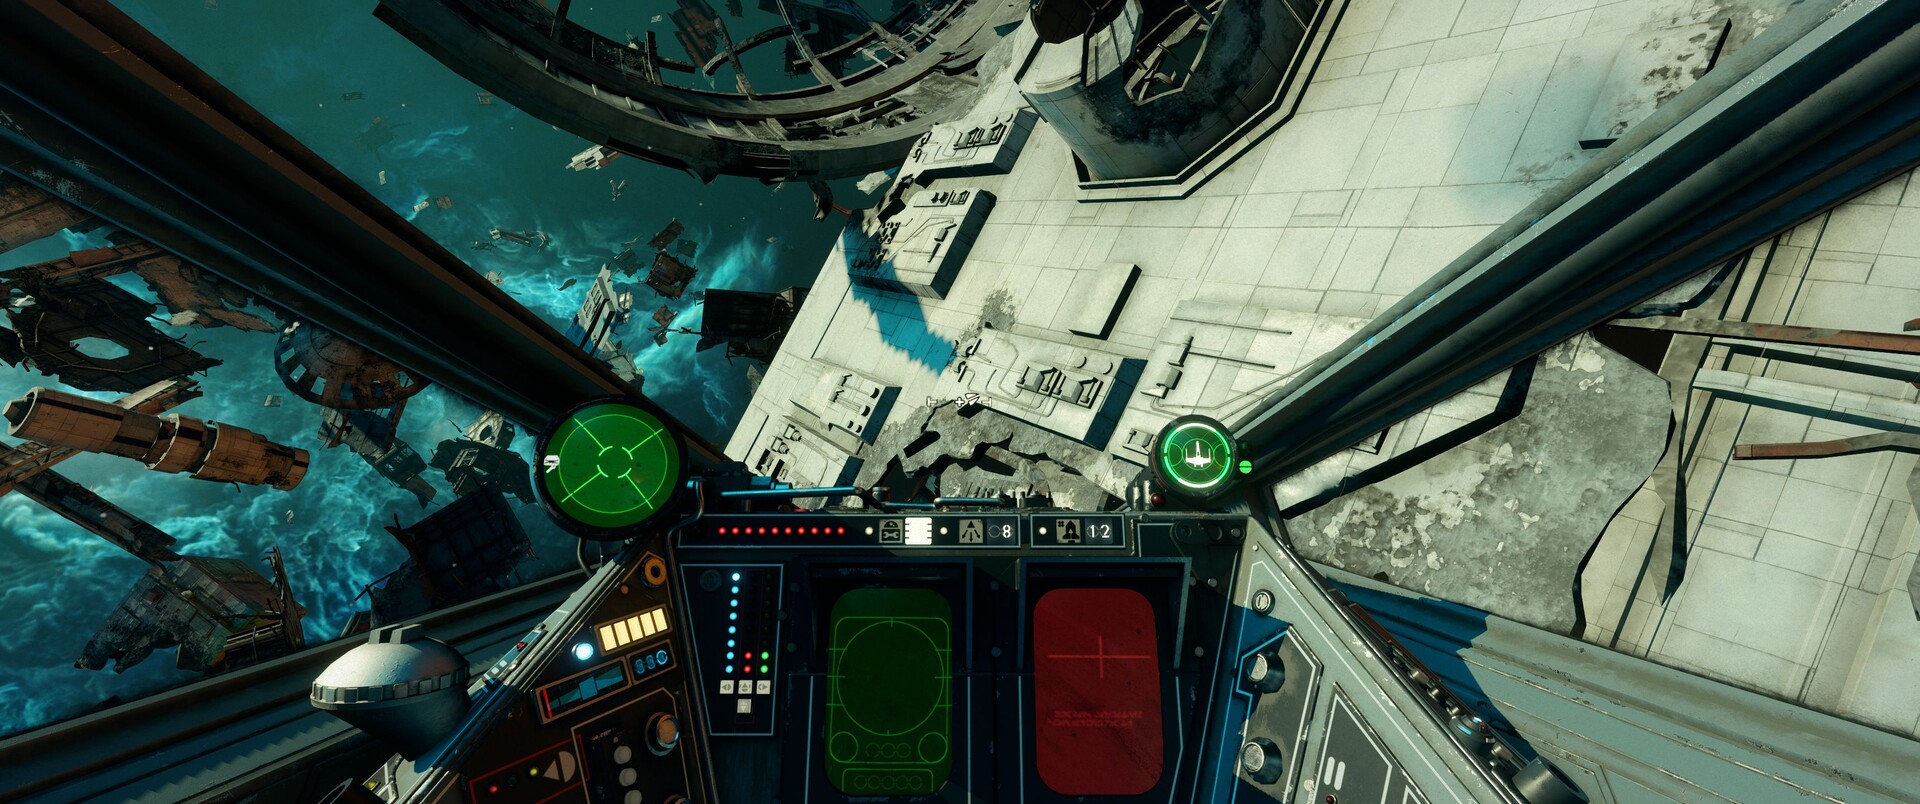
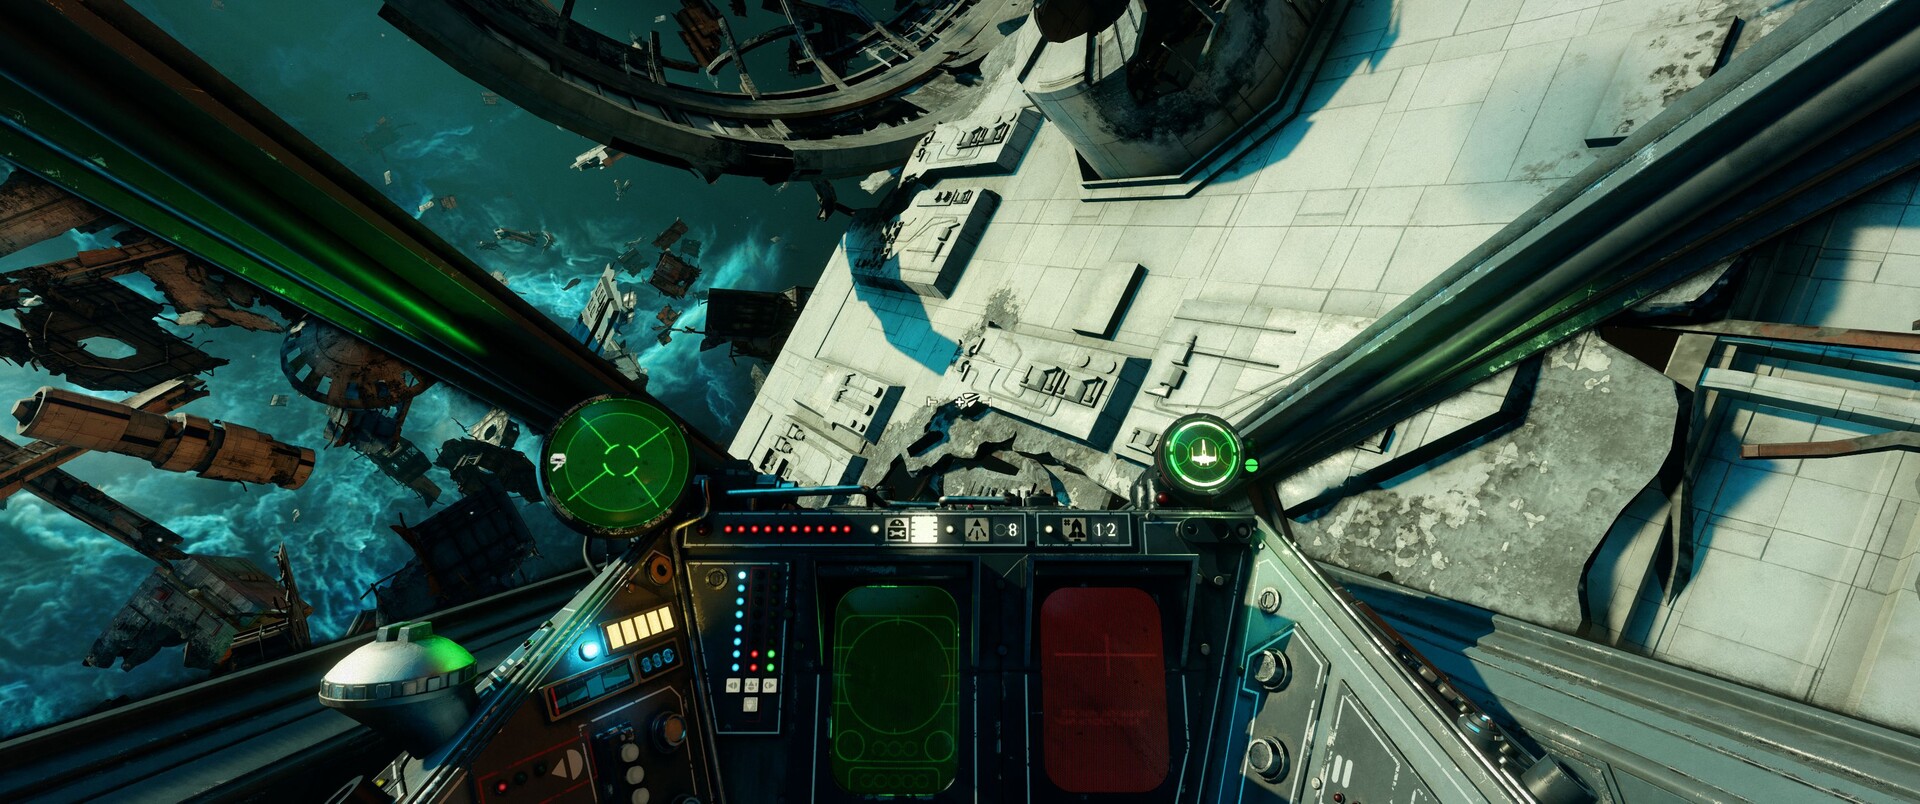
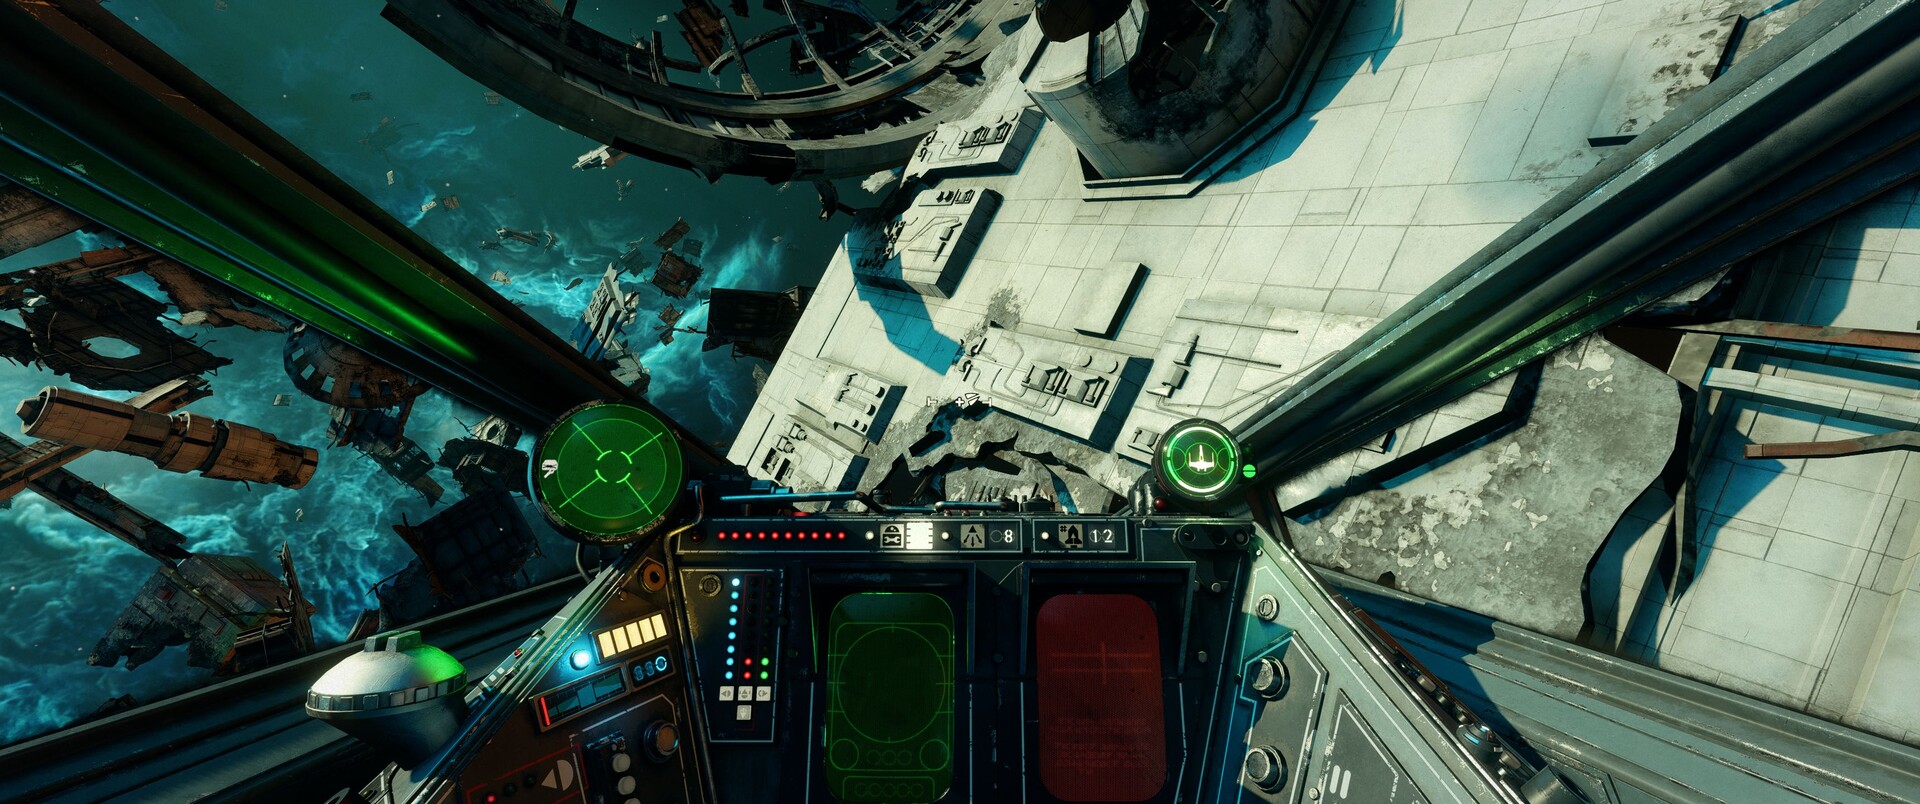
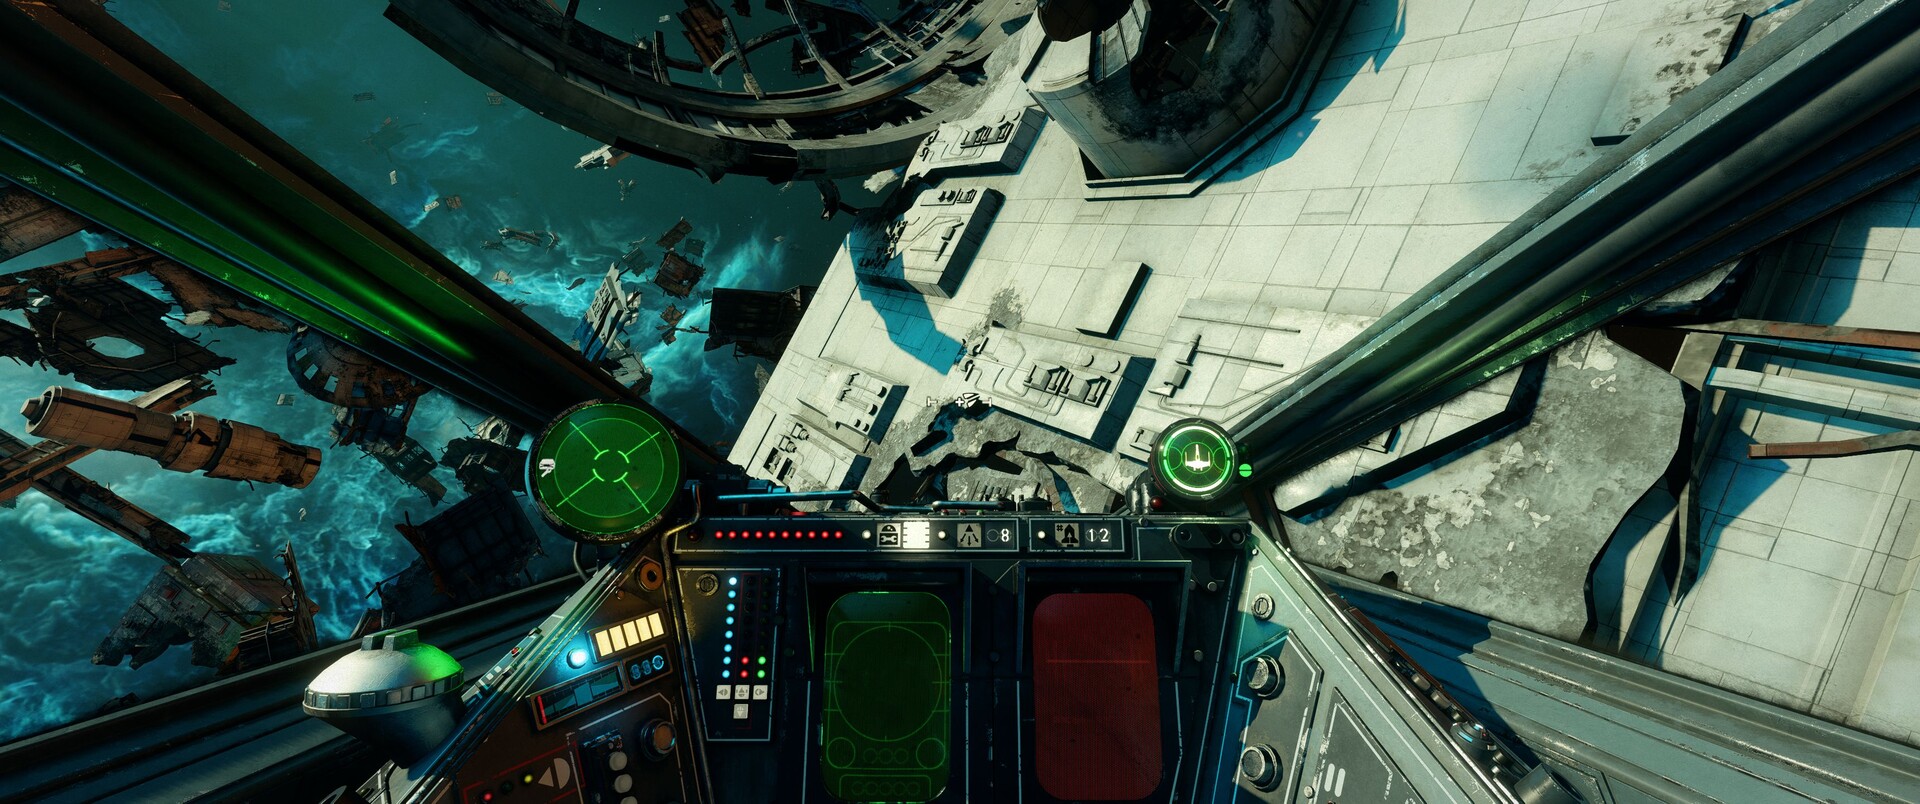
Squadrons scores with a chic look. In addition to the effects (laser beams, explosions etc.), the lighting and the sharpness of the textures can convince. Star Wars fans also look forward to the detailed spaceships and lovingly crafted interiors on the space station. Thanks to the original music and coherent atmosphere, there is generally a lot of Star Wars flair. Even Newbies find their way into the space genre, thanks to the quick start and the easy access (keyword controls).

Star Wars Squadrons
Star Wars Squadrons
Star Wars Squadrons
Star Wars Squadrons
Star Wars Squadrons
Star Wars Squadrons

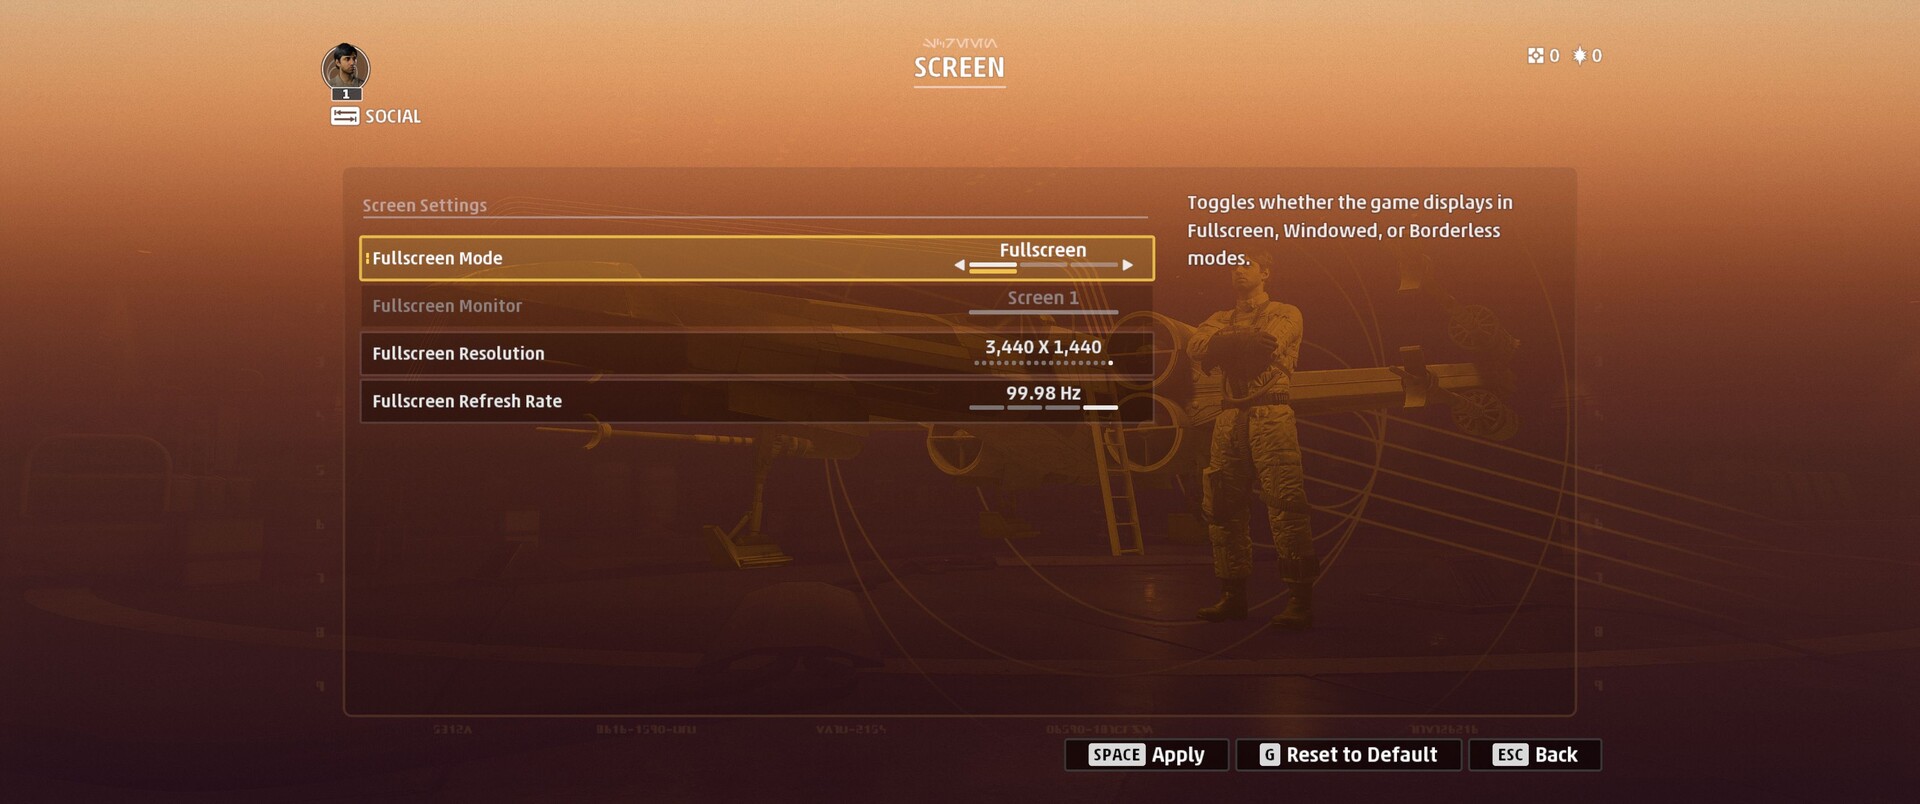
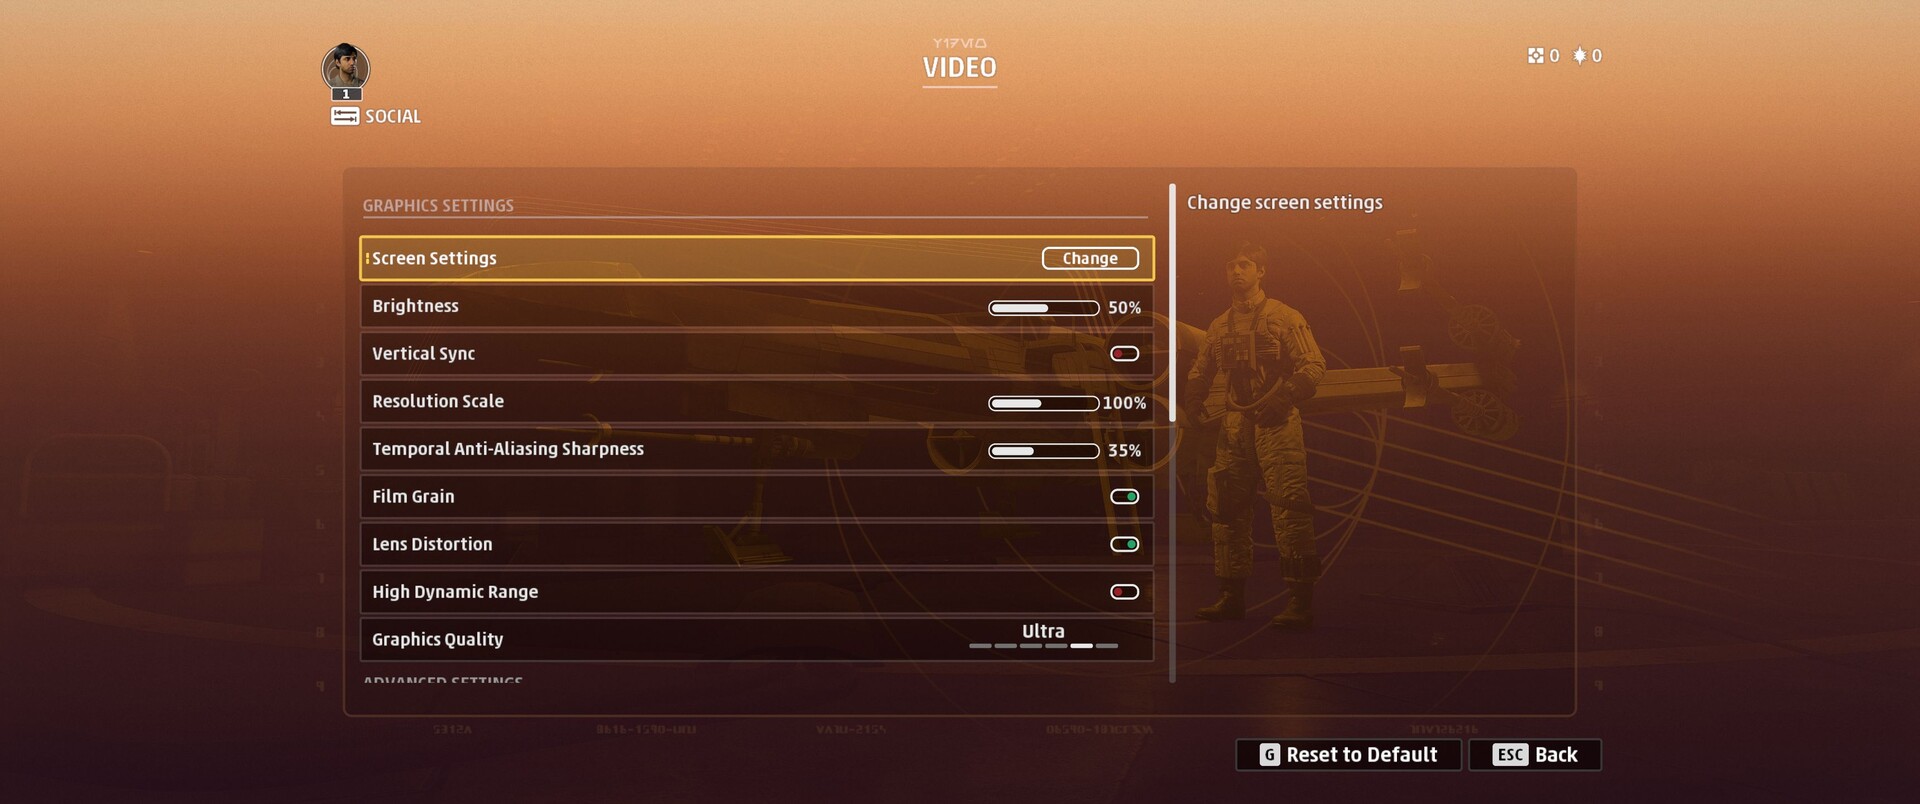
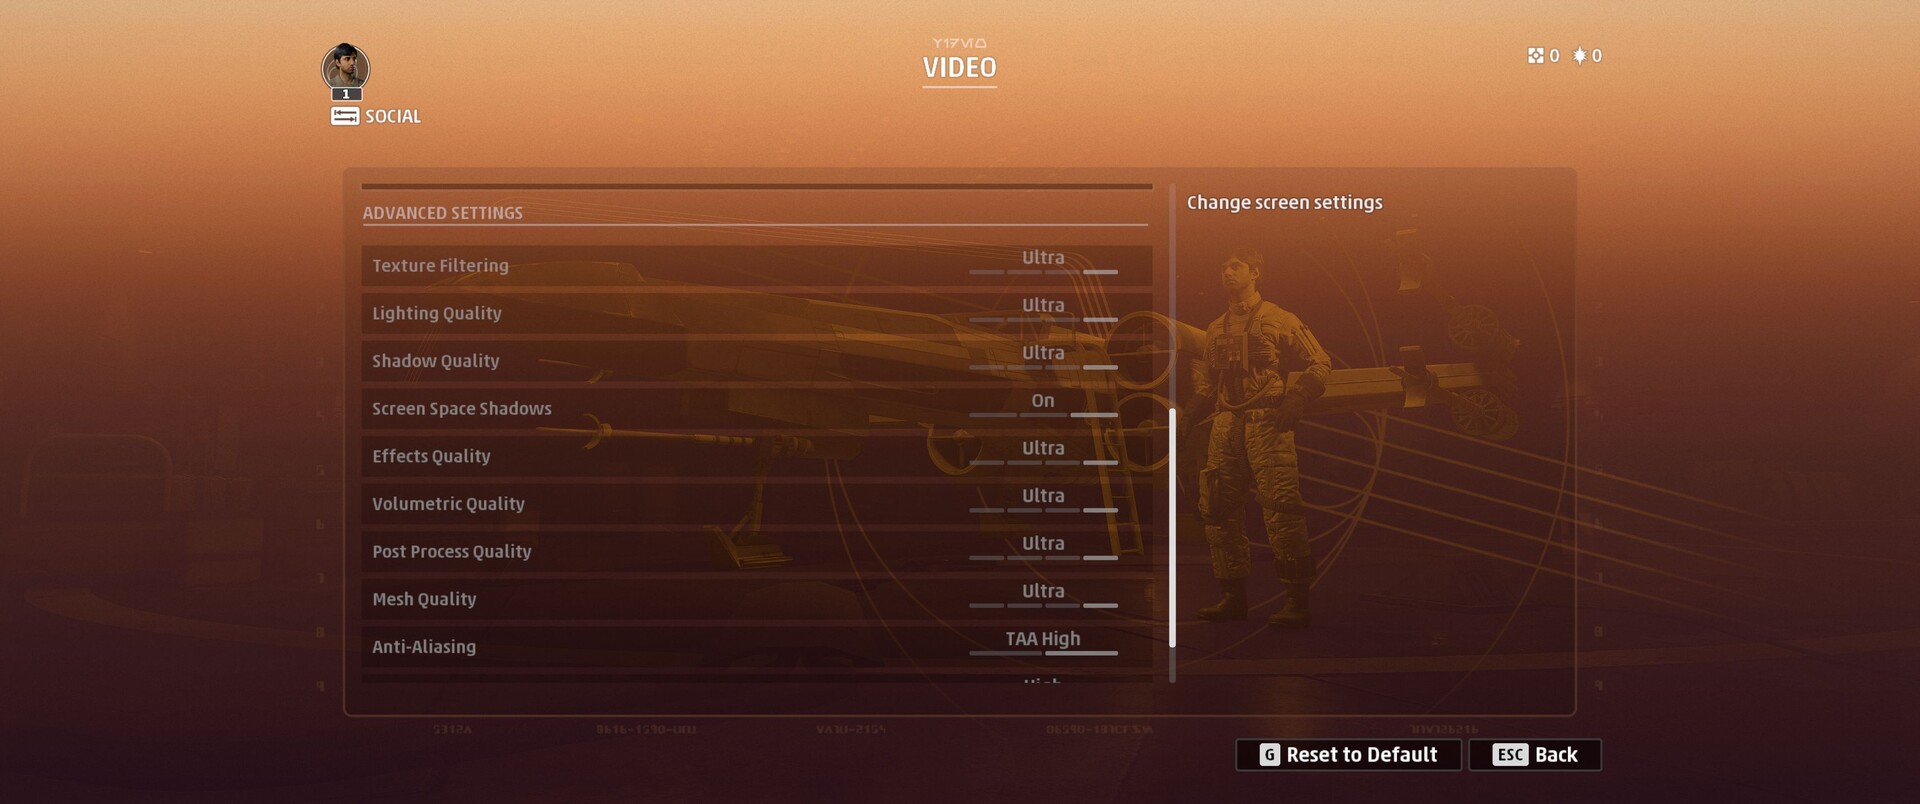
Concerning the graphics menus, no criticism is appropriate too. The video menu offers close to 10 detailed settings in the lower area, which can be changed globally via Graphics Quality presets. There are also controls for the brightness, resolution scaling, sharpness of antialiasing as well as on and off switches for the vertical sync, film graining, and HDR. The resolution, picture mode, and framerate can of course also be adjusted. Very nice: Chenges to the settings can be applied without restarting the game.

Star Wars Squadrons
Star Wars Squadrons
Star Wars Squadrons
Star Wars Squadrons
Star Wars Squadrons
Star Wars Squadrons

Typical for the Frostbite engine, many settings have little effect on the look or the performance. Therefore, Squadrons still sports nice visuals even in low details, except for the weak shadows. Because the engine is being used for many years, the game usually leaves a well-optimized and clean impression as we will see in the benchmarks.

Star Wars Squadrons
Star Wars Squadrons
Star Wars Squadrons

There were hardly any technical problems during our tests, although - independent of the installed hardware and the chosen settings - occasional stutters were observed (especially shortly after loading new levels or savegames). Sometimes, the game wouldn't start correctly (the anti-cheat software then reported an error code). Loading times vary depending on the storage device used. They are acceptible with an SSD but quite long with an HDD.

Low Preset
Low Preset
Medium Preset
Medium Preset
High Preset
High Preset
Ultra Preset
Ultra Preset

Benchmarks

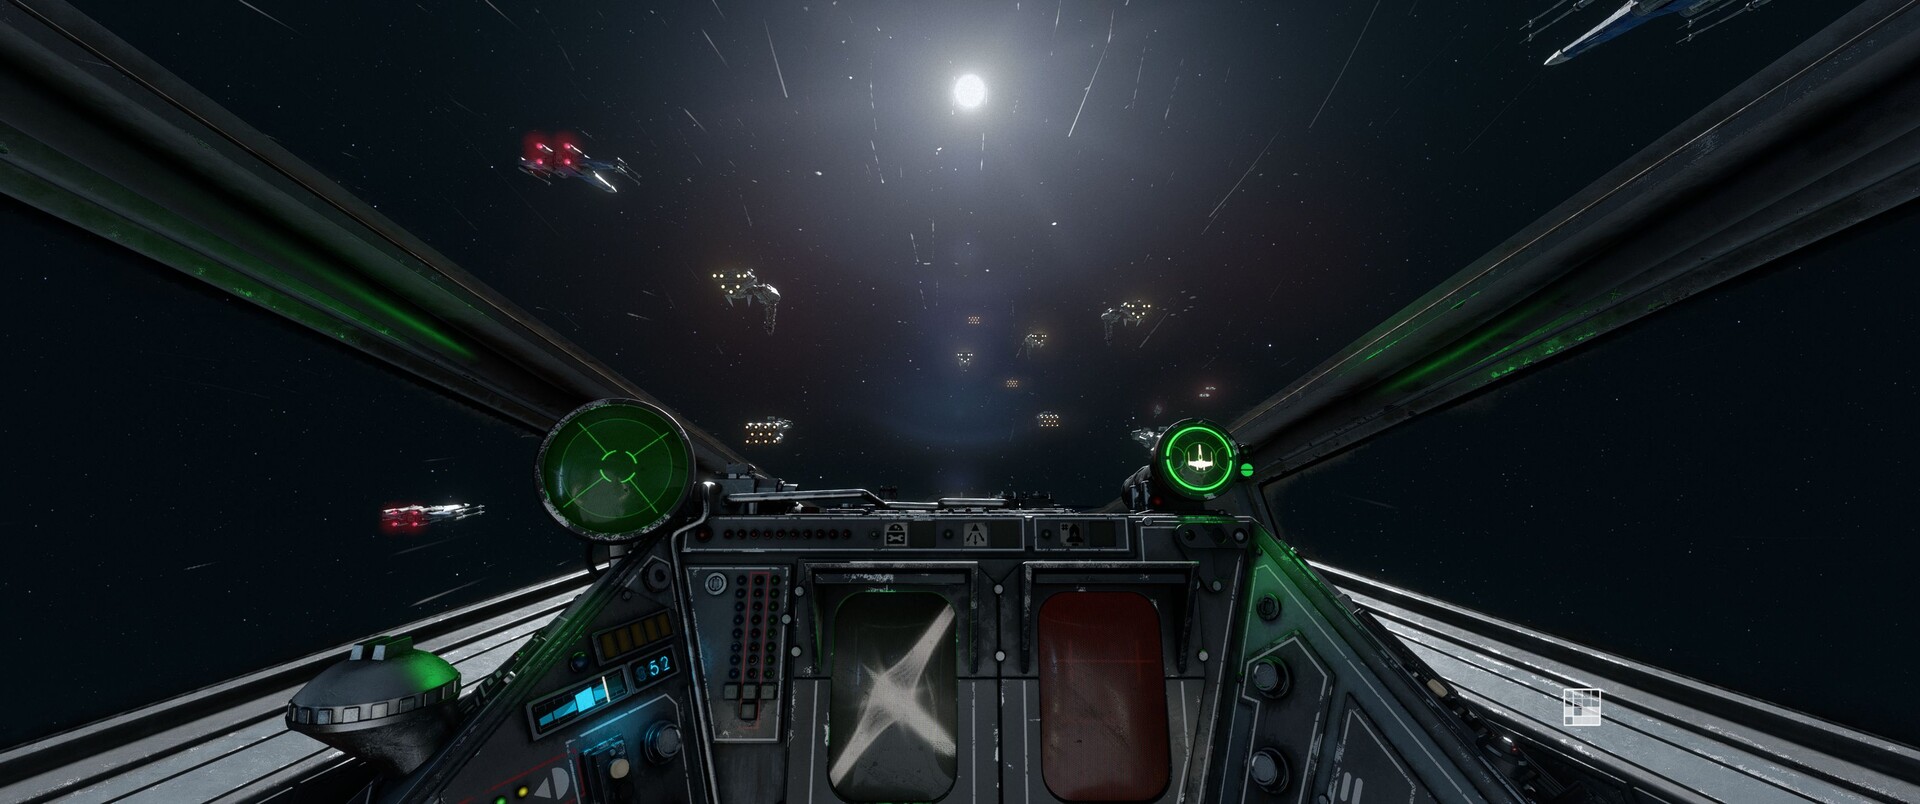
We use the Practice mode for our speed tests, it is hidden in the Multiplayer and Training menu. We start a flight on the Galactic Empires side and use the tool CapFrameX to capture the performance for 30s (see video). The demands of the sequence are on a medium level, which means that there are more demanding but also less demanding scenes within the game.

Since Squadrons is a fast pace first-person action game which requires quick response times, it should reach at least 40 FPS or better 60 FPS.

Results

FHD (1.920 x 1.080)

While most other action games scream for a real gaming-GPU, Squadrons proofs to be very modest in relation to the offered graphics quality. 1.920 x 1.080 pixels and medium settings can be played on a low-end chip such as the GeForce MX330 or MX350.

Während die meisten Action-Games nach einer waschechten Gaming-GPU schreien, erweist sich Squadrons in Relation zur gebotenen Grafikqualität als sehr genügsam. 1.920 x 1.080 Pixel und mittlere Settings werden bereits von einem Low-End-Chip auf dem Level der GeForce MX330 bzw. MX350 ordentlich befeuert. Letzteres Modell reicht laut unseren Benchmarks auch für hohe Details. Wer Squadrons in Full-HD mit allen Reglern auf Anschlag genießen möchte, dürfte derweil ab einer GeForce GTX 1050 (Ti) glücklich werden, welche in der unteren Mittelklasse angesiedelt ist.

Star Wars Squadrons
    1920x1080 Medium Preset     1920x1080 High Preset     1920x1080 Ultra Preset
NVIDIA GeForce RTX 2080 Ti (Desktop)
MSI GeForce RTX 2080 Ti, i9-9900K
354 (112min, 238P1) fps ∼40%
331 (80.5min, 224P1) fps ∼40%
326 (113min, 227P1) fps ∼42%
NVIDIA GeForce RTX 2080 (Desktop)
MSI GeForce RTX 2080, i9-9900K
350 (181min, 251P1) fps ∼39%
308 (169min, 239P1) fps ∼37%
284 (152min, 223P1) fps ∼36%
NVIDIA GeForce RTX 2070 (Desktop)
MSI GeForce RTX 2070, i9-9900K
304 (173min, 233P1) fps ∼34%
261 (131min, 207P1) fps ∼32%
242 (146min, 192P1) fps ∼31%
NVIDIA GeForce RTX 2080 Mobile
MSI GT76 Titan DT 9SG, i9-9900K
288 (19.6min, 232P1) fps ∼32%
249 (135min, 202P1) fps ∼30%
232 (148min, 187P1) fps ∼30%
NVIDIA GeForce RTX 2060 (Desktop)
MSI GeForce RTX 2060, i9-9900K
269 (140min, 211P1) fps ∼30%
227 (152min, 179P1) fps ∼28%
214 (145min, 170P1) fps ∼27%
NVIDIA GeForce RTX 2060 Mobile
MSI GE65 Raider 9SE, i7-9750H
235 (15.8min, 181P1) fps ∼26%
198 (69.1min, 155P1) fps ∼24%
181 (104min, 142P1) fps ∼23%
NVIDIA GeForce RTX 2070 Mobile
MSI GP65 Leopard 9SF, i7-9750H
234 (104min, 179P1) fps ∼26%
228 (46.6min, 147P1) fps ∼28%
214 (142min, 163P1) fps ∼27%
NVIDIA GeForce GTX 1660 Ti Mobile
MSI GP65 Leopard 9SD, i7-9750H
219 (68.1min, 164P1) fps ∼25%
185 (81.1min, 147P1) fps ∼22%
168 (106min, 134P1) fps ∼21%
NVIDIA GeForce GTX 1080 Mobile
Alienware 17 R4, i7-7820HK
212 (64.3min, 141P1) fps ∼24%
209 (94.1min, 159P1) fps ∼25%
193 (79.8min, 129P1) fps ∼25%
NVIDIA GeForce GTX 1070 Mobile
Asus G752VS, 6820HK
184 (88.4min, 122P1) fps ∼21%
166 (79.6min, 124P1) fps ∼20%
166 (78.9min, 112P1) fps ∼21%
AMD Radeon RX 5500M
MSI Alpha 15, R7 3750H
172 (28.9min, 80P1) fps ∼19%
163 (72.8min, 123P1) fps ∼20%
147 (82.3min, 112P1) fps ∼19%
NVIDIA GeForce GTX 1060 Mobile
MSI GT62VR, 6820HK
152 (33.4min, 81.6P1) fps ∼17%
125 (89.7min, 101P1) fps ∼15%
112 (68.4min, 89.2P1) fps ∼14%
NVIDIA GeForce GTX 1050 Ti Mobile
MSI GE72 7RE, i7-7700HQ
102 (58.6min, 80.6P1) fps ∼11%
85.3 (49.7min, 68.4P1) fps ∼10%
60.8 (31.5min, 50P1) fps ∼8%
NVIDIA GeForce GTX 1050 Mobile
MSI GL62M 7RD, i7-7700HQ
81 (42.5min, 64.8P1) fps ∼9%
68.5 (37min, 55.3P1) fps ∼8%
50.5 (27.8min, 41.8P1) fps ∼6%
NVIDIA GeForce MX350
MSI Prestige 14, i7-10710U
60.4 (51min) fps ∼7%
49.5 (41min) fps ∼6%
45.9 (37min) fps ∼6%
NVIDIA GeForce MX330
MSI Prestige 14, i7-10510U
48.6 (31.5min, 37.9P1) fps ∼5%
40.9 (30.9min, 33P1) fps ∼5%
21.8 (18.3min, 19P1) fps ∼3%
NVIDIA GeForce MX150
Honor Magicbook, i5-8250U
47.4 (22.9min, 36.1P1) fps ∼5%
37.7 (19.5min, 30.7P1) fps ∼5%
21.7 (16.7min, 18.8P1) fps ∼3%
AMD Radeon RX Vega 6 (Ryzen 4000/5000)
Xiaomi RedmiBook 16 R5, R5 4500U
28.6 (3.48min, 21.8P1) fps ∼3%
23.6 (13.8min, 17.6P1) fps ∼3%
20.6 (12.5min, 15.9P1) fps ∼3%

QHD (2.560 x 1.440)

Eine Mischung aus 2.560 x 1.440 Pixeln und dem Preset Ultra wird ab dem oberen Midrange-Bereich flüssig auf den Bildschirm gezaubert (GeForce GTX 1650 aufwärts).

Star Wars Squadrons
    2560x1440 Ultra Preset
NVIDIA GeForce RTX 2080 Ti (Desktop), i9-9900K
MSI GeForce RTX 2080 Ti
246 (112min, 202P1) fps ∼42%
NVIDIA GeForce RTX 2080 (Desktop), i9-9900K
MSI GeForce RTX 2080
197 (114min, 158P1) fps ∼34%
NVIDIA GeForce RTX 2080 Mobile, i9-9900K
MSI GT76 Titan DT 9SG
164 (24min, 139P1) fps ∼28%
NVIDIA GeForce RTX 2070 (Desktop), i9-9900K
MSI GeForce RTX 2070
164 (103min, 137P1) fps ∼28%
NVIDIA GeForce RTX 2070 Mobile, i7-9750H
MSI GP65 Leopard 9SF
140 (99.2min, 116P1) fps ∼24%
NVIDIA GeForce GTX 1080 Mobile, i7-7820HK
Alienware 17 R4
137 (65.3min, 104P1) fps ∼23%
NVIDIA GeForce RTX 2060 (Desktop), i9-9900K
MSI GeForce RTX 2060
137 (88.9min, 104P1) fps ∼23%
NVIDIA GeForce RTX 2060 Mobile, i7-9750H
MSI GE65 Raider 9SE
117 (73.6min, 92.9P1) fps ∼20%
NVIDIA GeForce GTX 1660 Ti Mobile, i7-9750H
MSI GP65 Leopard 9SD
107 (73.1min, 83.5P1) fps ∼18%
NVIDIA GeForce GTX 1070 Mobile, 6820HK
Asus G752VS
105 (65.8min, 81.7P1) fps ∼18%
AMD Radeon RX 5500M, R7 3750H
MSI Alpha 15
93.8 (62.6min, 75.1P1) fps ∼16%
NVIDIA GeForce GTX 1060 Mobile, 6820HK
MSI GT62VR
71.3 (54.3min, 58.5P1) fps ∼12%
NVIDIA GeForce GTX 1050 Ti Mobile, i7-7700HQ
MSI GE72 7RE
40 (26.6min, 32.1P1) fps ∼7%
NVIDIA GeForce GTX 1050 Mobile, i7-7700HQ
MSI GL62M 7RD
33.8 (21.1min, 27.8P1) fps ∼6%

UHD (3.840 x 2.160)

Selbst beim Einsatz von 3.840 x 2.160 Pixeln muss es nicht unbedingt ein High-End-Vertreter sein. Schon eine GeForce GTX 1660 Ti knackt im Ultra-Preset fast die 60-FPS-Marke.

Star Wars Squadrons
    3840x2160 Ultra Preset
NVIDIA GeForce RTX 2080 Ti (Desktop), i9-9900K
MSI GeForce RTX 2080 Ti
144 (101min, 114P1) fps ∼33%
NVIDIA GeForce RTX 2080 (Desktop), i9-9900K
MSI GeForce RTX 2080
115 (62.5min, 89.6P1) fps ∼27%
NVIDIA GeForce RTX 2080 Mobile, i9-9900K
MSI GT76 Titan DT 9SG
101 (75.6min, 84.5P1) fps ∼23%
NVIDIA GeForce RTX 2070 (Desktop), i9-9900K
MSI GeForce RTX 2070
93.8 (43.2min, 76.6P1) fps ∼22%
NVIDIA GeForce RTX 2060 (Desktop), i9-9900K
MSI GeForce RTX 2060
78.2 (55min, 65.8P1) fps ∼18%
NVIDIA GeForce RTX 2070 Mobile, i7-9750H
MSI GP65 Leopard 9SF
78 (61.6min, 67.1P1) fps ∼18%
NVIDIA GeForce GTX 1080 Mobile, i7-7820HK
Alienware 17 R4
76.2 (59.6min, 63.2P1) fps ∼18%
NVIDIA GeForce RTX 2060 Mobile, i7-9750H
MSI GE65 Raider 9SE
63.7 (45.7min, 55.3P1) fps ∼15%
NVIDIA GeForce GTX 1660 Ti Mobile, i7-9750H
MSI GP65 Leopard 9SD
59.1 (48.1min, 51.4P1) fps ∼14%
NVIDIA GeForce GTX 1070 Mobile, 6820HK
Asus G752VS
58.9 (45.8min, 50.5P1) fps ∼14%
NVIDIA GeForce GTX 1060 Mobile, 6820HK
MSI GT62VR
39.5 (32.2min, 34.4P1) fps ∼9%
AMD Radeon RX 5500M, R7 3750H
MSI Alpha 15
31.5 (21.1min, 28.4P1) fps ∼7%
NVIDIA GeForce GTX 1050 Ti Mobile, i7-7700HQ
MSI GE72 7RE
17.9 (7.47min, 14.6P1) fps ∼4%
NVIDIA GeForce GTX 1050 Mobile, i7-7700HQ
MSI GL62M 7RD
14.5 (9.11min, 12P1) fps ∼3%

Hinweis

Da Gaming-Tests sehr zeitaufwändig sind und oft durch Installations- bzw. Aktivierungslimits behindert werden, können wir Ihnen zur Veröffentlichung der Artikel nur einen Teil der Benchmarks liefern. Weitere Grafikkarten werden jeweils in den kommenden Tagen und Wochen eingebaut.

Übersicht

Show Restrictions
PosModel< PrevNext >Star Wars Squadrons
 Star Wars Squadrons (2020)
low
1280x720
Low Preset
med.
1920x1080
Medium Preset
high
1920x1080
High Preset
ultra
1920x1080
Ultra Preset
QHD
2560x1440
Ultra Preset
4K
3840x2160
Ultra Preset
NVIDIA GeForce RTX 3090
451n2
415.65n2
400.4n2
386.6n2
301.1n2
192.65n2
NVIDIA GeForce RTX 3080
473n2
412.5n2
370.5n2
360n2
270n2
172n2
AMD Radeon RX 6800 XT
692
617
544
509
352
185
NVIDIA Titan RTX
440
367
334
315
232
144
NVIDIA GeForce RTX 3080 Ti Laptop GPU
407
378
354
261
144
NVIDIA GeForce RTX 3070
409.5n2
330n2
312.5n2
290n2
217.5n2
132n2
NVIDIA GeForce RTX 2080 Ti (Desktop)
360
354
331
326
246
144
AMD Radeon RX 6700 XT
622
448
404
372
247
126
NVIDIA GeForce RTX 3080 Laptop GPU
228n3
220n3
162n3
97.1n3
NVIDIA GeForce RTX 3070 Ti Laptop GPU
292
269
237
167
92.9
NVIDIA GeForce RTX 2080 Super (Desktop)
448
351
307
286
201
119
AMD Radeon RX 6600 XT
577
384
329
301
191
95
NVIDIA GeForce RTX 2080 (Desktop)
413
350
308
284
197
115
NVIDIA GeForce RTX 2080 Super Mobile
263
243
175
105
NVIDIA GeForce RTX 3070 Laptop GPU
229n2
214n2
156n2
89.75n2
AMD Radeon RX 6800S
328
291
276
174
89.6
NVIDIA GeForce RTX 3060
473
274
243
230
160
90.2
NVIDIA GeForce RTX 2080 Mobile
395
288
249
232
164
101
AMD Radeon RX 6700M
233
232
219
PosModel< PrevNext >Star Wars Squadrons
low med. high ultra QHD 4K
NVIDIA Titan X Pascal
429
316
264
245
166
94.4
NVIDIA GeForce RTX 2070 Super (Desktop)
442
321
278
262
178
103
AMD Radeon VII
421.4
364.3
339
326.6
220.4
115
AMD Radeon RX 5700 XT (Desktop)
470.6
370.6
315.6
296.8
188.7
99.6
NVIDIA GeForce RTX 2070 (Desktop)
370
304
261
242
164
93.8
NVIDIA GeForce RTX 3060 Laptop GPU
204.5n2
192.5n2
156
87.1
NVIDIA GeForce RTX 2070 Super Mobile
263.1
224.6
211.5
202.4
NVIDIA GeForce RTX 2060 Super (Desktop)
377.5n2
281.5n2
241n2
228.5n2
149.5n2
84.9n2
AMD Radeon RX 6600
510
306
272
253
163
79.1
AMD Radeon RX 5700 (Desktop)
477.1
339.9
291.3
266.4
171.4
88.8
AMD Radeon RX 6700S
286
245
224
146.7
NVIDIA GeForce RTX 2070 Mobile
265
234
228
214
140
78
NVIDIA GeForce RTX 2060 (Desktop)
373
269
227
214
137
78.2
AMD Radeon RX Vega 64
475.1
314.6
259.7
241.2
161.2
82.5
NVIDIA GeForce GTX 1080 Mobile
234
212
209
193
137
76.2
NVIDIA GeForce RTX 2070 Max-Q
272.2
192.7
182.4
172.4
NVIDIA GeForce RTX 2060 Mobile
262.1n3
202.7n3
176.5n3
156.8n3
117
63.7
AMD Radeon RX 5600 XT (Desktop)
510
319.5
269
251.4
165
87.4
NVIDIA GeForce GTX 1070 Mobile
225
184
166
166
105
58.9
NVIDIA GeForce GTX 1660 Super (Desktop)
400
220
193
176
116
64
PosModel< PrevNext >Star Wars Squadrons
low med. high ultra QHD 4K
AMD Radeon RX 5500 XT (Desktop)
430.4
210.6
195.8
179.2
119.3
60
Intel Arc A730M
167.1
149.4
140.6
97.4
AMD Radeon RX 5600M
187
175
166
125
58.5
NVIDIA GeForce GTX 1660 Ti Mobile
237
219
172n2
162n2
107
59.1
NVIDIA GeForce RTX 3050 Ti Laptop GPU
168n3
151n3
138n3
96.9
57.1
NVIDIA GeForce GTX 1660 (Desktop)
389
203
172
157
103
57.8
NVIDIA GeForce GTX 1650 Super (Desktop)
257.9
139
128.1
118.5
83.7
31.2
NVIDIA GeForce RTX 3050 4GB Laptop GPU
164
145
143
93.8
50.6
AMD Radeon RX 6500M
267
150.5
131.7
119.6
AMD Radeon RX 590 (Desktop)
471.6
224.8
181
162.8
105.8
52.9
NVIDIA GeForce GTX 1060 Mobile
210
152
125
112
71.3
39.5
NVIDIA GeForce GTX 1650 Ti Mobile
324
150
132
122
AMD Radeon RX 5500M
196
172
163
147
93.8
31.5
AMD Radeon Pro 5500M
95.6
69.7
26.4
NVIDIA GeForce RTX 2050 Mobile
202
114
111.2
93.5
NVIDIA GeForce GTX 1650 (Desktop)
312
146
123
114
72.9
39.6
NVIDIA GeForce GTX 1650 Mobile
143.55n2
107.8n2
98.85n2
90.4n2
NVIDIA GeForce GTX 1650 Ti Max-Q
222
124
112.9
103.4
70
30.7
NVIDIA GeForce GTX 1050 Ti Mobile
196
102
85.3
60.8
40
17.9
AMD Radeon 680M
191
91
79.2
69.3
PosModel< PrevNext >Star Wars Squadrons
low med. high ultra QHD 4K
NVIDIA T500 Laptop GPU
54.7
47.2
42.4
NVIDIA GeForce MX450
146
64.5
57.7
54.2
NVIDIA GeForce GTX 1050 Mobile
181
81
68.5
50.5
33.8
14.5
AMD Radeon 660M
170.4
66.6
57.4
AMD Radeon RX 560X (Laptop)
185
82.9
73.2
66.6
Intel Iris Xe Graphics G7 96EUs
105.9
52.3
42.8
37.3n2
18.6
NVIDIA GeForce MX350
122.5n2
60.2n2
51.2n2
35.55n2
NVIDIA GeForce GT 1030 (Desktop)
126.9
51.8
42.7
NVIDIA GeForce MX250
103.3
46
36.6
33.4
NVIDIA GeForce MX330
119
48.6
40.9
21.8
NVIDIA GeForce MX150
103
47.4
37.7
21.7
Intel Iris Xe Graphics G7 80EUs
80.1n2
33.3n2
29.35n2
27.4n2
AMD Radeon 540X
85.8
31.2
27
21.4
AMD Radeon RX Vega 10
54.3
26.7
26.3
23.3
Intel UHD Graphics Xe G4 48EUs
62.5
27.2
24.3
22.6
Intel UHD Graphics Xe 32EUs (Tiger Lake-H)
74.4
28
24
22
AMD Radeon RX Vega 8 (Ryzen 4000/5000)
115.15n2
47.55n2
42.5n2
38.35n2
27.5
AMD Radeon RX Vega 7
102.5
41.7
36.4
33.8
AMD Radeon RX Vega 8 (Ryzen 2000/3000)
61.6
30.7
21.8
19.6
NVIDIA GeForce 930MX
53.1
19.8
15.3
13.4
PosModel< PrevNext >Star Wars Squadrons
low med. high ultra QHD 4K
AMD Radeon RX Vega 6 (Ryzen 4000/5000)
71.35n2
31.35n2
25.75n2
23.7n2
AMD Radeon RX Vega 6 (Ryzen 2000/3000)
36.4
12.4
10.7
Intel UHD Graphics Xe 16EUs (Tiger Lake-H)
44.1
17.1
14.8
13.7
AMD Radeon RX Vega 3
34.9
11.9
NVIDIA GeForce GT 720M
29.7
11.3
(-) * Smaller values are better. / n123 Number of benchmarks for this median value / * Approximate position


Legend
5Stutters – This game is very likely to stutter and have poor frame rates. Based on all known benchmarks using the specified graphical settings, average frame rates are expected to fall below 25fps
May Stutter – This graphics card has not been explicitly tested on this game. Based on interpolated information from surrounding graphics cards of similar performance levels, stutters and poor frame rates are expected.
30Fluent – Based on all known benchmarks using the specified graphical settings, this game should run at or above 25fps
40Fluent – Based on all known benchmarks using the specified graphical settings, this game should run at or above 35fps
60Fluent – Based on all known benchmarks using the specified graphical settings, this game should run at or above 58fps
May Run Fluently – This graphics card has not been explicitly tested on this game. Based on interpolated information from surrounding graphics cards of similar performance levels, fluent frame rates are expected.
?Uncertain – This graphics card experienced unexpected performance issues during testing for this game. A slower card may be able to achieve better and more consistent frame rates than this particular GPU running the same benchmark scene.
Uncertain – This graphics card has not been explicitly tested on this game and no reliable interpolation can be made based on the performances of surrounding cards of the same class or family.
The value in the fields displays the average frame rate of all values in the database. Move your cursor over the value to see individual results.

Testsysteme

Gerät Grafikkarte Prozessor Arbeitsspeicher Betriebssystem
Desktop-PC I MSI GeForce RTX 2080 Ti (11 GB GDDR6)
MSI GeForce RTX 2080 (8 GB GDDR6)
MSI GeForce RTX 2070 (8 GB GDDR6)
MSI GeForce RTX 2060 (6 GB GDDR6)
Intel Core i9-9900K 4 x 8 GB DDR4 Windows 10 64 Bit
Desktop-PC II Nvidia GeForce GTX 1080 Ti (11 GB GDDR5X)
Asus GeForce GTX 980 Ti (6 GB GDDR5)
XFX Radeon R9 Fury (4 GB HBM)
Sapphire Radeon R9 290X (4 GB GDDR5)
Sapphire Radeon R9 280X (3 GB GDDR5)
MSI Radeon R7 370 (2 GB GDDR5)
Intel Core i7-8086K, Aorus Z370 Ultra Gaming 2 x 8 GB DDR4 Windows 10 64 Bit
Desktop-PC III Nvidia Titan RTX (24 GB GDDR6)
Nvidia GeForce RTX 2080 Super (8 GB GDDR6)
Nvidia GeForce RTX 2070 Super (8 GB GDDR6)
Nvidia GeForce RTX 2060 Super (8 GB GDDR6)
KFA2 GeForce RTX 2060 Super (8 GB GDDR6)
Nvidia Titan X (Pascal) (12 GB GDDR5X)
KFA2 GeForce GTX 1660 Super (6 GB GDDR6)
PNY GeForce GTX 1660 (6 GB GDDR5)
Gainward GeForce GTX 1650 (4 GB GDDR5)
Zotac GeForce GT 1030 (2 GB GDDR5)
AMD Radeon RX 5700 XT (8 GB GDDR6)
AMD Radeon RX 5700 (8 GB GDDR6)
AMD Radeon RX 5600 XT (8 GB GDDR6))
AMD Radeon RX Vega 64 (8 GB HBM2)
XFX AMD Radeon RX 590 (8 GB GDDR5)
AMD Ryzen 9 3900X 2 x 8 GB DDR4 Windows 10 64 Bit
MSI GT76 Nvidia GeForce RTX 2080 (8 GB GDDR6) Intel Core i9-9900K 2 x 16 GB DDR4 Windows 10 64 Bit
MSI GP65 Nvidia GeForce RTX 2070 (8 GB GDDR6) Intel Core i7-9750H 2 x 16 GB DDR4 Windows 10 64 Bit
MSI GE65 Nvidia GeForce RTX 2060 (6 GB GDDR6) Intel Core i7-9750H 2 x 8 GB DDR4 Windows 10 64 Bit
MSI GP65 Nvidia GeForce GTX 1660 Ti (6 GB GDDR6) Intel Core i7-9750H 2 x 16 GB DDR4 Windows 10 64 Bit
MSI GP75 Nvidia GeForce GTX 1650 (4 GB GDDR5) Intel Core i7-9750H 2 x 8 GB DDR4 Windows 10 64 Bit
Alienware 17 R4 Nvidia GeForce GTX 1080 (8 GB GDDR5X) Intel Core i7-7820HK 2 x 16 GB DDR4 Windows 10 64 Bit
Asus G752VS Nvidia GeForce GTX 1070 (8 GB GDDR5) Intel Core i7-6820HK 2 x 16 GB DDR4 Windows 10 64 Bit
MSI GT62VR Nvidia GeForce GTX 1060 (6 GB GDDR5) Intel Core i7-6820HK 2 x 8 GB DDR4 Windows 10 64 Bit
MSI GE72 Nvidia GeForce GTX 1050 Ti (2 GB GDDR5) Intel Core i7-7700HQ 2 x 4 GB DDR4 Windows 10 64 Bit
MSI GL62 Nvidia GeForce GTX 1050 (2 GB GDDR5) Intel Core i7-7700HQ 2 x 4 GB DDR4 Windows 10 64 Bit
MSI Prestige 14 Nvidia GeForce MX350 (2 GB GDDR5) Intel Core i7-10710U 1 x 16 GB DDR4 Windows 10 64 Bit
MSI Prestige 14 Nvidia GeForce MX330 (2 GB GDDR5) Intel Core i7-10510U 1 x 16 GB DDR4 Windows 10 64 Bit
MSI Alpha 15 AMD Radeon RX5500M (4 GB GDDR6) AMD Ryzen 7 3750H 2 x 8 GB DDR4 Windows 10 64 Bit
4K Monitore Nvidia Treiber AMD Treiber
Asus PB287Q, Philips Brilliance 329P9H ForceWare 456.55 Adrenalin 20.9.2
Read all 2 comments / answer
static version load dynamic
Loading Comments
Comment on this article
Please share our article, every link counts!
> Expert Reviews and News on Laptops, Smartphones and Tech Innovations > Reviews > Star Wars Squadrons Laptop and Desktop Benchmarks
Florian Glaser, 2020-10-15 (Update: 2021-03-12)