Xiaomi RedmiBook 16 Ryzen 5 4500U laptop review - attractive price warrior from the Far East
With the RedmiBook 16, Xiaomi offers a large 16-inch version of the affordable RedmiBook series. Visually obviously inspired by the Apple MacBook Pro 16, the Chinese manufacturer rather wants to serve the low-priced entry level. For this purpose, it relies on the brand-new Ryzen 4000 chips with 6 or 8 processor cores or alternatively on the Intel Ice Lake architecture with 4 cores and a dedicated Nvidia MX350 graphics card. In our test we look at the cheapest entry level model with a 6-core Ryzen 5 4500U, 8 GB RAM (soldered), and 512 GB SATA SSD. We bought our test device for 650.45 Euros (~$750) at Gearbest and then paid 118.26 Euros (~$136) at DHL for import duties and taxes (to Austria), a total of 769 Euros (~$887).
Rating | Date | Model | Weight | Height | Size | Resolution | Price |
|---|---|---|---|---|---|---|---|
| 82.9 % v7 (old) | 07 / 2020 | Xiaomi RedmiBook 16 R5 R5 4500U, Vega 6 | 1.8 kg | 21.7 mm | 16.00" | 1920x1080 | |
| 89.7 % v7 (old) | 12 / 2019 | Apple MacBook Pro 16 2019 i9 5500M i9-9880H, Radeon Pro 5500M | 2 kg | 16.2 mm | 16.00" | 3072x1920 | |
| 85.2 % v7 (old) | 03 / 2020 | Huawei MateBook D 15-53010TUY R5 3500U, Vega 8 | 1.5 kg | 16.9 mm | 15.60" | 1920x1080 | |
| 82.8 % v7 (old) | 07 / 2020 | Honor MagicBook 15 R5 3500U, Vega 8 | 1.5 kg | 16.9 mm | 15.60" | 1920x1080 | |
| 83.9 % v7 (old) | 11 / 2020 | Lenovo ThinkPad E15 Gen2-20T9S00K00 R7 4700U, Vega 7 | 1.8 kg | 18.9 mm | 15.60" | 1920x1080 | |
| 82.6 % v7 (old) | 07 / 2020 | HP ProBook 455 G7-175W8EA R7 4700U, Vega 7 | 1.8 kg | 19 mm | 15.60" | 1920x1080 | |
| 73.1 % v7 (old) | 04 / 2020 | Asus Vivobook 15 F512DA-SH31 R3 3200U, Vega 3 | 1.8 kg | 19.9 mm | 15.60" | 1920x1080 | |
| 77.9 % v7 (old) | 06 / 2020 | HP 15s-fq1440ng i7-1065G7, Iris Plus Graphics G7 (Ice Lake 64 EU) | 1.6 kg | 17.9 mm | 15.60" | 1920x1080 | |
| 84.8 % v7 (old) | 07 / 2020 | LG Gram 15Z90N i5-1035G7, Iris Plus Graphics G7 (Ice Lake 64 EU) | 1.1 kg | 16.8 mm | 15.60" | 1920x1080 | |
| 86.8 % v7 (old) | 05 / 2020 | Dell XPS 15 9500 Core i5 i5-10300H, UHD Graphics 630 | 1.8 kg | 18 mm | 15.60" | 1920x1200 | |
| 80.4 % v7 (old) | 06 / 2020 | HP Envy x360 15-dr1679cl i7-10510U, UHD Graphics 620 | 2.1 kg | 17.2 mm | 15.60" | 1920x1080 | |
| 76.6 % v7 (old) | 02 / 2020 | Acer Extensa 15 EX215-51-56UX i5-10210U, UHD Graphics 620 | 1.9 kg | 19.9 mm | 15.60" | 1920x1080 | |
| 81.8 % v7 (old) | 02 / 2020 | Lenovo ThinkBook 15 i5-10210U, UHD Graphics 620 | 1.9 kg | 18.9 mm | 15.60" | 1920x1080 | |
| 85.5 % v7 (old) | 06 / 2020 | HP Envy x360 13-ay0010nr R5 4500U, Vega 6 | 1.3 kg | 16.4 mm | 13.30" | 1920x1080 | |
| 86 % v7 (old) | 07 / 2020 | Lenovo IdeaPad 5 14ARE05 R5 4500U, Vega 6 | 1.4 kg | 16.9 mm | 14.00" | 1920x1080 | |
| 83.2 % v7 (old) | 07 / 2020 | HP ProBook 445 G7 175W4EA R5 4500U, Vega 6 | 1.6 kg | 18 mm | 14.00" | 1920x1080 |
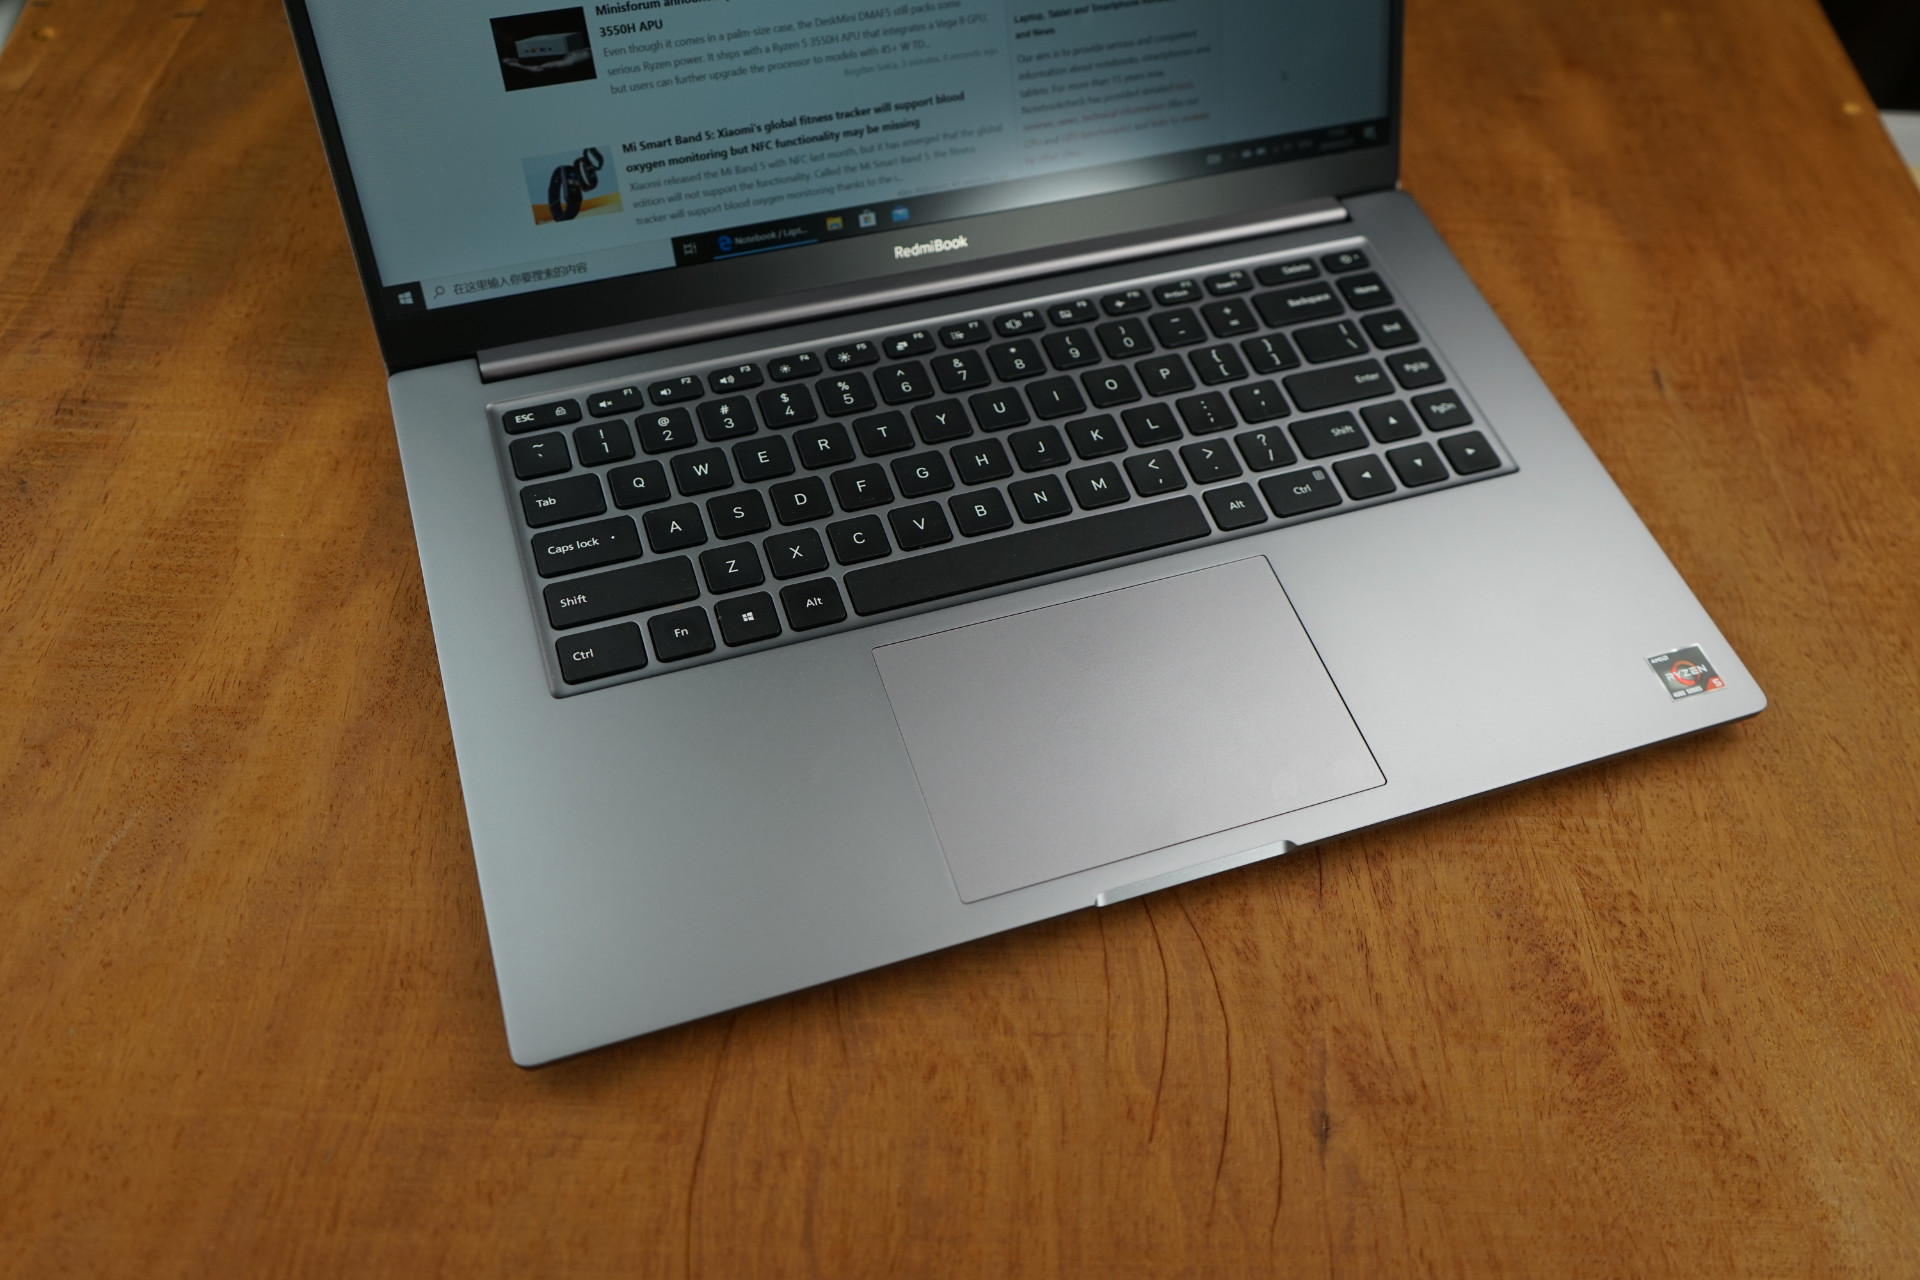
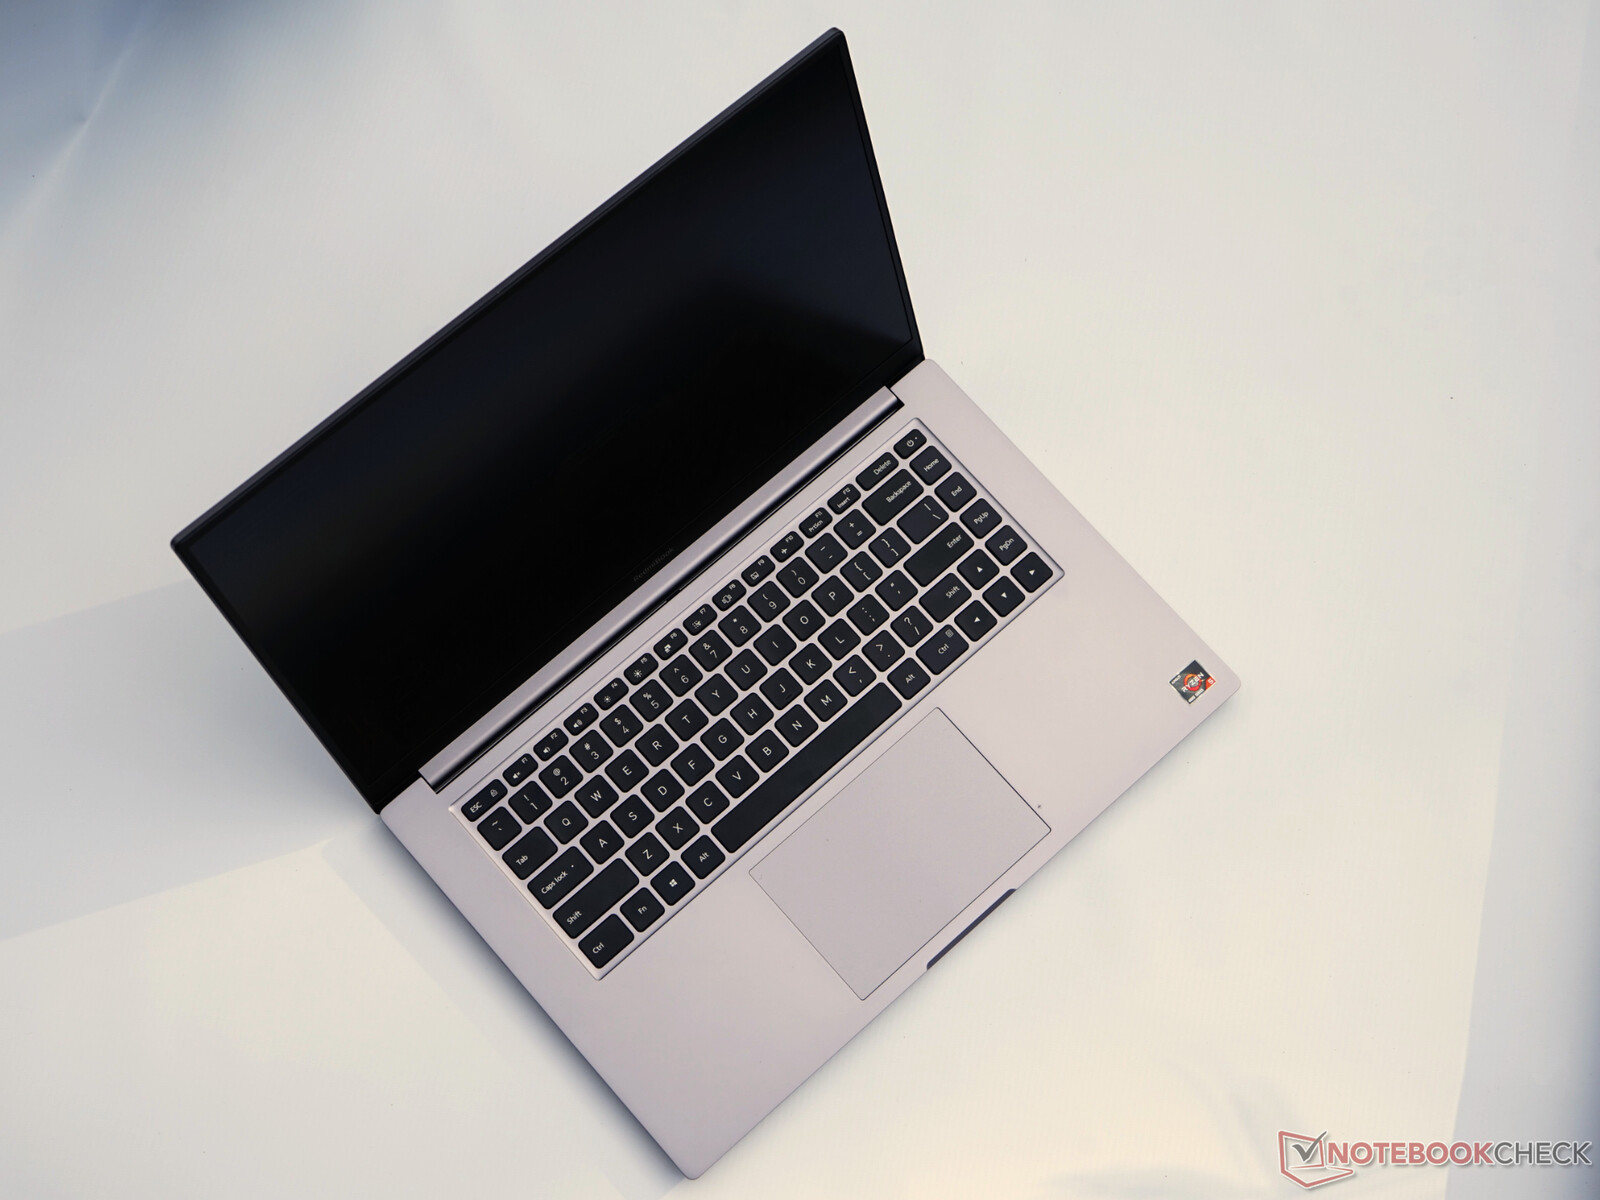
Case
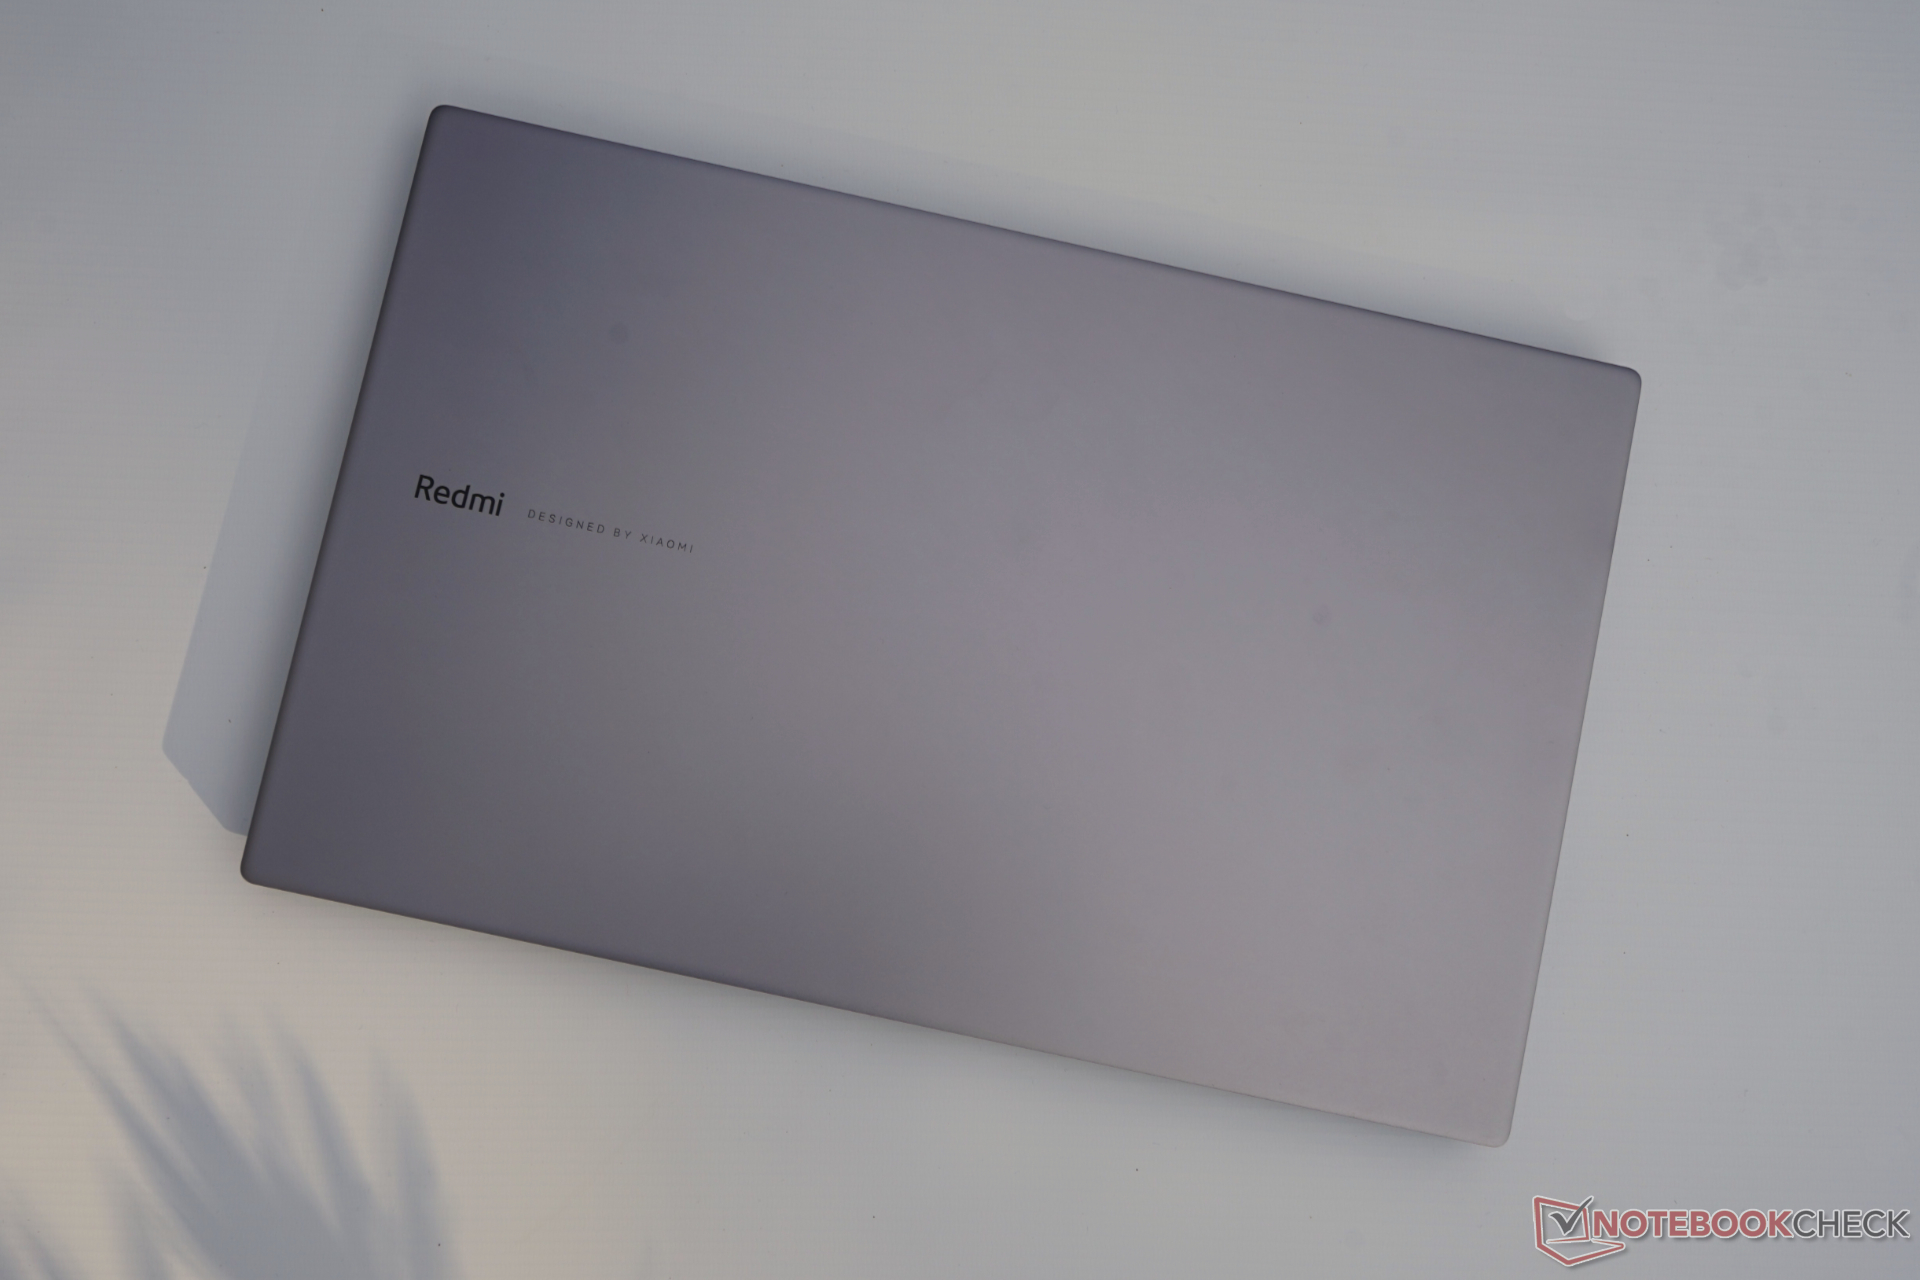
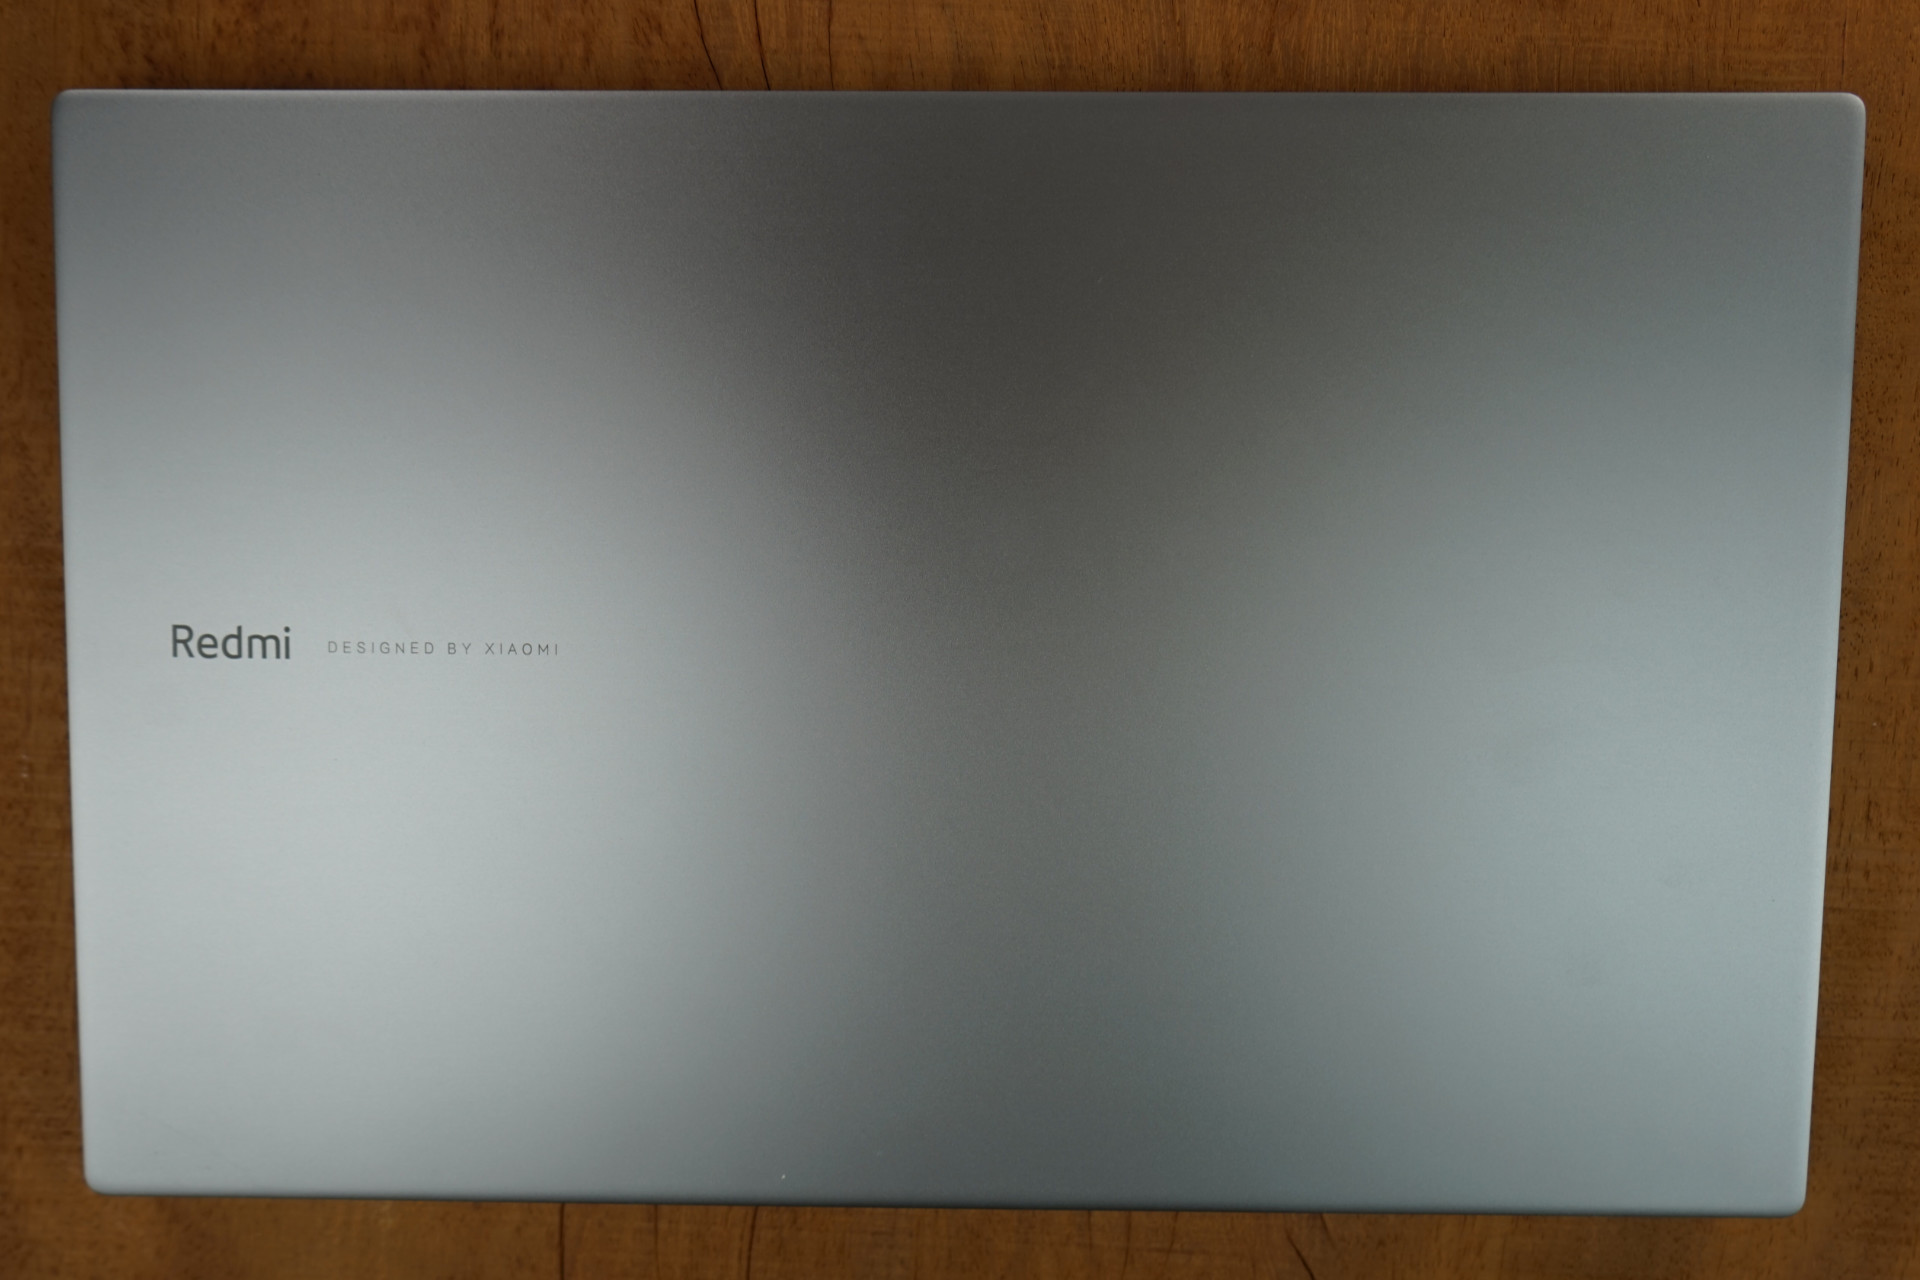
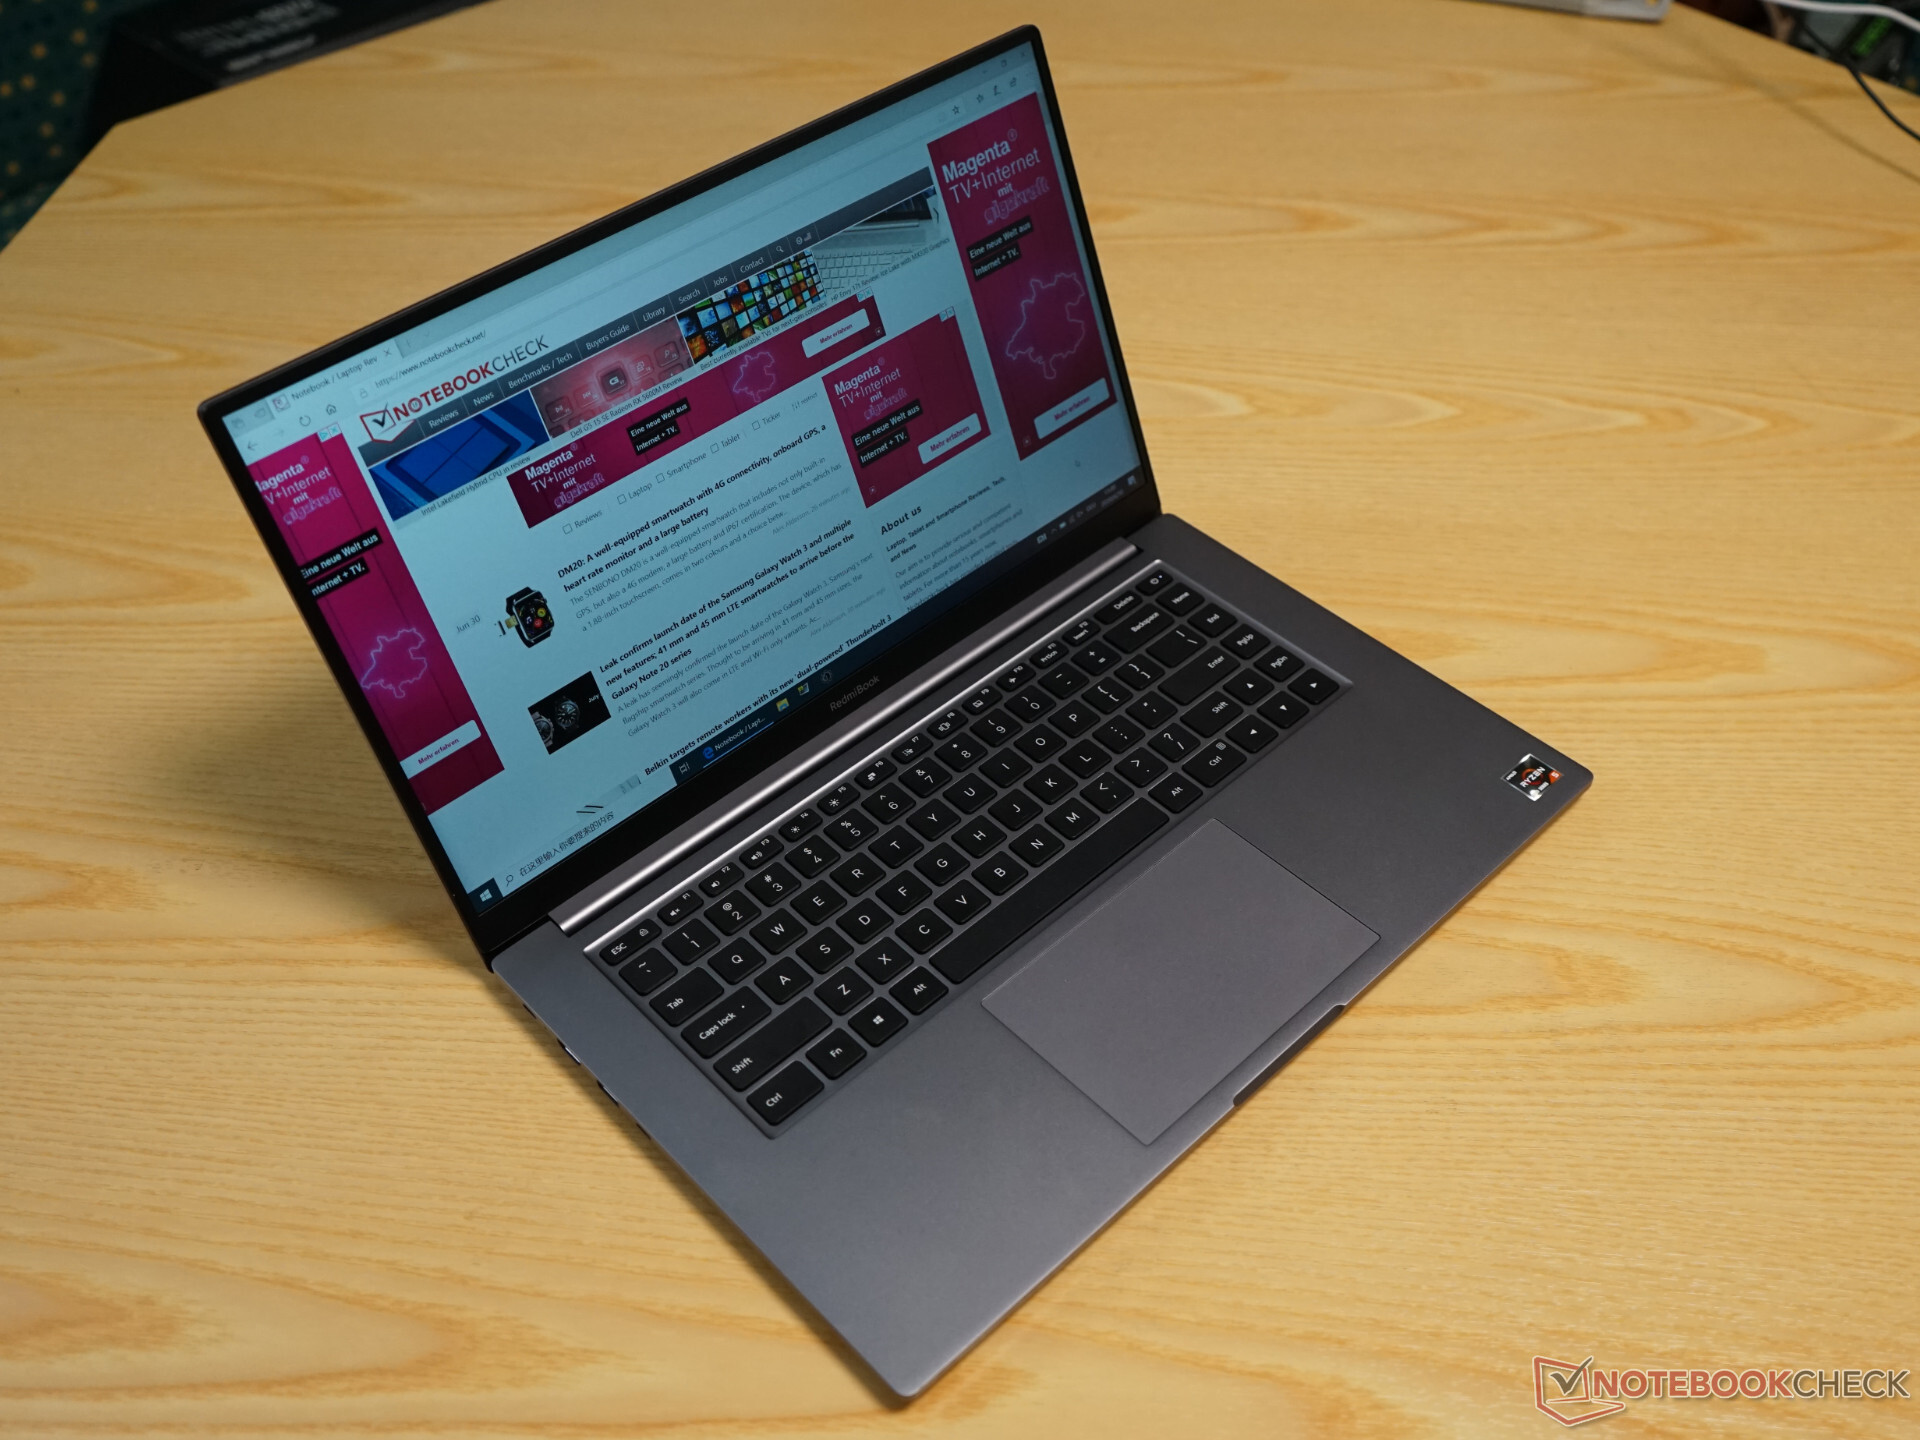
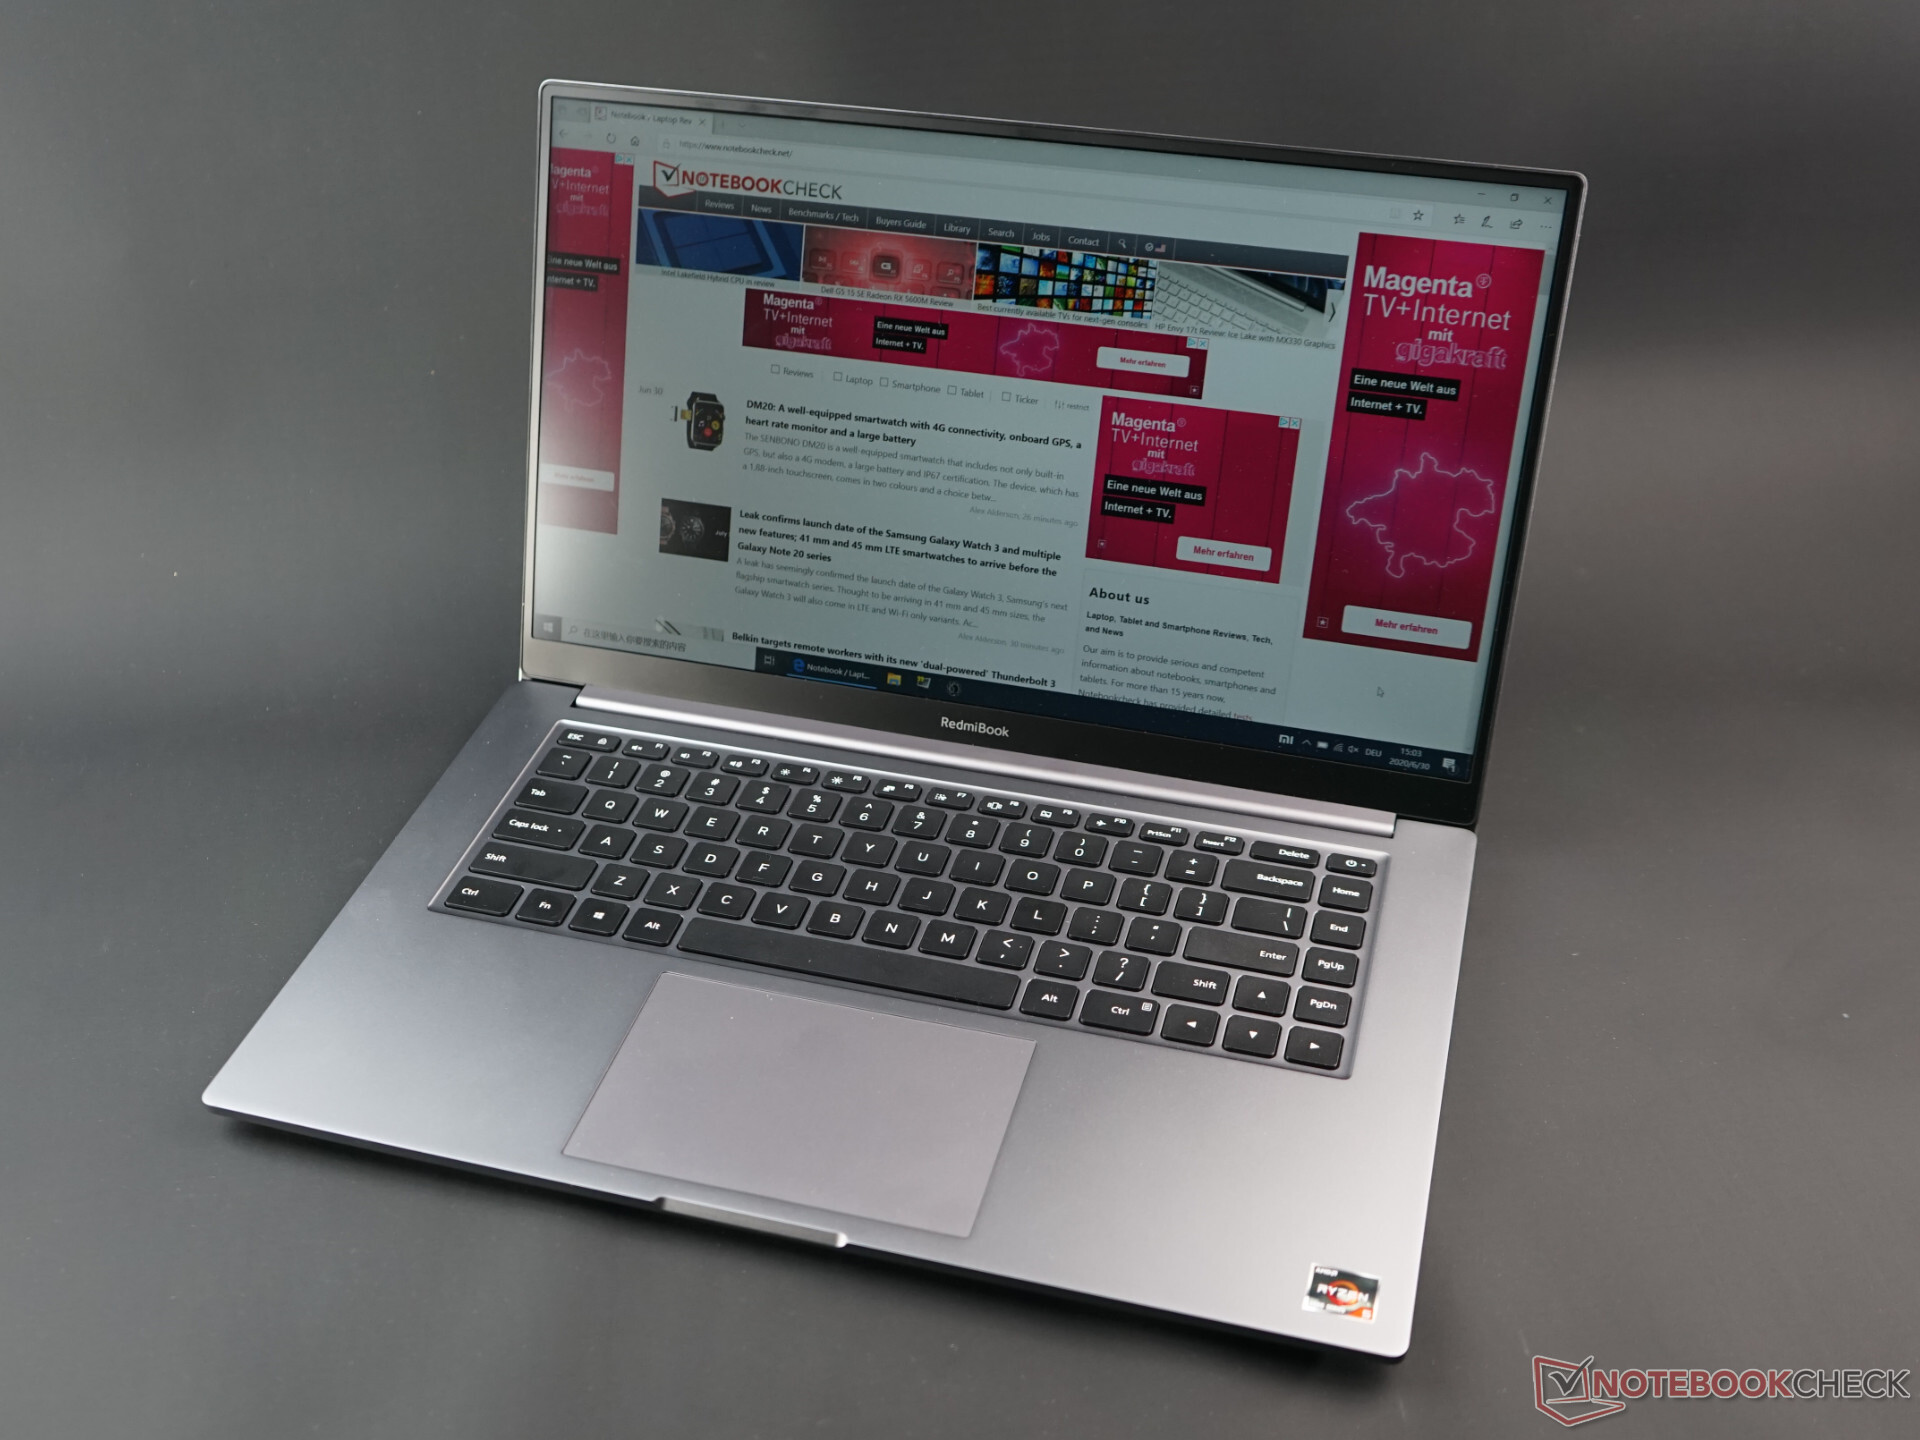
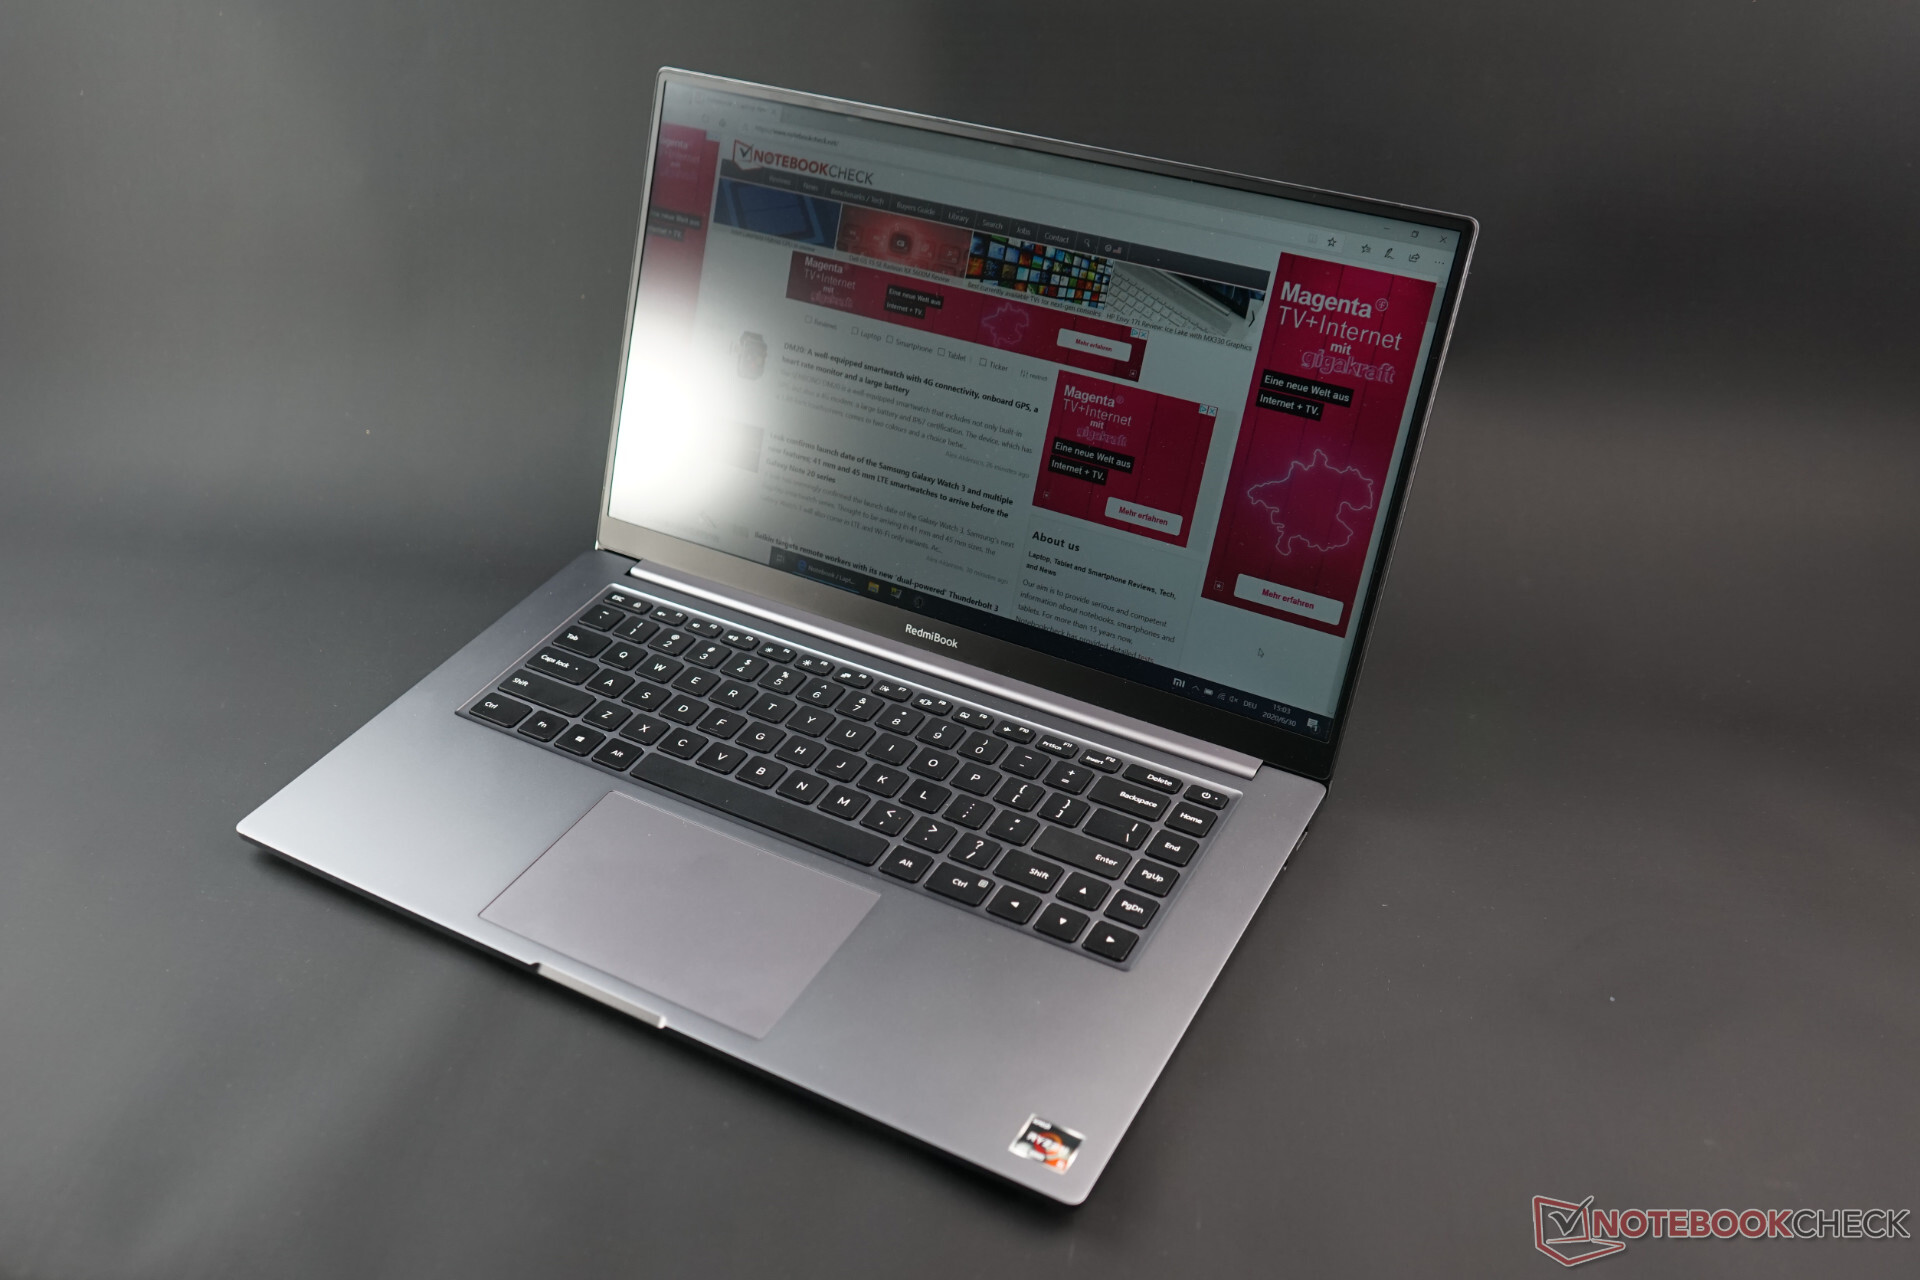
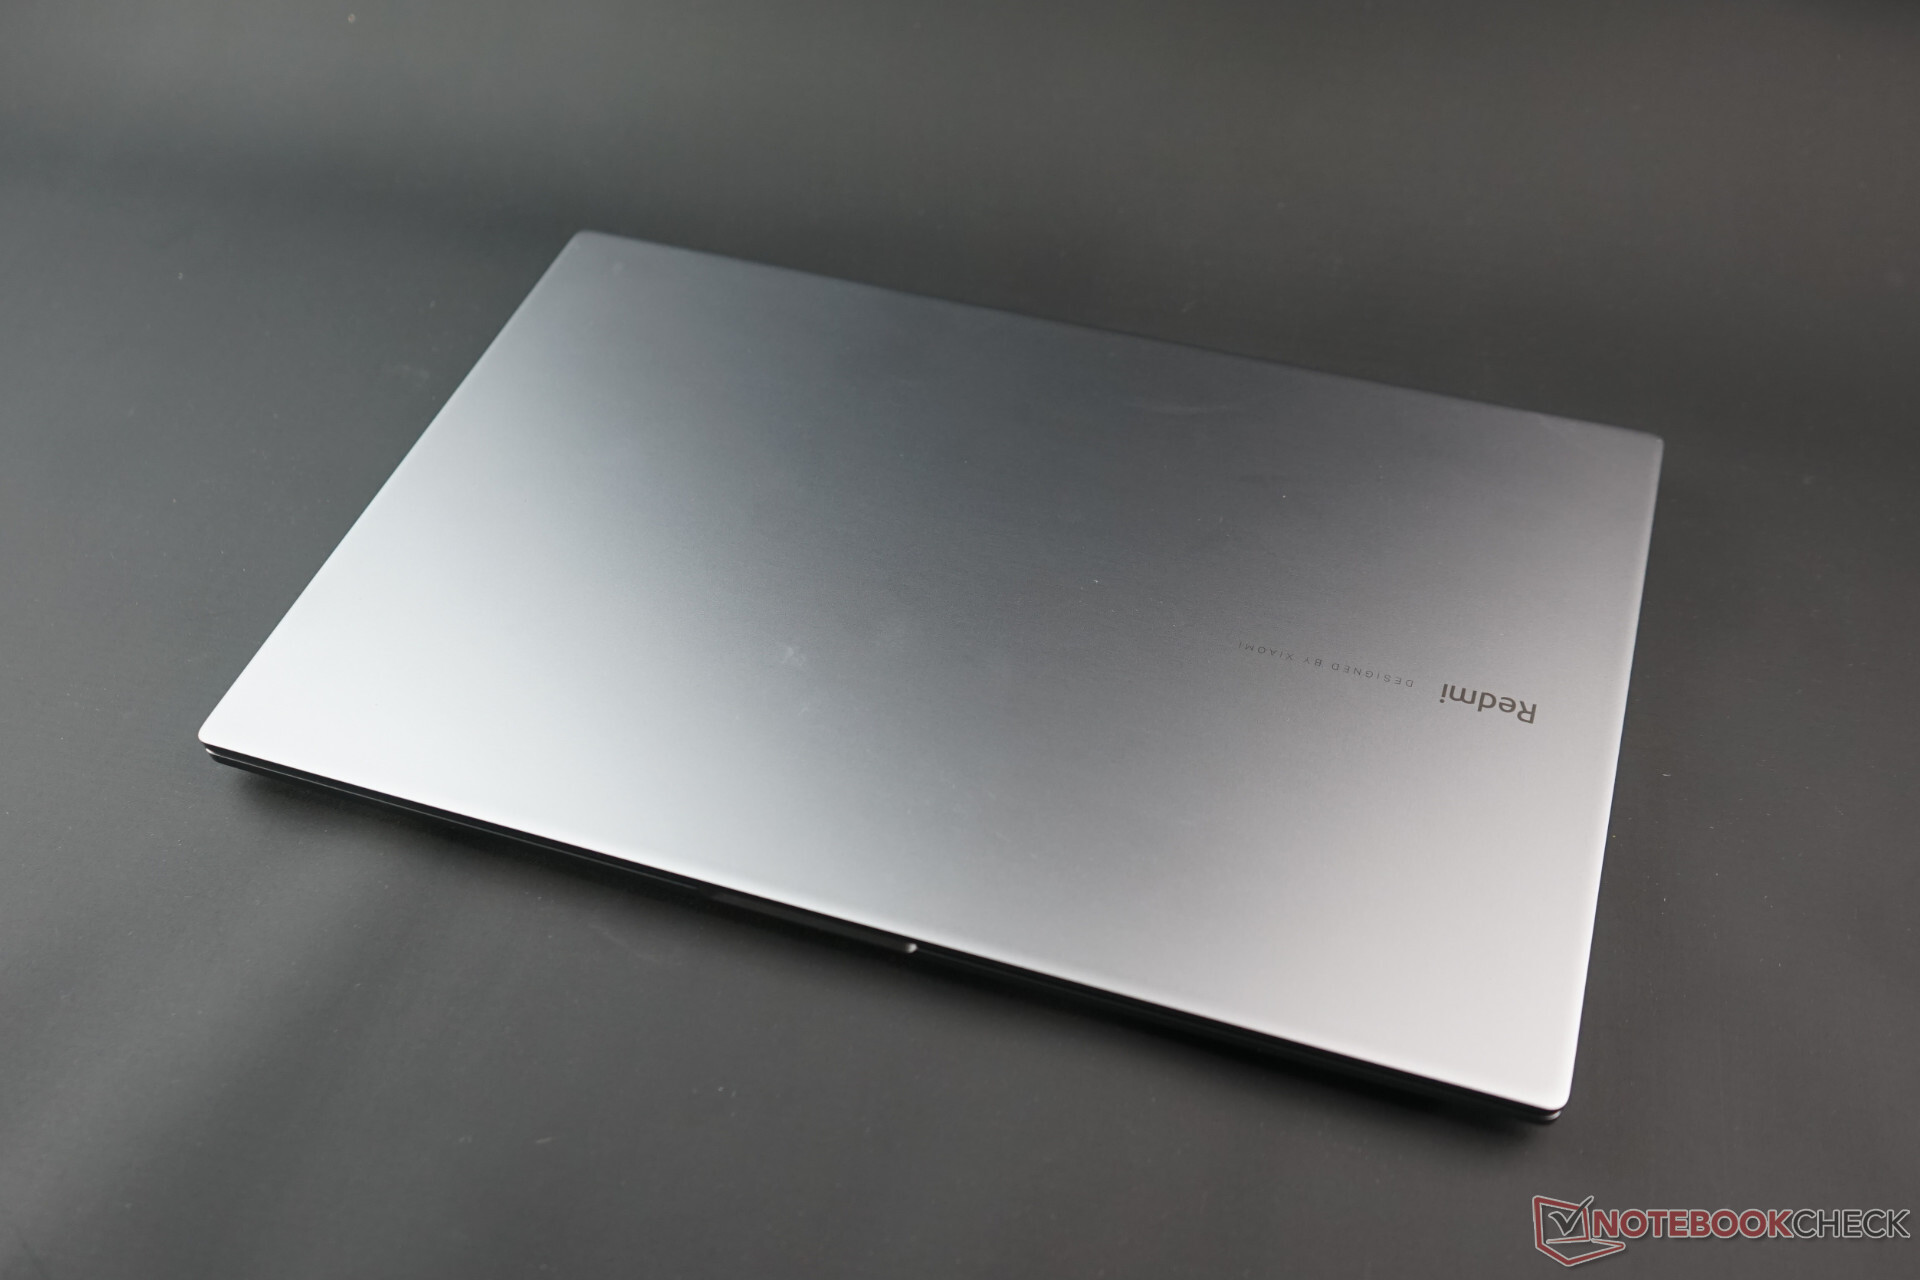
The case of the RedmiBook 16 is strongly reminiscent of the older Mi Notebook Pro models from Xiaomi. This is by no means negative and for the price range is a thoroughly successful approach. The stable aluminum case looks high-quality and is sufficiently torsionally stiff. It doesn't come close to its role model, the Apple MacBook Pro 16, but in comparison to plastic cases in this price range, it clearly wins.
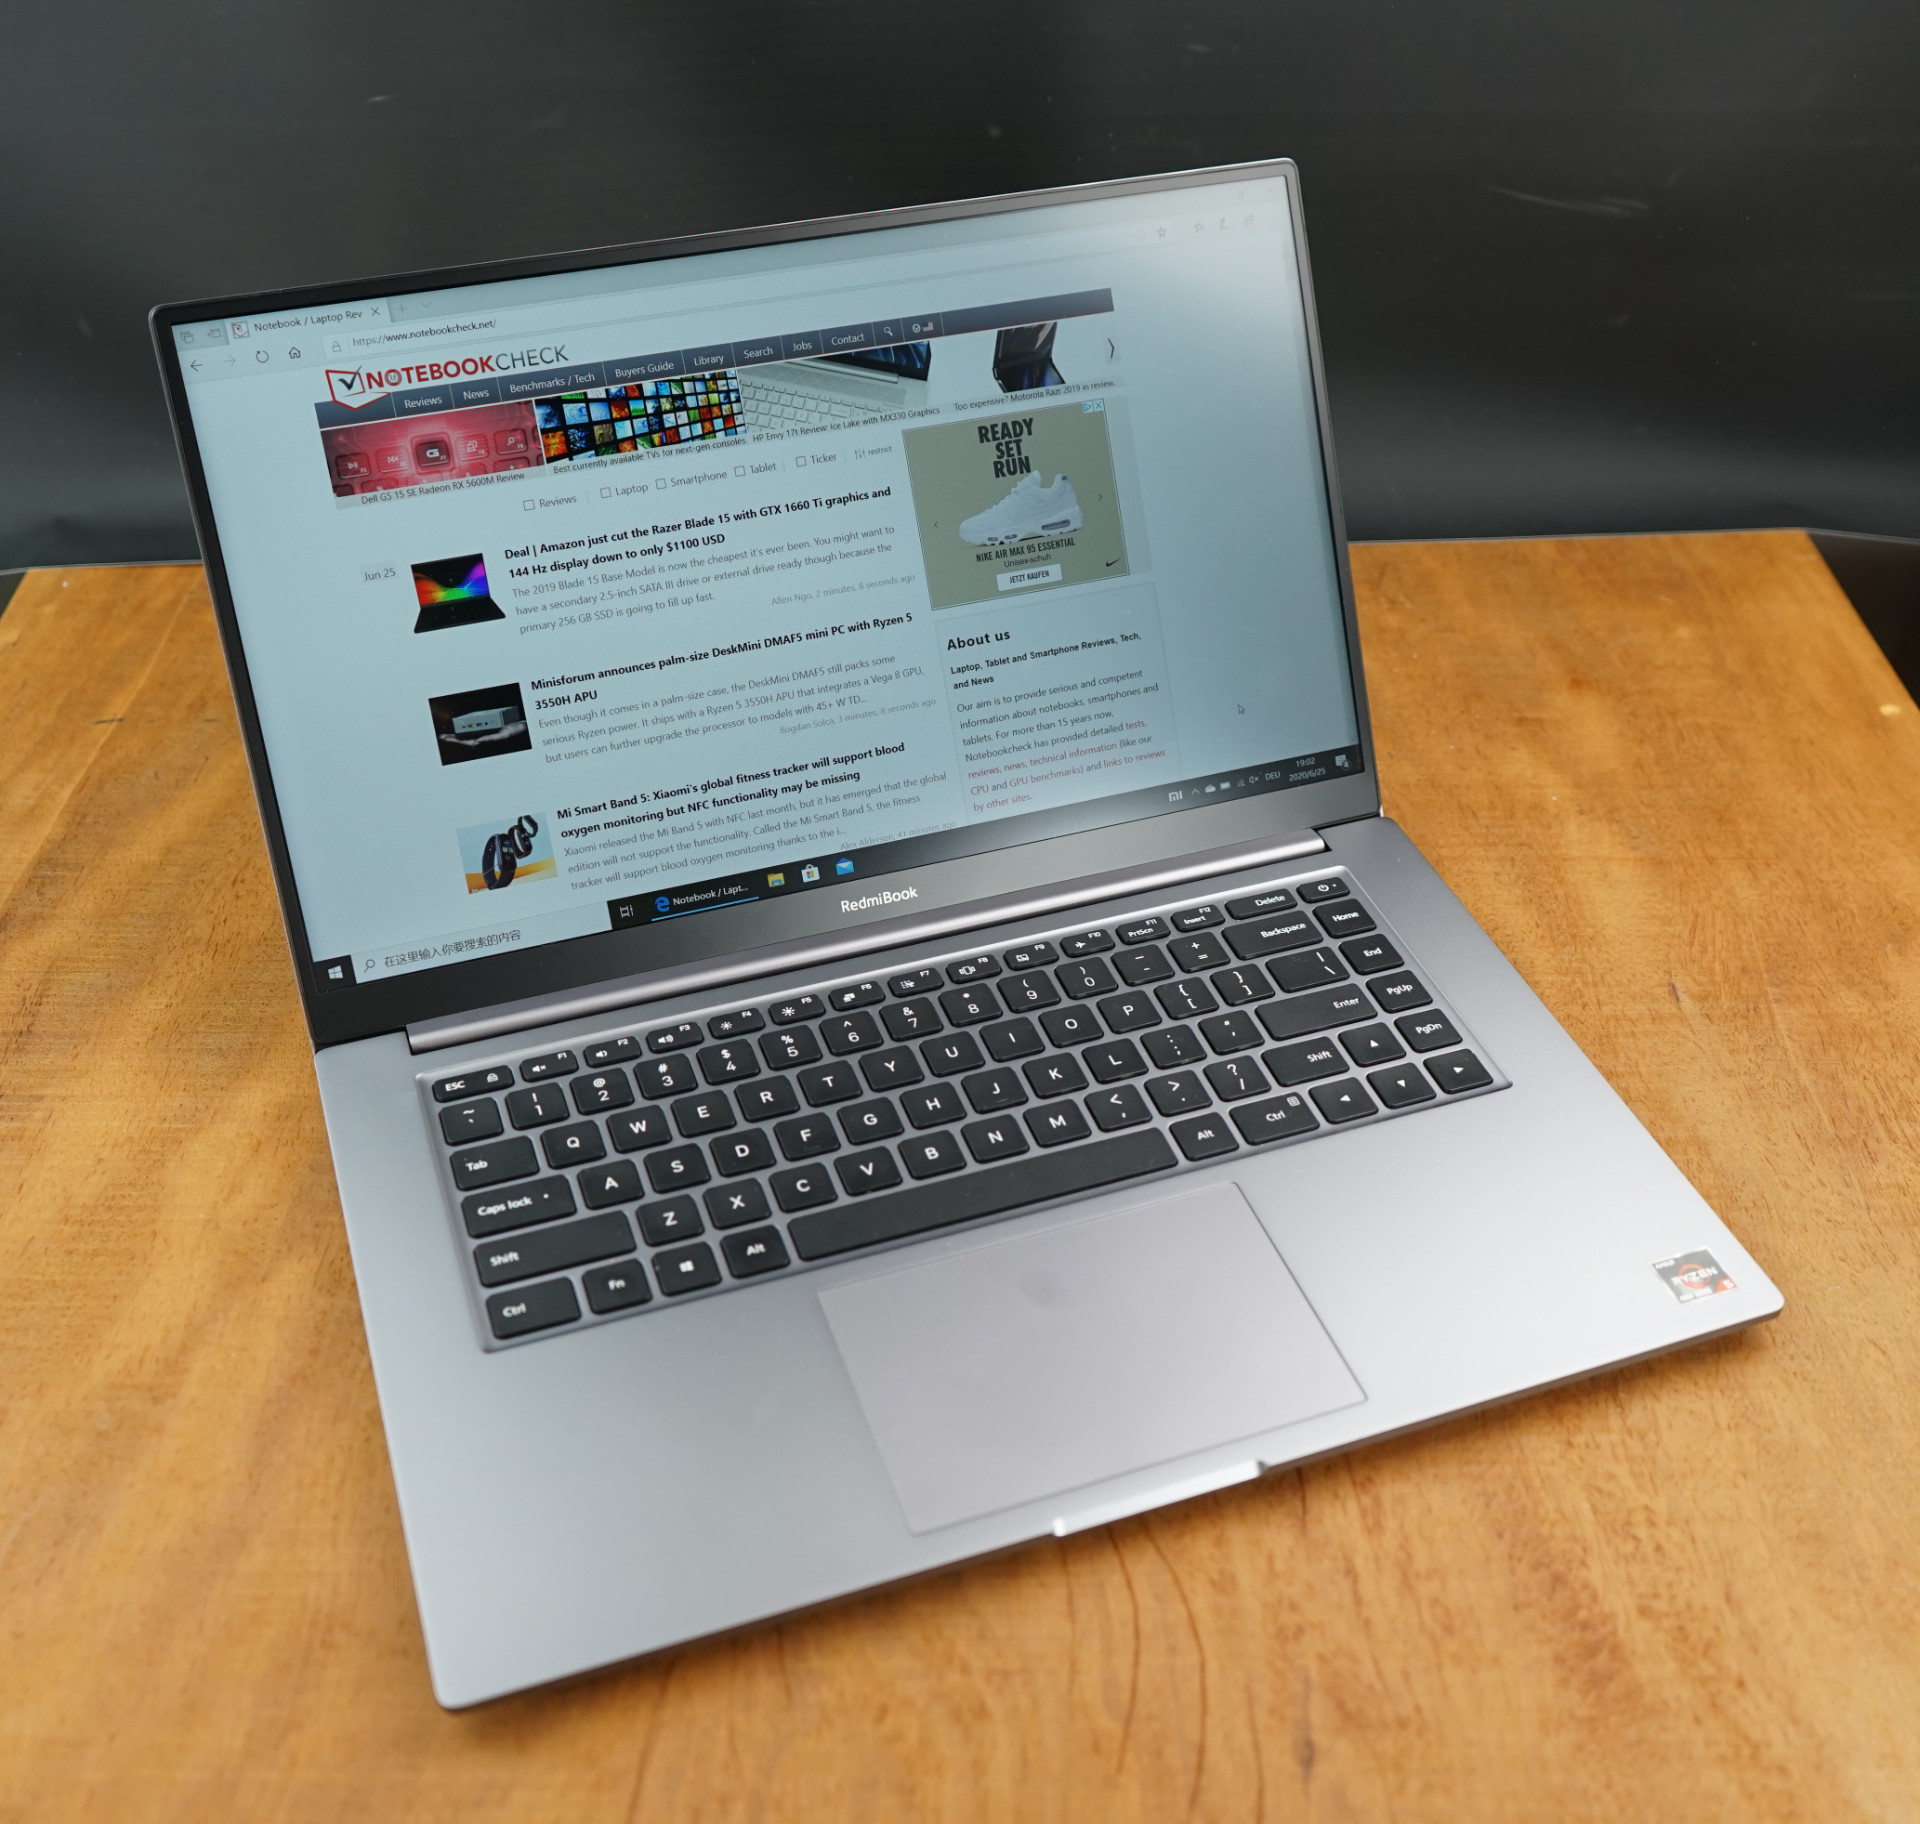
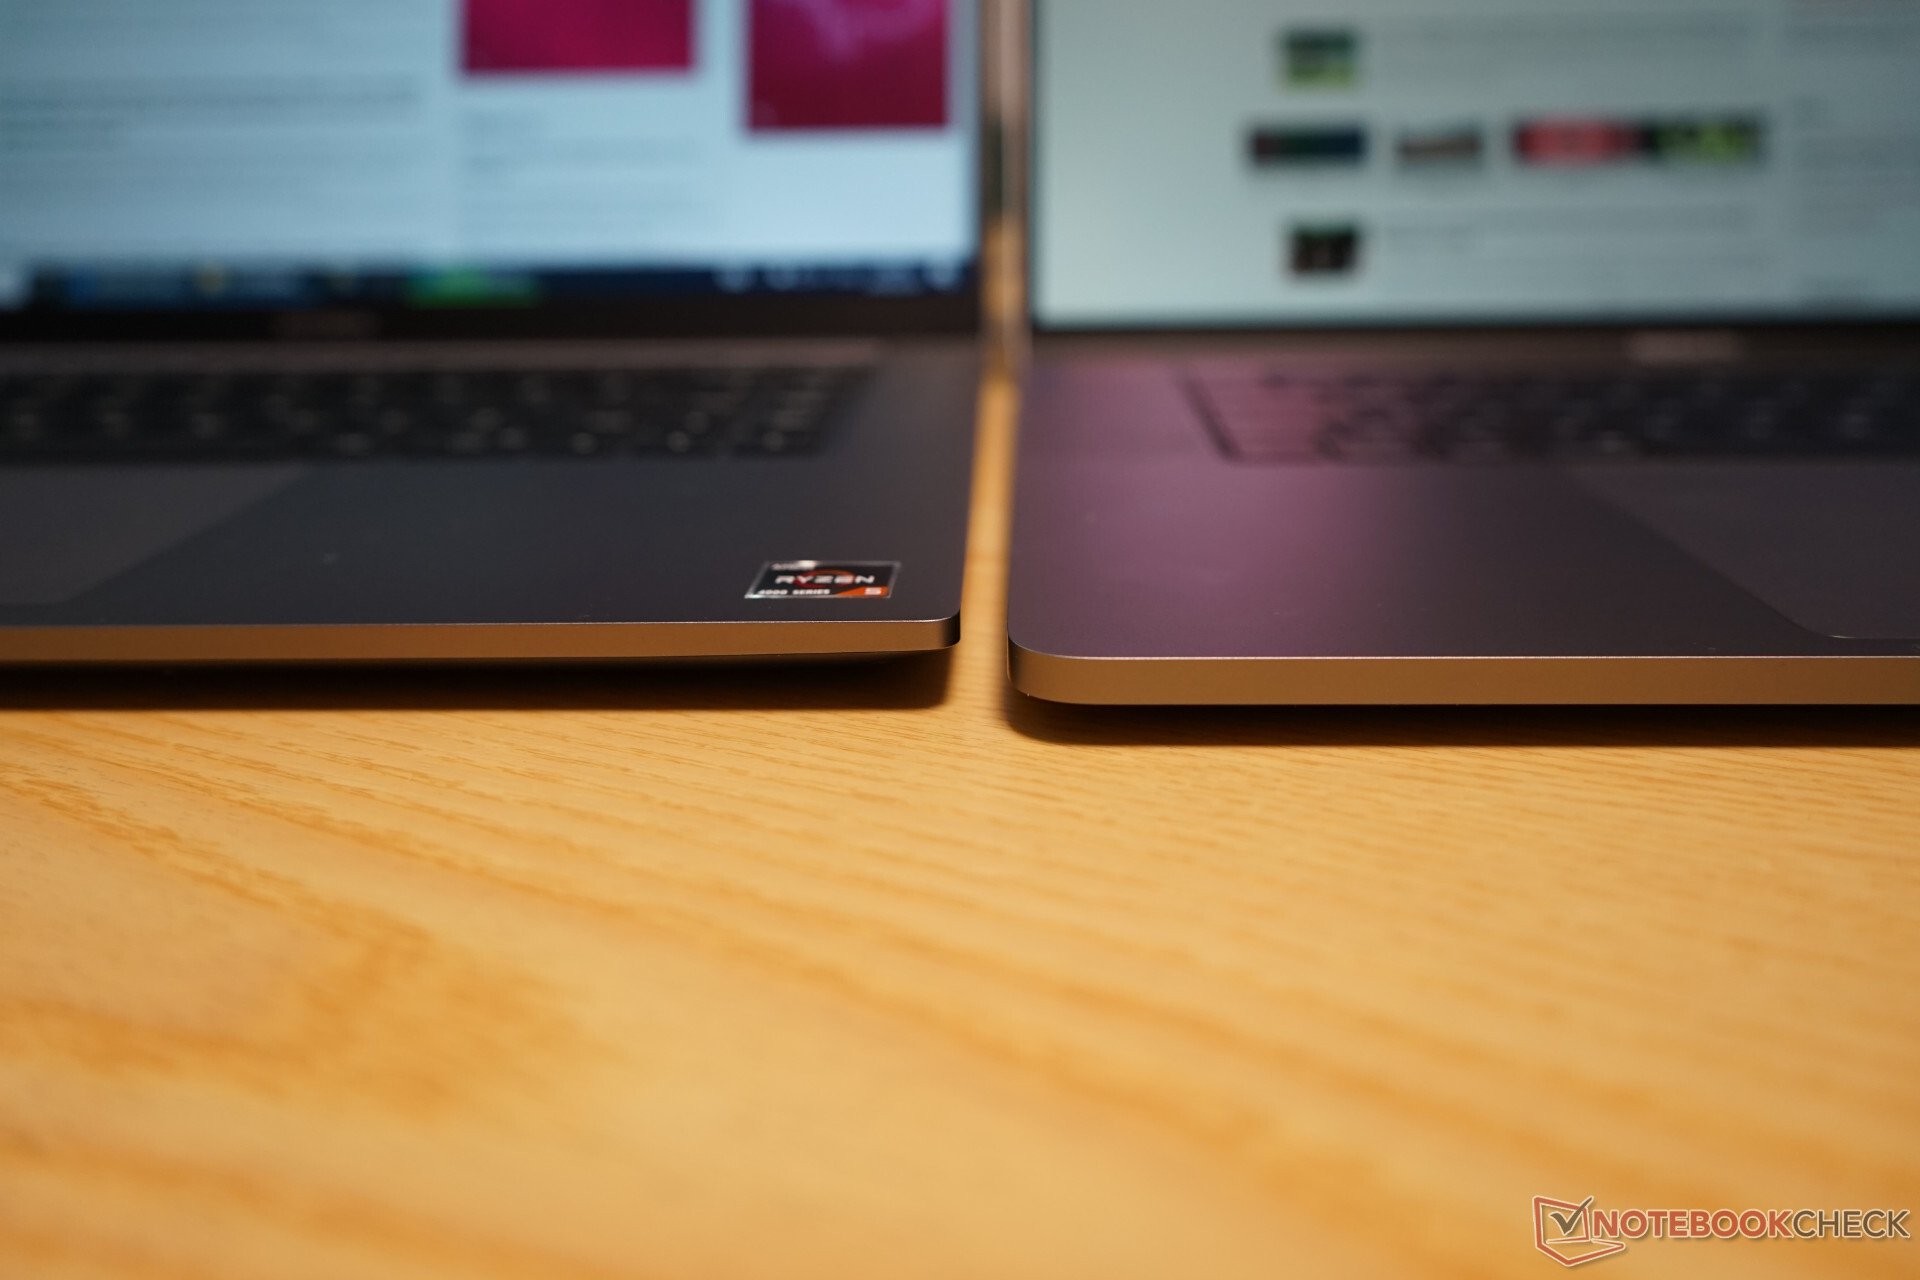
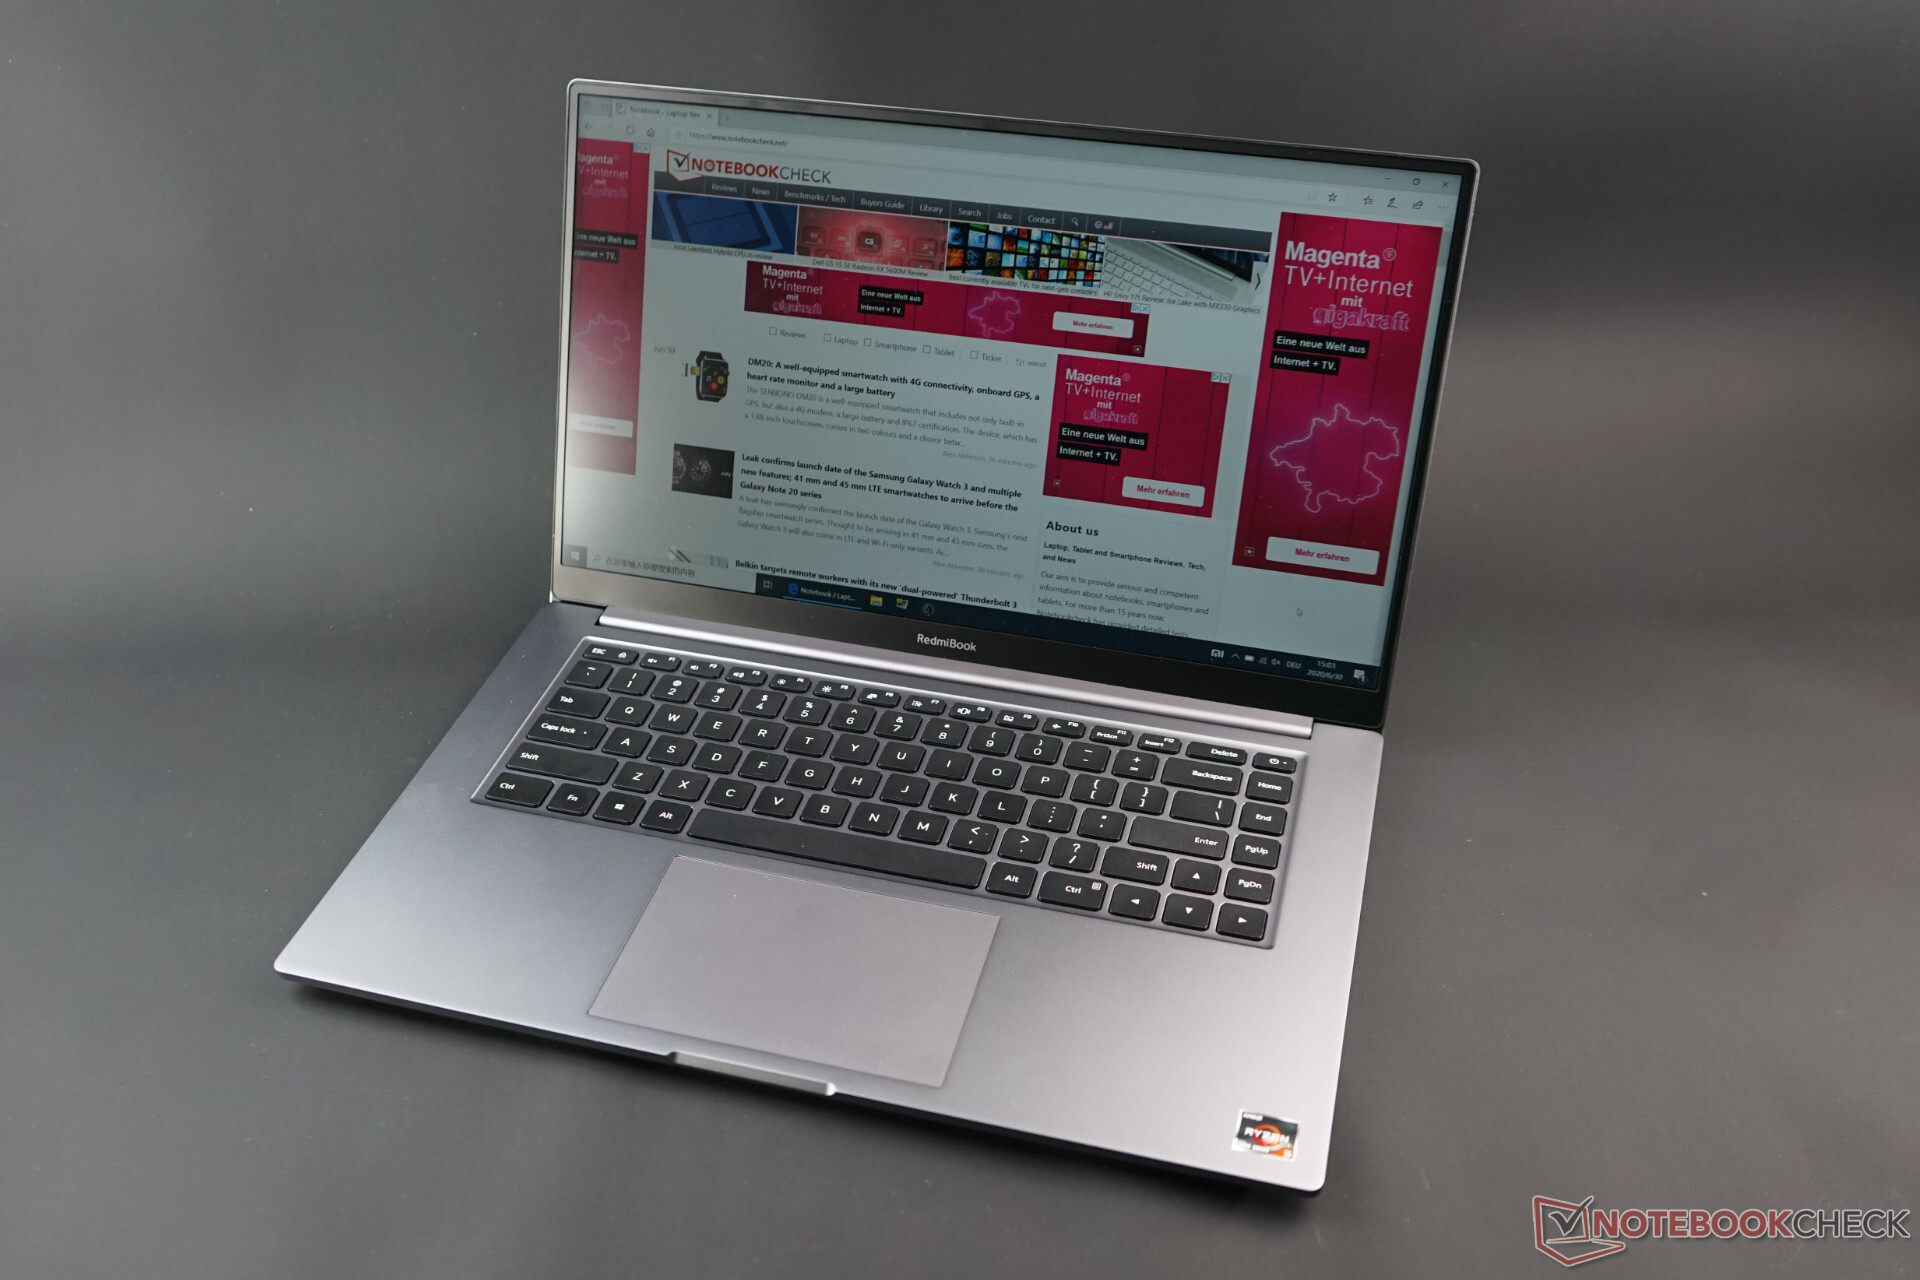
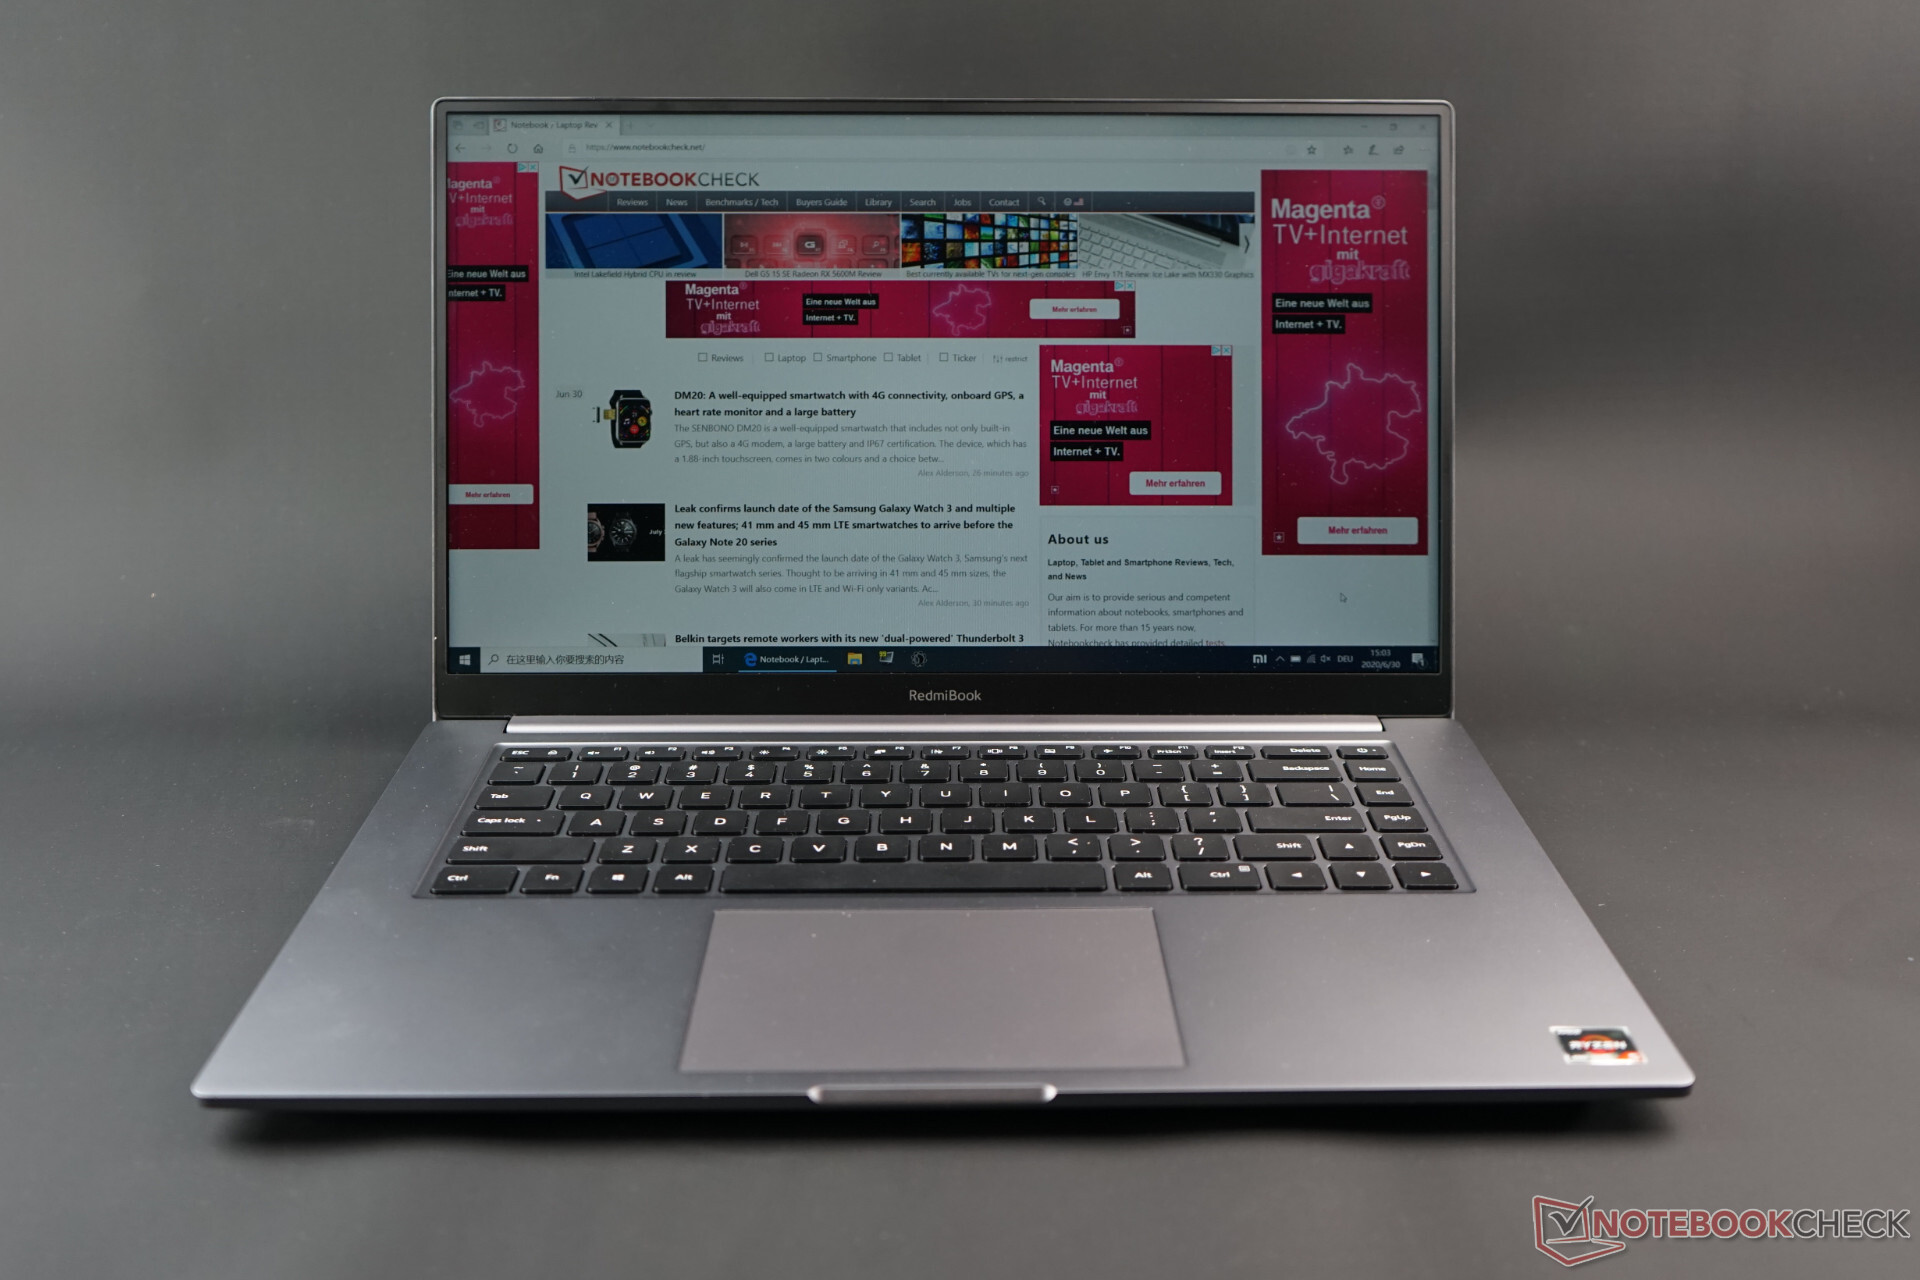
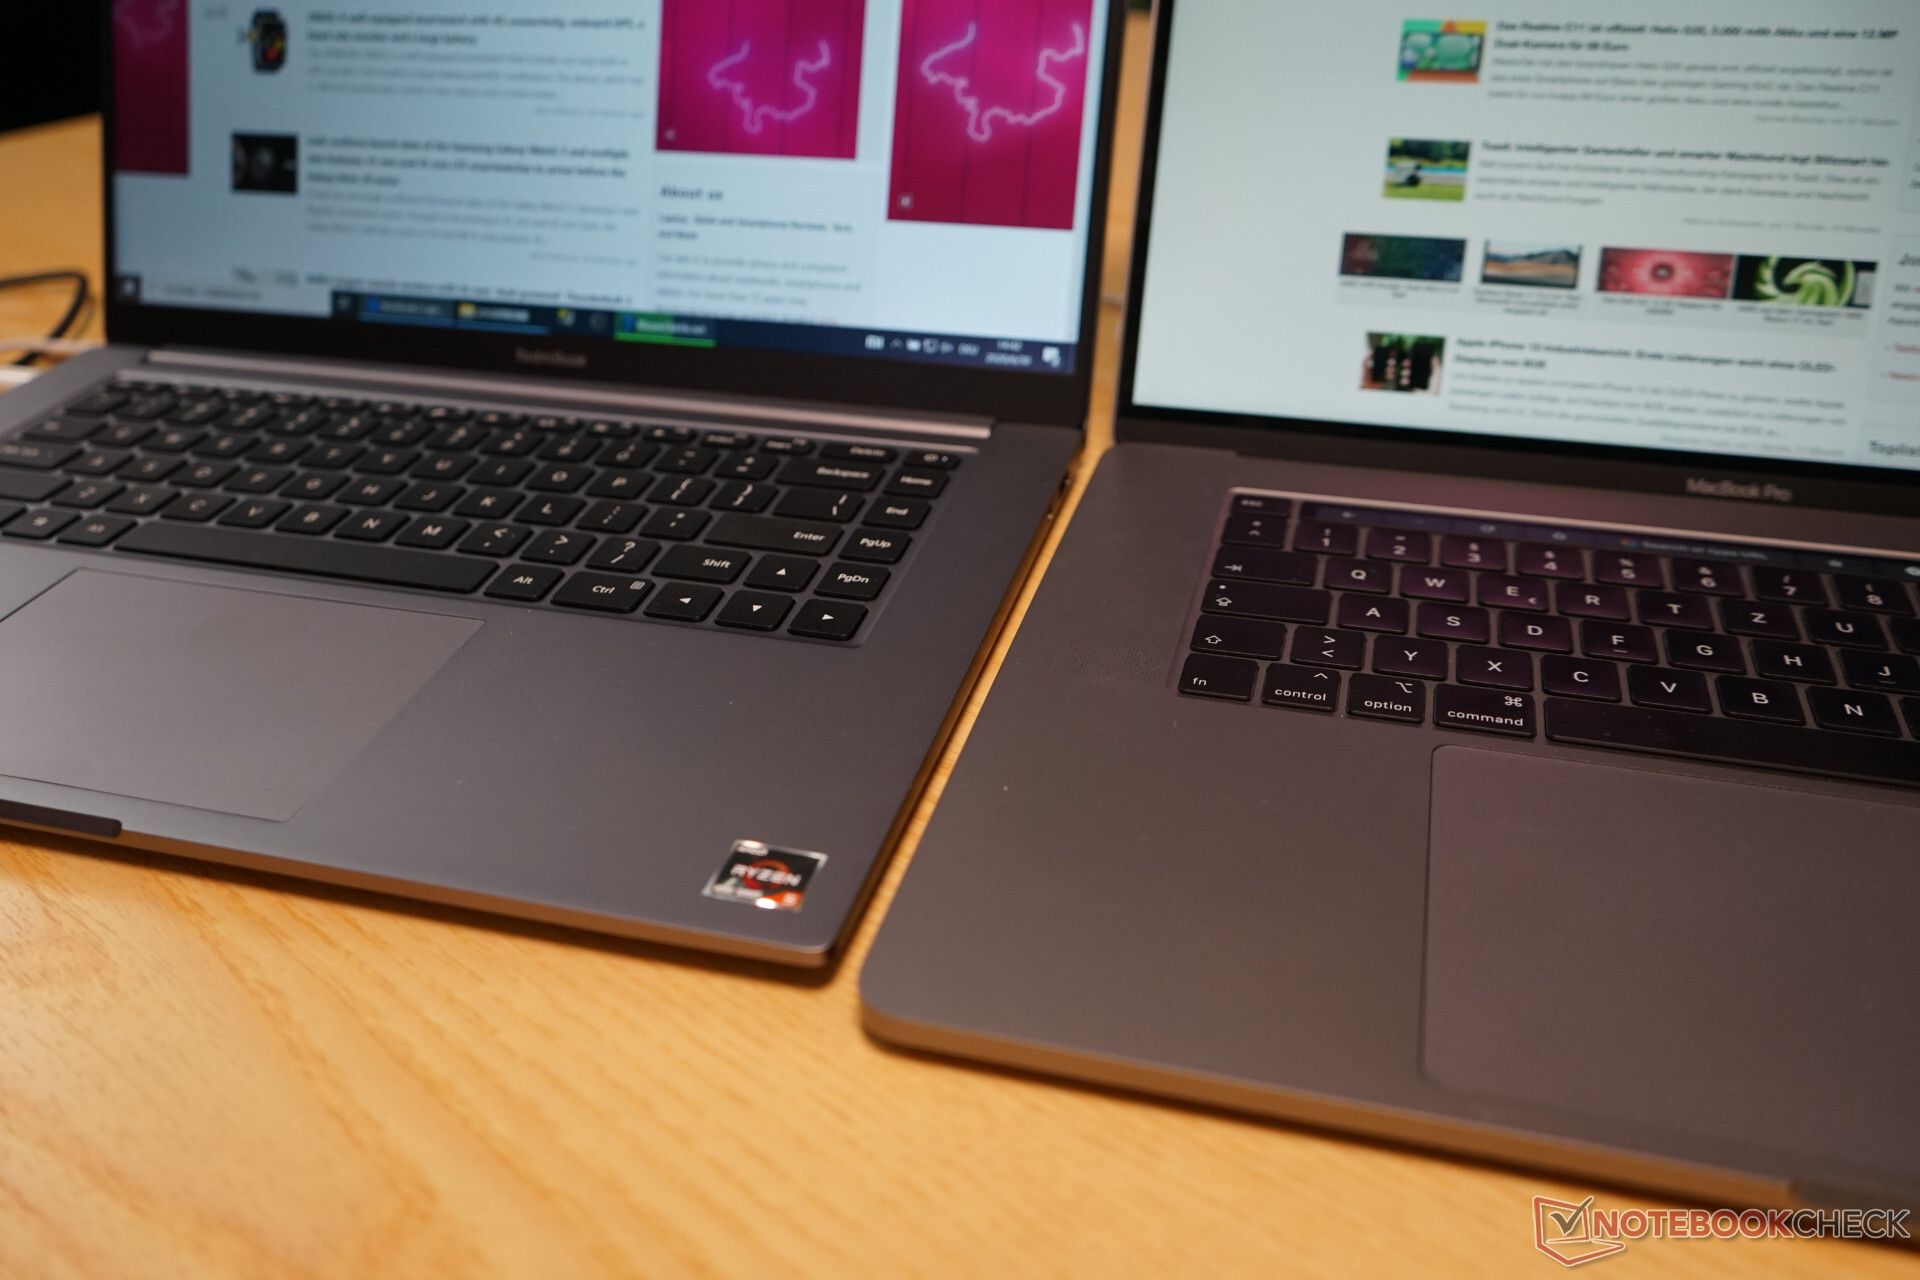
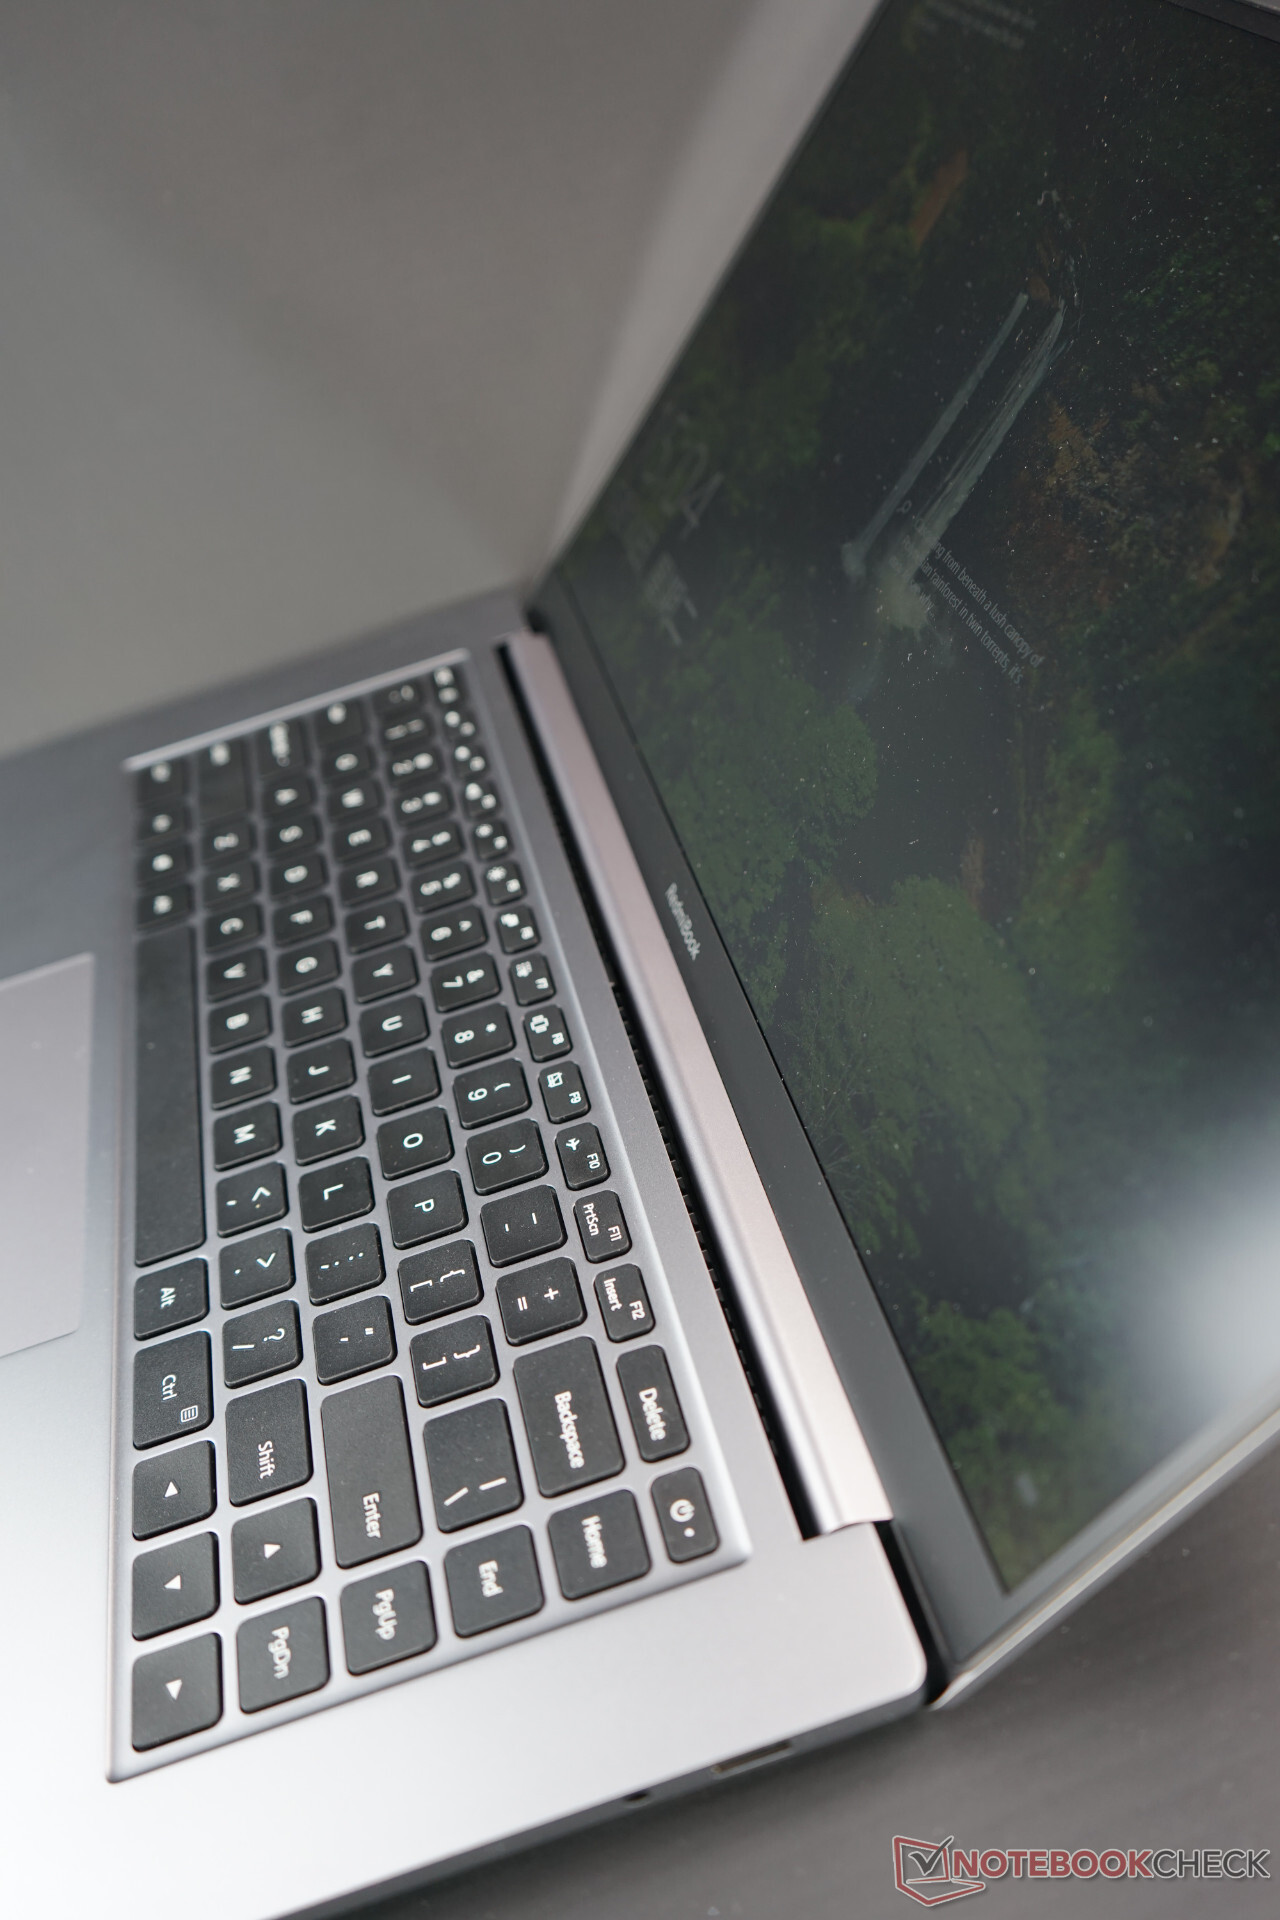

The dimensions differ significantly from its predecessor. The 16:9 display has a narrower but wider base area and the case is considerably thicker. In return, Xiaomi can also use larger ports in the RedmiBook.
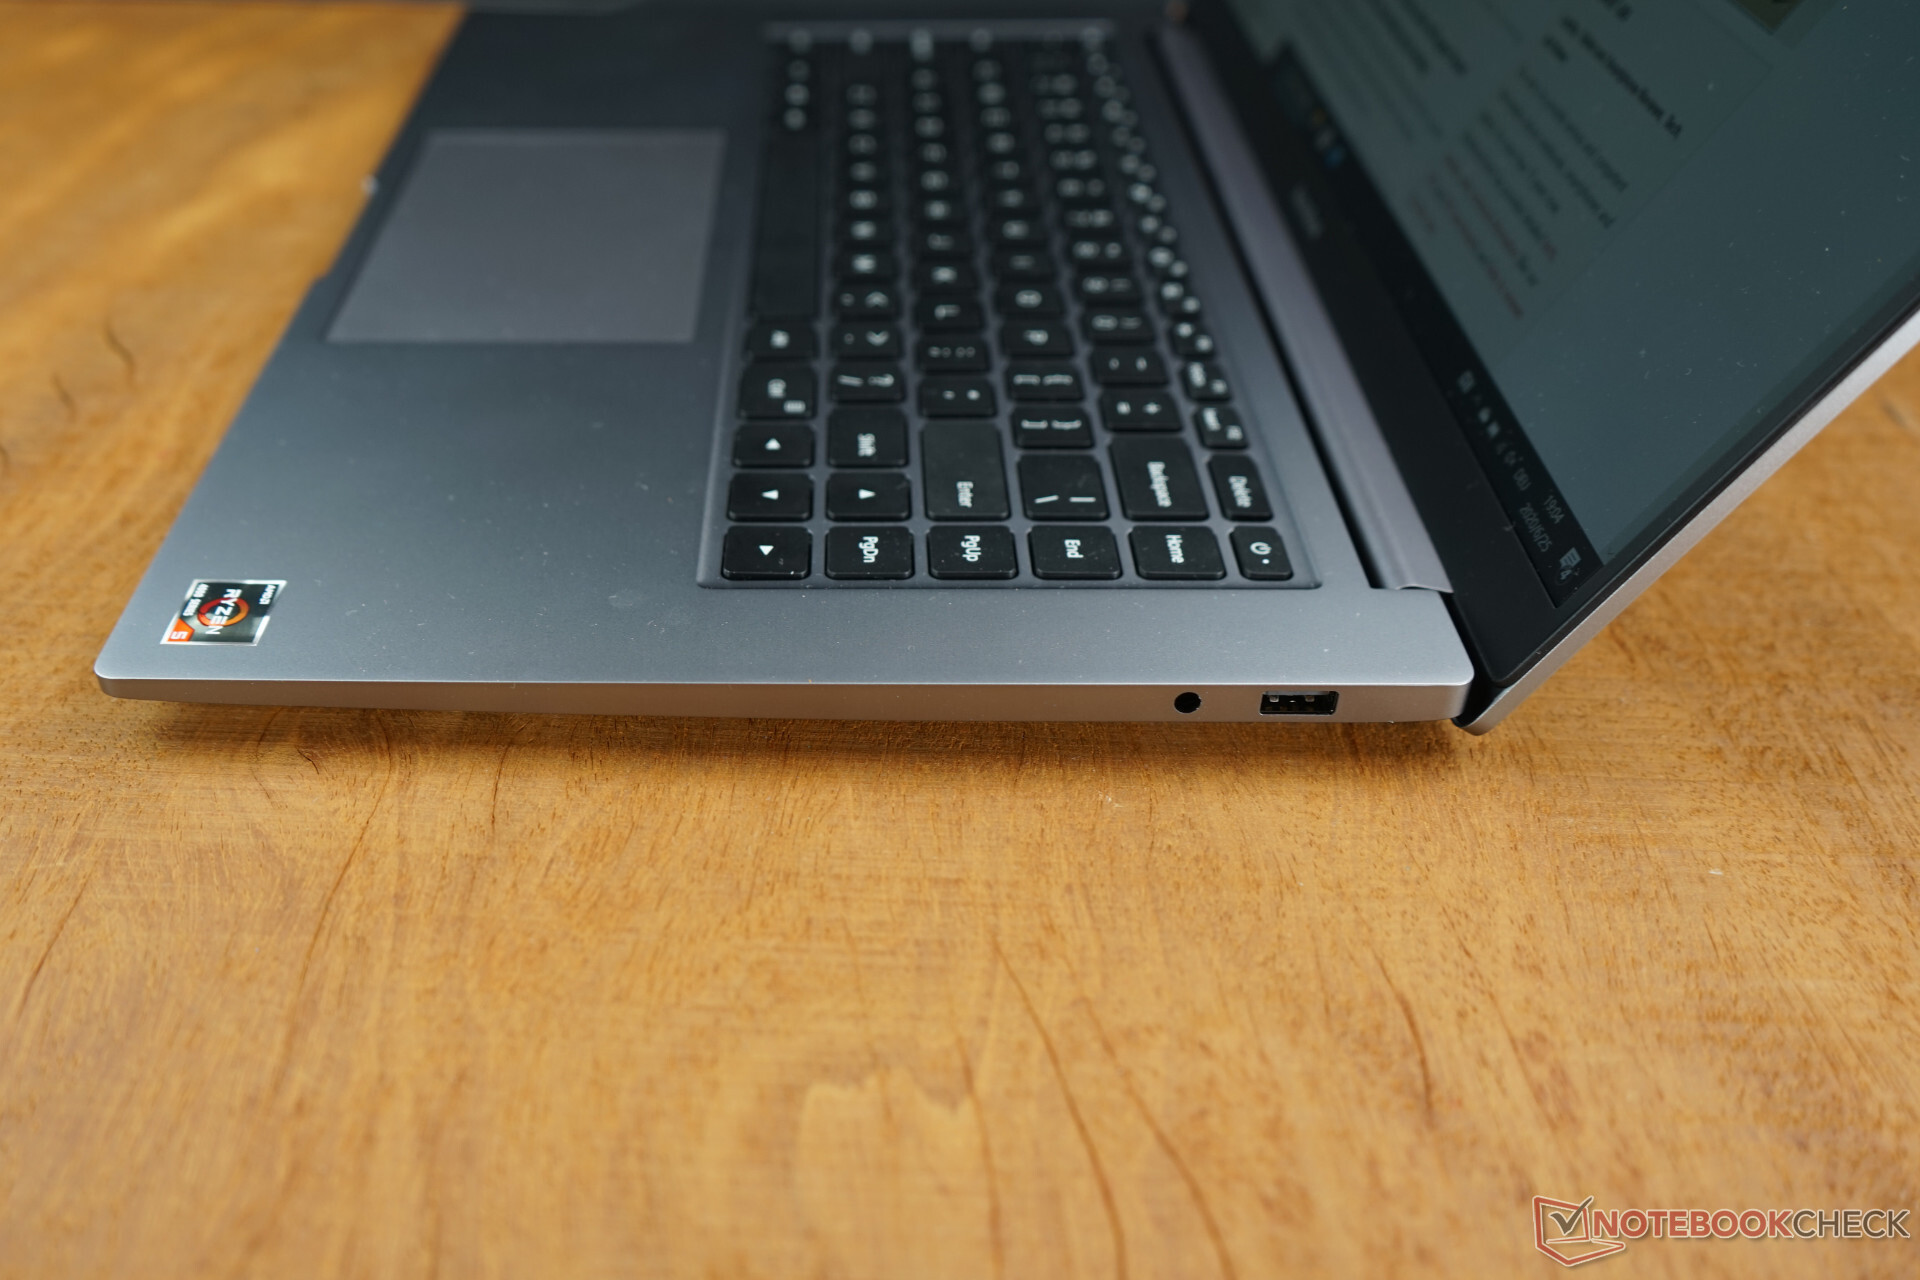
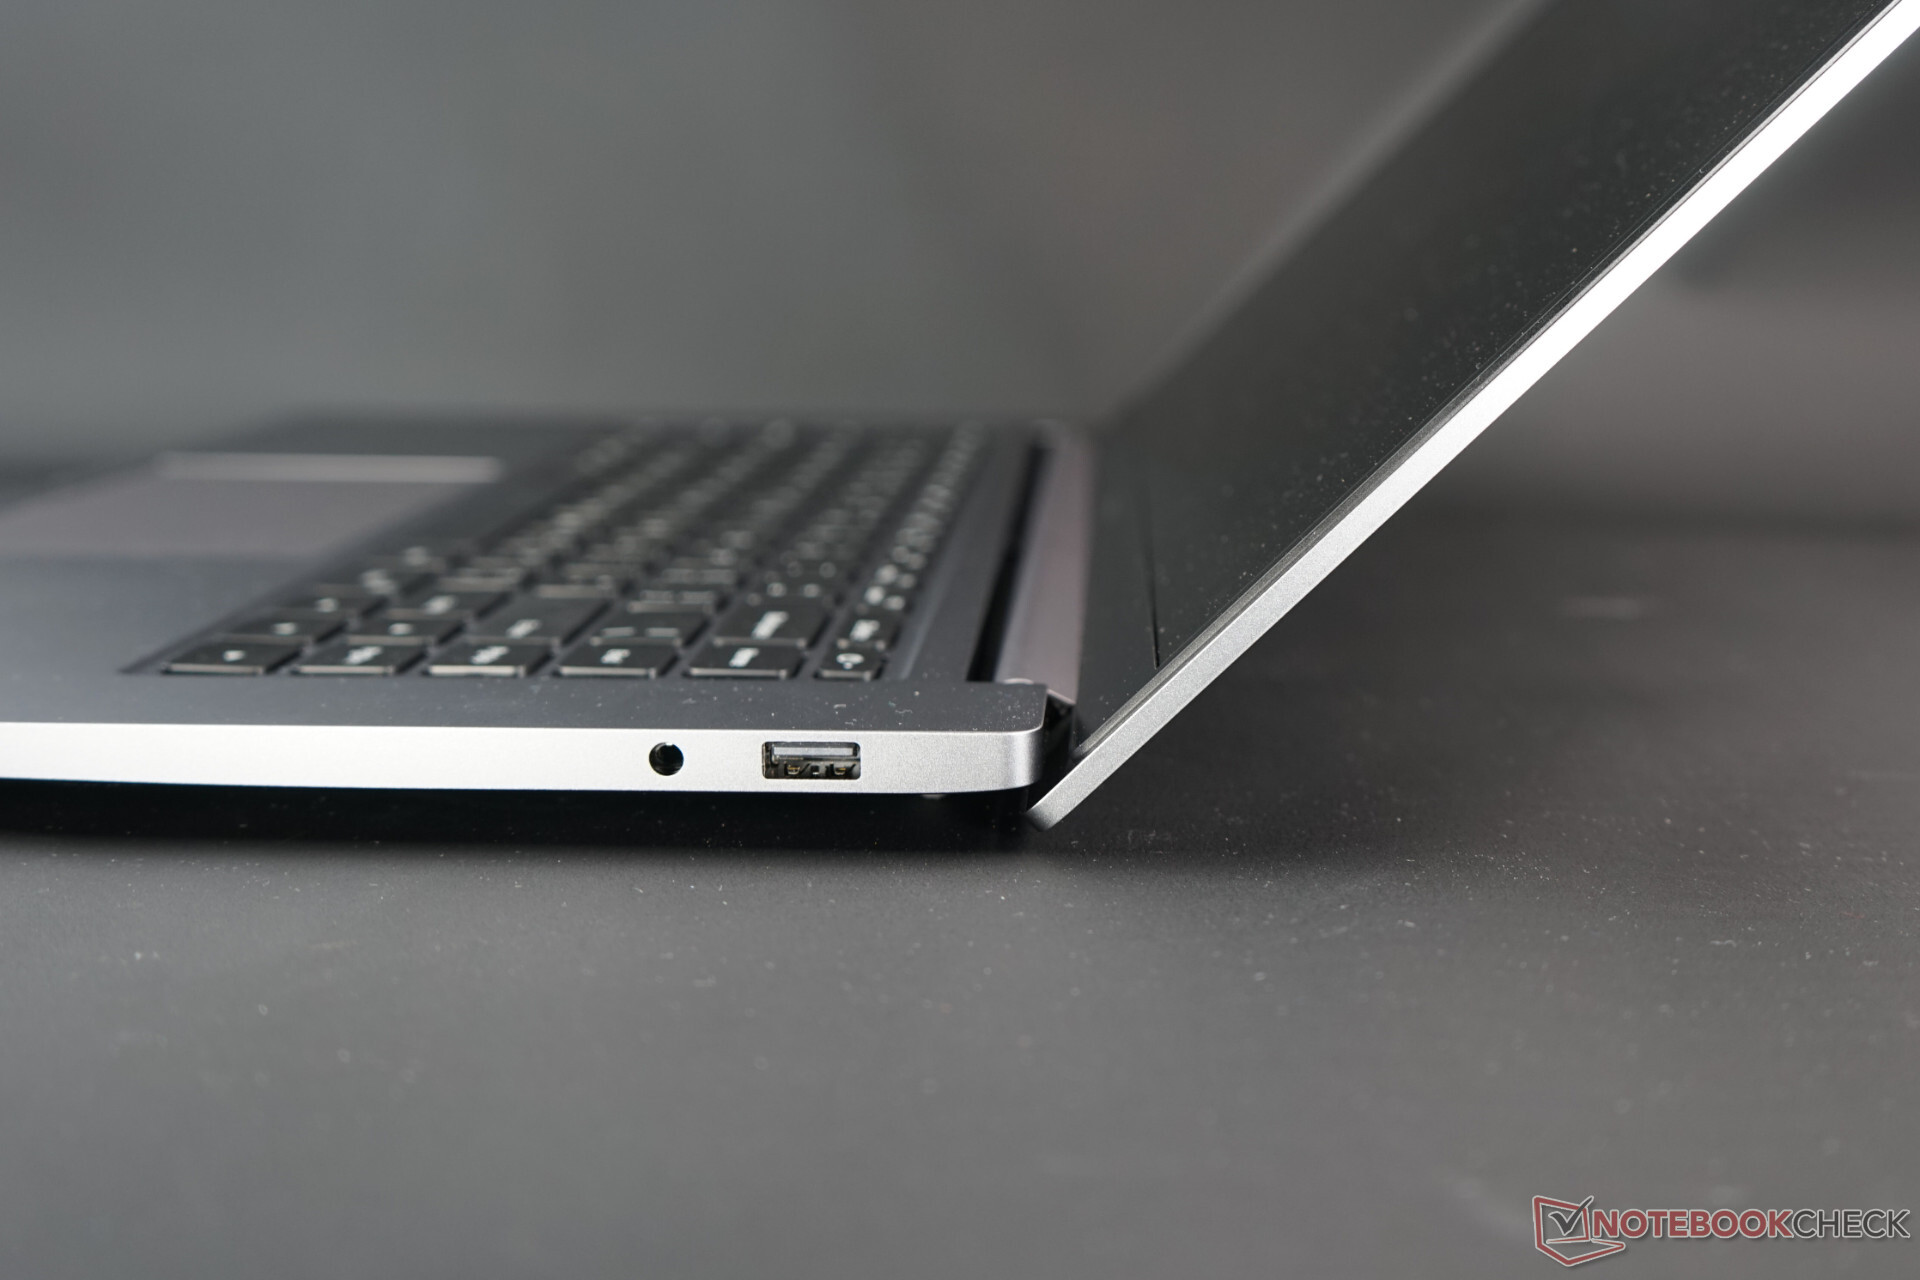
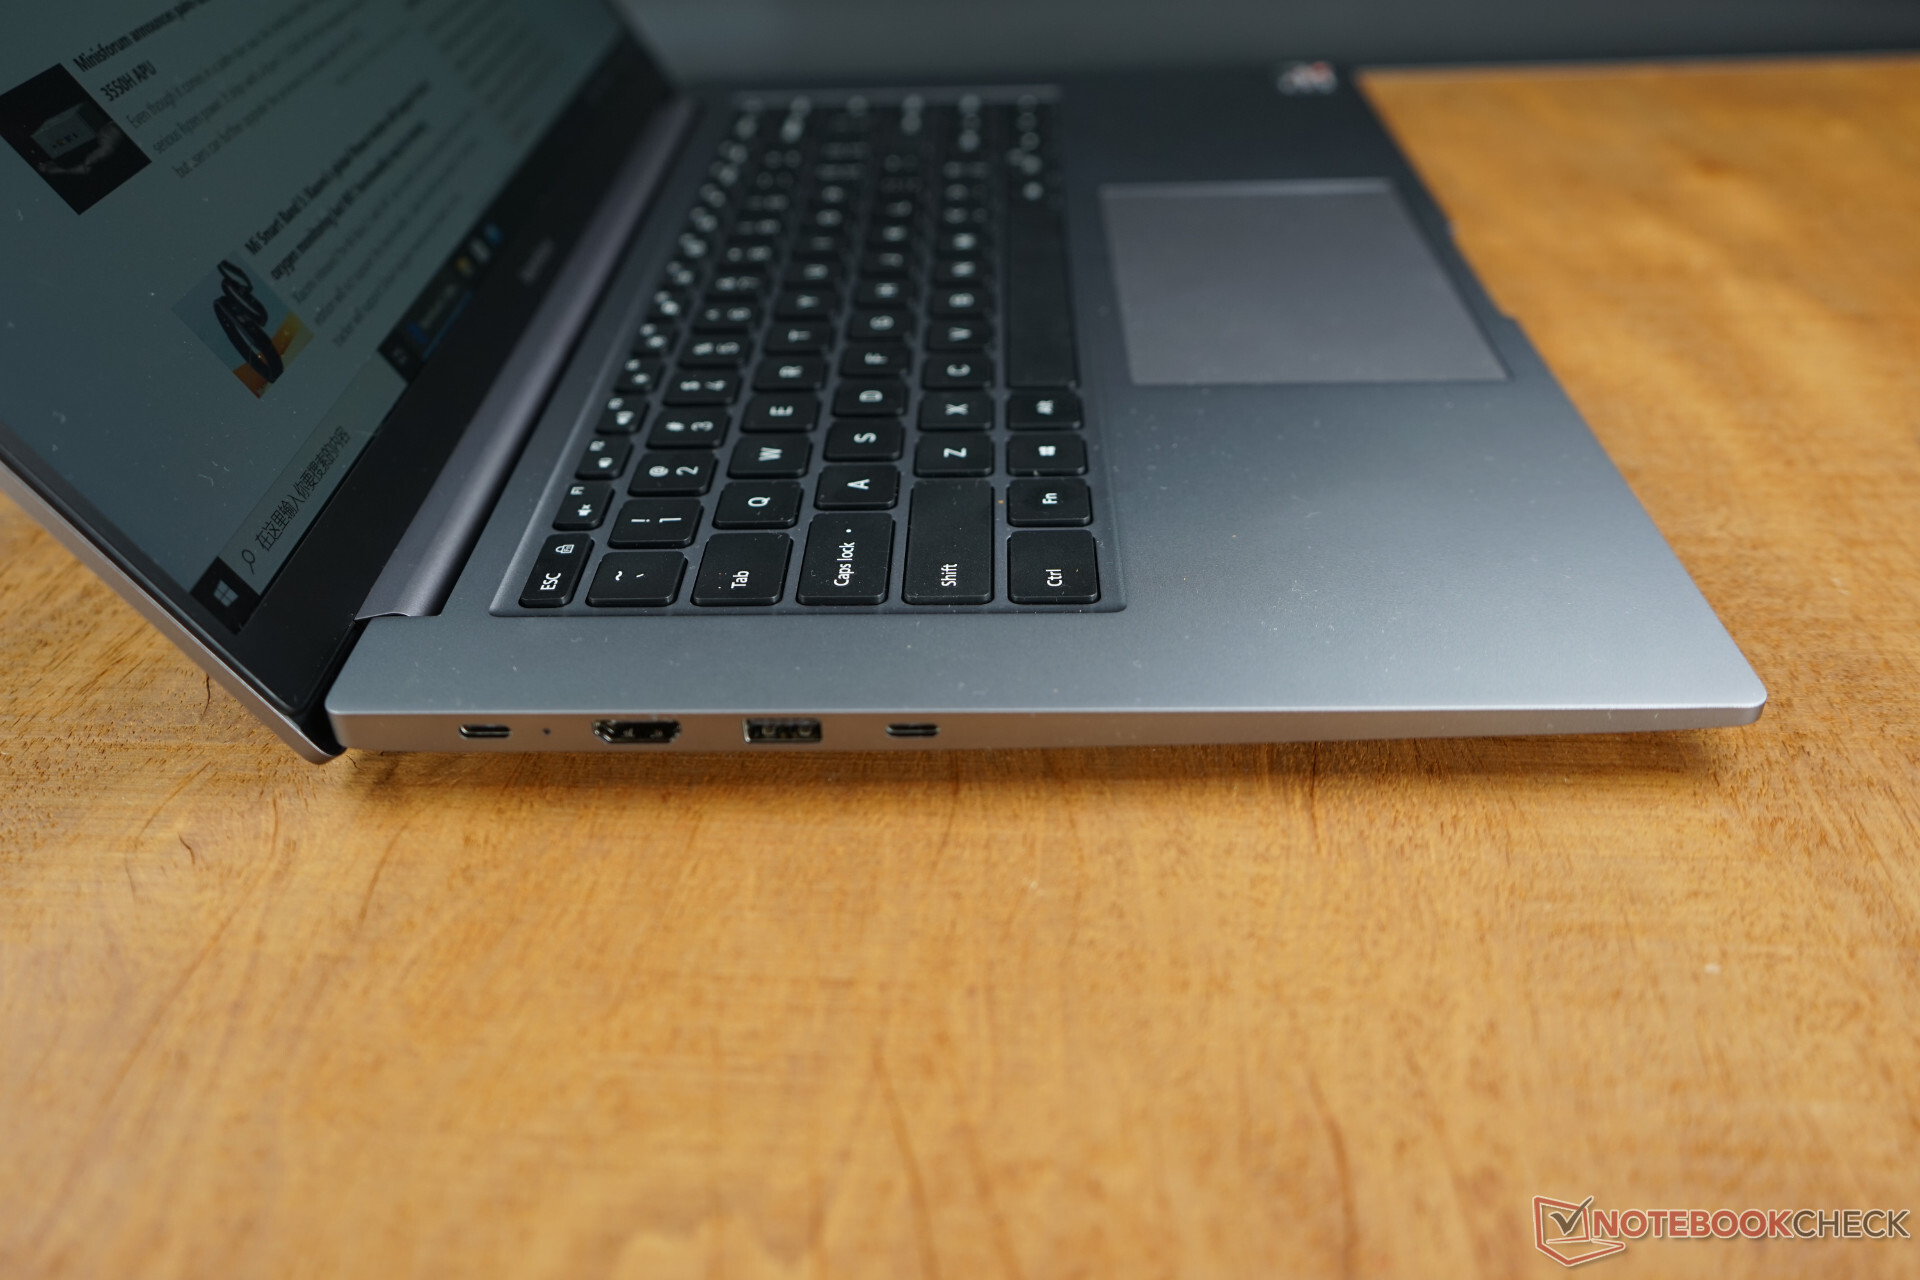
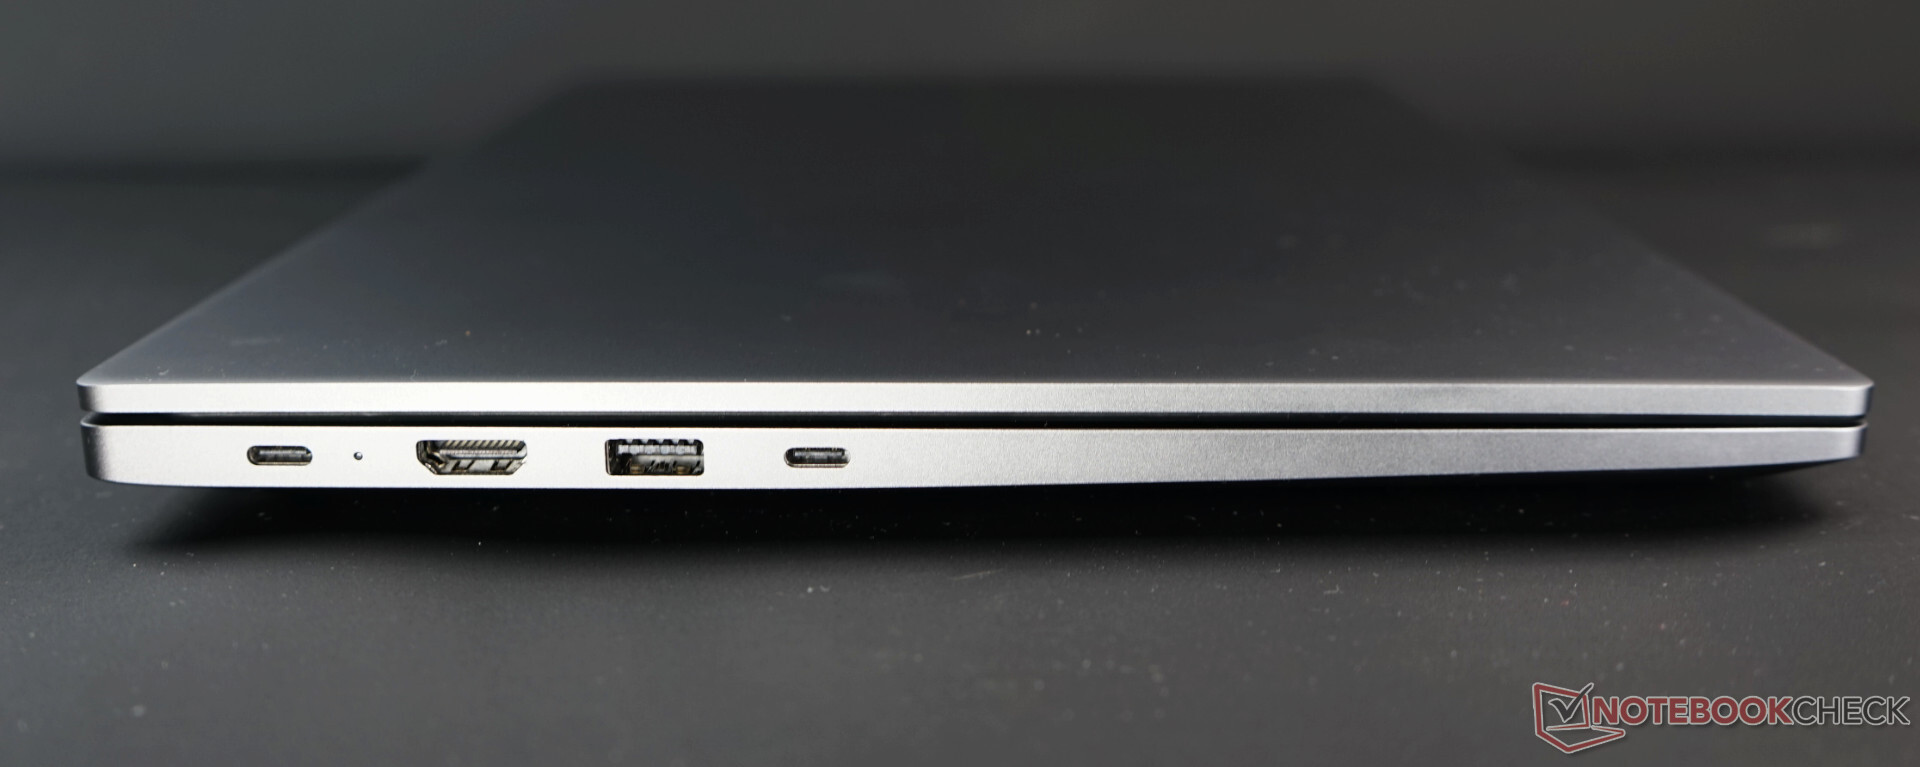
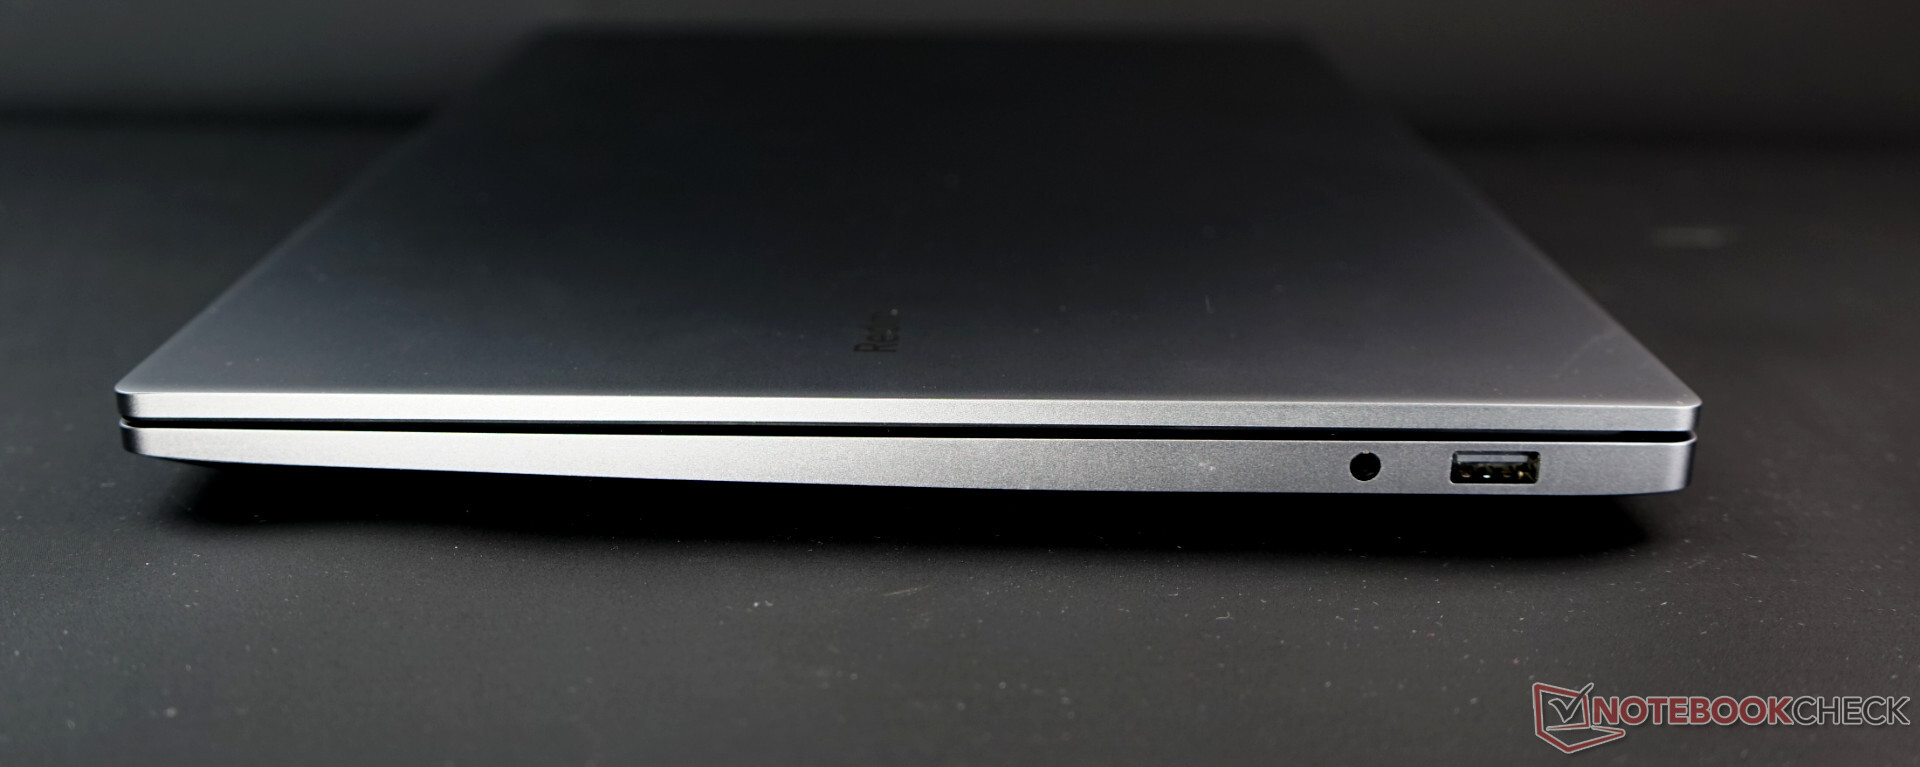
Connectivity
Xiaomi distributes the connections to the left and right sides of the case. The built-in first USB-C port is also used for power supply and as a DisplayPort. Unfortunately, the power transfer didn't work with two tested monitors (Philips Brilliance 329P9H and LG 27UD88-W), so we couldn't use the DisplayPort and charge the laptop at the same time. Fortunately though, the HDMI port worked perfectly with 4K and 60 Hz. Other USB-C chargers (Apple, Anker and Inateck) worked just as smoothly. Another surprise awaited us with the USB-A port on the right: It only supports the old USB 2.0 standard and therefore works very slowly with storage media. A card reader and a Kensington lock are completely missing.
Communication
As a WLAN card, Xiaomi uses a cheap Realtek 8822CE with support for Wi-Fi 5 (802.11ac). In comparison to the other 11 notebooks in our test with the same hardware, the RedmiBook shows average results. Compared to other AC cards, such as the old Intel 8265, the Realtek scores well. Modern and fast Wi-Fi 6 hardware, such as in the Envy x360, is significantly faster (in combination with Wi-Fi 6 routers).
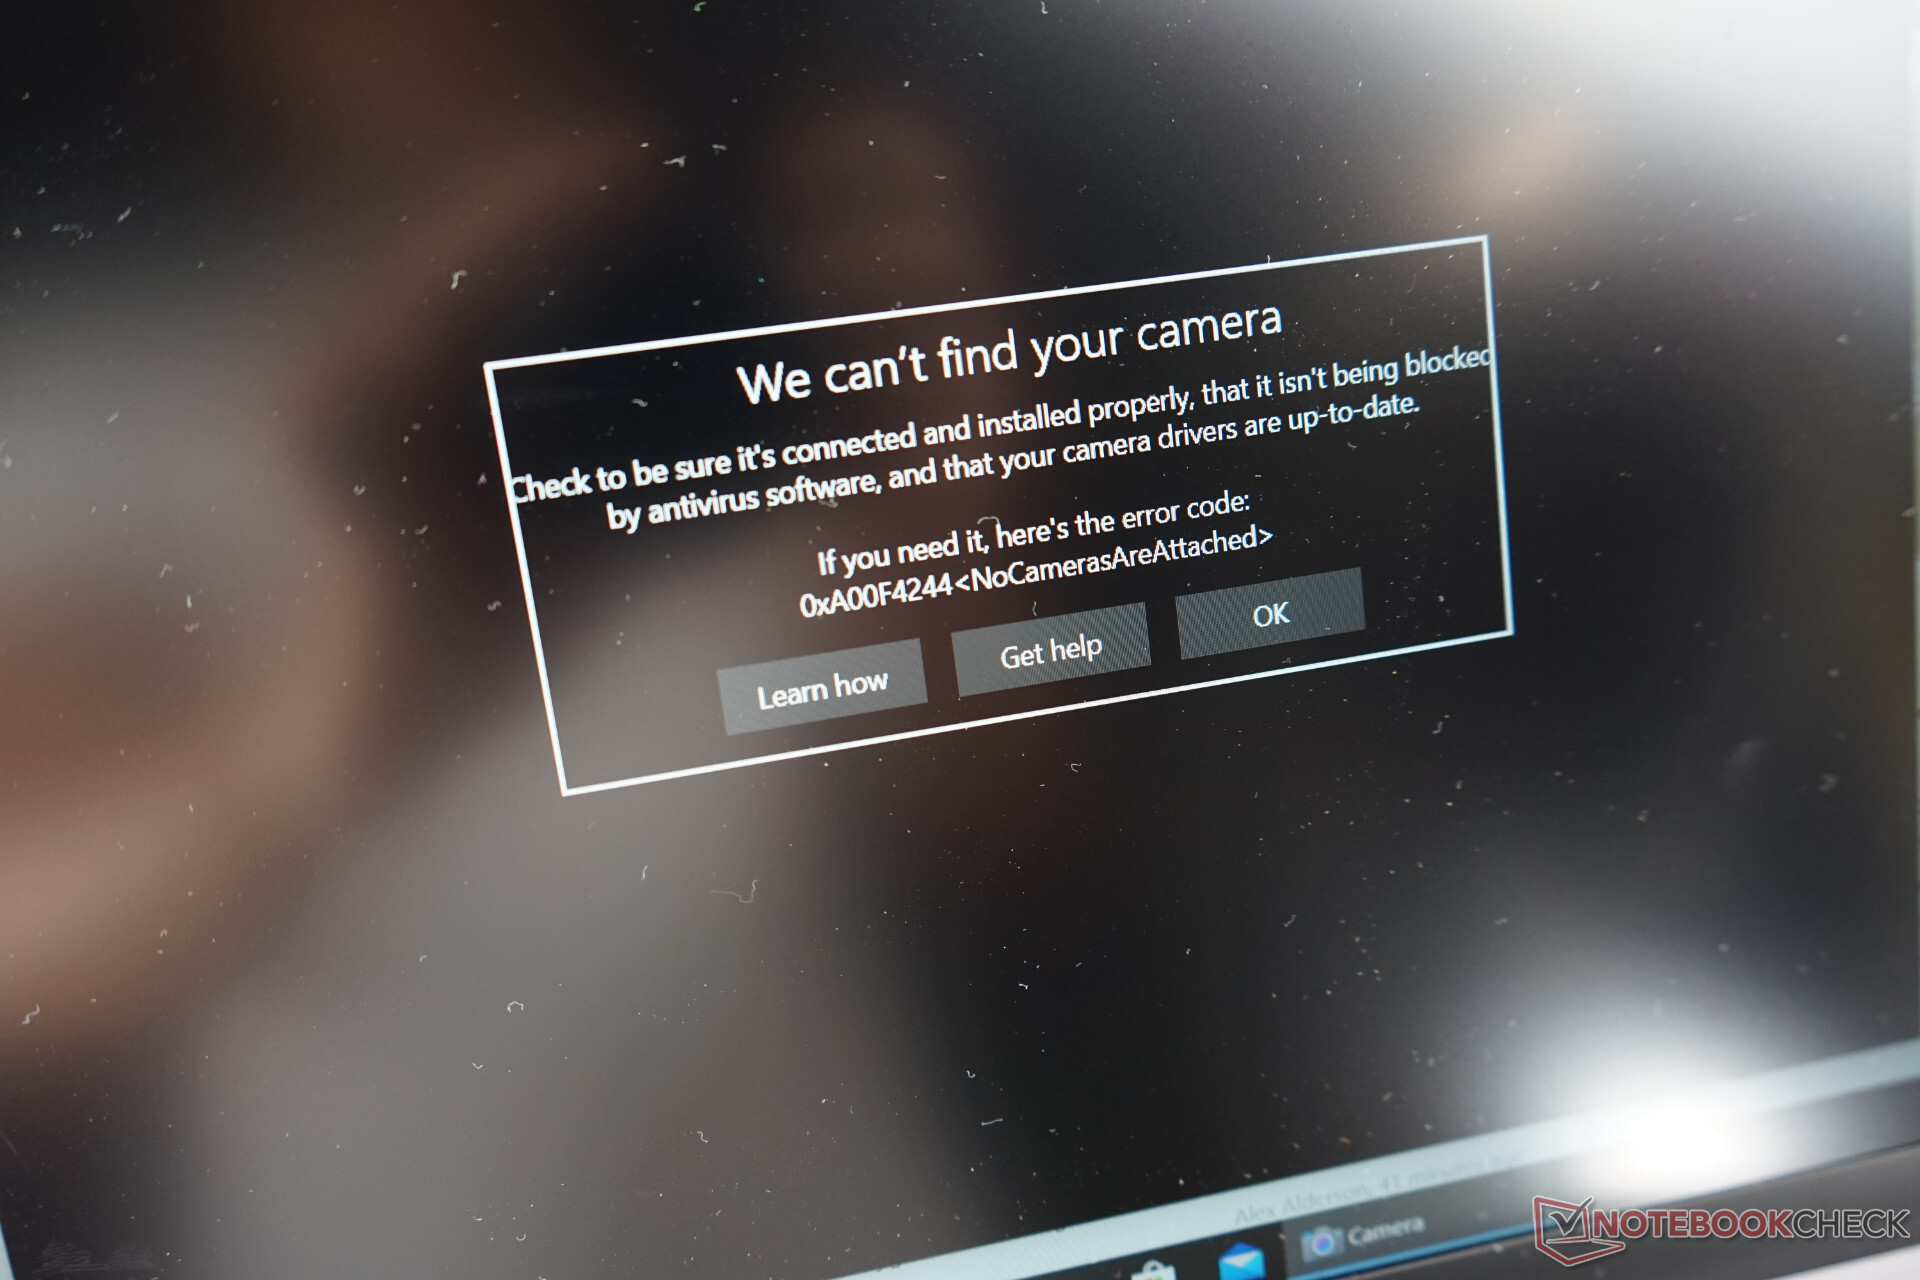
Webcam
Surprisingly, Xiaomi forgoes an integrated webcam in the RedmiBook 16.
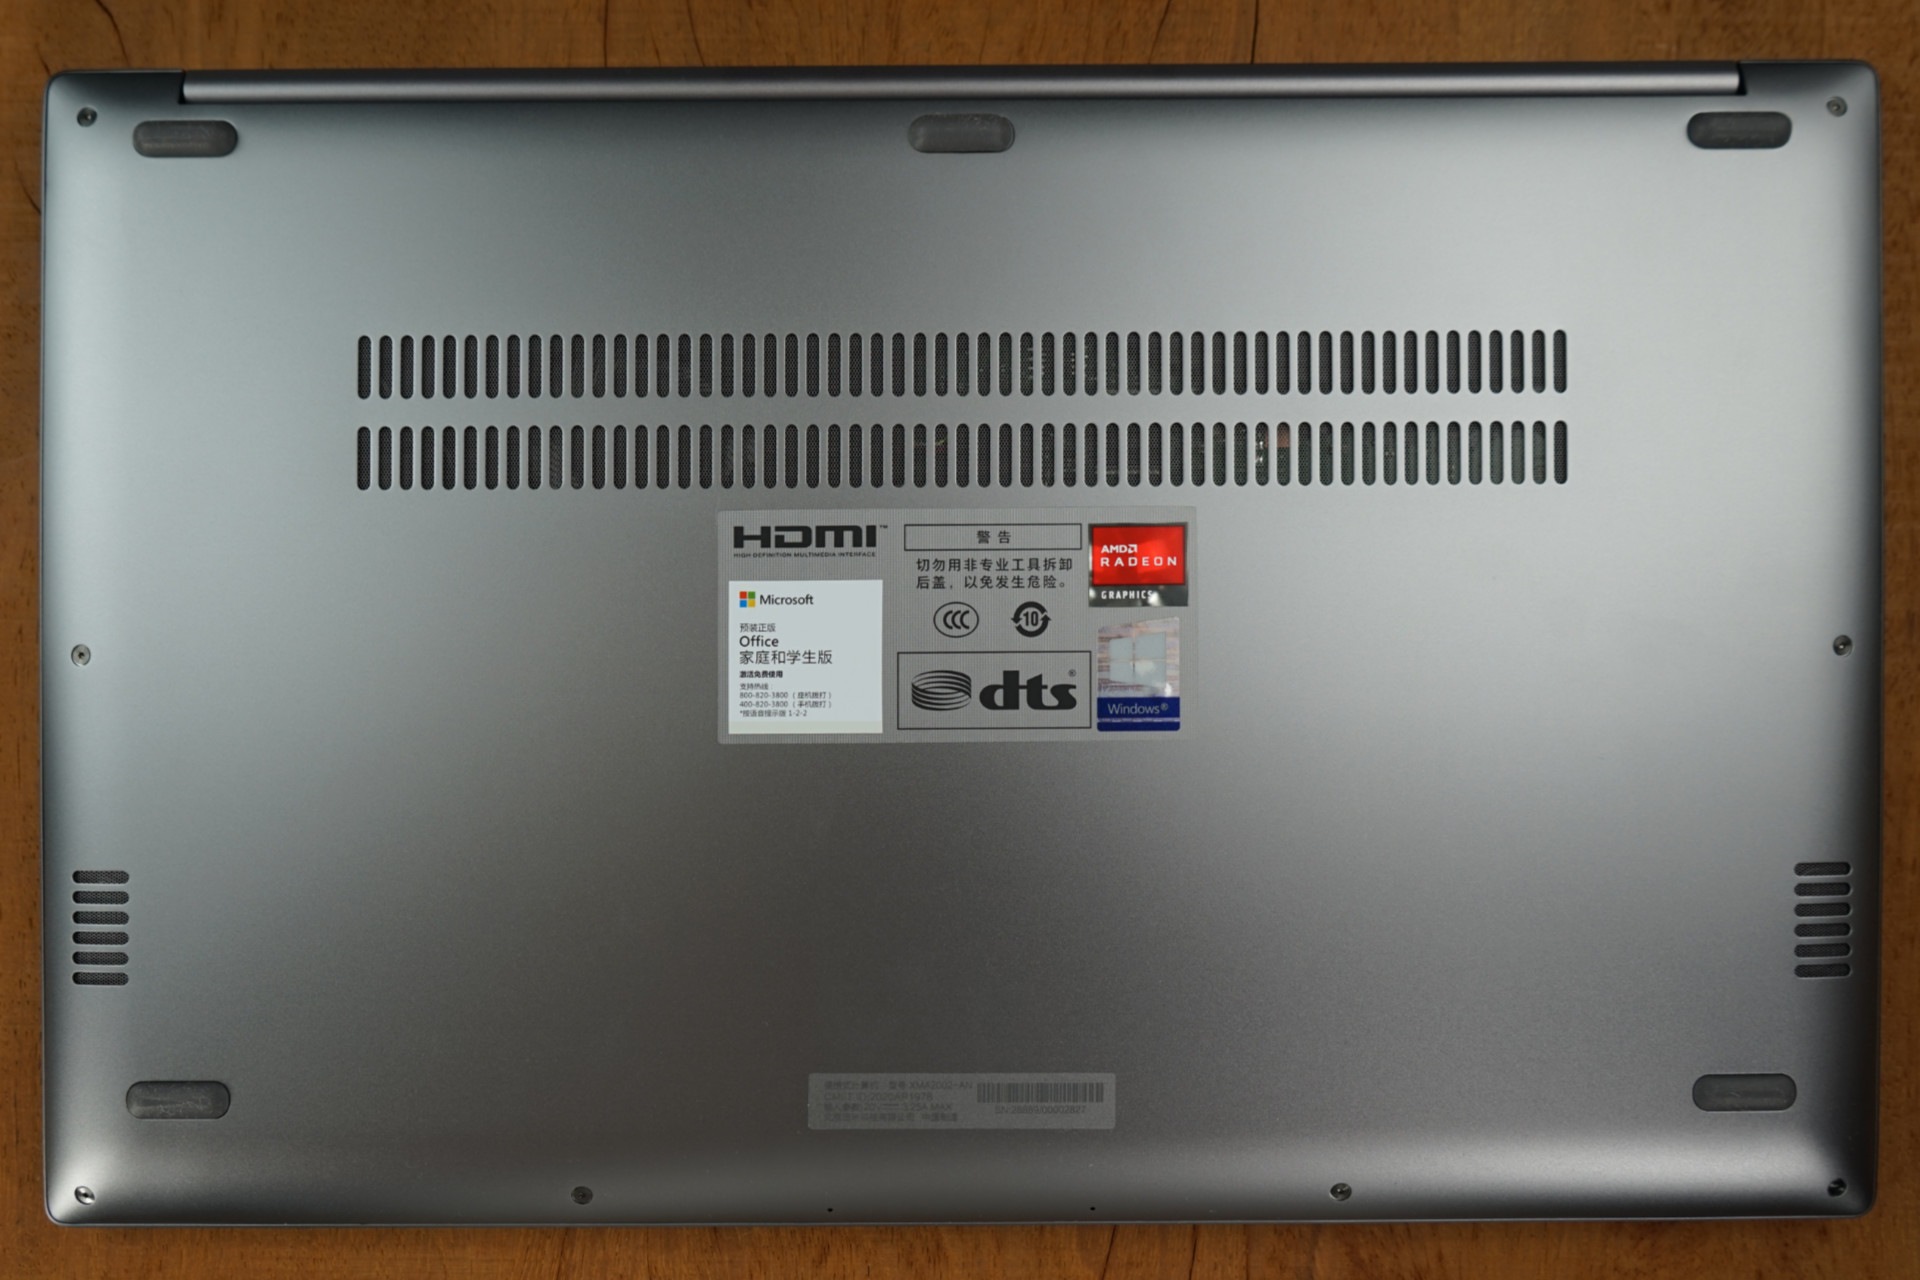
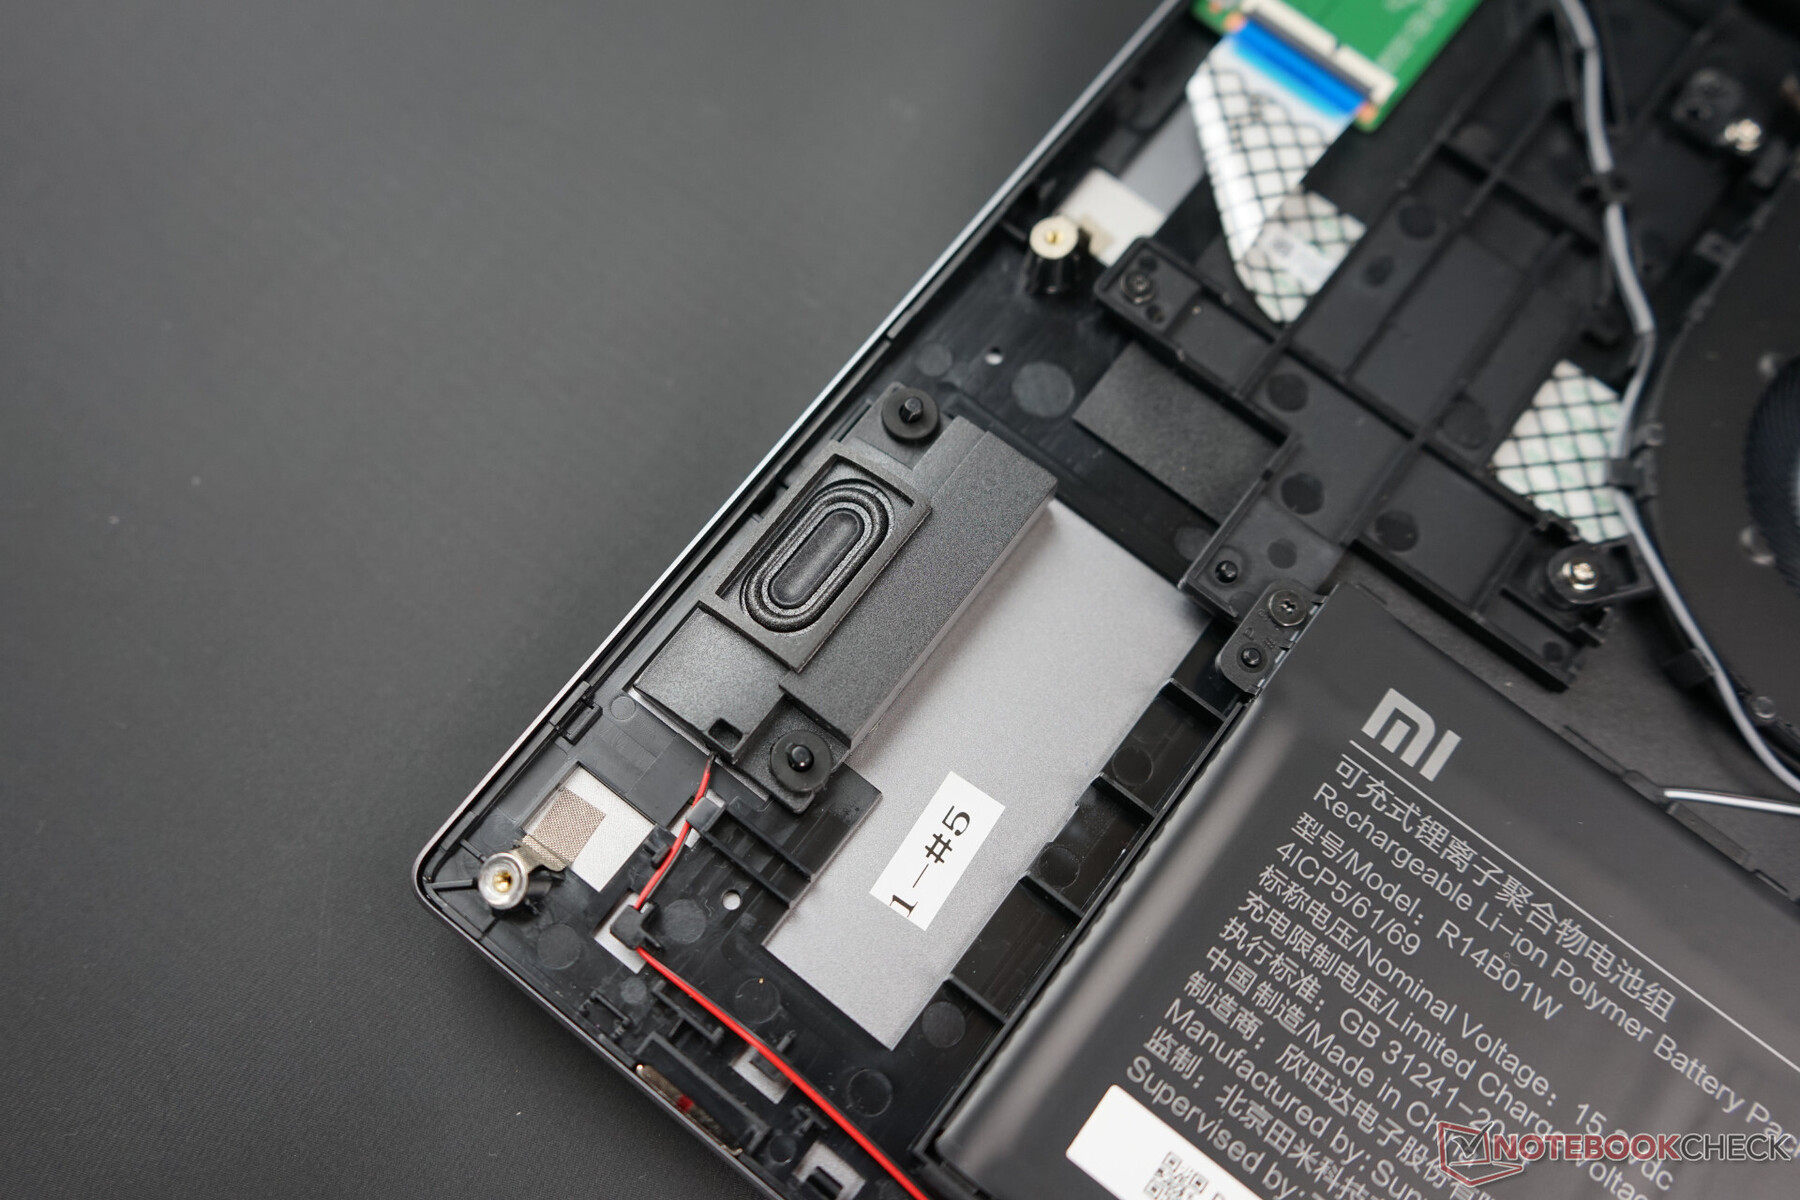
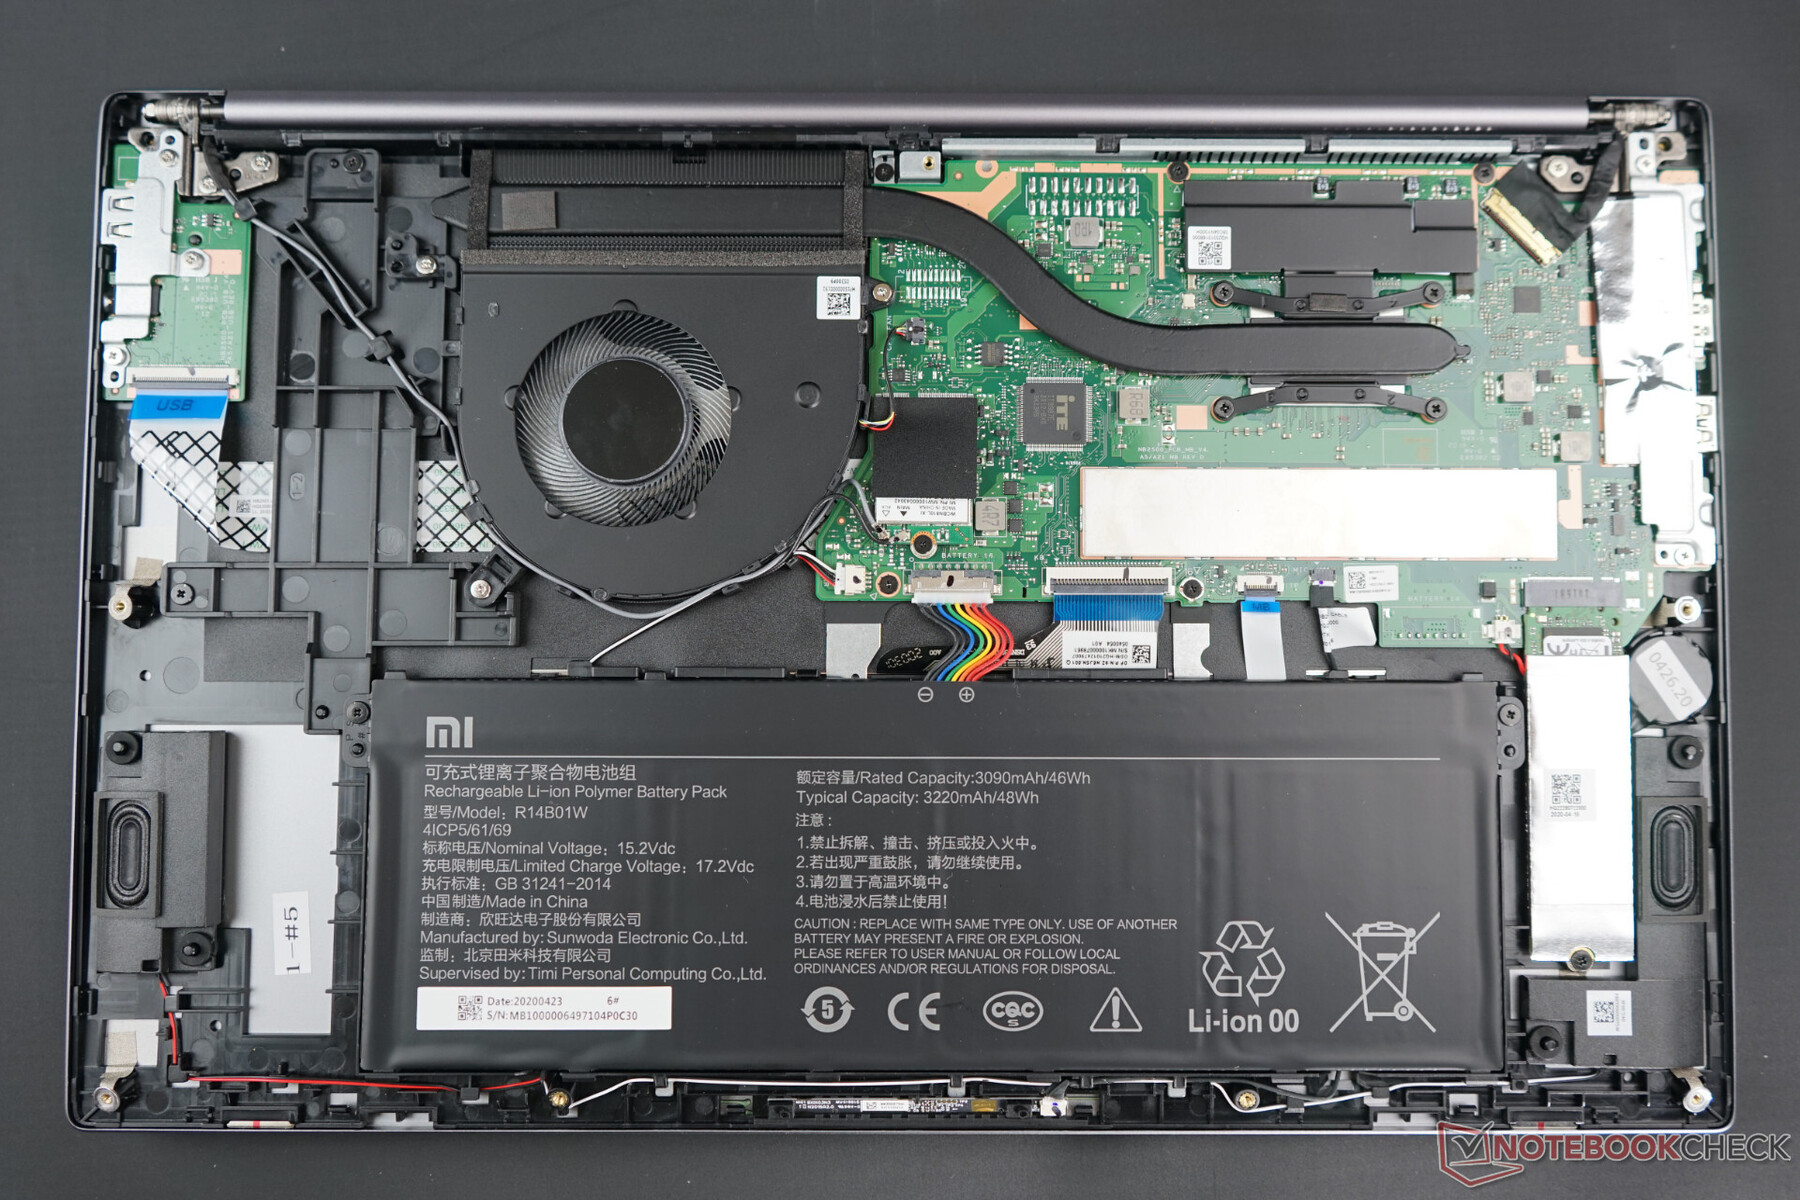
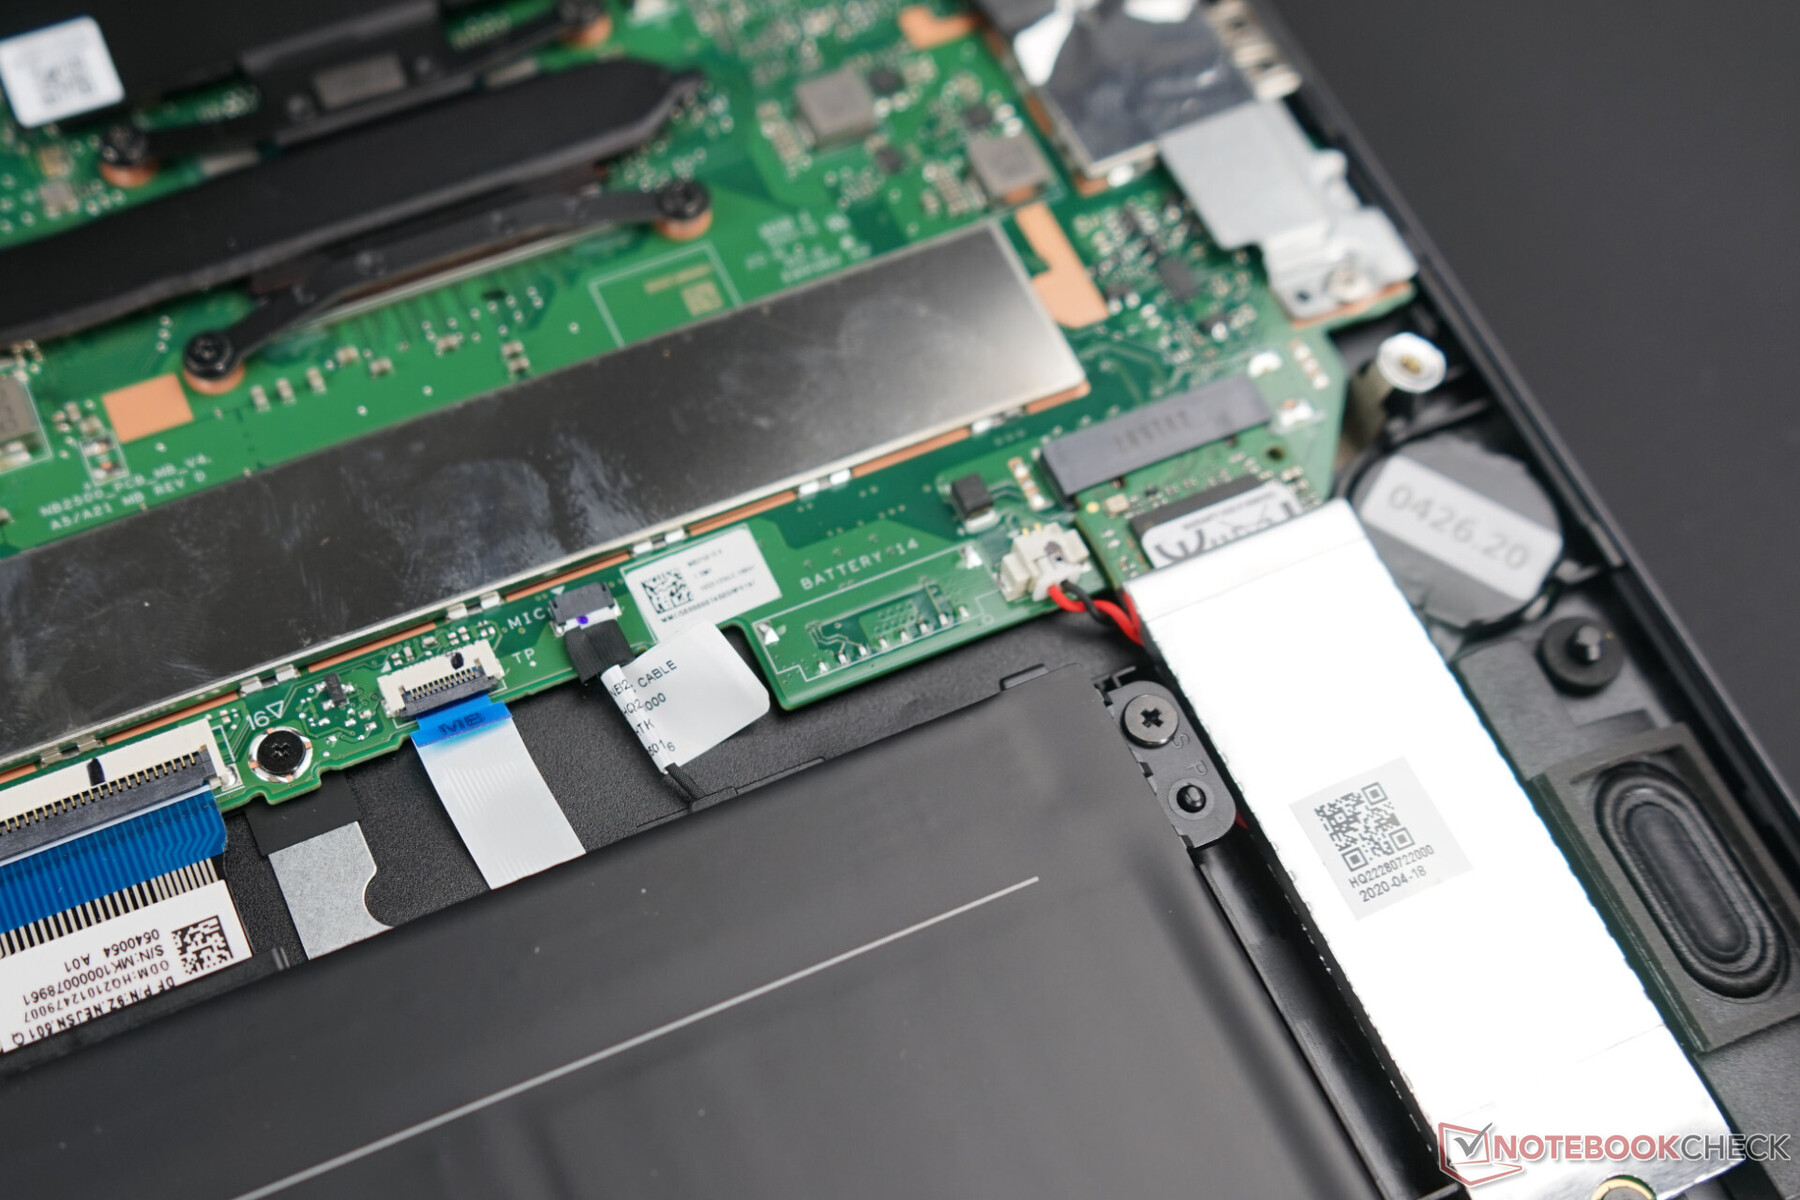
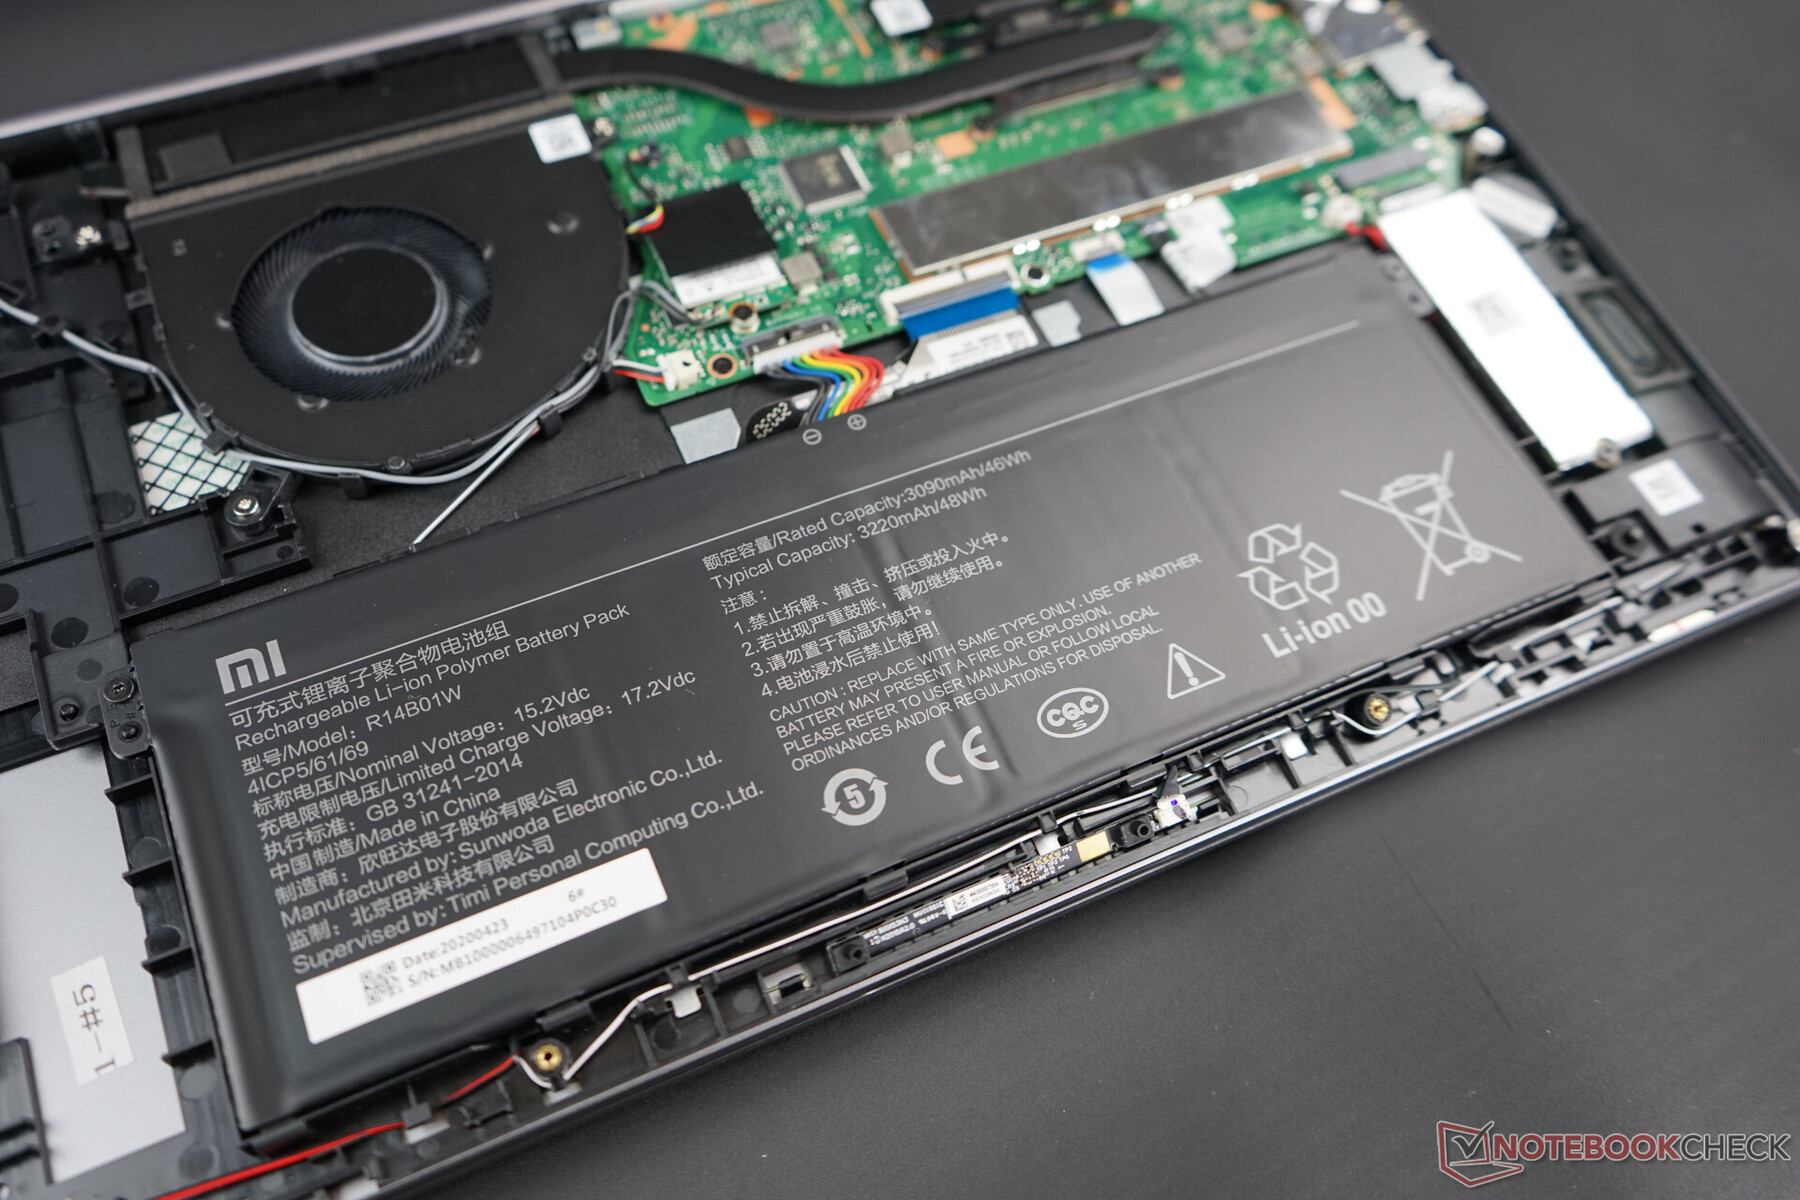
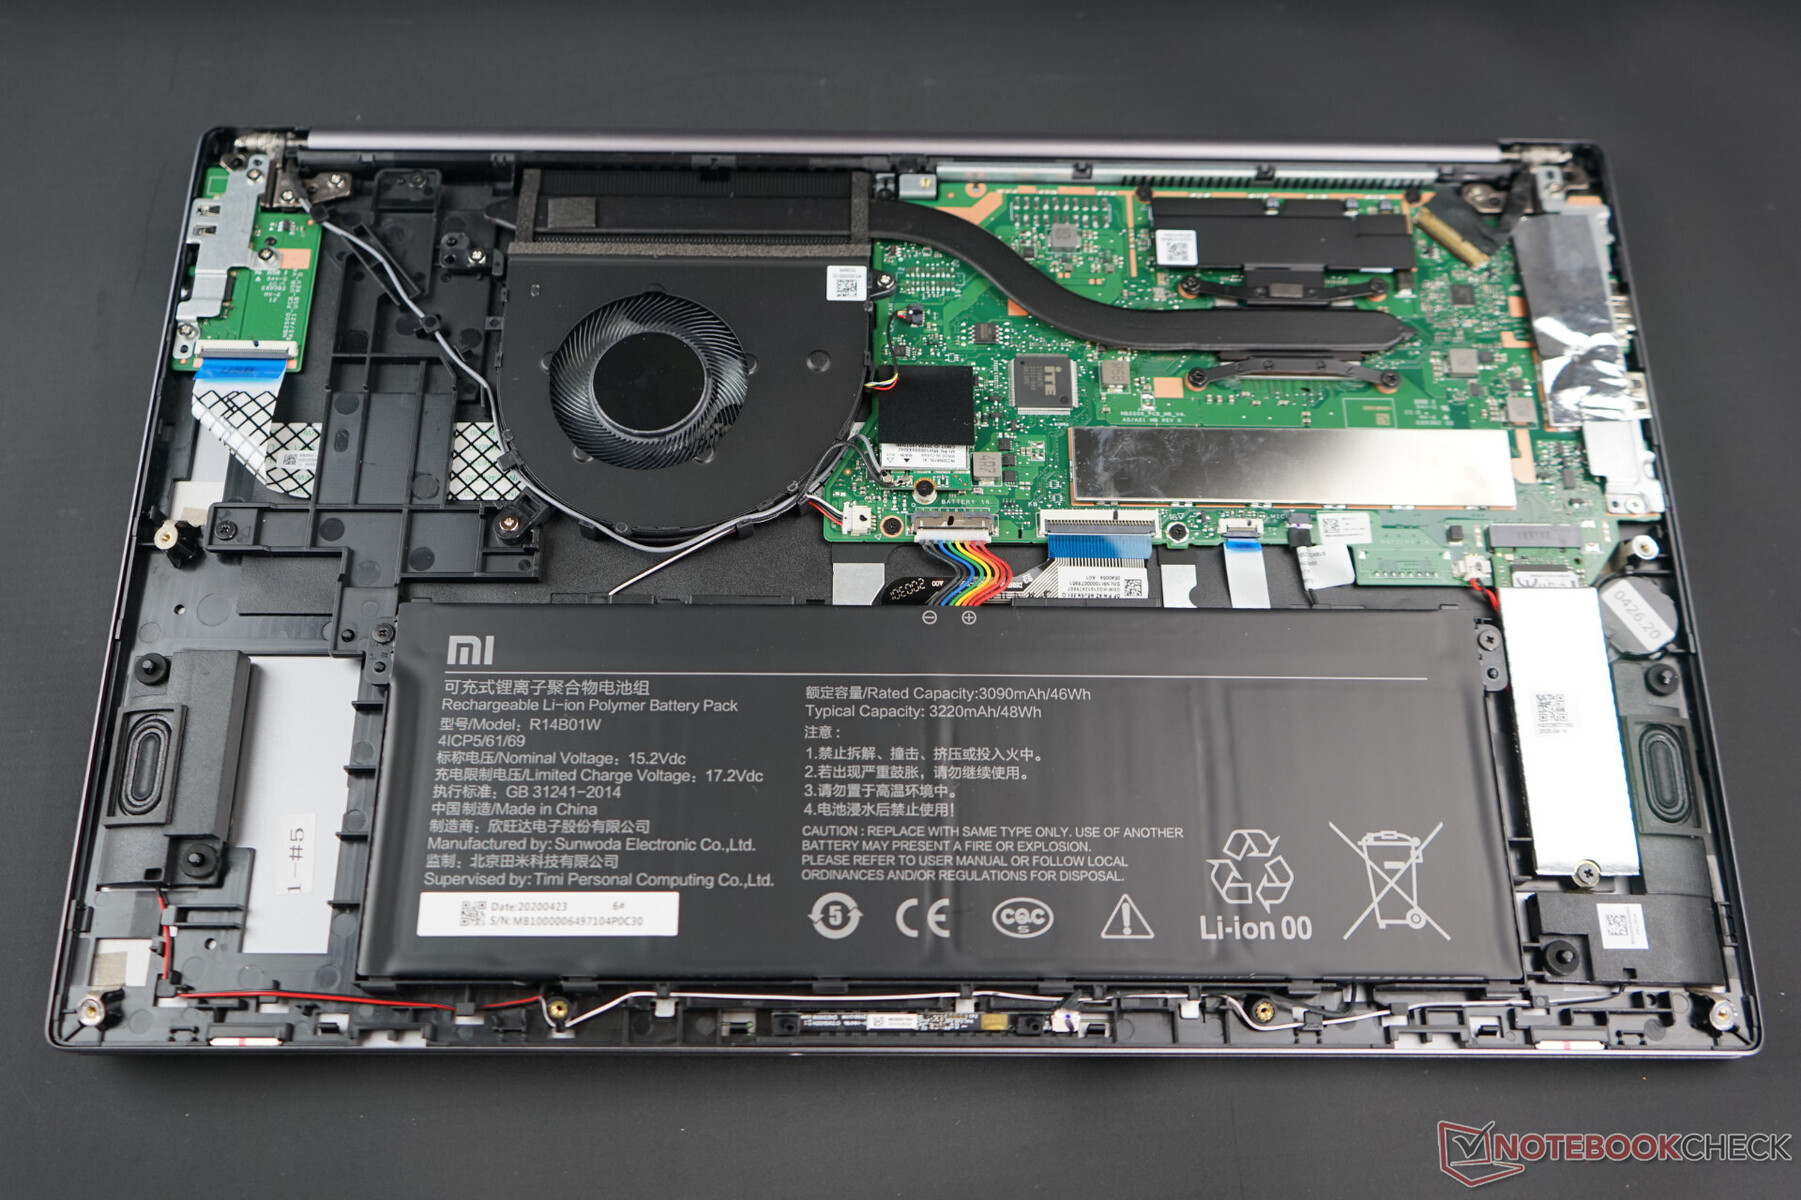
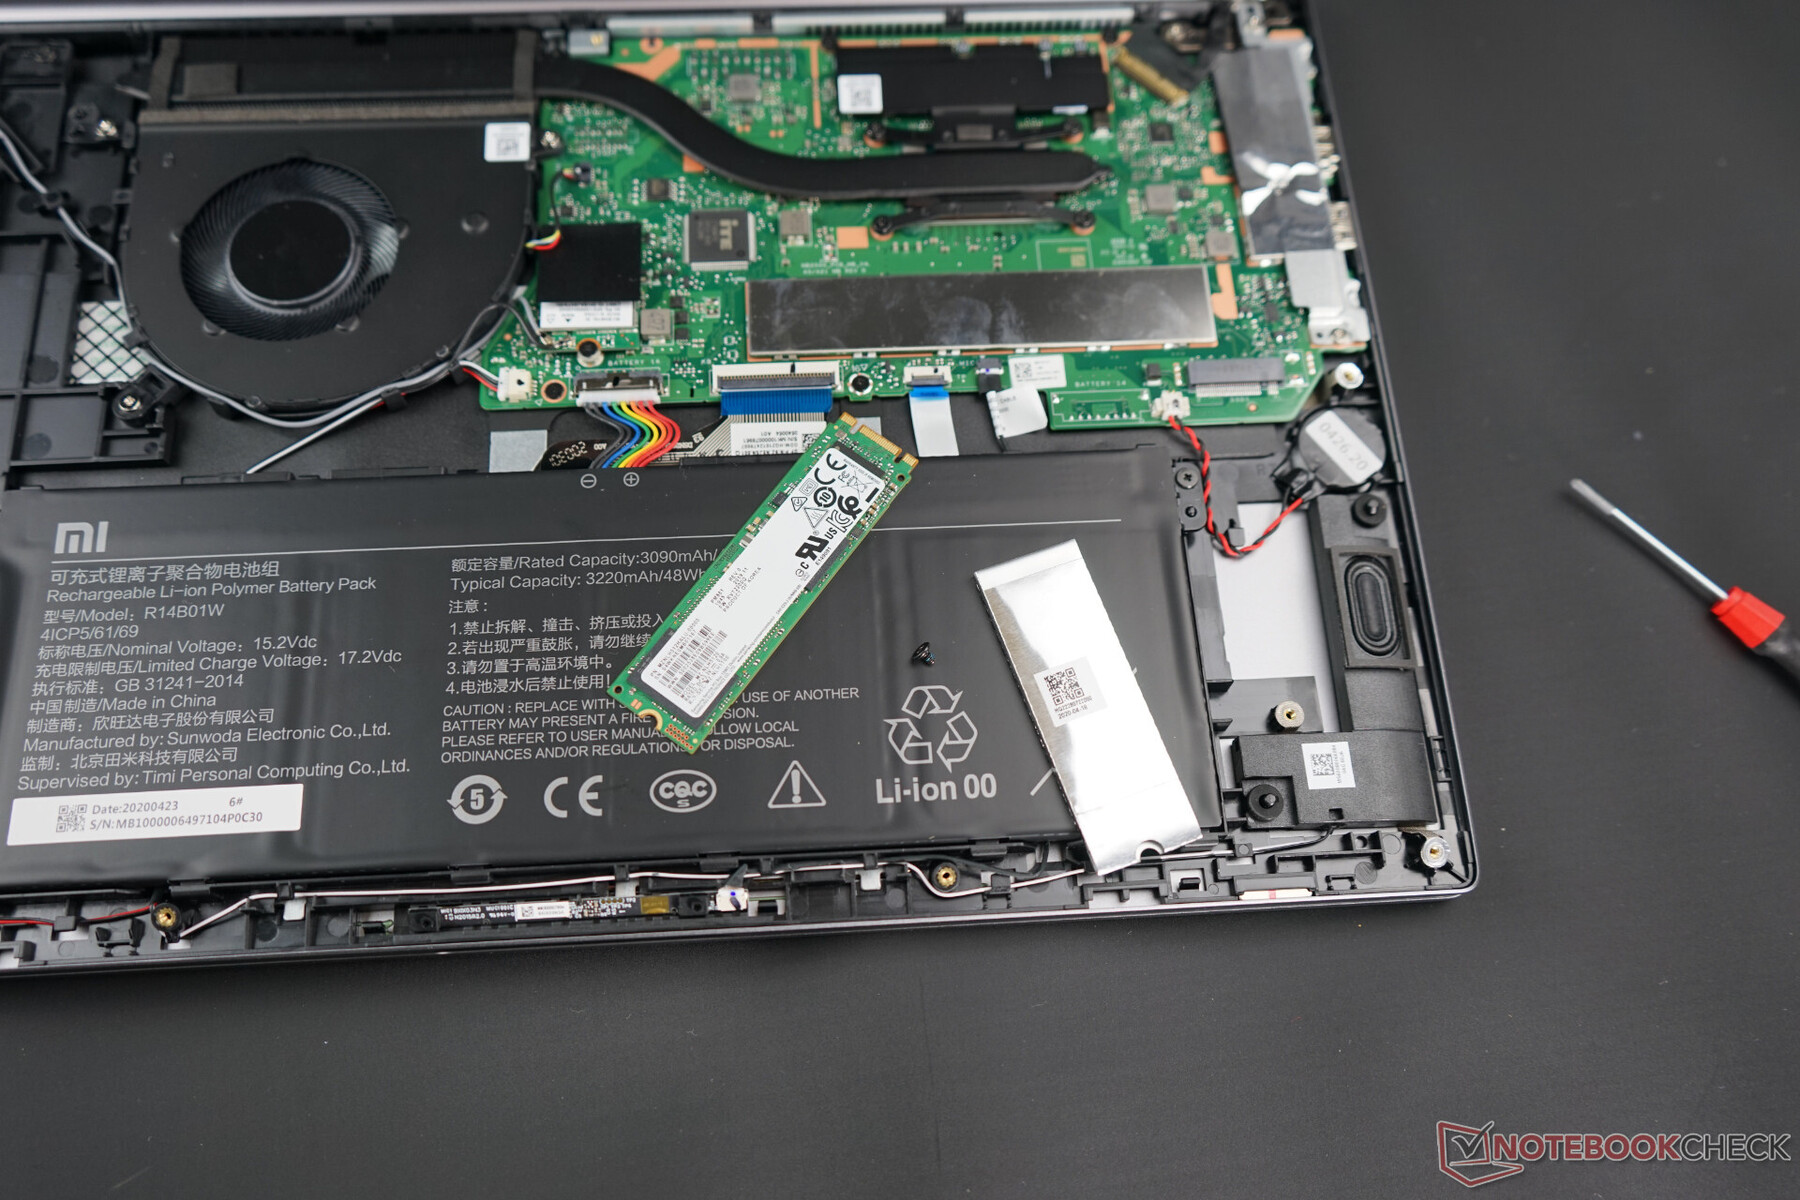
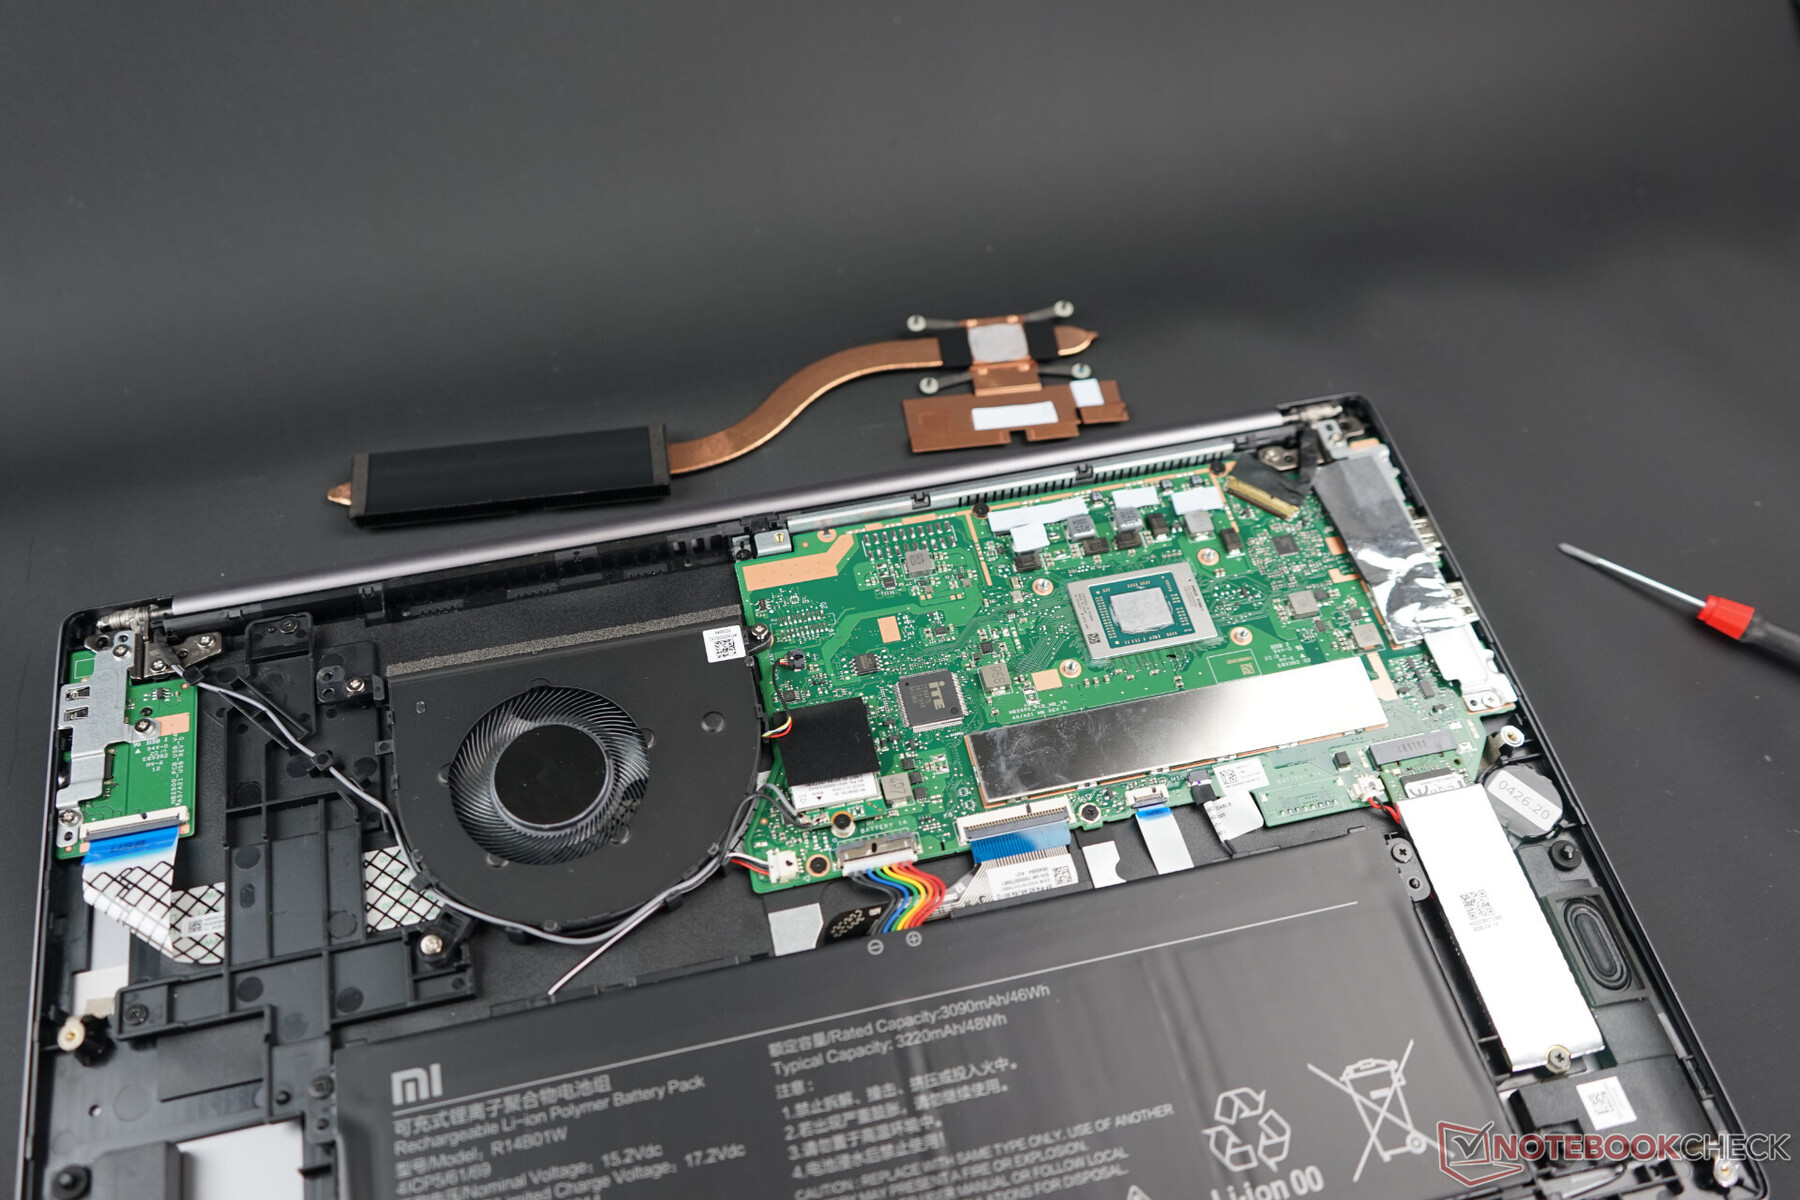
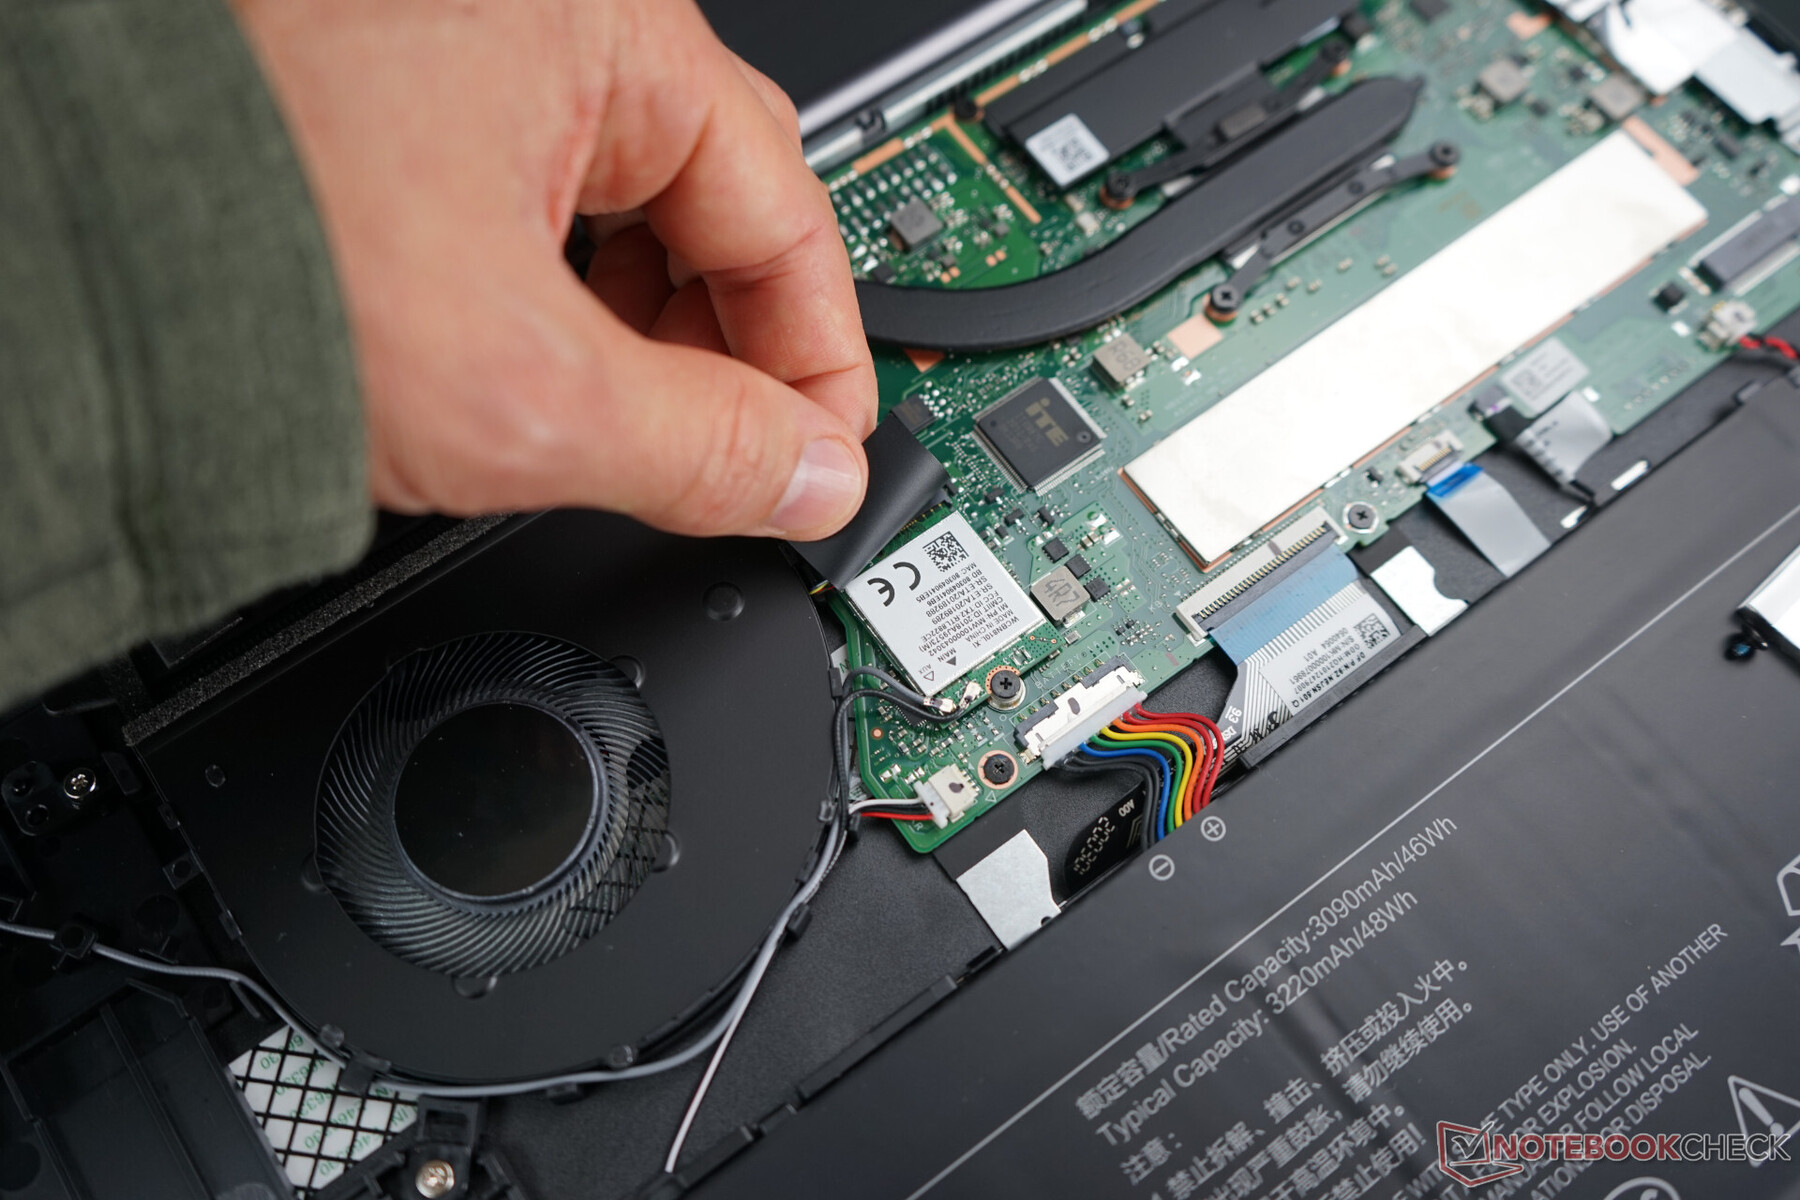
Maintenance
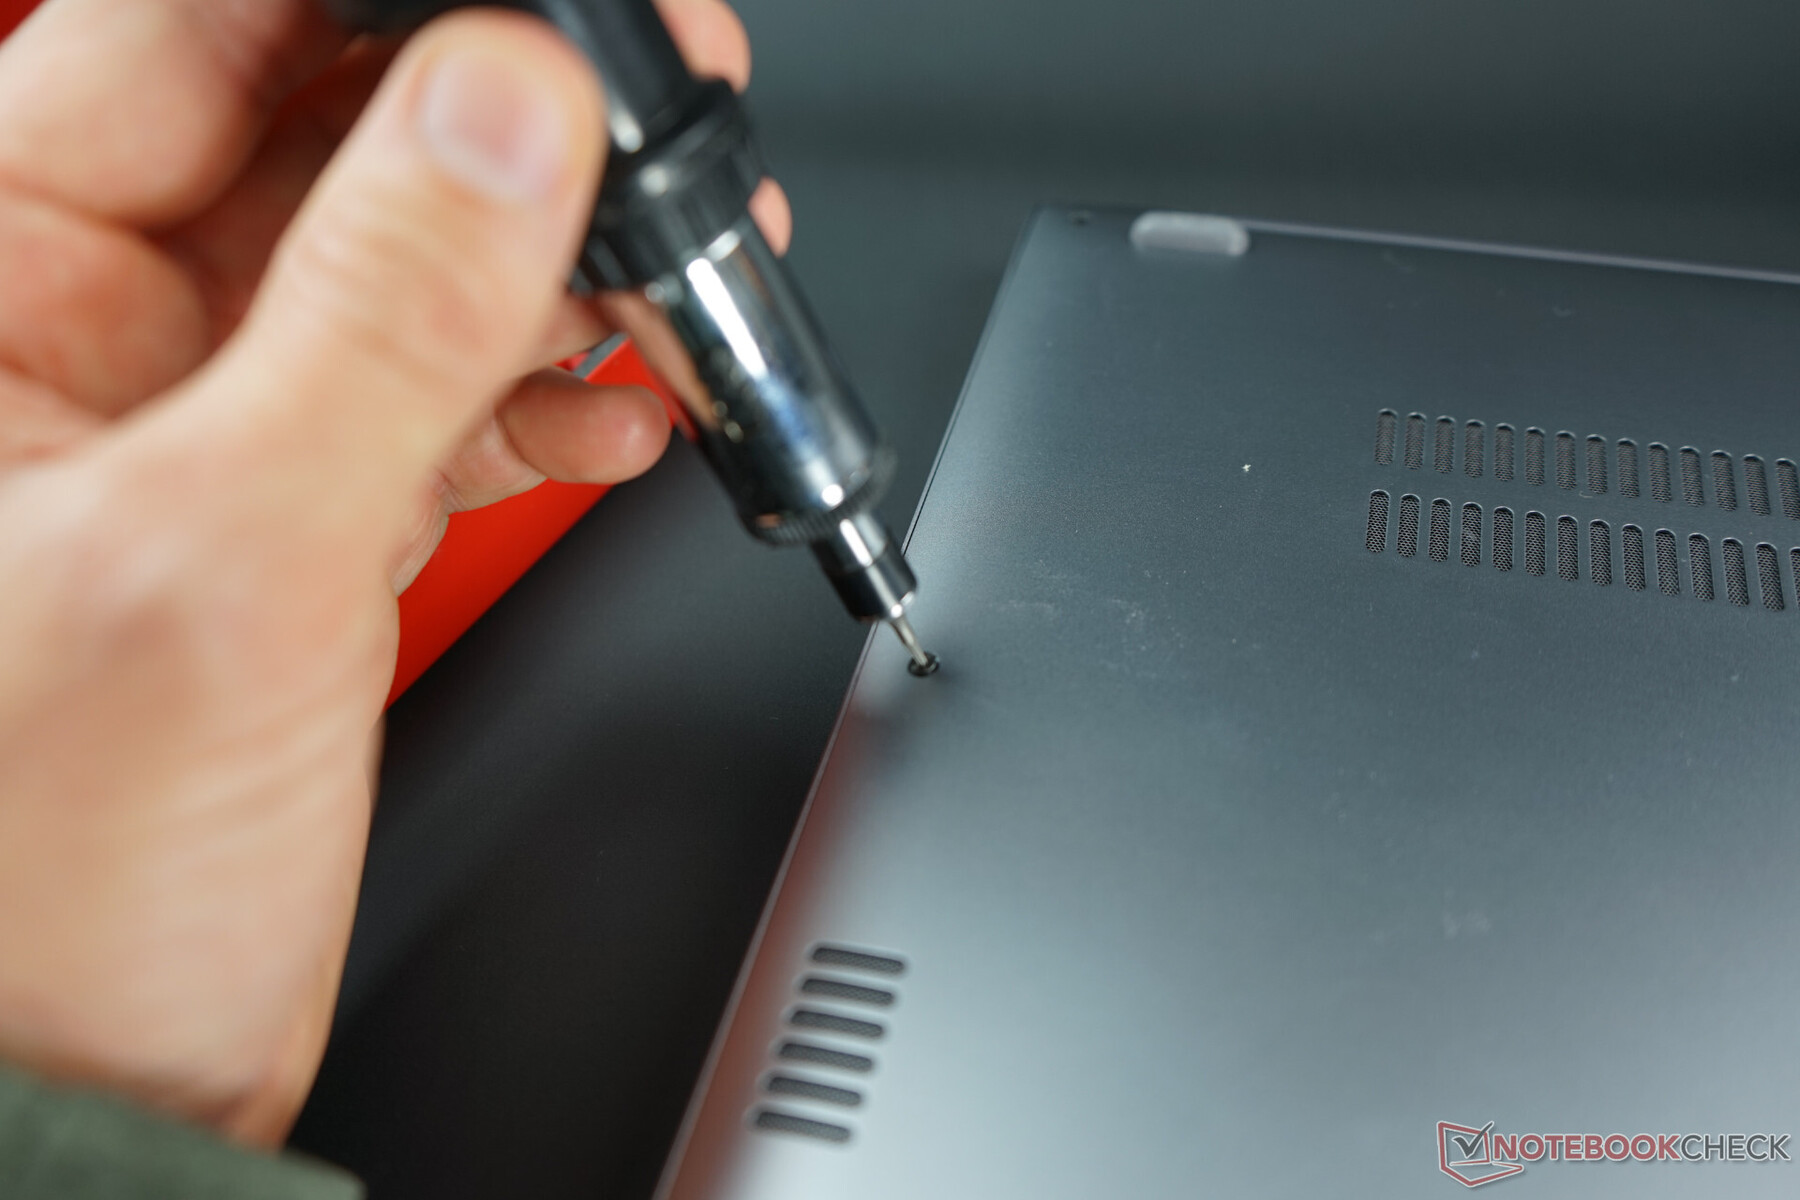
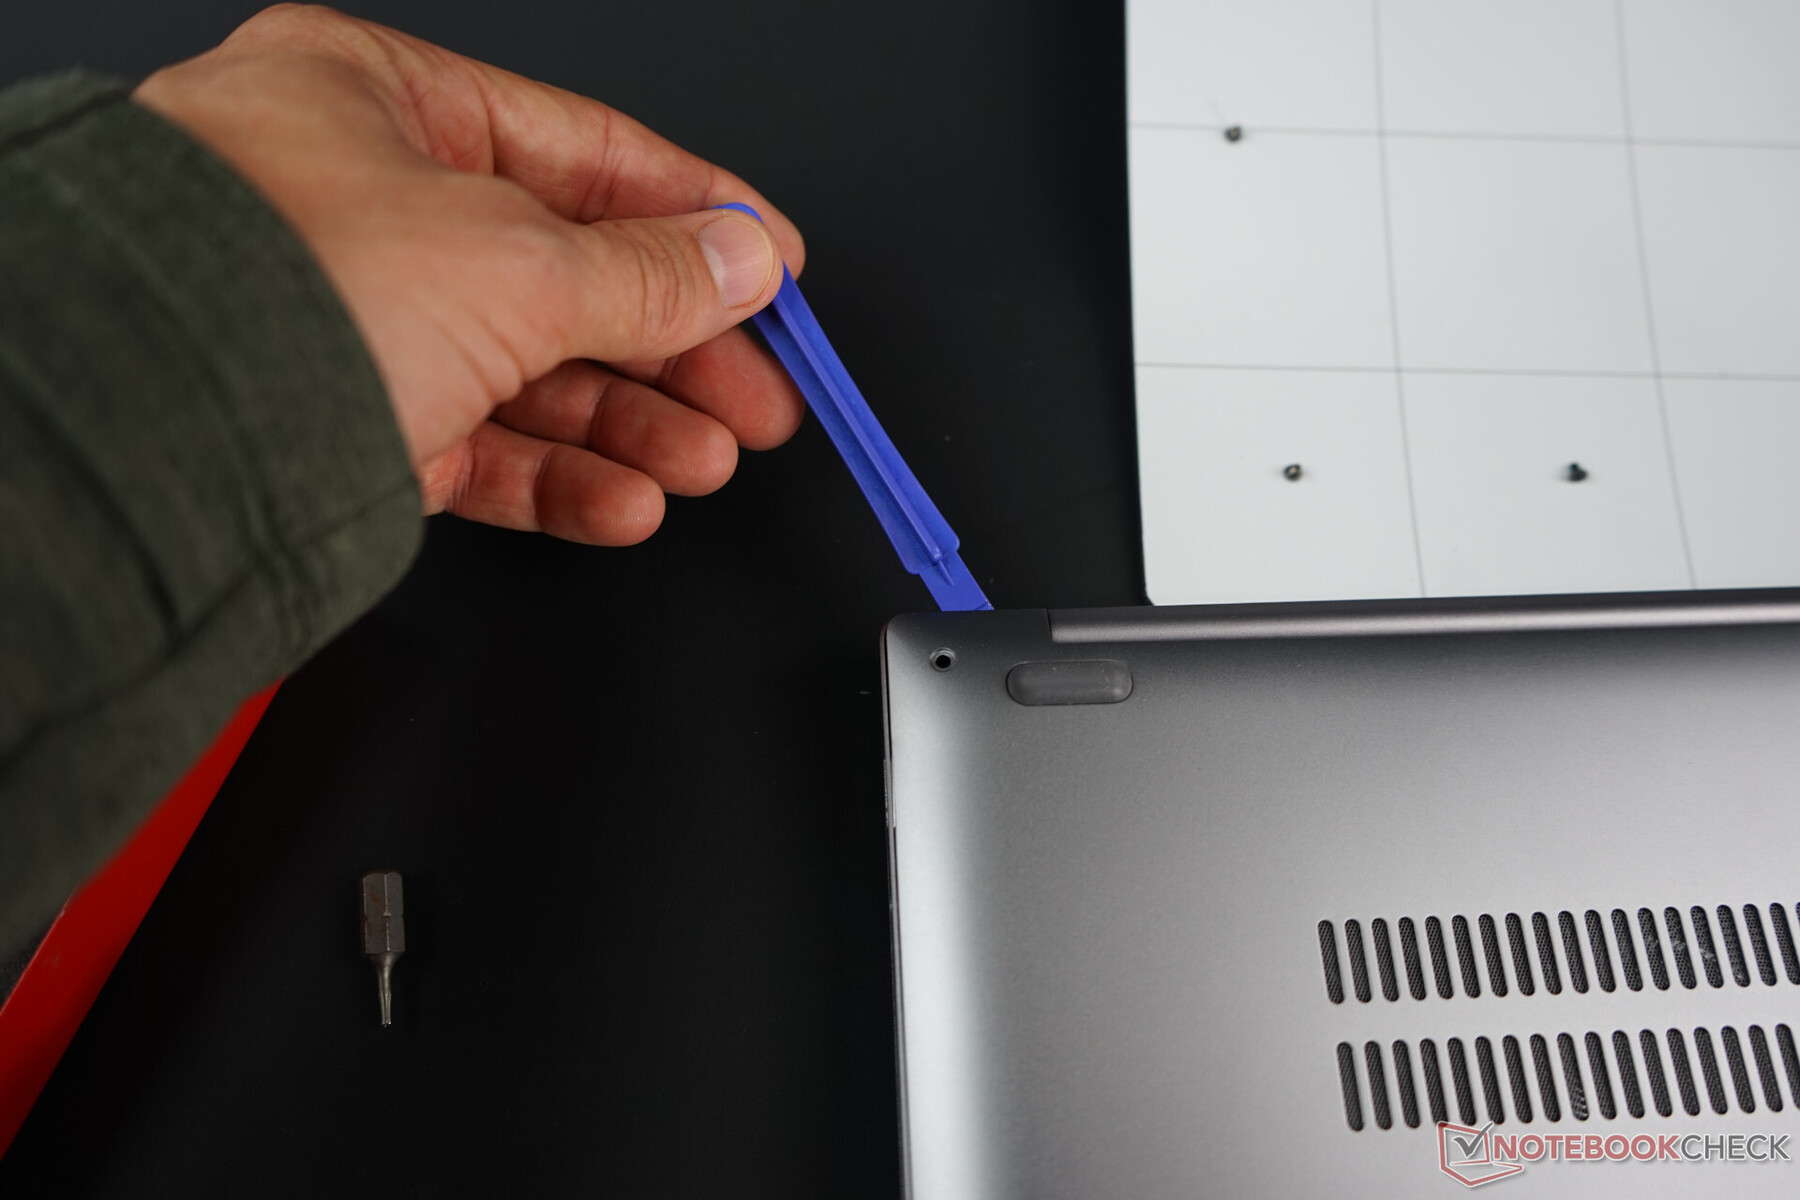
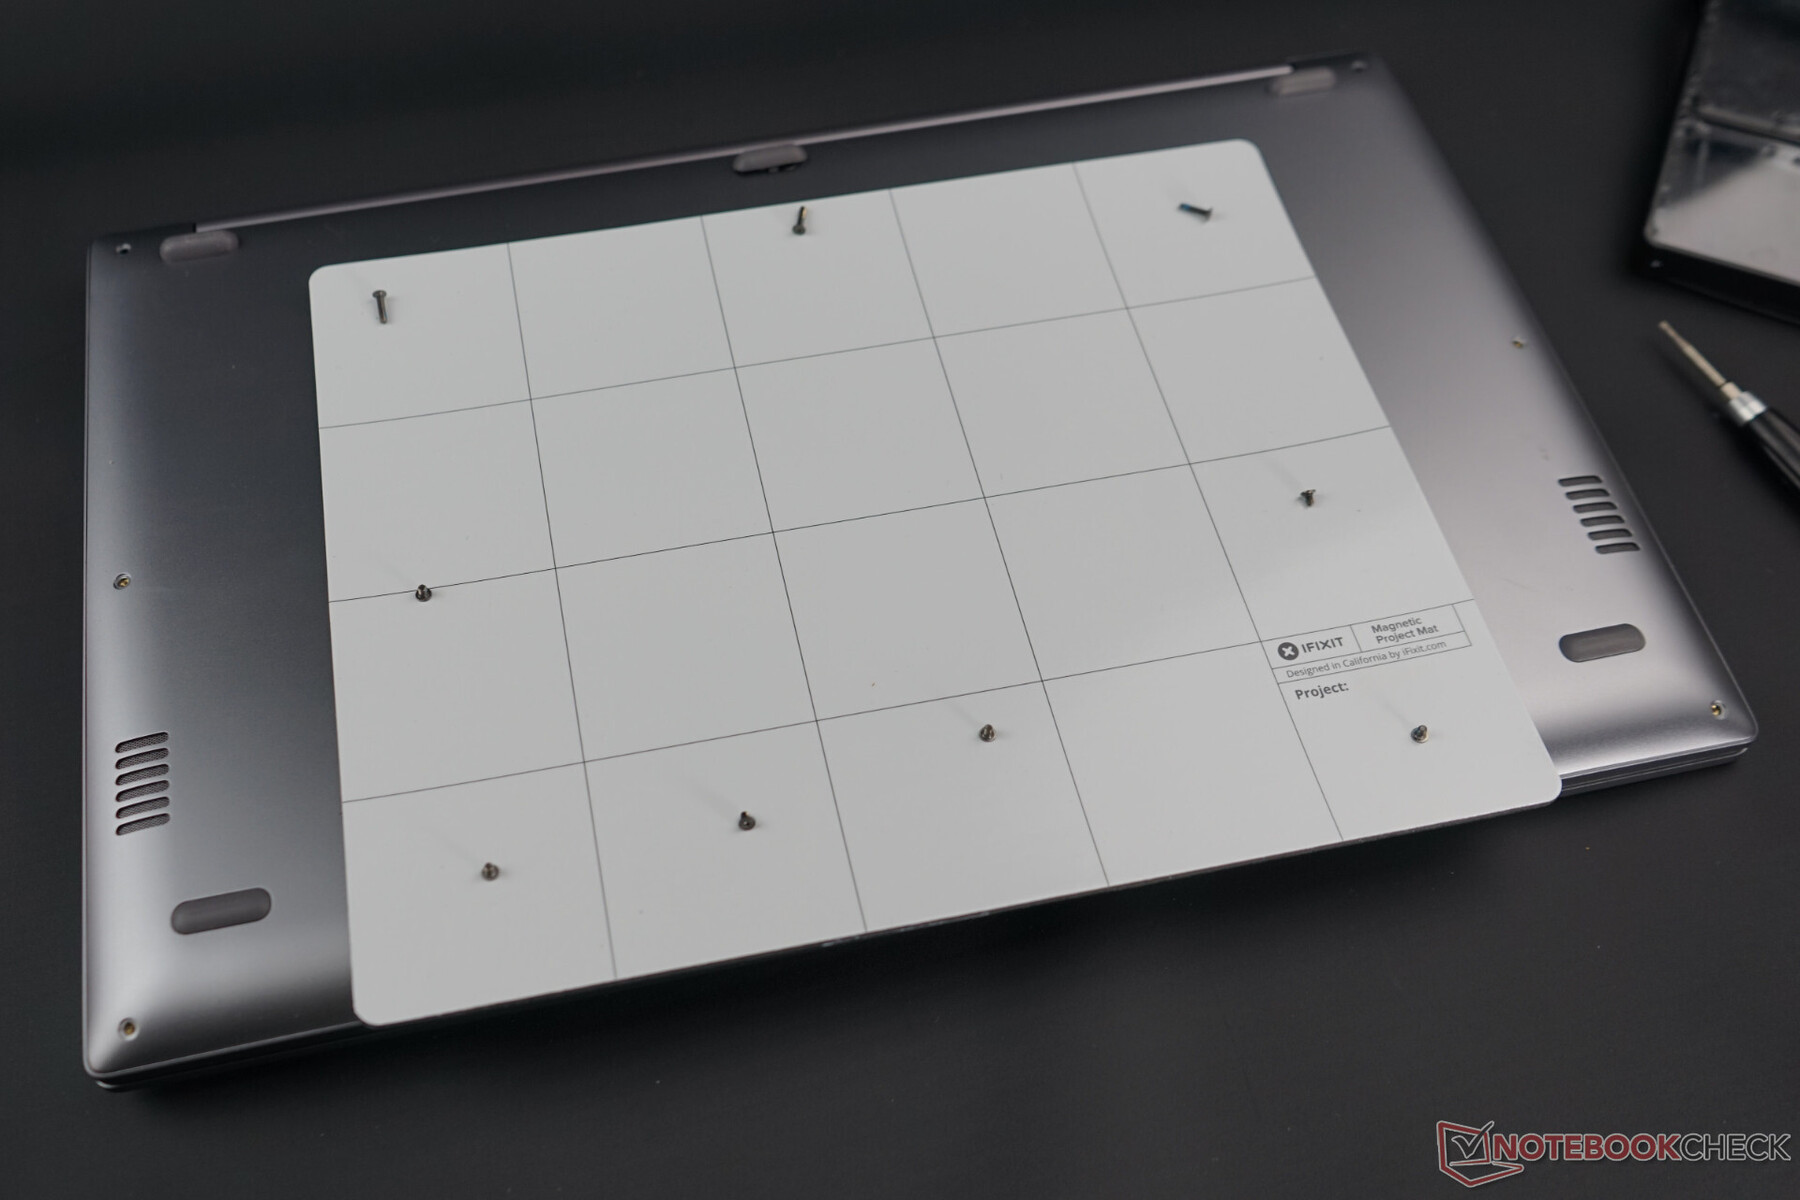
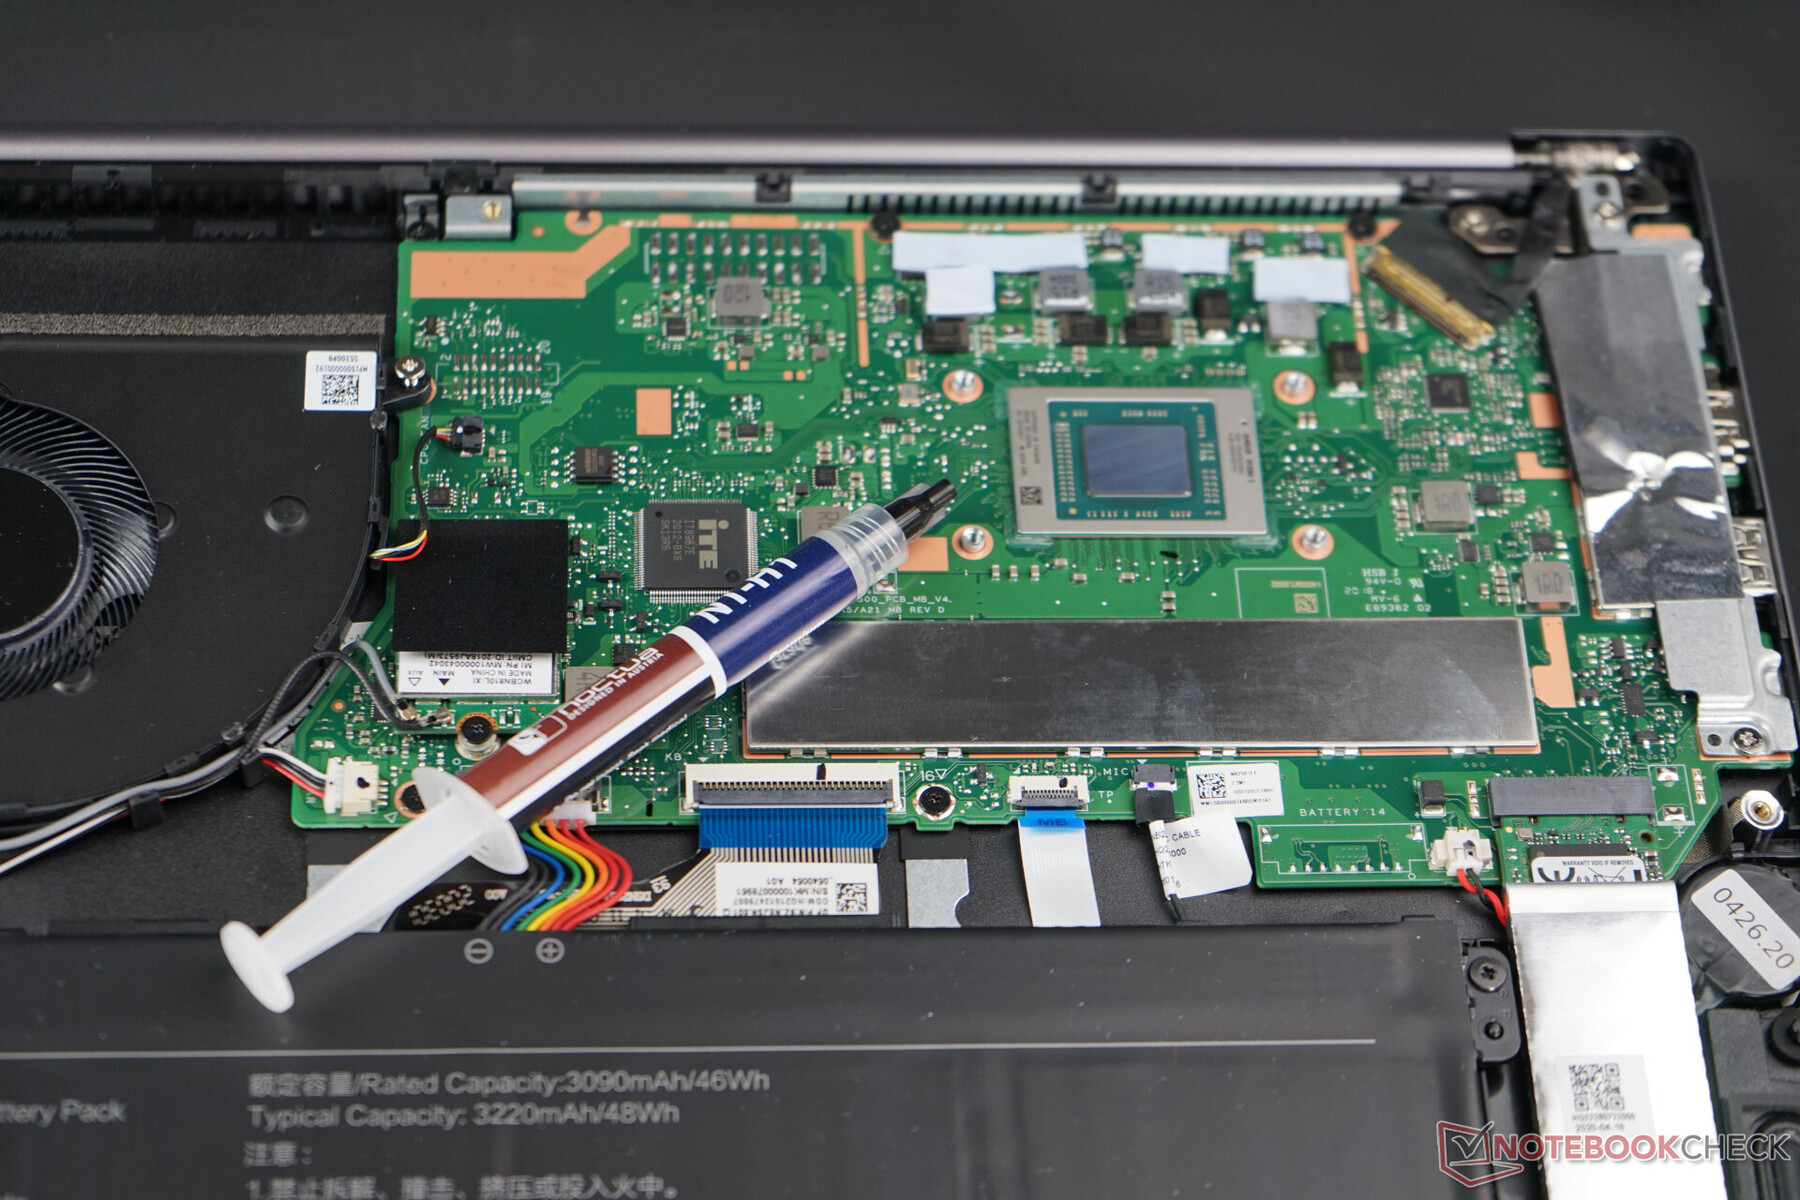
The components inside are relatively easy to reach via the base plate: First you have to loosen all Torx-5 screws, one of which is hidden under the rear center stand. After that, the plate only holds on to plastic clips at the edge, but these could be easily loosened on our test device (as always, a plastic pick and spudger is recommended).
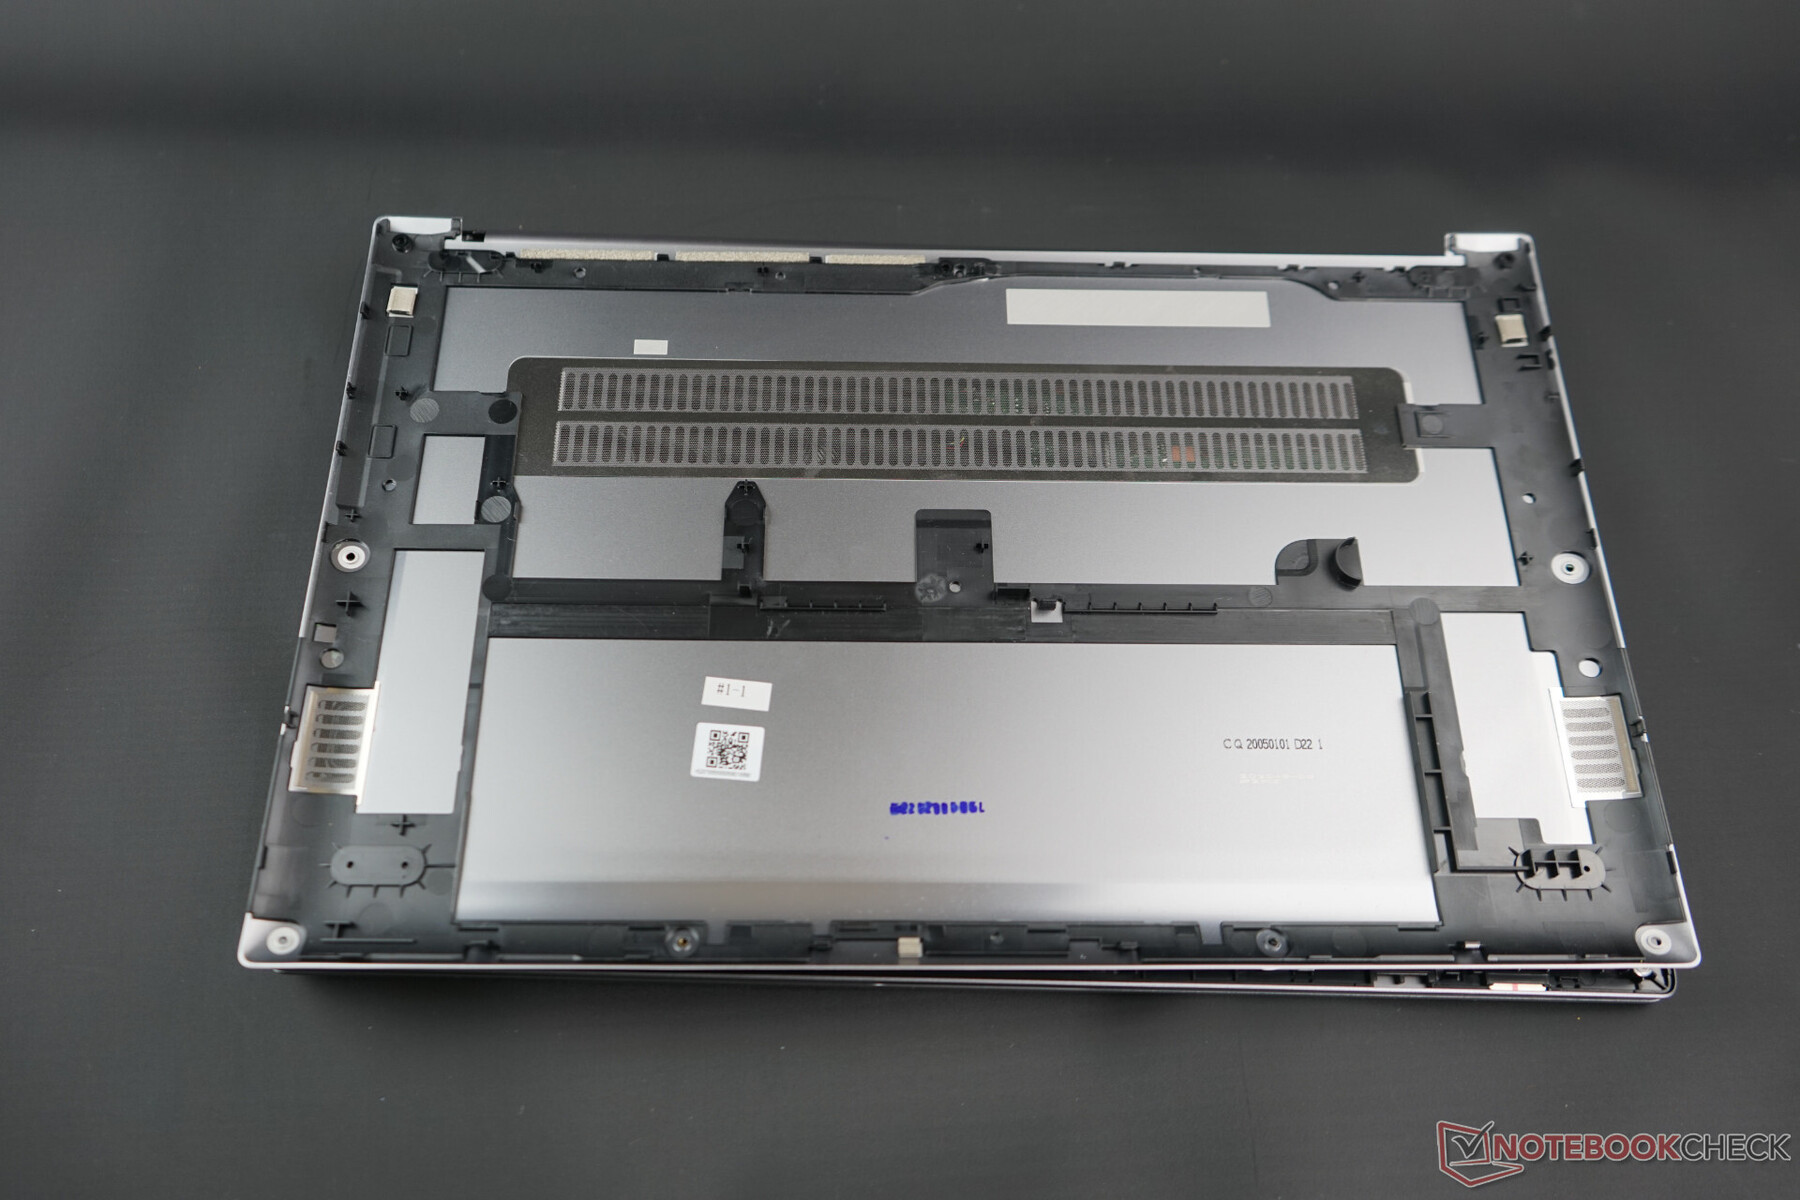
Inside you can reach the M.2 SSD and WLAN card for easy upgrades. The battery is only secured by screws and can therefore be replaced. The cooler is also easy to clean, but the RAM memory is directly soldered and therefore cannot be upgraded.


Input devices
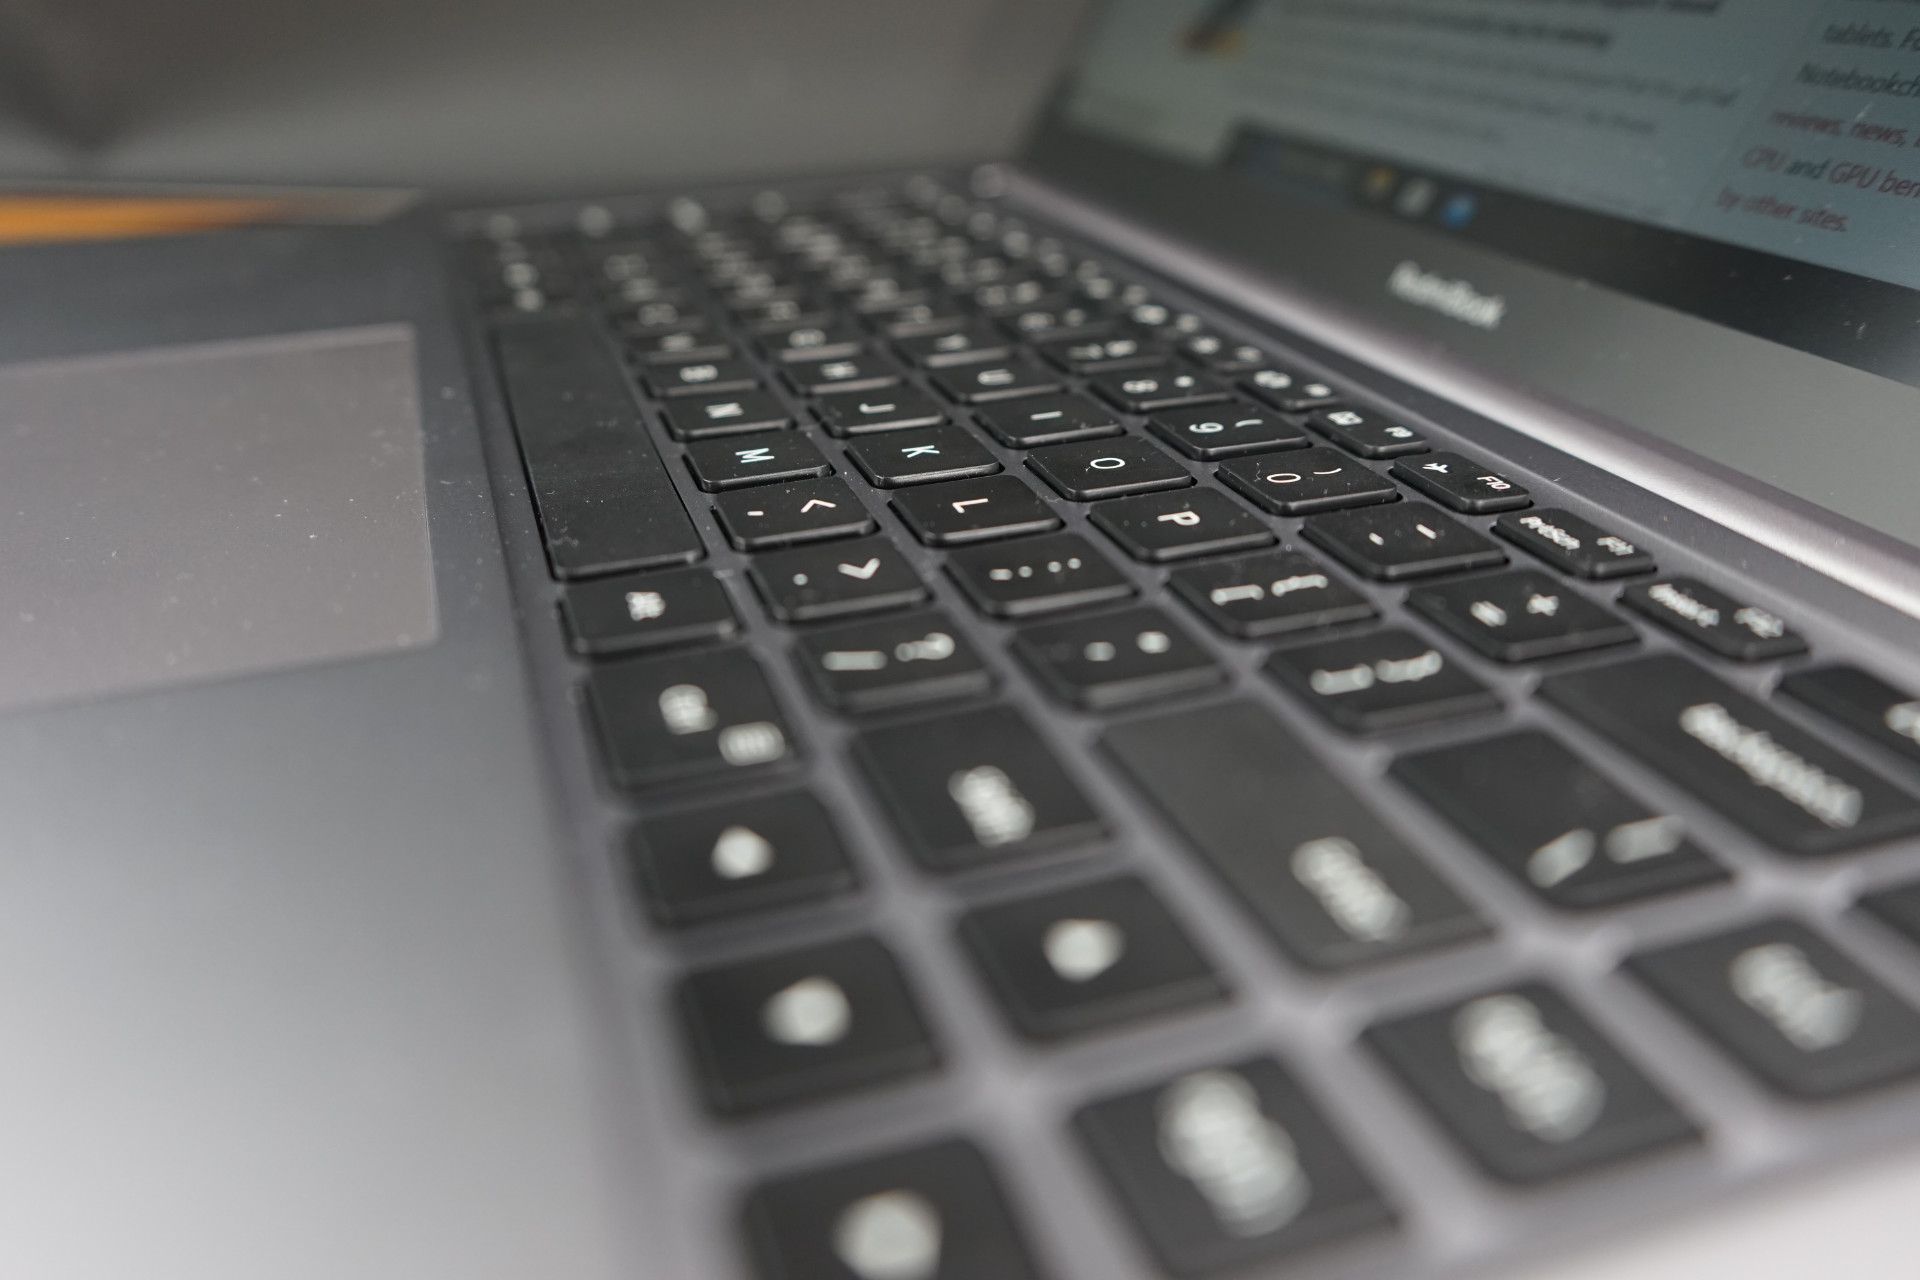
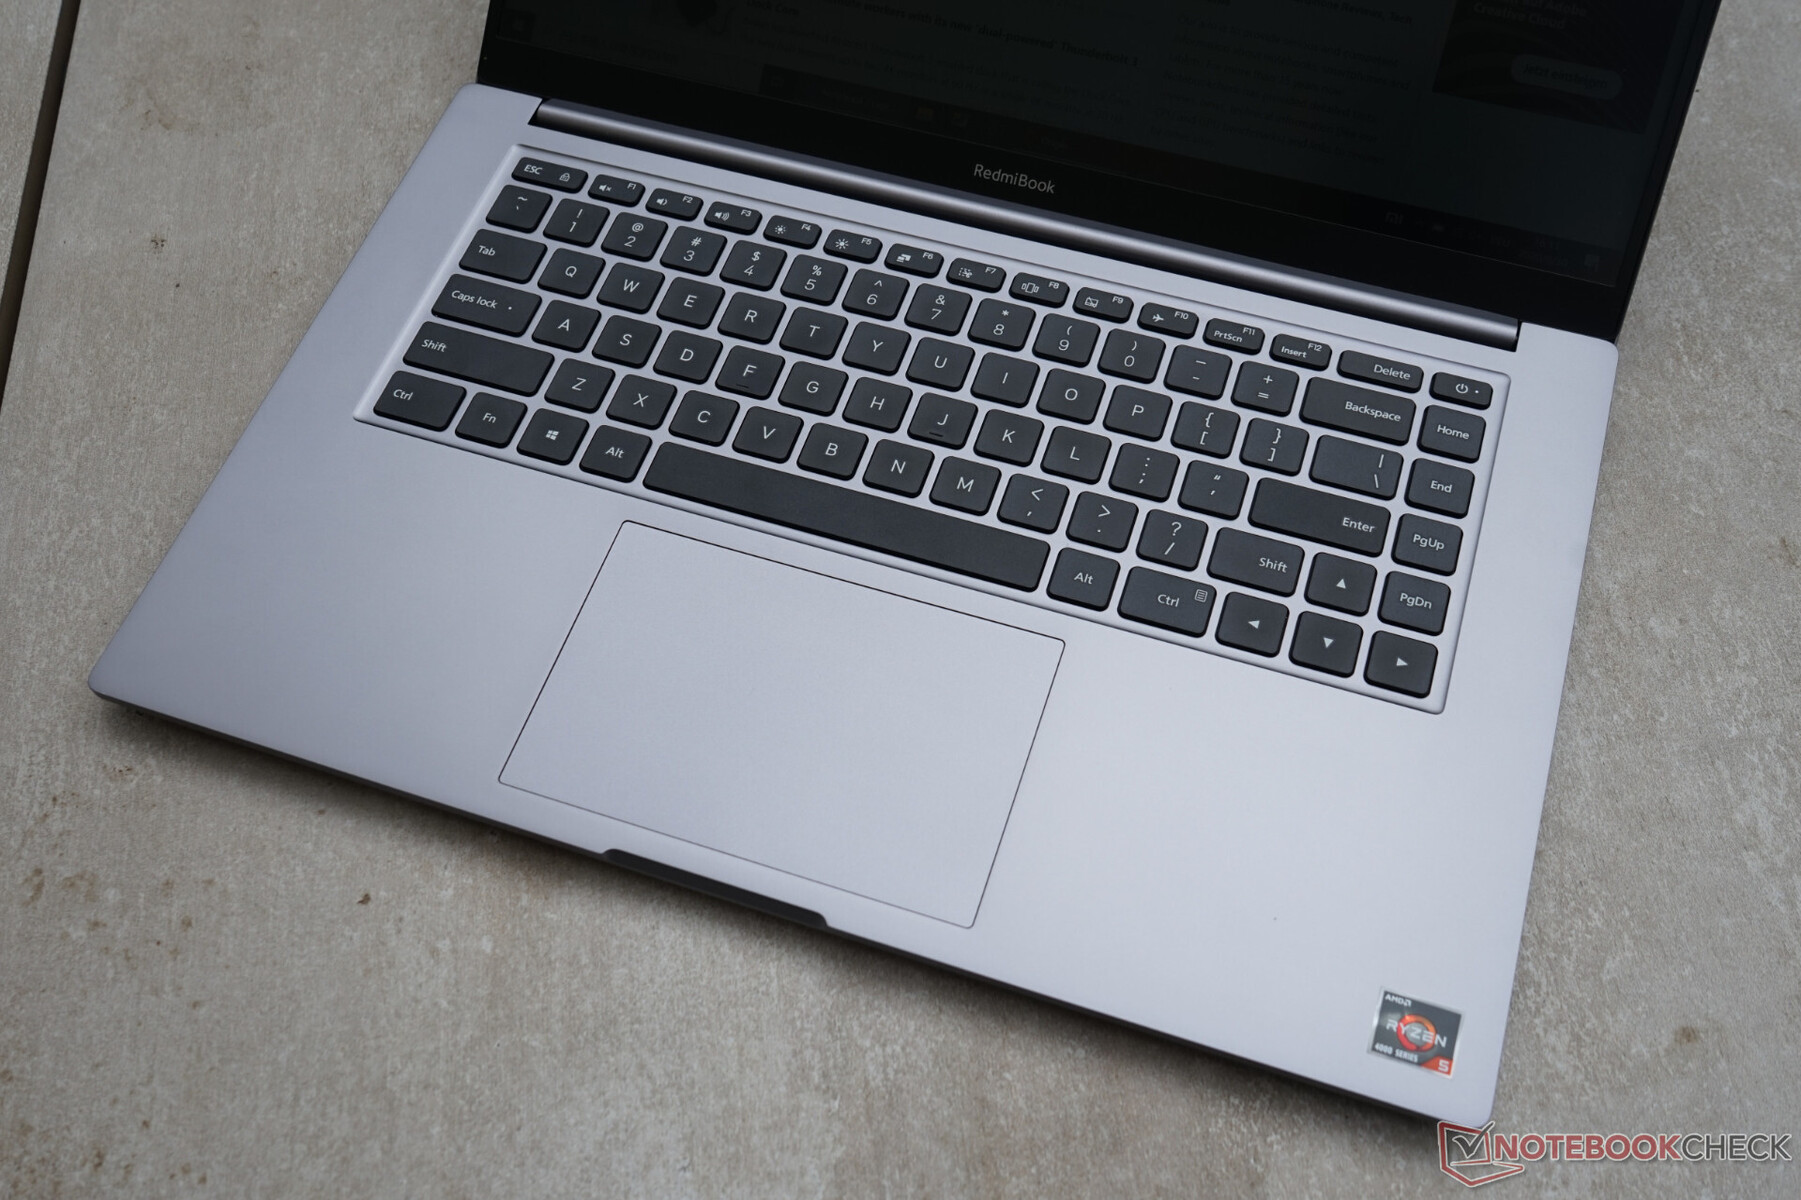
Keyboard
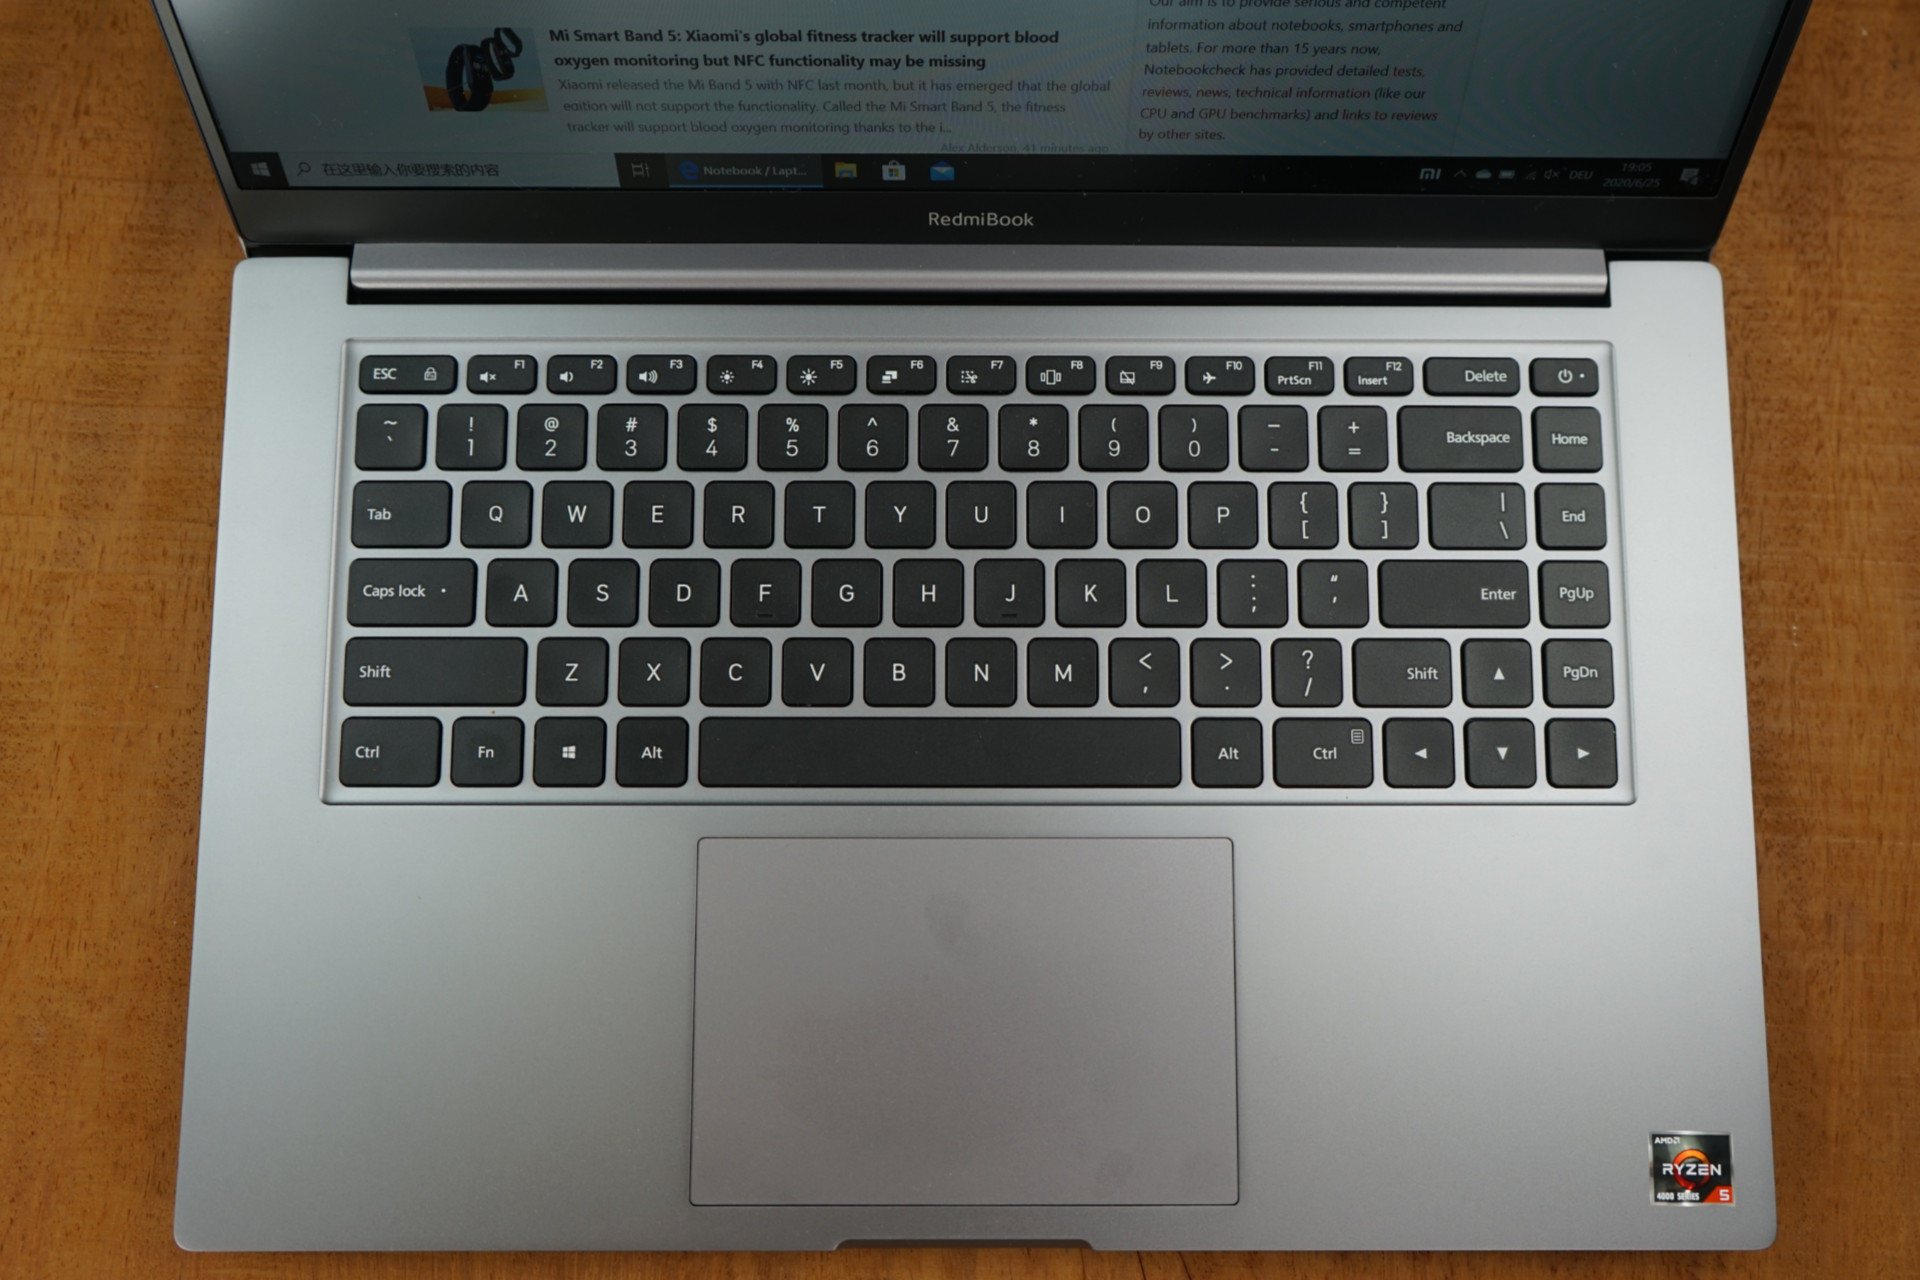
The built-in chiclet keyboard offers the same layout and design as in the Xiaomi Mi Notebook Pro, so you have to do without a dedicated number pad. Unfortunately, Xiaomi has cut backlighting in the RedmiBook. Up to now, the laptop is available as an import from China with US layout (QWERTY) as the only option. We liked the keyboard relatively well and also achieved a comparable typing speed as with our working keyboard. However, the touch was subjectively a bit too spongy.
Touchpad
The large glass ClickPad is embedded in the middle of the housing and offers very good sliding properties. Unfortunately, no dedicated mouse keys were built in and the hinge, with which the touchpad can be pressed into the lower two-thirds, is a bit wobbly. Therefore, you can't feel a clear pressure point and the touchpad can only be pressed well in the lower half. Two- and three-finger gestures work perfectly, though.
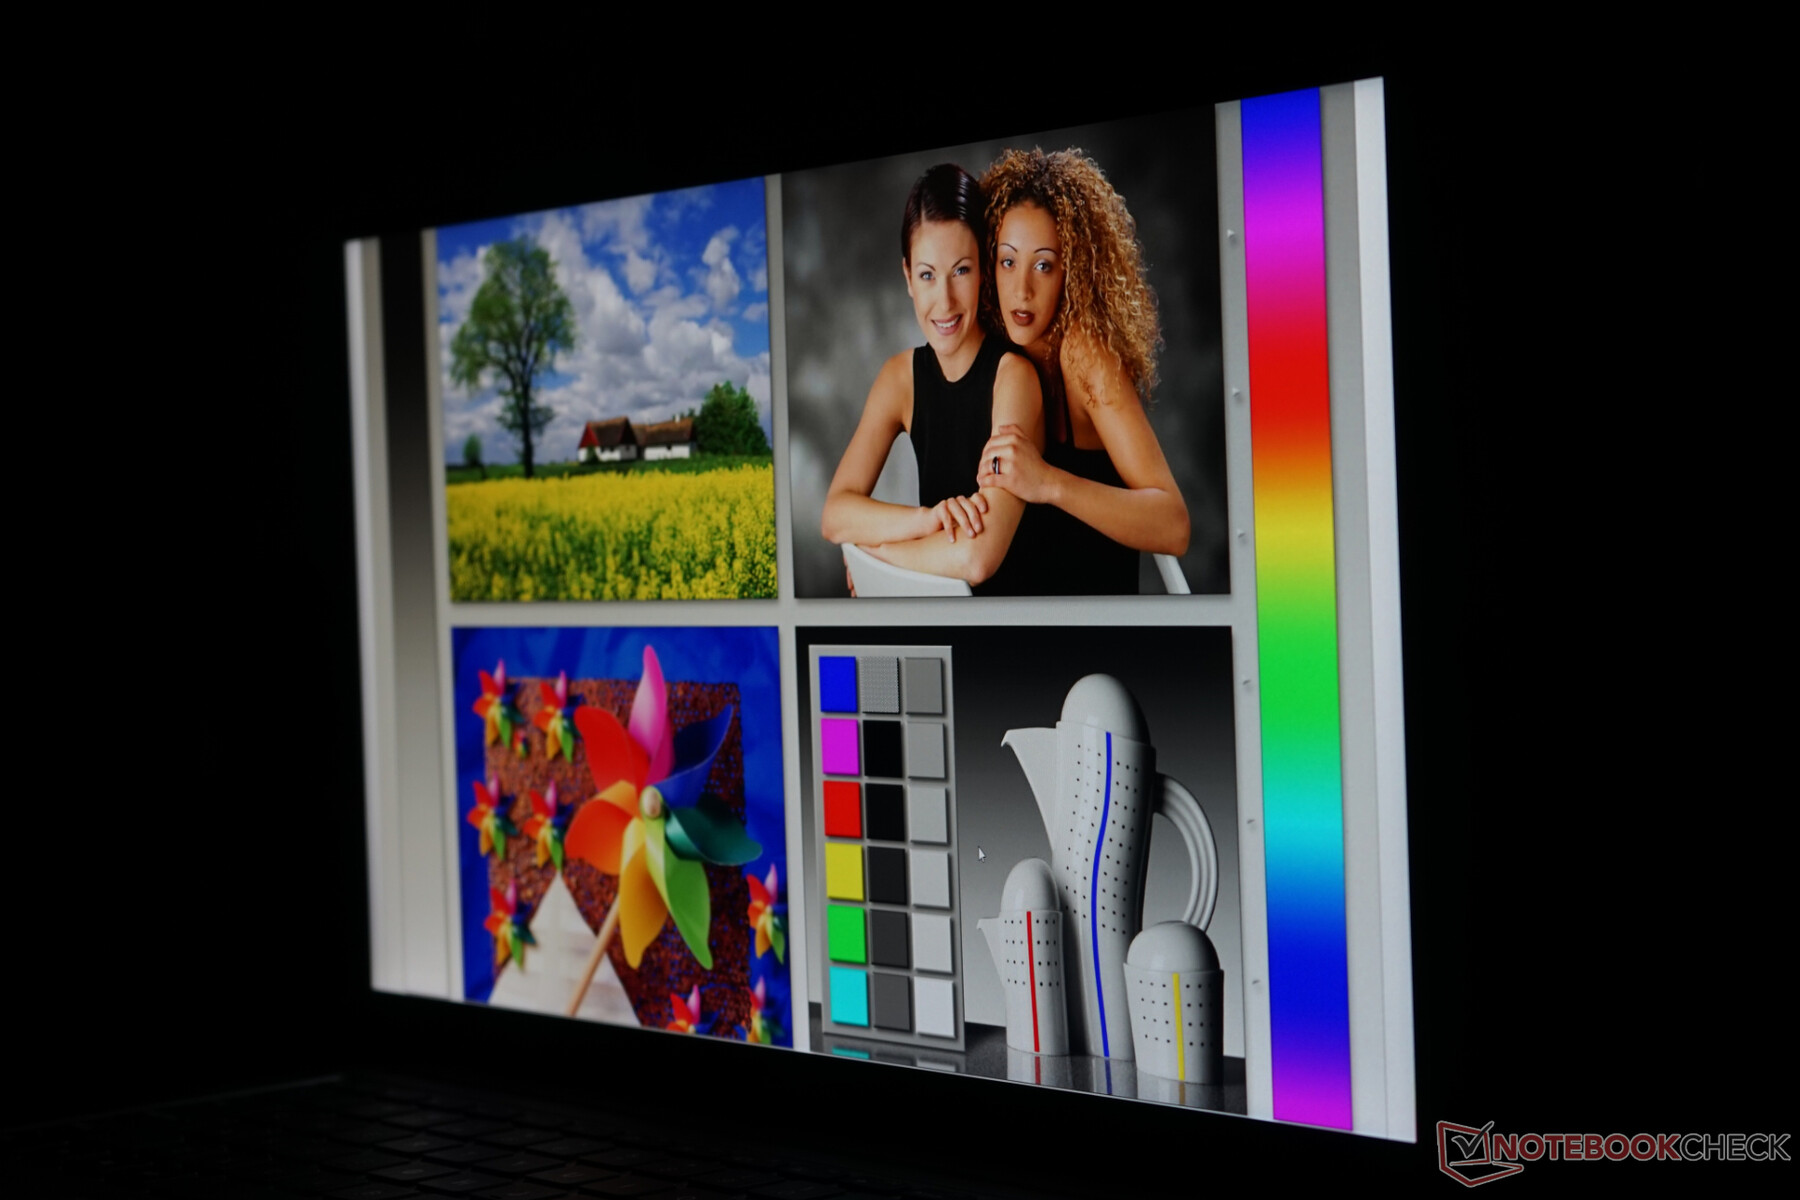
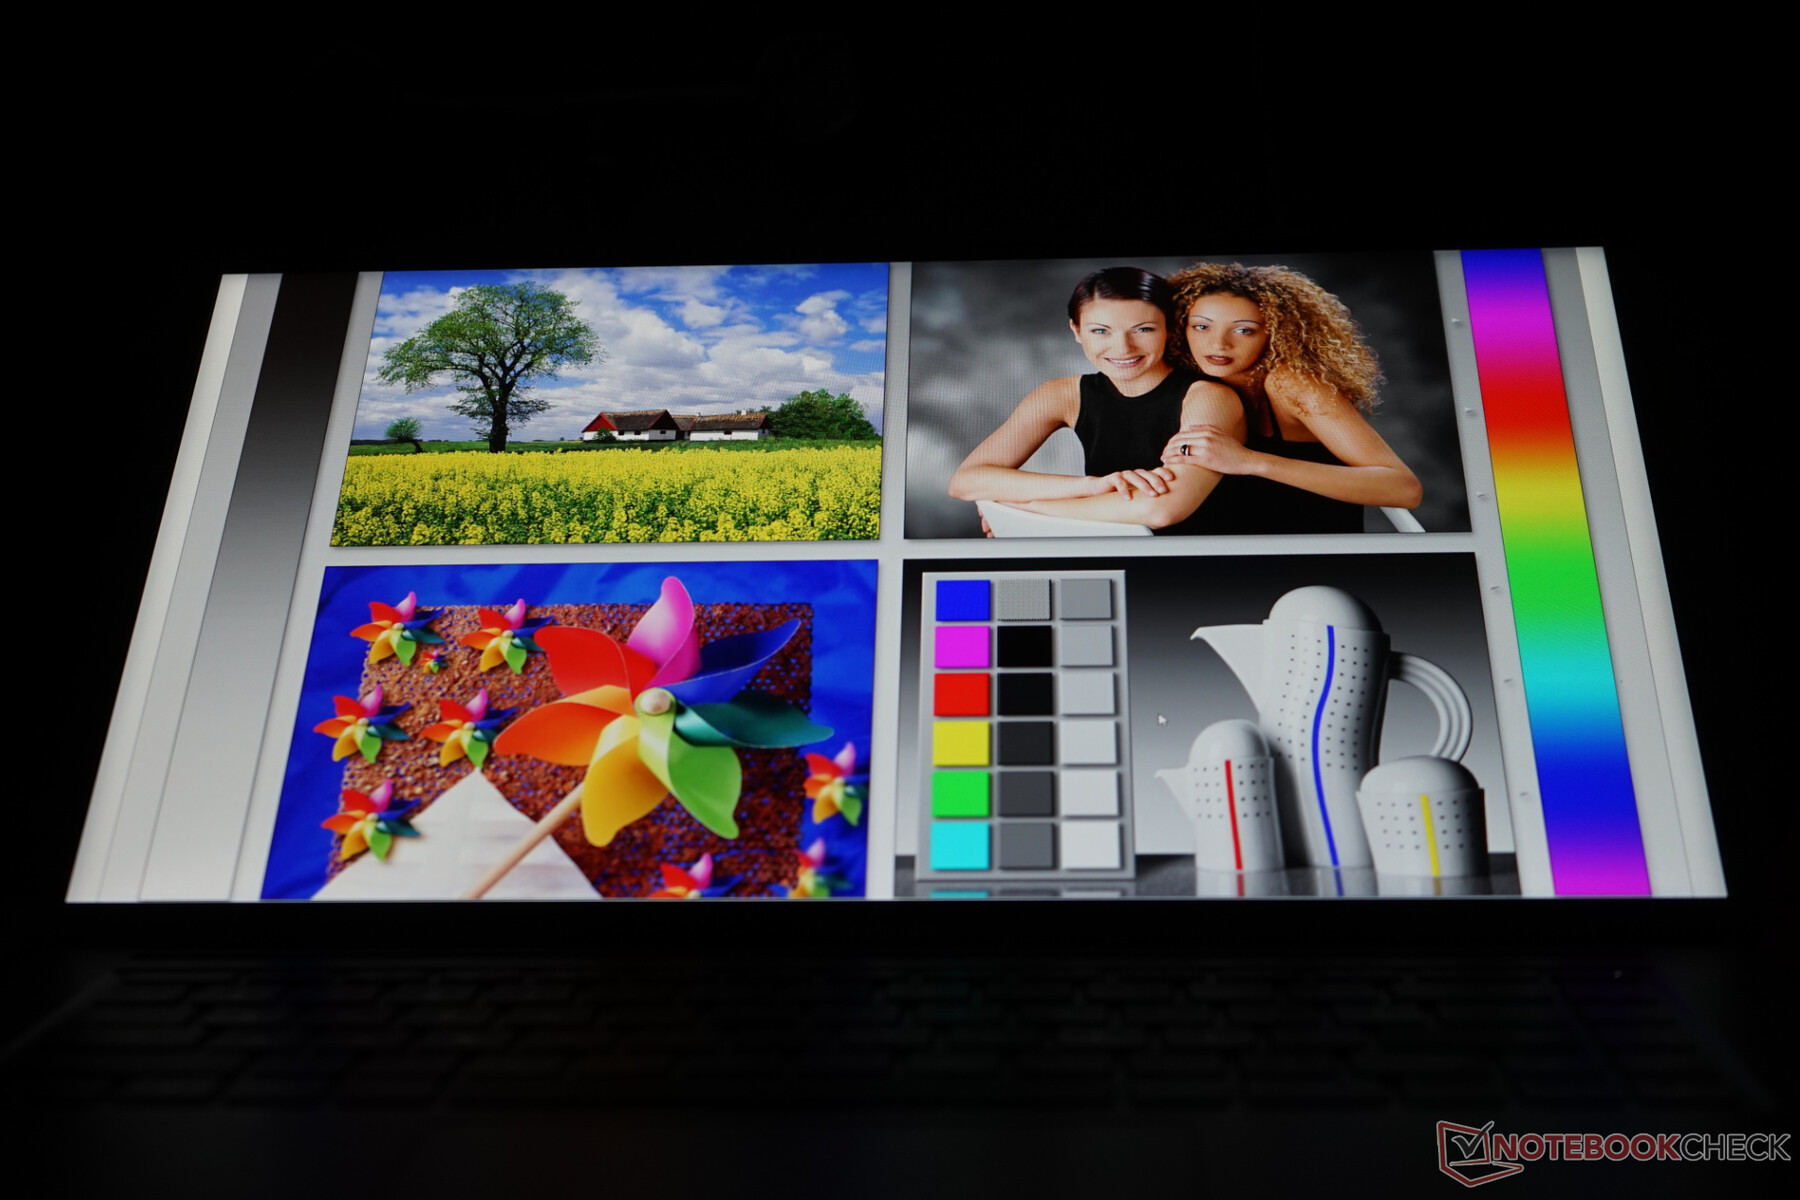
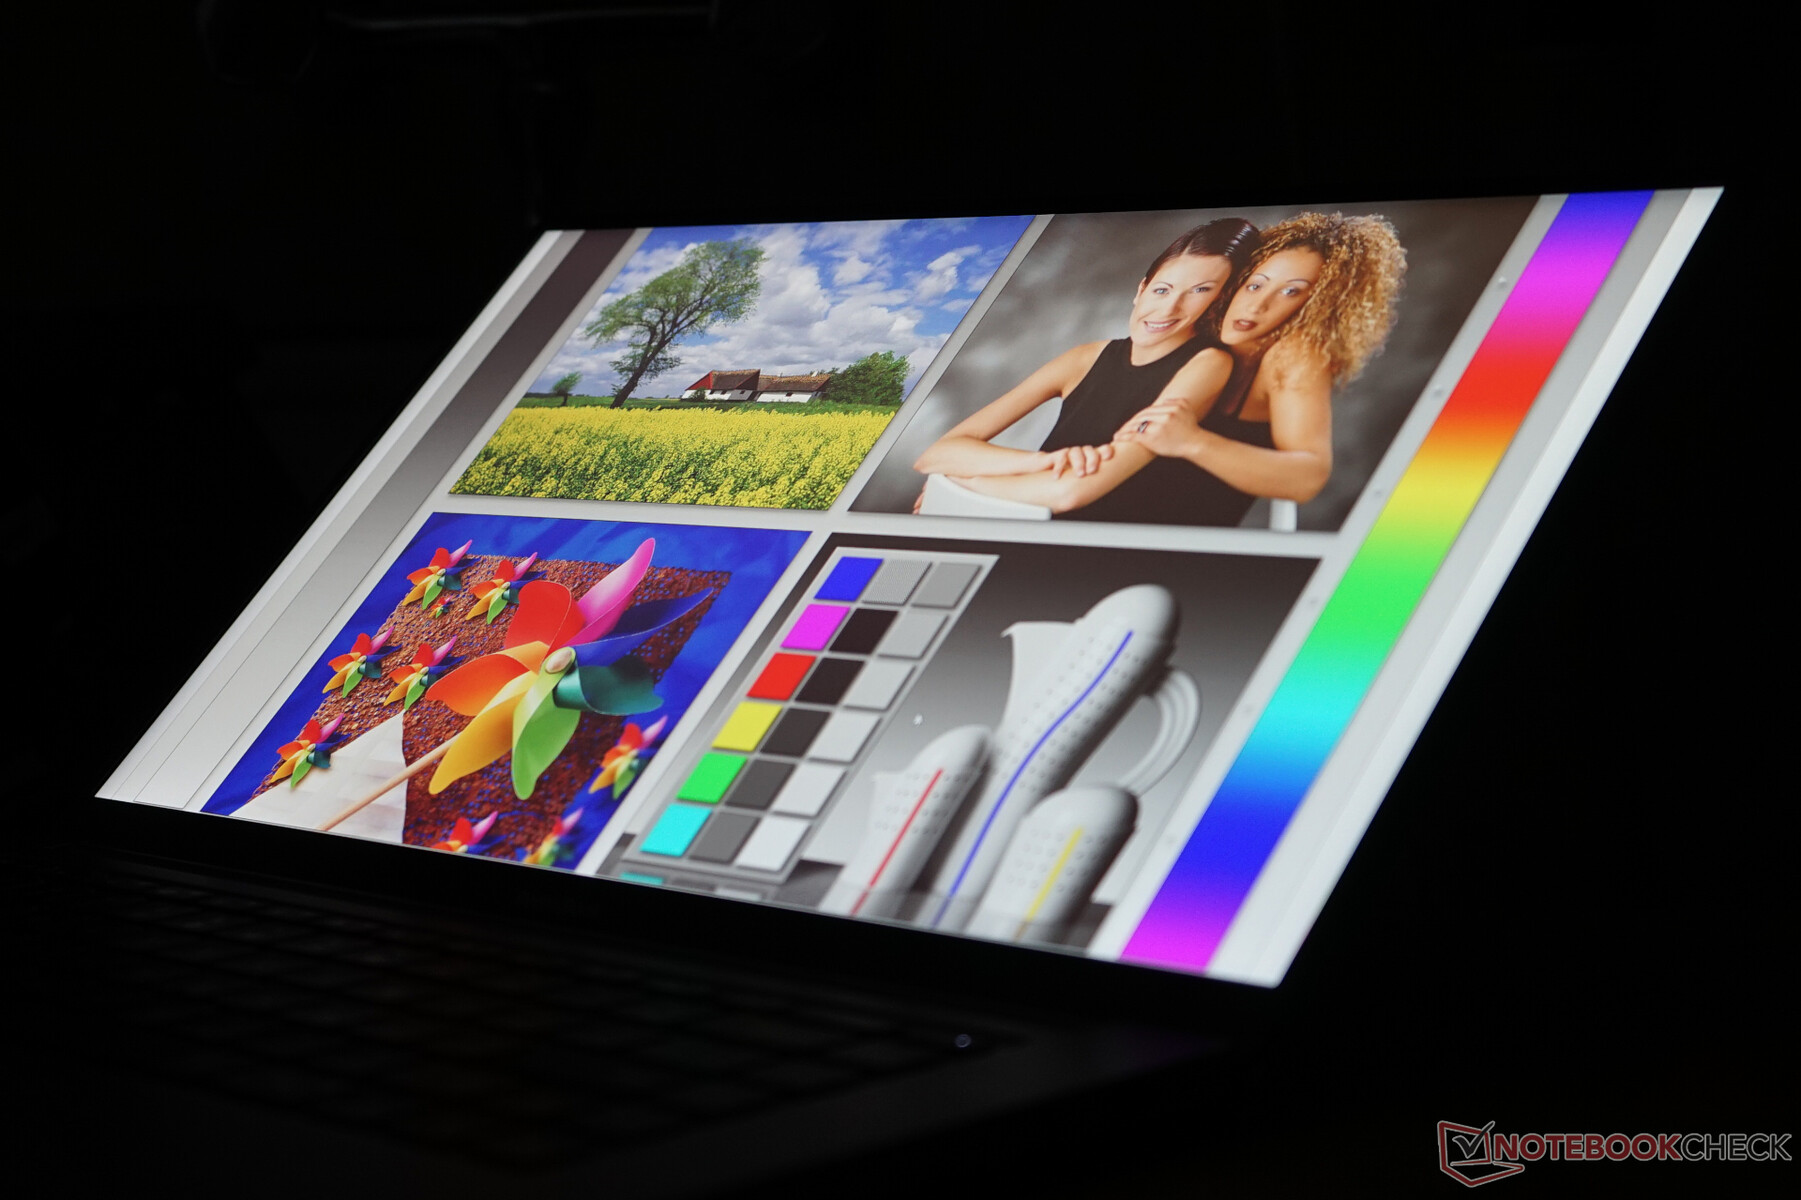
Display
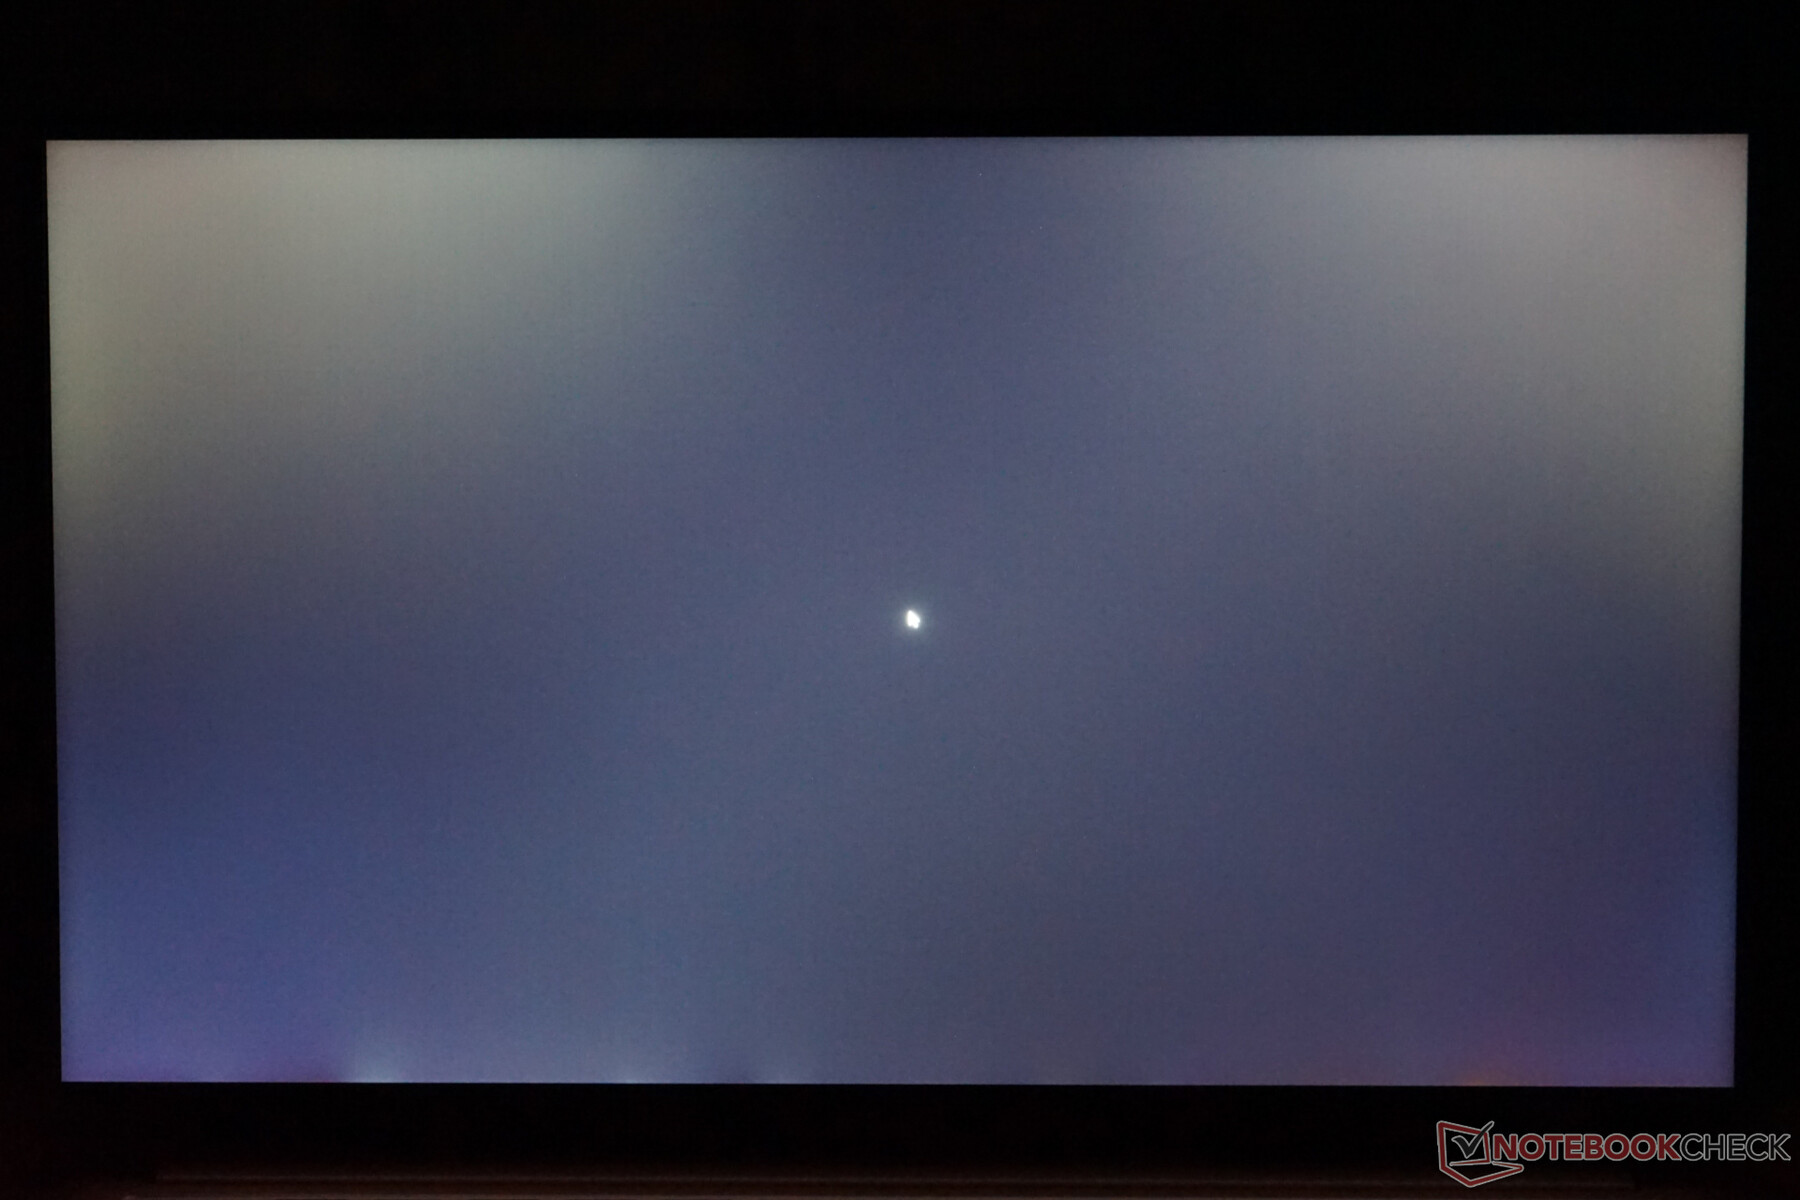
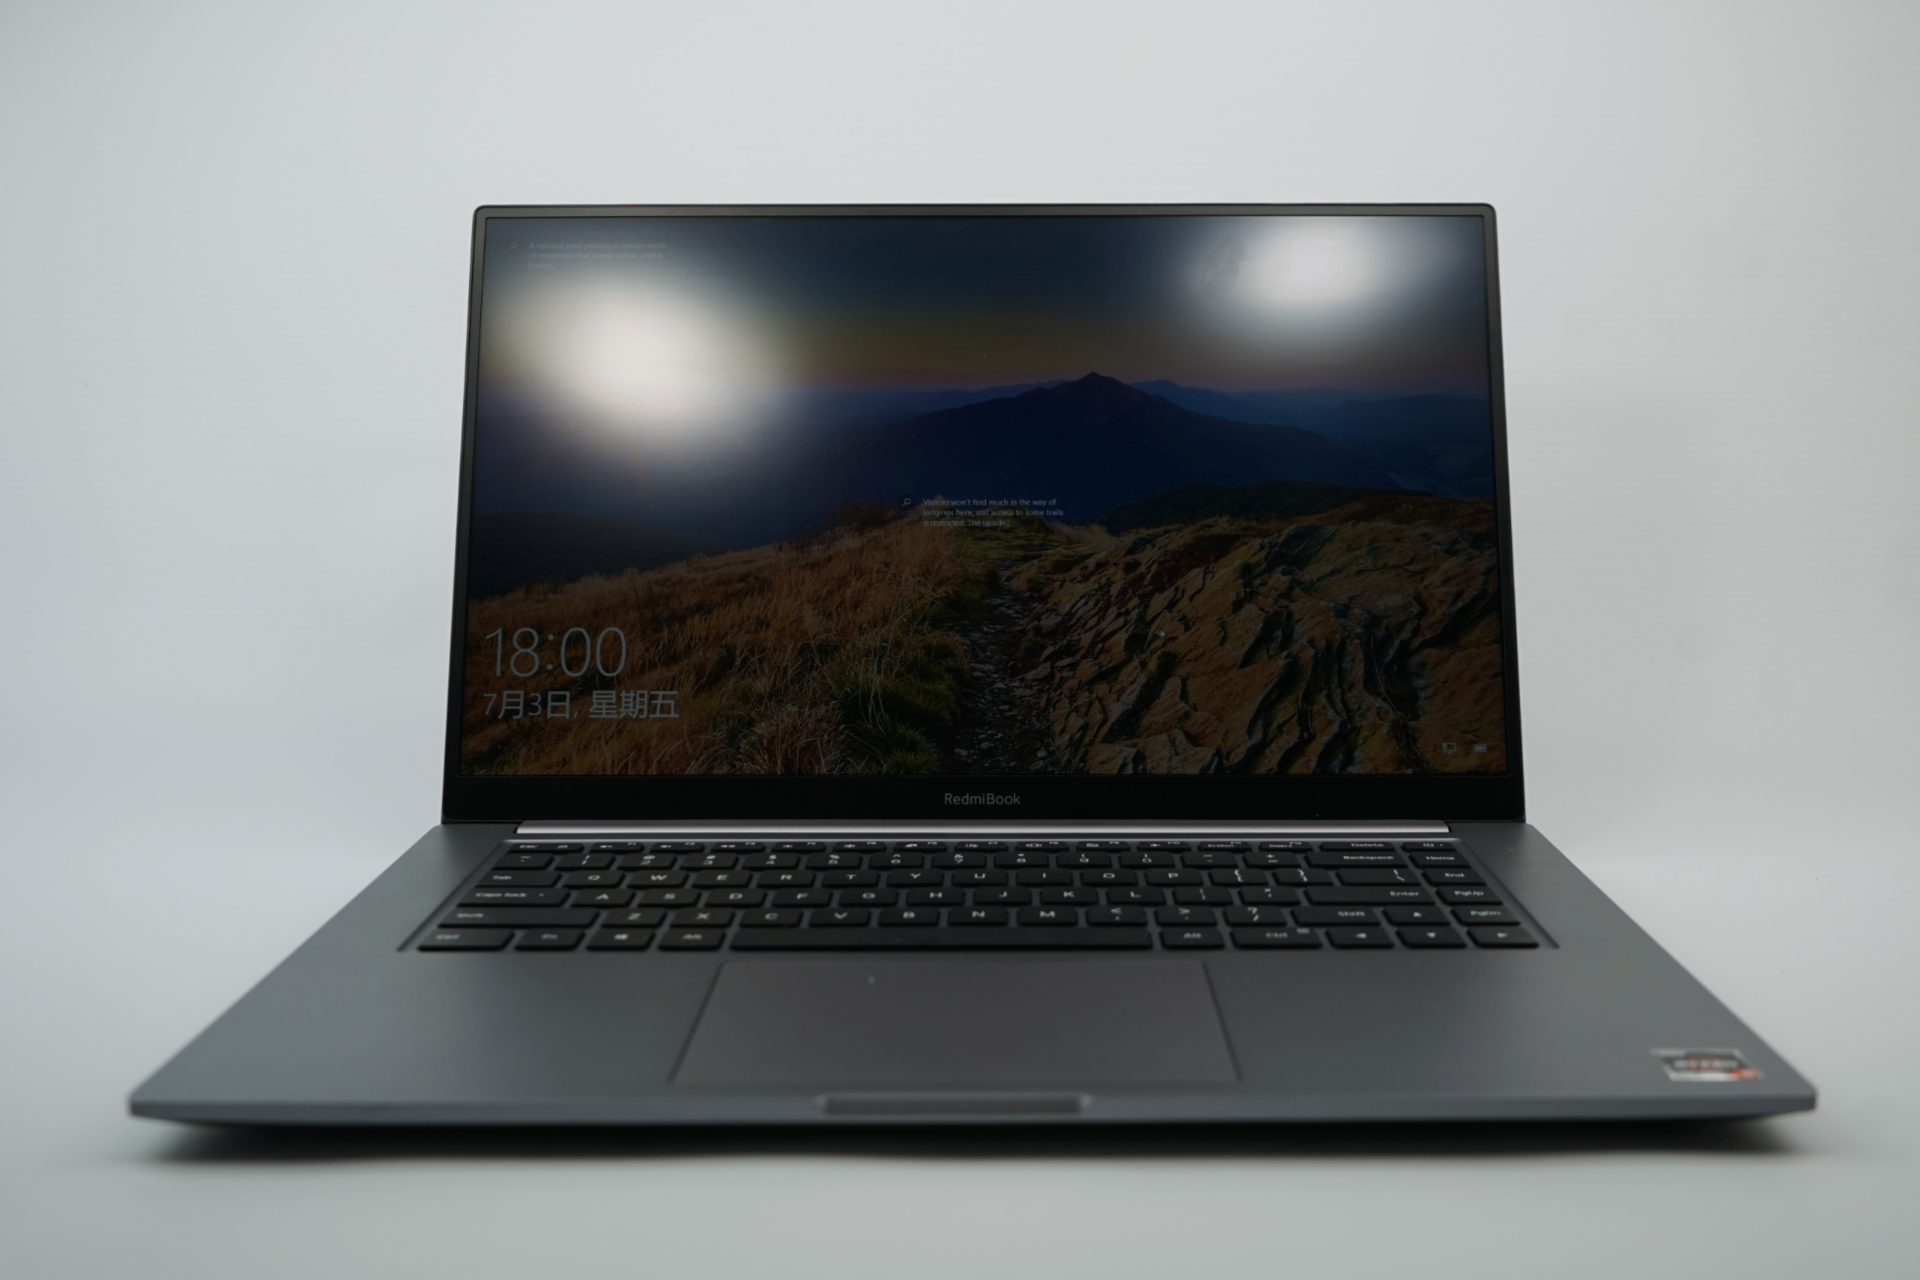
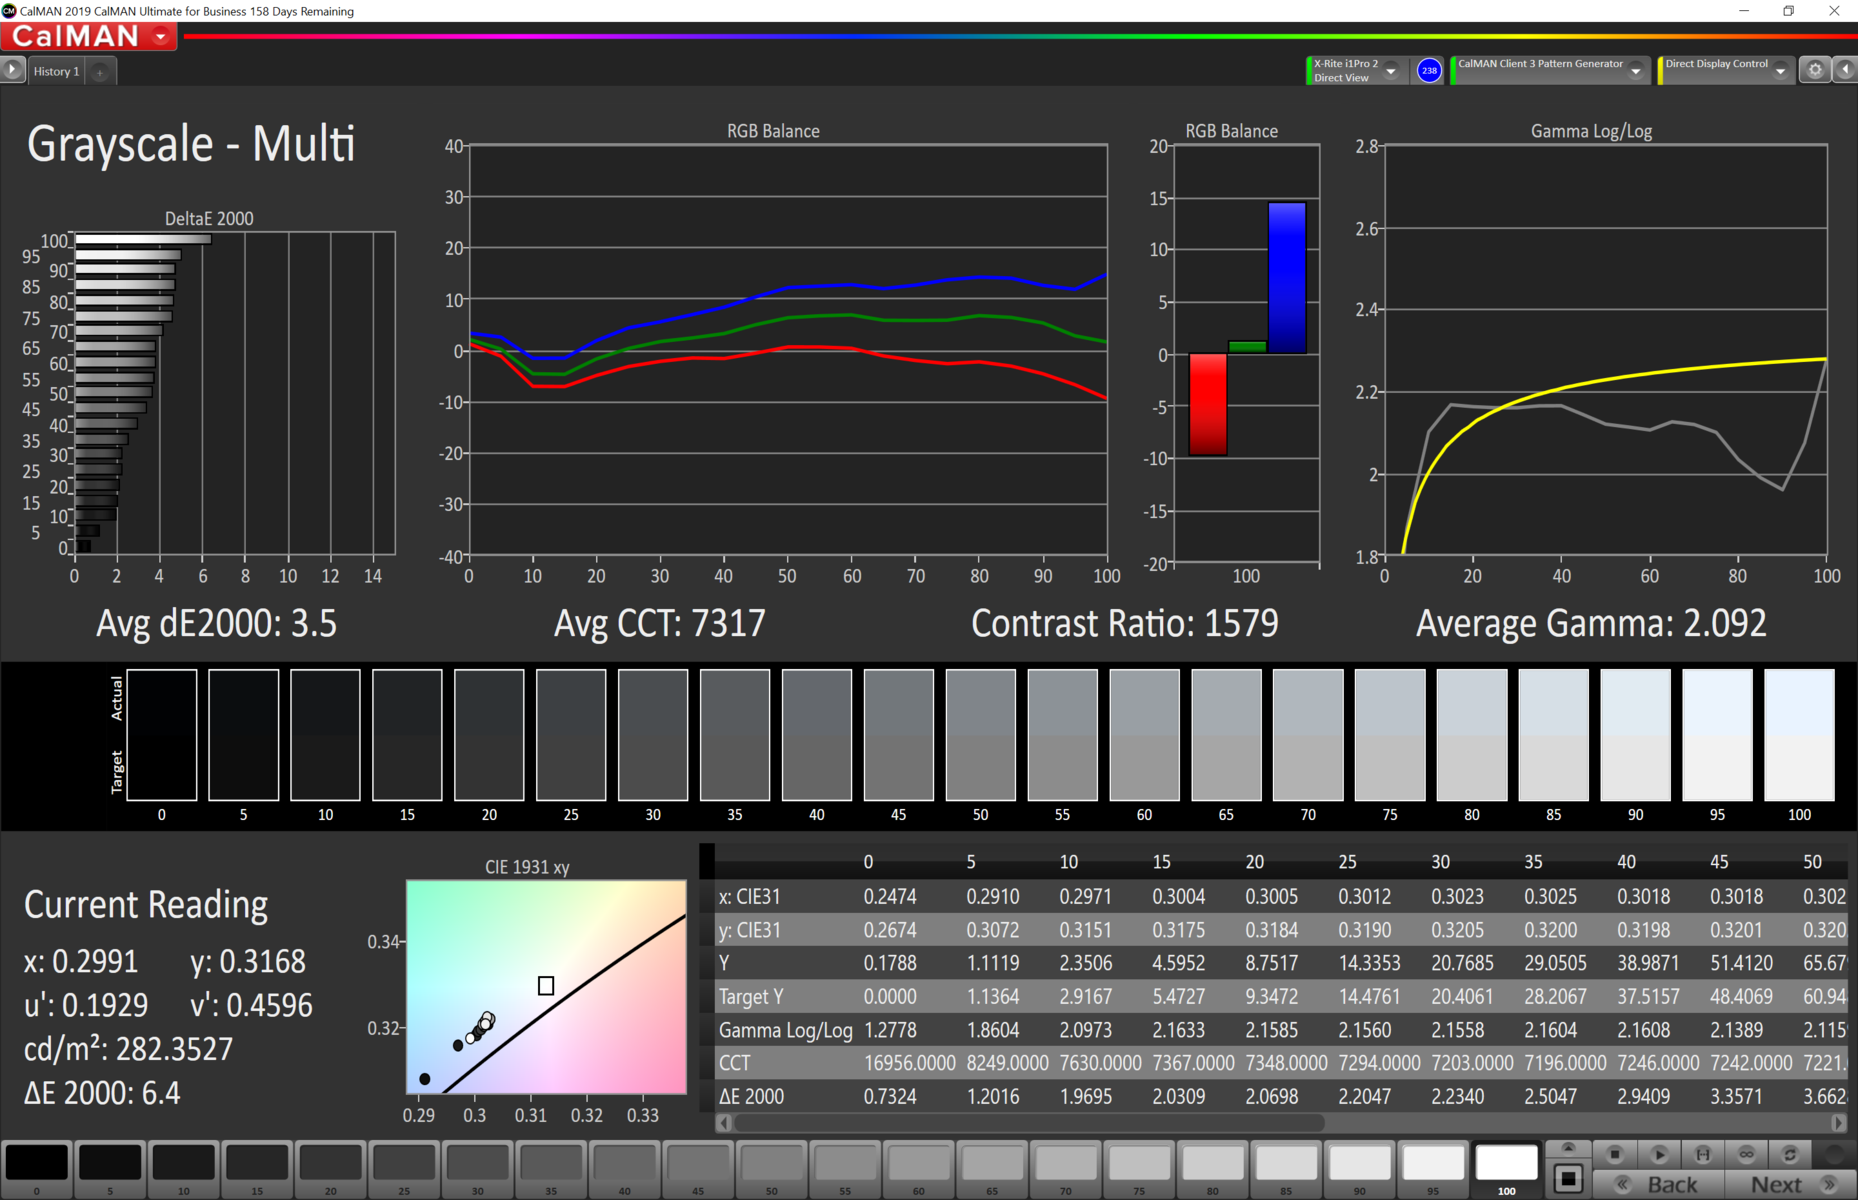
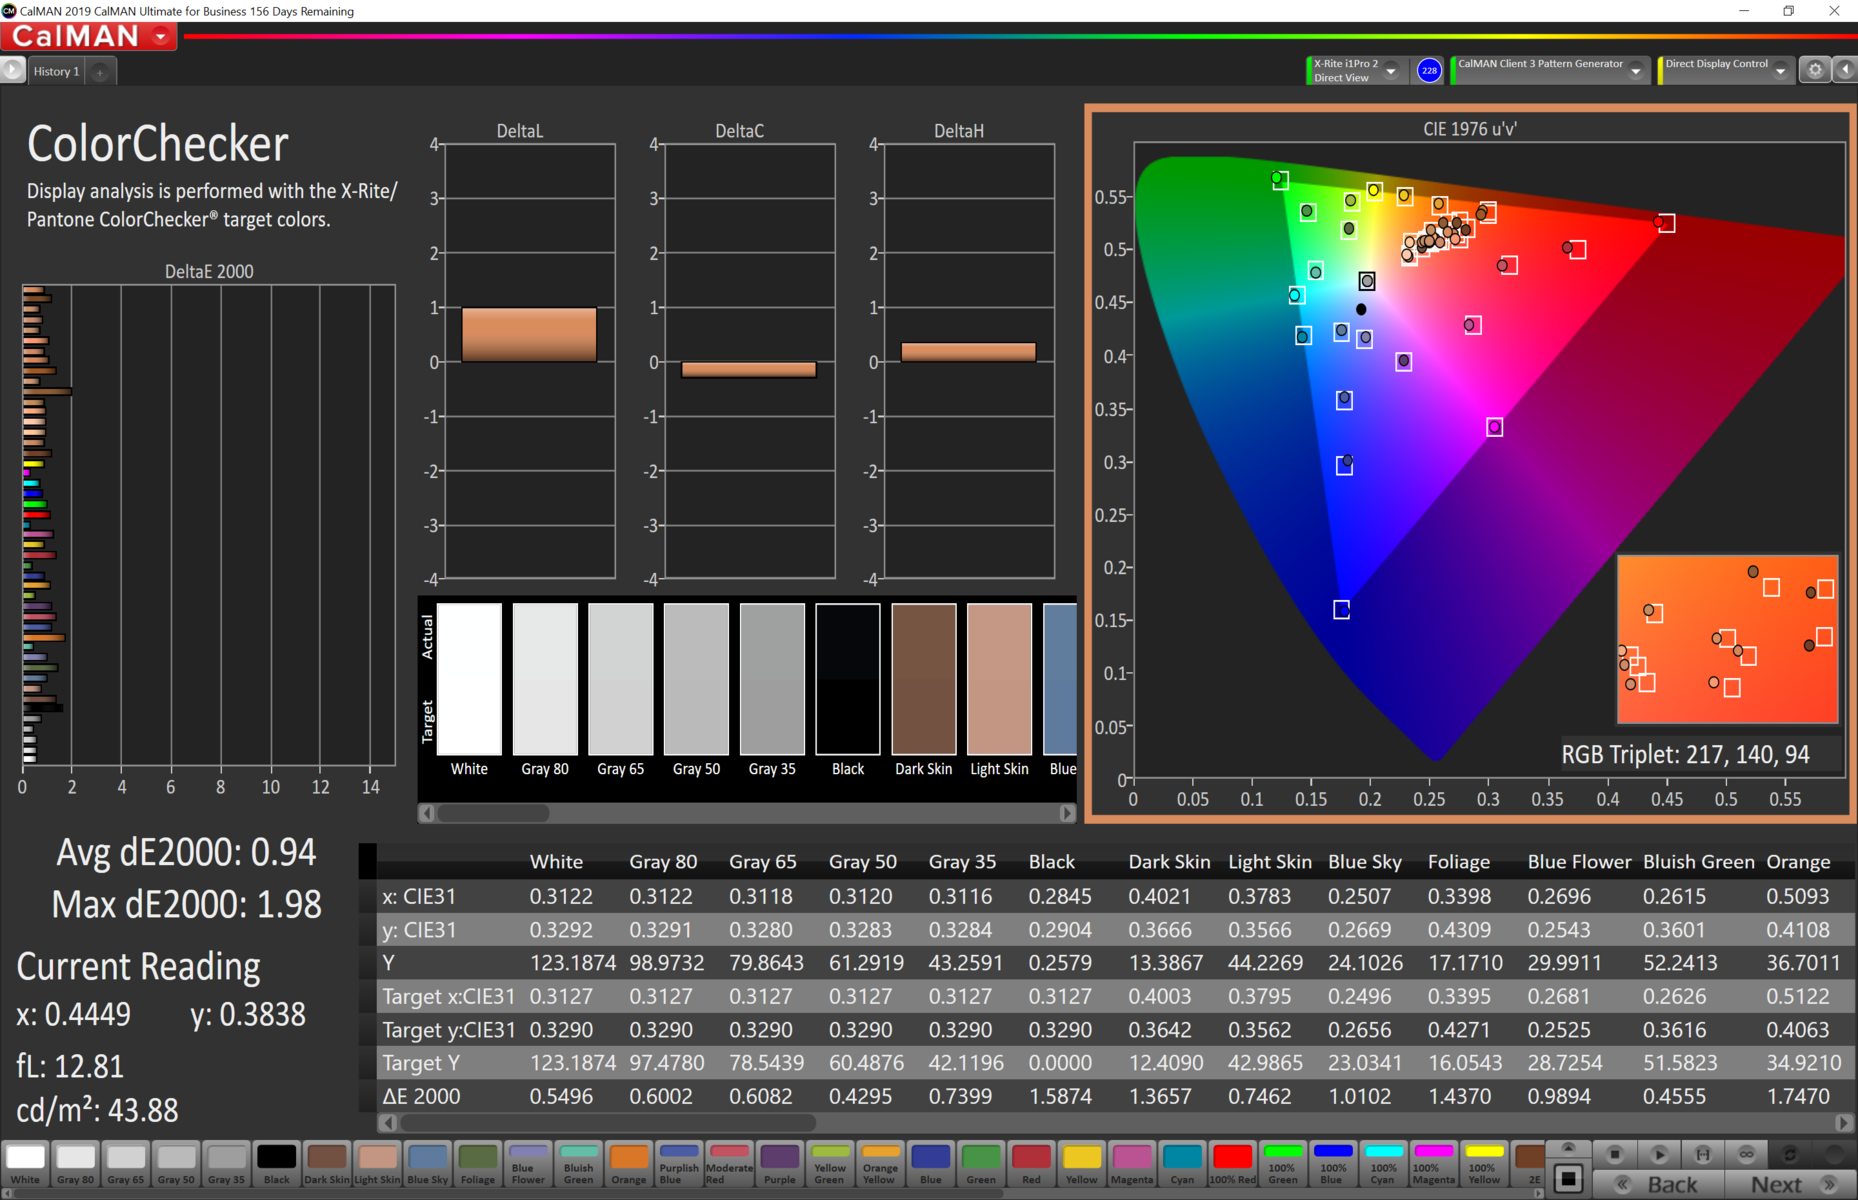
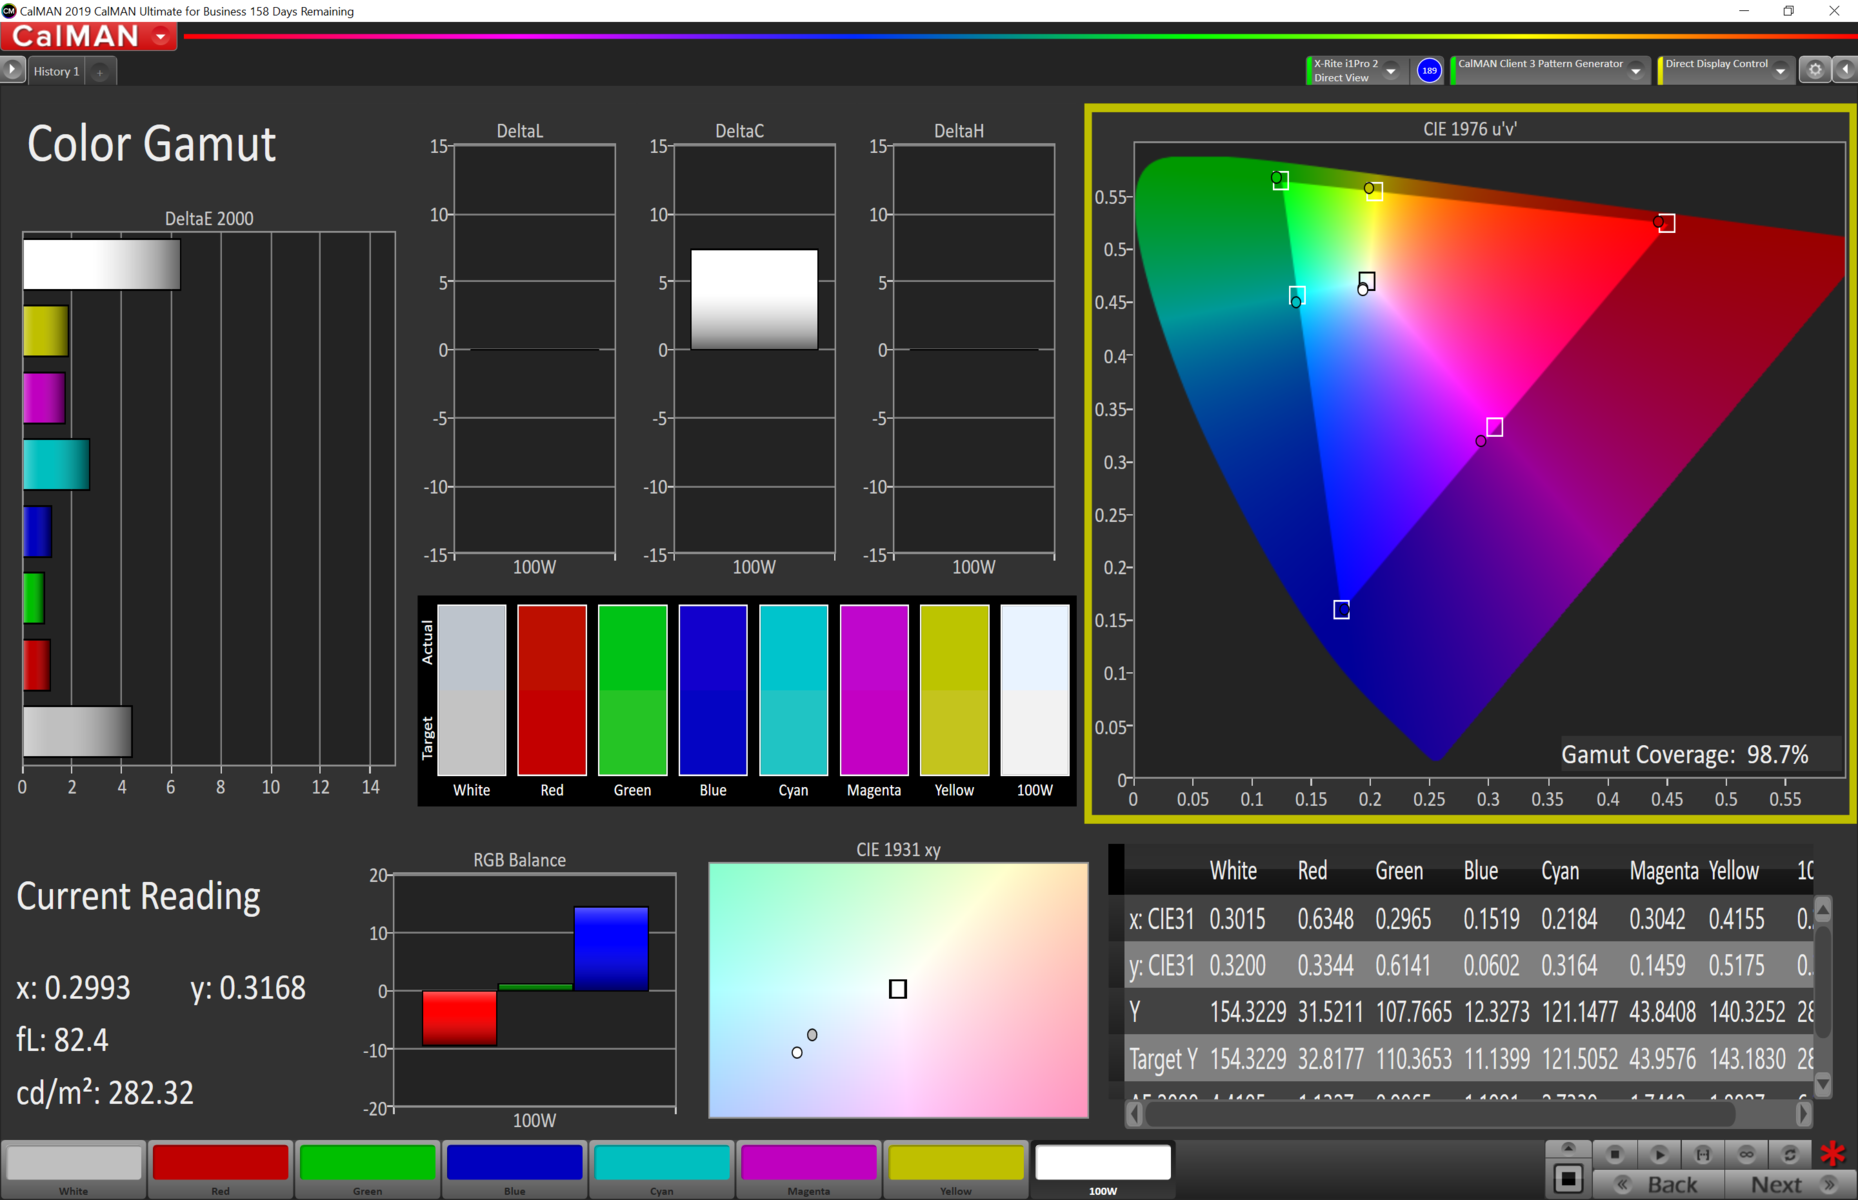
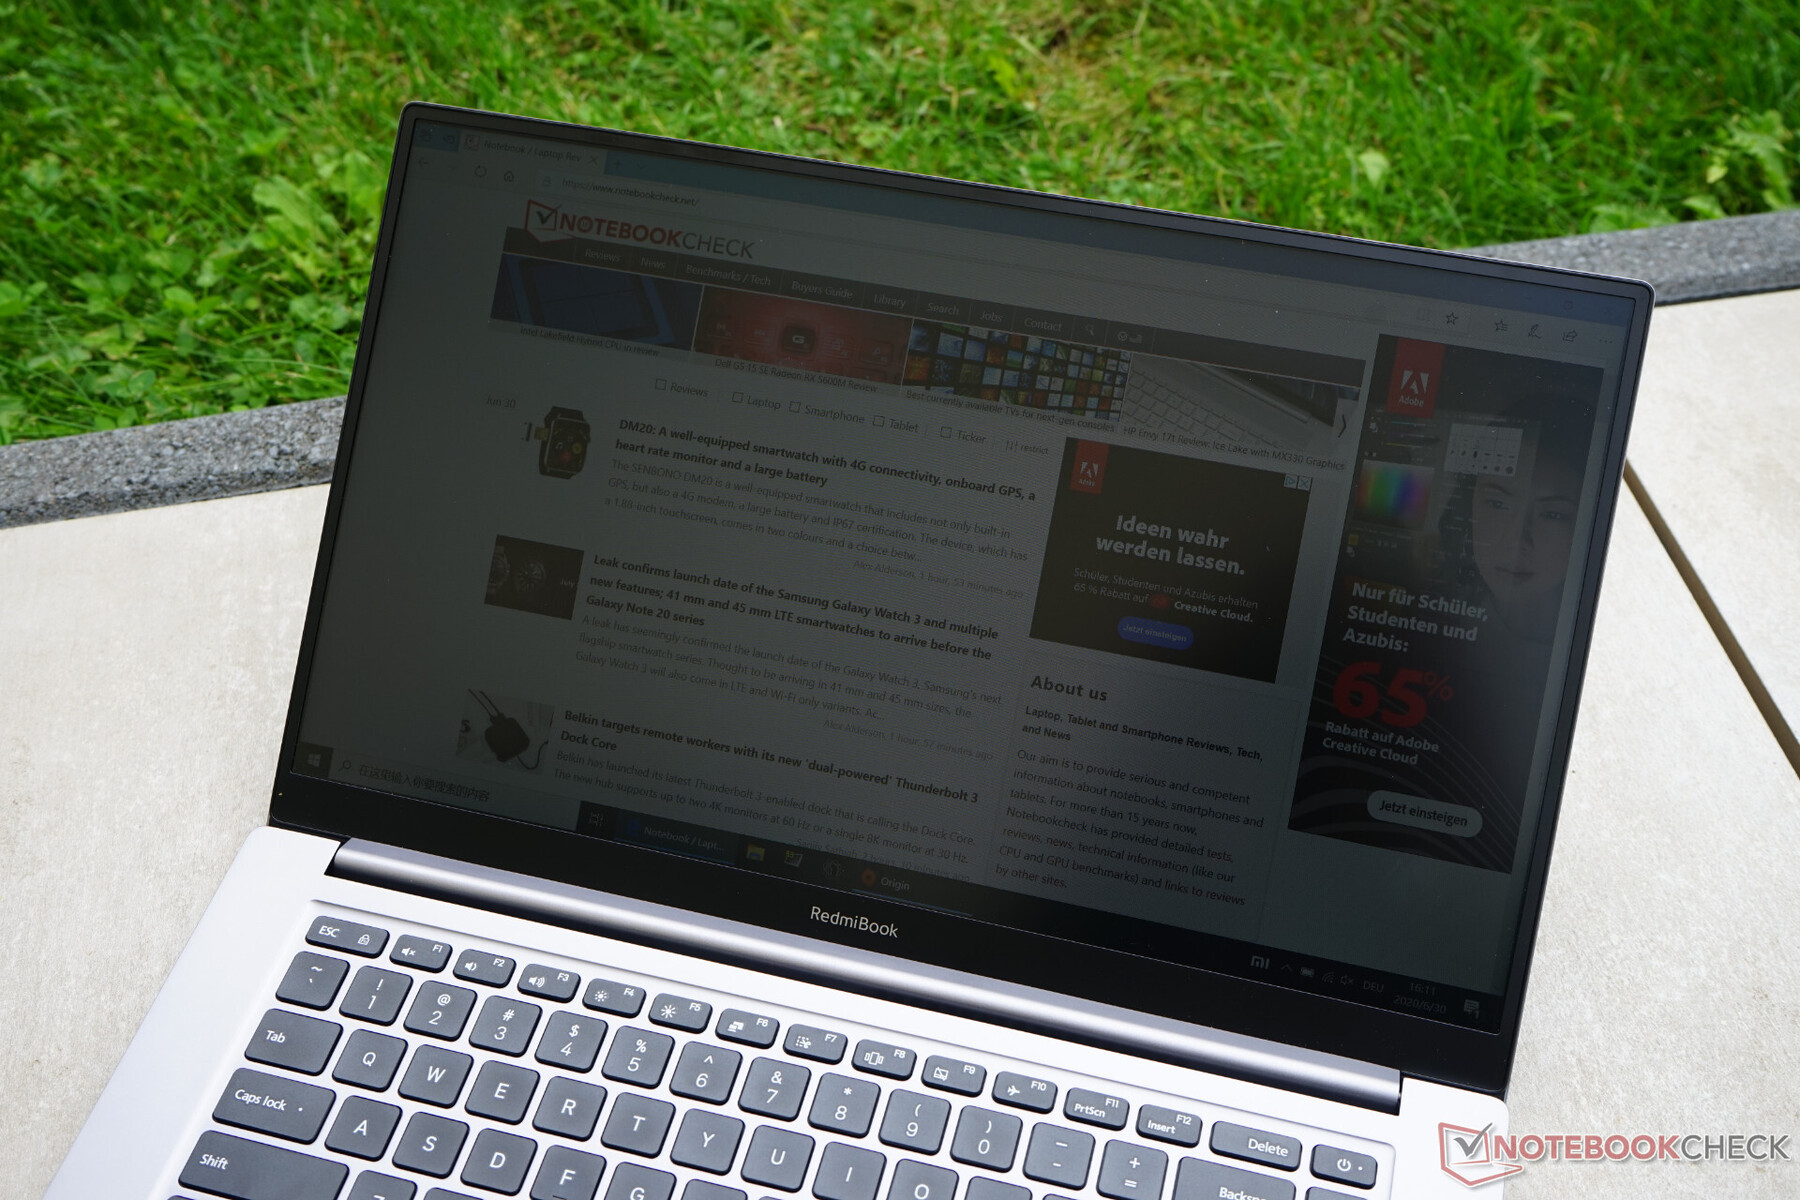
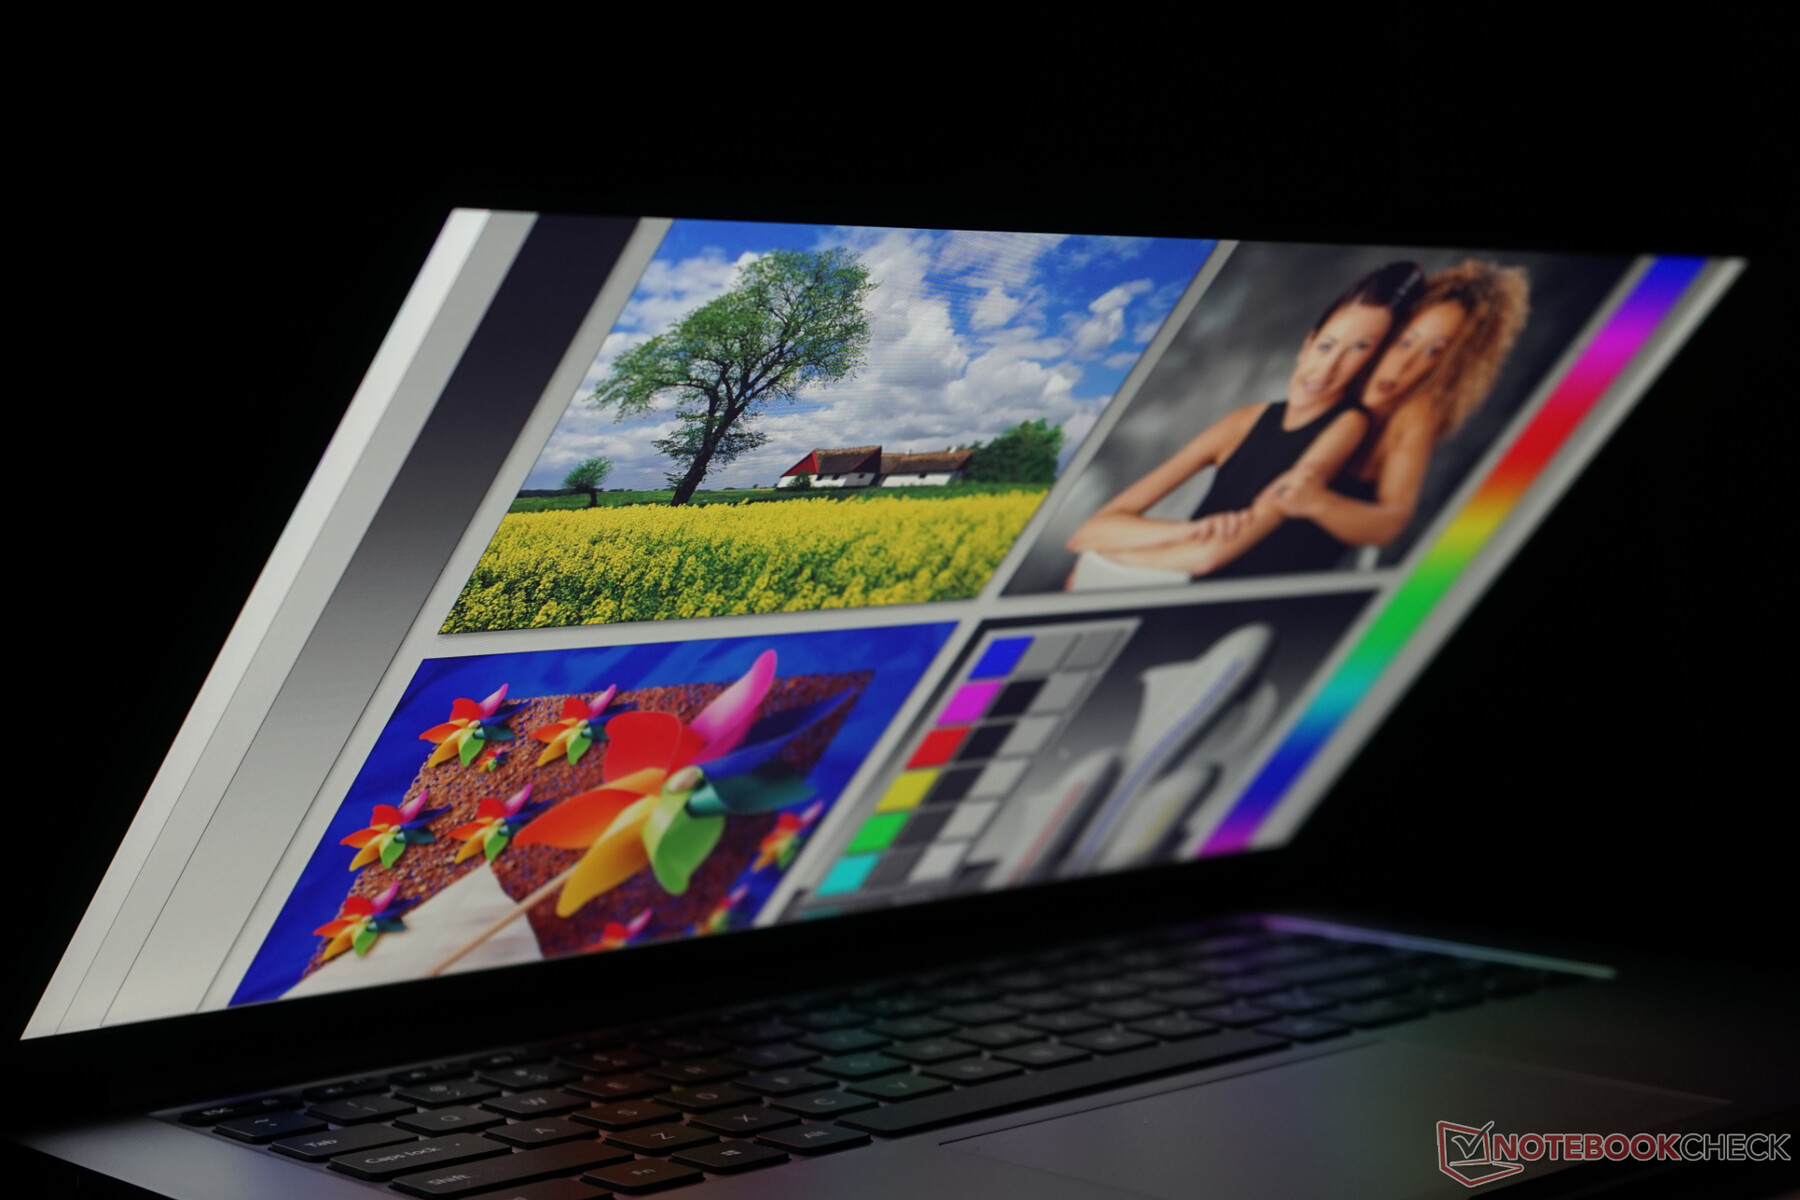
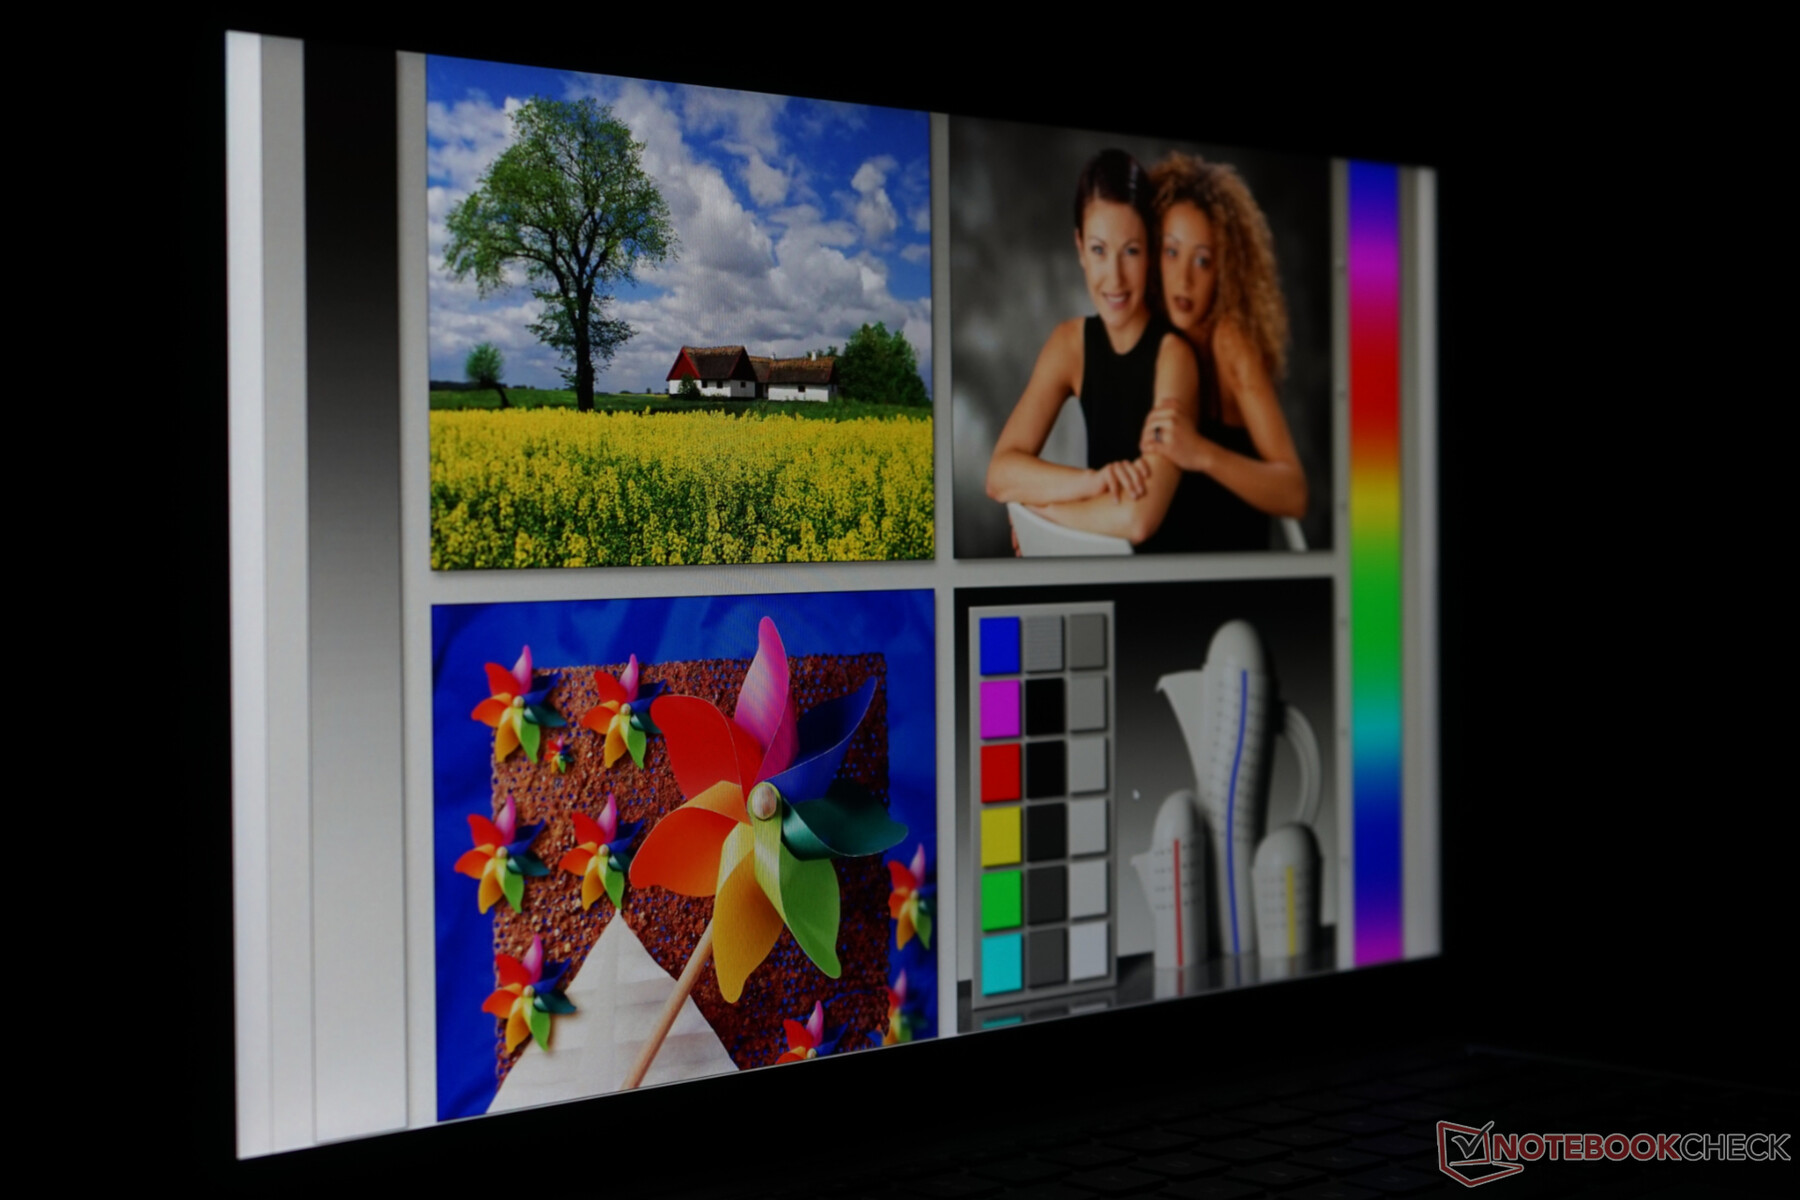
Our test sample uses a Chi Mei/Innolux CMN1608 (N161HCA-EA3) panel. On the internet you can only find data for the CMN1604 variant, which is specified with 300 cd/m² maximum brightness, 89° viewing angle, 60 Hz and with WLED backlight. In our brightness measurements, the screen with a matte surface doesn't quite manage the 300 cd/m². We see very good brightness values in the upper left area, but they decrease significantly in our sample towards the bottom. An illumination of only 78% is the result and is not ideal. In the clouding picture, you can see the bright spots in the upper corners well, but they are only so clearly visible in longer exposures (photo). At the lower edge we also have some light bleeding from the LED backlight. Our test sample can even surpass the specifications with a very good 1572:1 contrast ratio.
| |||||||||||||||||||||||||
Brightness Distribution: 78 %
Center on Battery: 283 cd/m²
Contrast: 1572:1 (Black: 0.18 cd/m²)
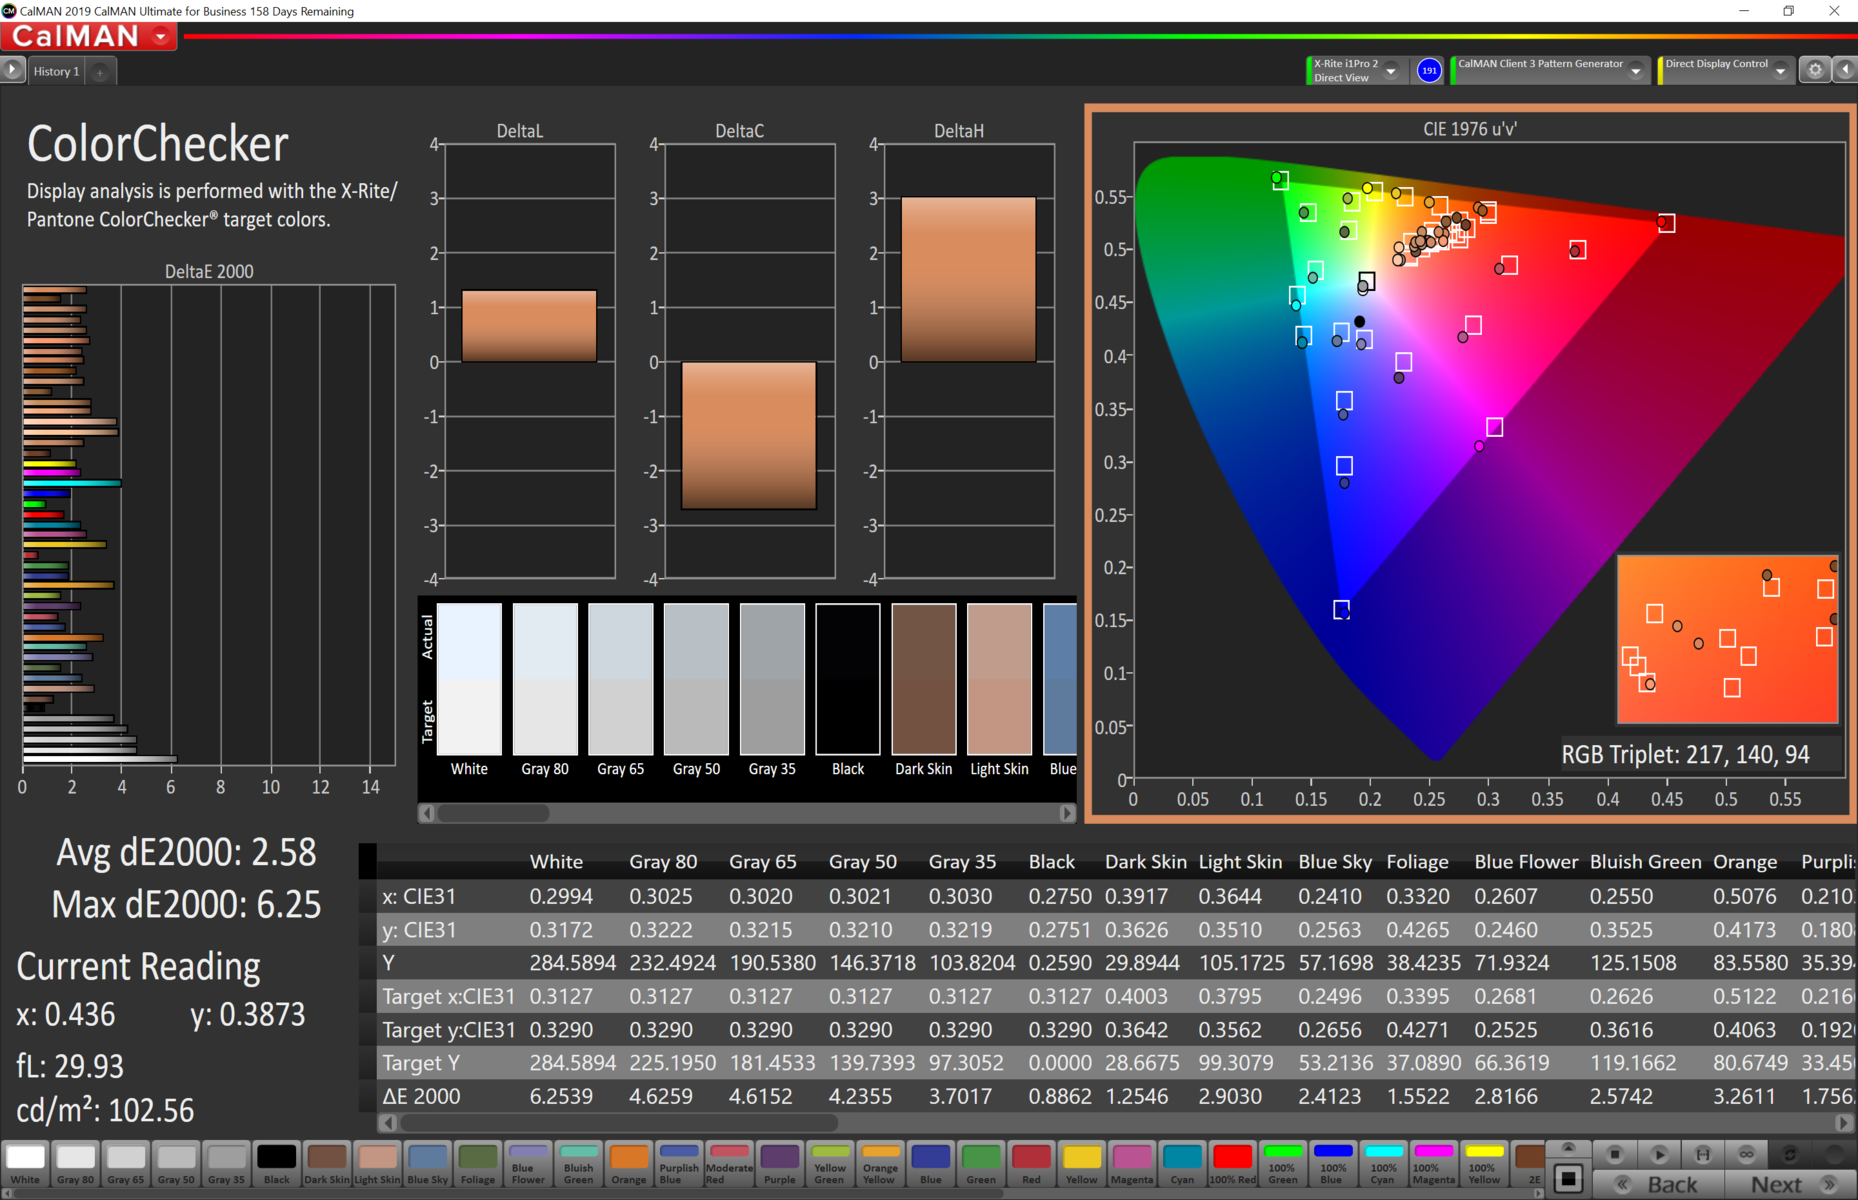
ΔE ColorChecker Calman: 2.58 | ∀{0.5-29.43 Ø4.75}
calibrated: 0.94
ΔE Greyscale Calman: 3.5 | ∀{0.09-98 Ø5}
98.7% sRGB (Calman 2D)
93.9% sRGB (Argyll 1.6.3 3D)
60.9% AdobeRGB 1998 (Argyll 1.6.3 3D)
66.2% AdobeRGB 1998 (Argyll 3D)
93.8% sRGB (Argyll 3D)
64.2% Display P3 (Argyll 3D)
Gamma: 2.09
CCT: 7317 K
| Xiaomi RedmiBook 16 R5 CMN1608, IPS, 1920x1080, 16" | Apple MacBook Pro 16 2019 i9 5500M APPA044, IPS, 3072x1920, 16" | Schenker Key 16 Chi Mei N161HCA-GA1 (CMN1602), IPS, 1920x1080, 16.1" | Average of class Office | |
|---|---|---|---|---|
| Display | 0% | -7% | ||
| Display P3 Coverage (%) | 64.2 | 63.8 -1% | 62.1 ? -3% | |
| sRGB Coverage (%) | 93.8 | 94.9 1% | 82.1 ? -12% | |
| AdobeRGB 1998 Coverage (%) | 66.2 | 65.9 0% | 62 ? -6% | |
| Response Times | -53% | 51% | 17% | |
| Response Time Grey 50% / Grey 80% * (ms) | 32.2 ? | 52.4 ? -63% | 18 ? 44% | 29.1 ? 10% |
| Response Time Black / White * (ms) | 24.5 ? | 34.9 ? -42% | 10.4 ? 58% | 18.9 ? 23% |
| PWM Frequency (Hz) | 131700 | 25510 ? | 386 ? | |
| Screen | 16% | 4% | -54% | |
| Brightness middle (cd/m²) | 283 | 519 83% | 296 5% | 413 ? 46% |
| Brightness (cd/m²) | 260 | 477 83% | 271 4% | |
| Brightness Distribution (%) | 78 | 86 10% | 88 13% | |
| Black Level * (cd/m²) | 0.18 | 0.39 -117% | 0.26 -44% | 0.248 ? -38% |
| Contrast (:1) | 1572 | 1331 -15% | 1138 -28% | |
| Colorchecker dE 2000 * | 2.58 | 2.28 12% | 2.24 13% | 4.19 ? -62% |
| Colorchecker dE 2000 max. * | 6.25 | 6.54 -5% | 4.04 35% | 11.1 ? -78% |
| Colorchecker dE 2000 calibrated * | 0.94 | 0.86 9% | 0.72 23% | 2.6 ? -177% |
| Greyscale dE 2000 * | 3.5 | 0.9 74% | 2.76 21% | 4.04 ? -15% |
| Gamma | 2.09 105% | 2145 0% | 2.52 87% | 2.22 99% ? |
| CCT | 7317 89% | 6572 99% | 6830 95% | 6716 97% ? |
| Color Space (Percent of AdobeRGB 1998) (%) | 60.9 | 78 28% | 60 -1% | |
| Color Space (Percent of sRGB) (%) | 93.9 | 99 5% | ||
| Total Average (Program / Settings) | -19% /
5% | 18% /
9% | -15% /
-28% |
* ... smaller is better
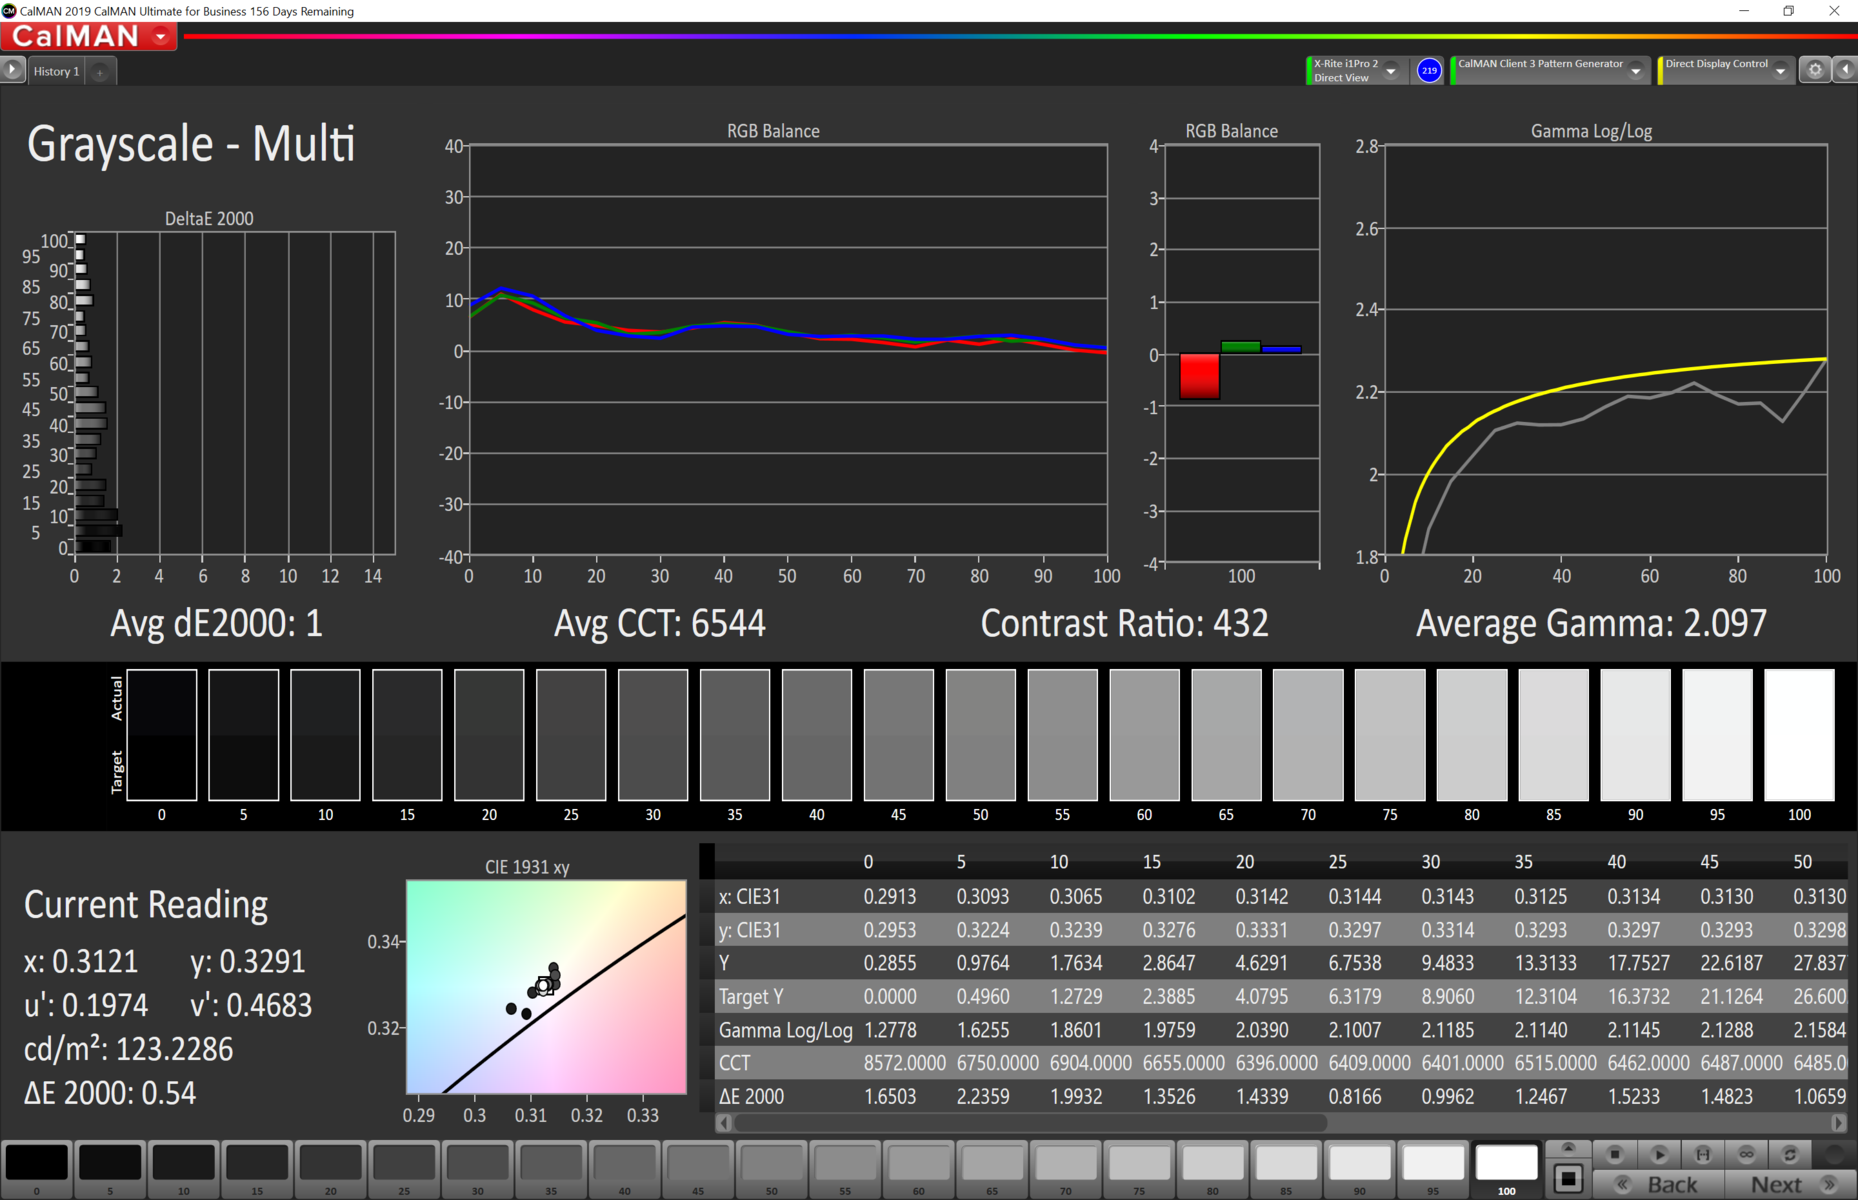
The color representation in the delivery state is significantly better than the class average. However, most colors and also the grayscales have too much blue. After calibration we achieve very good DeltaE values and thus color fidelity, but the maximum brightness was reduced to only 123 cd/m² during calibration.

Despite the matte surface, the RedmiBook 16 is only suitable for shady environments. The maximum brightness is too low to create a sufficient contrast. 500 candelas or more would be recommended for this. A modern smartphone, such as the iPhone 11 Pro, reaches around 800 cd/m² here.
The response times of the display are, typical for a 60-Hz IPS display, not the fastest. However, the measured values are slightly better than the average in the class. Xiaomi doesn't use PWM for brightness control. Therefore, the panel can also be used in dark environments by sensitive people without restrictions.
Display Response Times
| ↔ Response Time Black to White | ||
|---|---|---|
| 24.5 ms ... rise ↗ and fall ↘ combined | ↗ 14.4 ms rise | 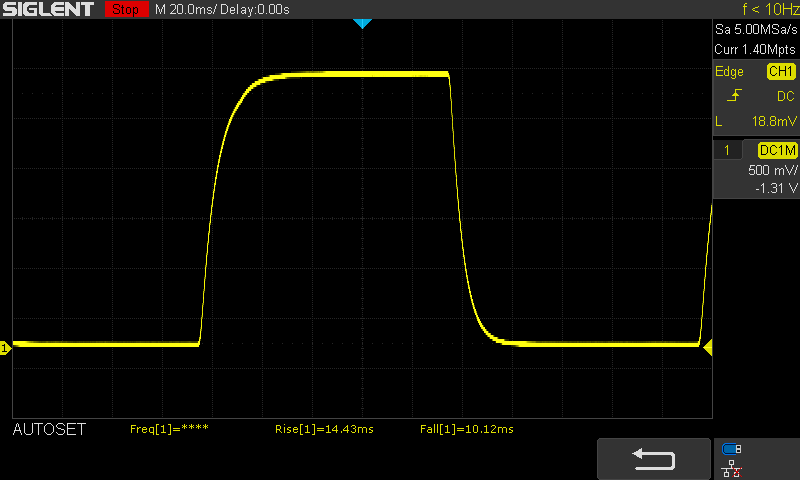 |
| ↘ 10.1 ms fall | ||
| The screen shows good response rates in our tests, but may be too slow for competitive gamers. In comparison, all tested devices range from 0.1 (minimum) to 240 (maximum) ms. » 57 % of all devices are better. This means that the measured response time is worse than the average of all tested devices (20.1 ms). | ||
| ↔ Response Time 50% Grey to 80% Grey | ||
| 32.2 ms ... rise ↗ and fall ↘ combined | ↗ 14.7 ms rise | 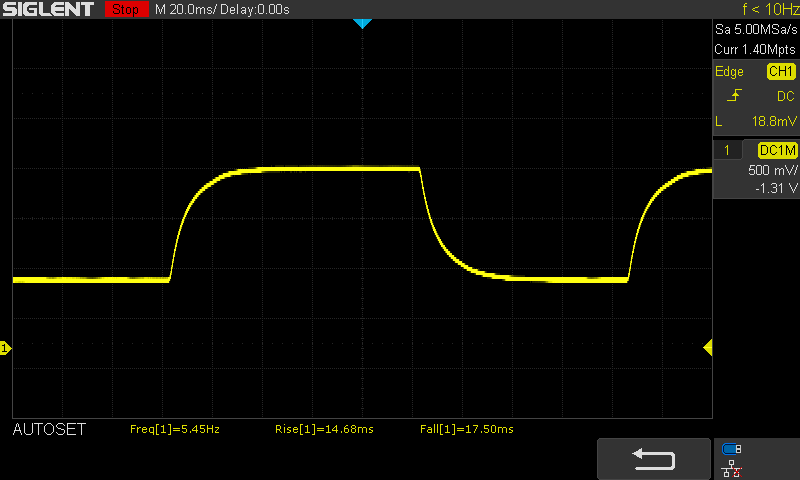 |
| ↘ 17.5 ms fall | ||
| The screen shows slow response rates in our tests and will be unsatisfactory for gamers. In comparison, all tested devices range from 0.165 (minimum) to 636 (maximum) ms. » 43 % of all devices are better. This means that the measured response time is similar to the average of all tested devices (31.4 ms). | ||
Screen Flickering / PWM (Pulse-Width Modulation)
| Screen flickering / PWM not detected | 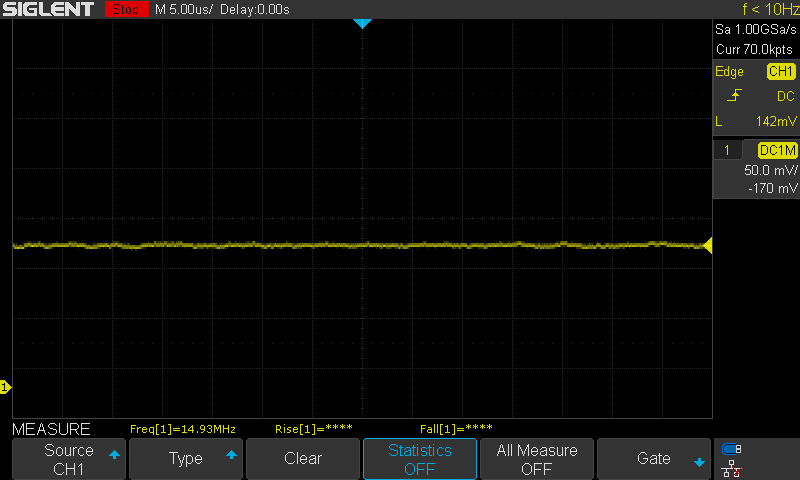 | ||
In comparison: 53 % of all tested devices do not use PWM to dim the display. If PWM was detected, an average of 7996 (minimum: 5 - maximum: 343500) Hz was measured. | |||
The IPS panel impresses with a stable color display and little loss of brightness, even from extreme viewing angles.


Performance
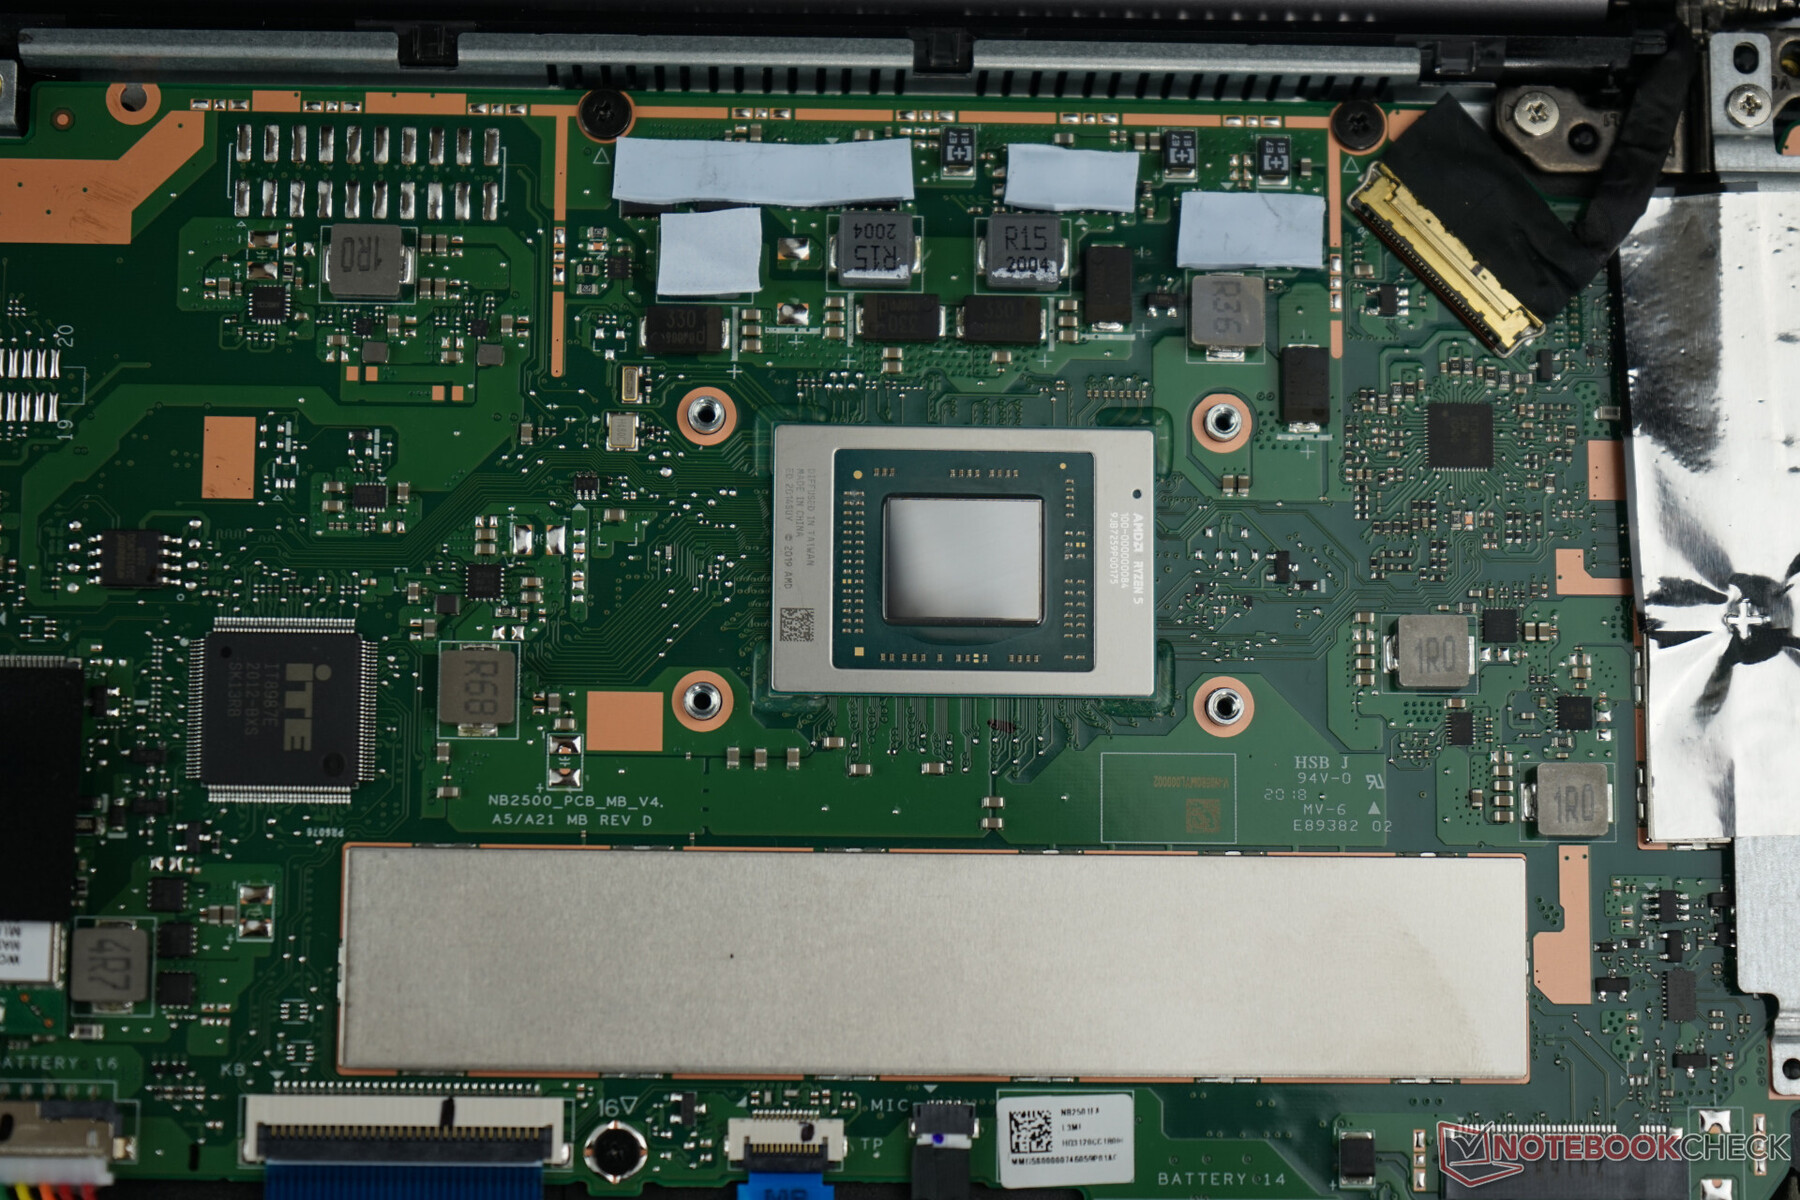
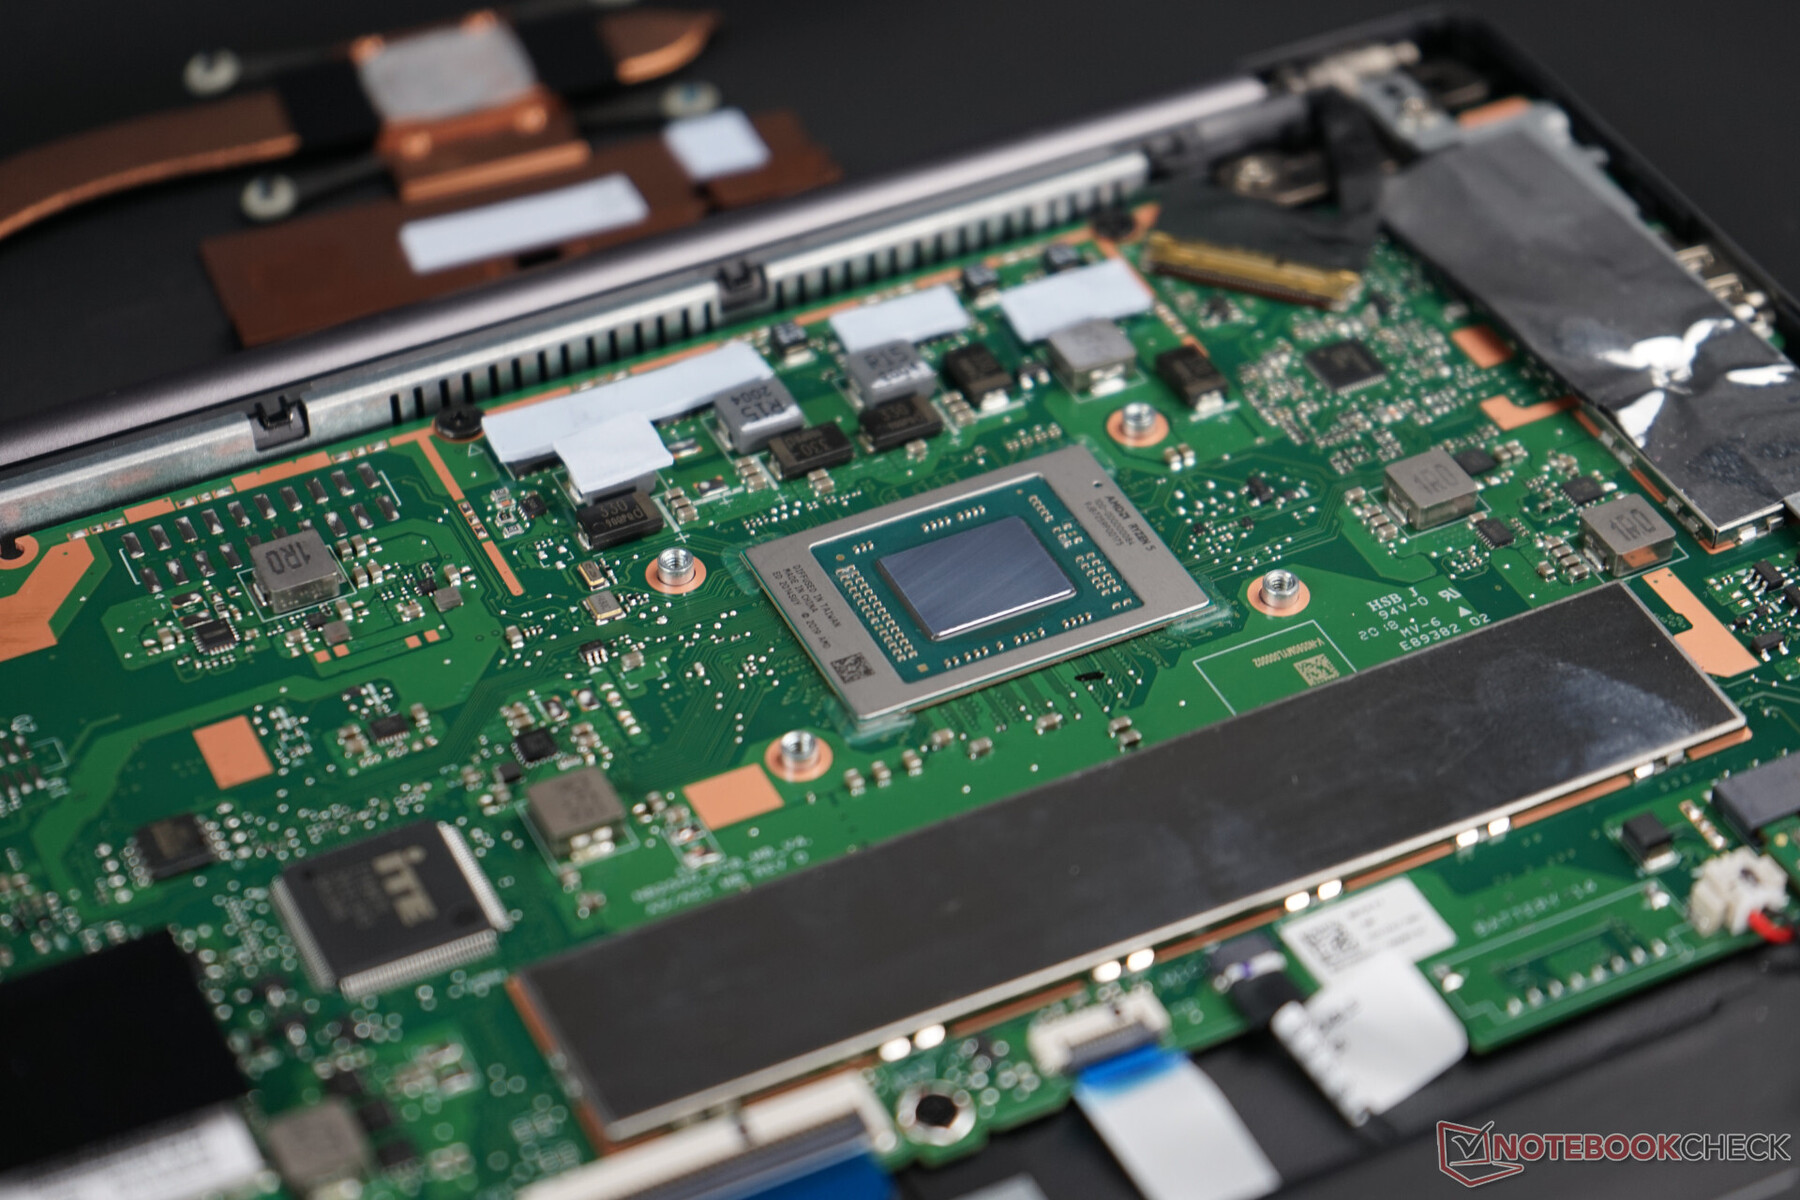
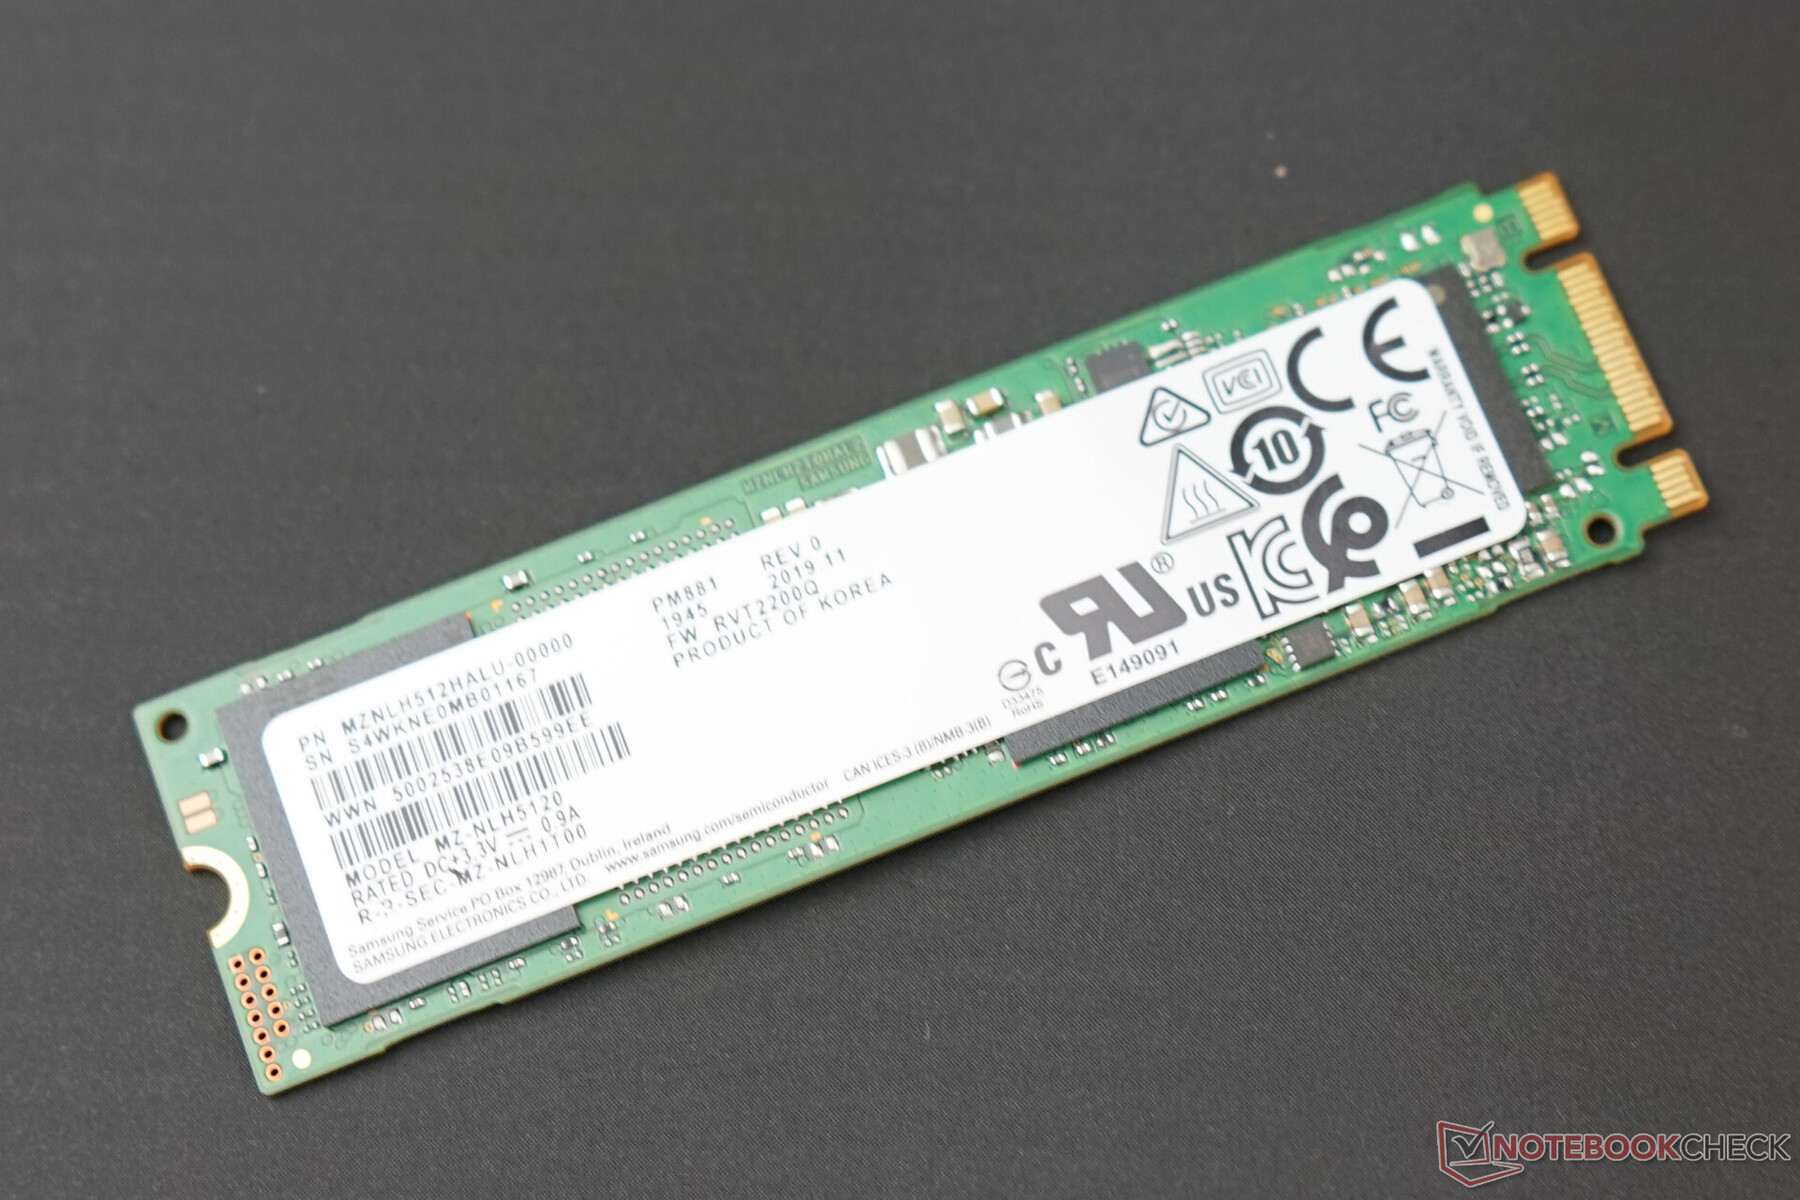
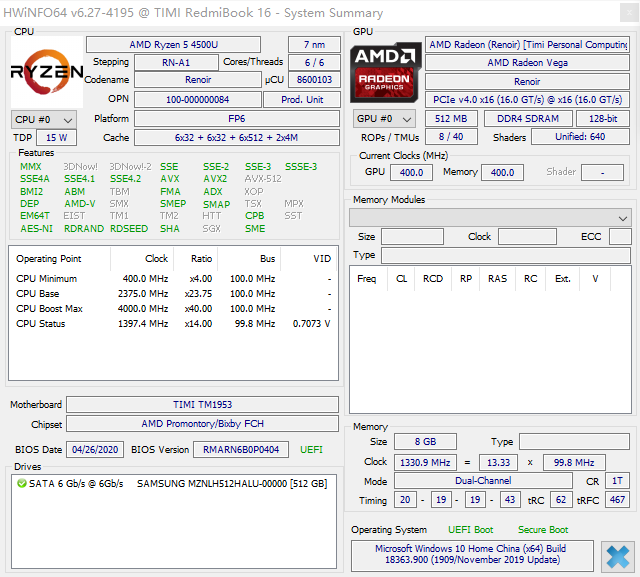
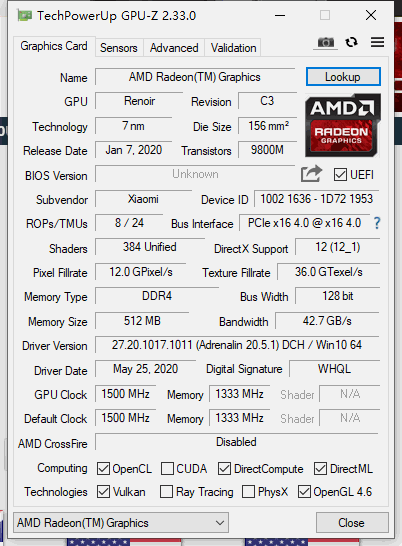
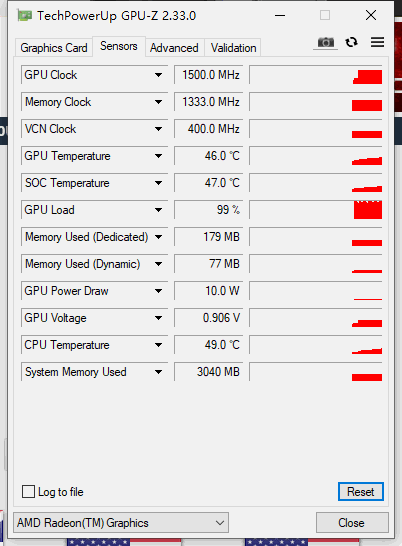
This entry-level model shows a reasonable configuration with the fast Ryzen 5 4500U six-core chip, integrated Vega 6 graphics card, 8 GB DDR4-2667 RAM in dual-channel operation, and a Samsung MZNLH512HALU SATA 3 SSD.
Processor
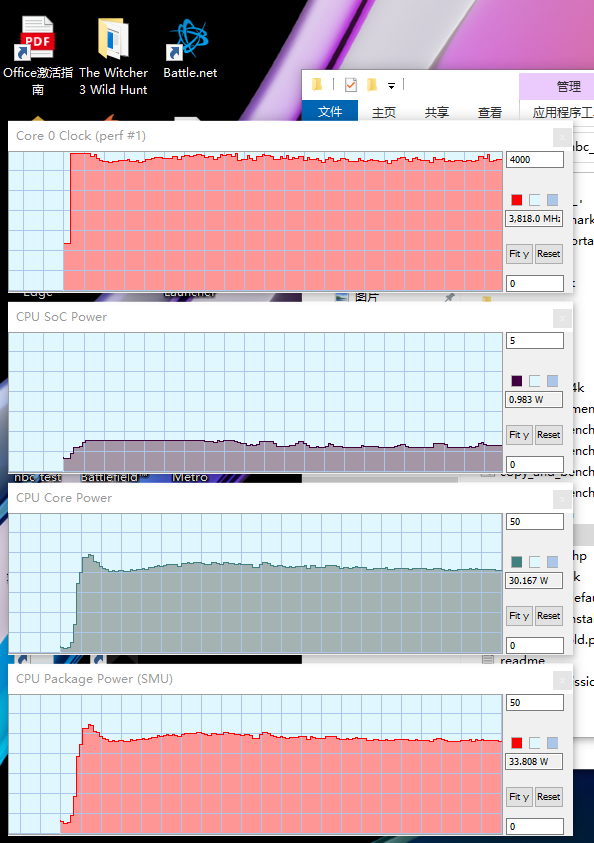
The Ryzen 5 4500U is clearly a highlight in the RedmiBook 16. The price-performance ratio of the 6-core processor is remarkable for the cooling system installed. In the test, it can clearly place itself in front of the expensive Ice-Lake Core i7-1065G7; the average Ryzen 5 3500U is already a respectable 27% behind. The maximum turbo of 4 GHz is initially also reached in multi-core benchmarks, but then the clock rate settles down at around 3.8 GHz (Blender).
According to HWiNFO64 the CPU package draws 37.7 watts and then settles at 33-34 watts. Therefore, one is clearly away from the specified 15 watts TDP. The performance drop in our Cinebench R15 loop is within the limits with a maximum of 10%. In comparison to other Ryzen 5 4500U's tested so far, the RedmiBook can hold its own well, and only the IdeaPad 5 is able to sustain its performance a bit better.
Cinebench R20: CPU (Single Core) | CPU (Multi Core)
Cinebench R15: CPU Single 64Bit | CPU Multi 64Bit
Blender: v2.79 BMW27 CPU
7-Zip 18.03: 7z b 4 -mmt1 | 7z b 4
Geekbench 5.5: Single-Core | Multi-Core
HWBOT x265 Benchmark v2.2: 4k Preset
LibreOffice : 20 Documents To PDF
R Benchmark 2.5: Overall mean
| Performance rating | |
| Average of class Office | |
| Apple MacBook Pro 16 2019 i9 5500M | |
| Average AMD Ryzen 7 4800U | |
| Average AMD Ryzen 7 4700U | |
| Xiaomi RedmiBook 16 R5 | |
| Average Intel Core i7-10810U | |
| Average Intel Core i7-10510U | |
| Average Intel Core i7-10610U | |
| Average Intel Core i7-1065G7 | |
| Huawei MateBook D 15-53010TUY -1! | |
| Average Intel Core i5-10210U | |
| Cinebench R20 / CPU (Single Core) | |
| Average of class Office (285 - 816, n=79, last 2 years) | |
| Average AMD Ryzen 7 4800U (474 - 488, n=4) | |
| Average AMD Ryzen 7 4700U (448 - 478, n=9) | |
| Apple MacBook Pro 16 2019 i9 5500M | |
| Apple MacBook Pro 16 2019 i9 5500M | |
| Xiaomi RedmiBook 16 R5 | |
| Average Intel Core i7-1065G7 (358 - 474, n=31) | |
| Average Intel Core i7-10610U (349 - 482, n=6) | |
| Average Intel Core i7-10510U (362 - 497, n=37) | |
| Average Intel Core i7-10810U (396 - 447, n=5) | |
| Average Intel Core i5-10210U (322 - 428, n=30) | |
| Huawei MateBook D 15-53010TUY | |
| Cinebench R20 / CPU (Multi Core) | |
| Average of class Office (590 - 8840, n=79, last 2 years) | |
| Apple MacBook Pro 16 2019 i9 5500M | |
| Apple MacBook Pro 16 2019 i9 5500M | |
| Average AMD Ryzen 7 4800U (2943 - 3306, n=4) | |
| Average AMD Ryzen 7 4700U (2401 - 3095, n=9) | |
| Xiaomi RedmiBook 16 R5 | |
| Average Intel Core i7-10810U (1498 - 2344, n=5) | |
| Huawei MateBook D 15-53010TUY | |
| Average Intel Core i7-1065G7 (1081 - 2024, n=31) | |
| Average Intel Core i7-10610U (1271 - 1663, n=6) | |
| Average Intel Core i7-10510U (1015 - 1897, n=38) | |
| Average Intel Core i5-10210U (722 - 1820, n=30) | |
| Cinebench R15 / CPU Single 64Bit | |
| Average of class Office (99.5 - 312, n=81, last 2 years) | |
| Apple MacBook Pro 16 2019 i9 5500M | |
| Apple MacBook Pro 16 2019 i9 5500M | |
| Average AMD Ryzen 7 4800U (182 - 187, n=3) | |
| Average AMD Ryzen 7 4700U (176 - 185, n=11) | |
| Average Intel Core i7-10510U (113 - 202, n=42) | |
| Xiaomi RedmiBook 16 R5 | |
| Average Intel Core i7-10610U (133 - 200, n=6) | |
| Average Intel Core i7-10810U (161 - 183, n=5) | |
| Average Intel Core i7-1065G7 (141 - 190, n=35) | |
| Average Intel Core i5-10210U (134 - 174, n=35) | |
| Huawei MateBook D 15-53010TUY | |
| Cinebench R15 / CPU Multi 64Bit | |
| Average of class Office (246 - 3380, n=81, last 2 years) | |
| Average AMD Ryzen 7 4800U (1281 - 1639, n=3) | |
| Apple MacBook Pro 16 2019 i9 5500M | |
| Apple MacBook Pro 16 2019 i9 5500M | |
| Average AMD Ryzen 7 4700U (801 - 1253, n=12) | |
| Xiaomi RedmiBook 16 R5 | |
| Average Intel Core i7-10810U (623 - 1064, n=4) | |
| Huawei MateBook D 15-53010TUY | |
| Average Intel Core i7-10510U (482 - 856, n=45) | |
| Average Intel Core i7-1065G7 (288 - 836, n=36) | |
| Average Intel Core i7-10610U (548 - 738, n=6) | |
| Average Intel Core i5-10210U (320 - 790, n=35) | |
| Blender / v2.79 BMW27 CPU | |
| Average Intel Core i7-1065G7 (675 - 1650, n=23) | |
| Average Intel Core i5-10210U (585 - 1339, n=24) | |
| Average Intel Core i7-10510U (628 - 1051, n=31) | |
| Average Intel Core i7-10610U (641 - 816, n=6) | |
| Average Intel Core i7-10810U (571 - 875, n=5) | |
| Huawei MateBook D 15-53010TUY | |
| Xiaomi RedmiBook 16 R5 | |
| Average AMD Ryzen 7 4700U (407 - 537, n=8) | |
| Average of class Office (158 - 1956, n=82, last 2 years) | |
| Average AMD Ryzen 7 4800U (322 - 374, n=3) | |
| Apple MacBook Pro 16 2019 i9 5500M | |
| 7-Zip 18.03 / 7z b 4 -mmt1 | |
| Average of class Office (3046 - 6469, n=81, last 2 years) | |
| Apple MacBook Pro 16 2019 i9 5500M | |
| Average Intel Core i7-10510U (3747 - 4981, n=31) | |
| Average Intel Core i7-10810U (4398 - 4794, n=5) | |
| Average AMD Ryzen 7 4800U (4420 - 4603, n=3) | |
| Average Intel Core i7-10610U (3653 - 4853, n=6) | |
| Average AMD Ryzen 7 4700U (4208 - 4470, n=8) | |
| Xiaomi RedmiBook 16 R5 | |
| Average Intel Core i7-1065G7 (3289 - 4589, n=24) | |
| Average Intel Core i5-10210U (3504 - 4467, n=24) | |
| Huawei MateBook D 15-53010TUY | |
| 7-Zip 18.03 / 7z b 4 | |
| Average of class Office (7532 - 76886, n=82, last 2 years) | |
| Average AMD Ryzen 7 4800U (38654 - 44804, n=3) | |
| Apple MacBook Pro 16 2019 i9 5500M | |
| Average AMD Ryzen 7 4700U (26652 - 33890, n=8) | |
| Xiaomi RedmiBook 16 R5 | |
| Average Intel Core i7-10810U (16072 - 25244, n=5) | |
| Average Intel Core i7-10610U (15369 - 20332, n=6) | |
| Average Intel Core i7-10510U (12196 - 21298, n=31) | |
| Average Intel Core i7-1065G7 (10406 - 22898, n=24) | |
| Huawei MateBook D 15-53010TUY | |
| Average Intel Core i5-10210U (10920 - 21679, n=24) | |
| Geekbench 5.5 / Single-Core | |
| Average of class Office (811 - 2128, n=78, last 2 years) | |
| Average Intel Core i7-1065G7 (948 - 1348, n=18) | |
| Average Intel Core i7-10810U (1219 - 1274, n=5) | |
| Average Intel Core i7-10610U (1155 - 1261, n=6) | |
| Average Intel Core i7-10510U (977 - 1287, n=31) | |
| Average AMD Ryzen 7 4800U (1150 - 1192, n=4) | |
| Average AMD Ryzen 7 4700U (1101 - 1168, n=8) | |
| Apple MacBook Pro 16 2019 i9 5500M | |
| Xiaomi RedmiBook 16 R5 | |
| Average Intel Core i5-10210U (949 - 1133, n=27) | |
| Huawei MateBook D 15-53010TUY | |
| Geekbench 5.5 / Multi-Core | |
| Average of class Office (1719 - 16999, n=78, last 2 years) | |
| Apple MacBook Pro 16 2019 i9 5500M | |
| Average AMD Ryzen 7 4800U (5798 - 6950, n=4) | |
| Average AMD Ryzen 7 4700U (4792 - 6502, n=8) | |
| Xiaomi RedmiBook 16 R5 | |
| Average Intel Core i7-10810U (3351 - 5553, n=5) | |
| Average Intel Core i7-1065G7 (2464 - 4855, n=18) | |
| Average Intel Core i7-10610U (3731 - 4622, n=6) | |
| Average Intel Core i7-10510U (2474 - 4484, n=31) | |
| Average Intel Core i5-10210U (2079 - 4256, n=27) | |
| Huawei MateBook D 15-53010TUY | |
| HWBOT x265 Benchmark v2.2 / 4k Preset | |
| Average of class Office (1.72 - 26, n=80, last 2 years) | |
| Apple MacBook Pro 16 2019 i9 5500M | |
| Average AMD Ryzen 7 4800U (9.48 - 10.8, n=3) | |
| Average AMD Ryzen 7 4700U (6.79 - 10.1, n=8) | |
| Xiaomi RedmiBook 16 R5 | |
| Average Intel Core i7-10810U (3.81 - 6.45, n=5) | |
| Average Intel Core i7-10610U (4.54 - 5.66, n=6) | |
| Average Intel Core i7-10510U (3.41 - 6.04, n=31) | |
| Average Intel Core i7-1065G7 (2.2 - 6.38, n=22) | |
| Average Intel Core i5-10210U (2.36 - 6.28, n=24) | |
| Huawei MateBook D 15-53010TUY | |
| LibreOffice / 20 Documents To PDF | |
| Average Intel Core i7-10610U (56.1 - 106, n=6) | |
| Average AMD Ryzen 7 4700U (55.5 - 115.7, n=8) | |
| Average Intel Core i7-10810U (60.6 - 68.2, n=5) | |
| Average Intel Core i5-10210U (49.6 - 80.3, n=18) | |
| Average AMD Ryzen 7 4800U (57.8 - 62.6, n=3) | |
| Average Intel Core i7-1065G7 (46.9 - 85.3, n=19) | |
| Average Intel Core i7-10510U (50.7 - 77.8, n=27) | |
| Apple MacBook Pro 16 2019 i9 5500M | |
| Apple MacBook Pro 16 2019 i9 5500M | |
| Xiaomi RedmiBook 16 R5 | |
| Average of class Office (41.5 - 129.6, n=80, last 2 years) | |
| R Benchmark 2.5 / Overall mean | |
| Huawei MateBook D 15-53010TUY | |
| Average Intel Core i5-10210U (0.658 - 0.901, n=24) | |
| Average Intel Core i7-1065G7 (0.661 - 0.798, n=18) | |
| Average Intel Core i7-10610U (0.637 - 0.855, n=6) | |
| Apple MacBook Pro 16 2019 i9 5500M | |
| Apple MacBook Pro 16 2019 i9 5500M | |
| Average Intel Core i7-10810U (0.651 - 0.717, n=5) | |
| Average Intel Core i7-10510U (0.637 - 0.81, n=28) | |
| Xiaomi RedmiBook 16 R5 | |
| Average AMD Ryzen 7 4700U (0.598 - 0.651, n=8) | |
| Average AMD Ryzen 7 4800U (0.576 - 0.613, n=3) | |
| Average of class Office (0.4098 - 1.06, n=80, last 2 years) | |
* ... smaller is better
System Performance
We measure the general system performance with UL's PCMark products. The RedmiBook can score well here with six fast-clocked cores, dual-channel RAM, and SSD. The significantly more expensive HP Envy x360 with the same CPU can't achieve higher average results despite a faster SSD and higher-clocked RAM. The big role model, the MacBook Pro 16 with Core i9 and strong Radeon Pro 5500M, is only 3% faster on average. Competitors from Intel with an expensive Core i7-1065G7 are on average 12% slower.
Overall, we note an impressive performance even for the entry level model, and it turns out that only a few users will benefit from the faster, optional Ryzen 7 4700U.
PCMark 8: Home Score Accelerated v2 | Work Score Accelerated v2
PCMark 10: Score | Essentials | Productivity | Digital Content Creation
| Performance rating | |
| Average of class Office | |
| Apple MacBook Pro 16 2019 i9 5500M -3! | |
| Xiaomi RedmiBook 16 R5 | |
| HP Envy x360 13-ay0010nr | |
| Average AMD Ryzen 7 4700U | |
| Lenovo IdeaPad 5 14ARE05 | |
| Average AMD Ryzen 5 4500U | |
| Average AMD Ryzen 5 4500U, AMD Radeon RX Vega 6 (Ryzen 4000/5000) | |
| HP ProBook 455 G7-175W8EA | |
| Dell XPS 15 9500 Core i5 | |
| Lenovo ThinkBook 15 | |
| HP ProBook 445 G7 175W4EA | |
| HP Envy x360 15-dr1679cl | |
| Average Intel Core i7-1065G7 | |
| Lenovo ThinkPad E15 Gen2-20T9S00K00 | |
| Acer Extensa 15 EX215-51-56UX | |
| LG Gram 15Z90N | |
| Honor MagicBook 15 | |
| Huawei MateBook D 15-53010TUY | |
| HP 15s-fq1440ng | |
| Asus Vivobook 15 F512DA-SH31 | |
| PCMark 8 / Home Score Accelerated v2 | |
| Average of class Office (n=1last 2 years) | |
| Apple MacBook Pro 16 2019 i9 5500M | |
| Xiaomi RedmiBook 16 R5 | |
| Lenovo ThinkBook 15 | |
| Average AMD Ryzen 5 4500U (3889 - 4658, n=9) | |
| Average AMD Ryzen 5 4500U, AMD Radeon RX Vega 6 (Ryzen 4000/5000) (3889 - 4658, n=9) | |
| Average AMD Ryzen 7 4700U (4015 - 4402, n=6) | |
| Lenovo IdeaPad 5 14ARE05 | |
| Lenovo ThinkPad E15 Gen2-20T9S00K00 | |
| HP Envy x360 13-ay0010nr | |
| HP ProBook 445 G7 175W4EA | |
| HP ProBook 455 G7-175W8EA | |
| Dell XPS 15 9500 Core i5 | |
| HP 15s-fq1440ng | |
| Average Intel Core i7-1065G7 (3029 - 4523, n=25) | |
| Huawei MateBook D 15-53010TUY | |
| Honor MagicBook 15 | |
| LG Gram 15Z90N | |
| HP Envy x360 15-dr1679cl | |
| Acer Extensa 15 EX215-51-56UX | |
| Asus Vivobook 15 F512DA-SH31 | |
| PCMark 8 / Work Score Accelerated v2 | |
| Average of class Office (n=1last 2 years) | |
| Xiaomi RedmiBook 16 R5 | |
| Lenovo IdeaPad 5 14ARE05 | |
| HP Envy x360 15-dr1679cl | |
| Dell XPS 15 9500 Core i5 | |
| Average AMD Ryzen 5 4500U (5084 - 5543, n=9) | |
| Average AMD Ryzen 5 4500U, AMD Radeon RX Vega 6 (Ryzen 4000/5000) (5084 - 5543, n=9) | |
| HP Envy x360 13-ay0010nr | |
| HP ProBook 445 G7 175W4EA | |
| Lenovo ThinkBook 15 | |
| HP ProBook 455 G7-175W8EA | |
| Acer Extensa 15 EX215-51-56UX | |
| Apple MacBook Pro 16 2019 i9 5500M | |
| Average AMD Ryzen 7 4700U (3010 - 5361, n=5) | |
| LG Gram 15Z90N | |
| Huawei MateBook D 15-53010TUY | |
| Honor MagicBook 15 | |
| Average Intel Core i7-1065G7 (2460 - 5488, n=25) | |
| Asus Vivobook 15 F512DA-SH31 | |
| Lenovo ThinkPad E15 Gen2-20T9S00K00 | |
| HP 15s-fq1440ng | |
| PCMark 10 / Score | |
| Average of class Office (2823 - 9298, n=69, last 2 years) | |
| Apple MacBook Pro 16 2019 i9 5500M | |
| Average AMD Ryzen 7 4700U (4527 - 5307, n=8) | |
| HP Envy x360 13-ay0010nr | |
| Xiaomi RedmiBook 16 R5 | |
| Average AMD Ryzen 5 4500U (4393 - 5024, n=12) | |
| Average AMD Ryzen 5 4500U, AMD Radeon RX Vega 6 (Ryzen 4000/5000) (4393 - 5024, n=12) | |
| Lenovo IdeaPad 5 14ARE05 | |
| Lenovo ThinkPad E15 Gen2-20T9S00K00 | |
| HP ProBook 455 G7-175W8EA | |
| HP ProBook 445 G7 175W4EA | |
| HP Envy x360 15-dr1679cl | |
| Average Intel Core i7-1065G7 (3862 - 4679, n=29) | |
| Dell XPS 15 9500 Core i5 | |
| Lenovo ThinkBook 15 | |
| Acer Extensa 15 EX215-51-56UX | |
| LG Gram 15Z90N | |
| Honor MagicBook 15 | |
| HP 15s-fq1440ng | |
| Huawei MateBook D 15-53010TUY | |
| Asus Vivobook 15 F512DA-SH31 | |
| PCMark 10 / Essentials | |
| Average of class Office (6567 - 11594, n=69, last 2 years) | |
| Dell XPS 15 9500 Core i5 | |
| HP Envy x360 15-dr1679cl | |
| Lenovo ThinkPad E15 Gen2-20T9S00K00 | |
| HP Envy x360 13-ay0010nr | |
| Lenovo ThinkBook 15 | |
| Average AMD Ryzen 7 4700U (8303 - 9559, n=8) | |
| Average Intel Core i7-1065G7 (7822 - 9902, n=29) | |
| Xiaomi RedmiBook 16 R5 | |
| Lenovo IdeaPad 5 14ARE05 | |
| Average AMD Ryzen 5 4500U (8204 - 9124, n=11) | |
| Average AMD Ryzen 5 4500U, AMD Radeon RX Vega 6 (Ryzen 4000/5000) (8204 - 9124, n=11) | |
| HP ProBook 445 G7 175W4EA | |
| HP 15s-fq1440ng | |
| HP ProBook 455 G7-175W8EA | |
| LG Gram 15Z90N | |
| Acer Extensa 15 EX215-51-56UX | |
| Honor MagicBook 15 | |
| Huawei MateBook D 15-53010TUY | |
| Asus Vivobook 15 F512DA-SH31 | |
| PCMark 10 / Productivity | |
| Average of class Office (4167 - 17243, n=69, last 2 years) | |
| HP Envy x360 13-ay0010nr | |
| Average AMD Ryzen 7 4700U (5348 - 7945, n=8) | |
| HP Envy x360 15-dr1679cl | |
| Xiaomi RedmiBook 16 R5 | |
| Dell XPS 15 9500 Core i5 | |
| Average AMD Ryzen 5 4500U (6400 - 7752, n=11) | |
| Average AMD Ryzen 5 4500U, AMD Radeon RX Vega 6 (Ryzen 4000/5000) (6400 - 7752, n=11) | |
| Acer Extensa 15 EX215-51-56UX | |
| Lenovo ThinkBook 15 | |
| HP ProBook 455 G7-175W8EA | |
| Average Intel Core i7-1065G7 (5462 - 7433, n=29) | |
| Lenovo IdeaPad 5 14ARE05 | |
| HP ProBook 445 G7 175W4EA | |
| LG Gram 15Z90N | |
| Honor MagicBook 15 | |
| Huawei MateBook D 15-53010TUY | |
| HP 15s-fq1440ng | |
| Asus Vivobook 15 F512DA-SH31 | |
| Lenovo ThinkPad E15 Gen2-20T9S00K00 | |
| PCMark 10 / Digital Content Creation | |
| Average of class Office (2049 - 13541, n=69, last 2 years) | |
| Lenovo ThinkPad E15 Gen2-20T9S00K00 | |
| Average AMD Ryzen 7 4700U (4459 - 5495, n=8) | |
| Lenovo IdeaPad 5 14ARE05 | |
| Xiaomi RedmiBook 16 R5 | |
| Average AMD Ryzen 5 4500U (4189 - 4808, n=11) | |
| Average AMD Ryzen 5 4500U, AMD Radeon RX Vega 6 (Ryzen 4000/5000) (4189 - 4808, n=11) | |
| HP Envy x360 13-ay0010nr | |
| HP ProBook 455 G7-175W8EA | |
| HP ProBook 445 G7 175W4EA | |
| Average Intel Core i7-1065G7 (2706 - 4424, n=29) | |
| Honor MagicBook 15 | |
| HP 15s-fq1440ng | |
| Huawei MateBook D 15-53010TUY | |
| Lenovo ThinkBook 15 | |
| HP Envy x360 15-dr1679cl | |
| Dell XPS 15 9500 Core i5 | |
| LG Gram 15Z90N | |
| Acer Extensa 15 EX215-51-56UX | |
| Asus Vivobook 15 F512DA-SH31 | |
PCMark 8: Home Score Accelerated v2 | Work Score Accelerated v2
PCMark 10: Score | Essentials | Productivity | Digital Content Creation
| PCMark 8 Home Score Accelerated v2 | 4592 points | |
| PCMark 8 Creative Score Accelerated v2 | 5800 points | |
| PCMark 8 Work Score Accelerated v2 | 5344 points | |
| PCMark 10 Score | 4784 points | |
Help | ||
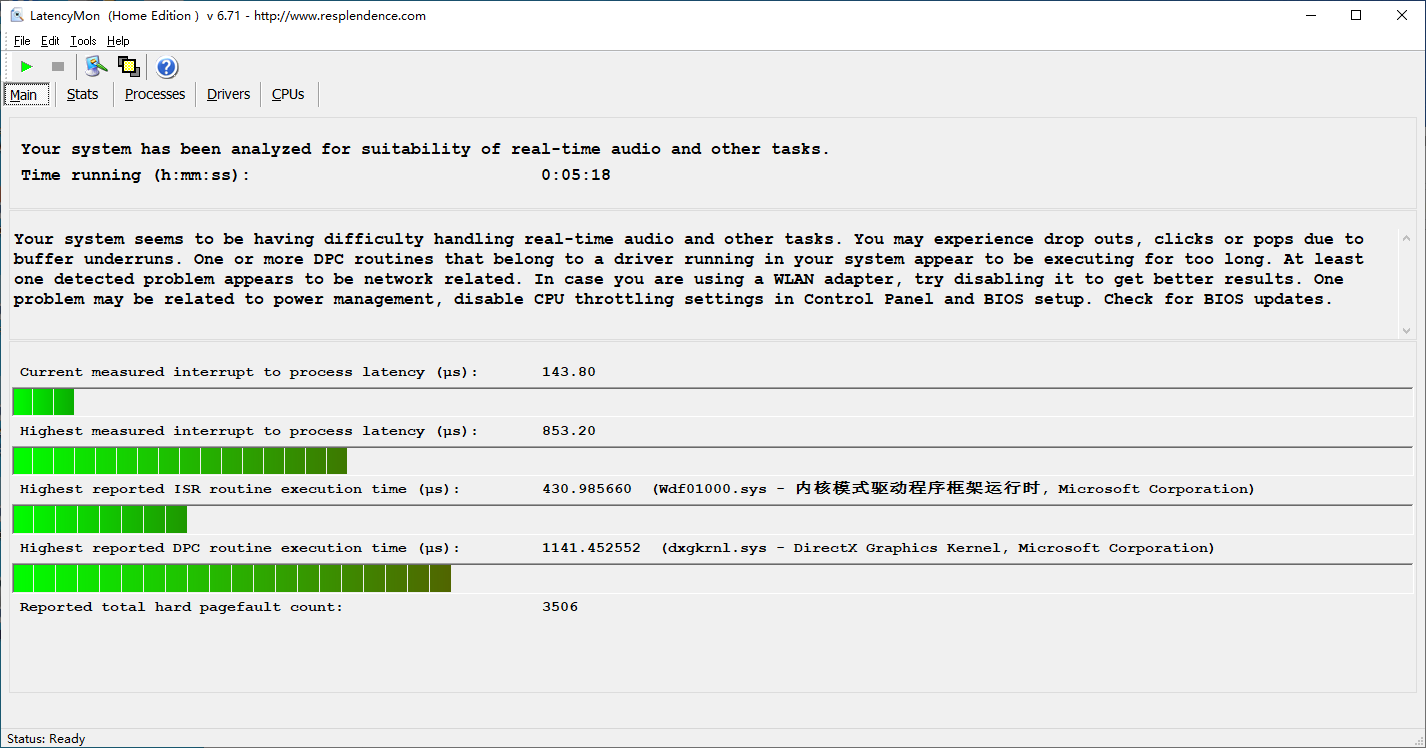
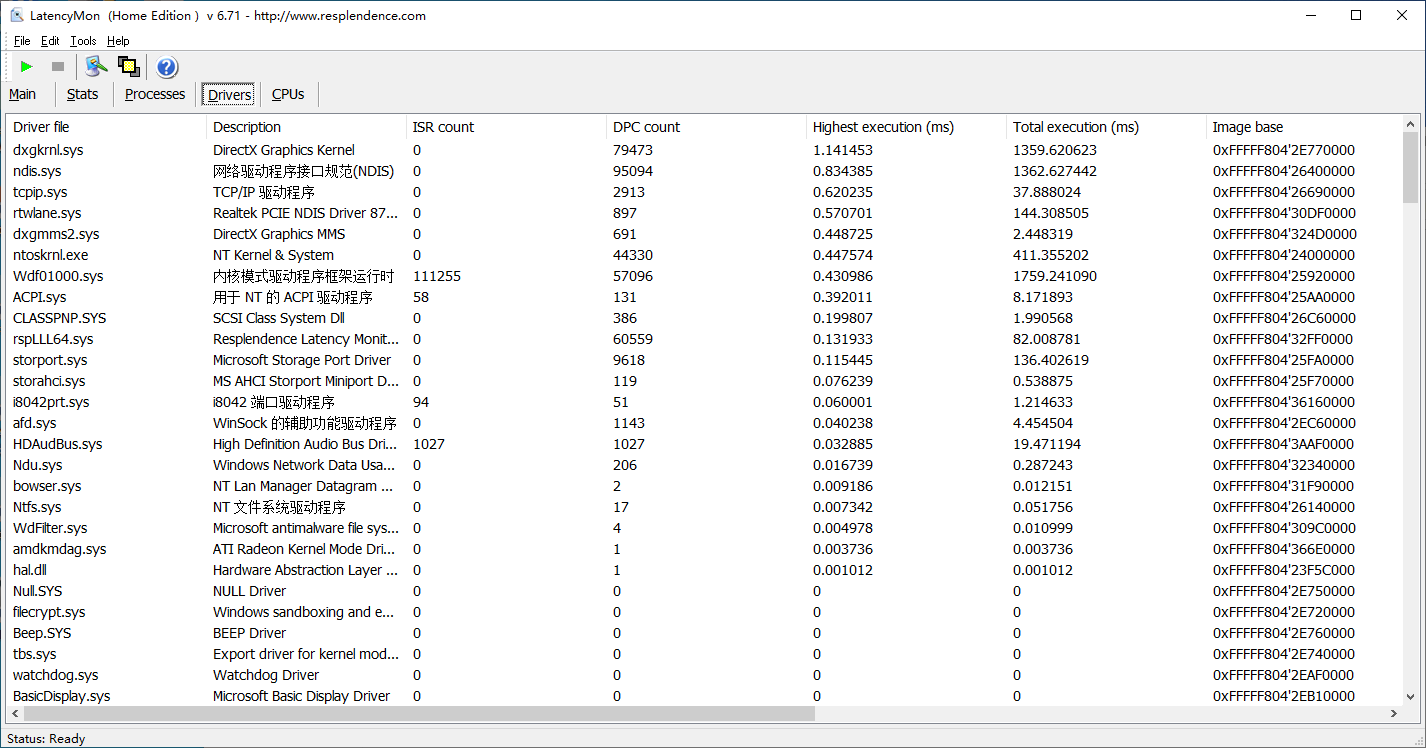
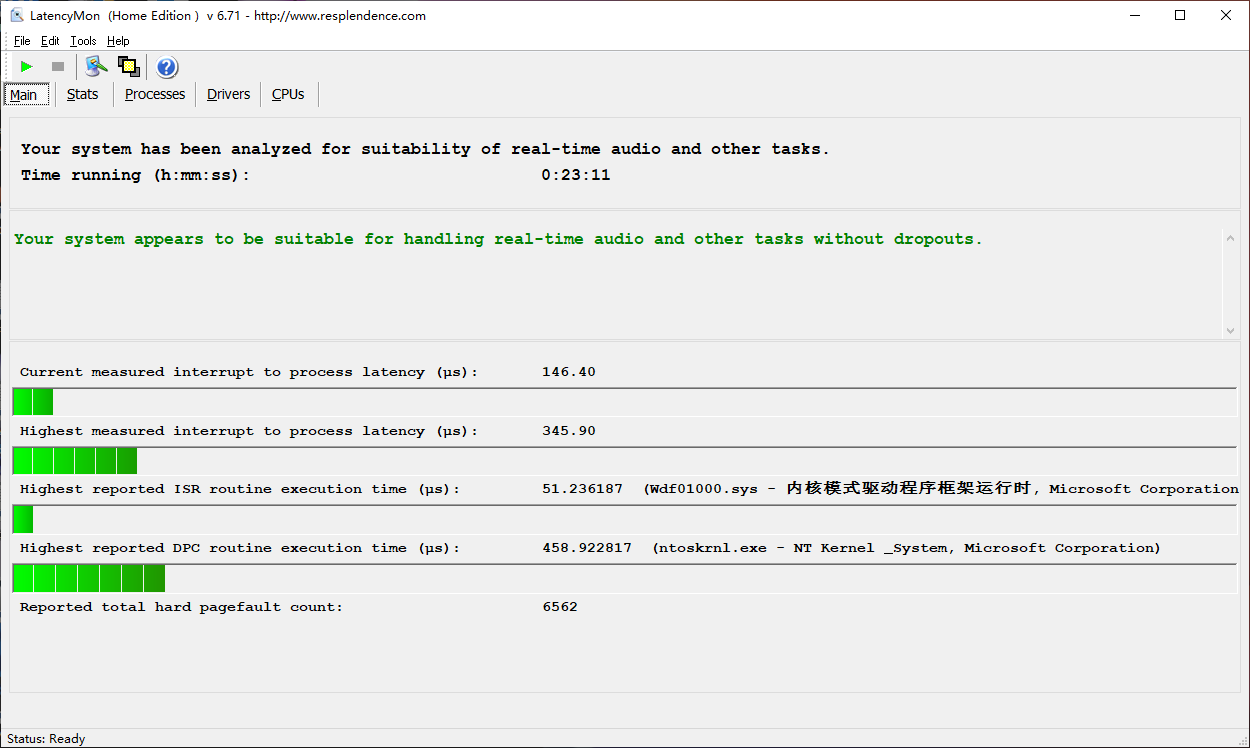
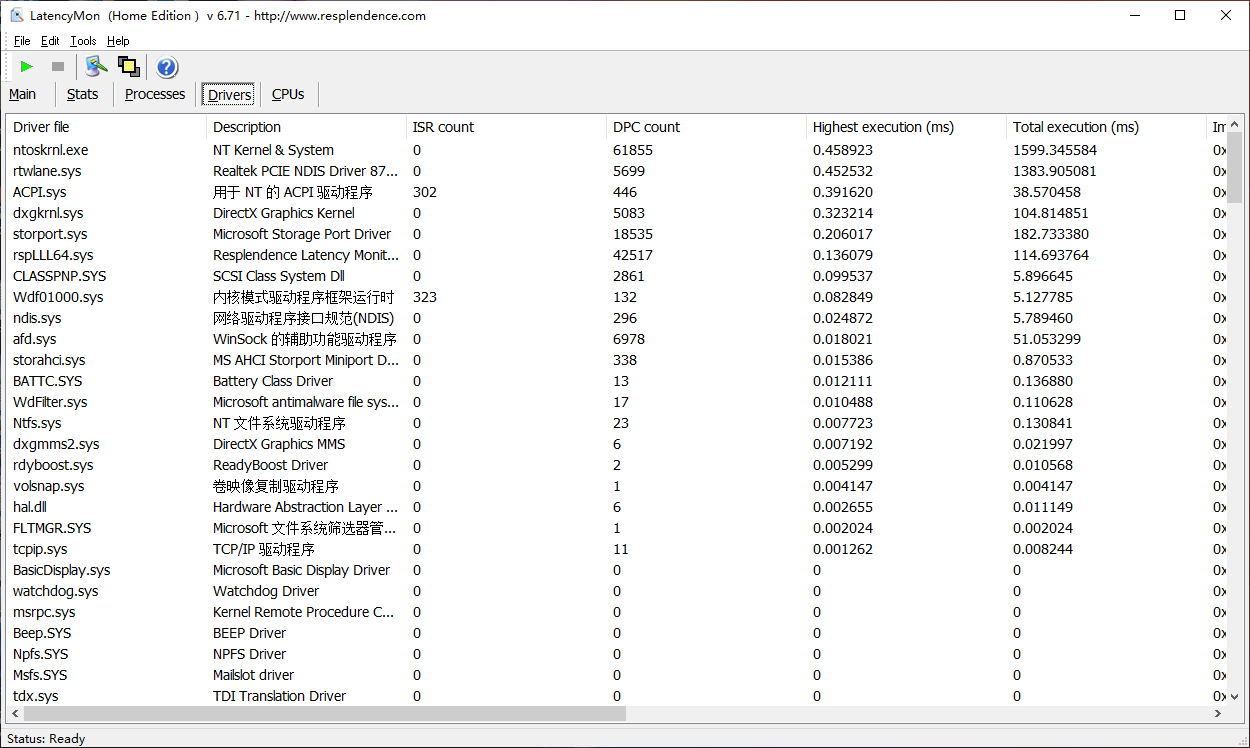
DPC Latencies
The DPC latencies showed better than average in the test, but according to LatencyMon they are still not completely in the green area. However, our latency test is very demanding with web surfing via WLAN, 4K YouTube video and maximum CPU load.
* ... smaller is better
Storage solution
Xiaomi has economized on the M.2 SSD from Samsung and has only installed a cheap SATA SSD. This noticeably limits the data rates. In comparison to fast SSDs, like in the MacBook Pro 16 or also in the Huawei MateBook D 15, the benchmark results are very weak.
| Xiaomi RedmiBook 16 R5 Samsung PM881 MZNLH512HALU-0000/07 | Apple MacBook Pro 16 2019 i9 5500M Apple SSD AP1024 7171 | Huawei MateBook D 15-53010TUY Samsung SSD PM981 MZVLB256HAHQ | Average of class Office | |
|---|---|---|---|---|
| CrystalDiskMark 5.2 / 6 | 188% | 174% | 358% | |
| Write 4K (MB/s) | 44.95 | 55.5 23% | 134.8 200% | 156.3 ? 248% |
| Read 4K (MB/s) | 27.19 | 16.21 -40% | 41.68 53% | 72.3 ? 166% |
| Write Seq (MB/s) | 1959 | 1651 | 2522 ? | |
| Read Seq (MB/s) | 1763 | 2300 | 3262 ? | |
| Write 4K Q32T1 (MB/s) | 252.5 | 398.5 58% | 260 3% | 423 ? 68% |
| Read 4K Q32T1 (MB/s) | 257.4 | 648 152% | 335.1 30% | 521 ? 102% |
| Write Seq Q32T1 (MB/s) | 505 | 2727 440% | 1641 225% | 3852 ? 663% |
| Read Seq Q32T1 (MB/s) | 546 | 3242 494% | 3452 532% | 5727 ? 949% |
| Write 4K Q8T8 (MB/s) | 258.6 | 977 ? 278% | ||
| Read 4K Q8T8 (MB/s) | 279.1 | 1373 ? 392% | ||
| AS SSD | 405% | 355% | 468% | |
| Seq Read (MB/s) | 458.9 | 2531 452% | 2613 469% | 4153 ? 805% |
| Seq Write (MB/s) | 338.1 | 2289 577% | 1549 358% | 2622 ? 676% |
| 4K Read (MB/s) | 24.8 | 15.85 -36% | 47.15 90% | 56.8 ? 129% |
| 4K Write (MB/s) | 39.48 | 39.88 1% | 111.6 183% | 164.3 ? 316% |
| 4K-64 Read (MB/s) | 159.1 | 1267 696% | 748 370% | 937 ? 489% |
| 4K-64 Write (MB/s) | 129.1 | 1749 1255% | 1275 888% | 1599 ? 1139% |
| Access Time Read * (ms) | 0.089 | 0.122 -37% | 0.062 30% | 0.08568 ? 4% |
| Access Time Write * (ms) | 0.066 | 0.095 -44% | 0.042 36% | 0.06956 ? -5% |
| Score Read (Points) | 230 | 1536 568% | 1057 360% | 1409 ? 513% |
| Score Write (Points) | 202 | 2018 899% | 1542 663% | 2025 ? 902% |
| Score Total (Points) | 553 | 4317 681% | 3097 460% | 4091 ? 640% |
| Copy ISO MB/s (MB/s) | 491 | 1995 306% | 2470 ? 403% | |
| Copy Program MB/s (MB/s) | 223 | 584 162% | 761 ? 241% | |
| Copy Game MB/s (MB/s) | 395 | 1135 187% | 1584 ? 301% | |
| Total Average (Program / Settings) | 297% /
340% | 265% /
291% | 413% /
428% |
* ... smaller is better

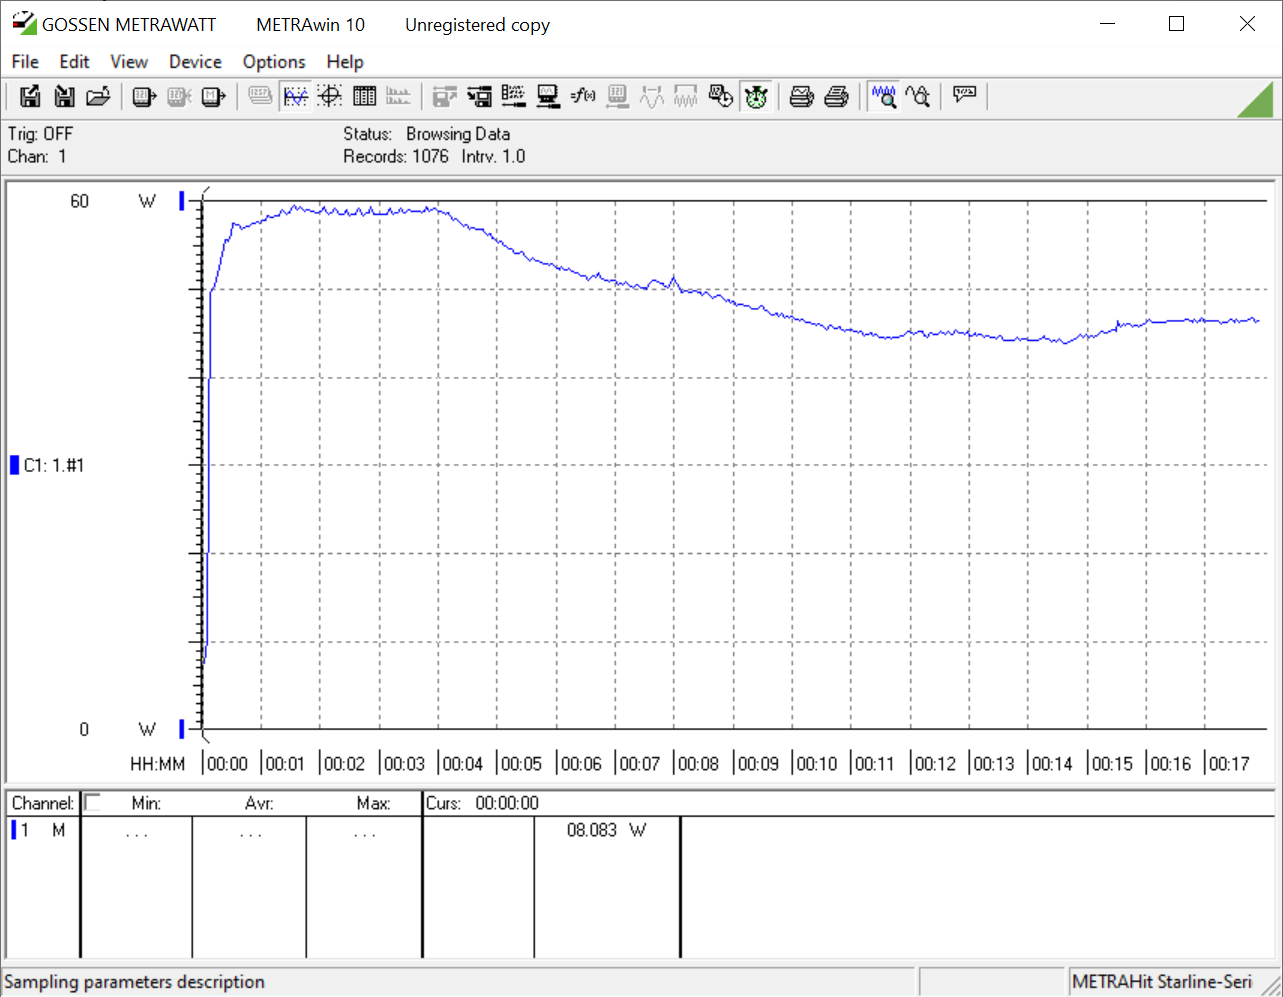
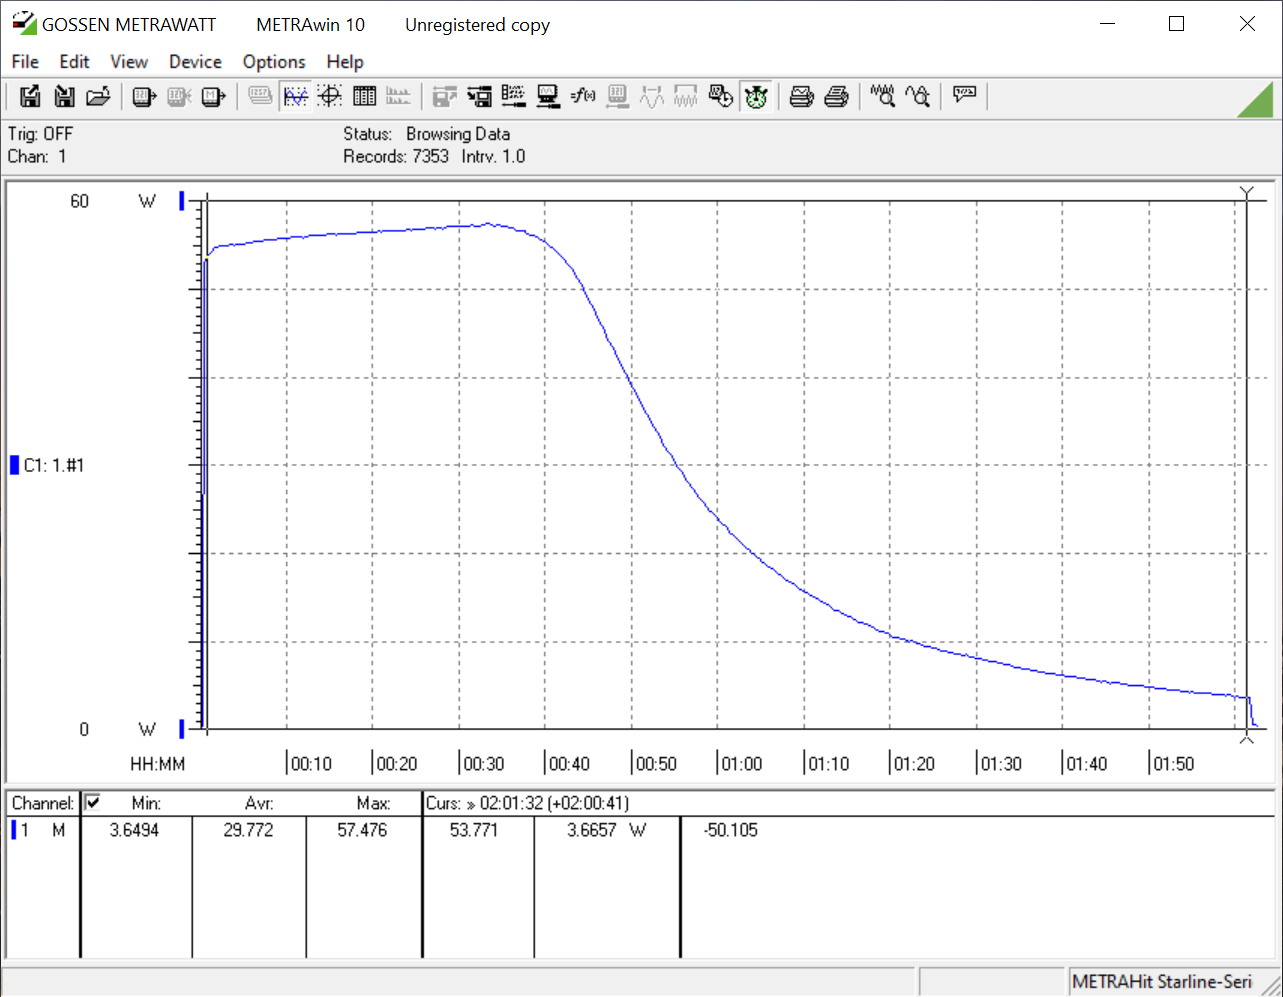
Continuous load read: DiskSpd Read Loop, Queue Depth 8
Graphics card
The integrated Vega 6 graphics card was already part of the Ryzen 3000 series, but has been significantly redesigned for the new Ryzen 4000 APUs and now clocks higher. This is also noticeable in the performance.
| 3DMark 11 - 1280x720 Performance GPU | |
| Average of class Office (1468 - 18313, n=73, last 2 years) | |
| Xiaomi RedmiBook 16 R5 | |
| Average AMD Radeon RX Vega 6 (Ryzen 4000/5000) (3401 - 4713, n=23) | |
| 3DMark | |
| 1280x720 Cloud Gate Standard Graphics | |
| Average of class Office (8594 - 118515, n=42, last 2 years) | |
| Xiaomi RedmiBook 16 R5 | |
| Average AMD Radeon RX Vega 6 (Ryzen 4000/5000) (15227 - 24163, n=16) | |
| 1920x1080 Fire Strike Graphics | |
| Average of class Office (736 - 21871, n=77, last 2 years) | |
| Average AMD Radeon RX Vega 6 (Ryzen 4000/5000) (2122 - 3239, n=23) | |
| Xiaomi RedmiBook 16 R5 | |
| 2560x1440 Time Spy Graphics | |
| Average of class Office (322 - 6679, n=73, last 2 years) | |
| Average AMD Radeon RX Vega 6 (Ryzen 4000/5000) (650 - 996, n=22) | |
| Xiaomi RedmiBook 16 R5 | |
| 3DMark 06 Standard Score | 17824 points | |
| 3DMark 11 Performance | 4446 points | |
| 3DMark Cloud Gate Standard Score | 15263 points | |
| 3DMark Fire Strike Score | 2404 points | |
| 3DMark Time Spy Score | 891 points | |
Help | ||
Gaming Performance
The integrated Vega 6 is relatively strong for an iGPU but still too weak for current demanding games. In most games it is only enough for minimal graphic details at reduced resolution. The GeForce MX350 available in the Intel-based device offers a significantly higher performance.
Sadly, Xiaomi limits the shared main memory for the GPU to 512 MB, which prevents many demanding games from starting (e.g. Doom Eternal, Death Stranding). Unfortunately there are no options in the BIOS to increase this and a registry setting didn't help either.
We can't see any throttling in the graphics performance, and even in battery mode The Witcher 3 runs with consistent fps.
| low | med. | high | ultra | QHD | 4K | |
|---|---|---|---|---|---|---|
| Diablo III (2012) | 67.9 | |||||
| Counter-Strike: GO (2012) | 52.7 | |||||
| GTA V (2015) | 79.4 | 20.5 | 9.19 | |||
| The Witcher 3 (2015) | 41.9 | 15.7 | 9.68 | |||
| Dota 2 Reborn (2015) | 90.1 | 70.5 | 42.4 | 39.8 | ||
| World of Warships (2015) | 49.9 | 35.8 | ||||
| Overwatch (2016) | 102 | 50.6 | 40.2 | 19.5 | ||
| Rocket League (2017) | 108 | 45.6 | 28.9 | |||
| Fortnite (2018) | 76.6 | 29.7 | 20.7 | |||
| Final Fantasy XV Benchmark (2018) | 25.4 | 12.3 | 4.82 | |||
| X-Plane 11.11 (2018) | 37.7 | 28.9 | 26.2 | |||
| Far Cry 5 (2018) | 31 | 14 | ||||
| Strange Brigade (2018) | 59.6 | 22.9 | 19.3 | 16.7 | ||
| Shadow of the Tomb Raider (2018) | 40 | 14 | ||||
| Assassin´s Creed Odyssey (2018) | 30 | 15 | ||||
| Battlefield V (2018) | 40.1 | 22.3 | ||||
| Apex Legends (2019) | 58.4 | |||||
| Far Cry New Dawn (2019) | 28 | 14 | ||||
| Metro Exodus (2019) | 28.7 | 12.3 | ||||
| Dirt Rally 2.0 (2019) | 99.4 | 31.4 | 25.5 | |||
| The Division 2 (2019) | 33.7 | 15.6 | ||||
| Anno 1800 (2019) | 43 | 14.1 | ||||
| Rage 2 (2019) | 29.3 | 12.9 | ||||
| Total War: Three Kingdoms (2019) | 0 game wont start | |||||
| F1 2019 (2019) | 59.9 | 23.9 | 21 | 19.8 | ||
| Control (2019) | 29.8 | 9.83 | ||||
| Borderlands 3 (2019) | 34.6 | 15.8 | ||||
| FIFA 20 (2019) | 101 | 69.7 | 57.9 | 49.8 | 32.9 | |
| Ghost Recon Breakpoint (2019) | 27 | 13 | ||||
| GRID 2019 (2019) | 45.4 | 23.9 | ||||
| Call of Duty Modern Warfare 2019 (2019) | 34.2 | 19.6 | ||||
| Need for Speed Heat (2019) | 33.1 | |||||
| Star Wars Jedi Fallen Order (2019) | 21.7 | |||||
| Red Dead Redemption 2 (2019) | 28.9 | |||||
| Fall Guys (2020) | 40.9 | 18.1 | ||||
| Hearthstone (2020) | 59.6 | 26.6 | ||||
| Hunt Showdown (2020) | 35.9 | |||||
| Doom Eternal (2020) | 0 game wont start | |||||
| Gears Tactics (2020) | 63 | 25 | 14.9 | |||
| Valorant (2020) | 97.2 | 73.2 | 48.5 | 22 | ||
| F1 2020 (2020) | 65.2 | 30.2 | 22.7 | 16.3 | ||
| Death Stranding (2020) | 0 game wont start | |||||
| Horizon Zero Dawn (2020) | 0 game wont start | |||||
| Flight Simulator 2020 (2020) | 15.2 | 7.1 | ||||
| Serious Sam 4 (2020) | 0 game wont start | |||||
| Mafia Definitive Edition (2020) | 24.8 | 10.3 | ||||
| Star Wars Squadrons (2020) | 61.6 | 28.6 | 23.6 | 20.6 | ||
| FIFA 21 (2020) | 93.4 | 61.5 | 50 | 41.8 | ||
| Watch Dogs Legion (2020) | 26.3 | 13.3 | 0 | |||
| Dirt 5 (2020) | 19.3 | 9.3 | ||||
| Assassin´s Creed Valhalla (2020) | 18 | 0 | ||||
| Immortals Fenyx Rising (2020) | 13 | |||||
| Cyberpunk 2077 1.0 (2020) | 12.9 | |||||
| Hitman 3 (2021) | 39.1 | 14.9 | ||||
| Outriders (2021) | 26.7 | 18.8 | ||||
| Resident Evil Village (2021) | 14.2 | |||||
| Mass Effect Legendary Edition (2021) | 40.4 | 20 | ||||
| Days Gone (2021) | 25.8 | 14.3 | ||||
| Monster Hunter Stories 2 (2021) | 50.8 | 30 | 26.1 | |||
| F1 2021 (2021) | 31.9 | 14.3 | ||||
| FIFA 22 (2021) | 85.1 | 44.5 | 41.7 | 34.3 | 27.5 | 0 |
| Far Cry 6 (2021) | 0 game wont start | |||||
| Forza Horizon 5 (2021) | 26 | 12 | ||||
| Farming Simulator 22 (2021) | 69.6 | 25.3 | 18 | 14.4 | 0 | |
| God of War (2022) | ||||||
| Rainbow Six Extraction (2022) | 13 | 12 | ||||
| GRID Legends (2022) | 35.3 | 24.9 | 21.3 | 13.6 | ||
| Elden Ring (2022) | 16.7 | |||||
| Cyberpunk 2077 1.6 (2022) | 11.2 | 9.2 | 6.4 | |||
| Ghostwire Tokyo (2022) | 10.5 | |||||
| Tiny Tina's Wonderlands (2022) | 18.8 | 0 | ||||
| Vampire Bloodhunt (2022) | 17.6 | 16.4 | ||||
| F1 22 (2022) | 17.4 | 0 | ||||
| FIFA 23 (2022) | 0 |
Emissions
Noise emissions
In our test, the Ryzen 5 4500U's cooling is convincing: The small fan stays off most of the time while idling and under light load, so the device is silent. On lower speeds - for example when loading demanding websites and the fan starts to spin - it still remains pleasantly quiet. We also only measured around 34 dB during gaming - very good. Under maximum load the fan noise subjectively remains very unobtrusive and doesn't get excessively loud with a maximum of 42.2 dB.
Noise level
| Idle |
| 30.1 / 30.1 / 31 dB(A) |
| Load |
| 34.1 / 42.2 dB(A) |
 | ||
30 dB silent 40 dB(A) audible 50 dB(A) loud |
||
min: | ||
Temperature
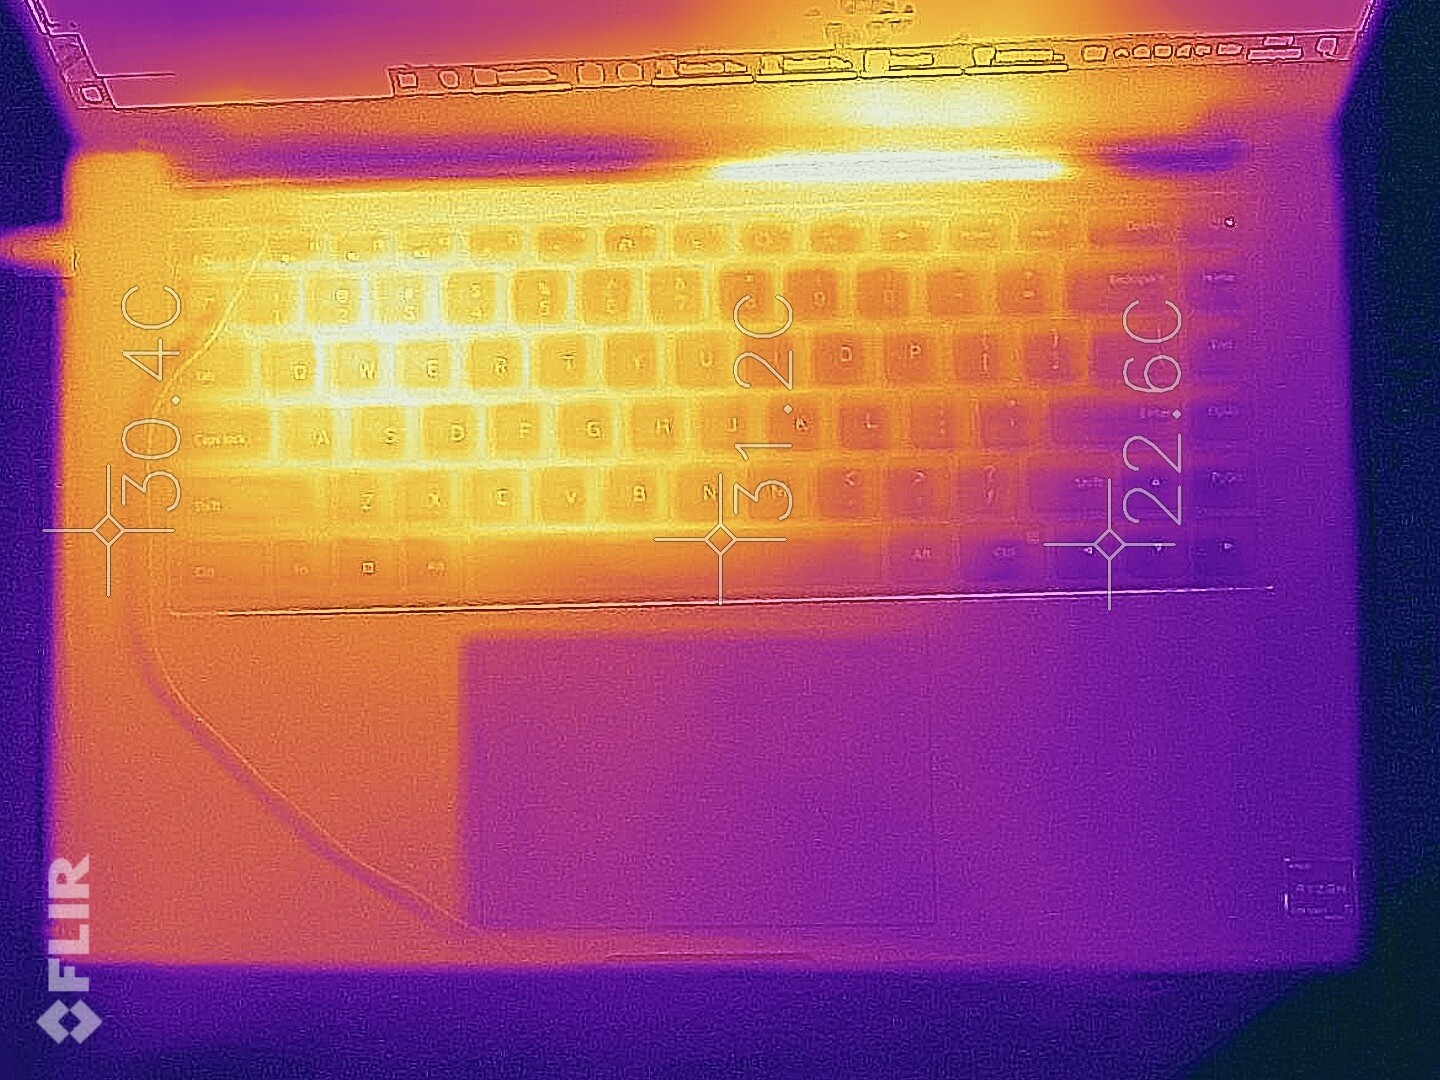
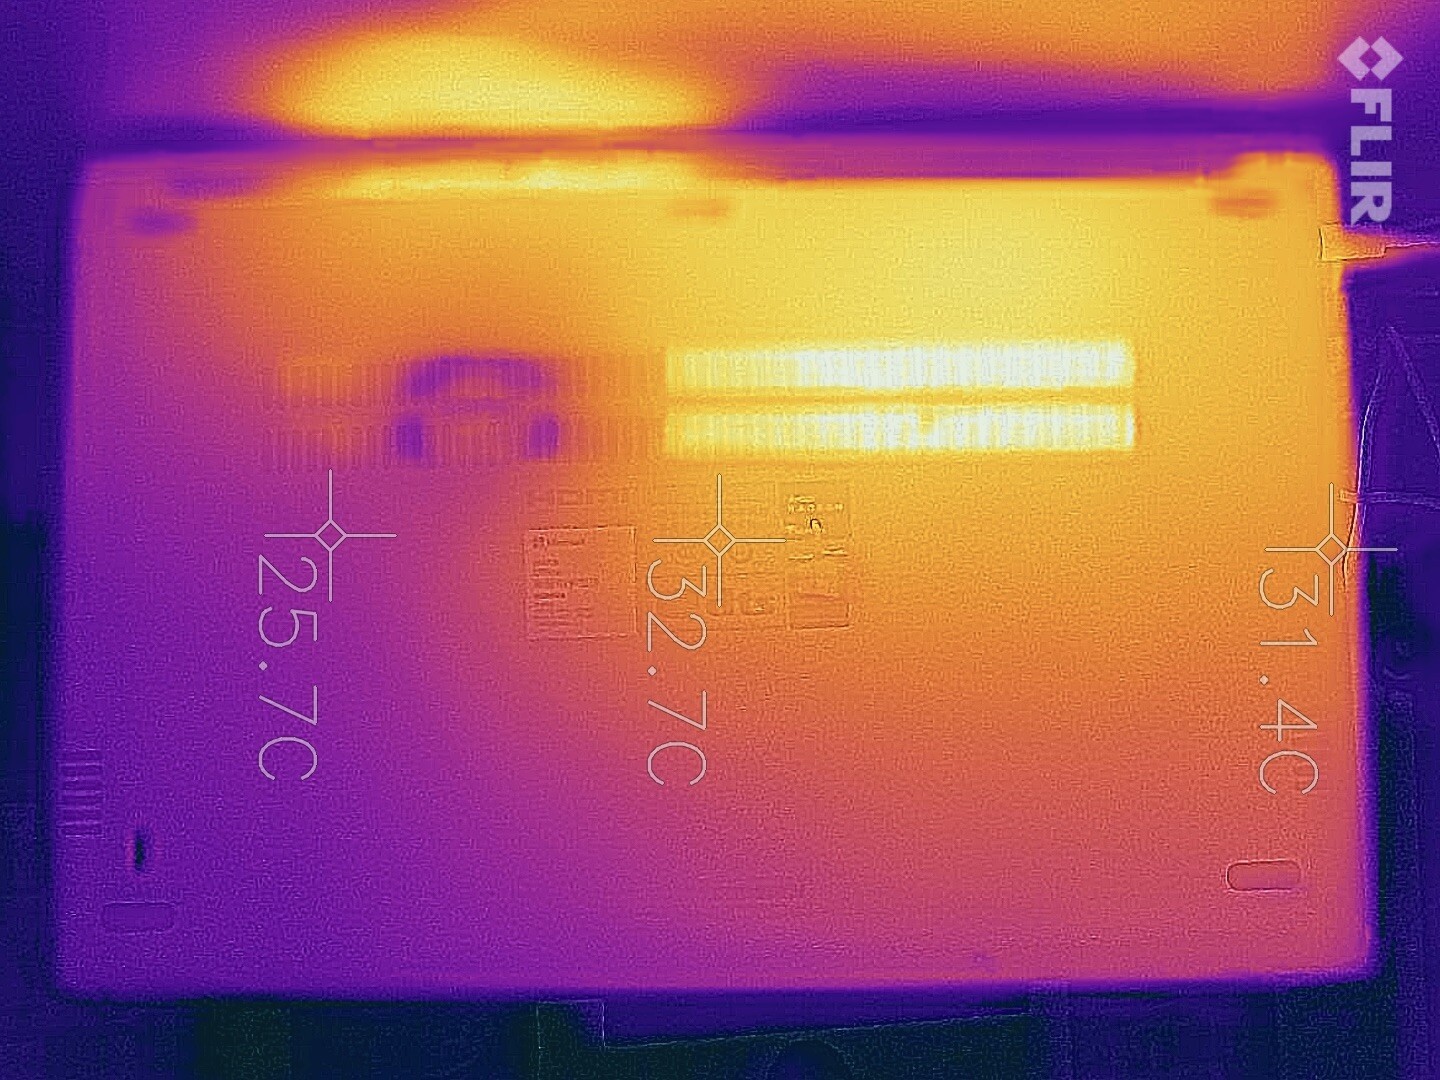
The cooling system is also convincing in terms of surface temperatures. Even under extreme load, we only measured 38 °C at the hotspot of the upper side.
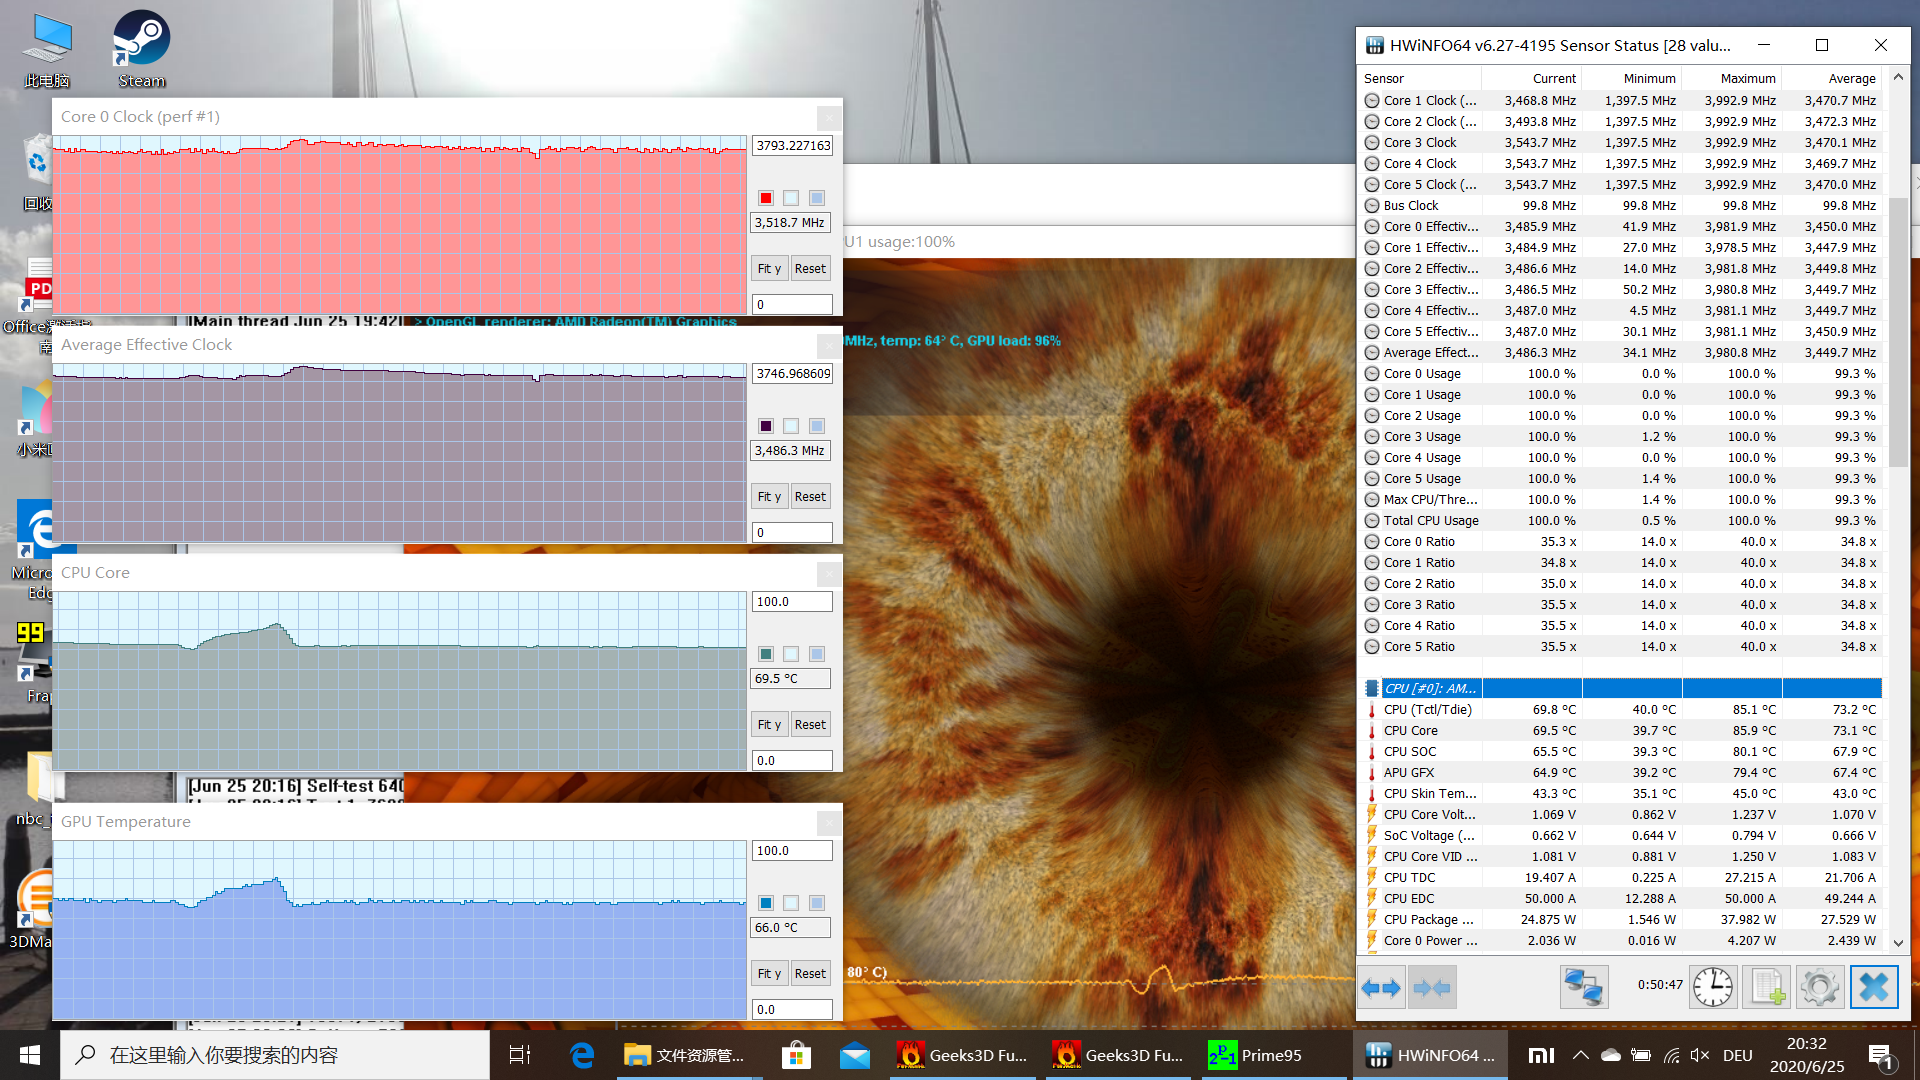
The reported internal temperatures of HWiNFO64 also remain within the limits. As peak temperature, the SoC reaches 86 °C (CPU cores) and then settles at a good 70 °C at maximum fan speed. The integrated GPU settles in at 66 °C. Throttling or low clock rates aren't the reason for the low temperatures, either. The CPU permanently clocks at 3.8 GHz in this extreme load test.
(+) The maximum temperature on the upper side is 38 °C / 100 F, compared to the average of 34.3 °C / 94 F, ranging from 21.2 to 62.5 °C for the class Office.
(+) The bottom heats up to a maximum of 38 °C / 100 F, compared to the average of 36.8 °C / 98 F
(+) In idle usage, the average temperature for the upper side is 23.4 °C / 74 F, compared to the device average of 29.5 °C / 85 F.
(+) The palmrests and touchpad are cooler than skin temperature with a maximum of 27 °C / 80.6 F and are therefore cool to the touch.
(±) The average temperature of the palmrest area of similar devices was 27.5 °C / 81.5 F (+0.5 °C / 0.9 F).
Speakers
The built-in stereo speakers in the RedmiBook 16 are loud enough but can't keep up with the top class. The playback quality is sufficient for undemanding tasks, such as YouTube videos, but the complete lack of bass spoils the music experience. They are no match for the excellent speakers in the MacBook Pro 16.
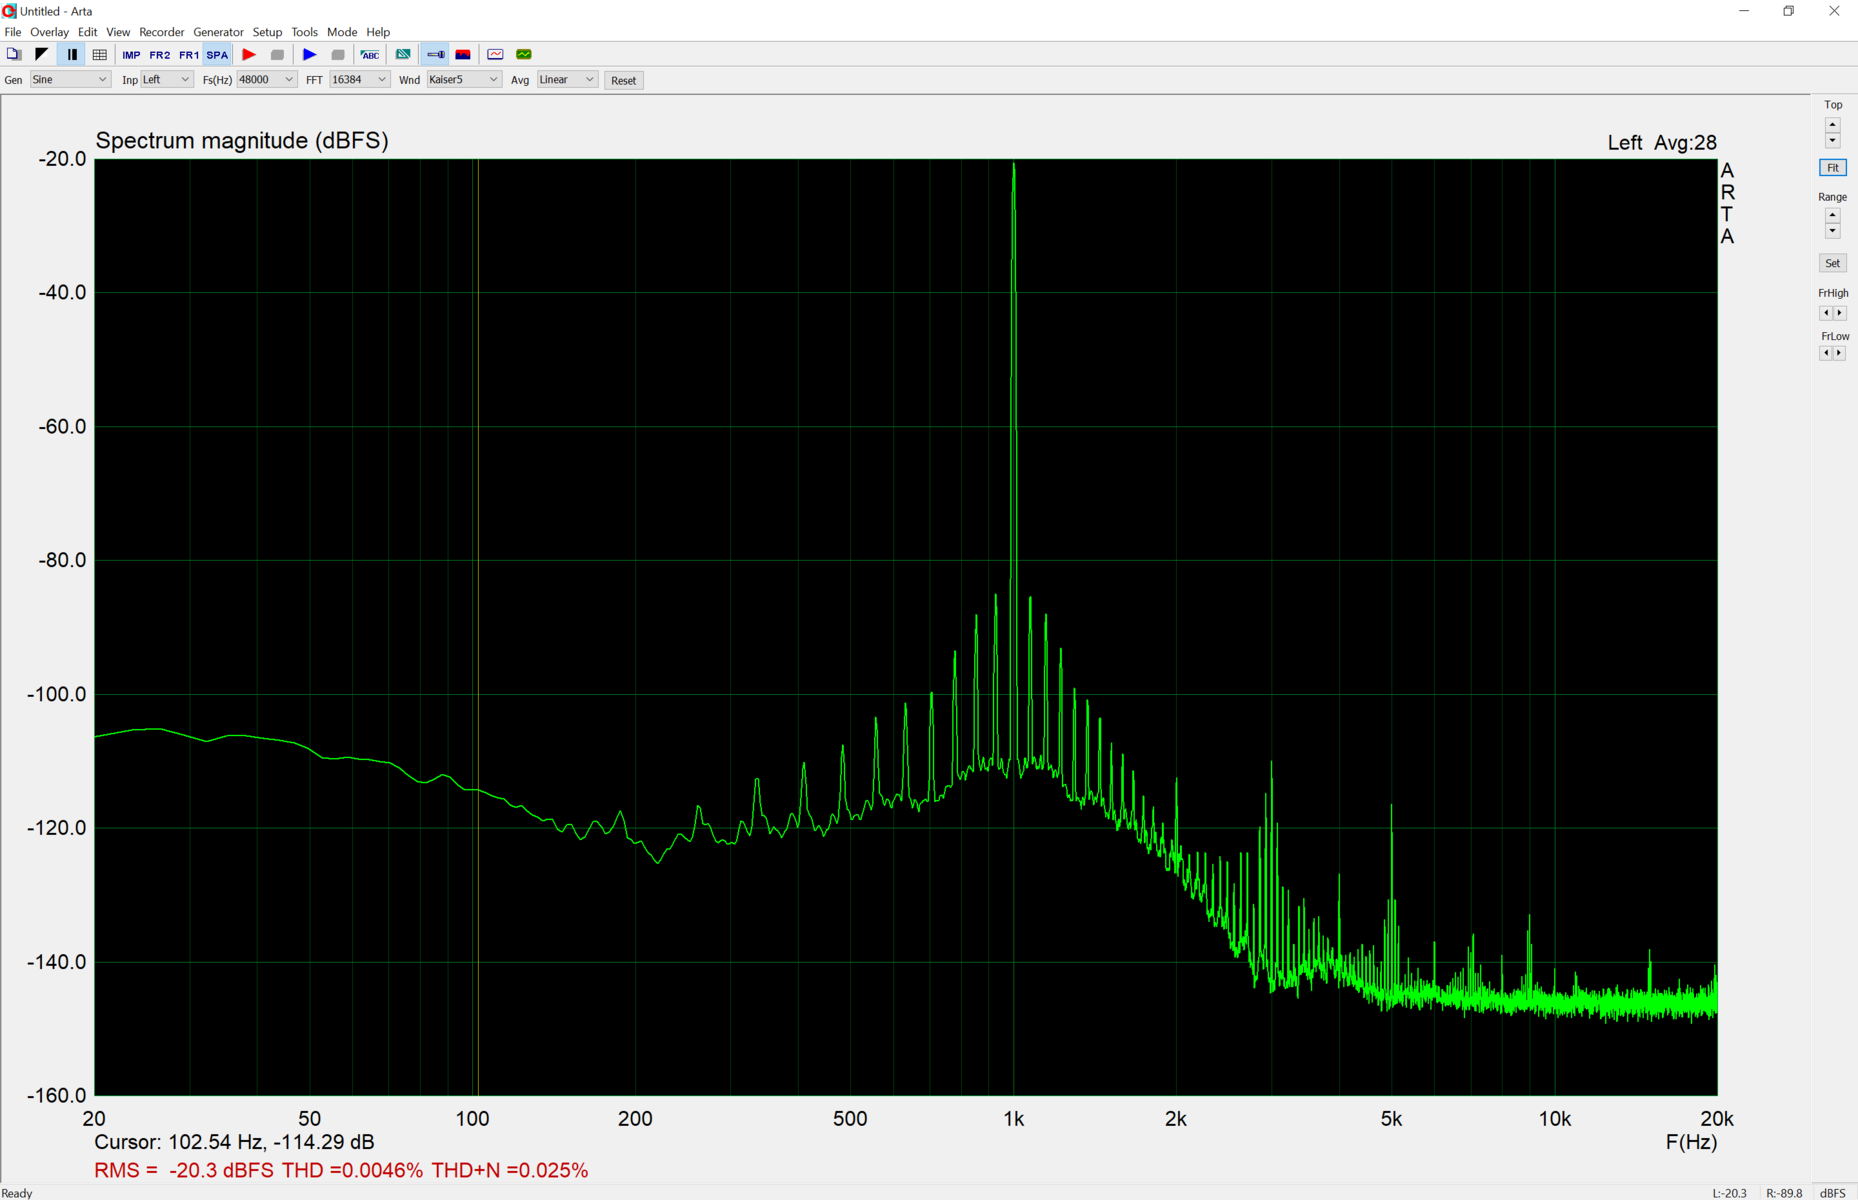
The built-in jack is absolutely sufficient for undemanding users in the subjective listening test, but it shows clear weaknesses in the test with an external sound card with a THD+N of 0.025% (smaller is better).
Xiaomi RedmiBook 16 R5 audio analysis
(±) | speaker loudness is average but good (77.8 dB)
Bass 100 - 315 Hz
(-) | nearly no bass - on average 19.4% lower than median
(±) | linearity of bass is average (13% delta to prev. frequency)
Mids 400 - 2000 Hz
(+) | balanced mids - only 2.5% away from median
(+) | mids are linear (4.9% delta to prev. frequency)
Highs 2 - 16 kHz
(+) | balanced highs - only 1.4% away from median
(+) | highs are linear (4% delta to prev. frequency)
Overall 100 - 16.000 Hz
(±) | linearity of overall sound is average (16.3% difference to median)
Compared to same class
» 19% of all tested devices in this class were better, 6% similar, 75% worse
» The best had a delta of 7%, average was 21%, worst was 53%
Compared to all devices tested
» 26% of all tested devices were better, 6% similar, 68% worse
» The best had a delta of 4%, average was 24%, worst was 134%
Apple MacBook Pro 16 2019 i9 5500M audio analysis
(+) | speakers can play relatively loud (82.3 dB)
Bass 100 - 315 Hz
(+) | good bass - only 2.3% away from median
(+) | bass is linear (5% delta to prev. frequency)
Mids 400 - 2000 Hz
(+) | balanced mids - only 2.7% away from median
(+) | mids are linear (3.4% delta to prev. frequency)
Highs 2 - 16 kHz
(+) | balanced highs - only 2.1% away from median
(+) | highs are linear (2.6% delta to prev. frequency)
Overall 100 - 16.000 Hz
(+) | overall sound is linear (6.9% difference to median)
Compared to same class
» 5% of all tested devices in this class were better, 0% similar, 95% worse
» The best had a delta of 5%, average was 17%, worst was 45%
Compared to all devices tested
» 1% of all tested devices were better, 0% similar, 99% worse
» The best had a delta of 4%, average was 24%, worst was 134%
Power management
Energy consumption
Thanks to the integrated graphics card and the SoC manufactured in the 7-nm process, the RedmiBook 16 is very energy efficient. In comparison to the Huawei MateBook D 15 with Ryzen 5 3500U, the 4500U can clearly establish itself. Only under extreme load (using all six cores) does it need a bit more power. The RedmiBook is also very modest in comparison to the Lenovo IdeaPad 5. The HP Envy x360 is overall just marginally more efficient.
Compared to modern Ice Lake devices, the RedmiBook is also very convincing.
| Off / Standby | |
| Idle | |
| Load |
|
Key:
min: | |
| Xiaomi RedmiBook 16 R5 R5 4500U, Vega 6, Samsung PM881 MZNLH512HALU-0000/07, IPS, 1920x1080, 16" | Apple MacBook Pro 16 2019 i9 5500M i9-9880H, Radeon Pro 5500M, Apple SSD AP1024 7171, IPS, 3072x1920, 16" | Huawei MateBook D 15-53010TUY R5 3500U, Vega 8, Samsung SSD PM981 MZVLB256HAHQ, IPS, 1920x1080, 15.6" | Honor MagicBook 15 R5 3500U, Vega 8, Samsung SSD PM981a MZVLB256HBHQ, IPS, 1920x1080, 15.6" | HP ProBook 455 G7-175W8EA R7 4700U, Vega 7, Samsung PM991 MZVLQ512HALU, IPS, 1920x1080, 15.6" | Asus Vivobook 15 F512DA-SH31 R3 3200U, Vega 3, SanDisk X600 SD9SN8W-128G, IPS, 1920x1080, 15.6" | HP 15s-fq1440ng i7-1065G7, Iris Plus Graphics G7 (Ice Lake 64 EU), Samsung PM991 MZVLQ512HALU, TN, 1920x1080, 15.6" | LG Gram 15Z90N i5-1035G7, Iris Plus Graphics G7 (Ice Lake 64 EU), SK Hynix PC401 512GB M.2 (HFS512GD9TNG), .2 IPS LED, 1920x1080, 15.6" | Dell XPS 15 9500 Core i5 i5-10300H, UHD Graphics 630, Toshiba KBG40ZNS256G NVMe, IPS, 1920x1200, 15.6" | HP Envy x360 15-dr1679cl i7-10510U, UHD Graphics 620, Intel Optane Memory H10 with Solid State Storage 32GB + 512GB HBRPEKNX0202A(L/H), IPS, 1920x1080, 15.6" | Acer Extensa 15 EX215-51-56UX i5-10210U, UHD Graphics 620, WDC PC SN520 SDAPNUW-512G, TN LED, 1920x1080, 15.6" | Lenovo ThinkBook 15 i5-10210U, UHD Graphics 620, Samsung SSD PM981 MZVLB512HAJQ, IPS, 1920x1080, 15.6" | HP Envy x360 13-ay0010nr R5 4500U, Vega 6, Toshiba KBG30ZMV256G, IPS, 1920x1080, 13.3" | Lenovo IdeaPad 5 14ARE05 R5 4500U, Vega 6, Samsung PM991 MZALQ512HALU, IPS, 1920x1080, 14" | Average AMD Radeon RX Vega 6 (Ryzen 4000/5000) | Average Intel Core i5-1035G7 | Average Intel Core i7-1065G7 | Average AMD Ryzen 5 3500U | Average of class Office | |
|---|---|---|---|---|---|---|---|---|---|---|---|---|---|---|---|---|---|---|---|
| Power Consumption | -106% | -21% | -12% | -4% | 11% | -25% | 4% | -15% | -10% | 34% | -5% | 4% | -19% | -1% | -10% | -20% | -13% | -16% | |
| Idle Minimum * (Watt) | 3.2 | 3.7 -16% | 5.2 -63% | 4.6 -44% | 3.8 -19% | 3.2 -0% | 6.9 -116% | 2.9 9% | 2.9 9% | 4.3 -34% | 2.3 28% | 3.5 -9% | 3.9 -22% | 4.4 -38% | 3.98 ? -24% | 4 ? -25% | 4.4 ? -38% | 4.88 ? -53% | 4.41 ? -38% |
| Idle Average * (Watt) | 6.7 | 12.1 -81% | 8.8 -31% | 8.5 -27% | 7.7 -15% | 6.8 -1% | 9.2 -37% | 7.7 -15% | 7.6 -13% | 7.2 -7% | 4.8 28% | 7.1 -6% | 5.8 13% | 7.6 -13% | 6.53 ? 3% | 7.7 ? -15% | 7.81 ? -17% | 7.98 ? -19% | 7.39 ? -10% |
| Idle Maximum * (Watt) | 8.7 | 17 -95% | 10.2 -17% | 9.1 -5% | 10.5 -21% | 7.7 11% | 9.5 -9% | 11.4 -31% | 8 8% | 7.5 14% | 5.7 34% | 7.8 10% | 6 31% | 9.9 -14% | 8.65 ? 1% | 9.77 ? -12% | 9.61 ? -10% | 9.37 ? -8% | 8.66 ? -0% |
| Load Average * (Watt) | 35 | 91.5 -161% | 37.5 -7% | 38 -9% | 32 9% | 30.3 13% | 31 11% | 31.5 10% | 41.7 -19% | 40.4 -15% | 26.2 25% | 38.9 -11% | 41.5 -19% | 46 -31% | 35 ? -0% | 38.6 ? -10% | 47.1 ? -35% | 36.7 ? -5% | 42.7 ? -22% |
| Witcher 3 ultra * (Watt) | 33 | 103 -212% | 28.2 15% | ||||||||||||||||
| Load Maximum * (Watt) | 59.6 | 102.3 -72% | 50.9 15% | 44 26% | 45.4 24% | 44.4 26% | 45.4 24% | 32 46% | 94.8 -59% | 65.7 -10% | 27 55% | 65.4 -10% | 50.4 15% | 59 1% | 51.5 ? 14% | 52.6 ? 12% | 59.4 ? -0% | 47.5 ? 20% | 64.9 ? -9% |
* ... smaller is better
Battery life
The relatively small 48 Wh battery delivers good runtimes thanks to the low power consumption and the factory setting, which causes the RedmiBook to only turn off at 2% (and not the usual 5% in Windows). The RedmiBook stands up well in direct comparison with the competition. A whole workday in battery mode is no problem at reduced brightness.
| Xiaomi RedmiBook 16 R5 R5 4500U, Vega 6, 48 Wh | Apple MacBook Pro 16 2019 i9 5500M i9-9880H, Radeon Pro 5500M, 99.8 Wh | Huawei MateBook D 15-53010TUY R5 3500U, Vega 8, 42 Wh | HP ProBook 455 G7-175W8EA R7 4700U, Vega 7, 45 Wh | Asus Vivobook 15 F512DA-SH31 R3 3200U, Vega 3, 37 Wh | HP 15s-fq1440ng i7-1065G7, Iris Plus Graphics G7 (Ice Lake 64 EU), 41 Wh | LG Gram 15Z90N i5-1035G7, Iris Plus Graphics G7 (Ice Lake 64 EU), 80 Wh | Dell XPS 15 9500 Core i5 i5-10300H, UHD Graphics 630, 56 Wh | HP Envy x360 15-dr1679cl i7-10510U, UHD Graphics 620, 55.67 Wh | Acer Extensa 15 EX215-51-56UX i5-10210U, UHD Graphics 620, 37 Wh | Lenovo ThinkBook 15 i5-10210U, UHD Graphics 620, 45 Wh | HP Envy x360 13-ay0010nr R5 4500U, Vega 6, 51 Wh | Average AMD Ryzen 5 3500U | Average Intel Core i5-1035G7 | Average Intel Core i7-1065G7 | Average of class Office | |
|---|---|---|---|---|---|---|---|---|---|---|---|---|---|---|---|---|
| Battery runtime | -36% | -32% | -32% | -43% | -38% | 30% | -18% | -1% | -34% | -39% | 1% | -30% | 6% | -14% | 3% | |
| H.264 (h) | 14.7 | 9.7 -34% | 6.7 -54% | 6 -59% | 11.2 -24% | 8.4 -43% | 7 -52% | 9.06 ? -38% | 11.2 ? -24% | 10.7 ? -27% | 15 ? 2% | |||||
| WiFi v1.3 (h) | 10.5 | 12 14% | 7.8 -26% | 7.6 -28% | 6 -43% | 5.3 -50% | 12.1 15% | 9.3 -11% | 9.2 -12% | 6.7 -36% | 6.8 -35% | 11.8 12% | 7.71 ? -27% | 10.2 ? -3% | 8.69 ? -17% | 12.7 ? 21% |
| Witcher 3 ultra (h) | 3.1 | 0.9 -71% | ||||||||||||||
| Load (h) | 2.1 | 1 -52% | 1.3 -38% | 1.8 -14% | 2 -5% | 4.2 100% | 1.6 -24% | 2.3 10% | 1.6 -24% | 1.5 -29% | 1.9 -10% | 1.585 ? -25% | 3.03 ? 44% | 2.14 ? 2% | 1.79 ? -15% | |
| Reader / Idle (h) | 12.6 | 15.2 | 25.6 | 26.4 | 25.4 | 17.4 | 17.9 | 31.9 | 12.5 ? | 30 ? | 20.9 ? | 22.9 ? |
Pros
Cons
Verdict
The Xiaomi RedmiBook 16 is an affordable office/multimedia laptop with a powerful Ryzen 5 4500U and integrated graphics card. The case is very reminiscent of the good Xiaomi Mi Notebook Pro devices with aluminum cases. The Apple MacBook Pro 16 is clearly the design inspiration, but in contrast to it, the RedmiBook is positioned in the lowest price segment. Xiaomi had to make cutbacks in various places to achieve this: no webcam, a slow SATA SSD, and no keyboard backlight.
Despite the outdated SATA SSD, the system performance is outstanding.
This is where the new Ryzen 5 4500U can flex its muscles and even the low clock speed and non-upgradeable main memory only slows it down slightly. The graphics performance is not overwhelming with the integrated Vega 6, so the RedmiBook is hardly suitable for gamers. The Intel variant with MX350 should be considerably more powerful here. The CPU's cooling is first class, the fans stay quiet, and the surfaces stay cool.
The 16-inch screen has a much lower resolution than the considerably more expensive model in the MBP16, but it achieves the stated coverage of the sRGB color space and pleases with a matte coating and good color representation in the test. It could be a bit brighter at maximum brightness so that the laptop could be put to better use outdoors, since the battery life of our test device would not dissuade from mobile use. A full workday with reduced brightness is possible thanks to good energy efficiency.
As the device was only available in China at the time of this review, the usual restrictions have to be contended with in Europe: long delivery times, customs and import tax, high shipping costs for returns, possible issues in case of defects, Chinese Windows (language not changeable) and currently only an American QWERTY keyboard make a purchase seem unexciting for most customers at the moment.
Xiaomi RedmiBook 16 R5
- 07/08/2020 v7 (old)
Klaus Hinum
Price comparison
