2020 HP Envy x360 13 Convertible 2-in-1 Review: Ryzen 5 Beats a Core i7
As detailed in our launch article here, the 2020 Envy x360 13 is a full-on update of the 2019 model meaning there's a lot of changes both inside and out. HP has dropped the older 9th gen Whiskey Lake-U and Zen+ Ryzen U-series options in favor of 10th gen Ice Lake and Zen 2, respectively.
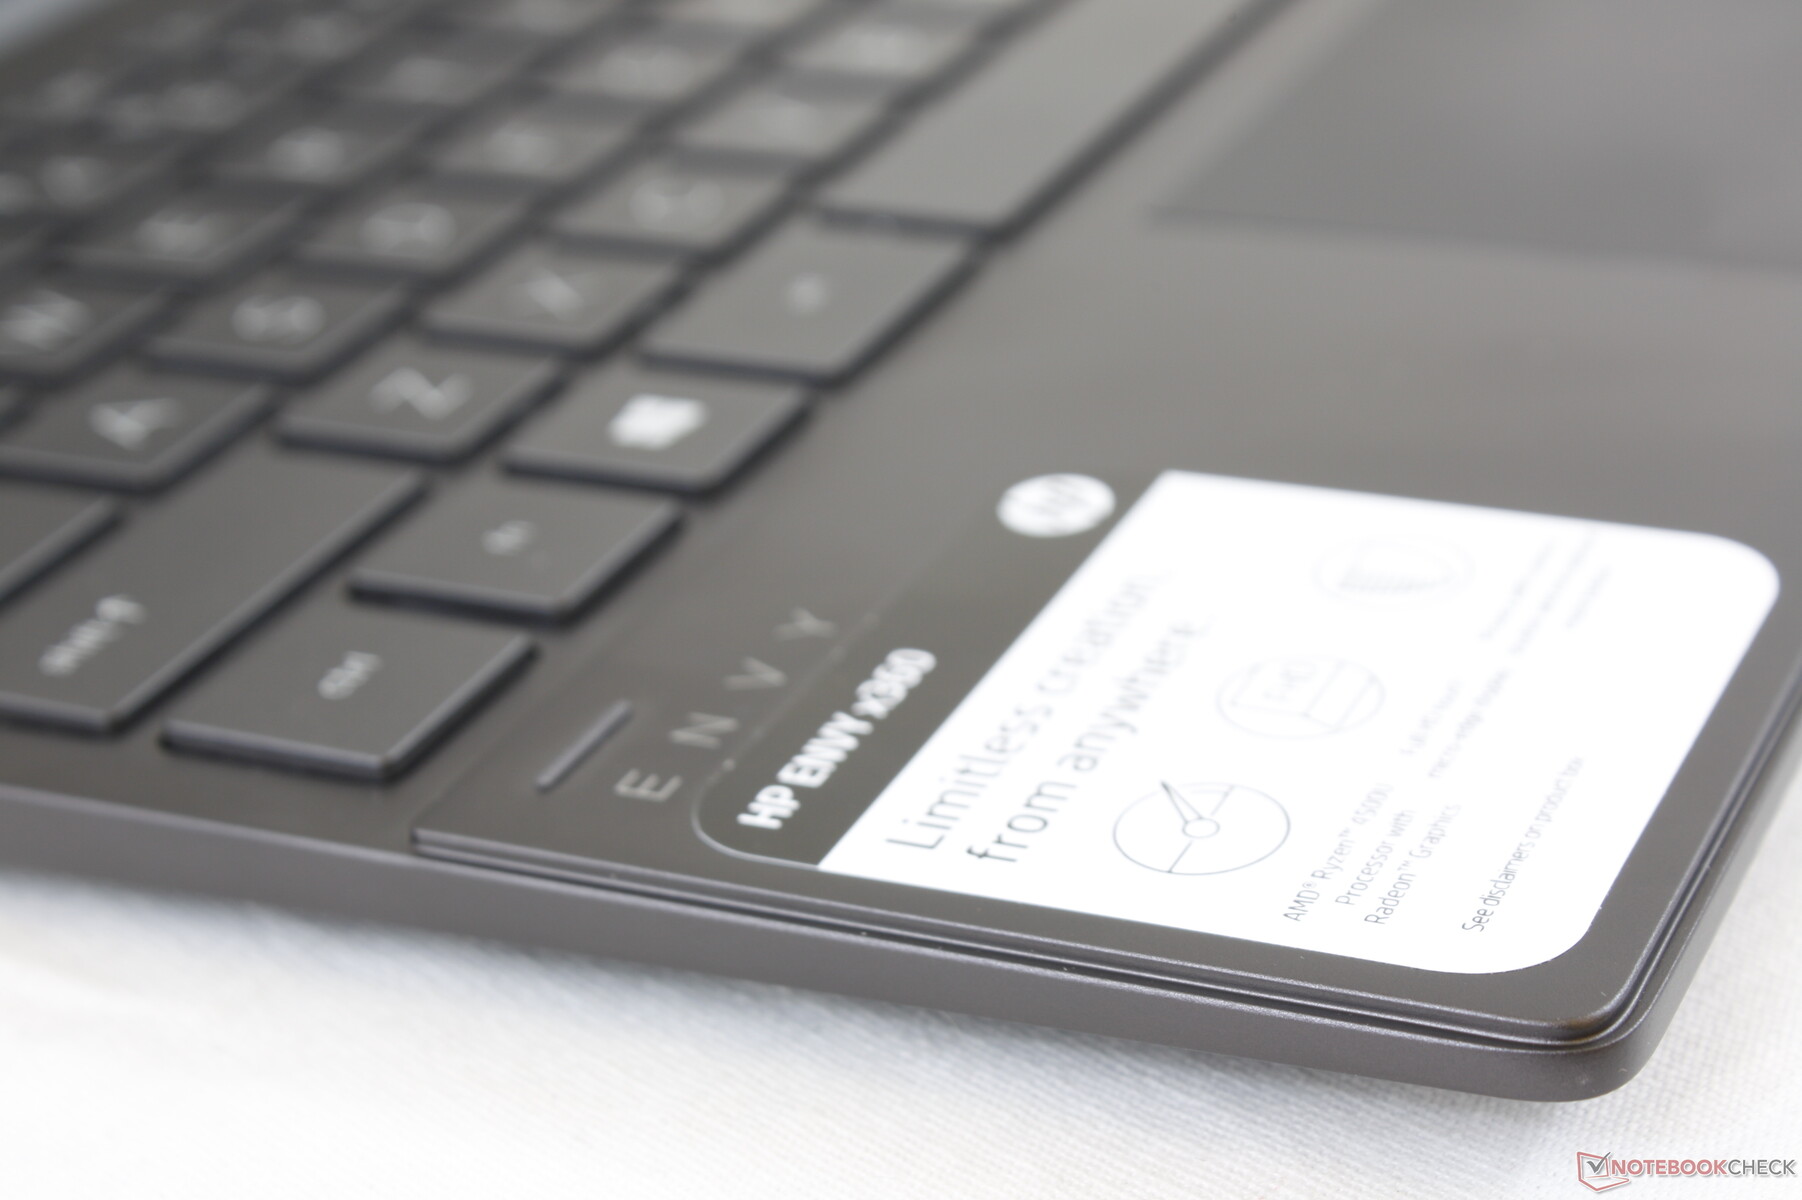
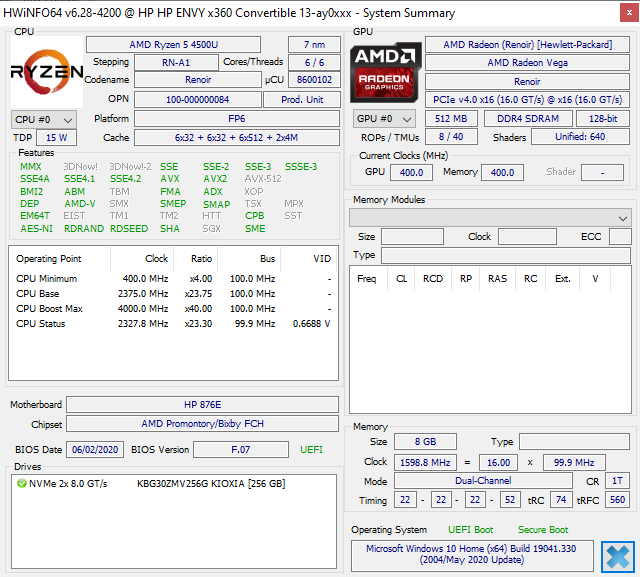
The Envy x360 13 series is positioned as a mid-range convertible between the cheaper Pavilion x360 and pricier Spectre x360. As our review below will show, however, the 2020 Envy model feels and performs surprisingly close to a Spectre without costing nearly as much. Our test unit comes with the Ryzen 5 4500U, 8 GB of soldered dual-channel RAM, and a 256 GB NVMe SSD for approximately $800 USD retail. Lesser Ryzen 3 and greater Ryzen 7 options are also available.
Direct competitors to the Envy x360 13 include mid-range to flagship subnotebook convertibles like the Lenovo Yoga C940, Dell XPS 13 7390 2-in-1, Asus ZenBook Flip 14, or the Acer Spin series.
More HP reviews:
Rating | Date | Model | Weight | Height | Size | Resolution | Price |
|---|---|---|---|---|---|---|---|
| 85.5 % v7 (old) | 06 / 2020 | HP Envy x360 13-ay0010nr R5 4500U, Vega 6 | 1.3 kg | 16.4 mm | 13.30" | 1920x1080 | |
| 86.3 % v7 (old) | 10 / 2019 | Dell XPS 13 7390 2-in-1 Core i7 i7-1065G7, Iris Plus Graphics G7 (Ice Lake 64 EU) | 1.3 kg | 13 mm | 13.40" | 1920x1200 | |
| 88.4 % v7 (old) | 12 / 2019 | HP Spectre x360 13-aw0013dx i7-1065G7, Iris Plus Graphics G7 (Ice Lake 64 EU) | 1.2 kg | 16.9 mm | 13.30" | 1920x1080 | |
| 86.6 % v6 (old) | 05 / 2019 | Asus ZenBook S13 UX392FN i7-8565U, GeForce MX150 | 1.1 kg | 12.9 mm | 13.90" | 1920x1080 | |
| 92.1 % v7 (old) | 06 / 2020 | Apple MacBook Pro 13 2020 2GHz i5 10th-Gen i5-1038NG7, Iris Plus Graphics G7 (Ice Lake 64 EU) | 1.4 kg | 15.6 mm | 13.30" | 2560x1600 |
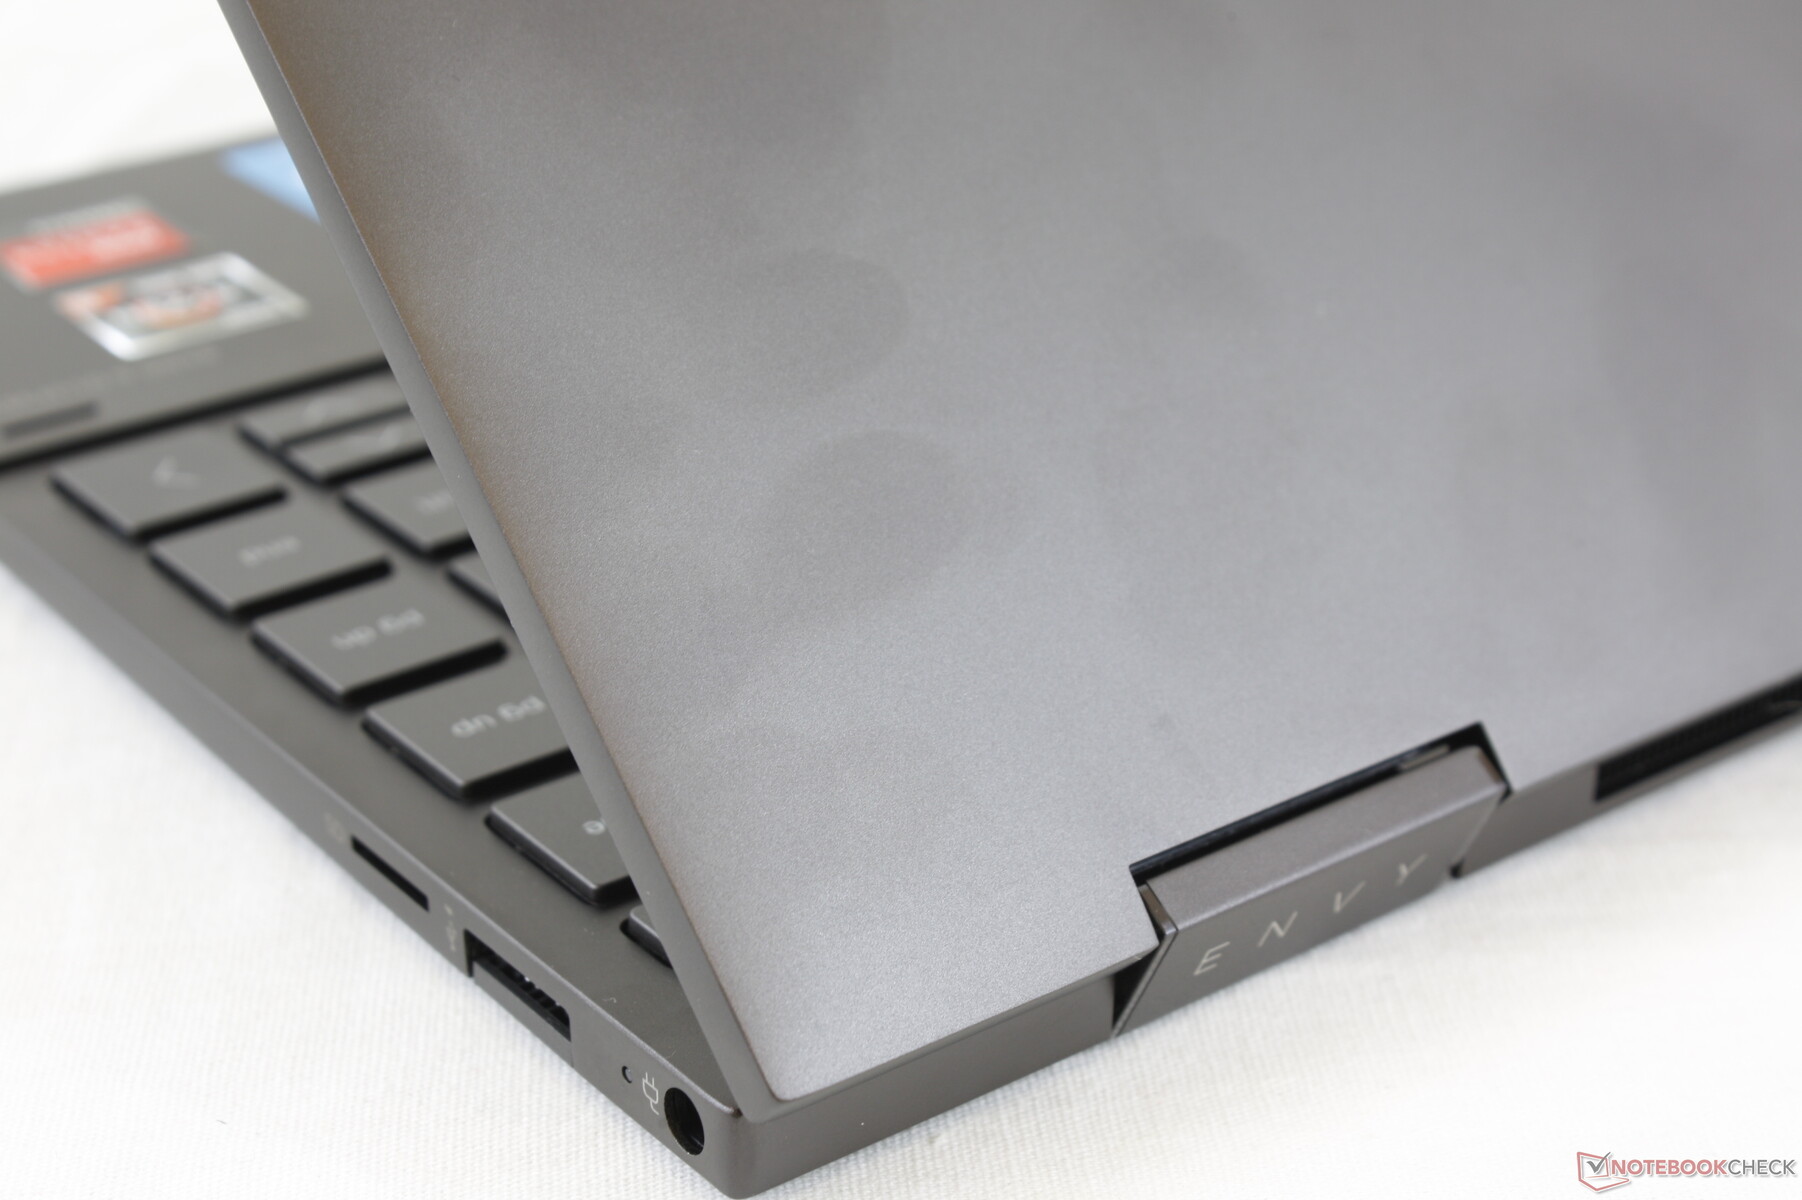
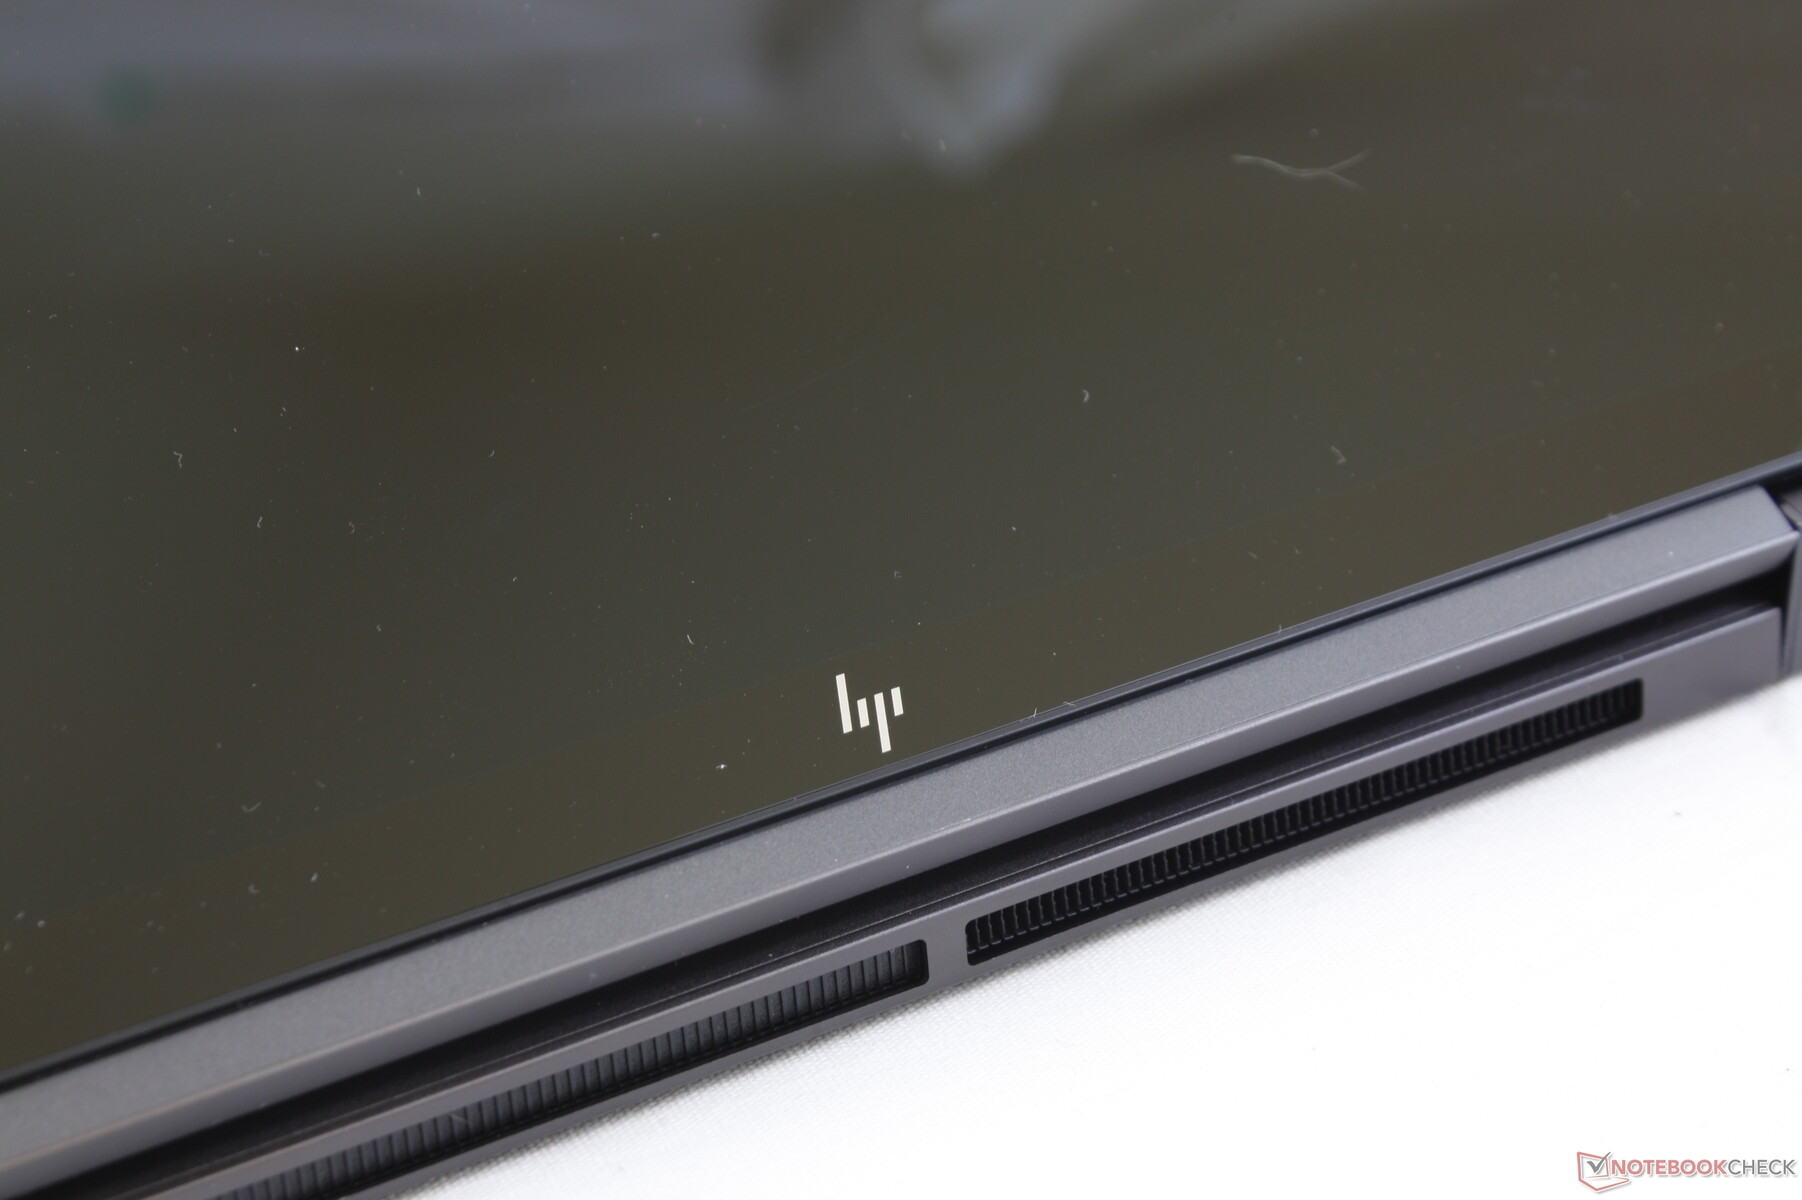
Case
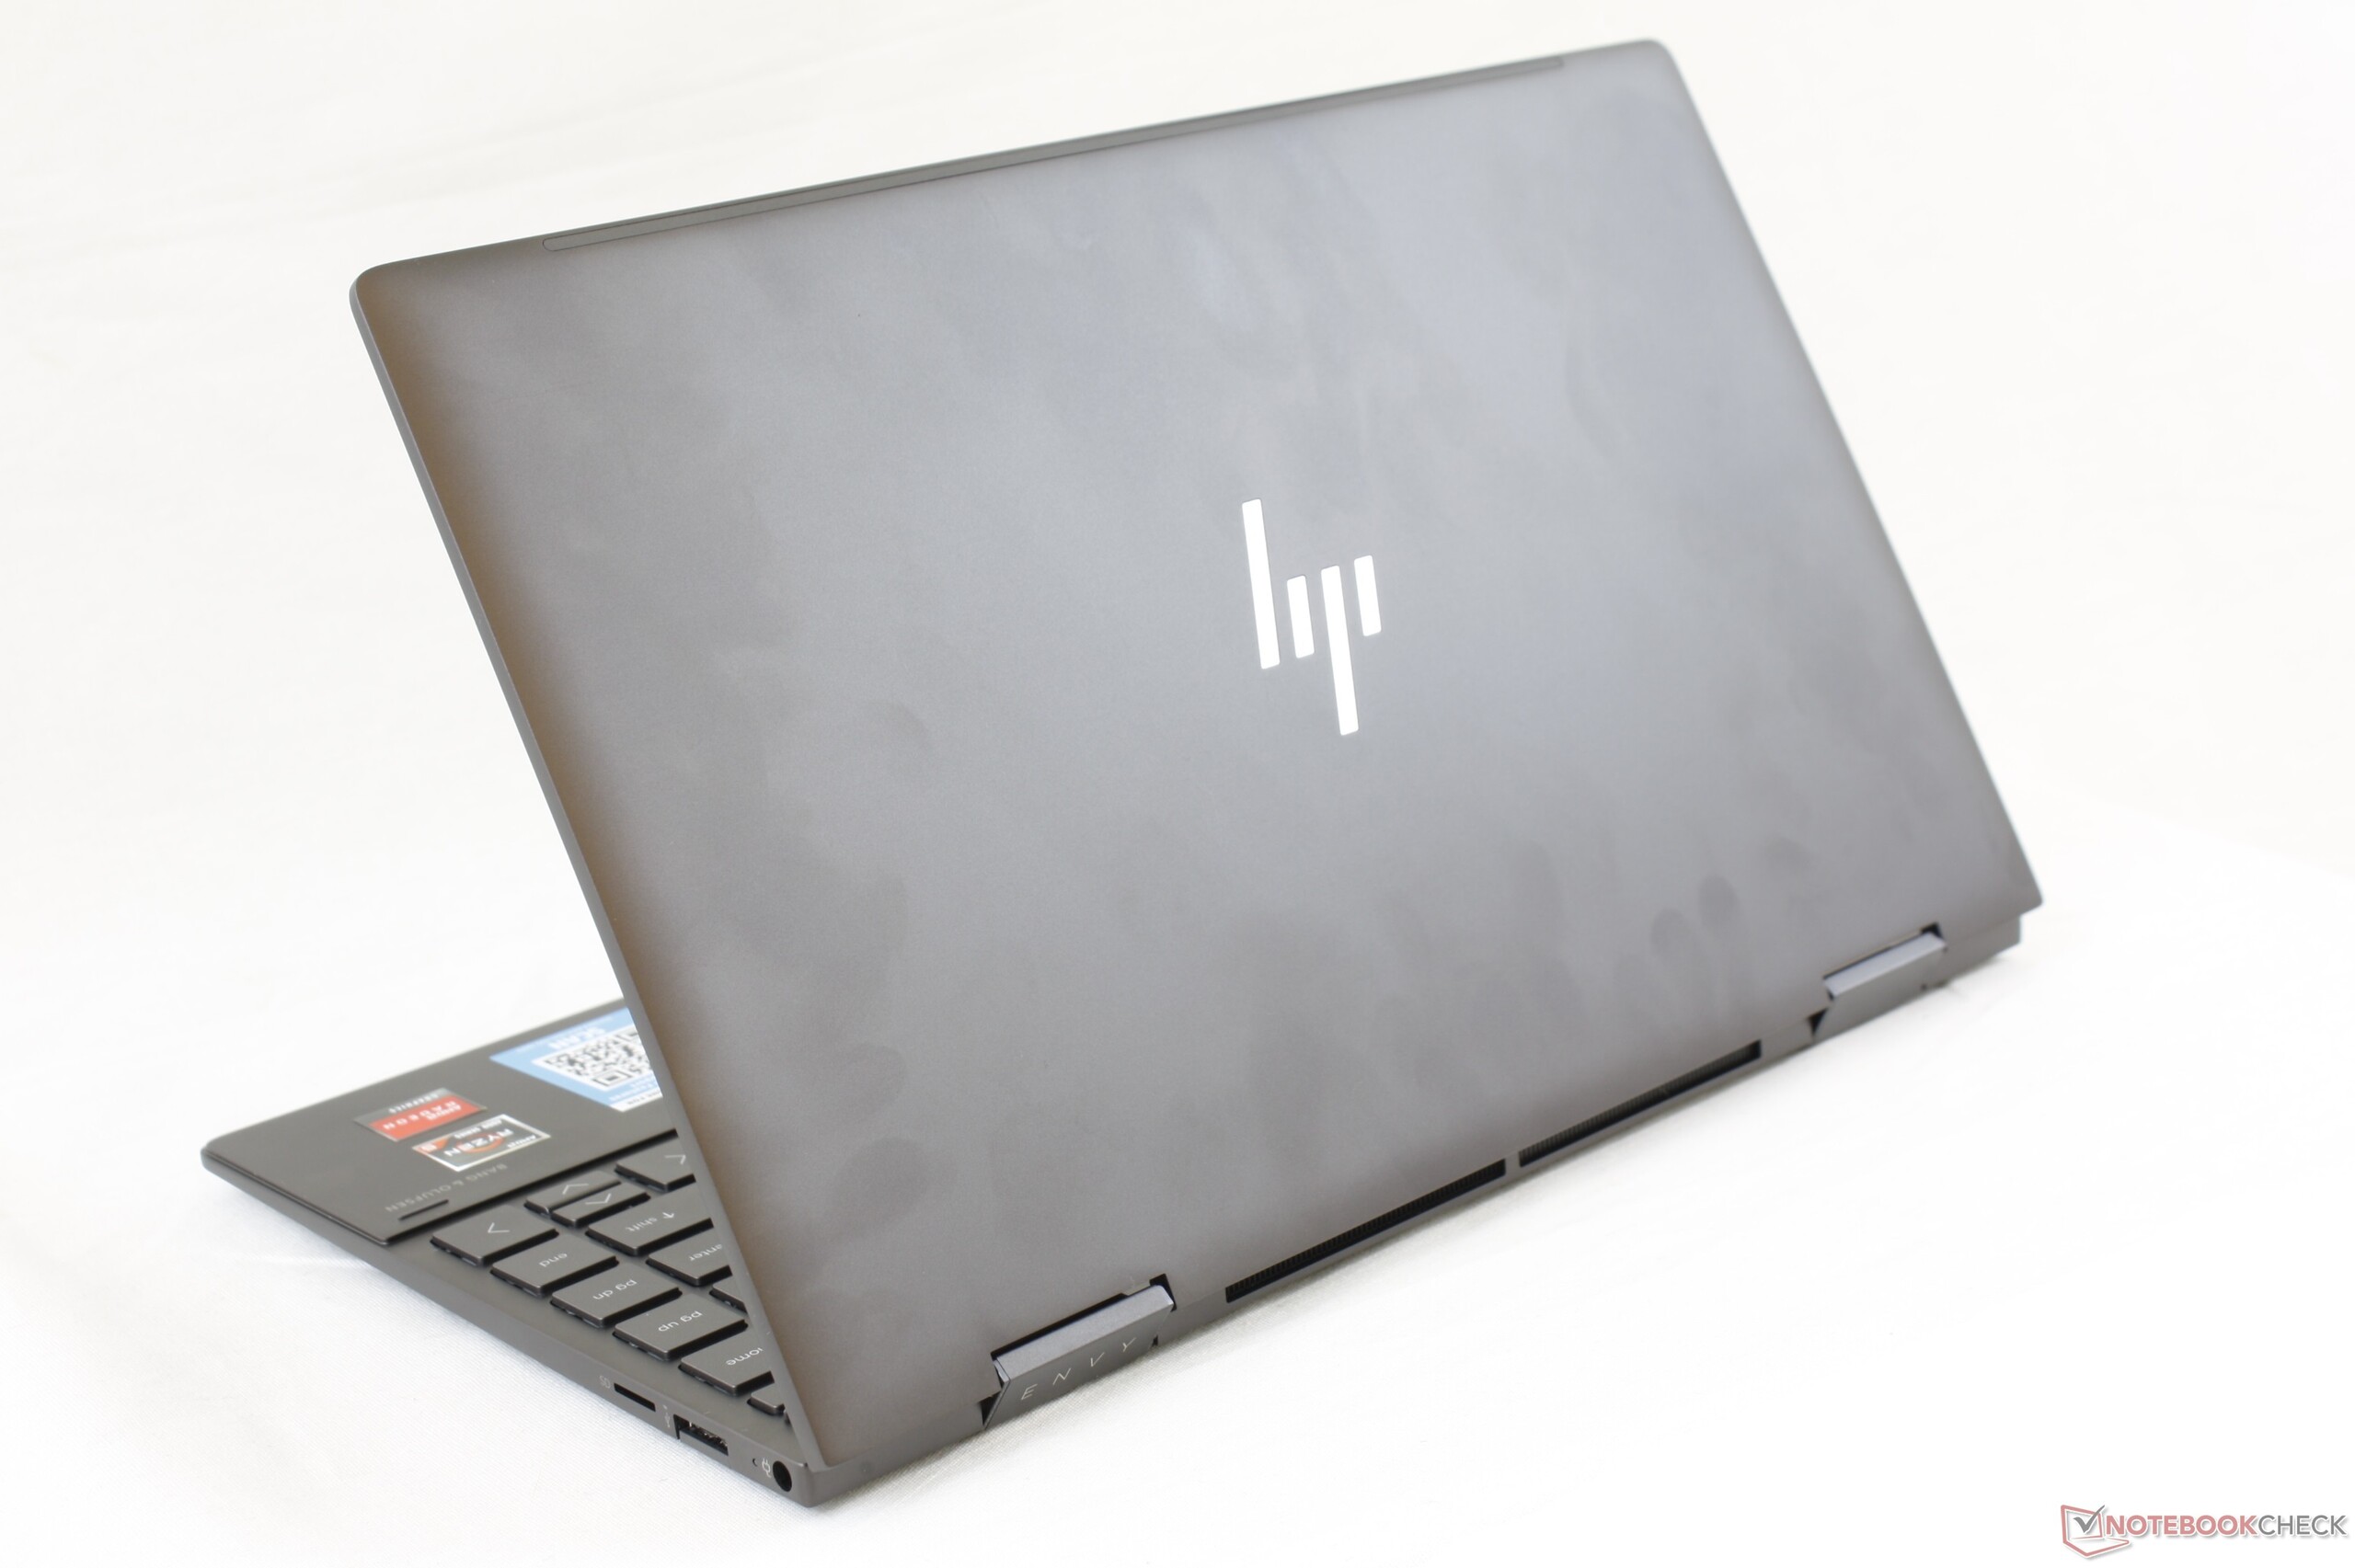
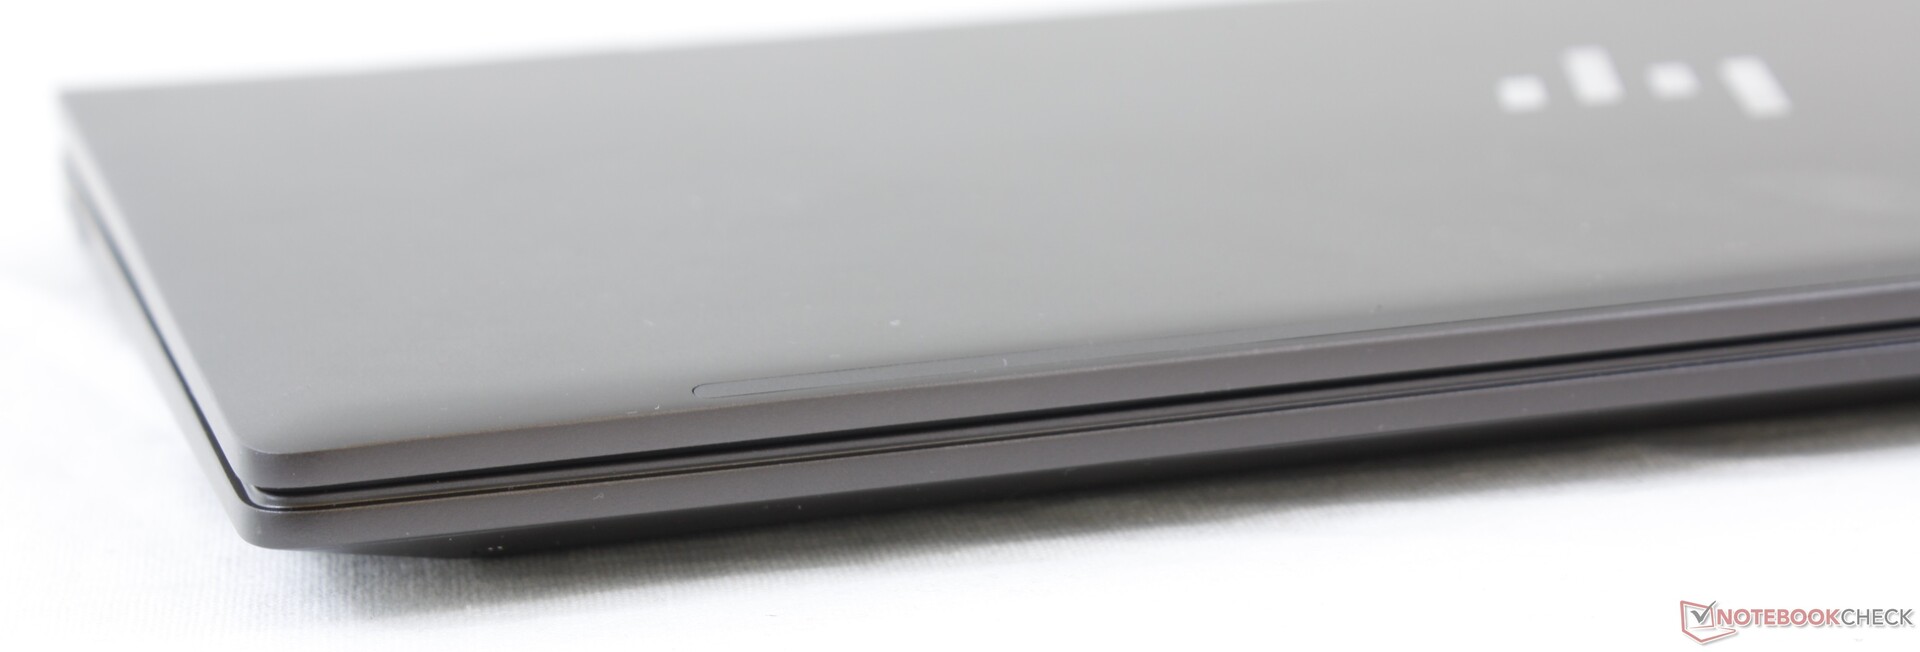
The metal chassis materials are similar to the ones used on the 2019 Spectre x360 13 for a familiar texture and build quality. In fact, the two are nearly identical in size and weight. Attempting to twist the lid or base results in minimal creaking or warping for solid first impressions especially for such a small and lightweight system. Flexing is most noticeable down the center of the lid, but it's not anything to worry about.
The one aspect we think could have been better is the rigidity of the hinges. While satisfactory, they don't feel as strong as the hinges on last year's Spectre x360 13. They become weaker and more likely to teeter once they reach around 150 degrees or greater.
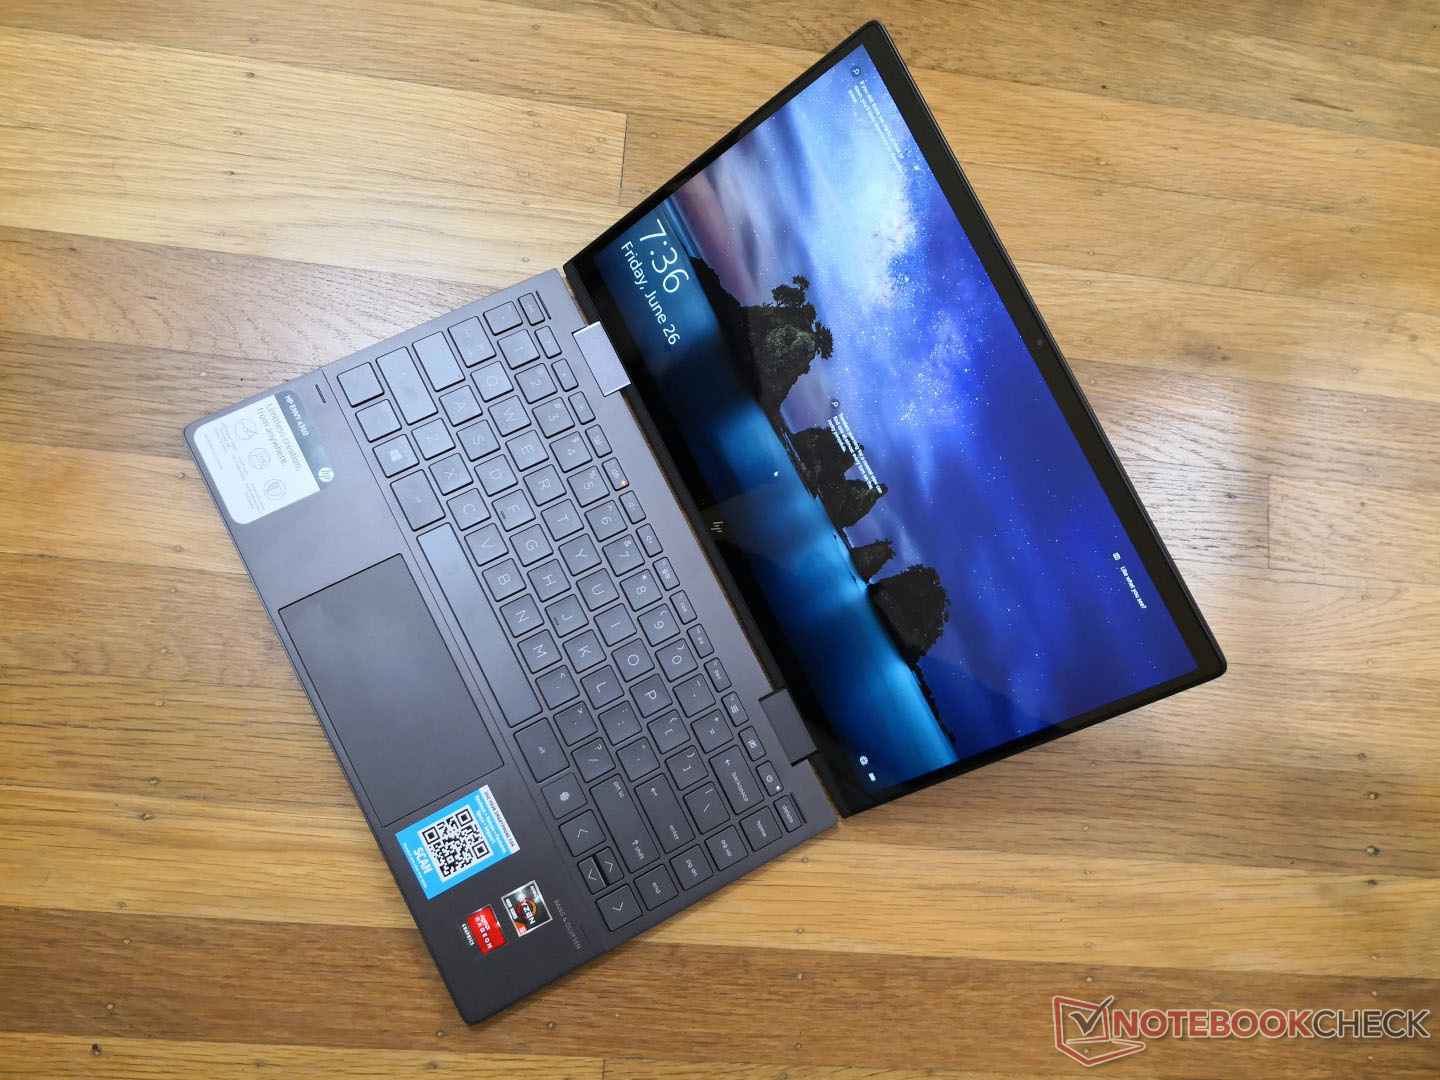
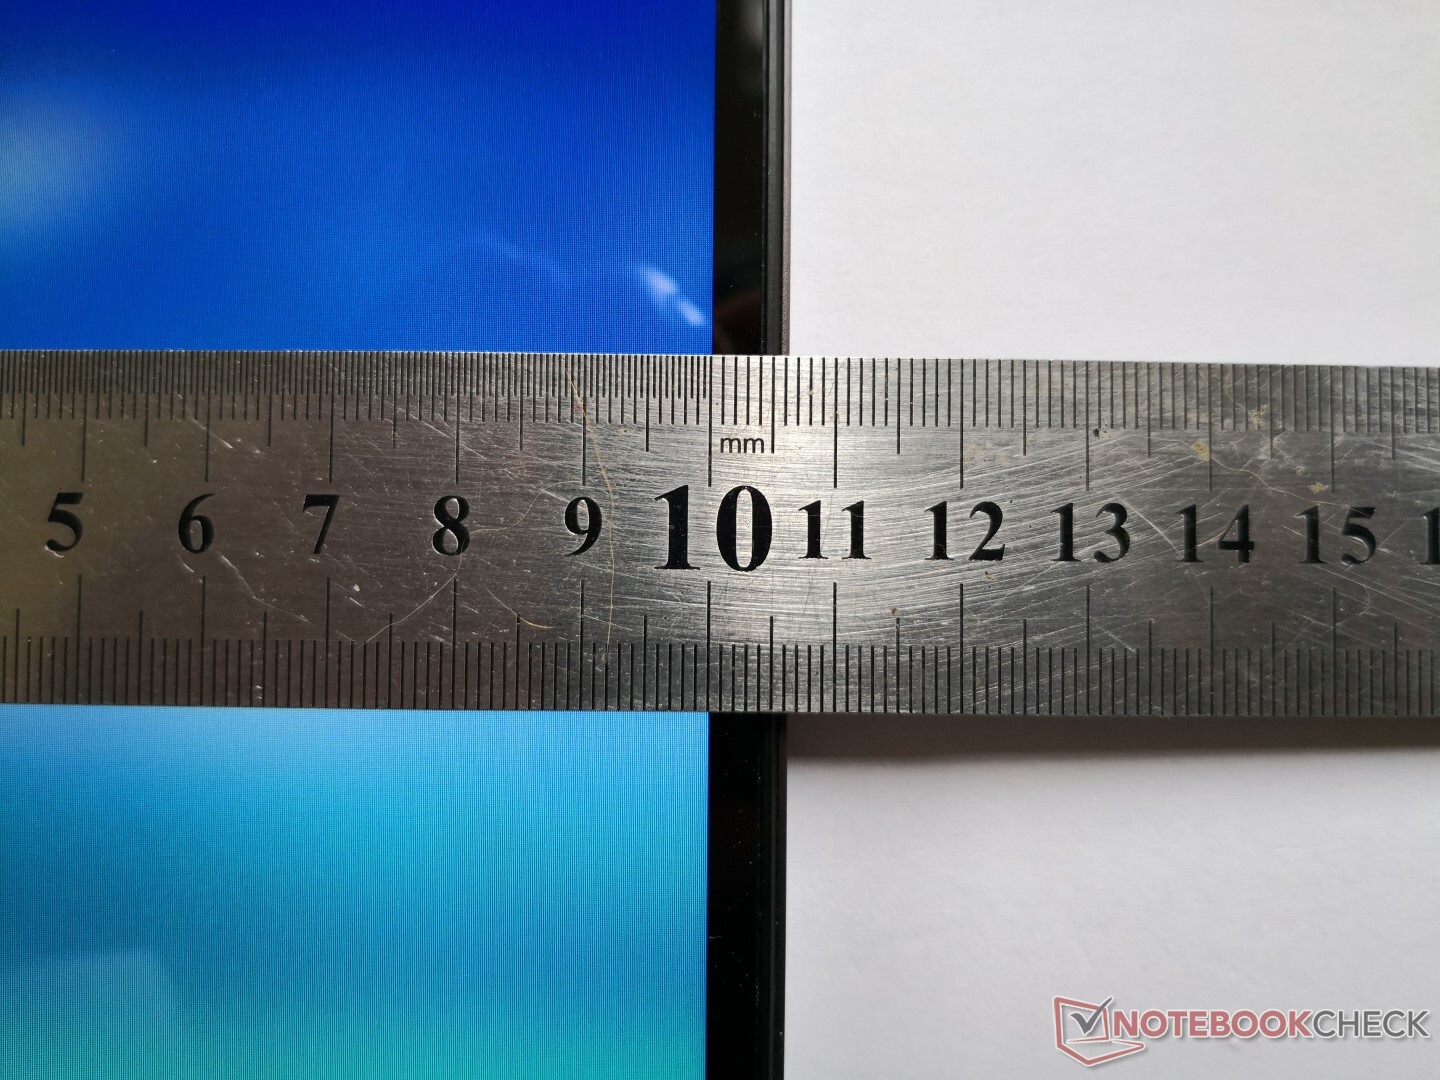
The 2020 Envy x360 13 has a much smaller footprint than the 2019 version because of its reduced "chin" bezel. Overall length, for example, is almost 2 cm shorter year-over-year. Interestingly, weight remains almost the same at 1.3 kg and the newer design is actually slightly thicker (16.4 mm vs 14.7 mm), but these are fair trade-offs for a more compact convertible that rivals Dell's more expensive XPS 13 7390 2-in-1.
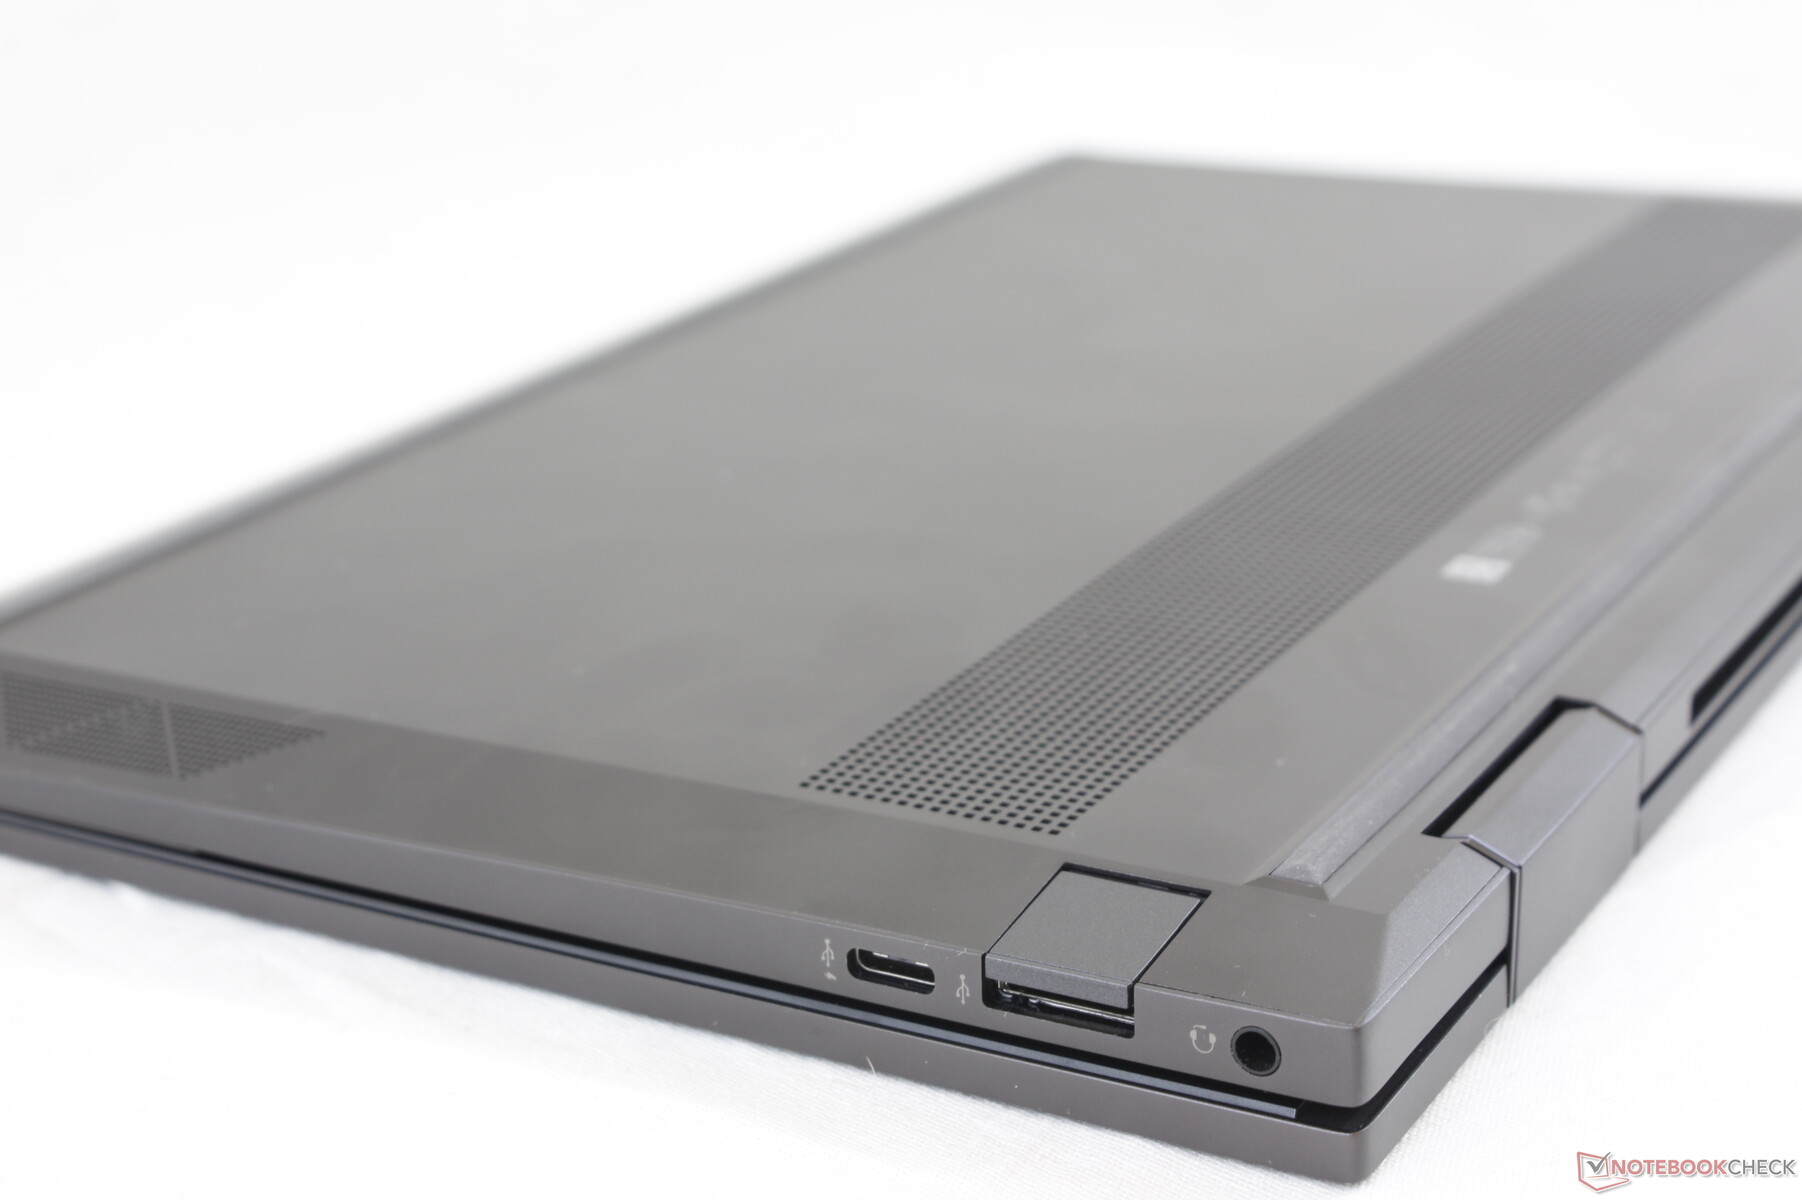
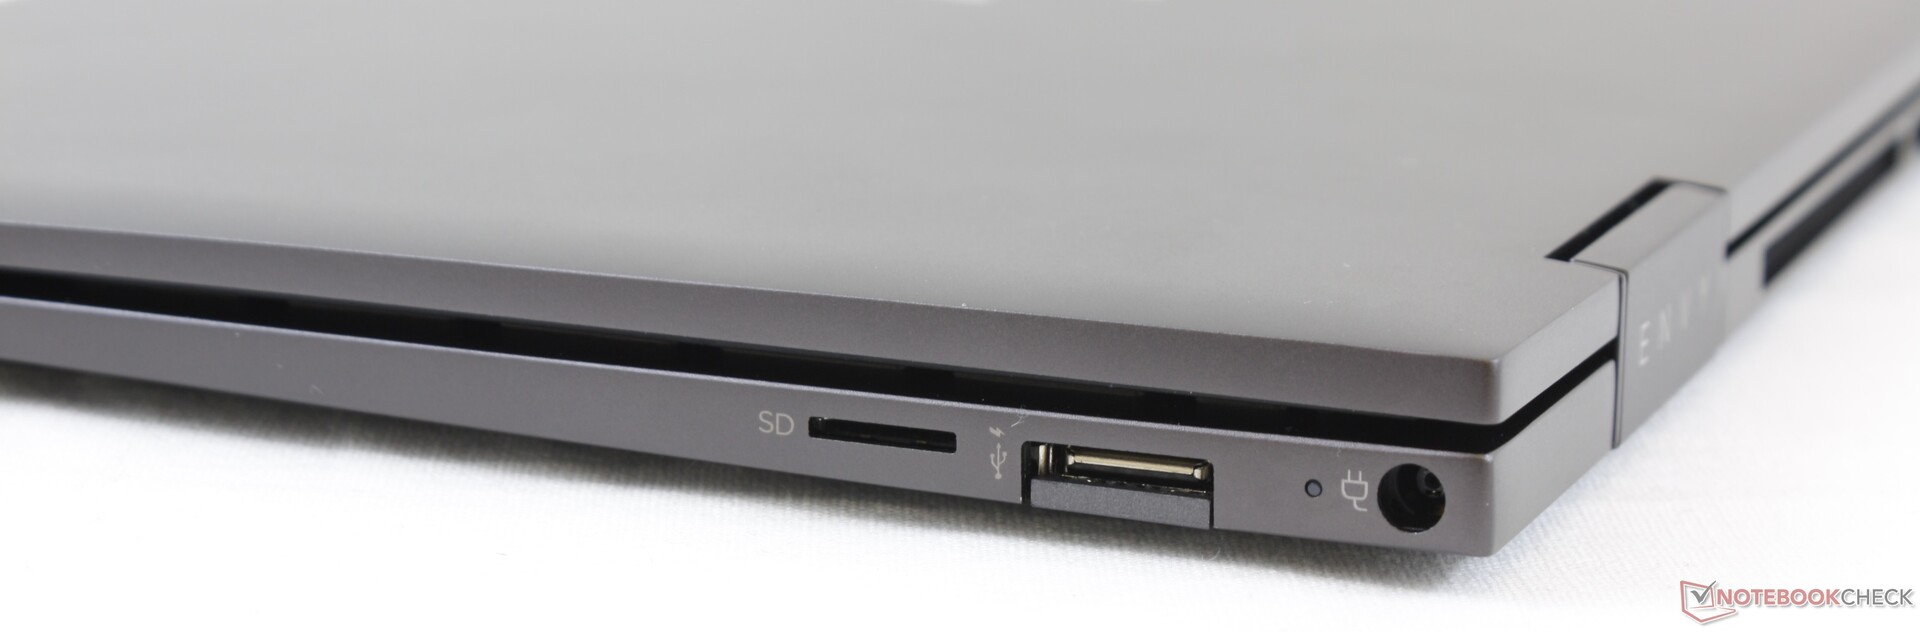
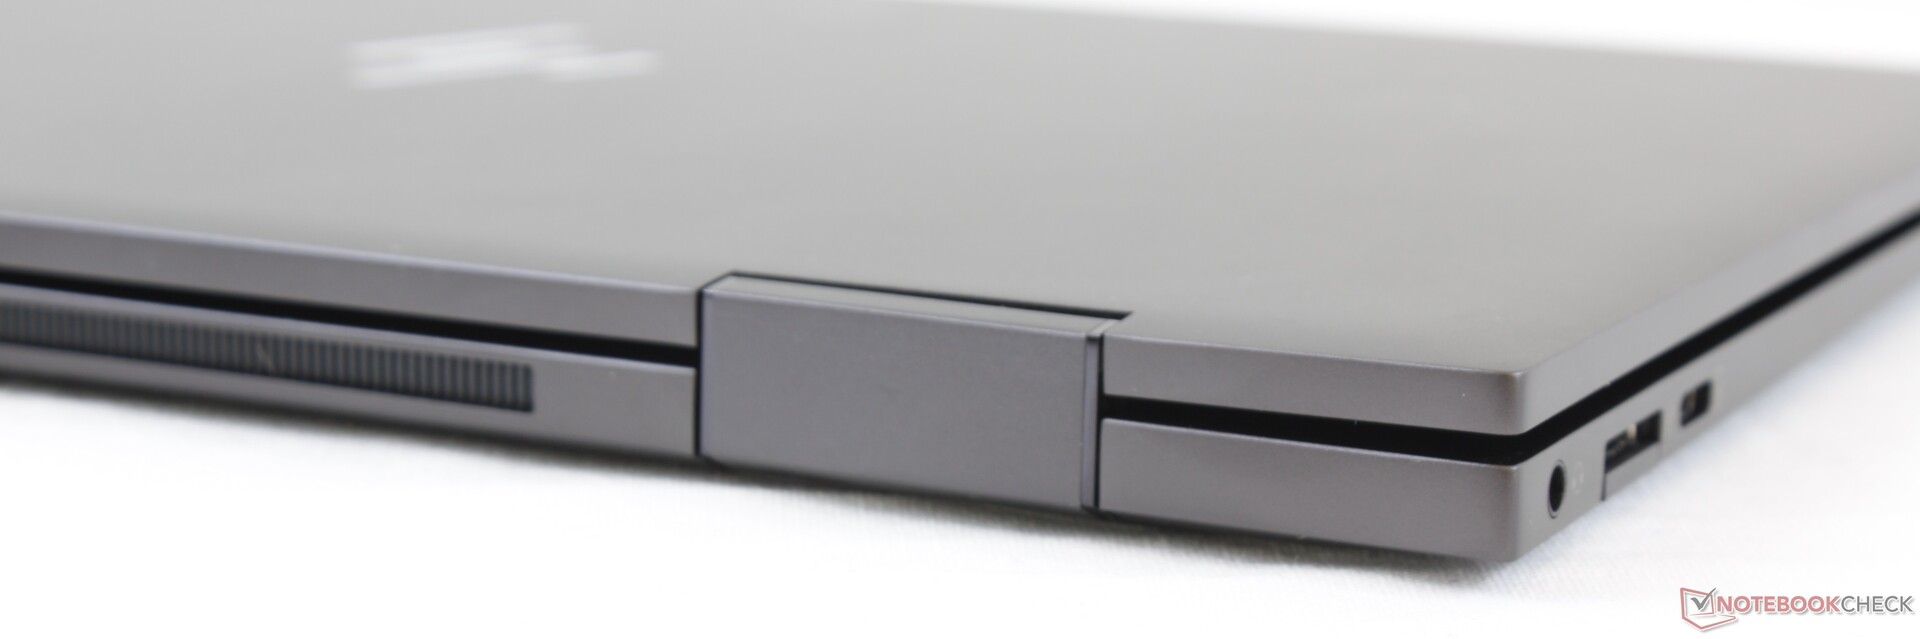
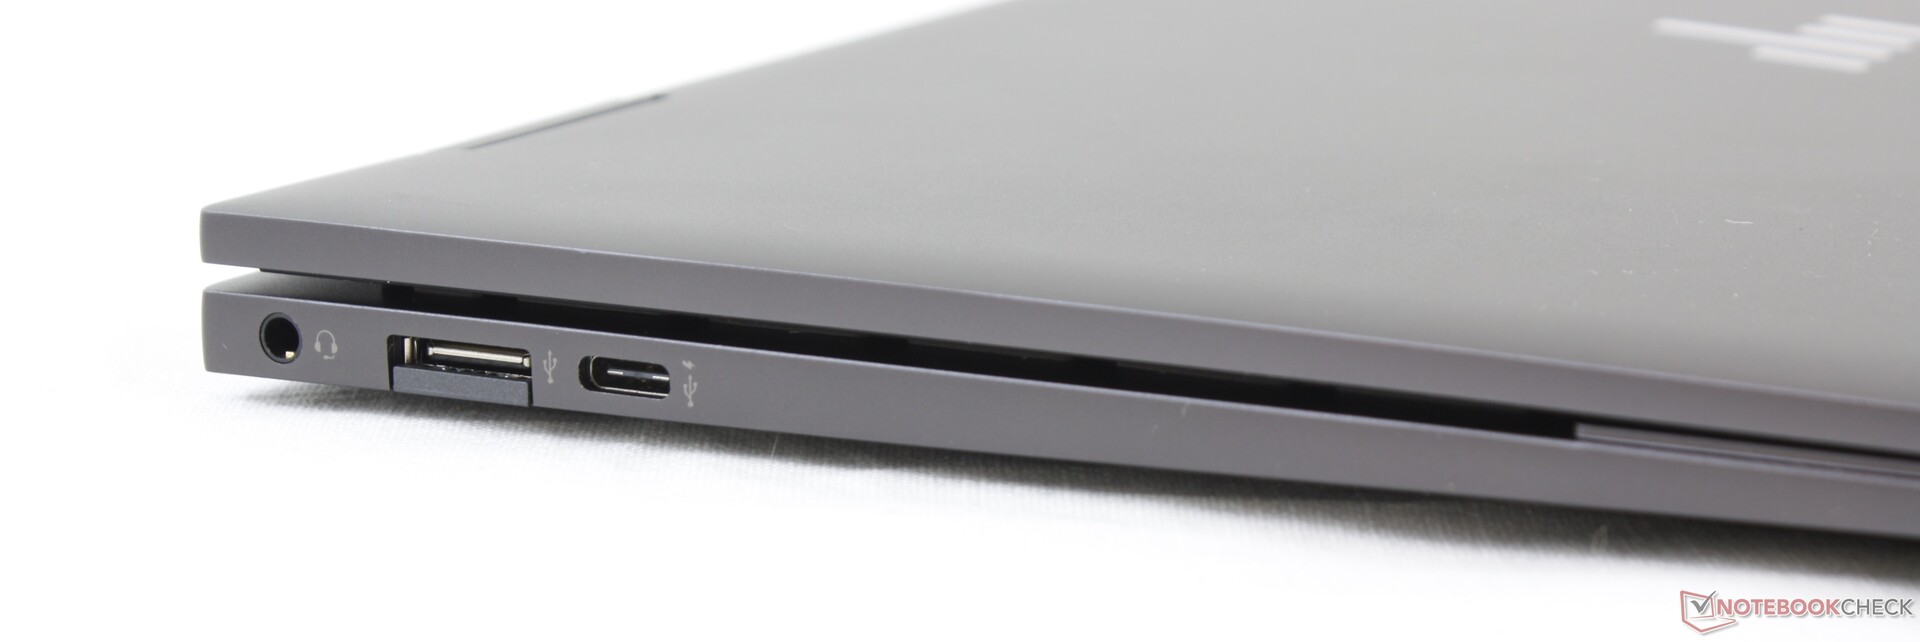
Connectivity
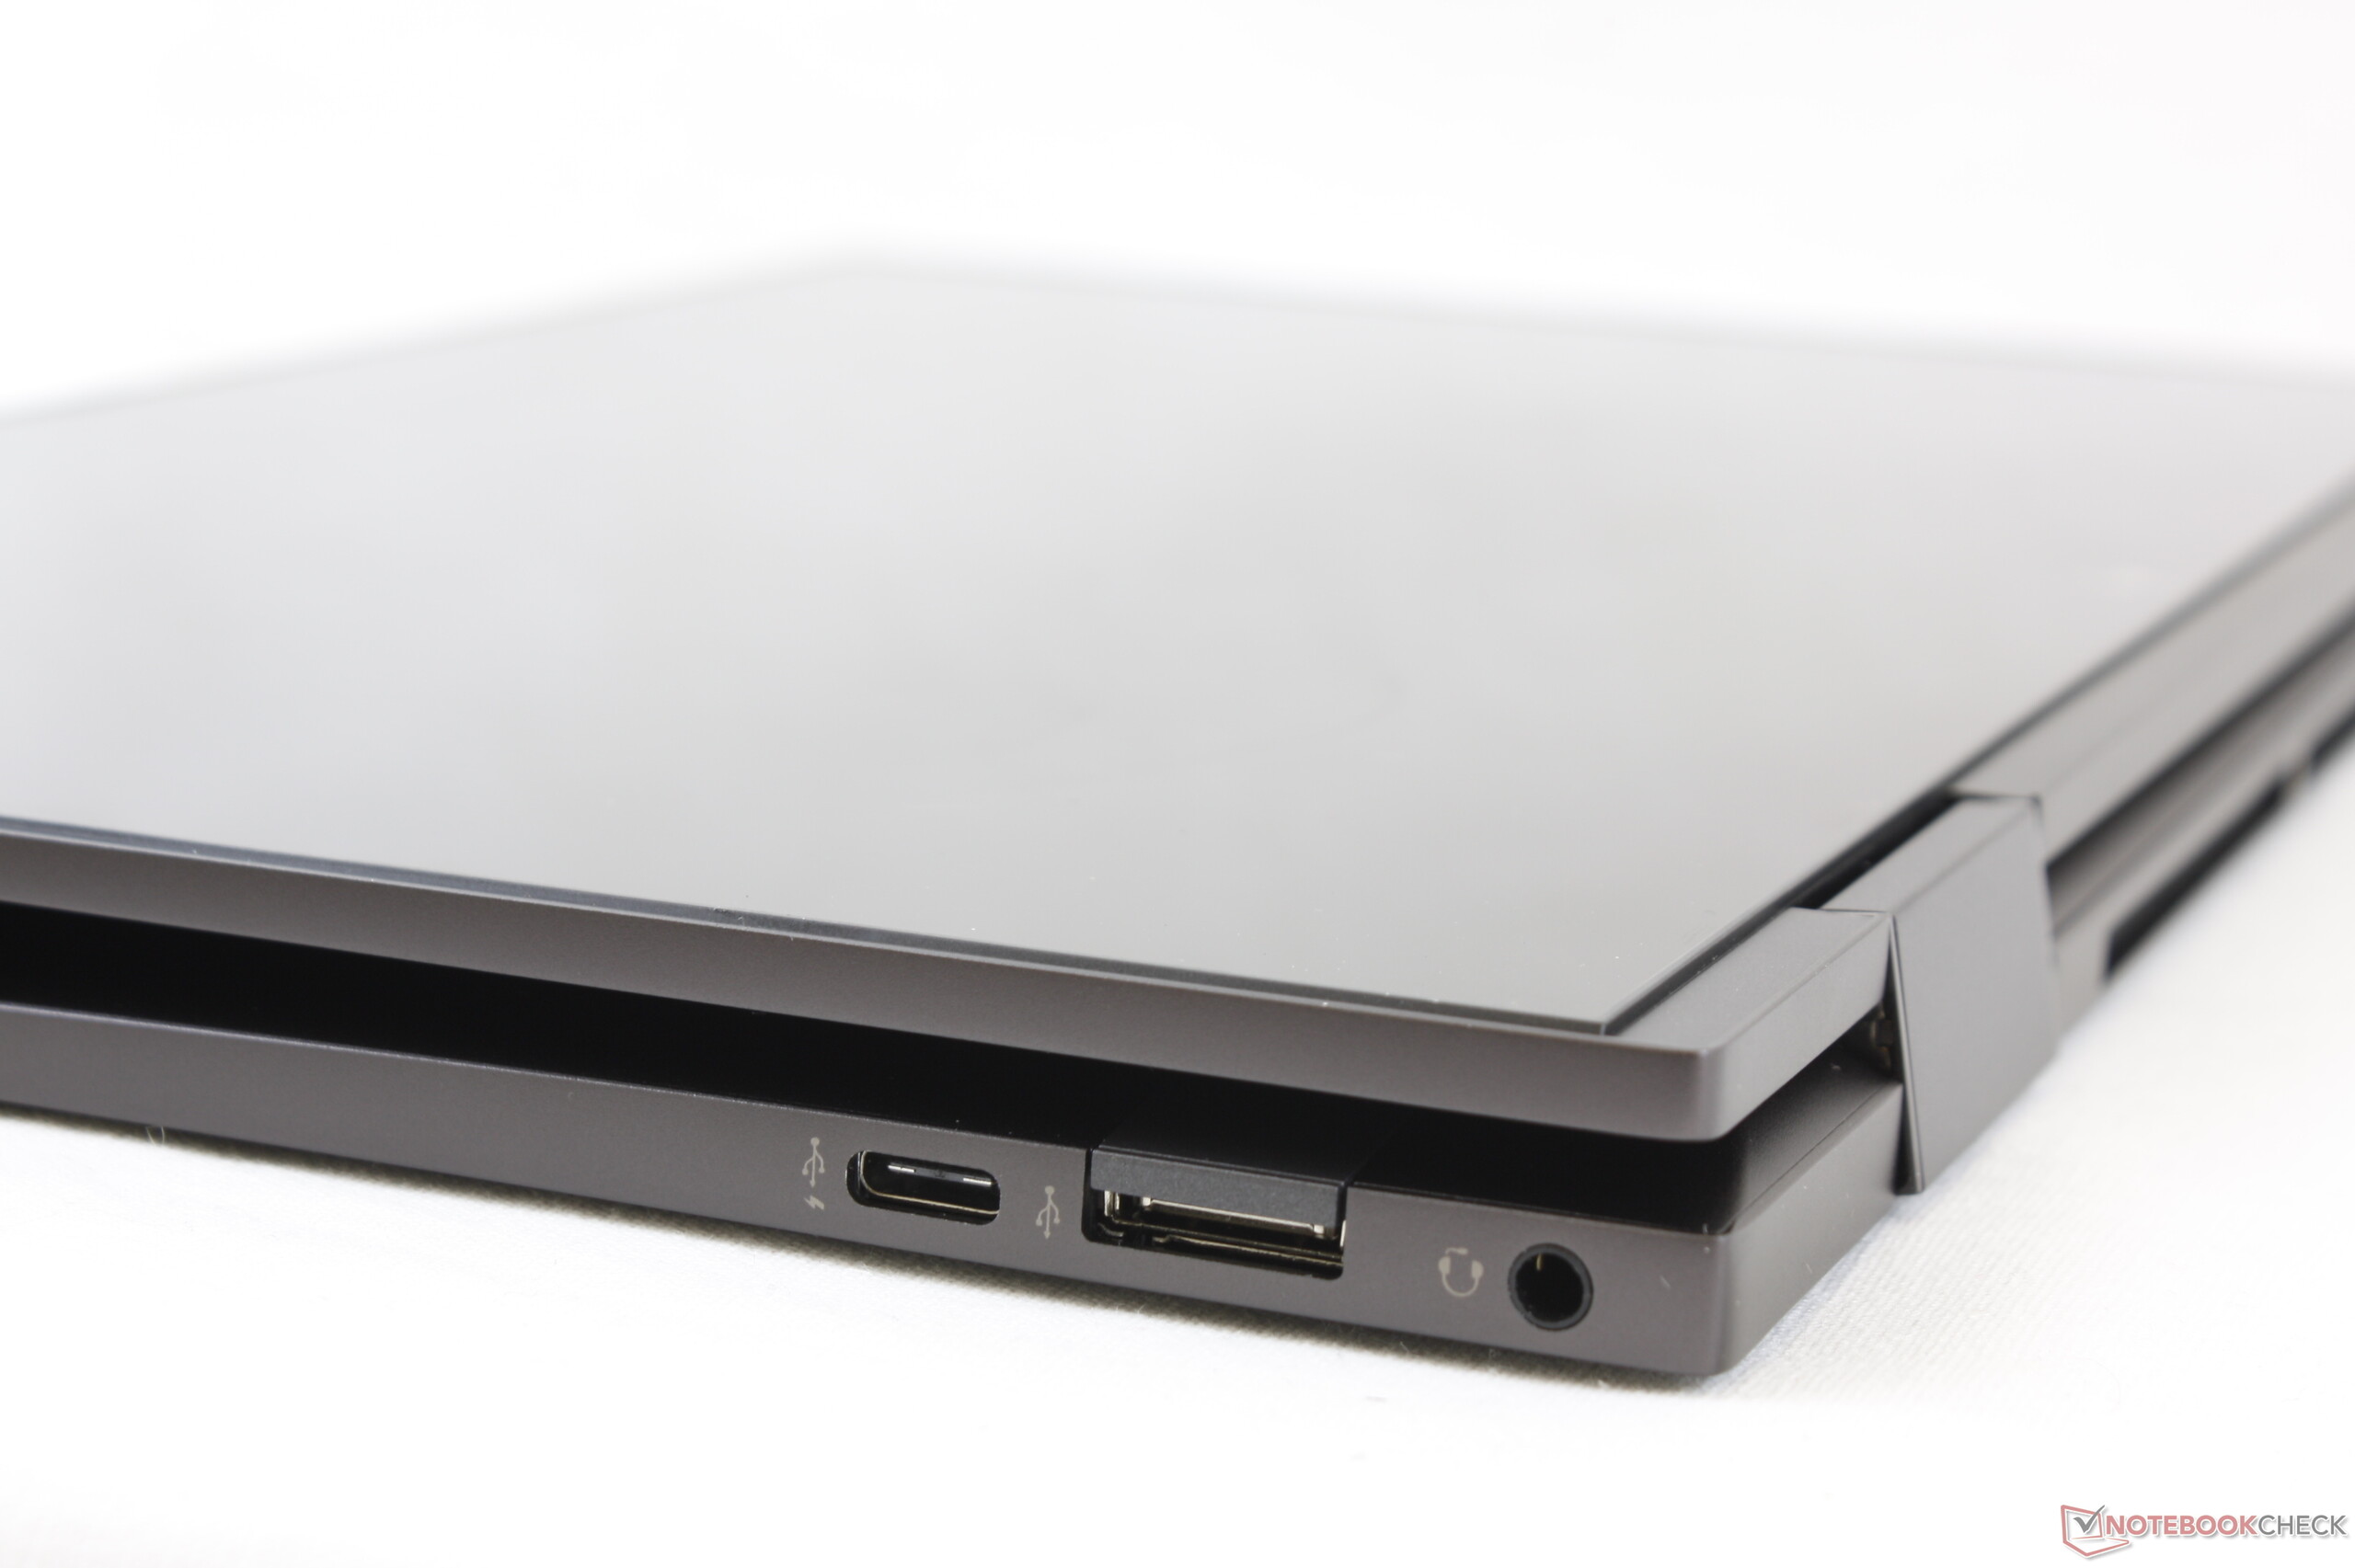
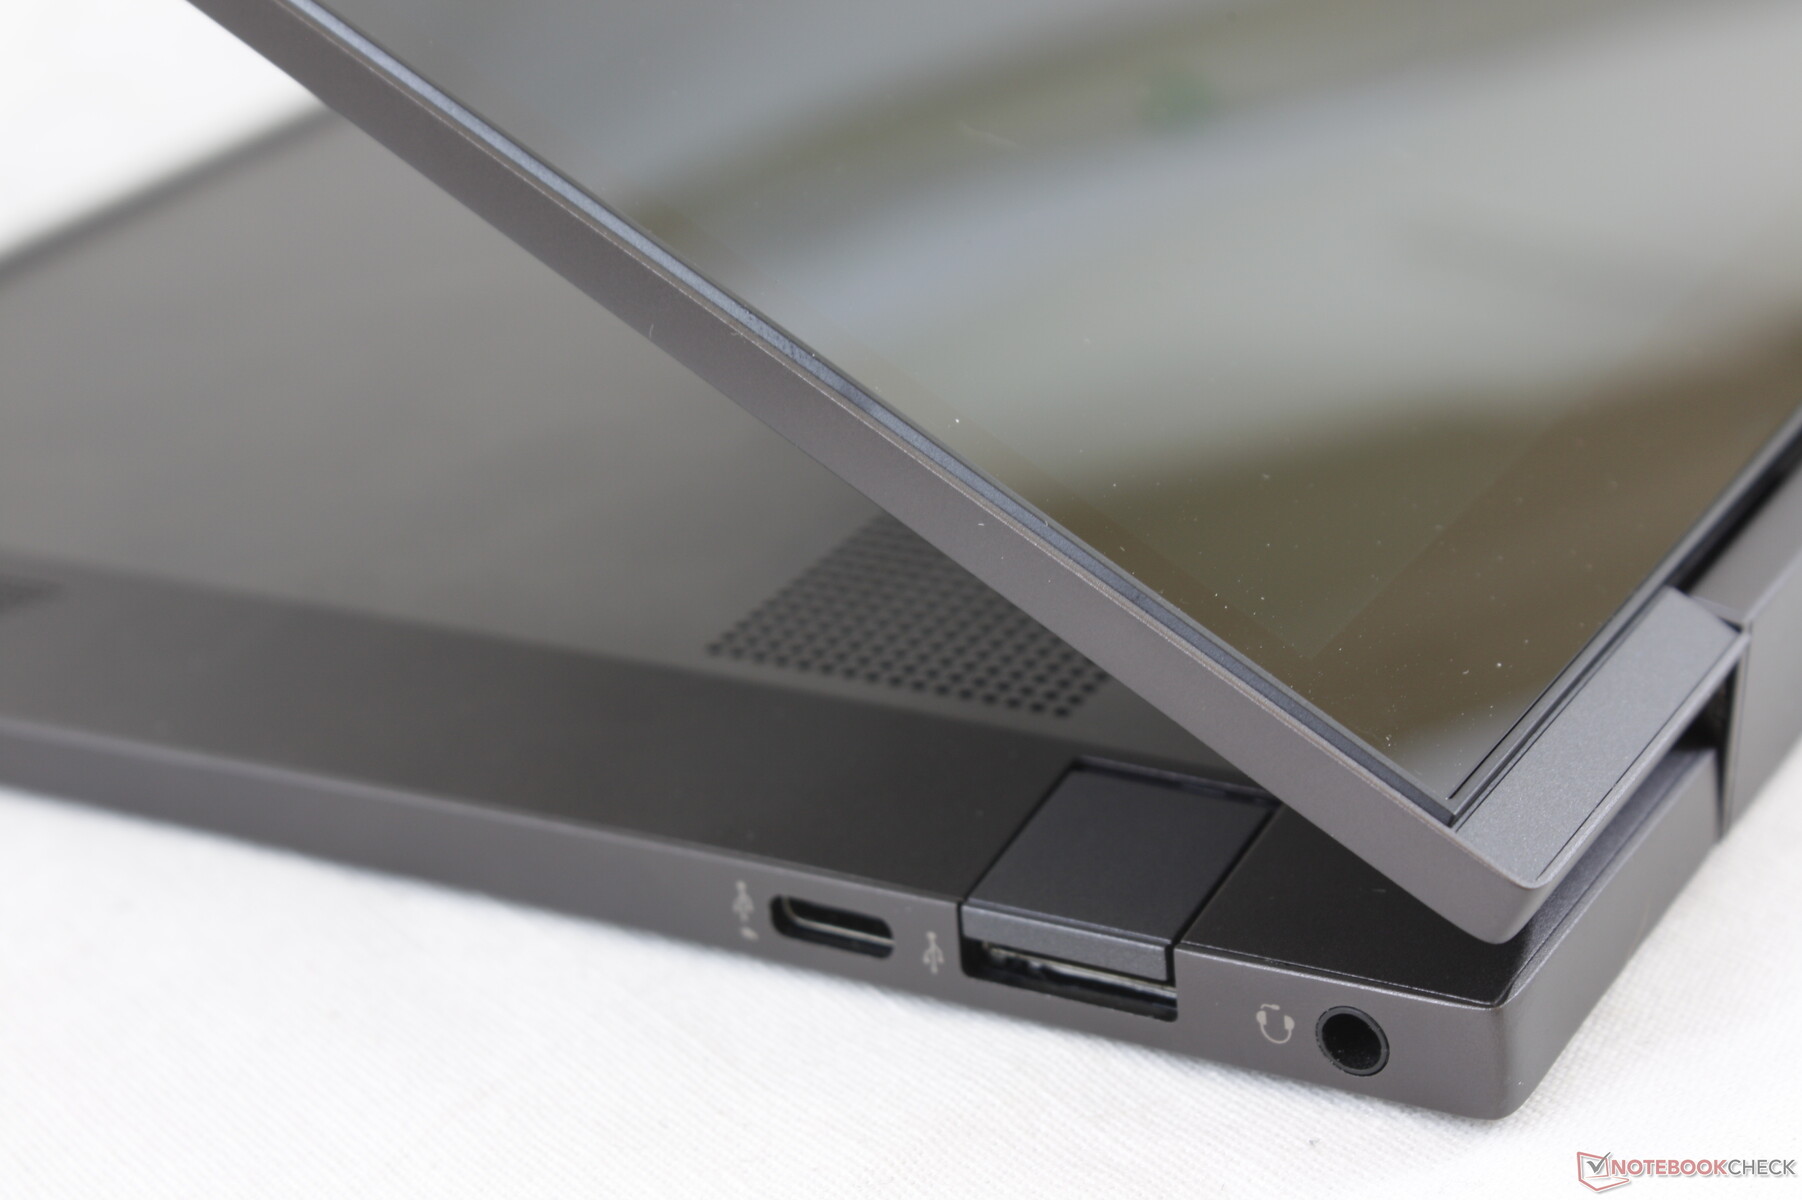
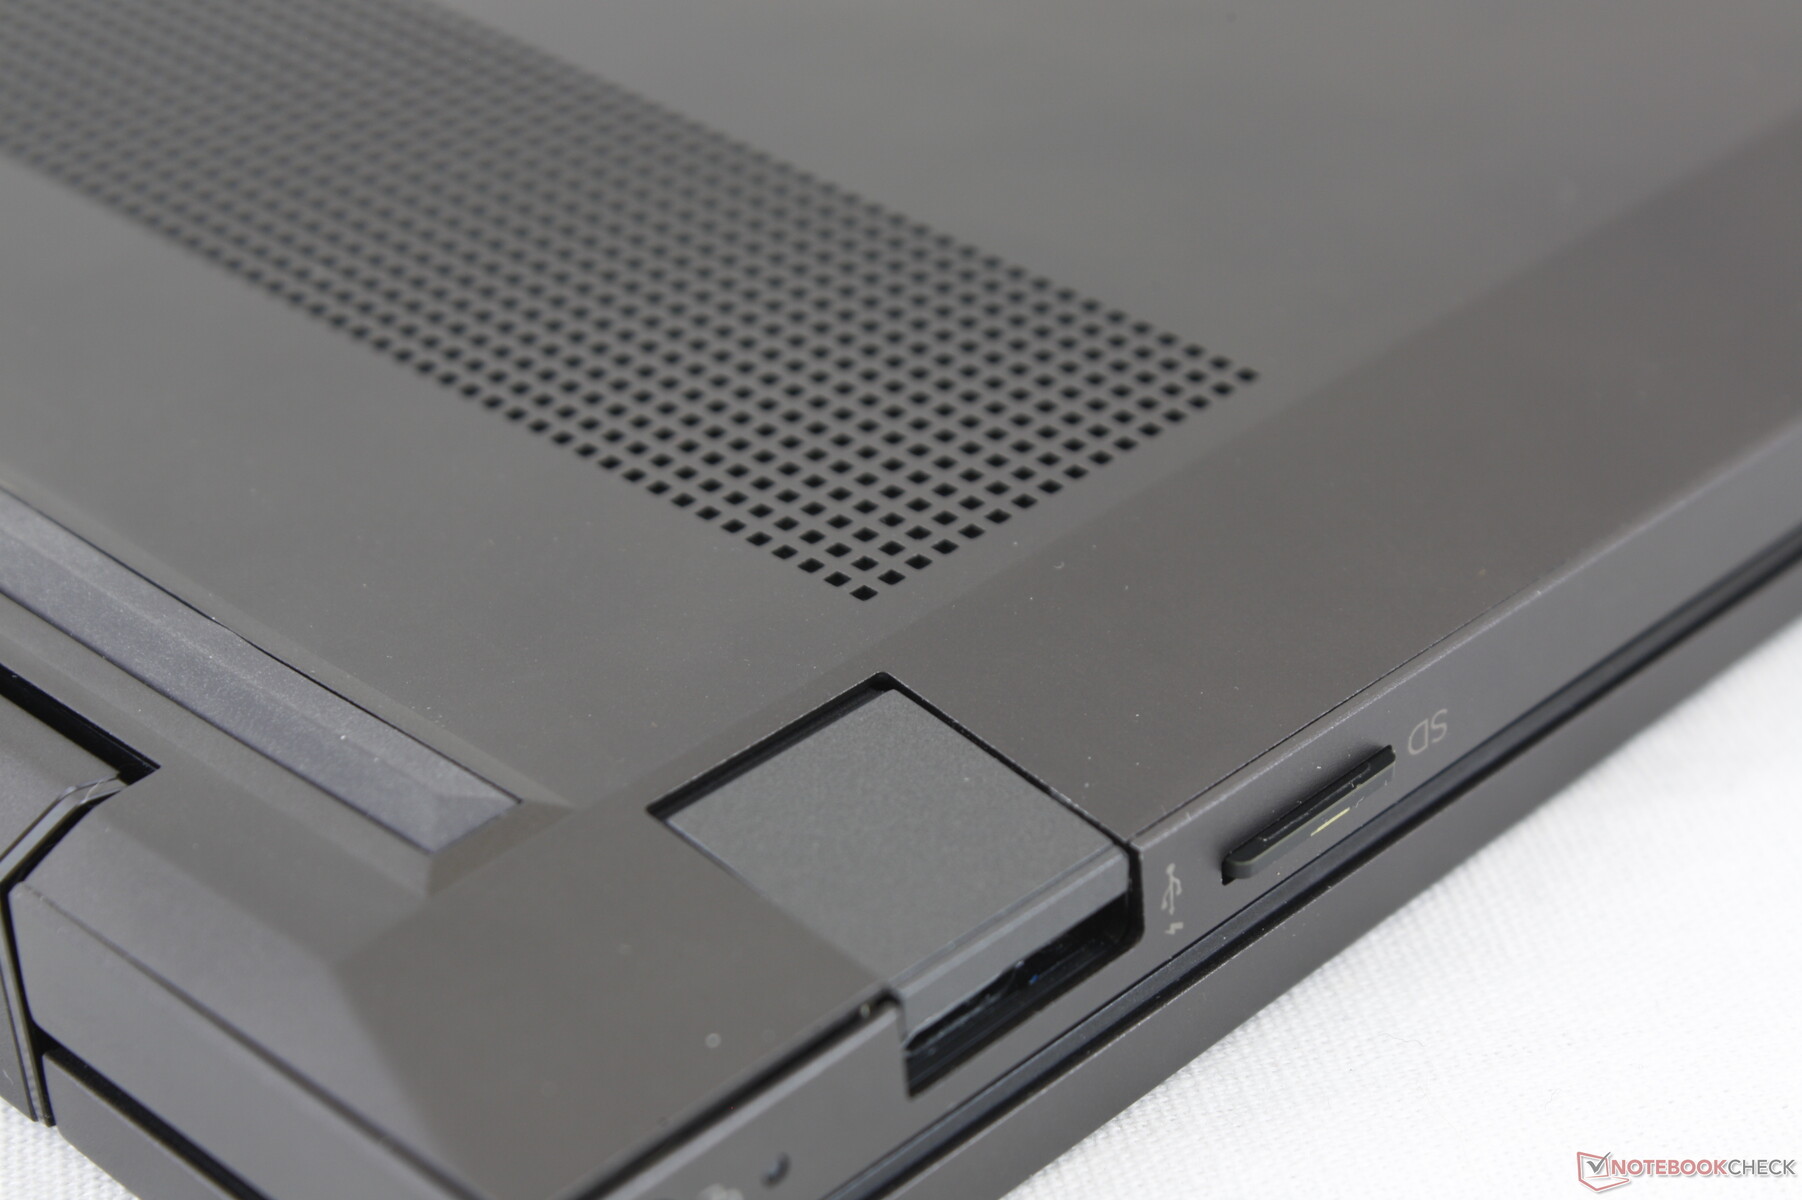
Port options are essentially identical to last year's Envy x360 13 with just a couple of minor changes: port positioning is now slightly different and the USB-C port has doubled in speed from 5 Gbps to 10 Gbps. There is still no HDMI port meaning users will have to rely on DisplayPort over USB-C for connecting external monitors.
Keep in mind that there is no Thunderbolt 3 support on this AMD SKU. Users will have to choose either the Intel version of the Envy x360 13 or the Spectre x360 13 for Thunderbolt 3 compatibility.
SD Card Reader
The spring-loaded MicroSD card hasn't changed from last year's Envy x360 13 in terms of performance. Transferring 1 GB of pictures from our UHS-II test card to desktop still takes about 13 seconds.
| SD Card Reader | |
| average JPG Copy Test (av. of 3 runs) | |
| HP Spectre x360 13-aw0013dx (Toshiba Exceria Pro M501 microSDXC 64GB) | |
| Dell XPS 13 7390 2-in-1 Core i7 (Toshiba Exceria Pro M501 64 GB UHS-II) | |
| HP Envy x360 13-ay0010nr (Toshiba Exceria Pro M501 64 GB UHS-II) | |
| HP Envy x360 13-ar0601ng (Toshiba Exceria Pro M501 microSDXC 64GB) | |
| Asus ZenBook S13 UX392FN (Toshiba Exceria Pro M501 64 GB UHS-II) | |
| maximum AS SSD Seq Read Test (1GB) | |
| Dell XPS 13 7390 2-in-1 Core i7 (Toshiba Exceria Pro M501 64 GB UHS-II) | |
| HP Spectre x360 13-aw0013dx (Toshiba Exceria Pro M501 microSDXC 64GB) | |
| HP Envy x360 13-ar0601ng (Toshiba Exceria Pro M501 microSDXC 64GB) | |
| HP Envy x360 13-ay0010nr (Toshiba Exceria Pro M501 64 GB UHS-II) | |
| Asus ZenBook S13 UX392FN (Toshiba Exceria Pro M501 64 GB UHS-II) | |
Communication
Our unit comes with an Intel AX200 for Bluetooth 5 and Wi-Fi 6 connectivity. Some SKUs may come with the slower Realtek Wi-Fi 5 module instead. We experienced no issues when connected to our Netgear RAX200 test router.
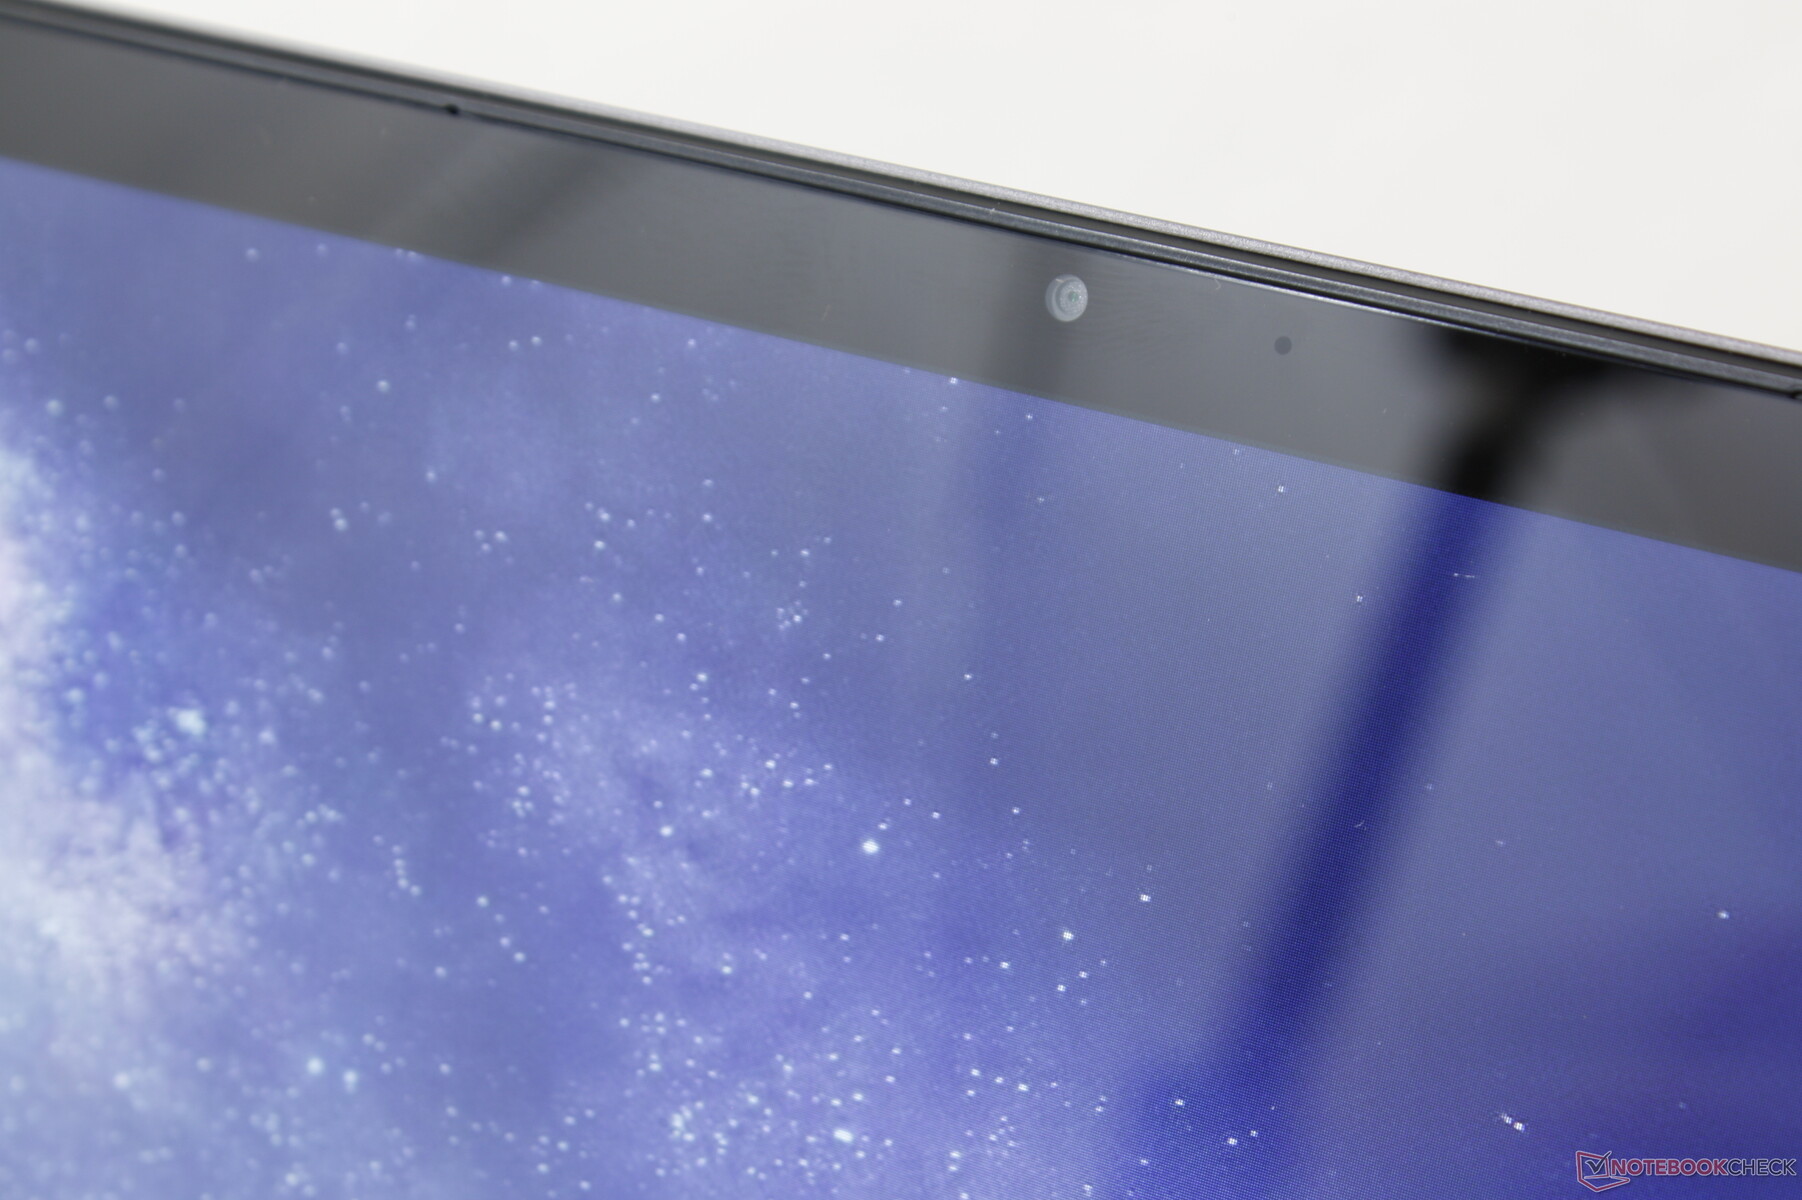
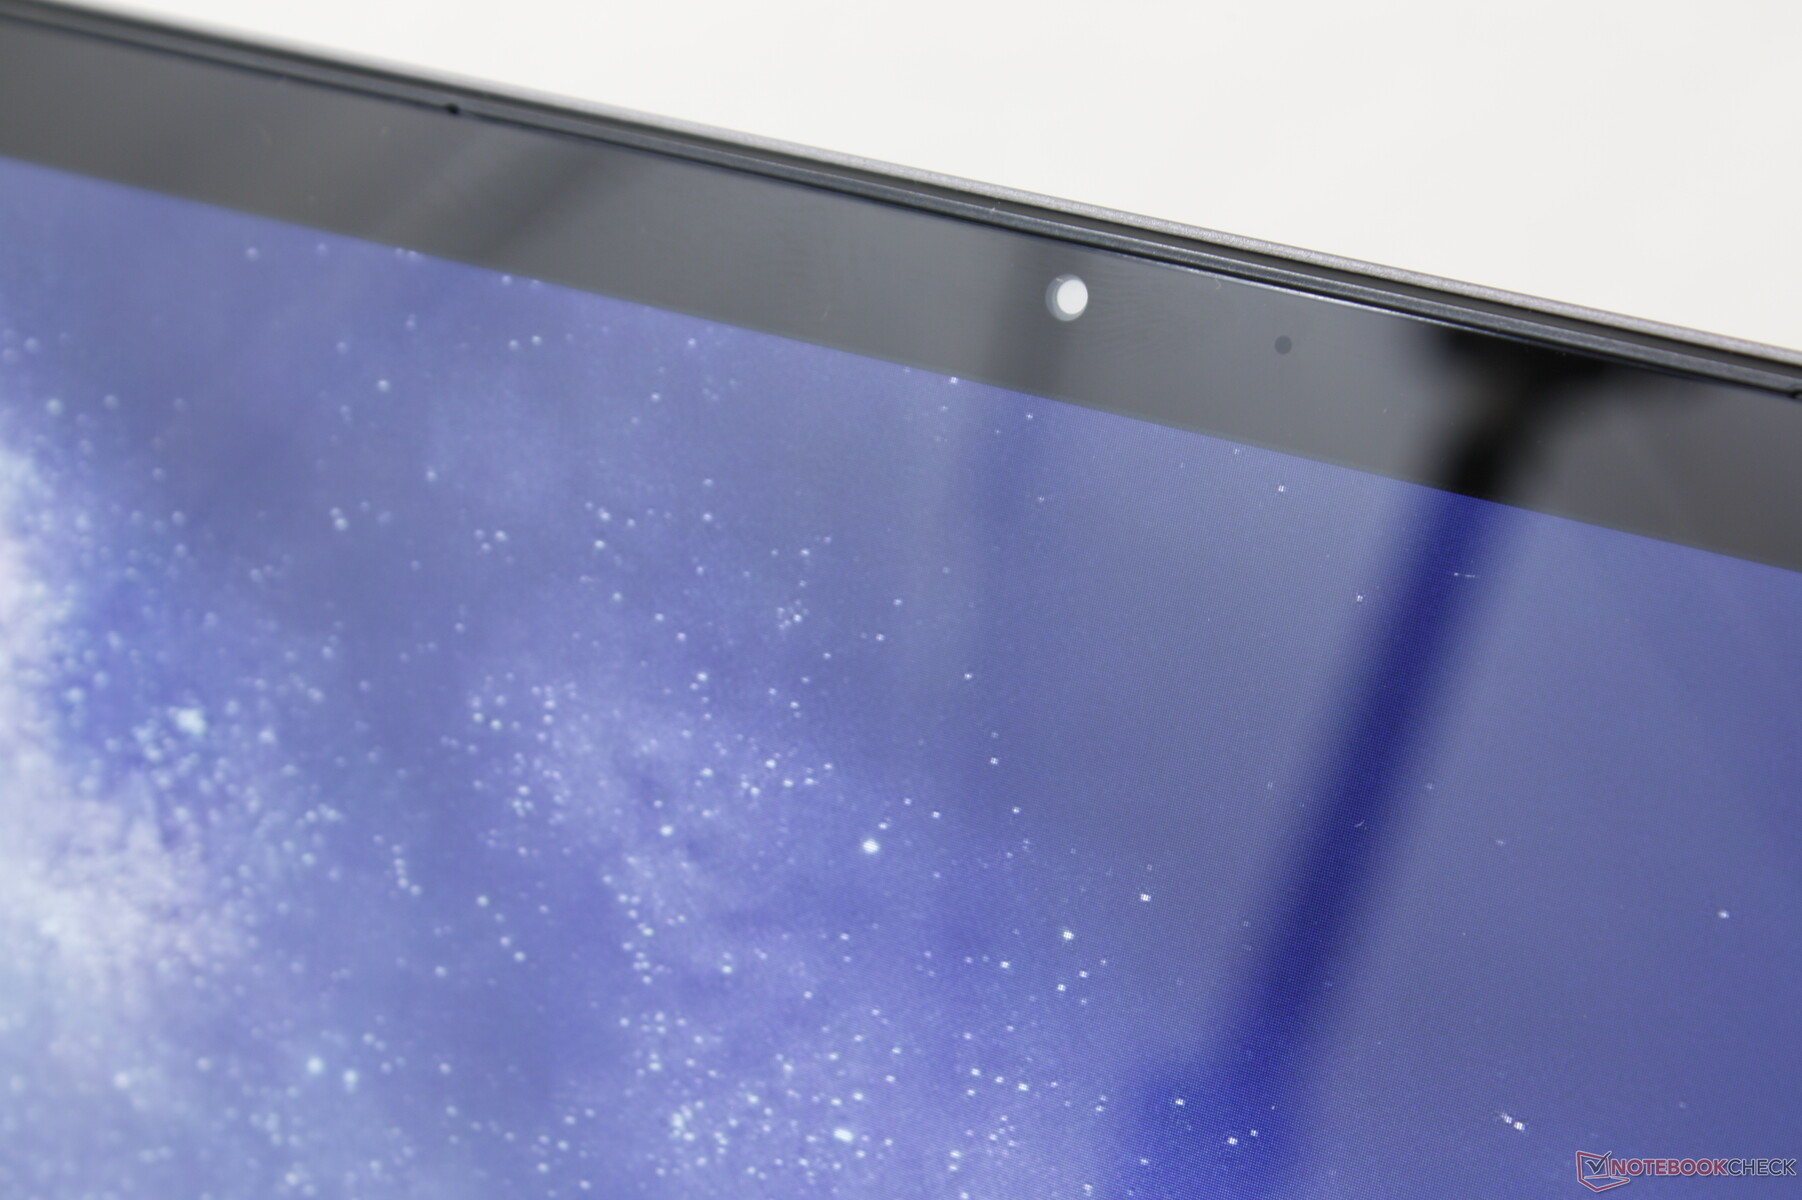
Webcam


Maintenance
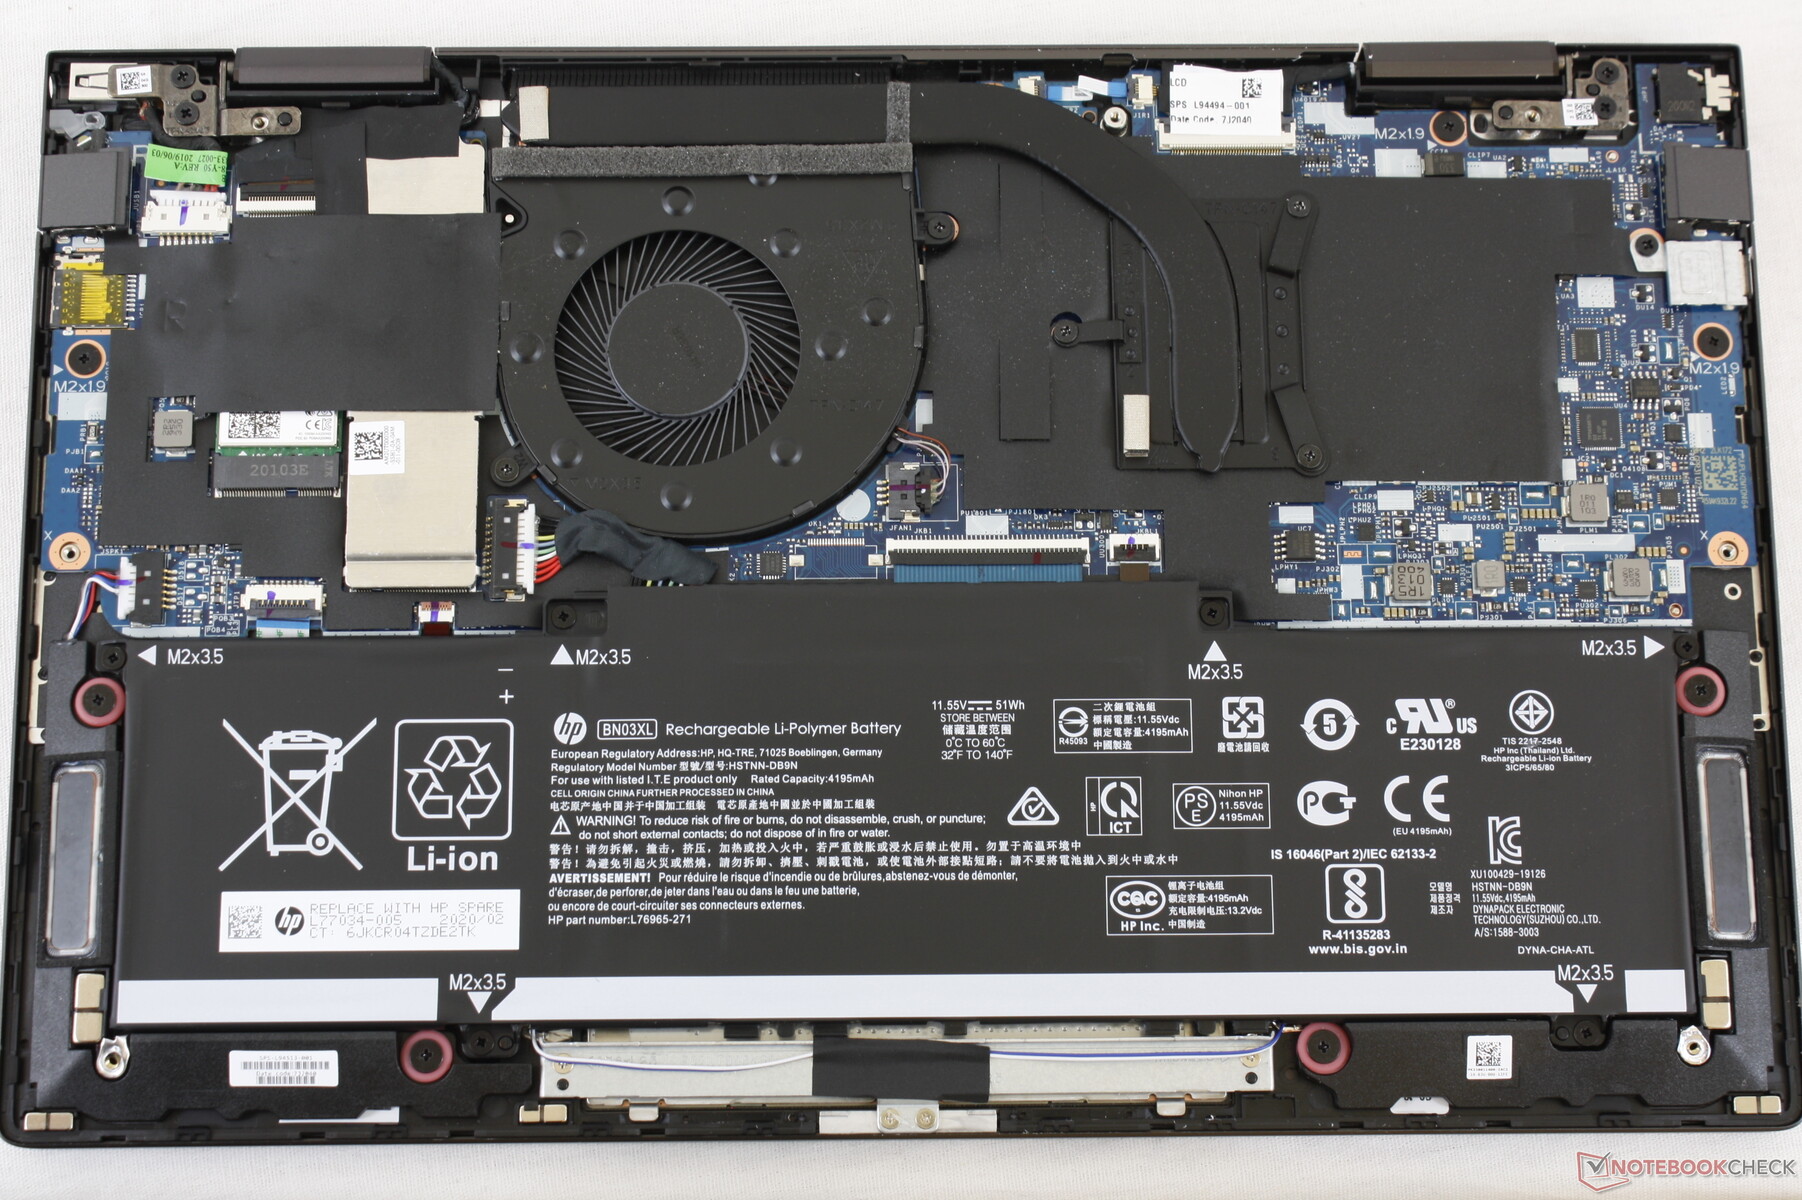
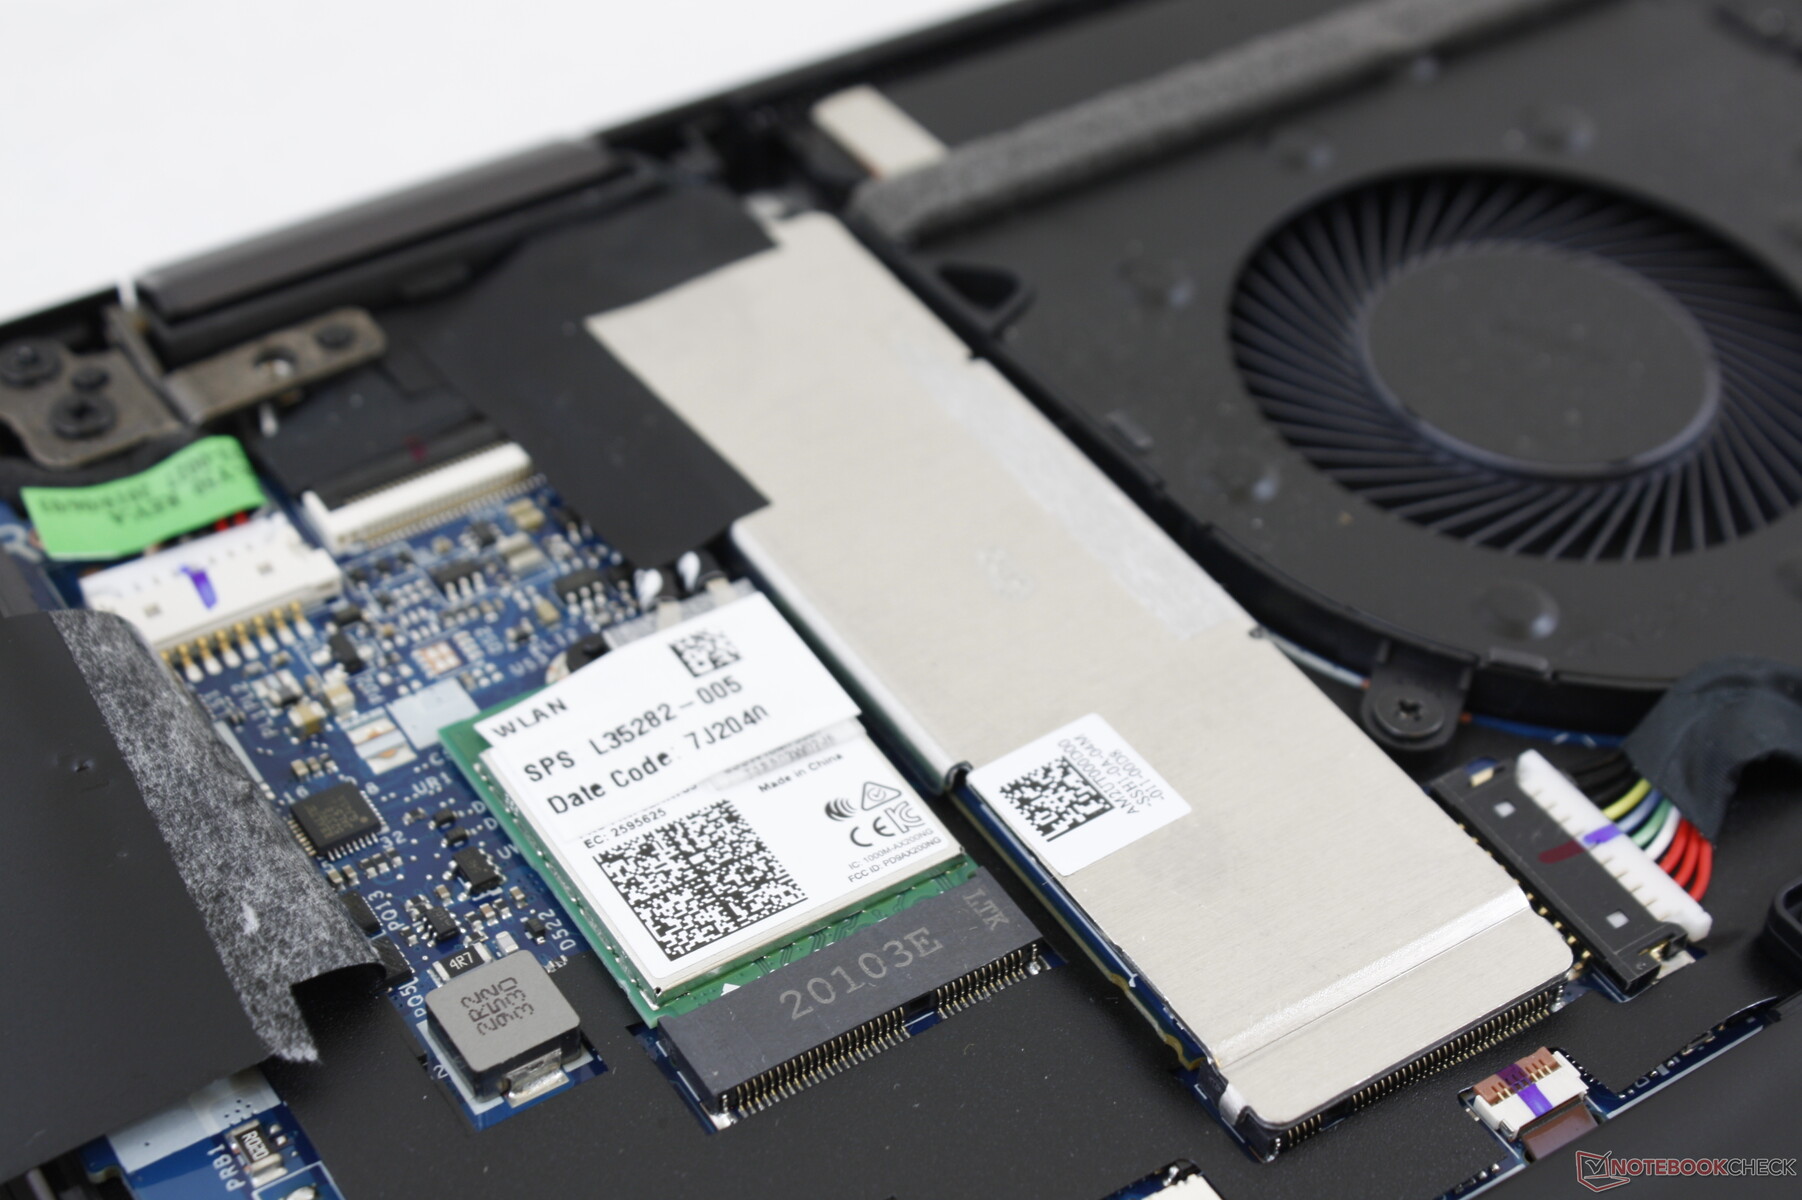
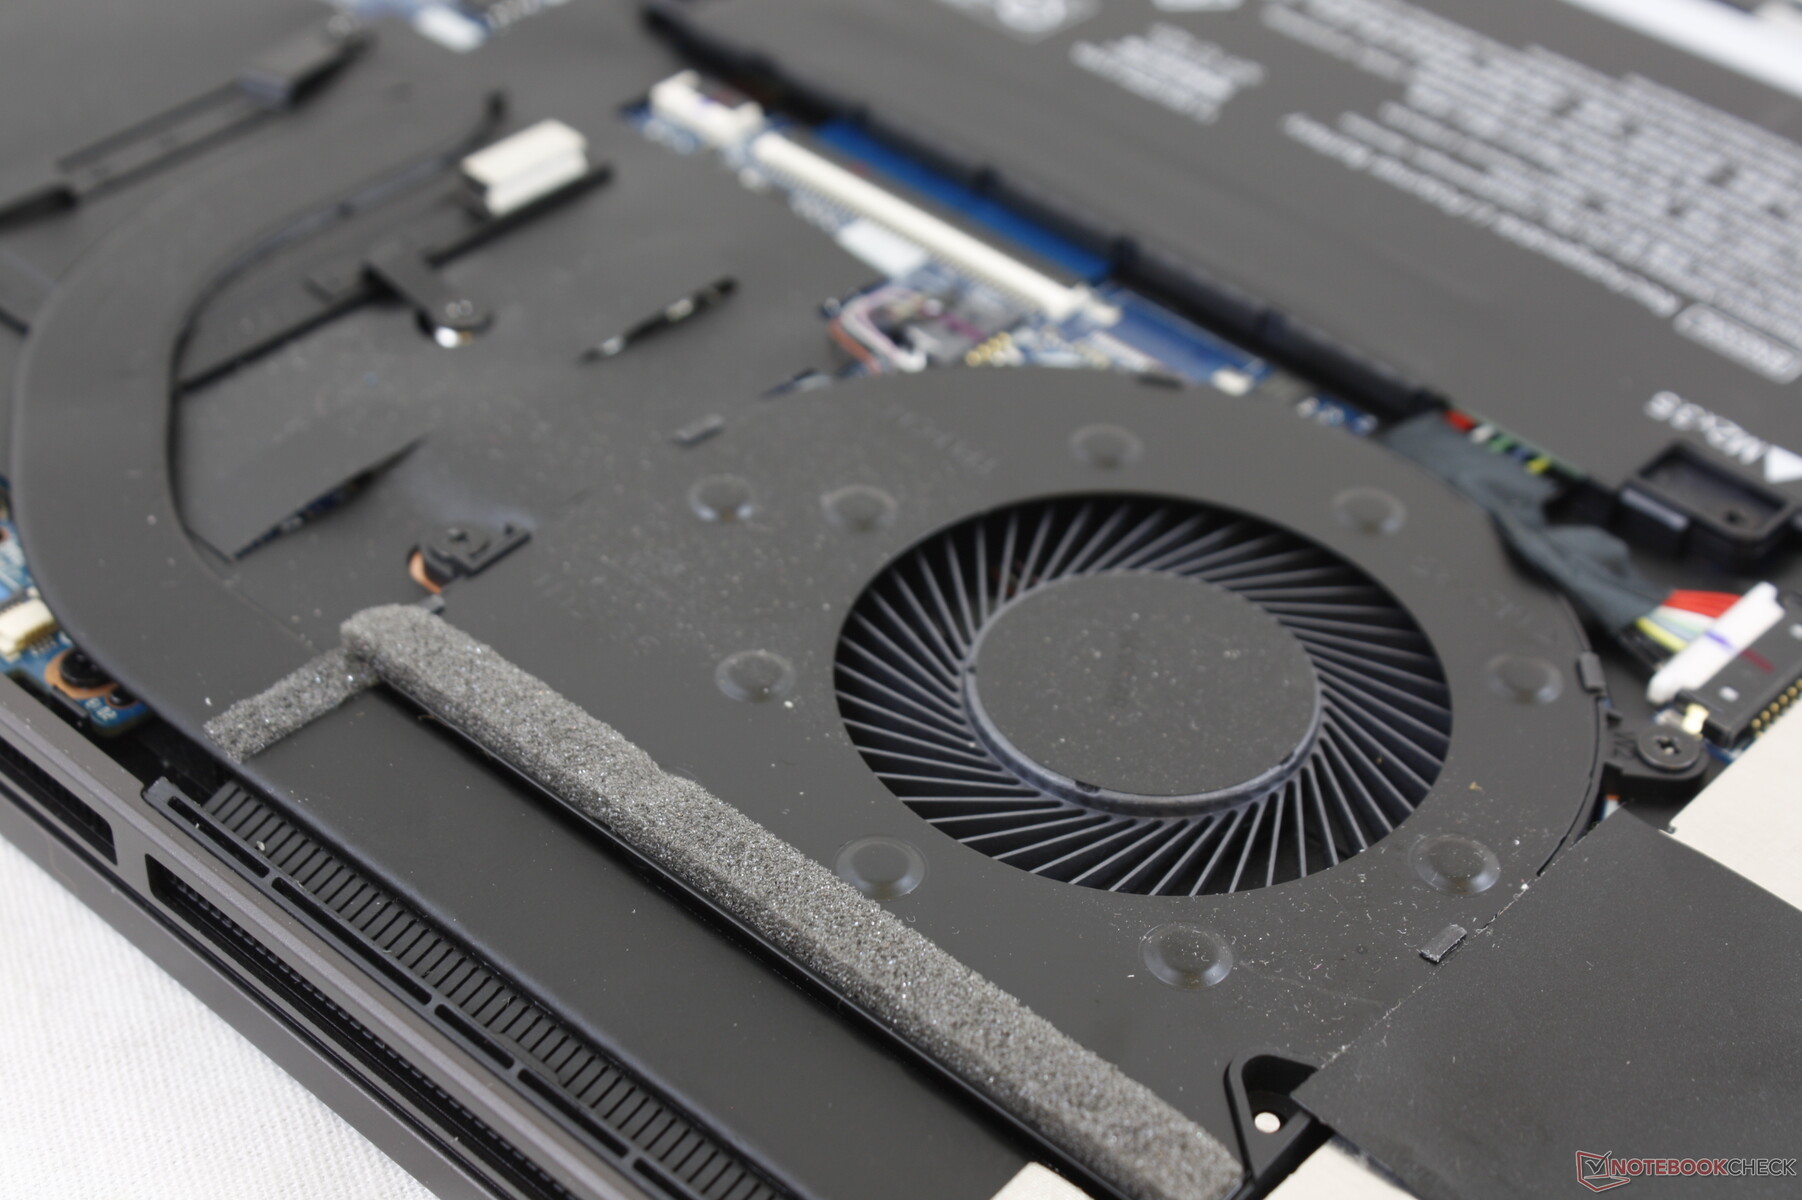
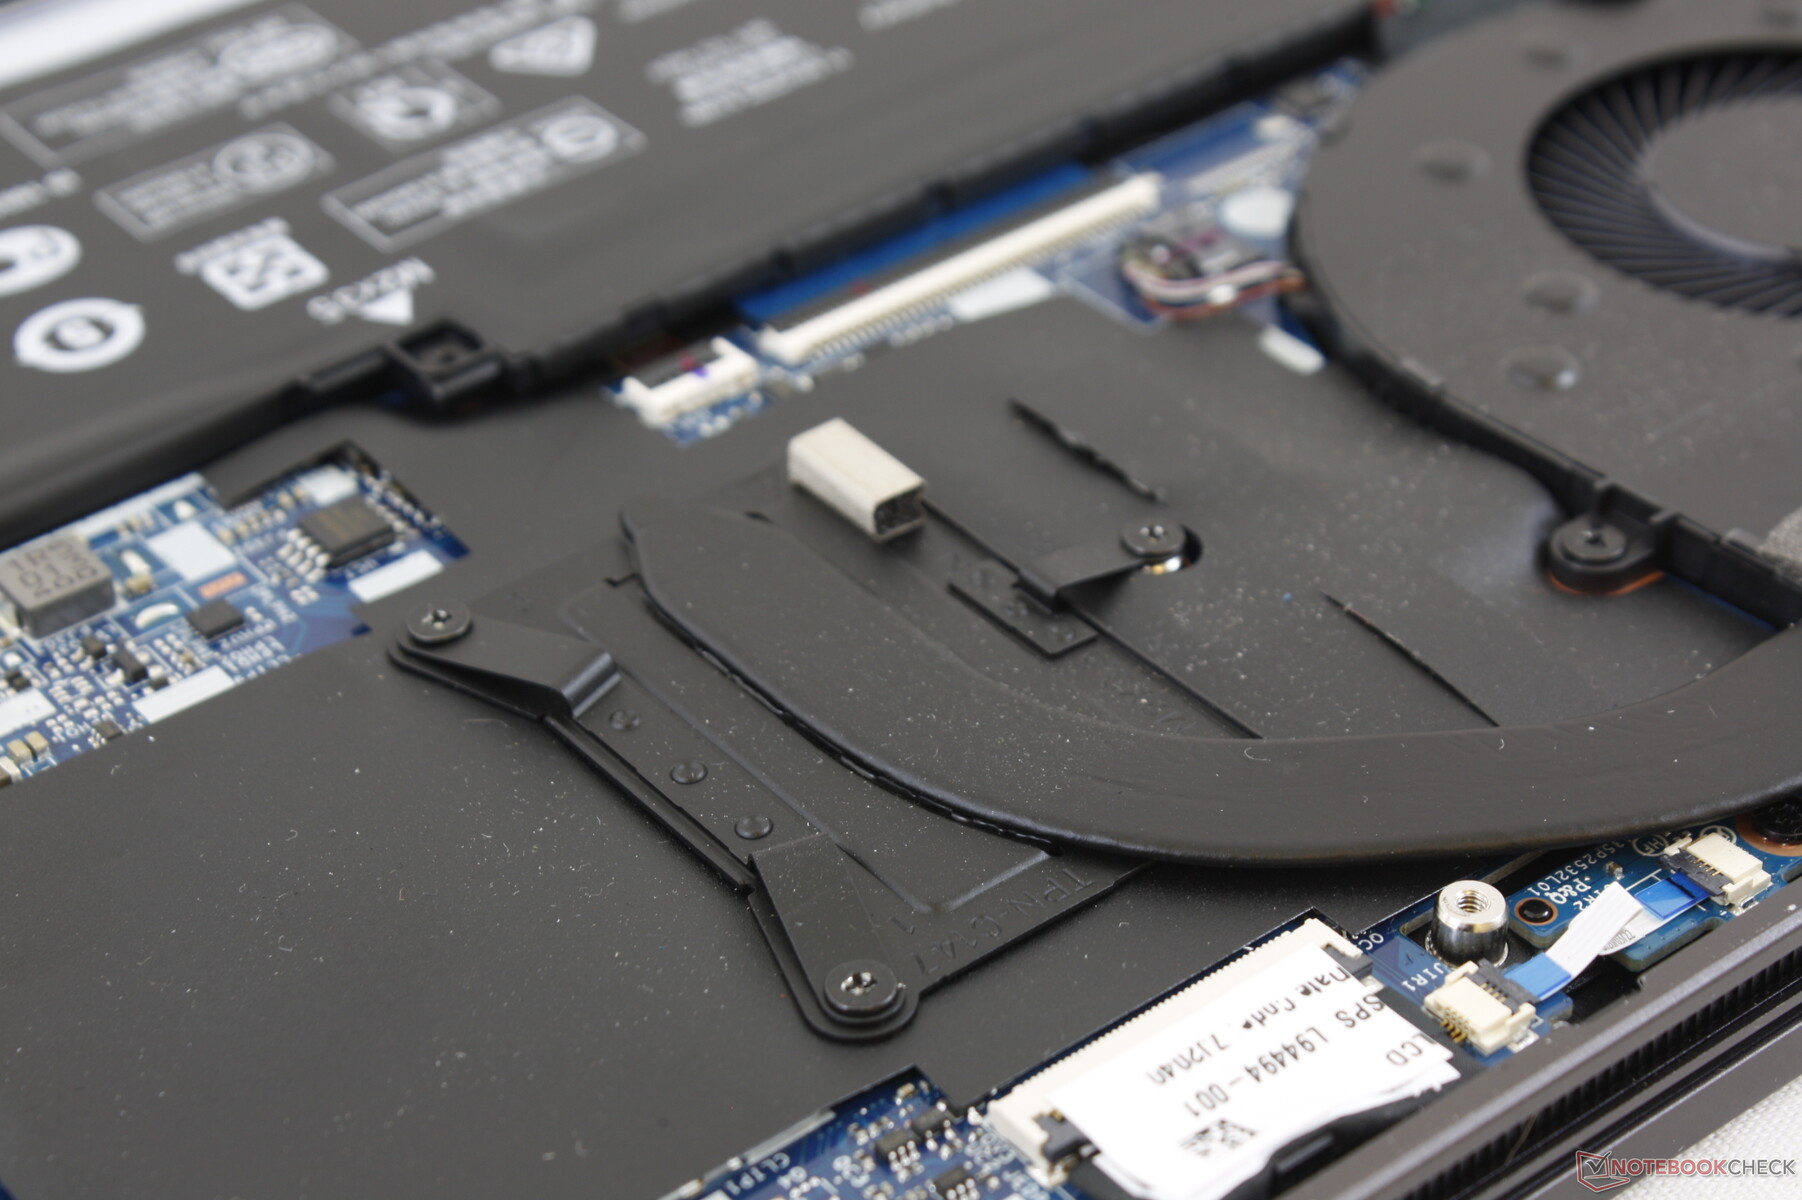
The bottom panel can be tricky to remove since there are three screws hidden underneath the rear rubber footing and two types of screwdrivers (Philips and Torx) are required. Users will not have much to upgrade beyond the WLAN and M.2 SSD modules as RAM is soldered.
Accessories and Warranty
There are no extras in the box outside of the AC adapter and usual paperwork. Active pens are supported and HP offers a wide variety of external mice, adapters, and bags.
The standard one-year limited warranty applies with extension options of up to three years if purchased directly from HP.com.
Input Devices
Keyboard
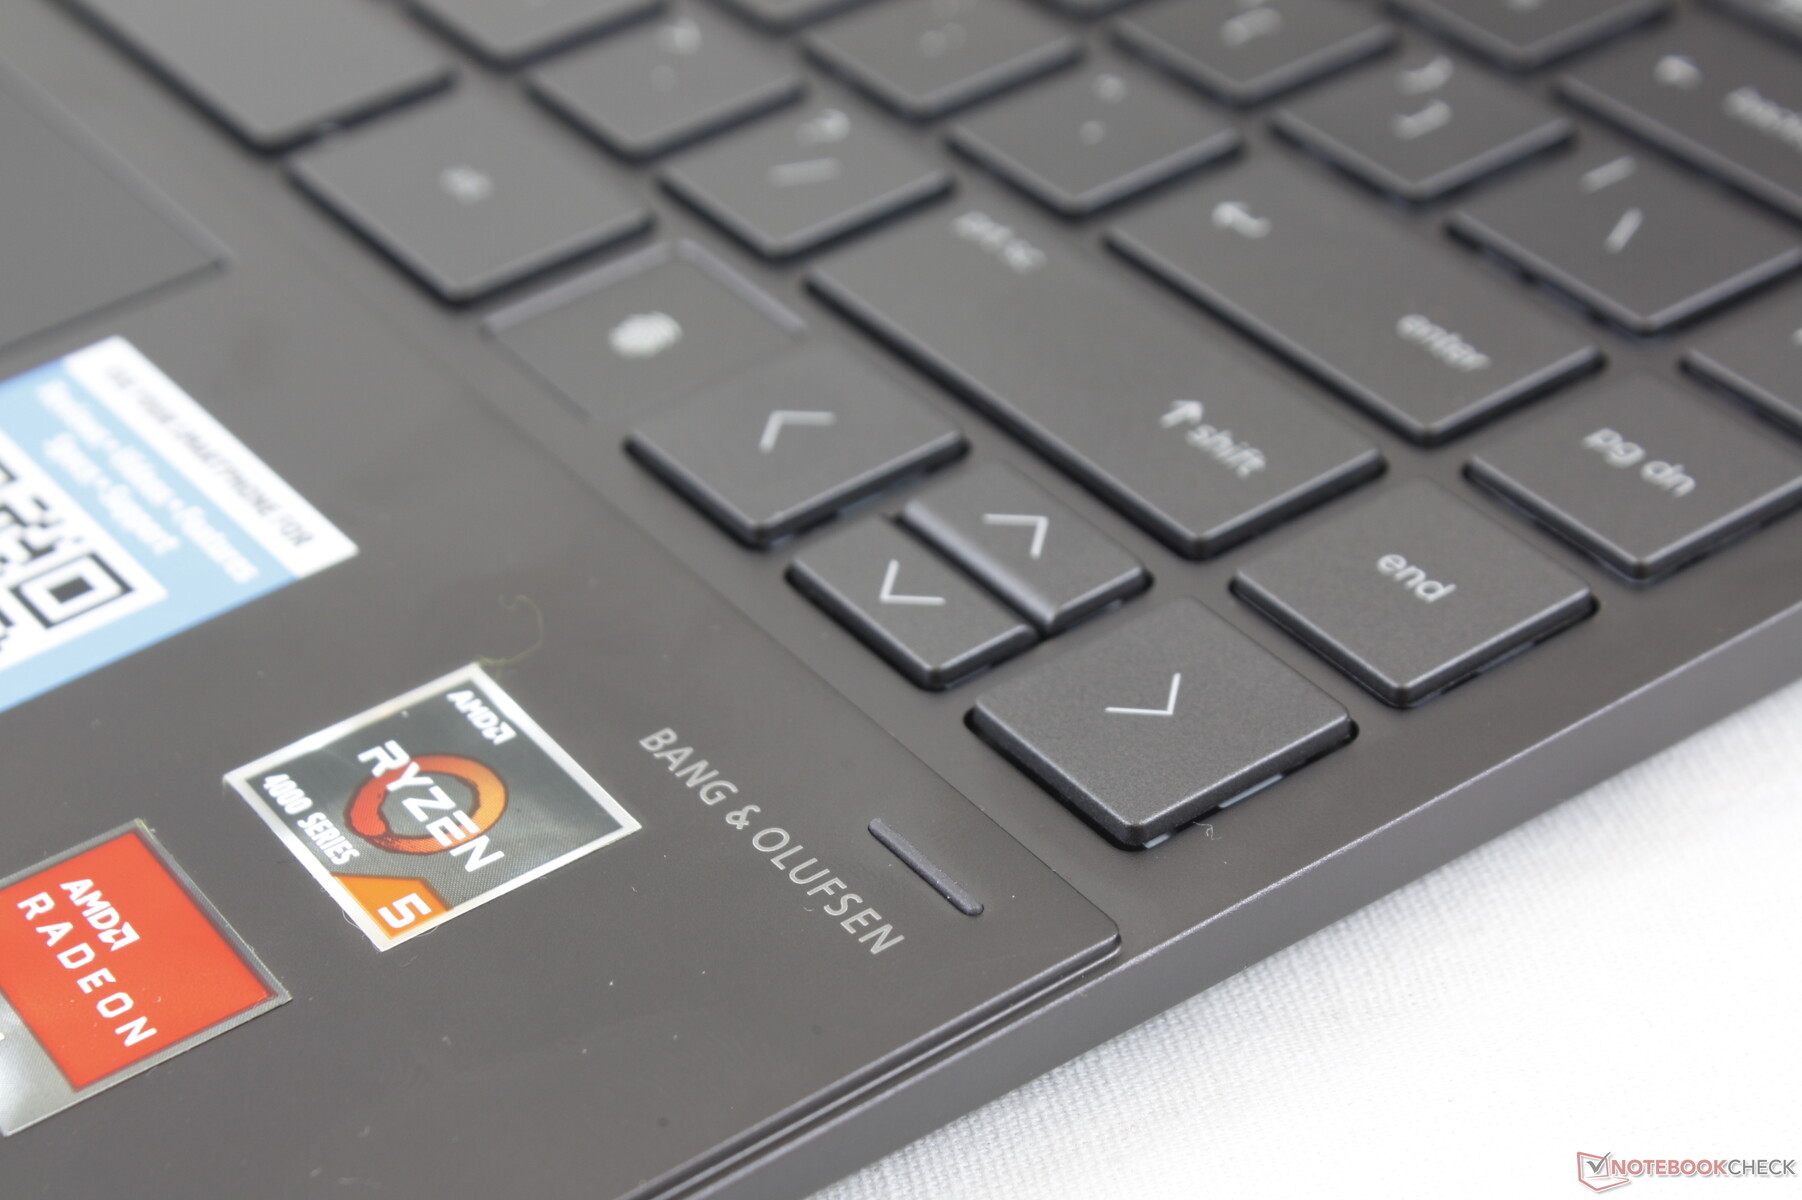
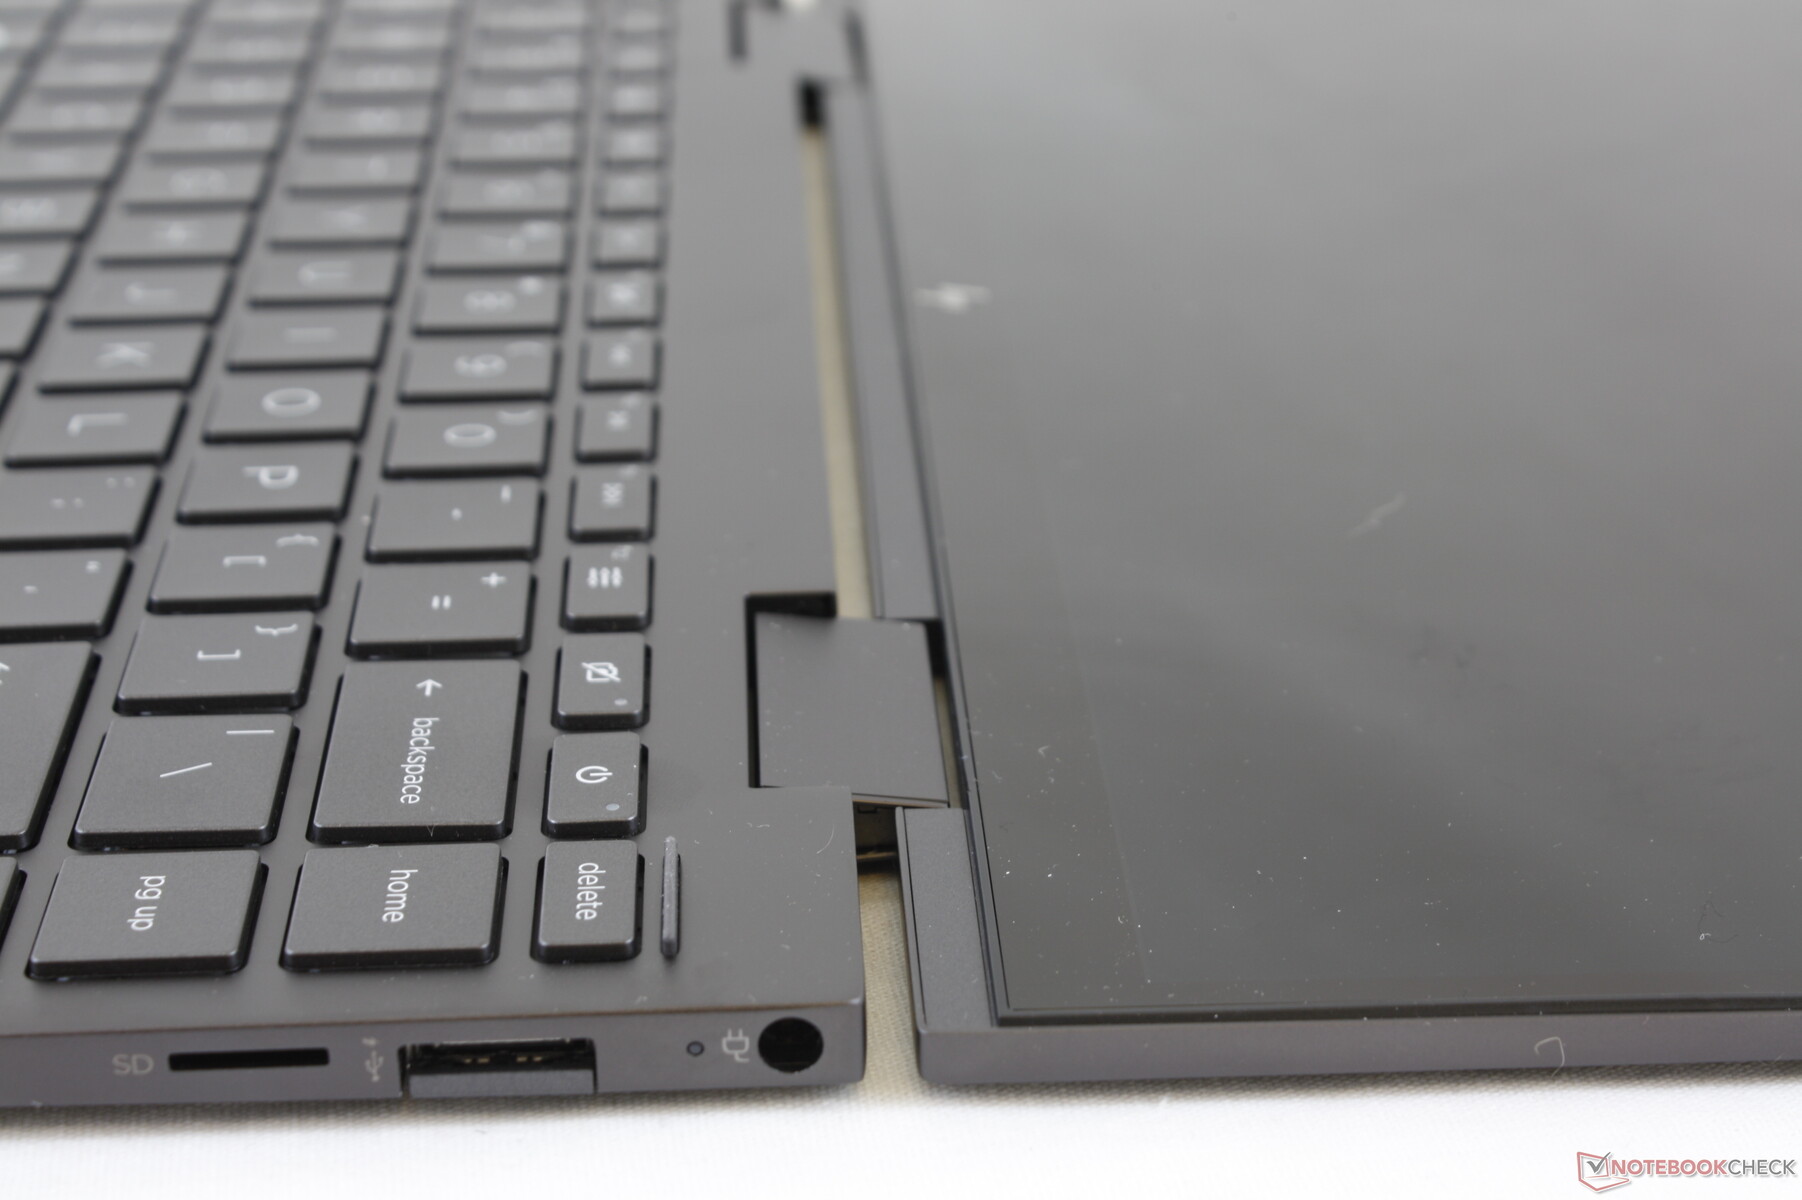
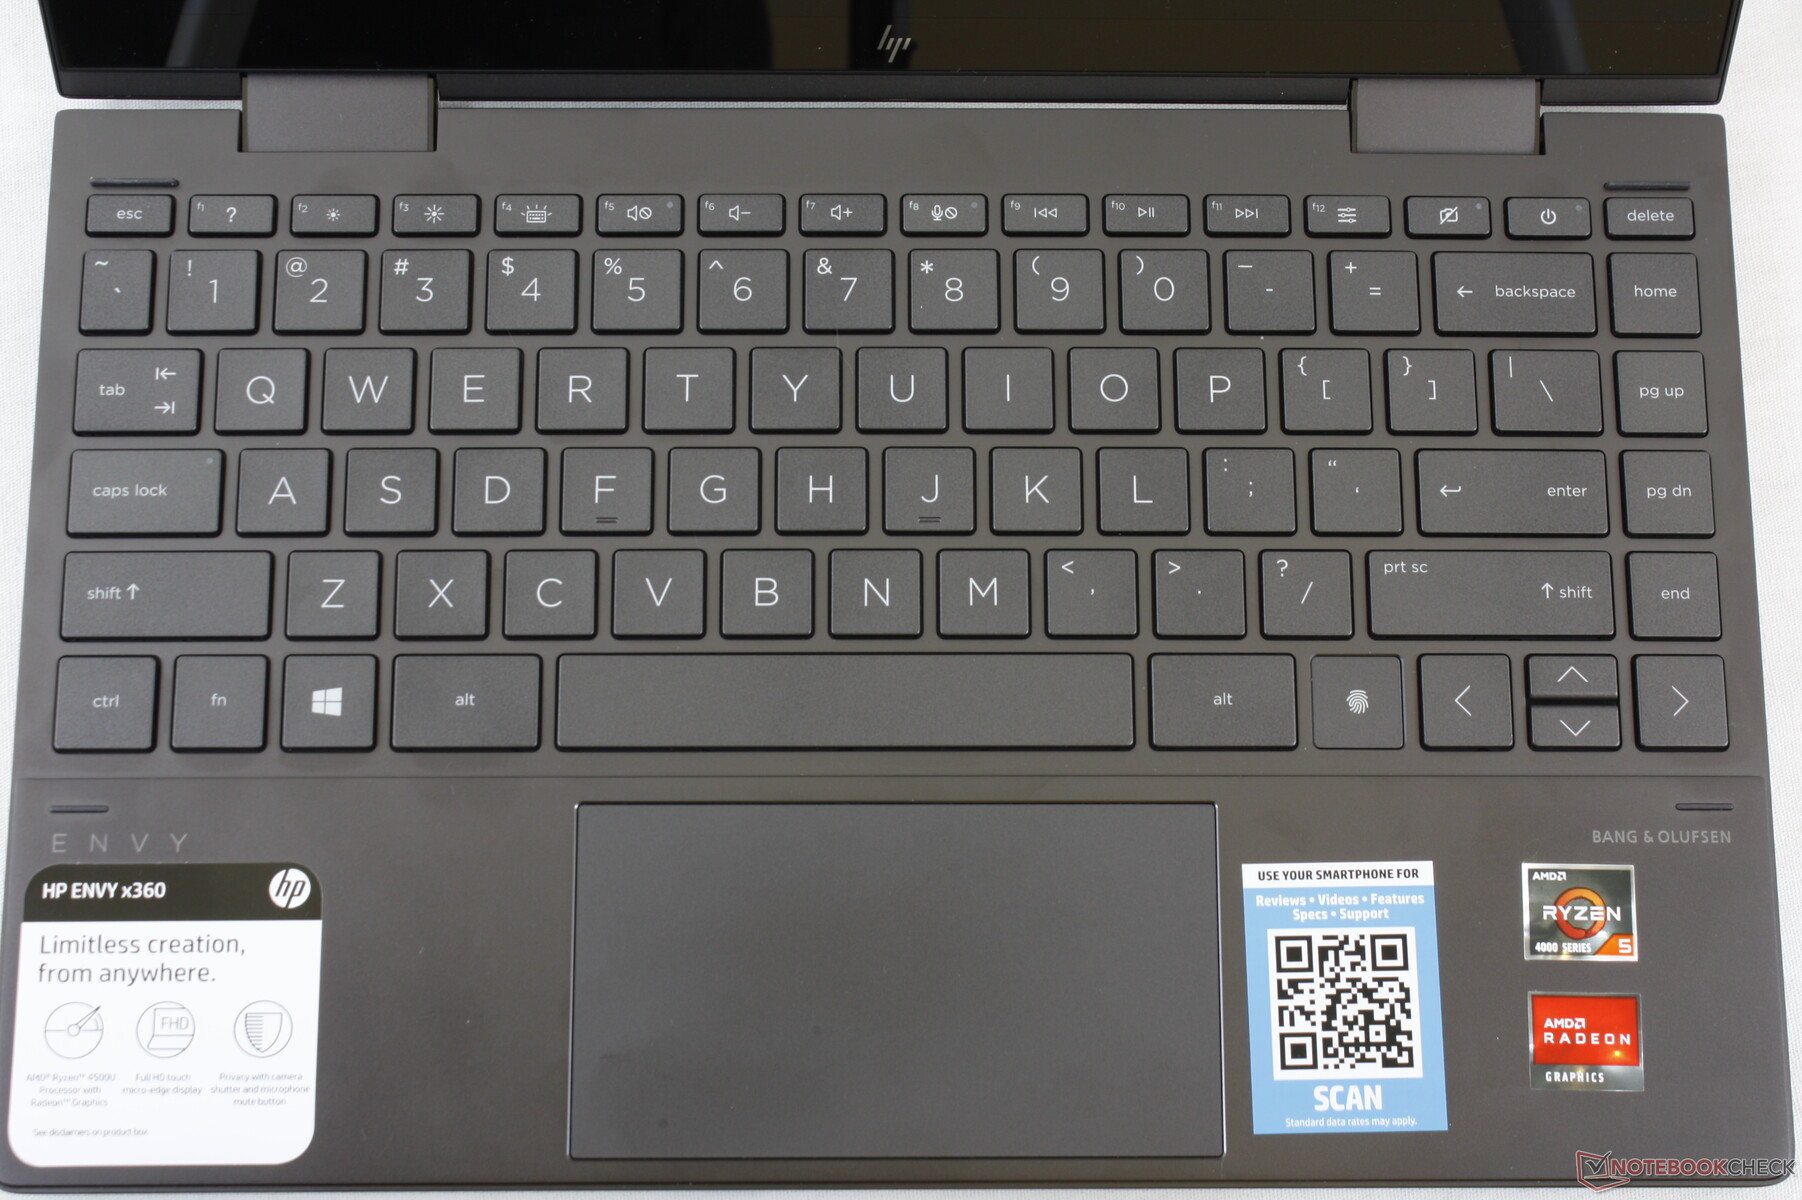
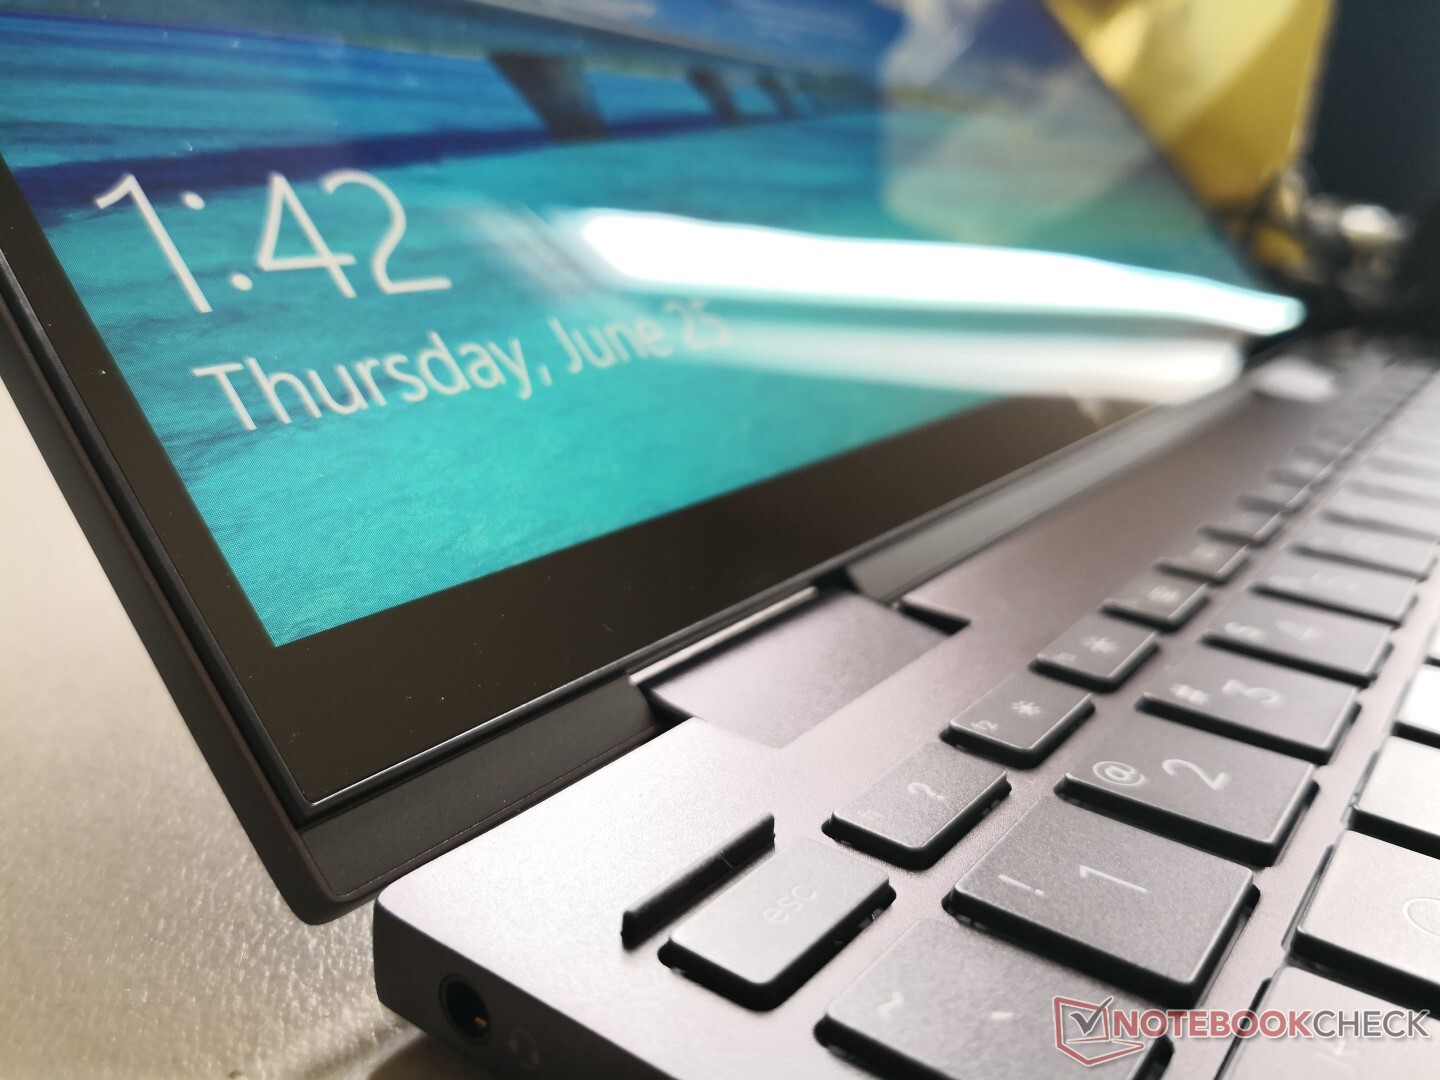
Typing on the Envy x360 feels closer to a Spectre x360 rather than the cheaper Pavilion x360. Key feedback is relatively firm with moderate clatter for a familiar Ultrabook typing experience as opposed to the special MagLev keys of the XPS 13 7390 2-in-1. We especially like that the Caps Lock, Mute, Microphone, Camera, and Power keys each have their own individual LED indicators so you will always know when they are toggled on or off.
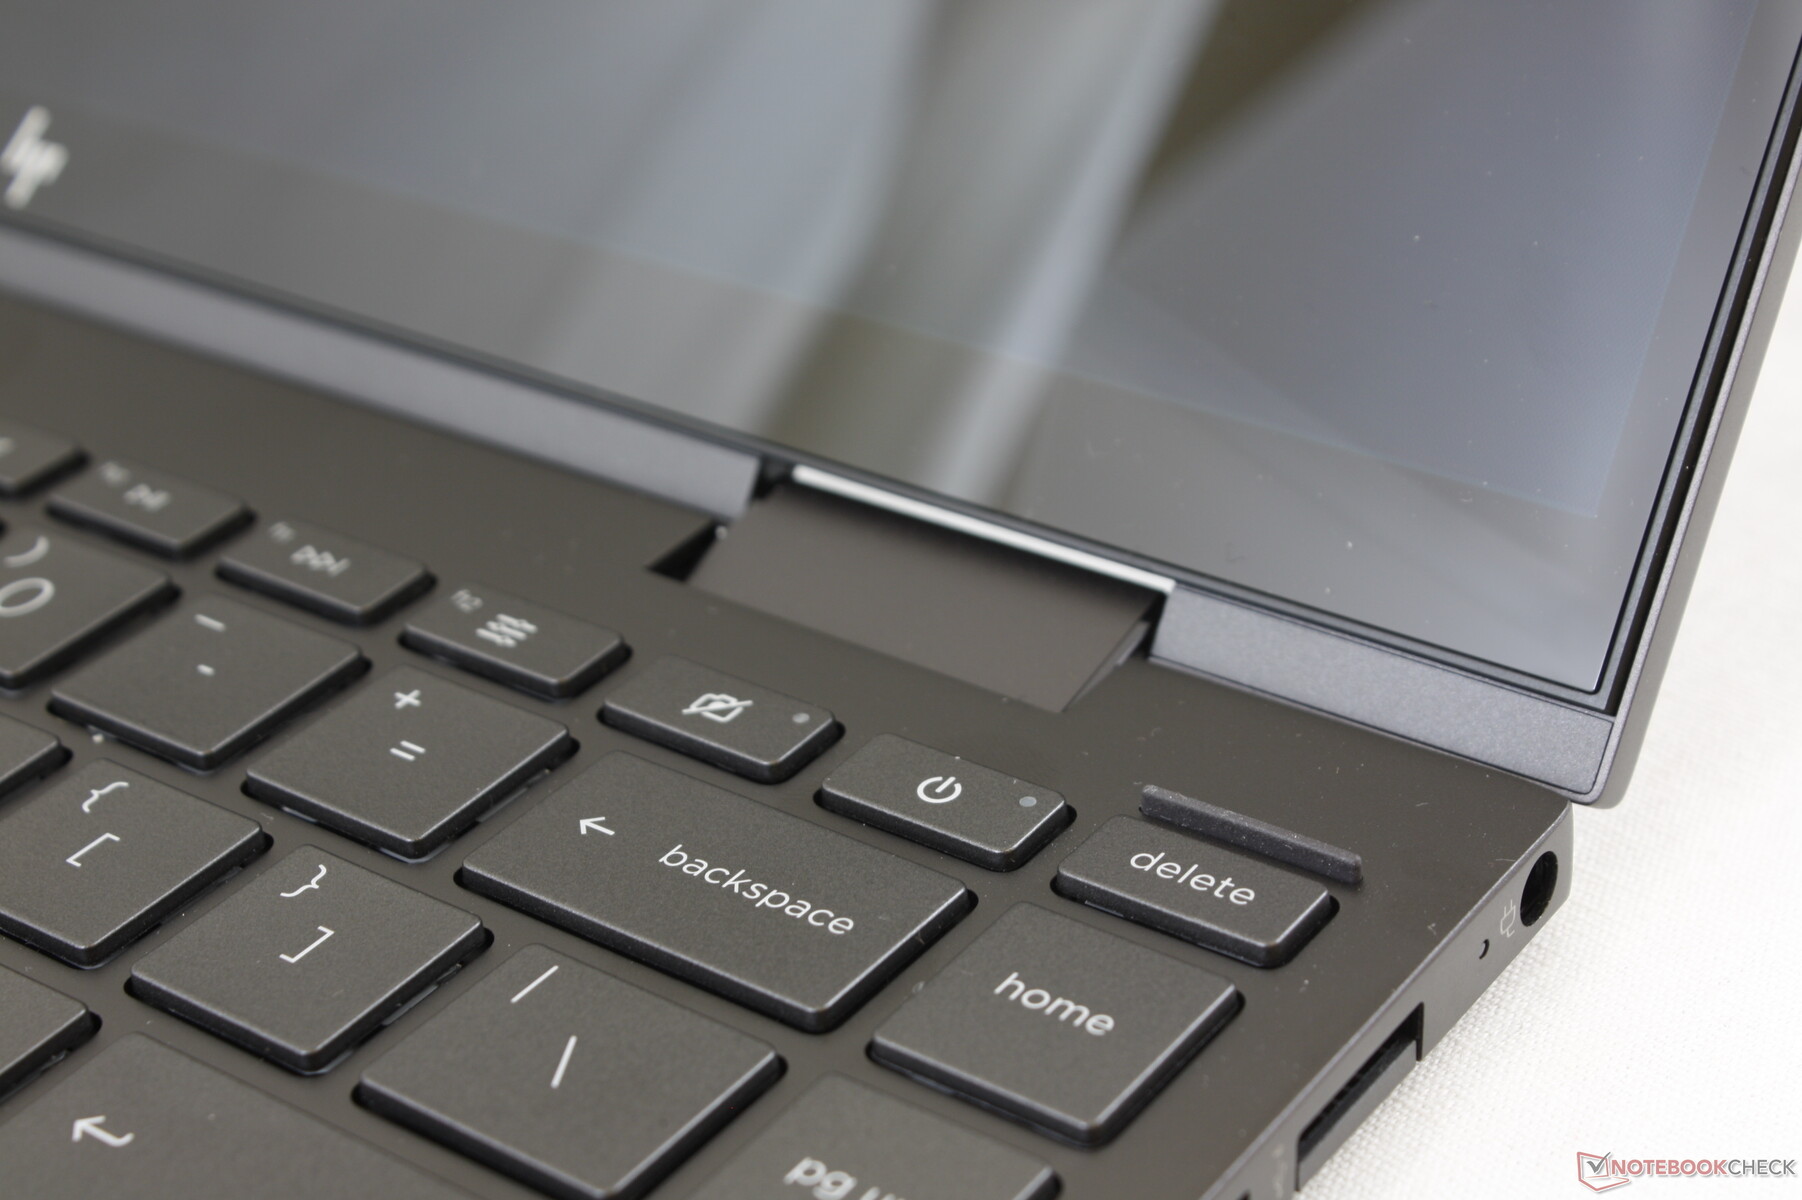
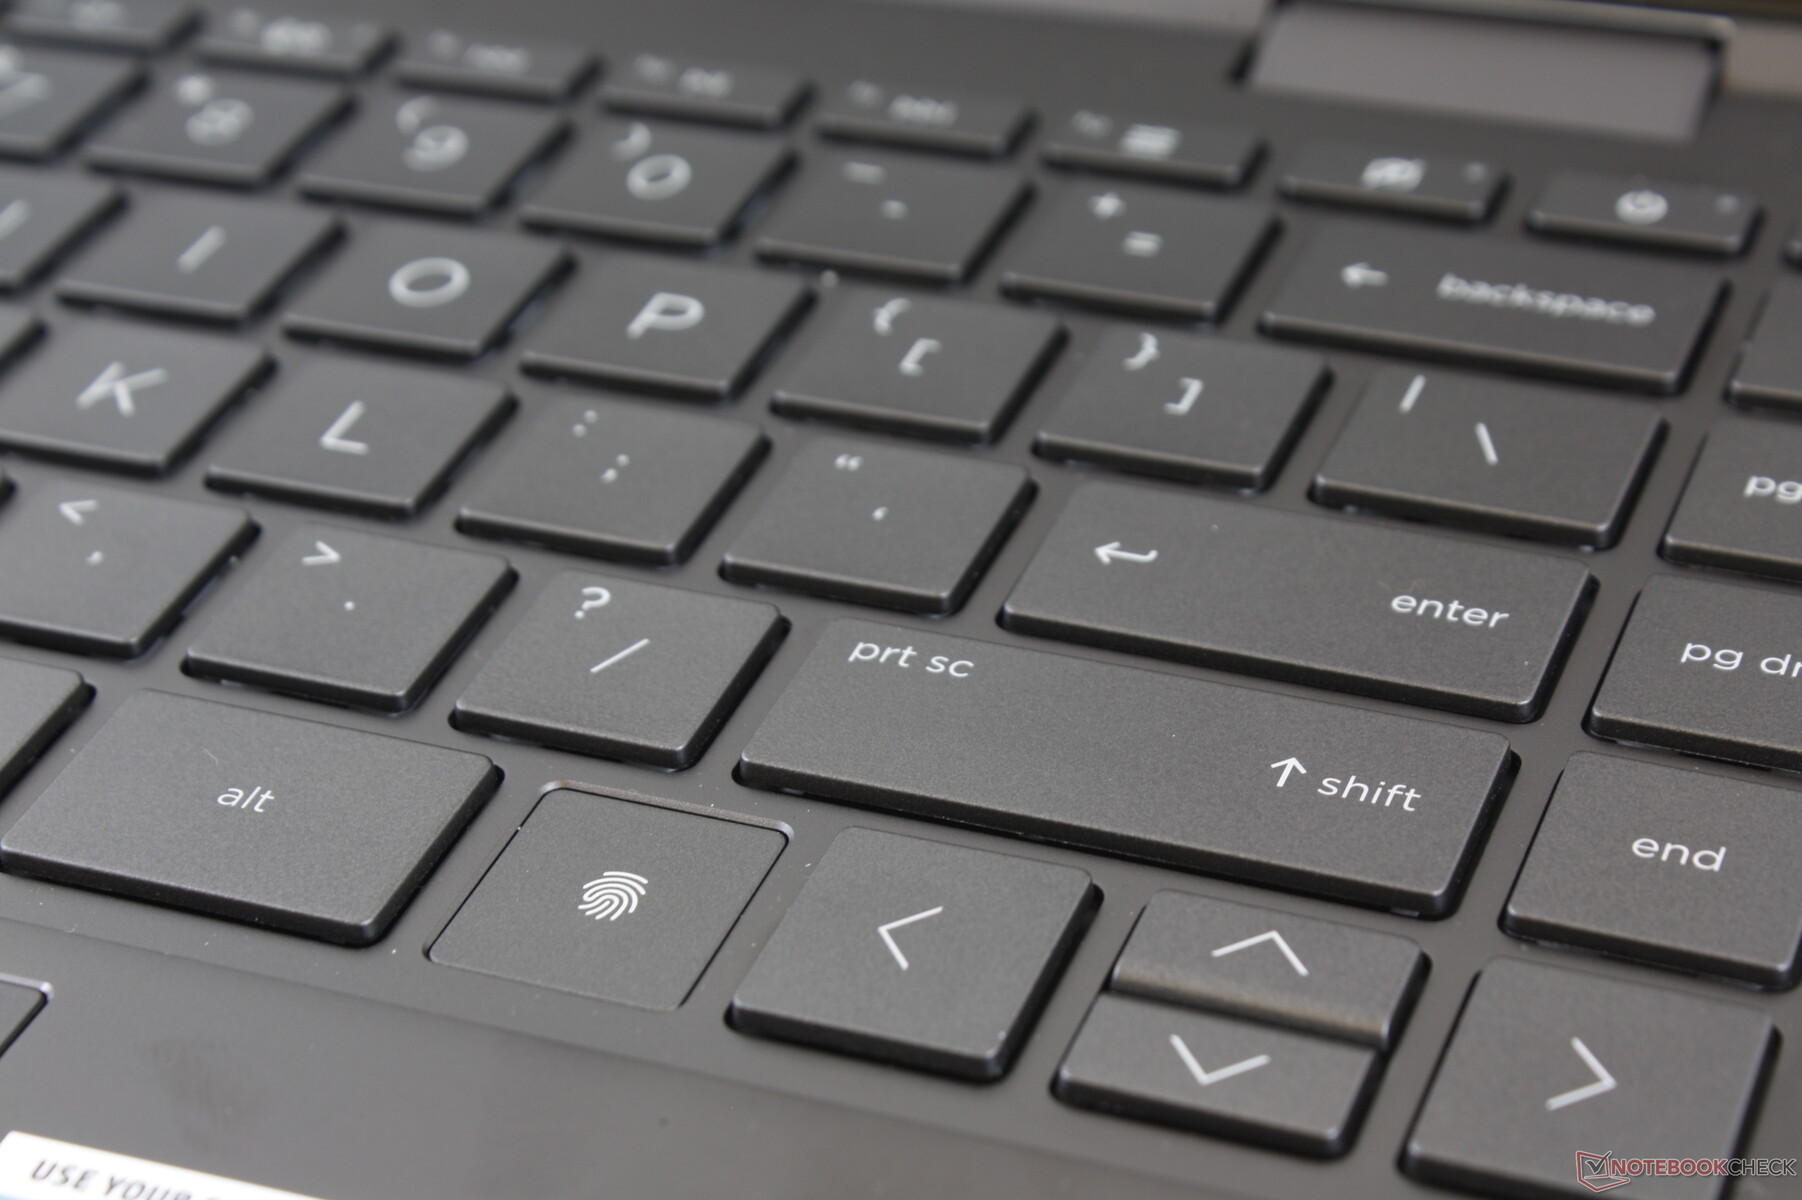
Our least favorite characteristic of the keyboard is the positioning of some of the keys. The Power button, for example, is at an uncommon spot making it easy to accidentally hit instead of the adjacent Delete or Camera keys. Furthermore, the fingerprint reader completely replaces the Ctrl key much like on the latest 17.3-inch Envy 17t which will inevitably annoy typists who rely on this key. A combo power-fingerprint button approach like on the XPS 13 series would have solved this issue.
Touchpad
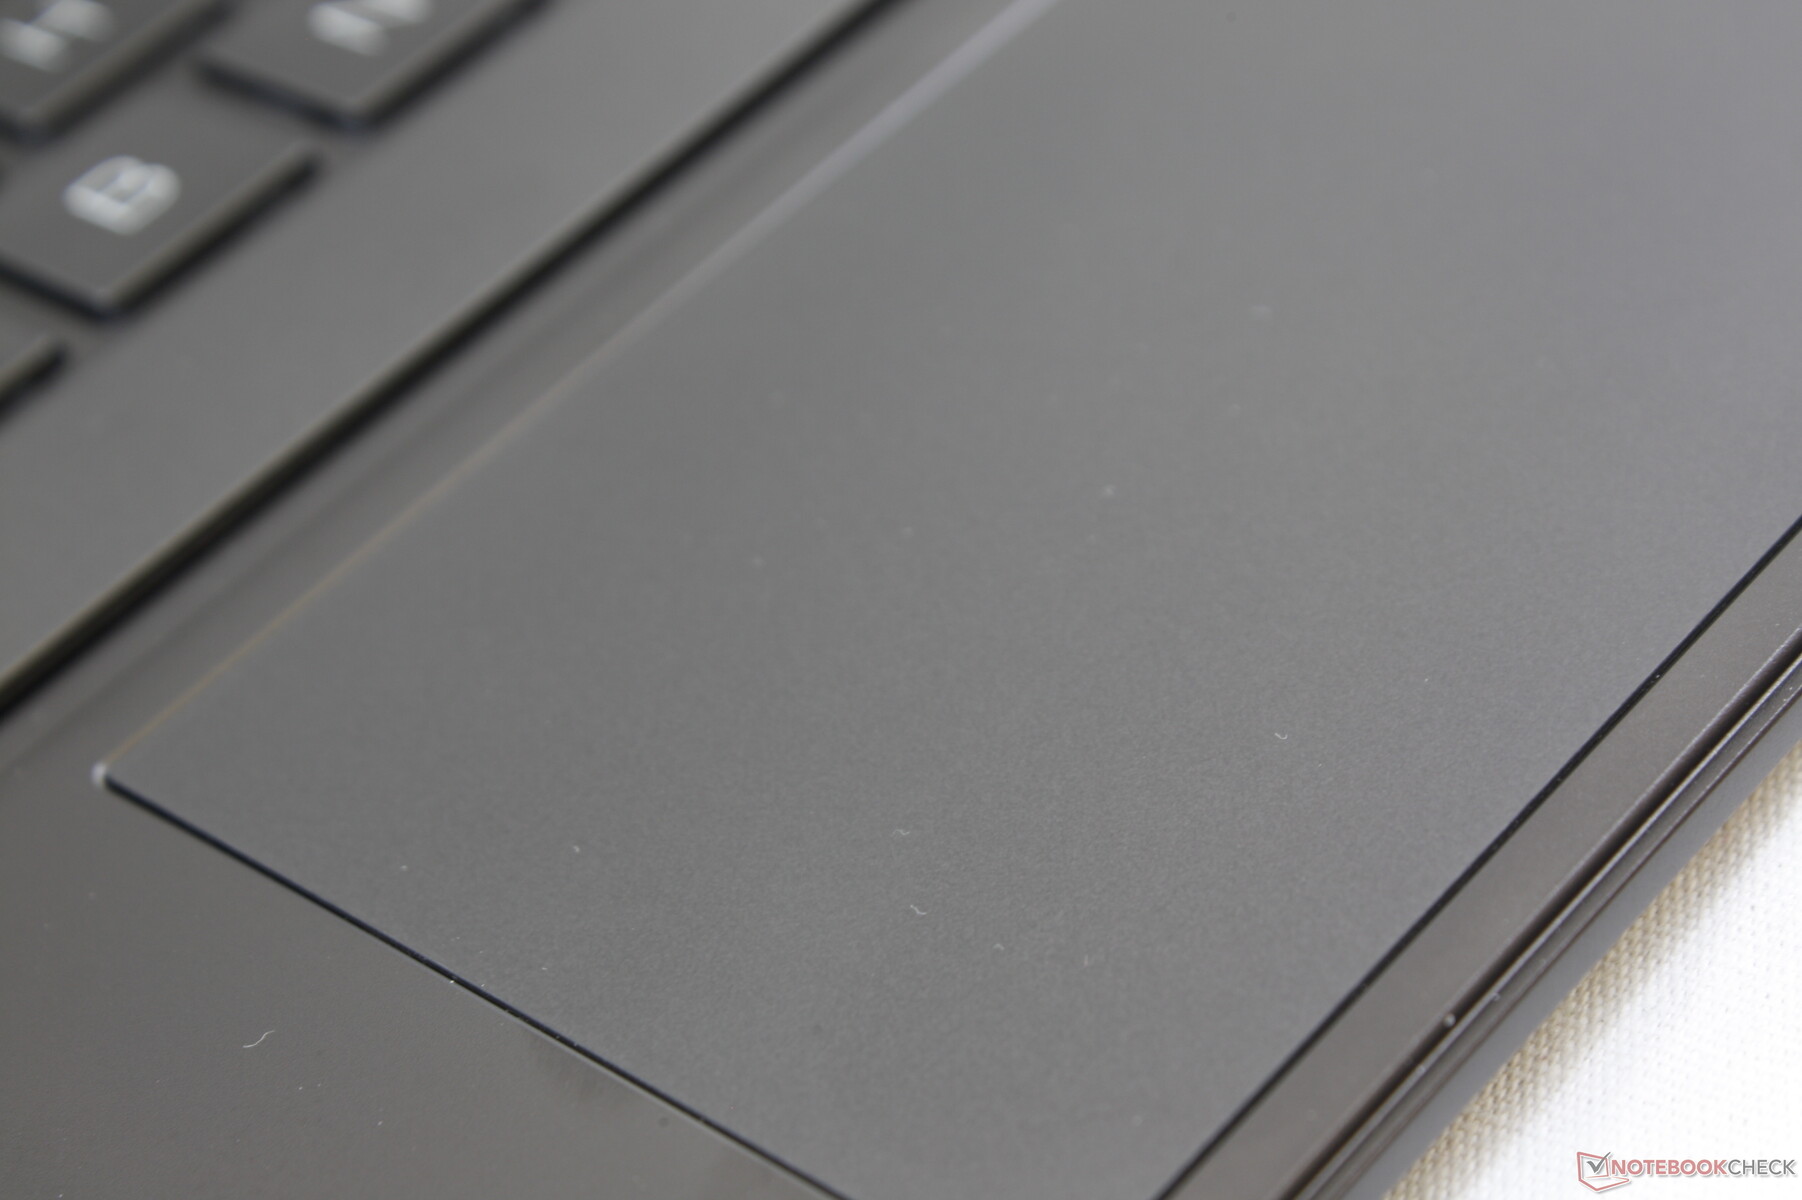
The clickpad here is slightly larger than the clickpad on the 2019 Spectre x360 13 (11 x 6 cm vs. 11.1 x 5.6 cm). Cursor movements are reliable and somewhat sticky when gliding at slower speeds, but this allows for more precise control. Moving vertically still feels cramped since the clickpad is so short.
The integrated click keys are shallow in travel with a soft auditory click when pressed. Feedback could have been firmer for a more satisfying click.

Display
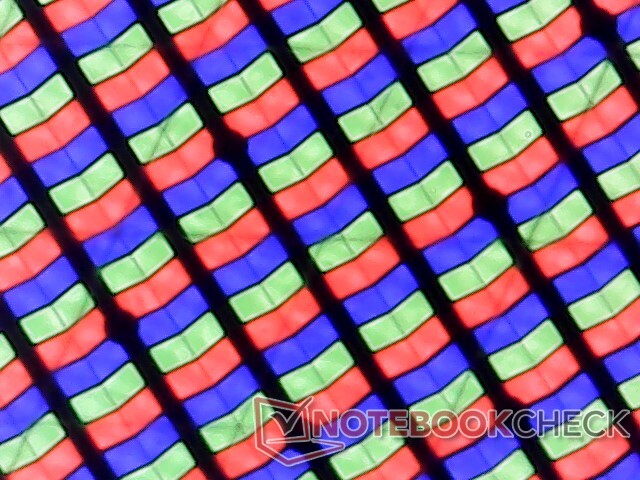
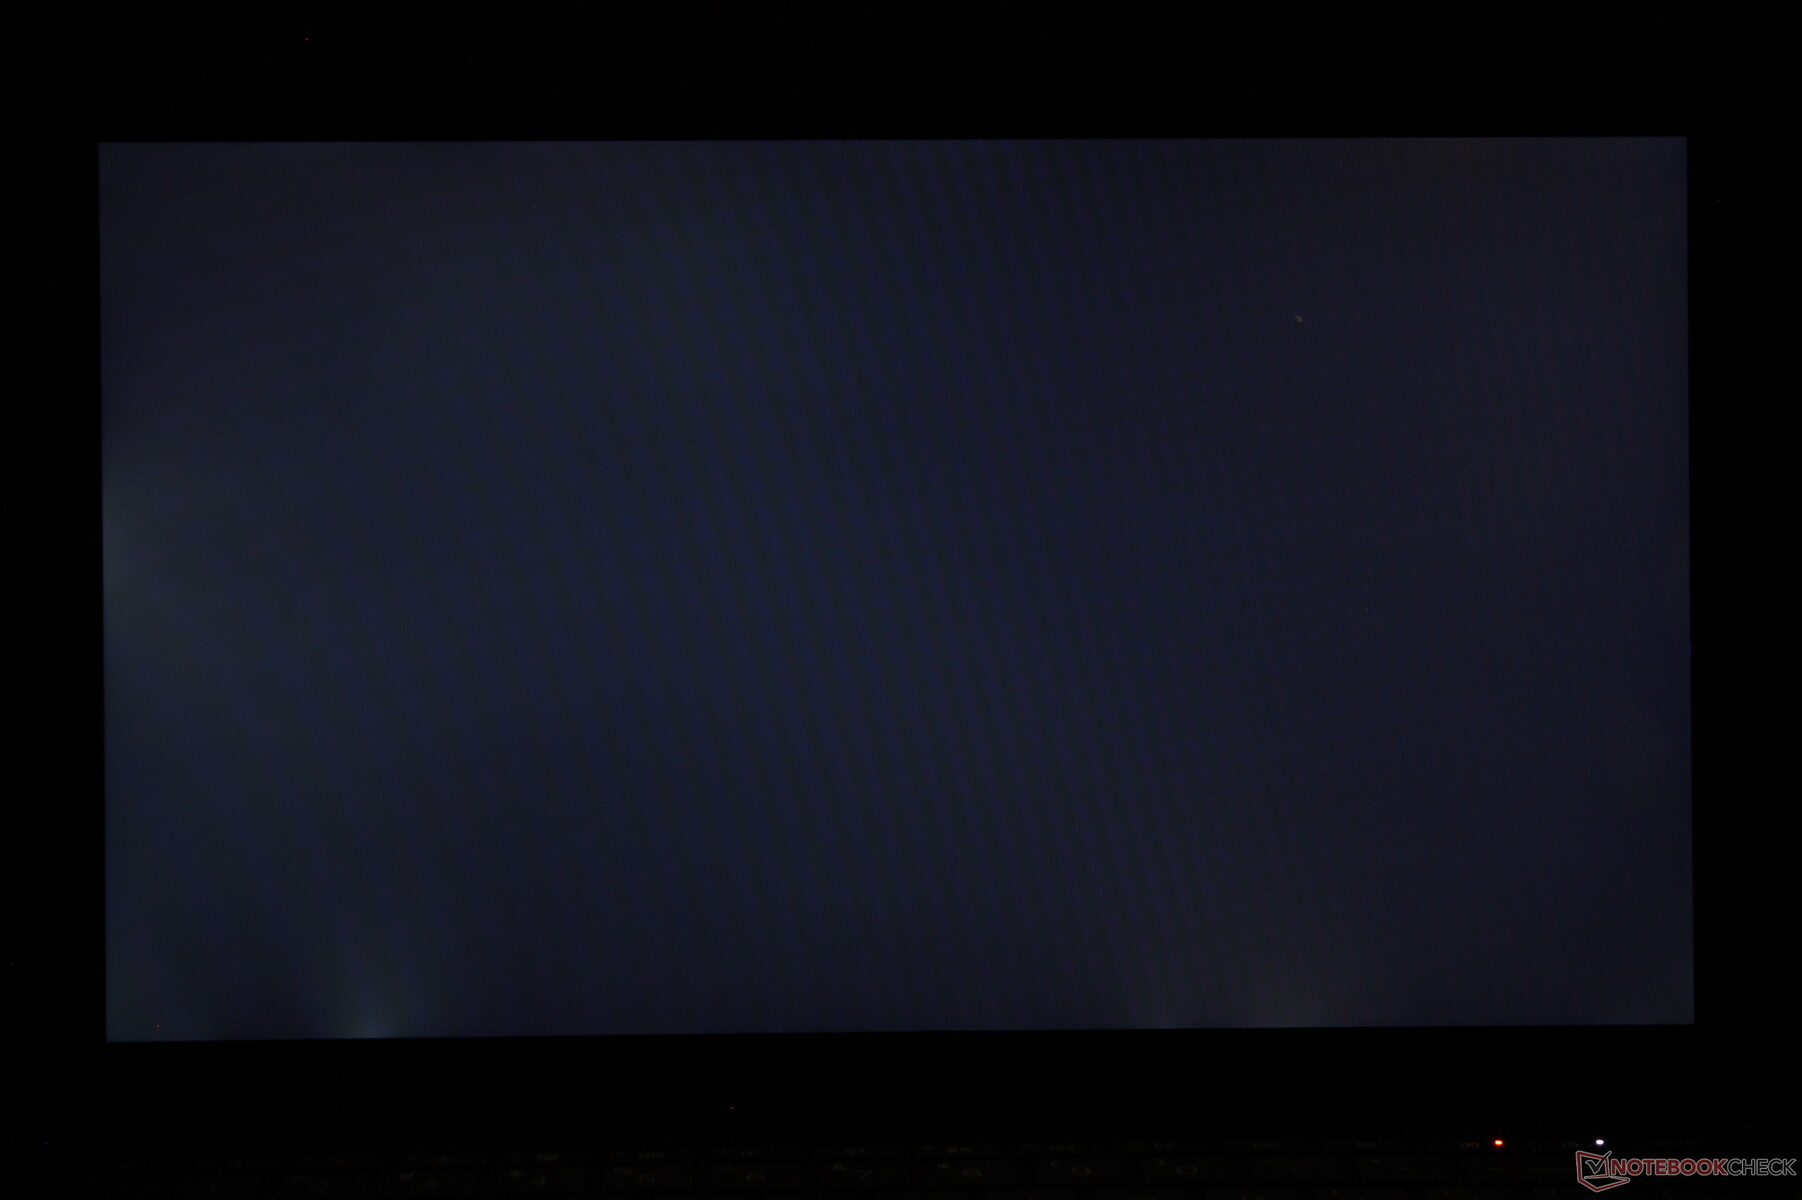
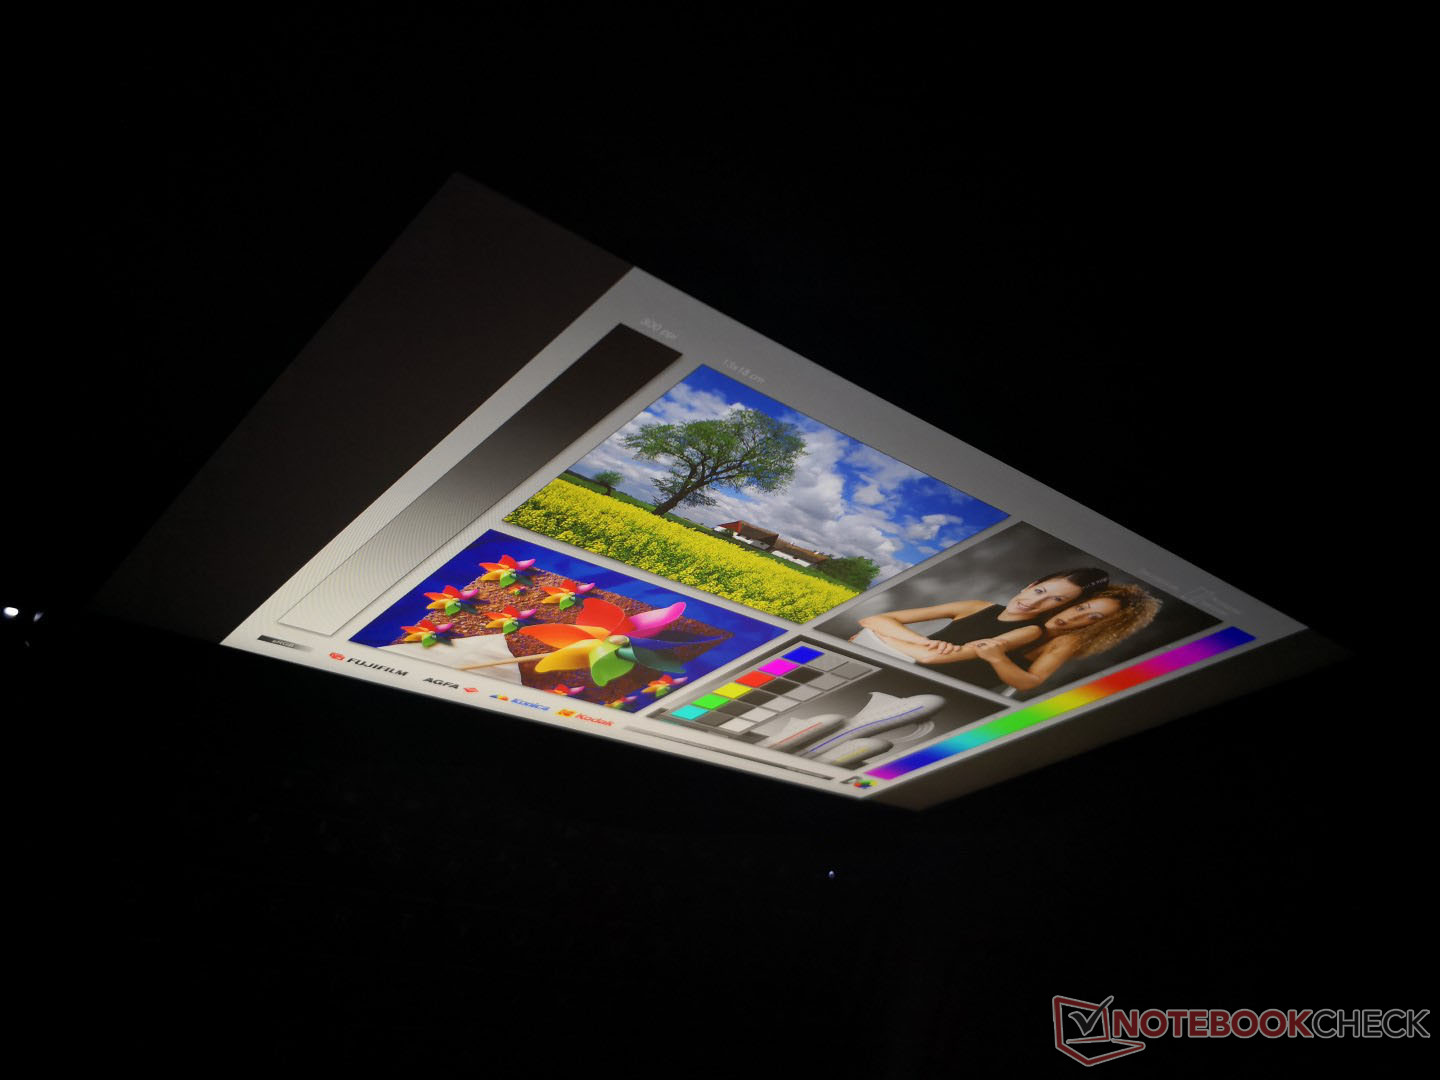
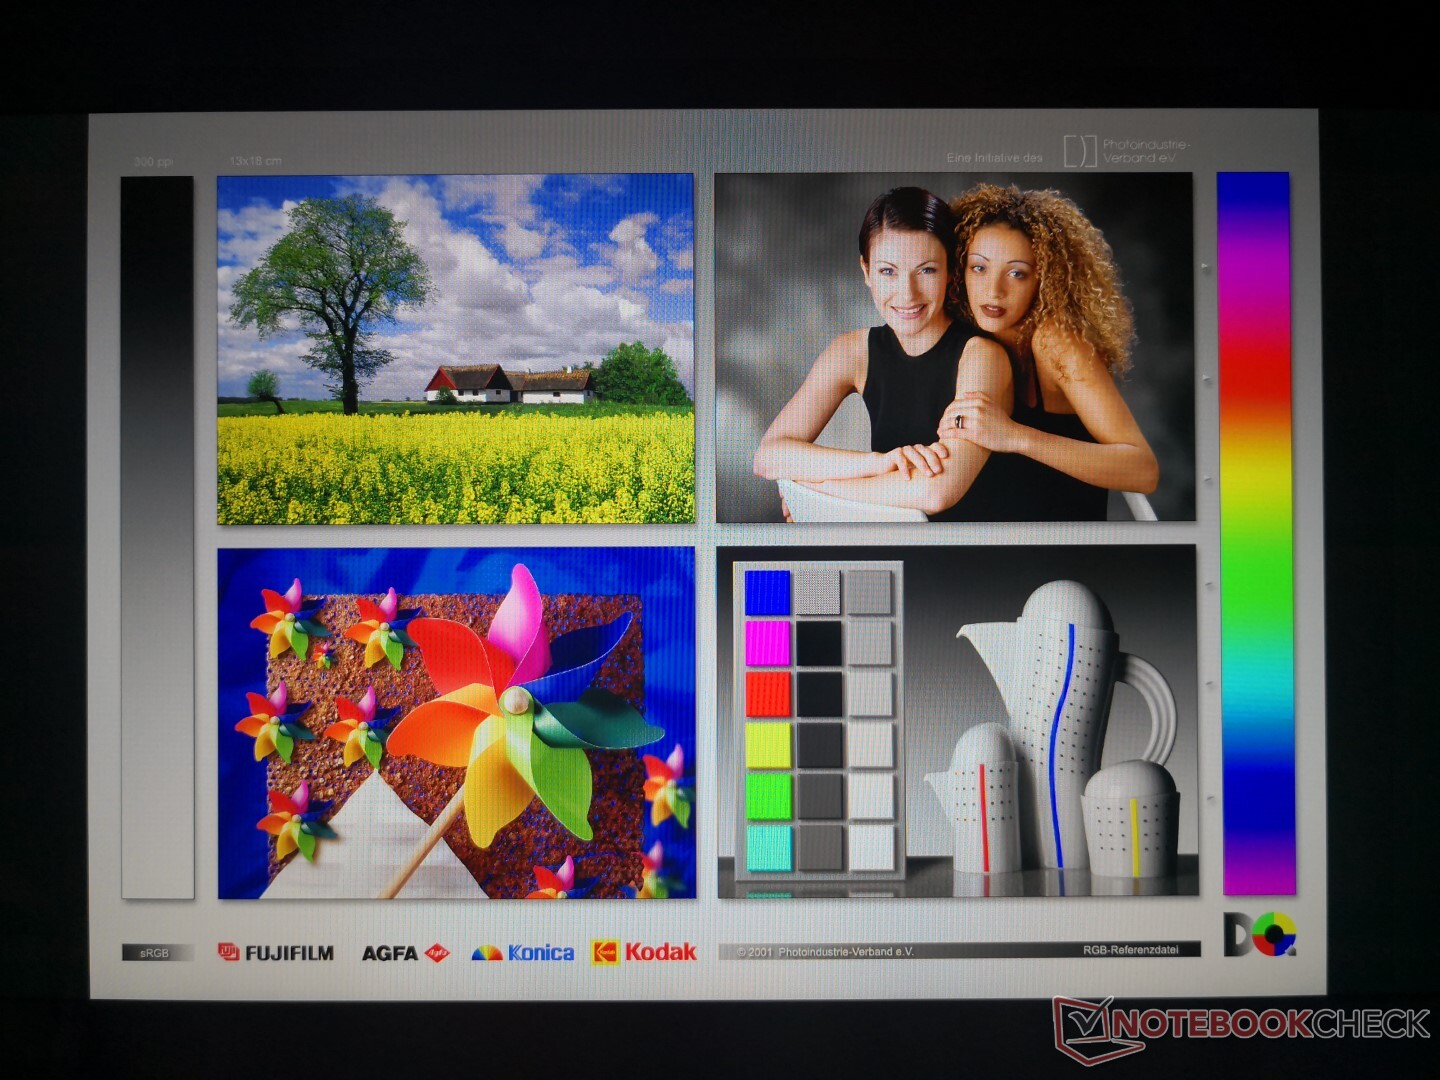
We're unable to identify the exact touchscreen panel in use here, but HWiNFO confirms it to be of Chi Mei origin with a CMN139D controller as opposed to the InfoVision or AU Optronics panels on the older Envy x360 or Spectre x360 models, respectively. Display quality is crisp with excellent contrast and colors, but response times remain average while last year's 120 Hz refresh rate panel is now gone.
Unlike most other OEMs, HP offers three brightness options at configuration: 300 nits, 400 nits, and 1000 nits all at 1080p. We recommend the 1000-nit option if you plan on using the convertible in outdoor conditions frequently. Our measurements below reflect only the 400-nit option.
| |||||||||||||||||||||||||
Brightness Distribution: 93 %
Center on Battery: 452.6 cd/m²
Contrast: 1561:1 (Black: 0.29 cd/m²)
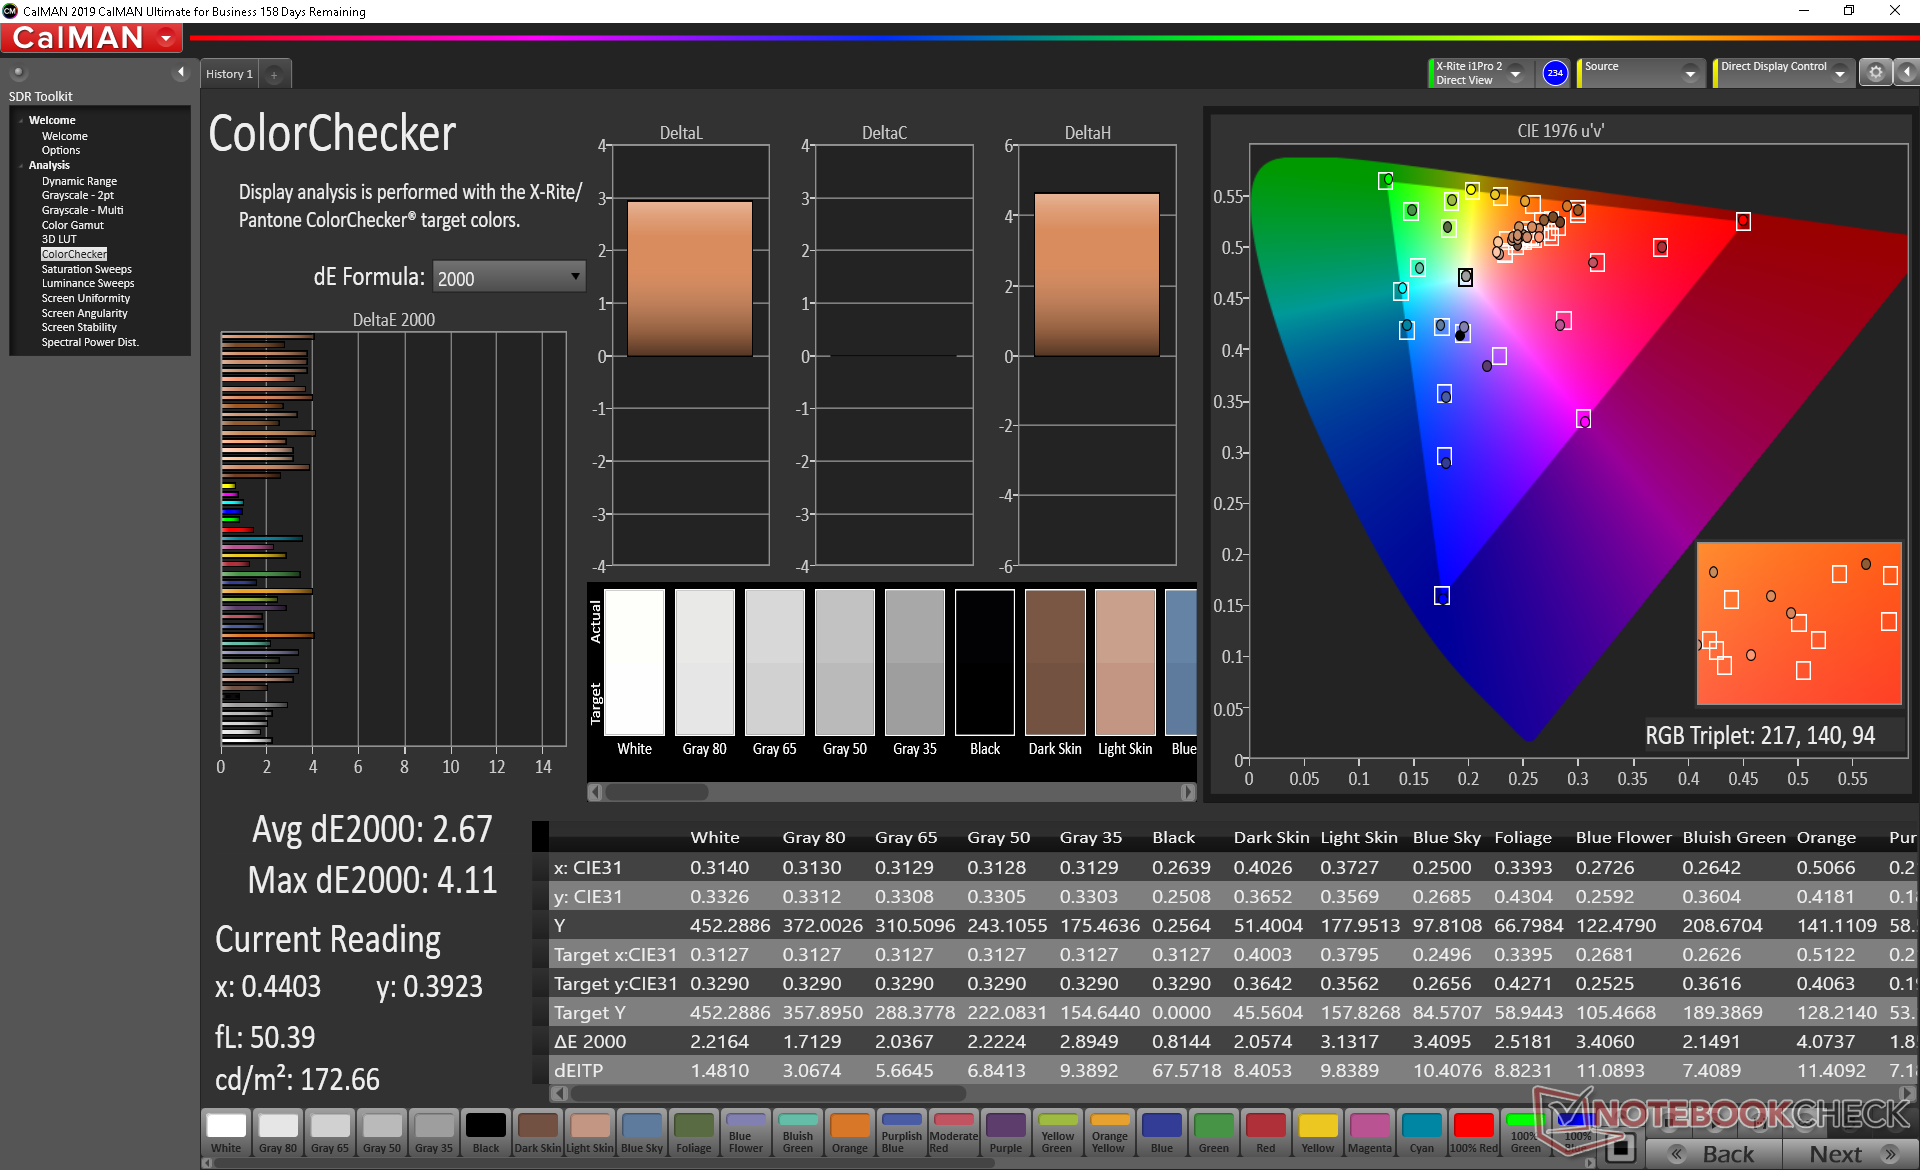
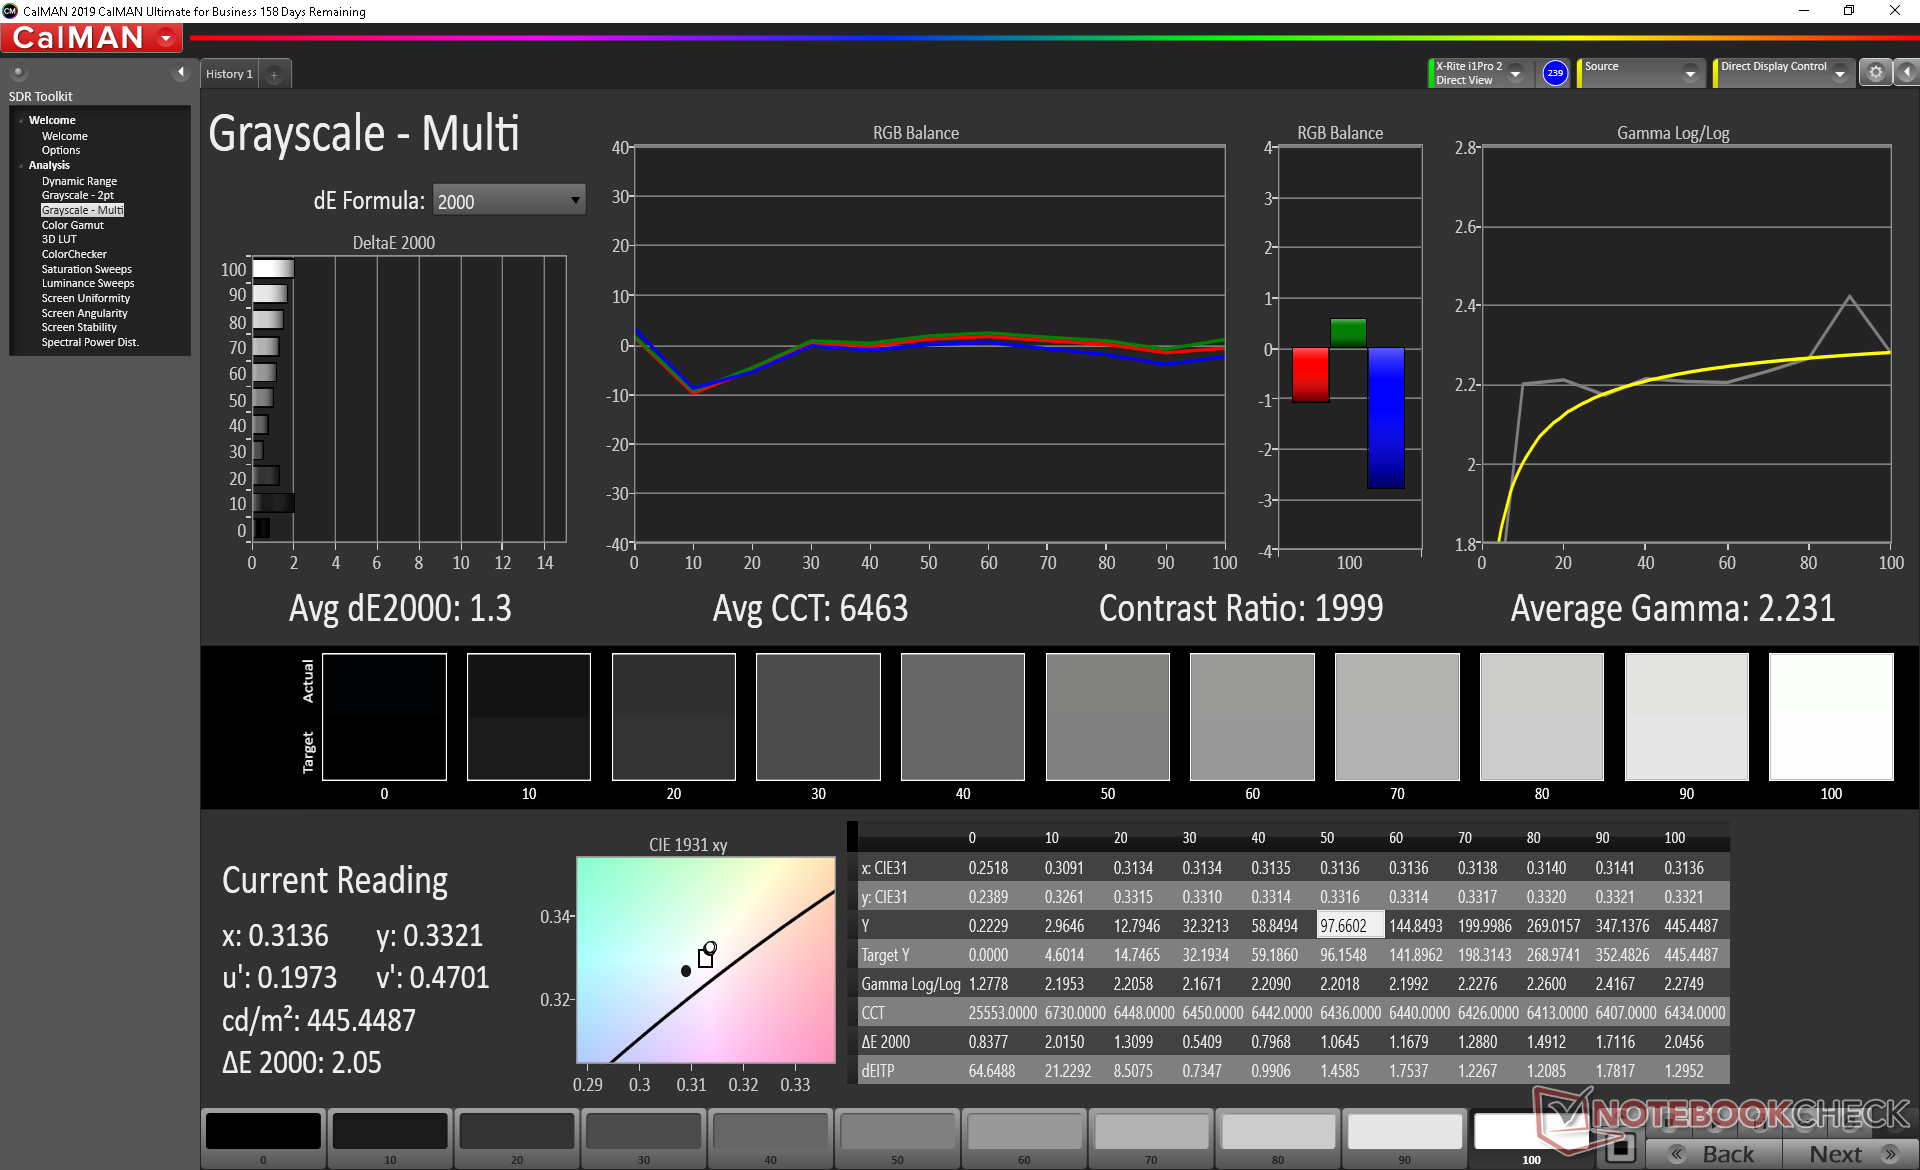
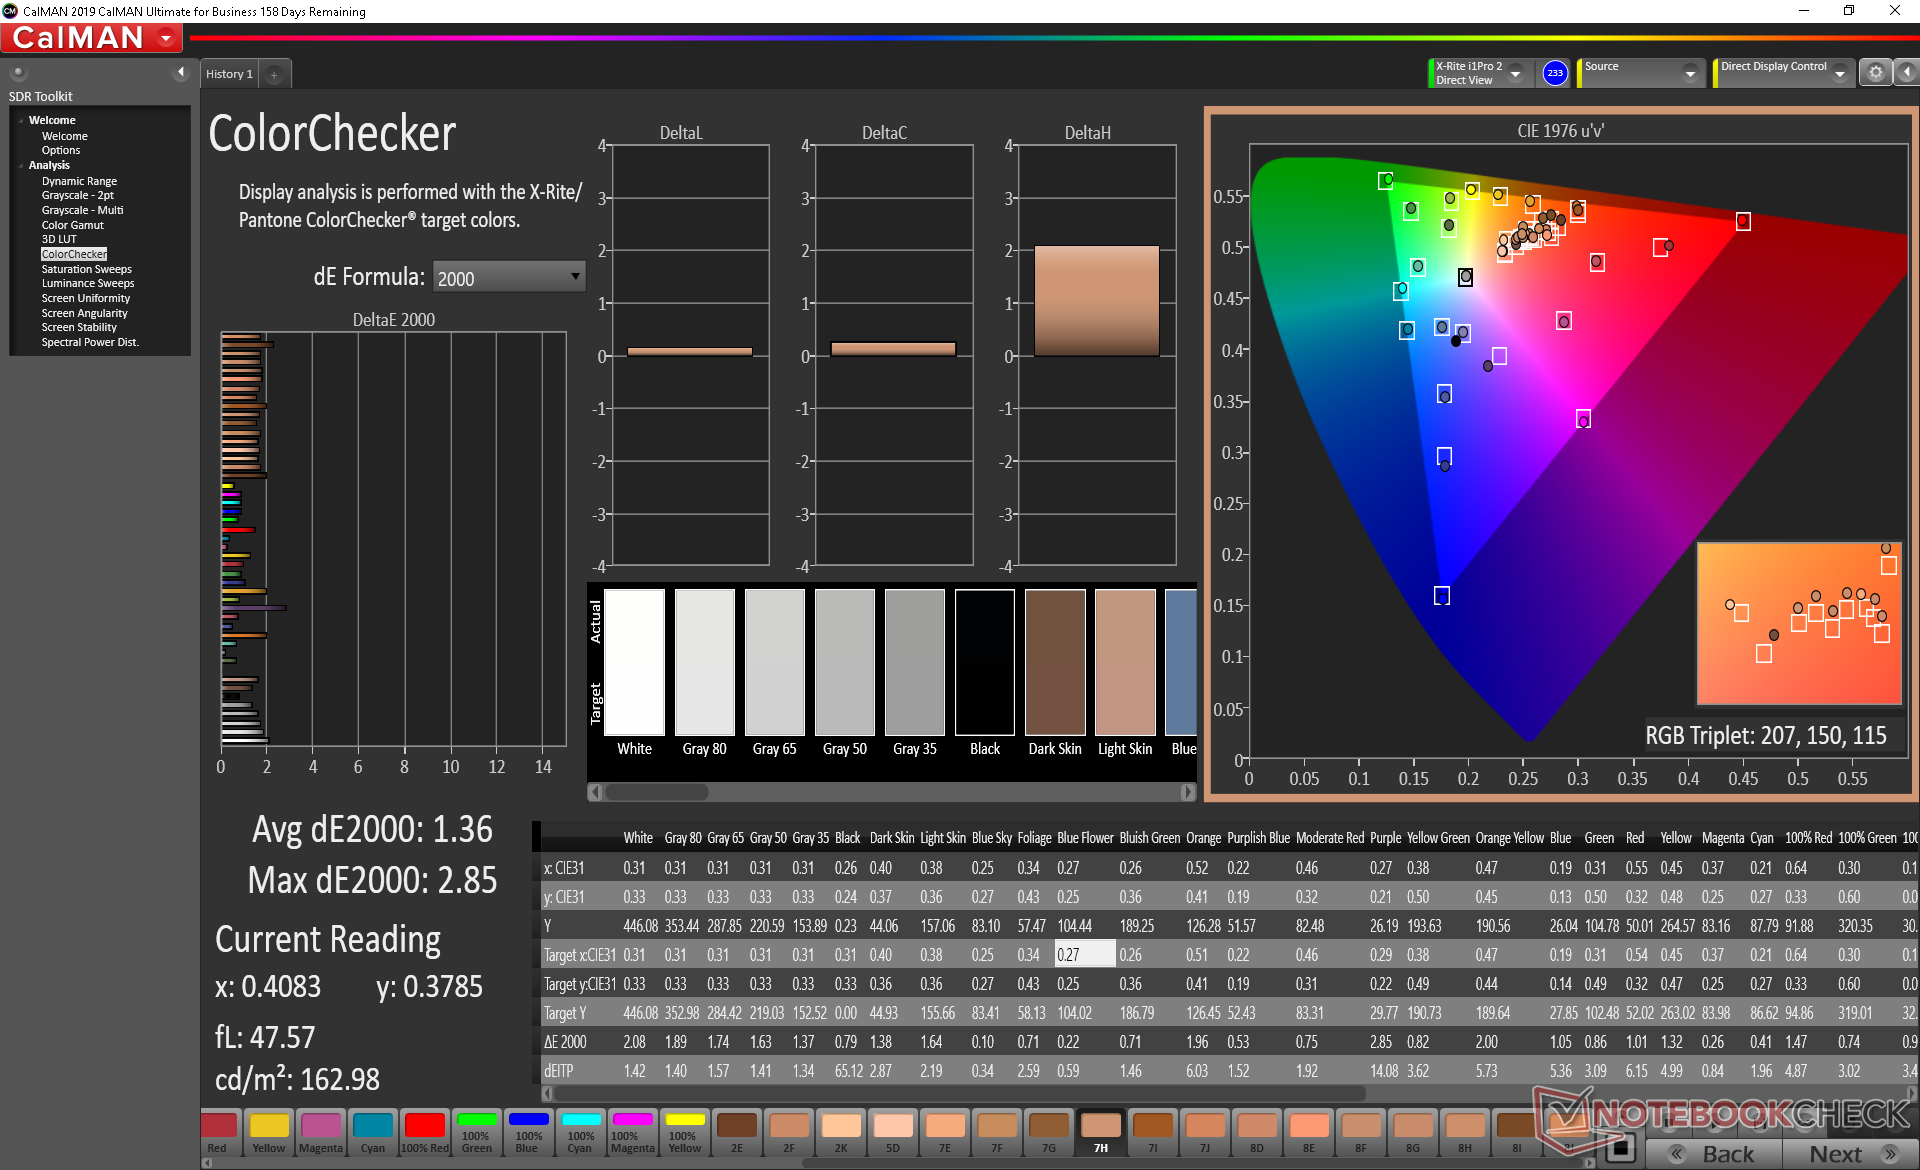
ΔE ColorChecker Calman: 2.67 | ∀{0.5-29.43 Ø4.73}
calibrated: 1.36
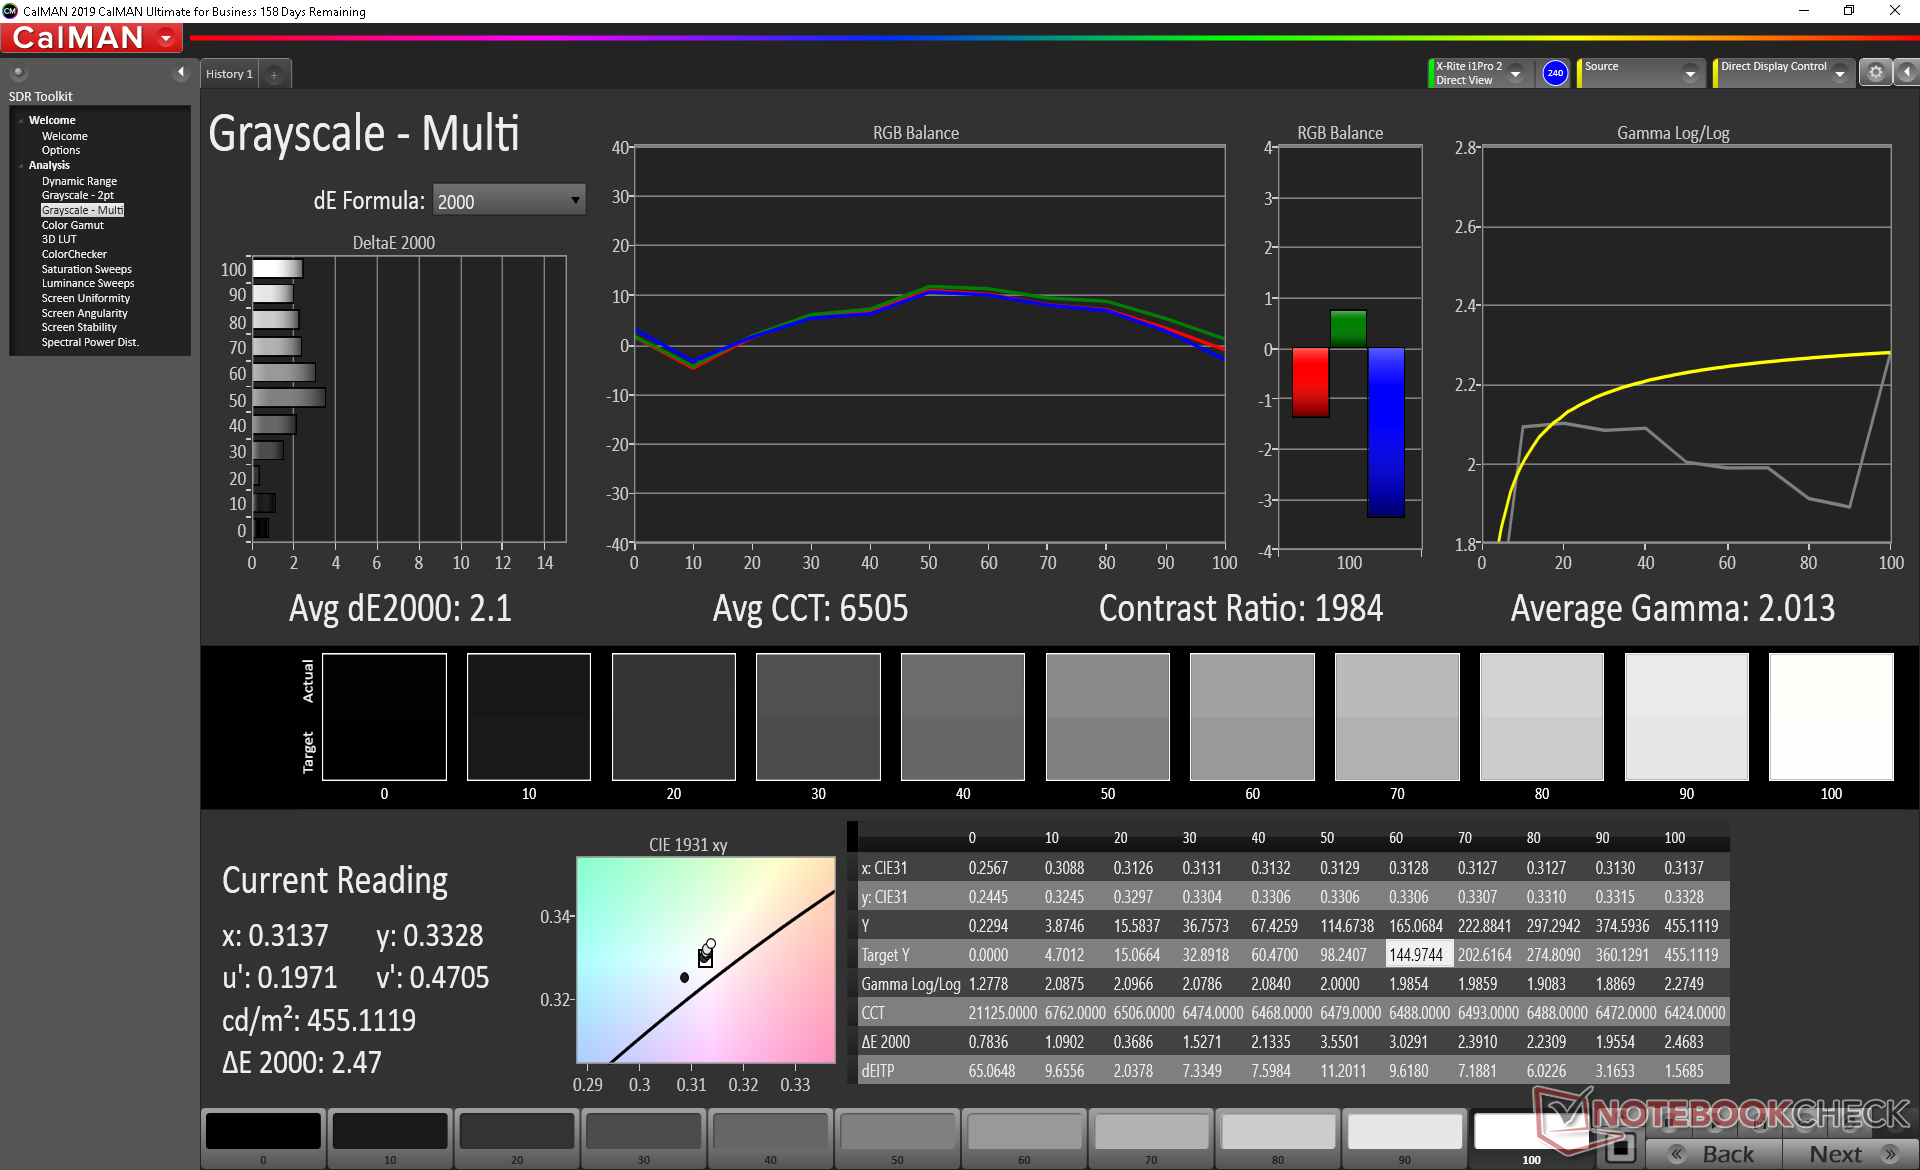
ΔE Greyscale Calman: 2.1 | ∀{0.09-98 Ø4.97}
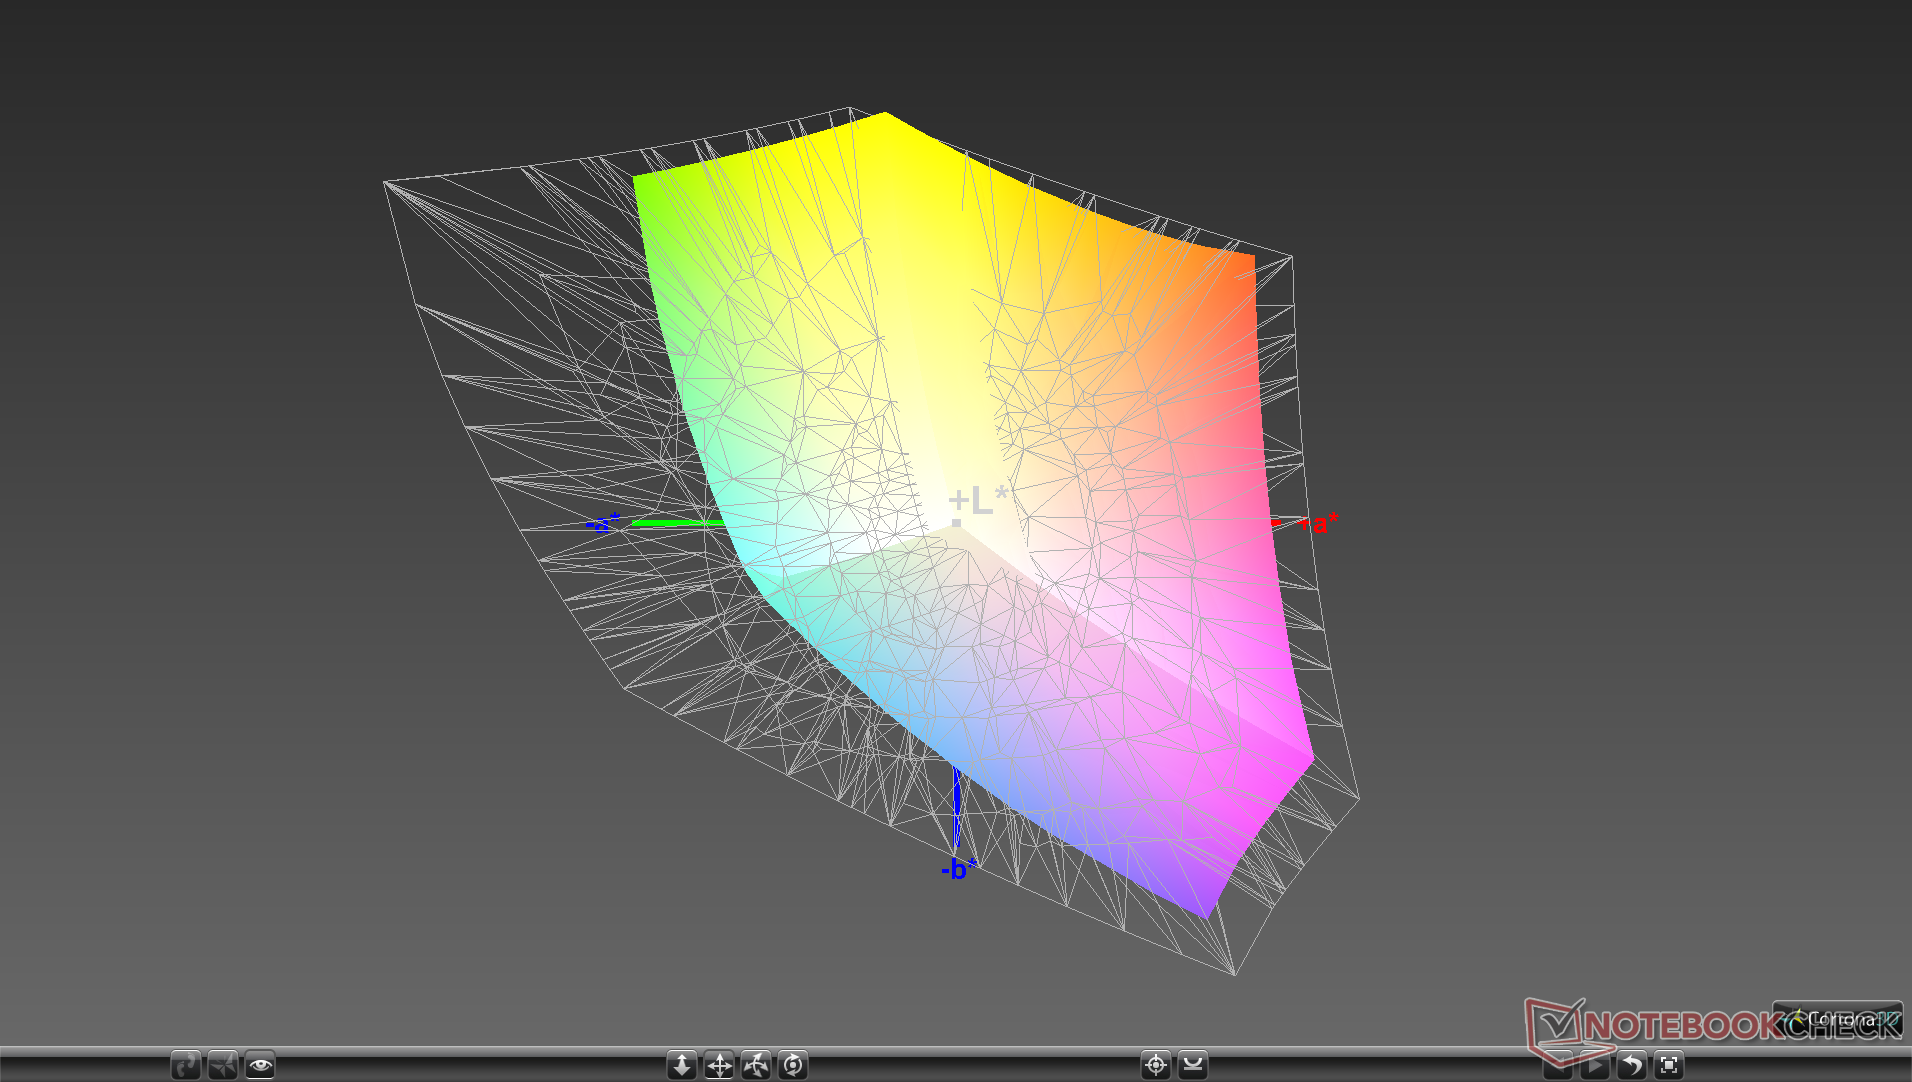
97.6% sRGB (Argyll 1.6.3 3D)
62.2% AdobeRGB 1998 (Argyll 1.6.3 3D)
67.8% AdobeRGB 1998 (Argyll 3D)
97.4% sRGB (Argyll 3D)
65.9% Display P3 (Argyll 3D)
Gamma: 2.01
CCT: 6505 K
| HP Envy x360 13-ay0010nr IPS, 13.3", 1920x1080 | HP Envy x360 13-ar0601ng InfoVision, M133NVF3 R2, IPS, 120 Hz, 13.3", 1920x1080 | Dell XPS 13 7390 2-in-1 Core i7 Sharp LQ134N1, IPS, 13.4", 1920x1200 | HP Spectre x360 13-aw0013dx AU Optronics AUO5E2D, IPS, 13.3", 1920x1080 | Asus ZenBook S13 UX392FN Tianma XM, IPS, 13.9", 1920x1080 | Apple MacBook Pro 13 2020 2GHz i5 10th-Gen APPA03D, IPS, 13.3", 2560x1600 | |
|---|---|---|---|---|---|---|
| Display | -6% | 4% | 4% | 1% | 27% | |
| Display P3 Coverage (%) | 65.9 | 63 -4% | 69.9 6% | 69.6 6% | 67.5 2% | 98.8 50% |
| sRGB Coverage (%) | 97.4 | 90.8 -7% | 99.2 2% | 98.9 2% | 95.8 -2% | 99.9 3% |
| AdobeRGB 1998 Coverage (%) | 67.8 | 63.8 -6% | 71.5 5% | 71.5 5% | 69 2% | 86.4 27% |
| Response Times | 29% | 5% | -21% | 12% | 2% | |
| Response Time Grey 50% / Grey 80% * (ms) | 47.6 ? | 35 ? 26% | 47.6 ? -0% | 60.8 ? -28% | 47.2 ? 1% | 46 ? 3% |
| Response Time Black / White * (ms) | 32.4 ? | 22 ? 32% | 29.2 ? 10% | 36.8 ? -14% | 24.8 ? 23% | 32.4 ? -0% |
| PWM Frequency (Hz) | 25000 ? | 4065 ? | 2500 ? | 113600 ? | ||
| Screen | -22% | 0% | -36% | -2% | 12% | |
| Brightness middle (cd/m²) | 452.6 | 633 40% | 549.8 21% | 447.4 -1% | 466 3% | 512 13% |
| Brightness (cd/m²) | 438 | 675 54% | 520 19% | 420 -4% | 462 5% | 491 12% |
| Brightness Distribution (%) | 93 | 75 -19% | 86 -8% | 85 -9% | 90 -3% | 91 -2% |
| Black Level * (cd/m²) | 0.29 | 0.55 -90% | 0.39 -34% | 0.31 -7% | 0.33 -14% | 0.32 -10% |
| Contrast (:1) | 1561 | 1151 -26% | 1410 -10% | 1443 -8% | 1412 -10% | 1600 2% |
| Colorchecker dE 2000 * | 2.67 | 3.12 -17% | 2.12 21% | 4.23 -58% | 1.93 28% | 1.7 36% |
| Colorchecker dE 2000 max. * | 4.11 | 6.37 -55% | 3.66 11% | 9.34 -127% | 4.26 -4% | 3.4 17% |
| Colorchecker dE 2000 calibrated * | 1.36 | 1.83 -35% | 1.37 -1% | 1.32 3% | 1.99 -46% | 1 26% |
| Greyscale dE 2000 * | 2.1 | 3.89 -85% | 2.6 -24% | 6.1 -190% | 1.7 19% | 1.9 10% |
| Gamma | 2.01 109% | 2.39 92% | 2.3 96% | 2.11 104% | 2.15 102% | 2.19 100% |
| CCT | 6505 100% | 6476 100% | 6884 94% | 6136 106% | 6382 102% | 6817 95% |
| Color Space (Percent of AdobeRGB 1998) (%) | 62.2 | 59 -5% | 65.4 5% | 64.8 4% | 62.2 0% | 77.4 24% |
| Color Space (Percent of sRGB) (%) | 97.6 | 91 -7% | 99.7 2% | 98.9 1% | 95.7 -2% | 99.9 2% |
| Total Average (Program / Settings) | 0% /
-13% | 3% /
2% | -18% /
-27% | 4% /
0% | 14% /
13% |
* ... smaller is better
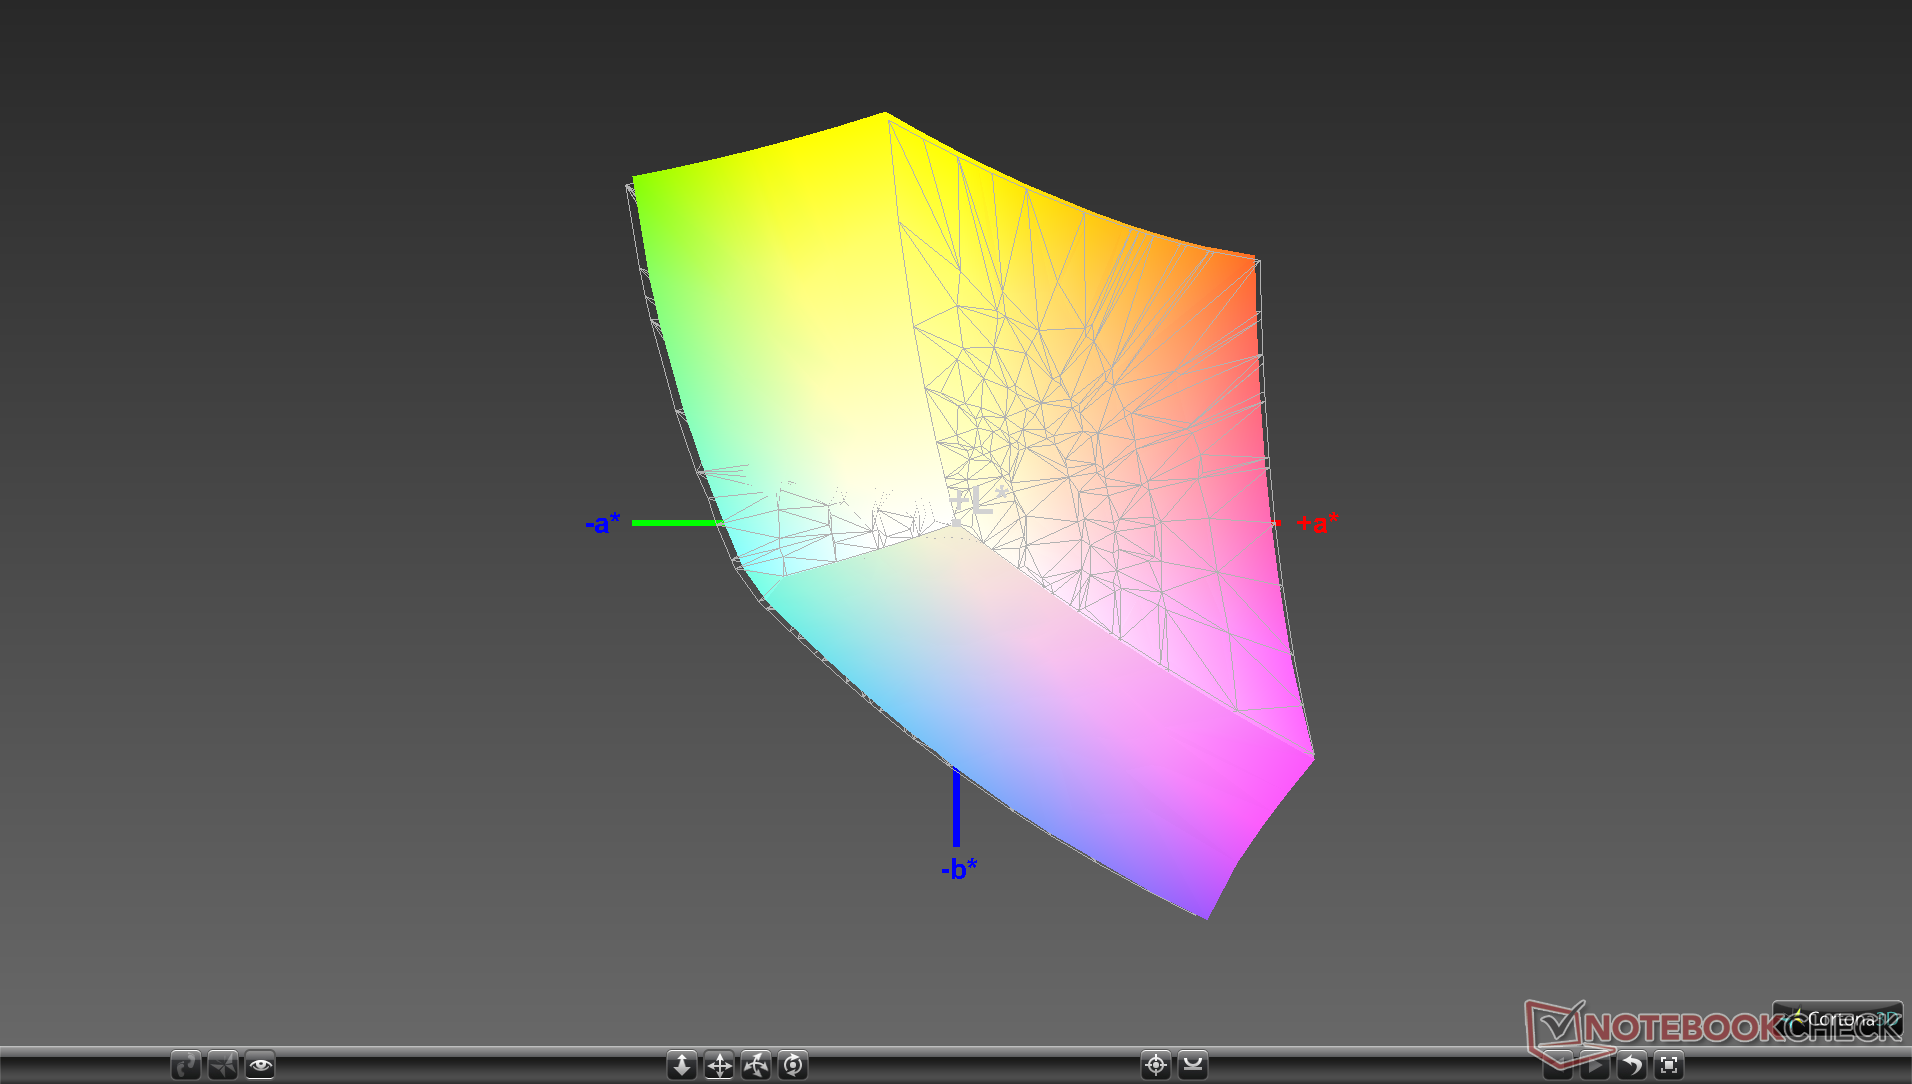
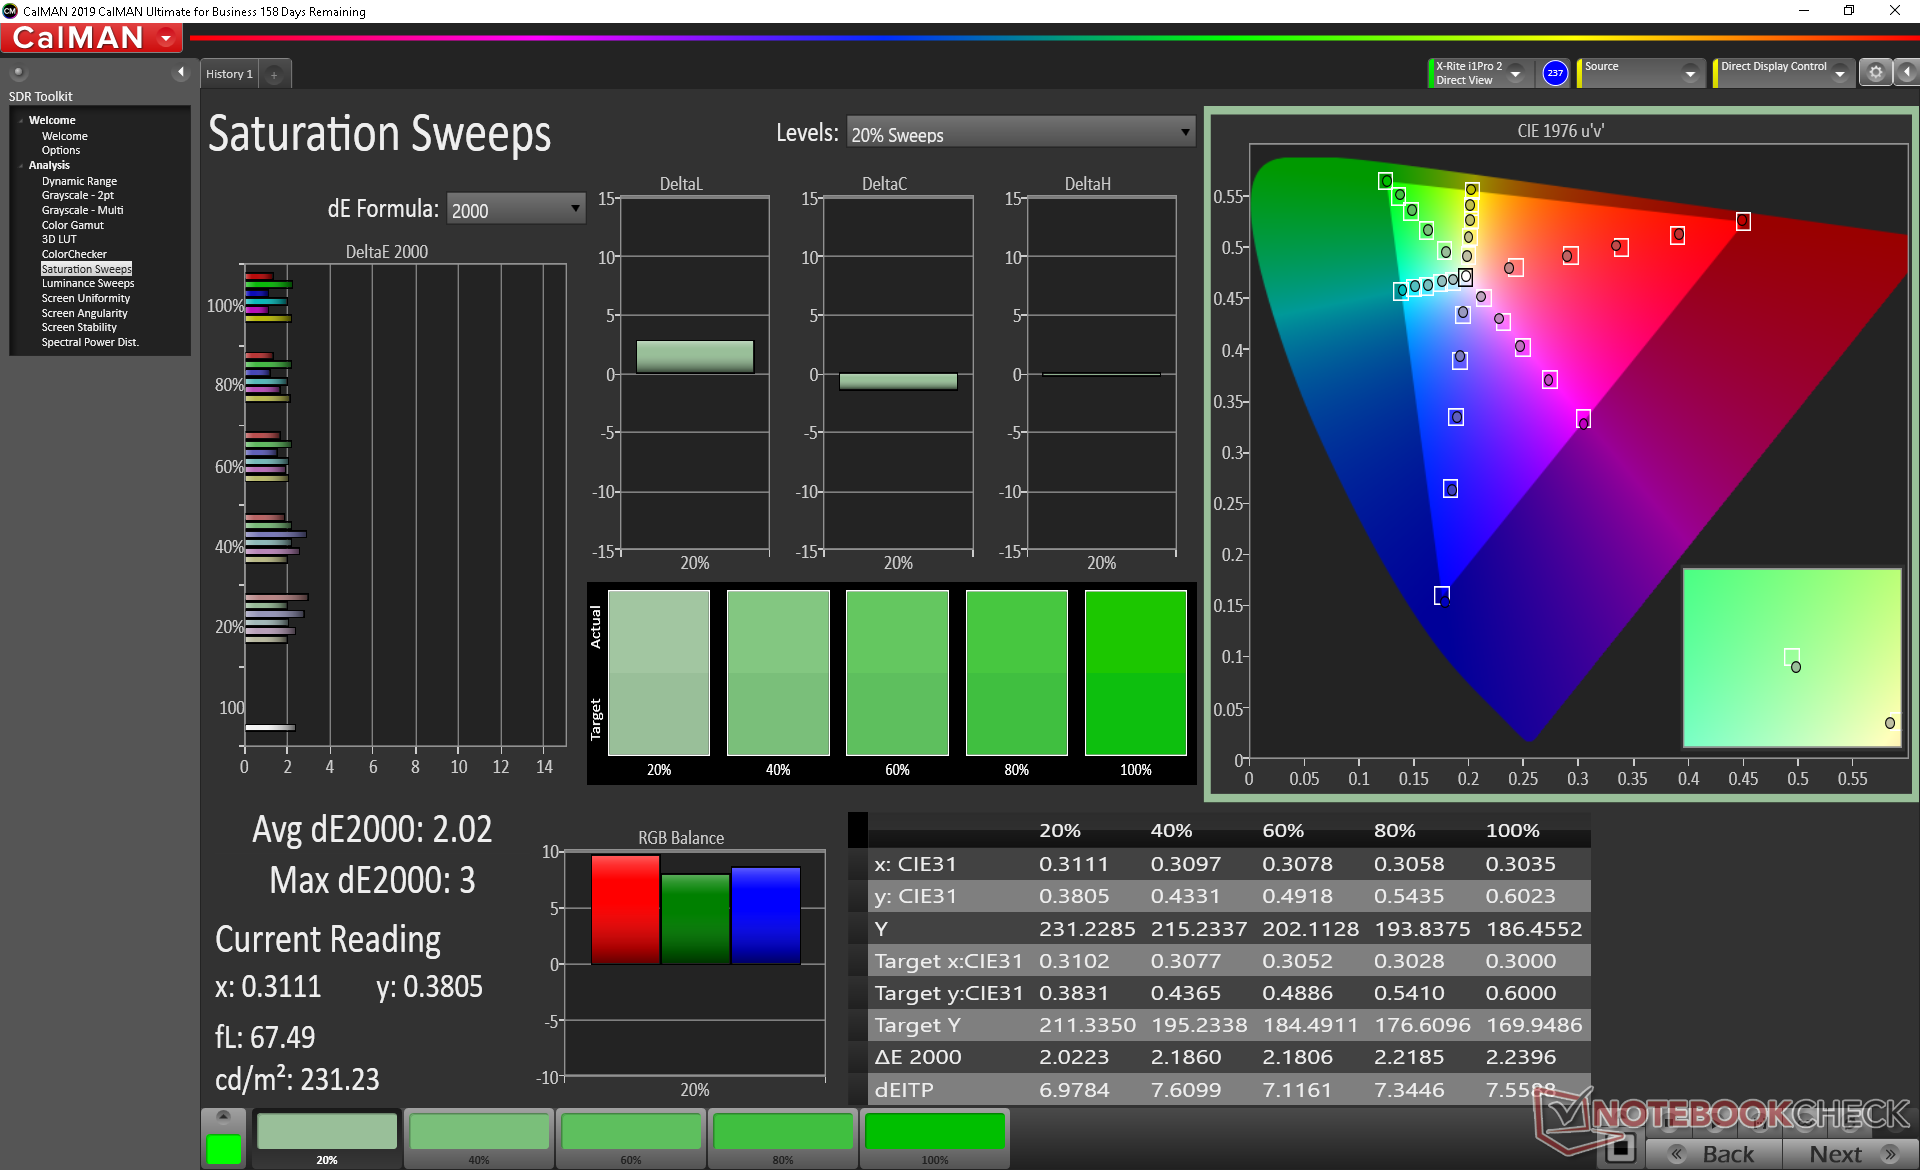
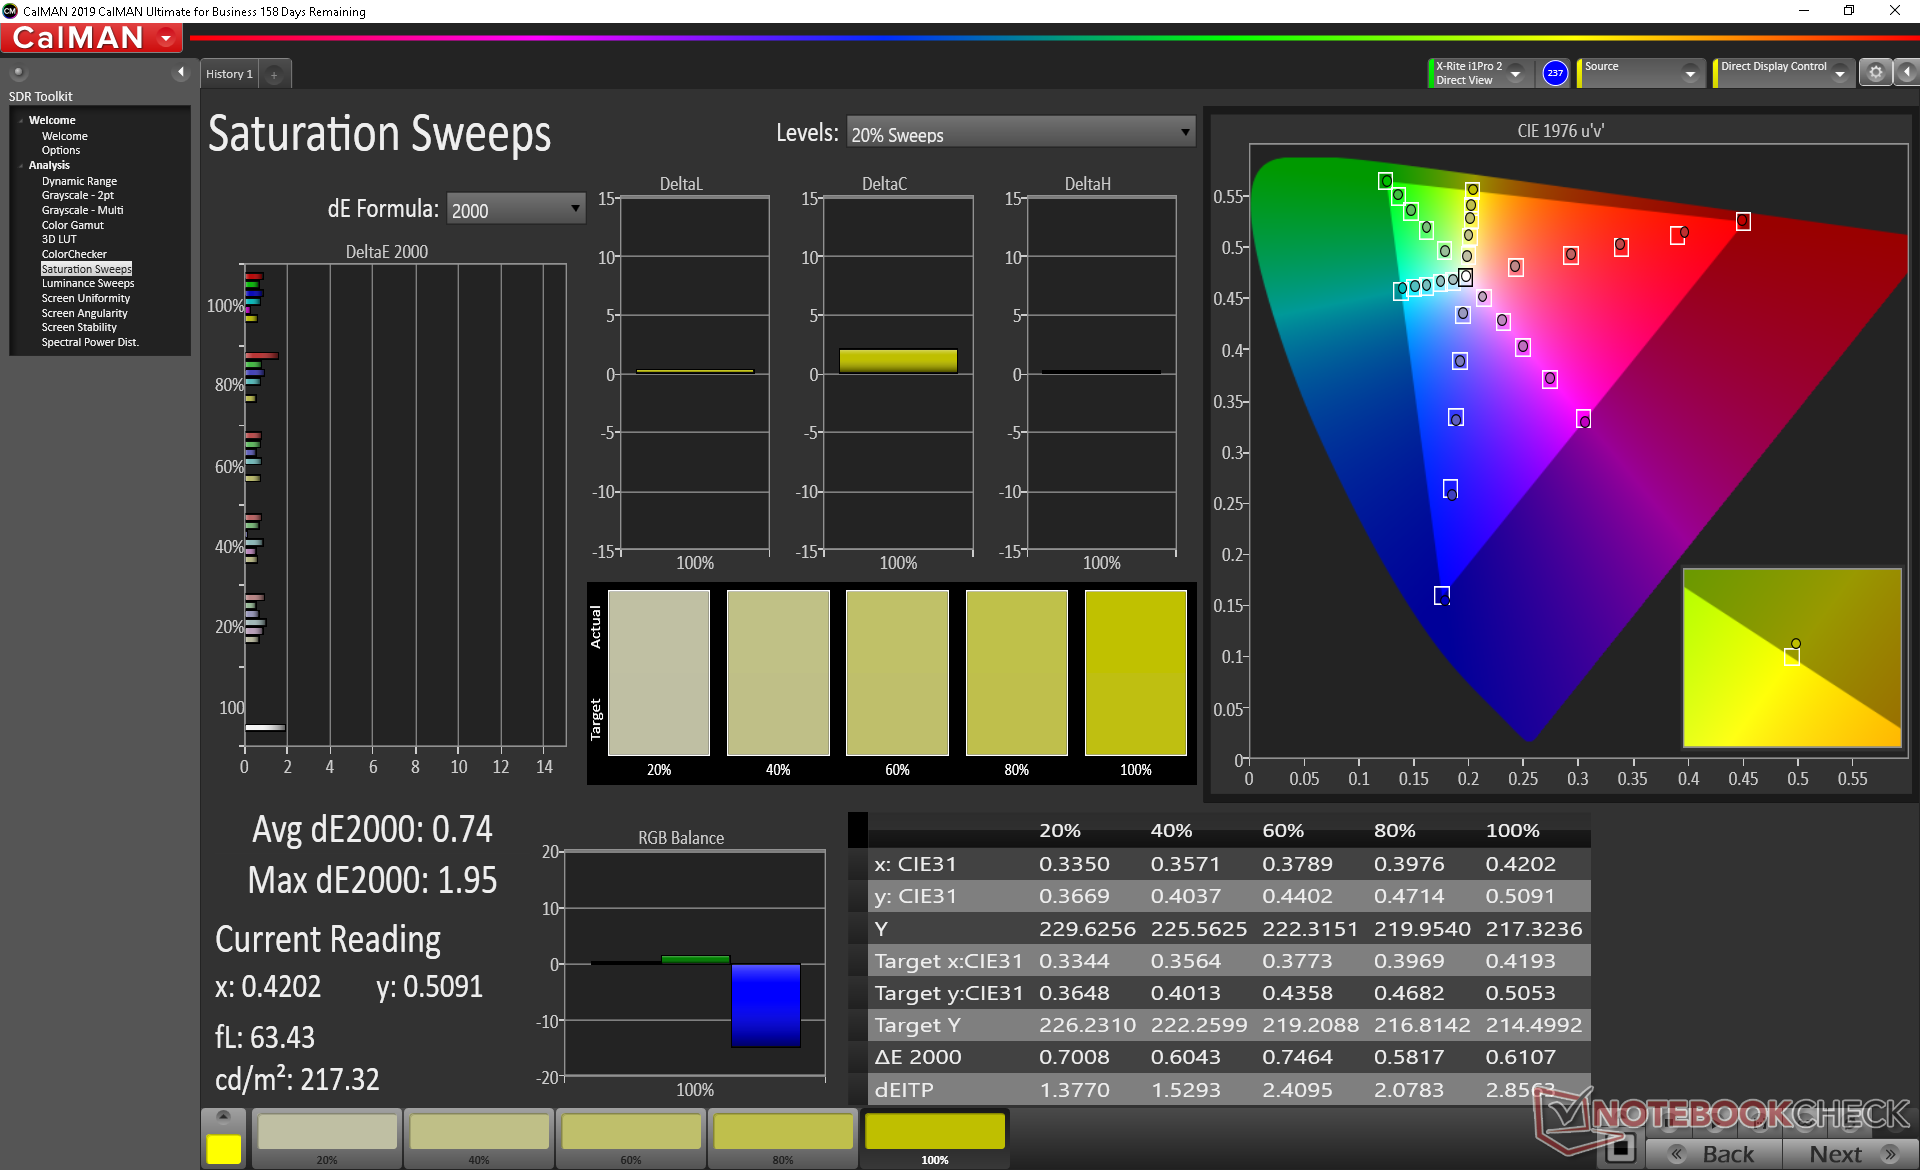
Color space is nearly identical to last year's Envy x360 13 if not slightly wider to cover sRGB almost completely. Results are comparable to most other high-end Ultrabooks or convertibles in the market. HP offers deeper colors on the larger Spectre x360 15 series.
Furthe measurements with a colorimeter show a decently calibrated display out of the box with an average grayscale deltaE of only 2.1. Calibrating the panel ourselves would improve grayscale and colors even further albeit just marginally.
Display Response Times
| ↔ Response Time Black to White | ||
|---|---|---|
| 32.4 ms ... rise ↗ and fall ↘ combined | ↗ 16.4 ms rise | 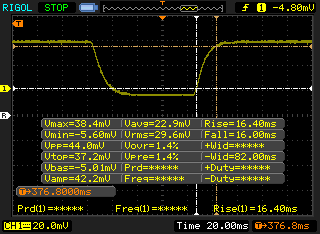 |
| ↘ 16 ms fall | ||
| The screen shows slow response rates in our tests and will be unsatisfactory for gamers. In comparison, all tested devices range from 0.1 (minimum) to 240 (maximum) ms. » 88 % of all devices are better. This means that the measured response time is worse than the average of all tested devices (19.9 ms). | ||
| ↔ Response Time 50% Grey to 80% Grey | ||
| 47.6 ms ... rise ↗ and fall ↘ combined | ↗ 24.8 ms rise | 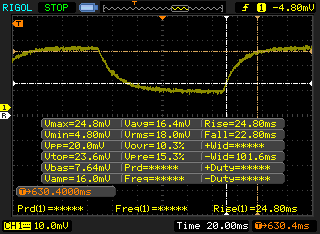 |
| ↘ 22.8 ms fall | ||
| The screen shows slow response rates in our tests and will be unsatisfactory for gamers. In comparison, all tested devices range from 0.165 (minimum) to 636 (maximum) ms. » 82 % of all devices are better. This means that the measured response time is worse than the average of all tested devices (31.1 ms). | ||
Screen Flickering / PWM (Pulse-Width Modulation)
| Screen flickering / PWM detected | 25000 Hz | ≤ 45 % brightness setting | 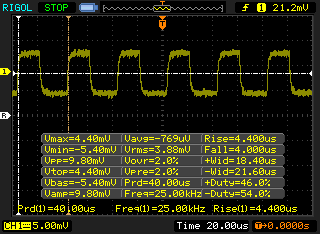 |
The display backlight flickers at 25000 Hz (worst case, e.g., utilizing PWM) Flickering detected at a brightness setting of 45 % and below. There should be no flickering or PWM above this brightness setting. The frequency of 25000 Hz is quite high, so most users sensitive to PWM should not notice any flickering. In comparison: 52 % of all tested devices do not use PWM to dim the display. If PWM was detected, an average of 7798 (minimum: 5 - maximum: 343500) Hz was measured. | |||
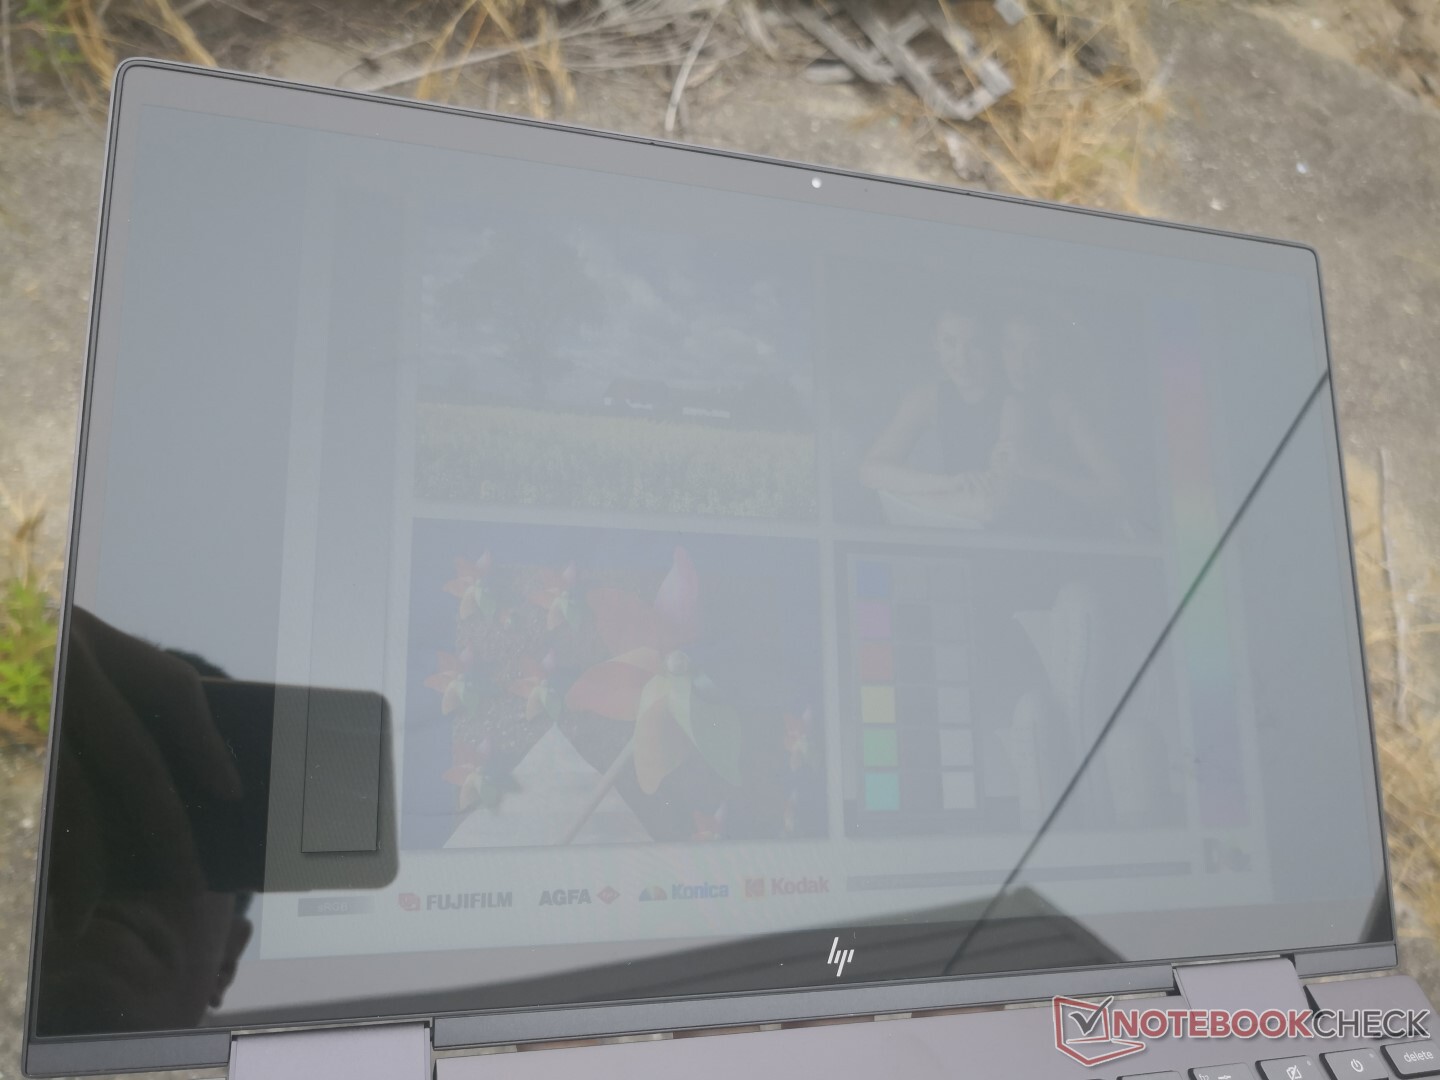
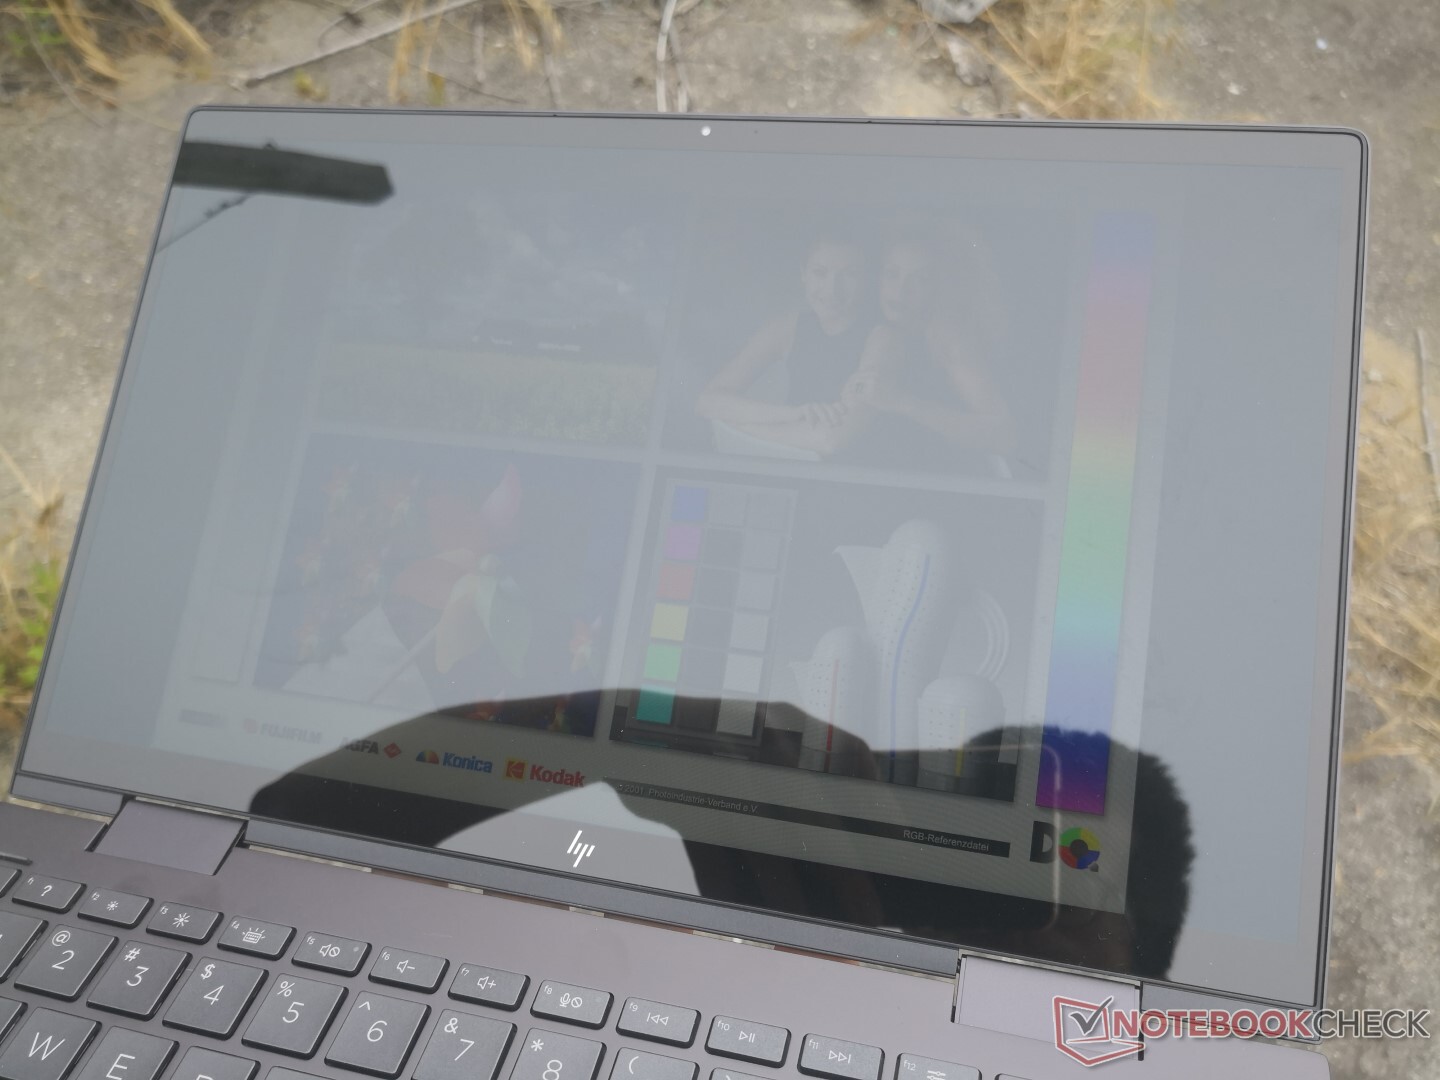
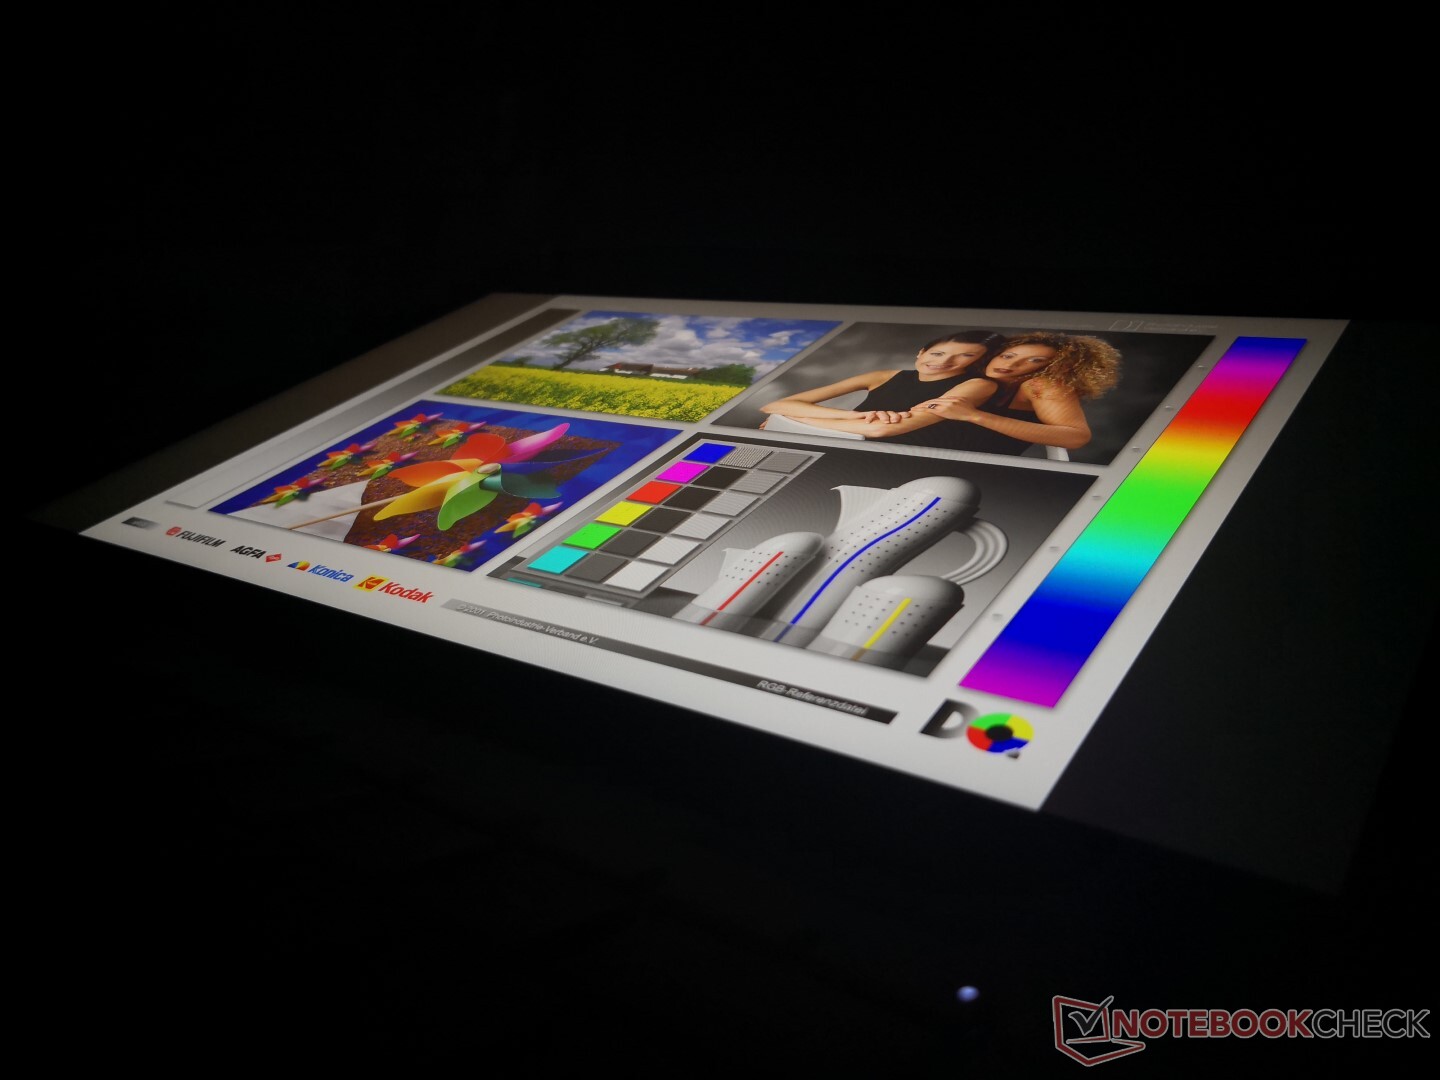
Outdoor visibility is average on our 400-nit display due to the reflective touchscreen. The 1000-nit panel option should improve this dramatically — such a feature is unheard of for a laptop in this price range.

Performance
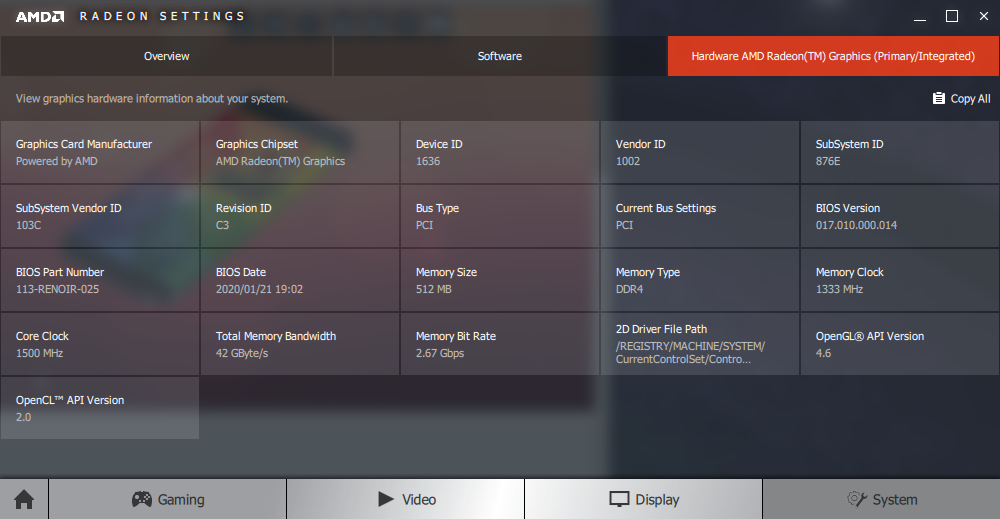
HP offers a wider selection of processors here when compared to its Spectre x360 13 series. Users can configure with the 4/4 core/thread Ryzen 3 4300U, 6/6 core/thread Ryzen 5 4500U, or the 8/8 core/thread Ryzen 7 4700U. In addition, users can also configure with Intel Ice Lake options up to the 4/8 core/thread Core i7-1065G7. There are no discrete GPU options meaning users will have to make do with integrated Radeon RX Vega or Iris Plus solutions.
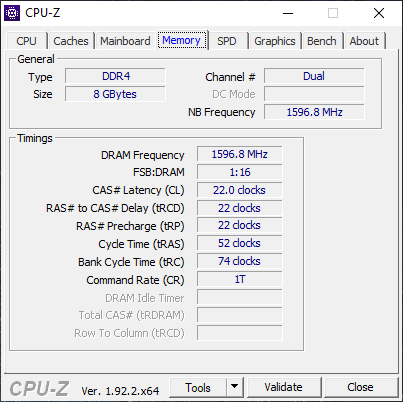
RAM is soldered at 8 GB to 16 GB of DDR4-3200. Thankfully, memory runs in dual-channel mode no matter the SKU.
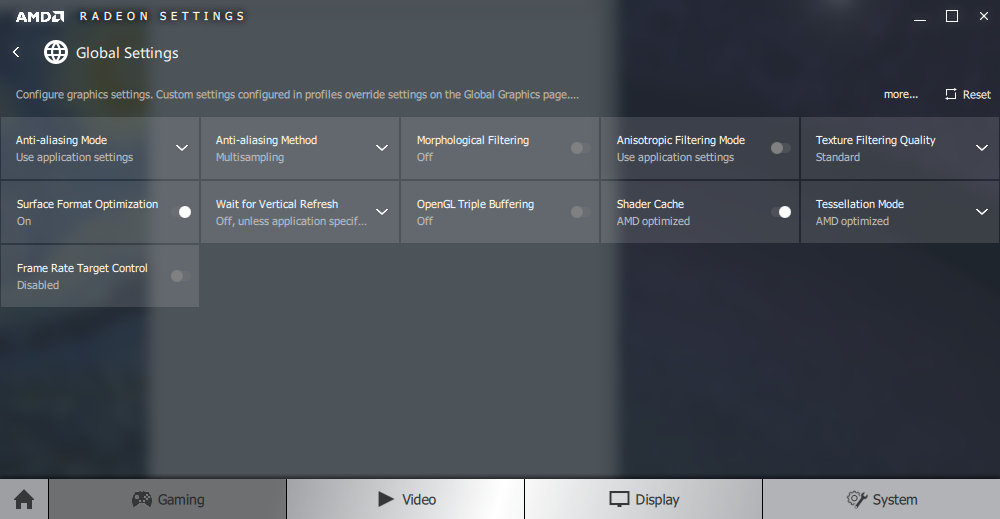
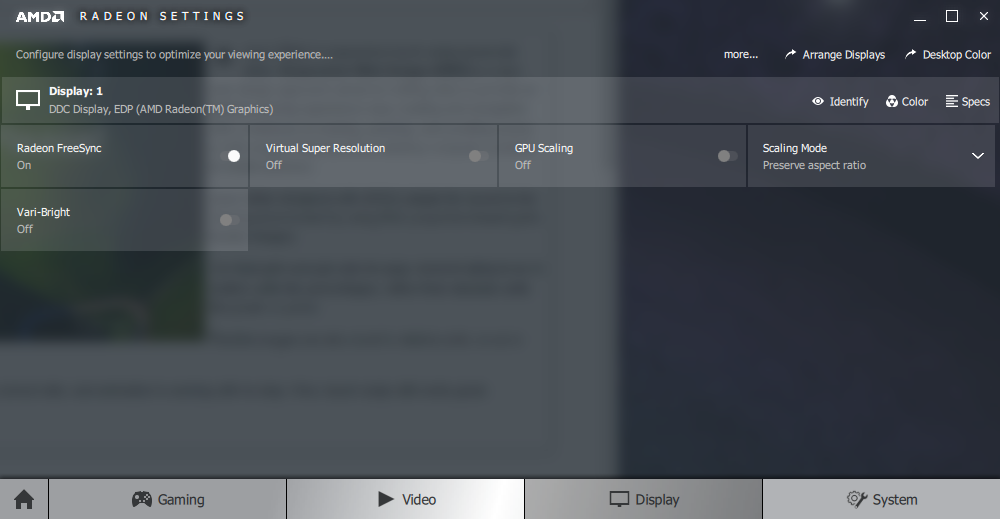
All benchmarks below were performed on the HP Performance mode setting unless otherwise stated. AMD FreeSync is supported which is not expected from a subnotebook convertible.

Processor
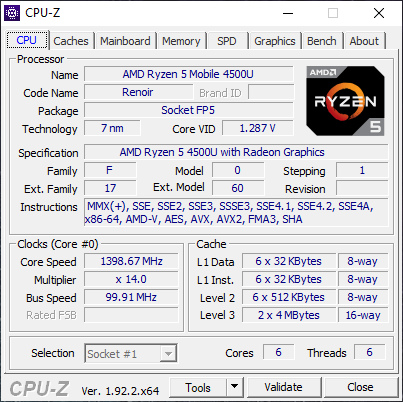
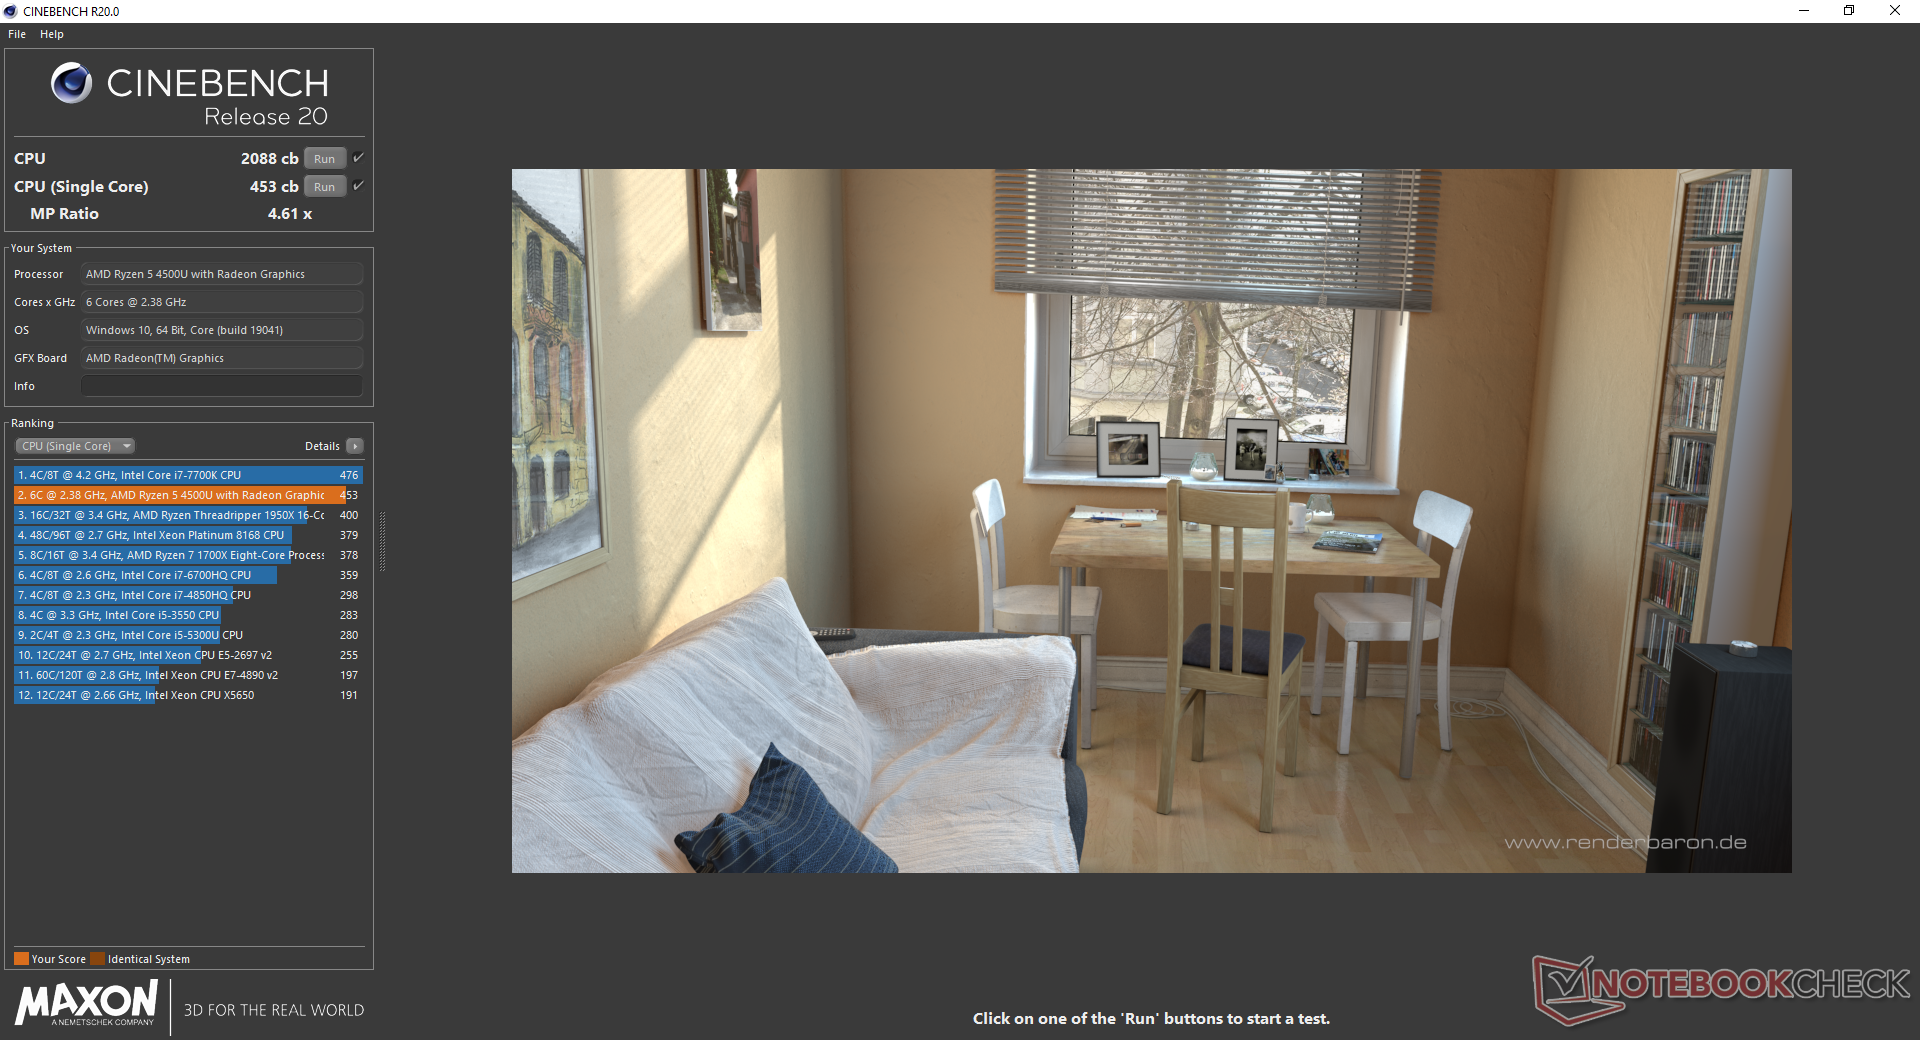
CPU performance is impressive especially when considering than the Ryzen 5 4500U is supposed to be AMD's budget-to-midrange offering. Multi-thread performance is roughly 10 percent faster than the pricier Intel Core i7-1065G7 in the latest XPS 13 9300 while being roughly 10 percent slower in single-threaded workloads. Applications that exploit multiple threads — which are most nowadays — will run just as fast on the cheaper Ryzen 5 4500U. Upgrading to the Ryzen 7 4700U will net roughly 15 to 25 percent faster multi-thread performance while downgrading to the base Ryzen 3 4300U option would lose about 35 percent.
See our dedicated page on the Ryzen 5 4500U for more technical information and benchmark comparisons.
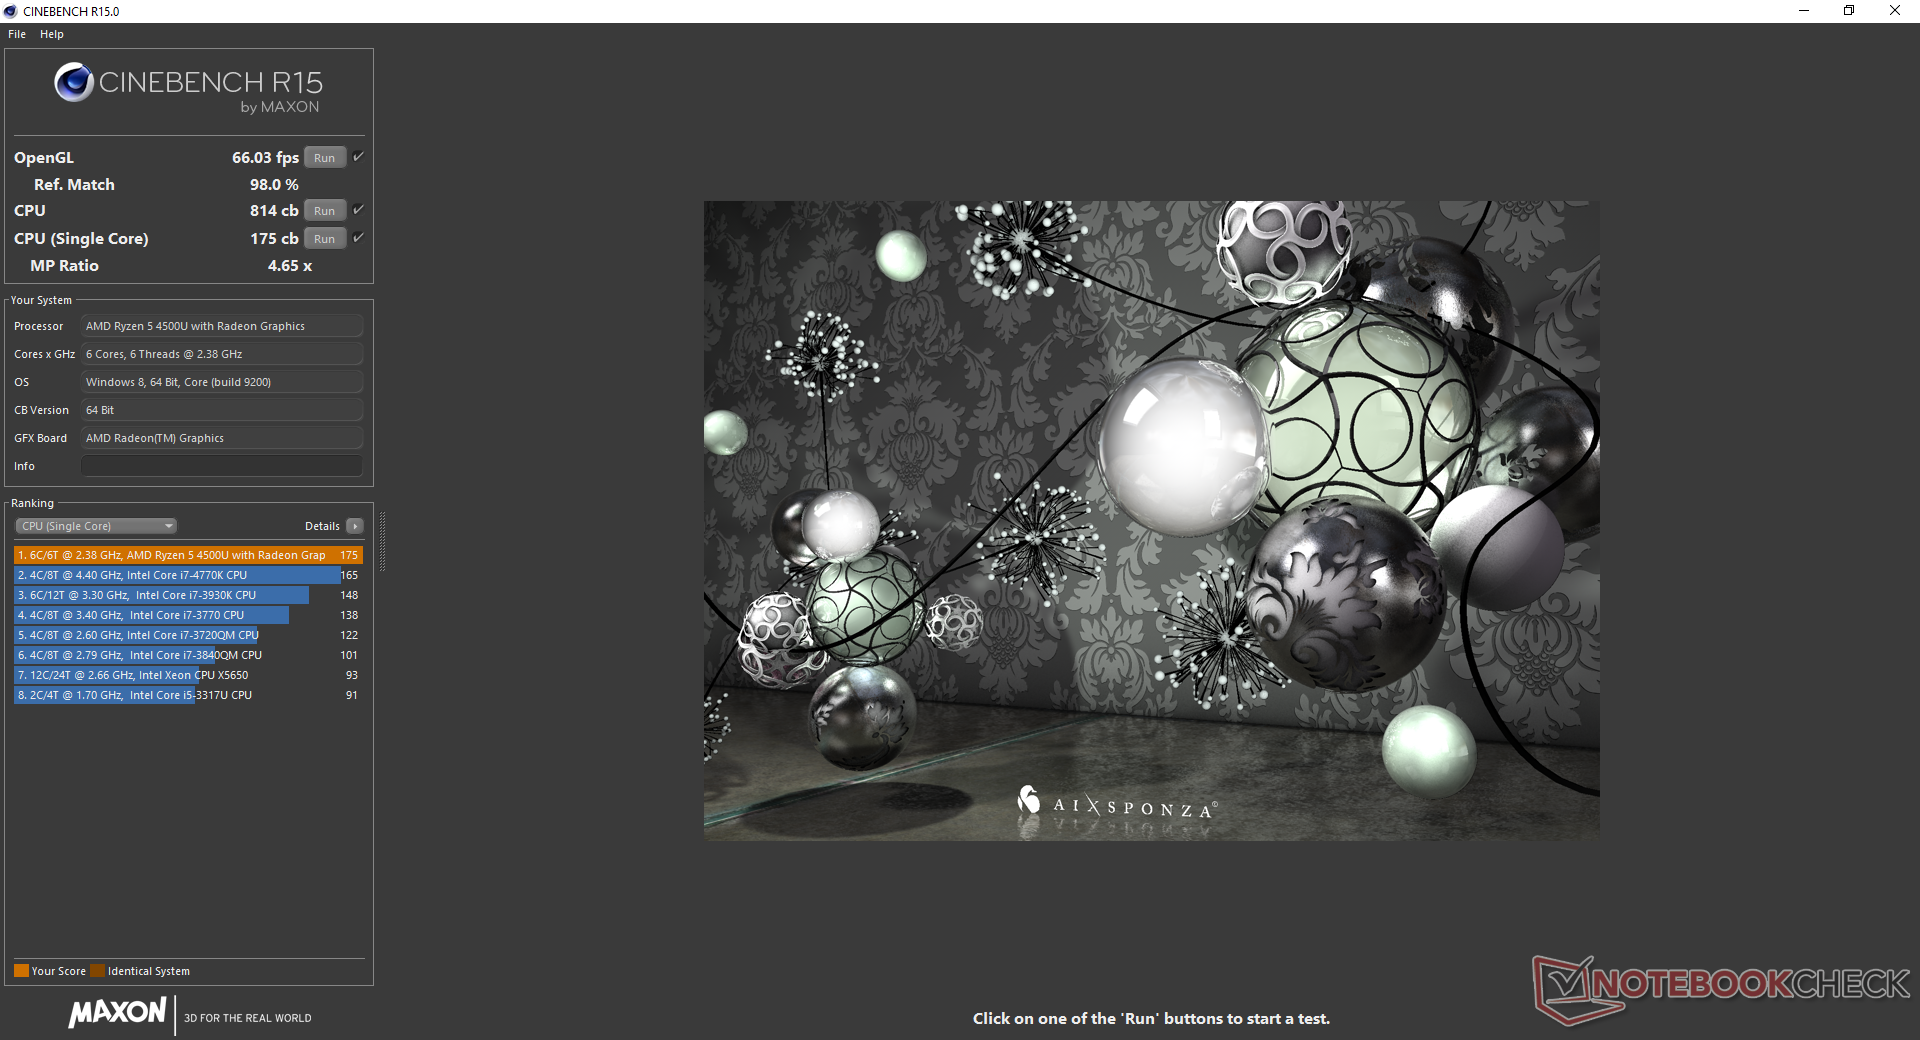
Cinebench R15: CPU Multi 64Bit | CPU Single 64Bit
Blender: v2.79 BMW27 CPU
7-Zip 18.03: 7z b 4 -mmt1 | 7z b 4
Geekbench 5.5: Single-Core | Multi-Core
HWBOT x265 Benchmark v2.2: 4k Preset
LibreOffice : 20 Documents To PDF
R Benchmark 2.5: Overall mean
| Geekbench 5.5 / Single-Core | |
| Dell XPS 13 9300 i5 FHD | |
| Lenovo ThinkPad X1 Carbon 2020-20UAS04T00 | |
| Average AMD Ryzen 5 4500U (1082 - 1220, n=10) | |
| Acer Swift 3 SF314-42-R4XJ | |
| HP Envy x360 13-ay0010nr | |
| Acer Swift 3 SF314-42-R27B | |
| Huawei MateBook 13 2020 AMD | |
| Geekbench 5.5 / Multi-Core | |
| Acer Swift 3 SF314-42-R4XJ | |
| Average AMD Ryzen 5 4500U (4352 - 6234, n=10) | |
| HP Envy x360 13-ay0010nr | |
| Dell XPS 13 9300 i5 FHD | |
| Lenovo ThinkPad X1 Carbon 2020-20UAS04T00 | |
| Acer Swift 3 SF314-42-R27B | |
| Huawei MateBook 13 2020 AMD | |
| HWBOT x265 Benchmark v2.2 / 4k Preset | |
| Acer Swift 3 SF314-42-R4XJ | |
| Average AMD Ryzen 5 4500U (5.86 - 7.33, n=10) | |
| HP Envy x360 13-ay0010nr | |
| Dell XPS 13 7390 Core i7-10710U | |
| Lenovo ThinkPad X1 Carbon 2020-20UAS04T00 | |
| Acer Swift 3 SF314-42-R27B | |
| Dell XPS 13 9300 i5 FHD | |
| Dell Latitude 13 3390 | |
| Huawei MateBook 13 2020 AMD | |
| LibreOffice / 20 Documents To PDF | |
| Huawei MateBook 13 2020 AMD | |
| Average AMD Ryzen 5 4500U (58.2 - 78, n=11) | |
| Acer Swift 3 SF314-42-R27B | |
| HP Envy x360 13-ay0010nr | |
| Acer Swift 3 SF314-42-R4XJ | |
| Lenovo ThinkPad X1 Carbon 2020-20UAS04T00 | |
| R Benchmark 2.5 / Overall mean | |
| Huawei MateBook 13 2020 AMD | |
| Dell XPS 13 9300 i5 FHD | |
| Acer Swift 3 SF314-42-R27B | |
| Lenovo ThinkPad X1 Carbon 2020-20UAS04T00 | |
| Average AMD Ryzen 5 4500U (0.614 - 0.654, n=10) | |
| Acer Swift 3 SF314-42-R4XJ | |
| HP Envy x360 13-ay0010nr | |
Cinebench R15: CPU Multi 64Bit | CPU Single 64Bit
Blender: v2.79 BMW27 CPU
7-Zip 18.03: 7z b 4 -mmt1 | 7z b 4
Geekbench 5.5: Single-Core | Multi-Core
HWBOT x265 Benchmark v2.2: 4k Preset
LibreOffice : 20 Documents To PDF
R Benchmark 2.5: Overall mean
* ... smaller is better
System Performance
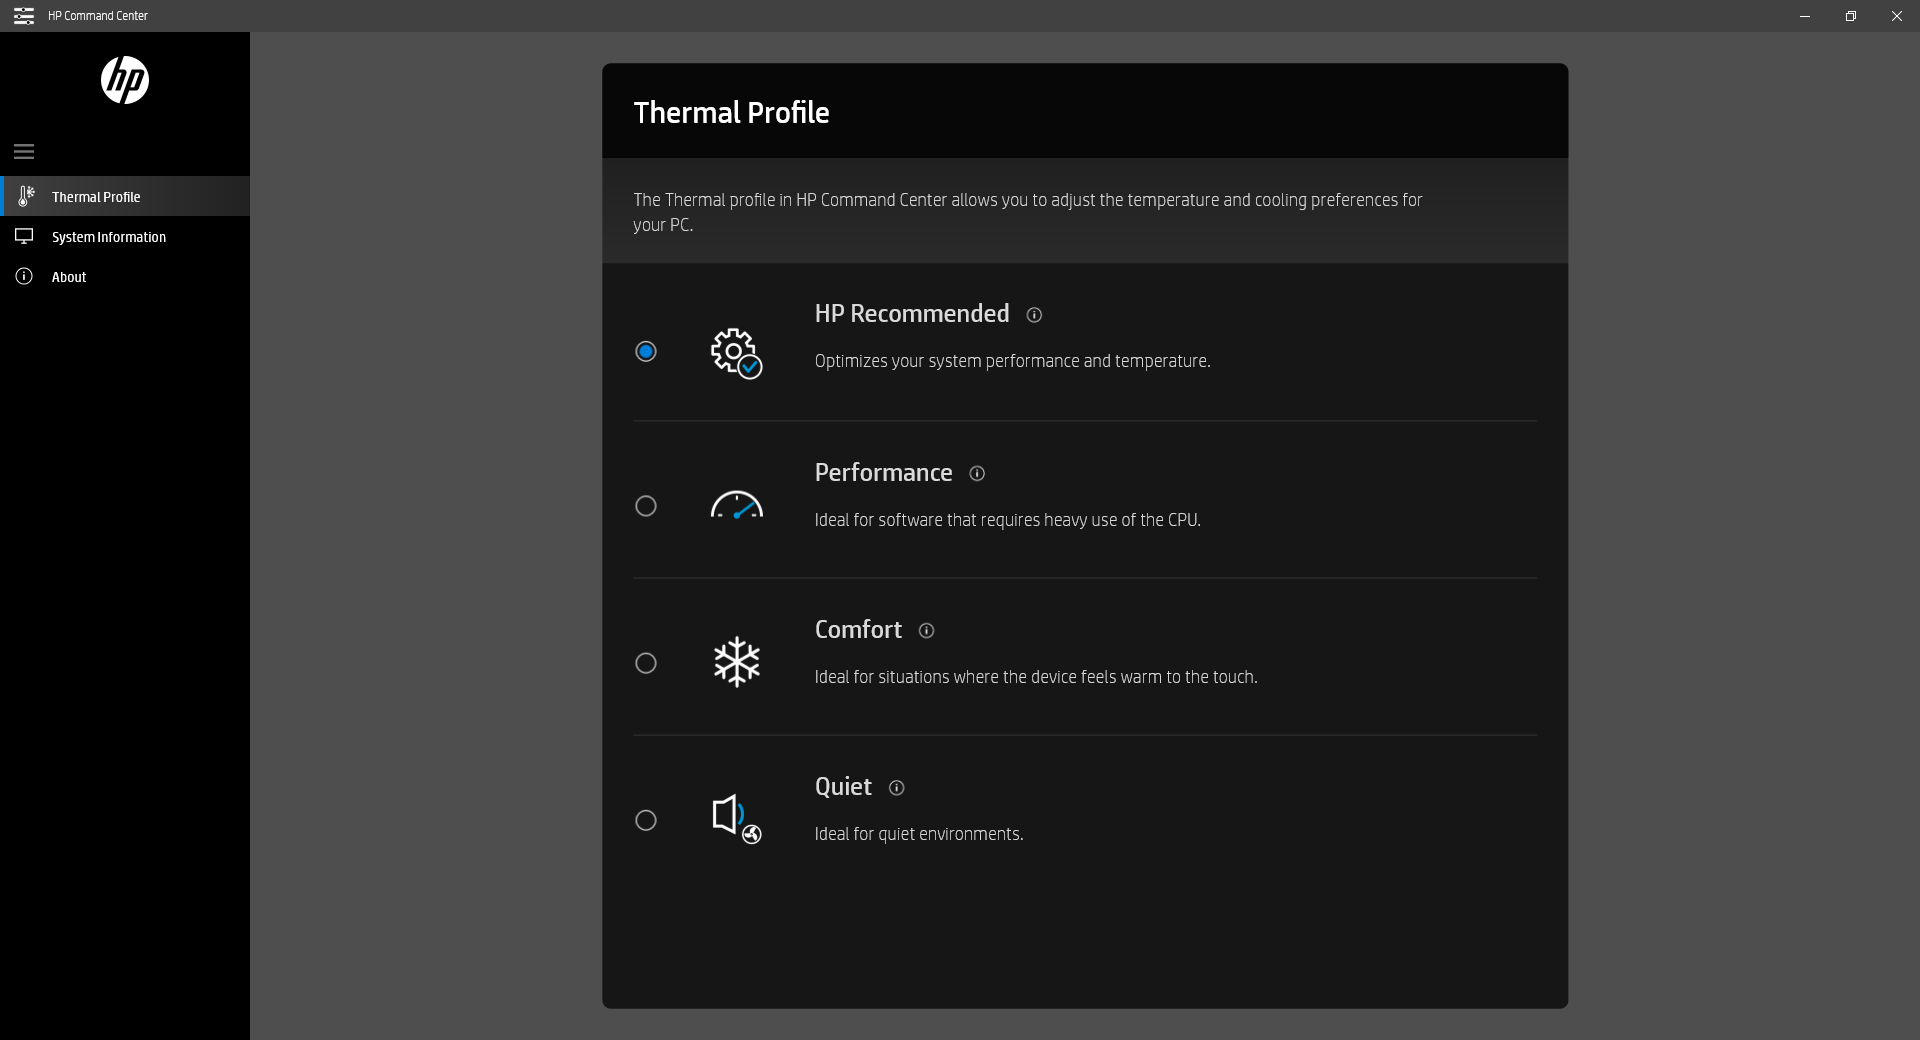
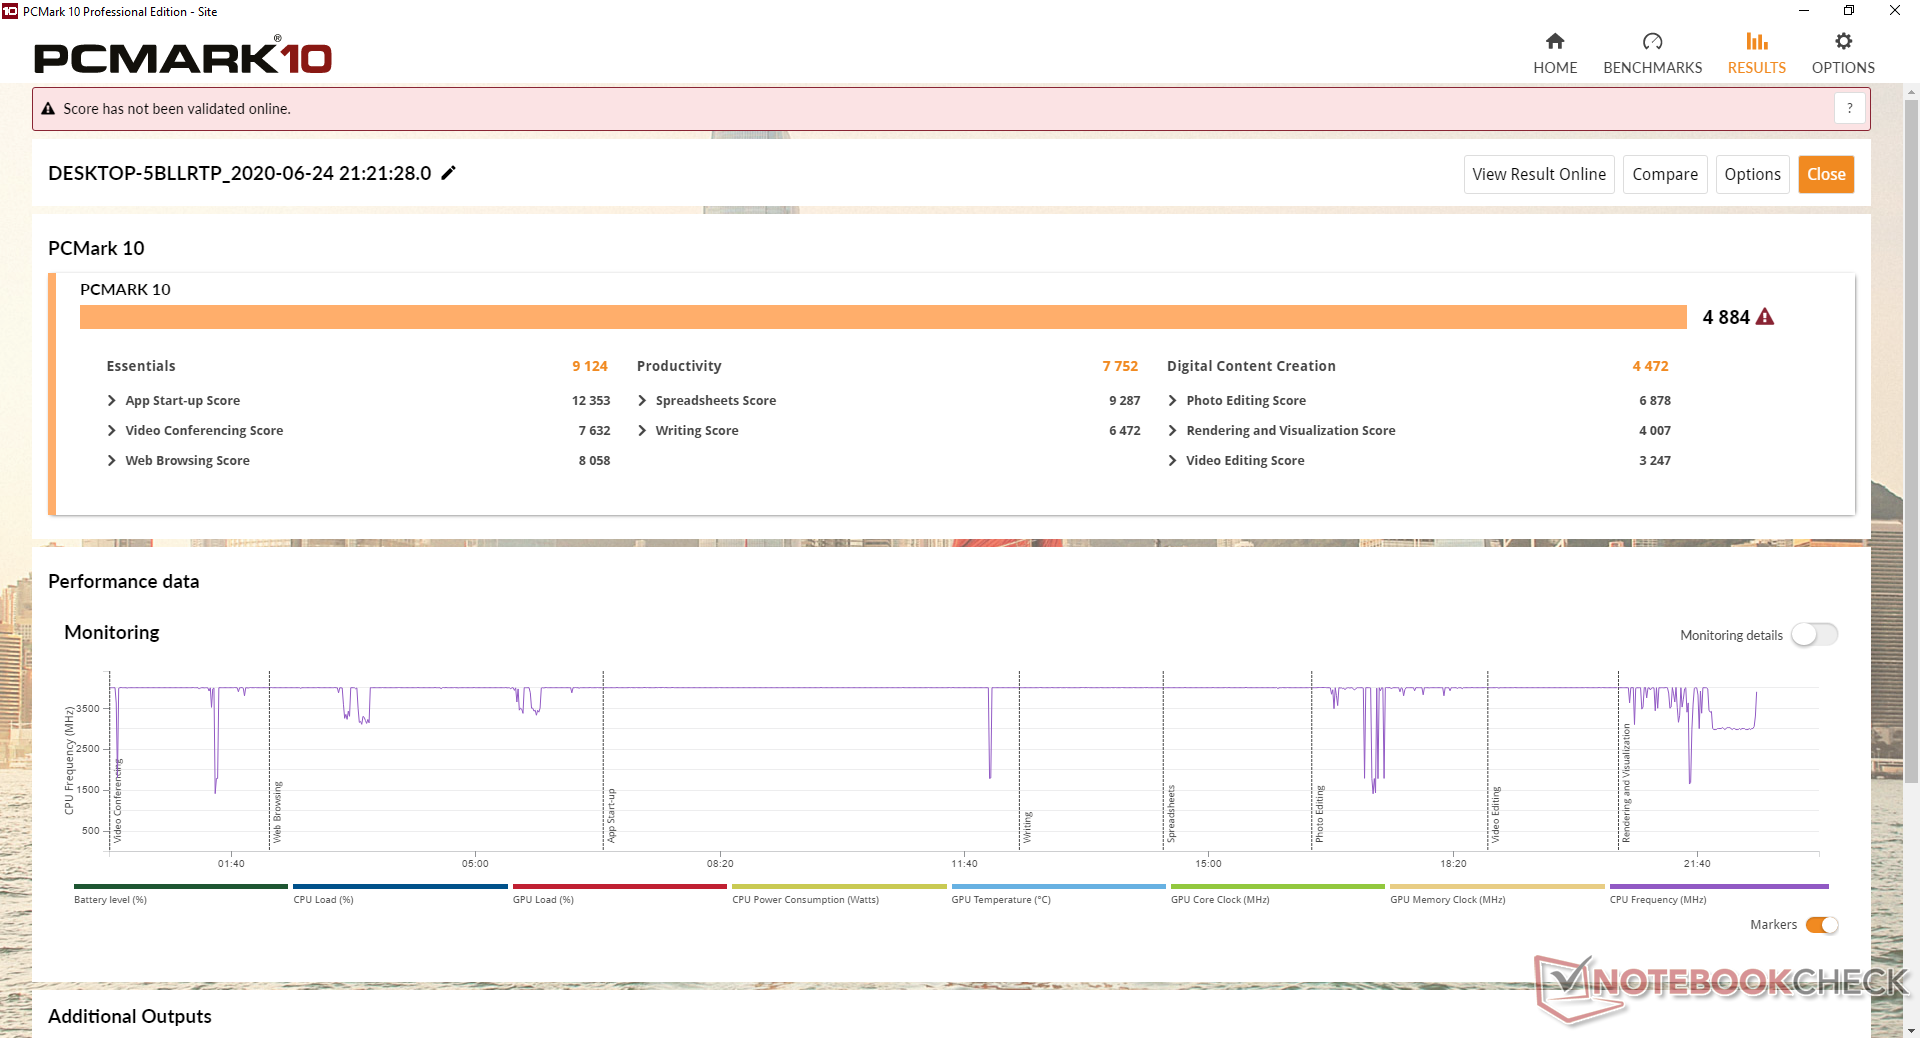
PCMark benchmarks are in line with other Ultrabooks powered by the pricier Intel Ice Lake Core i7 CPU, if not slightly higher. We recommend that owners become familiar with the pre-installed HP Command Center software as its settings directly influence both the performance and fan noise of the system.
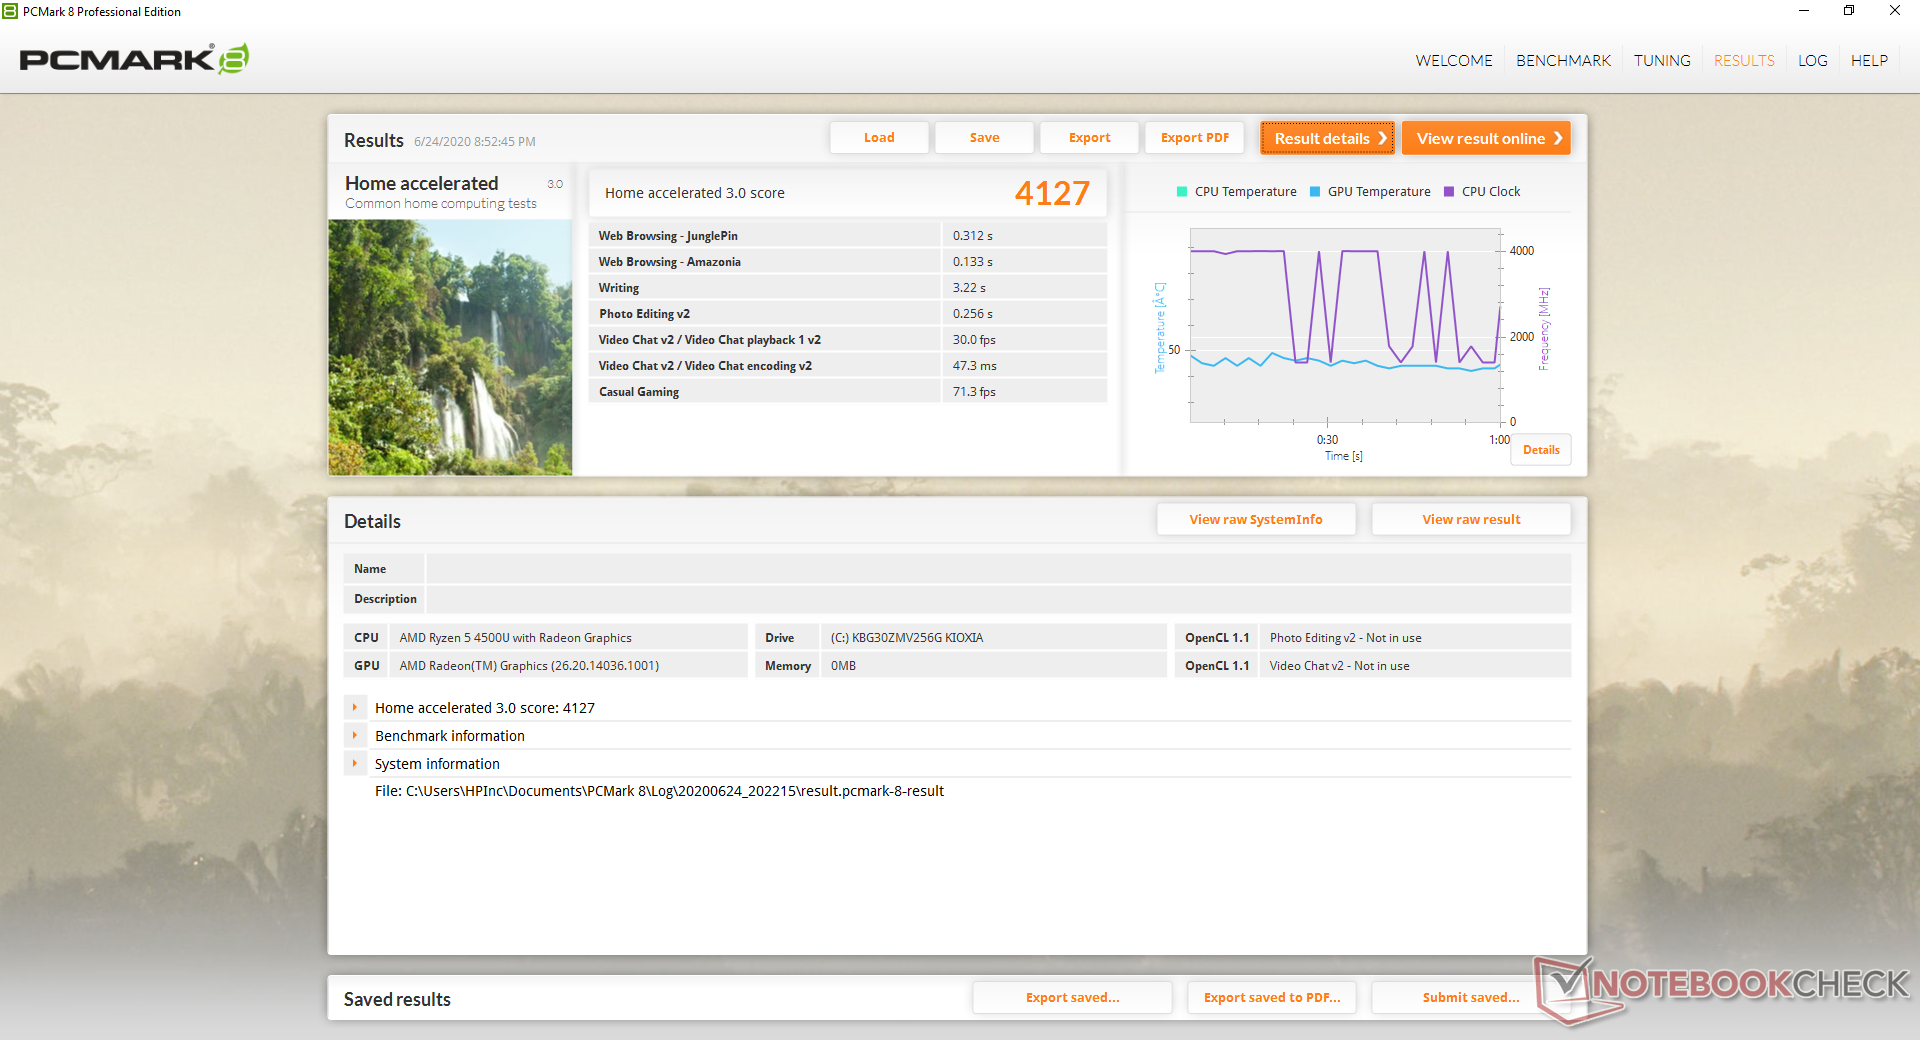
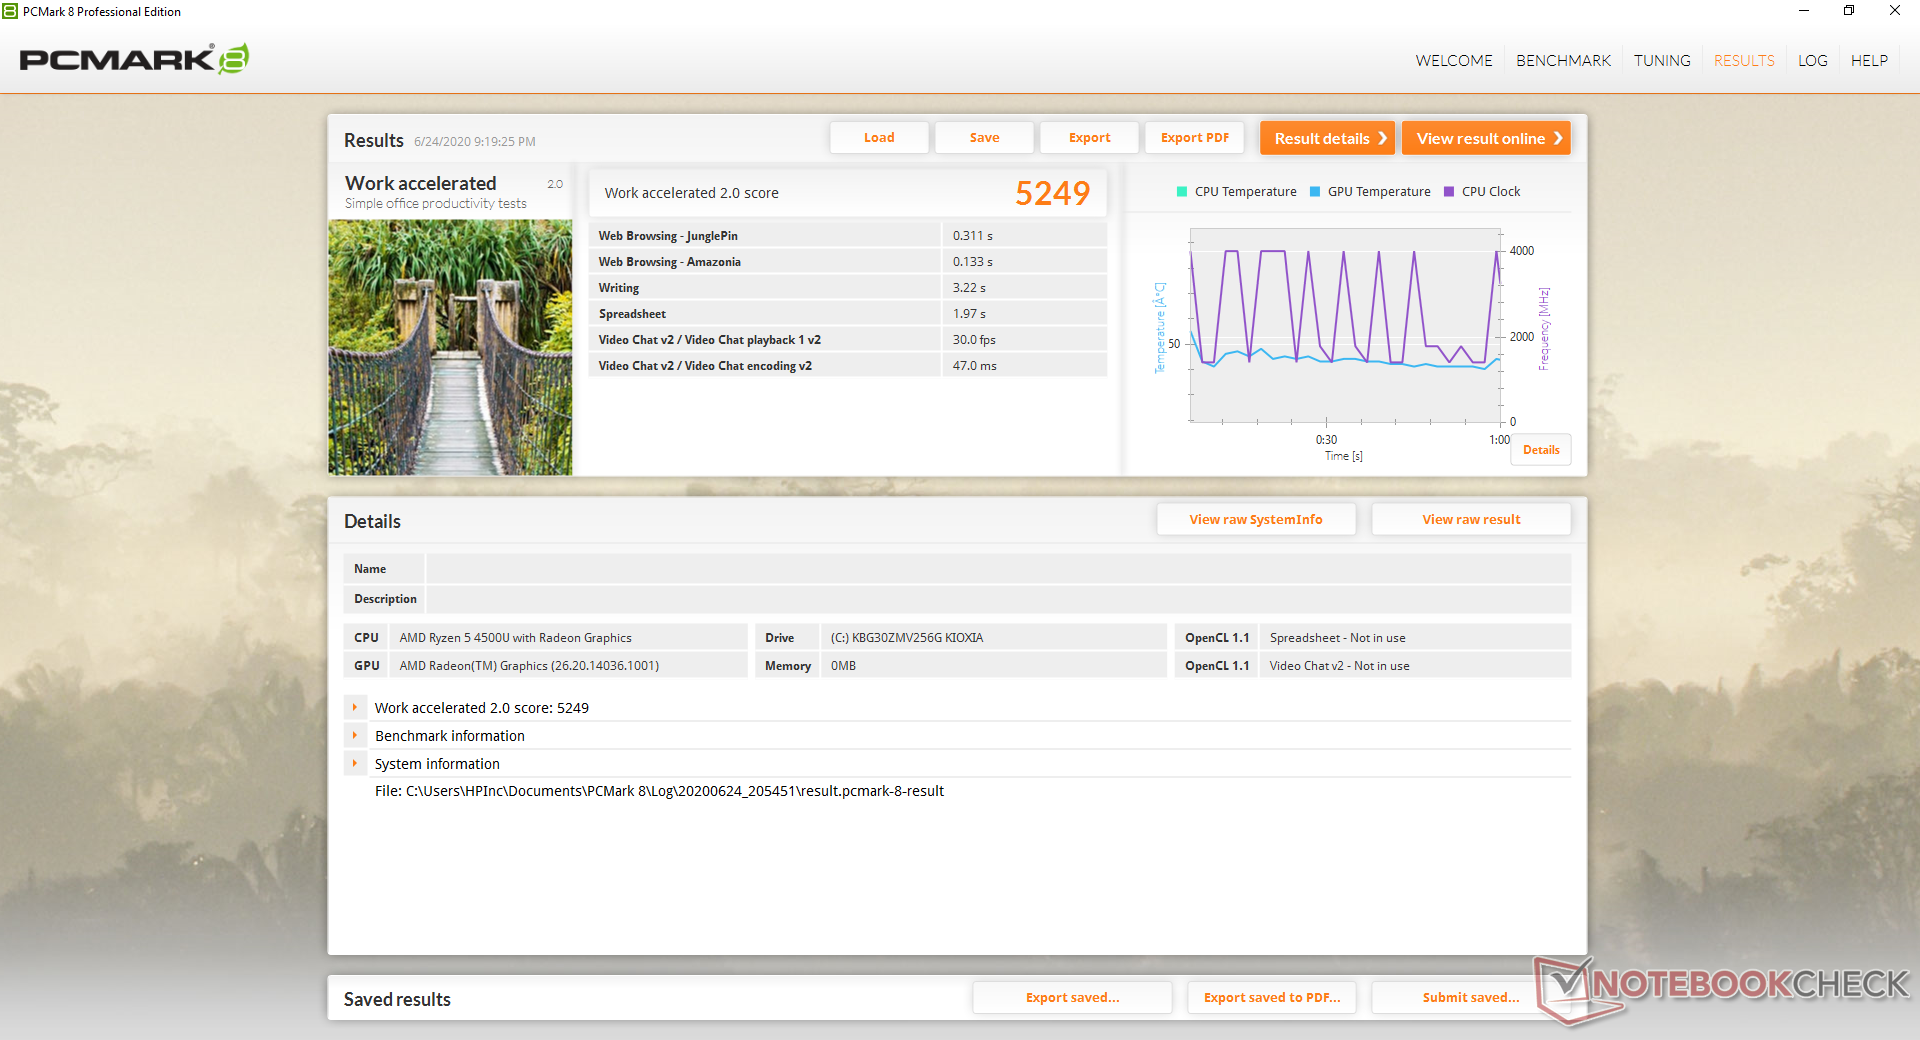
| PCMark 8 Home Score Accelerated v2 | 4127 points | |
| PCMark 8 Work Score Accelerated v2 | 5249 points | |
| PCMark 10 Score | 4884 points | |
Help | ||
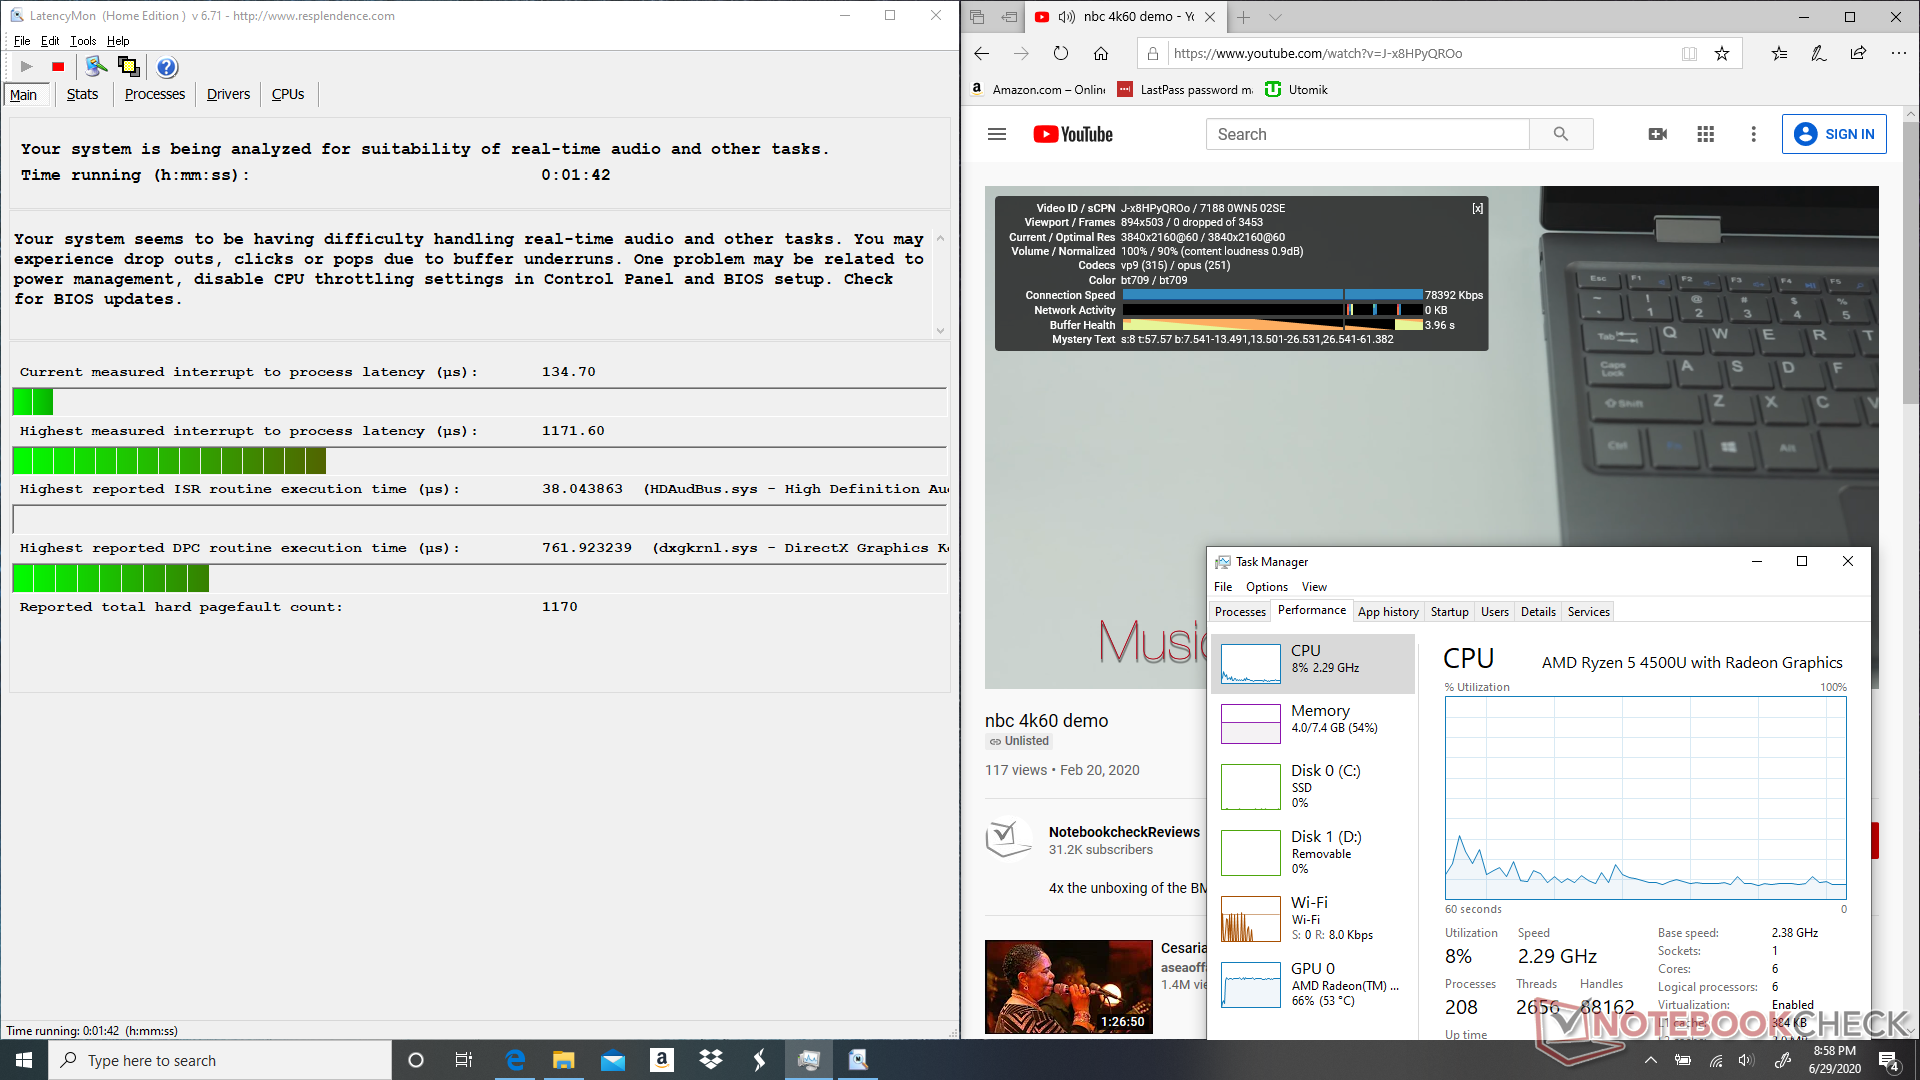
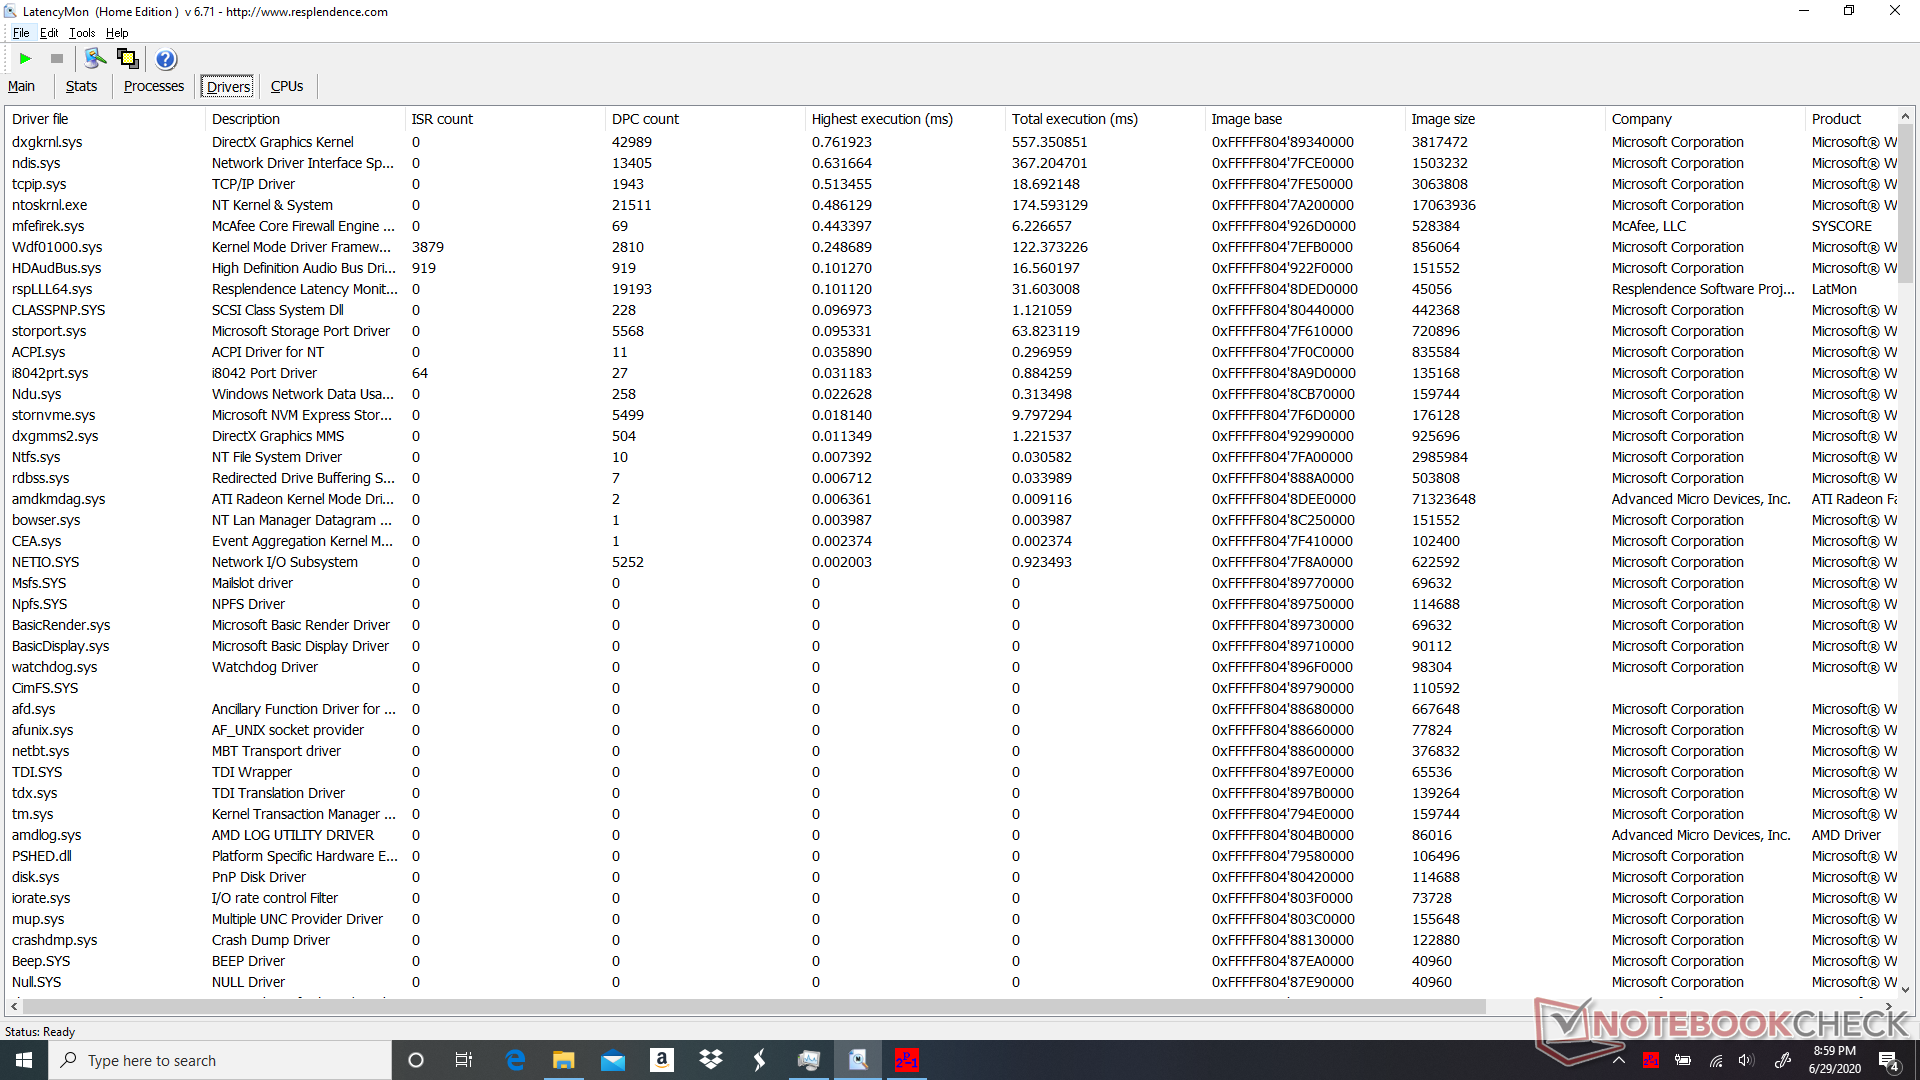
DPC Latency
LatencyMon shows some minor latency issues when opening multiple tabs on our homepage. 4K video playback on YouTube is broken when using the pre-installed AMD drivers that shipped with our unit. Updating the drivers as explained here, however, fixes the issue.
| DPC Latencies / LatencyMon - interrupt to process latency (max), Web, Youtube, Prime95 | |
| Dell XPS 15 9500 Core i7 4K UHD | |
| Razer Blade Stealth Core i7 GTX 1650 Ti Max-Q 4K | |
| HP Envy x360 13-ay0010nr | |
| Asus VivoBook 17 S712FA-DS76 | |
* ... smaller is better
Storage Devices
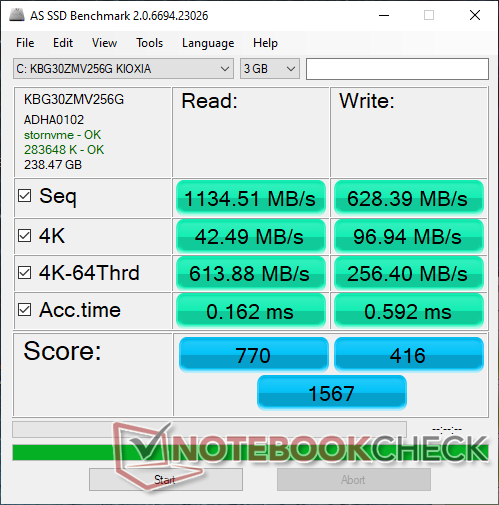
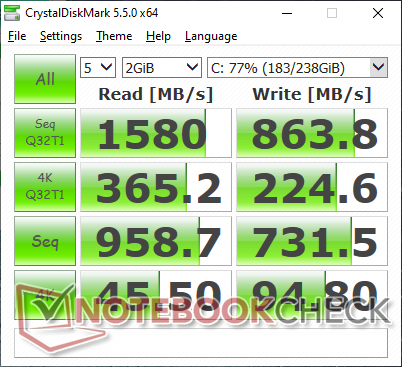
Our test unit comes with a 256 GB Toshiba PCIe x2 M.2 drive as opposed to the SK Hynix drive on our 2019 Envy x360 13 unit. Performance is otherwise comparable between these two budget NVMe drives which is just fine considering the sub $1000 price range. The more expensive Samsung PM981 series can offer over two to three times the sequential write rates of our Toshiba SSD.
See our table of SSDs and HDDs for more benchmark comparisons.
| HP Envy x360 13-ay0010nr Toshiba KBG30ZMV256G | HP Envy x360 13-ar0601ng SK Hynix BC501 HFM512GDJTNG | Dell XPS 13 7390 2-in-1 Core i7 Toshiba BG4 KBG40ZPZ512G | HP Spectre x360 13-aw0013dx Intel Optane Memory H10 with Solid State Storage 32GB + 512GB HBRPEKNX0202A(L/H) | Asus ZenBook S13 UX392FN WDC PC SN520 SDAPNUW-512G | |
|---|---|---|---|---|---|
| AS SSD | 21% | 37% | 18% | 86% | |
| Seq Read (MB/s) | 1135 | 1412 24% | 1801 59% | 1039 -8% | 1224 8% |
| Seq Write (MB/s) | 628 | 540 -14% | 1125 79% | 310.1 -51% | 907 44% |
| 4K Read (MB/s) | 42.49 | 32.24 -24% | 39.7 -7% | 76 79% | 41.46 -2% |
| 4K Write (MB/s) | 96.9 | 74.7 -23% | 67 -31% | 118 22% | 126.2 30% |
| 4K-64 Read (MB/s) | 614 | 567 -8% | 1253 104% | 371.8 -39% | 1021 66% |
| 4K-64 Write (MB/s) | 256.4 | 700 173% | 209 -18% | 469.5 83% | 1251 388% |
| Access Time Read * (ms) | 0.162 | 0.049 70% | 0.069 57% | 0.067 59% | 0.053 67% |
| Access Time Write * (ms) | 0.592 | 0.048 92% | 0.625 -6% | 0.138 77% | 0.027 95% |
| Score Read (Points) | 770 | 741 -4% | 1472 91% | 552 -28% | 1185 54% |
| Score Write (Points) | 416 | 829 99% | 388 -7% | 618 49% | 1468 253% |
| Score Total (Points) | 1567 | 1913 22% | 2583 65% | 1448 -8% | 3250 107% |
| Copy ISO MB/s (MB/s) | 843 | 521 -38% | 1293 53% | 764 -9% | 1404 67% |
| Copy Program MB/s (MB/s) | 367.9 | 253.1 -31% | 560 52% | 465.8 27% | 402.4 9% |
| Copy Game MB/s (MB/s) | 727 | 392.9 -46% | 927 28% | 764 5% | 902 24% |
| CrystalDiskMark 5.2 / 6 | -1% | 46% | 44% | 53% | |
| Write 4K (MB/s) | 94.8 | 88.3 -7% | 106.7 13% | 112.6 19% | 149.2 57% |
| Read 4K (MB/s) | 45.5 | 34.84 -23% | 49.94 10% | 131 188% | 47.18 4% |
| Write Seq (MB/s) | 732 | 740 1% | 1223 67% | 458.9 -37% | 750 2% |
| Read Seq (MB/s) | 959 | 985 3% | 1801 88% | 1355 41% | 1137 19% |
| Write 4K Q32T1 (MB/s) | 224.6 | 313.7 40% | 325.3 45% | 341.3 52% | 749 233% |
| Read 4K Q32T1 (MB/s) | 365.2 | 243.1 -33% | 551 51% | 320.6 -12% | 478.7 31% |
| Write Seq Q32T1 (MB/s) | 864 | 846 -2% | 1224 42% | 1219 41% | 1453 68% |
| Read Seq Q32T1 (MB/s) | 1580 | 1783 13% | 2350 49% | 2462 56% | 1713 8% |
| Write 4K Q8T8 (MB/s) | 305.7 | ||||
| Read 4K Q8T8 (MB/s) | 698 | ||||
| Total Average (Program / Settings) | 10% /
13% | 42% /
40% | 31% /
28% | 70% /
74% |
* ... smaller is better

Disk Throttling: DiskSpd Read Loop, Queue Depth 8
GPU Performance
Graphics performance is roughly on par with the discrete 10 W GeForce MX150 or integrated Intel Iris Plus G7 commonly found on newer Ultrabooks according to 3DMark benchmarks. Real-world performance in games, however, will vary greatly depending on drivers and compatibility as 3DMark never tells the whole story between GPUs of different manufacturers and architectures. Based on experience, integrated AMD Radeon Vega GPUs are well-optimized for popular undemanding games like DOTA 2, LoL, or Rocket League.
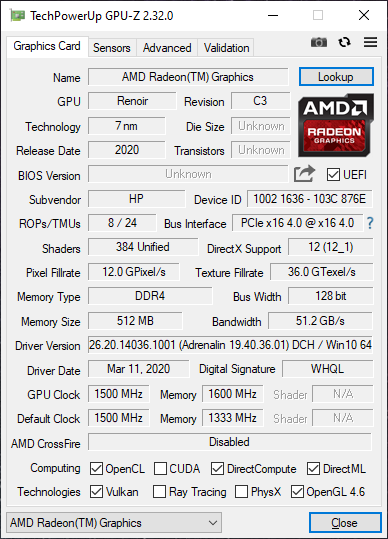
See our dedicated page on the Radeon RX Vega 6 for more technical information and benchmarks.
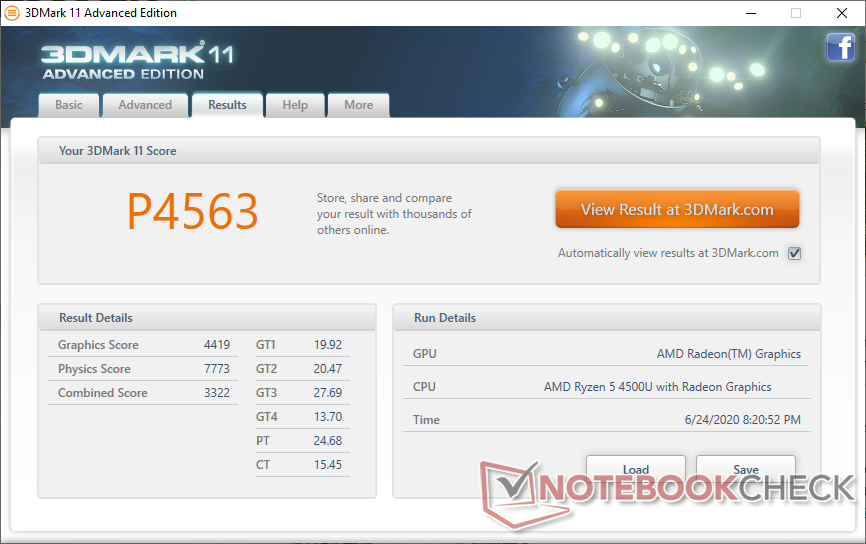
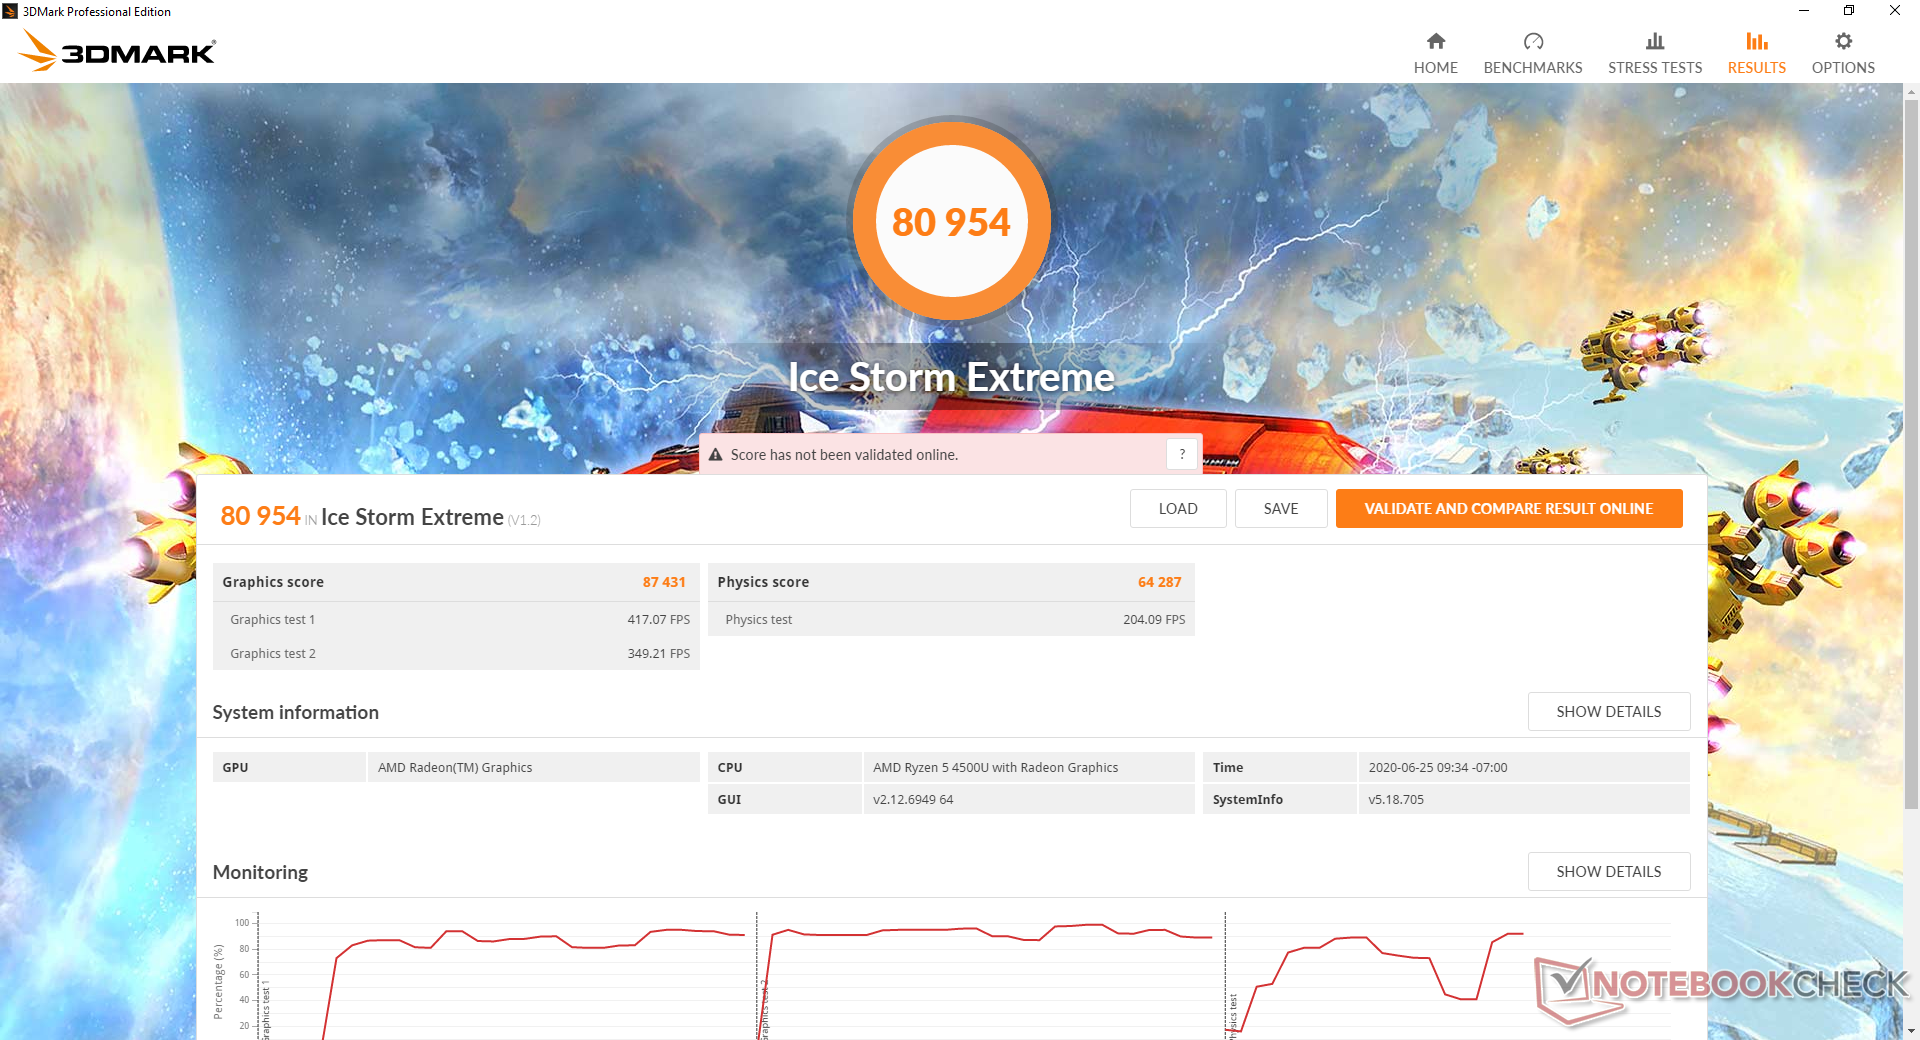
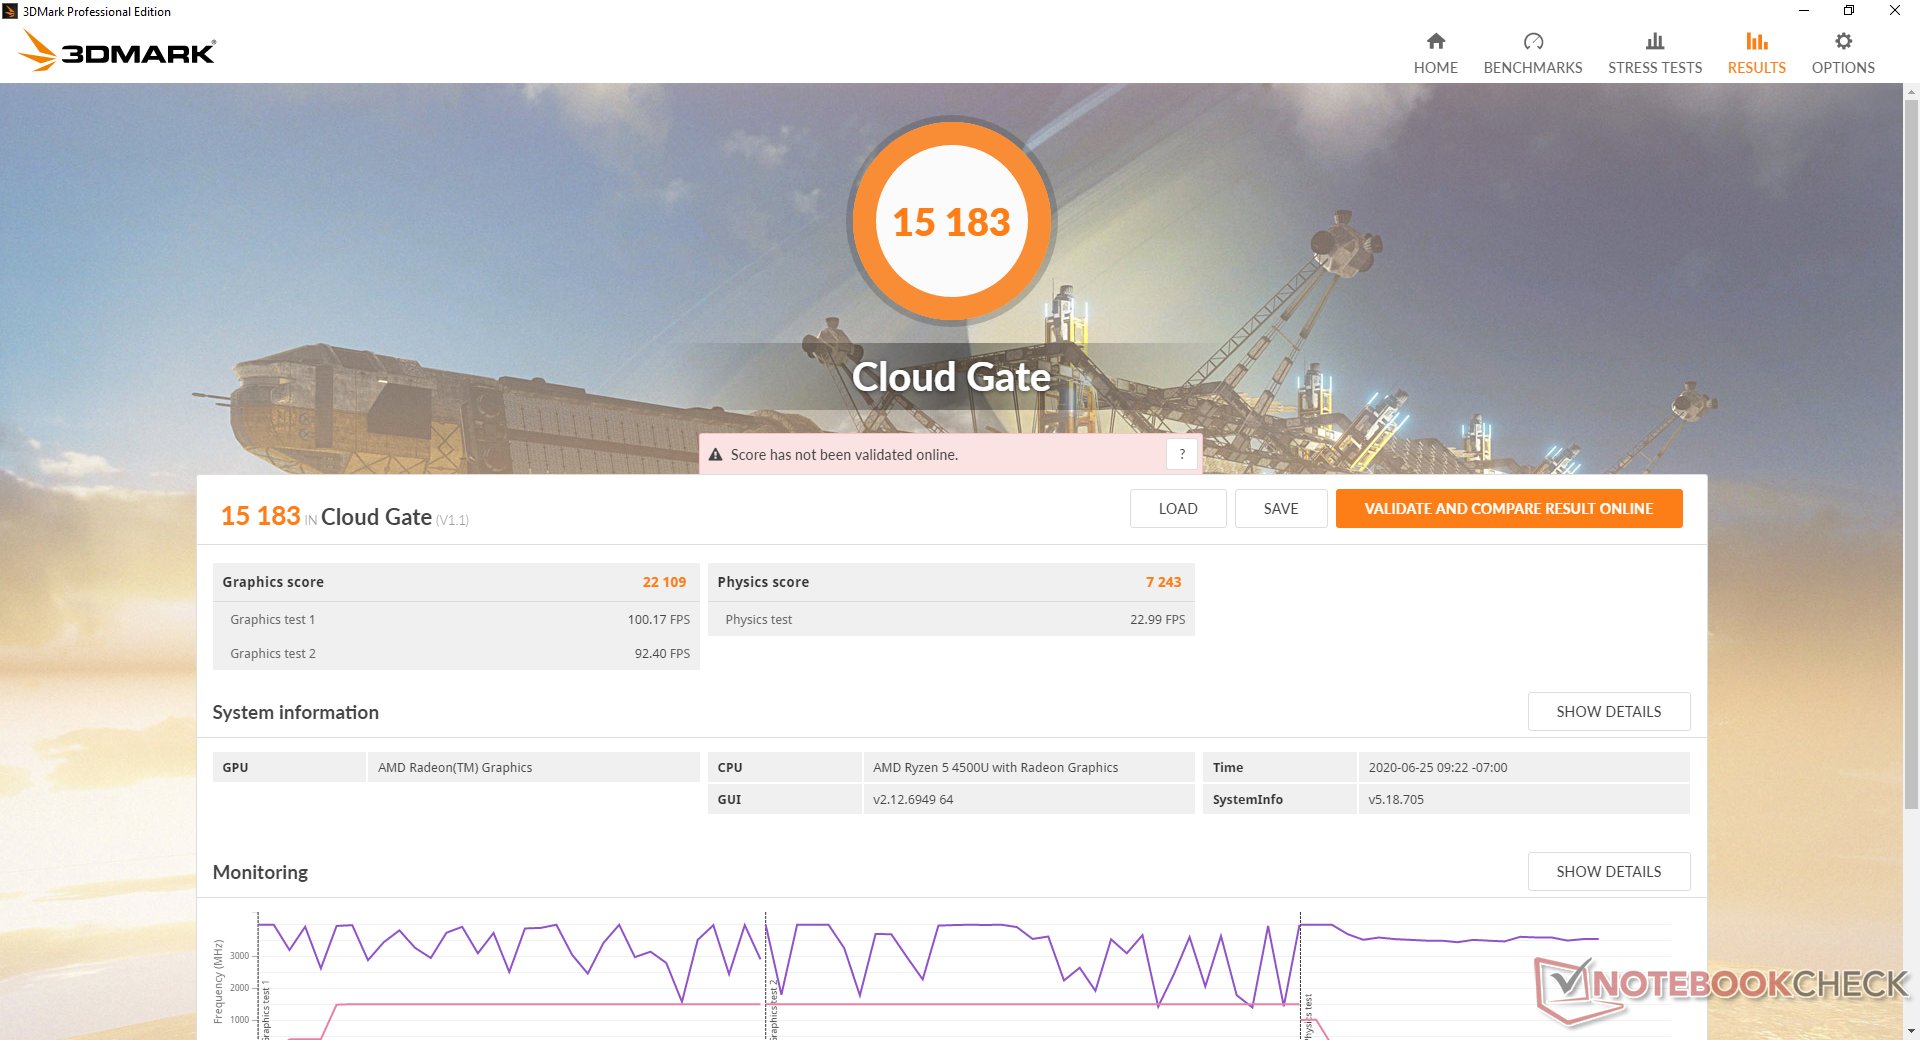
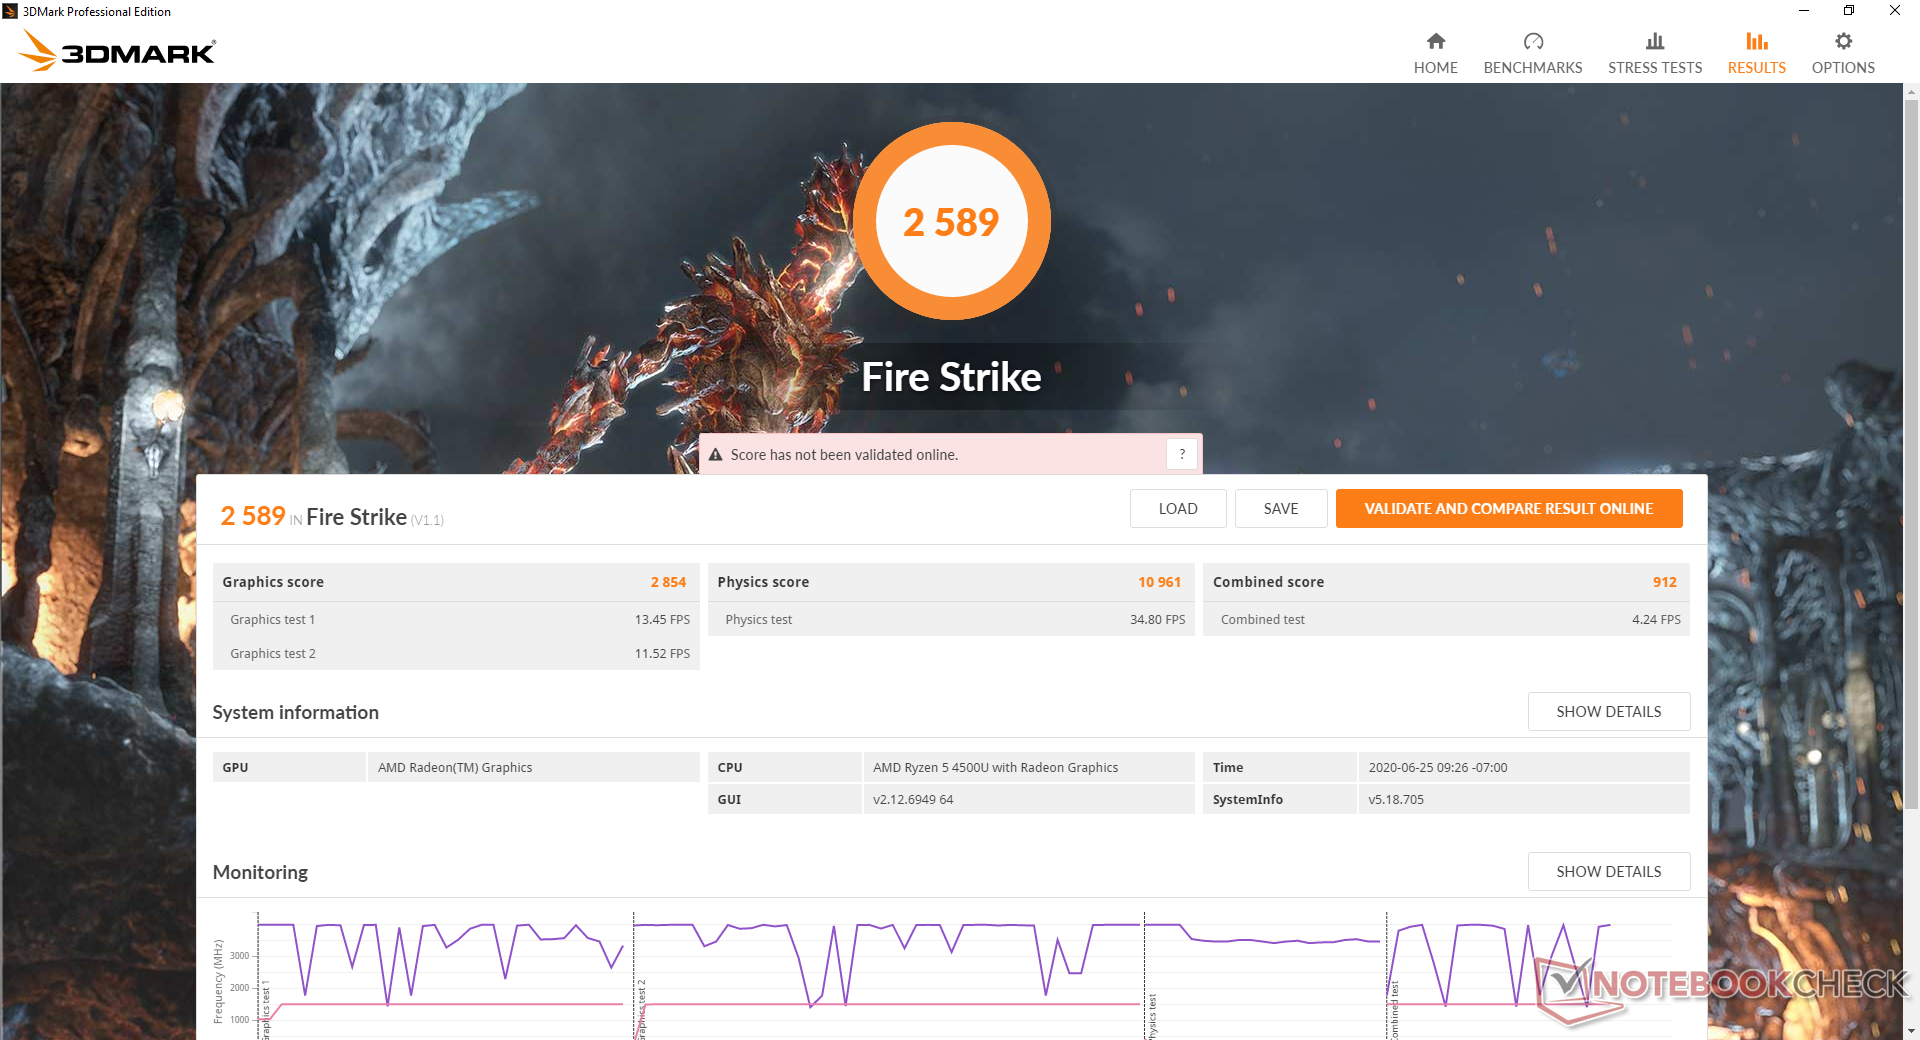
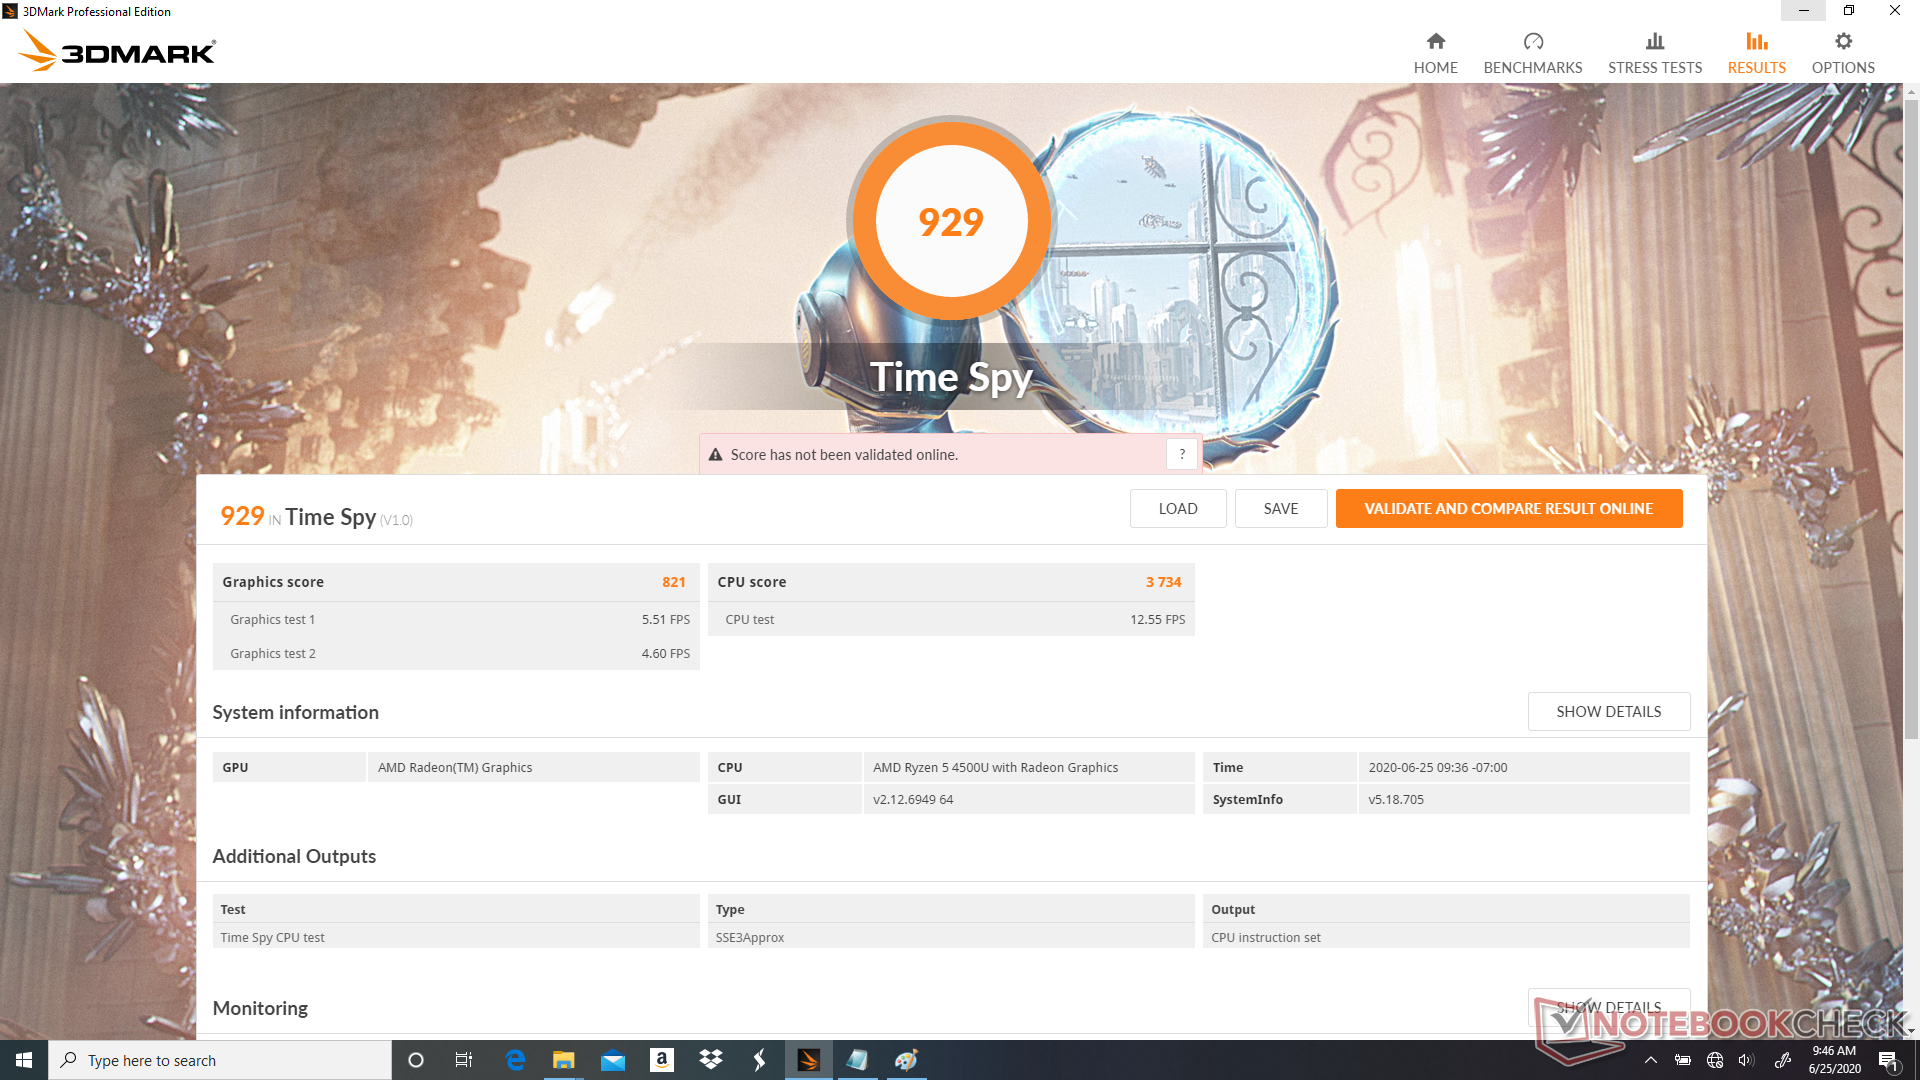
| 3DMark 11 Performance | 4563 points | |
| 3DMark Cloud Gate Standard Score | 15183 points | |
| 3DMark Fire Strike Score | 2589 points | |
| 3DMark Time Spy Score | 929 points | |
Help | ||
When idling on Witcher 3 at Low 768p settings for an hour, frame rates start out strong at around 53 FPS before falling and cycling between 46 FPS and 50 FPS every minute or so. It's an undesirable behavior likely due to the dynamic clock rates between the CPU and GPU when both are under load. Luckily, FreeSync will eliminate the screen tearing that is usually associated with such frame rate fluctuations.
| low | med. | high | ultra | |
|---|---|---|---|---|
| The Witcher 3 (2015) | 56.4 | 16.6 | 10.6 | |
| Dota 2 Reborn (2015) | 95.1 | 75.6 | 46.3 | 43.3 |
| X-Plane 11.11 (2018) | 39.1 | 30.1 | 26.8 |
Emissions
System Noise
Fan noise is quiet when idling on desktop, but it ramps up rather quickly to the low-to-mid 30 dB(A) range when browsing or video streaming on the HP Recommended power profile. When running the first 90-second benchmark scene of 3DMark 06, fan noise would climb to 41 dB(A) halfway into the test. Results are comparable to what we observed on last year's Envy x360 13 and the Asus ZenBook S13. The Dell XPS 13 7390 2-in-1 is able to remain quieter for longer than the HP.
The system fan will pulse more frequently if HP Command Center is set to Performance mode. Keep the laptop in Recommended, Comfort, or Quiet mode to limit performance and lower the fan noise ceiling.
| HP Envy x360 13-ay0010nr Vega 6, R5 4500U, Toshiba KBG30ZMV256G | HP Envy x360 13-ar0601ng Vega 10, R7 3700U, SK Hynix BC501 HFM512GDJTNG | Dell XPS 13 7390 2-in-1 Core i7 Iris Plus Graphics G7 (Ice Lake 64 EU), i7-1065G7, Toshiba BG4 KBG40ZPZ512G | HP Spectre x360 13-aw0013dx Iris Plus Graphics G7 (Ice Lake 64 EU), i7-1065G7, Intel Optane Memory H10 with Solid State Storage 32GB + 512GB HBRPEKNX0202A(L/H) | Asus ZenBook S13 UX392FN GeForce MX150, i7-8565U, WDC PC SN520 SDAPNUW-512G | |
|---|---|---|---|---|---|
| Noise | -8% | 4% | 7% | 1% | |
| off / environment * (dB) | 28 | 30.5 -9% | 28.1 -0% | 28.5 -2% | 28.1 -0% |
| Idle Minimum * (dB) | 28 | 32.2 -15% | 28.1 -0% | 28.5 -2% | 28.1 -0% |
| Idle Average * (dB) | 28 | 32.2 -15% | 28.1 -0% | 28.5 -2% | 28.1 -0% |
| Idle Maximum * (dB) | 28.5 | 32.2 -13% | 28.1 1% | 28.5 -0% | 29 -2% |
| Load Average * (dB) | 41.1 | 40.8 1% | 31.7 23% | 28.5 31% | 41.1 -0% |
| Load Maximum * (dB) | 43.5 | 41.9 4% | 43.4 -0% | 35.3 19% | 41.1 6% |
| Witcher 3 ultra * (dB) | 43.4 | 35.3 | 41.1 |
* ... smaller is better
Noise level
| Idle |
| 28 / 28 / 28.5 dB(A) |
| Load |
| 41.1 / 43.5 dB(A) |
 | ||
30 dB silent 40 dB(A) audible 50 dB(A) loud |
||
min: | ||
Temperature
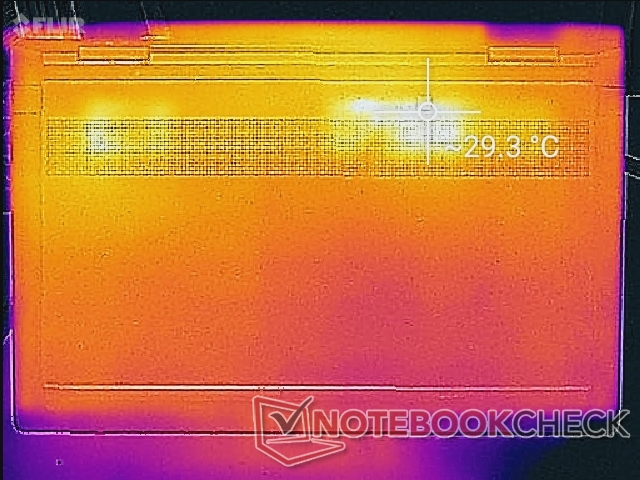
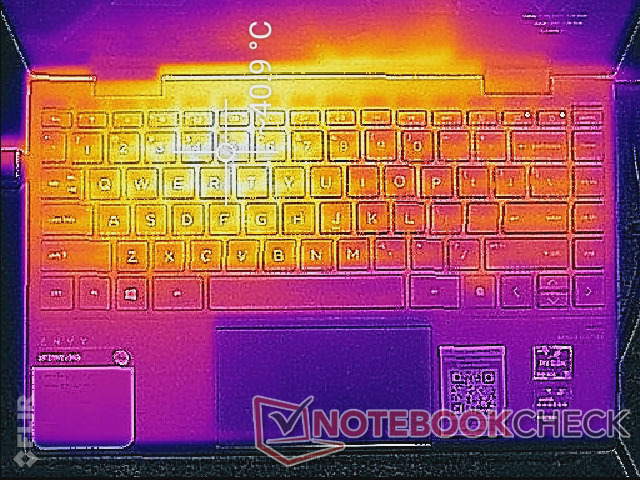
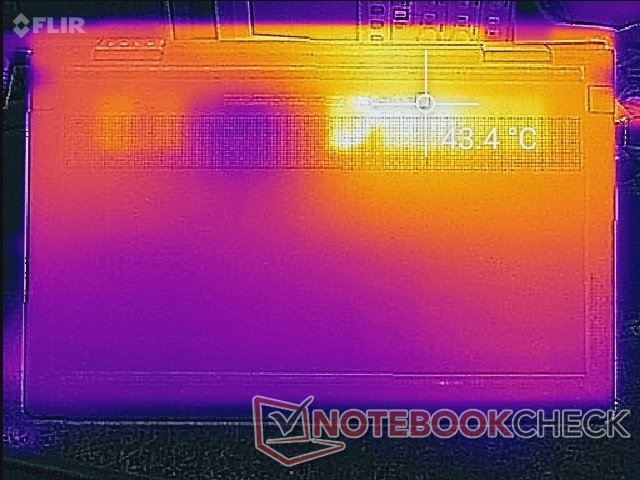
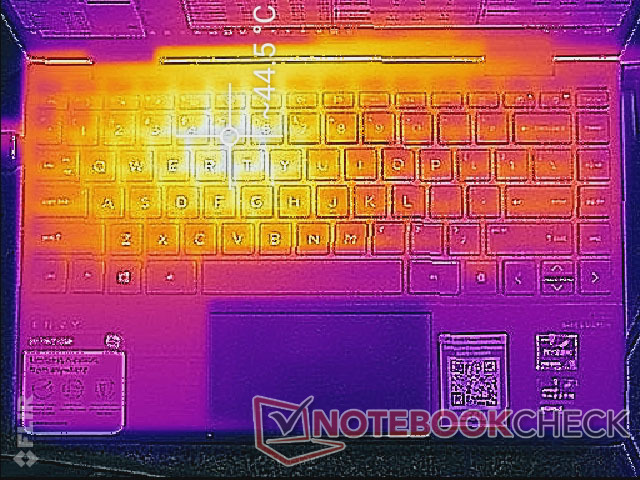
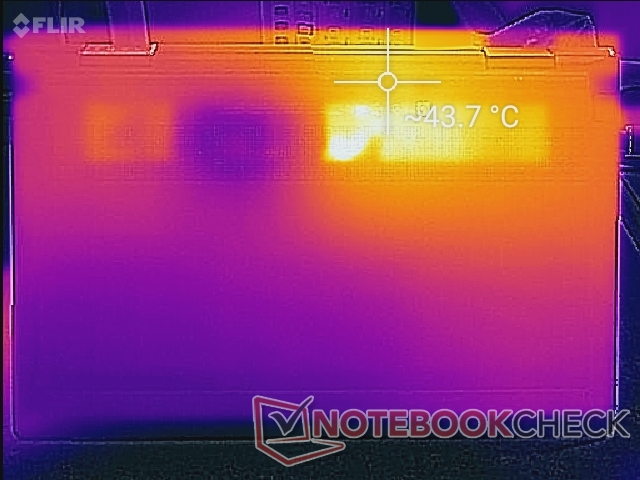
Surface temperatures are almost always warm even when simply idling on desktop likely due to very small form factor and inert fan. When under high loads like gaming, the center of the keyboard can become as warm as 45 C to be slightly cooler than what we recorded on the Dell XPS 13 7390 2-in-1 under similar conditions. Though they could be certainly be cooler, surfaces never become uncomfortably warm if simply browsing or video streaming.
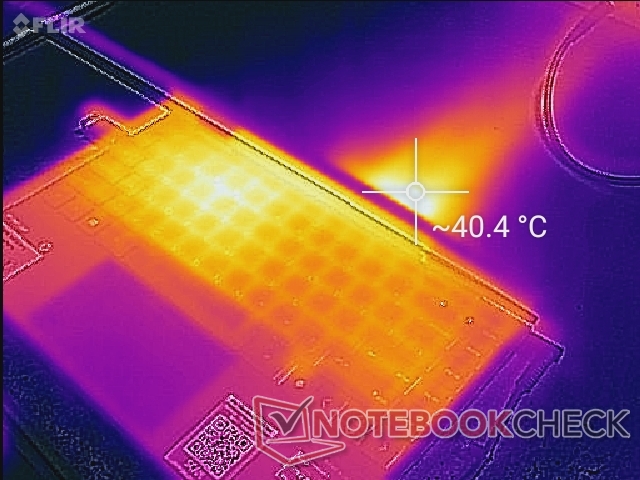

(±) The maximum temperature on the upper side is 44.8 °C / 113 F, compared to the average of 35.4 °C / 96 F, ranging from 19.6 to 60 °C for the class Convertible.
(±) The bottom heats up to a maximum of 43.8 °C / 111 F, compared to the average of 36.9 °C / 98 F
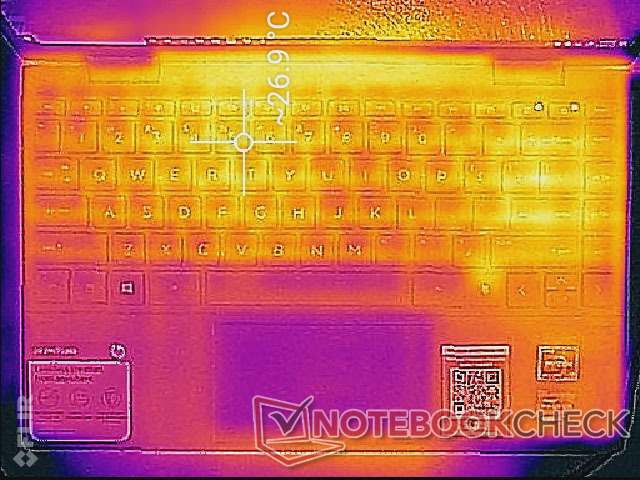
(+) In idle usage, the average temperature for the upper side is 25.9 °C / 79 F, compared to the device average of 30.3 °C / 87 F.
(±) Playing The Witcher 3, the average temperature for the upper side is 33.4 °C / 92 F, compared to the device average of 30.3 °C / 87 F.
(+) The palmrests and touchpad are cooler than skin temperature with a maximum of 30.2 °C / 86.4 F and are therefore cool to the touch.
(-) The average temperature of the palmrest area of similar devices was 28 °C / 82.4 F (-2.2 °C / -4 F).
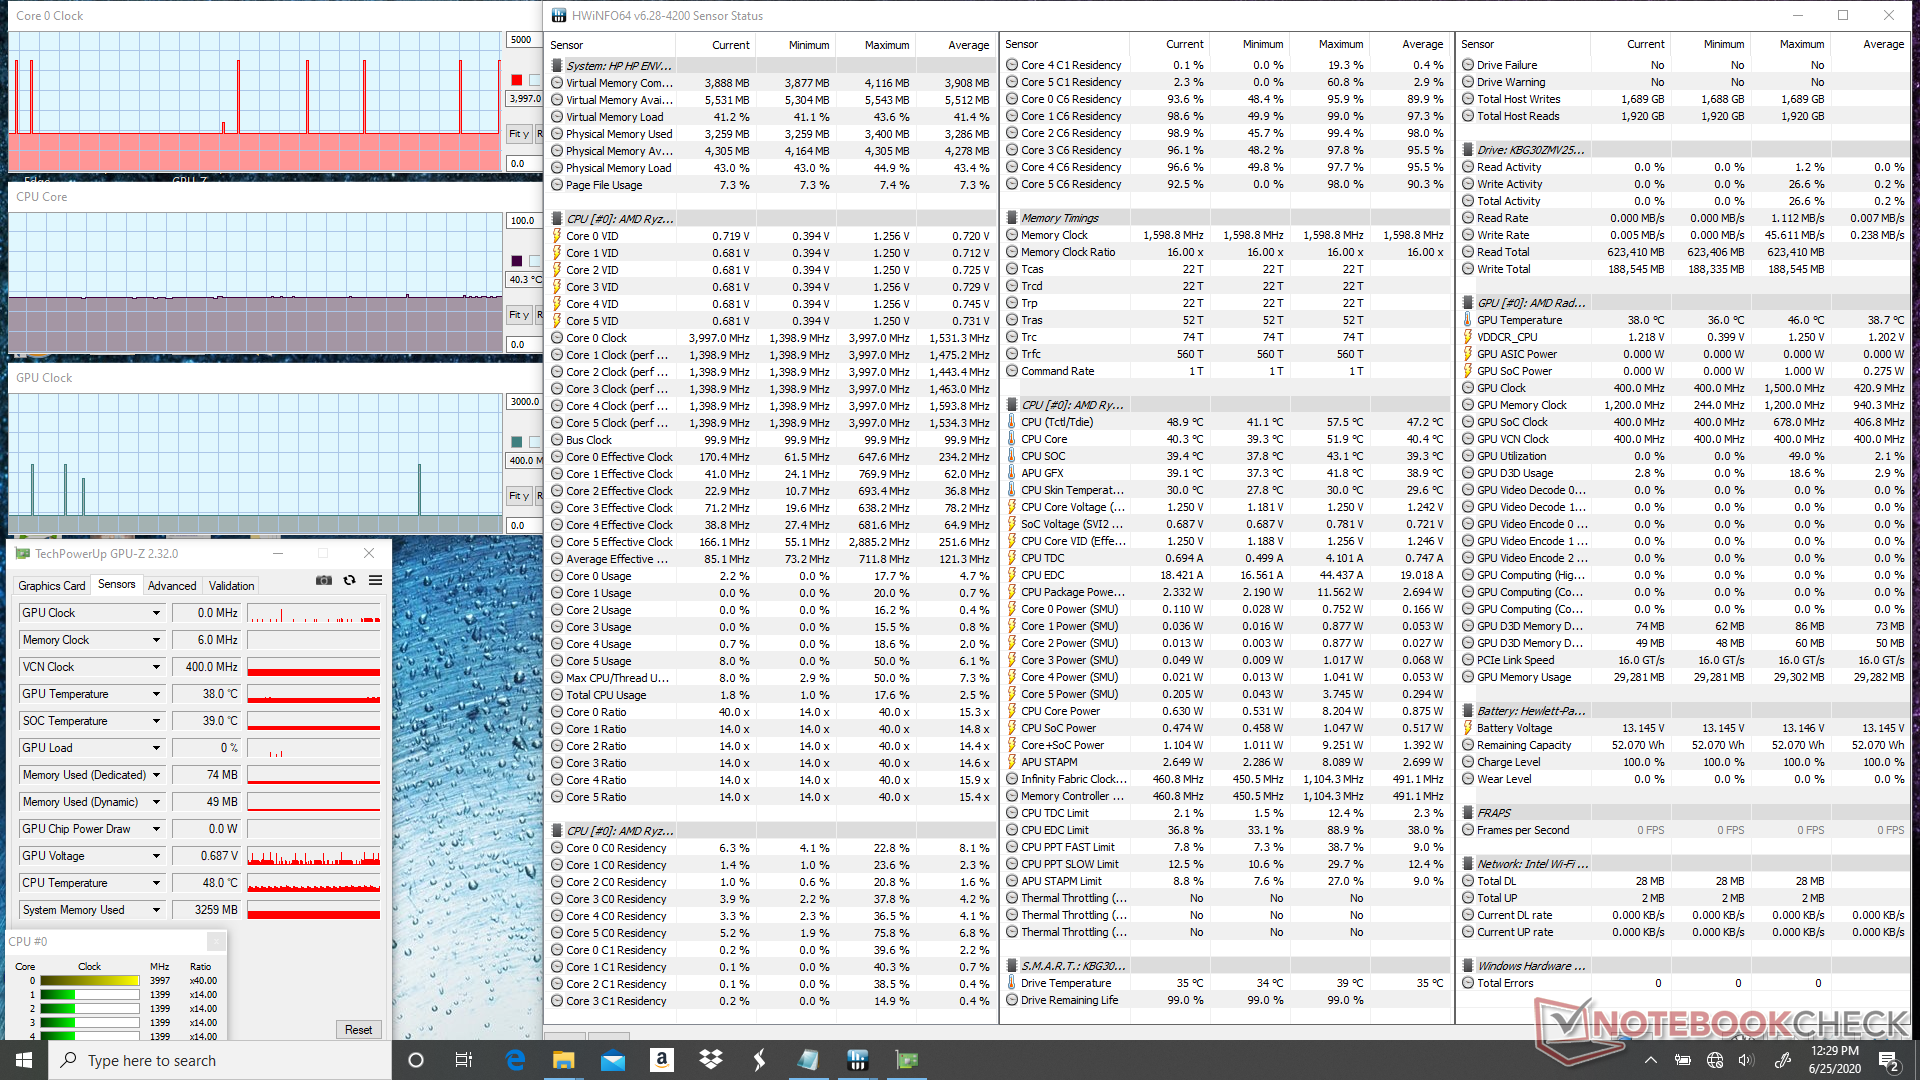
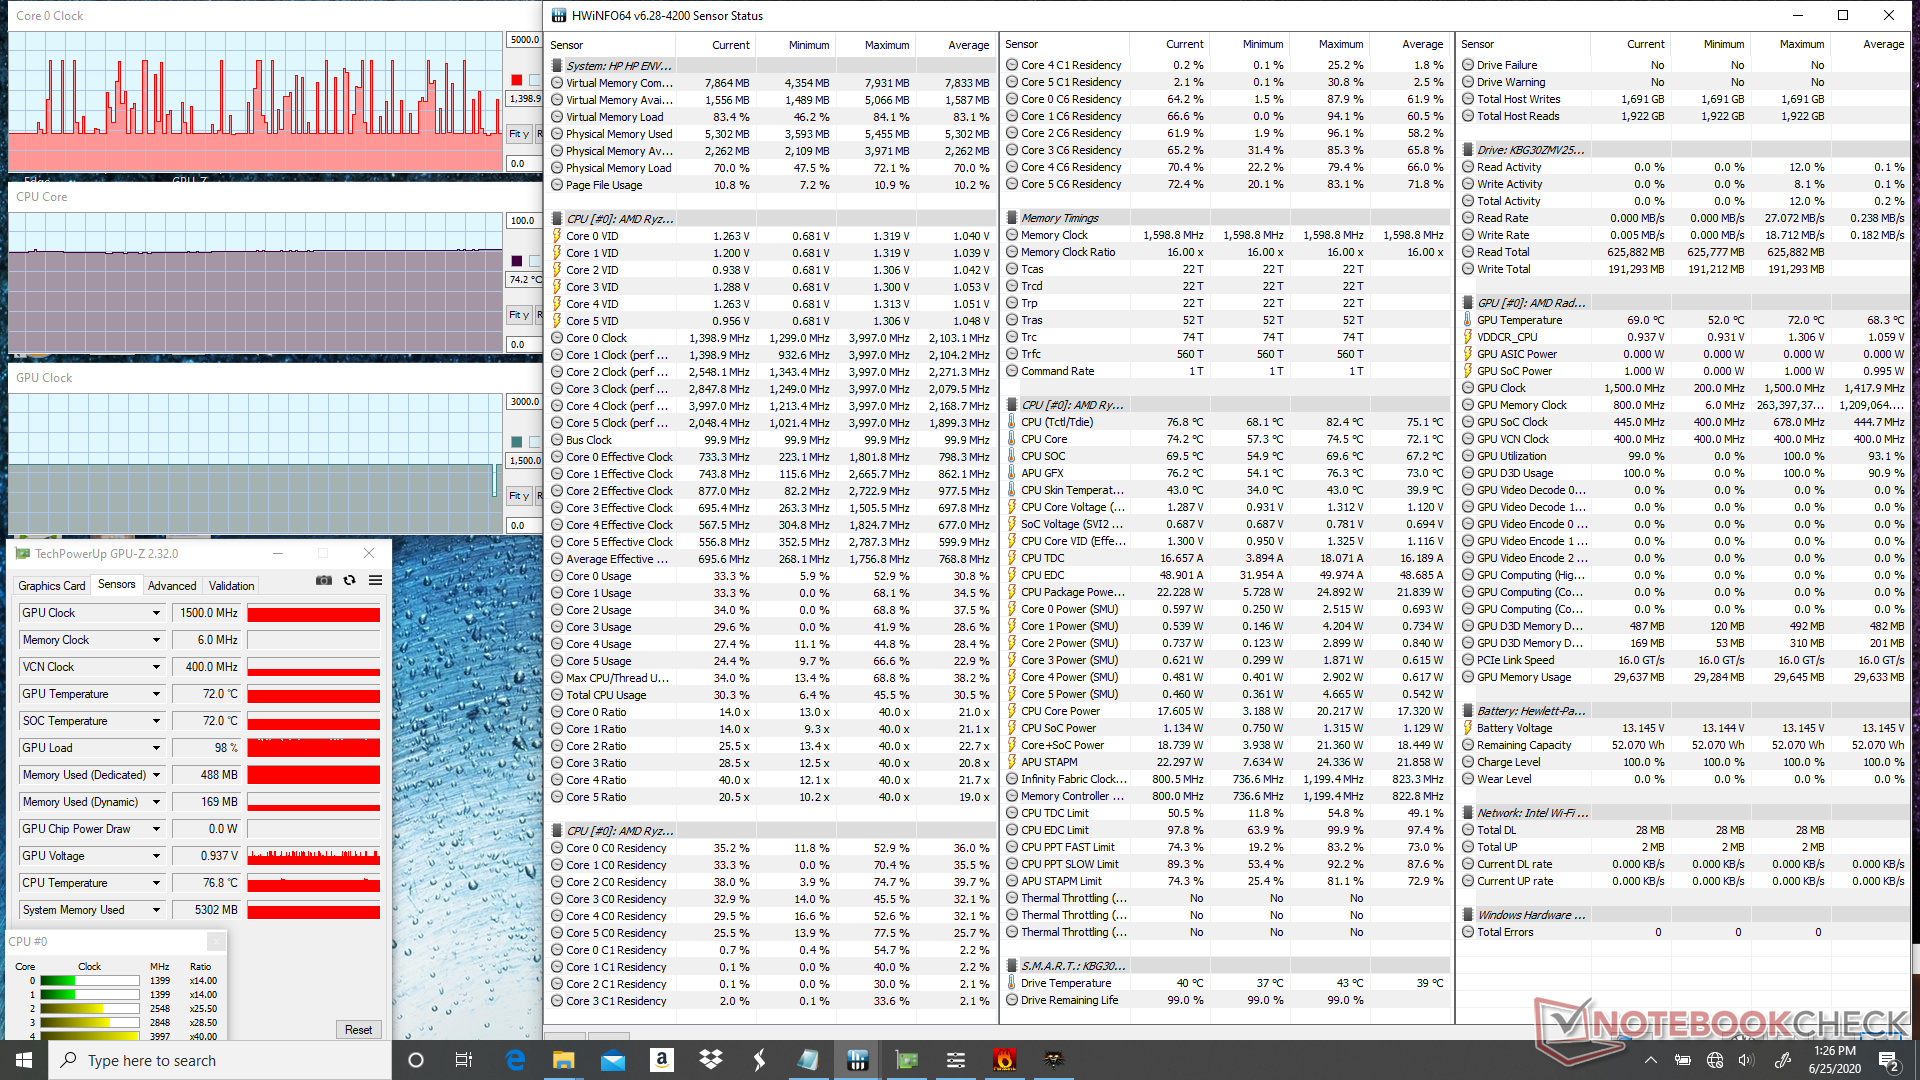
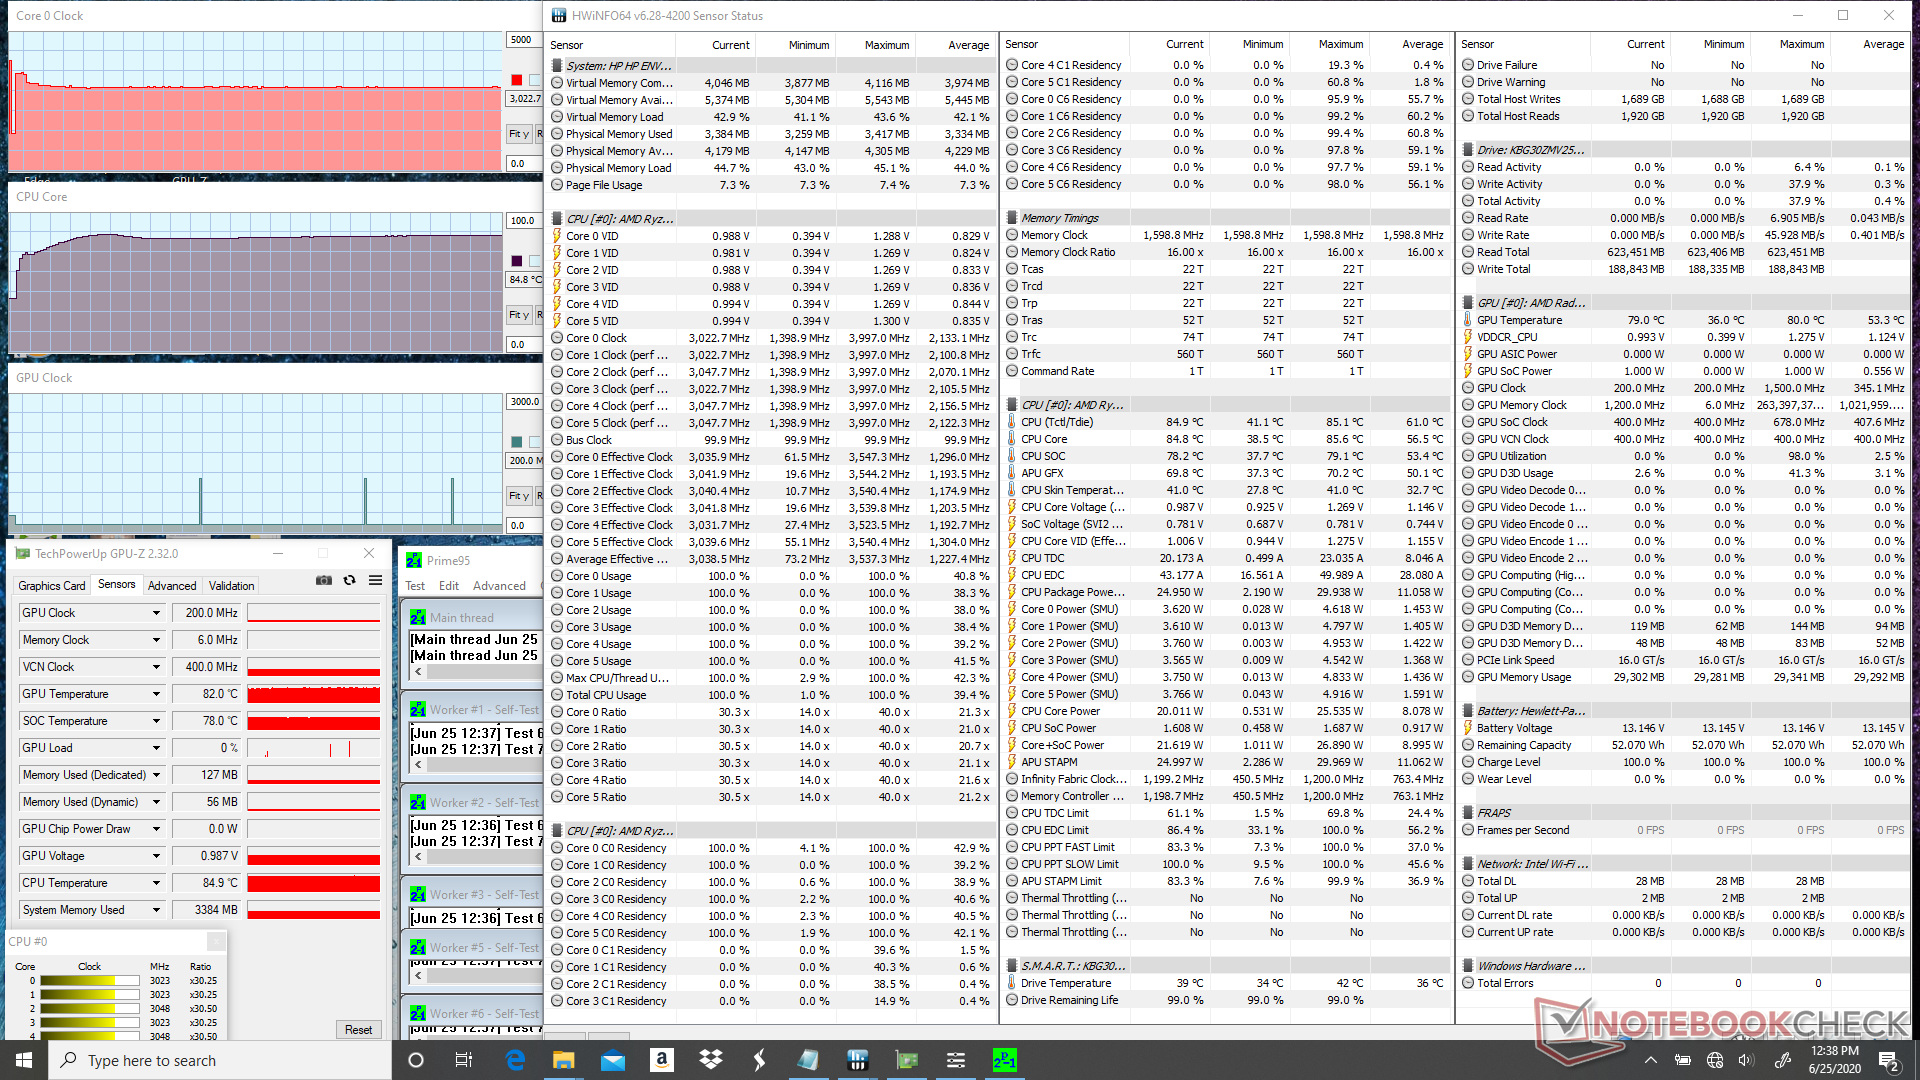
Stress Test
We stress the system with synthetic loads to identify for any potential throttling or stability issues. When running Prime95, the CPU can be observed running at up to 3.6 GHz for the first few seconds before falling and stabilizing at about 3.0 GHz and 85 C. In comparison, the Core i7 Ice Lake CPU in the XPS 13 2-in-1 would stabilize at a much warmer 99 C when under similar conditions.
Running on batteries will not limit performance by all that much. A 3DMark 11 test on battery power would return Physics and Graphics scores of 7691 and 4276 points, respectively, compared to 7773 and 4419 points when on mains.
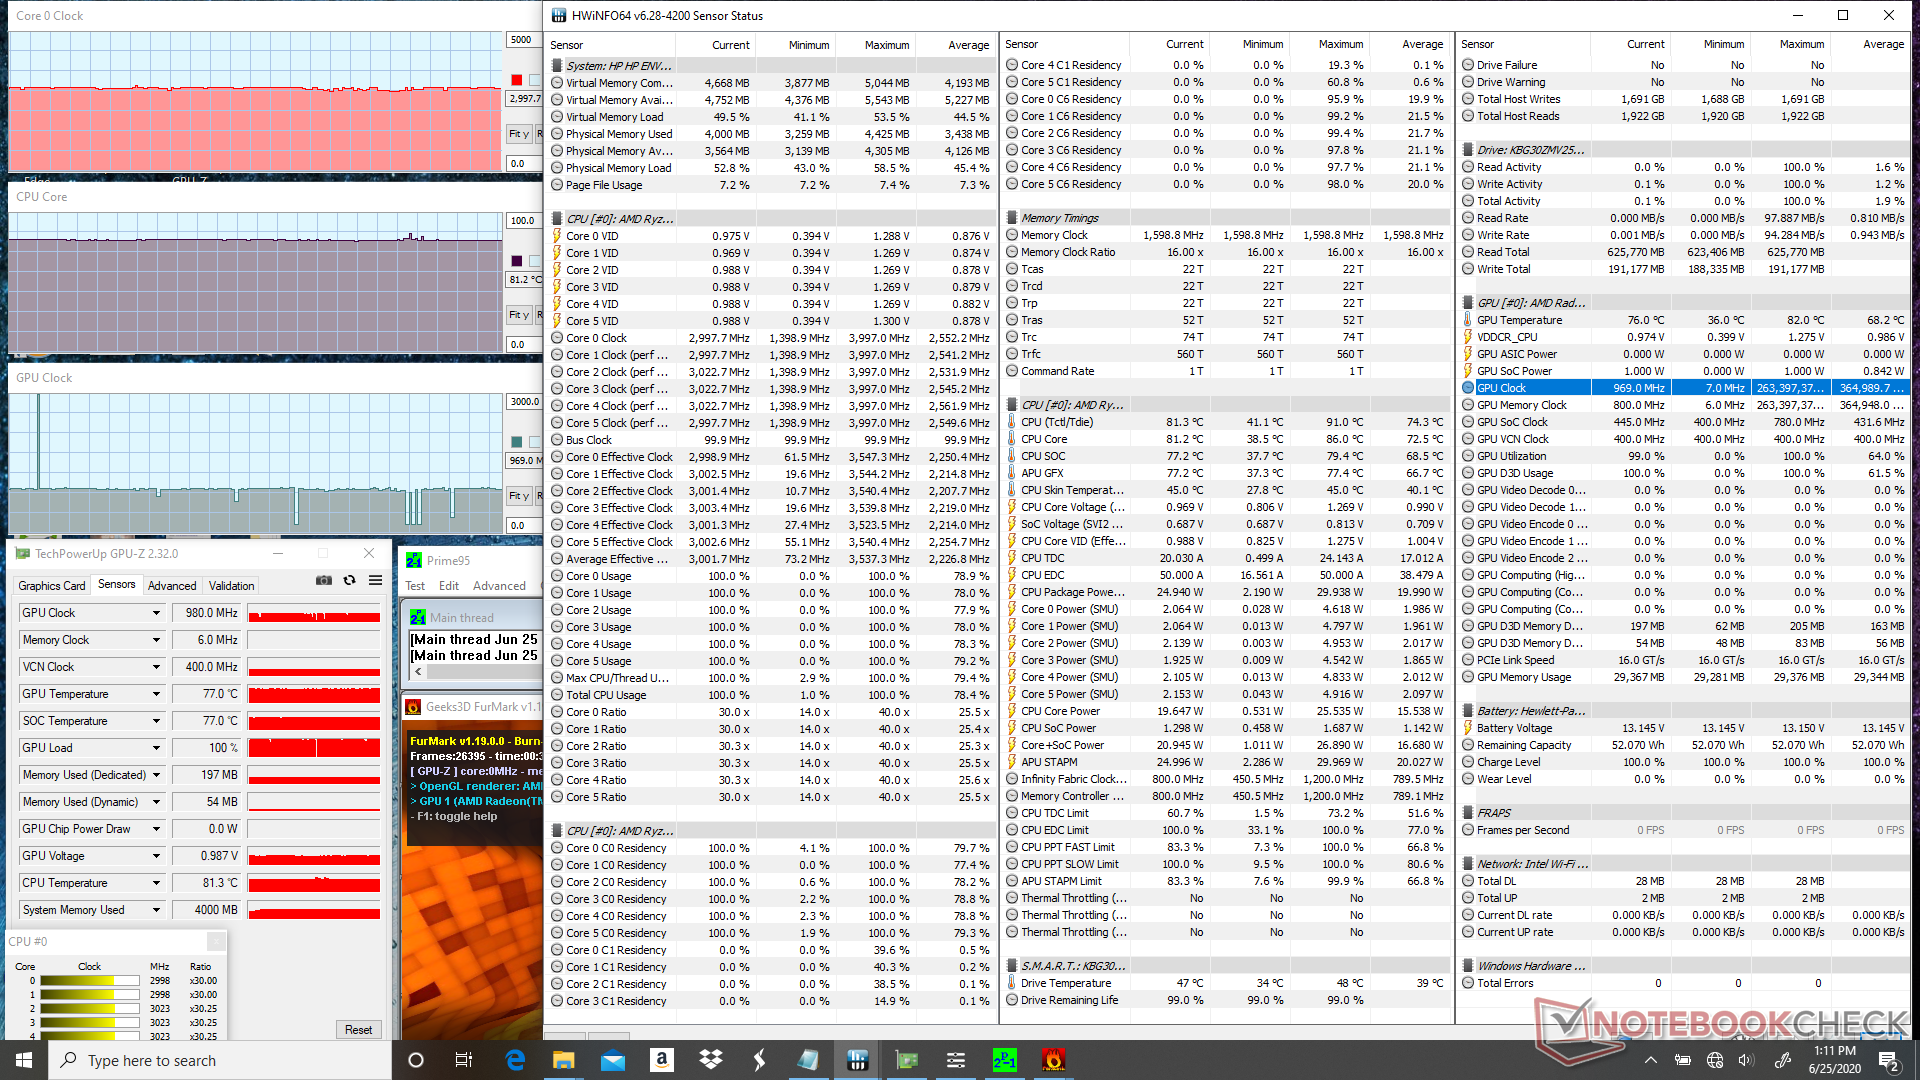
| CPU Clock (GHz) | GPU Clock (MHz) | Average CPU Temperature (°C) | |
| System Idle | -- | -- | 40 |
| Prime95 Stress | 3.0 | -- | 85 |
| Witcher 3 stress | 1.4+ | 1500 | 74 |
| Prime95 + FurMark Stress | 3.0 | 980 | 81 |
Speakers


Energy Management
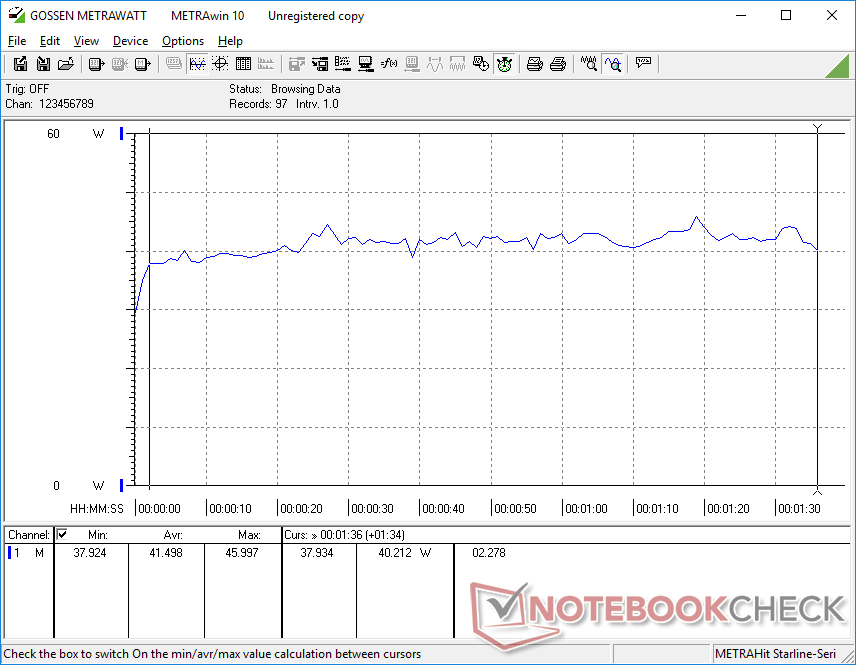
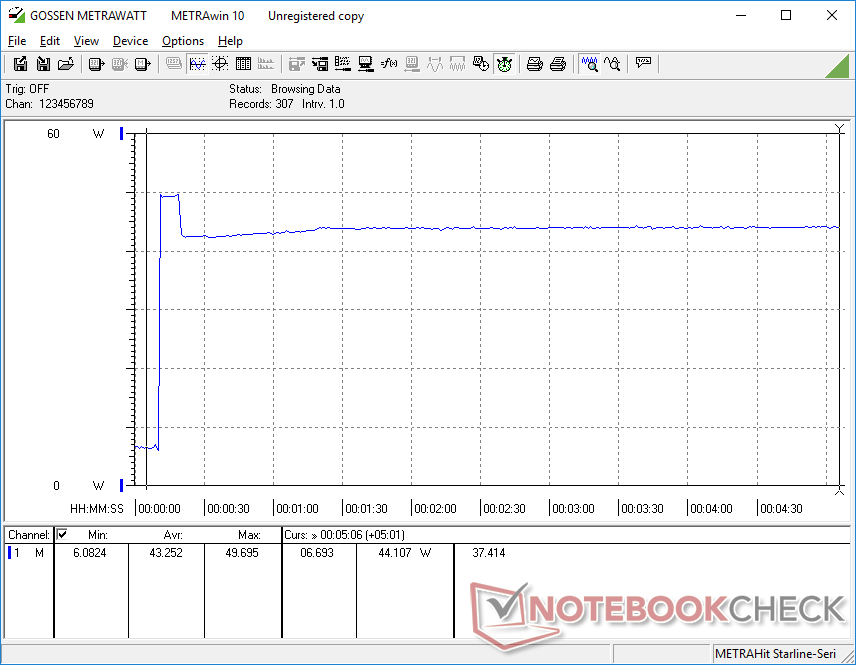
Power Consumption
Power consumption is very close to the Dell XPS 13 7390 powered by the competing Core i7-1065G7 Ice Lake CPU. Idling on desktop draws between 3 W and 6 W while gaming will draw upwards of 41 W. Consumption is generally higher than the older HP Envy x360 13 with the last generation Ryzen 7 3700U since the Ryzen 5 4500U offers significantly faster processor performance.
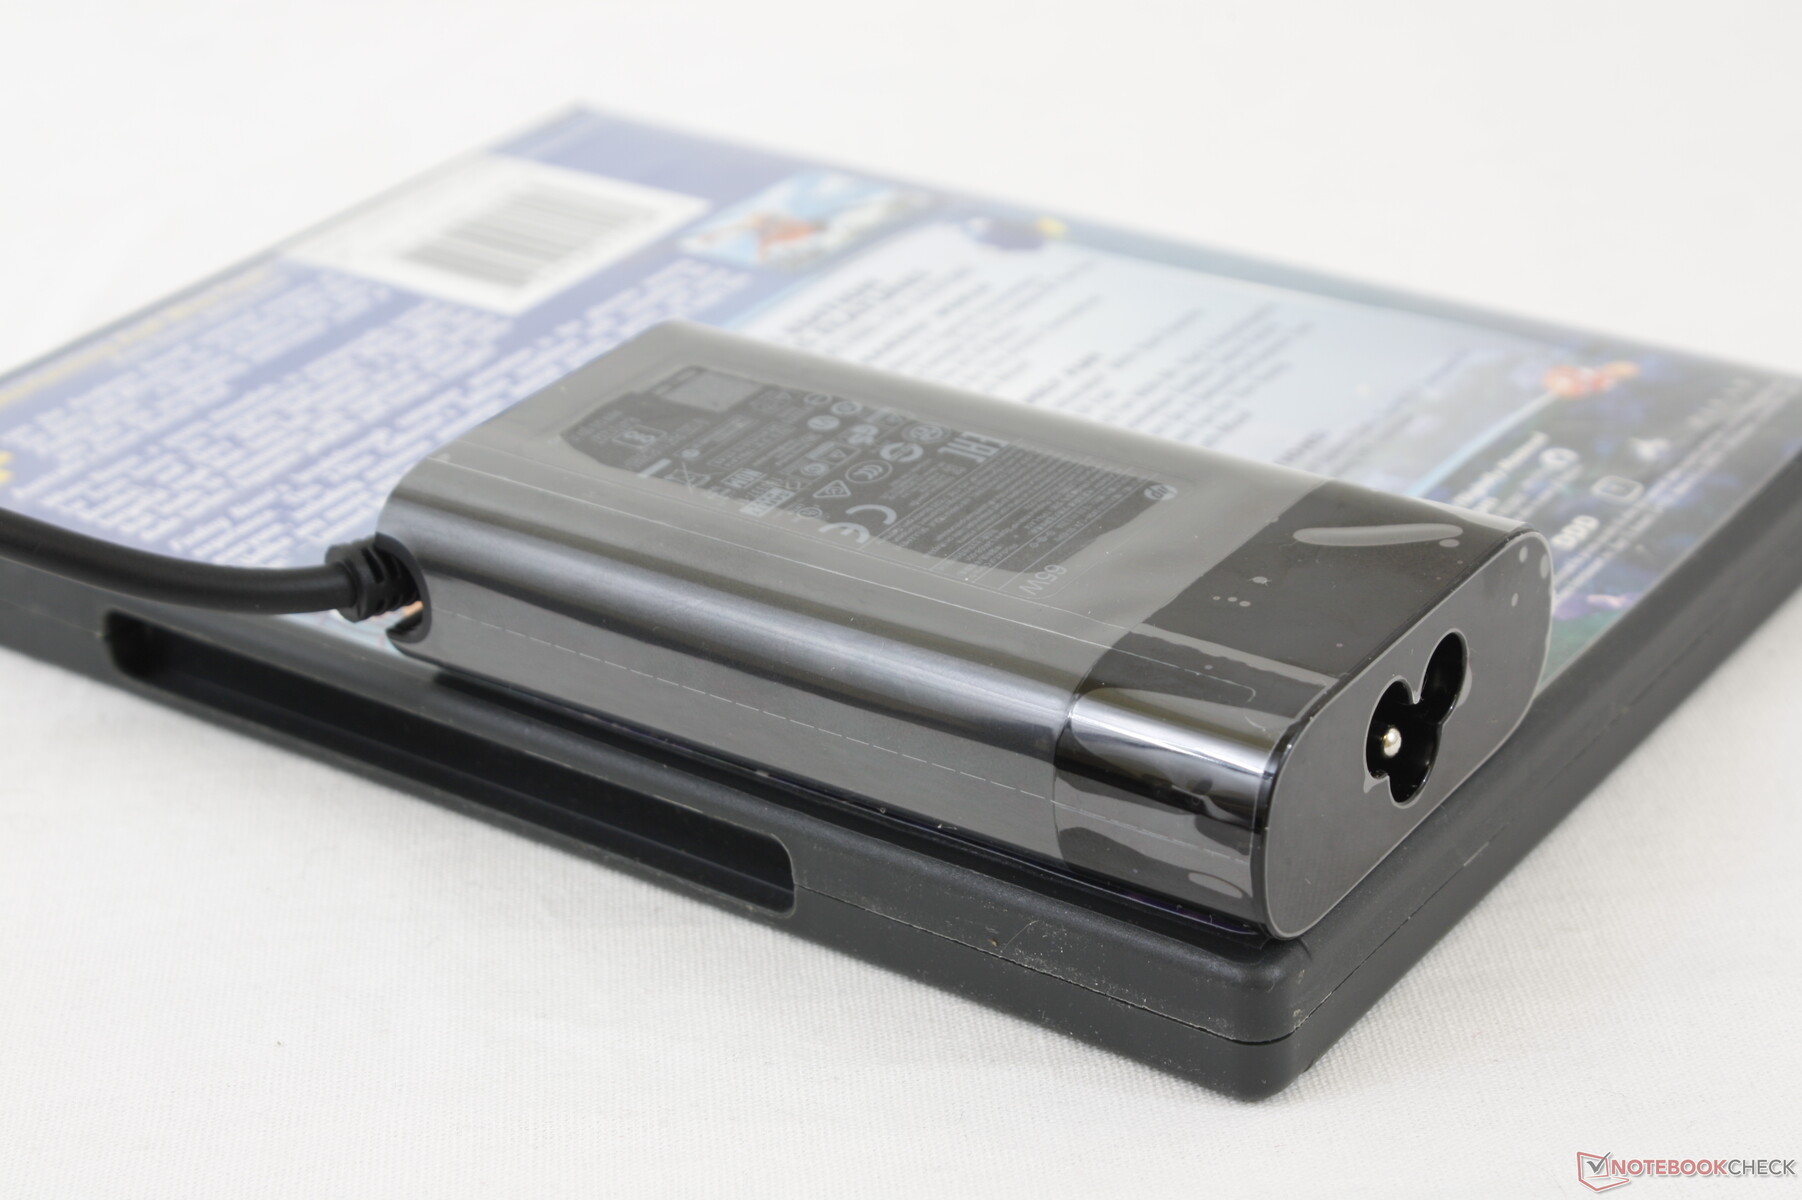
We're able to record a temporary maximum of 50.4 W from the small (~9.8 x 5.5 x 2.2 cm) 65 W AC adapter as shown by our graphs below.
| Off / Standby | |
| Idle | |
| Load |
|
Key:
min: | |
| HP Envy x360 13-ay0010nr R5 4500U, Vega 6, Toshiba KBG30ZMV256G, IPS, 1920x1080, 13.3" | HP Envy x360 13-ar0601ng R7 3700U, Vega 10, SK Hynix BC501 HFM512GDJTNG, IPS, 120 Hz, 1920x1080, 13.3" | Dell XPS 13 7390 2-in-1 Core i7 i7-1065G7, Iris Plus Graphics G7 (Ice Lake 64 EU), Toshiba BG4 KBG40ZPZ512G, IPS, 1920x1200, 13.4" | HP Spectre x360 13-aw0013dx i7-1065G7, Iris Plus Graphics G7 (Ice Lake 64 EU), Intel Optane Memory H10 with Solid State Storage 32GB + 512GB HBRPEKNX0202A(L/H), IPS, 1920x1080, 13.3" | Asus ZenBook S13 UX392FN i7-8565U, GeForce MX150, WDC PC SN520 SDAPNUW-512G, IPS, 1920x1080, 13.9" | Apple MacBook Pro 13 2020 2GHz i5 10th-Gen i5-1038NG7, Iris Plus Graphics G7 (Ice Lake 64 EU), Apple SSD SM0512F, IPS, 2560x1600, 13.3" | |
|---|---|---|---|---|---|---|
| Power Consumption | 1% | 5% | -4% | -23% | -34% | |
| Idle Minimum * (Watt) | 3.9 | 3.2 18% | 2.6 33% | 3.9 -0% | 3.4 13% | 3.8 3% |
| Idle Average * (Watt) | 5.8 | 2.8 52% | 5.3 9% | 6.3 -9% | 6.3 -9% | 8.6 -48% |
| Idle Maximum * (Watt) | 6 | 12.4 -107% | 7 -17% | 6.8 -13% | 10.4 -73% | 10.3 -72% |
| Load Average * (Watt) | 41.5 | 24.2 42% | 43.1 -4% | 32.6 21% | 51 -23% | 52.1 -26% |
| Load Maximum * (Watt) | 50.4 | 50 1% | 49 3% | 59 -17% | 62.7 -24% | 65.2 -29% |
| Witcher 3 ultra * (Watt) | 43.1 | 25.6 | 39 | 48.2 |
* ... smaller is better
Battery Life
Runtimes are long despite the small 51 Wh internal battery. We're able to record almost 12 hours of real-world WLAN use before automatic shutdown to be comparable to the Apple MacBook Pro 13.
Recharging from empty to full capacity takes about 1.5 to 2 hours with the included AC adapter. It's possible to recharge the laptop via USB-C as well. We suspect that future Envy models will eventually drop the proprietary barrel charger for a more universal USB-C charger instead.
| HP Envy x360 13-ay0010nr R5 4500U, Vega 6, 51 Wh | HP Envy x360 13-ar0601ng R7 3700U, Vega 10, 53 Wh | Dell XPS 13 7390 2-in-1 Core i7 i7-1065G7, Iris Plus Graphics G7 (Ice Lake 64 EU), 51 Wh | HP Spectre x360 13-aw0013dx i7-1065G7, Iris Plus Graphics G7 (Ice Lake 64 EU), 60 Wh | Asus ZenBook S13 UX392FN i7-8565U, GeForce MX150, 50 Wh | Apple MacBook Pro 13 2020 2GHz i5 10th-Gen i5-1038NG7, Iris Plus Graphics G7 (Ice Lake 64 EU), 58 Wh | |
|---|---|---|---|---|---|---|
| Battery runtime | -30% | -24% | 14% | -17% | 3% | |
| Reader / Idle (h) | 31.9 | 10.5 -67% | 37.1 16% | 28.5 -11% | ||
| WiFi v1.3 (h) | 11.8 | 7.3 -38% | 9 -24% | 9.9 -16% | 8.4 -29% | 12.1 3% |
| Load (h) | 1.9 | 2.2 16% | 2.7 42% | 1.7 -11% |
Pros
Cons
Verdict
The AMD-powered 2020 Envy x360 13 looks and performs better than what its relatively low price would otherwise suggest. It's essentially a less expensive version of the 2019 Spectre x360 13 that doesn't sacrifice chassis quality or system performance to reach the lower price point. If you were considering an older Envy x360 13 or Spectre convertible, then it would be worth checking out this faster, cheaper, and leaner 2020 Envy model instead.
Some hardware limitations prevent the Envy x360 13 from being the "ultimate" 13.3-inch convertible. There is no Thunderbolt 3 or HDMI and RAM is not user-upgradeable meaning HP can charge extra for 16 GB DDR4 SKUs. Meanwhile, the oddly positioned fingerprint reader takes some getting used to and we feel that the hinges could be stiffer. Alternatives like the Lenovo Yoga C940 integrate stylus holders which can come in handy when in tablet mode.
We had named the 14-inch Yoga C940 as the consumer convertible to beat when we reviewed it late last year, but that particular system retailed for nearly $1500 USD. For under $1000, you're not going to find a 13.3-inch convertible that balances performance, weight, build quality, and price better than the 2020 HP Envy x360 13 right now.
It's pretty amazing what a swap to an AMD processor can do in terms of price and performance-per-dollar. The redesigned 2020 Envy x360 13 is noticeably smaller and more compact than last year's model while being much faster in the process.
HP Envy x360 13-ay0010nr
- 06/30/2020 v7 (old)
Allen Ngo
Price comparison
