HP Envy x360 15 (2020) Review: Ryzen 5 with bad performance utilization

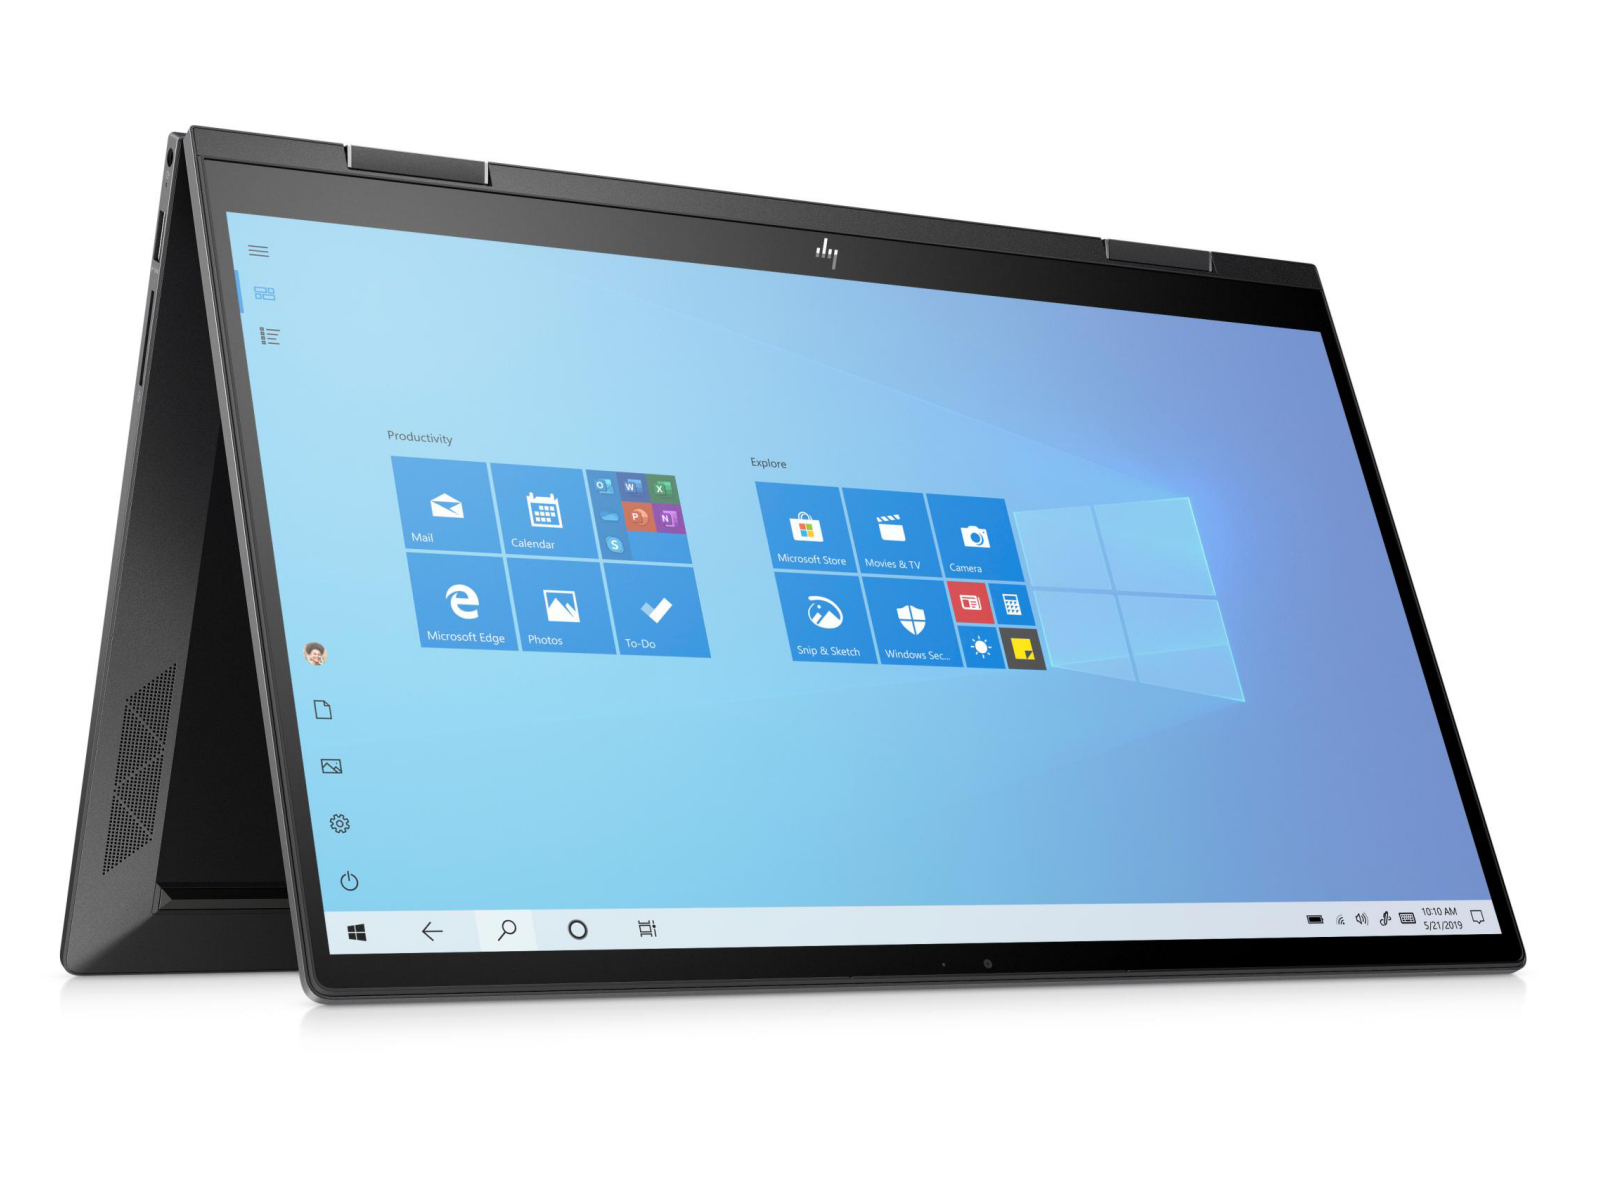
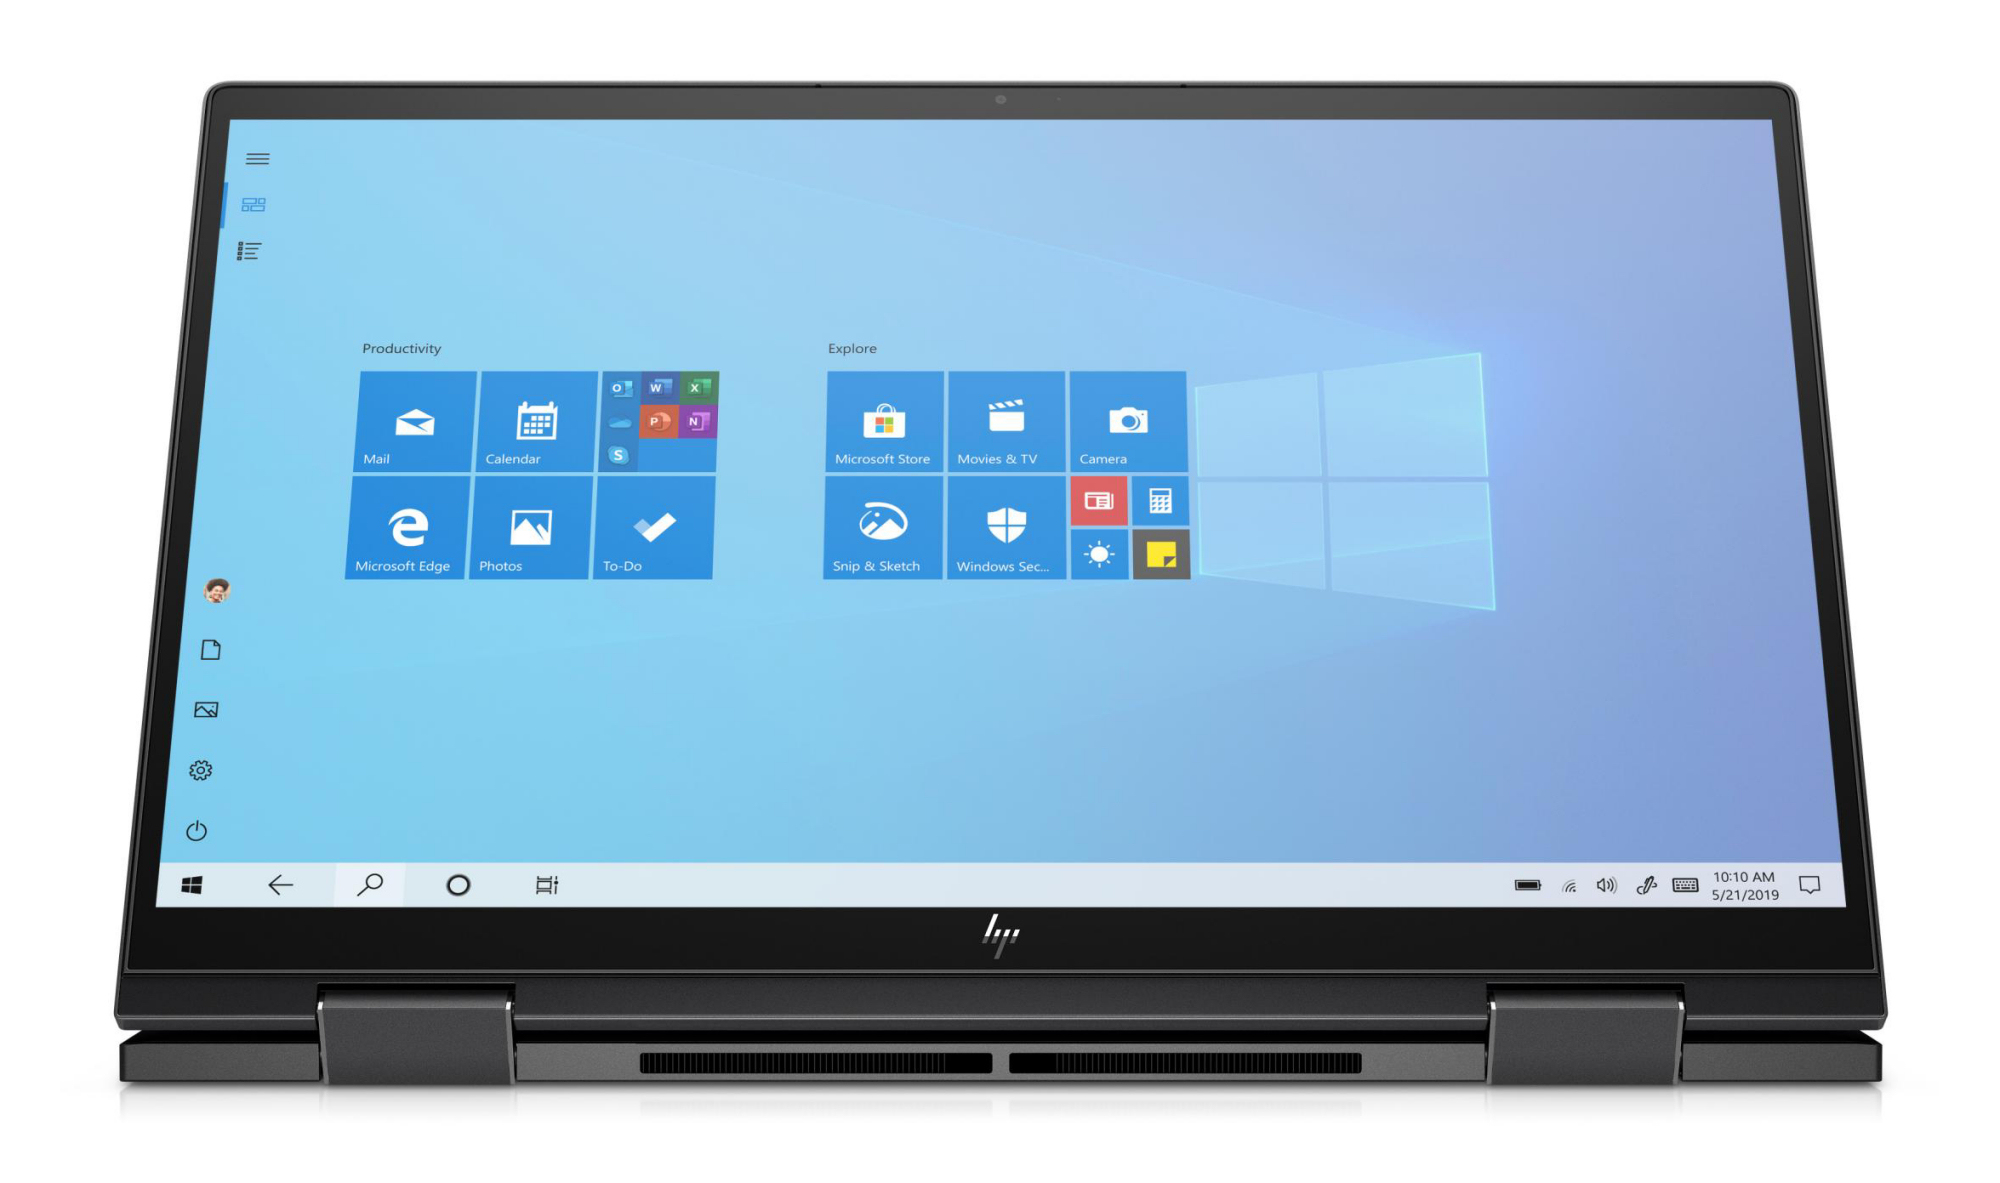
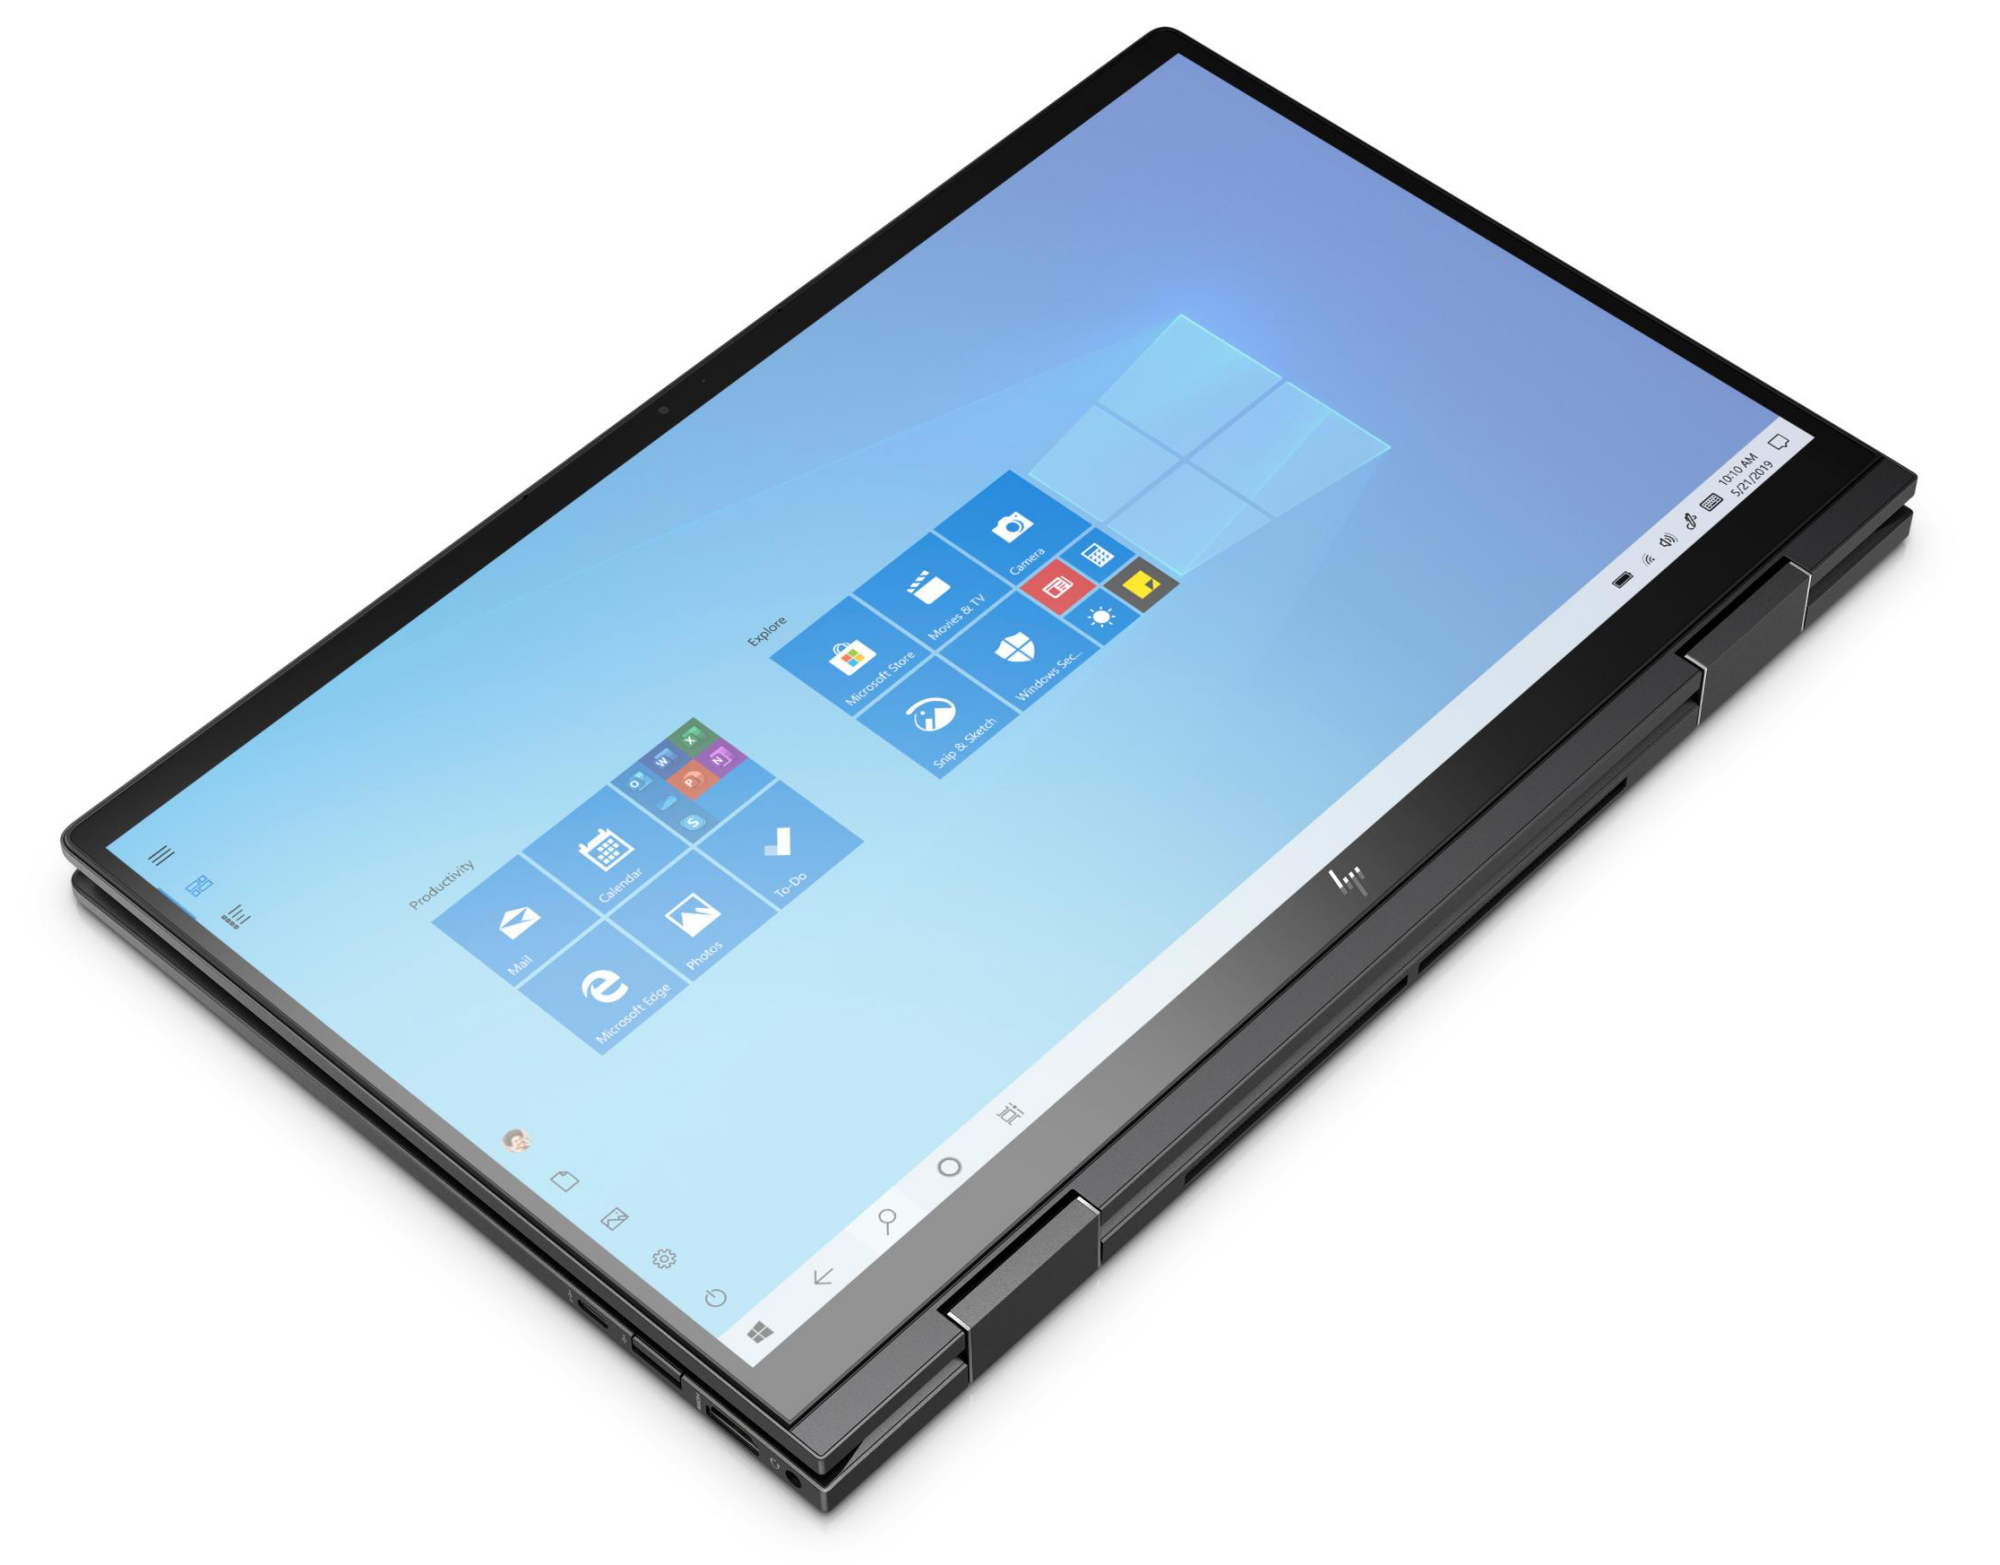
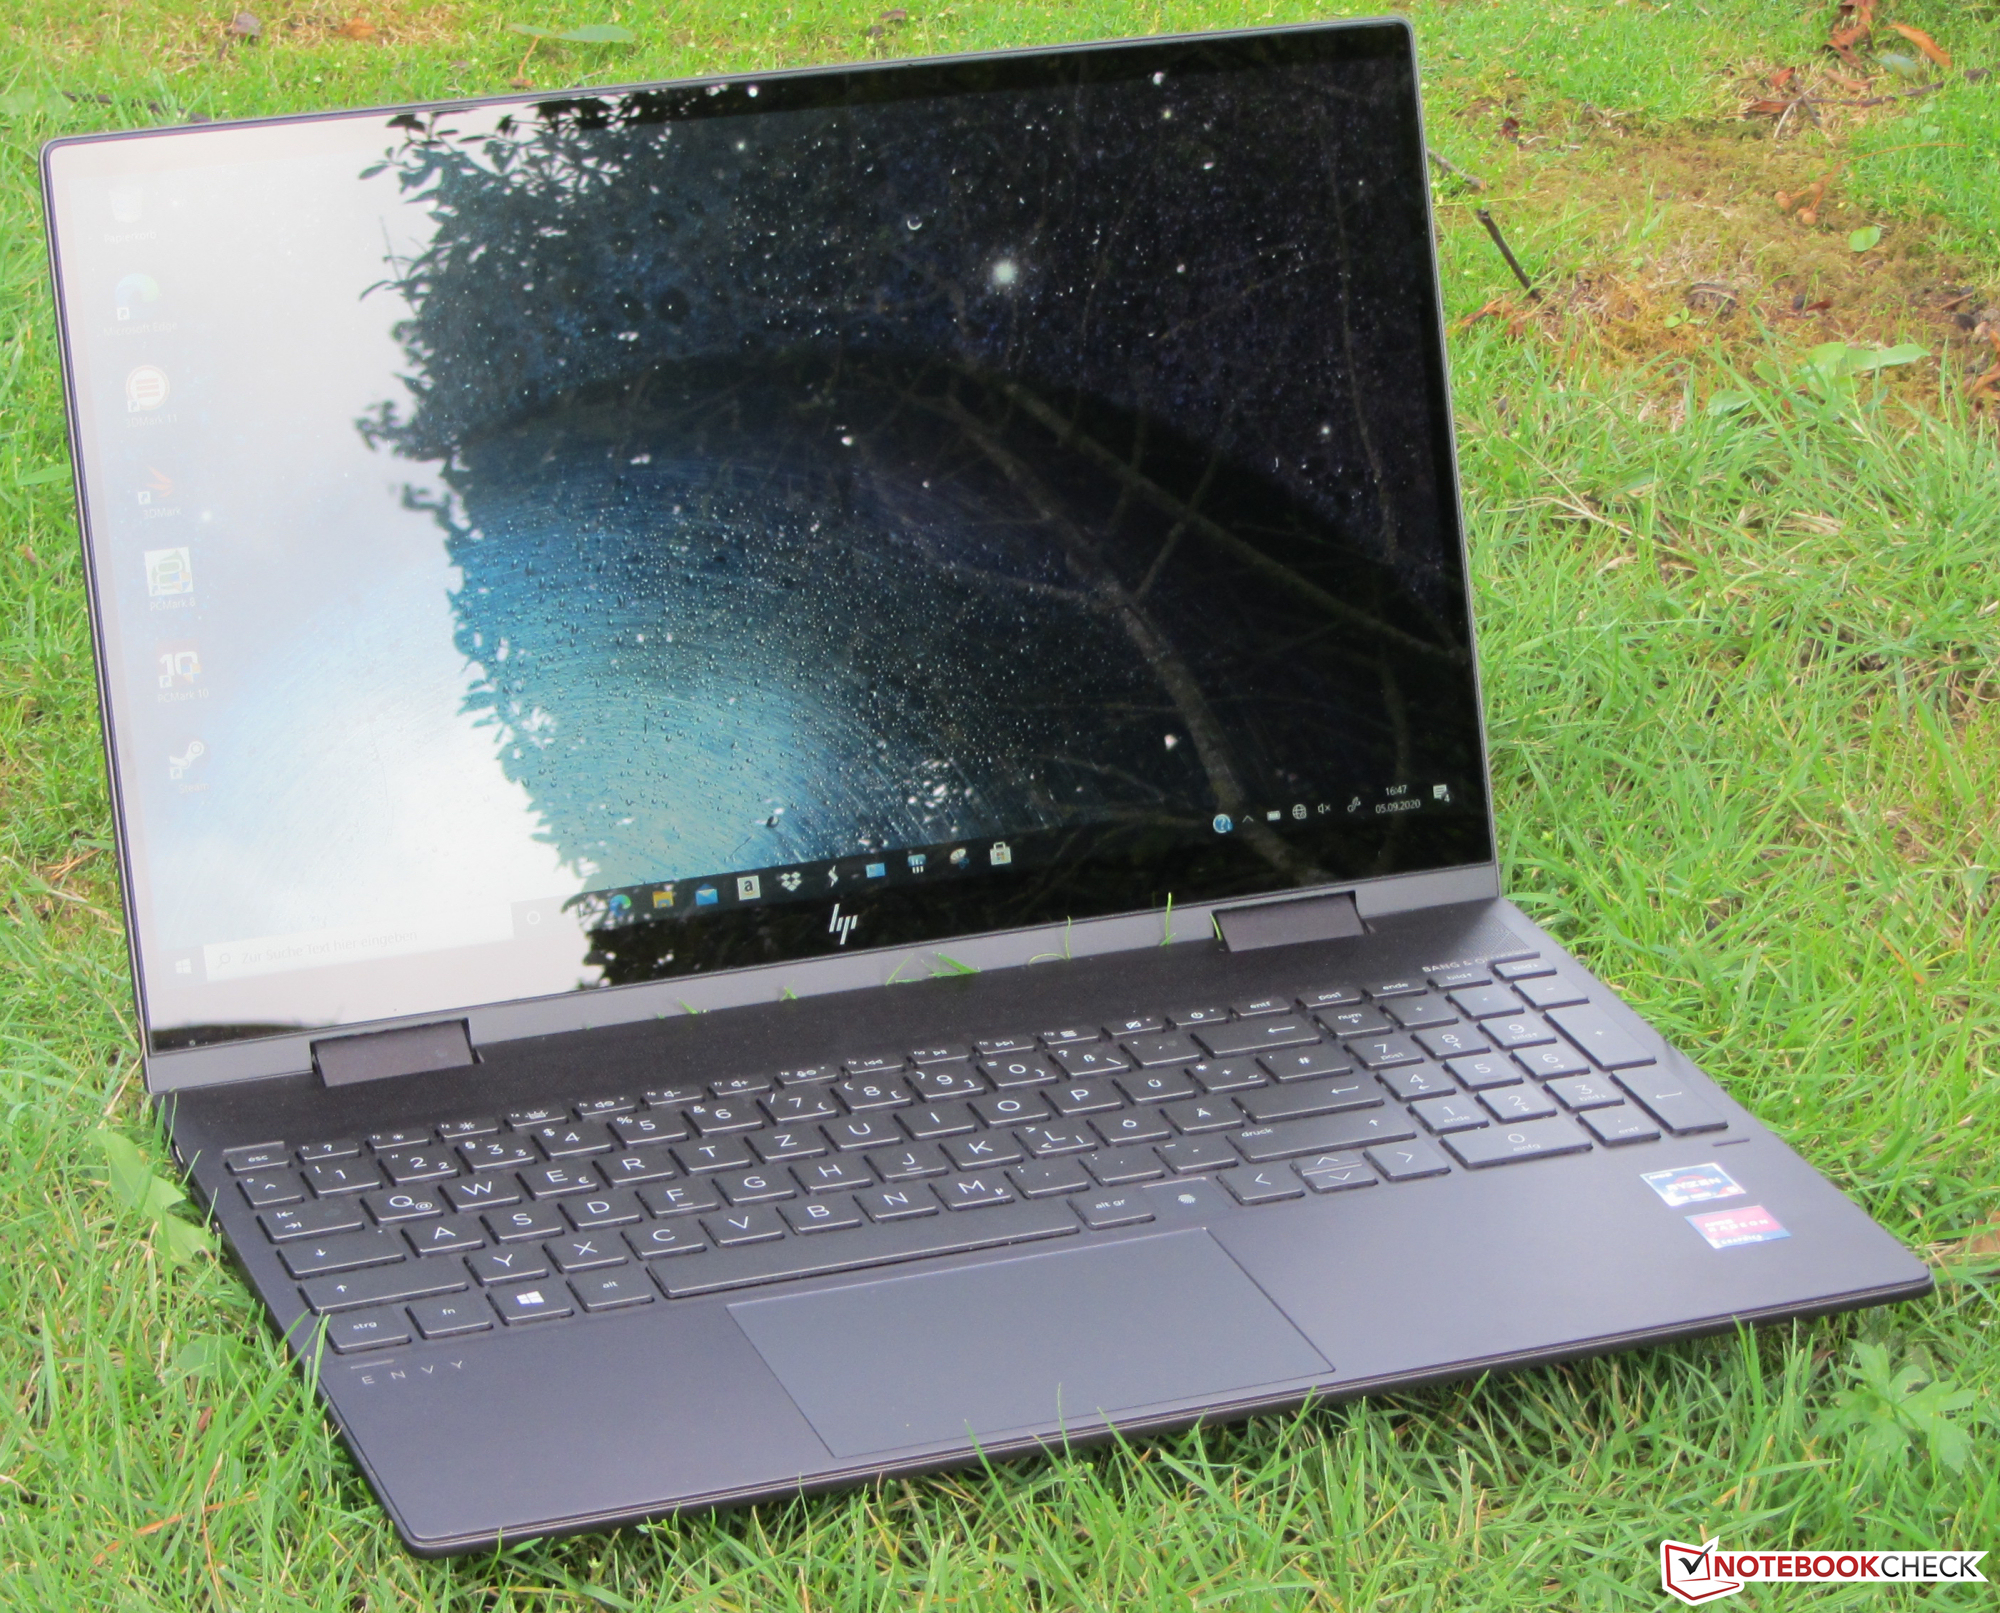
The Envy x360 15 represents a Windows convertible in the 15.6-inch format. While it has a very close resemblance to its predecessor, the build is not identical. The current model turns out slightly more compact, the connections are positioned in other places, and it has a different keyboard. The competitors include devices such as the Lenovo Yoga C740-15IML and the Asus ZenBook Flip 15 UX563FD.
Rating | Date | Model | Weight | Height | Size | Resolution | Price |
|---|---|---|---|---|---|---|---|
| 82.8 % v7 (old) | 09 / 2020 | HP Envy x360 15-ee0257ng R5 4500U, Vega 6 | 2 kg | 18.9 mm | 15.60" | 1920x1080 | |
| 84.8 % v7 (old) | 01 / 2020 | Lenovo Yoga C740-15IML i7-10510U, UHD Graphics 620 | 1.9 kg | 17.25 mm | 15.60" | 1920x1080 | |
| 86.5 % v7 (old) | 03 / 2020 | Asus ZenBook Flip 15 UX563FD-A1027T i7-10510U, GeForce GTX 1050 Max-Q | 1.9 kg | 19.9 mm | 15.60" | 3840x2160 | |
| 80.4 % v7 (old) | 06 / 2020 | HP Envy x360 15-dr1679cl i7-10510U, UHD Graphics 620 | 2.1 kg | 17.2 mm | 15.60" | 1920x1080 |
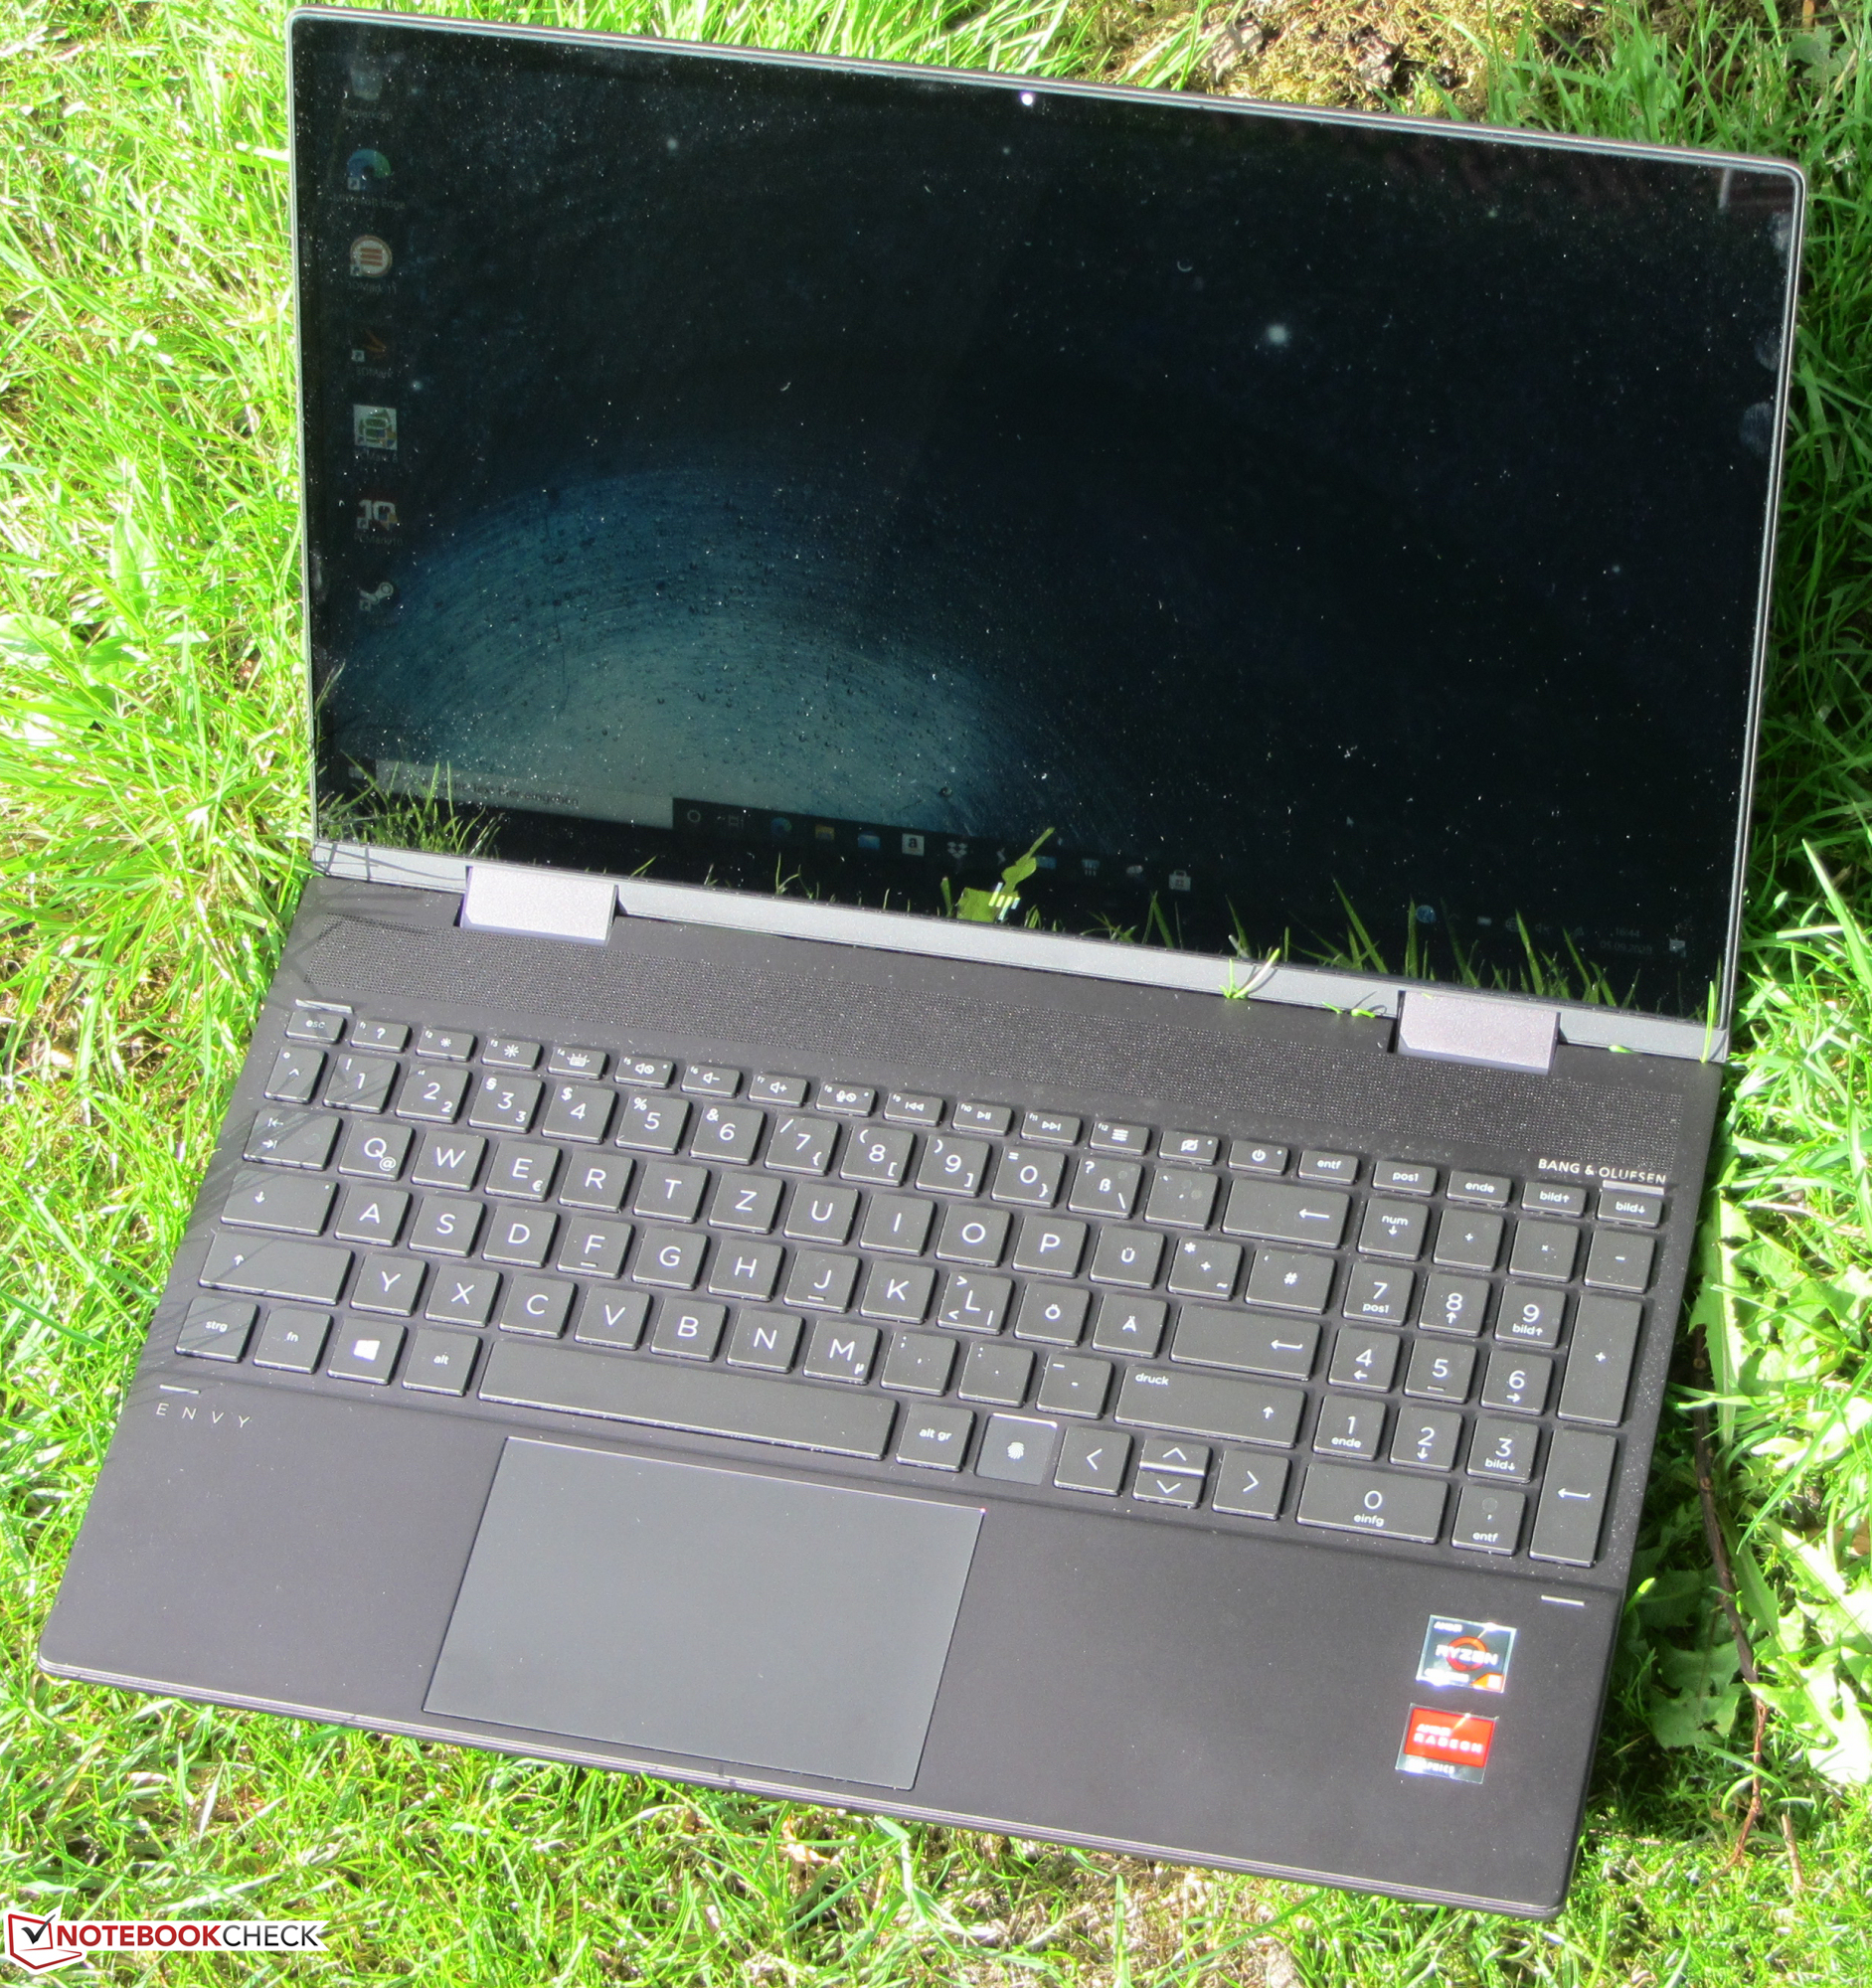
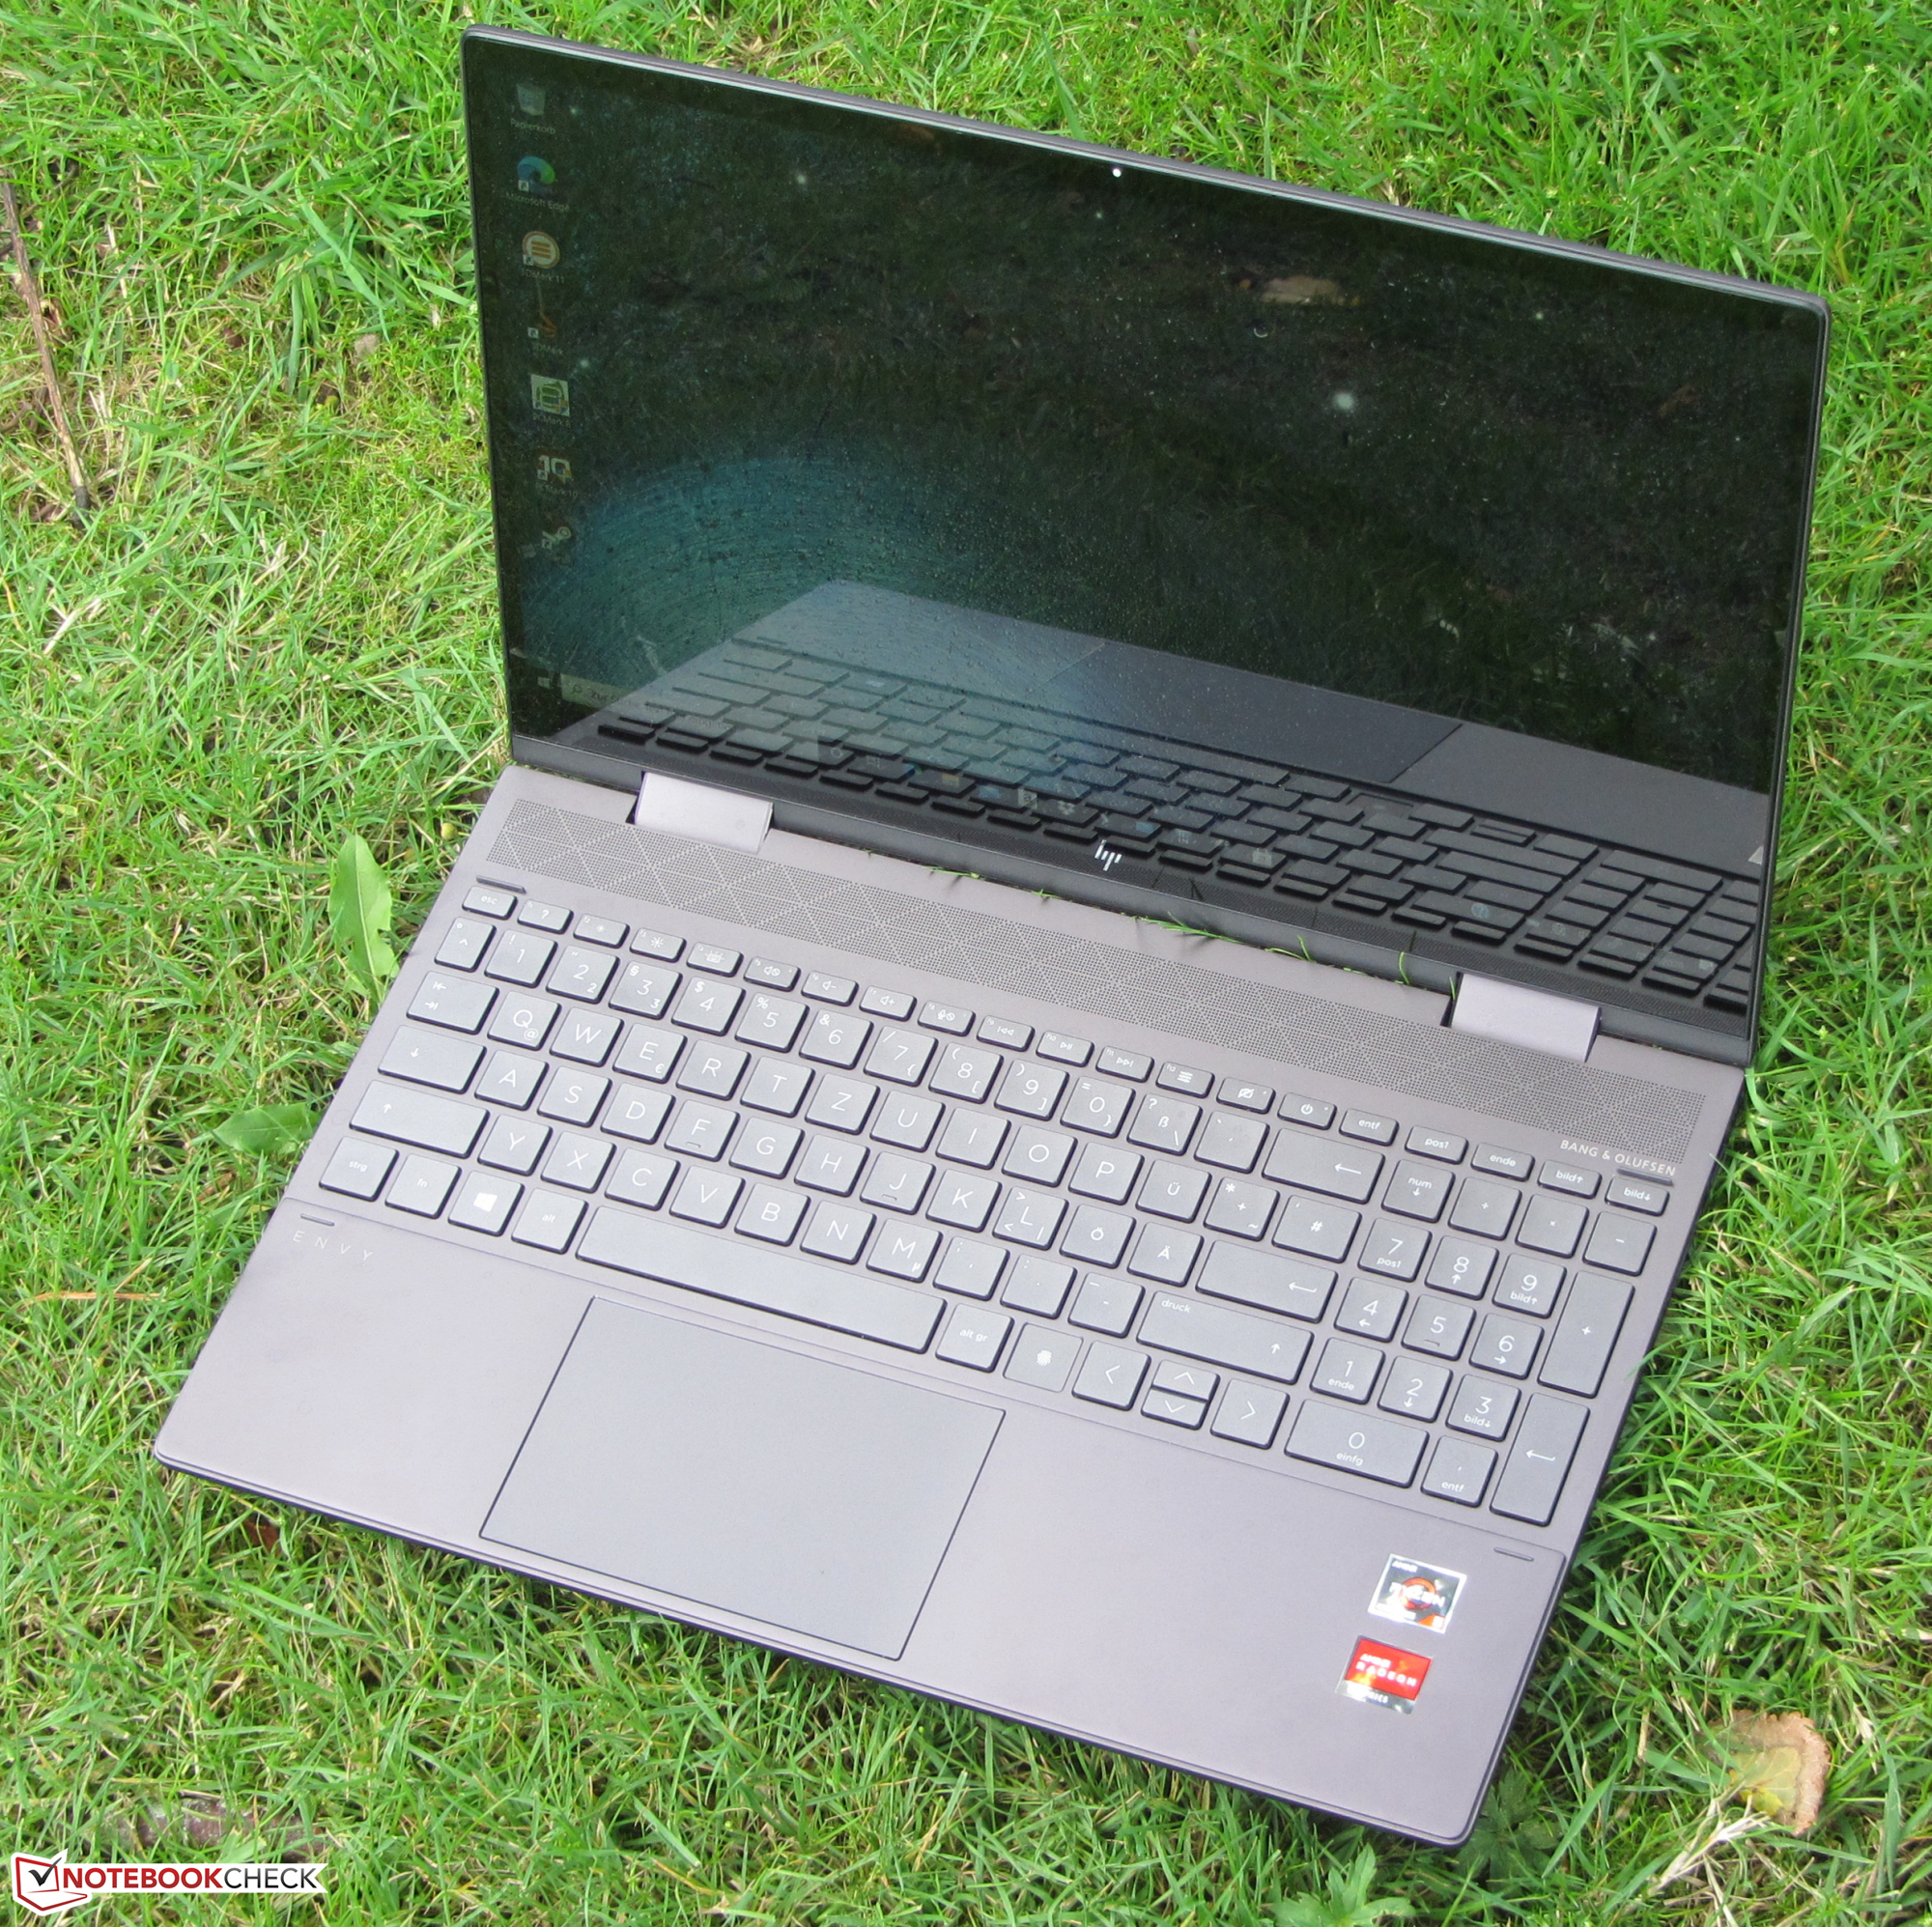
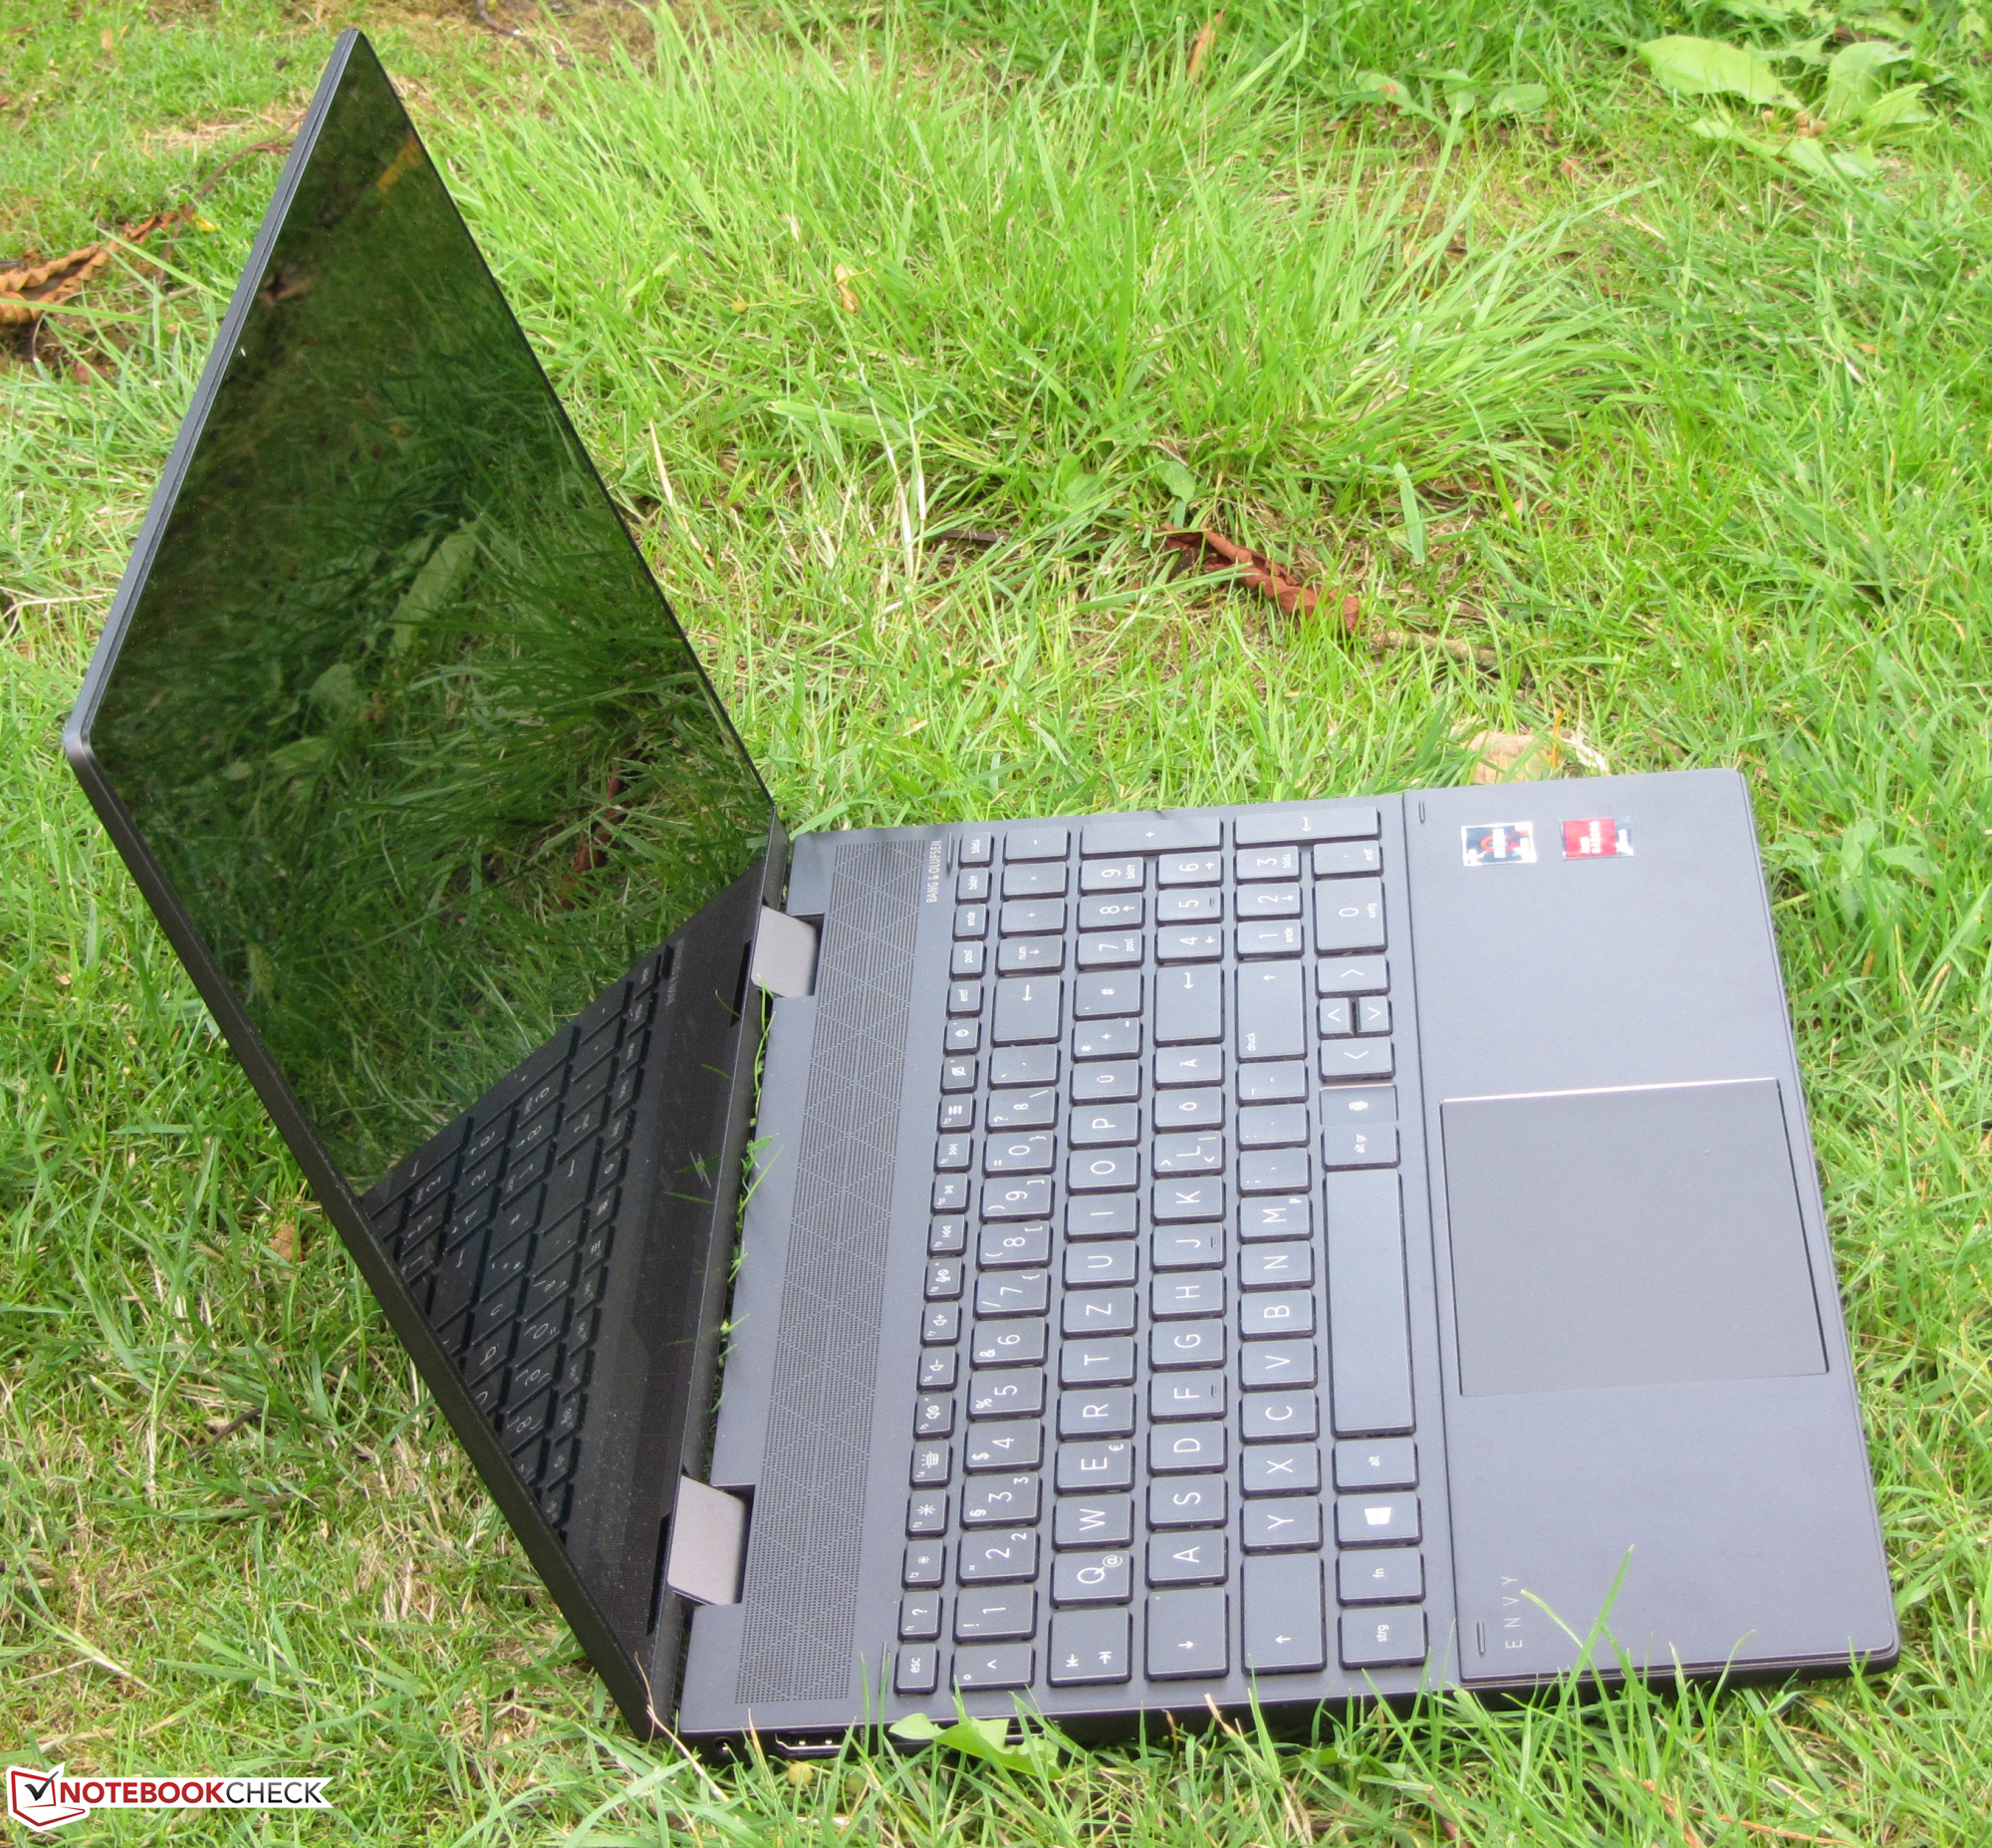
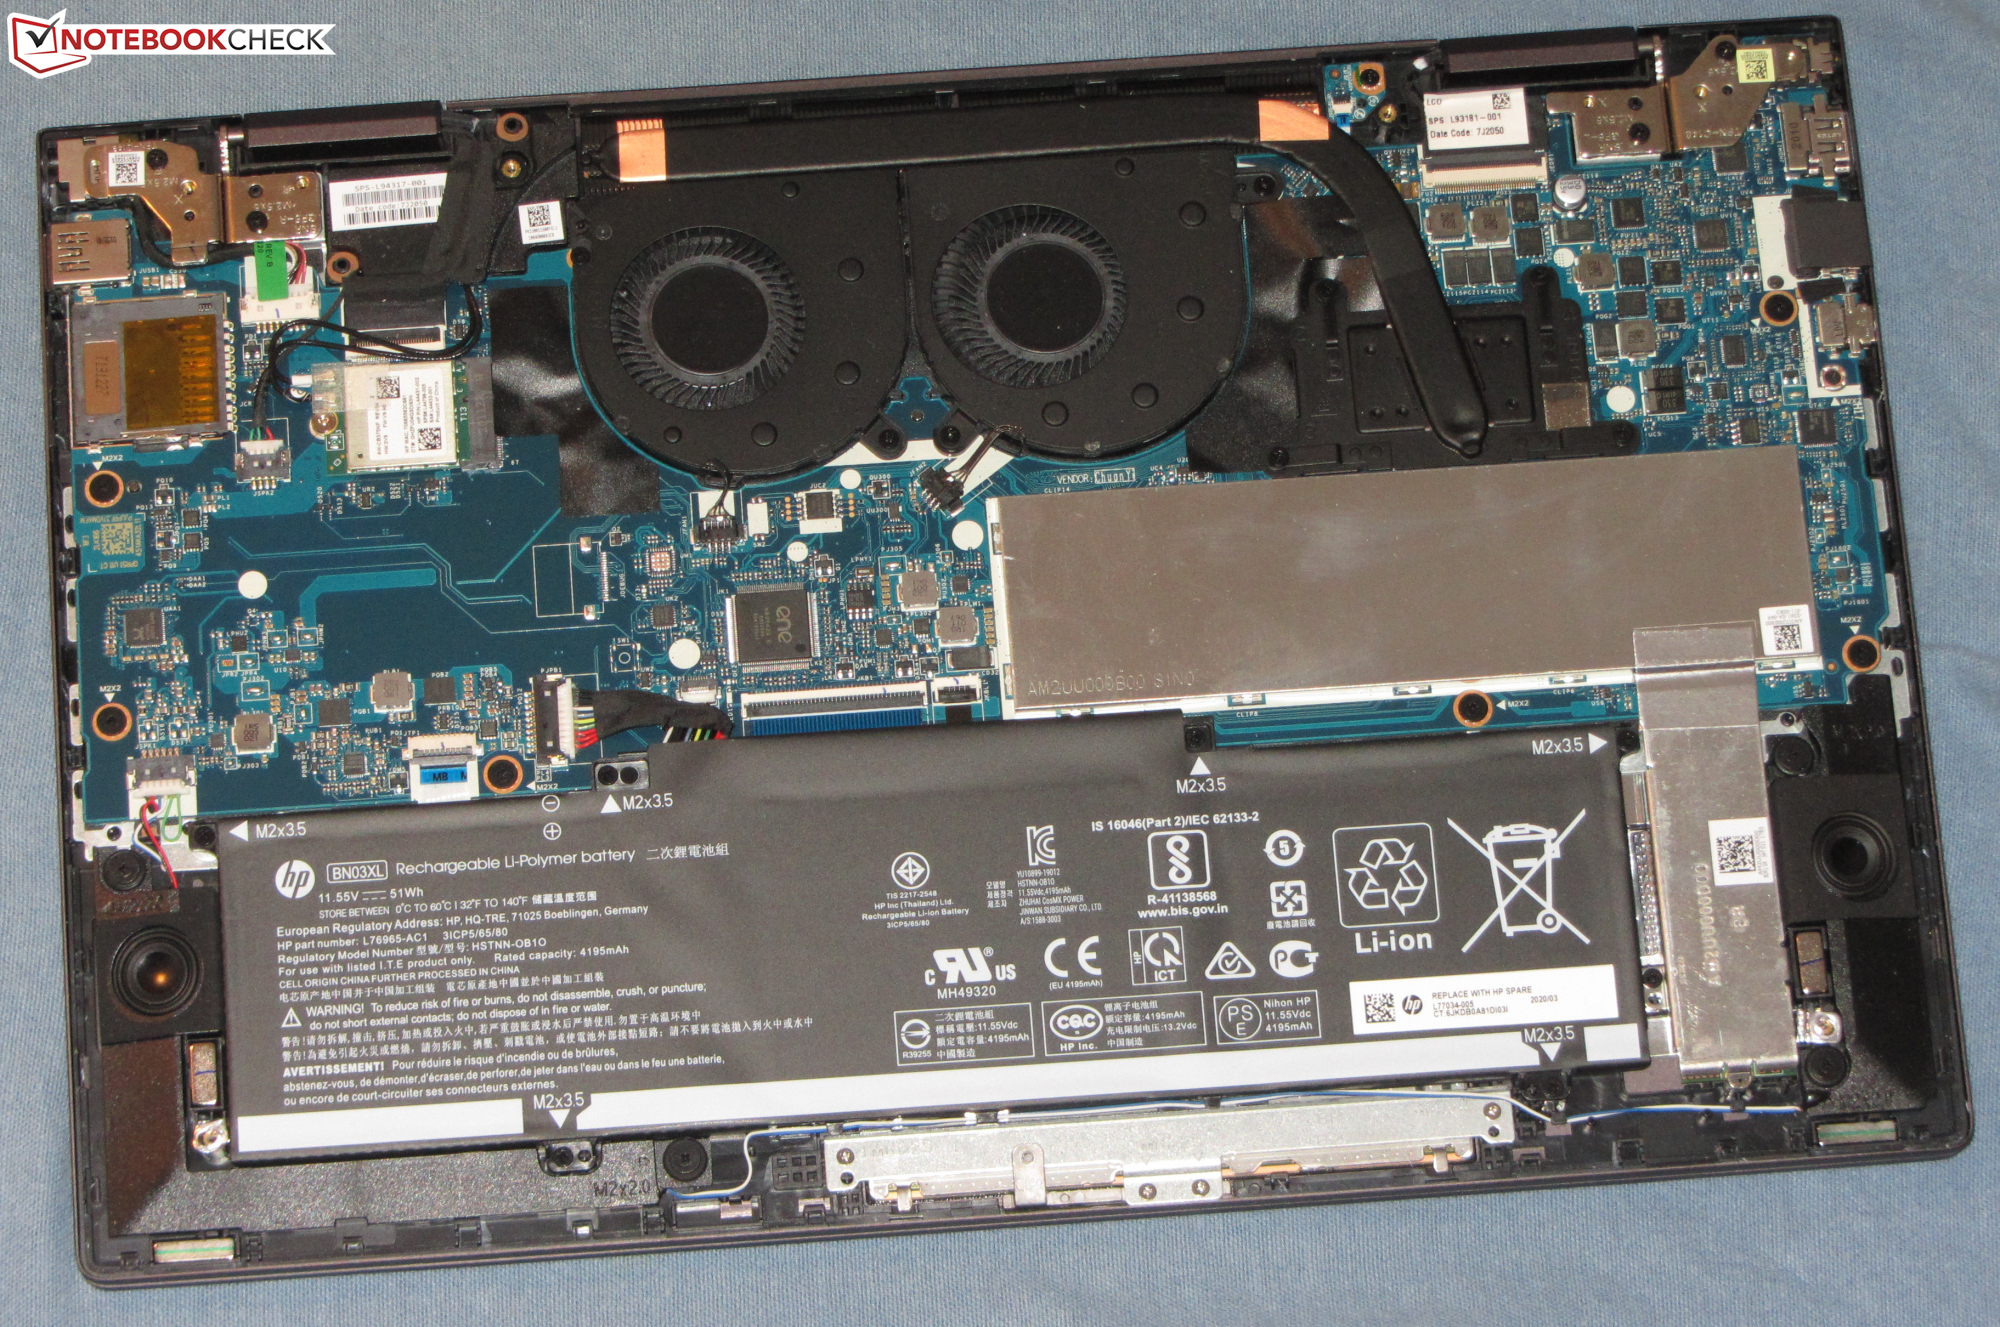
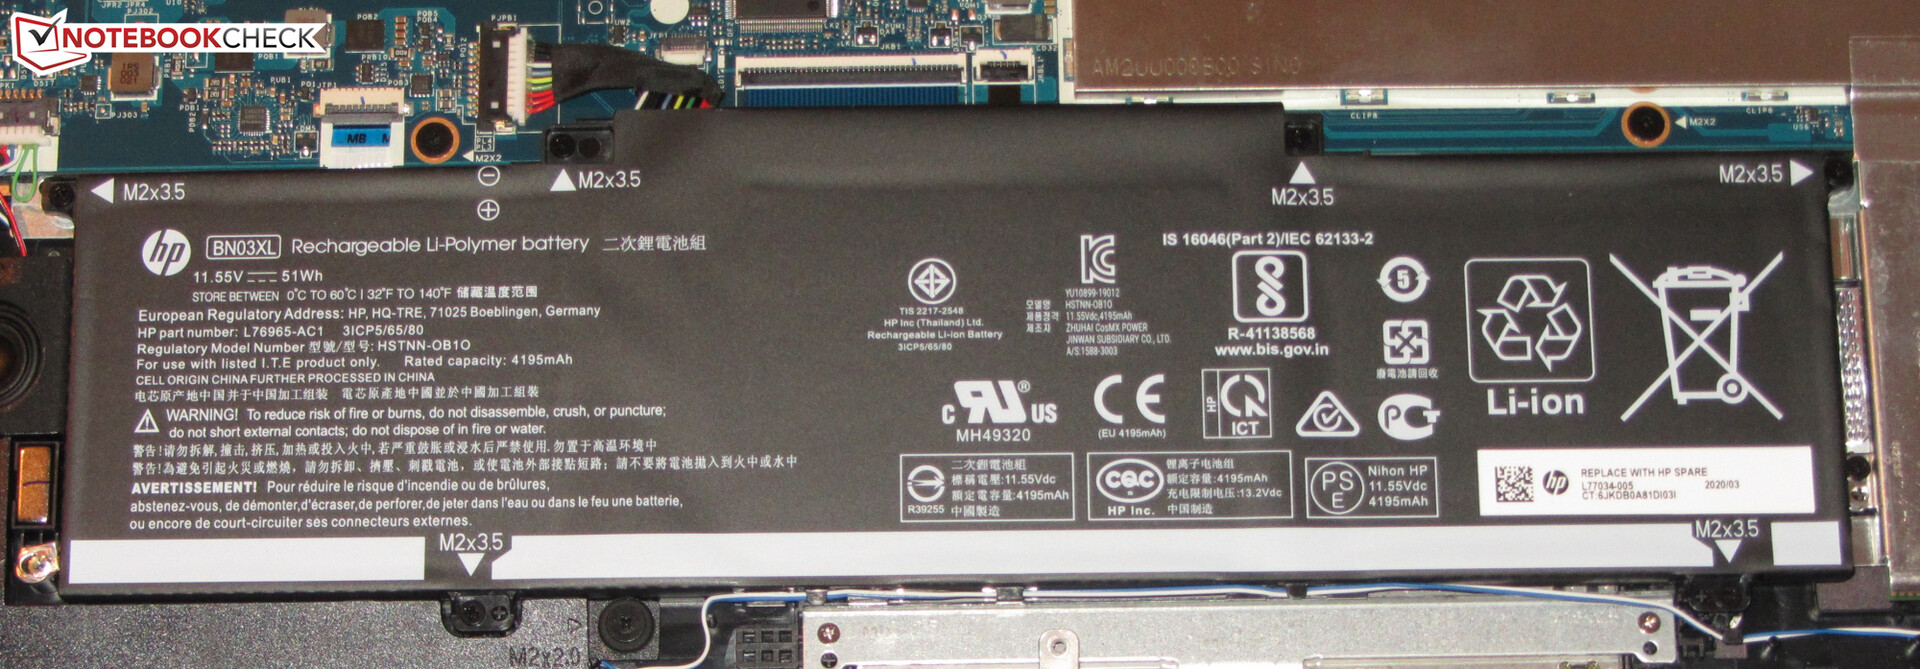
Case and Equipment - The Envy has a metal case
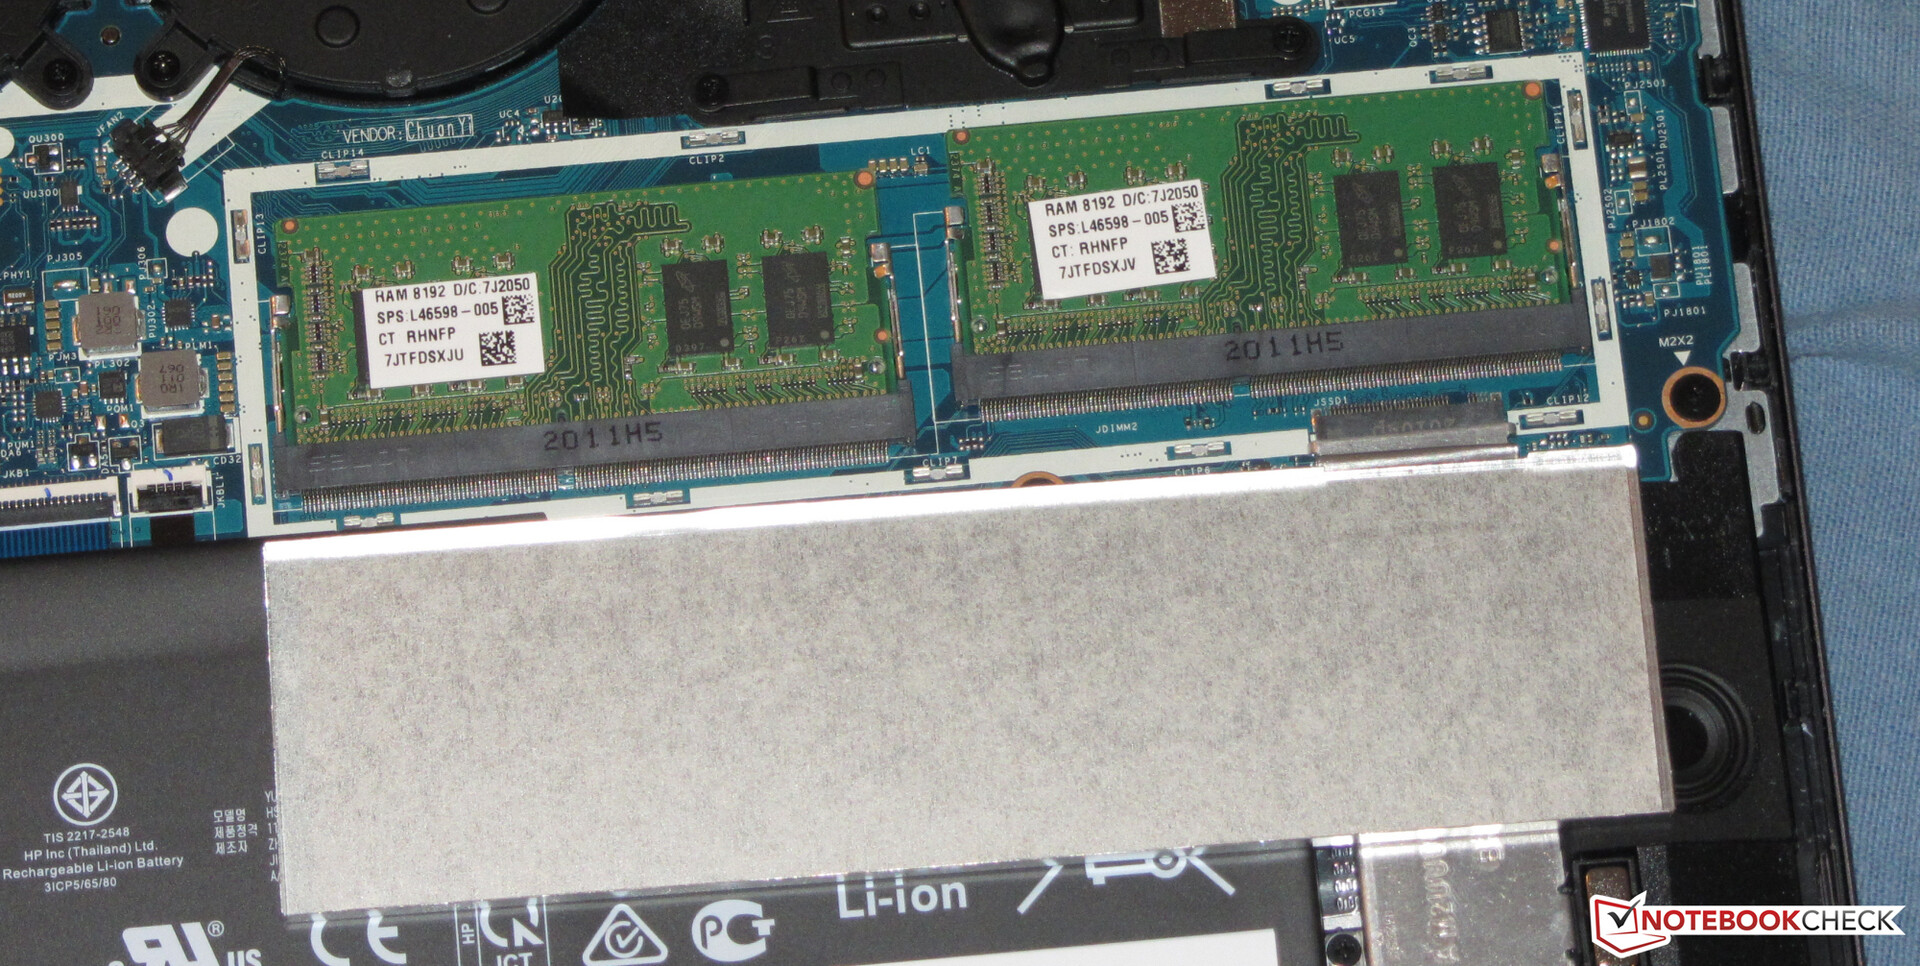
The gap clearances in the elegant, matte-black metal case are right, and there are no noticeable material protrusions. The base unit could have turned out a little stiffer. The battery is built in. You can access the insides after removing the bottom of the case, which is not a process that HP made particularly user-friendly.
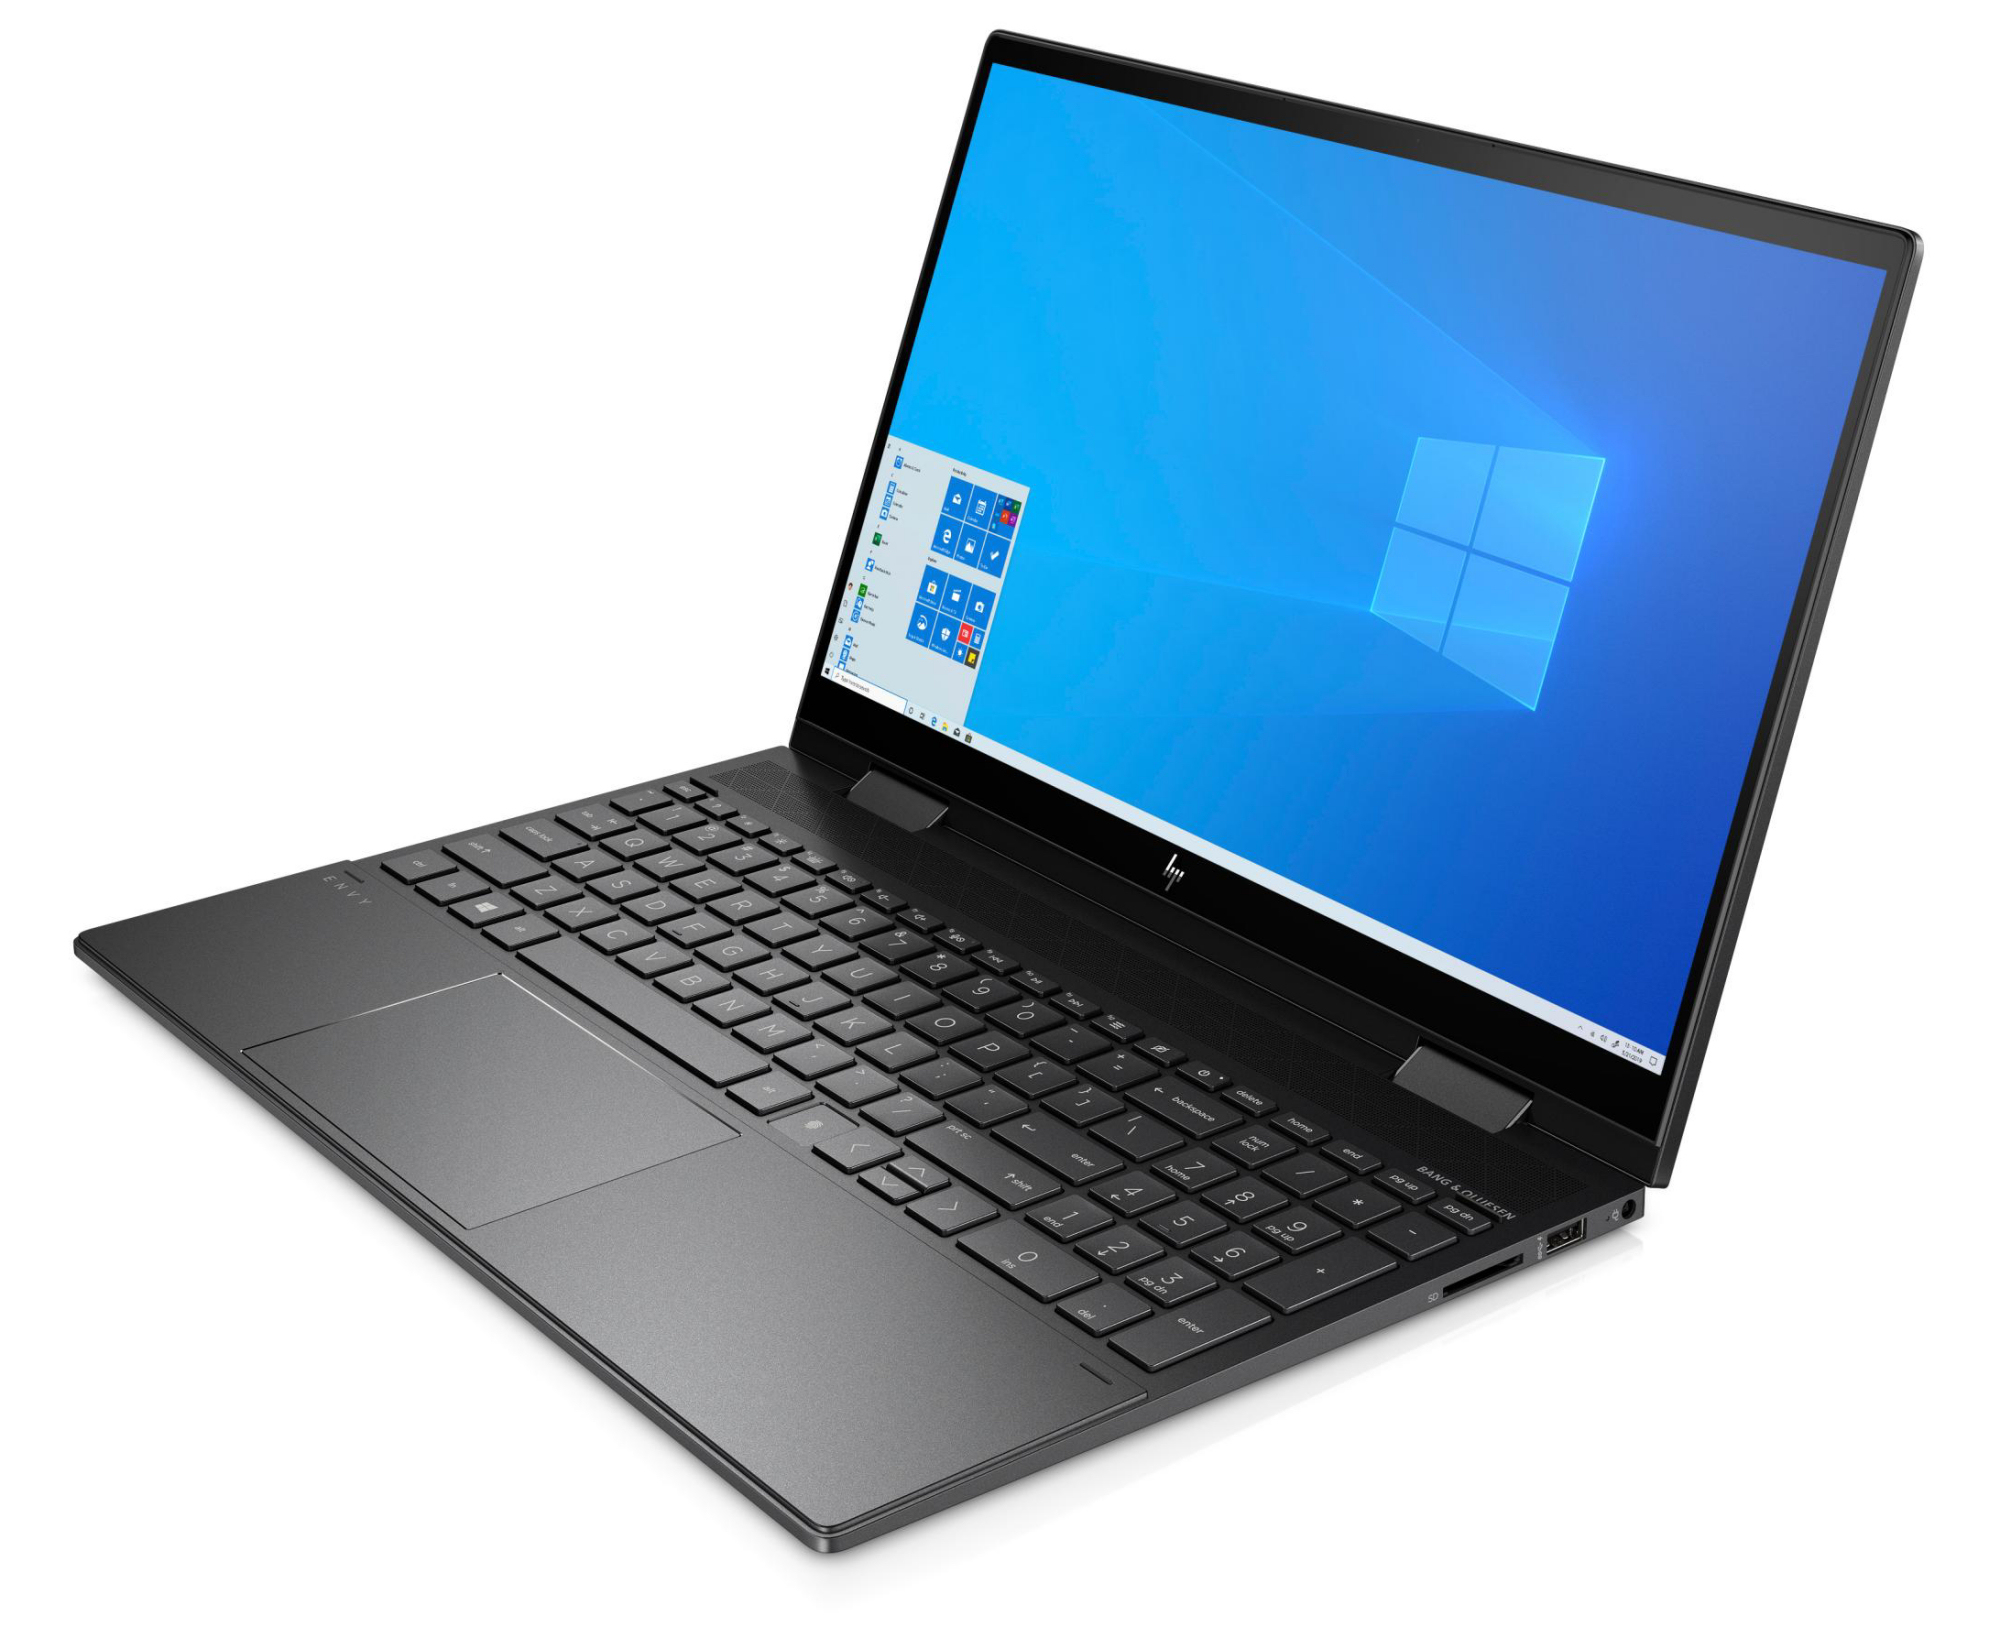
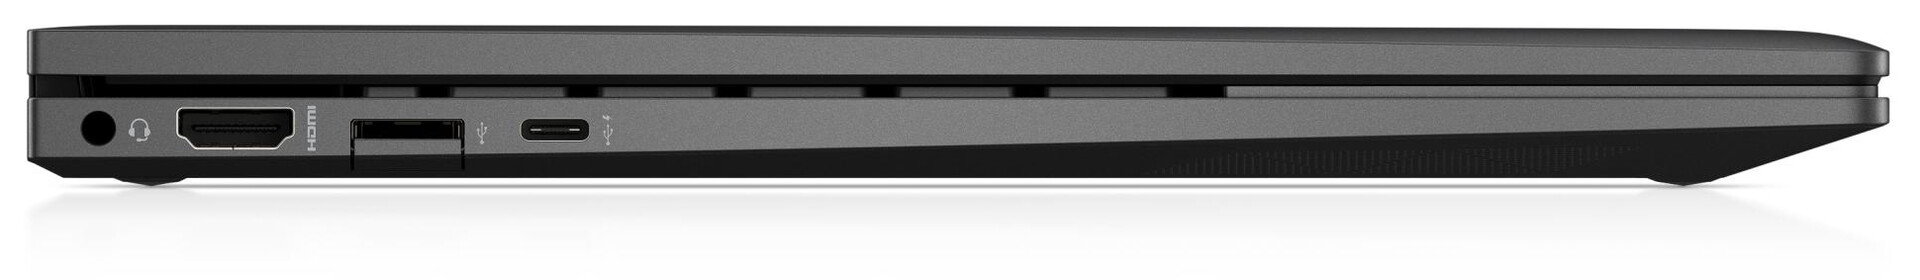
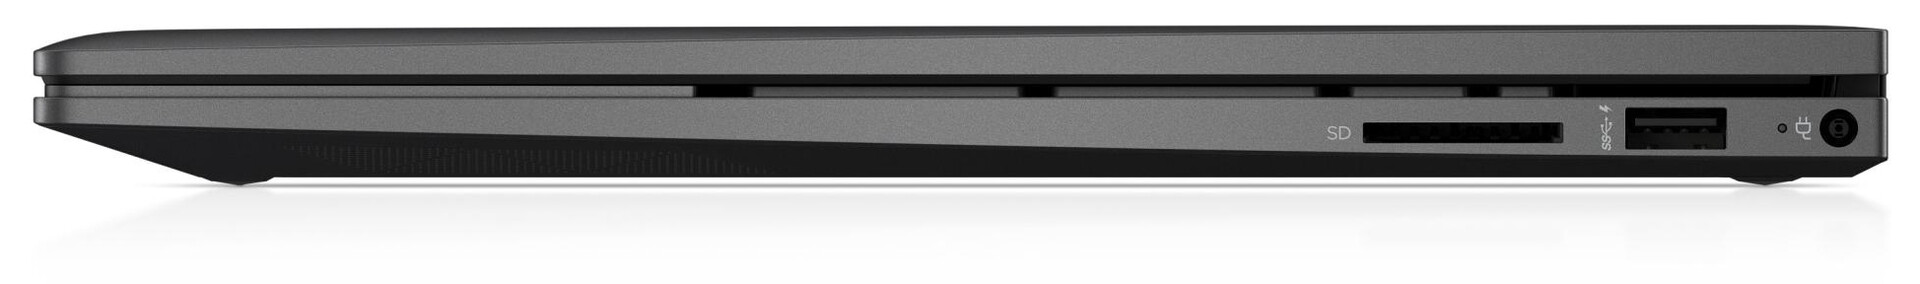
The x360 brings two USB Type-A connections (USB 3.2 Gen 1), and in addition there is one USB Type-C connection (USB 3.2 Gen 2) that supports power delivery and DisplayPort via USB-C. So together with the HDMI connection, the convertible offers two video-output ports.
With maximum transfer rates of 78.6 MB/s (transferring 250 jpg files at about 5 MB each) and 86 MB/s (copying large data blocks), the SD storage card reader belongs to the faster representatives of its kind (using the Toshiba Exceria Pro SDXC 64 GB UHS-II reference card). SD cards can be inserted completely.
The WLAN chip (Realtek RTL8822CE) supports the 802.11a/b/g/n/ac standards. The data rates measured under optimal conditions (no additional WLAN devices close by, close distance between laptop and server PC; Netgear Nighthawk AX12 router) turn out good.
Connection Equipment
| SD Card Reader | |
| average JPG Copy Test (av. of 3 runs) | |
| HP Envy x360 15-ee0257ng (Toshiba Exceria Pro SDXC 64 GB UHS-II) | |
| HP Envy x360 15-dr1679cl (Toshiba Exceria Pro SDXC 64 GB UHS-II) | |
| Asus ZenBook Flip 15 UX563FD-A1027T (Toshiba Exceria Pro SDXC 64 GB UHS-II) | |
| Average of class Convertible (29.4 - 141, n=21, last 2 years) | |
| maximum AS SSD Seq Read Test (1GB) | |
| Average of class Convertible (67.5 - 254, n=20, last 2 years) | |
| HP Envy x360 15-ee0257ng (Toshiba Exceria Pro SDXC 64 GB UHS-II) | |
| HP Envy x360 15-dr1679cl (Toshiba Exceria Pro SDXC 64 GB UHS-II) | |


")
")


Input Devices - Optional pen input
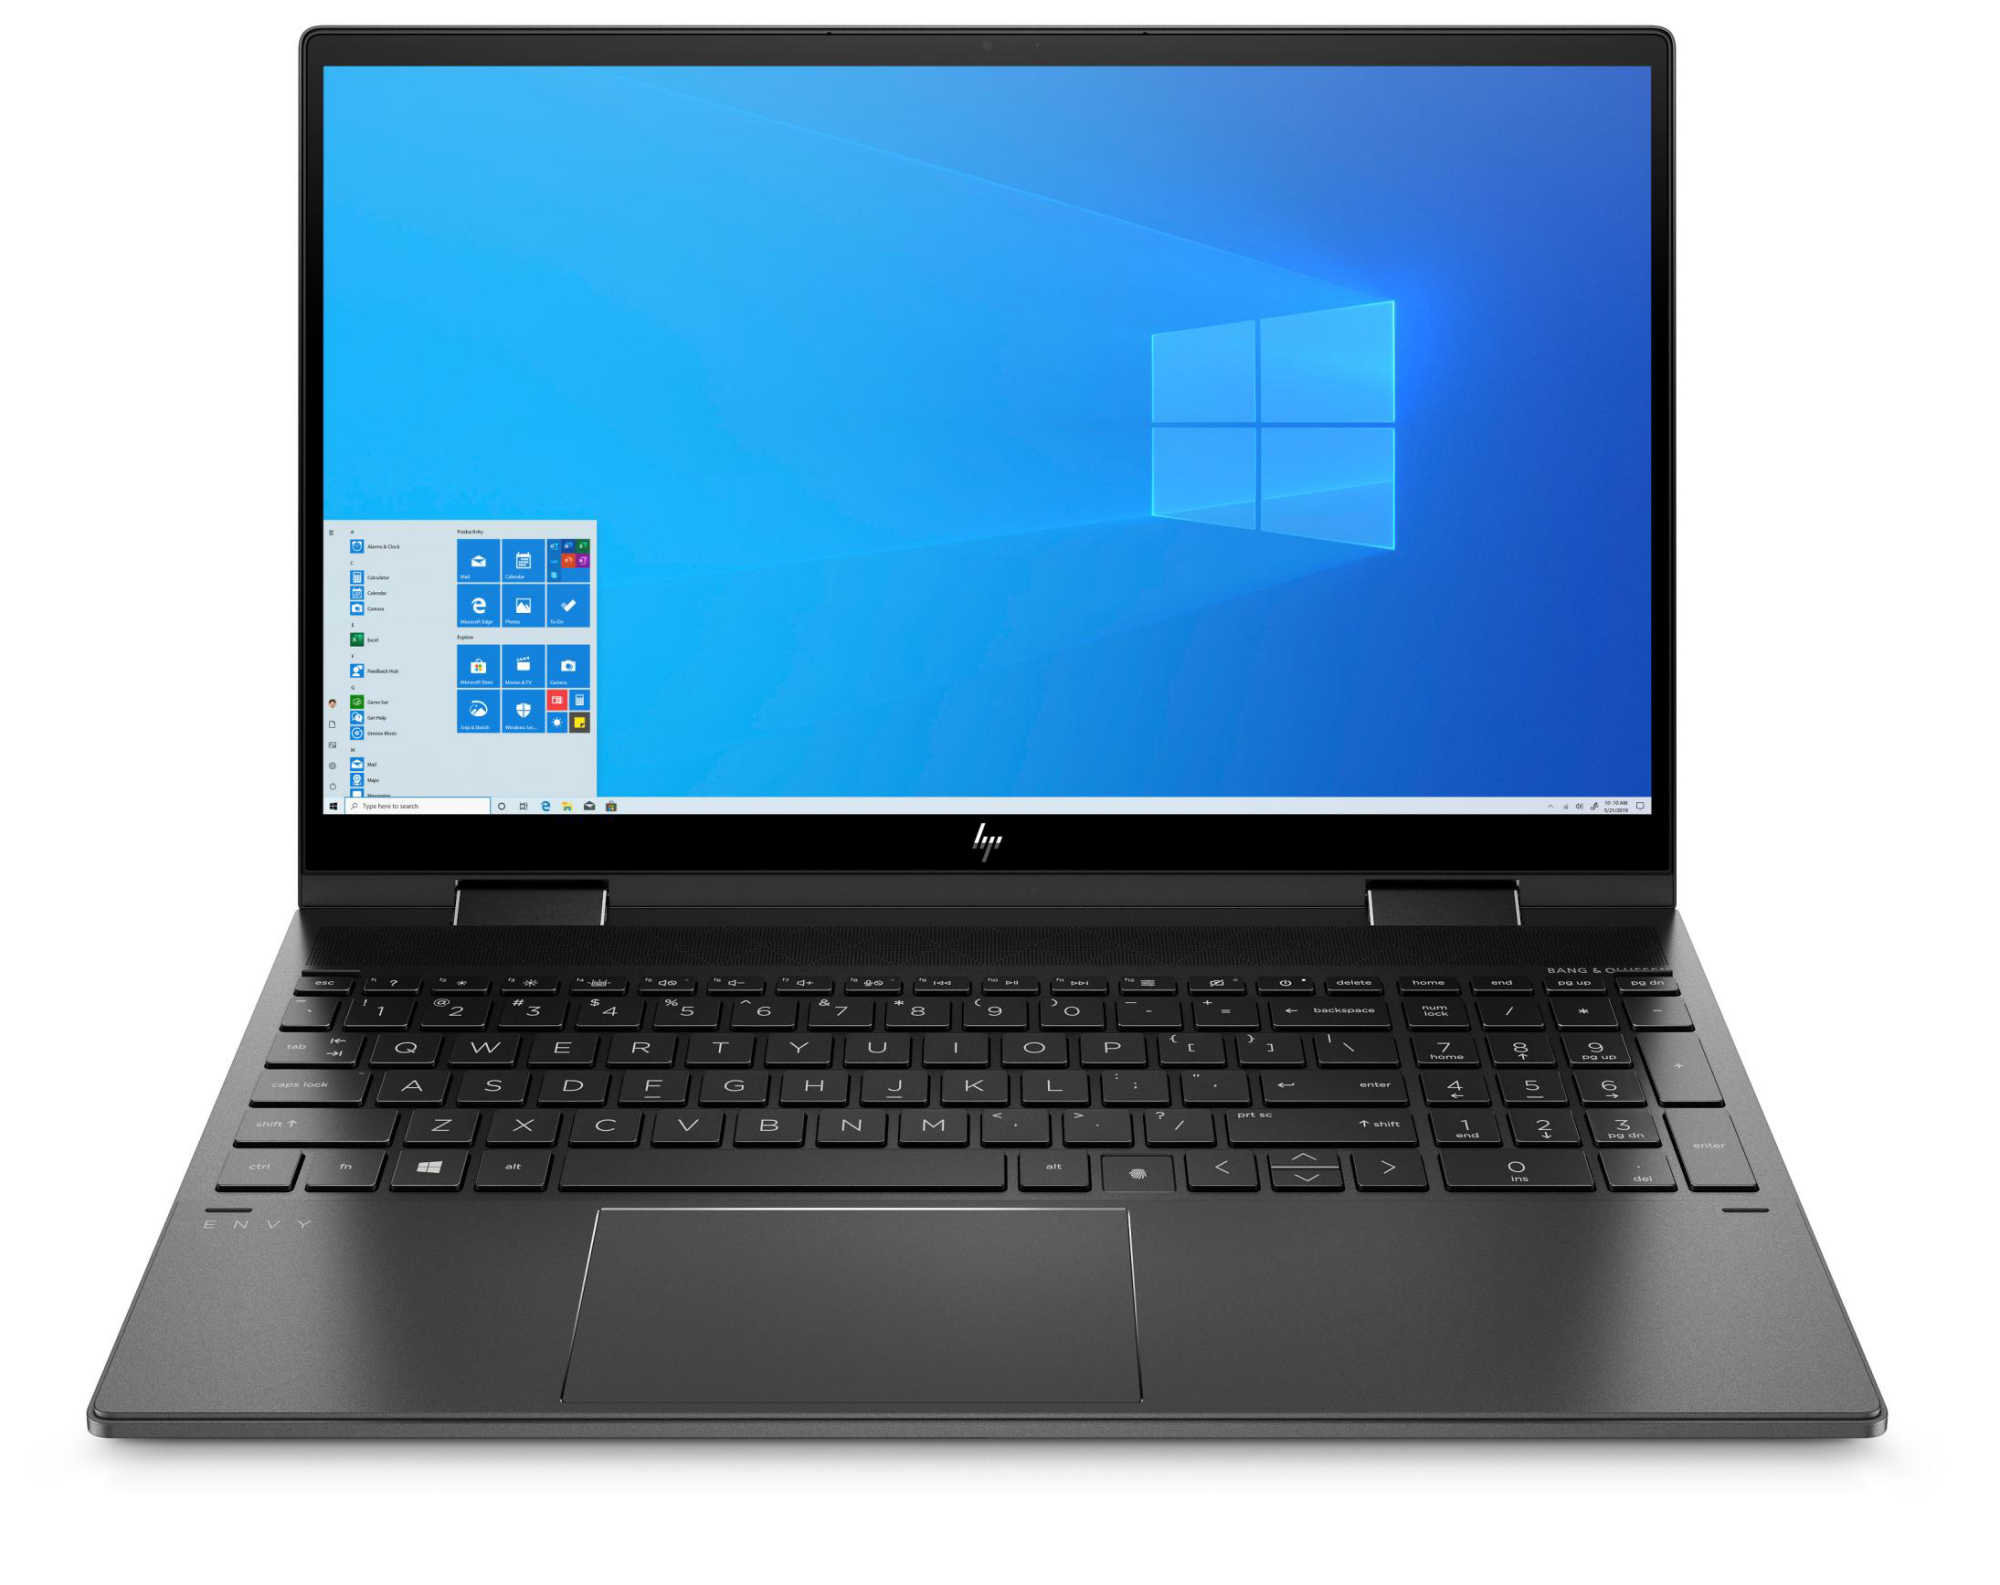
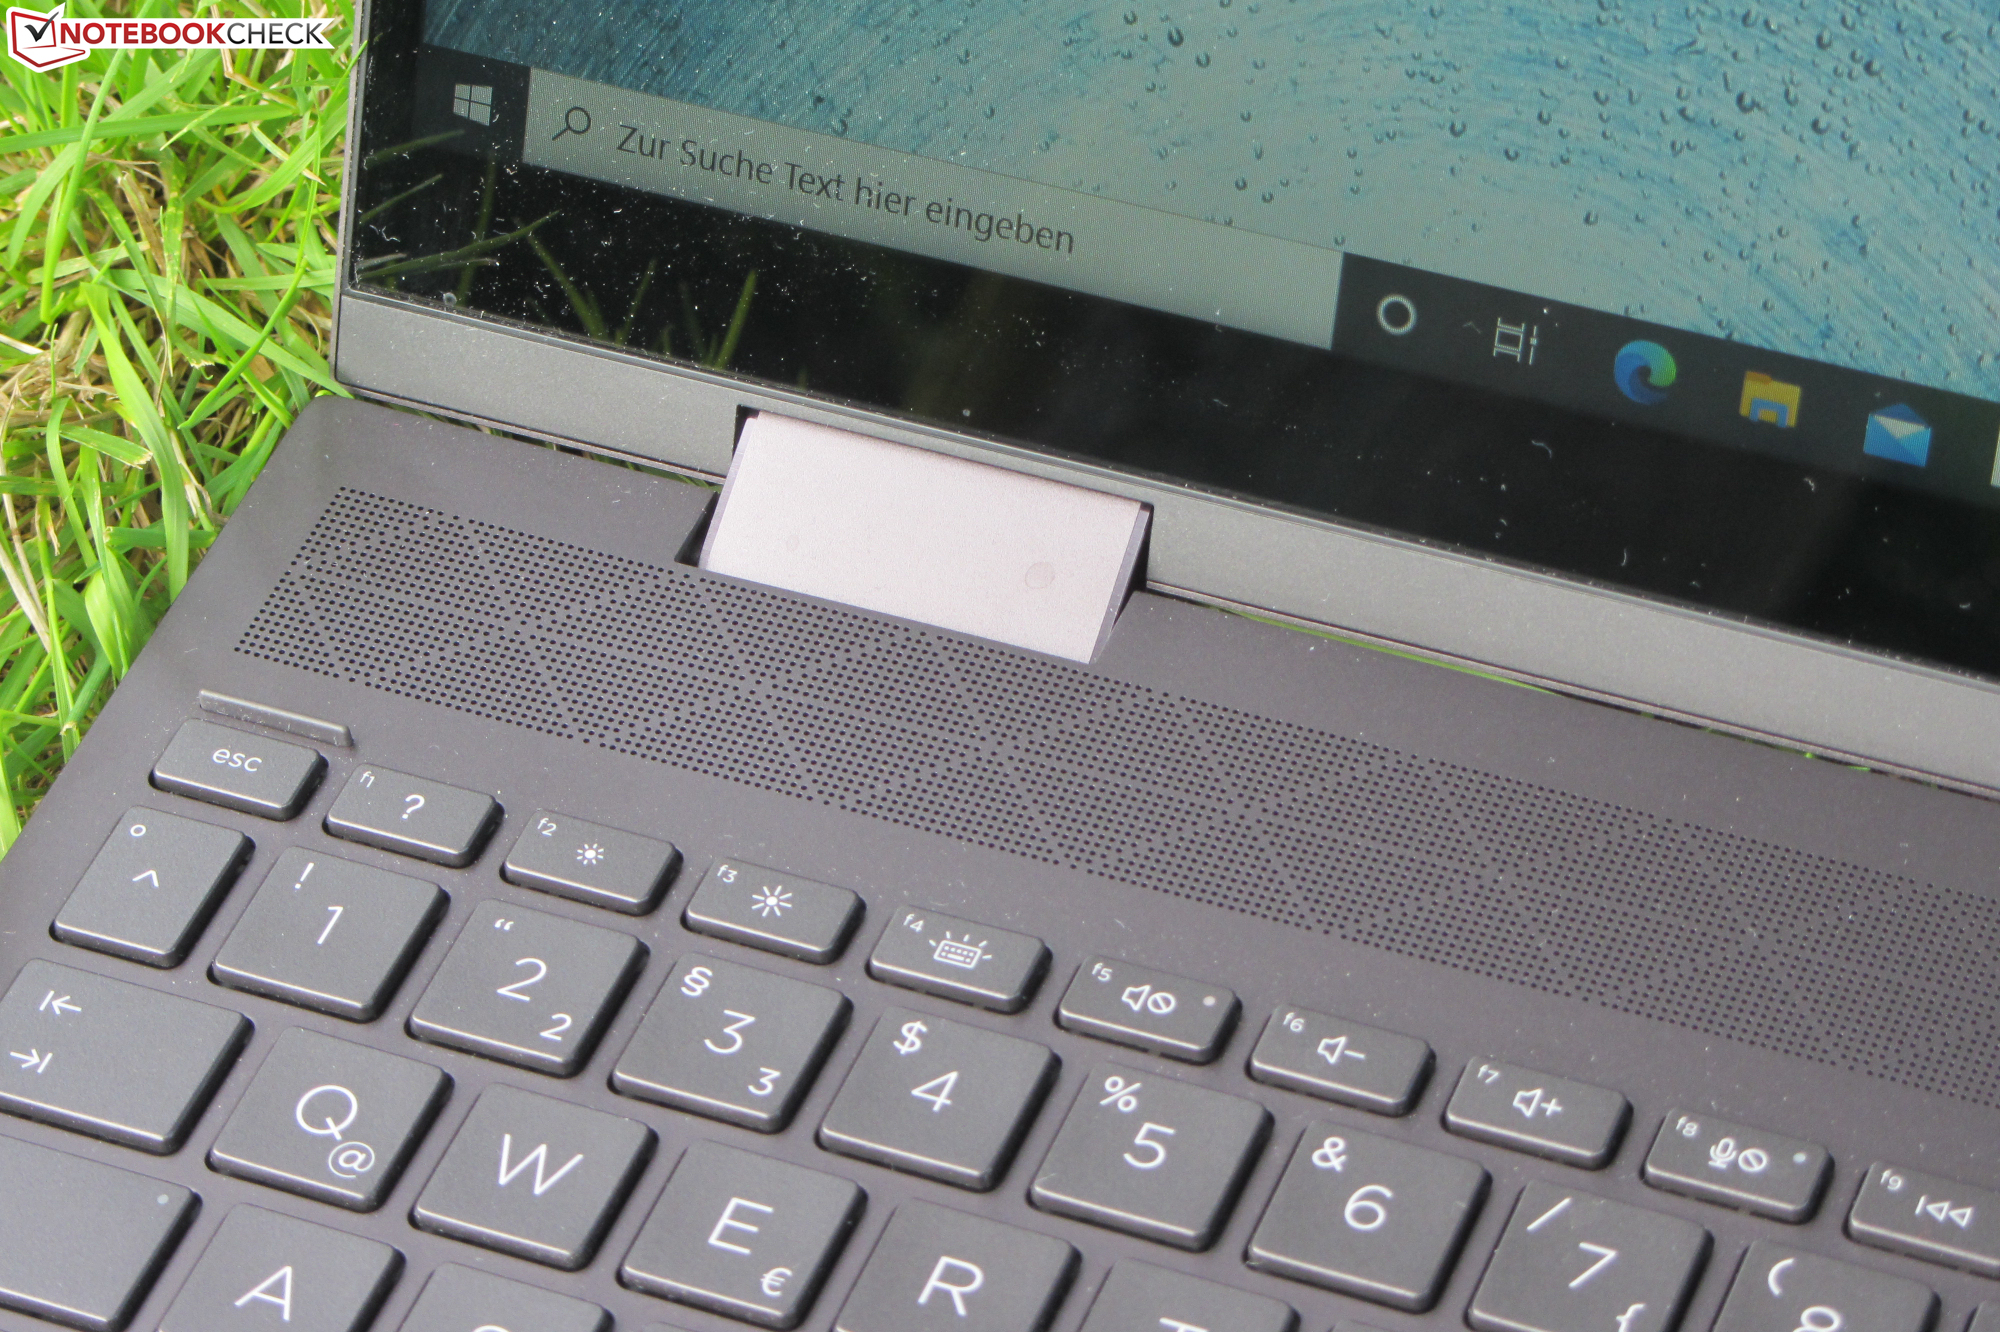
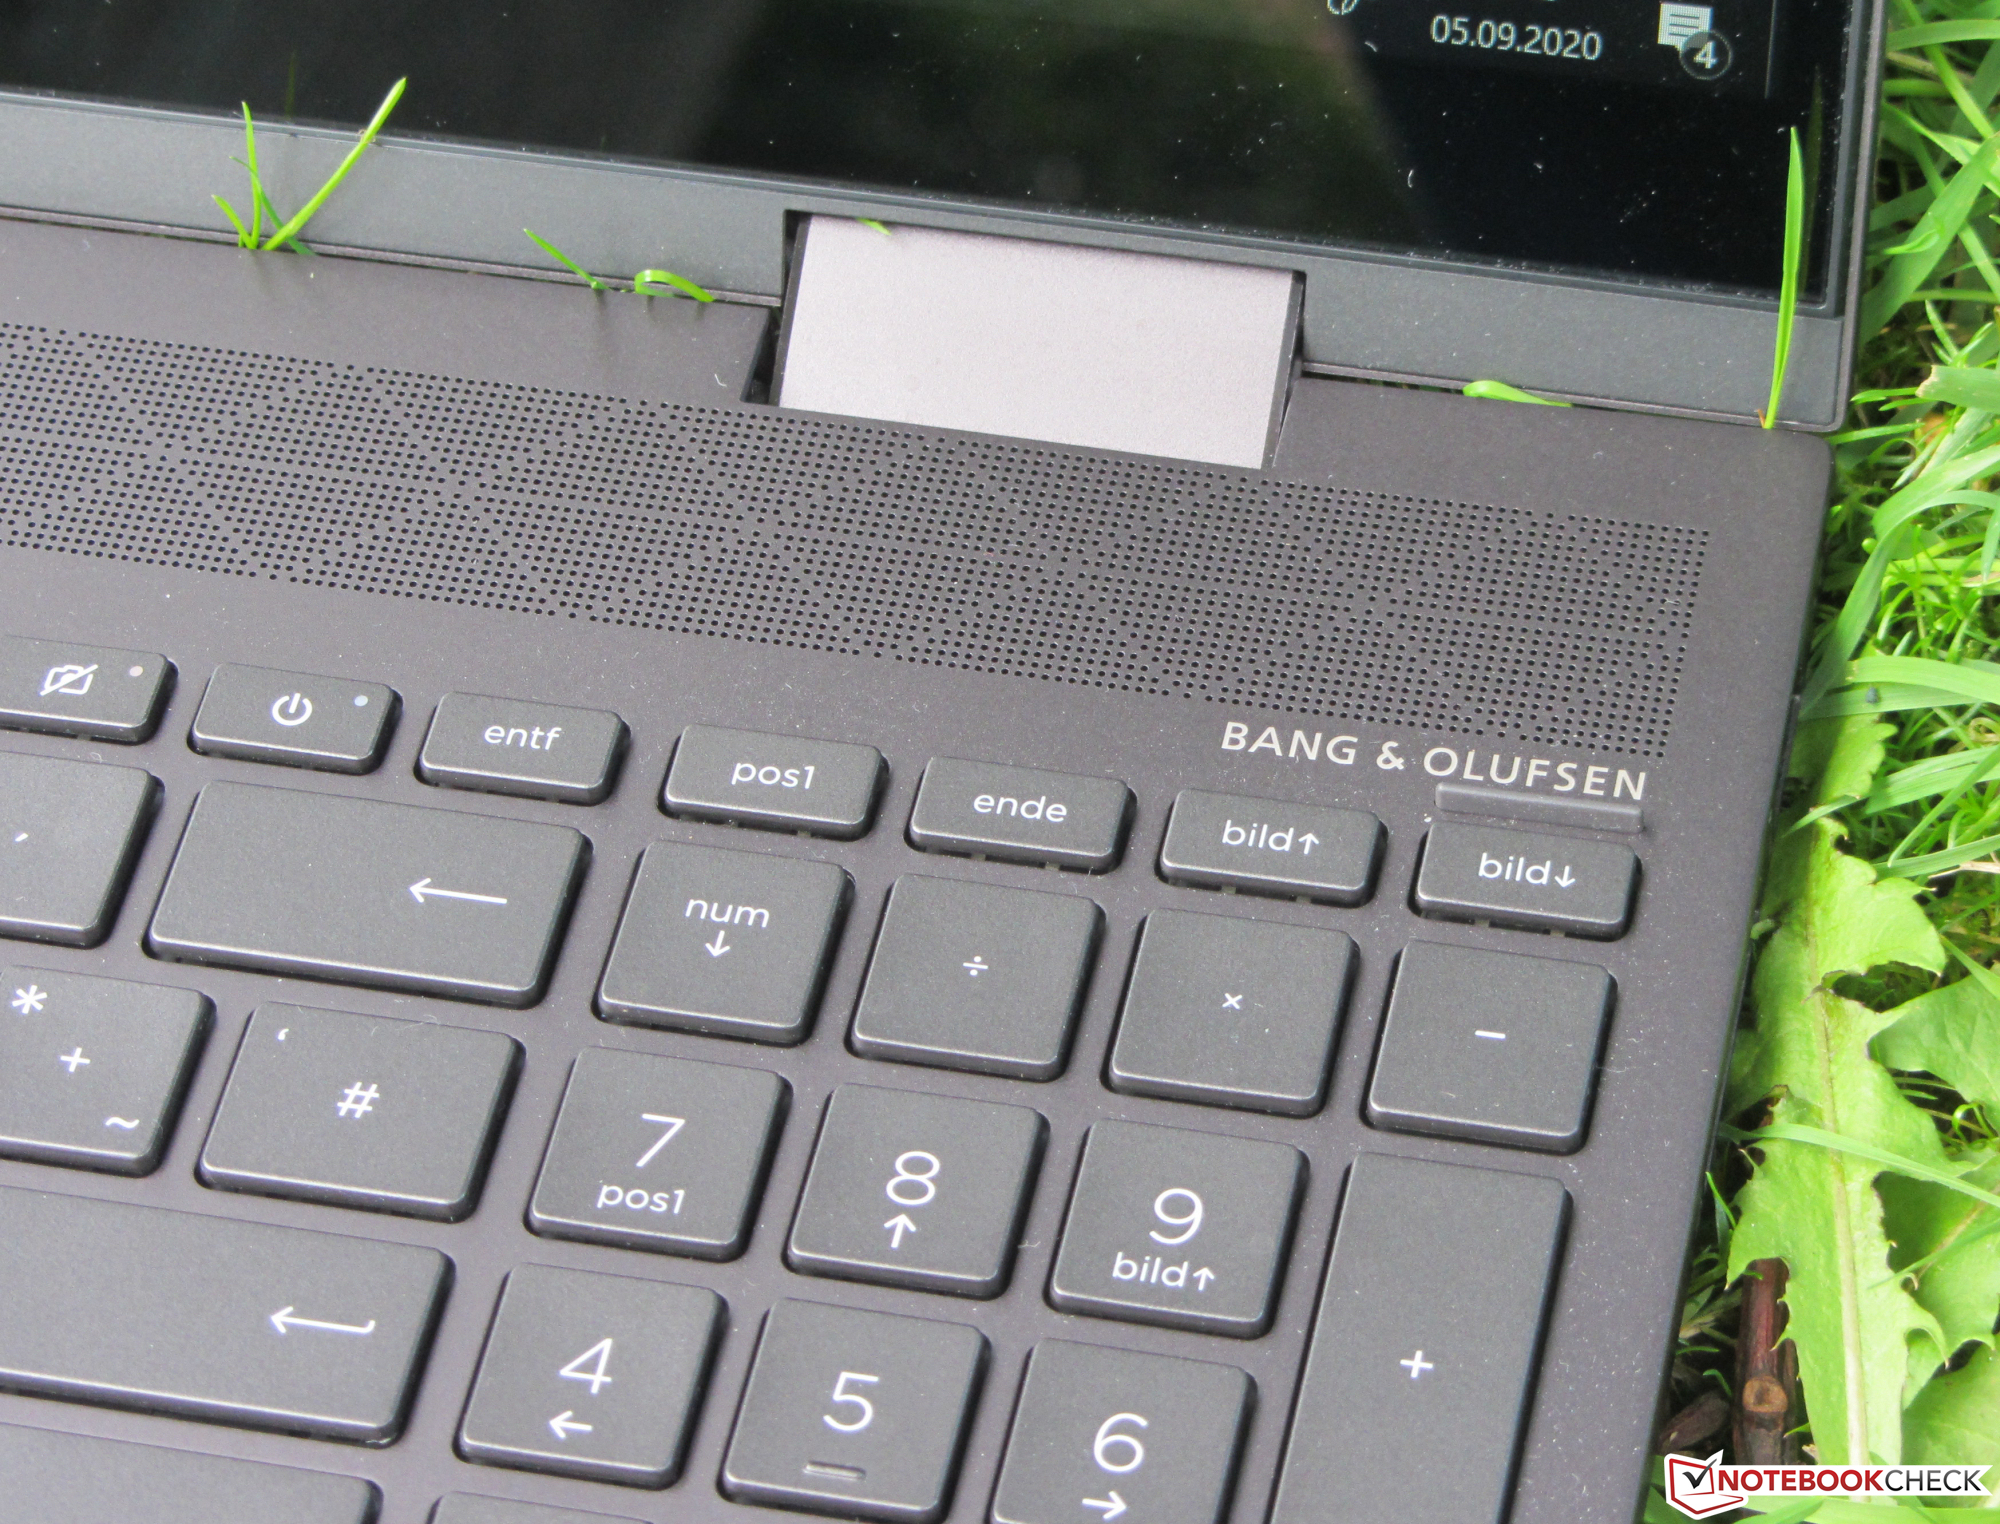
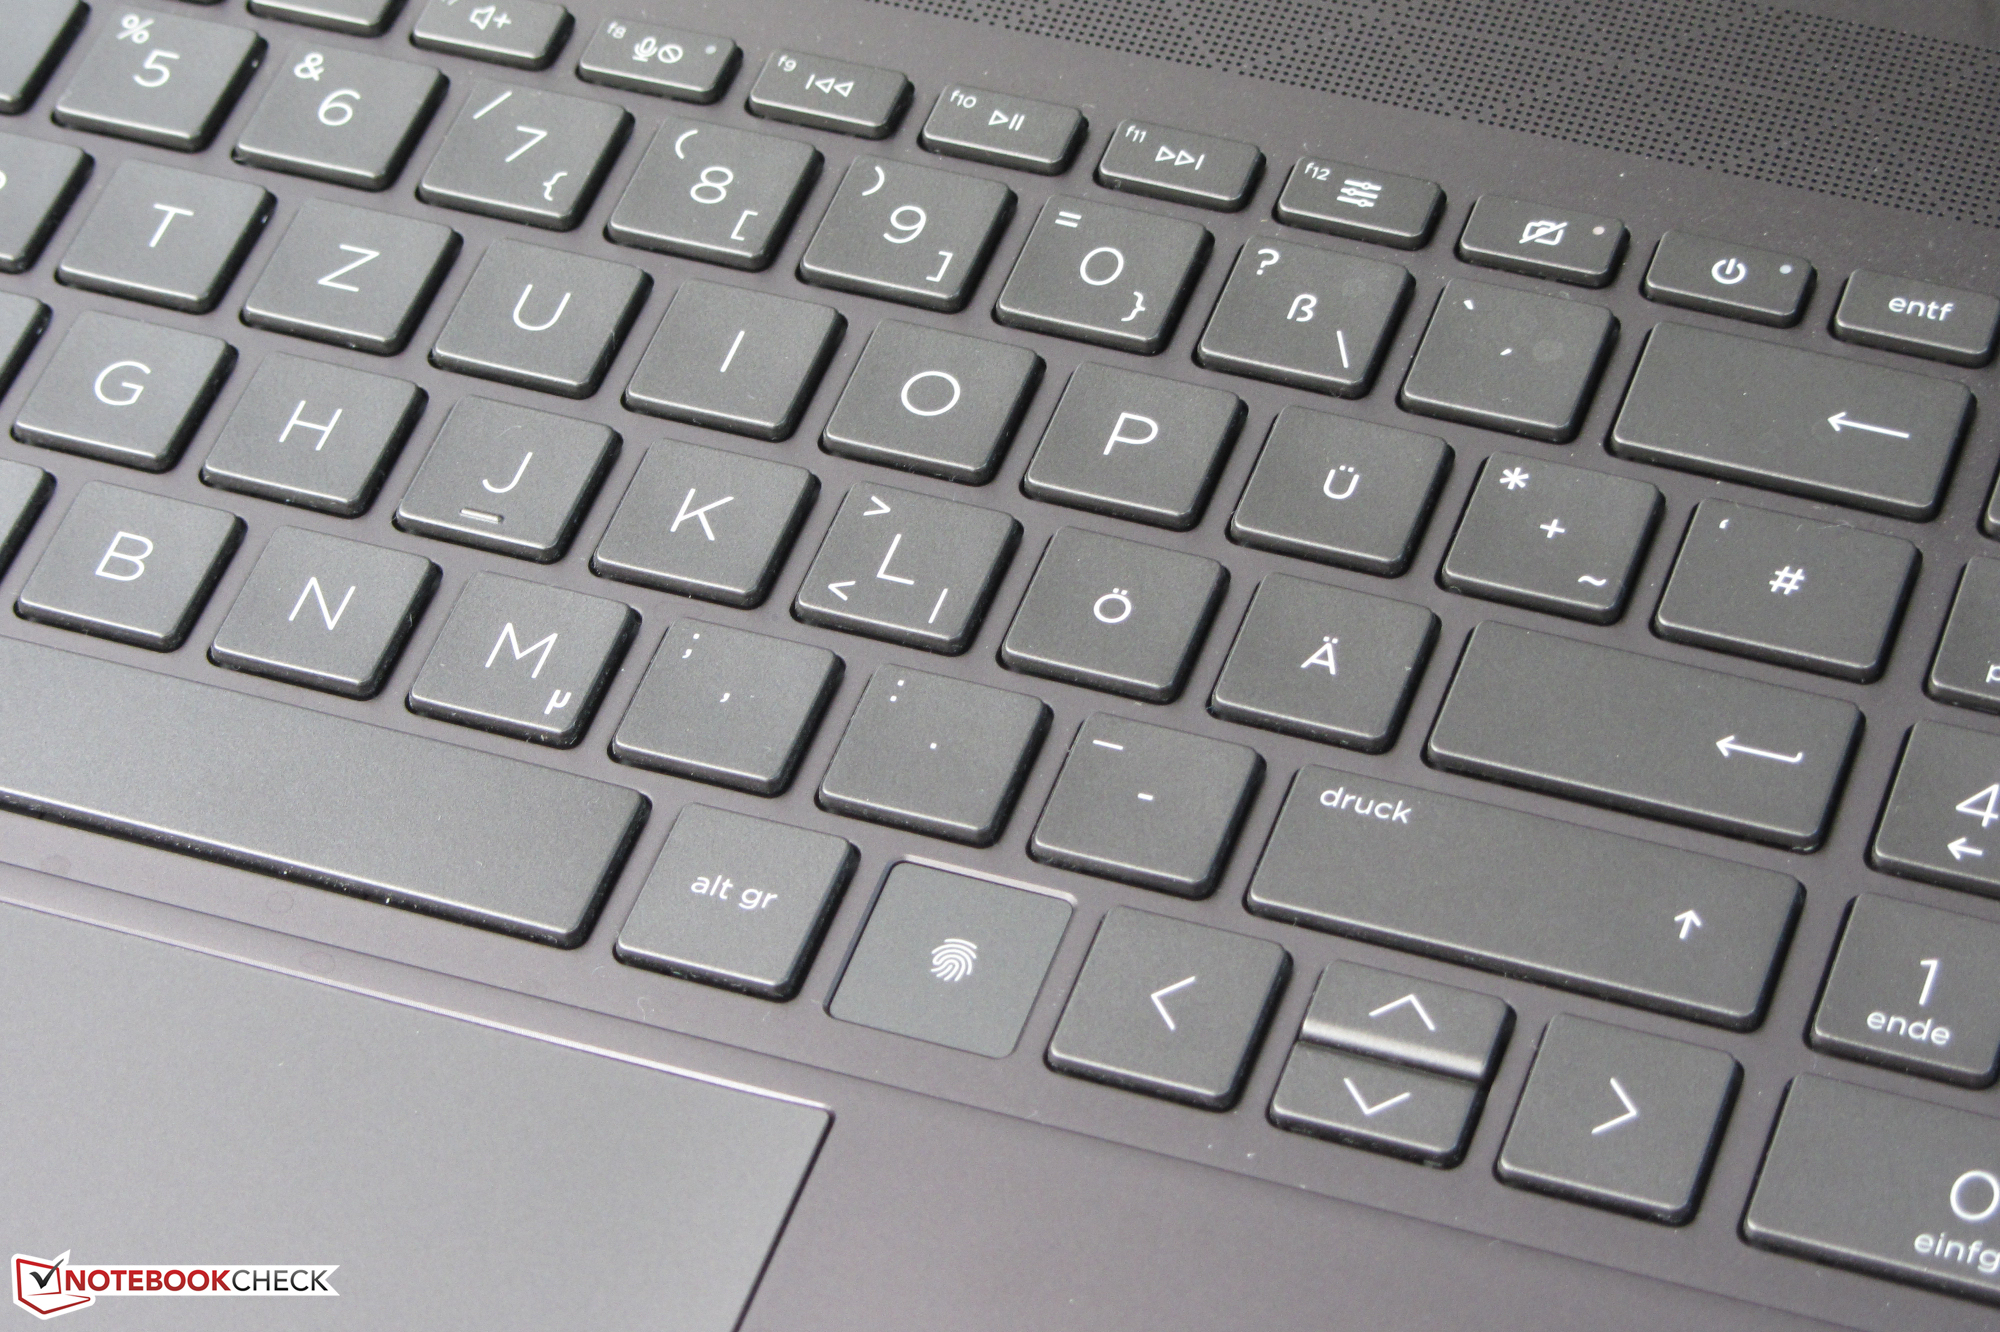
The flat and smooth keys of the illuminated chiclet keyboard (two brightness levels) offer a short stroke and a clear pressure point. The keyboard does get pressed down while typing. Overall, HP delivers a keyboard suitable for everyday operation that is also suited for regular typing tasks.
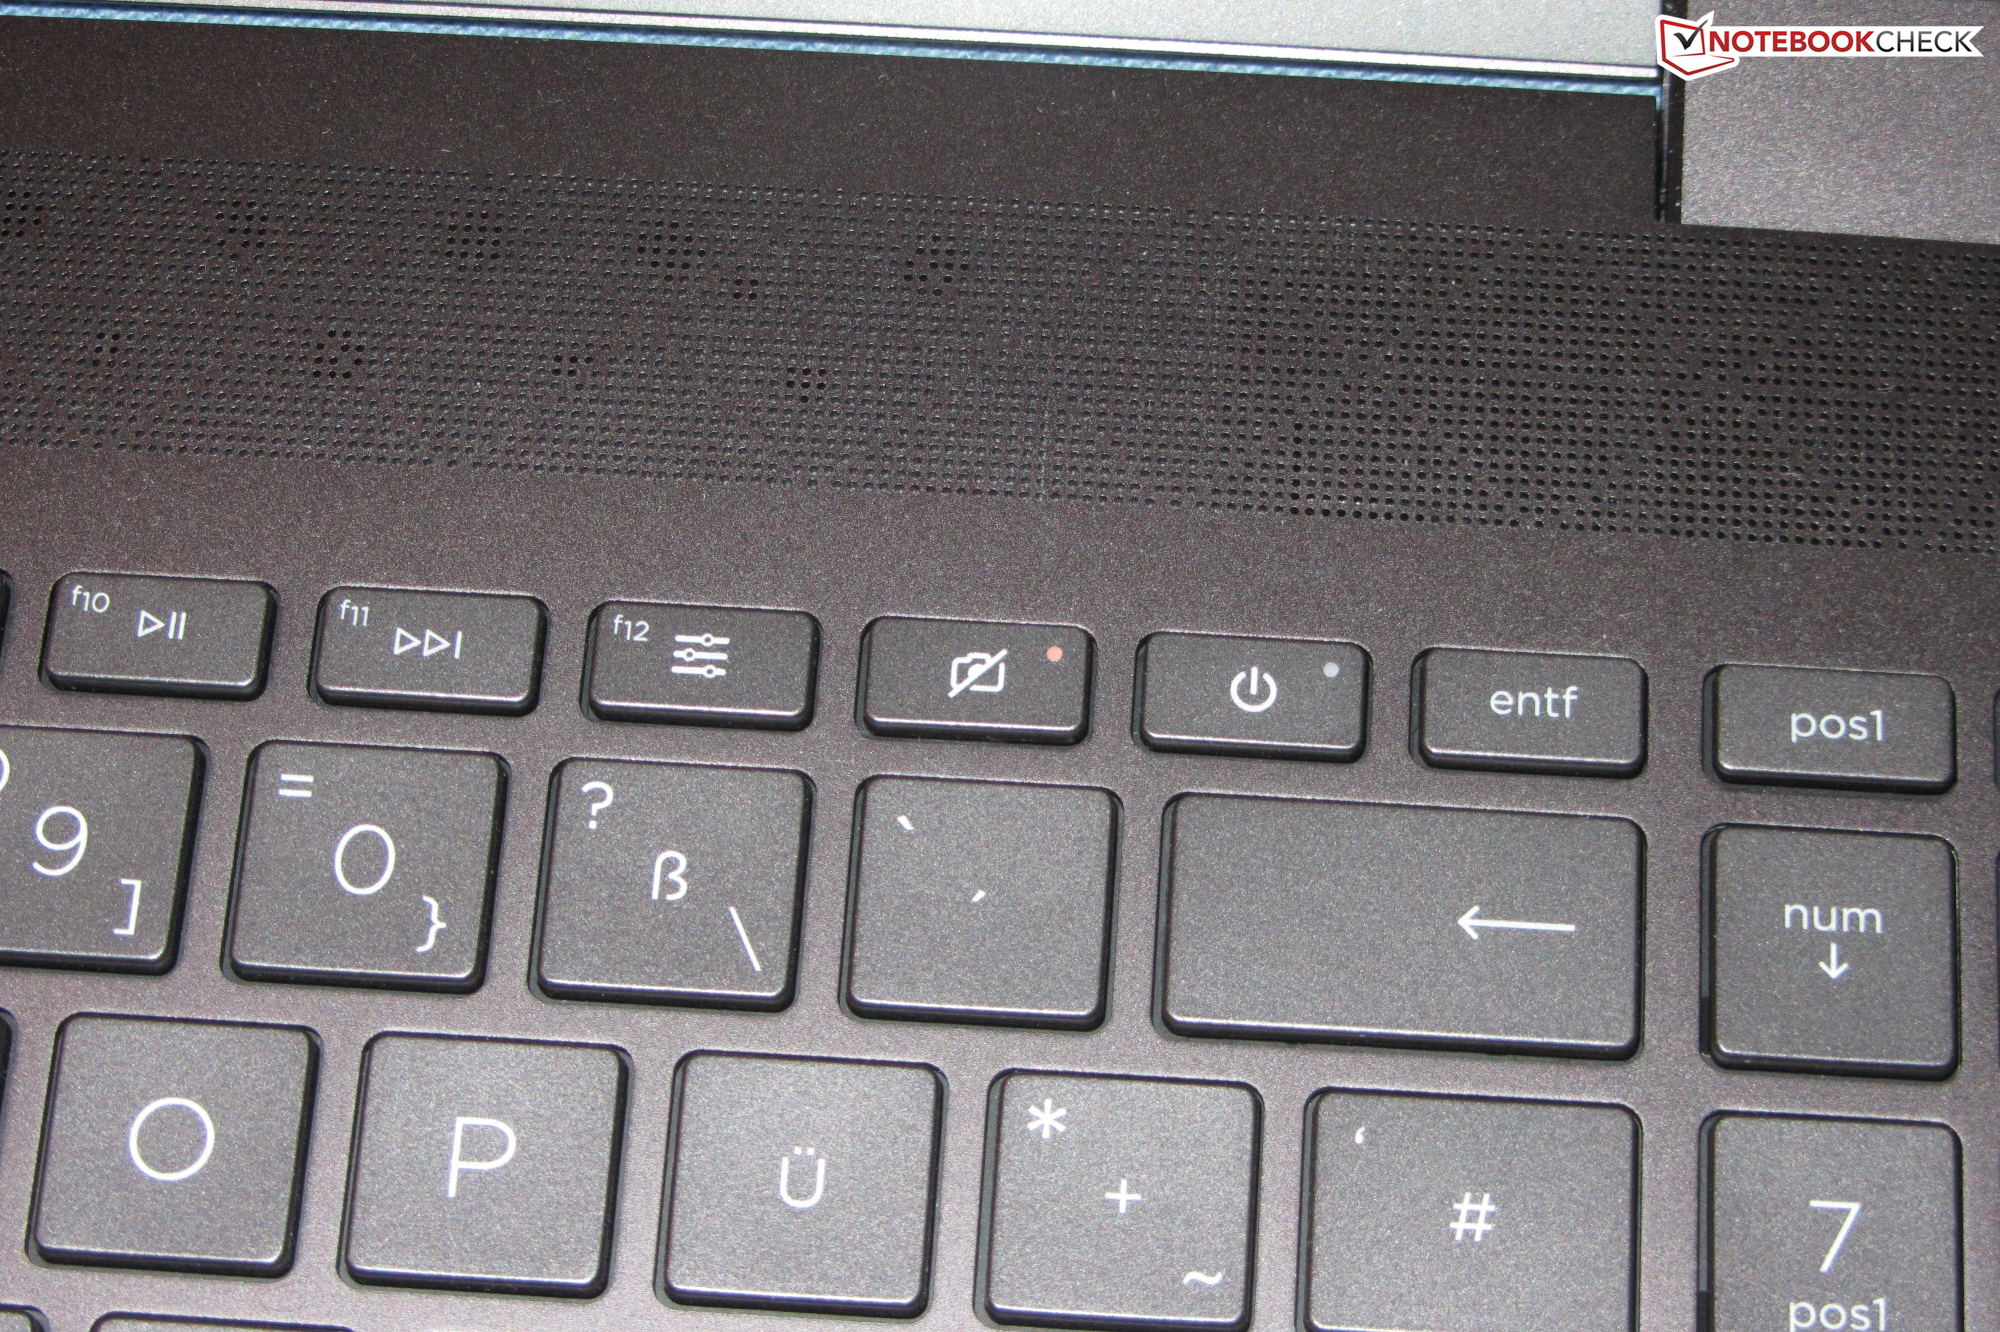
In contrast to the predecessor, the power button and fingerprint reader are now integrated into the keyboard. In addition, there is a key to turn the camera on or off (the camera app is not opened) and another key to open the Command Center.
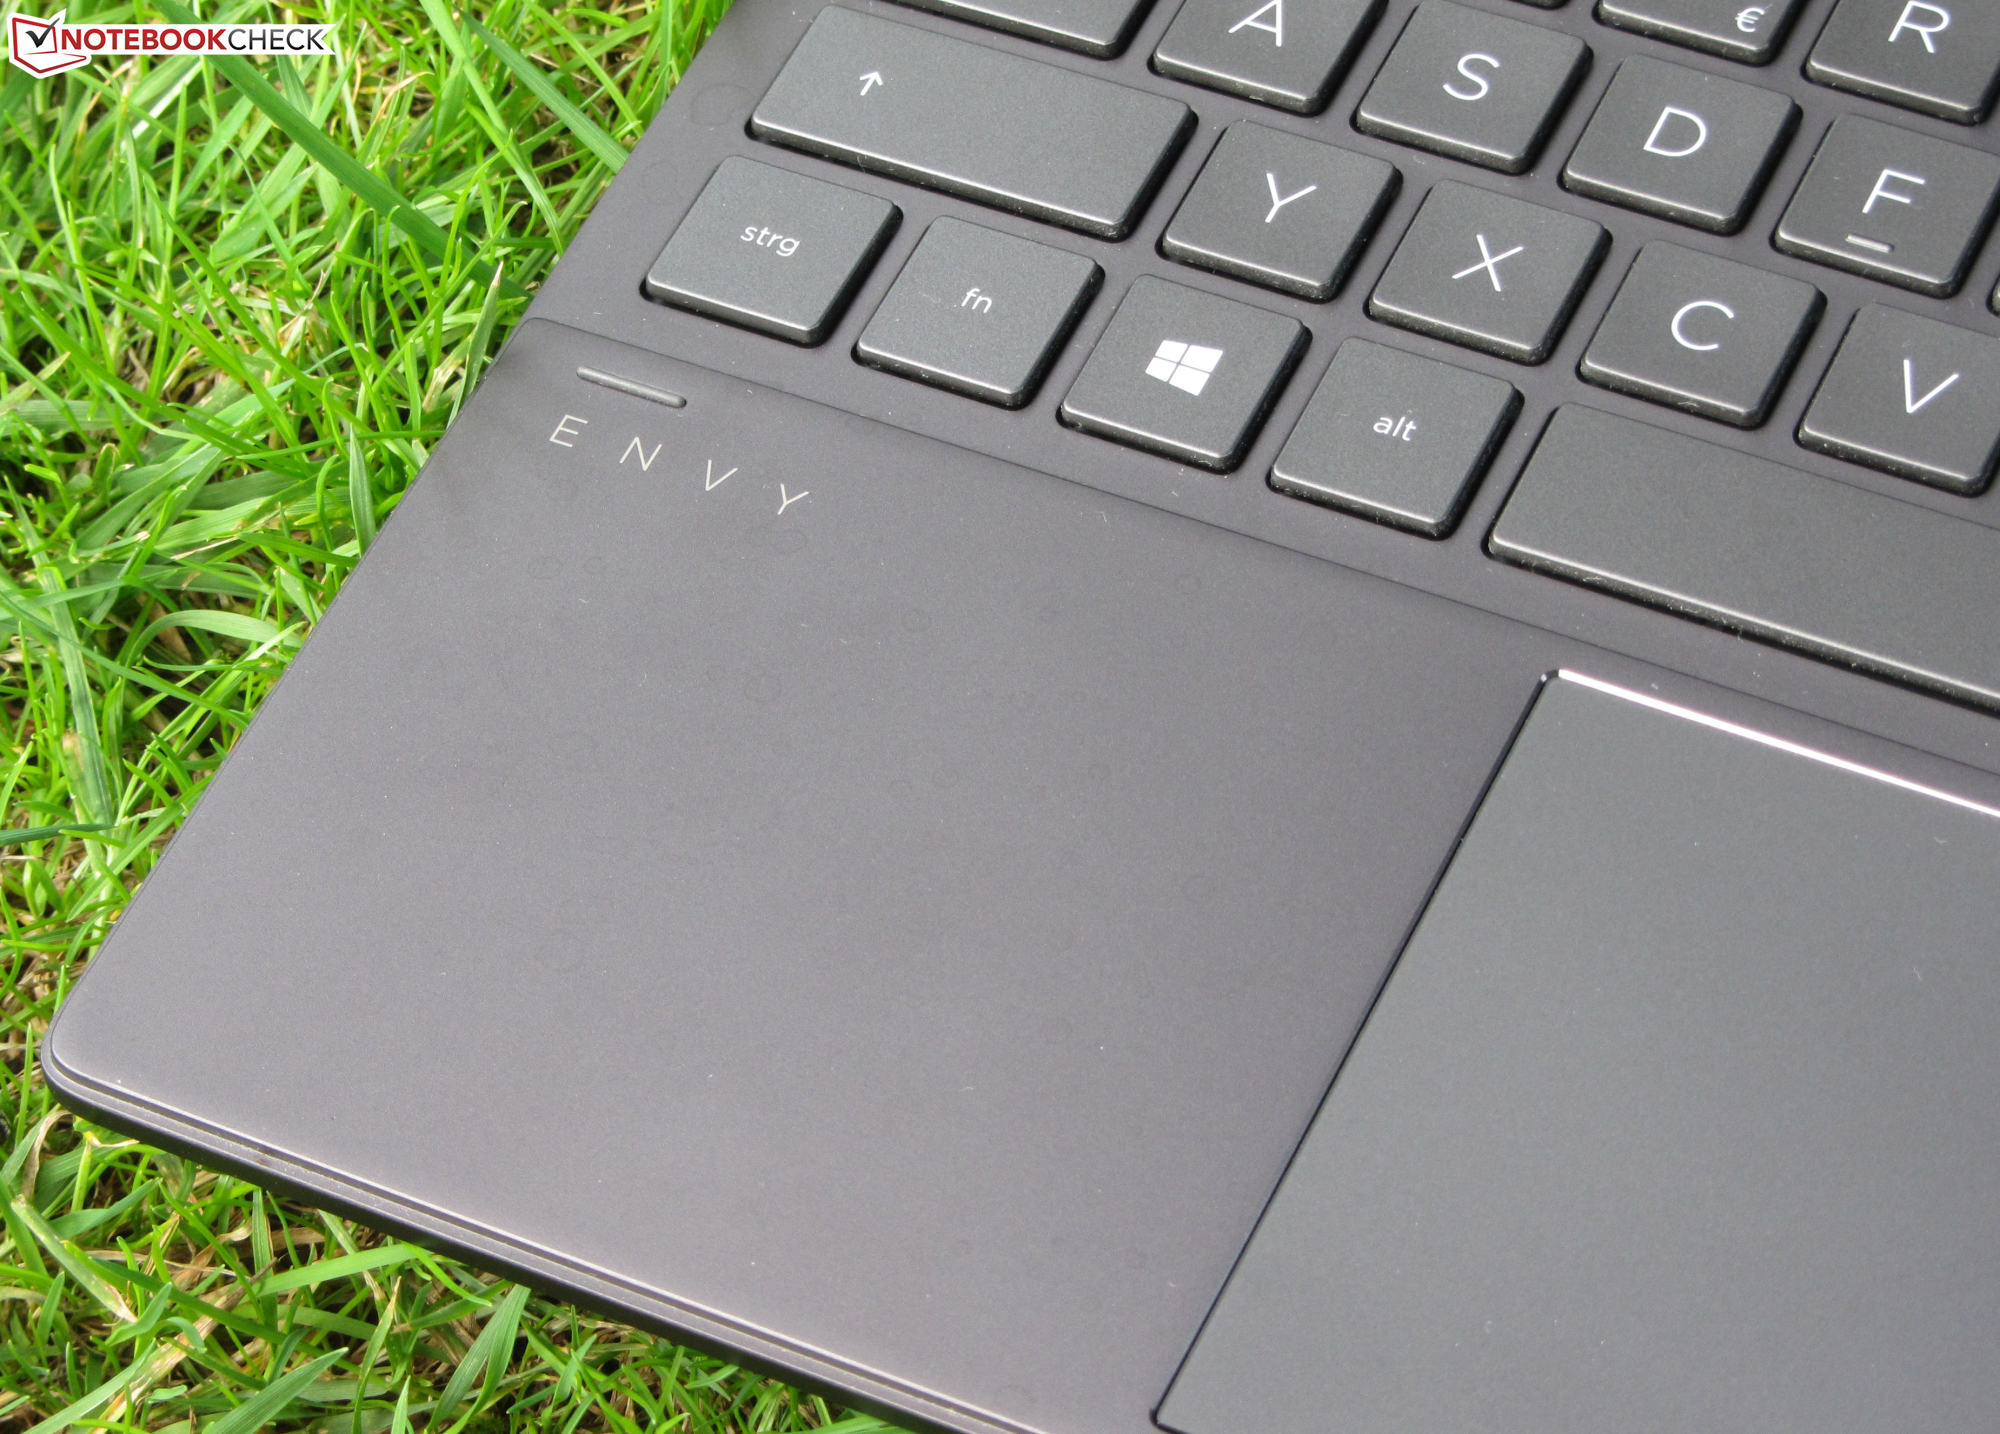
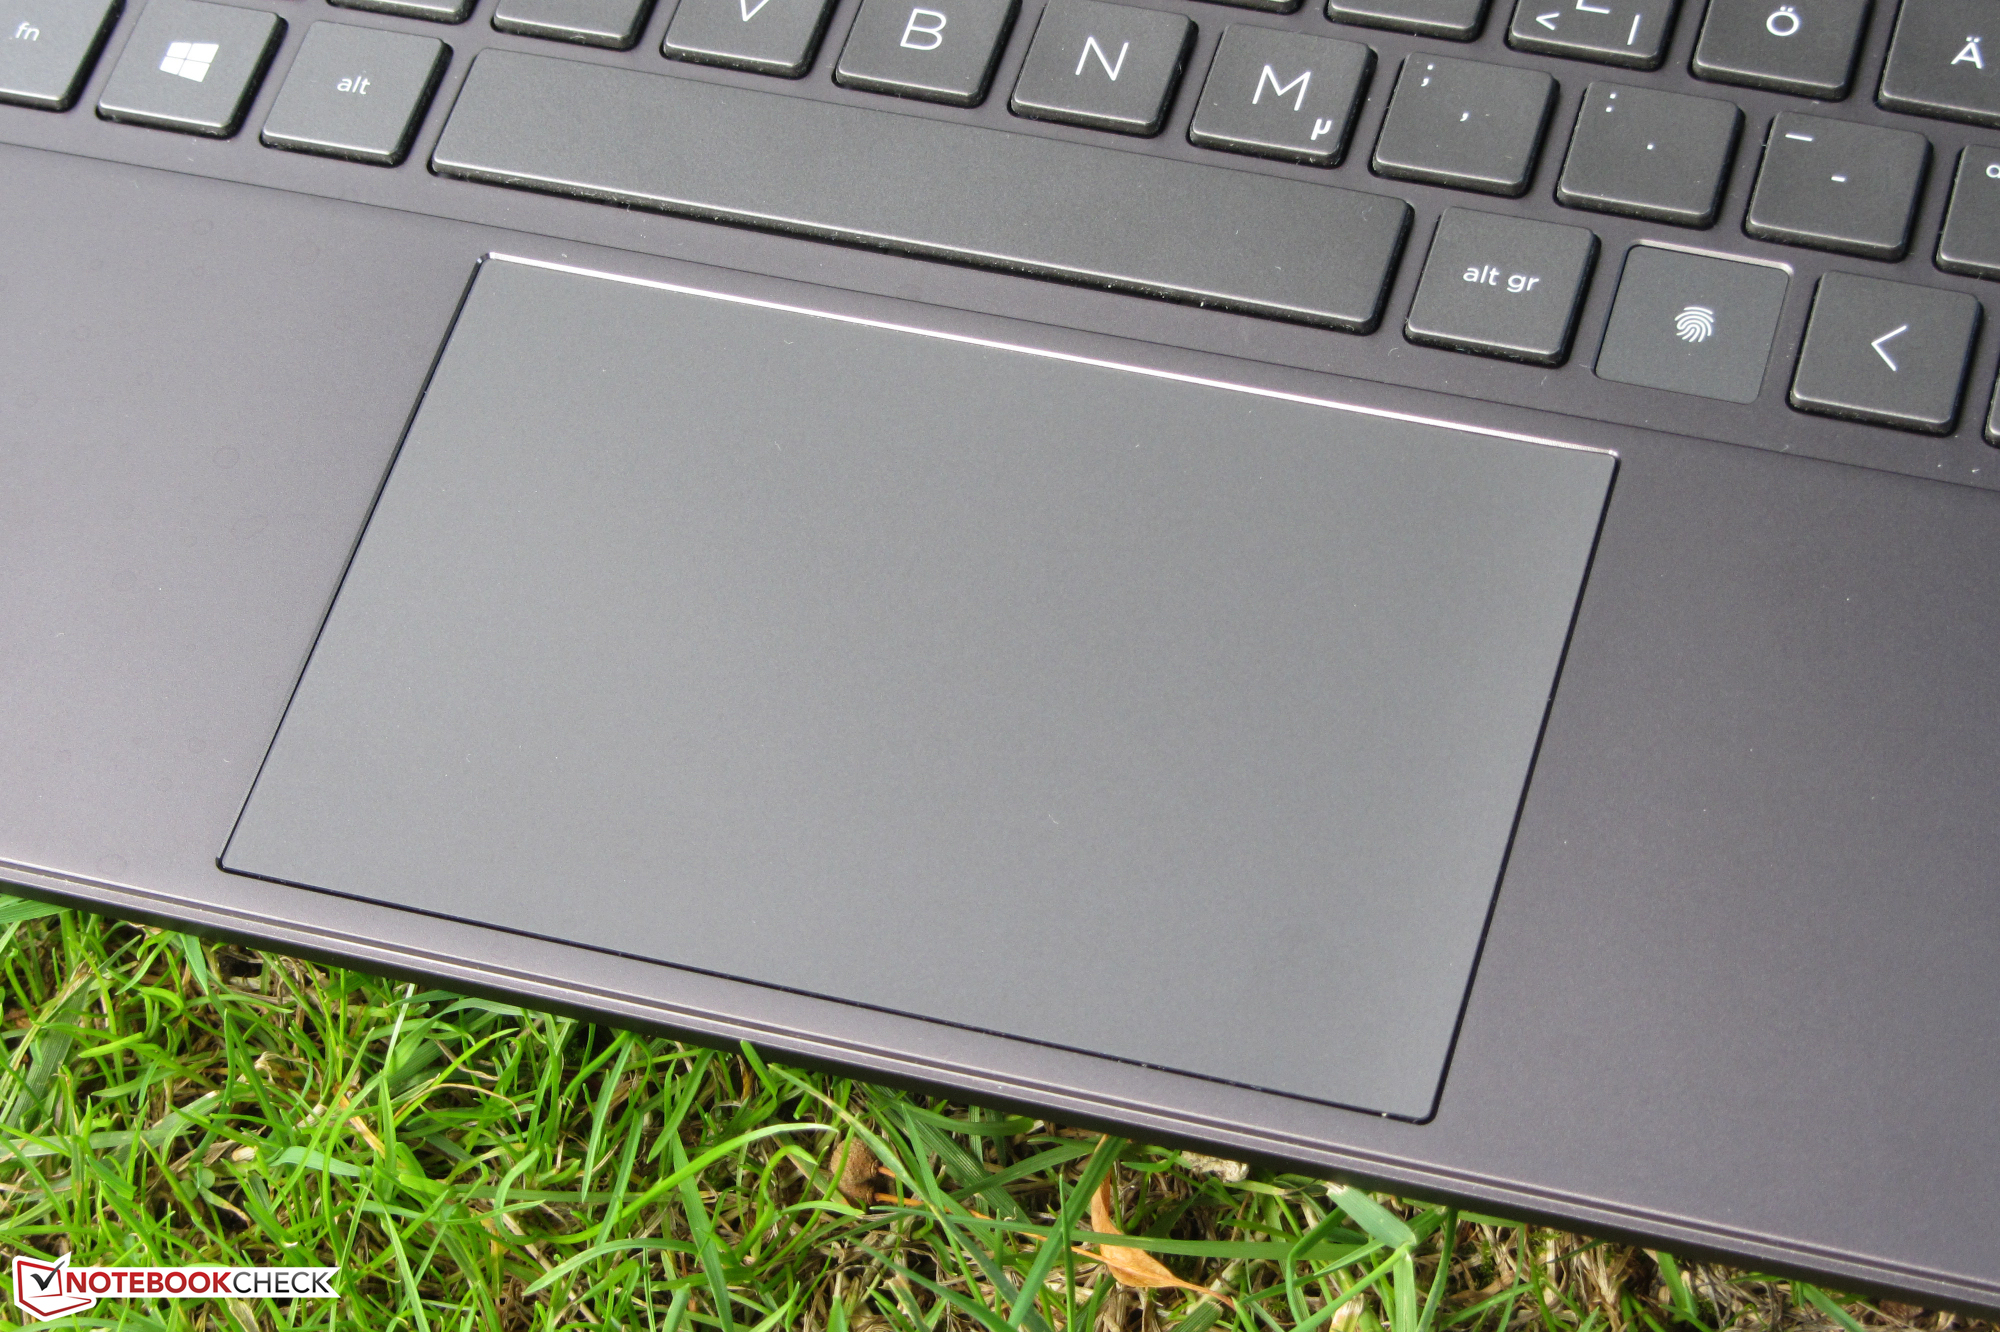
The multi-touch capable ClickPad (approx. 11.5 x 7.3 cm; ~4.5 x 2.9 in) offers sufficient space for using gesture control and also responds to inputs in the corners. The smooth surface facilitates the sliding of fingers. The pad offers a short stroke and clear pressure point.
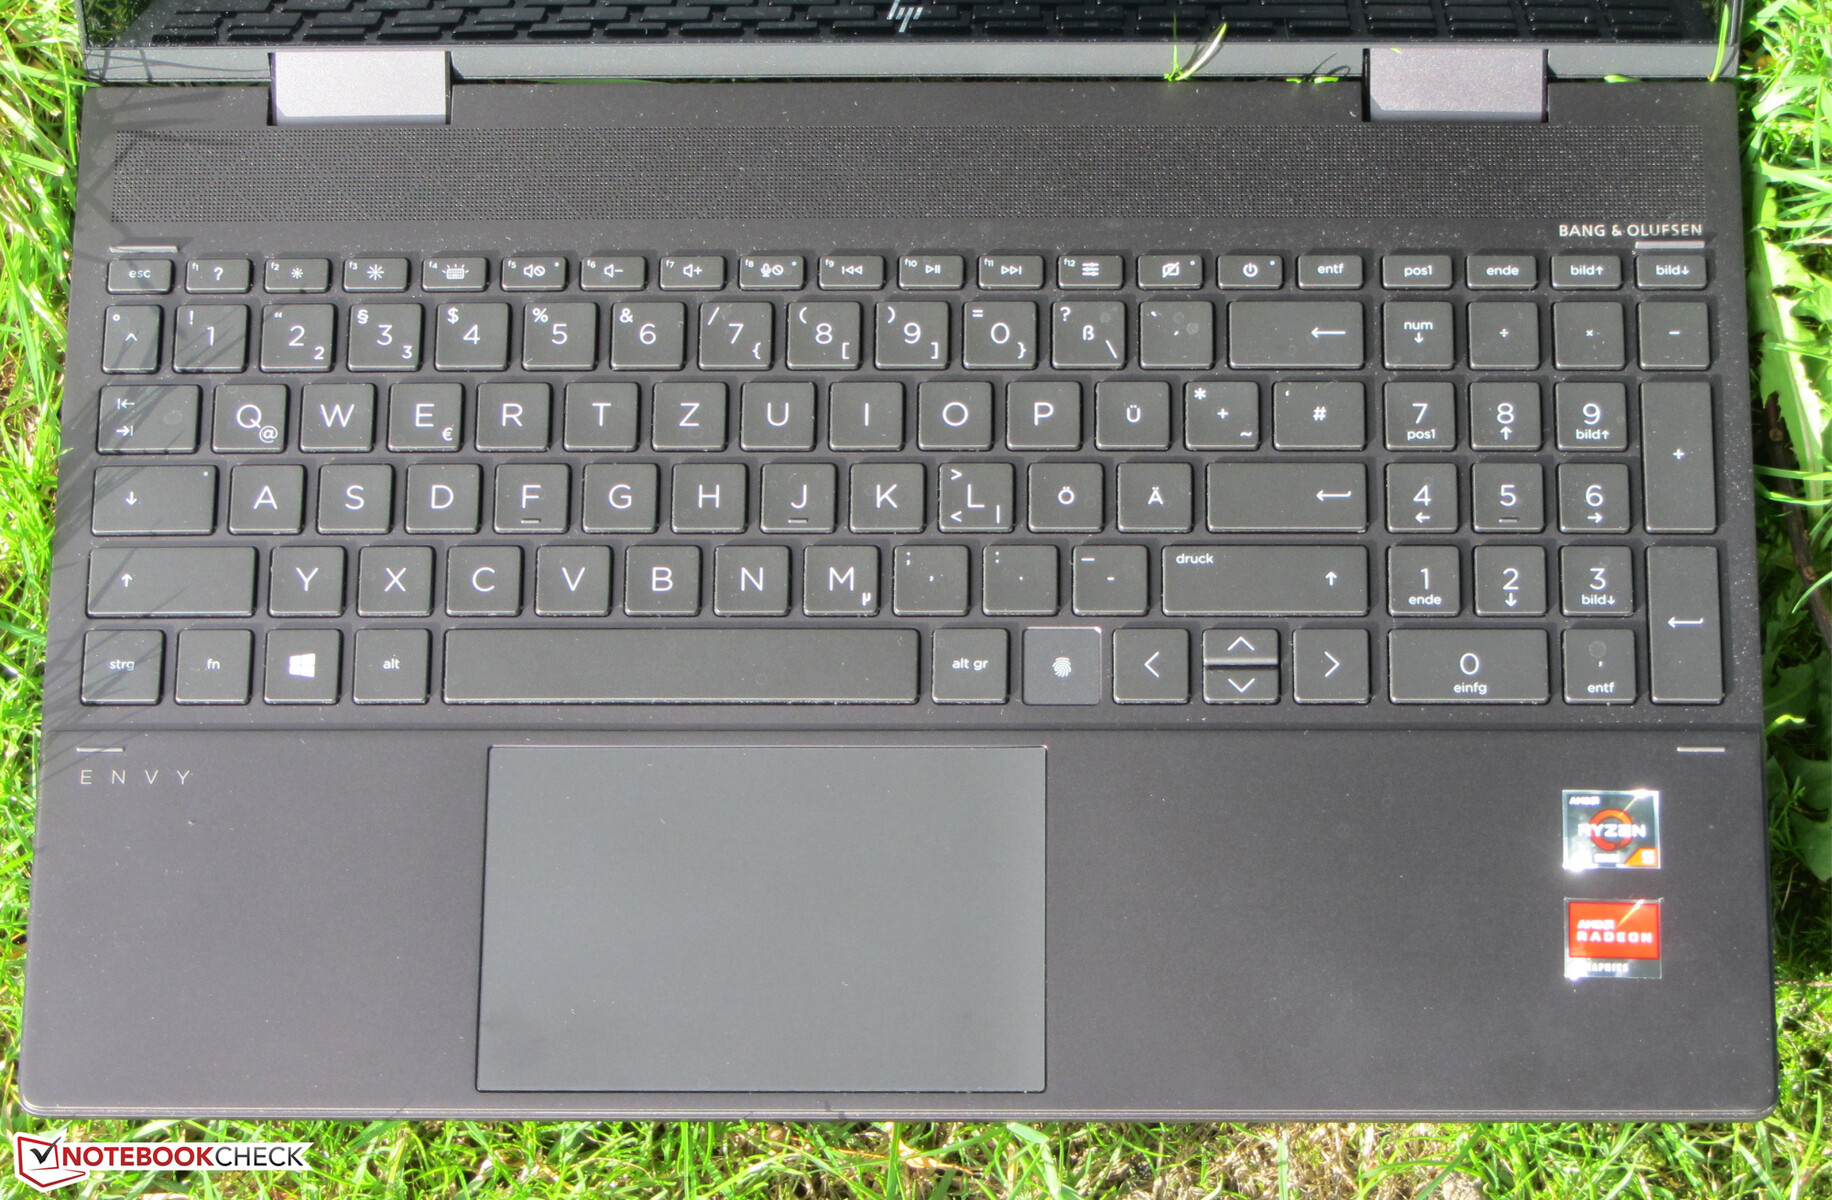
The touchscreen (10 touch points) creates no problems and responds to input promptly. The screen can be operated with the fingers as well as the HP Pen (1MR94AA; approx. 30 to 40 Euros; ~$36-47) which needs to be purchased separately.
Display - IPS onboard
The 15.6-inch touchscreen display (1920x1080 pixels) offers a good contrast (1142:1), but the maximum brightness is too low (279.6 cd/m²). We consider values beyond 300 cd/m² as good. The brightness distribution of the panel turns out fairly uneven.
| |||||||||||||||||||||||||
Brightness Distribution: 72 %
Center on Battery: 312 cd/m²
Contrast: 1142:1 (Black: 0.275 cd/m²)
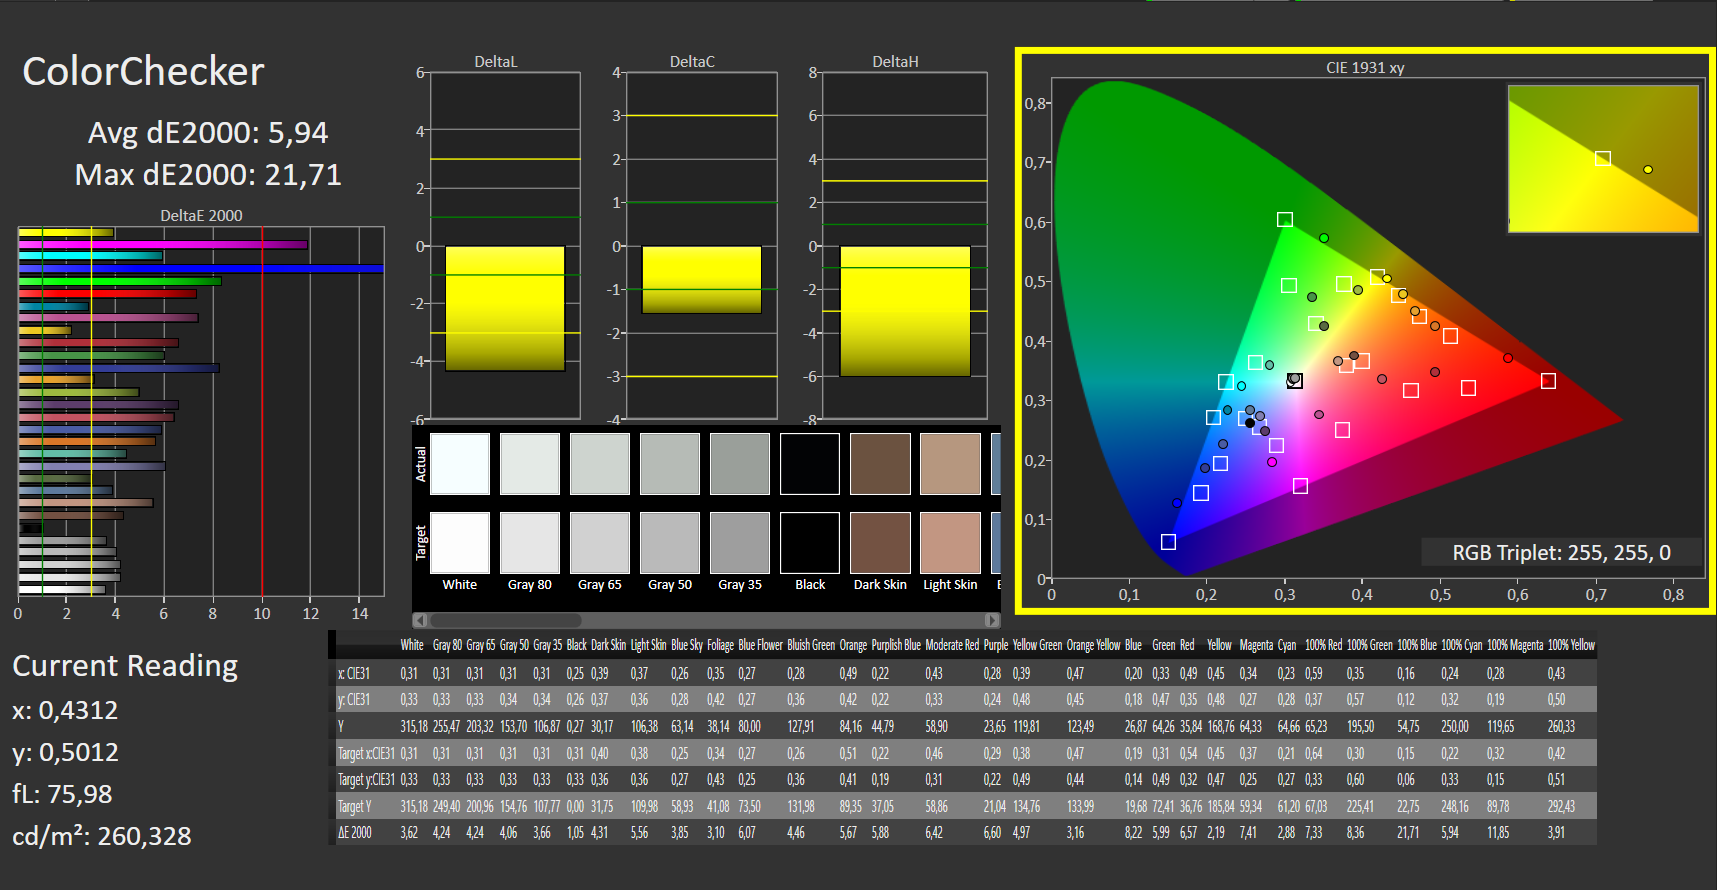
ΔE ColorChecker Calman: 5.94 | ∀{0.5-29.43 Ø4.72}
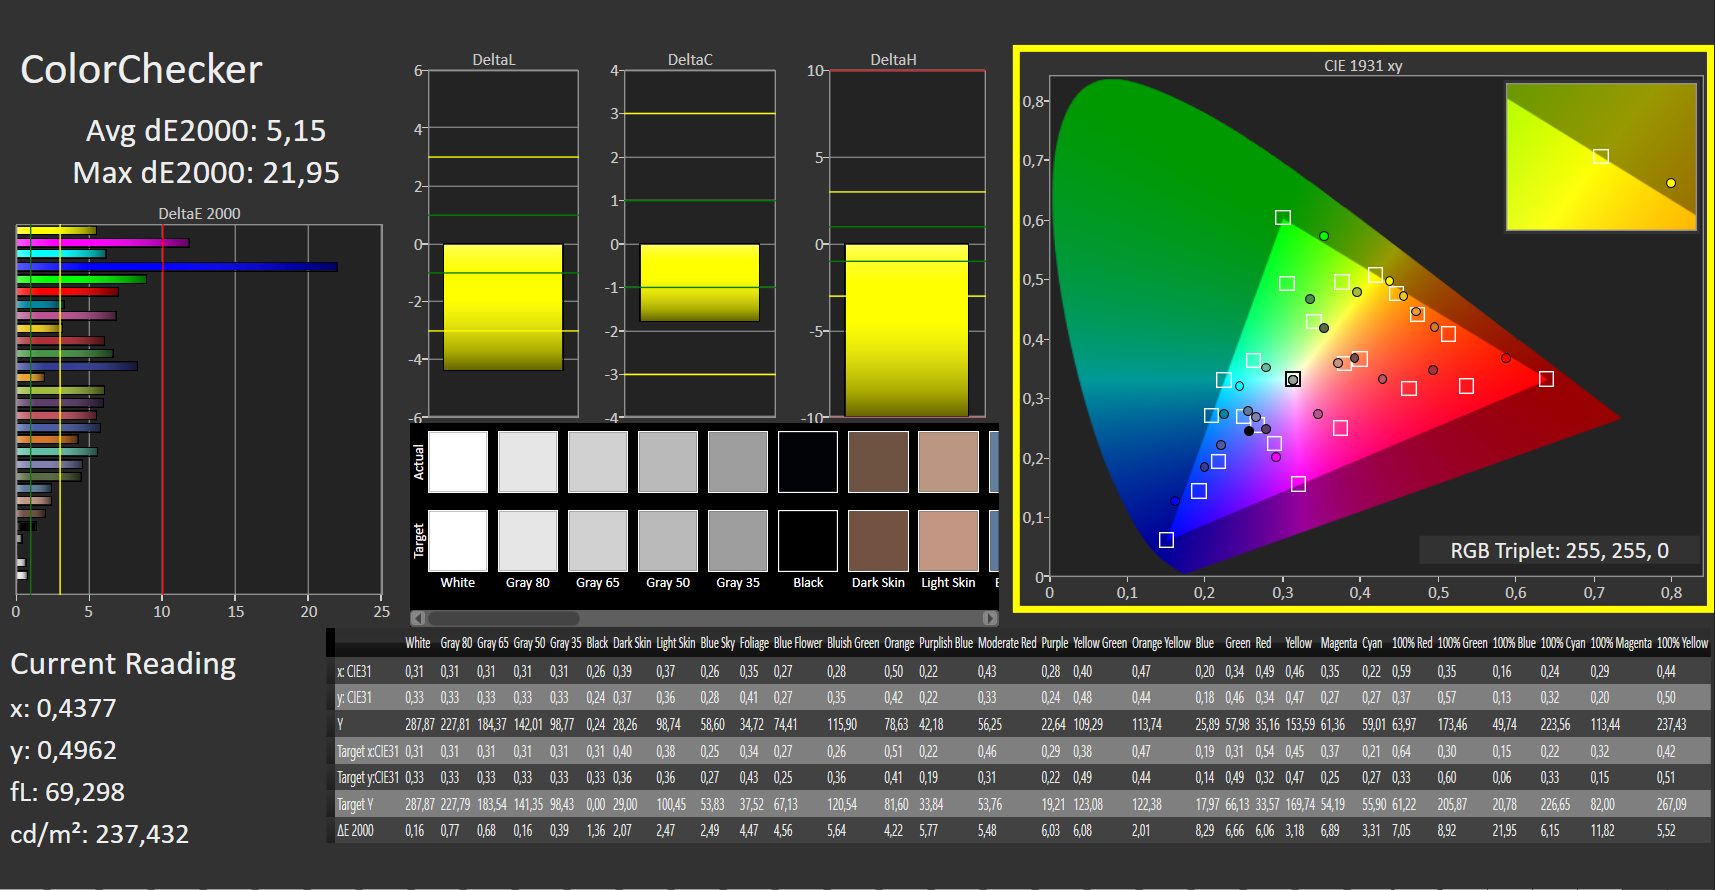
calibrated: 5.15
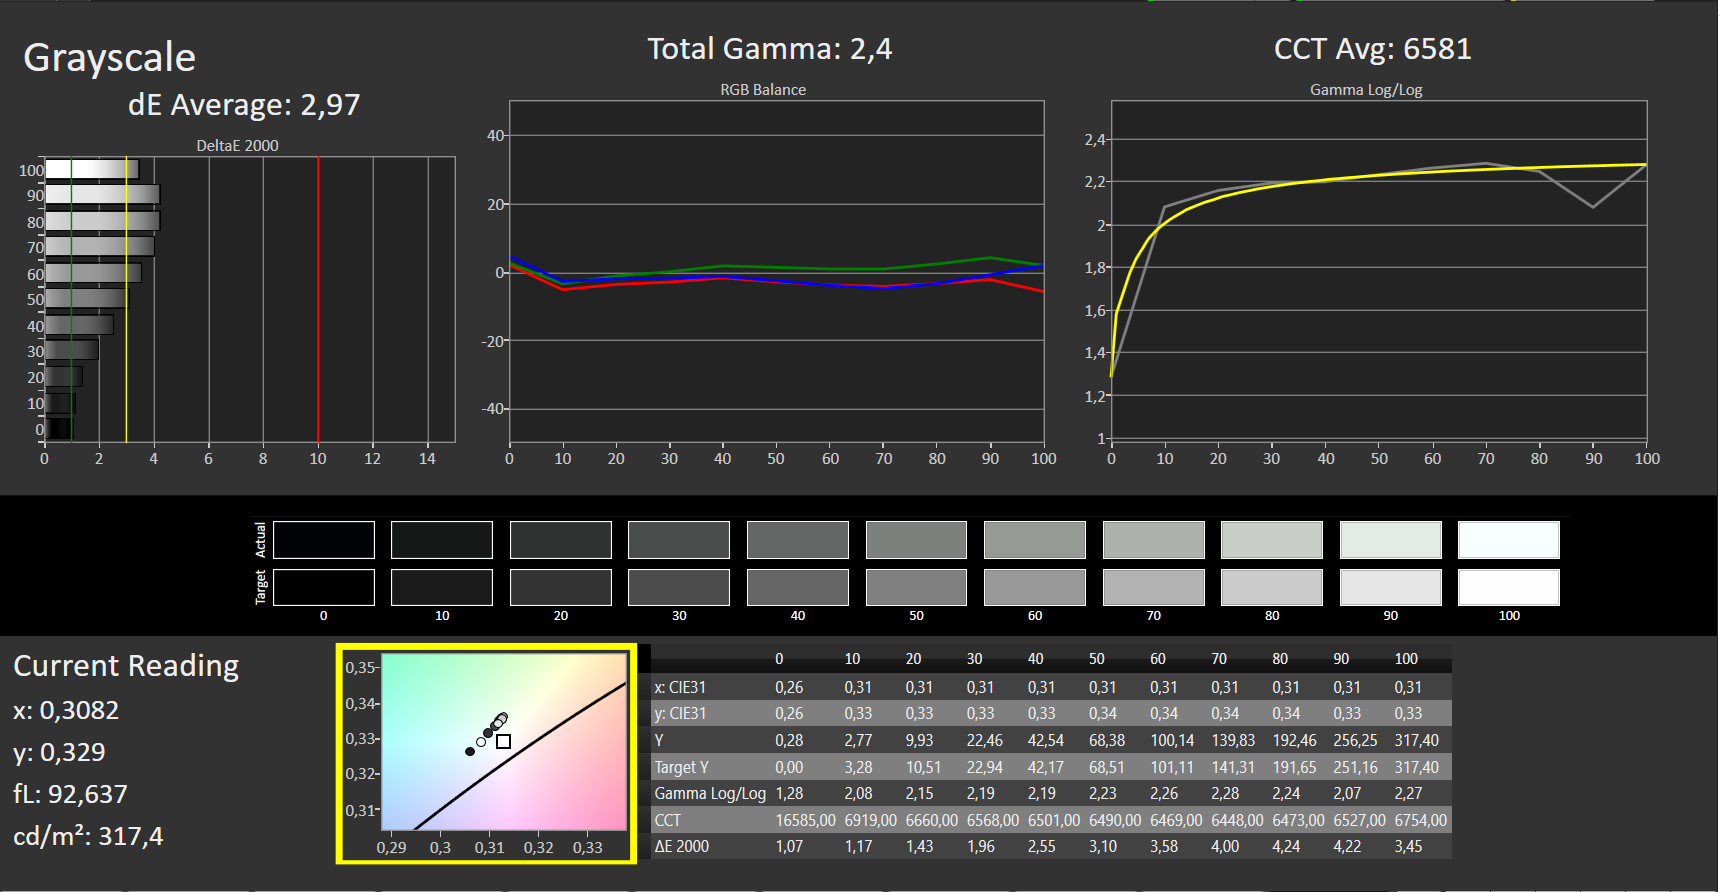
ΔE Greyscale Calman: 2.97 | ∀{0.09-98 Ø4.97}
59.1% sRGB (Argyll 1.6.3 3D)
38.1% AdobeRGB 1998 (Argyll 1.6.3 3D)
41.77% AdobeRGB 1998 (Argyll 3D)
59.6% sRGB (Argyll 3D)
40.43% Display P3 (Argyll 3D)
Gamma: 2.4
CCT: 6581 K
| HP Envy x360 15-ee0257ng BOE NV156FHM-N4T, IPS, 1920x1080, 15.6" | Lenovo Yoga C740-15IML B156HAN02.5, IPS LED, 1920x1080, 15.6" | Asus ZenBook Flip 15 UX563FD-A1027T BOE HF NE156QUM-N64, IPS, 3840x2160, 15.6" | HP Envy x360 15-dr1679cl AU Optronics B156HW02, IPS, 1920x1080, 15.6" | |
|---|---|---|---|---|
| Display | -3% | 64% | -2% | |
| Display P3 Coverage (%) | 40.43 | 39.04 -3% | 66.2 64% | 39.28 -3% |
| sRGB Coverage (%) | 59.6 | 57.9 -3% | 97.2 63% | 58.8 -1% |
| AdobeRGB 1998 Coverage (%) | 41.77 | 40.33 -3% | 68.3 64% | 40.58 -3% |
| Response Times | -52% | -72% | -14% | |
| Response Time Grey 50% / Grey 80% * (ms) | 34 ? | 50.8 ? -49% | 60 ? -76% | 39.6 ? -16% |
| Response Time Black / White * (ms) | 21 ? | 32.4 ? -54% | 35 ? -67% | 23.6 ? -12% |
| PWM Frequency (Hz) | ||||
| Screen | -10% | 35% | -5% | |
| Brightness middle (cd/m²) | 314 | 286 -9% | 351 12% | 261.2 -17% |
| Brightness (cd/m²) | 280 | 268 -4% | 335 20% | 248 -11% |
| Brightness Distribution (%) | 72 | 83 15% | 87 21% | 92 28% |
| Black Level * (cd/m²) | 0.275 | 0.2 27% | 0.31 -13% | 0.38 -38% |
| Contrast (:1) | 1142 | 1430 25% | 1132 -1% | 687 -40% |
| Colorchecker dE 2000 * | 5.94 | 7.3 -23% | 1.74 71% | 5.4 9% |
| Colorchecker dE 2000 max. * | 21.71 | 21.7 -0% | 2.76 87% | 16.31 25% |
| Colorchecker dE 2000 calibrated * | 5.15 | 5.1 1% | 3.81 26% | |
| Greyscale dE 2000 * | 2.97 | 7 -136% | 2.22 25% | 4.1 -38% |
| Gamma | 2.4 92% | 2.35 94% | 2.35 94% | 2.53 87% |
| CCT | 6581 99% | 5847 111% | 6667 97% | 6611 98% |
| Color Space (Percent of AdobeRGB 1998) (%) | 38.1 | 36.9 -3% | 62 63% | 37.4 -2% |
| Color Space (Percent of sRGB) (%) | 59.1 | 57.5 -3% | 97 64% | 58.7 -1% |
| Total Average (Program / Settings) | -22% /
-14% | 9% /
26% | -7% /
-6% |
* ... smaller is better
Display Response Times
| ↔ Response Time Black to White | ||
|---|---|---|
| 21 ms ... rise ↗ and fall ↘ combined | ↗ 12 ms rise | 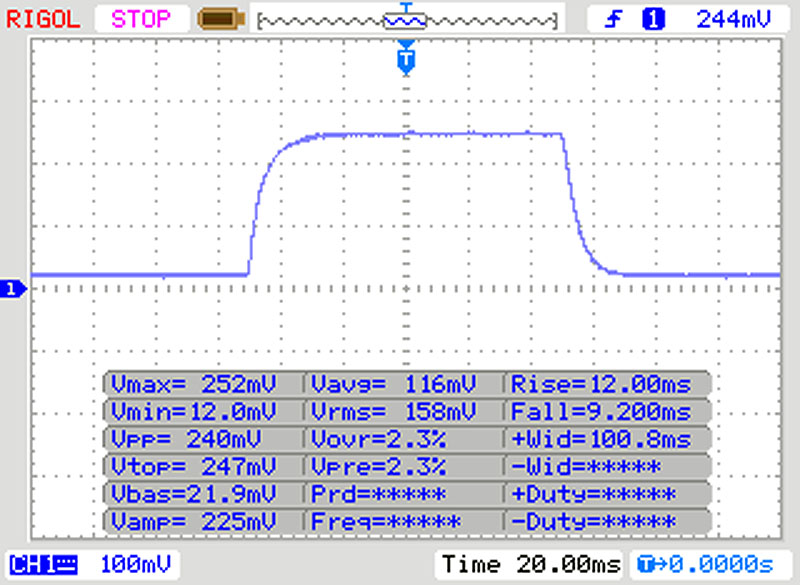 |
| ↘ 9 ms fall | ||
| The screen shows good response rates in our tests, but may be too slow for competitive gamers. In comparison, all tested devices range from 0.1 (minimum) to 240 (maximum) ms. » 47 % of all devices are better. This means that the measured response time is similar to the average of all tested devices (19.8 ms). | ||
| ↔ Response Time 50% Grey to 80% Grey | ||
| 34 ms ... rise ↗ and fall ↘ combined | ↗ 17 ms rise | 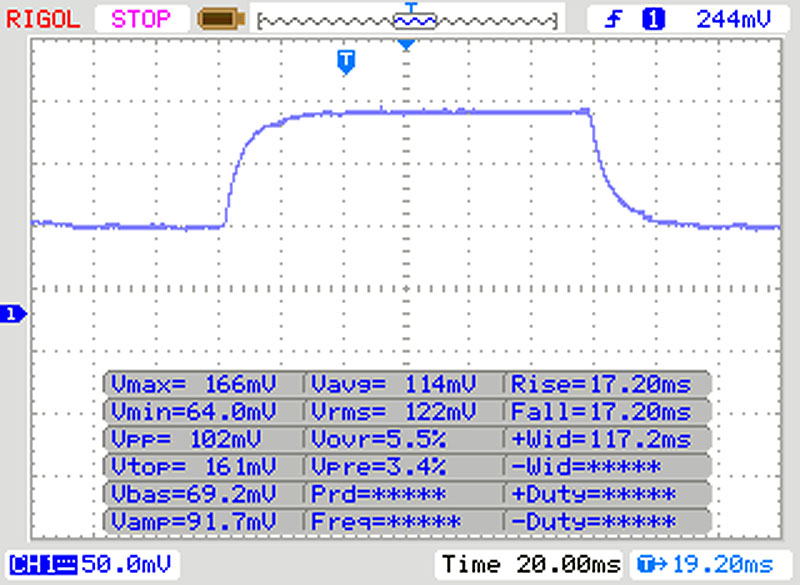 |
| ↘ 17 ms fall | ||
| The screen shows slow response rates in our tests and will be unsatisfactory for gamers. In comparison, all tested devices range from 0.165 (minimum) to 636 (maximum) ms. » 47 % of all devices are better. This means that the measured response time is similar to the average of all tested devices (31 ms). | ||
Screen Flickering / PWM (Pulse-Width Modulation)
| Screen flickering / PWM not detected | 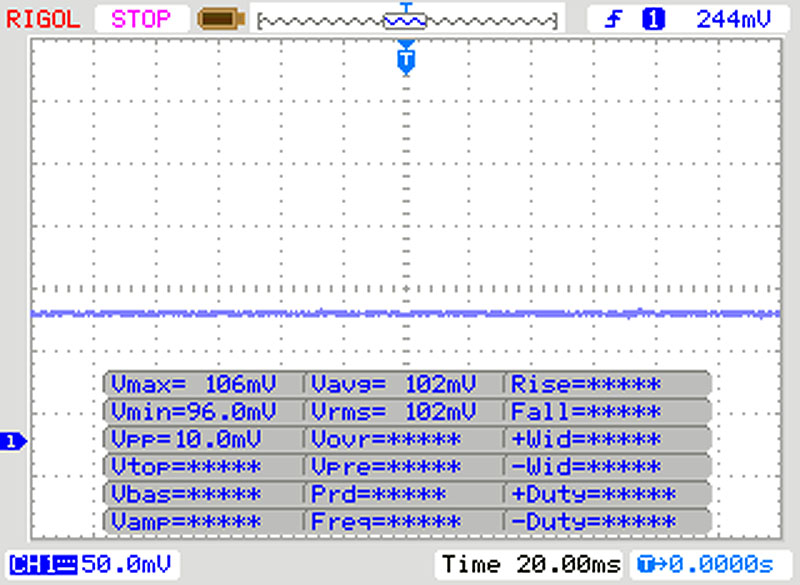 | ||
In comparison: 52 % of all tested devices do not use PWM to dim the display. If PWM was detected, an average of 7750 (minimum: 5 - maximum: 343500) Hz was measured. | |||
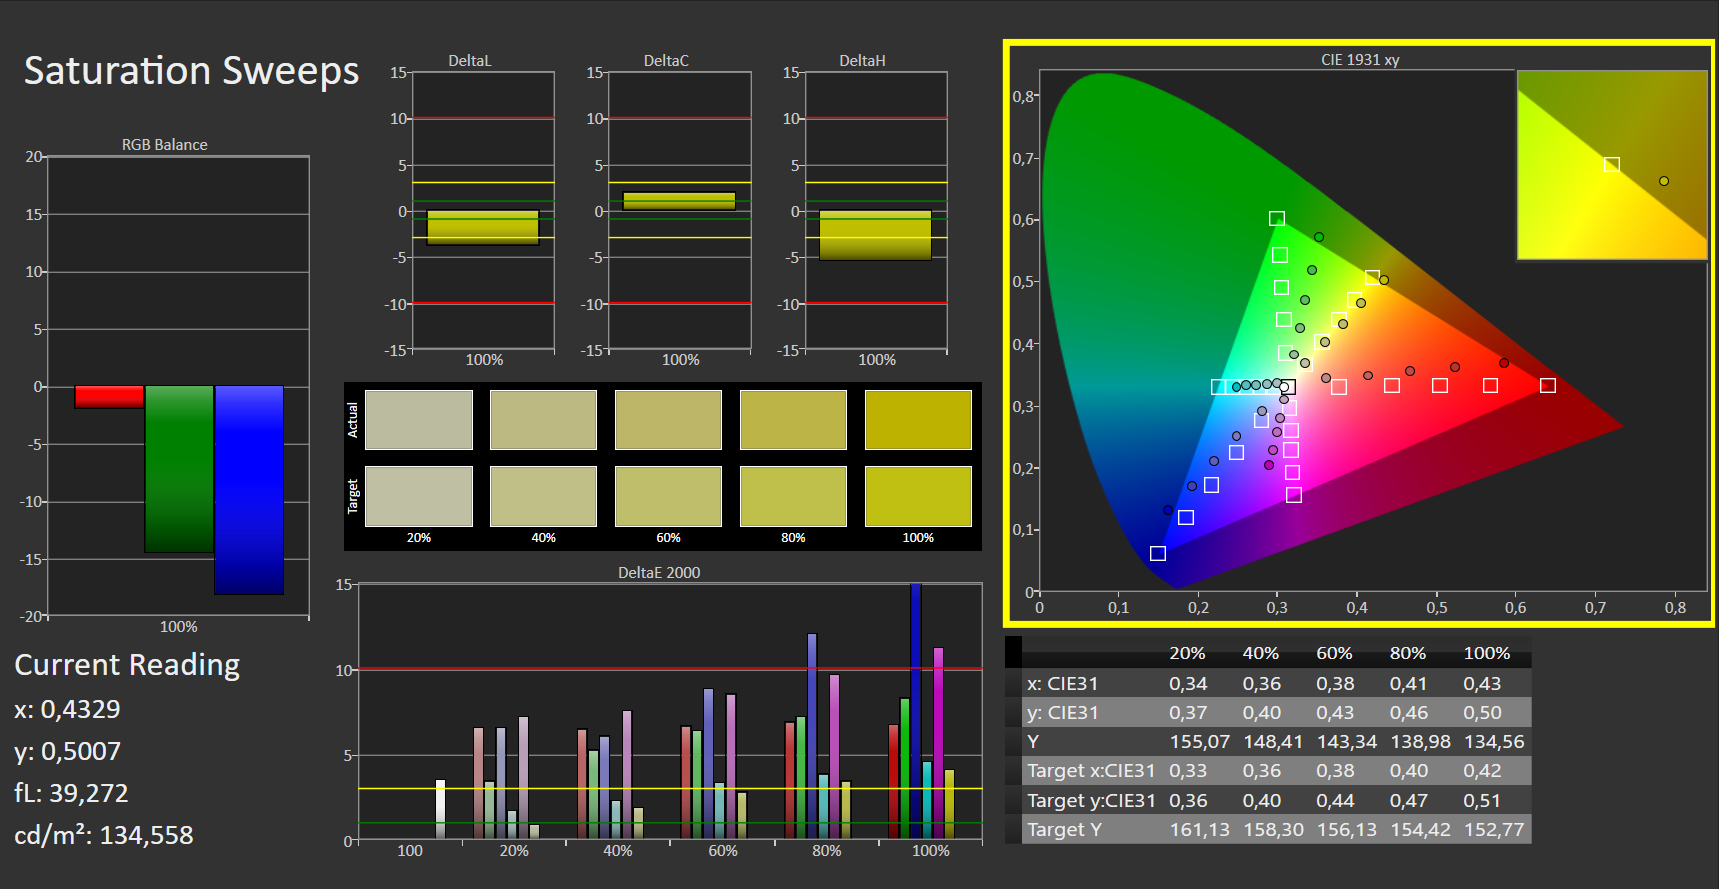
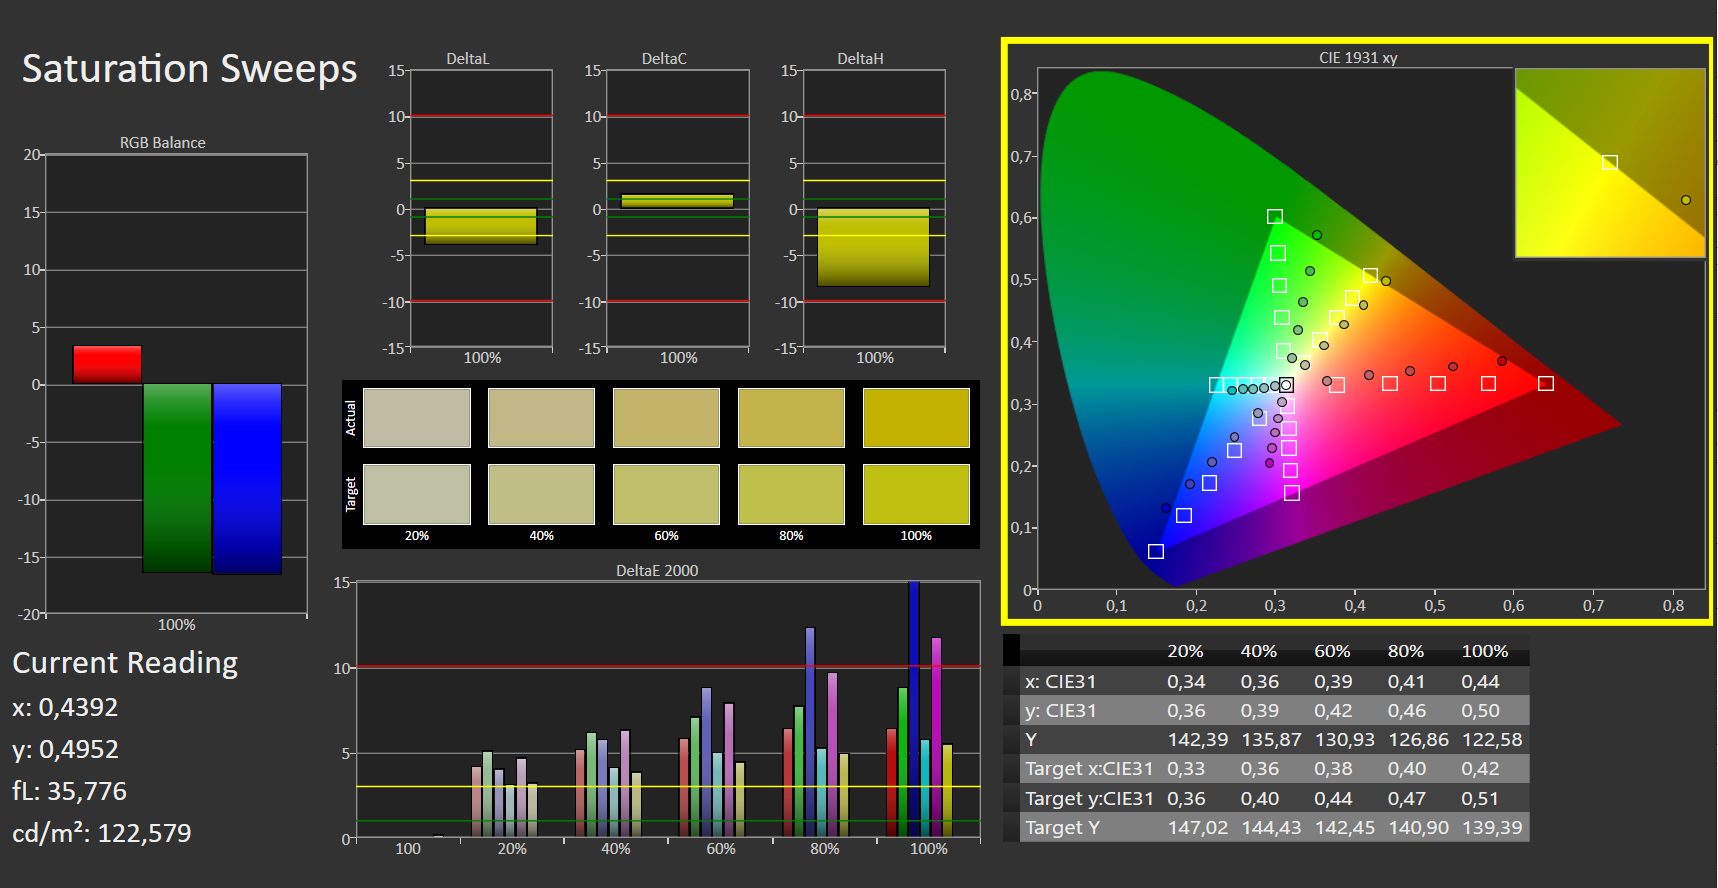
In the state of delivery, the display produces an acceptable color reproduction but misses the target (Delta-E < 3) with a Delta-E 2000 deviation of about 6.1. The display does not suffer from a blue tint. Calibration only offers marginal improvements. The AdobeRGB (38.1%) and sRGB (59.1%) color spaces are not covered completely.

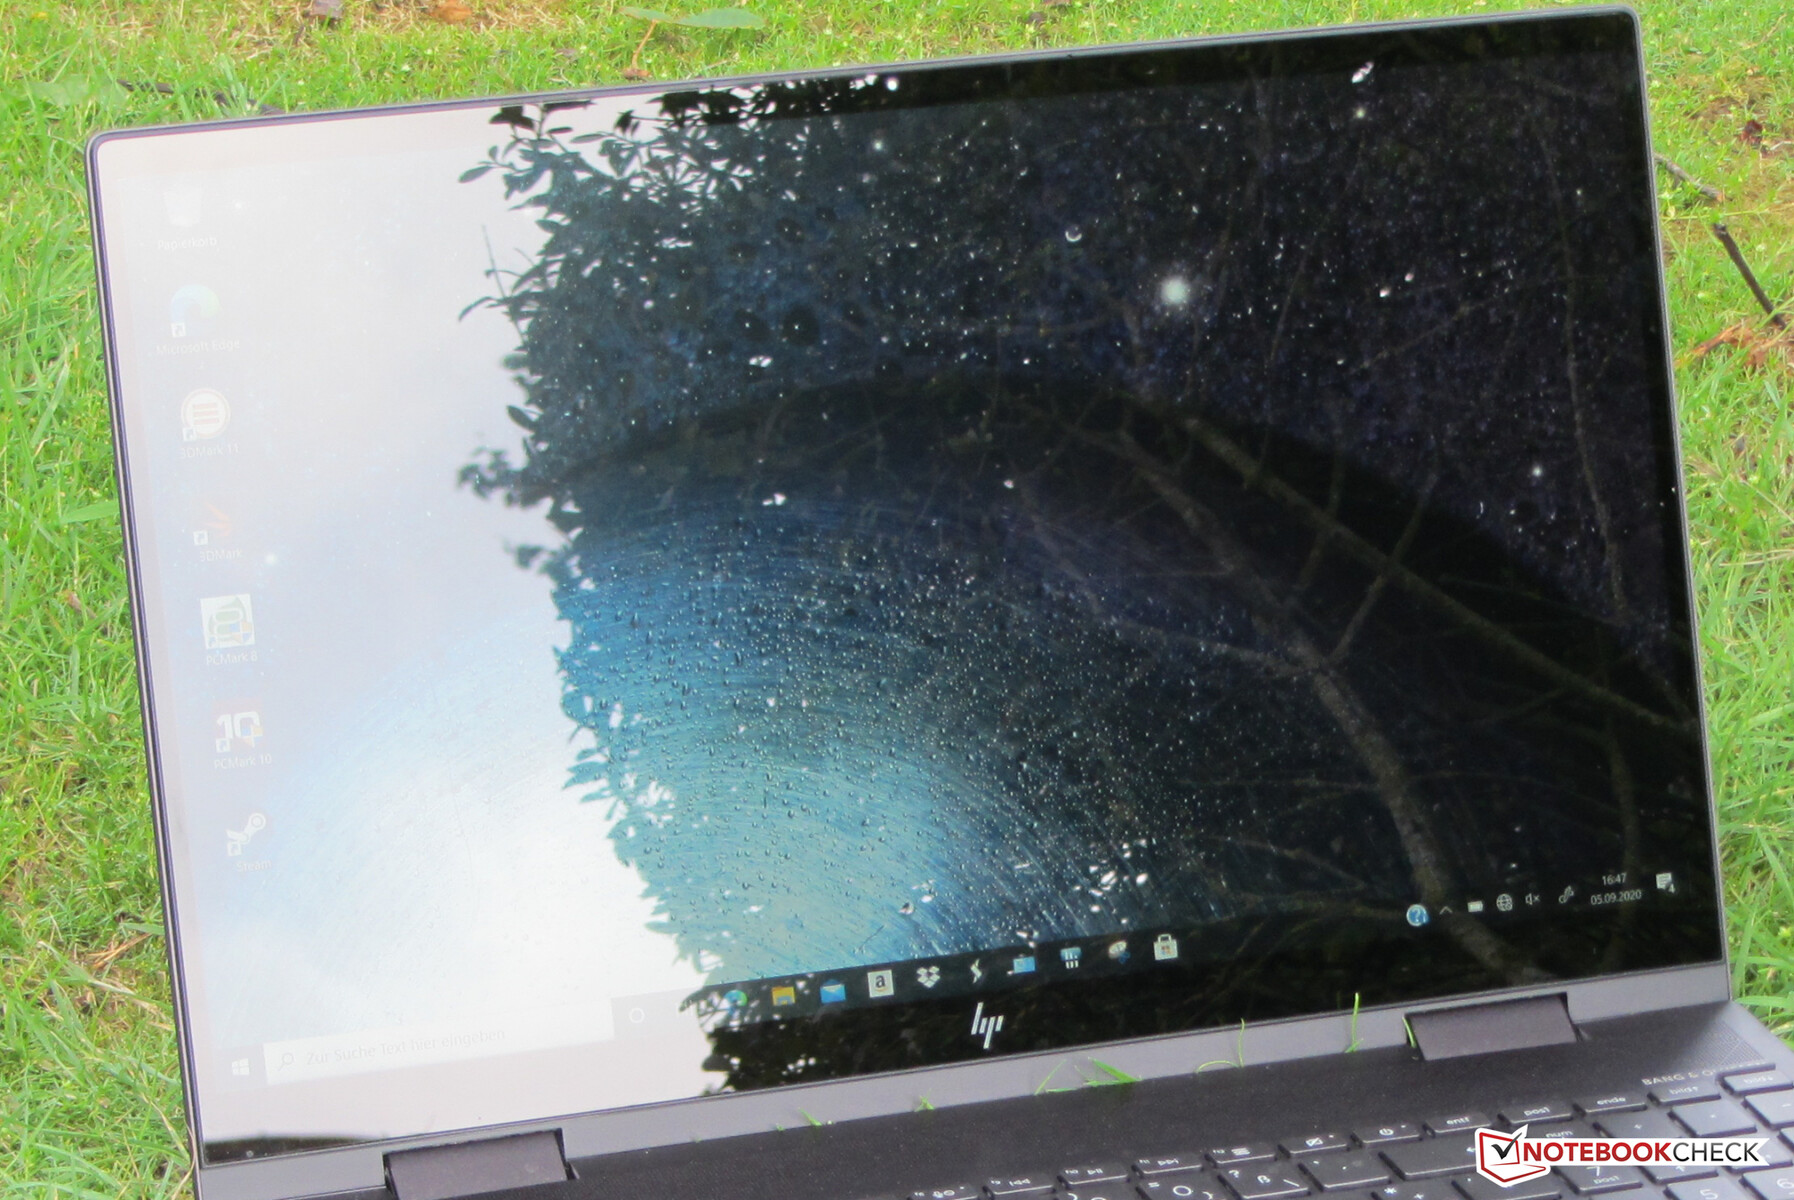
HP has equipped the convertible with an IPS panel with stable viewing angles, allowing the display to be read from any position. Outdoors, the display is hardly readable, since the reflective display surface prevents this.
Performance - Ryzen 5 with mediocre performance
With the Envy x360 15, HP delivers a 15.6-inch convertible that offers sufficient computing performance for office and Internet applications. The test unit that was made available to us can be purchased for between 950 and 1000 Euros (~$1126-1185), with other configurations also being available.
Test Conditions
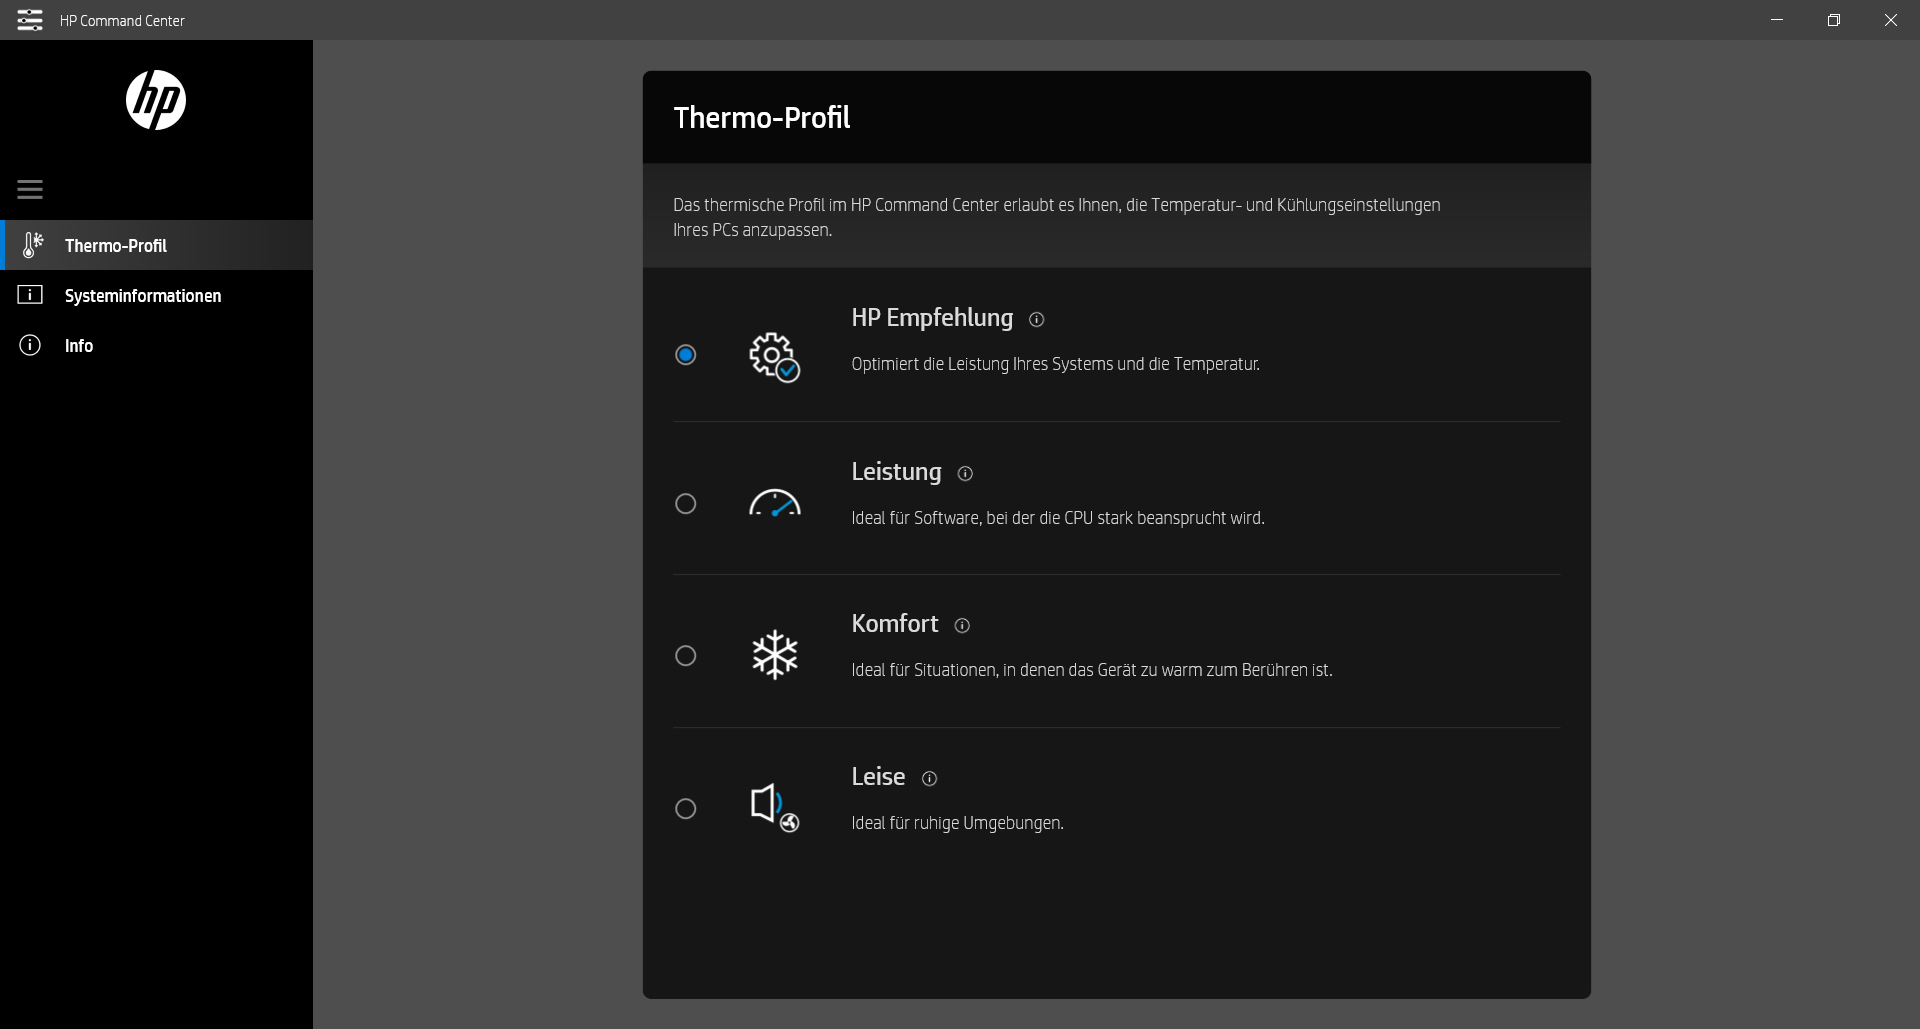
The preinstalled HP Command Center allows selection of a thermal profile. We ran our tests with the "HP recommended" profile activated.
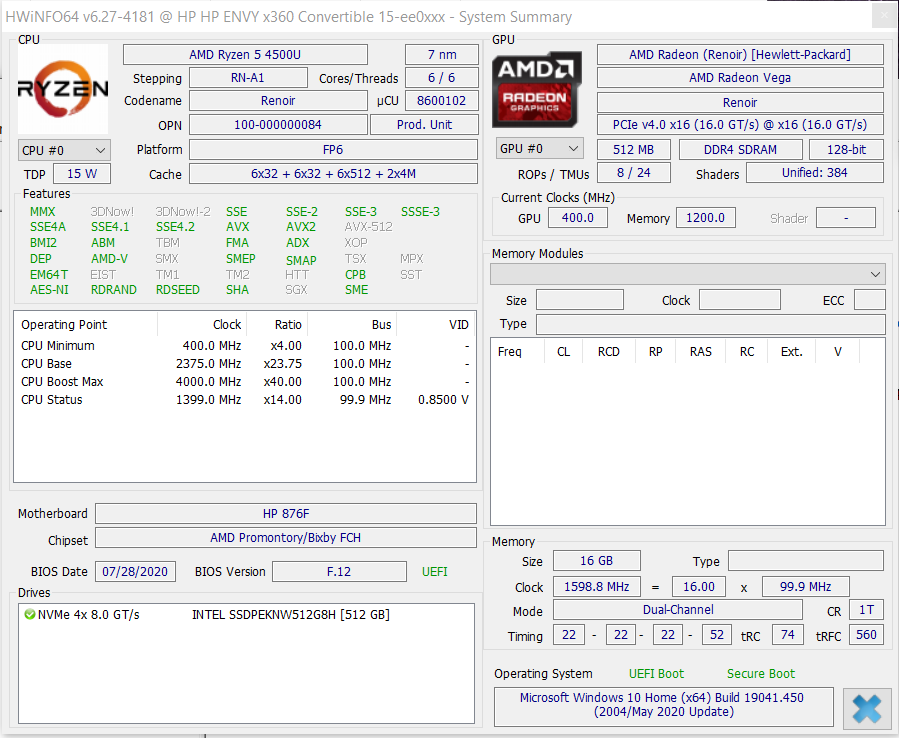
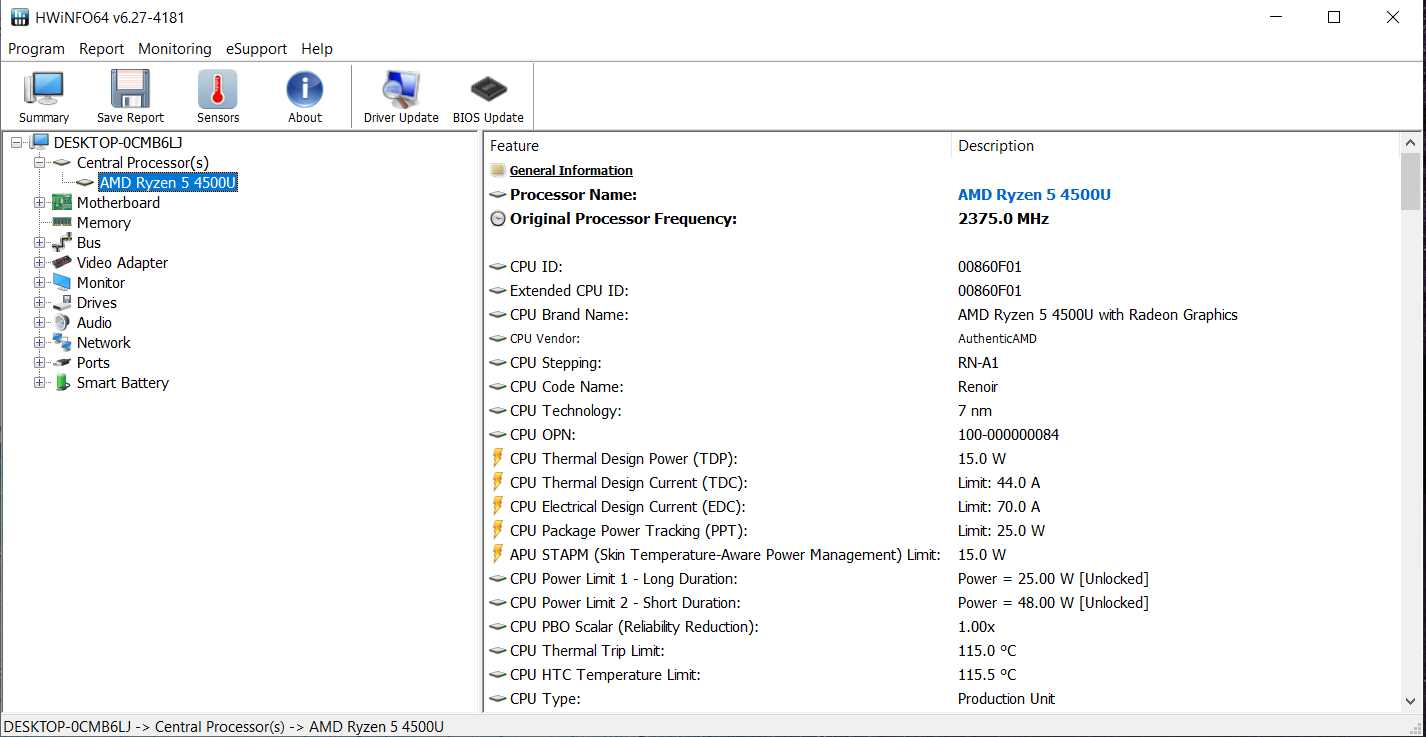
Processor
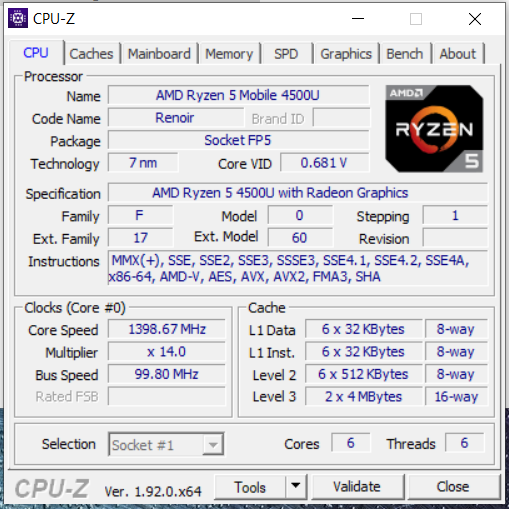
The CPU portion of the Ryzen 5 4500U APU (Renoir) consists of a hexa-core processor that operates with speeds between 2.3 GHz (basic clock speed) and 4 GHz (Turbo). Simultaneous multithreading (two threads per core) is not supported.
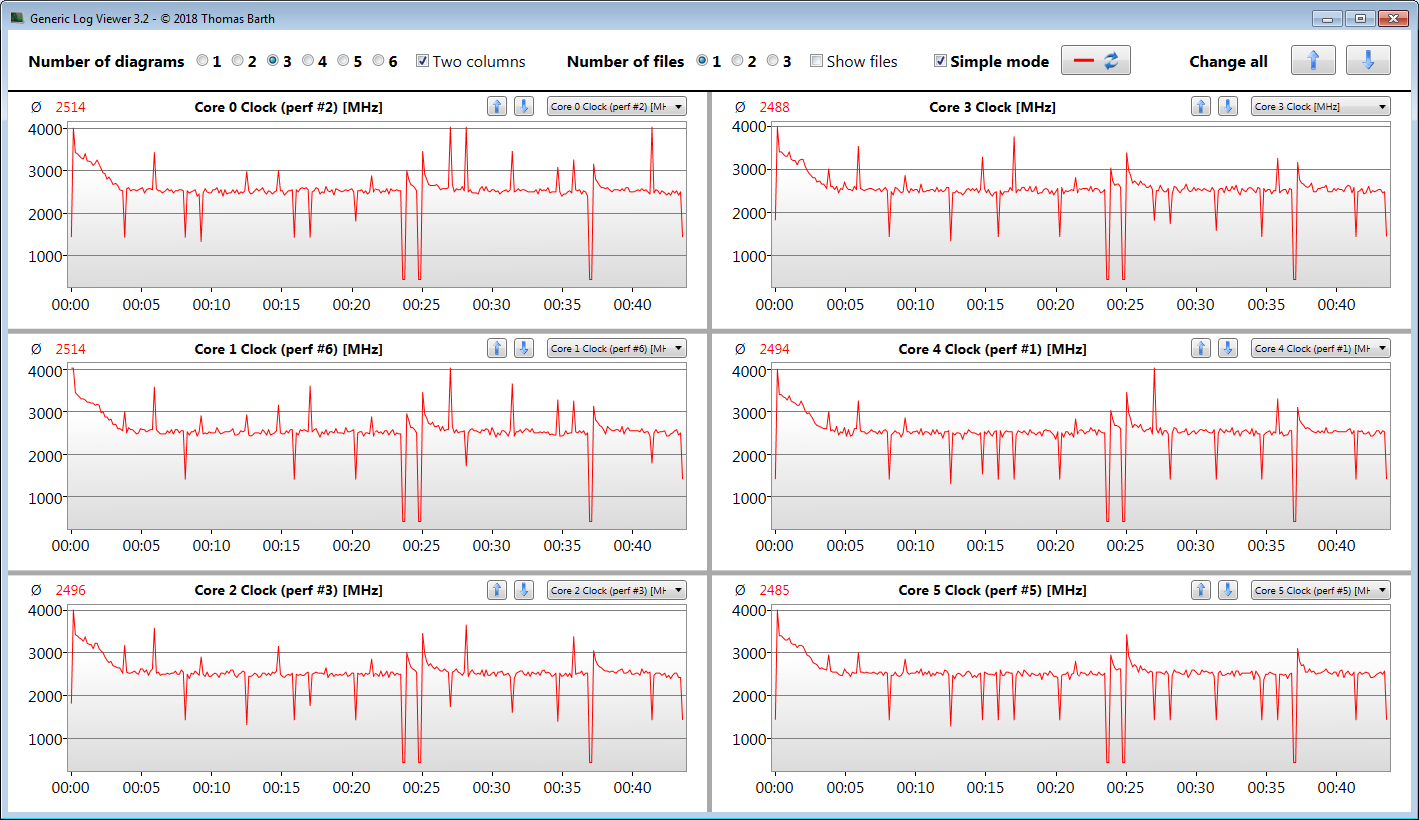
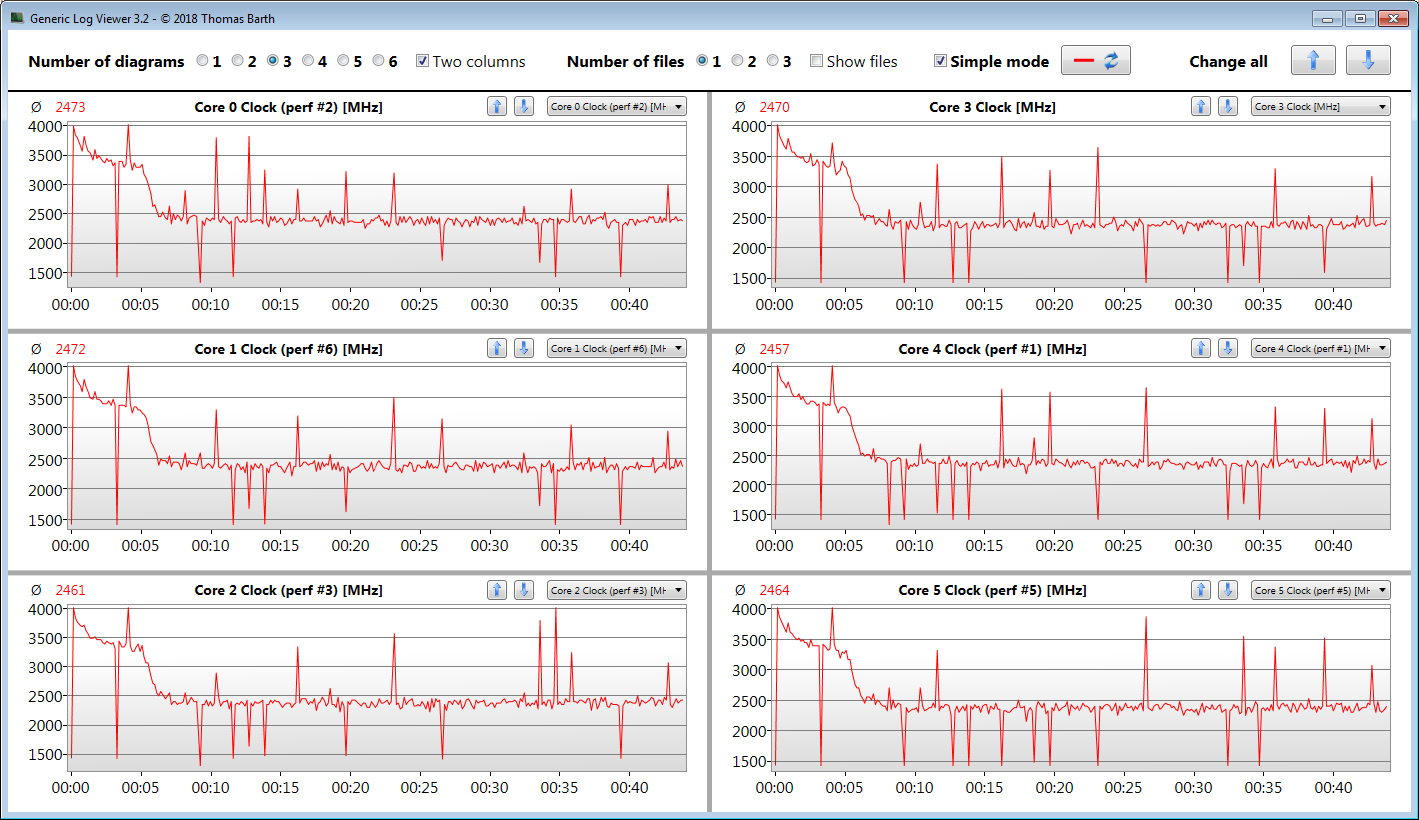
It briefly starts running through the multithread tests of the Cinebench benchmark at 4 GHz, before the clock speed drops down in steps to between 3.1 and 3.2 GHz. The single-thread tests are completed at clock speeds between 1.4 and 4 GHz. In battery operation, the CPU starts at 1.4 to 2.4 GHz (single and multithread), before it goes to similar clock speeds as in mains operation.
We evaluate whether the CPU Turbo is maintained constantly in mains operation by running the multithread test of the Cinebench R15 benchmark for at least 30 minutes in a constant loop. After an initially high Turbo speed, it drops significantly from the first to the fifth run.
The laptop responds to brief peak loads with high clock speeds. The highest speeds are reached with the "Performance" profile activated. Under longer load, the CPU speed drops, which is a surprising behavior that happens in all the temperature profiles. All the other Ryzen 5 4500U devices we tested until now reach significantly higher constant clock speeds while running though our loop.
| Cinebench R15 | |
| CPU Single 64Bit | |
| Average of class Convertible (149.8 - 317, n=48, last 2 years) | |
| Asus ZenBook Flip 15 UX563FD-A1027T | |
| Lenovo Yoga C740-15IML | |
| Asus VivoBook Flip 14 TM420IA | |
| HP Envy x360 15-ee0257ng (Leistung) | |
| HP Envy x360 15-ee0257ng | |
| Average AMD Ryzen 5 4500U (156 - 177, n=13) | |
| HP Envy x360 15-dr1679cl | |
| CPU Multi 64Bit | |
| Average of class Convertible (478 - 4940, n=48, last 2 years) | |
| Asus VivoBook Flip 14 TM420IA | |
| HP Envy x360 15-ee0257ng (Leistung) | |
| Average AMD Ryzen 5 4500U (715 - 1007, n=18) | |
| HP Envy x360 15-ee0257ng | |
| Asus ZenBook Flip 15 UX563FD-A1027T | |
| Lenovo Yoga C740-15IML | |
| HP Envy x360 15-dr1679cl | |
* ... smaller is better
System Performance
HP has delivered a quick and smoothly running system here. The APU delivers sufficient computing performance for office and Internet applications. However, it is only able to run at its highest performance level for a short time. These results are accompanied by good PCMark results.
| PCMark 8 Home Score Accelerated v2 | 4245 points | |
| PCMark 8 Creative Score Accelerated v2 | 4360 points | |
| PCMark 8 Work Score Accelerated v2 | 5161 points | |
| PCMark 10 Score | 4768 points | |
Help | ||
DPC Latencies
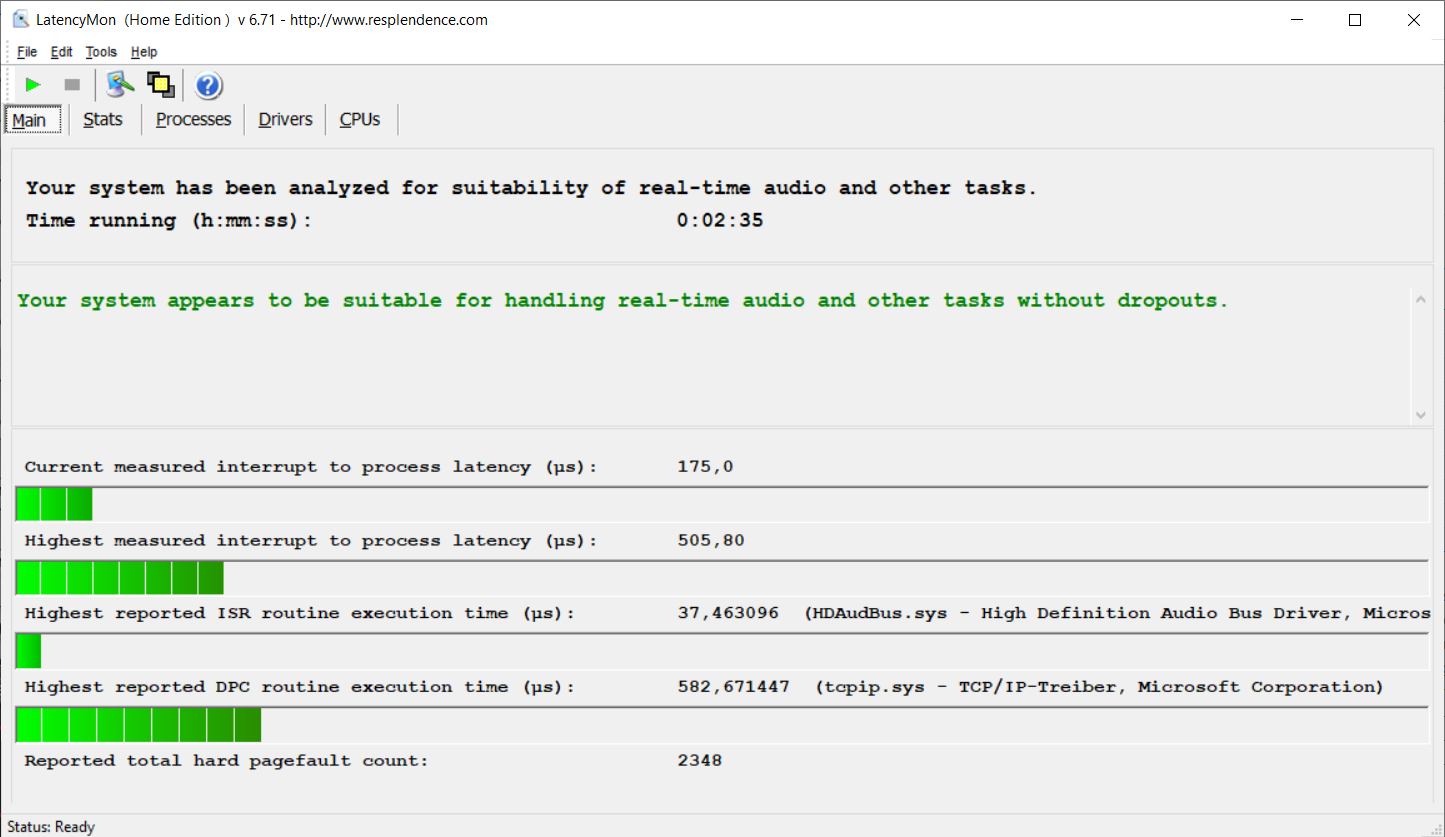
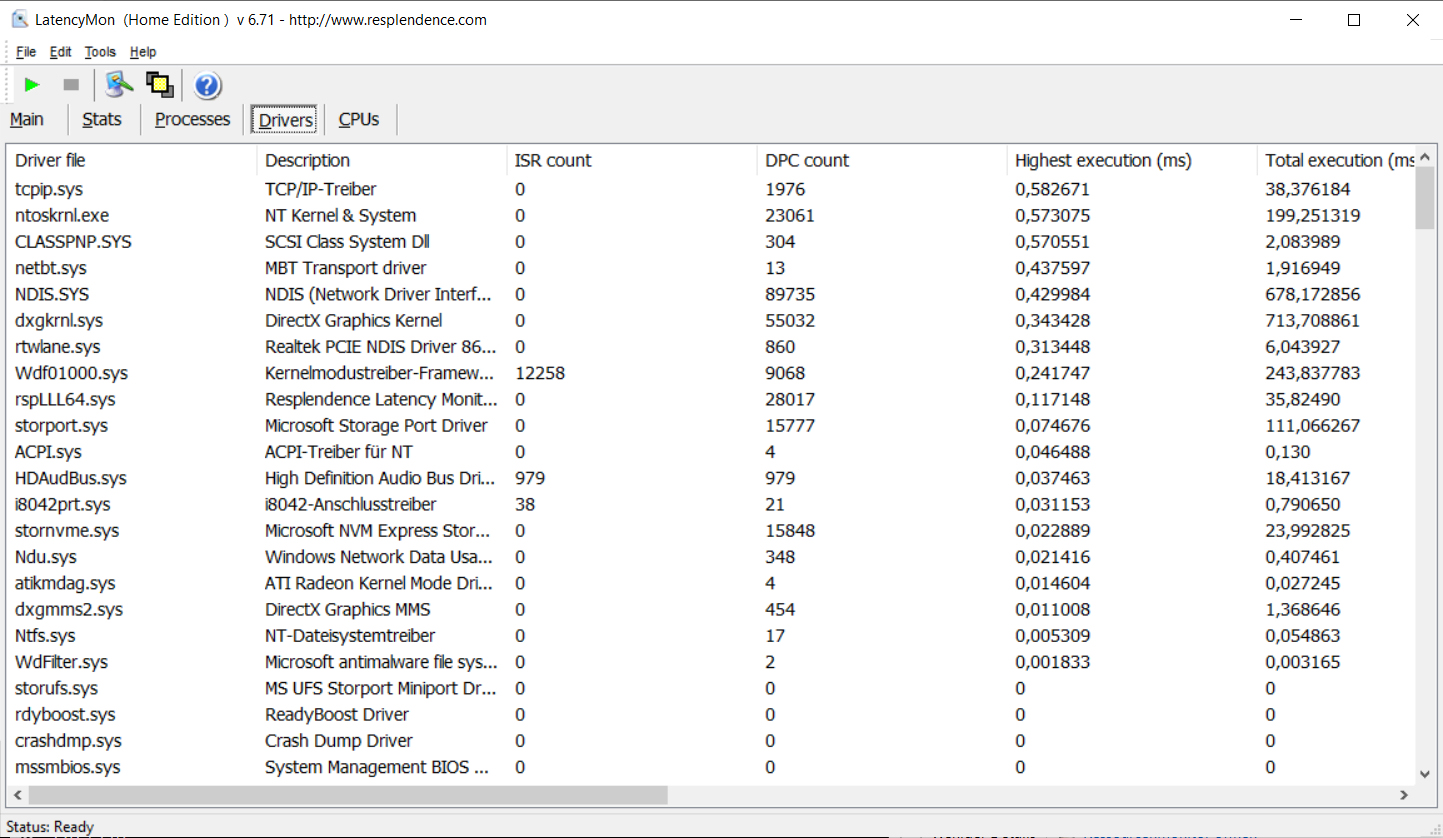
| DPC Latencies / LatencyMon - interrupt to process latency (max), Web, Youtube, Prime95 | |
| HP Envy x360 15-dr1679cl | |
| Asus VivoBook Flip 14 TM420IA | |
| HP Envy x360 15-ee0257ng | |
* ... smaller is better
Storage Solution
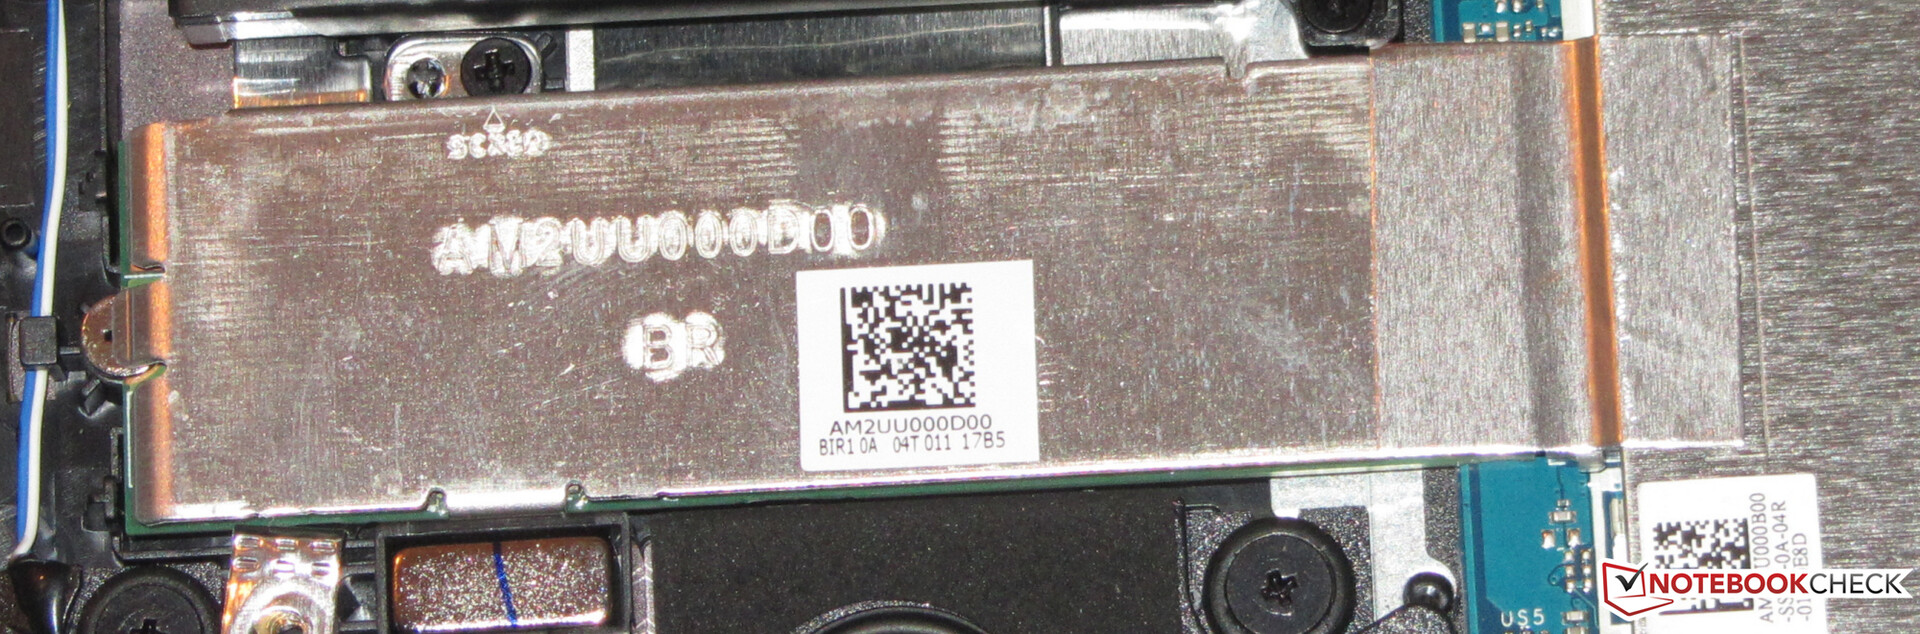
The system drive is a 512-GB NVMe SSD (M.2-2280) from Intel that delivers good transfer speeds, but it does not belong to the fastest models among SSDs.

| HP Envy x360 15-ee0257ng Intel SSD 660p SSDPEKNW512G8 | Lenovo Yoga C740-15IML Samsung SSD PM981 MZVLB512HAJQ | Asus ZenBook Flip 15 UX563FD-A1027T Samsung SSD PM981 MZVLB1T0HALR | HP Envy x360 15-dr1679cl Intel Optane Memory H10 with Solid State Storage 32GB + 512GB HBRPEKNX0202A(L/H) | Average Intel SSD 660p SSDPEKNW512G8 | Average of class Convertible | |
|---|---|---|---|---|---|---|
| CrystalDiskMark 5.2 / 6 | 72% | 56% | 29% | 5% | 127% | |
| Write 4K (MB/s) | 104.5 | 142.3 36% | 137.8 32% | 125.6 20% | 136 ? 30% | 144.6 ? 38% |
| Read 4K (MB/s) | 49.7 | 47.56 -4% | 44.15 -11% | 145.8 193% | 55.2 ? 11% | 67.2 ? 35% |
| Write Seq (MB/s) | 981 | 2185 123% | 2073 111% | 509 -48% | 926 ? -6% | 2553 ? 160% |
| Read Seq (MB/s) | 1517 | 2235 47% | 2165 43% | 1536 1% | 1523 ? 0% | 2965 ? 95% |
| Write 4K Q32T1 (MB/s) | 398.8 | 515 29% | 431.9 8% | 362.4 -9% | 380 ? -5% | 452 ? 13% |
| Read 4K Q32T1 (MB/s) | 338.4 | 413.4 22% | 427.7 26% | 307.3 -9% | 334 ? -1% | 582 ? 72% |
| Write Seq Q32T1 (MB/s) | 982 | 2981 204% | 2253 129% | 1320 34% | 987 ? 1% | 4383 ? 346% |
| Read Seq Q32T1 (MB/s) | 1650 | 3565 116% | 3480 111% | 2489 51% | 1744 ? 6% | 5831 ? 253% |
| AS SSD | 82% | 67% | -22% | -4% | 108% | |
| Seq Read (MB/s) | 1587 | 2732 72% | 2739 73% | 931 -41% | 1423 ? -10% | 4283 ? 170% |
| Seq Write (MB/s) | 864 | 1477 71% | 1307 51% | 331.5 -62% | 828 ? -4% | 3000 ? 247% |
| 4K Read (MB/s) | 51.6 | 57.7 12% | 47.43 -8% | 72.8 41% | 51.3 ? -1% | 61 ? 18% |
| 4K Write (MB/s) | 125.1 | 136.3 9% | 126 1% | 119 -5% | 128.9 ? 3% | 165.1 ? 32% |
| 4K-64 Read (MB/s) | 323.1 | 1021 216% | 1013 214% | 389.7 21% | 326 ? 1% | 933 ? 189% |
| 4K-64 Write (MB/s) | 724 | 1651 128% | 1371 89% | 573 -21% | 721 ? 0% | 1739 ? 140% |
| Access Time Read * (ms) | 0.101 | 0.062 39% | 0.082 19% | 0.07 31% | 0.09003 ? 11% | 0.076 ? 25% |
| Access Time Write * (ms) | 0.046 | 0.028 39% | 0.029 37% | 0.138 -200% | 0.07378 ? -60% | 0.08527 ? -85% |
| Score Read (Points) | 533 | 1352 154% | 1335 150% | 556 4% | 519 ? -3% | 1423 ? 167% |
| Score Write (Points) | 935 | 1935 107% | 1628 74% | 725 -22% | 932 ? 0% | 2204 ? 136% |
| Score Total (Points) | 1725 | 3929 128% | 3582 108% | 1565 -9% | 1708 ? -1% | 4305 ? 150% |
| Copy ISO MB/s (MB/s) | 1323 | 1972 49% | 1931 46% | 593 -55% | 1109 ? -16% | 2591 ? 96% |
| Copy Program MB/s (MB/s) | 340.8 | 642 88% | 457.9 34% | 495.5 45% | 468 ? 37% | 772 ? 127% |
| Copy Game MB/s (MB/s) | 823 | 1090 32% | 1242 51% | 566 -31% | 760 ? -8% | 1595 ? 94% |
| Total Average (Program / Settings) | 77% /
78% | 62% /
63% | 4% /
-3% | 1% /
-1% | 118% /
114% |
* ... smaller is better
Constant Performance Reads: DiskSpd Read Loop, Queue Depth 8
Graphics Card
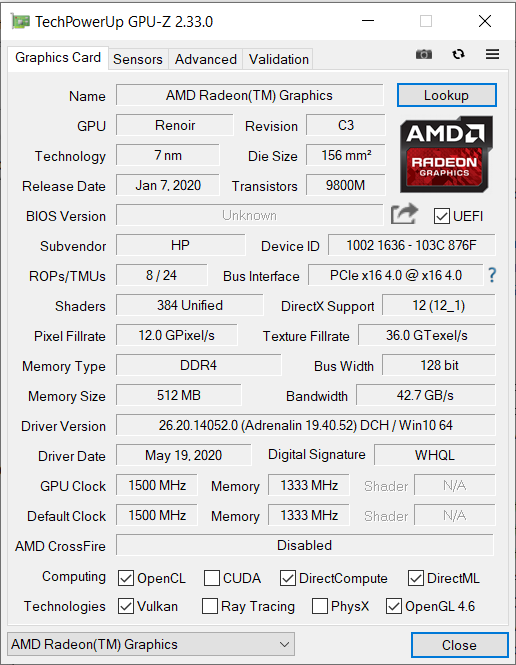
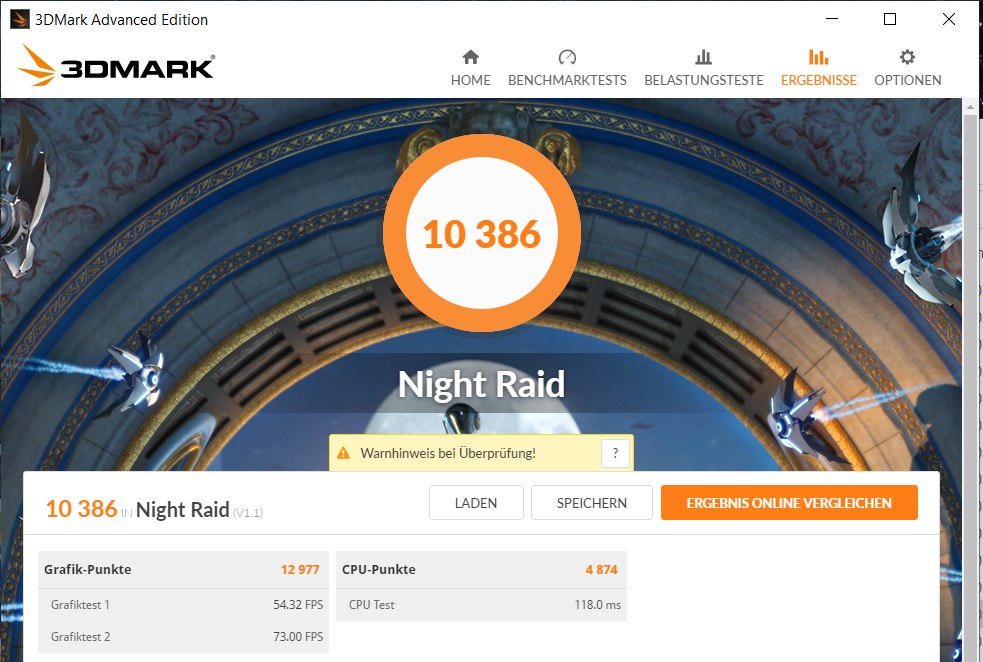
AMD's integrated Vega 6 graphics core supports DirectX 12 and reaches speeds of up to 1500 MHz. The results in the 3DMark benchmarks represent the best results that we were able to achieve with this GPU until now. The "Performance" profile does not lead to an increase in the graphics performance.
| 3DMark 11 Performance | 4978 points | |
| 3DMark Ice Storm Standard Score | 109288 points | |
| 3DMark Cloud Gate Standard Score | 16104 points | |
| 3DMark Fire Strike Score | 2941 points | |
| 3DMark Time Spy Score | 1047 points | |
Help | ||
Gaming Performance
In theory, the APU used would be able to bring many games to the screen smoothly. This should not only include older games or games with moderate demands on the hardware but also various current games.
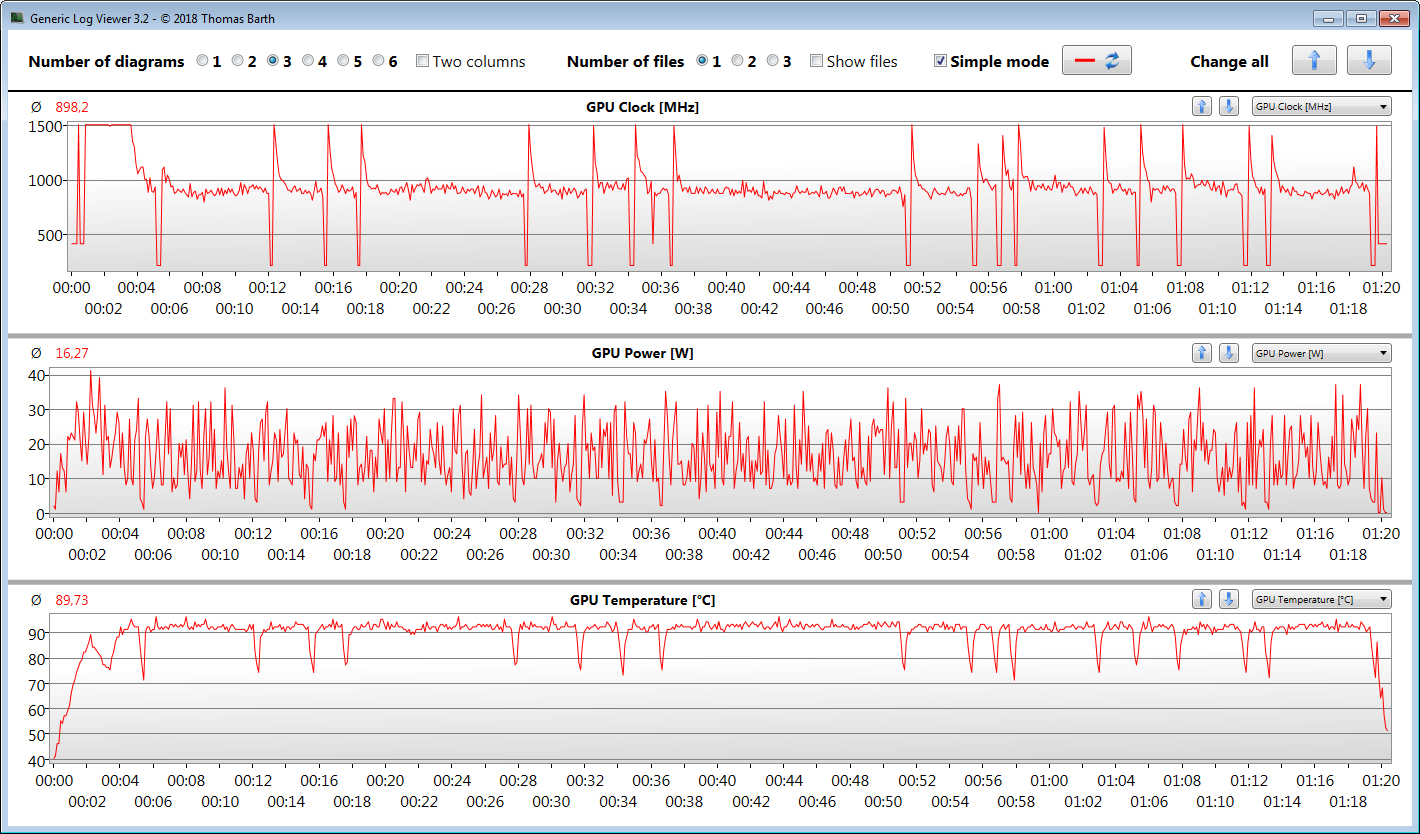
However, our The Witcher 3 test (the game runs for about 1 h at FHD resolution and max. quality settings; the main game character is not moved) shows that after a few minutes at its top speed (1500 MHz), the GPU speed is decreased to about 800 to 950 MHz. Until the end of the test, the speeds and frame rates continue to show some brief drops. This will not warrant undiluted gaming pleasure.
To double check, we also ran the test at minimum settings, but the result remained identical.
| low | med. | high | ultra | |
|---|---|---|---|---|
| BioShock Infinite (2013) | 173.6 | 103.2 | 82.5 | 26.8 |
| The Witcher 3 (2015) | 60 | 36.7 | 16.8 | 10.1 |
| Total War: Three Kingdoms (2019) | 54 | 13.7 | 8.1 | |
| Doom Eternal (2020) | 51.9 | 24.9 | 19.1 | 18.8 |
| F1 2020 (2020) | 60 | 20 | 15 | |
| Horizon Zero Dawn (2020) | 17 | 11 | 9 |
| BioShock Infinite - 1366x768 High Preset | |
| Asus ZenBook Flip 15 UX563FD-A1027T | |
| HP Envy x360 15-ee0257ng | |
| Average AMD Radeon RX Vega 6 (Ryzen 4000/5000) (73.2 - 82.5, n=2) | |
| Lenovo Yoga C740-15IML | |
Emissions and Power Management - The HP convertible offers a good battery life
Noise Emissions
During idle operation, the two fans usually remain turned off and there is complete silence. Under load, they rev up and we measure a maximum noise level of 43.2 dB(A) during the stress test.
Noise level
| Idle |
| 27 / 27 / 27 dB(A) |
| Load |
| 43.2 / 43.2 dB(A) |
 | ||
30 dB silent 40 dB(A) audible 50 dB(A) loud |
||
min: | ||
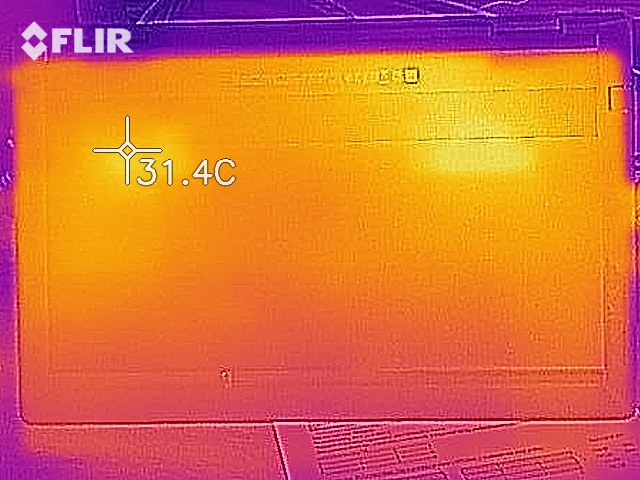
Temperature
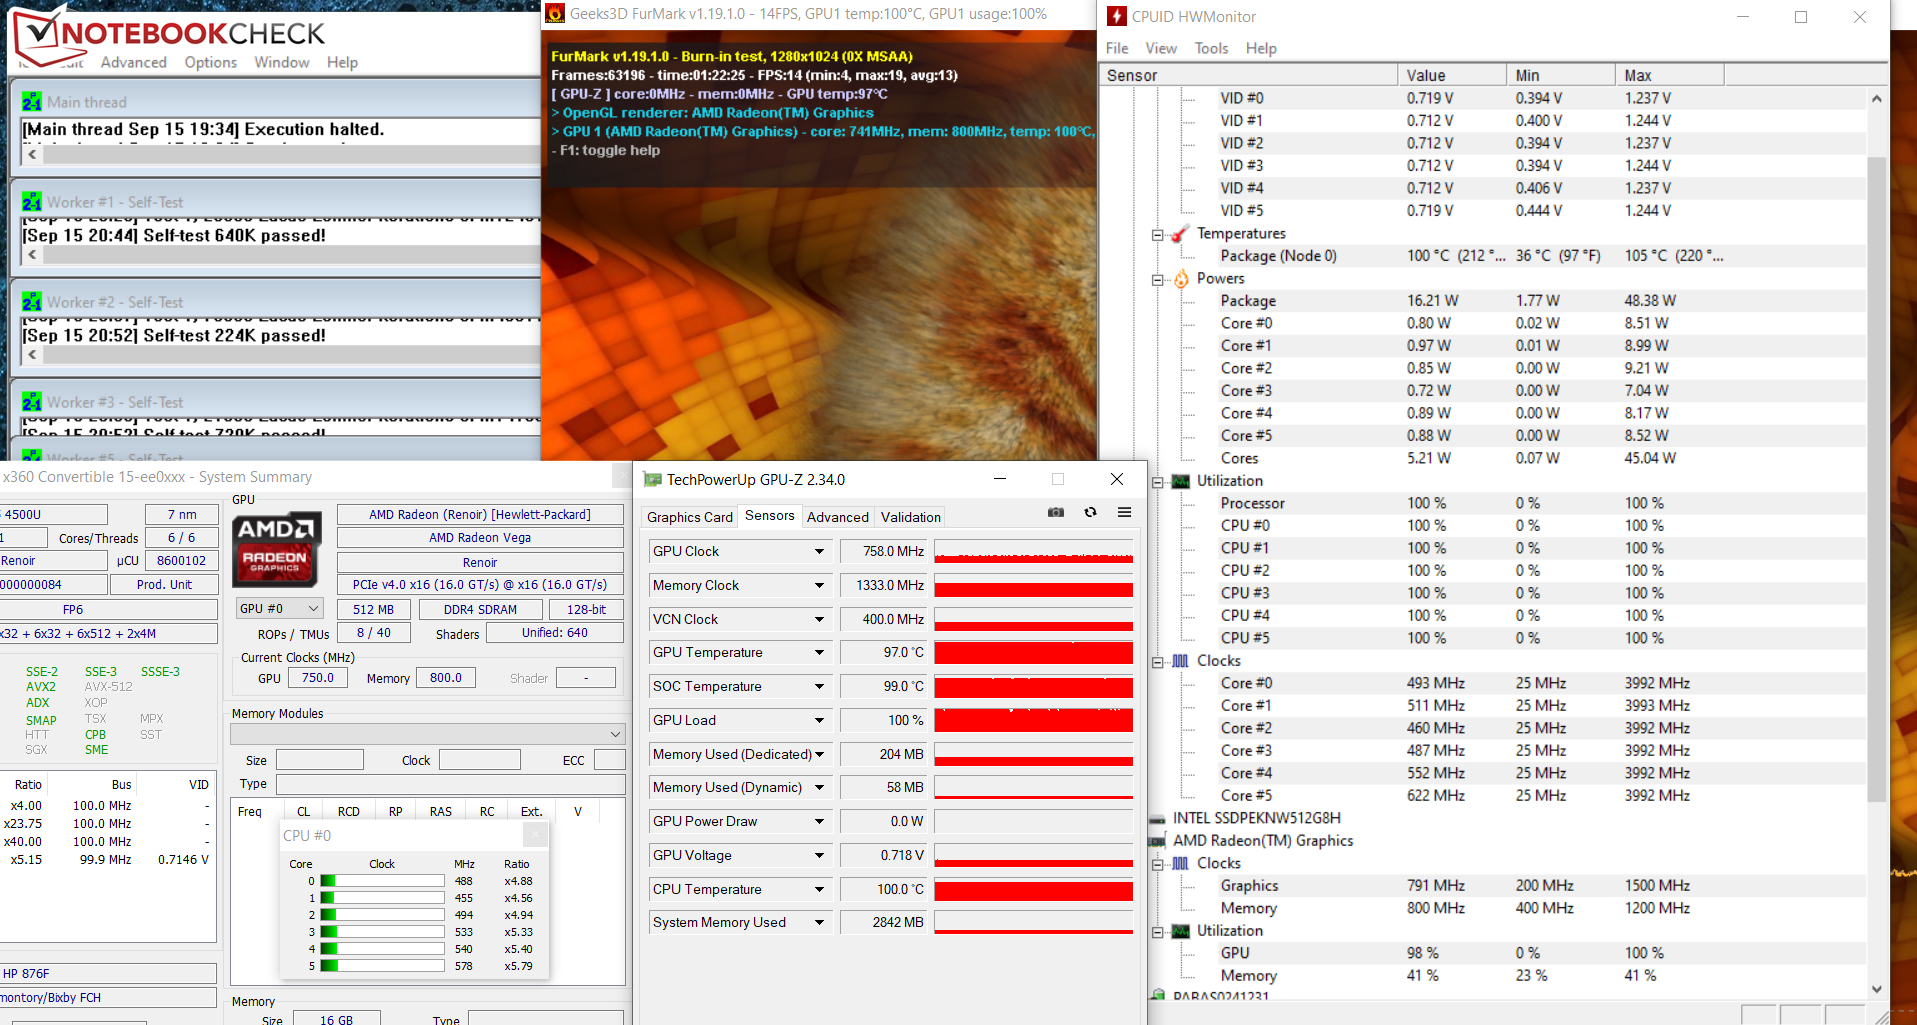
During our stress test (Prime95 and Furmark running for at least 1 hour), the CPU and GPU run at high speeds for the first few minutes. After that, they are throttled to values below 1 GHz (CPU) and 700 to 800 MHz (GPU), respectively. The behavior is the same in mains and battery operation. The stress test represents an extreme scenario that does not occur in everyday operation. We use this test to evaluate whether the system remains stable under full load.
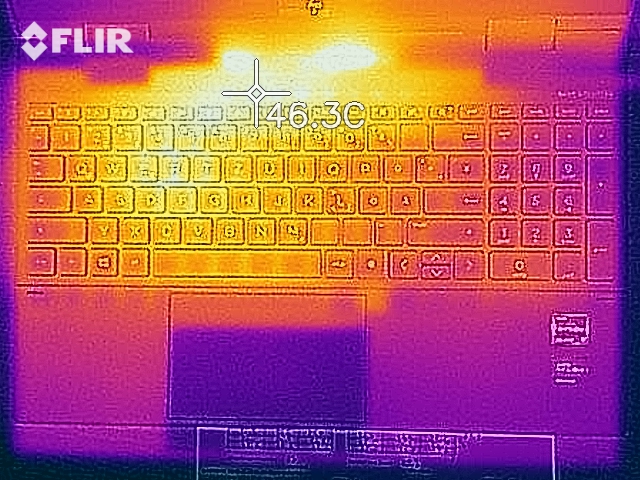
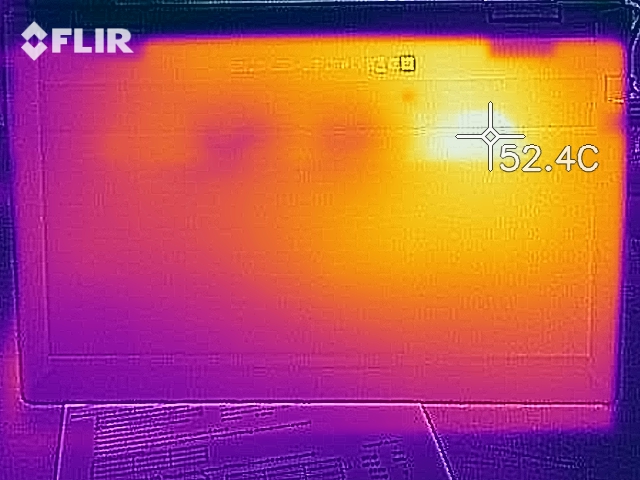
The HP convertible does not get particularly hot. During the stress test, we measure temperatures just above 40 °C (104 °F) in two measurement spots. In everyday operation, the values remain within the green range.
(±) The maximum temperature on the upper side is 40.2 °C / 104 F, compared to the average of 35.4 °C / 96 F, ranging from 19.6 to 60 °C for the class Convertible.
(±) The bottom heats up to a maximum of 40.1 °C / 104 F, compared to the average of 36.9 °C / 98 F
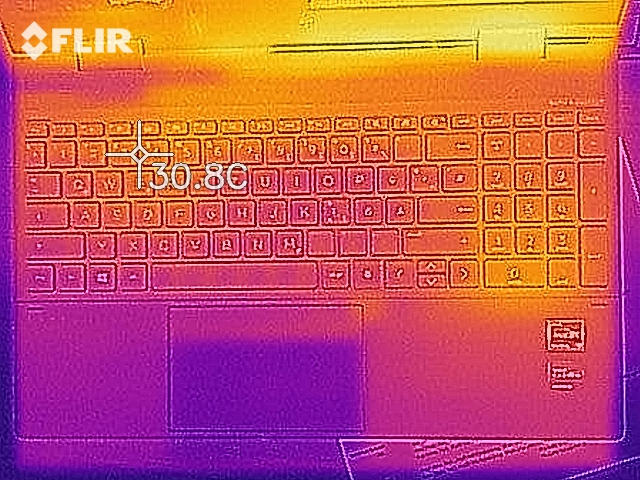
(+) In idle usage, the average temperature for the upper side is 26 °C / 79 F, compared to the device average of 30.3 °C / 87 F.
(+) The palmrests and touchpad are cooler than skin temperature with a maximum of 30.6 °C / 87.1 F and are therefore cool to the touch.
(-) The average temperature of the palmrest area of similar devices was 28 °C / 82.4 F (-2.6 °C / -4.7 F).
Speakers
The audio system of the Envy x360 is made up of two stereo speakers and a subwoofer. Together, they produce a decent sound spectrum that strangely lacks some bass. The maximum volume turns out relatively low.
HP Envy x360 15-ee0257ng audio analysis
(-) | not very loud speakers (66.8 dB)
Bass 100 - 315 Hz
(-) | nearly no bass - on average 21.1% lower than median
(±) | linearity of bass is average (9.7% delta to prev. frequency)
Mids 400 - 2000 Hz
(+) | balanced mids - only 2.1% away from median
(+) | mids are linear (3.5% delta to prev. frequency)
Highs 2 - 16 kHz
(+) | balanced highs - only 1.1% away from median
(+) | highs are linear (2.7% delta to prev. frequency)
Overall 100 - 16.000 Hz
(±) | linearity of overall sound is average (17.1% difference to median)
Compared to same class
» 32% of all tested devices in this class were better, 8% similar, 60% worse
» The best had a delta of 6%, average was 20%, worst was 57%
Compared to all devices tested
» 31% of all tested devices were better, 8% similar, 61% worse
» The best had a delta of 4%, average was 23%, worst was 134%
Power Consumption
Overall, the power consumption ranges at a normal level for the hardware used here. The power supply is rated at 65 watts.
| Off / Standby | |
| Idle | |
| Load |
|
Key:
min: | |
Battery Life
In our realistic WLAN test, the HP convertible achieves a battery life of 9:24 h. This test simulates the load when opening websites via a script.
Pros
Cons
Verdict
With the Envy x360 15, HP delivers an elegant 15.6-inch convertible with a matte-black metal case that should be stiffer. Across the whole load range, the laptop only warms up moderately and does not produce too much noise.
The HP Envy x360 15 (2020) is made for usage scenarios where demanding loads are only put on the system for short periods of time.
Thanks to the very good battery life (WLAN runtime of almost 9.5 h) most users should get through the day without a charger. The laptop can be recharged using the included proprietary power supply or a universal USB charger (via the USB Type-C port).
The IPS touchscreen scores with a good contrast, stable viewing angles, and decent color reproduction. However, the maximum brightness and color-space coverage turn out too low. The touchscreen can be operated with the fingers as well as the HP Pen, which can optionally be purchased separately (1MR94AA; approx 30 to 40 Euros; ~$36-47).
The main weakness is the poor performance utilization of the Ryzen 5 4500U APU. While it is able to handle brief load bursts (single and multithread) with a lot of computing performance, it responds to constant multithread CPU load with reduced clock speeds. The same goes for the GPU. In addition, the frame rates drop repeatedly while gaming.
Other compact Ryzen 5 4500U devices such as the Lenovo IdeaPad 5 14ARE05 have shown that it is possible to maintain the performance constantly at a high level. We can only hope that HP will be able to offer some improvements via a BIOS or software update.
HP Envy x360 15-ee0257ng
- 09/22/2020 v7 (old)
Sascha Mölck
Price comparison

