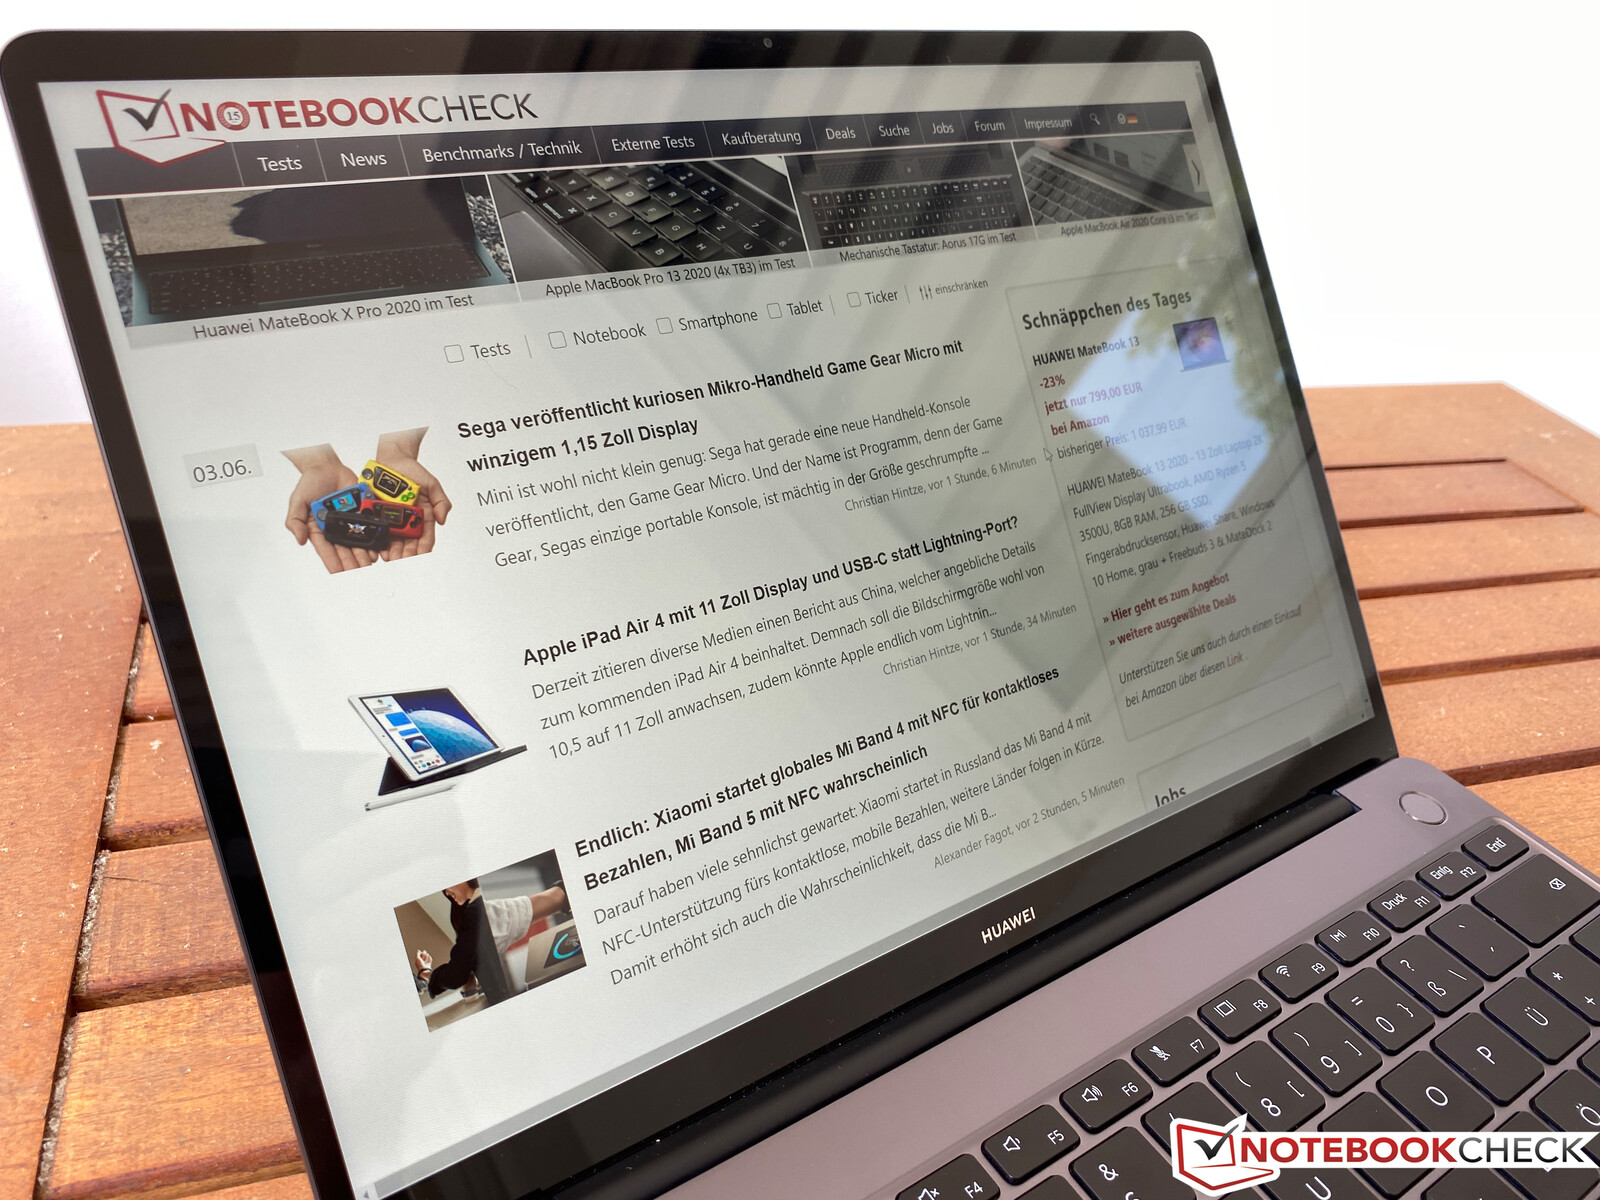
Huawei MateBook 13 2020 Subnotebook Review – Comet Lake update without performance benefits
The Huawei MateBook 13 is a compact subnotebook with a 13-inch screen. At prices of less than 1000 Euros (~$1,137), it is basically the cheaper sibling of the MateBook X Pro. The Chinese manufacturer keeps the familiar design for the 2020 model, and only updates the processors. Our test model for 899 Euros (~$1,023) is equipped with the Intel Core i5-10210U (Comet Lake), 8 GB RAM, and a 512 GB NVMe SSD. You can also get the MateBook 13 with an AMD processor (Ryzen 5 3500U) for 799 Euros (~$909). The display is always a glossy 2K-IPS screen with the 3:2 aspect ratio. There will be no SKU with the dedicated GeForce MX250 GPU in Germany. We will also try to review the AMD powered MateBook 13 as soon as possible.
There are no changes compared to the previous model when it comes to the case, the input devices, and the speakers, so please see our comprehensive reviews for more information on these sections. By the way, the compact port replicator MateDock 2 is not part of the box anymore; the 2020 model only gets a small adapter from USB-A to USB-C.
Rating | Date | Model | Weight | Height | Size | Resolution | Price |
|---|---|---|---|---|---|---|---|
| 84.4 % v7 (old) | 06 / 2020 | Huawei MateBook 13 2020 i5 i5-10210U, UHD Graphics 620 | 1.3 kg | 14.9 mm | 13.00" | 2160x1440 | |
| 84.2 % v7 (old) | 06 / 2019 | Huawei Matebook 13-53010FYW i7-8565U, UHD Graphics 620 | 1.3 kg | 15 mm | 13.00" | 2160x1440 | |
| 89.6 % v7 (old) | 05 / 2020 | Apple MacBook Air 2020 i3 i3-1000NG4, Iris Plus Graphics G4 (Ice Lake 48 EU) | 1.3 kg | 16.1 mm | 13.30" | 2560x1600 | |
| 88.8 % v7 (old) | 03 / 2020 | Dell XPS 13 9300 i5 FHD i5-1035G1, UHD Graphics G1 (Ice Lake 32 EU) | 1.2 kg | 14.8 mm | 13.40" | 1920x1200 | |
| 85.9 % v7 (old) | 06 / 2020 | Acer Swift 3 SF313-52-52AS i5-1035G4, Iris Plus Graphics G4 (Ice Lake 48 EU) | 1.2 kg | 16.6 mm | 13.50" | 2256x1504 |
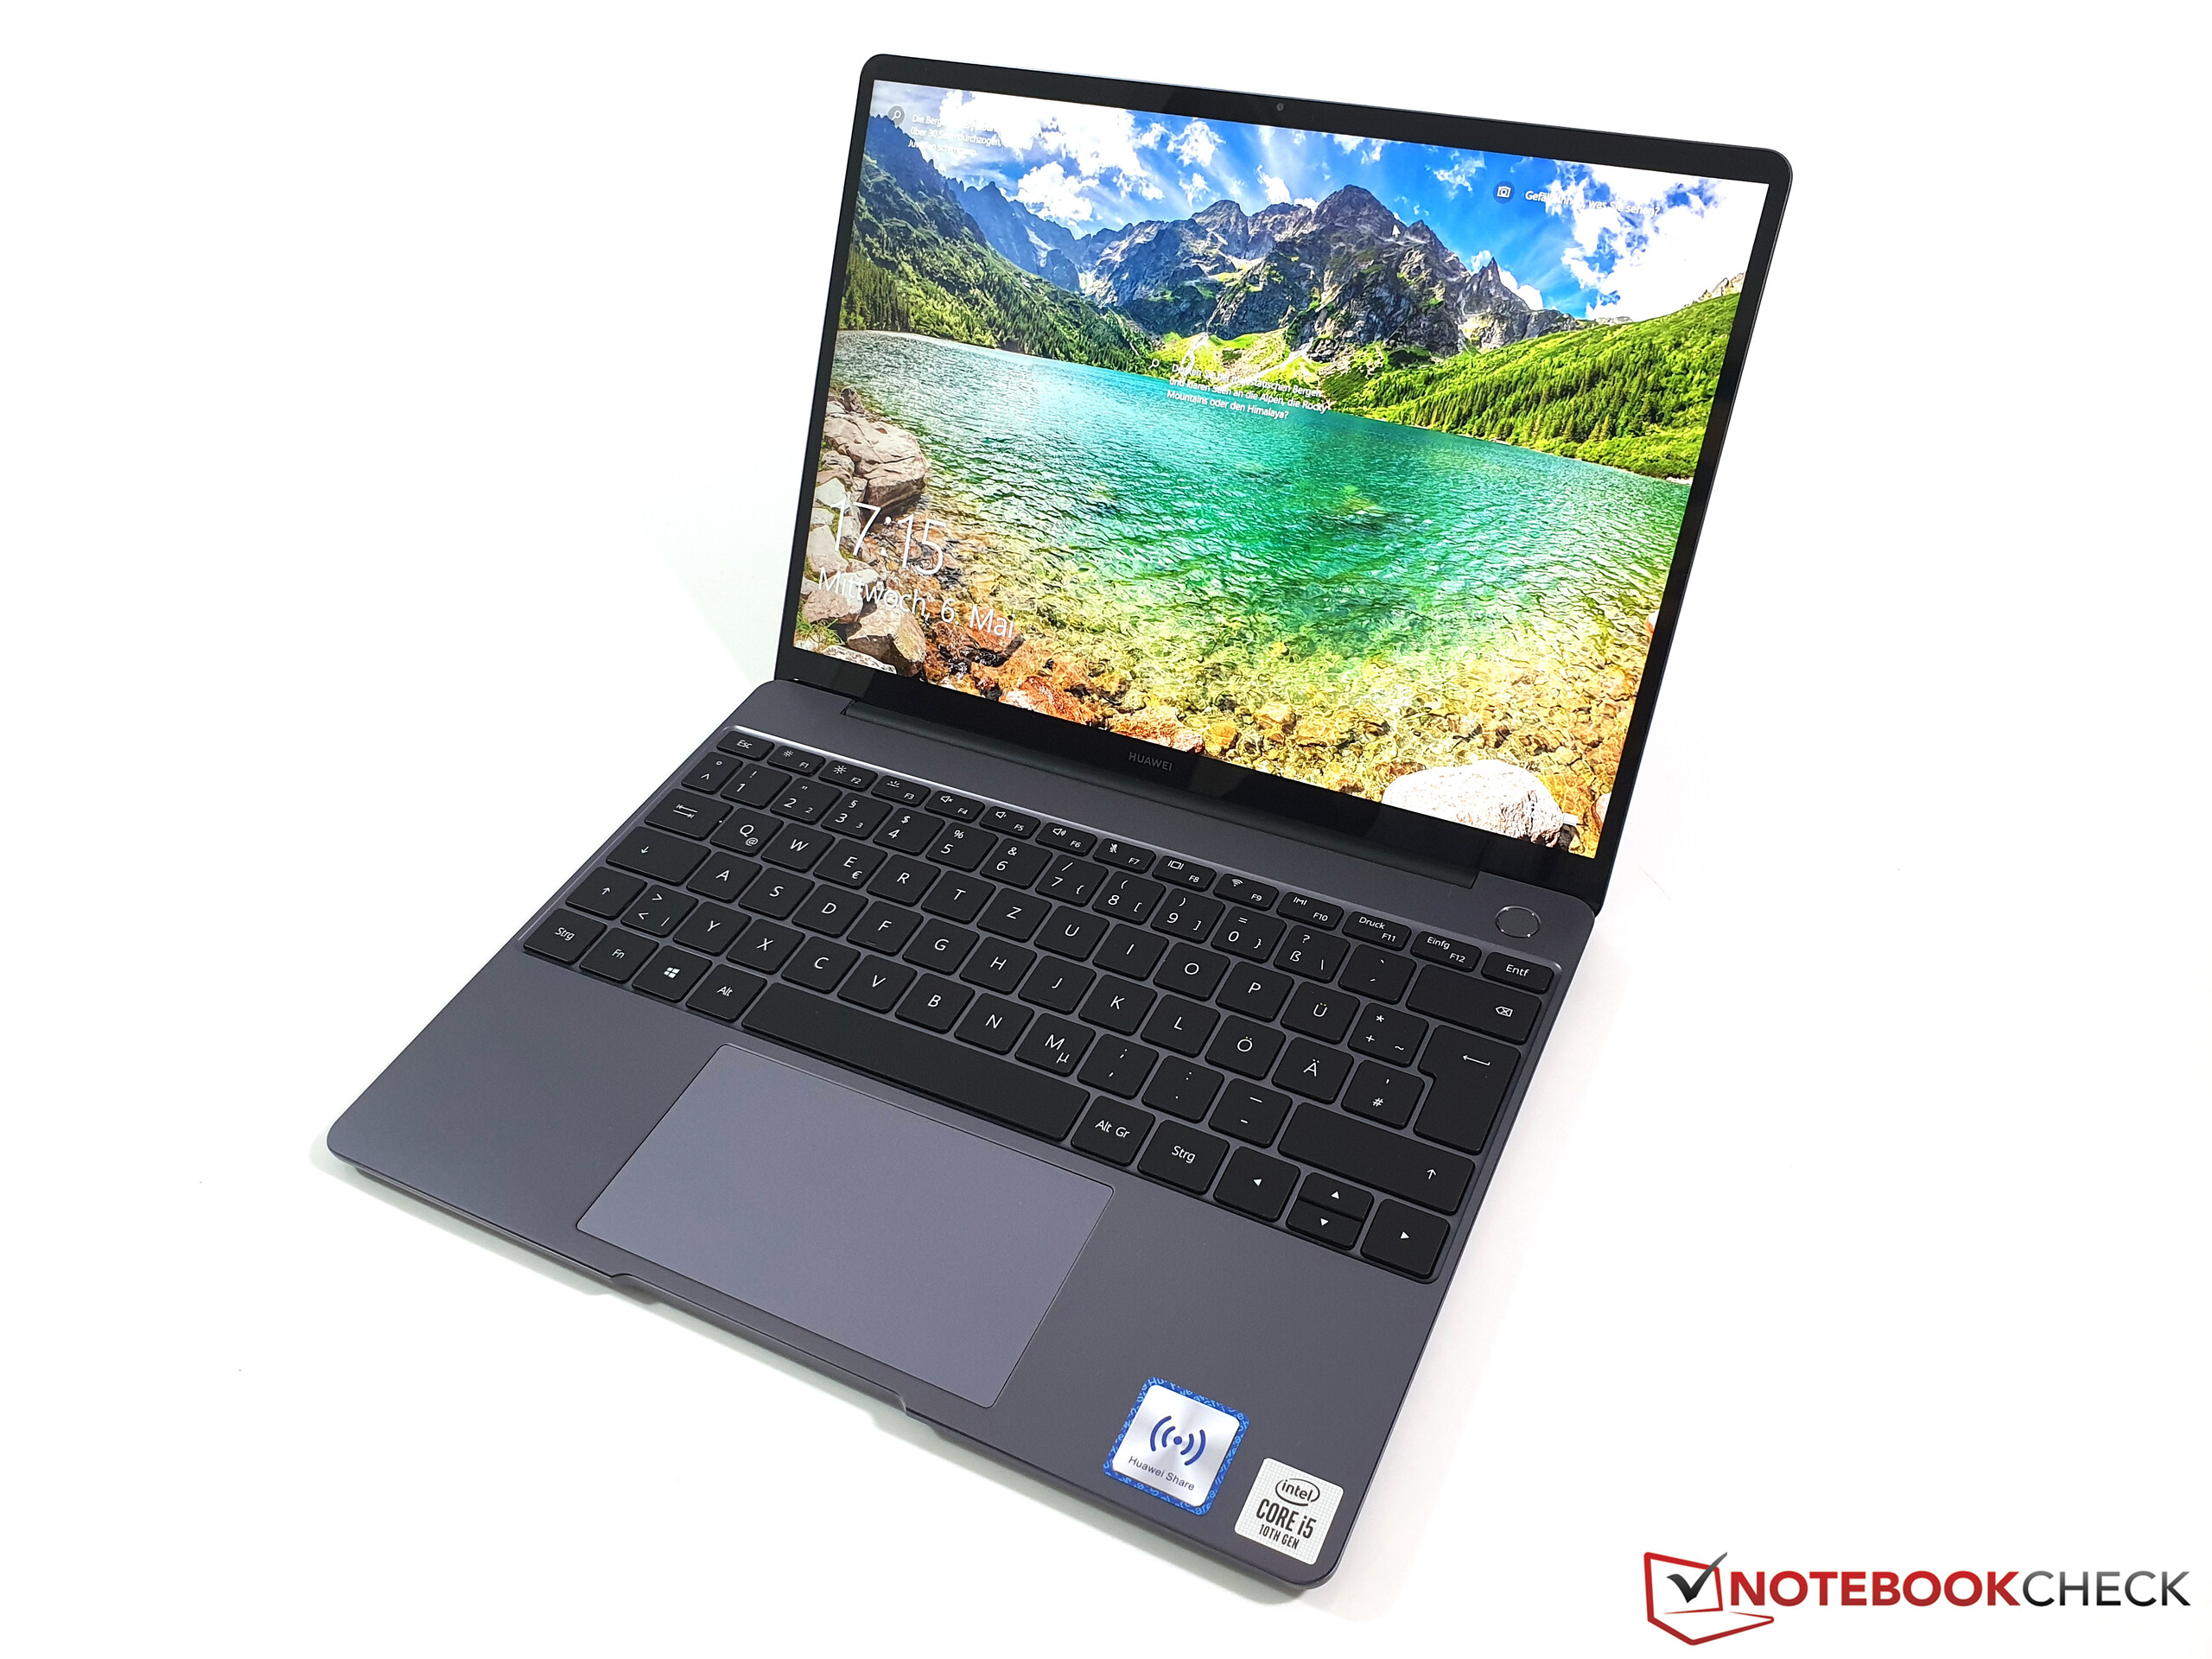
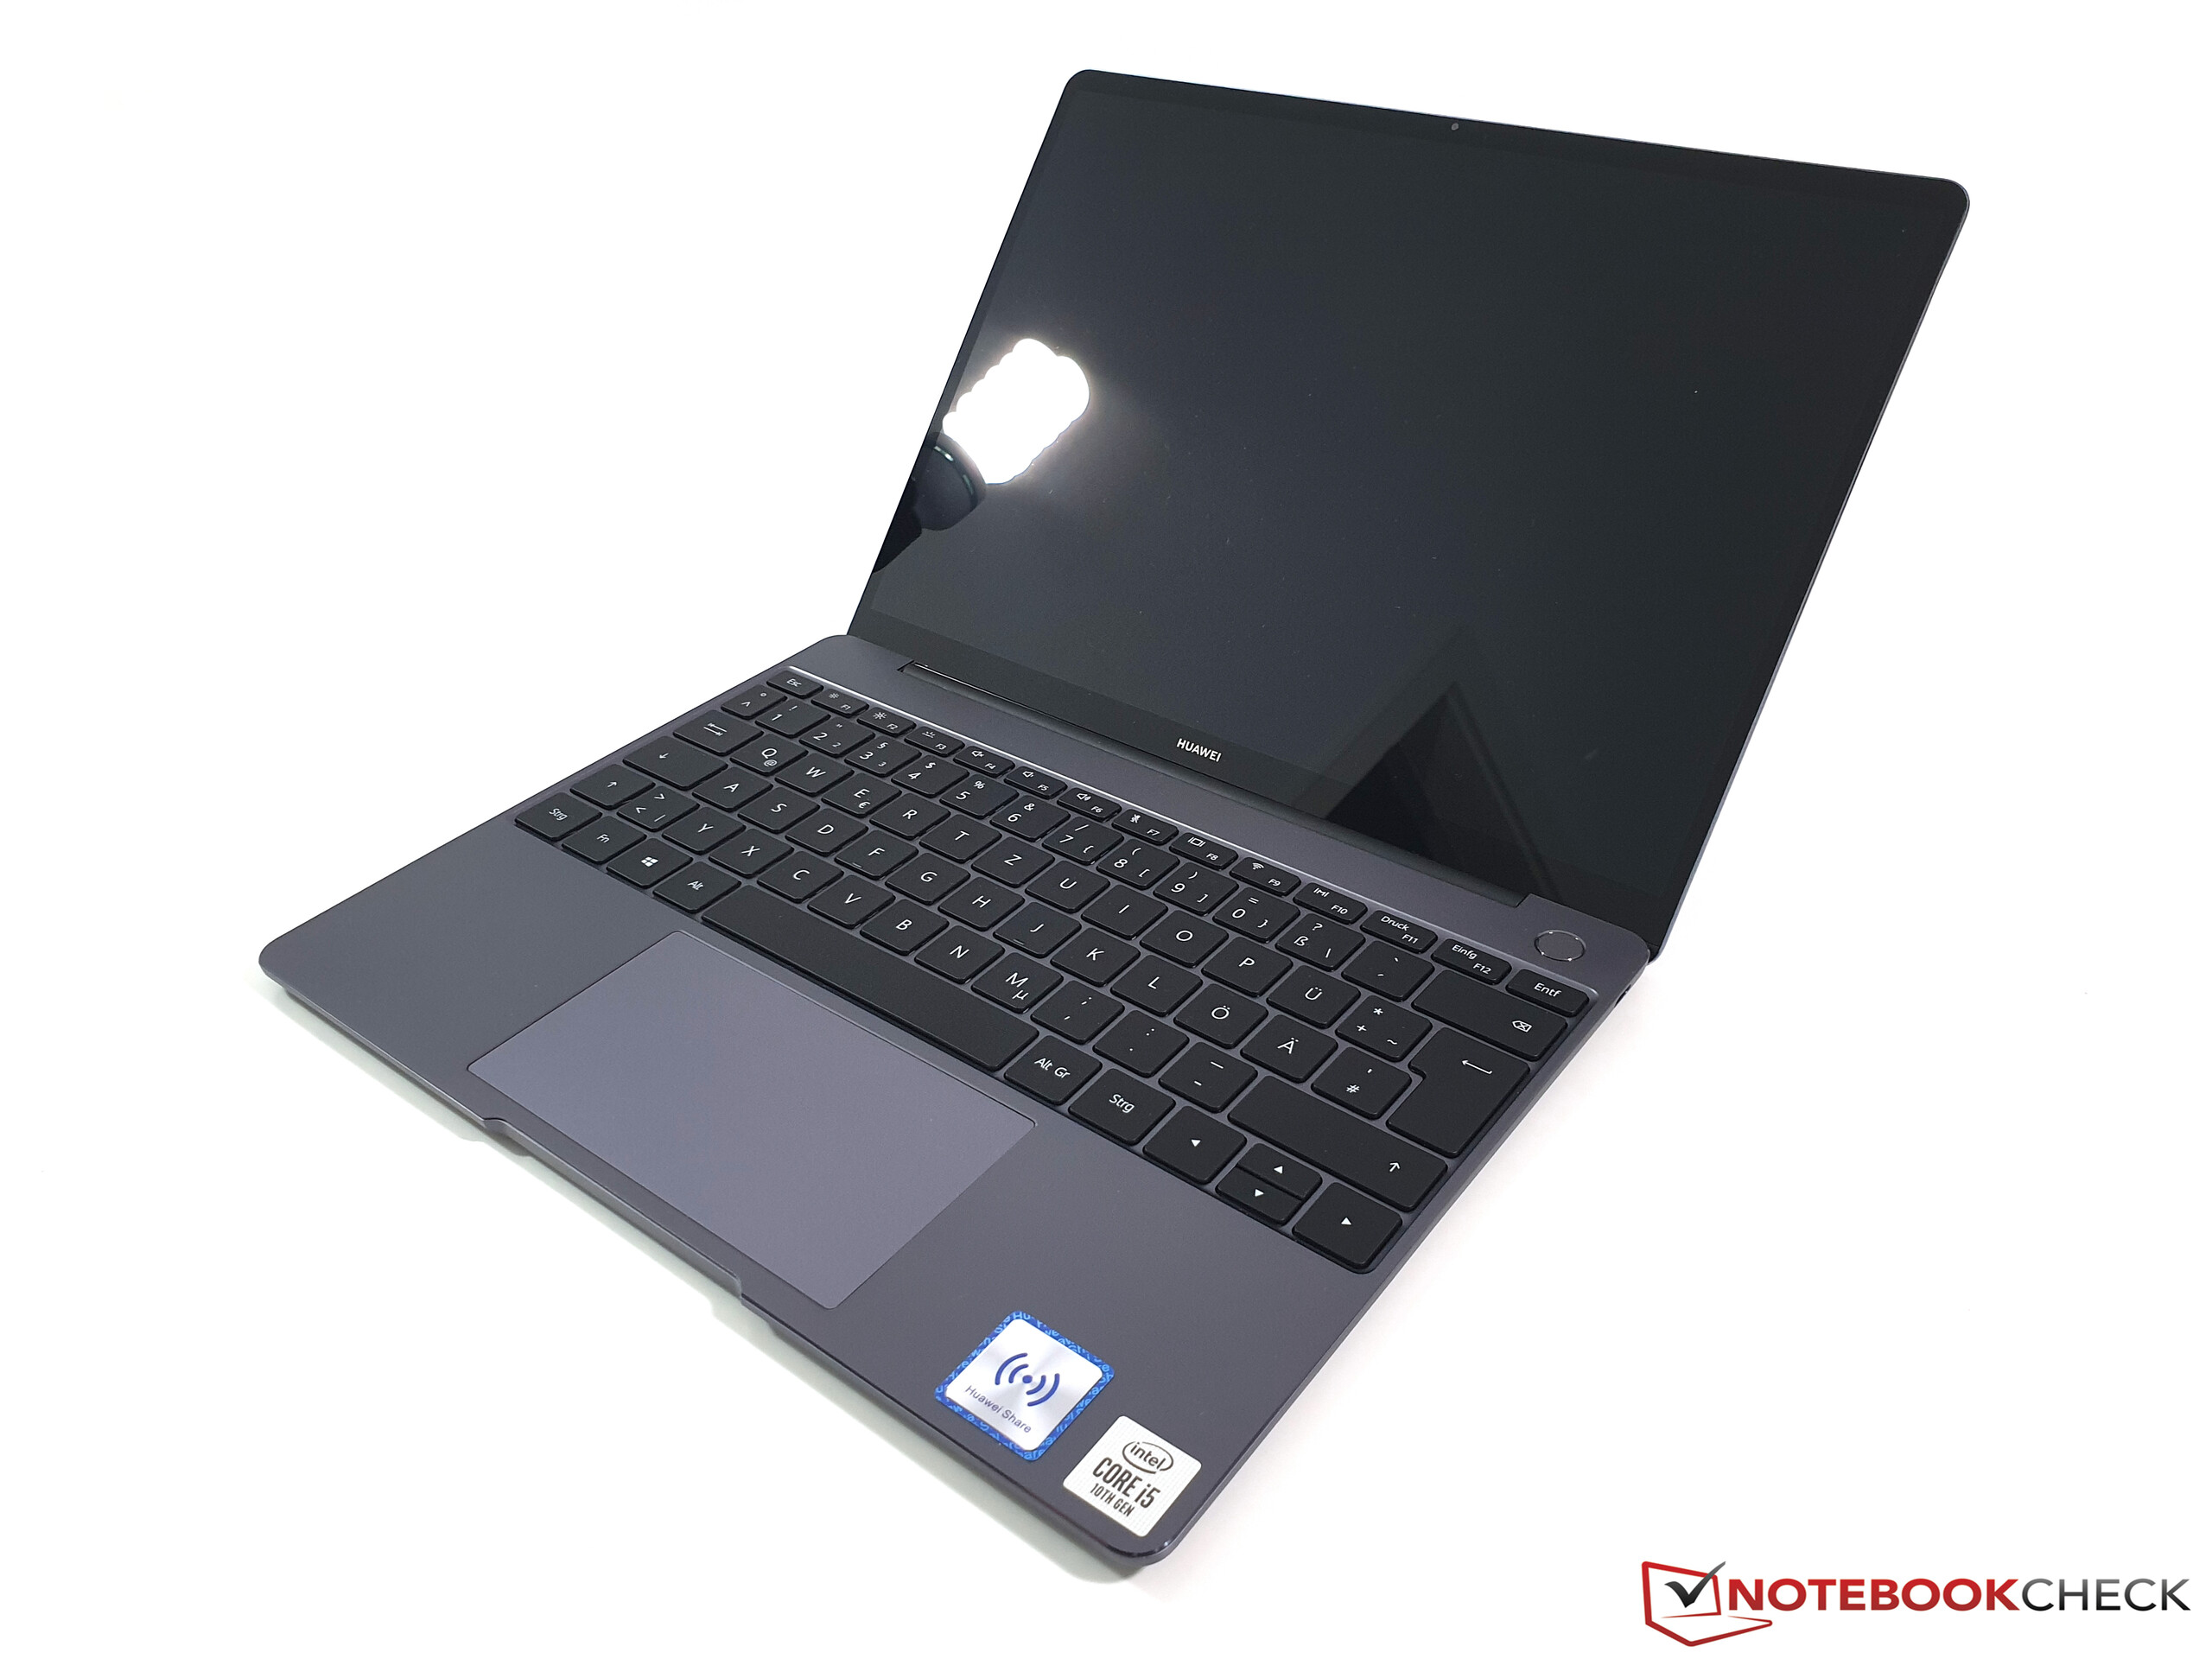
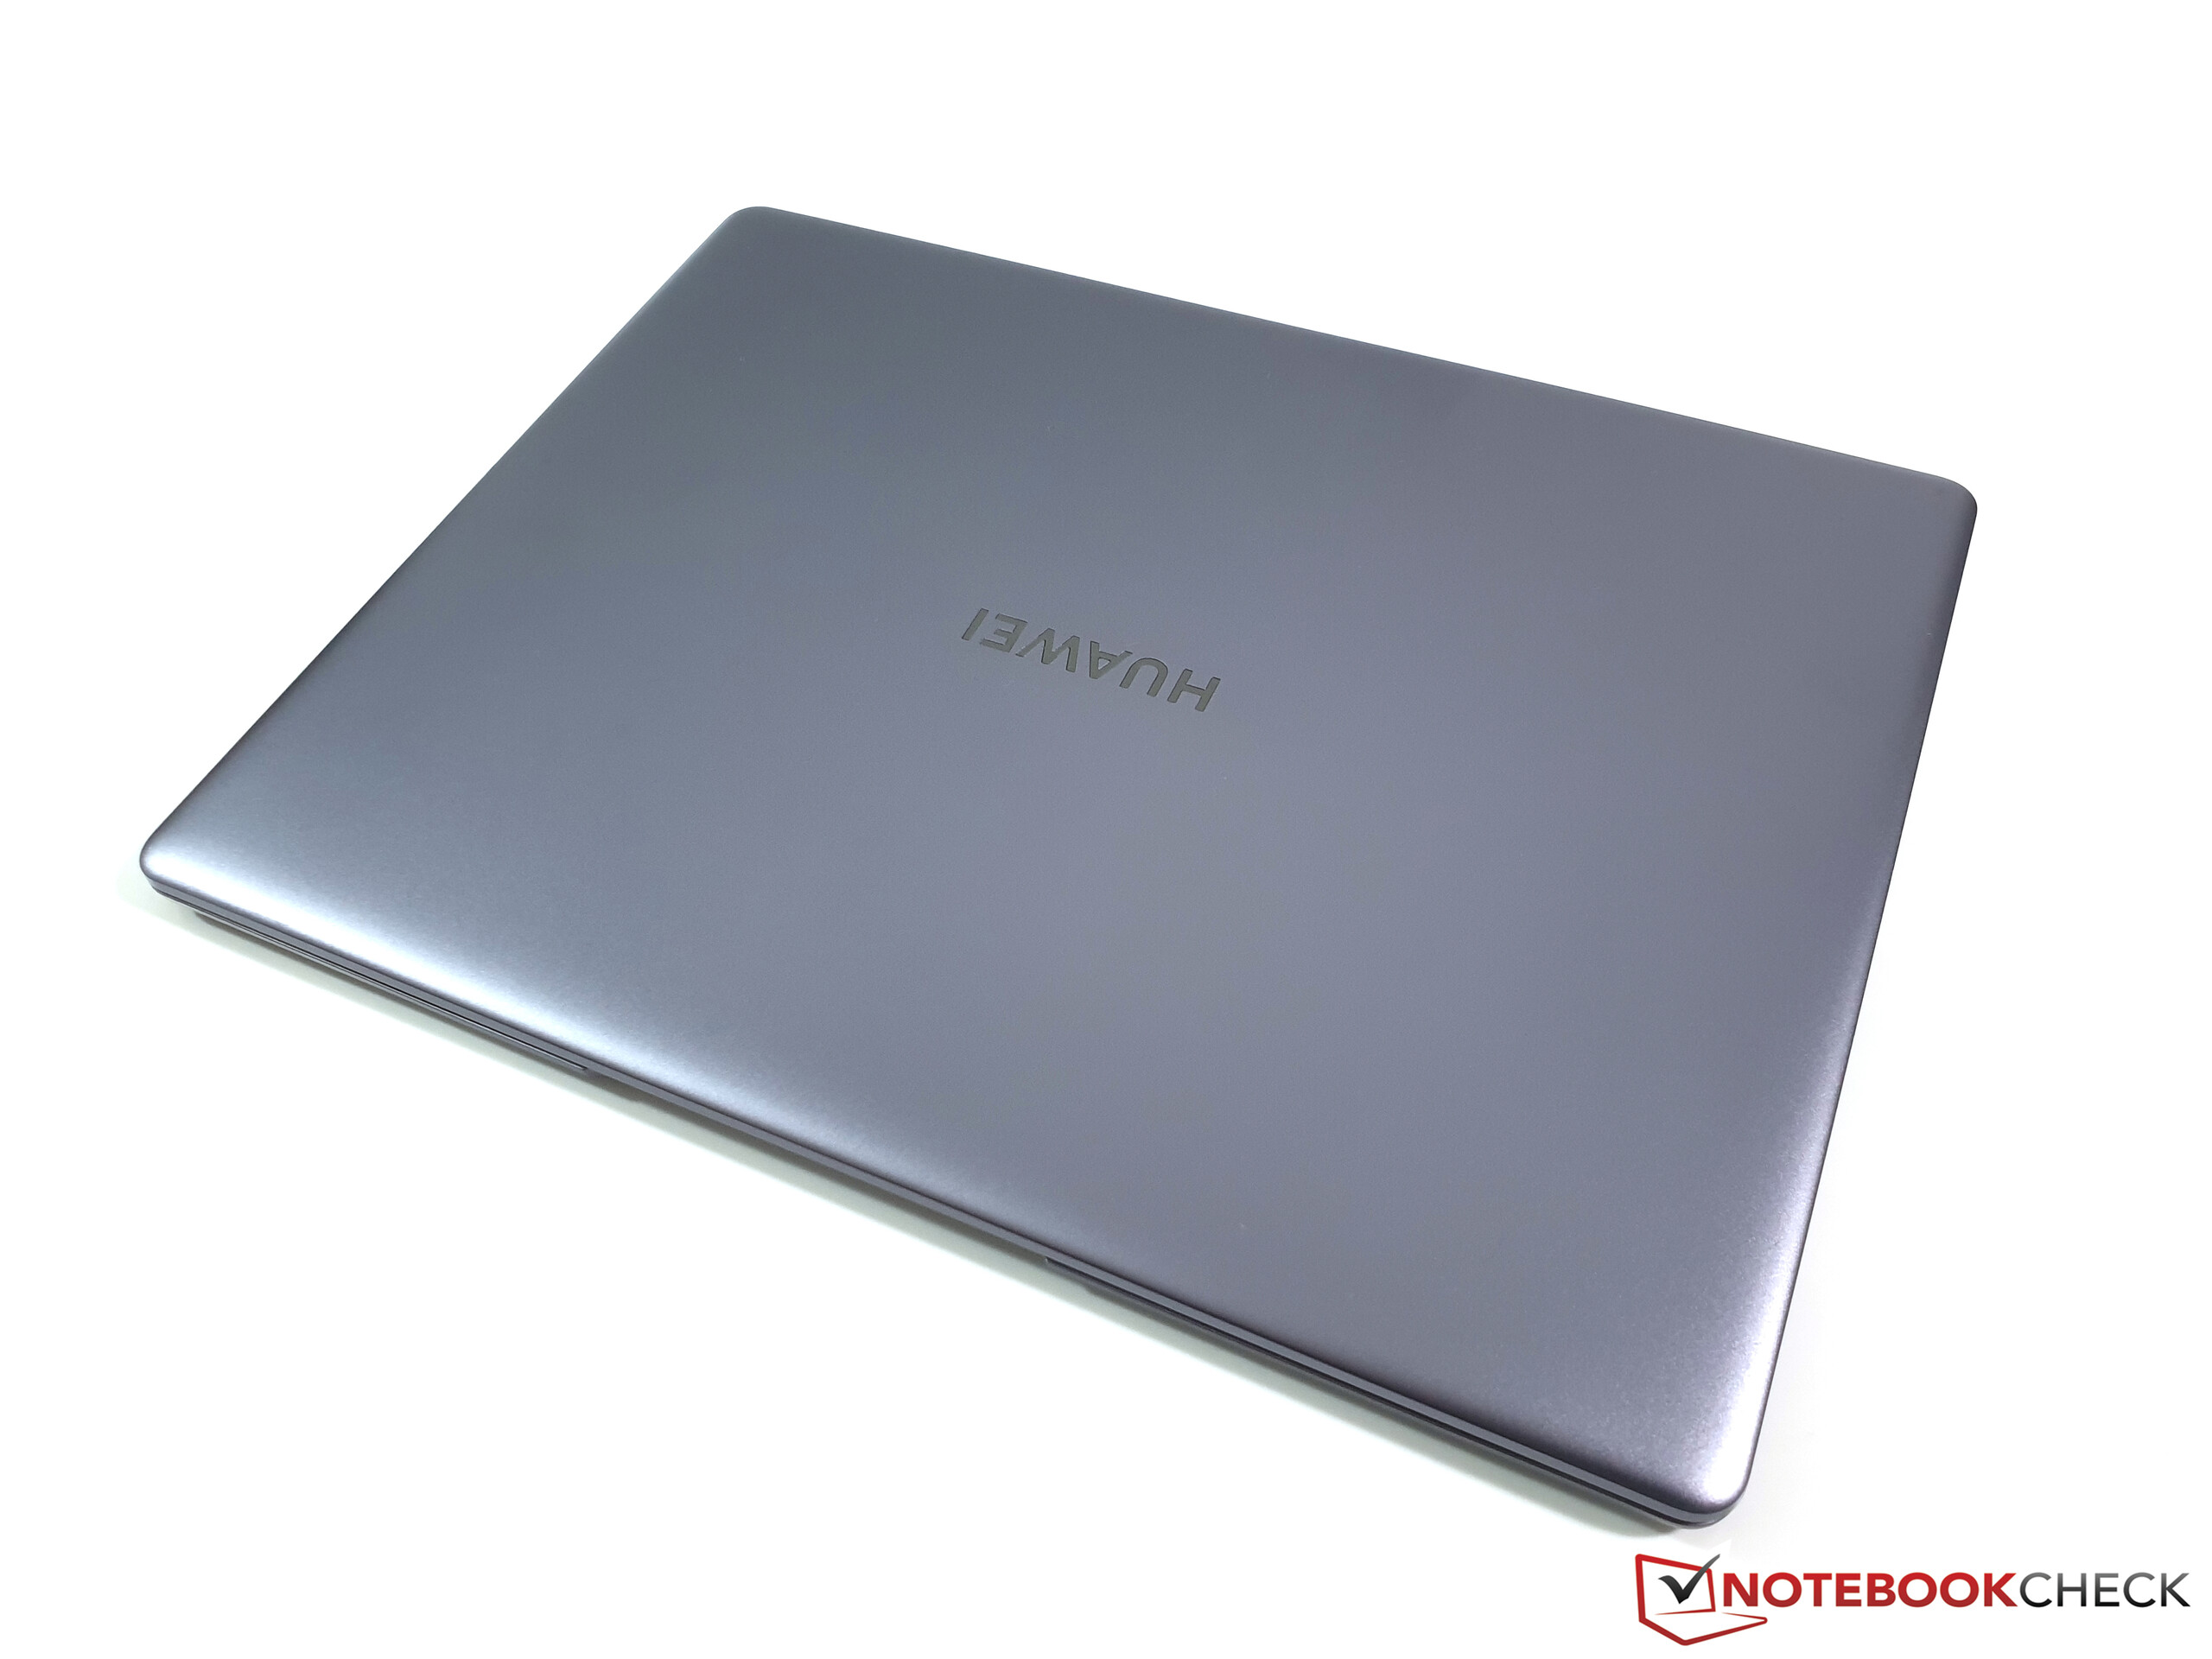
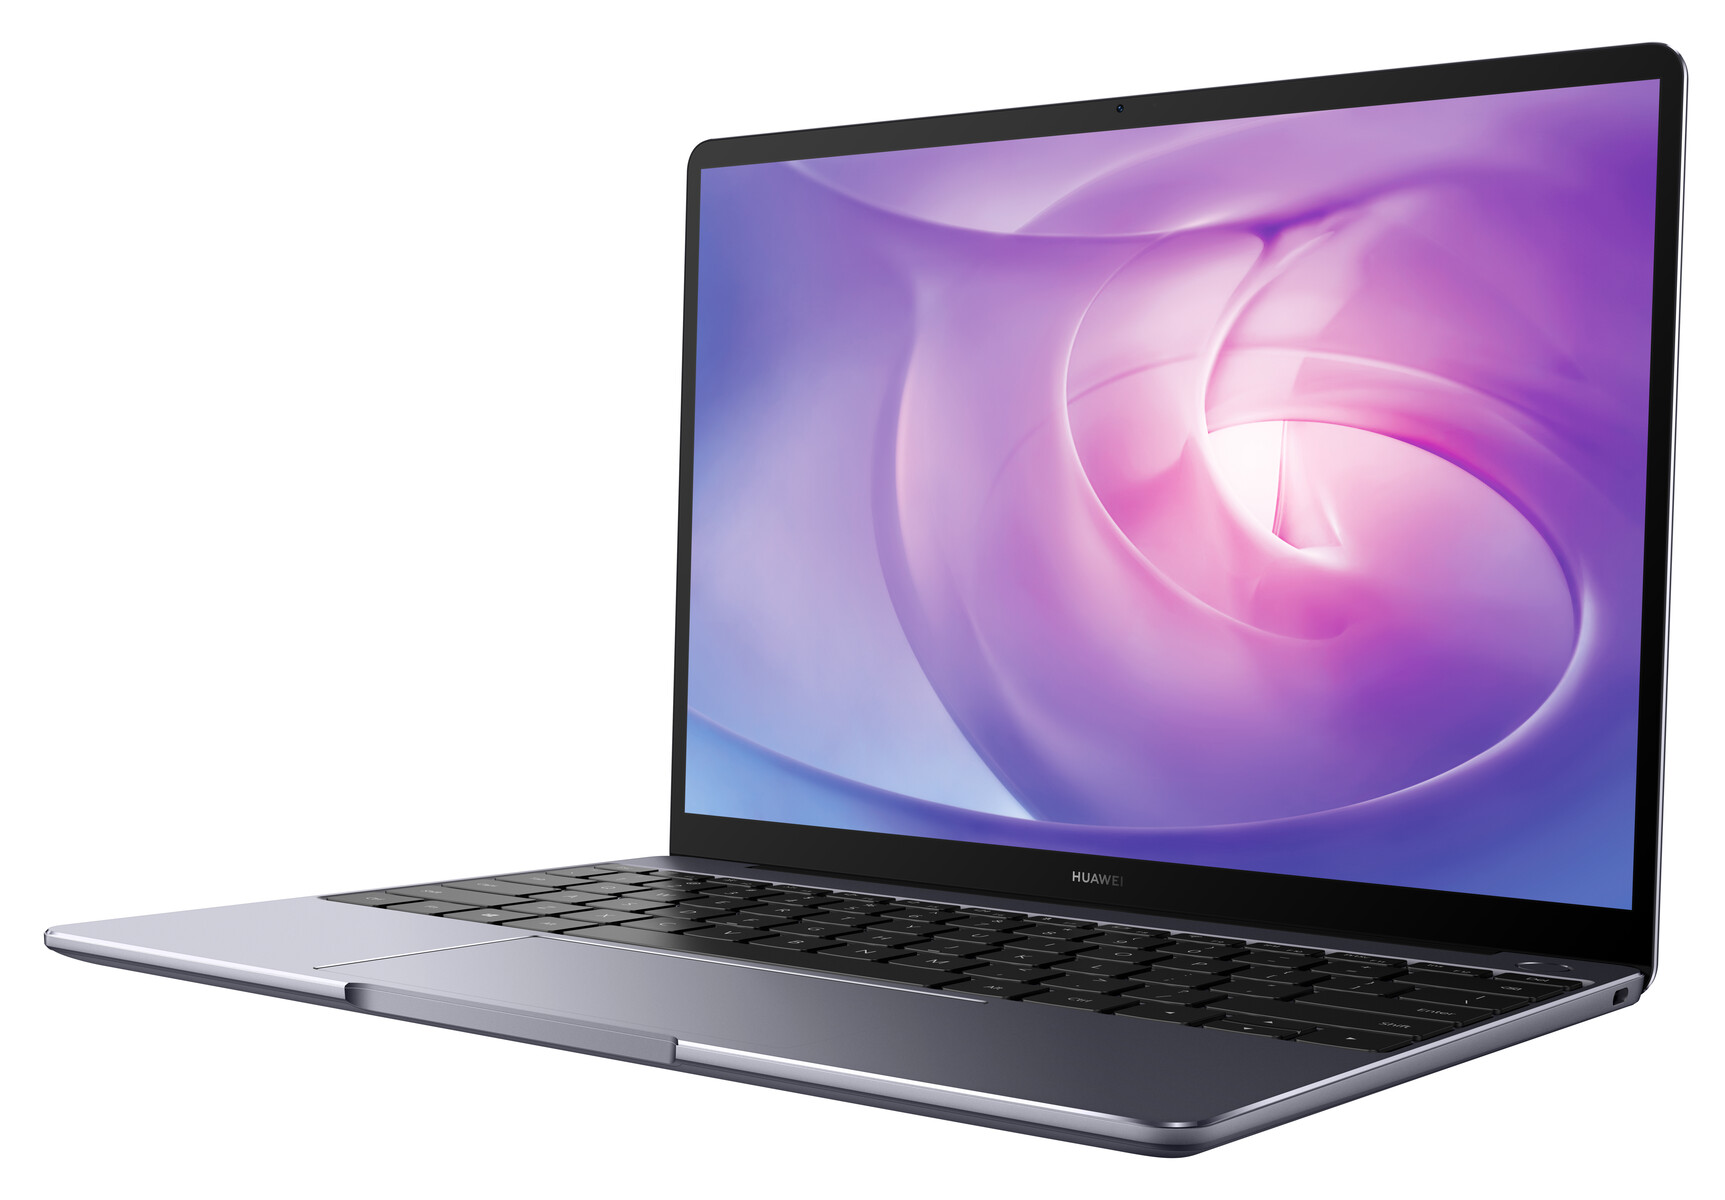
Case - MateBook 13 with appealing metal chassis
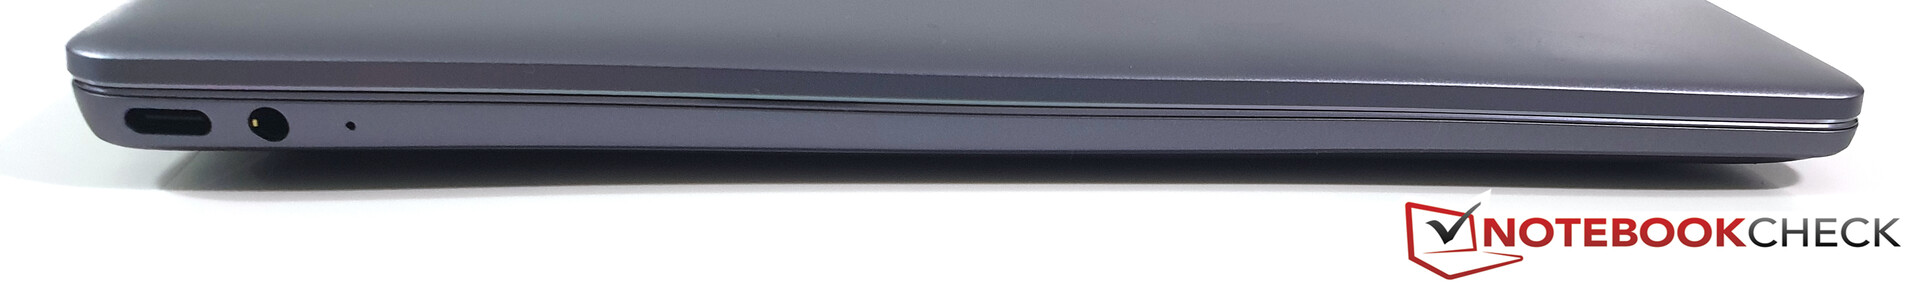
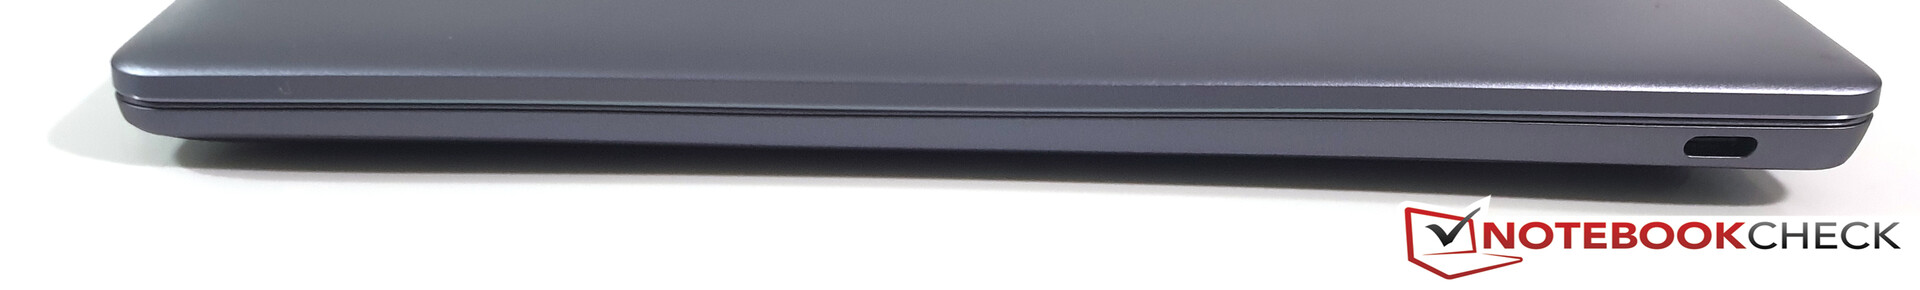
Connectivity - MateBook 13 only with USB-C
The port situation has not changed and the MateBook 13 is still limited to a 3.5 mm stereo jack as well as two USB-C ports (USB 3.1 Gen.1), but there are restrictions. The left port can only be used for data transfers and charging, while the right port only supports data transfers as well as the connection with an external display. We attached an external 4K screen and it worked well.
Webcam - 1 MP above the display
There is not that much to say about the MateBook 13 in terms of quality, because it is on the common (low) level of quality for laptops. However, the MateBook 13 is the only device in Huawei's current line-up where the camera is located at the usual spot in the upper bezel and not integrated into the keyboard as a hidden module.


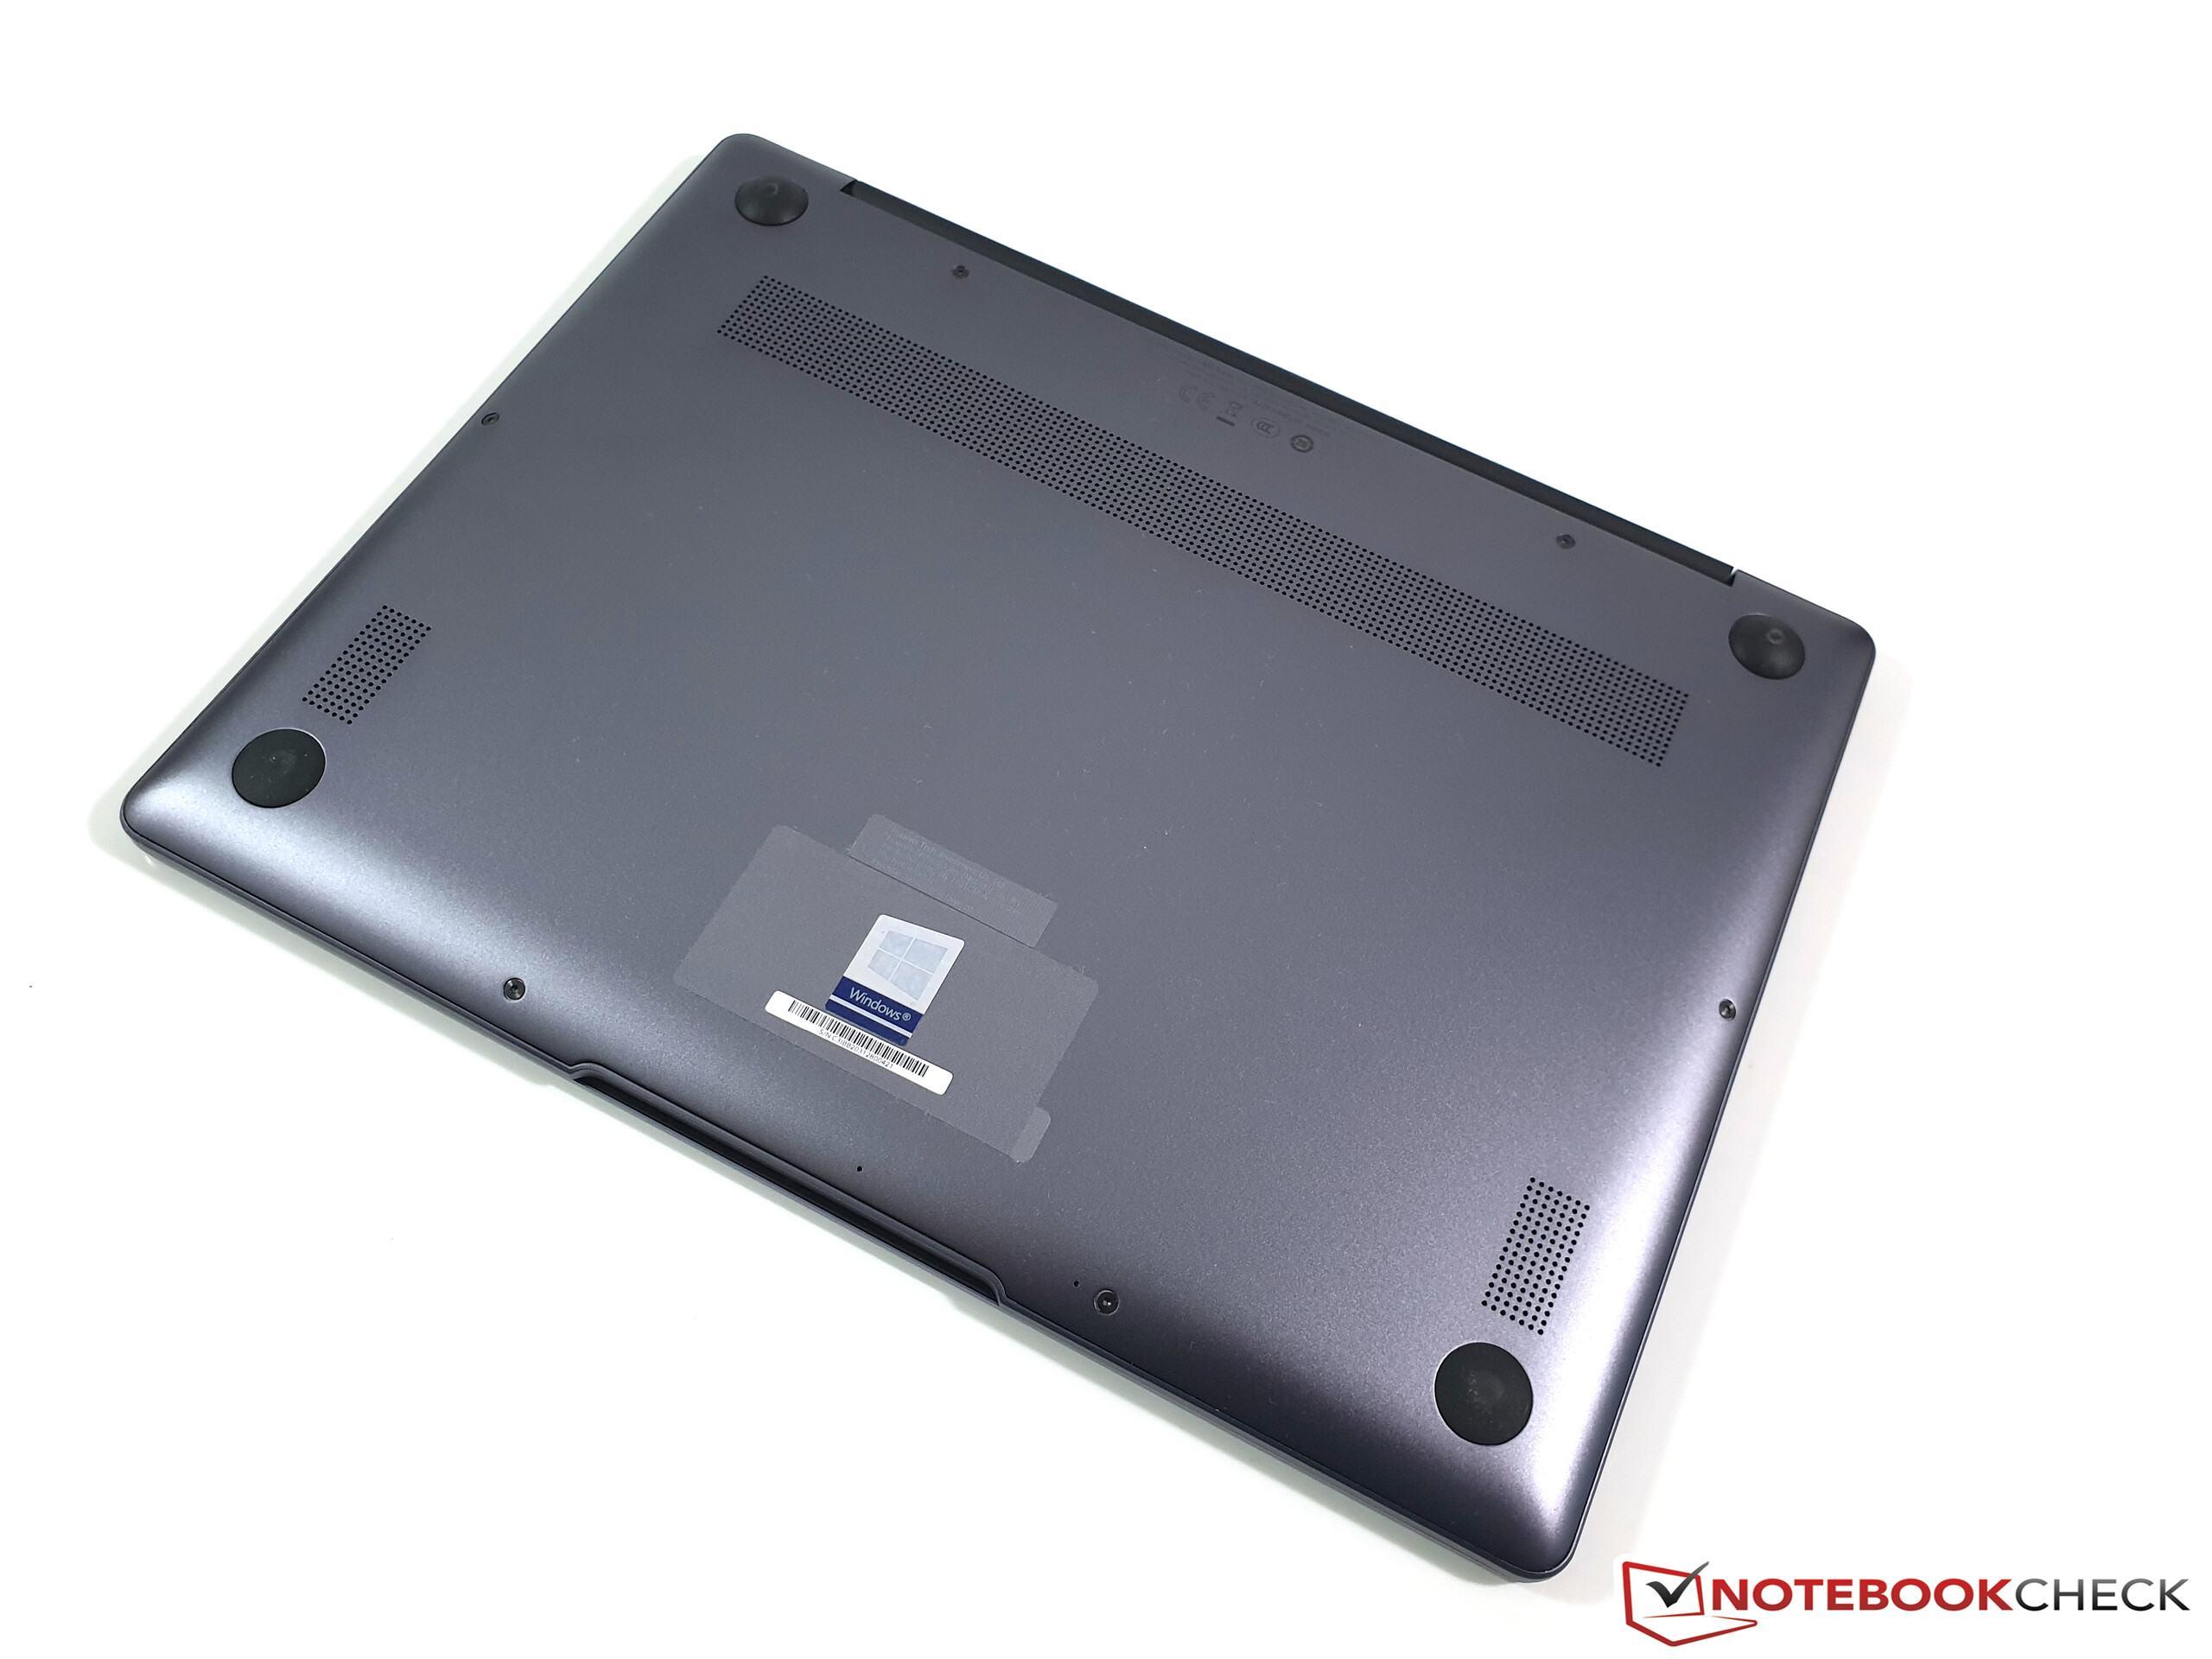
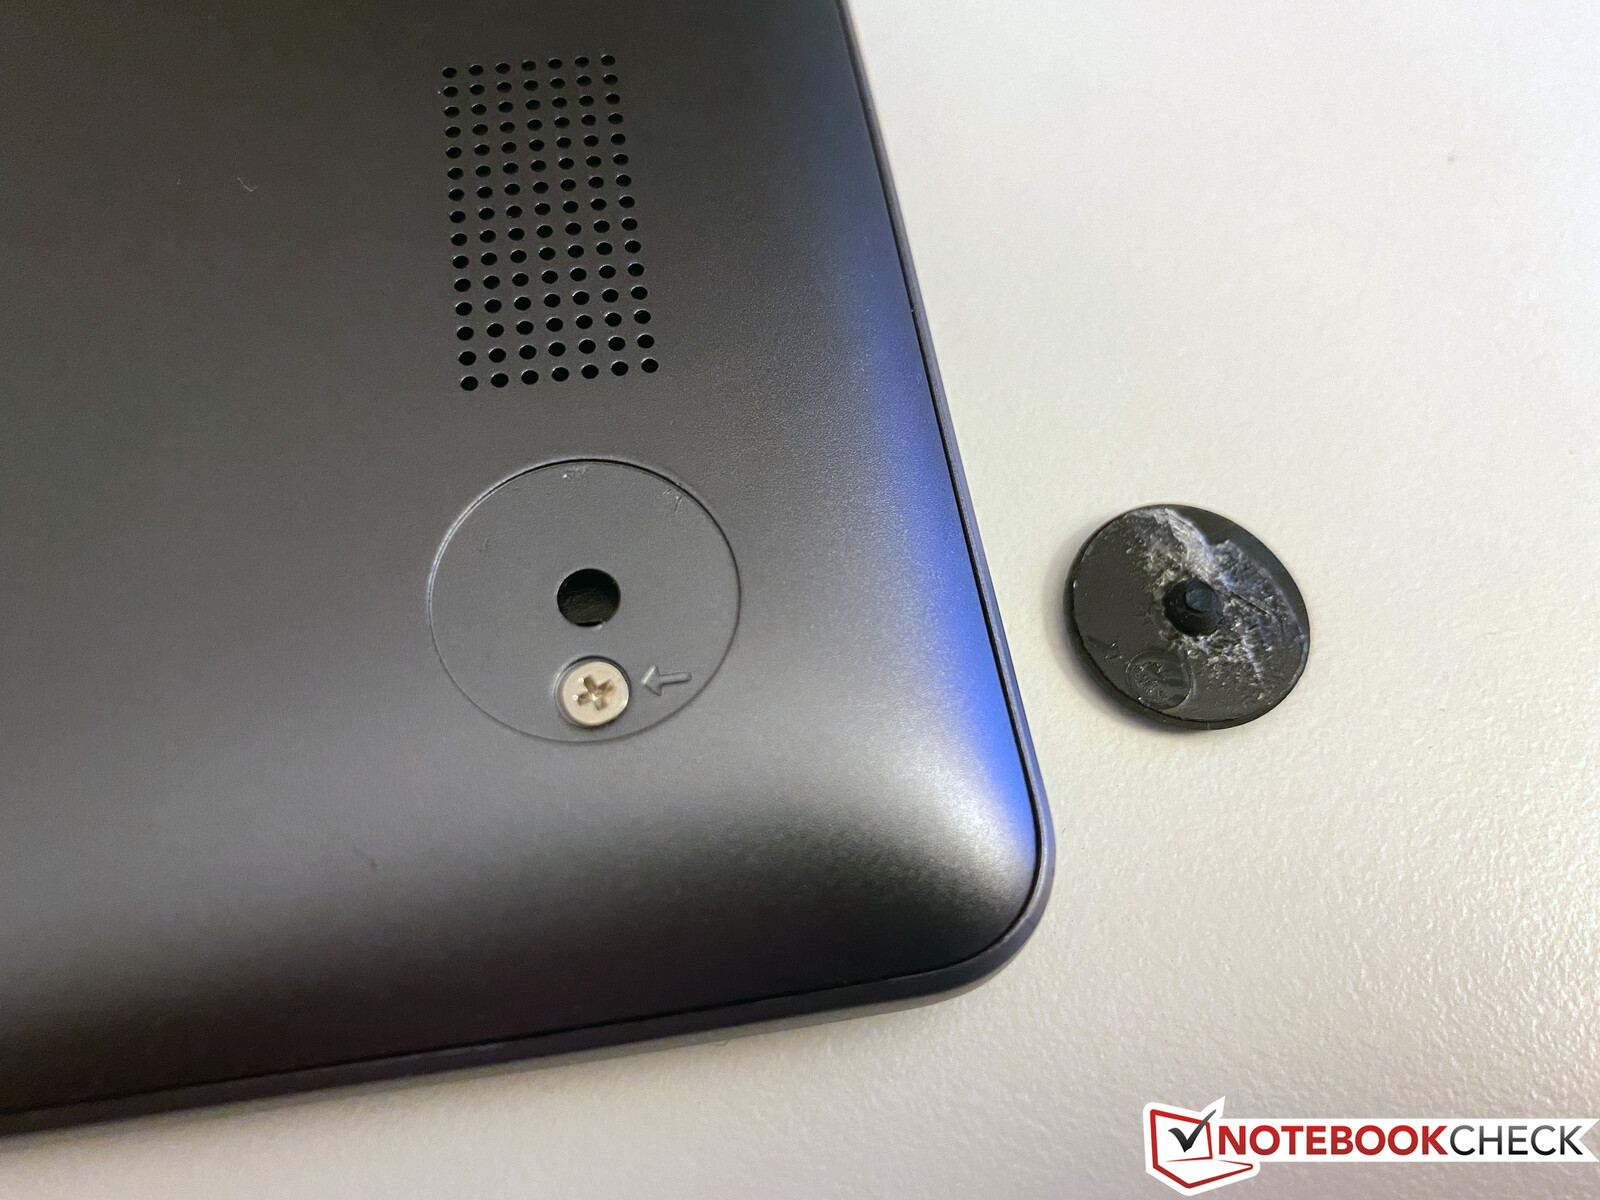
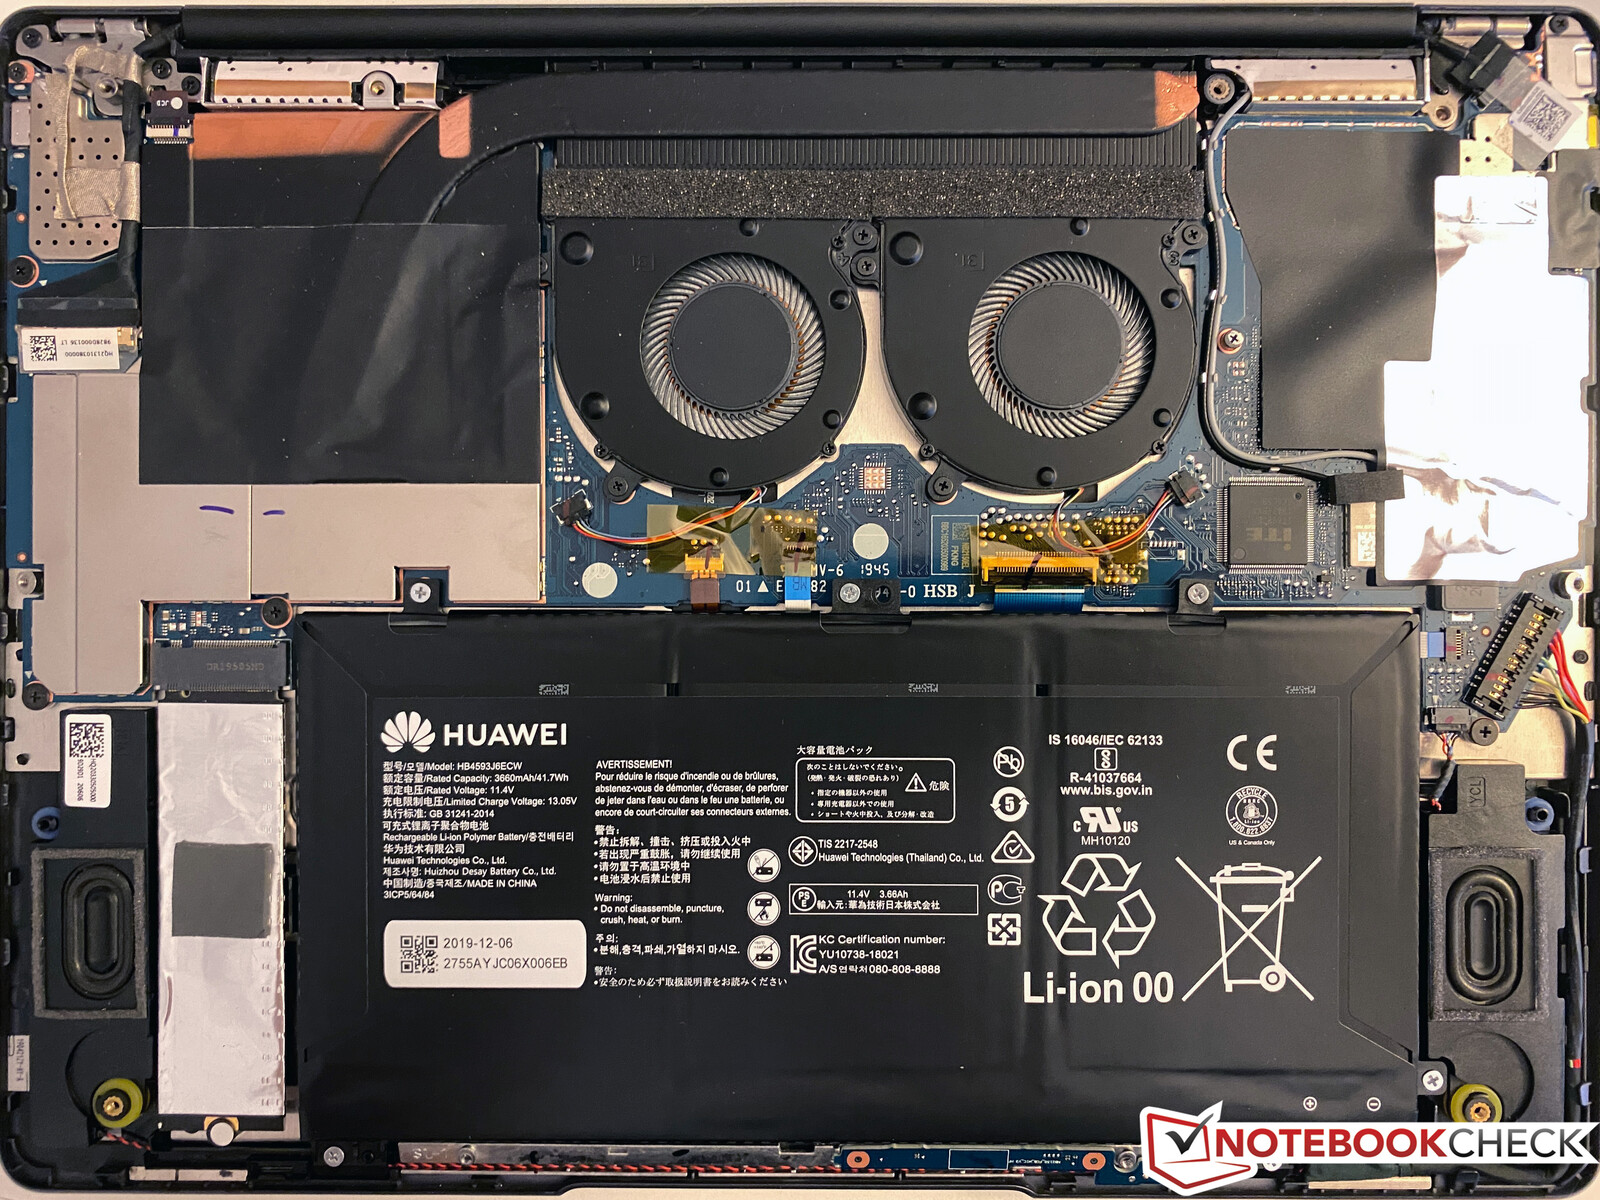
Maintenance - Tricky access to the MateBook
In addition to visible Torx screws, there are also hidden Philips screws underneath all four rubber feet. However, they are glued, which makes it unnecessarily tricky for the end user to get access. The internal layout is identical to the model from 2018, but there is only one heat pipe compared to the SKU with the dedicated GeForce GPU. You can replace the M.2-SSD, but there are some stickers you have to remove first.
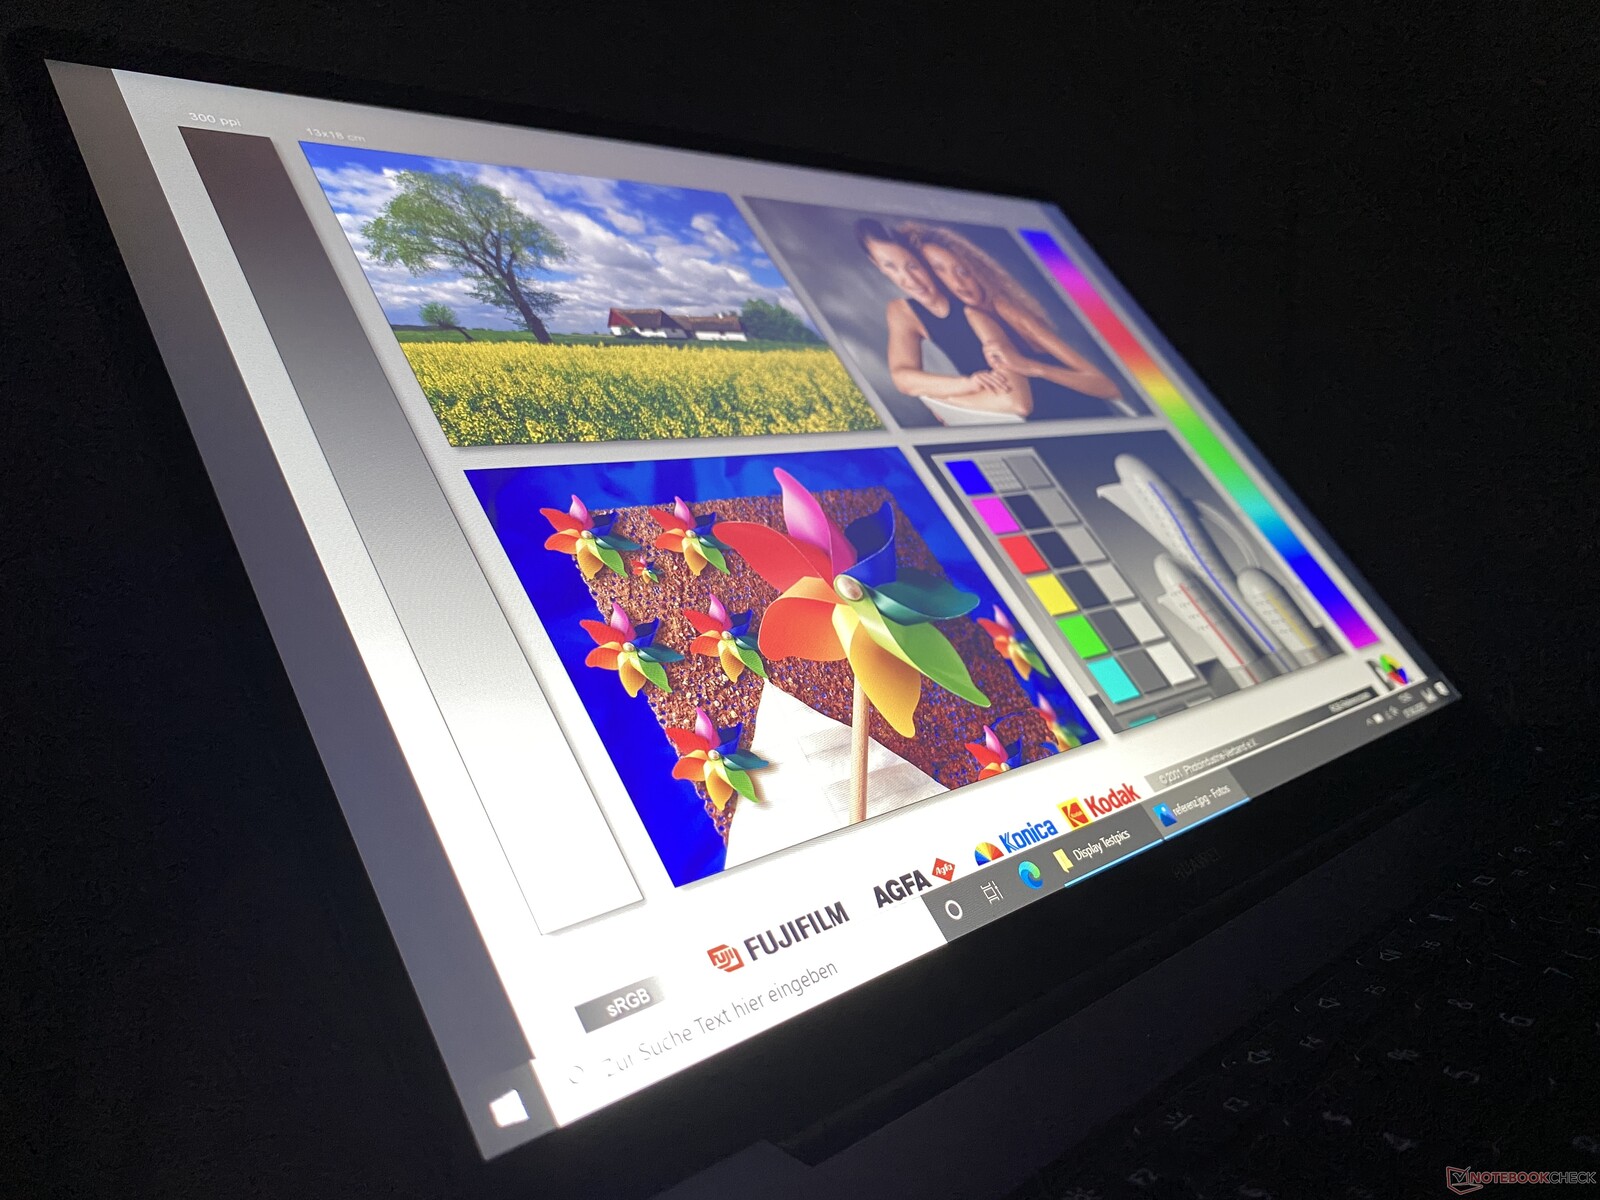
Display - Bright 3:2 panel
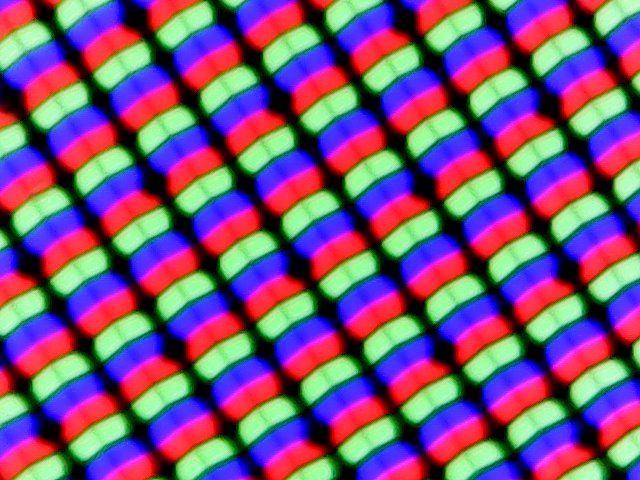
Huawei does not offer the touchscreen in Germany, but the 3:2 panel with 2160x1440 pixels still has a very reflective surface. The subjective picture impression of the IPS panel is very good: Rich colors, decent contrast ratio, and high brightness. However, you can also see a slight color cast towards green/blue, especially if you are you used to working with calibrated screens.
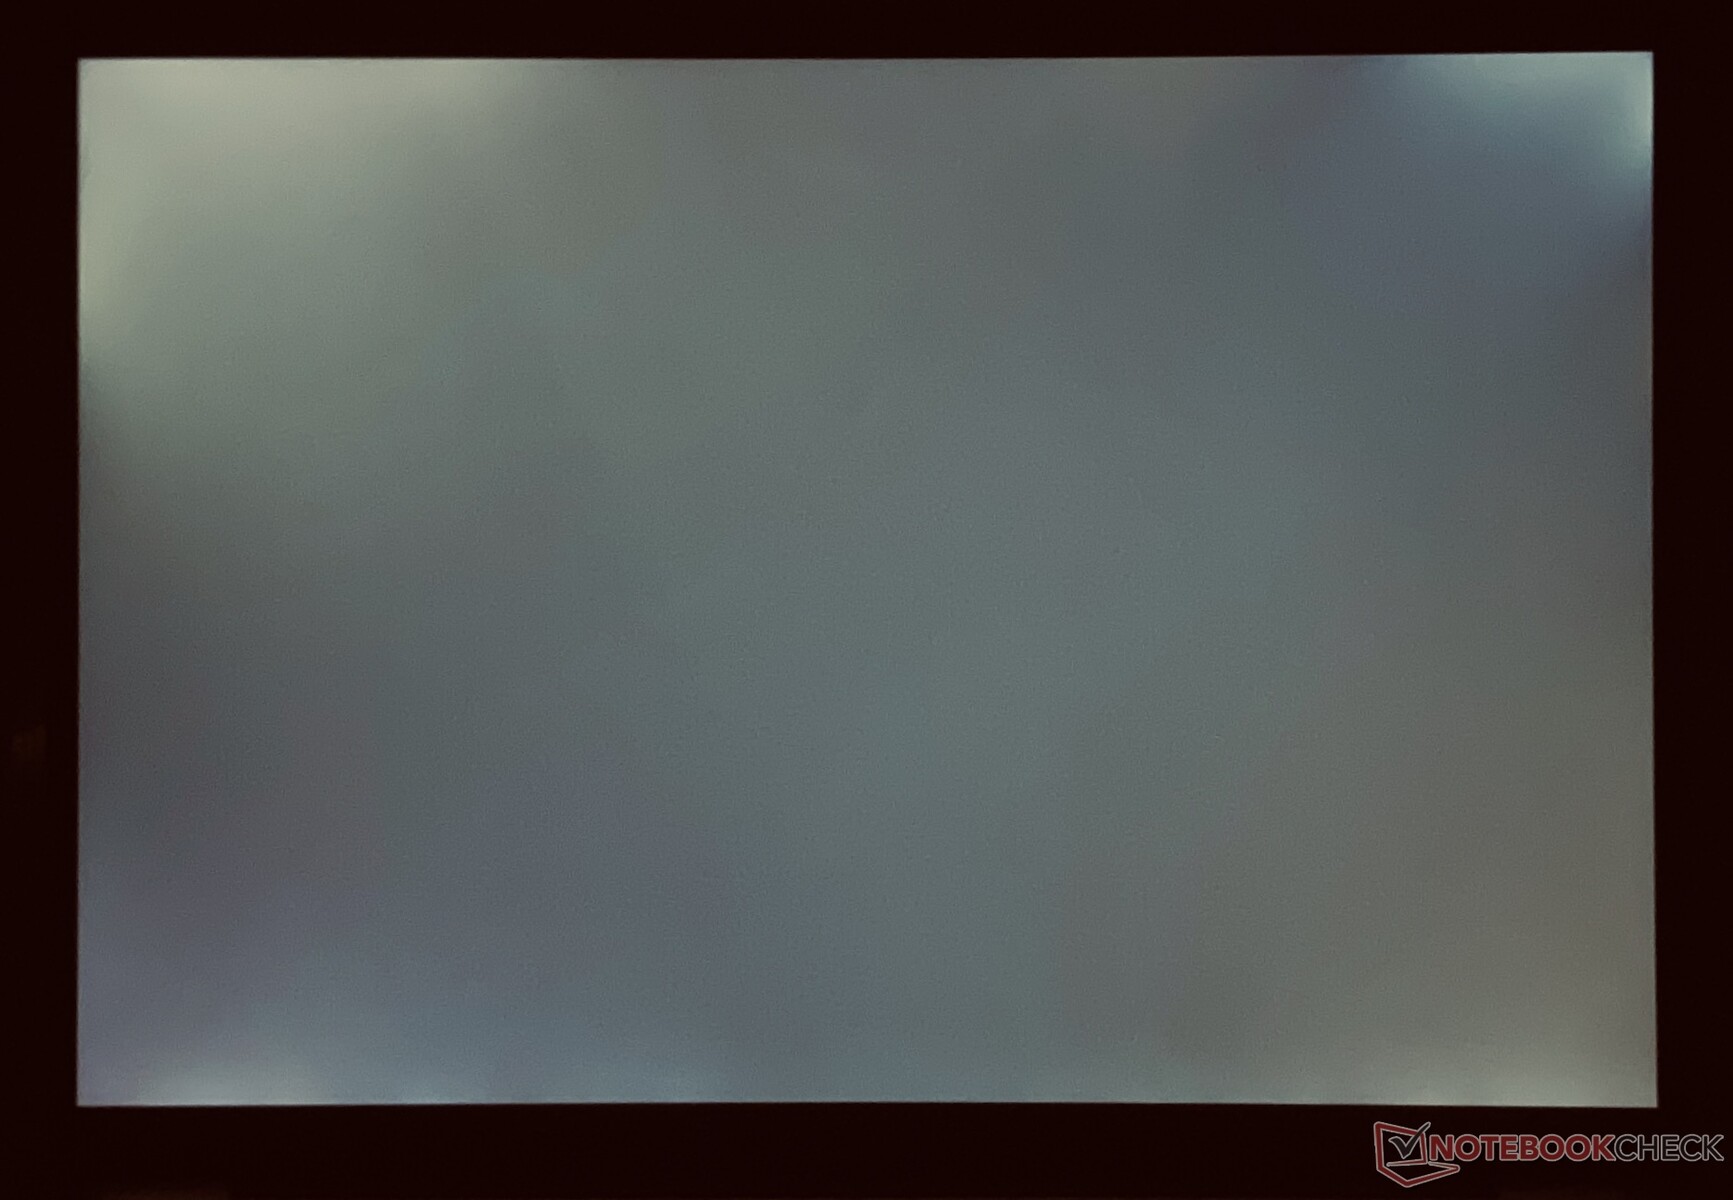
Here we can see an improvement over the previous model, where we measured a luminance of around 350 nits. The 2020 model is quite a bit brighter at around 415 nits, but the black value is also a bit higher, so the contrast ratio is still the same at ~1000:1. You can see backlight bleeding along the edges at the maximum brightness level, which is also noticeable when you watch 16:9 videos with black bars, for example. We can detect PWM at brightness levels of 30% and lower, but the frequency above 62 kHz is very high and should not result in problems.
| |||||||||||||||||||||||||
Brightness Distribution: 94 %
Center on Battery: 423 cd/m²
Contrast: 1041:1 (Black: 0.41 cd/m²)
ΔE ColorChecker Calman: 4.4 | ∀{0.5-29.43 Ø4.73}
calibrated: 1.1
ΔE Greyscale Calman: 7.5 | ∀{0.09-98 Ø4.97}
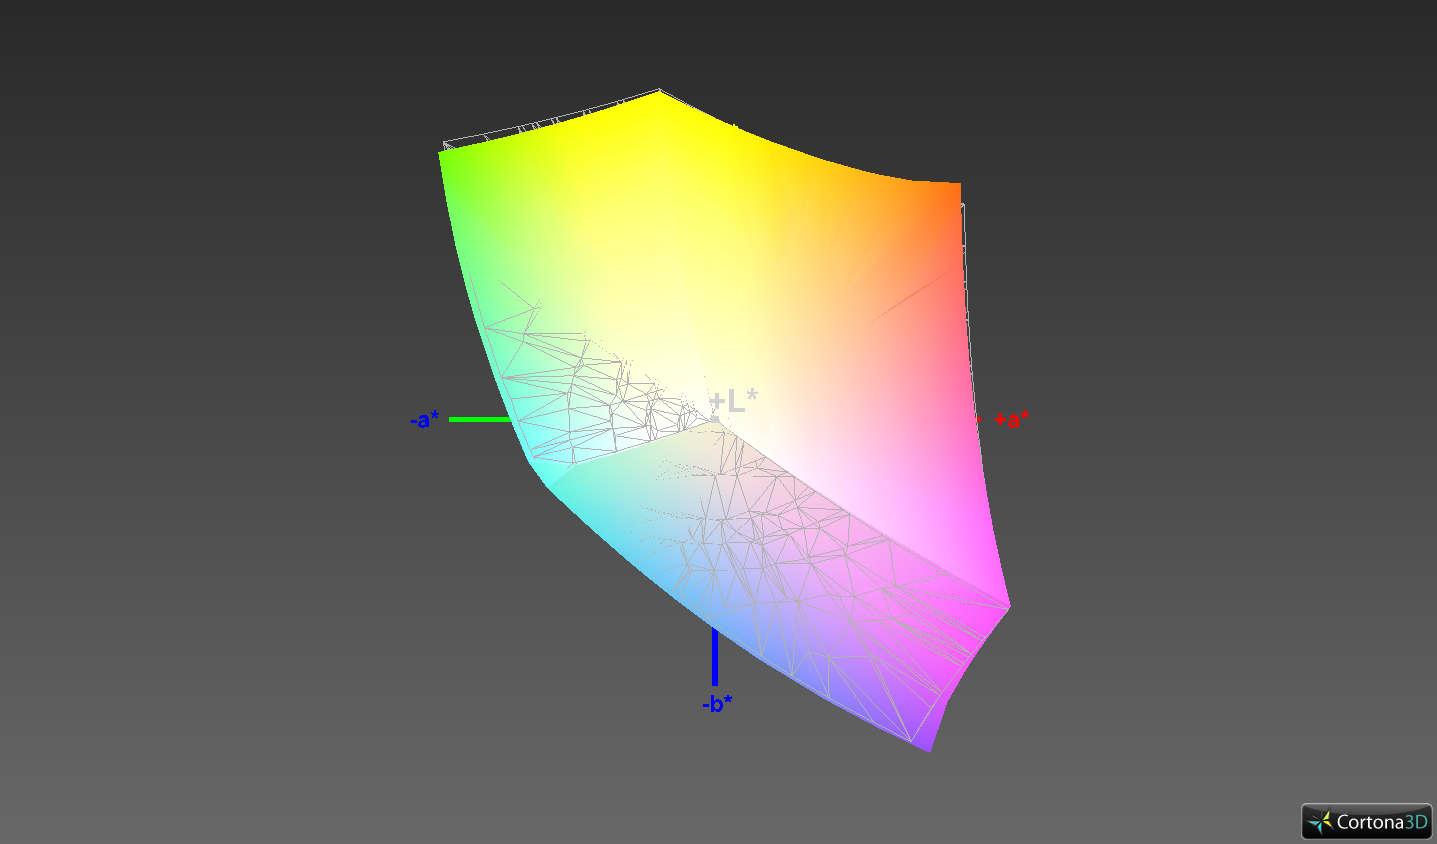
98.6% sRGB (Argyll 1.6.3 3D)
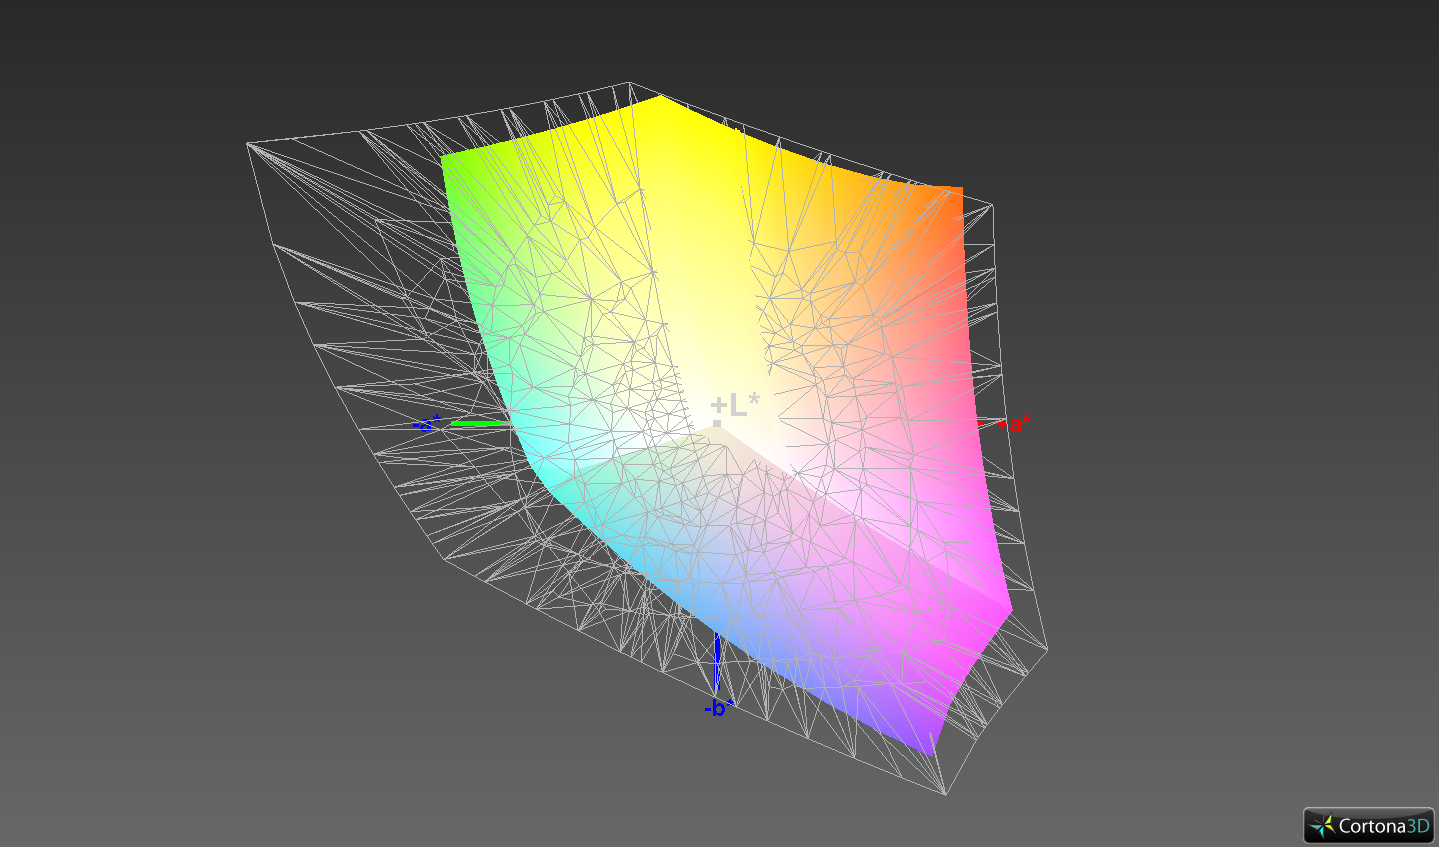
64% AdobeRGB 1998 (Argyll 1.6.3 3D)
69.6% AdobeRGB 1998 (Argyll 3D)
98.5% sRGB (Argyll 3D)
67.9% Display P3 (Argyll 3D)
Gamma: 2.16
CCT: 6642 K
| Huawei MateBook 13 2020 i5 CMN8201 P130ZFA-BA1, IPS, 2160x1440, 13" | Huawei Matebook 13-53010FYW Chi Mei CMN8201, IPS, 2160x1440, 13" | Apple MacBook Air 2020 i3 APPA042, IPS, 2560x1600, 13.3" | Dell XPS 13 9300 i5 FHD SHP14CB, IPS, 1920x1200, 13.4" | Acer Swift 3 SF313-52-52AS BOE08BC, IPS, 2256x1504, 13.5" | |
|---|---|---|---|---|---|
| Display | 0% | 2% | 4% | 2% | |
| Display P3 Coverage (%) | 67.9 | 68.1 0% | 70.3 4% | 71.5 5% | 70.3 4% |
| sRGB Coverage (%) | 98.5 | 99.3 1% | 98 -1% | 99.4 1% | 99.8 1% |
| AdobeRGB 1998 Coverage (%) | 69.6 | 69.7 0% | 71.6 3% | 73.5 6% | 71.3 2% |
| Response Times | -16% | -5% | -41% | -25% | |
| Response Time Grey 50% / Grey 80% * (ms) | 41.6 ? | 43.2 ? -4% | 38.4 ? 8% | 60 ? -44% | 50 ? -20% |
| Response Time Black / White * (ms) | 24 ? | 30.4 ? -27% | 28.4 ? -18% | 33.2 ? -38% | 31 ? -29% |
| PWM Frequency (Hz) | 62500 ? | 60240 ? | 119000 ? | 2500 ? | 192 ? |
| Screen | 4% | 30% | 25% | 16% | |
| Brightness middle (cd/m²) | 427 | 356 -17% | 416 -3% | 619 45% | 456 7% |
| Brightness (cd/m²) | 415 | 346 -17% | 403 -3% | 591 42% | 432 4% |
| Brightness Distribution (%) | 94 | 86 -9% | 95 1% | 91 -3% | 88 -6% |
| Black Level * (cd/m²) | 0.41 | 0.35 15% | 0.34 17% | 0.35 15% | 0.32 22% |
| Contrast (:1) | 1041 | 1017 -2% | 1224 18% | 1769 70% | 1425 37% |
| Colorchecker dE 2000 * | 4.4 | 3.3 25% | 0.9 80% | 3 32% | 3.49 21% |
| Colorchecker dE 2000 max. * | 11 | 8.7 21% | 1.4 87% | 8.2 25% | 8.4 24% |
| Colorchecker dE 2000 calibrated * | 1.1 | 1.1 -0% | 0.6 45% | 1 9% | 0.72 35% |
| Greyscale dE 2000 * | 7.5 | 5.8 23% | 1 87% | 5.2 31% | 5.53 26% |
| Gamma | 2.16 102% | 2.21 100% | 2.2 100% | 2.14 103% | 2.41 91% |
| CCT | 6642 98% | 6670 97% | 6629 98% | 6340 103% | 6675 97% |
| Color Space (Percent of AdobeRGB 1998) (%) | 64 | 64.1 0% | 63.9 0% | 66.9 5% | 65 2% |
| Color Space (Percent of sRGB) (%) | 98.6 | 99.4 1% | 97.6 -1% | 99.3 1% | 100 1% |
| Total Average (Program / Settings) | -4% /
1% | 9% /
20% | -4% /
13% | -2% /
8% |
* ... smaller is better
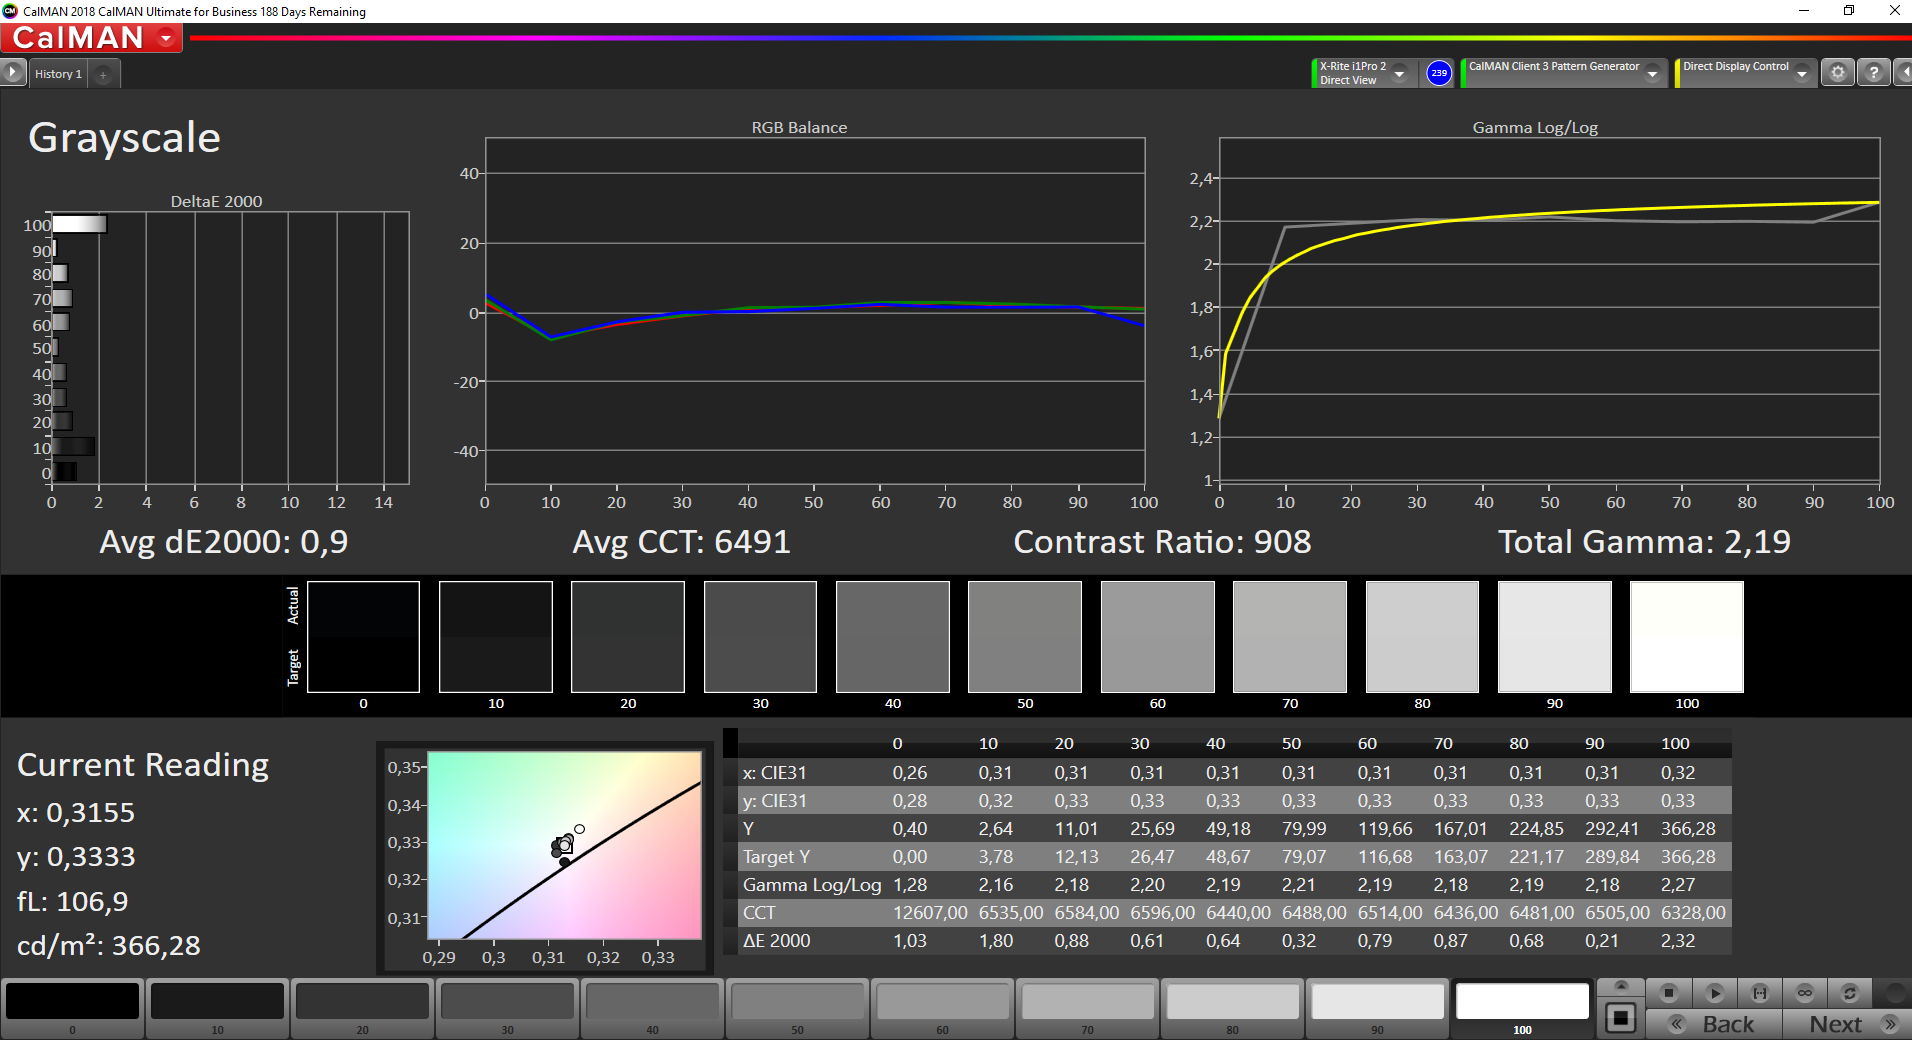
Our analysis with the professional CalMAN software and the X-Rite i1 Pro 2 spectrophotometer reveals pretty high deviations compared to the sRGB reference and the previously mentioned color cast is confirmed. However, this improves the brightness, because it drops by ~60 nits after our calibration. The grayscale deviations are now very low in return and the color cast is also gone. You can download the calibrated profile in the display box above.
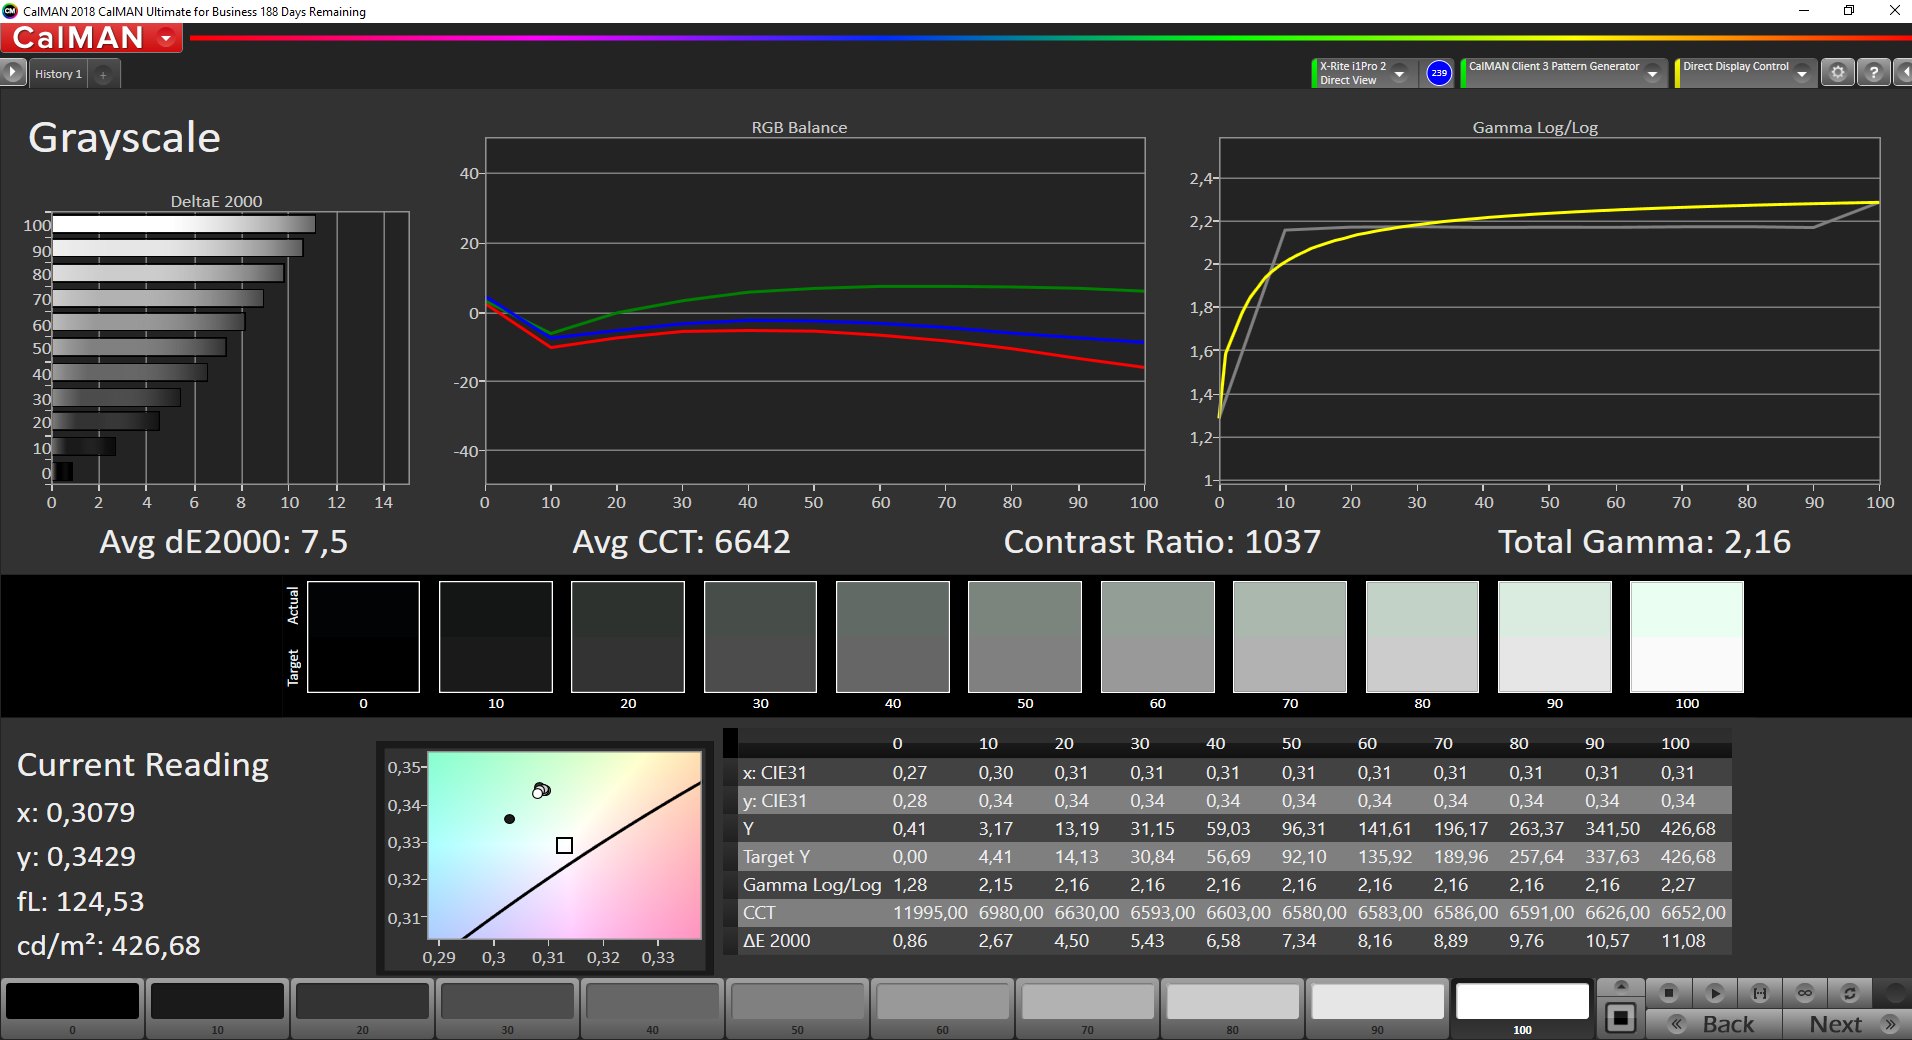
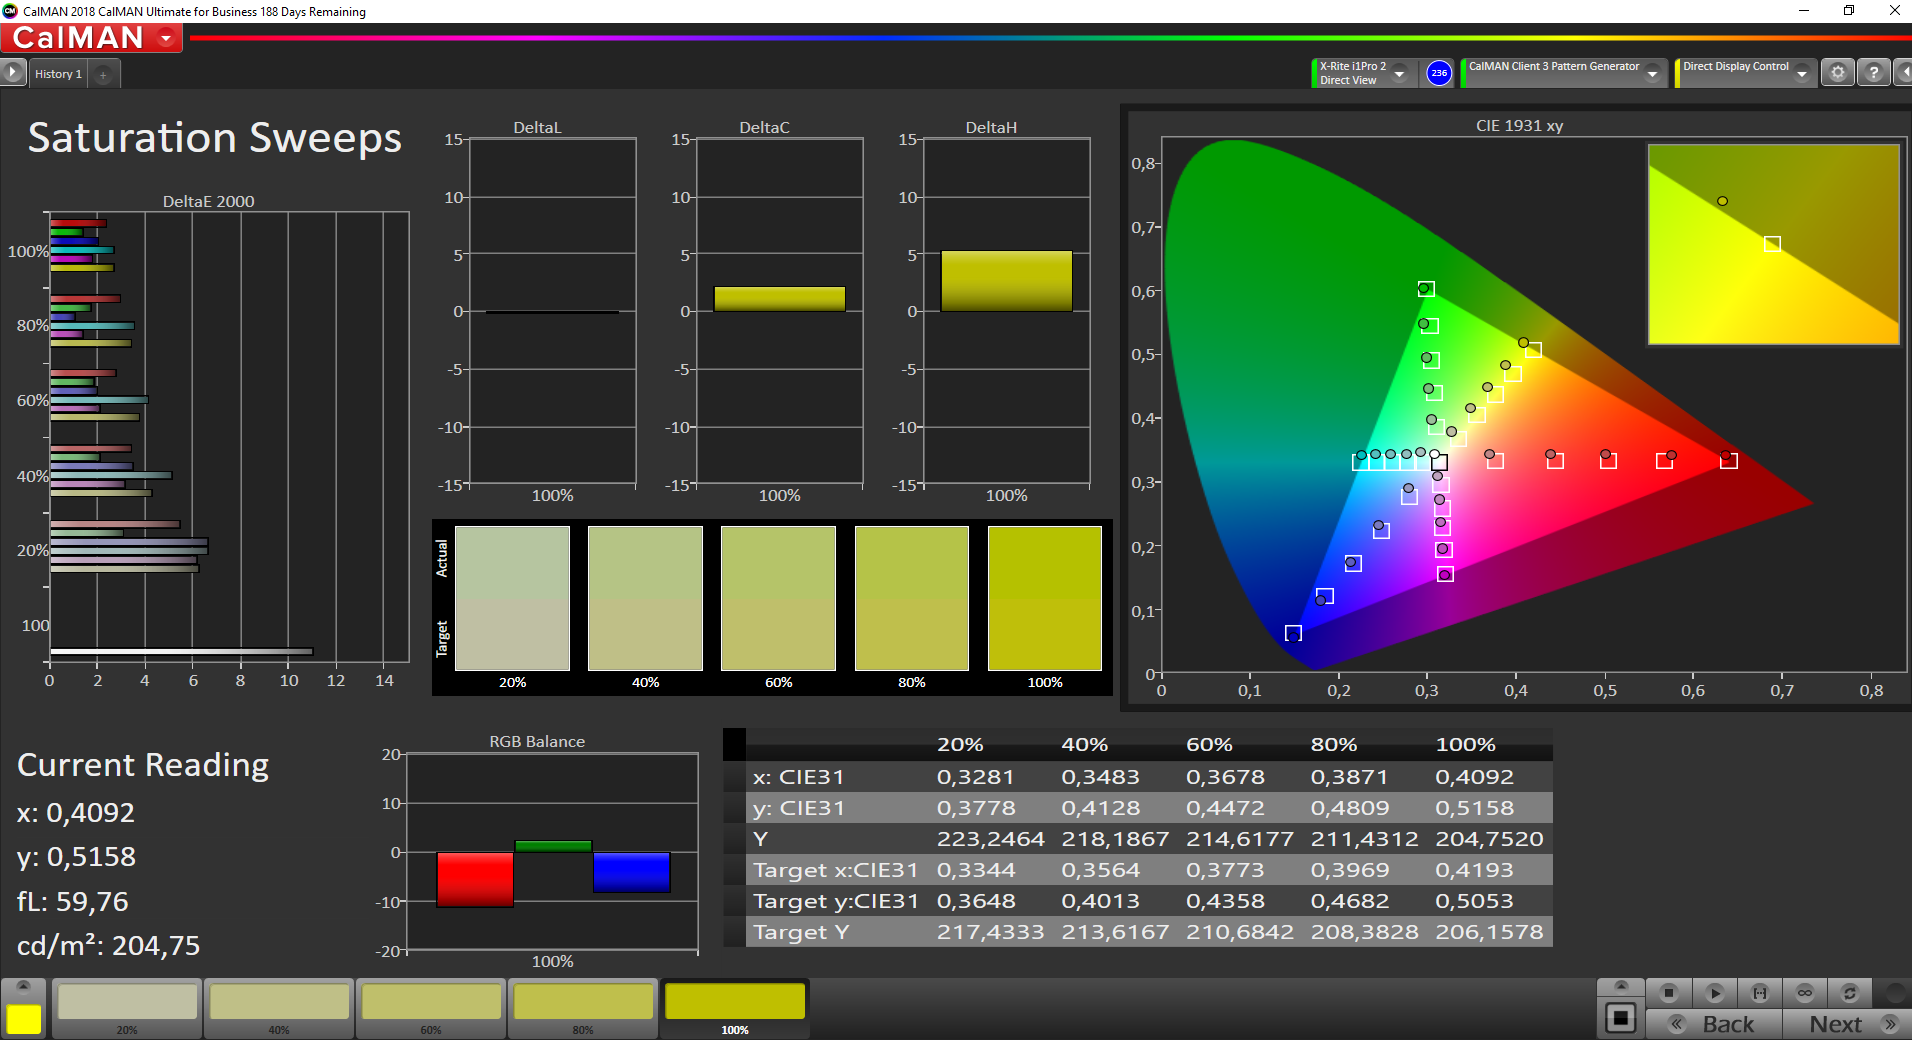
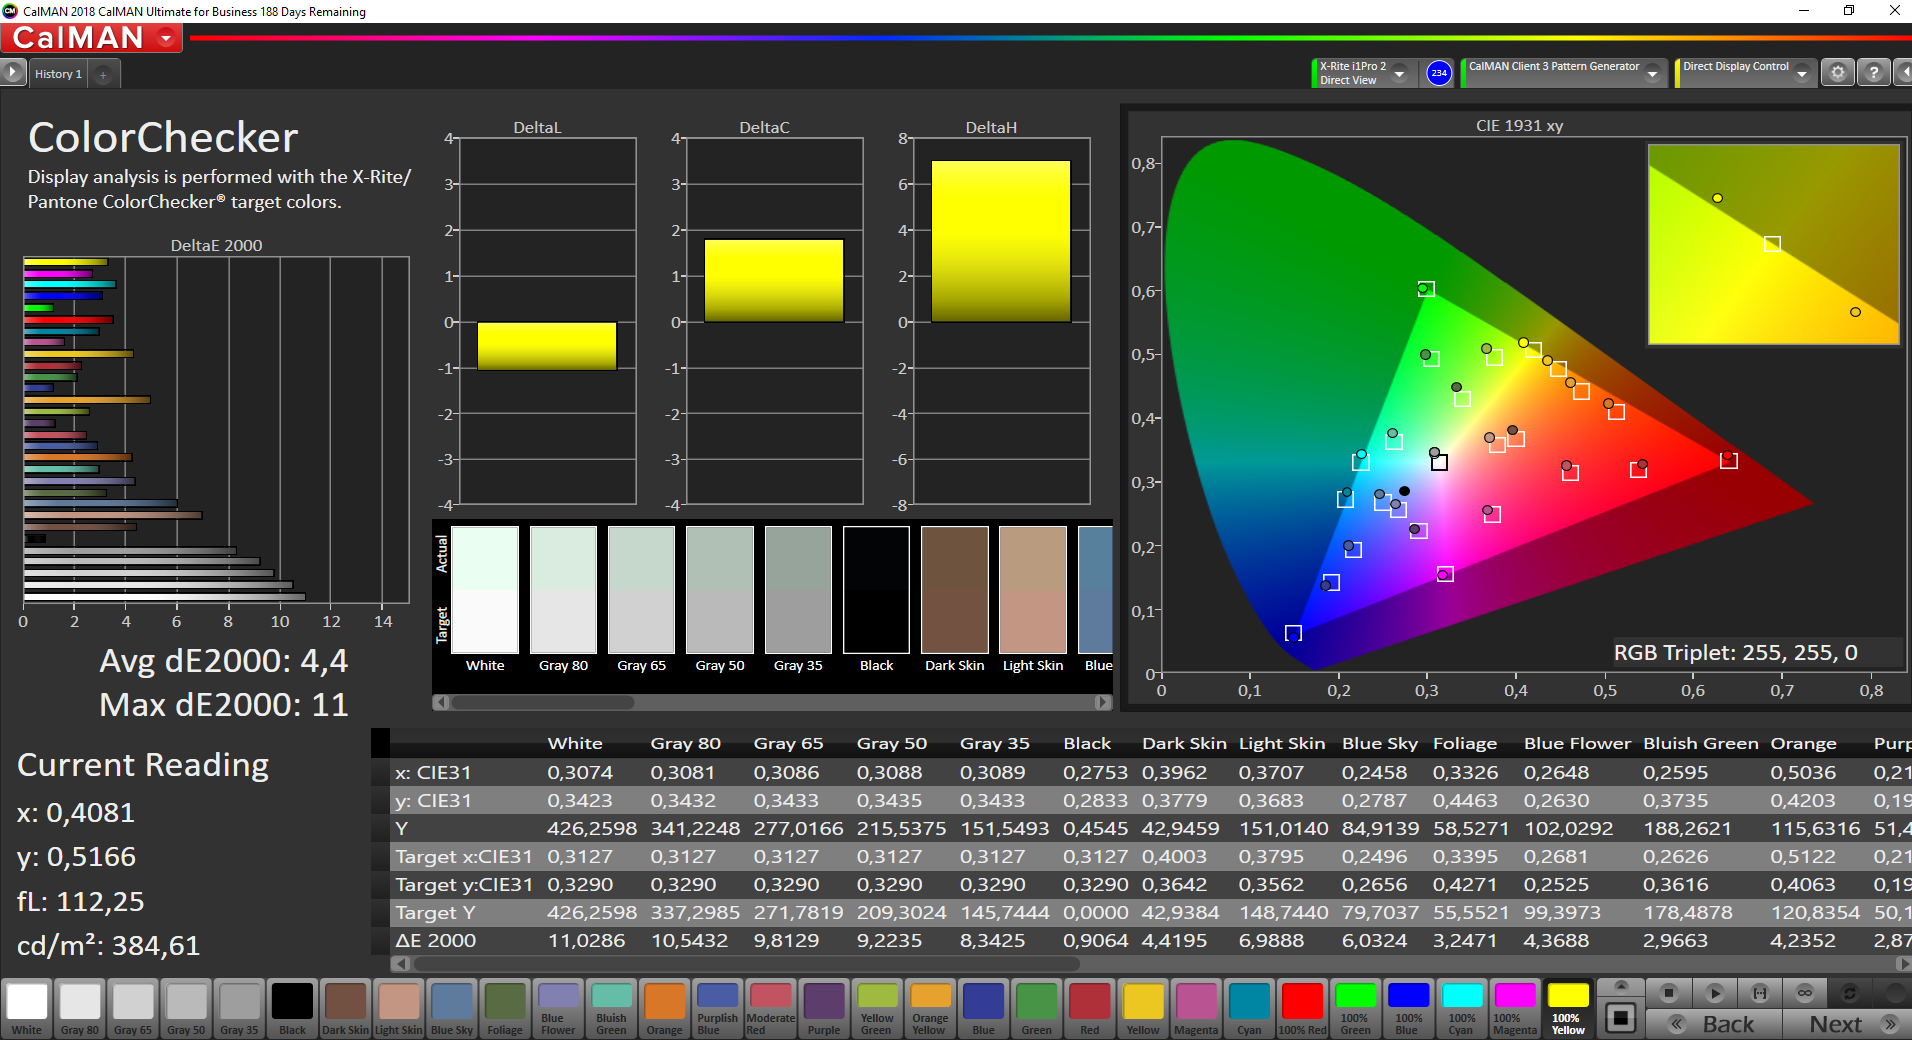
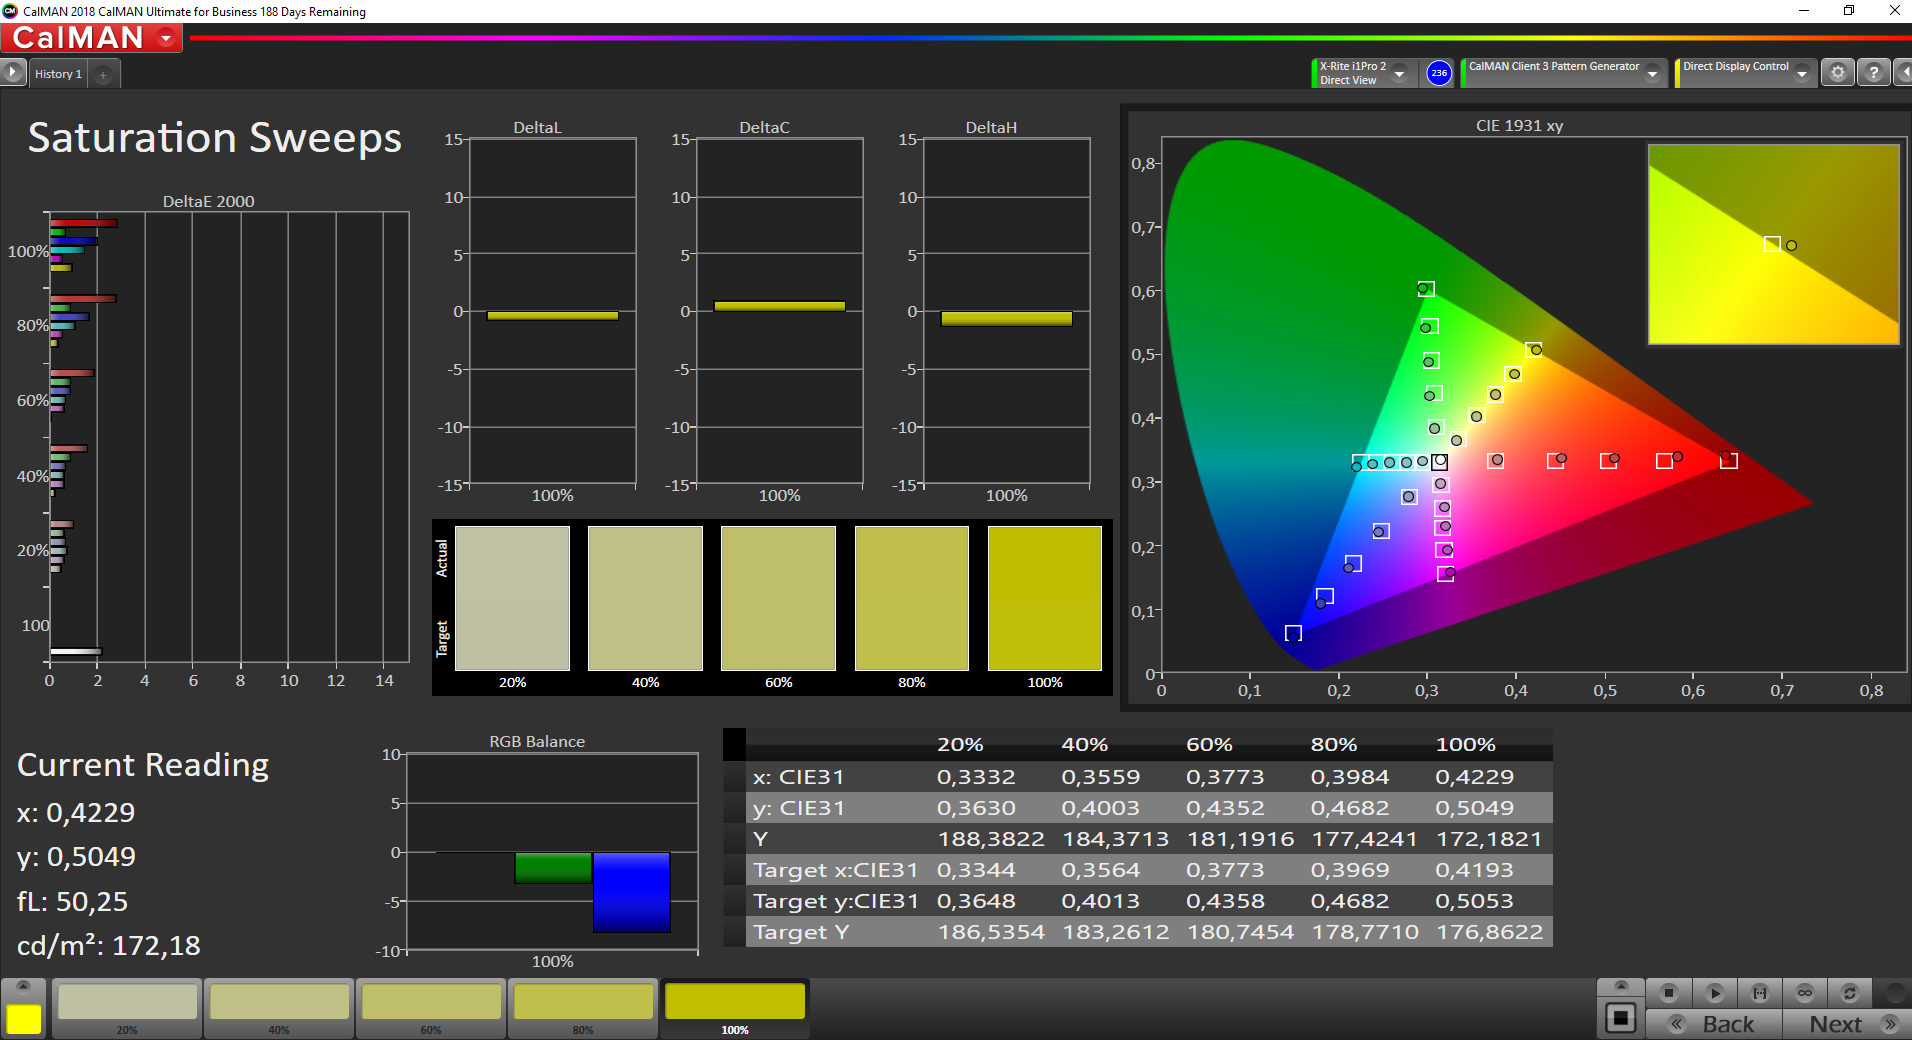
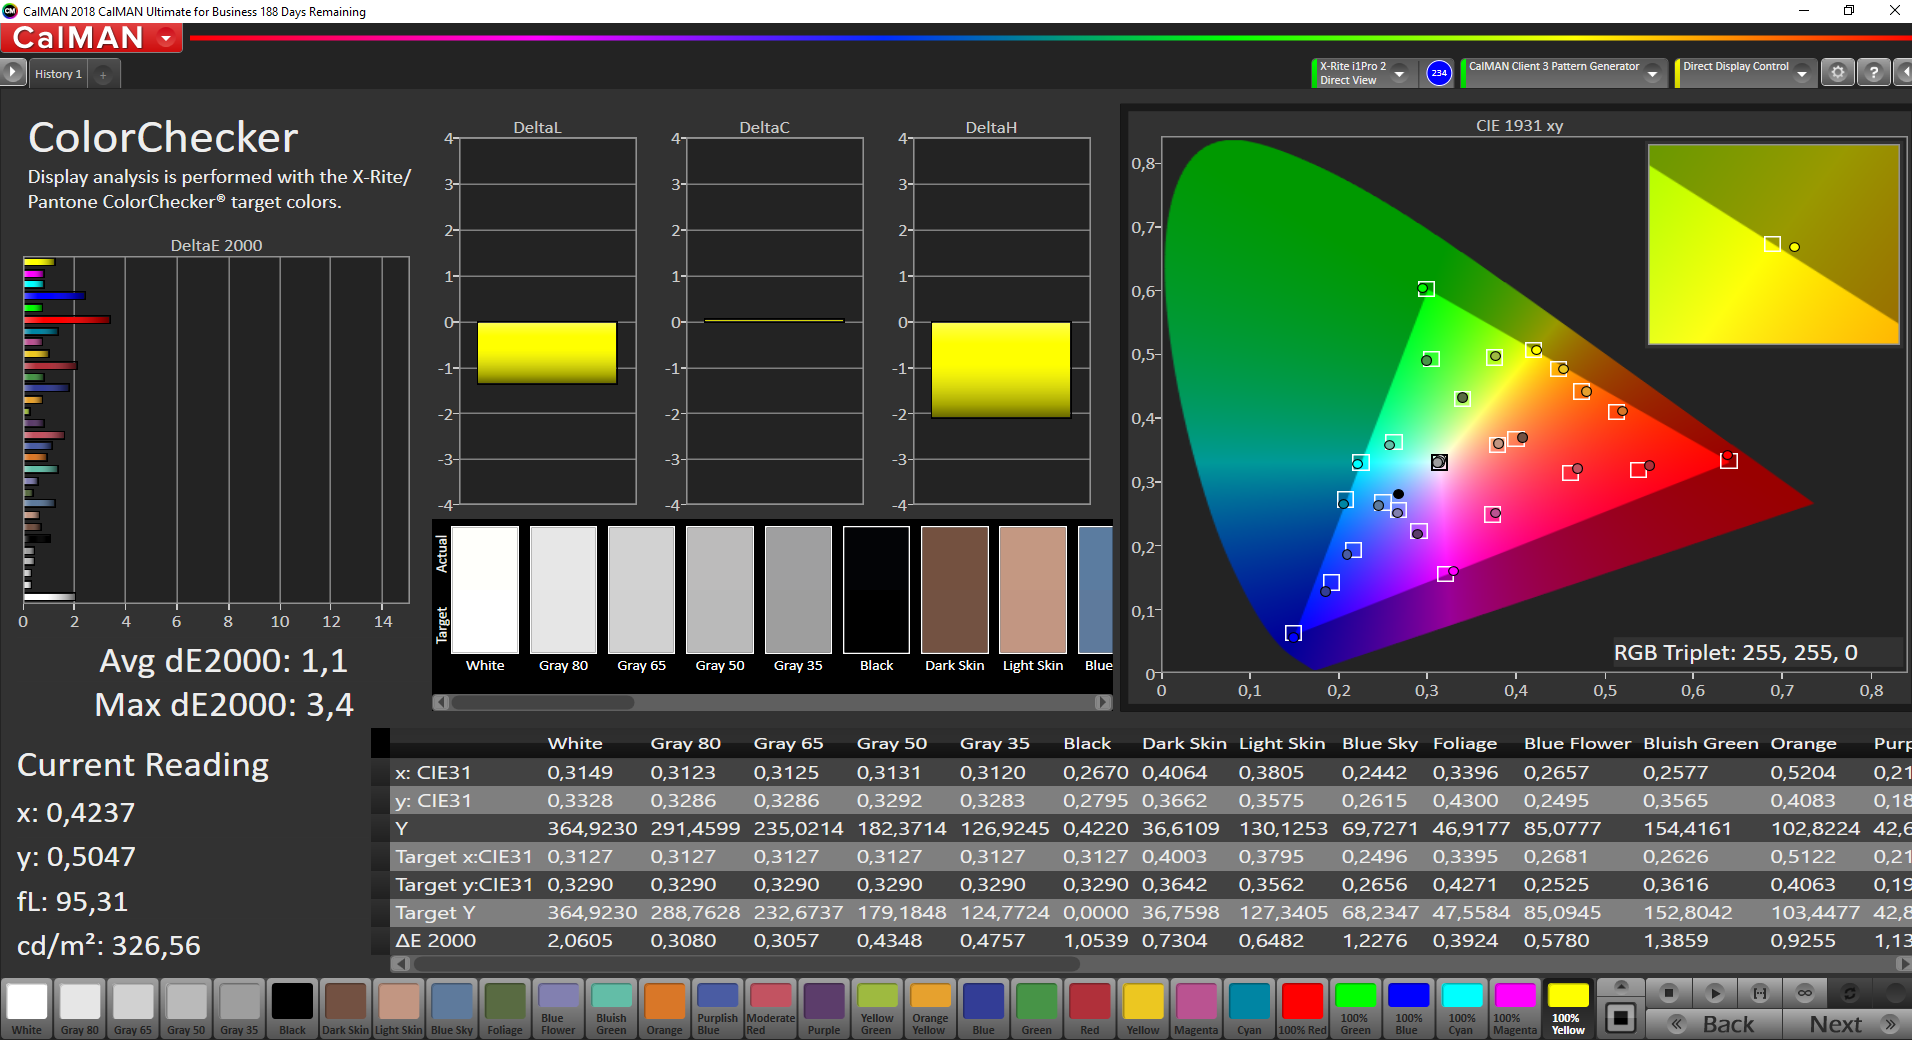
The calibration also improves the color accuracy, because some colors are clearly above the important mark of 3 out of the box. Only 100% red still deviates a bit too much after the calibration. Thanks to the almost full sRGB coverage, you can also edit pictures/videos.
Display Response Times
| ↔ Response Time Black to White | ||
|---|---|---|
| 24 ms ... rise ↗ and fall ↘ combined | ↗ 12 ms rise | 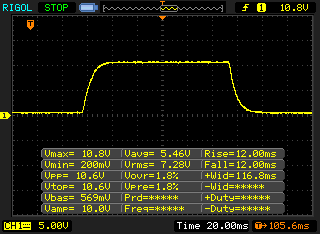 |
| ↘ 12 ms fall | ||
| The screen shows good response rates in our tests, but may be too slow for competitive gamers. In comparison, all tested devices range from 0.1 (minimum) to 240 (maximum) ms. » 54 % of all devices are better. This means that the measured response time is worse than the average of all tested devices (19.9 ms). | ||
| ↔ Response Time 50% Grey to 80% Grey | ||
| 41.6 ms ... rise ↗ and fall ↘ combined | ↗ 22.8 ms rise | 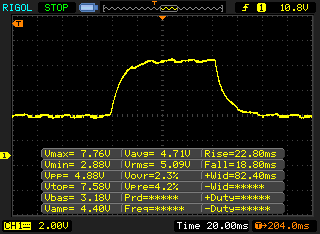 |
| ↘ 18.8 ms fall | ||
| The screen shows slow response rates in our tests and will be unsatisfactory for gamers. In comparison, all tested devices range from 0.165 (minimum) to 636 (maximum) ms. » 67 % of all devices are better. This means that the measured response time is worse than the average of all tested devices (31.1 ms). | ||
Screen Flickering / PWM (Pulse-Width Modulation)
| Screen flickering / PWM detected | 62500 Hz | ≤ 30 % brightness setting | 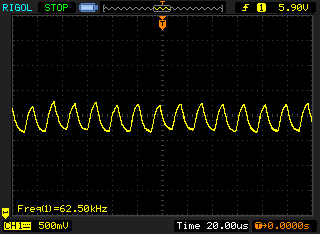 |
The display backlight flickers at 62500 Hz (worst case, e.g., utilizing PWM) Flickering detected at a brightness setting of 30 % and below. There should be no flickering or PWM above this brightness setting. The frequency of 62500 Hz is quite high, so most users sensitive to PWM should not notice any flickering. In comparison: 52 % of all tested devices do not use PWM to dim the display. If PWM was detected, an average of 7801 (minimum: 5 - maximum: 343500) Hz was measured. | |||
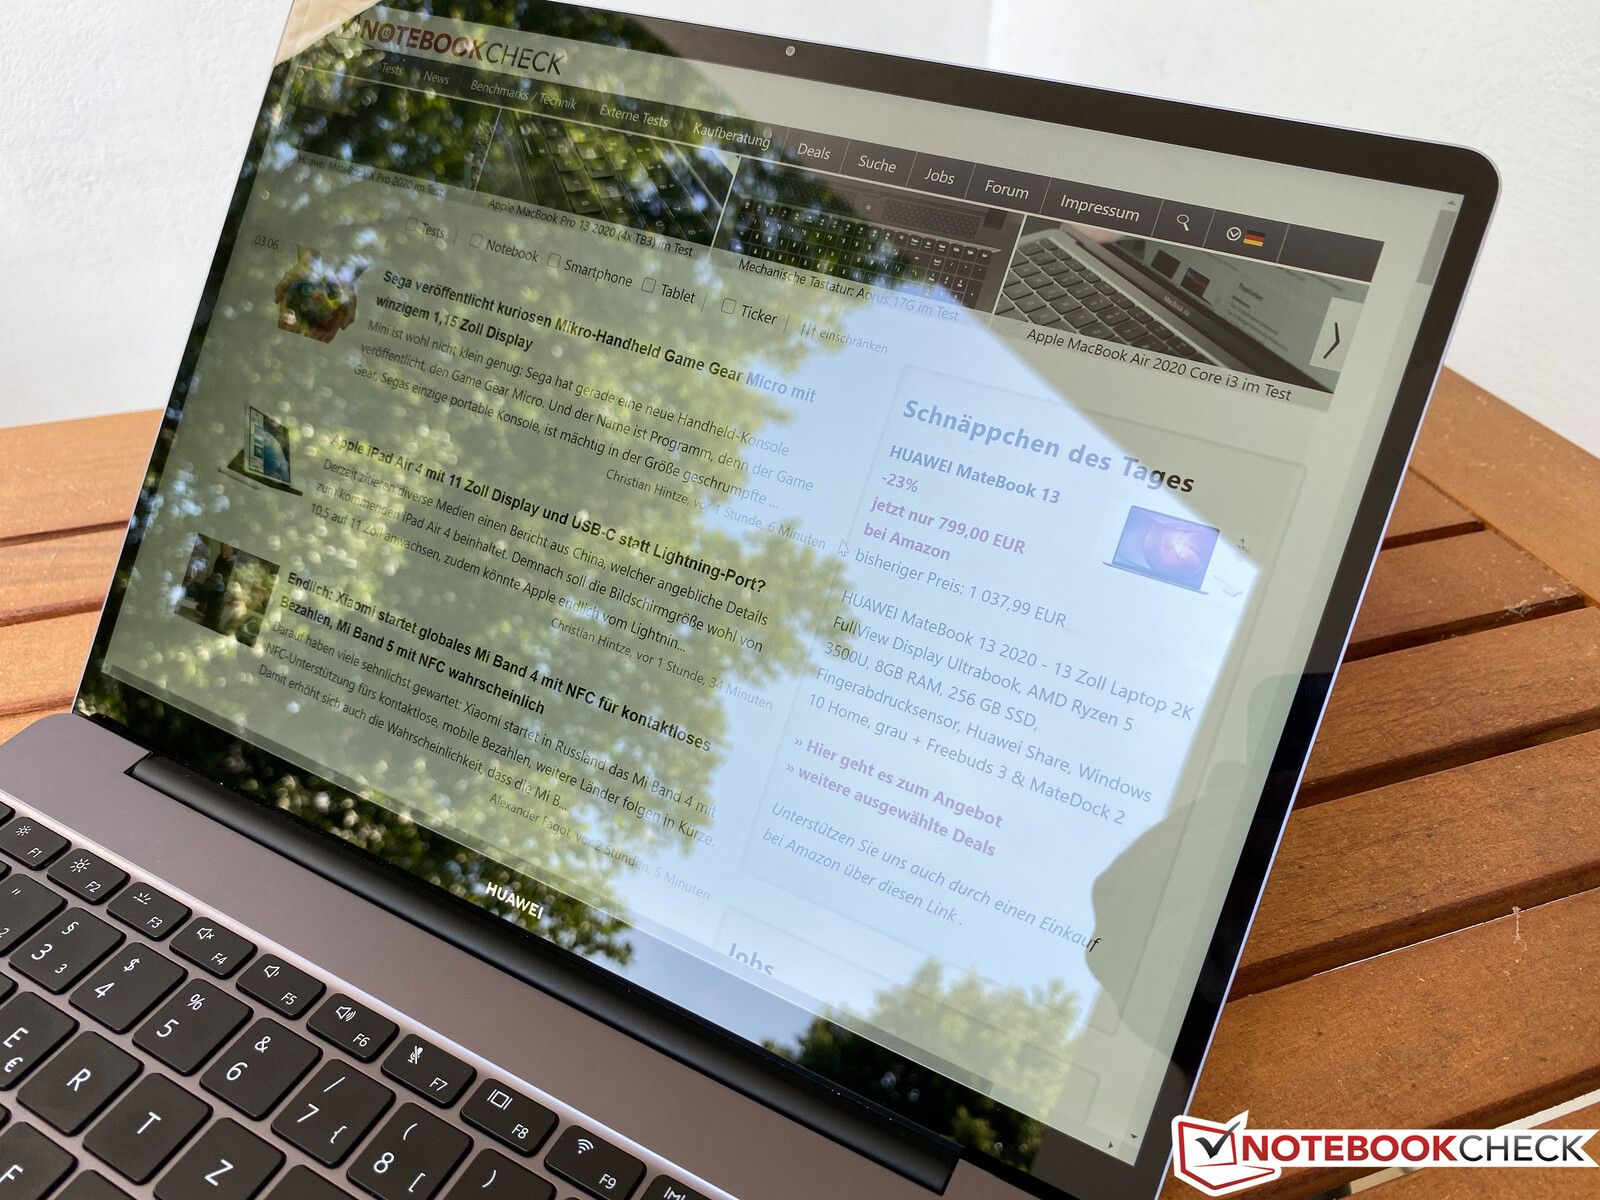
The viewing-angle stability of the IPS panel is good; you can only notice a brighter image from very wide angles and there should not be any limitations during your regular use. The glossy screen is a problem outdoors. The panel is very bright at more than 400 nits, but you always have issues with reflections in bright environments.
Performance
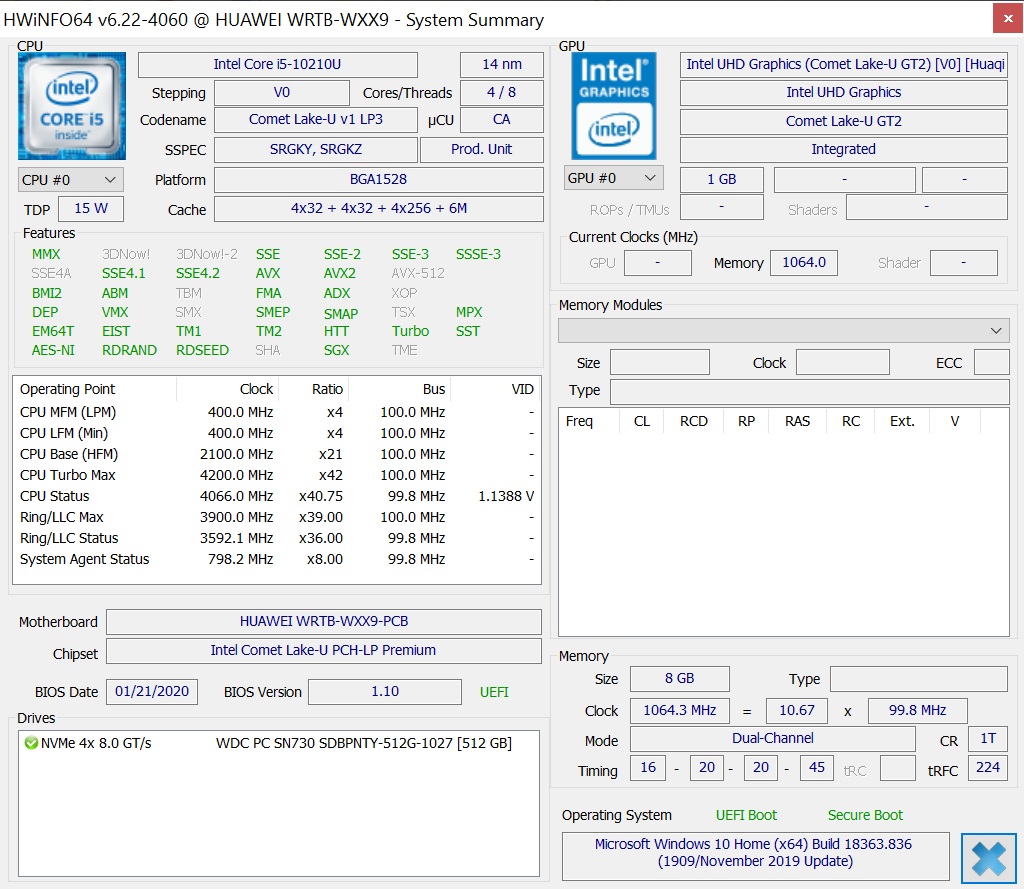
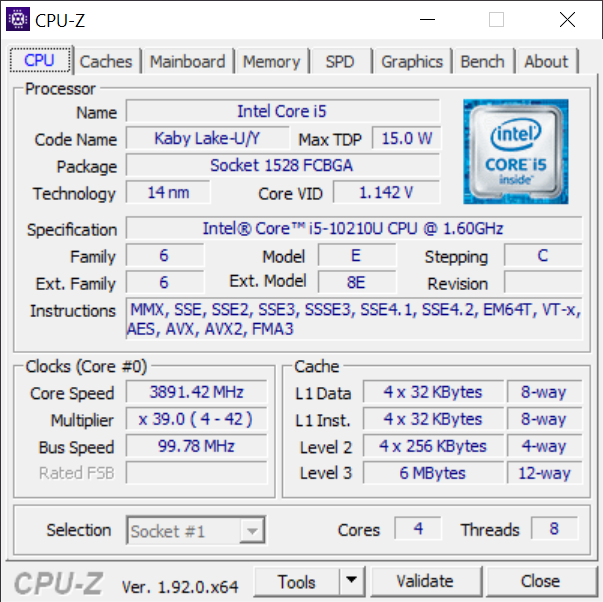
Processor - Intel Comet Lake
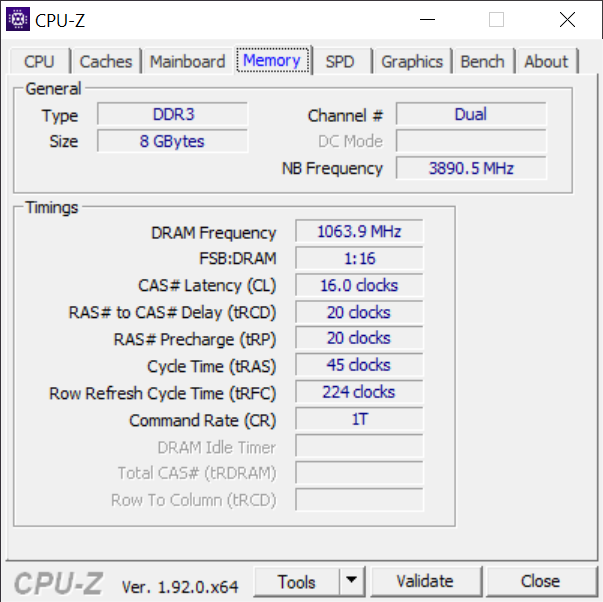
Huawei equips the current MateBook 13 with a Comet Lake processor (10th gen), which is still manufactured in the old 14nm process. This also means the Core i5-10210U in our review unit is not much different from the old Core i7-8565U of the predecessor. Please see our tech section for more technical information on the processor.
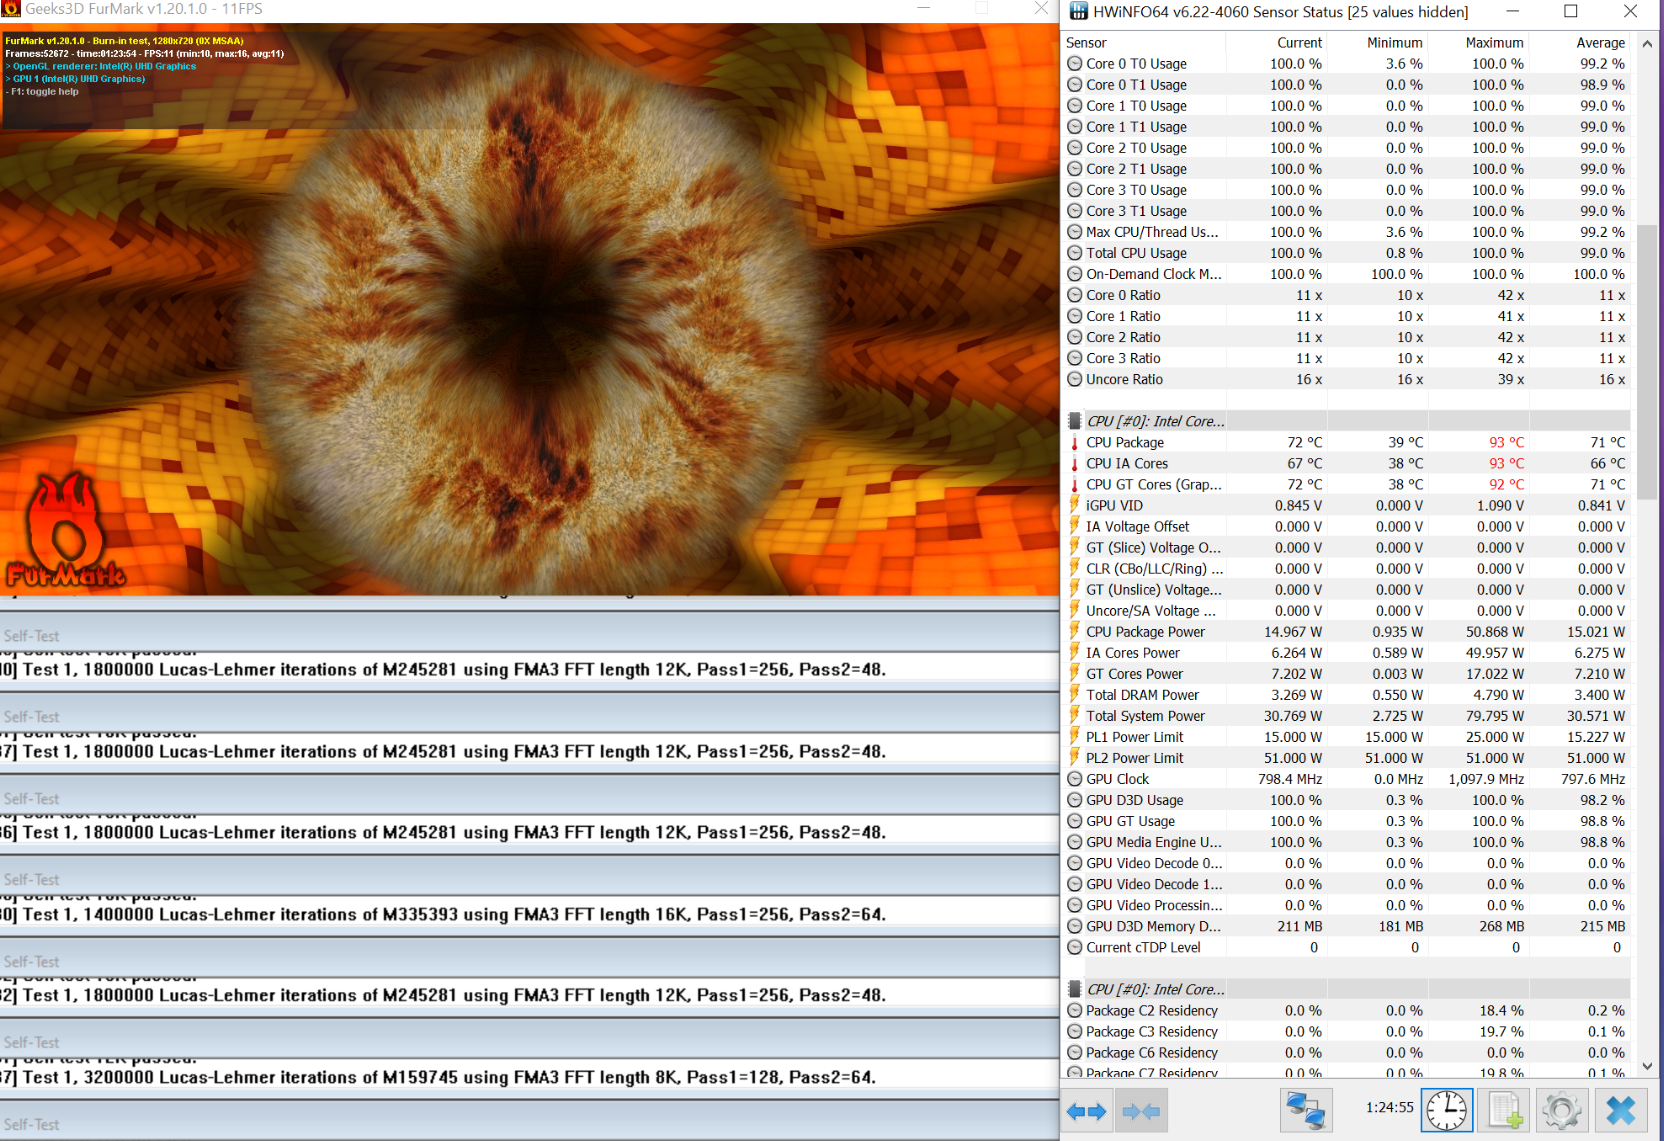
Modern Intel CPUs can reach very high Turbo clocks (in this case up to 3.9 GHz for all four cores), but the performance utilization depends on the cooling solution and the TDP configuration of the manufacturer, respectively. We can actually see the maximum clock of 3.9 GHz under load for a short time, but this results in a power consumption of 42 Watts. The consumption quickly drops to 25 W and then quickly levels off at 15 W and 4x 2.4 GHz. The result is that the CPU performance is very similar to the previous model, which is actually slightly ahead in terms of single-core performance. The performance is not reduced on battery power.
The MateBook 13 performs well within the comparison group and is also ahead of the Dell XPS 13 and the Acer Swift 3, which are equipped with an Ice Lake Core i5 (10nm).
Cinebench R15: CPU Single 64Bit | CPU Multi 64Bit
Blender: v2.79 BMW27 CPU
7-Zip 18.03: 7z b 4 -mmt1 | 7z b 4
Geekbench 5.5: Single-Core | Multi-Core
HWBOT x265 Benchmark v2.2: 4k Preset
LibreOffice : 20 Documents To PDF
R Benchmark 2.5: Overall mean
| Cinebench R20 / CPU (Single Core) | |
| Average of class Subnotebook (128 - 832, n=60, last 2 years) | |
| Dell XPS 13 9300 i5 FHD | |
| Huawei MateBook 13 2020 i5 | |
| Average Intel Core i5-10210U (322 - 428, n=30) | |
| Acer Swift 3 SF313-52-52AS | |
| Acer Swift 3 SF313-52-52AS | |
| Apple MacBook Air 2020 i3 | |
| Cinebench R20 / CPU (Multi Core) | |
| Average of class Subnotebook (579 - 8541, n=60, last 2 years) | |
| Dell XPS 13 9300 i5 FHD | |
| Huawei MateBook 13 2020 i5 | |
| Average Intel Core i5-10210U (722 - 1820, n=30) | |
| Acer Swift 3 SF313-52-52AS | |
| Acer Swift 3 SF313-52-52AS | |
| Apple MacBook Air 2020 i3 | |
| Cinebench R15 / CPU Single 64Bit | |
| Average of class Subnotebook (72.4 - 322, n=60, last 2 years) | |
| Huawei Matebook 13-53010FYW | |
| Huawei MateBook 13 2020 i5 | |
| Dell XPS 13 9300 i5 FHD | |
| Average Intel Core i5-10210U (134 - 174, n=35) | |
| Acer Swift 3 SF313-52-52AS | |
| Apple MacBook Air 2020 i3 | |
| Cinebench R15 / CPU Multi 64Bit | |
| Average of class Subnotebook (327 - 3345, n=60, last 2 years) | |
| Huawei Matebook 13-53010FYW | |
| Dell XPS 13 9300 i5 FHD | |
| Dell XPS 13 9300 i5 FHD | |
| Huawei MateBook 13 2020 i5 | |
| Average Intel Core i5-10210U (320 - 790, n=35) | |
| Acer Swift 3 SF313-52-52AS | |
| Apple MacBook Air 2020 i3 | |
| Blender / v2.79 BMW27 CPU | |
| Apple MacBook Air 2020 i3 | |
| Acer Swift 3 SF313-52-52AS | |
| Acer Swift 3 SF313-52-52AS | |
| Average Intel Core i5-10210U (585 - 1339, n=24) | |
| Huawei MateBook 13 2020 i5 | |
| Dell XPS 13 9300 i5 FHD | |
| Average of class Subnotebook (159 - 2271, n=61, last 2 years) | |
| 7-Zip 18.03 / 7z b 4 -mmt1 | |
| Average of class Subnotebook (2643 - 6699, n=62, last 2 years) | |
| Huawei MateBook 13 2020 i5 | |
| Average Intel Core i5-10210U (3504 - 4467, n=24) | |
| Dell XPS 13 9300 i5 FHD | |
| Acer Swift 3 SF313-52-52AS | |
| Acer Swift 3 SF313-52-52AS | |
| Apple MacBook Air 2020 i3 | |
| 7-Zip 18.03 / 7z b 4 | |
| Average of class Subnotebook (11668 - 77867, n=60, last 2 years) | |
| Dell XPS 13 9300 i5 FHD | |
| Average Intel Core i5-10210U (10920 - 21679, n=24) | |
| Huawei MateBook 13 2020 i5 | |
| Acer Swift 3 SF313-52-52AS | |
| Acer Swift 3 SF313-52-52AS | |
| Apple MacBook Air 2020 i3 | |
| Geekbench 5.5 / Single-Core | |
| Average of class Subnotebook (726 - 2224, n=51, last 2 years) | |
| Dell XPS 13 9300 i5 FHD | |
| Apple MacBook Air 2020 i3 | |
| Huawei MateBook 13 2020 i5 | |
| Acer Swift 3 SF313-52-52AS | |
| Acer Swift 3 SF313-52-52AS | |
| Average Intel Core i5-10210U (949 - 1133, n=27) | |
| Geekbench 5.5 / Multi-Core | |
| Average of class Subnotebook (2557 - 17218, n=51, last 2 years) | |
| Dell XPS 13 9300 i5 FHD | |
| Huawei MateBook 13 2020 i5 | |
| Average Intel Core i5-10210U (2079 - 4256, n=27) | |
| Acer Swift 3 SF313-52-52AS | |
| Acer Swift 3 SF313-52-52AS | |
| Apple MacBook Air 2020 i3 | |
| HWBOT x265 Benchmark v2.2 / 4k Preset | |
| Average of class Subnotebook (0.97 - 25.1, n=60, last 2 years) | |
| Huawei MateBook 13 2020 i5 | |
| Average Intel Core i5-10210U (2.36 - 6.28, n=24) | |
| Dell XPS 13 9300 i5 FHD | |
| Acer Swift 3 SF313-52-52AS | |
| Acer Swift 3 SF313-52-52AS | |
| Apple MacBook Air 2020 i3 | |
| LibreOffice / 20 Documents To PDF | |
| Apple MacBook Air 2020 i3 | |
| Acer Swift 3 SF313-52-52AS | |
| Acer Swift 3 SF313-52-52AS | |
| Average Intel Core i5-10210U (49.6 - 80.3, n=18) | |
| Huawei MateBook 13 2020 i5 | |
| Average of class Subnotebook (39.9 - 220, n=59, last 2 years) | |
| R Benchmark 2.5 / Overall mean | |
| Apple MacBook Air 2020 i3 | |
| Acer Swift 3 SF313-52-52AS | |
| Acer Swift 3 SF313-52-52AS | |
| Average Intel Core i5-10210U (0.658 - 0.901, n=24) | |
| Dell XPS 13 9300 i5 FHD | |
| Huawei MateBook 13 2020 i5 | |
| Average of class Subnotebook (0.4024 - 1.456, n=61, last 2 years) | |
* ... smaller is better
System Performance
The MateBook 13 2020 runs very well in practice. The quad-core processor is powerful enough and the system executes our inputs without noticeable delays thanks to the fast SSD. We cannot notice any problems in the synthetic PCMark benchmarks, either.
| PCMark 8 Home Score Accelerated v2 | 3946 points | |
| PCMark 8 Creative Score Accelerated v2 | 5110 points | |
| PCMark 8 Work Score Accelerated v2 | 4773 points | |
| PCMark 10 Score | 4067 points | |
Help | ||
DPC-Latencies
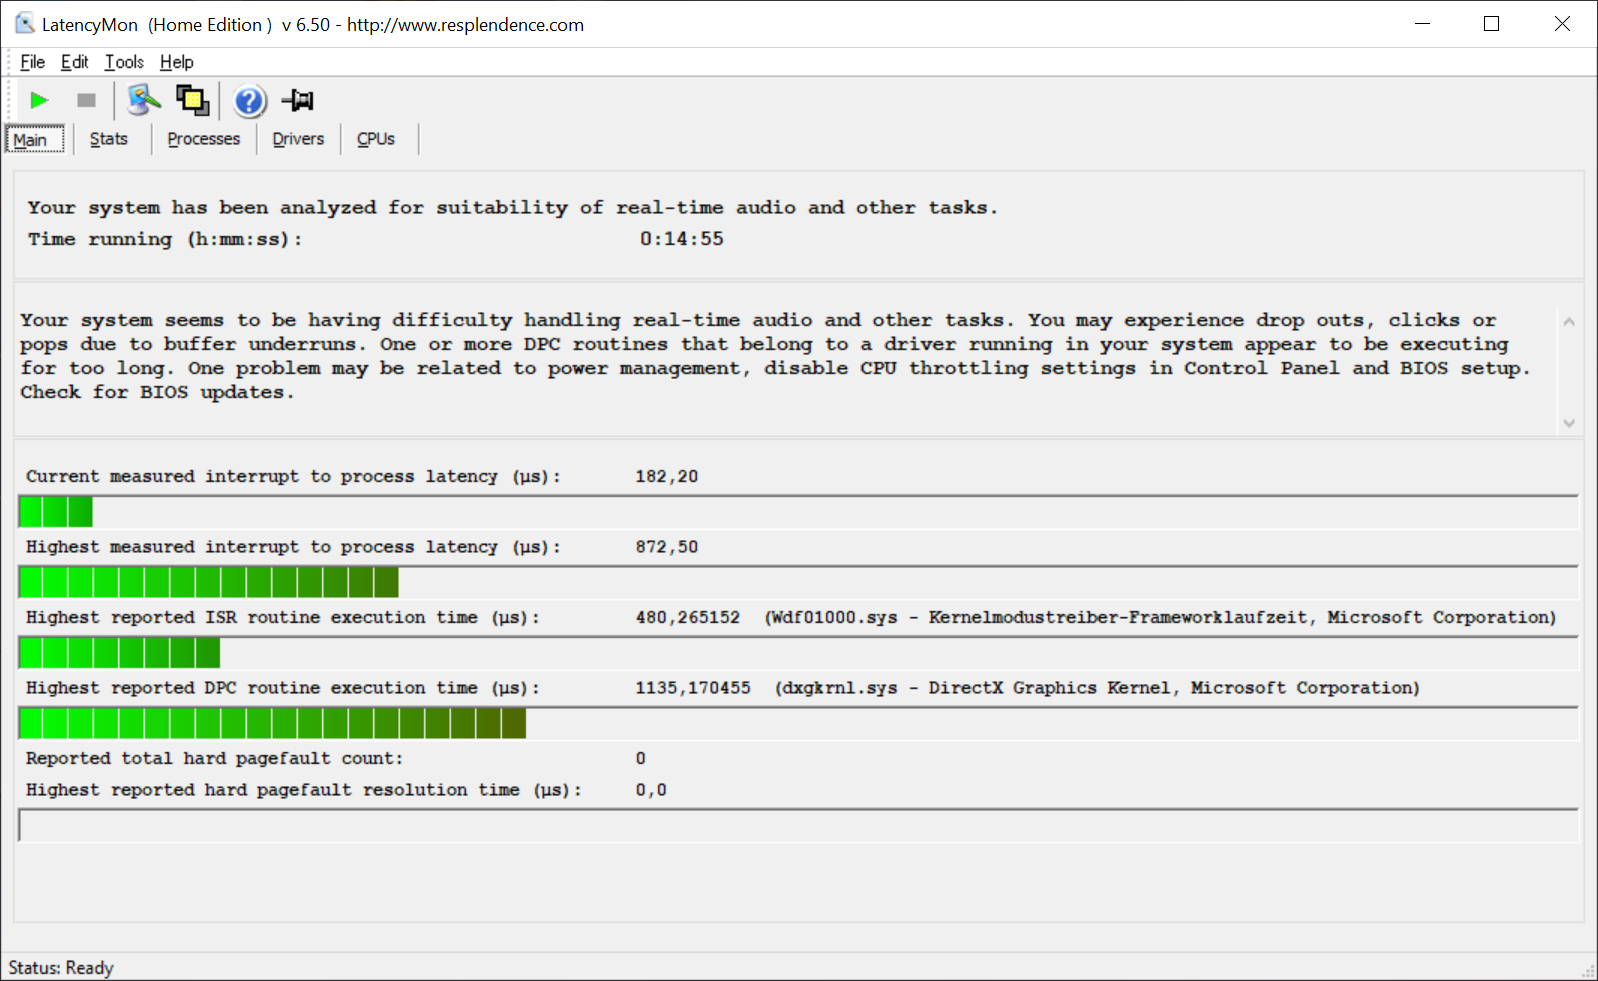
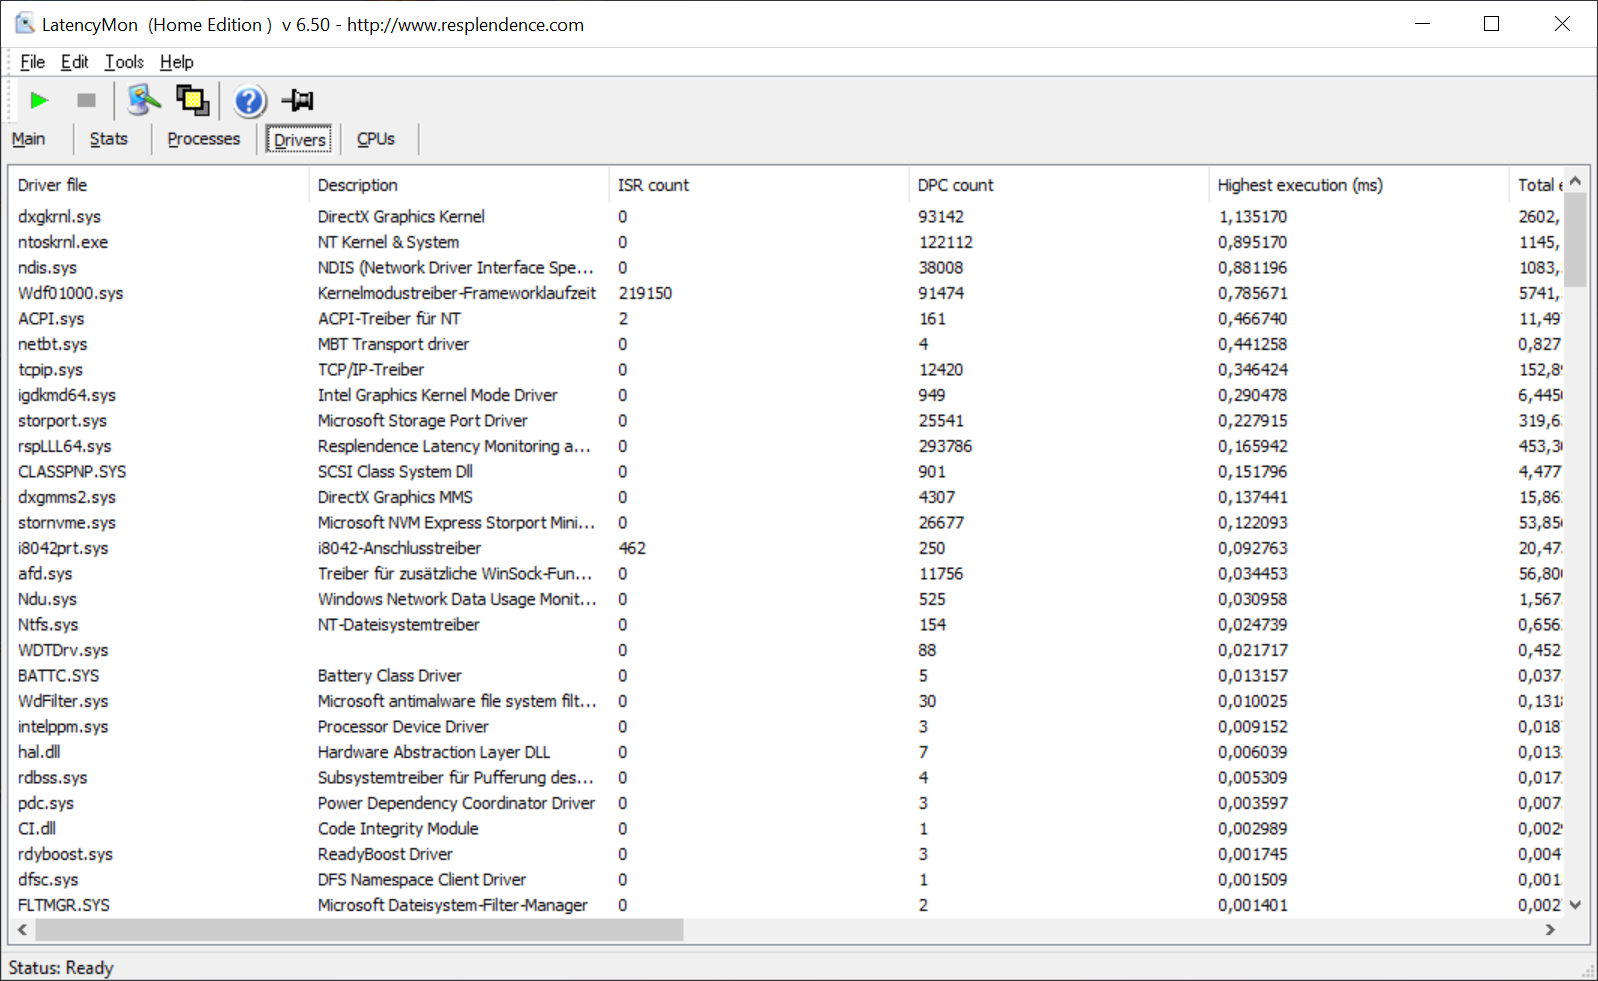
| DPC Latencies / LatencyMon - interrupt to process latency (max), Web, Youtube, Prime95 | |
| Acer Swift 3 SF313-52-52AS | |
| Dell XPS 13 9300 i5 FHD | |
| Huawei MateBook 13 2020 i5 | |
* ... smaller is better
Storage Solution - Fast NVMe SSD from WDC
The 512 GB NVMe SSD (M.2-2280) from WDC is attached via PCIe-x4 interface and manages very high transfer rates in our tests. So far so good, but similar to the MateBook X Pro, we do not like the partition of the hard drive out of the box. You can only use 42 GB on the system drive (C) after the initial launch. This can be quickly filled if you do not pay attention when you download files or install applications. The remaining capacity (381 GB) is available on the data drive (D).
| Huawei MateBook 13 2020 i5 WDC PC SN730 SDBPNTY-512G | Huawei Matebook 13-53010FYW WDC PC SN520 SDAPNUW-512G | Apple MacBook Air 2020 i3 Apple SSD AP0256 | Dell XPS 13 9300 i5 FHD Toshiba XG6 KXG60ZNV512G | Acer Swift 3 SF313-52-52AS SK Hynix BC501 HFM512GDJTNG | Average WDC PC SN730 SDBPNTY-512G | |
|---|---|---|---|---|---|---|
| CrystalDiskMark 5.2 / 6 | 19% | -41% | 1% | -25% | 15% | |
| Write 4K (MB/s) | 190.5 | 191.2 0% | 34.57 -82% | 121.9 -36% | 120.6 -37% | 164.3 ? -14% |
| Read 4K (MB/s) | 53.7 | 53.1 -1% | 28.48 -47% | 50 -7% | 46.88 -13% | 48.2 ? -10% |
| Write Seq (MB/s) | 1436 | 1768 23% | 1026 -29% | 1497 4% | 1044 -27% | 2096 ? 46% |
| Read Seq (MB/s) | 1356 | 1710 26% | 1109 -18% | 2111 56% | 1147 -15% | 2123 ? 57% |
| Write 4K Q32T1 (MB/s) | 382.5 | 575 50% | 178.4 -53% | 365.9 -4% | 332.4 -13% | 451 ? 18% |
| Read 4K Q32T1 (MB/s) | 502 | 654 30% | 557 11% | 384.6 -23% | 443.3 -12% | 509 ? 1% |
| Write Seq Q32T1 (MB/s) | 2114 | 2544 20% | 970 -54% | 2748 30% | 1052 -50% | 2551 ? 21% |
| Read Seq Q32T1 (MB/s) | 3410 | 3433 1% | 1513 -56% | 3119 -9% | 2171 -36% | 3330 ? -2% |
| AS SSD | -10% | -85% | -32% | -43% | -20% | |
| Seq Read (MB/s) | 2912 | 2934 1% | 1135 -61% | 2328 -20% | 1370 -53% | 2605 ? -11% |
| Seq Write (MB/s) | 2190 | 2407 10% | 1090 -50% | 1137 -48% | 1019 -53% | 1905 ? -13% |
| 4K Read (MB/s) | 49.52 | 48.31 -2% | 14.87 -70% | 48.07 -3% | 50.8 3% | 45.8 ? -8% |
| 4K Write (MB/s) | 167.1 | 179.7 8% | 26.27 -84% | 120.6 -28% | 111.2 -33% | 155.6 ? -7% |
| 4K-64 Read (MB/s) | 1447 | 1296 -10% | 585 -60% | 899 -38% | 770 -47% | 1181 ? -18% |
| 4K-64 Write (MB/s) | 1513 | 1459 -4% | 154.6 -90% | 1220 -19% | 713 -53% | 1372 ? -9% |
| Access Time Read * (ms) | 0.05 | 0.103 -106% | 0.126 -152% | 0.085 -70% | 0.0801 ? -60% | |
| Access Time Write * (ms) | 0.023 | 0.021 9% | 0.058 -152% | 0.033 -43% | 0.034 -48% | 0.04195 ? -82% |
| Score Read (Points) | 1787 | 1638 -8% | 713 -60% | 1180 -34% | 958 -46% | 1488 ? -17% |
| Score Write (Points) | 1899 | 1879 -1% | 290 -85% | 1455 -23% | 926 -51% | 1718 ? -10% |
| Score Total (Points) | 4569 | 4334 -5% | 1365 -70% | 3189 -30% | 2370 -48% | 3938 ? -14% |
| Copy ISO MB/s (MB/s) | 2290 | 1718 ? -25% | ||||
| Copy Program MB/s (MB/s) | 555 | 536 ? -3% | ||||
| Copy Game MB/s (MB/s) | 1300 | 1193 ? -8% | ||||
| Total Average (Program / Settings) | 5% /
2% | -63% /
-66% | -16% /
-18% | -34% /
-35% | -3% /
-8% |
* ... smaller is better

Continuous Performance Read: DiskSpd Read Loop, Queue Depth 8
GPU Performance - MateBook 13 only with iGPU
Intel's Comet Lake processors are still equipped with the familiar UHD Graphics 620 iGPU. It offers sufficient performance for multimedia applications and high-resolution video playback is no problem, either, but the MateBook 13 is hardly suited for gaming. You will either have to play very old or simple games. Competitors with newer 10nm Ice Lake CPUs have an advantage in terms of iGPU performance. The MateBook 13 with the dedicated GeForce MX250 GPU is not available in all regions.
| 3DMark 11 Performance | 2079 points | |
| 3DMark Cloud Gate Standard Score | 9653 points | |
| 3DMark Fire Strike Score | 1175 points | |
Help | ||
| low | med. | high | ultra | |
|---|---|---|---|---|
| The Witcher 3 (2015) | 18.8 | 12.1 | ||
| Dota 2 Reborn (2015) | 81.3 | 47.8 | 22.1 | 19.4 |
| X-Plane 11.11 (2018) | 13.2 | 10.9 | 10.5 | |
| Far Cry 5 (2018) | 13 | 7 | ||
| F1 2019 (2019) | 32 | 13 |
Emissions - Usually cool and quiet
System Noise - Two fans for the processor
The MateBook 13 with the iGPU also has two central fans, but there is only one heat pipe from the processor instead of two for the dGPU configuration. The fans have no problem with the heat of the ULV processor and are often deactivated during light workloads. If you stress the system, there is only a quiet murmur and the measurement results are pretty much identical to the predecessor. We cannot hear any other electronic sounds like coil whine, for example.
Noise level
| Idle |
| 29.7 / 29.7 / 29.9 dB(A) |
| Load |
| 31.7 / 32.8 dB(A) |
 | ||
30 dB silent 40 dB(A) audible 50 dB(A) loud |
||
min: | ||
| Huawei MateBook 13 2020 i5 UHD Graphics 620, i5-10210U, WDC PC SN730 SDBPNTY-512G | Huawei Matebook 13-53010FYW UHD Graphics 620, i7-8565U, WDC PC SN520 SDAPNUW-512G | Apple MacBook Air 2020 i3 Iris Plus Graphics G4 (Ice Lake 48 EU), i3-1000NG4, Apple SSD AP0256 | Dell XPS 13 9300 i5 FHD UHD Graphics G1 (Ice Lake 32 EU), i5-1035G1, Toshiba XG6 KXG60ZNV512G | Acer Swift 3 SF313-52-52AS Iris Plus Graphics G4 (Ice Lake 48 EU), i5-1035G4, SK Hynix BC501 HFM512GDJTNG | |
|---|---|---|---|---|---|
| Noise | 1% | -2% | 2% | -5% | |
| off / environment * (dB) | 29.7 | 29.2 2% | 29 2% | 29.3 1% | 31.2 -5% |
| Idle Minimum * (dB) | 29.7 | 29.2 2% | 29 2% | 29.3 1% | 31.2 -5% |
| Idle Average * (dB) | 29.7 | 29.2 2% | 29 2% | 29.3 1% | 31.2 -5% |
| Idle Maximum * (dB) | 29.9 | 29.2 2% | 29 3% | 29.3 2% | 31.2 -4% |
| Load Average * (dB) | 31.7 | 31.7 -0% | 31.6 -0% | 30 5% | 33.2 -5% |
| Load Maximum * (dB) | 32.8 | 33 -1% | 39.4 -20% | 32.4 1% | 34.9 -6% |
* ... smaller is better
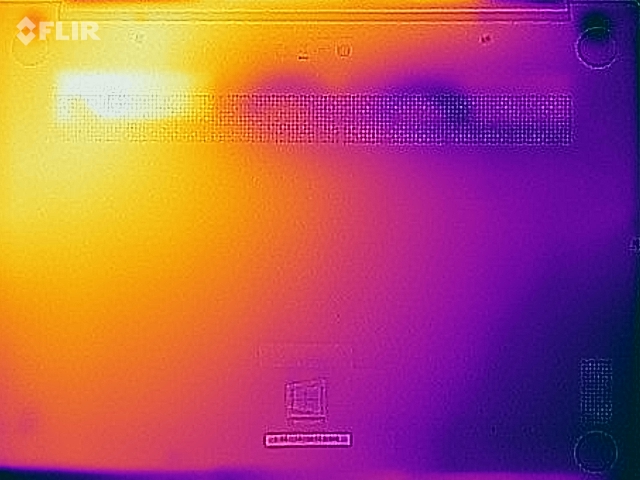
Temperature - MateBook 13 only warms up on one side
Due to the special layout (two fans in the center, processor and dGPU on the sides) and the lack of the GeForce GPU in our test unit, the device only warms up on the right side (where the CPU is located) under load. We can measure up to 46 °C in the rear right corner, so you should not use the device on your lap in this scenario. Otherwise, the surface temperatures are no problem.
The behavior during our stress test is similar to pure CPU load, because the power consumption of the processor quickly levels off at 15 Watts. This is sufficient for 4x 1.1 GHz (CPU) and ~800 MHz (iGPU). The performance is not limited immediately after the stress test.
(±) The maximum temperature on the upper side is 42.1 °C / 108 F, compared to the average of 35.9 °C / 97 F, ranging from 21.4 to 59 °C for the class Subnotebook.
(-) The bottom heats up to a maximum of 46.2 °C / 115 F, compared to the average of 39.2 °C / 103 F
(+) In idle usage, the average temperature for the upper side is 23.8 °C / 75 F, compared to the device average of 30.8 °C / 87 F.
(±) The palmrests and touchpad can get very hot to the touch with a maximum of 37.2 °C / 99 F.
(-) The average temperature of the palmrest area of similar devices was 28.2 °C / 82.8 F (-9 °C / -16.2 F).

Speakers
Huawei MateBook 13 2020 i5 audio analysis
(±) | speaker loudness is average but good (75.7 dB)
Bass 100 - 315 Hz
(-) | nearly no bass - on average 18.8% lower than median
(±) | linearity of bass is average (11.3% delta to prev. frequency)
Mids 400 - 2000 Hz
(±) | higher mids - on average 5.7% higher than median
(+) | mids are linear (6.2% delta to prev. frequency)
Highs 2 - 16 kHz
(+) | balanced highs - only 3.1% away from median
(+) | highs are linear (6.9% delta to prev. frequency)
Overall 100 - 16.000 Hz
(±) | linearity of overall sound is average (24.1% difference to median)
Compared to same class
» 82% of all tested devices in this class were better, 4% similar, 14% worse
» The best had a delta of 5%, average was 18%, worst was 53%
Compared to all devices tested
» 73% of all tested devices were better, 6% similar, 21% worse
» The best had a delta of 4%, average was 24%, worst was 134%
Acer Swift 3 SF313-52-52AS audio analysis
(±) | speaker loudness is average but good (77.1 dB)
Bass 100 - 315 Hz
(-) | nearly no bass - on average 26.7% lower than median
(±) | linearity of bass is average (7.8% delta to prev. frequency)
Mids 400 - 2000 Hz
(±) | reduced mids - on average 6.1% lower than median
(±) | linearity of mids is average (10.8% delta to prev. frequency)
Highs 2 - 16 kHz
(±) | higher highs - on average 11% higher than median
(+) | highs are linear (3.9% delta to prev. frequency)
Overall 100 - 16.000 Hz
(-) | overall sound is not linear (32.2% difference to median)
Compared to same class
» 94% of all tested devices in this class were better, 2% similar, 4% worse
» The best had a delta of 5%, average was 18%, worst was 53%
Compared to all devices tested
» 91% of all tested devices were better, 2% similar, 7% worse
» The best had a delta of 4%, average was 24%, worst was 134%
Energy Management - Small battery prevents longer runtimes
Power Consumption
Our consumption measurements do not reveal any surprises and there are no major differences compared to the predecessor. The highest level of the keyboard illumination increases the consumption by around 1.1 Watts. We can determine up to 66.7 W under load, but this value quickly drops to ~34 Watts, so the included 65 W power adapter (USB-C) is completely sufficient.
| Off / Standby | |
| Idle | |
| Load |
|
Key:
min: | |
| Huawei MateBook 13 2020 i5 i5-10210U, UHD Graphics 620, WDC PC SN730 SDBPNTY-512G, IPS, 2160x1440, 13" | Huawei Matebook 13-53010FYW i7-8565U, UHD Graphics 620, WDC PC SN520 SDAPNUW-512G, IPS, 2160x1440, 13" | Apple MacBook Air 2020 i3 i3-1000NG4, Iris Plus Graphics G4 (Ice Lake 48 EU), Apple SSD AP0256, IPS, 2560x1600, 13.3" | Dell XPS 13 9300 i5 FHD i5-1035G1, UHD Graphics G1 (Ice Lake 32 EU), Toshiba XG6 KXG60ZNV512G, IPS, 1920x1200, 13.4" | Acer Swift 3 SF313-52-52AS i5-1035G4, Iris Plus Graphics G4 (Ice Lake 48 EU), SK Hynix BC501 HFM512GDJTNG, IPS, 2256x1504, 13.5" | Average Intel UHD Graphics 620 | Average of class Subnotebook | |
|---|---|---|---|---|---|---|---|
| Power Consumption | -7% | 33% | 6% | 25% | 5% | -0% | |
| Idle Minimum * (Watt) | 2.97 | 3.84 -29% | 2.1 29% | 3.4 -14% | 3 -1% | 3.81 ? -28% | 3.78 ? -27% |
| Idle Average * (Watt) | 7.5 | 7.68 -2% | 6.2 17% | 6 20% | 6.1 19% | 6.94 ? 7% | 6.6 ? 12% |
| Idle Maximum * (Watt) | 9.6 | 9.36 2% | 7 27% | 10.2 -6% | 8.4 12% | 8.75 ? 9% | 7.93 ? 17% |
| Load Average * (Watt) | 38.9 | 43.2 -11% | 24.7 37% | 36.6 6% | 25.7 34% | 35 ? 10% | 41.8 ? -7% |
| Load Maximum * (Watt) | 66.7 | 64.8 3% | 30.6 54% | 49.3 26% | 27.6 59% | 47.5 ? 29% | 64.7 ? 3% |
* ... smaller is better
Battery Runtimes - MateBook only with 41.7 Wh battery
The battery capacity is once again 41.7 Wh, and it is the smallest battery within the comparison group. The runtimes are therefore only average. 7:20 hours for our Wi-Fi test and 9:40 hours for video playback (both at 150 nits) are not bad, but the competition lasts longer. The runtime drops to 5:20 hours (-2 hours) when we run the Wi-Fi test at the maximum display brightness.
| Huawei MateBook 13 2020 i5 i5-10210U, UHD Graphics 620, 41.7 Wh | Huawei Matebook 13-53010FYW i7-8565U, UHD Graphics 620, 41.7 Wh | Apple MacBook Air 2020 i3 i3-1000NG4, Iris Plus Graphics G4 (Ice Lake 48 EU), 49.9 Wh | Dell XPS 13 9300 i5 FHD i5-1035G1, UHD Graphics G1 (Ice Lake 32 EU), 52 Wh | Acer Swift 3 SF313-52-52AS i5-1035G4, Iris Plus Graphics G4 (Ice Lake 48 EU), 54.5 Wh | Average of class Subnotebook | |
|---|---|---|---|---|---|---|
| Battery runtime | 1% | 32% | 83% | 46% | 64% | |
| H.264 (h) | 9.7 | 11.1 14% | 14.4 48% | 15.8 ? 63% | ||
| WiFi v1.3 (h) | 7.4 | 7 -5% | 11 49% | 11.7 58% | 10.8 46% | 14 ? 89% |
| Load (h) | 1.4 | 1.5 7% | 3.4 143% | 1.942 ? 39% |
Pros
Cons
Verdict - 2020 MateBook 13 does not offer any improvements
The 2020 MateBook 13 is just a very small update. You get a new processor, but the performance is basically identical to the predecessor. Huawei does not offer all configurations in every region: German customers, for example, do not get the MateBook 13 with the dedicated GeForce GPU.
Still, the MateBook 13 is not a bad subnotebook. We particularly like the metal case and the good screen, even though it is not a touchscreen and you should calibrate the panel for the best results. The SKU with the iGPU is also very quiet under load.
The MateBook 13 does not show any advancements, but it is still a good subnotebook for an appealing price.
The performance is still more than sufficient for everyday tasks, even though rivals mit newer Ice lake processors have an advantage in terms of GPU performance. The port situation is no perfect, either, since you can only charge the laptop at the left side and attach an external monitor at the right side. There is no USB Type-A port, so you will probably have to use adapters in practice.
Huawei MateBook 13 2020 i5
- 06/09/2020 v7 (old)
Andreas Osthoff
Price comparison
