Huawei MateBook 13 (i7-8565U, GeForce MX150) Laptop Review
The MateBook 13 launched in late 2018 for Asian territories before finally landing in North America on January 2019. Prior to its launch, Huawei had the entry-level MateBook D and flagship MateBook X Pro with no middle-ground option in between. The mid-tier MateBook 13 was thus introduced to fill in the gap.
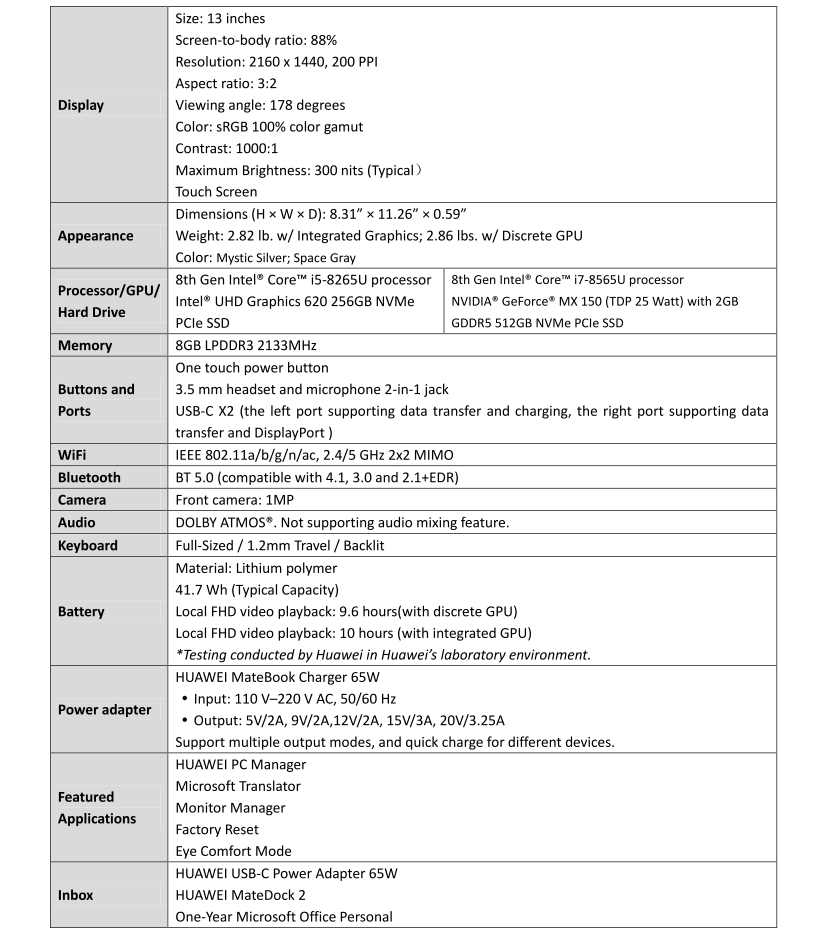
The laptop starts at $999 USD with a Core i5-8265U CPU and 256 GB PCIe SSD up to the $1299 SKU with a Core i7-8565U CPU, 512 GB PCIe SSD, and a dedicated 25 W GeForce MX150 GPU. All other core specifications remain identical between the SKUs including the unique 13.0-inch 3:2 2160 x 1440 IPS touchscreen and 8 GB of LPDDR3 RAM.
Direct competitors in this space are the same as the MateBook X Pro including the Dell XPS 13, HP Spectre 13, Apple MacBook Pro 13, Acer Swift 7, Asus ZenBook 13 UX333, Microsoft Surface Laptop 2, and even the new Razer Blade Stealth. For this review, we'll be seeing how the MateBook 13 compares to the competition as well as its pricier MateBook X Pro sibling.
More Huawei MateBook reviews:
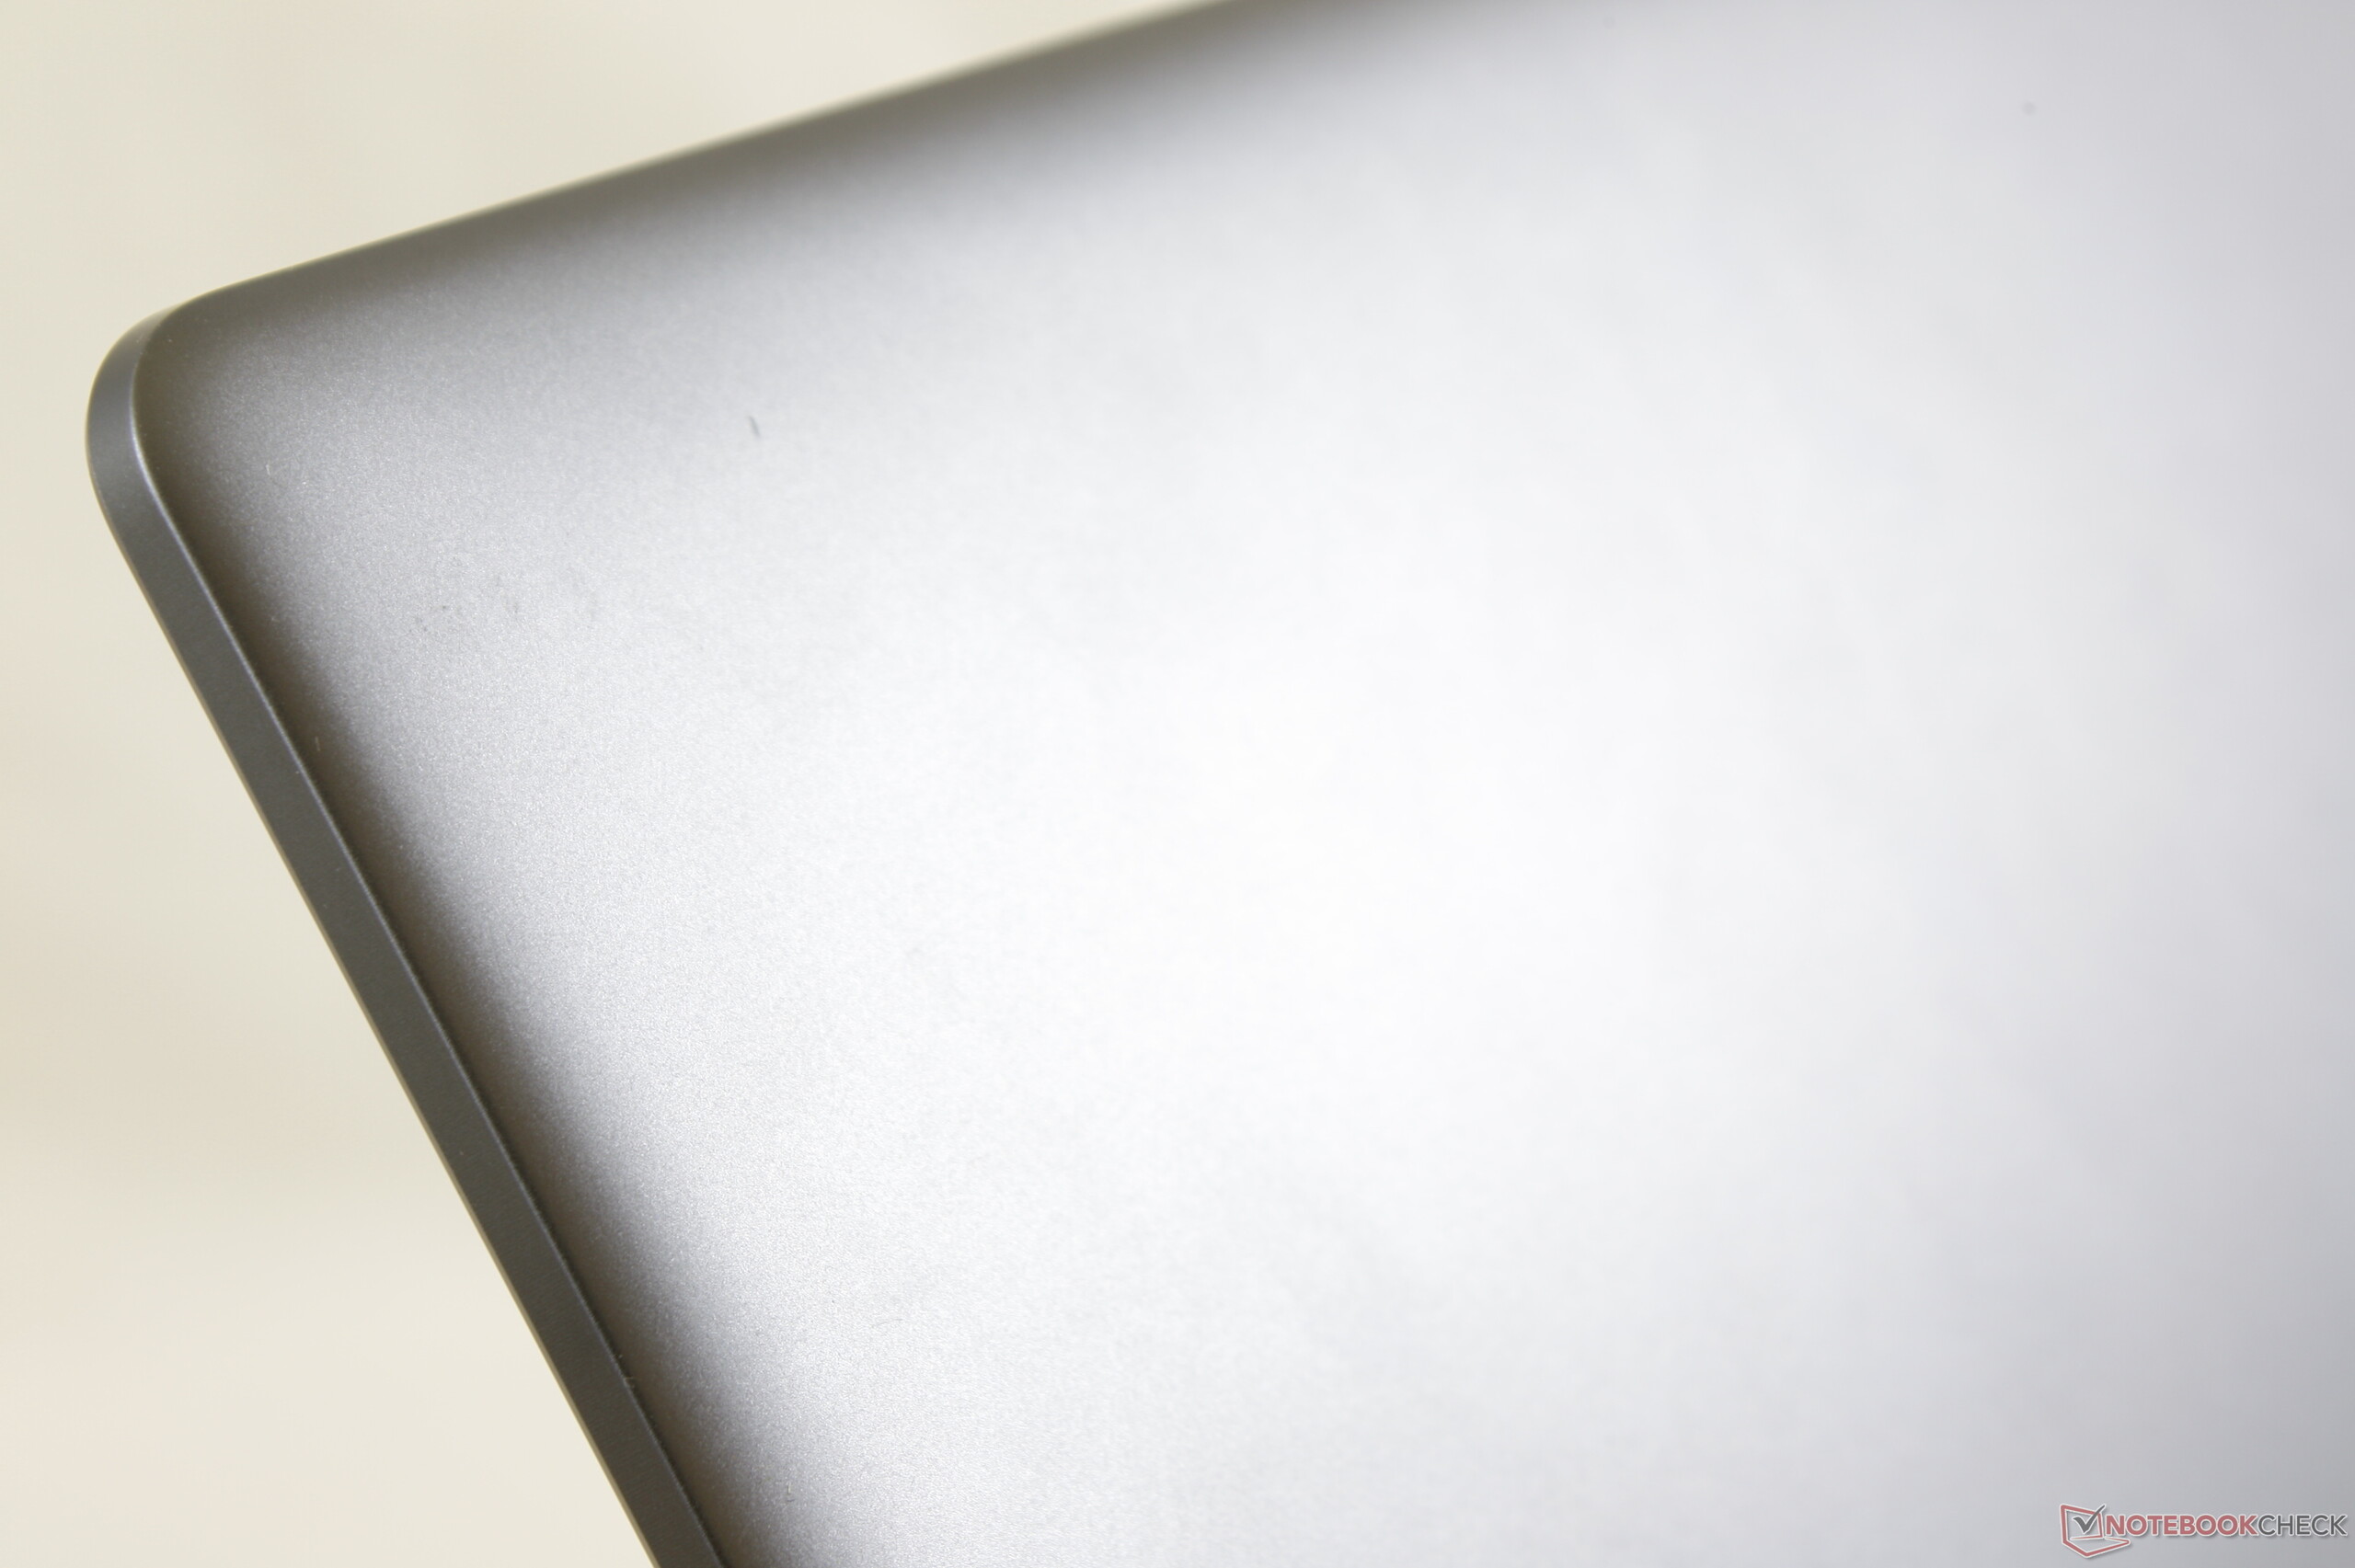
Case
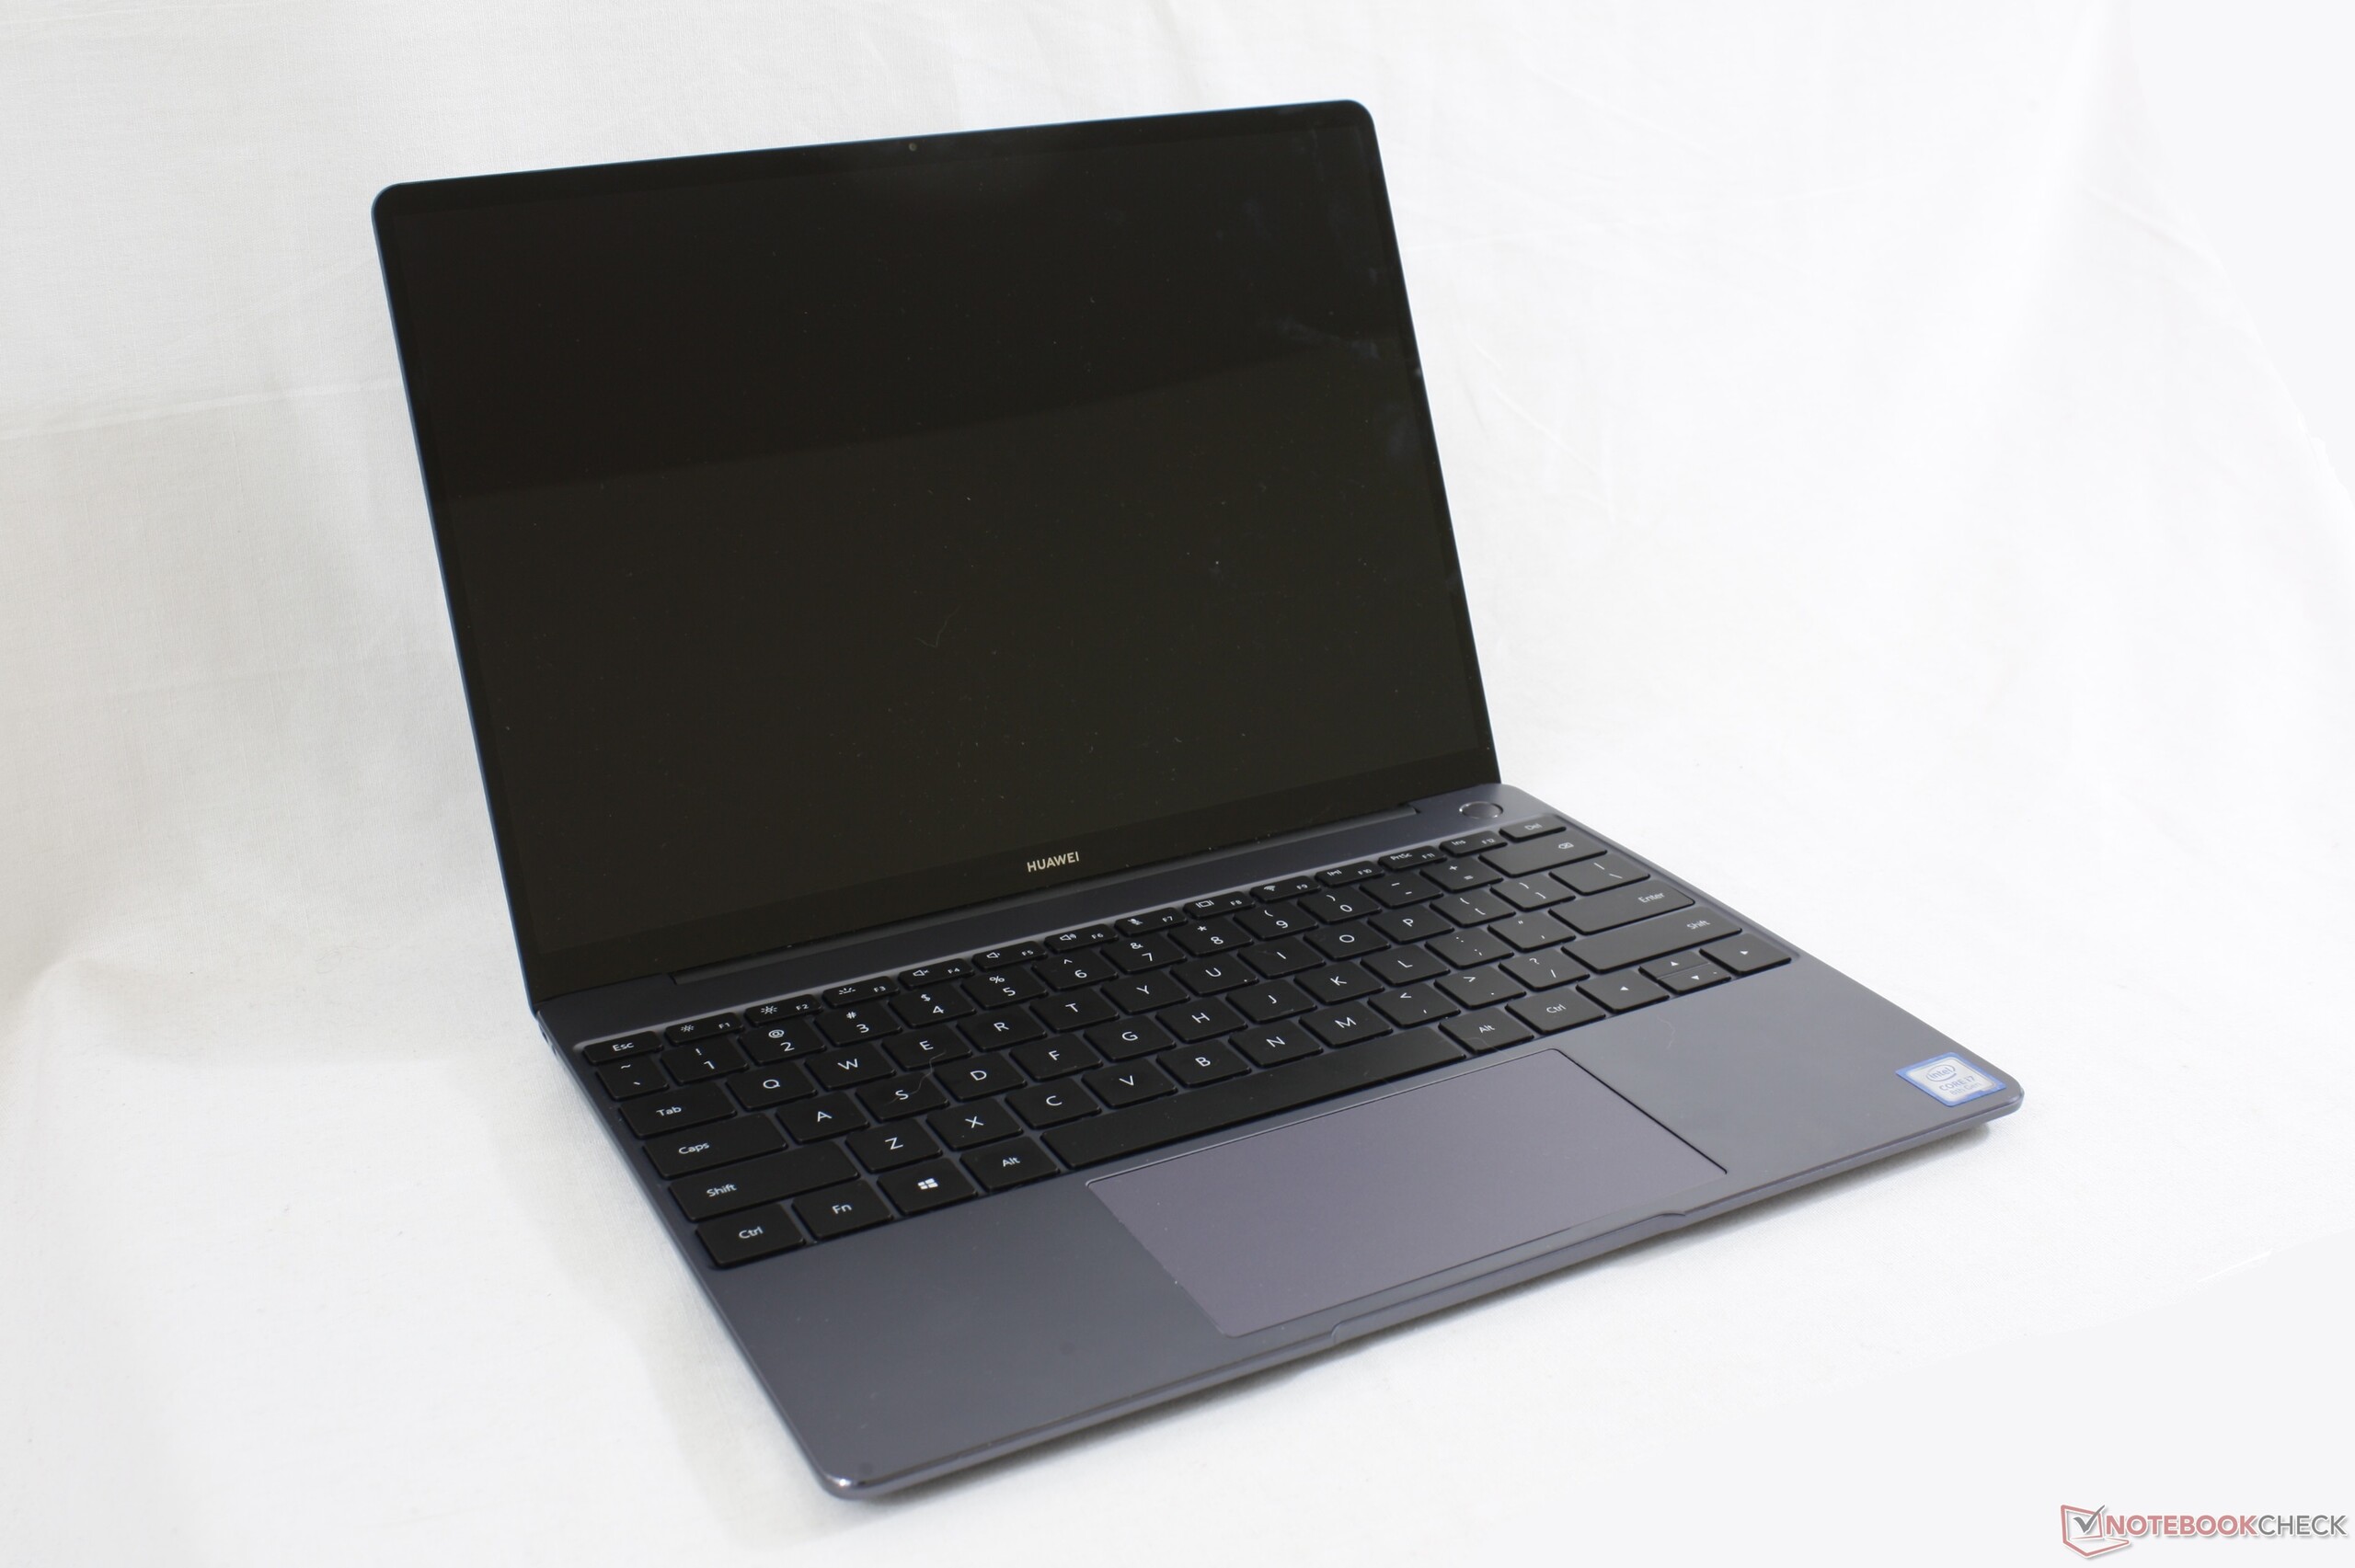
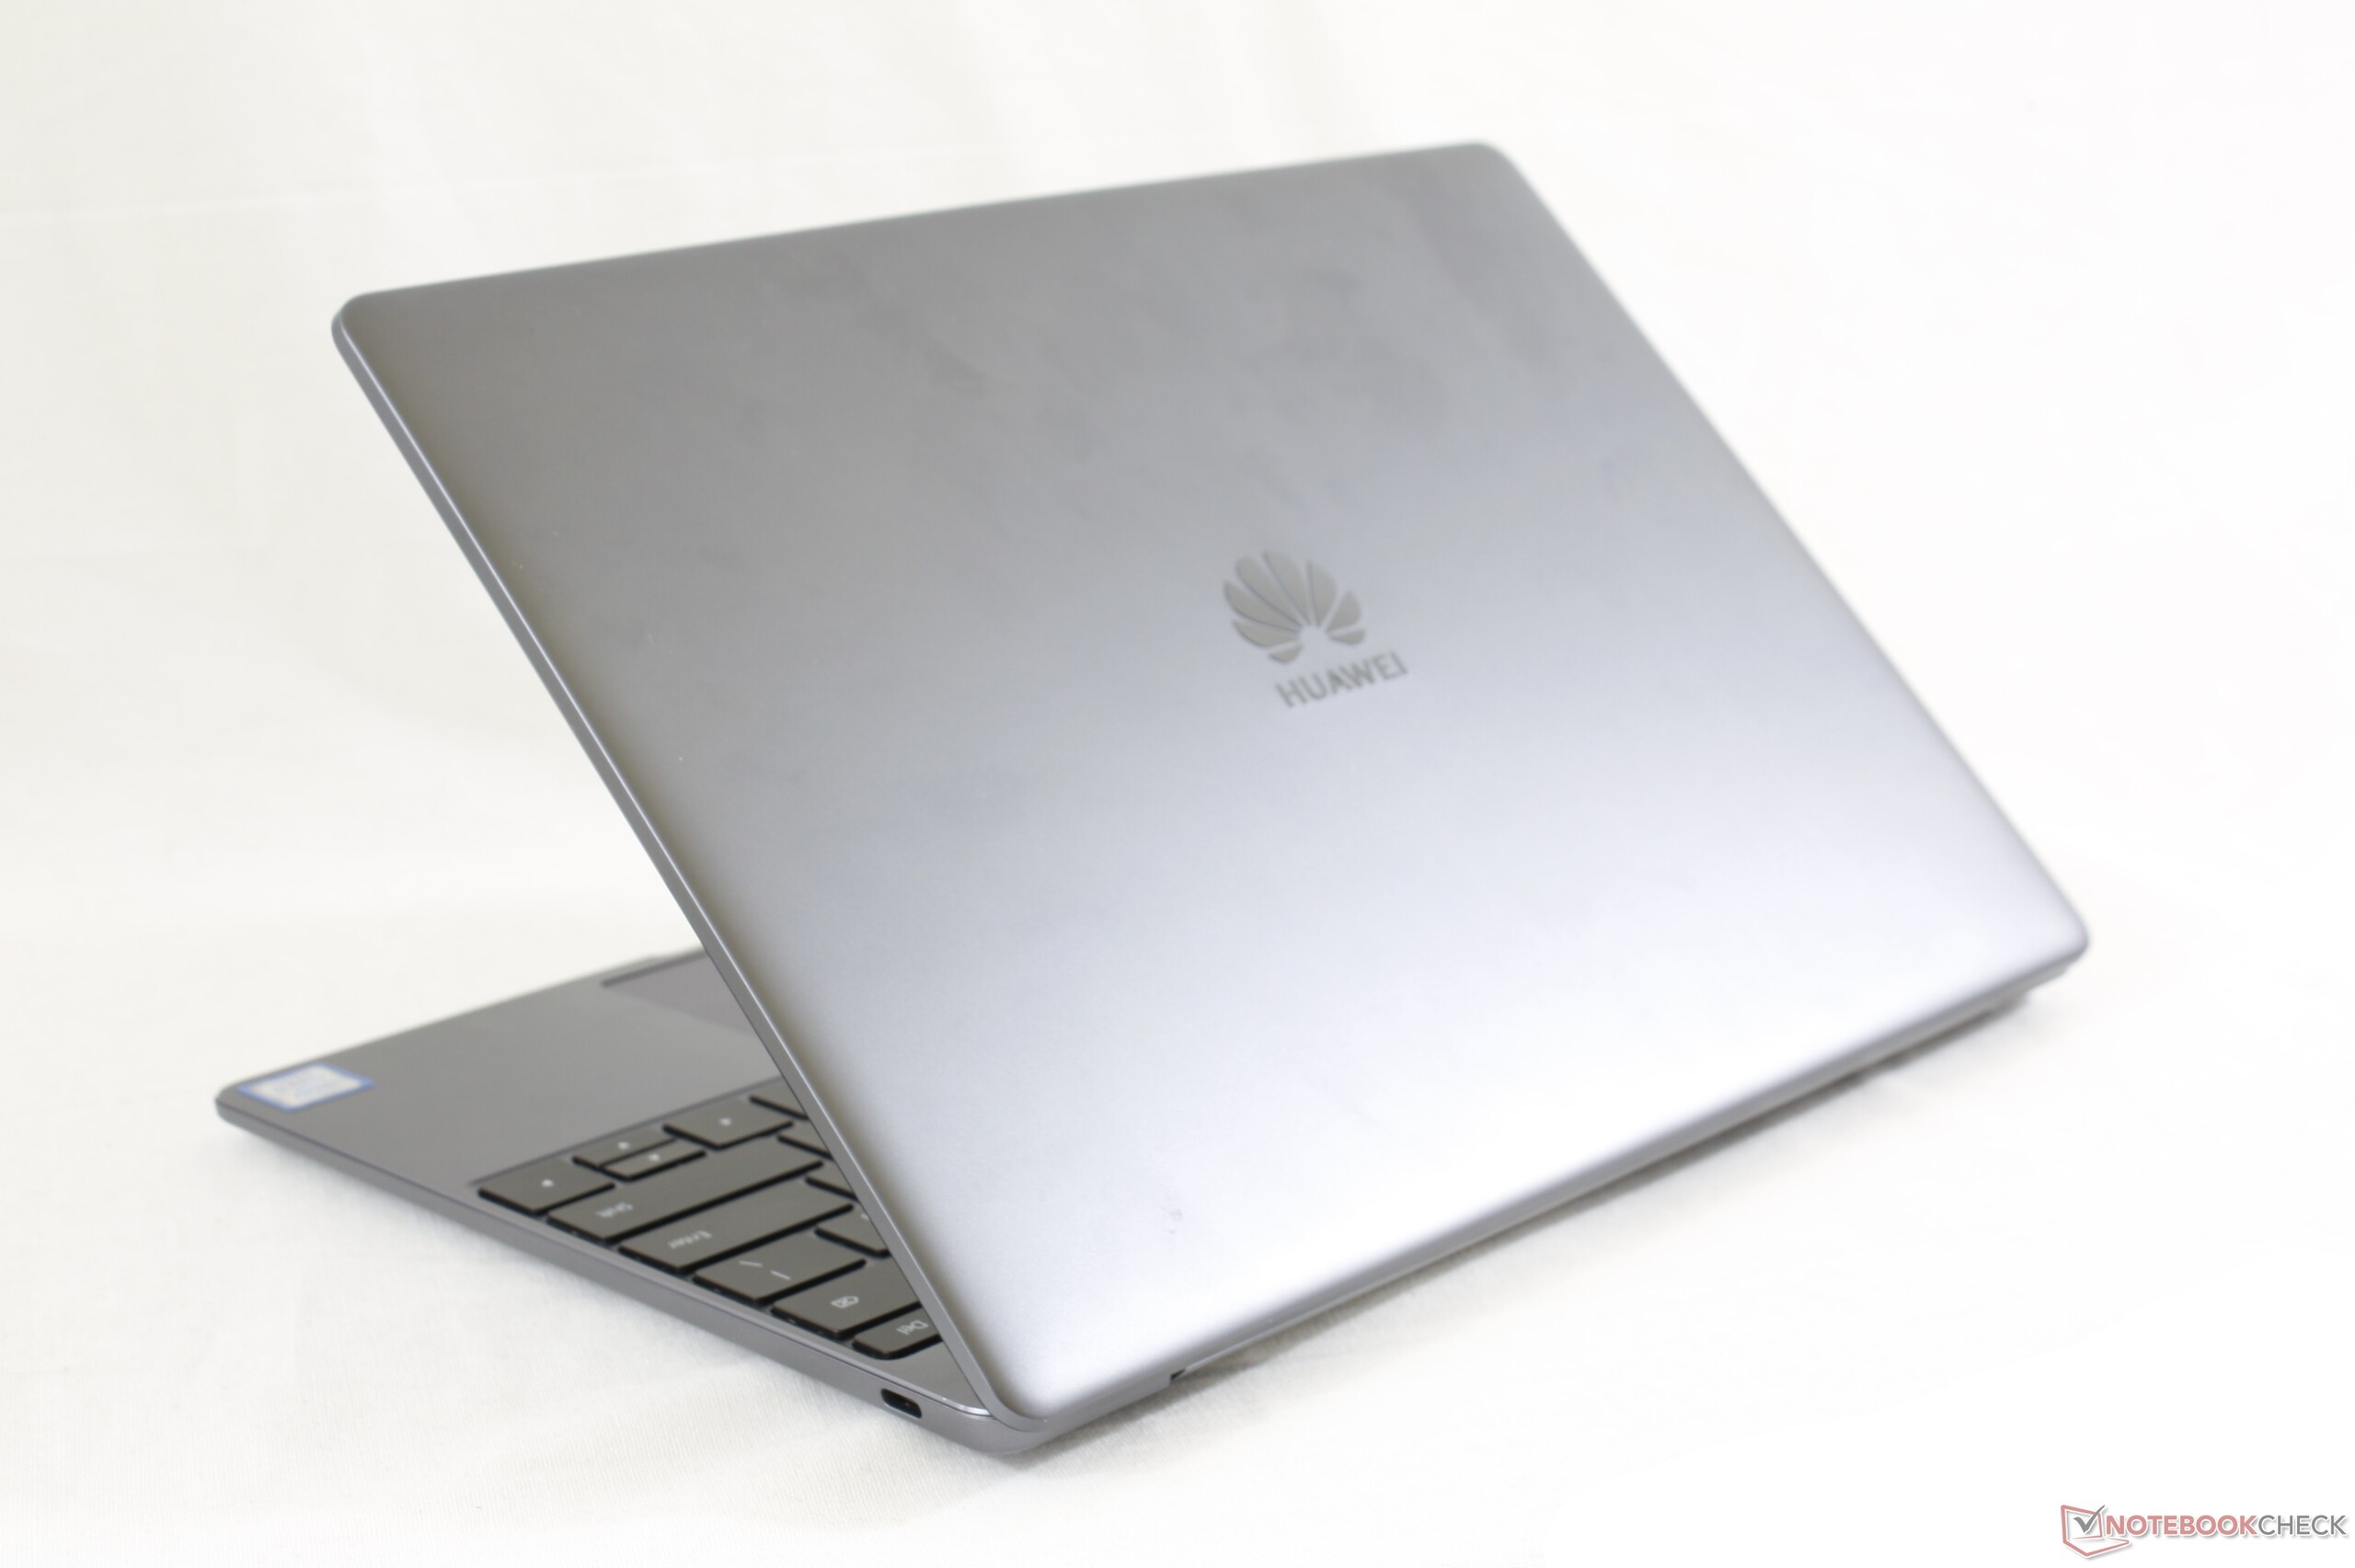
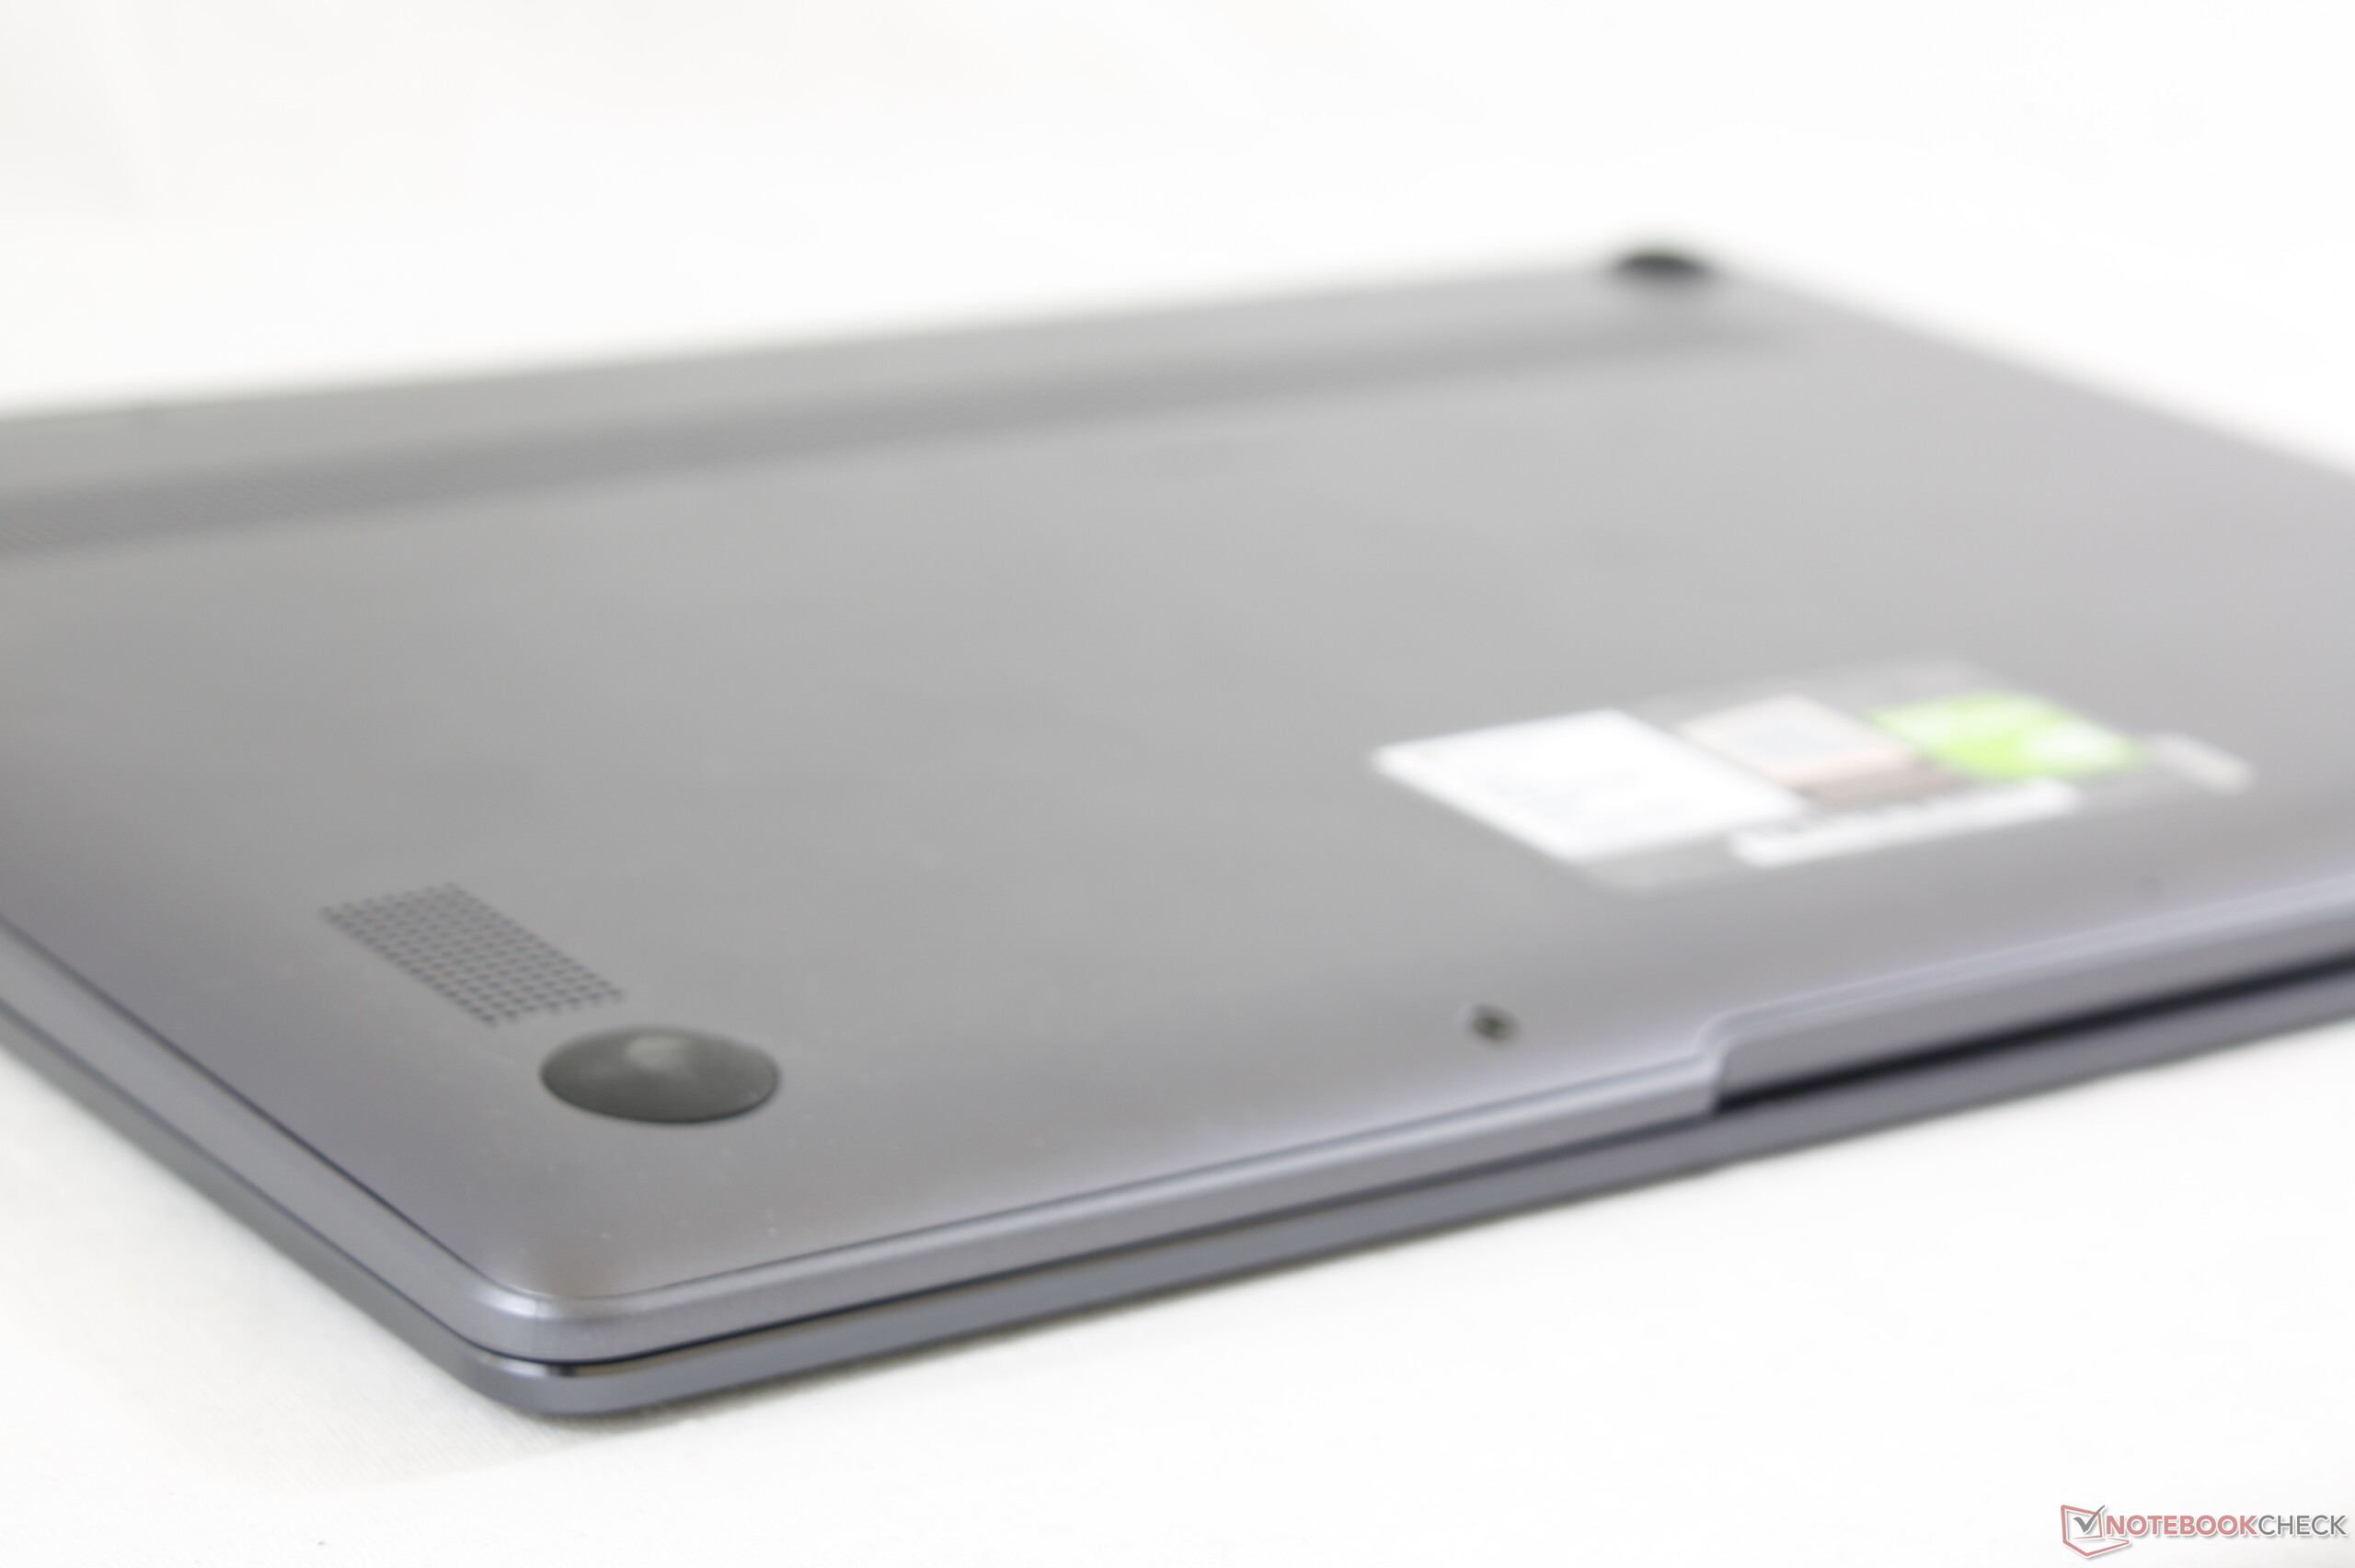
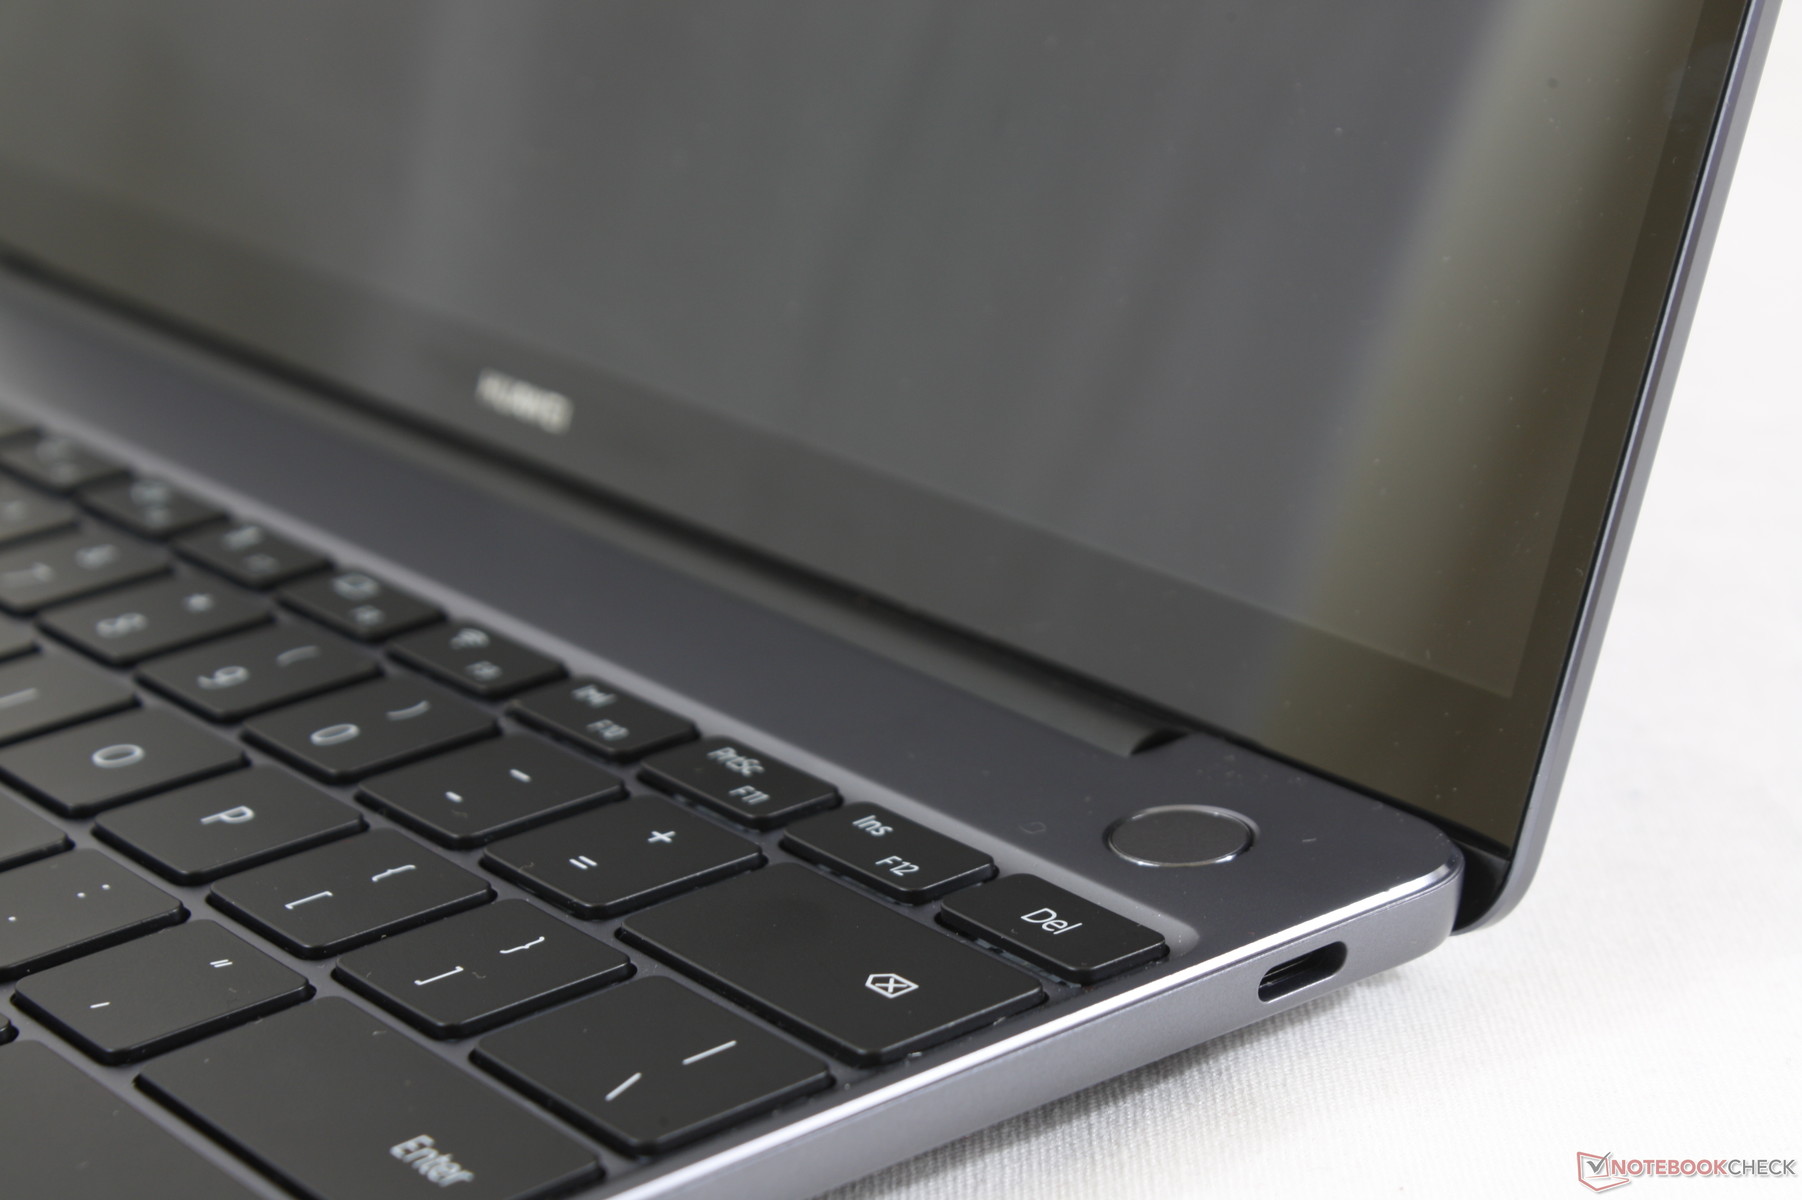
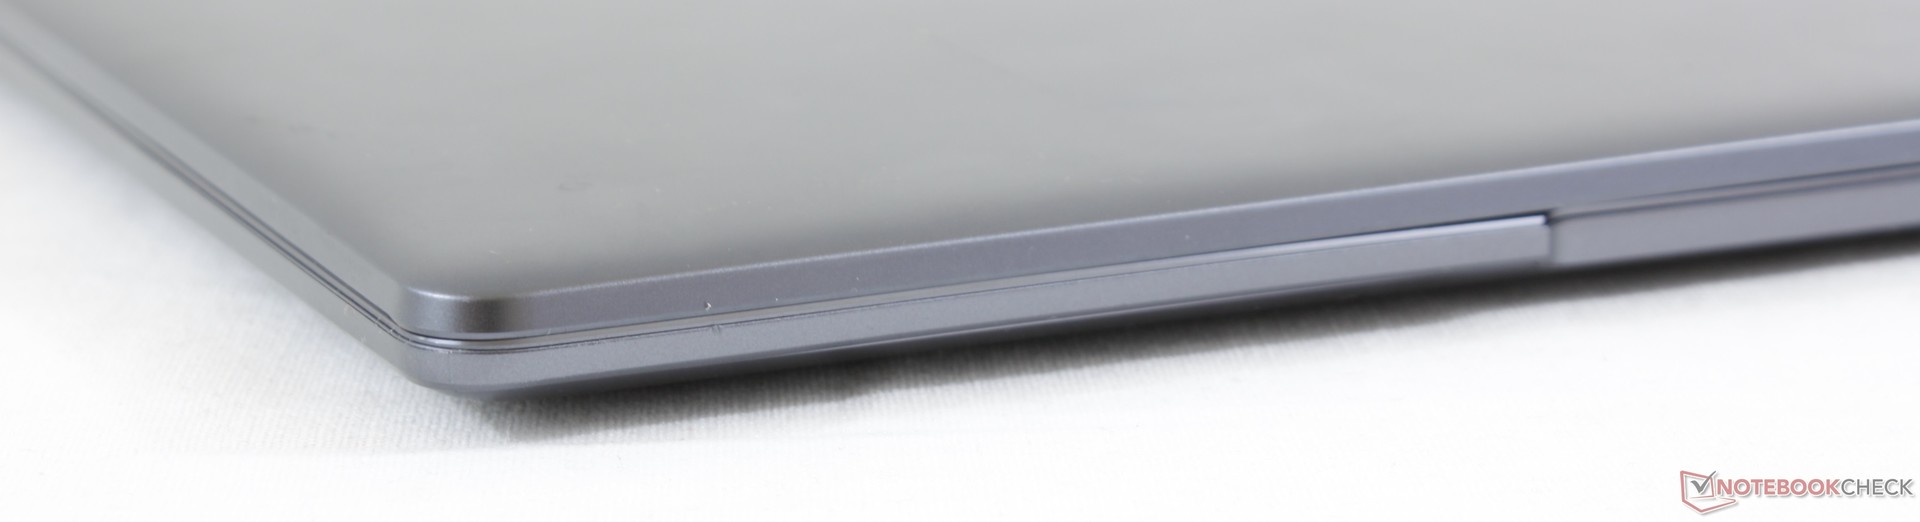
The case is best described as a 13-inch version of the 13.9-inch MateBook X Pro. The aluminum build, smooth matte surfaces, rounded edges and corners, and visual style are all quite similar between the two laptops. The most notable differences are the narrower edges to the sides of the keyboard and the re-positioned webcam. The silly pop-up webcam on the Pro model has been dropped in favor of a traditional approach.
Chassis rigidity is excellent even if it's not the best in class. We can notice slightly more warping than on the XPS 13, Spectre 13, and Blade Stealth when attempting to twist the base. The centers of the keyboard and outer lid will warp slightly as well when applying pressure with a finger. The overall build falls just short of the aforementioned alternatives, but it's still significantly stronger than what LG and Samsung have to offer in this category.
Construction quality is perfect on our specific test unit as we can notice no uneven gaps or defects. Perhaps a slightly stiffer hinge would have made the lid feel stronger and reduce any weakening over time.
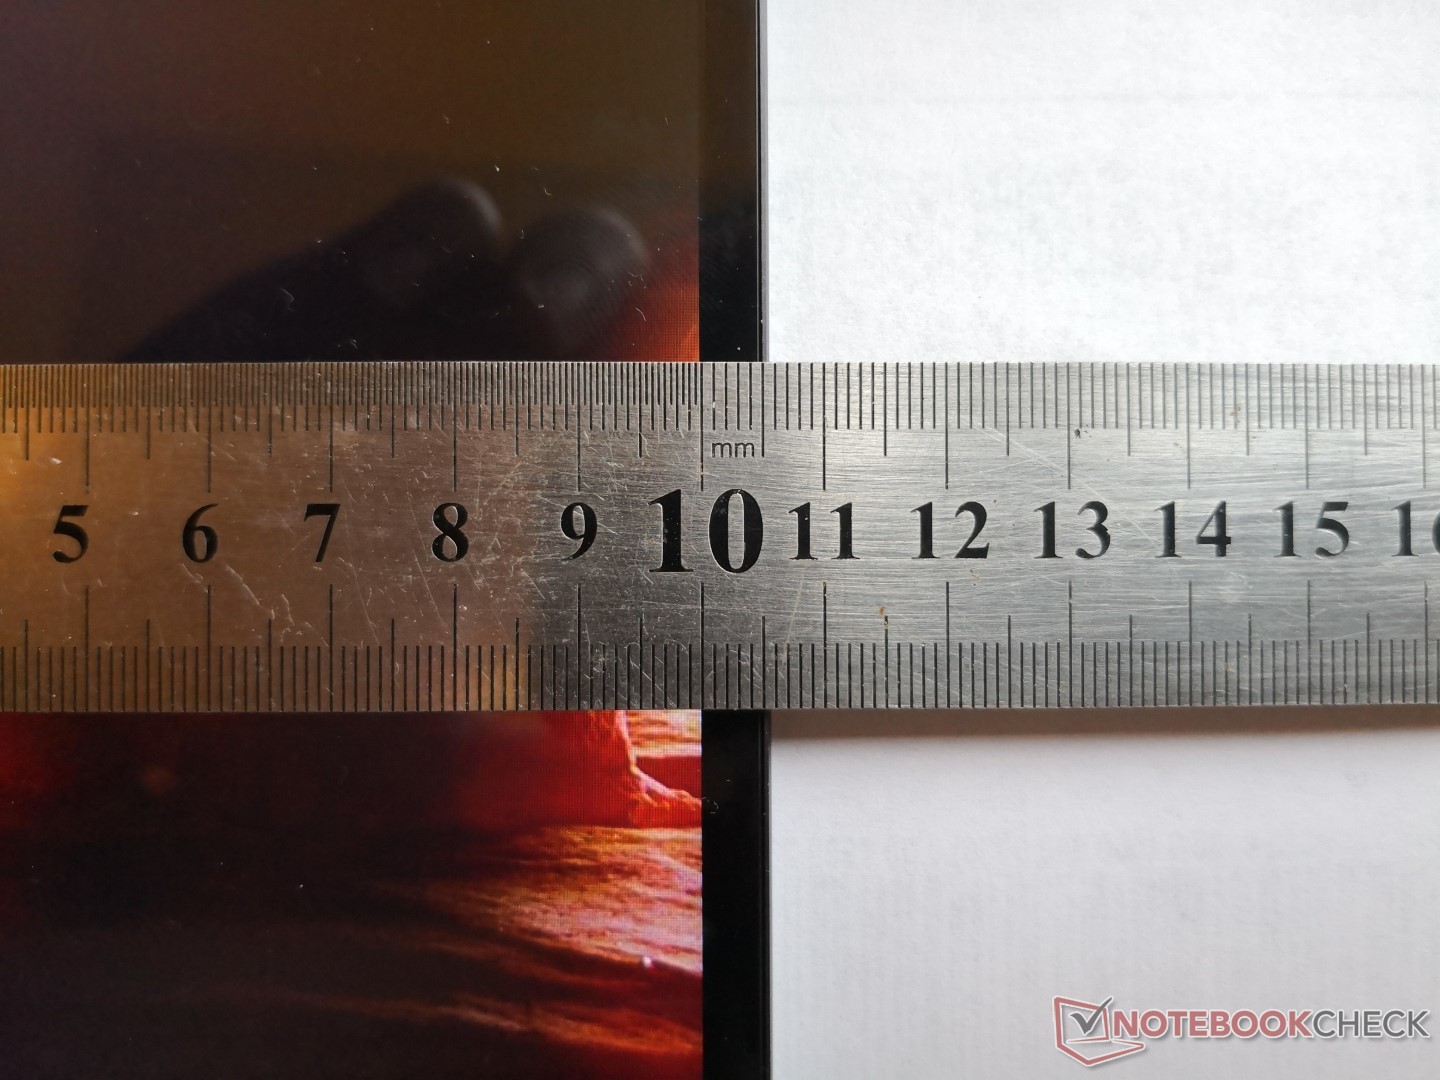
Dimensions are noticeably shorter and squarer than many competitors because of the laptop's unique 3:2 aspect ratio. The MacBook Pro 13, for example, is almost 20 mm longer even though their widths and thicknesses are nearly identical. Weight is about where we expect a 13-inch subnotebook to be at around 1.3 kg. Users who want an even lighter subnotebook should consider the LG Gram 13.
Connectivity
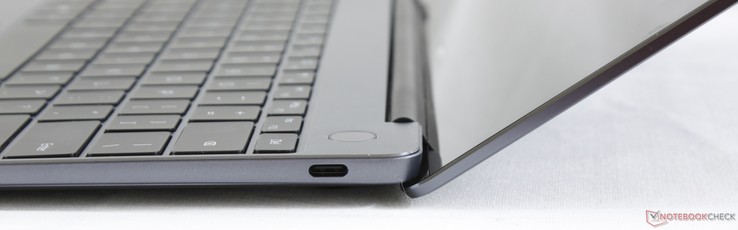
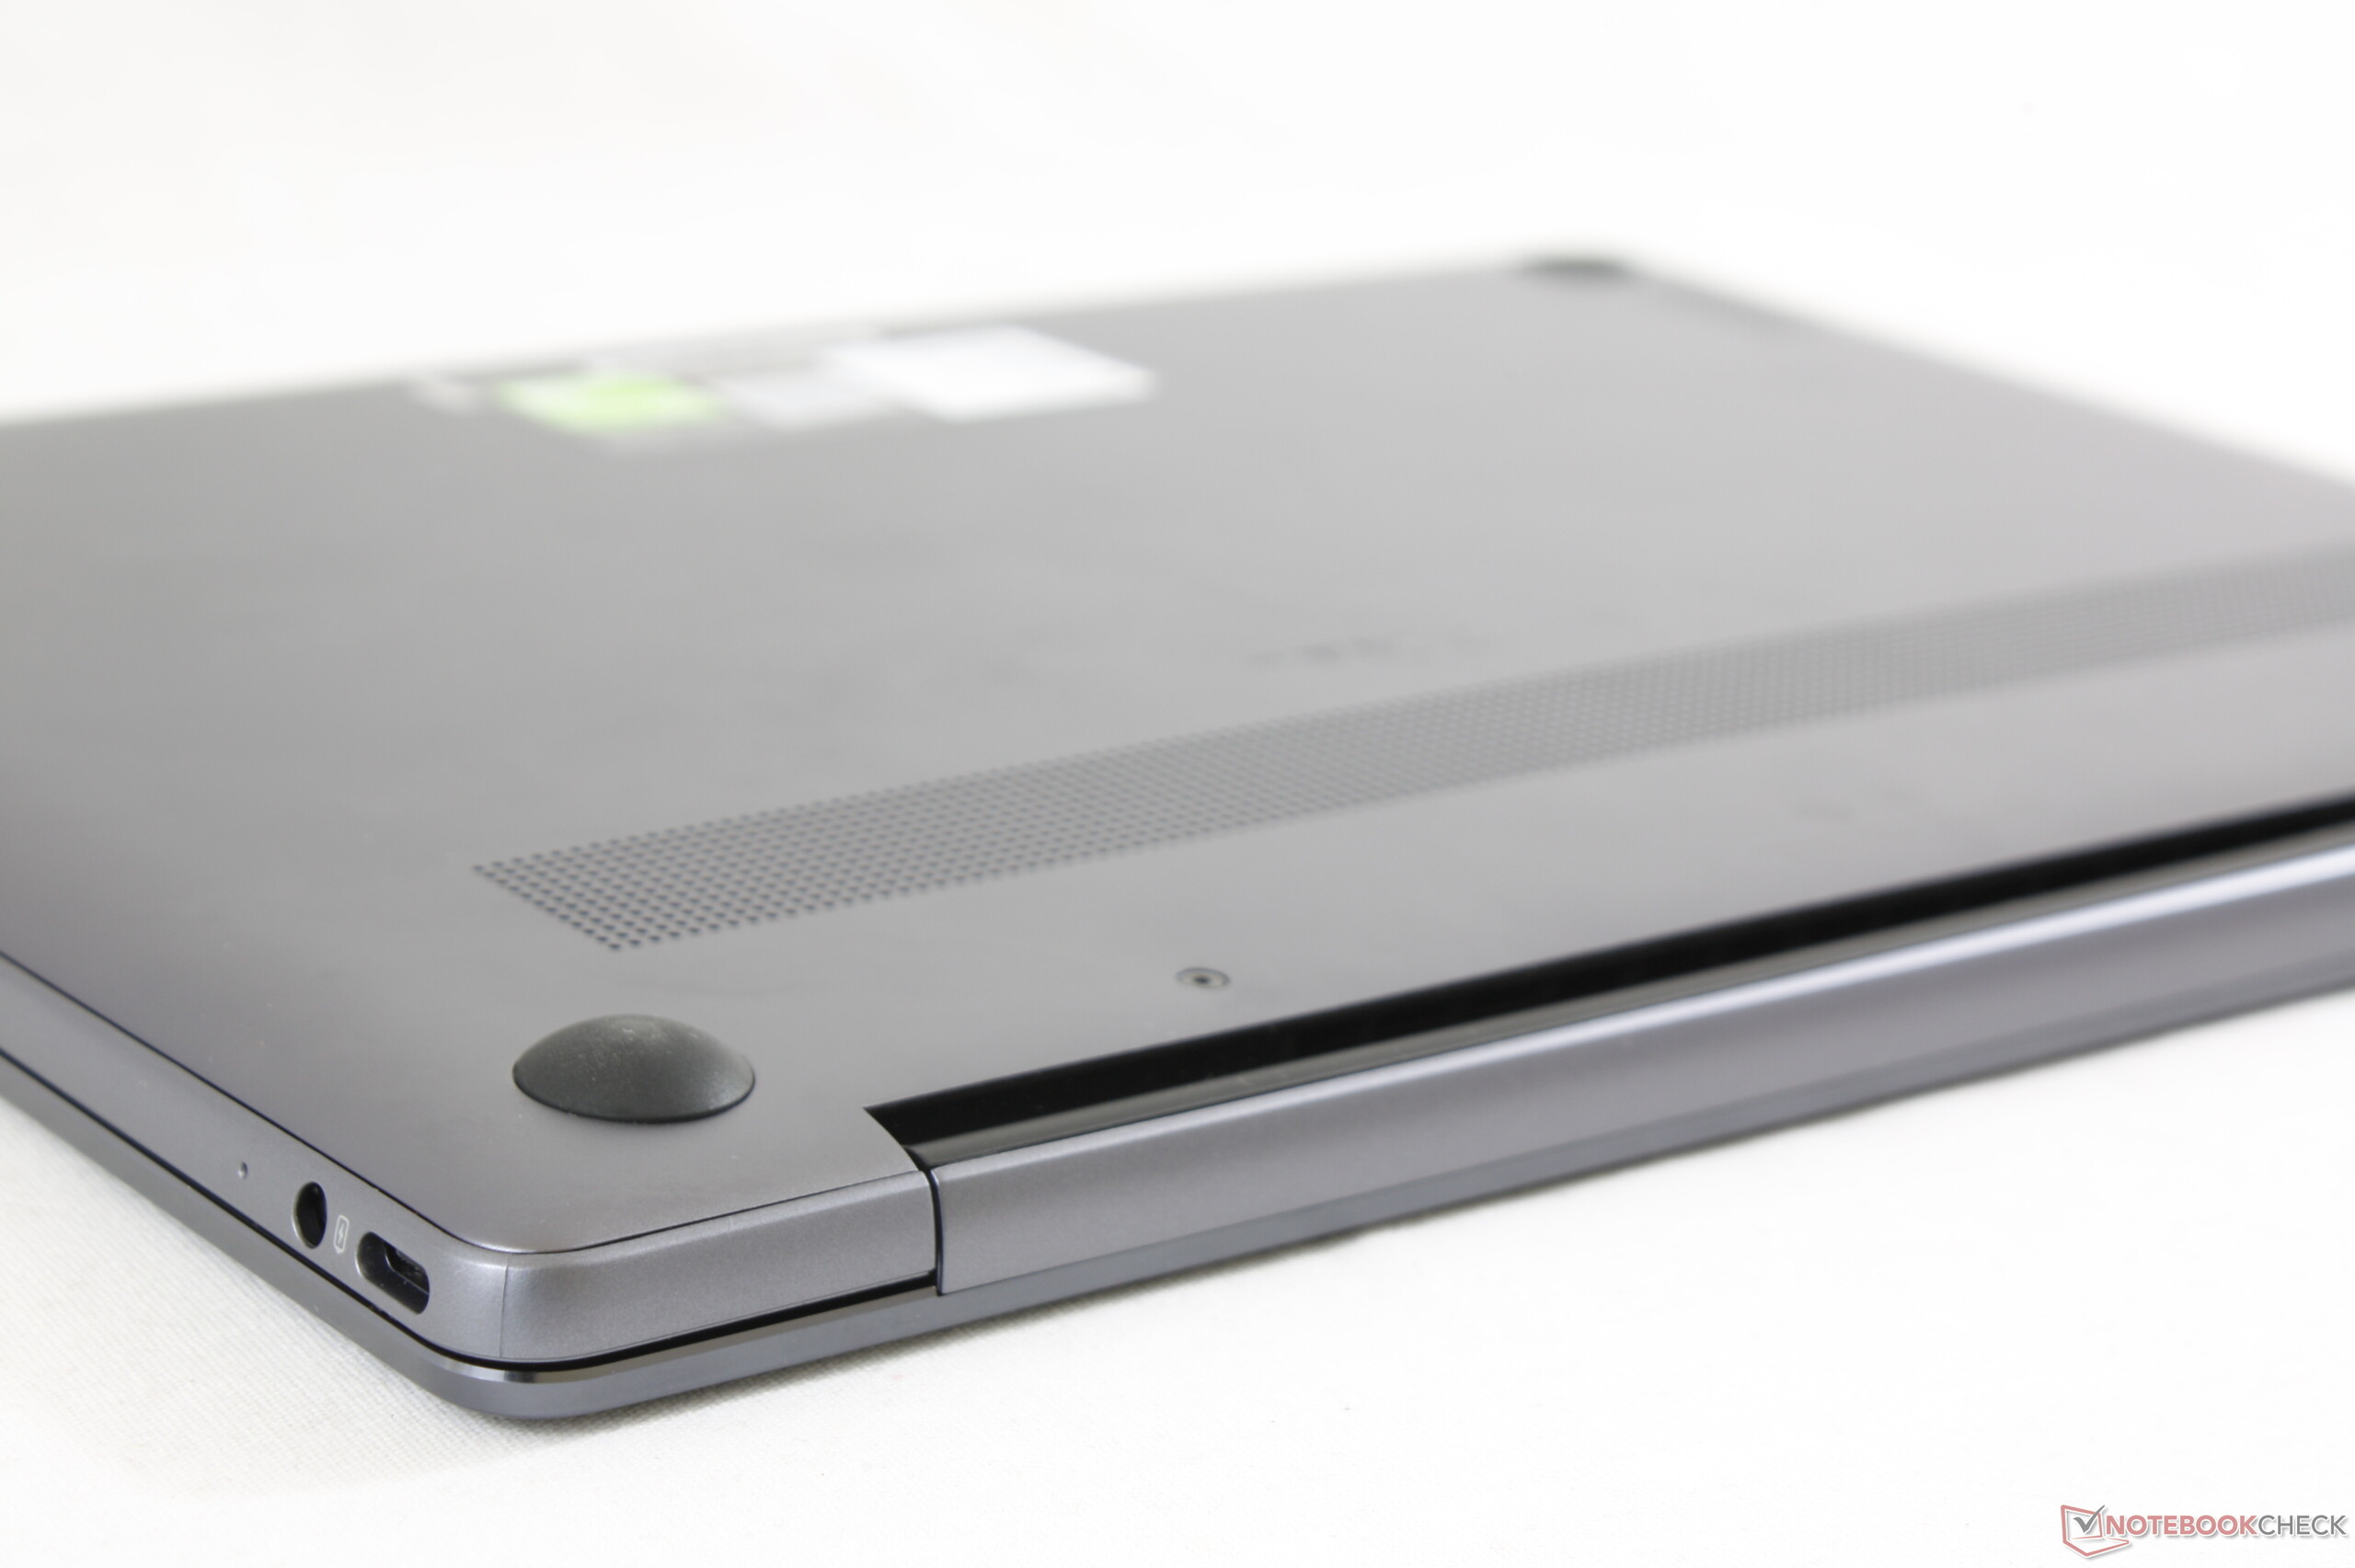
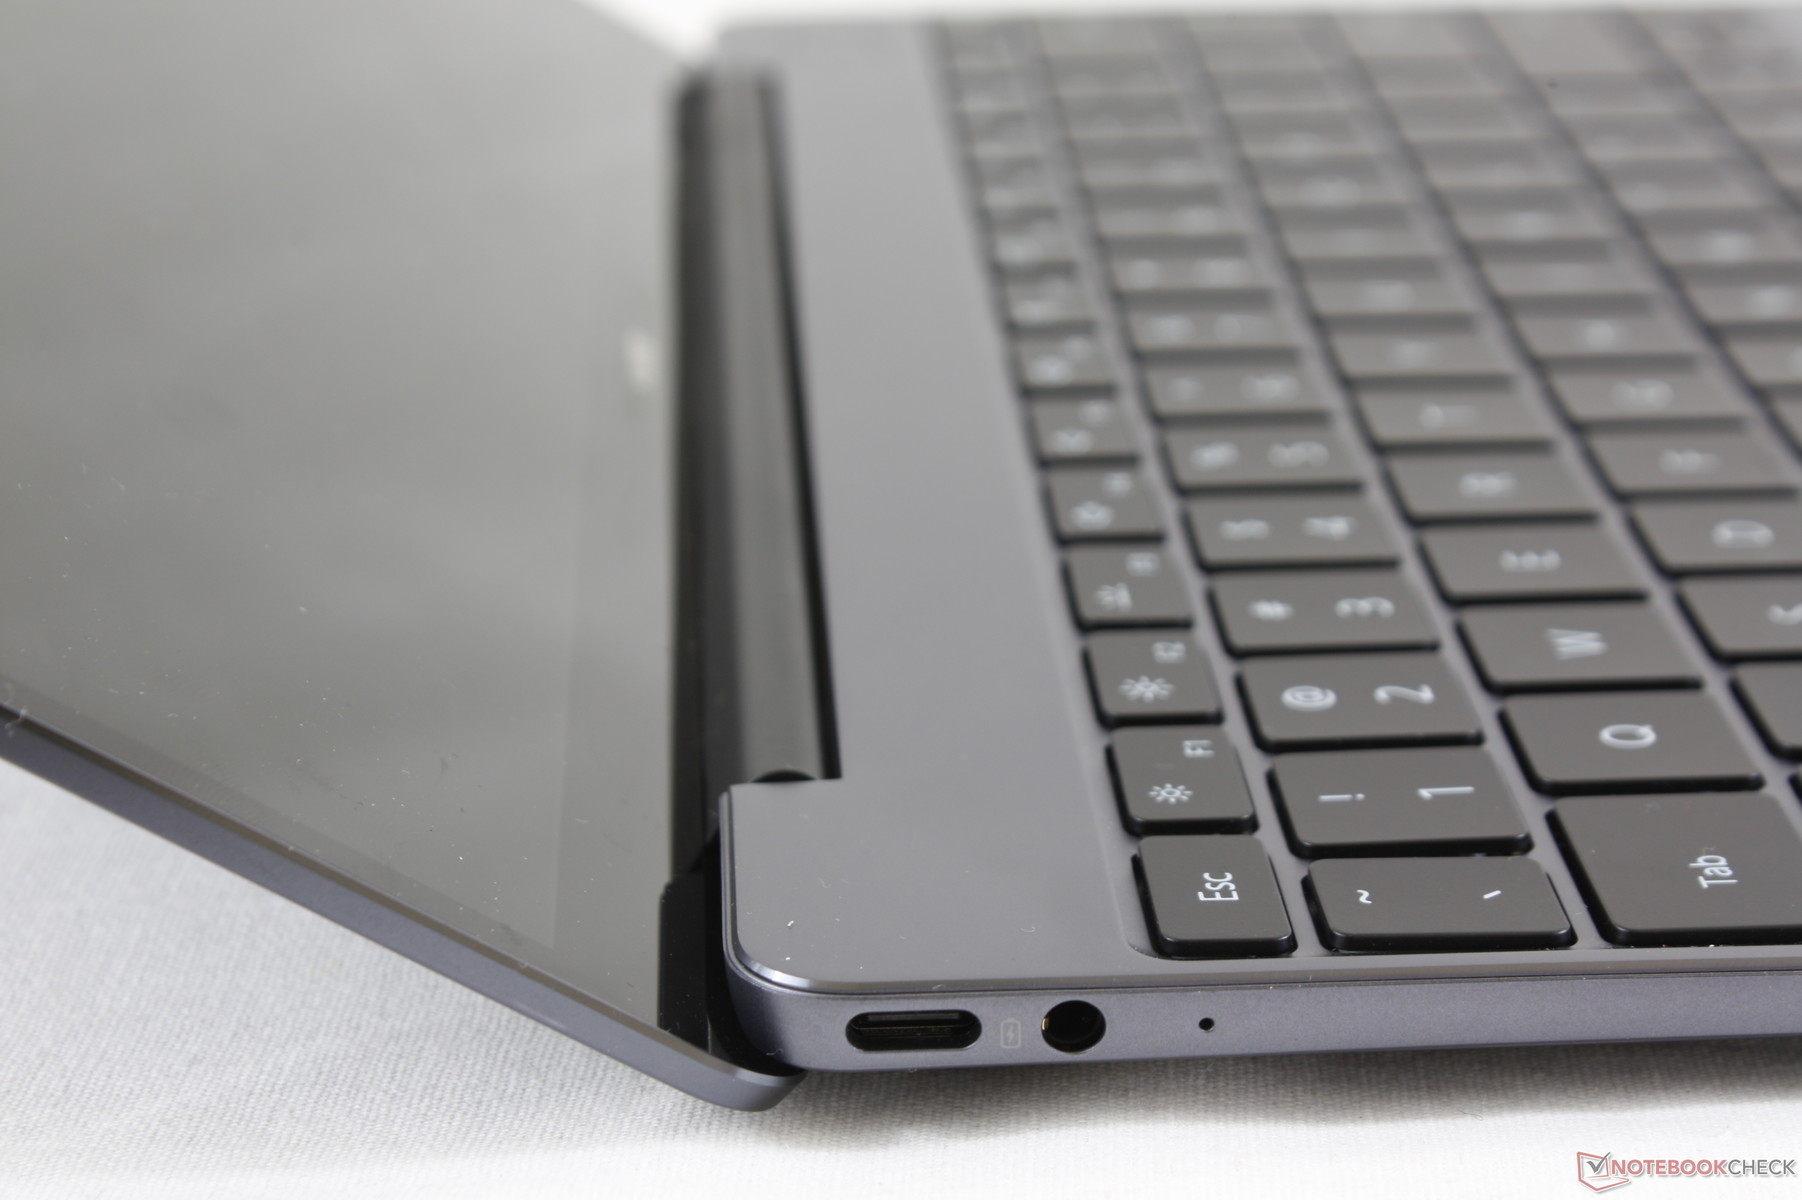
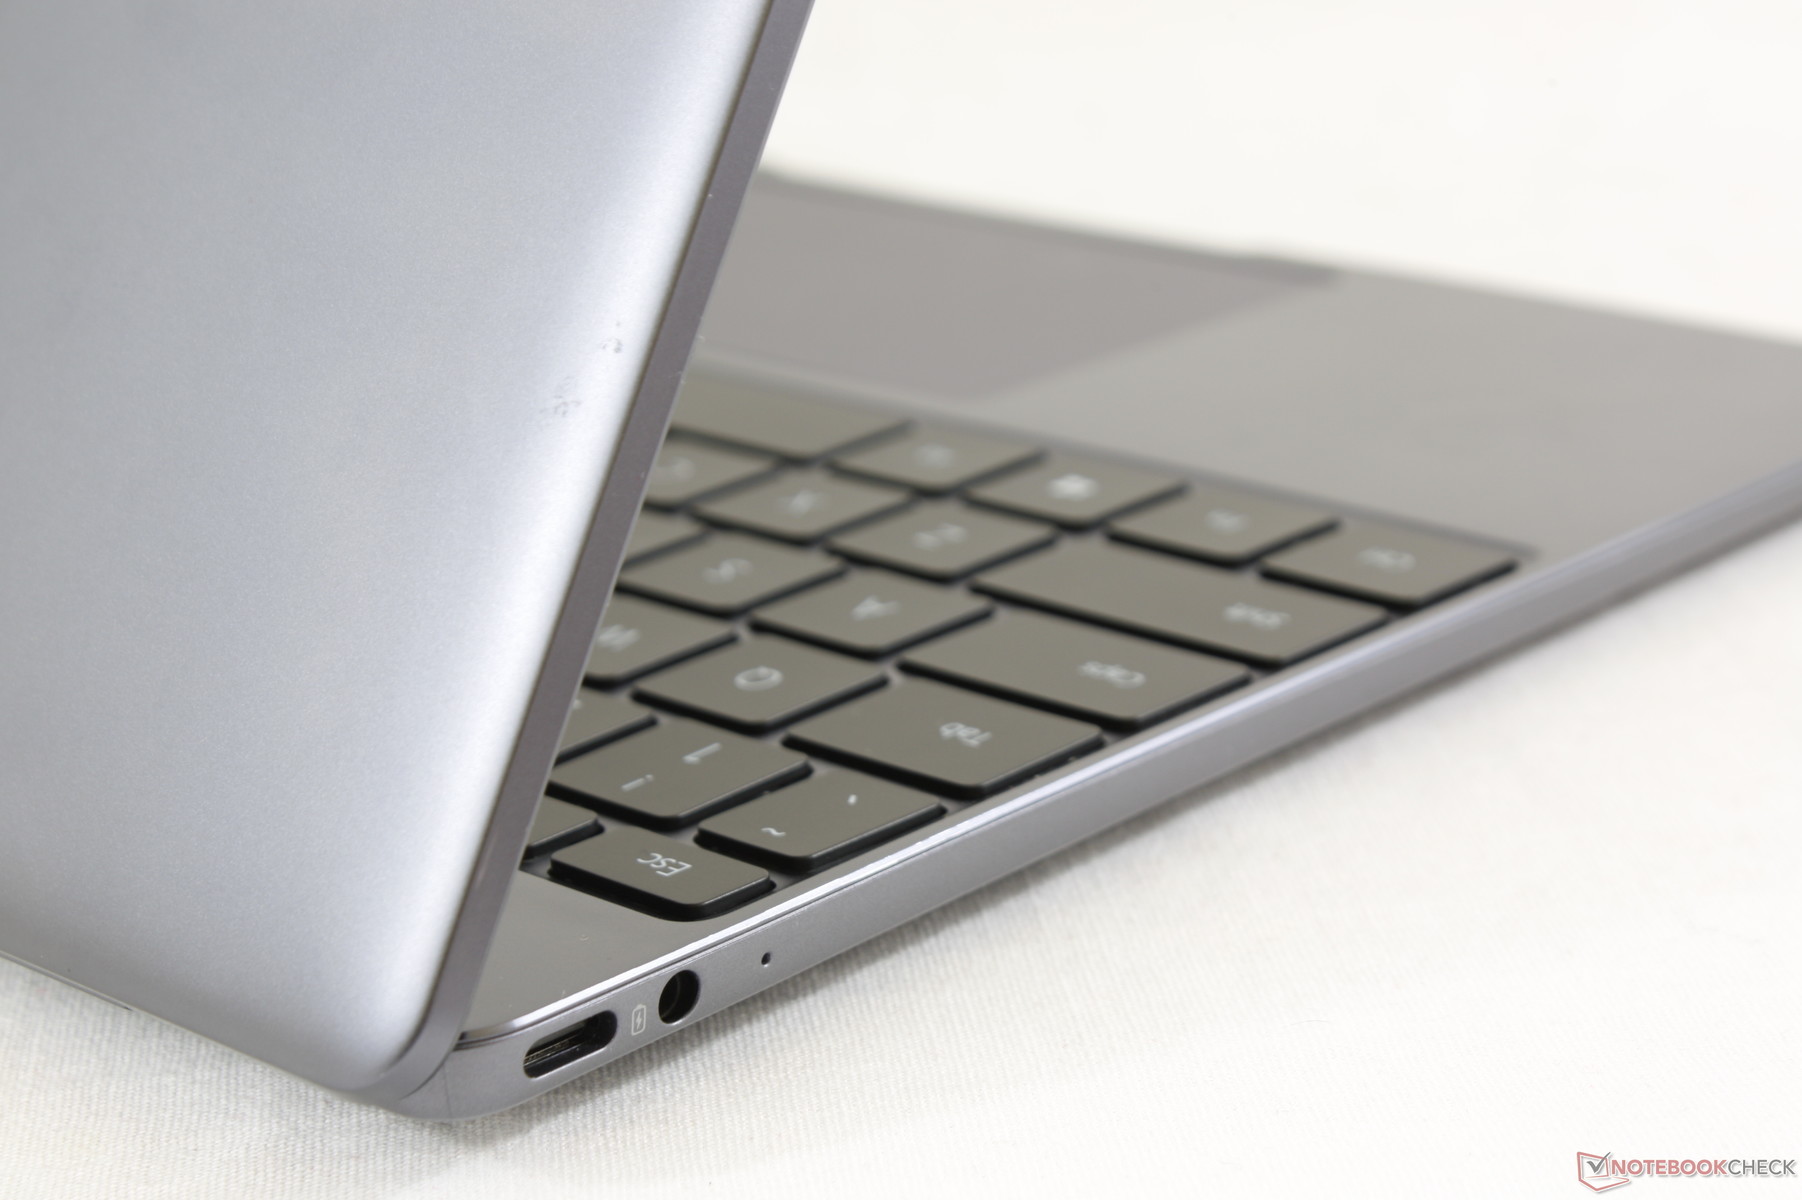
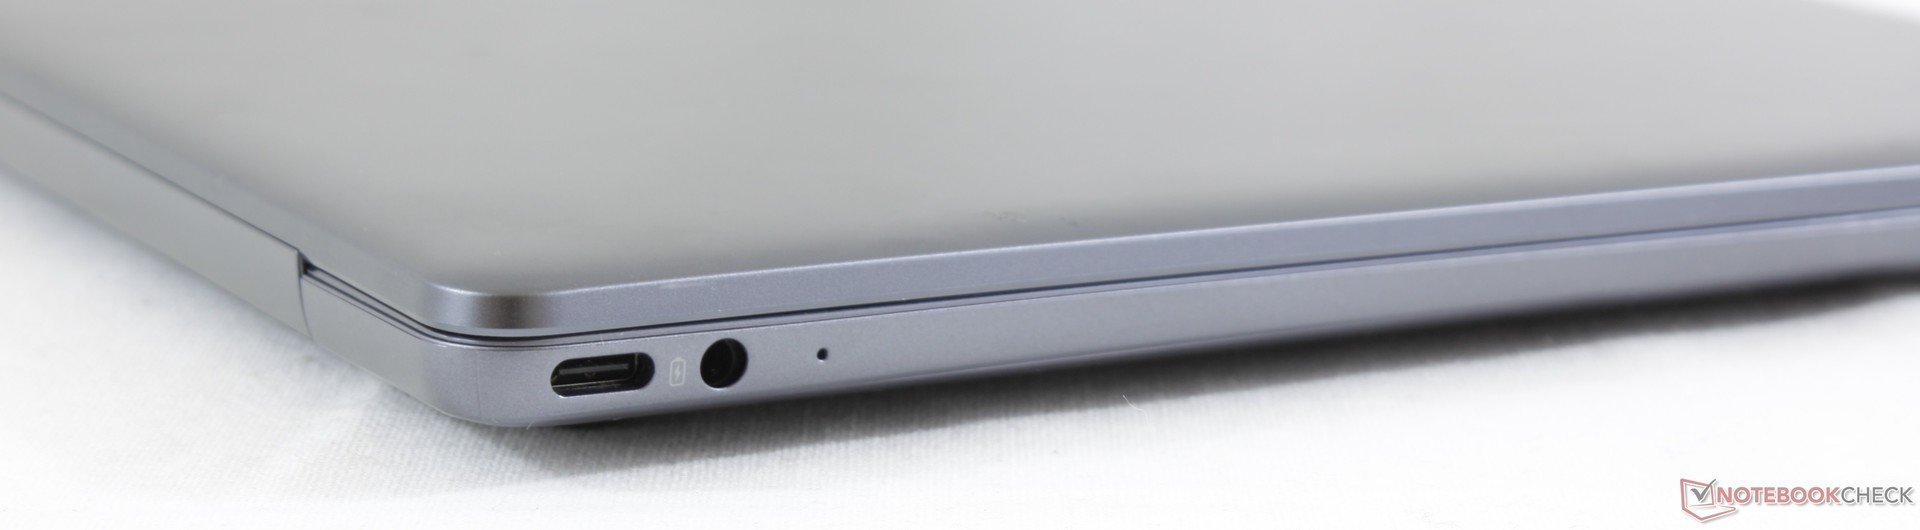
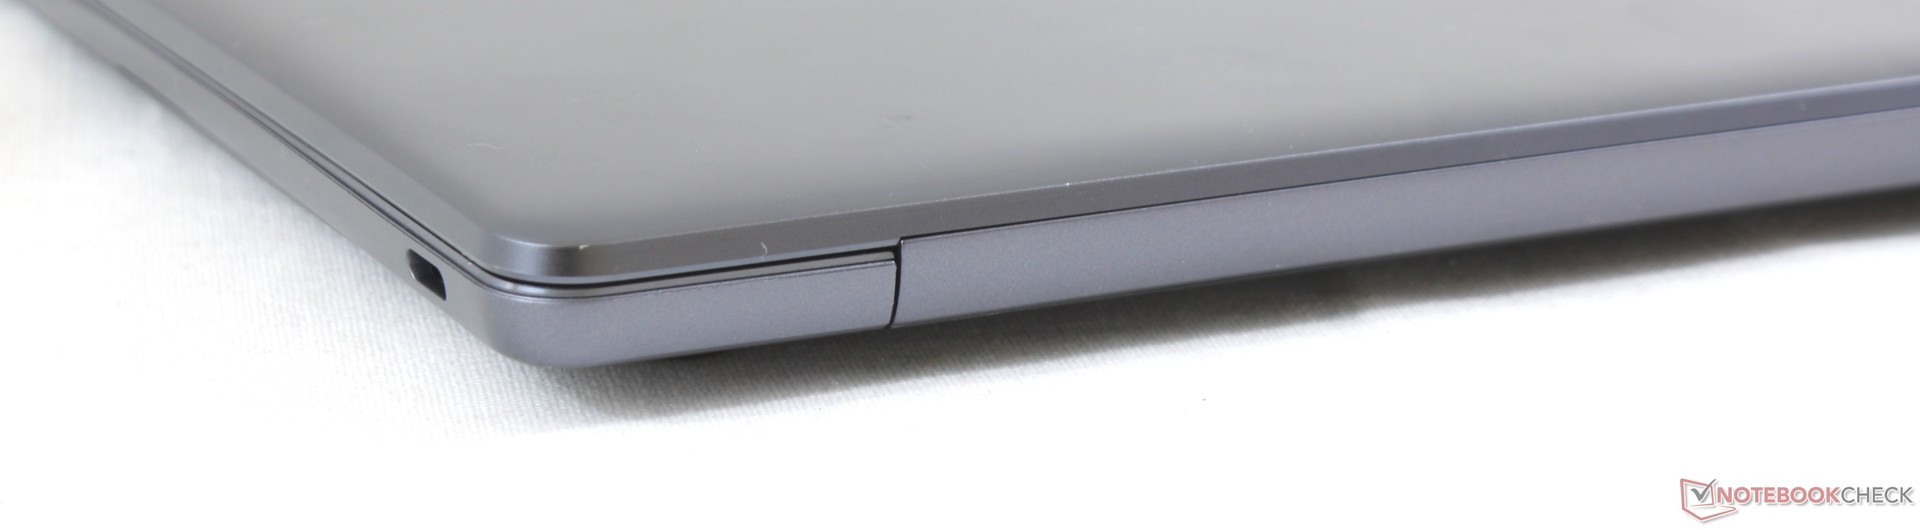
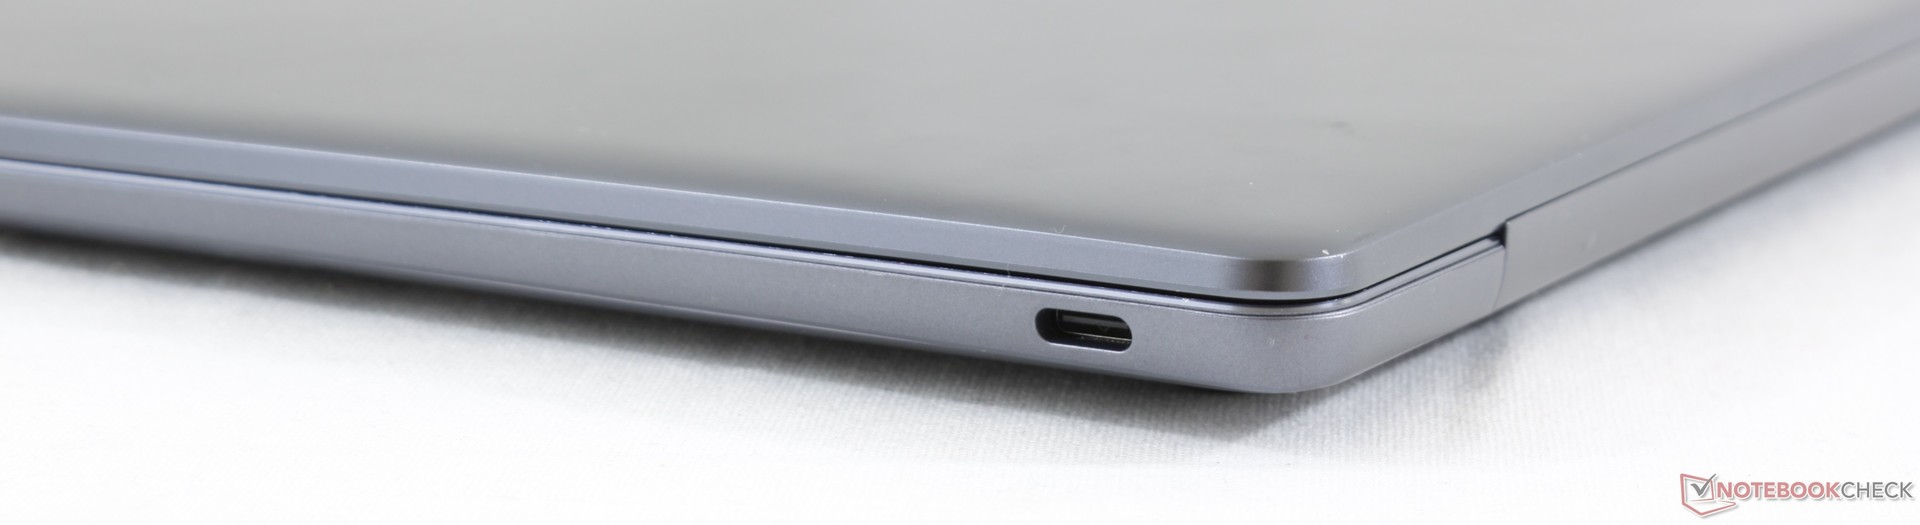
Available ports are limited to just two USB Type-C ports. Furthermore, only the left port is capable of recharging the laptop as a pop-up warning message will occur if attempting to charge through the right port. Either port can still be used to charge external devices such as smartphones. In contrast, the Razer Blade Stealth can be charged from any of its multiple USB Type-C ports.
Thunderbolt 3 is absent likely to further differentiate the laptop from the higher-end MateBook X Pro. There is no SD card reader as well unlike on the competing XPS 13 or ZenBook UX333. DisplayPort can be connected via the right USB Type-C port.
Communication
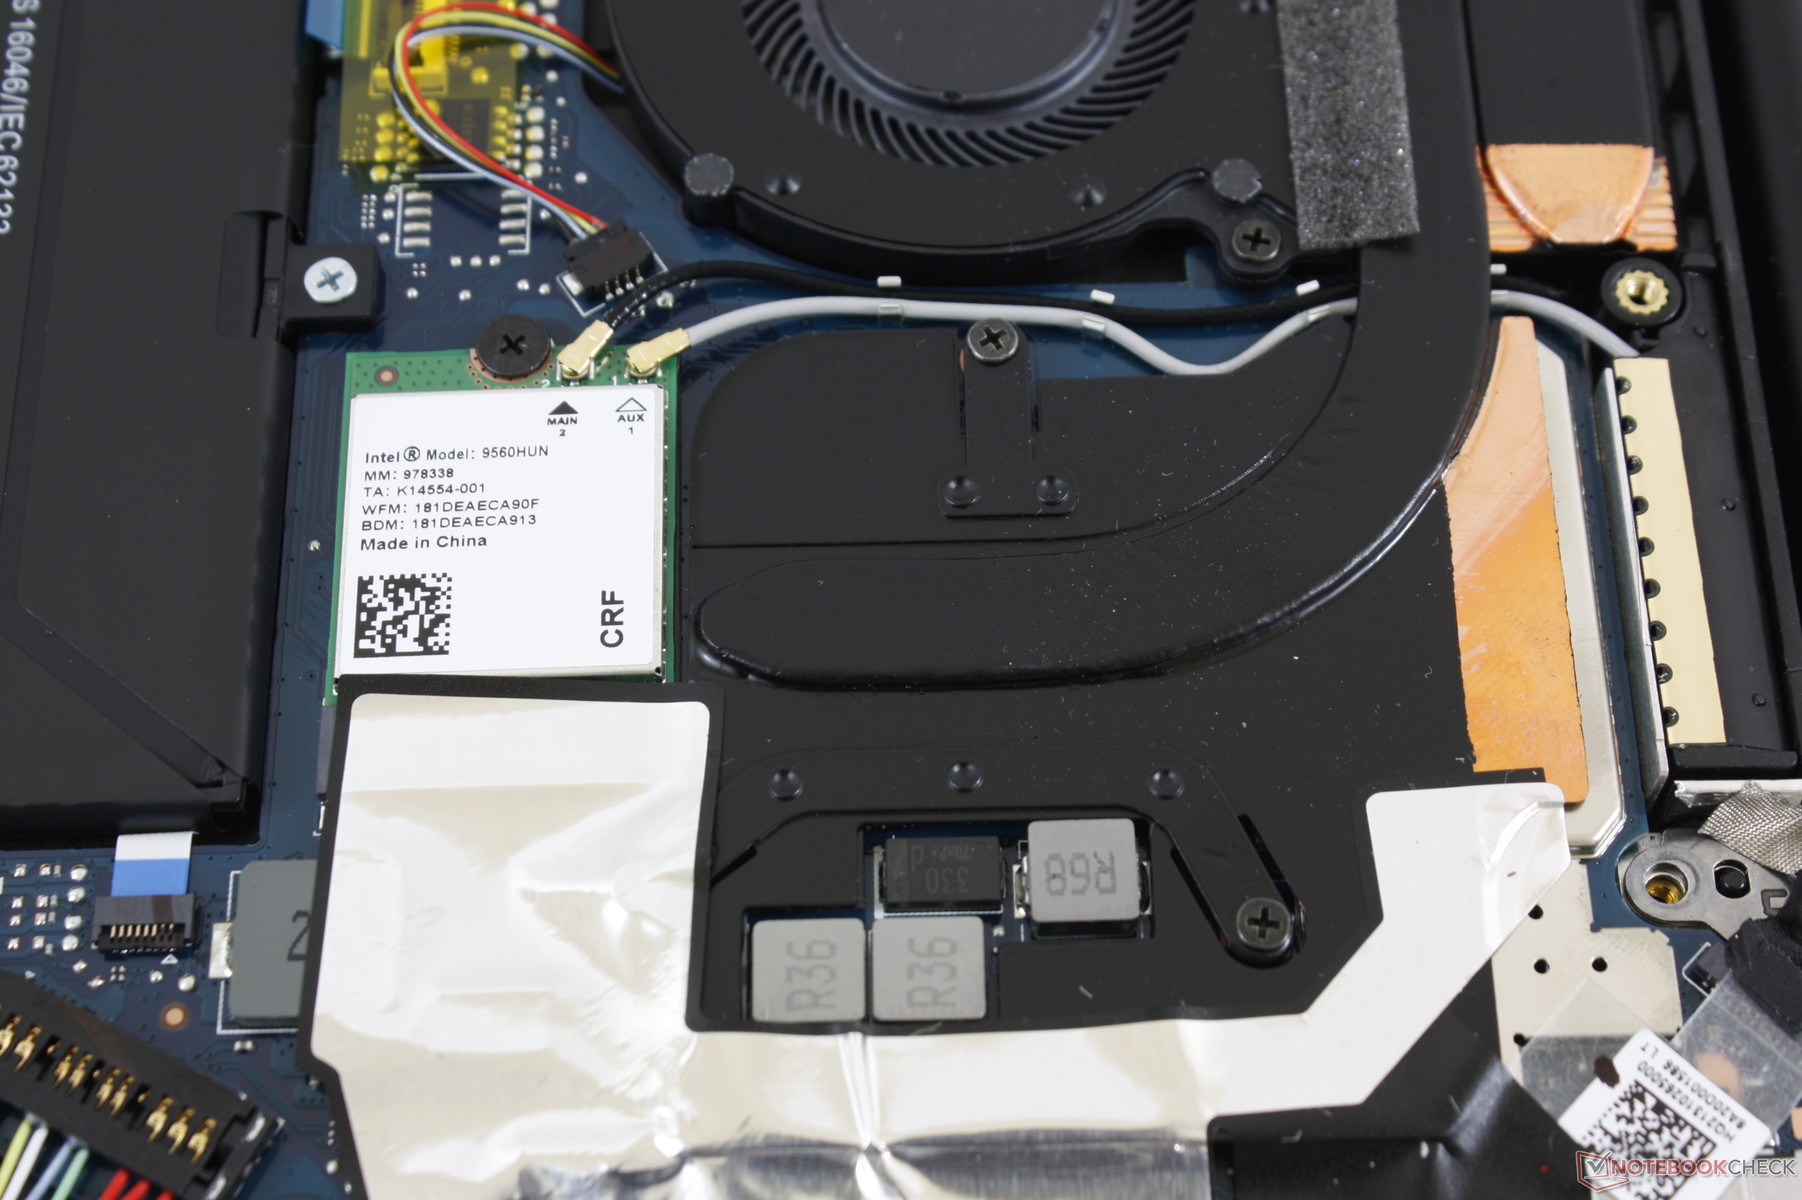
WLAN is provided by an Intel 9560 with integrated Bluetooth 5. Theoretical transfer rates are up to 1.73 Gbps if the connected network supports it. Our numbers below are significantly slower since our server setup is limited by a 1 Gbps line.
We didn't experience any connectivity issues during our time with the unit. It's worth pointing out that the MateBook X Pro uses the older and slower Intel 8265 with Bluetooth 4.2.
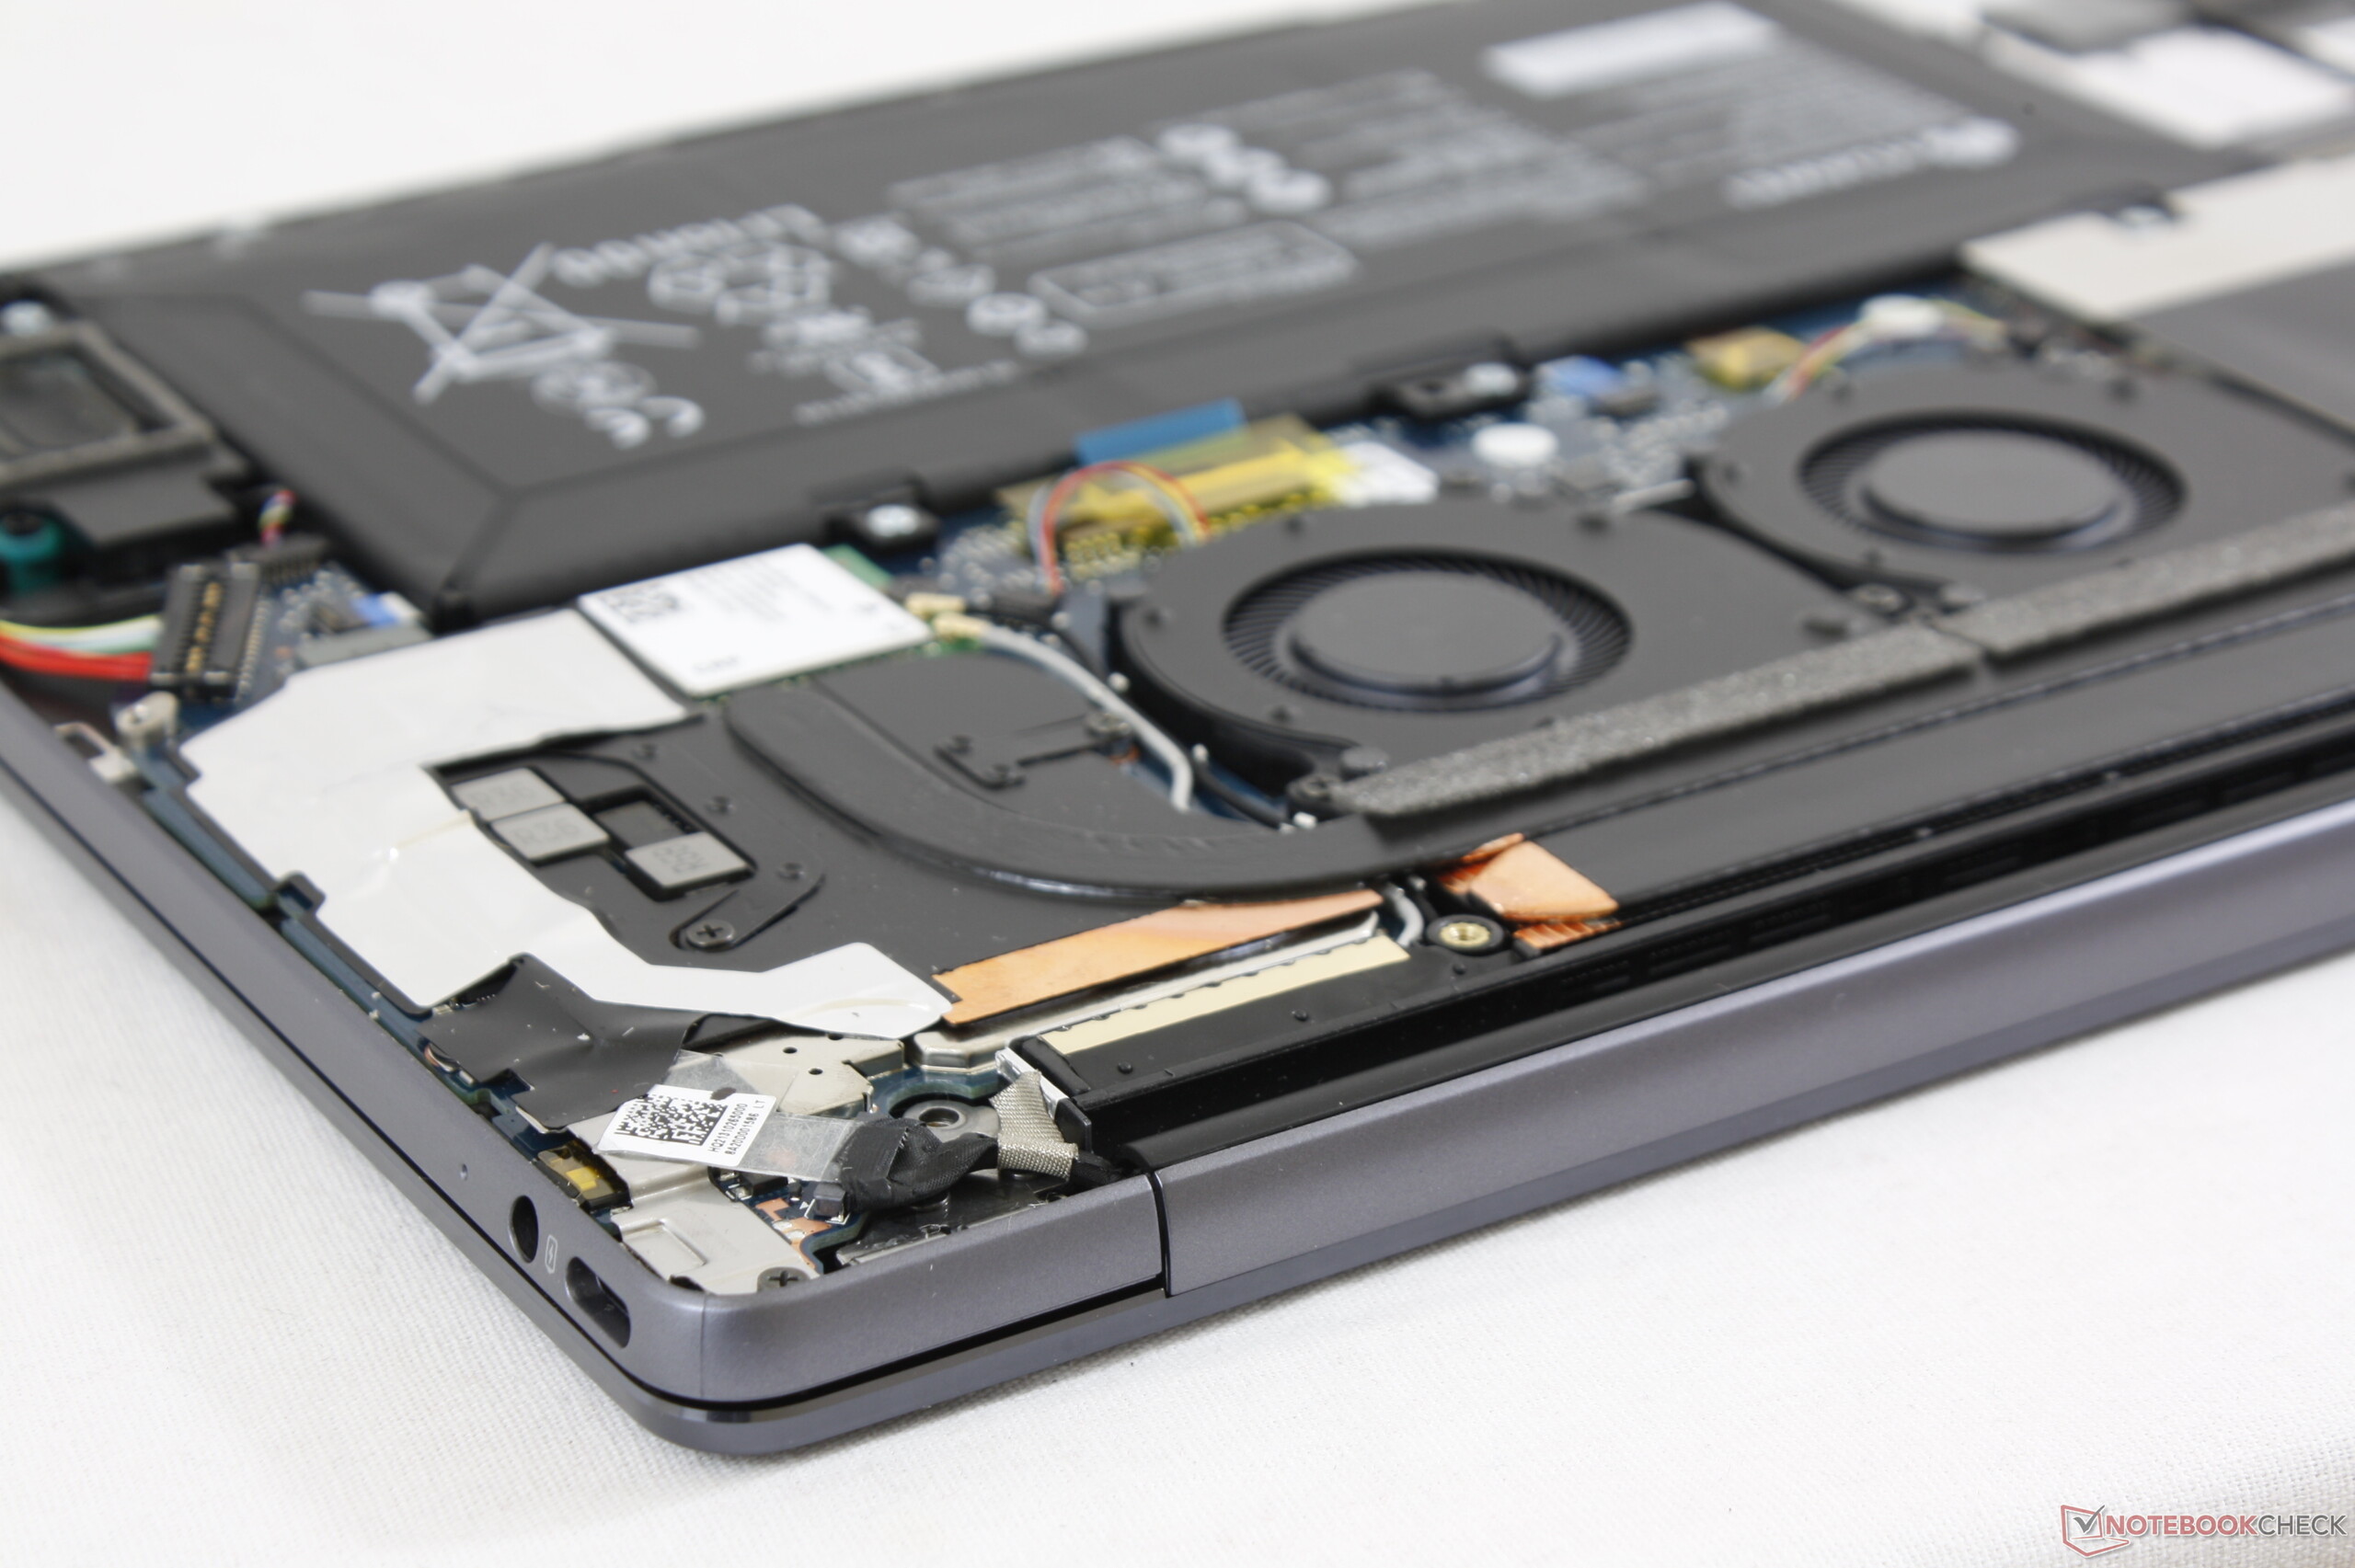
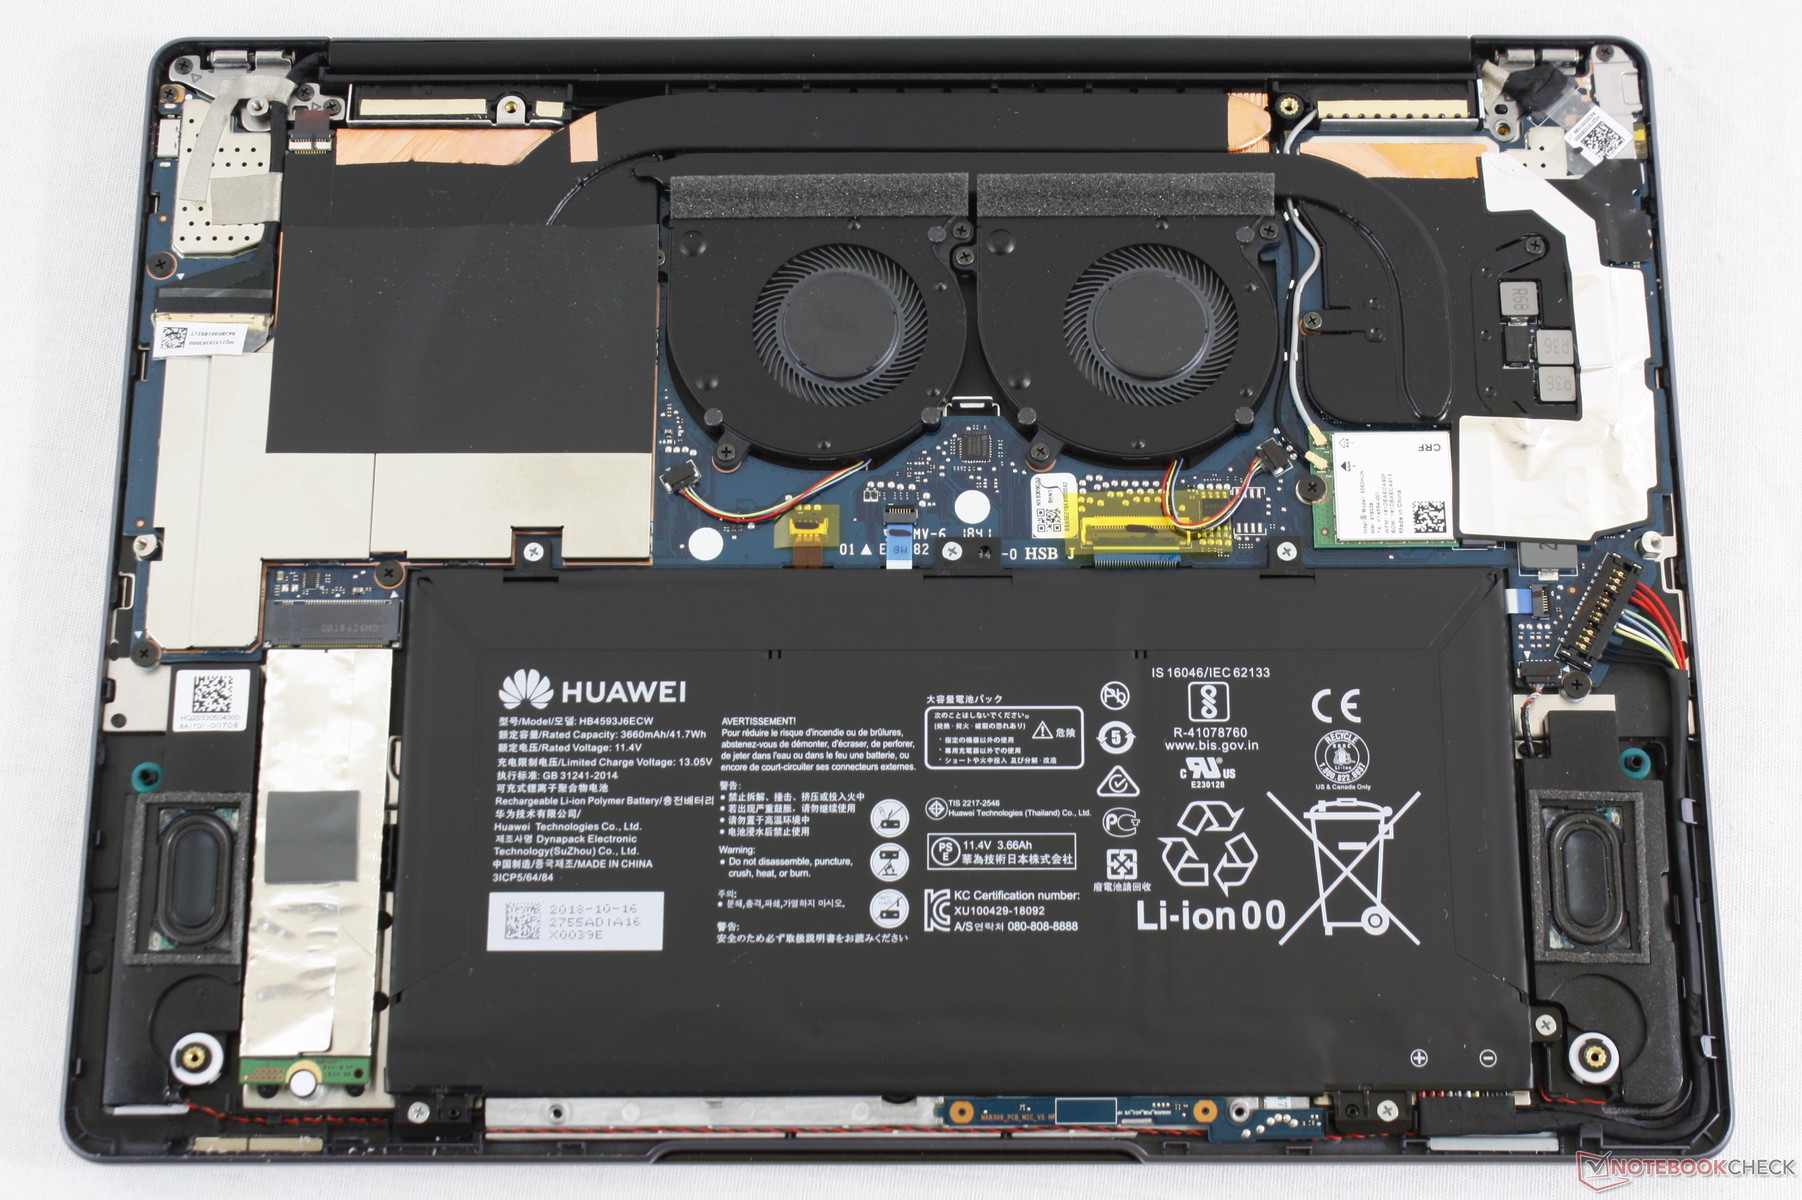
Maintenance
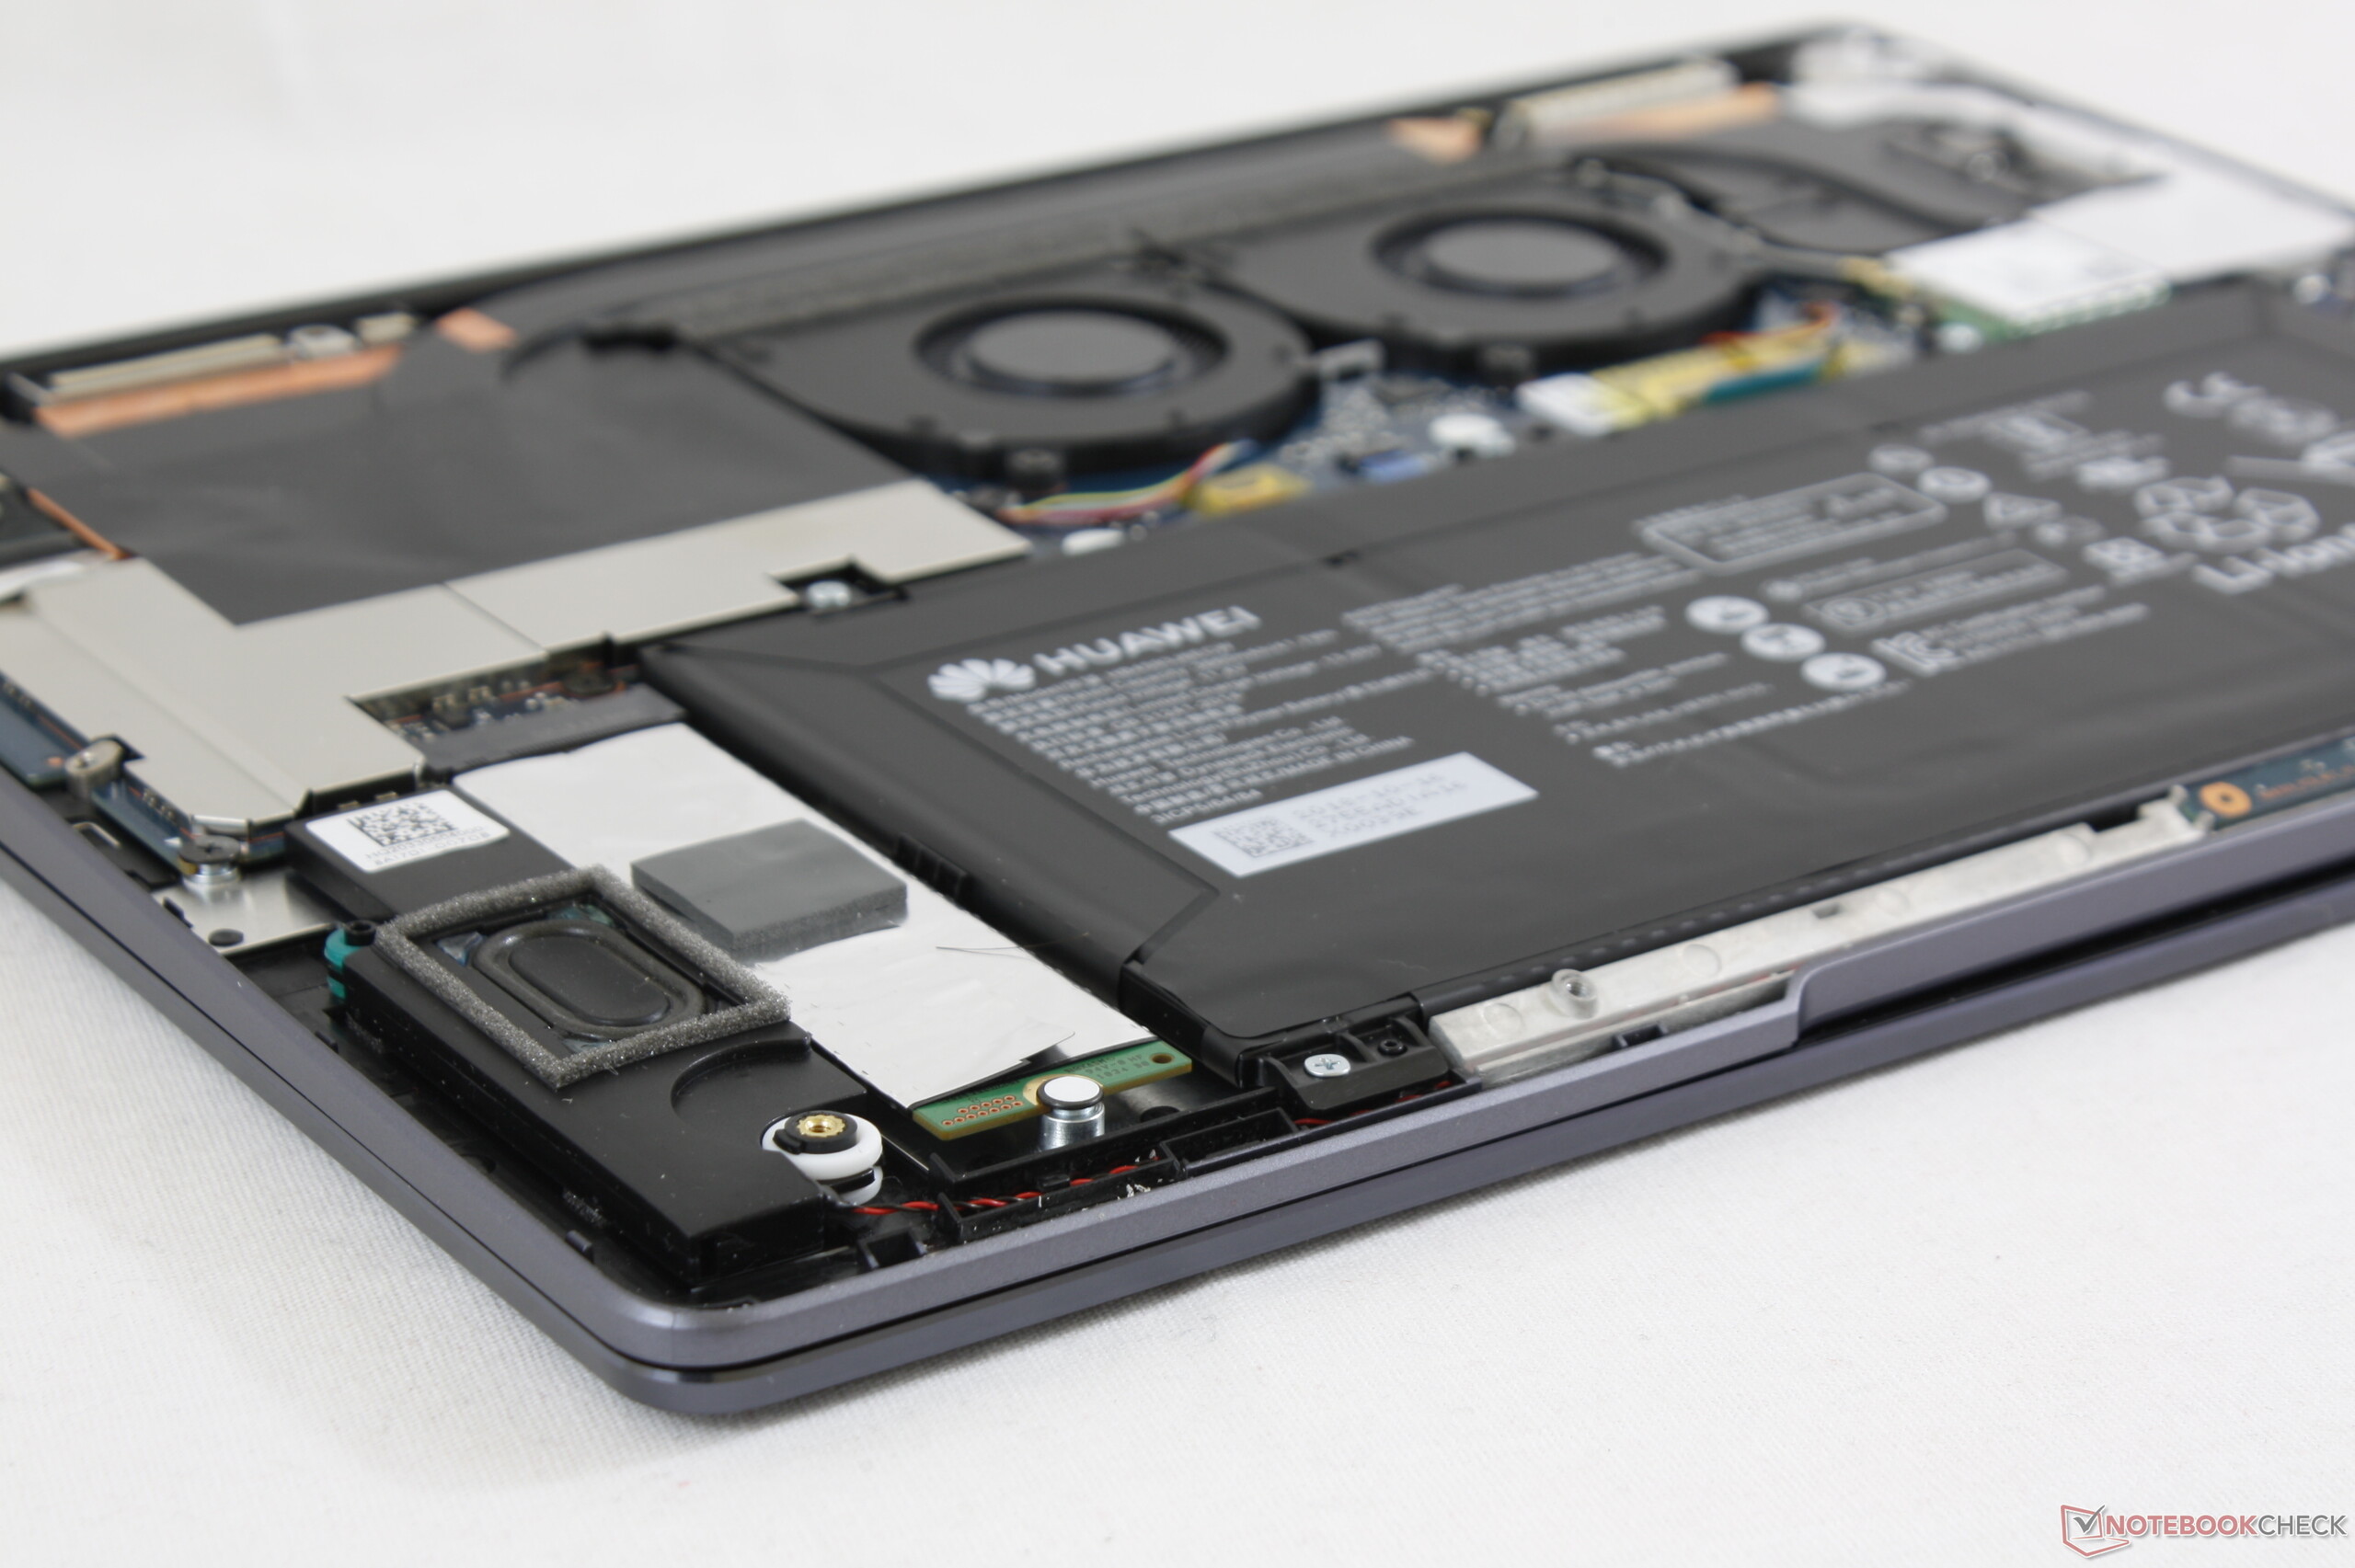
Serviceability is possible even though Huawei does not recommend it. The bottom panel is secured by six Torx screws in addition to four Philips screws hidden underneath the glued rubber feet. Internal layout and design are completely different from the MateBook X Pro despite the fact that both laptops share similar chassis characteristics.
Accessories and Warranty
Huawei throws in a free MateDock 2 USB Type-C dock in the box to make up for the limited integrated ports. The portable dock adds USB 3.0 Type-A, USB 3.0 Type-C, VGA, and full-size HDMI with support for up to 2160p30. An Ethernet port would have been appreciated.
The standard one-year limited warranty applies if purchased in the US. Please see our Guarantees, Return policies and Warranties article for country-specific information.
Input Devices
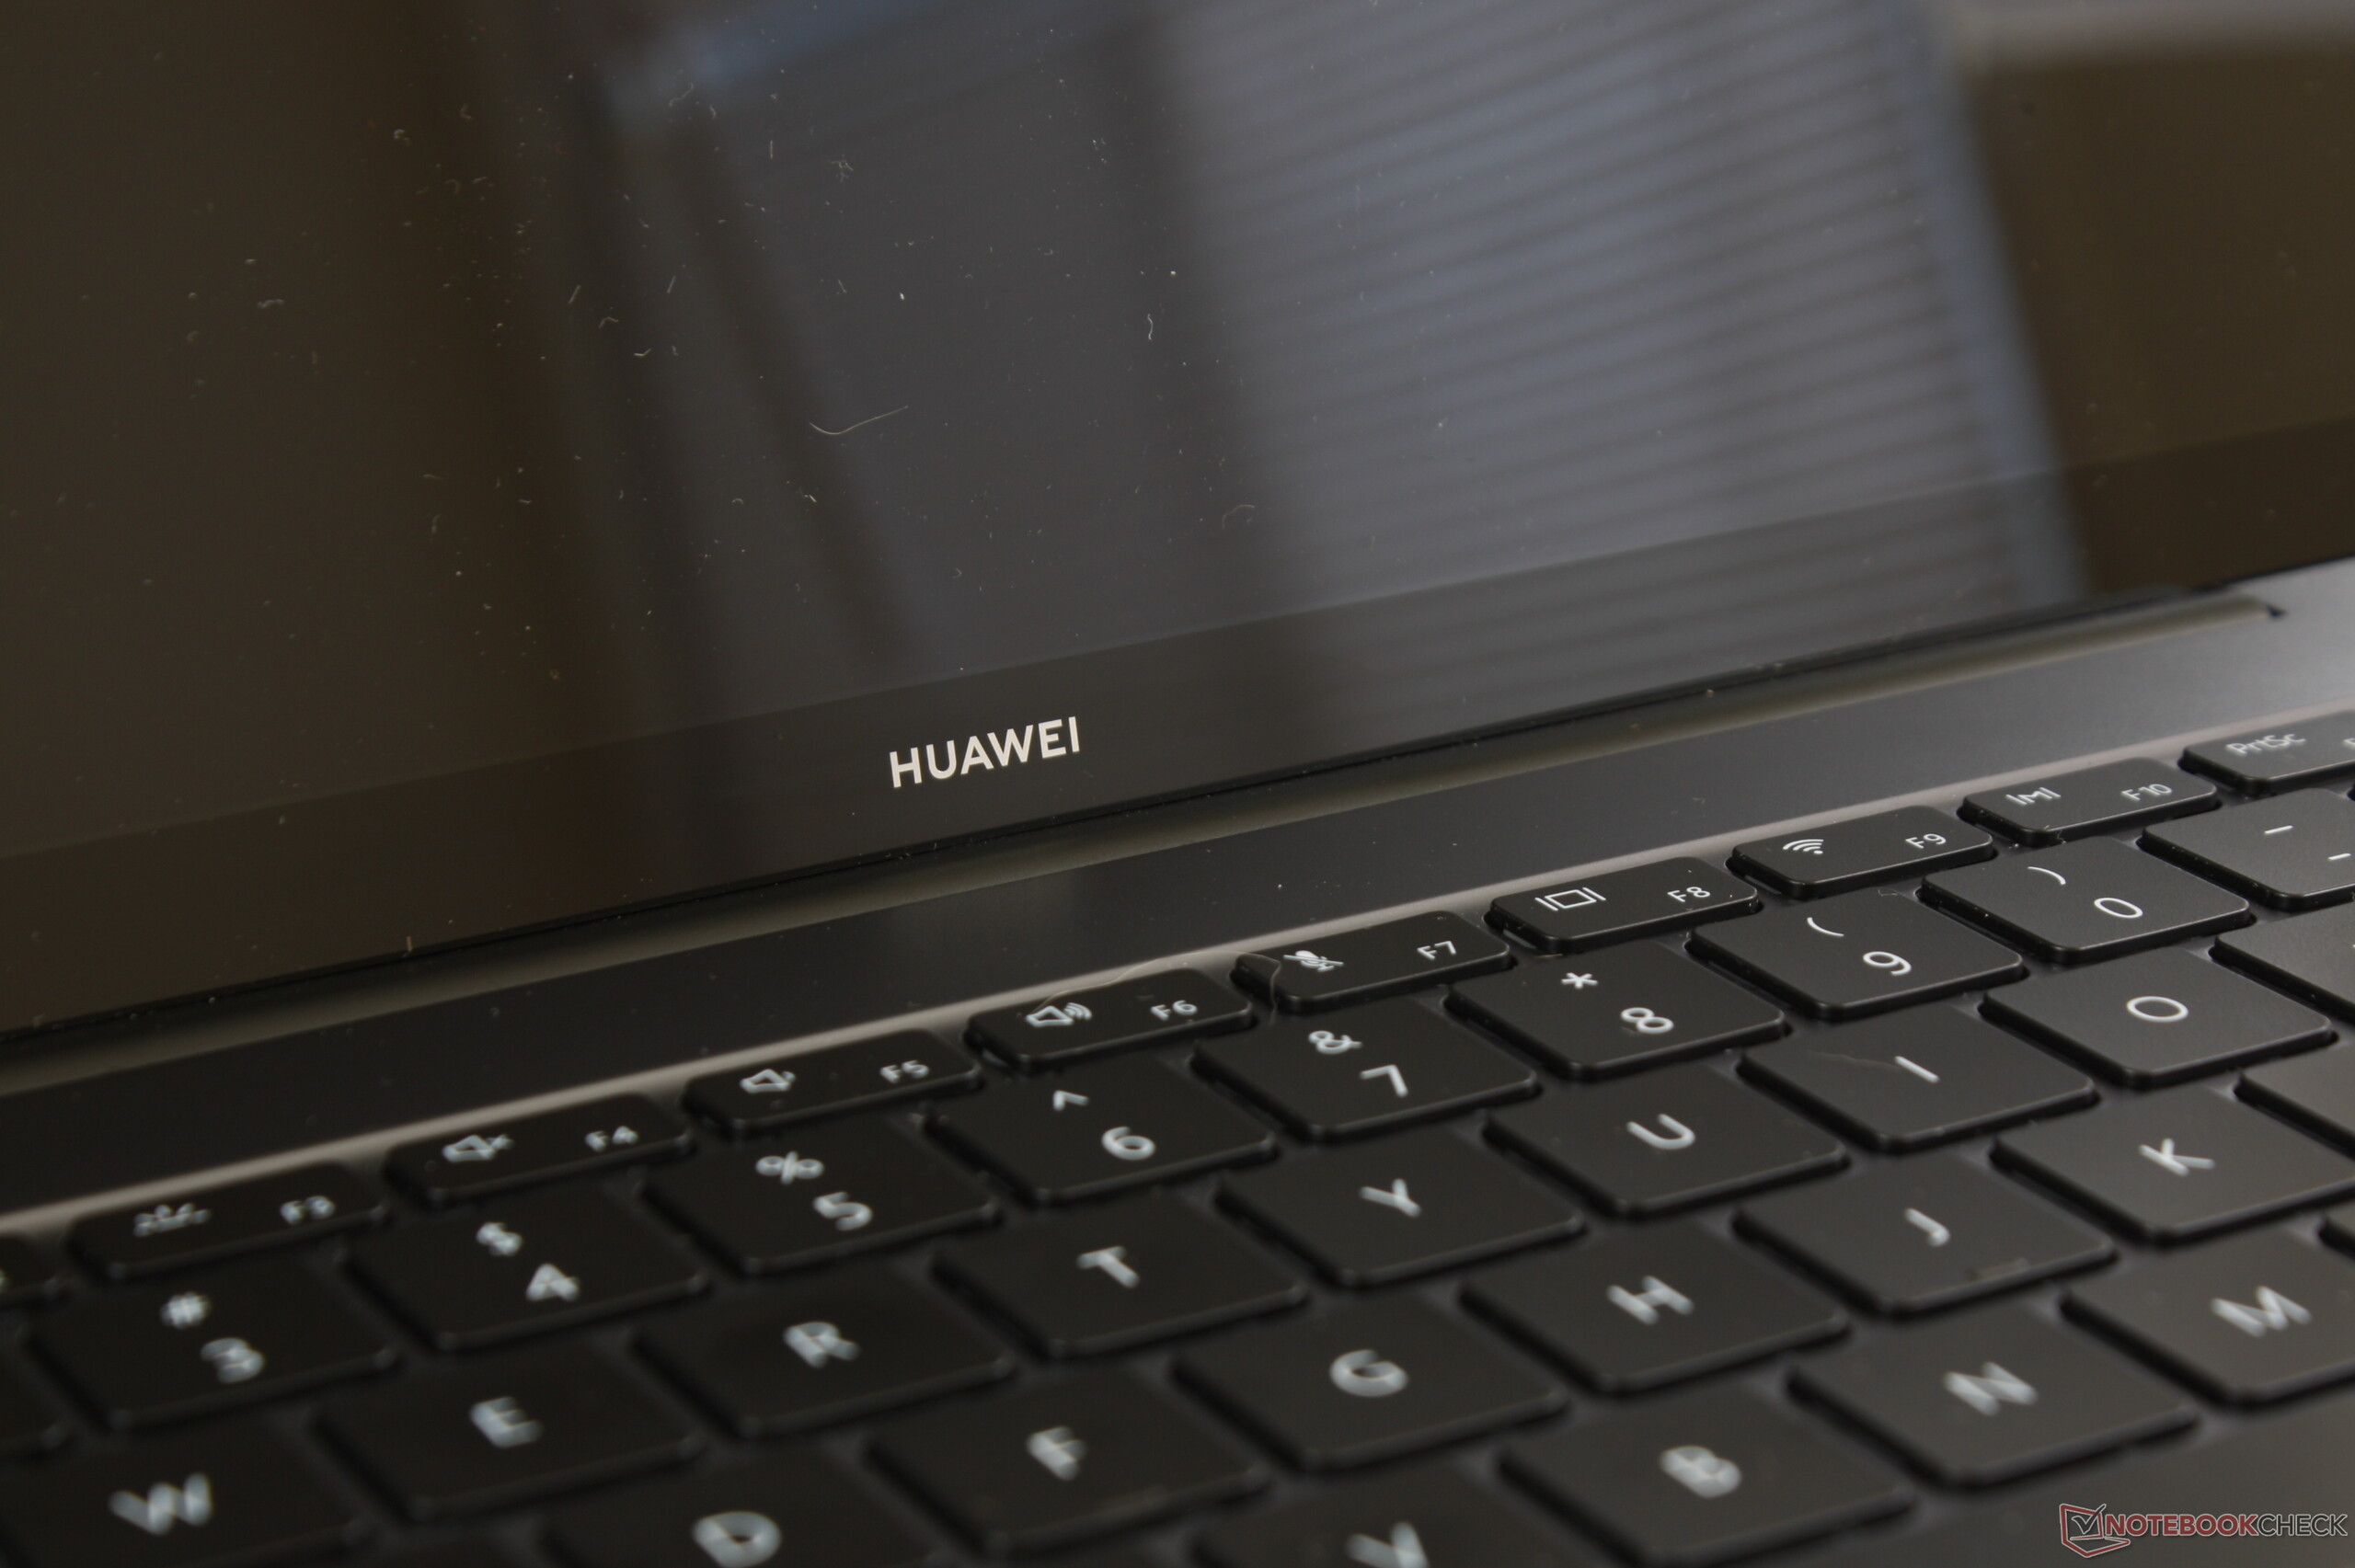
Keyboard
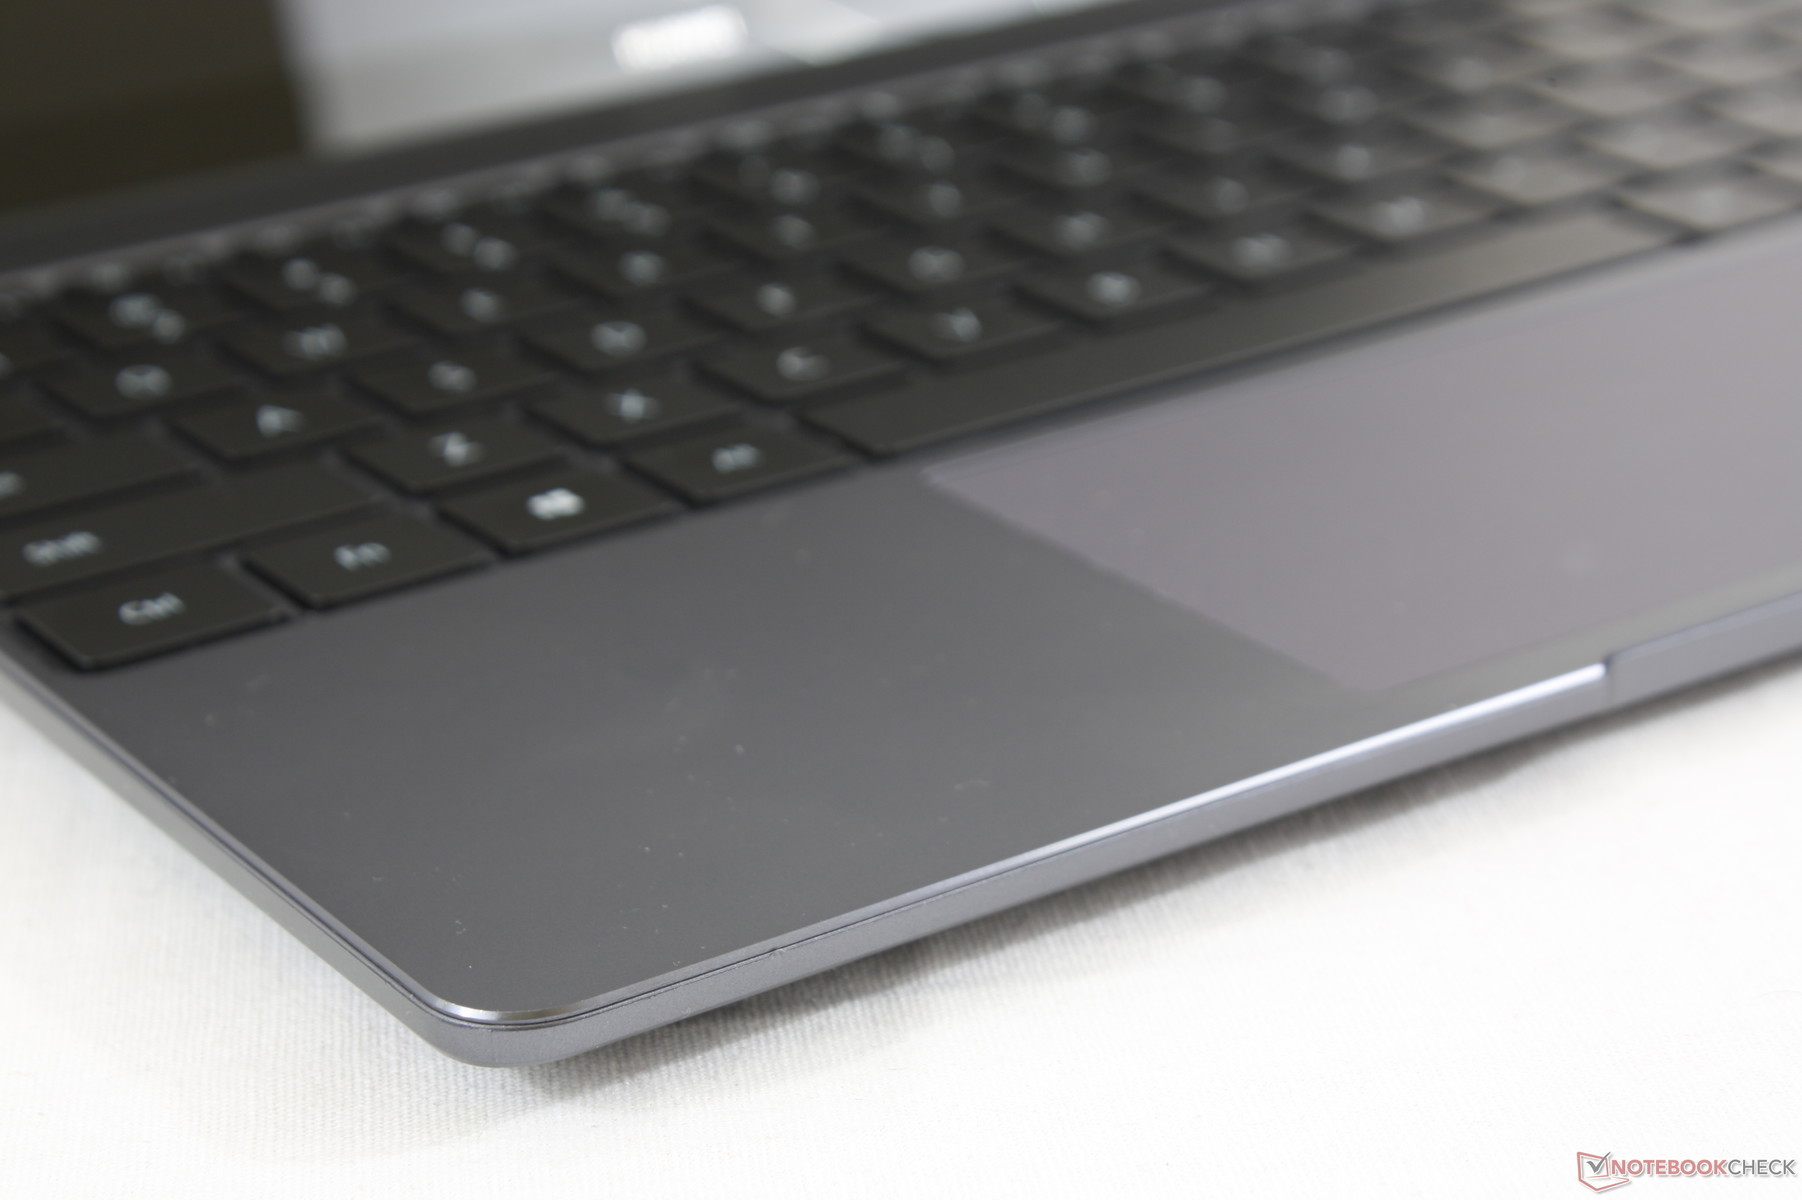
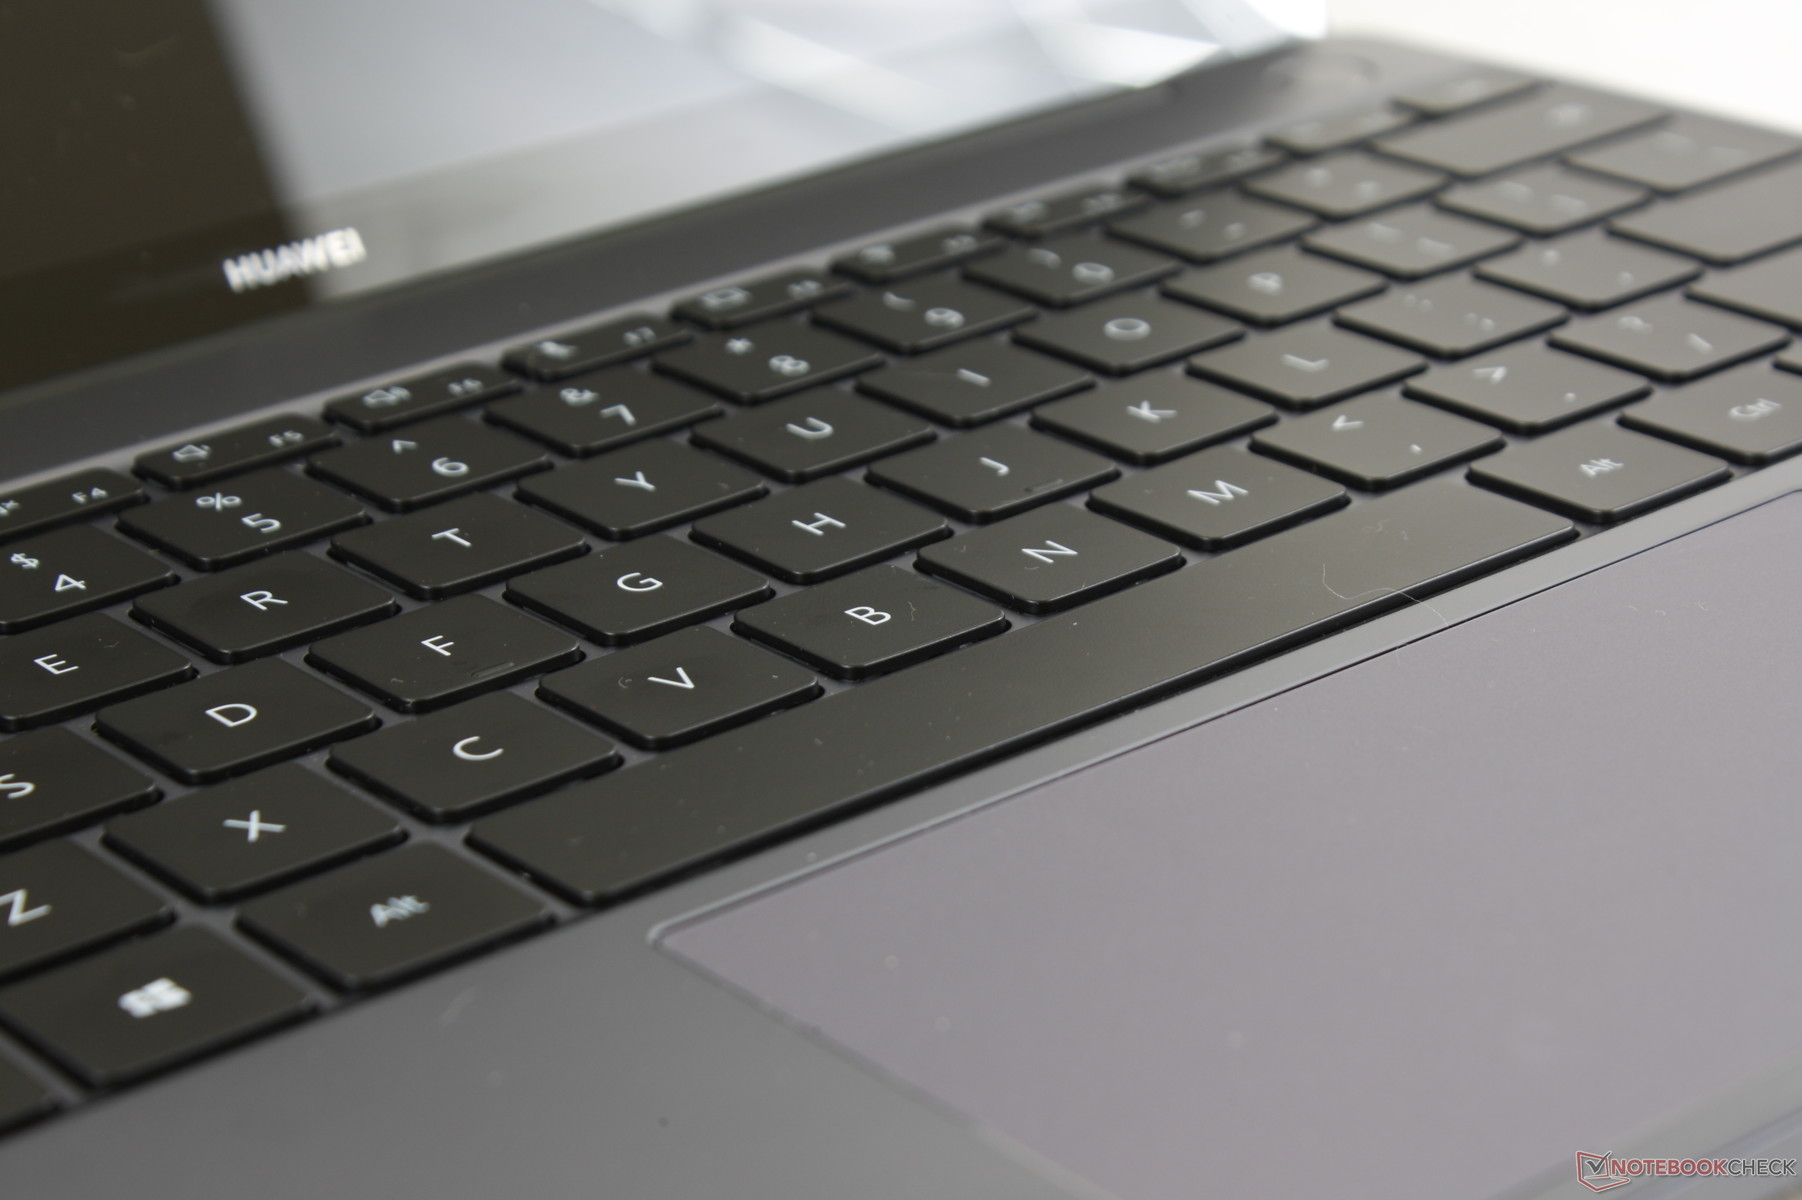
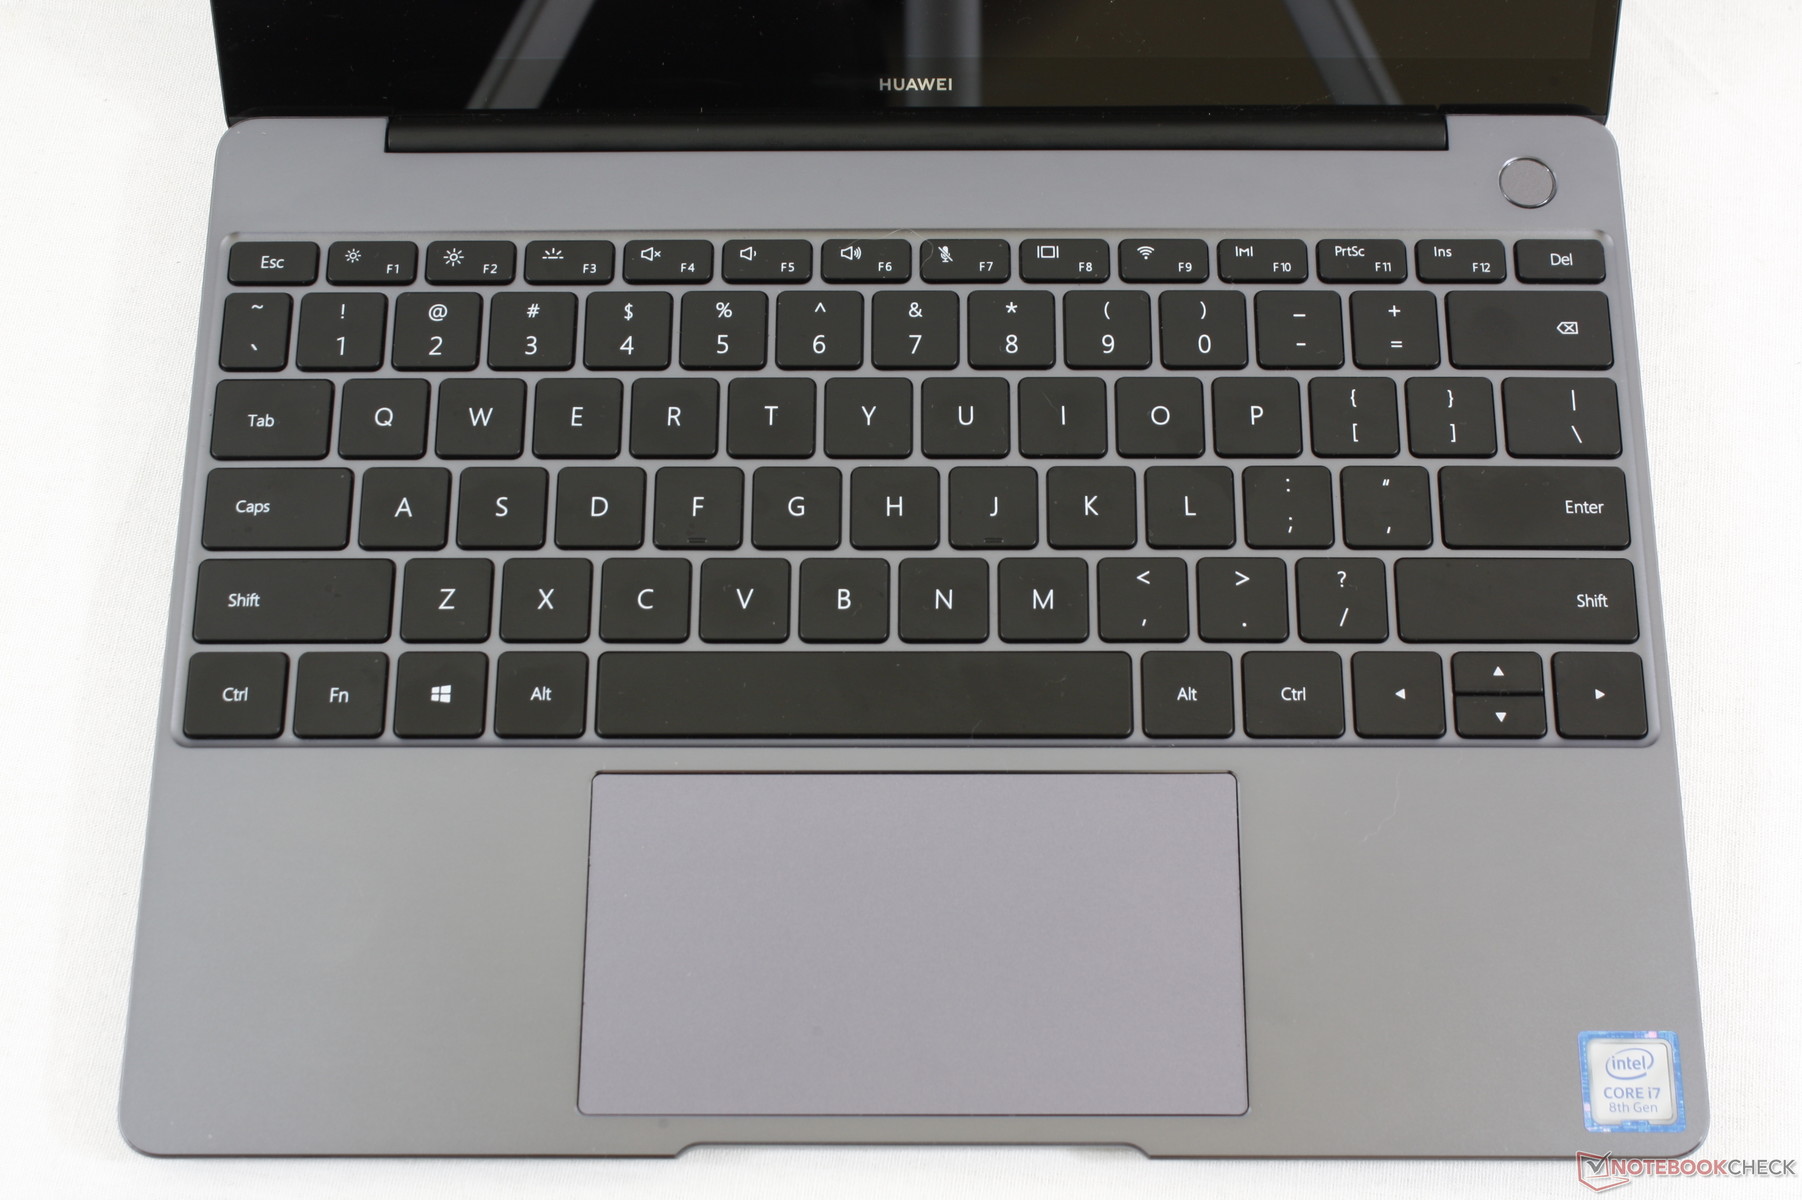
The laptop offers the same size keyboard (~27.6 x 10.5 cm) as on the larger MateBook X Pro. Despite this, feedback and travel seem spongier with quieter-than-average clatter. Firmer feedback and perhaps a deeper travel of 1.5 mm like on the Spectre x360 15 would have avoided the typically shallow typing experience commonly associated with mainstream Ultrabooks.
A two-level white backlight is included by default and we appreciate that both the FN and Caps Lock keys have individual LEDs when toggled. The Up and Down arrow keys are unfortunately halved in size with weak feedback.
Touchpad
The extra-wide (12 x 6.5 cm) Precision clickpad is larger than the clickpad on the XPS 13 (10.5 x 6 cm) while being smaller than the one on the MateBook X Pro (12 x 7.8 cm). It offers a smooth and uniform glide no matter the cursor speed with no responsiveness issues around corners and edges.
The integrated mouse keys are shallow and somewhat soft relative to the loud audible click when pressed. Drag and drop actions are still relatively easy nonetheless due to the ample surface area available.
Unlike the aluminum surfaces surrounding it, the trackpad collects and accumulates fingerprints very quickly. We suspect that its surface will become glossy with unsightly grease over time.
Display
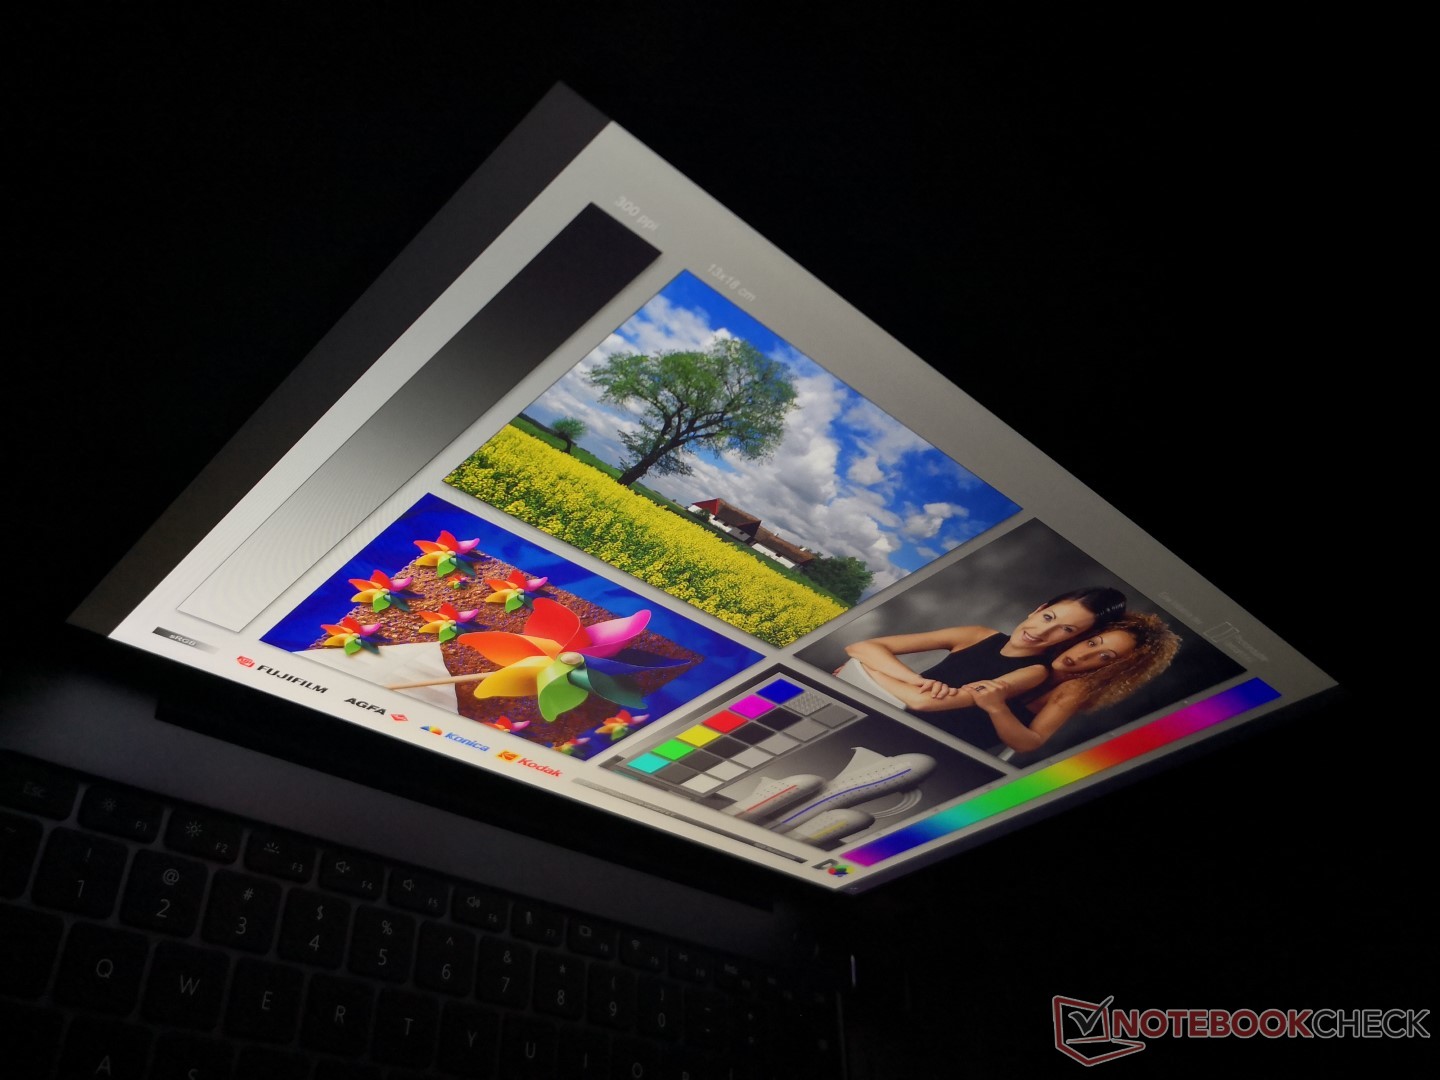
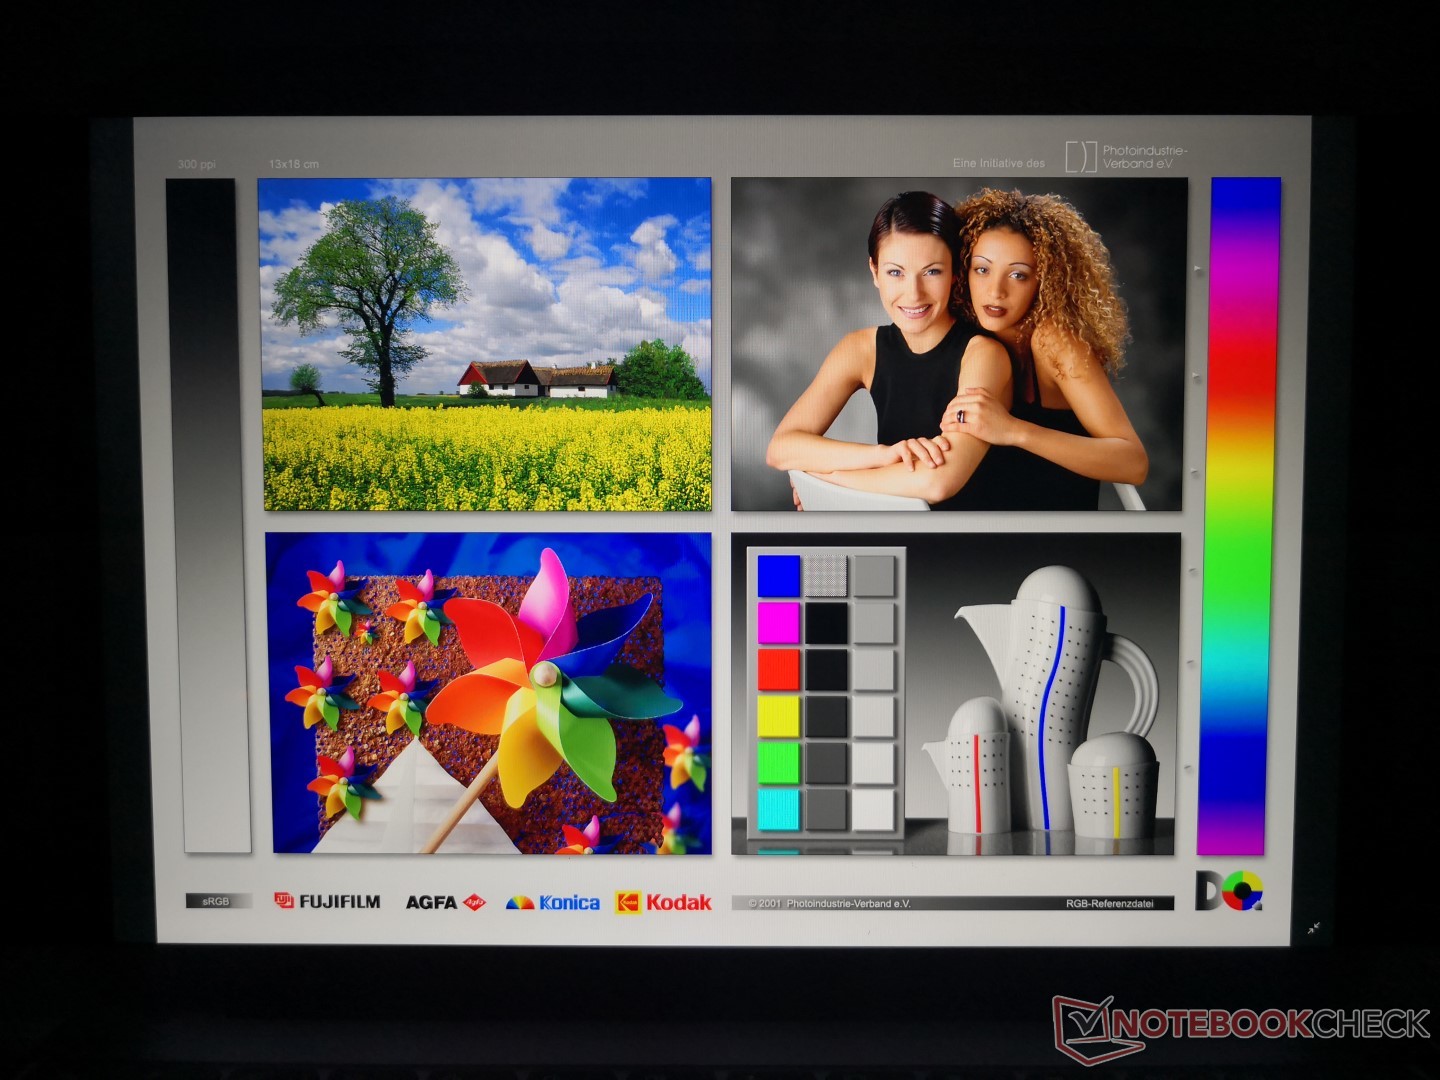
Instead of being a "me too" Ultrabook, Huawei decided to forego the common 16:9 aspect ratio for 3:2. Even so, this is where the MateBook 13 differentiates itself the most from the MateBook X Pro as core characteristics like size, resolution, response times, PPI, brightness, and contrast are all a step down from the pricier Pro version. It's still a very high quality glossy touchscreen regardless with a similar color gamut to the Pro model for positive first impressions all around. The 13.9-inch Yoga C930, for example, is comparatively dimmer and with less accurate colors out of the box.
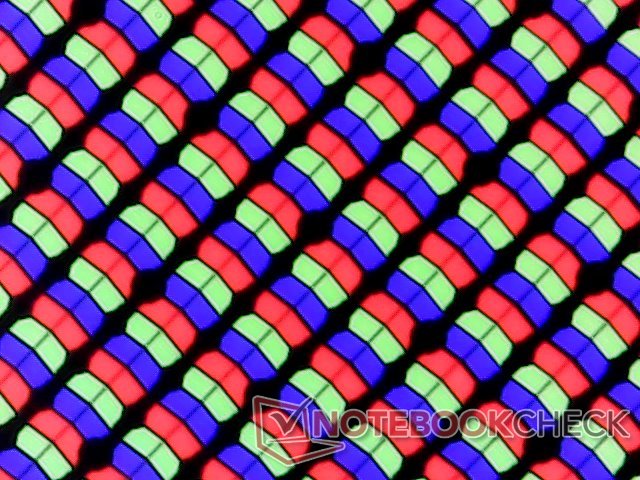
The Chi Mei CMN8201 panel in use here is not unlike the Chi Mei panel on the original 2017 MateBook X albeit just slightly smaller.
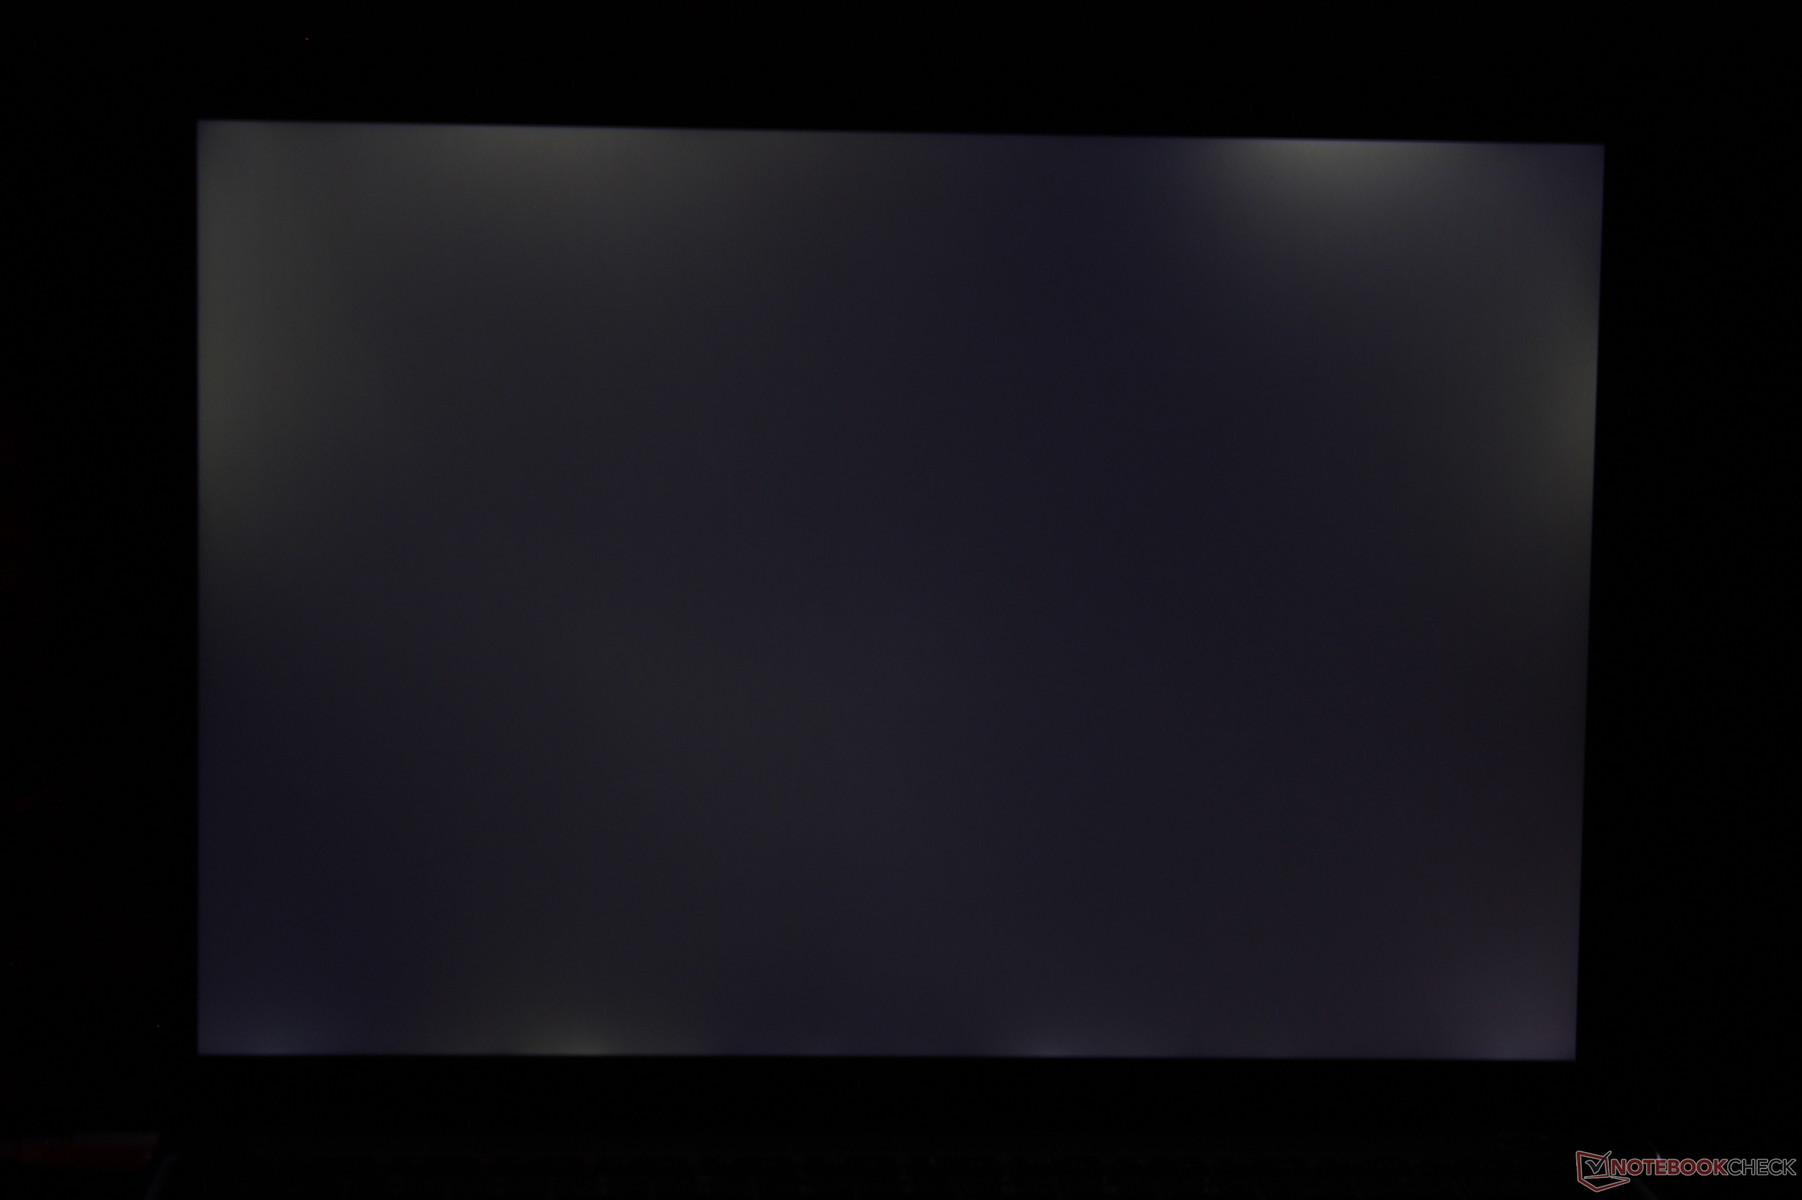
Our test unit exhibits heavy uneven backlight bleeding as shown by the image below. This is unexpected considering the four-digit price range of the system and we can only hope that it isn't widespread on consumer units. The light bleed is generally unnoticeable during day-to-day use, but it will be visible during video playback or the system boot up sequence.

| |||||||||||||||||||||||||
Brightness Distribution: 93 %
Center on Battery: 366.7 cd/m²
Contrast: 940:1 (Black: 0.39 cd/m²)
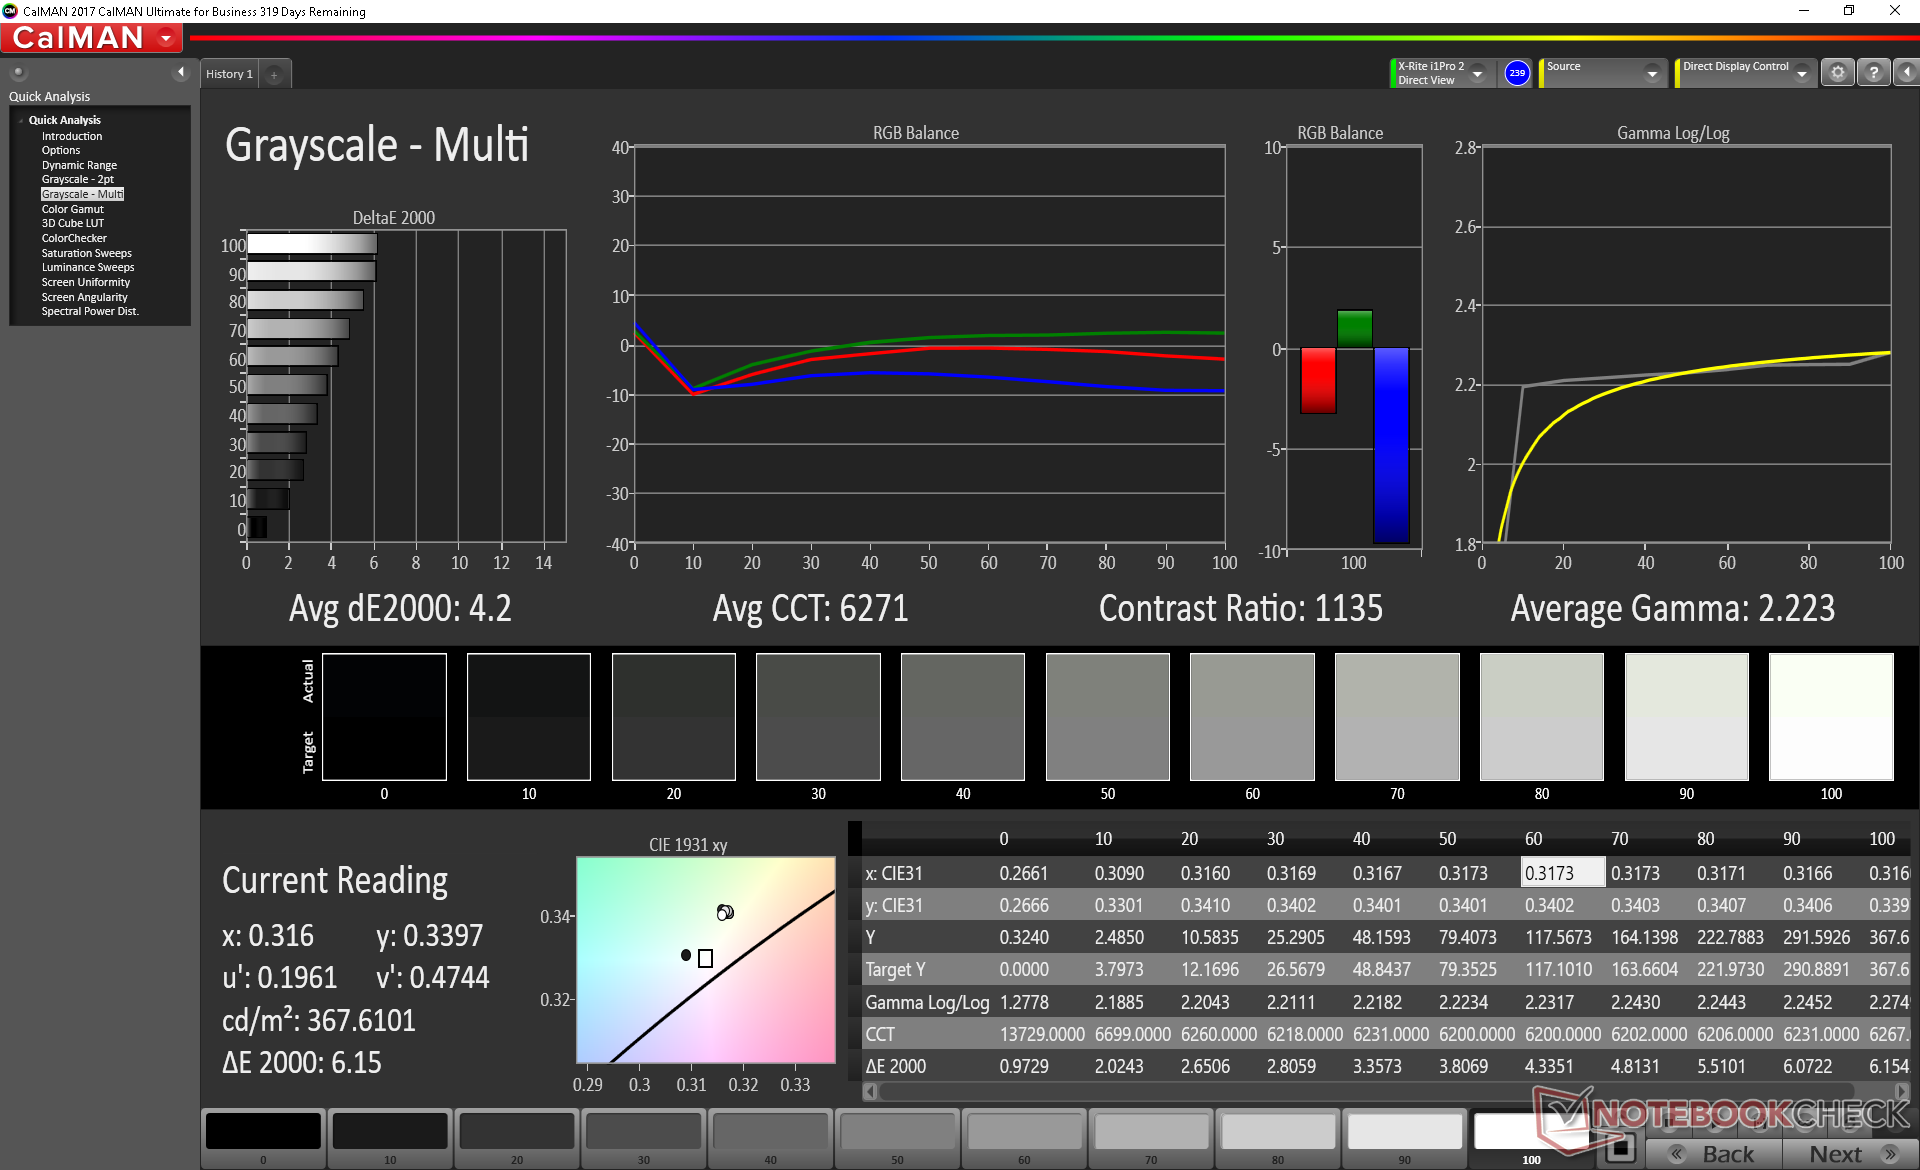
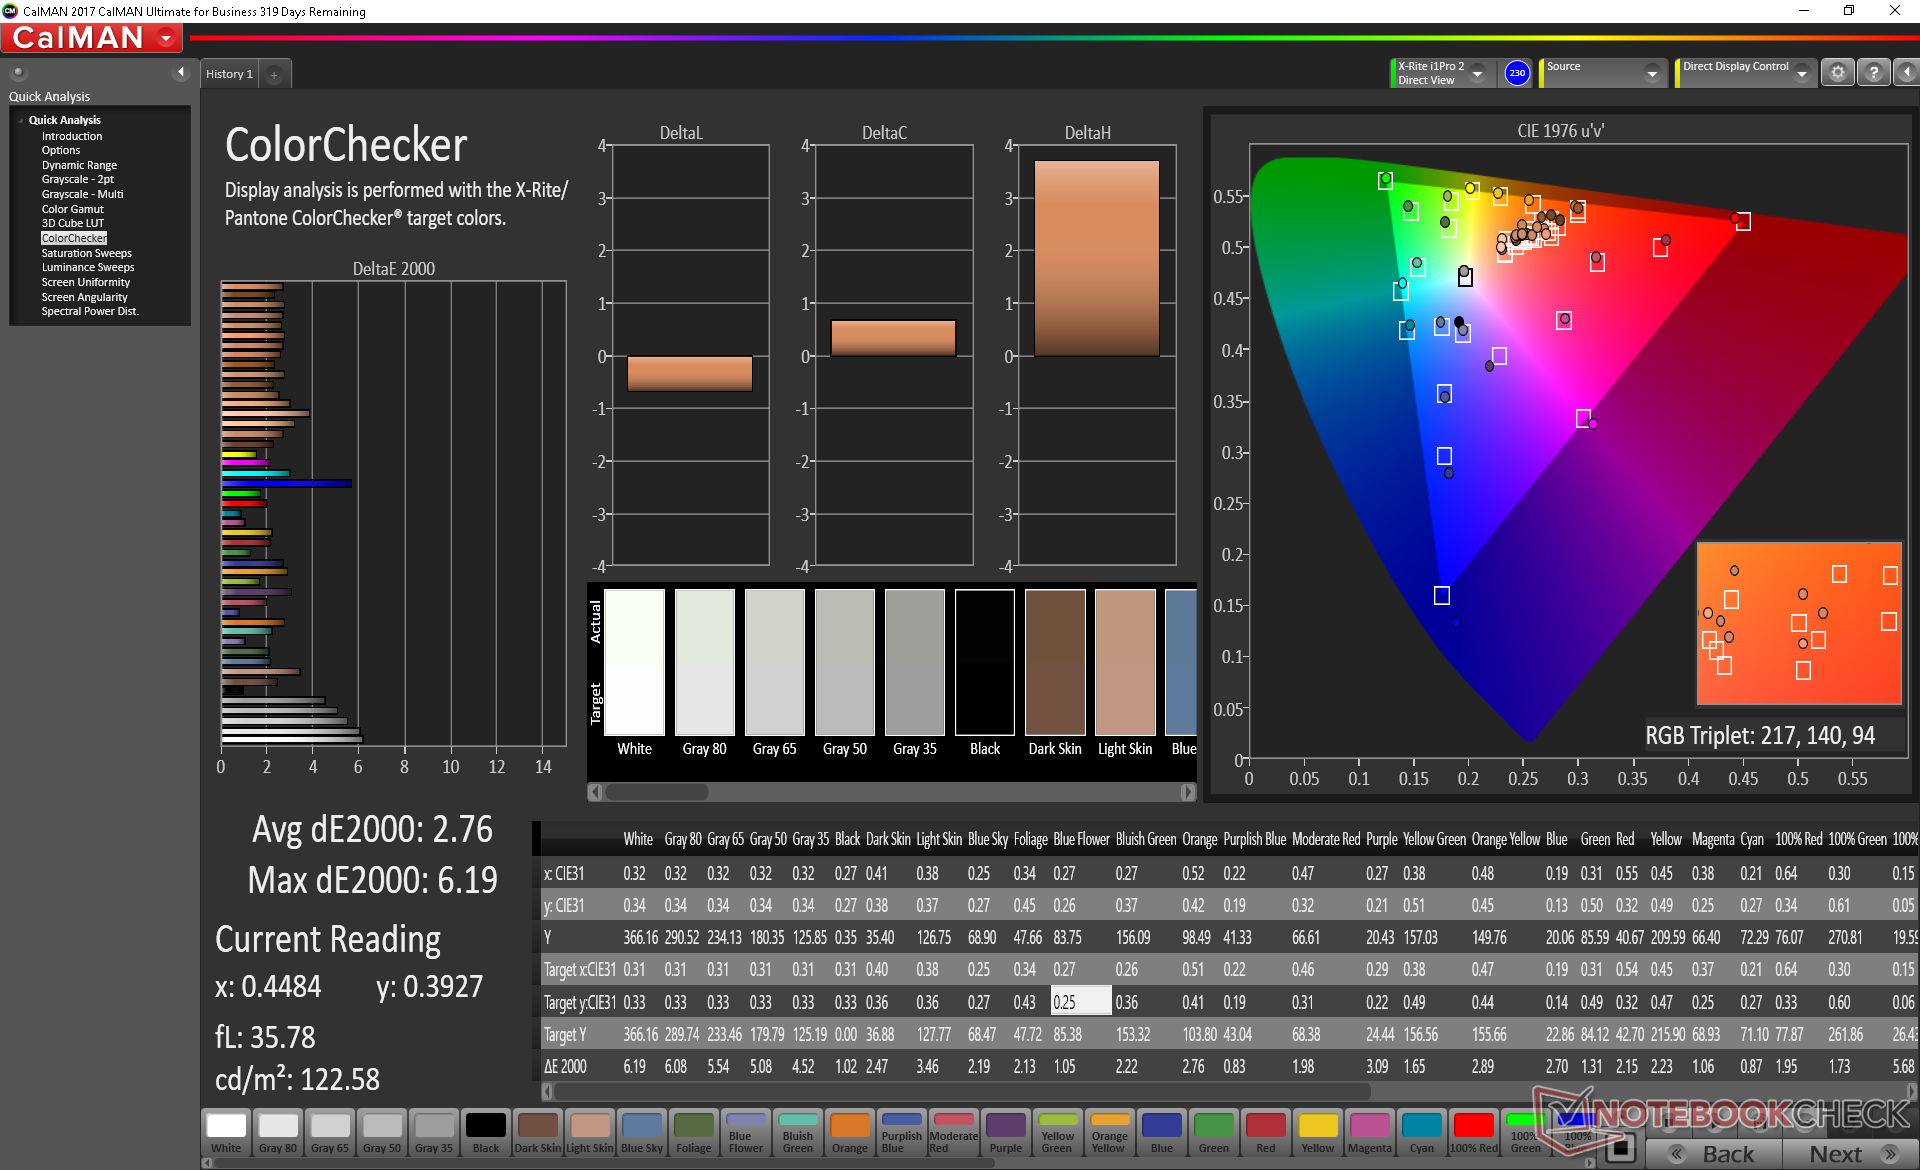
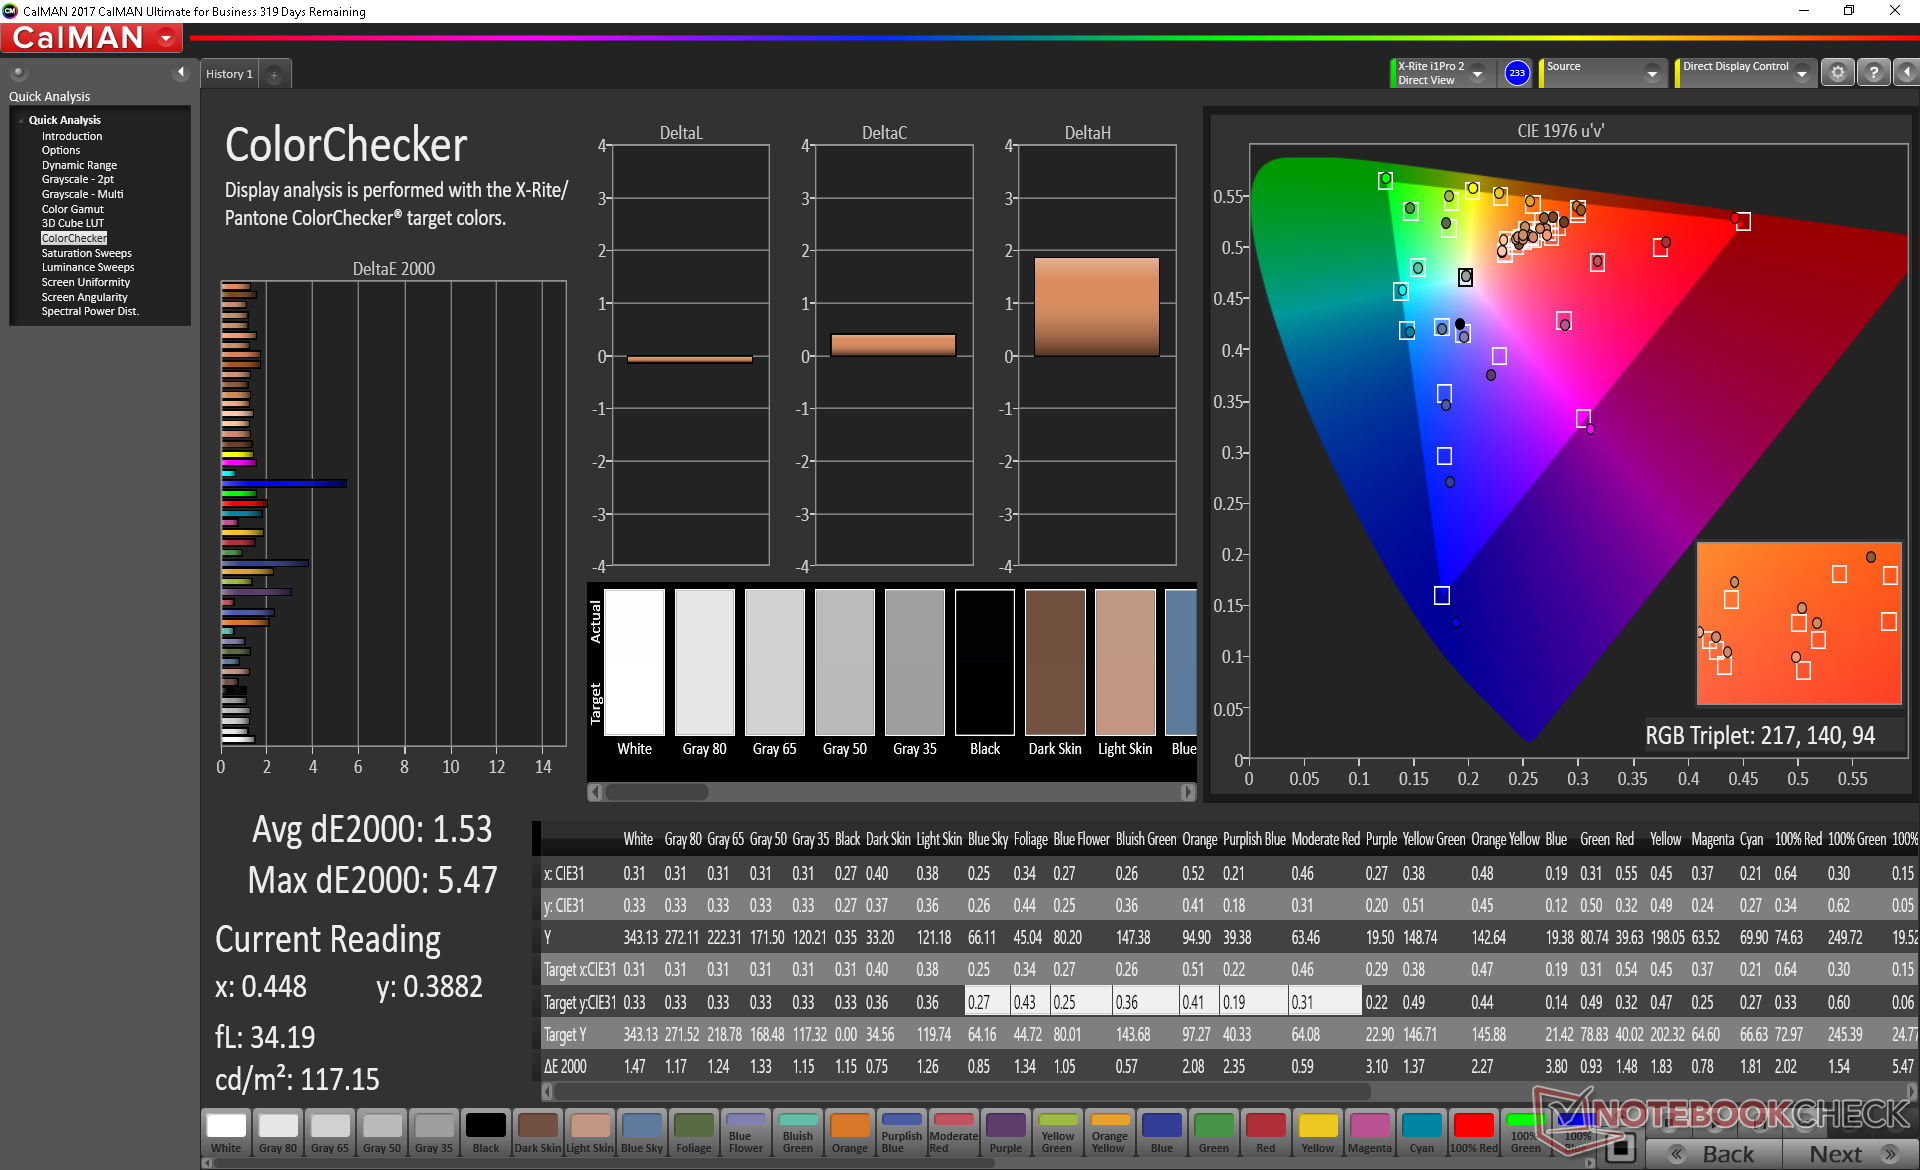
ΔE ColorChecker Calman: 2.76 | ∀{0.5-29.43 Ø4.72}
calibrated: 1.53
ΔE Greyscale Calman: 4.2 | ∀{0.09-98 Ø4.97}
97.6% sRGB (Argyll 1.6.3 3D)
63.2% AdobeRGB 1998 (Argyll 1.6.3 3D)
69.2% AdobeRGB 1998 (Argyll 3D)
97.7% sRGB (Argyll 3D)
68.1% Display P3 (Argyll 3D)
Gamma: 2.22
CCT: 6271 K
| Huawei MateBook 13 i7 Chi Mei CMN8201, IPS, 13", 2160x1440 | Dell XPS 13 9370 i7 UHD ID: Sharp SHP148B, Name: LQ133D1, Dell P/N: 8XDHY, IPS, 13.3", 3840x2160 | Apple MacBook Pro 13 2018 Touchbar i5 APPA03E, IPS, 13.3", 2560x1600 | HP Spectre x360 13t-ae000 LGD0588, IPS, 13.3", 3840x2160 | Lenovo Yoga C930-13IKB B139HAN03_0, IPS, 13.9", 1920x1080 | Huawei Matebook X Pro i5 Tianma XM, IPS, 13.9", 3000x2000 | |
|---|---|---|---|---|---|---|
| Display | 1% | 24% | 4% | -4% | -3% | |
| Display P3 Coverage (%) | 68.1 | 68.9 1% | 98.5 45% | 71.9 6% | 64.3 -6% | 65.9 -3% |
| sRGB Coverage (%) | 97.7 | 98.4 1% | 99.9 2% | 98.1 0% | 94.6 -3% | 95.2 -3% |
| AdobeRGB 1998 Coverage (%) | 69.2 | 69.5 0% | 87.3 26% | 73.1 6% | 66.2 -4% | 67.6 -2% |
| Response Times | -50% | -3% | -10% | 10% | 13% | |
| Response Time Grey 50% / Grey 80% * (ms) | 43.2 ? | 69.6 ? -61% | 46 ? -6% | 51.6 ? -19% | 40.8 ? 6% | 40.4 ? 6% |
| Response Time Black / White * (ms) | 32 ? | 44 ? -38% | 32 ? -0% | 32.4 ? -1% | 27.6 ? 14% | 25.6 ? 20% |
| PWM Frequency (Hz) | 3759 ? | 118000 ? | ||||
| Screen | 6% | 34% | 12% | -33% | -0% | |
| Brightness middle (cd/m²) | 366.6 | 478.5 31% | 519 42% | 329.8 -10% | 316 -14% | 442.7 21% |
| Brightness (cd/m²) | 360 | 466 29% | 504 40% | 318 -12% | 291 -19% | 428 19% |
| Brightness Distribution (%) | 93 | 86 -8% | 95 2% | 74 -20% | 83 -11% | 84 -10% |
| Black Level * (cd/m²) | 0.39 | 0.43 -10% | 0.33 15% | 0.25 36% | 0.36 8% | 0.31 21% |
| Contrast (:1) | 940 | 1113 18% | 1573 67% | 1319 40% | 878 -7% | 1428 52% |
| Colorchecker dE 2000 * | 2.76 | 3.09 -12% | 1.4 49% | 2.37 14% | 5.9 -114% | 2.24 19% |
| Colorchecker dE 2000 max. * | 6.19 | 5.94 4% | 2.8 55% | 4.08 34% | 12.9 -108% | 7.19 -16% |
| Colorchecker dE 2000 calibrated * | 1.53 | 2.06 -35% | 1.3 15% | 1.11 27% | ||
| Greyscale dE 2000 * | 4.2 | 2.4 43% | 2.2 48% | 2.8 33% | 8.6 -105% | 9.7 -131% |
| Gamma | 2.22 99% | 2.063 107% | 2.22 99% | 2.145 103% | 2.1 105% | 1.42 155% |
| CCT | 6271 104% | 6883 94% | 6908 94% | 6441 101% | 6854 95% | 6227 104% |
| Color Space (Percent of AdobeRGB 1998) (%) | 63.2 | 69.47 10% | 77.3 22% | 67 6% | 60.7 -4% | 61.6 -3% |
| Color Space (Percent of sRGB) (%) | 97.6 | 98.36 1% | 99.99 2% | 98 0% | 94.5 -3% | 95 -3% |
| Total Average (Program / Settings) | -14% /
-2% | 18% /
27% | 2% /
8% | -9% /
-22% | 3% /
1% |
* ... smaller is better
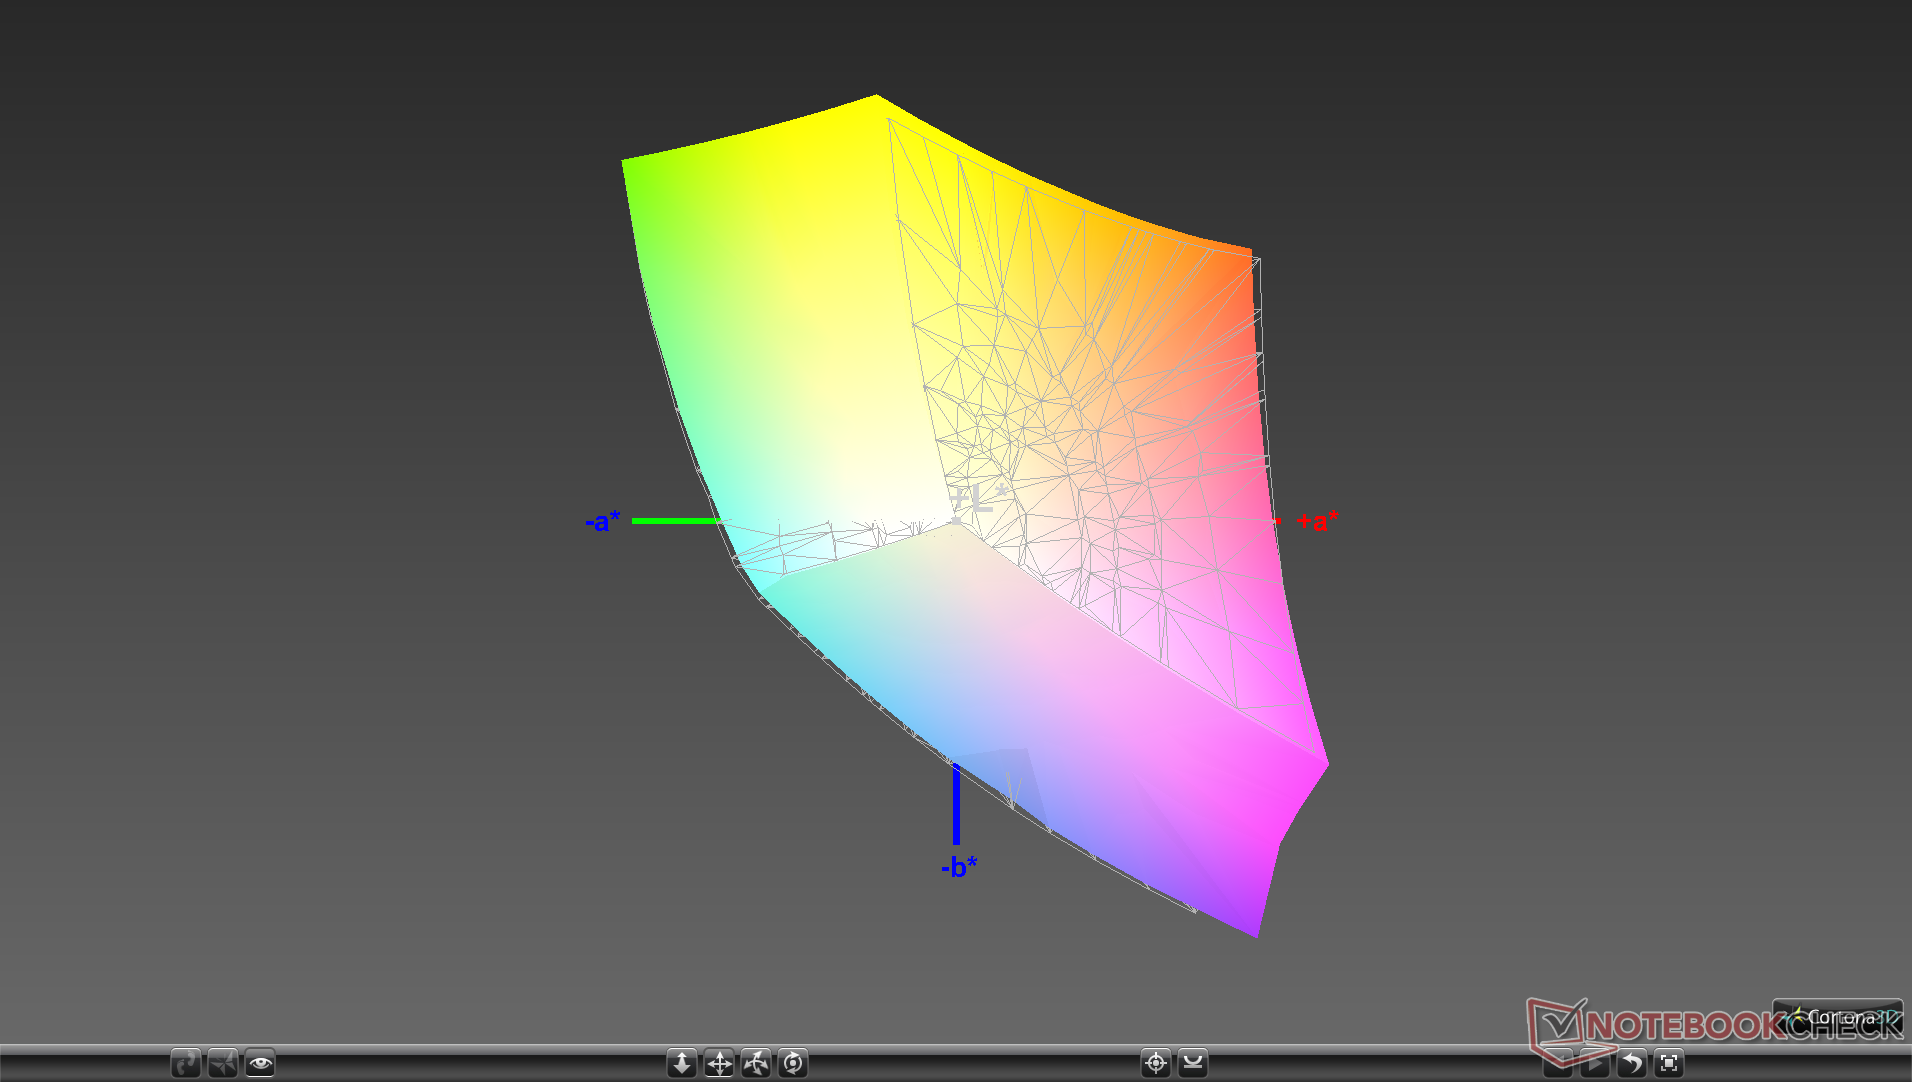
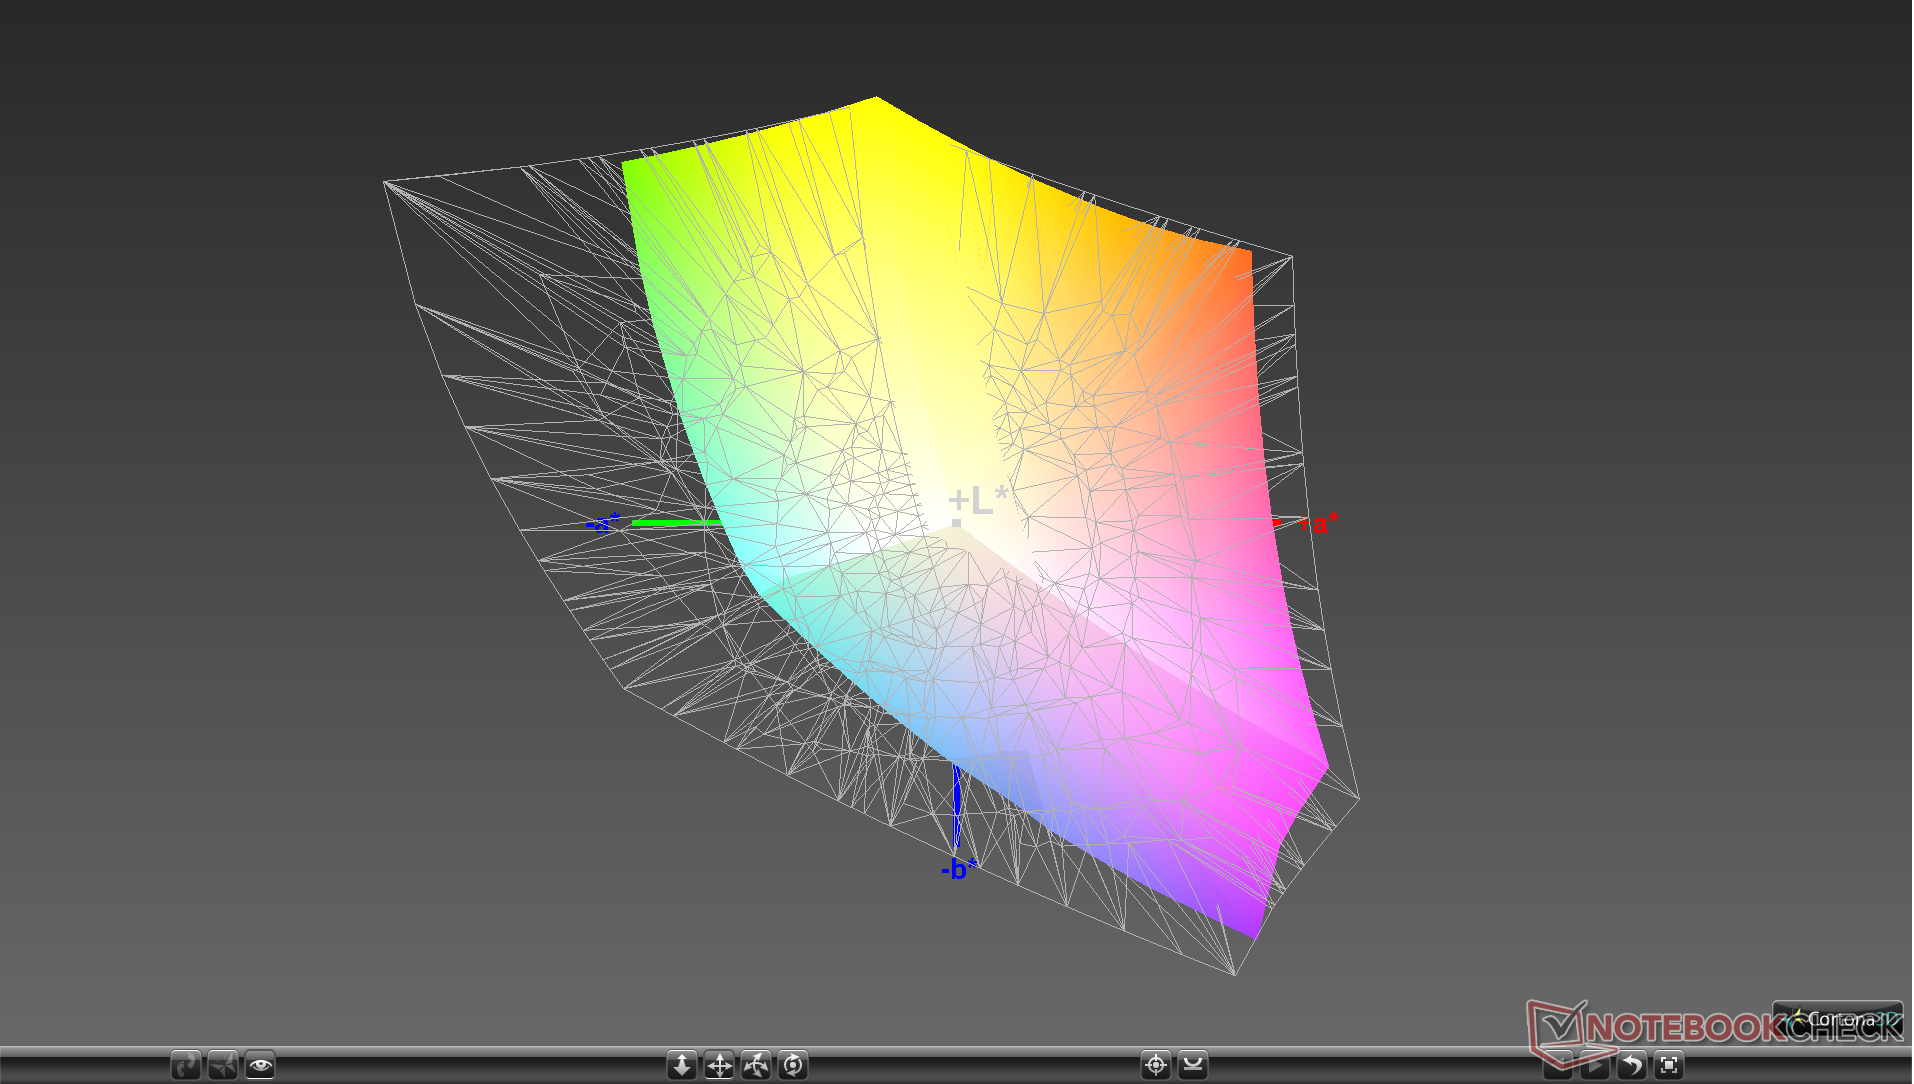
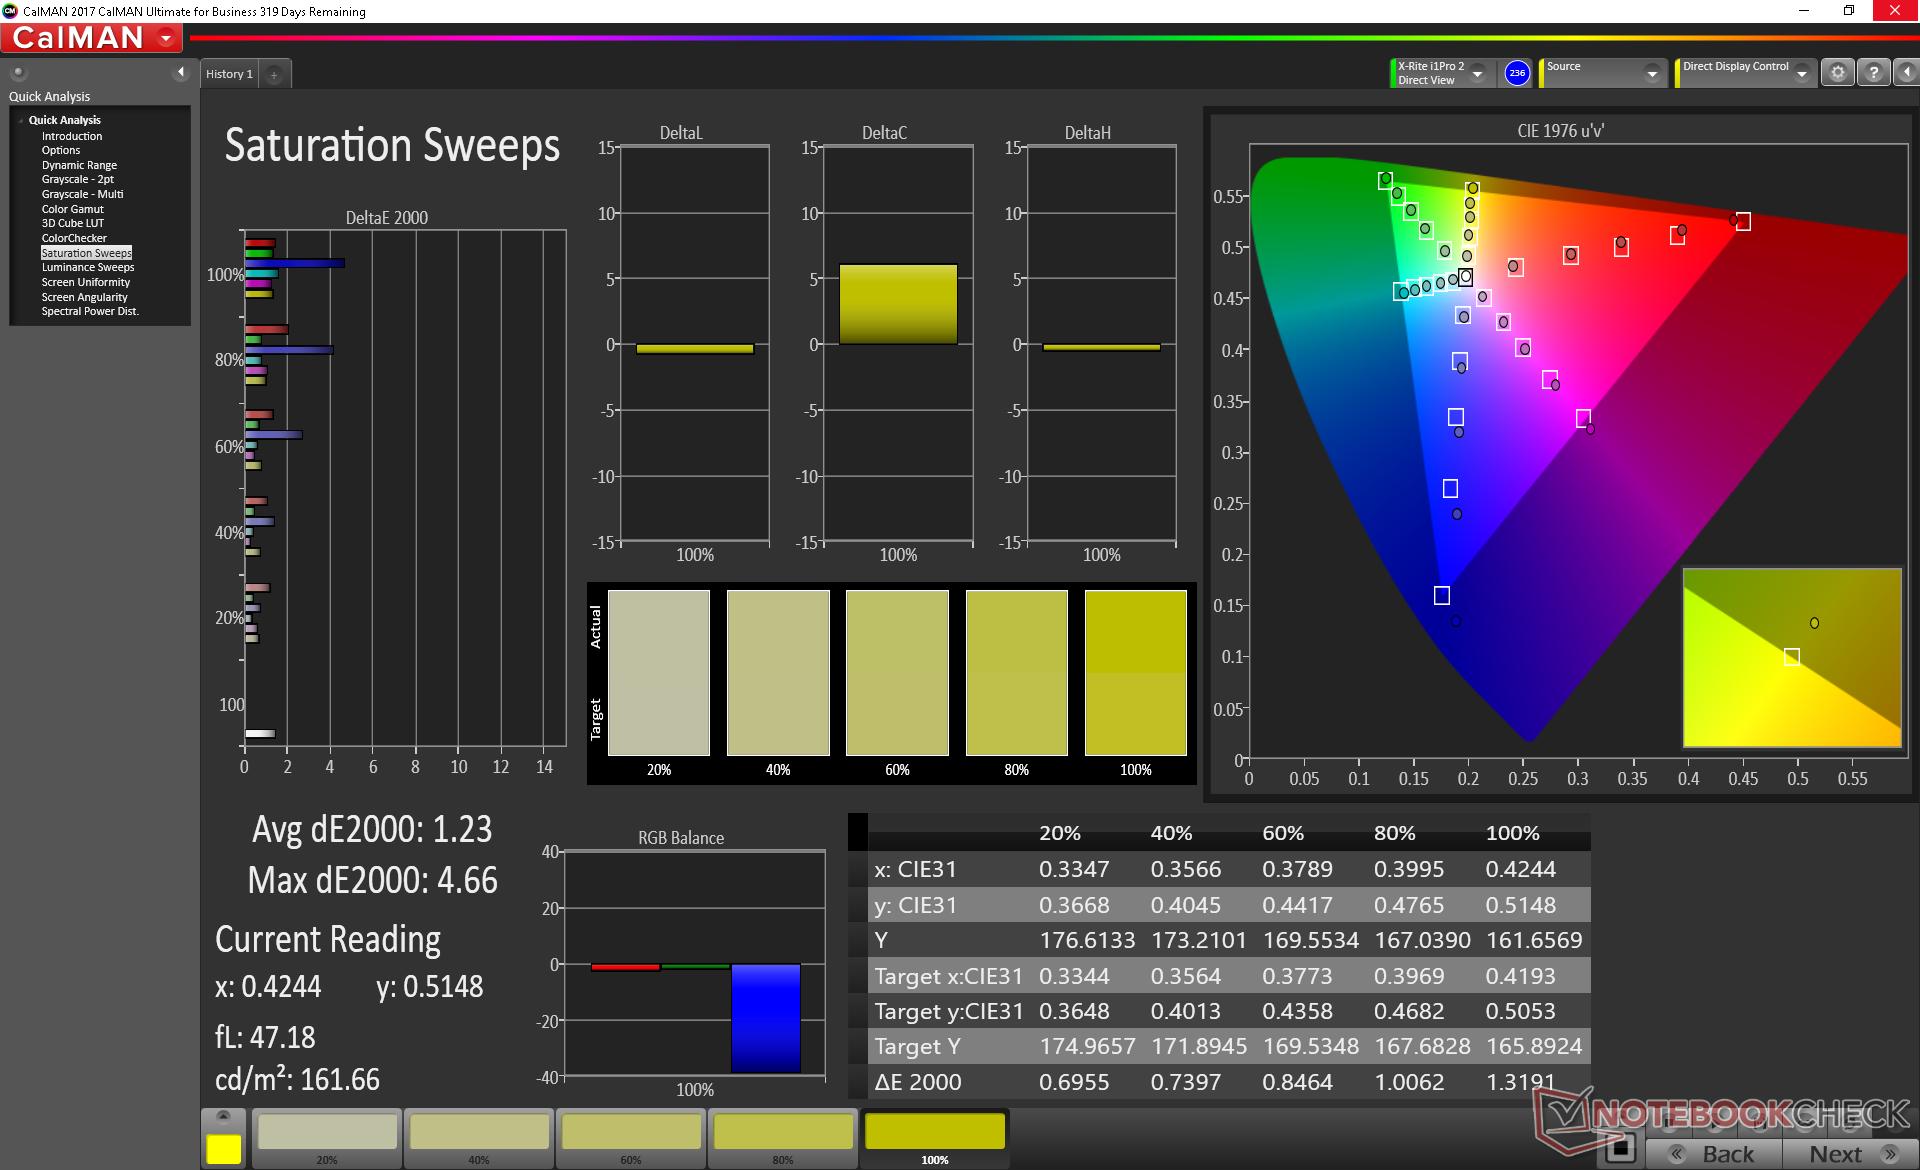
Color space is wide at approximately 98 percent and 63 percent of the sRGB and AdobeRGB standards, respectively. To Huawei's credit, it does advertise full sRGB coverage for the MateBook 13. Artists who need even wider color coverage may want to consider the MacBook Pro 13 or ZenBook Pro UX580.
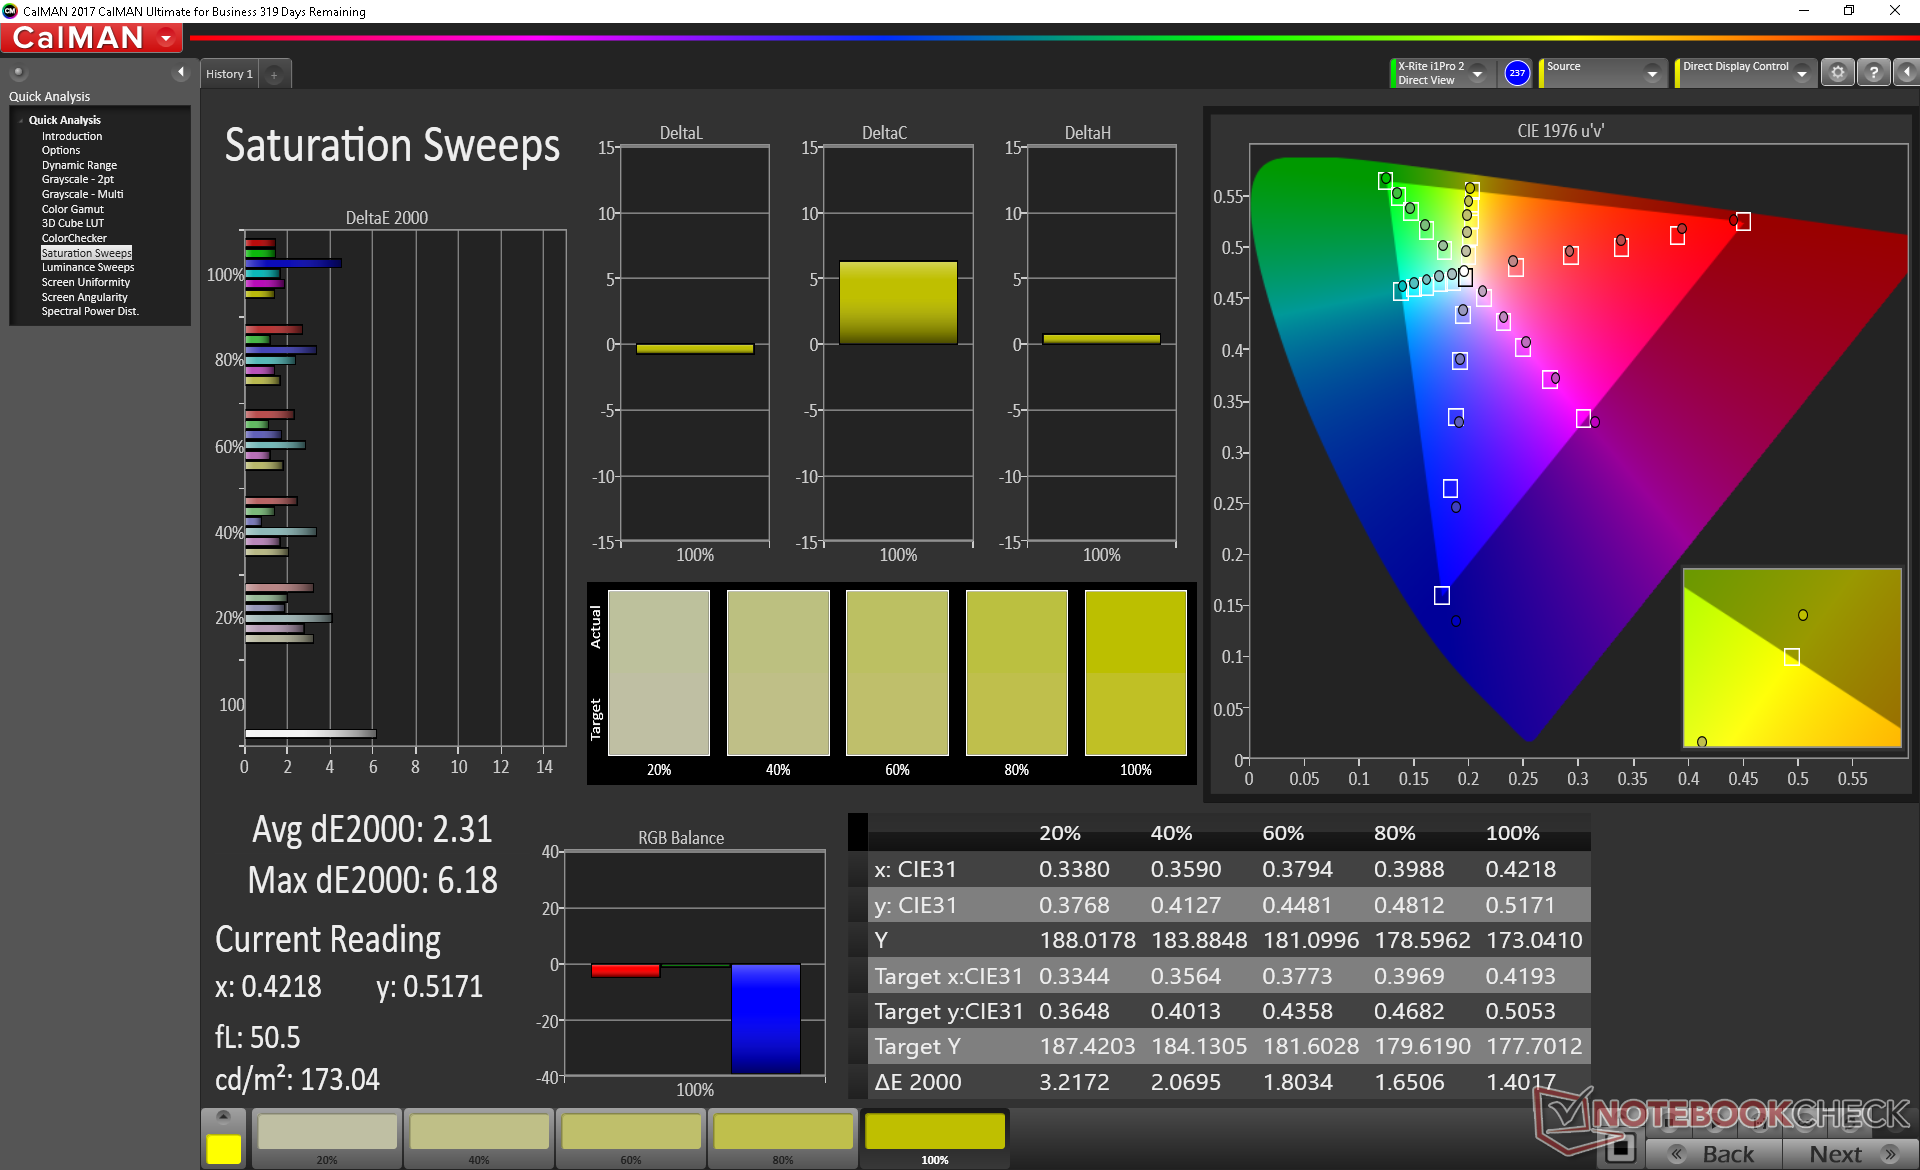
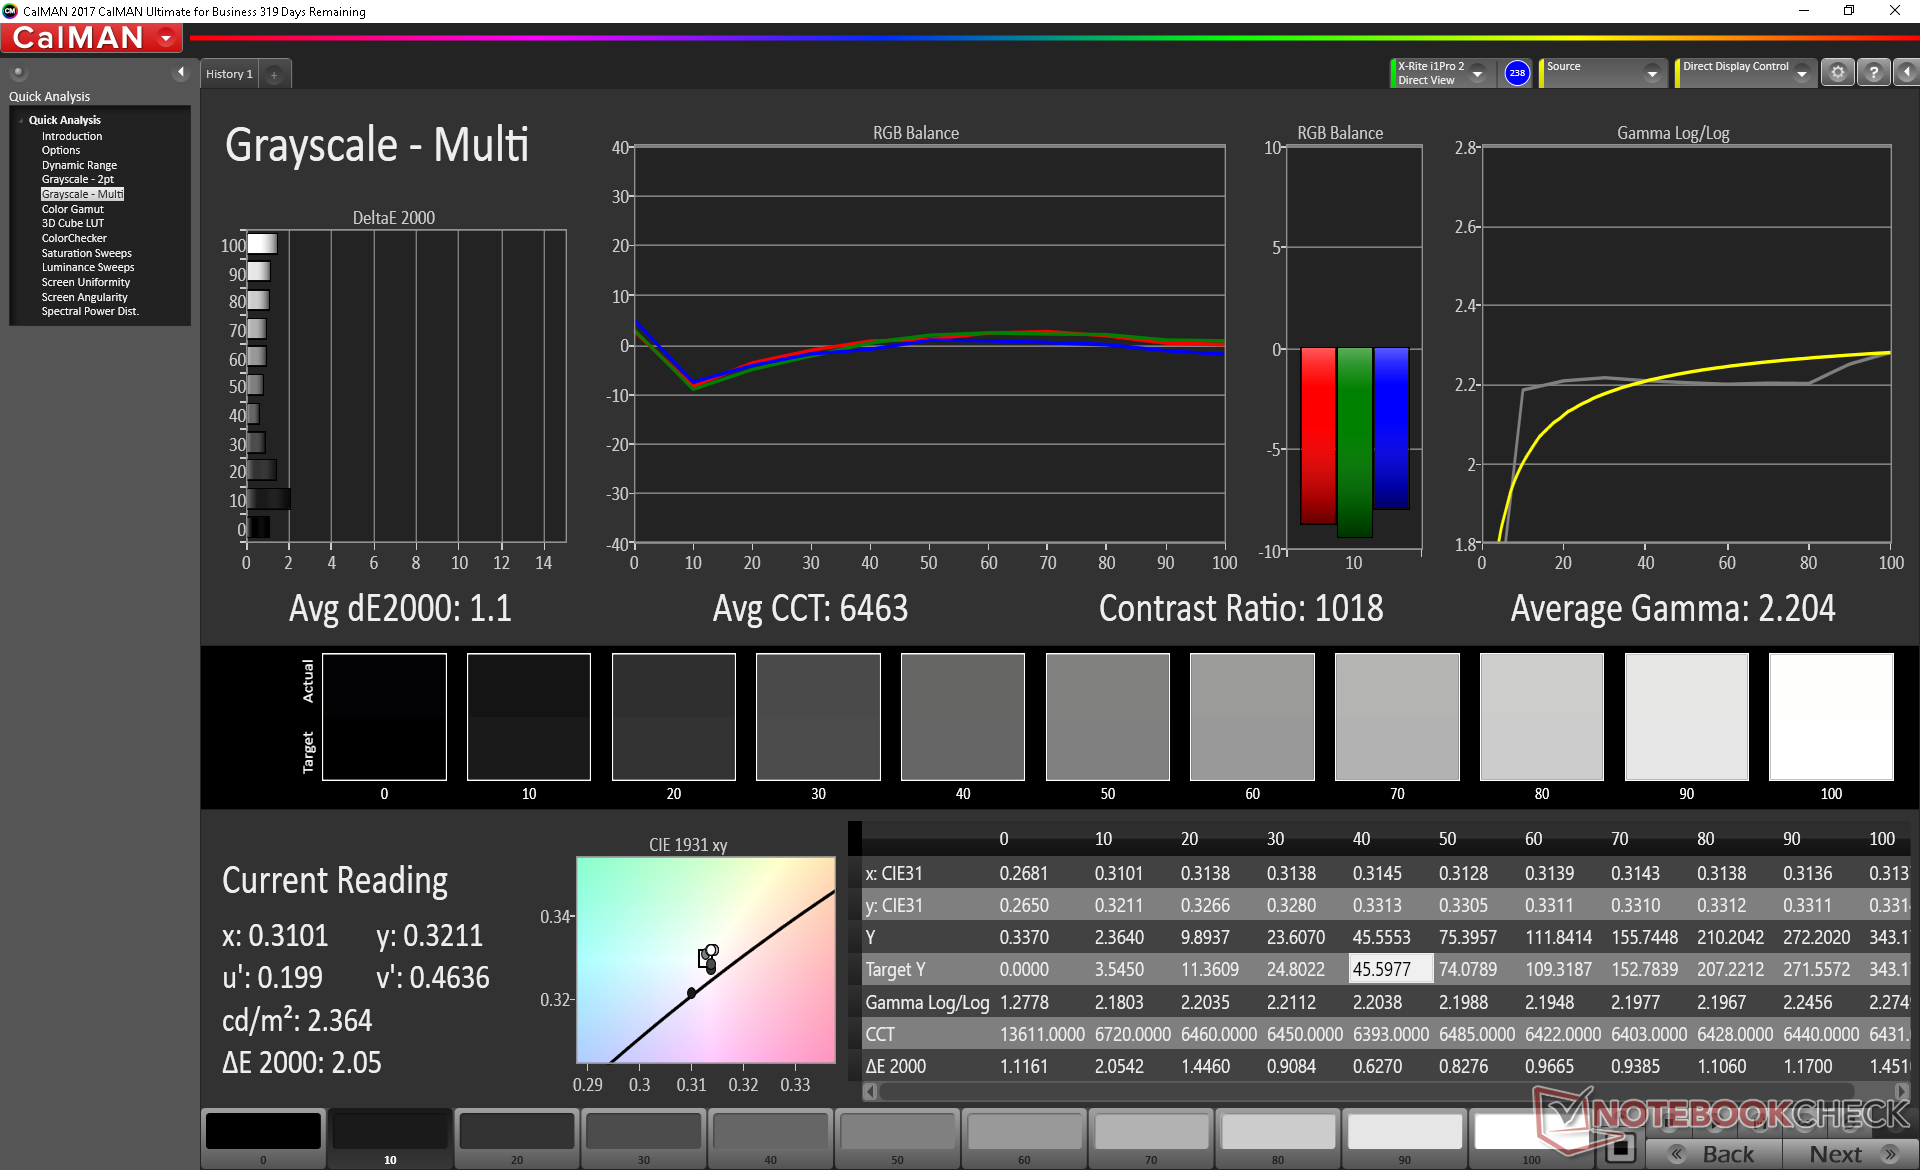
Further measurements with a X-Rite colorimeter reveal good RGB Balance but with a color temperature slightly on the warmer side. Our calibration addresses this to improve colors across the board at all tested saturation levels. We've discovered that Blue is represented slightly less accurately compared to other colors on this particular panel. Even so, this is a very accurate display overall with average deltaE values of less than 1.5 after calibration.
Display Response Times
| ↔ Response Time Black to White | ||
|---|---|---|
| 32 ms ... rise ↗ and fall ↘ combined | ↗ 18 ms rise | 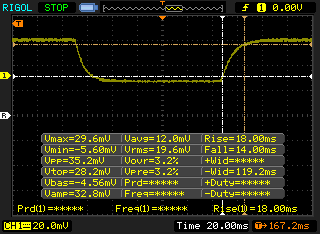 |
| ↘ 14 ms fall | ||
| The screen shows slow response rates in our tests and will be unsatisfactory for gamers. In comparison, all tested devices range from 0.1 (minimum) to 240 (maximum) ms. » 86 % of all devices are better. This means that the measured response time is worse than the average of all tested devices (19.8 ms). | ||
| ↔ Response Time 50% Grey to 80% Grey | ||
| 43.2 ms ... rise ↗ and fall ↘ combined | ↗ 22 ms rise | 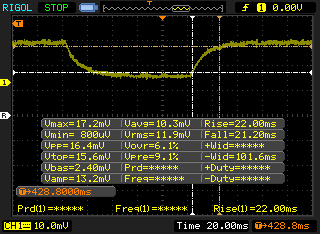 |
| ↘ 21.2 ms fall | ||
| The screen shows slow response rates in our tests and will be unsatisfactory for gamers. In comparison, all tested devices range from 0.165 (minimum) to 636 (maximum) ms. » 72 % of all devices are better. This means that the measured response time is worse than the average of all tested devices (31 ms). | ||
Screen Flickering / PWM (Pulse-Width Modulation)
| Screen flickering / PWM not detected | 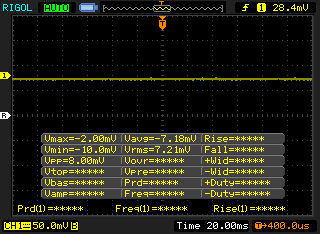 | ||
In comparison: 52 % of all tested devices do not use PWM to dim the display. If PWM was detected, an average of 7750 (minimum: 5 - maximum: 343500) Hz was measured. | |||
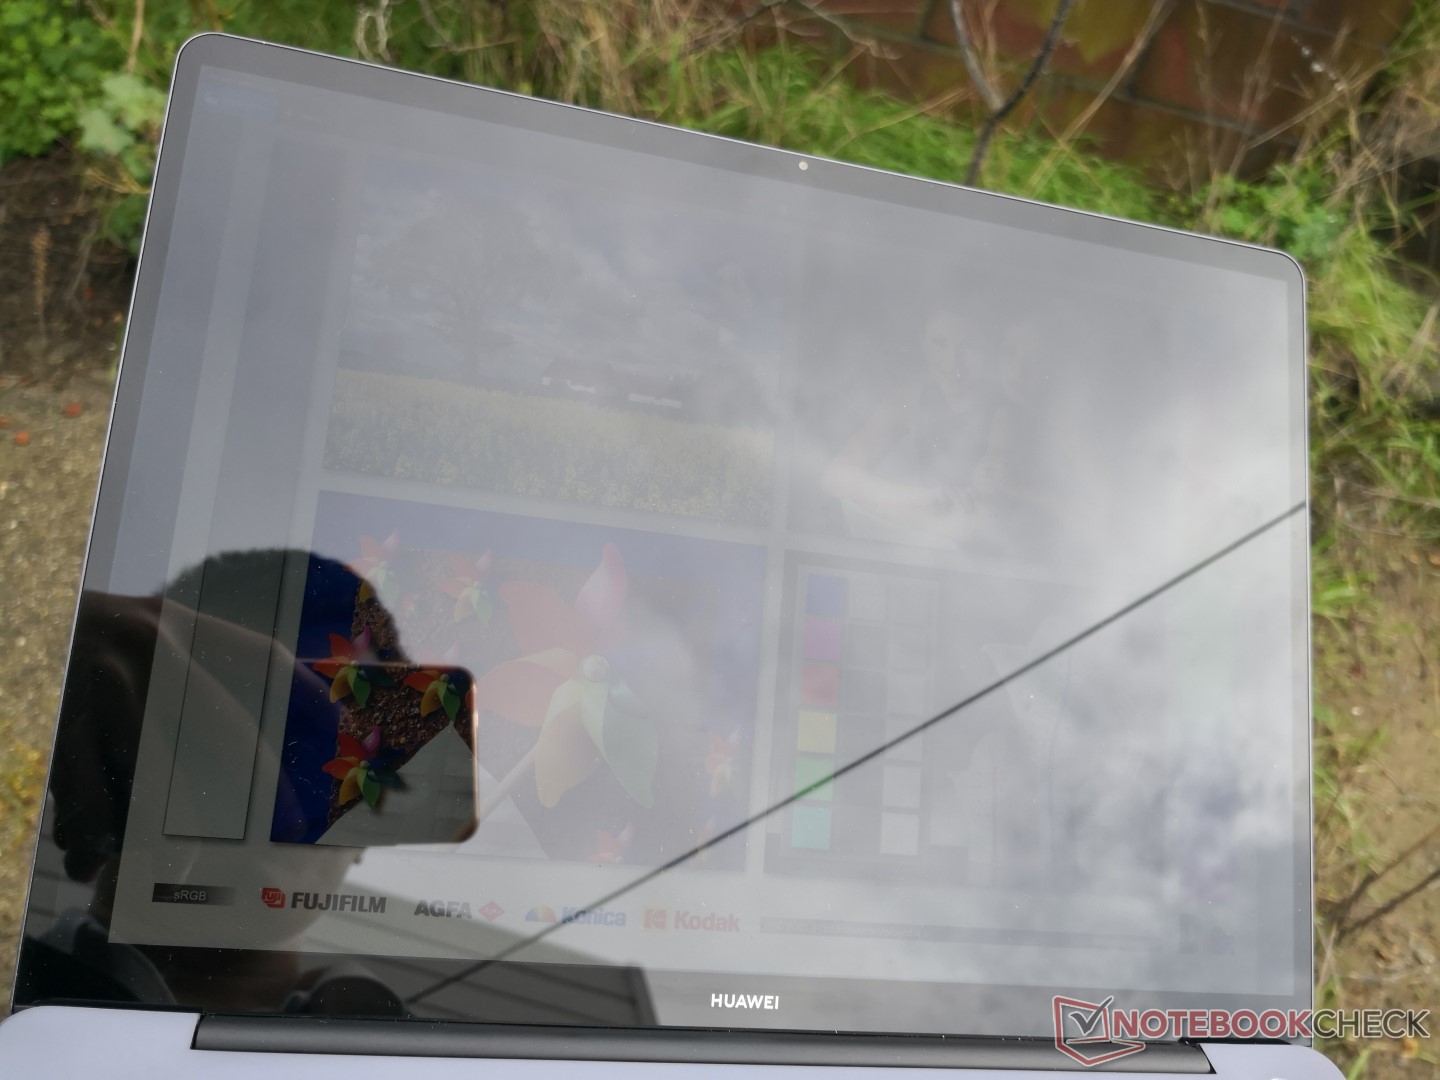
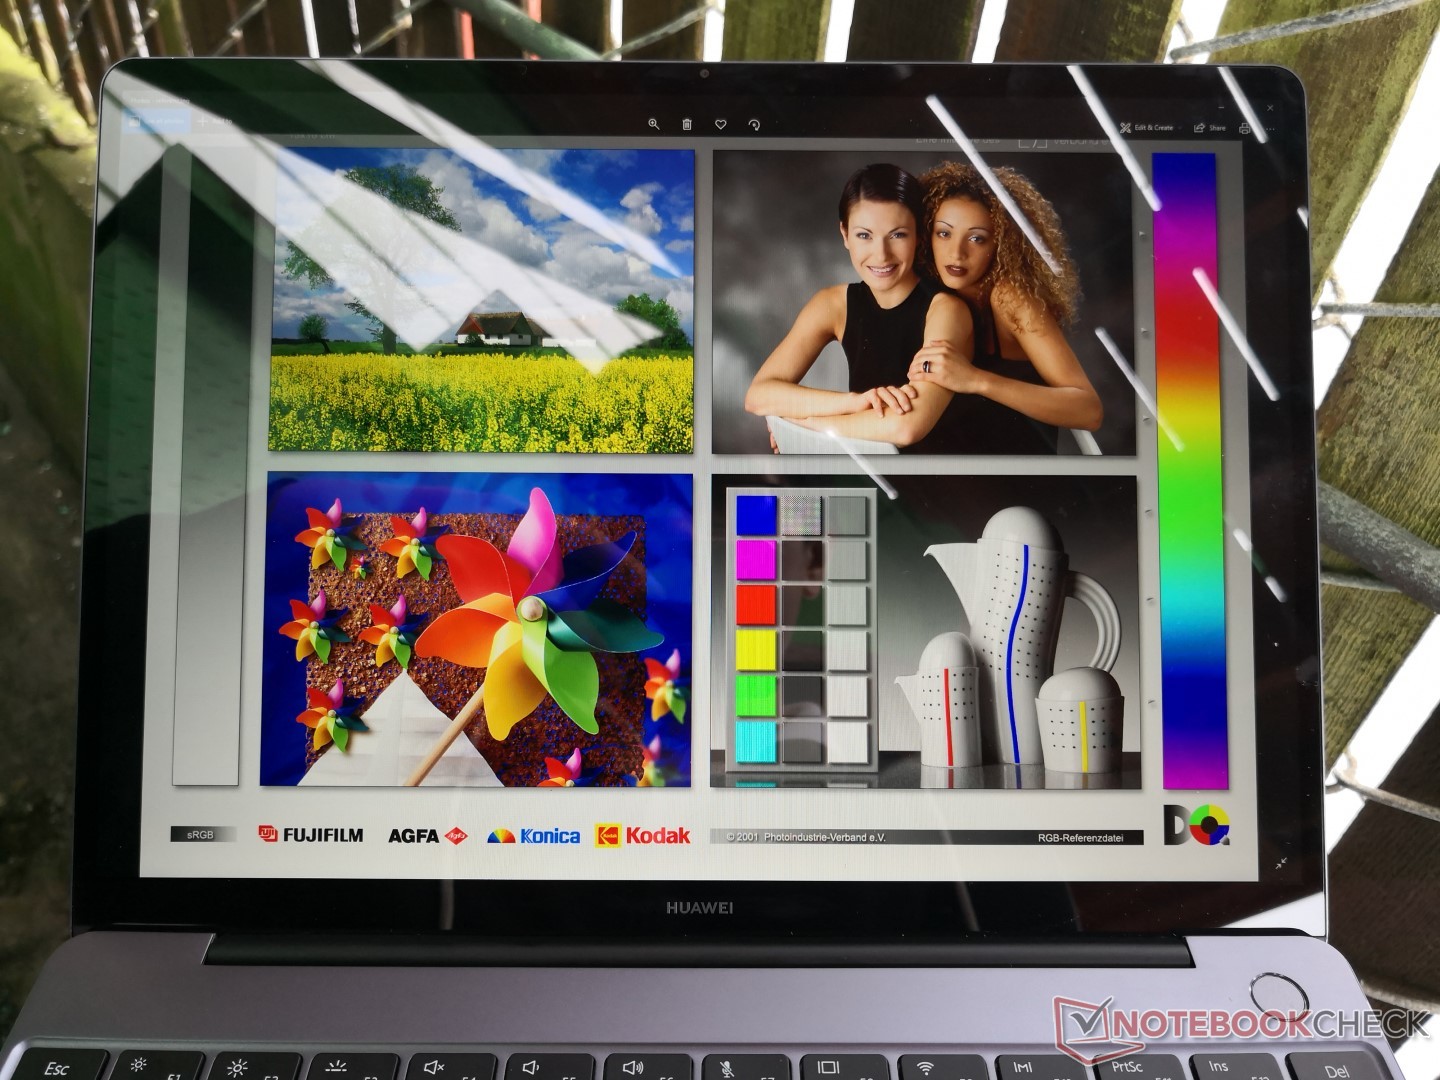
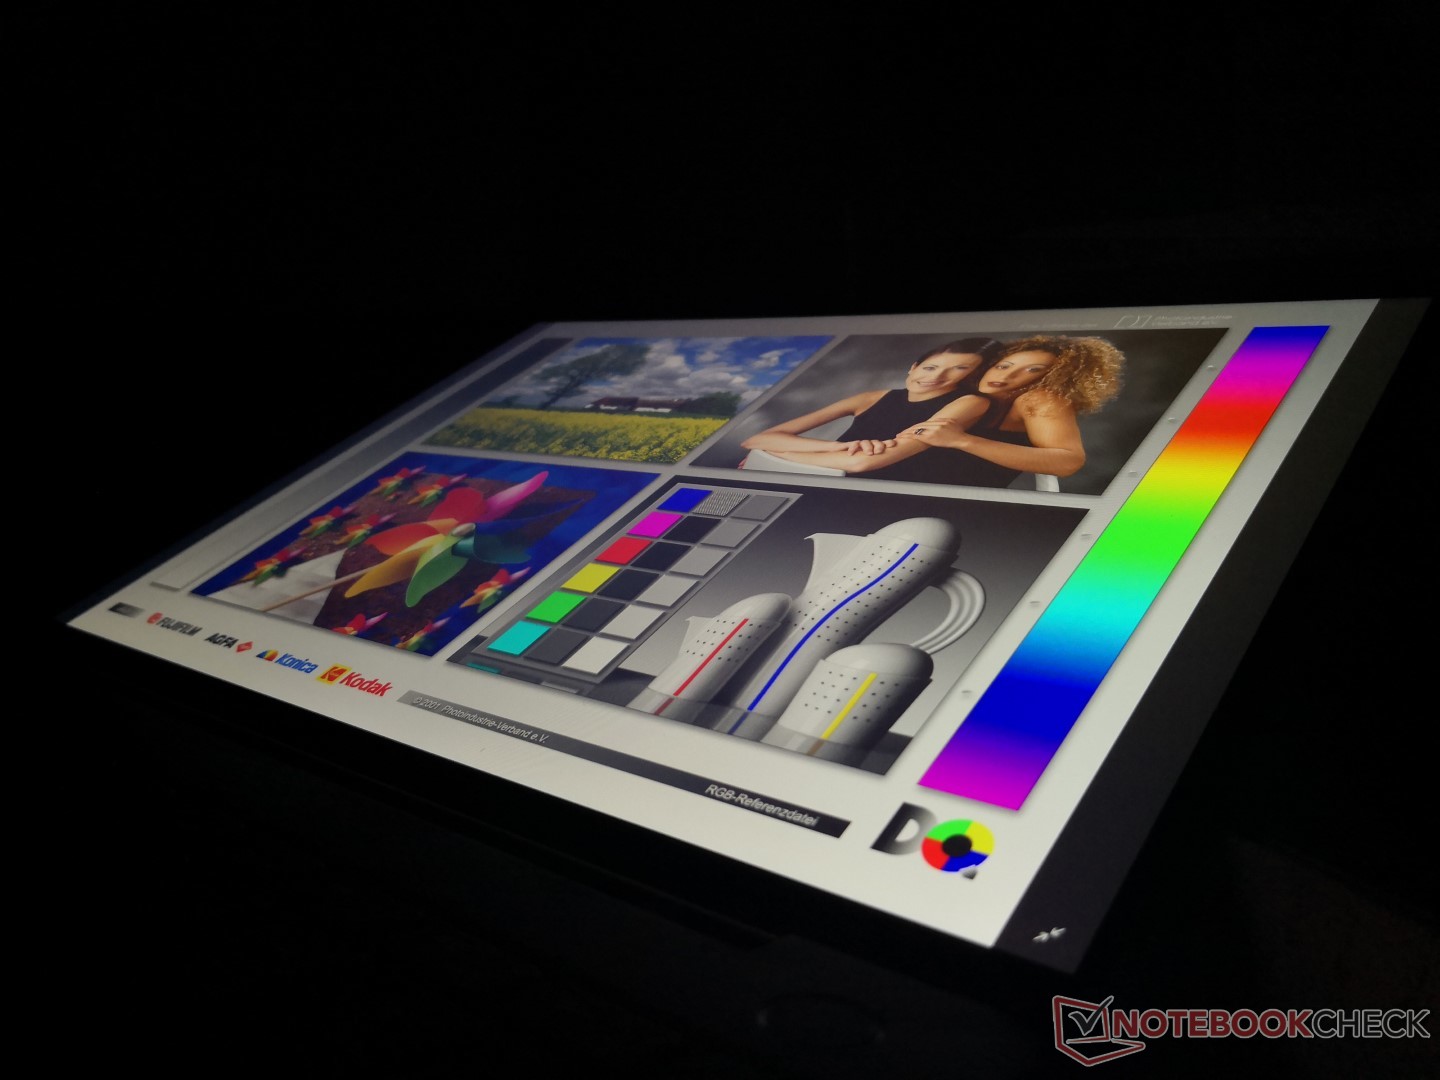
Outdoor visibility is poorer than the MateBook X Pro since the backlight is not as bright. Direct sunlight will overwhelm onscreen content and glare is ever present. If outdoor visibility is paramount, then users may want to consider the Samsung Notebook 9 or HP EliteBook 1020 G2 whose displays can be almost twice as bright as our Huawei. Viewing angles are otherwise excellent with just minor shifts in color and contrast from extreme angles.
Performance
The Core i5-8265U and i7-8565U Whiskey Lake-U CPU options are set to be standard on Ultrabooks until the arrival of Ice Lake in late 2019. Whiskey Lake-U offers just minimal raw performance boosts over the last generation Kaby Lake-R, however, so don't expect any significant performance gains like the jump from Kaby Lake to Kaby Lake-R.
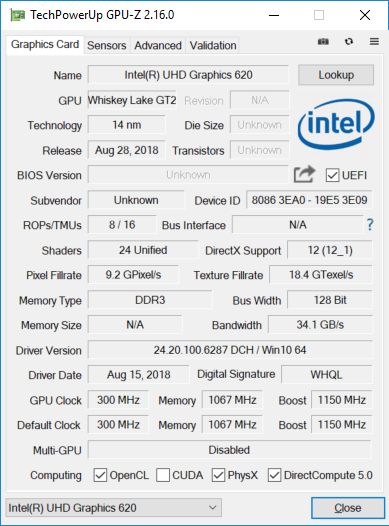
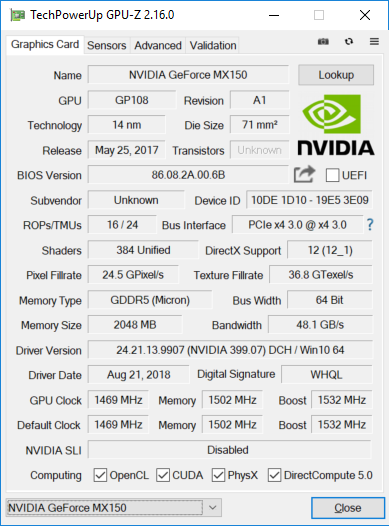
The more notable specification is the 25 W '1D10' GeForce MX150 GPU in the MateBook 13. Most Ultrabooks are limited to just Intel integrated graphics and even if a dedicated GPU is available, only the slower 10 W '1D12' GeForce MX150 is used. This exact scenario was seen on last year's MateBook X Pro. Razer leveraged this fact in its marketing for the recent Blade Stealth as it also ships with the faster 25 W GeForce MX150 instead of the 10 W variant.
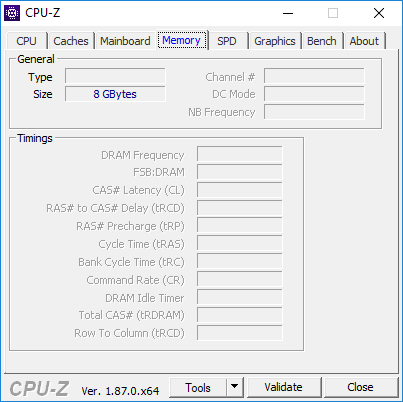
System RAM is non-removable and limited to just 8 GB across all SKUs as of this writing. We're hopeful for a 16 GB option at some point in the future. Nvidia Optimus is supported for switching to the integrated UHD Graphics 620.
Interestingly, attempting to download the latest graphics drivers from the official Nvidia website does not work. Instead, the software says owners must download the graphics driver from the manufacturer website.
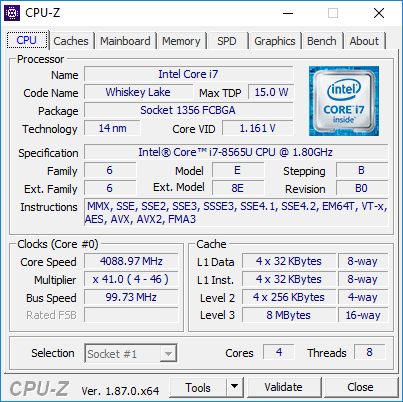

Processor
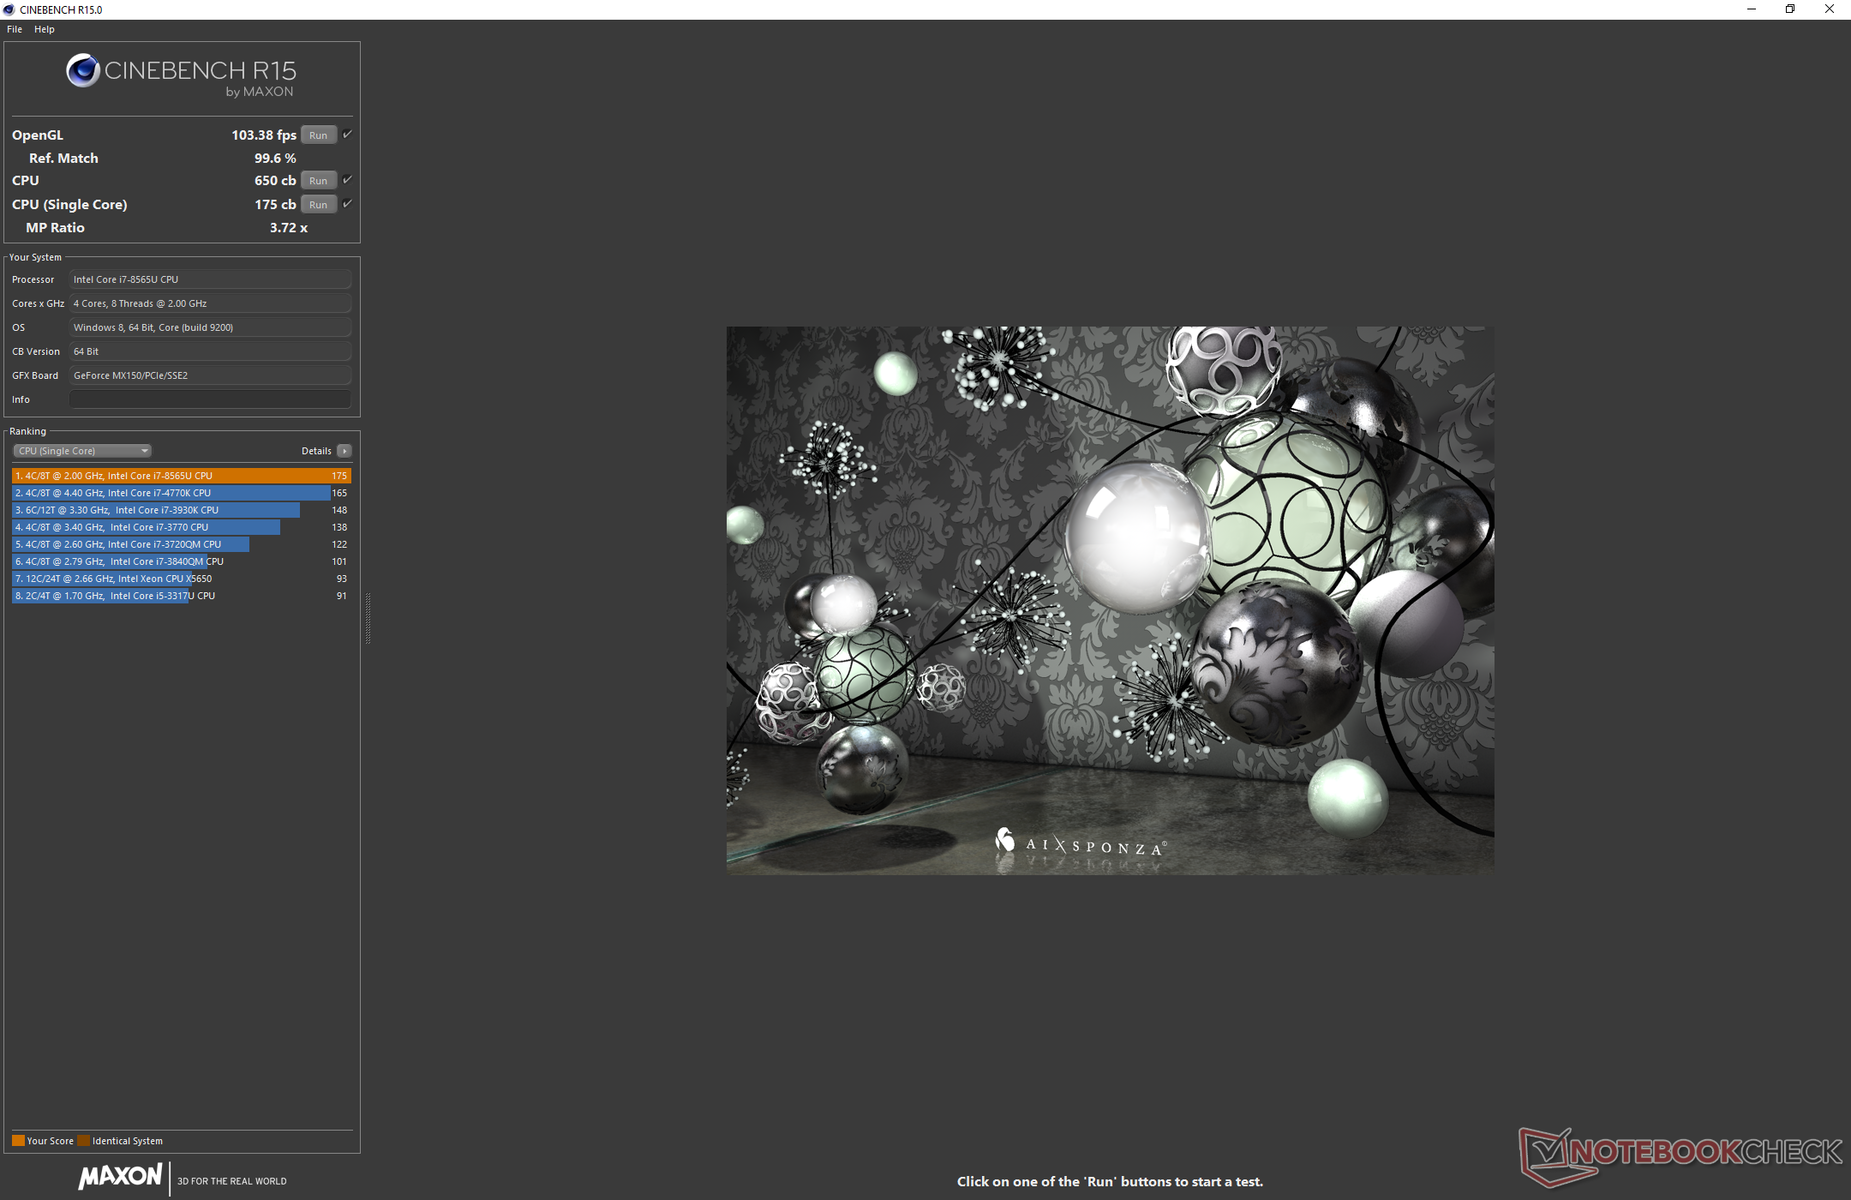
CineBench results are within single-digit percentages of the last generation Core i7-8550U as found on the XPS 13. Nonetheless, raw CPU performance is 26 percent faster than the i7-8550U in the MateBook X Pro due to more intense throttling on the flagship Huawei. Surprisingly, the Ryzen 5 2500U in the less expensive Honor MagicBook comes quite close to the CPU performance of the new MateBook 13.
We are able to observe processor performance over time by running CineBench R15 Multi-Thread in a loop. As shown by the graph below, its initial score of 697 points drops to about 586 points by the third loop to represent a performance dip of 16 percent. While still better than the MateBook X Pro, the laptop is unable to maintain maximum Turbo Boost for extended periods. Dell's implementation of the i7-8550U is superior and more consistent overall.
See our dedicated page on the Core i7-8565U for more technical information and benchmark comparisons.
System Performance
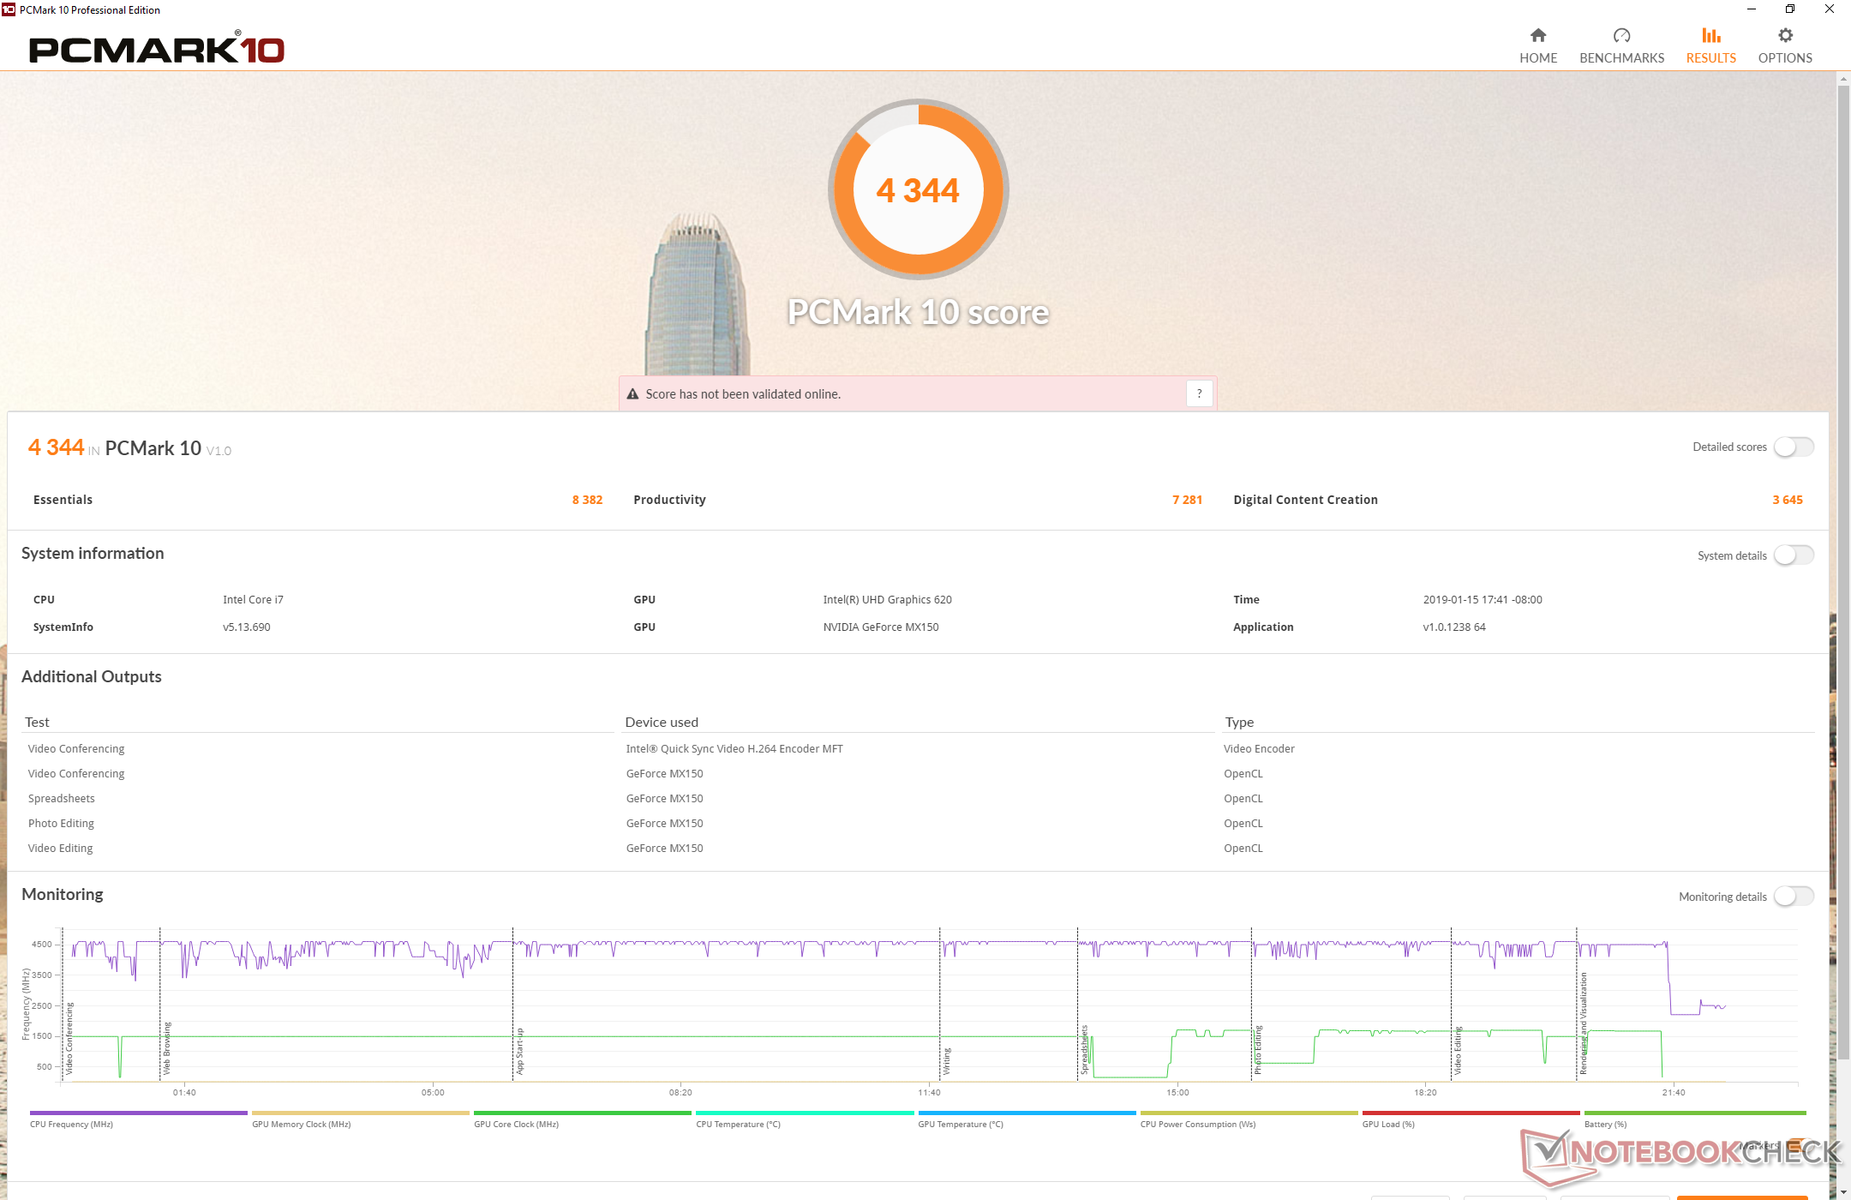
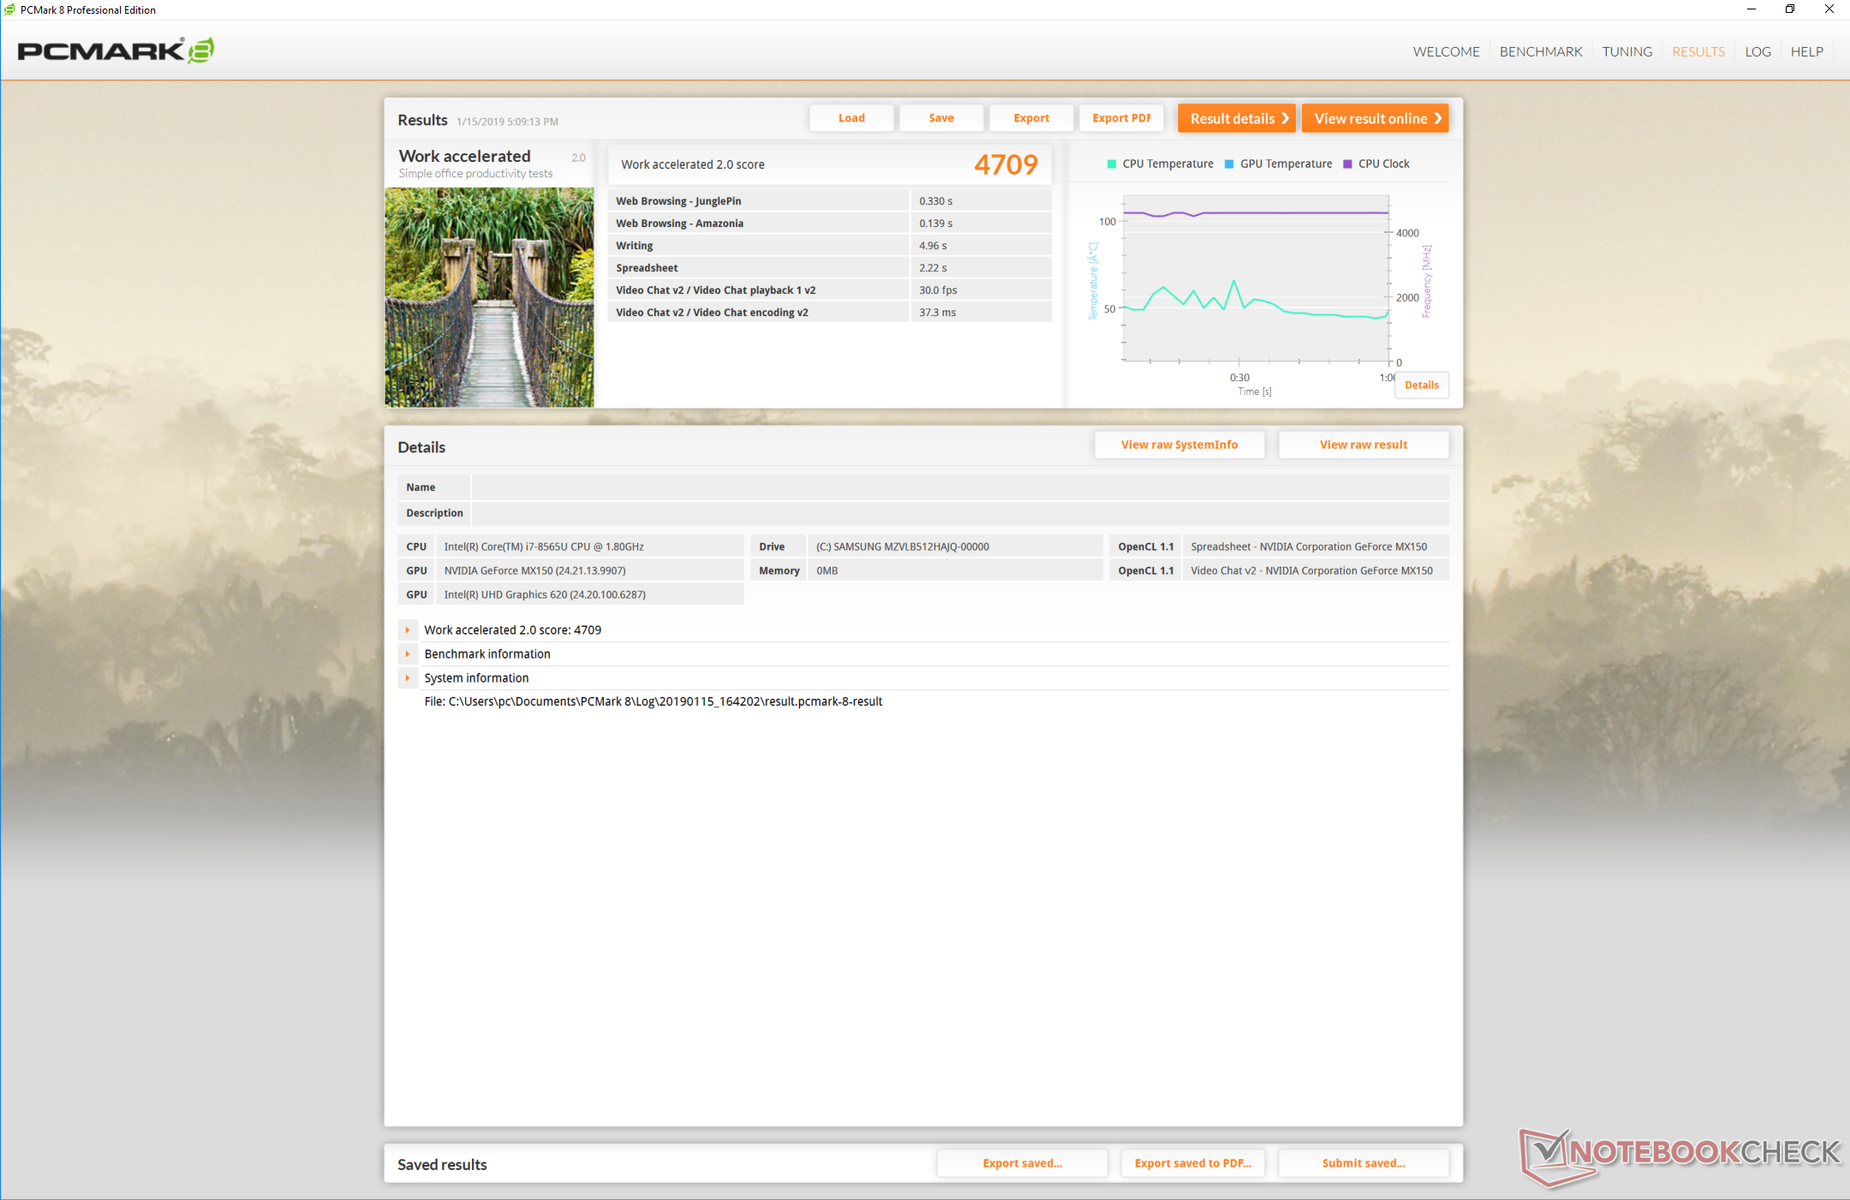
PCMark benchmarks rank the MateBook 13 higher than many of its competitors including the HP Spectre x360 13 likely due to its dedicated graphics. We didn't experience any software or hardware issues during our time with the test unit.
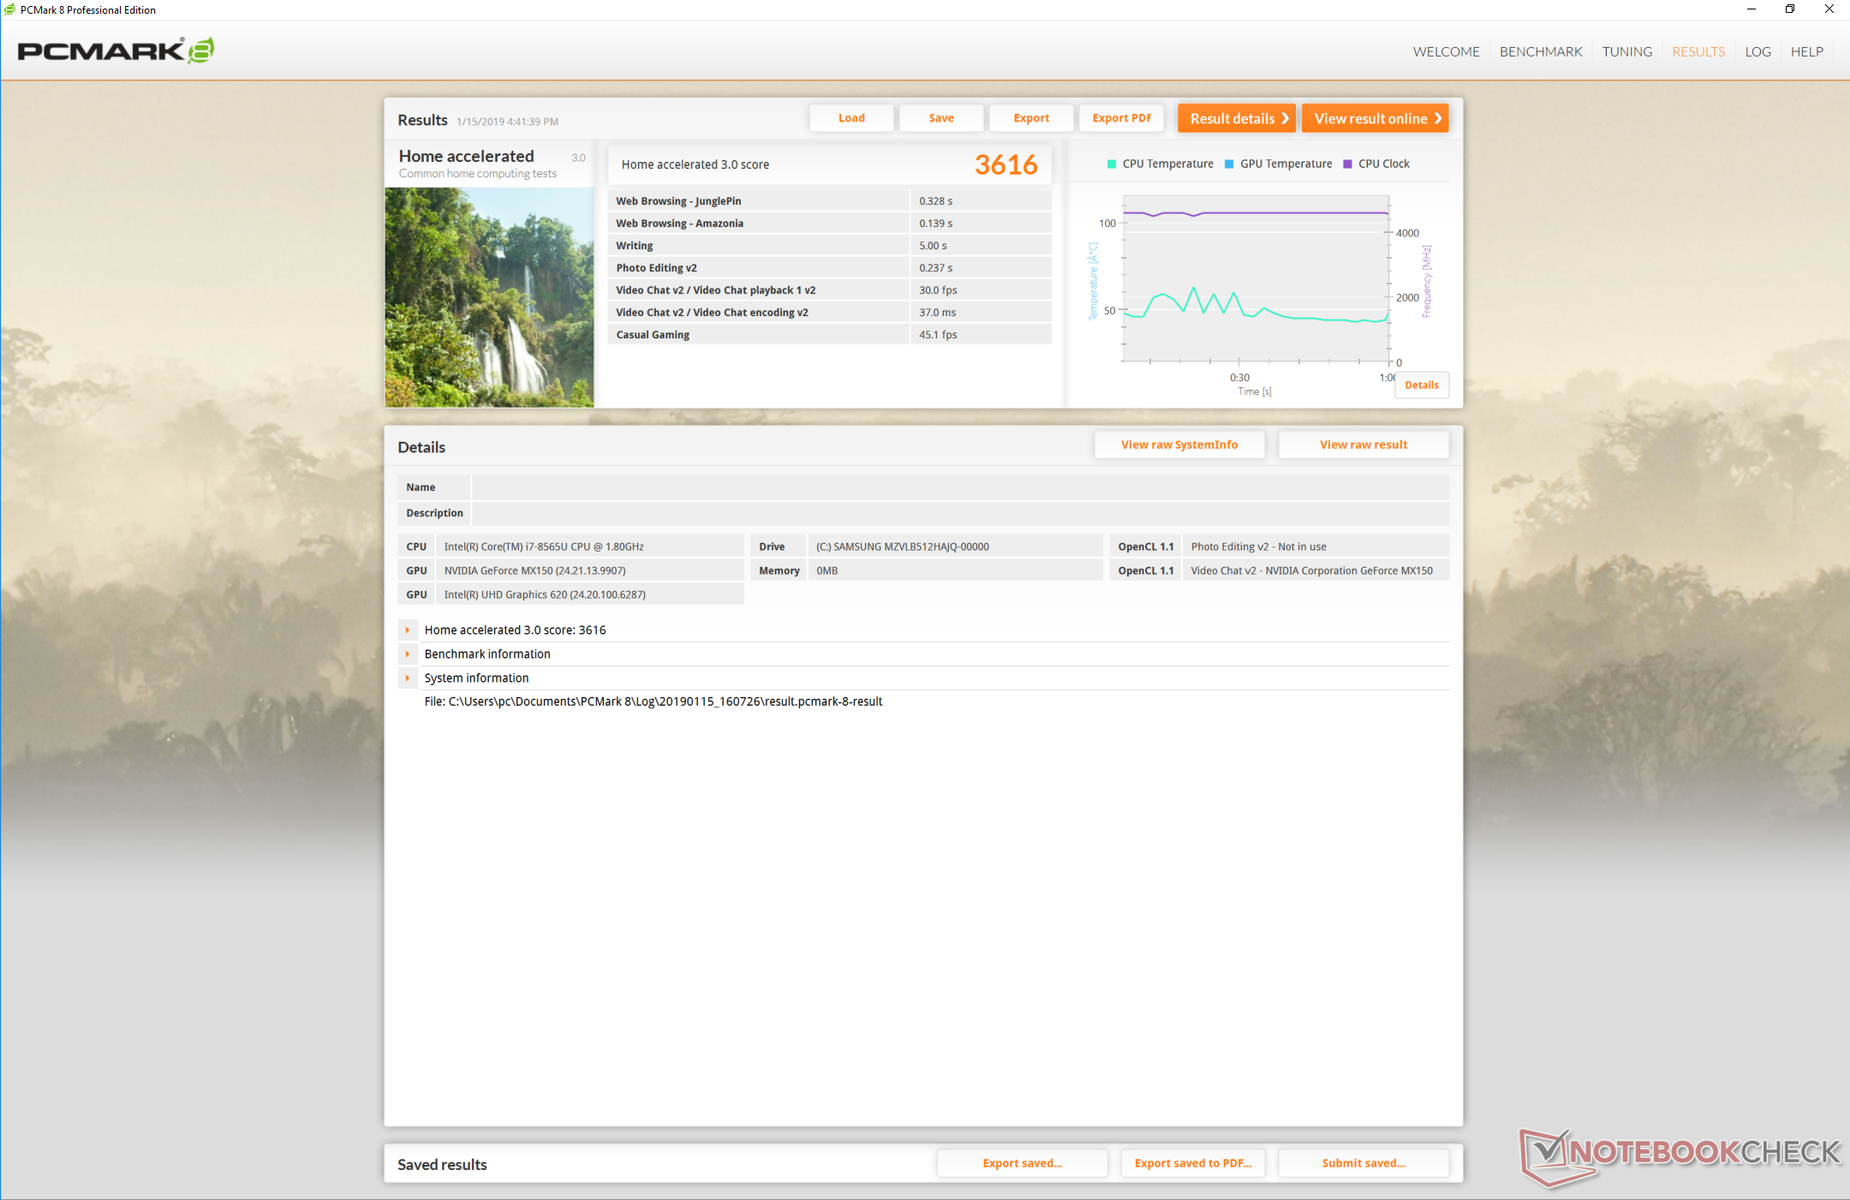
| PCMark 8 Home Score Accelerated v2 | 3616 points | |
| PCMark 8 Work Score Accelerated v2 | 4709 points | |
| PCMark 10 Score | 4344 points | |
Help | ||
Storage Devices
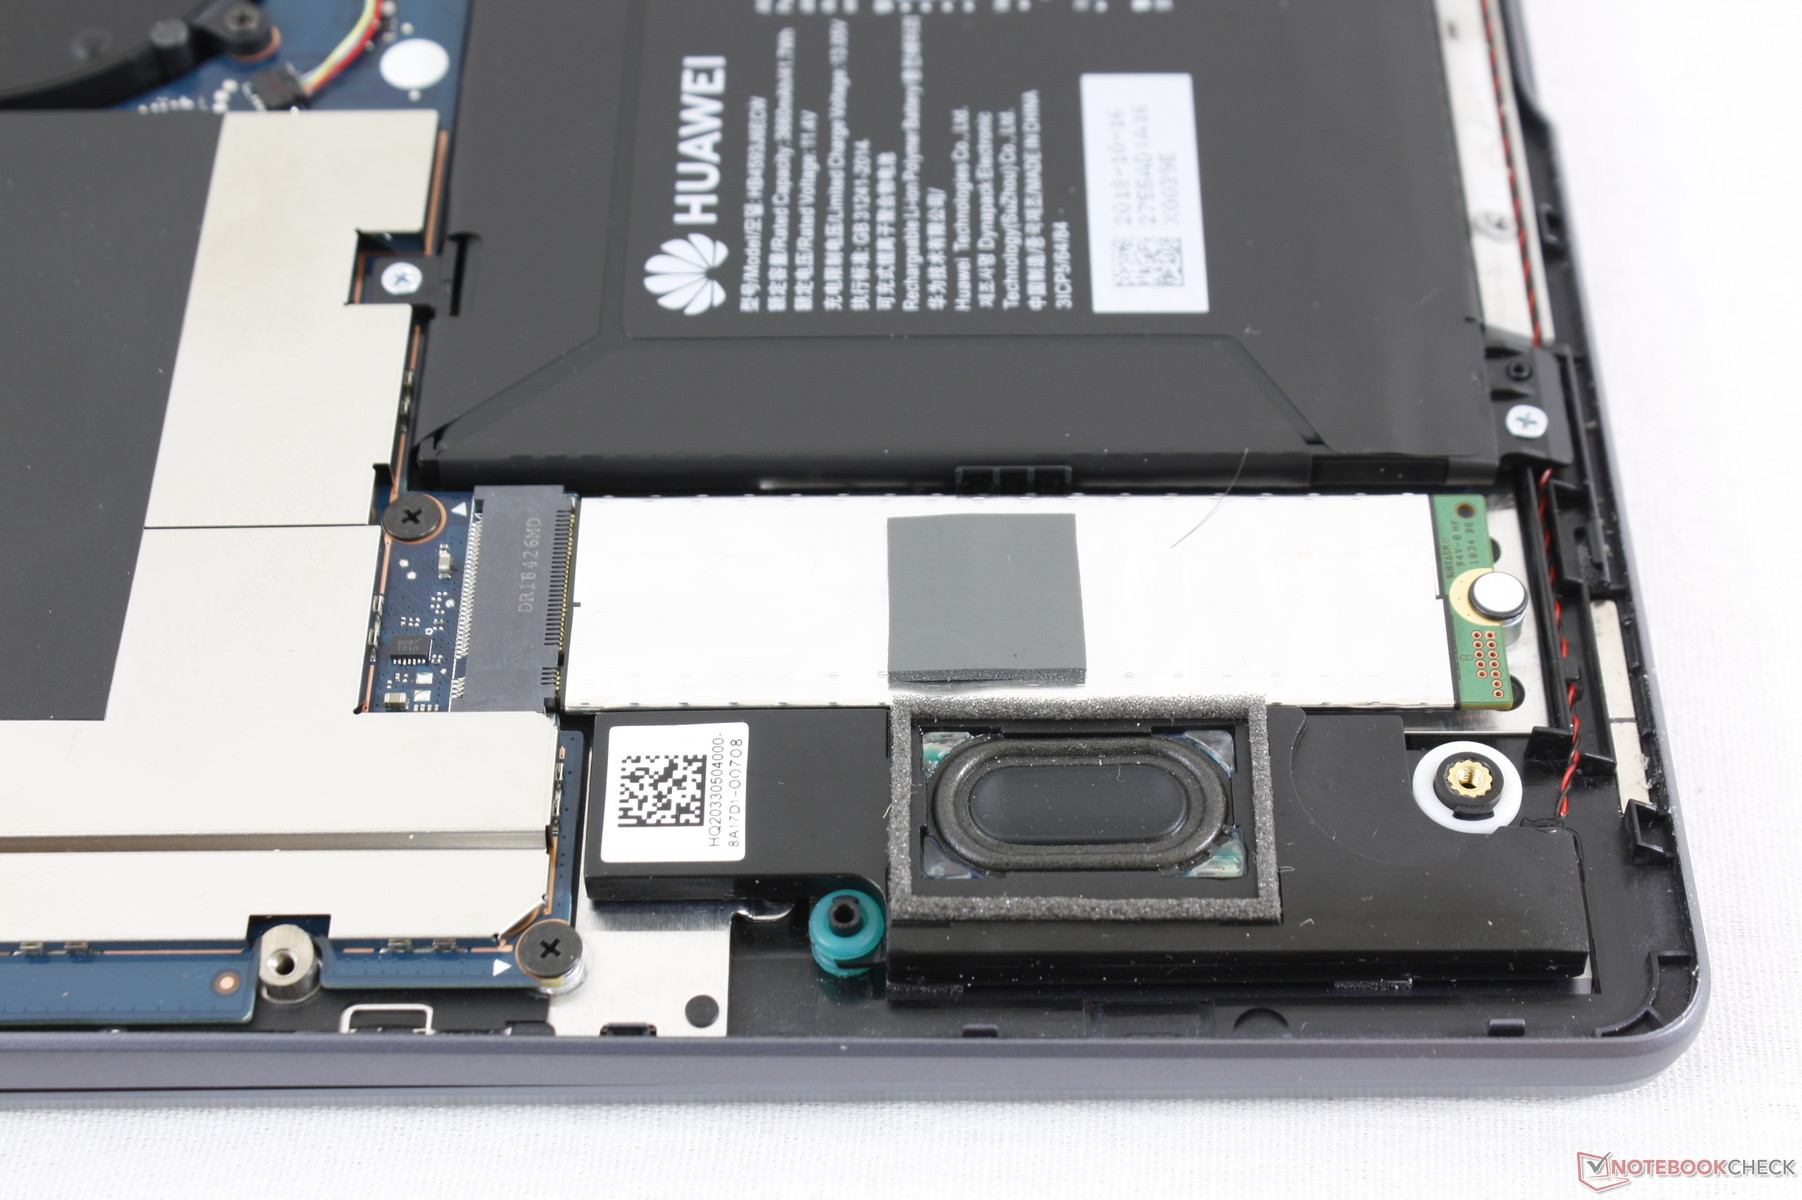
A single M.2 2280 slot is available. Our specific test unit houses a 512 GB Samsung SSD PM981 NVMe compared to the PM961 in last year's MateBook X Pro. Note that there is tape over the screw holding the SSD in place and so any tampering may affect the warranty.
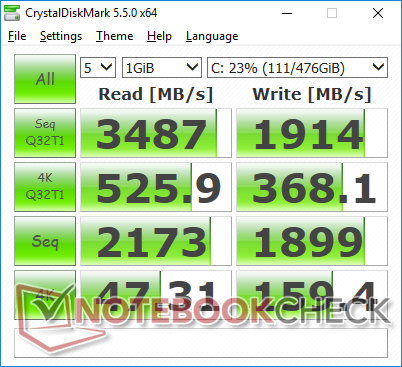
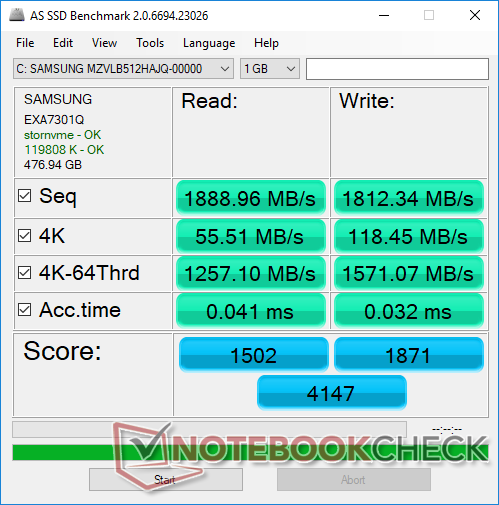
Performance is superior than the Toshiba XG5, Lite-on CA1, and SK Hynix PC401 SSDs found on competing laptops as shown by our table below. In particular, read and write rates of smaller blocks are faster across the board on the MateBook 13.
See our table of HDDs and SSDs for more benchmark comparisons.
| Huawei MateBook 13 i7 Samsung SSD PM981 MZVLB512HAJQ | Dell XPS 13 9370 i7 UHD Toshiba XG5 KXG50ZNV512G | HP Spectre x360 13t-ae000 Lite-On CA1-8D256-HP | Lenovo Yoga C930-13IKB SK hynix PC401 HFS256GD9TNG | Huawei Matebook X Pro i5 Samsung PM961 MZVLW256HEHP | |
|---|---|---|---|---|---|
| AS SSD | -41% | -67% | -56% | -30% | |
| Seq Read (MB/s) | 1889 | 2205 17% | 2133 13% | 1850 -2% | 2416 28% |
| Seq Write (MB/s) | 1812 | 435.8 -76% | 945 -48% | 661 -64% | 1170 -35% |
| 4K Read (MB/s) | 55.5 | 29.36 -47% | 29.84 -46% | 38.04 -31% | 48.33 -13% |
| 4K Write (MB/s) | 118.4 | 107.4 -9% | 91.4 -23% | 95 -20% | 103.1 -13% |
| 4K-64 Read (MB/s) | 1257 | 678 -46% | 725 -42% | 434.3 -65% | 1039 -17% |
| 4K-64 Write (MB/s) | 1571 | 444.8 -72% | 404.1 -74% | 266.3 -83% | 399.6 -75% |
| Access Time Read * (ms) | 0.041 | 0.059 -44% | 0.121 -195% | 0.069 -68% | 0.058 -41% |
| Access Time Write * (ms) | 0.032 | 0.055 -72% | 0.13 -306% | 0.056 -75% | 0.036 -13% |
| Score Read (Points) | 1502 | 926 -38% | 968 -36% | 657 -56% | 1329 -12% |
| Score Write (Points) | 1871 | 596 -68% | 590 -68% | 427 -77% | 620 -67% |
| Score Total (Points) | 4147 | 1911 -54% | 1998 -52% | 1373 -67% | 2575 -38% |
| Copy ISO MB/s (MB/s) | 1800 | 585 -67% | 1492 -17% | 539 -70% | 739 -59% |
| Copy Program MB/s (MB/s) | 385.6 | 570 48% | 300.9 -22% | 209.7 -46% | 312.3 -19% |
| Copy Game MB/s (MB/s) | 982 | 503 -49% | 839 -15% | 340 -65% | 486.3 -50% |
* ... smaller is better

GPU Performance
3DMark benchmarks are over 30 percent higher than the costlier MateBook X Pro to show just how large of a performance boost the 25 W GeForce MX150 can offer over the 10 W GeForce MX150. Overall results are about 5 percent slower than the Blade Stealth likely due to the higher system RAM capacity and VRAM capacity of the Razer. Users upgrading from the UHD Graphics 620 as found on most other Ultrabooks will have an immense jump in GPU power greater than any Intel Iris GPU available at the time of writing.
The high GPU power available makes the MateBook 13 a good system for popular titles like Fortnite, LoL, Rocket League, or Overwatch. Frame rates greater than 30 FPS at the native resolution of 2160 x 1440 are achievable on these undemanding titles when graphical embellishments are set to low. Otherwise, be prepared for scaling and black borders for most titles due to the uncommon 3:2 aspect ratio.
We can observe no recurring frame drops when running Witcher 3 to suggest no interfering background activity whilst gaming.
See our dedicated page on the GeForce MX150 for more technical details and benchmark comparisons.
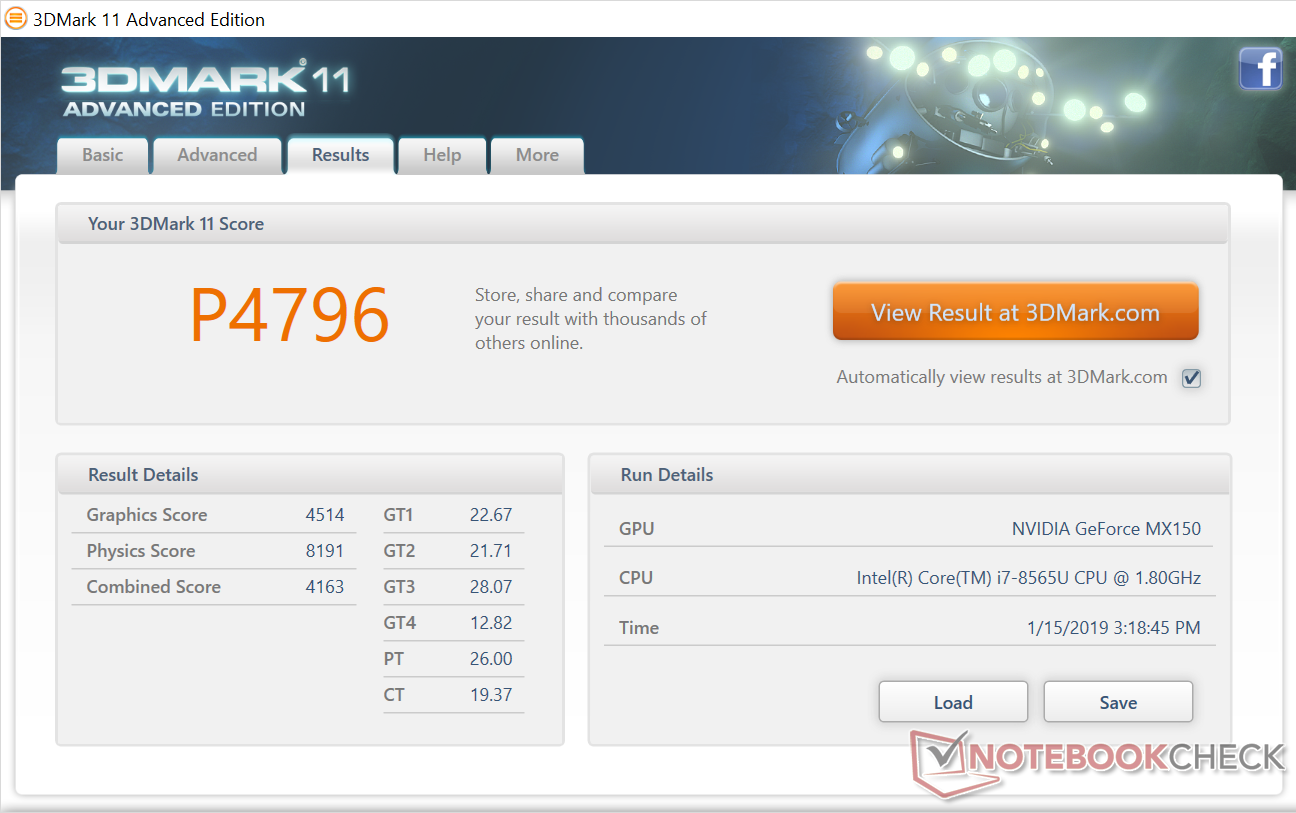

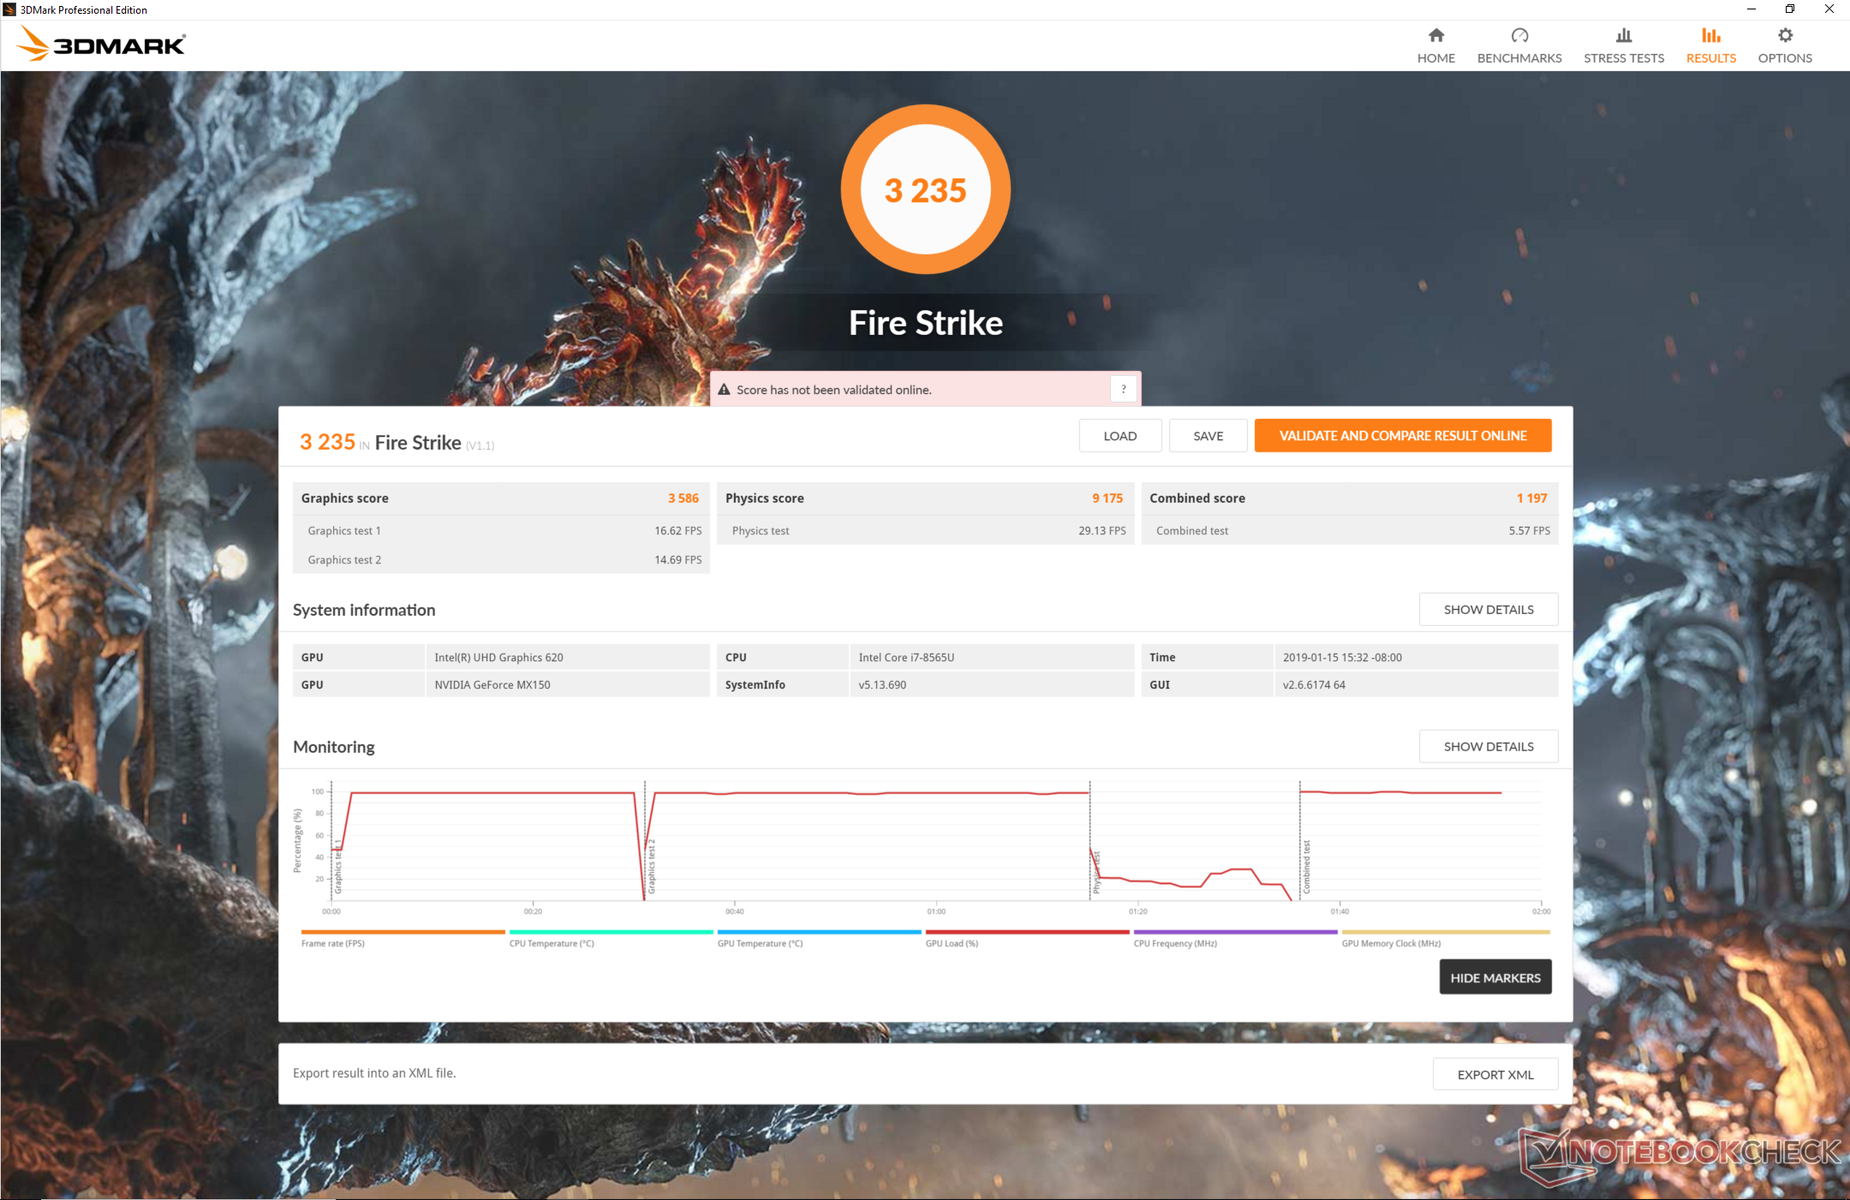
| 3DMark 11 Performance | 4796 points | |
| 3DMark Cloud Gate Standard Score | 14722 points | |
| 3DMark Fire Strike Score | 3235 points | |
Help | ||
| low | med. | high | ultra | |
|---|---|---|---|---|
| BioShock Infinite (2013) | 195 | 110.3 | 93.4 | 34.3 |
| The Witcher 3 (2015) | 70.5 | 39.7 | 22.1 | 11.9 |
| Rocket League (2017) | 156 | 76.1 | 47.4 |
Emissions
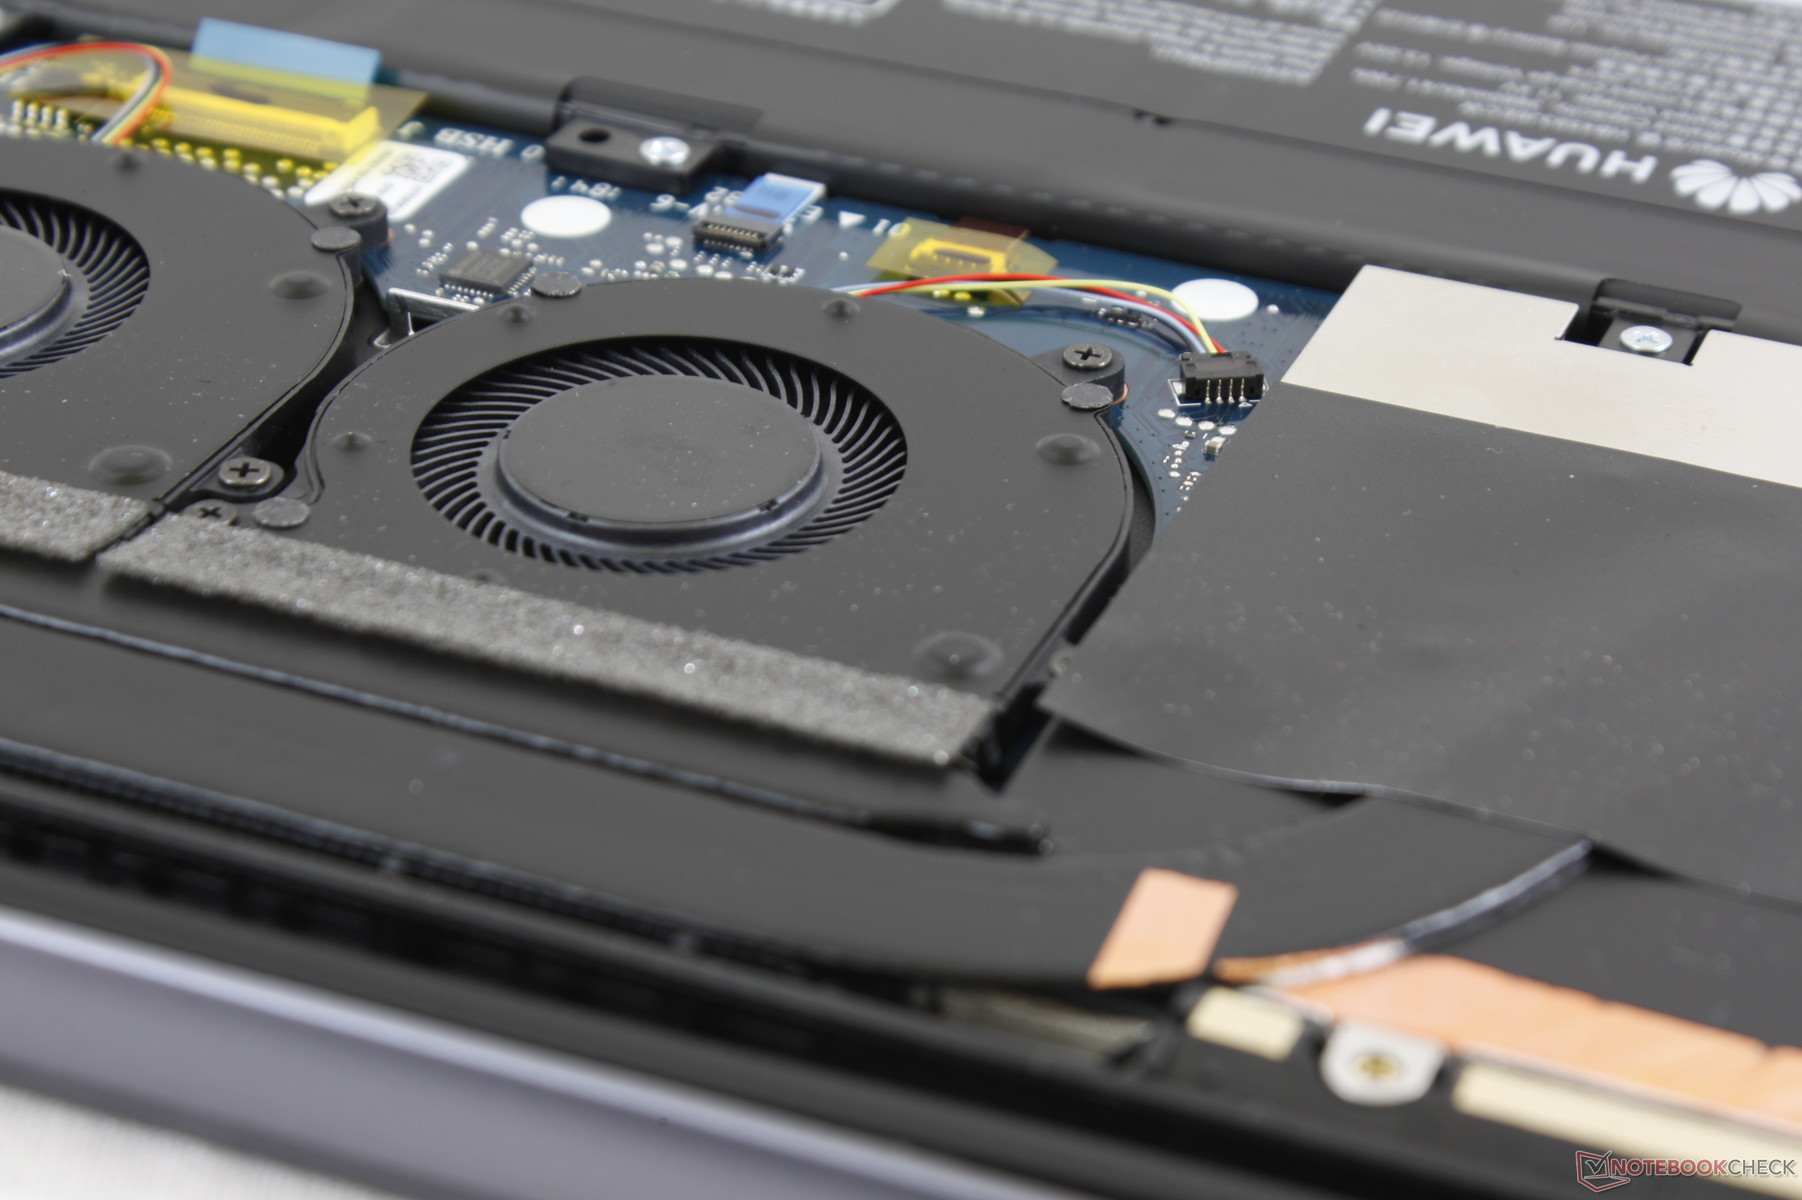
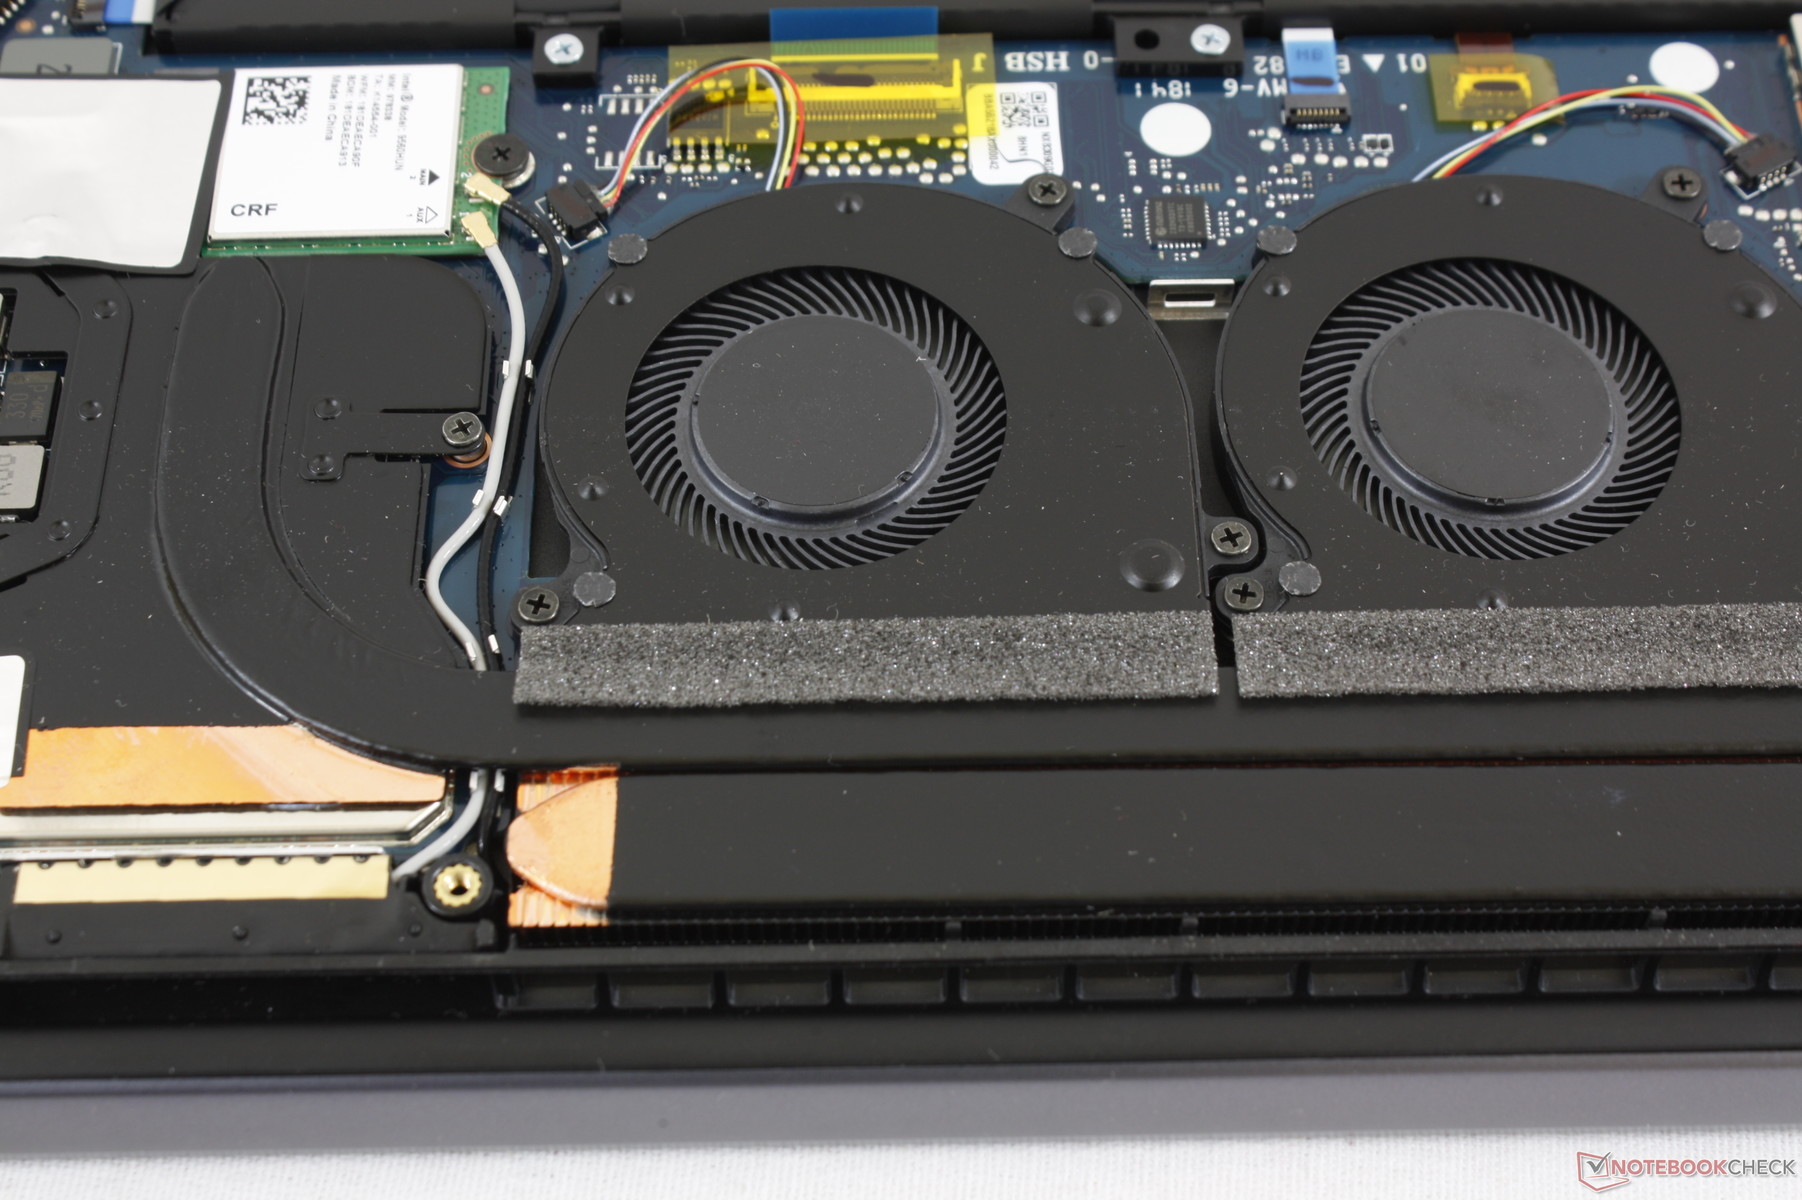
System Noise
The cooling solution consists of twin fans and two heat pipes in a center-positioned arrangement that Huawei likes to call "Shark Fin Design 2.0". The approach is unique in that the processors are placed closer to the rear corners with the fans in center whereas the opposite is true on most other laptops.
Fans are idle during low loads for a silent browsing, typing, or streaming experience. Impressively, both fans remain idle throughout most of the first benchmark scene of 3DMark 06 whereas the fans on other laptops begin revving much sooner. In other words, the MateBook 13 can remain quieter for longer during heavier loads. At worst, fan noise can hover in the 32 dB(A) if multi-tasking and browsing for long periods.
When gaming, however, fan noise becomes similar to the MateBook X Pro at the 43 to 47 dB(A) range to be louder than the XPS 13 and even Blade Stealth. Since the fans are small (<40 mm diameter), fan pitch is slightly higher and thus more noticeable as well.
We are able to hear some slight electronic noise when placing an ear near the right side of the keyboard. It's thankfully unnoticeable in practice.
| Huawei MateBook 13 i7 GeForce MX150, i7-8565U, Samsung SSD PM981 MZVLB512HAJQ | Huawei Matebook X Pro i5 GeForce MX150, i5-8250U, Samsung PM961 MZVLW256HEHP | Dell XPS 13 9370 i7 UHD UHD Graphics 620, i5-8550U, Toshiba XG5 KXG50ZNV512G | Apple MacBook Pro 13 2018 Touchbar i5 Iris Plus Graphics 655, i5-8259U | Razer Blade Stealth i7-8565U GeForce MX150, i7-8565U, Lite-On CA3-8D256-Q11 | |
|---|---|---|---|---|---|
| Noise | 0% | 4% | 1% | -2% | |
| off / environment * (dB) | 28.6 | 27.9 2% | 28 2% | 29.6 -3% | 28.4 1% |
| Idle Minimum * (dB) | 28.6 | 27.9 2% | 28 2% | 29.6 -3% | 28.5 -0% |
| Idle Average * (dB) | 28.6 | 27.9 2% | 28 2% | 29.6 -3% | 29 -1% |
| Idle Maximum * (dB) | 28.6 | 27.9 2% | 28 2% | 29.6 -3% | 29.1 -2% |
| Load Average * (dB) | 34.2 | 36.2 -6% | 32.5 5% | 36.7 -7% | 42.8 -25% |
| Witcher 3 ultra * (dB) | 43 | 45 -5% | 32.5 24% | 41.4 4% | |
| Load Maximum * (dB) | 47 | 45.2 4% | 42.2 10% | 46.7 1% | 41.6 11% |
* ... smaller is better
Noise level
| Idle |
| 28.6 / 28.6 / 28.6 dB(A) |
| Load |
| 34.2 / 47 dB(A) |
 | ||
30 dB silent 40 dB(A) audible 50 dB(A) loud |
||
min: | ||
Temperature
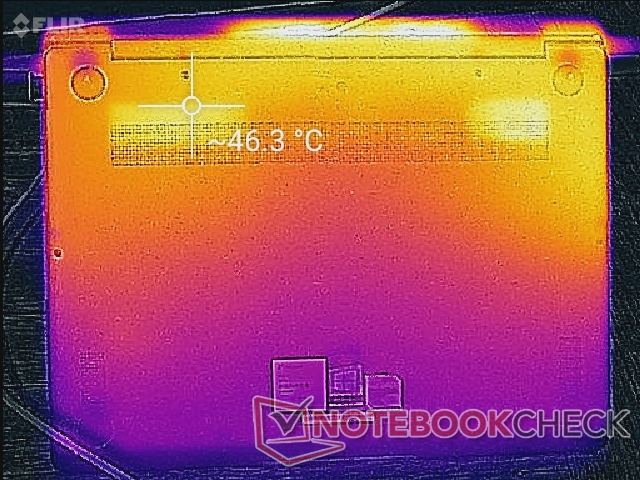
Huawei's all-aluminum alloy approach means a more even heat distribution across both sides of the laptop. In contrast, the carbon fiber and magnesium chassis of the XPS 13 means the palm rests can remain much cooler while the rest of the notebook can grow warmer. Surface temperatures are thus more similar to the all-aluminum Razer Blade Stealth.
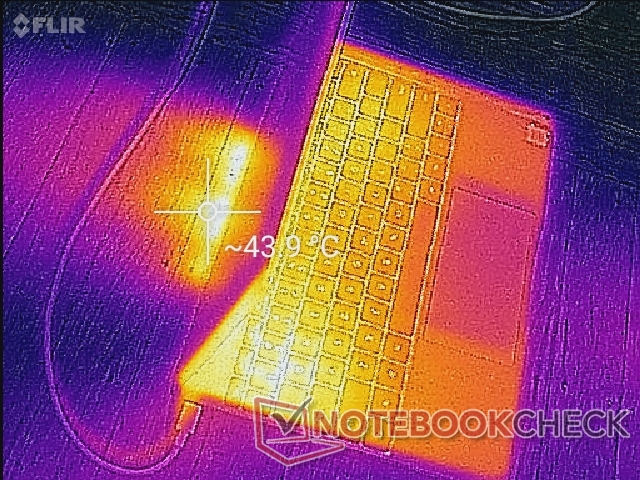
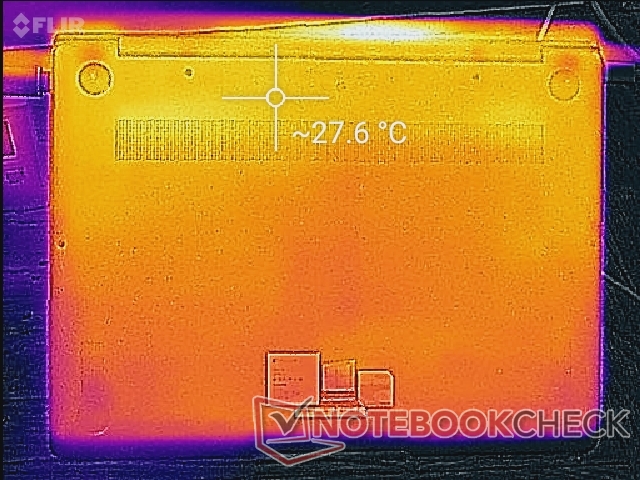
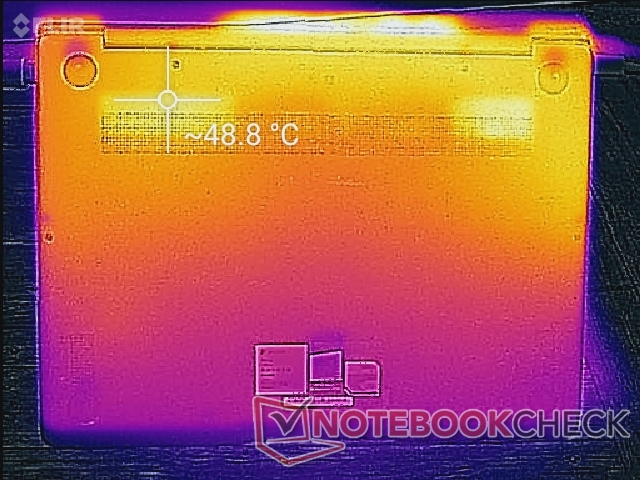
The bottom surface averages about 27 C when idling on desktop against a room temperature of 22 C. It becomes noticeably warmer during use, though never uncomfortably so. We recommend using a table if gaming since the bottom surface can be as warm as 46 C when under stress.
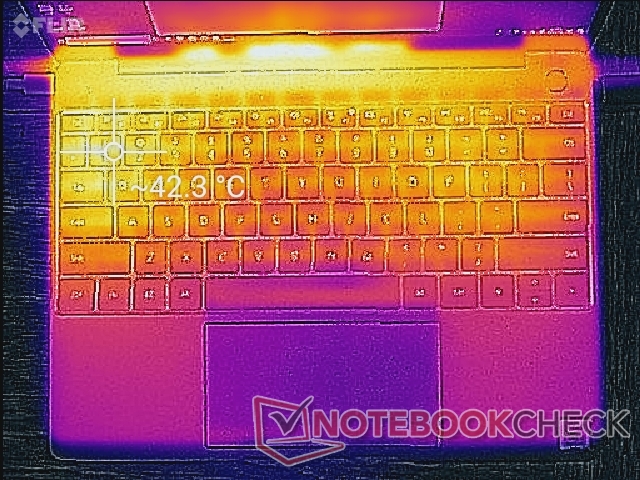
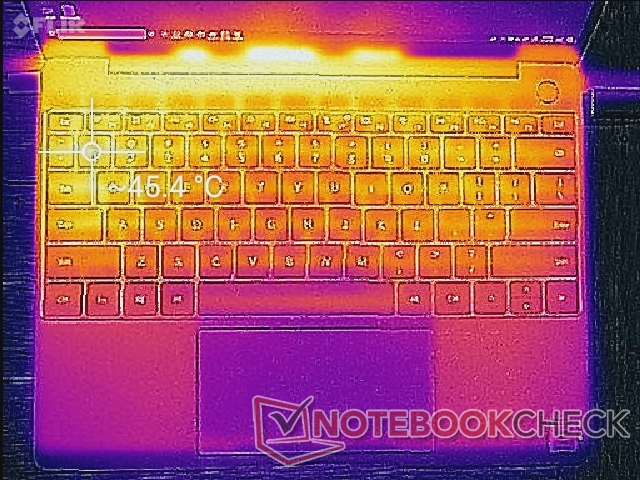
Commonly used keys for gaming like 'WASD' and '123' will be very warm when under high processing loads. It's not a huge issue for most users, but cooler key caps here would be preferable for gamers. This is a direct consequence of positioning the GPU so close to these keys underneath.
Stress Test
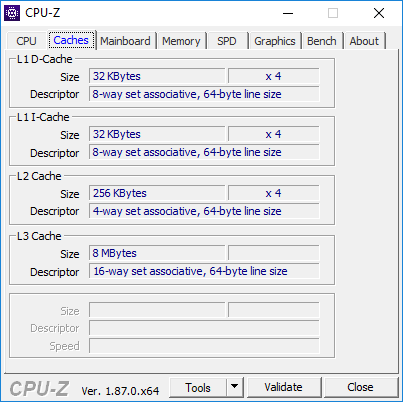
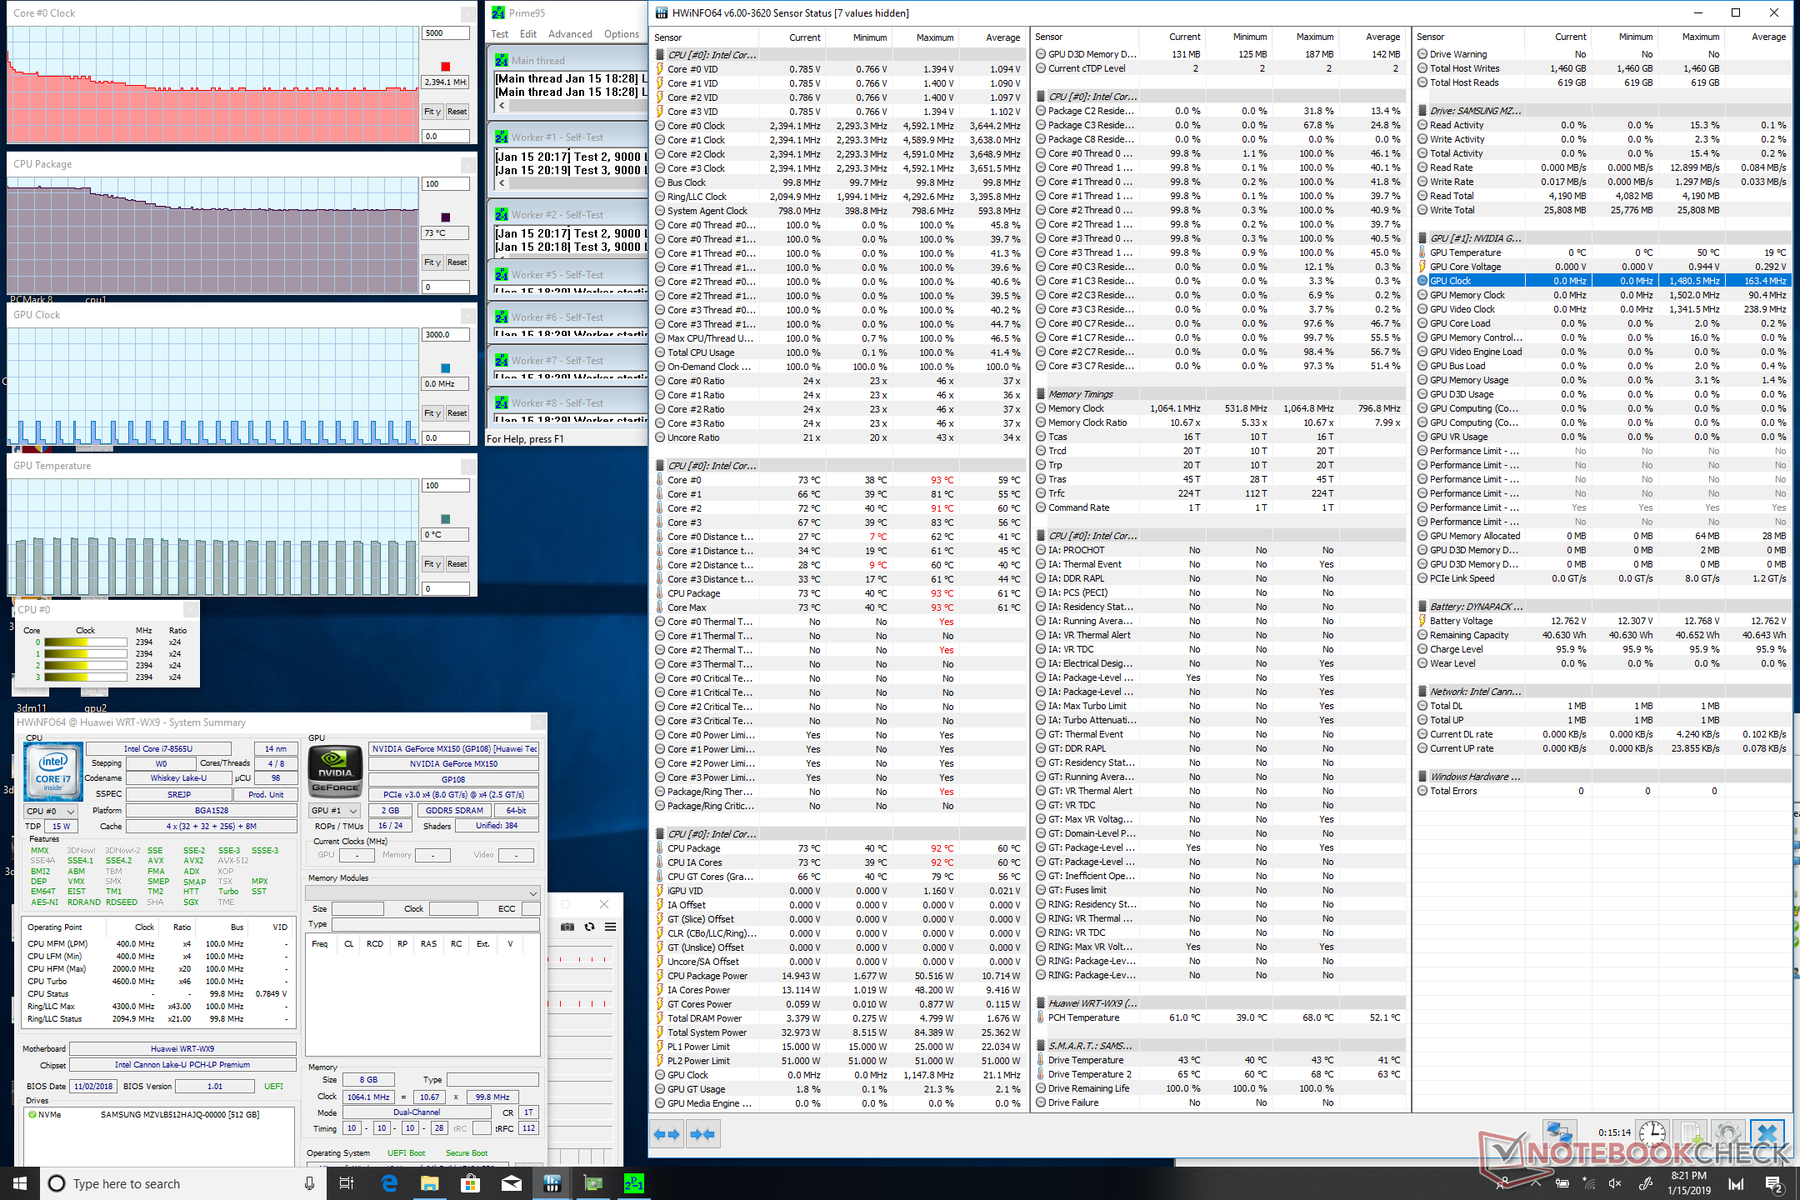
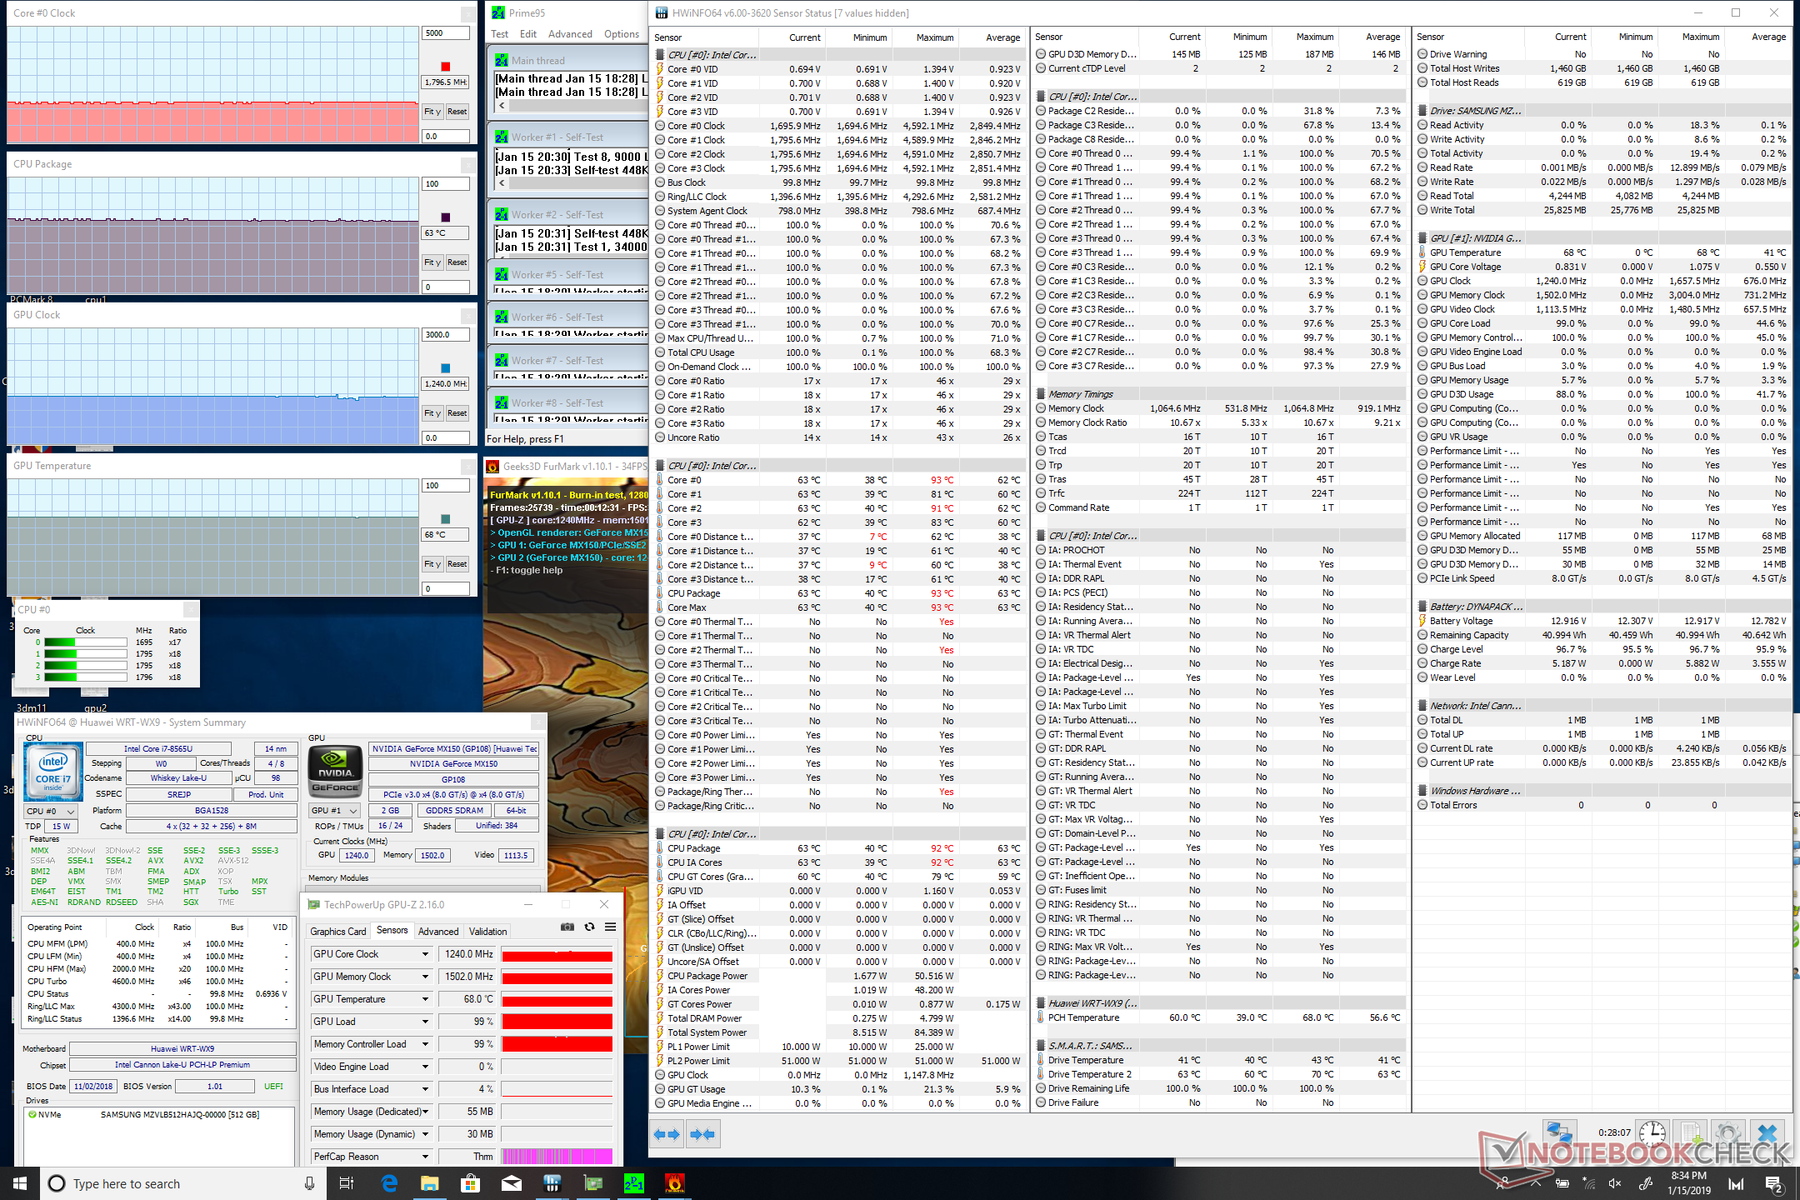
We stress the system to identify for any potential throttling or stability issues. When subjected to Prime95 load, the CPU would operate at 4 GHz for the first few seconds at a maximum core temperature of 92 C. Thereafter, clock rates steadily drop to 2.3 GHz in order to maintain a cooler core temperature of 73 C as shown by the screenshot below. This is still 500 MHz above the base clock rate of the i7-8565U for an acceptable level of sustainable Turbo Boost. The observed behavior matches our CineBench loop test above where CPU performance is fastest during the start of the test only. Clock rates never dip below 1.8 GHz even when running both Prime95 and FurMark.
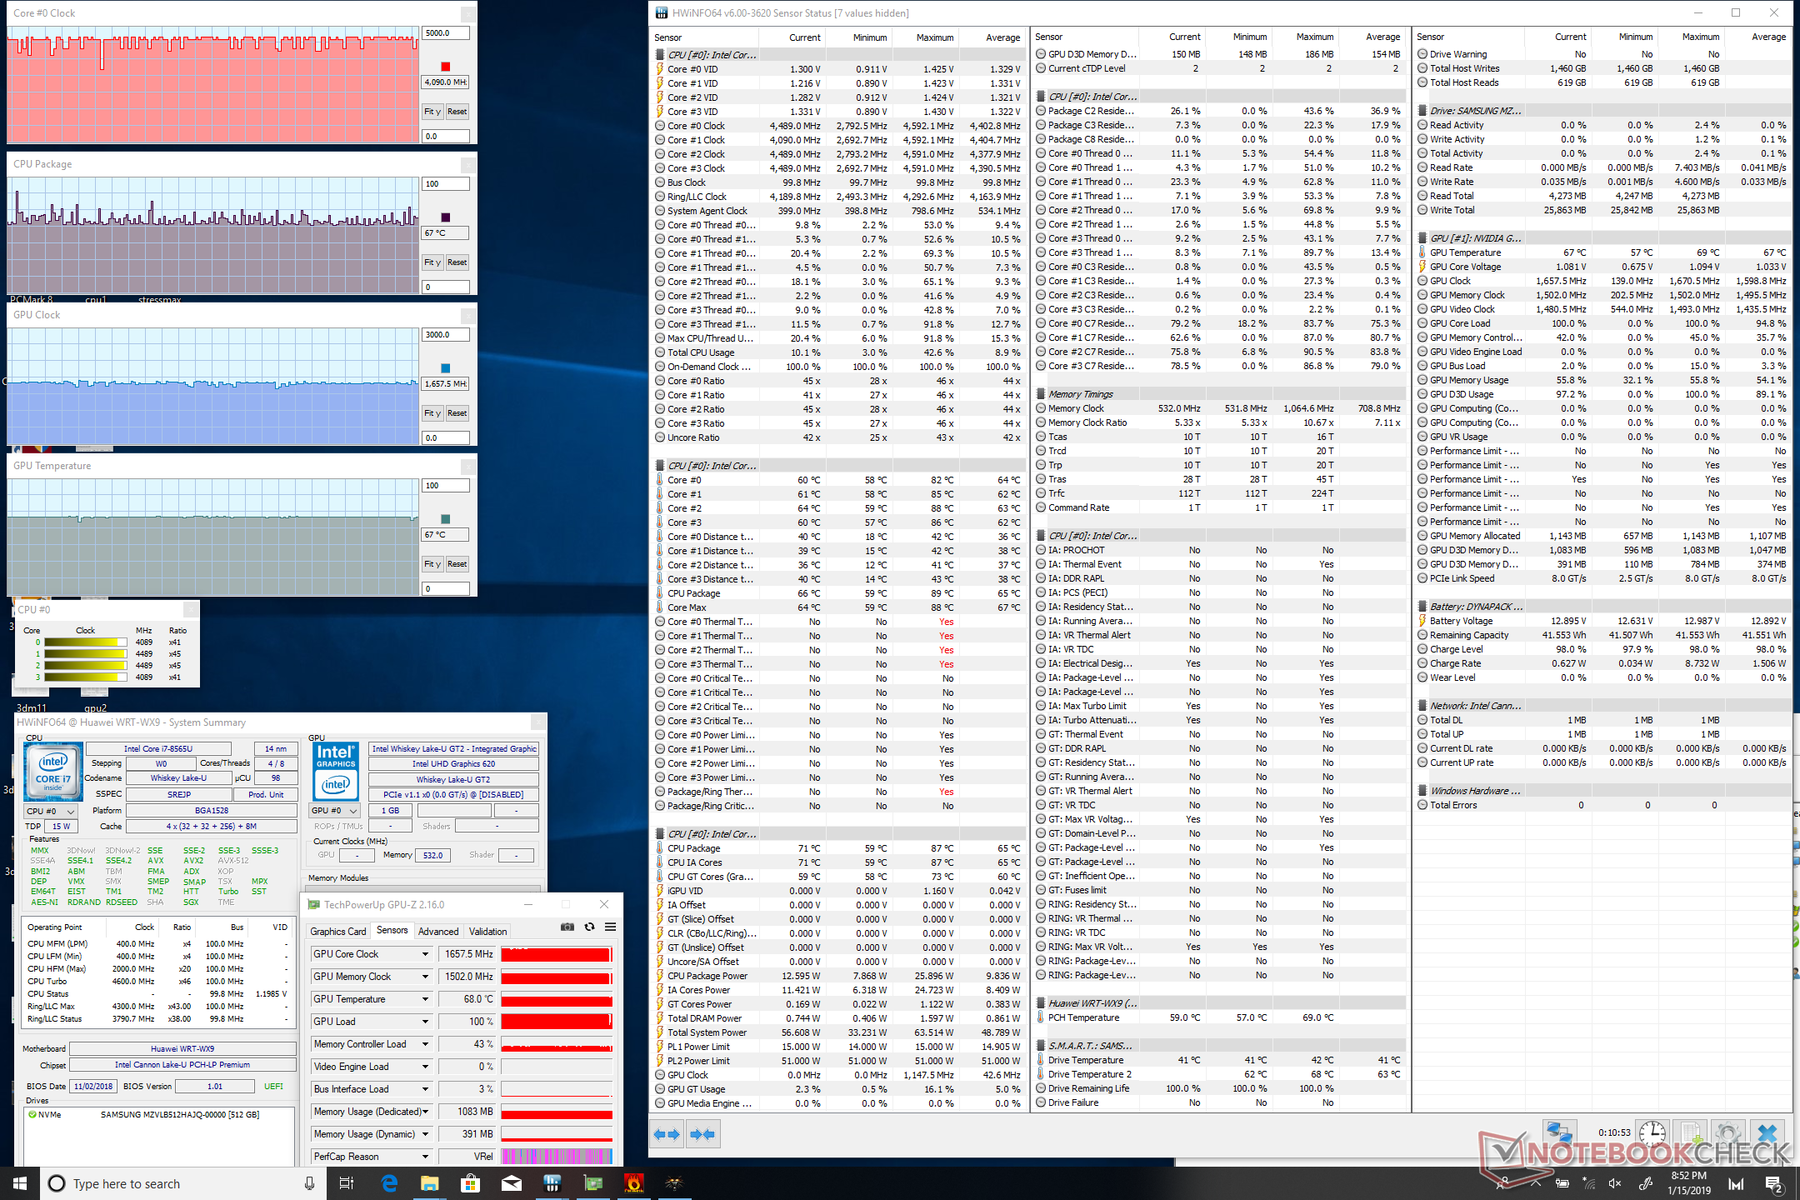
When running Witcher 3, both the CPU and GPU are able to maintain a core temperature of 67 C each. In comparison, the processors in the Blade Stealth run cooler at just under 60 C when subjected to the same gaming loads.
Running on battery power will impact GPU performance while the CPU remains intact. A 3DMark 11 run on batteries returns Physics and Graphics scores of 8868 and 3587 points, respectively, compared to 8191 and 4514 points when on mains.
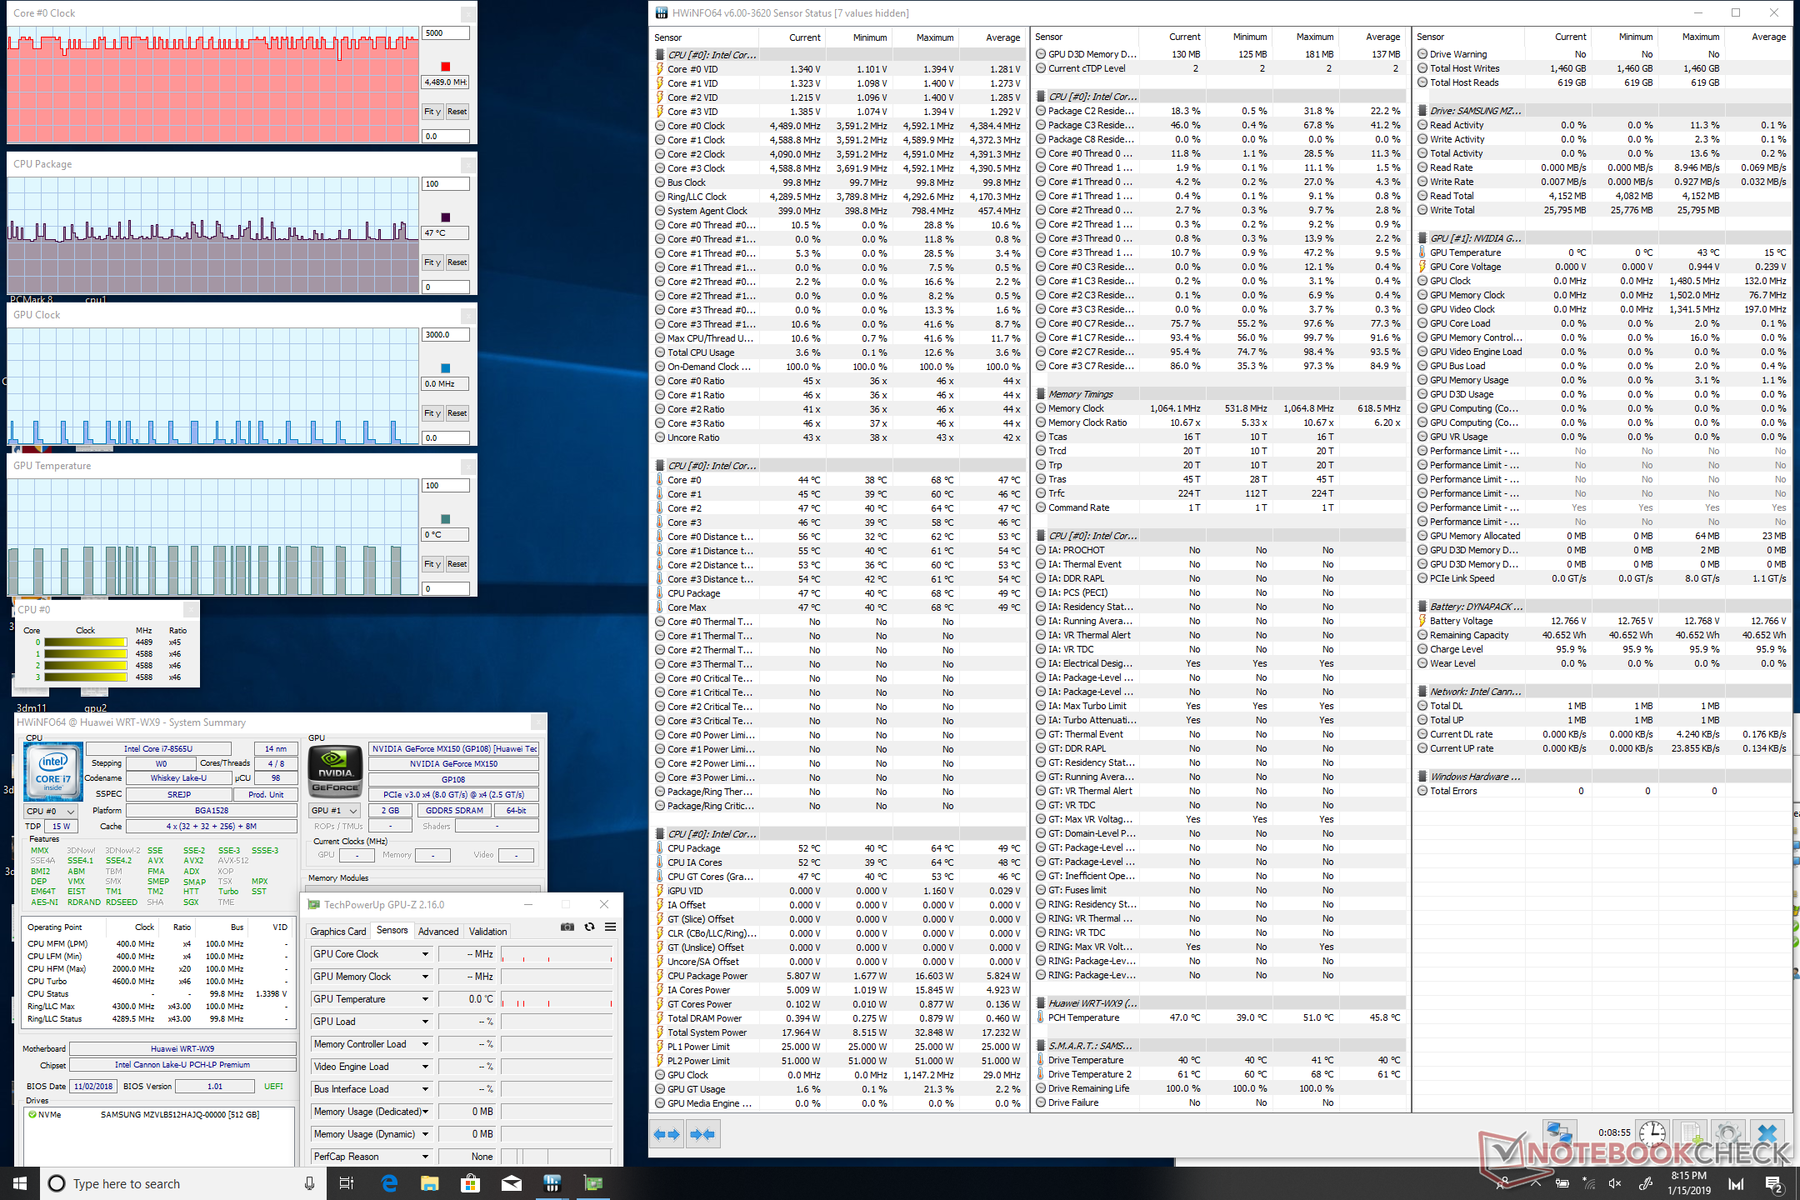
| CPU Clock (GHz) | GPU Clock (MHz) | Average CPU Temperature (°C) | Average GPU Temperature (°C) | |
| System Idle | -- | -- | 47 | 43 |
| Prime95 Stress | 2.4 | -- | 73 | -- |
| Prime95 + FurMark Stress | 1.8 | 1240 | 63 | 68 |
| Witcher 3 Stress | 3.0 - 4.1 | 1658 | 67 | 67 |
(±) The maximum temperature on the upper side is 44.2 °C / 112 F, compared to the average of 35.9 °C / 97 F, ranging from 21.4 to 59 °C for the class Subnotebook.
(-) The bottom heats up to a maximum of 48 °C / 118 F, compared to the average of 39.2 °C / 103 F
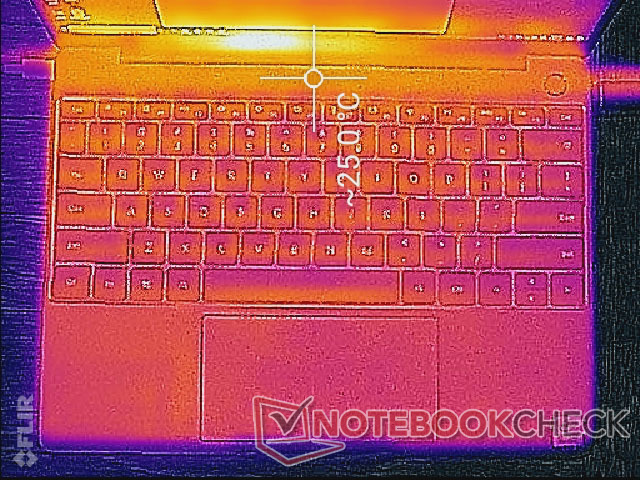
(+) In idle usage, the average temperature for the upper side is 24 °C / 75 F, compared to the device average of 30.8 °C / 87 F.
(±) Playing The Witcher 3, the average temperature for the upper side is 36 °C / 97 F, compared to the device average of 30.8 °C / 87 F.
(+) The palmrests and touchpad are reaching skin temperature as a maximum (33.2 °C / 91.8 F) and are therefore not hot.
(-) The average temperature of the palmrest area of similar devices was 28.2 °C / 82.8 F (-5 °C / -9 F).
Speakers
Audio quality is good for the size with the expected drawback of weak bass not unlike on the MateBook X Pro. The stereo speakers do the job for video conferencing or the occasional media playback with relatively good balance and minimal vibration at higher volume settings. Headphones are still recommended for a better audio experience.


Huawei MateBook 13 i7 audio analysis
(-) | not very loud speakers (70.7 dB)
Bass 100 - 315 Hz
(-) | nearly no bass - on average 16.3% lower than median
(-) | bass is not linear (15.7% delta to prev. frequency)
Mids 400 - 2000 Hz
(+) | balanced mids - only 4.9% away from median
(±) | linearity of mids is average (7.3% delta to prev. frequency)
Highs 2 - 16 kHz
(+) | balanced highs - only 3.5% away from median
(±) | linearity of highs is average (7.5% delta to prev. frequency)
Overall 100 - 16.000 Hz
(±) | linearity of overall sound is average (21.7% difference to median)
Compared to same class
» 73% of all tested devices in this class were better, 6% similar, 21% worse
» The best had a delta of 5%, average was 18%, worst was 53%
Compared to all devices tested
» 62% of all tested devices were better, 7% similar, 31% worse
» The best had a delta of 4%, average was 23%, worst was 134%
Apple MacBook 12 (Early 2016) 1.1 GHz audio analysis
(+) | speakers can play relatively loud (83.6 dB)
Bass 100 - 315 Hz
(±) | reduced bass - on average 11.3% lower than median
(±) | linearity of bass is average (14.2% delta to prev. frequency)
Mids 400 - 2000 Hz
(+) | balanced mids - only 2.4% away from median
(+) | mids are linear (5.5% delta to prev. frequency)
Highs 2 - 16 kHz
(+) | balanced highs - only 2% away from median
(+) | highs are linear (4.5% delta to prev. frequency)
Overall 100 - 16.000 Hz
(+) | overall sound is linear (10.2% difference to median)
Compared to same class
» 7% of all tested devices in this class were better, 2% similar, 91% worse
» The best had a delta of 5%, average was 18%, worst was 53%
Compared to all devices tested
» 5% of all tested devices were better, 1% similar, 94% worse
» The best had a delta of 4%, average was 23%, worst was 134%
Energy Management
Power Consumption
When idling on desktop, the MateBook 13 demands anywhere between 3 W and 12 W depending on the brightness level and power profile much like on the MateBook X Pro. More demanding loads like gaming may draw over 60 W to be measurably higher than competing Ultrabooks. This can be attributed to the GeForce MX150 which is significantly more demanding than the integrated Intel GPU found on most competitors.
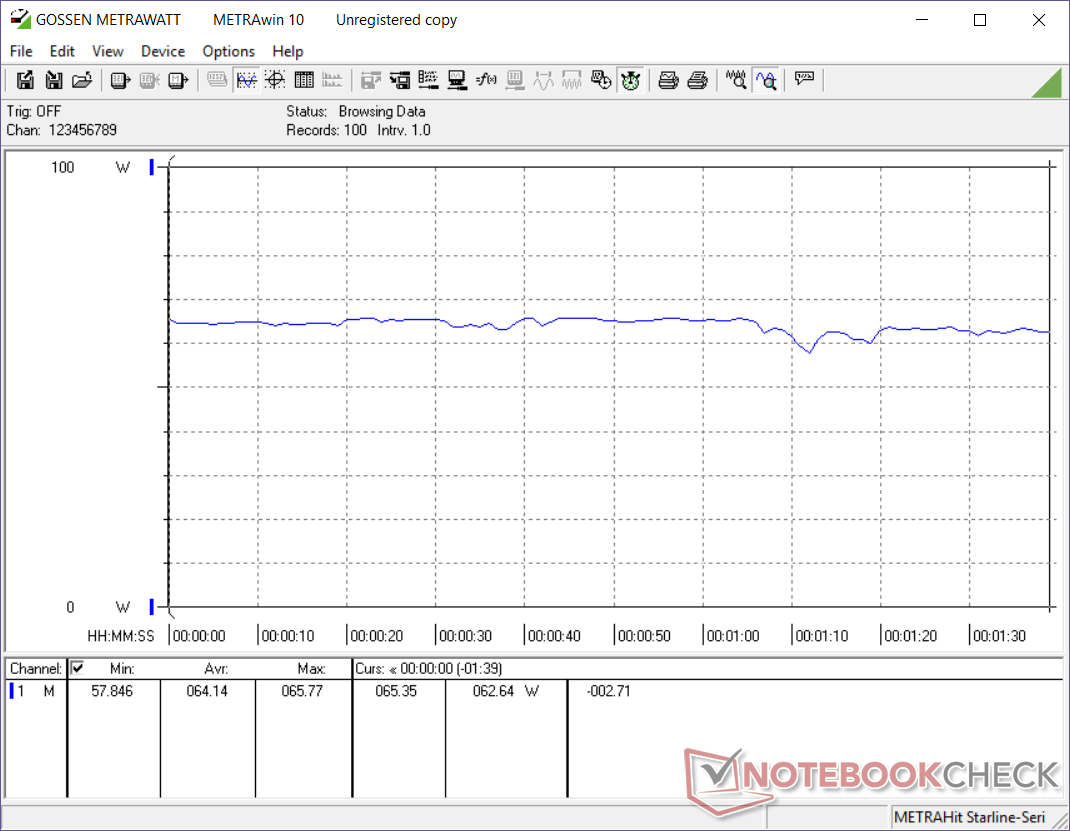
We are able to record a maximum draw of almost 66 W from the small (~6 x 6 x 3 cm) 65 W AC adapter when running both Prime95 and FurMark simultaneously. Note that the MateBook 13 draws almost 15 W more power than the MateBook X Pro when running Witcher 3 to almost match the TDP difference of the 10 W '1D12' MX150 and the 25 W '1D10' MX150.
Playing games at lower settings and higher frame rates will demand almost the entire 65 W capacity of the AC adapter to impact charging. For example, the battery slowly drains when playing Rocket League even when connected to an outlet. If low on battery, it may be best to avoid gaming and let the system recharge at its normal rate.
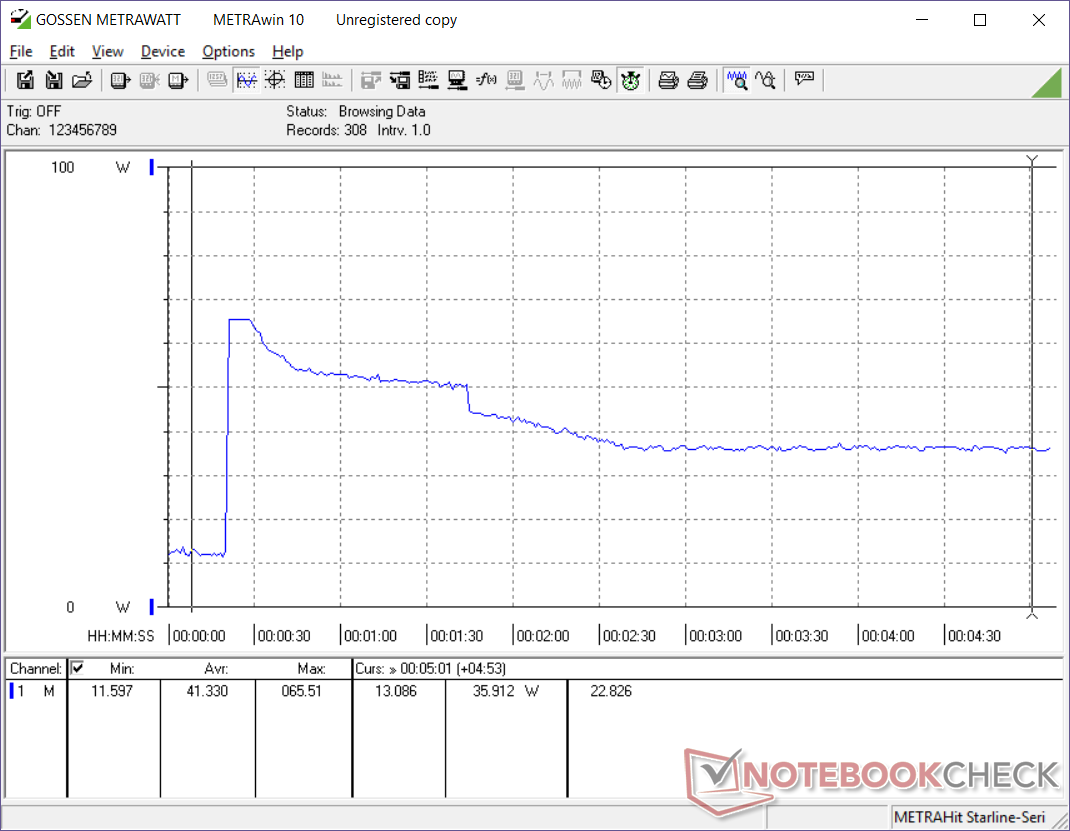
When running Prime95, we can observe an initial power spike up to 65.5 W before quickly stabilizing at about 36 W as shown by our graph below. This behavior suggests that maximum Turbo Boost clock rates are unsustainable to reflect our CineBench loop test results from above.
The universal USB Type-C AC adapter can be used to charge other devices as well including the MateBook X Pro and most smartphones.
| Off / Standby | |
| Idle | |
| Load |
|
Key:
min: | |
| Huawei MateBook 13 i7 i7-8565U, GeForce MX150, Samsung SSD PM981 MZVLB512HAJQ, IPS, 2160x1440, 13" | Dell XPS 13 9370 i7 UHD i5-8550U, UHD Graphics 620, Toshiba XG5 KXG50ZNV512G, IPS, 3840x2160, 13.3" | Apple MacBook Pro 13 2018 Touchbar i5 i5-8259U, Iris Plus Graphics 655, , IPS, 2560x1600, 13.3" | HP Spectre x360 13t-ae000 i5-8550U, UHD Graphics 620, Lite-On CA1-8D256-HP, IPS, 3840x2160, 13.3" | Lenovo Yoga C930-13IKB i5-8250U, UHD Graphics 620, SK hynix PC401 HFS256GD9TNG, IPS, 1920x1080, 13.9" | Huawei Matebook X Pro i5 i5-8250U, GeForce MX150, Samsung PM961 MZVLW256HEHP, IPS, 3000x2000, 13.9" | |
|---|---|---|---|---|---|---|
| Power Consumption | 6% | 8% | 1% | 17% | 6% | |
| Idle Minimum * (Watt) | 3.5 | 5 -43% | 2.3 34% | 5.9 -69% | 3.3 6% | 3.5 -0% |
| Idle Average * (Watt) | 7.5 | 8.3 -11% | 8.7 -16% | 9.8 -31% | 6.8 9% | 8.9 -19% |
| Idle Maximum * (Watt) | 12.4 | 8.8 29% | 12.2 2% | 10.6 15% | 9.5 23% | 12.3 1% |
| Load Average * (Watt) | 64.2 | 46.4 28% | 53.3 17% | 36.6 43% | 40.8 36% | 54.2 16% |
| Witcher 3 ultra * (Watt) | 52.5 | 42.4 19% | ||||
| Load Maximum * (Watt) | 65.7 | 48.6 26% | 64 3% | 34.3 48% | 57 13% | 52.1 21% |
* ... smaller is better
Battery Life
Battery capacity is 27 percent smaller than on the MateBook X Pro. Combine this with the more powerful GPU in the MateBook 13 and overall runtimes will indubitably be shorter. We are able to record a battery life of 7.5 hours during real-world WLAN conditions compared to over 9 hours on the MateBook X Pro when subjected to similar loads. Even so, results are comparable to the XPS 13 and Spectre x360 13.
Charging from empty to full capacity takes between 1.5 to 2 hours. If gaming or running very high loads, however, the battery may slowly discharge as noted in the above section.
| Huawei MateBook 13 i7 i7-8565U, GeForce MX150, 41.7 Wh | Dell XPS 13 9370 i7 UHD i5-8550U, UHD Graphics 620, 52 Wh | Apple MacBook Pro 13 2018 Touchbar i5 i5-8259U, Iris Plus Graphics 655, 58 Wh | HP Spectre x360 13t-ae000 i5-8550U, UHD Graphics 620, 60 Wh | Lenovo Yoga C930-13IKB i5-8250U, UHD Graphics 620, 60 Wh | Huawei Matebook X Pro i5 i5-8250U, GeForce MX150, 57.4 Wh | |
|---|---|---|---|---|---|---|
| Battery runtime | 31% | 28% | 58% | 70% | 67% | |
| Reader / Idle (h) | 15.4 | 13.7 -11% | 23.9 55% | 20.7 34% | ||
| WiFi v1.3 (h) | 7.6 | 7.8 3% | 9.7 28% | 7.1 -7% | 9.2 21% | 9.3 22% |
| Load (h) | 0.9 | 1.8 100% | 2 122% | 2.1 133% | 2.2 144% | |
| Witcher 3 ultra (h) | 1.6 |
Verdict
Pros
Cons
The MateBook 13 is priced slightly lower than the flagship MateBook X Pro because it's supposed to be a lower-tier option. In reality, it actually outperforms the X Pro while keeping the super-thin and attractive chassis design intact. We're not just talking about marginal benefits either as the MateBook 13 has superior throttling control and a more powerful GPU for 25 to 30 percent faster performance all around. It even has faster WiFi and a better webcam to boot.
The main aspect preventing the MateBook 13 from being wholly better than the MateBook X Pro is its display. While still excellent and color accurate, it's slightly smaller and dimmer with lower contrast and resolution. The Pro version still offers the superior display in this regard. Other disadvantages of the MateBook 13 when compared to its pricier alternative are its smaller battery, lack of Thunderbolt 3, and lack of USB Type-A.
The MateBook 13 is a sound option for users who are turned off by the weak graphics potential of popular 13-inch Ultrabooks like the XPS 13, Spectre 13, Gram 13, or ZenBook 13. If the powerful GPU is not alluring, then users would be better off with the XPS 13 or Spectre 13 as these models are more rigid with a wider selection of ports and arguably better keyboards.
The only Ultrabook so far with a 13-inch 3:2 display and a full-power 25 W GeForce MX150 for gaming-level performance. The MateBook 13 packs immense power for its size that both casual gamers and traditional Ultrabook users can appreciate.
Huawei MateBook 13 i7
- 01/19/2019 v6 (old)
Allen Ngo
Price comparison
