Huawei Mate 20 Smartphone Review
The new Huawei Mate 20 series has already been making a name for itself in the premium smartphone market. We reviewed the Mate 20 Pro last month, which scored highly not only for its strong performance in our tests but also for its arsenal of features that it includes.
Its lesser sibling, the Mate 20, may interest many buyers though. The Mate 20 costs around 200 Euros (~$225) less than the Pro, but it is largely the same device. Both devices share the same form factor, SoC, 128 GB of UFS 2.1 flash storage, version of EMUI and a Leica-branded triple rear-facing camera array.
Our review will pit the Mate 20 against the Mate 20 Pro to determine which is the better deal and for whom the Mate 20 is suited. We will also compare the Mate 20 against the Huawei Mate 10 and other flagship devices, including the HTC U12 Plus, LG V30, OnePlus 6T and Xiaomi Mi 8.
Case
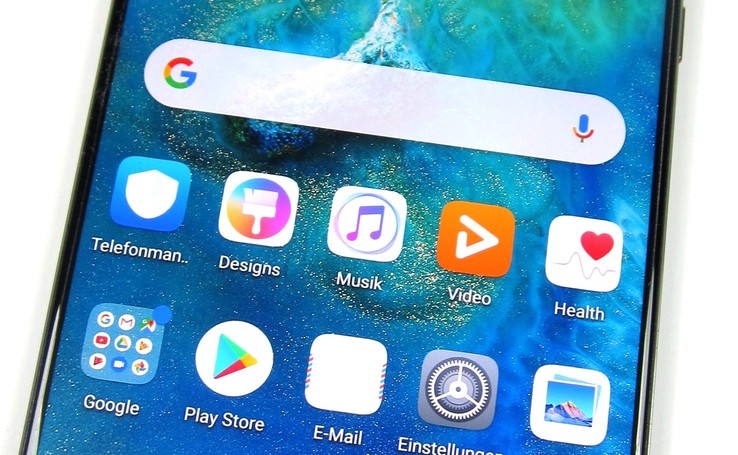
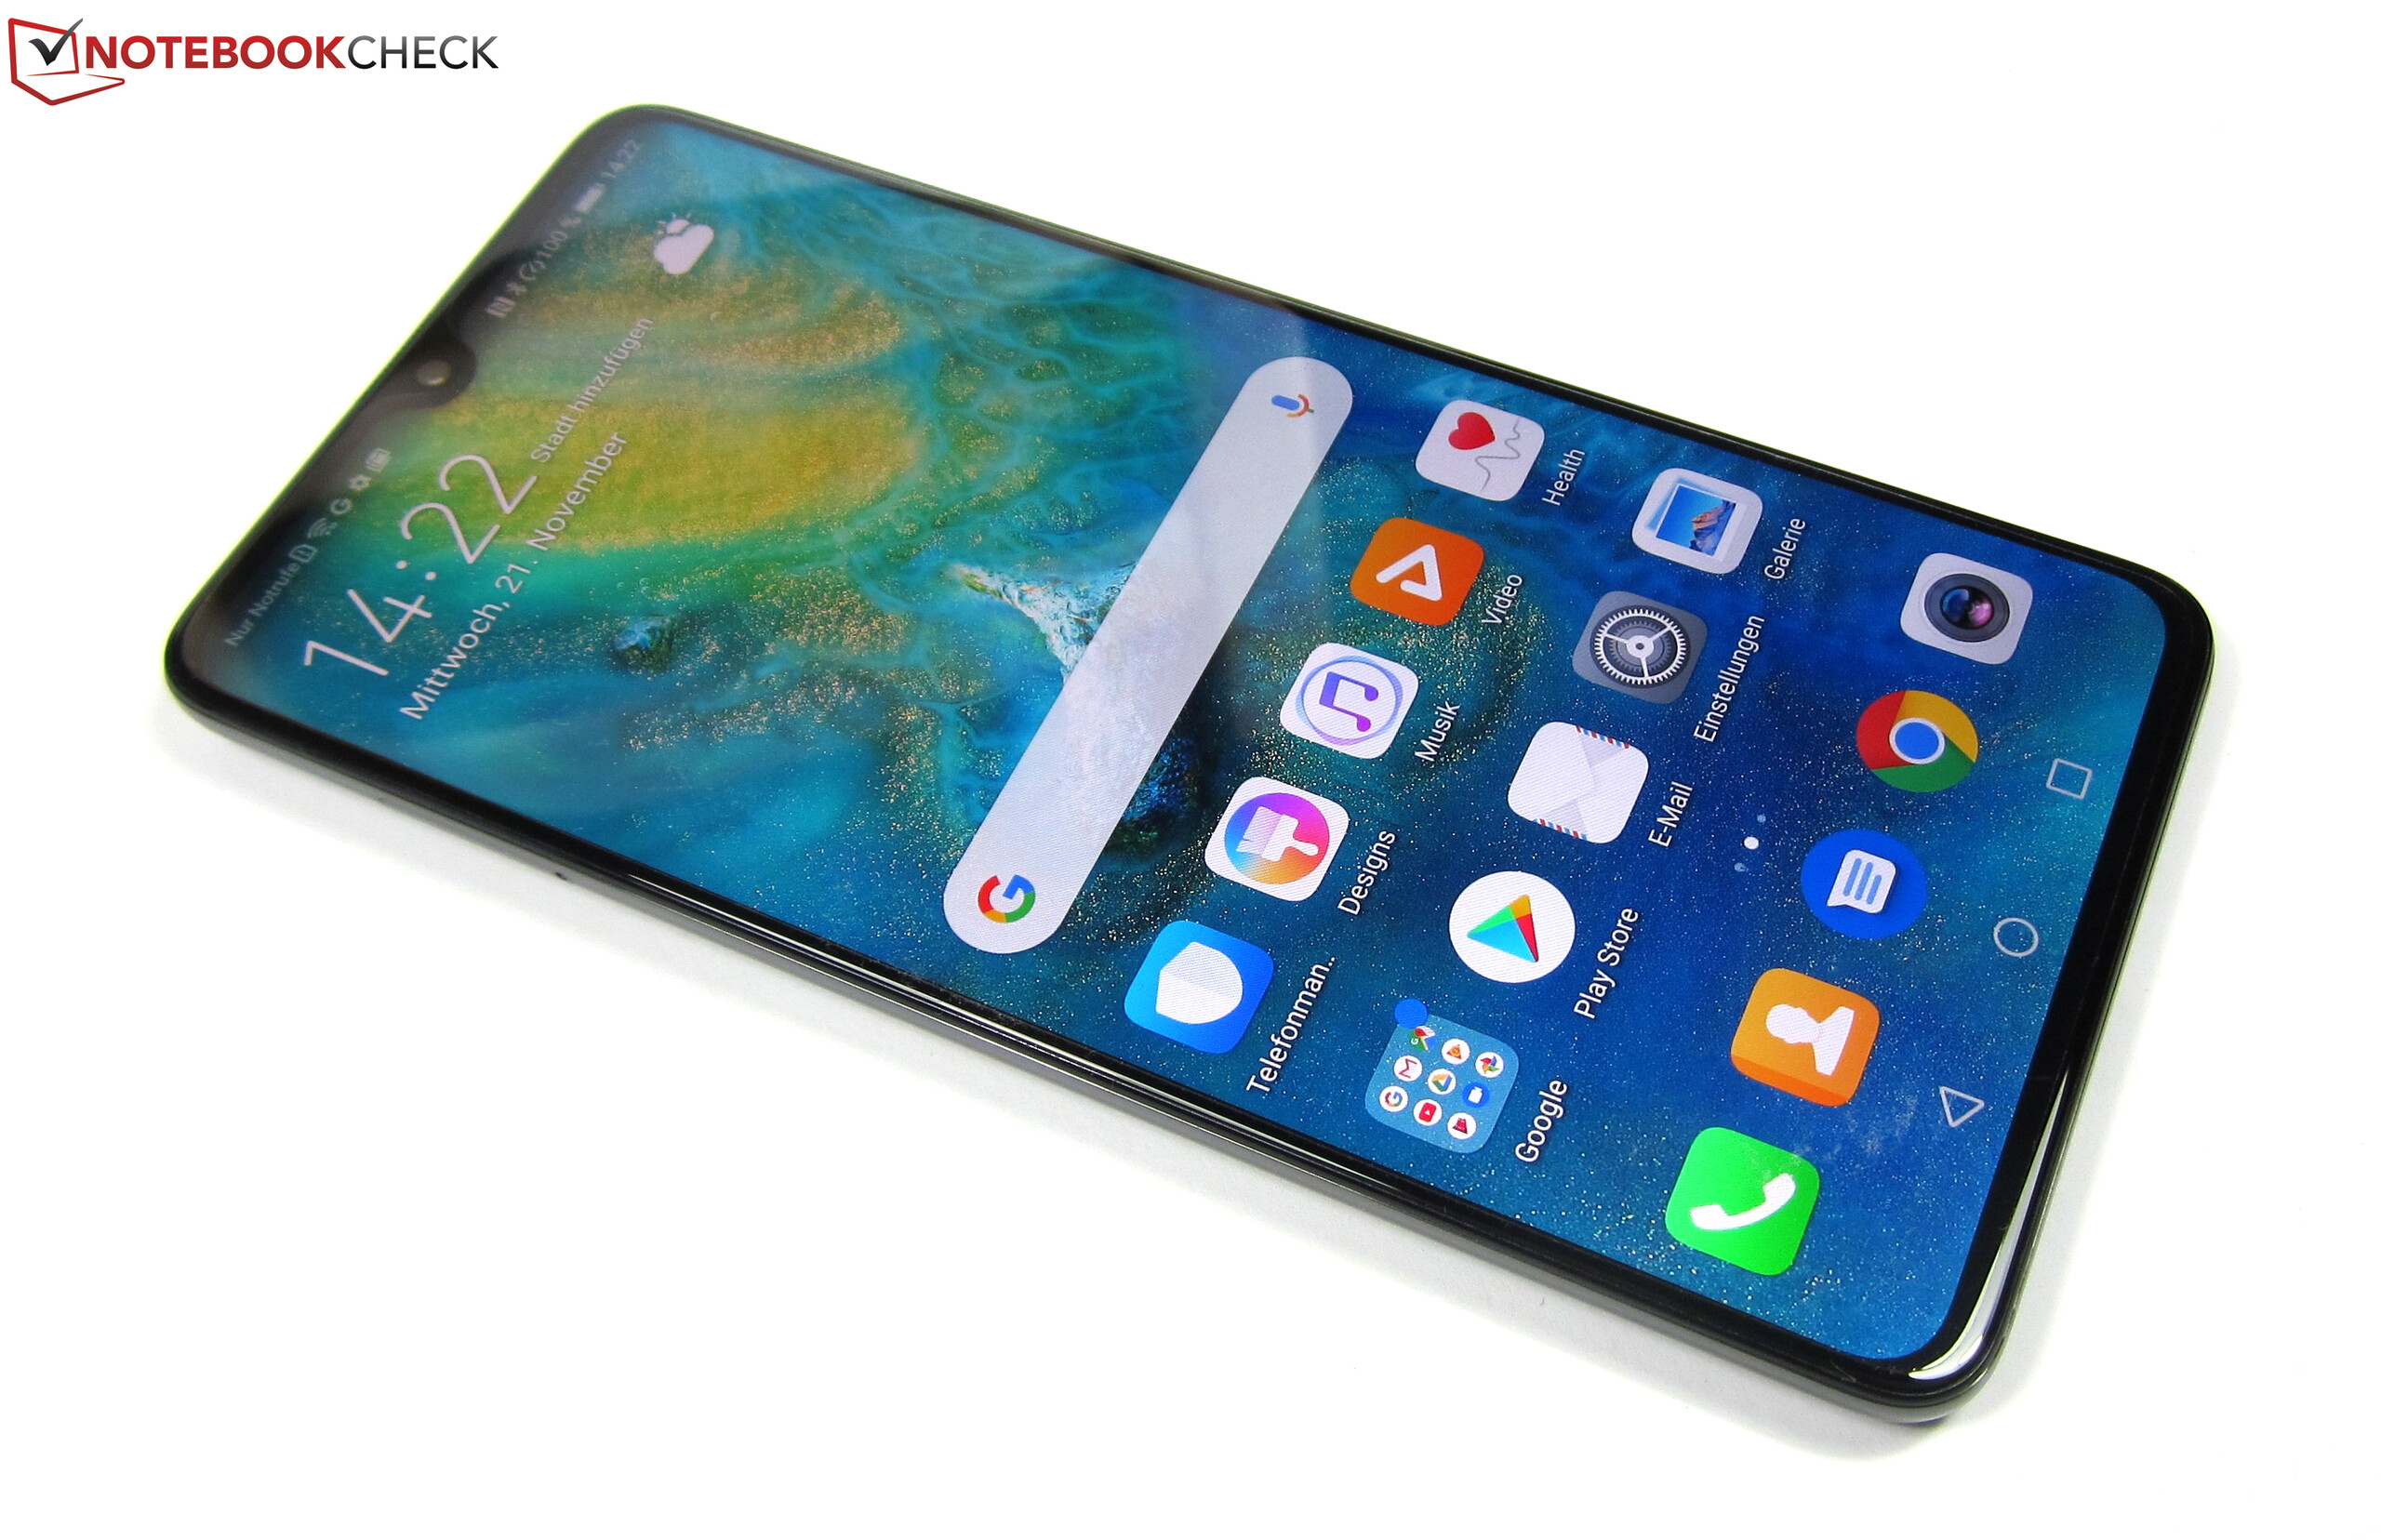
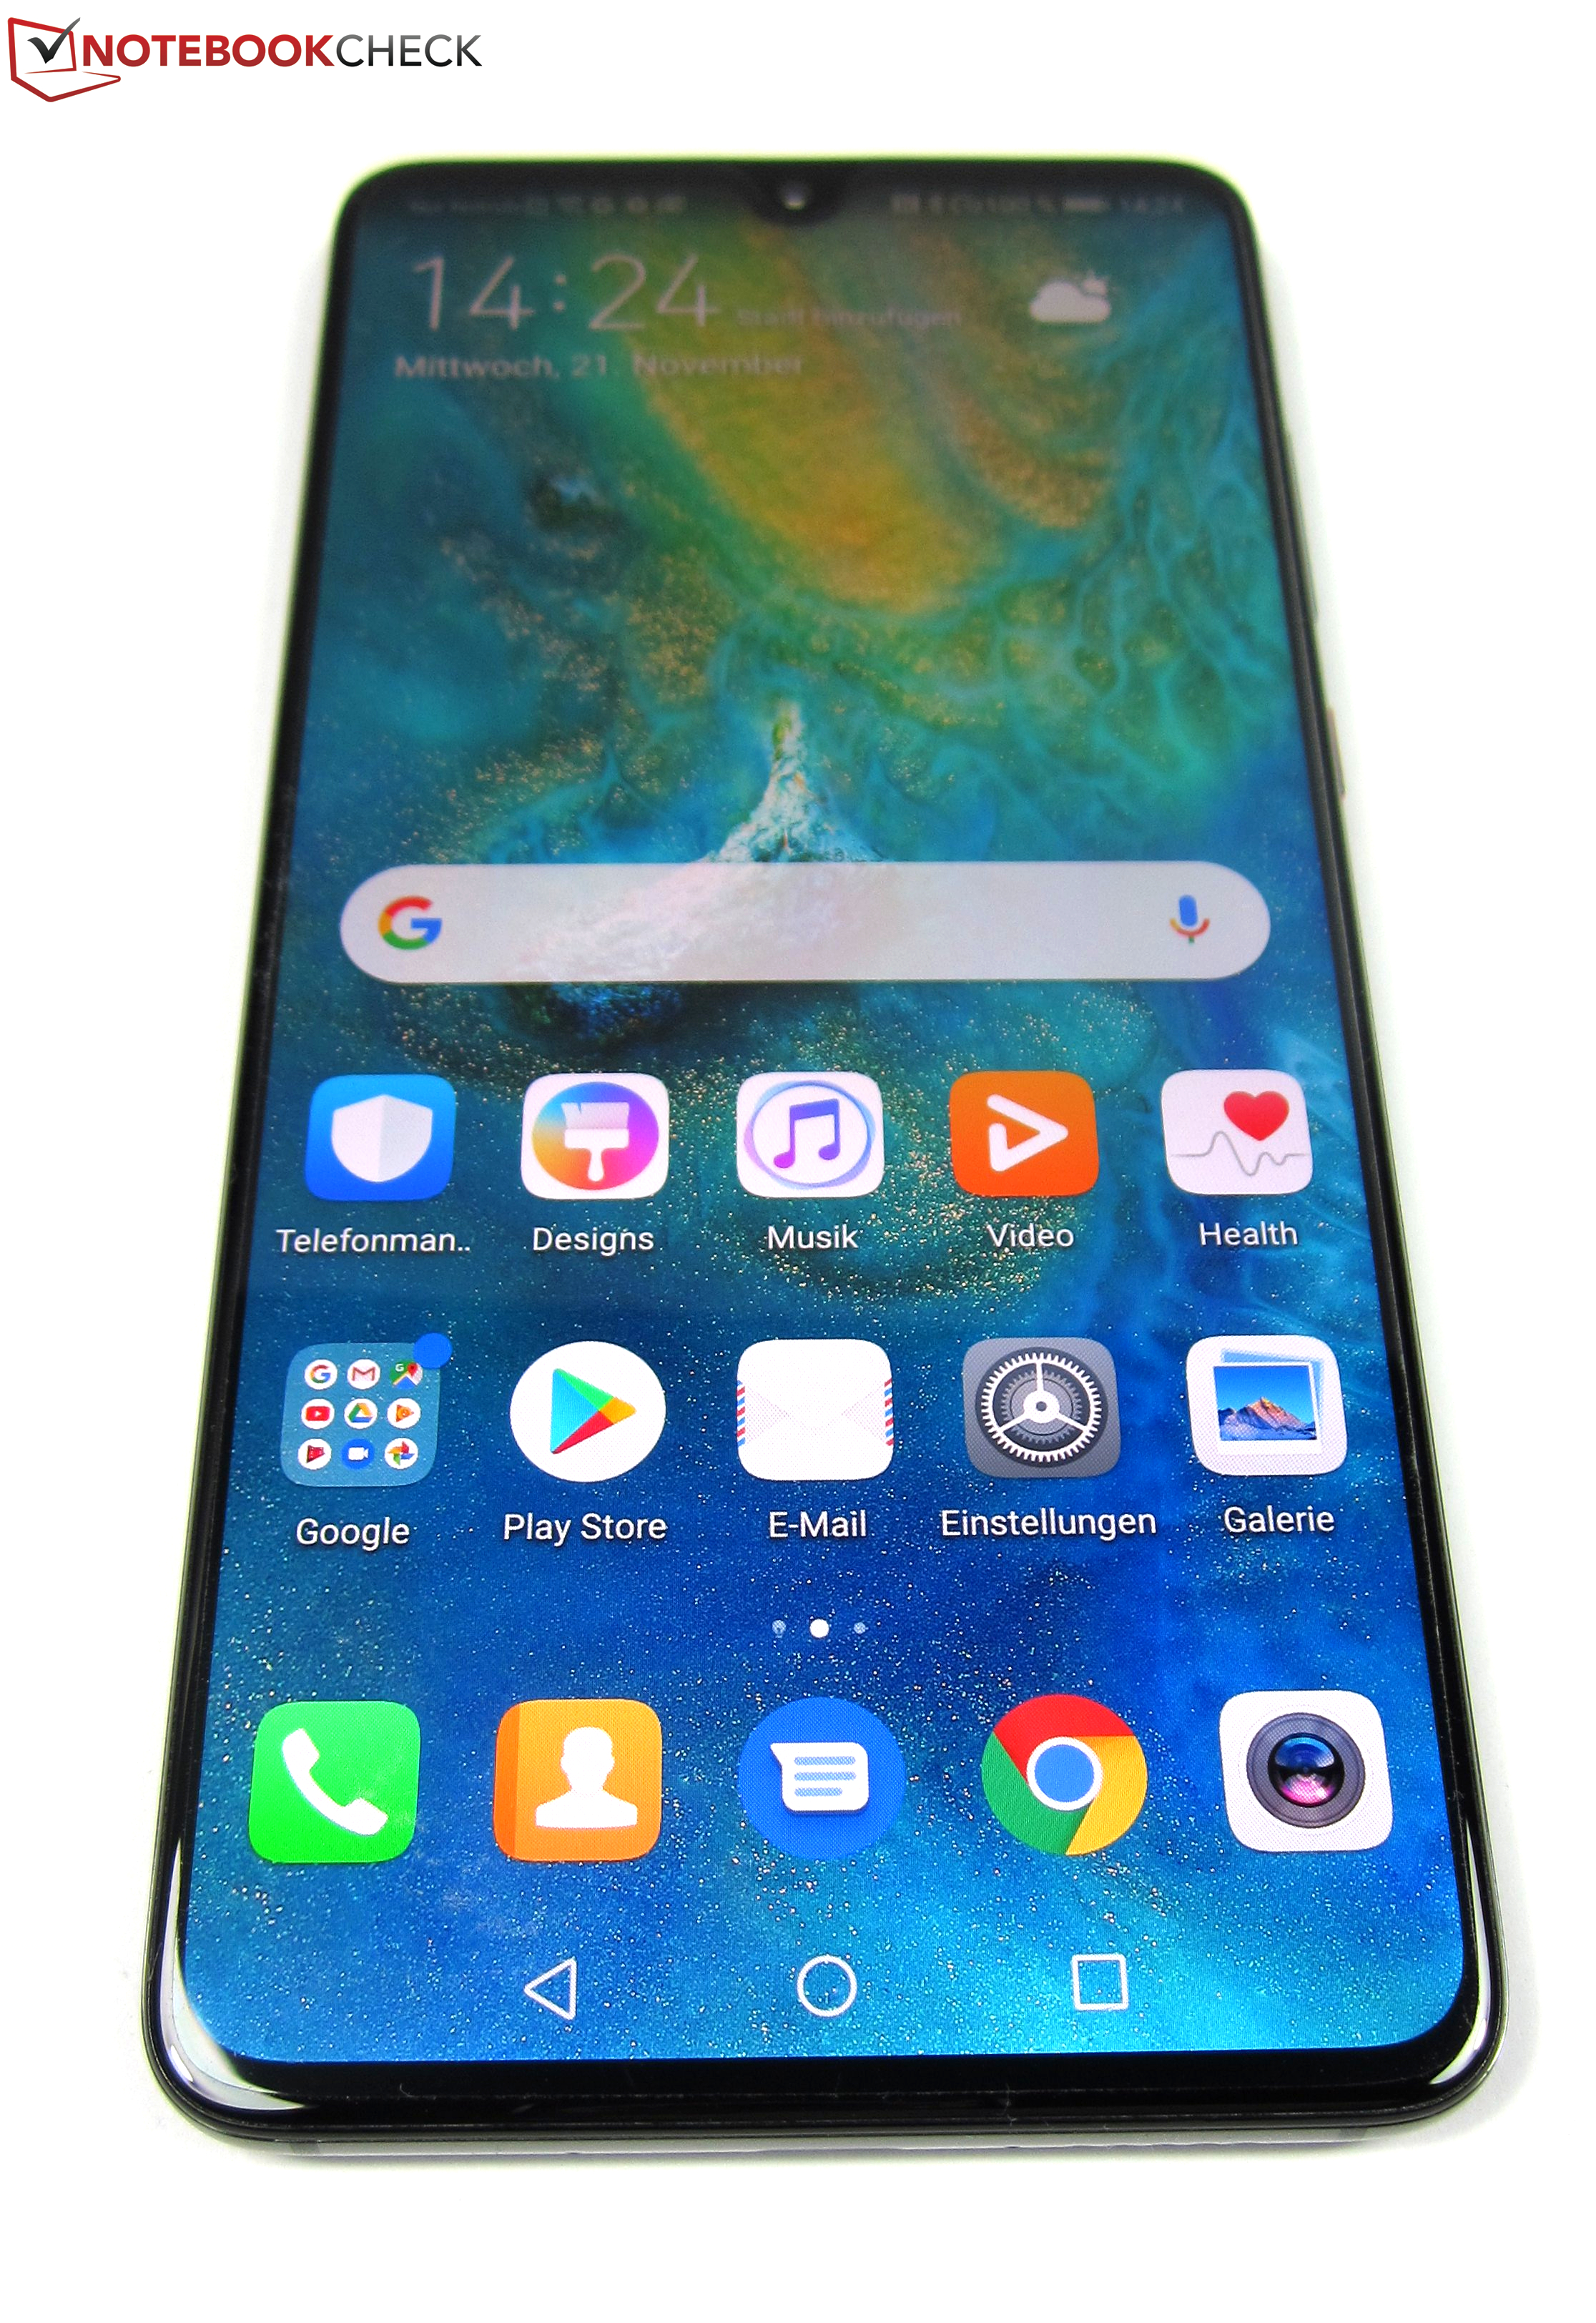
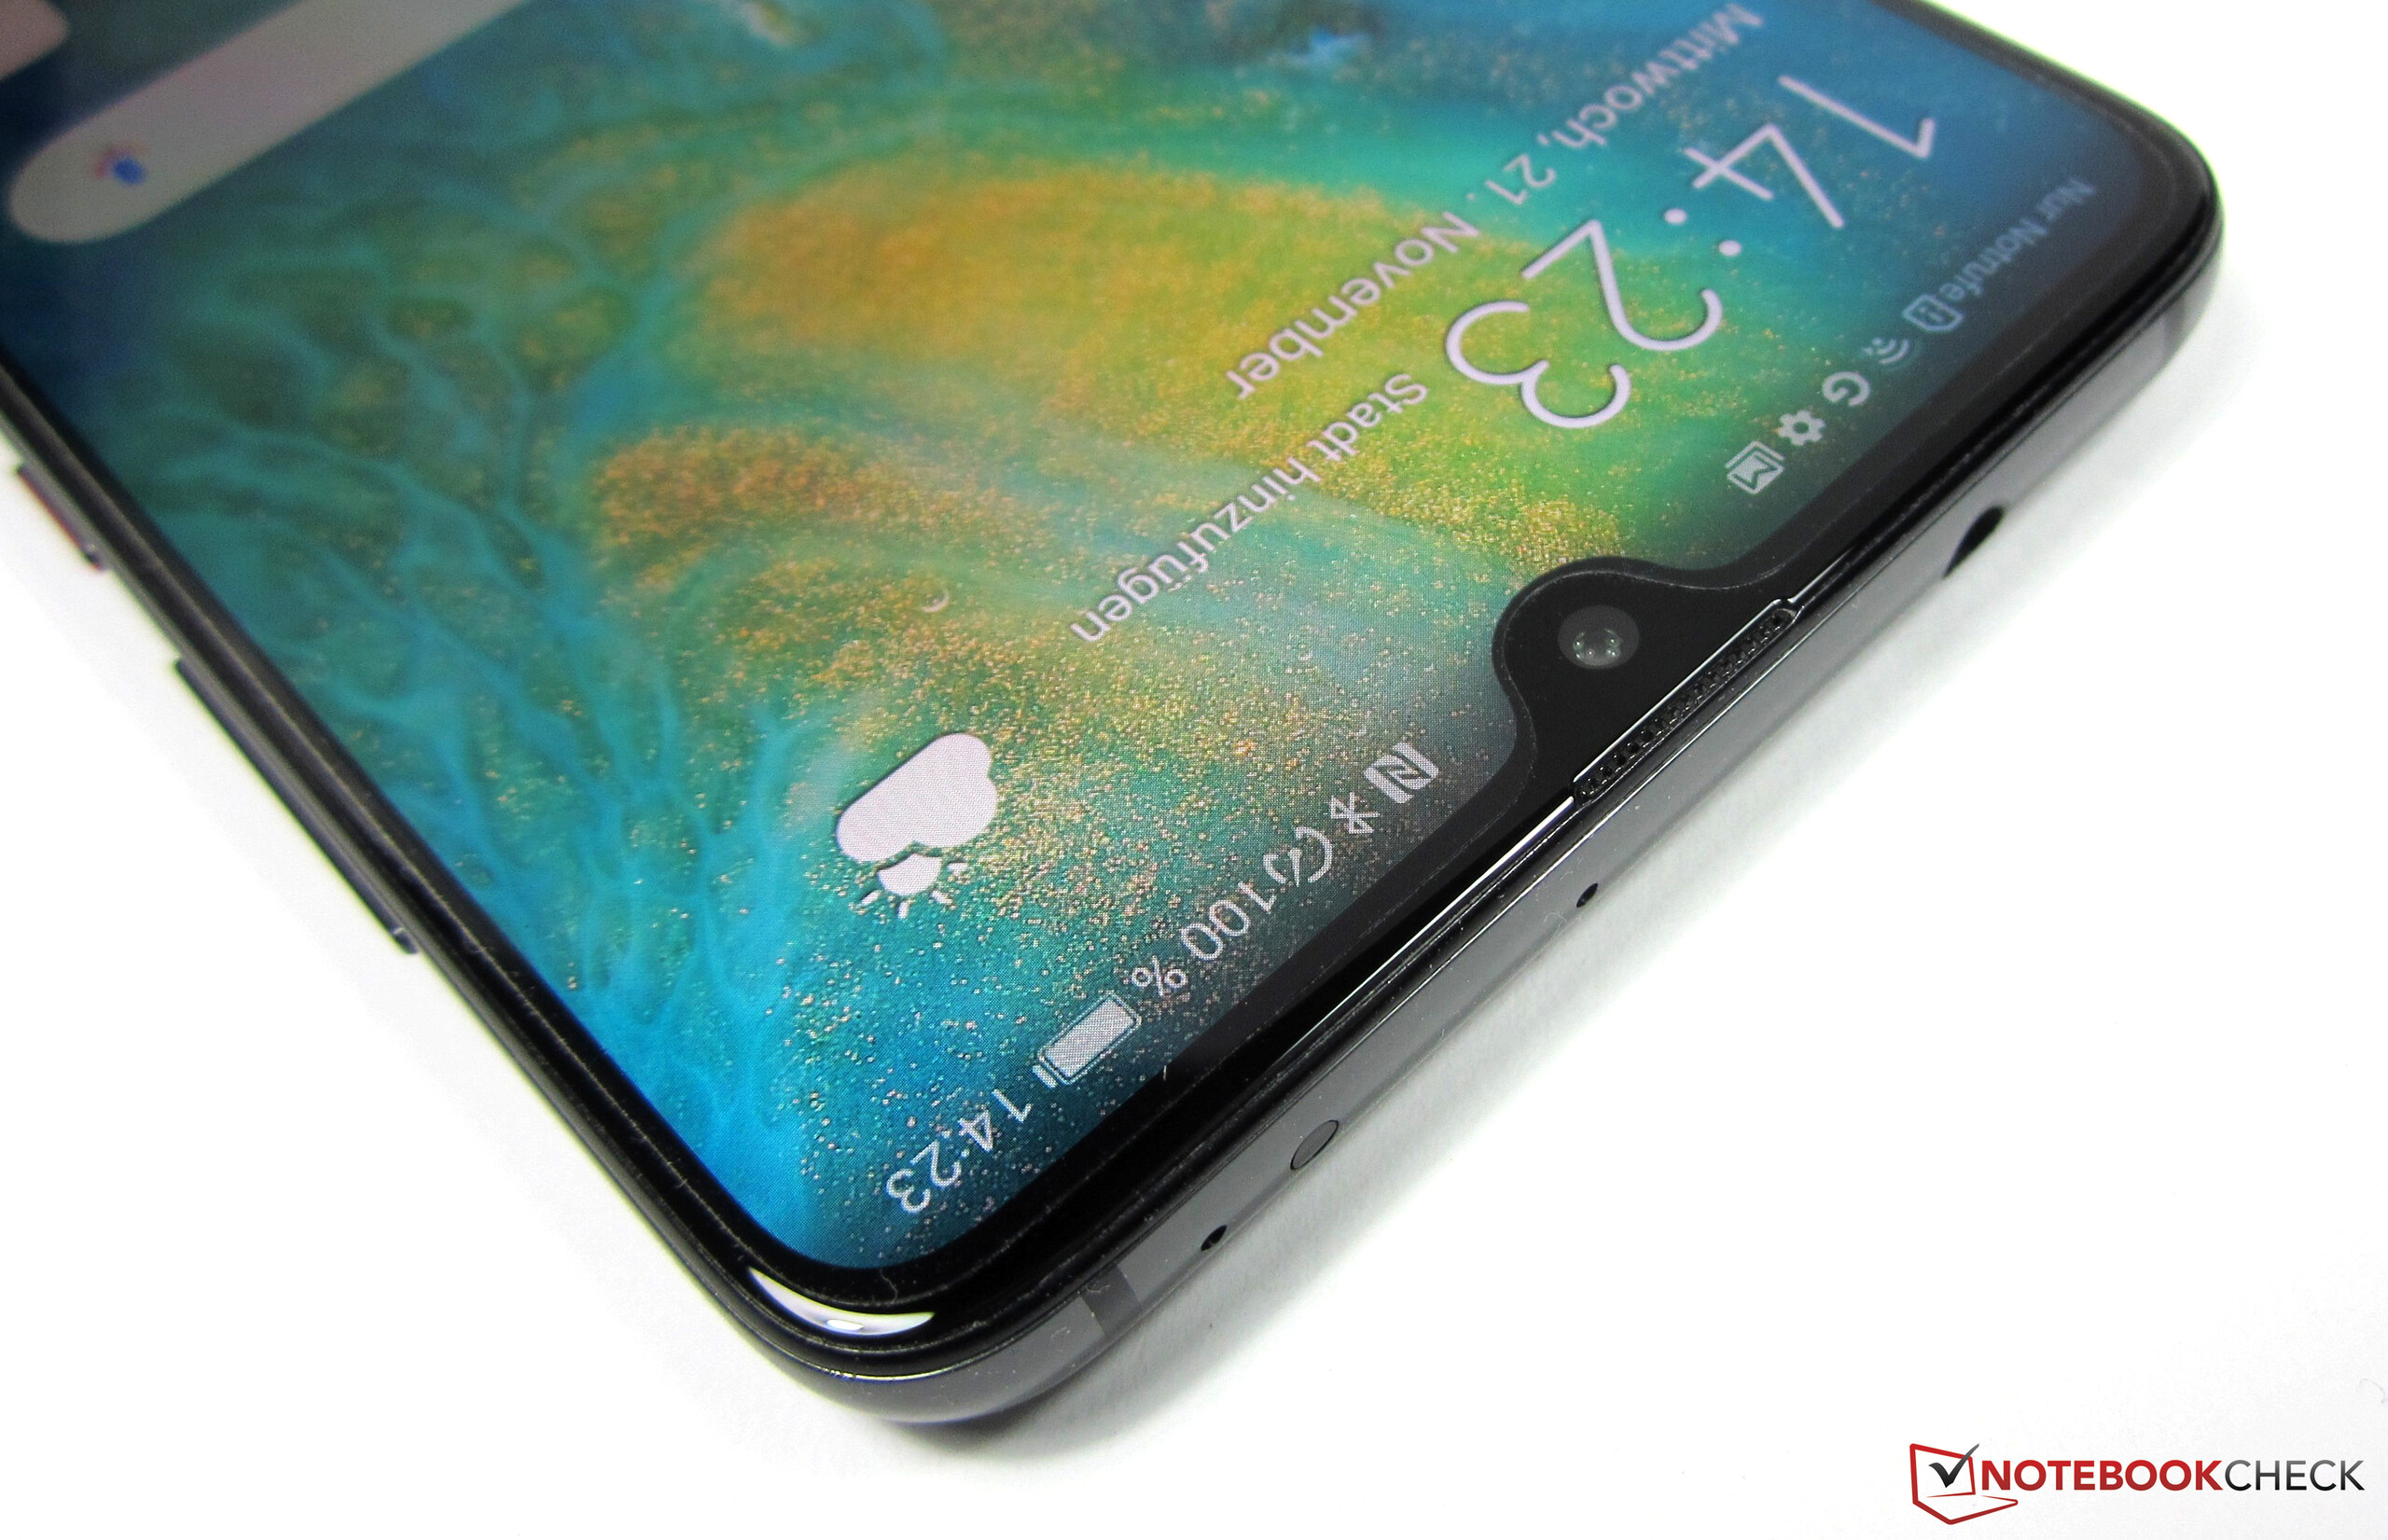
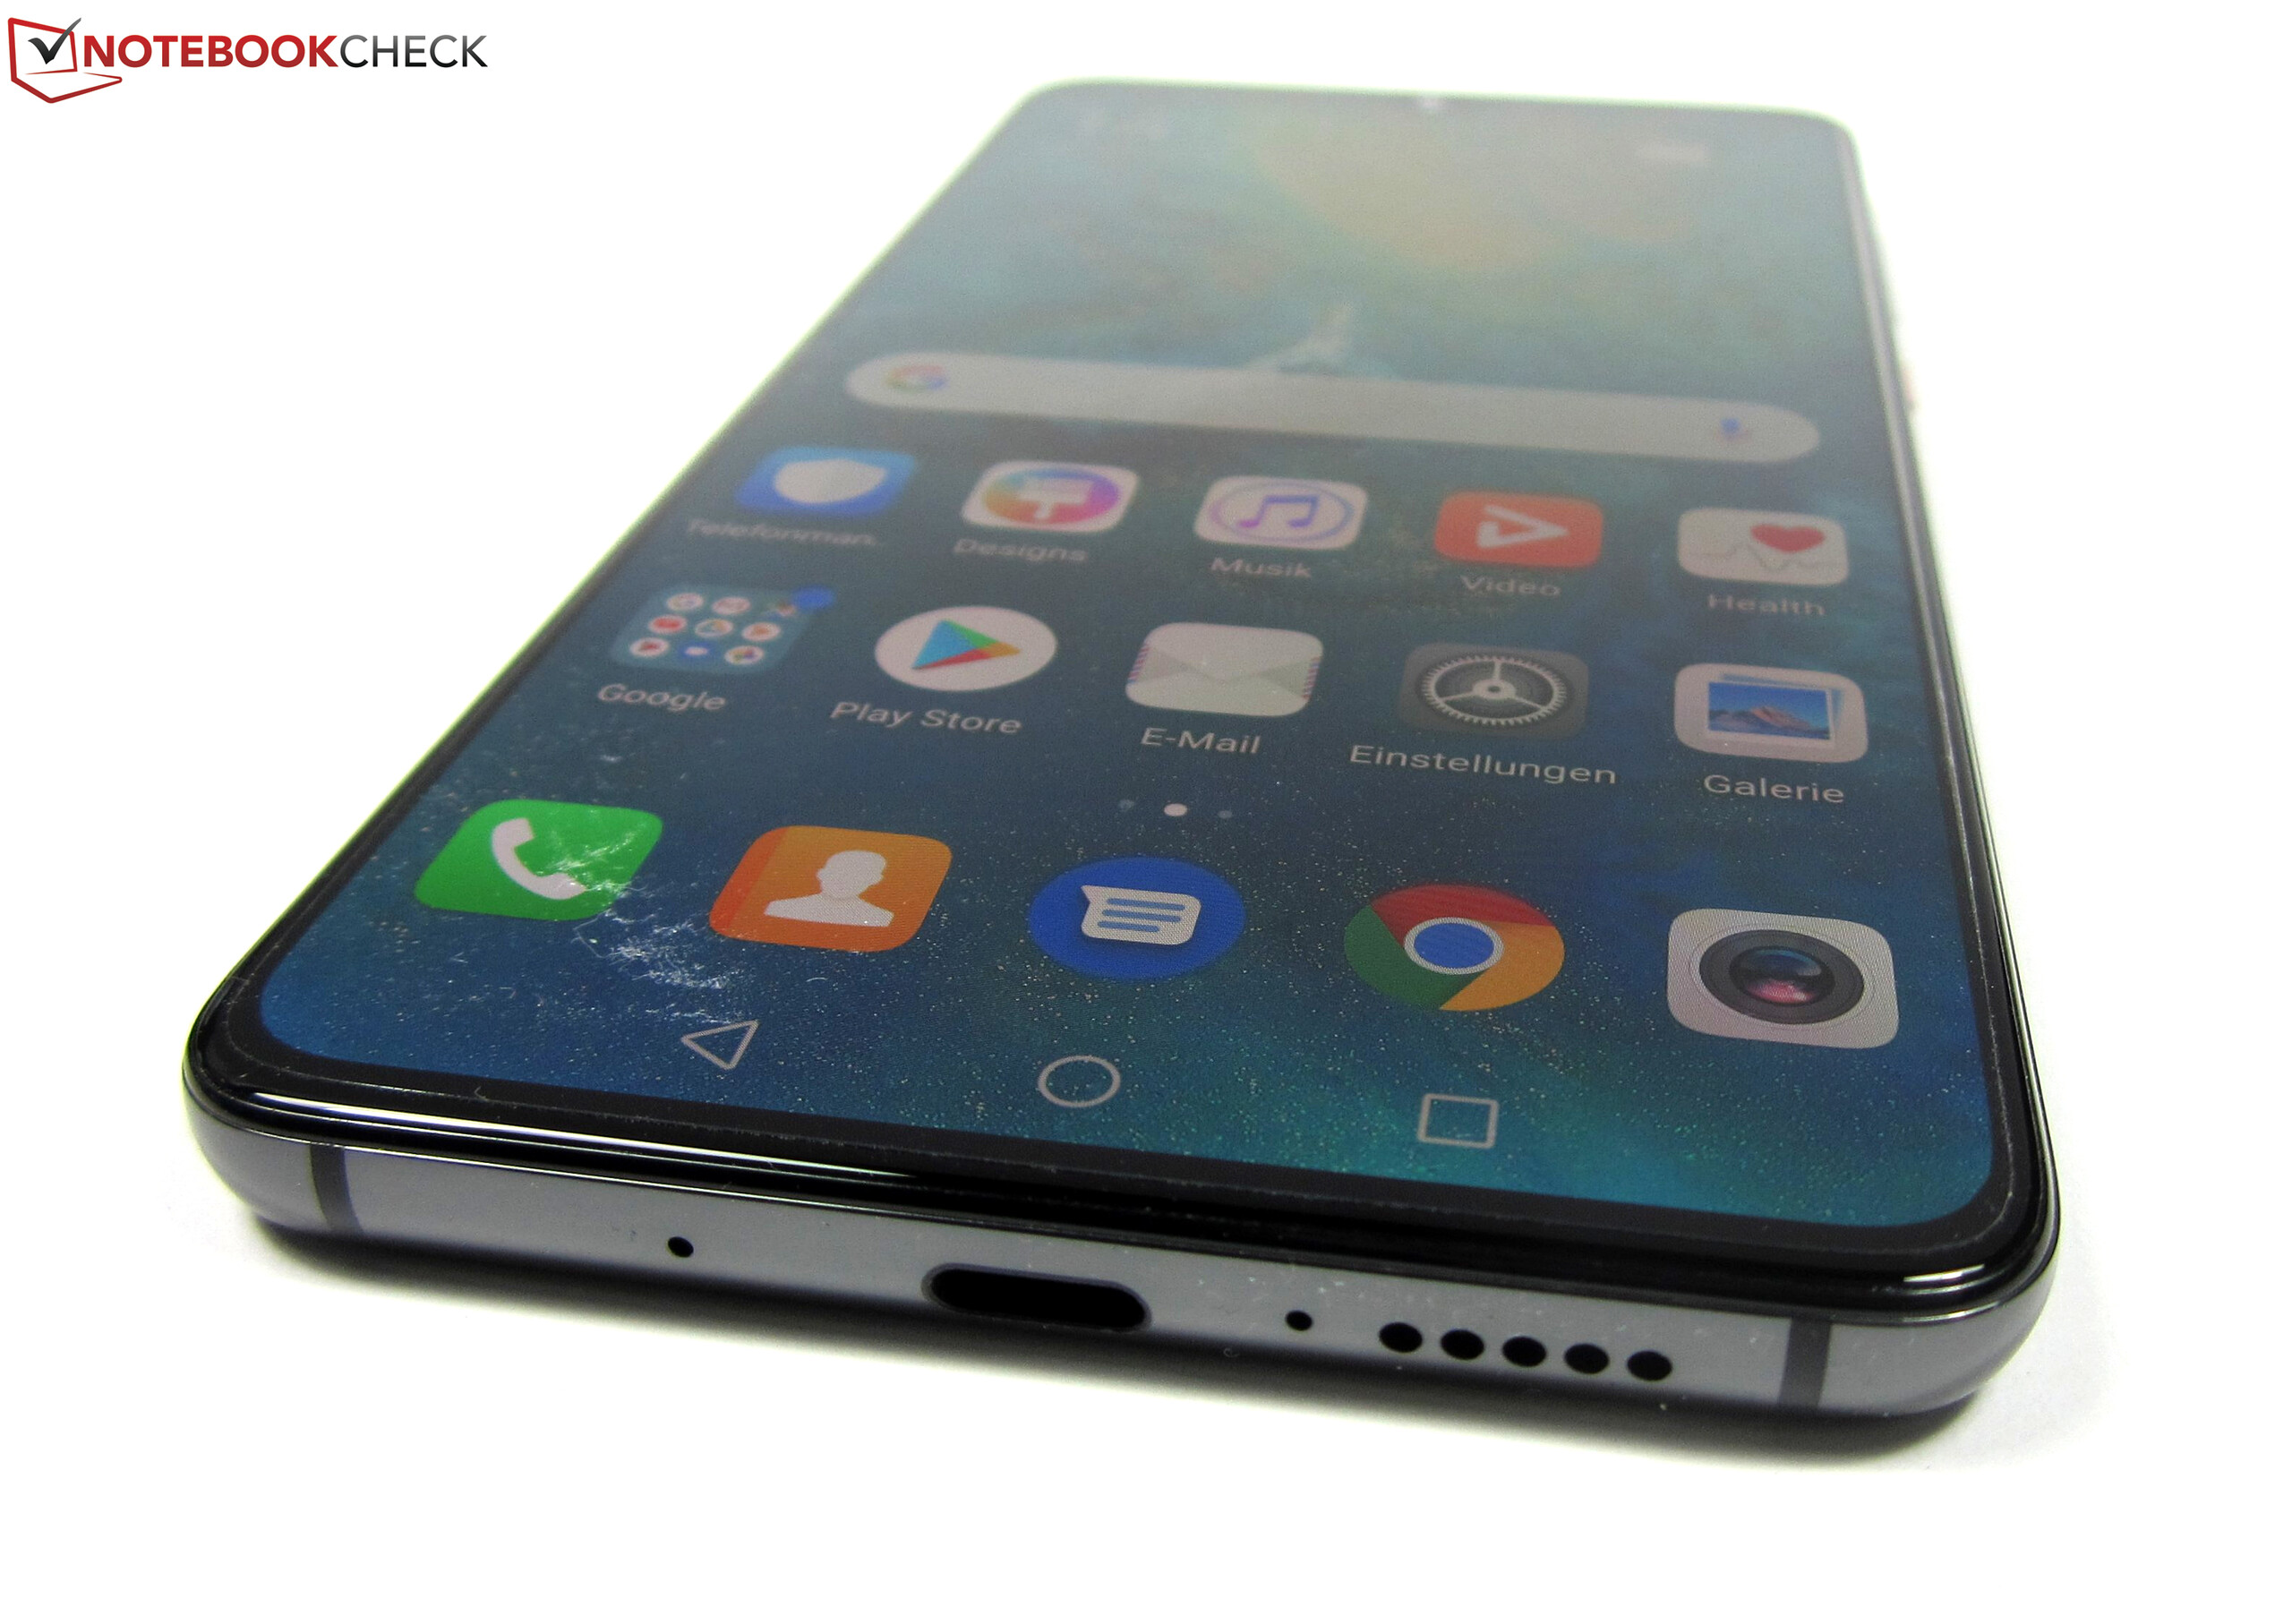
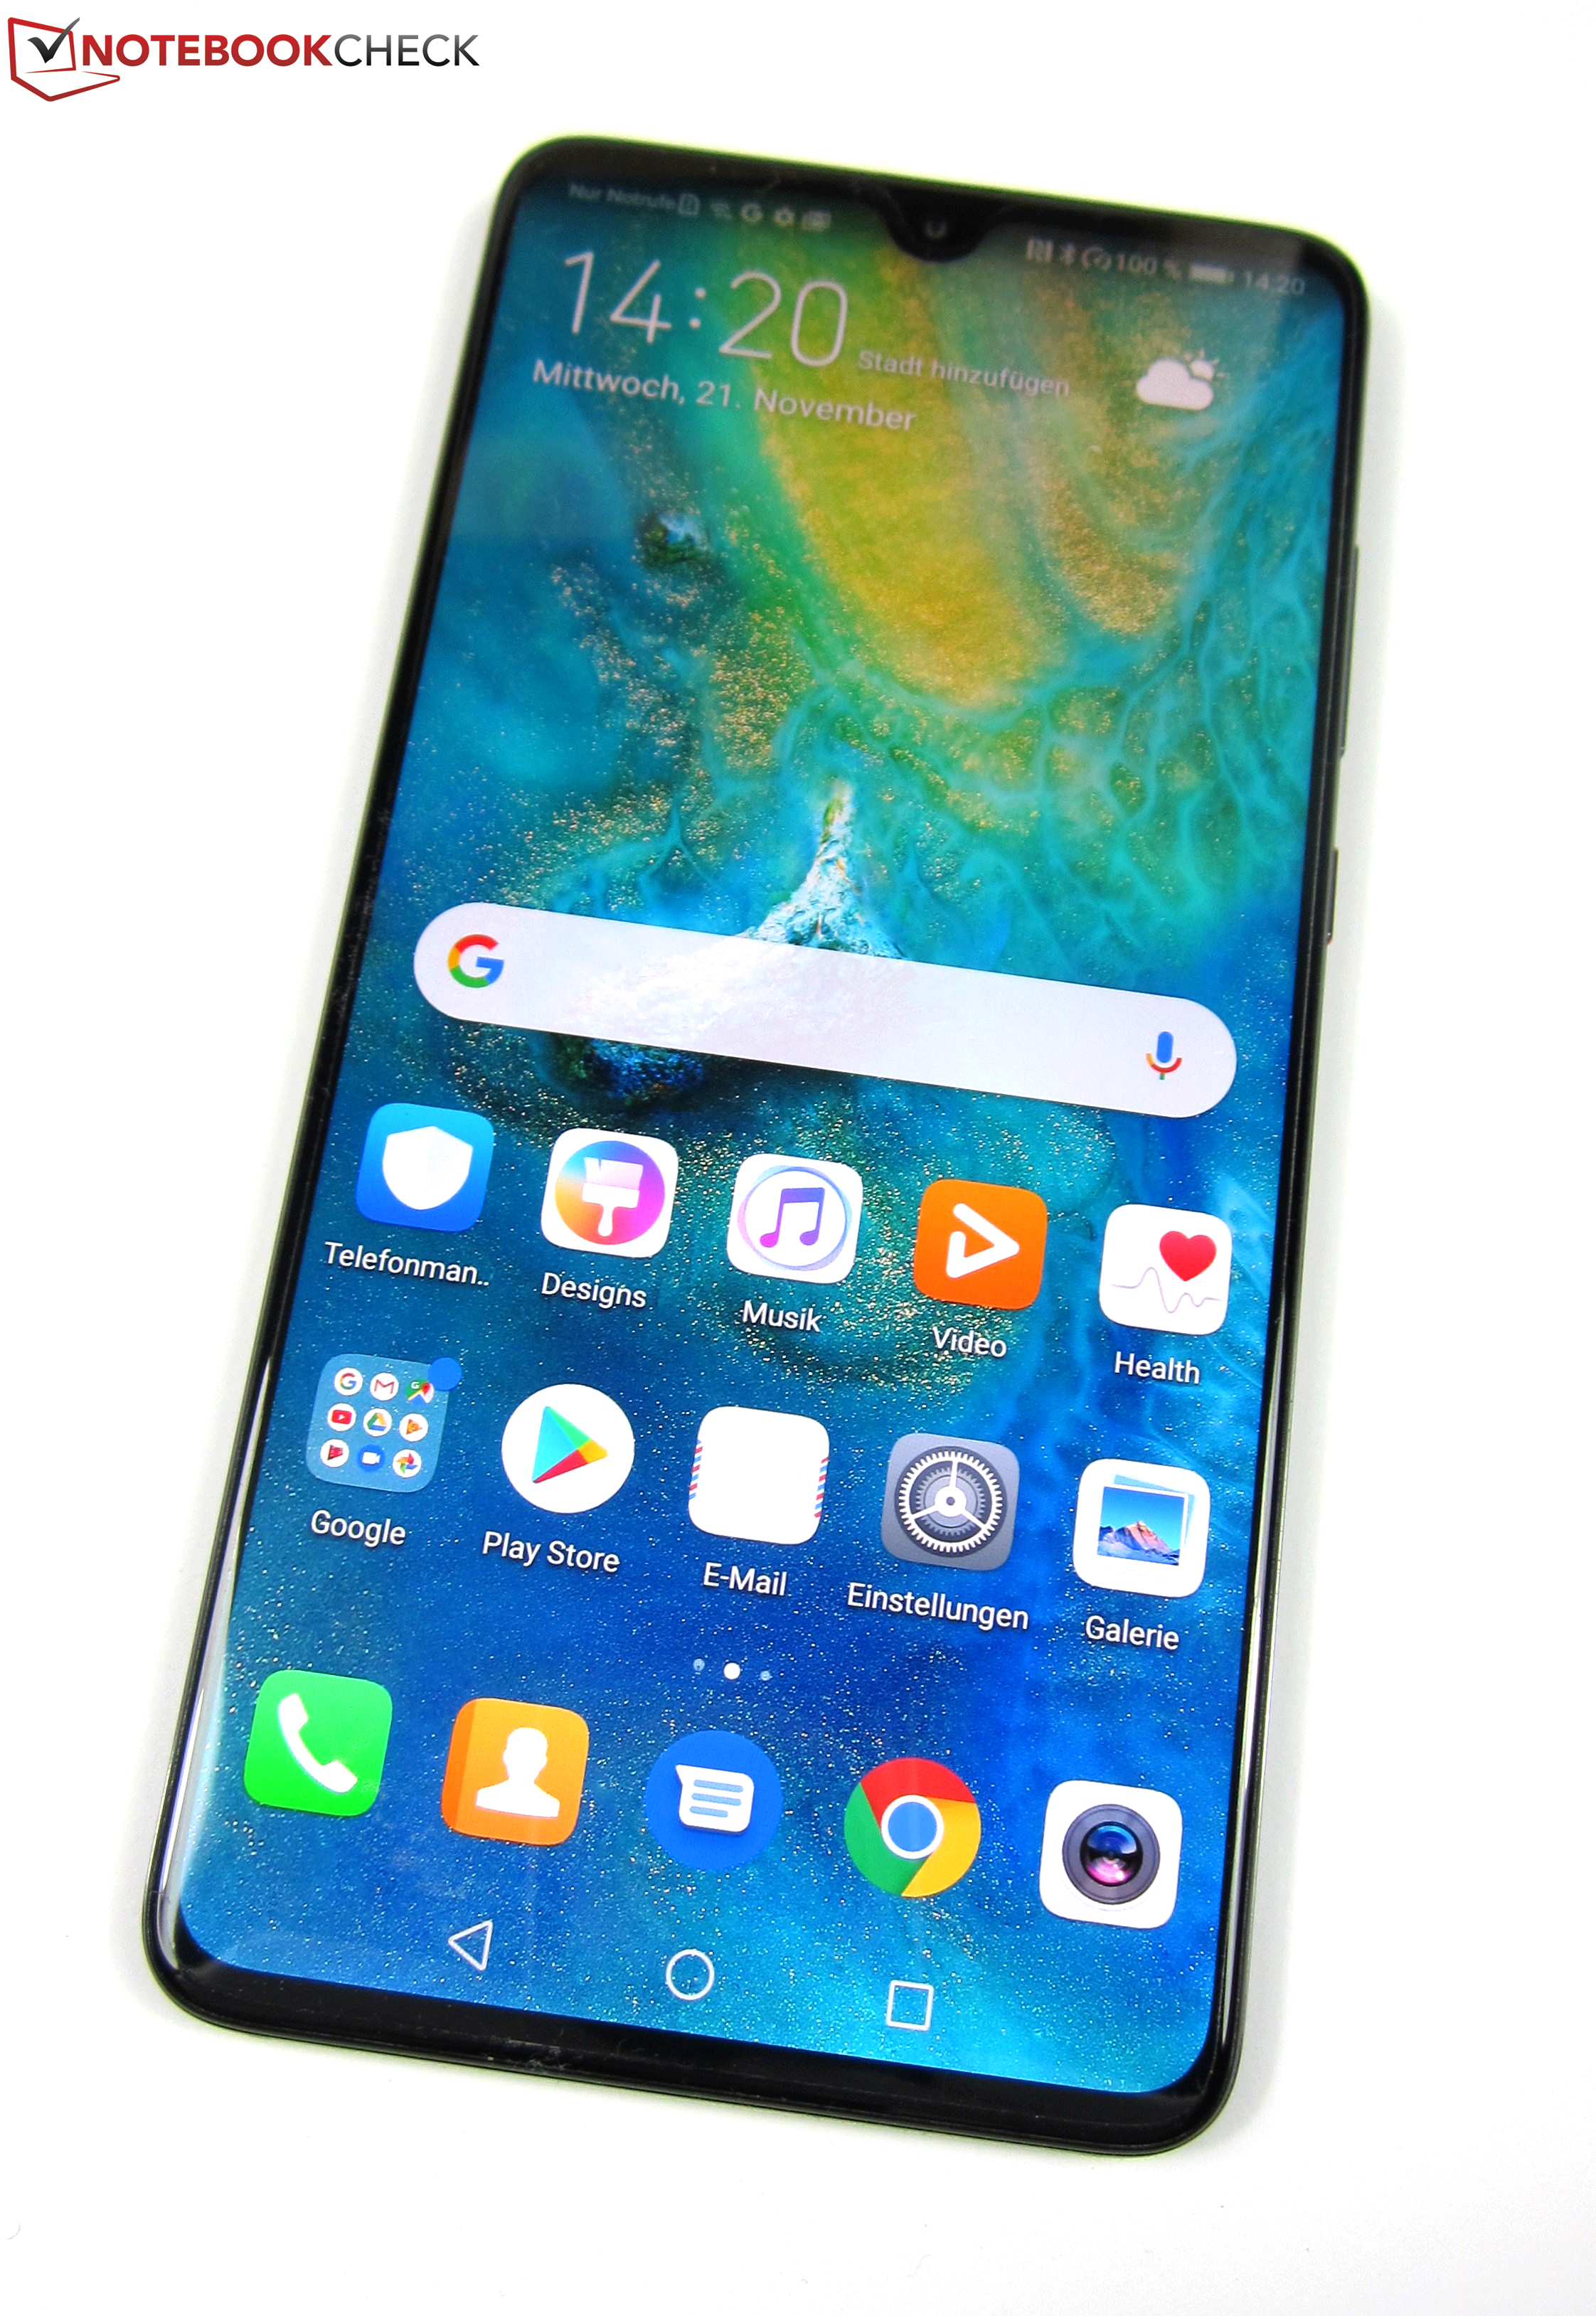
The first visual difference that we spotted between the Mate 20 and the Mate 20 Pro is that they have different displays. The Mate 20 has a flat display like many other smartphones compared to the curved display in the Mate 20 Pro, which makes the former look less premium than the latter in our opinion. With that said, the cheaper model has a noticeably smaller notch, which gives the device a more consistent design. Unfortunately, the smaller notch only houses a 24 MP front-facing camera. There are no notification LEDs or IR sensors that are used for 3D face recognition like in the Mate 20 Pro.
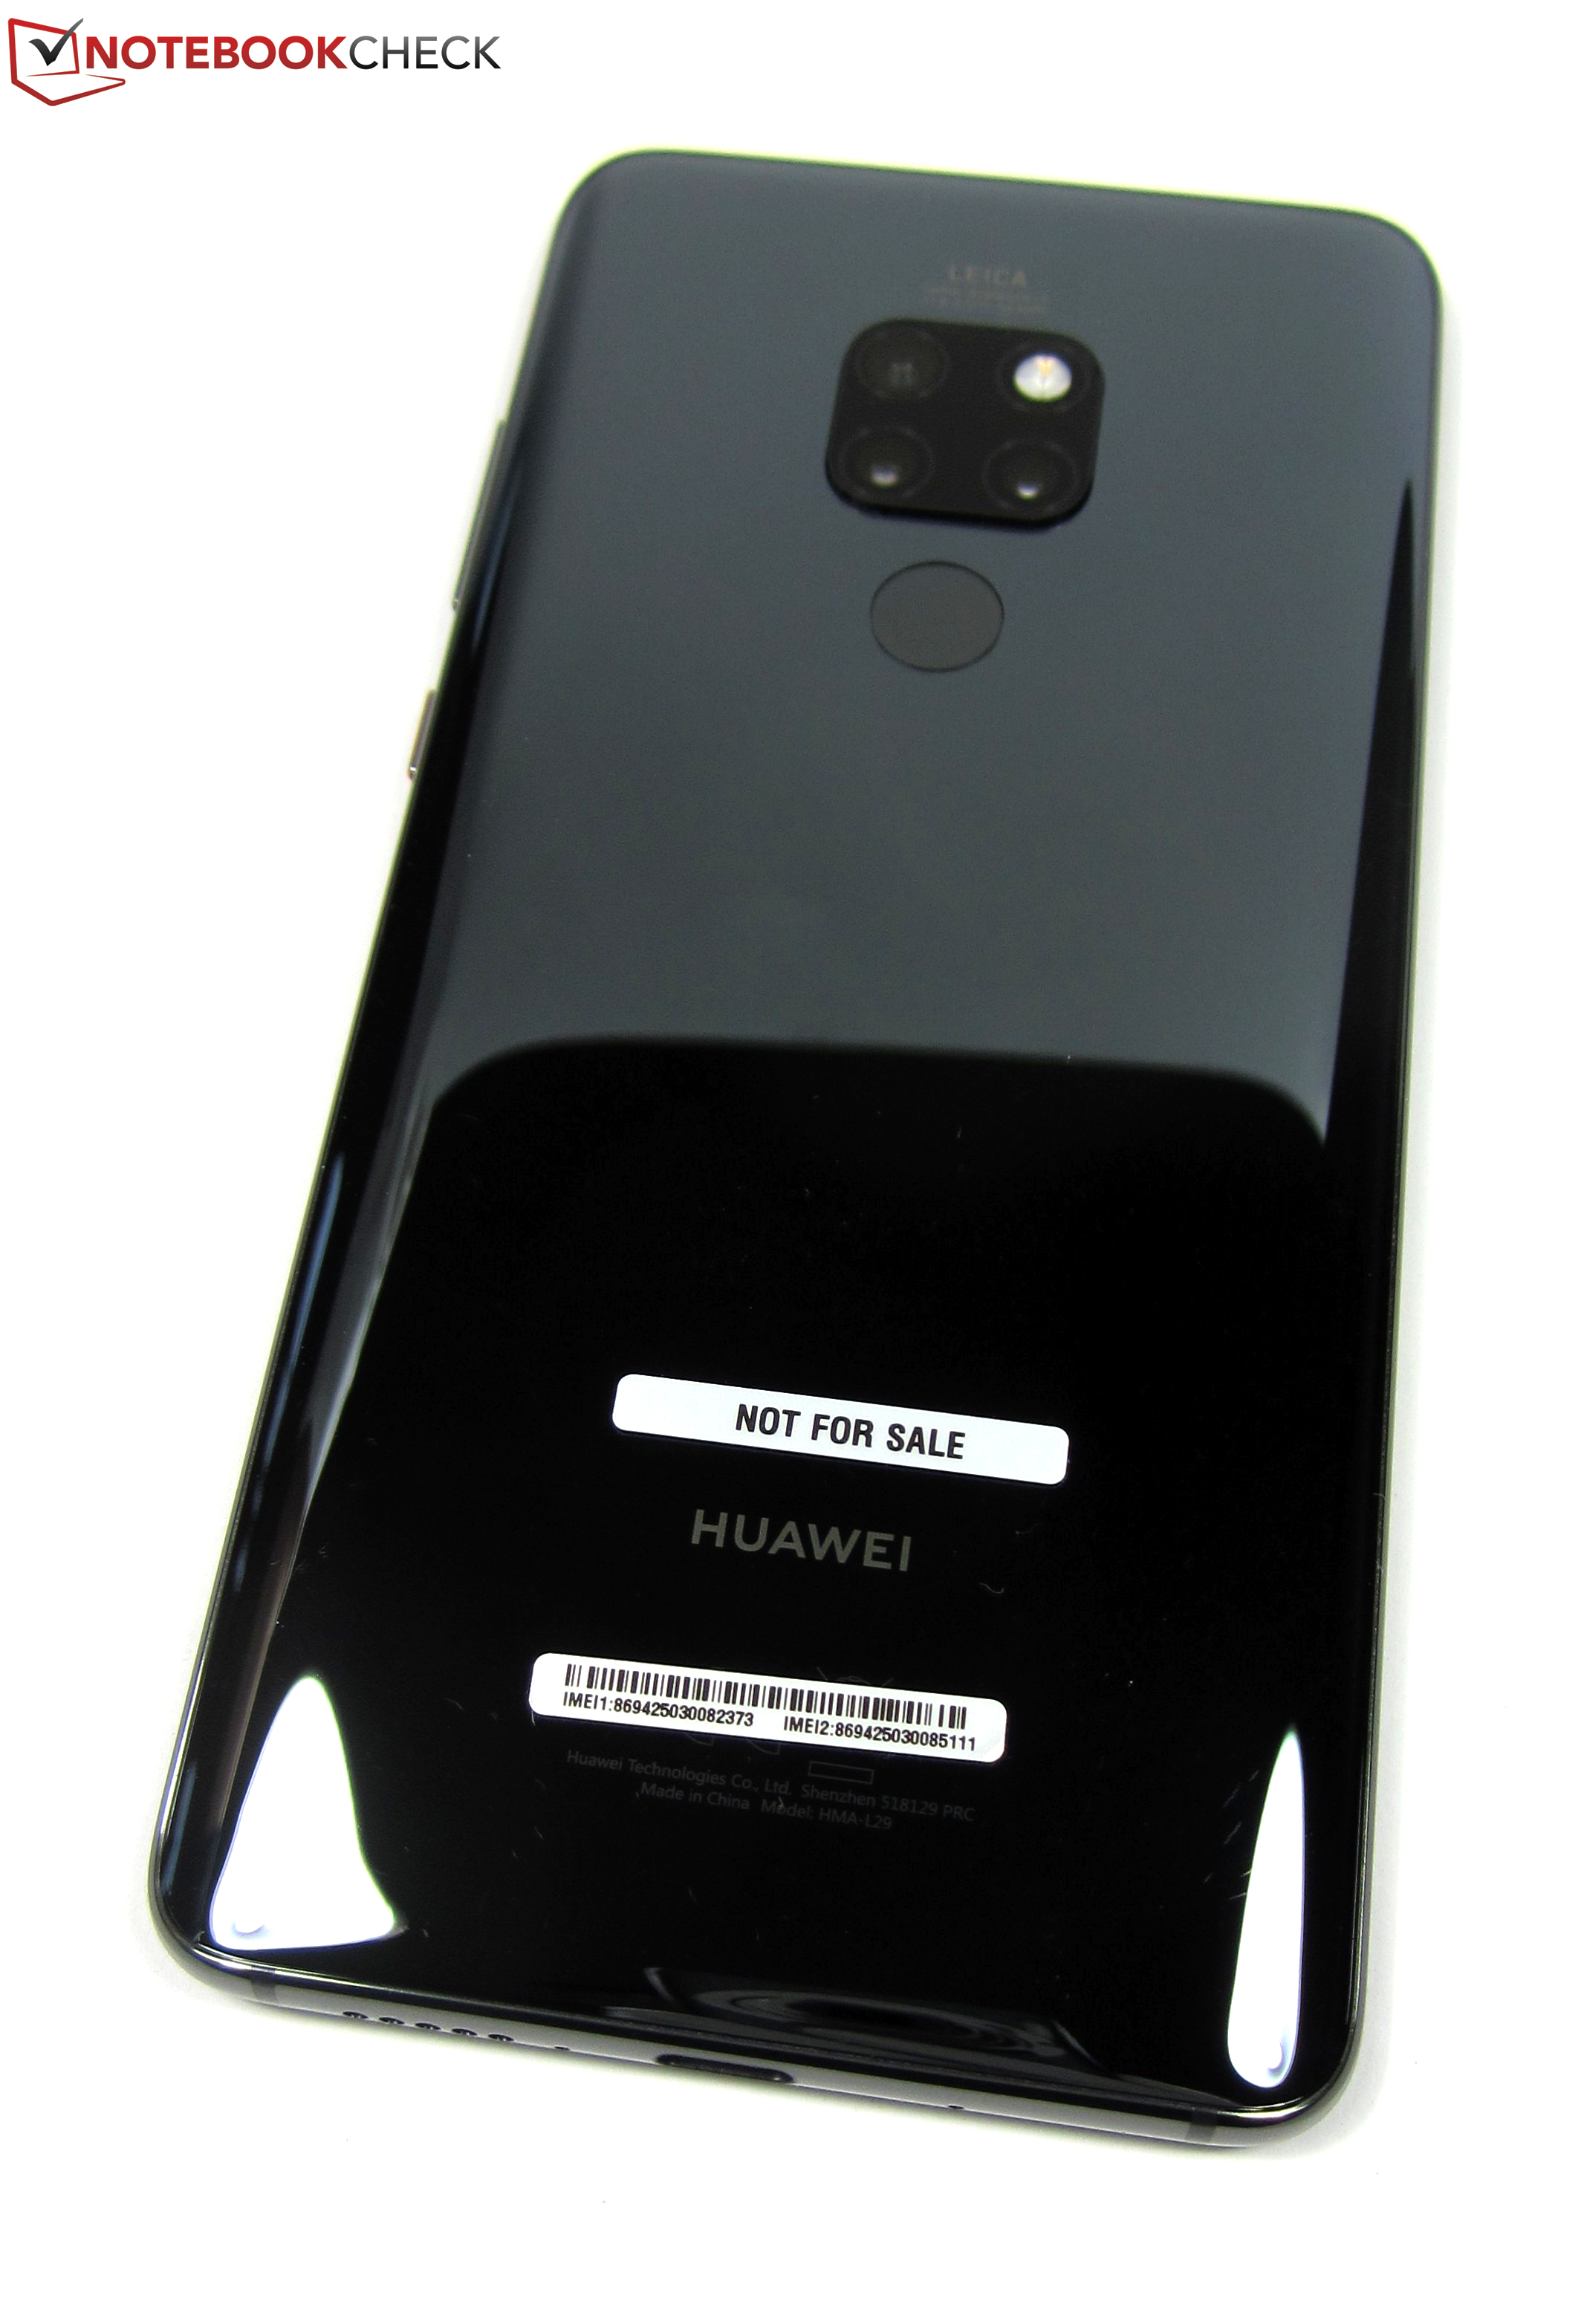
The Mate 20 has an aluminium frame that is sandwiched between two layers of glass like its sibling. Our test device is sturdy, while gaps between materials are consistently even and tight. Moreover, we could not twist the device regardless of how hard we tried, although the display brightens slightly if we apply pressure to the front or back glass.
Our test device feels good in the hand thanks to its rounded corners, and it is surprisingly grippy despite having a glass back. We never felt like the Mate 20 would slip out of our hands or off a flat surface during testing. Our test device is the ‘Black’ version, and Huawei also sells the Mate 20 in ‘Midnight Blue" and ‘Twilight’. The blue has a ‘Hyper Optical Pattern’ like the ‘Emerald Green’ Mate 20 Pro, which should be grippier and will pick up fewer fingerprints than the glossier ‘Black’ and ‘Twilight’ variants.
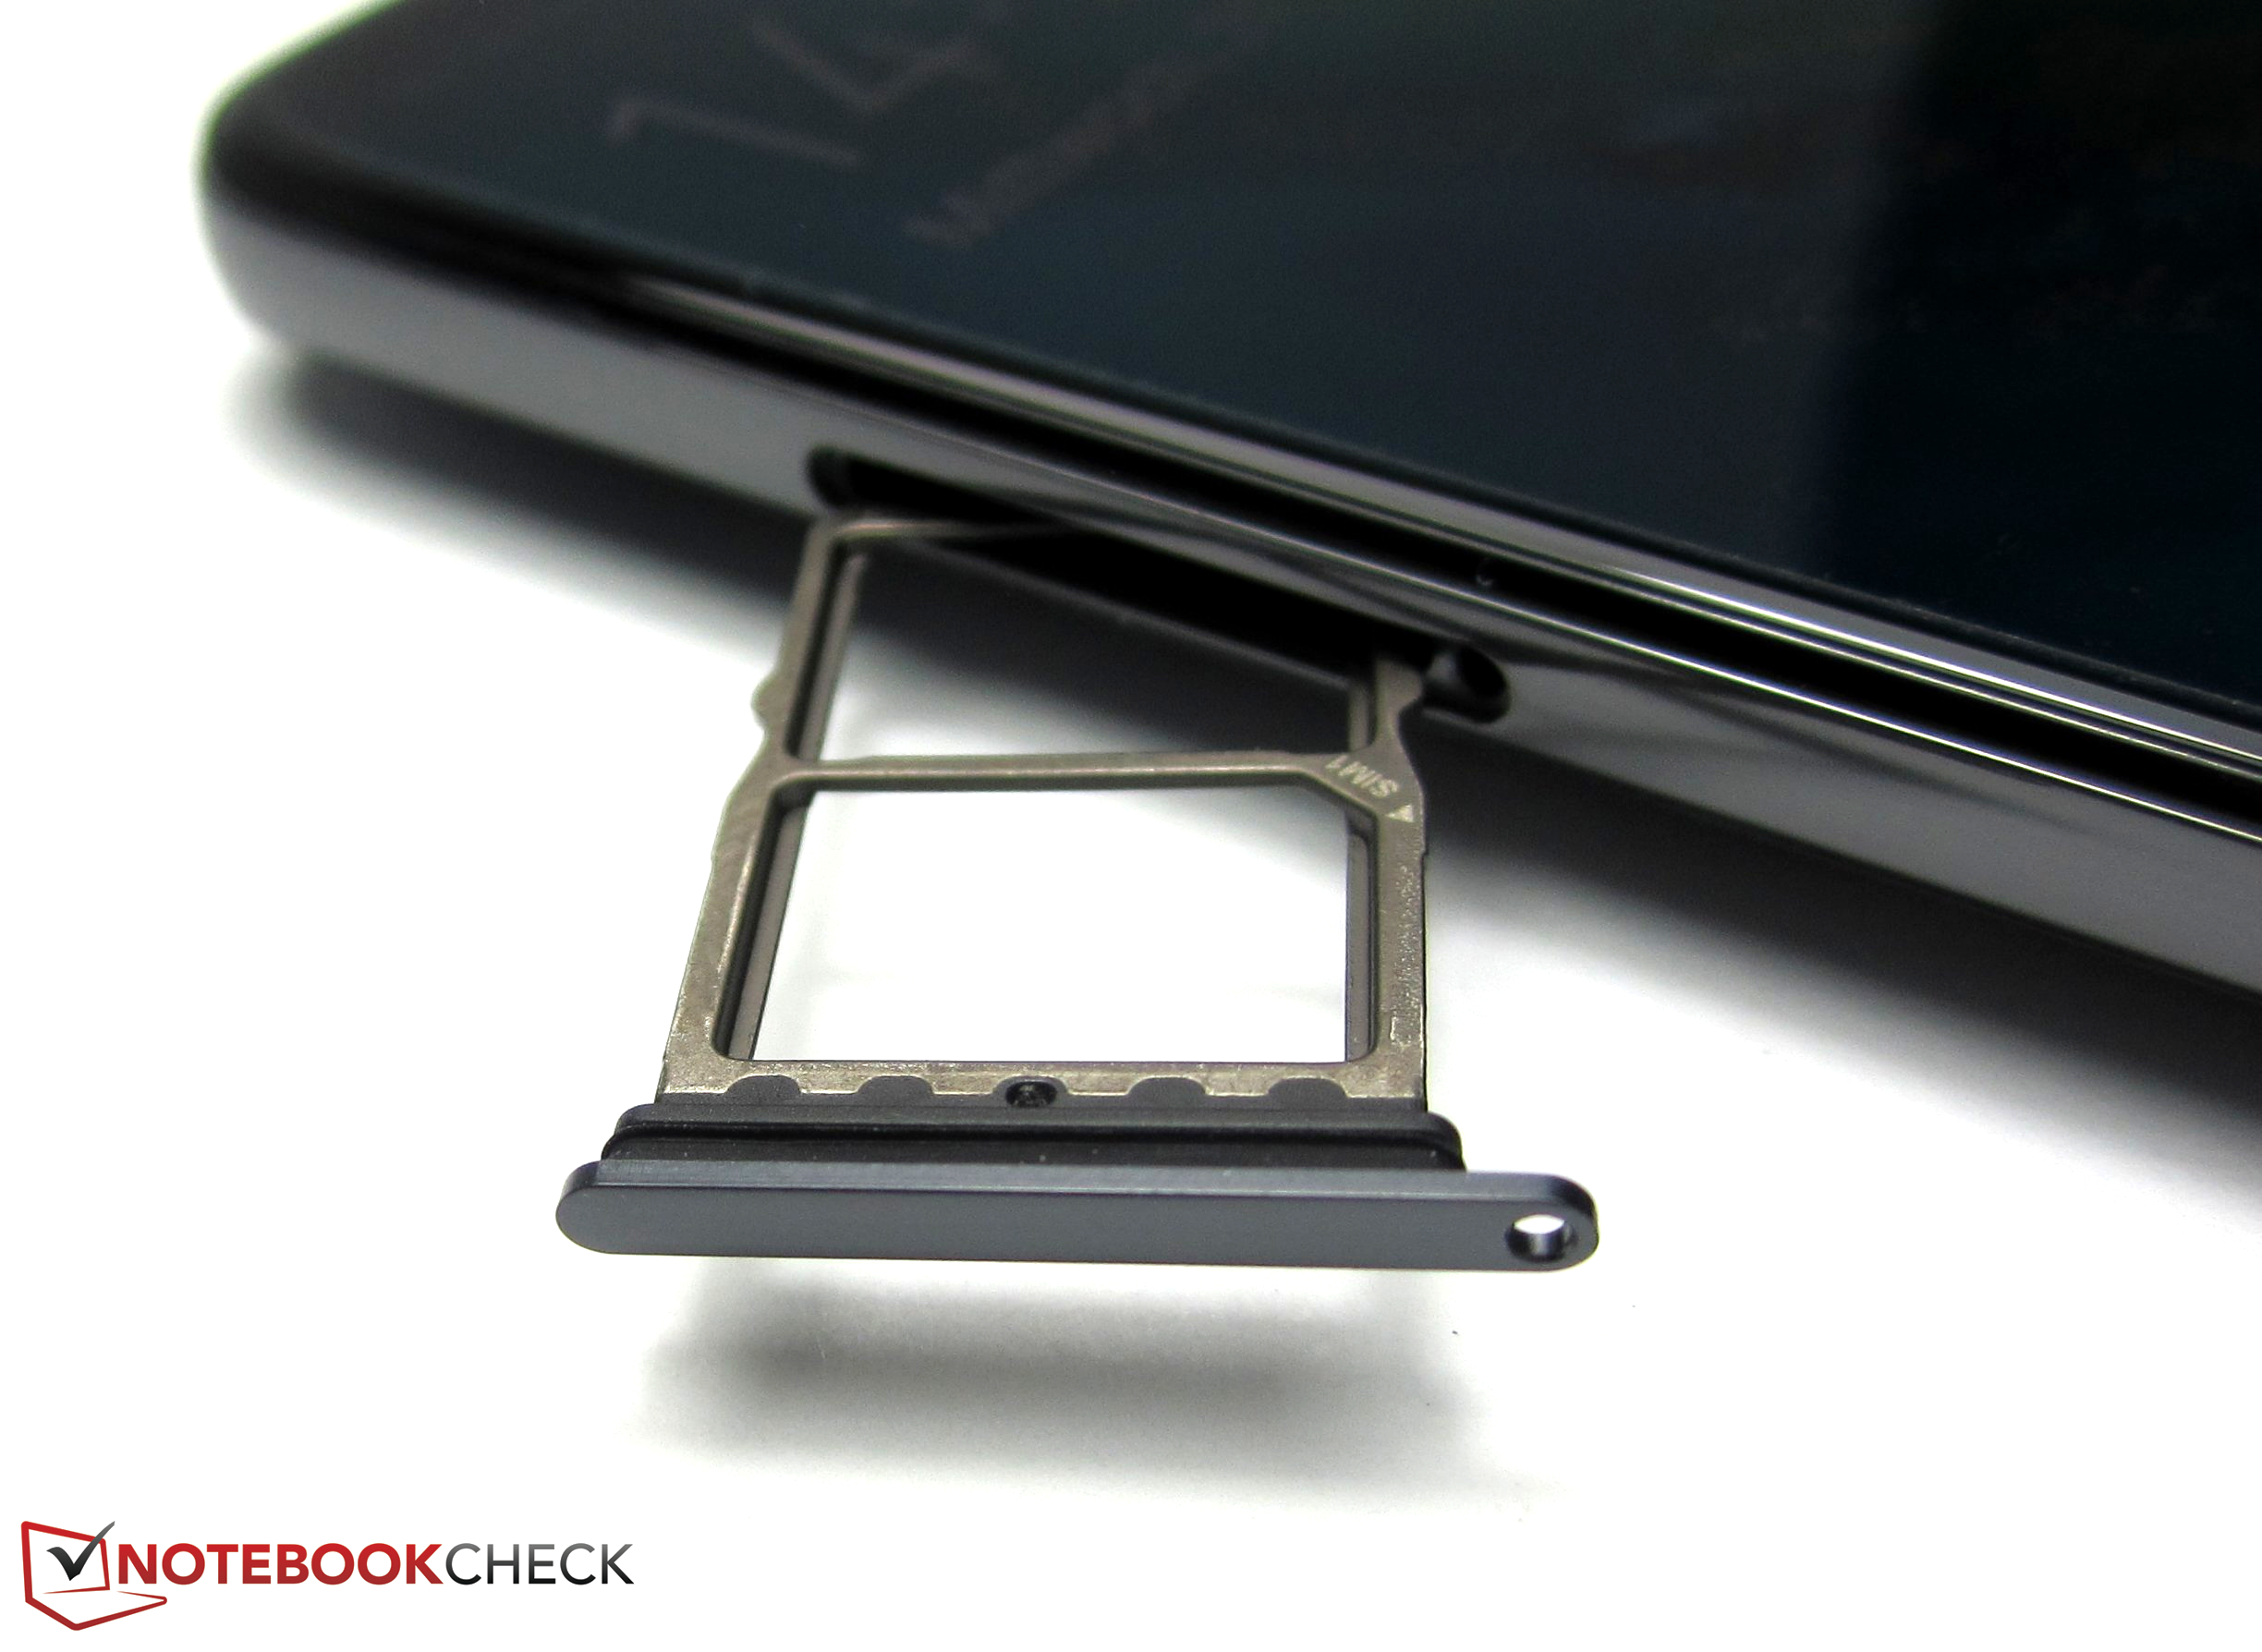
The card slot is on the left-hand side of the device and houses either two nano-SIM cards or a SIM and a nano-memory card (NM card). Oddly, the Mate 20 is only IP53-rated, which certifies that the device is protected against dust but not completely so and that it can withstand water falling as a spray. By contrast, the Mate 20 Pro is IP68-rated, which guarantees that it is dust proof and that it will work even after being immersed in up to one metre of water. In short, the Mate 20 is not waterproof.
Connectivity
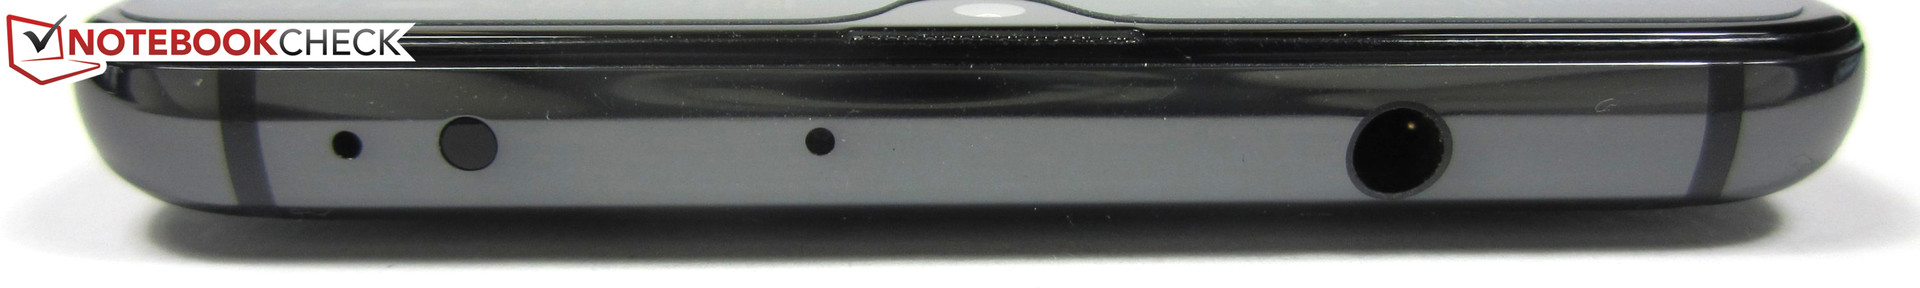
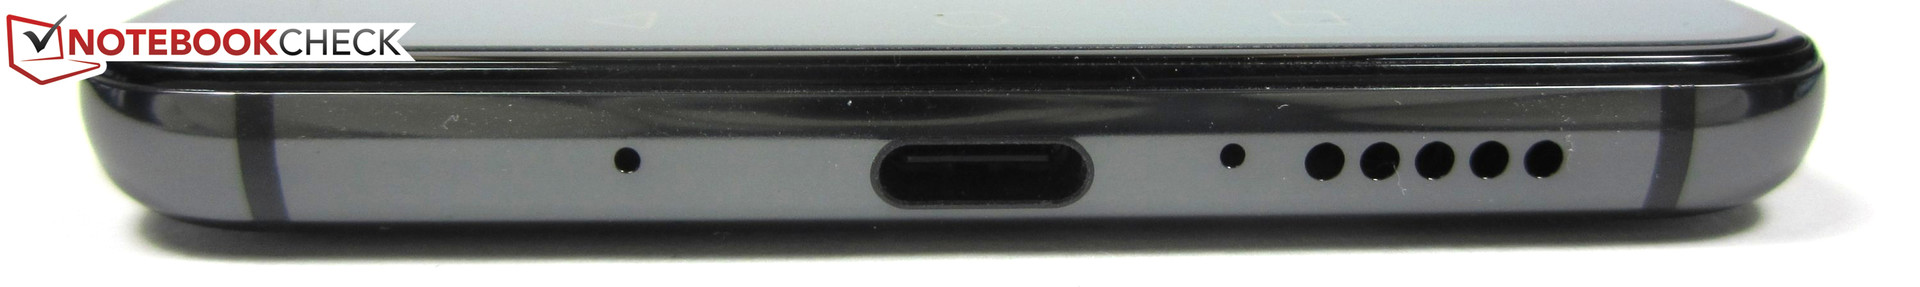
The Mate 20 has an impressive array of connectivity. The device has MIMO Wi-Fi, Bluetooth 5.0 with aptX HD, NFC and an IR transmitter for controlling electrical appliances like the Mate 20 Pro. There is also the same USB 3.1 Type-C port that supports USB On-The-Go (OTG) and video output over HDMI or DisplayPort. The Mate 20 supports fast charging like its more expensive sibling too, but the former comes with a smaller 22.5 W charger. By contrast, Huawei includes a 40 W charger with the Mate 20 Pro. Moreover, the Mate 20 supports slower Cat.16 LTE compared to the Cat.21 that the Mate 20 Pro utilises. However, our test device has a headphone jack, which is a welcome inclusion and is something that the Mate 20 Pro lacks.
The list of Mate 20 Pro features that are missing from the Mate 20 continues. Huawei has not included wireless charging, reverse wireless charging, an in-screen fingerprint sensor or IR face detection. The Mate 20 supports the company’s NM card though. The NM card is as small as a nano-SIM, but it has no other advantages over a traditional microSD card. NM cards currently cost more per GB than microSD cards too.


Software
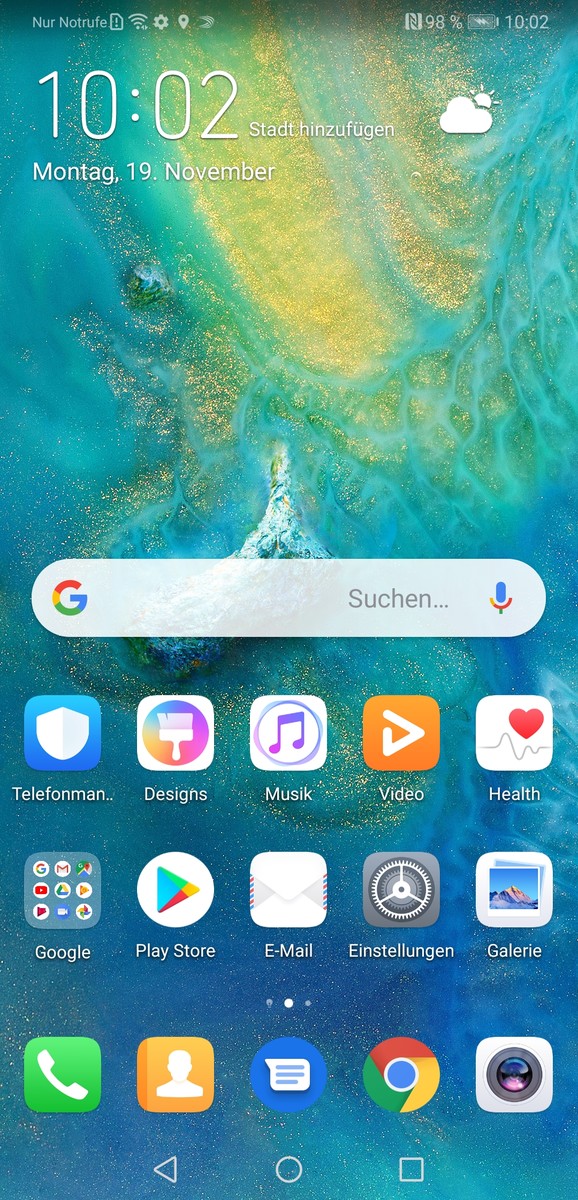
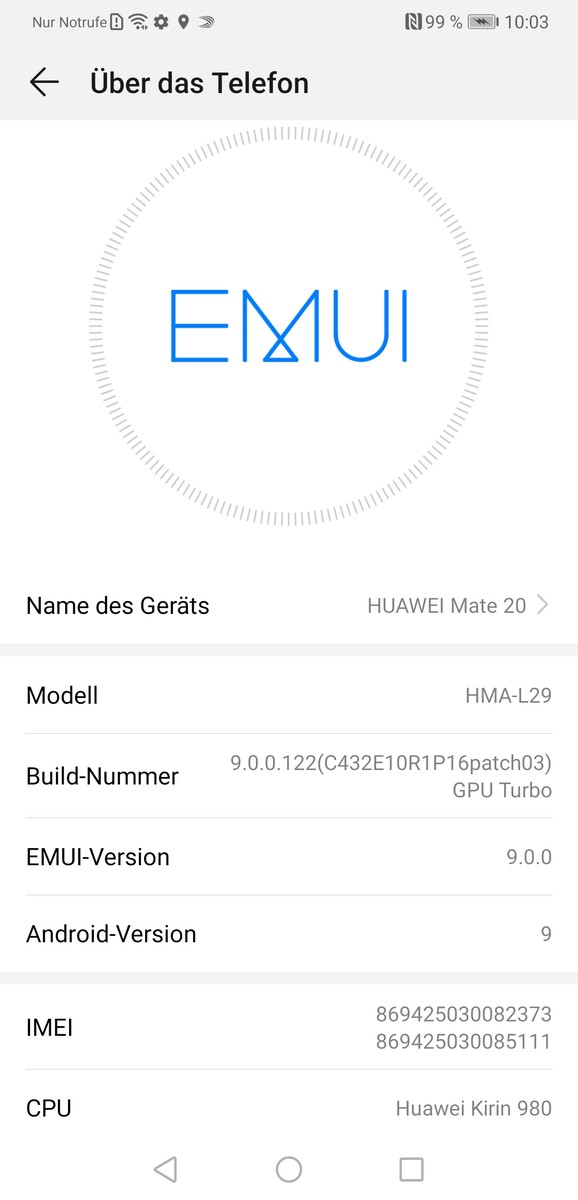
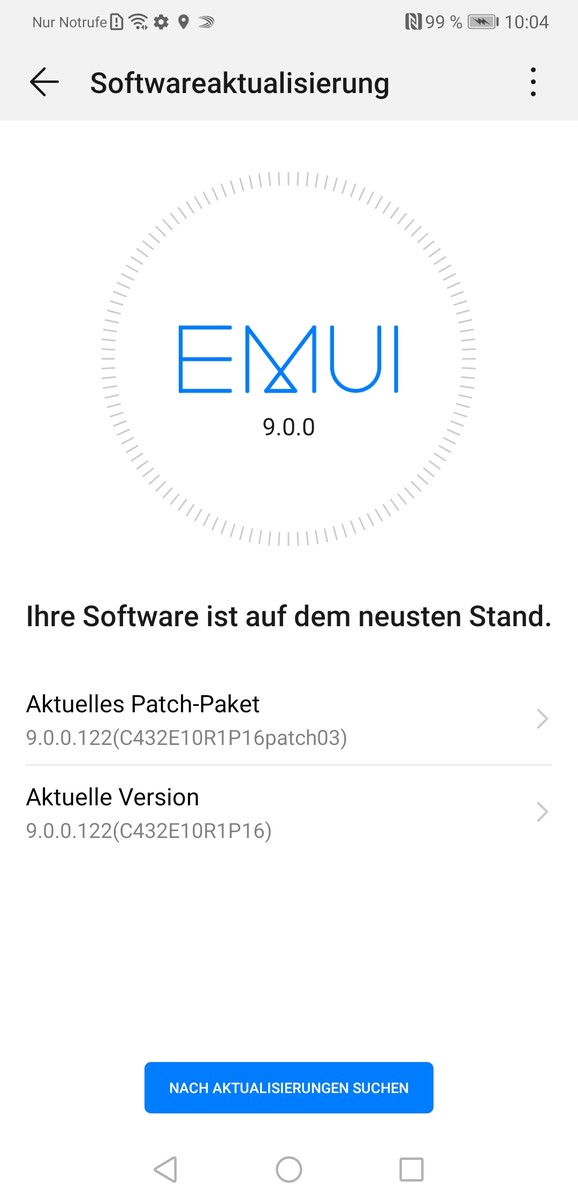
The Mate 20 currently ships with EMUI 9.0, which is a Huawei-customised version of Android 9.0 Pie. EMUI 9.0 looks and feels practically identical to its predecessor, but it should react and load apps more quickly than EMUI 8.0 can.
EMUI 9.0 offers familiar features like a Google search bar on the home screen and gesture control, examples of which include waking the display when the device is lifted or tapping the display to take a screenshot. The OS can also open apps if a letter is drawn on-screen. These features can be disabled if you prefer.
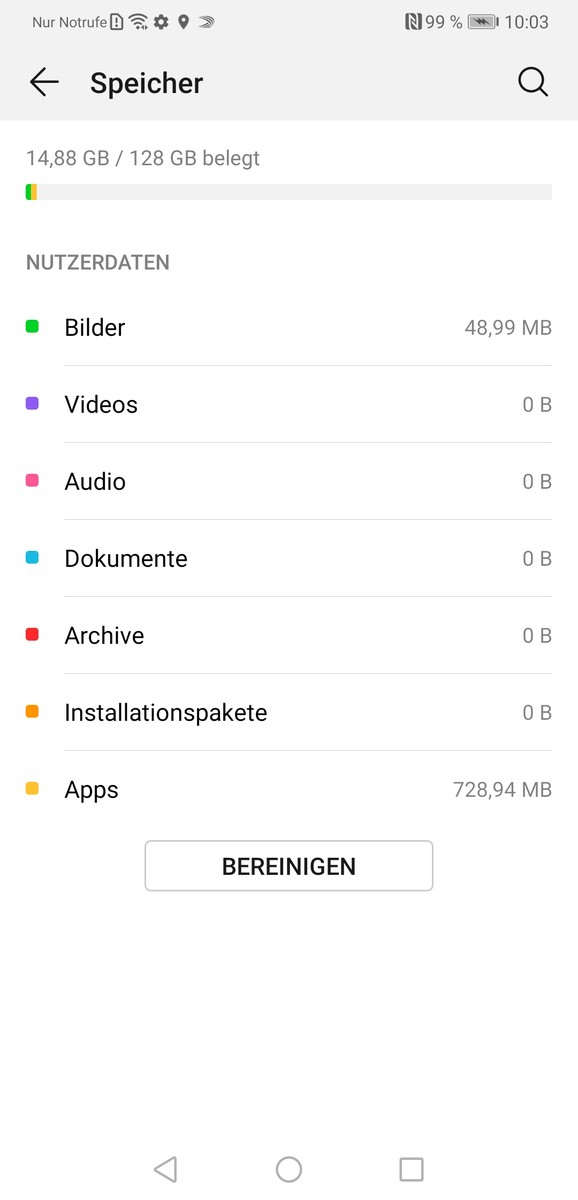
Fortunately, Huawei does not include much bloatware besides a few tools and Google apps. The Mate 20 has an integrated radio receiver too with headphones acting as the antenna. Our test device had around 113 GB of free storage upon delivery.
Impressively, our test device had the most recent Android security patches at the time of testing, which is rarely the case. Huawei has promised to update security patches regularly and to deliver two major updates per year.
Communication & GPS
Huawei has included support for a total of 21 LTE TDD and LTE FDD bands to ensure that the Mate 20 will have LTE coverage practically worldwide. The device utilises LTE Cat.16 for gigabit download speeds like the Mate 20 Pro too.
The Mate 20 supports all modern Wi-Fi standards up to IEEE 802.11 ac and can connect to either 2.4 GHz or 5.0 GHz Wi-Fi networks. The 2x2 MIMO antenna should provide fast transfer speeds in daily use too.
Our test device performed well in iperf3 Client Wi-Fi benchmarks when tested with our Linksys EA8500 reference router. The Mate 20 averaged 663 Mb/s in the download and 507 Mb/s in the upload test, both of which are significantly higher than what the Mate 10 could achieve. However, the Mate 20 finished behind the Mate 20 Pro in our comparison tables, which indicates that Huawei is using a different Wi-Fi modem. Overall, the Mate 20 should have fast Wi-Fi connectivity in daily use.
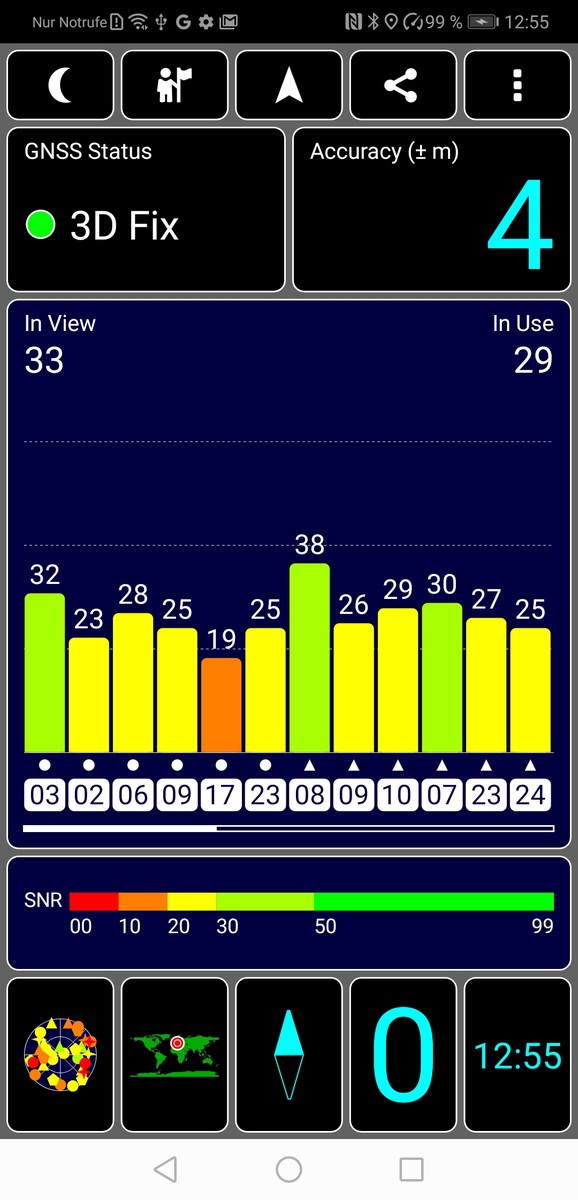
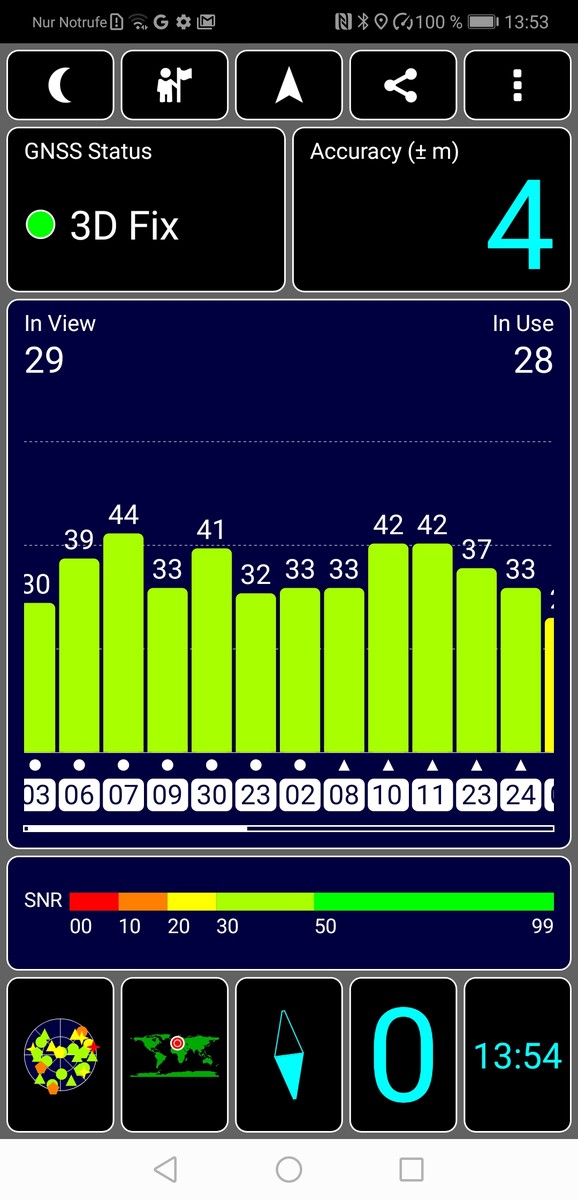
The Mate 20 uses BeiDou, Galileo, GLONASS, and GPS including A-GPS and SBAS for location services. Most smartphones rely on band L1 for finding a satellite fix, but the Mate 20 also uses band L5 for a more accurate satfix. The Mate 20 was able to locate it almost instantaneously and for four metres at a time. Our test device utilised its two frequency bands well and achieved a location accuracy of up to four metres both inside and outdoors.
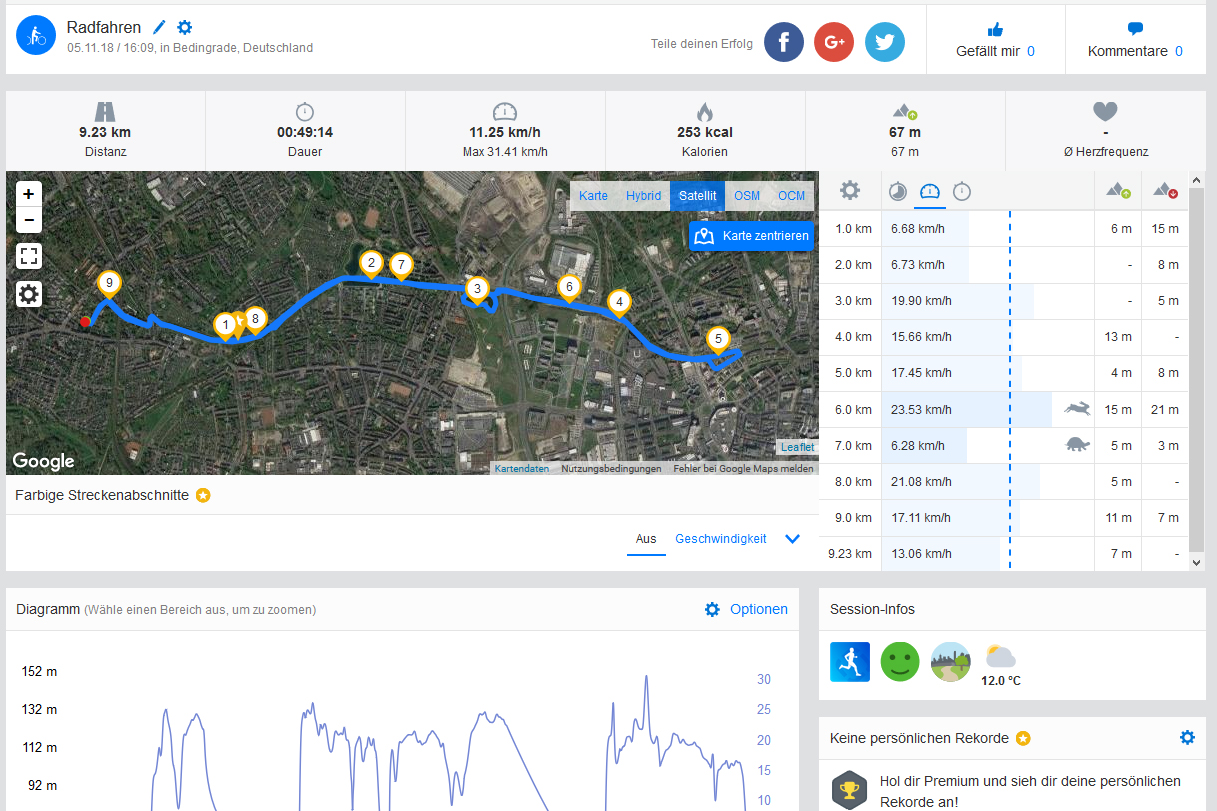
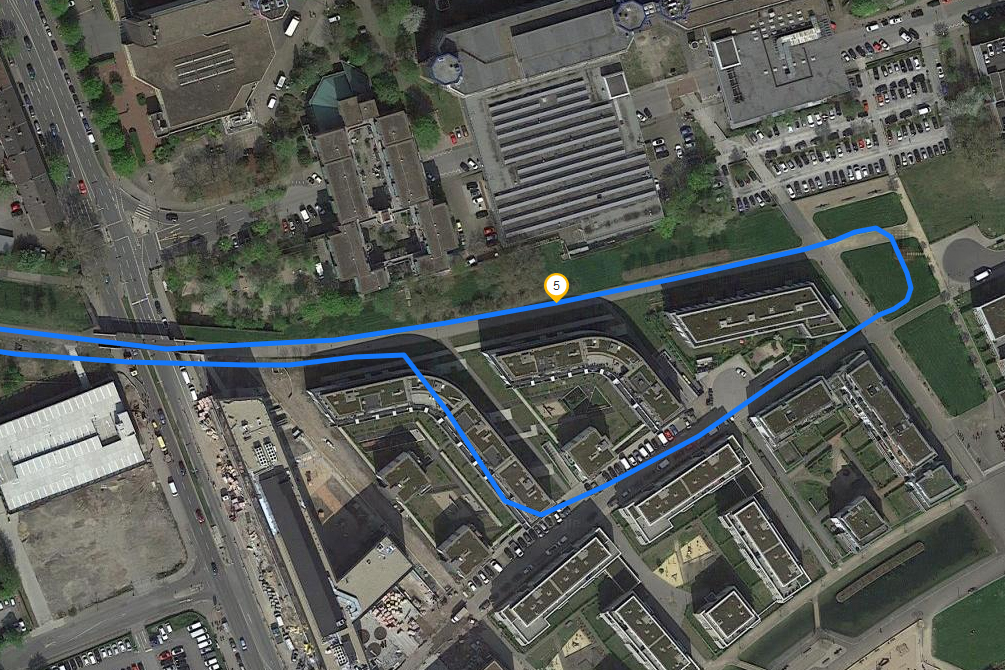
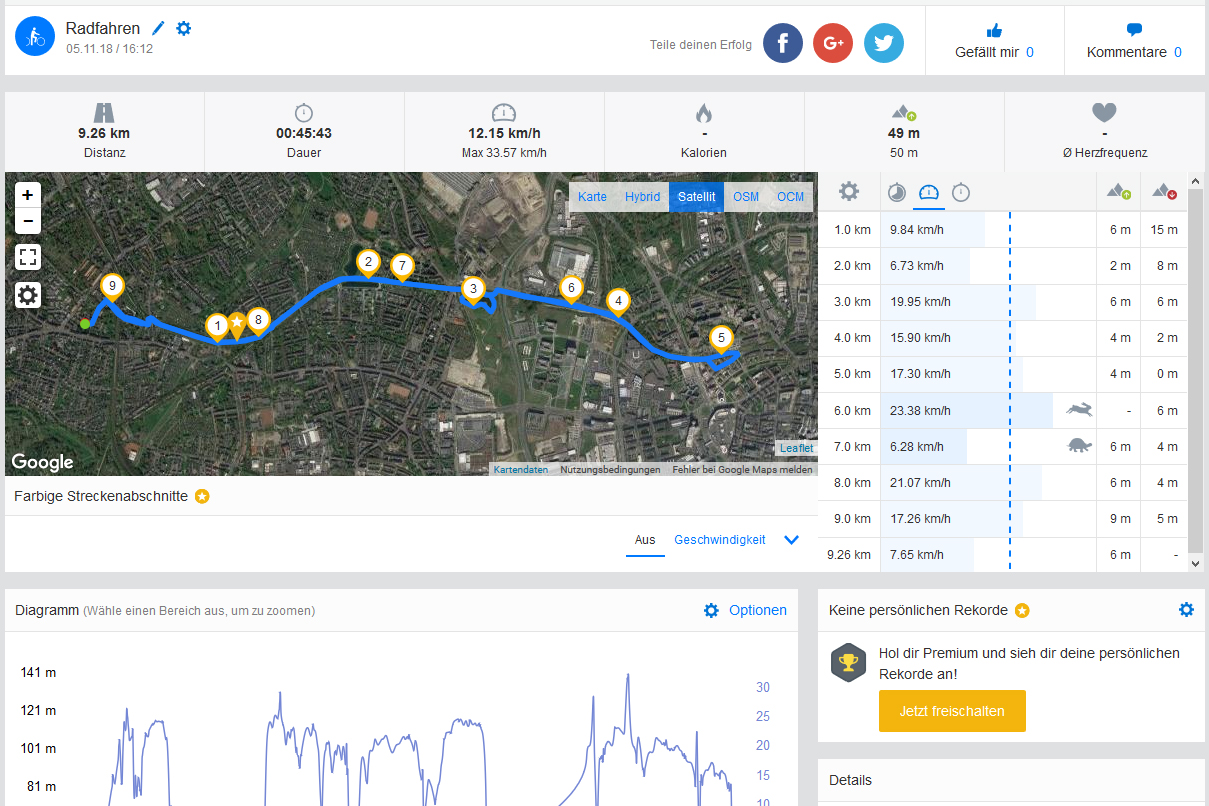
We also took the Mate 20 on a bike ride to compare its navigation accuracy against the Garmin Edge 500, a professional navigation device. Our test device plotted a route that deviated by just 30 metres compared to the one that the Garmin recorded. Both devices struggled for accuracy on certain points of our route, but overall the Mate 20 is accurate enough for all general navigation activities.

Telephone Features & Call Quality
Huawei has left the phone app in its original state despite tweaking much of the UI. The keypad appears after the app opens like the stock Android app, which is accompanied by tabs for contacts, favourites and call history.
The Mate 20 has four microphones, which filtered ambient noise reliably in our tests and delivered decent call quality. The device supports VoLTE and VoWiFi, but these technologies will only work on carriers that support them and specifically the Mate 20. Huawei sells the device in single or dual-SIM variants, the latter of which supports two nano-SIM cards with full 4G, VoLTE and VoWiFi on both SIMs.
Cameras

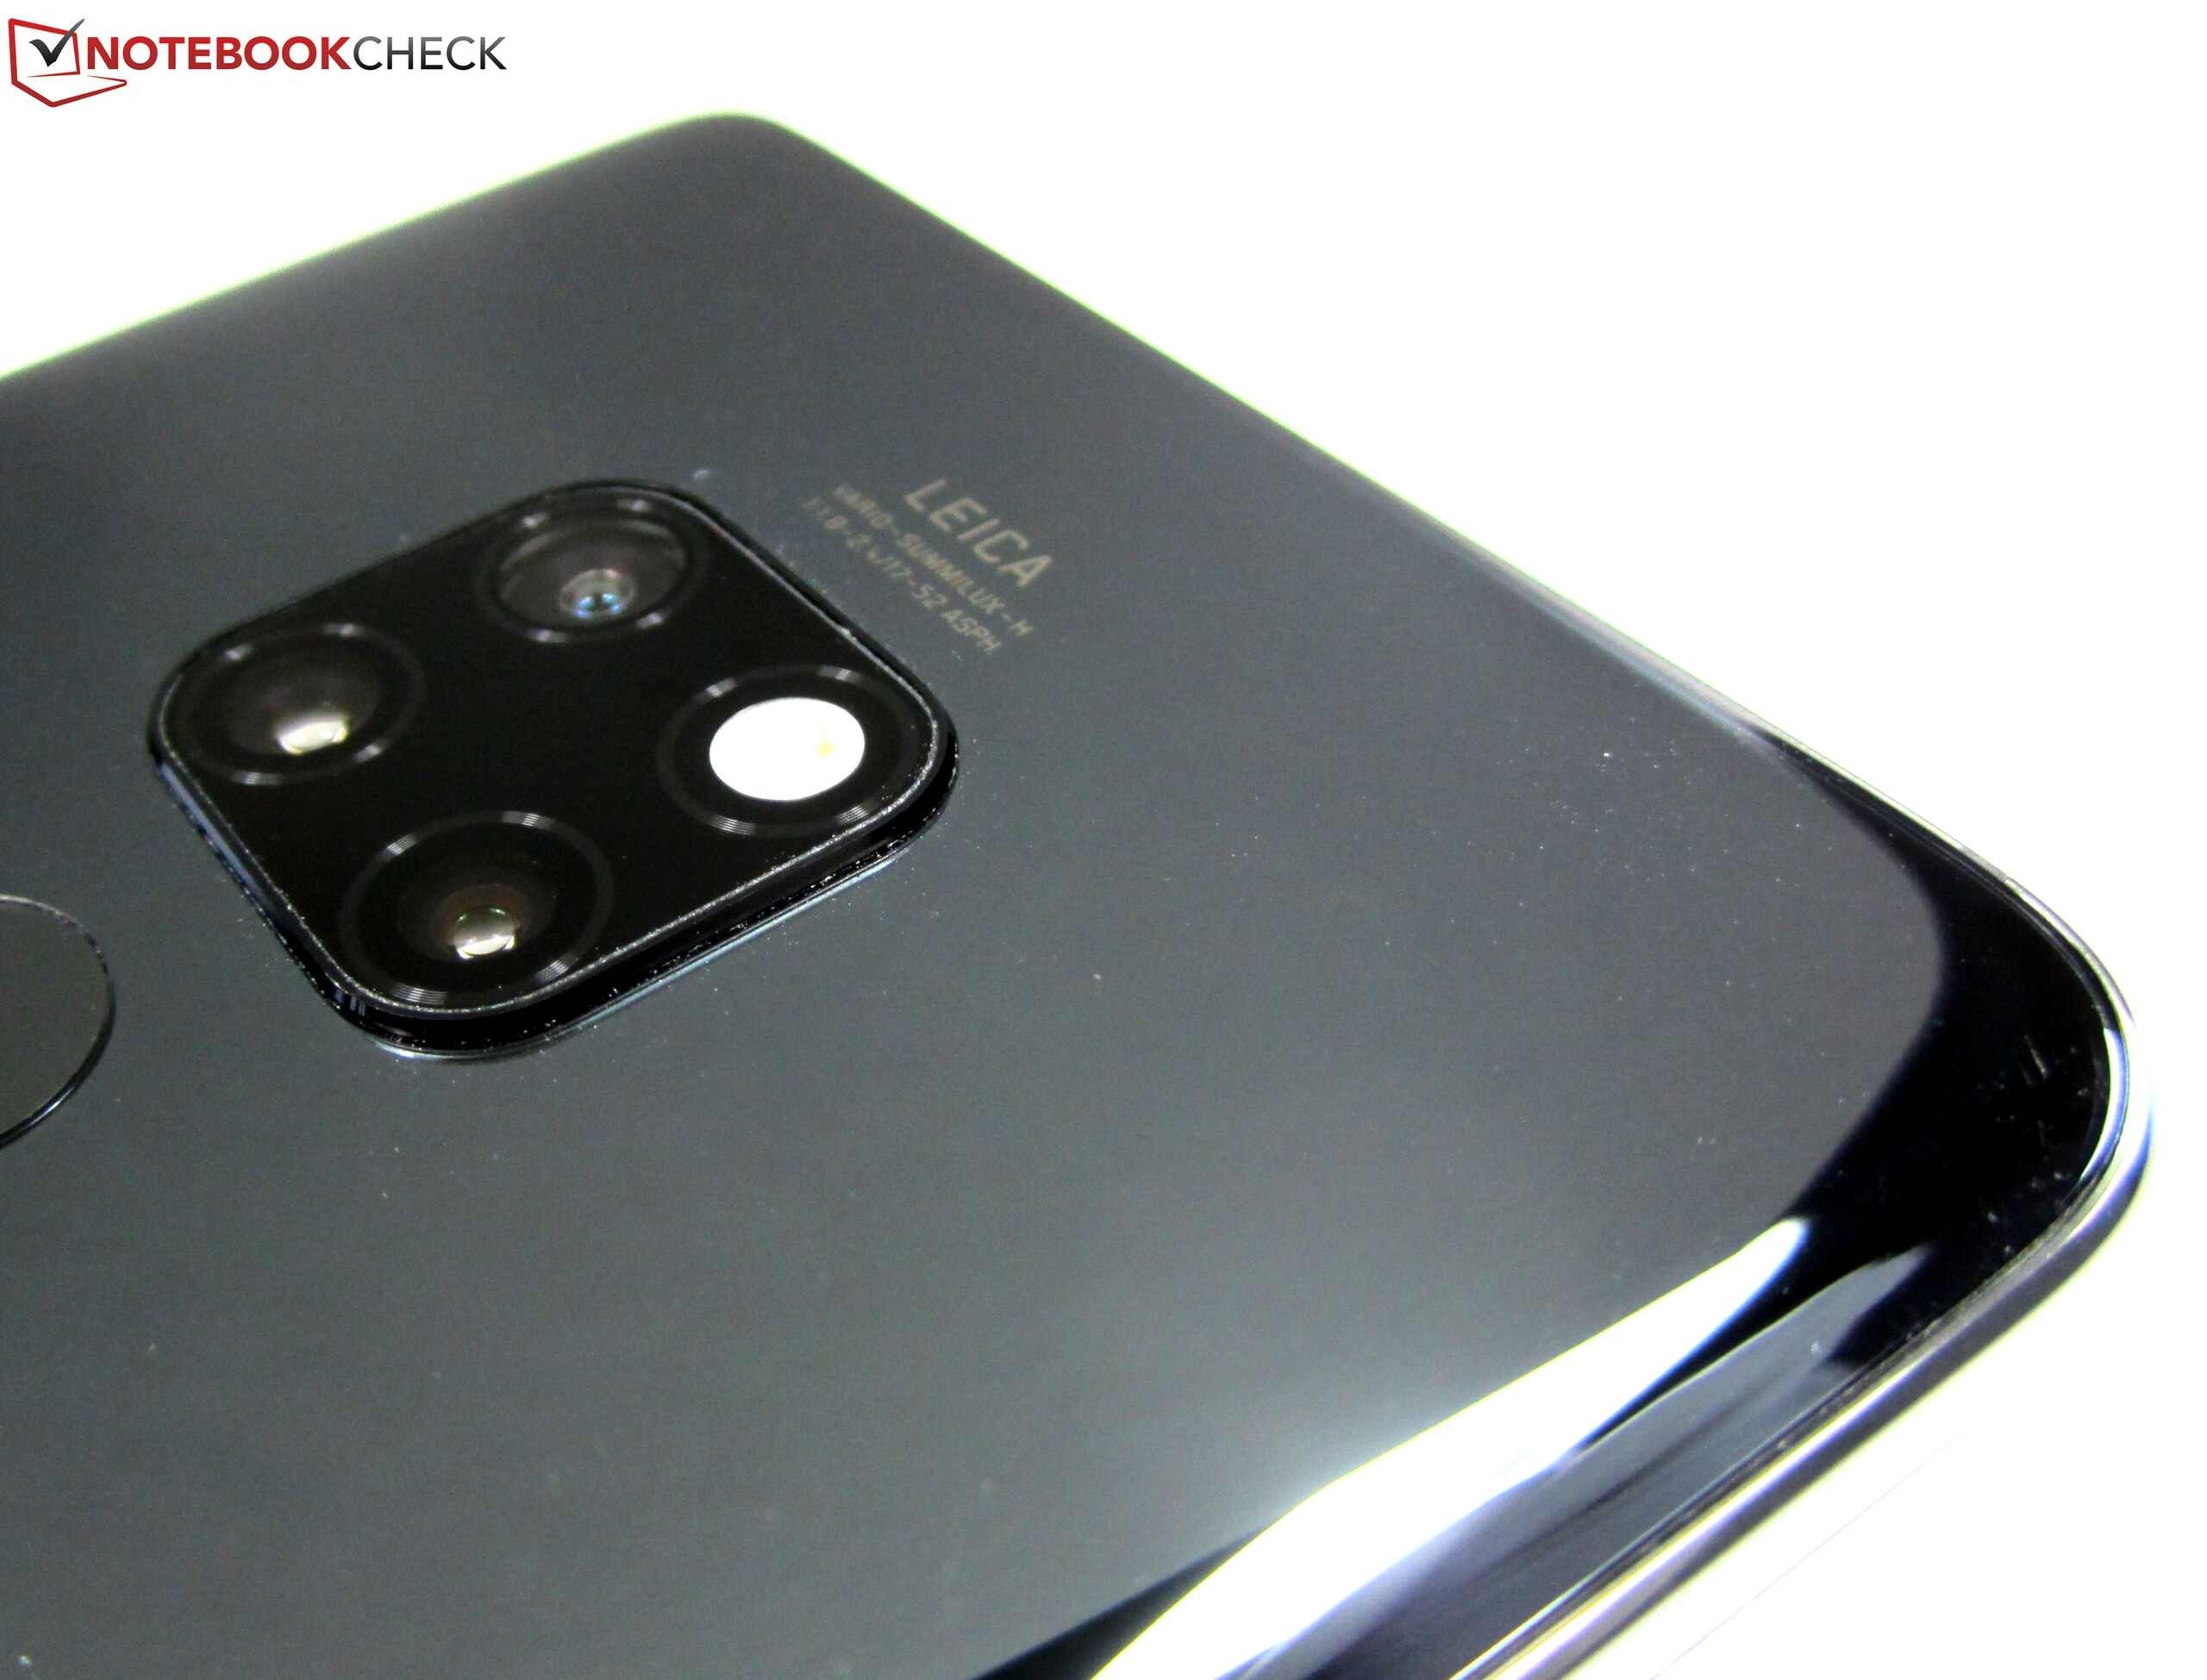
The Mate 20 has a Leica triple rear-facing camera array like the Mate 20 Pro. These consist of a 12 MP RGB sensor with a wide-angle lens and an f/1.8 aperture, a 16 MP ultra-wide-angle lens with an f/2.2 aperture and an 8 MP telephoto lens with an f/2.4 aperture. Huawei has equipped the Mate 20 with a 24 MP front-facing camera too that has an f/2.0 aperture.
On paper, there are big differences between the cameras with which Huawei has equipped the Mate 20 and the Mate 20 Pro. The latter has a 40 MP main sensor, a 24 MP ultra-wide-angle lens and an 8 MP telephoto lens. The telephoto lens also has 3x optical zoom compared to the 2x optical zoom that the equivalent in the Mate 20 supports. In short, our test device has decent cameras, but they are not on the same level as the Mate 20 Pro.
The Mate 20 delivers excellent-looking and detailed photos in good lighting though. Objects look sharp and dynamic range is high, which is something that scenes 1 and 2 show well. In our opinion, our test device fares well against the Mate 20 Pro in this scenario, but it cannot keep up in low-light conditions. The Mate 20 Pro captures objects in greater detail in poor lighting than the Mate 20, while photos taken with the latter also have noticeably more image noise.
The Mate 20 can record videos in up to 4K at 30 FPS, which is on par with other flagships like the Pixel 3 or Pixel 3 XL. Other recent flagships can record in up to 60 FPS though. Videos look good in our opinion, but the practical AI image stabilization is only available in 1080p at 60 FPS, which is a pity.


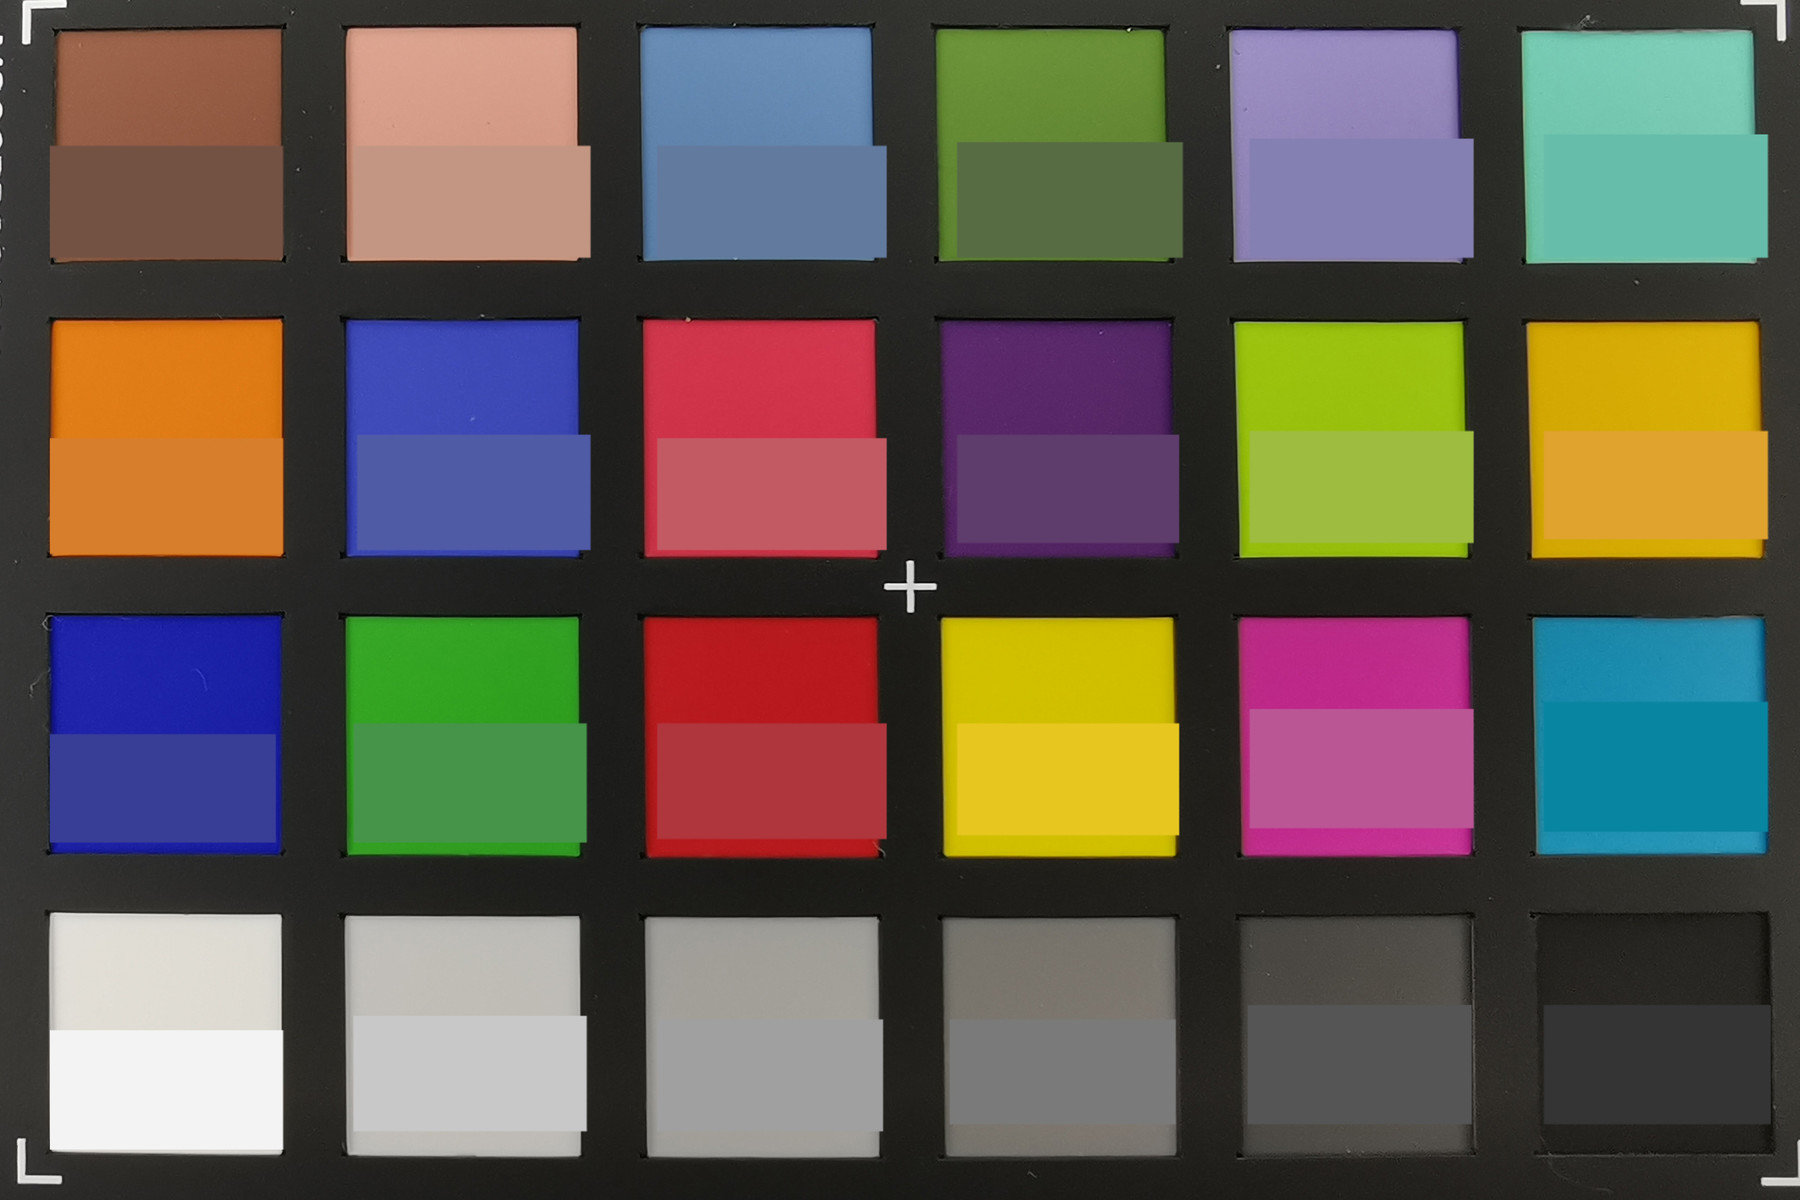
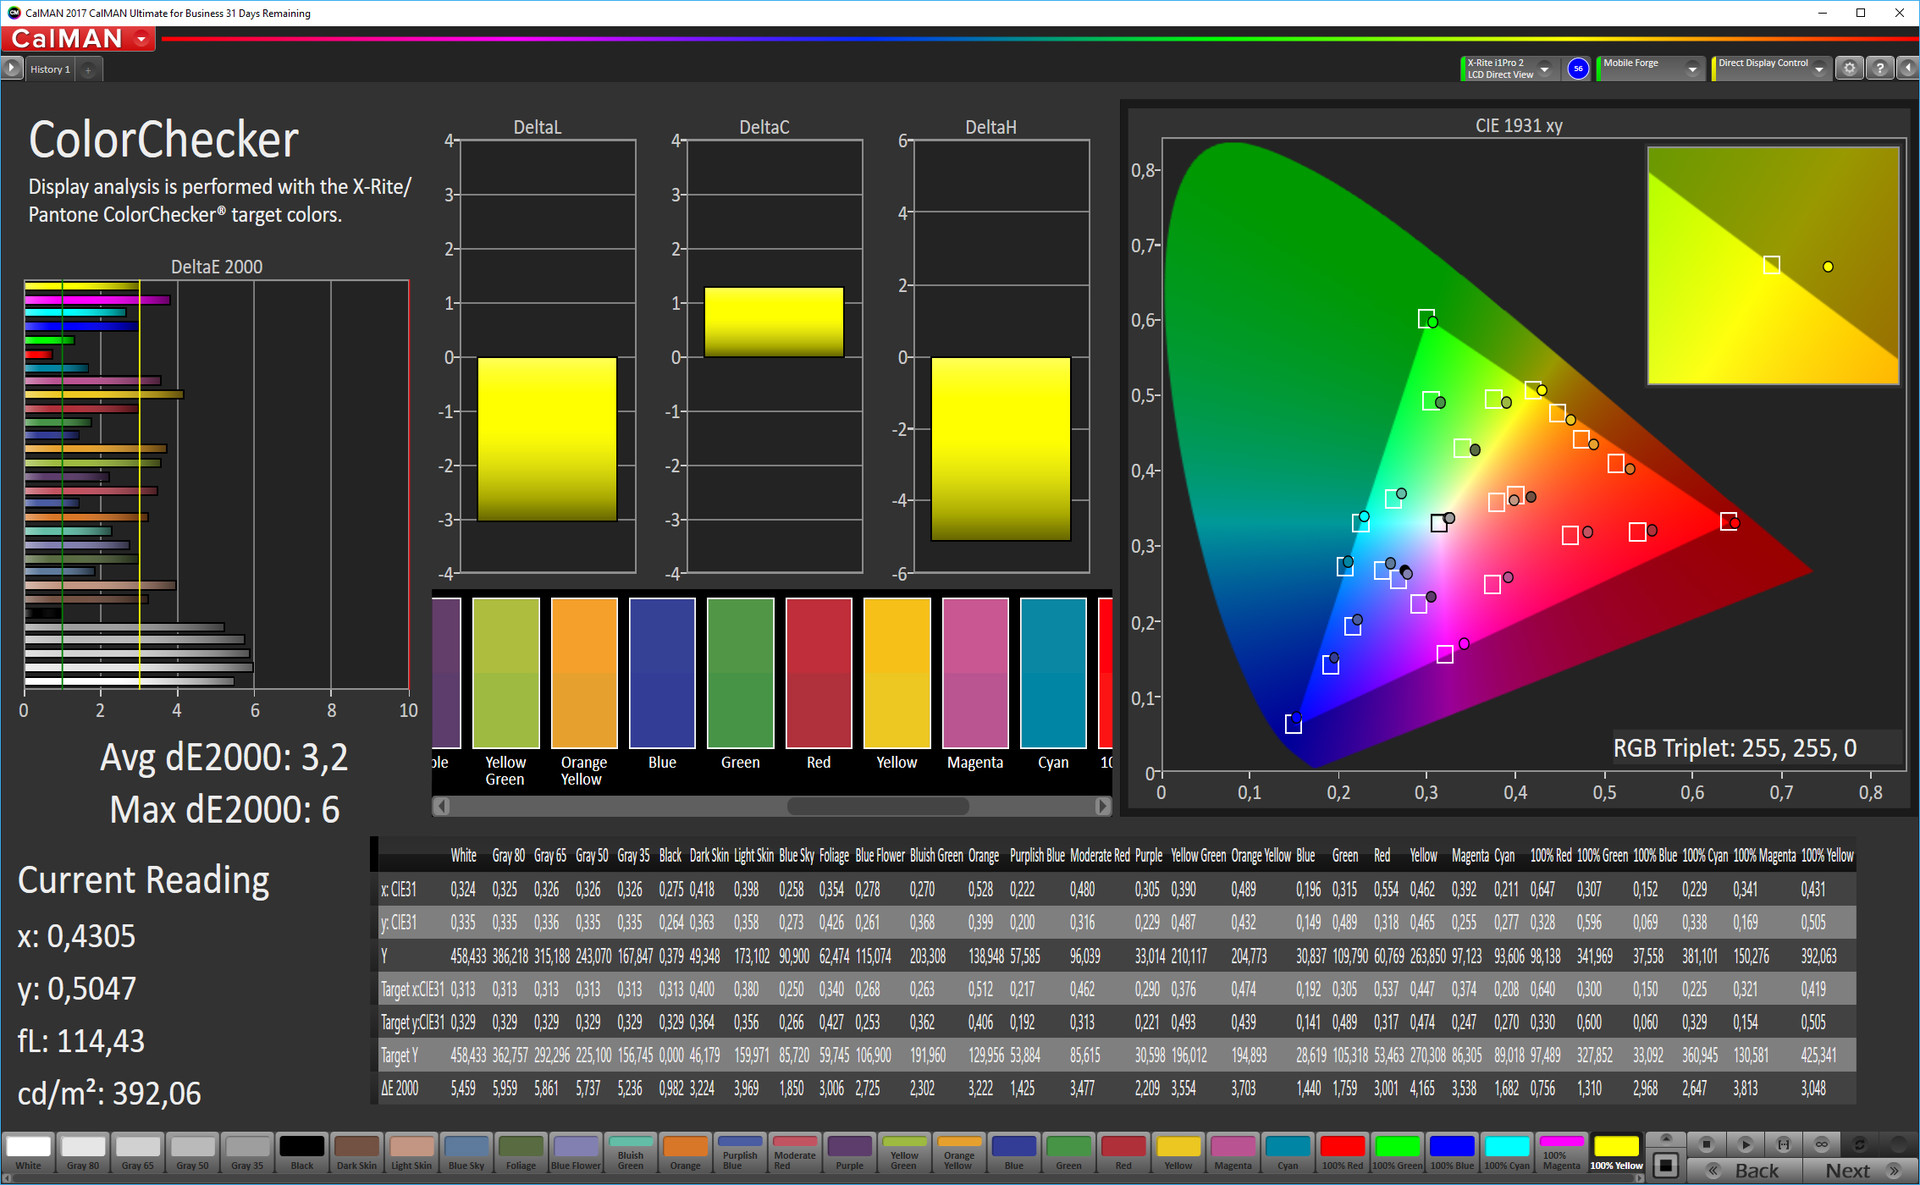
We also examined how well the Mate 20’s triple camera performs under controlled lighting conditions. As the ColorChecker test chart to the right shows, our test device reproduces colours accurately, although skin tones look more saturated than they should. Additionally, the white balance looks accurate, albeit black tones tend to look a touch warm and whites are slightly paler than the reference colour.
Moreover, our test chart looks detailed, while colour gradients, fonts and object edges are reproduced sharply. Overall, the photo of our test chart looks uniformly sharp, although the lower half of the image is somewhat darker than the rest of the chart.

Accessories & Warranty
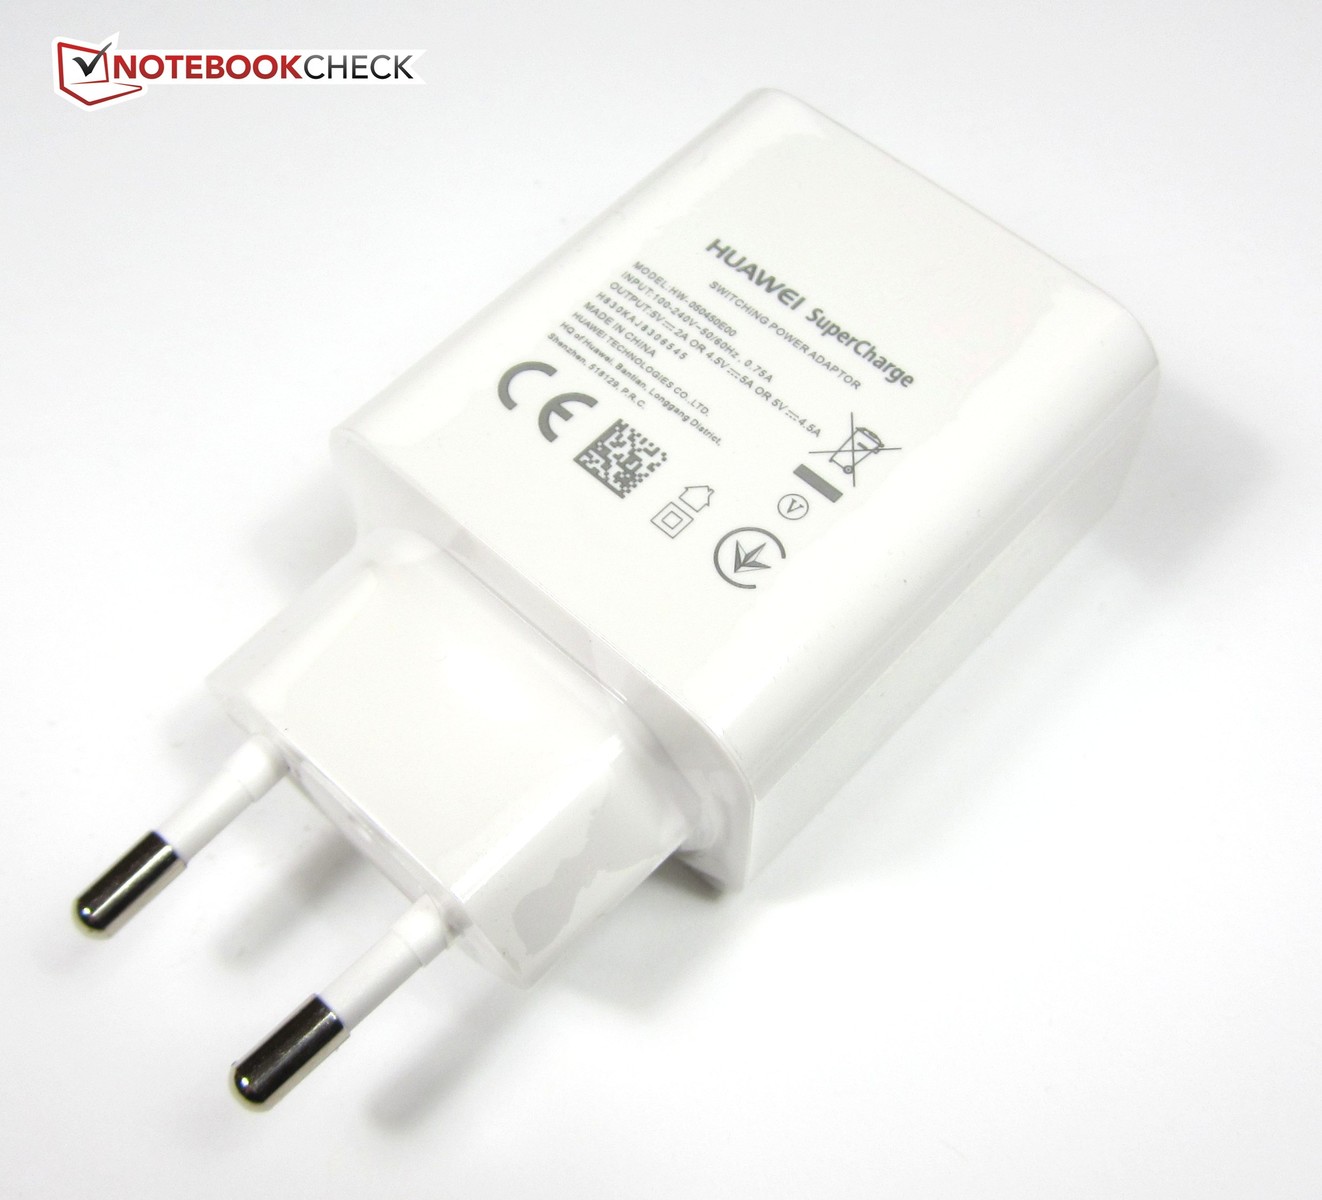
The Mate 20 comes with a 22.5 W SuperCharge power supply (5V/2A, 4.5V/5A, 5V/4.5A) that carries the model number HW-050450E00. There is a matching USB Type-A to Type-C cable, a set of headphones, a SIM tool and a quick-start guide in the box too.
Huawei sells numerous accessories on its website including wireless headphones, power banks and selfie sticks among others. Unfortunately, the company does not currently sell its 40 W SuperCharge power supply that it includes with the Mate 20 Pro.
The Mate 20 comes with a 24-month manufacturer’s warranty. Please see our Guarantees, Return policies and Warranties FAQ for country-specific information.
Input Devices & Operation
The Mate 20 has a 6.53-inch capacitive touchscreen that recognises up to 10 inputs simultaneously. The Gorilla Glass 5-protected touchscreen reproduced our inputs precisely even into the corners of the display. Huawei preinstalls SwiftKey as the Mate 20’s default keyboard, which can be replaced with any keyboard downloadable from the Google Play Store if necessary.
As mentioned in the Connectivity section, the Mate 20 lacks the IR sensors with which Huawei equipped the Mate 20 Pro, which are necessary for 3D face recognition. The Mate 20 supports 2D face unlock via the front-facing camera, although this unlock method is not as secure as the 3D equivalent or using a fingerprint sensor.
Moreover, the Mate 20 has a fingerprint sensor on its rear rather than having the in-screen sensor that Huawei used on the Mate 20 Pro. While some may consider this a backwards step, the fingerprint sensor on the Mate 20 works just as well as the one in the Mate 20 Pro. Additionally, the fingerprint sensor is easy to find when holding the device, while its central positioning is conducive to using the Mate 20 with one hand.


Display
The Mate 20 has a 6.53-inch IPS display with a 2244x1080 native resolution that yields a 353 PPI pixel density. By contrast, the Mate 20 Pro has a slightly smaller yet higher resolution OLED panel that has a 545 PPI pixel density.
Our test device has a brighter display than its more expensive sibling though. The Mate 20 achieves an average maximum brightness of 784.2 cd/m² according to X-Rite i1Pro2, which the more realistic APL50 test confirms. However, turning off the ambient light sensor reduces the maximum brightness to 496 cd/m². The latter value is still brighter than most of our comparison devices though. Our test device has a 94% evenly lit display, which is slightly more uniform than the display in the Mate 20 Pro and 1% short of our best comparison device, the OnePlus 6T.
The Mate 20 also has an excellent 0.36 cd/m² black level that results in an impressive 2,172:1 contrast ratio. The Mate 10 has a 16% higher contrast ratio though, but the Mate 20 demolishes the HTC U12 Plus, which can only manage a meagre 1,068:1 contrast ratio.
The only drawback of the Mate 20’s display is that it uses pulse-width modulation (PWM) to regulate display brightness. We record a PWM frequency of 14,880 Hz at 28% and below, which is so high that it should not both even those who are PWM-sensitive.
| |||||||||||||||||||||||||
Brightness Distribution: 94 %
Center on Battery: 782 cd/m²
Contrast: 2172:1 (Black: 0.36 cd/m²)
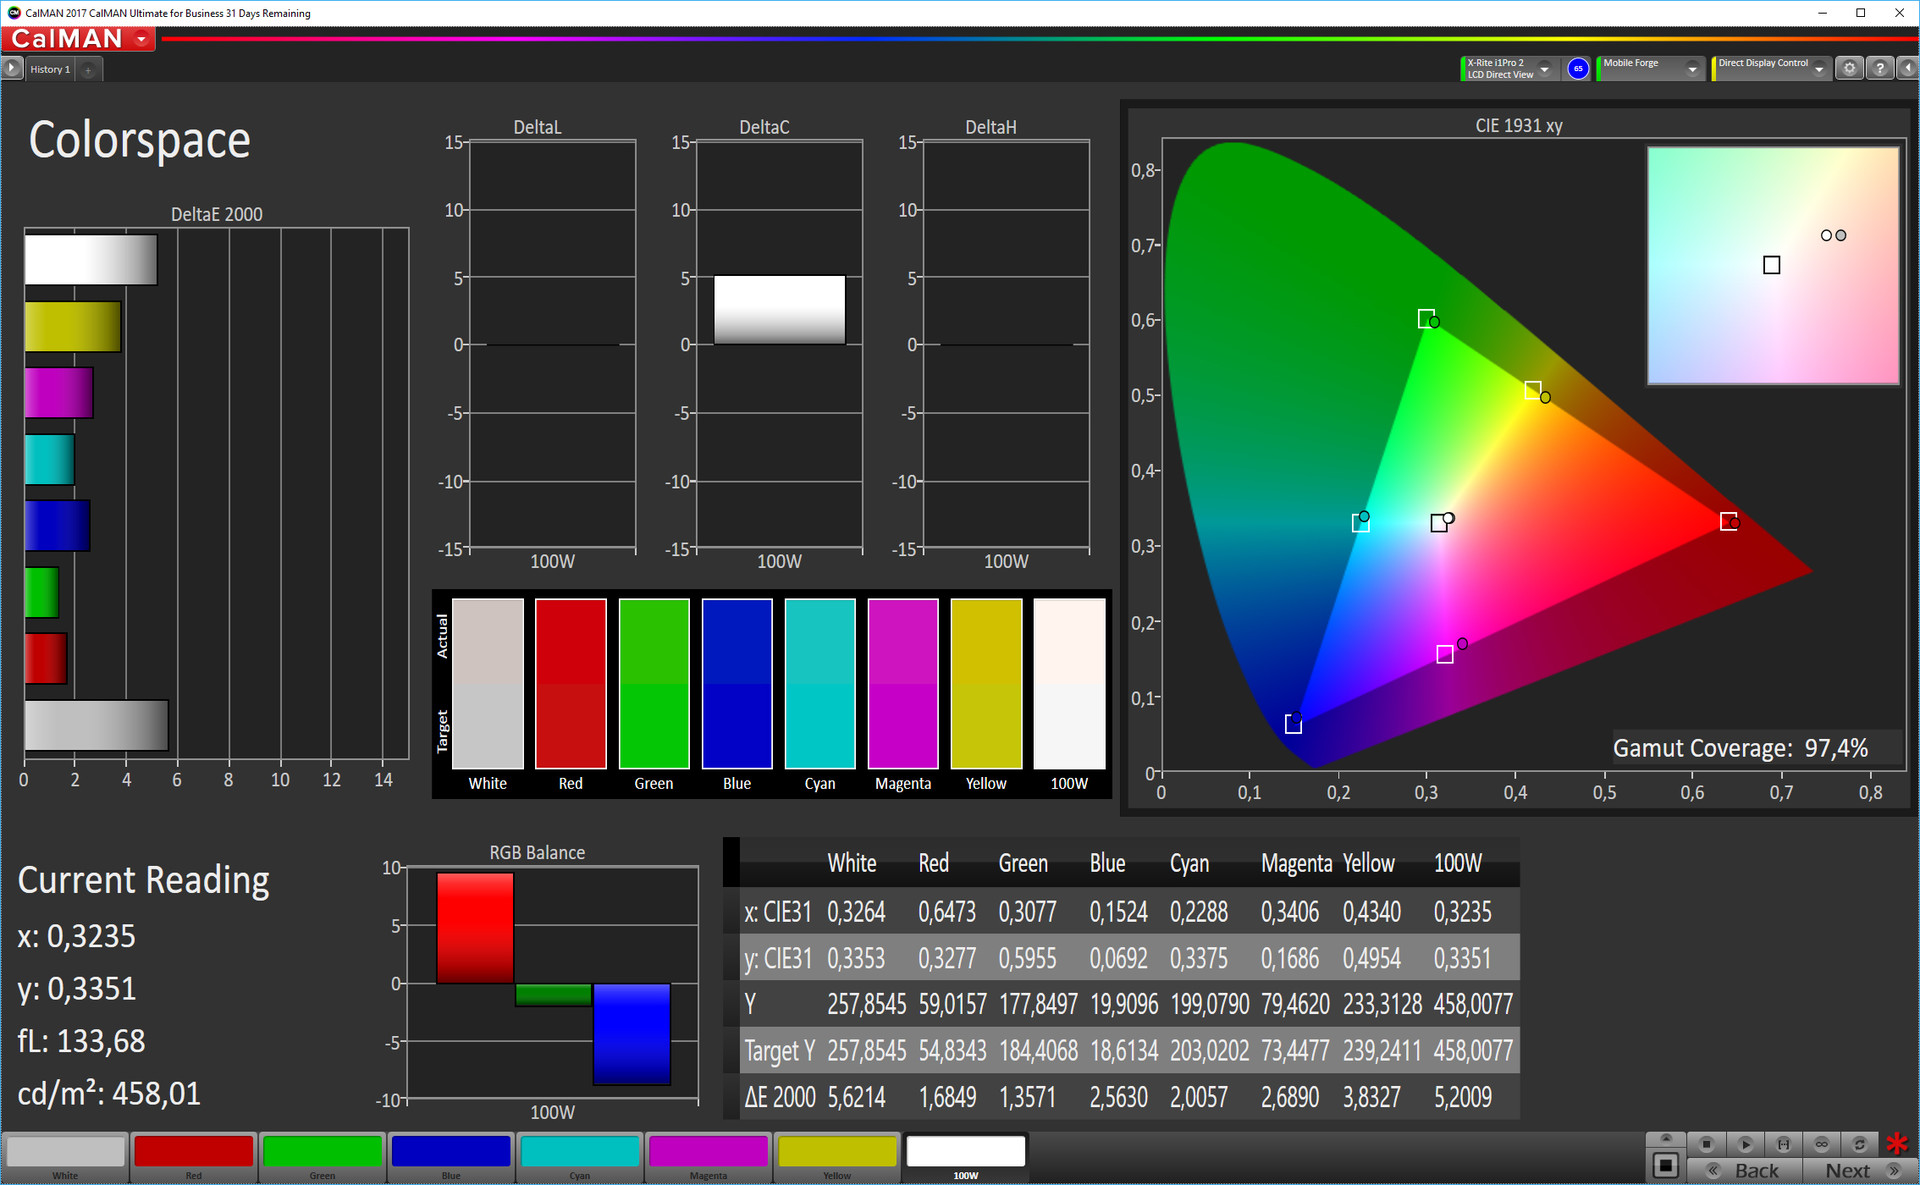
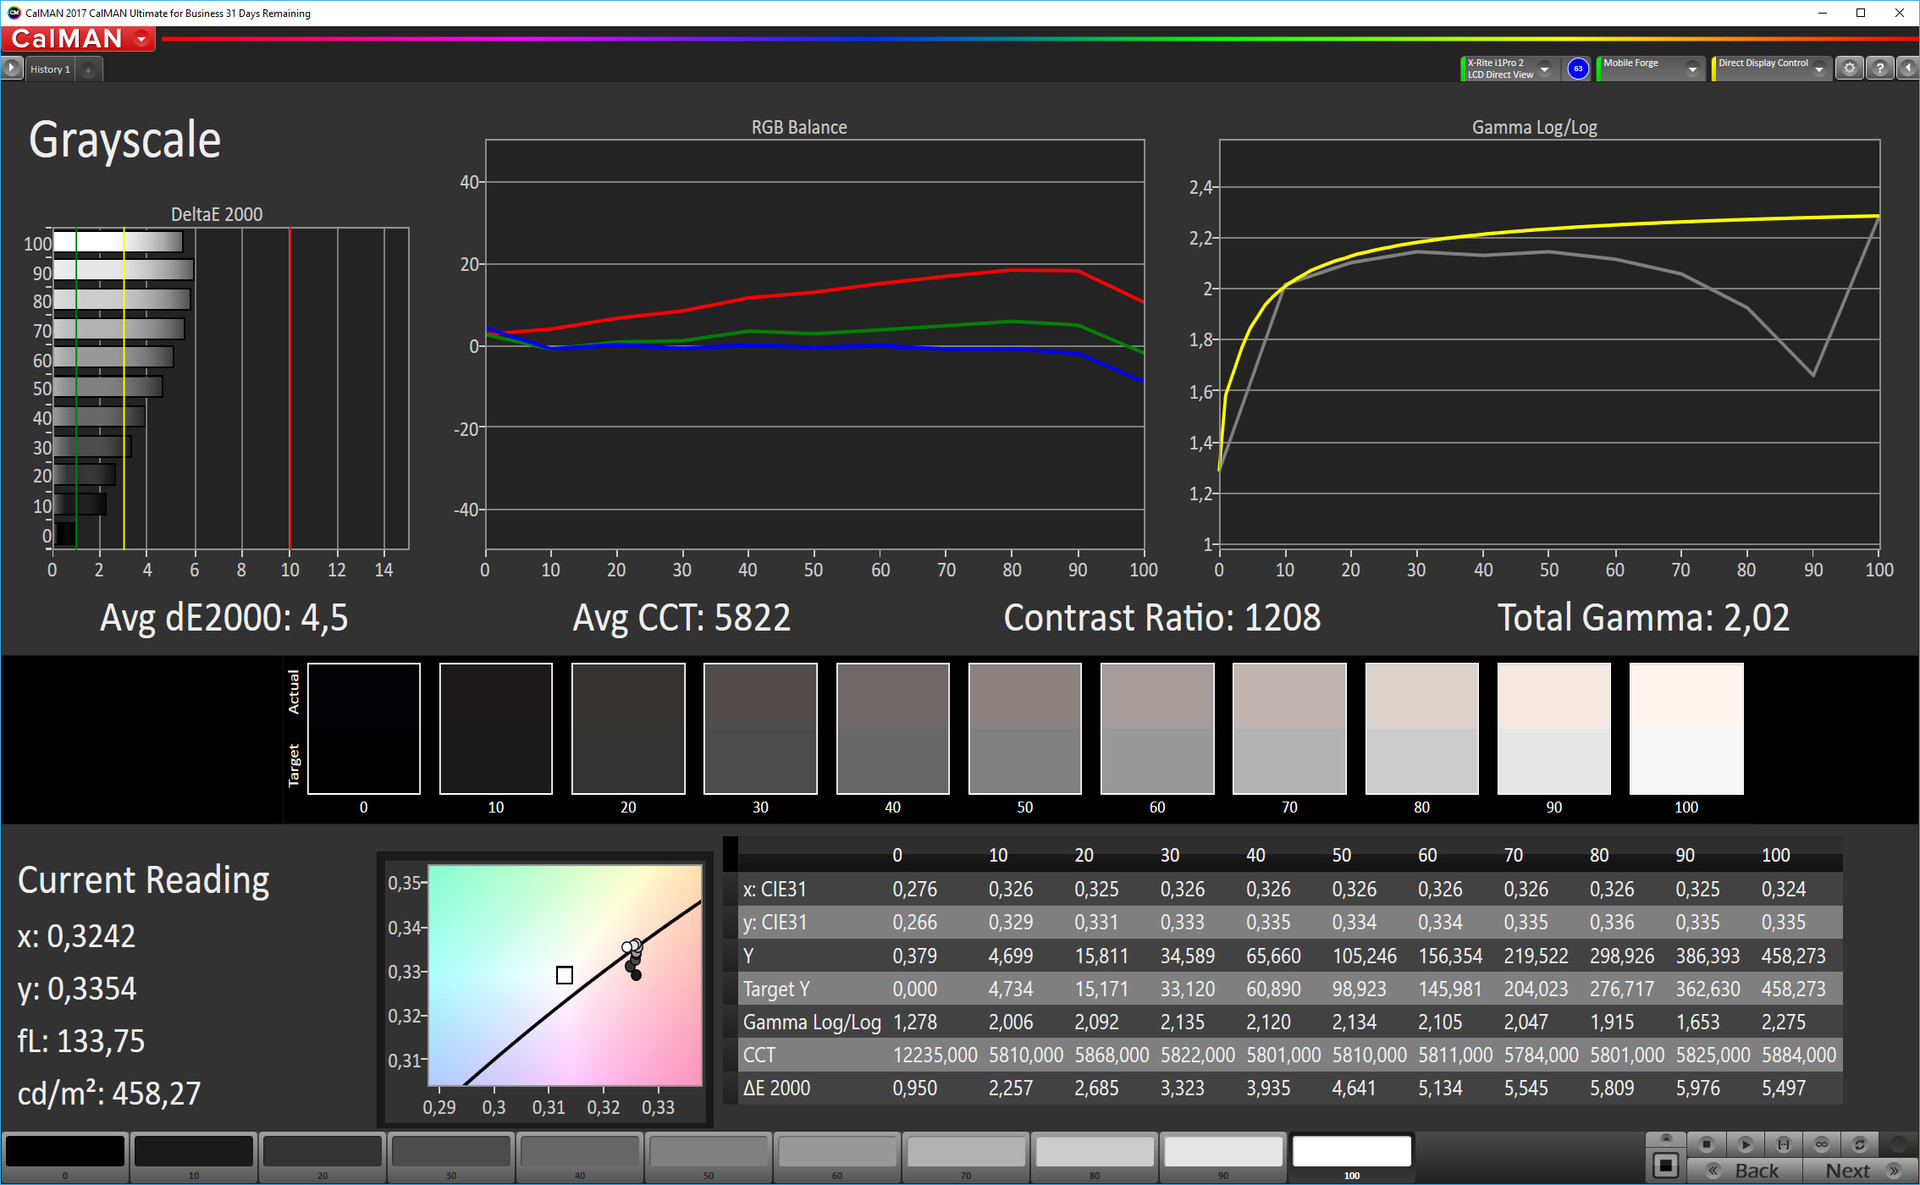
ΔE ColorChecker Calman: 2.3 | ∀{0.5-29.43 Ø4.71}
ΔE Greyscale Calman: 2.4 | ∀{0.09-98 Ø4.96}
97.4% sRGB (Calman 2D)
Gamma: 2.22
CCT: 6839 K
| Huawei Mate 20 TFT-LCD (IPS), 2244x1080, 6.5" | HTC U12 Plus Super LCD 6, 2880x1440, 6" | Huawei Mate 20 Pro OLED, 3120x1440, 6.3" | Huawei Mate 10 IPS, 2560x1440, 5.9" | LG V30 OLED, 2880x1440, 6" | OnePlus 6T Optic AMOLED, 2340x1080, 6.4" | Xiaomi Mi 8 Explorer Edition Super AMOLED, 2248x1080, 6.2" | |
|---|---|---|---|---|---|---|---|
| Screen | -3% | 12% | 4% | -54% | -5% | -26% | |
| Brightness middle (cd/m²) | 782 | 395 -49% | 576 -26% | 704 -10% | 432 -45% | 437 -44% | 429 -45% |
| Brightness (cd/m²) | 784 | 402 -49% | 582 -26% | 692 -12% | 428 -45% | 442 -44% | 432 -45% |
| Brightness Distribution (%) | 94 | 90 -4% | 90 -4% | 94 0% | 87 -7% | 95 1% | 88 -6% |
| Black Level * (cd/m²) | 0.36 | 0.37 -3% | 0.28 22% | ||||
| Contrast (:1) | 2172 | 1068 -51% | 2514 16% | ||||
| Colorchecker dE 2000 * | 2.3 | 1.6 30% | 1.3 43% | 2.4 -4% | 4.18 -82% | 2.21 4% | 3.39 -47% |
| Colorchecker dE 2000 max. * | 7 | 3.4 51% | 3.5 50% | 4.2 40% | 8.53 -22% | 4.27 39% | 5.25 25% |
| Greyscale dE 2000 * | 2.4 | 1.1 54% | 1.6 33% | 2.8 -17% | 5.3 -121% | 2.1 12% | 3.3 -38% |
| Gamma | 2.22 99% | 2.14 103% | 2.18 101% | 2.34 94% | 2.33 94% | 2.307 95% | 2.238 98% |
| CCT | 6839 95% | 6536 99% | 6561 99% | 6423 101% | 7487 87% | 6353 102% | 7135 91% |
* ... smaller is better
Screen Flickering / PWM (Pulse-Width Modulation)
| Screen flickering / PWM detected | 14880 Hz | ≤ 28 % brightness setting | 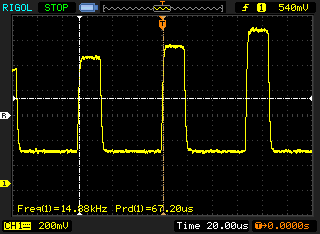 |
The display backlight flickers at 14880 Hz (worst case, e.g., utilizing PWM) Flickering detected at a brightness setting of 28 % and below. There should be no flickering or PWM above this brightness setting. The frequency of 14880 Hz is quite high, so most users sensitive to PWM should not notice any flickering. In comparison: 52 % of all tested devices do not use PWM to dim the display. If PWM was detected, an average of 7754 (minimum: 5 - maximum: 343500) Hz was measured. | |||
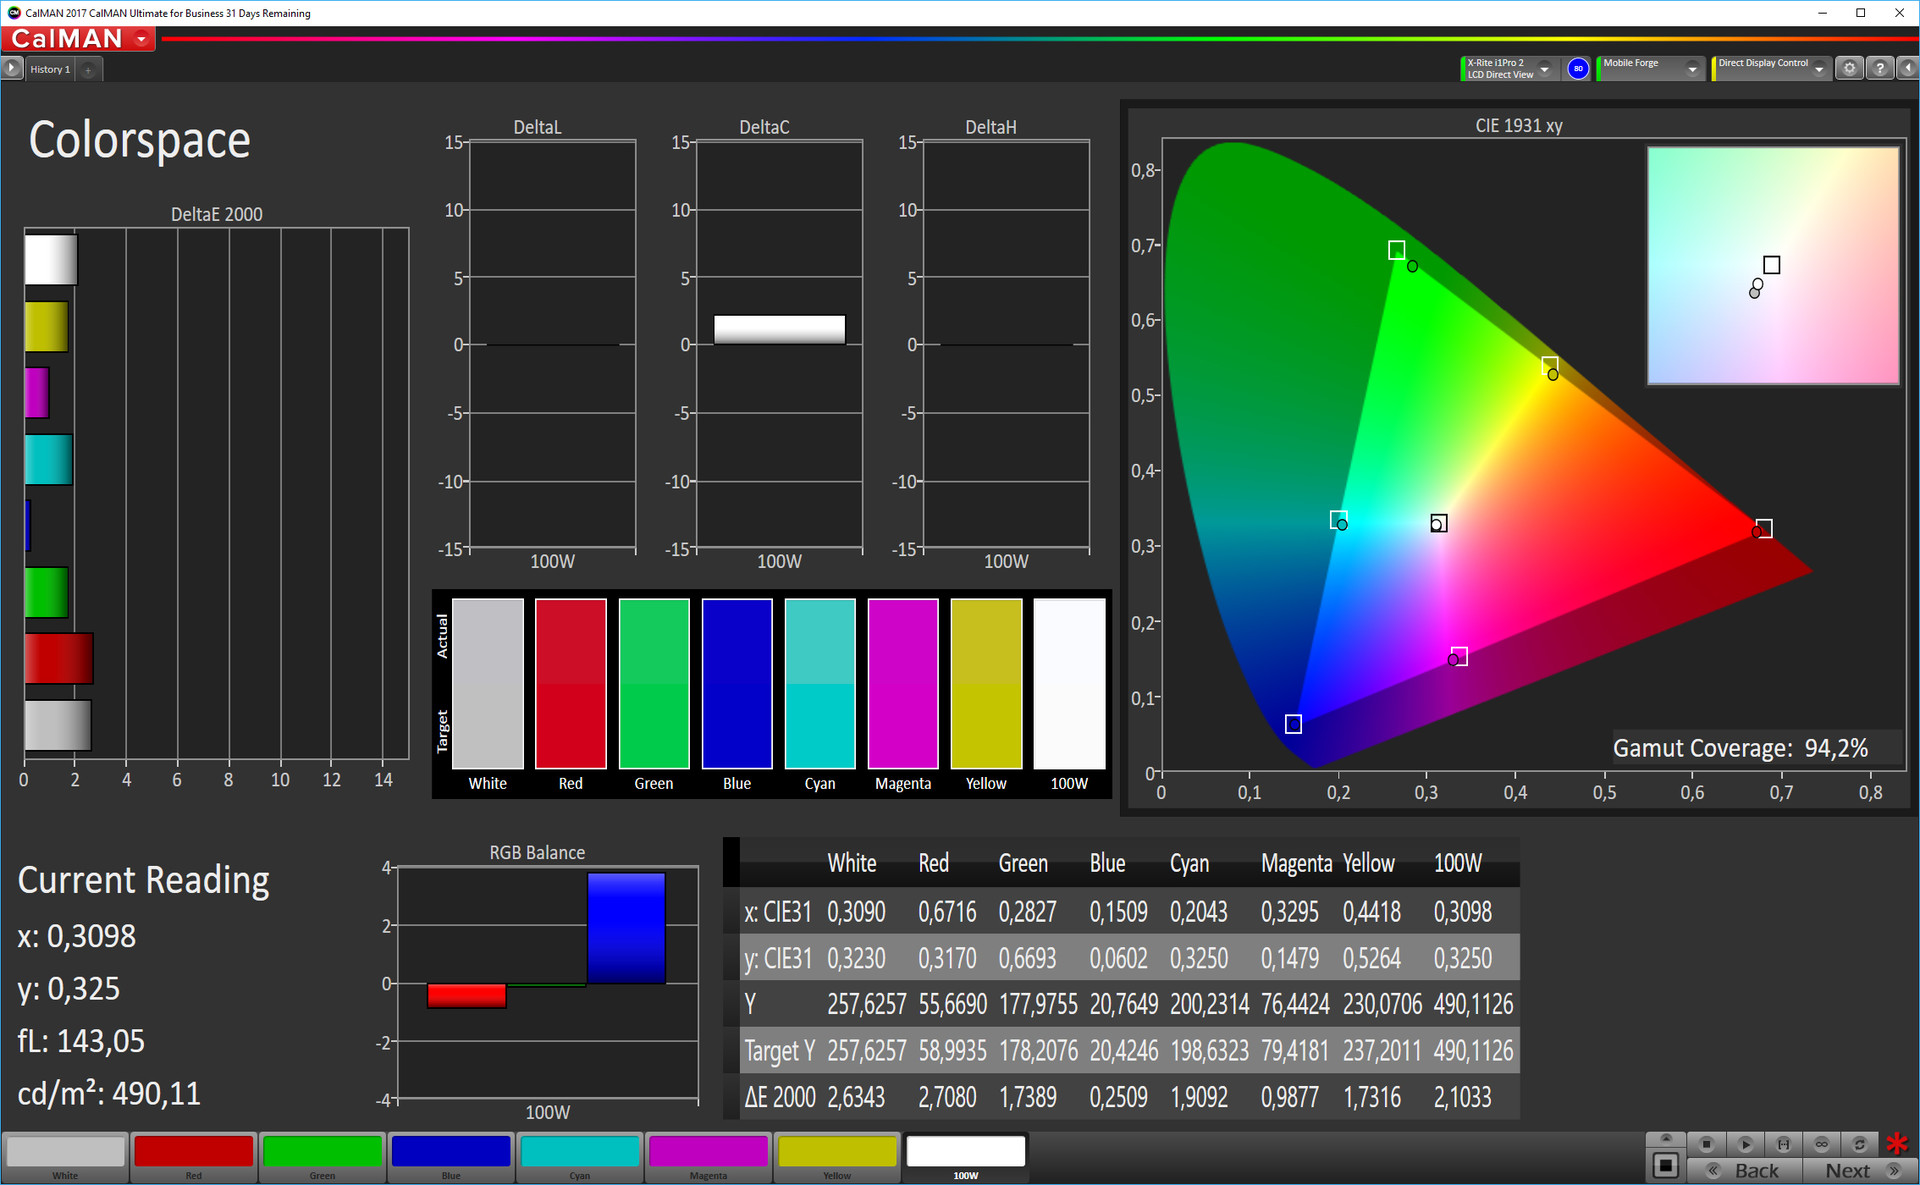
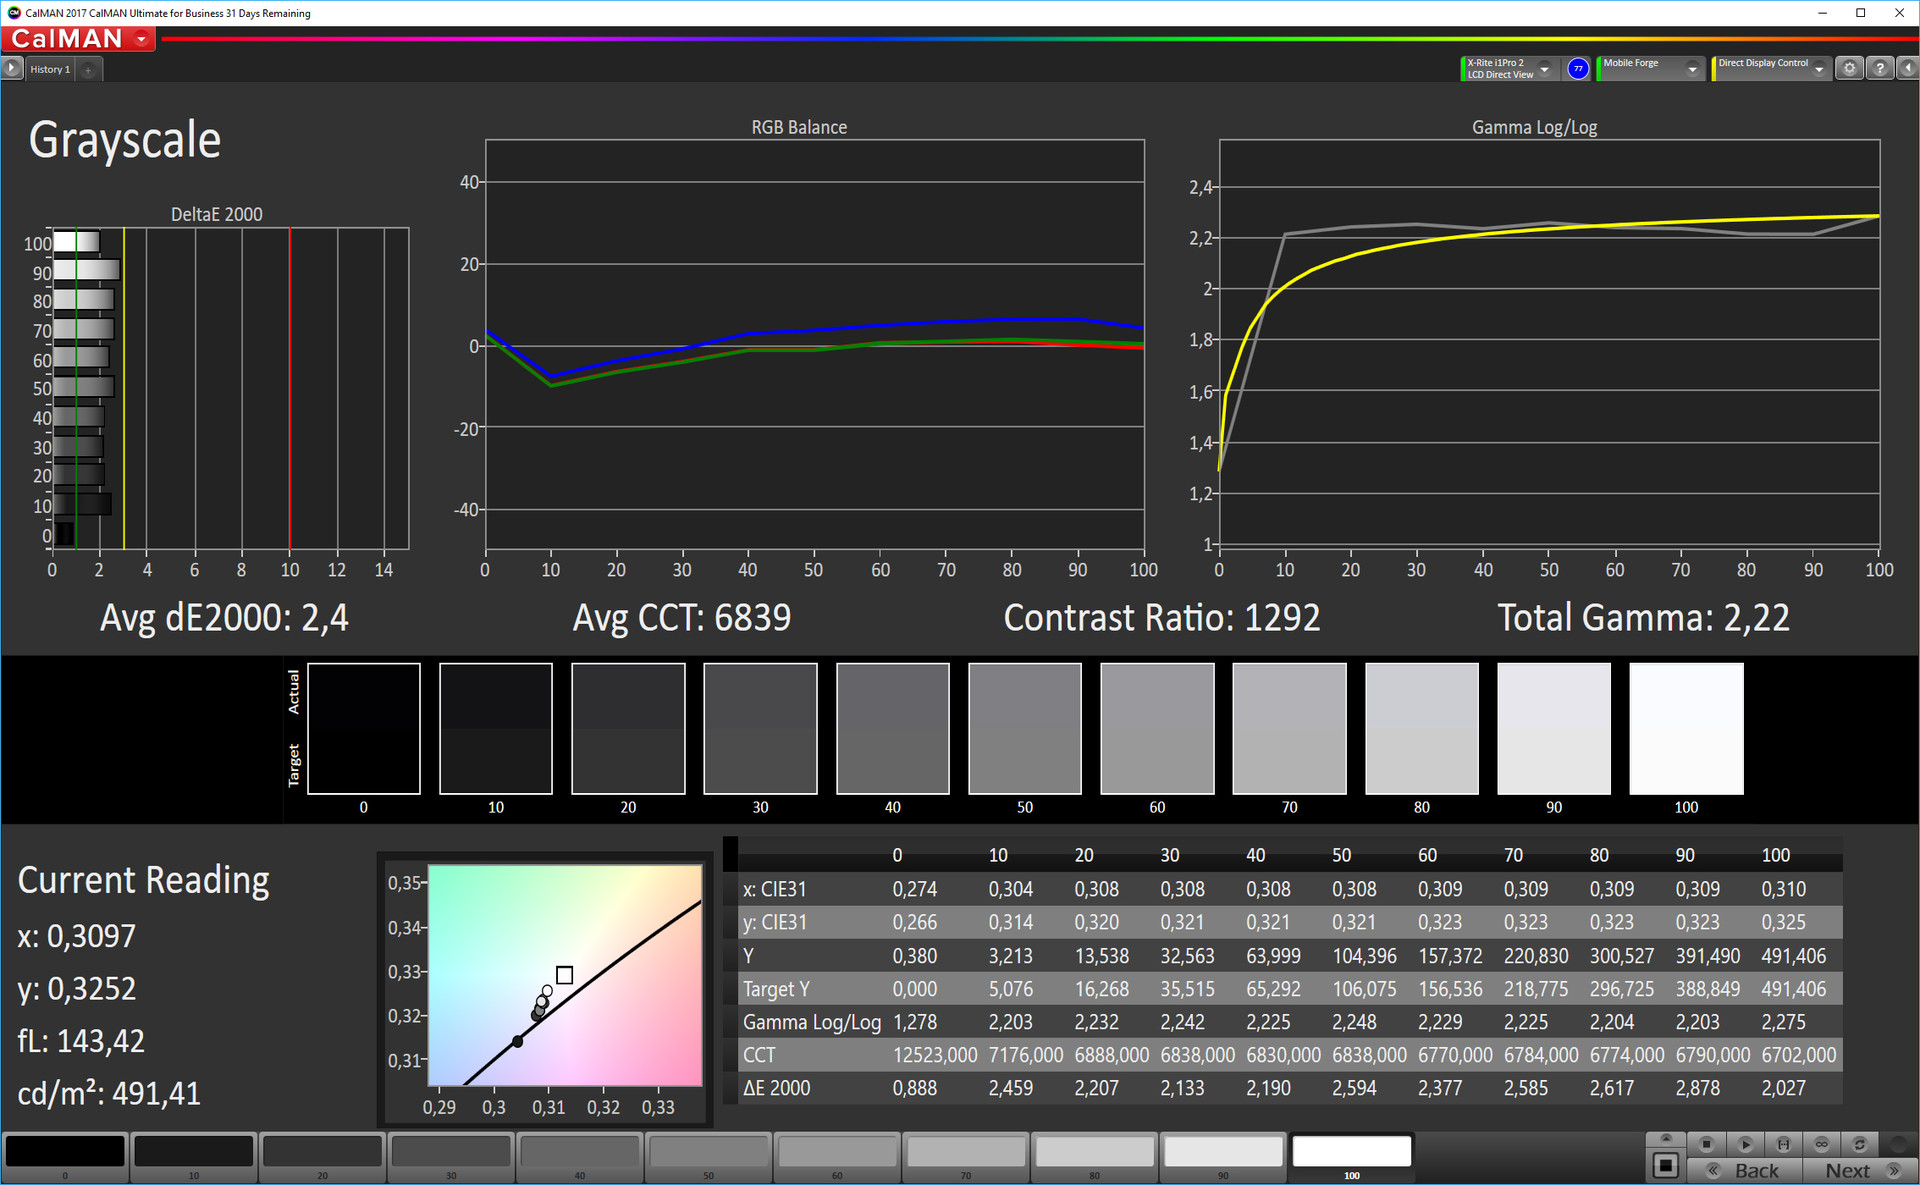
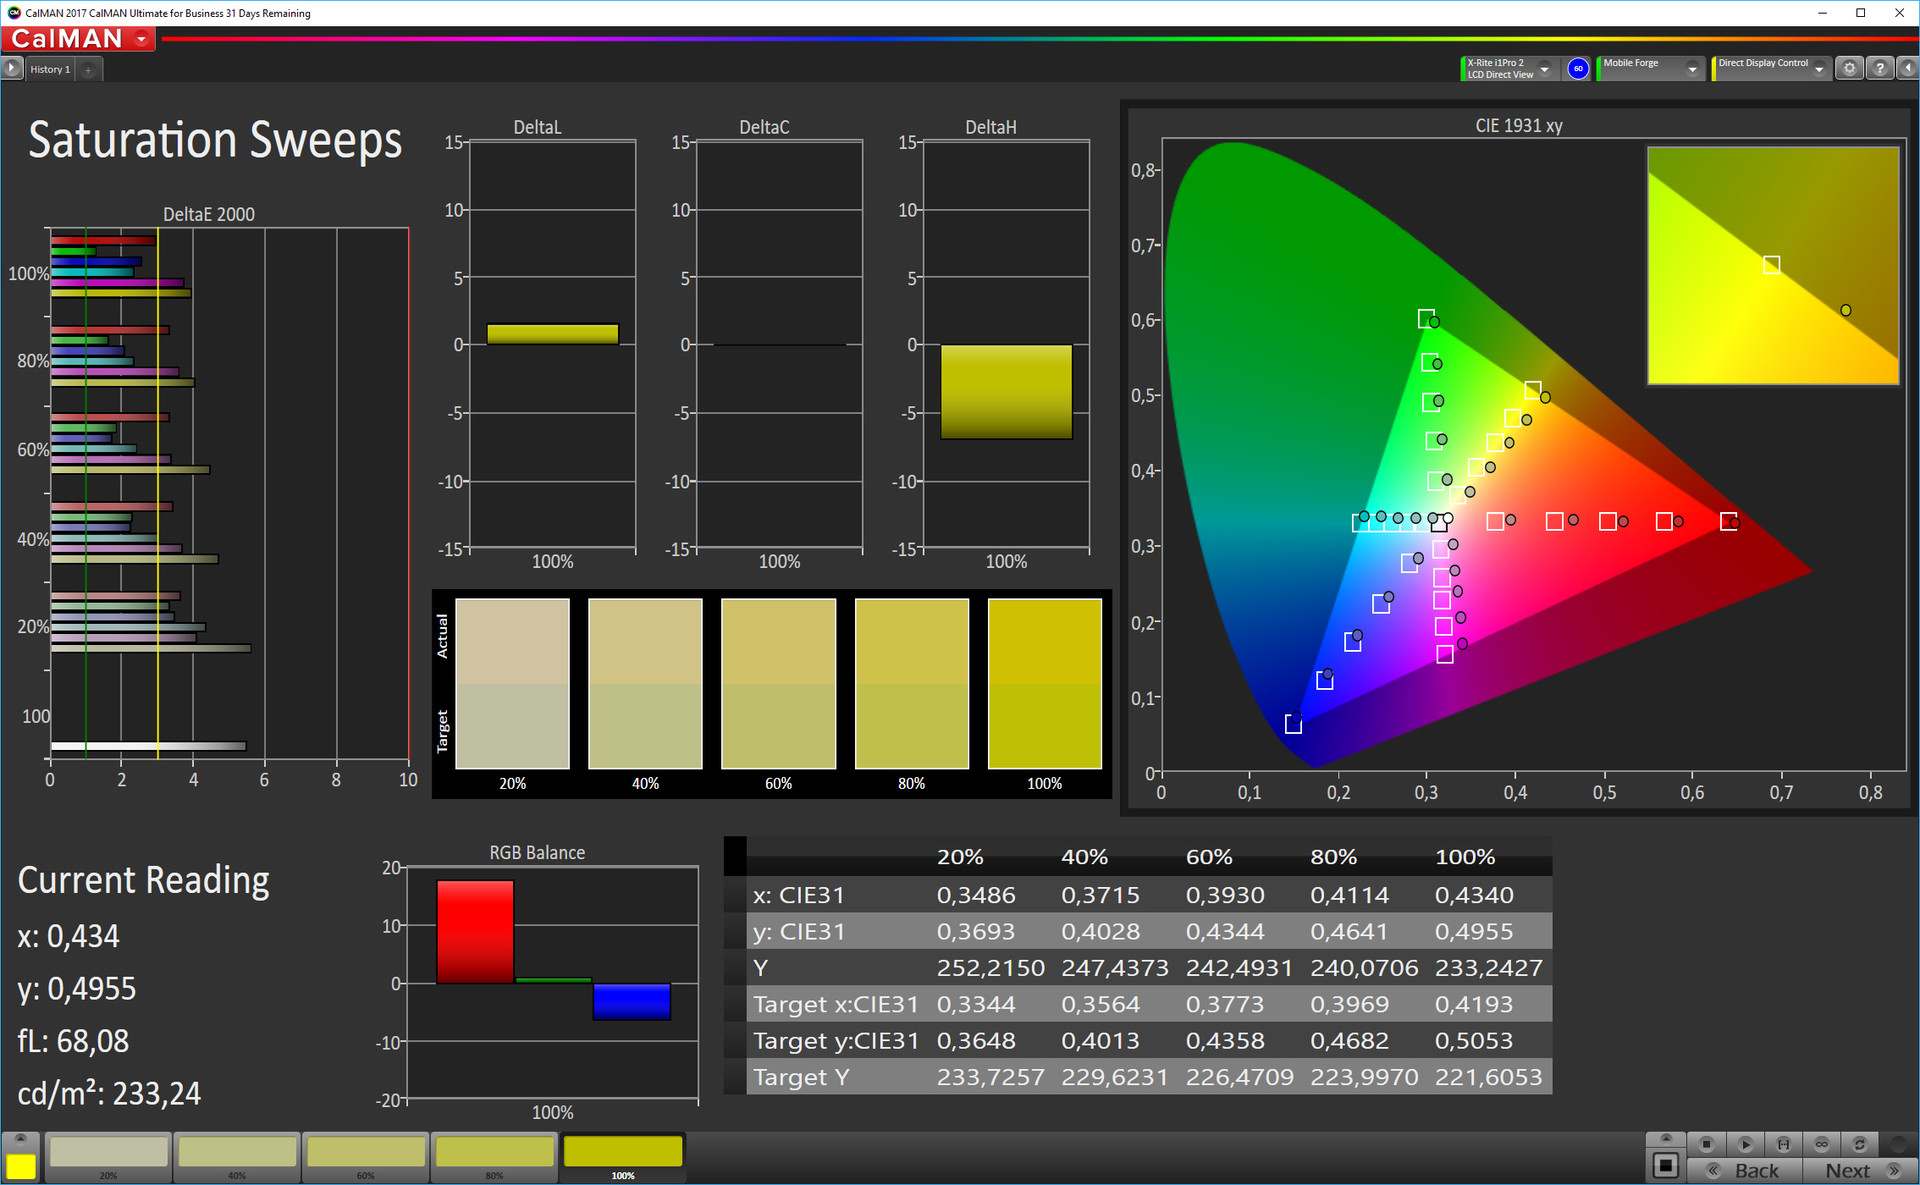
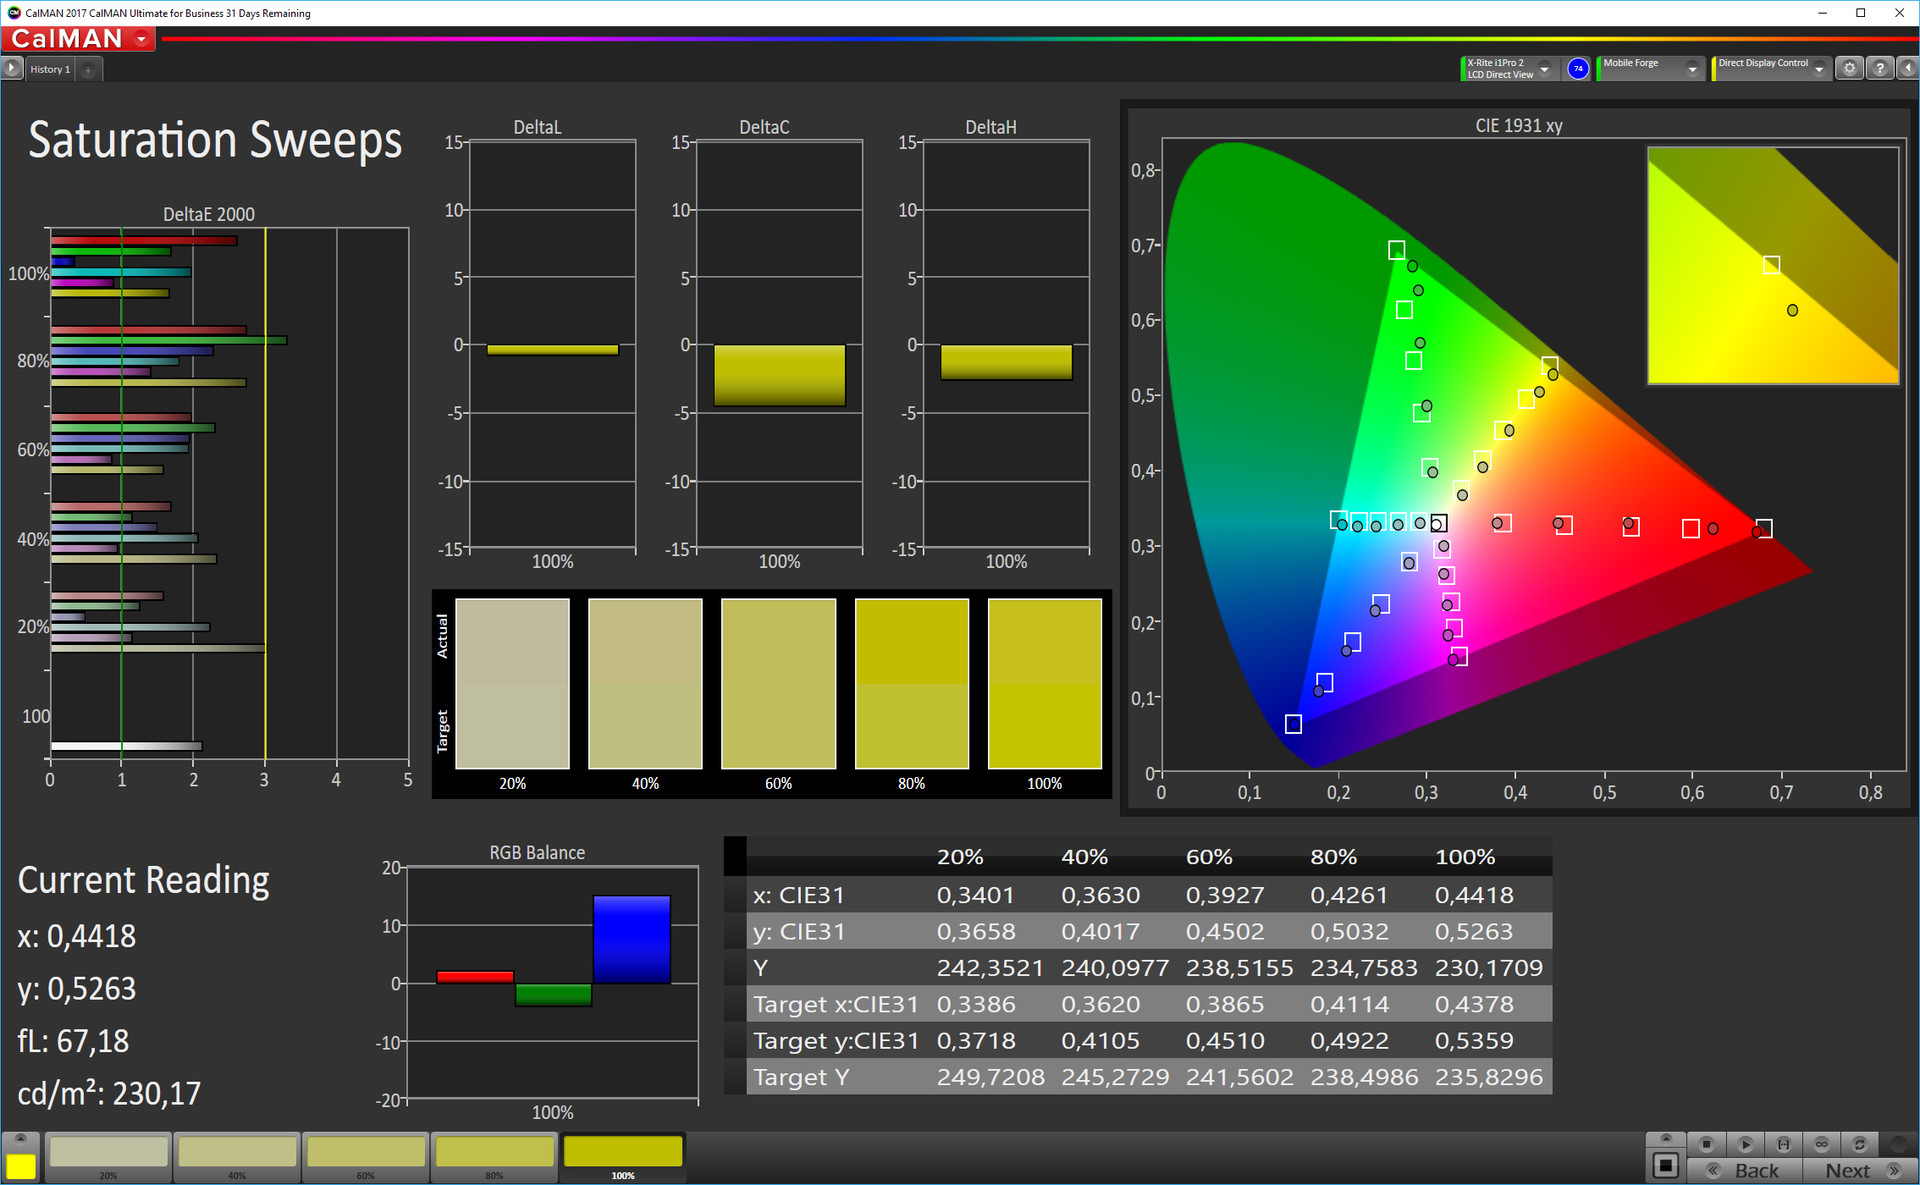
The Mate 20 has two display colour modes, which Huawei calls ‘Normal’ and ‘Vivid’. We took a closer look at our test device’s colour accuracy using a spectrophotometer and CalMAN analysis software. Both modes are colour accurate and do a better job than many other smartphones. CalMAN demonstrates that the ‘Vivid’ mode has lower DeltaE deviations and a closer to ideal colour temperature than the ‘Normal’ mode, which looks a touch too cool for our liking.
Display Response Times
| ↔ Response Time Black to White | ||
|---|---|---|
| 26 ms ... rise ↗ and fall ↘ combined | ↗ 8.4 ms rise | 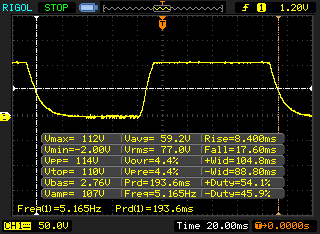 |
| ↘ 17.6 ms fall | ||
| The screen shows relatively slow response rates in our tests and may be too slow for gamers. In comparison, all tested devices range from 0.1 (minimum) to 240 (maximum) ms. » 63 % of all devices are better. This means that the measured response time is worse than the average of all tested devices (19.8 ms). | ||
| ↔ Response Time 50% Grey to 80% Grey | ||
| 59.2 ms ... rise ↗ and fall ↘ combined | ↗ 26.8 ms rise | 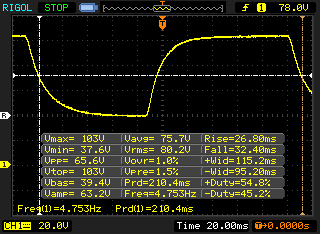 |
| ↘ 32.4 ms fall | ||
| The screen shows slow response rates in our tests and will be unsatisfactory for gamers. In comparison, all tested devices range from 0.165 (minimum) to 636 (maximum) ms. » 95 % of all devices are better. This means that the measured response time is worse than the average of all tested devices (31 ms). | ||
Our test device is easy to use outside thanks to its bright display. The display remained easy to read even in direct sunlight on a sunny day, and we had no issues with using the device under bright ambient light either.
The Mate 20 has stable viewing angles too thanks to its IPS display. We did notice a minor drop in brightness at acute viewing angles, but there were no colour or image distortions.

Performance
The Mate 20, like its more-expensive sibling, is powered by a HiSilicon Kirin 980 SoC. The SoC is the first 7 nm chip used in Android smartphones according to Huawei and has eight processor cores that are divided into three clusters. The most powerful are two Cortex A76 cores that clock up to 2.6 GHz, followed by two Cortex A76 cores that can reach up to 1.92 GHz. These four cores are supported by four power-efficient Cortex A53 cores that clock up to 1.8 GHz. The Kirin 980 also integrates an ARM Mali-G76 MP10 GPU and is complemented by 4 GB/6 GB LPDDR4x RAM, depending on the model.
Our test device performed on par with the Mate 20 Pro in synthetic benchmarks thanks to its identical SoC. The Mate 20 outscored most of our comparison devices in AnTuTu v7, 3DMark and PCMark. By contrast, its predecessor is on par with the LG V30, while our closest comparison devices are the HTC U12 Plus and the OnePlus 6T; these generally finished well behind the Mate 20 though.
| AnTuTu v7 - Total Score (sort by value) | |
| Huawei Mate 20 | |
| HTC U12 Plus | |
| Huawei Mate 20 Pro | |
| OnePlus 6T | |
| Xiaomi Mi 8 Explorer Edition | |
| Average HiSilicon Kirin 980 (268359 - 322616, n=10) | |
| AnTuTu v6 - Total Score (sort by value) | |
| Huawei Mate 20 | |
| HTC U12 Plus | |
| Huawei Mate 20 Pro | |
| Huawei Mate 10 | |
| LG V30 | |
| OnePlus 6T | |
| Xiaomi Mi 8 Explorer Edition | |
| Average HiSilicon Kirin 980 (245662 - 254229, n=9) | |
The Mate 20 expectedly outperformed all our comparison devices in browser benchmarks. The Mate 20 Pro outscores our test device by 2% in two of our five browser benchmarks, but the Mate 20 has a slight edge in Mozilla Kraken 1.1. Overall, there is no difference between the Mate 20 and Mate 20 Pro.
Our test device loaded websites quickly throughout testing too. Even complex websites like Google Interland loaded without issue and worked smoothly.
| JetStream 1.1 - 1.1 Total | |
| Huawei Mate 20 Pro (Chrome 69) | |
| Huawei Mate 20 (Chrome 70.0.3538.80) | |
| Average HiSilicon Kirin 980 (93.2 - 109.9, n=9) | |
| HTC U12 Plus (Chrome 66) | |
| OnePlus 6T (Chrome 70) | |
| Xiaomi Mi 8 Explorer Edition (Chrome 69) | |
| Huawei Mate 10 (Chrome Version 63) | |
| LG V30 (Chrome 62) | |
| Octane V2 - Total Score | |
| Average of class Smartphone (2800 - 126661, n=142, last 2 years) | |
| Huawei Mate 20 Pro (Chrome 69) | |
| Huawei Mate 20 (Chrome 70.0.3538.80) | |
| Average HiSilicon Kirin 980 (20618 - 23285, n=10) | |
| OnePlus 6T (Chrome 70) | |
| HTC U12 Plus (Chrome 66) | |
| Xiaomi Mi 8 Explorer Edition (Chrome 69) | |
| Huawei Mate 10 (Chrome Version 63) | |
| LG V30 (Chrome 62) | |
| Mozilla Kraken 1.1 - Total | |
| Huawei Mate 10 (Chrome Version 63) | |
| LG V30 (Chrome 62) | |
| HTC U12 Plus (Chrome 66) | |
| Xiaomi Mi 8 Explorer Edition (Chrome 69) | |
| OnePlus 6T (Chrome 70) | |
| Average HiSilicon Kirin 980 (1948 - 3098, n=10) | |
| Huawei Mate 20 Pro (Chrome 69) | |
| Huawei Mate 20 (Chrome 70.0.3538.80) | |
| Average of class Smartphone (257 - 28190, n=121, last 2 years) | |
| WebXPRT 3 - Overall | |
| Average of class Smartphone (104 - 380, n=12, last 2 years) | |
| Huawei Mate 20 (Chrome 70.0.3538.80) | |
| Huawei Mate 20 Pro (Chrome 69) | |
| Average HiSilicon Kirin 980 (86 - 124, n=10) | |
| HTC U12 Plus (Chrome 66) | |
| WebXPRT 2015 - Overall | |
| Huawei Mate 20 Pro (Chrome 69) | |
| Huawei Mate 20 (Chrome 70.0.3538.80) | |
| Average HiSilicon Kirin 980 (228 - 334, n=5) | |
| OnePlus 6T (Chrome 70) | |
| HTC U12 Plus (Chrome 66) | |
| Xiaomi Mi 8 Explorer Edition (Chrome 69) | |
| Huawei Mate 10 (Chrome Version 63) | |
| LG V30 (Chrome 62) | |
* ... smaller is better
Our test device has 128 GB of UFS 2.1 flash storage, which AndroBench 3-5 demonstrates is the same module Huawei used in the Mate 20 Pro. The Mate 20 has faster internal storage overall than our other comparison devices, although the Mate 10, OnePlus 6T and Mi 8 Explorer Edition achieved slightly faster sequential write 256 KB transfer speeds.
The NM card reader is as fast as the one in the Mate 20 Pro too. However, they offer no real speed increases over microSD cards. The Mate 20 and Mate 20 Pro averaged higher sequential write speeds than our comparison devices, but the HTC U12 Plus has a marginally faster sequential read speed.
| Huawei Mate 20 | HTC U12 Plus | Huawei Mate 20 Pro | Huawei Mate 10 | LG V30 | OnePlus 6T | Xiaomi Mi 8 Explorer Edition | Average 128 GB UFS 2.1 Flash | Average of class Smartphone | |
|---|---|---|---|---|---|---|---|---|---|
| AndroBench 3-5 | -14% | 0% | -8% | -38% | -27% | -29% | -0% | 314% | |
| Sequential Read 256KB (MB/s) | 840 | 709 -16% | 853 2% | 790 -6% | 669 -20% | 735 -12% | 692 -18% | 762 ? -9% | 2225 ? 165% |
| Sequential Write 256KB (MB/s) | 196.7 | 195.8 0% | 196.4 0% | 201.7 3% | 193.2 -2% | 204.4 4% | 205.2 4% | 300 ? 53% | 1903 ? 867% |
| Random Read 4KB (MB/s) | 157.9 | 118.1 -25% | 157.4 0% | 169.7 7% | 78.2 -50% | 138.5 -12% | 135.2 -14% | 154.7 ? -2% | 311 ? 97% |
| Random Write 4KB (MB/s) | 158.1 | 104.2 -34% | 157.8 0% | 105.3 -33% | 10.21 -94% | 22 -86% | 22.65 -86% | 131.1 ? -17% | 358 ? 126% |
| Sequential Read 256KB SDCard (MB/s) | 83.2 ? | 84.3 ? 1% | 83.2 ? 0% | 80.6 ? -3% | 62.8 -25% | 76 ? -9% | |||
| Sequential Write 256KB SDCard (MB/s) | 72.3 ? | 63.6 ? -12% | 72.4 ? 0% | 62.9 ? -13% | 47.2 -35% | 59.6 ? -18% |
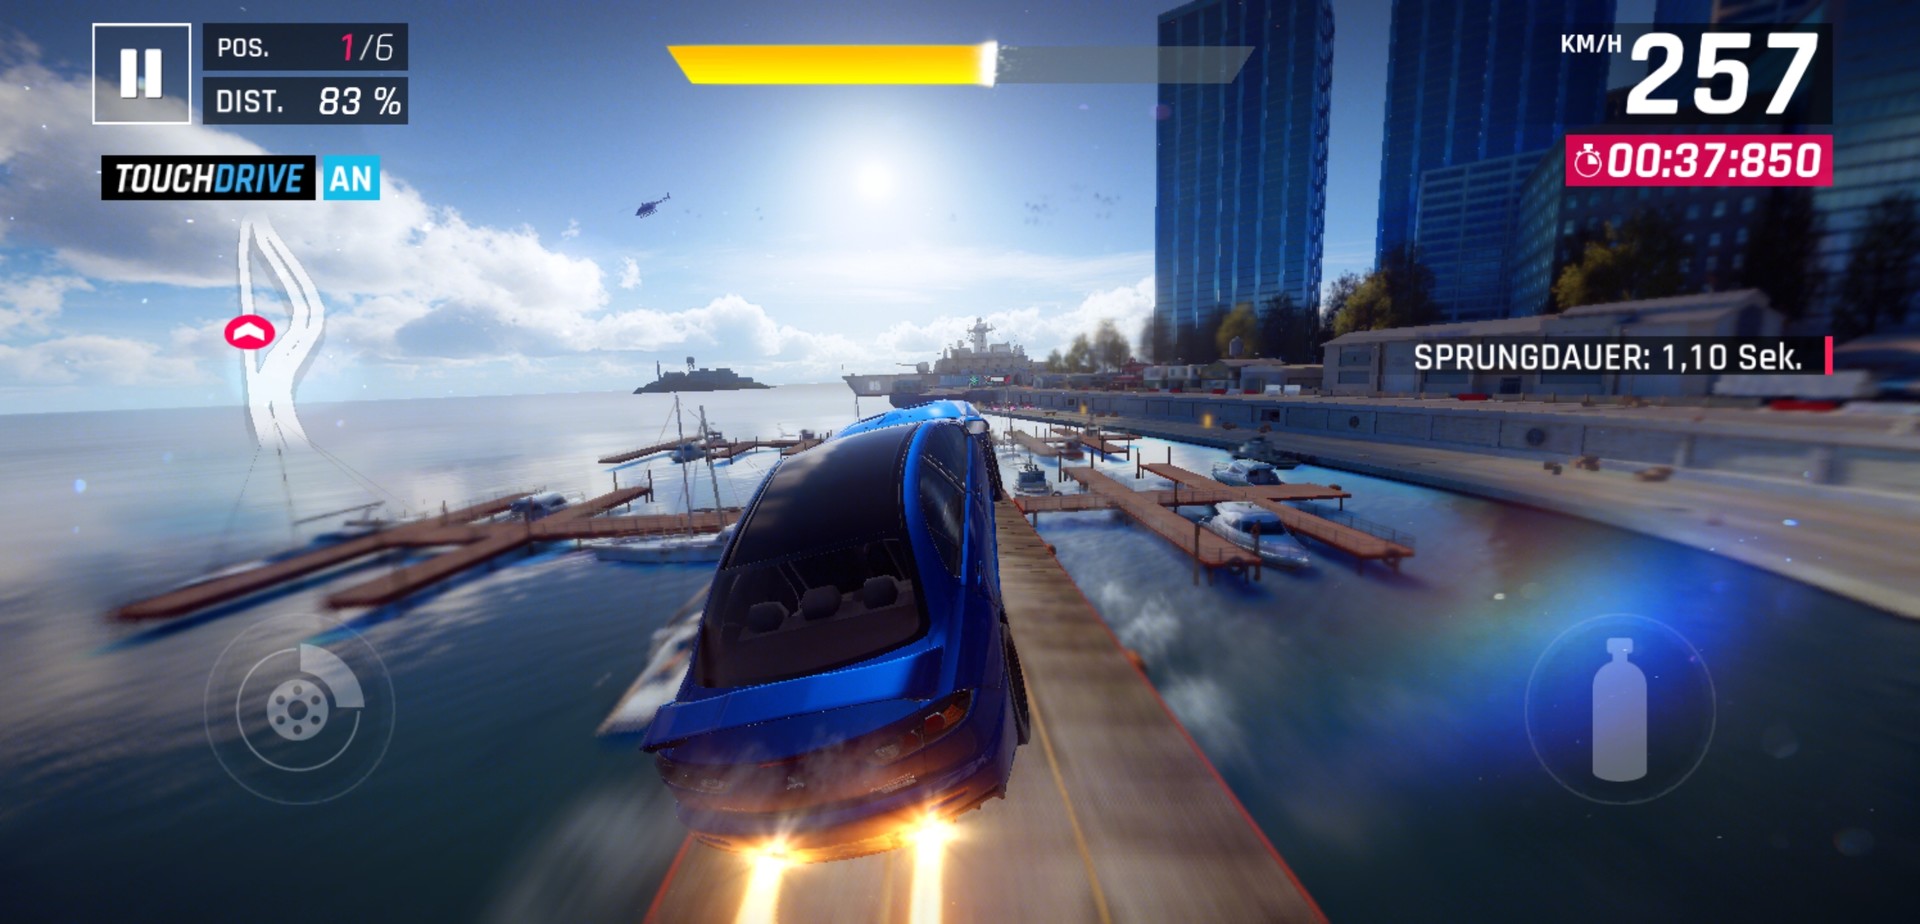
Games
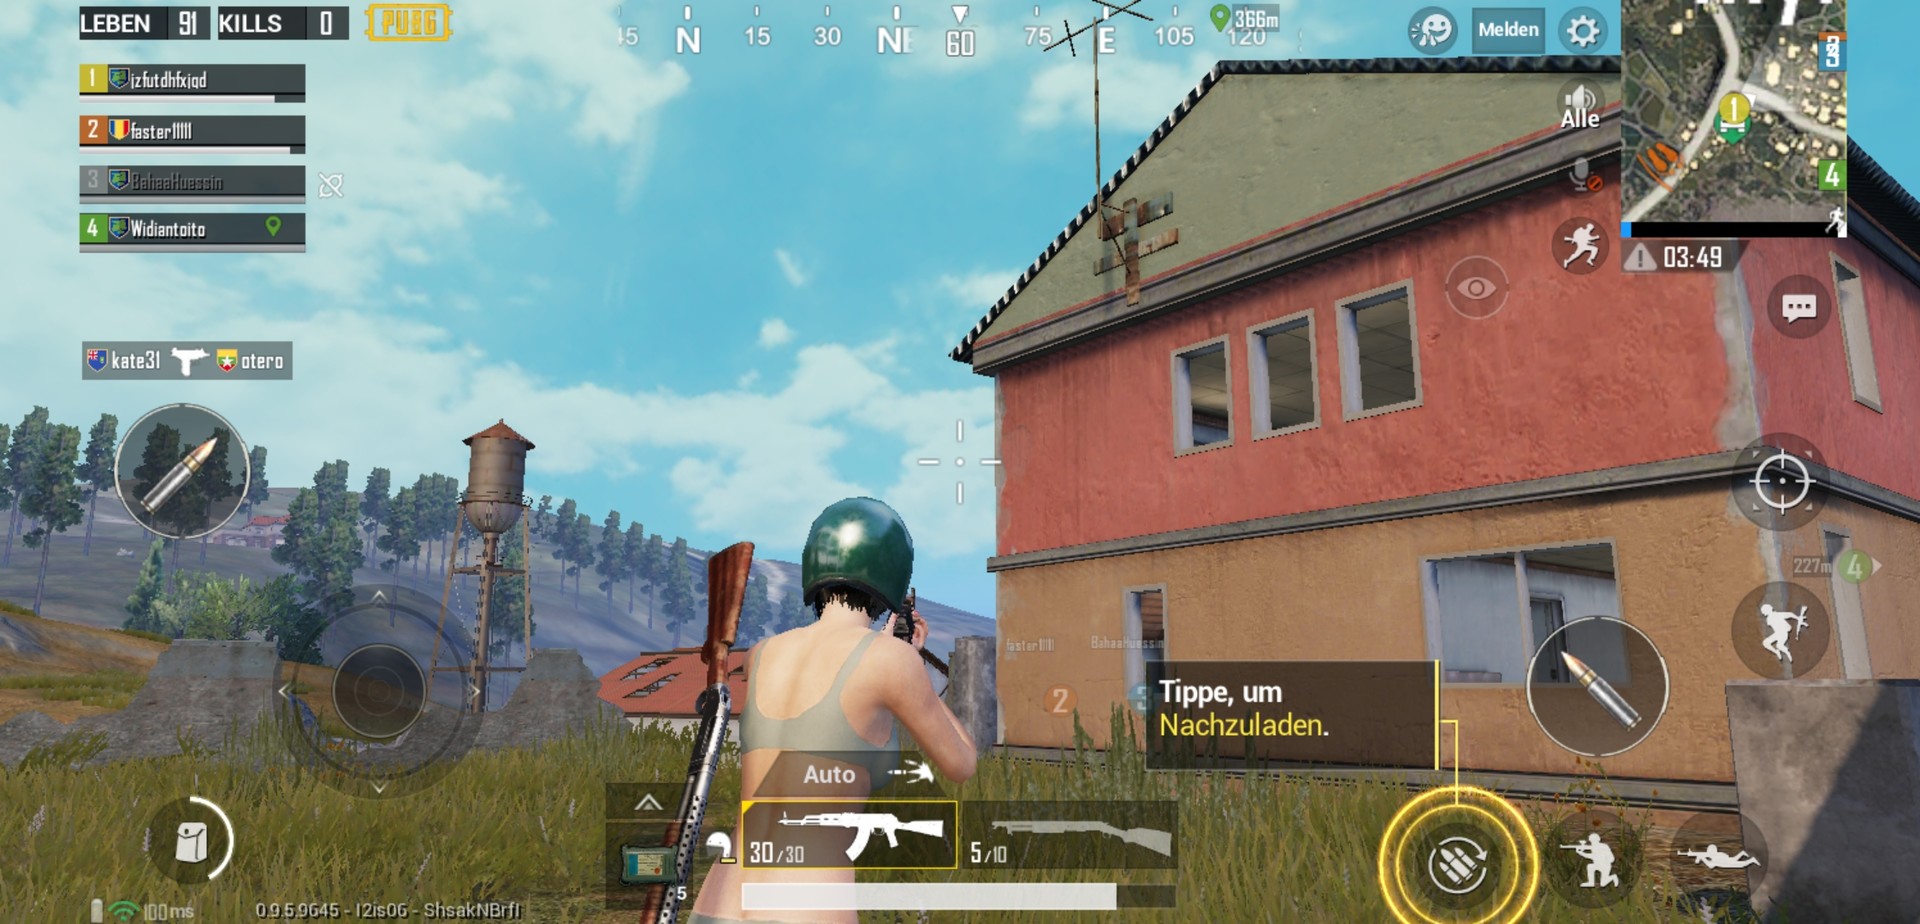
The Mate 20 is an excellent gaming smartphone thanks to its powerful hardware. Complex games like PUBG Mobile and Asphalt 9: Legends run smoothly even at high graphics, which we confirmed with GameBench. Both games are capped at 30 FPS for some reason, but our performance graphs indicate that the Mate 20 could probably achieve higher frame rates if these caps were lifted.
The positional sensor and touchscreen worked perfectly throughout our games testing. The front-firing speakers are difficult to obscure too and create a good atmosphere while gaming.
Asphalt 9: Legends
PUBG Mobile
Emissions
Temperature

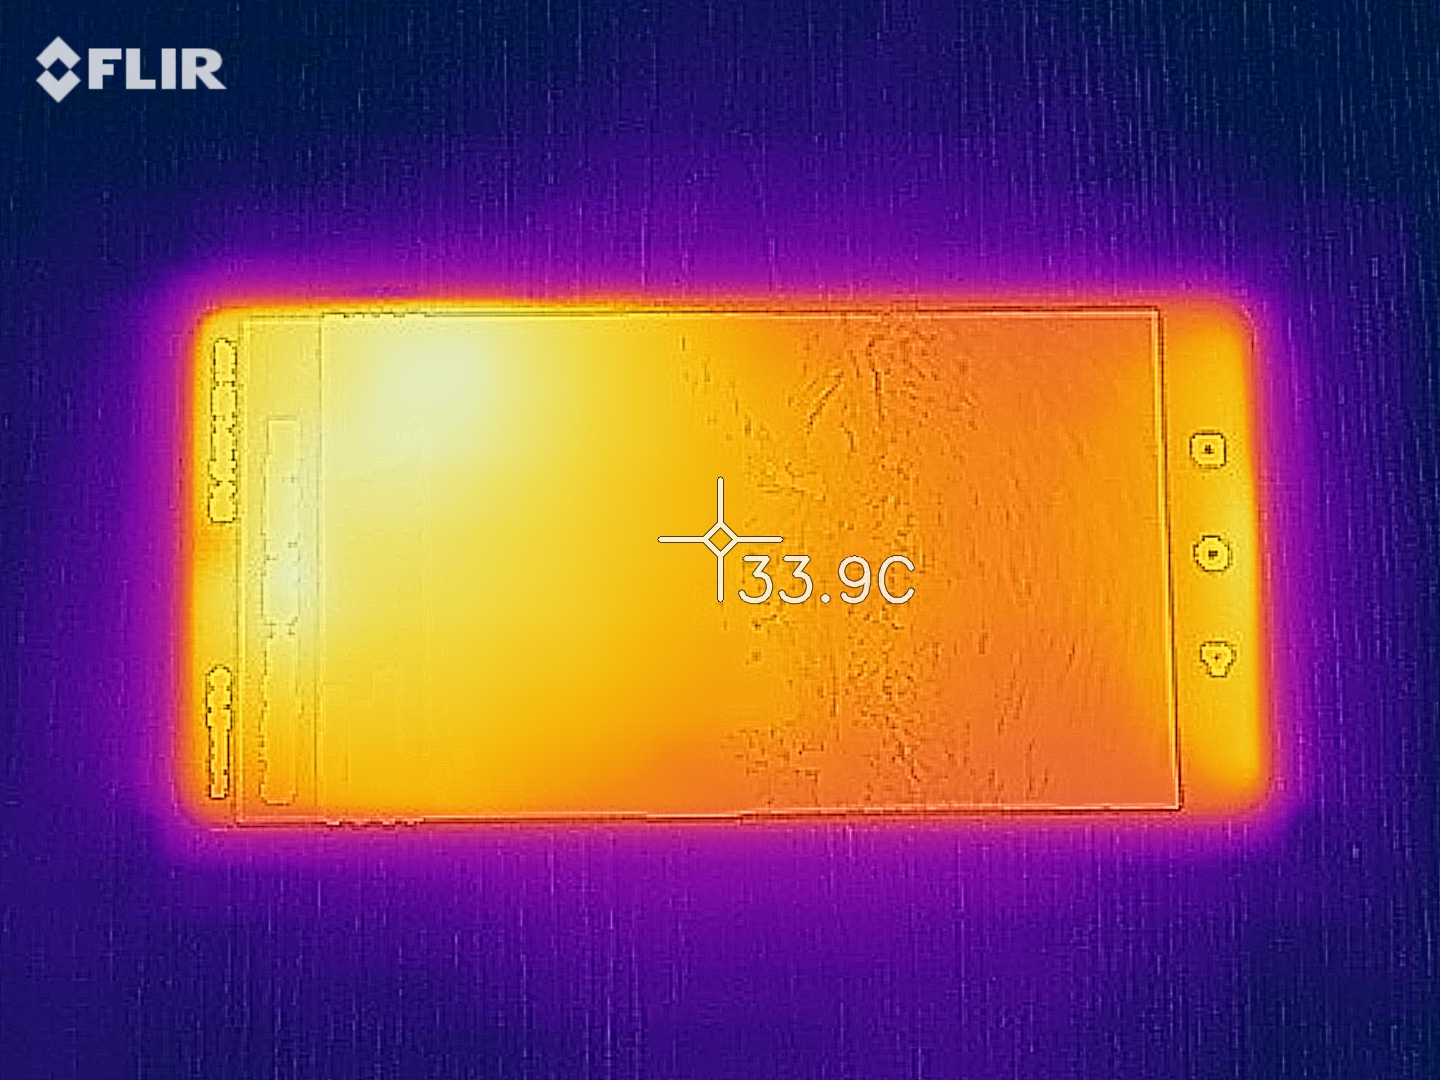
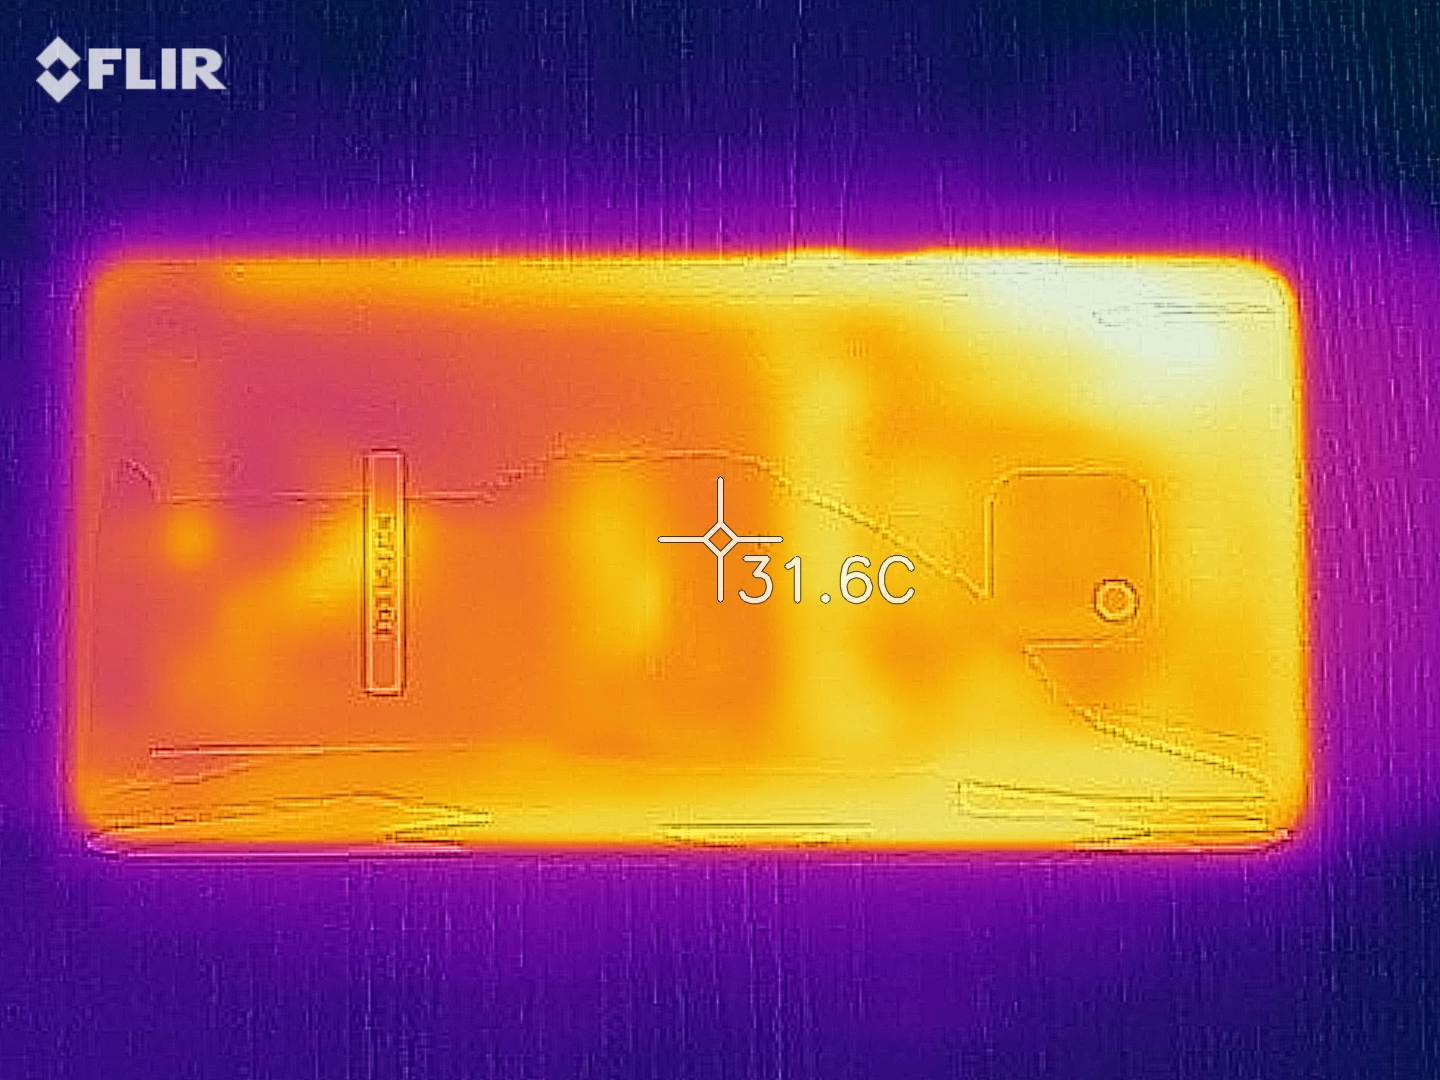
The Mate 20 feels pleasantly cool when it is idling. The bottom of the display can reach a rather warm 34.7 °C. Overall, surface temperatures average around 31 °C at idle, which is acceptable. Our test device manages its surfaces temperatures well under sustained load too. The device reached a maximum of 37.3 °C during a stress test even with performance mode activated, which is comparatively lukewarm.
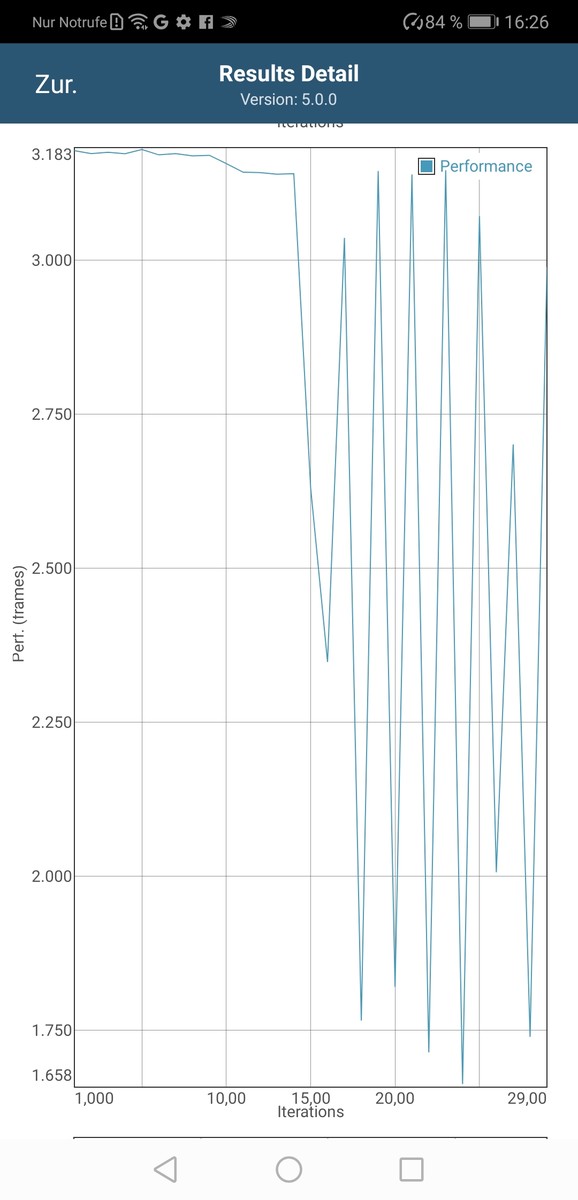
We also subjected the Mate 20 to a looped GFXBench Battery test to determine how well it manages its performance under sustained load. We measured average frame rates for each benchmark and changes in battery levels. Our test device handled the T-Rex benchmark with ease, but frame rates varied wildly after the 14th loop of the more complex Manhattan benchmark. Overall, the Mate 20 should not thermal throttle in daily use even if you push the device hard.
(+) The maximum temperature on the upper side is 37.3 °C / 99 F, compared to the average of 35.3 °C / 96 F, ranging from 21.9 to 247 °C for the class Smartphone.
(+) The bottom heats up to a maximum of 36.4 °C / 98 F, compared to the average of 34 °C / 93 F
(±) In idle usage, the average temperature for the upper side is 32.3 °C / 90 F, compared to the device average of 33 °C / 91 F.
Speakers
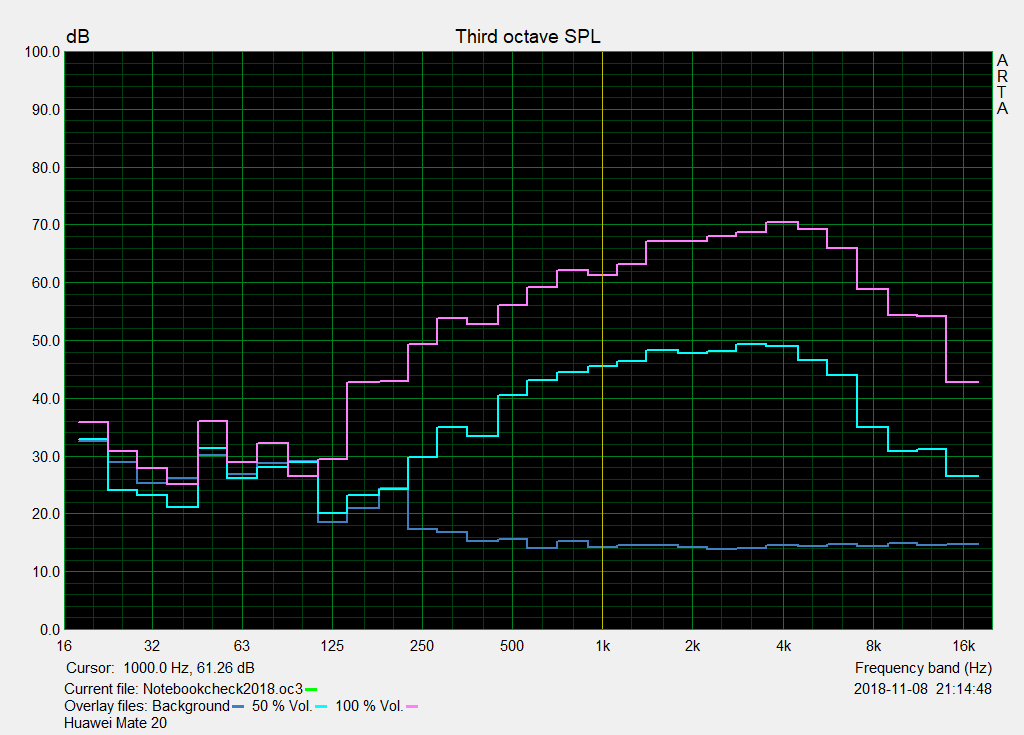
The Mate 20 has stereo front-firing speakers that reached a maximum of 78.4 dB(A) in our tests. The speakers lack bass tones, which is a common failing for smartphone speakers. However, the speakers reproduce detailed-sounding audio with balanced mid tones and treble.
Huawei has included a headphone jack, which is a rarity for flagship smartphones released in 2018 and is something that the Mate 20 Pro lacks. The Mate 20 can connect to external speakers or headphones with up to Bluetooth 5.0 too and can utilise aptX, aptX HD, LDAC or SBC.
Huawei Mate 20 audio analysis
(±) | speaker loudness is average but good (78.4 dB)
Bass 100 - 315 Hz
(-) | nearly no bass - on average 18.1% lower than median
(±) | linearity of bass is average (12.5% delta to prev. frequency)
Mids 400 - 2000 Hz
(+) | balanced mids - only 4.5% away from median
(+) | mids are linear (4.8% delta to prev. frequency)
Highs 2 - 16 kHz
(±) | higher highs - on average 7.5% higher than median
(+) | highs are linear (6.2% delta to prev. frequency)
Overall 100 - 16.000 Hz
(±) | linearity of overall sound is average (23.2% difference to median)
Compared to same class
» 53% of all tested devices in this class were better, 7% similar, 40% worse
» The best had a delta of 11%, average was 34%, worst was 134%
Compared to all devices tested
» 70% of all tested devices were better, 5% similar, 25% worse
» The best had a delta of 4%, average was 23%, worst was 134%
Huawei Mate 20 Pro audio analysis
(±) | speaker loudness is average but good (77.7 dB)
Bass 100 - 315 Hz
(±) | reduced bass - on average 14.2% lower than median
(±) | linearity of bass is average (12.4% delta to prev. frequency)
Mids 400 - 2000 Hz
(±) | higher mids - on average 6.7% higher than median
(+) | mids are linear (5.5% delta to prev. frequency)
Highs 2 - 16 kHz
(±) | higher highs - on average 7.3% higher than median
(+) | highs are linear (6.7% delta to prev. frequency)
Overall 100 - 16.000 Hz
(±) | linearity of overall sound is average (22.9% difference to median)
Compared to same class
» 51% of all tested devices in this class were better, 7% similar, 42% worse
» The best had a delta of 11%, average was 34%, worst was 134%
Compared to all devices tested
» 68% of all tested devices were better, 6% similar, 26% worse
» The best had a delta of 4%, average was 23%, worst was 134%
Battery Life
Power Consumption
The Mate 20 is a surprisingly consumptive device. Our test device consumes an average of 4% more than the Mate 20 Pro and a maximum of 28% more under load. The Mate 20’s 0.69 W minimum consumption at idle is lower than all our comparison devices, but it consumes more on average at idle and under load except for the Mi 8 Explorer Edition. The latter comparison device is the outlier in our comparison table though. Overall, the Mate 20 finishes in the middle of our comparison table, significantly behind the LG V30 and the OnePlus 6T.
We were surprised at the efficiency of the 22.5 W charger. We had expected the Mate 20 to charge noticeably slower than the Mate 20 Pro does with its 40 W charger, but the former’s charging speed pleasantly surprised us. Our test device took around 30 minutes to reach 50% charge, which should be long enough for a full workday’s use. The 22.5 W charger took another 10 minutes to recharge our test device by a further 15/16% and finally finished charging after around 90 minutes. Please keep in mind that the Mate 20 can only be charged via its USB Type-C port. There is no support for wireless charging.
| Off / Standby | |
| Idle | |
| Load |
|
Key:
min: | |
| Huawei Mate 20 4000 mAh | HTC U12 Plus 3500 mAh | Huawei Mate 20 Pro 4200 mAh | Huawei Mate 10 4000 mAh | LG V30 3300 mAh | OnePlus 6T 3700 mAh | Xiaomi Mi 8 Explorer Edition 3000 mAh | Average HiSilicon Kirin 980 | Average of class Smartphone | |
|---|---|---|---|---|---|---|---|---|---|
| Power Consumption | -7% | 4% | -5% | 24% | 18% | -50% | 4% | -4% | |
| Idle Minimum * (Watt) | 0.69 | 0.77 -12% | 0.95 -38% | 0.89 -29% | 0.72 -4% | 0.7 -1% | 1.8 -161% | 0.802 ? -16% | 0.887 ? -29% |
| Idle Average * (Watt) | 2.28 | 2.18 4% | 2.17 5% | 2.31 -1% | 1.37 40% | 1.1 52% | 2.9 -27% | 2.07 ? 9% | 1.485 ? 35% |
| Idle Maximum * (Watt) | 2.52 | 2.21 12% | 2.25 11% | 2.38 6% | 1.41 44% | 2.1 17% | 3.5 -39% | 2.37 ? 6% | 1.672 ? 34% |
| Load Average * (Watt) | 5.21 | 6.25 -20% | 4.47 14% | 4.87 7% | 3.46 34% | 4.2 19% | 4.8 8% | 4.87 ? 7% | 6.76 ? -30% |
| Load Maximum * (Watt) | 8.49 | 10.16 -20% | 6.15 28% | 9.16 -8% | 7.83 8% | 8.3 2% | 11.2 -32% | 7.46 ? 12% | 11.2 ? -32% |
* ... smaller is better
Battery Life
The Mate 20 has a 4,000 mAh battery, the longevity of which exceeded our expectations. The Mate 20 Pro averaged around 10% shorter runtimes than our test device even with its 200 mAh larger battery. It should be noted that the Mate 20 Pro has a higher resolution display that presumably has a higher cost to battery life than the one in the Mate 20.
Our test device lasted an impressively long 14:45 hours in our Wi-Fi battery life test and 17:10 hours in our H.264 looped video battery life test. These runtimes exceed anything that our comparison devices can achieve. The Mate 20 is only beaten by the LG V30 and OnePlus 6T in our battery life at idle test, underlining how good the Mate 20’s battery life is. In short, our test device has longer battery life than all our comparison devices and should comfortably last most people a full workday of mixed use.
It is worth noting that we conducted all our battery life tests with our test device set to performance mode. Therefore, the Mate 20 could achieve even longer runtimes if that mode was disabled. Equally, the ‘power-saving’ and ‘ultra power-saving’ modes could help to further extend battery life too.
| Huawei Mate 20 4000 mAh | HTC U12 Plus 3500 mAh | Huawei Mate 20 Pro 4200 mAh | Huawei Mate 10 4000 mAh | LG V30 3300 mAh | OnePlus 6T 3700 mAh | Xiaomi Mi 8 Explorer Edition 3000 mAh | |
|---|---|---|---|---|---|---|---|
| Battery runtime | -36% | -10% | -7% | -10% | -5% | -23% | |
| Reader / Idle (h) | 31.5 | 24.2 -23% | 29.1 -8% | 27.9 -11% | 31.9 1% | 32.3 3% | 23.4 -26% |
| H.264 (h) | 17.2 | 7.7 -55% | 14.2 -17% | 16.7 -3% | 13.7 -20% | 15.1 -12% | 15.4 -10% |
| WiFi v1.3 (h) | 14.8 | 8.5 -43% | 12.8 -14% | 14.4 -3% | 12.9 -13% | 14.4 -3% | 11.6 -22% |
| Load (h) | 4.8 | 3.8 -21% | 4.7 -2% | 4.3 -10% | 4.5 -6% | 4.4 -8% | 3.2 -33% |
Pros
Cons
Verdict

The Huawei Mate 20 is a premium flagship just like its more-expensive sibling, the Mate 20 Pro. Huawei has equipped the Mate 20 with its Kirin 980 SoC, which makes the device as powerful as the Pro model. Moreover, the former’s lower resolution display helps it achieve outstanding battery life, while the inclusion of a headphone jack is a welcome bonus. The Mate 20 lacks some of the Mate 20 Pro’s fancy features though like its 3D face scanning, in-screen fingerprint sensor or wireless charging, which may frustrate some people.
The Huawei Mate 20 is a fantastic smartphone, but one which forgoes some of the Mate 20 Pro’s premium features. The 200-Euro (~$225) saving is worth it in our opinion though.
Moreover, the Mate 20 uses an inferior Leica triple camera array, which performs noticeably worse in low light. However, the cameras are still on par with the best of what other 2018 flagships offer. Nonetheless, it is a compromise. Likewise, Huawei has equipped the device with a flat LCD display compared to the curved OLED panel in the Mate 20 Pro. Finally, the device has an inferior IP rating, for which we can offer no explanation. IP53 is simply not good enough for an expensive flagship smartphone released in 2018, particularly when so many of its competitors are IP67/68-rated. Our concerns about the smaller power supply were unfounded though as the Mate 20 charges quickly. Overall, the Mate 20 is excellent value for money and a great alternative to the Mate 20 Pro, but the former lacks some of the latter's most talked about features.
Huawei Mate 20
- 11/27/2018 v6 (old)
Manuel Masiero
Price comparison

