Apple MacBook Air 2020 Review: Is the Core i3 the better choice?
After our recent review of the quad-core MacBook Air, we have a closer look at the entry-level SKU with the slower Core i3 processor. It only features two CPU cores and therefore reminds us a lot of the previous MacBook Air (MY 2019 and older). We are particularly interested in the emissions, because the fan noise turned out to be a problem during our review of the quad-core model.
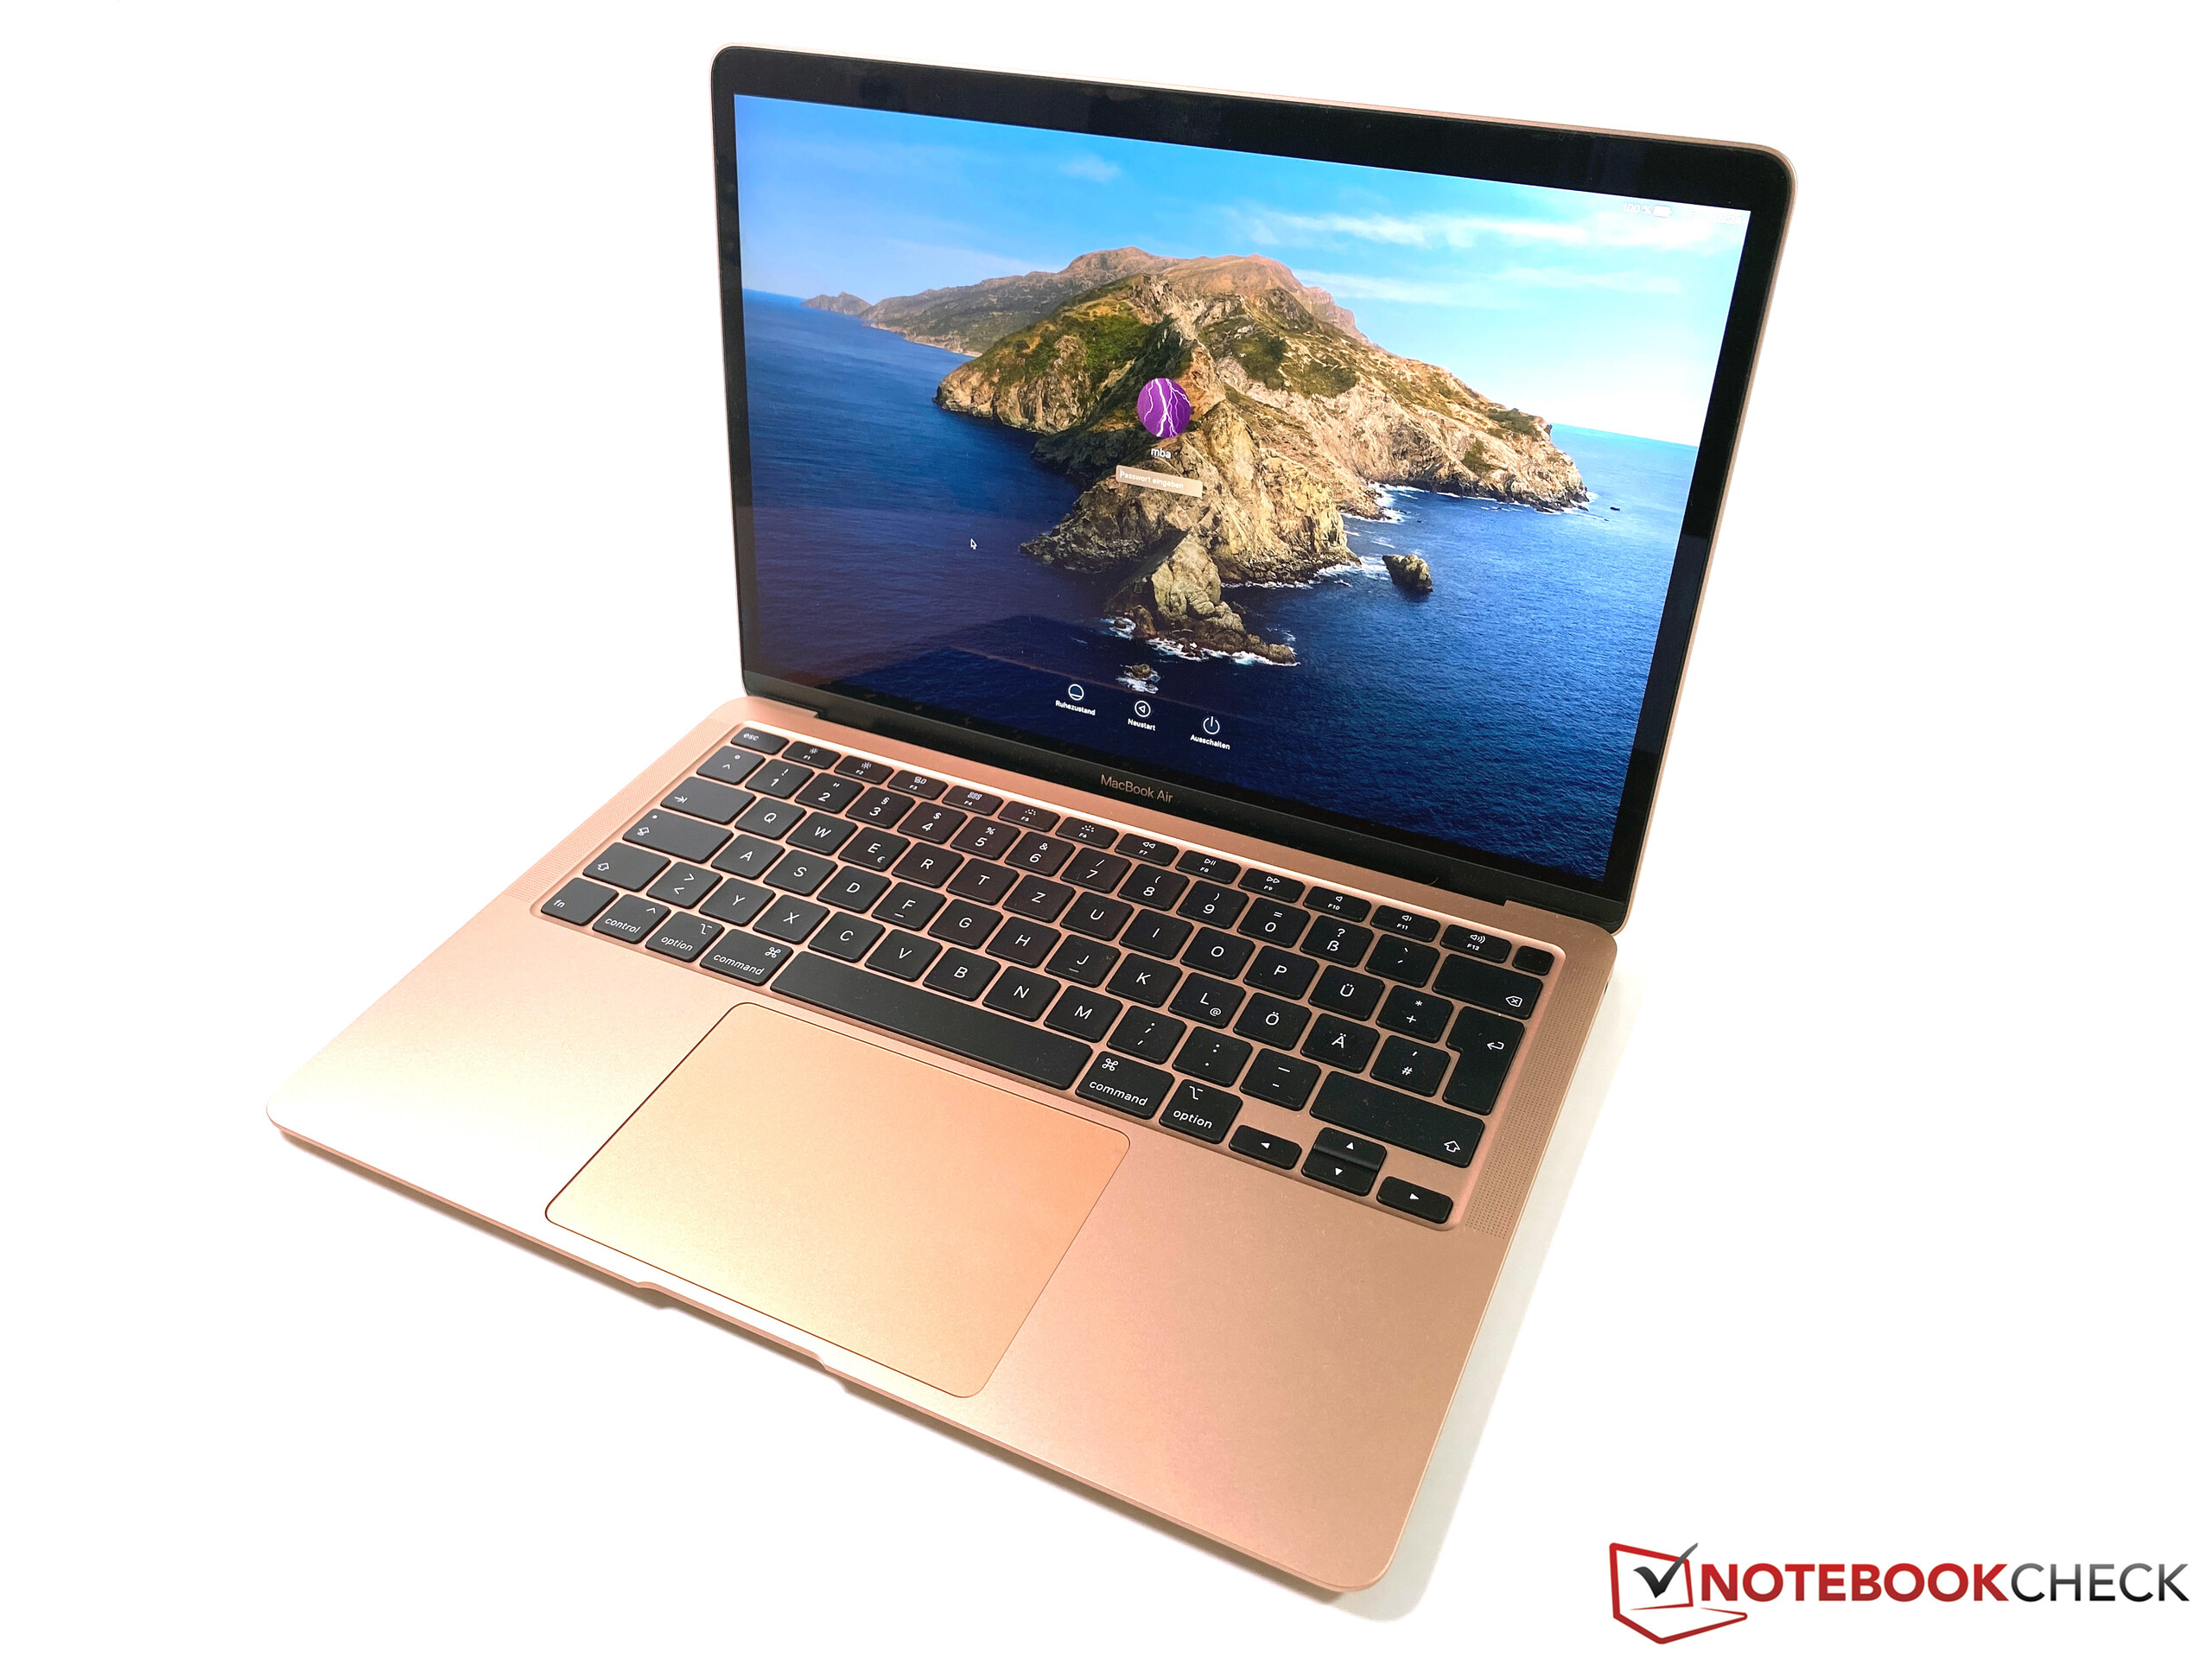
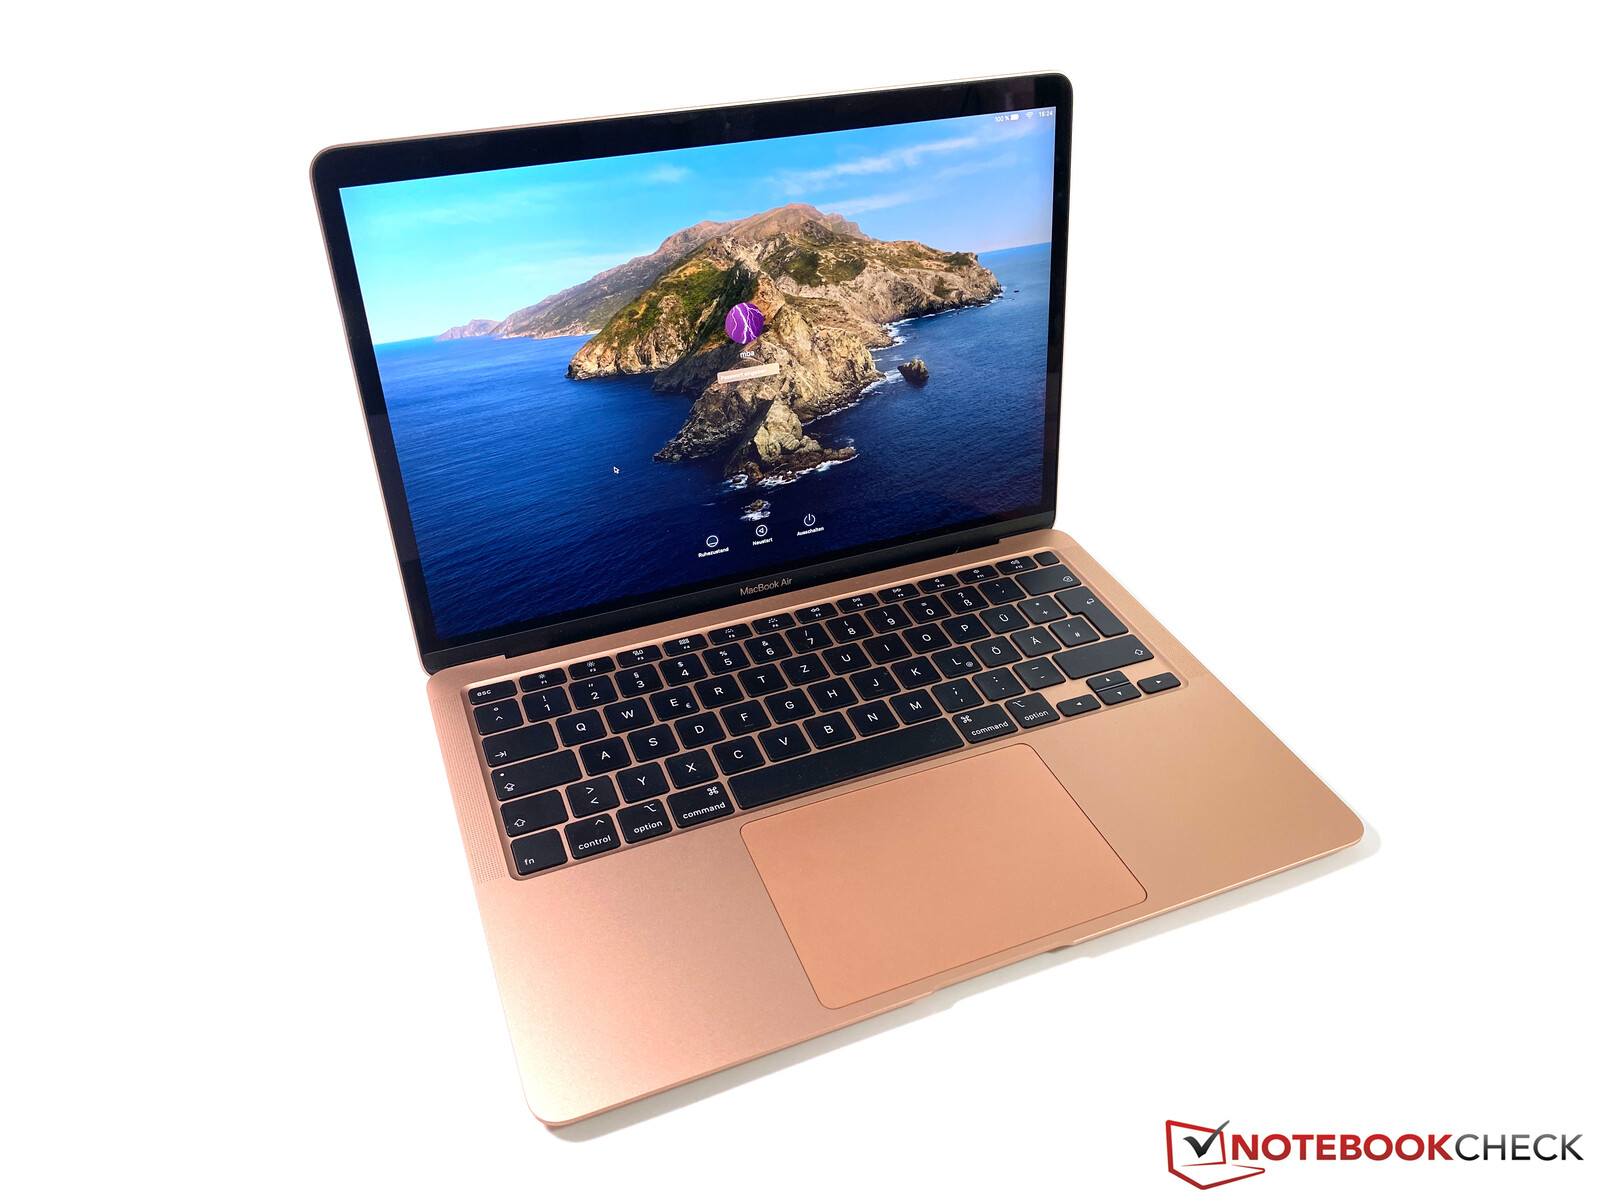
Our test unit in Gold is the entry-level spec for 1199 Euros (~$1298). In addition to the Core i3 processor, customers get 8 GB RAM and 256 GB SSD storage. You also get the updated keyboard (Magic Keyboard), which once again uses a more conventional scissor mechanism. There are no differences in terms of chassis, connectivity, or input devices compared to our last review unit, so please see our comprehensive review of the MacBook Air 2020 Core i5 for more information about these topics. We will focus on the performance of the entry-level processor and the emissions in this article.
Rating | Date | Model | Weight | Height | Size | Resolution | Price |
|---|---|---|---|---|---|---|---|
| 89.6 % v7 (old) | 05 / 2020 | Apple MacBook Air 2020 i3 i3-1000NG4, Iris Plus Graphics G4 (Ice Lake 48 EU) | 1.3 kg | 16.1 mm | 13.30" | 2560x1600 | |
| 88 % v7 (old) | 04 / 2020 | Apple MacBook Air 2020 i5 i5-1030NG7, Iris Plus Graphics G7 (Ice Lake 64 EU) | 1.3 kg | 16.1 mm | 13.30" | 2560x1600 | |
| 85.6 % v7 (old) | 01 / 2020 | Apple Macbook Air 2019 i5-8210Y, UHD Graphics 617 | 1.3 kg | 15.6 mm | 13.30" | 2560x1600 | |
| 88.8 % v7 (old) | 03 / 2020 | Dell XPS 13 9300 i5 FHD i5-1035G1, UHD Graphics G1 (Ice Lake 32 EU) | 1.2 kg | 14.8 mm | 13.40" | 1920x1200 | |
| 87 % v7 (old) | 02 / 2020 | Acer Swift 3 SF313-52-71Y7 i7-1065G7, Iris Plus Graphics G7 (Ice Lake 64 EU) | 1.2 kg | 16.6 mm | 13.50" | 2256x1504 | |
| 84 % v7 (old) | 02 / 2020 | Microsoft Surface Laptop 3 13 Core i5-1035G7 i5-1035G7, Iris Plus Graphics G7 (Ice Lake 64 EU) | 1.3 kg | 14.5 mm | 13.50" | 2256x1504 |
Display – Retina-Display is brighter when you use Windows
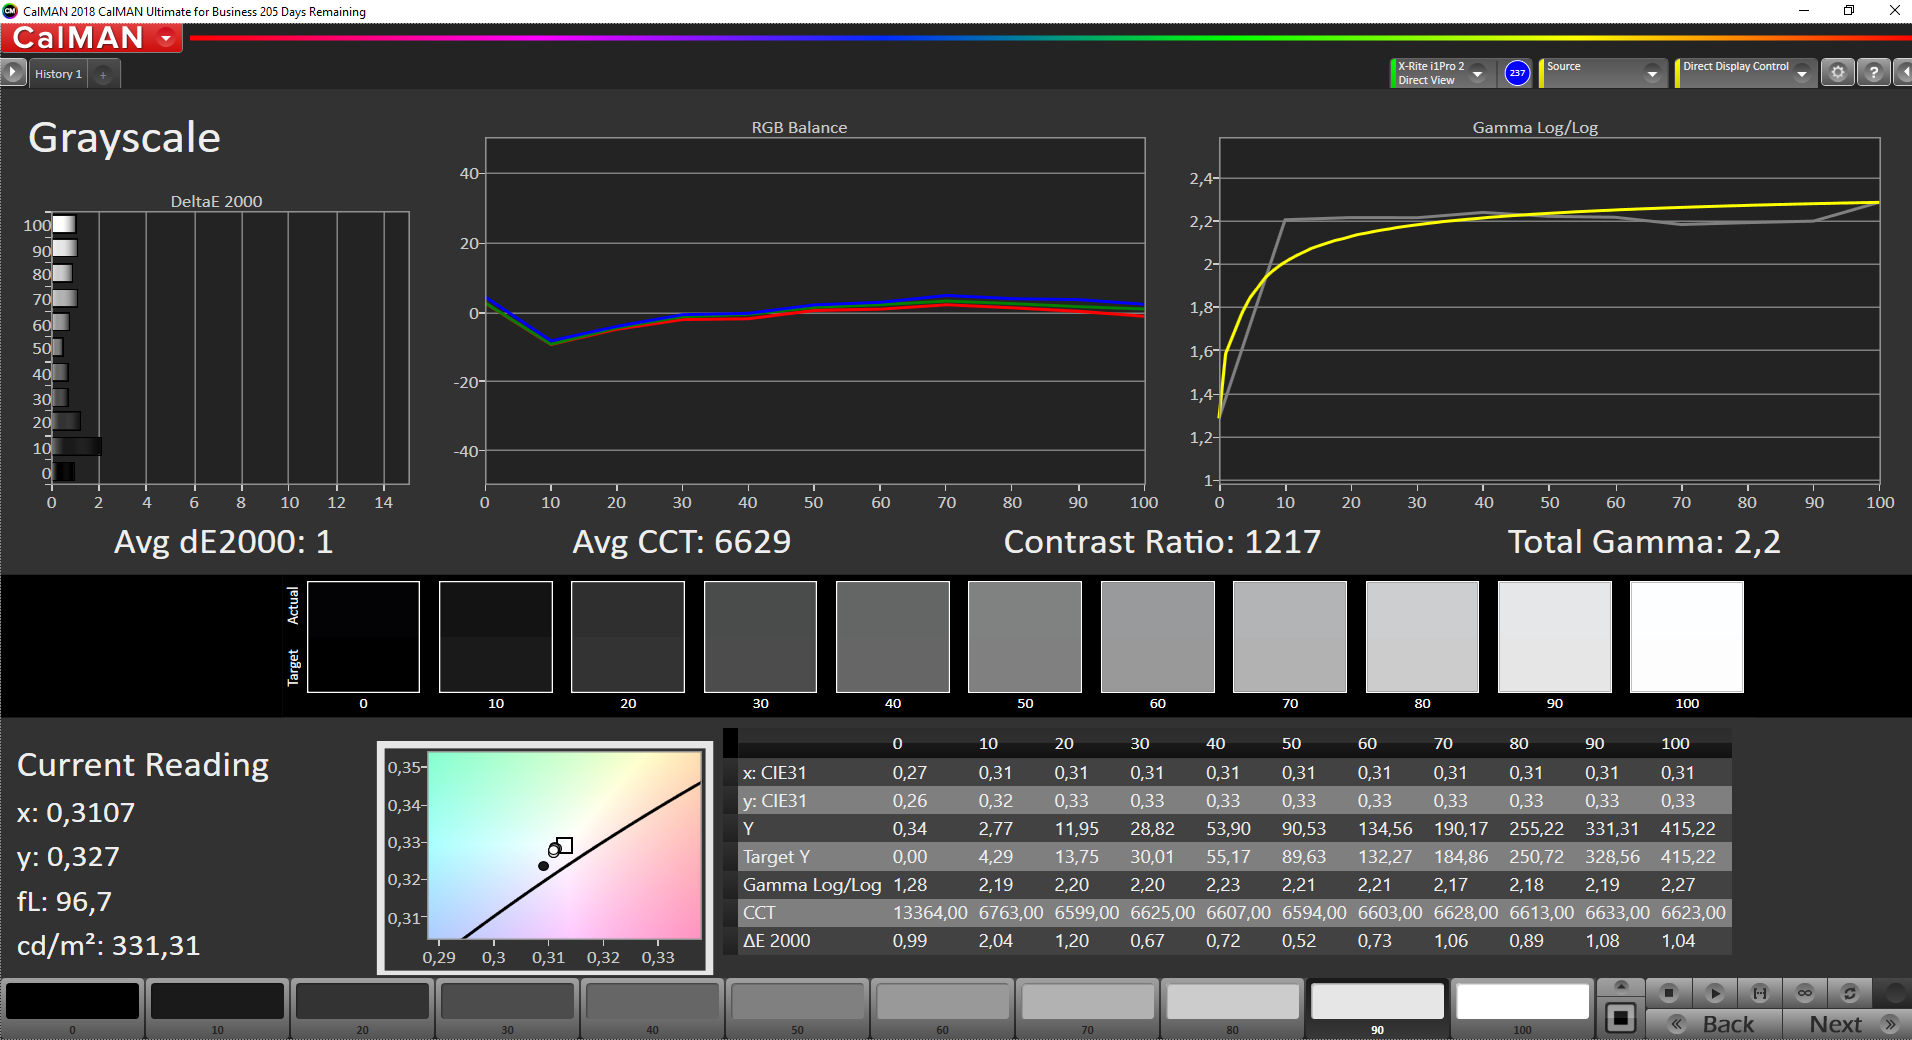
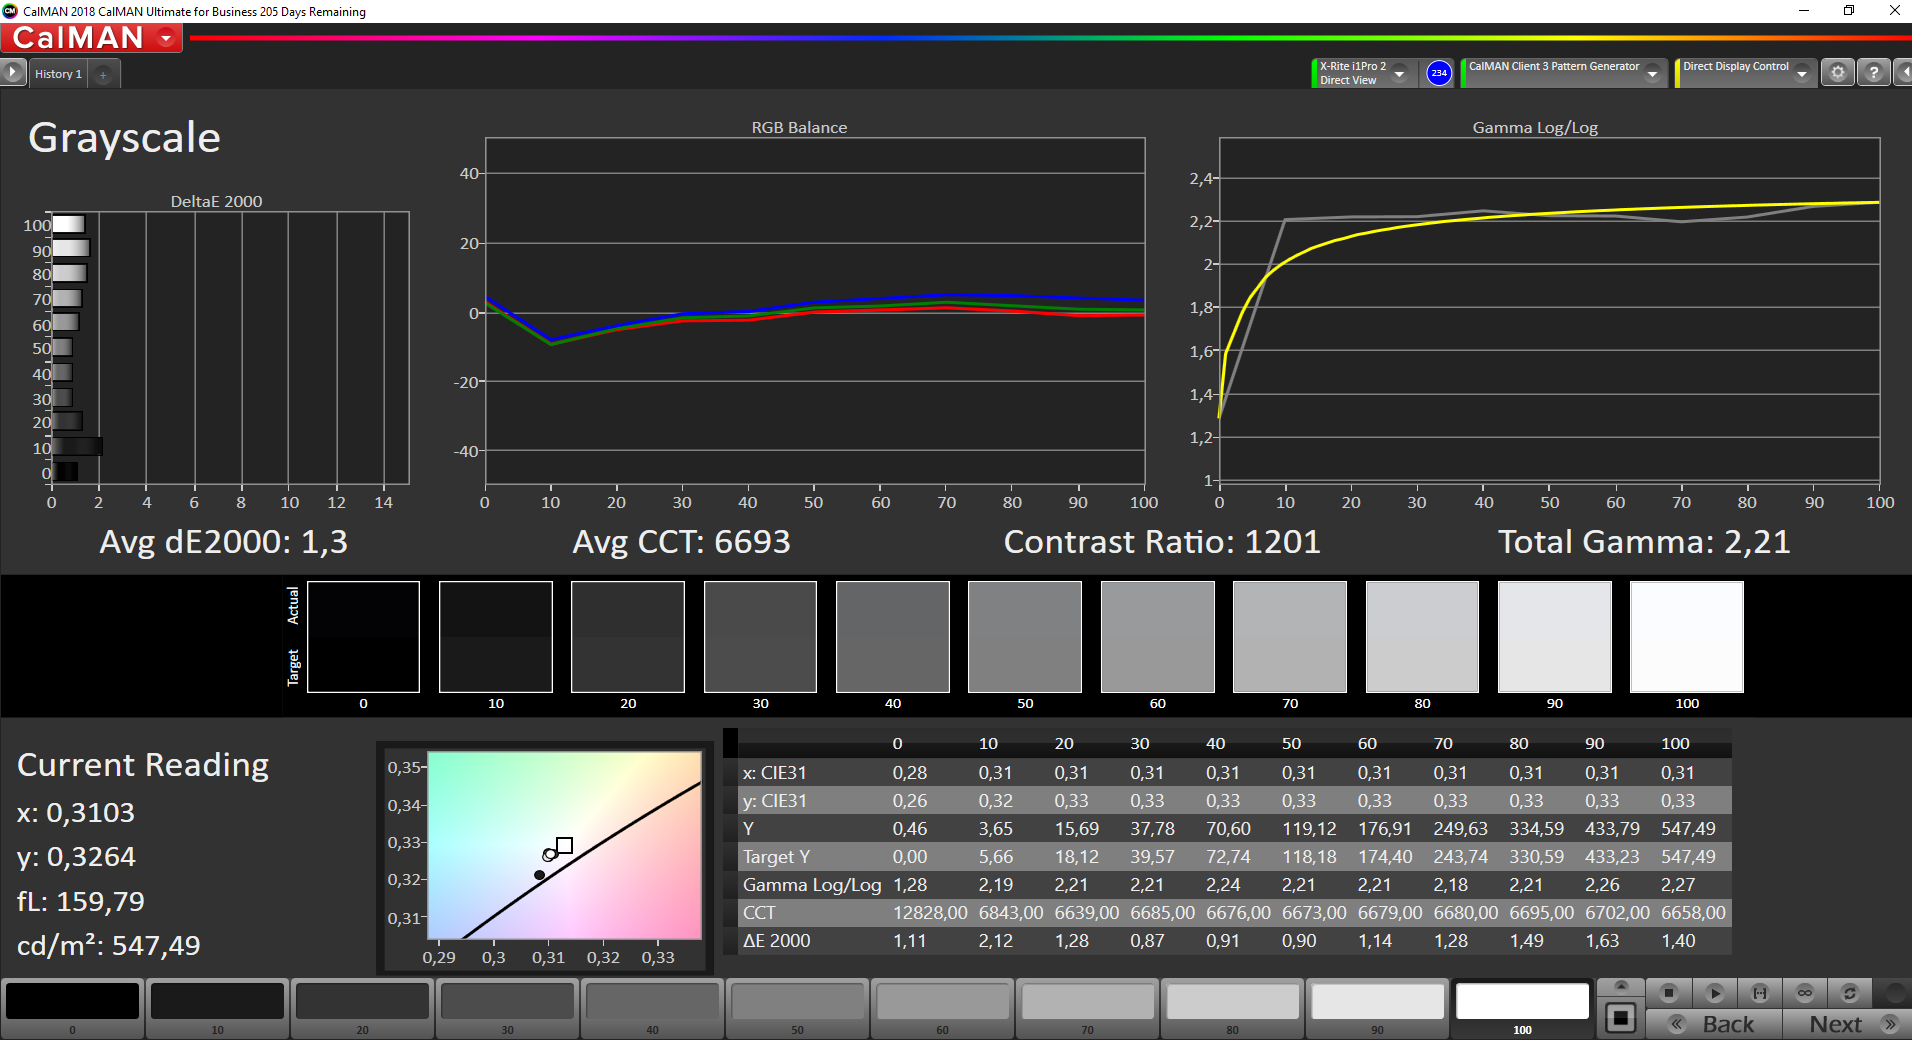
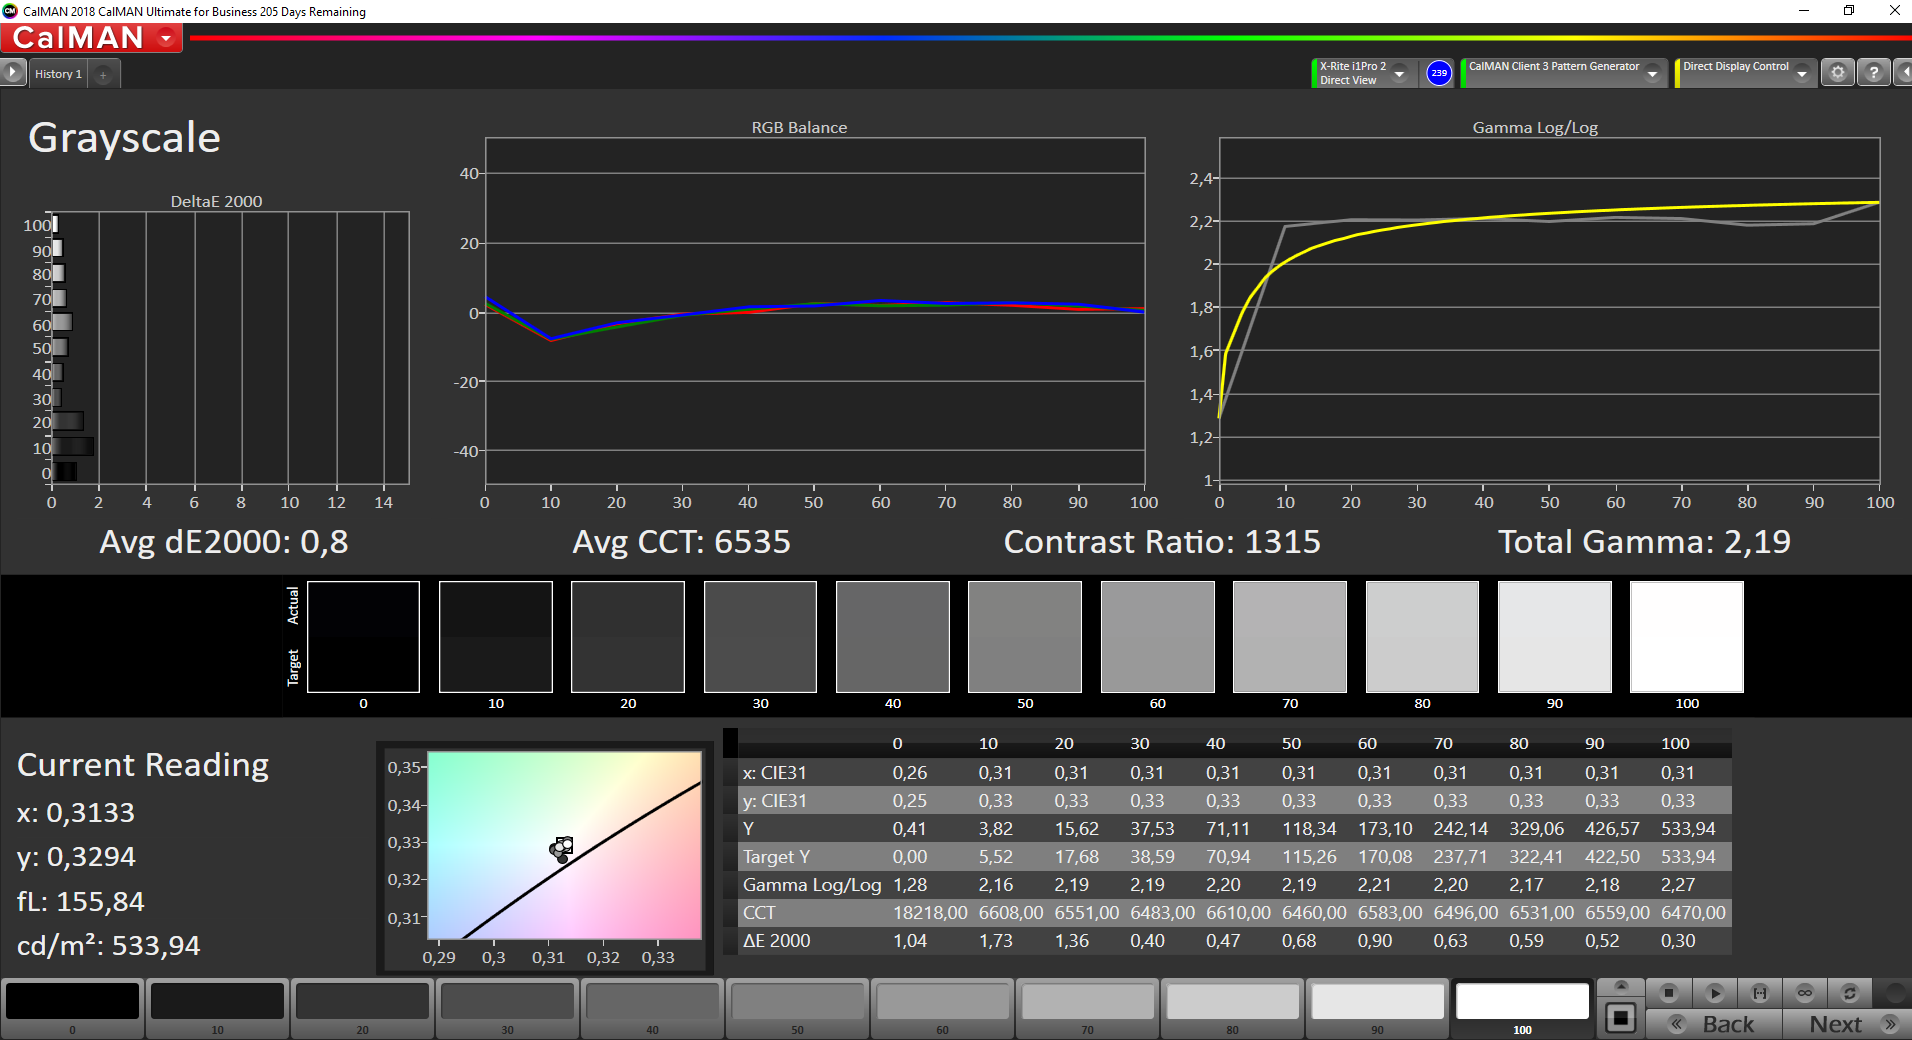
The display is very similar to the previous review unit. The panel ID is once again APPA042 and the resolution is 2560 x 1600 pixels. Subjectively, the picture impression is very good and the measurement results are almost identical to our last test model (only small deviations). The deviations are only determined by measuring devices, but not the naked eye. Our measurement results are okay at ~400 nits and a contrast ratio of more than 1200:1, but some Windows competitors manage much better results.
We can determine PWM flickering at a brightness of 75% or lower, but the frequency is extremely high at 119 kHz. Similar to the more expensive MacBook Pro models, the small MacBook Air supports True Tone (automatic adjustment of the color temperature based on the ambient lighting) as well as a brightness sensor.
| |||||||||||||||||||||||||
Brightness Distribution: 95 %
Center on Battery: 414 cd/m²
Contrast: 1224:1 (Black: 0.34 cd/m²)
ΔE ColorChecker Calman: 0.9 | ∀{0.5-29.43 Ø4.75}
calibrated: 0.6
ΔE Greyscale Calman: 1 | ∀{0.09-98 Ø5}
97.6% sRGB (Argyll 1.6.3 3D)
63.9% AdobeRGB 1998 (Argyll 1.6.3 3D)
71.6% AdobeRGB 1998 (Argyll 3D)
98% sRGB (Argyll 3D)
70.3% Display P3 (Argyll 3D)
Gamma: 2.2
CCT: 6629 K
| Apple MacBook Air 2020 i3 APPA042, IPS, 2560x1600, 13.3" | Apple MacBook Air 2020 i5 APPA042, IPS, 2560x1600, 13.3" | Apple Macbook Air 2019 APPA041, IPS, 2560x1600, 13.3" | Dell XPS 13 9300 i5 FHD SHP14CB, IPS, 1920x1200, 13.4" | Acer Swift 3 SF313-52-71Y7 BOE, NE135FBM-N41, IPS, 2256x1504, 13.5" | Microsoft Surface Laptop 3 13 Core i5-1035G7 Sharp LQ135P1JX51, IPS, 2256x1504, 13.5" | |
|---|---|---|---|---|---|---|
| Display | 0% | -3% | 2% | 0% | -4% | |
| Display P3 Coverage (%) | 70.3 | 70.4 0% | 67.4 -4% | 71.5 2% | 70.1 0% | 65.7 -7% |
| sRGB Coverage (%) | 98 | 97.7 0% | 94.7 -3% | 99.4 1% | 99.8 2% | 98.6 1% |
| AdobeRGB 1998 Coverage (%) | 71.6 | 71.7 0% | 69.1 -3% | 73.5 3% | 71.2 -1% | 67.8 -5% |
| Response Times | -4% | -7% | -37% | -26% | -50% | |
| Response Time Grey 50% / Grey 80% * (ms) | 38.4 ? | 38.7 ? -1% | 42.4 ? -10% | 60 ? -56% | 55 ? -43% | 59.2 ? -54% |
| Response Time Black / White * (ms) | 28.4 ? | 30.44 ? -7% | 29.6 ? -4% | 33.2 ? -17% | 31 ? -9% | 41.6 ? -46% |
| PWM Frequency (Hz) | 119000 ? | 117000 ? | 111100 ? | 2500 ? | 208 ? | 21740 ? |
| Screen | -45% | -27% | -97% | -95% | -17% | |
| Brightness middle (cd/m²) | 416 | 430 3% | 421 1% | 619 49% | 474 14% | 403.4 -3% |
| Brightness (cd/m²) | 403 | 405 0% | 393 -2% | 591 47% | 426 6% | 397 -1% |
| Brightness Distribution (%) | 95 | 89 -6% | 88 -7% | 91 -4% | 82 -14% | 89 -6% |
| Black Level * (cd/m²) | 0.34 | 0.32 6% | 0.34 -0% | 0.35 -3% | 0.29 15% | 0.34 -0% |
| Contrast (:1) | 1224 | 1344 10% | 1238 1% | 1769 45% | 1634 33% | 1186 -3% |
| Colorchecker dE 2000 * | 0.9 | 1.8 -100% | 1.5 -67% | 3 -233% | 2.38 -164% | 0.94 -4% |
| Colorchecker dE 2000 max. * | 1.4 | 4.6 -229% | 3.8 -171% | 8.2 -486% | 5.88 -320% | 2.92 -109% |
| Colorchecker dE 2000 calibrated * | 0.6 | 1.6 -167% | 1 -67% | 2.69 -348% | 0.99 -65% | |
| Greyscale dE 2000 * | 1 | 1.1 -10% | 1.2 -20% | 5.2 -420% | 3.75 -275% | 0.9 10% |
| Gamma | 2.2 100% | 2.21 100% | 2.14 103% | 2.37 93% | 2.13 103% | |
| CCT | 6629 98% | 6644 98% | 6694 97% | 6340 103% | 6466 101% | 6620 98% |
| Color Space (Percent of AdobeRGB 1998) (%) | 63.9 | 64.2 0% | 61.3 -4% | 66.9 5% | 65 2% | 62.3 -3% |
| Color Space (Percent of sRGB) (%) | 97.6 | 97.6 0% | 94.6 -3% | 99.3 2% | 100 2% | 98.7 1% |
| Total Average (Program / Settings) | -16% /
-31% | -12% /
-20% | -44% /
-71% | -40% /
-69% | -24% /
-18% |
* ... smaller is better
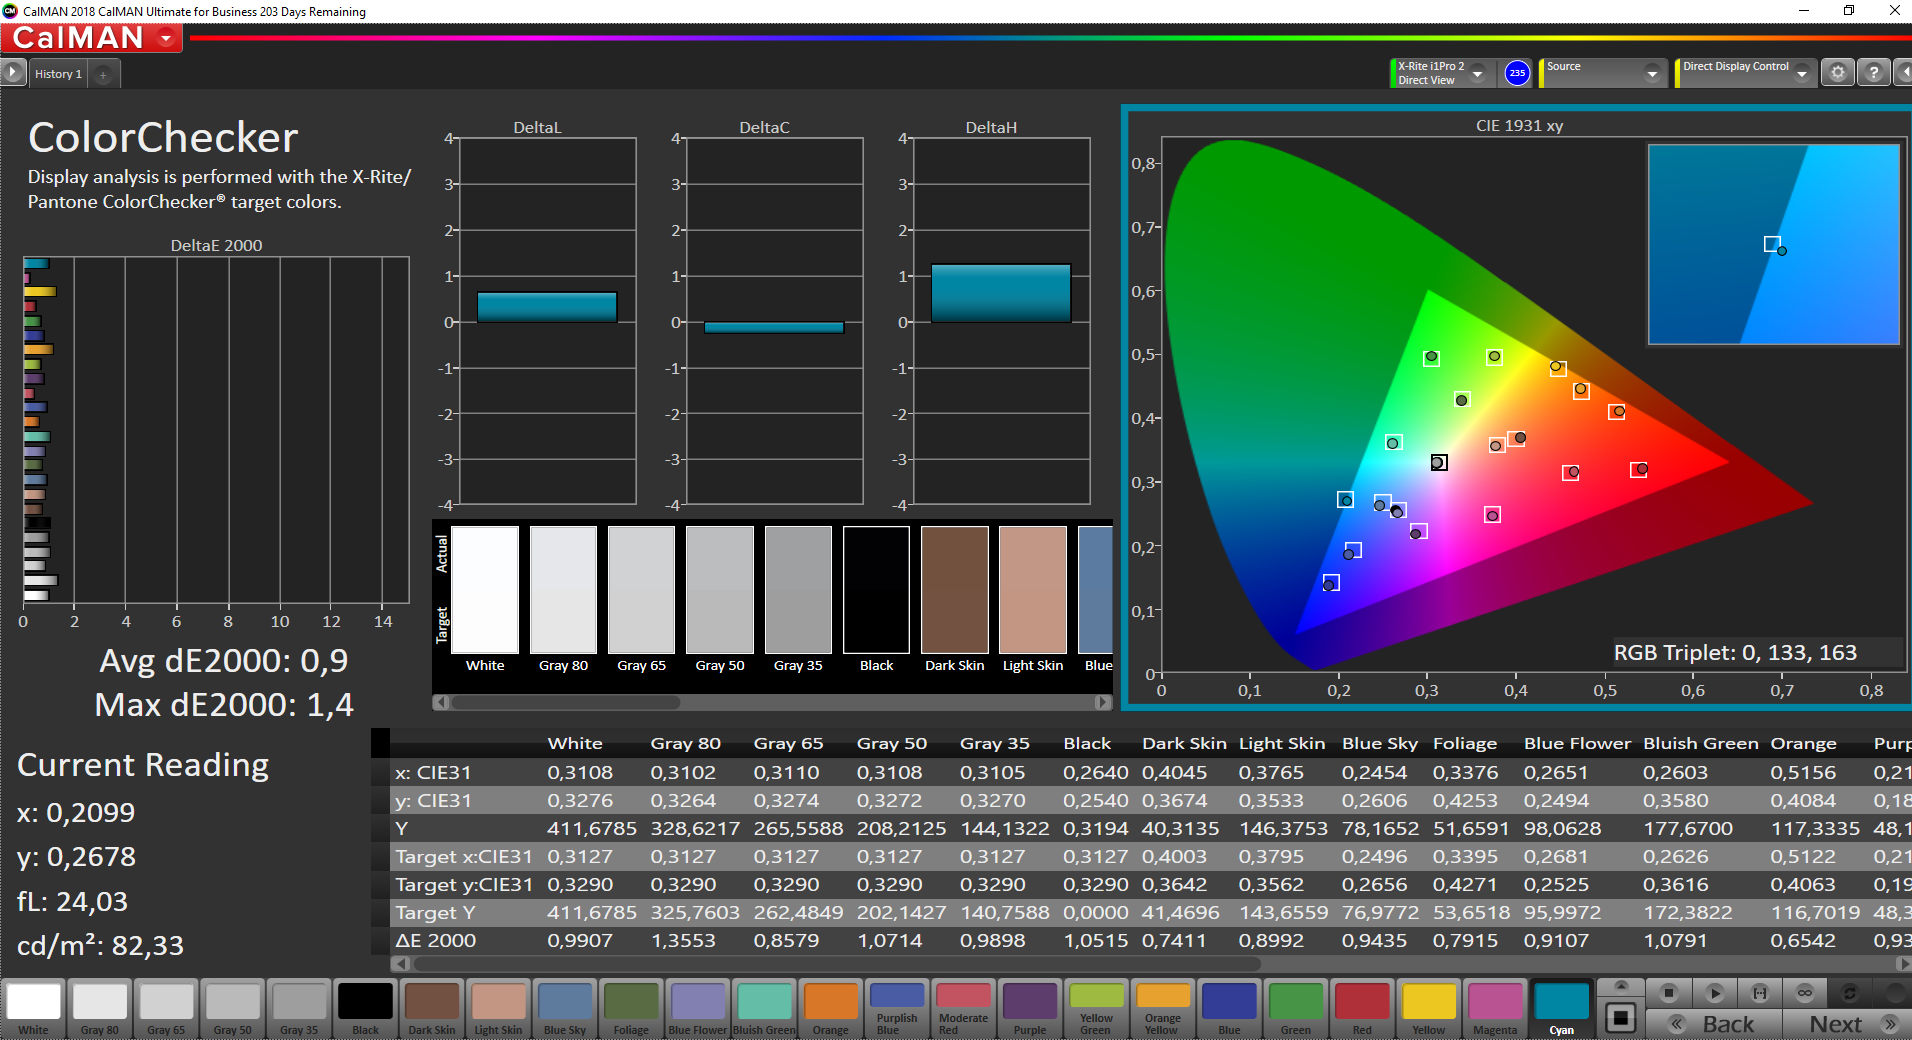
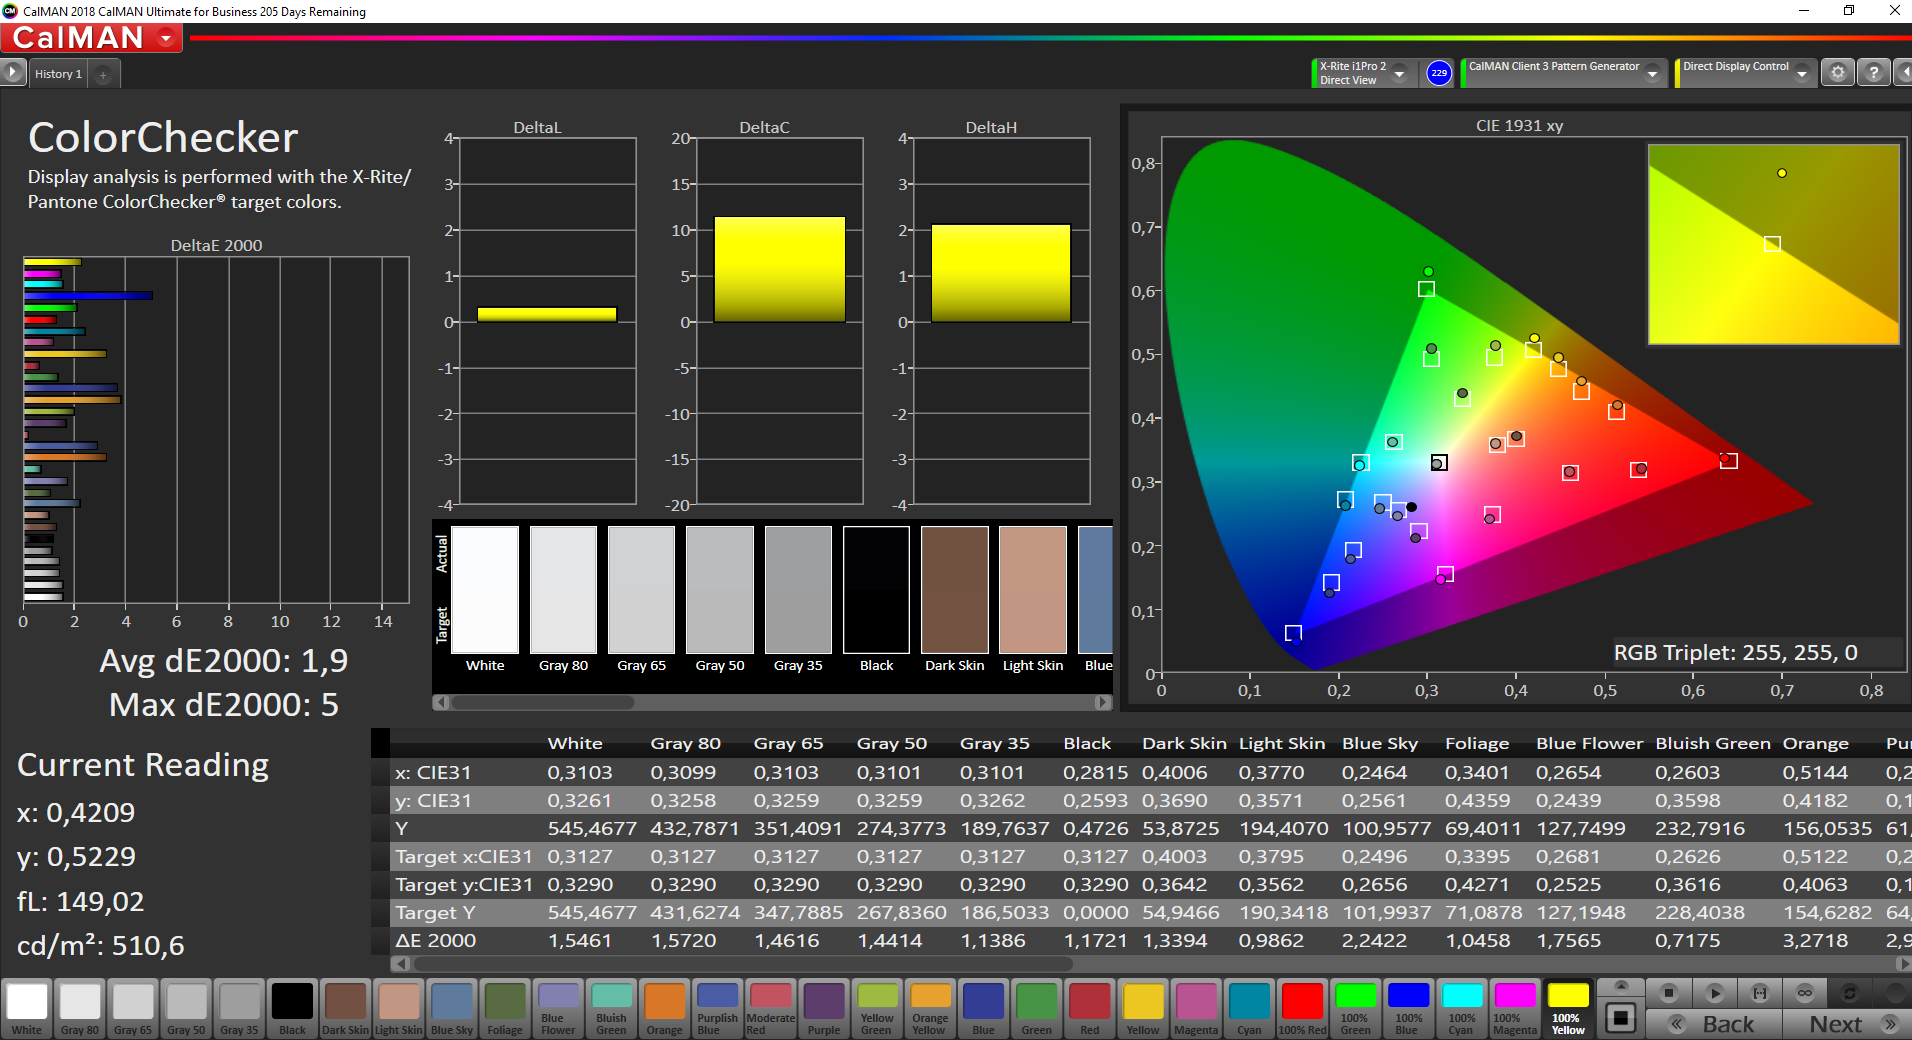
Our analysis with the professional CalMAN software and the X-Rite i1 Pro 2 spectrophotometer reveals a very precise calibration out of the box. There is no color cast and the deviations are clearly below the important mark of 3. We only managed to improve the results slightly with our own calibration, so an additional calibration by the user is not required. The small sRGB gamut is covered completely, so picture editing is no problem. By the way, this is one difference compared to the more expensive MacBook Pro 13 siblings, which target the wider P3 color gamut.
During our tests, we also noticed that the maximum brightness is much higher when you use Windows. Our test unit was more than 30% brighter, which is quite a lot. However, the black value is higher as well, so the resulting contrast ratio is similar at 1200:1. We have already published a dedicated article about possible reasons for this variation. Windows performs slightly worse in terms of color accuracy and some colors miss the important value of 3 (even after a calibration).

Display Response Times
| ↔ Response Time Black to White | ||
|---|---|---|
| 28.4 ms ... rise ↗ and fall ↘ combined | ↗ 16 ms rise | 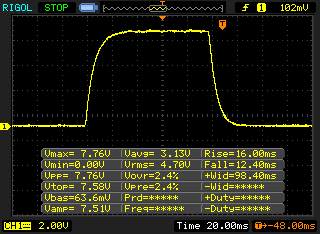 |
| ↘ 12.4 ms fall | ||
| The screen shows relatively slow response rates in our tests and may be too slow for gamers. In comparison, all tested devices range from 0.1 (minimum) to 240 (maximum) ms. » 75 % of all devices are better. This means that the measured response time is worse than the average of all tested devices (20.1 ms). | ||
| ↔ Response Time 50% Grey to 80% Grey | ||
| 38.4 ms ... rise ↗ and fall ↘ combined | ↗ 20.4 ms rise | 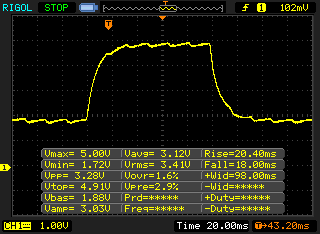 |
| ↘ 18 ms fall | ||
| The screen shows slow response rates in our tests and will be unsatisfactory for gamers. In comparison, all tested devices range from 0.165 (minimum) to 636 (maximum) ms. » 57 % of all devices are better. This means that the measured response time is worse than the average of all tested devices (31.4 ms). | ||
Screen Flickering / PWM (Pulse-Width Modulation)
| Screen flickering / PWM detected | 119000 Hz | ≤ 75 % brightness setting | 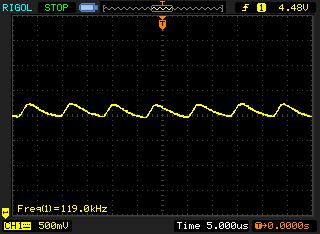 |
The display backlight flickers at 119000 Hz (worst case, e.g., utilizing PWM) Flickering detected at a brightness setting of 75 % and below. There should be no flickering or PWM above this brightness setting. The frequency of 119000 Hz is quite high, so most users sensitive to PWM should not notice any flickering. In comparison: 53 % of all tested devices do not use PWM to dim the display. If PWM was detected, an average of 7986 (minimum: 5 - maximum: 343500) Hz was measured. | |||
Performance – Is the Core i3 sufficient in the MacBook Air?
In addition to the macOS benchmarks, we have also installed Windows 10 via BootCamp to run our usual test suite and enable a certain comparability with Windows devices. However, please remember that the BootCamp drivers are not perfectly optimized by Apple. It is no problem to use Windows, but the benchmark results do not always show the real performance. The power consumption is also noticeably higher when you use Windows.
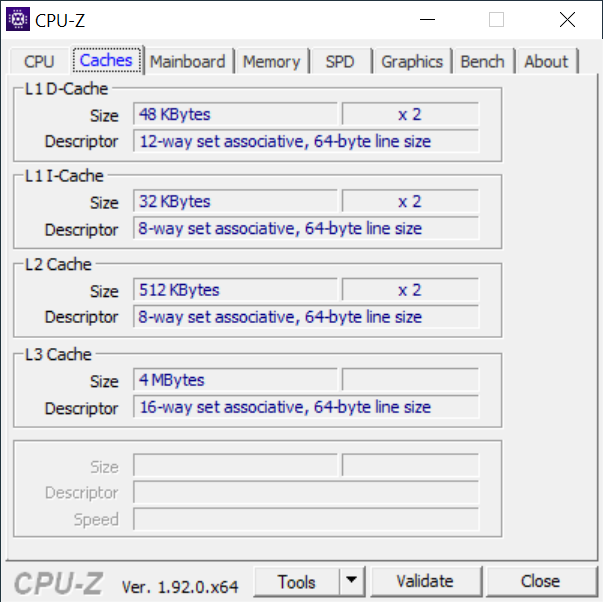
Processor – MacBook Air with Ice Lake Core i3
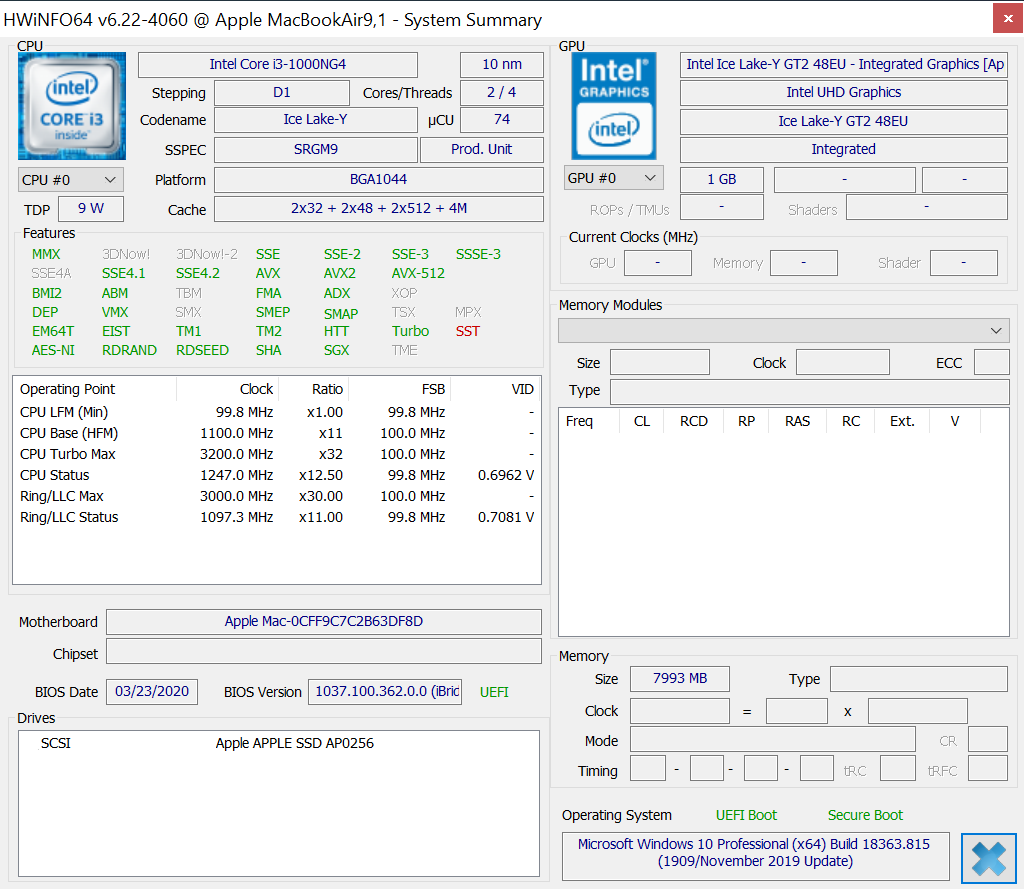
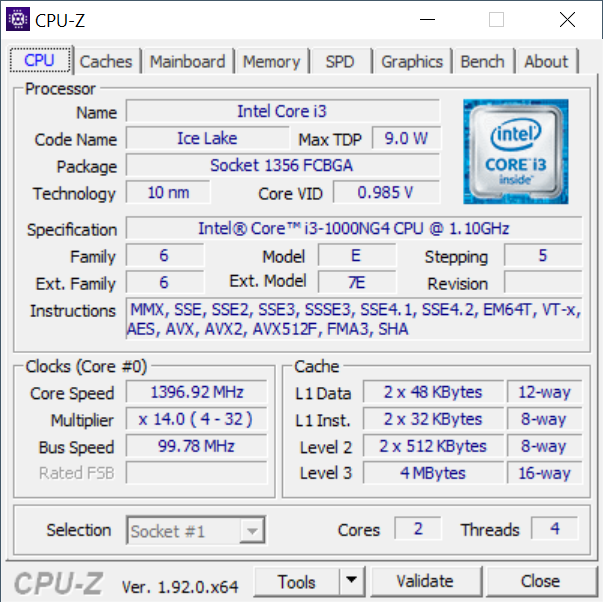
The base model of the MacBook Air 2020 also gets a modern Ice Lake processor, but the Core i3-1000NG4 only offers two cores (4 threads) compared to the Core i5 and Core i7, so it is closer to the old MacBook Air from 2018 and 2019 in terms of raw CPU performance. The new Core i3 is a little bit faster than the old Core i5-8210Y in the predecessors, but the advantage is not huge.
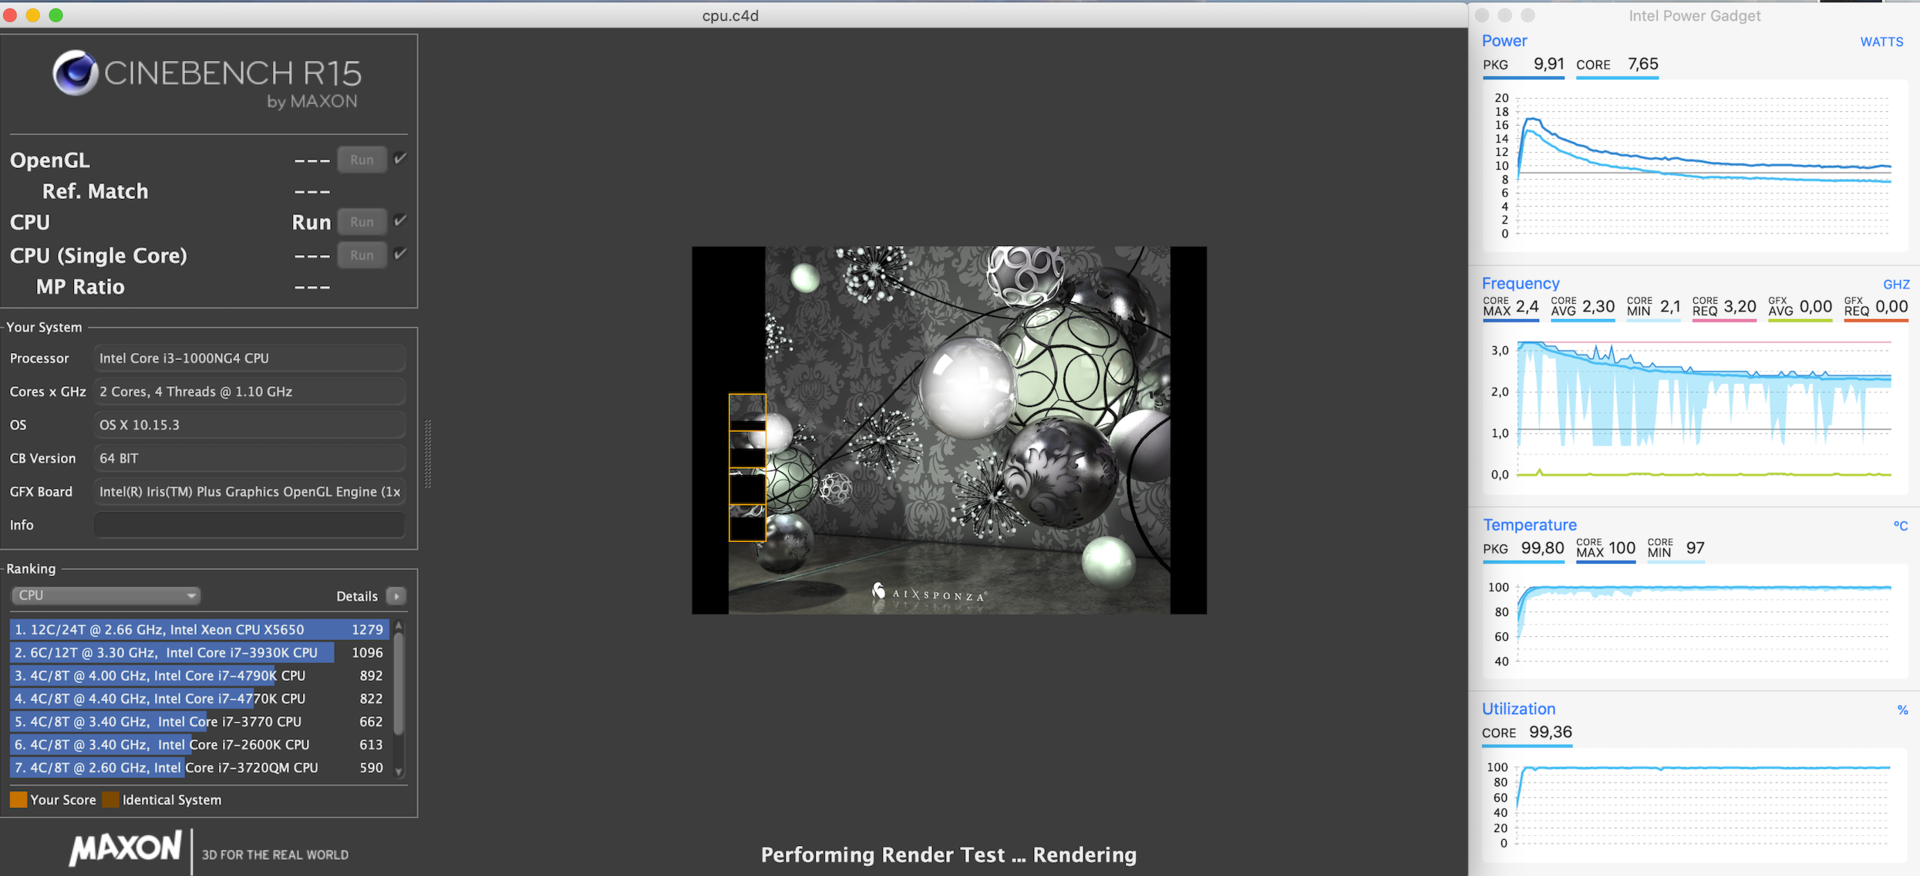
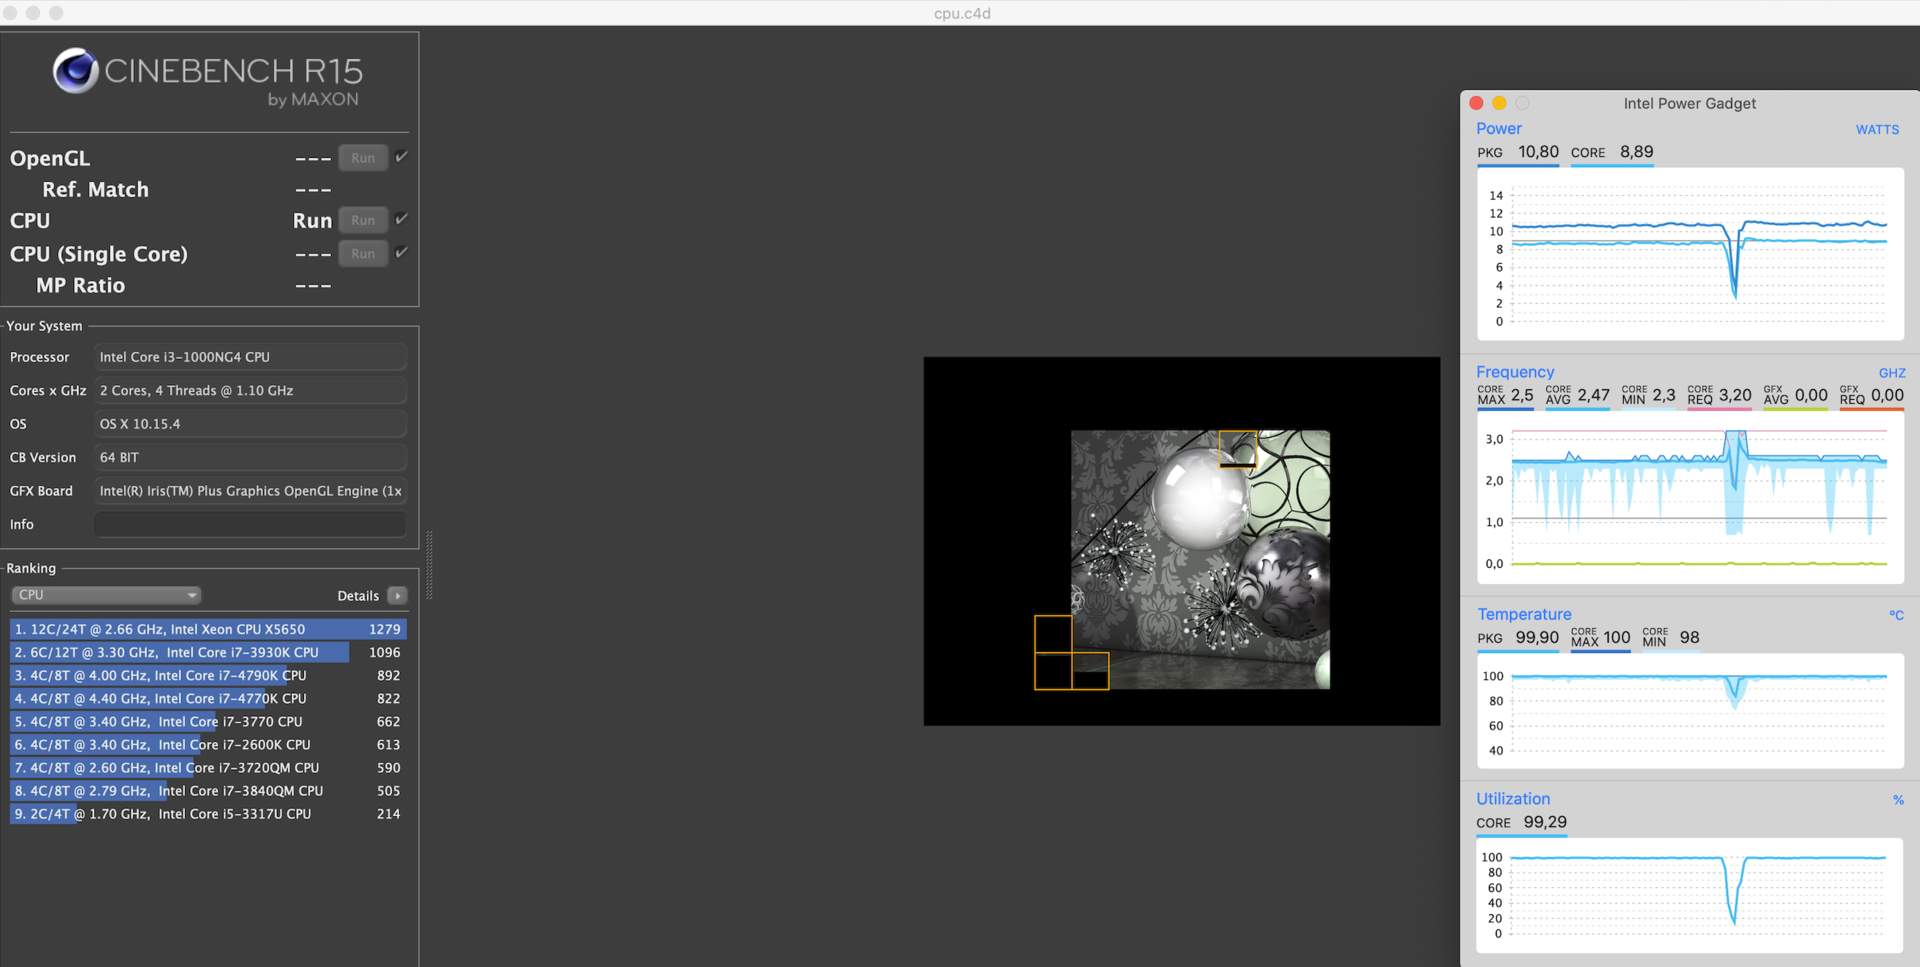
The performance also drops very quickly: We see a maximum power consumption of up to 18 Watts (2x 3.2 GHz), but this value drops to just 10-11 Watts (2x 2.3-2.4 GHz) within a couple of seconds. Our Cinebench Multi loop also results in a similar power usage.
We noticed bigger fluctuations during our review of MacBook Air with the quad-core i5. The latter has an advantage of around 35% when you use all cores, but the single-core performance, which is still important in everyday tasks, is actually identical between the i3 and i5. The performance is not further reduced on battery power. All the Windows competitors offer much more CPU performance with their 15W CPUs.
Cinebench R15: CPU Single 64Bit | CPU Multi 64Bit
Blender: v2.79 BMW27 CPU
7-Zip 18.03: 7z b 4 -mmt1 | 7z b 4
Geekbench 5.5: Single-Core | Multi-Core
HWBOT x265 Benchmark v2.2: 4k Preset
LibreOffice : 20 Documents To PDF
R Benchmark 2.5: Overall mean
| Cinebench R20 / CPU (Single Core) | |
| Average of class Subnotebook (128 - 826, n=62, last 2 years) | |
| Acer Swift 3 SF313-52-71Y7 | |
| Microsoft Surface Laptop 3 13 Core i5-1035G7 | |
| Dell XPS 13 9300 i5 FHD | |
| Apple MacBook Air 2020 i5 | |
| Apple MacBook Air 2020 i5 | |
| Apple MacBook Air 2020 i3 | |
| Average Intel Core i3-1000NG4 (n=1) | |
| Apple Macbook Air 2019 | |
| Cinebench R20 / CPU (Multi Core) | |
| Average of class Subnotebook (579 - 8541, n=62, last 2 years) | |
| Microsoft Surface Laptop 3 13 Core i5-1035G7 | |
| Dell XPS 13 9300 i5 FHD | |
| Acer Swift 3 SF313-52-71Y7 | |
| Apple MacBook Air 2020 i5 | |
| Apple MacBook Air 2020 i5 | |
| Apple Macbook Air 2019 | |
| Apple MacBook Air 2020 i3 | |
| Average Intel Core i3-1000NG4 (n=1) | |
| Cinebench R15 / CPU Single 64Bit | |
| Average of class Subnotebook (72.4 - 322, n=62, last 2 years) | |
| Acer Swift 3 SF313-52-71Y7 | |
| Microsoft Surface Laptop 3 13 Core i5-1035G7 | |
| Dell XPS 13 9300 i5 FHD | |
| Apple MacBook Air 2020 i3 | |
| Average Intel Core i3-1000NG4 (n=1) | |
| Apple MacBook Air 2020 i5 | |
| Apple Macbook Air 2019 | |
| Cinebench R15 / CPU Multi 64Bit | |
| Average of class Subnotebook (327 - 3345, n=62, last 2 years) | |
| Microsoft Surface Laptop 3 13 Core i5-1035G7 | |
| Dell XPS 13 9300 i5 FHD | |
| Dell XPS 13 9300 i5 FHD | |
| Acer Swift 3 SF313-52-71Y7 | |
| Apple MacBook Air 2020 i5 | |
| Apple MacBook Air 2020 i3 | |
| Average Intel Core i3-1000NG4 (n=1) | |
| Apple Macbook Air 2019 | |
| Blender / v2.79 BMW27 CPU | |
| Apple MacBook Air 2020 i3 | |
| Average Intel Core i3-1000NG4 (n=1) | |
| Apple Macbook Air 2019 | |
| Apple MacBook Air 2020 i5 | |
| Acer Swift 3 SF313-52-71Y7 | |
| Microsoft Surface Laptop 3 13 Core i5-1035G7 | |
| Dell XPS 13 9300 i5 FHD | |
| Average of class Subnotebook (159 - 2271, n=63, last 2 years) | |
| 7-Zip 18.03 / 7z b 4 -mmt1 | |
| Average of class Subnotebook (2643 - 6442, n=64, last 2 years) | |
| Acer Swift 3 SF313-52-71Y7 | |
| Microsoft Surface Laptop 3 13 Core i5-1035G7 | |
| Dell XPS 13 9300 i5 FHD | |
| Apple MacBook Air 2020 i5 | |
| Apple MacBook Air 2020 i3 | |
| Average Intel Core i3-1000NG4 (n=1) | |
| Apple Macbook Air 2019 | |
| 7-Zip 18.03 / 7z b 4 | |
| Average of class Subnotebook (11668 - 77867, n=63, last 2 years) | |
| Microsoft Surface Laptop 3 13 Core i5-1035G7 | |
| Dell XPS 13 9300 i5 FHD | |
| Acer Swift 3 SF313-52-71Y7 | |
| Apple MacBook Air 2020 i5 | |
| Apple Macbook Air 2019 | |
| Apple MacBook Air 2020 i3 | |
| Average Intel Core i3-1000NG4 (n=1) | |
| Geekbench 5.5 / Single-Core | |
| Average of class Subnotebook (726 - 2132, n=55, last 2 years) | |
| Acer Swift 3 SF313-52-71Y7 | |
| Dell XPS 13 9300 i5 FHD | |
| Apple MacBook Air 2020 i5 | |
| Apple MacBook Air 2020 i5 | |
| Apple MacBook Air 2020 i3 | |
| Average Intel Core i3-1000NG4 (n=1) | |
| Geekbench 5.5 / Multi-Core | |
| Average of class Subnotebook (2557 - 17218, n=55, last 2 years) | |
| Acer Swift 3 SF313-52-71Y7 | |
| Dell XPS 13 9300 i5 FHD | |
| Apple MacBook Air 2020 i5 | |
| Apple MacBook Air 2020 i5 | |
| Apple MacBook Air 2020 i3 | |
| Average Intel Core i3-1000NG4 (n=1) | |
| HWBOT x265 Benchmark v2.2 / 4k Preset | |
| Average of class Subnotebook (0.97 - 25.1, n=62, last 2 years) | |
| Acer Swift 3 SF313-52-71Y7 | |
| Microsoft Surface Laptop 3 13 Core i5-1035G7 | |
| Dell XPS 13 9300 i5 FHD | |
| Apple MacBook Air 2020 i5 | |
| Apple Macbook Air 2019 | |
| Apple MacBook Air 2020 i3 | |
| Average Intel Core i3-1000NG4 (n=1) | |
| LibreOffice / 20 Documents To PDF | |
| Apple MacBook Air 2020 i5 | |
| Apple MacBook Air 2020 i3 | |
| Average Intel Core i3-1000NG4 (n=1) | |
| Average of class Subnotebook (38.5 - 220, n=61, last 2 years) | |
| R Benchmark 2.5 / Overall mean | |
| Apple MacBook Air 2020 i5 | |
| Apple MacBook Air 2020 i5 | |
| Apple MacBook Air 2020 i3 | |
| Average Intel Core i3-1000NG4 (n=1) | |
| Dell XPS 13 9300 i5 FHD | |
| Acer Swift 3 SF313-52-71Y7 | |
| Average of class Subnotebook (0.403 - 1.456, n=63, last 2 years) | |
* ... smaller is better
System Performance – MacBook Air fast enough for basic tasks
Benchmark results are one thing, but the subjective performance impression is much more important, especially when you use a device like the MacBook Air, which was designed for casual users in the first place. Every user obviously has its own routine, but we did not notice any limitations when we used typical apps during our review period. This includes things like writing mails, chats via Skype or Discord, web browsing, playback of YouTube videos or video streaming (like Netflix, Amazon Prime Video or Disney+). The MacBook Air definitely benefits from the fast SSD and the powerful video decoder in these scenarios. The CPU performance is also completely sufficient for this kind of work.
However, you should not do too much multitasking or use too many browser tabs at the same time, otherwise you can notice some slight stutters. The MacBook Air is hardly suited for power users anyway, and this is also the case for the more expensive SKUs with quad-core CPUs. The MacBook Pro 13 is a much better device for more demanding applications, for example.
| PCMark 8 Home Score Accelerated v2 | 2701 points | |
| PCMark 8 Creative Score Accelerated v2 | 3619 points | |
| PCMark 10 Score | 2229 points | |
Help | ||

GPU Performance – Iris Plus Graphics G4
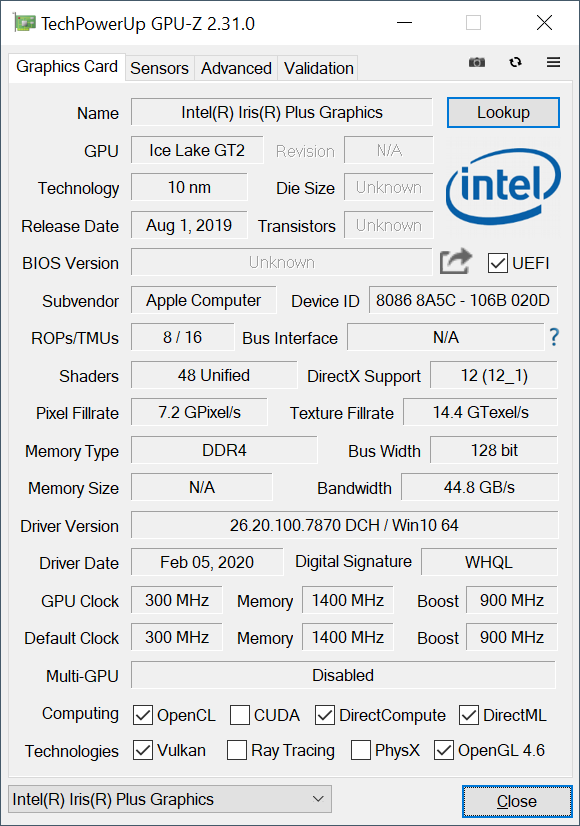
The Core i3 processor is equipped with a slower version of the Intel Iris Plus Graphics compared to the optional quad-core chips. The G4 iGPU only features 48 shader units; the faster G7 version 64. However, the graphics performance is further limited by the low TDP, because other G4 iGPUs in our database are between 30-70% faster depending on the benchmark. The MacBook Air 2020 with the G7 iGPU is about 50% faster, but the overall performance level is still low. You will not notice this difference in practice and the slower iGPU is sufficient. Playback of high-resolution videos, for example, is no problem at all, but the MacBook Air is usually too slow for gaming. Only very simple titles run smoothly at lowest settings, but the performance also drops after a while. The Fire Strike stress test is not passed at just 70%, so the gaming performance will suffer when you play for a couple of minutes. The graphics performance is not further reduced on battery power.
| Unigine Valley 1.0 - 1920x1080 Extreme HD Preset OpenGL AA:x8 | |
| Average of class Subnotebook (4.7 - 26.2, n=5, last 2 years) | |
| Apple MacBook Air 2020 i5 | |
| Average Intel Iris Plus Graphics G4 (Ice Lake 48 EU) (7.1 - 9.3, n=2) | |
| Apple MacBook Air 2020 i3 | |
| Unigine Heaven 4.0 - Extreme Preset OpenGL | |
| Average of class Subnotebook (7 - 35.7, n=4, last 2 years) | |
| Average Intel Iris Plus Graphics G4 (Ice Lake 48 EU) (8.1 - 11.8, n=2) | |
| Apple MacBook Air 2020 i5 | |
| Apple MacBook Air 2020 i3 | |
| 3DMark 06 Standard Score | 6413 points | |
| 3DMark Vantage P Result | 5516 points | |
| 3DMark 11 Performance | 1980 points | |
| 3DMark Fire Strike Score | 839 points | |
Help | ||
| low | med. | high | ultra | |
|---|---|---|---|---|
| BioShock Infinite (2013) | 34 | 22.6 | 20.3 | 9.1 |
| The Witcher 3 (2015) | 9.1 | |||
| Dota 2 Reborn (2015) | 48.2 | 23.4 | 14.7 | 14.1 |
| Rise of the Tomb Raider (2016) | 10.2 | |||
| Overwatch (2016) | 8 | |||
| Rocket League (2017) | 53.2 | 22.7 | ||
| X-Plane 11.11 (2018) | 17.8 | 9.32 | 9.16 | |
| Shadow of the Tomb Raider (2018) | 9 |
Emissions
System Noise – Dual-Core MacBook Air is quieter
Compared to the quad-core model of the MacBook Air, it takes longer for the fan to reach its maximum speed. The fan is also noticeably quieter overall. Medium workloads (also gaming) will also result in the maximum fan noise, but this process will take a couple of minutes. Still, the passive cooling in combination with the additional chassis fan is anything but great. Other manufactures can handle such a processor with a completely passive cooling solution.
Noise level
| Idle |
| 29 / 29 / 29 dB(A) |
| Load |
| 31.6 / 39.4 dB(A) |
 | ||
30 dB silent 40 dB(A) audible 50 dB(A) loud |
||
min: | ||
| Apple MacBook Air 2020 i3 Iris Plus Graphics G4 (Ice Lake 48 EU), i3-1000NG4, Apple SSD AP0256 | Apple MacBook Air 2020 i5 Iris Plus Graphics G7 (Ice Lake 64 EU), i5-1030NG7, Apple SSD AP0512 | Apple Macbook Air 2019 UHD Graphics 617, i5-8210Y, Apple SSD AP0256 | Dell XPS 13 9300 i5 FHD UHD Graphics G1 (Ice Lake 32 EU), i5-1035G1, Toshiba XG6 KXG60ZNV512G | Acer Swift 3 SF313-52-71Y7 Iris Plus Graphics G7 (Ice Lake 64 EU), i7-1065G7, Intel SSD 660p 1TB SSDPEKNW010T8 | Microsoft Surface Laptop 3 13 Core i5-1035G7 Iris Plus Graphics G7 (Ice Lake 64 EU), i5-1035G7, SK hynix BC501 HFM256GDGTNG | |
|---|---|---|---|---|---|---|
| Noise | -12% | -3% | 3% | 0% | 3% | |
| off / environment * (dB) | 29 | 30 -3% | 29.5 -2% | 29.3 -1% | 30.3 -4% | 28.5 2% |
| Idle Minimum * (dB) | 29 | 30 -3% | 29.5 -2% | 29.3 -1% | 30.3 -4% | 28.5 2% |
| Idle Average * (dB) | 29 | 30 -3% | 29.5 -2% | 29.3 -1% | 30.3 -4% | 28.5 2% |
| Idle Maximum * (dB) | 29 | 30 -3% | 29.5 -2% | 29.3 -1% | 30.3 -4% | 28.5 2% |
| Load Average * (dB) | 31.6 | 45.5 -44% | 34 -8% | 30 5% | 31.7 -0% | 28.5 10% |
| Load Maximum * (dB) | 39.4 | 45.8 -16% | 41 -4% | 32.4 18% | 32.7 17% | 40.4 -3% |
| Witcher 3 ultra * (dB) | 40.4 |
* ... smaller is better
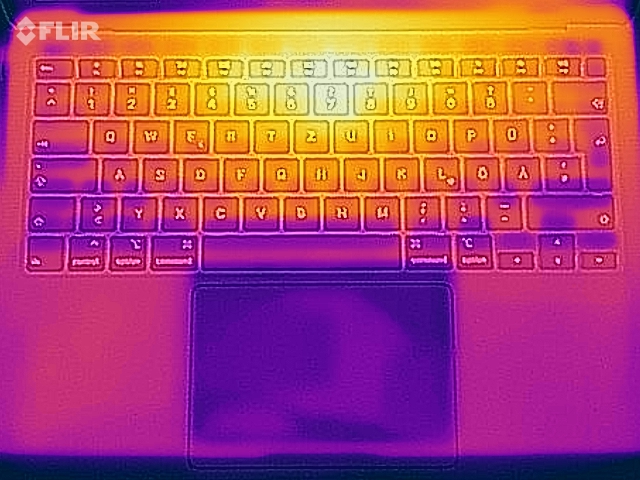
Temperature – Core i3 SKU stays cooler
The entry-level model of the MacBook Air also has an advantage in terms of surface temperatures, and the hotspot at the top of the keyboard in particular stays a couple of degrees cooler. You will notice up to 44 °C (111.2 °F) when you type on the keyboard, but there are no limitations. Up to 40 °C (104 °F) at the bottom is no problem, either. Less demanding tasks usually result in a lukewarm device, if at all.
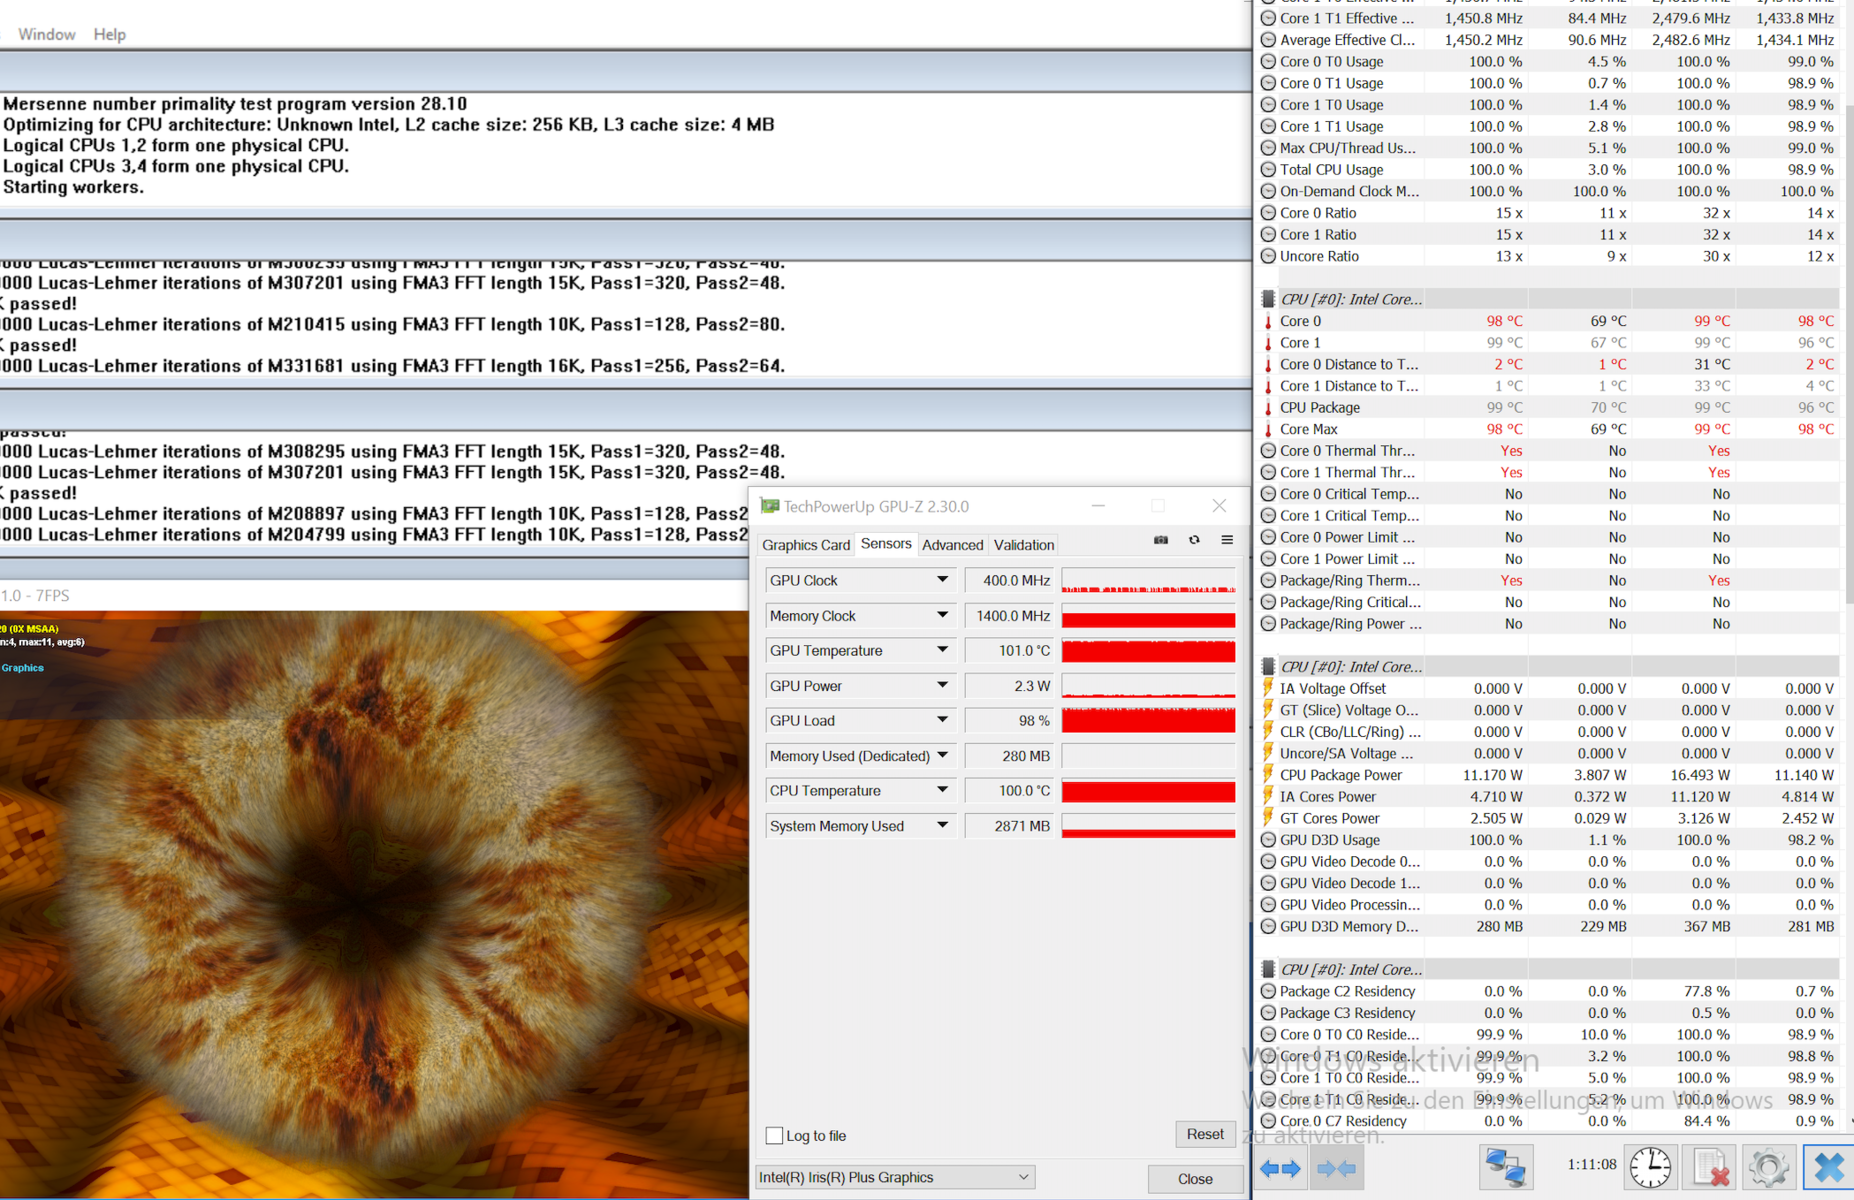
Similar to pure CPU load, the power consumption of the SoC will level off at around 11 Watts during our stress test. However, both the CPU and the iGPU are stressed now, which results in lower clocks. The CPU only runs at 2x 1.5 GHz and the iGPU at 400 MHz. The performance is not limited immediately after the stress test.
(±) The maximum temperature on the upper side is 44.3 °C / 112 F, compared to the average of 35.9 °C / 97 F, ranging from 21.4 to 59 °C for the class Subnotebook.
(±) The bottom heats up to a maximum of 40.9 °C / 106 F, compared to the average of 39.2 °C / 103 F
(+) In idle usage, the average temperature for the upper side is 23.4 °C / 74 F, compared to the device average of 30.8 °C / 87 F.
(+) The palmrests and touchpad are cooler than skin temperature with a maximum of 29.1 °C / 84.4 F and are therefore cool to the touch.
(±) The average temperature of the palmrest area of similar devices was 28.2 °C / 82.8 F (-0.9 °C / -1.6 F).

Energy Management – Efficient Ice Lake SoC
Power Consumption
The Core i3 MacBook Air is a slightly more efficient in our idle measurements, but there is no difference in our load tests. This once again shows that the TDP setting or the cooling solution, respectively, is the limiting factor for the performance.
| Off / Standby | |
| Idle | |
| Load |
|
Key:
min: | |
| Apple MacBook Air 2020 i3 i3-1000NG4, Iris Plus Graphics G4 (Ice Lake 48 EU), Apple SSD AP0256, IPS, 2560x1600, 13.3" | Apple MacBook Air 2020 i5 i5-1030NG7, Iris Plus Graphics G7 (Ice Lake 64 EU), Apple SSD AP0512, IPS, 2560x1600, 13.3" | Dell XPS 13 9300 i5 FHD i5-1035G1, UHD Graphics G1 (Ice Lake 32 EU), Toshiba XG6 KXG60ZNV512G, IPS, 1920x1200, 13.4" | Acer Swift 3 SF313-52-71Y7 i7-1065G7, Iris Plus Graphics G7 (Ice Lake 64 EU), Intel SSD 660p 1TB SSDPEKNW010T8, IPS, 2256x1504, 13.5" | Microsoft Surface Laptop 3 13 Core i5-1035G7 i5-1035G7, Iris Plus Graphics G7 (Ice Lake 64 EU), SK hynix BC501 HFM256GDGTNG, IPS, 2256x1504, 13.5" | Average Intel Iris Plus Graphics G4 (Ice Lake 48 EU) | Average of class Subnotebook | |
|---|---|---|---|---|---|---|---|
| Power Consumption | -15% | -43% | 11% | -64% | -32% | -59% | |
| Idle Minimum * (Watt) | 2.1 | 2.4 -14% | 3.4 -62% | 1.8 14% | 4.4 -110% | 3.26 ? -55% | 3.9 ? -86% |
| Idle Average * (Watt) | 6.2 | 6.8 -10% | 6 3% | 4.6 26% | 7.5 -21% | 7.28 ? -17% | 6.91 ? -11% |
| Idle Maximum * (Watt) | 7 | 10.5 -50% | 10.2 -46% | 6.1 13% | 7.8 -11% | 8.66 ? -24% | 8.24 ? -18% |
| Load Average * (Watt) | 24.7 | 25.7 -4% | 36.6 -48% | 27.4 -11% | 41.9 -70% | 34.4 ? -39% | 42.1 ? -70% |
| Load Maximum * (Watt) | 30.6 | 30.4 1% | 49.3 -61% | 27 12% | 63.9 -109% | 38.9 ? -27% | 64.2 ? -110% |
| Witcher 3 ultra * (Watt) | 24.5 | 40.8 |
* ... smaller is better
Battery Runtime – macOS with a distinct advantage
The battery runtime is a bit better compared to the MacBook Air with the quad-core i5 processor. Both our Wi-Fi test and the video test (macOS, both at 150 nits) run for about 11 hours. The runtime in the Wi-Fi test is reduced to 7:17 hours (macOS) when we use the maximum display brightness.
We also performed the Wi-Fi test with Windows, and as expected, the results are much shorter. At 150 nits, we record about 7.5 hours, and just little more than 4 hours at the maximum brightness.
| Apple MacBook Air 2020 i3 i3-1000NG4, Iris Plus Graphics G4 (Ice Lake 48 EU), 49.9 Wh | Apple MacBook Air 2020 i5 i5-1030NG7, Iris Plus Graphics G7 (Ice Lake 64 EU), 49.9 Wh | Apple Macbook Air 2019 i5-8210Y, UHD Graphics 617, 49.9 Wh | Dell XPS 13 9300 i5 FHD i5-1035G1, UHD Graphics G1 (Ice Lake 32 EU), 52 Wh | Acer Swift 3 SF313-52-71Y7 i7-1065G7, Iris Plus Graphics G7 (Ice Lake 64 EU), 54.5 Wh | Microsoft Surface Laptop 3 13 Core i5-1035G7 i5-1035G7, Iris Plus Graphics G7 (Ice Lake 64 EU), 45 Wh | Average of class Subnotebook | |
|---|---|---|---|---|---|---|---|
| Battery runtime | -5% | 5% | 18% | -6% | -25% | 34% | |
| H.264 (h) | 11.1 | 10.7 -4% | 14.4 30% | 10.5 -5% | 15.8 ? 42% | ||
| WiFi v1.3 (h) | 11 | 10.3 -6% | 11.5 5% | 11.7 6% | 10.3 -6% | 8.3 -25% | 13.7 ? 25% |
| Load (h) | 2.9 | 3.4 | 2.3 | 1.9 | 1.933 ? | ||
| Reader / Idle (h) | 21.4 | 34.4 | 27.8 ? |
Pros
Cons
Verdict – The Core i3 is the better choice for everyday tasks
With all the discussions about the performance of the new quad-core CPUs, you should not forget that the MacBook Air is still primarily a device for casual users with simple workloads. This includes basic things like writing mails, video playback, or web browsing. The MacBook Air is great for this stuff, also thanks to the fast SSD storage. Because of the limited TDP configuration, the entry-level MacBook Air is even on par with the supposedly faster quad-core i5 when it comes to the single-core performance, which is still important for everyday tasks. There are also noticeable advantages in terms of the emissions, and especially the fan is much quieter with a slower maximum speed. This means the i3 MacBook Air is quieter for longer periods of time, even when you stress it.
The MacBook Air with the dual-core i3 processor is the better device for basic workloads. The subjective performance impression is very good in these scenarios, the fan is quieter, and you can still enjoy the good display as well as the improved keyboard.
There are still drawbacks, because the overall level of performance is just very low. This would not be a huge problem, but why does Apple not manage to create a completely passively cooled device? A silent MacBook Air would be a great, but we have the suspicion that Apple limits the Air on purpose. This step might be reserved for future models with the heavily speculated ARM SoCs.
The price is another problem, because you can get Windows laptops with much more performance for 1200 Euros (~$1298). Still, thanks to the high-quality case, the good panel, and the good optimization for macOS, the MacBook Air is a very well-balanced package for your basic tasks. If you need more performance or if you already know that you will stress the components a lot, however, we believe you should skip the more expensive quad-core models of the Air and just get a MacBook Pro 13 (or something similarly powerful) instead.
Apple MacBook Air 2020 i3
- 05/13/2020 v7 (old)
Andreas Osthoff
Price comparison
