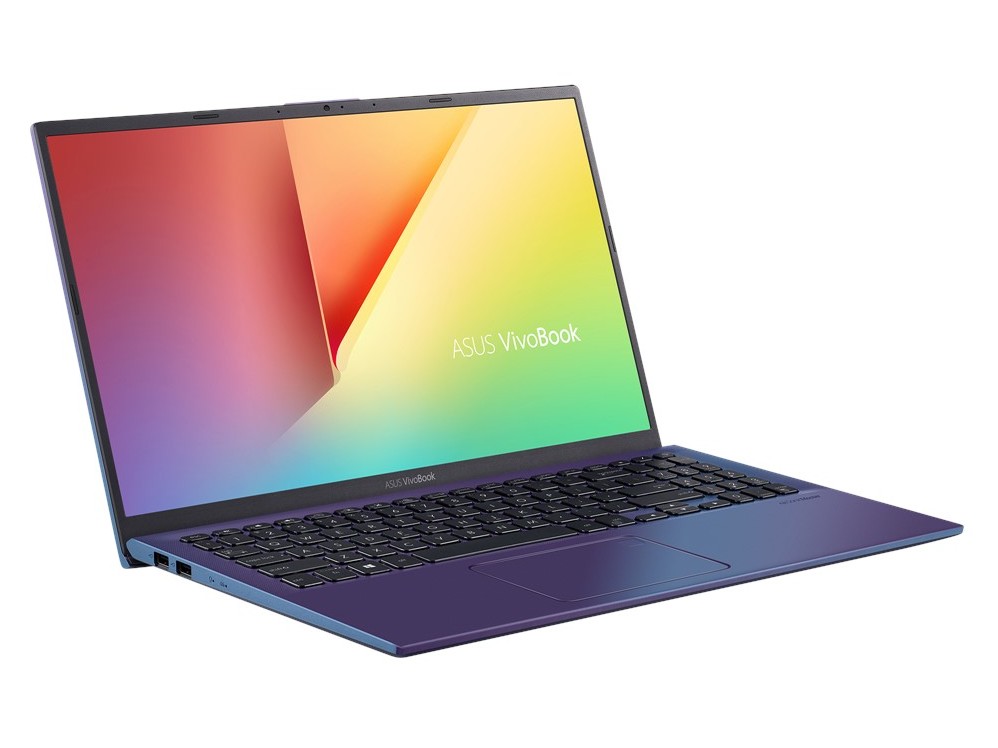
Asus Vivobook 15 F512DA Laptop Review: AMD Ryzen 3 for $400
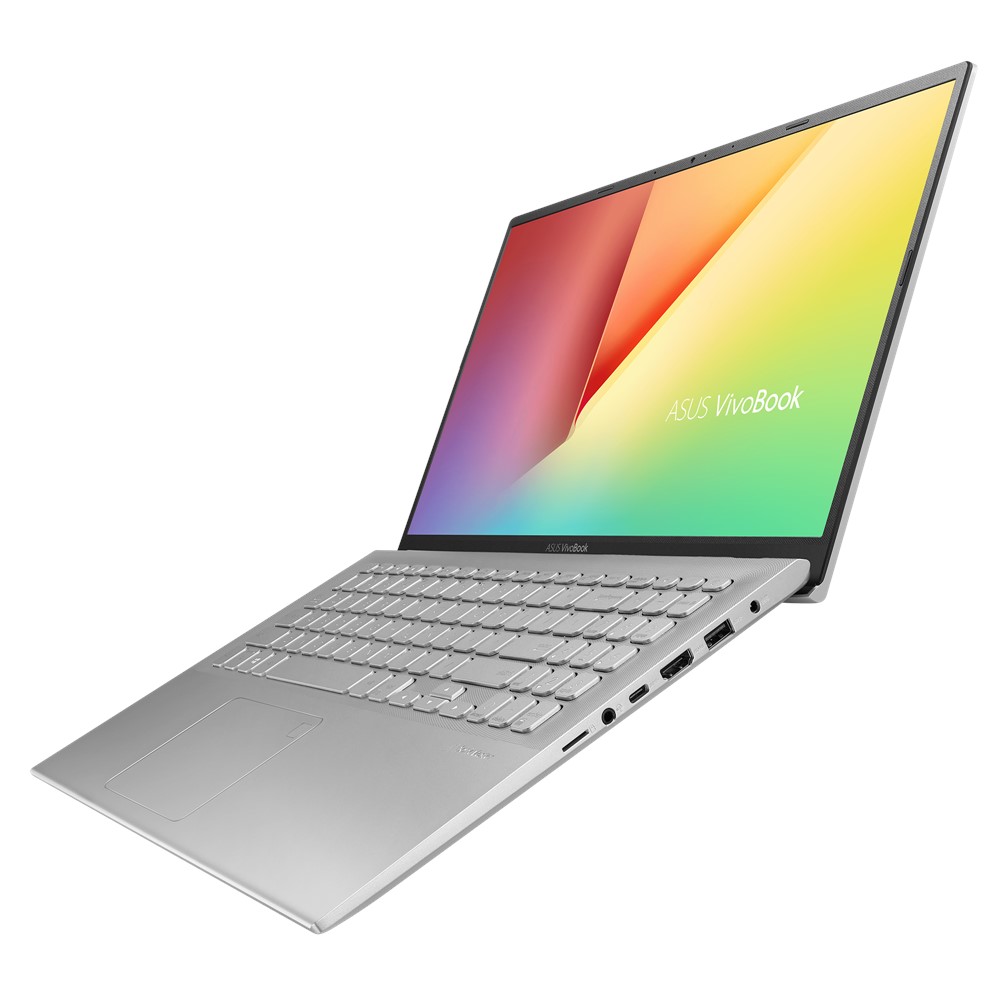
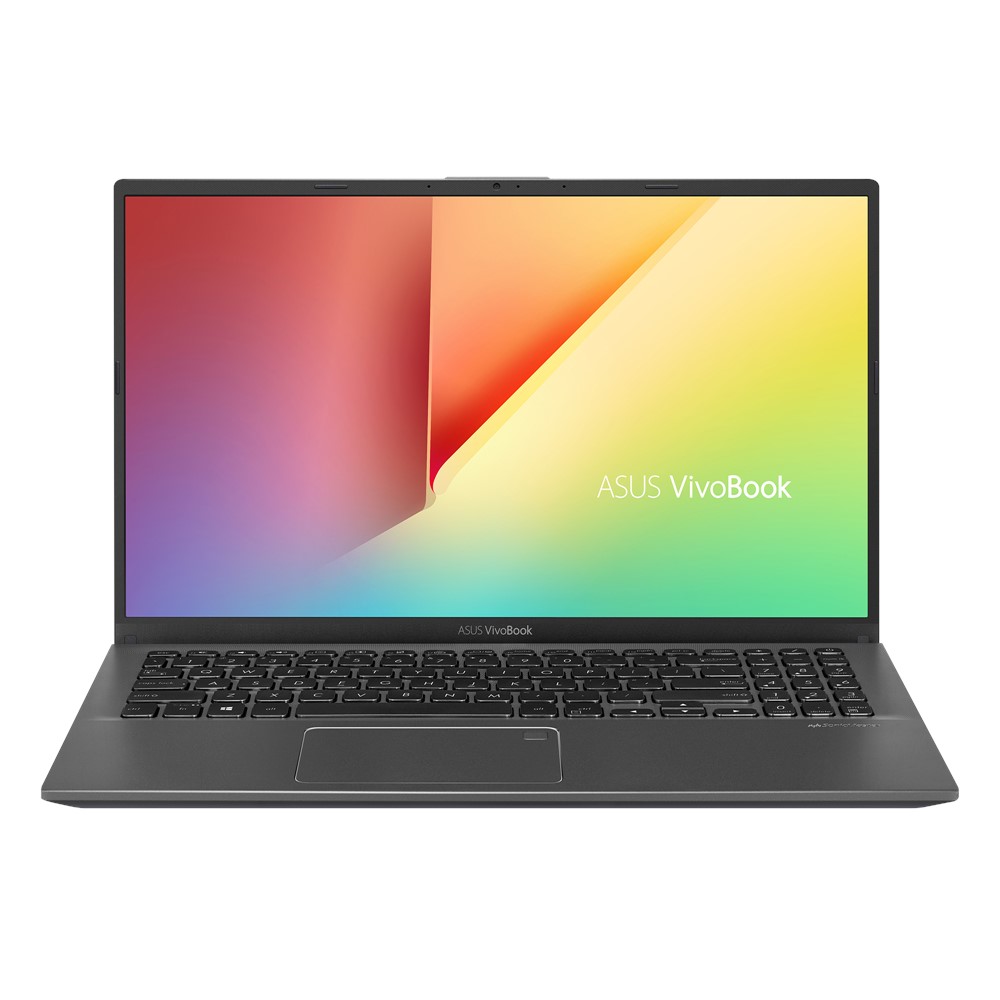
The Asus VivoBook series consists of budget to mid-range laptops to complement the higher-end and more expensive ZenBook series. The unit we have here is the 15.6-inch VivoBook 15 equipped with the entry-level 2nd gen Zen+ Ryzen 3 3200U processor from AMD. This particular SKU with 4 GB RAM, 128 GB SSD, and 1080p display can be found online for about $400 USD. SKUs with the Intel Core i3-8145U, Core i5-8265U, Core i7-8565U, or GeForce MX110 graphics are also available. These visually identical Intel variants are marketed as the VivoBook X512 series instead to contrast our AMD-powered VivoBook F512 series.
Direct competitors include other budget 15.6-inch multimedia laptops like the Lenovo Ideapad S340-15, Acer Aspire 5 A515, Dell Inspiron 15 3585, and Huawei MateBook D.
More Asus reviews:
Rating | Date | Model | Weight | Height | Size | Resolution | Price |
|---|---|---|---|---|---|---|---|
| 73.1 % v7 (old) | 04 / 2020 | Asus Vivobook 15 F512DA-SH31 R3 3200U, Vega 3 | 1.8 kg | 19.9 mm | 15.60" | 1920x1080 | |
| 79.4 % v7 (old) | 03 / 2020 | Lenovo Ideapad S340-15IIL i7-1065G7, Iris Plus Graphics G7 (Ice Lake 64 EU) | 1.8 kg | 17.9 mm | 15.60" | 1920x1080 | |
| 78.4 % v7 (old) | 11 / 2019 | Acer Aspire 5 A515-43-R6WW R5 3500U, Vega 8 | 1.8 kg | 18 mm | 15.60" | 1920x1080 | |
| 77.6 % v6 (old) | 06 / 2019 | Dell Inspiron 15 3585 (2300U, Vega 6) R3 2300U, Vega 6 | 1.9 kg | 20 mm | 15.60" | 1920x1080 | |
| 85.2 % v7 (old) | 03 / 2020 | Huawei MateBook D 15-53010TUY R5 3500U, Vega 8 | 1.5 kg | 16.9 mm | 15.60" | 1920x1080 |
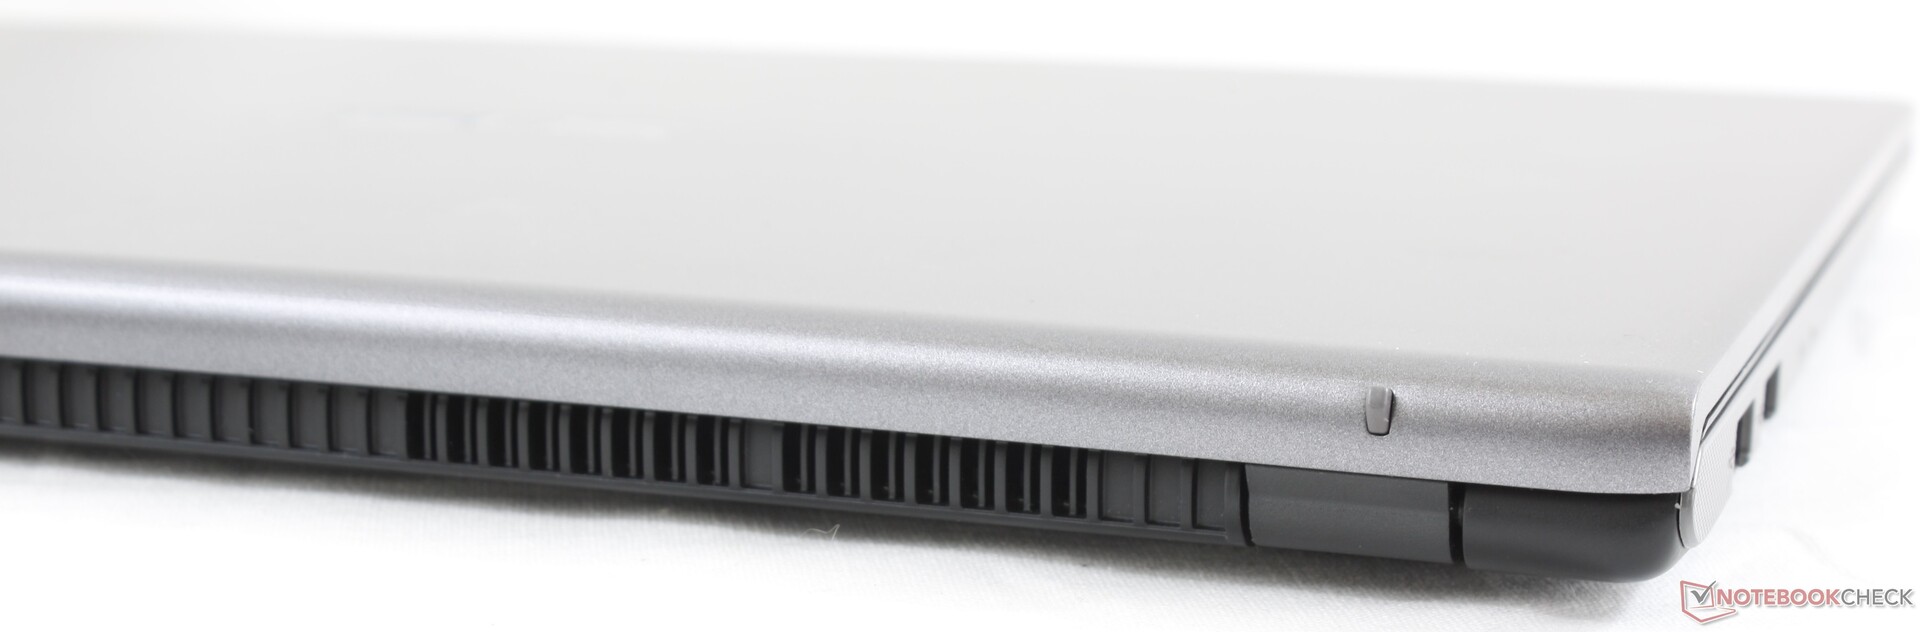
Case
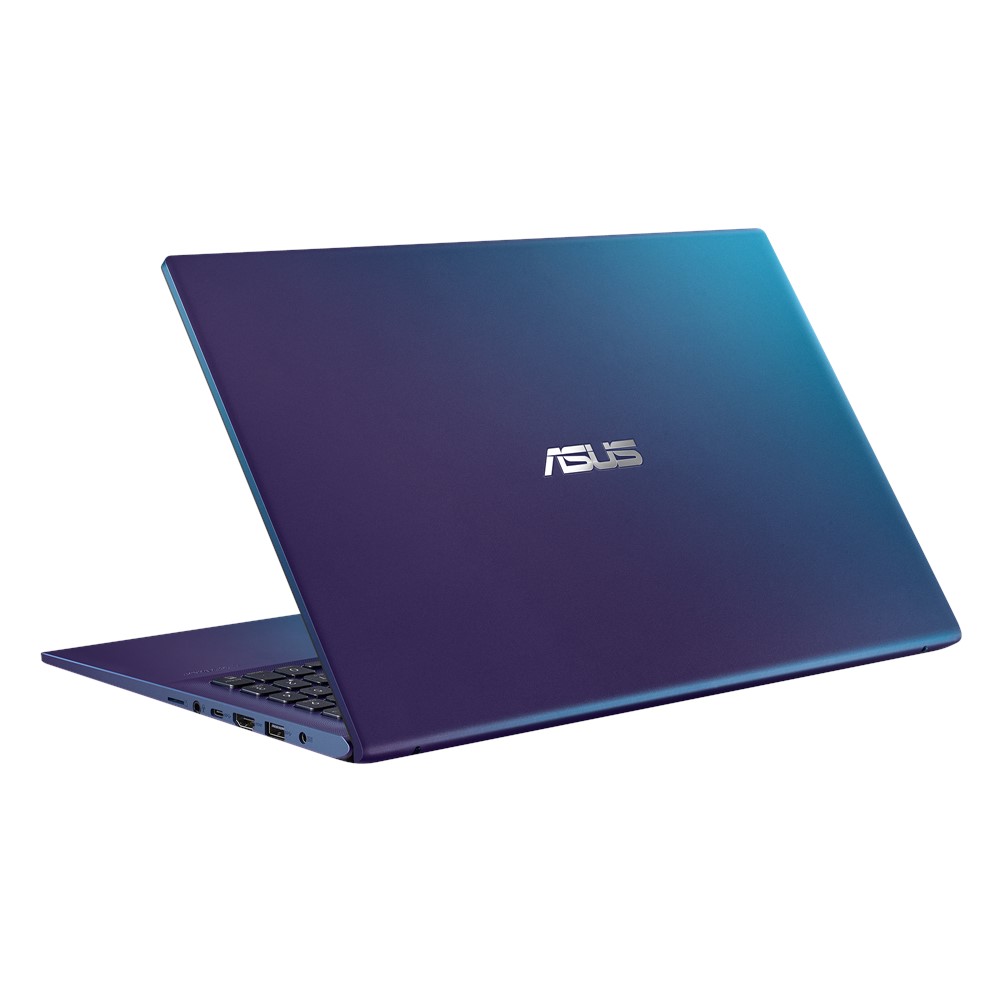
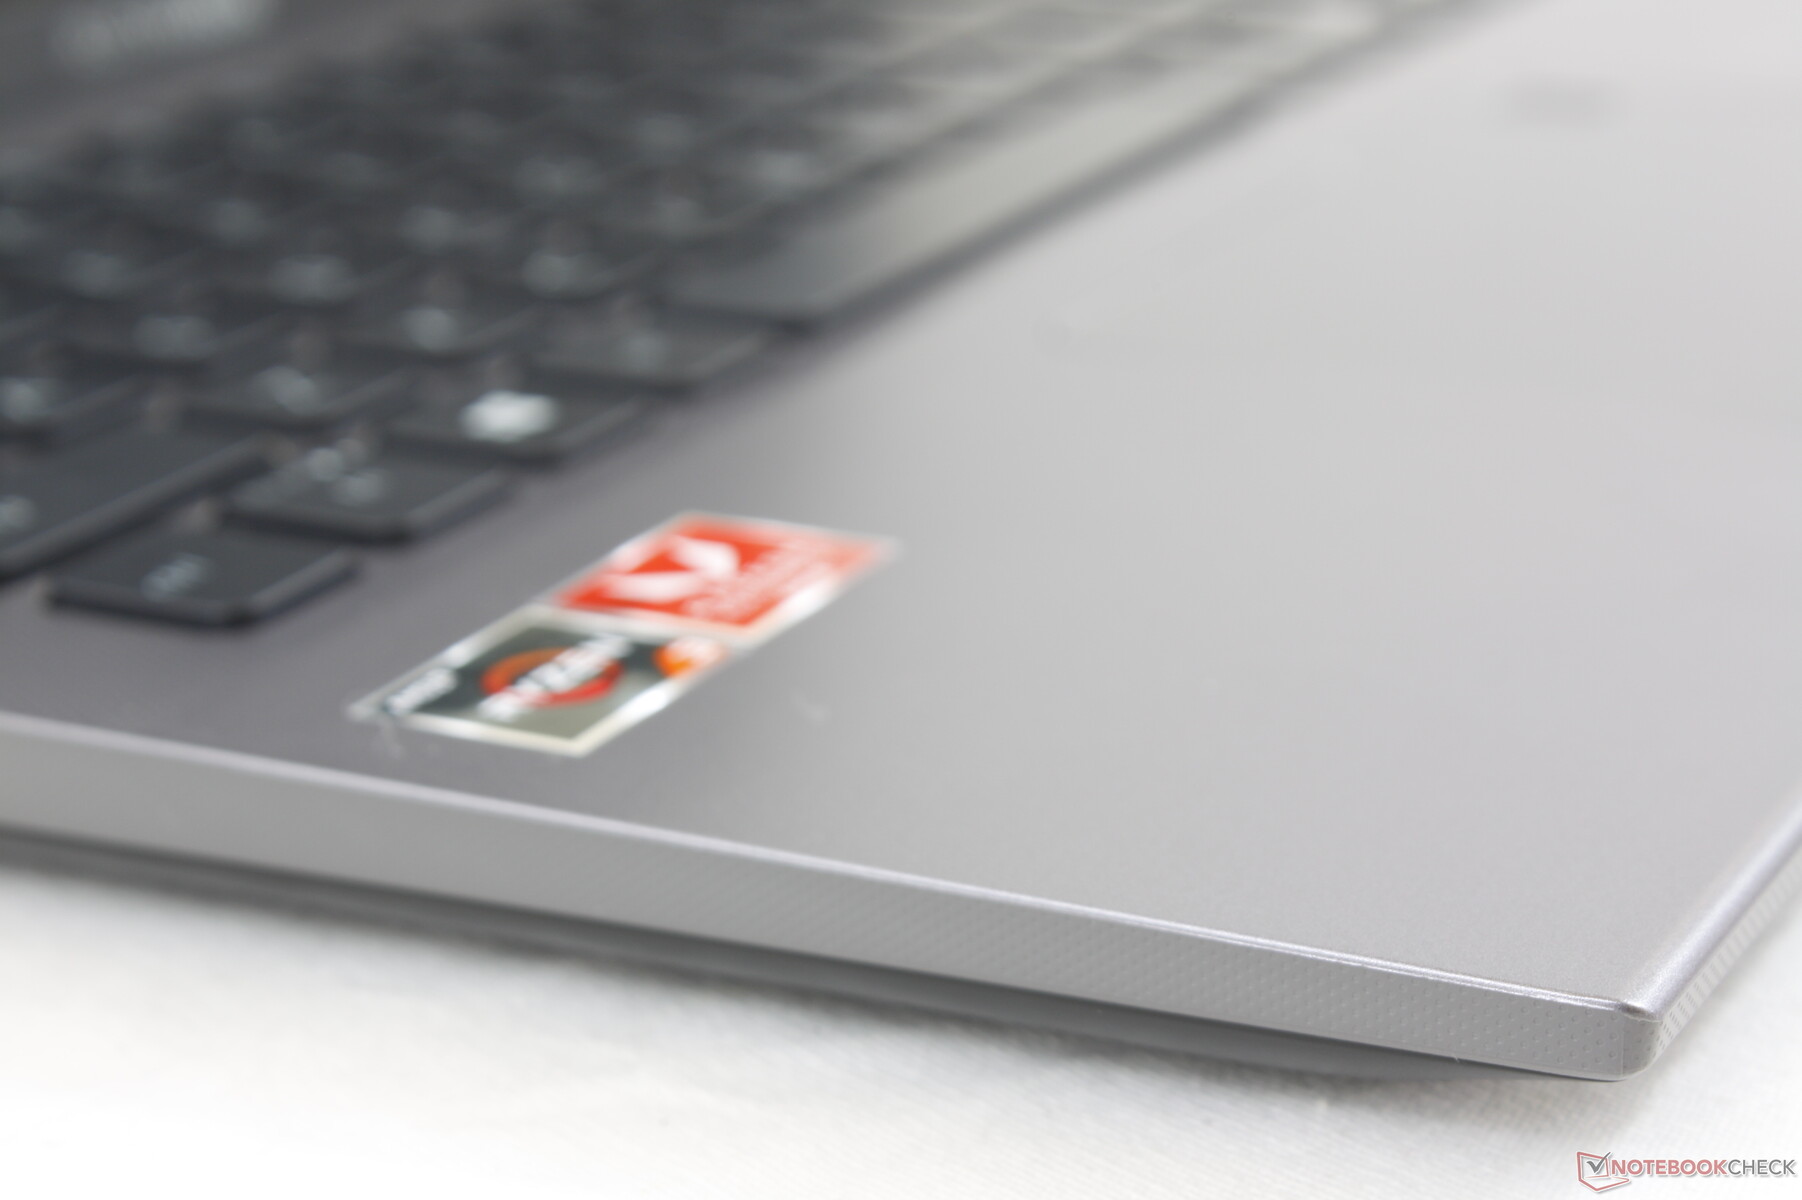
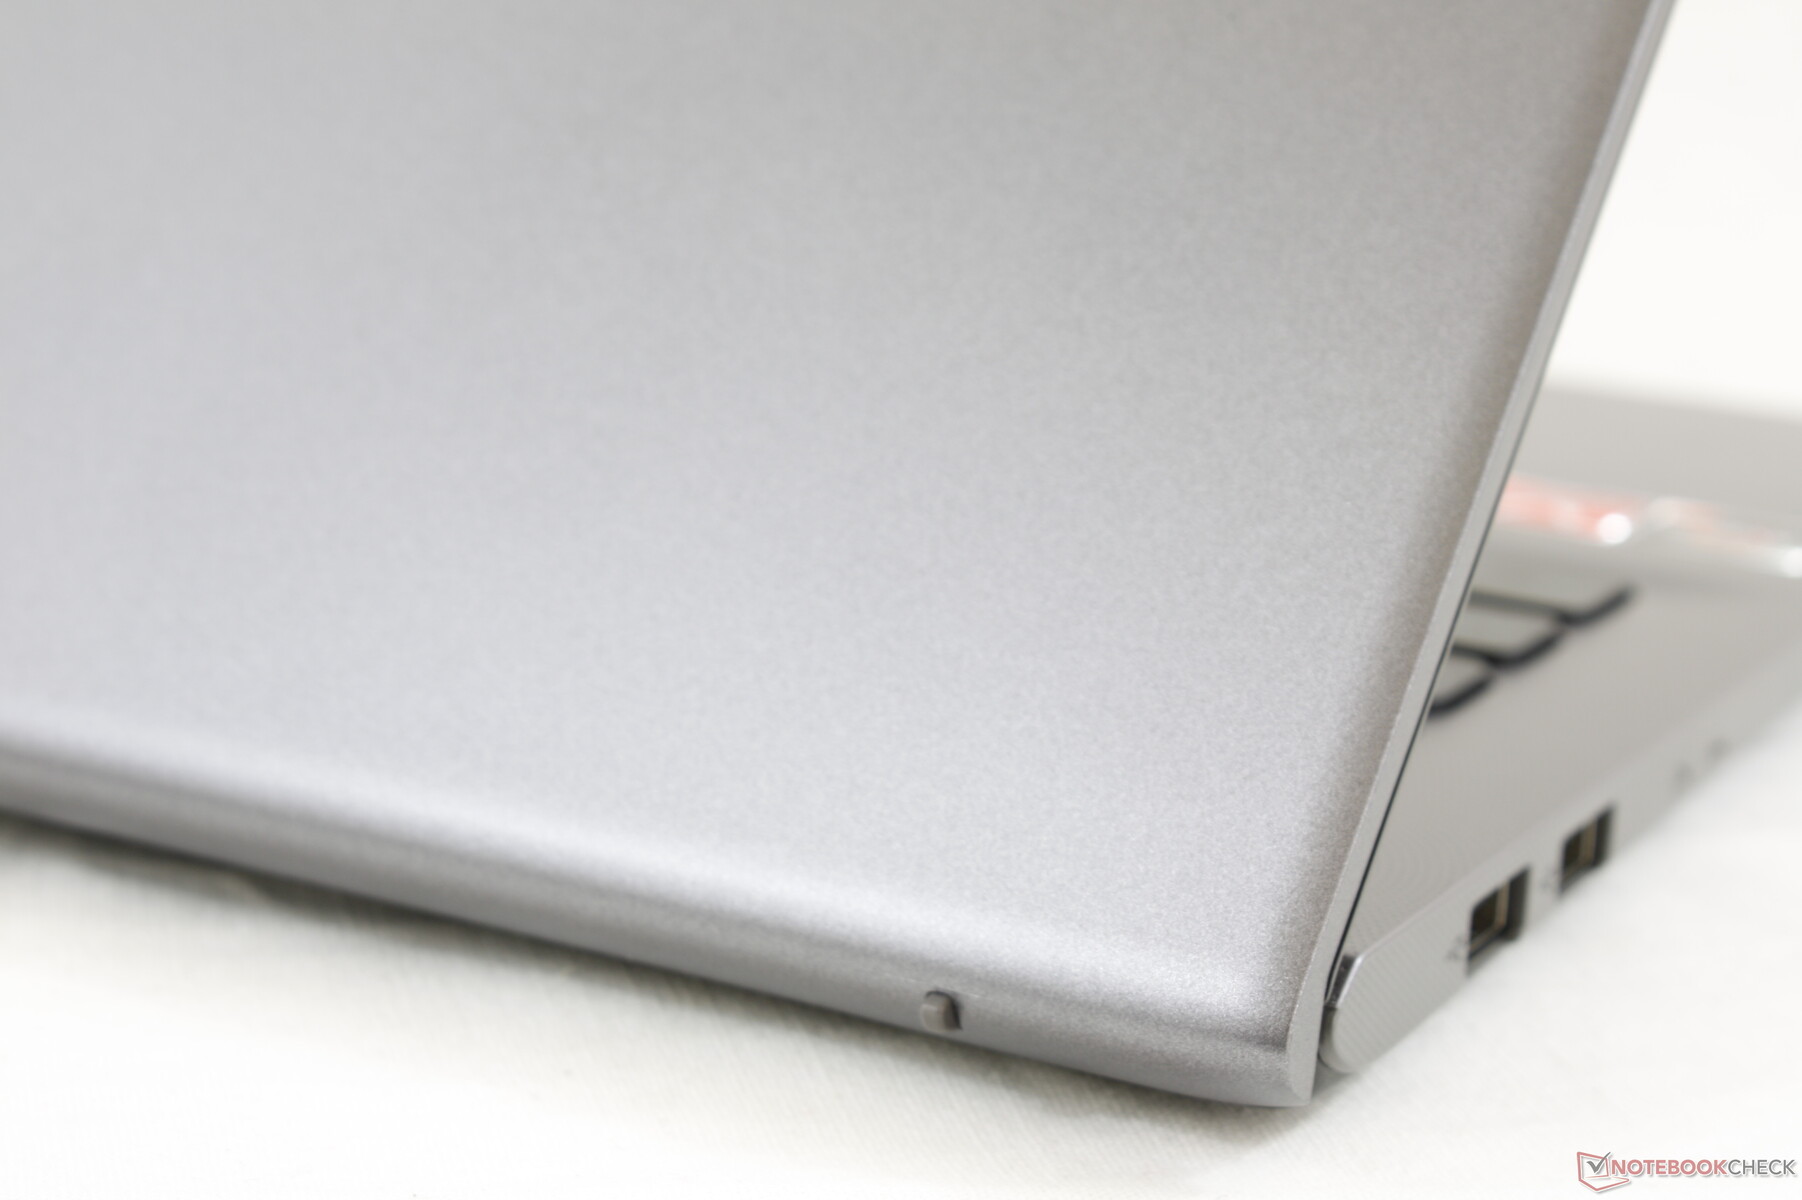
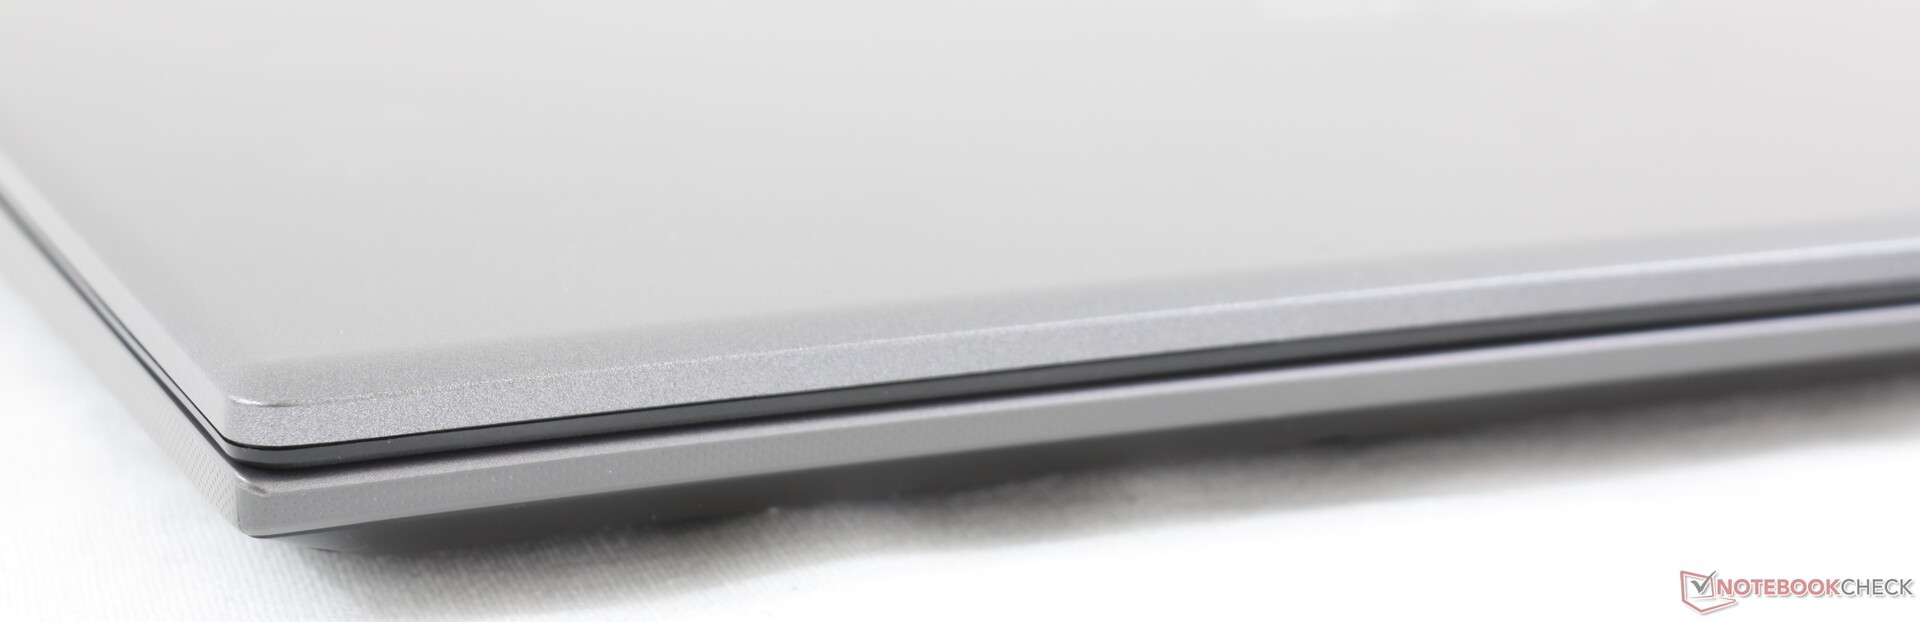
The chassis skeleton is essentially identical to the VivoBook S15 S532 albeit without the ScreenPad. Thus, many of our existing comments on the S532 chassis apply here on the F512. The lid, however, is flimsier than expected as it flexes more easily when twisting it from the corners. The base is comparatively more rigid with only slight flexing and creaking despite the plastic materials.


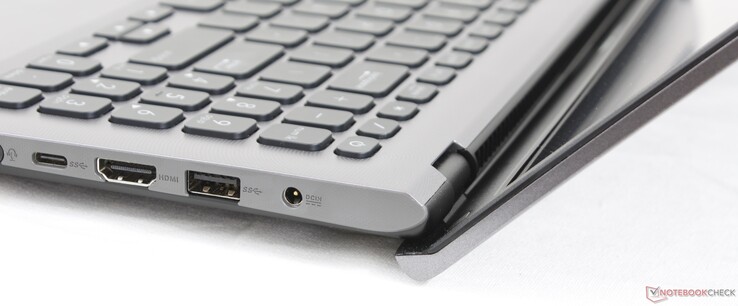
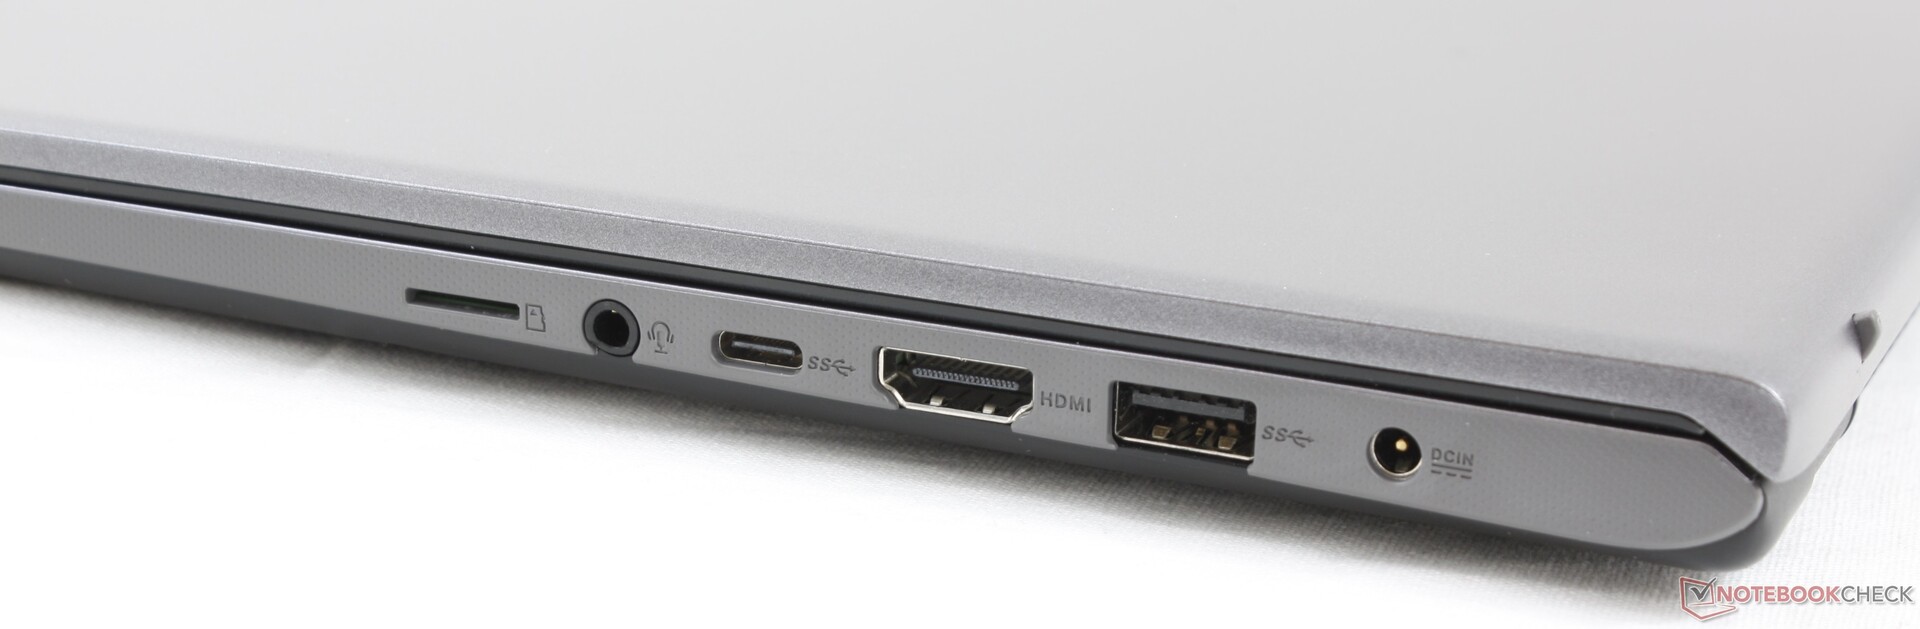
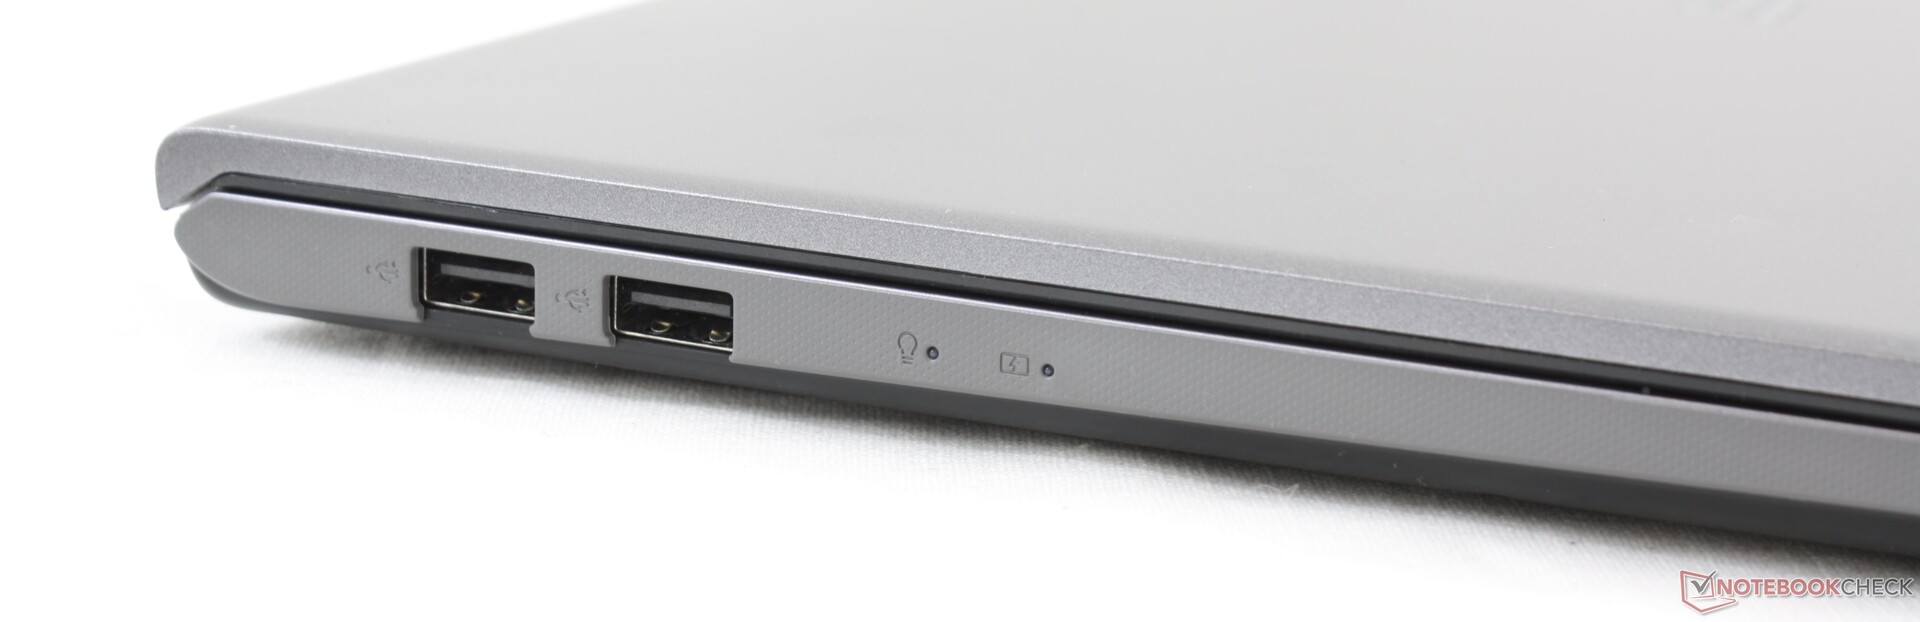
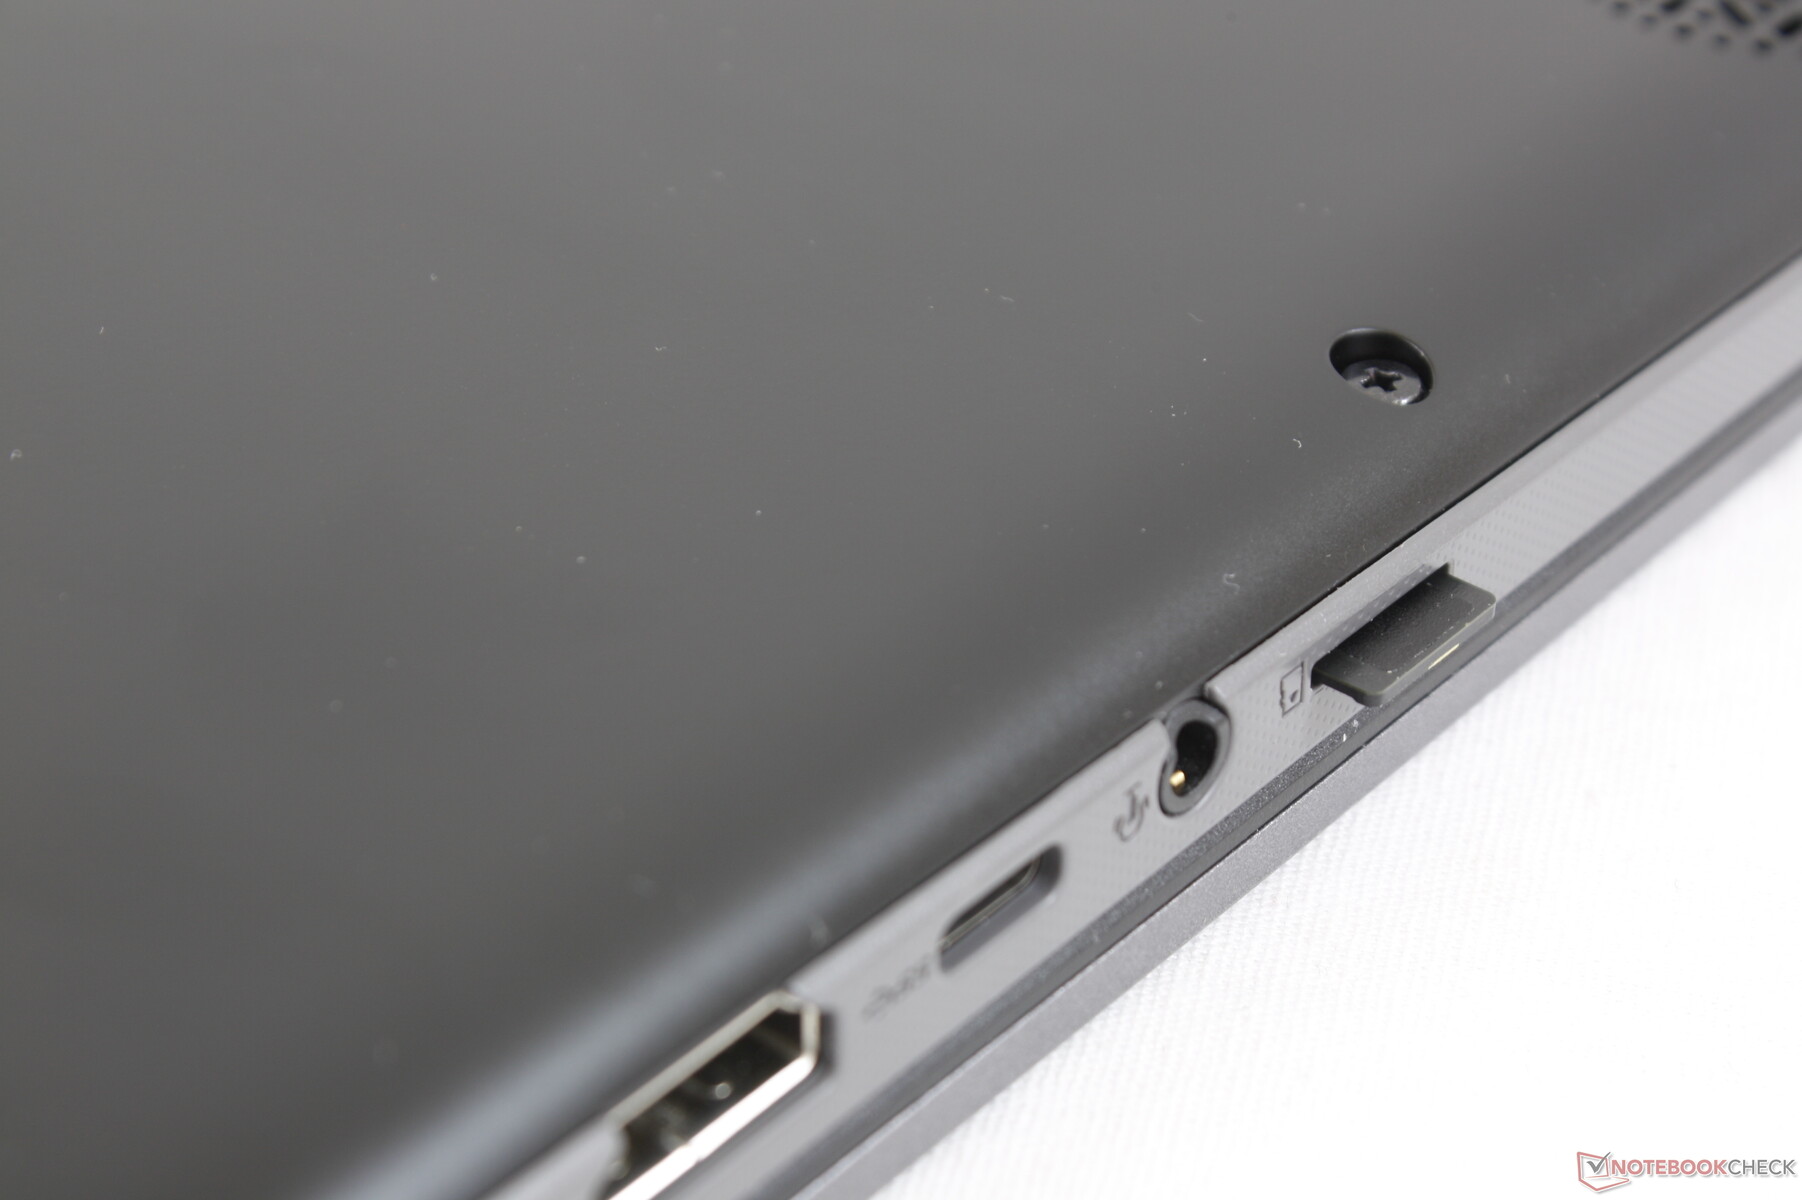
Connectivity
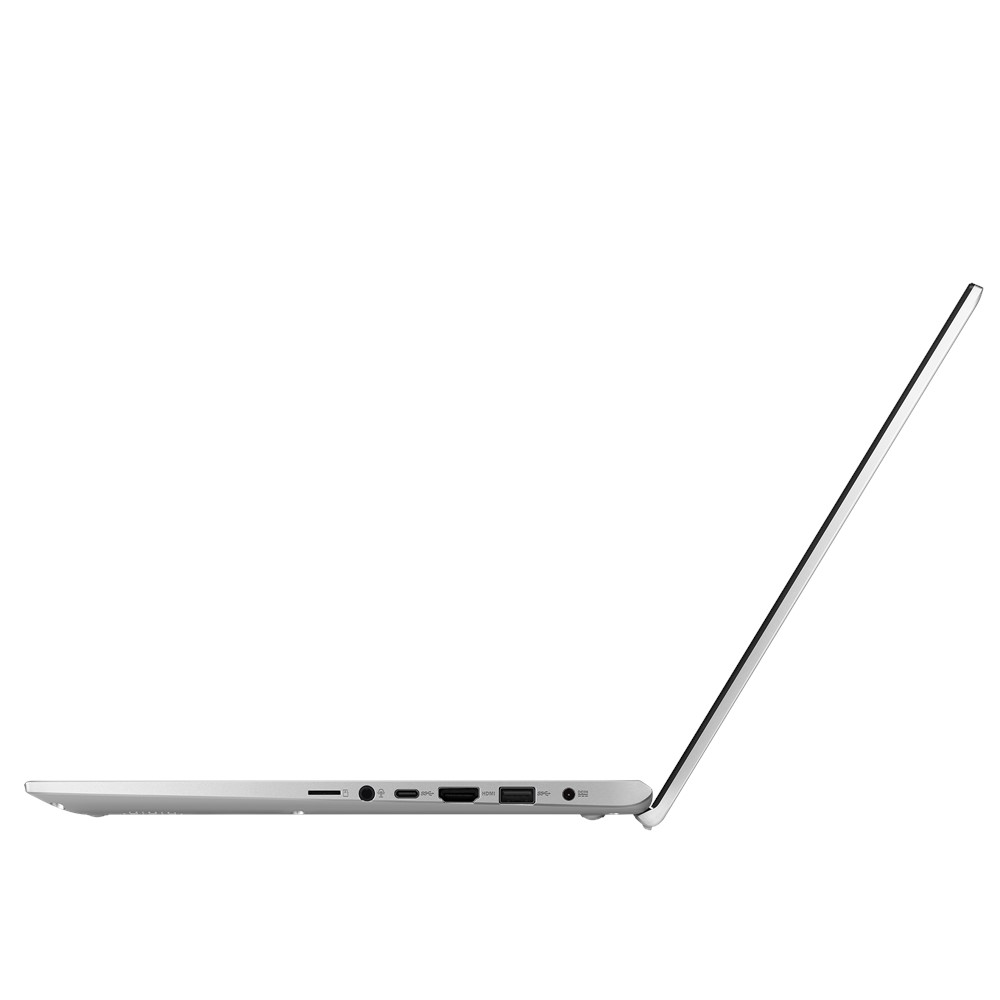
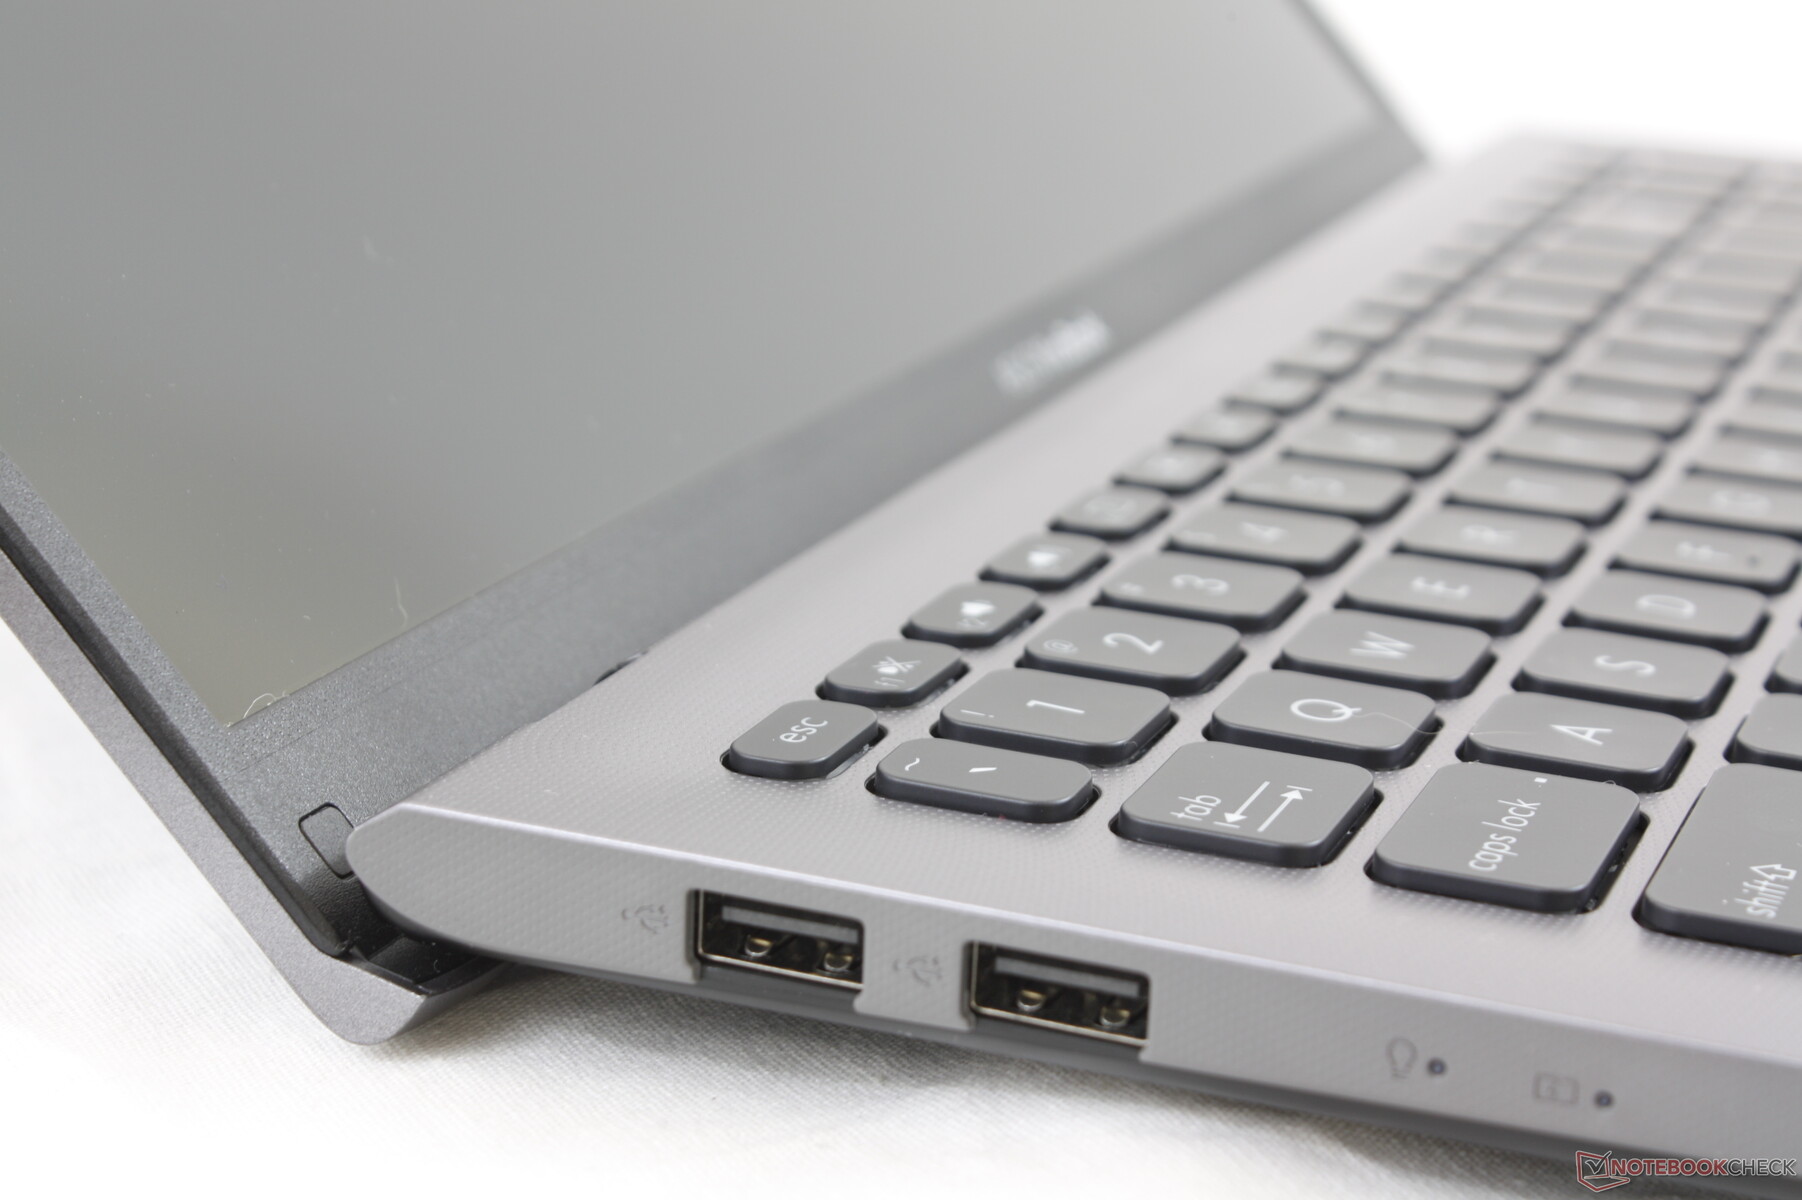
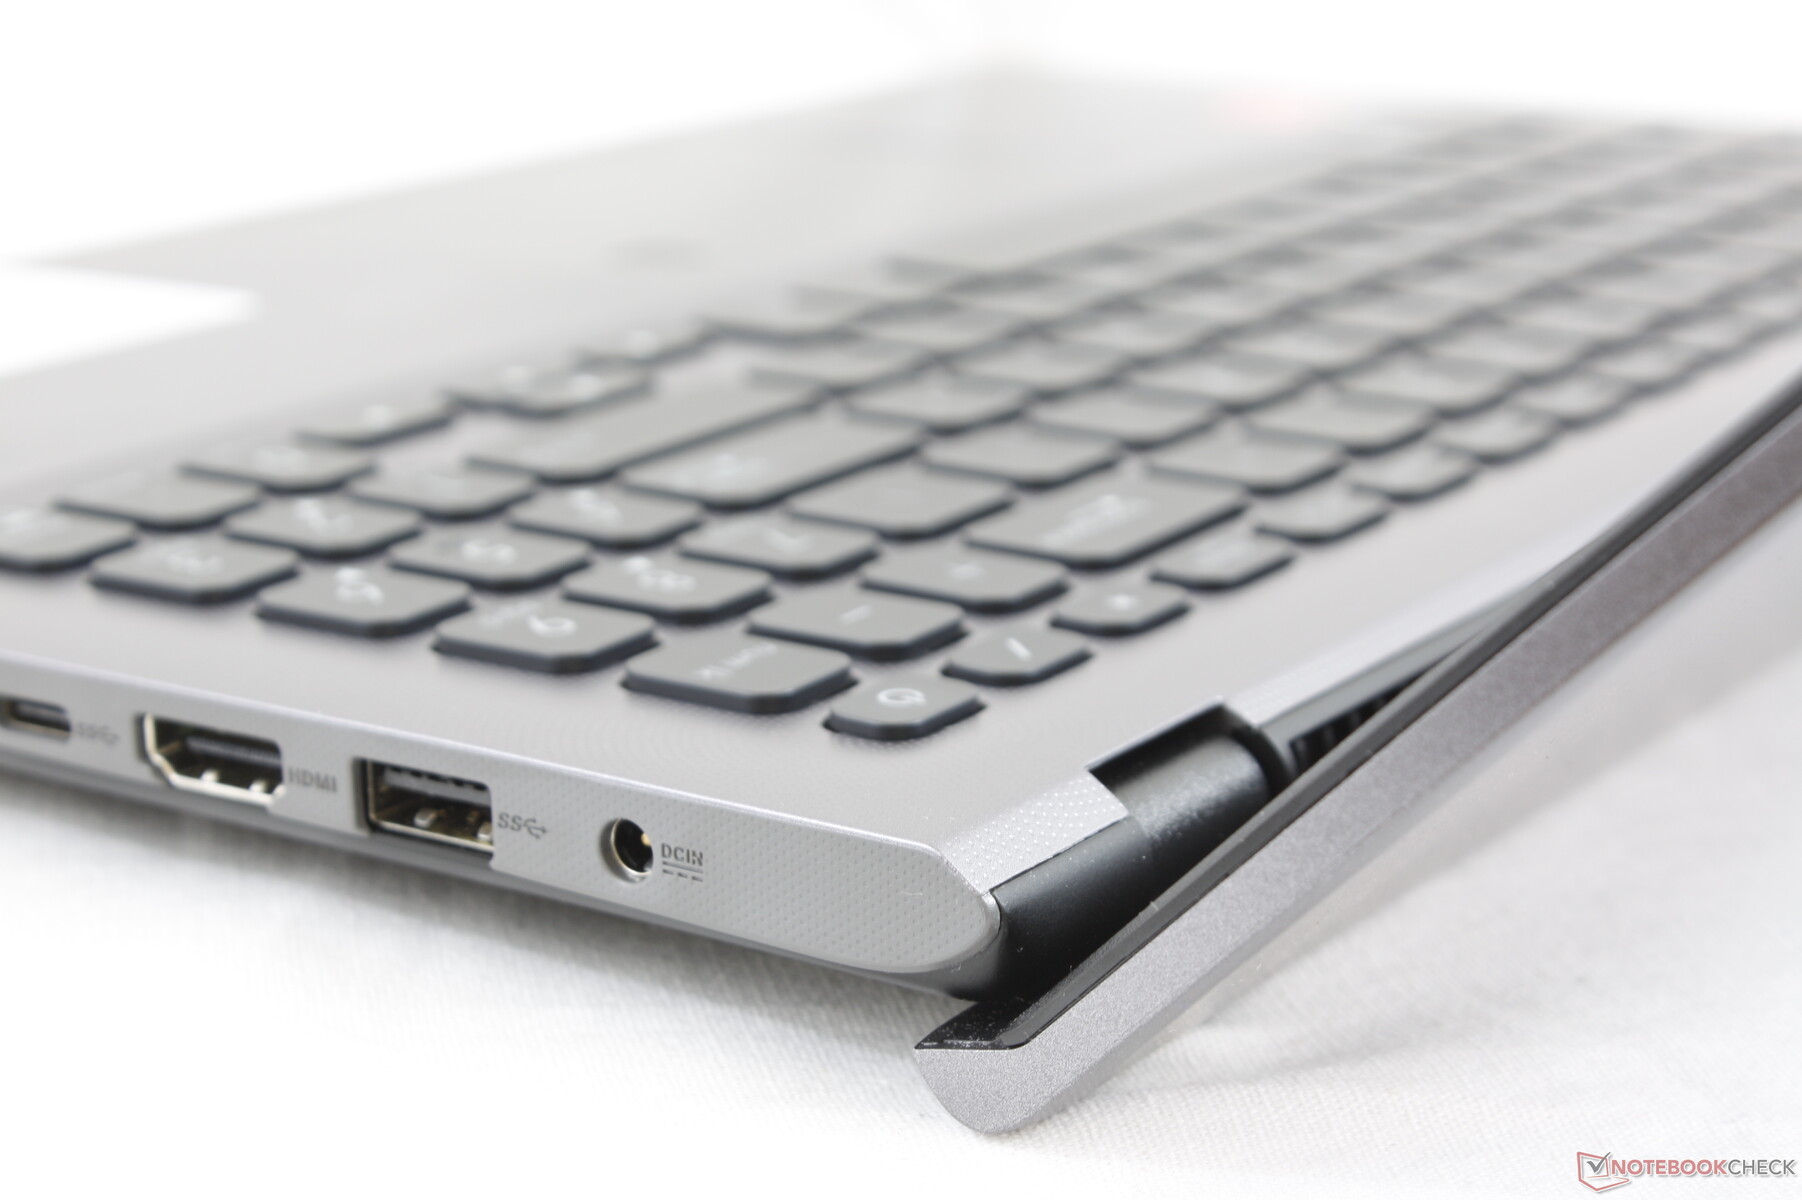
Port options are identical to the VivoBook S15 S532. The HDMI and USB ports along the right edge have been swapped for reasons unknown, but port positioning is otherwise identical between the two Asus laptops. We would have preferred wider spacing between the ports since they can feel cramped.
SD Card Reader
| SD Card Reader | |
| average JPG Copy Test (av. of 3 runs) | |
| Dell XPS 15 9570 Core i9 UHD (Toshiba Exceria Pro SDXC 64 GB UHS-II) | |
| Lenovo Ideapad S340-15IIL (Toshiba Exceria Pro SDXC 64 GB UHS-II) | |
| Dell Inspiron 15 3585 (2300U, Vega 6) (Toshiba Exceria Pro SDXC 64 GB UHS-II) | |
| Asus Vivobook 15 F512DA-SH31 (Toshiba Exceria Pro M501 64 GB UHS-II) | |
| maximum AS SSD Seq Read Test (1GB) | |
| Dell XPS 15 9570 Core i9 UHD (Toshiba Exceria Pro SDXC 64 GB UHS-II) | |
| Lenovo Ideapad S340-15IIL (Toshiba Exceria Pro SDXC 64 GB UHS-II) | |
| Asus Vivobook 15 F512DA-SH31 (Toshiba Exceria Pro M501 64 GB UHS-II) | |
| Dell Inspiron 15 3585 (2300U, Vega 6) (Toshiba Exceria Pro SDXC 64 GB UHS-II) | |
Communication
The Intel 8265 with Bluetooth 4.2 come standard. The system appears to have issues maintaining high transfer rates with transmit rates in particular being especially low despite multiple retests with our Netgear RAX200 router. We otherwise experienced no connectivity issues when web browsing or video streaming.
Webcam


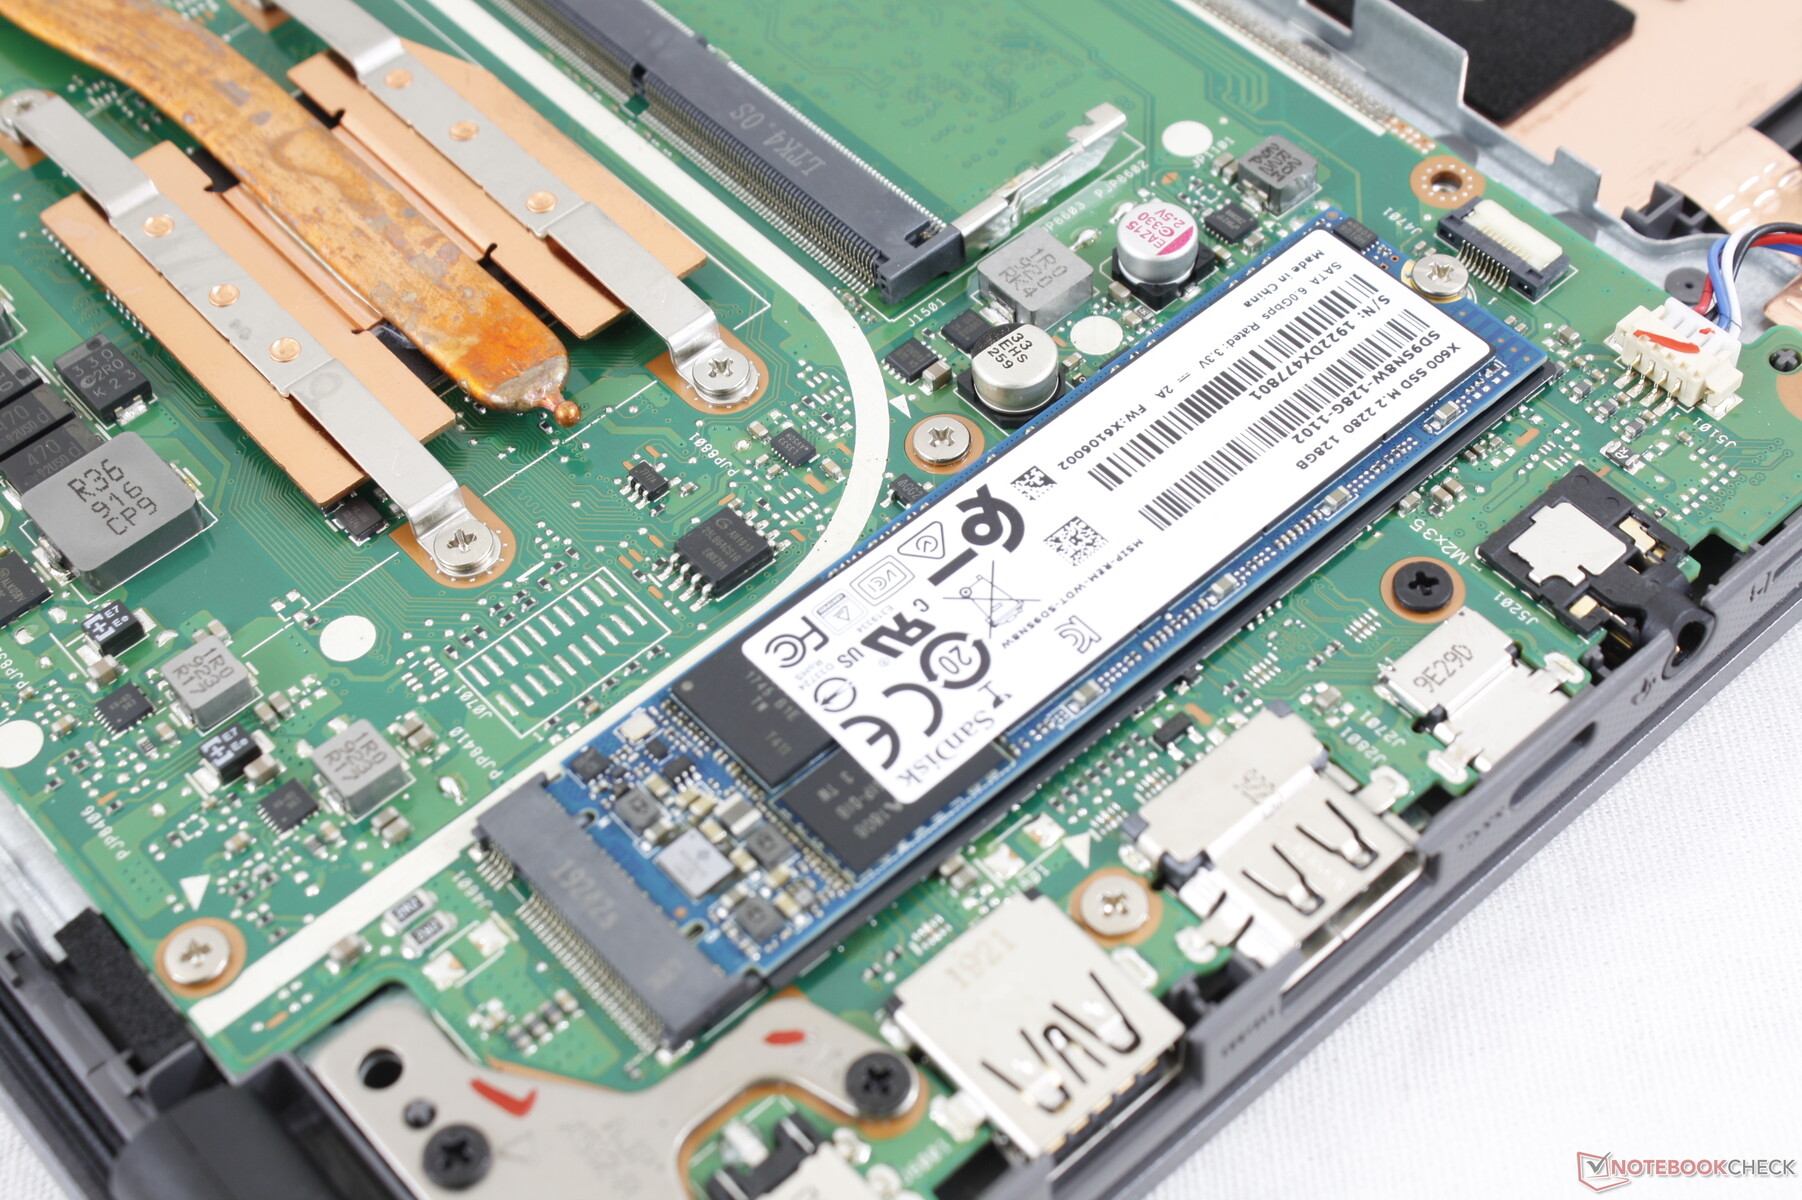
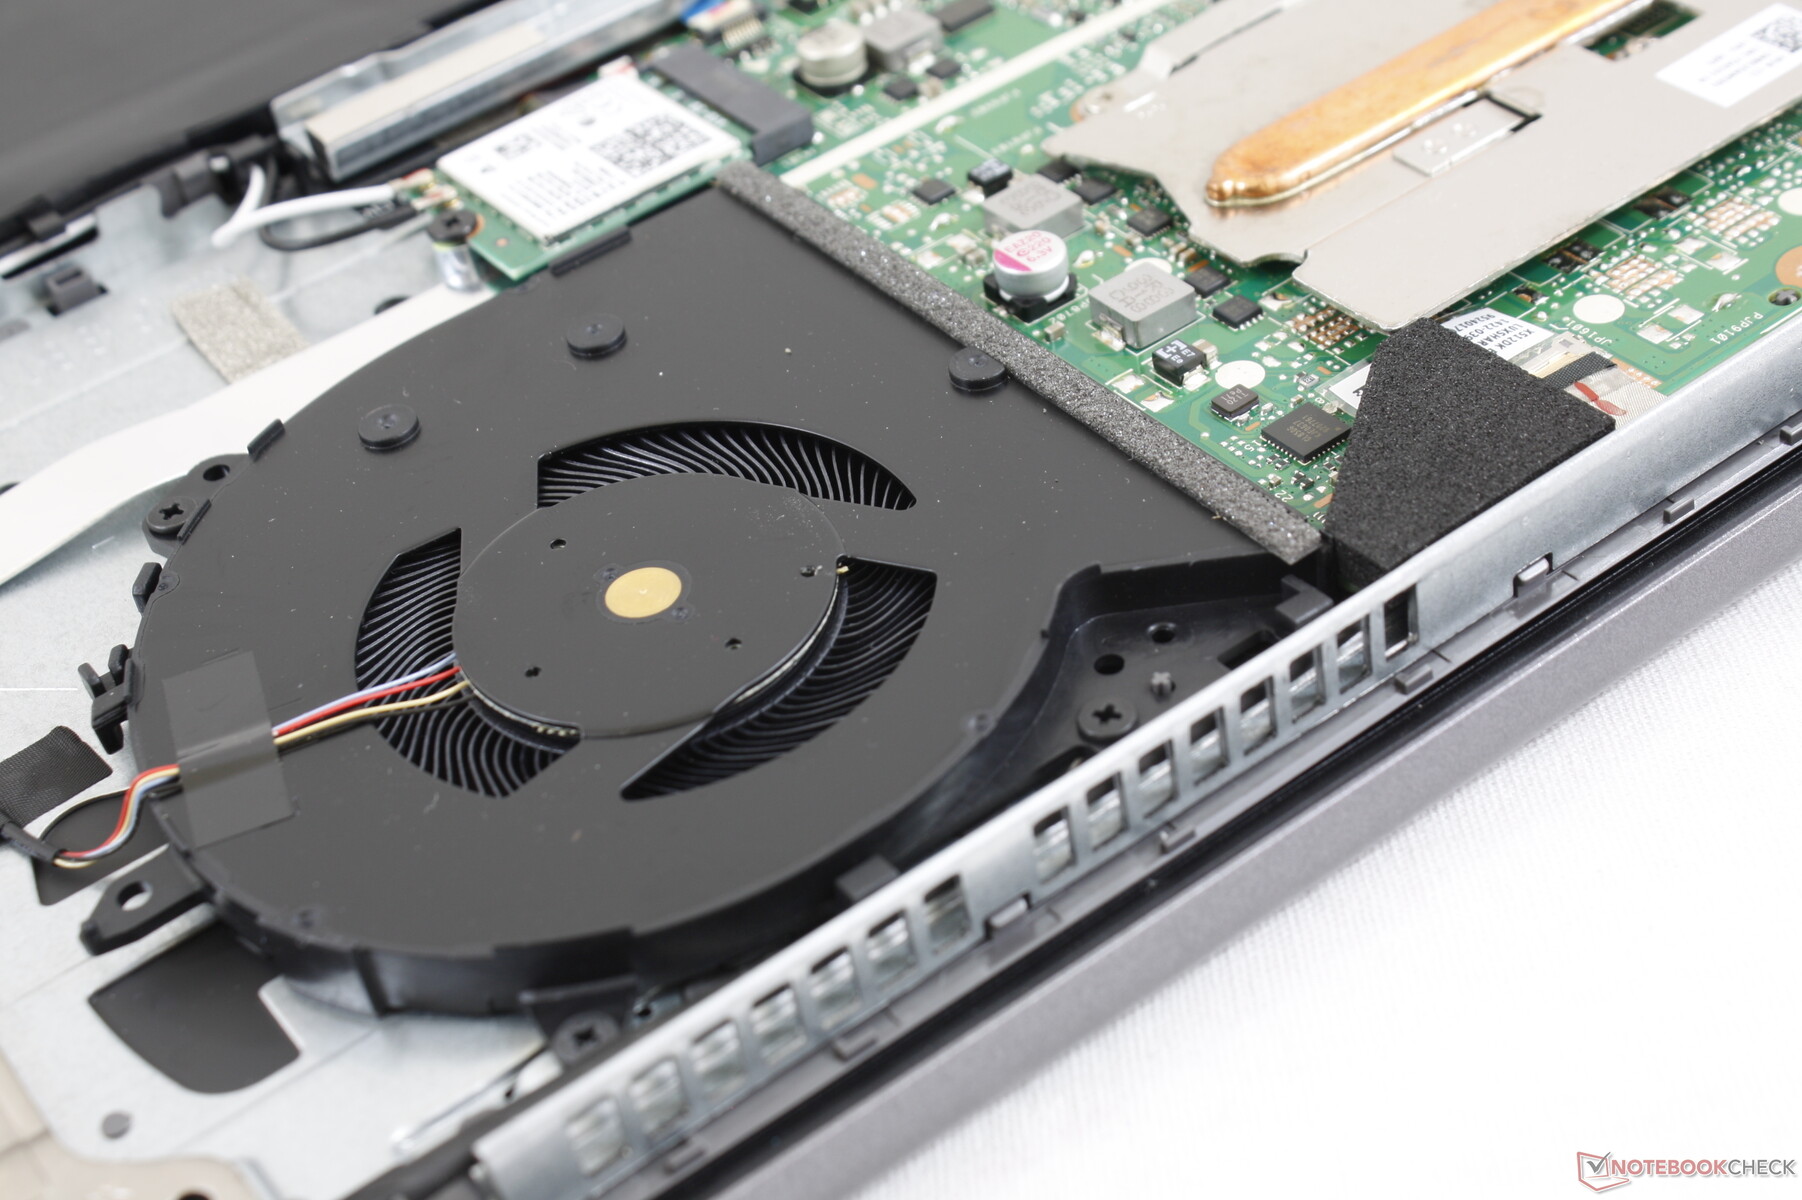
Maintenance
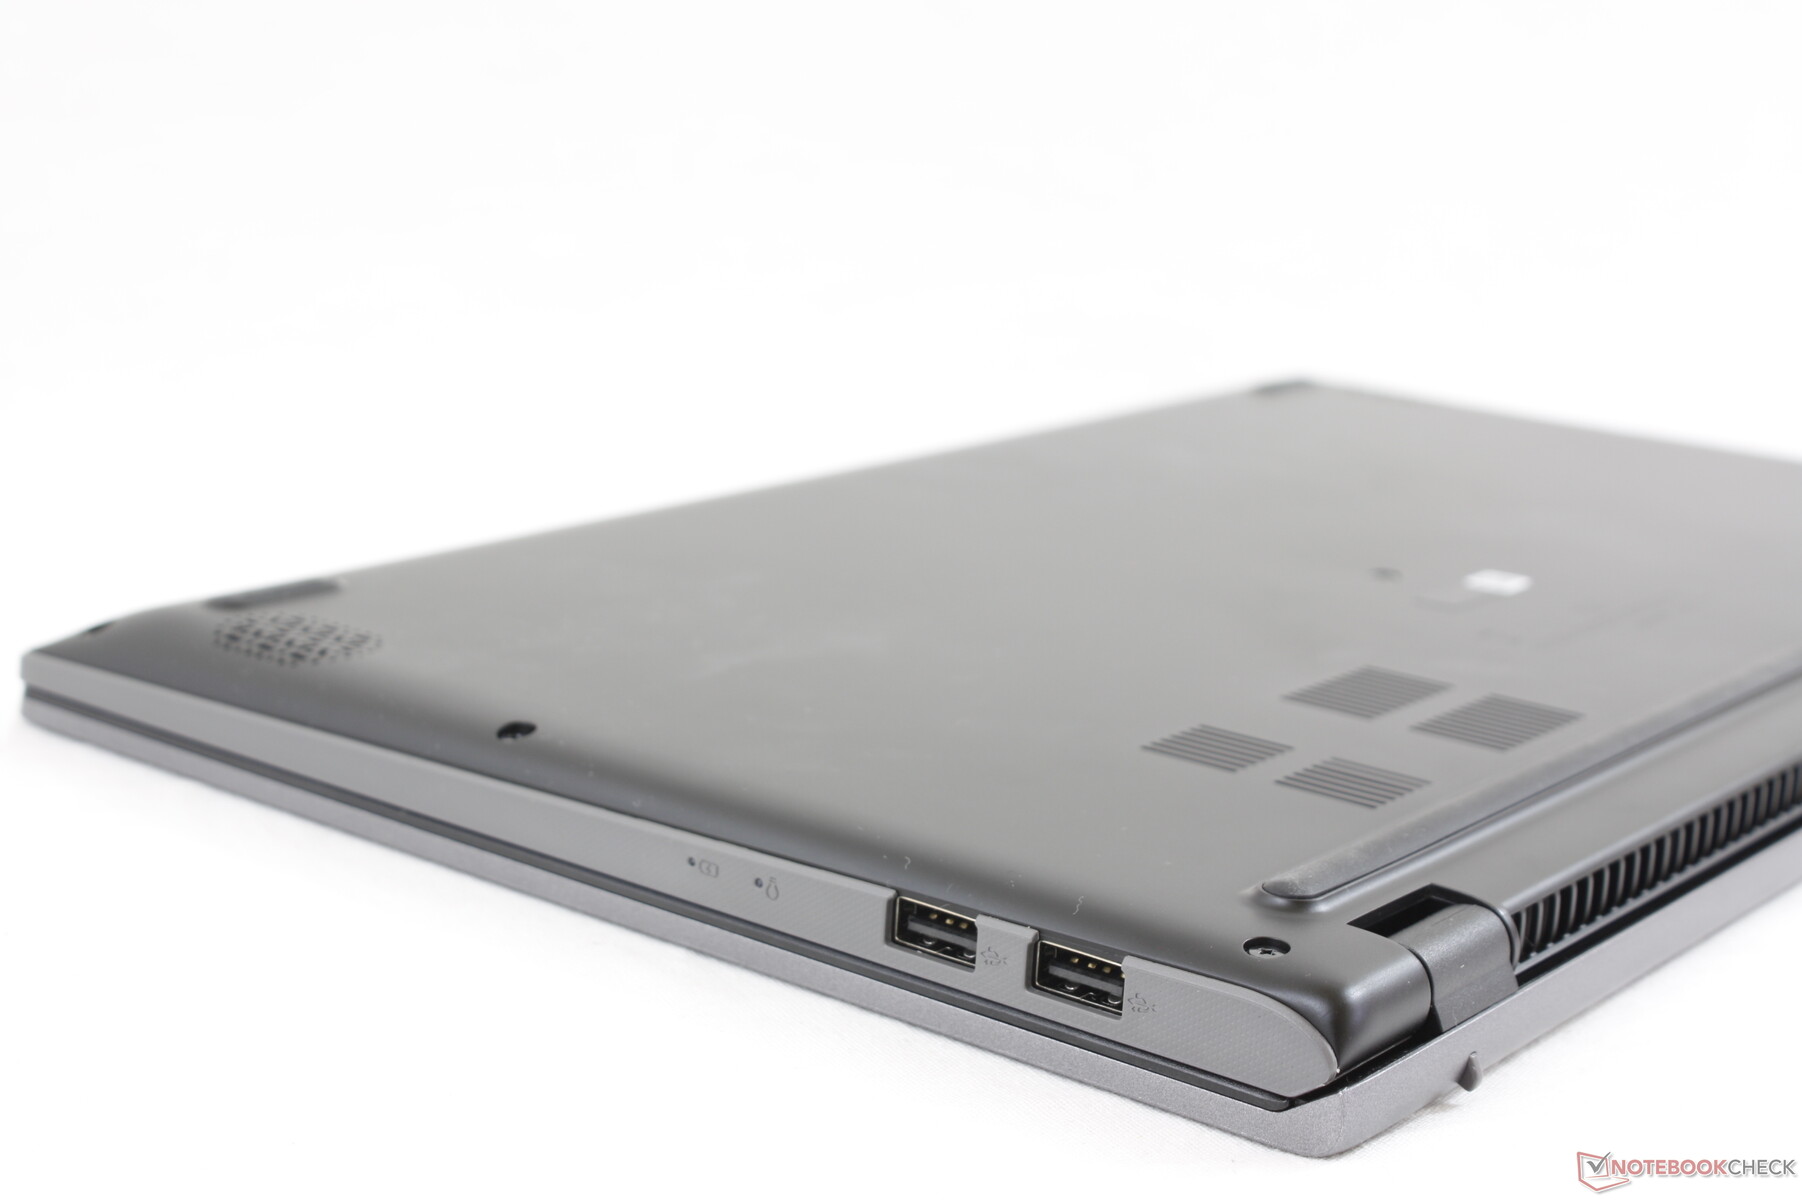
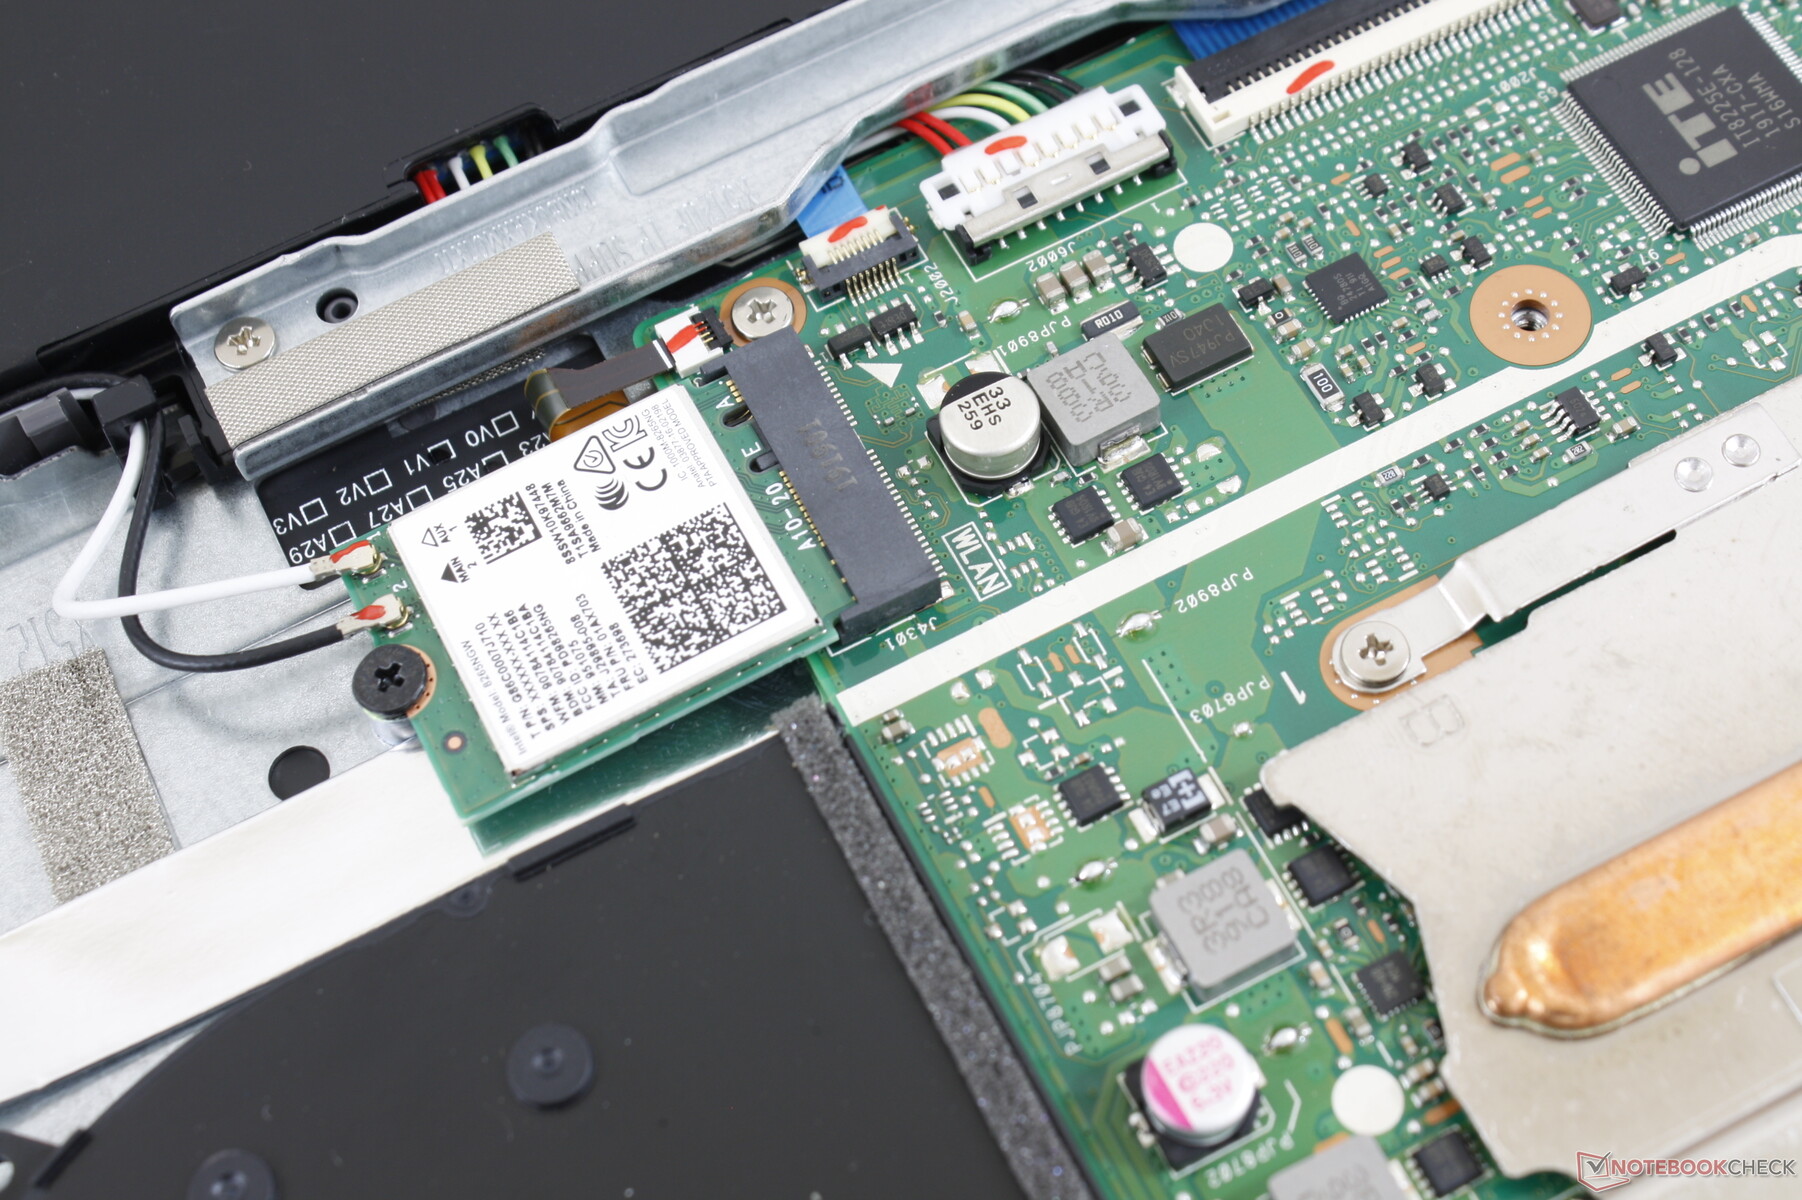
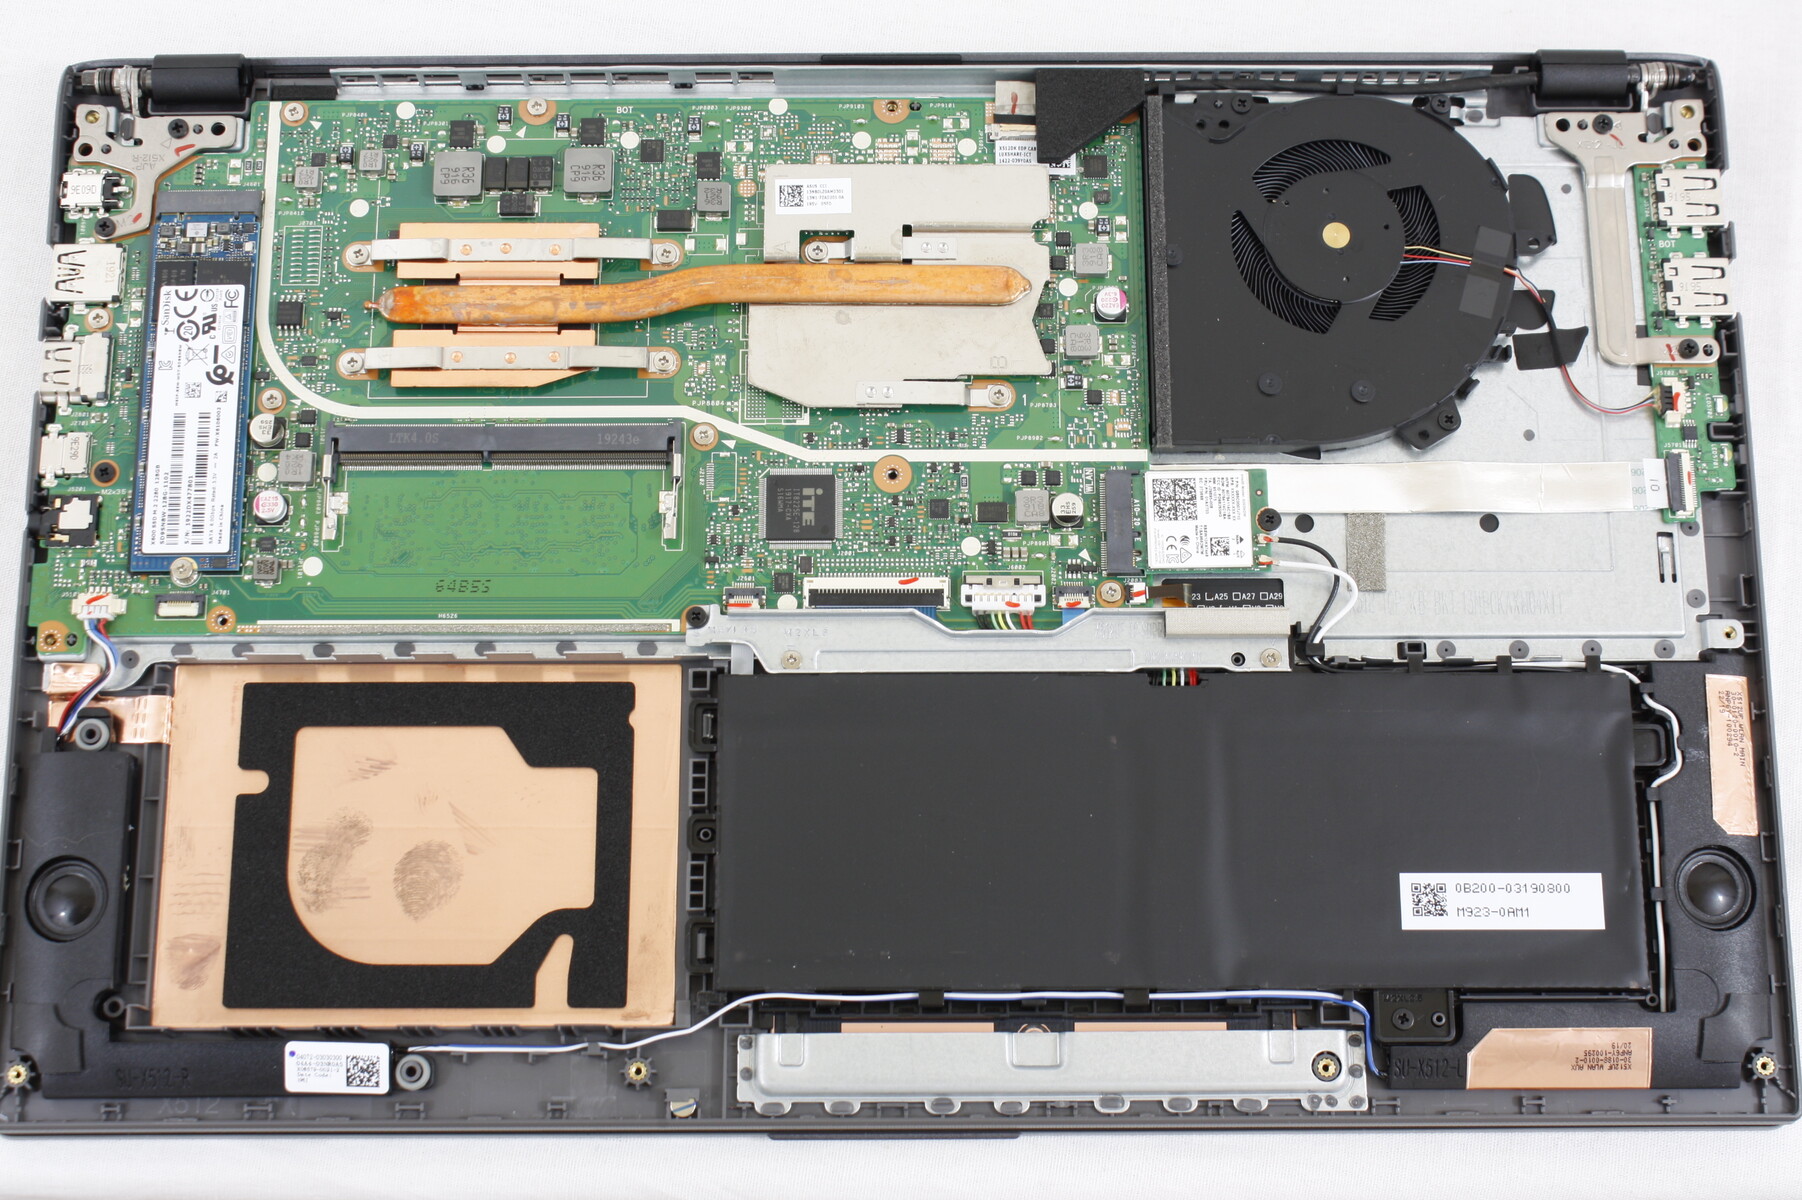
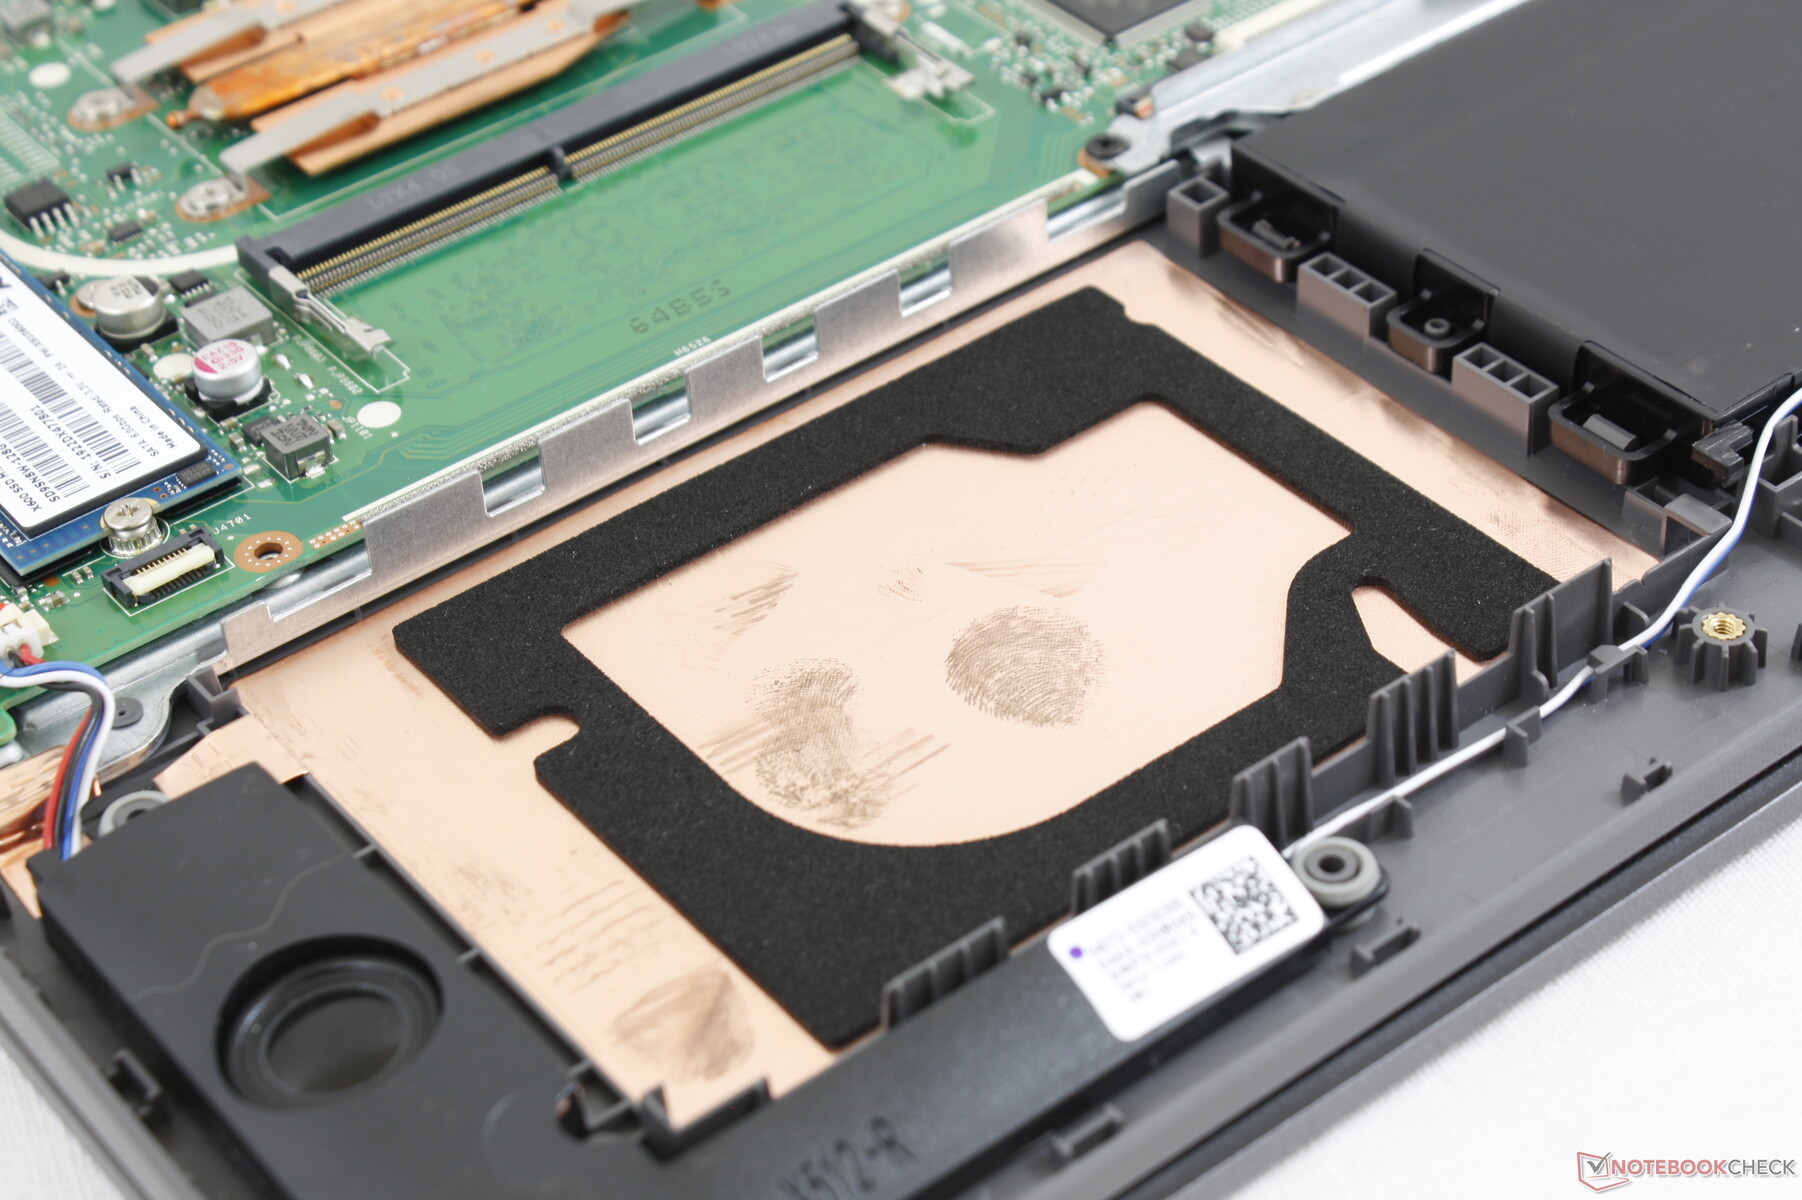
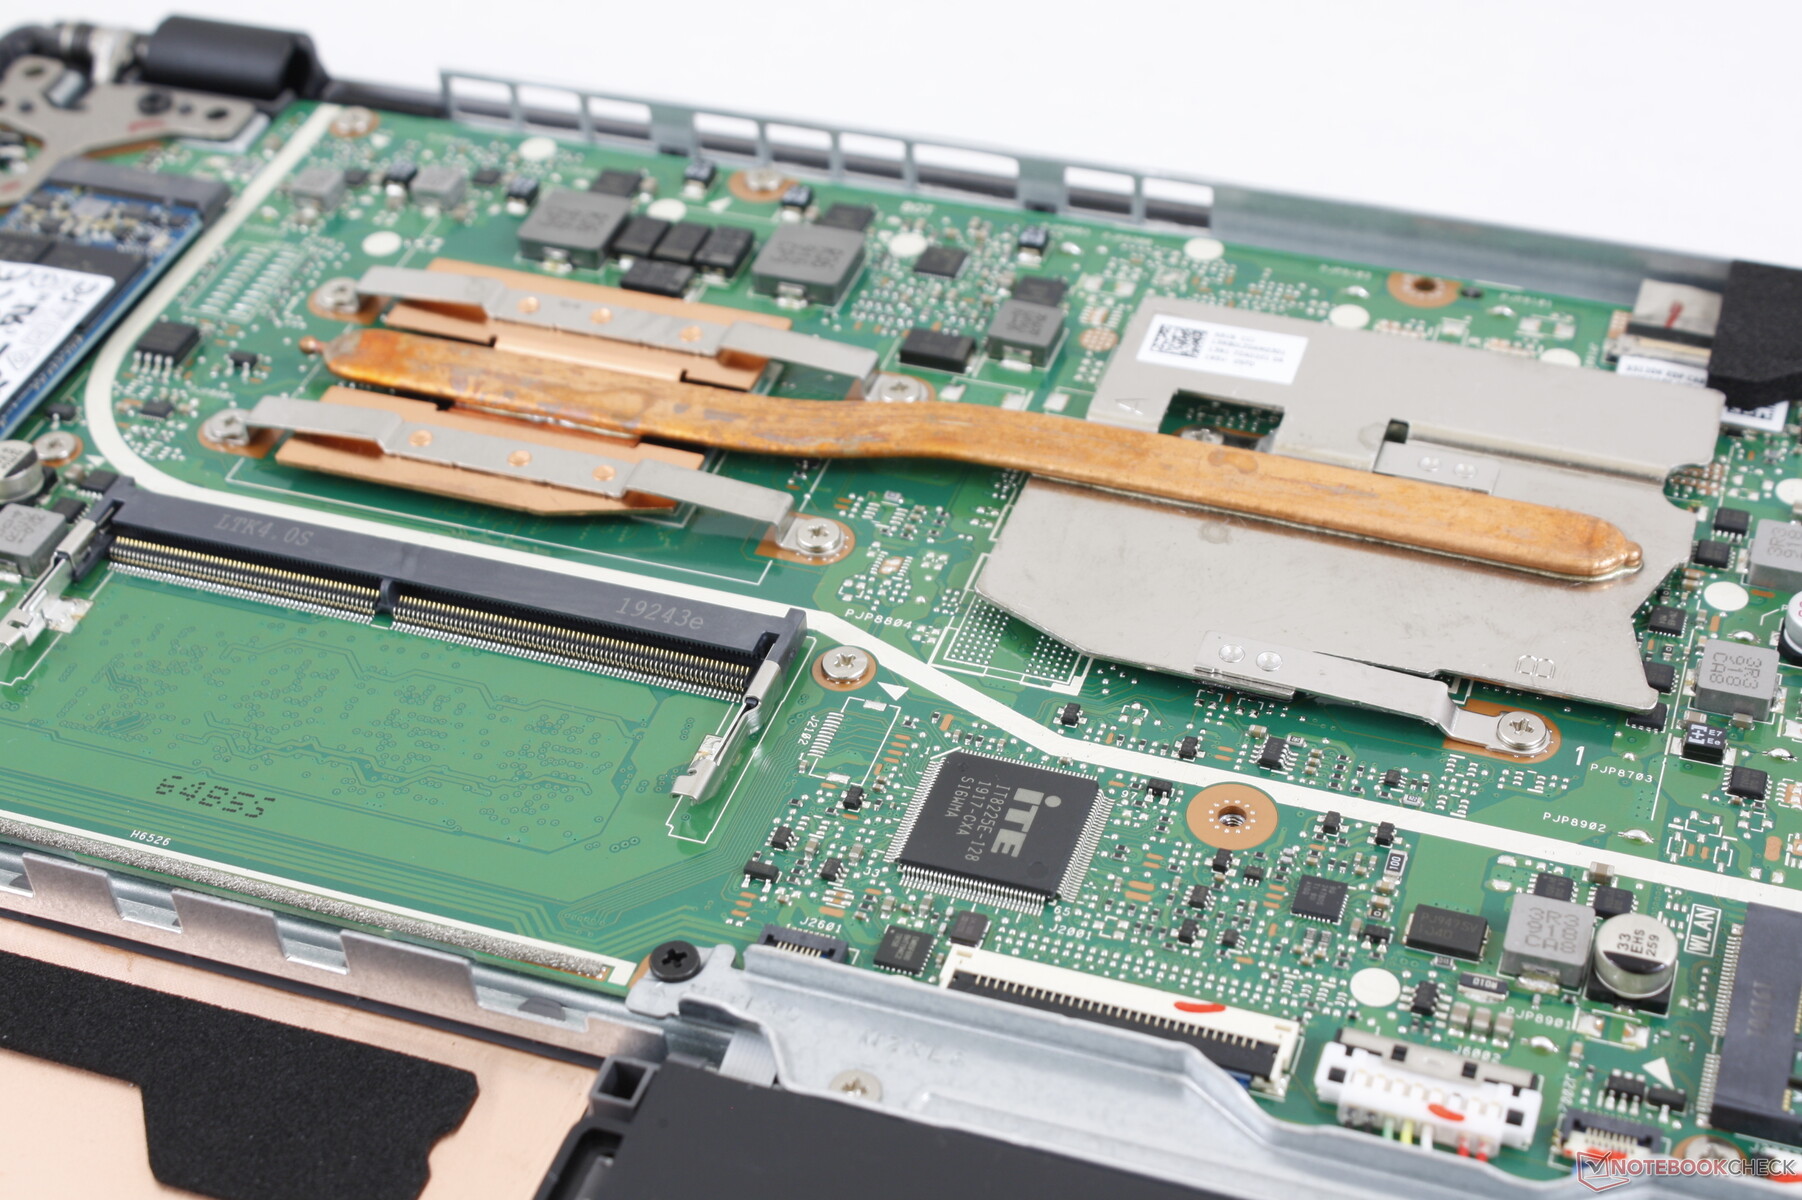
The bottom panel is easy to remove as it requires only a Philips screwdriver. Once inside, there is one SODIMM slot and one M.2 2280 slot. Note the large unused spaces next to the battery and system fan.
Accessories and Warranty
There are no extras in the box other than the AC adapter and paperwork. The standard one-year limited warranty applies.
Input Devices
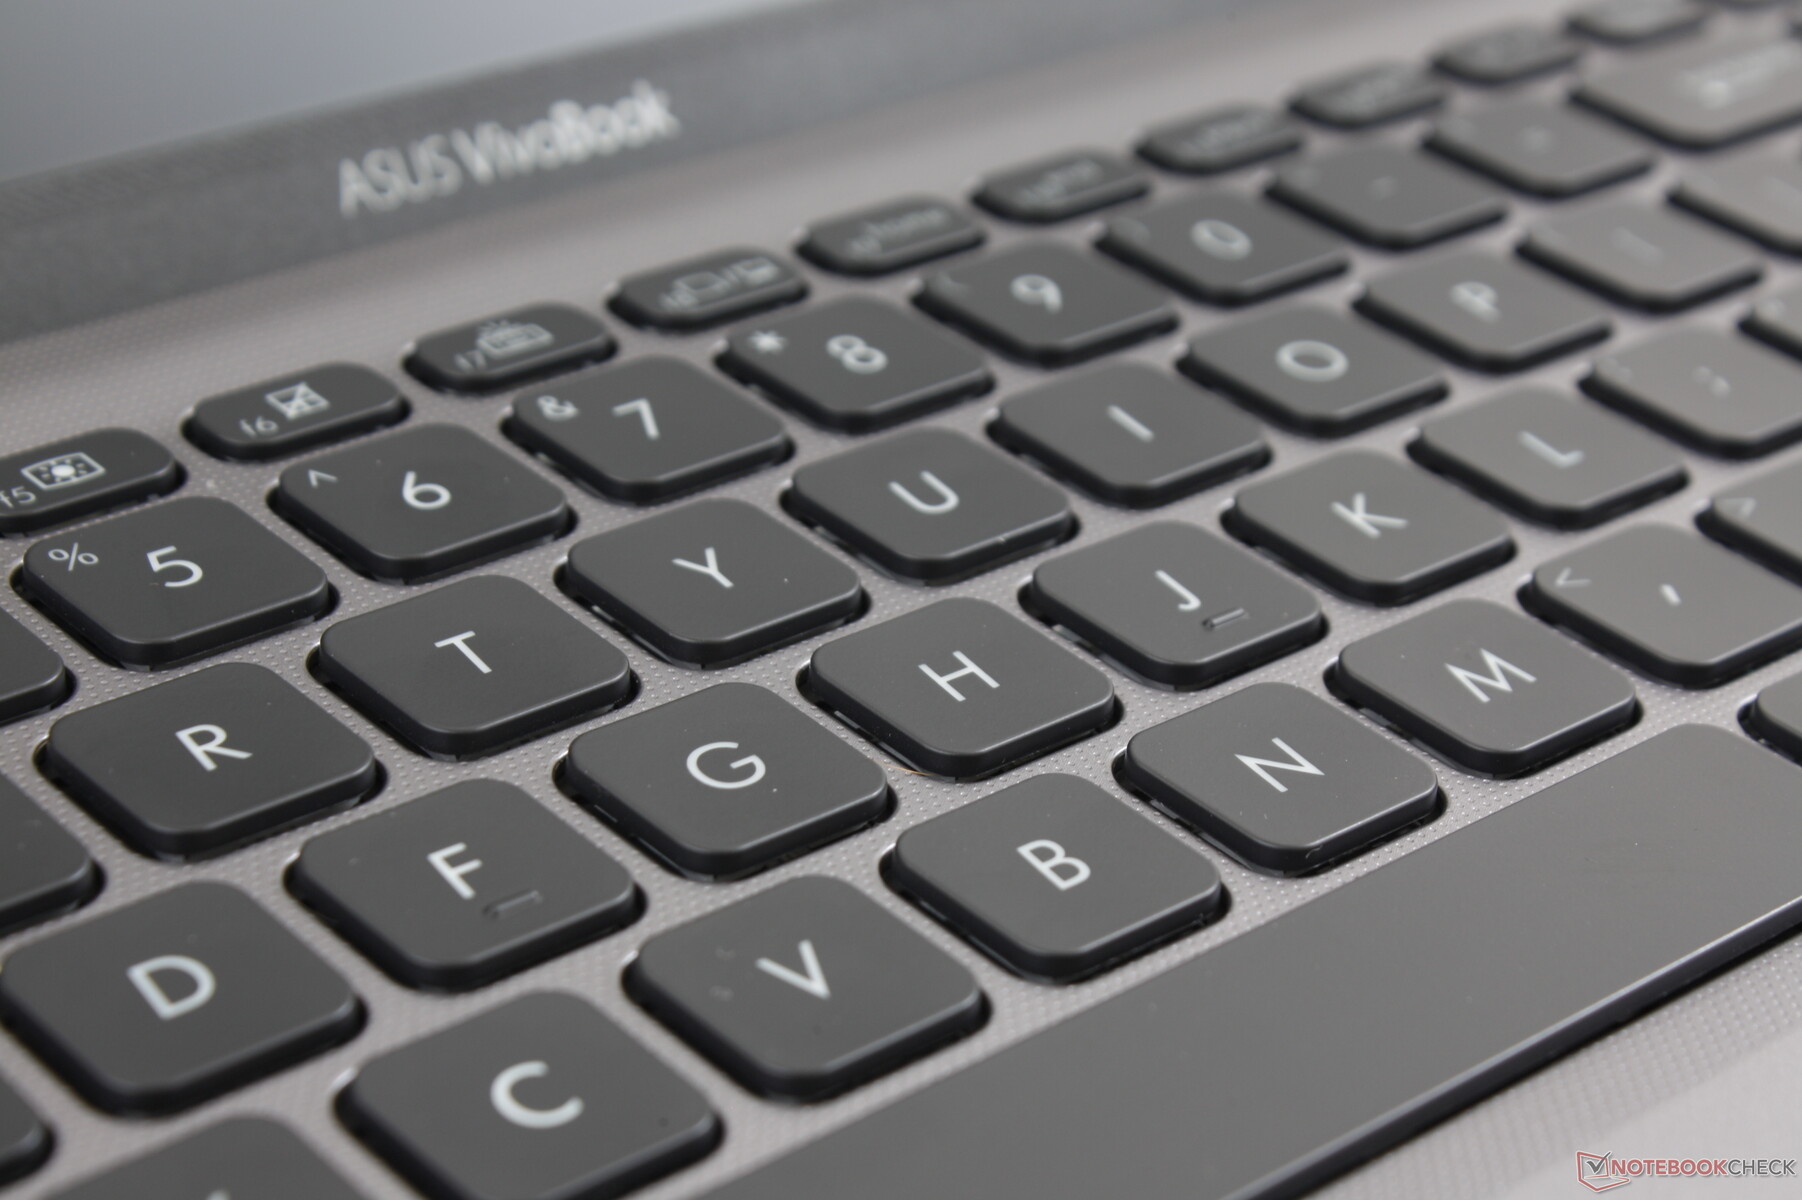
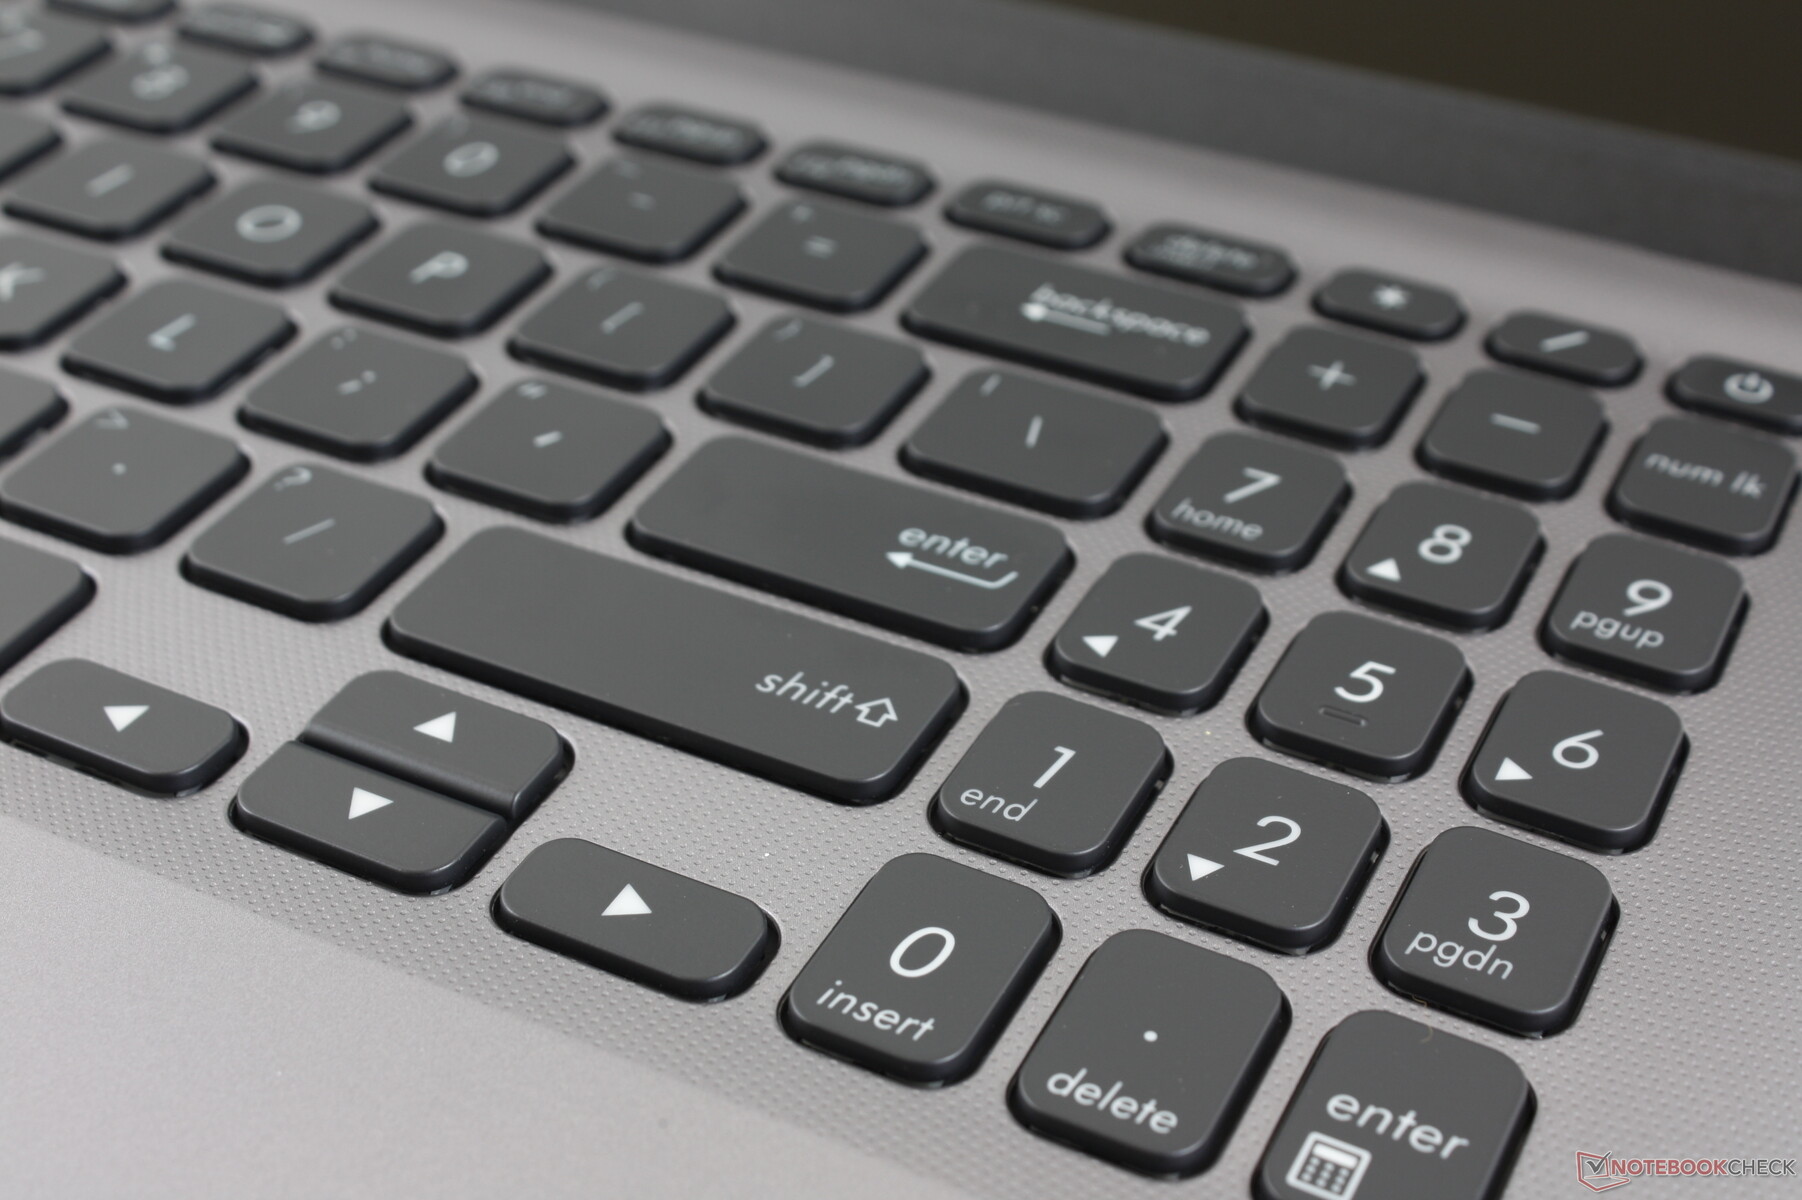
Keyboard
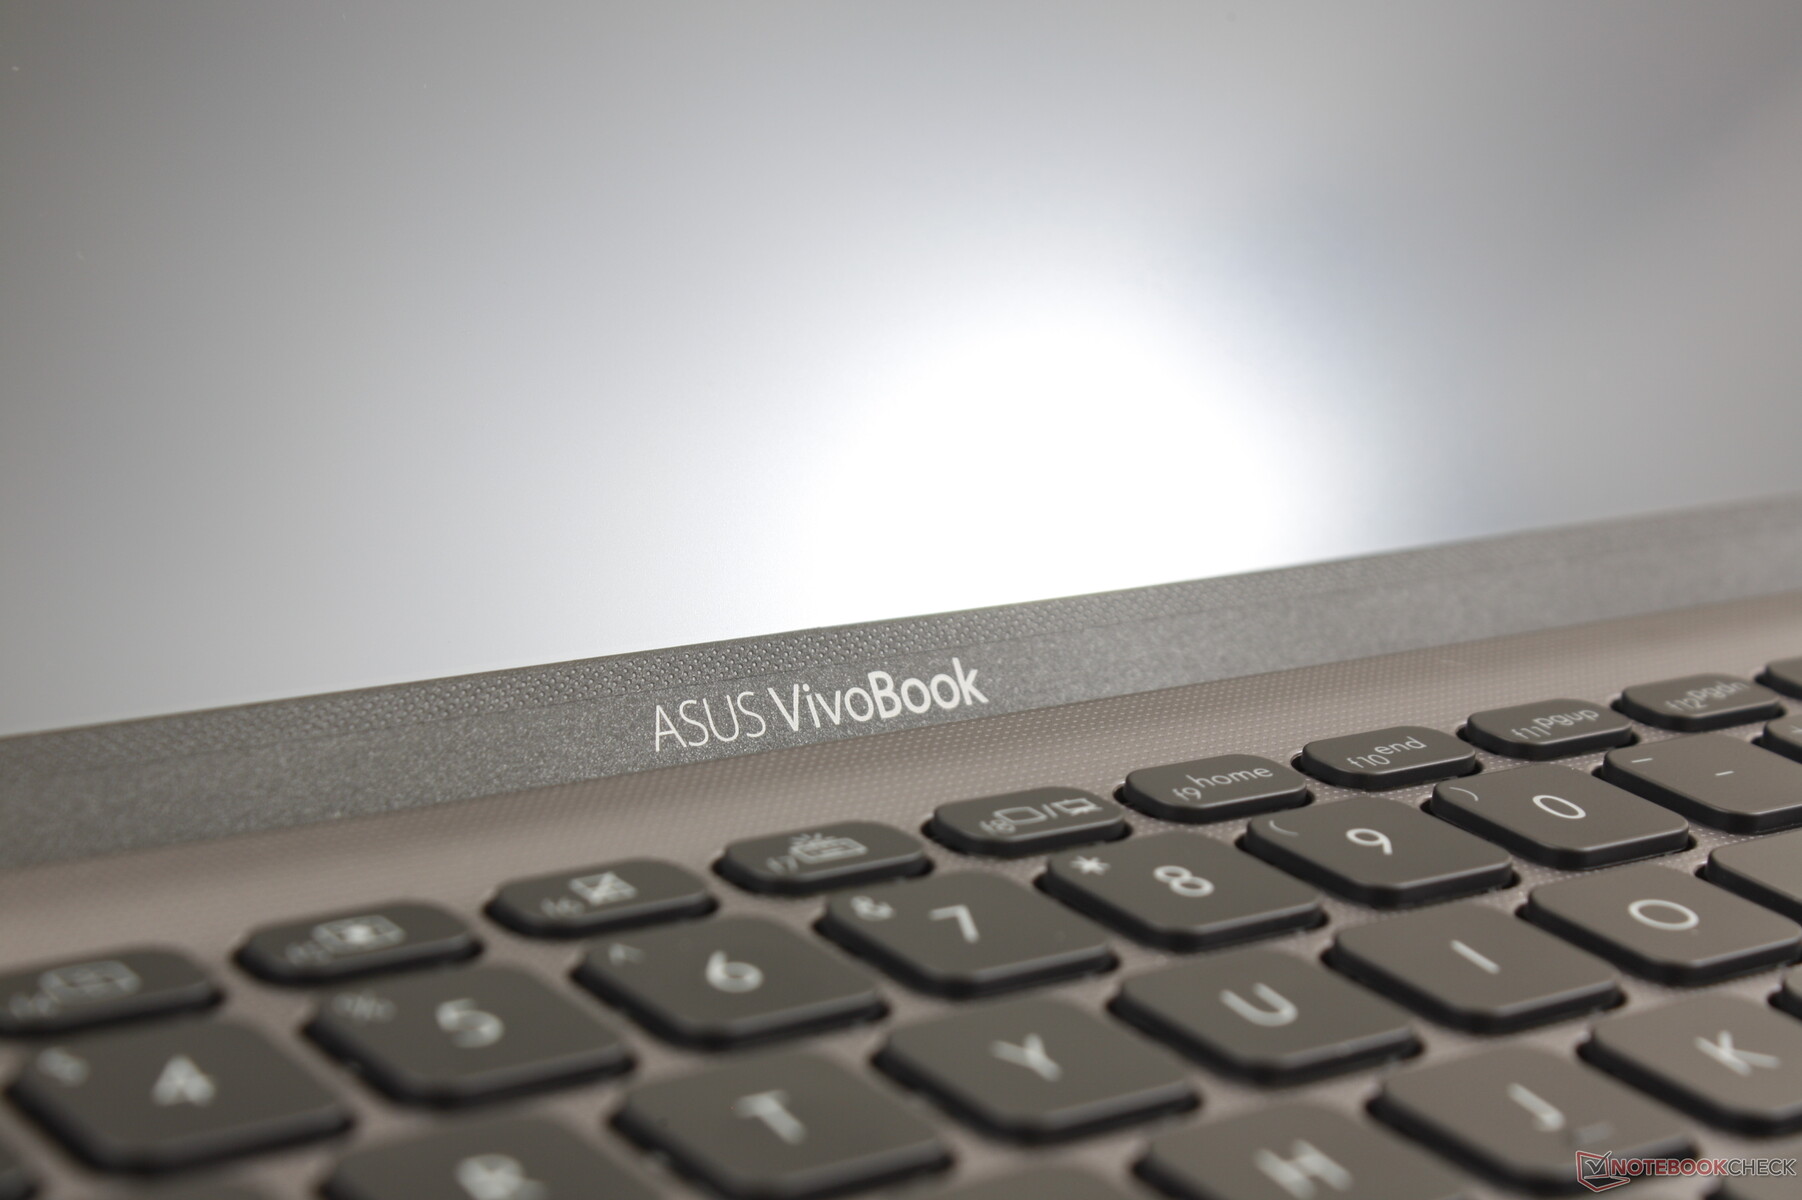
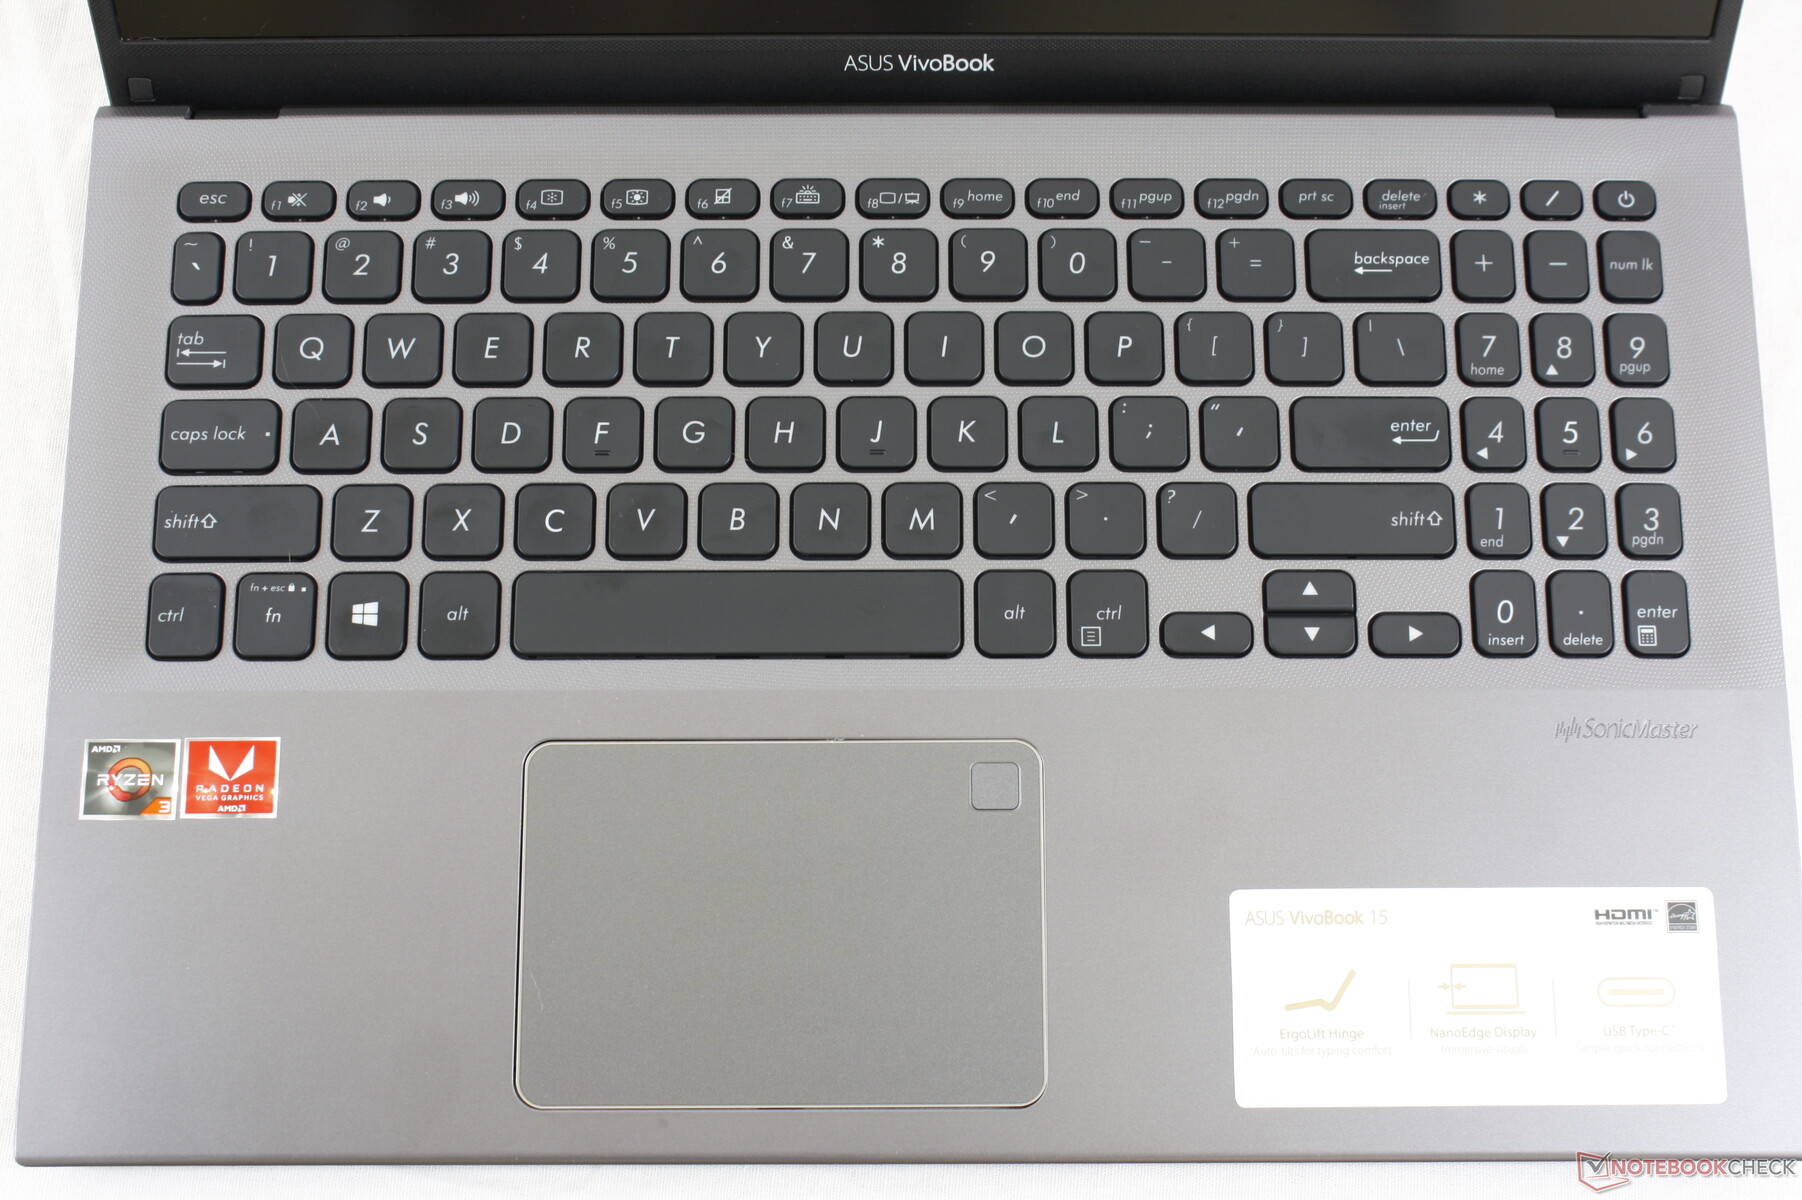
The backlit keyboard is identical to size, layout, and feel to the keyboard on the VivoBook S15 S532. The main QWERTY keys have great feedback considering the sub $500 price point, but the cramped NumPad keys and small Arrow keys are too spongy and uncomfortable.
Touchpad
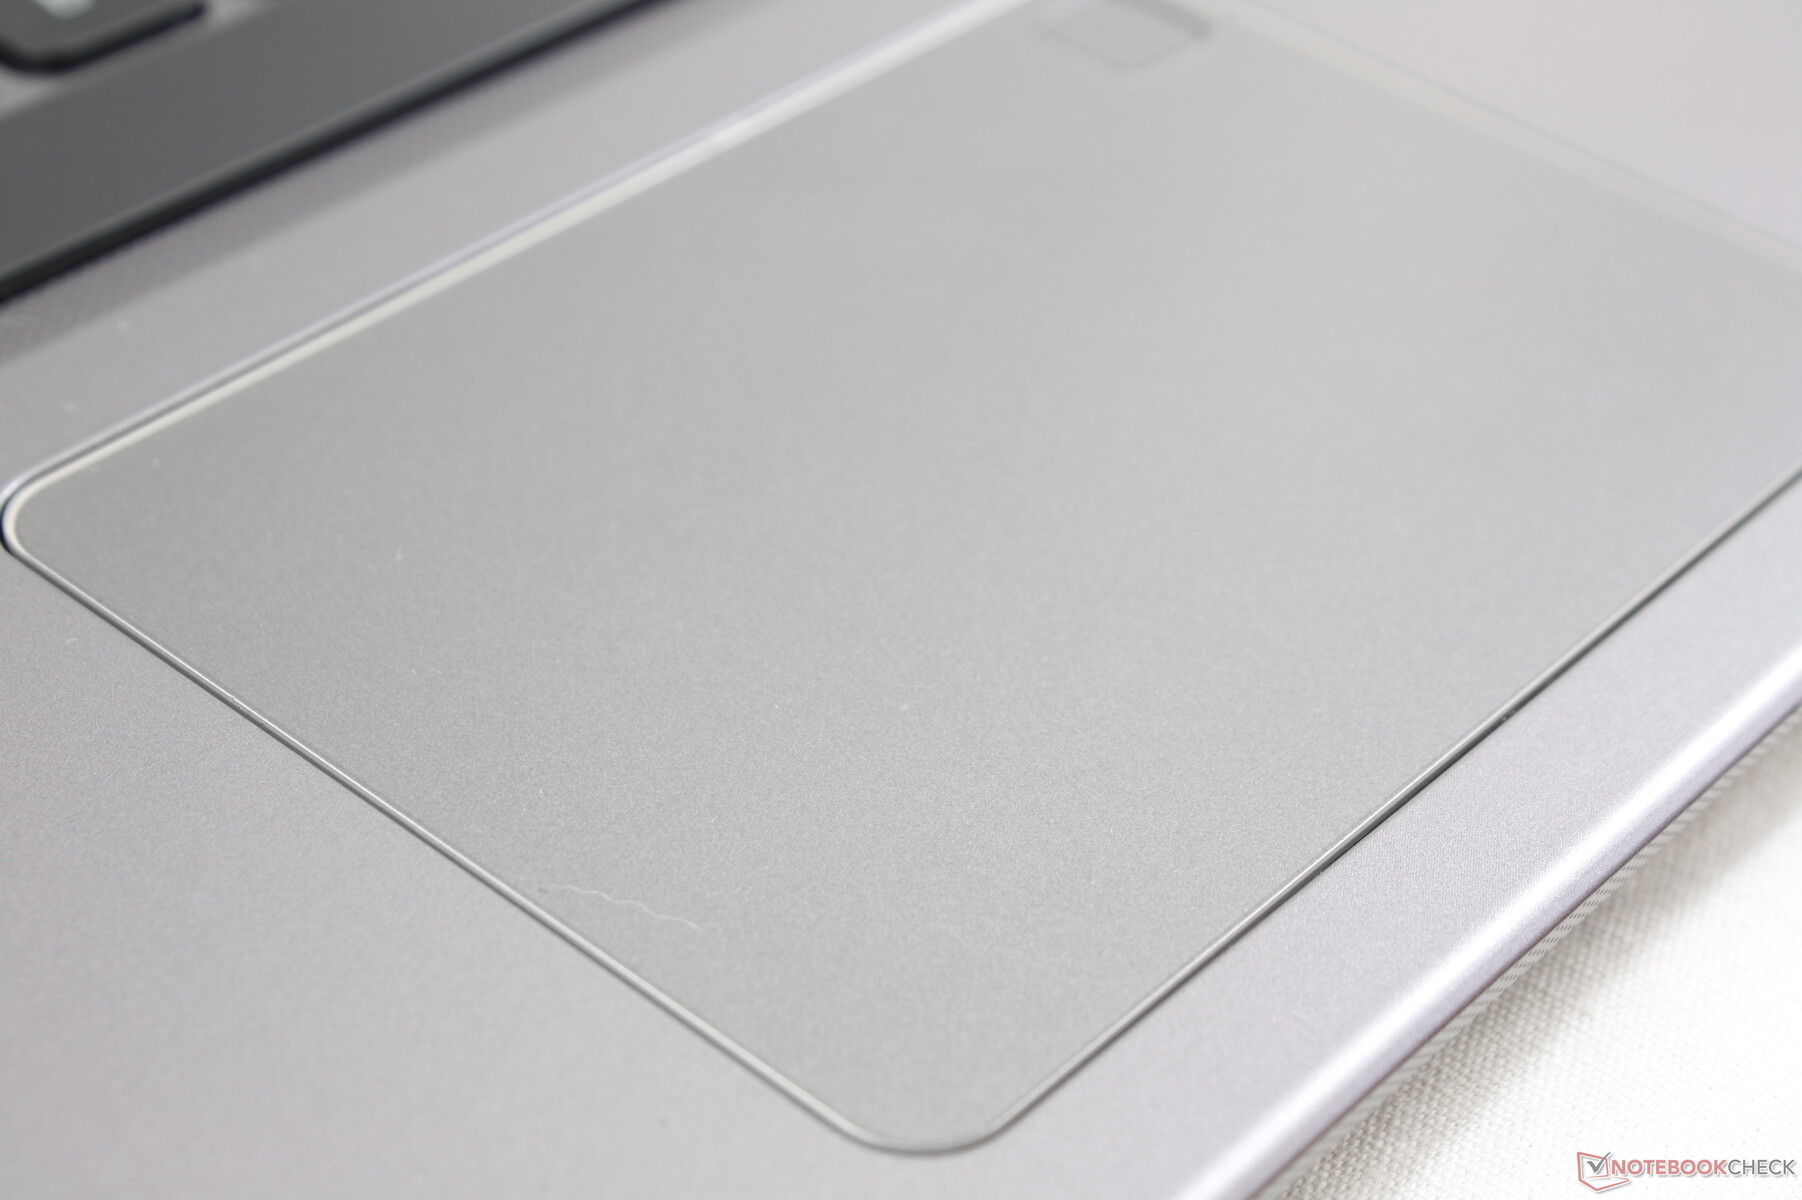
The Precision-enabled clickpad (10.5 x 7.4 cm) is smaller than the one on the ZenBook 15 (13 x 6.7 cm). Cursor movement is smooth with no noticeable bugs or cursor jumping. Clicking, however, feels spongy and could have been firmer.
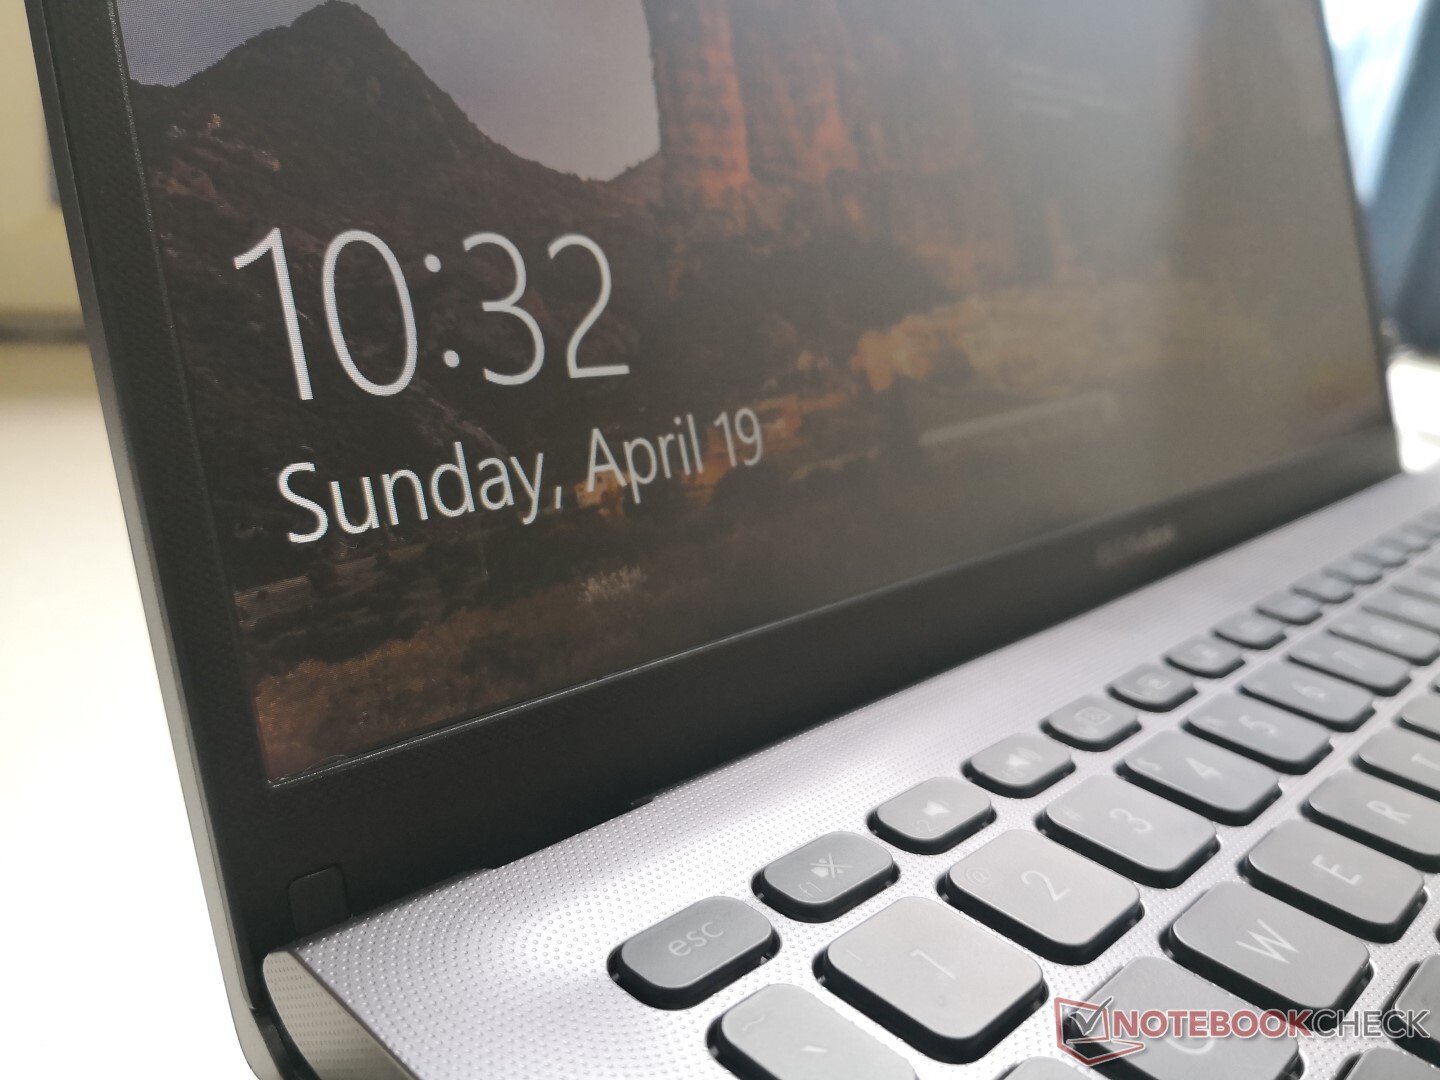
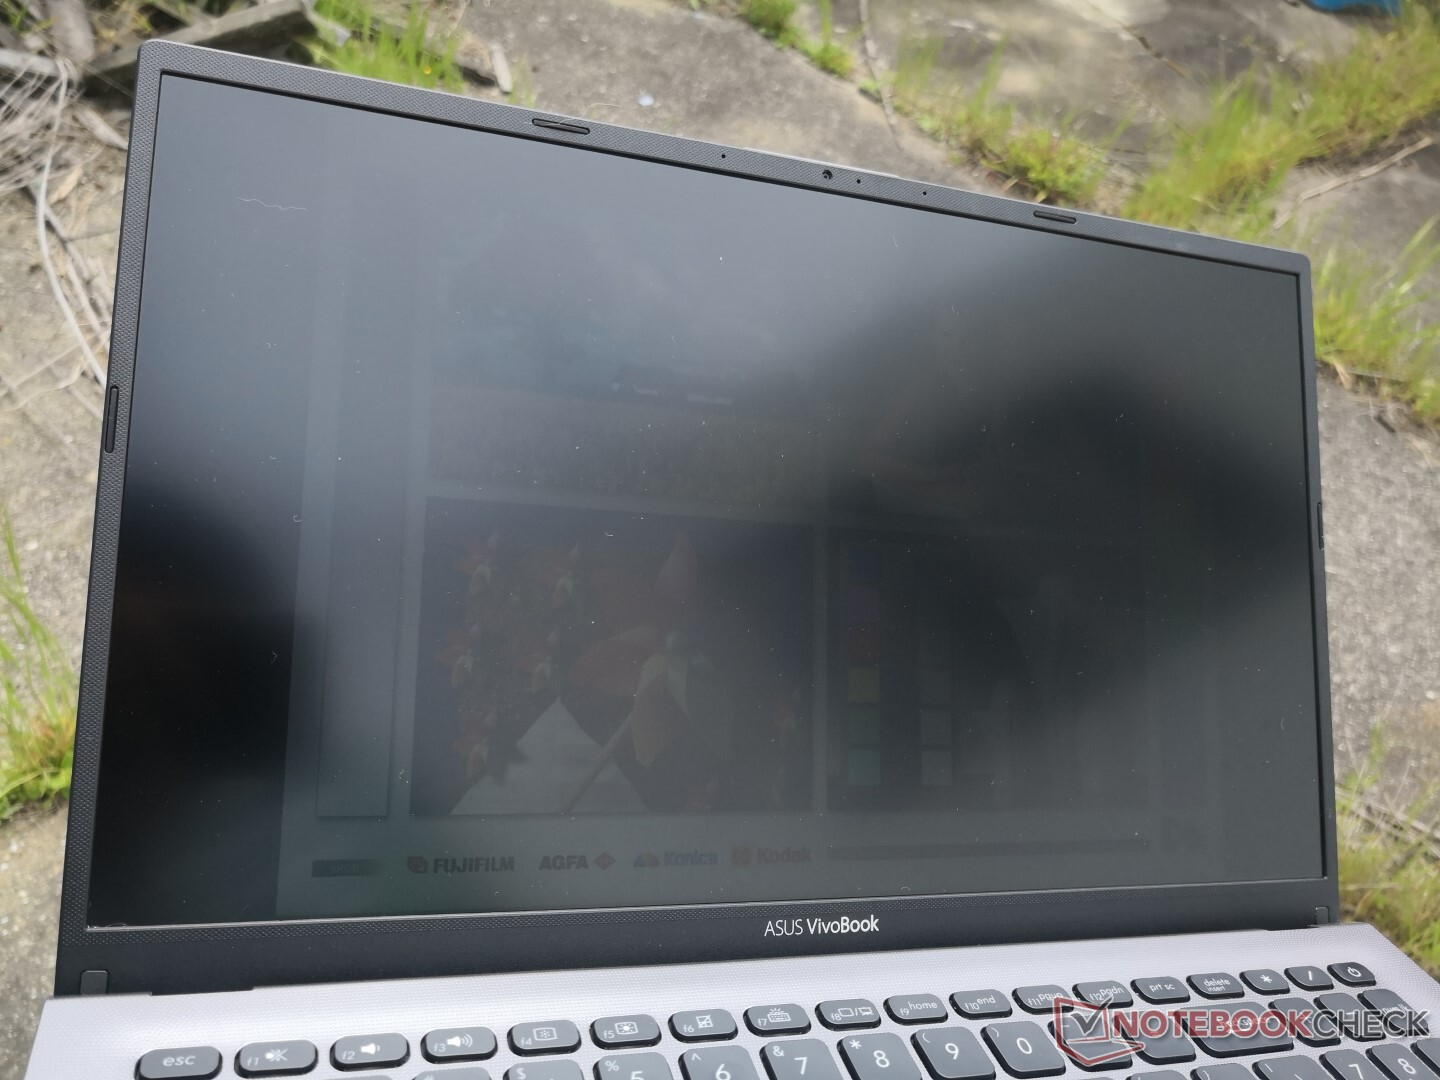
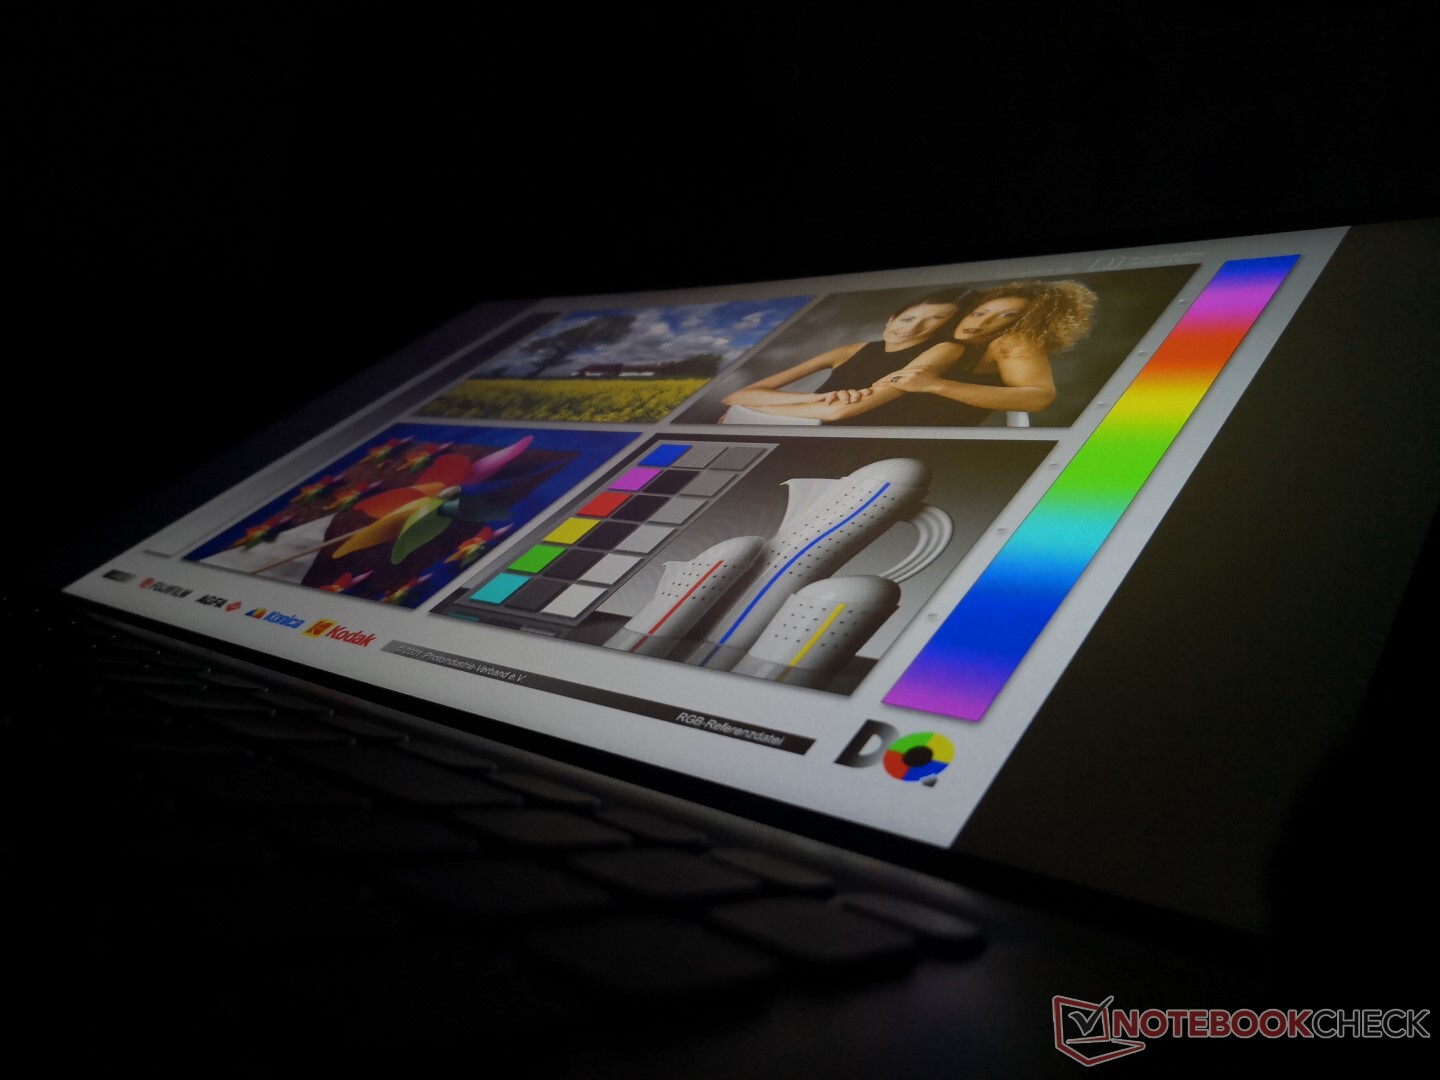
Display
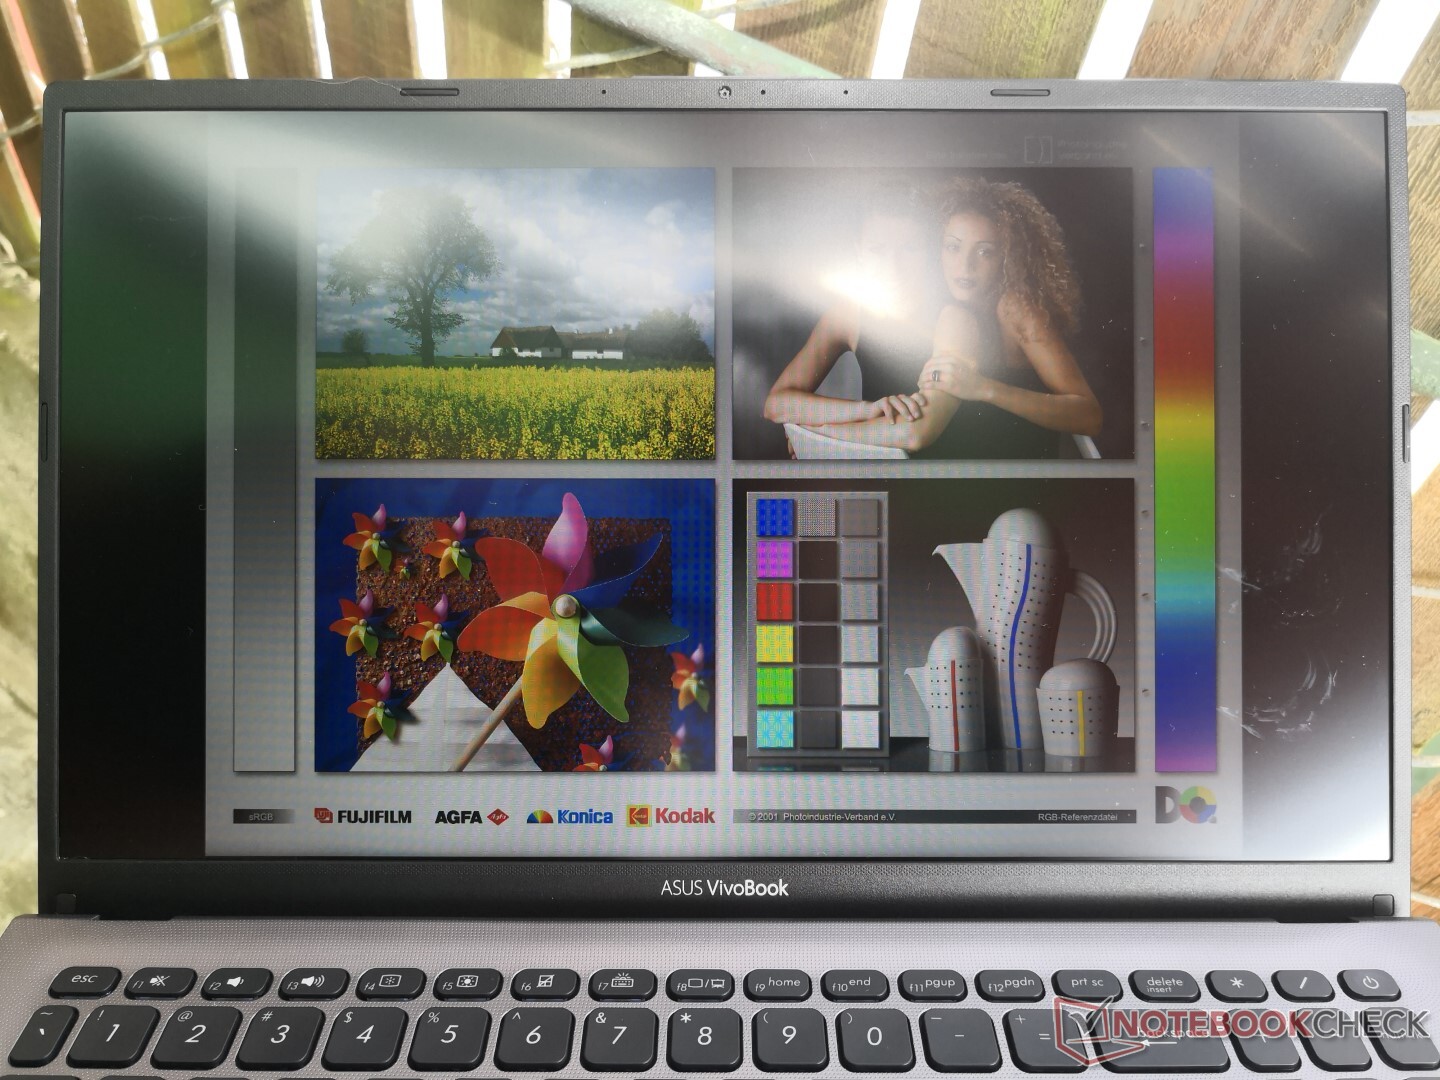
The AU Optronics B156HAN02.1 IPS panel here can be found on a number of other budget 15.6-inch laptops including the ThinkPad E590 and Asus' own 2017 VivoBook S15 S510UQ. The low contrast ratio of just 300:1 and the narrow sRGB color space coverage of just 58 percent are all indicative of a cheap panel. While we're not expecting top-tier Ultrabook quality, some competing low-end laptops like the IdeaPad S340 have brighter displays and much higher contrast ratios for a better viewing experience than our Asus.
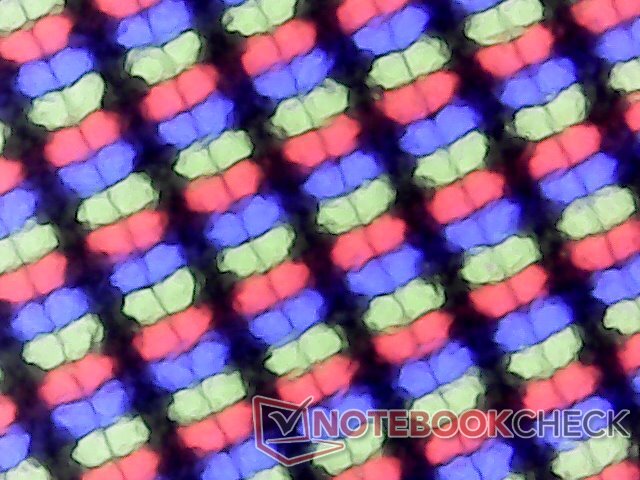
There is a slight but noticeable layer of graininess that is common on matte displays. The screen gets the job done so long as you're not expecting colors that pop or super crisp text and images.


| |||||||||||||||||||||||||
Brightness Distribution: 89 %
Center on Battery: 216.3 cd/m²
Contrast: 294:1 (Black: 0.86 cd/m²)
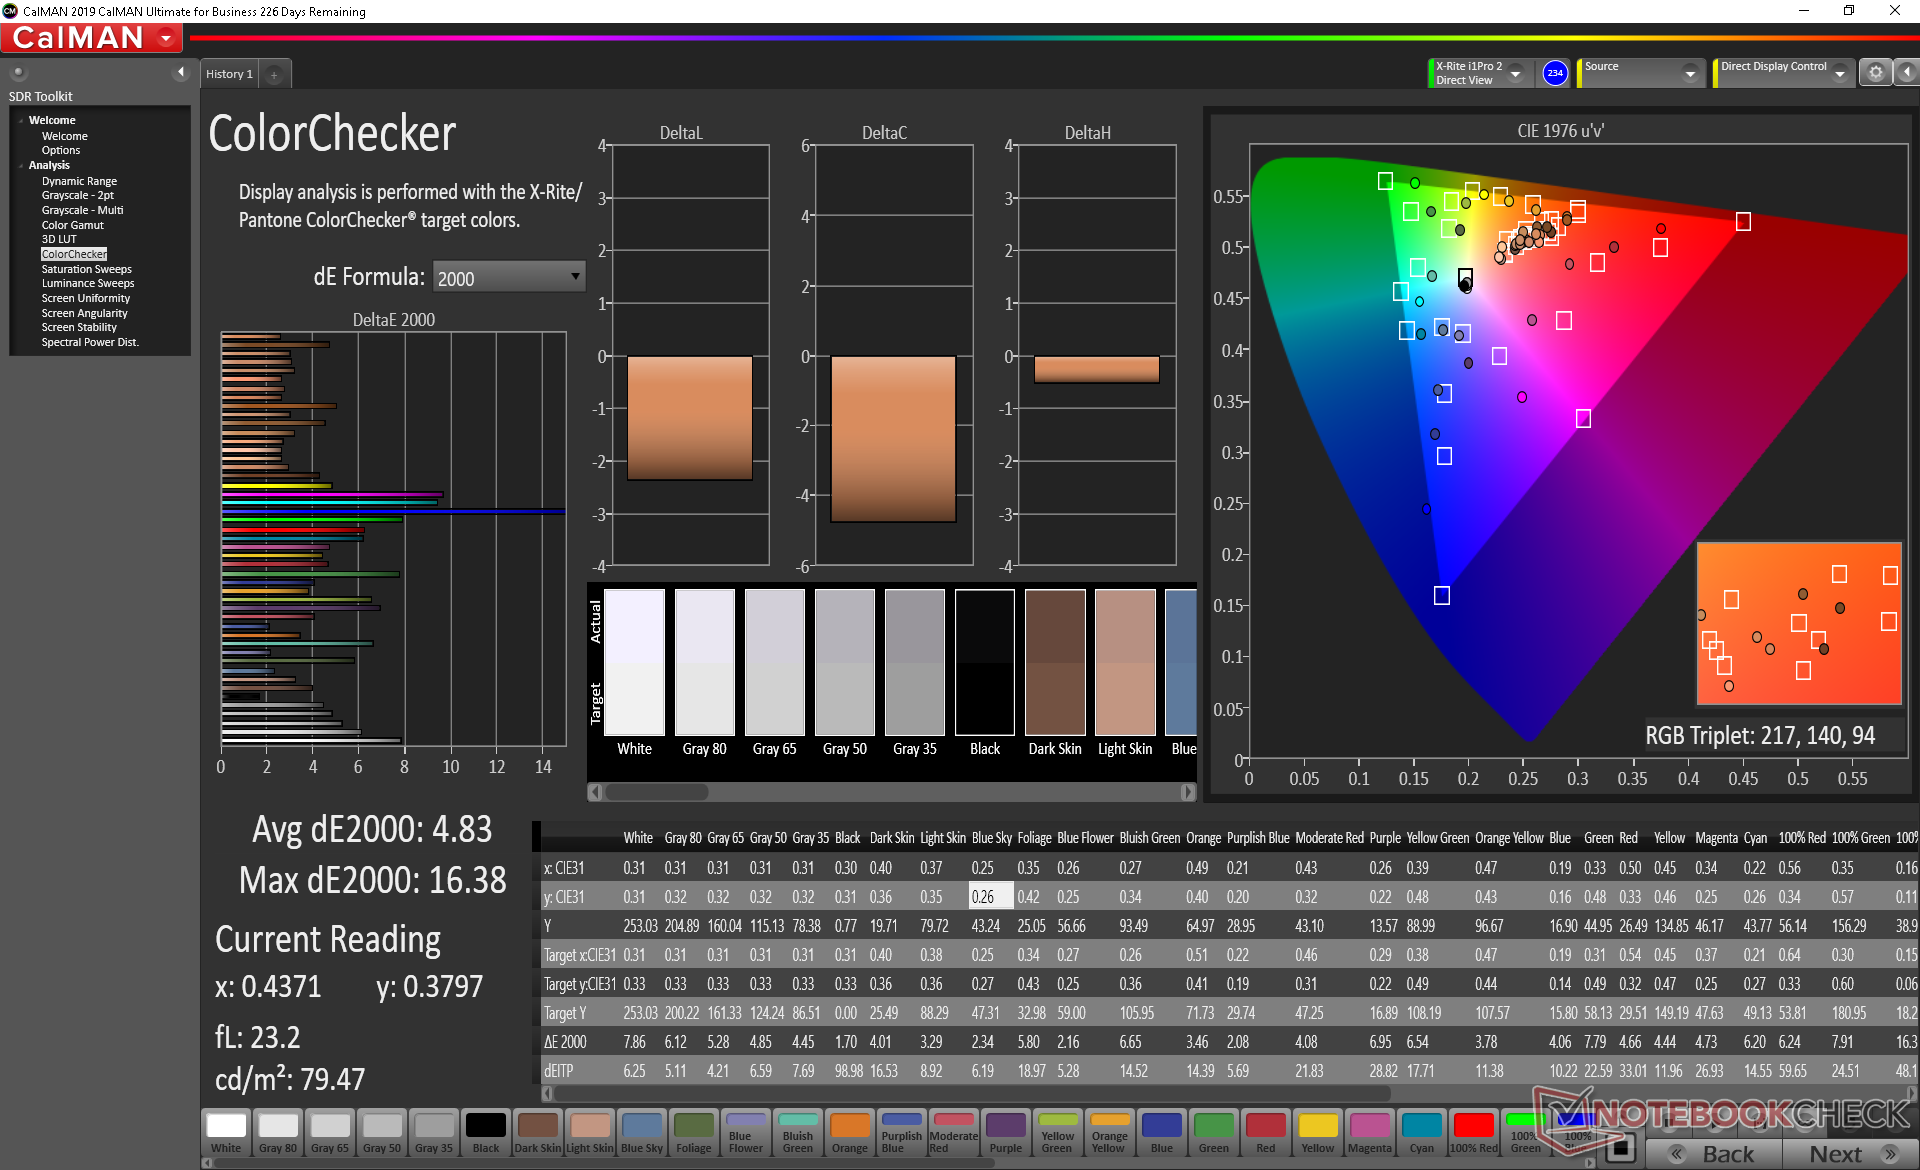
ΔE ColorChecker Calman: 4.83 | ∀{0.5-29.43 Ø4.75}
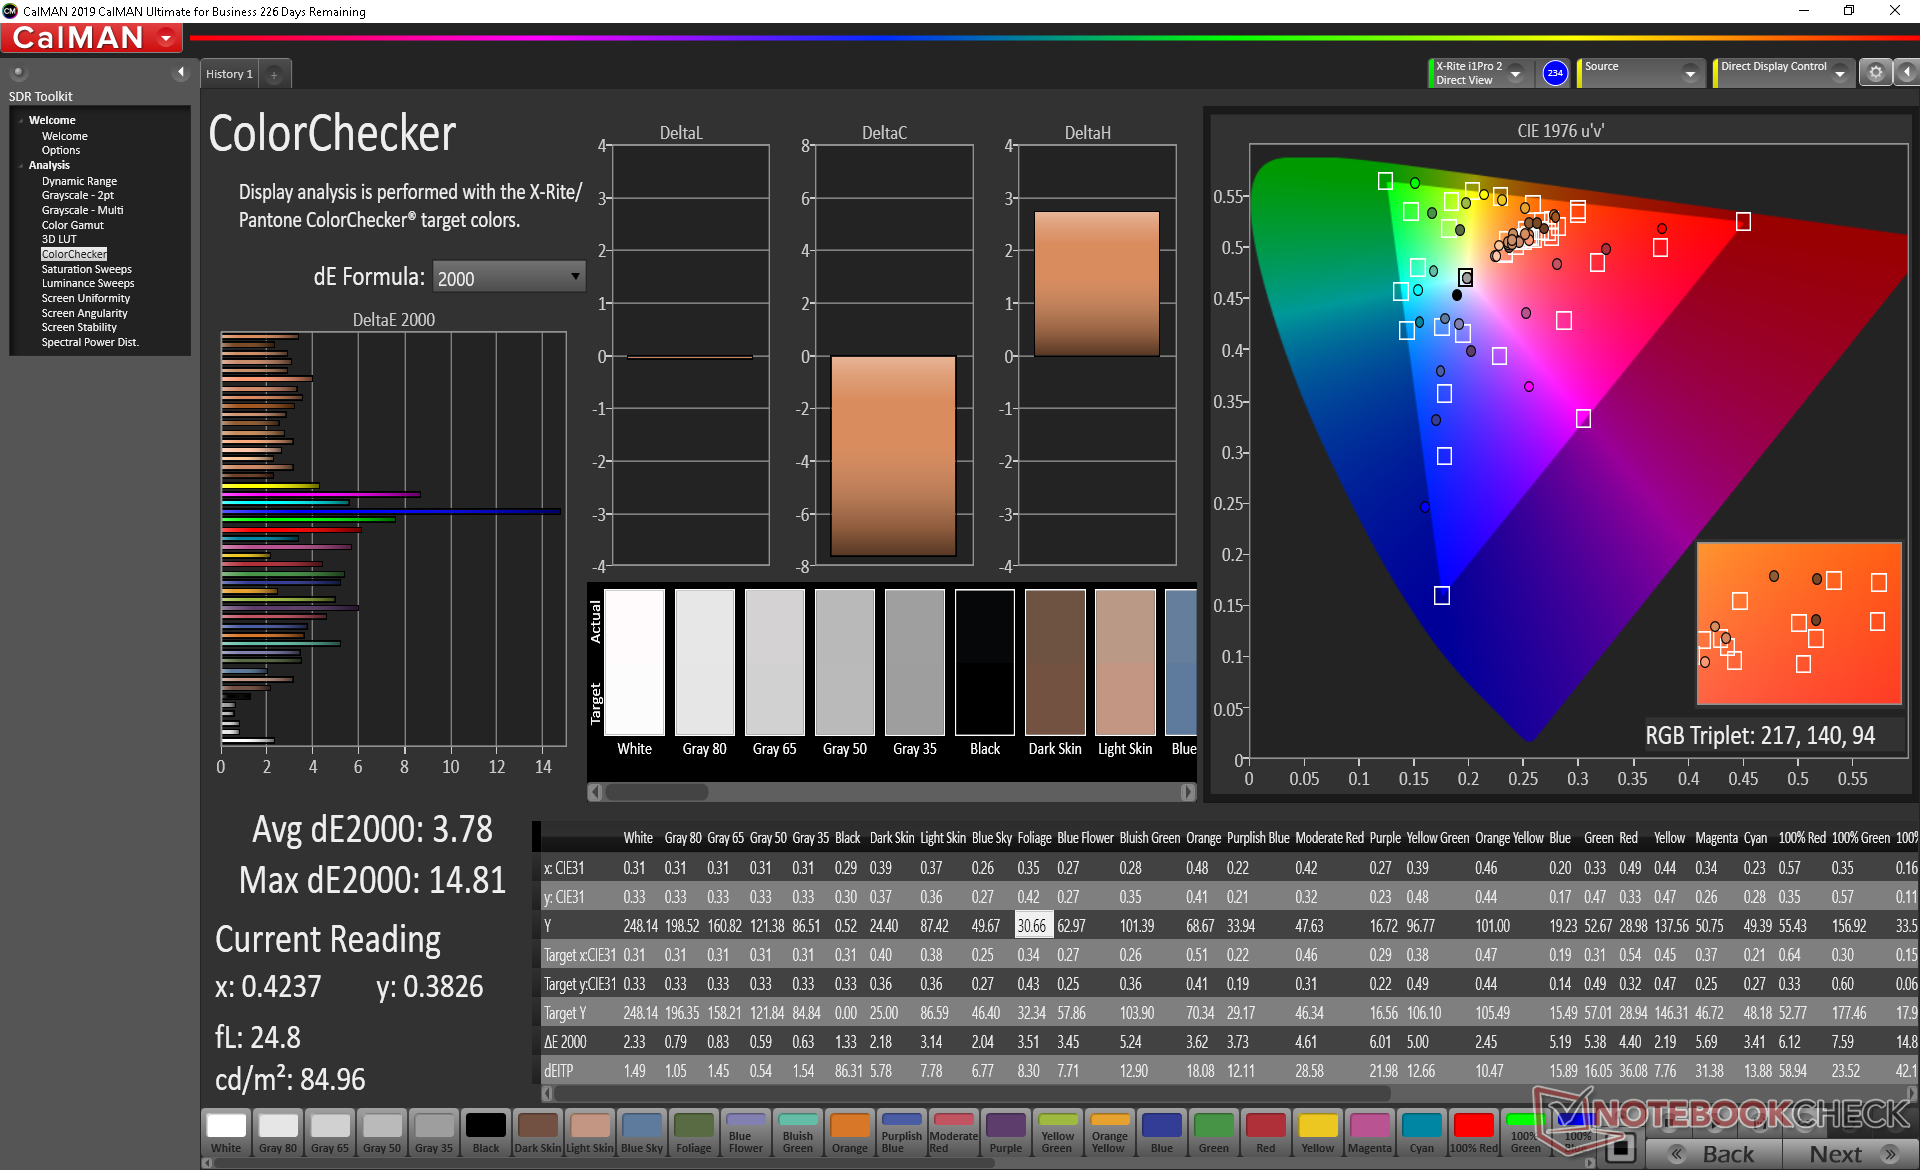
calibrated: 3.78
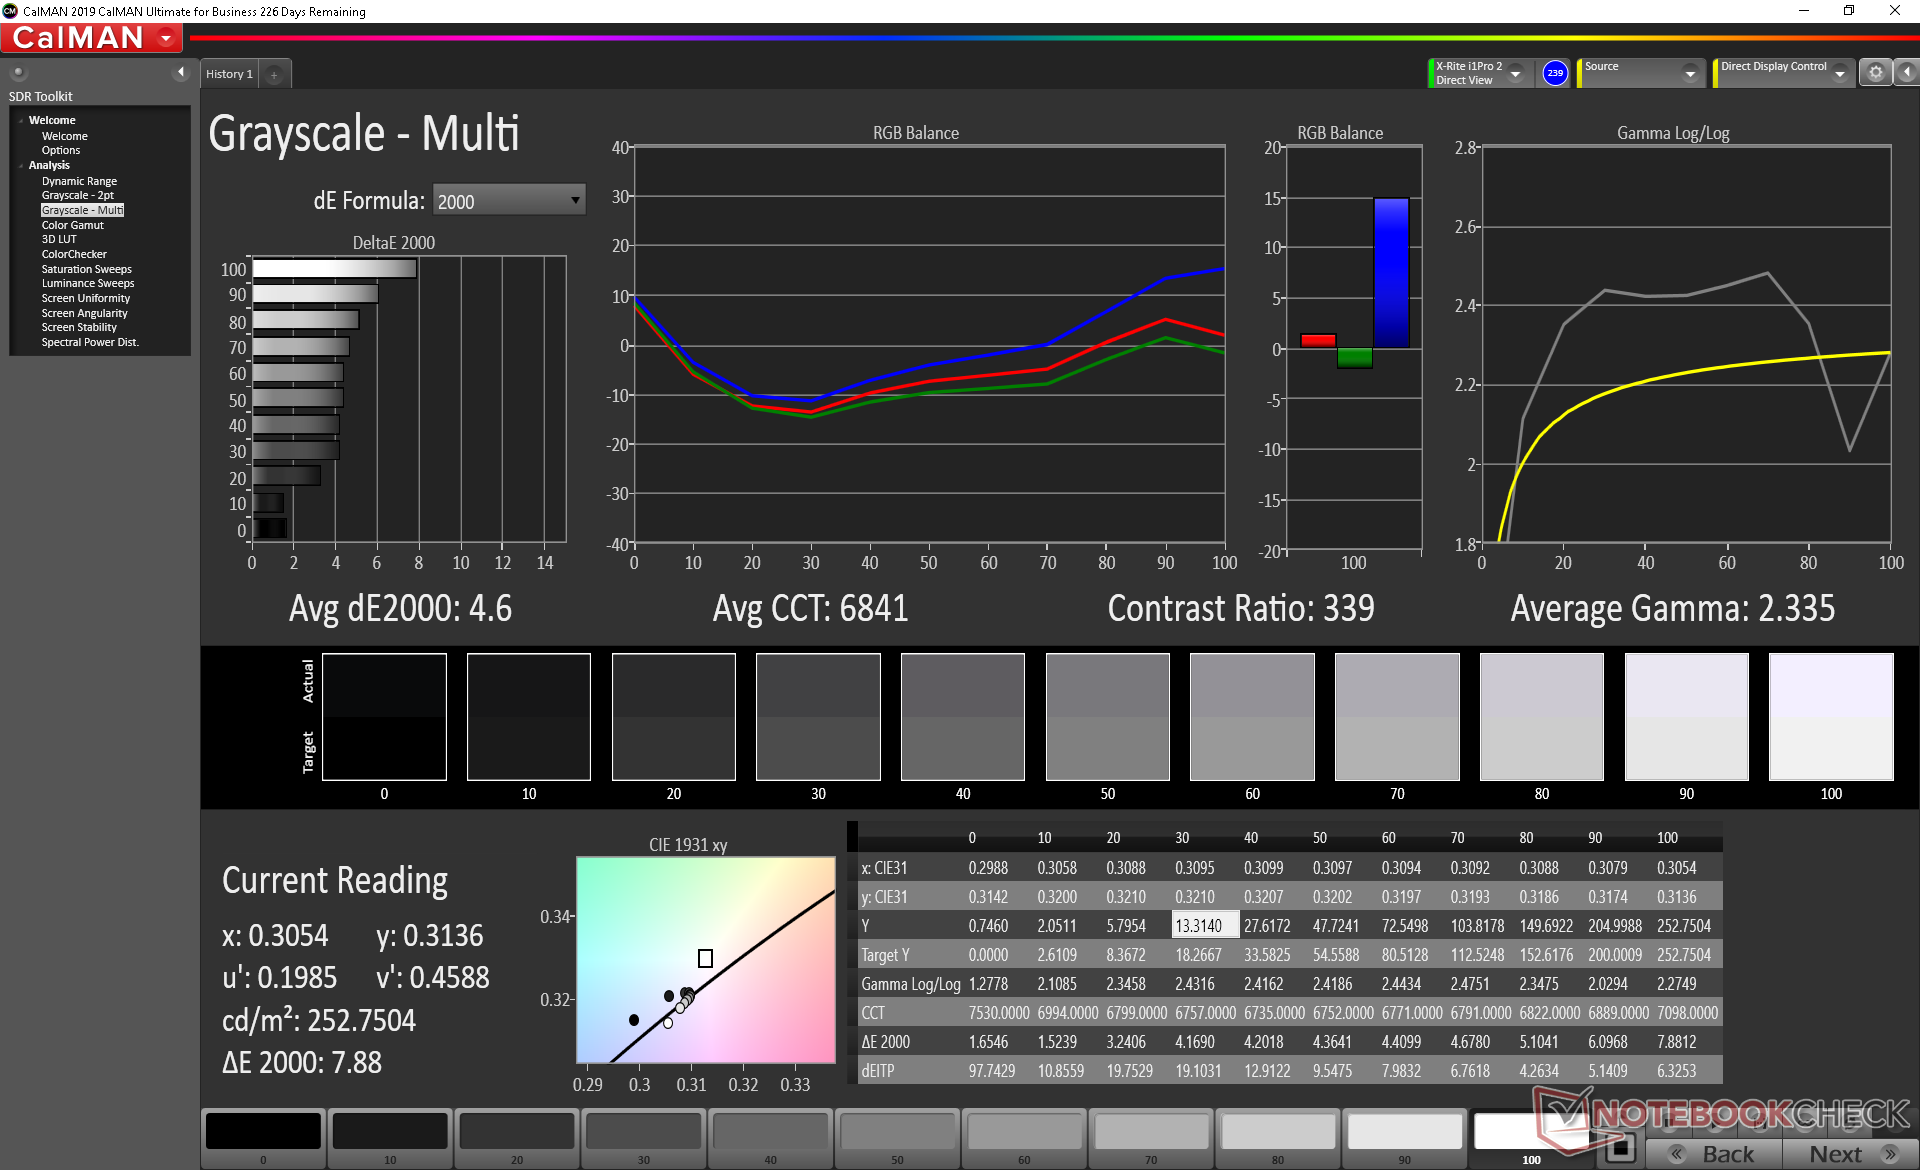
ΔE Greyscale Calman: 4.6 | ∀{0.09-98 Ø5}
58.1% sRGB (Argyll 1.6.3 3D)
36.9% AdobeRGB 1998 (Argyll 1.6.3 3D)
40% AdobeRGB 1998 (Argyll 3D)
58.2% sRGB (Argyll 3D)
38.71% Display P3 (Argyll 3D)
Gamma: 2.34
CCT: 6841 K
| Asus Vivobook 15 F512DA-SH31 AU Optronics B156HAN02.1, IPS, 15.6", 1920x1080 | Lenovo Ideapad S340-15IIL BOE CQ NV156FHM-T03, IPS, 15.6", 1920x1080 | Acer Aspire 5 A515-43-R6WW CEC PANDA LM156LF-CL07, IPS, 15.6", 1920x1080 | Dell Inspiron 15 3585 (2300U, Vega 6) BOE0802, TN, 15.6", 1920x1080 | Asus ZenBook 15 UX534FTC-A8190T BOE CQ NV156FHM-N63, IPS, 15.6", 1920x1080 | Huawei MateBook D 15-53010TUY AU Optronics AUO28ED, IPS, 15.6", 1920x1080 | |
|---|---|---|---|---|---|---|
| Display | 3% | 2% | 1% | 58% | 5% | |
| Display P3 Coverage (%) | 38.71 | 40.43 4% | 39.53 2% | 39.22 1% | 65 68% | 40.49 5% |
| sRGB Coverage (%) | 58.2 | 58.8 1% | 59.5 2% | 58.9 1% | 86.2 48% | 60.9 5% |
| AdobeRGB 1998 Coverage (%) | 40 | 41.77 4% | 40.84 2% | 40.52 1% | 62.9 57% | 41.84 5% |
| Response Times | -24% | 8% | 26% | -17% | -13% | |
| Response Time Grey 50% / Grey 80% * (ms) | 36 ? | 46.4 ? -29% | 36 ? -0% | 39 ? -8% | 45 ? -25% | 43.6 ? -21% |
| Response Time Black / White * (ms) | 29.6 ? | 35.2 ? -19% | 25 ? 16% | 12 ? 59% | 32 ? -8% | 31.2 ? -5% |
| PWM Frequency (Hz) | 178 ? | 250 ? | ||||
| Screen | 23% | 35% | -22% | 67% | 58% | |
| Brightness middle (cd/m²) | 252.8 | 320.8 27% | 250 -1% | 225 -11% | 299 18% | 271 7% |
| Brightness (cd/m²) | 237 | 309 30% | 228 -4% | 213 -10% | 280 18% | 256 8% |
| Brightness Distribution (%) | 89 | 87 -2% | 83 -7% | 88 -1% | 89 0% | 90 1% |
| Black Level * (cd/m²) | 0.86 | 0.27 69% | 0.205 76% | 0.535 38% | 0.21 76% | 0.15 83% |
| Contrast (:1) | 294 | 1188 304% | 1220 315% | 421 43% | 1424 384% | 1807 515% |
| Colorchecker dE 2000 * | 4.83 | 7.68 -59% | 5.65 -17% | 10.37 -115% | 4.76 1% | 4.7 3% |
| Colorchecker dE 2000 max. * | 16.38 | 21.97 -34% | 13.7 16% | 19.75 -21% | 9 45% | 20.4 -25% |
| Colorchecker dE 2000 calibrated * | 3.78 | 4.65 -23% | 3.89 -3% | 4.6 -22% | ||
| Greyscale dE 2000 * | 4.6 | 7.3 -59% | 6.32 -37% | 12.09 -163% | 3.53 23% | 1.6 65% |
| Gamma | 2.34 94% | 2.12 104% | 2.45 90% | 2.72 81% | 2.3 96% | 2.17 101% |
| CCT | 6841 95% | 6213 105% | 7287 89% | 13335 49% | 7228 90% | 6649 98% |
| Color Space (Percent of AdobeRGB 1998) (%) | 36.9 | 37.8 2% | 38 3% | 37 0% | 56 52% | 38.5 4% |
| Color Space (Percent of sRGB) (%) | 58.1 | 58.3 0% | 59 2% | 59 2% | 86 48% | 60.6 4% |
| Total Average (Program / Settings) | 1% /
14% | 15% /
25% | 2% /
-12% | 36% /
54% | 17% /
40% |
* ... smaller is better
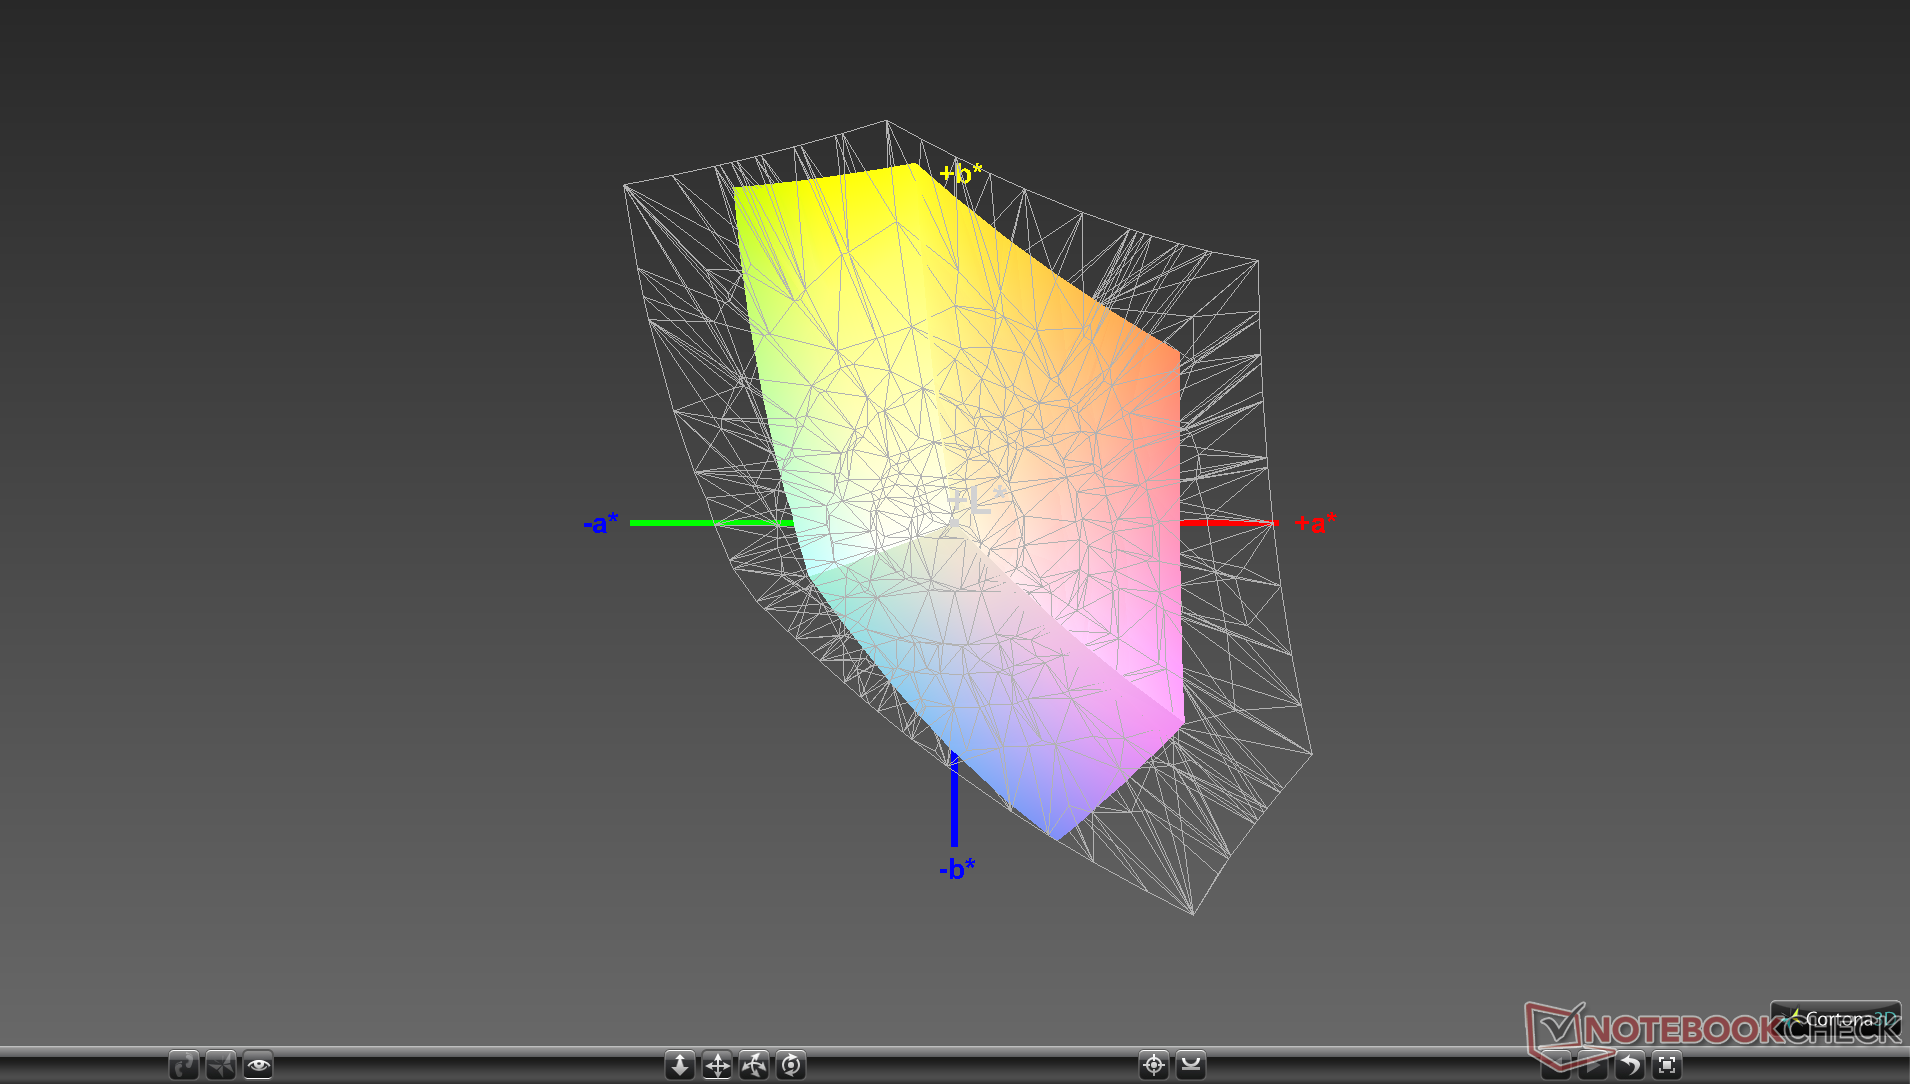
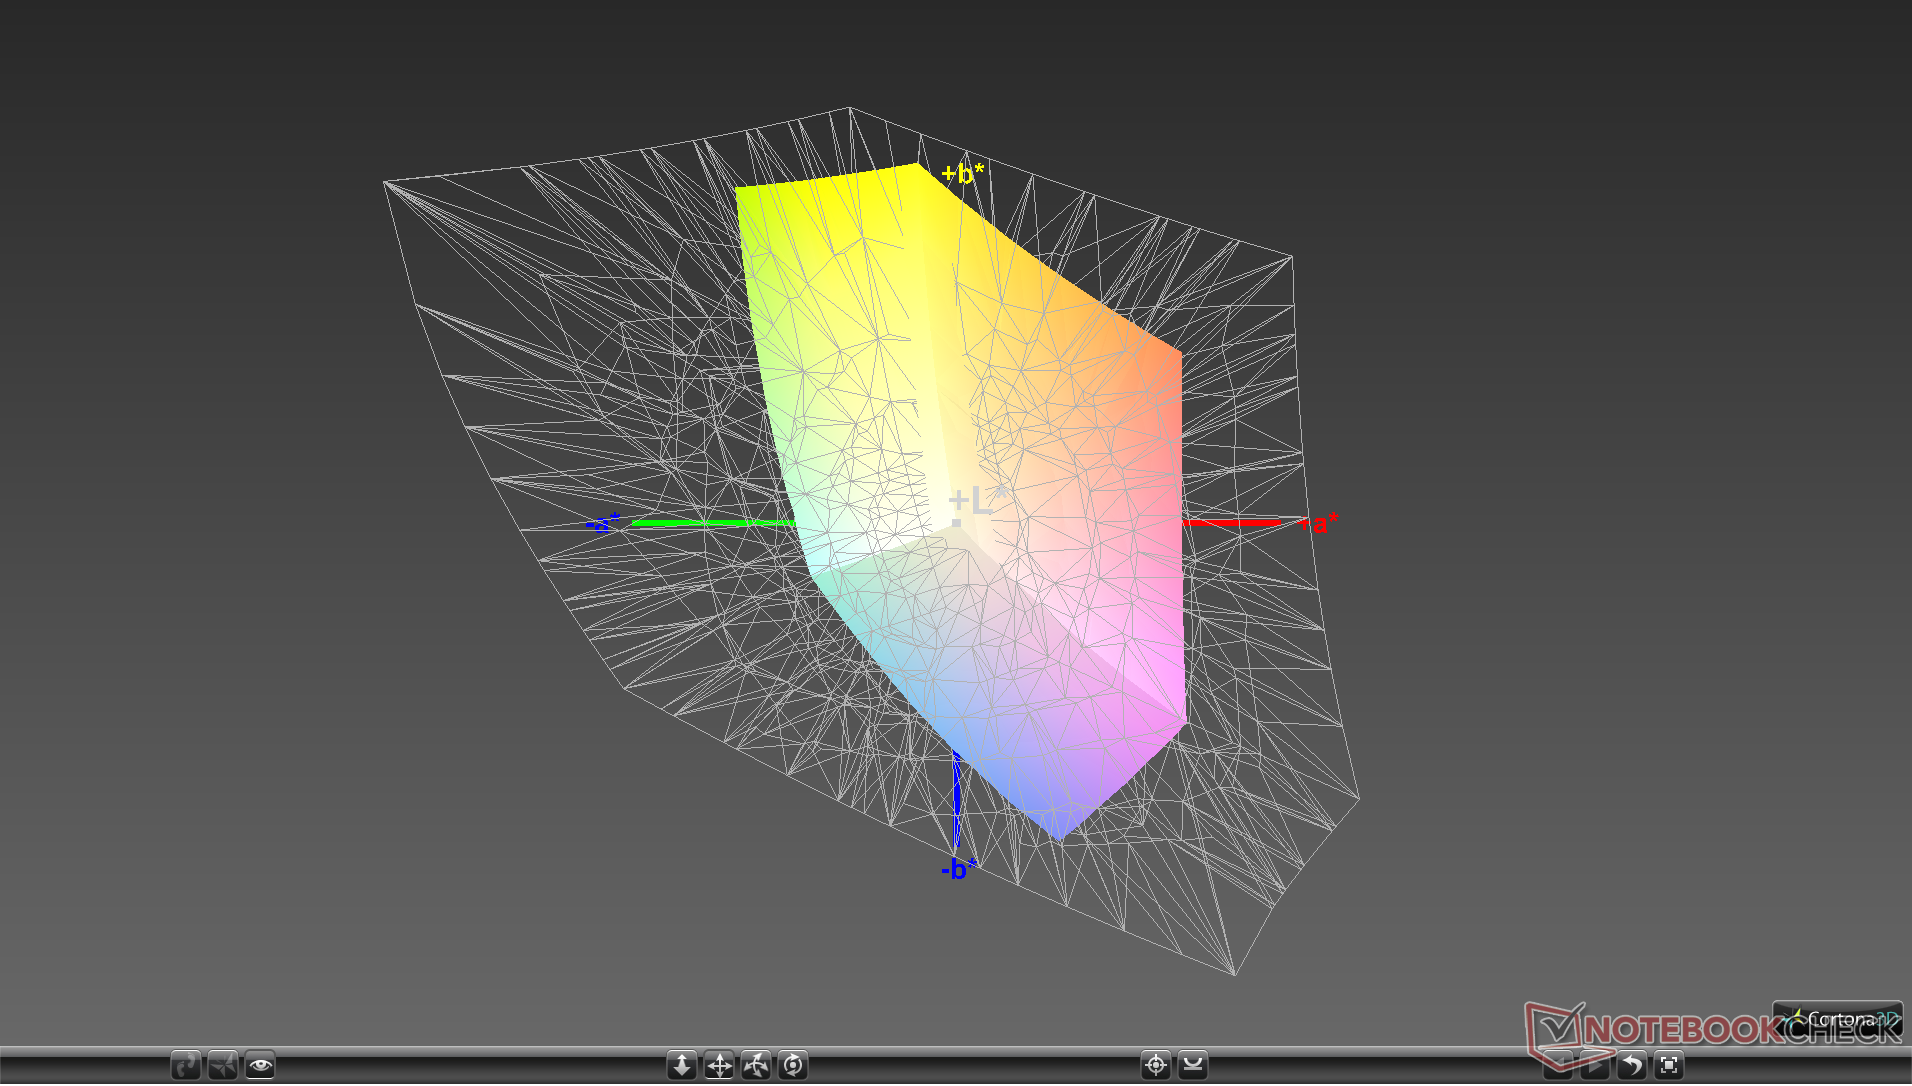
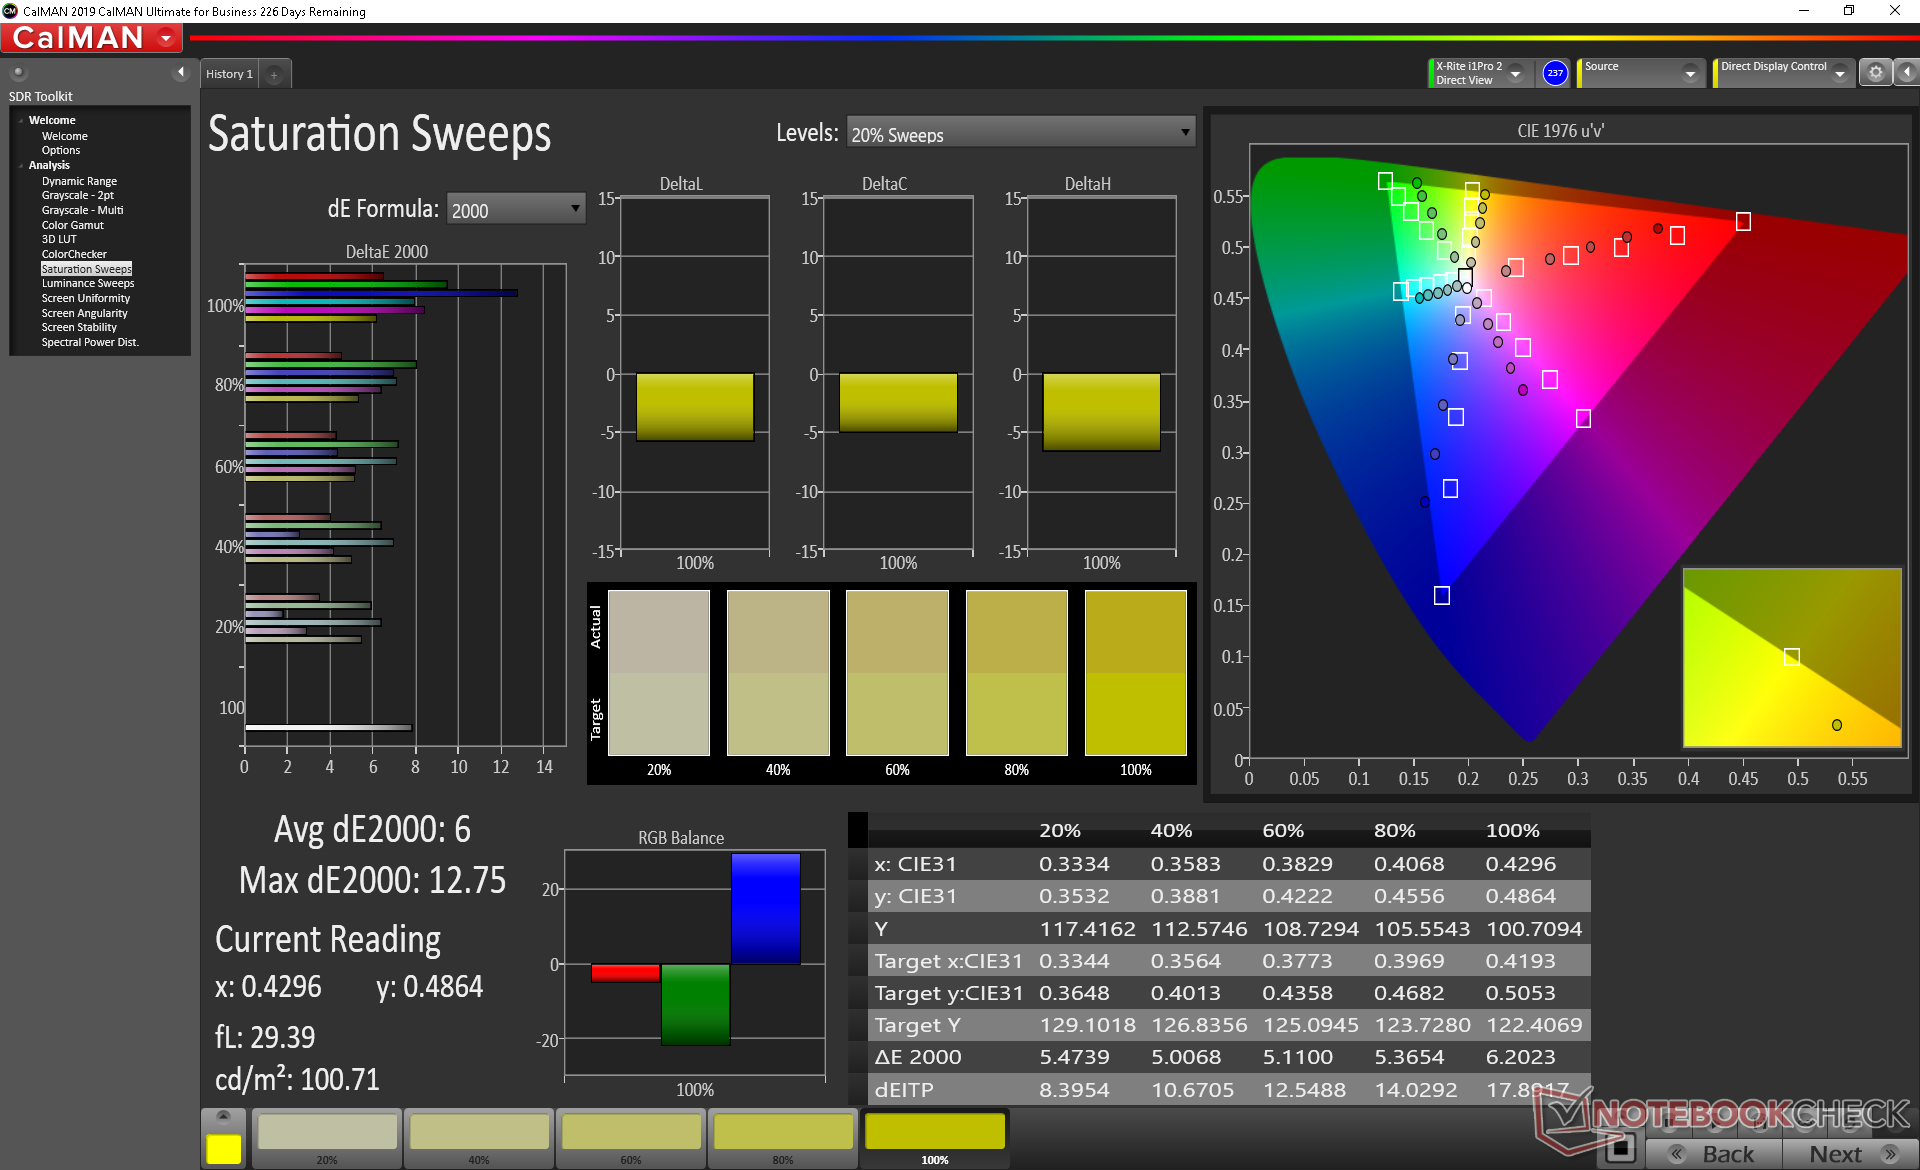
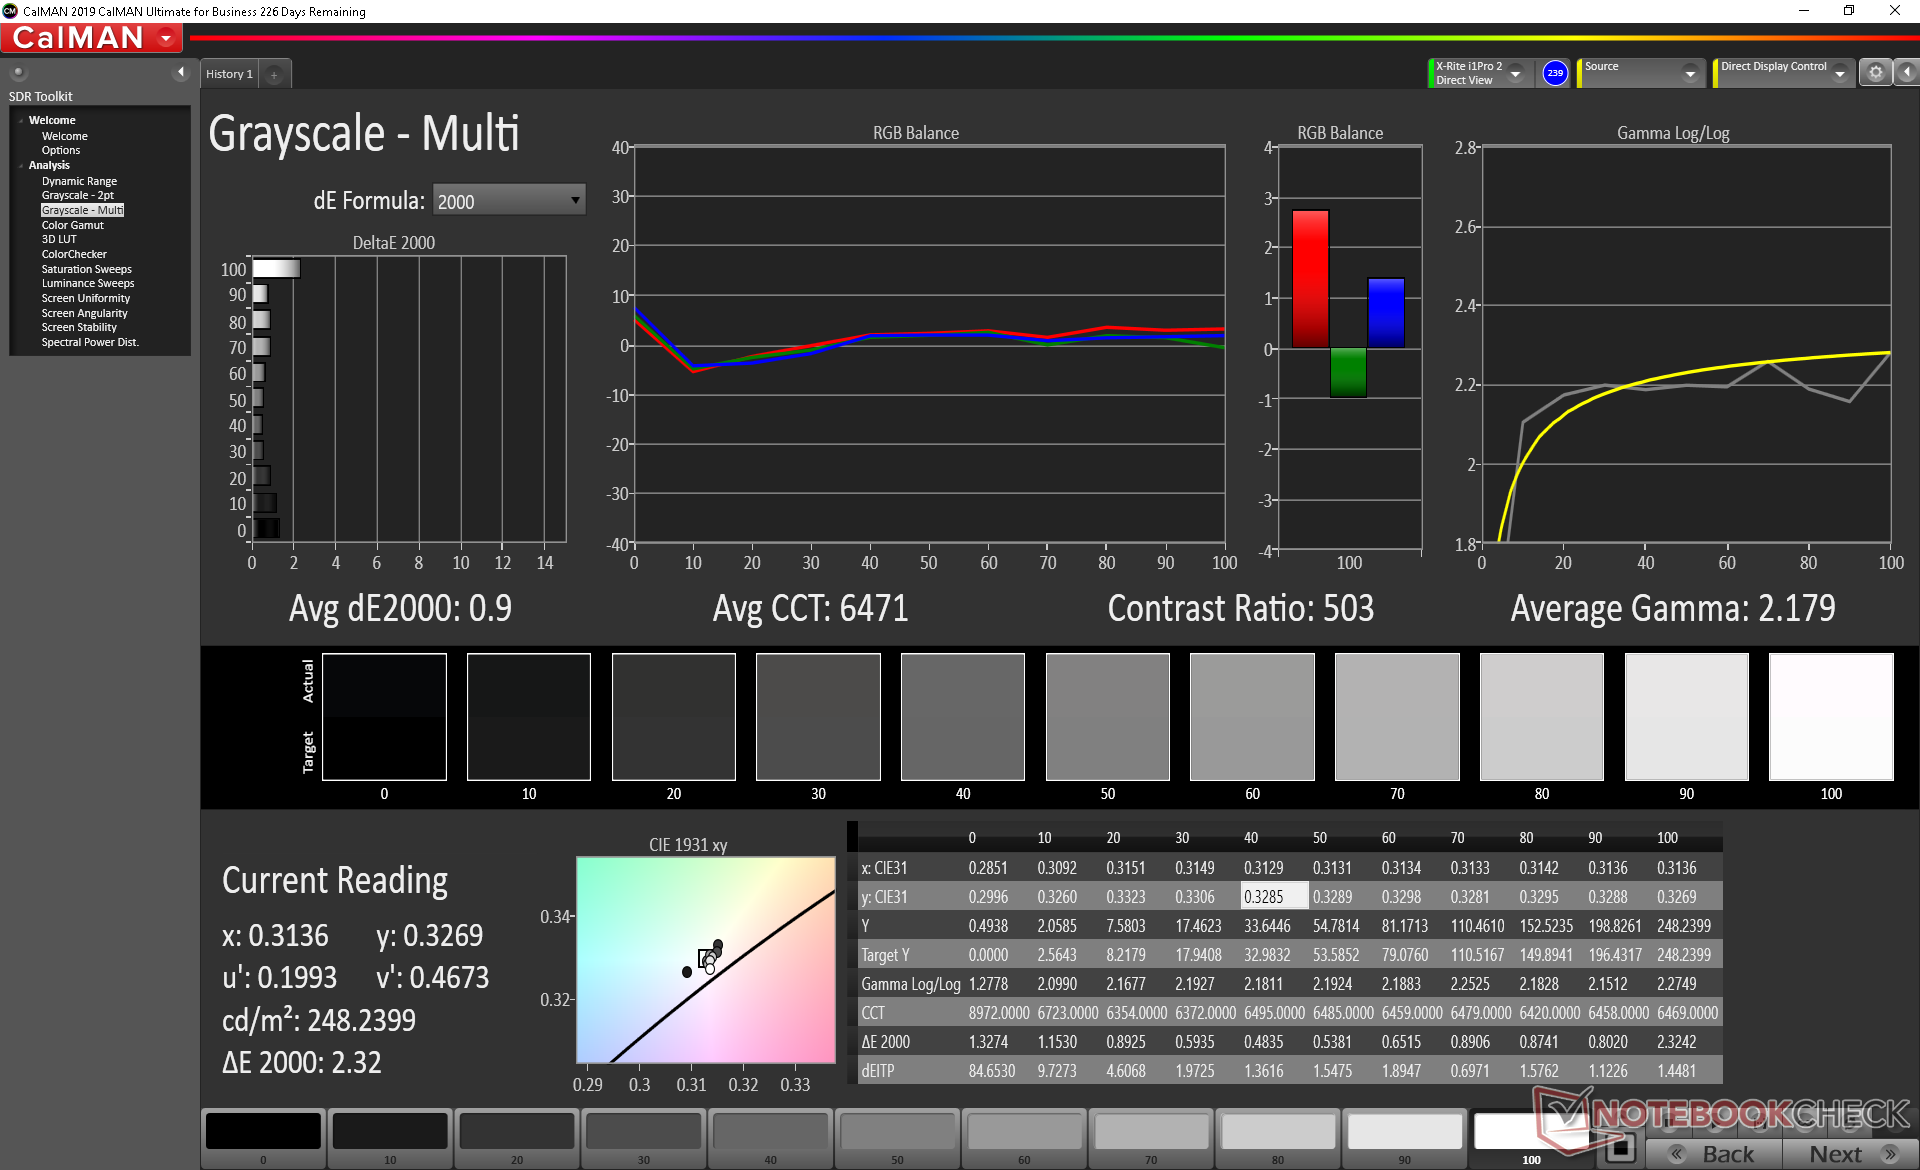
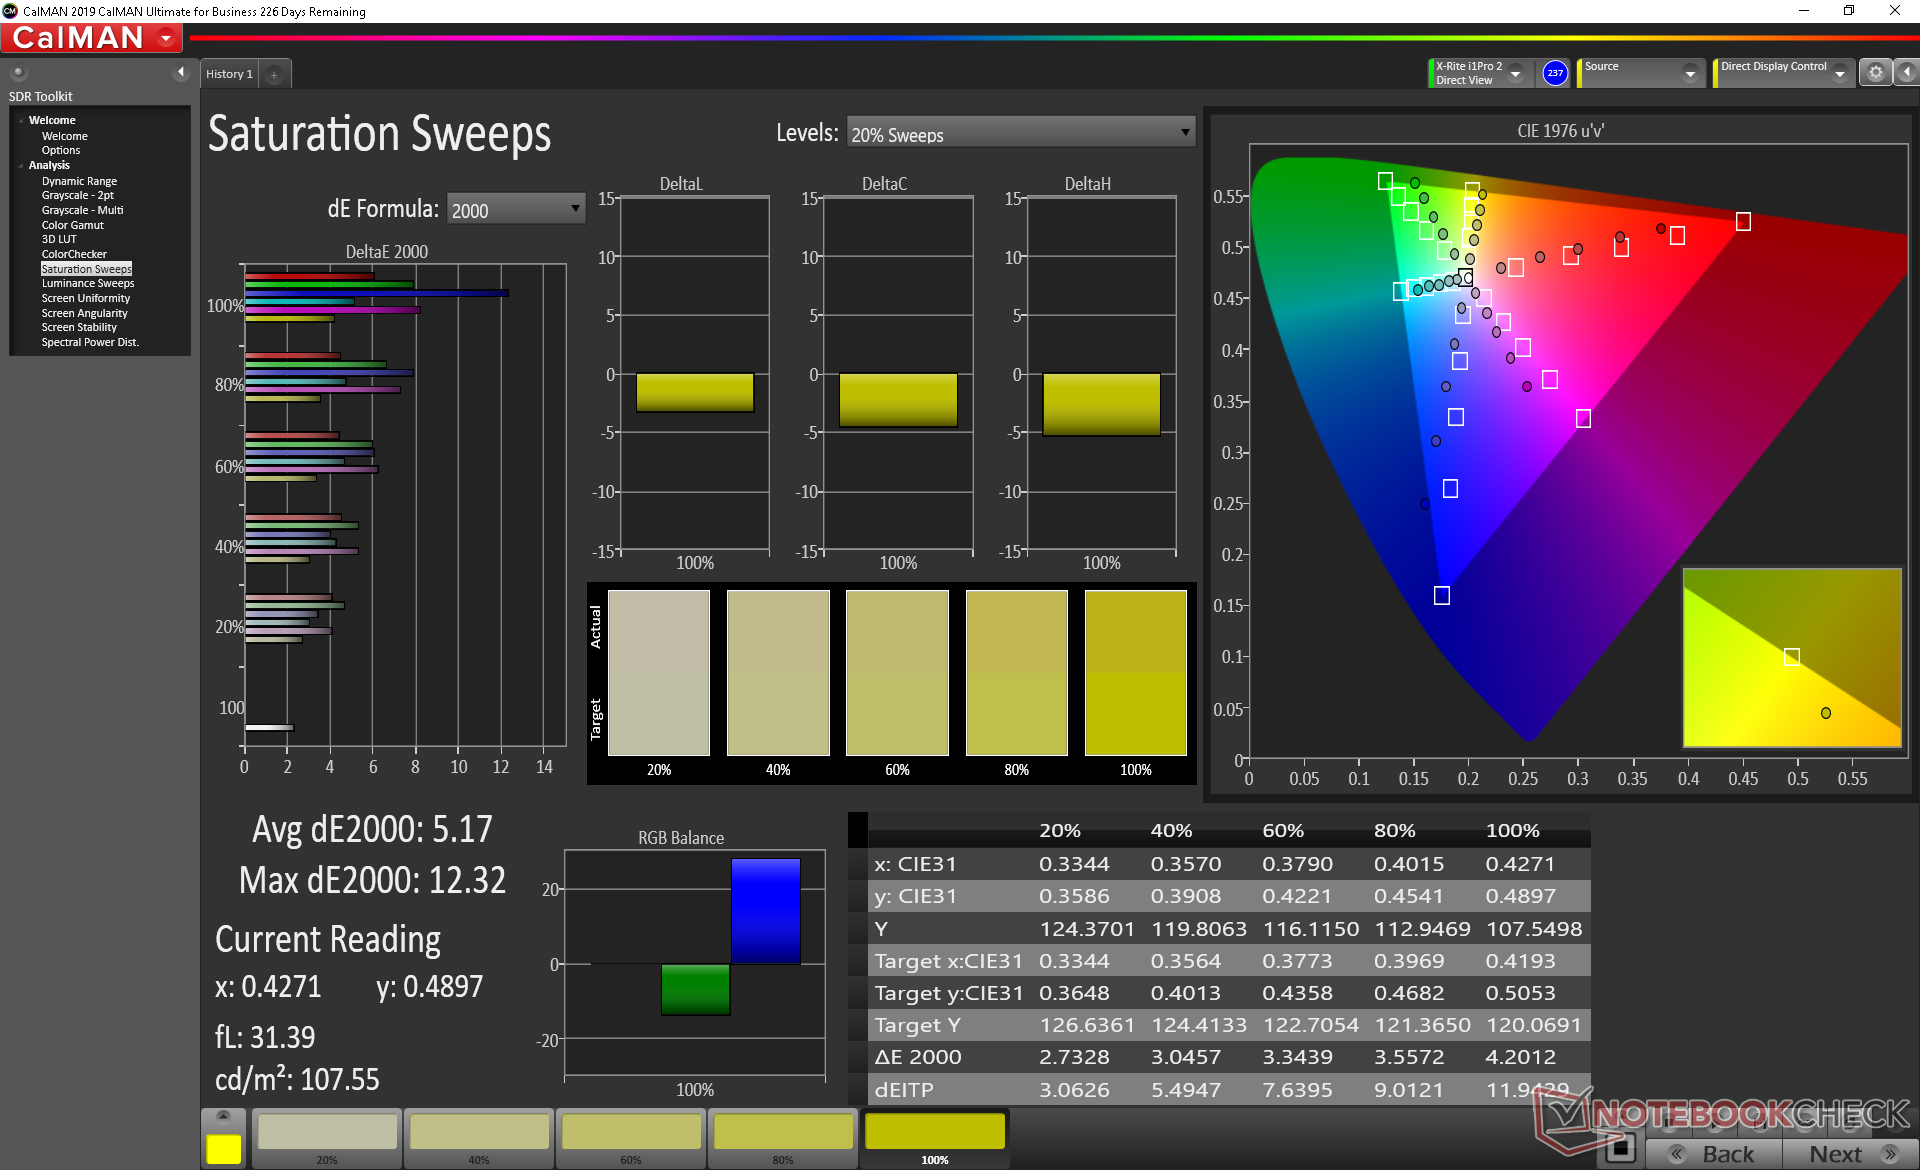
Calibrating the display ourselves improves grayscale significantly from an average DeltaE of 4.6 to just 0.9. Color accuracy, however, changes little since the color space of the panel is so narrow. Blue is represented much more inaccurately than other primary and secondary colors.
Display Response Times
| ↔ Response Time Black to White | ||
|---|---|---|
| 29.6 ms ... rise ↗ and fall ↘ combined | ↗ 18 ms rise | 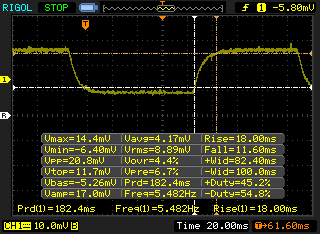 |
| ↘ 11.6 ms fall | ||
| The screen shows relatively slow response rates in our tests and may be too slow for gamers. In comparison, all tested devices range from 0.1 (minimum) to 240 (maximum) ms. » 78 % of all devices are better. This means that the measured response time is worse than the average of all tested devices (20 ms). | ||
| ↔ Response Time 50% Grey to 80% Grey | ||
| 36 ms ... rise ↗ and fall ↘ combined | ↗ 20 ms rise | 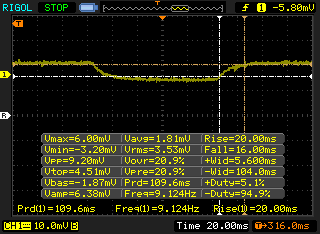 |
| ↘ 16 ms fall | ||
| The screen shows slow response rates in our tests and will be unsatisfactory for gamers. In comparison, all tested devices range from 0.165 (minimum) to 636 (maximum) ms. » 50 % of all devices are better. This means that the measured response time is worse than the average of all tested devices (31.4 ms). | ||
Screen Flickering / PWM (Pulse-Width Modulation)
| Screen flickering / PWM not detected | 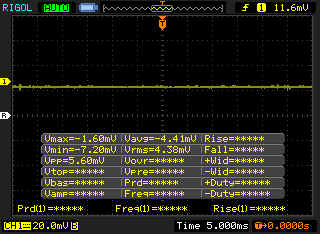 | ||
In comparison: 53 % of all tested devices do not use PWM to dim the display. If PWM was detected, an average of 7979 (minimum: 5 - maximum: 343500) Hz was measured. | |||
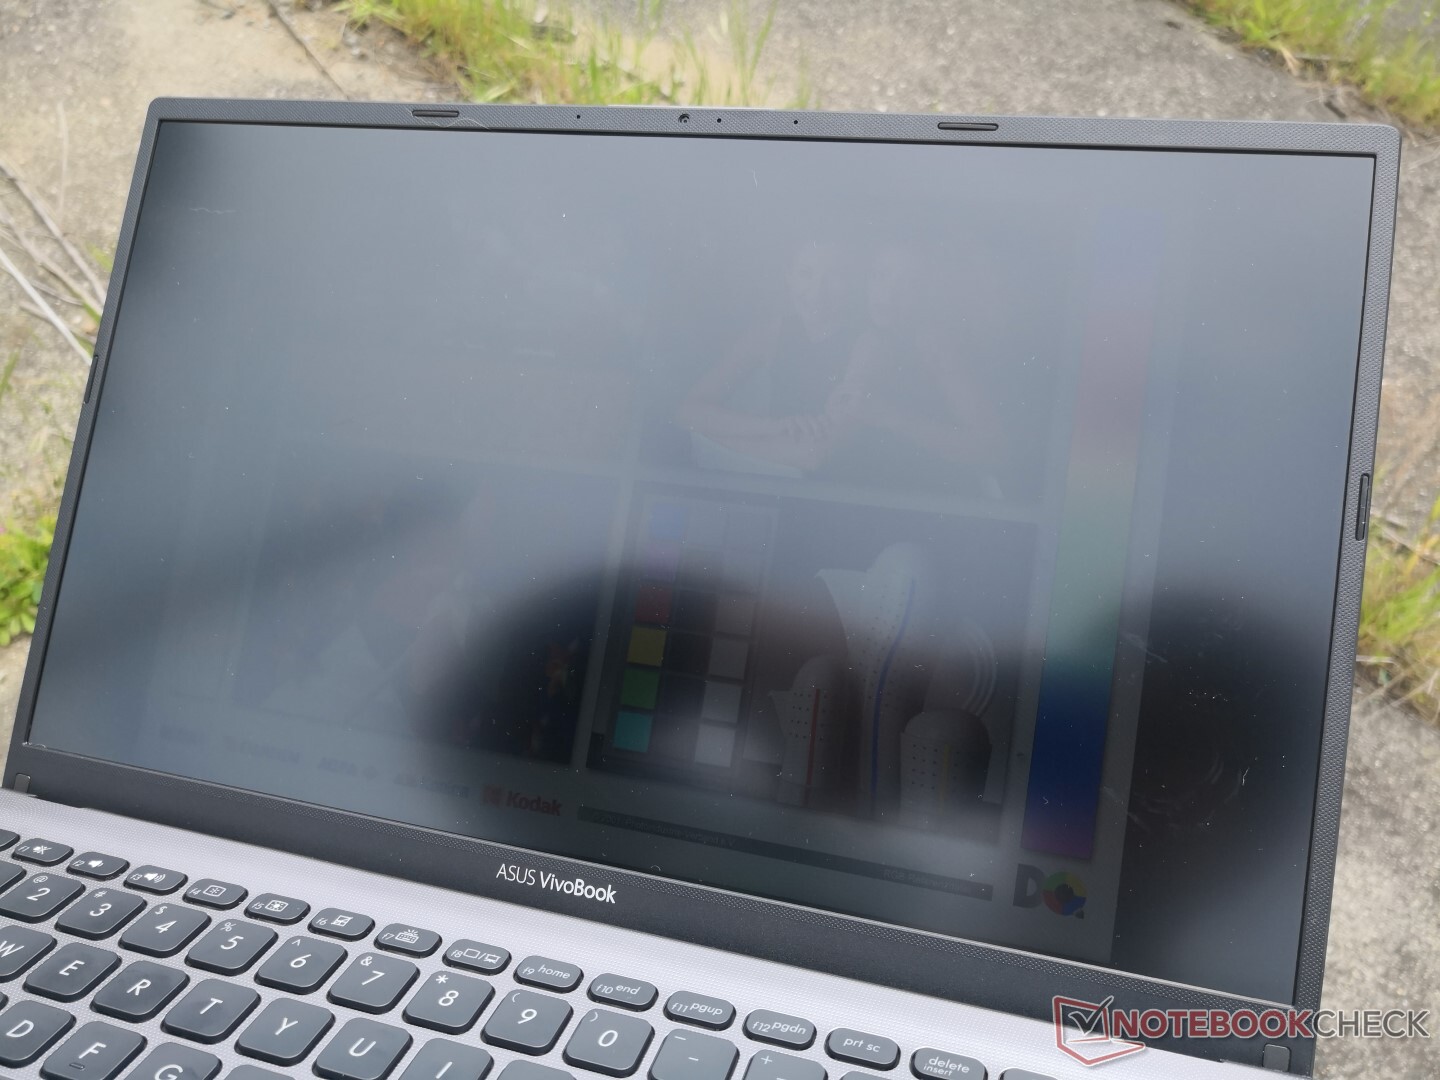
Outdoor visibility is poor but expected for its budget category. This is made worse by both the shallow contrast ratio and lowered maximum brightness level of the display from 252 nits to just 216 nits when disconnected from a power outlet. You may need to manually install AMD Adrenalin to activate the Radeon settings for disabling the automatic brightness reduction.
Performance
Processor
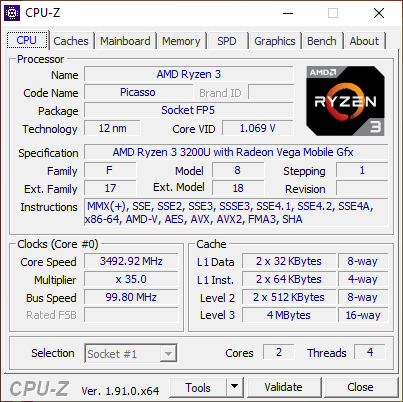
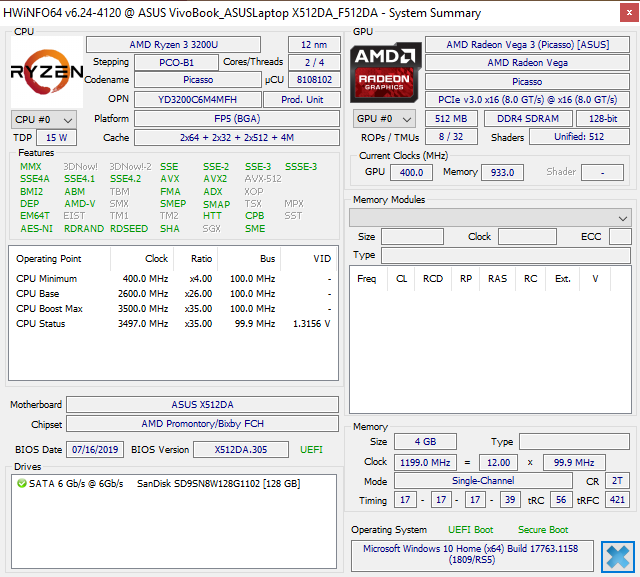
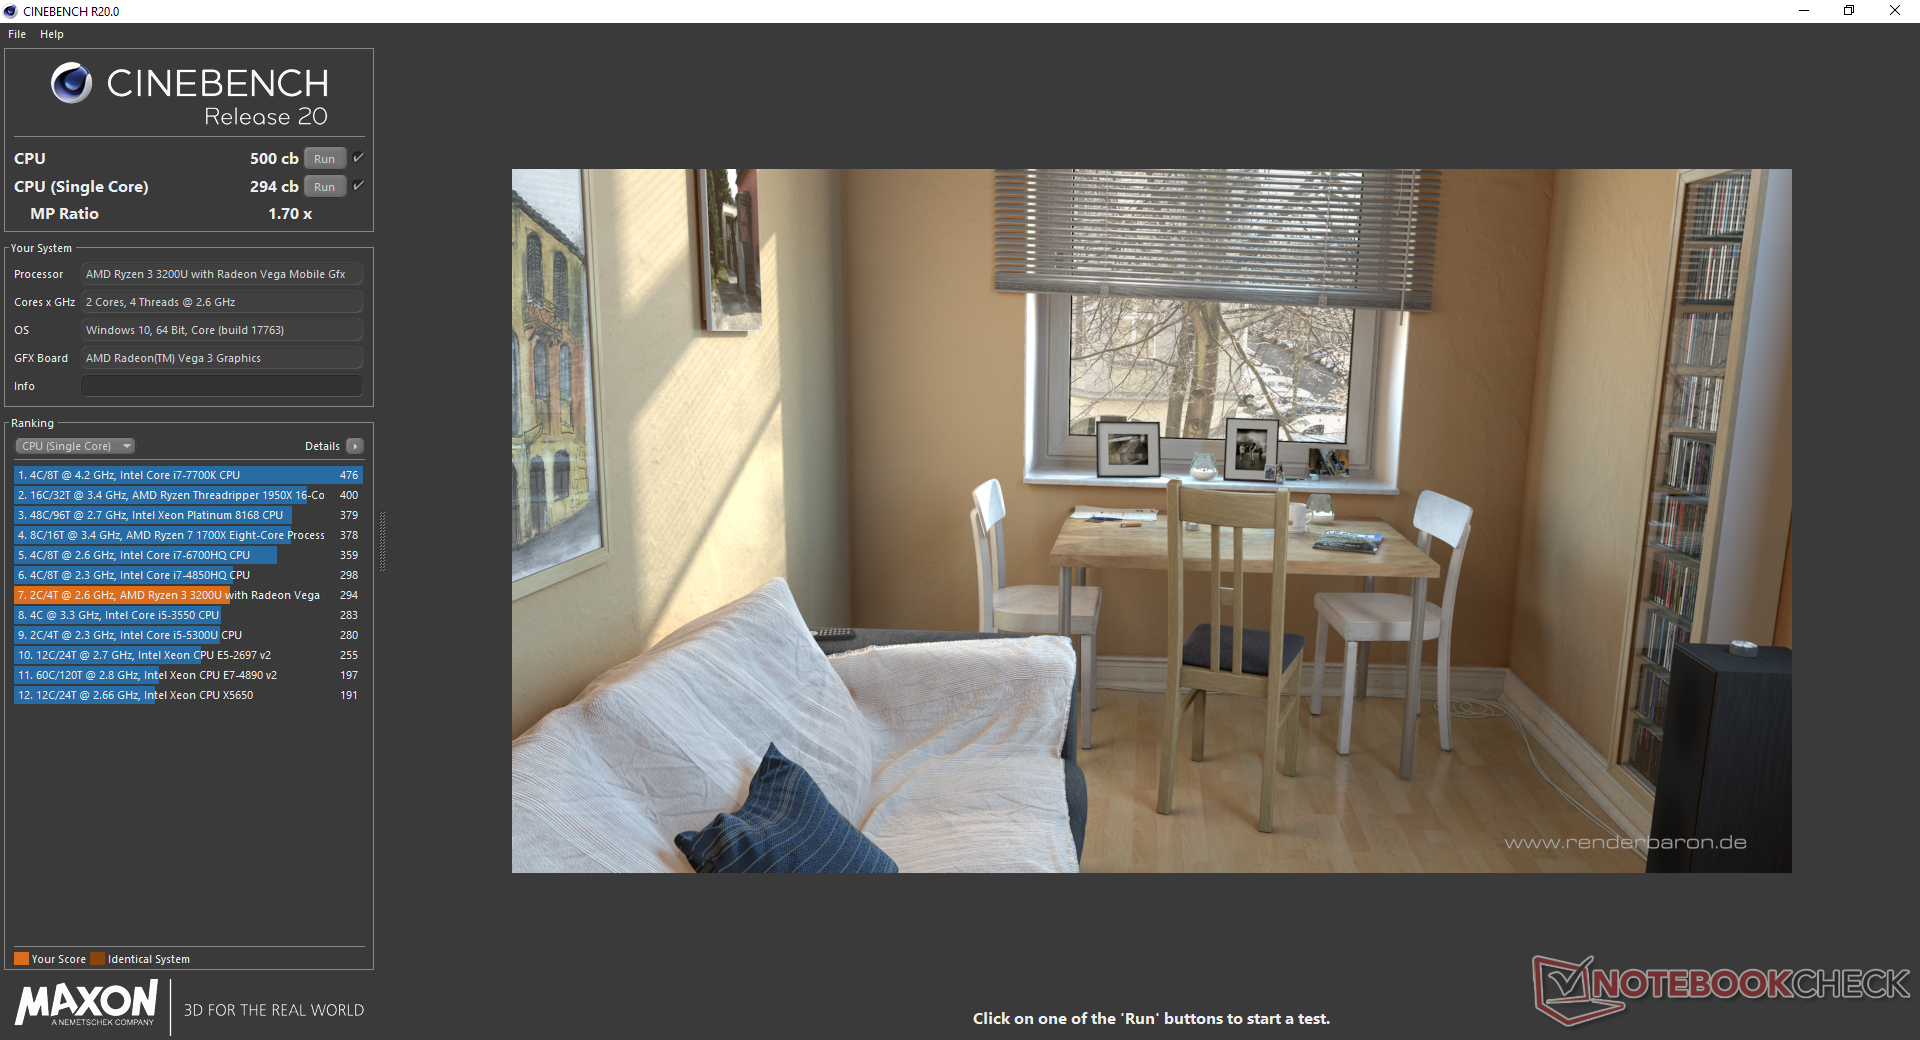
CPU performance is most similar to Intel's last generation Kaby Lake Core i3-8130U or Whiskey Lake-U Core i3-8145U. Intel's latest 10th gen Core i3-1005G1 as found on the Dell XPS 13 offers about 20 to 30 percent faster processor performance. Asus offers Core i7-8565U options for this VivoBook model for approximately 50 percent faster multi-thread performance than our budget Ryzen 3 configuration.
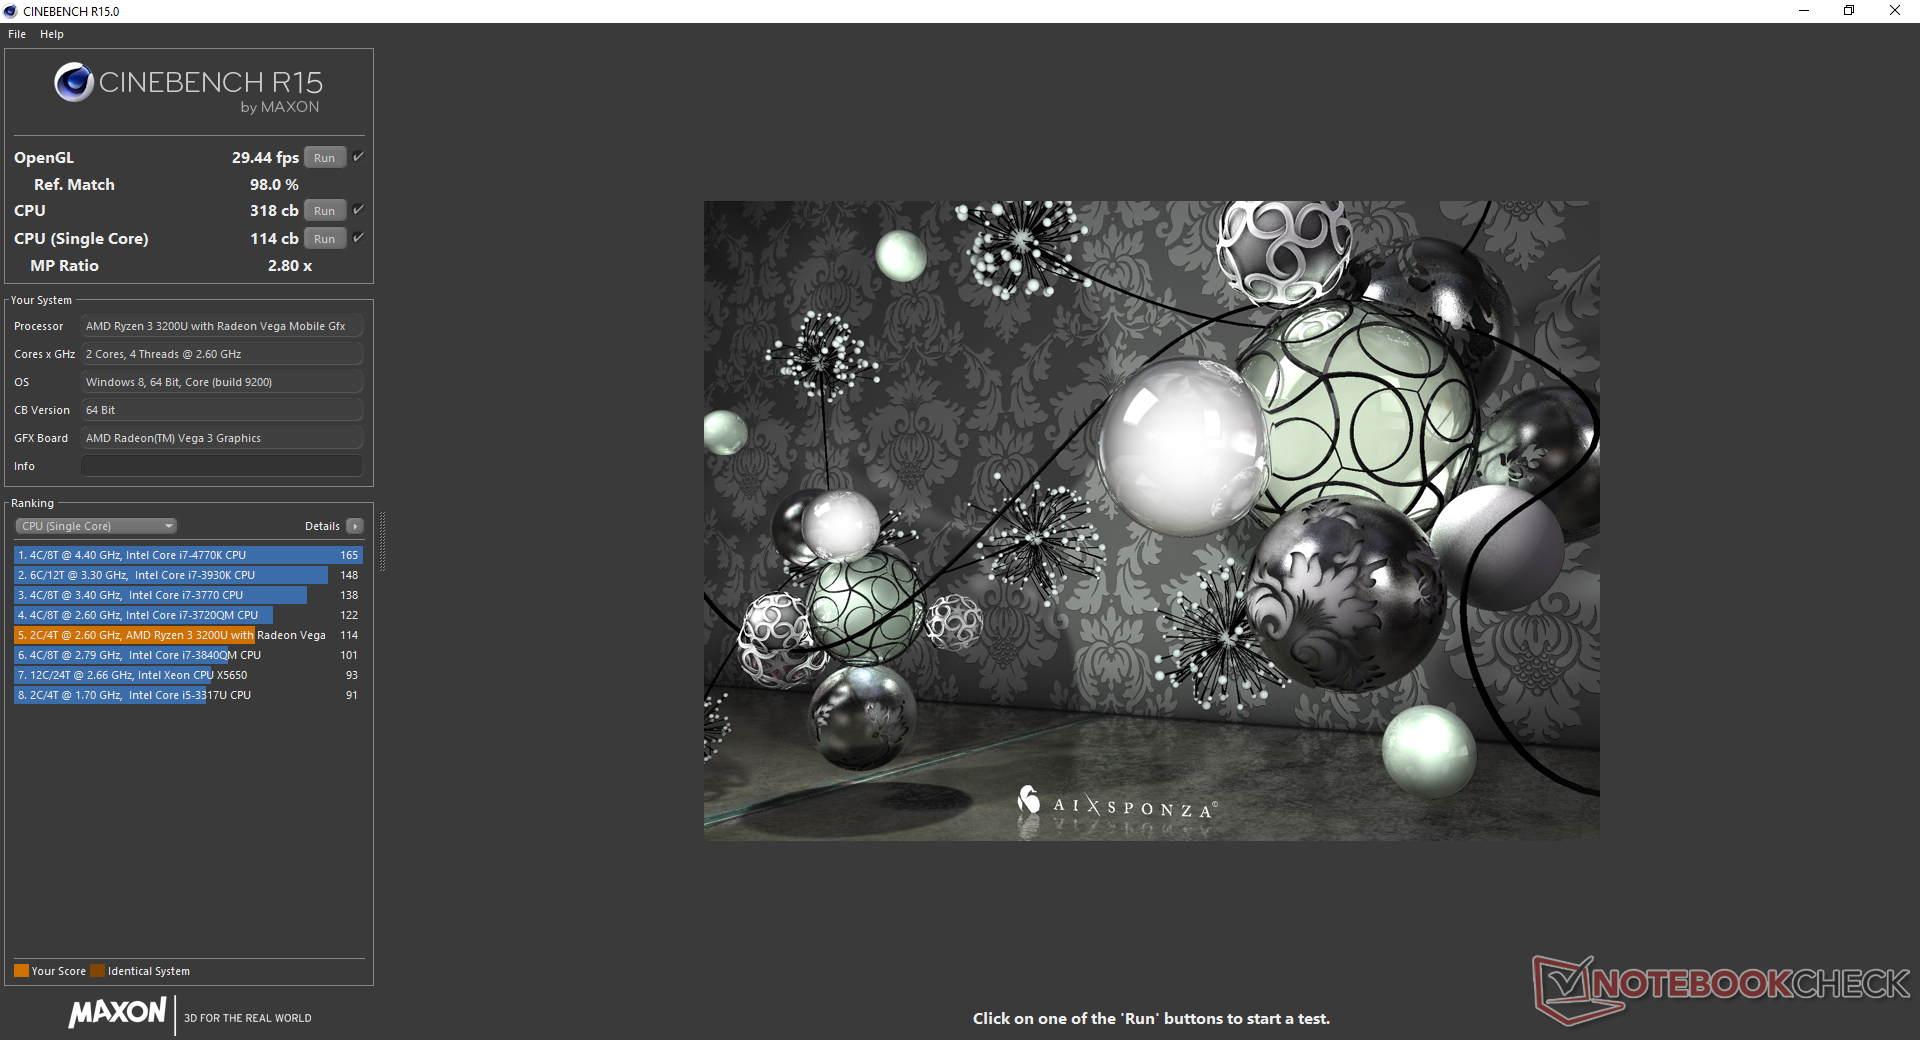
Running CineBench R15 Multi-Thread in a loop shows relatively steady performance throughout. See our dedicated page on the Ryzen 3 3200U for more technical information and benchmark comparisons. The Ryzen 3 3200U will be succeeded by the Ryzen 3 4300U in the coming months.
| Cinebench R11.5 | |
| CPU Single 64Bit | |
| Dell XPS 13 7390 2-in-1 Core i3 | |
| Dell Inspiron 15 5000 5585 | |
| Chuwi LapBook Plus | |
| CPU Multi 64Bit | |
| Dell Inspiron 15 5000 5585 | |
| Dell XPS 13 7390 2-in-1 Core i3 | |
| Chuwi LapBook Plus | |
| wPrime 2.10 - 1024m | |
| Chuwi LapBook Plus | |
| HP ProBook x360 11 G4 | |
| Intel NUC5i3RYK | |
| Average AMD Ryzen 3 3200U (n=1) | |
| Dell XPS 13 7390 2-in-1 Core i3 | |
* ... smaller is better
System Performance
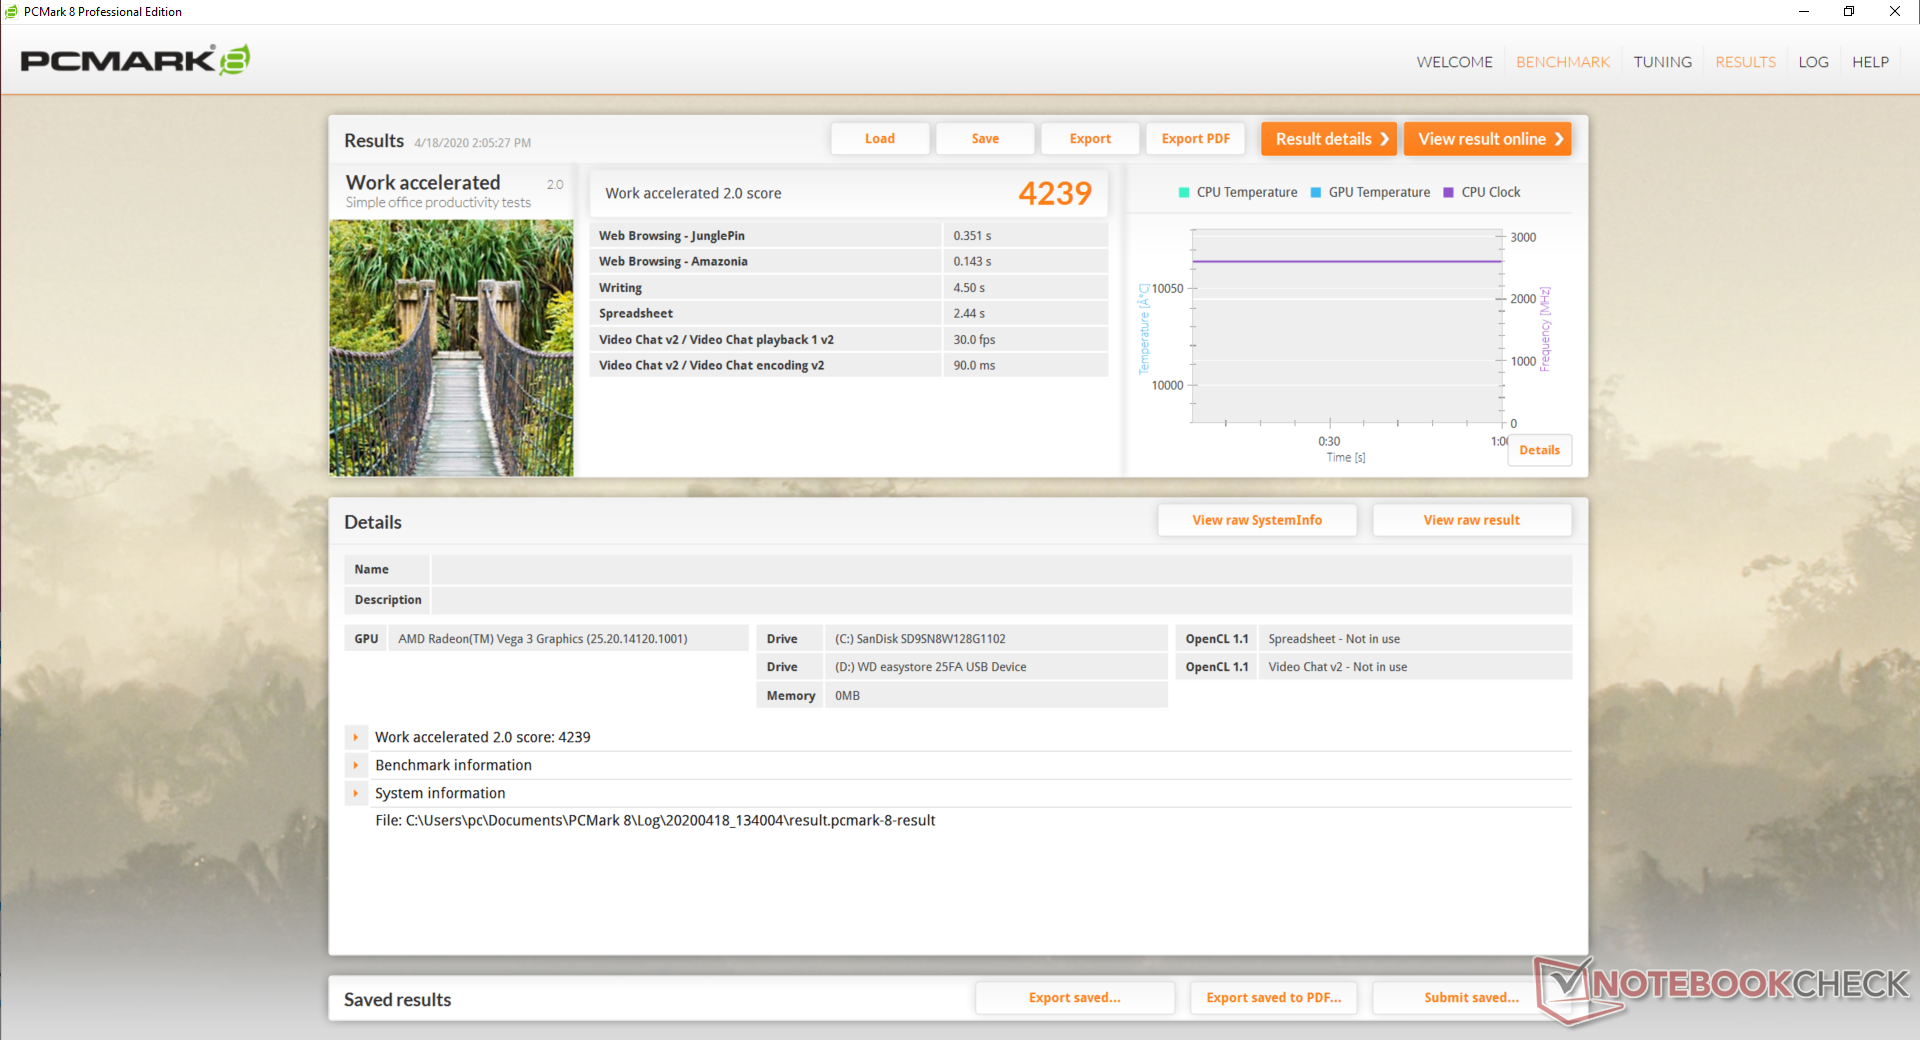
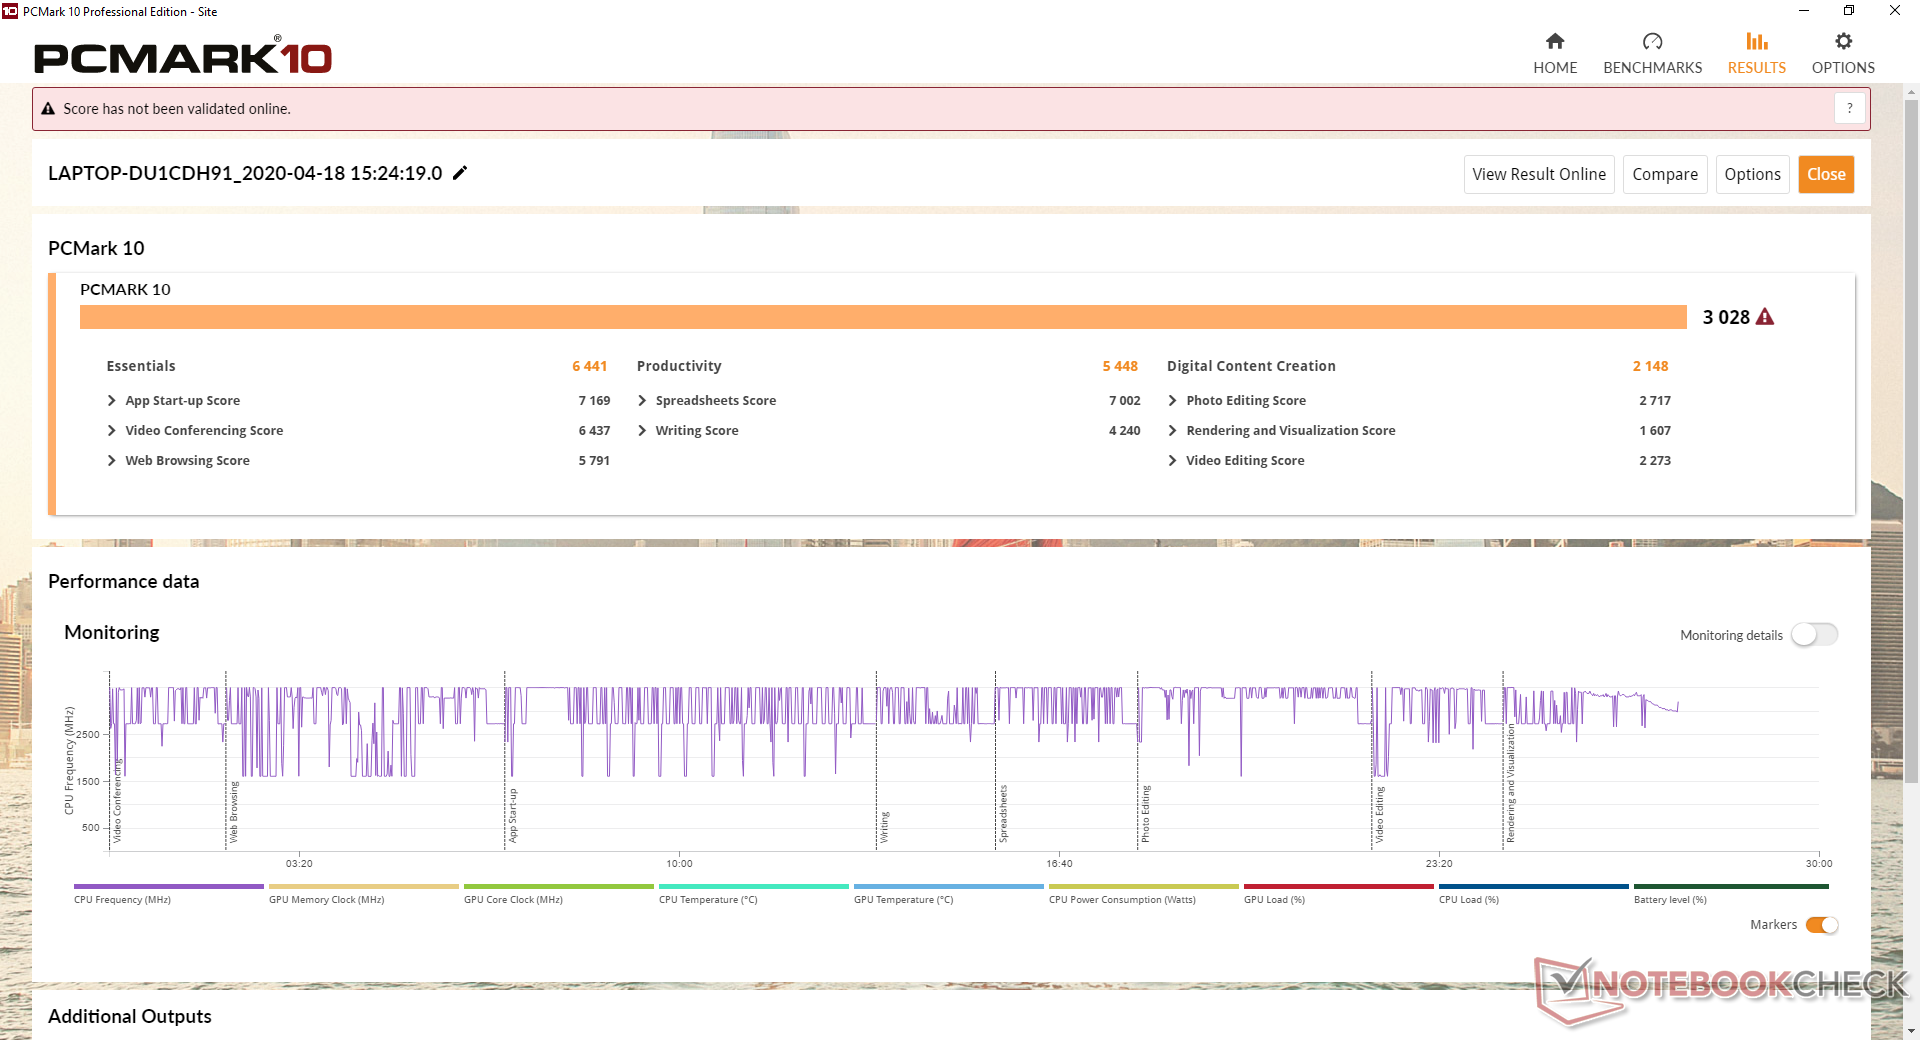
PCMark benchmarks are where expect them to be relative to competing Core i3 alternatives while being far ahead of Intel Atom-based laptops like the Chuwi LapBook.

| PCMark 8 Home Score Accelerated v2 | 2742 points | |
| PCMark 8 Work Score Accelerated v2 | 4239 points | |
| PCMark 10 Score | 3028 points | |
Help | ||
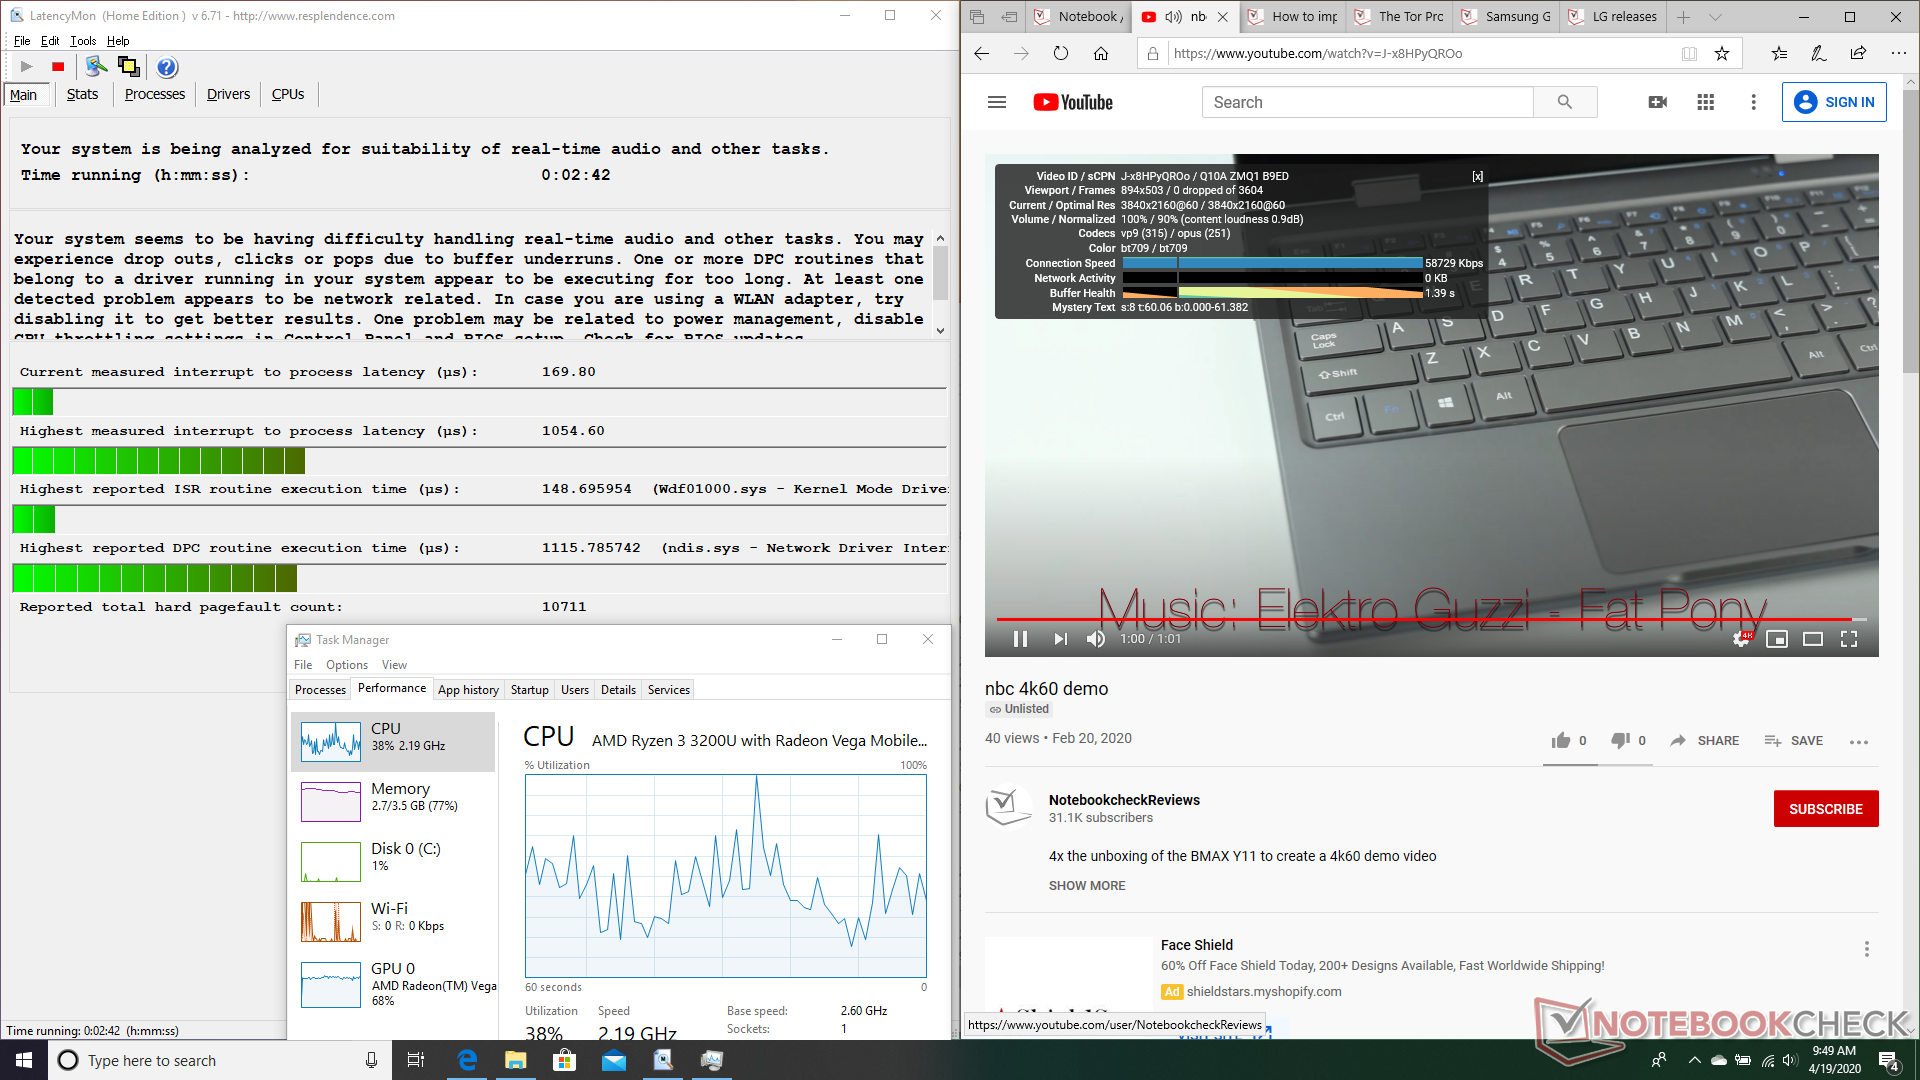
DPC Latency
The system exhibits DPC latency issues when opening multiple Edge tabs, playing 4K UHD video, and running Prime95 in sequence. Fortunately, we're not able to observe any dropped frames during our 4K UHD video test.
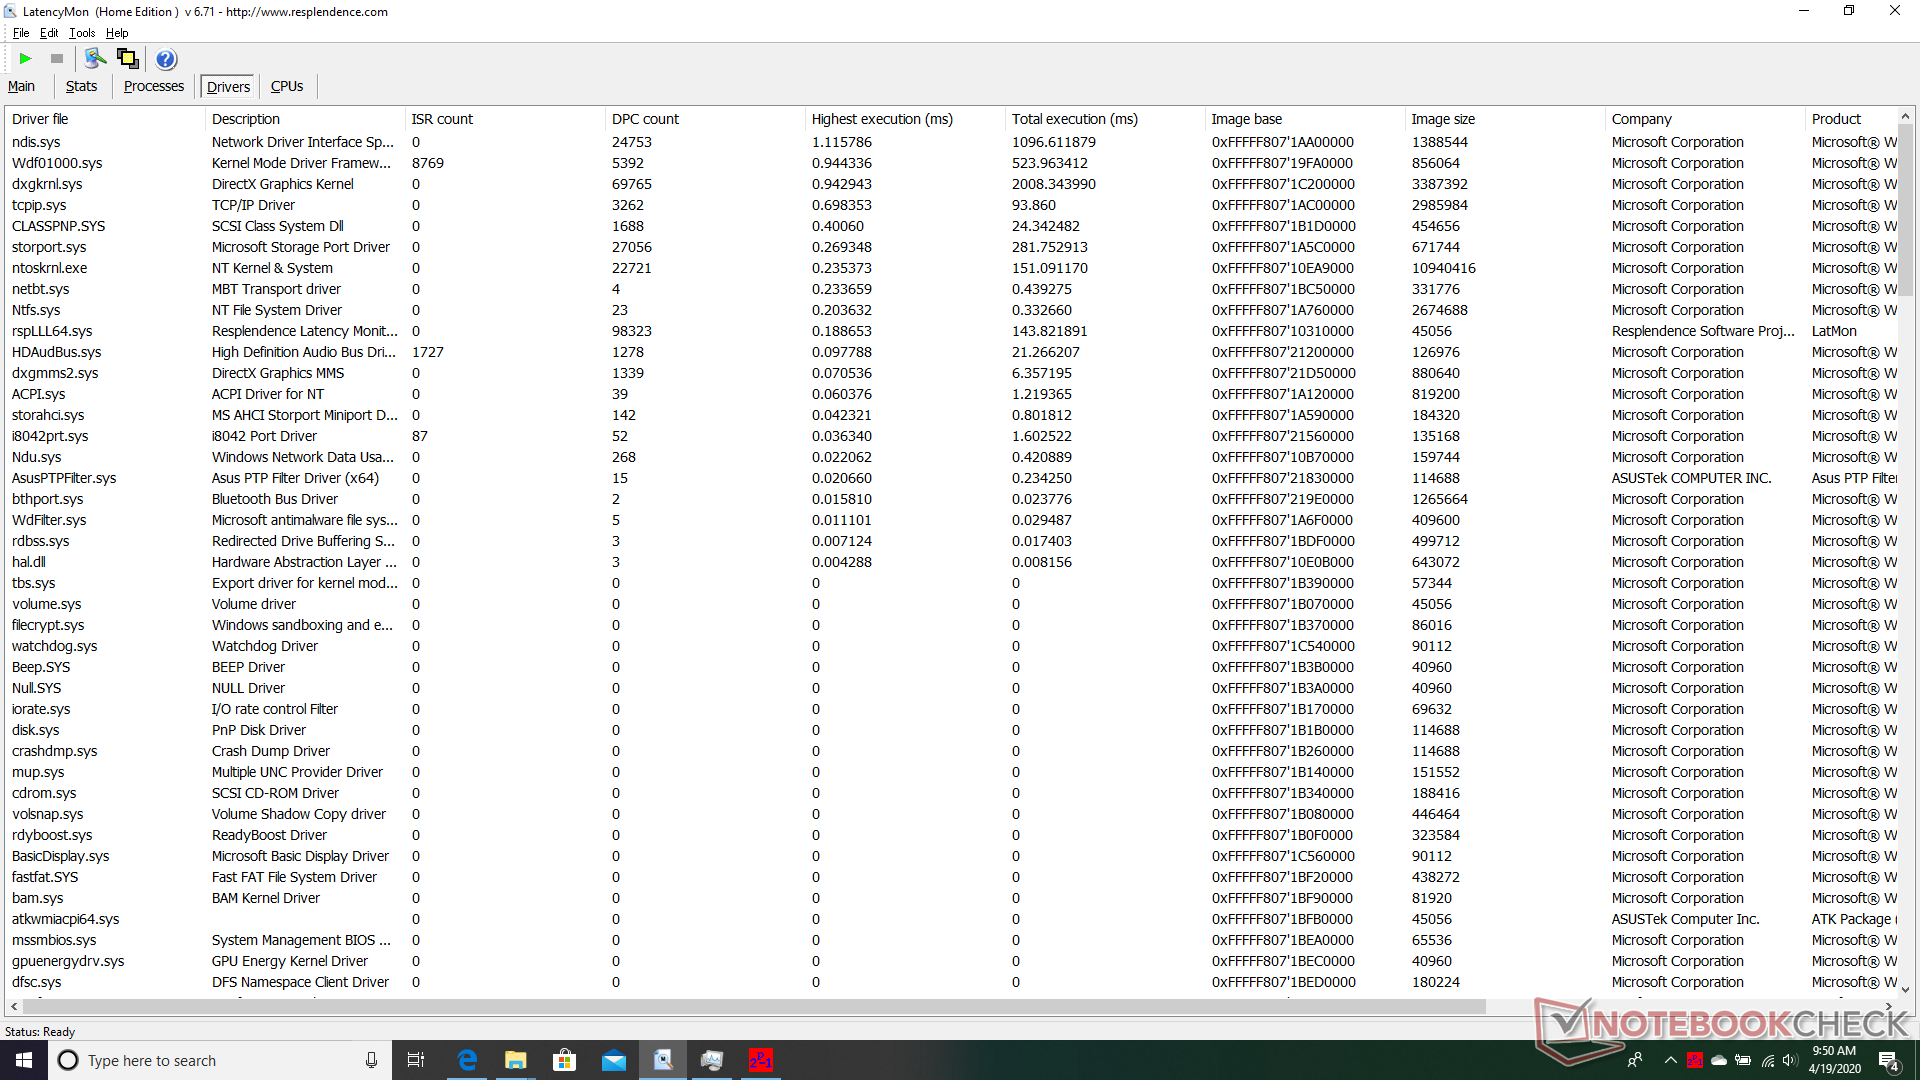
| DPC Latencies / LatencyMon - interrupt to process latency (max), Web, Youtube, Prime95 | |
| Asus Vivobook 15 F512DA-SH31 | |
* ... smaller is better
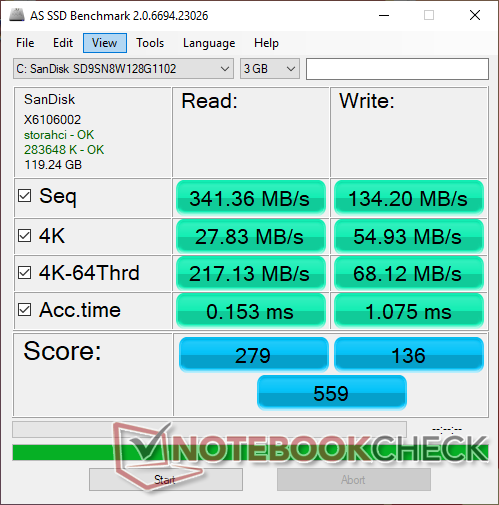
Storage Devices
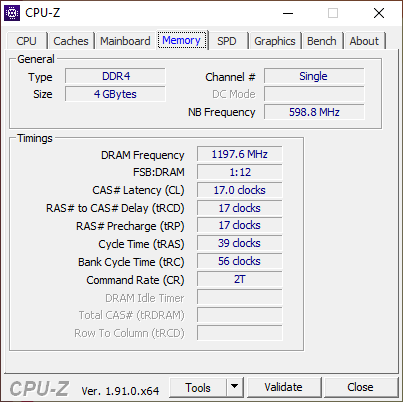
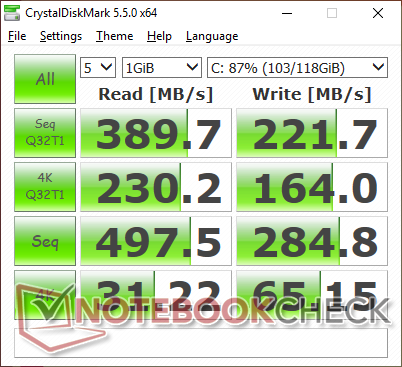
Our test unit comes with an inexpensive 128 GB SanDisk SD9SN8W128G M.2 SSD in order to keep prices low. Sequential read and write rates are slower than most SATA III SSDs at just 341 MB/s and 134 MB/s, respectively, according to AS SSD. Results on CrystalDiskMark are faster, but still disappointing for the category.
| Asus Vivobook 15 F512DA-SH31 SanDisk X600 SD9SN8W-128G | Lenovo Ideapad S340-15IIL Intel SSD 660p SSDPEKNW512G8 | Acer Aspire 5 A515-43-R6WW Intel SSD 660p 1TB SSDPEKNW010T8 | Dell Inspiron 15 3585 (2300U, Vega 6) Toshiba BG3 KBG30ZMS256G | Asus ZenBook 15 UX534FTC-A8190T Samsung SSD PM981 MZVLB1T0HALR | Huawei MateBook D 15-53010TUY Samsung SSD PM981 MZVLB256HAHQ | |
|---|---|---|---|---|---|---|
| AS SSD | 444% | 357% | 153% | 773% | 530% | |
| Seq Read (MB/s) | 341.4 | 1447 324% | 1358 298% | 1291 278% | 2643 674% | 2613 665% |
| Seq Write (MB/s) | 134.2 | 926 590% | 1300 869% | 688 413% | 1533 1042% | 1549 1054% |
| 4K Read (MB/s) | 27.83 | 40.06 44% | 44.88 61% | 21.87 -21% | 49.12 77% | 47.15 69% |
| 4K Write (MB/s) | 54.9 | 97.9 78% | 77.5 41% | 35.62 -35% | 134.7 145% | 111.6 103% |
| 4K-64 Read (MB/s) | 217.1 | 323.7 49% | 586 170% | 632 191% | 1028 374% | 748 245% |
| 4K-64 Write (MB/s) | 68.1 | 791 1062% | 738 984% | 221.2 225% | 1353 1887% | 1275 1772% |
| Access Time Read * (ms) | 0.153 | 0.06 61% | 0.33 -116% | 0.033 78% | 0.062 59% | |
| Access Time Write * (ms) | 1.075 | 0.144 87% | 0.057 95% | 0.234 78% | 0.028 97% | 0.042 96% |
| Score Read (Points) | 279 | 508 82% | 767 175% | 783 181% | 1342 381% | 1057 279% |
| Score Write (Points) | 136 | 982 622% | 945 595% | 326 140% | 1641 1107% | 1542 1034% |
| Score Total (Points) | 559 | 1738 211% | 2115 278% | 1489 166% | 3622 548% | 3097 454% |
| Copy ISO MB/s (MB/s) | 115.9 | 943 714% | 432.6 273% | 2226 1821% | ||
| Copy Program MB/s (MB/s) | 44.51 | 612 1275% | 95.6 115% | 506 1037% | ||
| Copy Game MB/s (MB/s) | 74.3 | 826 1012% | 263.4 255% | 1230 1555% | ||
| CrystalDiskMark 5.2 / 6 | 198% | 204% | 96% | 395% | 314% | |
| Write 4K (MB/s) | 65.2 | 130.8 101% | 114.9 76% | 87.3 34% | 138.1 112% | 134.8 107% |
| Read 4K (MB/s) | 31.22 | 54.8 76% | 52.7 69% | 23.54 -25% | 45.89 47% | 41.68 34% |
| Write Seq (MB/s) | 284.8 | 978 243% | 1361 378% | 824 189% | 2147 654% | 1651 480% |
| Read Seq (MB/s) | 497.5 | 1627 227% | 1385 178% | 715 44% | 2188 340% | 2300 362% |
| Write 4K Q32T1 (MB/s) | 164 | 450.1 174% | 181.1 10% | 147.8 -10% | 427.8 161% | 260 59% |
| Read 4K Q32T1 (MB/s) | 230.2 | 345.9 50% | 340.5 48% | 256.1 11% | 404 75% | 335.1 46% |
| Write Seq Q32T1 (MB/s) | 221.7 | 982 343% | 1519 585% | 733 231% | 2396 981% | 1641 640% |
| Read Seq Q32T1 (MB/s) | 389.7 | 1842 373% | 1515 289% | 1525 291% | 3454 786% | 3452 786% |
| Total Average (Program / Settings) | 321% /
354% | 281% /
289% | 125% /
132% | 584% /
635% | 422% /
439% |
* ... smaller is better

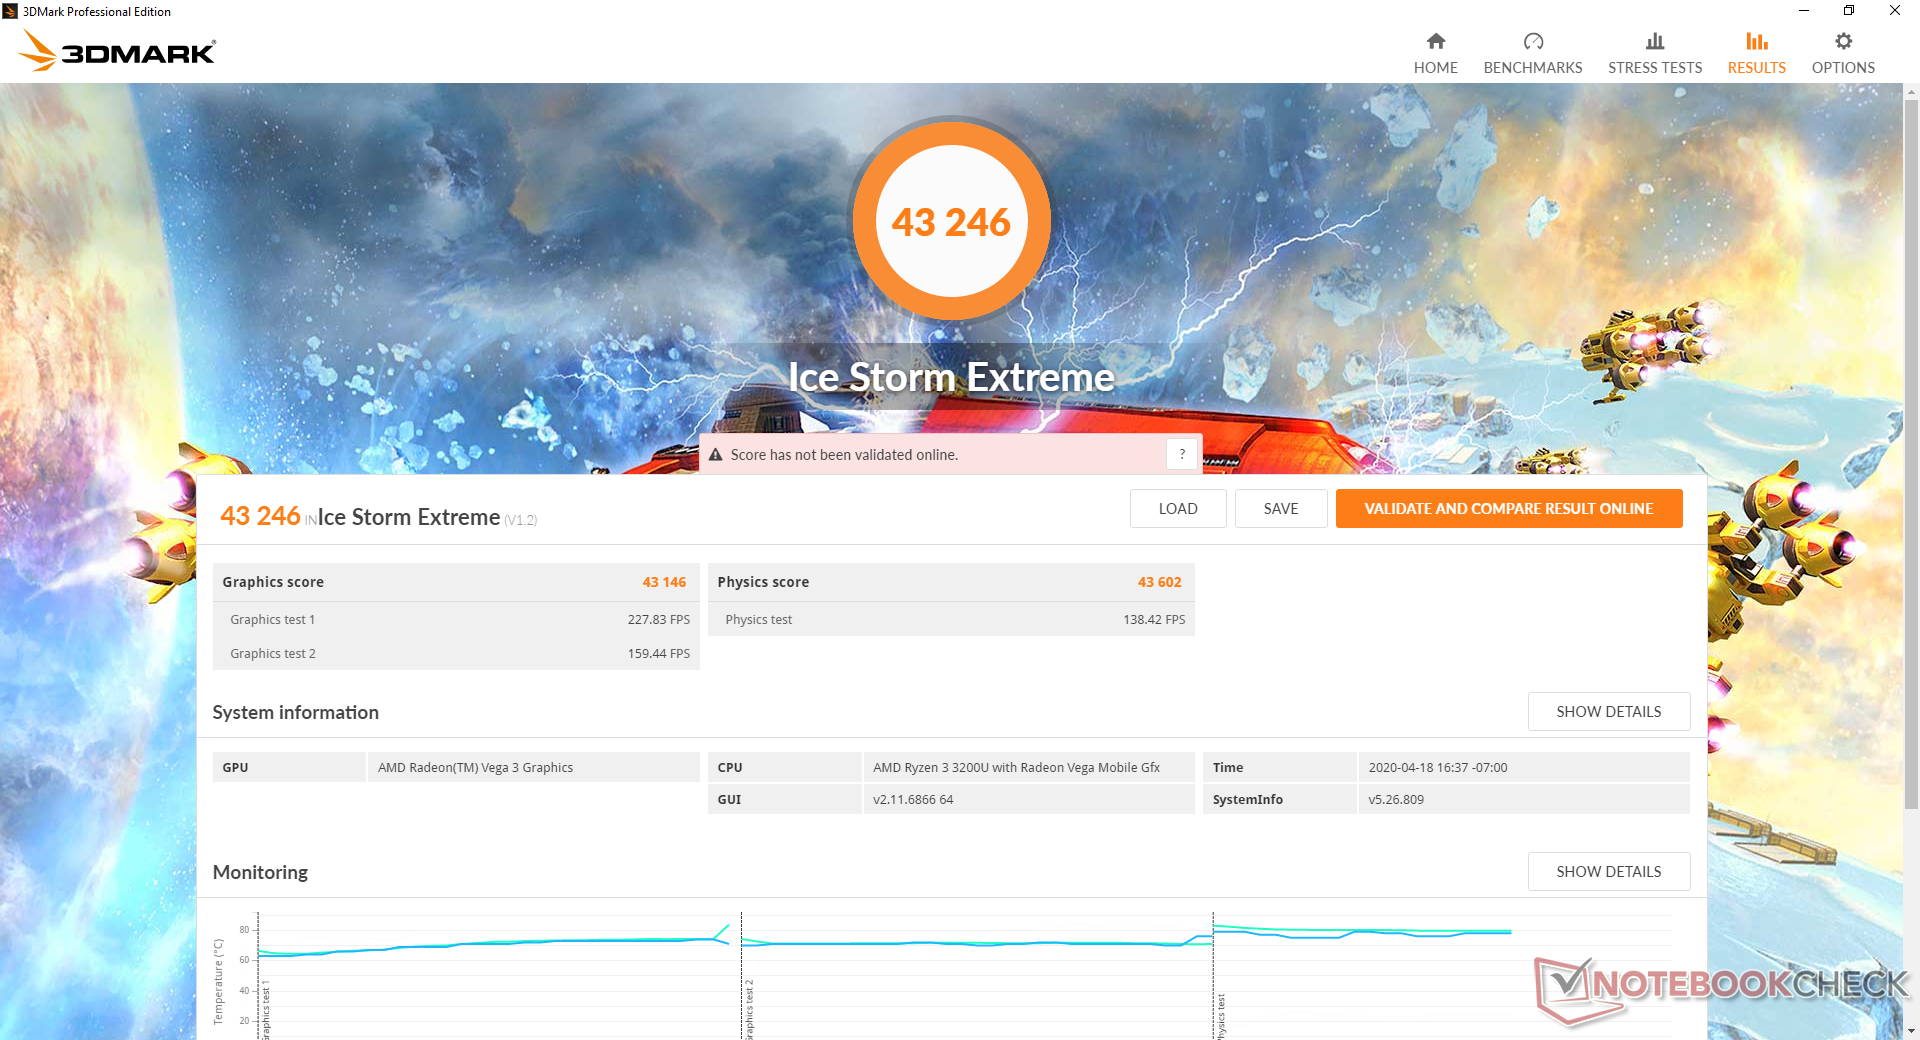
GPU Performance
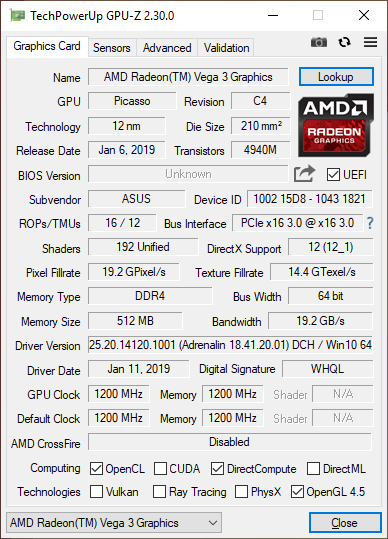
The integrated Radeon RX Vega 3 is essentially neck-to-neck with the competing Intel UHD Graphics 620 which makes it unfit for most 3D games. For light games like DOTA 2 or Rocket League, consider laptops with the RX Vega 10, Ice lake Core i7, or the GeForce MX150/MX250 instead.
See our dedicated page on the RX Vega 3 for more benchmark comparisons.
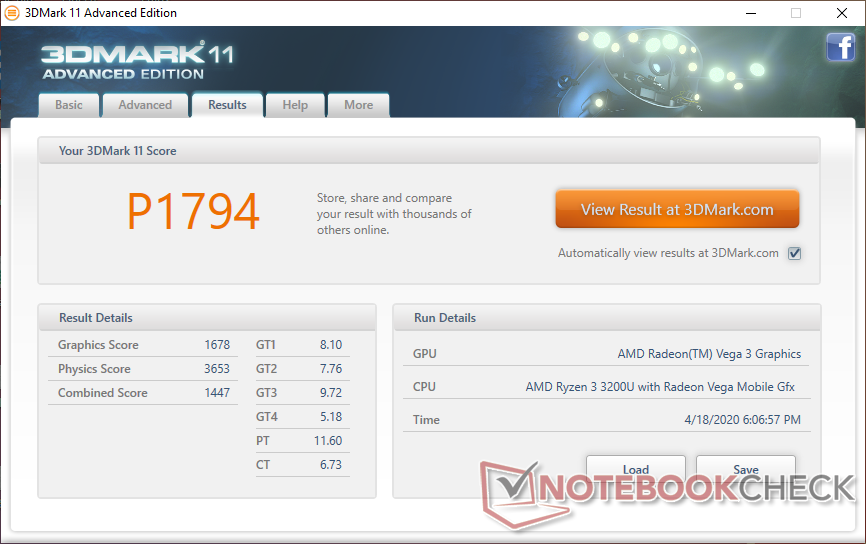
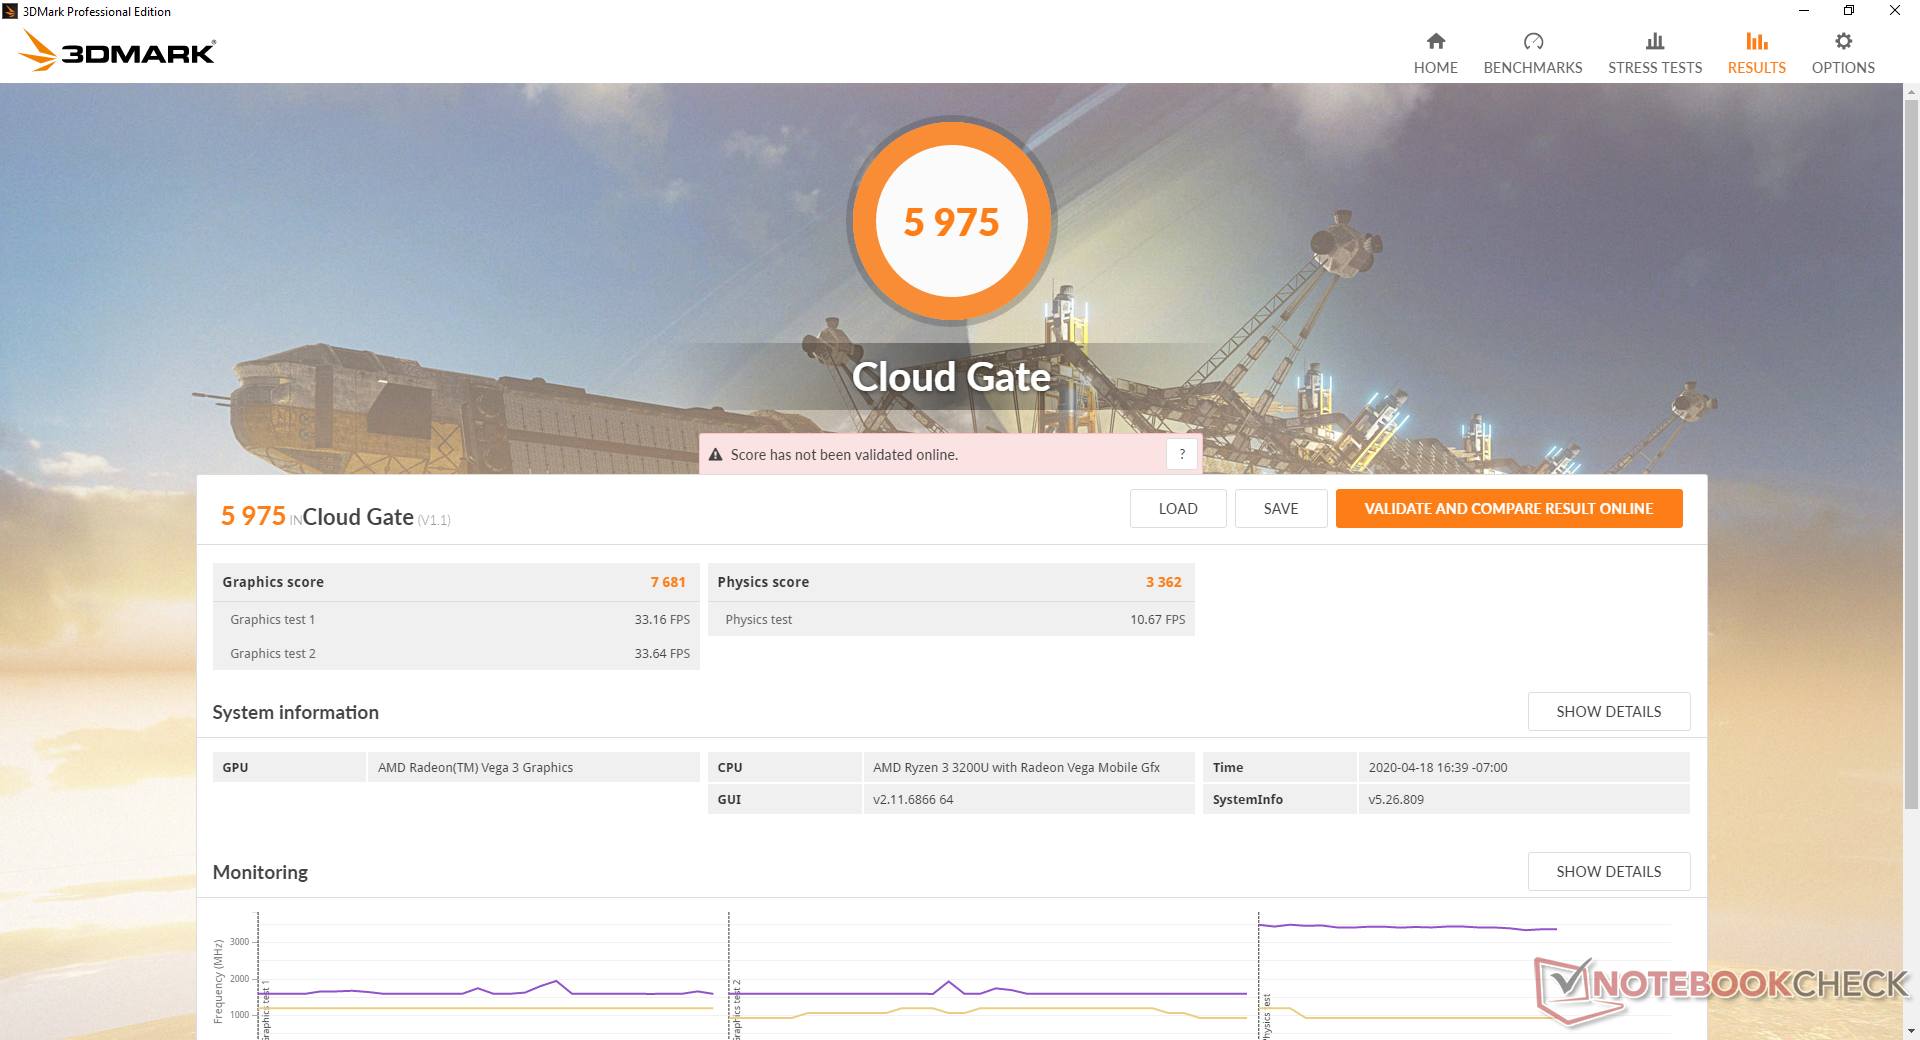
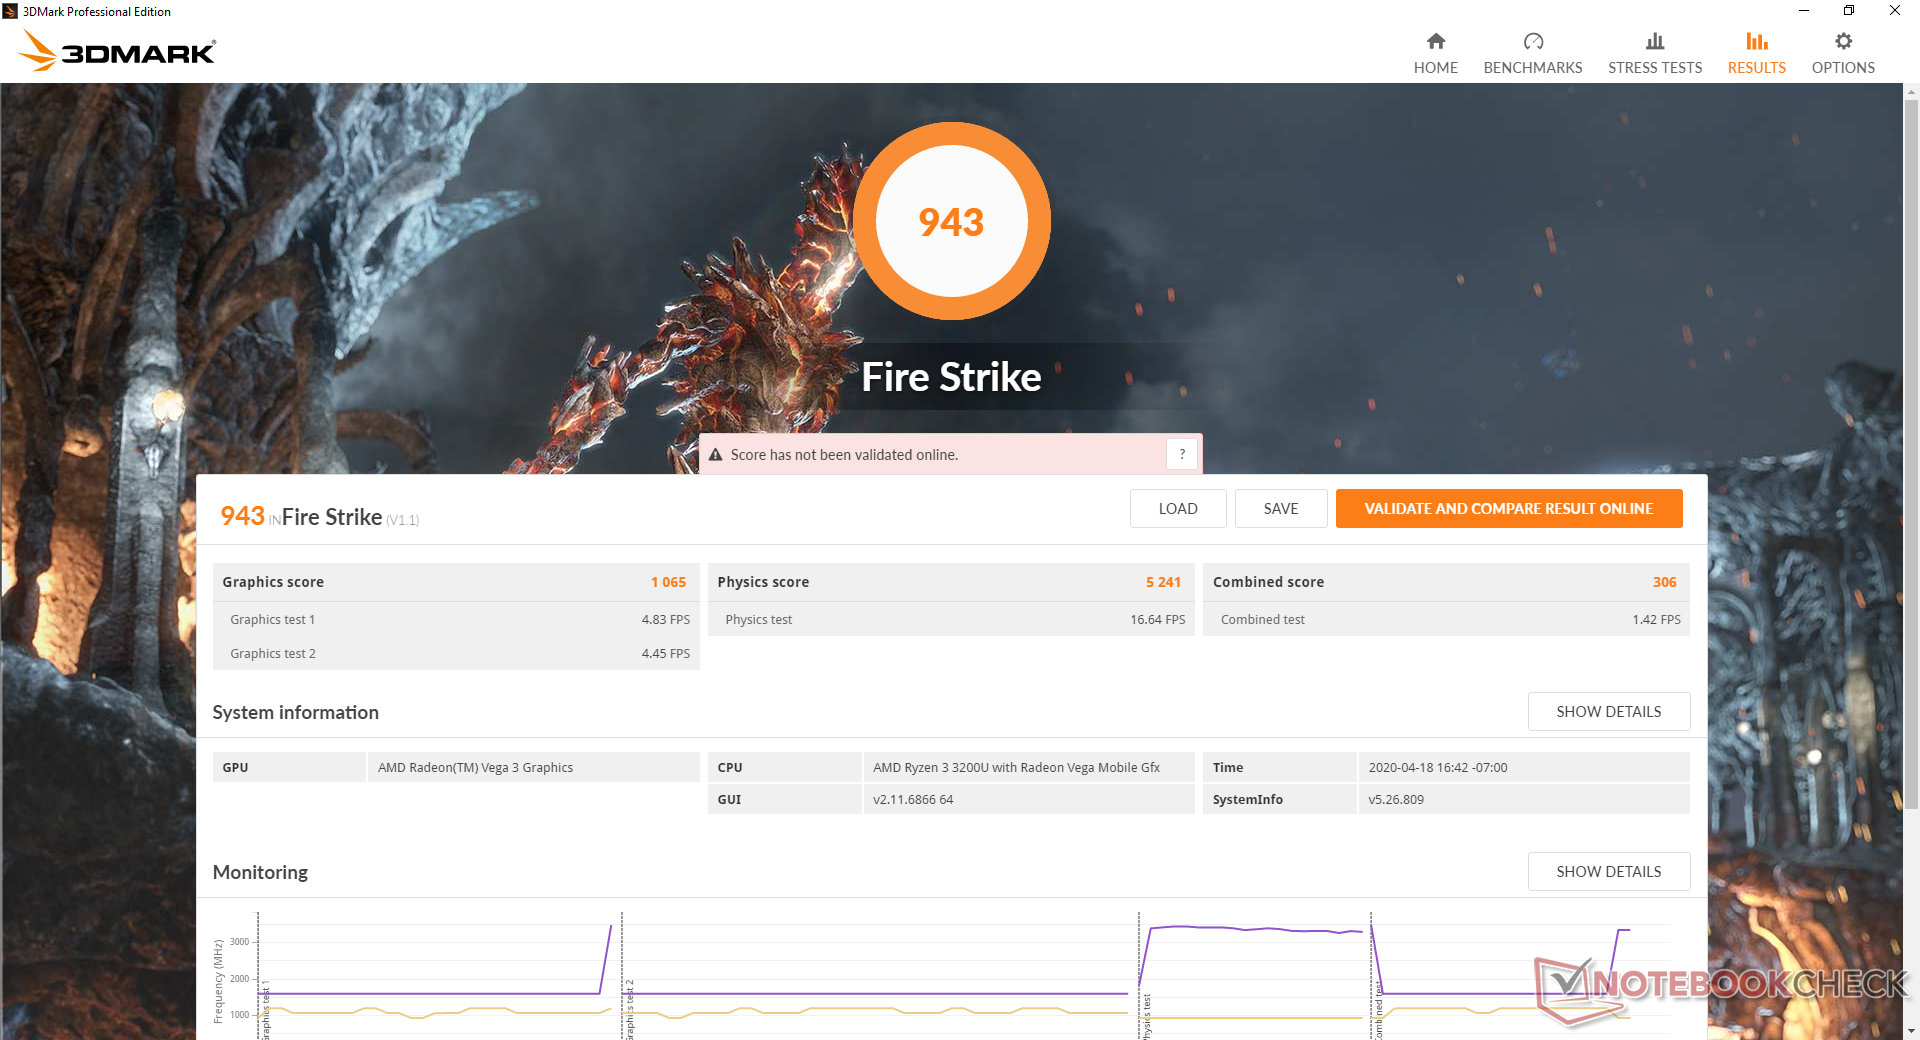
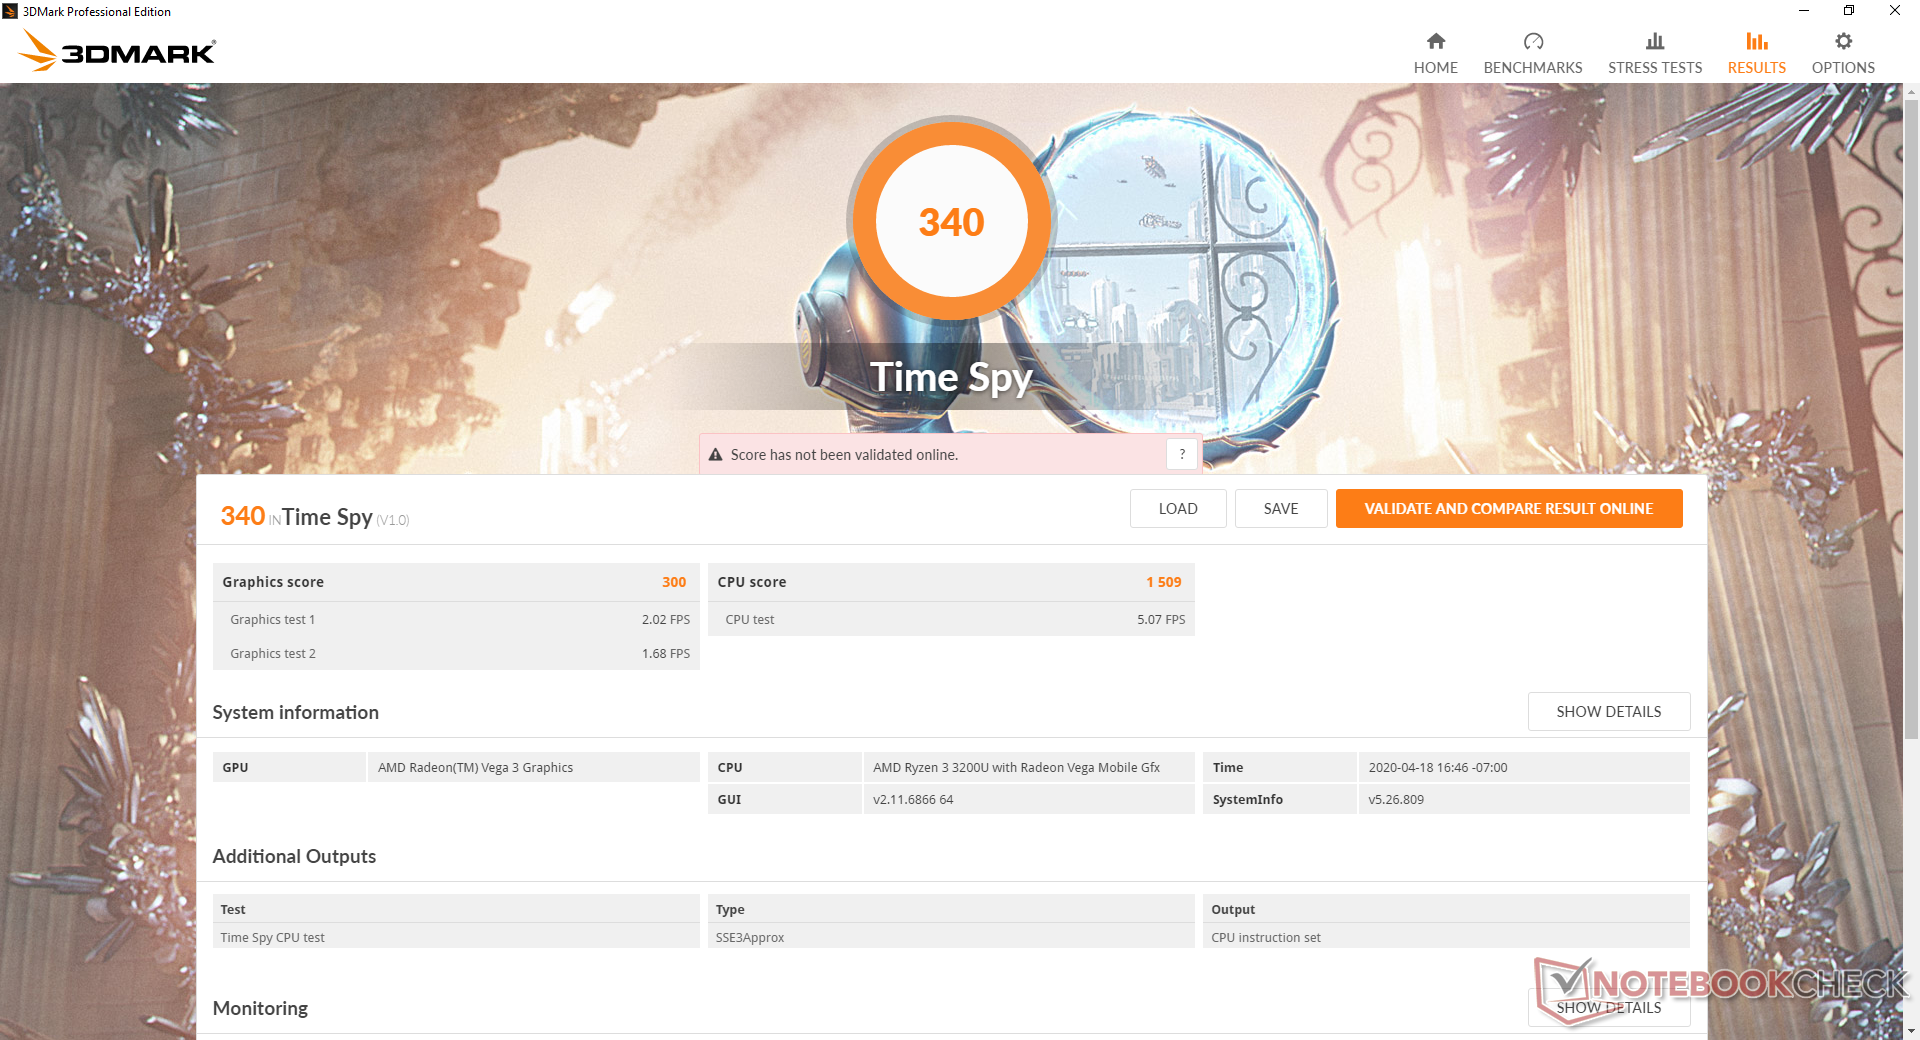
| 3DMark 11 Performance | 1794 points | |
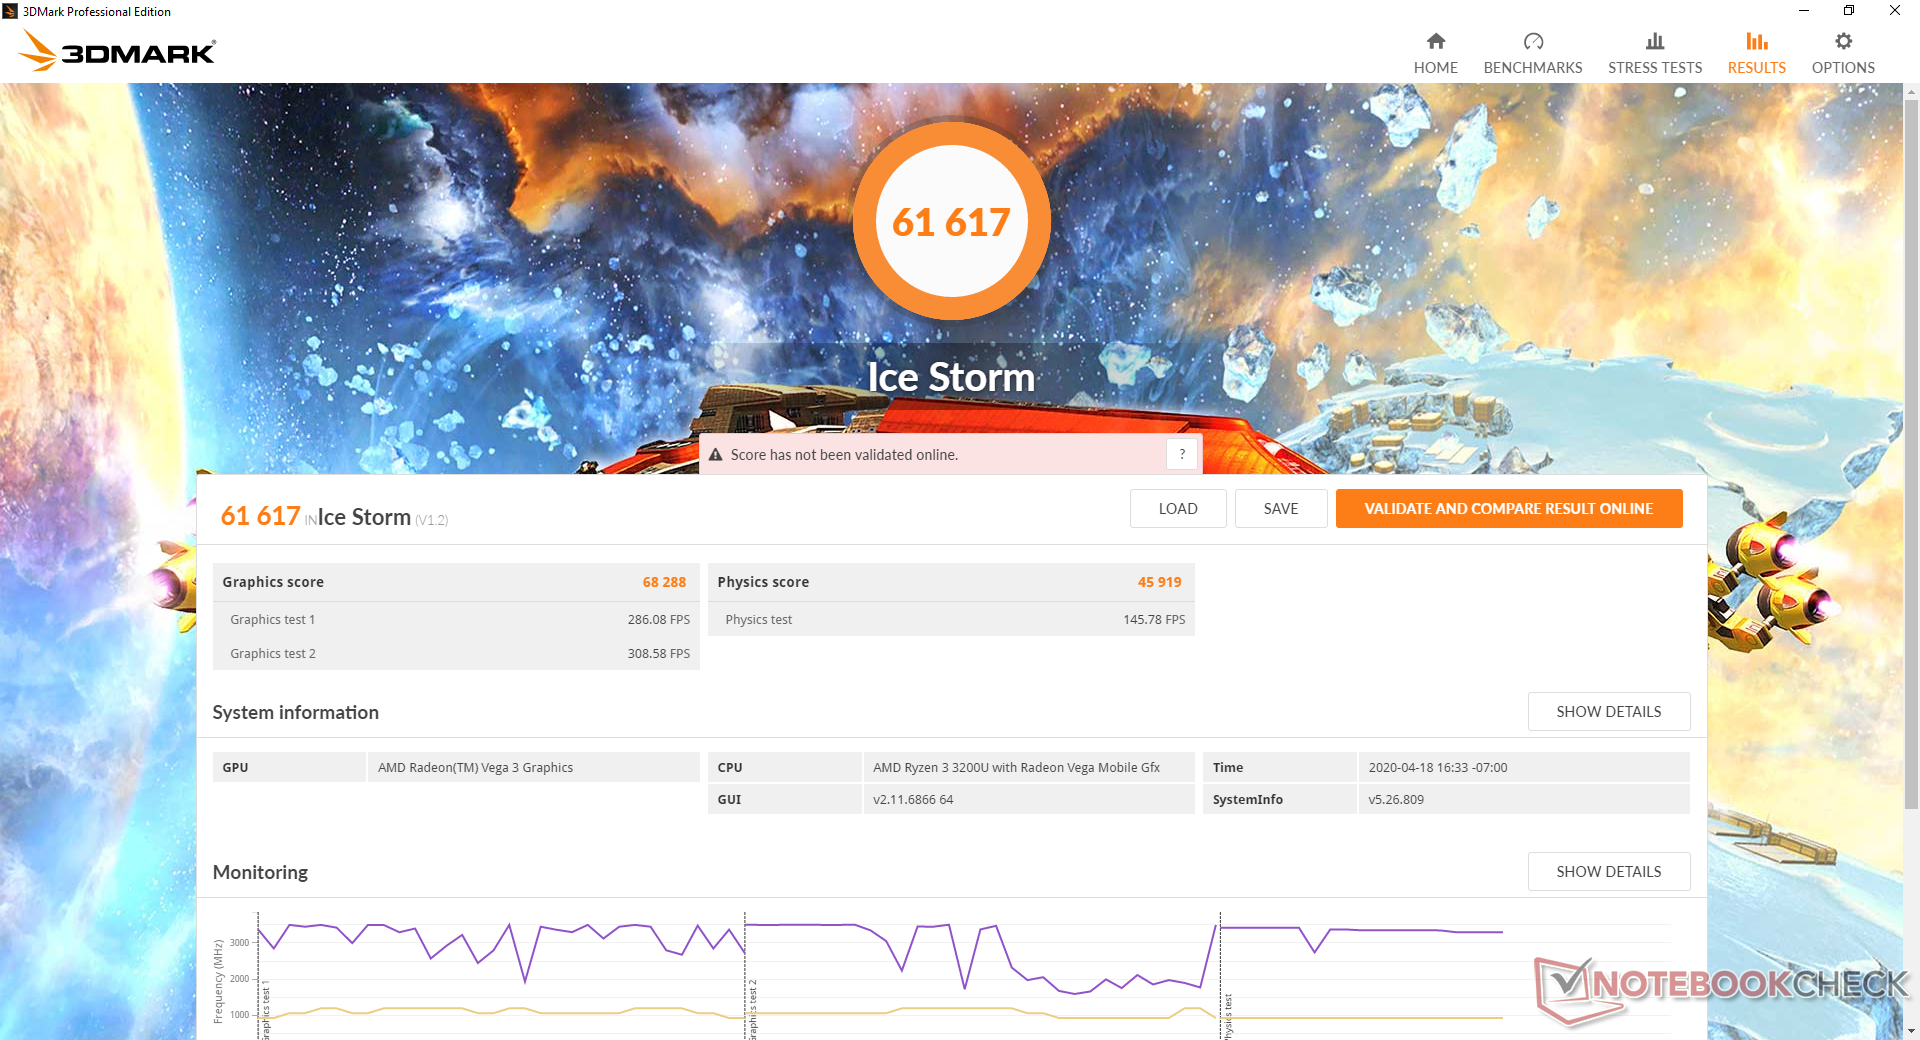
| 3DMark Ice Storm Standard Score | 61617 points | |
| 3DMark Cloud Gate Standard Score | 5975 points | |
| 3DMark Fire Strike Score | 943 points | |
| 3DMark Time Spy Score | 340 points | |
Help | ||
| Dota 2 Reborn | |
| 1280x720 min (0/3) fastest | |
| Acer Aspire 5 A515-54G | |
| Lenovo ThinkBook 15 | |
| Dell XPS 13 9300 i5 FHD | |
| Asus VivoBook S15 S510UA | |
| Lenovo ThinkPad X1 Yoga 20SA000GUS | |
| Intel NUC5i3RYK | |
| Huawei MateBook D 15-53010TUY | |
| HP Pavilion 15-cw1212ng | |
| Asus Vivobook 15 F512DA-SH31 | |
| 1366x768 med (1/3) | |
| Acer Aspire 5 A515-54G | |
| Huawei MateBook D 15-53010TUY | |
| Asus VivoBook S15 S510UA | |
| Lenovo ThinkBook 15 | |
| Lenovo ThinkPad X1 Yoga 20SA000GUS | |
| Dell XPS 13 9300 i5 FHD | |
| HP Pavilion 15-cw1212ng | |
| Asus Vivobook 15 F512DA-SH31 | |
| Intel NUC5i3RYK | |
| low | med. | high | ultra | |
|---|---|---|---|---|
| Dota 2 Reborn (2015) | 60.8 | 38.8 | 18.2 | 16.9 |
| X-Plane 11.11 (2018) | 18.3 | 12.3 | 11.1 |
Emissions
System Noise
Fan noise is not an issue on the system. Expect a quiet experience when typing, browsing, or word processing with a fan noise of up to 31 dB(A) during these workloads. We're able to record a maximum of 34 dB(A) which is only temporary when running extreme loads.
We're not able to notice any electronic noise or coil whine on our test unit.
| Asus Vivobook 15 F512DA-SH31 Vega 3, R3 3200U, SanDisk X600 SD9SN8W-128G | Lenovo Ideapad S340-15IIL Iris Plus Graphics G7 (Ice Lake 64 EU), i7-1065G7, Intel SSD 660p SSDPEKNW512G8 | Acer Aspire 5 A515-43-R6WW Vega 8, R5 3500U, Intel SSD 660p 1TB SSDPEKNW010T8 | Dell Inspiron 15 3585 (2300U, Vega 6) Vega 6, R3 2300U, Toshiba BG3 KBG30ZMS256G | Asus ZenBook 15 UX534FTC-A8190T GeForce GTX 1650 Max-Q, i7-10510U, Samsung SSD PM981 MZVLB1T0HALR | Huawei MateBook D 15-53010TUY Vega 8, R5 3500U, Samsung SSD PM981 MZVLB256HAHQ | |
|---|---|---|---|---|---|---|
| Noise | 1% | -7% | -10% | -6% | -1% | |
| off / environment * (dB) | 29.2 | 28.5 2% | 30.2 -3% | 30.6 -5% | 30.3 -4% | 29.6 -1% |
| Idle Minimum * (dB) | 29.2 | 28.5 2% | 30.2 -3% | 30.6 -5% | 30.3 -4% | 29.6 -1% |
| Idle Average * (dB) | 29.2 | 28.5 2% | 30.2 -3% | 30.6 -5% | 30.3 -4% | 29.6 -1% |
| Idle Maximum * (dB) | 29.2 | 28.5 2% | 30.2 -3% | 30.6 -5% | 30.9 -6% | 29.6 -1% |
| Load Average * (dB) | 30.5 | 30.3 1% | 34.8 -14% | 36.7 -20% | 31.3 -3% | 30.6 -0% |
| Load Maximum * (dB) | 34 | 35.5 -4% | 39.5 -16% | 41.1 -21% | 38.2 -12% | 33.8 1% |
| Witcher 3 ultra * (dB) | 38.1 |
* ... smaller is better
Noise level
| Idle |
| 29.2 / 29.2 / 29.2 dB(A) |
| Load |
| 30.5 / 34 dB(A) |
 | ||
30 dB silent 40 dB(A) audible 50 dB(A) loud |
||
min: | ||
Temperature
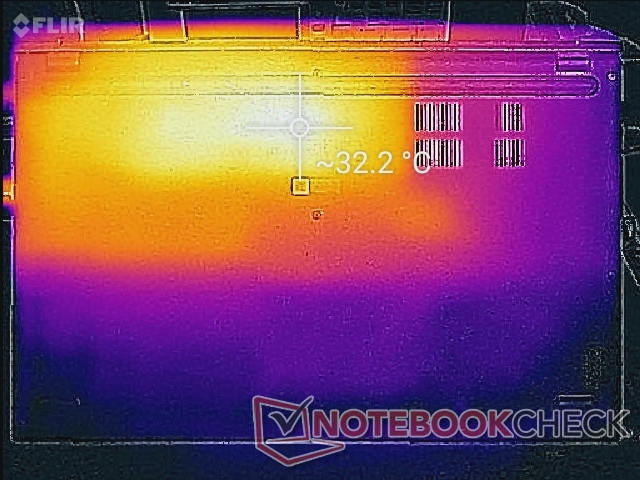
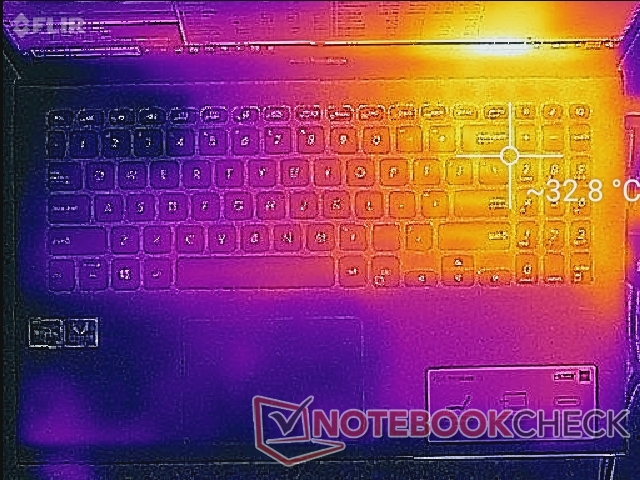
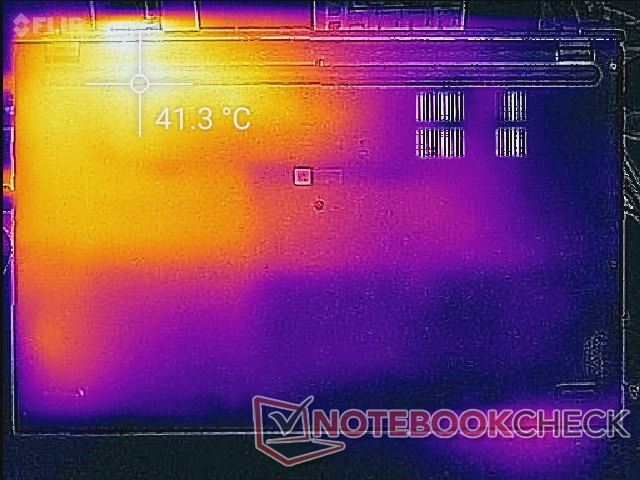
Surface temperatures on the VivoBook F512/X512 will always be warmer on the right half of the chassis than the left half due to how the processor and cooling solution are positioned inside. When under extreme loads, the keyboard hot spot plateaus to about 33 C whereas the bottom hot spot can be as high as 42 C. The system never becomes uncomfortable to use no matter the load despite the noticeable temperature differences between opposite corners of the chassis.
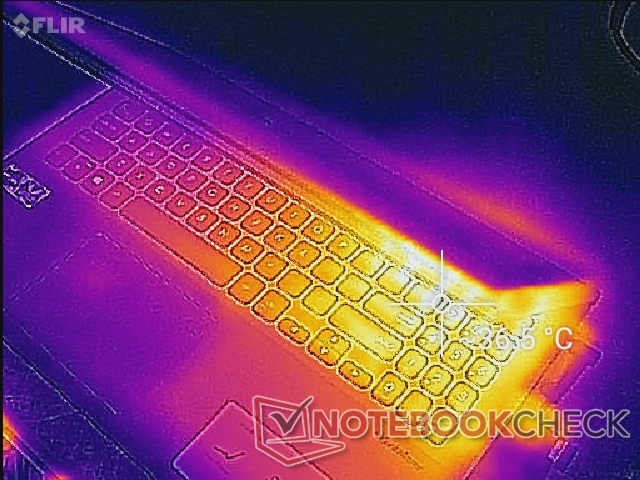
(+) The maximum temperature on the upper side is 33 °C / 91 F, compared to the average of 36.9 °C / 98 F, ranging from 21 to 71 °C for the class Multimedia.
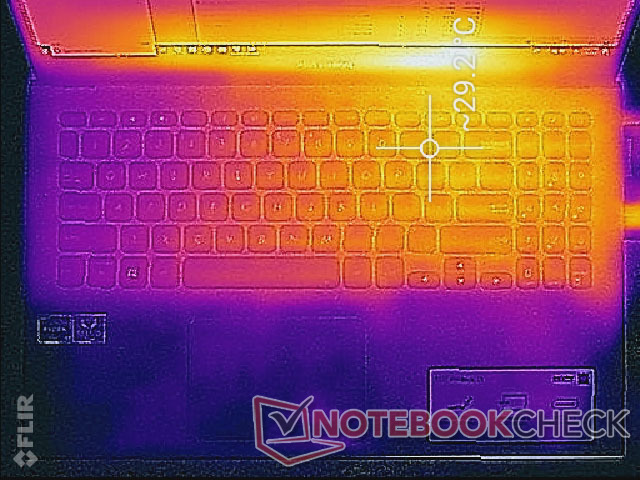
(±) The bottom heats up to a maximum of 41.4 °C / 107 F, compared to the average of 39.1 °C / 102 F
(+) In idle usage, the average temperature for the upper side is 25.8 °C / 78 F, compared to the device average of 31.3 °C / 88 F.
(+) The palmrests and touchpad are cooler than skin temperature with a maximum of 24.2 °C / 75.6 F and are therefore cool to the touch.
(+) The average temperature of the palmrest area of similar devices was 28.7 °C / 83.7 F (+4.5 °C / 8.1 F).
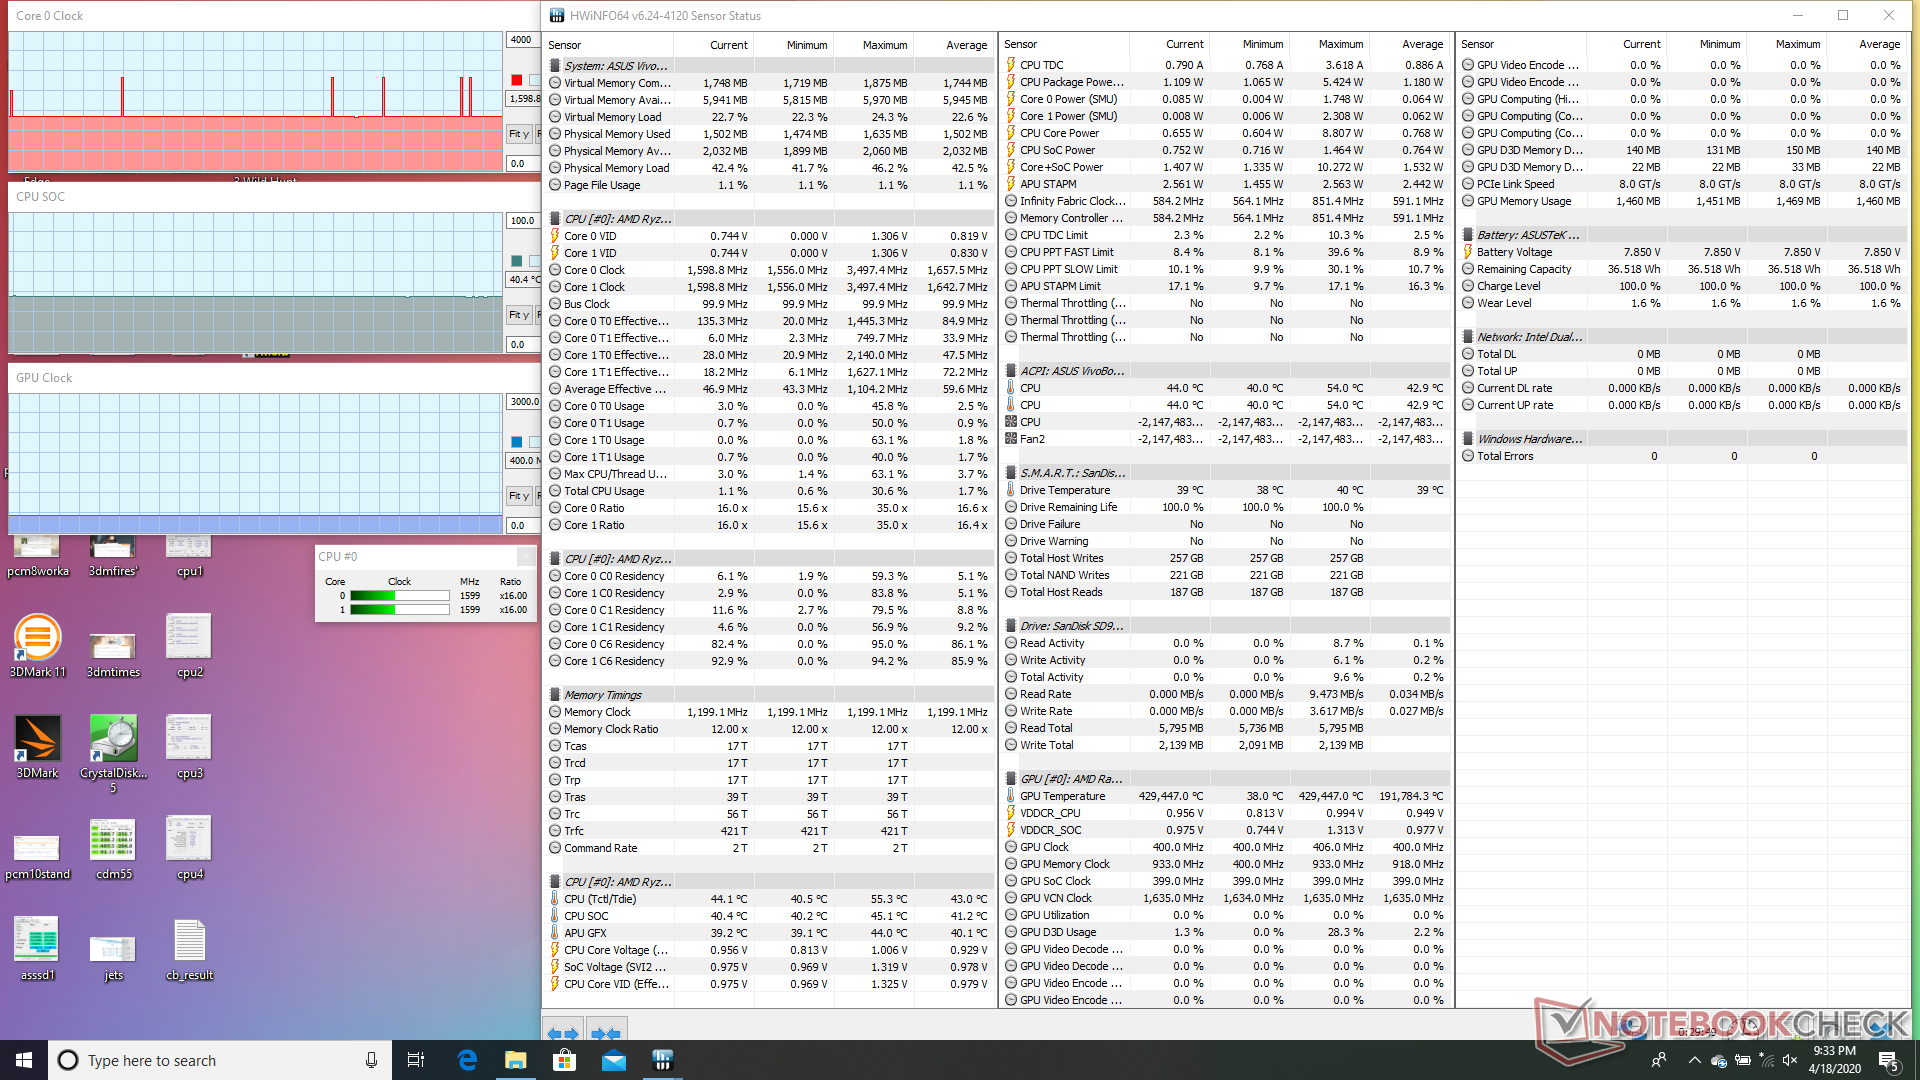
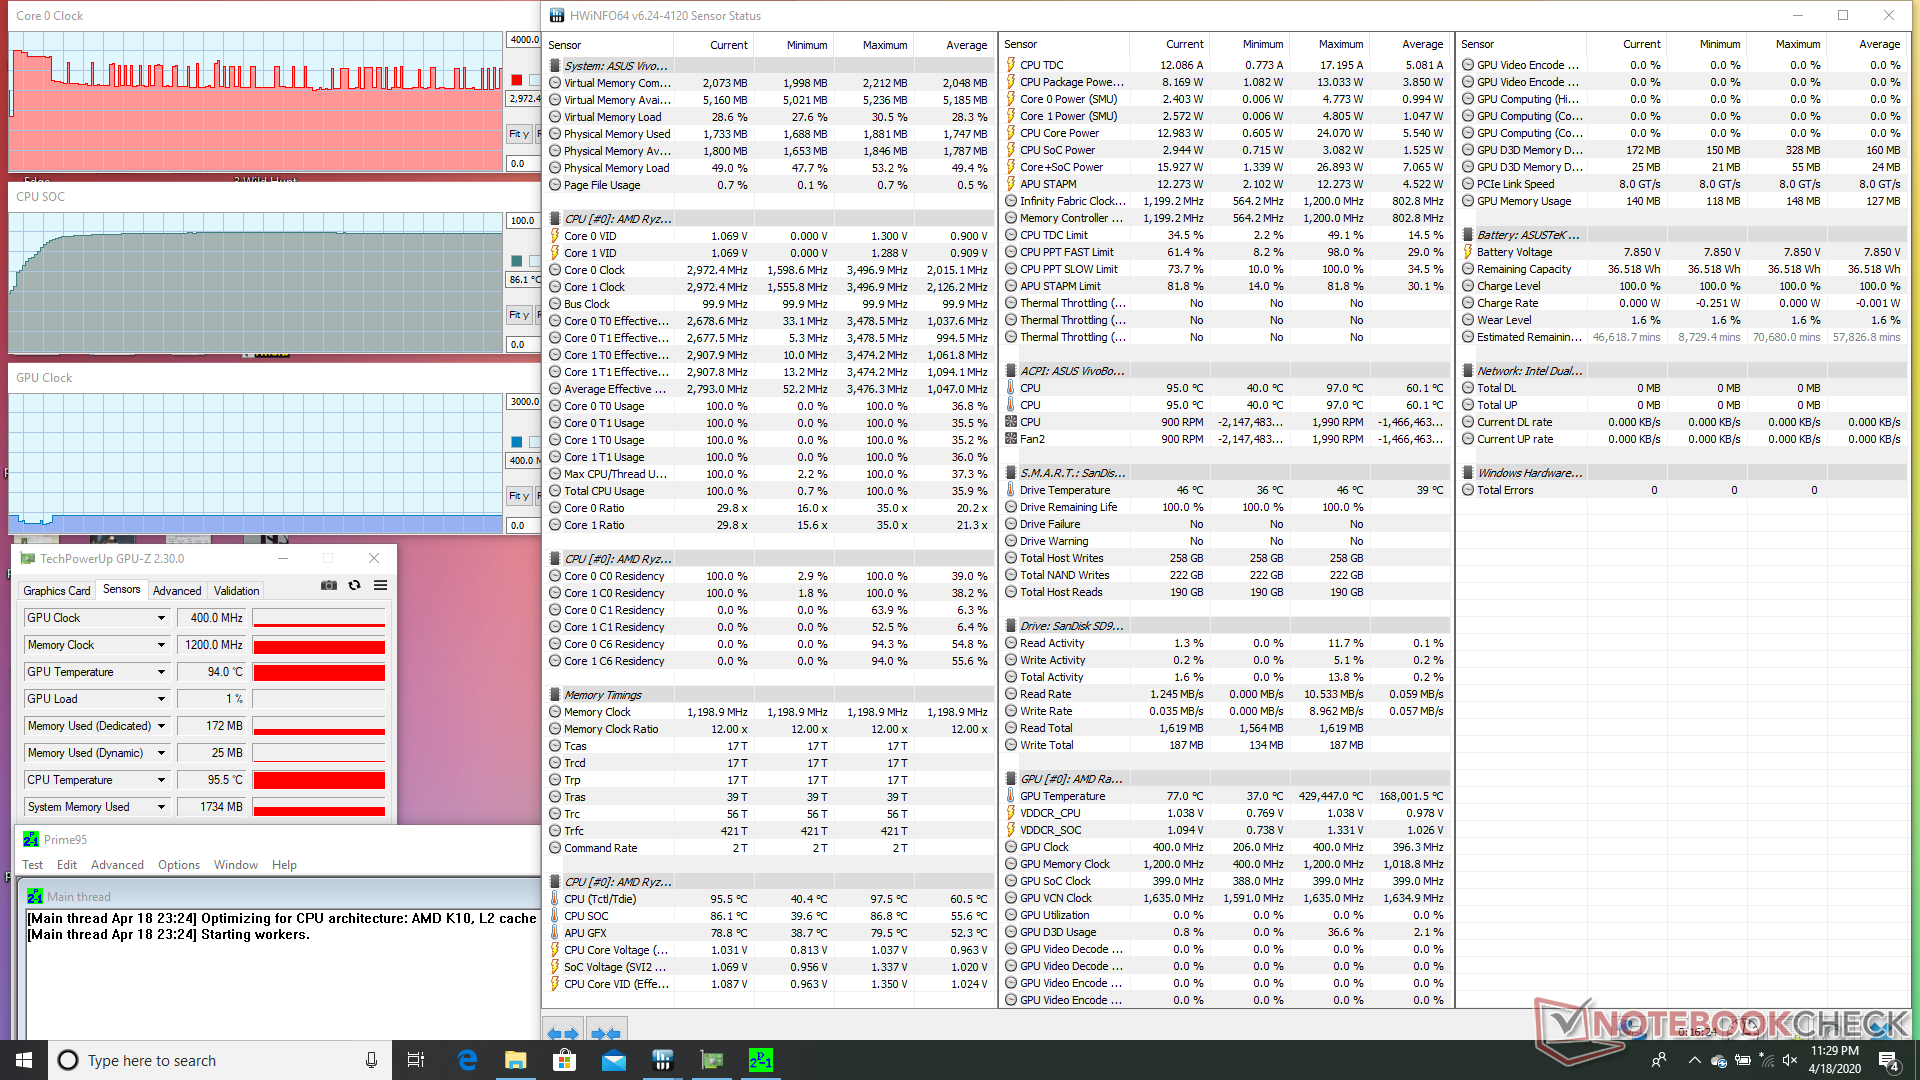
Stress Test
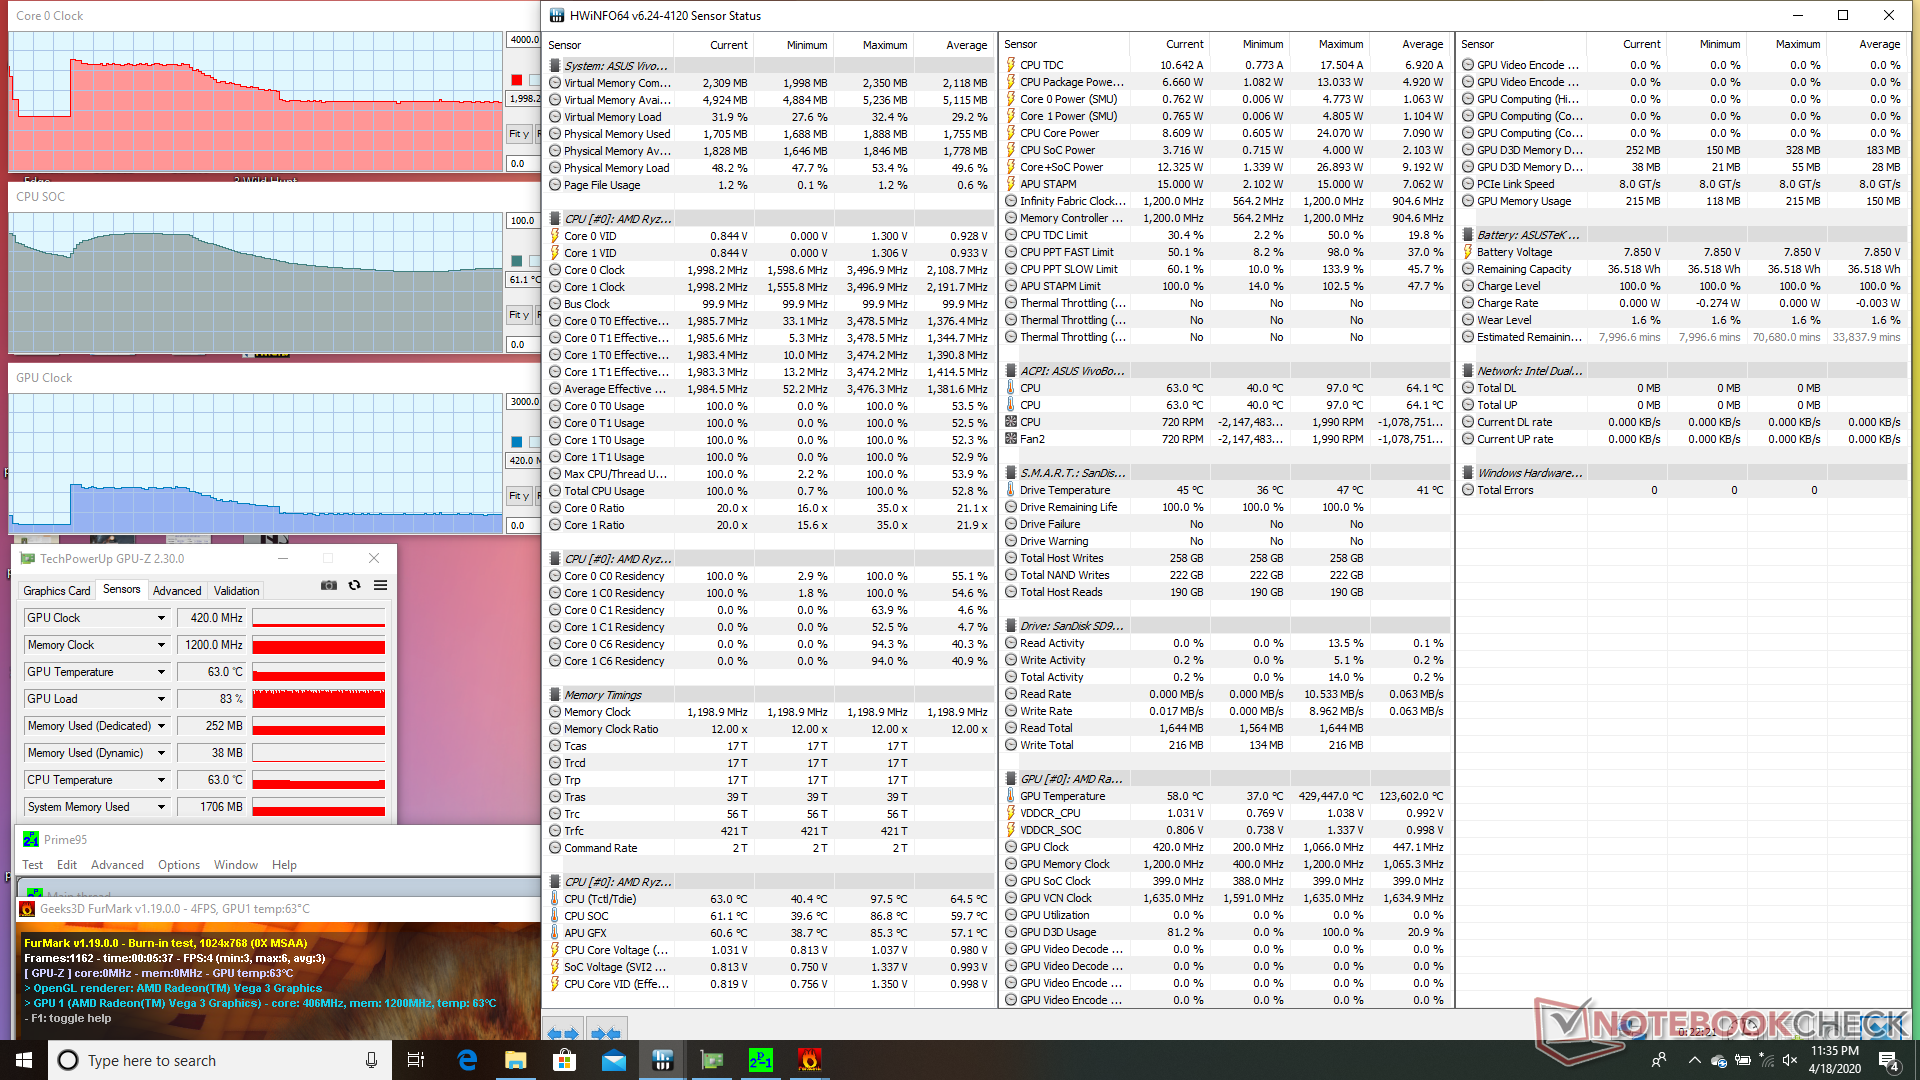
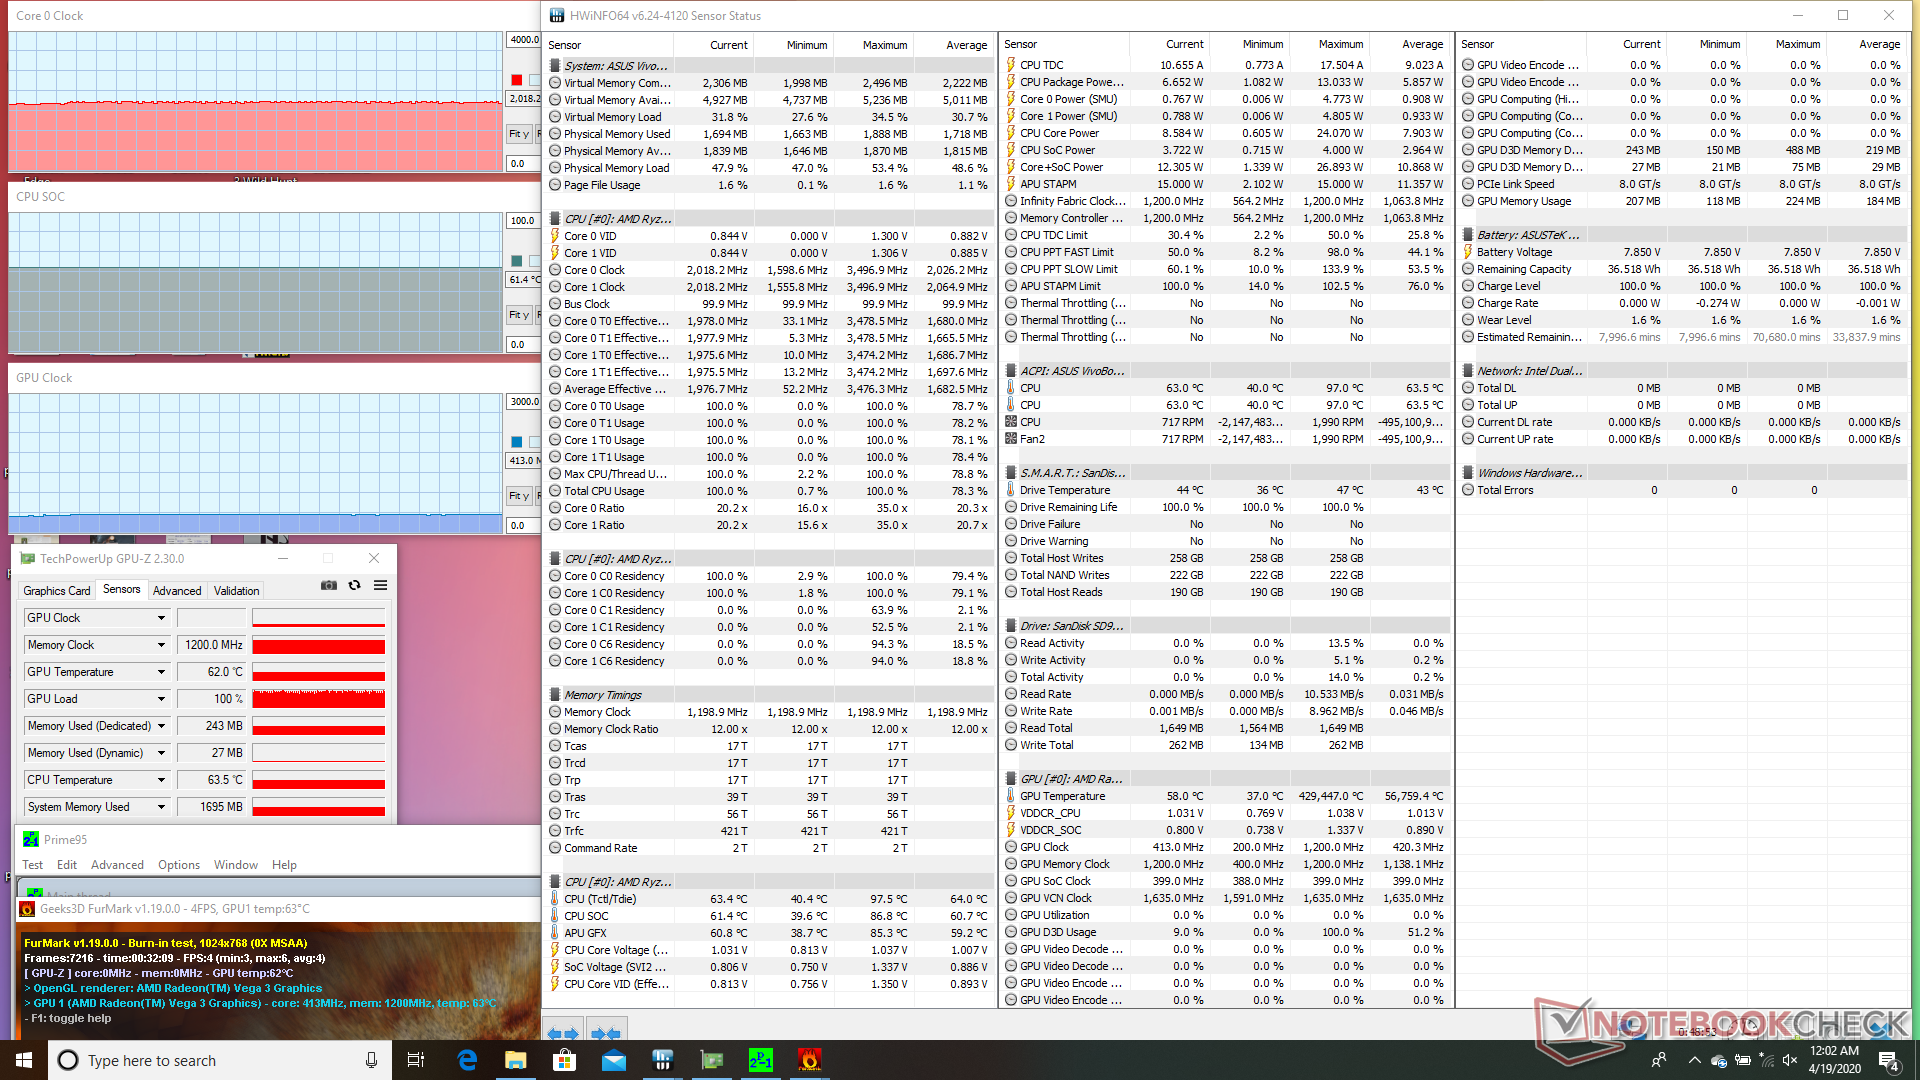
We stress the system with synthetic loads to identify for any potential throttling or stability issues. Running Prime95 will cause the CPU to spike to 3.5 GHz and 3.3 GHz for the first few seconds only. Thereafter, clock rates stabilize at 2.5 GHz and 86 C with recurring spikes to 3.1 GHz. If both the CPU and GPU are stressed, clock rates drop to 2 GHz.
Running on battery power will limit performance. A 3DMark 11 run on mains returns Physics and Graphics scores of 3653 and 1678 points, respectively, compared to 1866 and 1596 points when on batteries.
| CPU Clock (GHz) | GPU Clock (MHz) | Average CPU Temperature (°C) | |
| System Idle | -- | -- | 40 |
| Prime95 Stress | 2.5 - 3.1 | -- | 86 |
| Prime95 + FurMark Stress | 2.0 | 413 | 61 |
Speakers
There is no nothing extraordinary about the speakers here which is fine considering the price. High volume settings will not introduce any static, but the front palm rests will vibrate moderately to the touch. Maximum volume is not loud enough for a large conference room.


Asus Vivobook 15 F512DA-SH31 audio analysis
(±) | speaker loudness is average but good (78.6 dB)
Bass 100 - 315 Hz
(±) | reduced bass - on average 13.6% lower than median
(±) | linearity of bass is average (13.9% delta to prev. frequency)
Mids 400 - 2000 Hz
(+) | balanced mids - only 3.7% away from median
(+) | mids are linear (5% delta to prev. frequency)
Highs 2 - 16 kHz
(+) | balanced highs - only 3% away from median
(+) | highs are linear (6.2% delta to prev. frequency)
Overall 100 - 16.000 Hz
(±) | linearity of overall sound is average (18.9% difference to median)
Compared to same class
» 58% of all tested devices in this class were better, 8% similar, 34% worse
» The best had a delta of 5%, average was 17%, worst was 45%
Compared to all devices tested
» 44% of all tested devices were better, 8% similar, 49% worse
» The best had a delta of 4%, average was 24%, worst was 134%
Apple MacBook 12 (Early 2016) 1.1 GHz audio analysis
(+) | speakers can play relatively loud (83.6 dB)
Bass 100 - 315 Hz
(±) | reduced bass - on average 11.3% lower than median
(±) | linearity of bass is average (14.2% delta to prev. frequency)
Mids 400 - 2000 Hz
(+) | balanced mids - only 2.4% away from median
(+) | mids are linear (5.5% delta to prev. frequency)
Highs 2 - 16 kHz
(+) | balanced highs - only 2% away from median
(+) | highs are linear (4.5% delta to prev. frequency)
Overall 100 - 16.000 Hz
(+) | overall sound is linear (10.2% difference to median)
Compared to same class
» 7% of all tested devices in this class were better, 2% similar, 91% worse
» The best had a delta of 5%, average was 18%, worst was 53%
Compared to all devices tested
» 5% of all tested devices were better, 1% similar, 94% worse
» The best had a delta of 4%, average was 24%, worst was 134%
Energy Management
Power Consumption
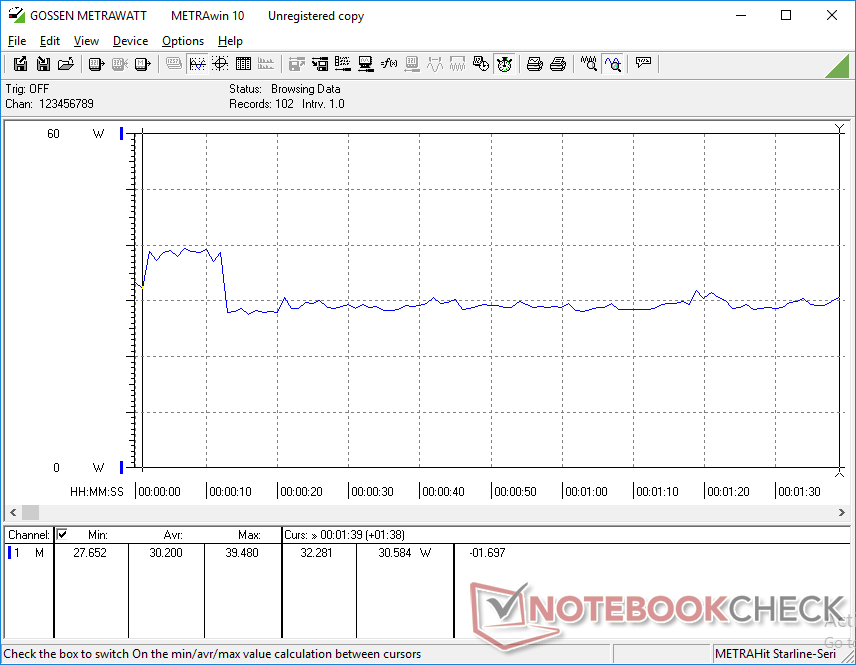
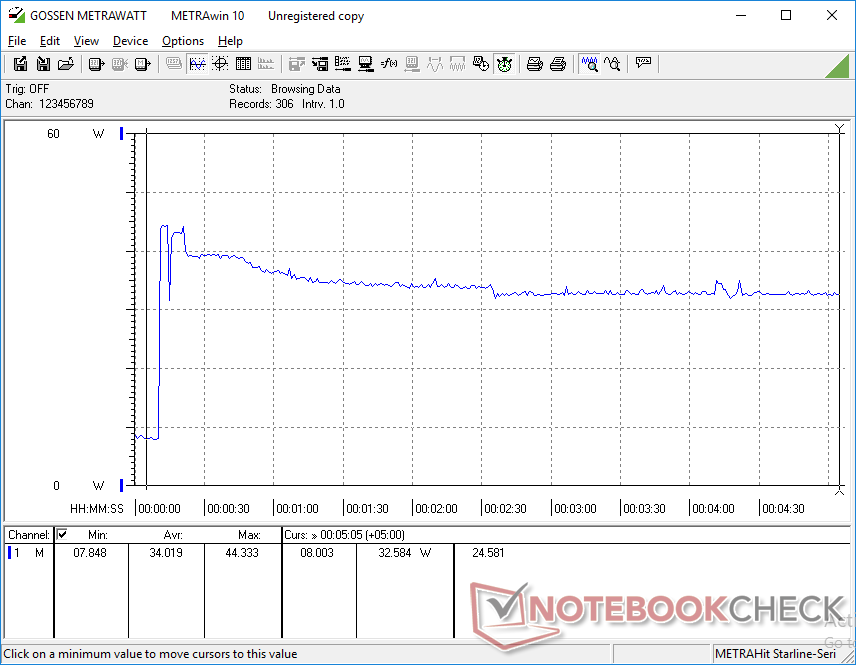
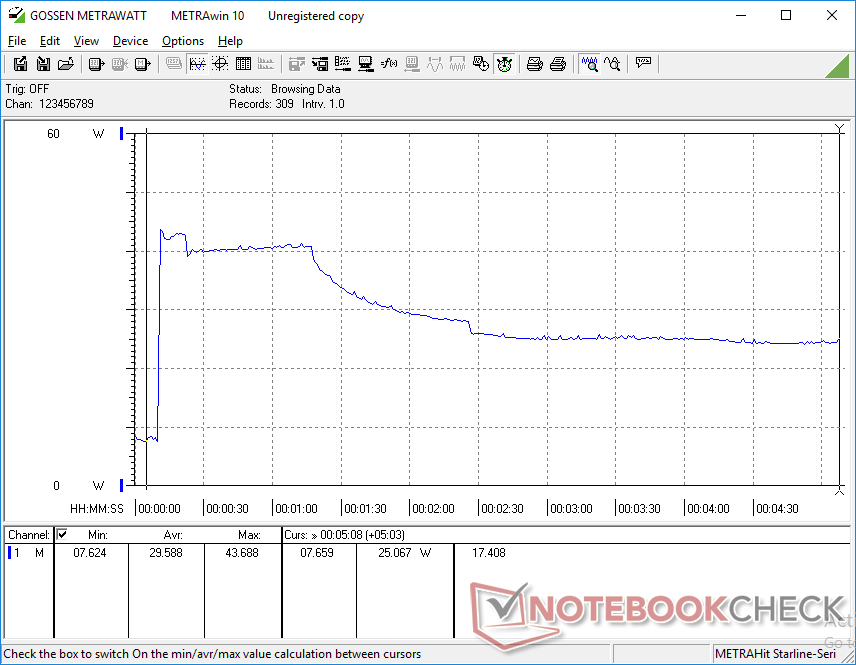
Idling on desktop draws between 3 W and 8 W depending on the power setting and brightness level. When running 3DMark 06, average consumption is just 30 W to be comparable to what we recorded on the Acer Aspire A515 with the higher-end Ryzen 5 3500U.
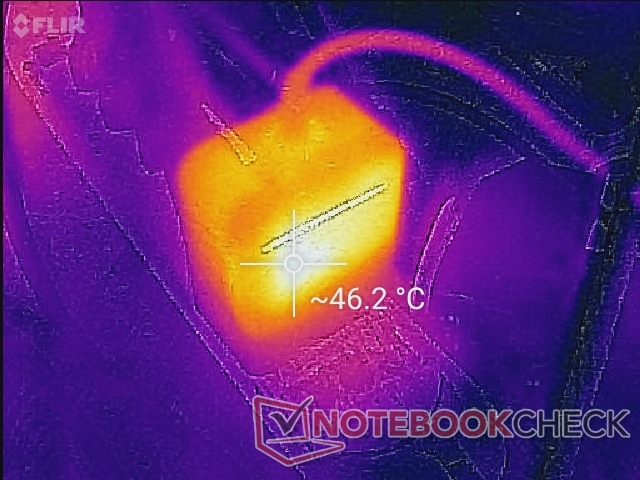
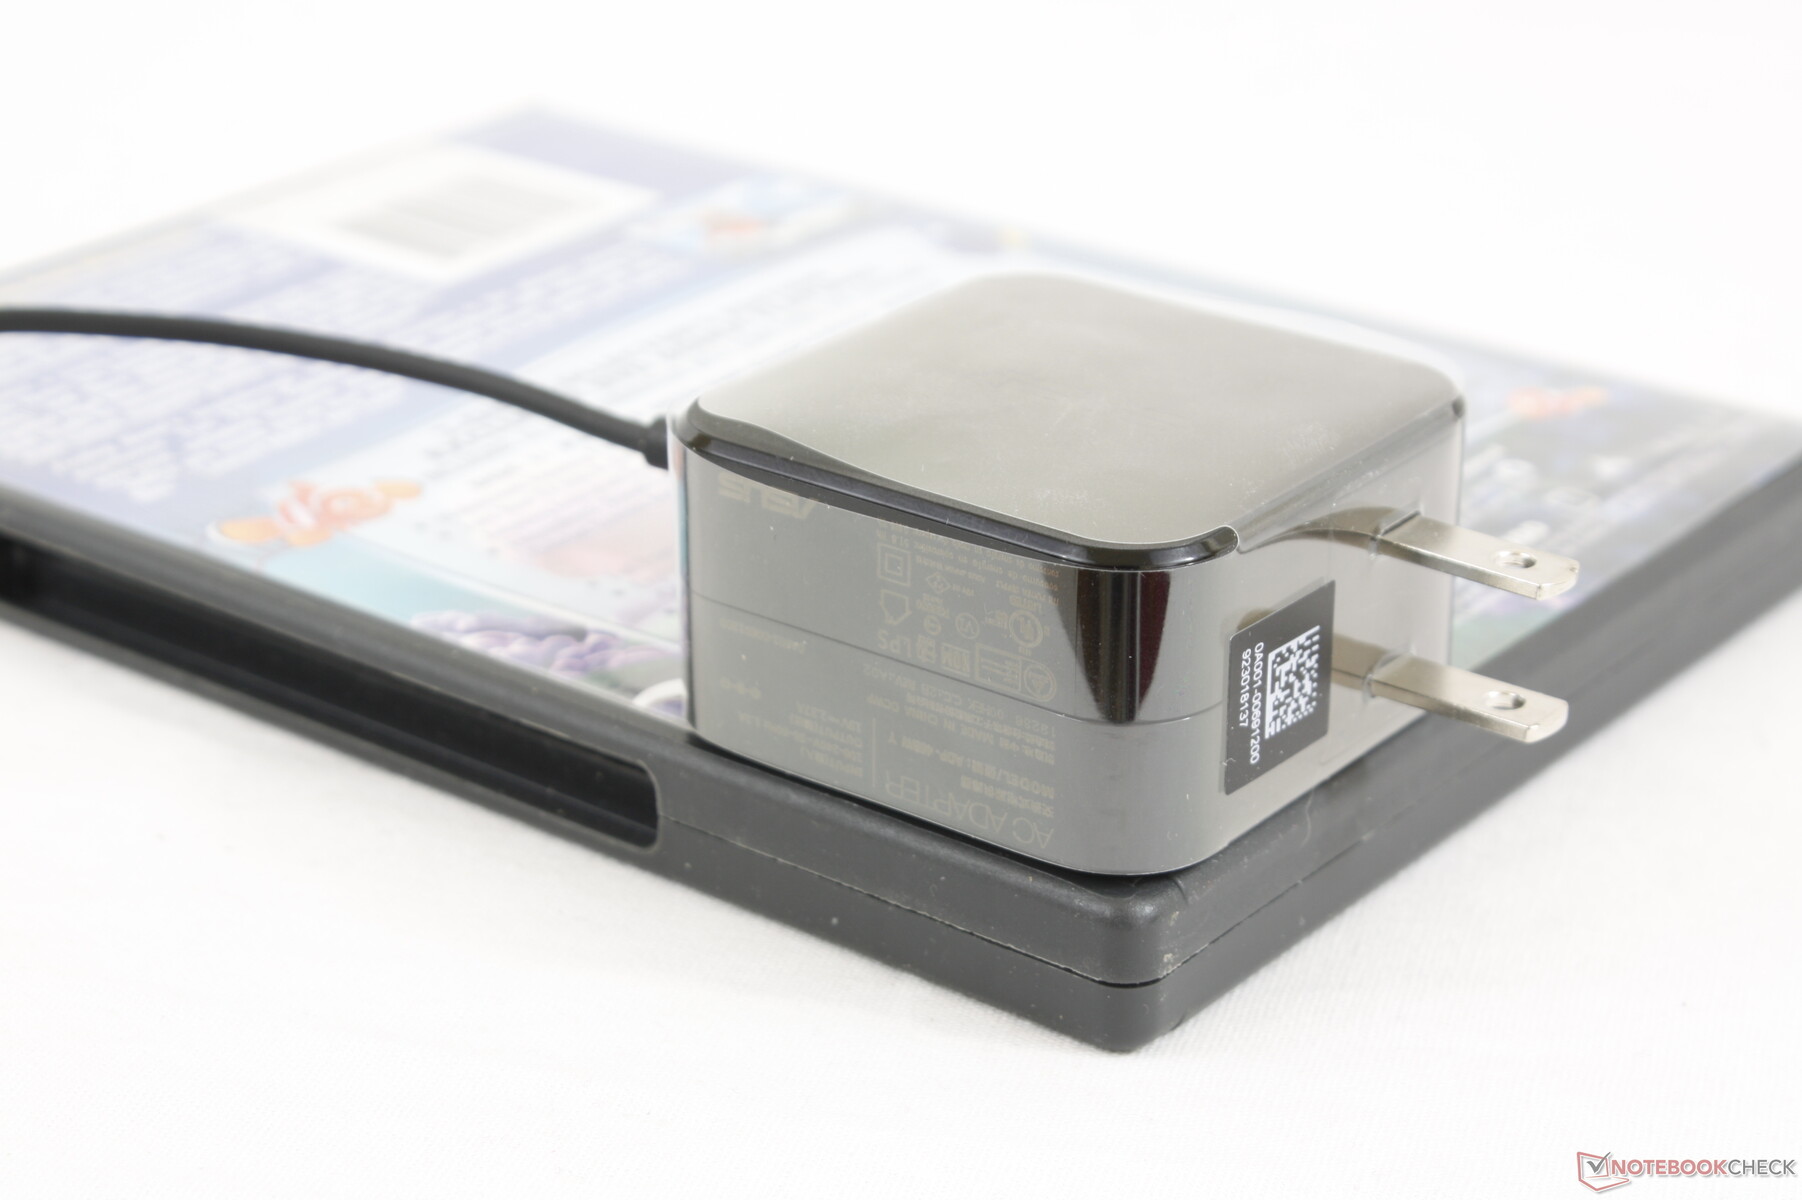
We're able to record a maximum consumption of 44.4 W from the small (~5.3 x 5.3 x 2.8 cm) 45 W AC adapter. This high of a consumption falls over time due to performance throttling as shown by our graphs below.
| Off / Standby | |
| Idle | |
| Load |
|
Key:
min: | |
| Asus Vivobook 15 F512DA-SH31 R3 3200U, Vega 3, SanDisk X600 SD9SN8W-128G, IPS, 1920x1080, 15.6" | Lenovo Ideapad S340-15IIL i7-1065G7, Iris Plus Graphics G7 (Ice Lake 64 EU), Intel SSD 660p SSDPEKNW512G8, IPS, 1920x1080, 15.6" | Acer Aspire 5 A515-43-R6WW R5 3500U, Vega 8, Intel SSD 660p 1TB SSDPEKNW010T8, IPS, 1920x1080, 15.6" | Dell Inspiron 15 3585 (2300U, Vega 6) R3 2300U, Vega 6, Toshiba BG3 KBG30ZMS256G, TN, 1920x1080, 15.6" | Asus ZenBook 15 UX534FTC-A8190T i7-10510U, GeForce GTX 1650 Max-Q, Samsung SSD PM981 MZVLB1T0HALR, IPS, 1920x1080, 15.6" | Huawei MateBook D 15-53010TUY R5 3500U, Vega 8, Samsung SSD PM981 MZVLB256HAHQ, IPS, 1920x1080, 15.6" | |
|---|---|---|---|---|---|---|
| Power Consumption | -19% | -3% | -37% | -65% | -33% | |
| Idle Minimum * (Watt) | 3.2 | 3.8 -19% | 3.7 -16% | 6.3 -97% | 2.8 13% | 5.2 -63% |
| Idle Average * (Watt) | 6.8 | 6.9 -1% | 6.2 9% | 9.2 -35% | 7.7 -13% | 8.8 -29% |
| Idle Maximum * (Watt) | 7.7 | 7.7 -0% | 8.4 -9% | 9.6 -25% | 9.4 -22% | 10.2 -32% |
| Load Average * (Watt) | 30.3 | 43.3 -43% | 31.1 -3% | 38 -25% | 57 -88% | 37.5 -24% |
| Witcher 3 ultra * (Watt) | 28.2 | 40.4 -43% | 62 -120% | |||
| Load Maximum * (Watt) | 44.4 | 47.5 -7% | 43.1 3% | 46 -4% | 116 -161% | 50.9 -15% |
* ... smaller is better
Battery Life
The small internal battery is common for the budget category whereas higher-end laptops like the XPS 15 can carry batteries of over 90 Wh. Battery life, however, is decent on our Asus at just under 6 hours of real-world WLAN use.
Recharging from empty to full capacity takes about 1.5 hours. The system cannot be recharged via USB Type-C.
| Asus Vivobook 15 F512DA-SH31 R3 3200U, Vega 3, 37 Wh | Lenovo Ideapad S340-15IIL i7-1065G7, Iris Plus Graphics G7 (Ice Lake 64 EU), 36 Wh | Acer Aspire 5 A515-43-R6WW R5 3500U, Vega 8, 48 Wh | Dell Inspiron 15 3585 (2300U, Vega 6) R3 2300U, Vega 6, 42 Wh | Asus ZenBook 15 UX534FTC-A8190T i7-10510U, GeForce GTX 1650 Max-Q, 71 Wh | Huawei MateBook D 15-53010TUY R5 3500U, Vega 8, 42 Wh | |
|---|---|---|---|---|---|---|
| Battery runtime | -28% | 30% | -12% | 107% | 30% | |
| WiFi v1.3 (h) | 6 | 4.3 -28% | 7.8 30% | 5.3 -12% | 12.4 107% | 7.8 30% |
| Reader / Idle (h) | 10 | 17.7 | 7.3 | 27.2 | ||
| Load (h) | 1.1 | 2.2 | 1.8 | 2.4 | 1.3 |
Pros
Cons
Verdict
Our Ryzen 3 configuration retails for less than the Intel Core i3 configuration while offering essentially the same performance in the process. This is a good example of AMD's superior performance-per-dollar against Intel even in the budget space. Drawbacks include the limited 4 GB of RAM and low storage space, but this VivoBook is surprisingly easy to service and upgrade to give the system both longer legs and a low barrier of entry.
If you're willing to spend about $200 more, we recommend checking out the AMD-powered Huawei MateBook D 15 instead especially if you plan on traveling a lot with the laptop. The dim display of the VivoBook makes it tough to use in most outdoor conditions. If your office work and video streams are mostly indoors, then the baseline VivoBook can get the job done. Be sure to check that your wireless is performing smoothly since we experienced issues on our test unit.
Asus Vivobook 15 F512DA-SH31
- 04/20/2020 v7 (old)
Allen Ngo
Price comparison
