Review of the Dell Inspiron 15 3585: Locked-In Office Ryzen
Dell’s entry-level Inspiron series is not only available with Intel processor but AMD’s counterparts as well. The current Inspiron 15 3585 is based on AMD’s Ryzen 3 2300U with integrated Vega 6. The device starts at around $500 and is currently available with an additional 15% discount in the US. Find out in our review how well the device fared against its Intel-based competitors and whether or not it is worth the price.
Given that this is our first ever encounter with this particular Ryzen APU with integrated Vega 6 GPU we had to pick our competitors from a wide variety of devices, including the Dell Inspiron 15 5575 (Ryzen 3 2200U, Vega 3), Lenovo ThinkPad E485 (Ryzen 5, Vega 8), Acer Swift 3 (i3-8145U, SSD, FHD) and HP 250 G7 (i5-8265U, UHD620). In other words: In addition to two comparable Ryzen-based laptops we will also include two Intel laptops with a slightly slower GPU. All devices sell for between $500 and $700. Since the Swift 3 and the ThinkPad are both 14-inch devices, we decided to also include the Acer Aspire 3 (Ryzen 3 2200U, Vega 3, SSD, FHD) whenever necessary.
Case
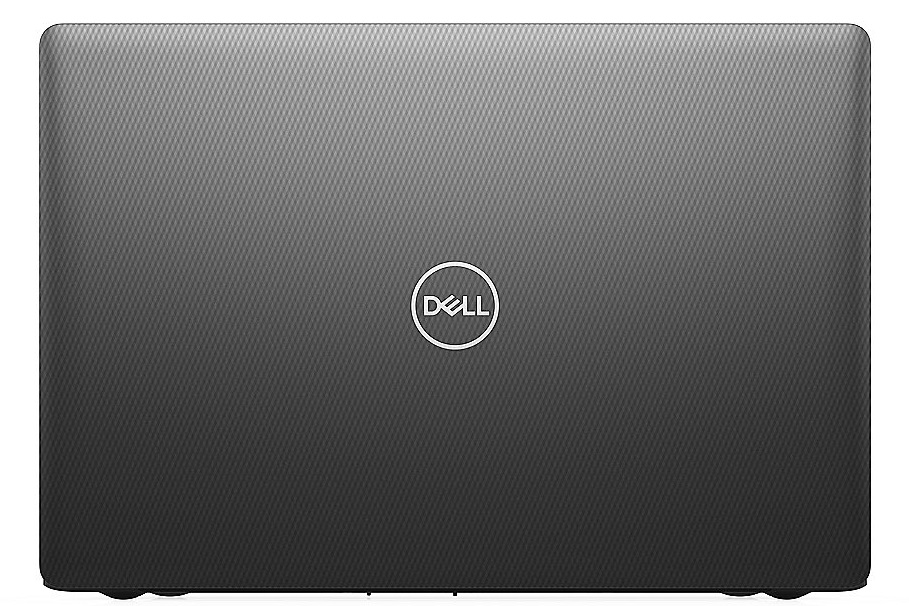
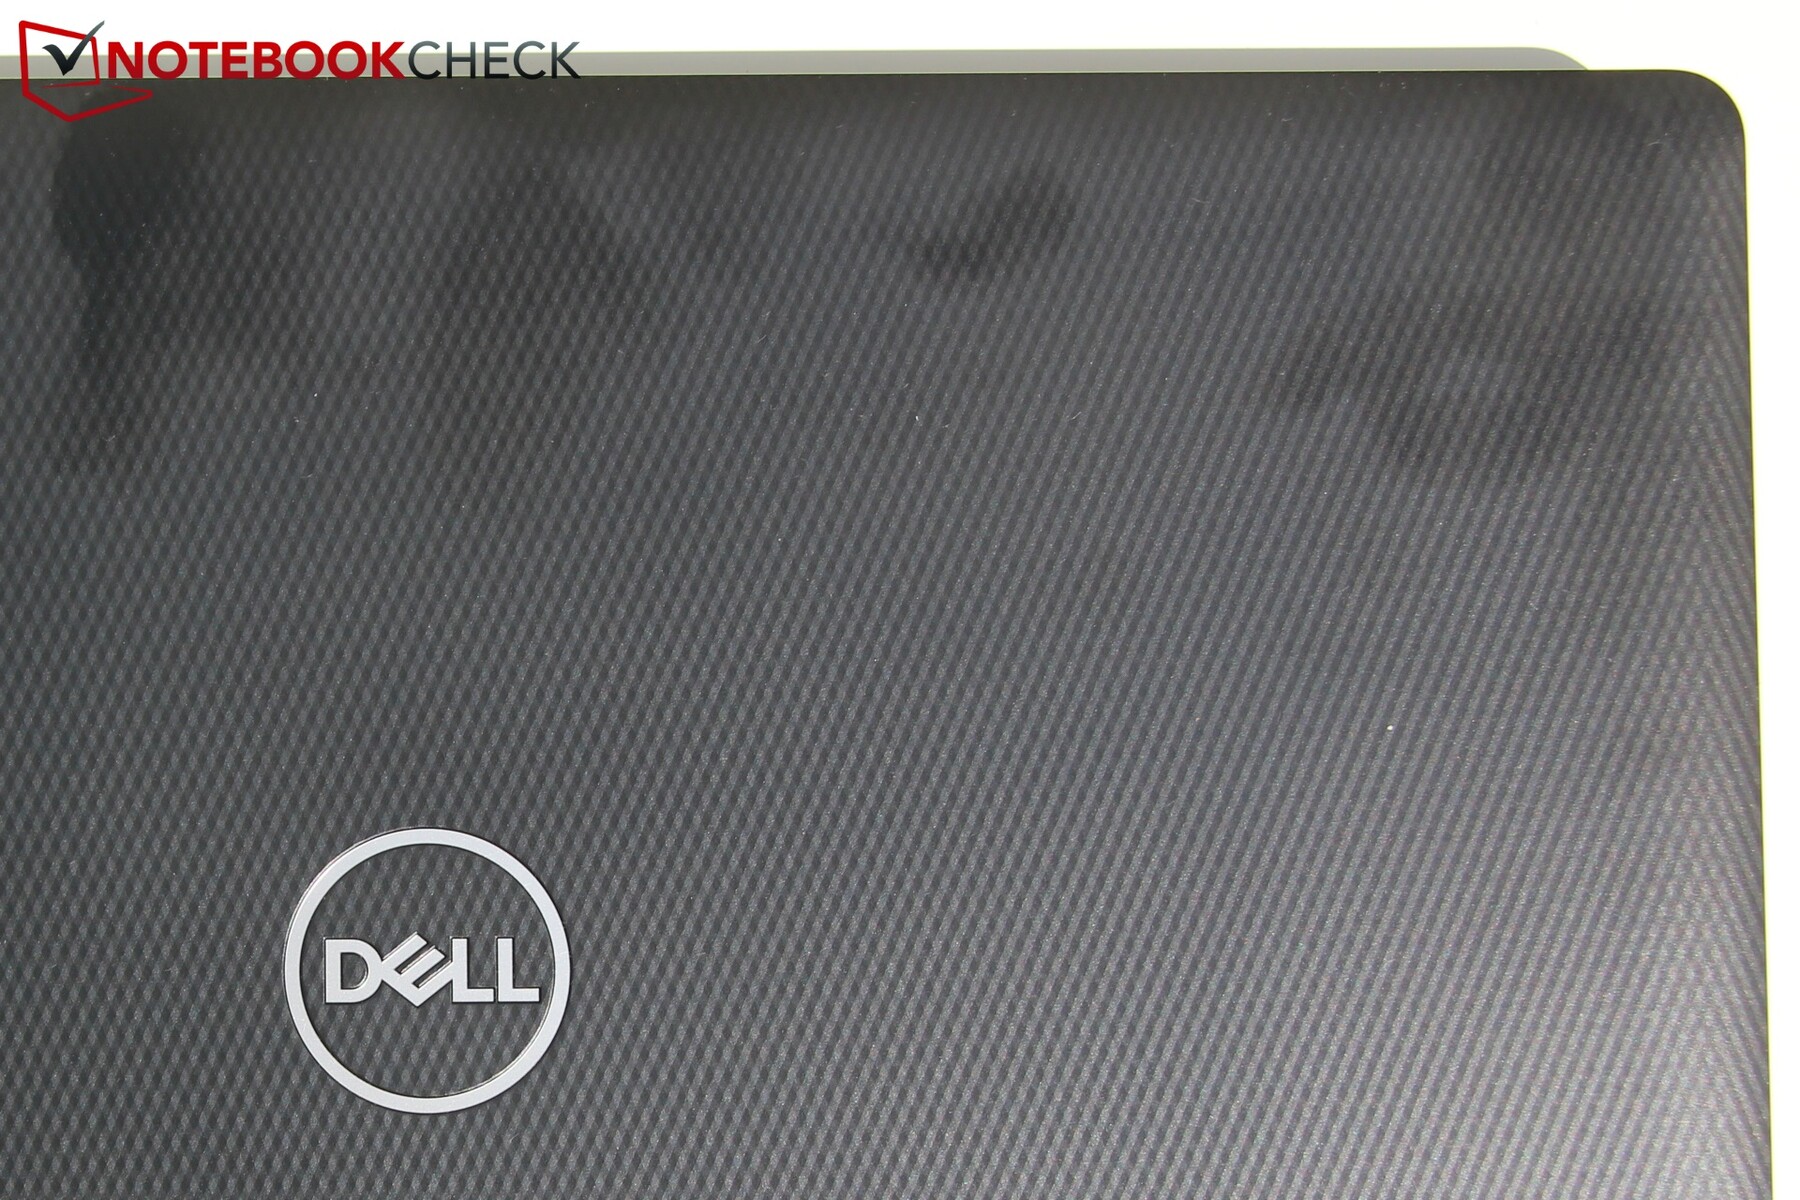
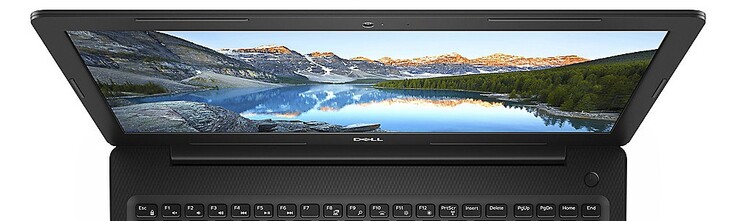
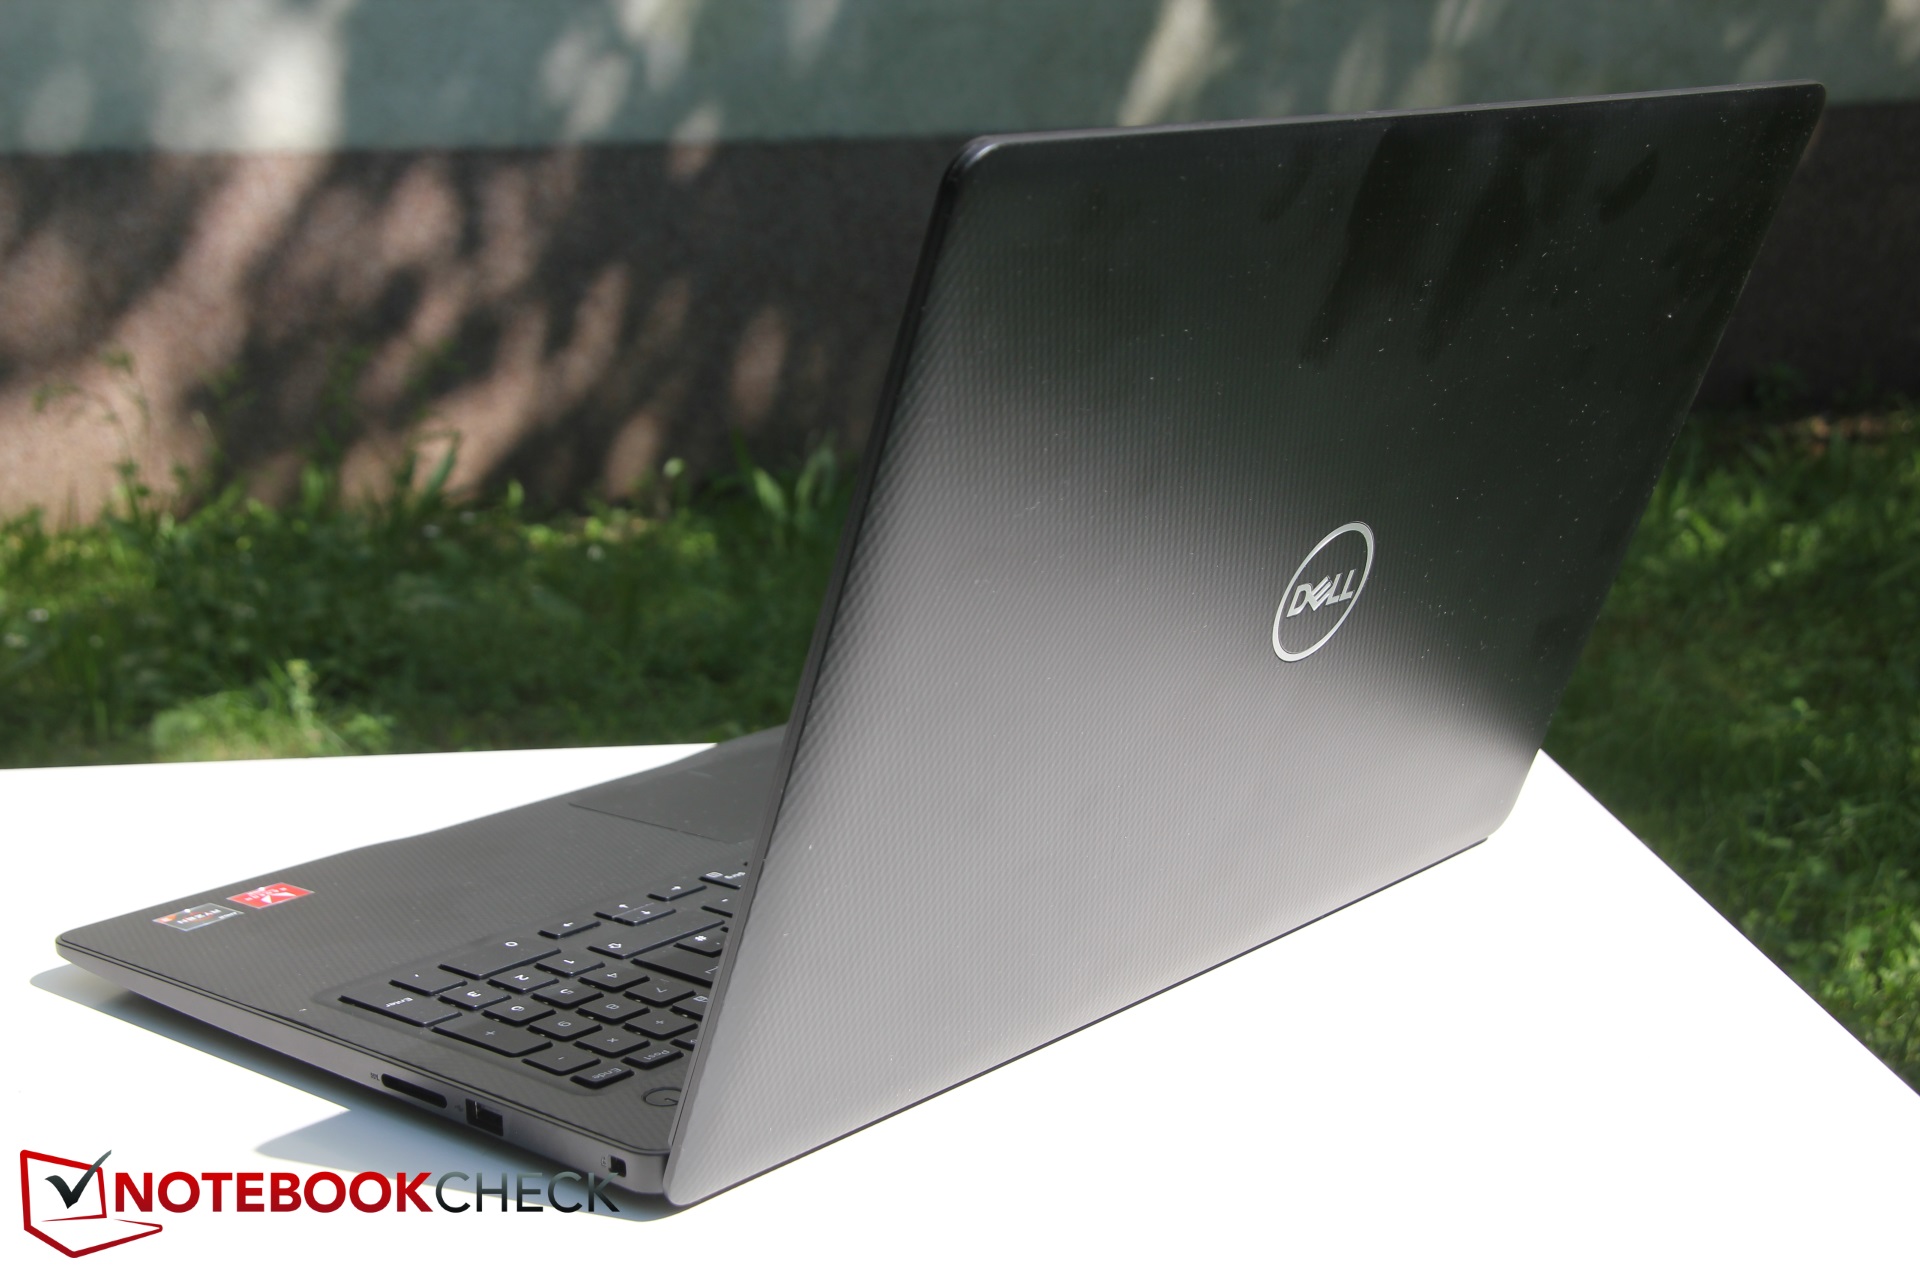
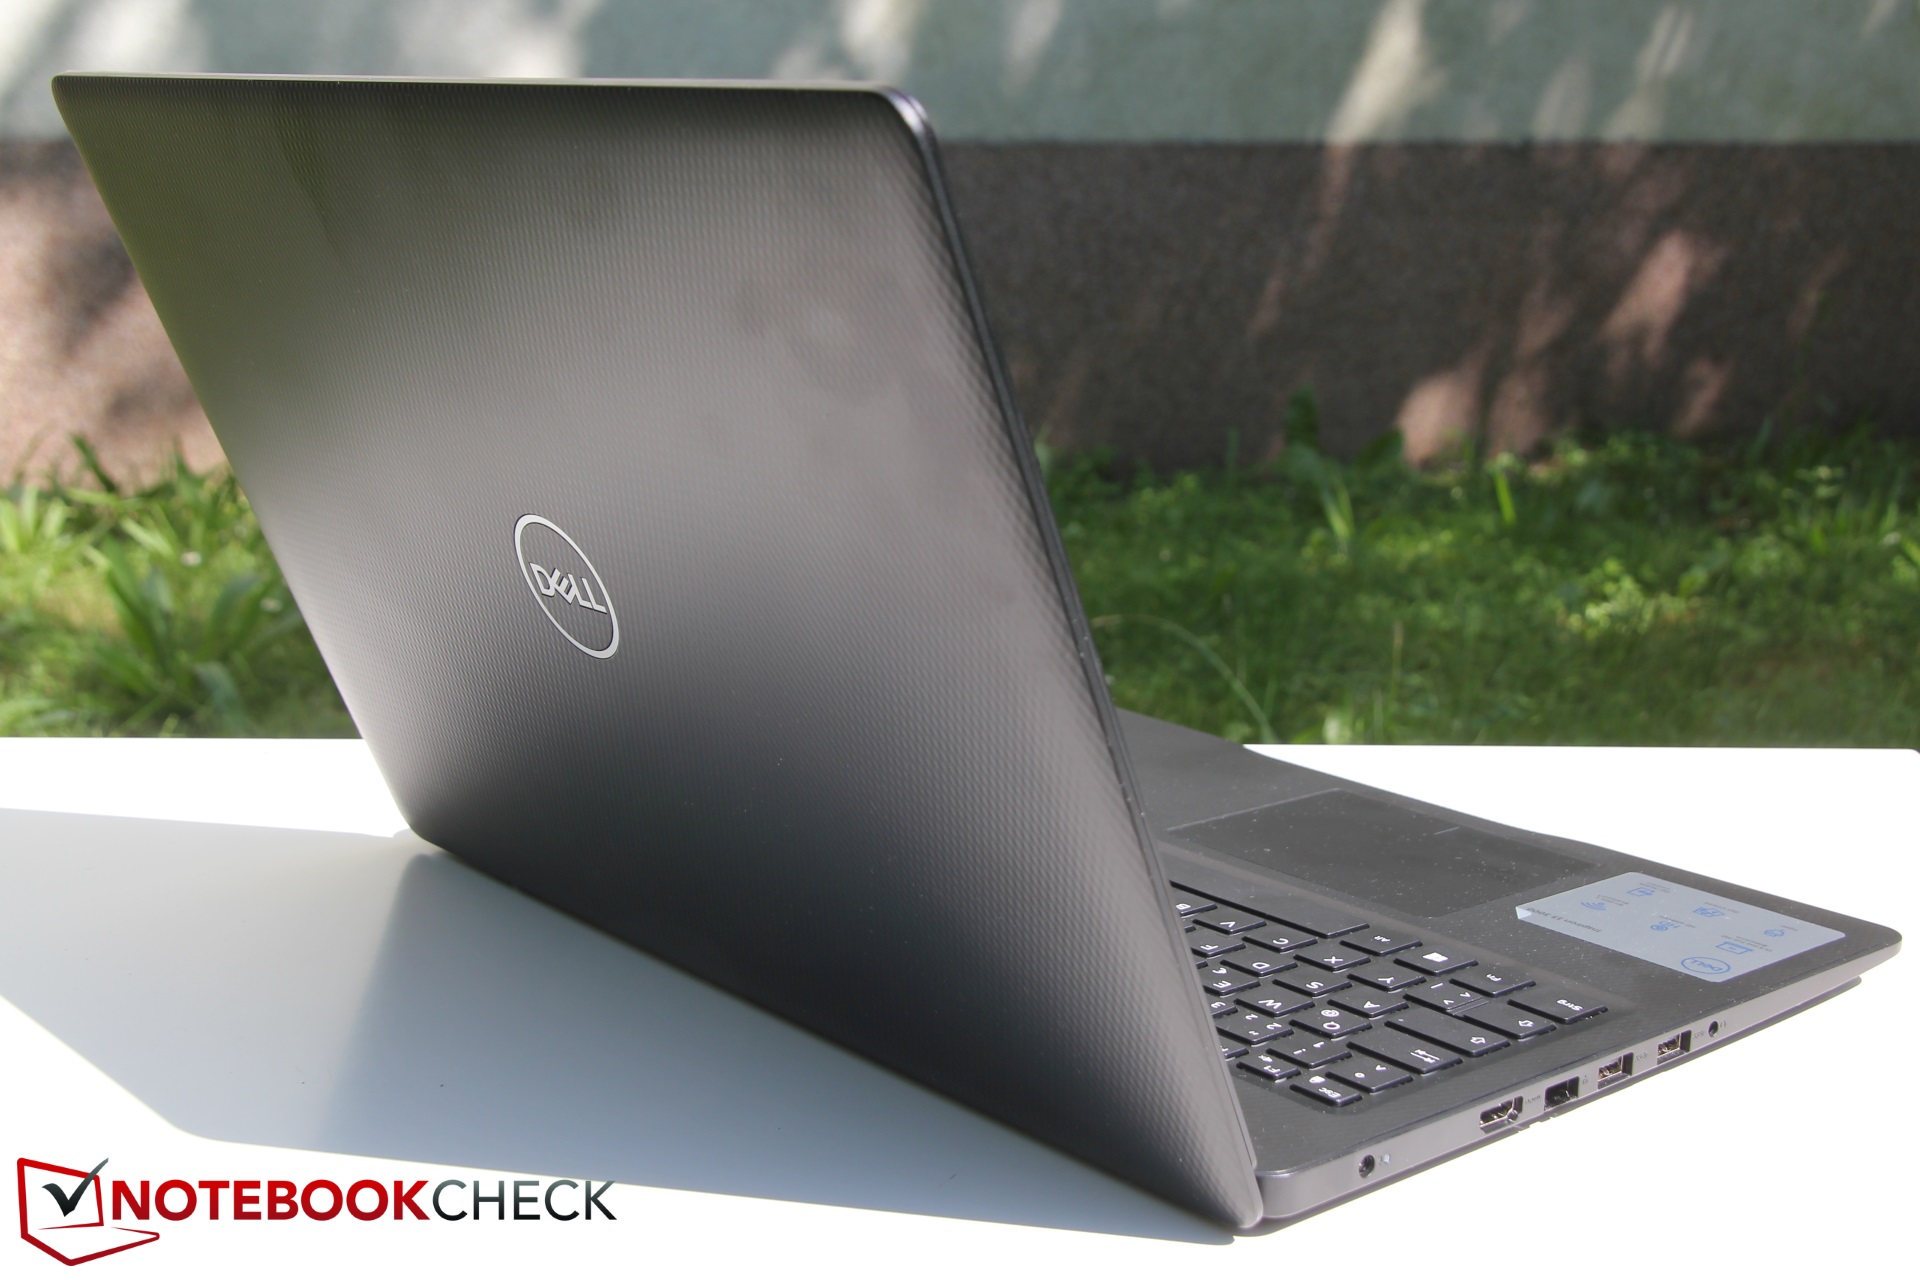
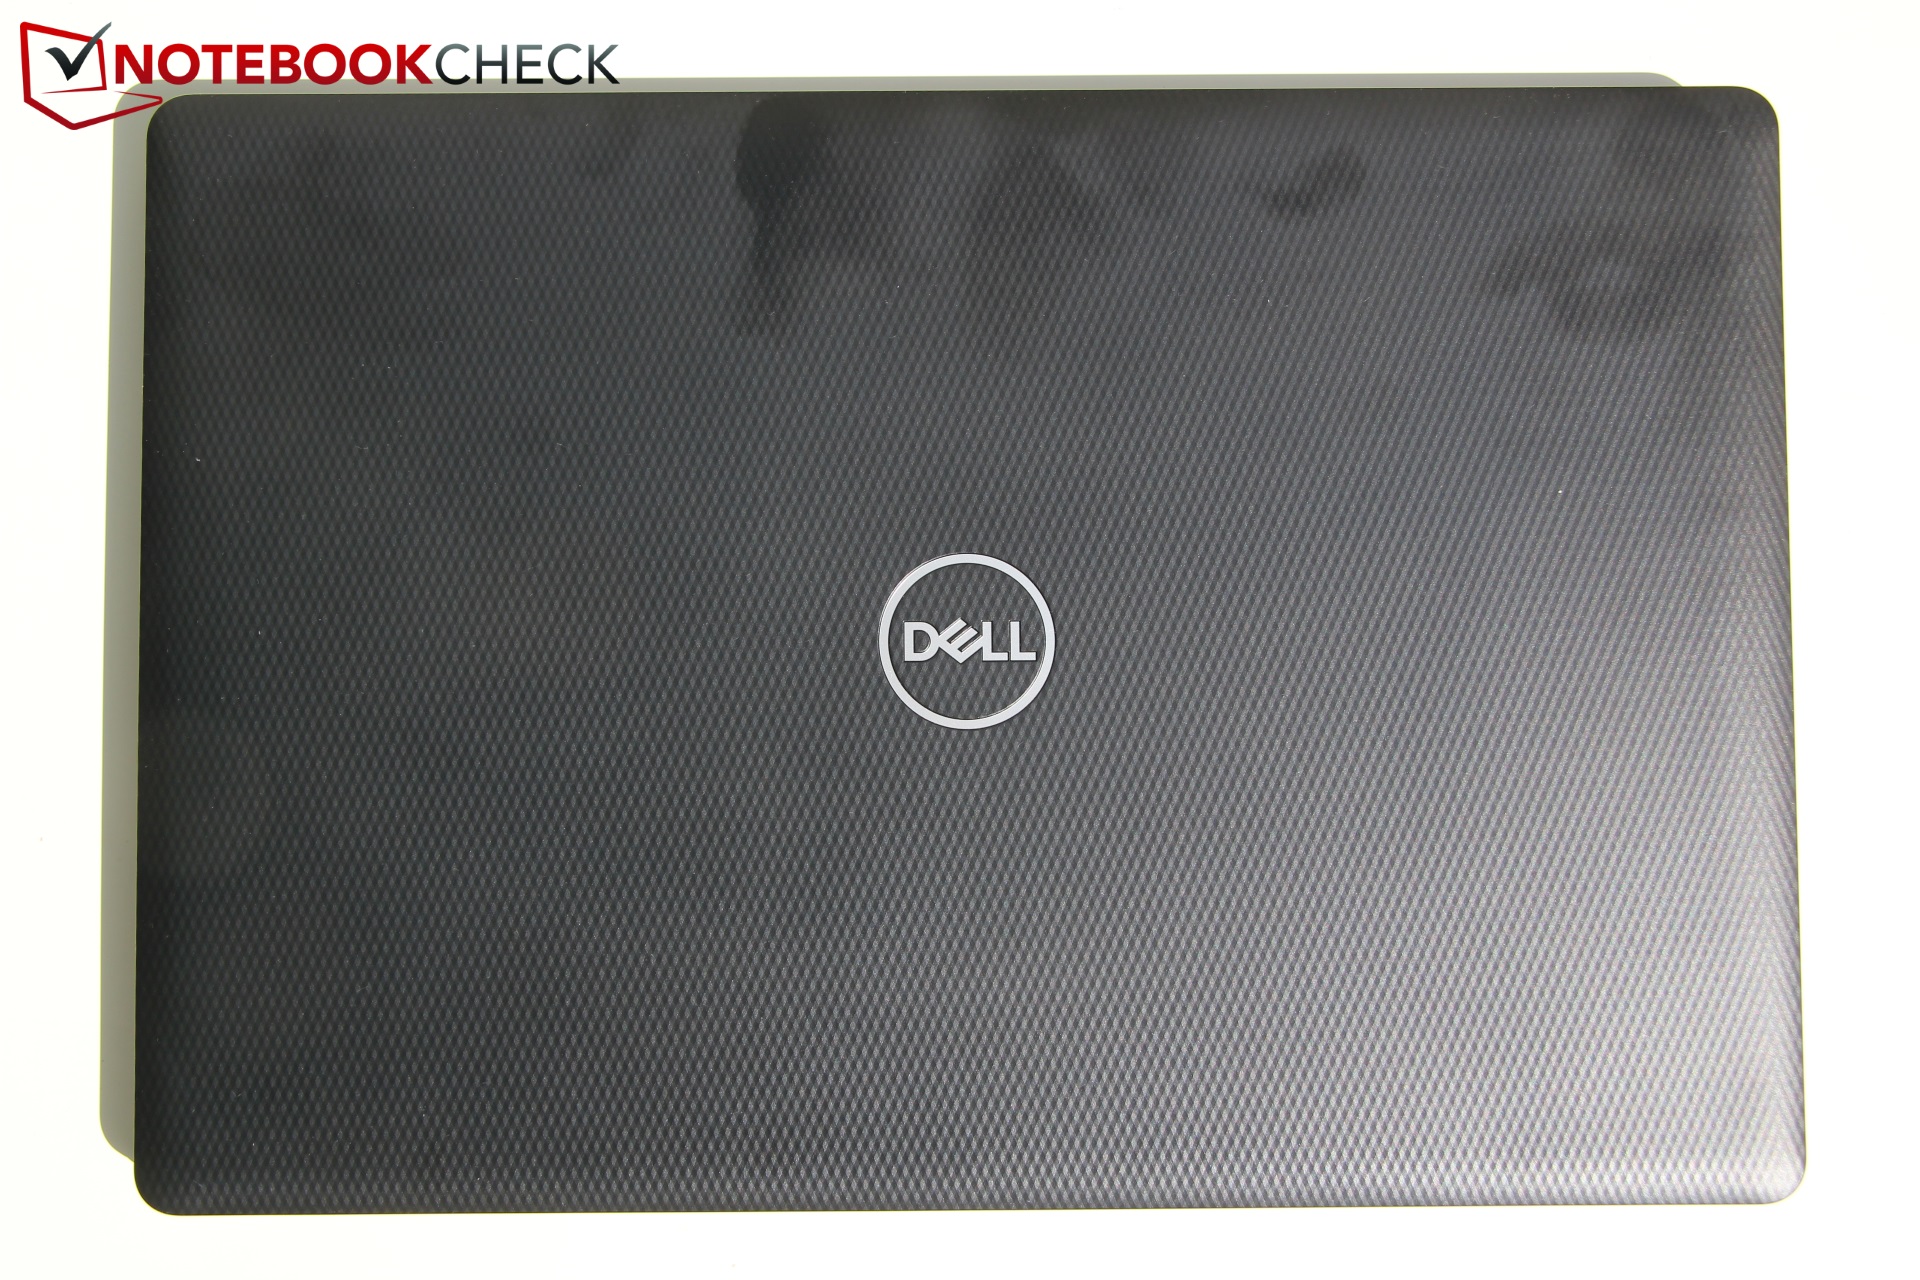
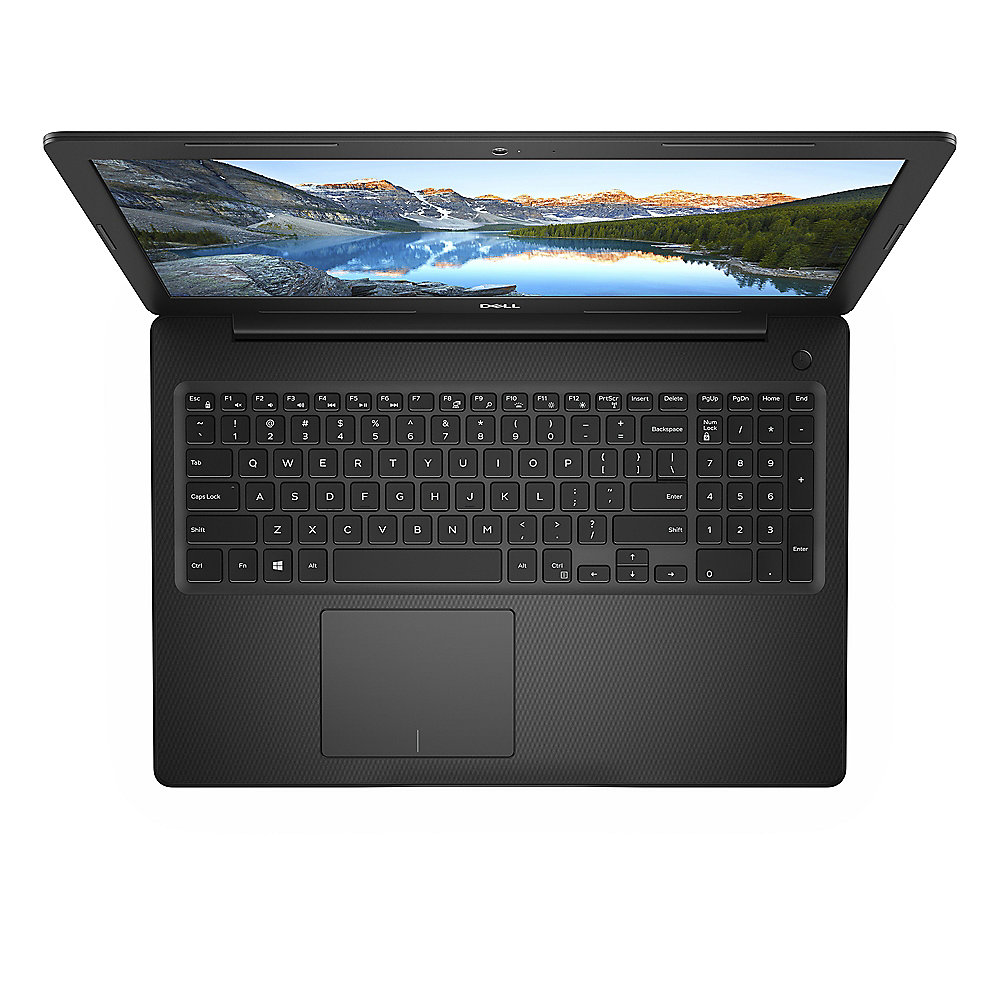
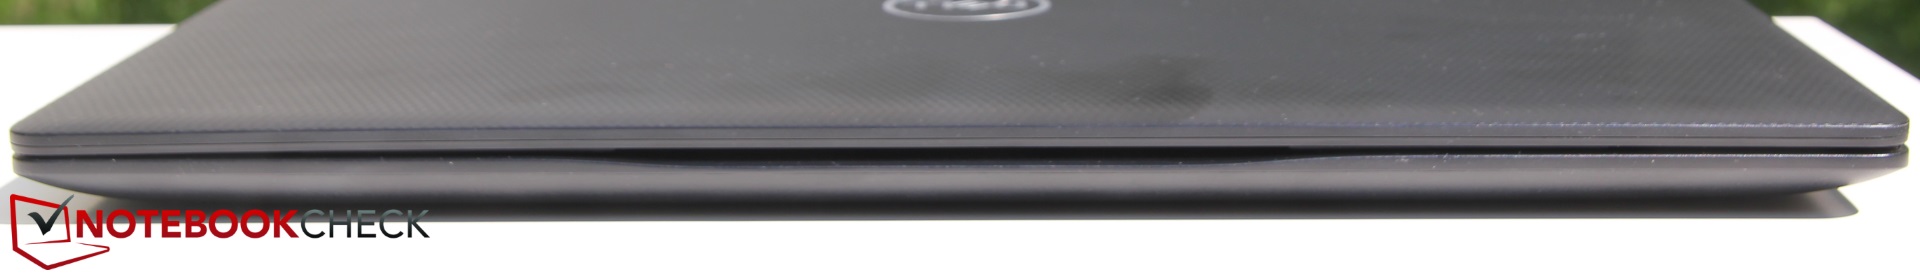
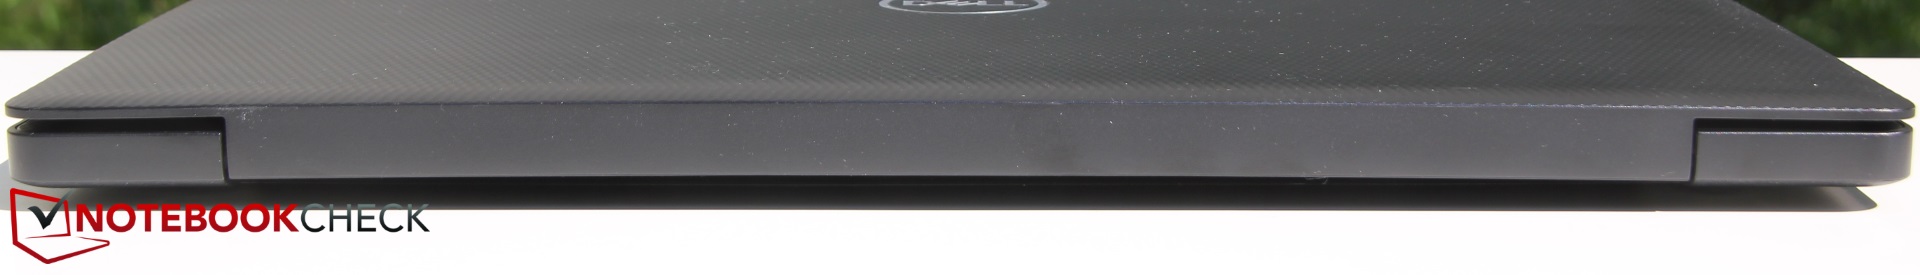
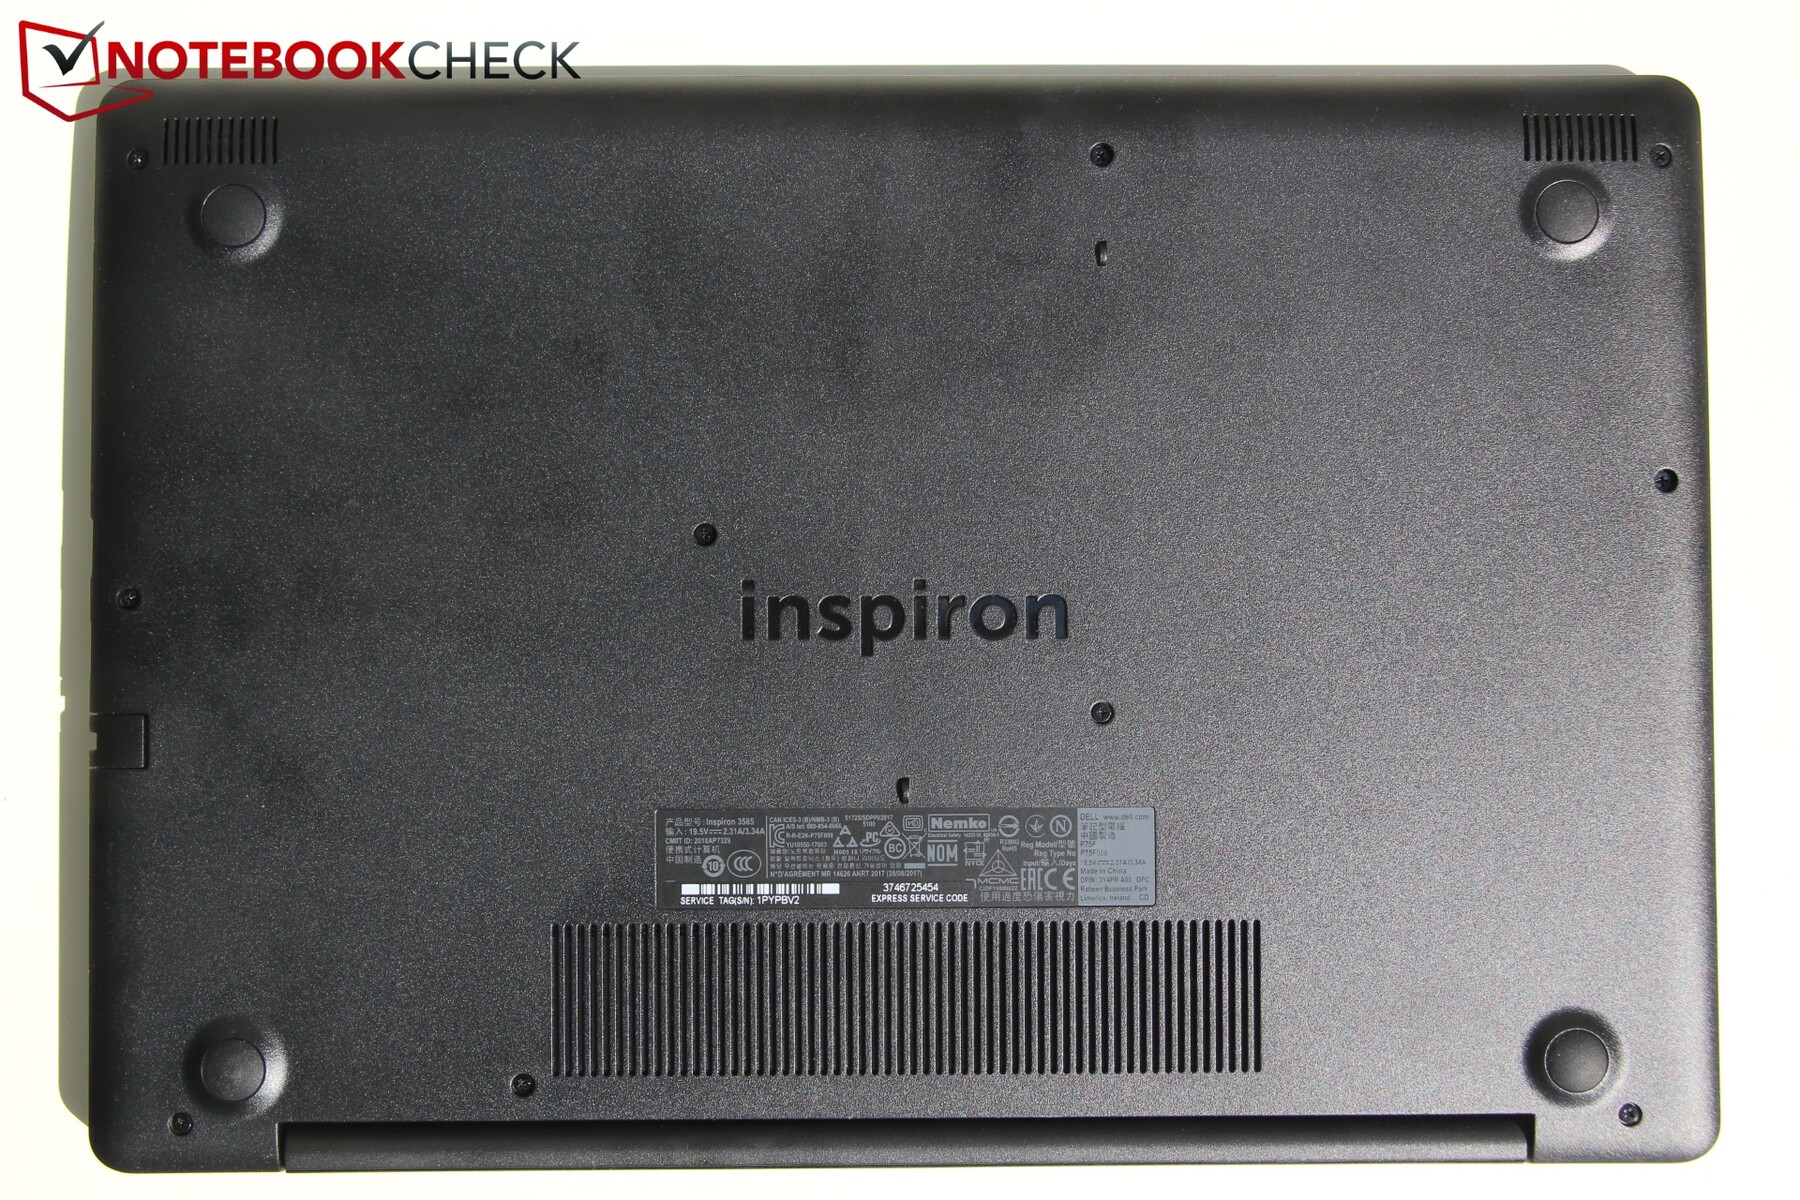
The black all-plastic case is relatively thin and covered in a honeycomb structure at the top and on the palm rests. This certainly makes the case unique yet inconspicuous nevertheless.
All surfaces are very susceptible to fingerprints.
The base is comparatively robust and only flexes insignificantly. The display lid is very thin and therefore less robust; however, overall build quality remained very decent. The hinge could be a tad firmer - when grabbing the open device and pulling it towards oneself the display tended to swing open.
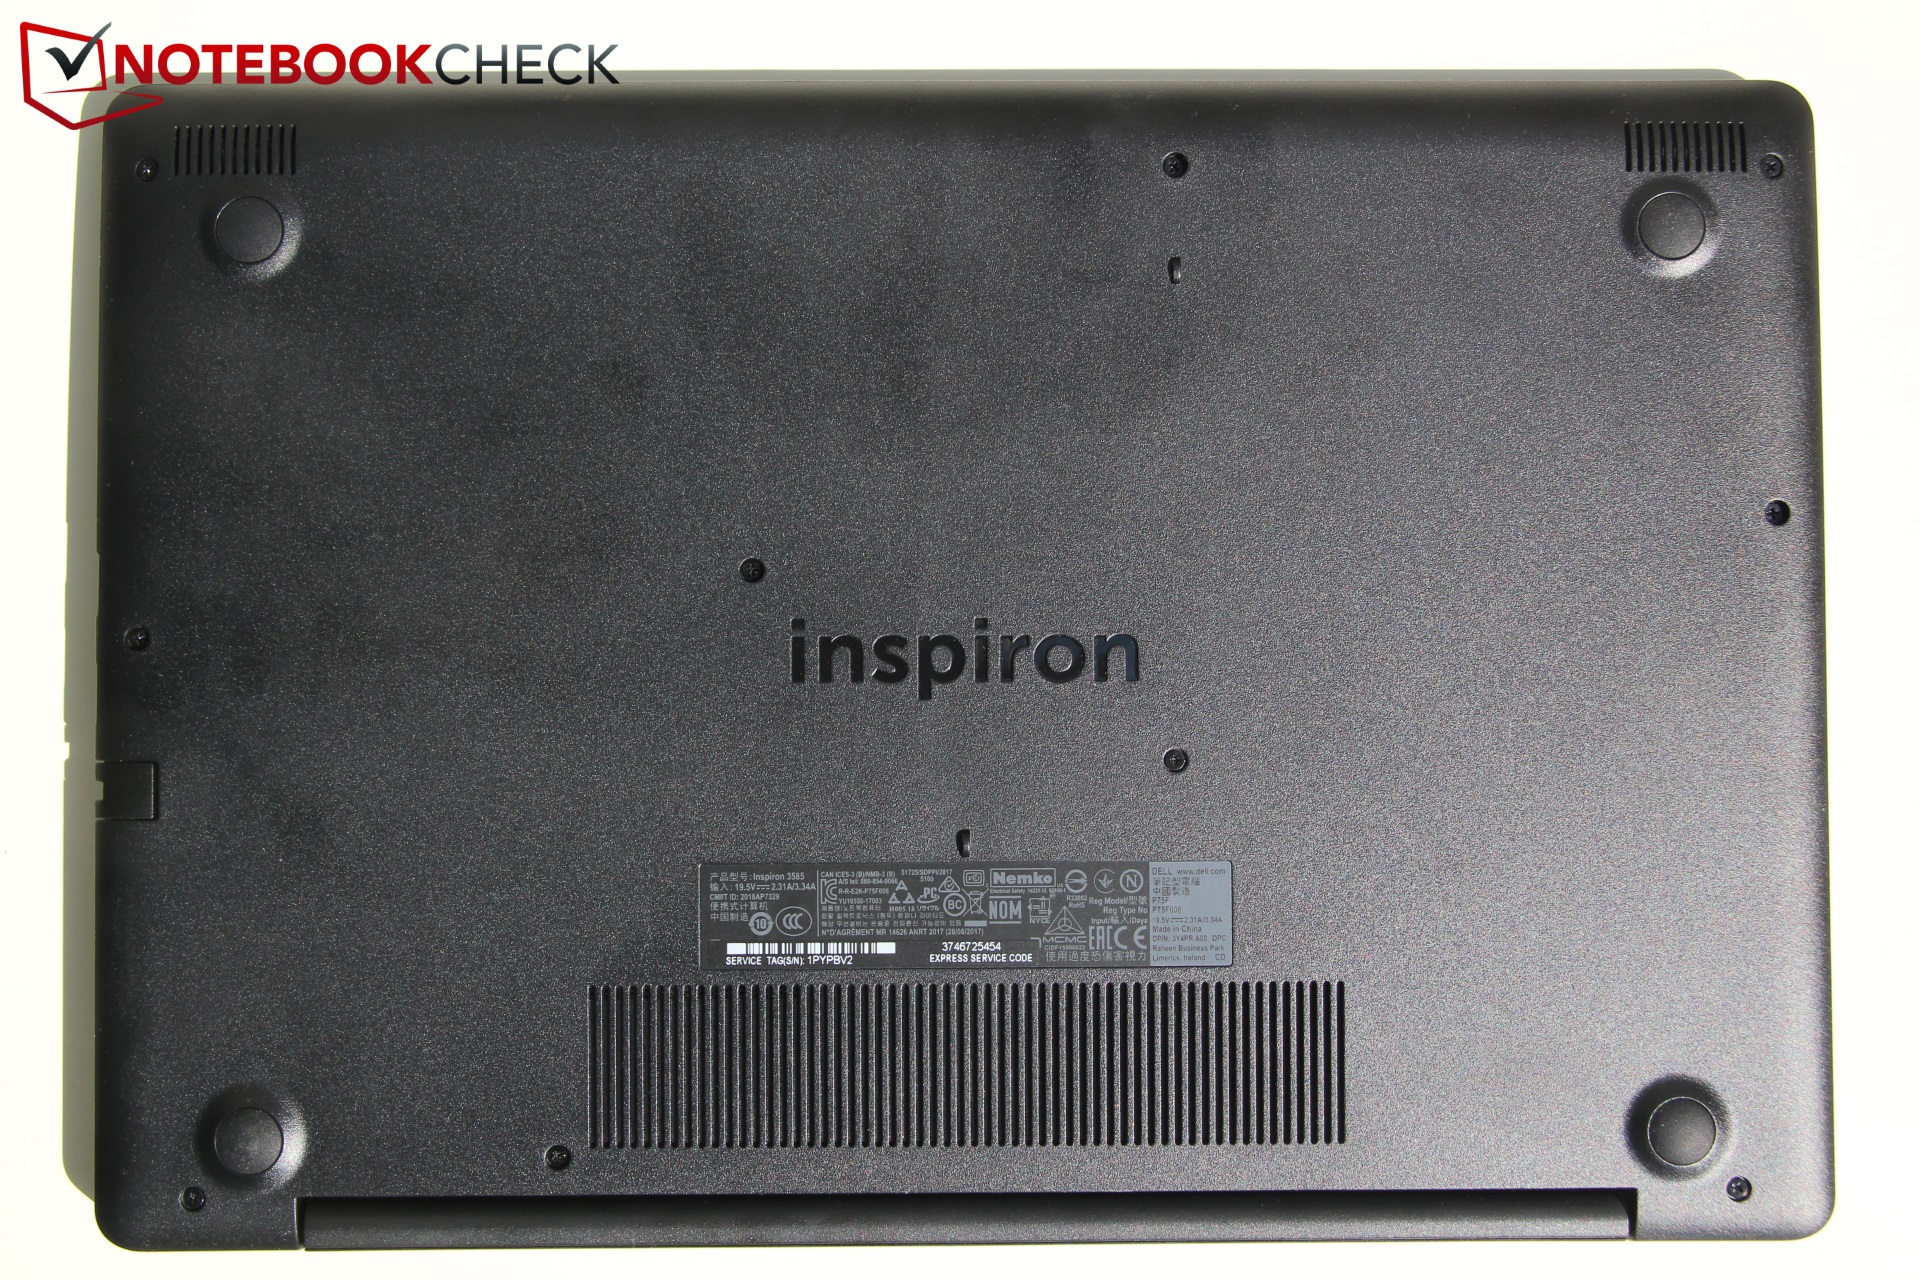
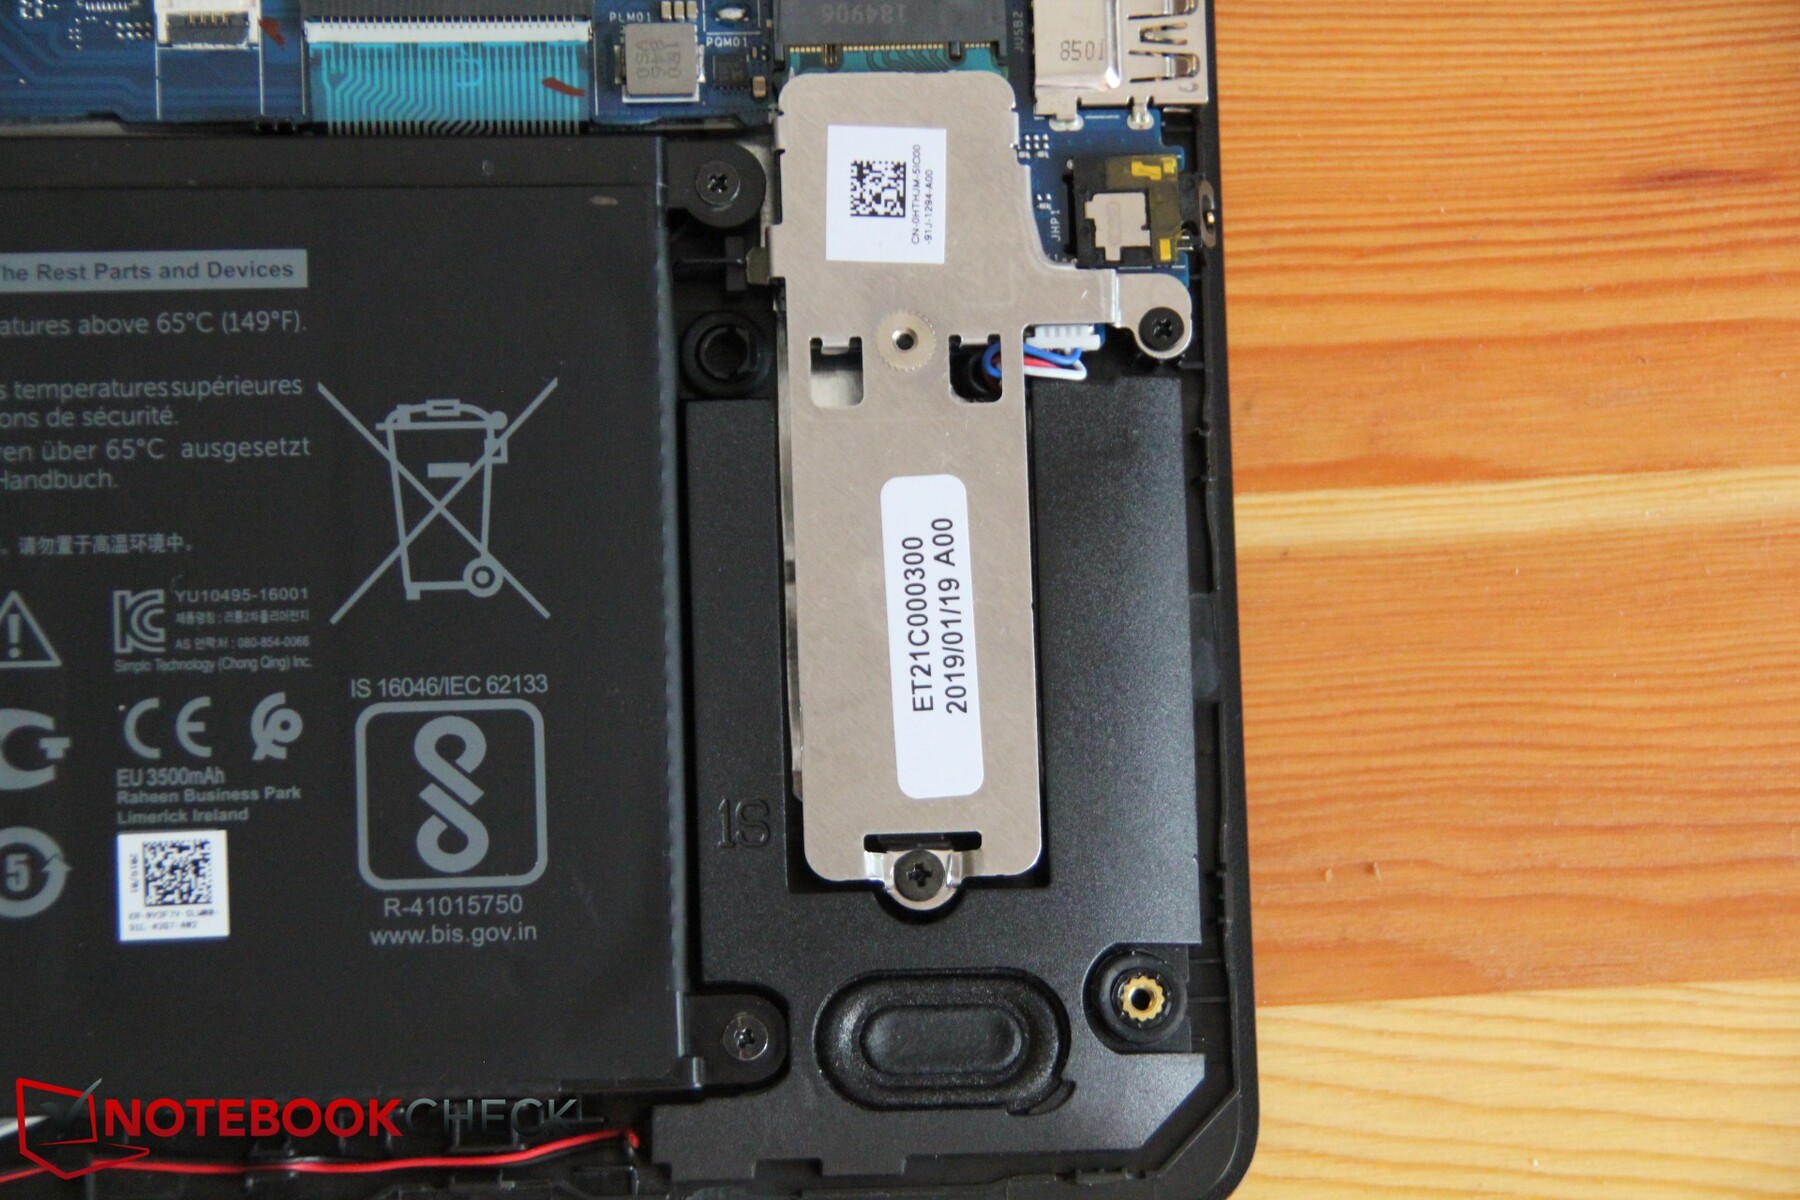
A maintenance opening is nowhere to be found on the case, and the entire bottom cover must be removed in order to perform maintenance or upgrade hardware. More on that later. The battery is not user-replaceable.
Compared to its sibling the Inspiron 15 3585 is around 200 g (0.44 lbs) lighter, most likely because of the former’s additional HDD. Despite different cases both devices are exactly the same size.
Overall, our review unit was noticeably thinner than its competitors. Acer’s Acer Aspire 3 has an almost identical footprint but is 9 mm thicker, the HP is 2.5 mm thicker, and the ThinkPad is almost 2 mm thicker despite its smaller 14-inch display. In return, the Inspiron’s footprint is quite large, and when stored inside a protective case the device barely fit in our backpack.
Connectivity
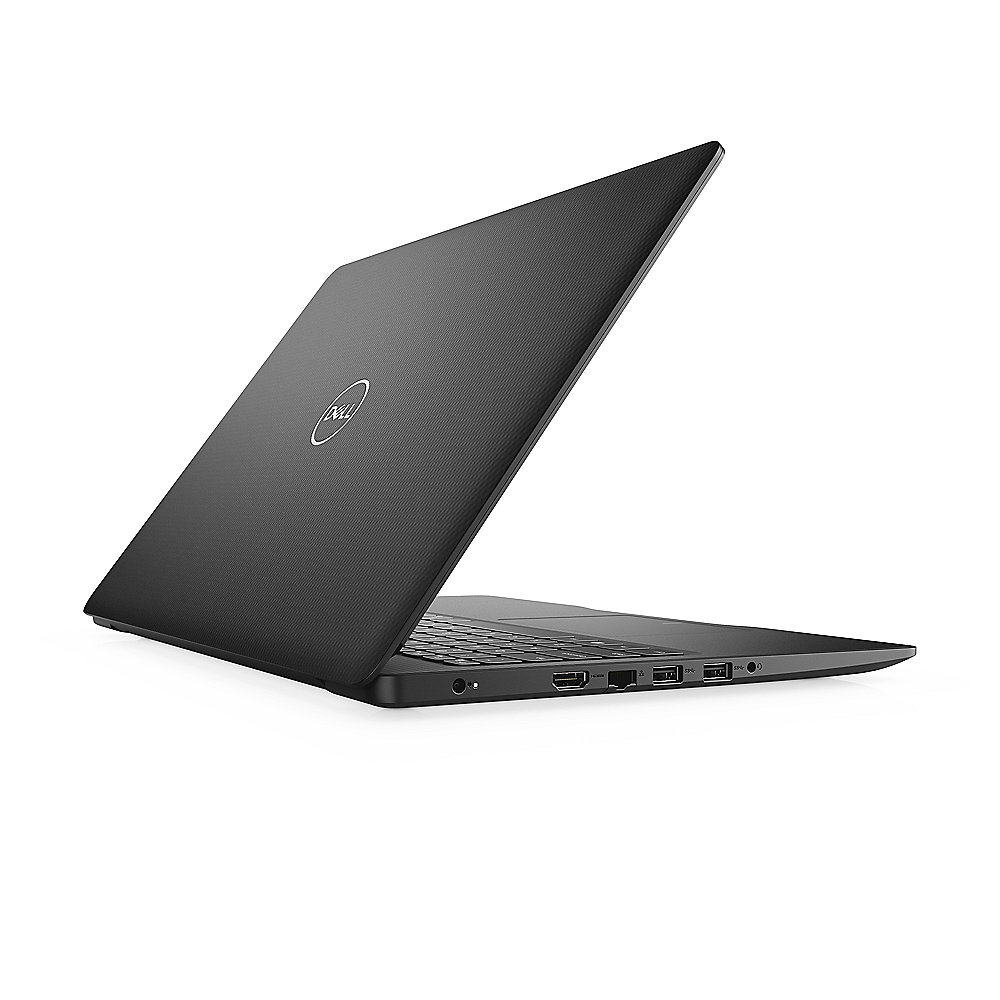
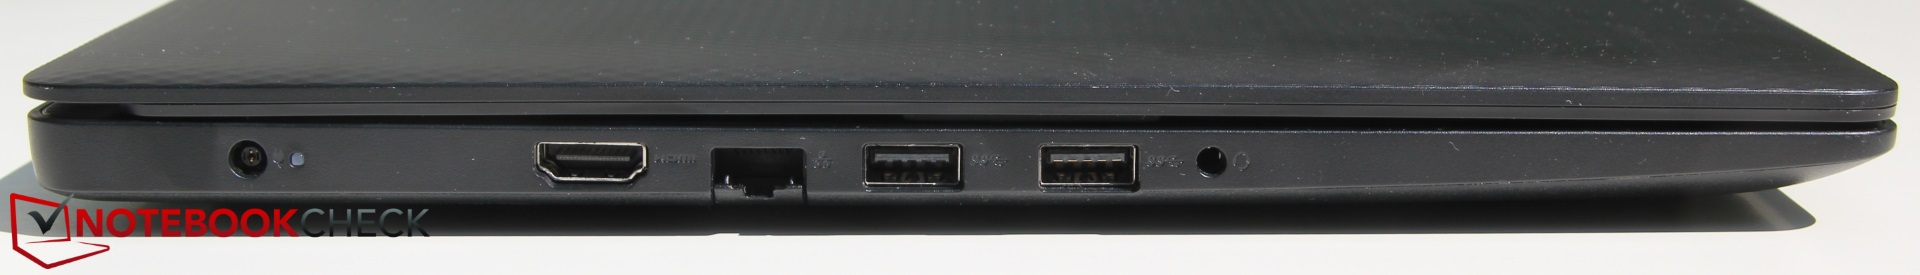
Given its low price, connectivity is limited to a bare minimum. At least it features a full-sized SD card reader, which is located on the right-hand side next to a USB 3.0 port. All other ports are located on the left-hand side, which is great for right-handers but somewhat of a downer for left-handers. A total of three USB-A ports, one of which is only connected via USB 2.0, are available but USB-C is nowhere to be found. That being said, its competitors were comparable overall when it came to port selection. Spacing between the ports is decent, and they span almost along the entire left side all but eliminating the chances of a cable jam.

SD Card Reader
| SD Card Reader | |
| average JPG Copy Test (av. of 3 runs) | |
| Lenovo ThinkPad E485-20KU000NGE (Toshiba Exceria Pro M501) | |
| Average of class Office (22.4 - 198.5, n=21, last 2 years) | |
| Dell Inspiron 15 3585 (2300U, Vega 6) (Toshiba Exceria Pro SDXC 64 GB UHS-II) | |
| Dell Inspiron 15 5575-98MH4 (Toshiba Exceria Pro SDXC 64 GB UHS-II) | |
| maximum AS SSD Seq Read Test (1GB) | |
| Lenovo ThinkPad E485-20KU000NGE (Toshiba Exceria Pro M501) | |
| Average of class Office (27.4 - 249, n=20, last 2 years) | |
| Dell Inspiron 15 5575-98MH4 (Toshiba Exceria Pro SDXC 64 GB UHS-II) | |
| Dell Inspiron 15 3585 (2300U, Vega 6) (Toshiba Exceria Pro SDXC 64 GB UHS-II) | |
Communication
Supported wireless communication protocols include Bluetooth 4.0 and Wi-Fi 802.11b/g/n (no ac). An RJ45 port for wired communication is available. Wi-Fi transfer rates were average and comparable to its direct competitors.
| Networking | |
| iperf3 transmit AX12 | |
| Dell Inspiron 15 5575-98MH4 | |
| Lenovo ThinkPad E485-20KU000NGE | |
| Dell Inspiron 15 3585 (2300U, Vega 6) | |
| iperf3 receive AX12 | |
| Dell Inspiron 15 5575-98MH4 | |
| Dell Inspiron 15 3585 (2300U, Vega 6) | |
| Lenovo ThinkPad E485-20KU000NGE | |
Security
In addition to the practically mandatory Kensington lock there are no additional security features available on the Inspiron 15 3585. According to the user manual a fingerprint reader is available on select SKUs.
Accessories
Dell does not include any accessories with its cheap Inspiron laptop. The only things we found in the box in addition to the notebook itself were the power supply, a quick-start guide, and a warranty booklet.
Maintenance
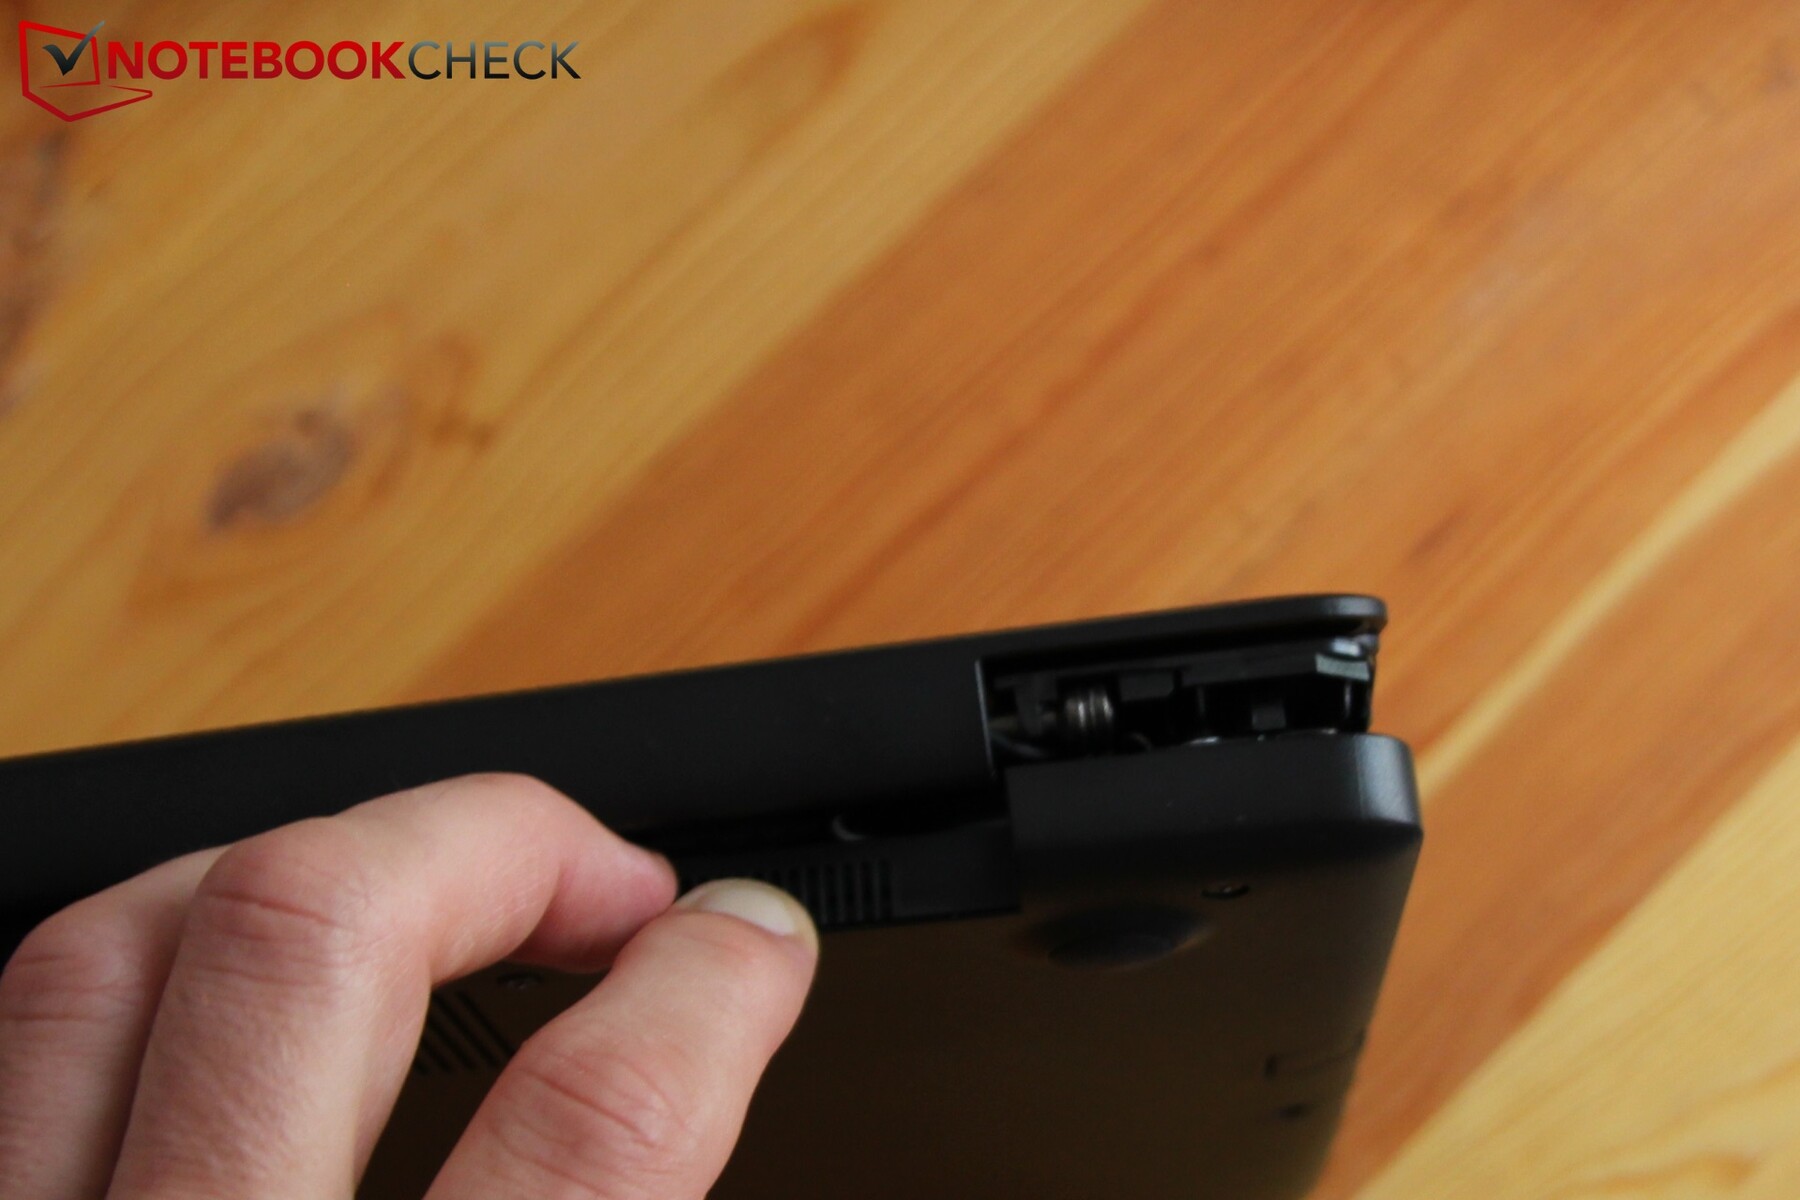
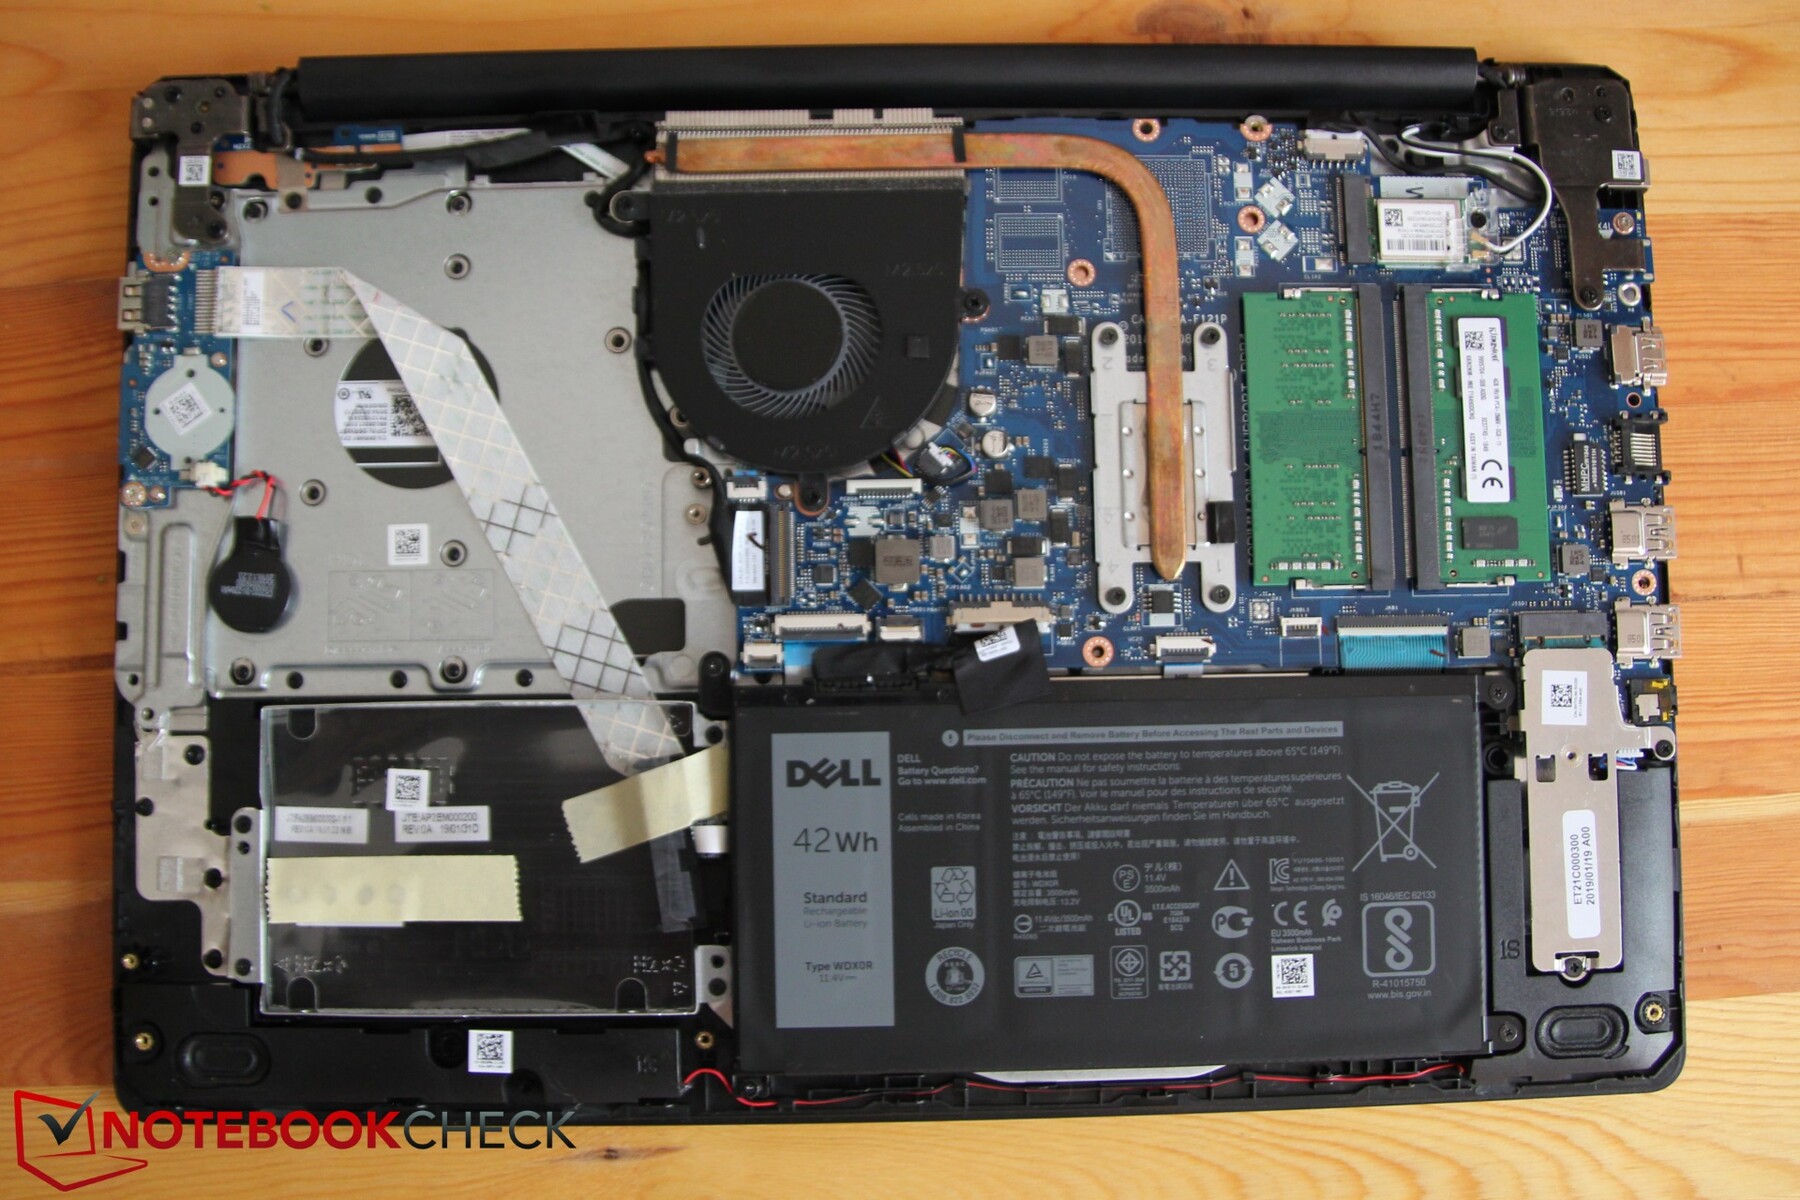
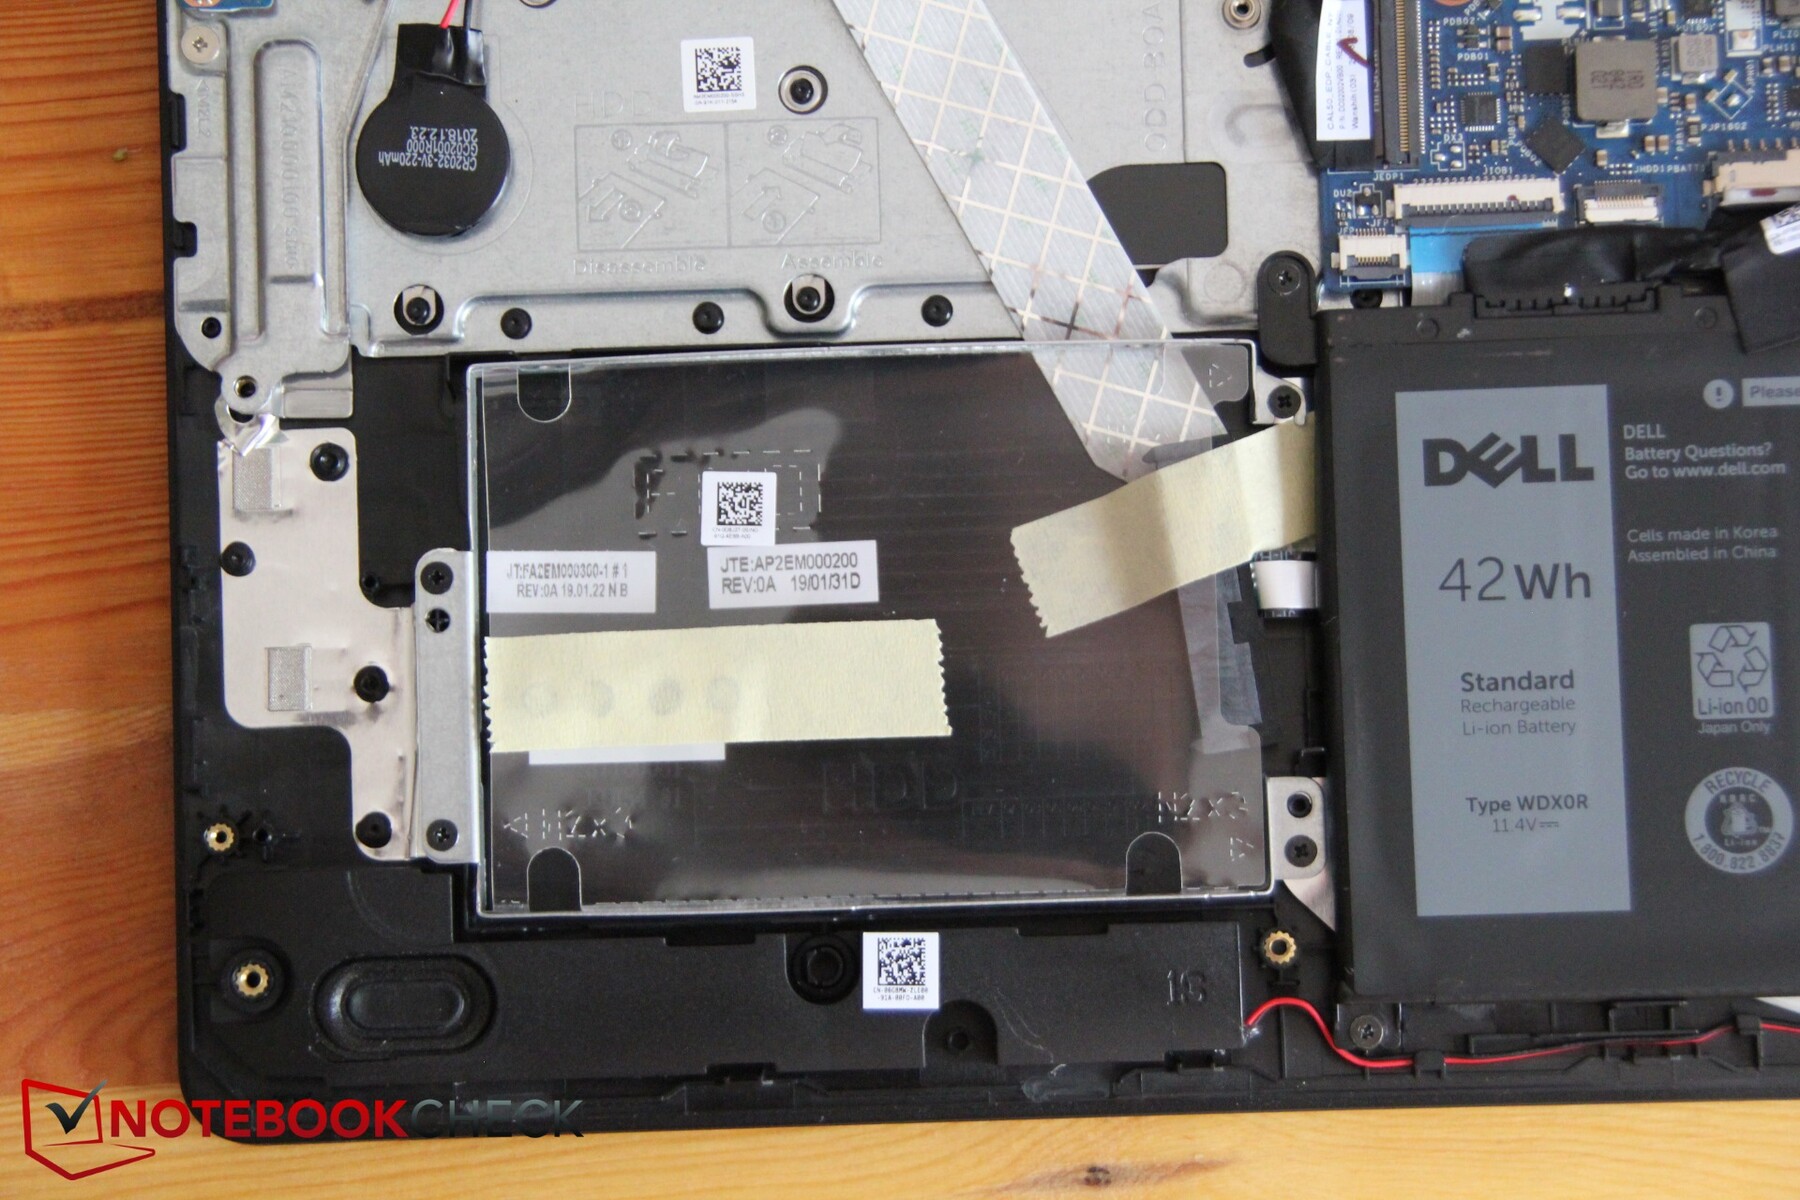
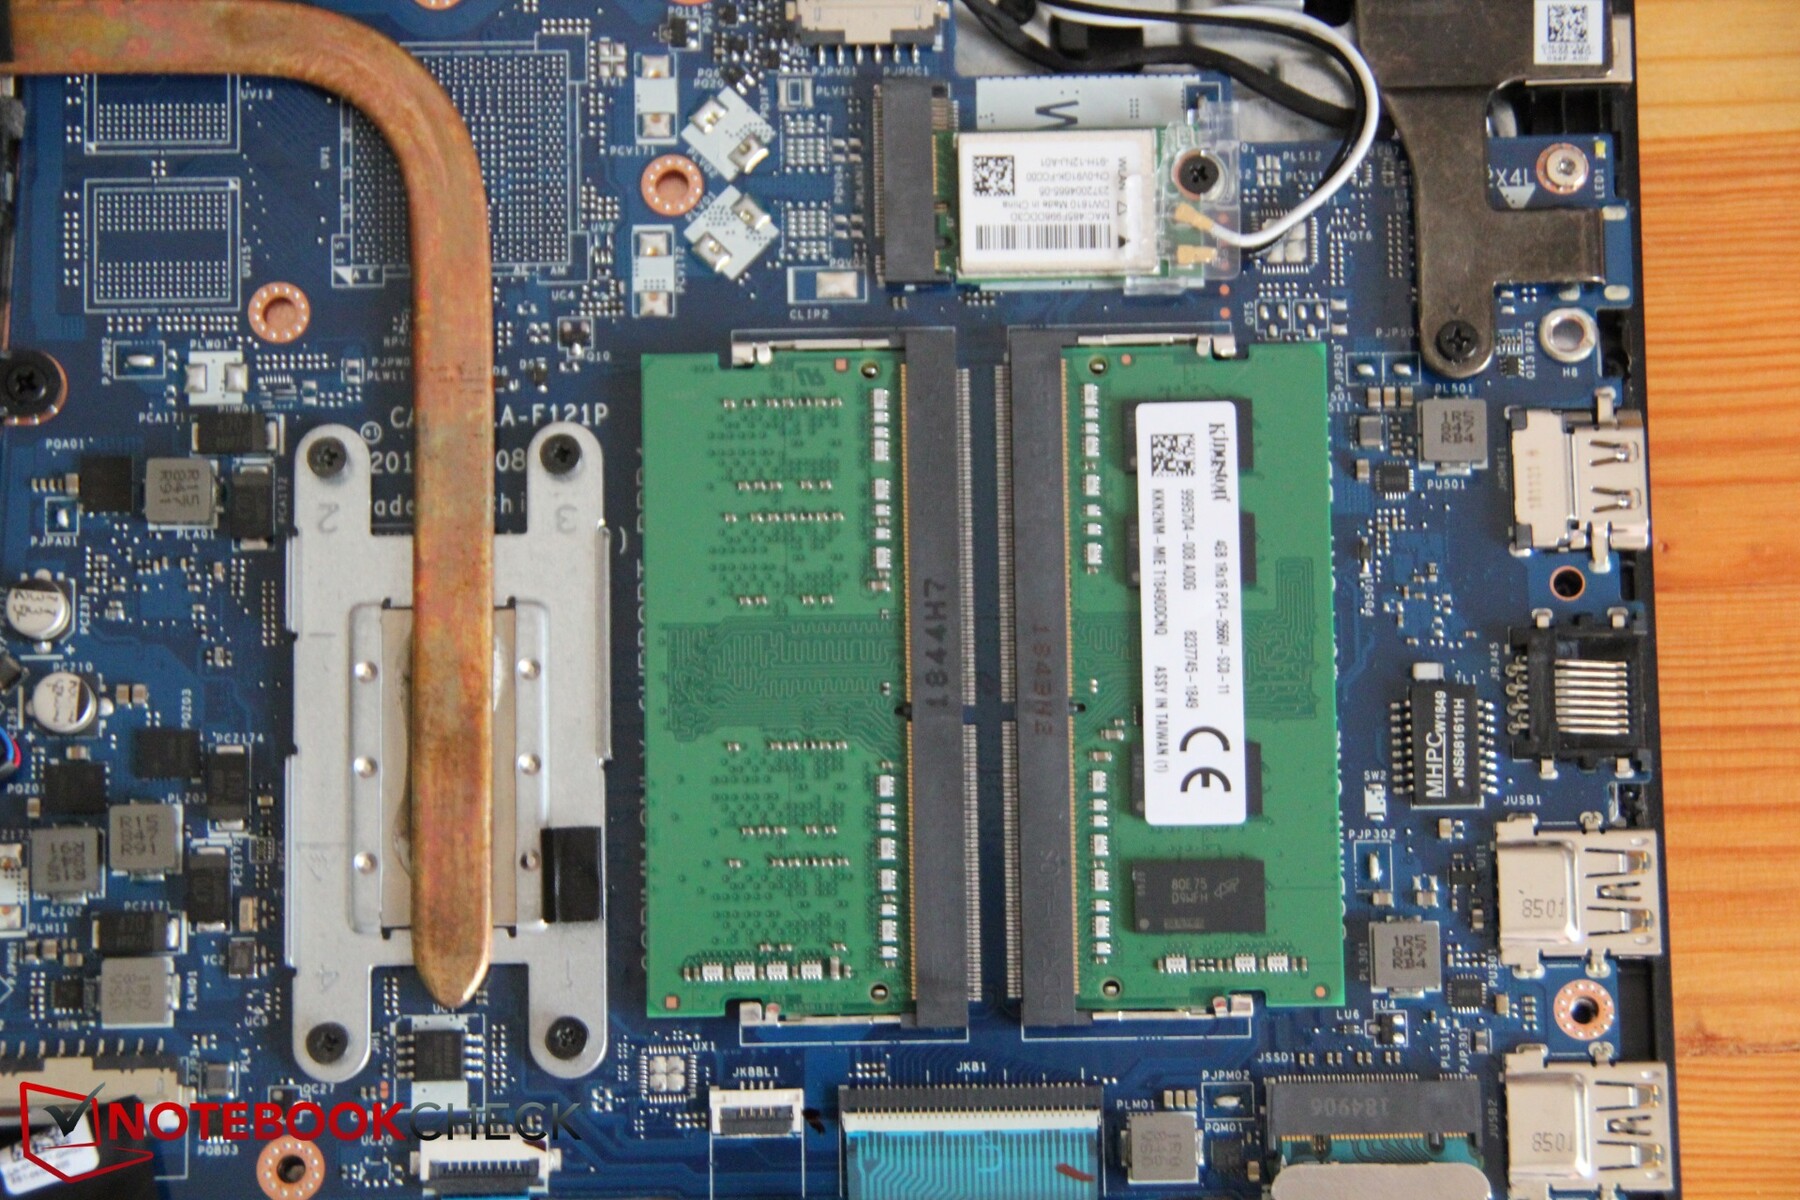
Given that the Inspiron 15 3585 lacks a dedicated maintenance opening the entire bottom cover must be removed in order to performance maintenance or upgrades. Fortunately, this turned out to be easier than expected. A total of 10 screws need to be removed. Keep in mind that the two screws in the middle are threaded differently than the others. Once unscrewed, the cover can be easily removed starting from the side and slowly going around the entire case. Underneath, we find the fan as well as almost all other important hardware components, including the unpopulated 2.5-inch SATA slot.
Warranty
Default warranty differs based on what country the device is purchased in. Our German review unit came with one year of pickup and return warranty by default. First and third-party warranty extensions are available.
Input Devices
Keyboard
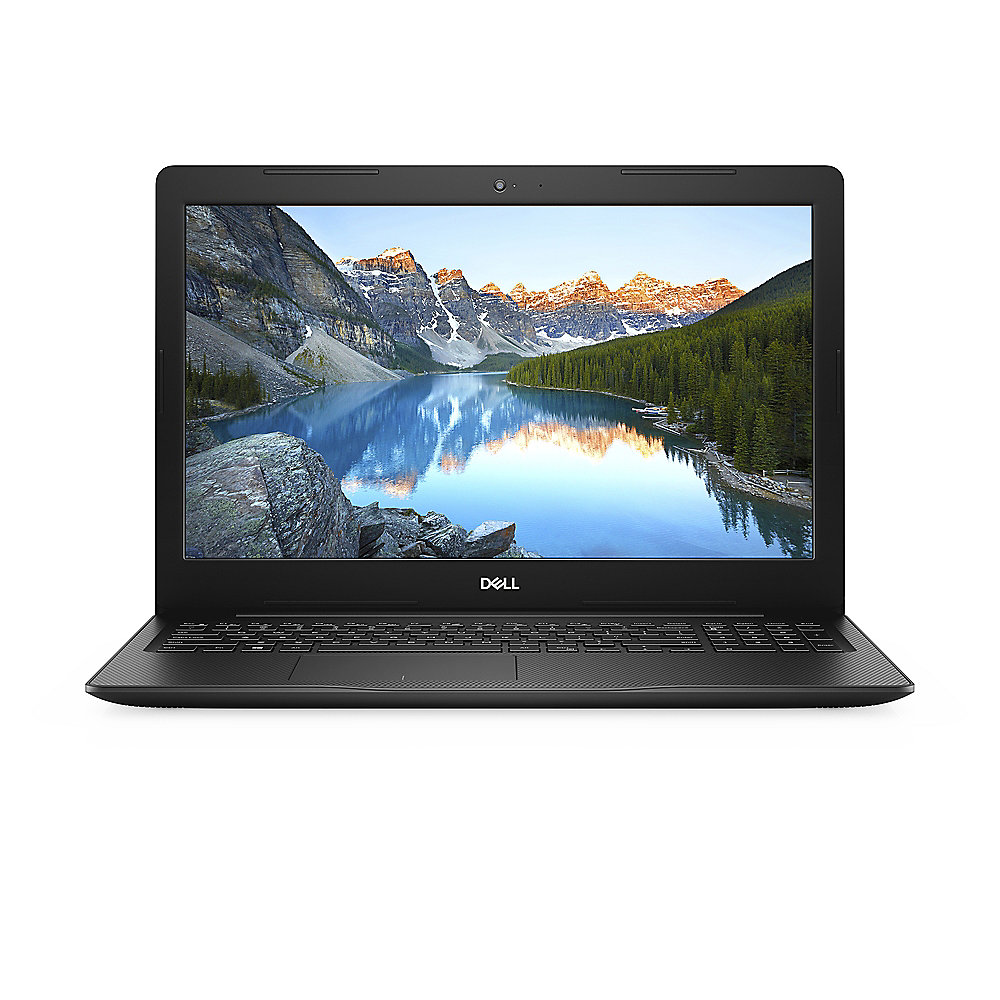
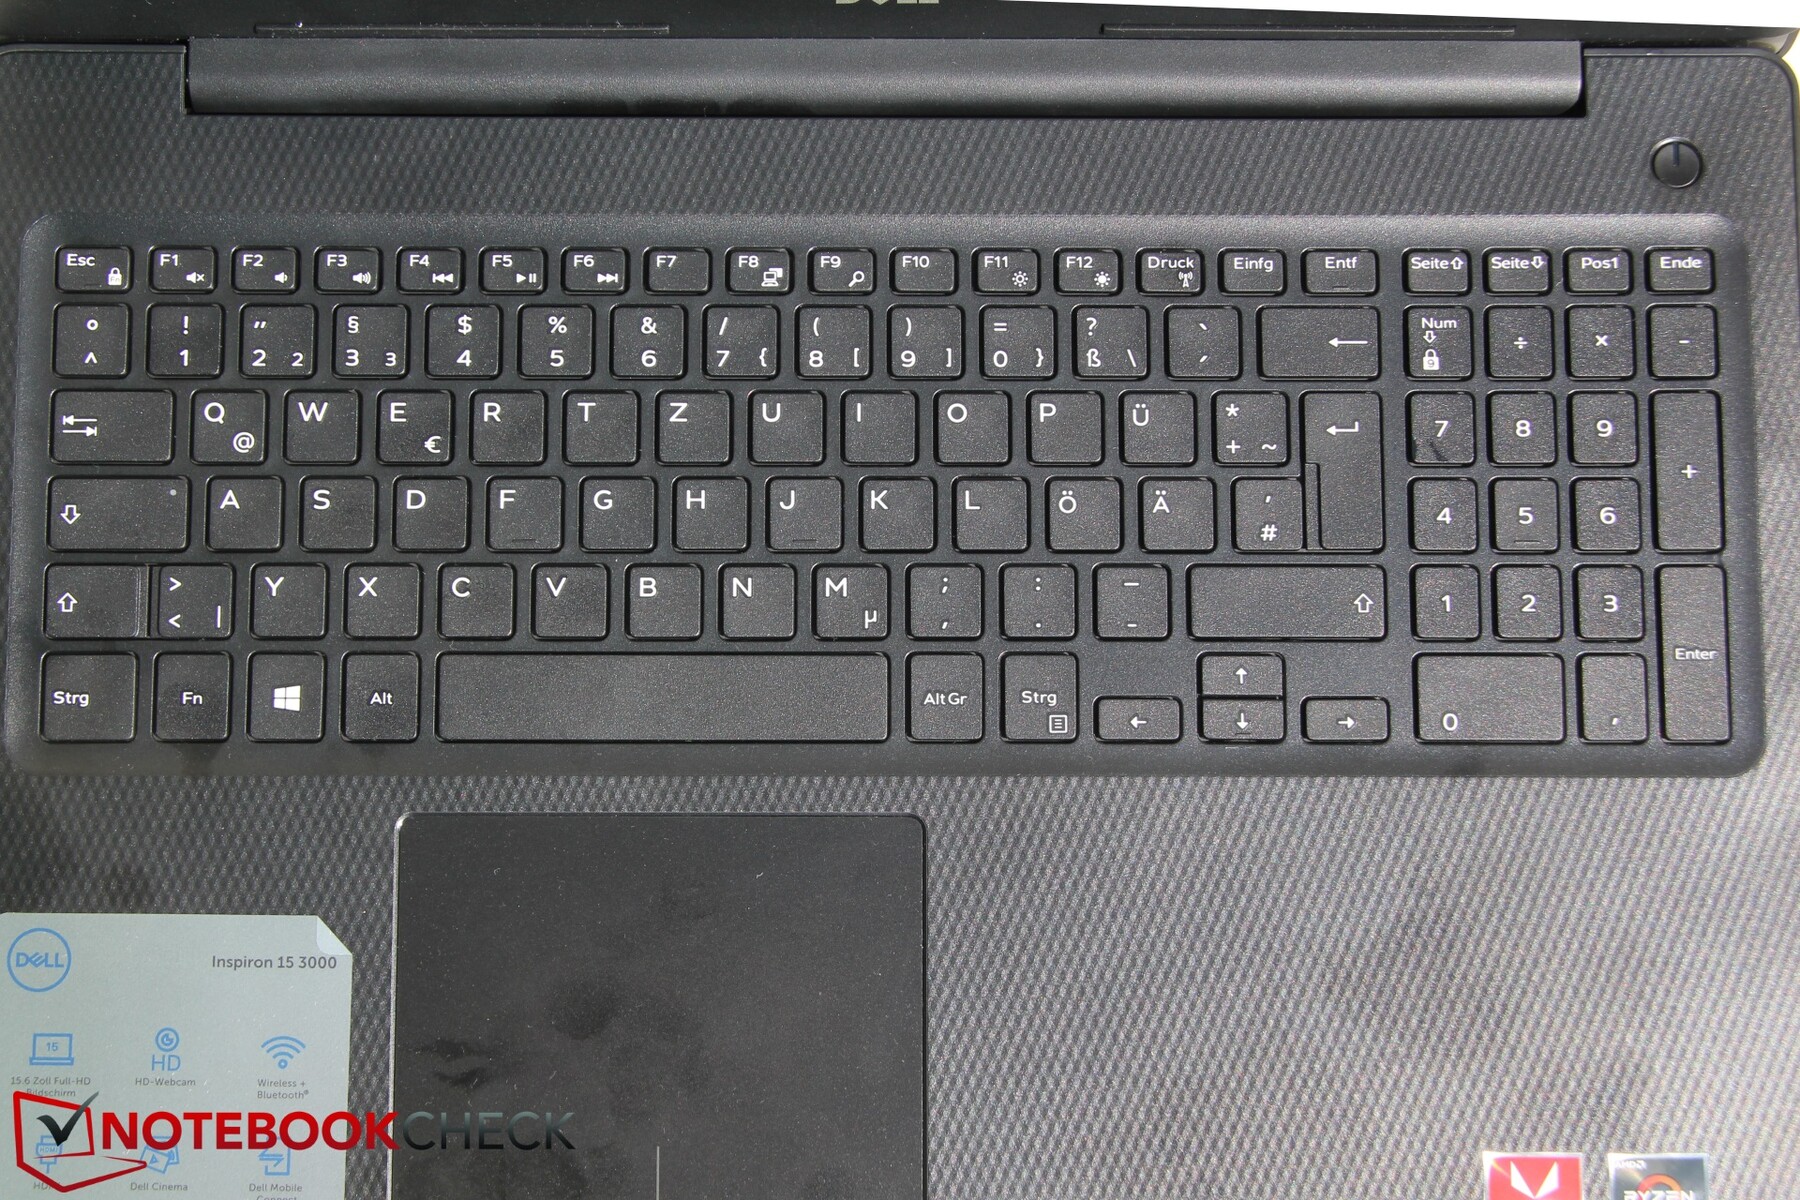
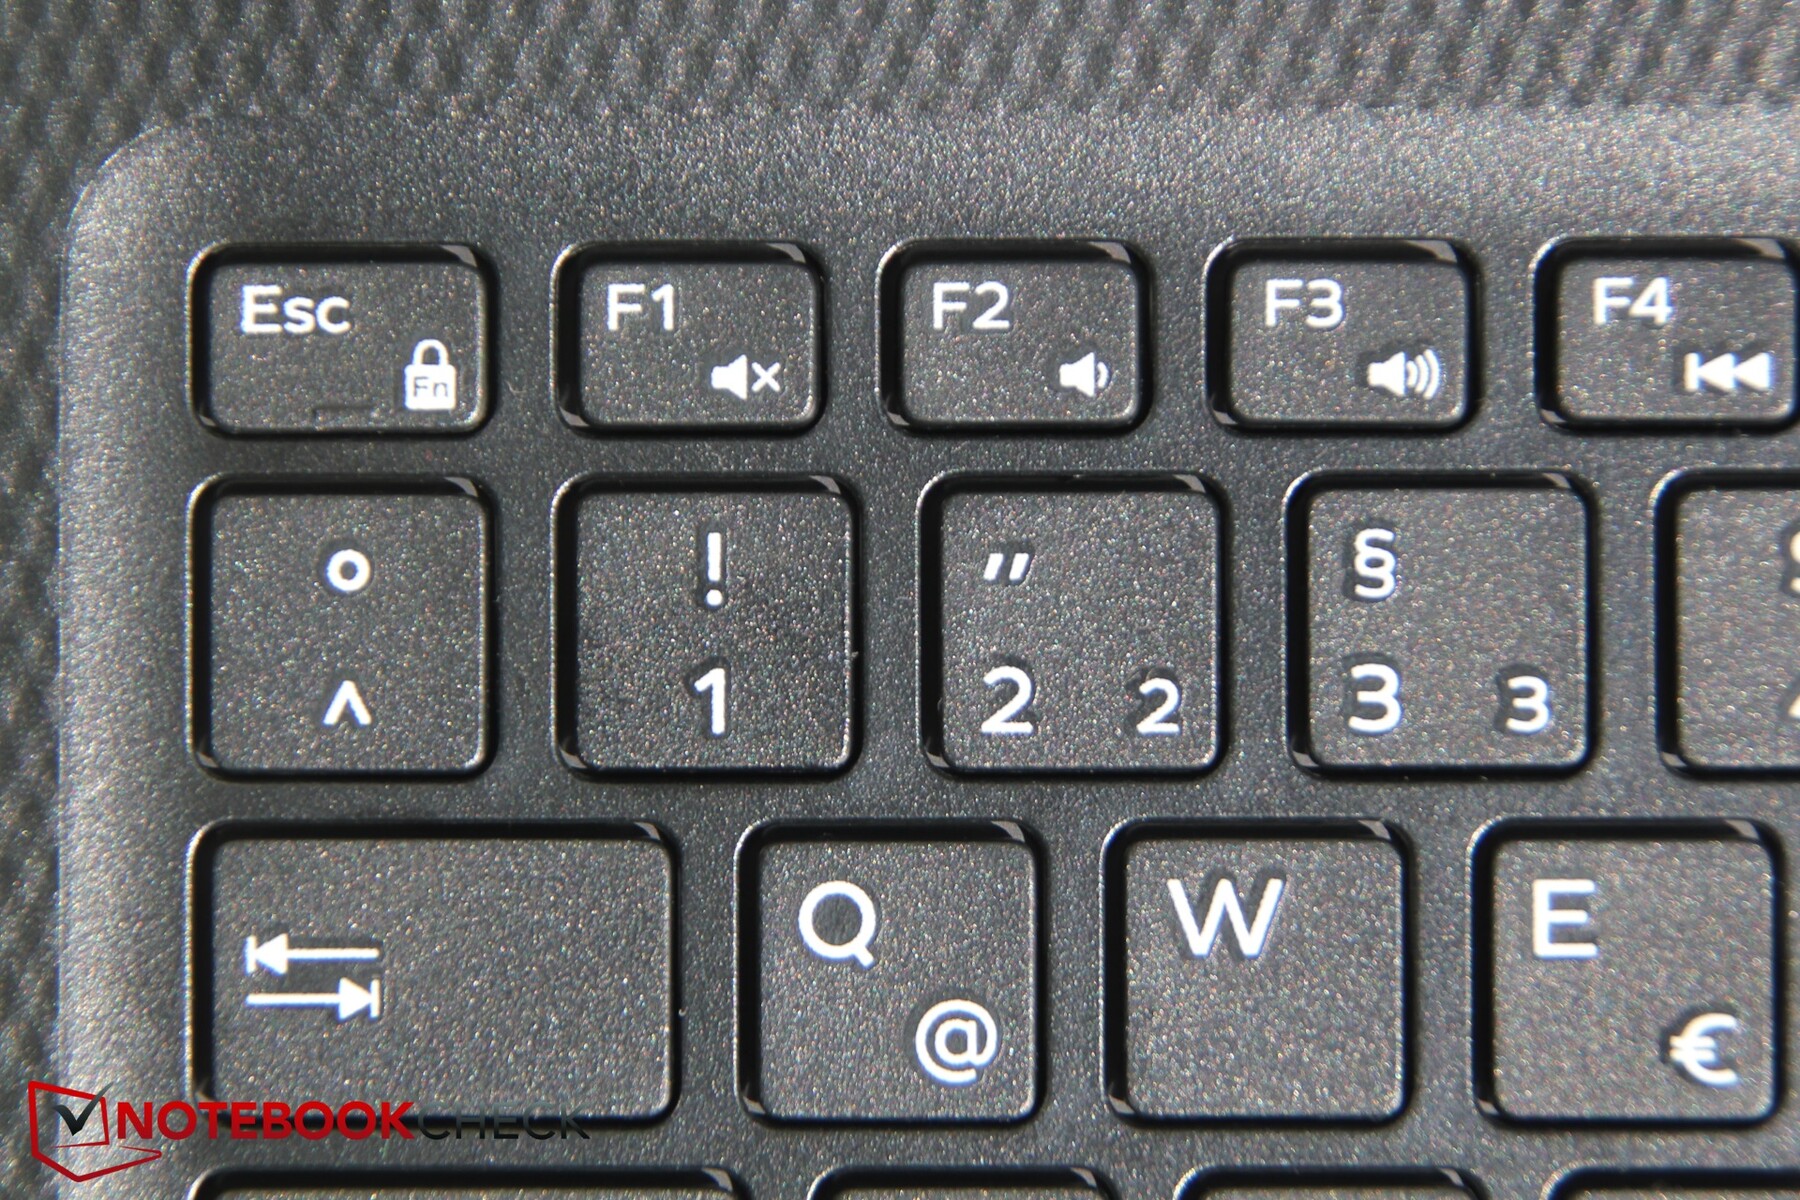
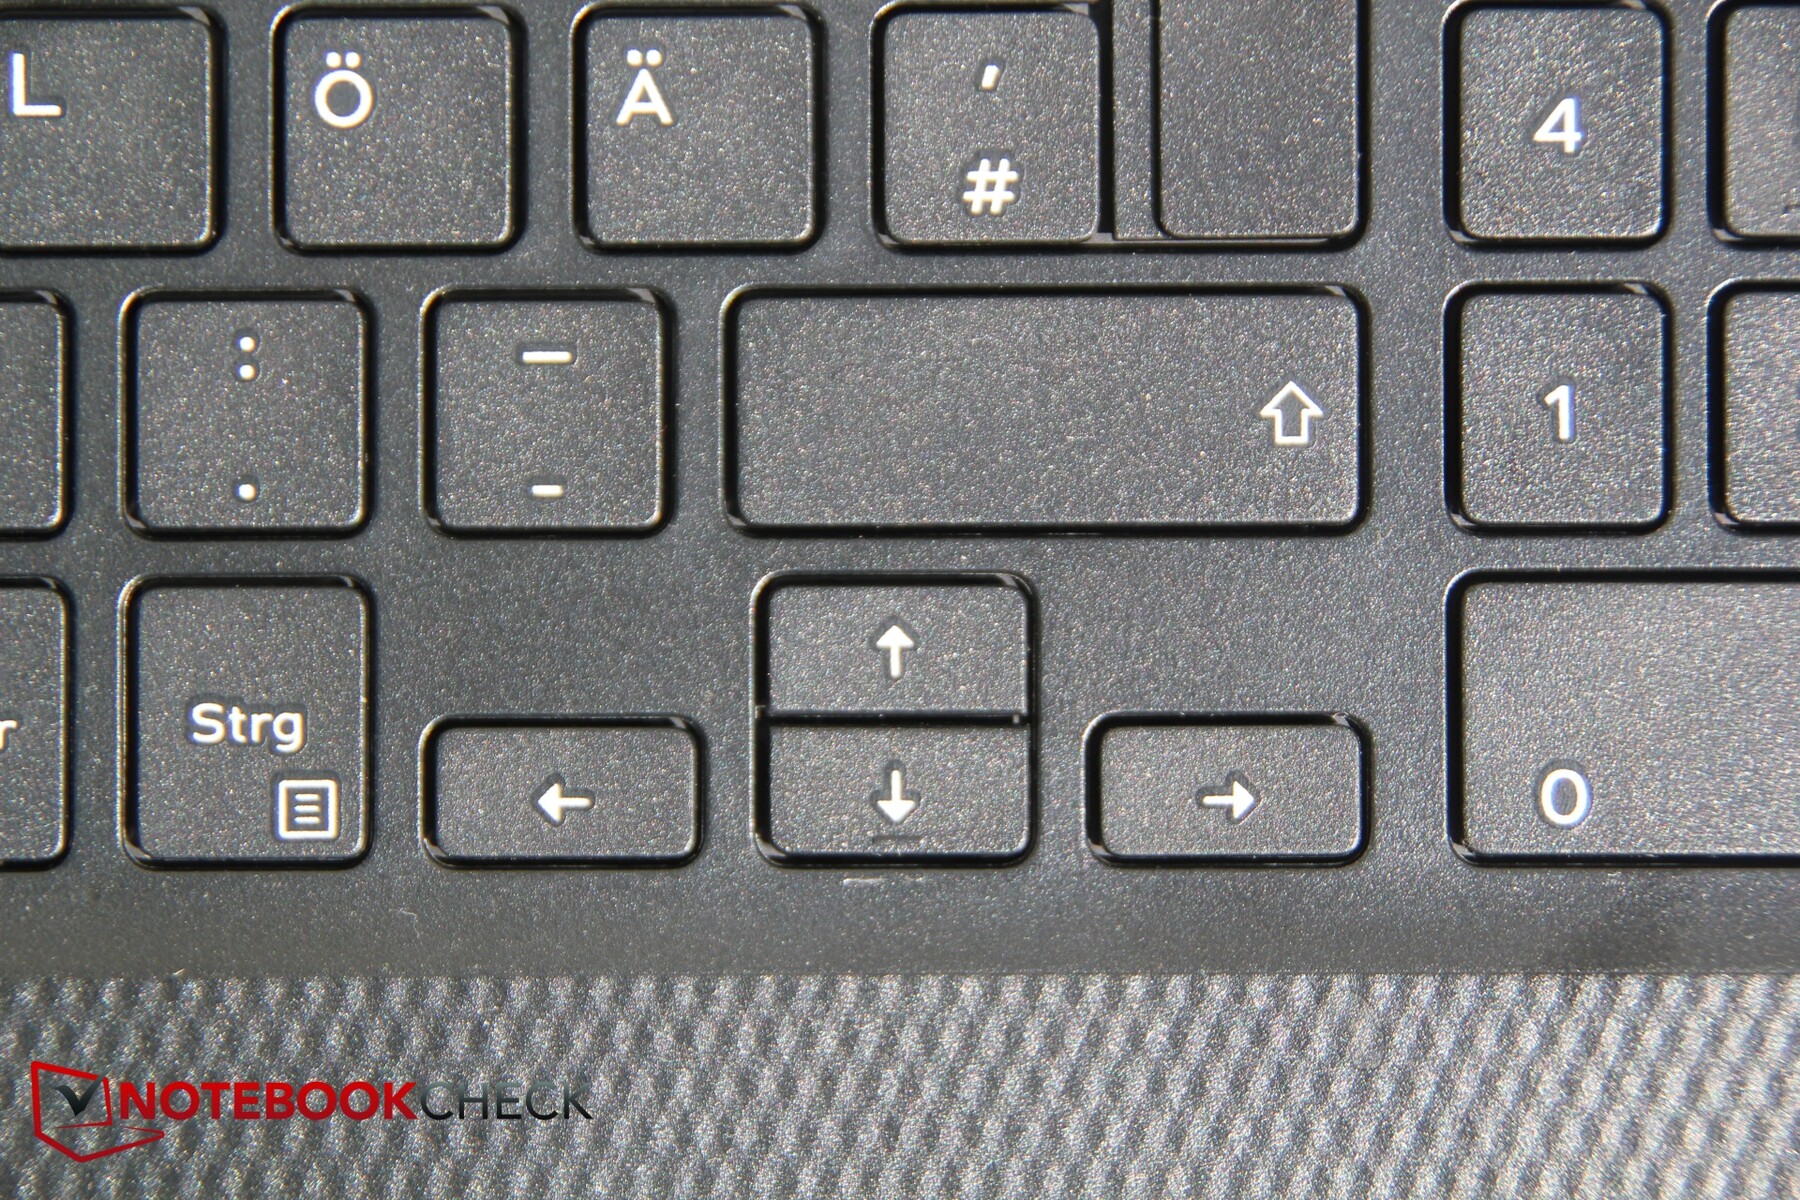
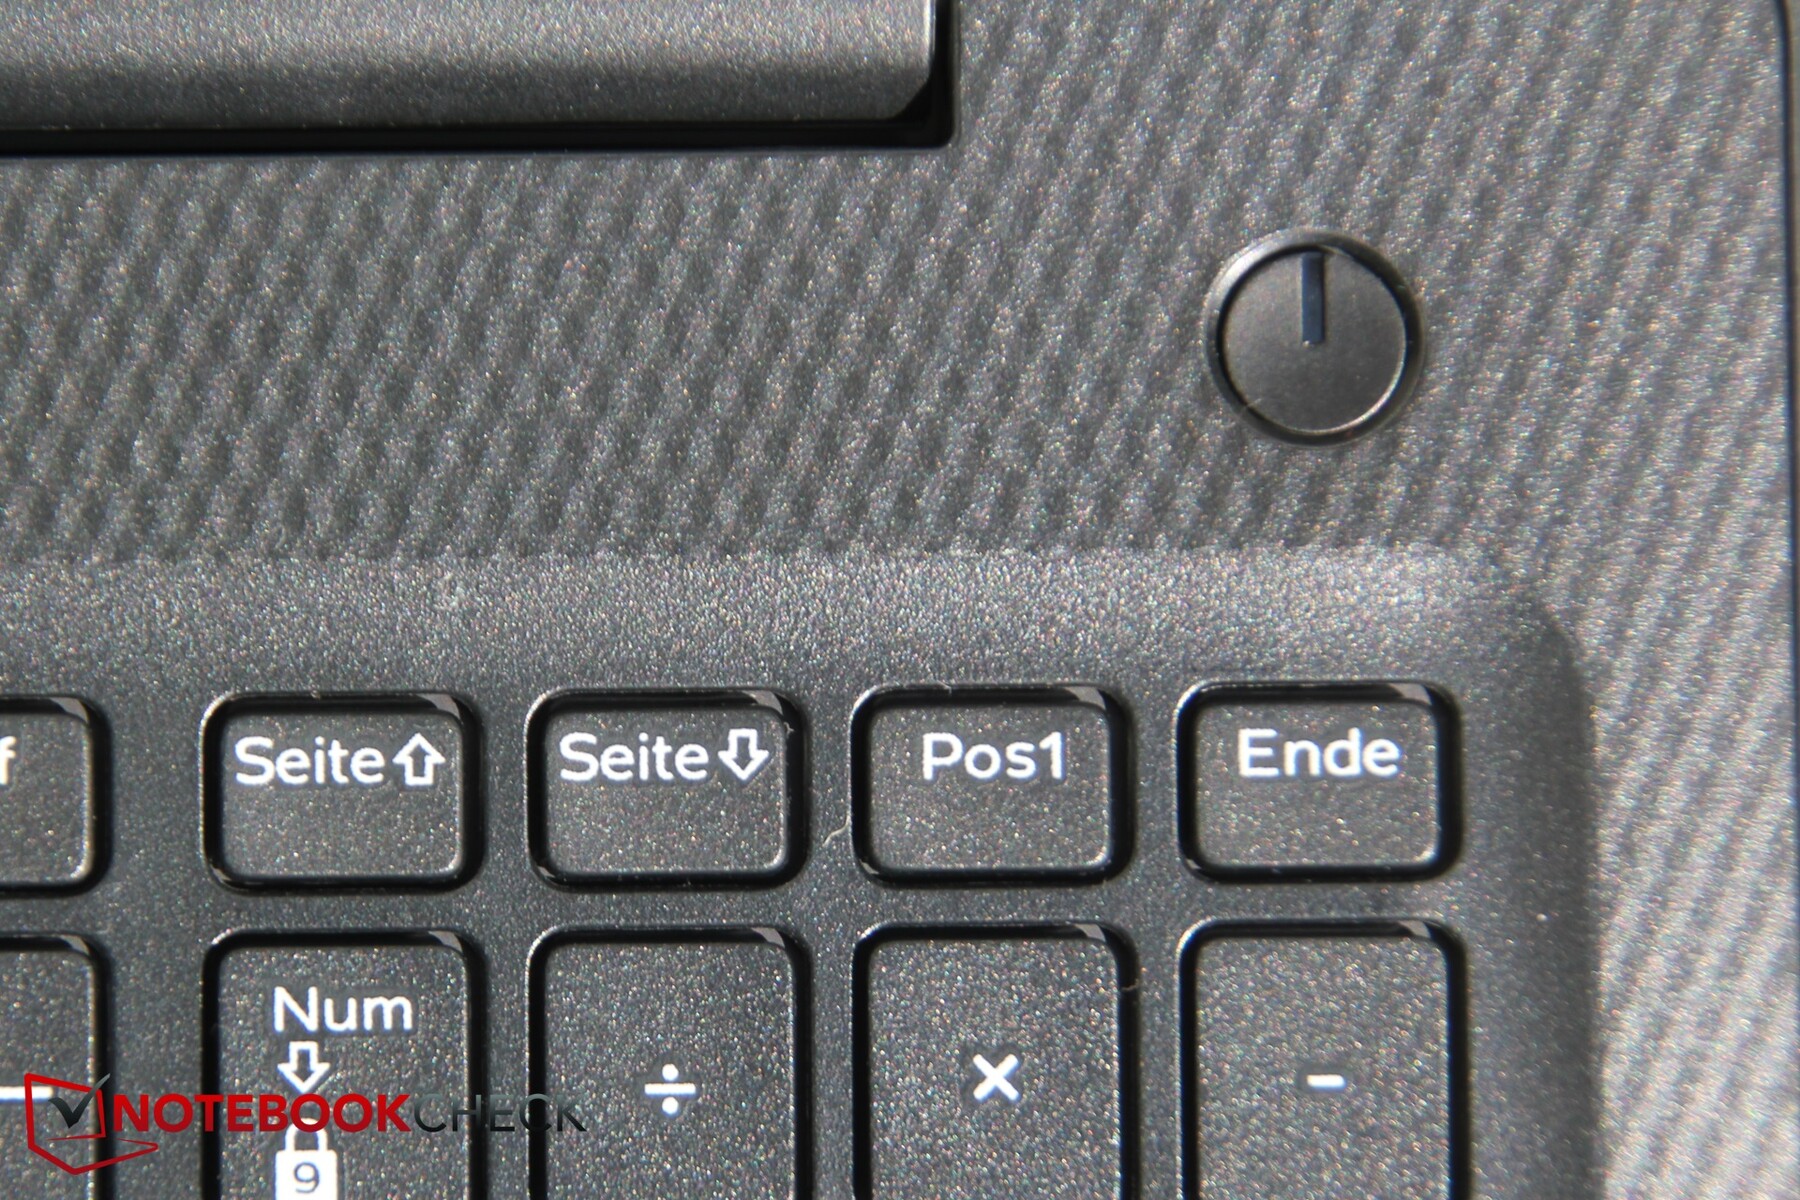
The ever so slightly recessed keyboard is uncluttered and tidy, and it includes a numerical pad on the right-hand side. At 14 x 14 mm the keys themselves are comparatively small and the arrow keys are only half-sized, but spacing was very decent at 3 mm.
The accentuation point was very spongy and weak, and the keys lacked precision and firmness. Key travel was comparatively short. Typing was decent, but the keys lacked distinct feedback. At least keyboard clatter was fairly low and overall very quiet.
While the labels on the individual keys were easy to read the keyboard lacks a backlight. Considering that the only competitor in our test group with a backlit keyboard was Acer’s Swift 3, the Inspiron was in good company.
The power button is separate from the main keyboard and located on the right-hand side above the keyboard itself. The round button felt rather flimsy, though.
Touchpad
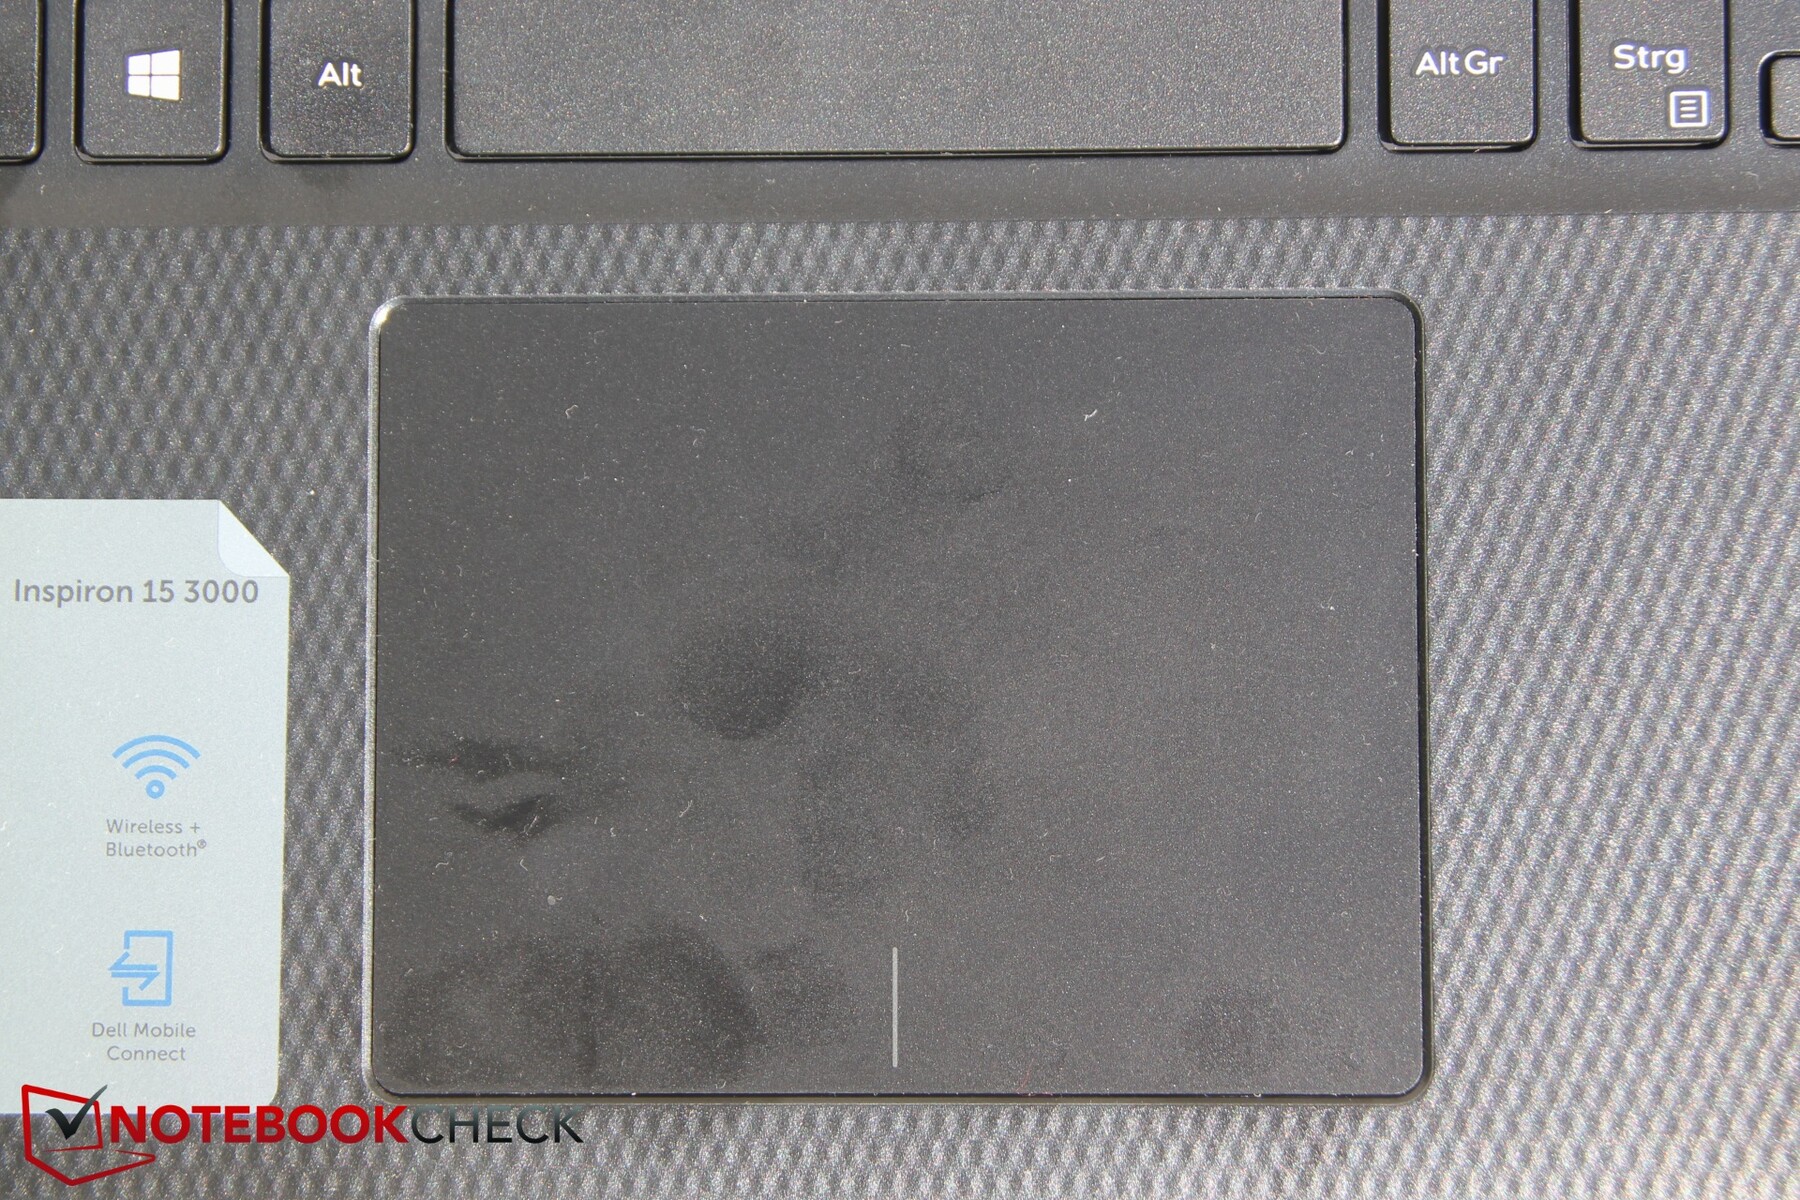
Due to the numpad, the touchpad is shifted slightly to the left. At 10.6 x 8 mm including the integrated click zones it is sufficiently sized and features a slightly roughened yet smooth surface. The mouse buttons were very loud and did not feel particularly premium or well-made.
Display

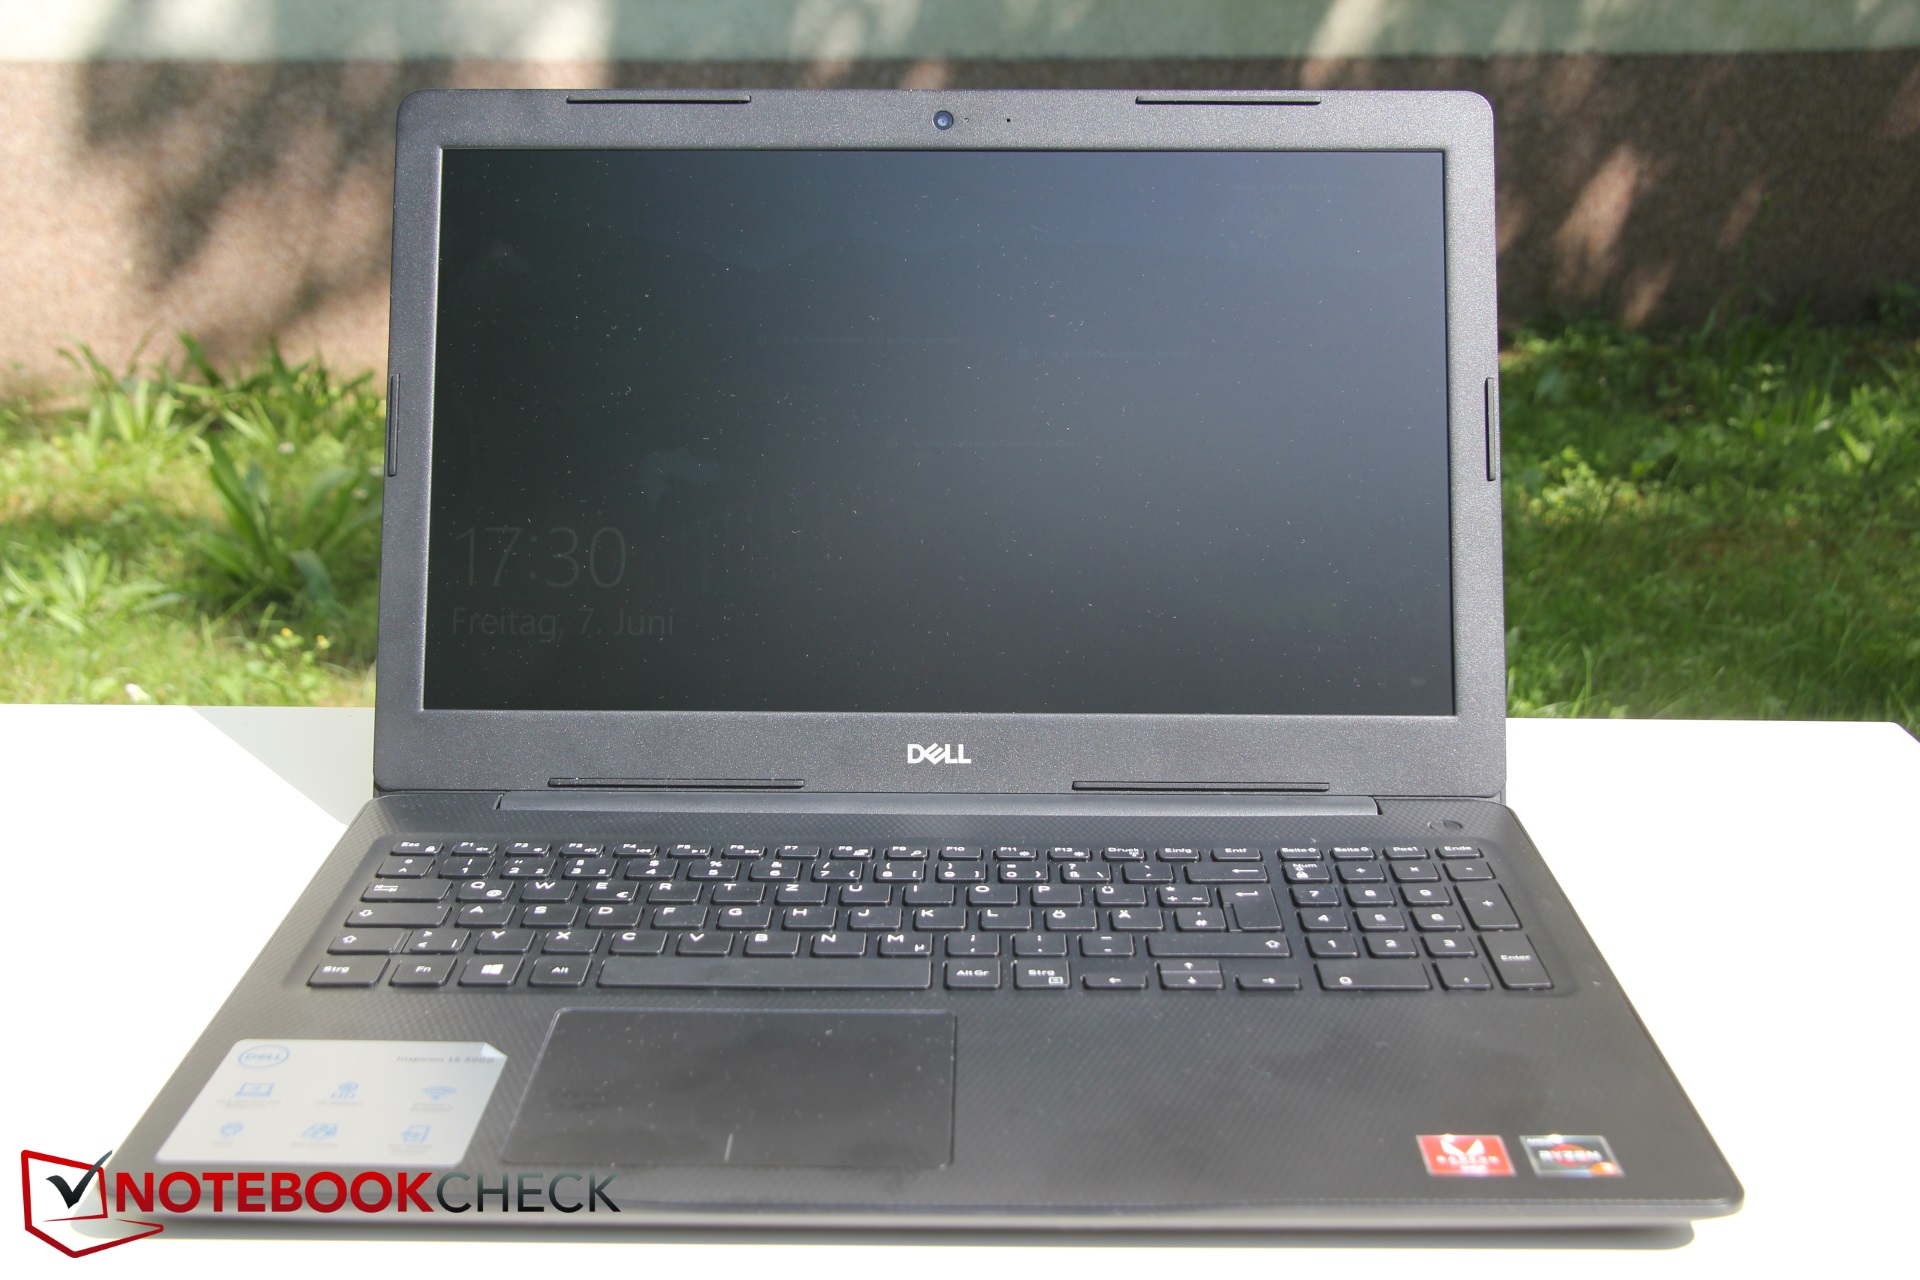
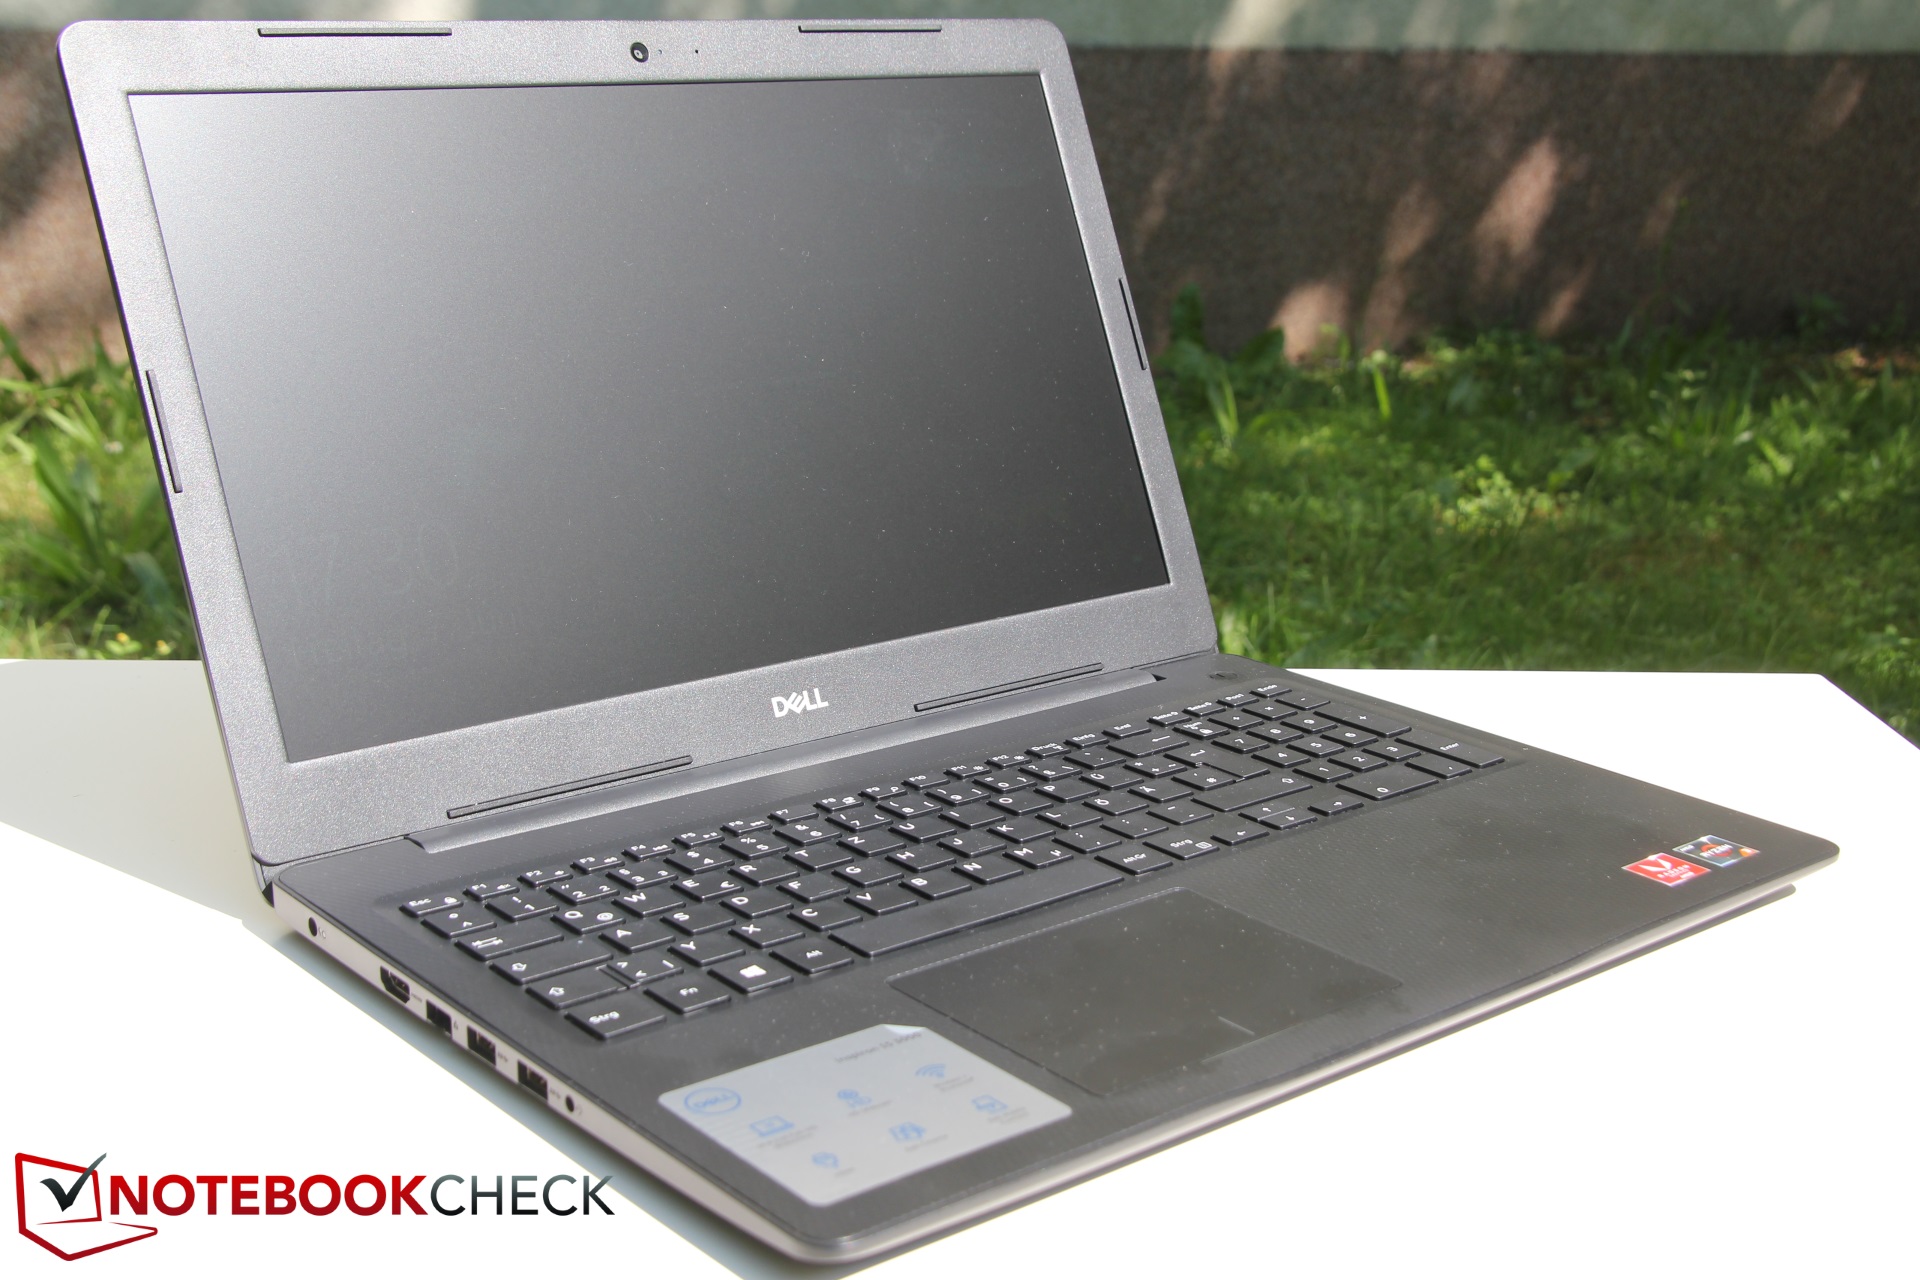
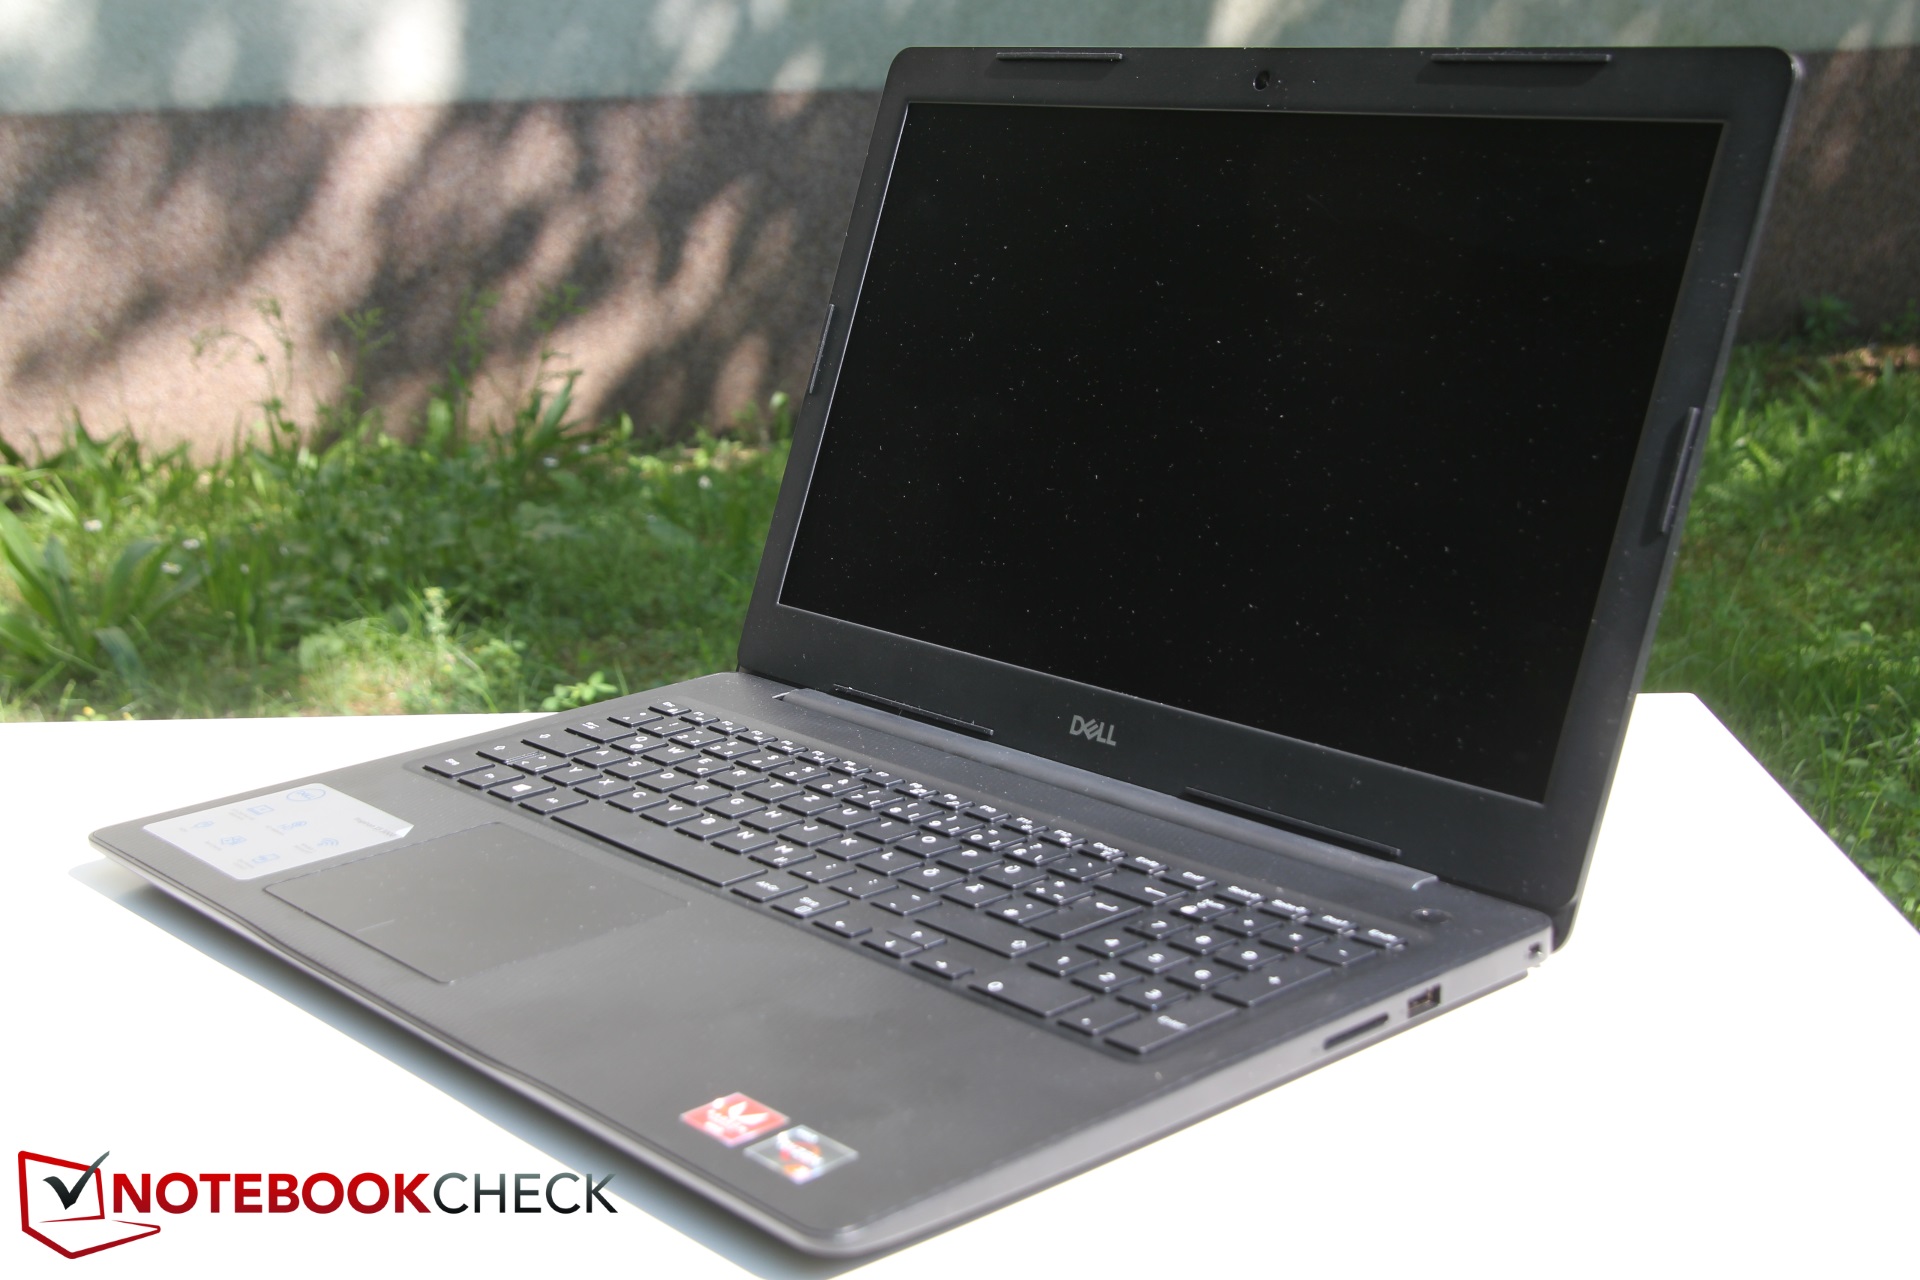
While the Swift 3 and ThinkPad feature IPS displays both Inspirons (15 3585 & 15 5575) are equipped with dim TN displays with poor viewing angles. The Acer Aspire 3 and HP 250 did not do any better in this regard either. The cheapest SKU even features an abysmal 1366x768 panel, and all four models currently available in the US can only be purchased with this ultra low-end display. Our review unit was equipped with a higher-resolution FHD panel.
Its average brightness of just 213 nits when connected to mains was pretty poor already and plummeted even further to just 173 nits on battery. Reducing maximum brightness to a level this low effectively renders the device unusable outdoors. At 88% at least brightness distribution was somewhat uniform.
To add insult to injury the display uses PWM at a low frequency of just 250 Hz for adjusting brightness. Even users that are not overly sensitive might suffer from eye strain caused by this display.
We found no backlight bleeding on the display but it did seem to be a bit brighter at the bottom than at the top.
| |||||||||||||||||||||||||
Brightness Distribution: 88 %
Center on Battery: 173 cd/m²
Contrast: 421:1 (Black: 0.535 cd/m²)
ΔE ColorChecker Calman: 10.37 | ∀{0.5-29.43 Ø4.73}
calibrated: 3.89
ΔE Greyscale Calman: 12.09 | ∀{0.09-98 Ø4.97}
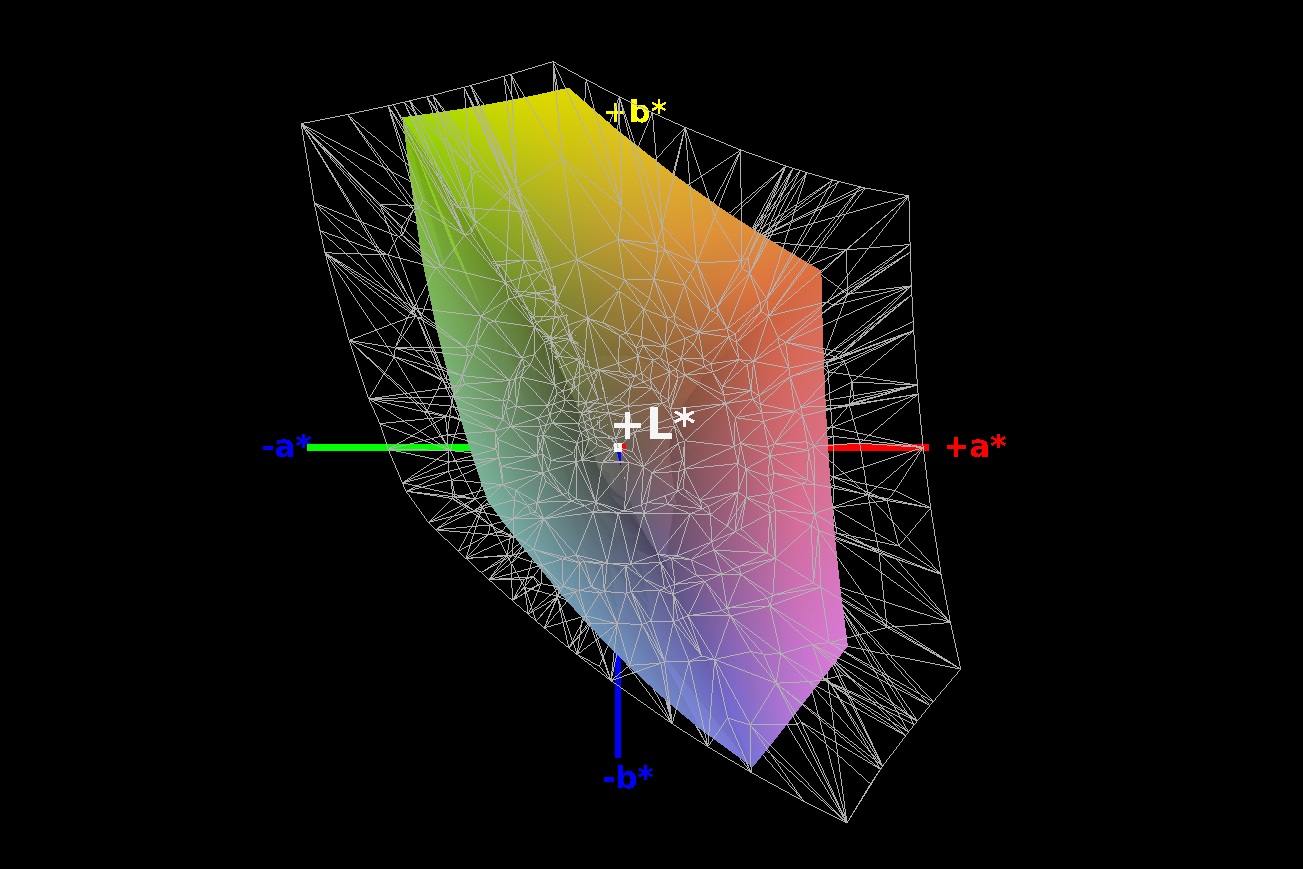
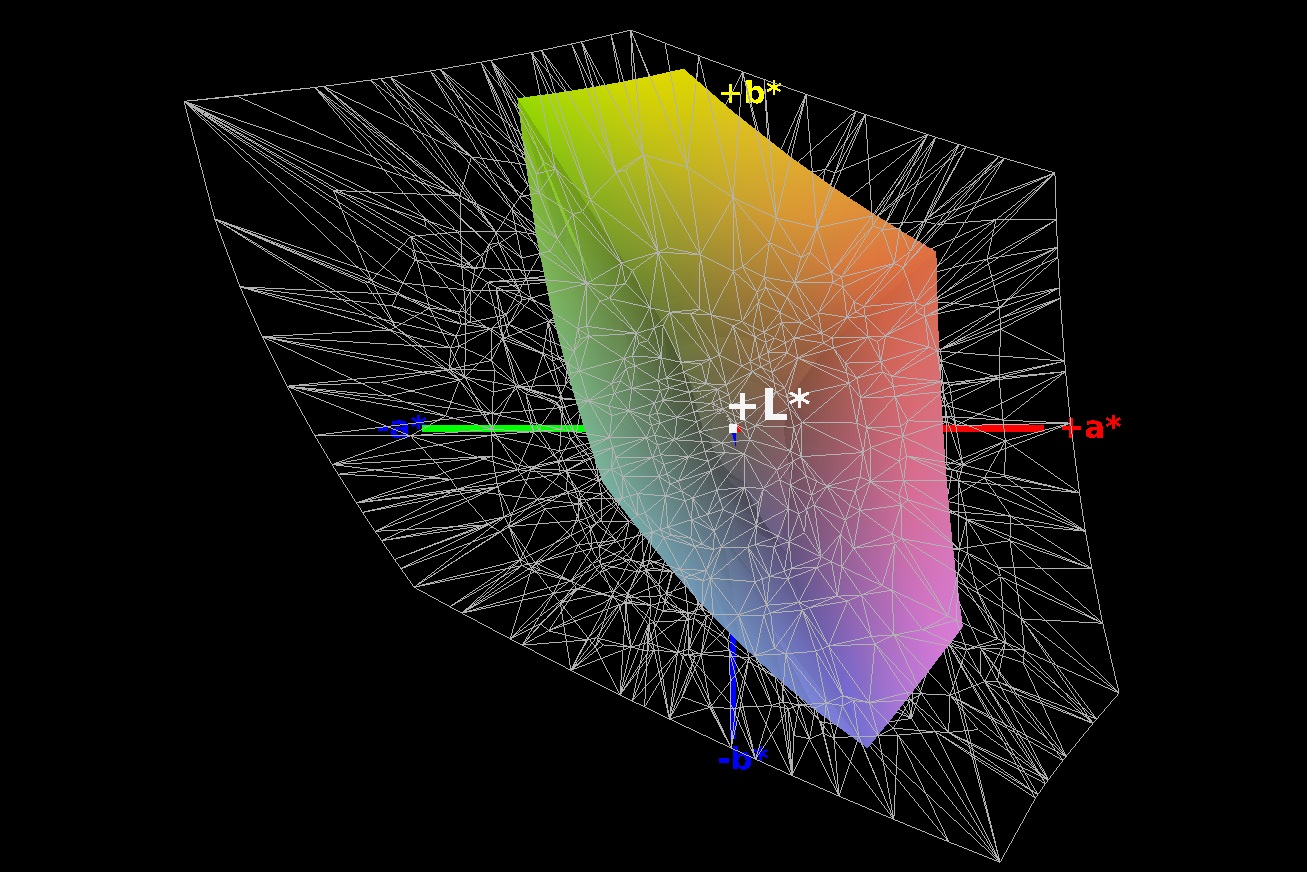
59% sRGB (Argyll 1.6.3 3D)
37% AdobeRGB 1998 (Argyll 1.6.3 3D)
40.52% AdobeRGB 1998 (Argyll 3D)
58.9% sRGB (Argyll 3D)
39.22% Display P3 (Argyll 3D)
Gamma: 2.72
CCT: 13335 K
| Dell Inspiron 15 3585 (2300U, Vega 6) BOE0802, , 1920x1080, 15.6" | Dell Inspiron 15 5575-98MH4 Innolux JMC9X 156BGA, , 1366x768, 15.6" | Lenovo ThinkPad E485-20KU000NGE B140HAN04.2, , 1920x1080, 14" | HP 250 G7 6HM85ES BOE0687, , 1920x1080, 15.6" | Acer Aspire 3 A315-41-R7BM Chi Mei CMN15D5, , 1920x1080, 15.6" | Acer Swift 3 SF314-55-31N8 Chi Mei N140HCE-EN2, , 1920x1080, 14" | |
|---|---|---|---|---|---|---|
| Display | 2% | -1% | 1% | 2% | 68% | |
| Display P3 Coverage (%) | 39.22 | 40.02 2% | 39.21 0% 38.48 -2% | 39.61 1% | 40.09 2% | 66.2 69% |
| sRGB Coverage (%) | 58.9 | 59.8 2% | 58.8 0% 57.9 -2% | 59.5 1% | 59.7 1% | 98.3 67% |
| AdobeRGB 1998 Coverage (%) | 40.52 | 41.37 2% | 40.52 0% 39.76 -2% | 40.93 1% | 41.47 2% | 67.8 67% |
| Response Times | -64% | -98% | -3% | -15% | -78% | |
| Response Time Grey 50% / Grey 80% * (ms) | 39 ? | 50 ? -28% | 44.8 ? -15% | 41 ? -5% | 44 ? -13% | 41 ? -5% |
| Response Time Black / White * (ms) | 12 ? | 24 ? -100% | 33.6 ? -180% | 12 ? -0% | 14 ? -17% | 30 ? -150% |
| PWM Frequency (Hz) | 250 ? | 250 ? | 25000 ? | 25000 ? | 25000 ? | |
| Screen | 3% | 43% | 0% | 6% | 58% | |
| Brightness middle (cd/m²) | 225 | 197 -12% | 289 28% | 205 -9% | 234 4% | 291 29% |
| Brightness (cd/m²) | 213 | 195 -8% | 271 27% | 205 -4% | 211 -1% | 276 30% |
| Brightness Distribution (%) | 88 | 78 -11% | 87 -1% | 88 0% | 83 -6% | 90 2% |
| Black Level * (cd/m²) | 0.535 | 0.43 20% | 0.19 64% | 0.52 3% | 0.43 20% | 0.27 50% |
| Contrast (:1) | 421 | 458 9% | 1521 261% | 394 -6% | 544 29% | 1078 156% |
| Colorchecker dE 2000 * | 10.37 | 10.35 -0% | 5.6 46% | 11.15 -8% | 11.27 -9% | 3.86 63% |
| Colorchecker dE 2000 max. * | 19.75 | 16.02 19% | 20.8 -5% | 19.08 3% | 18.03 9% | 8.26 58% |
| Colorchecker dE 2000 calibrated * | 3.89 | 4.7 -21% | 2.98 23% | |||
| Greyscale dE 2000 * | 12.09 | 11.25 7% | 2.7 78% | 12.62 -4% | 11.54 5% | 5.33 56% |
| Gamma | 2.72 81% | 2.08 106% | 1.96 112% | 2.38 92% | 2.09 105% | 2.25 98% |
| CCT | 13335 49% | 11592 56% | 6506 100% | 14189 46% | 11607 56% | 7426 88% |
| Color Space (Percent of AdobeRGB 1998) (%) | 37 | 38 3% | 37.2 1% | 38 3% | 38 3% | 62 68% |
| Color Space (Percent of sRGB) (%) | 59 | 60 2% | 58.5 -1% | 59 0% | 60 2% | 98 66% |
| Total Average (Program / Settings) | -20% /
-6% | -19% /
15% | -1% /
-0% | -2% /
2% | 16% /
42% |
* ... smaller is better
The rest of our measurements can also be considered a confession of failure. Black level and contrast ratio were extremely poor, color deviations were extremely high, and the covered color space was so poor it is not even worth mentioning. Given the prevalence of poor displays in entry-level devices such as this only the ThinkPad and Swift 3 did better than our review unit.
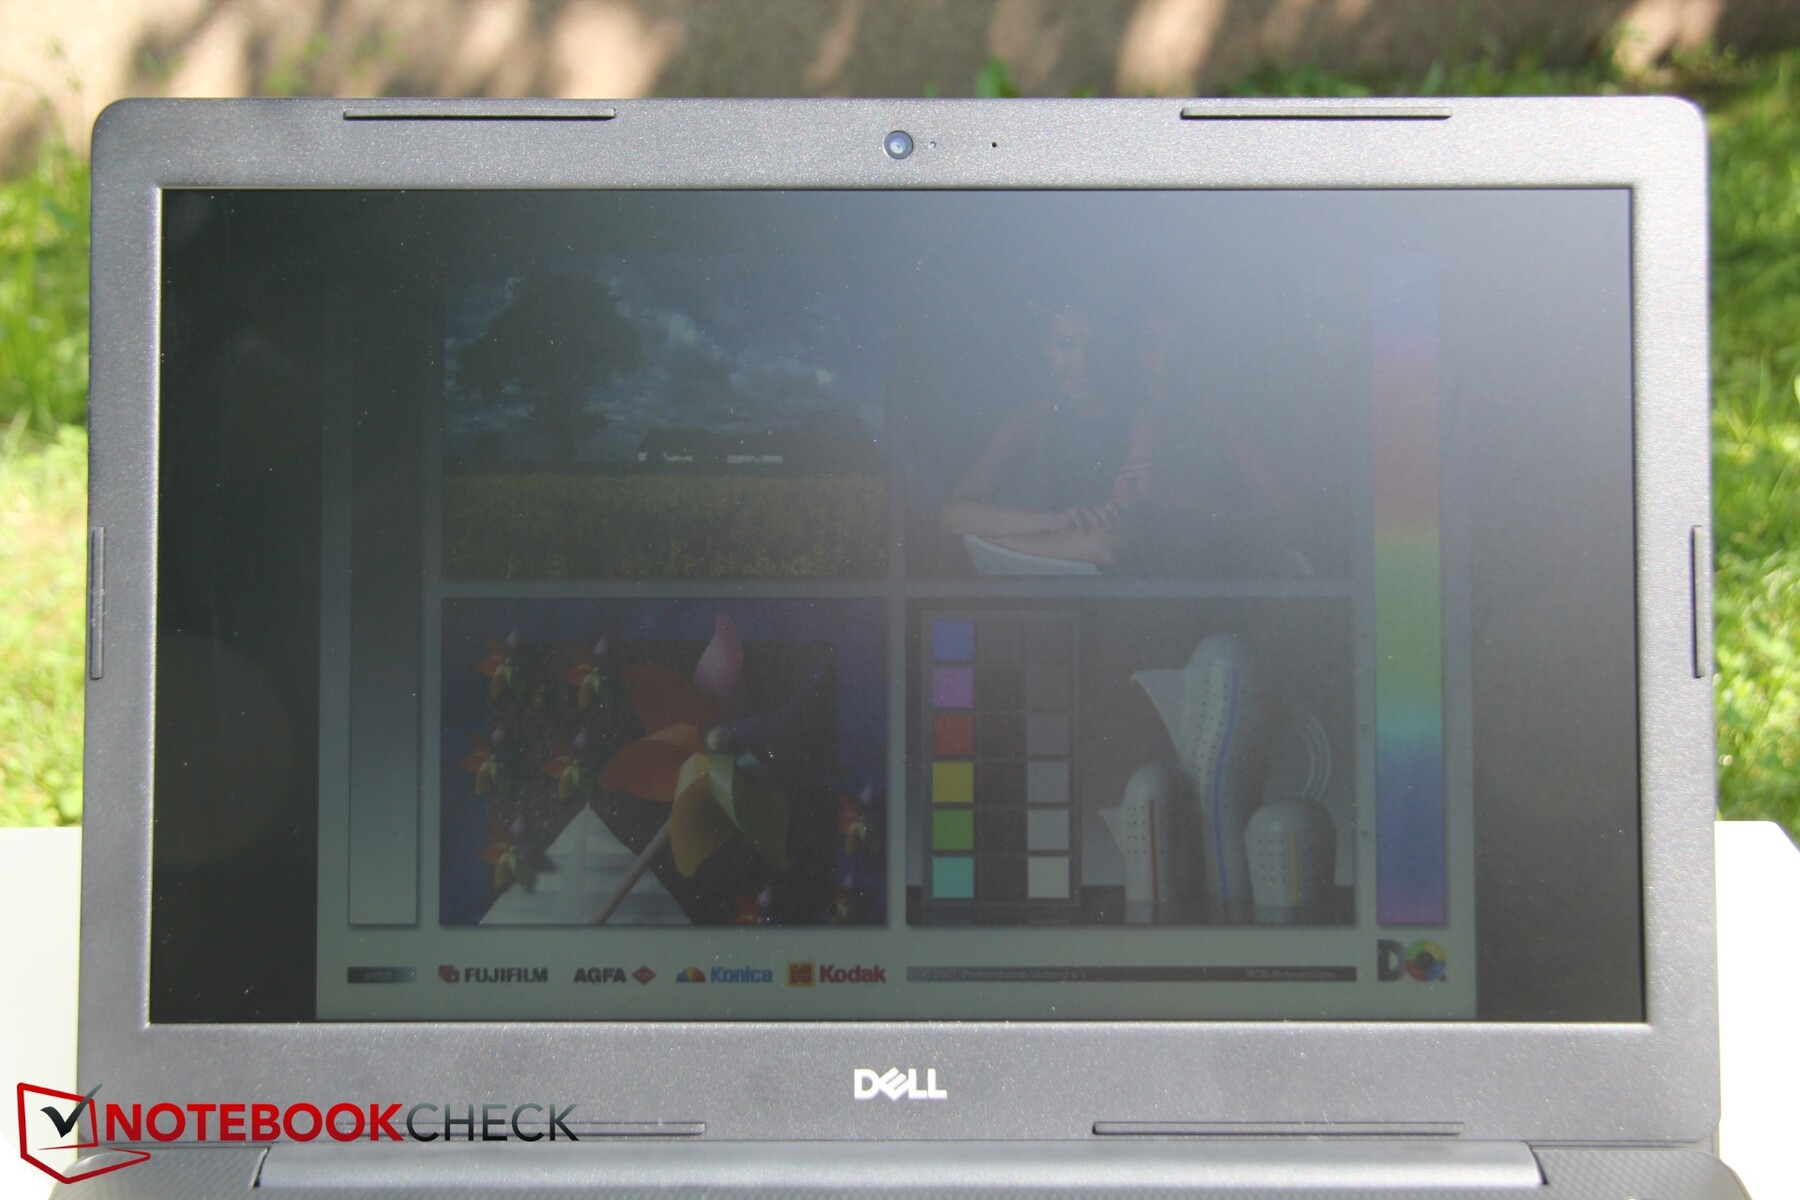
As already mentioned the Inspiron 15 3585 was practically unusable on battery outdoors due to its abysmal maximum brightness of just 174 nits on battery. The display was so dark that it was unreadable in sunlight despite its matte coating.
Display Response Times
| ↔ Response Time Black to White | ||
|---|---|---|
| 12 ms ... rise ↗ and fall ↘ combined | ↗ 7 ms rise |  |
| ↘ 5 ms fall | ||
| The screen shows good response rates in our tests, but may be too slow for competitive gamers. In comparison, all tested devices range from 0.1 (minimum) to 240 (maximum) ms. » 31 % of all devices are better. This means that the measured response time is better than the average of all tested devices (19.9 ms). | ||
| ↔ Response Time 50% Grey to 80% Grey | ||
| 39 ms ... rise ↗ and fall ↘ combined | ↗ 20 ms rise | 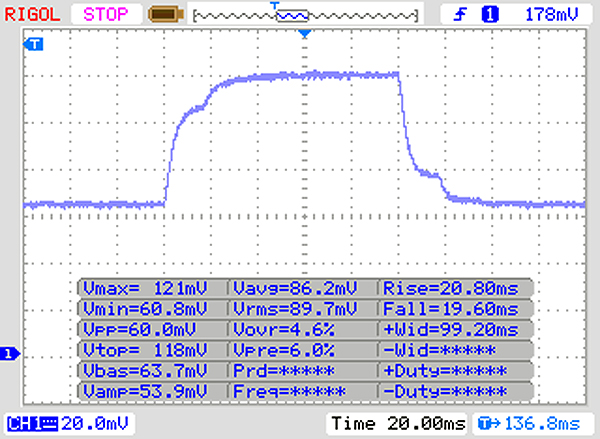 |
| ↘ 19 ms fall | ||
| The screen shows slow response rates in our tests and will be unsatisfactory for gamers. In comparison, all tested devices range from 0.165 (minimum) to 636 (maximum) ms. » 59 % of all devices are better. This means that the measured response time is worse than the average of all tested devices (31.1 ms). | ||
Screen Flickering / PWM (Pulse-Width Modulation)
| Screen flickering / PWM detected | 250 Hz | ≤ 90 % brightness setting | 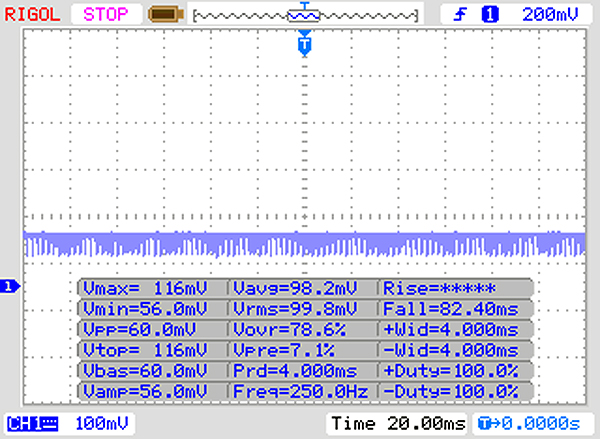 |
The display backlight flickers at 250 Hz (worst case, e.g., utilizing PWM) Flickering detected at a brightness setting of 90 % and below. There should be no flickering or PWM above this brightness setting. The frequency of 250 Hz is relatively low, so sensitive users will likely notice flickering and experience eyestrain at the stated brightness setting and below. In comparison: 52 % of all tested devices do not use PWM to dim the display. If PWM was detected, an average of 7794 (minimum: 5 - maximum: 343500) Hz was measured. | |||
Its viewing angles were also very poor. When looking at it from the top content quickly turned milky-white and colors faded rapidly. From the bottom, it turned very dark almost instantly. Things improved a bit from the sides although details and brightness suffered visibly as well.

Performance
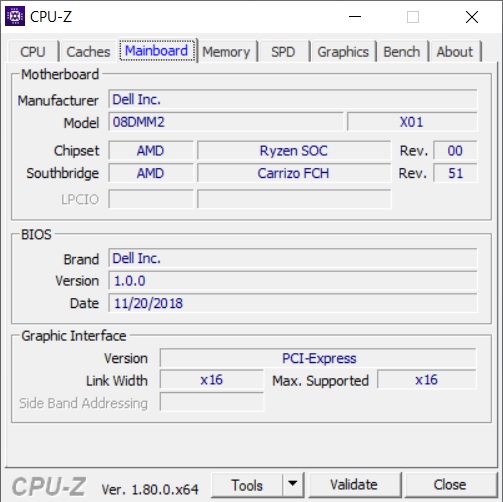
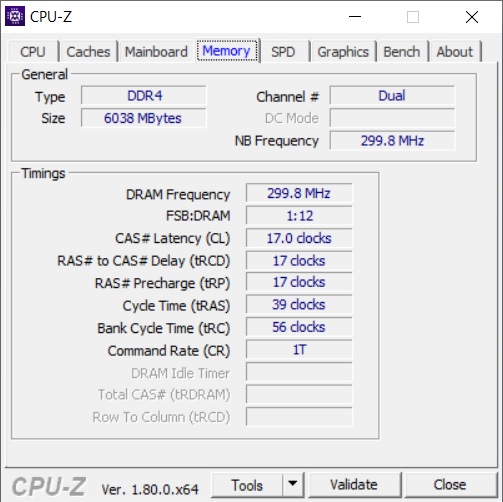
The Inspiron 15 3585 is equipped with an AMD Ryzen 3 2300U, an integrated Vega 6, 8 GB of dual-channel RAM, and a 256 GB Toshiba SSD. Dedicated GPUs are not available, and despite the fact that AMD’s Vega is more powerful than Intel’s integrated GPUs it still won’t turn this device into a gaming machine. Instead, the device is the ideal notebook for office and Internet applications. Alternatively, Dell also sells an SKU equipped with Ryzen 5 and Vega 8. However, we are very skeptical whether the Inspiron’s cooling system is capable of cooling the Ryzen 5. Dell’s Inspiron 15 3000 series can be had in many different flavors. However, not all models are available in all countries, and Dell reserves the right to sell only specific models in select countries and regions.
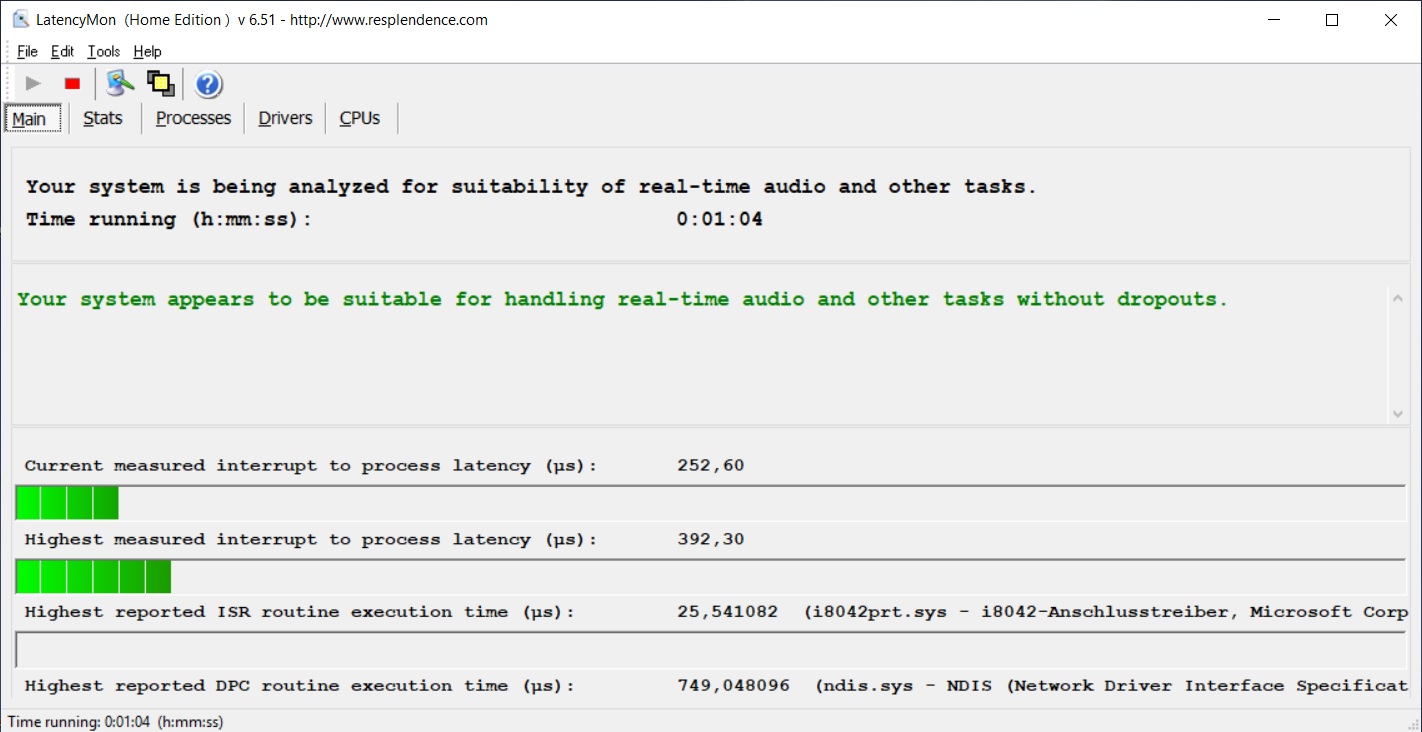
According to LatencyMon our review unit did not suffer from any driver-related latencies.
Processor
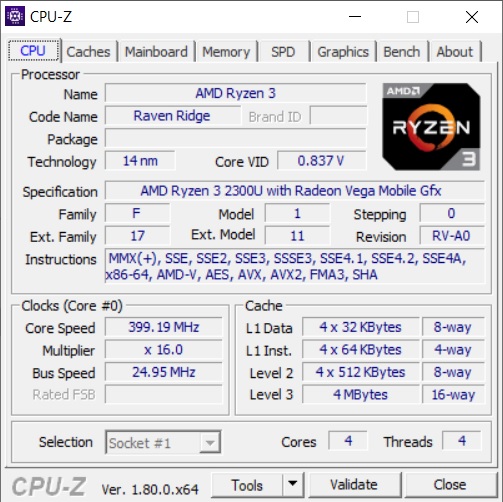
Since we have never had AMD’s Ryzen 3 2300U in review we cannot make any direct comparisons. This APU is a combination of a quad-core CPU without support for SMT running at 2 - 3.4 GHz and a Vega 6 GPU with a combined variable TDP of between 12 and 25 W. The manufacturer thus has a significant impact on the amount of throttling required.
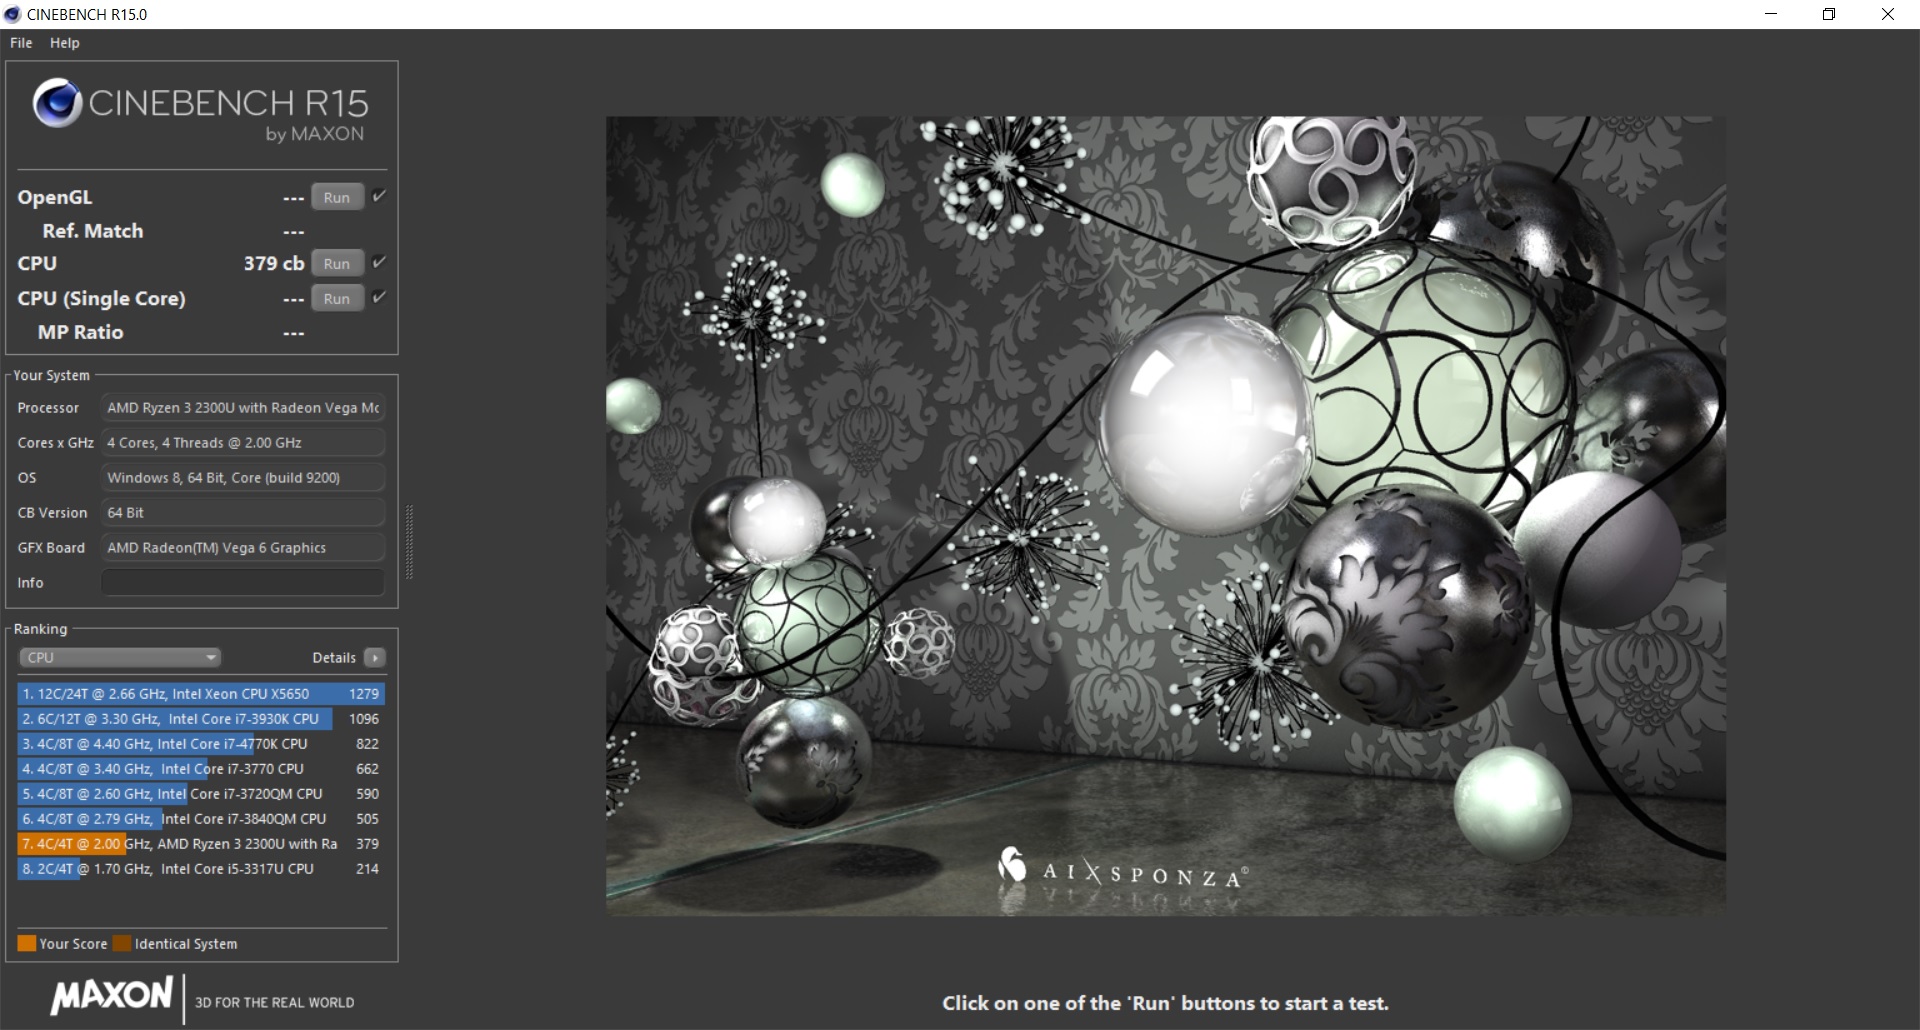
When running our CineBench R15 loop for 30 minutes we noticed a massive drop in performance after the first two iterations. Around the third rerun the score settled at about 82% of its initial level, which means performance decreased by roughly 18%. As can be seen below, this decrease is much more extreme than on all of its competitors. According to HWinfo the CPU ran at just 750 MHz in the multithread and 850 MHz in the single-thread test. This would mean that it had to throttle massively in order to keep cool, and it ran at a frequency much lower than its base clock speed.
On battery, performance was around 10% slower than when connected to mains.
Generally speaking the Ryzen 3 2300U seems to have a surprisingly poor single-thread performance - Acer’s Swift 3 equipped with an Intel Core i3-8145U was around 90% faster - yet a competitive multithread performance at the same time as it was 15% faster than the Swift 3. This came as a big surprise given that AMD’s Ryzen 3 2200U with two cores and SMT did not suffer from this low single-thread performance. We suspect that the cause for this incredibly poor single-thread performance was caused by massive throttling. Other versions of CineBench yielded similar results.
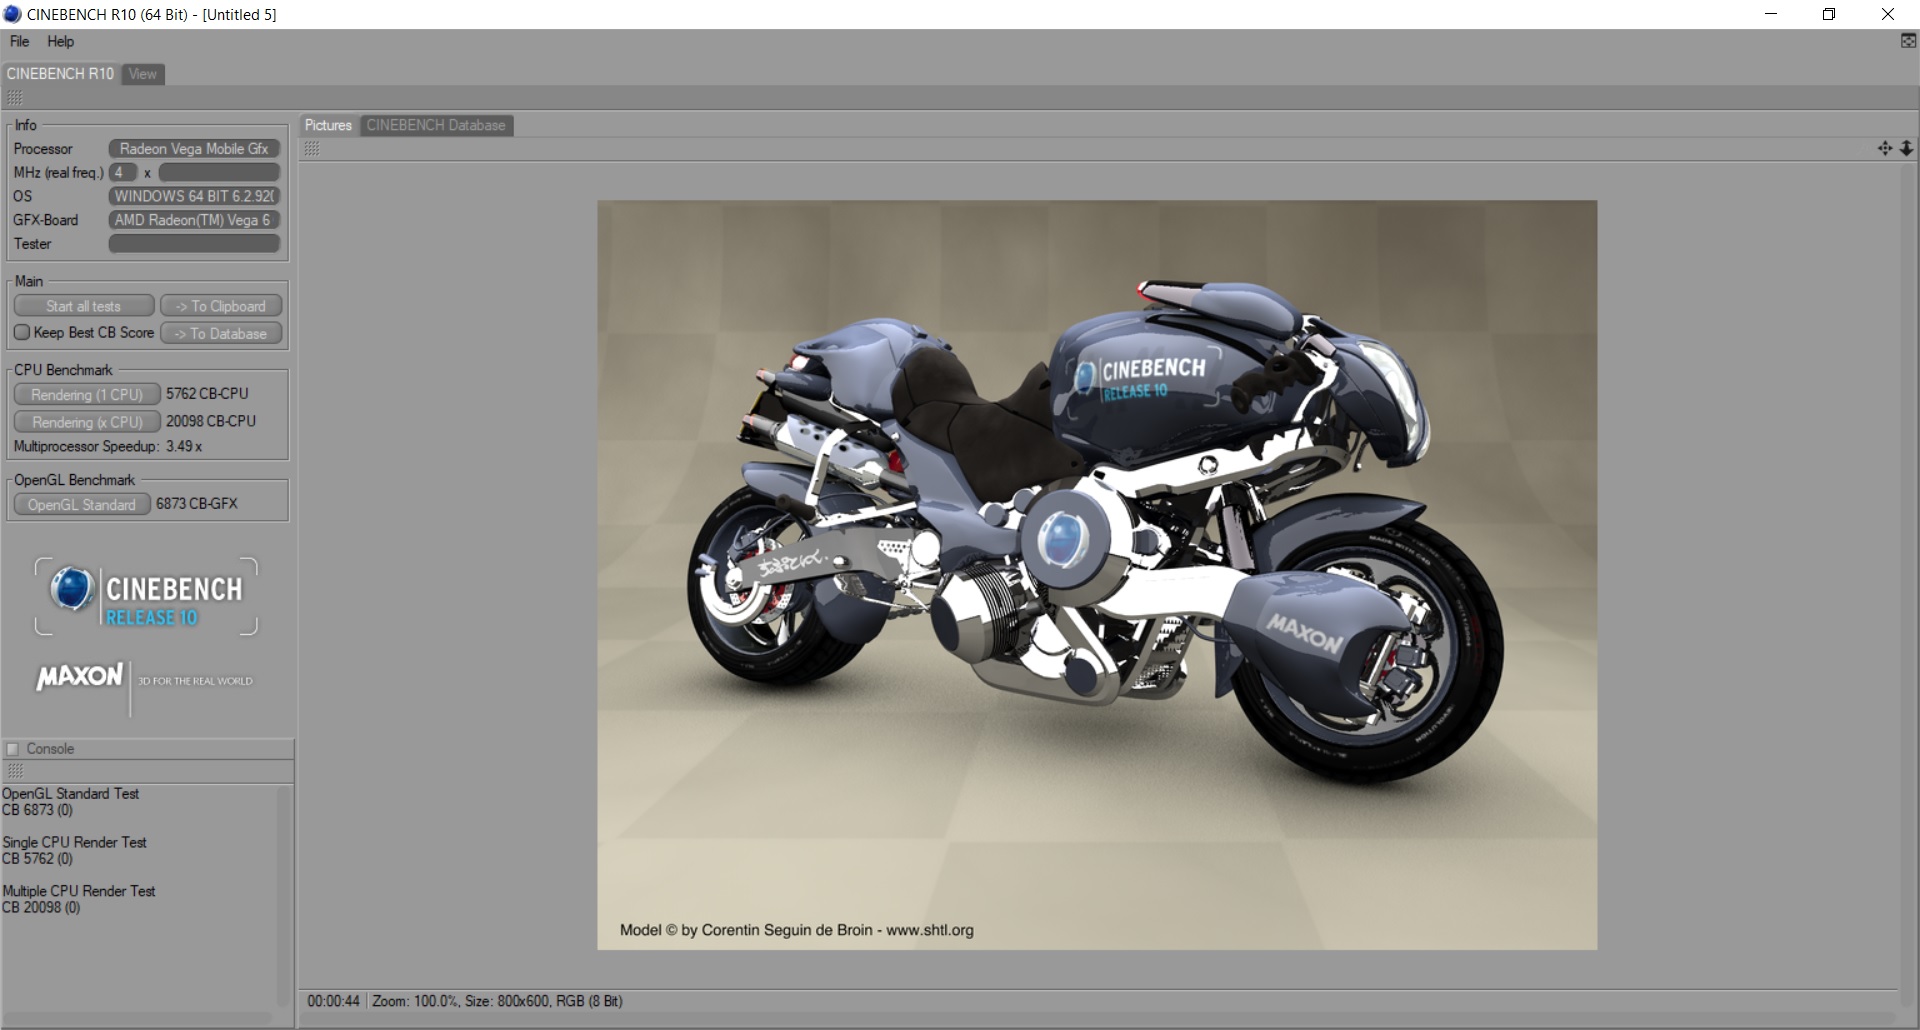
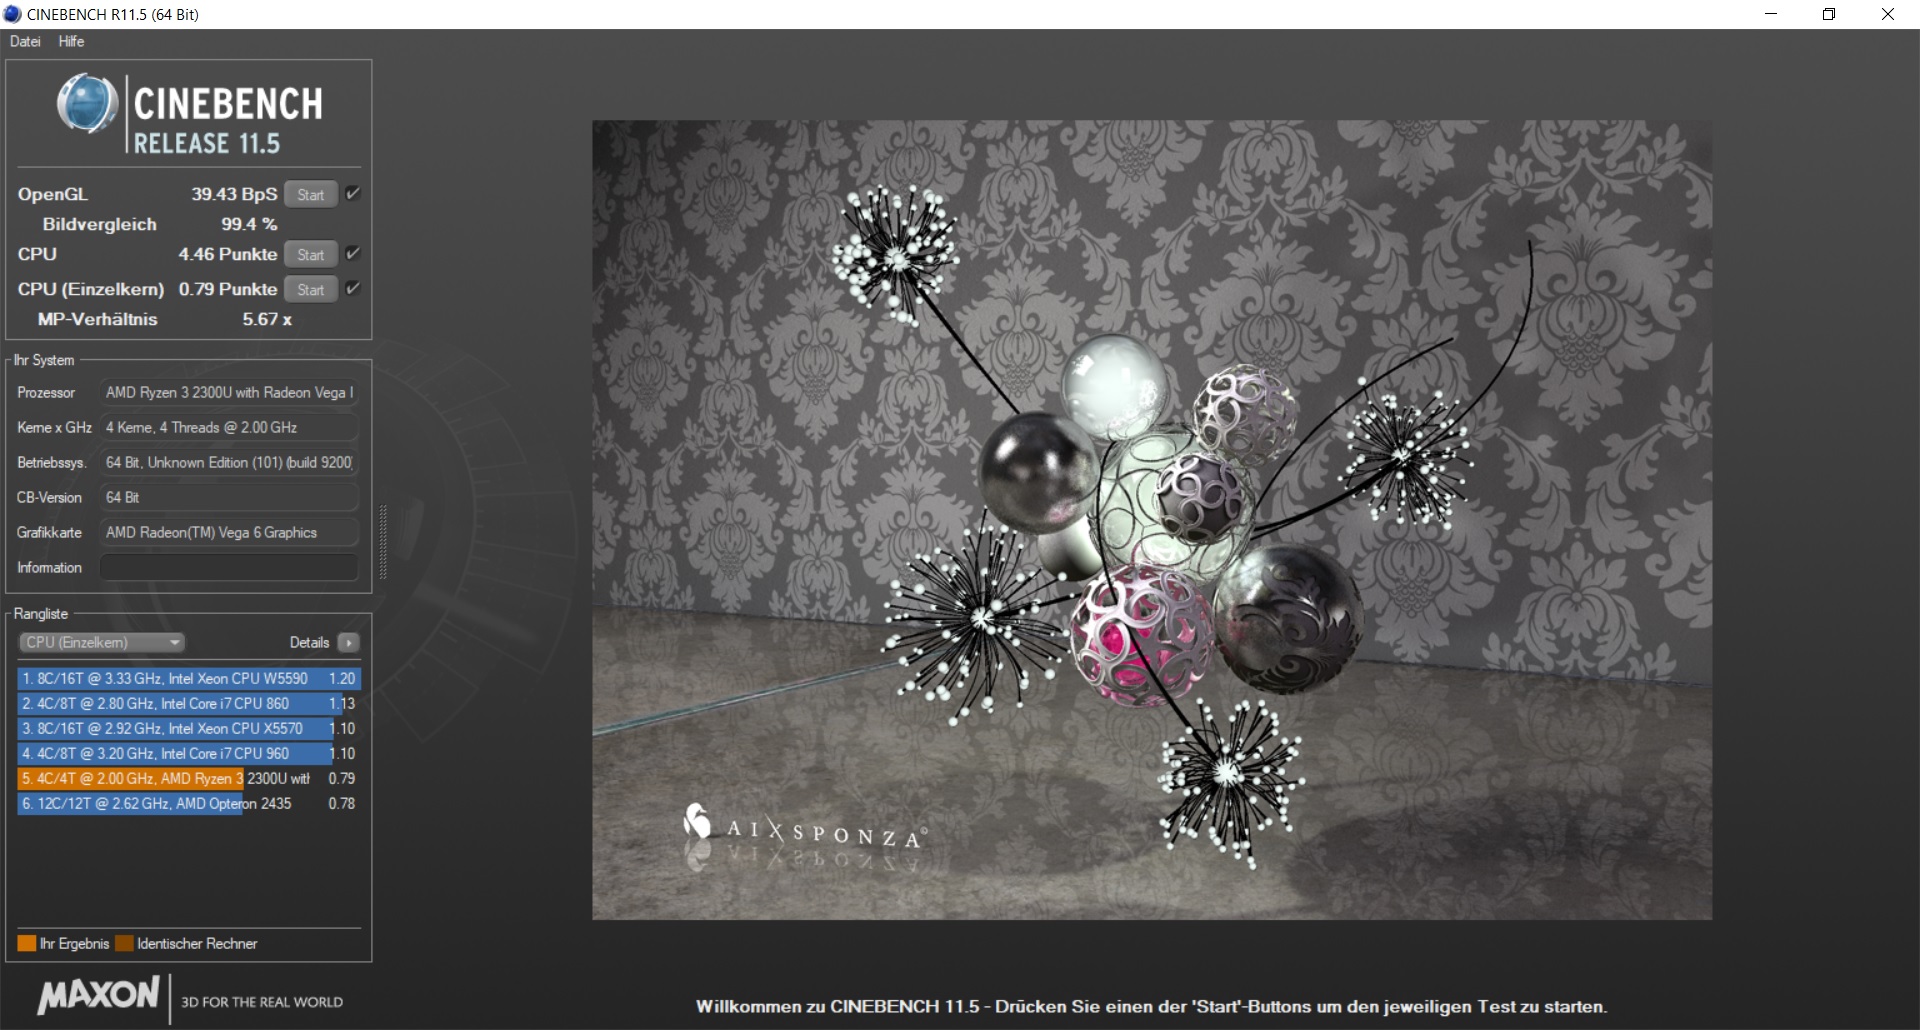

| Cinebench R10 | |
| Rendering Single CPUs 64Bit | |
| Average of class Office (11106 - 15443, n=6, last 2 years) | |
| HP 250 G7 6HM85ES | |
| Dell Inspiron 15 3585 (2300U, Vega 6) | |
| Average AMD Ryzen 3 2300U (n=1) | |
| Rendering Multiple CPUs 64Bit | |
| Average of class Office (48700 - 76704, n=6, last 2 years) | |
| Dell Inspiron 15 3585 (2300U, Vega 6) | |
| Average AMD Ryzen 3 2300U (n=1) | |
| HP 250 G7 6HM85ES | |
System Performance
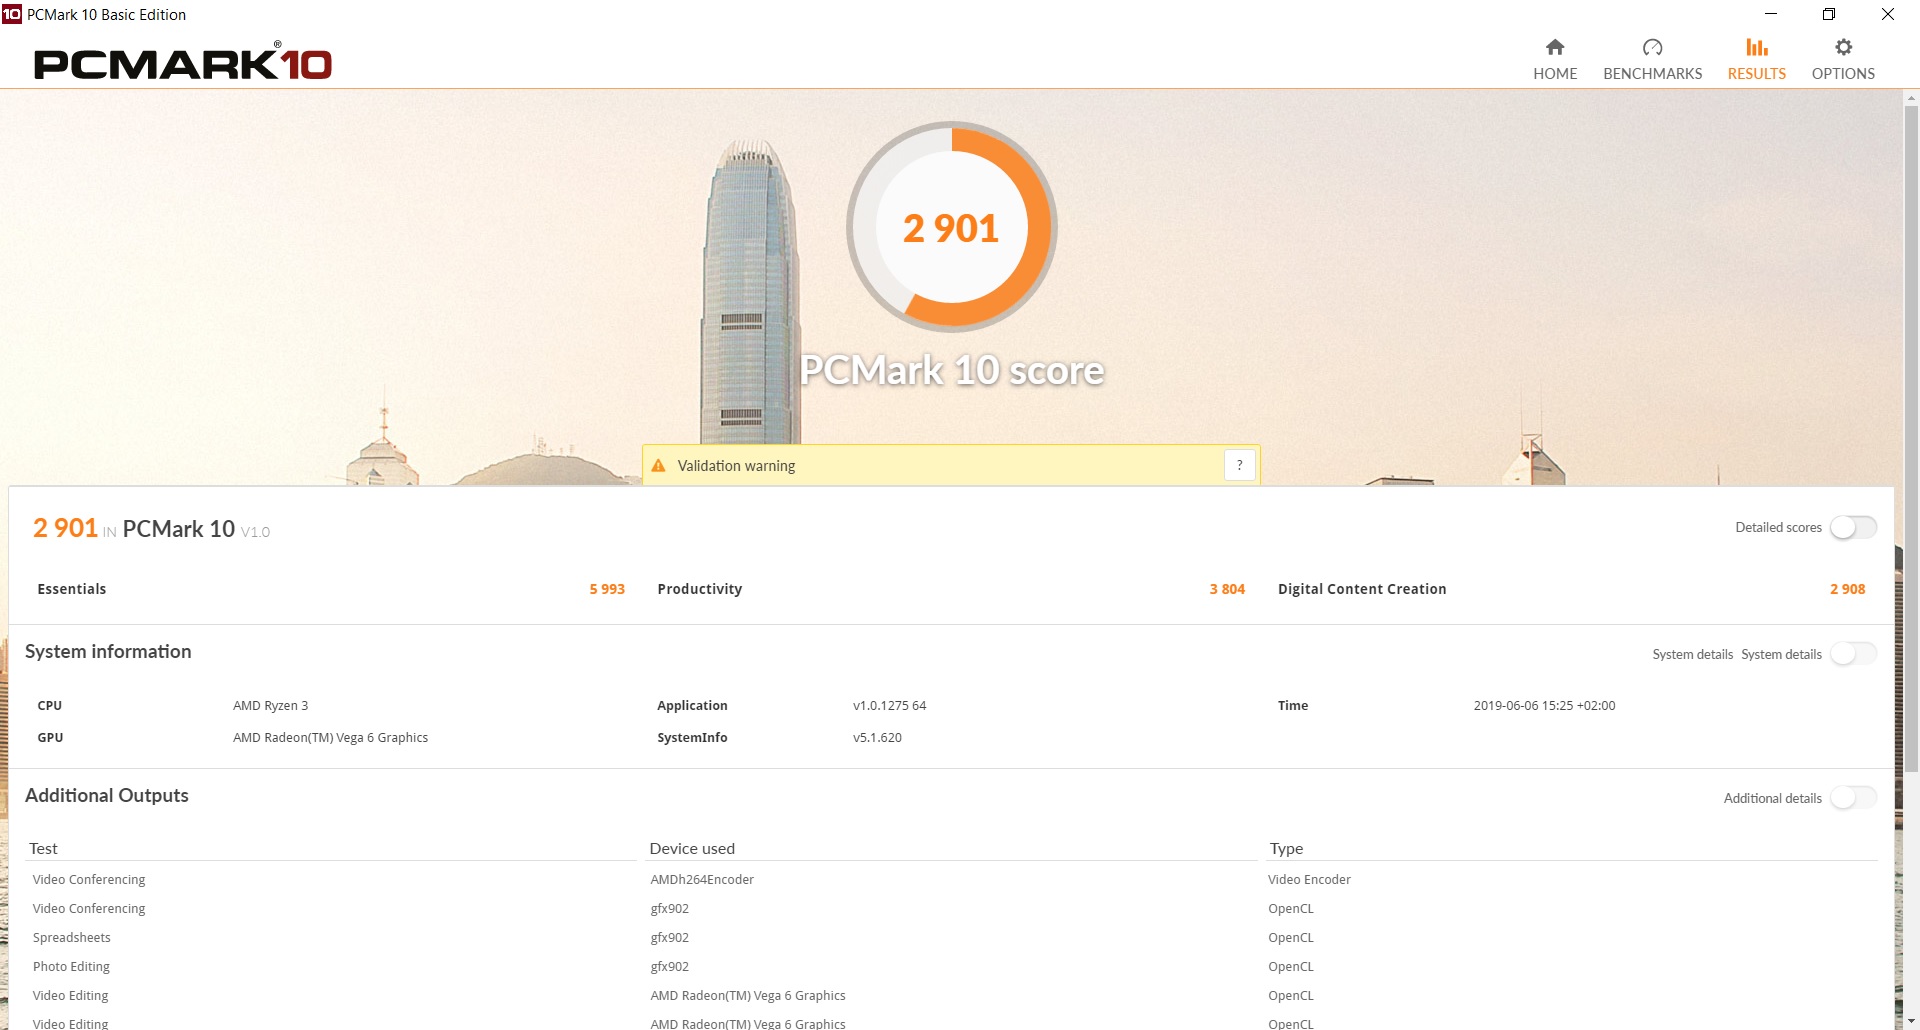
Both Inspiron notebooks scored dead last in PCMark 8 and 10, with one noteworthy exception: Our review unit landed in second place in PCMark 10’s “Digital Content Creation” test, a mere 4% behind the ThinkPad. In all other tests Acer’s Aspire equipped with a slower APU was up to 37% faster. Once again we suspect throttling to be the main culprit for this extremely poor performance.
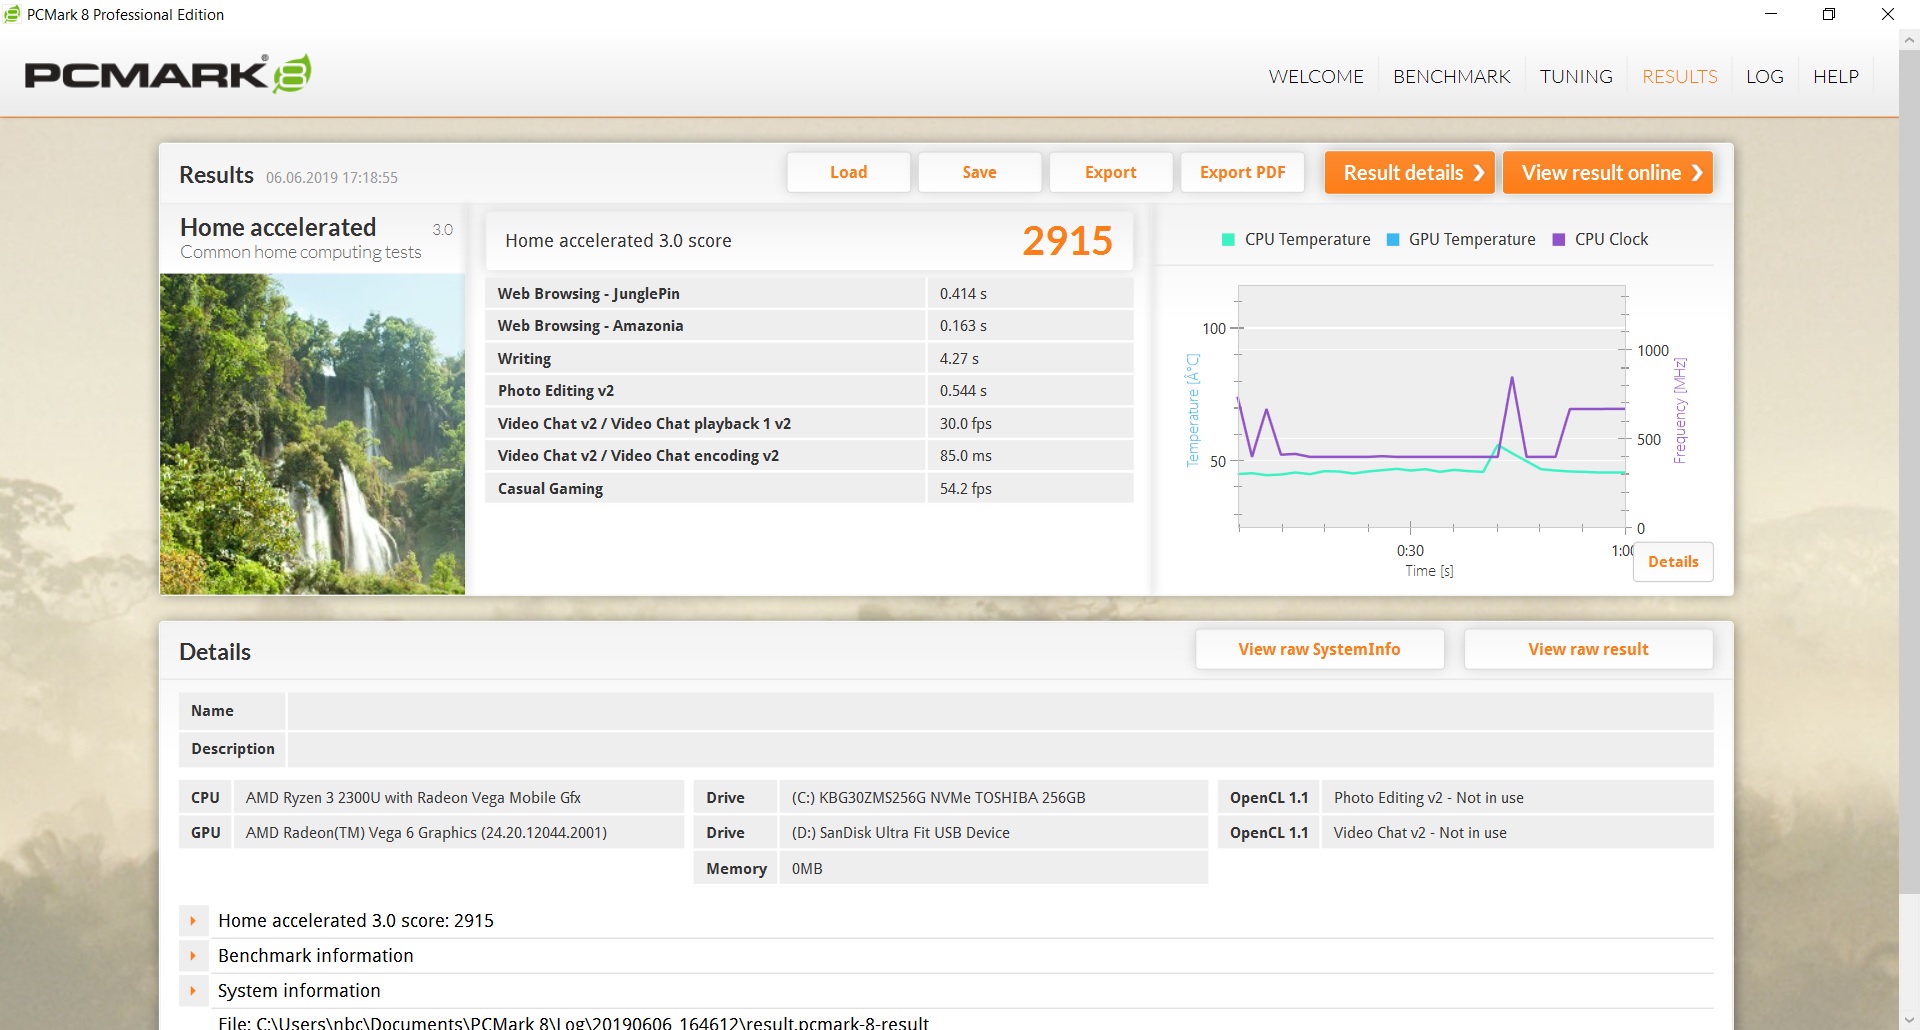
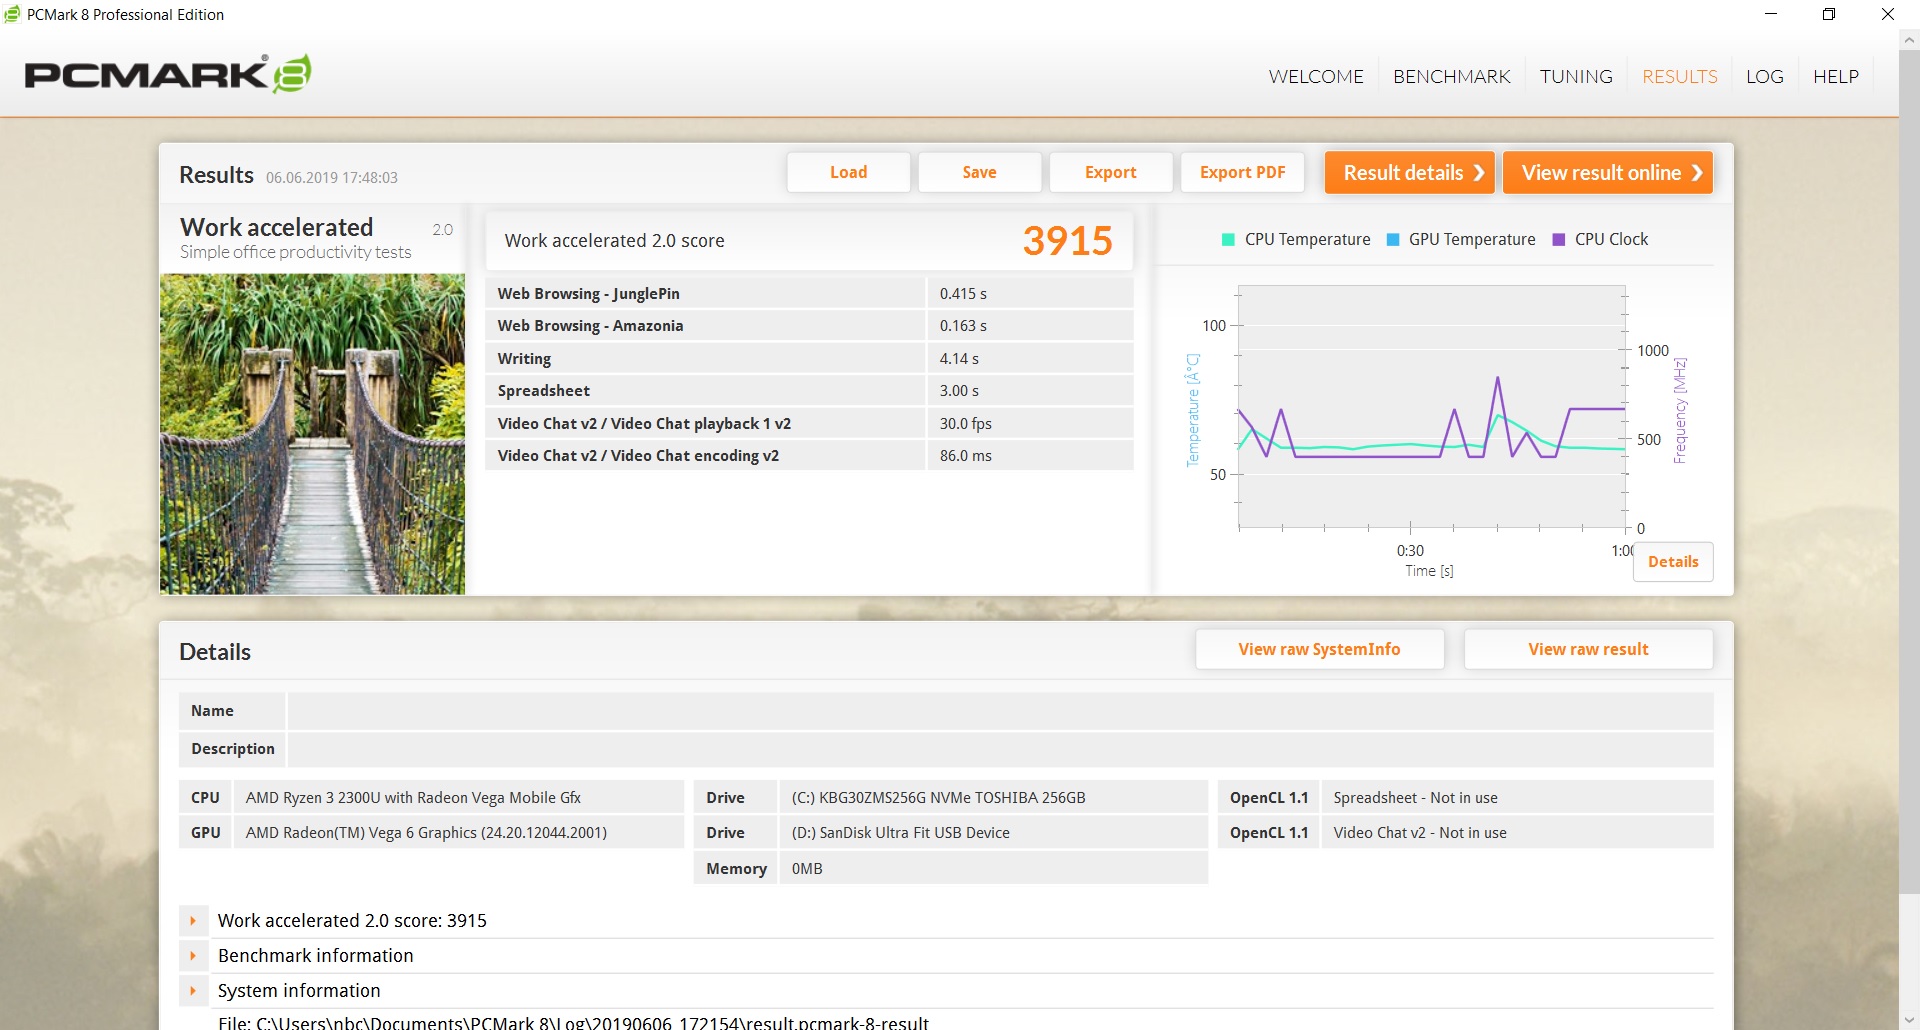
These differences were unnoticeable in everyday use, though, at least when browsing the web or using office and other productivity applications. Subjectively, the device felt snappy and smooth.
| PCMark 8 Home Score Accelerated v2 | 2915 points | |
| PCMark 8 Work Score Accelerated v2 | 3915 points | |
| PCMark 10 Score | 2901 points | |
Help | ||
Storage Devices
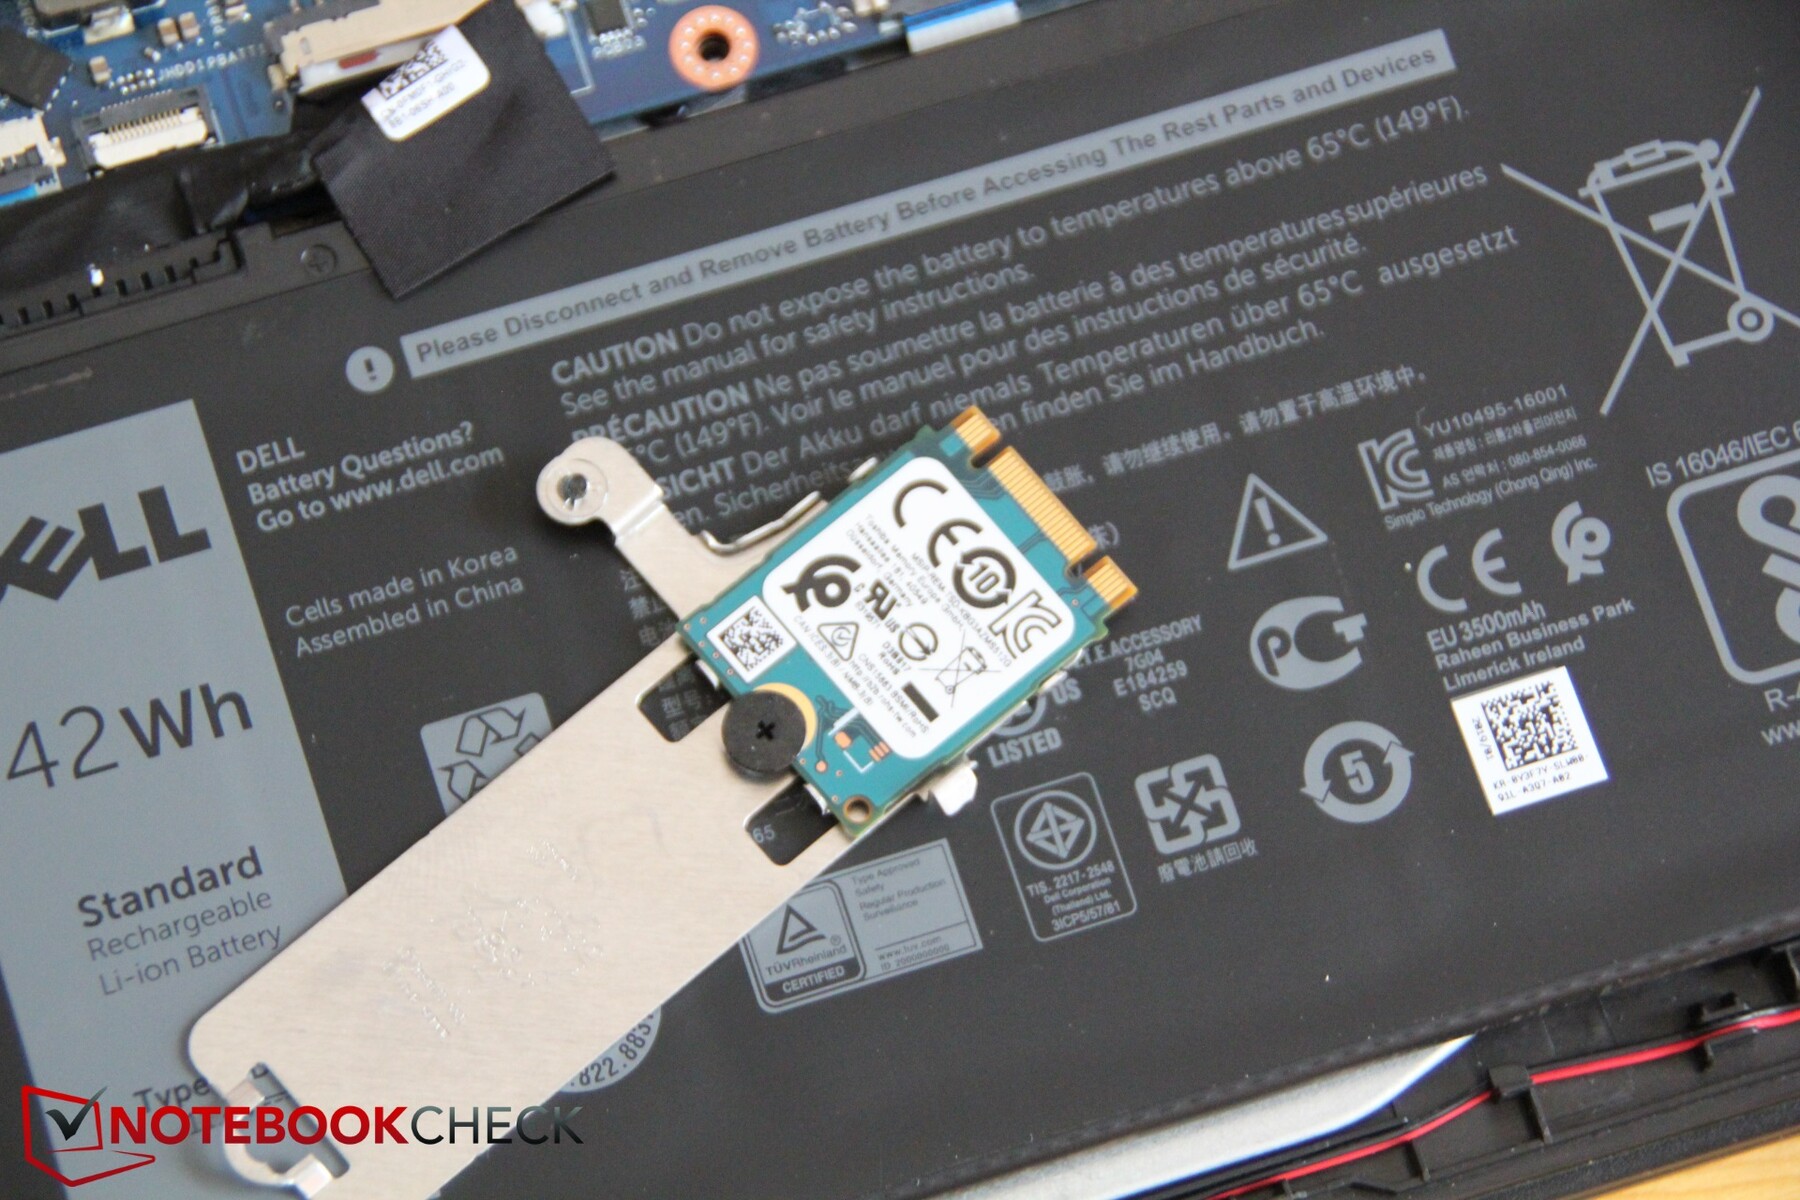
The 256 GB M.2 SSD was made by Toshiba. Out of the box around 196 GB was available to the user. This particular SSD can be found on place 288 of our HDD/SSD benchmark table and is thus only mediocre at best, which was further corroborated by the Inspiron 15 3585’s test results. It was faster than its sibling's SSD but slower than the SSDs found in the ThinkPad, HP, or Swift 3.
| Dell Inspiron 15 3585 (2300U, Vega 6) Toshiba BG3 KBG30ZMS256G | Dell Inspiron 15 5575-98MH4 Seagate Mobile HDD 1TB ST1000LM035 | Lenovo ThinkPad E485-20KU000NGE Samsung PM961 MZVLW256HEHP | HP 250 G7 6HM85ES WDC PC SN520 SDAPNUW-512G | Acer Aspire 3 A315-41-R7BM SK Hynix HFS256G39TND-N210A | Acer Swift 3 SF314-55-31N8 Kingston RBUSNS8154P3128GJ | Apple MacBook 12 (Early 2016) 1.1 GHz Apple SSD AP0256 | Average Toshiba BG3 KBG30ZMS256G | |
|---|---|---|---|---|---|---|---|---|
| CrystalDiskMark 5.2 / 6 | -92% | 45% | 95% | -32% | 16% | -8% | ||
| Write 4K (MB/s) | 87.3 | 3.776 -96% | 72.2 -17% | 179.3 105% | 64.5 -26% | 96.8 11% | 80.3 ? -8% | |
| Read 4K (MB/s) | 23.54 | 0.439 -98% | 35.25 50% | 47.7 103% | 25.1 7% | 36.99 57% | 30.1 ? 28% | |
| Write Seq (MB/s) | 824 | 74.9 -91% | 1412 71% | 1265 54% | 260.2 -68% | 463.1 -44% | 338 ? -59% | |
| Read Seq (MB/s) | 715 | 136.3 -81% | 1523 113% | 1184 66% | 505 -29% | 794 11% | 863 ? 21% | |
| Write 4K Q32T1 (MB/s) | 147.8 | 4.585 -97% | 102.1 -31% | 450.6 205% | 164 11% | 291.7 97% | 155 ? 5% | |
| Read 4K Q32T1 (MB/s) | 256.1 | 1.135 -100% | 170.9 -33% | 556 117% | 200.7 -22% | 352 37% | 297 ? 16% | |
| Write Seq Q32T1 (MB/s) | 733 | 114.5 -84% | 1429 95% | 1455 98% | 258.5 -65% | 468.1 -36% | 331 ? -55% | |
| Read Seq Q32T1 (MB/s) | 1525 | 146 -90% | 3204 110% | 1717 13% | 513 -66% | 1489 -2% | 1397 ? -8% | |
| AS SSD | 74% | 145% | -30% | 23% | -1% | -4% | ||
| Seq Read (MB/s) | 1291 | 2030 57% | 1477 14% | 457.6 -65% | 1201 -7% | 1056 -18% | 1143 ? -11% | |
| Seq Write (MB/s) | 688 | 1395 103% | 1339 95% | 241.8 -65% | 434.5 -37% | 651 -5% | 297 ? -57% | |
| 4K Read (MB/s) | 21.87 | 38.63 77% | 46.26 112% | 22.24 2% | 40.9 87% | 16.4 -25% | 27 ? 23% | |
| 4K Write (MB/s) | 35.62 | 63.9 79% | 143.9 304% | 40.46 14% | 90 153% | 22.1 -38% | 61.9 ? 74% | |
| 4K-64 Read (MB/s) | 632 | 1035 64% | 937 48% | 187.9 -70% | 425.5 -33% | 509 -19% | 390 ? -38% | |
| 4K-64 Write (MB/s) | 221.2 | 371.5 68% | 1190 438% | 145 -34% | 390.9 77% | 283 28% | 153.5 ? -31% | |
| Access Time Read * (ms) | 0.33 | 0.054 84% | 0.046 86% | 0.136 59% | 0.184 44% | 0.186 44% | 0.2922 ? 11% | |
| Access Time Write * (ms) | 0.234 | 0.059 75% | 0.024 90% | 0.225 4% | 0.048 79% | 0.2796 ? -19% | ||
| Score Read (Points) | 783 | 1277 63% | 1131 44% | 256 -67% | 586 -25% | 531 ? -32% | ||
| Score Write (Points) | 326 | 575 76% | 1468 350% | 210 -36% | 524 61% | 245 ? -25% | ||
| Score Total (Points) | 1489 | 2478 66% | 3181 114% | 594 -60% | 1386 -7% | 1014 ? -32% | ||
| Copy ISO MB/s (MB/s) | 432.6 | 765 77% | 199.8 -54% | 310.1 -28% | 545 26% | 457 ? 6% | ||
| Copy Program MB/s (MB/s) | 95.6 | 239.9 151% | 94 -2% | 88.4 -8% | 175.9 ? 84% | |||
| Copy Game MB/s (MB/s) | 263.4 | 528 100% | 145.4 -45% | 166.4 -37% | 239 ? -9% | |||
| Total Average (Program / Settings) | -92% /
-92% | 60% /
62% | 120% /
127% | -31% /
-31% | 20% /
20% | -1% /
-1% | -6% /
-5% |
* ... smaller is better

GPU Performance
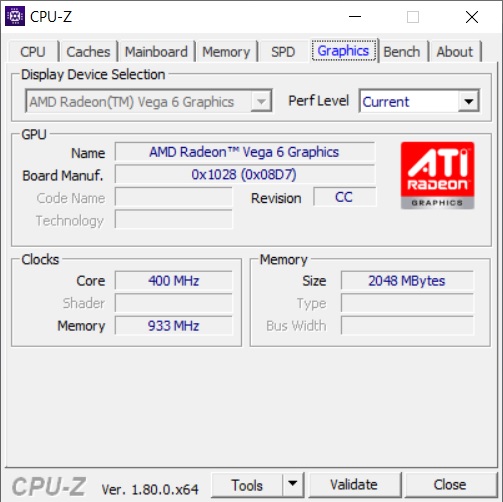
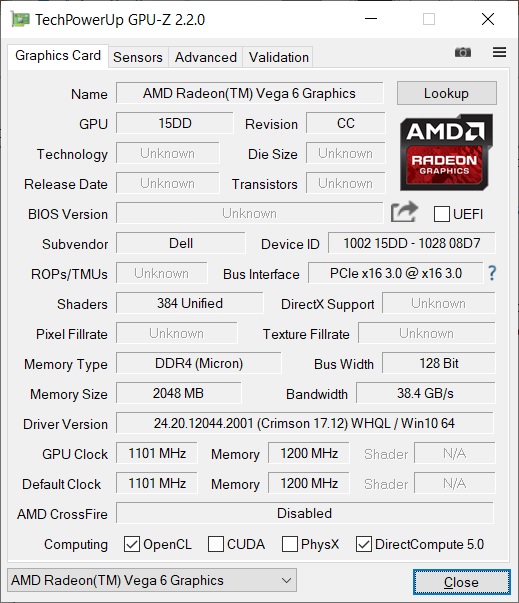
All things graphics are handled by AMD’s integrated Vega 6 GPU, which is overall comparable to Intel’s UHD Graphics 630. Gaming is not one of its strengths but certainly possible if you limit yourself to less-demanding games.
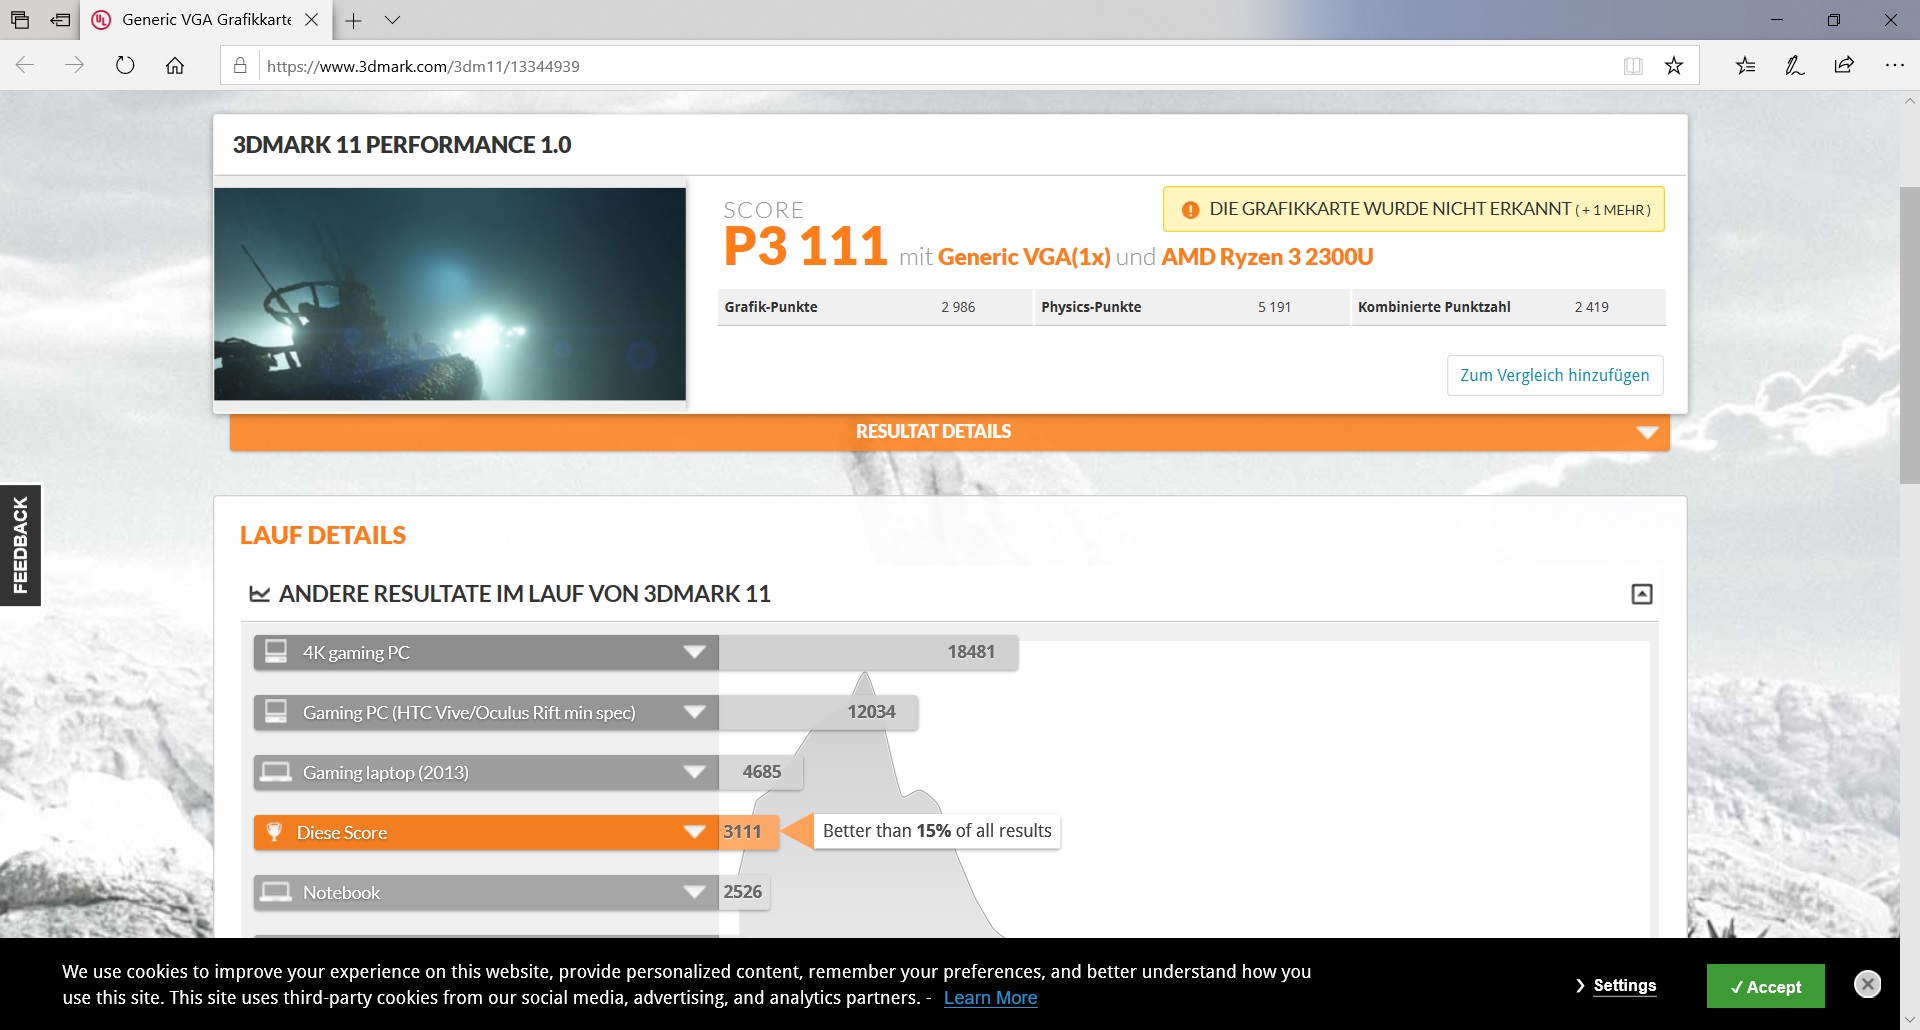
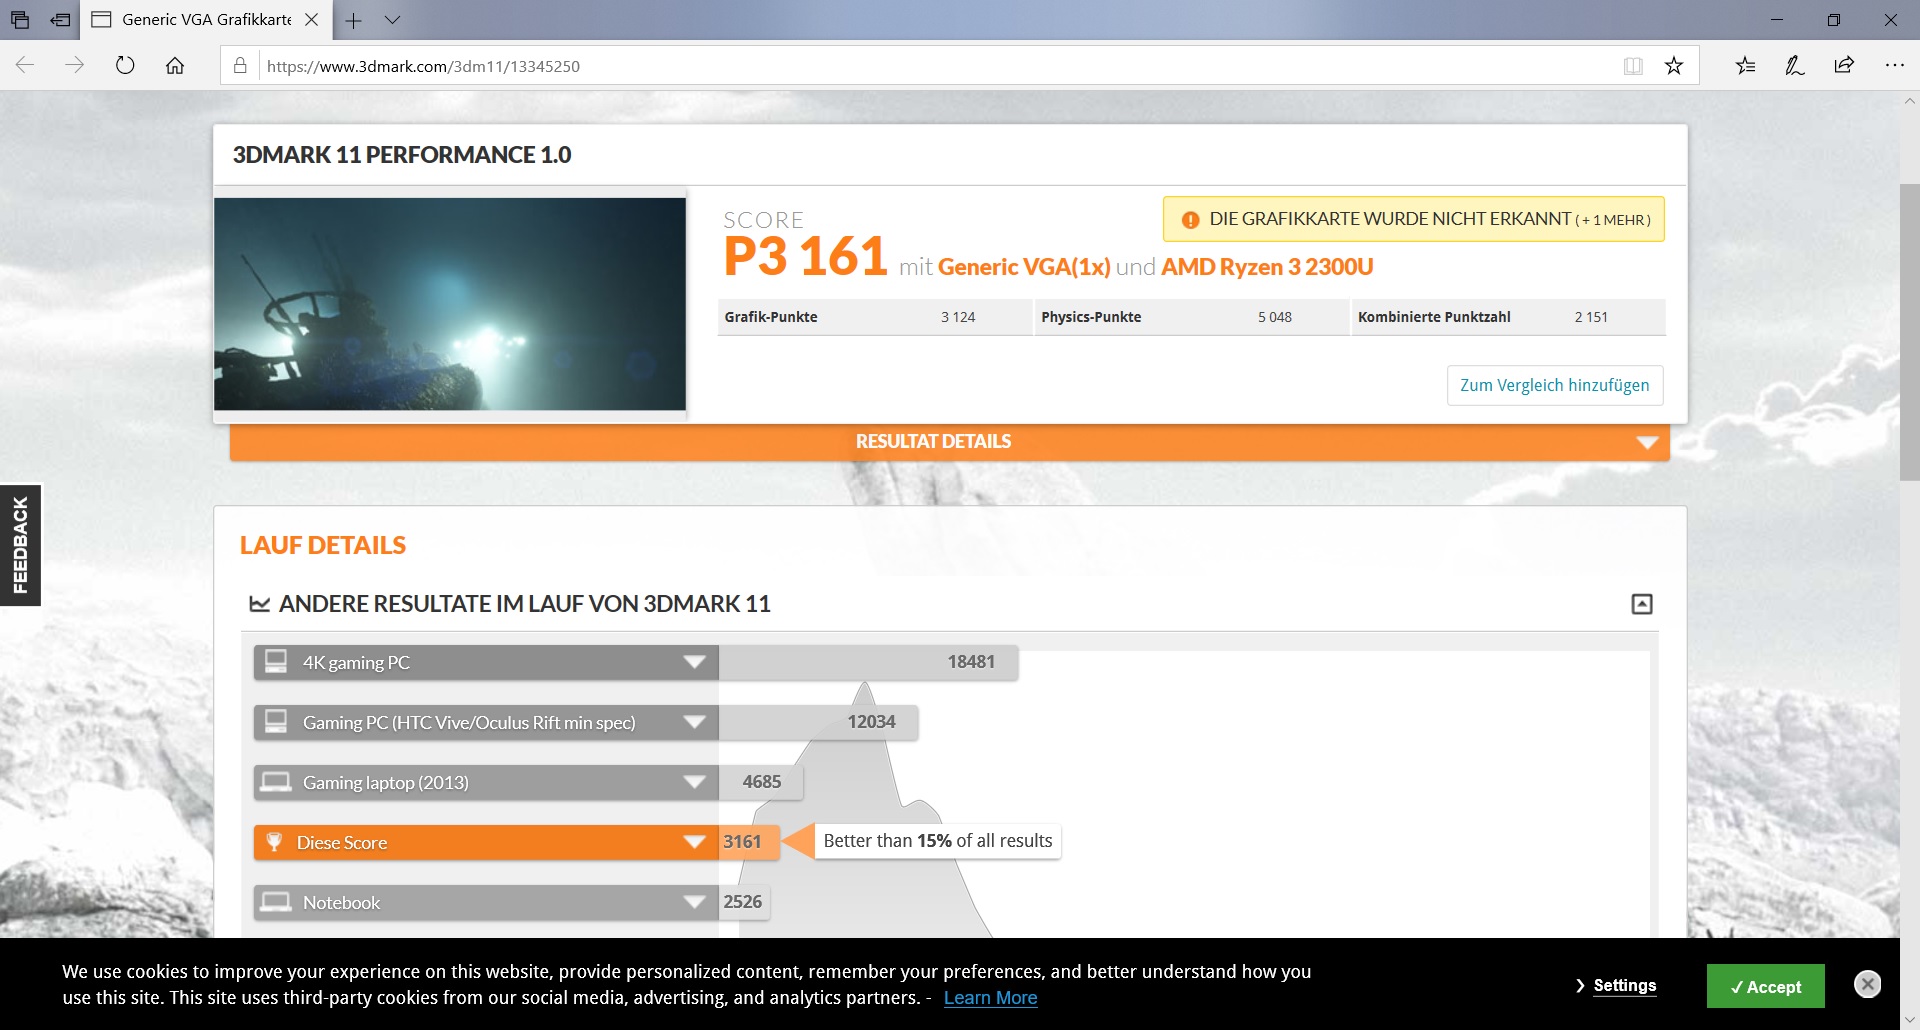
The Inspiron 15 did very well in our synthetic benchmarks and scored first place in all three tests. Even the ThinkPad with its (throttling) Vega 8 GPU was outperformed by between 8% (3DMark 11) and 36% (3DMark 2013 Cloud Gate). Intel’s Intel UHD Graphics 620 was up to 50% slower, and even Intel’s UHD Graphics 630 that can be found in Lenovo’s ThinkCentre M920z was still up to 40% slower than the Inspiron 15 3585.
We found no evidence of performance throttling on battery, and the 3DMark 11 benchmark results remained almost identical.

| 3DMark 06 Score 1366x768 | 11313 points | |
| 3DMark Vantage P Result | 8189 points | |
| 3DMark 11 Performance | 3111 points | |
| 3DMark Ice Storm Standard Score | 72343 points | |
| 3DMark Cloud Gate Standard Score | 9963 points | |
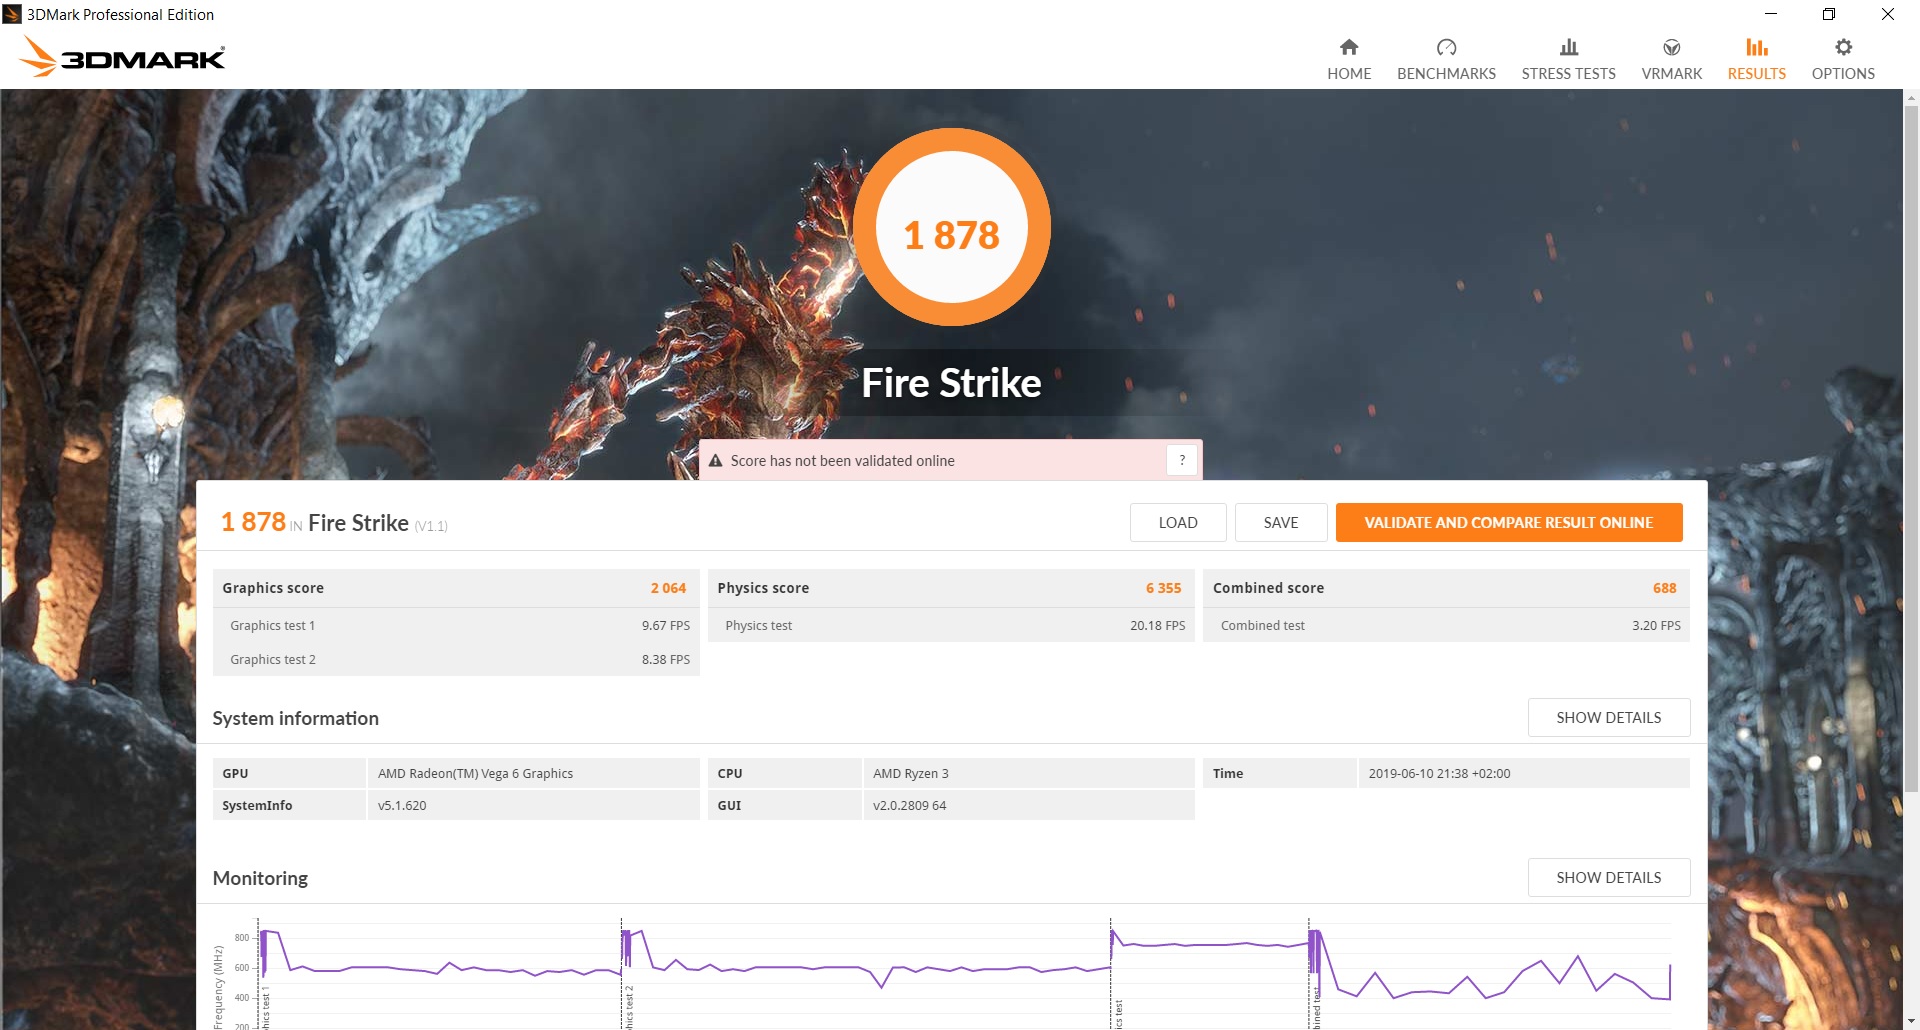
| 3DMark Fire Strike Score | 1878 points | |
| 3DMark Time Spy Score | 585 points | |
Help | ||
Gaming Performance
The more than decent results in our synthetic benchmarks left us with hope when tackling our gaming tests. Unfortunately, our hopes were all but squashed by the poor GPU drivers almost instantaneously. Reinstalling AMD’s Adrenalin Radeon drivers not only gave us additional resolutions to choose from but also improved upon graphics performance significantly. Microsoft’s Windows Update did not list this driver.
With this new graphics driver the Inspiron ran circles around its Intel-equipped competitors. It outperformed the Aspire by 30 to 50% in The Witcher 3, depending on resolution, and between 14 to 40% in Rise of the Tomb Raider. The more demanding a game the bigger the gap between AMD’s Vega 6 and Intel’s integrated GPUs, and the gap also widened in FHD when compared to 1366x768. The only device in our test group capable of keeping up or even besting our review unit was the ThinkPad with Vega 8 GPU. More benchmarks can be found in our Vega 6 overview.
Despite these promising and comparatively decent gaming benchmark results the Vega 6 remains very limited in regards to newer and more-demanding games even though it did much better than Intel’s integrated GPUs. For example, The Witcher 3 only ran smoothly in low details and low resolution, Rise of the Tomb Raider barely so, and Doom was unplayable at 1280x720. Accordingly, the GPU is limited to older and less-demanding titles with reduced details in low resolutions.
| The Witcher 3 | |
| 1024x768 Low Graphics & Postprocessing | |
| Average of class Office (32.2 - 103.7, n=4, last 2 years) | |
| Dell Inspiron 15 3585 (2300U, Vega 6) | |
| Average AMD Radeon RX Vega 6 (Ryzen 2000/3000) (38 - 39, n=2) | |
| Acer Aspire 3 A315-41-R7BM | |
| 1366x768 Medium Graphics & Postprocessing | |
| Average of class Office (44.7 - 63.9, n=4, last 2 years) | |
| Dell Inspiron 15 3585 (2300U, Vega 6) | |
| Average AMD Radeon RX Vega 6 (Ryzen 2000/3000) (n=1) | |
| Acer Aspire 3 A315-41-R7BM | |
| 1920x1080 High Graphics & Postprocessing (Nvidia HairWorks Off) | |
| Average of class Office (23.7 - 39.9, n=4, last 2 years) | |
| Average AMD Radeon RX Vega 6 (Ryzen 2000/3000) (7.4 - 9.7, n=2) | |
| Dell Inspiron 15 3585 (2300U, Vega 6) | |
| Acer Aspire 3 A315-41-R7BM | |
| Doom | |
| 1280x720 Low Preset | |
| Lenovo ThinkPad E485-20KU000NGE | |
| Dell Inspiron 15 3585 (2300U, Vega 6) | |
| Average AMD Radeon RX Vega 6 (Ryzen 2000/3000) (n=1) | |
| 1366x768 Medium Preset | |
| Dell Inspiron 15 3585 (2300U, Vega 6) | |
| Average AMD Radeon RX Vega 6 (Ryzen 2000/3000) (n=1) | |
| 1920x1080 Medium Preset | |
| Dell Inspiron 15 3585 (2300U, Vega 6) | |
| Average AMD Radeon RX Vega 6 (Ryzen 2000/3000) (n=1) | |
Unlike our CineBench scores the frame rates were fairly consistent in our The Witcher 3 loop, and they settled after an initial 20-minute phase of minor fluctuations.
| low | med. | high | ultra | |
|---|---|---|---|---|
| Crysis 3 (2013) | 21.9 | 14.6 | 11.5 | |
| SimCity (2013) | 59.1 | 34.5 | 19 | 8.7 |
| Total War: Rome II (2013) | 61.1 | 42.7 | 29.8 | |
| Battlefield 4 (2013) | 40.1 | 29.9 | 19.7 | 8.4 |
| Alien: Isolation (2014) | 26.7 | 19.7 | 10.6 | |
| GTA V (2015) | 43.2 | 34.1 | 10.4 | |
| Dirt Rally (2015) | 95 | 31.1 | 16.9 | |
| The Witcher 3 (2015) | 39 | 19.6 | 7.4 | 6 |
| Rise of the Tomb Raider (2016) | 29.8 | 18.5 | 9.7 | |
| Ashes of the Singularity (2016) | 11 | 5.7 | 4.1 | |
| Doom (2016) | 13.1 | 13.2 | ||
| Farming Simulator 17 (2016) | 99.6 | 50.6 | 18.4 | |
| Rocket League (2017) | 52.6 | 26.9 | 17.4 | |
| Dirt 4 (2017) | 57.5 | 21.6 | 12.6 | |
| Call of Duty WWII (2017) | 21.9 | 17.1 | 8.8 | |
| Fortnite (2018) | 55.1 | 22.2 | 7.7 | |
| F1 2018 (2018) | 19 | 12 | 12 | |
| Shadow of the Tomb Raider (2018) | 18 | 7 | 6 | |
| FIFA 19 (2018) | 31.7 | 18.1 | 14.9 | |
| Forza Horizon 4 (2018) | 22.6 | 10.2 | 9.2 | |
| Darksiders III (2018) | 43 | 7.7 | 7 | |
| Anthem (2019) | 6.7 | 5.3 | 4.6 | |
| Rage 2 (2019) | 24.7 | 6.3 | 5.3 |
Emissions
System Noise
The fans were never off even when the system was completely idle. The resulting system noise was comparable to its competitors with the ThinkPad being the only notable exception. We also experienced sudden, unexpected and inexplicable fan speed bursts without any accompanying increase in system load.
Under load, the Inspiron turned out to be louder than most of its competitors save for the Acer Aspire. With up to 41 dB(A) the fans were about as loud as its sibling's and the Aspire's. The ThinkPad, HP, and Swift 3 convertible were significantly quieter. We found no evidence of coil whine or other electrical noise.
| Dell Inspiron 15 3585 (2300U, Vega 6) Vega 6, R3 2300U, Toshiba BG3 KBG30ZMS256G | Dell Inspiron 15 5575-98MH4 Vega 3, R3 2200U, Seagate Mobile HDD 1TB ST1000LM035 | Lenovo ThinkPad E485-20KU000NGE Vega 8, R5 2500U, Samsung PM961 MZVLW256HEHP | HP 250 G7 6HM85ES UHD Graphics 620, i5-8265U, WDC PC SN520 SDAPNUW-512G | Acer Aspire 3 A315-41-R7BM Vega 3, R3 2200U, SK Hynix HFS256G39TND-N210A | Acer Swift 3 SF314-55-31N8 UHD Graphics 620, i3-8145U, Kingston RBUSNS8154P3128GJ | |
|---|---|---|---|---|---|---|
| Noise | 1% | 6% | 3% | 0% | 7% | |
| off / environment * (dB) | 30.6 | 30.4 1% | 29.4 4% | 30.7 -0% | 30.3 1% | 30.3 1% |
| Idle Minimum * (dB) | 30.6 | 31.4 -3% | 29.4 4% | 30.9 -1% | 30.3 1% | 30.3 1% |
| Idle Average * (dB) | 30.6 | 31.4 -3% | 29.4 4% | 31.6 -3% | 30.3 1% | 30.3 1% |
| Idle Maximum * (dB) | 30.6 | 31.6 -3% | 31.2 -2% | 31.6 -3% | 30.9 -1% | 30.3 1% |
| Load Average * (dB) | 36.7 | 31.9 13% | 32.7 11% | 34.3 7% | 37.8 -3% | 31 16% |
| Load Maximum * (dB) | 41.1 | 40.9 -0% | 35.3 14% | 33.8 18% | 40.6 1% | 31.4 24% |
| Witcher 3 ultra * (dB) | 34.3 |
* ... smaller is better
Noise level
| Idle |
| 30.6 / 30.6 / 30.6 dB(A) |
| Load |
| 36.7 / 41.1 dB(A) |
 | ||
30 dB silent 40 dB(A) audible 50 dB(A) loud |
||
min: | ||
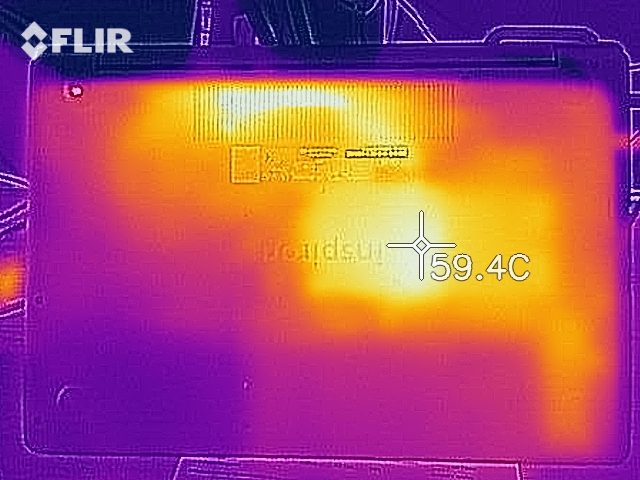
Temperature
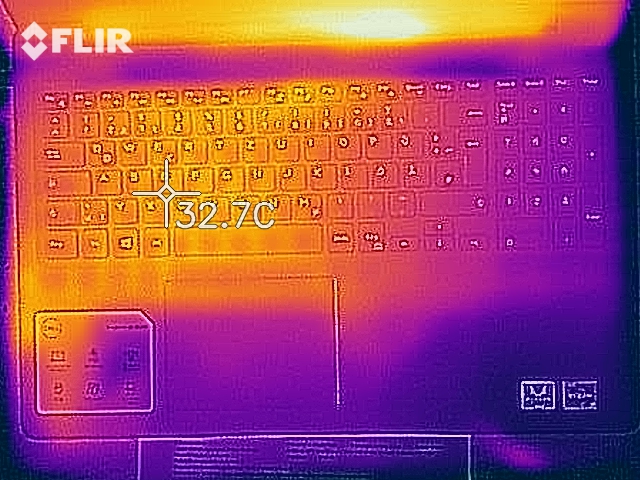
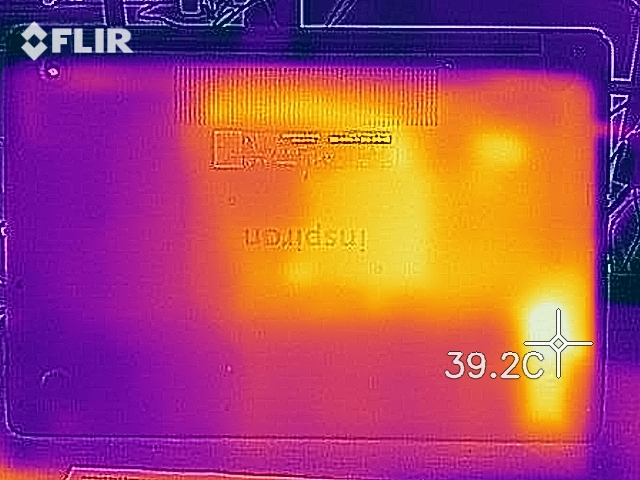
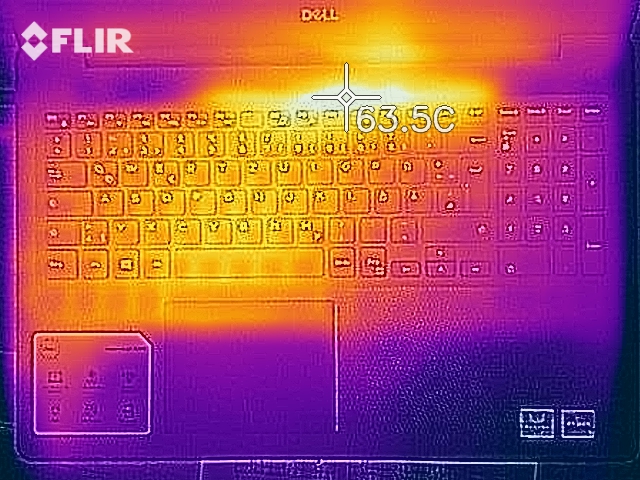
Unlike the HP and both Acer notebooks the Inspiron did not remain particularly cool under load despite its massive thermal throttling. Even when idle the surfaces warmed up to 31 °C and maxed out at 47 °C under load at the bottom. Using the Inspiron on your lap under load is thus not advisable.
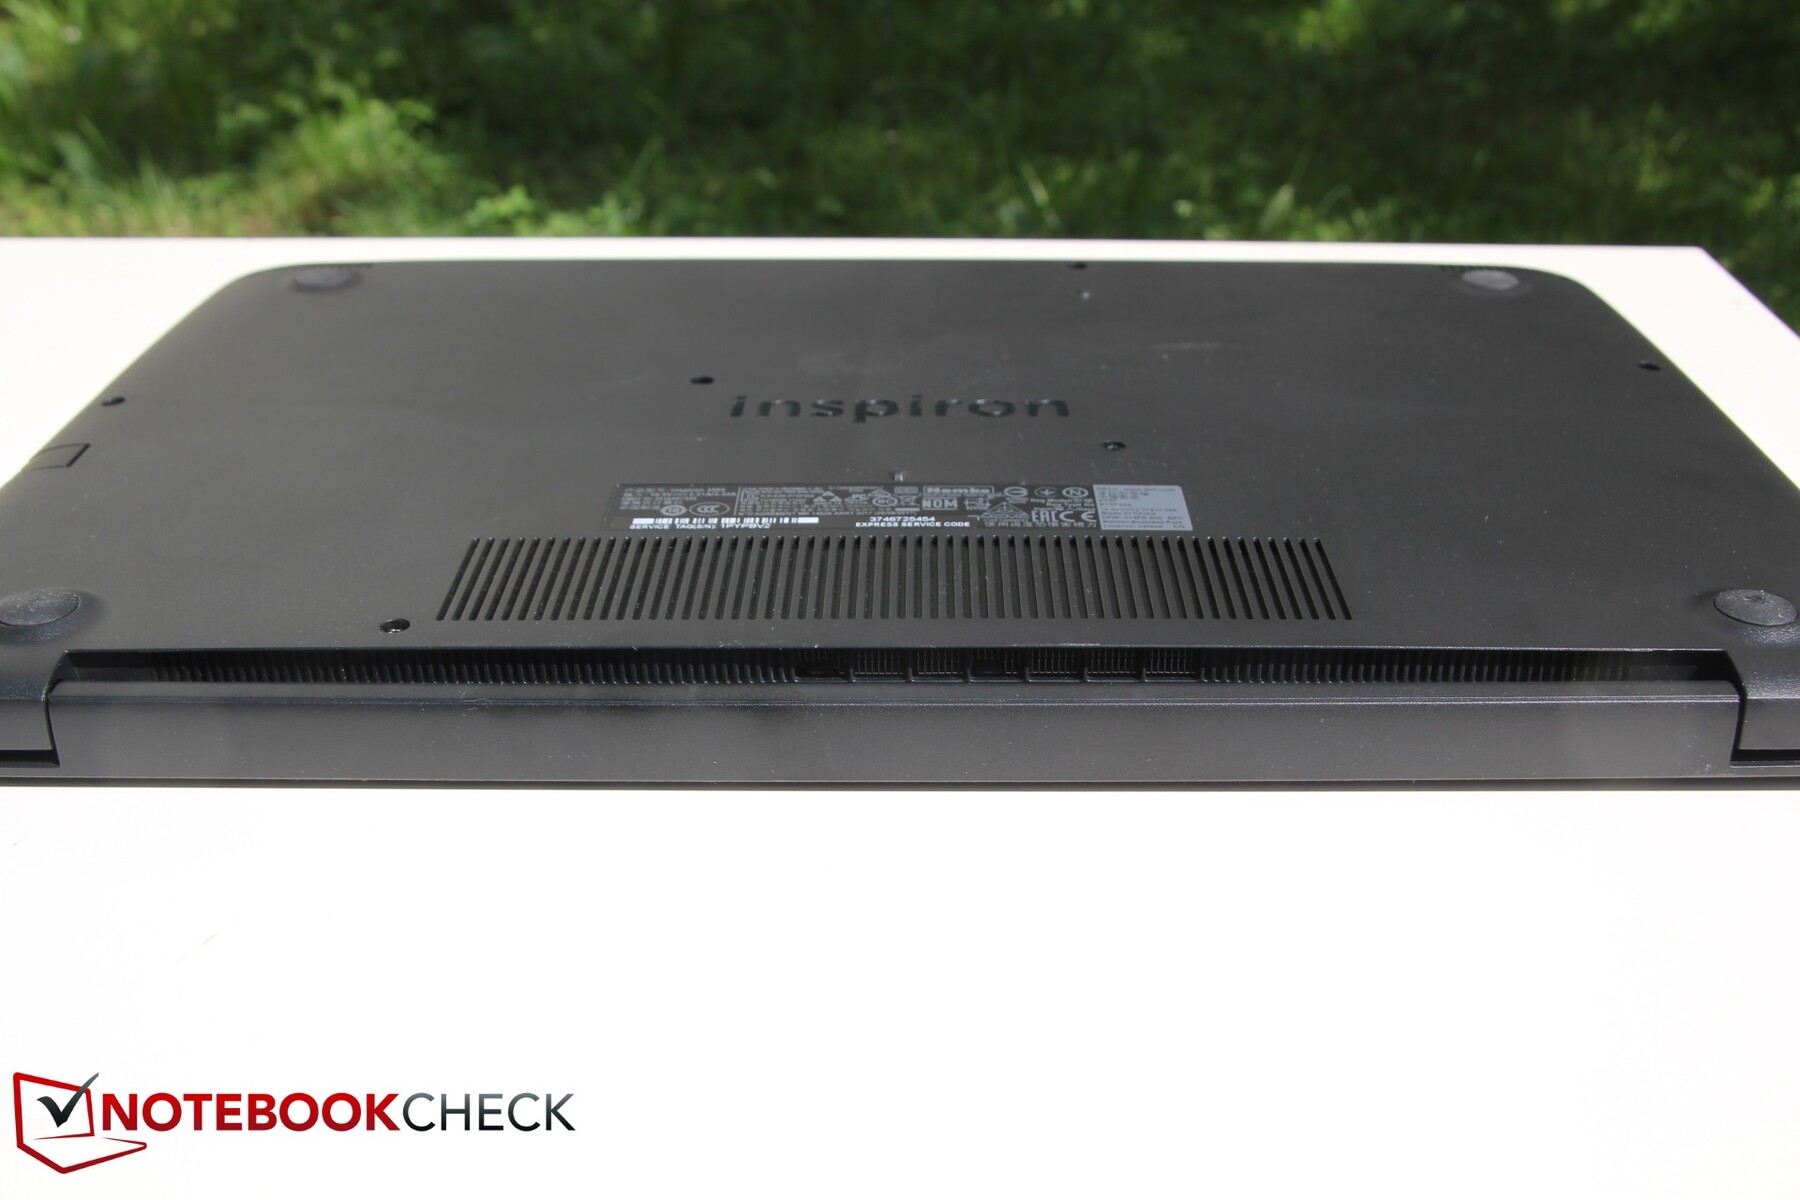
The hot spot was located in the center towards the rear near the fan vents. To make matters worse the vents are half-way covered by the display hinge heating up the bottom portion of the display and causing a significant accumulation of heat.
AMD’s CPUs are very obviously not as optimized and efficient as Intel’s counterparts. However, that is only half the truth. The other half is Dell’s poor and thoughtless cooling solution that we already criticized when reviewing the similarly restricted Inspiron 15 5575.
| Dell Inspiron 15 3585 (2300U, Vega 6) Vega 6, R3 2300U, Toshiba BG3 KBG30ZMS256G | Dell Inspiron 15 5575-98MH4 Vega 3, R3 2200U, Seagate Mobile HDD 1TB ST1000LM035 | Lenovo ThinkPad E485-20KU000NGE Vega 8, R5 2500U, Samsung PM961 MZVLW256HEHP | HP 250 G7 6HM85ES UHD Graphics 620, i5-8265U, WDC PC SN520 SDAPNUW-512G | Acer Aspire 3 A315-41-R7BM Vega 3, R3 2200U, SK Hynix HFS256G39TND-N210A | Acer Swift 3 SF314-55-31N8 UHD Graphics 620, i3-8145U, Kingston RBUSNS8154P3128GJ | |
|---|---|---|---|---|---|---|
| Heat | 3% | 4% | 16% | 25% | 16% | |
| Maximum Upper Side * (°C) | 44.8 | 45 -0% | 42.3 6% | 35.1 22% | 29.9 33% | 40.2 10% |
| Maximum Bottom * (°C) | 47.4 | 41.2 13% | 45.2 5% | 42.4 11% | 30.1 36% | 40 16% |
| Idle Upper Side * (°C) | 29.2 | 29.5 -1% | 28.8 1% | 25.4 13% | 25.2 14% | 24.4 16% |
| Idle Bottom * (°C) | 31.5 | 31.7 -1% | 30.7 3% | 25.8 18% | 26.6 16% | 24.1 23% |
* ... smaller is better
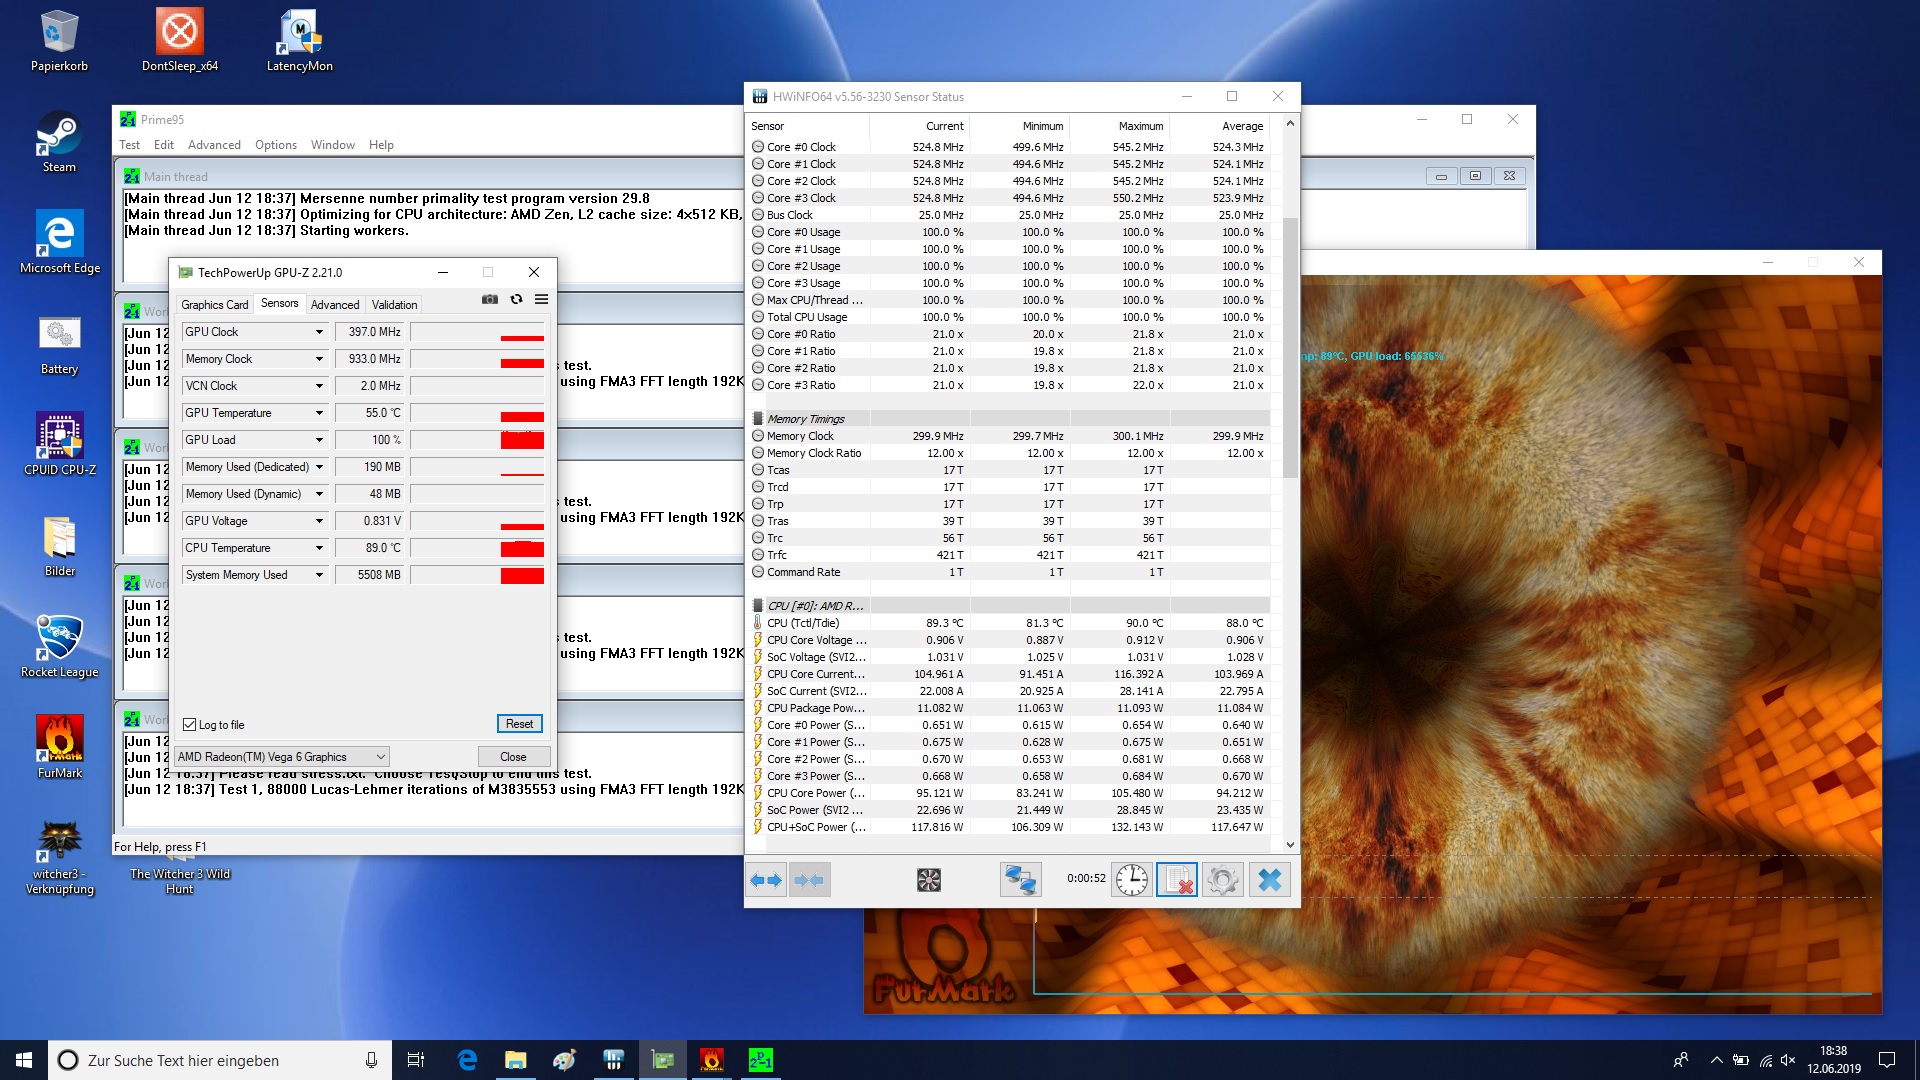
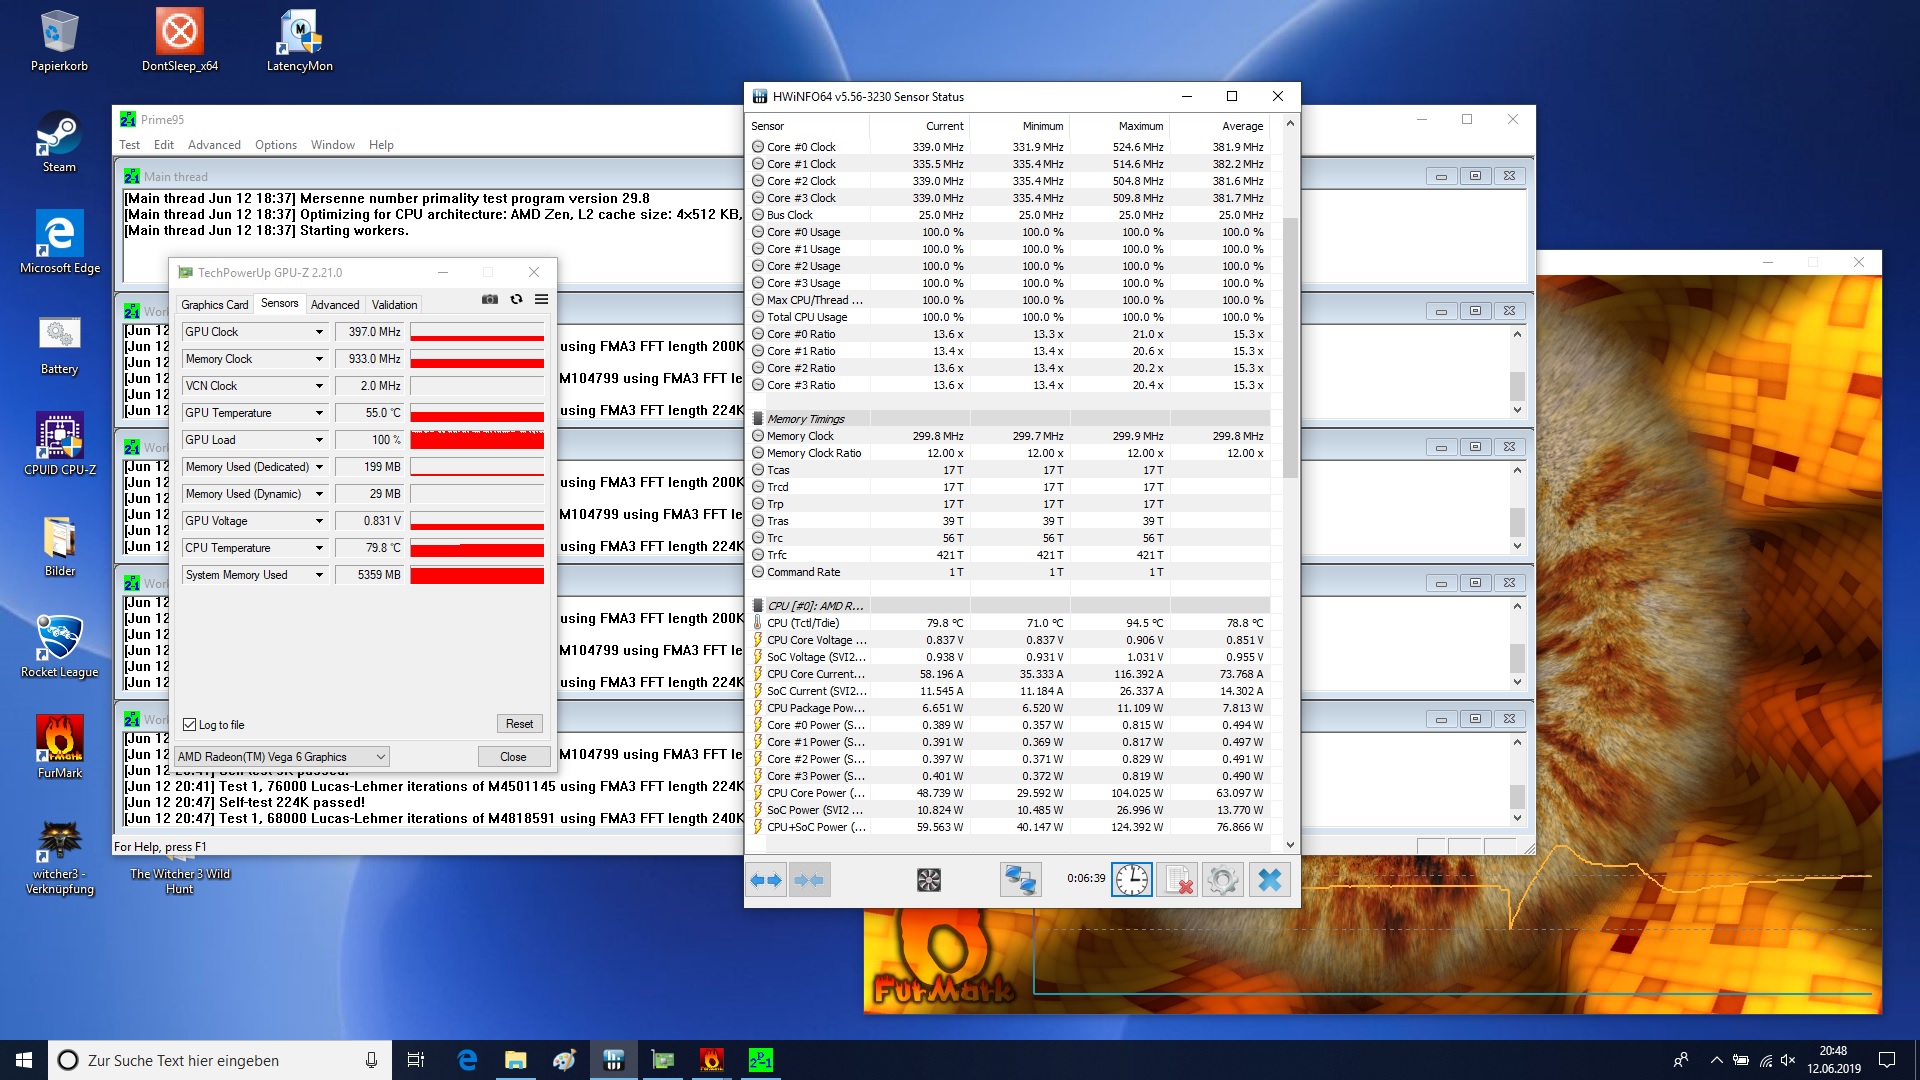
Our attempt to run our standard stress test of Prime95 and FurMark simultaneously for at least one hour was cut short after just a few minutes. The device crashed and rebooted, further confirming our suspicion that the cooling solution is simply inadequate for AMD’s Ryzen. Basically, the device shut off in order to protect the CPU and GPU from further damage. A second attempt with a smaller FurMark window was successful.
Clock speeds rarely exceeded 550 MHz from the very start of the test. The CPU was thus throttling severely in order to keep cool. Compare this intolerable frequency to the Ryzen 3 2300U's base clock speed of 2 GHz! The GPU ran at around 400 MHz and thus far below the Vega 6’s theoretical maximum of up to 1.1 GHz. Temperatures and clock speeds settled after less than 10 minutes. The GPU ran at around 55 °C, just like during our gaming tests, and the CPU at no more than 350 MHz (!) on all four cores and a temperature of around 80 °C.
(±) The maximum temperature on the upper side is 44.8 °C / 113 F, compared to the average of 34.3 °C / 94 F, ranging from 21.2 to 62.5 °C for the class Office.
(-) The bottom heats up to a maximum of 47.4 °C / 117 F, compared to the average of 36.8 °C / 98 F
(+) In idle usage, the average temperature for the upper side is 26.9 °C / 80 F, compared to the device average of 29.5 °C / 85 F.
(+) The palmrests and touchpad are cooler than skin temperature with a maximum of 31.6 °C / 88.9 F and are therefore cool to the touch.
(-) The average temperature of the palmrest area of similar devices was 27.5 °C / 81.5 F (-4.1 °C / -7.4 F).
Speakers
The two stereo speakers are located underneath the palm rest on the left and right sides. In terms of audio quality they were neither here nor there. However, considering the Inspiron’s price, they were pretty decent. Mids and highs were fairly balanced and bass was missing completely, as expected. They could have also been a bit louder. A 3.5-mm combo jack is available.
Dell Inspiron 15 3585 (2300U, Vega 6) audio analysis
(-) | not very loud speakers (69.4 dB)
Bass 100 - 315 Hz
(-) | nearly no bass - on average 19.7% lower than median
(±) | linearity of bass is average (14.8% delta to prev. frequency)
Mids 400 - 2000 Hz
(+) | balanced mids - only 1.2% away from median
(+) | mids are linear (4.2% delta to prev. frequency)
Highs 2 - 16 kHz
(+) | balanced highs - only 2% away from median
(+) | highs are linear (4.3% delta to prev. frequency)
Overall 100 - 16.000 Hz
(±) | linearity of overall sound is average (15.3% difference to median)
Compared to same class
» 15% of all tested devices in this class were better, 4% similar, 82% worse
» The best had a delta of 7%, average was 21%, worst was 53%
Compared to all devices tested
» 22% of all tested devices were better, 4% similar, 74% worse
» The best had a delta of 4%, average was 24%, worst was 134%
Acer Aspire 3 A315-41-R7BM audio analysis
(-) | not very loud speakers (67.8 dB)
Bass 100 - 315 Hz
(-) | nearly no bass - on average 25.3% lower than median
(±) | linearity of bass is average (12.5% delta to prev. frequency)
Mids 400 - 2000 Hz
(+) | balanced mids - only 3% away from median
(±) | linearity of mids is average (10.1% delta to prev. frequency)
Highs 2 - 16 kHz
(+) | balanced highs - only 1.8% away from median
(+) | highs are linear (5.5% delta to prev. frequency)
Overall 100 - 16.000 Hz
(±) | linearity of overall sound is average (22.7% difference to median)
Compared to same class
» 61% of all tested devices in this class were better, 8% similar, 31% worse
» The best had a delta of 7%, average was 21%, worst was 53%
Compared to all devices tested
» 67% of all tested devices were better, 6% similar, 27% worse
» The best had a delta of 4%, average was 24%, worst was 134%
Energy Management
Power Consumption
Given our test group we find it hard to make any statements regarding the Inspiron’s energy efficiency compared to Intel-equipped notebooks. After all, the only device it can be directly compared with is the HP. The Swift is smaller (14-inch) and trimmed for efficiency given that it is, after all, a convertible.
Nevertheless, the HP turned out to be around 30% more efficient than our review unit or other AMD-based notebooks regardless of load. Average power consumption under load was measured at 38 W. The power supply is rated at 45 W and should thus be amply dimensioned for most usage scenarios. We should note that we did detect peaks of up 46 W under load, however seldom and short-lived they were.
| Off / Standby | |
| Idle | |
| Load |
|
Key:
min: | |
| Dell Inspiron 15 3585 (2300U, Vega 6) R3 2300U, Vega 6, Toshiba BG3 KBG30ZMS256G, TN, 1920x1080, 15.6" | Dell Inspiron 15 5575-98MH4 R3 2200U, Vega 3, Seagate Mobile HDD 1TB ST1000LM035, TN LED, 1366x768, 15.6" | Lenovo ThinkPad E485-20KU000NGE R5 2500U, Vega 8, Samsung PM961 MZVLW256HEHP, IPS, 1920x1080, 14" | HP 250 G7 6HM85ES i5-8265U, UHD Graphics 620, WDC PC SN520 SDAPNUW-512G, TN, 1920x1080, 15.6" | Acer Aspire 3 A315-41-R7BM R3 2200U, Vega 3, SK Hynix HFS256G39TND-N210A, TN LED, 1920x1080, 15.6" | Acer Swift 3 SF314-55-31N8 i3-8145U, UHD Graphics 620, Kingston RBUSNS8154P3128GJ, IPS, 1920x1080, 14" | Average AMD Radeon RX Vega 6 (Ryzen 2000/3000) | Average of class Office | |
|---|---|---|---|---|---|---|---|---|
| Power Consumption | 12% | 3% | 29% | 5% | 35% | 9% | 2% | |
| Idle Minimum * (Watt) | 6.3 | 5 21% | 6.2 2% | 3.2 49% | 5.6 11% | 2.9 54% | 5.15 ? 18% | 4.44 ? 30% |
| Idle Average * (Watt) | 9.2 | 8.4 9% | 8.6 7% | 5.7 38% | 8.5 8% | 5.6 39% | 7.75 ? 16% | 7.38 ? 20% |
| Idle Maximum * (Watt) | 9.6 | 9.2 4% | 9.7 -1% | 6.1 36% | 8.4 12% | 6.1 36% | 9.45 ? 2% | 8.59 ? 11% |
| Load Average * (Watt) | 38 | 30 21% | 37.4 2% | 36.5 4% | 41 -8% | 29 24% | 36 ? 5% | 43 ? -13% |
| Load Maximum * (Watt) | 46 | 44.7 3% | 44.8 3% | 37.5 18% | 44.2 4% | 35.3 23% | 44 ? 4% | 64.5 ? -40% |
| Witcher 3 ultra * (Watt) | 32 |
* ... smaller is better
Battery Life
We use a variety of tests in order to determine battery life.
Maximum battery life is determined by running Battery Eater’s Reader test with all power-saving features disabled. In this test, our review unit lasted for 7:20 hours.
Minimum battery life is determined by enabling all features and running Batter Eater’s Classic test. In this scenario, our review unit lasted for 1:45 hours.
In-between these two extremes are two tests more applicable to real-world use. In the Wi-Fi test we browse the web occasionally loading YouTube videos at reduced brightness. In this test, the Inspiron ran out of power after 5 hours 18 minutes.
In our video playback test we run an FHD short film in a loop with all communication modules disabled, and our review unit turned itself off after 4.5 hours.
| Dell Inspiron 15 3585 (2300U, Vega 6) R3 2300U, Vega 6, 42 Wh | Dell Inspiron 15 5575-98MH4 R3 2200U, Vega 3, 42 Wh | Lenovo ThinkPad E485-20KU000NGE R5 2500U, Vega 8, 45 Wh | HP 250 G7 6HM85ES i5-8265U, UHD Graphics 620, 41 Wh | Acer Aspire 3 A315-41-R7BM R3 2200U, Vega 3, 37 Wh | Average of class Office | |
|---|---|---|---|---|---|---|
| Battery runtime | -6% | 4% | 35% | 4% | 150% | |
| Reader / Idle (h) | 7.3 | 9.5 30% | 9.1 25% | 13.9 90% | 8.9 22% | 23.7 ? 225% |
| H.264 (h) | 4.5 | 5.7 27% | 7.1 58% | 4.9 9% | 15 ? 233% | |
| WiFi v1.3 (h) | 5.3 | 4.2 -21% | 5.4 2% | 5.7 8% | 5.7 8% | 12.9 ? 143% |
| Load (h) | 1.8 | 1.3 -28% | 1.1 -39% | 1.5 -17% | 1.4 -22% | 1.807 ? 0% |
Pros
Cons
Verdict
Dell’s Inspiron 15 3585 is an entry-level notebook, and it shows. Among others it greeted us with a very poor display, a processor suffering from massive thermal throttling, a poor cooling solution, poor upgradeability, and lack of keyboard backlight. All these, however, are not very uncommon in the Inspiron’s price bracket.
A bonus is its integrated AMD Vega 6 GPU, which turned out to be much more powerful than its direct Intel rivals. That being said, GPU performance is often negligible in office notebooks, so keep that in mind. Easy maintenance thanks to an easily removable bottom cover is a bonus as well.
Unfortunately, AMD does not really profit from cheap entry-level devices such as this. More often than not OEMs opt for AMD hardware because of lower prices, and then proceed to thwart the real potential with extreme throttling. Intel CPUs are rarely ever this restricted and thwarted in their performance.
The Inspiron 15 3585 is an entry-level office notebook that offers easy maintenance, a gaming-capable Vega 6 GPU, and a low price. Unfortunately, the rest of the hardware is abysmal - a CPU suffering from extreme throttling, a case that gets too warm nonetheless, and a TN panel that seems to have time-traveled from the distant past.
Dell Inspiron 15 3585 (2300U, Vega 6)
- 06/17/2019 v6 (old)
Christian Hintze
Price comparison

