Lenovo ThinkPad E485 (Ryzen 5, Vega 8) Laptop Review
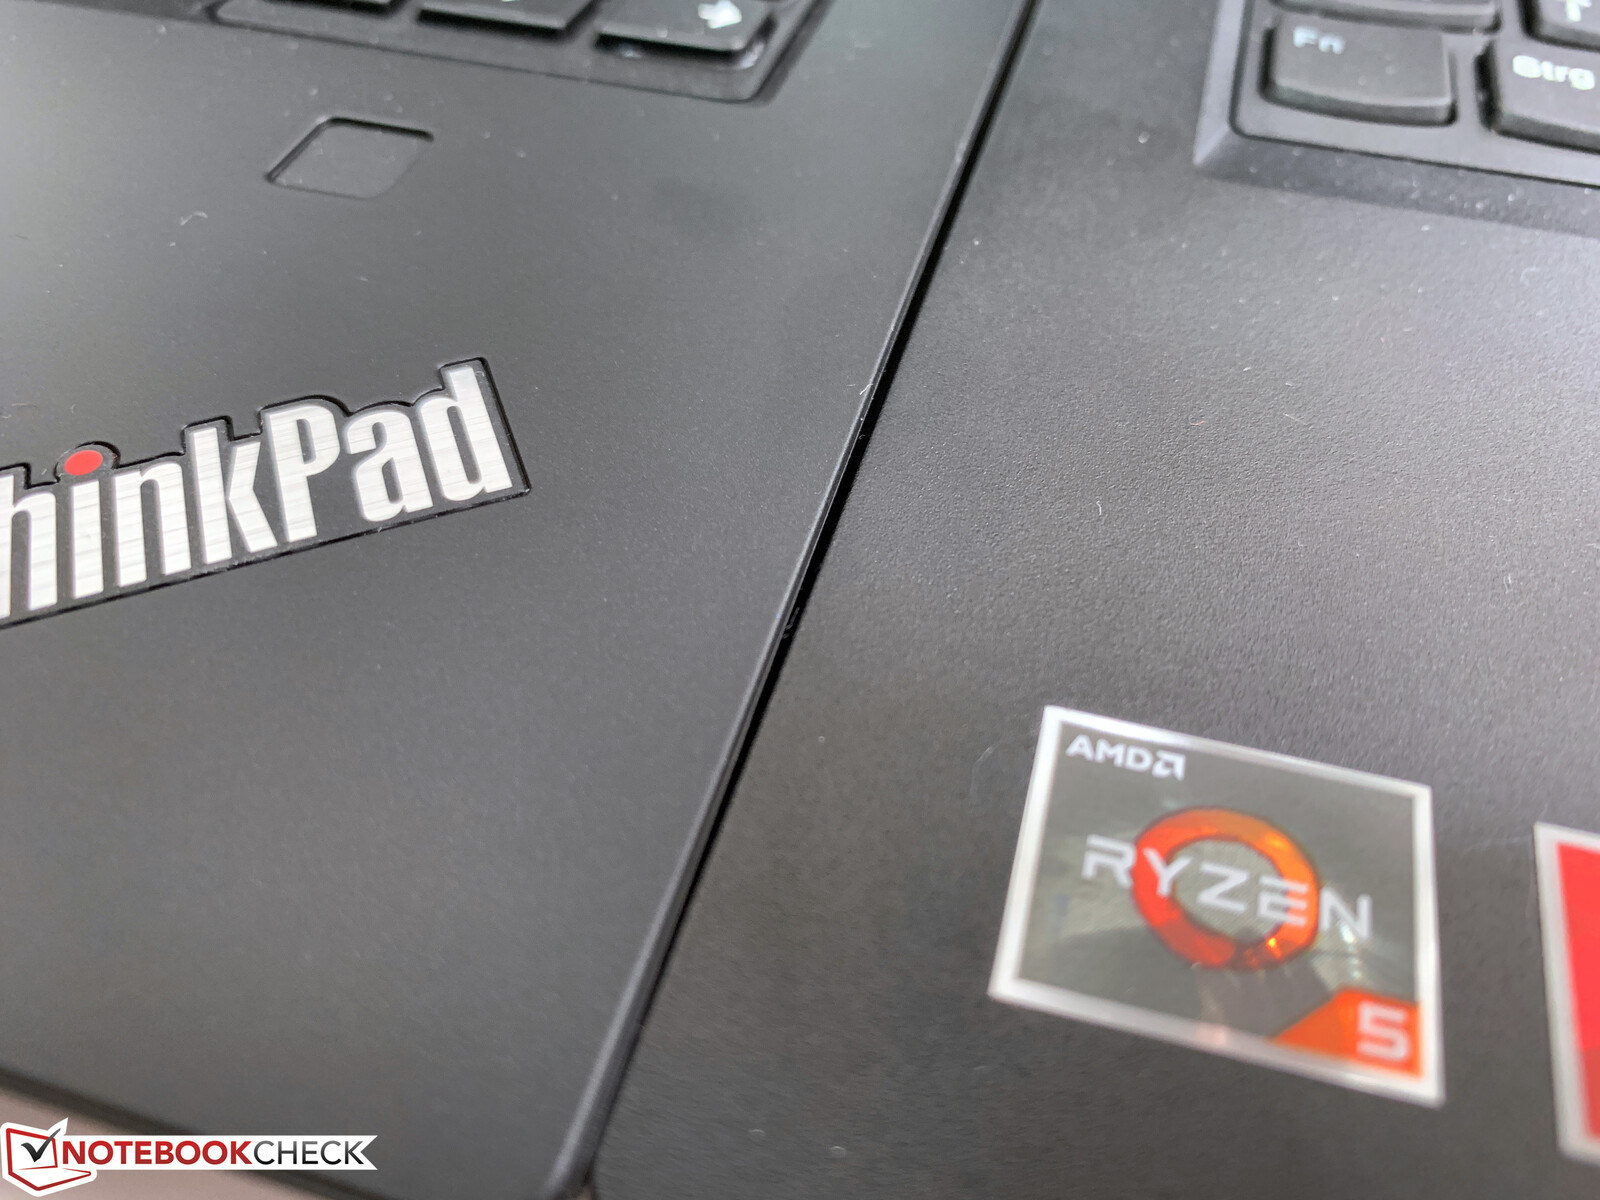
While at this point all the major PC manufacturers offer laptops with AMD's Ryzen processors, there are large differences in the model labels. At Lenovo, things are also a little more complicated, since the manufacturer mainly offers the ThinkPad A series with AMD APUs (although with the PRO chips) that are based however on the more expensive business models of the T and X series. On the other hand, our test unit, which is called ThinkPad E485, is part of the E series and is basically the AMD equivalent to the ThinkPad E480 or the new ThinkPad E490.
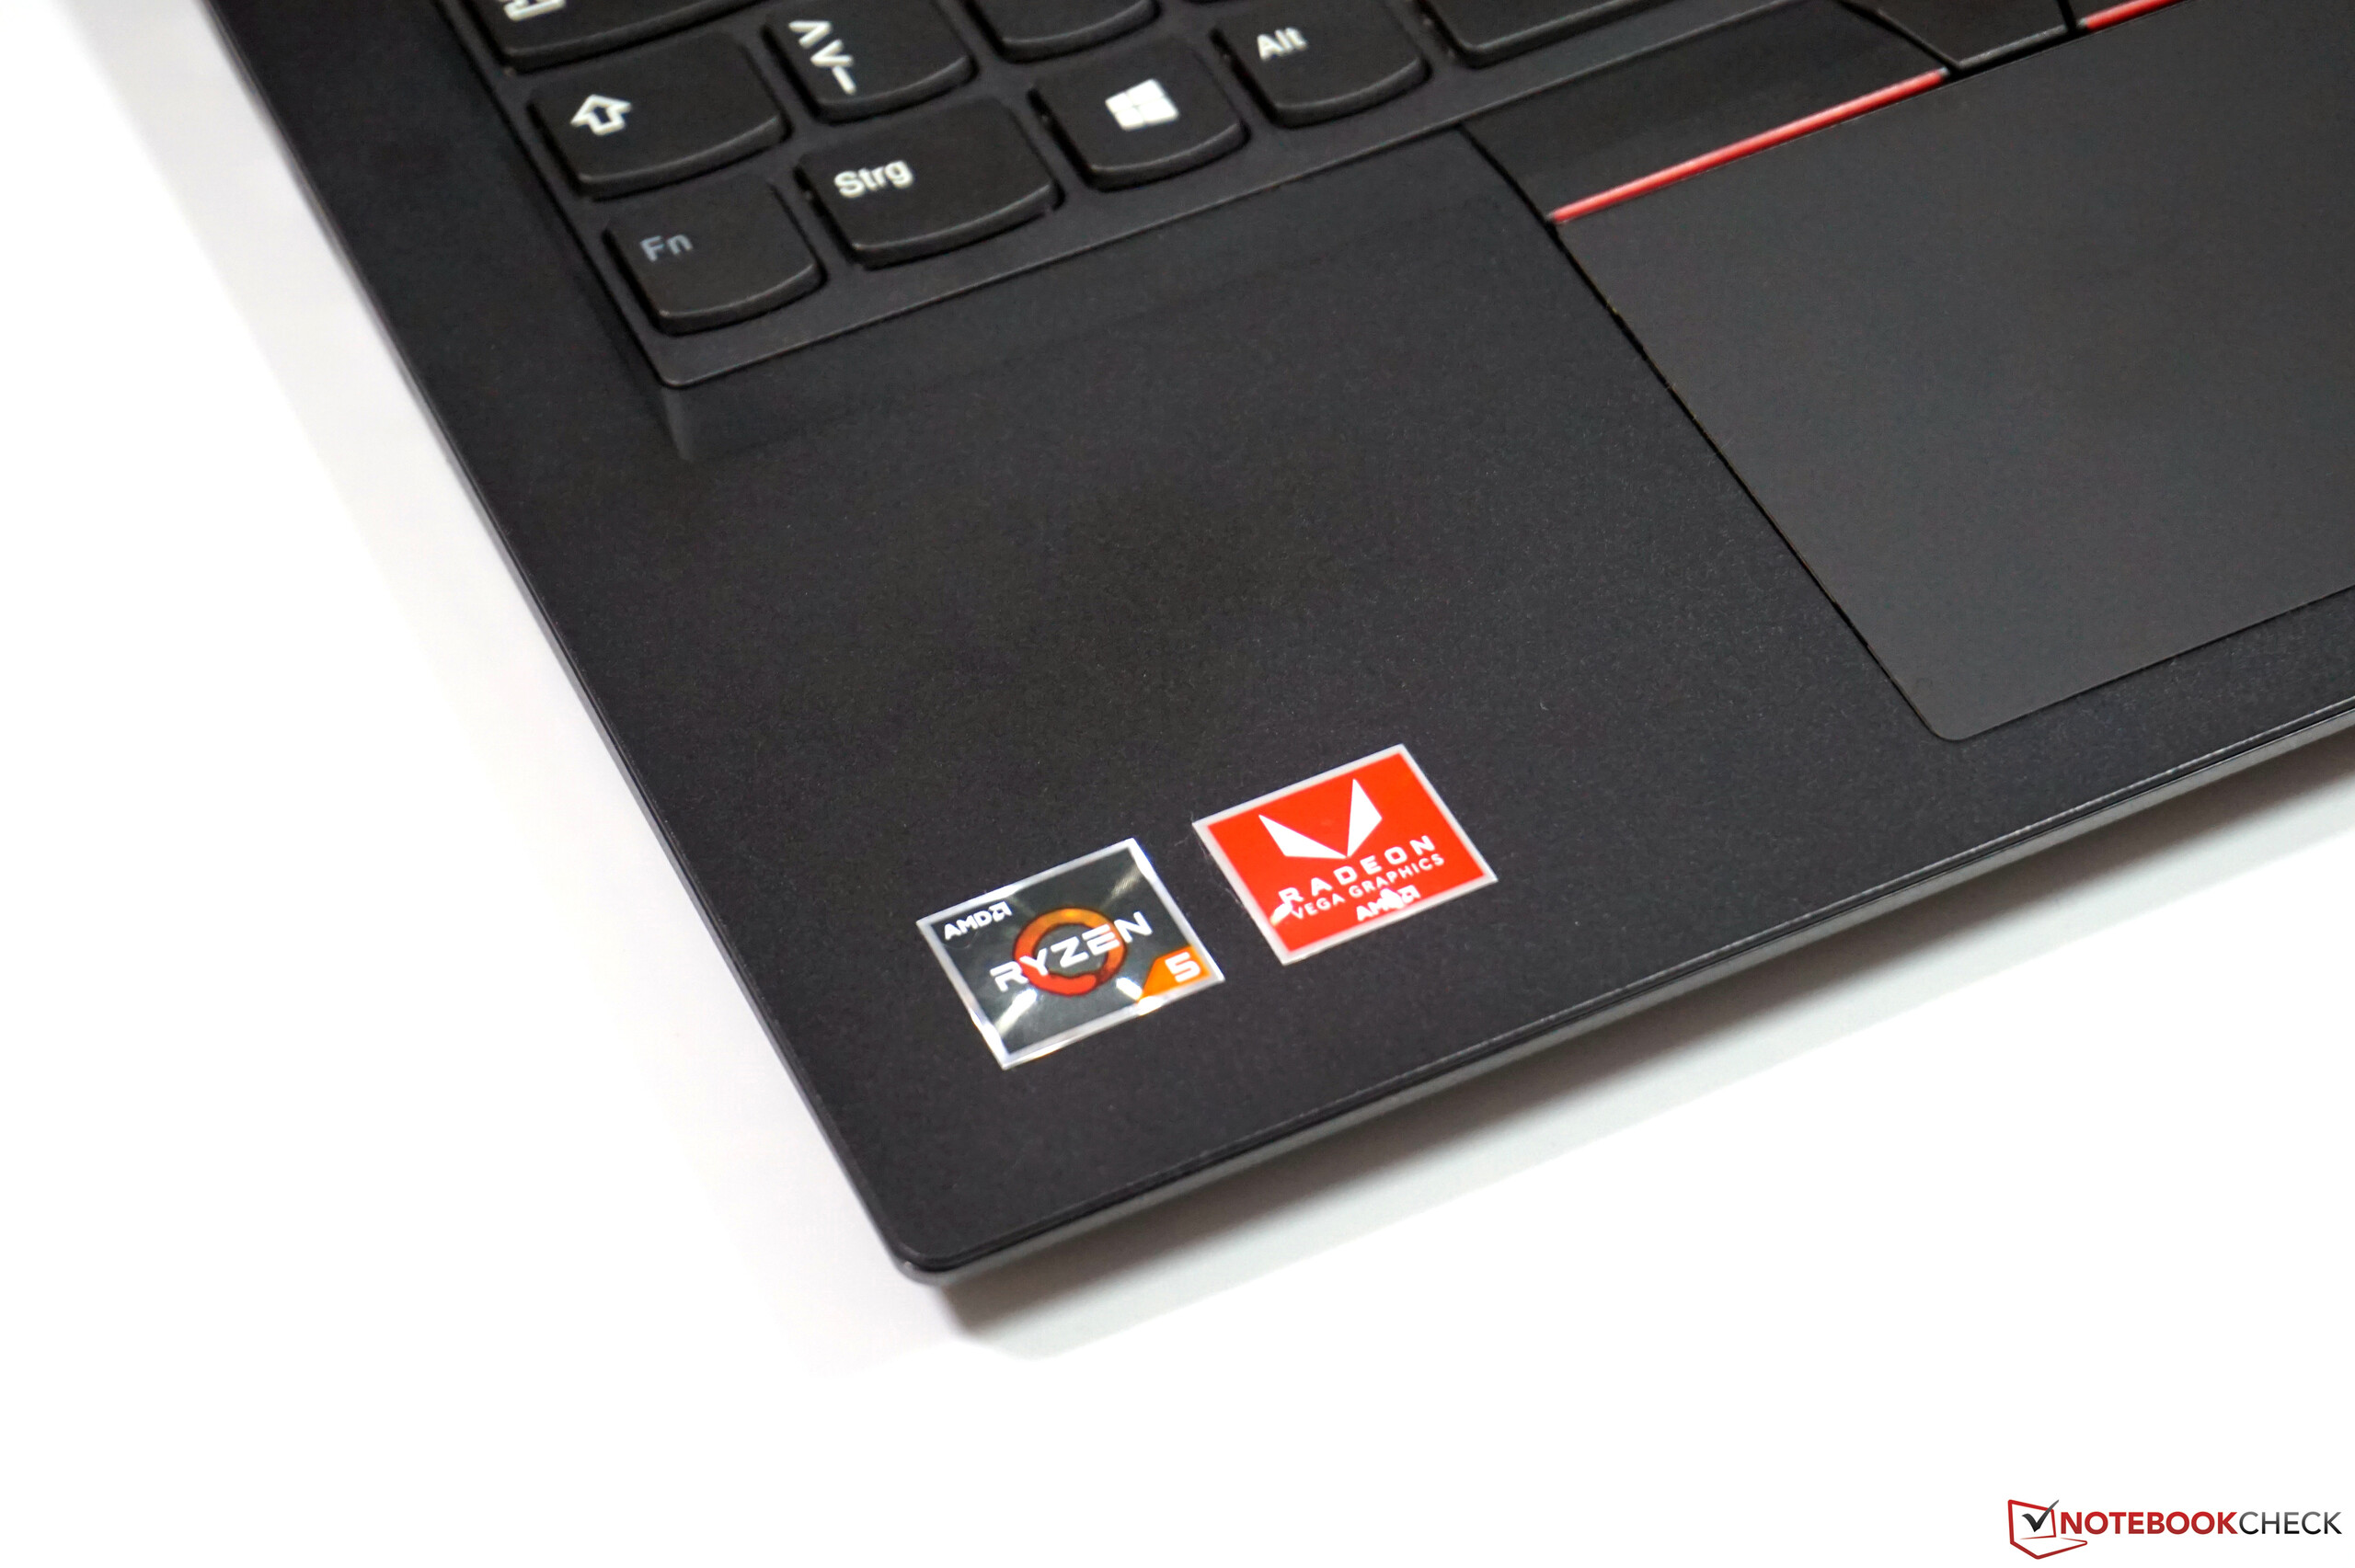
We test the 20KU000NGE configuration, which is available for about 650 Euros (~$731; starting at $573 in the US). This makes the E485 about 100 Euros (~$112) more affordable than a comparable Intel model. Our test unit includes a Ryzen 5 2500U quad-core processor together with a Vega-8-GPU, 8 GB of RAM, a 256 GB NVMe SSD, and the 14-inch FHD panel. You can continue to configure the device in Lenovo's online shop, but the optional dedicated graphics card of the E480/E490 is not available. The most affordable model with the Ryzen 3 processor is offered for only 550 Euros (~$618).
The strongest competitors of the ThinkPad E485 are naturally its own E480/E490 siblings, but of course we also compare our test unit with other laptops. These include the HP ProBook 645 G4 (also AMD), the ProBook 440 G6, and the Dell Latitude 3490.
Update: An additional test unit of the ThinkPad E485 was made available to us by notebooksandmore.de. This uses a different panel from Innolux, which differs fairly significantly from that of our first test unit in terms of its quality. The corresponding information is available in the Display section.
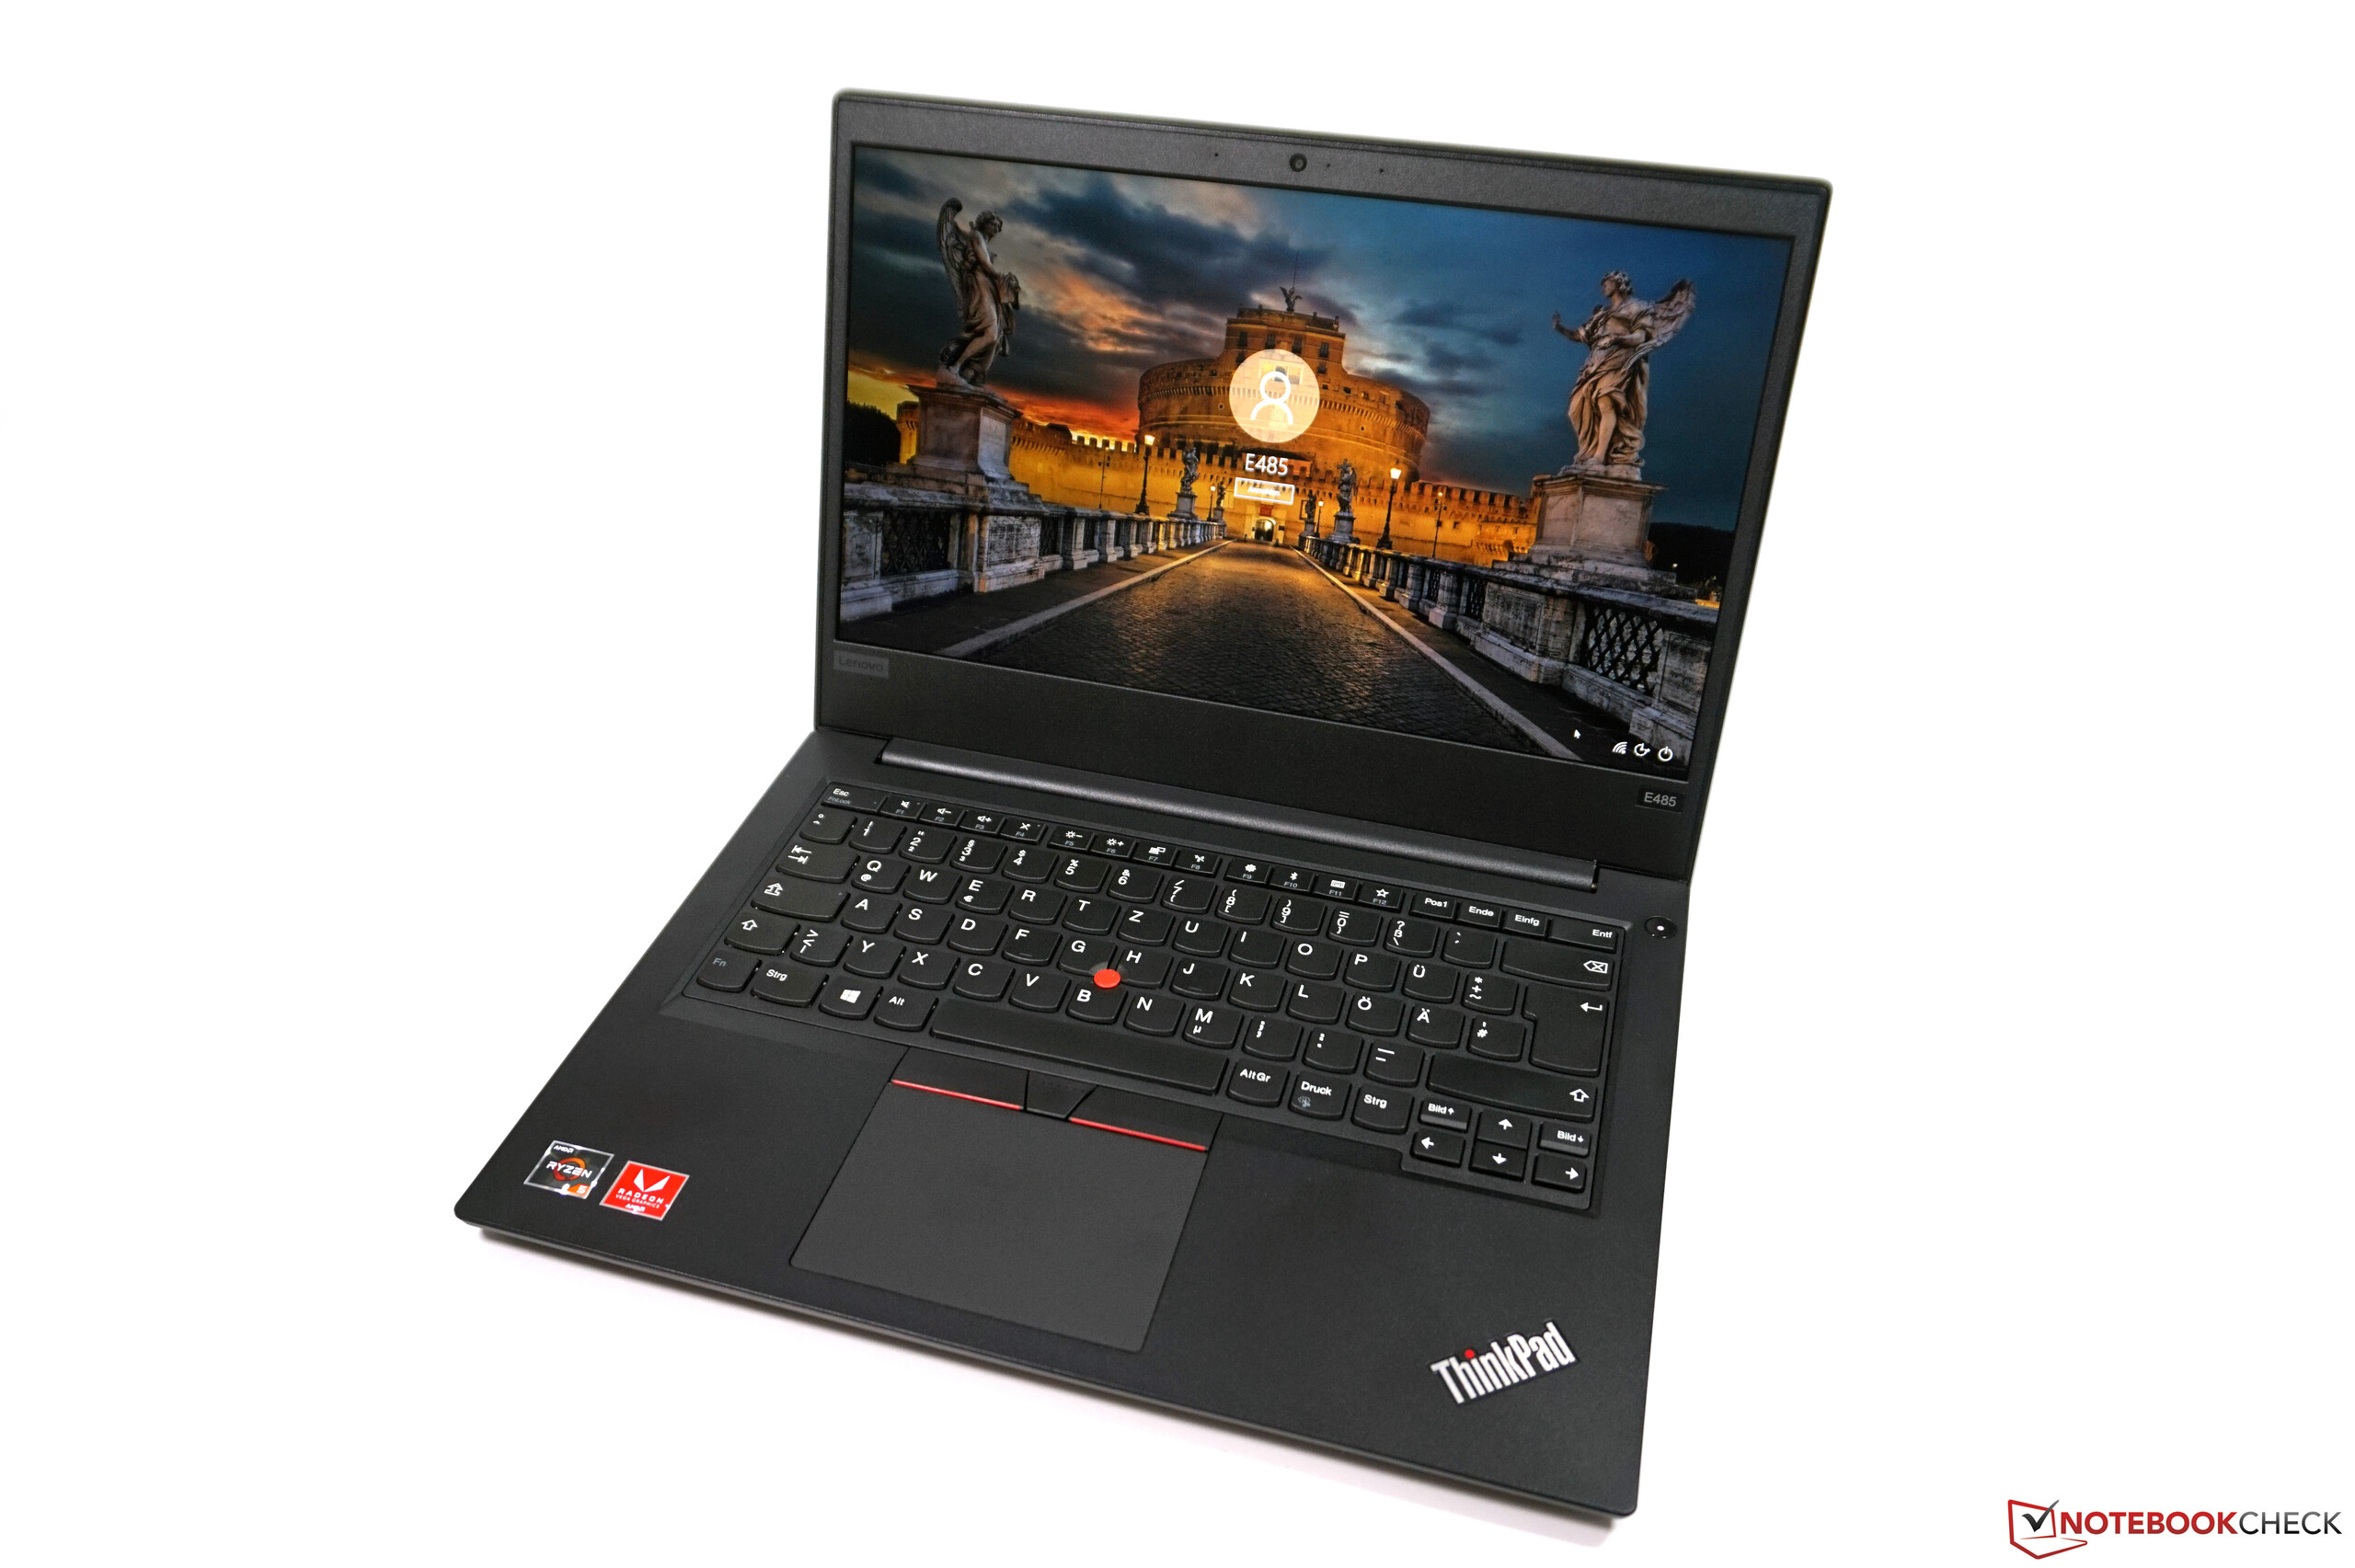
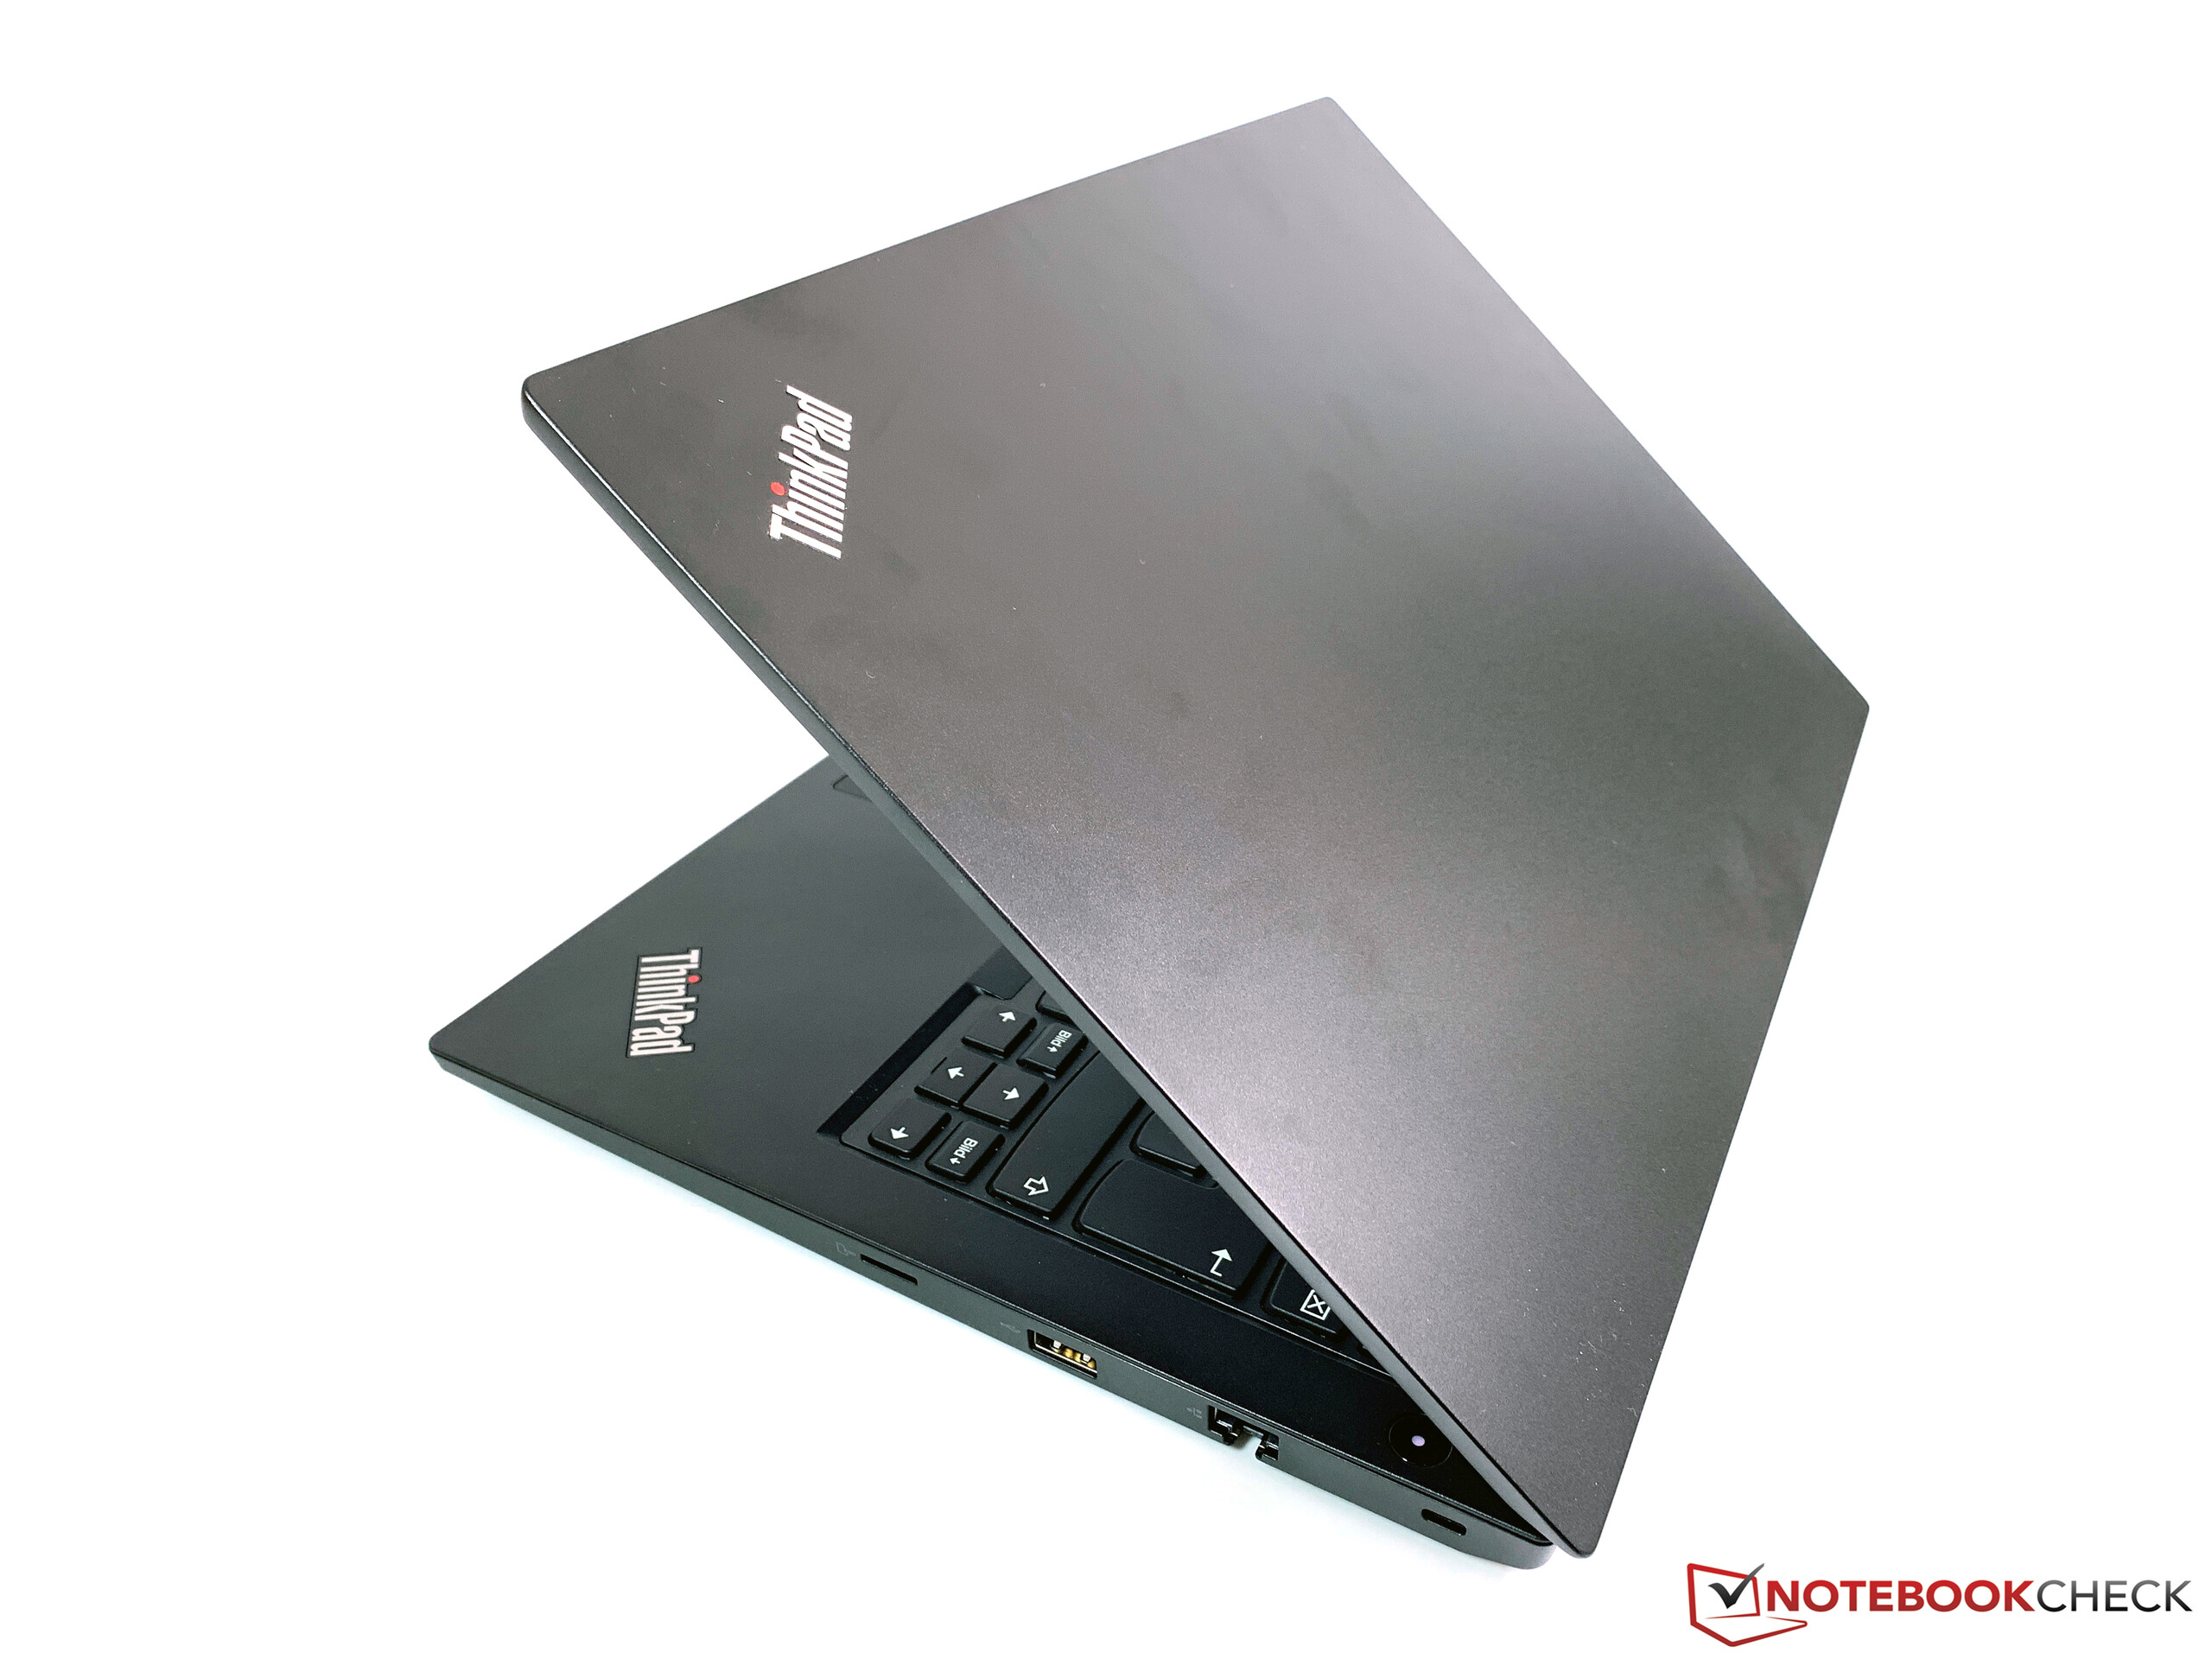
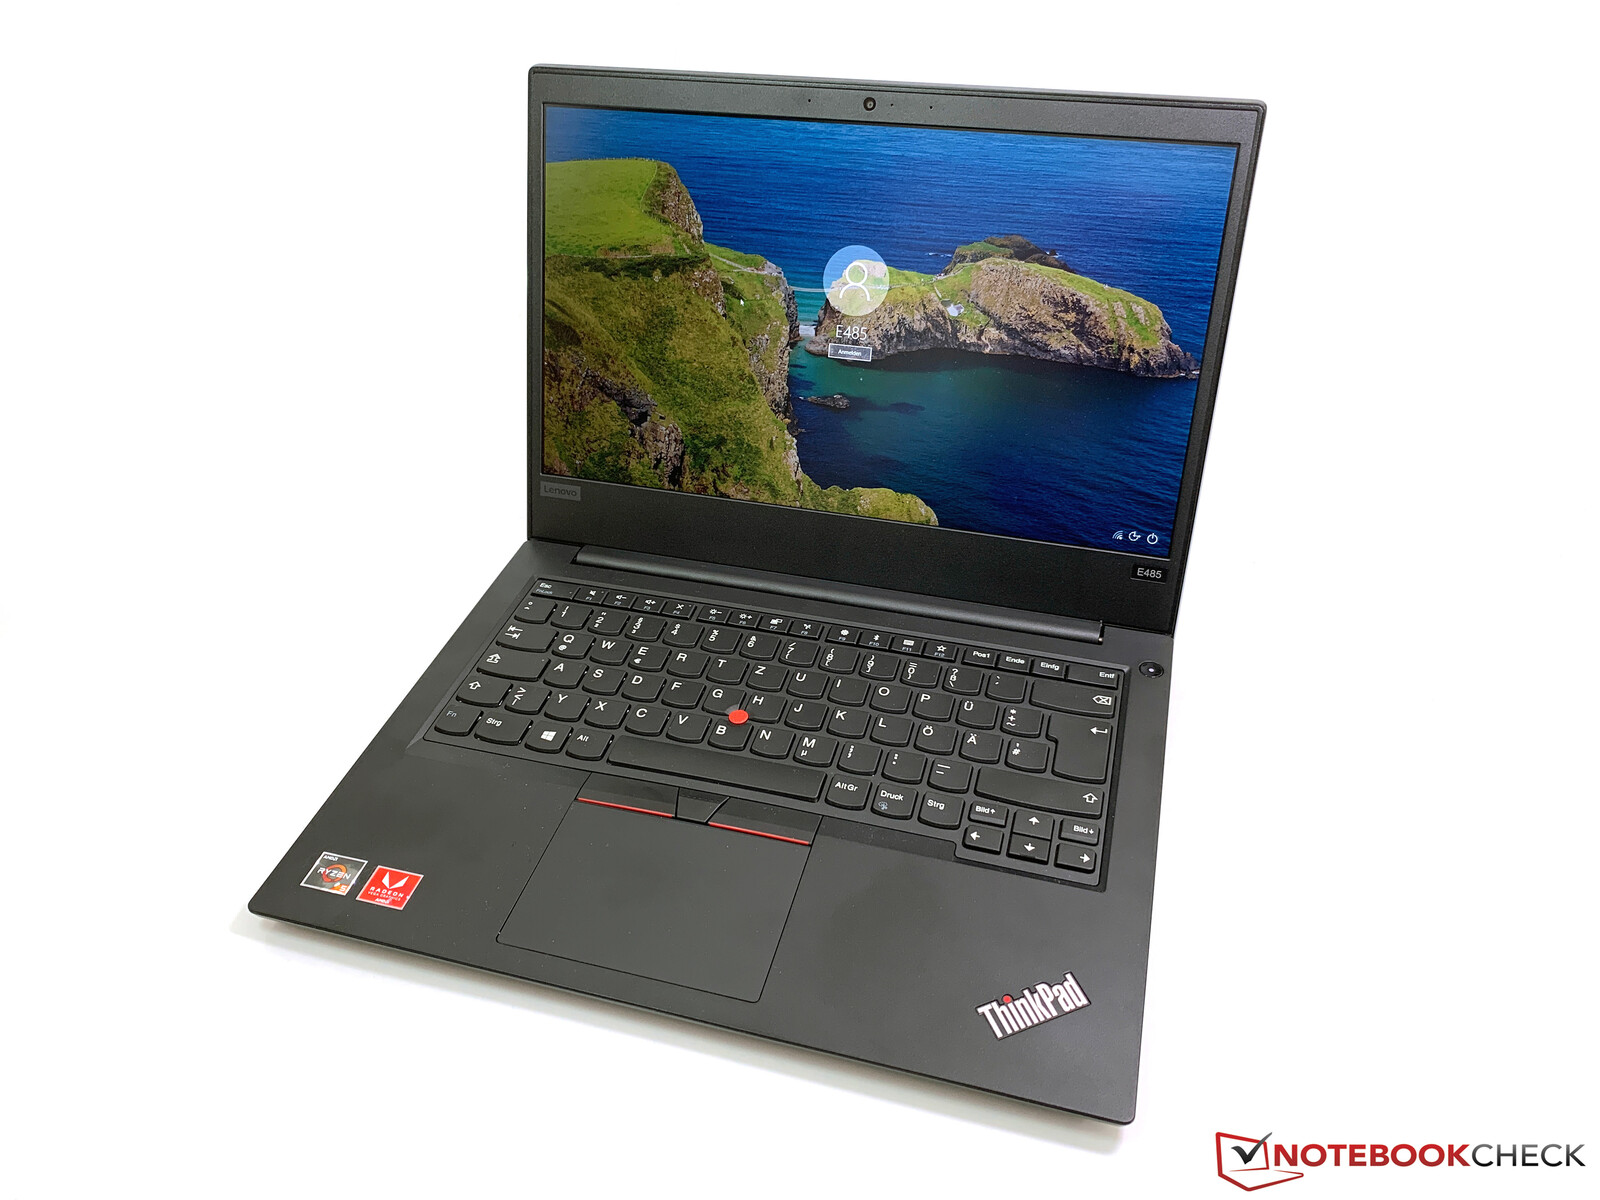
Case – Identical construction to the ThinkPad E480
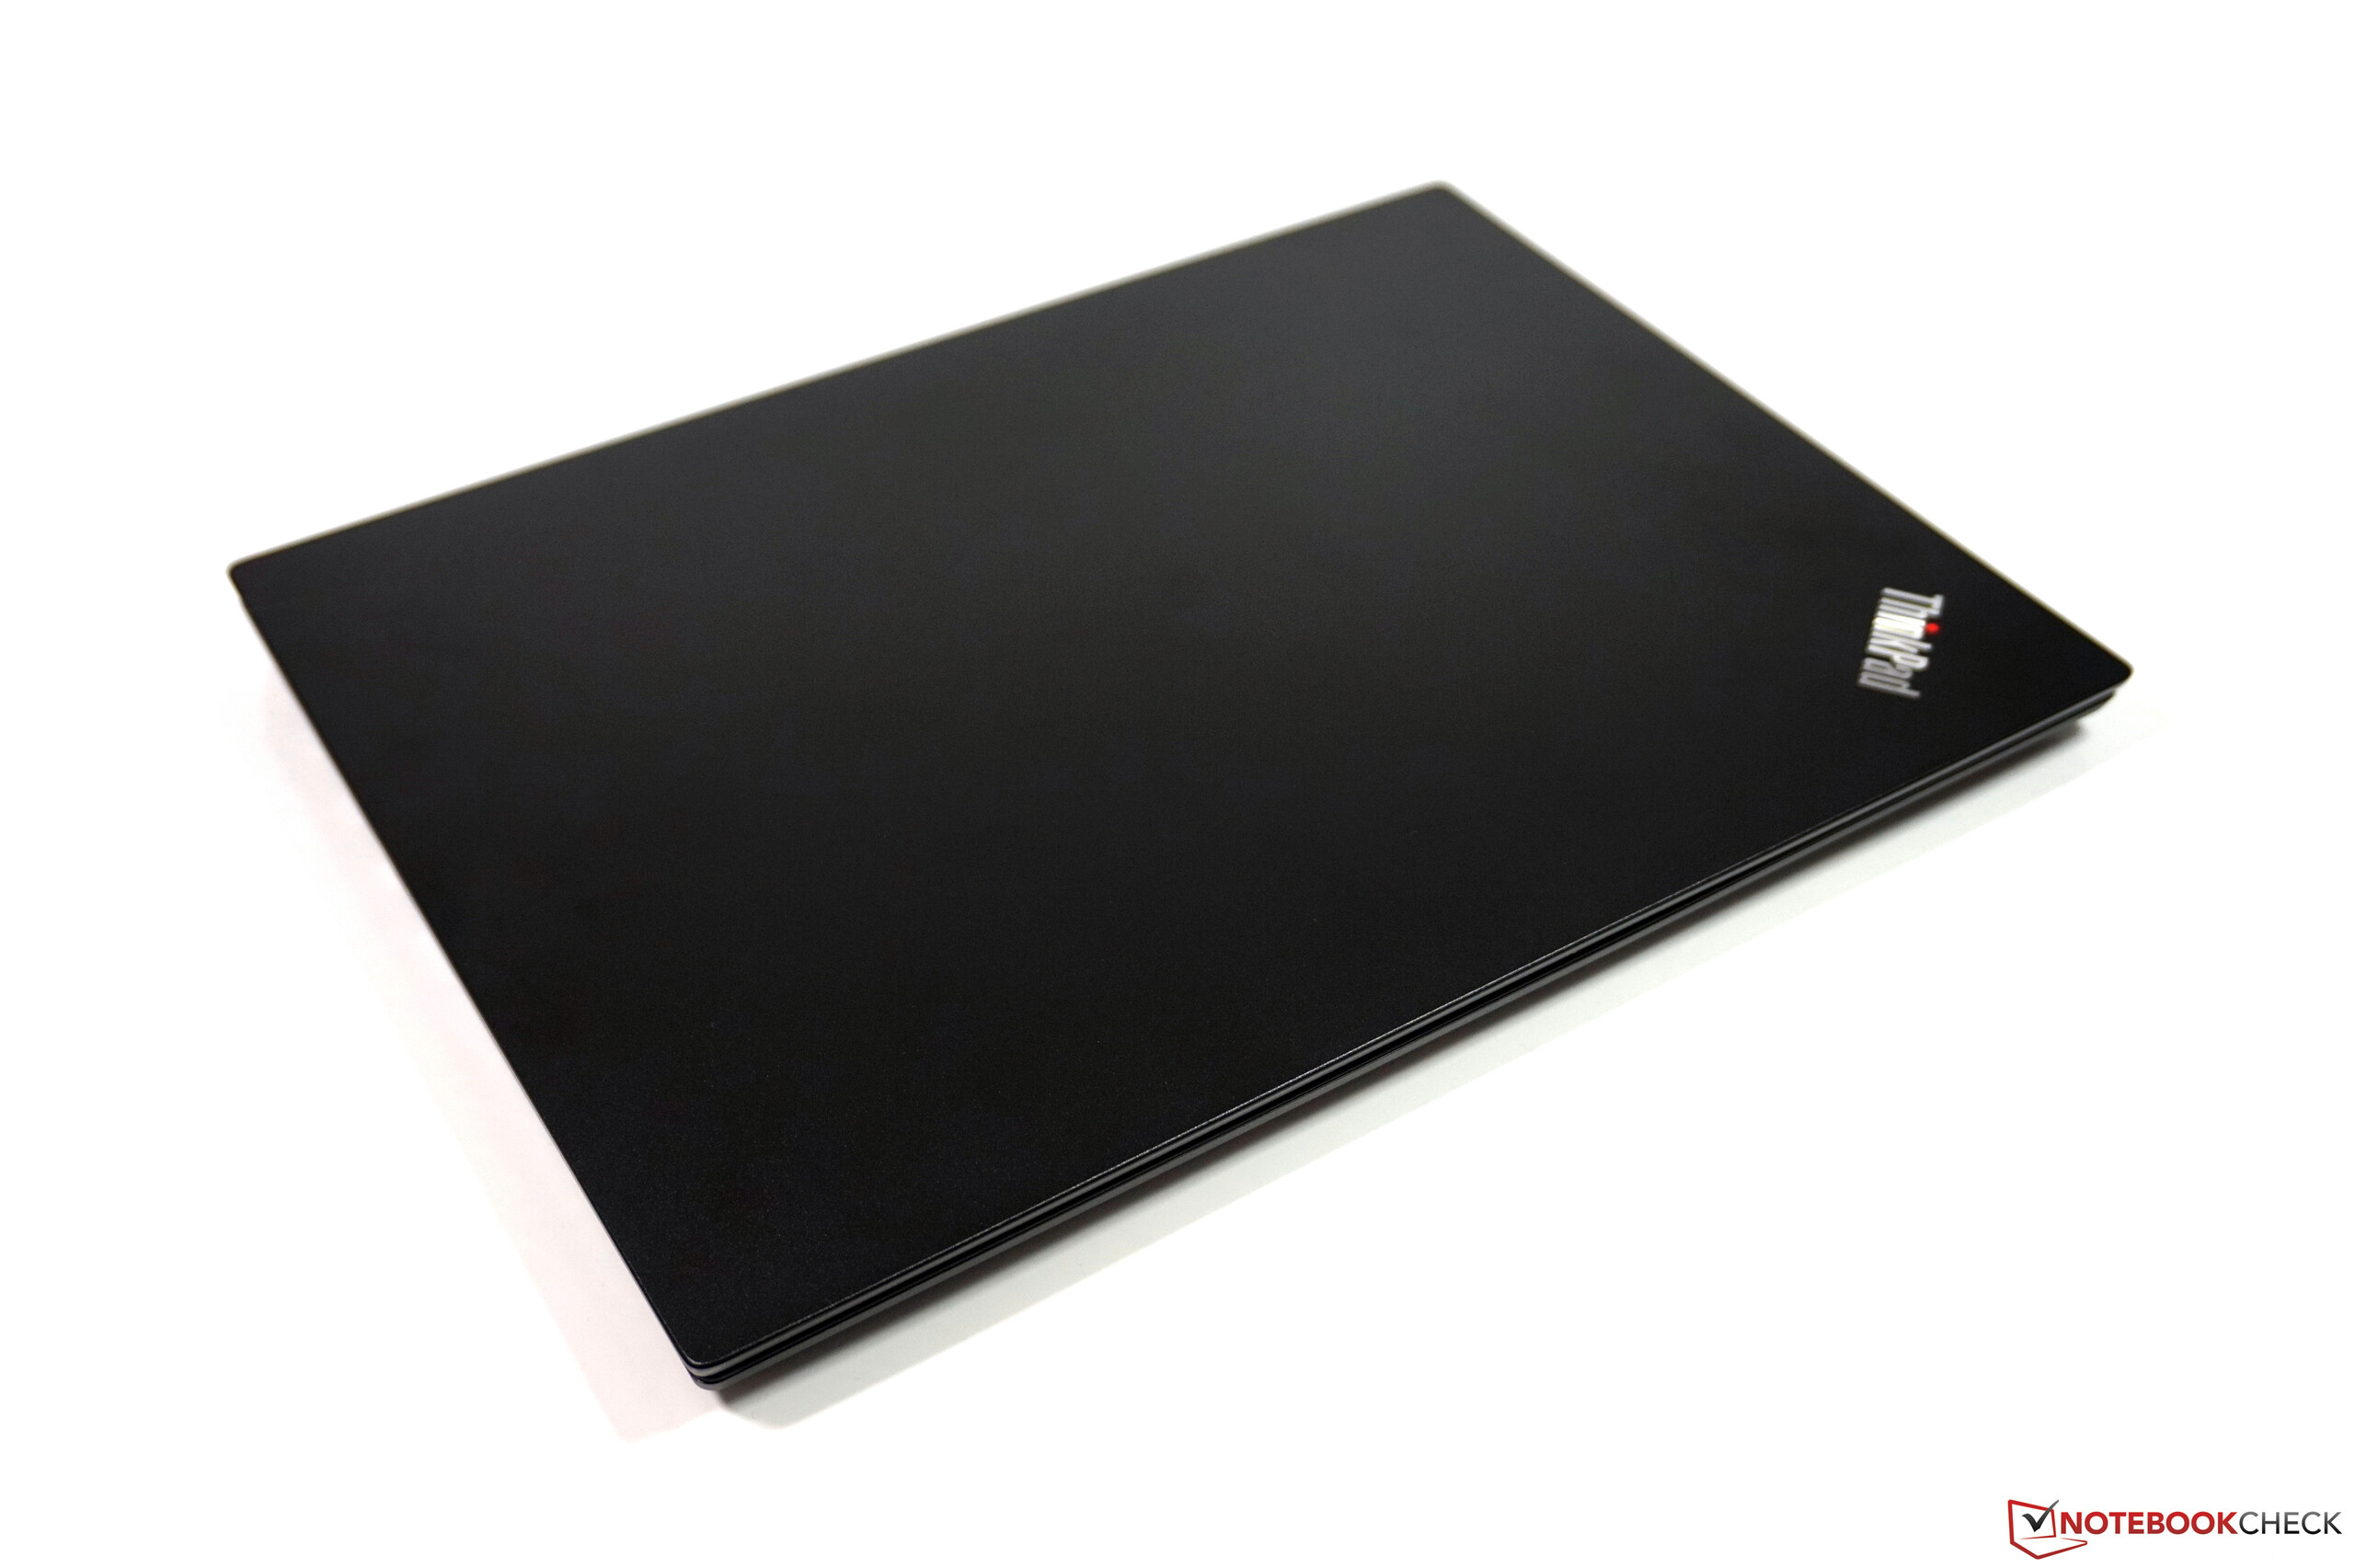
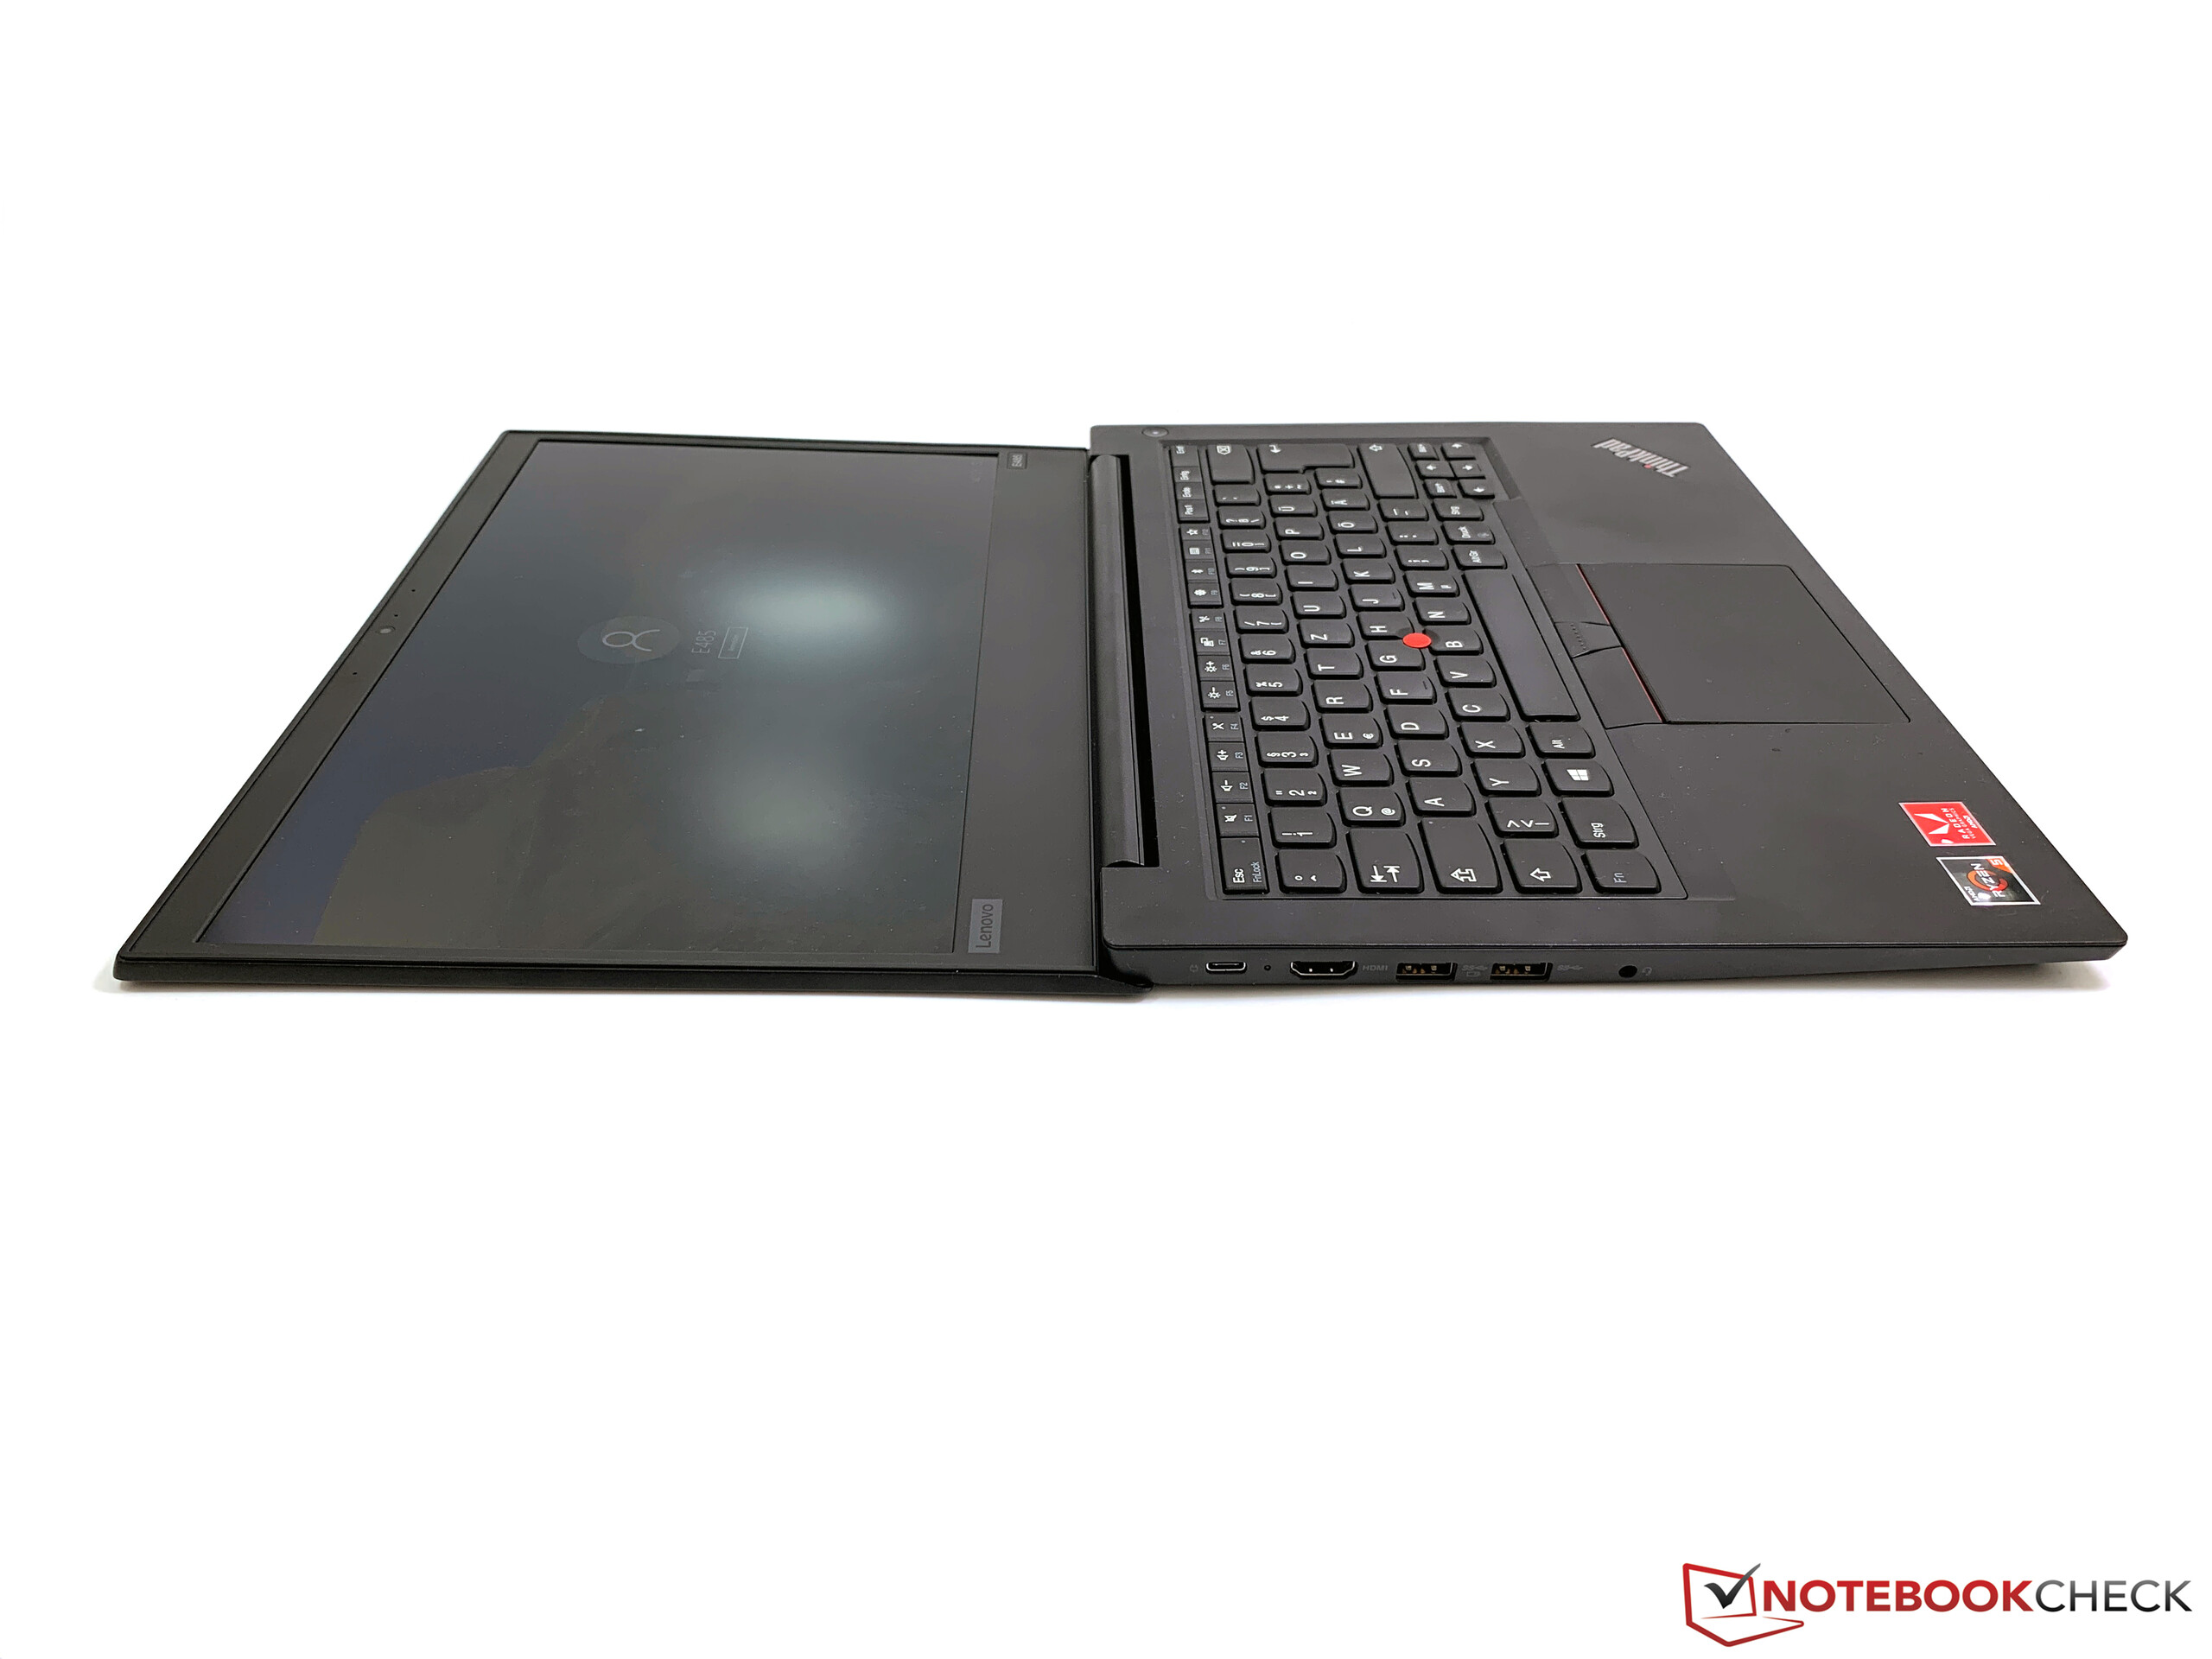
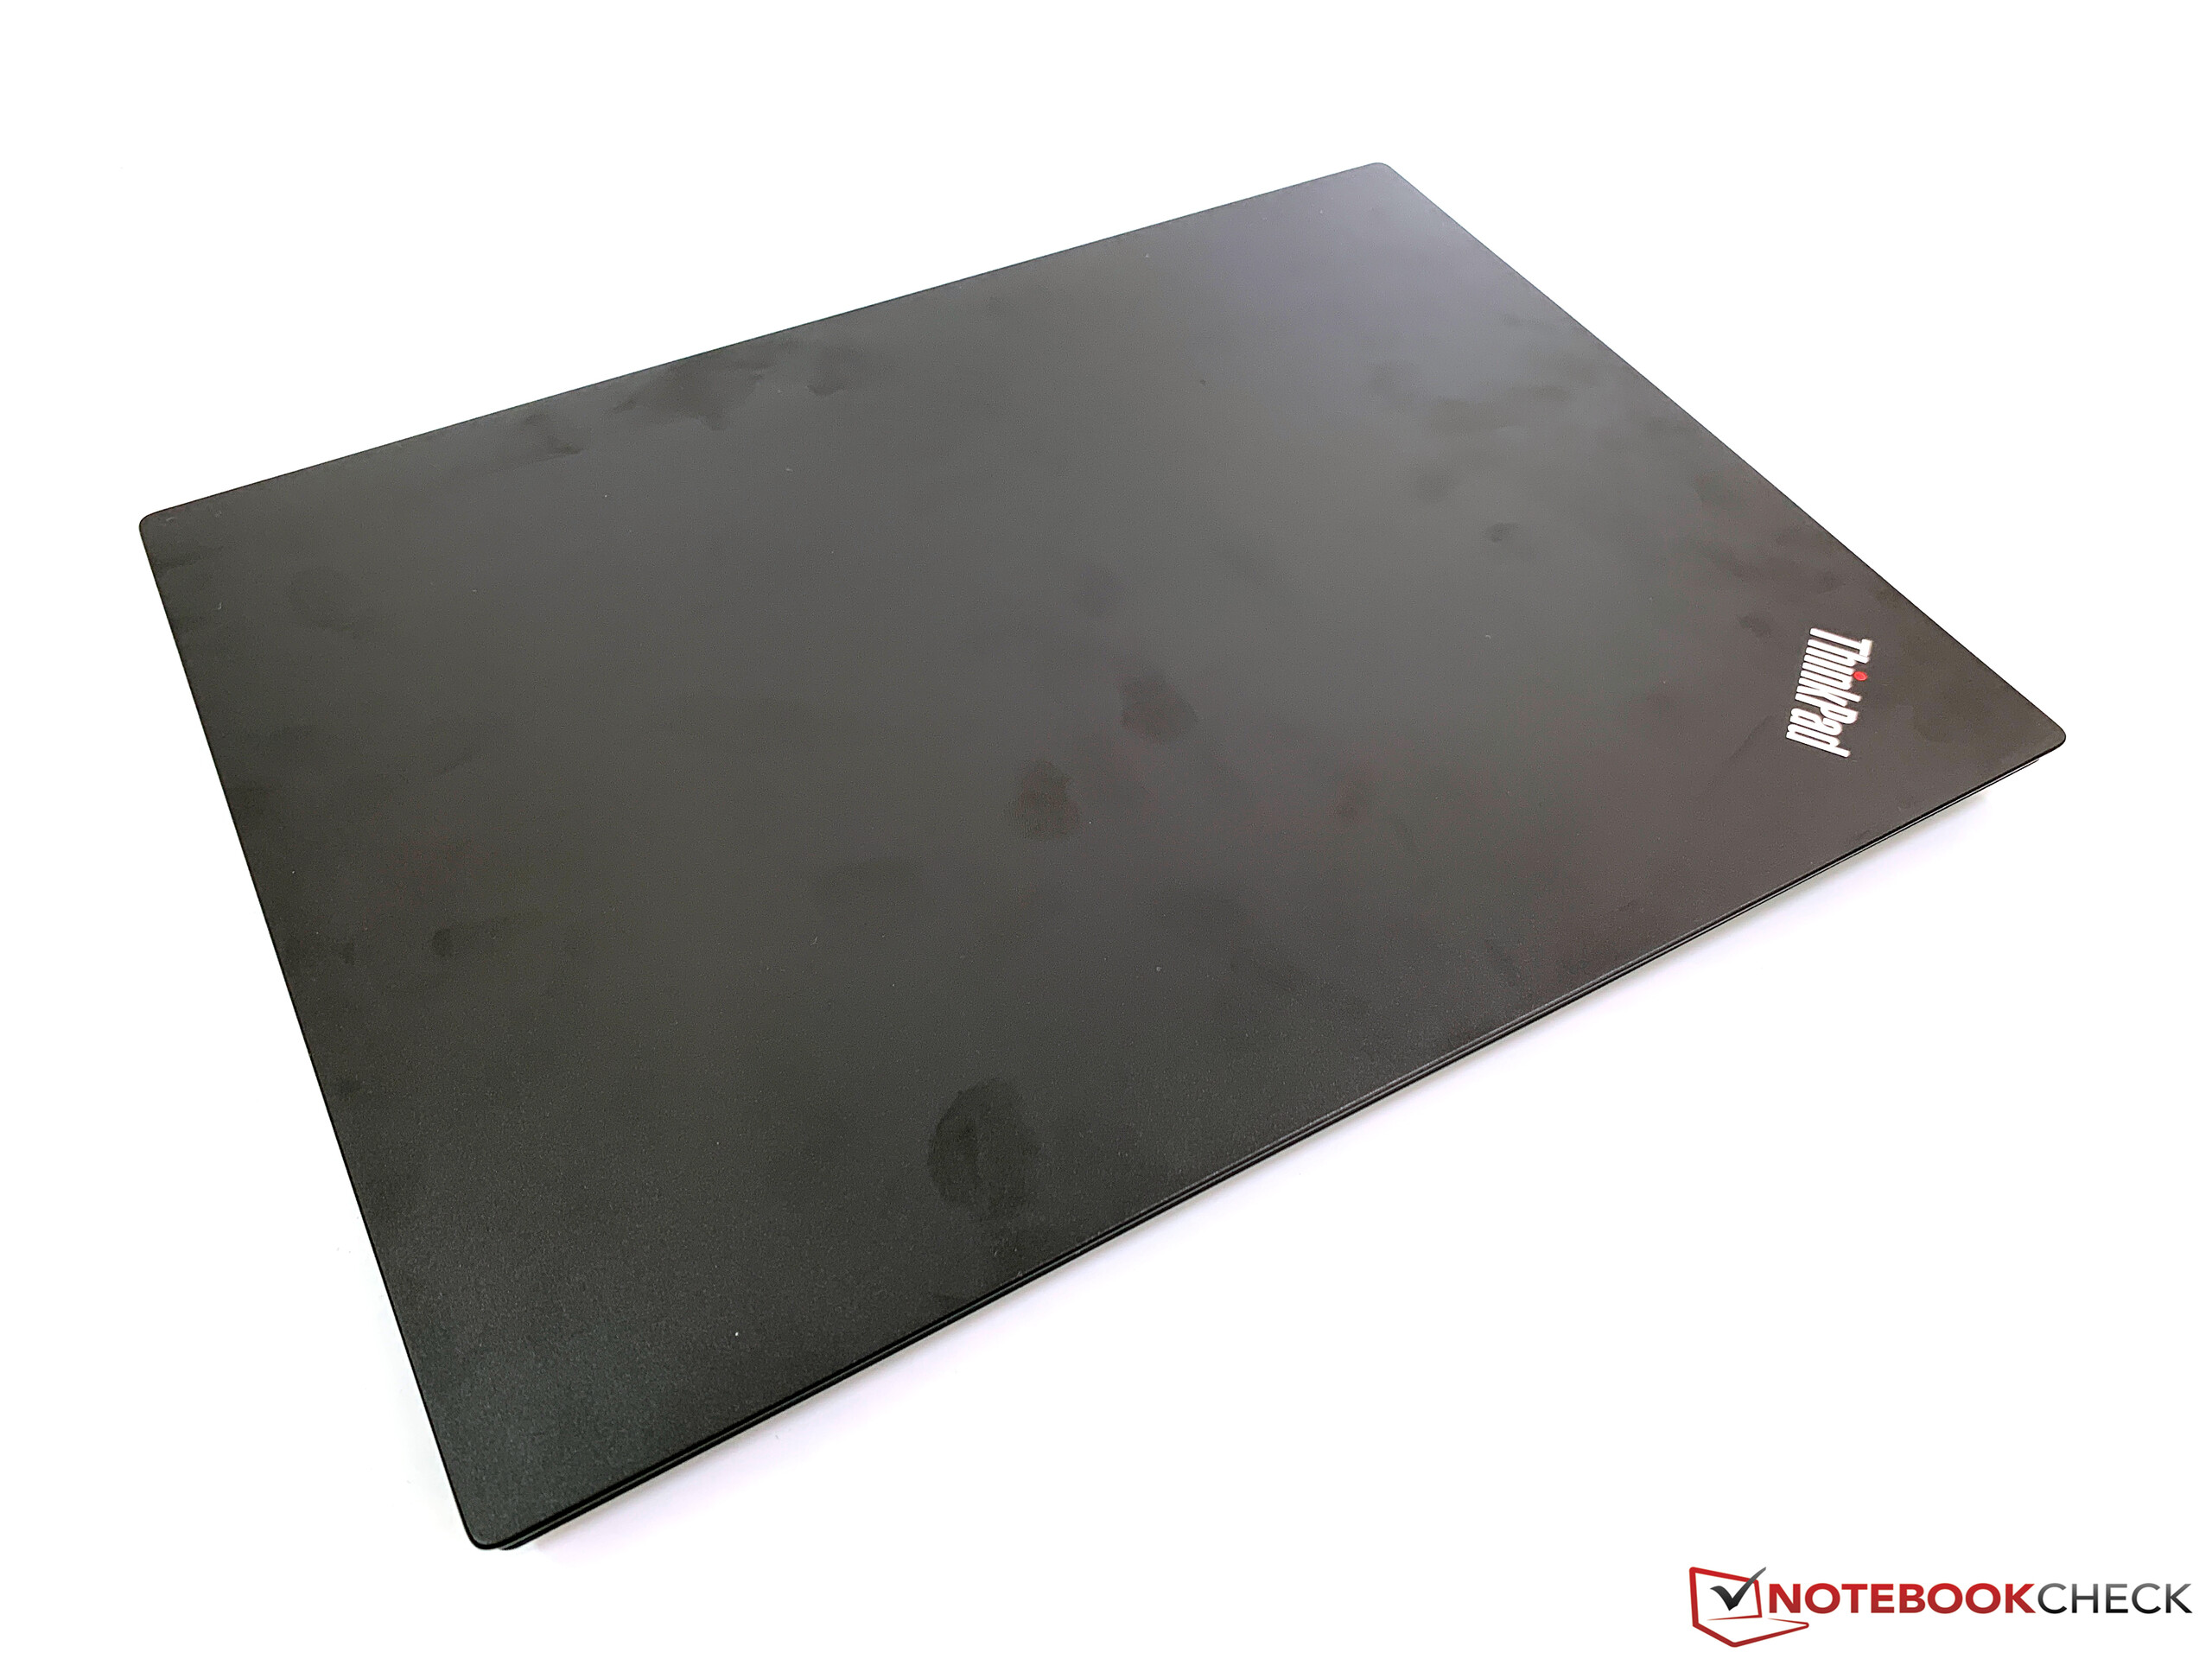
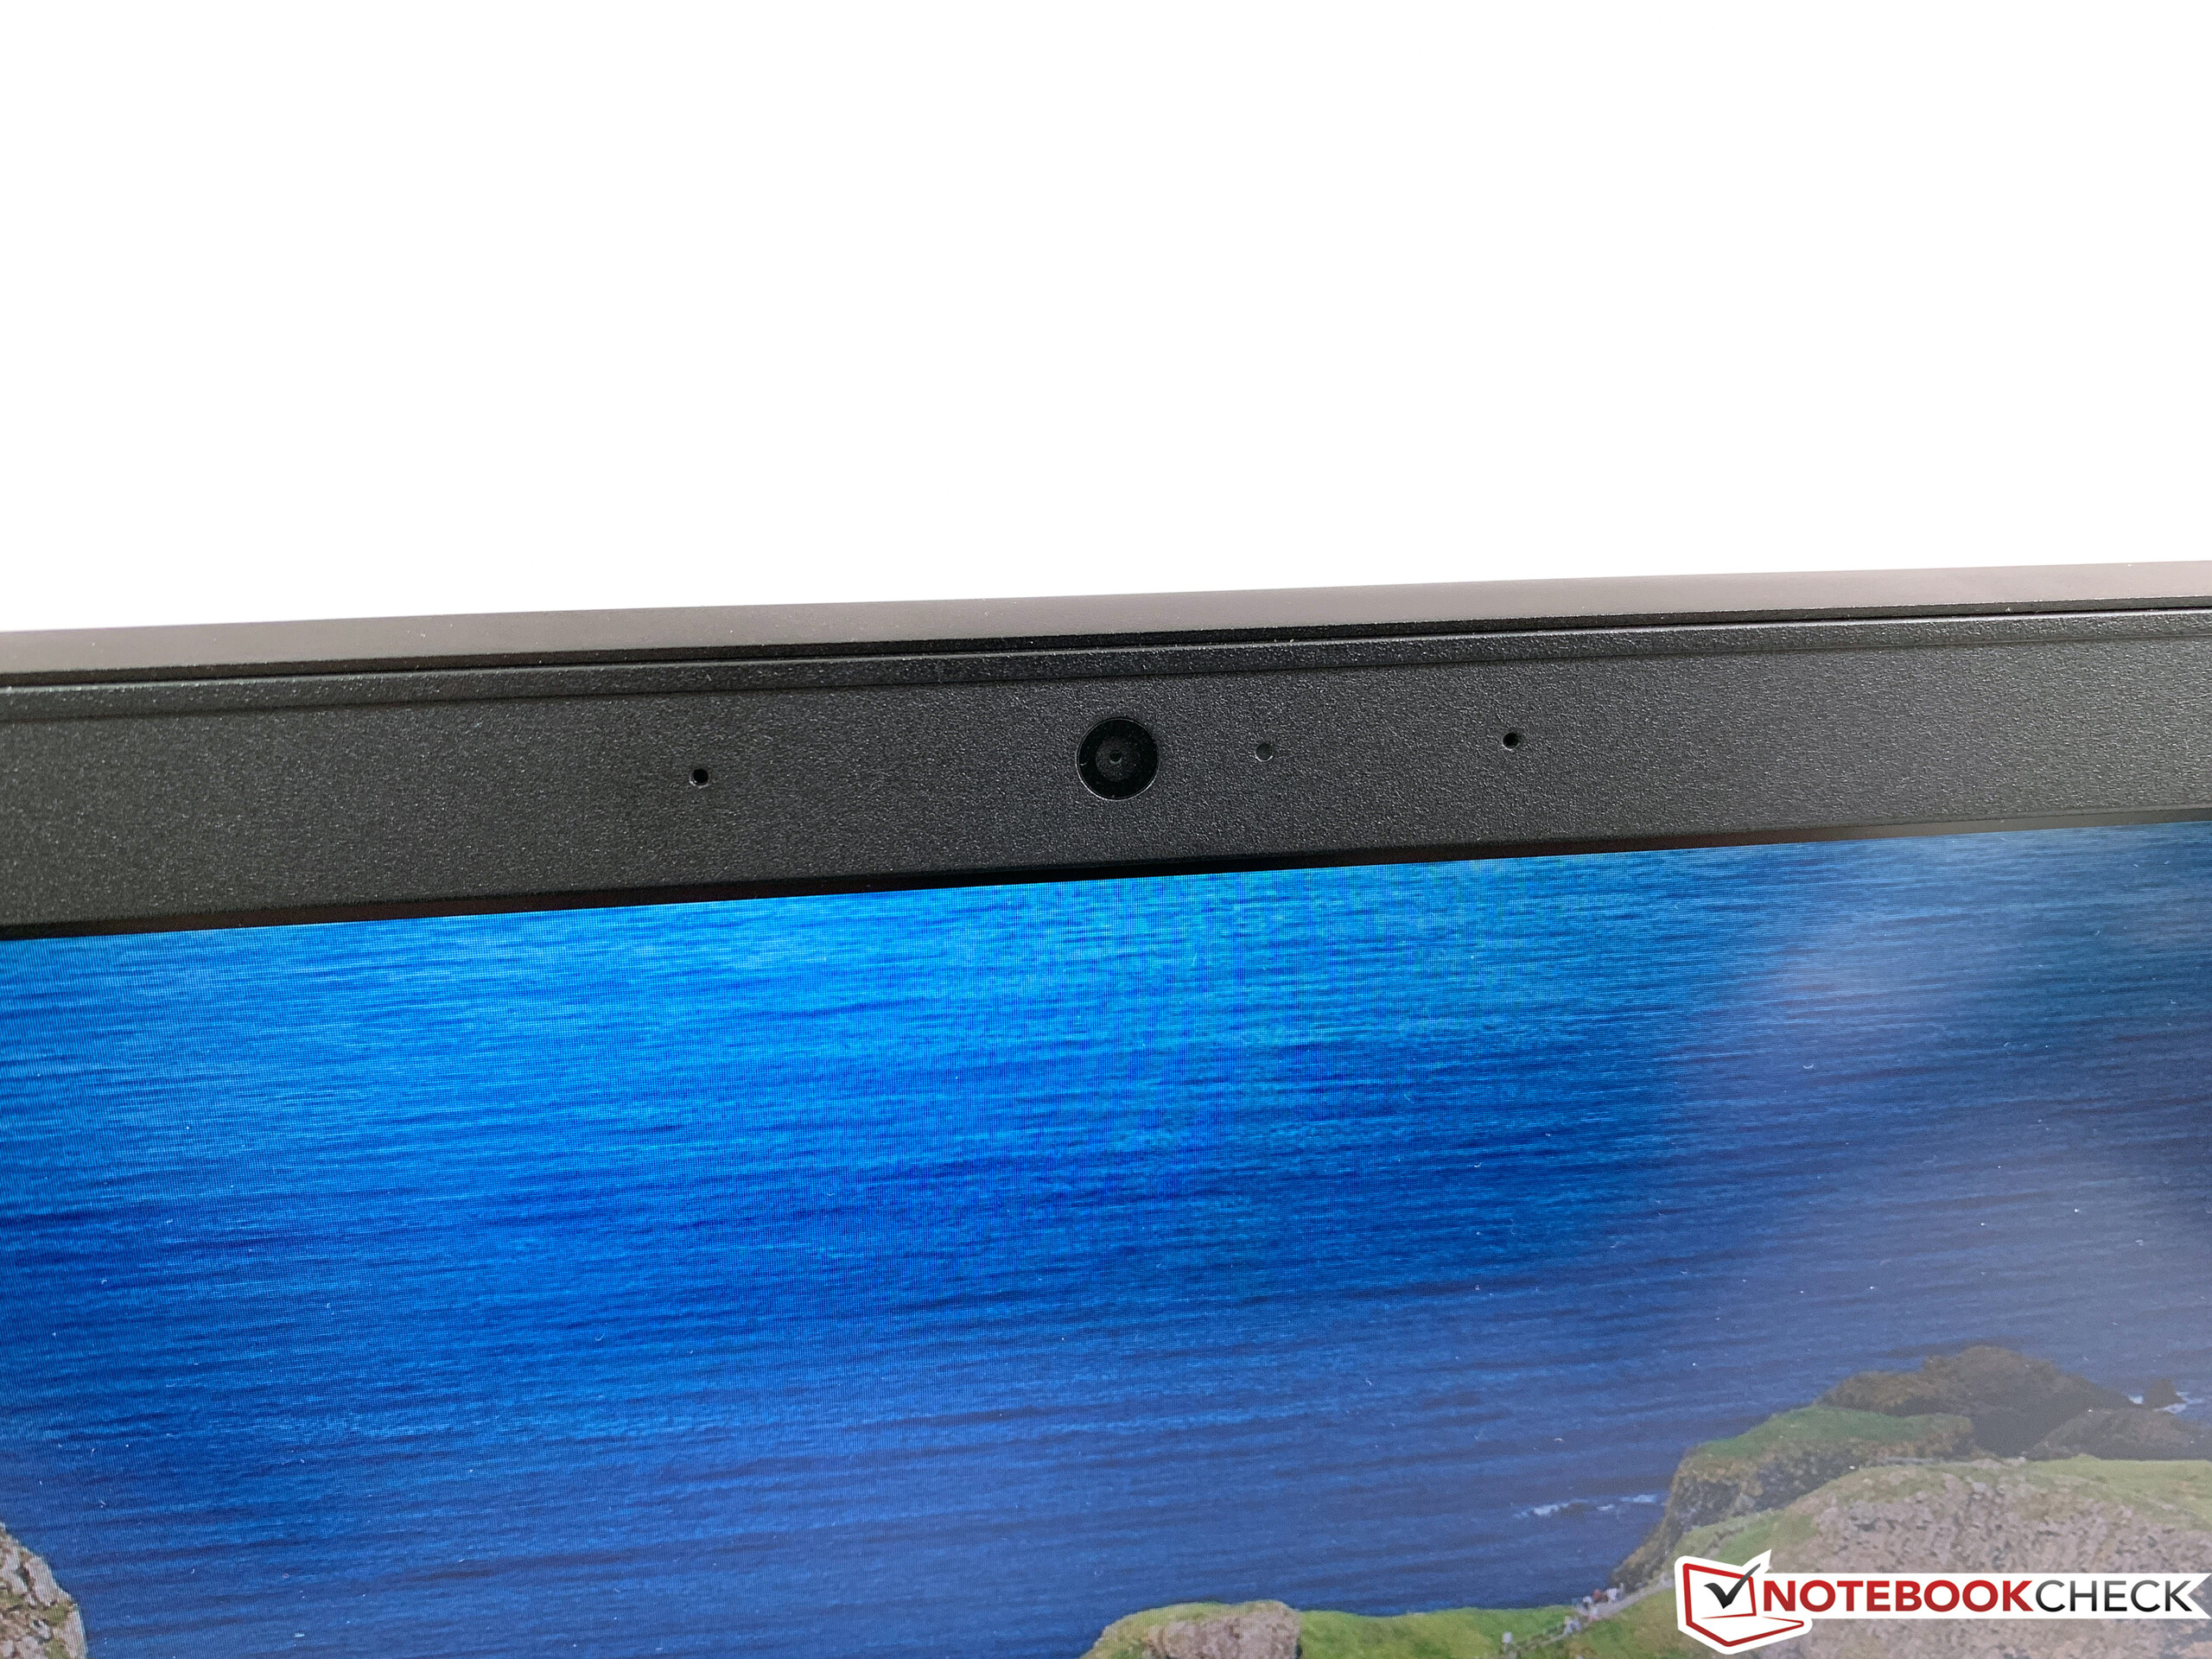
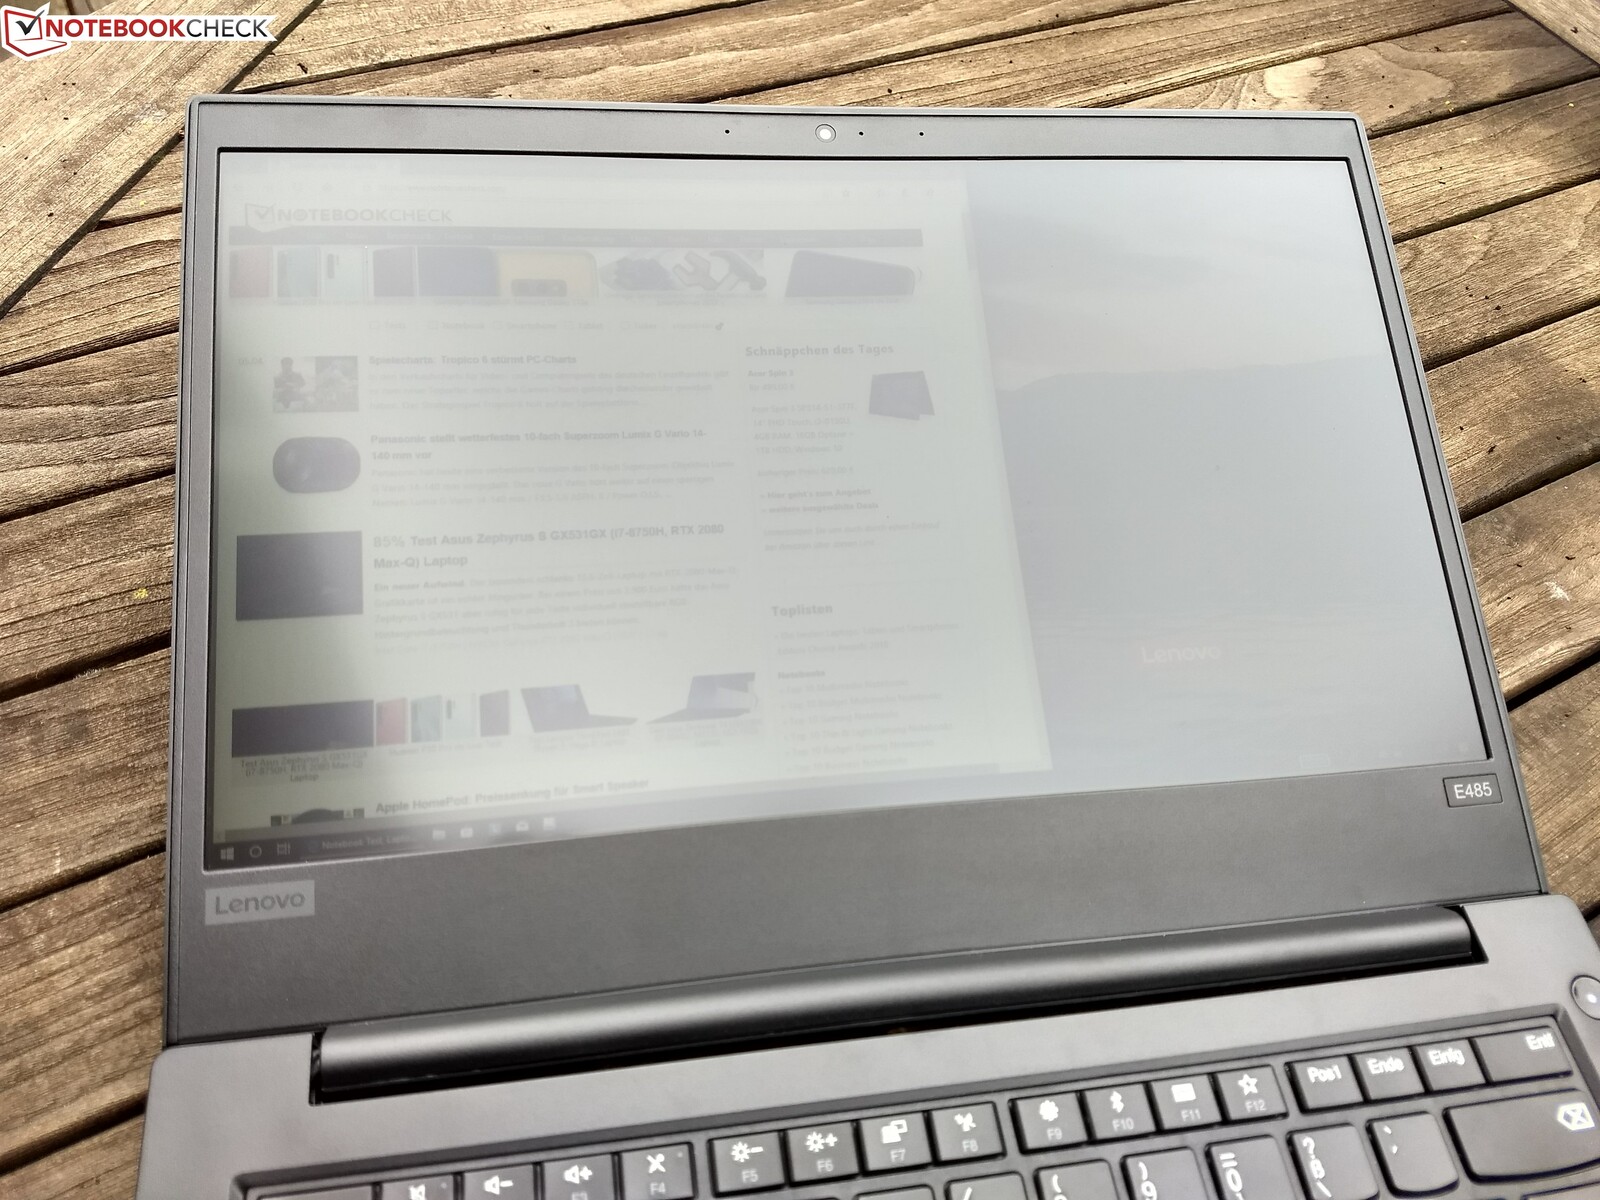
With its black color, the ThinkPad E485 is visually a typical ThinkPad. Having abandoned the more playful design of the ThinkPad E470 with the E480, the device fits in with everyday business operations significantly better and cannot immediately be identified as a "budget model." While the design might seem a bit boring to some people, the ThinkPad E485 basically strikes a good figure in the office as well as at your desk at home. The fairly thick display bezels continue to be a disadvantage in the design, particularly above and below the display. In addition, you have to clean the display lid regularly, since it quickly attracts fingerprints (see pictures).
Basically, Lenovo uses the case we know from the ThinkPad E480 also for the E485, but there is still a difference in terms of its quality. The plastic on top of the base unit is noticeably rougher than that of the Intel model, leaving a slightly lower-quality impression. In the E480, this rough plastic is only used on the display bezels. However, the other materials and surfaces (such as the aluminum display lid) are identical. The different use of materials might have possibly been done to reduce costs, but it could also be to differentiate the devices somewhat.
Fortunately, this has no effect on the stability of the case. The base unit can only be pressed in with the use of a lot of force, which will not impact everyday usage at all. There is also no creaking. While the fairly thin display lid can be warped slightly, it handles single-point pressure very well. The central hinge is very well adjusted and can prevent some wobble. One hand is sufficient to open the display, and the maximum opening angle is 180 degrees.
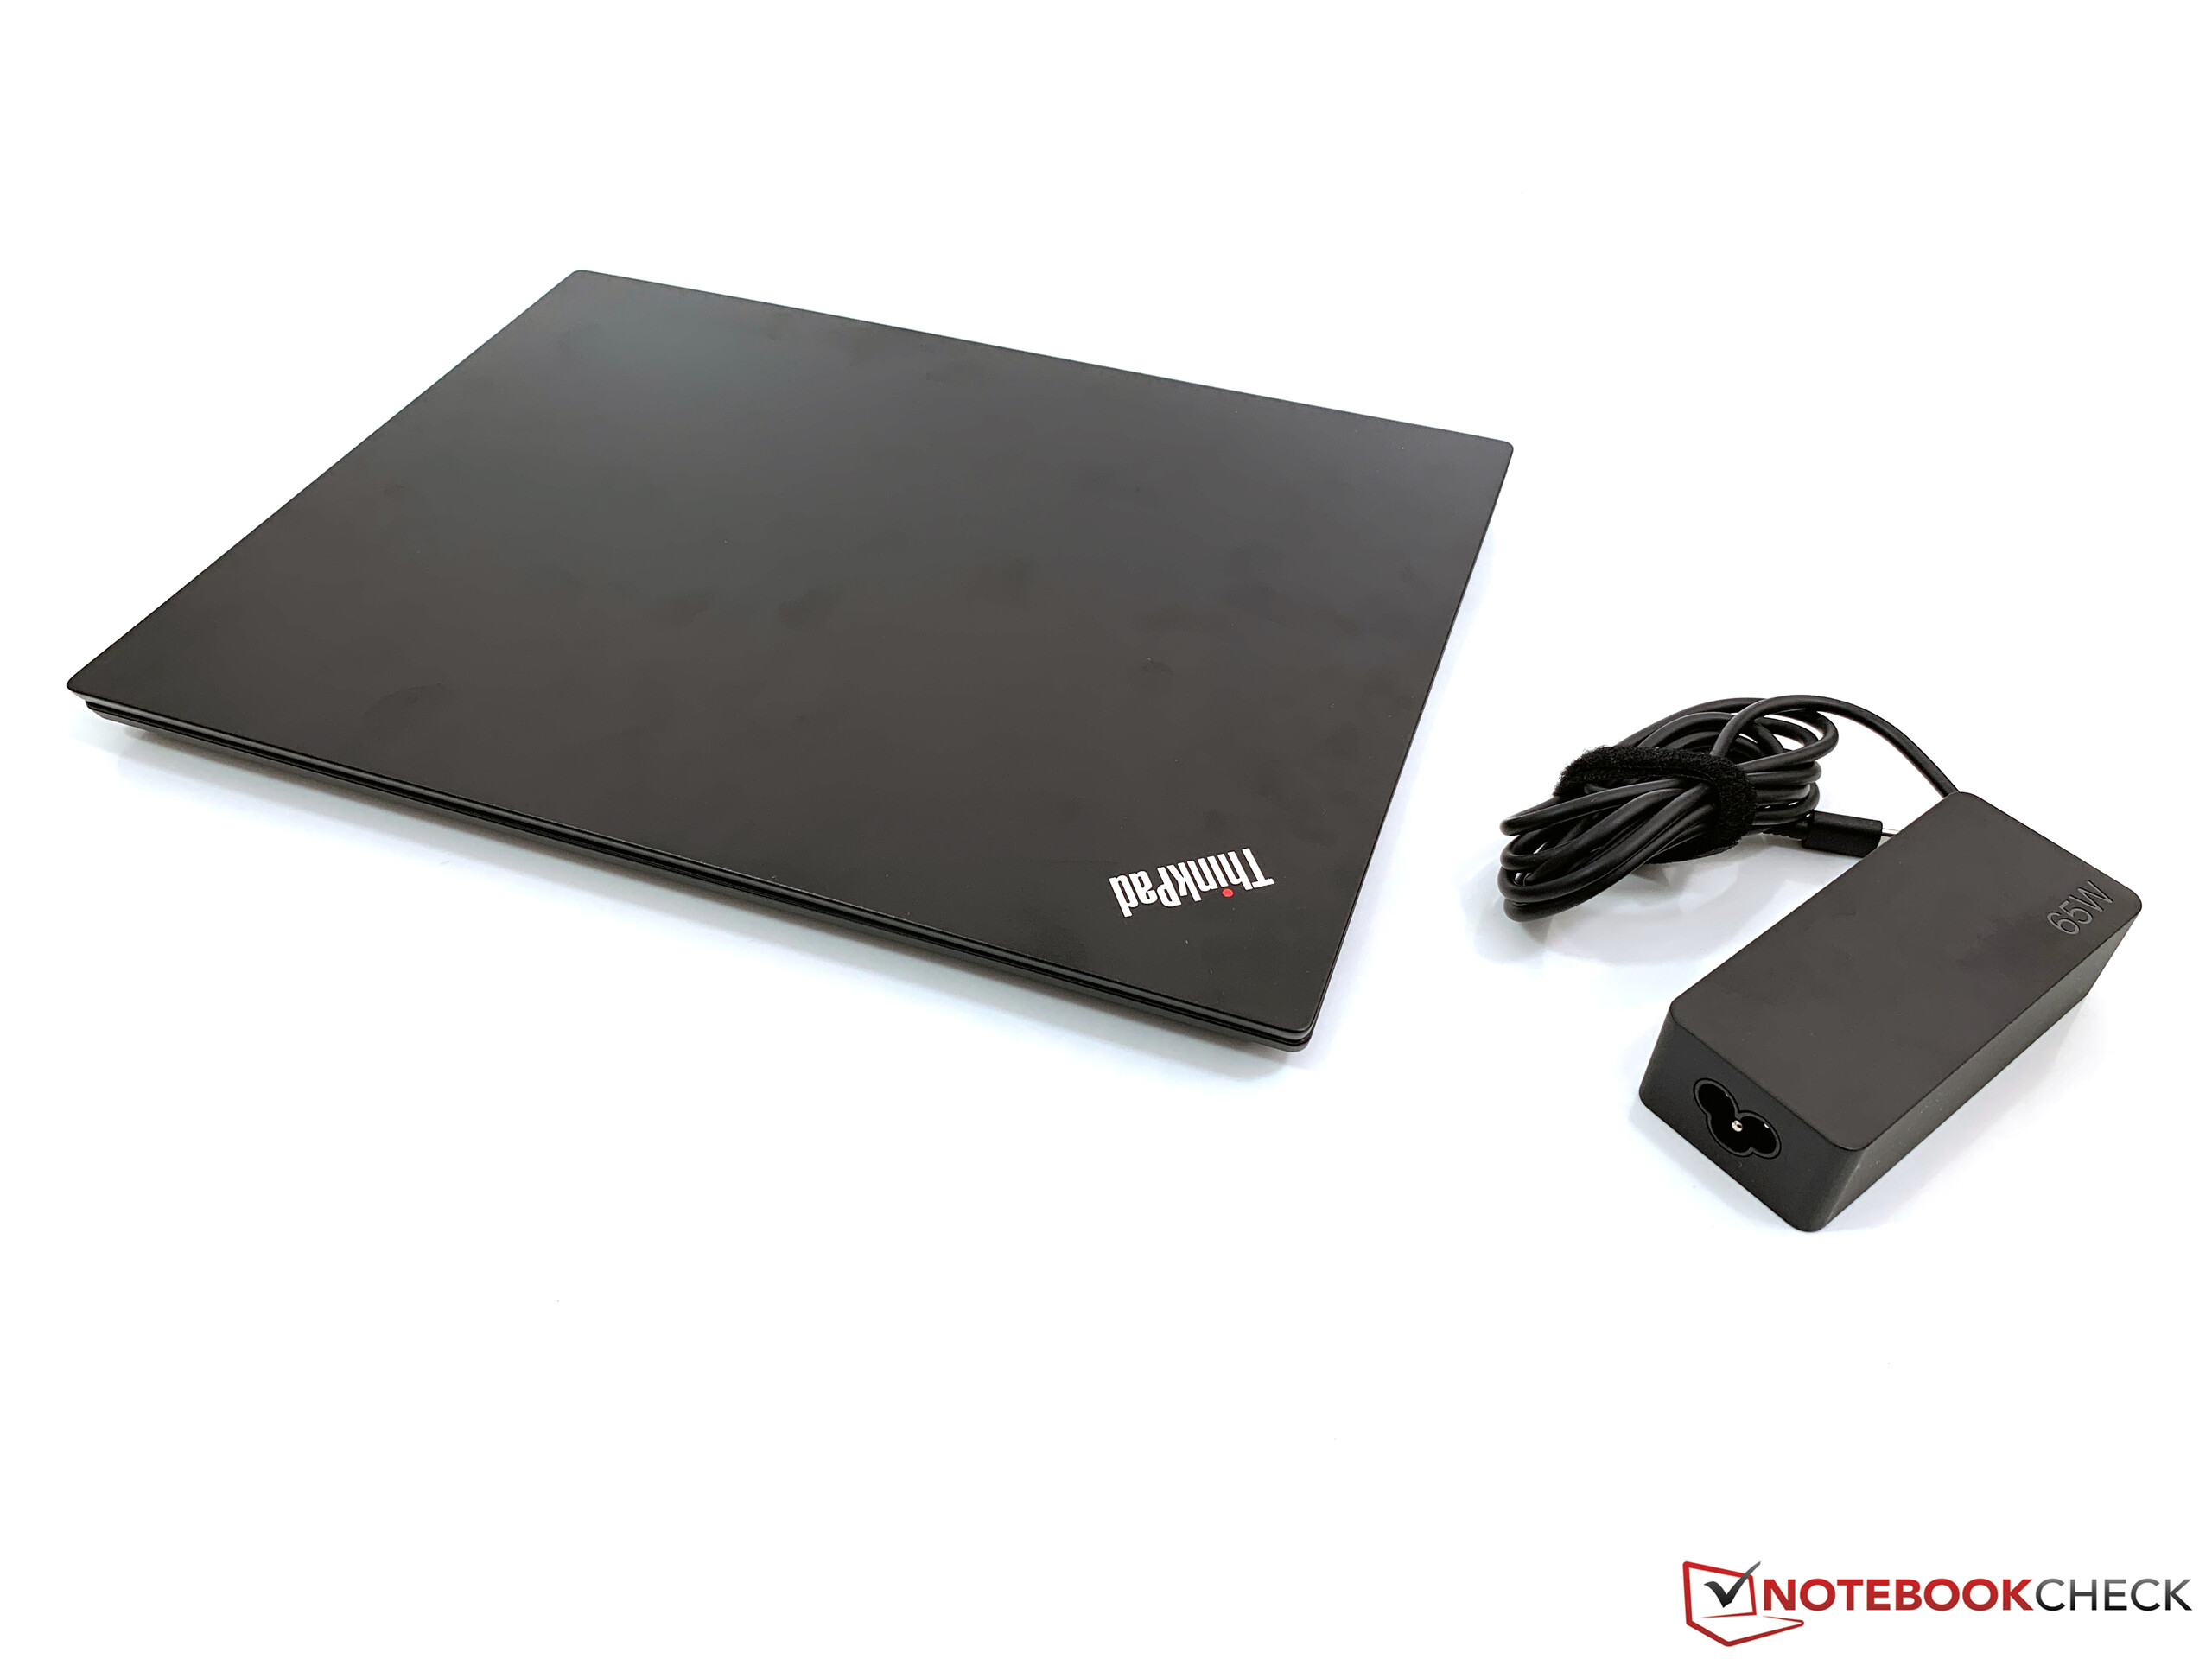
In the size comparison, all the devices range at a similar level overall, and the same goes for the weight. Only the ProBook 440 G6 is about 200 grams (~0.44 lb) lighter. In addition to the 1.8 kg (~4 lb) of the test unit, you have to add about 360 grams (~0.8 lb) for the power supply when transporting the laptop.
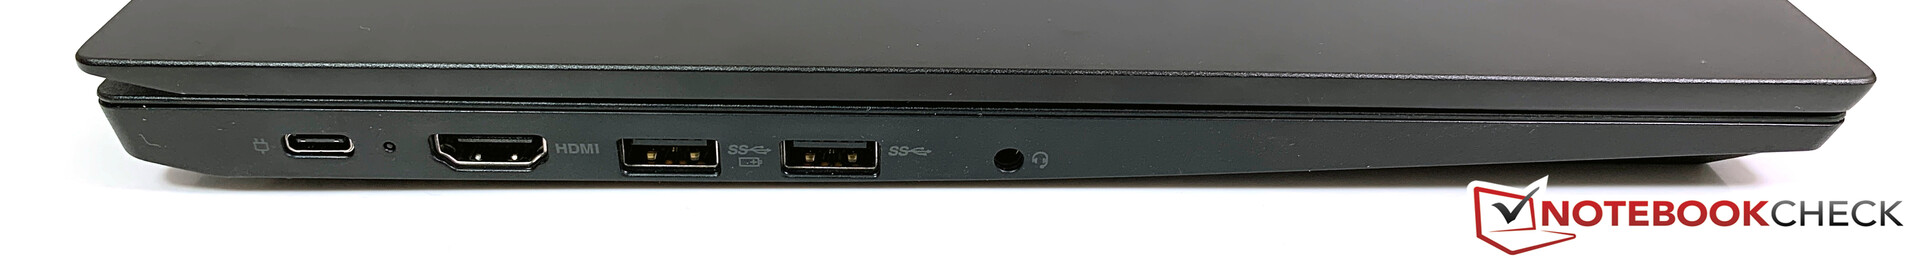
Connections
While the ThinkPad E485 offers all the necessary connections, you should not expect too much. The USB-C port (Gen. 2 with alternative DisplayPort mode) is good, but is also used to charge the device. So when you have it connected to the charger, it is not available for anything else. Thunderbolt 3 is also not available, which is not a surprise in this price range though. However, we still have two minor complaints, since instead of the USB-2.0 connection, Lenovo could really have built-in a third 3.0 connection and the case also would have offered sufficient space for a full SD card reader.
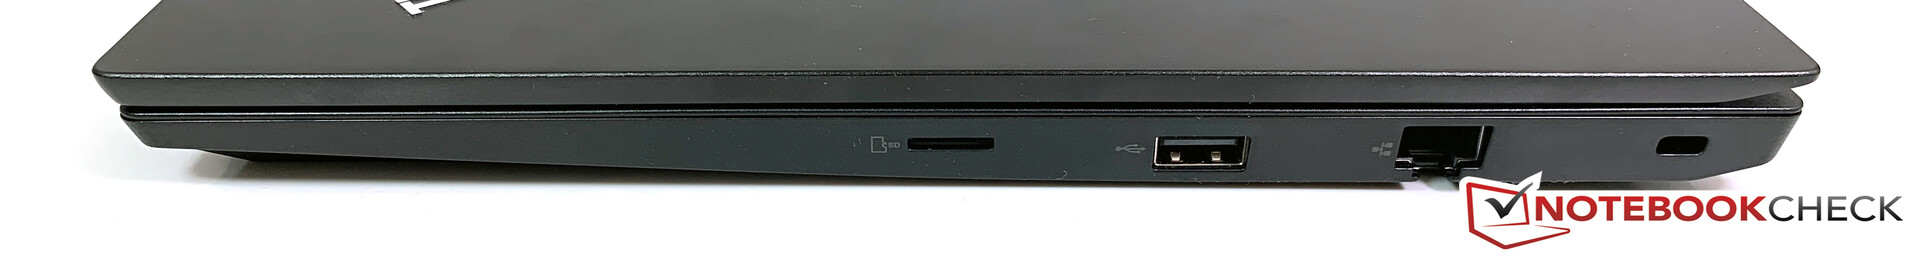
SD Card Reader
We evaluate the performance of the integrated microSD card reader with our Toshiba reference card (Exceria Pro M501 UHS-II 64 GB). The transfer rates range at around 80 MB/s, which is completely sufficient.
| SD Card Reader | |
| average JPG Copy Test (av. of 3 runs) | |
| HP ProBook 440 G6-5TK01EA (Toshiba Exceria Pro SDXC 64 GB UHS-II) | |
| Lenovo ThinkPad E480-20KNCTO1WW (Toshiba Exceria Pro M501) | |
| Lenovo ThinkPad E485-20KU000NGE (Toshiba Exceria Pro M501) | |
| HP ProBook 645 G4 3UP62EA (Toshiba Exceria Pro M501 microSDXC 64GB) | |
| Average of class Office (22.4 - 198.5, n=21, last 2 years) | |
| Dell Latitude 3490 (Toshiba Exceria Pro SDXC 64 GB UHS-II) | |
| maximum AS SSD Seq Read Test (1GB) | |
| Lenovo ThinkPad E480-20KNCTO1WW (Toshiba Exceria Pro M501) | |
| HP ProBook 645 G4 3UP62EA (Toshiba Exceria Pro M501 microSDXC 64GB) | |
| Lenovo ThinkPad E485-20KU000NGE (Toshiba Exceria Pro M501) | |
| HP ProBook 440 G6-5TK01EA (Toshiba Exceria Pro SDXC 64 GB UHS-II) | |
| Average of class Office (27.4 - 249, n=20, last 2 years) | |
| Dell Latitude 3490 (Toshiba Exceria Pro SDXC 64 GB UHS-II) | |
Communication
In this price class, you have to make do with some compromises in the communication modules as well. However, this does not have much of an impact in everyday usage. In addition to the Gigabit Ethernet module, a Qualcomm WLAN card handles the wireless network connections. This is a 1x1 adapter that supports all the usual standards, including 802.11ac and Bluetooth 4.1. The transfer rates in our standardized WLAN test using the Linksys EA8500 router turn out very good for a 1x1 module and are above the ThinkPad E480 overall. During our test, we did not notice any limitations.
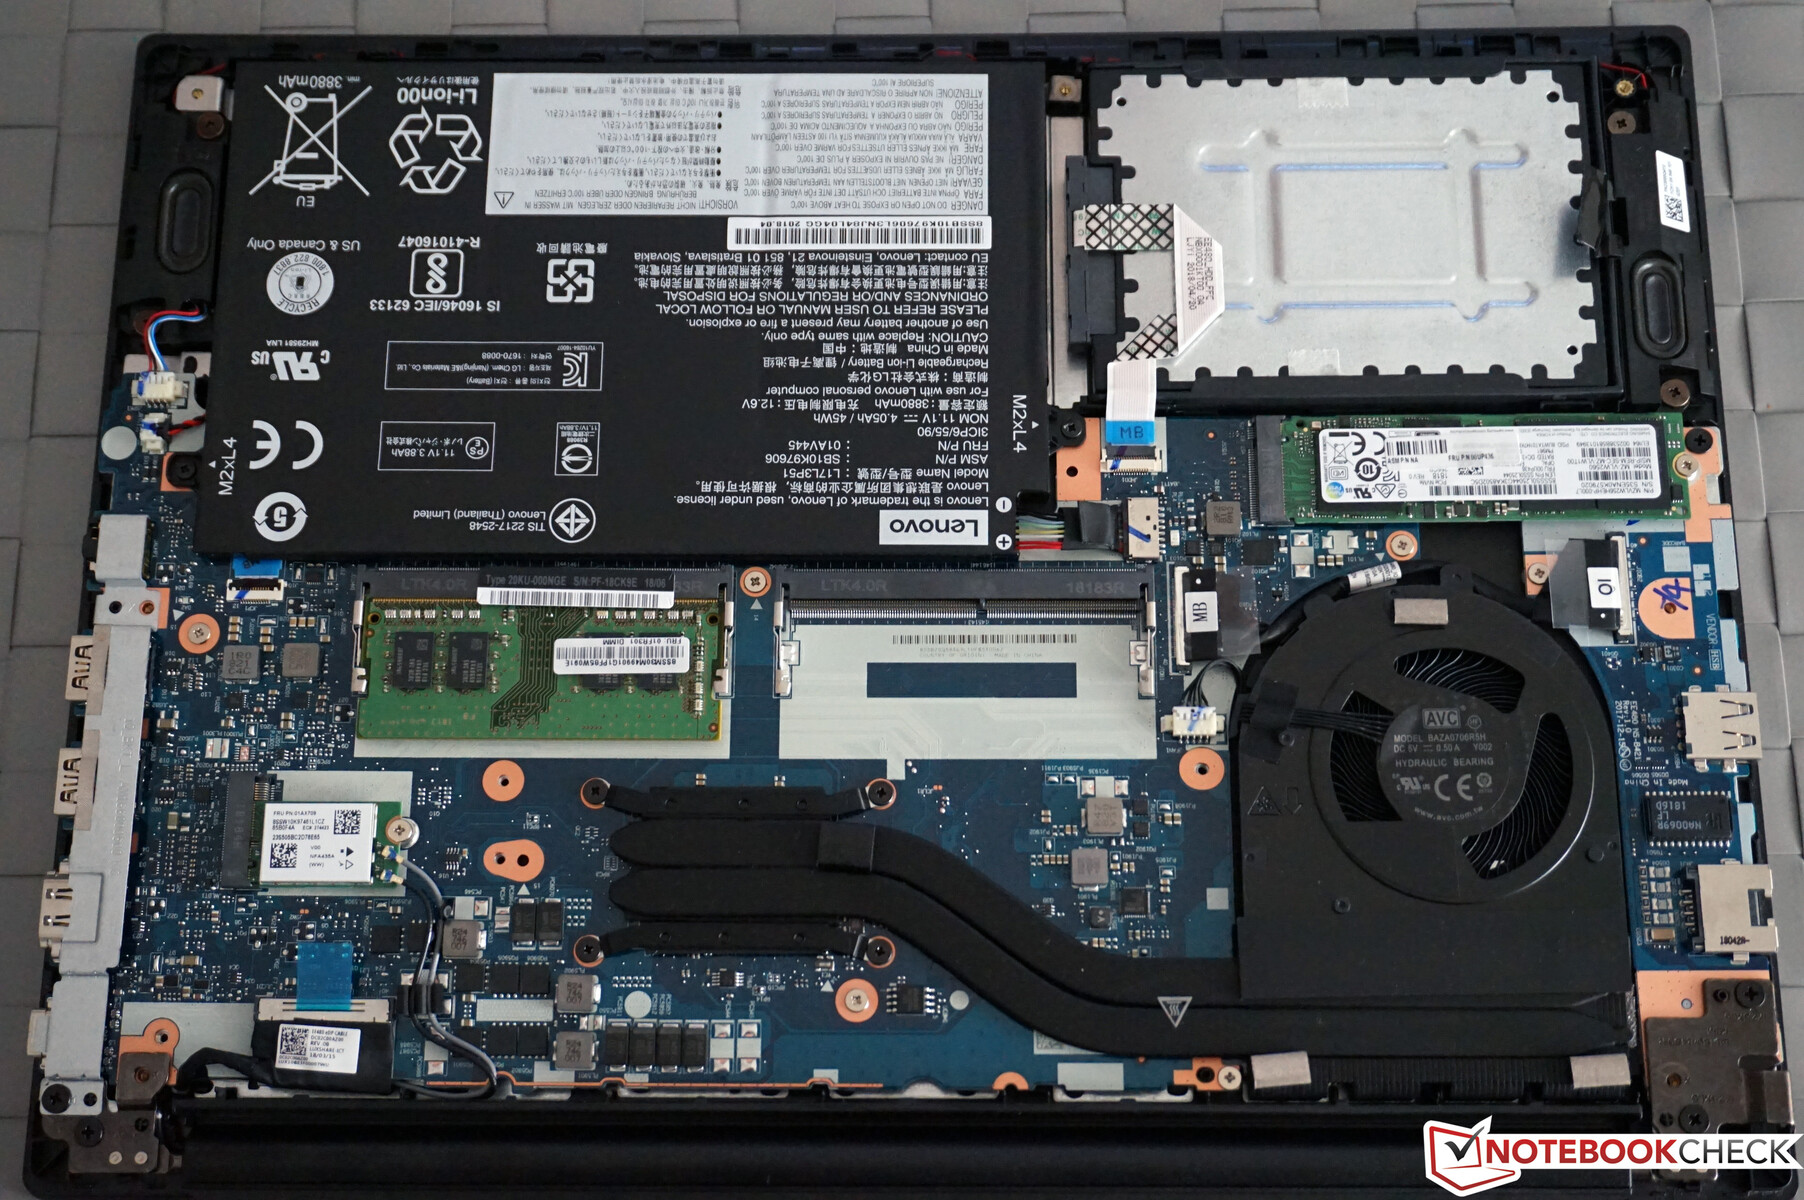
Maintenance
Although there is no maintenance cover, the whole bottom of the case can be removed with relative ease. After loosening the screws (only loosen them, do not take them out!), it is best to start removing the bottom cover from the back. After doing this, you will get access to the most important components, including the two RAM slots, the WLAN module, the cooling system, and the M.2 SSD. In addition, there is an empty 2.5-inch slot that is already equipped with a mount and the necessary connection cable, so you can easily insert an additional hard drive or SSD (SATA).
Warranty
The affordable entry-level price is also reflected in the warranty period, which covers only 12 months and includes a bring-in service. However, as for the more expensive ThinkPads, you can increase the service period as well as the extent of the services for an additional fee. For example, an upgrade to a three-year on-site service costs about 125 Euros (~$141).
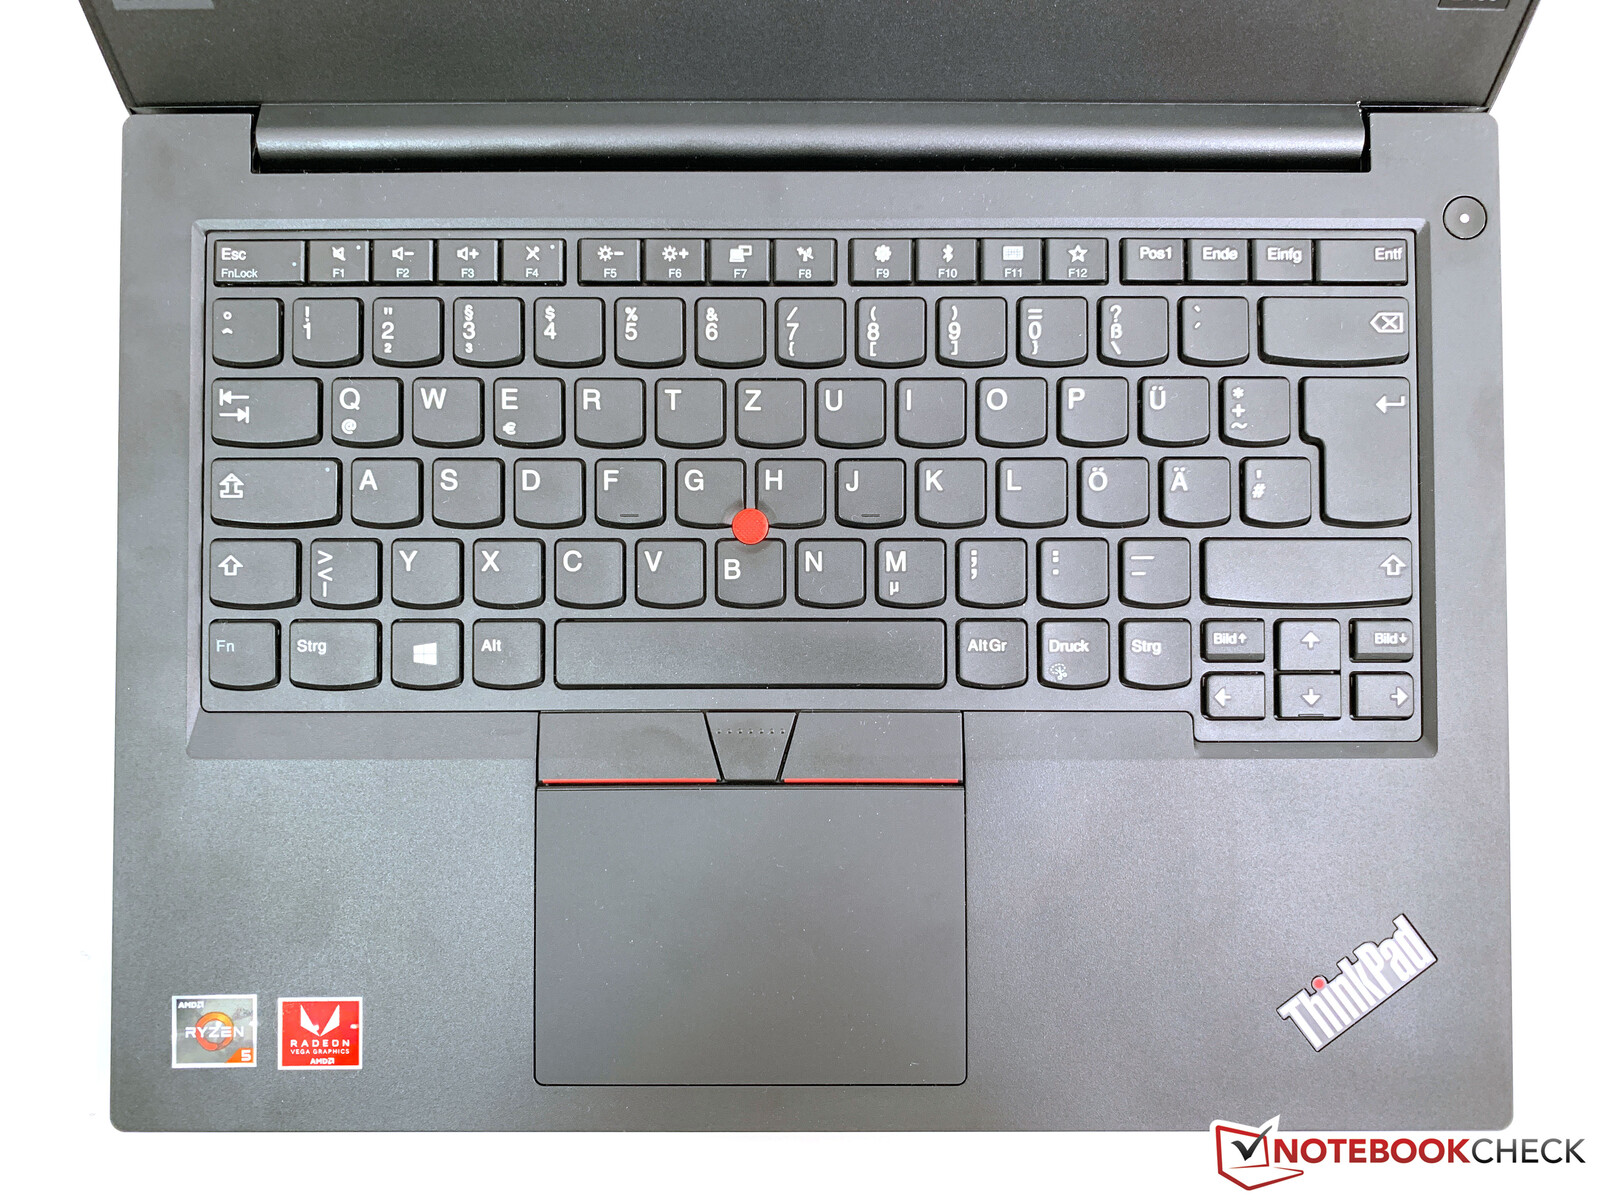
Input Devices – A typical ThinkPad, but without backlight
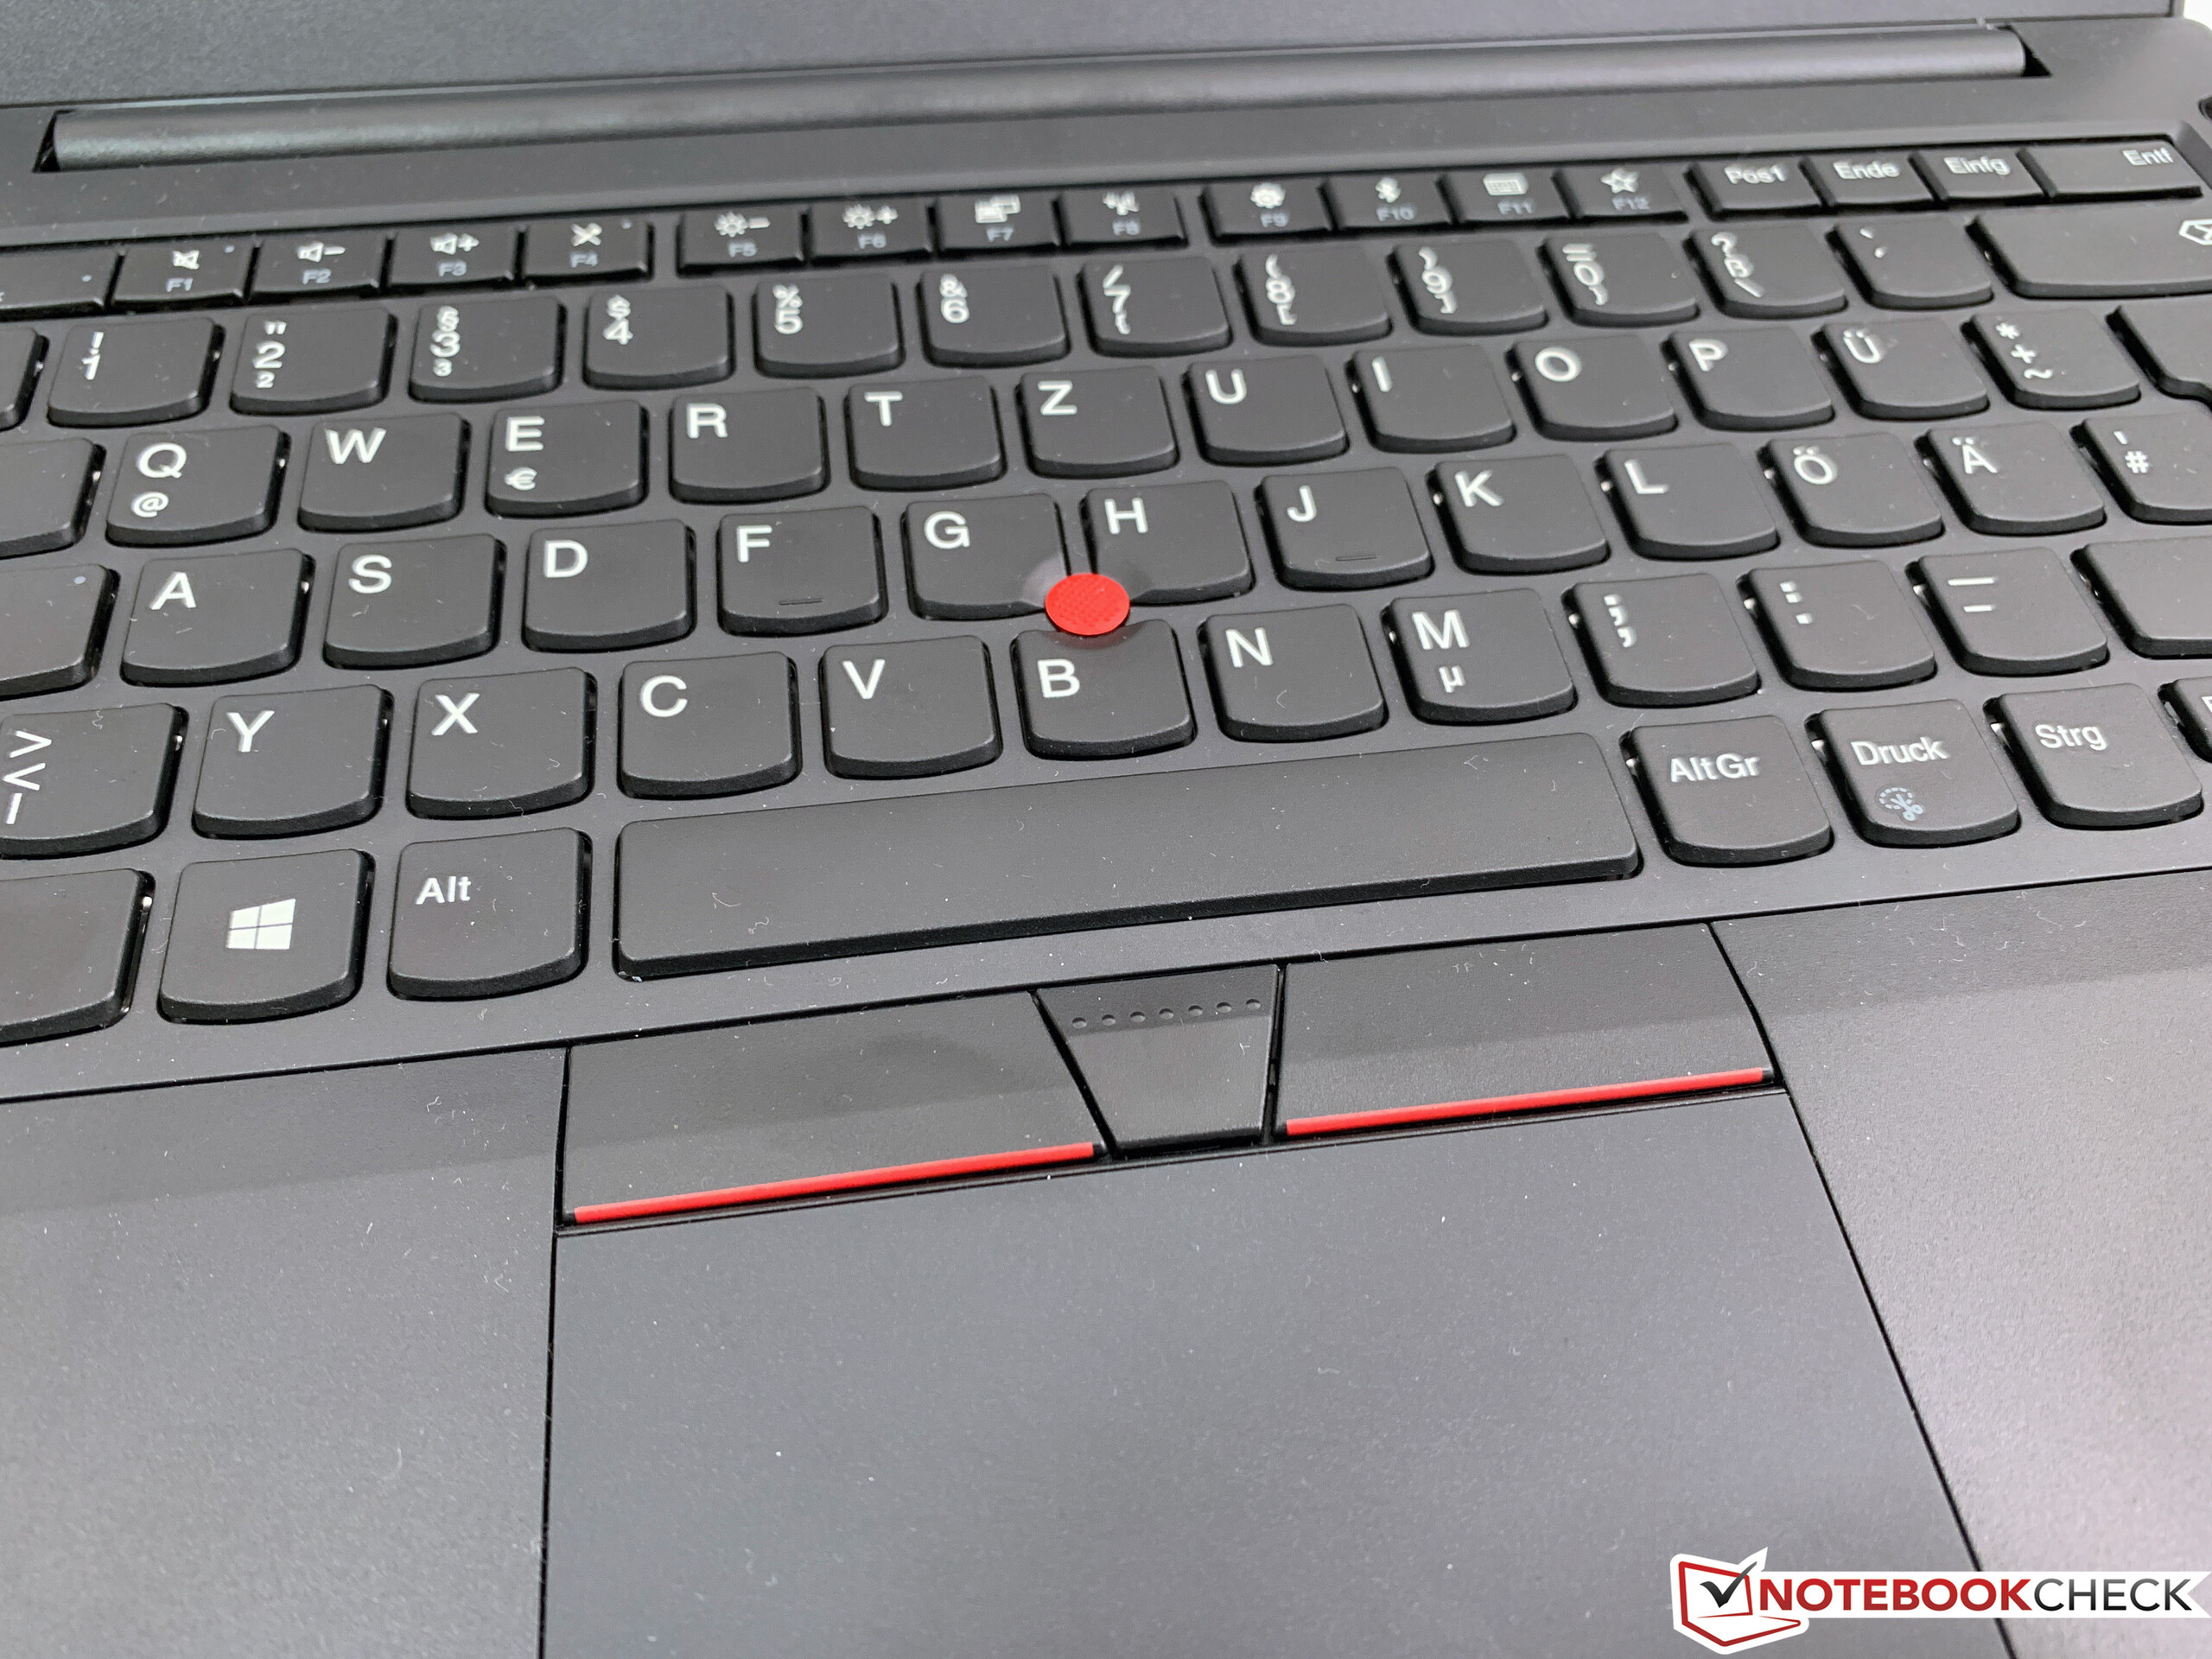
Basically, the keyboard also corresponds to that of the ThinkPad E480, so you get the excellent mechanics of the higher-quality models. Since there is an ample pressure point, sufficient hub, and a very good feedback, prolific writers will immediately feel comfortable. However, the main problem is the lack of a backlight, which we were unable to understand. It is not even available as an option, which reduces the writing comfort, particularly in darker surroundings significantly. We do not really see a good reason for this. Apparently this feature remains purposefully reserved for the Intel models.
The red TrackPoint including the dedicated keys and the ClickPad continue to serve as a mouse replacement. Operation works without a hitch, and you have the choice of your preferred method.
Display – ThinkPad E485 with a matte IPS panel

Lenovo lists two display variants in the data sheet of the ThinkPad E485: an HD panel with a brightness of 220 nits and a Full HD panel with 250 nits. However, the small HD panel is not available in the region encompassing Europe, the Middle East, and Africa. The Full HD IPS panel in our test unit comes from the supplier AU Optronics (B140HAN04.2), but in our experience various panels are used. We are a little surprised about Lenovo's specification of the contrast as barely 400:1, which is very low.
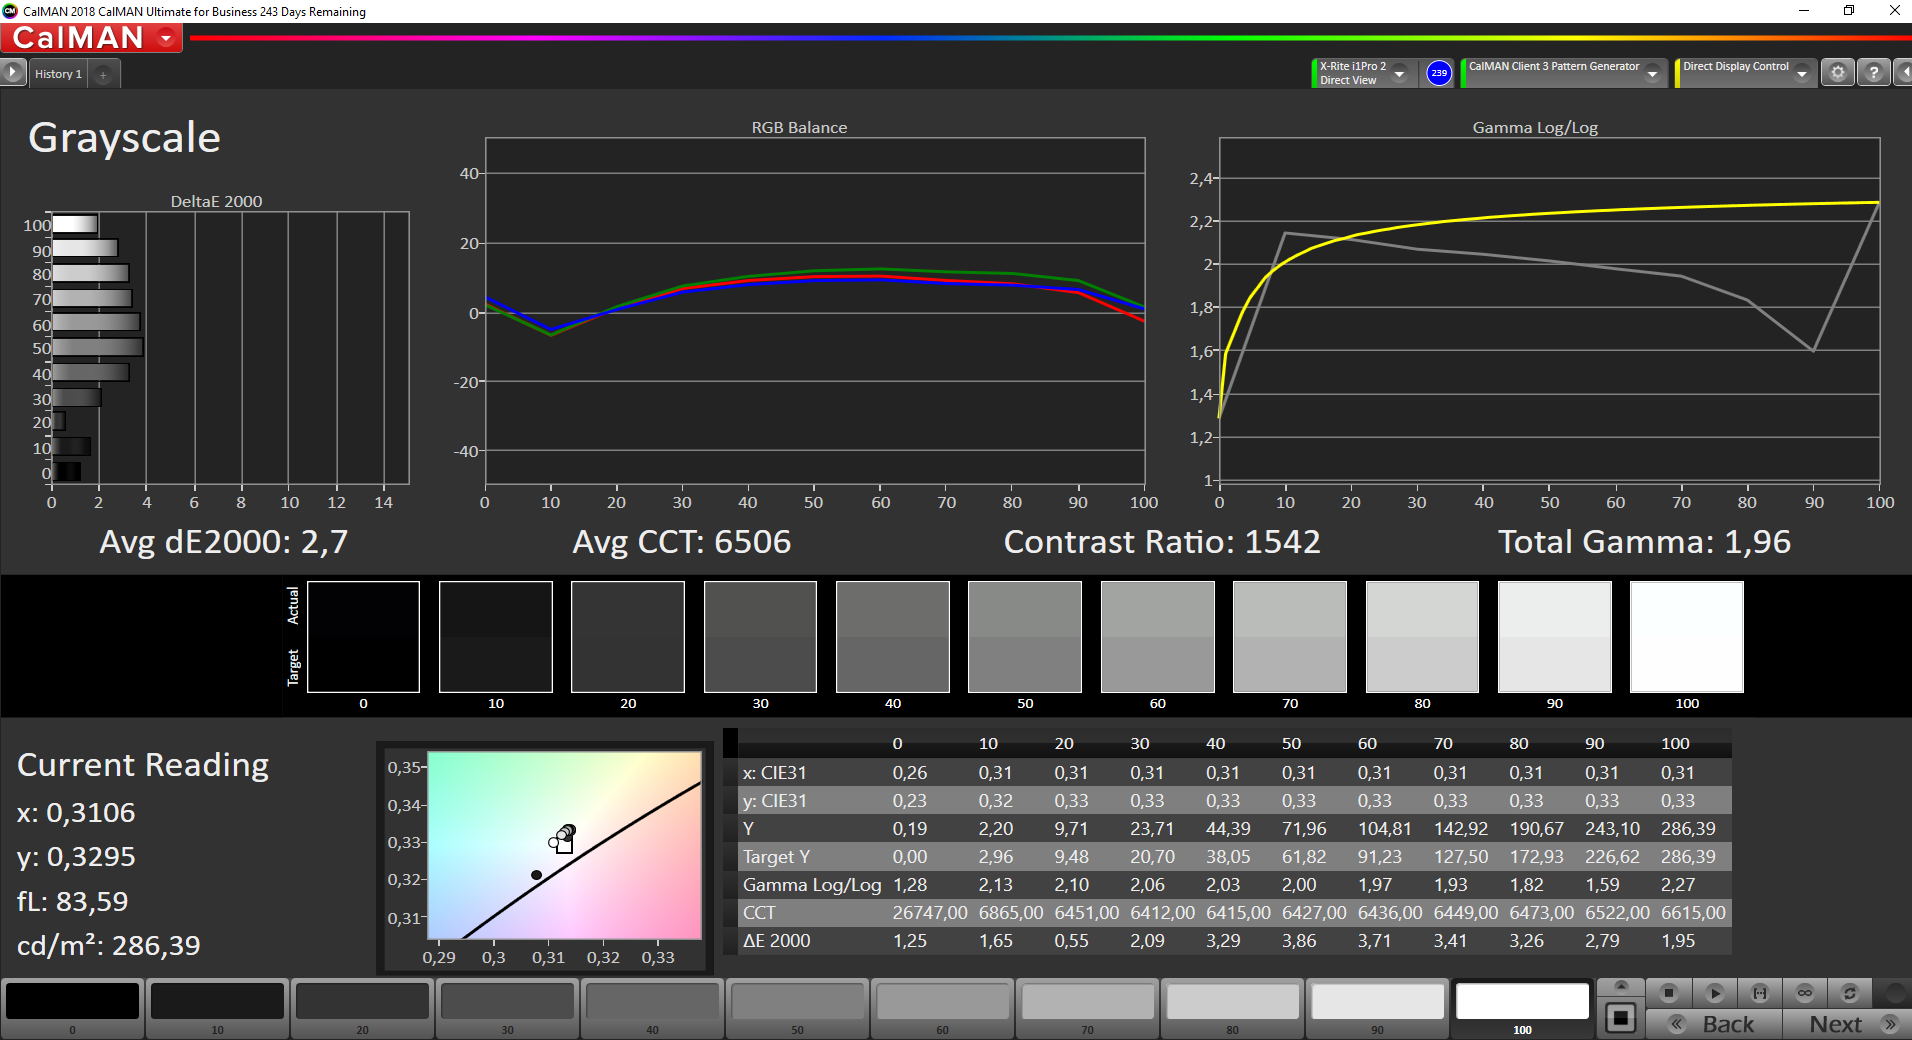
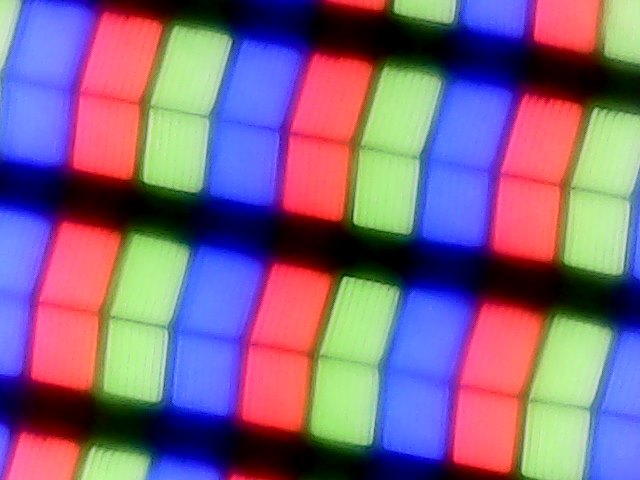
In our case, these values turn out significantly better, leading to a very good overall subjective impression of the image. The average brightness of the matte panels is at 270.6 cd/m² and the black value is a very good 0.19, which results in an excellent contrast ratio of more than 1500:1. Screen bleeding is not very pronounced (only minimal at the bottom edge) and there are also no problems with an impression of a grainy picture. PWM is not used.
| |||||||||||||||||||||||||
Brightness Distribution: 87 %
Center on Battery: 289 cd/m²
Contrast: 1521:1 (Black: 0.19 cd/m²)
ΔE ColorChecker Calman: 5.6 | ∀{0.5-29.43 Ø4.73}
calibrated: 4.7
ΔE Greyscale Calman: 2.7 | ∀{0.09-98 Ø4.97}
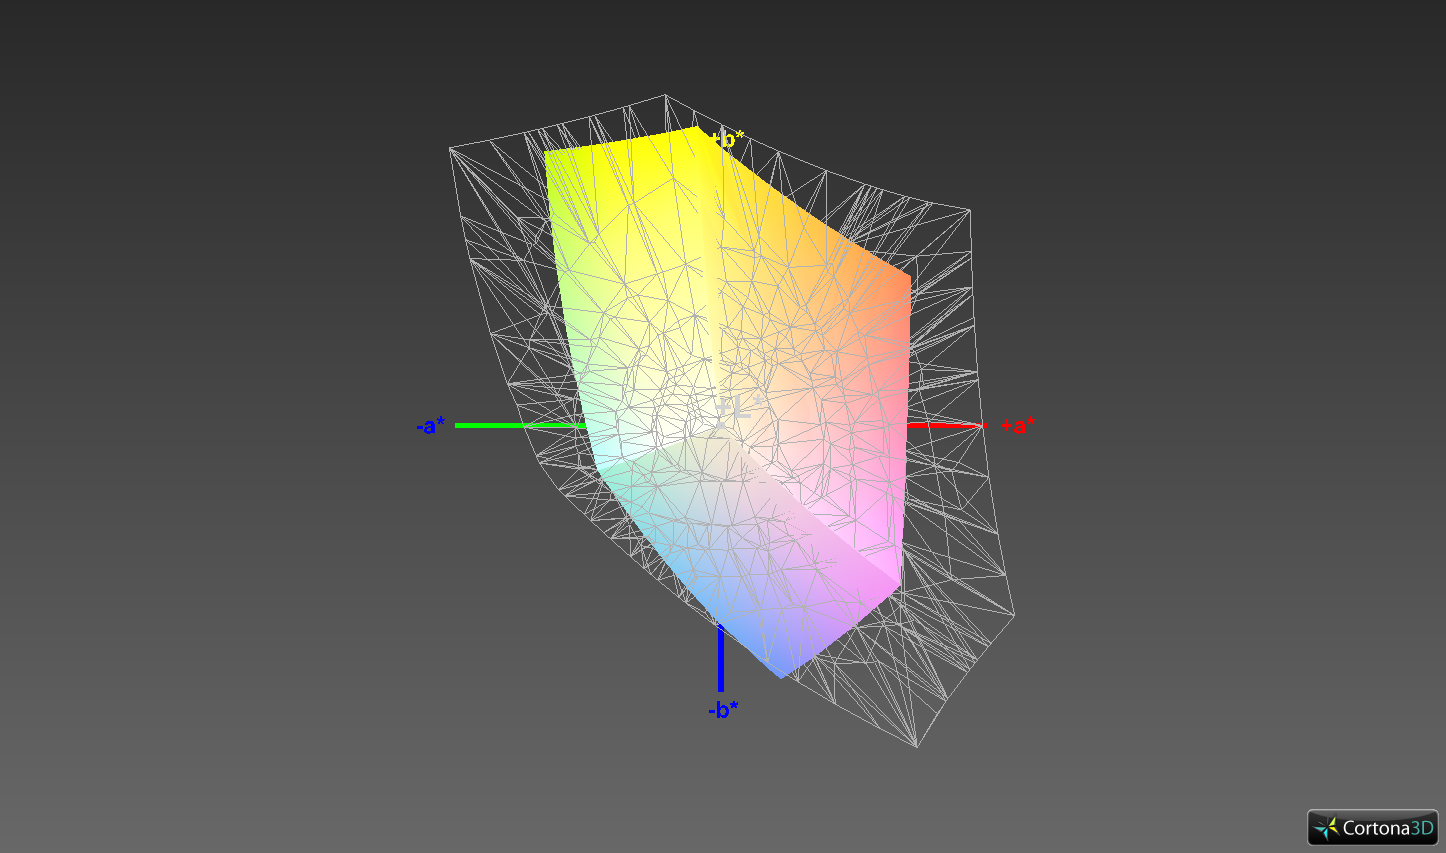
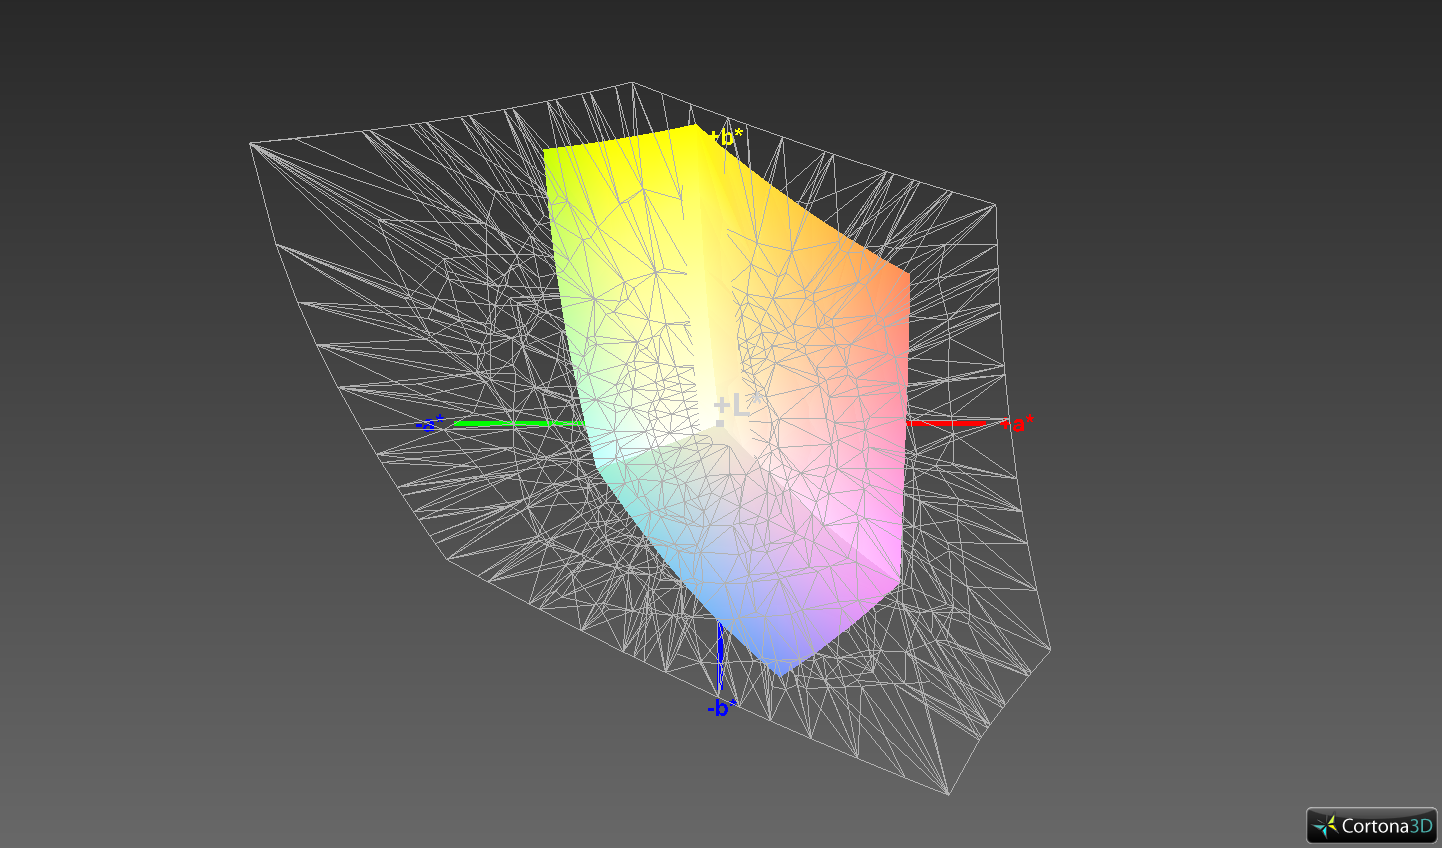
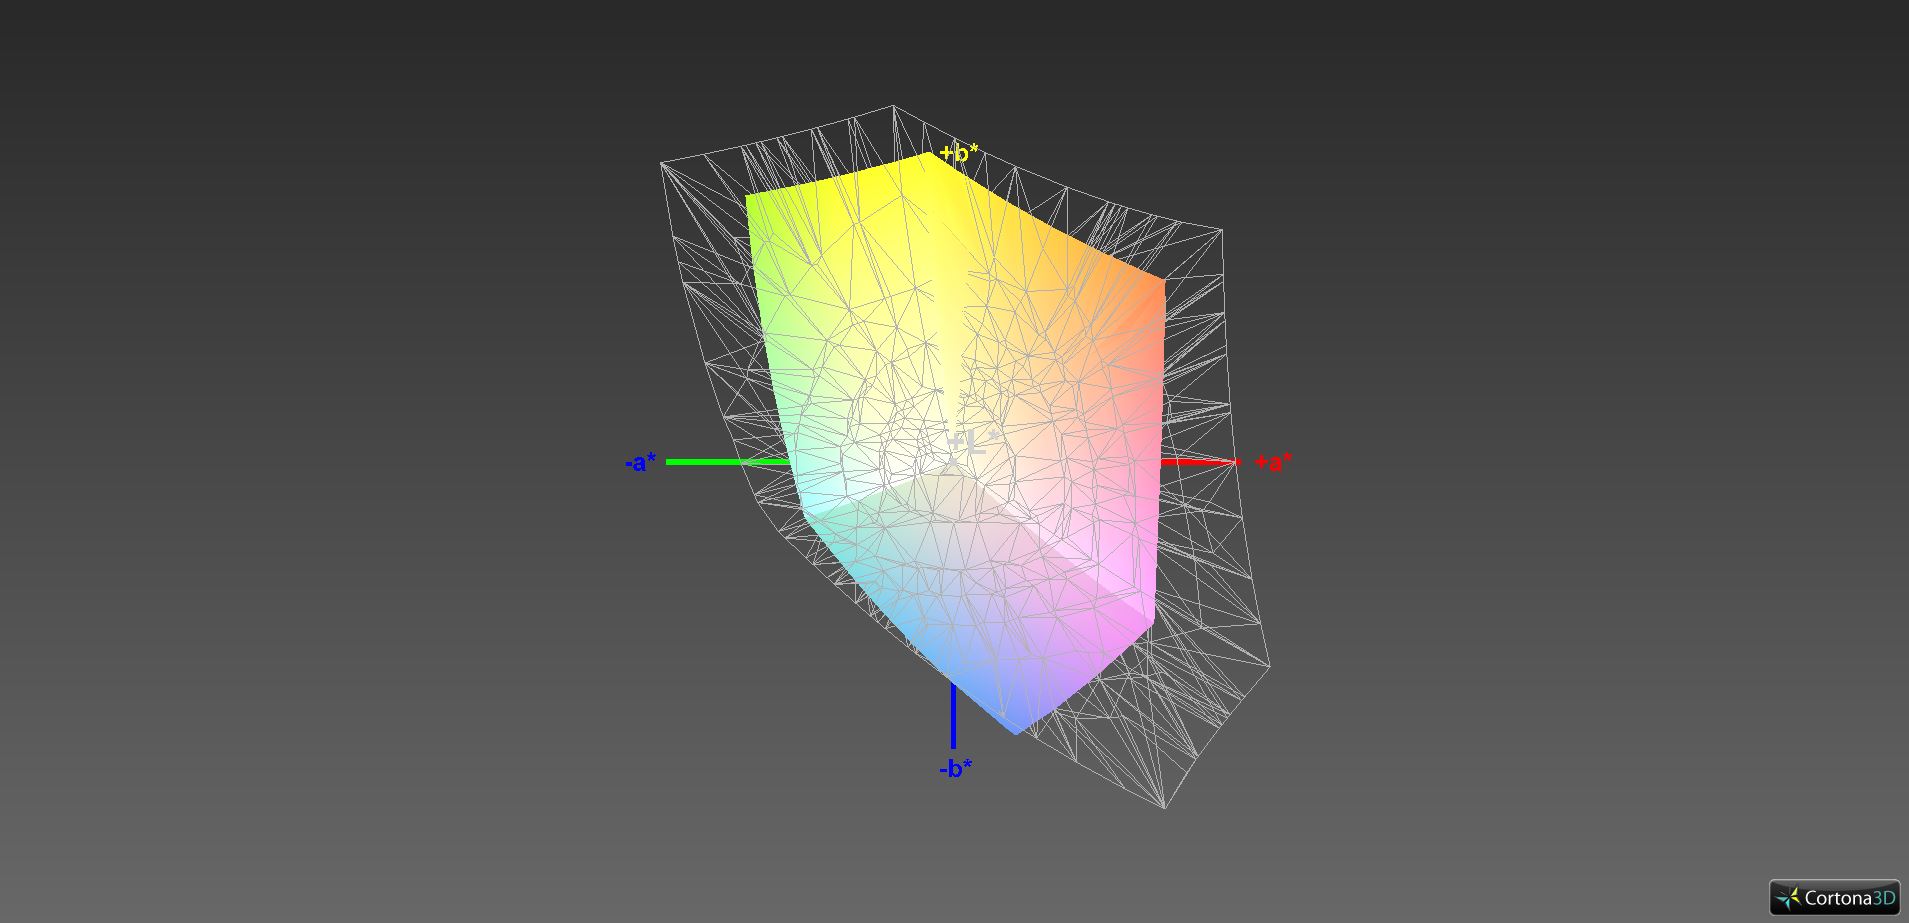
58.5% sRGB (Argyll 1.6.3 3D)
37.2% AdobeRGB 1998 (Argyll 1.6.3 3D)
39.76% AdobeRGB 1998 (Argyll 3D)
57.9% sRGB (Argyll 3D)
38.48% Display P3 (Argyll 3D)
Gamma: 1.96
CCT: 6506 K
| Lenovo ThinkPad E485-20KU000NGE B140HAN04.2, , 1920x1080, 14" | Lenovo ThinkPad E480-20KNCTO1WW Innolux N140HCA-EAC, , 1920x1080, 14" | HP ProBook 645 G4 3UP62EA Innolux N140HCA-EAB, , 1920x1080, 14" | Dell Latitude 3490 LP140WF6 / LGD059D, , 1920x1080, 14" | HP ProBook 440 G6-5TK01EA LG Philips, LGD05F1, , 1920x1080, 14" | |
|---|---|---|---|---|---|
| Display | 6% | 4% | 2% | -3% | |
| Display P3 Coverage (%) | 39.21 38.48 | 41.56 6% | 40.67 4% | 39.81 2% | 38.08 -3% |
| sRGB Coverage (%) | 58.8 57.9 | 62.2 6% | 61.2 4% | 59.6 1% | 57.2 -3% |
| AdobeRGB 1998 Coverage (%) | 40.52 39.76 | 42.96 6% | 42.03 4% | 41.16 2% | 39.37 -3% |
| Response Times | 4% | 25% | 24% | 13% | |
| Response Time Grey 50% / Grey 80% * (ms) | 44.8 ? | 44.8 ? -0% | 33 ? 26% | 36.4 ? 19% | 41.6 ? 7% |
| Response Time Black / White * (ms) | 33.6 ? | 31.2 ? 7% | 26 ? 23% | 24 ? 29% | 27.2 ? 19% |
| PWM Frequency (Hz) | 25000 ? | 100 ? | |||
| Screen | -20% | -27% | -12% | -12% | |
| Brightness middle (cd/m²) | 289 | 262 -9% | 225 -22% | 250 -13% | 256 -11% |
| Brightness (cd/m²) | 271 | 245 -10% | 209 -23% | 241 -11% | 238 -12% |
| Brightness Distribution (%) | 87 | 83 -5% | 89 2% | 81 -7% | 85 -2% |
| Black Level * (cd/m²) | 0.19 | 0.19 -0% | 0.68 -258% | 0.25 -32% | 0.23 -21% |
| Contrast (:1) | 1521 | 1379 -9% | 331 -78% | 1000 -34% | 1113 -27% |
| Colorchecker dE 2000 * | 5.6 | 7 -25% | 4.54 19% | 5.5 2% | 6.2 -11% |
| Colorchecker dE 2000 max. * | 20.8 | 23.6 -13% | 7.2 65% | 23.5 -13% | 18.2 13% |
| Colorchecker dE 2000 calibrated * | 4.7 | 2.87 39% | 4.8 -2% | 5.2 -11% | |
| Greyscale dE 2000 * | 2.7 | 6.4 -137% | 4.14 -53% | 3.5 -30% | 3.8 -41% |
| Gamma | 1.96 112% | 2.14 103% | 2.13 103% | 2.27 97% | 2.5 88% |
| CCT | 6506 100% | 6065 107% | 6624 98% | 7049 92% | 6643 98% |
| Color Space (Percent of AdobeRGB 1998) (%) | 37.2 | 39.5 6% | 39 5% | 37.9 2% | 36.1 -3% |
| Color Space (Percent of sRGB) (%) | 58.5 | 61.9 6% | 61 4% | 59.4 2% | 56.9 -3% |
| Total Average (Program / Settings) | -3% /
-11% | 1% /
-15% | 5% /
-5% | -1% /
-7% |
* ... smaller is better
The panel fares quite well already in the state of delivery, since there is no noticeable colored tint and the color temperature is optimal. However, you can see by the colors that it is a fairly affordable panel. There are some very high deviations in parts that cannot even be corrected by a calibration. The screen is simply unable to display the corresponding colors more accurately.
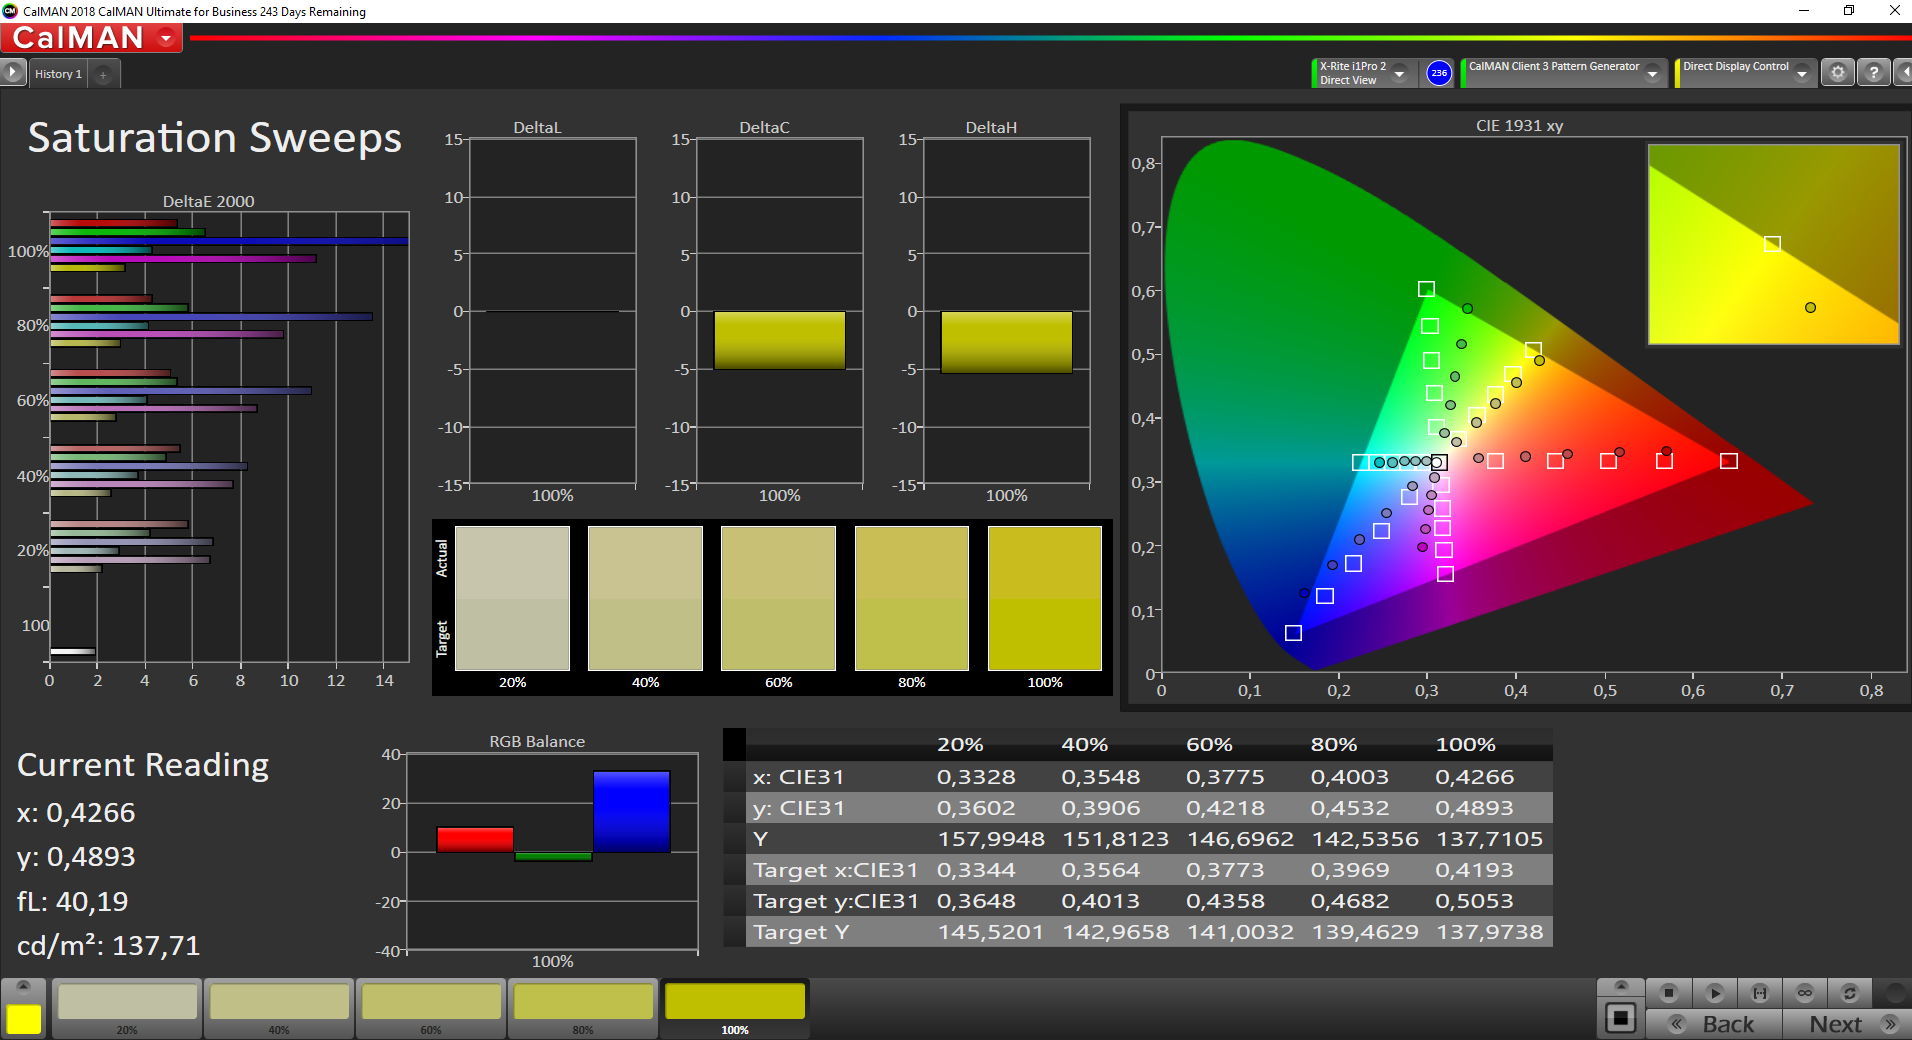
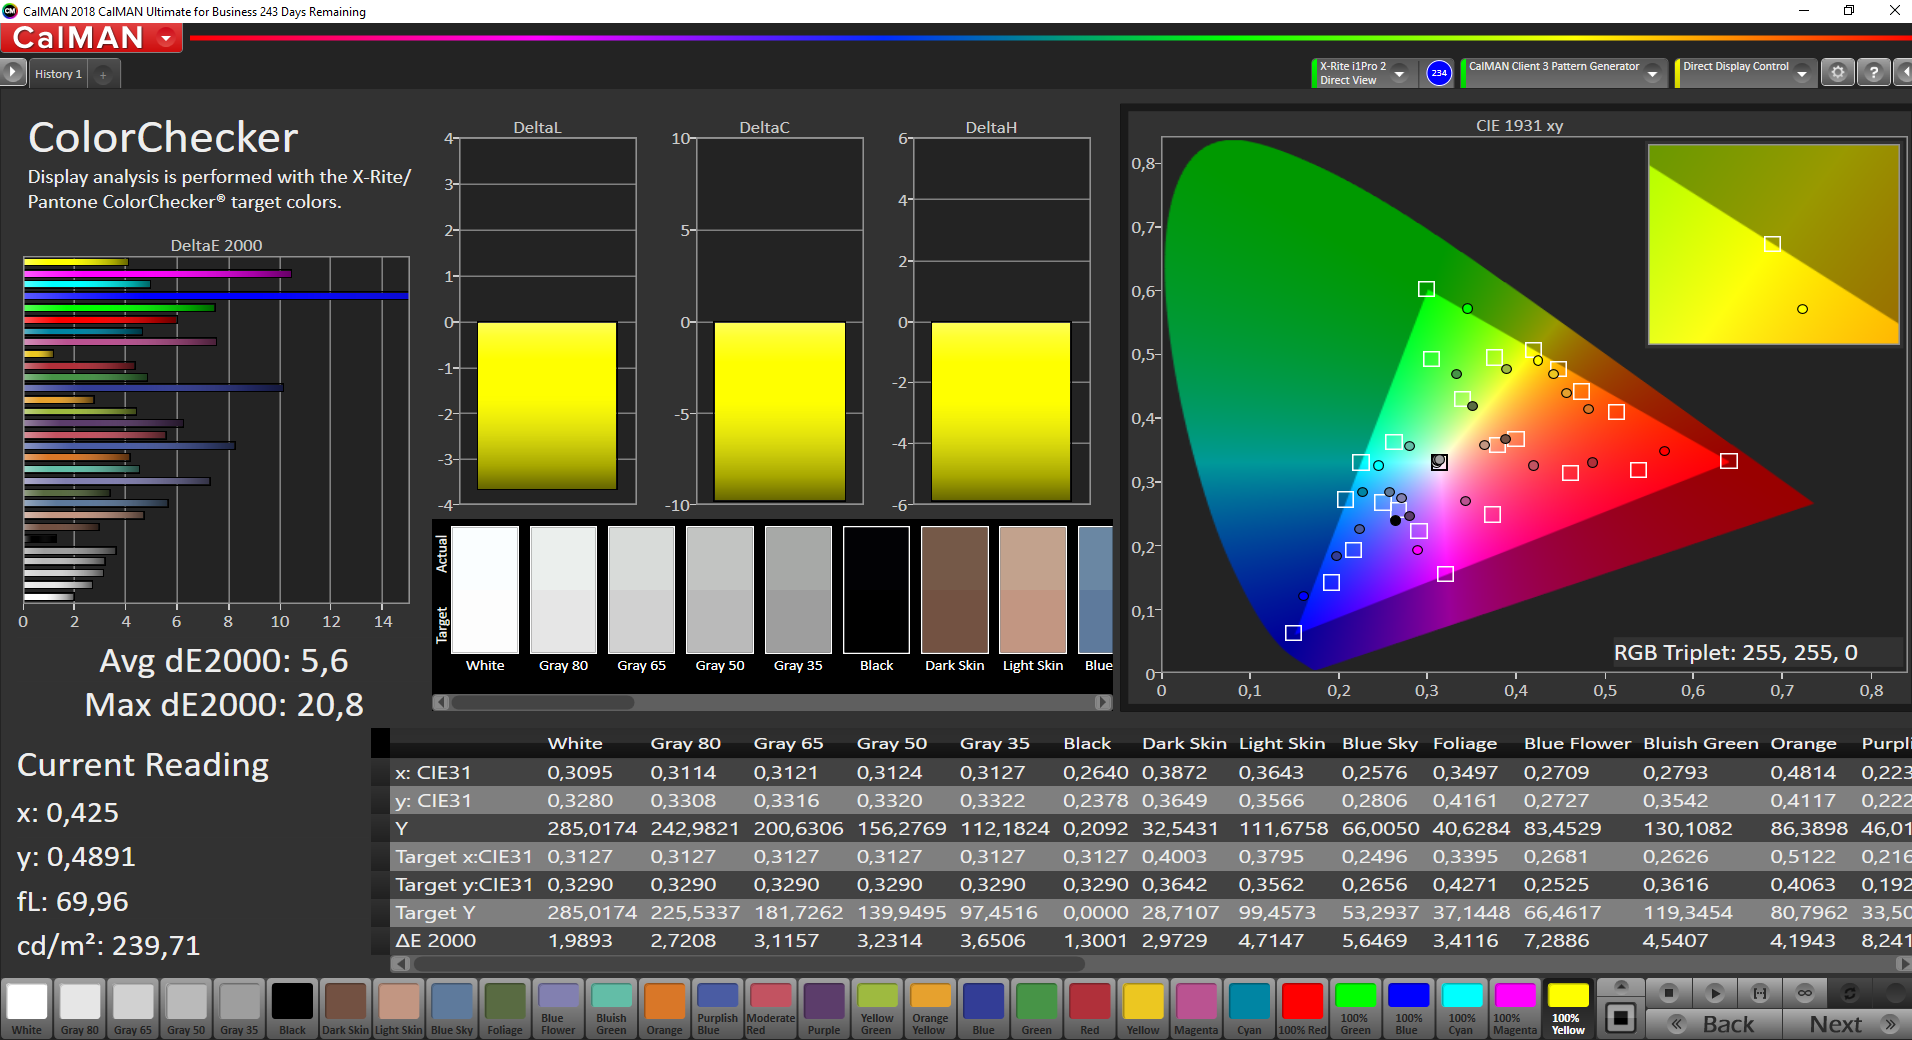
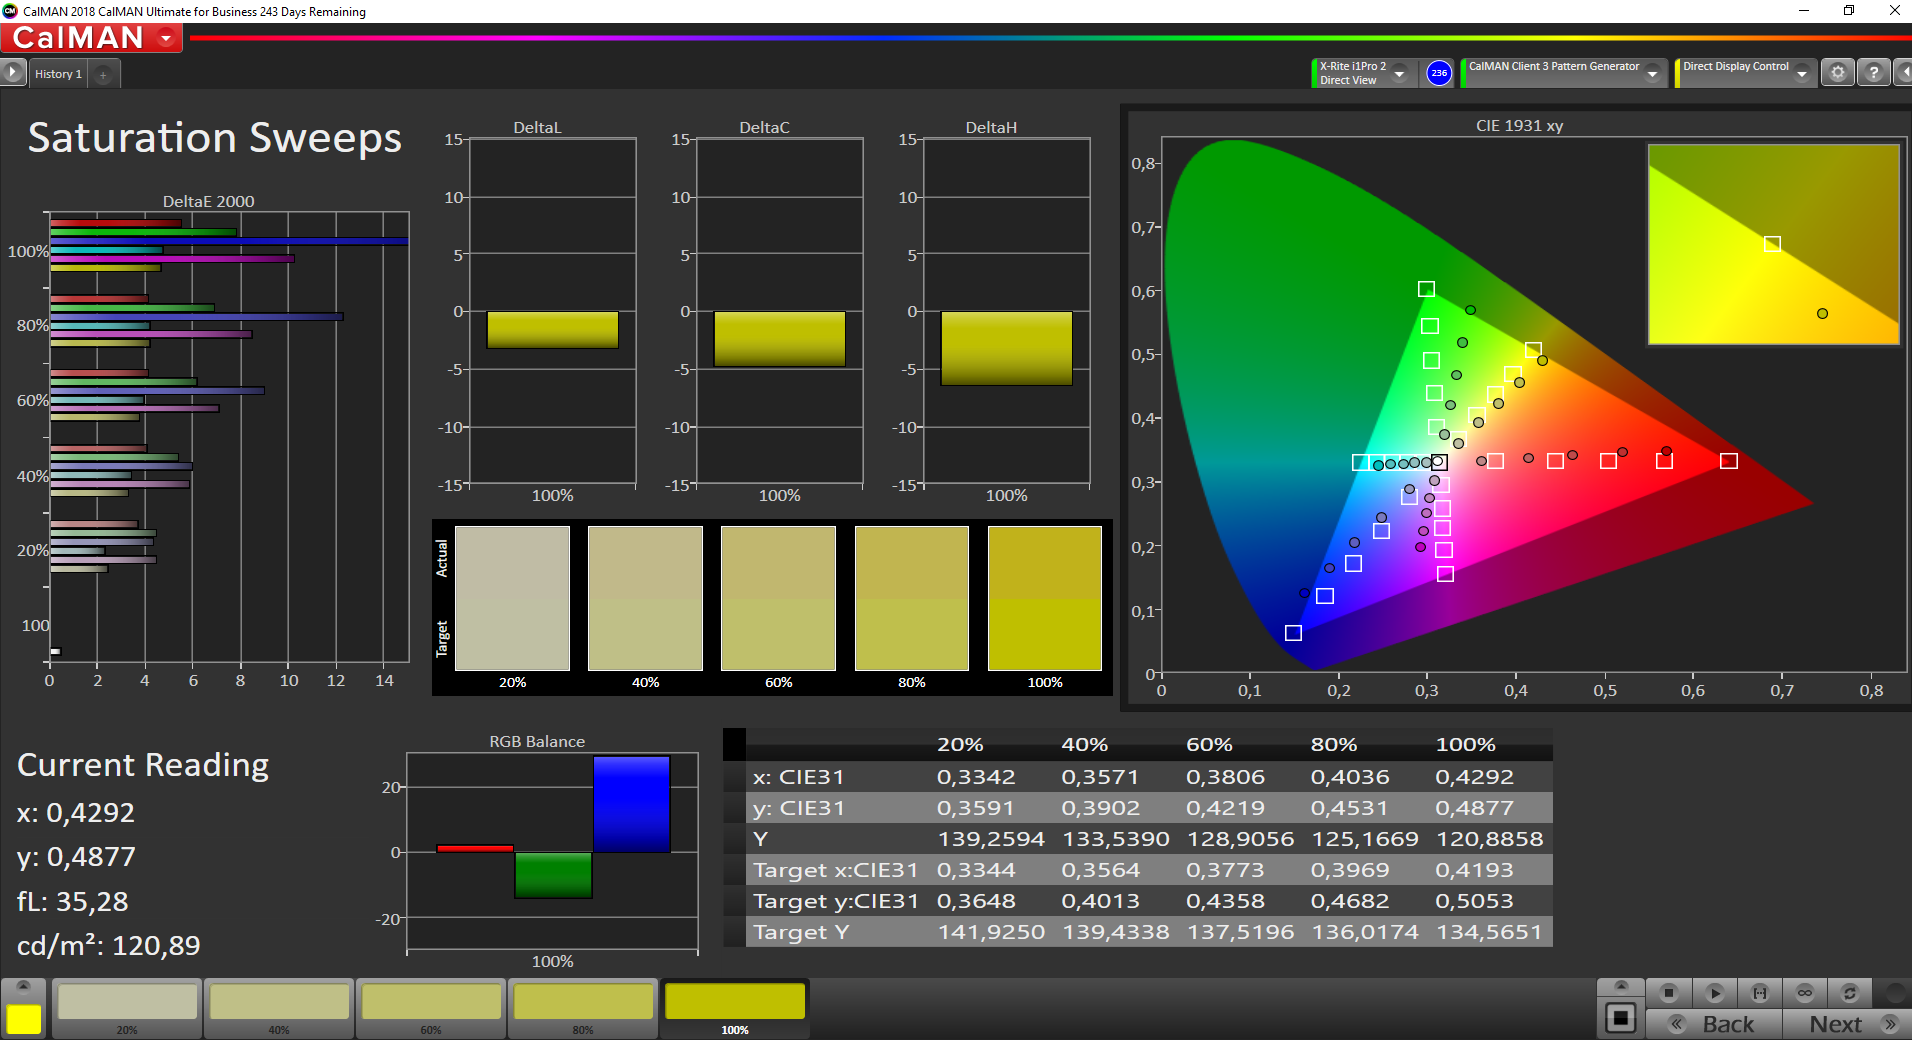

You should not expect too much in terms of the color space coverage either. While 58.5% sRGB is completely sufficient for everyday work in the office, anyone who likes to process images or videos and needs an accurate color representation has to use an external monitor.
Display Response Times
| ↔ Response Time Black to White | ||
|---|---|---|
| 33.6 ms ... rise ↗ and fall ↘ combined | ↗ 18 ms rise | 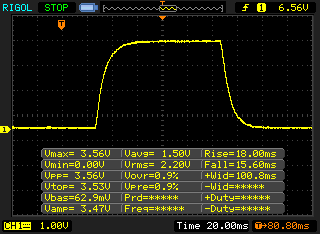 |
| ↘ 15.6 ms fall | ||
| The screen shows slow response rates in our tests and will be unsatisfactory for gamers. In comparison, all tested devices range from 0.1 (minimum) to 240 (maximum) ms. » 90 % of all devices are better. This means that the measured response time is worse than the average of all tested devices (19.9 ms). | ||
| ↔ Response Time 50% Grey to 80% Grey | ||
| 44.8 ms ... rise ↗ and fall ↘ combined | ↗ 20.4 ms rise | 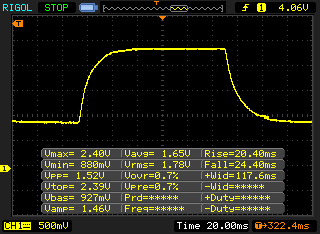 |
| ↘ 24.4 ms fall | ||
| The screen shows slow response rates in our tests and will be unsatisfactory for gamers. In comparison, all tested devices range from 0.165 (minimum) to 636 (maximum) ms. » 76 % of all devices are better. This means that the measured response time is worse than the average of all tested devices (31.1 ms). | ||
Screen Flickering / PWM (Pulse-Width Modulation)
| Screen flickering / PWM not detected | 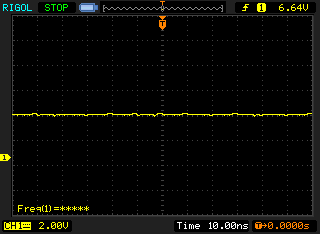 | ||
In comparison: 52 % of all tested devices do not use PWM to dim the display. If PWM was detected, an average of 7797 (minimum: 5 - maximum: 343500) Hz was measured. | |||
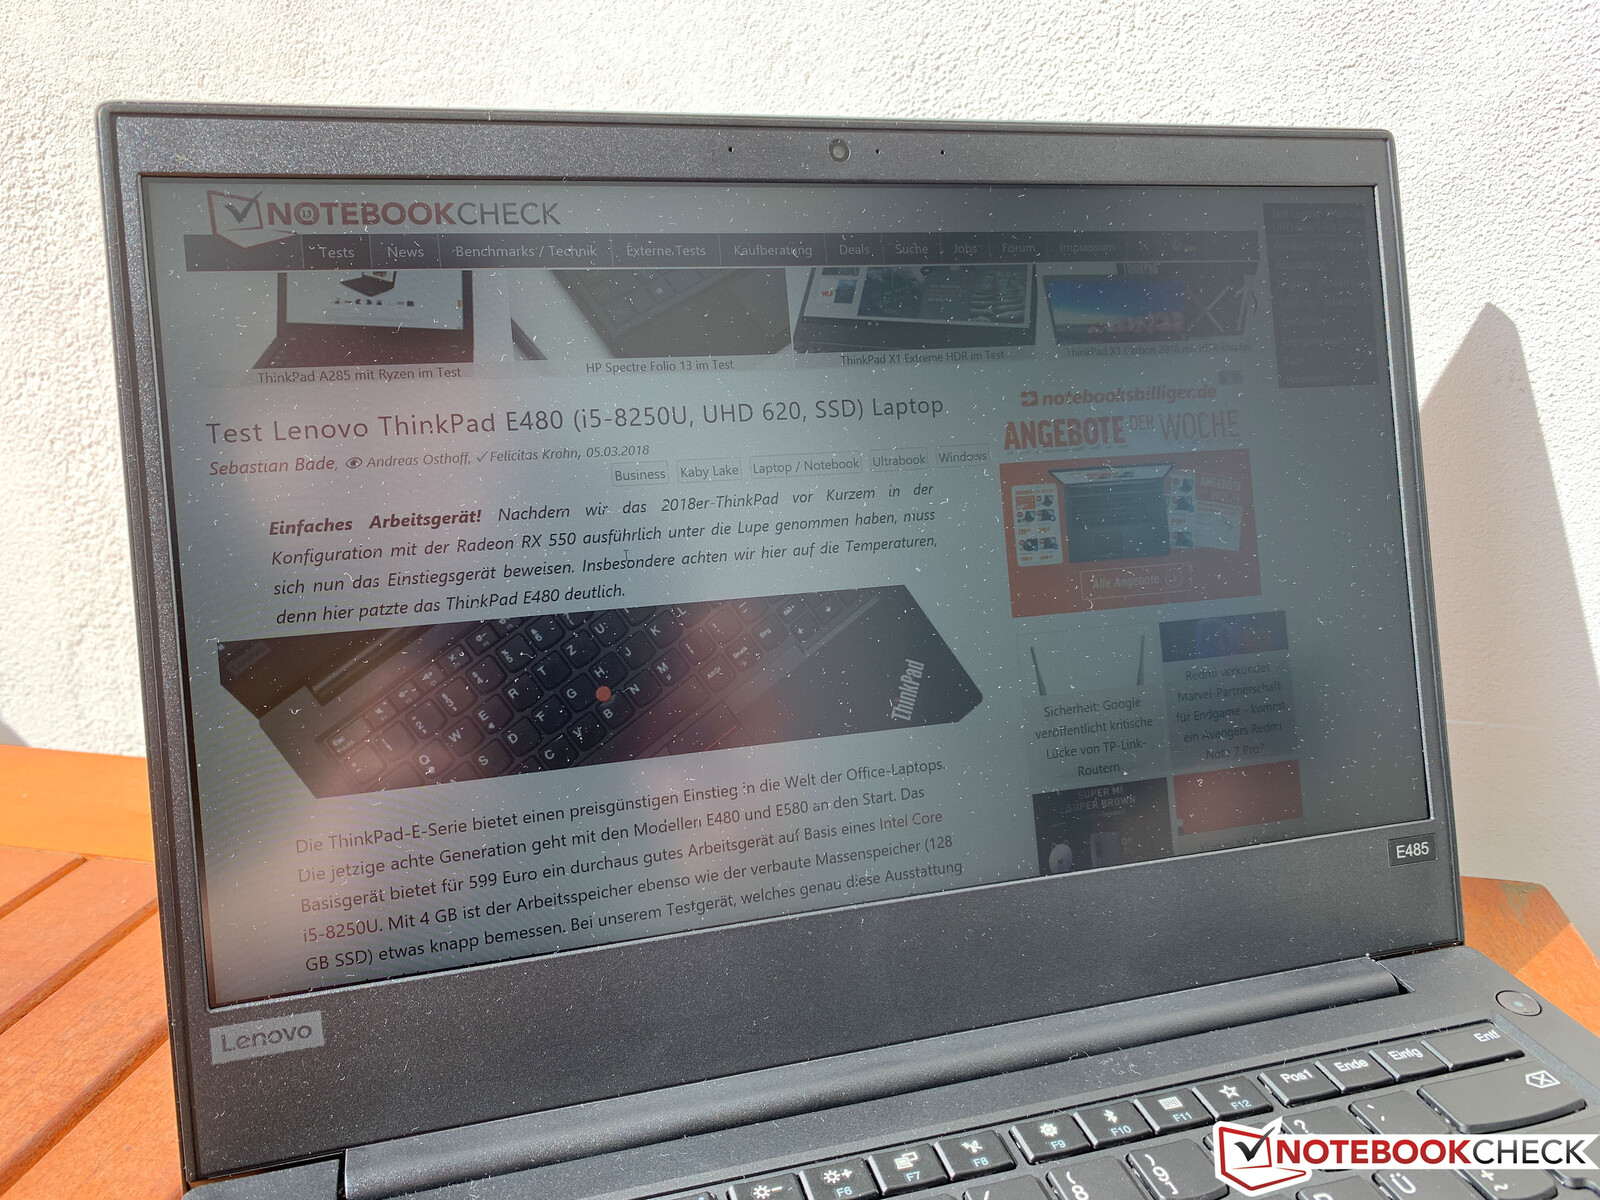
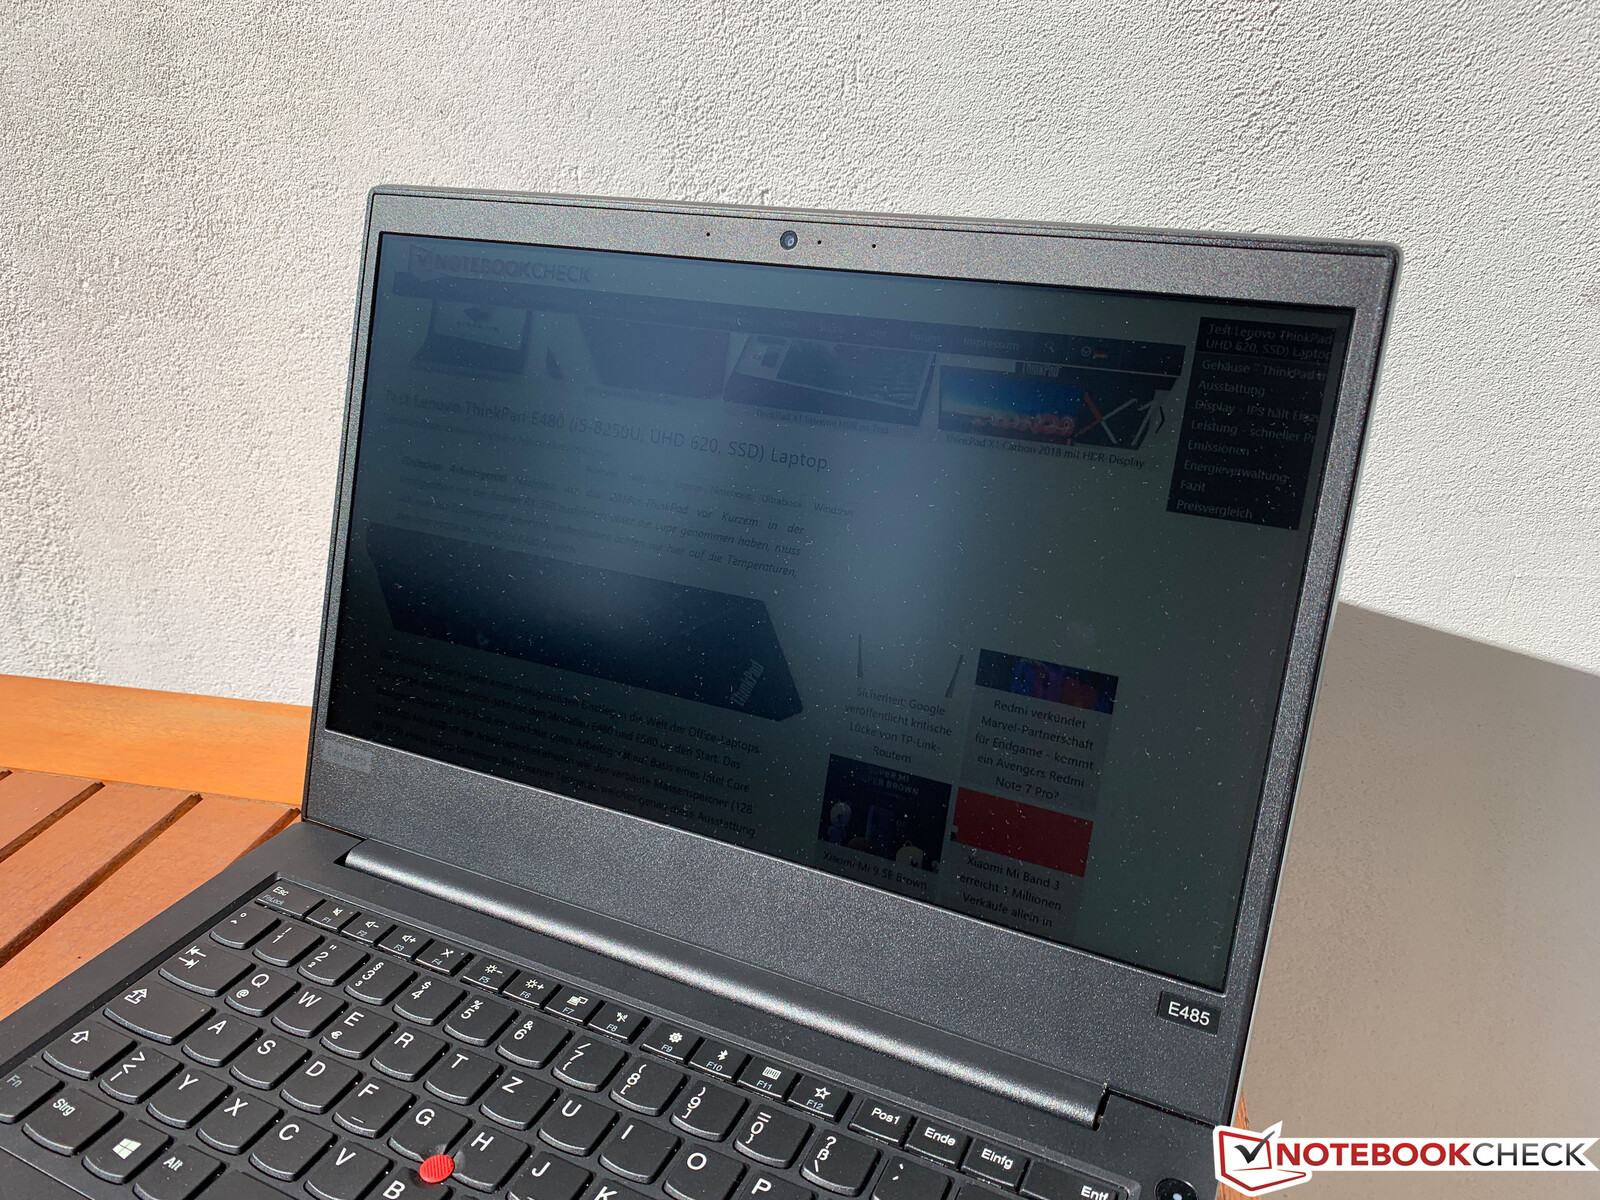
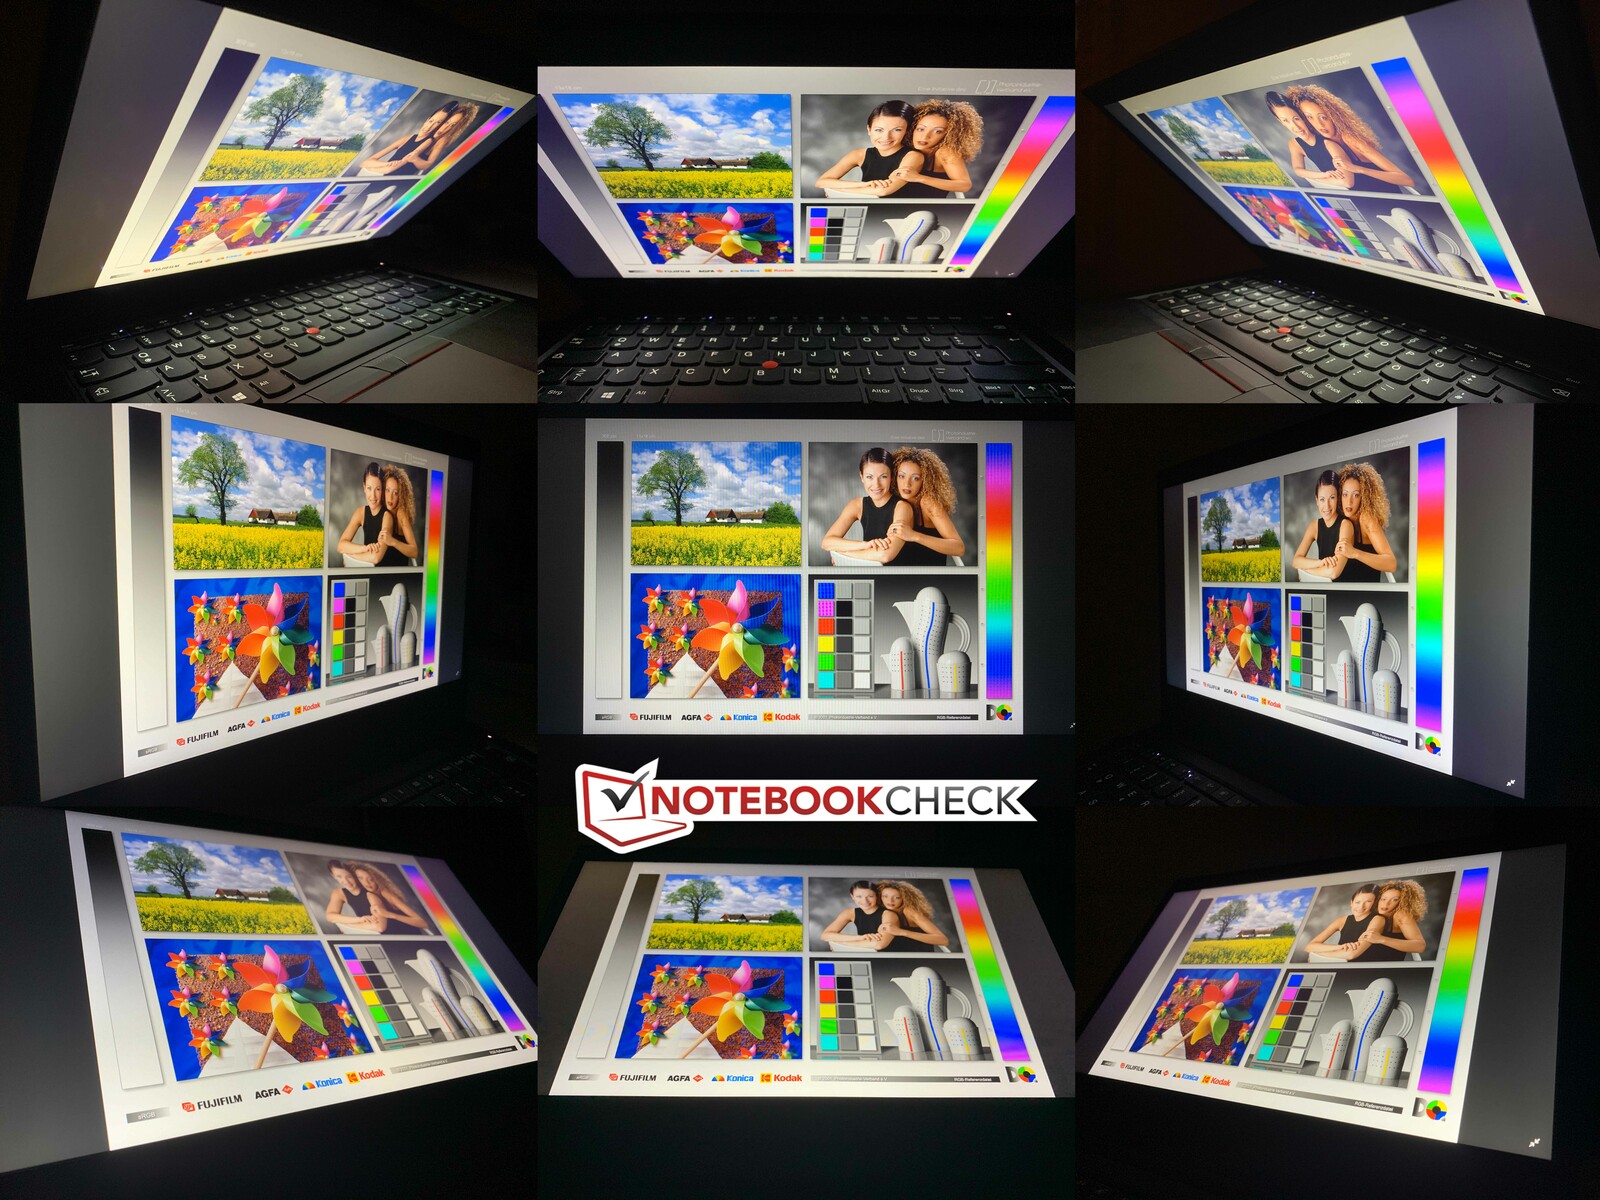
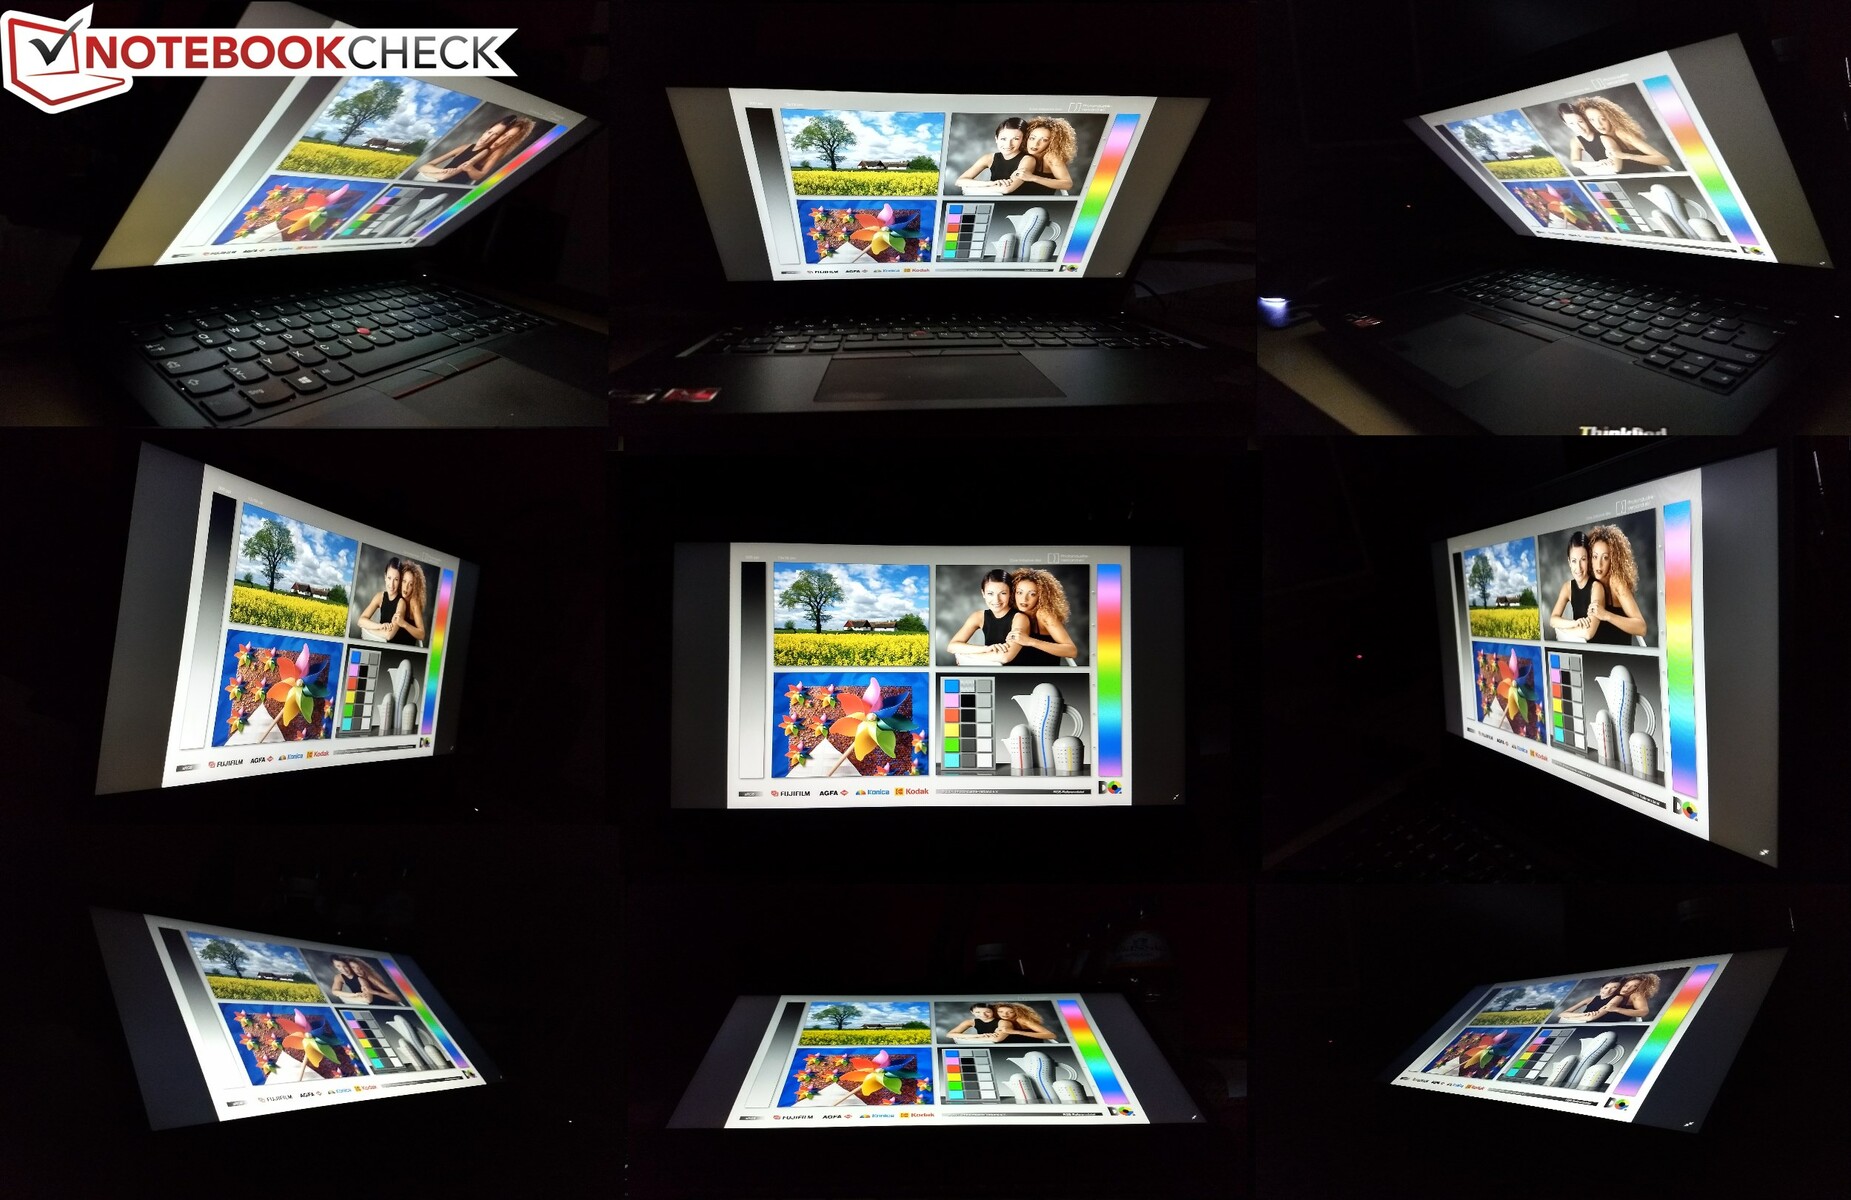
In principle, the ThinkPad E485 can also be used outdoors, since the reflections are reduced on the matte display surface. Although the brightness is not reduced in battery operation, it is not sufficient for comfortable operation in the sun or in bright surroundings. The viewing angle stability of the IPS displays turns out good and only at an angle from the top or bottom, there is a slight decrease in contrast.
Display #2 - Significantly darker Innolux N140HCA-EAC
We were able to test another Lenovo ThinkPad E485 device. While our second test unit is the same model 20KU000NGE, Lenovo has used a completely different panel here, and instead of the B140HAN04.2 from AUO we now have the E485 with the N140HCA-EAC from Innolux.
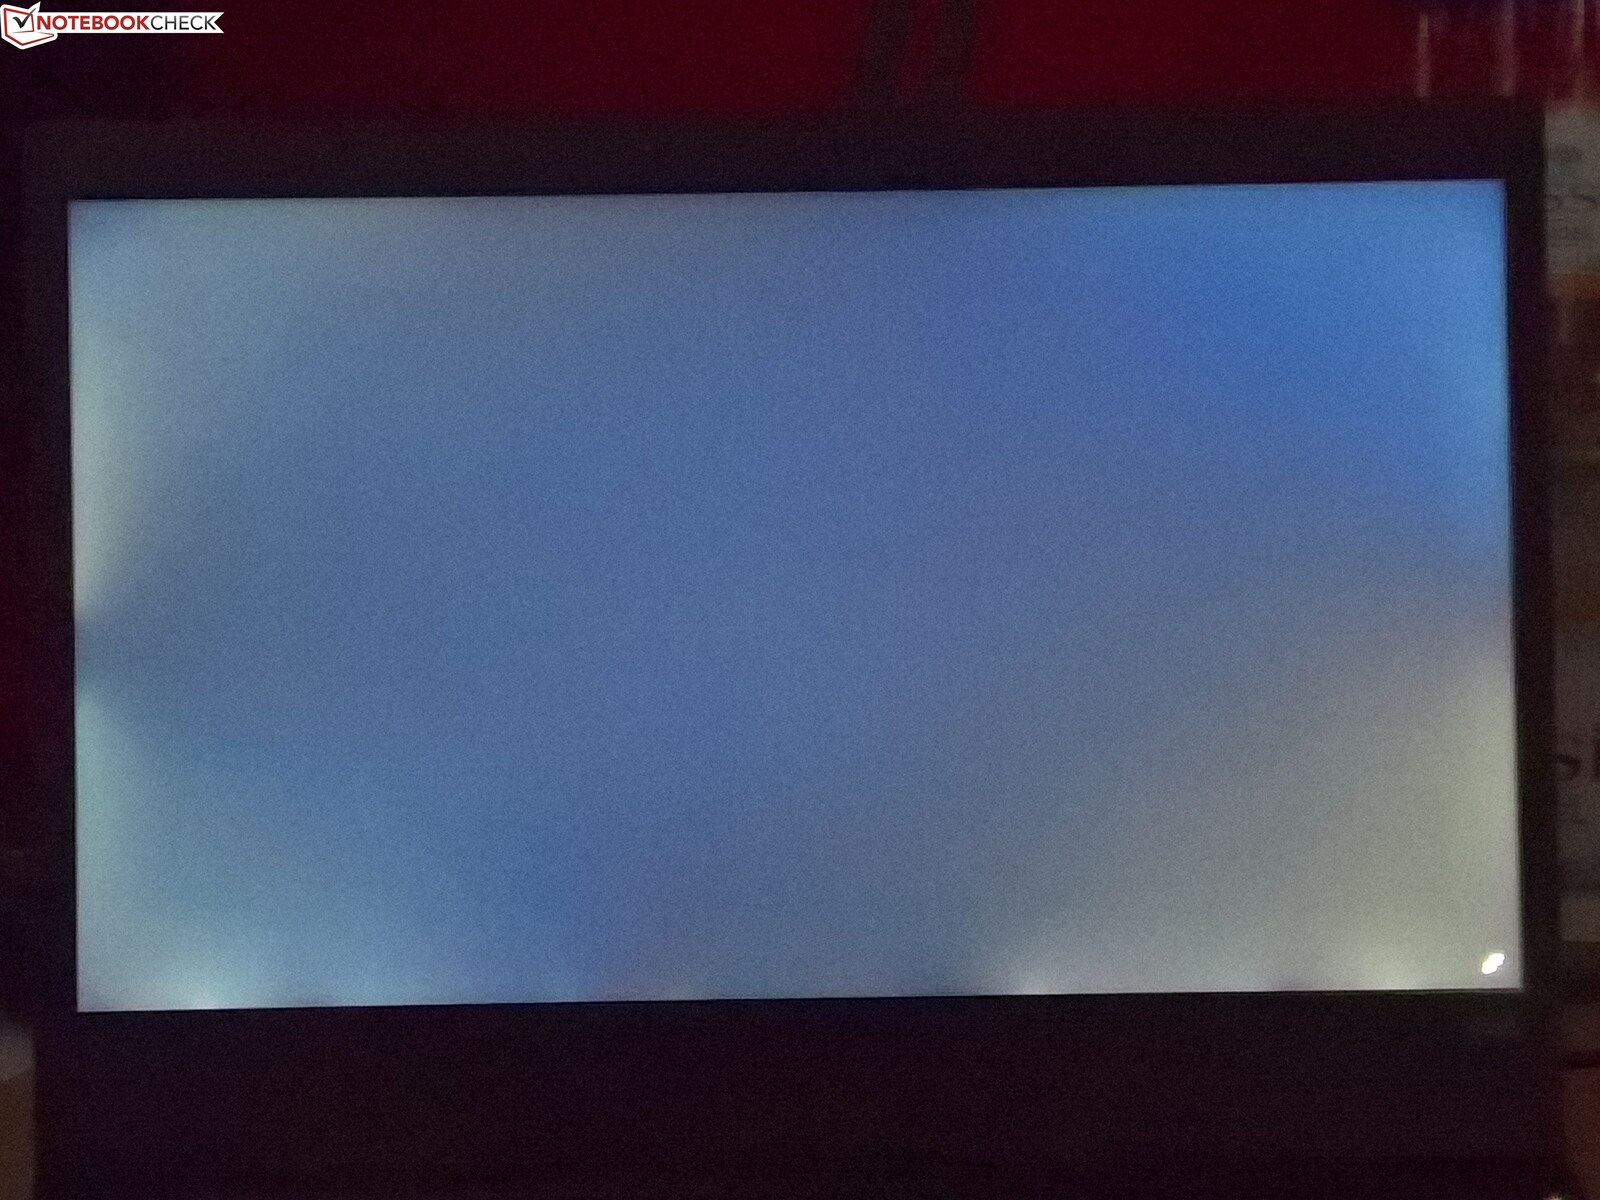
On paper, the specifications of this LCD panel are identical to the AUO display: 250 cd/m² of brightness, a Full-HD resolution, a matte surface, and 45% of NTSC color space coverage. However, theory and practice are two completely different things. In our measurements, the Innolux display only achieved an average brightness of 194 cd/m², which is a catastrophic result compared to the AUO LCD, which achieved 271 cd/m². What makes it even worse is that in this test unit the display is automatically darkened if you run it without a connected charger. But at least you can deactivate this setting, if you install the AMD Radeon Control Panel. However, in practice you can still forget almost completely about using it with this display outdoors.
In contrast to the AUO display, the Innolux LCD uses PWM, however, it has an extremely high frequency. So while the PWM does not create much of a problem, we are more annoyed by the backlight bleeding, which is significantly more pronounced in the Innolux display.
| |||||||||||||||||||||||||
Brightness Distribution: 74 %
Center on Battery: 168 cd/m²
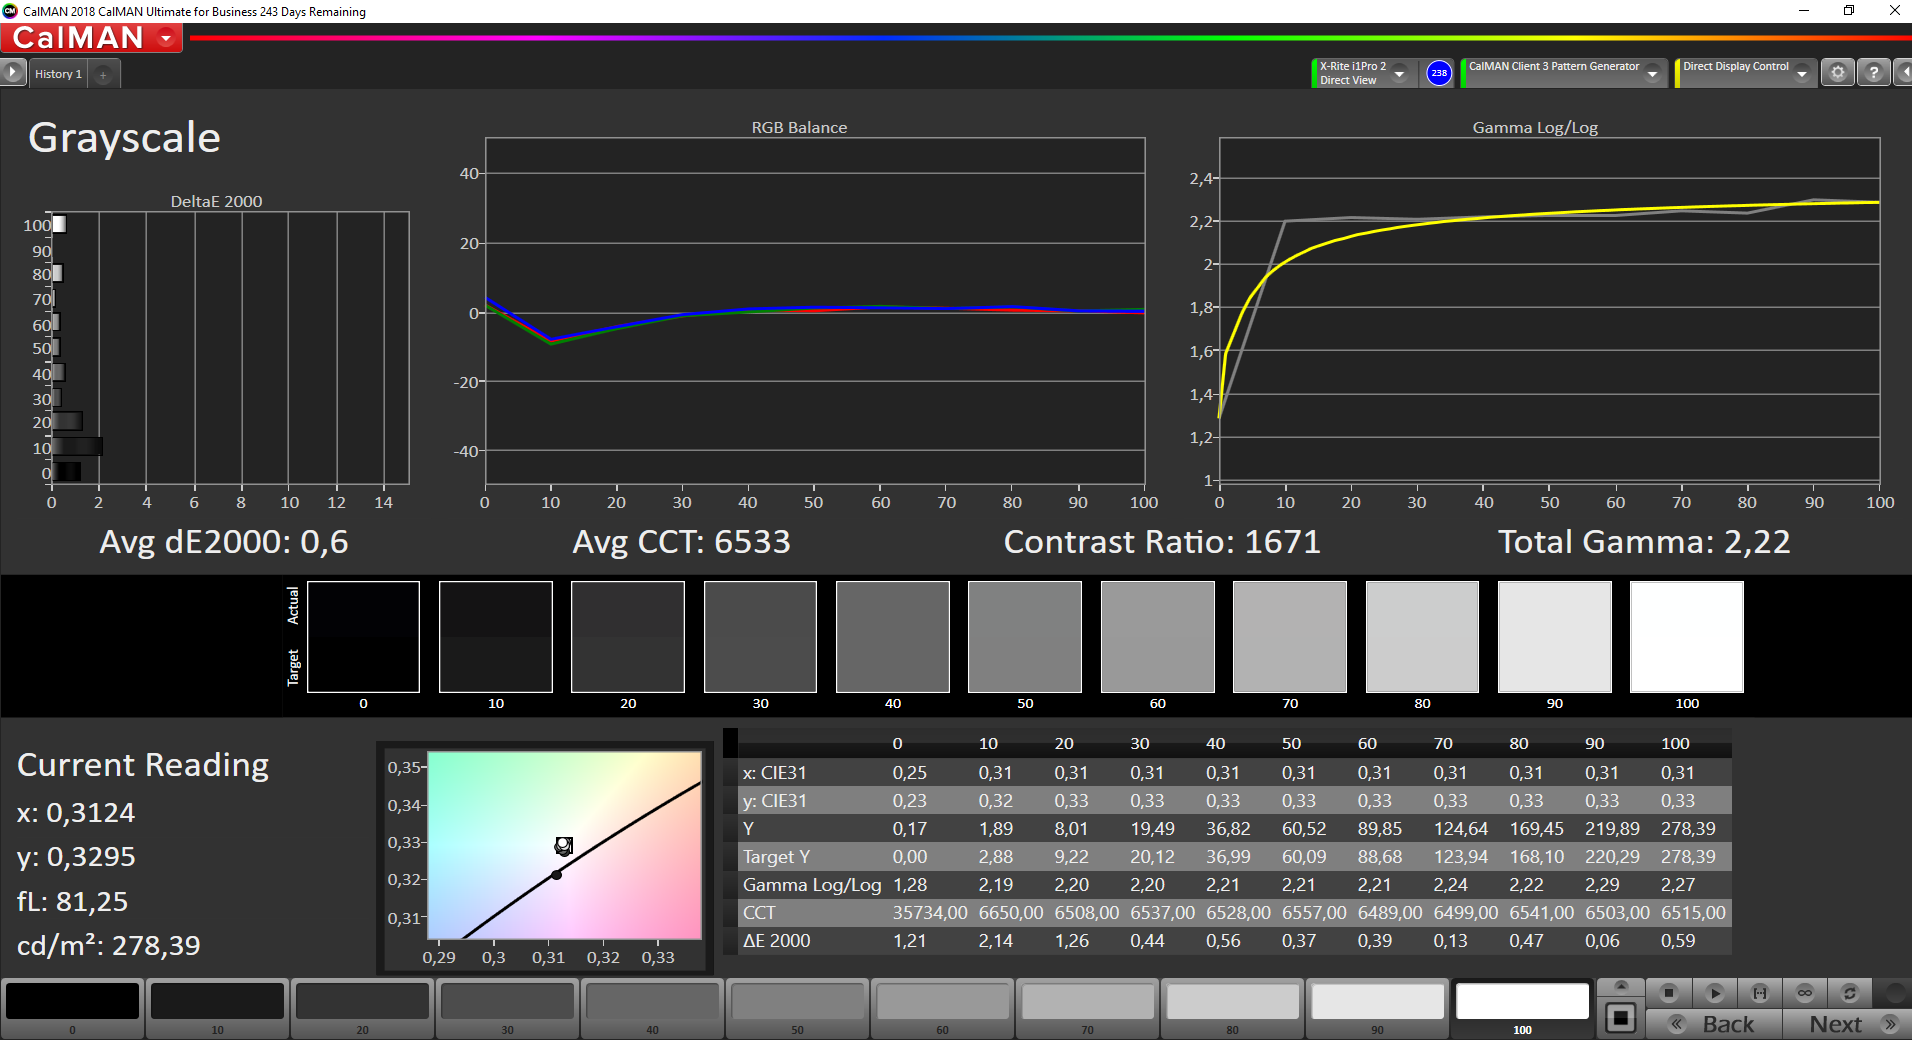
Contrast: 1163:1 (Black: 0.19 cd/m²)
ΔE ColorChecker Calman: 4.67 | ∀{0.5-29.43 Ø4.73}
calibrated: 4.3
ΔE Greyscale Calman: 3.81 | ∀{0.09-98 Ø4.97}
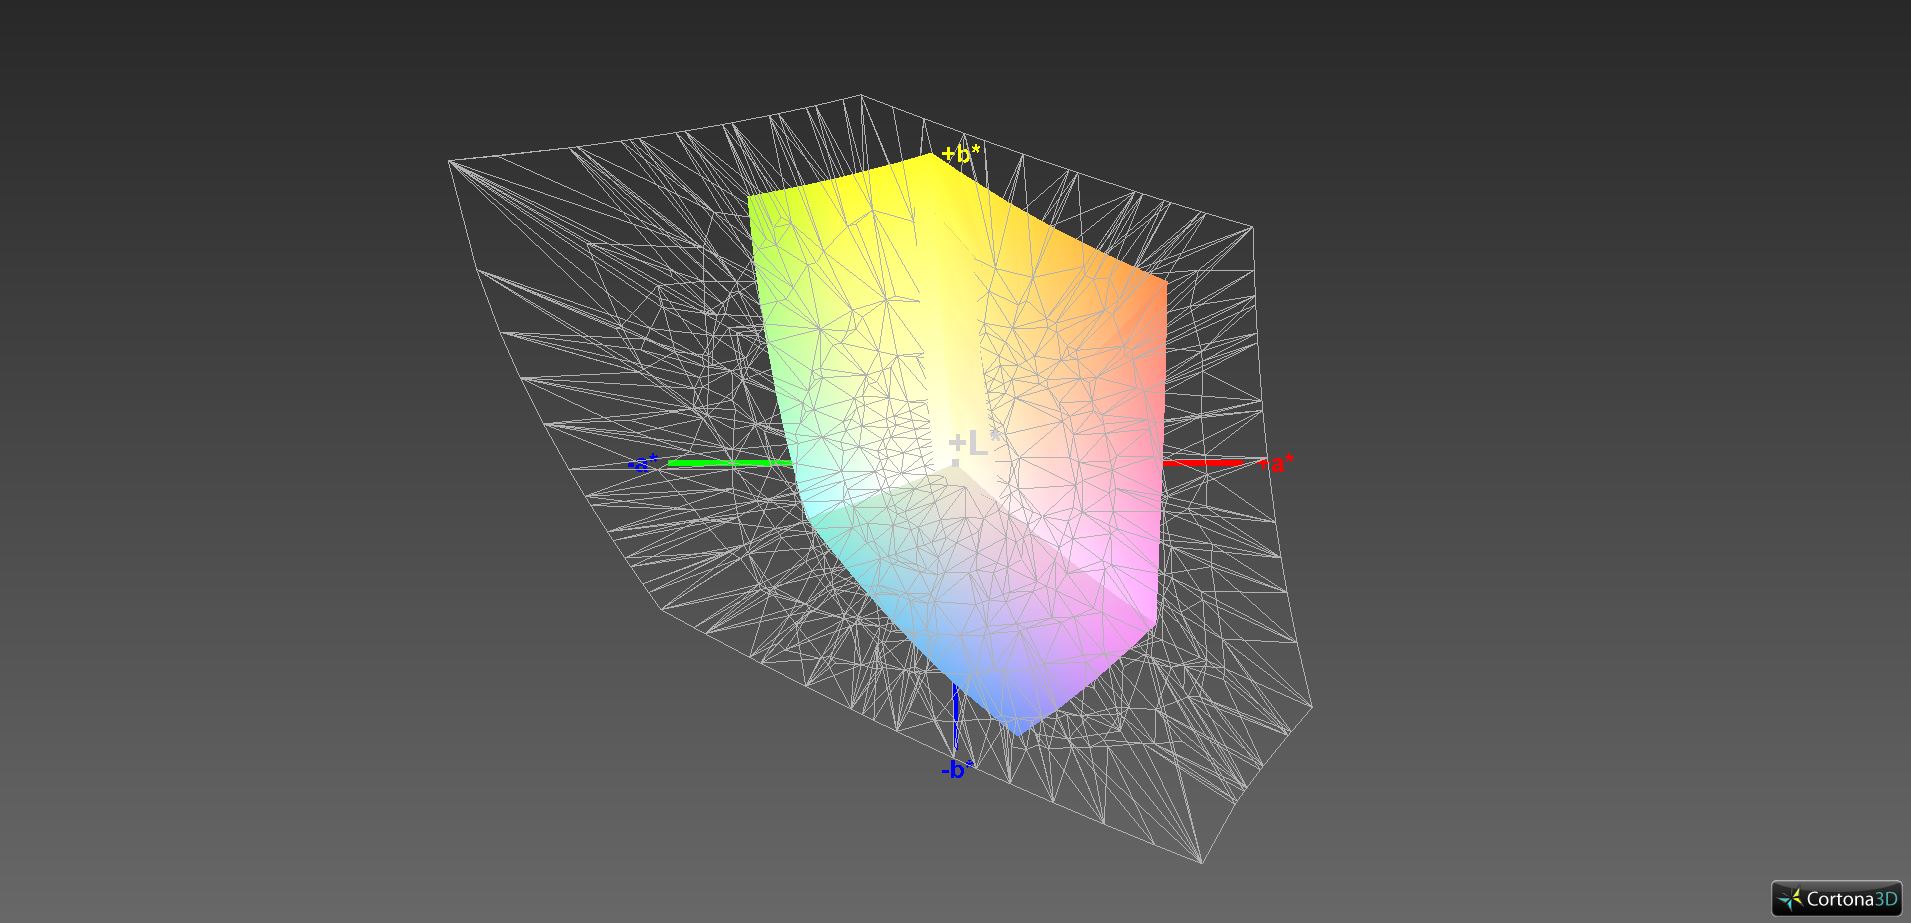
62% sRGB (Argyll 1.6.3 3D)
39% AdobeRGB 1998 (Argyll 1.6.3 3D)
Gamma: 2.24
CCT: 6177 K
In addition, the contrast ratio is also much worse in the Innolux display. However, this is not so bad, since 1163:1 is still a good value. The opposite is the case for the color space coverage, which is very bad in both the AUO display and the Innolux LCD. It hardly matters that the color space coverage is minimally better in the Innolux display.
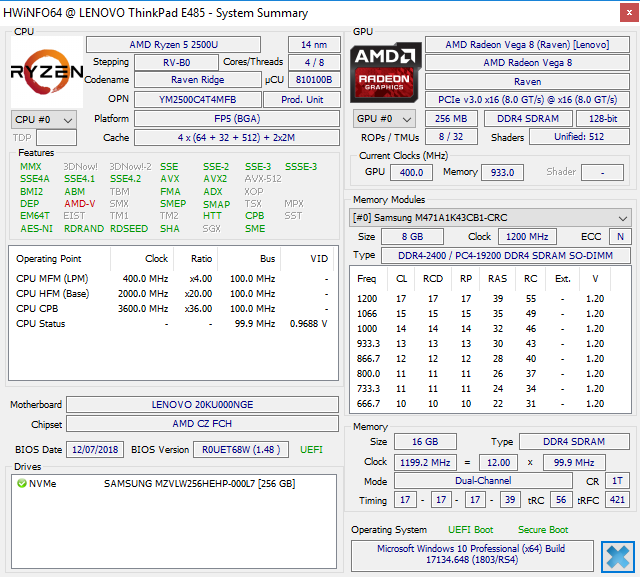
Performance – The ThinkPad E485 only comes with single-channel RAM
Lenovo offers three different processors for the ThinkPad E485: a Ryzen 3 2300U, a Ryzen 5 2500U, or a Ryzen 7 2700U. Depending on the CPU selection, the integrated GPU is also different (Vega 3, Vega 8, or Vega 10), which leads us to the selection of the working memory. In order to use the potential of the integrated GPU to the fullest, the working memory must run in a dual-channel configuration. Unfortunately, Lenovo offers the standard models only with single-channel RAM, so you need to configure it during the purchase or perform the upgrade yourself. This will probably lead to many users being unable to take advantage of the real performance potential of the Vega GPU. You can build in a maximum of 64 GB of RAM.
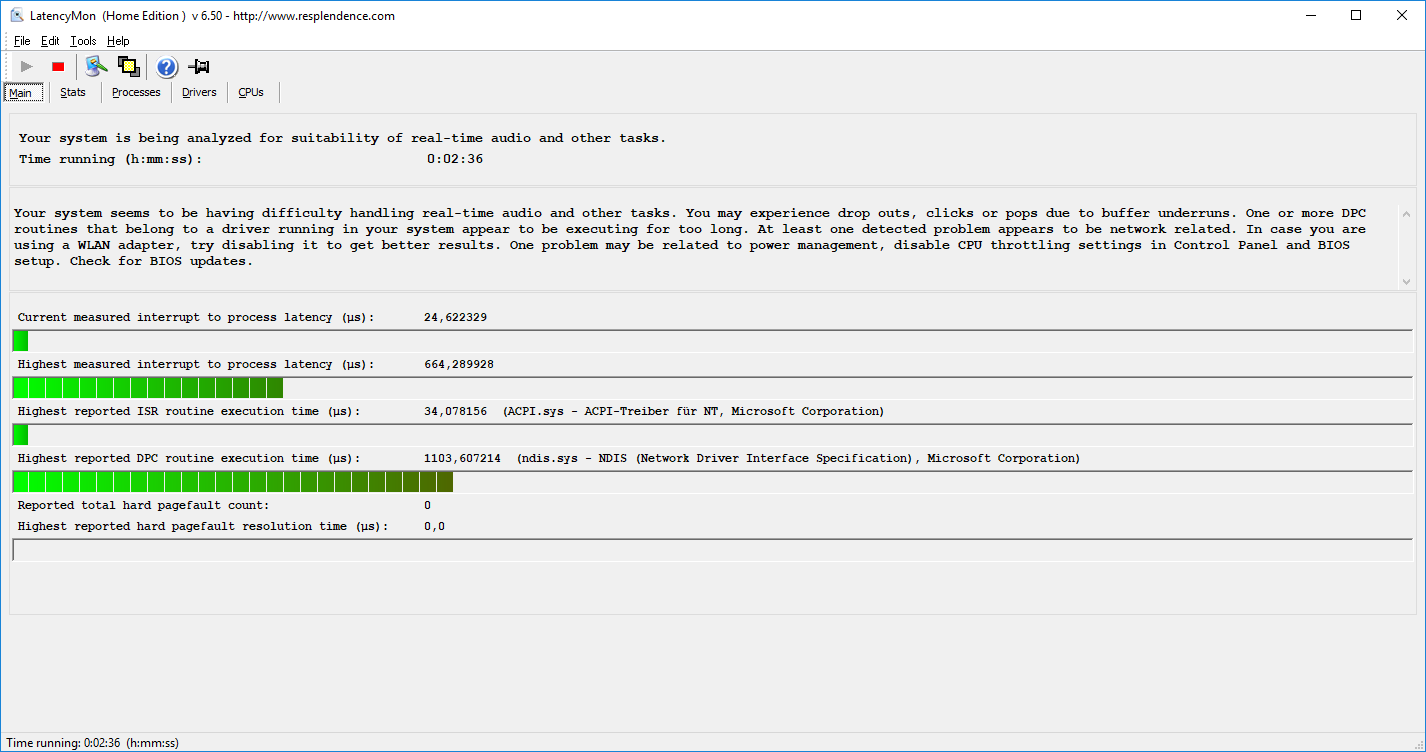
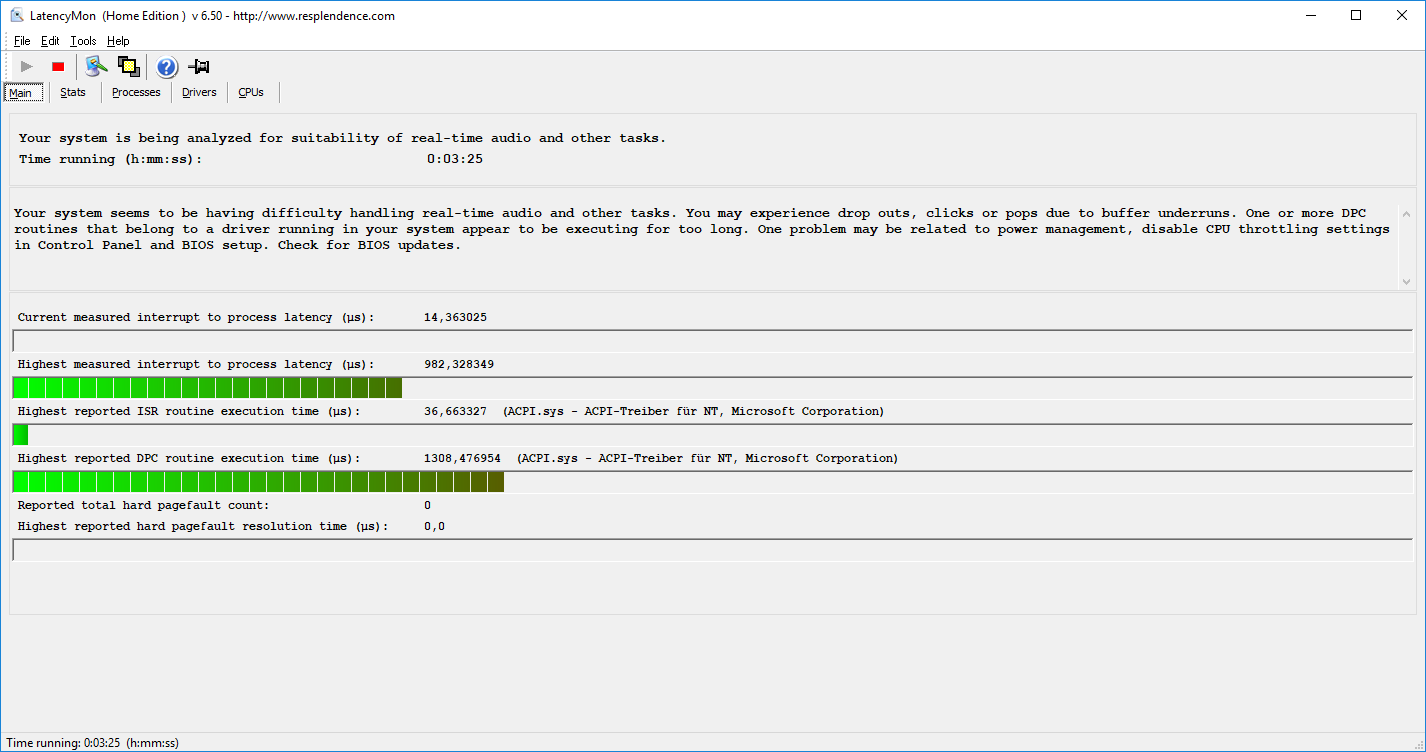
Unfortunately, the LatencyMon tool shows some dropouts that could interfere with the processing of real-time audio data. Whether the WLAN connection is activated or not has no effect on this.
Note: For the sections below, we ran some of the benchmarks with the standard single-channel RAM as well as with a dual-channel RAM configuration. For this, we expanded the working memory using an 8-GB module from Crucial to a total of 16 GB. However, for our evaluation of the device we only considered the values of our original test configuration which used only a single RAM module.
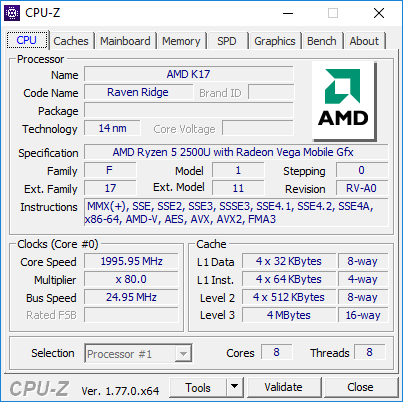
Processor – The Ryzen 5 2500U is competitive
The processor in our test unit represents the medium CPU option, the AMD Ryzen 5 2500U quad-core processor. Its four cores achieve a maximum of 3.6 GHz, which depends significantly on the TDP configuration. While the Intel competition typically operates at 15 watts, we read only 11 watts for the Ryzen 5 in our benchmarks. From time to time in the past, there have been some problems with reading the consumption of AMD systems correctly, so we are careful at this point. You can find additional technical details on the Ryzen 5 2500U here.
In the Cinebench R15 single test, the processor does not run at the full 3.6 GHz, but varies between 3.2 and 3.5 GHz. In the multi test however, it is 4x 2.9 GHz. While this leaves a lot of potential unused, the Ryzen 5 is still at the same level or even slightly faster than the comparison devices with the popular Core i5-8250U from Intel. It also stands out that the AMD processor is able to maintain the good result from the first run for several minutes, while the Intel competition already loses ground in the second run. The CPU performance is not reduced in battery operation.
System Performance
The ThinkPad E485 also does not need to hide behind the competition in terms of the system performance, neither in the subjective speed, nor in the benchmark results. Interestingly, the RAM configuration has no effect on the performance in the synthetic PCMarks.
| PCMark 8 Home Score Accelerated v2 | 3550 points | |
| PCMark 8 Creative Score Accelerated v2 | 4249 points | |
| PCMark 8 Work Score Accelerated v2 | 4870 points | |
| PCMark 10 Score | 3321 points | |
Help | ||
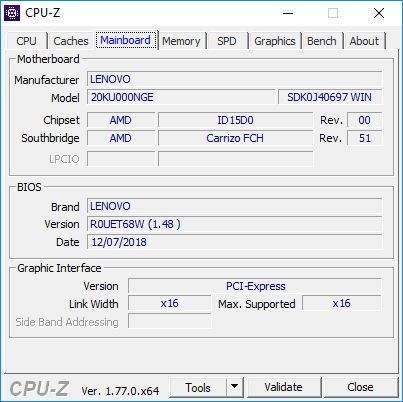
Storage Solution – Lenovo uses the fast PM961 from Samsung
In terms of the SSD, the name of the game is to not take half-measures, since Lenovo uses a very fast PM961 M.2 NVMe SSD from Samsung with a storage capacity of 256 GB in our test unit. The drive is connected via PCIe-x4, so it is not slowed down. The performance is correspondingly good in the benchmarks, and there would be no reason apart from the capacity to replace the drive. However, according to our experience we can say that Lenovo uses various suppliers, and drives from other manufacturers (such as Toshiba) might also be used.
As we have already indicated in the Maintenance section, the ThinkPad E485 still has an empty slot for a 2.5-inch hard drive (SATA). Fortunately, Lenovo includes the corresponding mount and connection cable, so you only have to insert an HDD or SSD.
Additional hard drive benchmarks are available in our extensive SSD/HDD comparison.
| Lenovo ThinkPad E485-20KU000NGE Samsung PM961 MZVLW256HEHP | Lenovo ThinkPad E480-20KNCTO1WW Toshiba KBG30ZMT128G | HP ProBook 645 G4 3UP62EA Toshiba XG5 KXG50ZNV256G | Dell Latitude 3490 SK hynix SC311 M.2 | HP ProBook 440 G6-5TK01EA Toshiba XG5 KXG50ZNV512G | Average Samsung PM961 MZVLW256HEHP | |
|---|---|---|---|---|---|---|
| AS SSD | -82% | -47% | -45% | -2% | -59% | |
| Score Total (Points) | 2478 | 638 -74% | 1290 -48% | 1006 -59% | 2040 -18% | 2565 ? 4% |
| Score Write (Points) | 575 | 182 -68% | 323 -44% | 387 -33% | 669 16% | 587 ? 2% |
| Score Read (Points) | 1277 | 324 -75% | 638 -50% | 409 -68% | 954 -25% | 1378 ? 8% |
| Access Time Write * (ms) | 0.059 | 0.235 -298% | 0.063 -7% | 0.052 12% | 0.047 20% | 0.4637 ? -686% |
| Access Time Read * (ms) | 0.054 | 0.106 -96% | 0.144 -167% | 0.097 -80% | 0.067 -24% | 0.06777 ? -25% |
| 4K-64 Write (MB/s) | 371.5 | 92.1 -75% | 216 -42% | 286.1 -23% | 499.5 34% | 419 ? 13% |
| 4K-64 Read (MB/s) | 1035 | 190.9 -82% | 433.3 -58% | 332.7 -68% | 724 -30% | 1112 ? 7% |
| 4K Write (MB/s) | 63.9 | 78.9 23% | 76.8 20% | 68.9 8% | 119.7 87% | 91.6 ? 43% |
| 4K Read (MB/s) | 38.63 | 31.13 -19% | 25.35 -34% | 27.67 -28% | 31.17 -19% | 45.1 ? 17% |
| Seq Write (MB/s) | 1395 | 115.4 -92% | 305.2 -78% | 318.8 -77% | 493.6 -65% | 960 ? -31% |
| Seq Read (MB/s) | 2030 | 1015 -50% | 1797 -11% | 484.7 -76% | 1983 -2% | 2019 ? -1% |
* ... smaller is better

Graphics Card
Things are getting interesting with the integrated graphics card which is called AMD Radeon Vega RX 8. Like the integrated GPUs from the Intel competitor, the AMD GPU benefits hugely from dual-channel RAM with a high speed. Already in the standard configuration with a single RAM module, the Vega 8 is clearly superior to the Intel UHD Graphics 620 (plus 40-50%). With a second module, you are at the level of the dedicated MX130 GPU from Nvidia and about twice as fast as the iGPU from Intel. The performance is not reduced in battery operation.
| 3DMark 11 - 1280x720 Performance GPU | |
| Average of class Office (2551 - 18313, n=68, last 2 years) | |
| Lenovo ThinkPad E485-20KU000NGE | |
| Average AMD Radeon RX Vega 8 (Ryzen 2000/3000) (1668 - 4317, n=44) | |
| HP ProBook 645 G4 3UP62EA | |
| Lenovo ThinkPad E485-20KU000NGE | |
| HP ProBook 440 G6-5TK01EA | |
| Dell Latitude 3490 | |
| Lenovo ThinkPad E480-20KNCTO1WW | |
| 3DMark - 1920x1080 Fire Strike Graphics | |
| Average of class Office (736 - 21871, n=72, last 2 years) | |
| Lenovo ThinkPad E485-20KU000NGE | |
| Average AMD Radeon RX Vega 8 (Ryzen 2000/3000) (1095 - 2901, n=41) | |
| HP ProBook 645 G4 3UP62EA | |
| Lenovo ThinkPad E485-20KU000NGE | |
| HP ProBook 440 G6-5TK01EA | |
| Dell Latitude 3490 | |
| Lenovo ThinkPad E480-20KNCTO1WW | |
| 3DMark 11 Performance | 2807 points | |
| 3DMark Cloud Gate Standard Score | 7035 points | |
| 3DMark Fire Strike Score | 1469 points | |
Help | ||
Gaming Performance
We had some problems with the resolutions in the gaming benchmarks, since the tests with 1366x768 pixels did not work. In the other presets, we again saw a clear performance increase with two RAM modules, however, we are still at a low performance level. Those who occasionally want to play some older or less demanding games should definitely expand the working memory. For modern games you are forced to reduce the resolution and also details. Additional gaming benchmarks with the Vega 8 are available here.
| BioShock Infinite - 1920x1080 Ultra Preset, DX11 (DDOF) | |
| Lenovo ThinkPad E480-20KQS00000 | |
| Lenovo ThinkPad E485-20KU000NGE | |
| Average AMD Radeon RX Vega 8 (Ryzen 2000/3000) (7.6 - 28, n=30) | |
| Lenovo ThinkPad E485-20KU000NGE | |
| HP ProBook 645 G4 3UP62EA | |
| HP ProBook 440 G6-5TK01EA | |
| Dell Latitude 3490 | |
| Lenovo ThinkPad E480-20KNCTO1WW | |
| Rise of the Tomb Raider | |
| 1024x768 Lowest Preset | |
| Lenovo ThinkPad E485-20KU000NGE | |
| Average AMD Radeon RX Vega 8 (Ryzen 2000/3000) (27.7 - 49.3, n=10) | |
| Lenovo ThinkPad E485-20KU000NGE | |
| HP ProBook 645 G4 3UP62EA | |
| HP ProBook 440 G6-5TK01EA | |
| Lenovo ThinkPad E480-20KNCTO1WW | |
| 1920x1080 High Preset AA:FX AF:4x | |
| Lenovo ThinkPad E485-20KU000NGE | |
| Average AMD Radeon RX Vega 8 (Ryzen 2000/3000) (5.9 - 15.4, n=11) | |
| Lenovo ThinkPad E485-20KU000NGE | |
| HP ProBook 645 G4 3UP62EA | |
| HP ProBook 440 G6-5TK01EA | |
| Lenovo ThinkPad E480-20KNCTO1WW | |
| low | med. | high | ultra | |
|---|---|---|---|---|
| BioShock Infinite (2013) | 74.4 | 13.26 | ||
| Rise of the Tomb Raider (2016) | 30.4 | 10.8 | ||
| Doom (2016) | 25.1 | 10.4 | ||
| Civilization 6 (2016) | 56.3 | 12.4 | ||
| Star Wars Battlefront 2 (2017) | 26.5 | 9.1 |
Emissions
Noise Emissions
Basically, the ThinkPad E485 is a very quiet companion. In everyday operation, the fan is often quiet or only starts up briefly, which does not interfere in any way. Even under load, the cooling remains restrained and will only rarely reach the maximum of 35.3 dB(A) in everyday operation. Our test unit did not produce any annoying electronic noises such as coil whine.
Noise level
| Idle |
| 29.4 / 29.4 / 31.2 dB(A) |
| Load |
| 32.7 / 35.3 dB(A) |
 | ||
30 dB silent 40 dB(A) audible 50 dB(A) loud |
||
min: | ||
| Lenovo ThinkPad E485-20KU000NGE Vega 8, R5 2500U, Samsung PM961 MZVLW256HEHP | Lenovo ThinkPad E480-20KNCTO1WW UHD Graphics 620, i5-8250U, Toshiba KBG30ZMT128G | HP ProBook 645 G4 3UP62EA Vega 8, R5 PRO 2500U, Toshiba XG5 KXG50ZNV256G | Dell Latitude 3490 UHD Graphics 620, i5-8250U, SK hynix SC311 M.2 | HP ProBook 440 G6-5TK01EA UHD Graphics 620, i7-8565U, Toshiba XG5 KXG50ZNV512G | |
|---|---|---|---|---|---|
| Noise | 2% | -4% | -7% | 2% | |
| off / environment * (dB) | 29.4 | 29.1 1% | 30.8 -5% | 29.8 -1% | 29.4 -0% |
| Idle Minimum * (dB) | 29.4 | 29.1 1% | 30.8 -5% | 29.8 -1% | 29.4 -0% |
| Idle Average * (dB) | 29.4 | 29.1 1% | 30.8 -5% | 29.8 -1% | 29.4 -0% |
| Idle Maximum * (dB) | 31.2 | 30.3 3% | 30.8 1% | 29.8 4% | 30.2 3% |
| Load Average * (dB) | 32.7 | 31.8 3% | 34.7 -6% | 39.1 -20% | 31.8 3% |
| Load Maximum * (dB) | 35.3 | 33.8 4% | 36.4 -3% | 44.3 -25% | 33.1 6% |
* ... smaller is better
Temperature
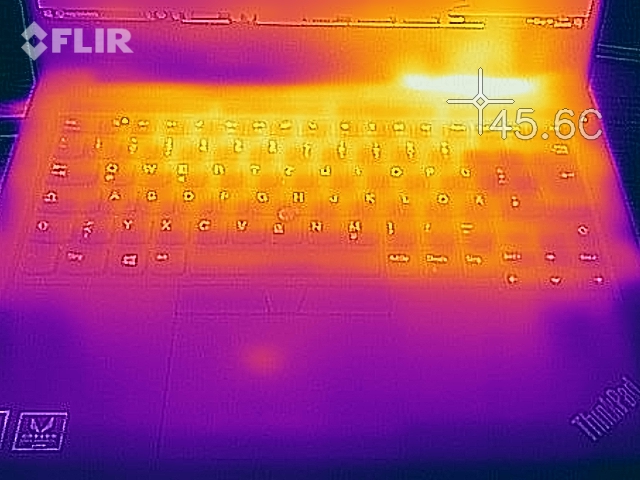
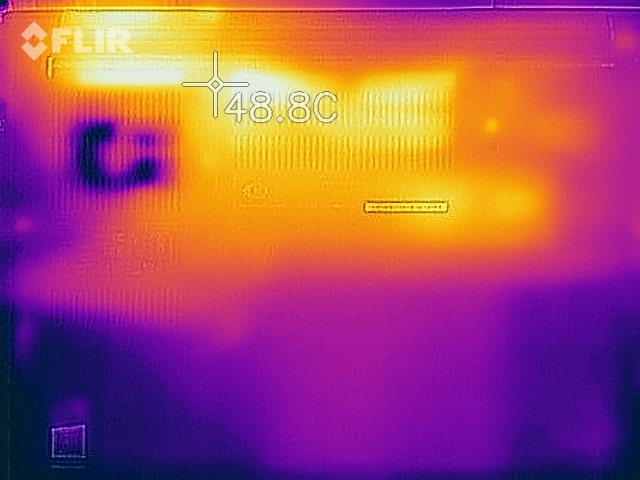
The surface temperatures are not problematic even under load, since the keyboard always remains at a comfortable level. Only at the area of the fan vents do we measure up to 45 °C (113 °F) on top, but you do not really come into contact with this area anyway. There is a hot spot along the heat pipe on the bottom, which you can see well in our pictures of the heat map.
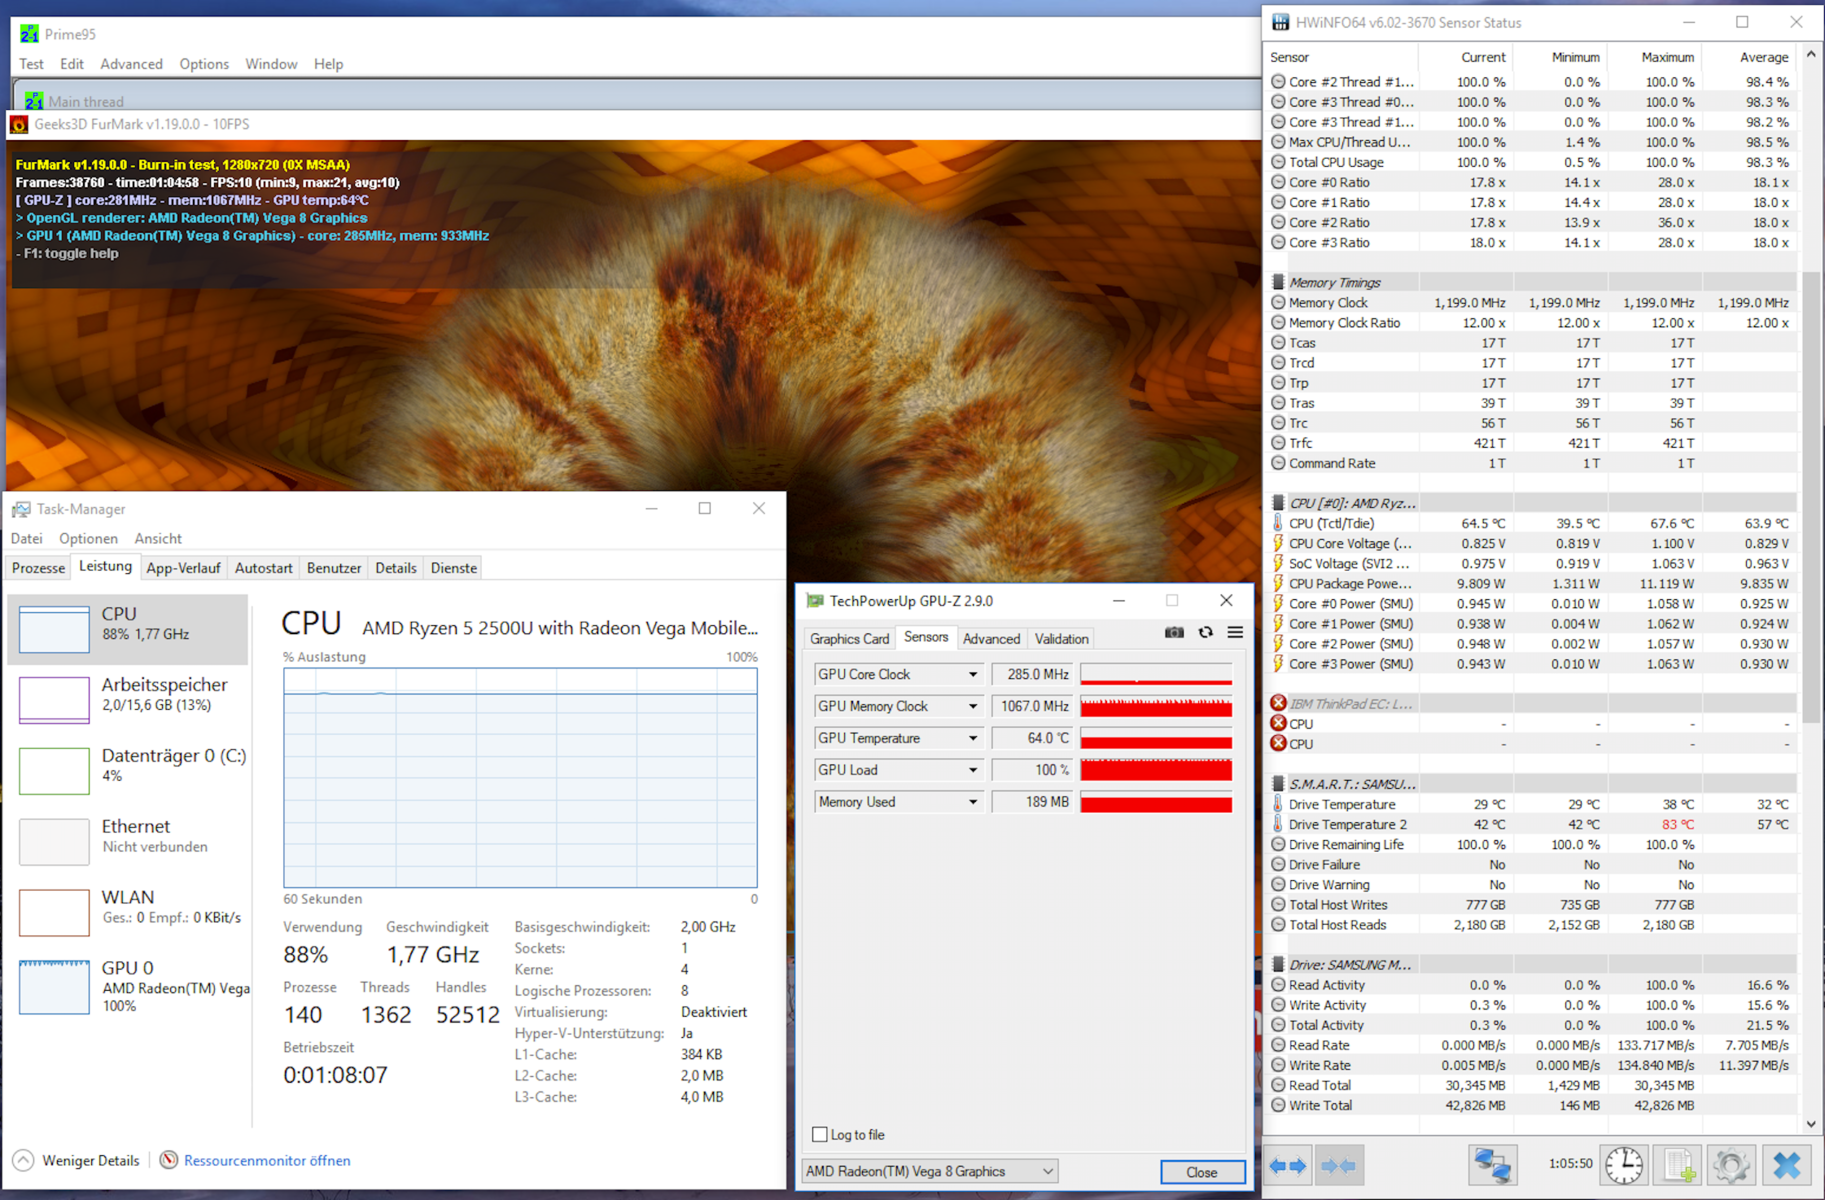
In the stress test with the two Prime95 and FurMark tools, we are shown a TDP limit of 11 watts again, which is barely sufficient for 4x 1.9 GHz for the processor and ~330 MHz for the GPU. During the stress test, the value drops to about 9.5 watts (4x 1.8 GHz CPU, ~280 MHz GPU). The APU temperature level is at only 64 °C (147 °F), so the presets from Lenovo are extremely conservative.
(±) The maximum temperature on the upper side is 42.3 °C / 108 F, compared to the average of 34.3 °C / 94 F, ranging from 21.2 to 62.5 °C for the class Office.
(-) The bottom heats up to a maximum of 45.2 °C / 113 F, compared to the average of 36.8 °C / 98 F
(+) In idle usage, the average temperature for the upper side is 26.9 °C / 80 F, compared to the device average of 29.5 °C / 85 F.
(+) The palmrests and touchpad are cooler than skin temperature with a maximum of 25.7 °C / 78.3 F and are therefore cool to the touch.
(±) The average temperature of the palmrest area of similar devices was 27.5 °C / 81.5 F (+1.8 °C / 3.2 F).
Speakers
Unfortunately, business laptops are often equipped with relatively bad speakers, and the ThinkPad E485 is no exception here. For everyday work at the office where you mostly need a comprehensible voice quality for conference calls, the speaker modules are surely sufficient, but we would recommend headphones or external speakers for anything else.
The built-in microphone works reliably and generally makes an external microphone unnecessary.
Lenovo ThinkPad E485-20KU000NGE audio analysis
(-) | not very loud speakers (70.5 dB)
Bass 100 - 315 Hz
(-) | nearly no bass - on average 21.5% lower than median
(±) | linearity of bass is average (12.6% delta to prev. frequency)
Mids 400 - 2000 Hz
(+) | balanced mids - only 4.3% away from median
(±) | linearity of mids is average (8.5% delta to prev. frequency)
Highs 2 - 16 kHz
(+) | balanced highs - only 2.8% away from median
(+) | highs are linear (6.2% delta to prev. frequency)
Overall 100 - 16.000 Hz
(±) | linearity of overall sound is average (26.4% difference to median)
Compared to same class
» 81% of all tested devices in this class were better, 7% similar, 13% worse
» The best had a delta of 7%, average was 21%, worst was 53%
Compared to all devices tested
» 81% of all tested devices were better, 4% similar, 15% worse
» The best had a delta of 4%, average was 24%, worst was 134%
HP ProBook 440 G6-5TK01EA audio analysis
(±) | speaker loudness is average but good (78.1 dB)
Bass 100 - 315 Hz
(-) | nearly no bass - on average 17.2% lower than median
(±) | linearity of bass is average (12.1% delta to prev. frequency)
Mids 400 - 2000 Hz
(+) | balanced mids - only 3.3% away from median
(+) | mids are linear (6.7% delta to prev. frequency)
Highs 2 - 16 kHz
(±) | higher highs - on average 5.7% higher than median
(±) | linearity of highs is average (7.1% delta to prev. frequency)
Overall 100 - 16.000 Hz
(±) | linearity of overall sound is average (20.8% difference to median)
Compared to same class
» 48% of all tested devices in this class were better, 9% similar, 43% worse
» The best had a delta of 7%, average was 21%, worst was 53%
Compared to all devices tested
» 56% of all tested devices were better, 8% similar, 36% worse
» The best had a delta of 4%, average was 24%, worst was 134%
Power Management
Power Consumption
One of the main problems of the ThinkPad E485 is the high power consumption in idle operation compared to the Intel competition. Particularly during tasks that are not very demanding and that often dominate during everyday operation, the Intel models are simply more efficient. Under load, the AMD combination also needs more power, but is also able to maintain this performance for a longer period. Even at the end of our stress test we are still measuring more than 40 watts.
The included 65-watt power supply (USB-C) is sized sufficiently and is also able to charge the battery under load.
| Off / Standby | |
| Idle | |
| Load |
|
Key:
min: | |
| Lenovo ThinkPad E485-20KU000NGE R5 2500U, Vega 8, Samsung PM961 MZVLW256HEHP, IPS, 1920x1080, 14" | Lenovo ThinkPad E480-20KNCTO1WW i5-8250U, UHD Graphics 620, Toshiba KBG30ZMT128G, IPS LED, 1920x1080, 14" | HP ProBook 645 G4 3UP62EA R5 PRO 2500U, Vega 8, Toshiba XG5 KXG50ZNV256G, IPS, 1920x1080, 14" | Dell Latitude 3490 i5-8250U, UHD Graphics 620, SK hynix SC311 M.2, IPS LED, 1920x1080, 14" | HP ProBook 440 G6-5TK01EA i7-8565U, UHD Graphics 620, Toshiba XG5 KXG50ZNV512G, IPS, 1920x1080, 14" | Average AMD Radeon RX Vega 8 (Ryzen 2000/3000) | Average of class Office | |
|---|---|---|---|---|---|---|---|
| Power Consumption | 29% | -9% | 8% | 24% | -0% | -1% | |
| Idle Minimum * (Watt) | 6.2 | 3.5 44% | 7.2 -16% | 3.2 48% | 2.98 52% | 5.68 ? 8% | 4.44 ? 28% |
| Idle Average * (Watt) | 8.6 | 5.3 38% | 9.7 -13% | 5.5 36% | 5.4 37% | 8.75 ? -2% | 7.38 ? 14% |
| Idle Maximum * (Watt) | 9.7 | 6.1 37% | 10.3 -6% | 8.1 16% | 7.9 19% | 10.1 ? -4% | 8.59 ? 11% |
| Load Average * (Watt) | 37.4 | 30 20% | 42 -12% | 40.8 -9% | 34.5 8% | 37.8 ? -1% | 43 ? -15% |
| Load Maximum * (Watt) | 44.8 | 42.3 6% | 44.2 1% | 68.1 -52% | 43.3 3% | 46.2 ? -3% | 64.5 ? -44% |
* ... smaller is better
Battery Life
As in the ThinkPad E480, Lenovo also uses a 45-Wh battery (3 cells) here, but due to the increased power consumption the battery life turns out significantly shorter. In practice, we are speaking about barely 5.5 hours, while the ThinkPad E480 lasts for almost 8 hours. This can be a huge difference if you don't have an outlet close by. Thus, you have to decide how important the battery life is for your personal usage scenarios.
| Lenovo ThinkPad E485-20KU000NGE R5 2500U, Vega 8, 45 Wh | Lenovo ThinkPad E480-20KNCTO1WW i5-8250U, UHD Graphics 620, 45 Wh | HP ProBook 645 G4 3UP62EA R5 PRO 2500U, Vega 8, 48 Wh | Dell Latitude 3490 i5-8250U, UHD Graphics 620, 56 Wh | HP ProBook 440 G6-5TK01EA i7-8565U, UHD Graphics 620, 45 Wh | Average of class Office | |
|---|---|---|---|---|---|---|
| Battery runtime | 62% | 0% | 115% | 76% | 132% | |
| Reader / Idle (h) | 9.1 | 18.4 102% | 9.3 2% | 17.1 88% | 23.7 ? 160% | |
| H.264 (h) | 5.7 | 7.2 26% | 4.2 -26% | 7.6 33% | 15 ? 163% | |
| WiFi v1.3 (h) | 5.4 | 8.3 54% | 4.8 -11% | 11.6 115% | 8.4 56% | 12.9 ? 139% |
| Load (h) | 1.1 | 1.8 64% | 1.5 36% | 2.5 127% | 1.807 ? 64% |
Verdict
Pros
Cons
The ThinkPad E485 leaves a slightly mixed impression. Looking at it by itself, it is a solid entry-level business notebook with a robust case, a decent display, and great input devices. However, if you compare it to the ThinkPad E480, the supposedly identical model with an Intel processor, there are several differences. We are speaking mainly about the lack of a keyboard backlight, which is not even available as an option, and also the plastic material on top of the base unit, which is of slightly poorer quality. Sometimes we have the feeling that the manufacturer wants to artificially distance it from the Intel models.
On the other hand, there is of course the lower price of the ThinkPad E485 and most users should be able to live with the differences in the materials. Another issue is the slightly unfortunate equipment. While everybody knows that the integrated AMD GPUs benefit massively from dual-channel RAM, all the preconfigured models are unfortunately only equipped with a single RAM module. Although you can upgrade relatively easily, in principle 8 GB should be sufficient for many users and more RAM also costs more. It would have been better, if Lenovo had built-in two 4-GB modules directly. But the most significant problem is probably the higher power consumption that leads to a much shorter battery life. Whether this is only due to a lack of optimization or AMD's platform simply consumes more power is a different question.
A missed opportunity: Compared to its Intel sibling, the ThinkPad E485 shows some weaknesses that have nothing to do with its AMD processor. For example, it is incomprehensible why users of the E485 have to make do without a keyboard backlight. However, anyone who can live with this and also the shorter battery life will receive a very solid entry-level device at an attractive price with the ThinkPad E485.
The ThinkPad E485 also offers a whole series of advantages that are not a given at this price range. The processor offers more than sufficient performance for most tasks, and thanks to the fast SSD from Samsung, you can look forward to a very responsive device in everyday operation. In addition, there is a decent IPS display (however, there might possibly be some small differences depending on the supplier). Particularly for the low price, we can recommend the E485 in any case.
Update: Unfortunately, the alternative Innolux display turns out much worse in our test than the model from AU Optronics, particularly in terms of the brightness. Using the alternative panel, the overall evaluation would drop from 86.4 to 85.8%. Unfortunately you do not have any influence on the built-in panel variant when purchasing the device, so you have to live with Lenovo's panel lottery.
Lenovo ThinkPad E485-20KU000NGE
- 04/05/2019 v6 (old)
Andreas Osthoff
Price comparison

