Dell Latitude 3490 (Core i5, FHD) Laptop Review
The Dell Latitude name is synonymous with high-quality business notebooks. Spending over 1,000 Euros (~$1166) is not appropriate for everyone though, and so Dell also produces cheaper notebooks under the Latitude brand to counteract this. Specifically, this is the Latitude 3000 series, the entry-level of Latitude notebooks.
Today’s review device is the 14-inch Latitude 3490, with a display size that is currently the most popular in the enterprise market. Our test device is equipped with an Intel Core i5-8250U processor, a 256 GB SSD, 8 GB RAM and a Full HD display. This configuration has an 830-Euro RRP (~$967).
The main competitors against which we will be comparing the Latitude 3490 are the Lenovo ThinkPad E480 and the HP ProBook 440 G5. Both these devices are the cheaper office offerings by both manufacturers. We will also be comparing the Latitude 3490 against the Latitude 14 3470. We did not test the Latitude 3480.
Case & Connectivity
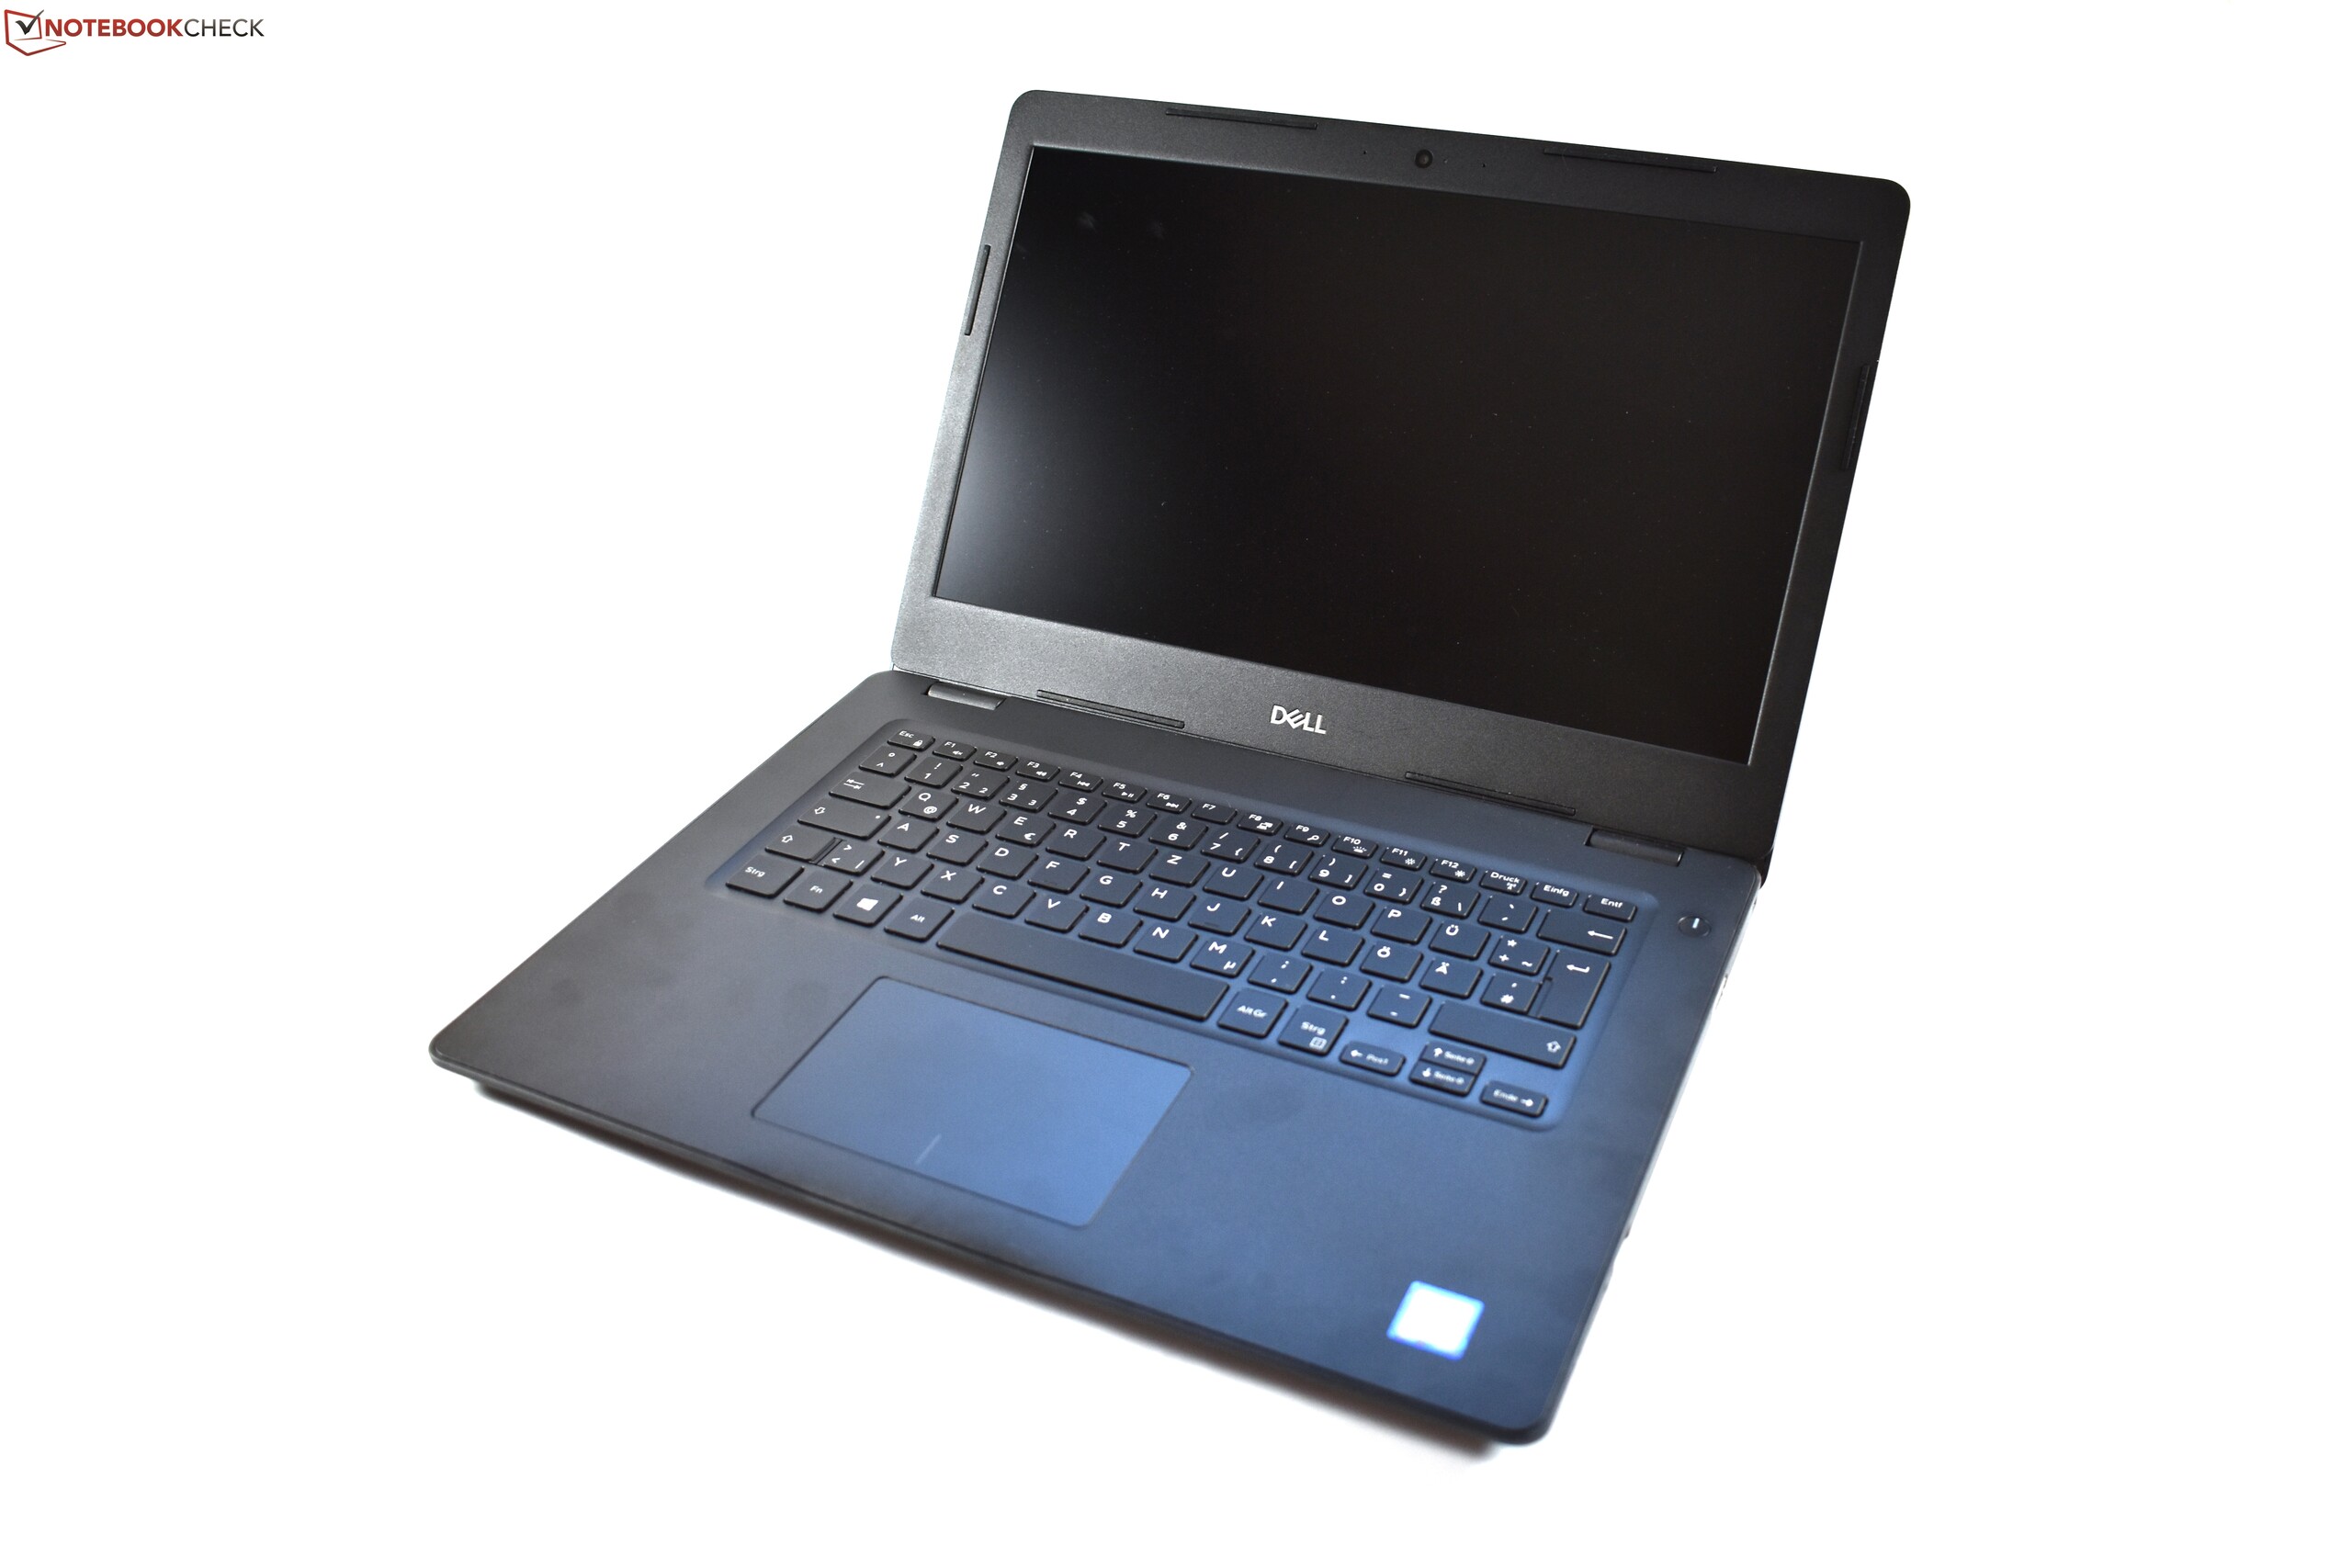
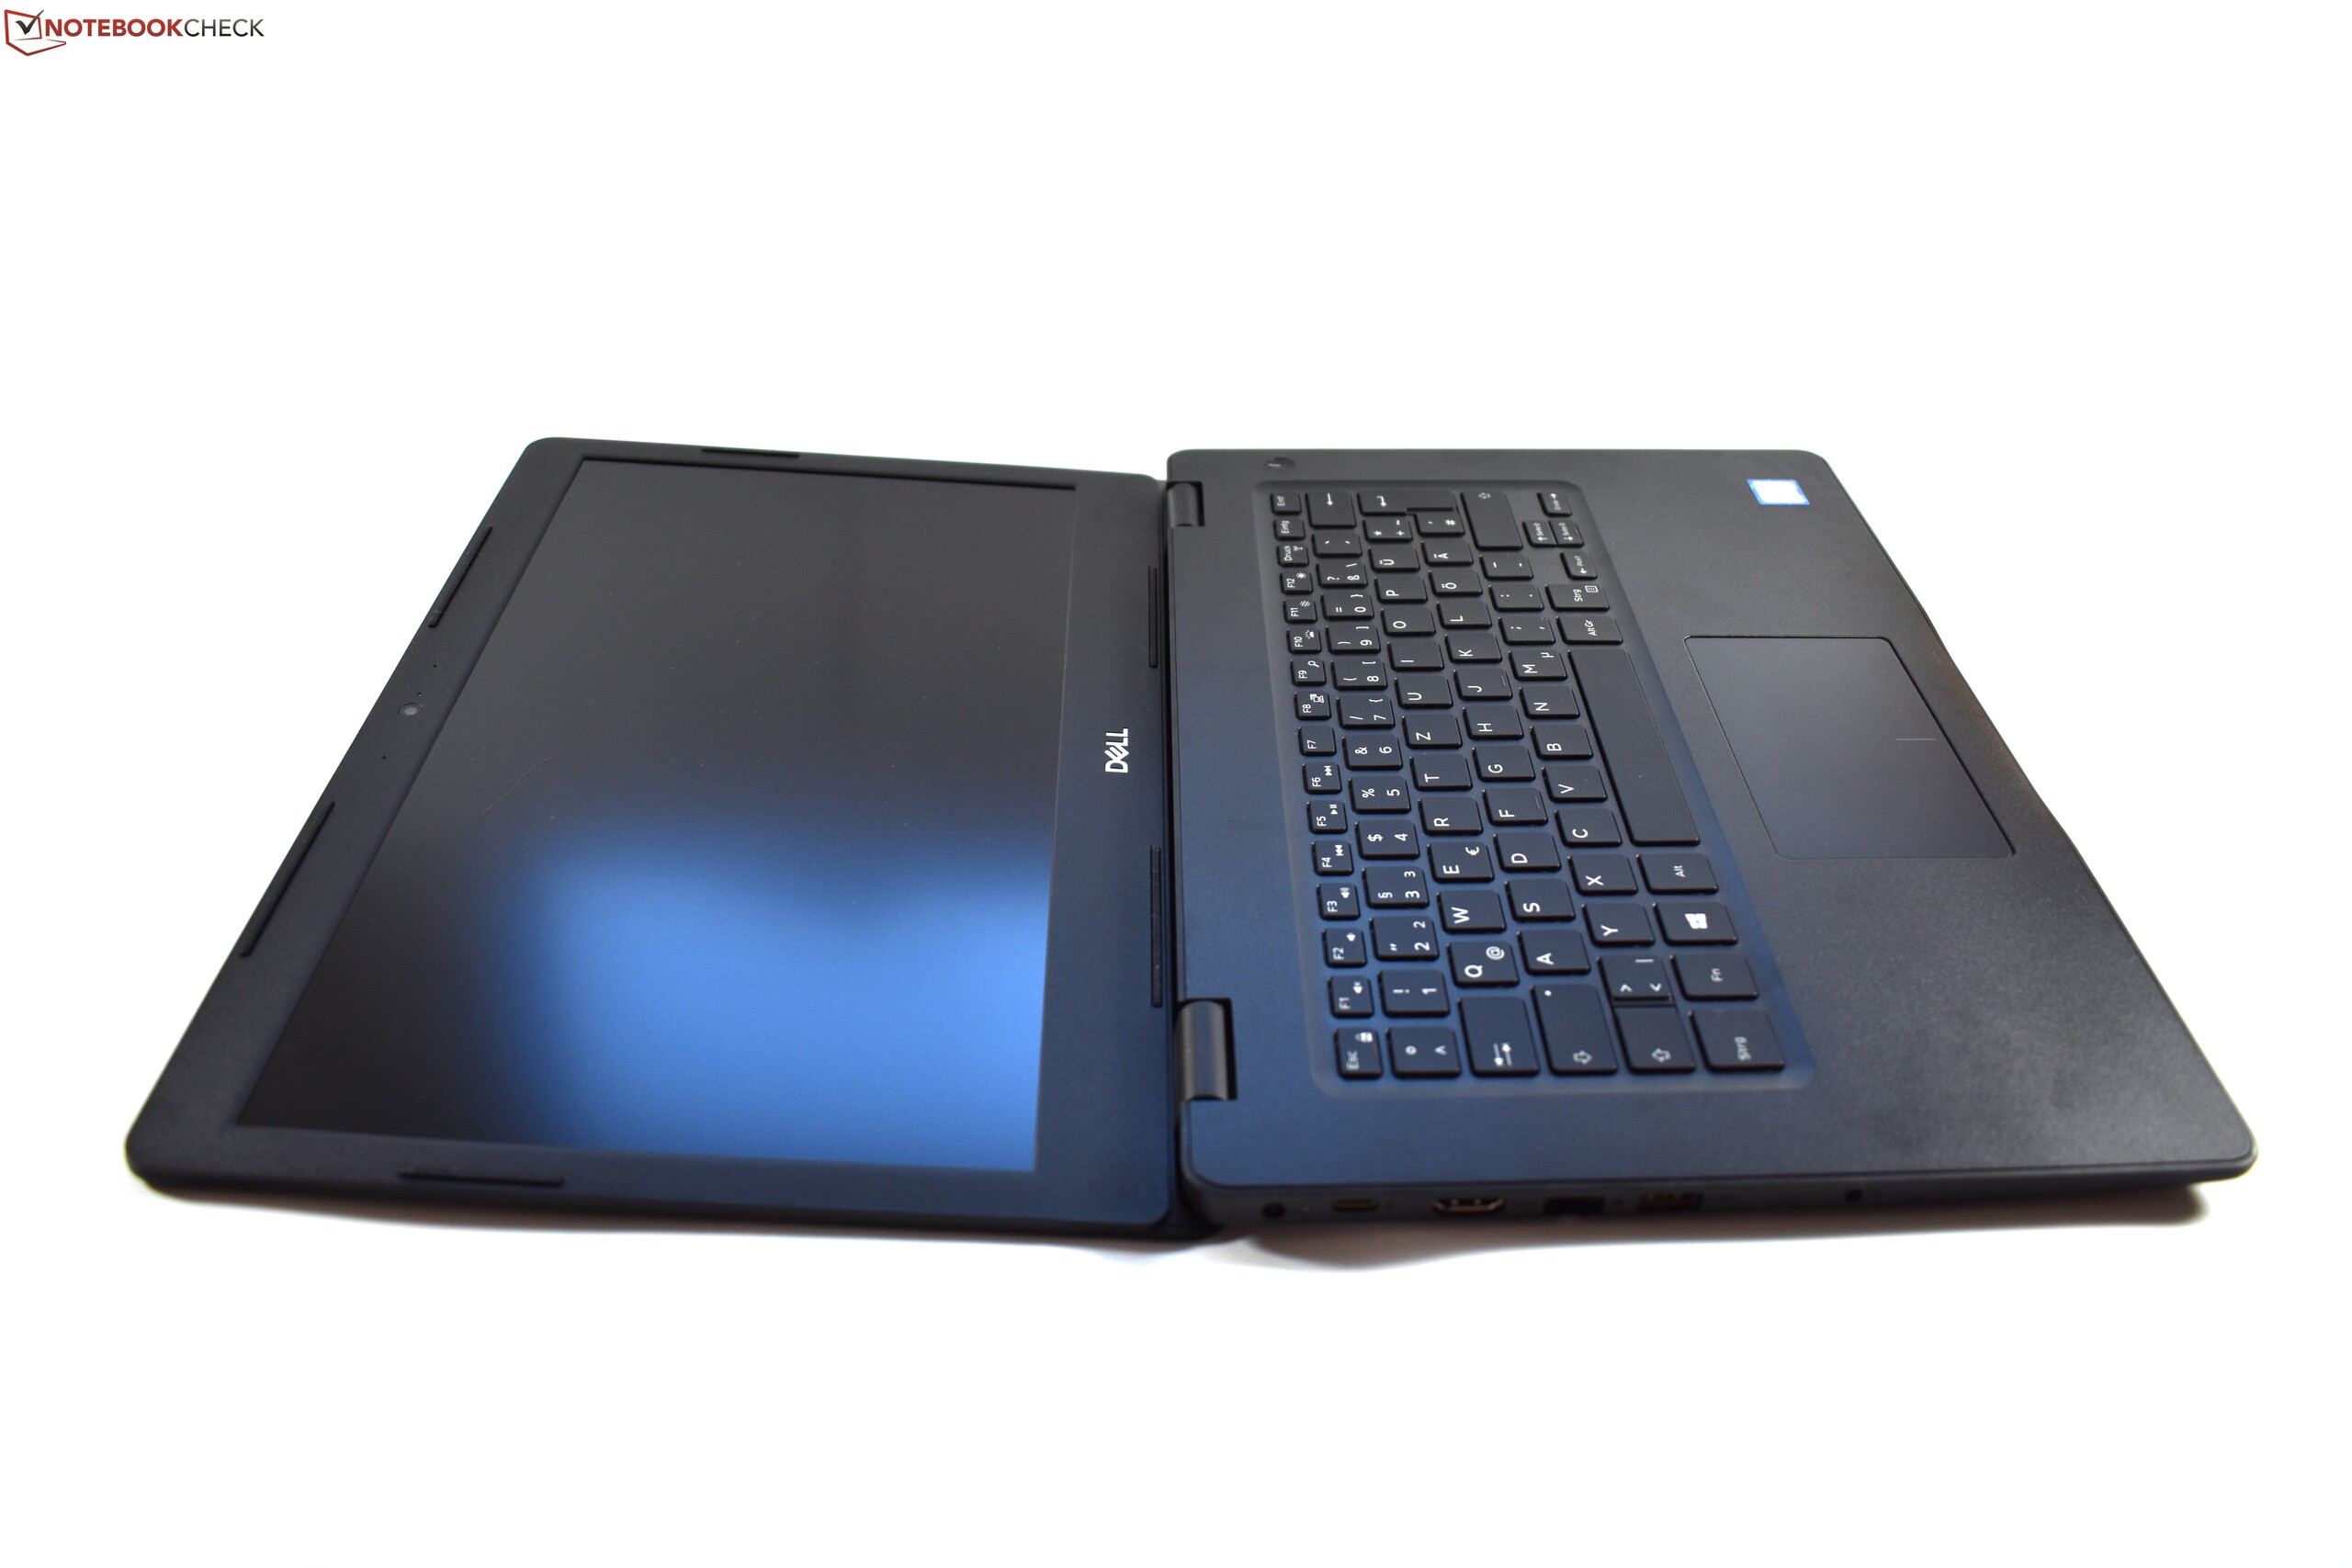
The Latitude 3490 is made from plastic, a far cry from the metal and carbon-fibrer cases that we have come to expect with more expensive business devices. Our test device has an unpainted black finish, which gives the device a rustic look and feel. By contrast, the ThinkPad E480 has a coated palm rest and the ProBook 440 G5 has an aluminum palm rest, both of which we prefer to the Latitude 3490. The case is thicker than the more expensive Latitude 7000 series to maintain structural integrity while using cheaper materials. The Latitude 3490 is still an Ultrabook at 21 mm thick, but this is about as thick as an Ultrabook can get. Dell has done a good job with case stability on a cheaper office notebook though. We could not depress the palm rest nor did the display immediately distort when we applied pressure to the back of the display lid. The display can be opened to 180 °, but you cannot open the device one-handed.
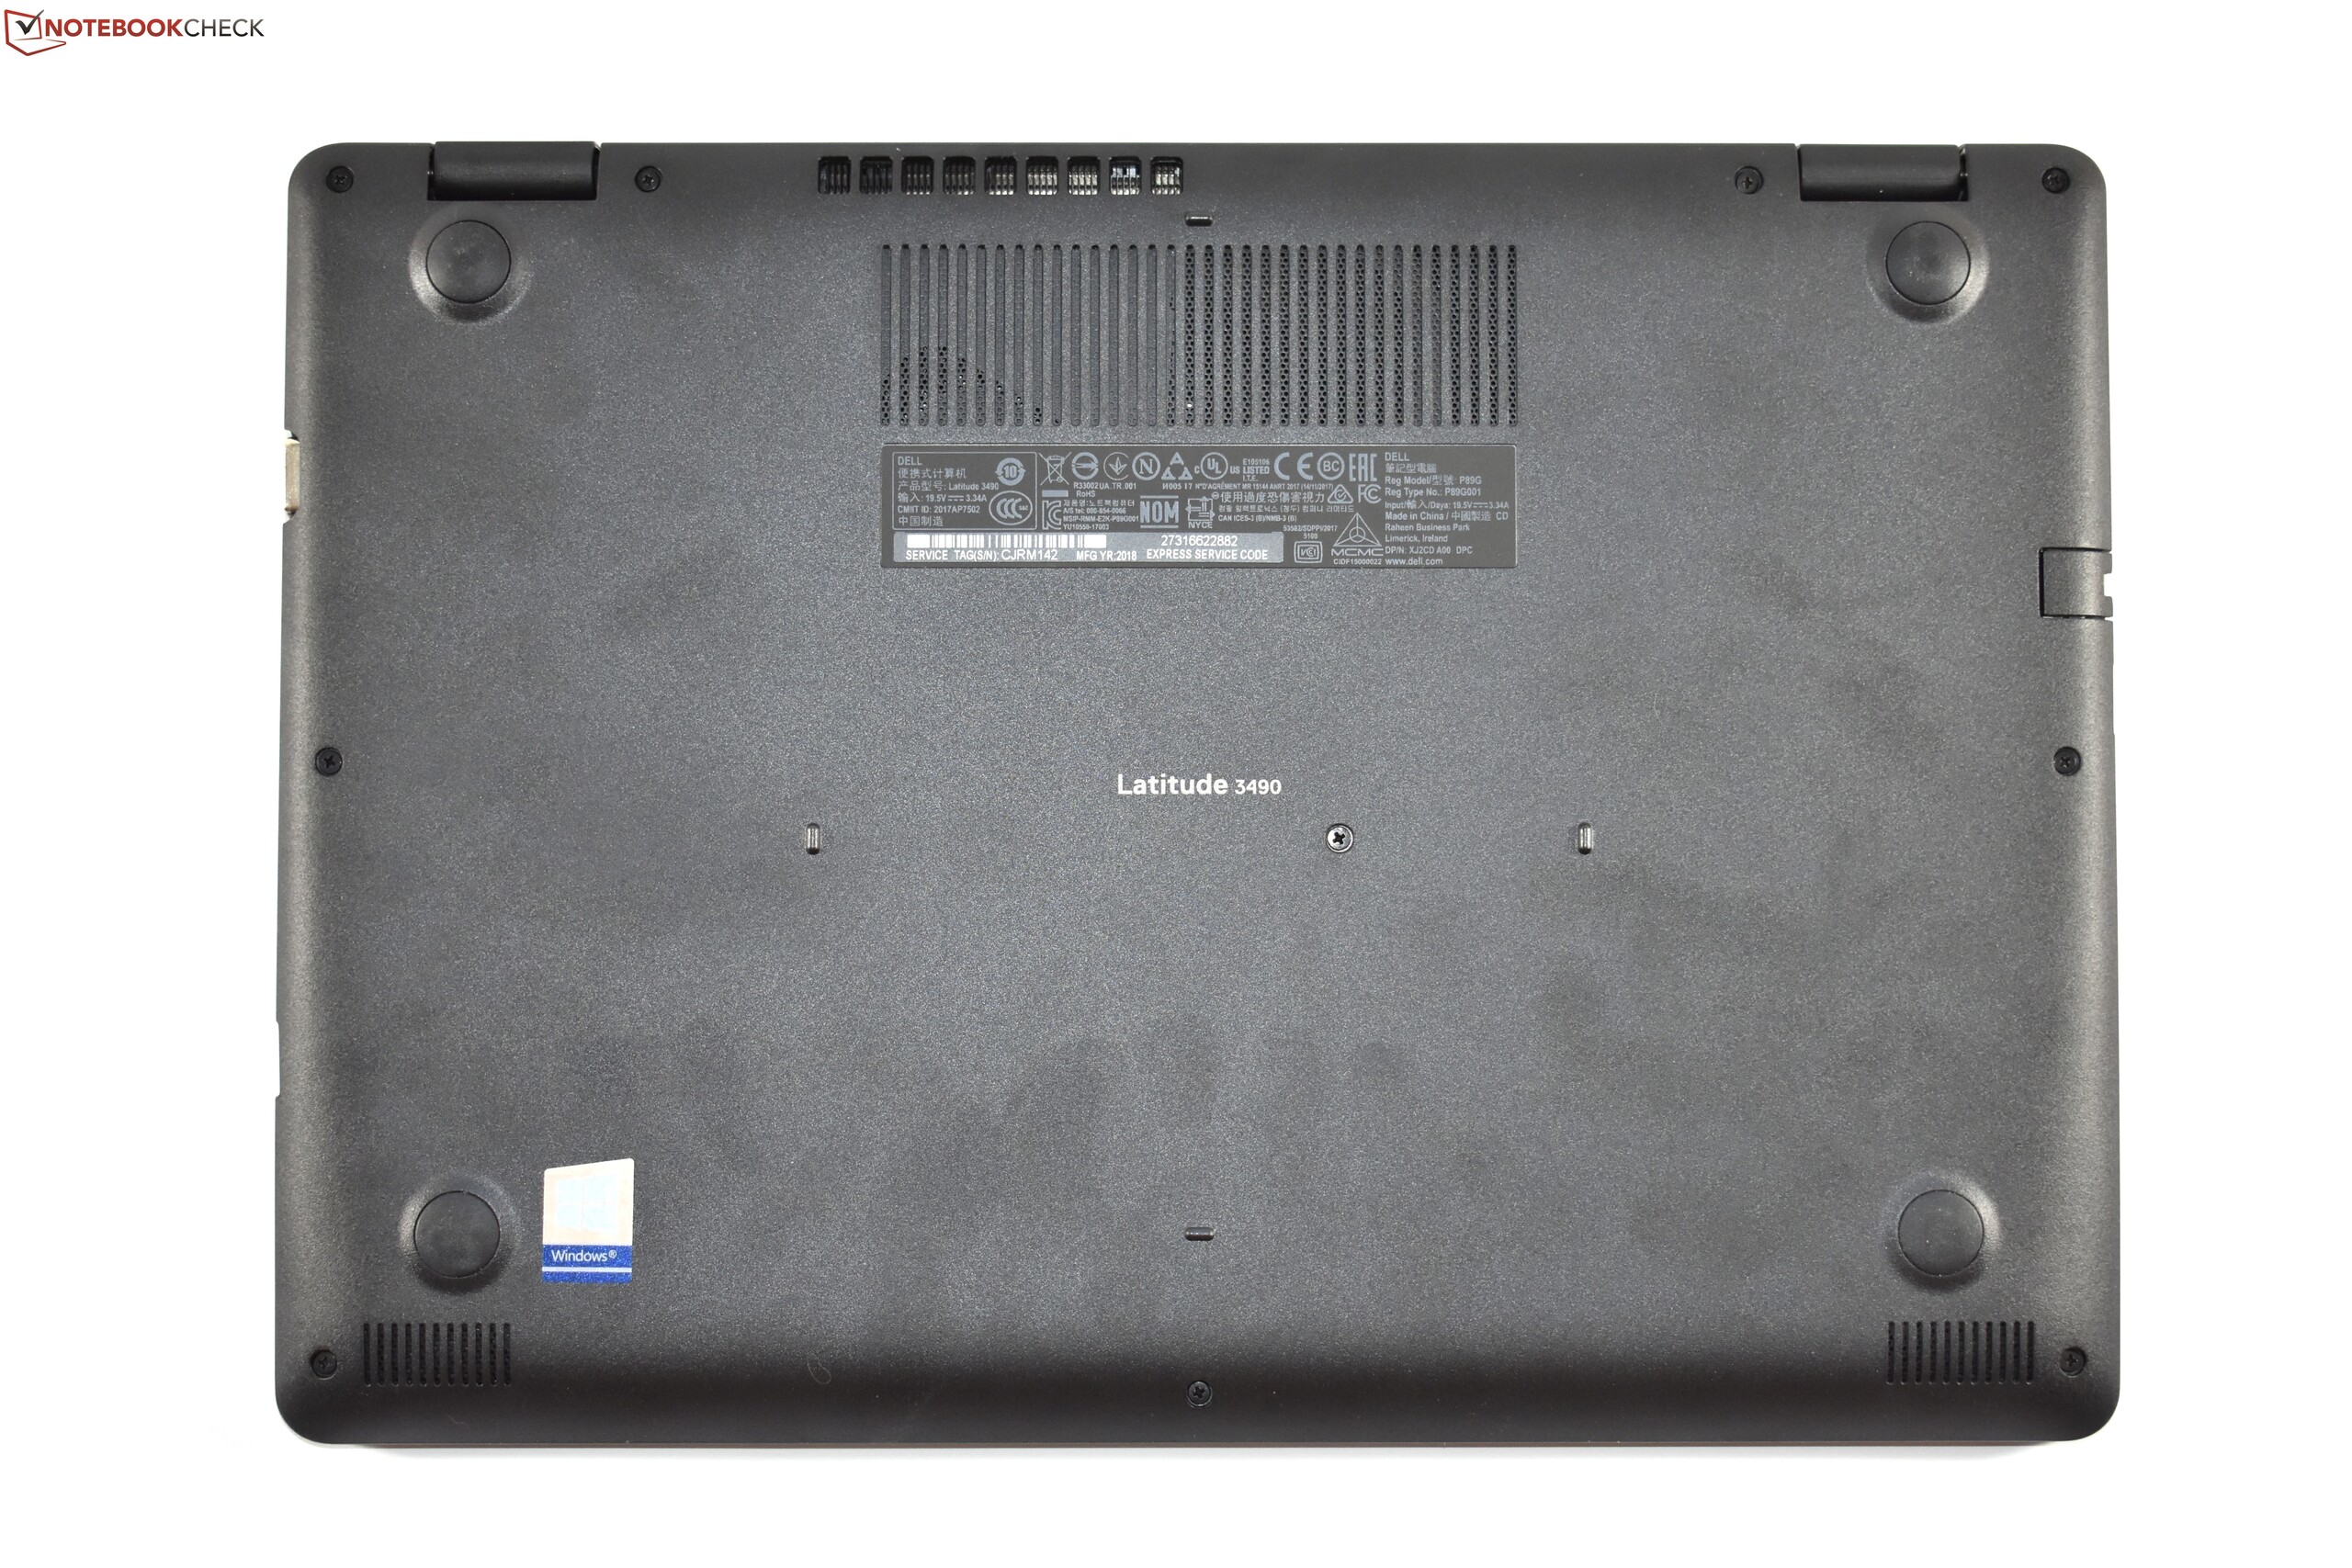
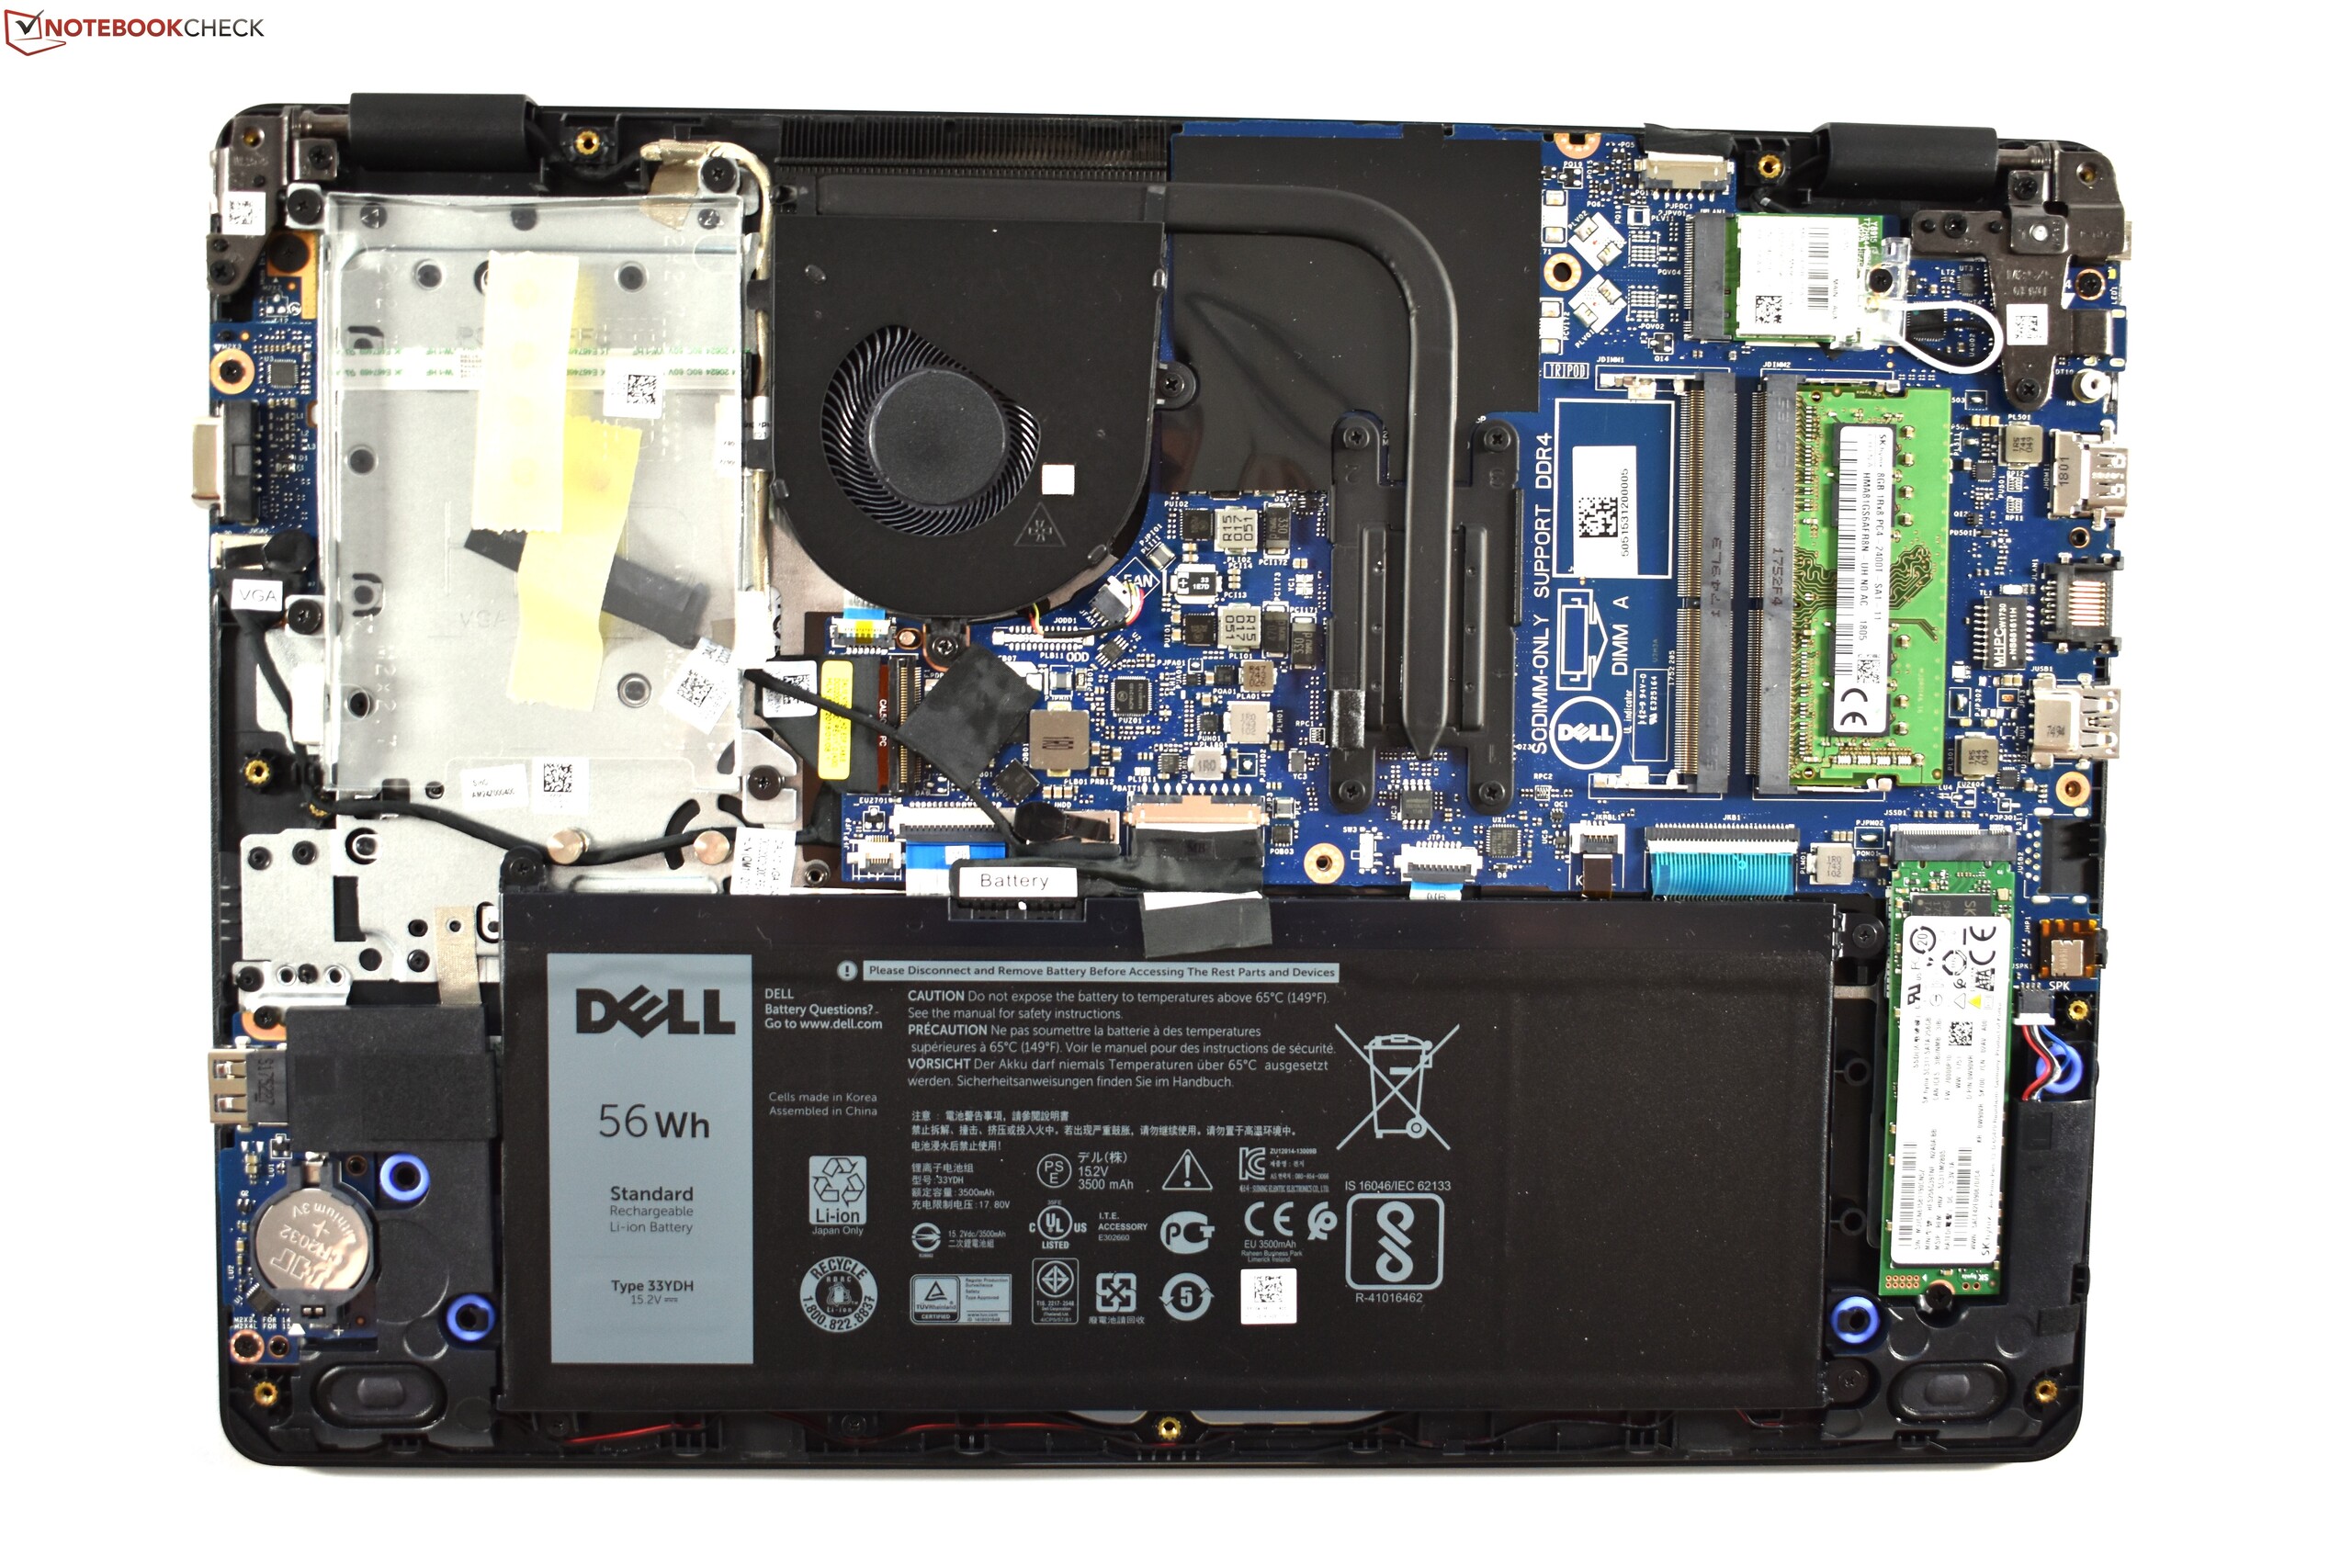
The internal components can be accessed by removing the bottom case, which is secured with several screws and plastic hooks. The Latitude 3490 has good upgradability with two SO-DIMM slots and an unoccupied 2.5-inch drive bay, for which Dell includes the necessary parts to install an additional drive.
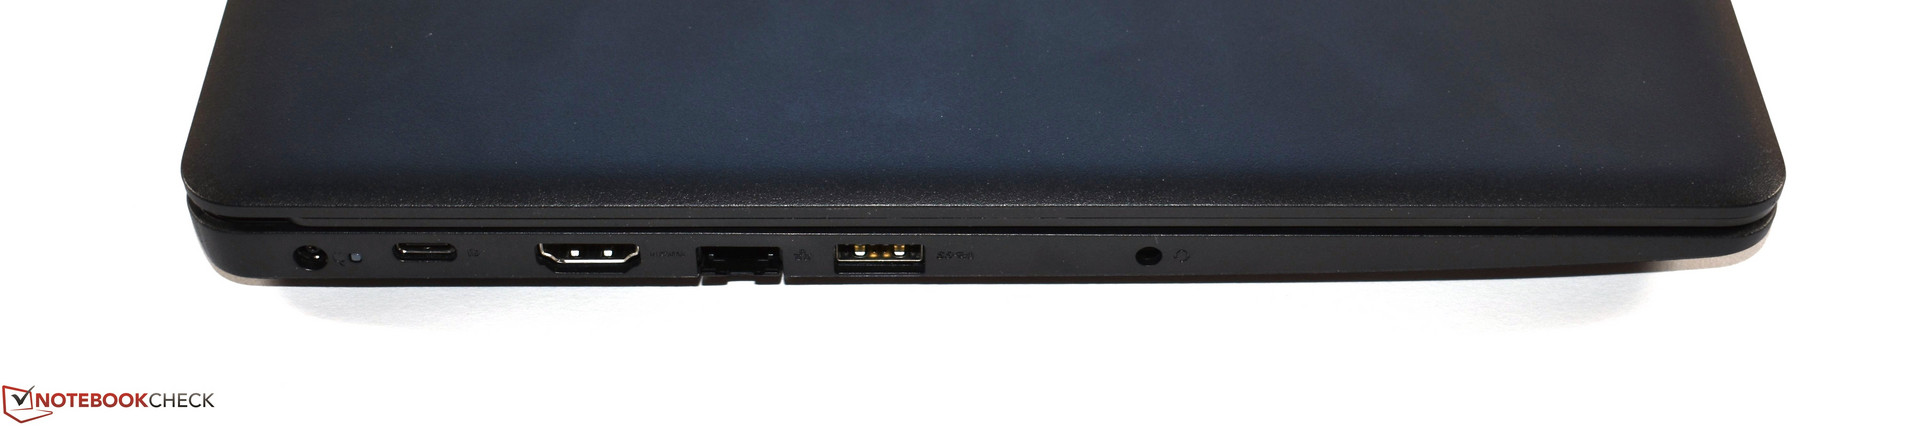
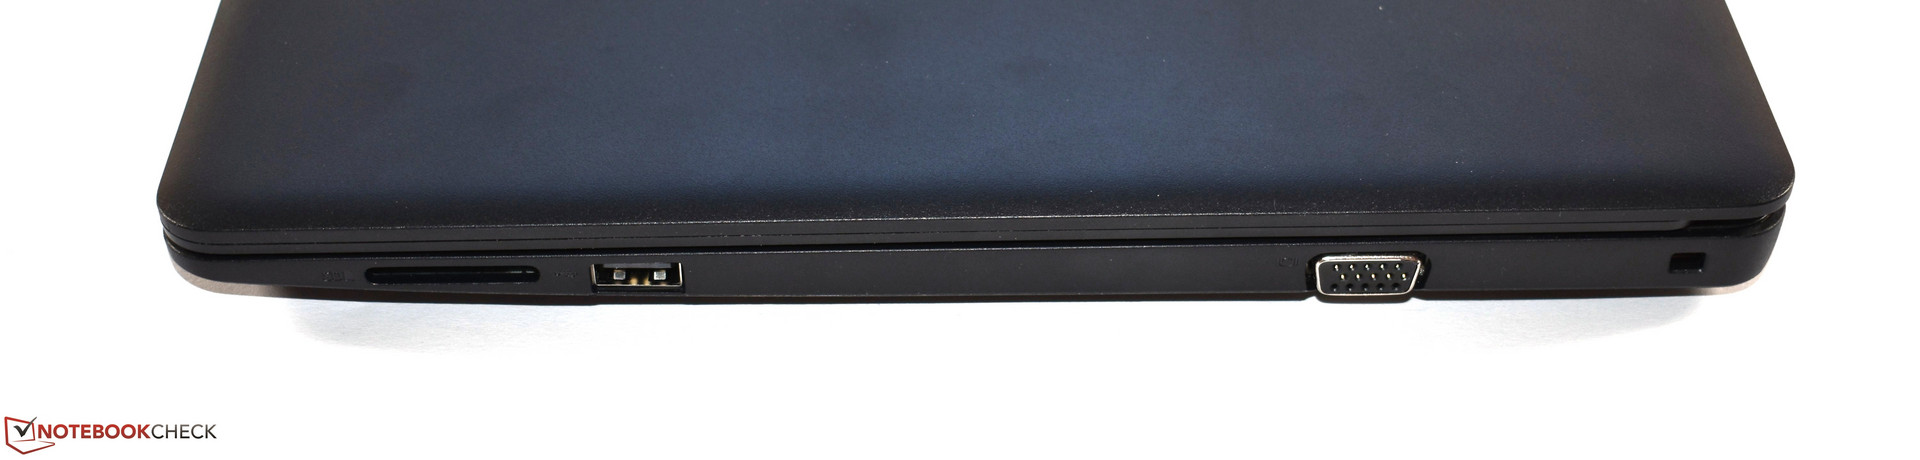
The Latitude 3490 has a wealth of ports including VGA, HDMI and USB Type-C with DisplayPort. Unlike the ThinkPad E480, the Latitude 3490 has a full-sized SD card reader. Unfortunately, the reader has slow transfer speeds and leaves a piece of the SD card protruding from the side of the device. Dell could have done better in terms of USB ports though. The USB port on the right-hand side is too close to the palm rest for our liking. Worse still, it only supports USB 2.0, which is restrictive given that there is only one other USB Type-A port.
Connectivity
| SD Card Reader | |
| average JPG Copy Test (av. of 3 runs) | |
| HP ProBook 440 G5-3KX87ES (Toshiba Exceria Pro SDXC 64 GB UHS-II) | |
| Lenovo ThinkPad E480-20KNCTO1WW (Toshiba Exceria Pro M501) | |
| Average of class Office (22.4 - 198.5, n=22, last 2 years) | |
| Dell Latitude 3490 (Toshiba Exceria Pro SDXC 64 GB UHS-II) | |
| Dell Latitude 14 3470 (Toshiba Exceria Pro SDXC 64 GB UHS-II) | |
| maximum AS SSD Seq Read Test (1GB) | |
| HP ProBook 440 G5-3KX87ES (Toshiba Exceria Pro SDXC 64 GB UHS-II) | |
| Lenovo ThinkPad E480-20KNCTO1WW (Toshiba Exceria Pro M501) | |
| Average of class Office (27.4 - 249, n=20, last 2 years) | |
| Dell Latitude 14 3470 (Toshiba Exceria Pro SDXC 64 GB UHS-II) | |
| Dell Latitude 3490 (Toshiba Exceria Pro SDXC 64 GB UHS-II) | |
| Networking | |
| iperf3 transmit AX12 | |
| HP ProBook 440 G5-3KX87ES | |
| Dell Latitude 3490 | |
| Lenovo ThinkPad E480-20KNCTO1WW | |
| iperf3 receive AX12 | |
| HP ProBook 440 G5-3KX87ES | |
| Dell Latitude 3490 | |
| Lenovo ThinkPad E480-20KNCTO1WW | |
Input Devices
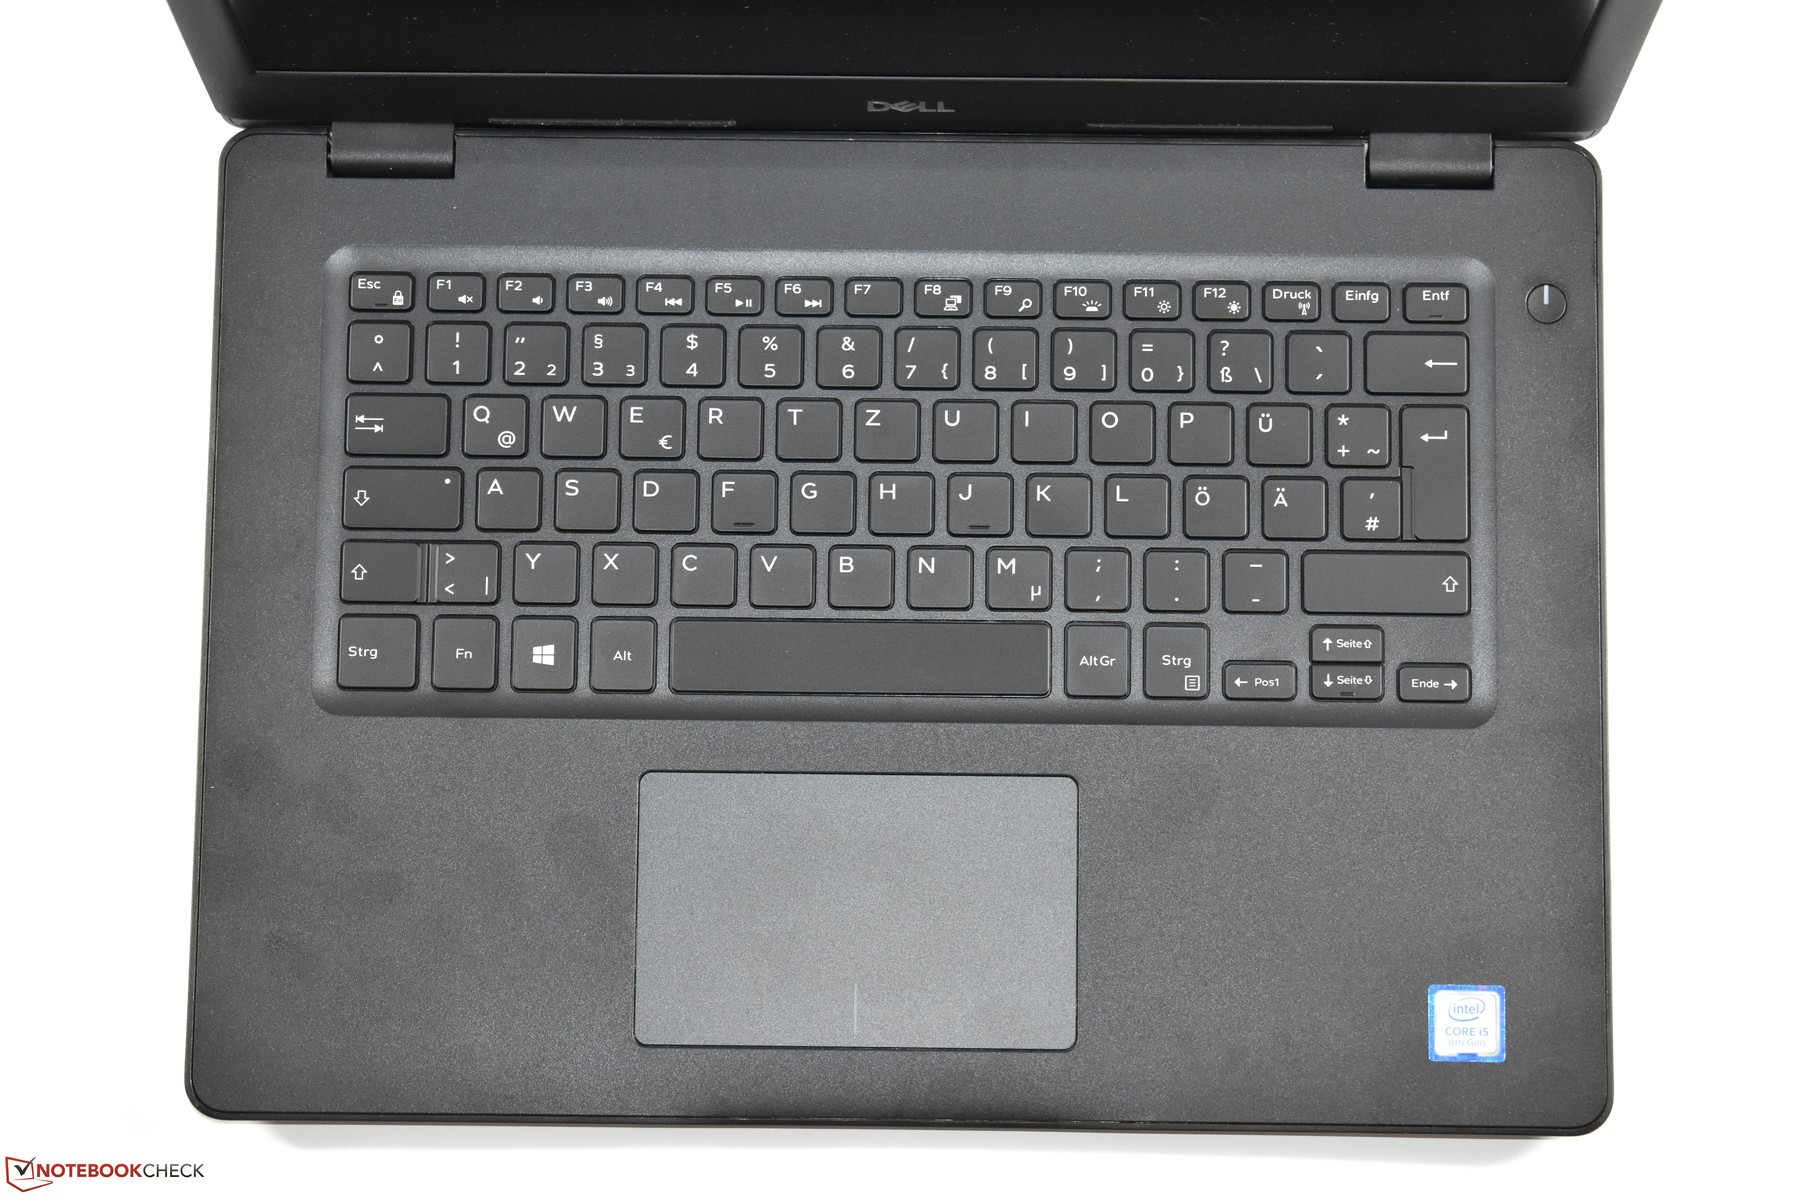
The keyboard is one of the most important aspects of an office notebook; it is likely to be the most used input device. Fortunately, the Latitude 3490 has an impressive backlit keyboard, the comfortability of which is only beaten by ThinkPad keyboards. The Latitude 3490 keyboard has a decent pressure point and a good stroke depth. One thing that will take some getting used to is the keyboard width, which is smaller than it could be. There is space for a full-width keyboard, but Dell has opted for a narrower layout, one of the compromises being a smaller Enter key among others.
The Latitude 3490 has a Windows Precision Touchpad that integrates mouse buttons. This contrasts with more expensive Latitude models which have dedicated mouse buttons like the Latitude 5490. The Microsoft Precision drivers mean that inputs are reproduced accurately and that the Latitude 3490 supports touchpad gestures. The touchpad has a plastic surface that is slightly angled, neither of which are ideal for smoothly moving your fingers across the surface. We would have preferred a glass surface rather than a plastic one as glass would be smoother. Additionally, the Latitude 3490 has no TrackPoint, which we have seen on the Latitude 5000 series upwards.
Display
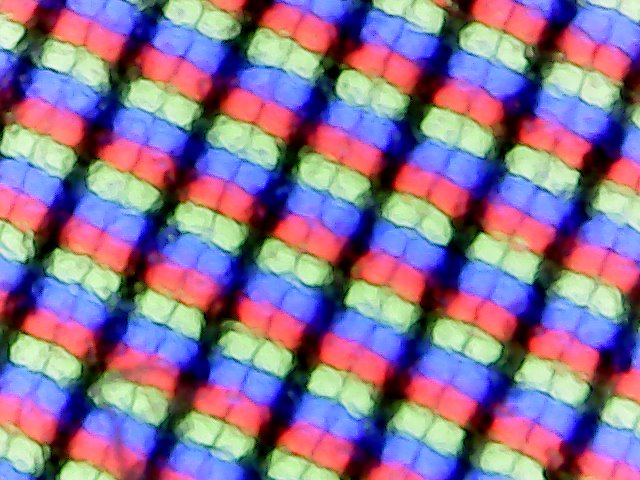
Dell lists three display options for the Latitude 3490. The base model is a 1366x786 TN display. The other two options are Full HD 1920x1080 IPS panels, one of which has a touchscreen. All three displays have matte finishes.
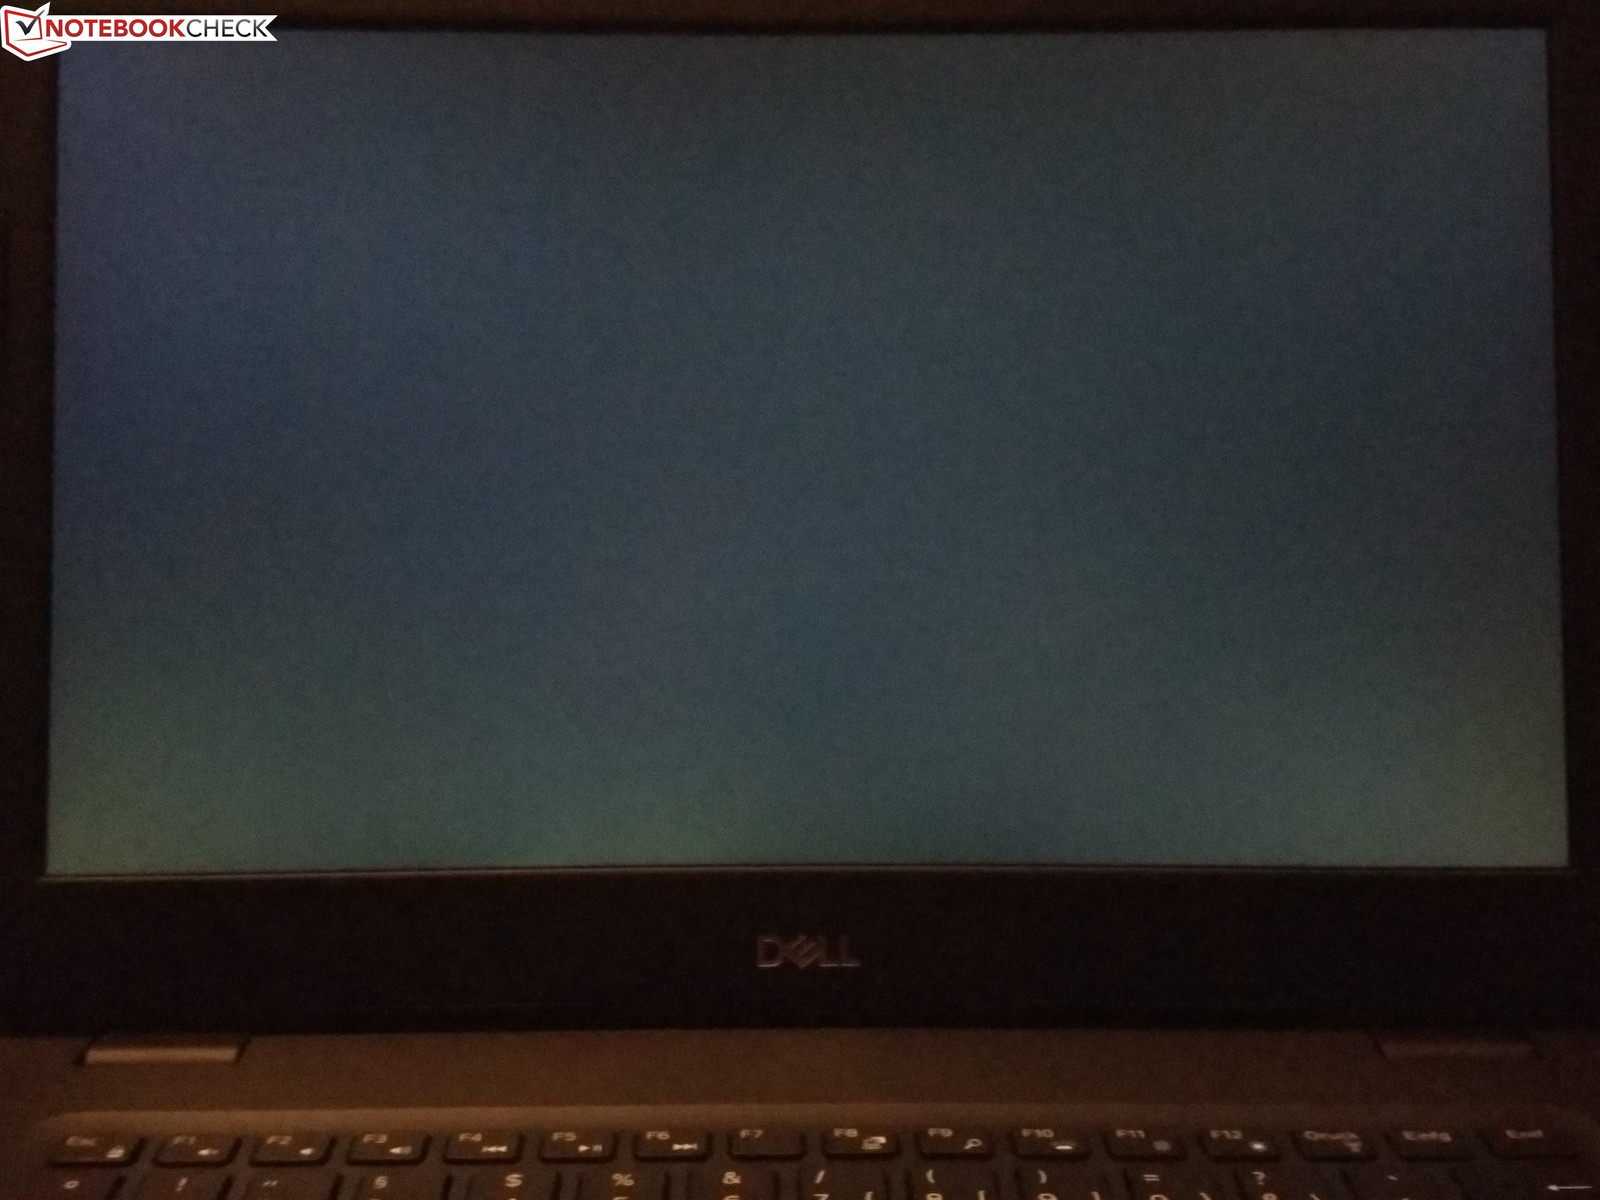
Our test device is equipped with the Full HD non-touch option made by LG, which Dell claims should reach an average brightness of 220 cd/m². Our test device exceeds this claim by achieving an average brightness of 241 cd/m². The display is dark when compared with more expensive devices, but the Latitude 3490 betters its direct competitors. The ThinkPad E480 and the ProBook 440 G5 have 10 cd/m² and 20 cd/m² dimmer screens, respectively.
We measure brightness uniformity at 81%, which is still in our green range. The Latitude 3490 does not use pulse width modulation (PWM) to regulate display brightness. Subjectively, there is no visible shadowing and hardly any backlight bleed.
| |||||||||||||||||||||||||
Brightness Distribution: 81 %
Center on Battery: 248 cd/m²
Contrast: 1000:1 (Black: 0.25 cd/m²)
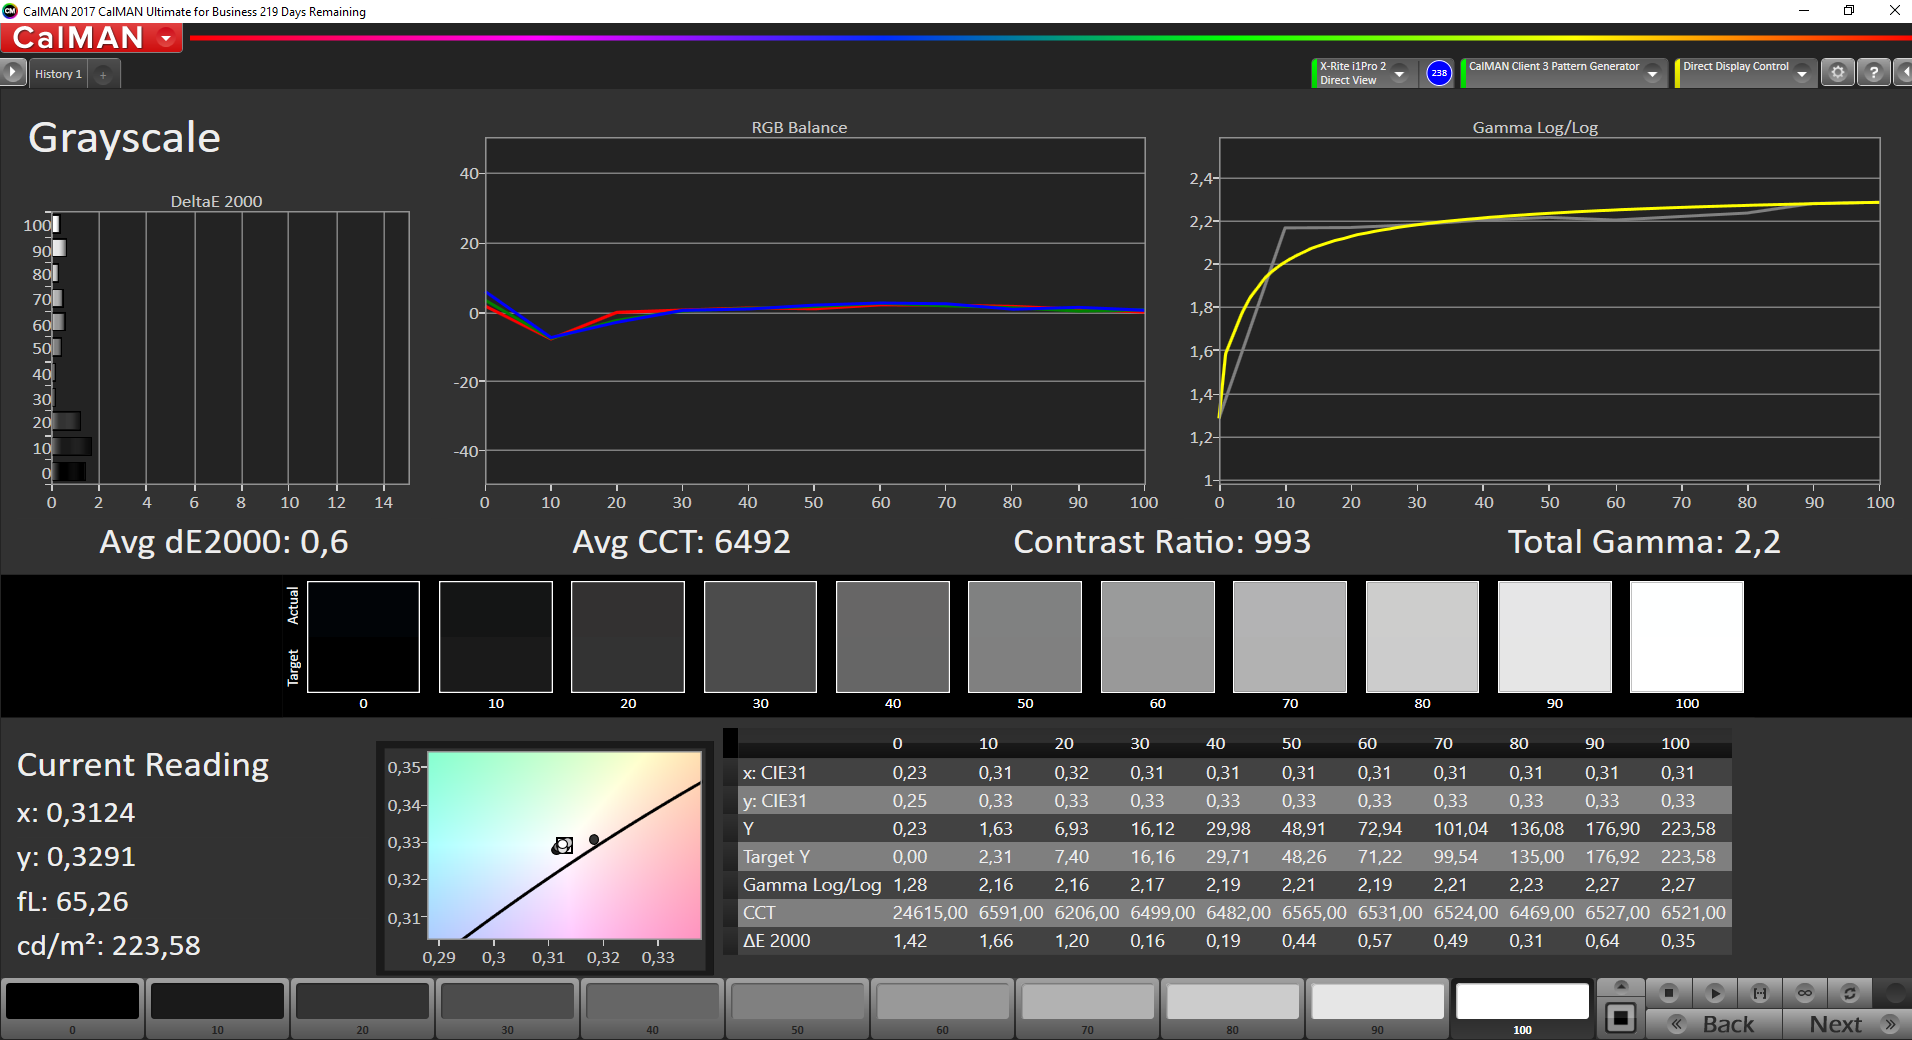
ΔE ColorChecker Calman: 5.5 | ∀{0.5-29.43 Ø4.73}
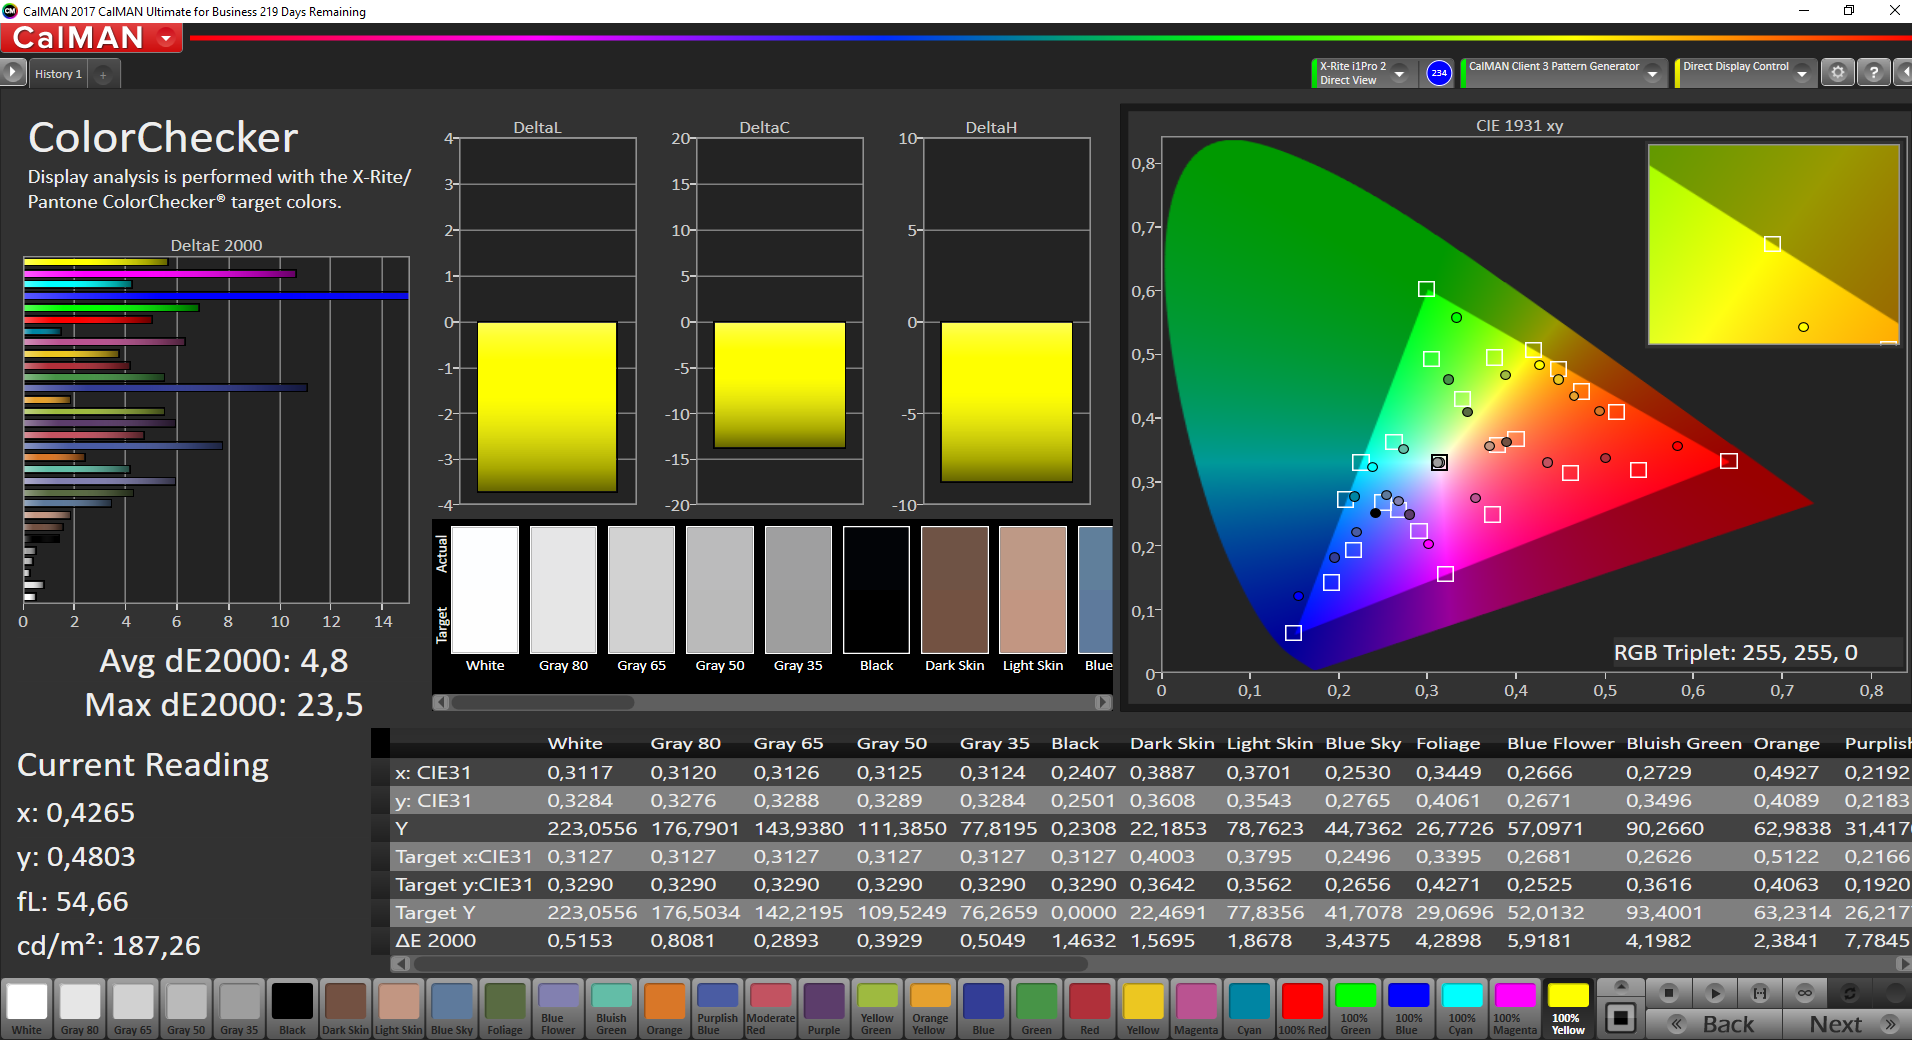
calibrated: 4.8
ΔE Greyscale Calman: 3.5 | ∀{0.09-98 Ø4.97}
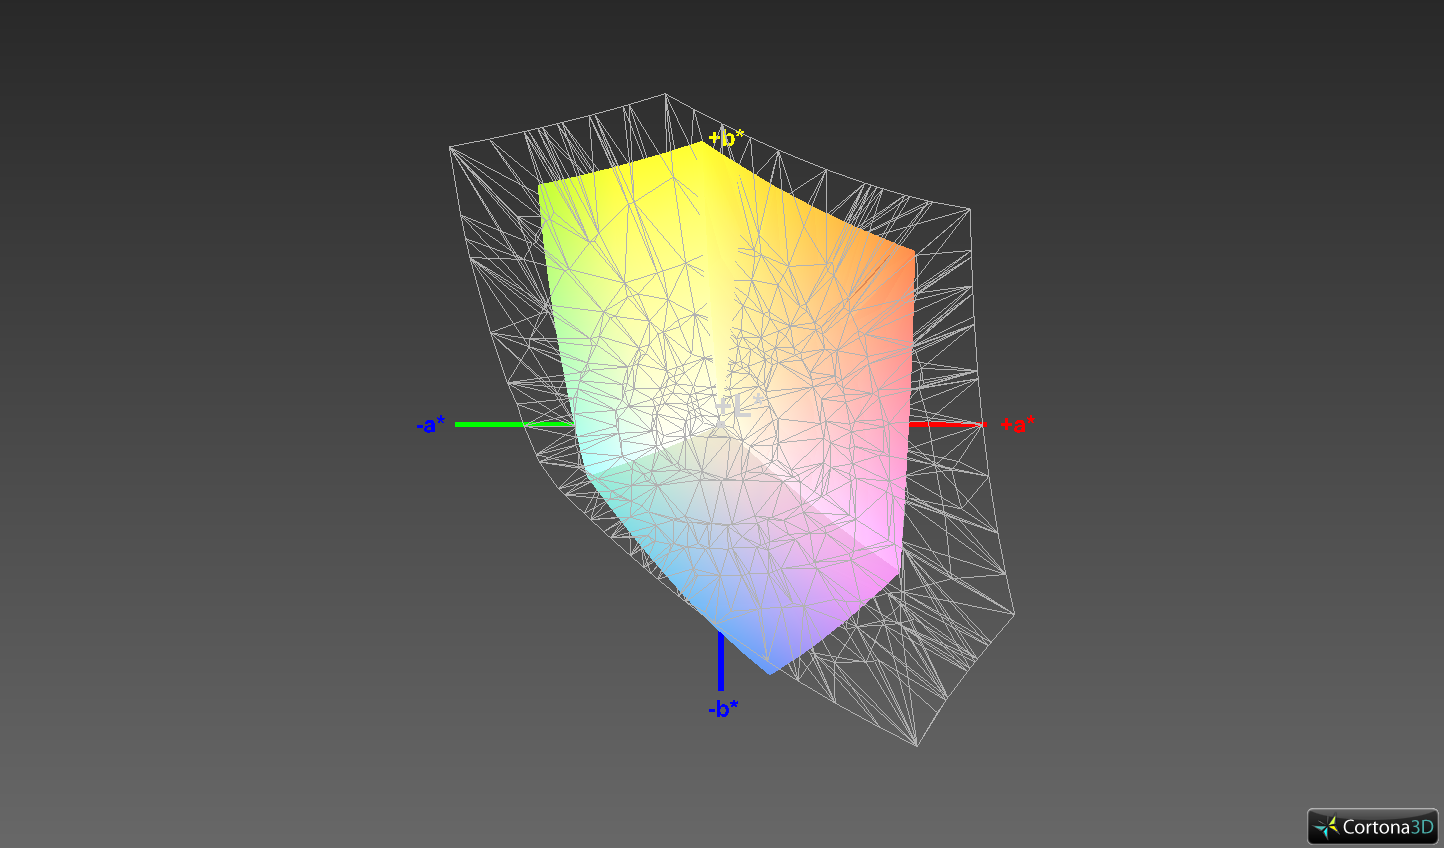
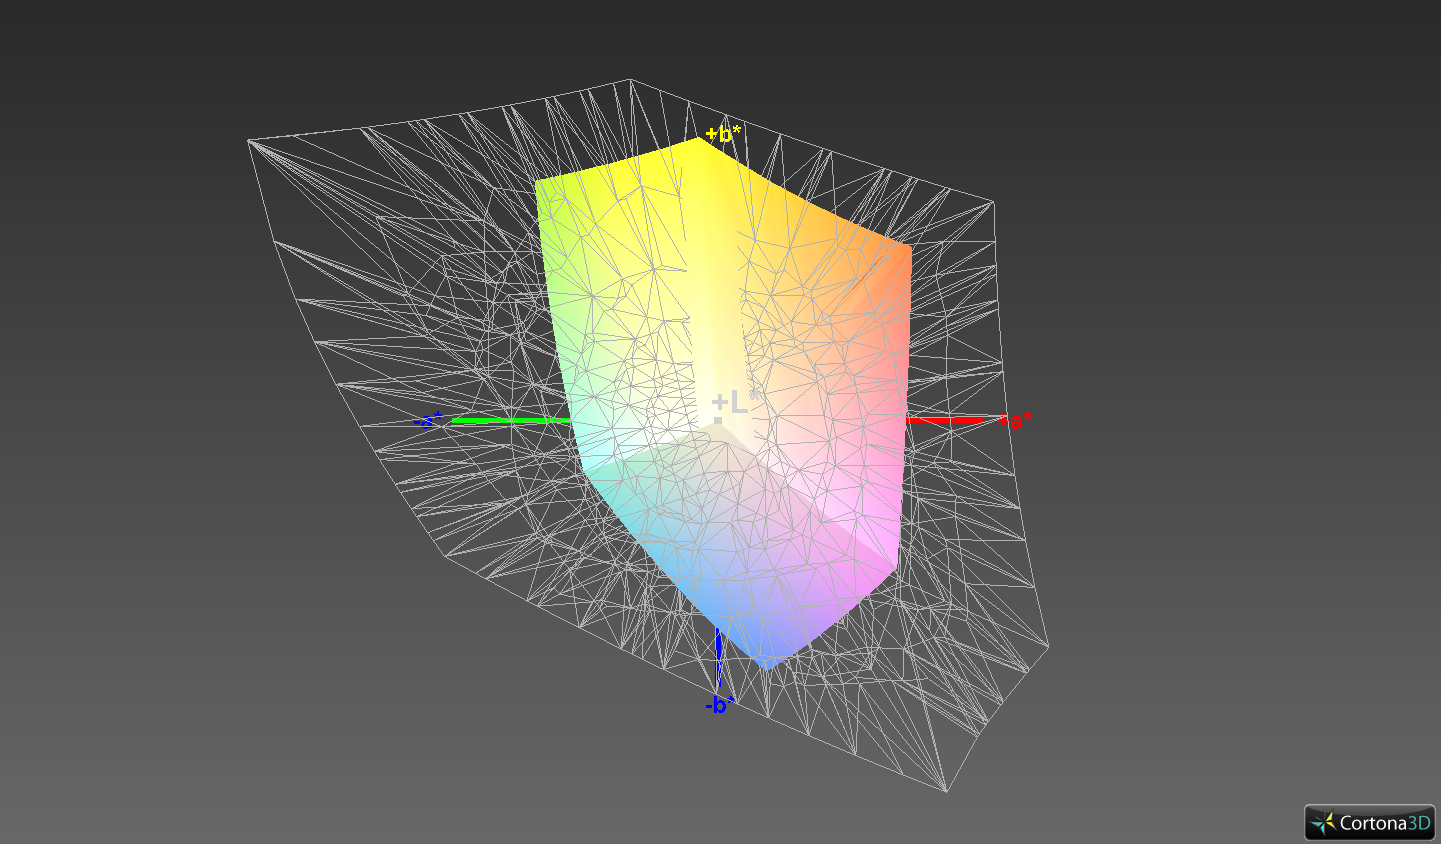
59.4% sRGB (Argyll 1.6.3 3D)
37.9% AdobeRGB 1998 (Argyll 1.6.3 3D)
41.16% AdobeRGB 1998 (Argyll 3D)
59.6% sRGB (Argyll 3D)
39.81% Display P3 (Argyll 3D)
Gamma: 2.27
CCT: 7049 K
| Dell Latitude 3490 LP140WF6 / LGD059D, , 1920x1080, 14" | Lenovo ThinkPad E480-20KQS00000 Innolux N140HCA-EAC, , 1920x1080, 14" | HP ProBook 440 G5-3KX87ES LGD04B2, , 1920x1080, 14" | Dell Latitude 14 3470 Innolux N140BGE, , 1366x768, 14" | Dell Latitude 5490-TD70X AU Optronics AUO263D, , 1920x1080, 14" | |
|---|---|---|---|---|---|
| Display | 5% | -1% | 1% | -9% | |
| Display P3 Coverage (%) | 39.81 | 41.88 5% | 39.56 -1% | 40.21 1% | 36.28 -9% |
| sRGB Coverage (%) | 59.6 | 62.8 5% | 59.3 -1% | 60.5 2% | 54.6 -8% |
| AdobeRGB 1998 Coverage (%) | 41.16 | 43.29 5% | 40.88 -1% | 41.55 1% | 37.48 -9% |
| Response Times | -26% | -15% | -19% | -30% | |
| Response Time Grey 50% / Grey 80% * (ms) | 36.4 ? | 44 ? -21% | 40 ? -10% | 47 ? -29% | 46.9 ? -29% |
| Response Time Black / White * (ms) | 24 ? | 31.2 ? -30% | 28.8 ? -20% | 26 ? -8% | 31.2 ? -30% |
| PWM Frequency (Hz) | 24880 ? | ||||
| Screen | 9% | -3% | -49% | 5% | |
| Brightness middle (cd/m²) | 250 | 251 0% | 236 -6% | 206 -18% | 227 -9% |
| Brightness (cd/m²) | 241 | 231 -4% | 221 -8% | 193 -20% | 211 -12% |
| Brightness Distribution (%) | 81 | 80 -1% | 88 9% | 87 7% | 88 9% |
| Black Level * (cd/m²) | 0.25 | 0.19 24% | 0.26 -4% | 0.48 -92% | 0.19 24% |
| Contrast (:1) | 1000 | 1321 32% | 908 -9% | 429 -57% | 1195 20% |
| Colorchecker dE 2000 * | 5.5 | 5.1 7% | 5.7 -4% | 11 -100% | 5.6 -2% |
| Colorchecker dE 2000 max. * | 23.5 | 10.6 55% | 22 6% | 19.57 17% | 22.4 5% |
| Colorchecker dE 2000 calibrated * | 4.8 | ||||
| Greyscale dE 2000 * | 3.5 | 4.5 -29% | 3.8 -9% | 11.51 -229% | 2.4 31% |
| Gamma | 2.27 97% | 2.18 101% | 2.1 105% | 2.23 99% | 2.44 90% |
| CCT | 7049 92% | 6146 106% | 7318 89% | 13671 48% | 6506 100% |
| Color Space (Percent of AdobeRGB 1998) (%) | 37.9 | 39.8 5% | 37.7 -1% | 38.46 1% | 34.5 -9% |
| Color Space (Percent of sRGB) (%) | 59.4 | 62.5 5% | 59.2 0% | 60.61 2% | 54.4 -8% |
| Total Average (Program / Settings) | -4% /
4% | -6% /
-4% | -22% /
-35% | -11% /
-2% |
* ... smaller is better
Display Response Times
| ↔ Response Time Black to White | ||
|---|---|---|
| 24 ms ... rise ↗ and fall ↘ combined | ↗ 13.2 ms rise | 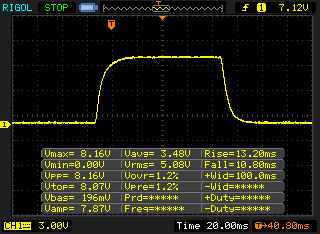 |
| ↘ 10.8 ms fall | ||
| The screen shows good response rates in our tests, but may be too slow for competitive gamers. In comparison, all tested devices range from 0.1 (minimum) to 240 (maximum) ms. » 54 % of all devices are better. This means that the measured response time is worse than the average of all tested devices (19.9 ms). | ||
| ↔ Response Time 50% Grey to 80% Grey | ||
| 36.4 ms ... rise ↗ and fall ↘ combined | ↗ 18.8 ms rise | 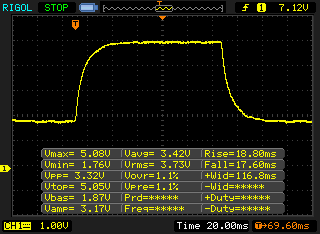 |
| ↘ 17.6 ms fall | ||
| The screen shows slow response rates in our tests and will be unsatisfactory for gamers. In comparison, all tested devices range from 0.165 (minimum) to 636 (maximum) ms. » 52 % of all devices are better. This means that the measured response time is worse than the average of all tested devices (31.1 ms). | ||
Screen Flickering / PWM (Pulse-Width Modulation)
| Screen flickering / PWM not detected | 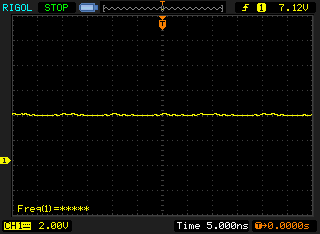 | ||
In comparison: 52 % of all tested devices do not use PWM to dim the display. If PWM was detected, an average of 7798 (minimum: 5 - maximum: 343500) Hz was measured. | |||
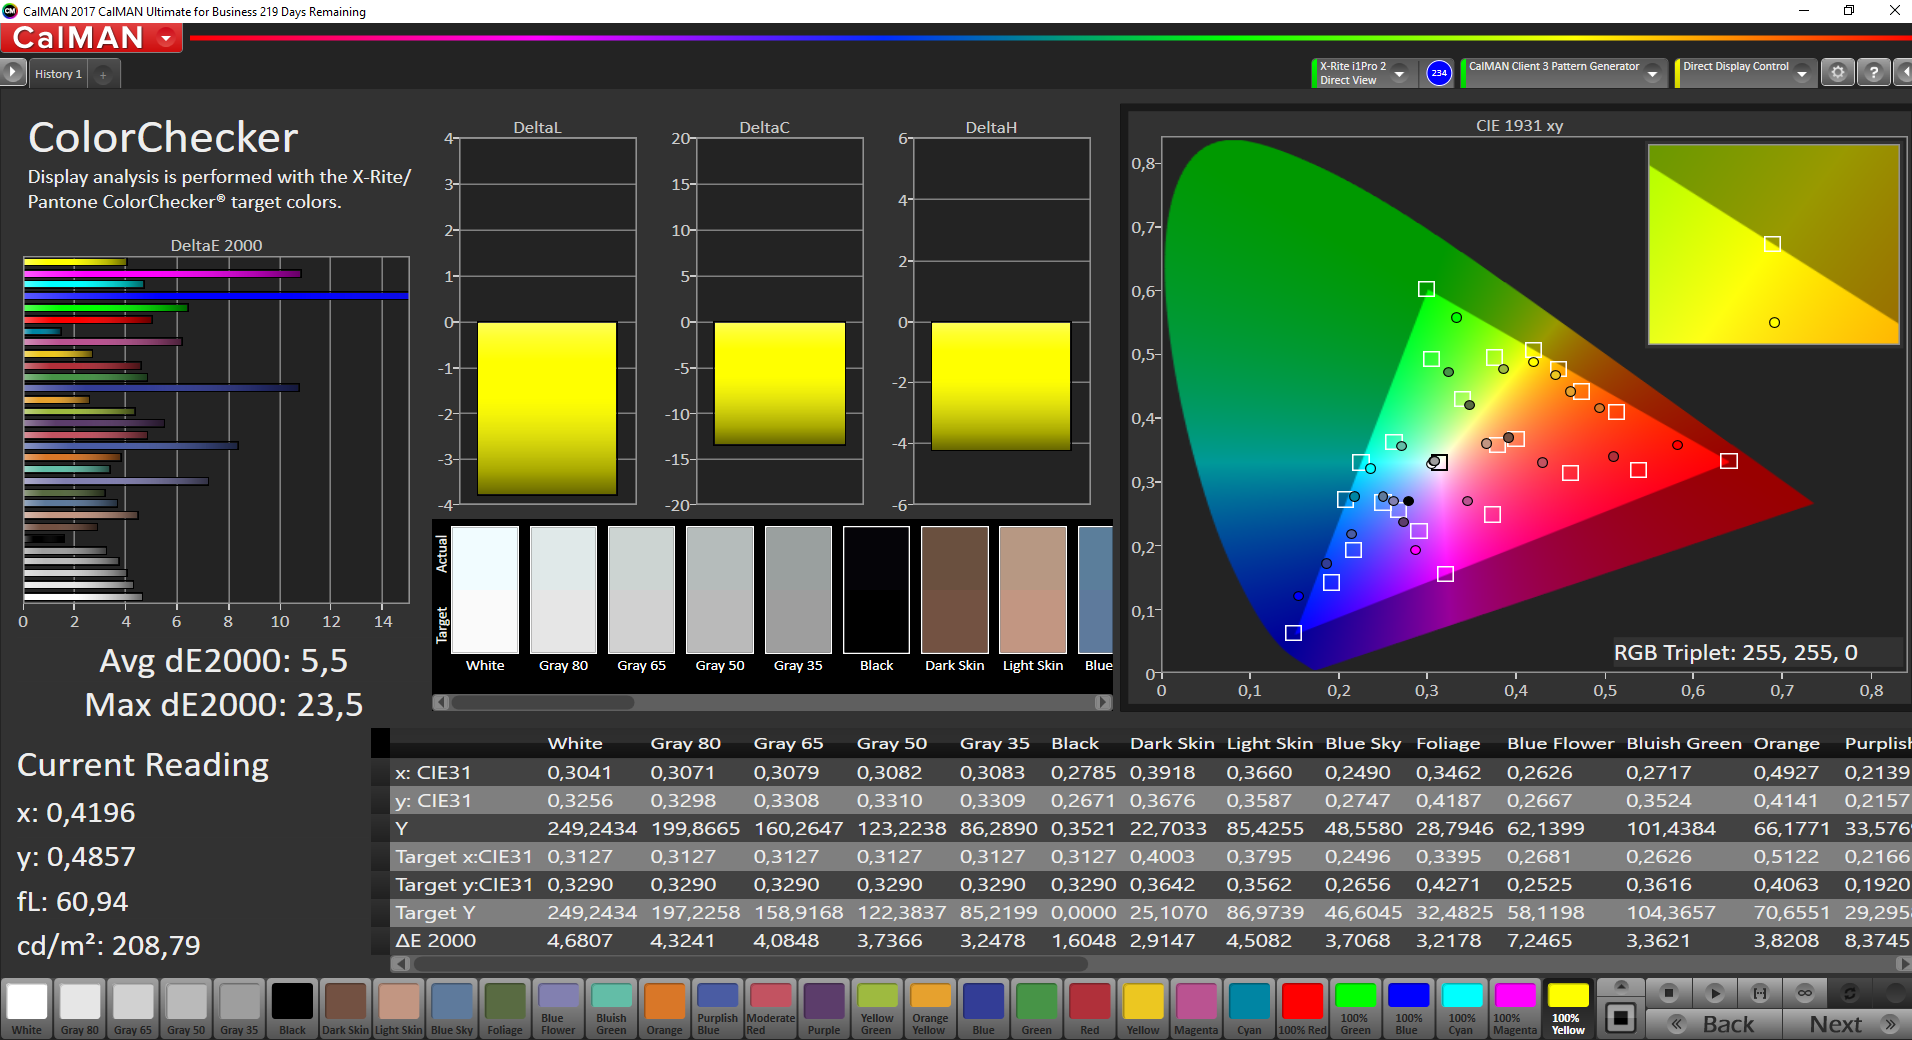


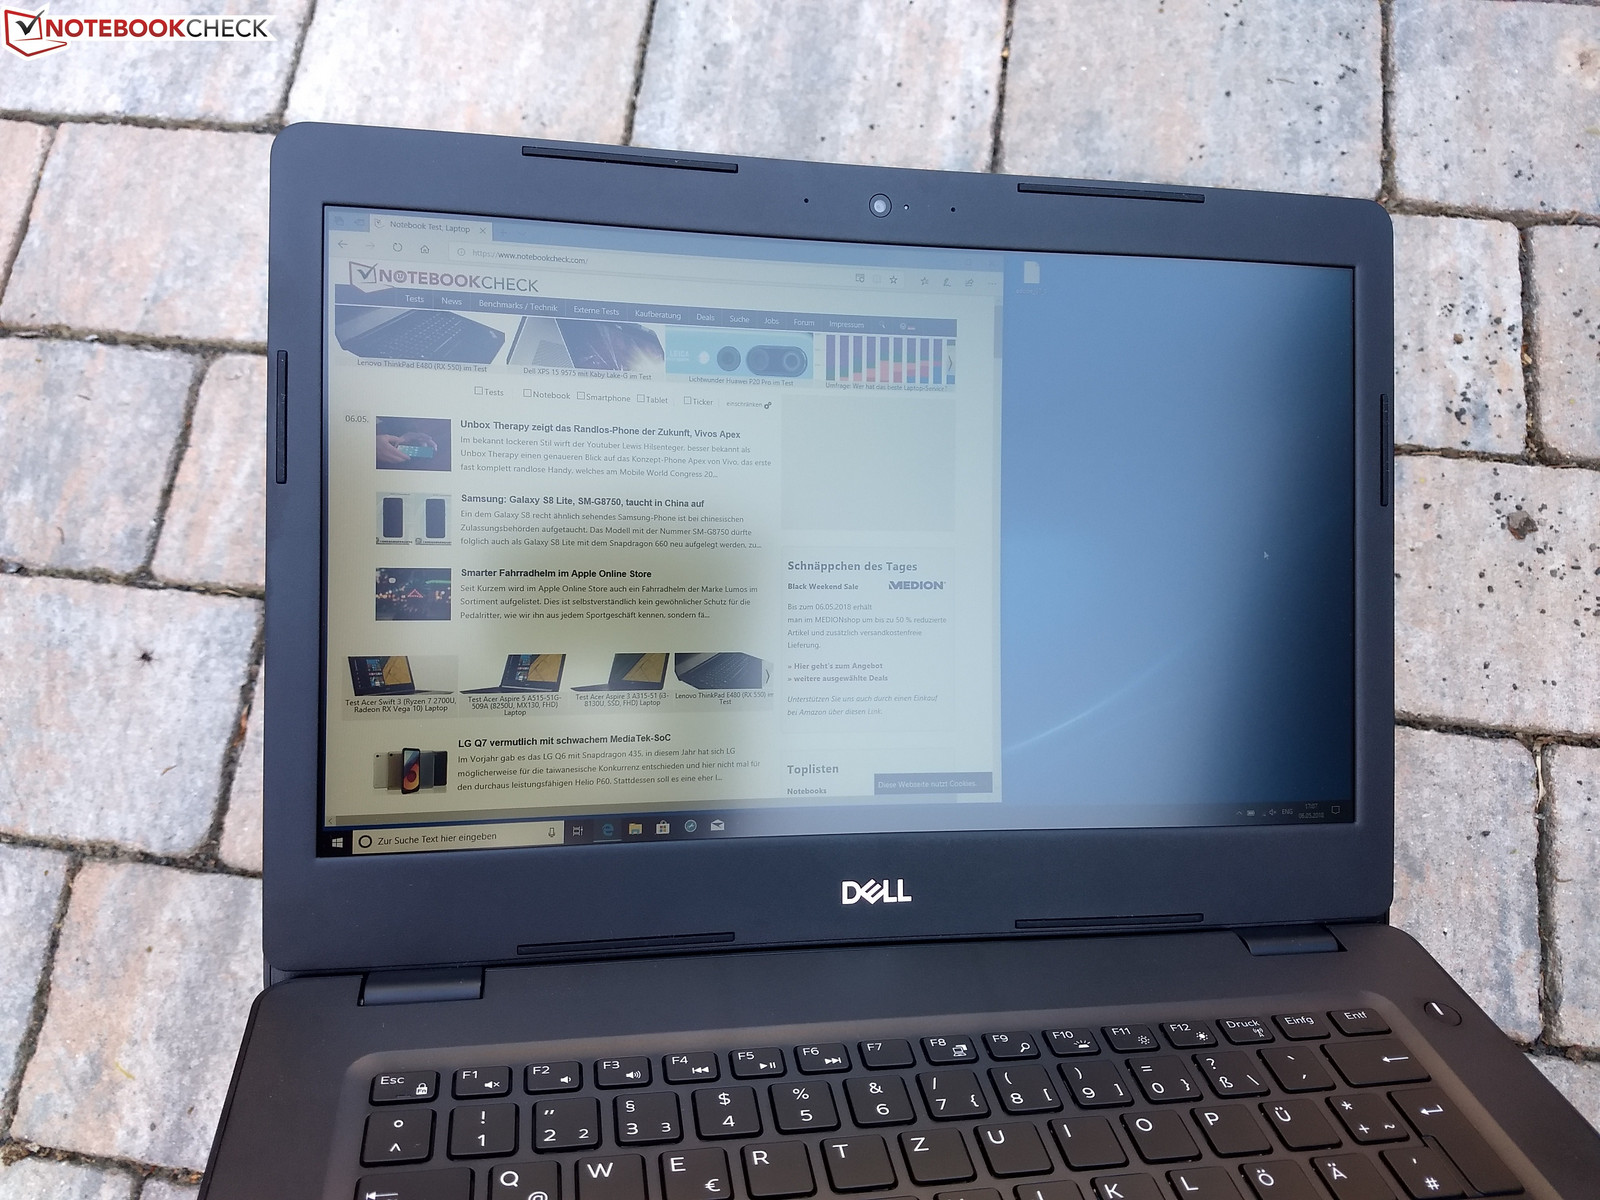
The display has poor color-space coverage, which is typical for budget IPS panels. Our test device is accurate to 59.4% sRGB and 37.9% AdobeRGB, so using the Latitude 3490 for image-editing is a no-go. Our test device is usable outdoors despite these shortcomings though. The matte display reduces reflections, but the low maximum brightness means that it would be best to use the device in the shade on sunny days.
IPS displays have several advantages over TN LCDs, one of which is higher contrast. The Dell Latitude 3490 does not disappoint thanks to a 1,000:1 contrast ratio that makes colors look strong despite the low color-space coverage. Likewise, blacks look inky thanks to the 0.25 cd/m² black value. The Latitude 3490 performs well against the competition, with slightly better values compared with the ProBook 440 G5 and considerably better than the Latitude 14 3470. The Latitude 3490 cannot match the ThinkPad E480 in this regard though, the latter of which has a 1,321:1 contrast ratio and a 0.19 cd/m² black value. This represents a 32% better contrast ratio and a 24% lower black value.
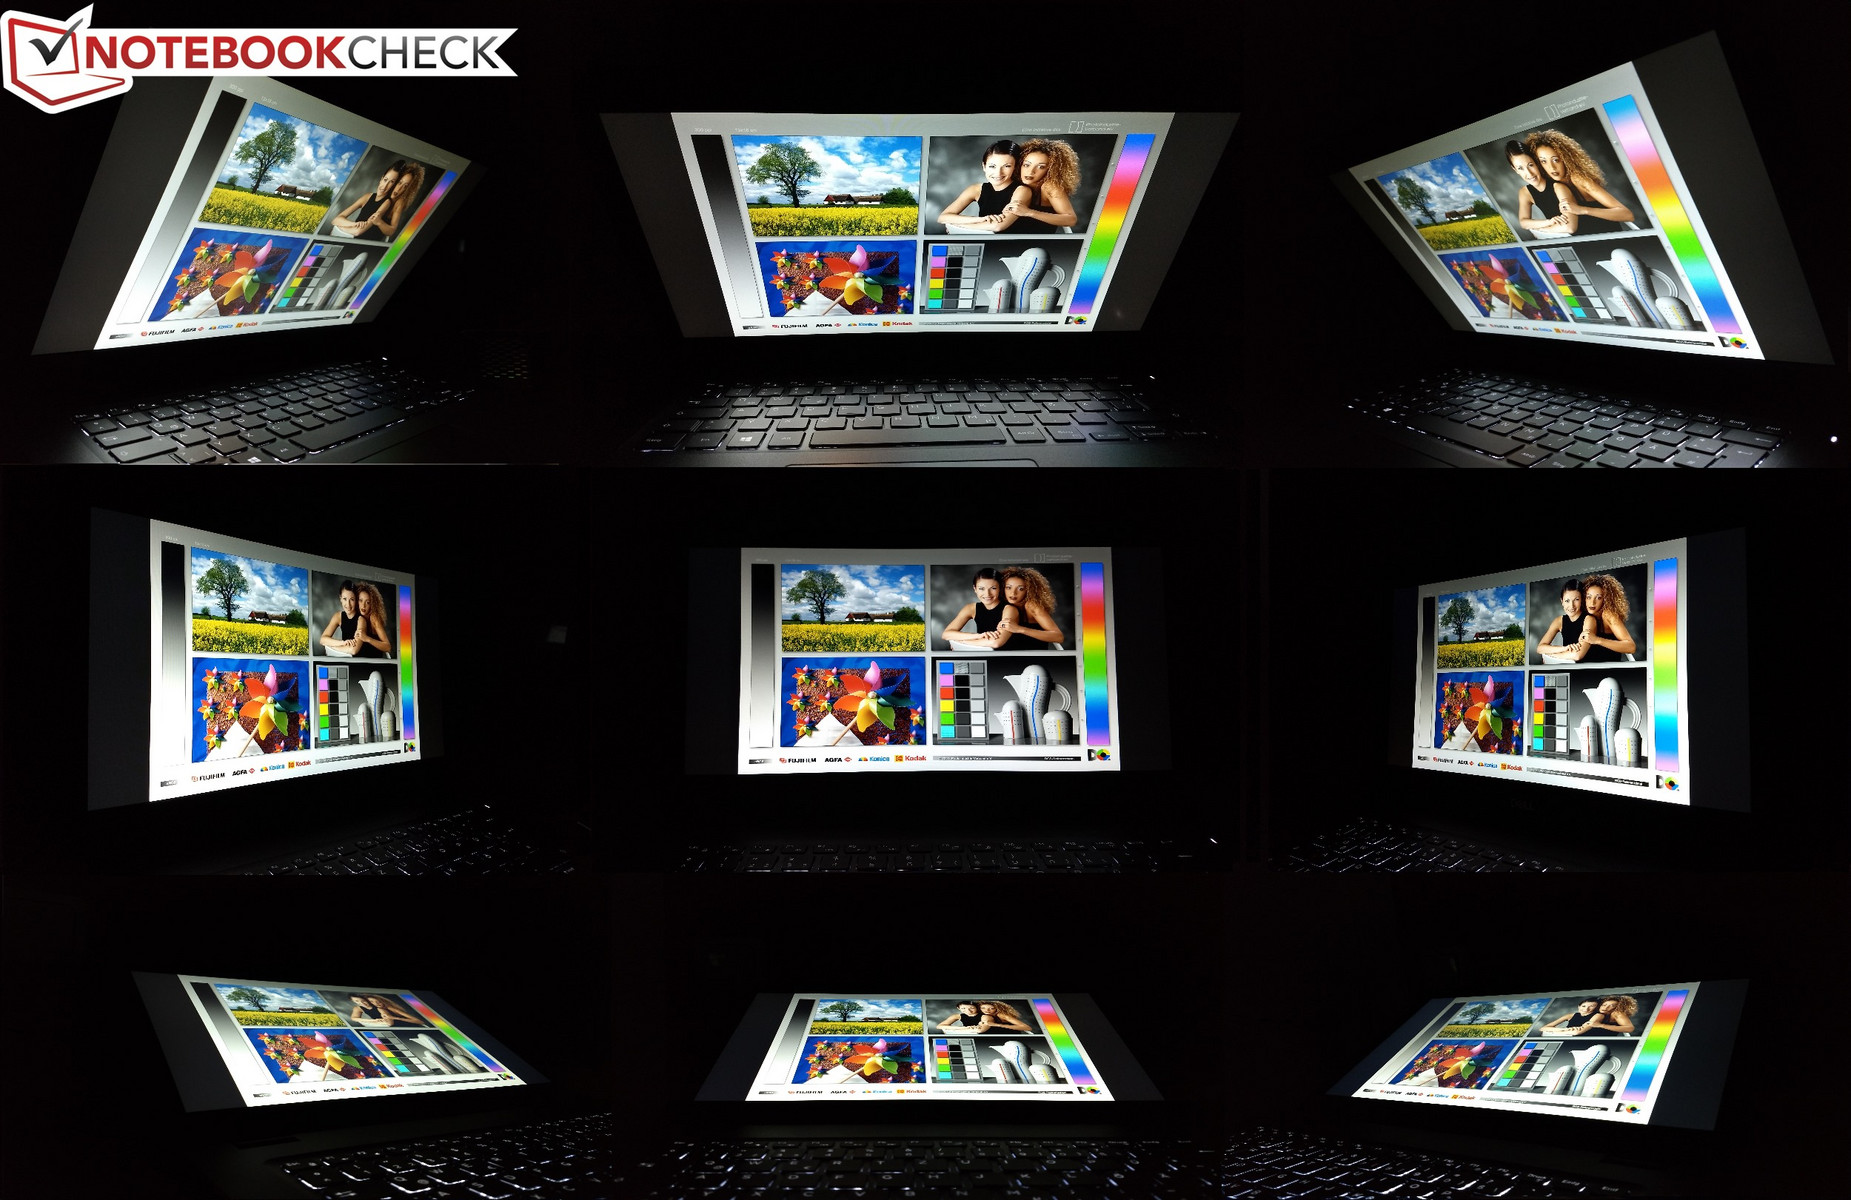
Another advantage of IPS displays is their strong viewing angles. Our test device follows suit with excellent viewing angles even at acute angles.
Performance
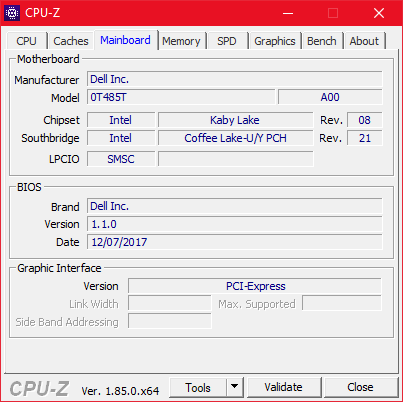
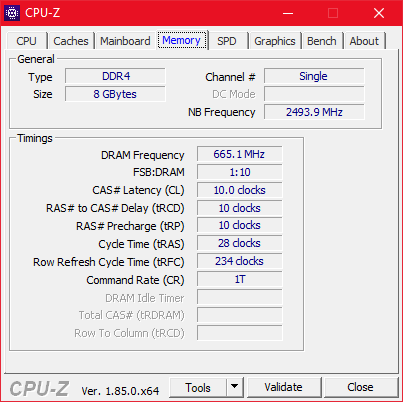
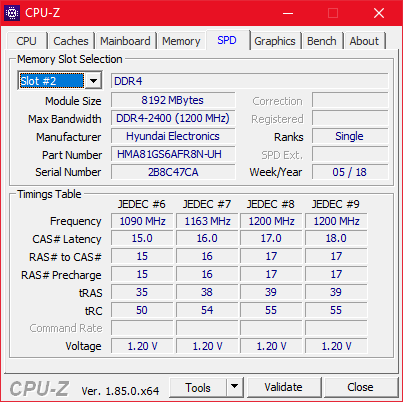
The Latitude 3490 has several configurations for the German market, the main differences being the processors and internal storage with which the configurations are equipped. In terms of CPUs, Dell offers a choice between Kaby Lake dual-core processors like the Intel Core i3-7130U and the Intel Core i5-7200U or Kaby Lake Refresh quad-core CPUs like the Intel Core i5-8250U. Dell offers only two internal storage options, either a 256 GB SSD or a 1 TB 5,400 RPM HDD. 8 GB DDR4 2400 RAM comes with all the German configurations. This occupies one SO-DIMM slot, with 32 GB being the maximum that the Latitude 3490 could handle.
Conversely, Dell USA offers slightly different configurations. This includes a 500 GB 7,200 RPM HDD instead of the 1 TB HDD and a 4GB DDR4 2400 RAM option. Moreover, there is the choice between an Intel Celeron 3865U or an Intel Core i7-8550U in addition to the processors that are offered in the German market.
Processor
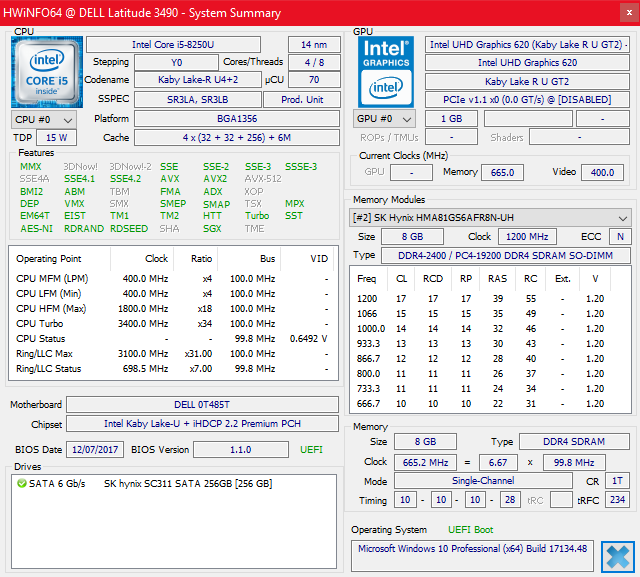
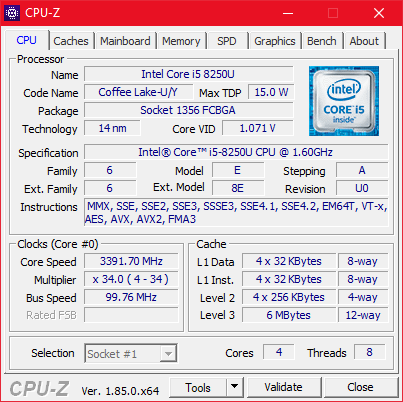
Our test device is powered by a Kaby Lake Refresh Intel Core i5-8250U quad-core processor. The 15 W ultra-low voltage (ULV) CPU has a 1.6 GHz base clock speed that can Turbo Boost up to 3.4 GHz when required.
Please see our CPU benchmark page for a comparison of the Core i5-8250U against other processors.
Dell has raised the Core i5-8250U’s thermal design power (TDP) in our test devices from 15 W to 22 W. The CPU can Turbo Boost up to 44 W for 28 seconds, during which time clock speeds reach 3.4 GHz. This temporarily boosted TDP helps our test device to score 646 points in the first pass of Cinebench R15. Scores drop on subsequent passes as the CPU is unable to harness that extra Turbo Boost power. The CPU stabilizes at around 2.8 GHz after the initial performance drop.
Overall, the Latitude 3490 has good full load and Turbo Boost performance that exceeds those of the ProBook 440 G5 and the ThinkPad E480.
The Latitude 3490 throttles its CPU when on battery by reducing the TDP to 15 W. In Cinebench R15 this results in a drop from 646 to 540 points.
System Performance
Our test device performed well in the PCMark benchmarks, something which translates into real-world performance too. The system feels fast and smooth in daily use with no issues or hiccups during our testing.
| PCMark 8 Home Score Accelerated v2 | 4458 points | |
| PCMark 10 Score | 3619 points | |
Help | ||
Storage Devices
Our test device is equipped with a 256 GB SSD, which is the same storage capacity as the ProBook 440 G5 and the ThinkPad E480. The similarities stop there though as the Latitude 3490 uses a SATA III SSD from Hynix whereas the other two devices use much faster PCIe NVMe SSDs. This is not a huge criticism against the Latitude 3490 given its budget business laptop price. While you may not notice the difference in daily use, a PCIe NVMe SSD will be quicker at copying large amounts of data than its SATA III counterpart.
| Dell Latitude 3490 SK hynix SC311 M.2 | Lenovo ThinkPad E480-20KQS00000 Lenovo LENSE20256GMSP34MEAT2TA | HP ProBook 440 G5-3KX87ES Intel SSD 600p SSDPEKKW256G7 | Dell Latitude 14 3470 Toshiba MQ01ACF050 | Average SK hynix SC311 M.2 | Average of class Office | |
|---|---|---|---|---|---|---|
| CrystalDiskMark 3.0 | 23% | 76% | -92% | -1% | 273% | |
| Read Seq (MB/s) | 495.5 | 1295 161% | 1181 138% | 108.9 -78% | 494 ? 0% | 3104 ? 526% |
| Write Seq (MB/s) | 389.2 | 160.6 -59% | 602 55% | 103.2 -73% | 401 ? 3% | 2916 ? 649% |
| Read 512 (MB/s) | 374.4 | 872 133% | 923 147% | 365 ? -3% | 899 ? 140% | |
| Write 512 (MB/s) | 323.4 | 122 -62% | 600 86% | 323 ? 0% | 2309 ? 614% | |
| Read 4k (MB/s) | 26.69 | 25.72 -4% | 35.48 33% | 0.362 -99% | 27.2 ? 2% | 54.1 ? 103% |
| Write 4k (MB/s) | 71.8 | 95.2 33% | 139.8 95% | 0.946 -99% | 68.3 ? -5% | 114.1 ? 59% |
| Read 4k QD32 (MB/s) | 283.2 | 389.9 38% | 287.8 2% | 0.721 -100% | 284 ? 0% | 463 ? 63% |
| Write 4k QD32 (MB/s) | 280.1 | 118.3 -58% | 417.1 49% | 0.901 -100% | 267 ? -5% | 370 ? 32% |

Graphics Card
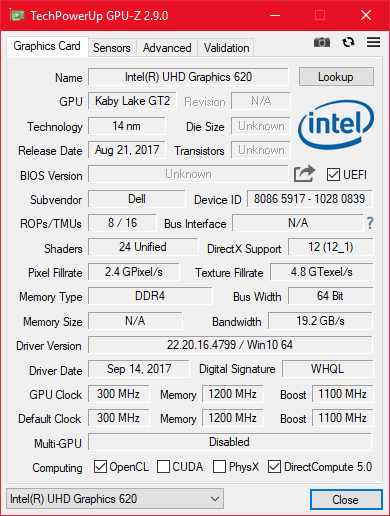
The Latitude 3490 only comes with Intel UHD Graphics 620, which is integrated with the CPU. Dell offers no dedicated GPU option. The UHD Graphics 620 performance is RAM dependent. The GPU performs best when there are two RAM modules installed; this unlocks dual-channel mode. Dell equips the Latitude 3490 with one 8 GB RAM module, which means that the system runs in single-channel mode. This limits GPU performance. The RAM is SO-DIMM rather than soldered so you could install a second RAM module for better GPU performance, among other practical benefits.
In contrast to the CPU, we noticed no GPU performance throttling on battery.
| 3DMark 11 Performance | 1790 points | |
| 3DMark Cloud Gate Standard Score | 7474 points | |
| 3DMark Fire Strike Score | 895 points | |
Help | ||
Gaming Performance
The Latitude 3490 is limited to playing older or less-demanding games because of the limitations associated with Intel UHD Graphics 620. Power-hungry games like Far Cry 5 or The Witcher 3 will not run smoothly, if at all, on the Latitude 3490.
| low | med. | high | ultra | |
|---|---|---|---|---|
| BioShock Infinite (2013) | 52.9 | 27.72 | 22.83 | 7.66 |
Emissions & Energy
Fan Noise
The fan is largely off at idle but gets loud under load. We measured our test device reaching up to 44.3 dB(A) when stress tested, which is louder than both the ProBook 440 G5 and the ThinkPad E480. This corresponds to lower overall performance though.
Unfortunately, we detected some coil whine with our test device. While relatively quiet, this could still be bothersome to those who are sensitive to certain frequencies.
Noise level
| Idle |
| 29.8 / 29.8 / 29.8 dB(A) |
| Load |
| 39.1 / 44.3 dB(A) |
 | ||
30 dB silent 40 dB(A) audible 50 dB(A) loud |
||
min: | ||
Temperature
Surface temperatures are cool at idle, measuring an average of 22.3 °C on the top and 21.6 °C on the bottom. Maximum temperatures are only a degree or so higher too at 23.5 °C and 22.9 °C, respectively.
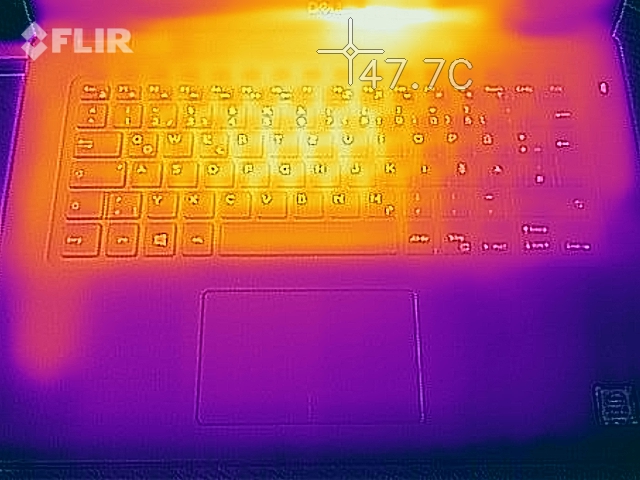
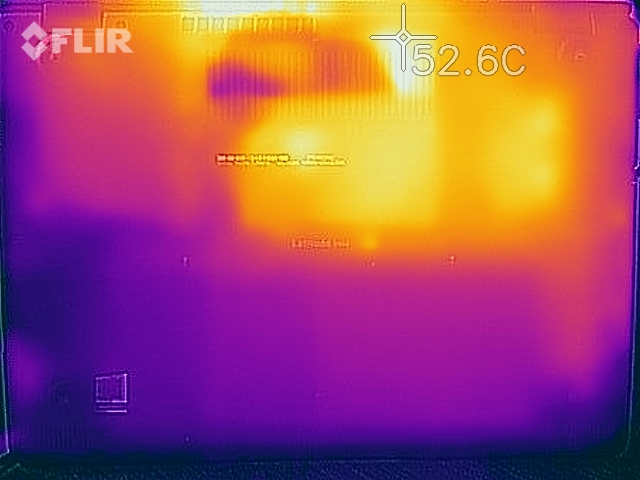
Surface temperatures ramp up under loud though, during which we measured the top reaching an average of 37.3 °C and 35.6 °C on the bottom. The temperature distribution is uneven on both sides of the case as there are hot and cool spots that differ wildly in temperature. While the palm rest and corresponding points on the bottom case stay below 30 °C, much of the case exceeds 40 °C. The hottest area is in the centre of the device next to display, where temperatures reach 46 °C on top and 48.8 °C underneath. 50 °C is the threshold at which we would recommend not using a device under load on your lap, but the Latitude 3490 will still feel hot and potentially uncomfortable.
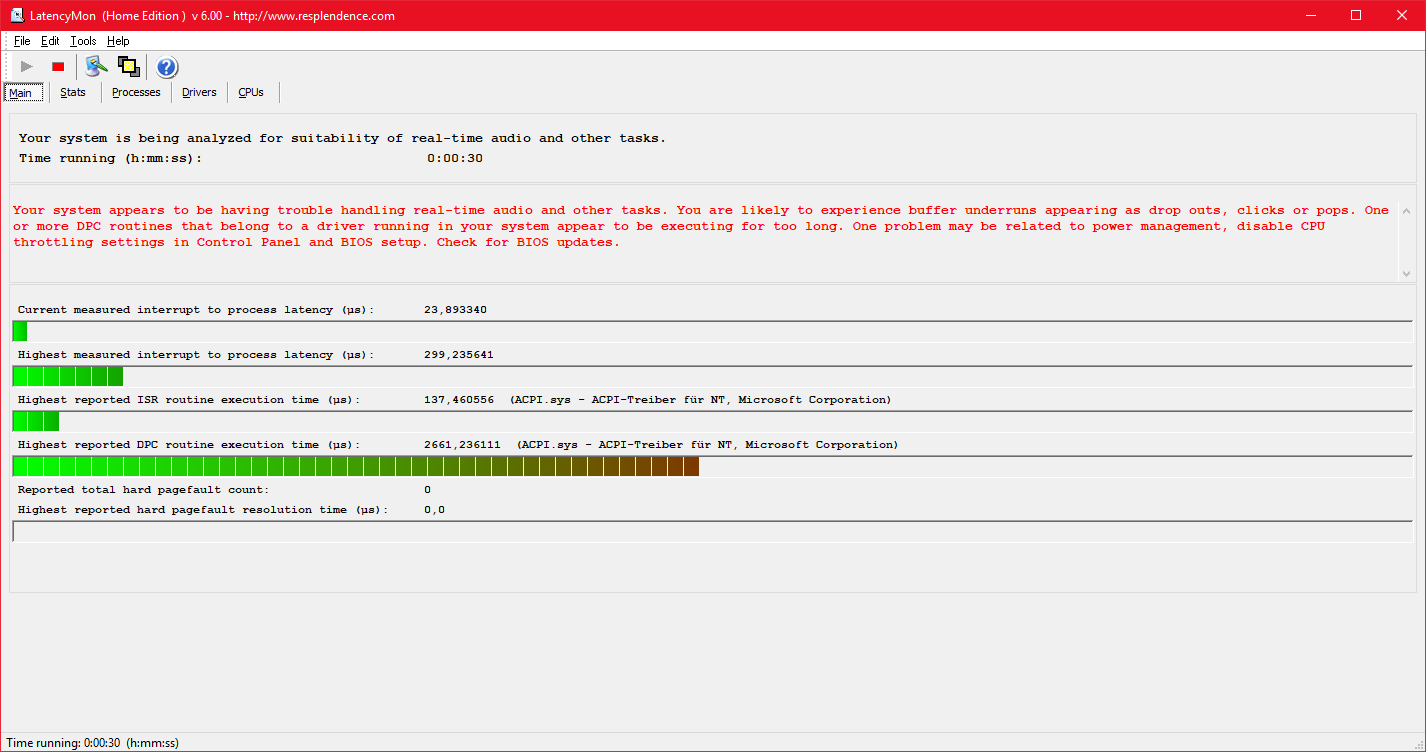
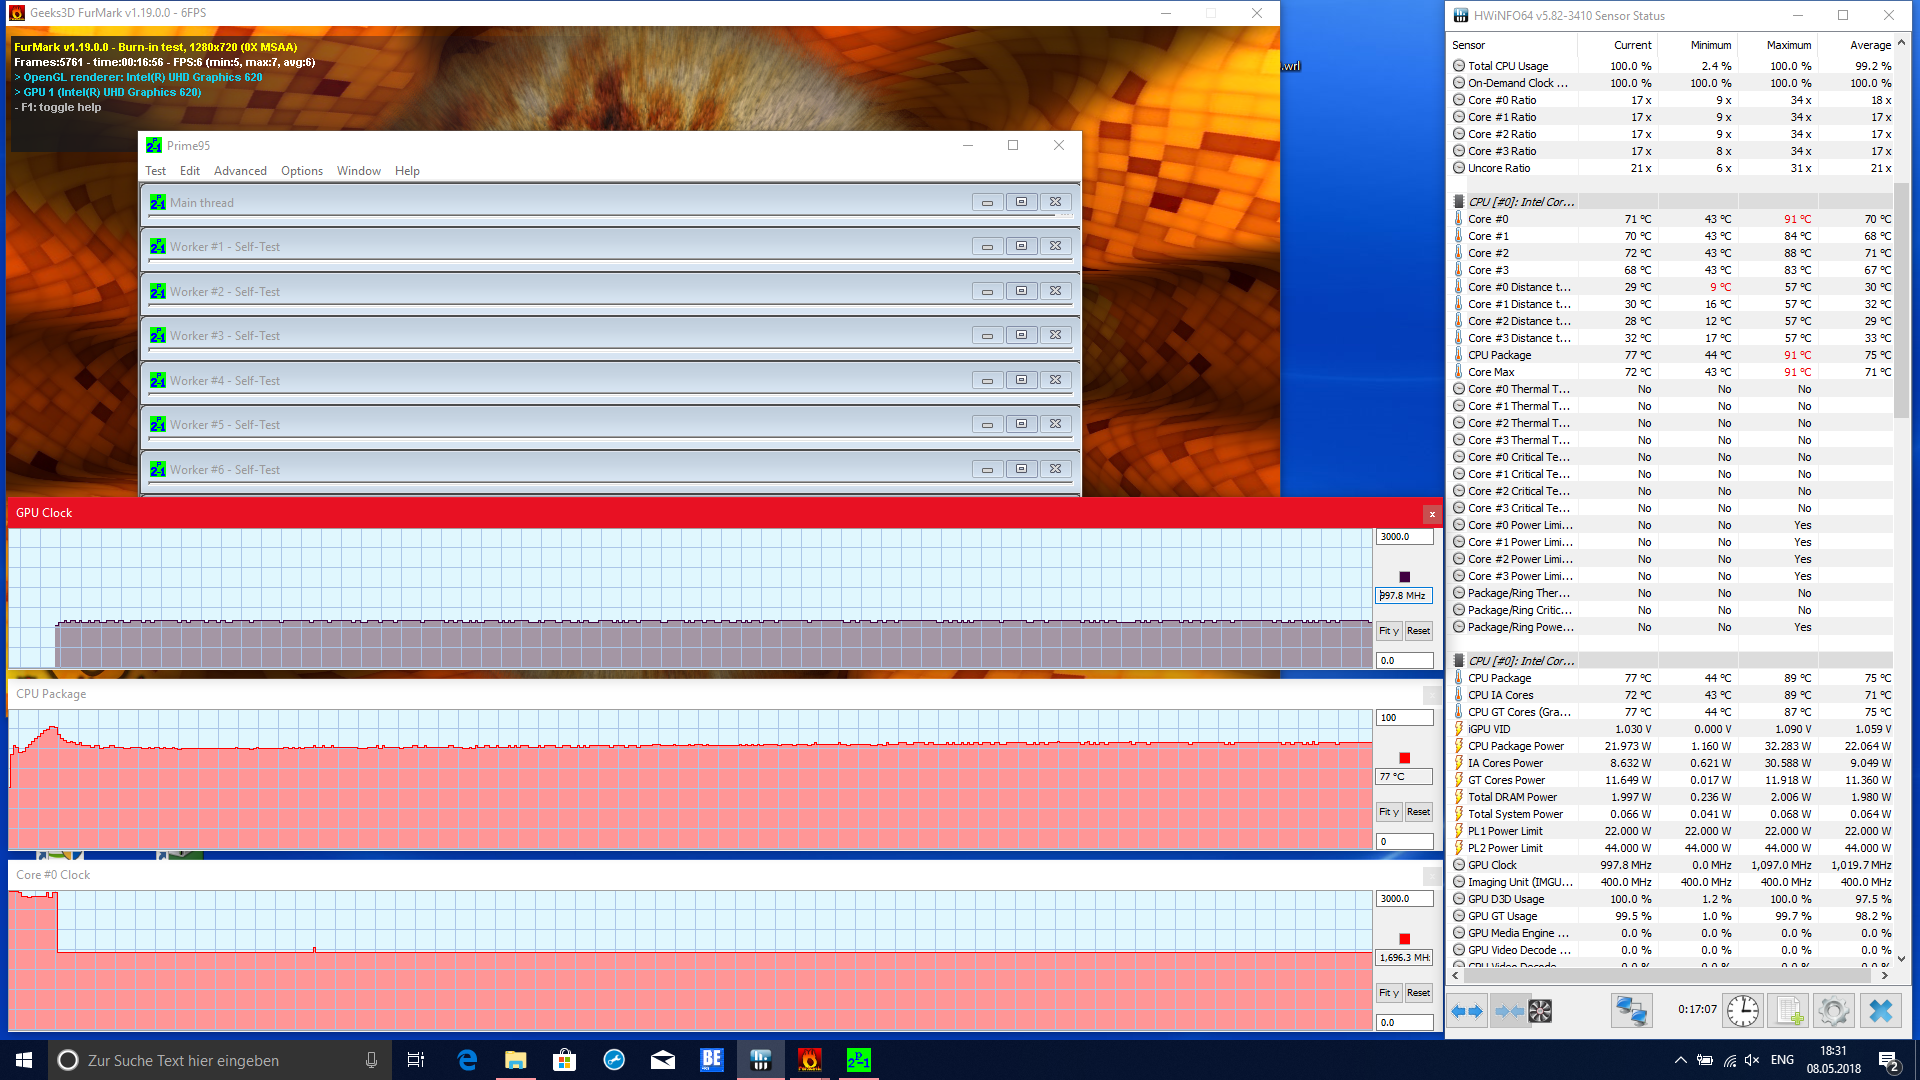
Our test device performed practically the same in Prime95 and FurMark stress tests as it did during a Cinebench R15 benchmark loop, except that the GPU is subjected to full load too. The CPU clocks lower during stress tests too as it shares its TDP with the integrated GPU. After around 10 minutes the CPU downclocks to 1.7 GHz, which is still above its 1.6 GHz base clock speed.
We ran 3DMark11 after stress testing our test device. There were no issues here and the Latitude 3490 performed as expected.
(-) The maximum temperature on the upper side is 46.6 °C / 116 F, compared to the average of 34.3 °C / 94 F, ranging from 21.2 to 62.5 °C for the class Office.
(-) The bottom heats up to a maximum of 48.8 °C / 120 F, compared to the average of 36.8 °C / 98 F
(+) In idle usage, the average temperature for the upper side is 22.3 °C / 72 F, compared to the device average of 29.5 °C / 85 F.
(+) The palmrests and touchpad are cooler than skin temperature with a maximum of 29.5 °C / 85.1 F and are therefore cool to the touch.
(±) The average temperature of the palmrest area of similar devices was 27.5 °C / 81.5 F (-2 °C / -3.6 F).
Speakers
The Latitude 3490 has downward-firing stereo speakers. The speakers reach around 83 dB(A), which is loud. While the sound quality is ok for notebook speakers, we still recommend connecting the device to external speakers or using headphones for a better listening experience.
Dell Latitude 3490 audio analysis
(+) | speakers can play relatively loud (83 dB)
Bass 100 - 315 Hz
(-) | nearly no bass - on average 21% lower than median
(±) | linearity of bass is average (9.4% delta to prev. frequency)
Mids 400 - 2000 Hz
(±) | higher mids - on average 5.4% higher than median
(±) | linearity of mids is average (7.5% delta to prev. frequency)
Highs 2 - 16 kHz
(±) | higher highs - on average 7% higher than median
(+) | highs are linear (6.2% delta to prev. frequency)
Overall 100 - 16.000 Hz
(±) | linearity of overall sound is average (21.8% difference to median)
Compared to same class
» 55% of all tested devices in this class were better, 9% similar, 36% worse
» The best had a delta of 7%, average was 21%, worst was 53%
Compared to all devices tested
» 62% of all tested devices were better, 7% similar, 31% worse
» The best had a delta of 4%, average was 24%, worst was 134%
HP ProBook 440 G5-3KX87ES audio analysis
(±) | speaker loudness is average but good (79 dB)
Bass 100 - 315 Hz
(-) | nearly no bass - on average 25.3% lower than median
(±) | linearity of bass is average (13.4% delta to prev. frequency)
Mids 400 - 2000 Hz
(+) | balanced mids - only 3.5% away from median
(+) | mids are linear (5.6% delta to prev. frequency)
Highs 2 - 16 kHz
(+) | balanced highs - only 4.1% away from median
(+) | highs are linear (3.3% delta to prev. frequency)
Overall 100 - 16.000 Hz
(±) | linearity of overall sound is average (23.1% difference to median)
Compared to same class
» 64% of all tested devices in this class were better, 7% similar, 29% worse
» The best had a delta of 7%, average was 21%, worst was 53%
Compared to all devices tested
» 69% of all tested devices were better, 5% similar, 26% worse
» The best had a delta of 4%, average was 24%, worst was 134%
Lenovo ThinkPad E480-20KQS00000 audio analysis
(±) | speaker loudness is average but good (76.6 dB)
Bass 100 - 315 Hz
(±) | reduced bass - on average 13.2% lower than median
(±) | linearity of bass is average (12.4% delta to prev. frequency)
Mids 400 - 2000 Hz
(±) | higher mids - on average 5.2% higher than median
(±) | linearity of mids is average (9.6% delta to prev. frequency)
Highs 2 - 16 kHz
(+) | balanced highs - only 3.8% away from median
(±) | linearity of highs is average (10.2% delta to prev. frequency)
Overall 100 - 16.000 Hz
(±) | linearity of overall sound is average (19.9% difference to median)
Compared to same class
» 42% of all tested devices in this class were better, 9% similar, 50% worse
» The best had a delta of 7%, average was 21%, worst was 53%
Compared to all devices tested
» 51% of all tested devices were better, 7% similar, 42% worse
» The best had a delta of 4%, average was 24%, worst was 134%
Power Consumption
Power consumption is on par with other laptops powered by the latest Intel quad-core ULV CPUs. By contrast, while the ThinkPad E480 is more energy-efficient, the ProBook 440 G5 consumes marginally more than the Latitude 3490.
Our test device exceeds 65 W under maximum load, which is greater than the included 65 W power supply. However, this high consumption is only when the CPU ramps up to 44 W TDP. As a result, average power consumption is lower and below 65 W. The power supply should have no problem charging the device in daily use.
| Off / Standby | |
| Idle | |
| Load |
|
Key:
min: | |
Battery Life
The Latitude 3490 has a 56 Wh battery that is 8 Wh larger than the batteries of the ThinkPad E480 and the ProBook 440 G5. Likewise, the Latitude 3490 has a 15 Wh larger battery than the Latitude 14 3470. This extra battery capacity helps the Latitude 3490 score 11 h 34 m in our practical Wi-Fi test, during which we run a script that simulates the load required to render websites. The Latitude 3490 performs exceedingly well against our comparison devices, with the ProBook 440 G5 being the best of the bunch with a 40% shorter runtime.
The Latitude 3490 takes 142 minutes to fully recharge with the 65 W power supply.
Pros
Cons
Verdict

The Dell Latitude 3490 is a good business notebook that is priced well.
The positive aspects of the device are often held back by drawbacks, but the Latitude 3490 is still a solid office device. For example, while we applaud the chassis stability, the materials look and feel cheap.
Moreover, while the connectivity is solid and includes VGA, HDMI and USB Type-C with DisplayPort, one of the two USB ports is placed too far forwards and only works at USB 2.0 speeds rather than the faster USB 3.1. Additionally, the SD card reader is slow and leaves a piece of the SD card overhanging the case.
Furthermore, the Latitude 3490 is not silent at idle even though the fan is off because it suffers from coil whine. Equally, while CPU performance is above average and superior to the competition, it is significantly throttled on battery power.
The Latitude 3490 does have impressive upgradability though, thanks to its SO-DIMM RAM and empty 2.5-inch drive bay that can be used without the need to buy additional parts. The battery life is impressive too and far exceeds those of the competition.
The Dell Latitude 3490 is a great choice for those with basic needs and is a solid office device despite its drawbacks.
Overall, the Dell Latitude 3490 gets a recommendation from us despite our criticisms; if you are not sensitive to coil whine that is.
Dell Latitude 3490
- 05/16/2018 v6 (old)
Benjamin Herzig
Price comparison

