Dell Latitude 7400 2-in-1 (i7-8665U) Convertible Review
A common thread has permeated our reviews of the last few generations of high-end business laptops: they’re becoming increasingly consumer-like. The goal of manufacturers in pursuing this evolution has been to incorporate some of the exciting, stylish design language of XPS/Spectre/Yoga devices without compromising the basic tenets of what constitutes a solid office companion. It’s a difficult balancing act because, while thinness/attractiveness and practicality/versatility aren’t exactly mutually exclusive, it certainly makes the engineer’s job a lot harder.
Few manufacturers have been more transparent in their journey toward luxury business-grade utopianism than Dell, but until now, their Latitude 7390 2-in-1 has probably been the closest thing to a larger high-end business convertible that the company has produced. Several months ago, we even saw the Latitude 7000 series machines add an optional sleek aluminum casing, inching them ever closer to their XPS cousins.
Today, the Latitude 7400 2-in-1 is the next massive step toward this careful merger of design philosophies. Adorned also in aluminum (versus the matte black-painted magnesium of yore), the 7400 includes a 14” display—the largest to date in the Dell Latitude family. Our review unit also packs a Whiskey Lake Intel Core i7-8665U CPU, 16 GB LPDDR3 RAM, and a 512 GB NVMe SSD. There are no dedicated graphics options, but with specs like those, this machine should have little problem dealing with the rigors of the daily office grind. Dell also promises long battery runtimes and introduces their ambitious ExpressSign-in functionality, which leverages proximity sensors and facial recognition to seamless lock/unlock your machine as you leave or approach it. At a pricey $2,800, we should expect little short of perfection.
But the sweeping changes absolutely bring challenges along with them. In our full review today, as always, we’ll lay bare the results of our relentless array of scientific measurements and benchmarks in pursuit of a full picture of just what does and doesn’t work on the Latitude 7400 2-in-1. Let’s go.
(June 7, 2019 update: We've rerun some performance tests including CineBench R15, PCMark 10, and Prime95 on a different review unit with more stable results. Our comments and numbers have been revised to reflect the new findings.)
(September 2, 2019 update: Since the Core i7 model quickly overpowers the cooling solution, we have now taken a look at the Core i5 SKU as well. We performed another round of PCMark 10 and CineBench R15 loop tests and added the results to the performance paragraphs.)
Case
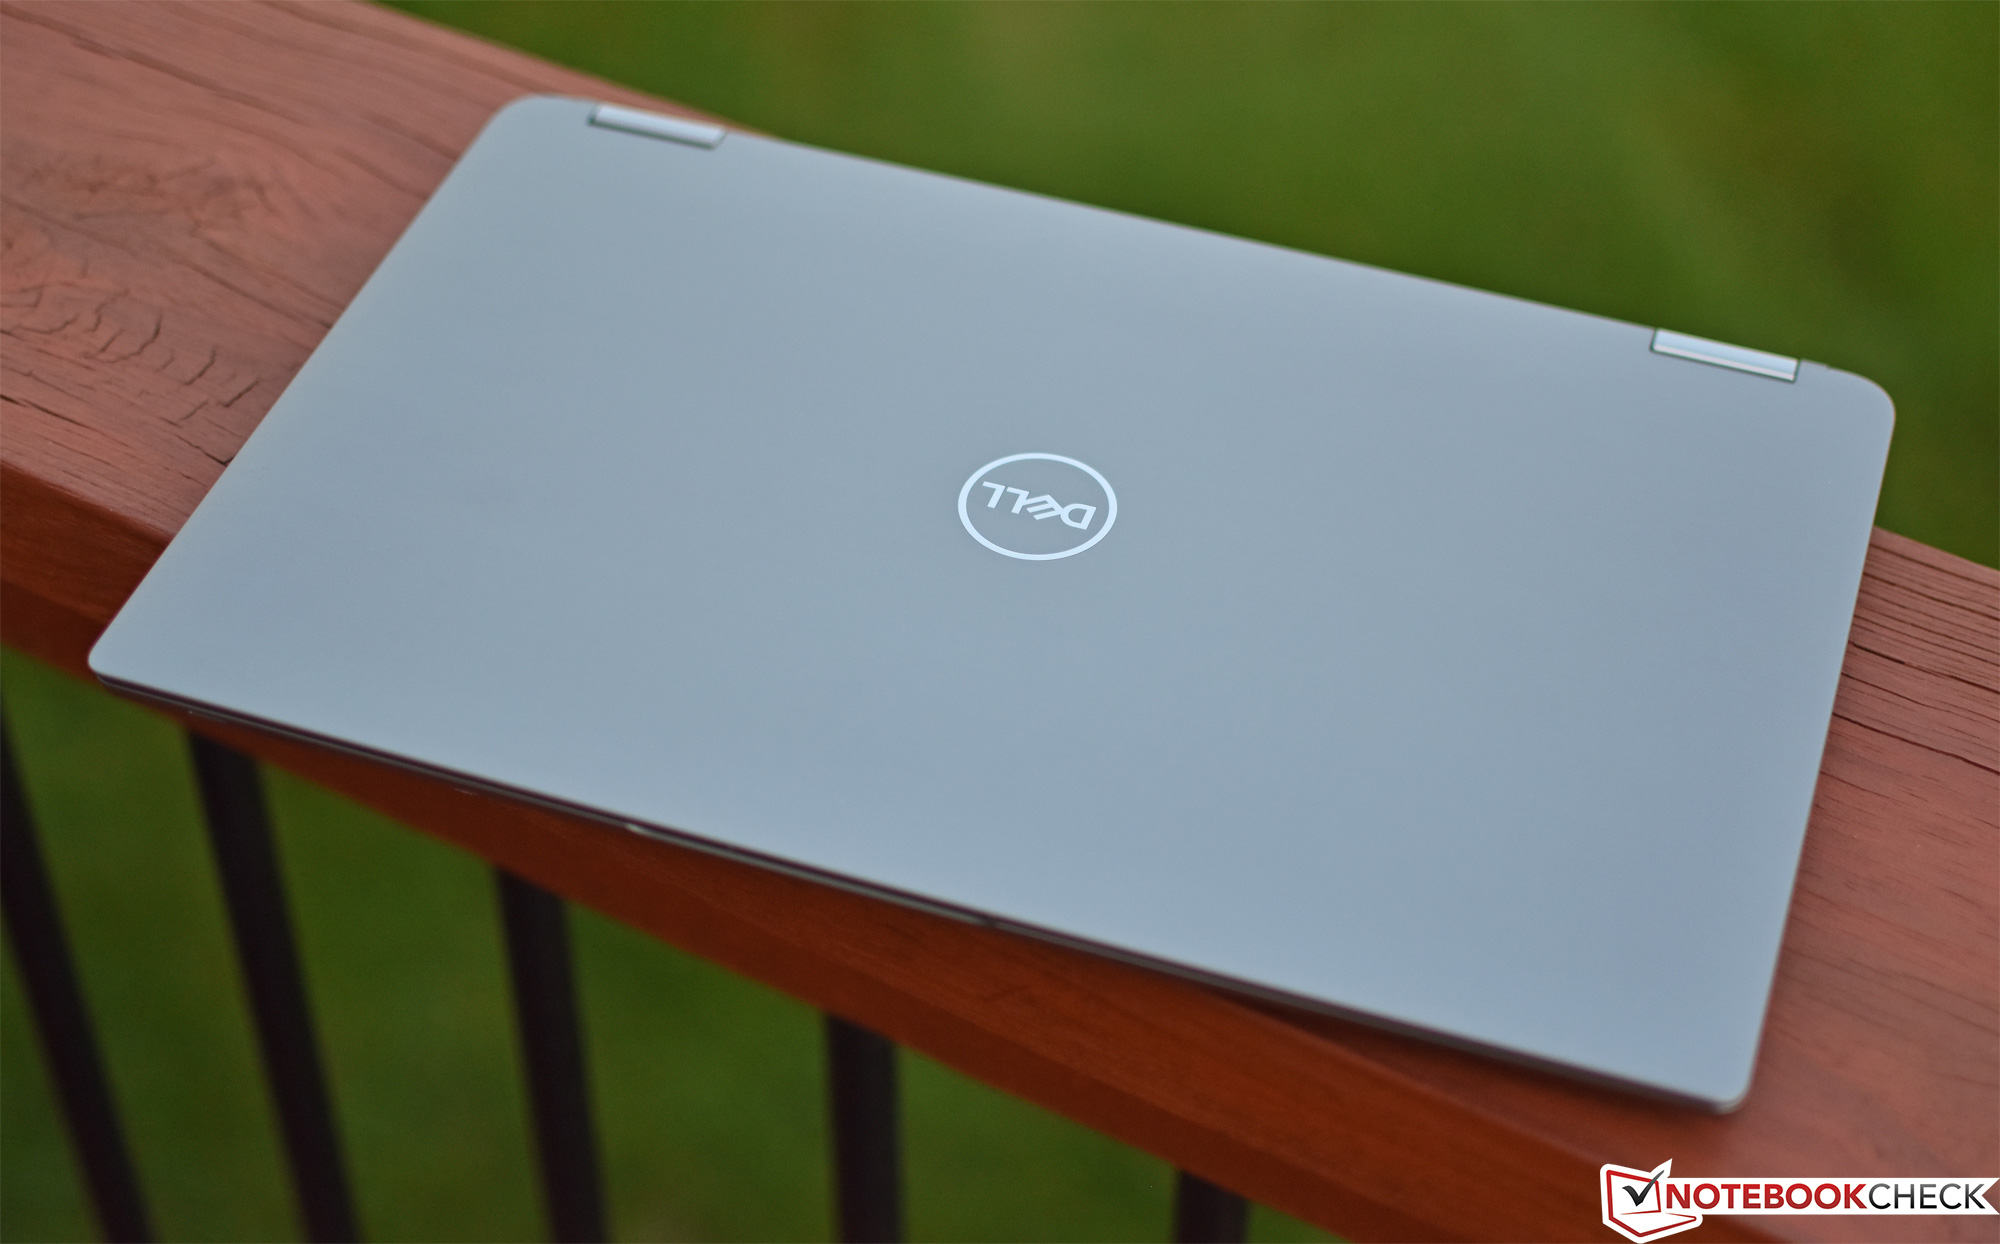
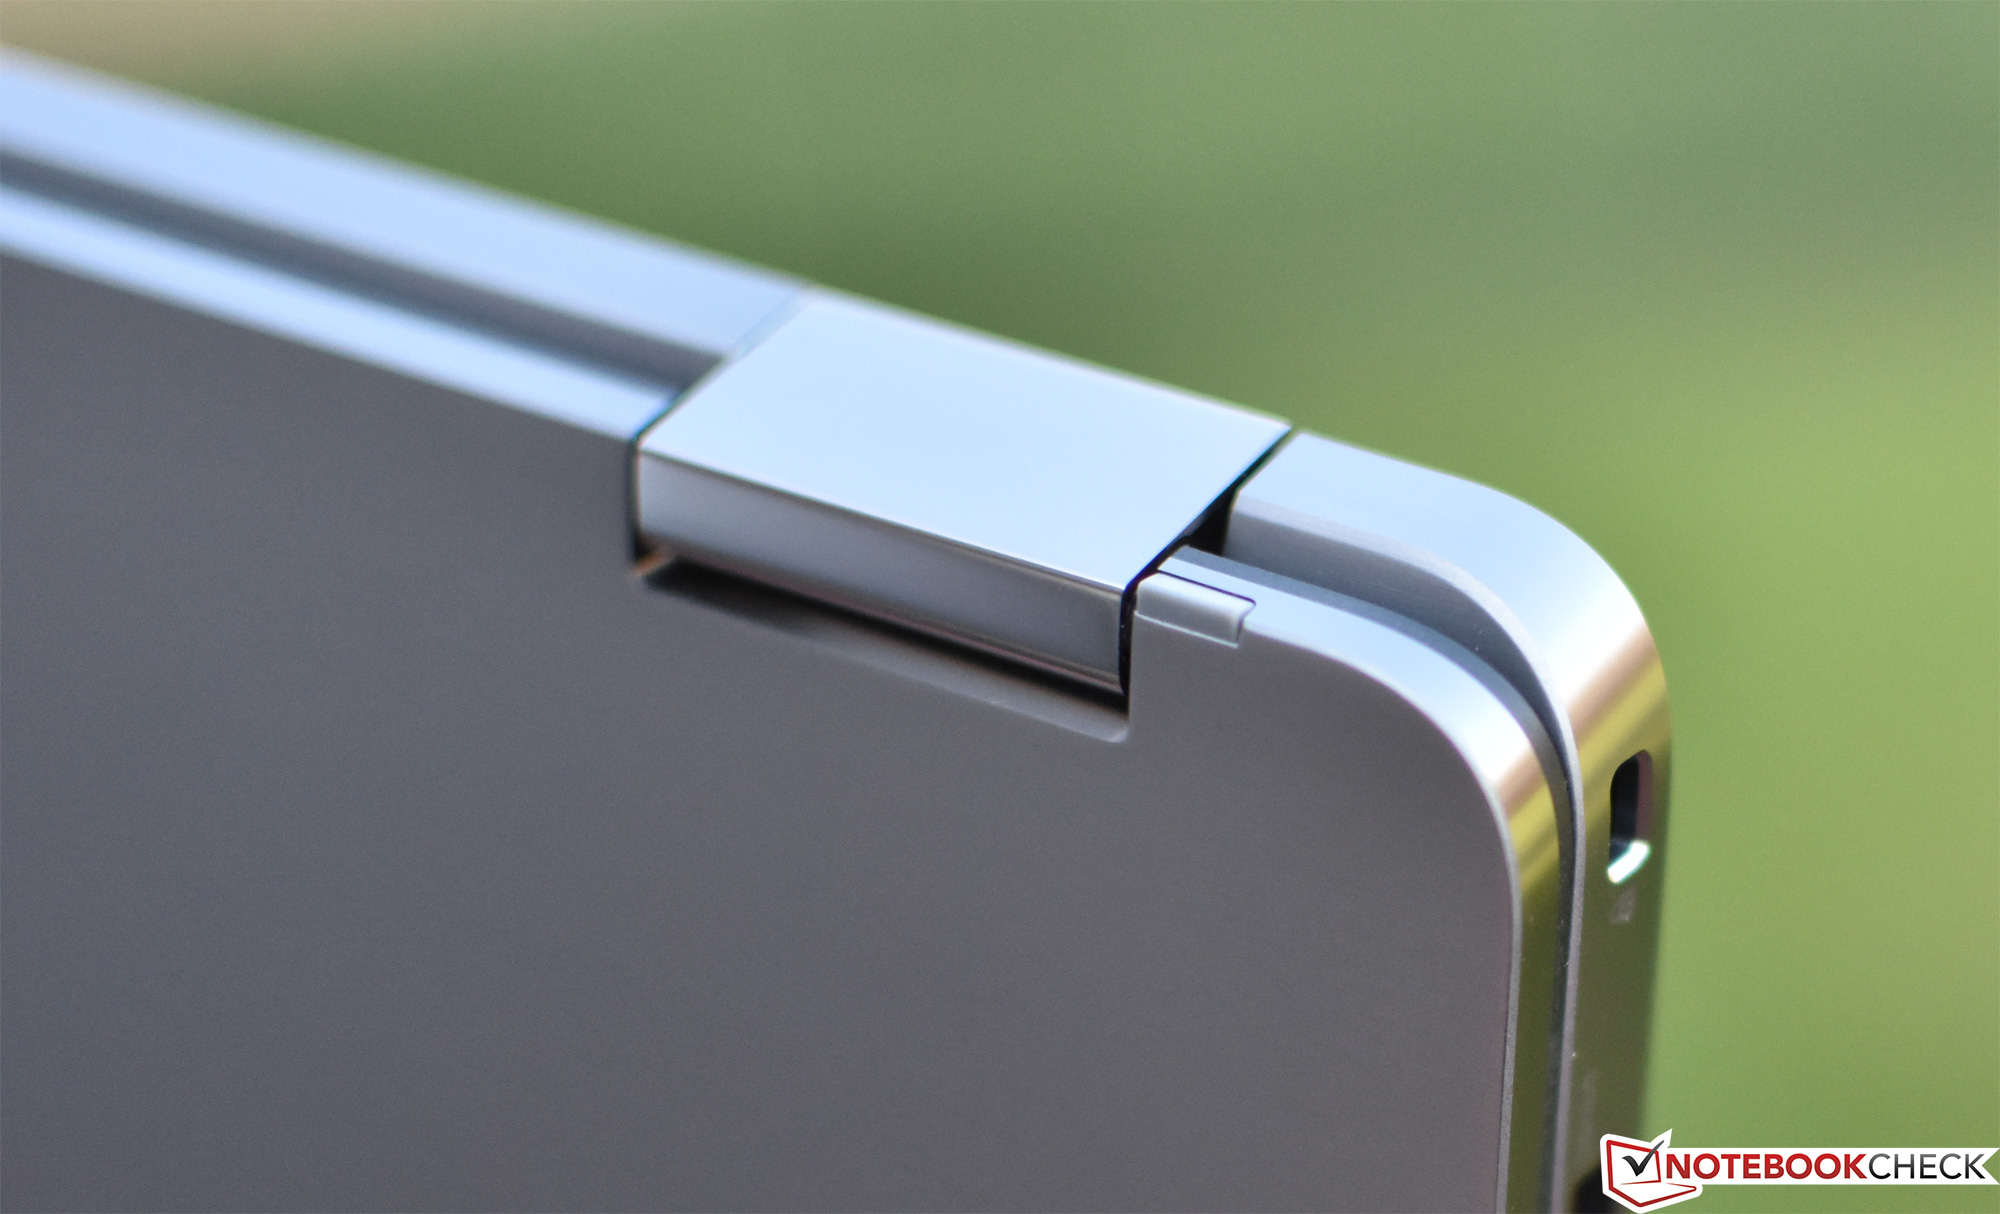
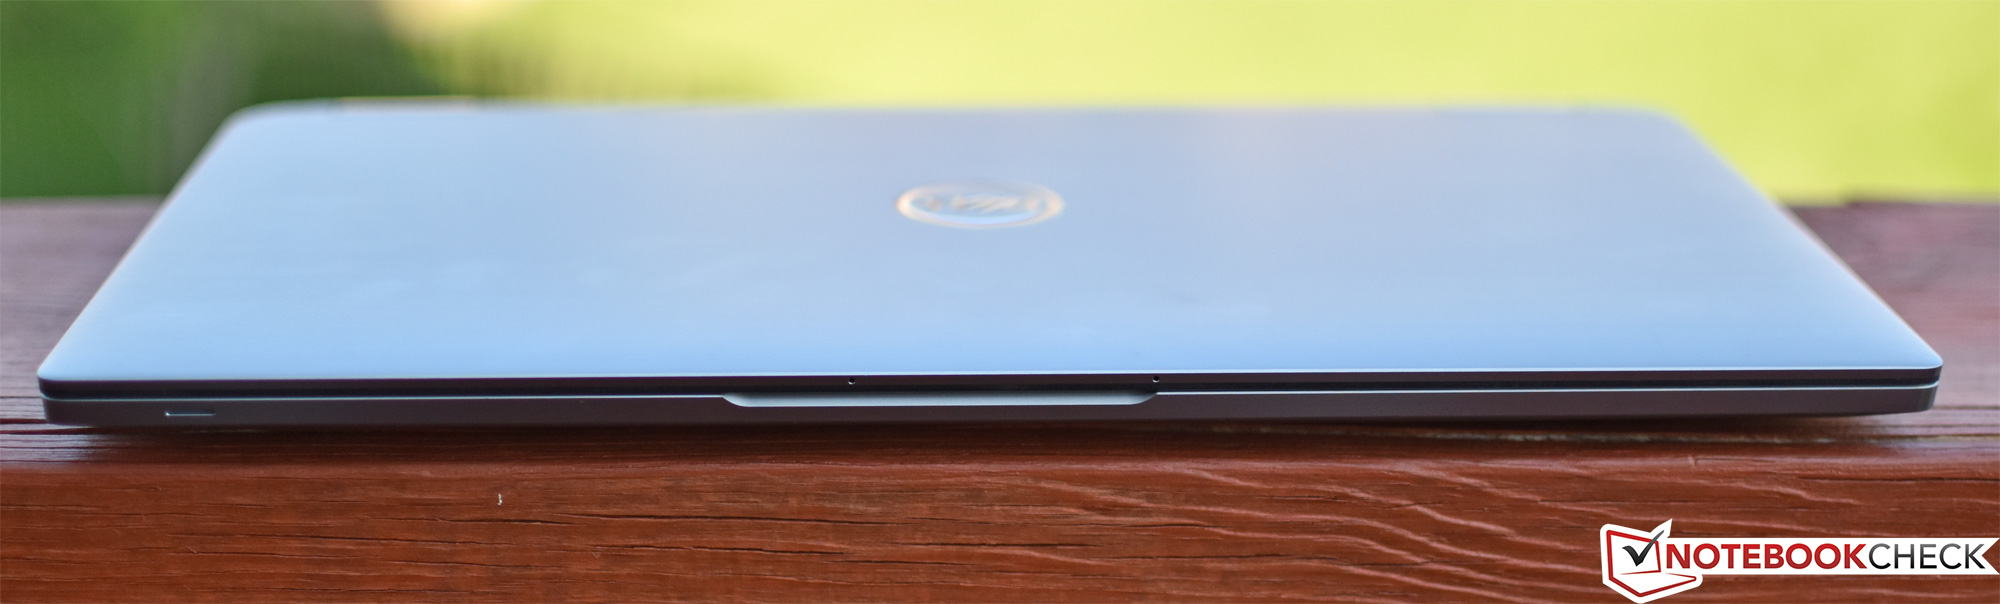
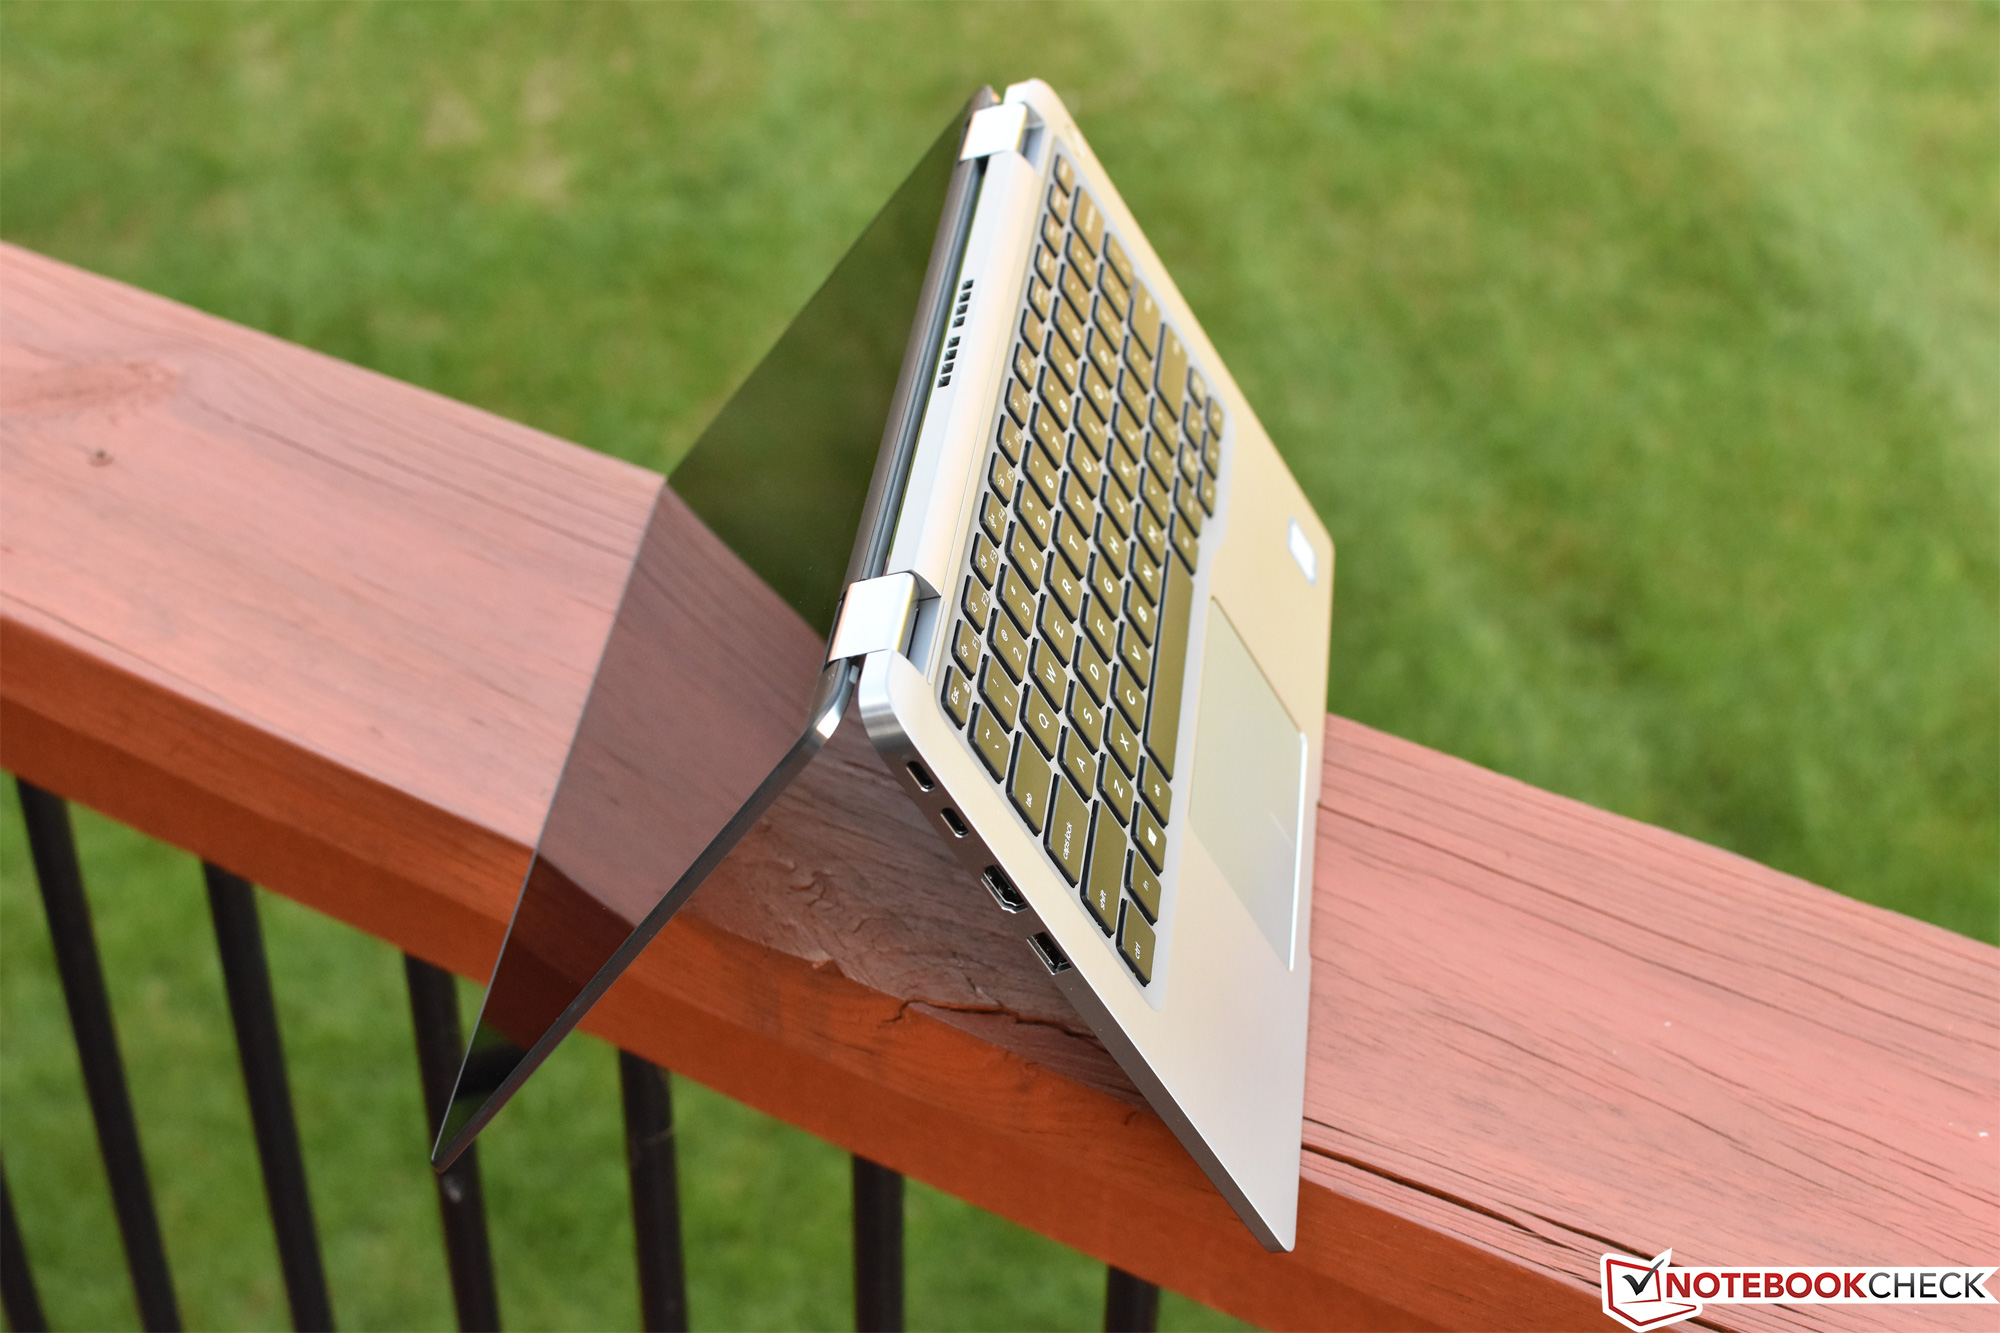
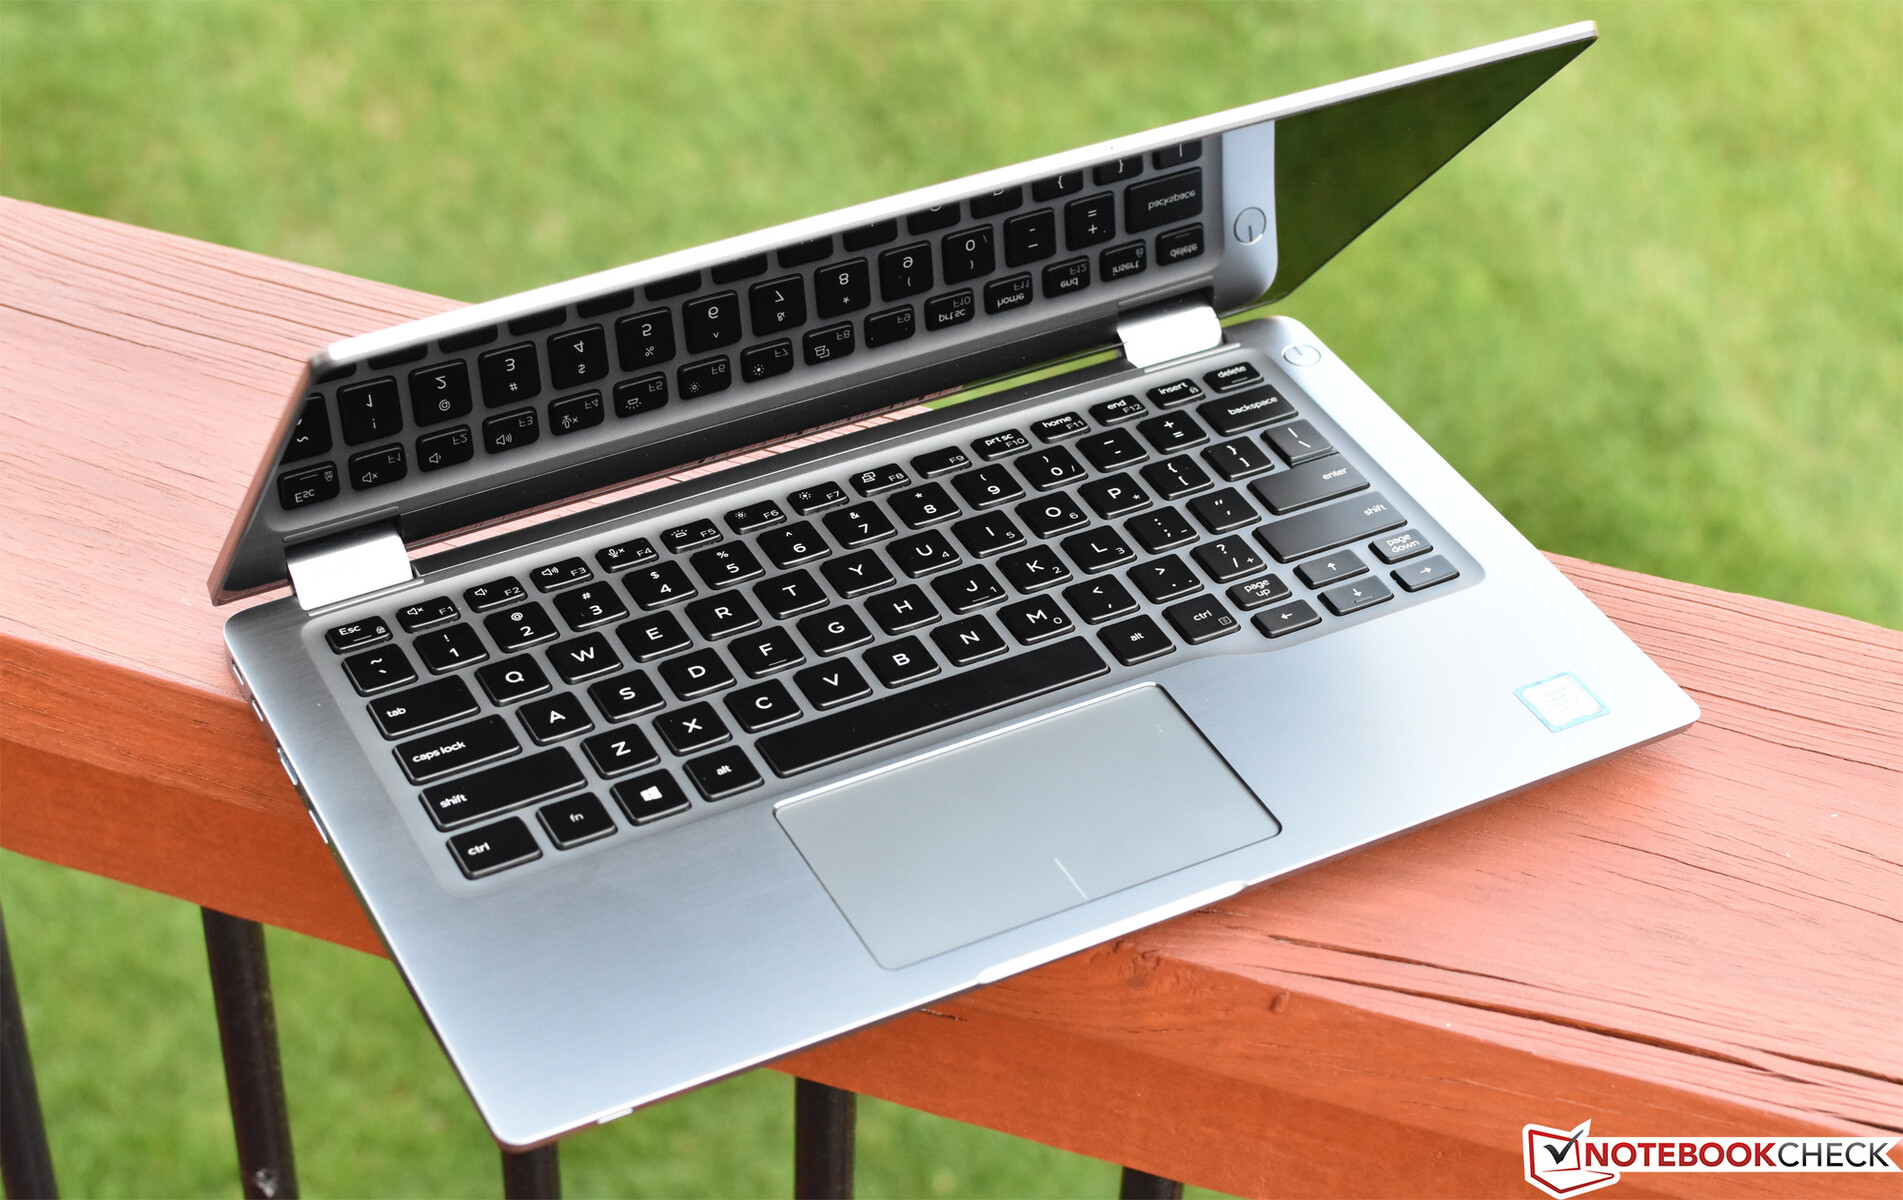
The Latitude 7400 2-in-1 is nothing if not attractive. Stunning, even. It’s the closest Dell’s ever gotten to a business-grade MacBook Pro competitor, right down to the heavy brushed aluminum casing. While predominantly matte in its finish, the shiny dual hinge covers and polished edges stand out as flashier than we’re used to in the professional segment. Still, in spite of its relative pomp, it’s undoubtedly suited for use in a boardroom.
As we’ve come to expect from the Latitude 7000 series machines, very little flex is detectable at any point on the case, and the machine rests firmly on a surface thanks to its large horizontal rubber feet; it's roughly comparable to the rigidity of an XPS 15, which is overall very good. The display lid is solid, effectively dispelling any twisting efforts and stably supported by the two hinges, which succumb only very slightly to vibrations under heavy typing and in transit. It’s almost possible to open the machine single-handedly, but the final ascent does require pressure on the base to prevent it from lifting off the surface.
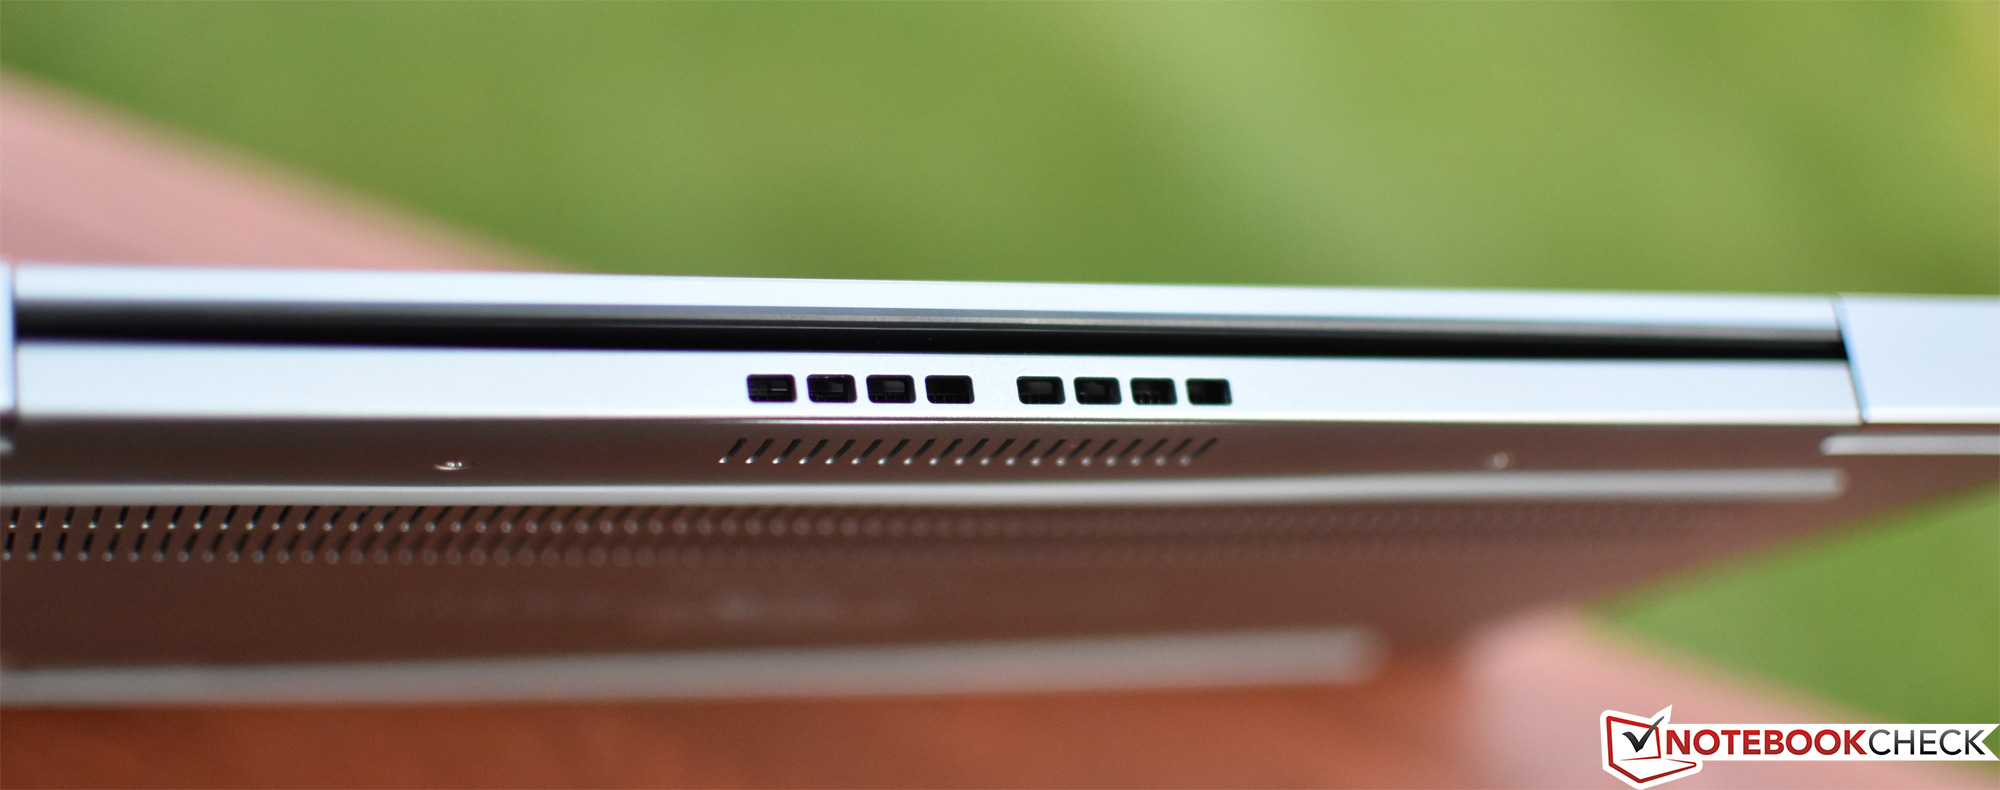


At 1.512 kg (equipped with the larger 6-cell internal battery), the system is similar in weight to its predecessor, the Latitude 7490, which registered 1.561 kg by comparison. The footprint has shrunk significantly, however: at just 320 mm x 202 mm, it’s nearly 12% smaller than before. It’s also quite a bit thinner (15 mm, down from 17.9 mm).
Connectivity
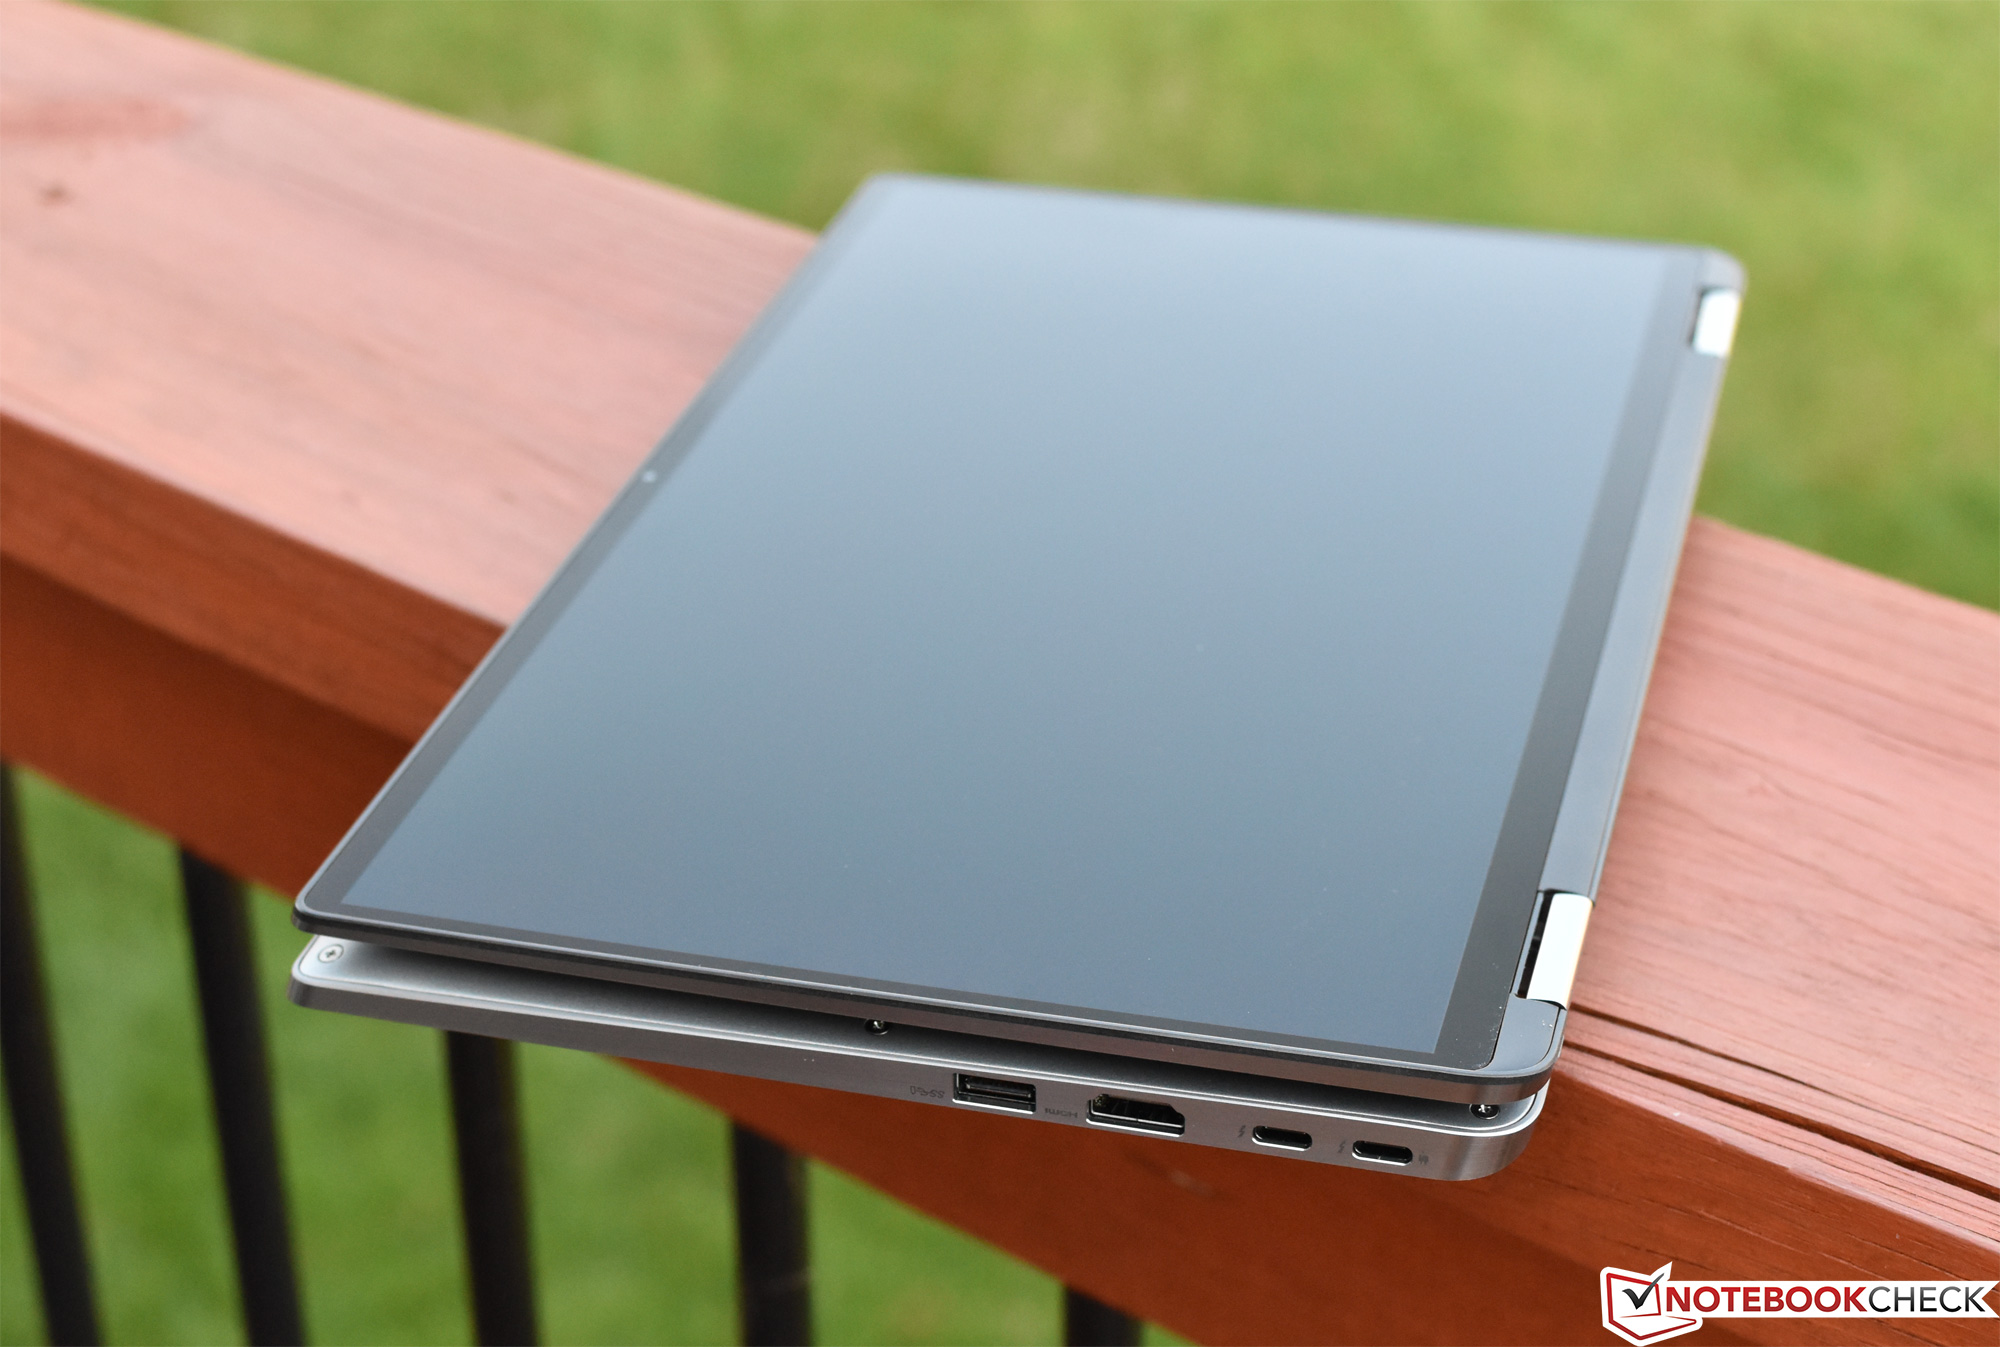
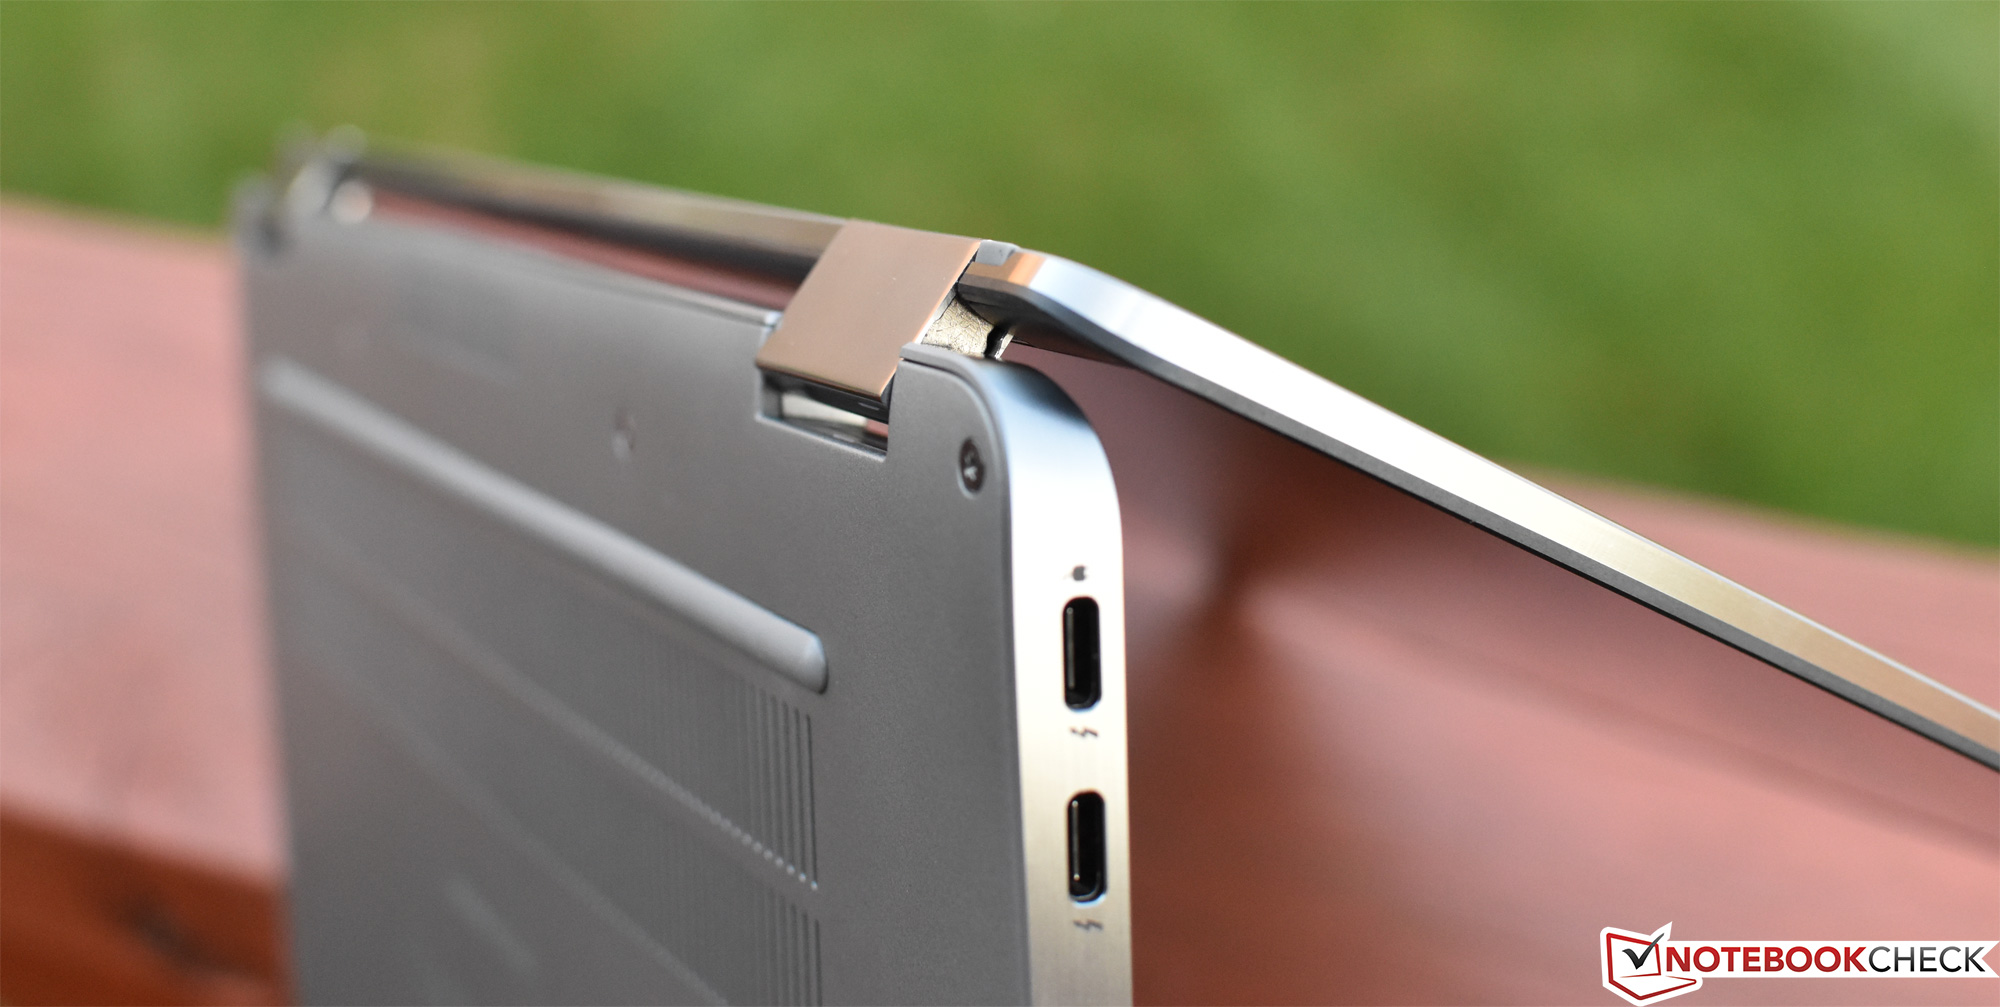
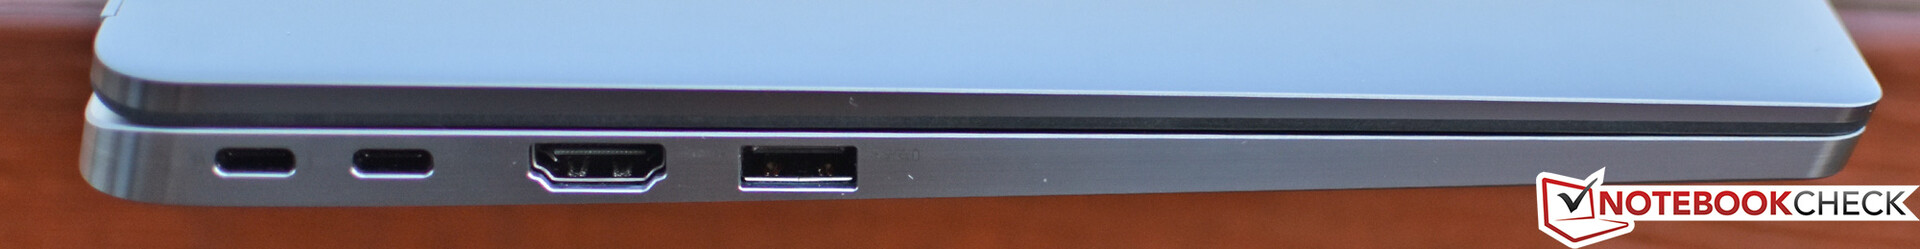
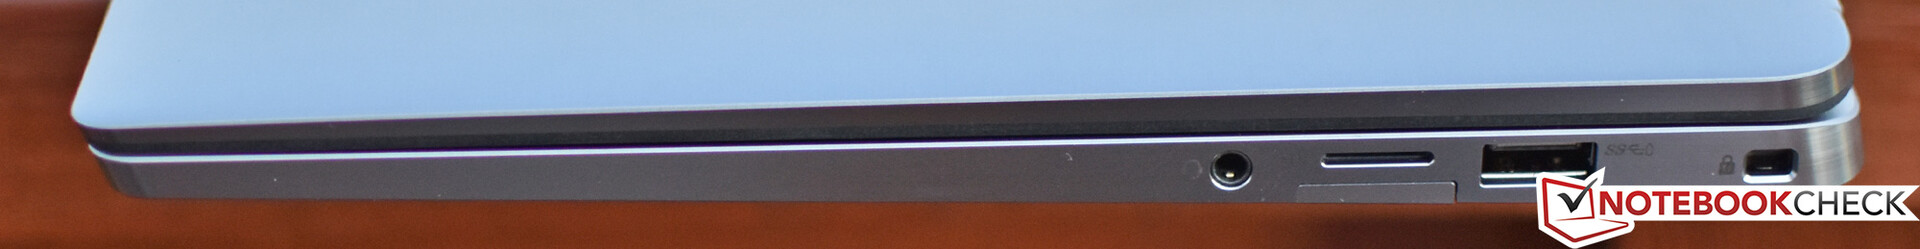
While the case has shrunk, only a few notable changes in terms of port selection apply. For starters, the Ethernet port is now completely missing—because the case is simply too thin for it to be practical, even with the hinge-based design of the last few revisions. In addition to that, one of the two USB 3.0 ports on the left side of the machine has now been exchanged for (upgraded to?) a ThunderBolt 3 port—but this port also replaces the dedicated charging port. Some people might consider this “forward-thinking” move toward a ThunderBolt-driven future a positive one, but others will lament the reduction in number of conventional USB Type-A ports and the dual obligations of the fourth port. It is true at least that now both Type-C ports carry DisplayPort connectivity, hypothetically opening the door to three-monitor configurations without the need for a docking station. External displays that support Type-C charging will also be able to charge the Latitude 7400 2-in-1 simultaneously.
Port organization, meanwhile, is practically identical to the 7490/7480. The ports are somewhat closely-spaced, but they’re all side-mounted and logically positioned. We have few complaints here apart from the usual concerns about larger connectors crowding out adjacent ports.
SD Card Reader
The integrated microSD card reader performs very well and comes close to topping our comparison charts, with 172.1 MB/s in our JPG copy test and 209.62 MB/s in the AS SSD Sequential Read Test.
| SD Card Reader | |
| average JPG Copy Test (av. of 3 runs) | |
| Lenovo ThinkPad X1 Yoga 2018-20LES01W00 (Toshiba Exceria Pro M501) | |
| Dell Latitude 7400 2-in-1 (Toshiba Exceria Pro M501 UHS-II) | |
| Average of class Convertible (29.4 - 186, n=21, last 2 years) | |
| HP Pavilion x360 14-cd0002ng (Toshiba Exceria Pro SDXC 64 GB UHS-II) | |
| Asus ZenBook Flip 14 UX461UA (Toshiba Exceria Pro M501 microSDXC 64GB) | |
| maximum AS SSD Seq Read Test (1GB) | |
| Lenovo ThinkPad X1 Yoga 2018-20LES01W00 (Toshiba Exceria Pro M501) | |
| Dell Latitude 7400 2-in-1 (Toshiba Exceria Pro M501 UHS-II) | |
| Average of class Convertible (67.5 - 254, n=20, last 2 years) | |
| HP Pavilion x360 14-cd0002ng (Toshiba Exceria Pro SDXC 64 GB UHS-II) | |
| Asus ZenBook Flip 14 UX461UA (Toshiba Exceria Pro M501 microSDXC 64GB) | |
Communication
Again, there’s no longer any Ethernet connection without an adapter—but at least the wireless connectivity is rock-solid. Powered by an Intel Wireless-AC 9560 adapter, the 7400 2-in-1 dominates most other competitors with WLAN receive/transmit speeds topping 600 Mb/s (we are currently limited in testing by a 1 Gbps server, so the 9560 actually theoretically can go higher).
The Intel adapter also includes Bluetooth 5.0.
Security
As usual, various security hardware authentication bundles exist for the Latitude 7400 2-in-1. However, the real story here is Dell’s new ExpressSign-in functionality, which seeks to lock/unlock your machine automatically through the synergistic use of a proximity sensor and IR facial recognition. We will test this feature as part of a separate article.
Either of these features can be disabled via the ExpressSign-in tray icon in Windows painlessly, as well as configured to automatically disengage when docked or connected to an external display.
Accessories
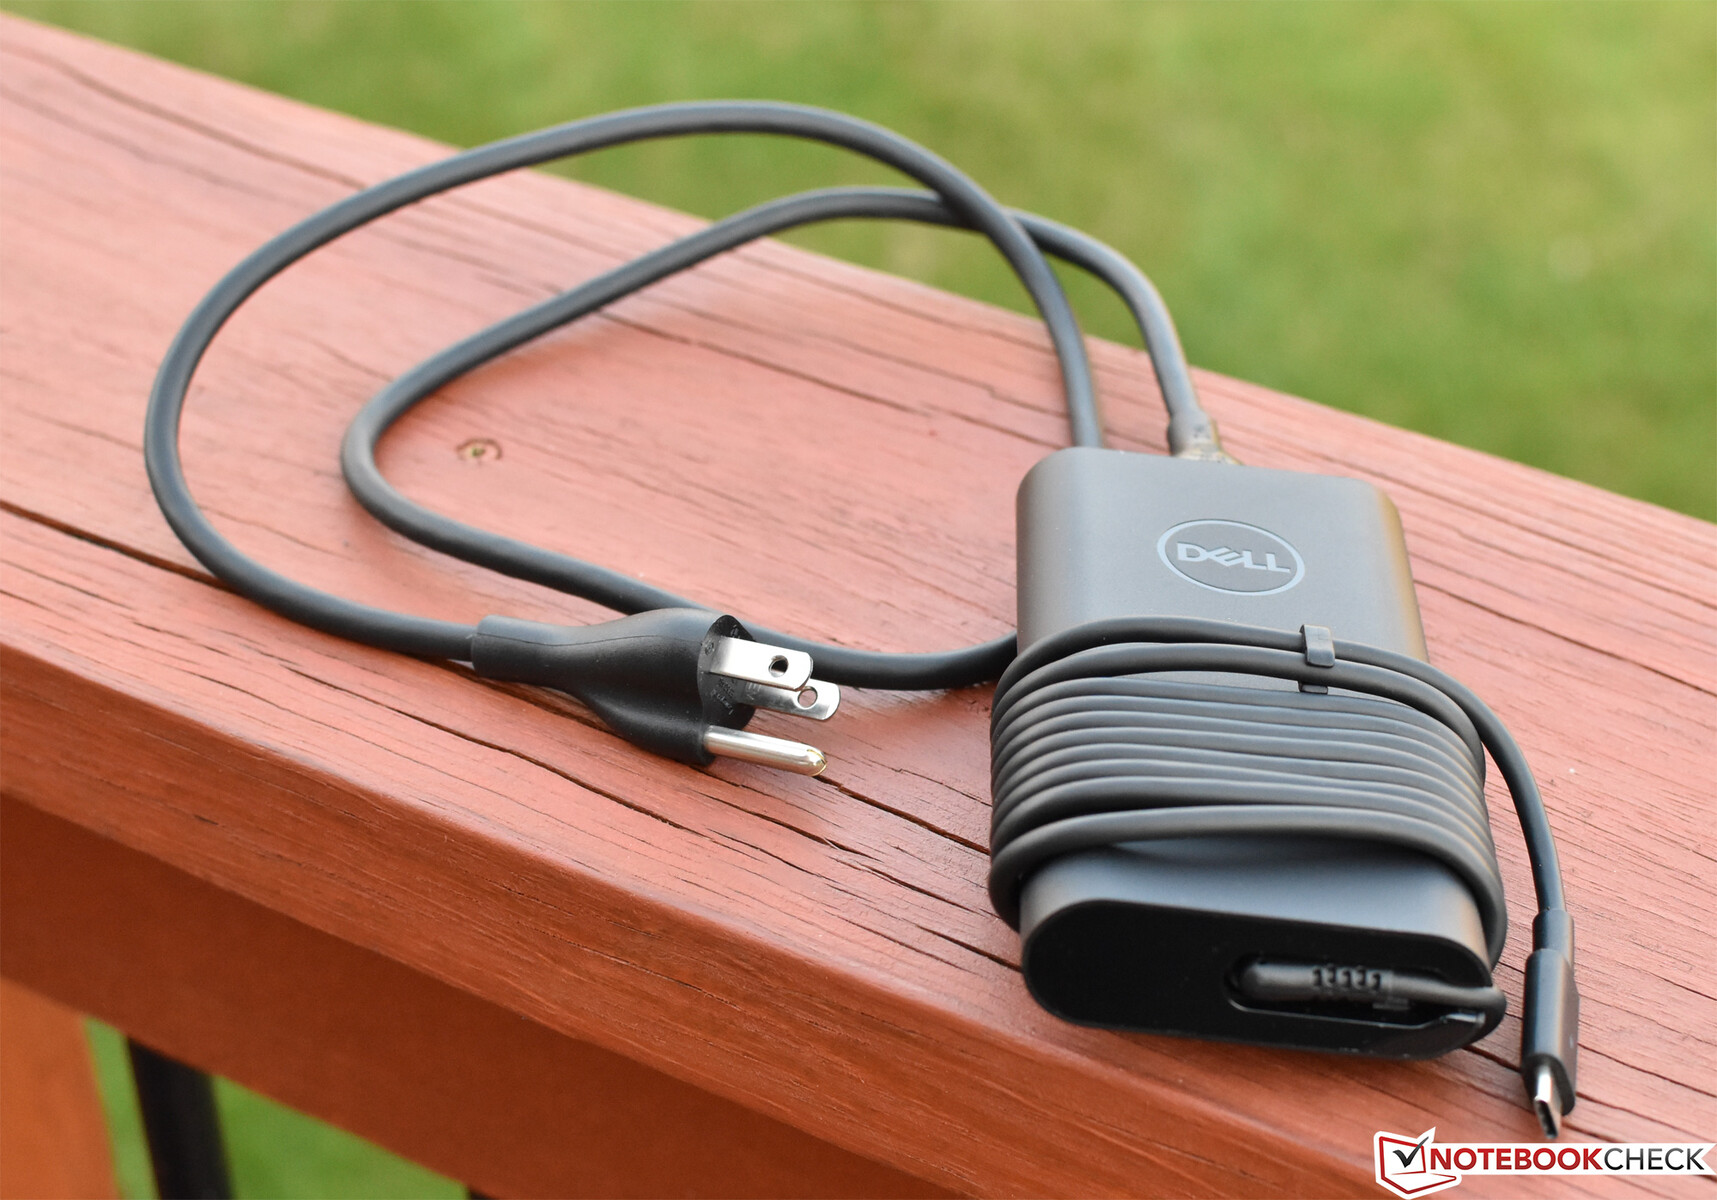
The Latitude 7400 ships with a single 90 W USB-C power adapter weighing 356 g. Again, after the move away from the proprietary 19.5 W Dell charging port, all older AC adapters will no longer work with this model.
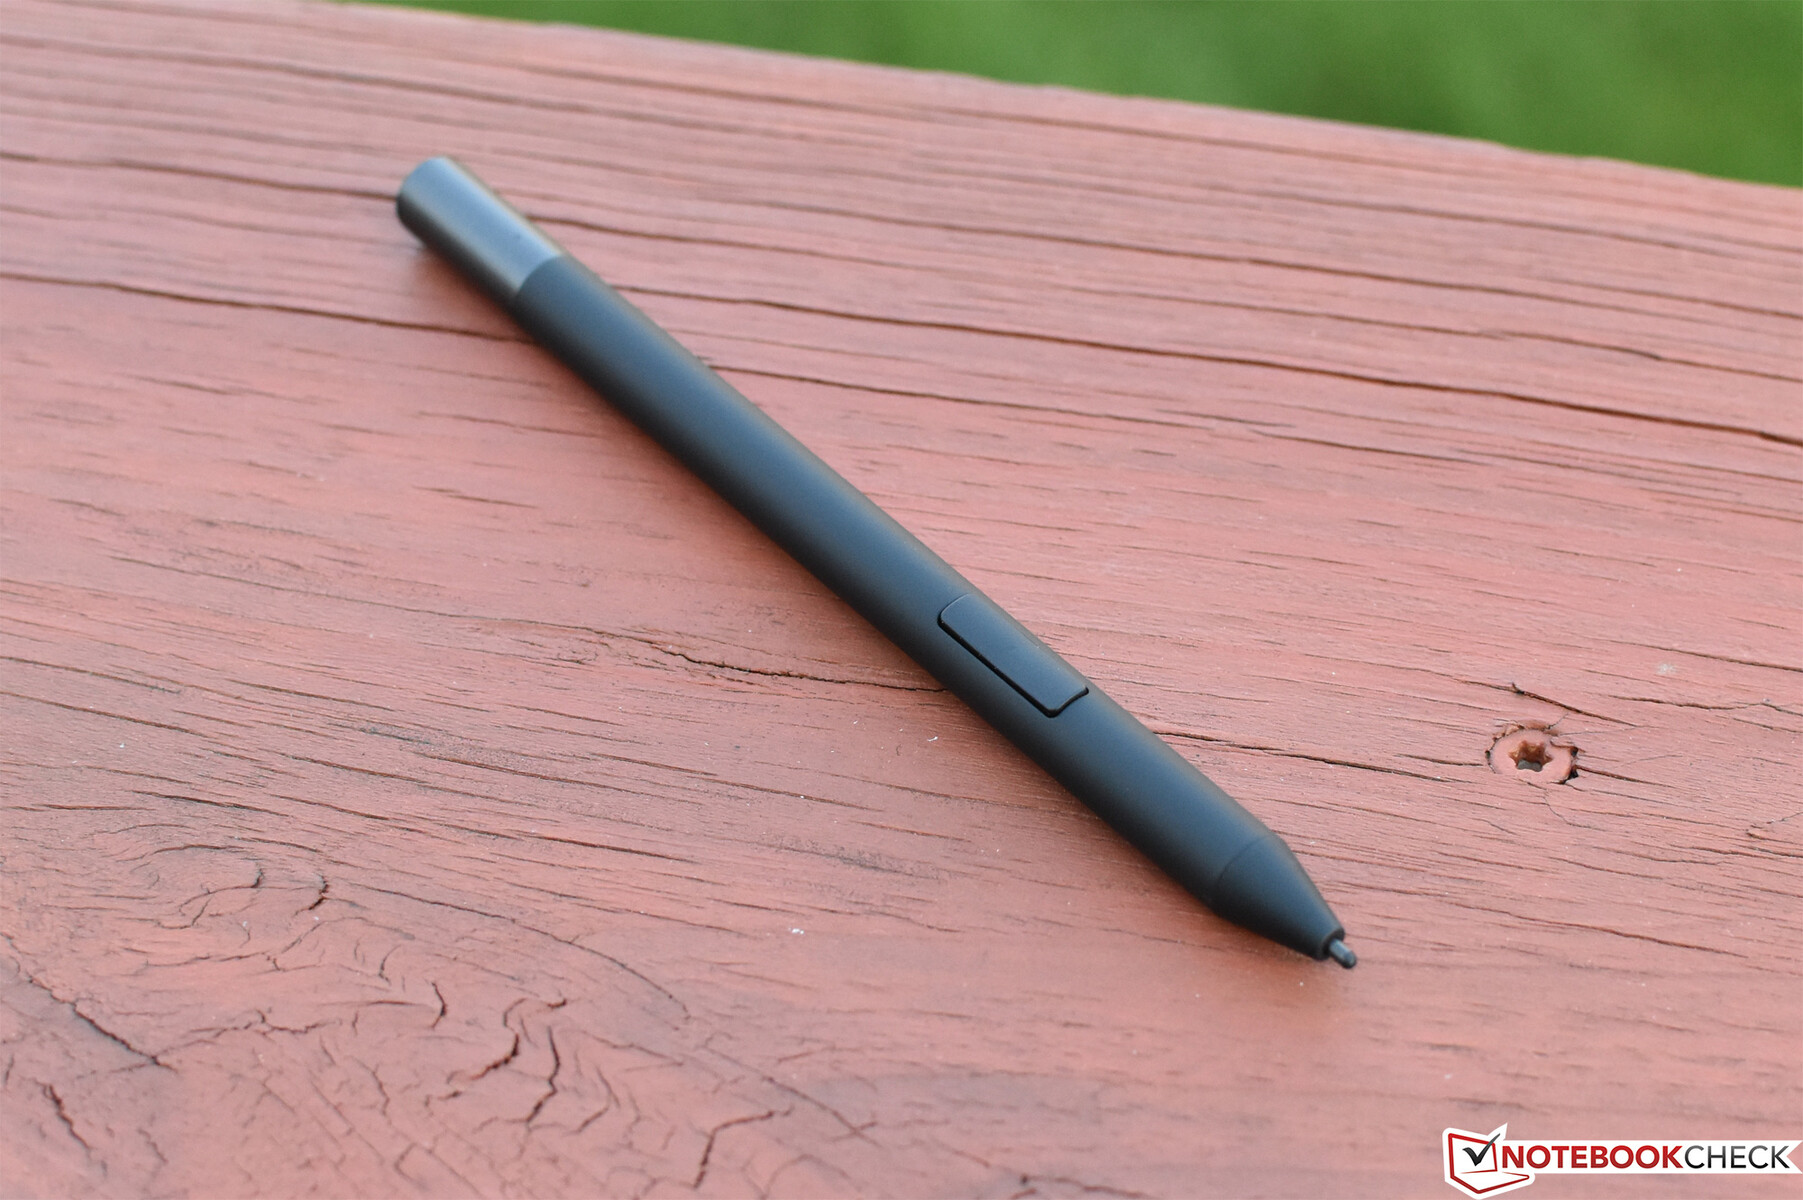
Dell also provided us with an Active Stylus Pen (sold separately, $42), which works seamlessly with the Latitude 7400 2-in-1 display. We’ve reviewed this pen on multiple occasions in the past but in short, while it works well enough, it’s not quite as natural a writing experience as that of the Microsoft Surface products. The tips don’t feel quite as authentic, and the side buttons lack the defined feedback of the Surface Pen buttons.
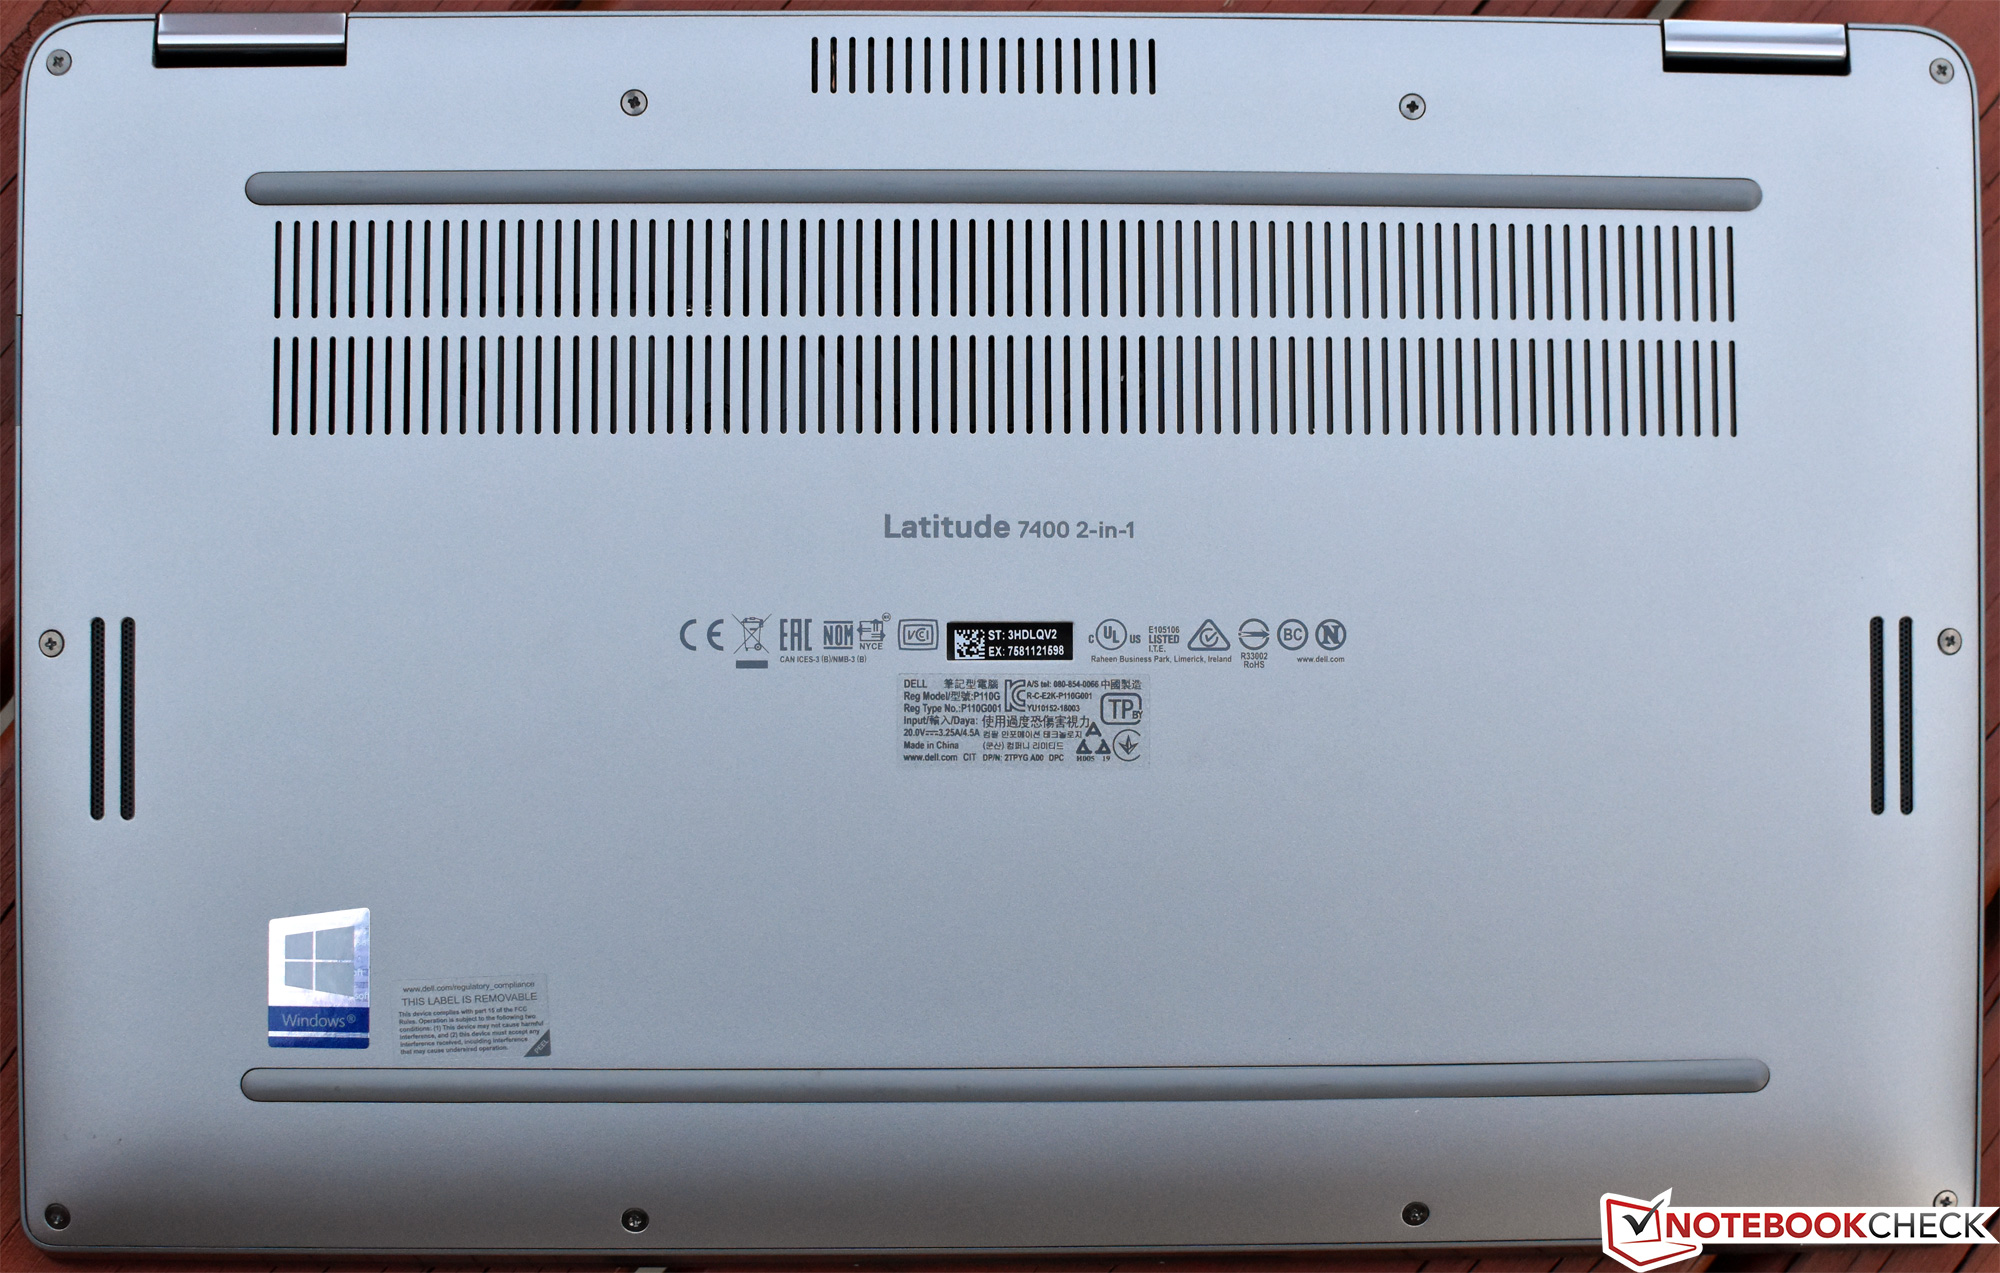
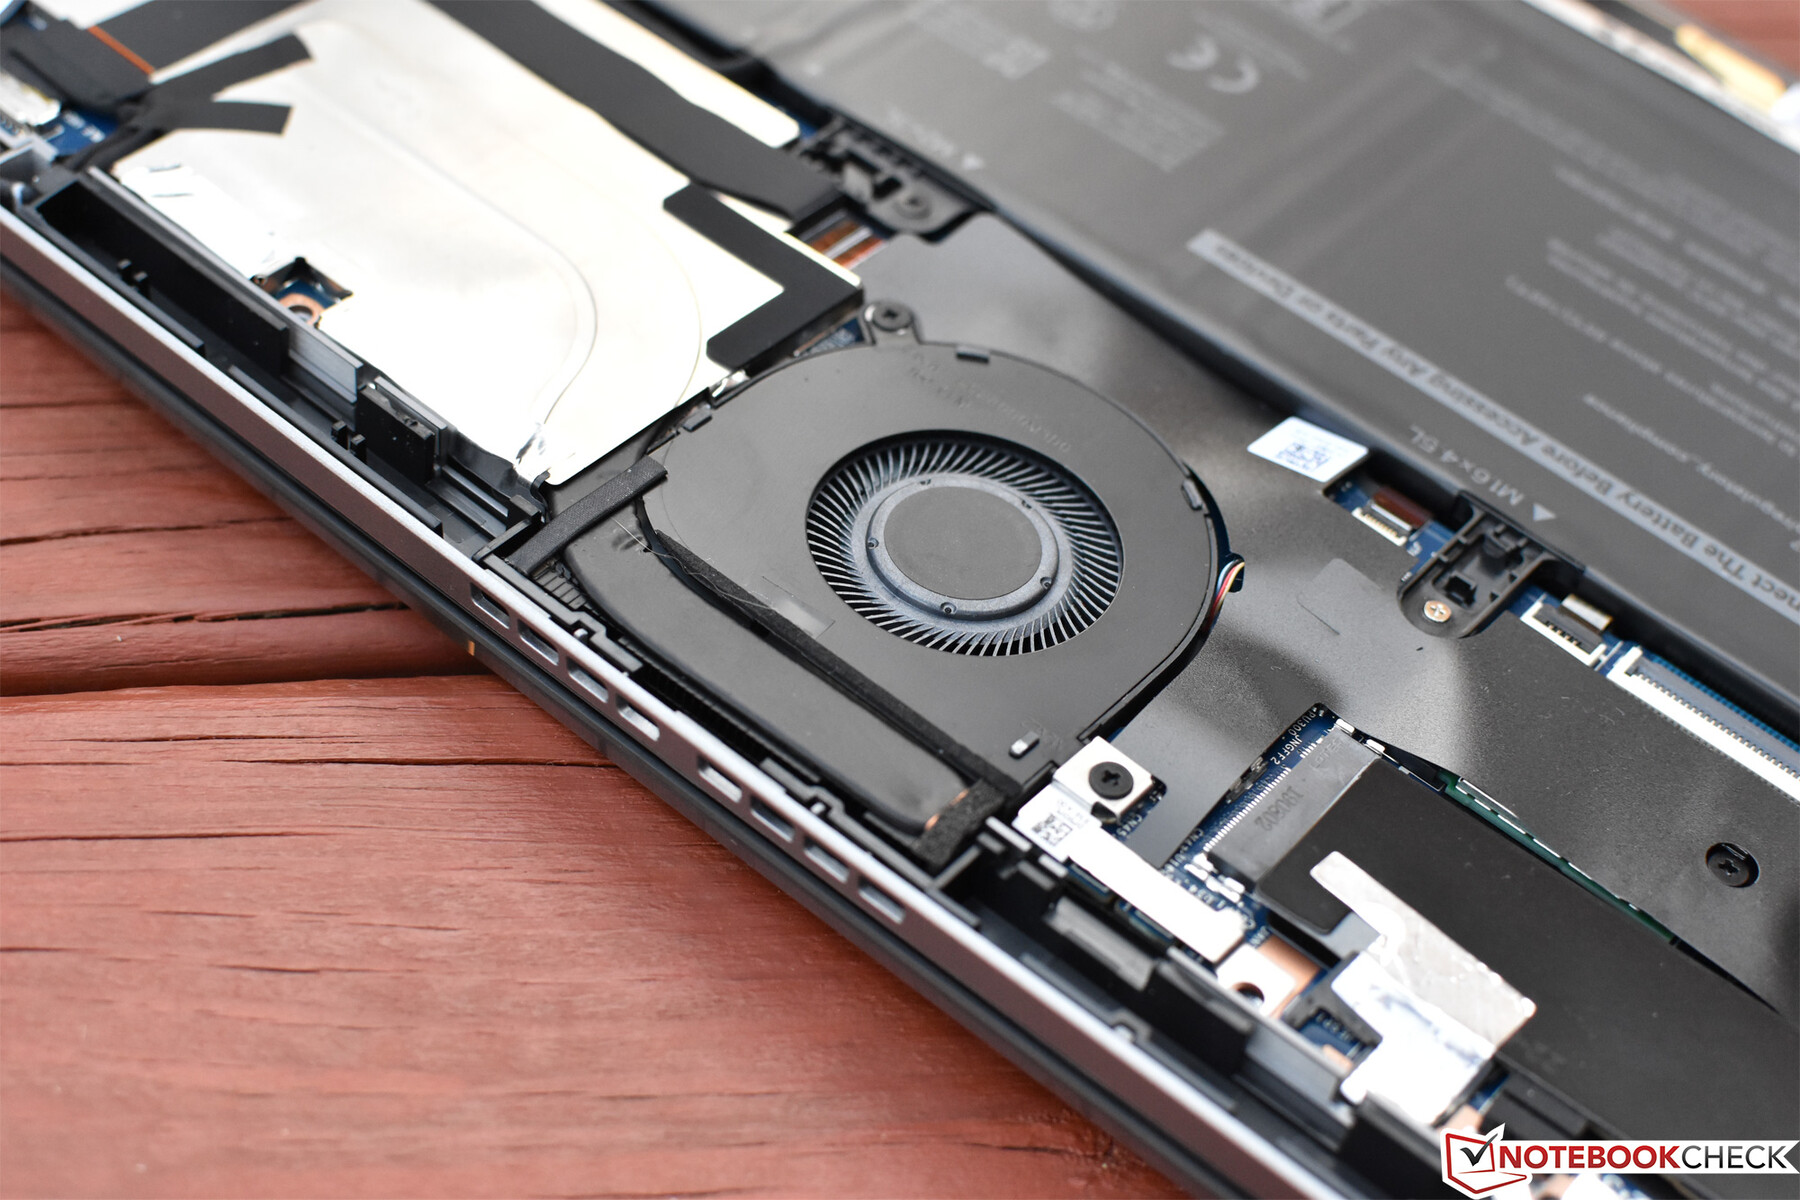
Maintenance
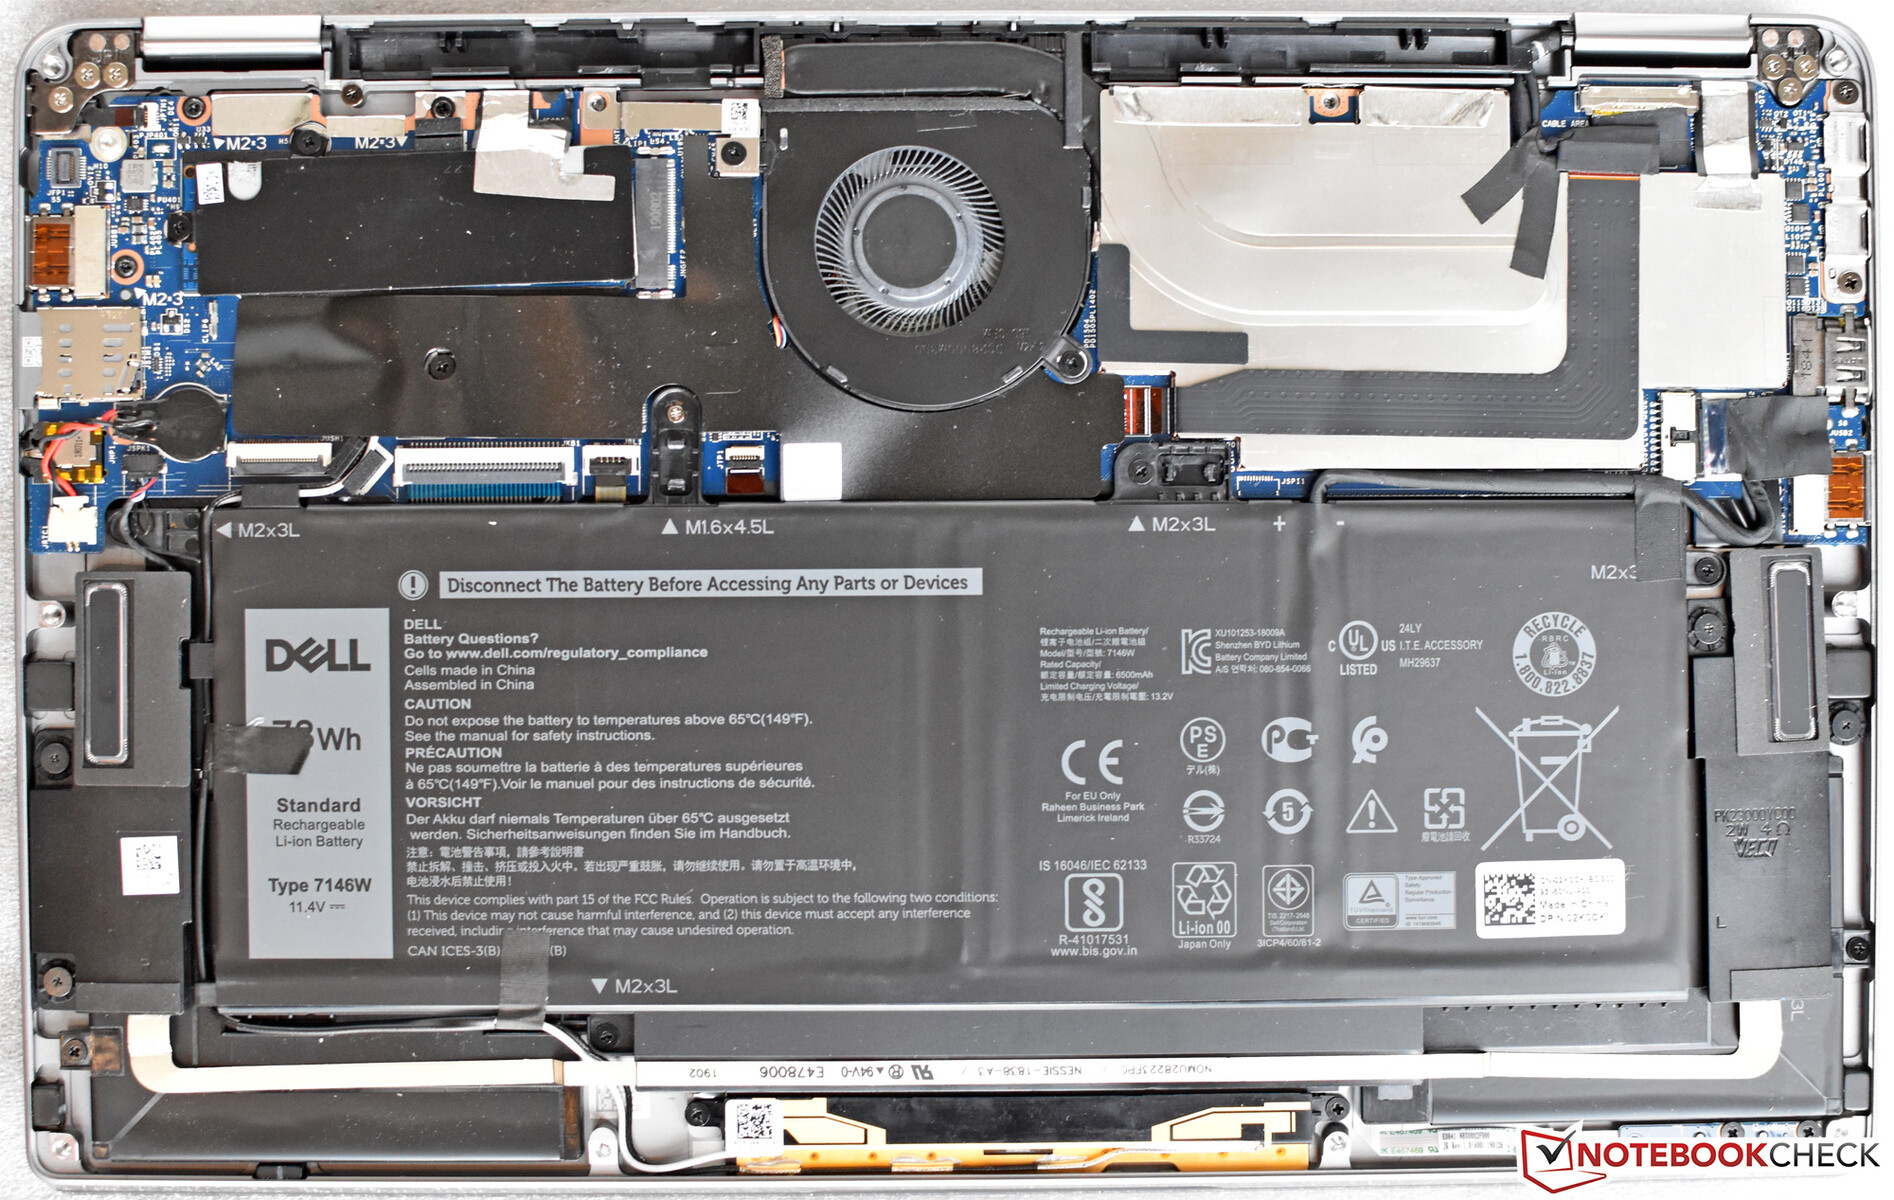
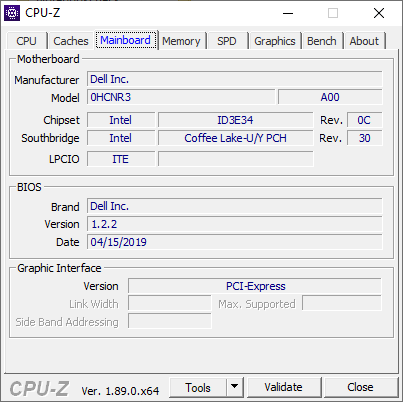
As is expected of a high-end business laptop, maintenance is relatively straightforward on the Latitude 7400 2-in-1. Ten Phillips-head screws secure the bottom cover to the machine, which can then be (carefully!) pried away from within either hinge cavity to reveal the internal FRUs. These include the battery, M.2 SSD, CMOS battery, heatsink/fan, speakers, and WLAN/WWAN adapters. The system memory is soldered directly to the board and is not replaceable or upgradeable.
Warranty
The Latitude 7400 2-in-1 spec sheet we received quotes a 1-year depot warranty, but our review unit (and all listed units on Dell’s website) include a 3-year on-site warranty, which is typical for Latitude 7000 series machines. It appears that a 3-year on-site warranty (as expected) is typical.
Input Devices
Keyboard
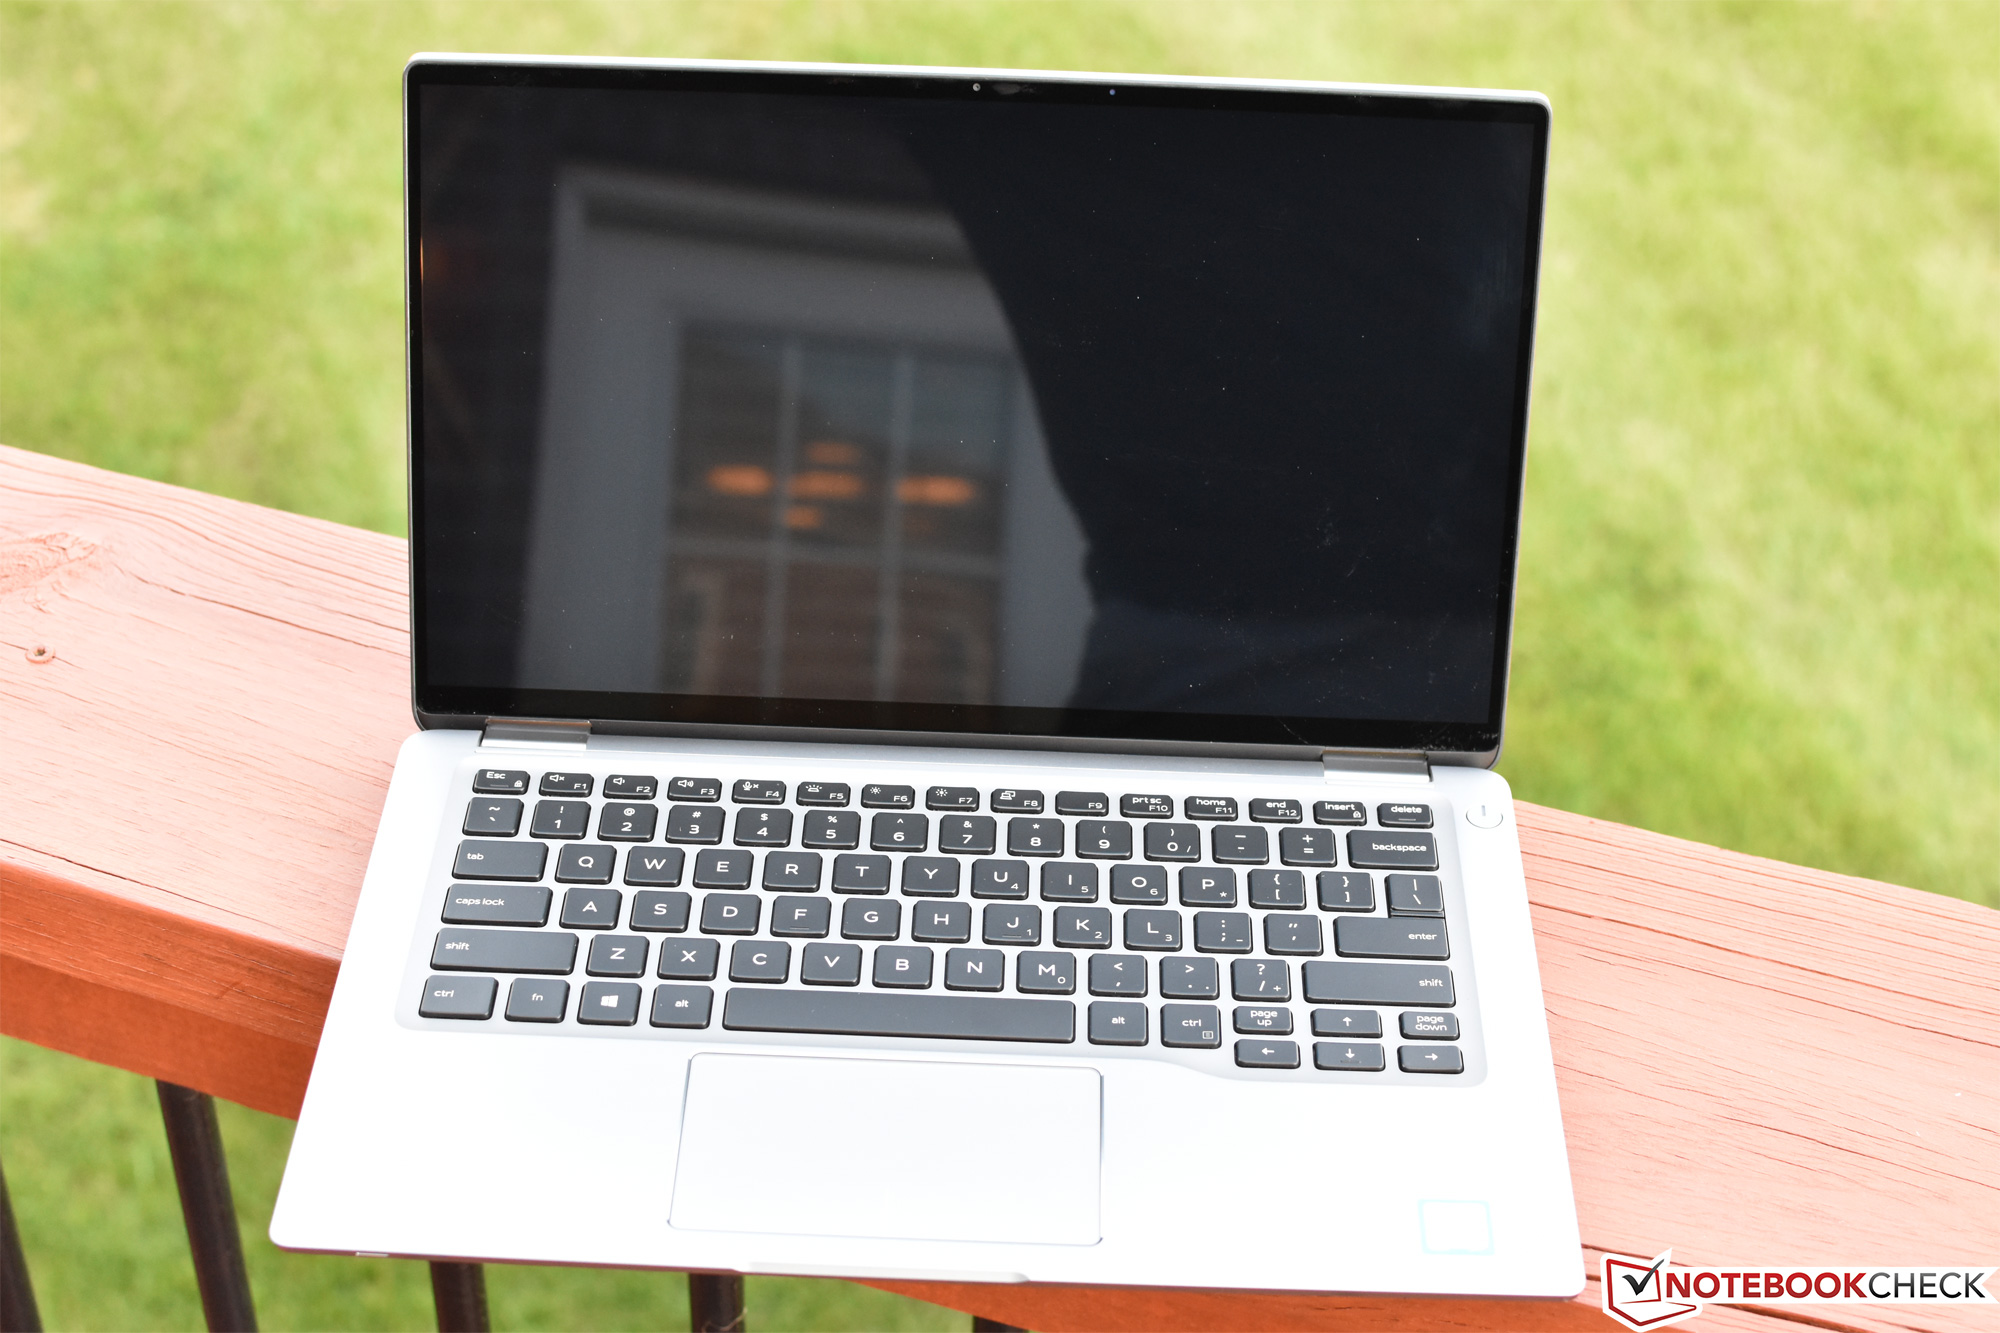
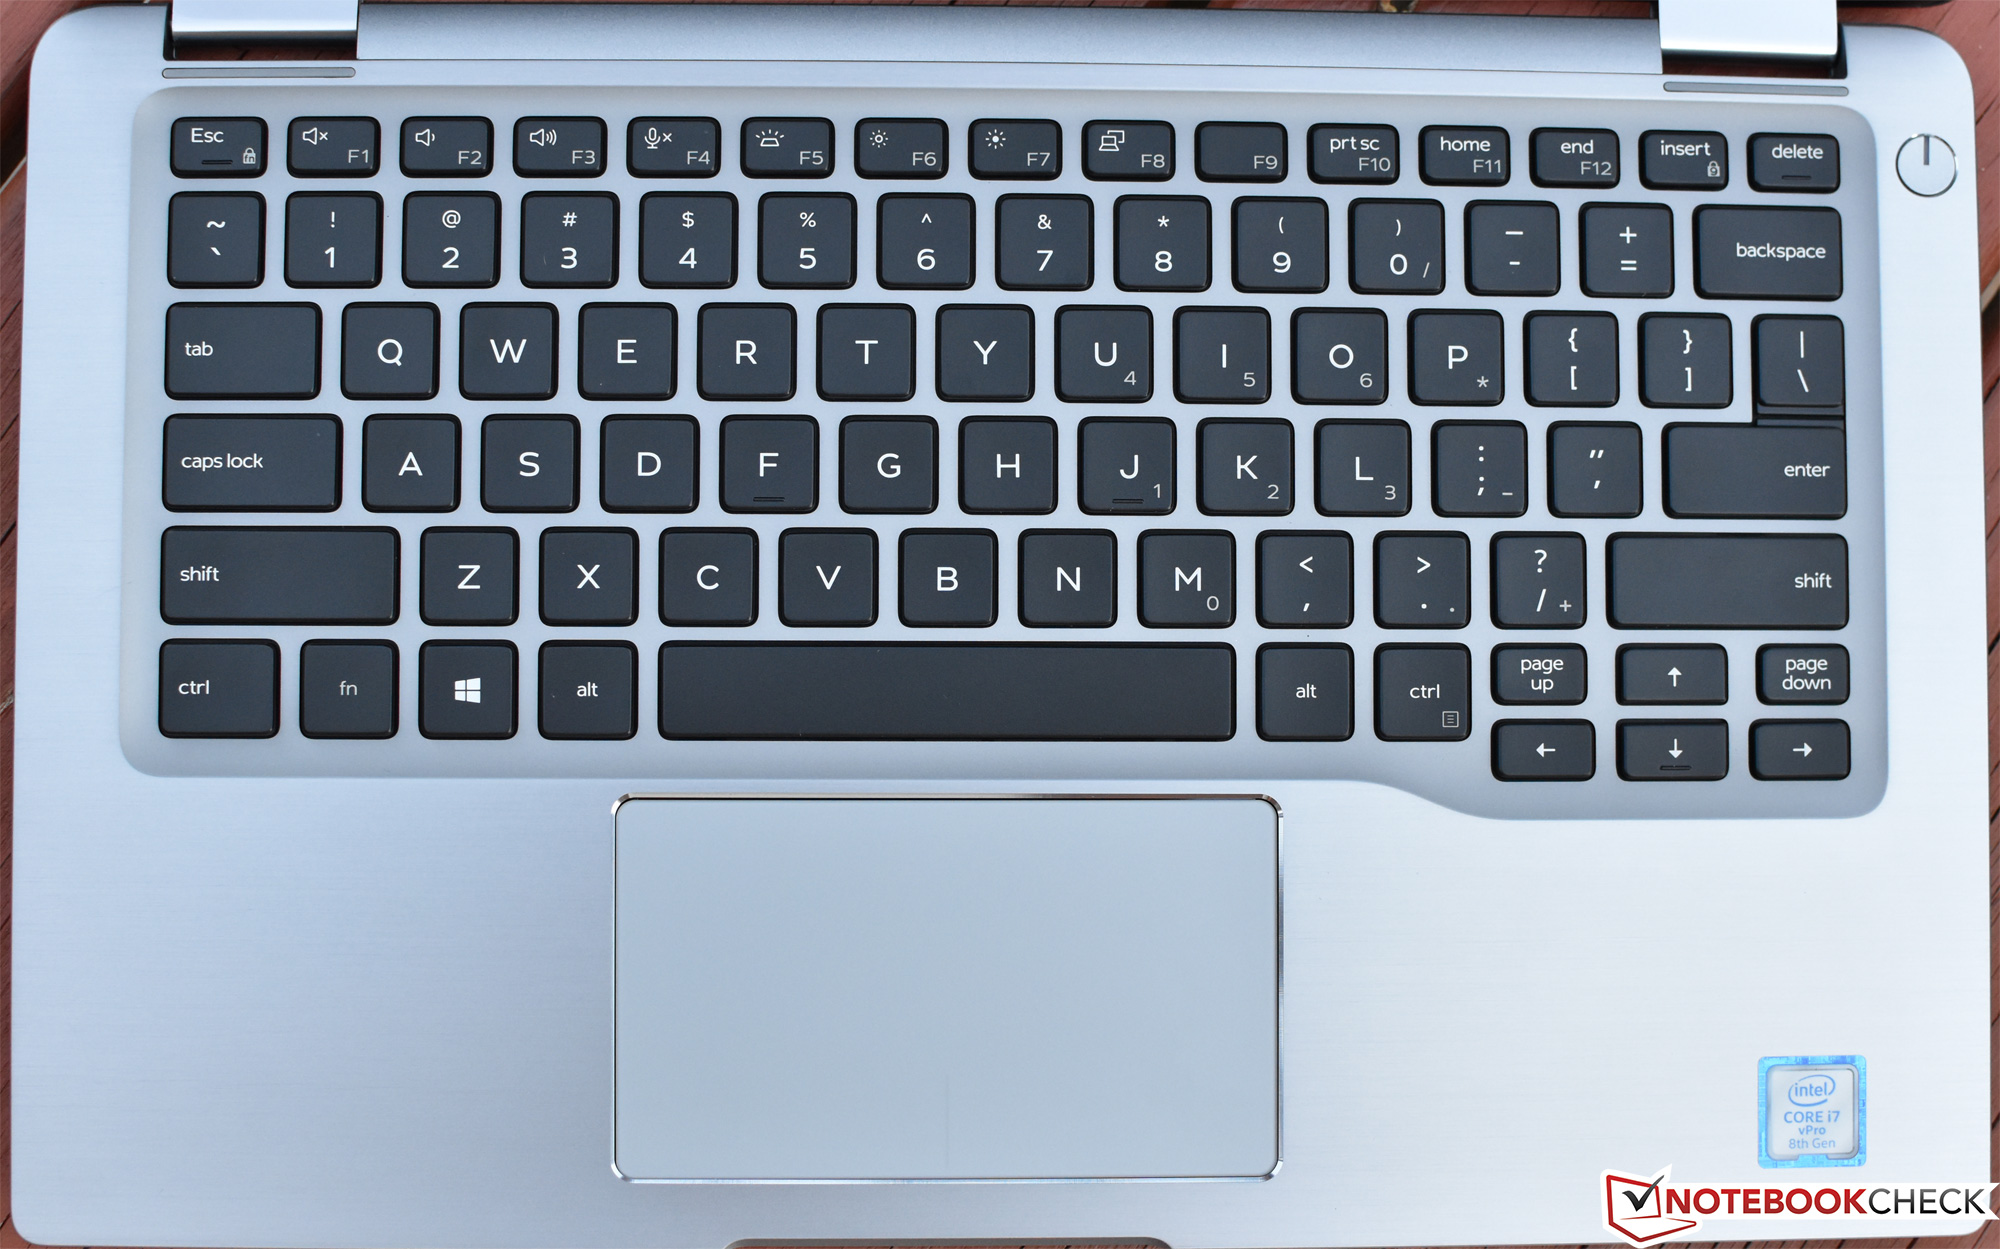
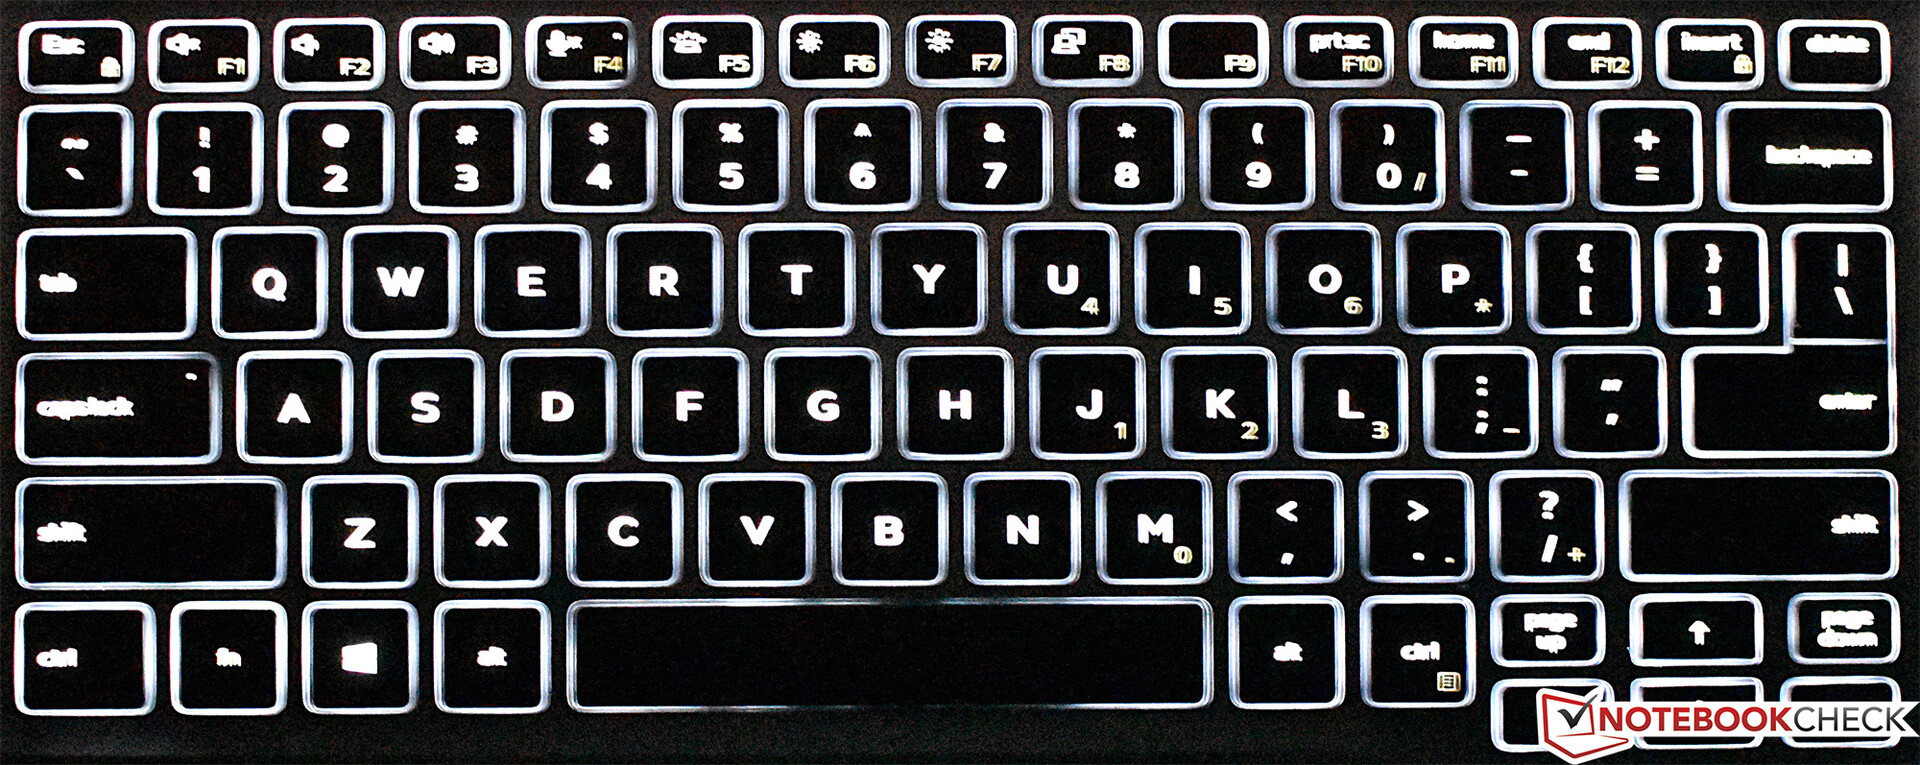
Overall, the Latitude 7400 2-in-1 keyboard is very good. Key travel seems only slightly shorter than that of its predecessors (it’s still relatively long travel), actuation force is ever-so-slightly higher than before, and—although keystrokes are quiet—feedback is fairly sharp. This makes for a nearly-immediately comfortable typing experience, and one that’s very similar to previous Latitude 7000 series machines as well as the ThinkPad AccuType keyboards.
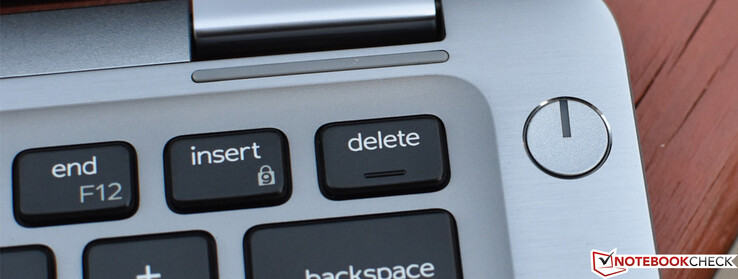
The layout is also very similar to previous models, though some key functions have been shuffled around to make room for PrtSc, Home, End, Insert, and Delete keys along the top right of the keyboard—an improvement by our judgment, as Home and End were previously located as secondary functions on the Left/Right arrow keys. Speaking of which, the arrow keys are still half-height, but they’re comfortable enough to use. PageUp/PageDown keys flank the sides of the Up arrow key, which is a sensible arrangement.
The keys are evenly backlit and feature well-contrasted dark backgrounds against white labels for easy visibility. The backlight is adjustable in three steps (Off, Dim, and Bright).

Touchpad
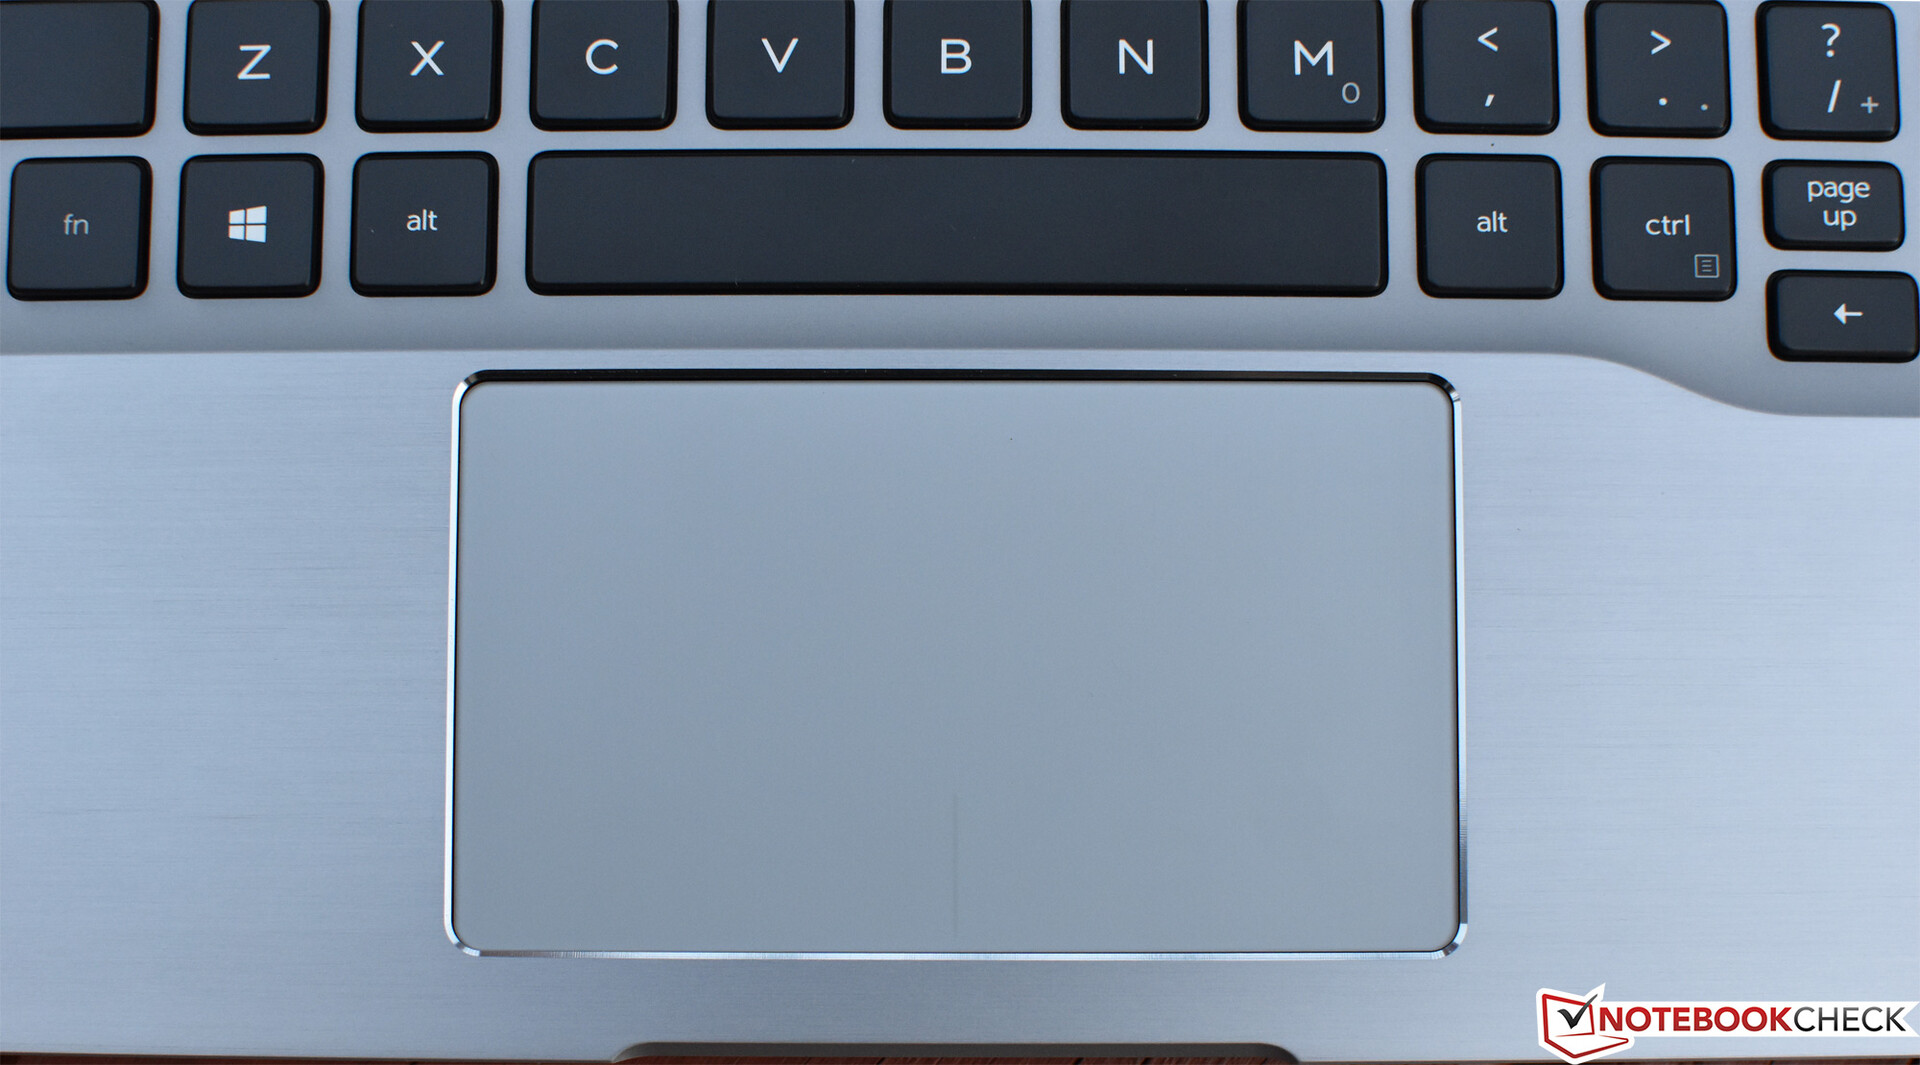
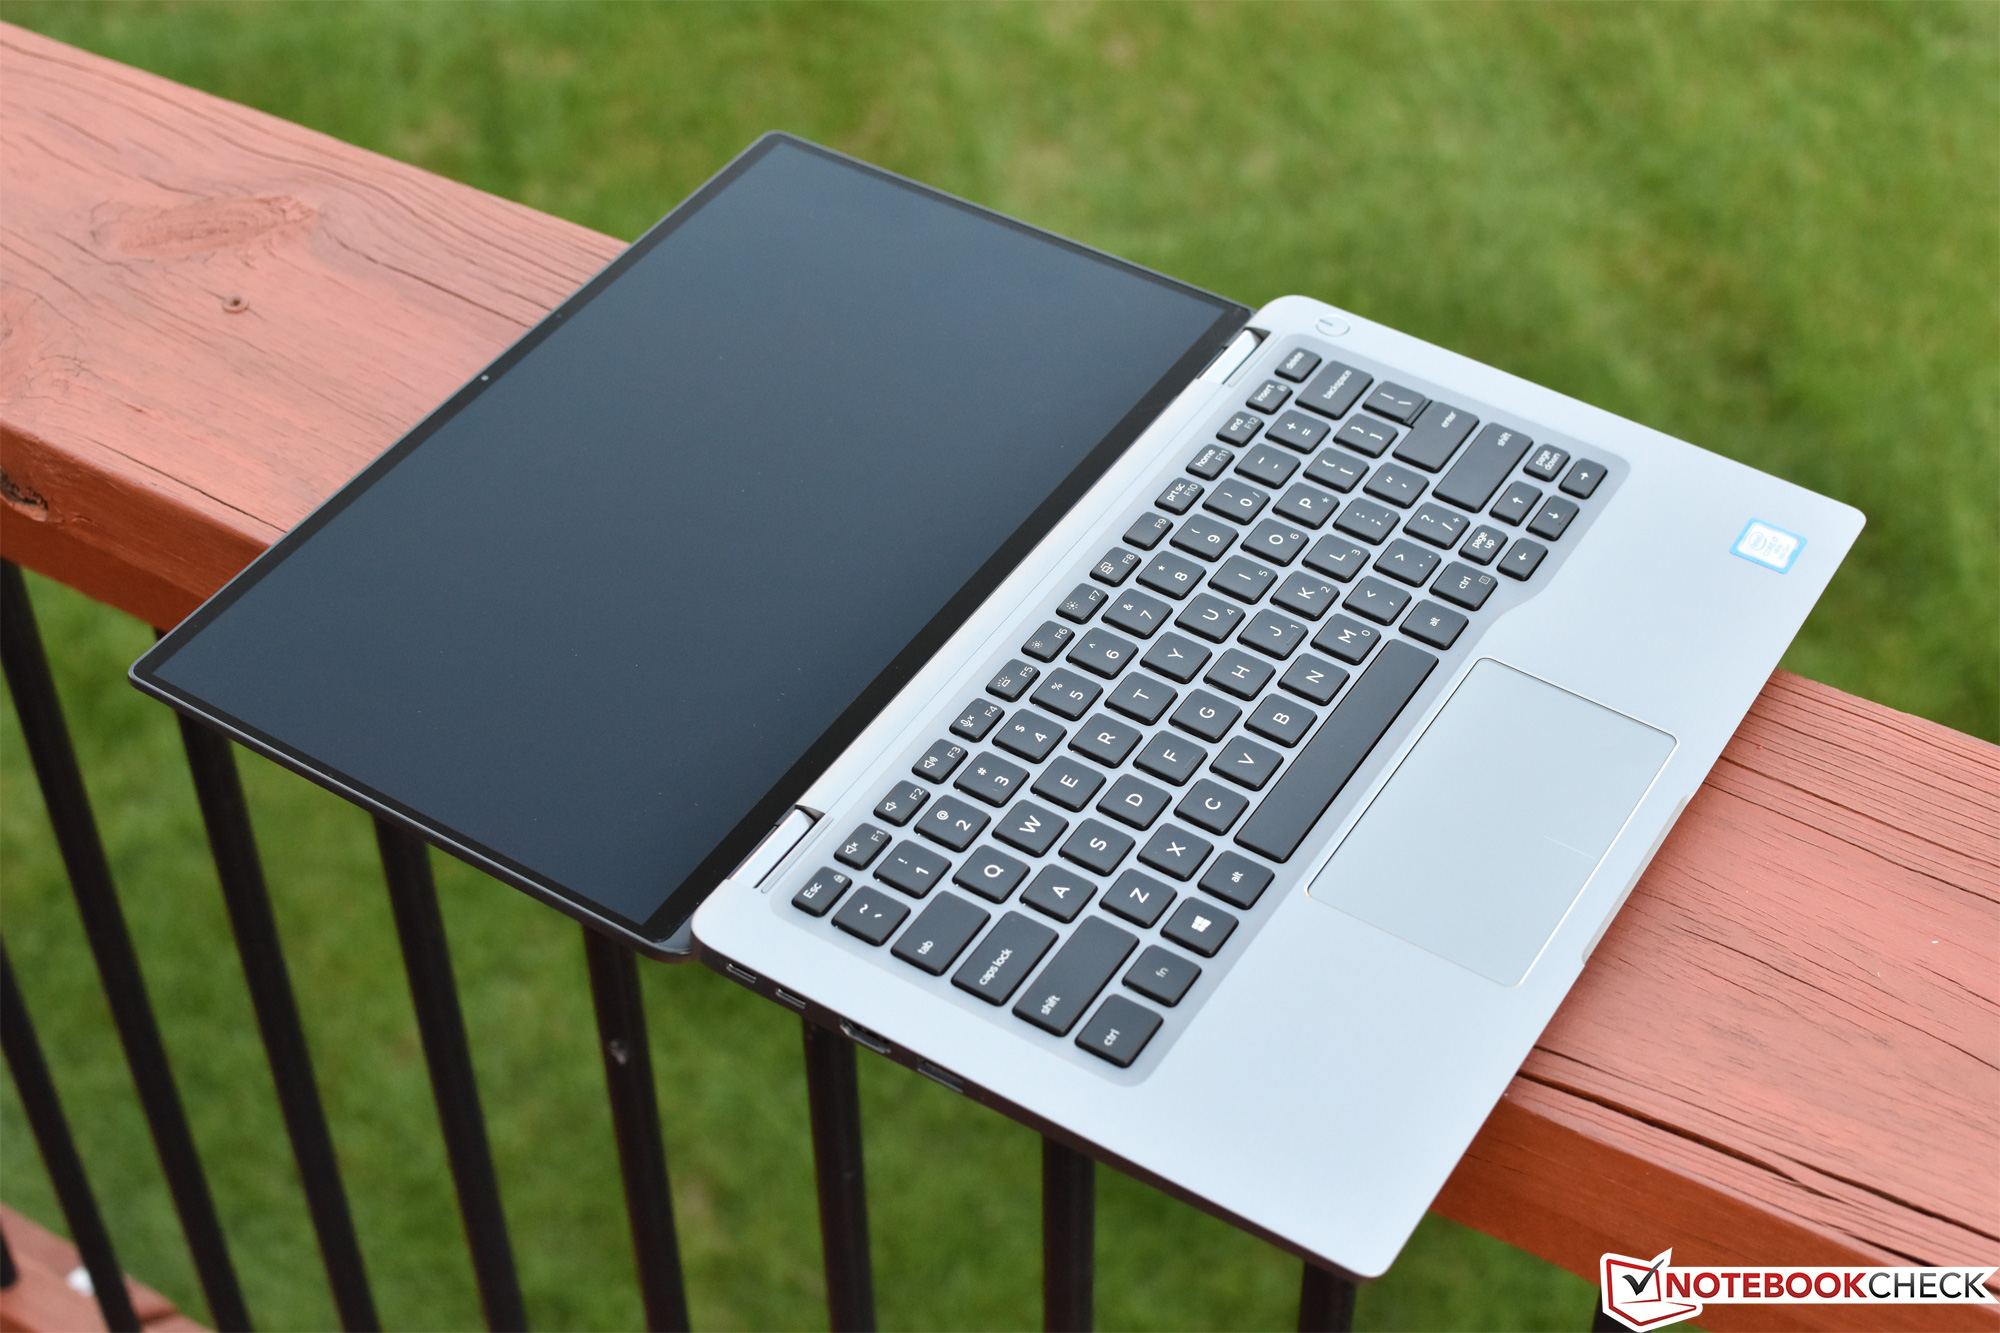
The Latitude 7400 2-in-1 finally also adopts the glass touchpad of its XPS cousins. This is, by our judgment, a definite improvement over the matte plastic pads of before, whose finish invariably would wear off from years of heavy use and which were more resistant to finger gliding than the smooth glass varieties.
The pad measures 104 mm x 59 mm which seems large enough for the screen size and resolution. It features integrated buttons which—while never as reliable as their separate, physical counterparts—are high-quality and worked well throughout our testing period. Cursor movement, thanks to Microsoft Precision drivers, is nearly lag-free and very accurate.
Display
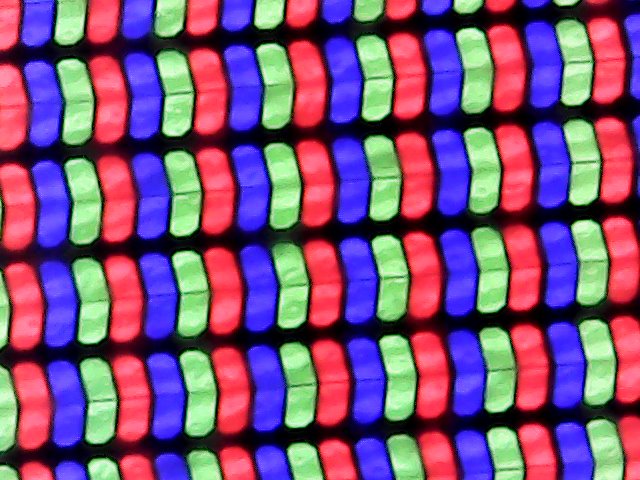
There is but a single display option for the Latitude 7400 2-in-1: a 14-inch, FHD (1920x1080), IPS touchscreen with a glossy Corning Gorilla Glass 5 finish. The display also features Active Pen support. Touch interface was accurate on our review unit and the Dell Active Pen worked well in conjunction with it also.
At a PPI of 157, FHD resolution seems perfectly practical for a machine of this size; for higher-end displays with more real estate and color accuracy, the XPS series exists. Business users are likely to appreciate the improved battery life of a lower-resolution panel as well, so there are benefits to this choice apart from simply cost.
Subjectively, color gamut, saturation, and contrast seem good on our test unit. Brightness seems perhaps a bit on the low side, but it’s fine for everyday indoor use. We also didn’t notice any untoward clouding or backlight bleed even in the dark on purely black screens. It’s a very pleasant display overall, though it absolutely is highly reflective (more on this later).
| |||||||||||||||||||||||||
Brightness Distribution: 83 %
Center on Battery: 277.2 cd/m²
Contrast: 1386:1 (Black: 0.2 cd/m²)
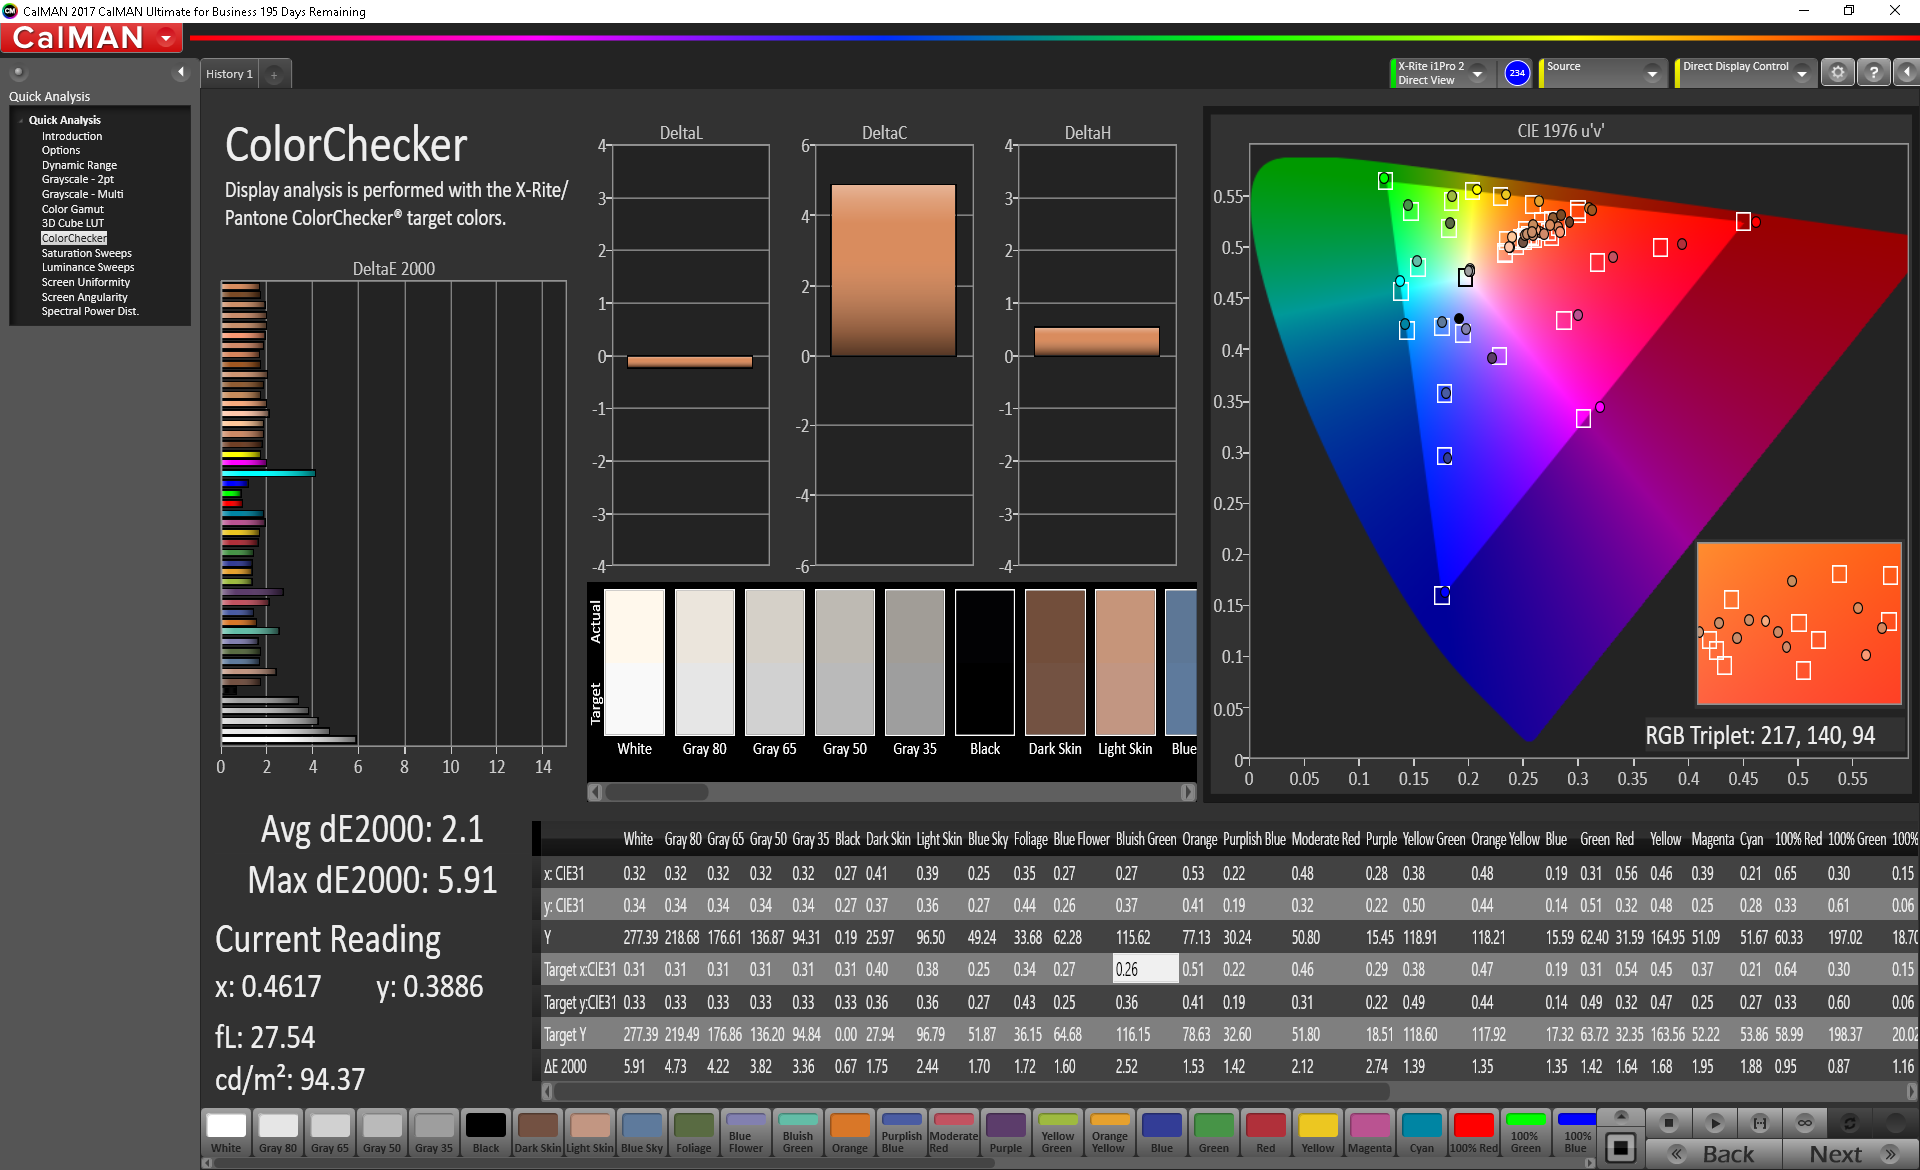
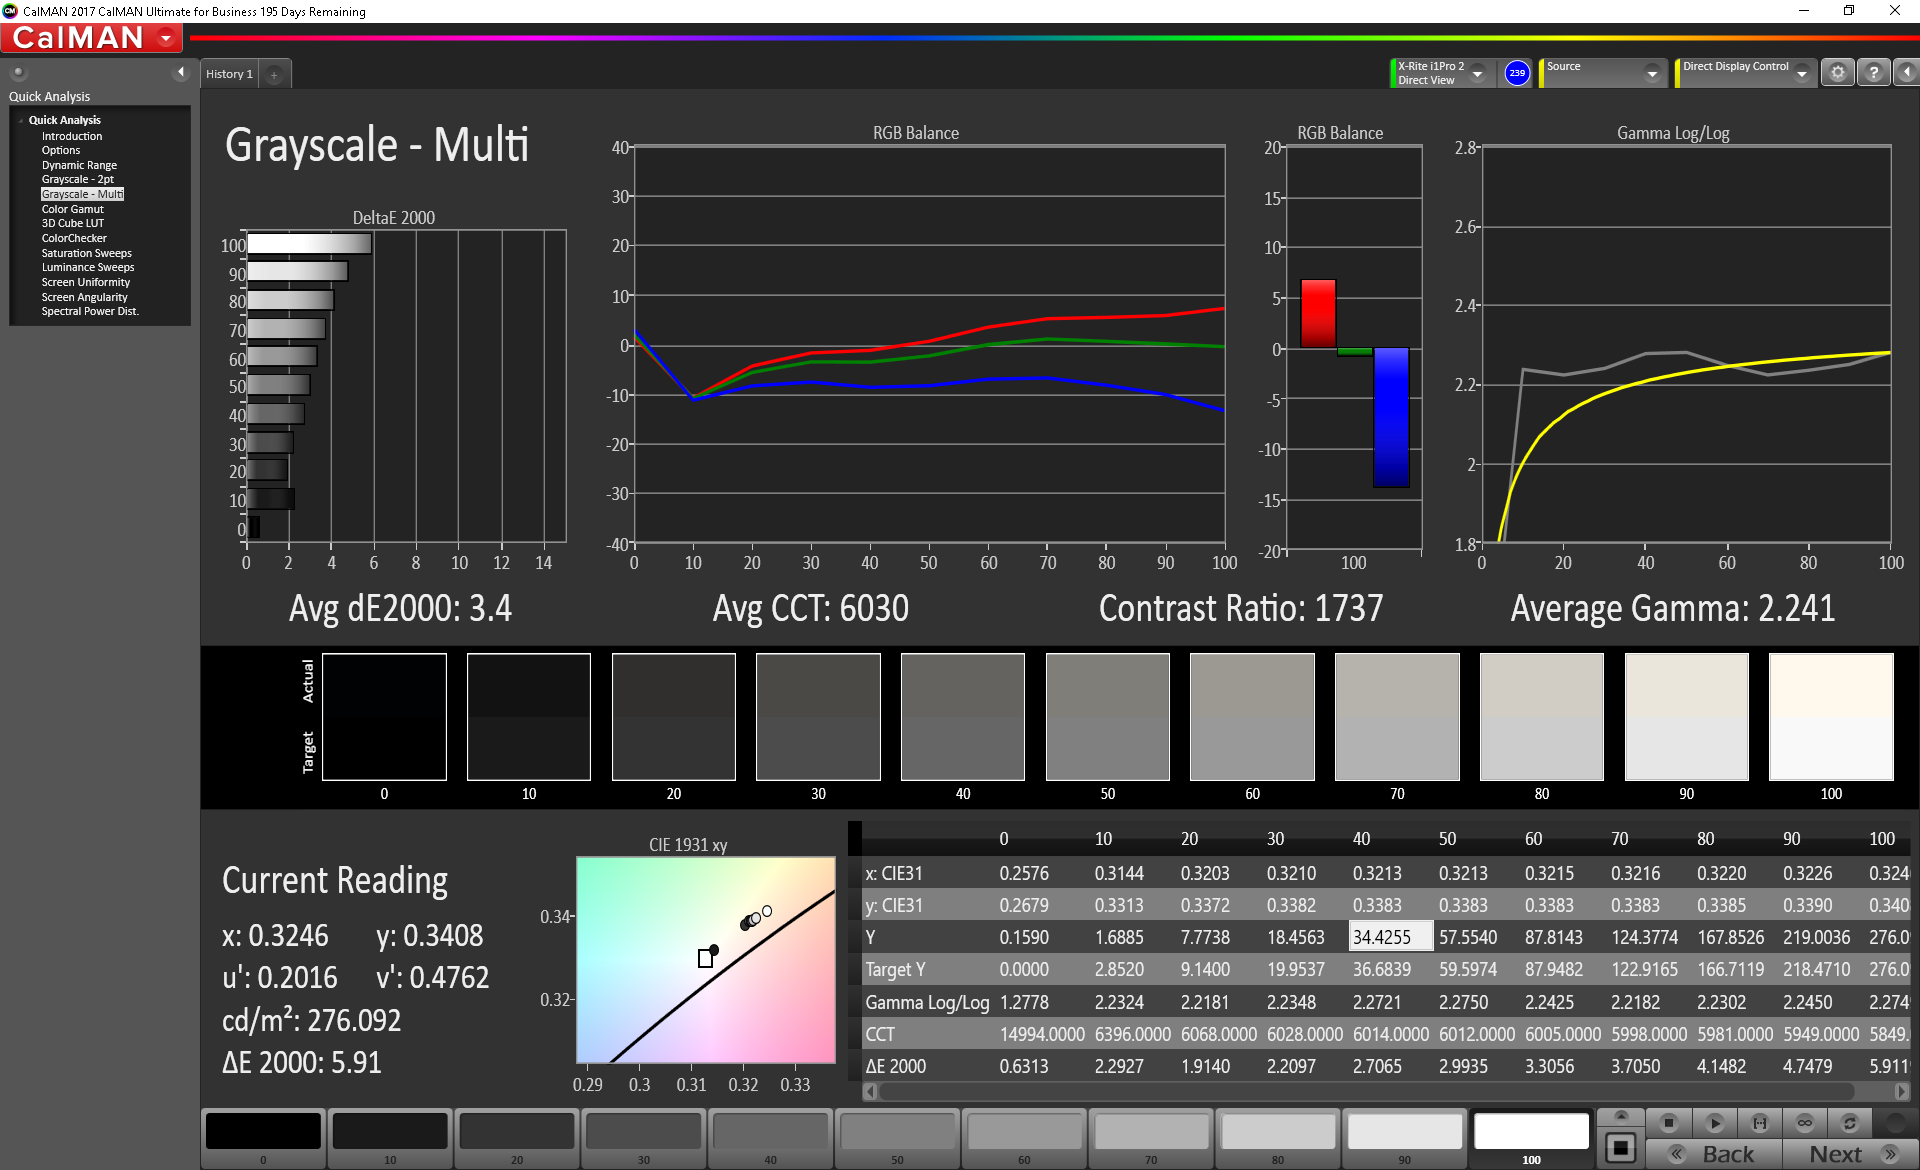
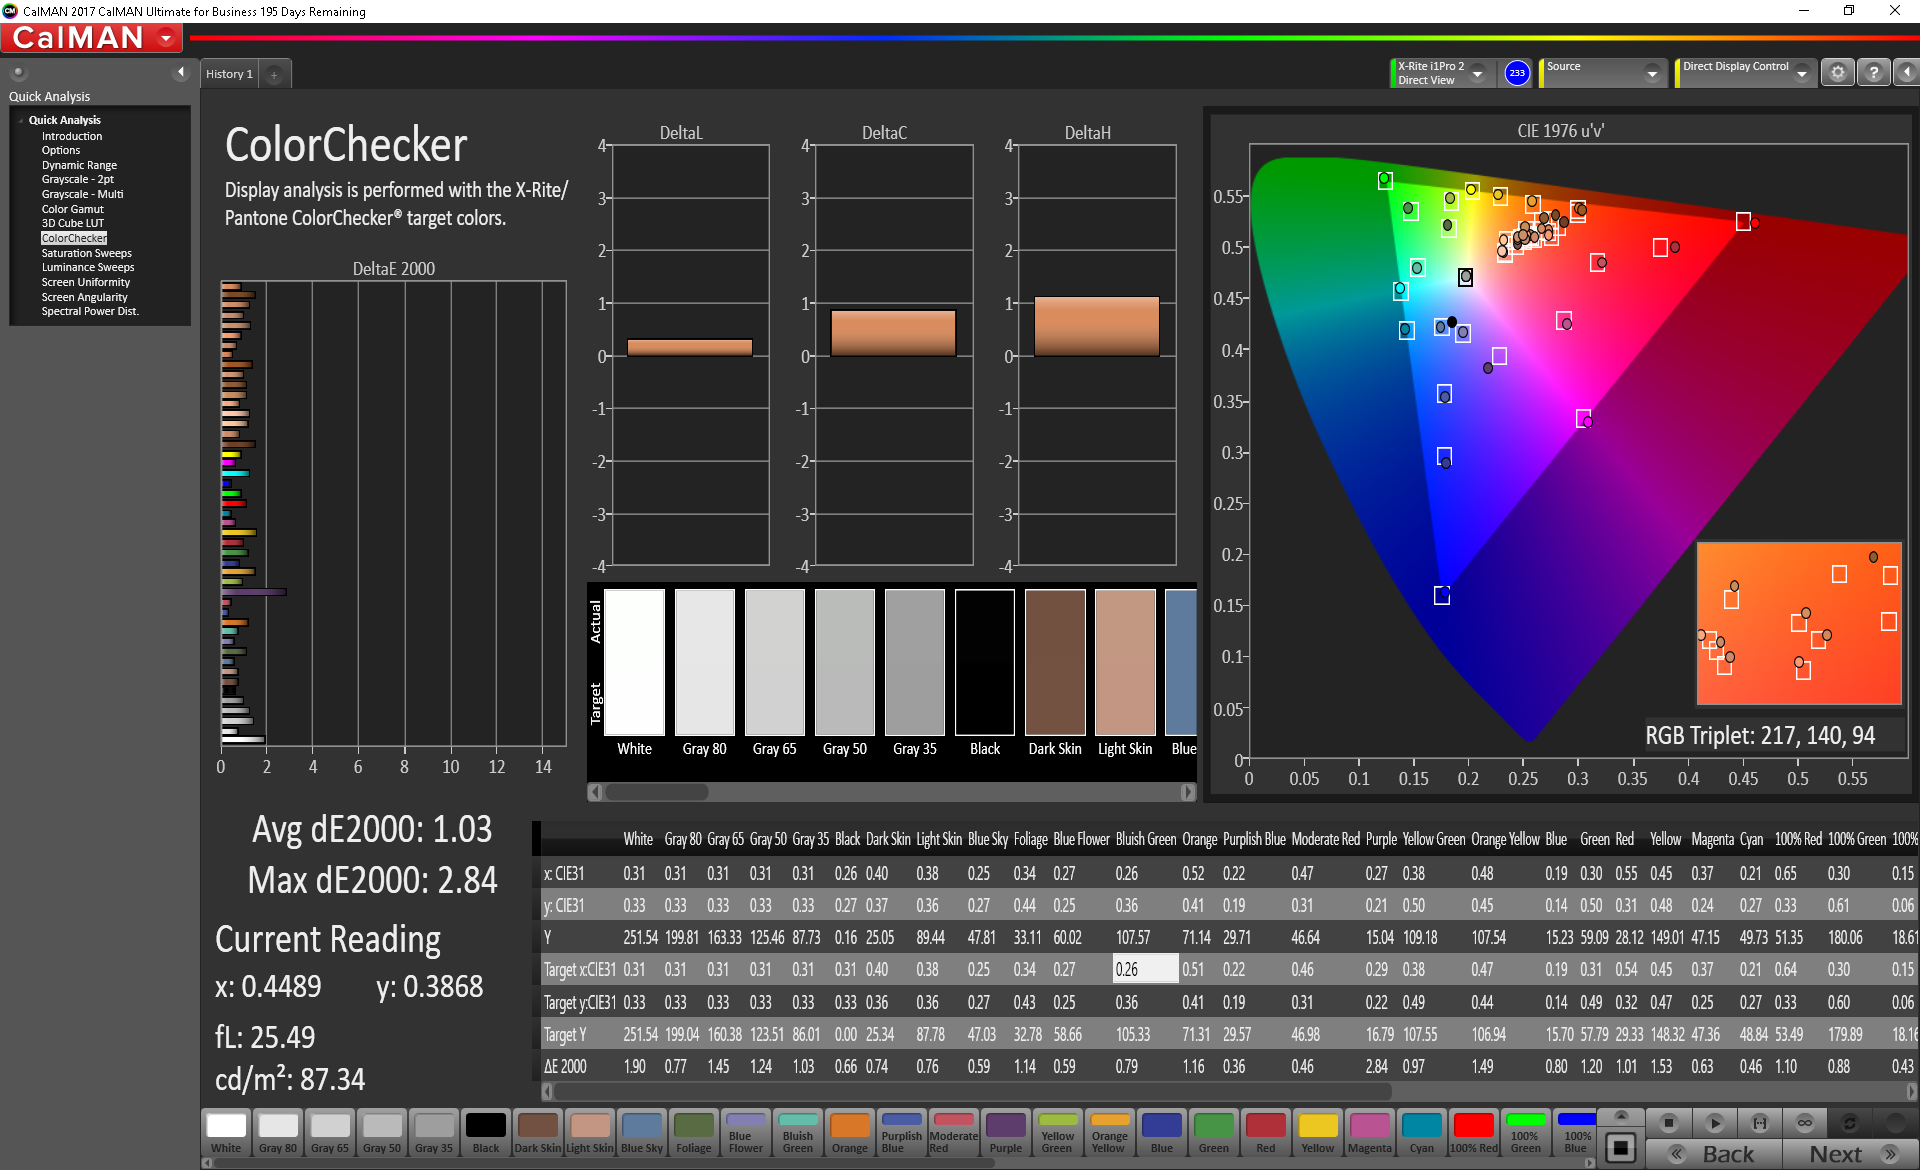
ΔE ColorChecker Calman: 2.1 | ∀{0.5-29.43 Ø4.71}
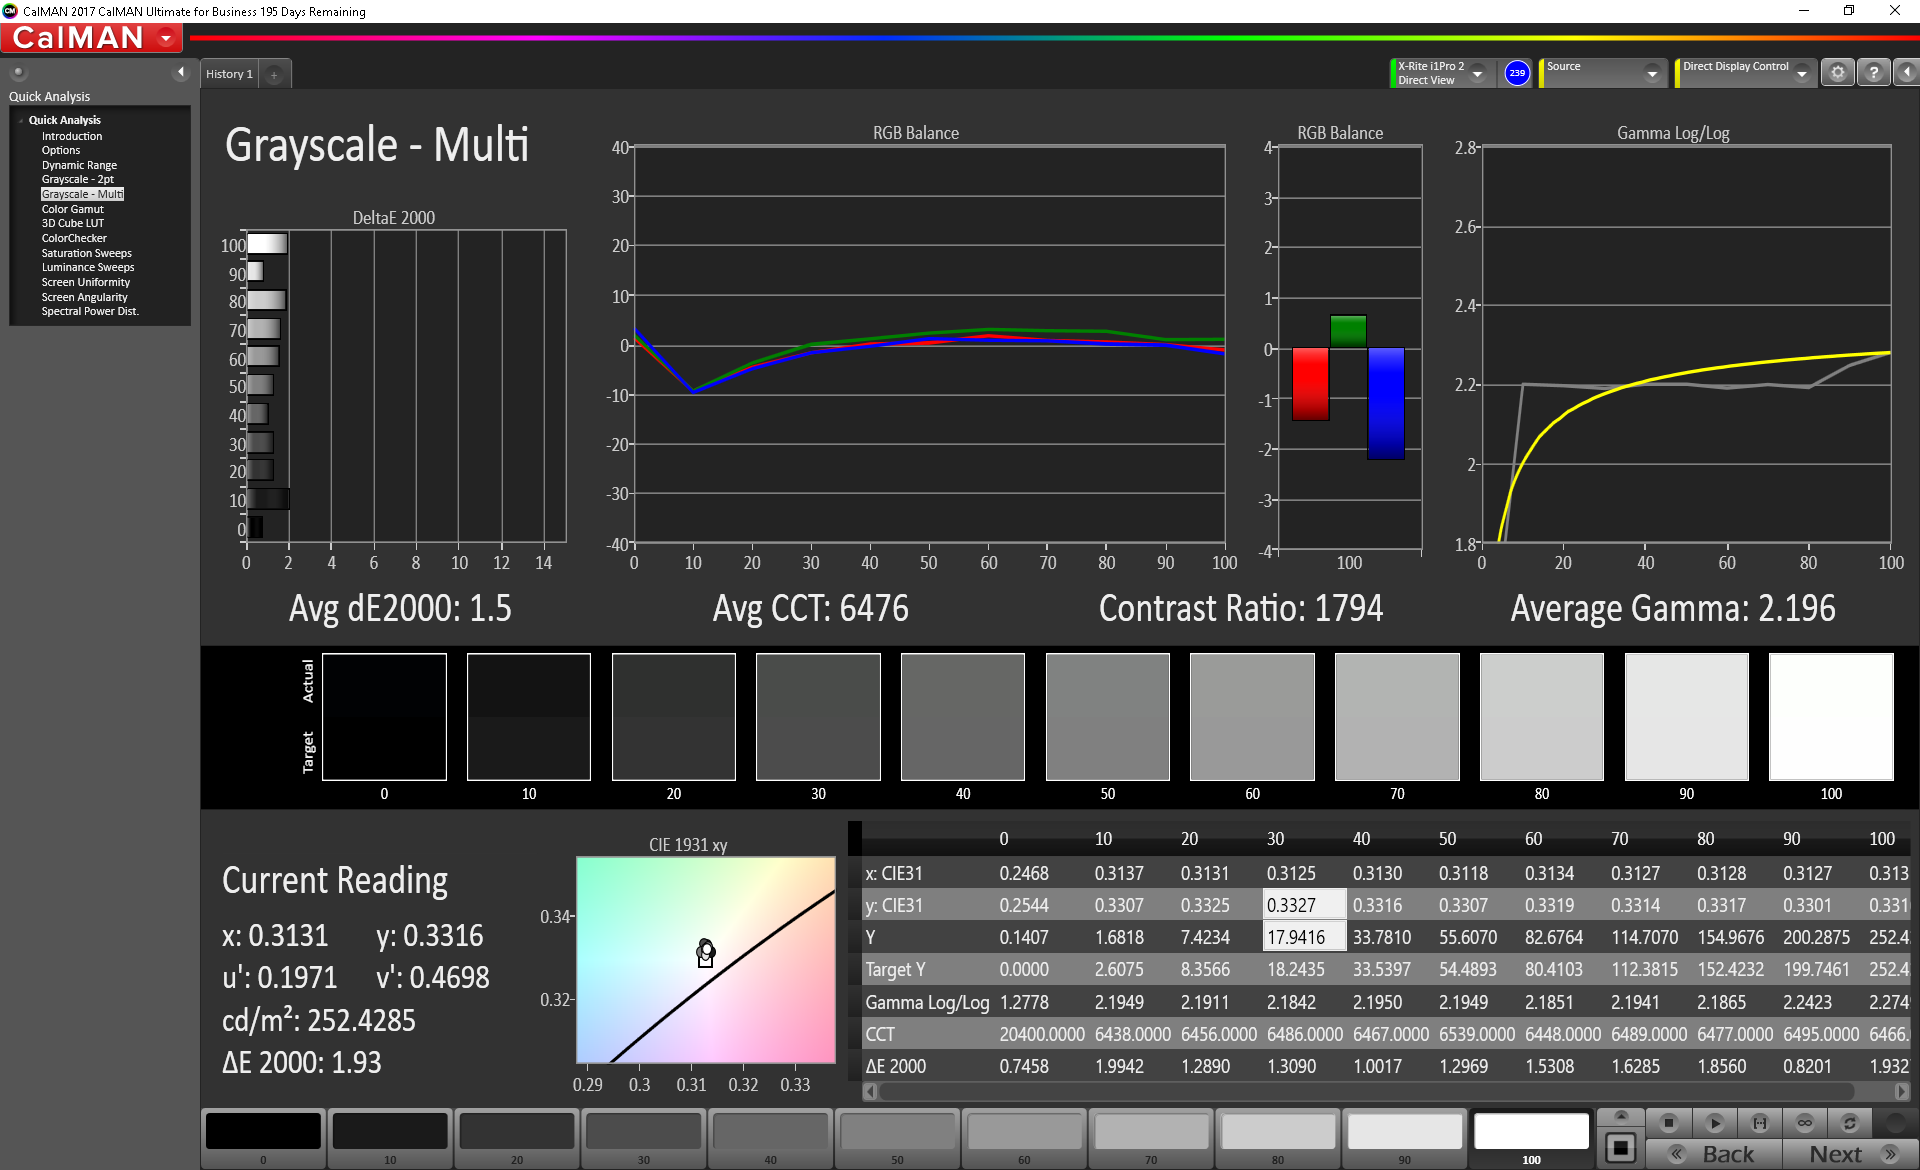
calibrated: 1.03
ΔE Greyscale Calman: 3.4 | ∀{0.09-98 Ø4.96}
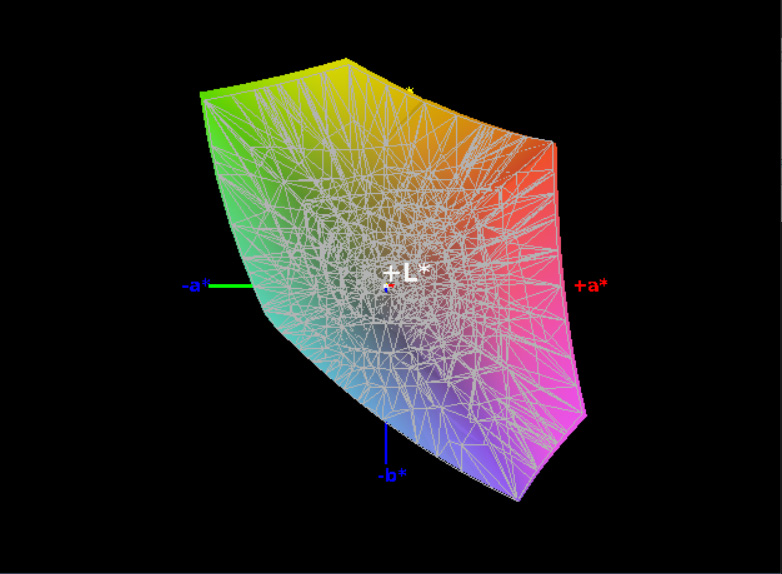
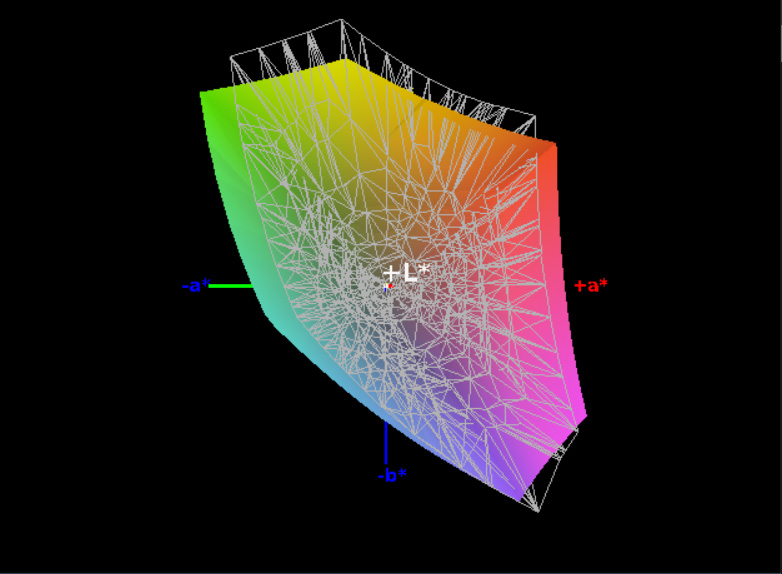
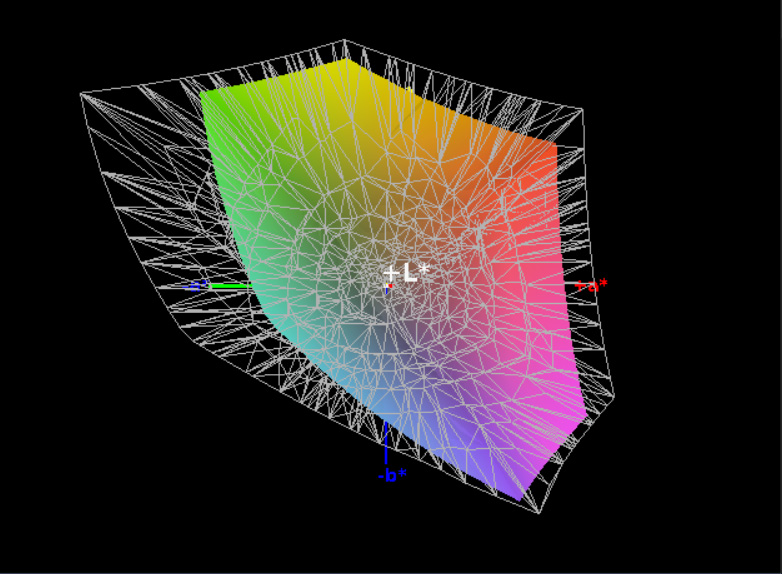
100% sRGB (Argyll 1.6.3 3D)
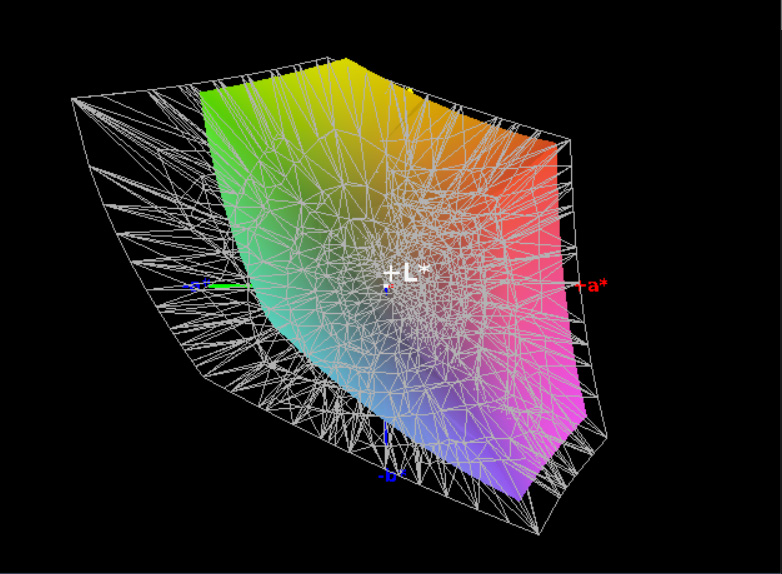
64% AdobeRGB 1998 (Argyll 1.6.3 3D)
70% AdobeRGB 1998 (Argyll 3D)
99.6% sRGB (Argyll 3D)
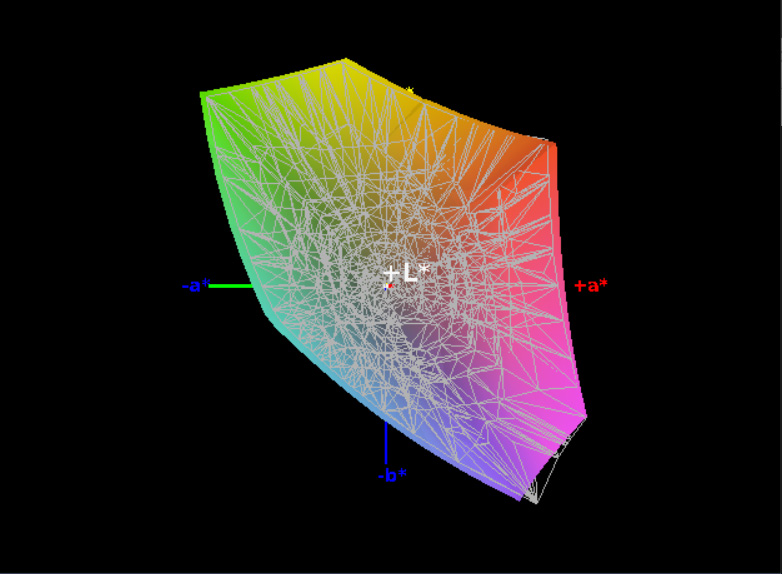
68.6% Display P3 (Argyll 3D)
Gamma: 2.241
CCT: 6030 K
| Dell Latitude 7400 2-in-1 SHP14A2, IPS, 14", 1920x1080 | HP Pavilion x360 14-cd0002ng Chi Mei CMN14D9, IPS, 14", 1920x1080 | Lenovo ThinkPad X1 Yoga 2018-20LES01W00 Lenovo 40AE / B140QAN02.0, IPS Dolby Vision HDR, 14", 2560x1440 | Asus ZenBook Flip 14 UX461UA BOE NV140FHM-N62, IPS, 14", 1920x1080 | HP Elitebook x360 1040 G5 AU Optronics AUO533D, IPS, 14", 1920x1080 | Lenovo ThinkPad X1 Carbon G6-20KG0025UK Lenovo LEN40A9 / AUO B140HAK02.3, IPS, 14", 1920x1080 | |
|---|---|---|---|---|---|---|
| Display | -39% | 23% | -11% | -6% | -2% | |
| Display P3 Coverage (%) | 68.6 | 41.32 -40% | 86.5 26% | 64.4 -6% | 64.3 -6% | 68.3 0% |
| sRGB Coverage (%) | 99.6 | 61.8 -38% | 100 0% | 84.6 -15% | 94.1 -6% | 94.9 -5% |
| AdobeRGB 1998 Coverage (%) | 70 | 42.74 -39% | 99.4 42% | 61.8 -12% | 65.5 -6% | 69.3 -1% |
| Response Times | 21% | 18% | 17% | -9% | 32% | |
| Response Time Grey 50% / Grey 80% * (ms) | 56 ? | 44 ? 21% | 56.8 ? -1% | 44 ? 21% | 70.8 ? -26% | 40 ? 29% |
| Response Time Black / White * (ms) | 38 ? | 30 ? 21% | 24 ? 37% | 33 ? 13% | 34.4 ? 9% | 25 ? 34% |
| PWM Frequency (Hz) | 1667 ? | 2439 ? | 200 ? | 735 ? | ||
| Screen | -51% | 17% | -42% | -4% | 3% | |
| Brightness middle (cd/m²) | 277.2 | 225 -19% | 562 103% | 302 9% | 416.3 50% | 298 8% |
| Brightness (cd/m²) | 263 | 195 -26% | 522 98% | 288 10% | 400 52% | 287 9% |
| Brightness Distribution (%) | 83 | 72 -13% | 86 4% | 90 8% | 89 7% | 91 10% |
| Black Level * (cd/m²) | 0.2 | 0.14 30% | 0.3 -50% | 0.57 -185% | 0.29 -45% | 0.2 -0% |
| Contrast (:1) | 1386 | 1607 16% | 1873 35% | 530 -62% | 1436 4% | 1490 8% |
| Colorchecker dE 2000 * | 2.1 | 5.44 -159% | 2.8 -33% | 5.17 -146% | 2.69 -28% | 2.19 -4% |
| Colorchecker dE 2000 max. * | 5.91 | 20.38 -245% | 5.8 2% | 7.68 -30% | 4.95 16% | 4.39 26% |
| Colorchecker dE 2000 calibrated * | 1.03 | 2.13 -107% | 1.67 -62% | |||
| Greyscale dE 2000 * | 3.4 | 3.98 -17% | 4.5 -32% | 3.26 4% | 2.9 15% | 1.97 42% |
| Gamma | 2.241 98% | 2.32 95% | 2.16 102% | 2.45 90% | 2.4 92% | 2.43 91% |
| CCT | 6030 108% | 6163 105% | 7205 90% | 7142 91% | 6623 98% | 6571 99% |
| Color Space (Percent of AdobeRGB 1998) (%) | 64 | 39 -39% | 88.9 39% | 55 -14% | 60.1 -6% | 62 -3% |
| Color Space (Percent of sRGB) (%) | 100 | 62 -38% | 100 0% | 85 -15% | 94.5 -5% | 95 -5% |
| Total Average (Program / Settings) | -23% /
-39% | 19% /
18% | -12% /
-28% | -6% /
-5% | 11% /
5% |
* ... smaller is better
We measured an average brightness of 263.4 cd/m², which is below Dell’s quoted value of 300 cd/m². Distribution is only around 83% on our review unit, but it’s not a noticeable discrepancy in general use. We computed a contrast ratio of 1386:1 based on a black value reading of 0.2 cd/m², which is very good overall.
By our measurements, the display manages 100% coverage of the sRGB spectrum and 64% of AdobeRGB. This is quite good overall and only beaten by the Lenovo ThinkPad X1 Yoga in today’s comparison field. Although it isn’t shown, these results are roughly equivalent to what we measured from last year’s Latitude 7490 contender.

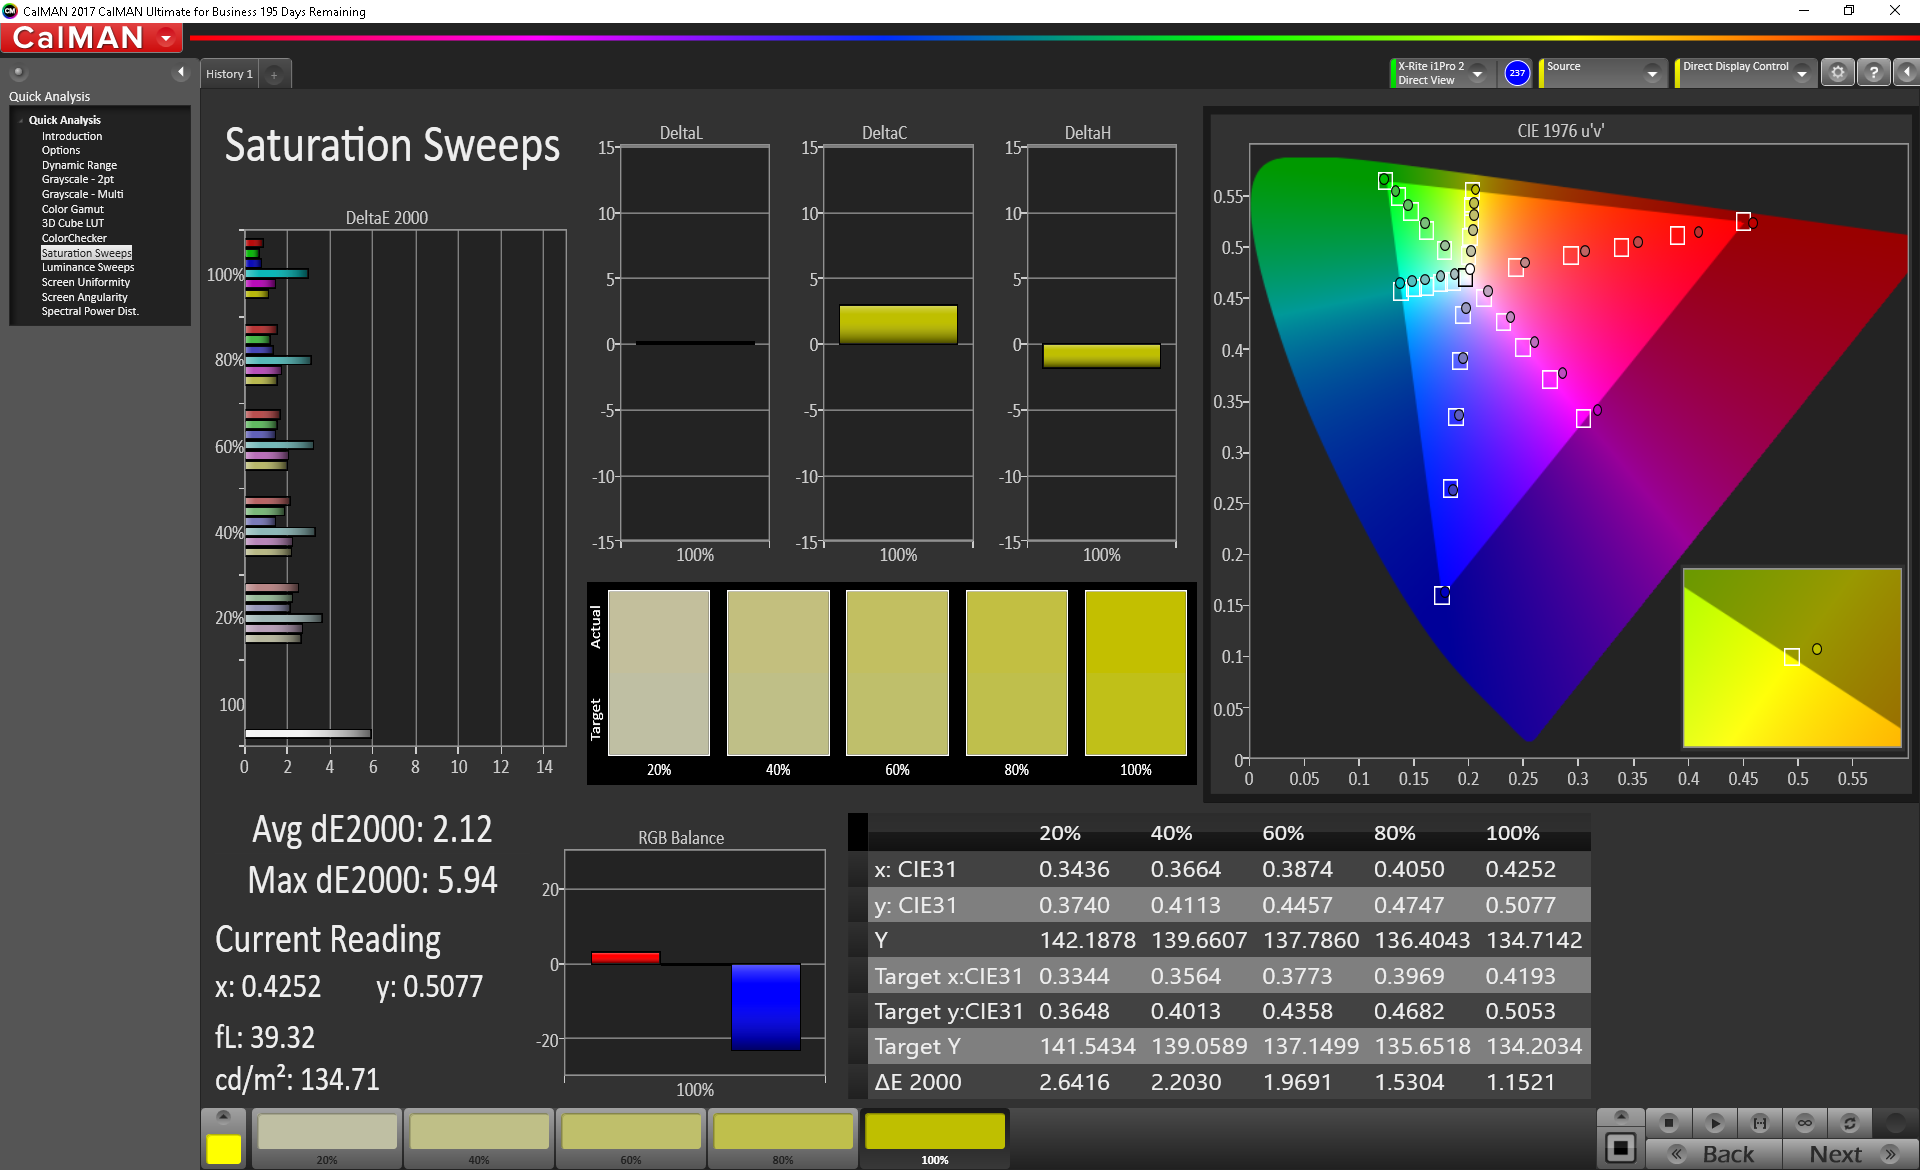
Color accuracy is also impressive. ColorChecker and Greyscale DeltaE averages of 2.1 and 3.4, respectively, suggest only a slight bit of inaccuracy out of the box, though most users won’t mind in the slightest as it’s virtually imperceptible to the naked eye. Still, calibration makes all the difference (post-calibration, these values drop further to 1.67 and 1.5). A measured CCT Average of 6030 (ideal: 6500) and Total Gamma of 2.241 (ideal: 2.2) are also not far off the mark.
Display Response Times
| ↔ Response Time Black to White | ||
|---|---|---|
| 38 ms ... rise ↗ and fall ↘ combined | ↗ 22.8 ms rise | 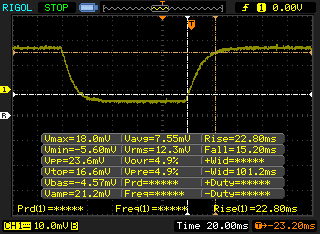 |
| ↘ 15.2 ms fall | ||
| The screen shows slow response rates in our tests and will be unsatisfactory for gamers. In comparison, all tested devices range from 0.1 (minimum) to 240 (maximum) ms. » 96 % of all devices are better. This means that the measured response time is worse than the average of all tested devices (19.8 ms). | ||
| ↔ Response Time 50% Grey to 80% Grey | ||
| 56 ms ... rise ↗ and fall ↘ combined | ↗ 31.6 ms rise | 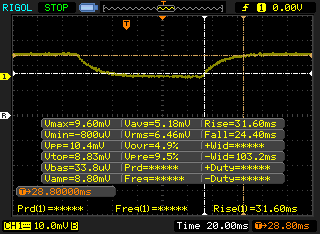 |
| ↘ 24.4 ms fall | ||
| The screen shows slow response rates in our tests and will be unsatisfactory for gamers. In comparison, all tested devices range from 0.165 (minimum) to 636 (maximum) ms. » 93 % of all devices are better. This means that the measured response time is worse than the average of all tested devices (30.9 ms). | ||
Screen Flickering / PWM (Pulse-Width Modulation)
| Screen flickering / PWM detected | 1667 Hz | ≤ 24 % brightness setting | 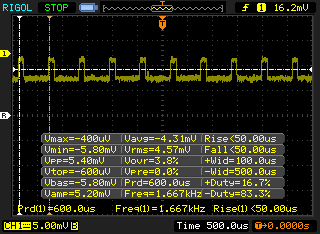 |
The display backlight flickers at 1667 Hz (worst case, e.g., utilizing PWM) Flickering detected at a brightness setting of 24 % and below. There should be no flickering or PWM above this brightness setting. The frequency of 1667 Hz is quite high, so most users sensitive to PWM should not notice any flickering. In comparison: 52 % of all tested devices do not use PWM to dim the display. If PWM was detected, an average of 7744 (minimum: 5 - maximum: 343500) Hz was measured. | |||
Unsurprisingly, response times from the screen are slow and unsuitable for competitive gaming—which is not what this laptop is meant to be used for anyway. PWM was detected at very low brightness levels (24% and below), but the frequency of 1.667 KHz is high enough that it shouldn’t bother most sensitive users.
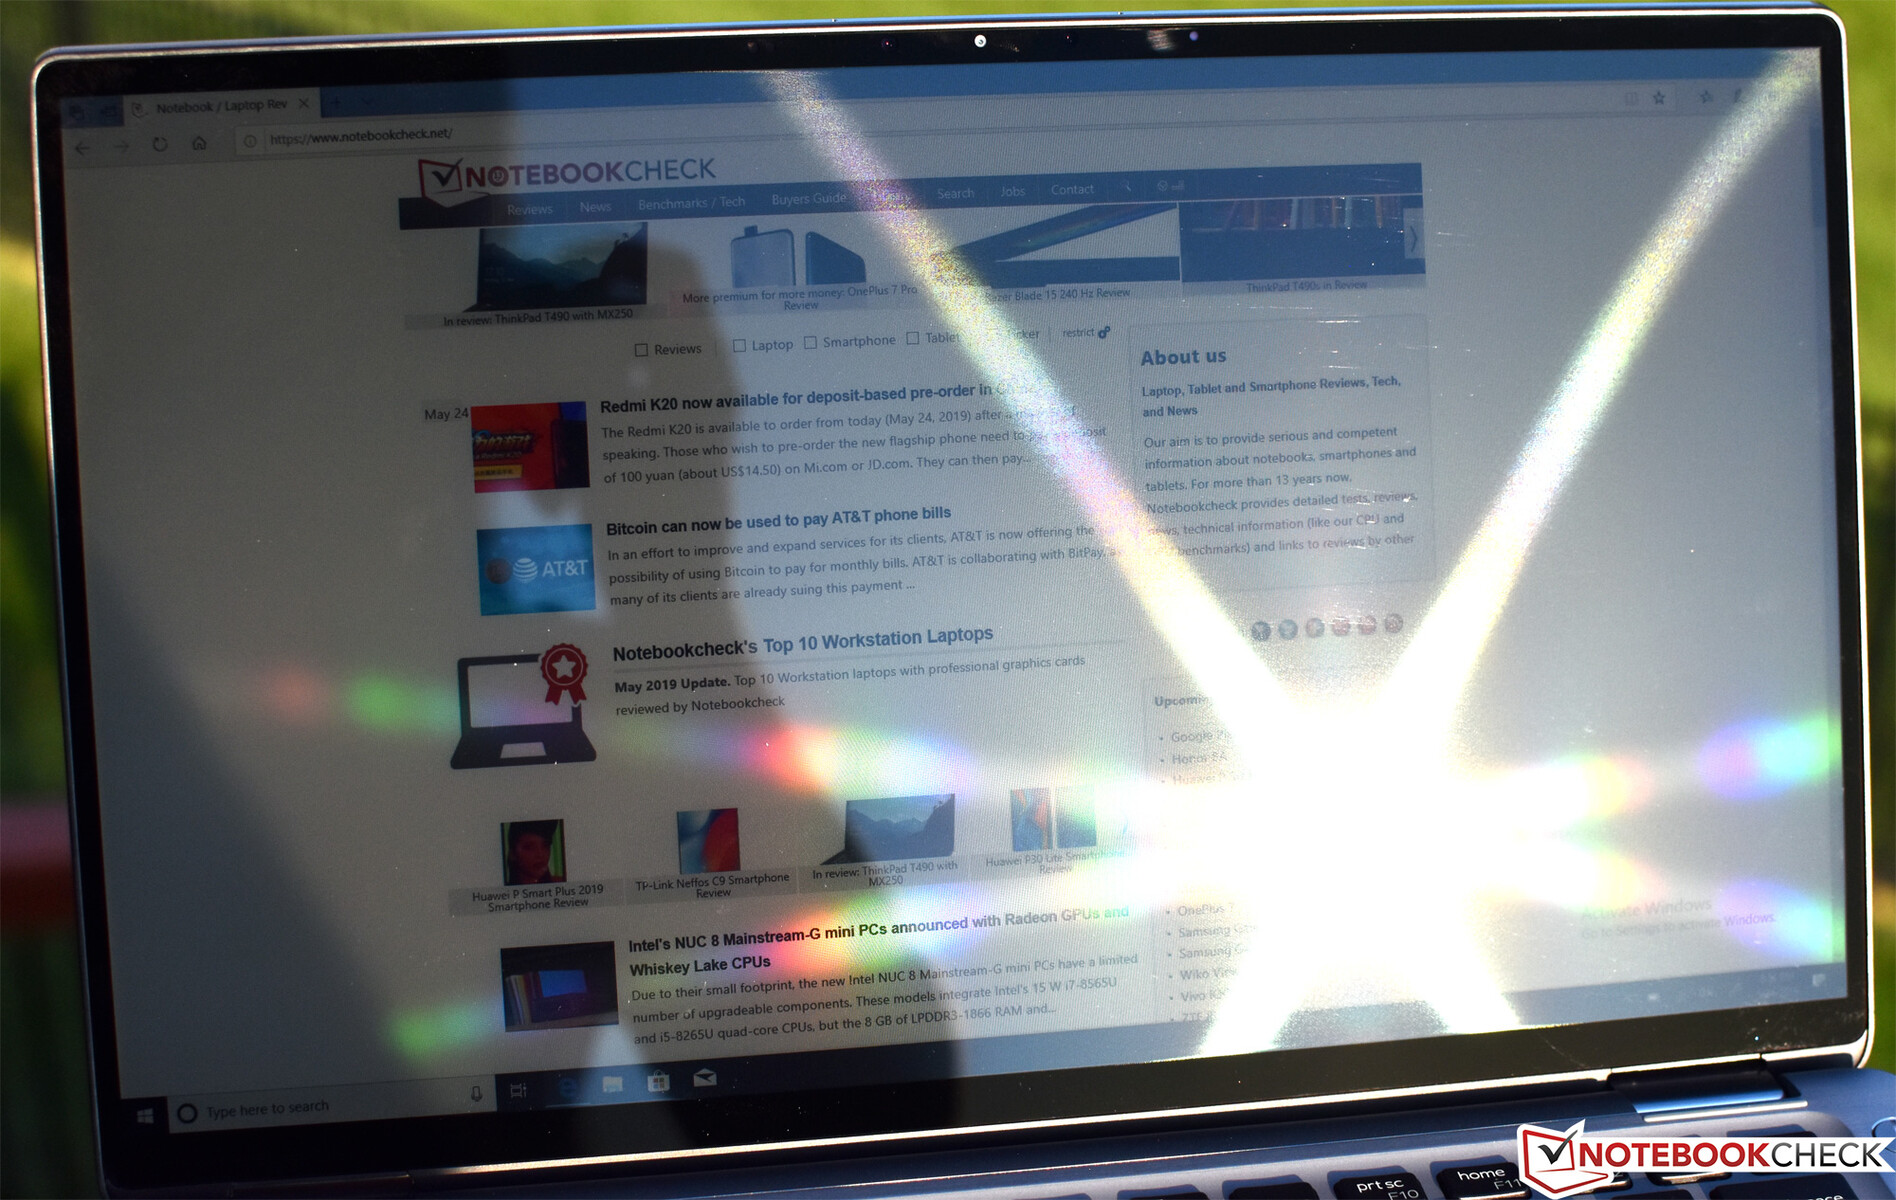
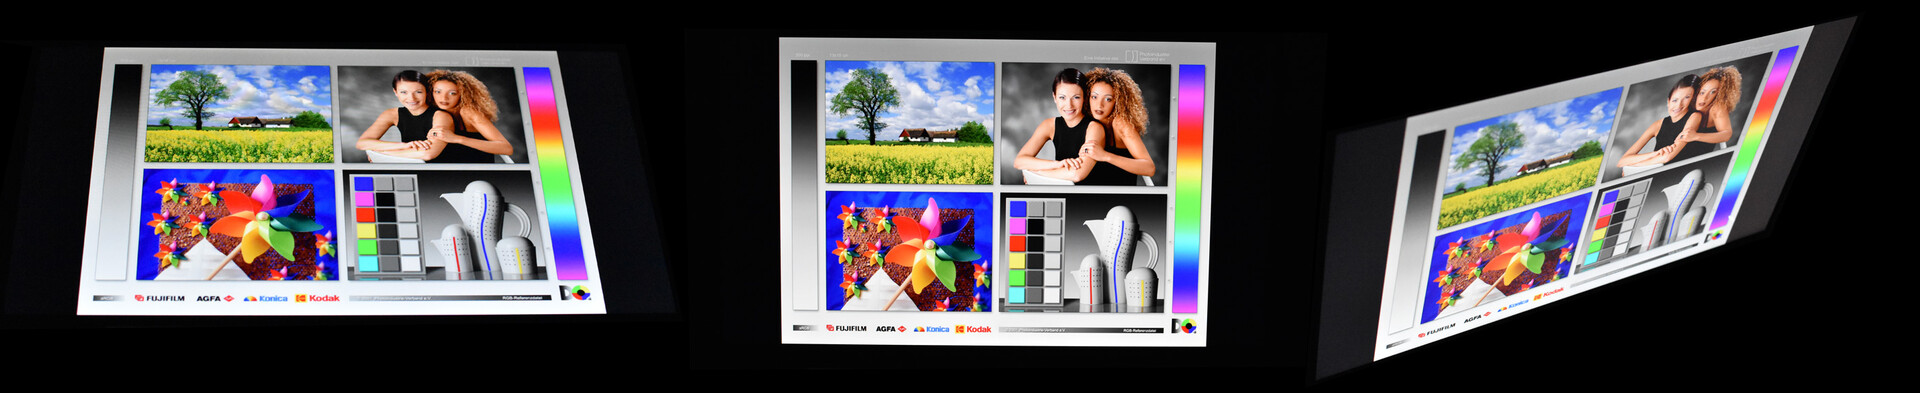
Outdoors, the display struggles and is barely usable in brighter environments. That’s because of the highly reflective finish in conjunction with the below-average brightness. In shaded areas, with tactful positioning, the picture is acceptable. As usual, we’d love to see an anti-glare option, but it’s unlikely.
Performance
The Latitude 7400 2-in-1 is configurable with Intel 8th-generation CPUs ranging from the Core i5-8265U all the way up to the i7-8665U. Either 8 GB or 16 GB of LPDDR3 RAM can be selected—but it’s important to note that the RAM cannot be upgraded post-purchase thanks to the fact that it’s soldered to the mainboard, so be sure to get what you need from the start. Storage device options are 100% comprised of M.2 NVMe solid-state drives, ranging in capacity from 128 GB up to 1 TB (and Dell promises eventually, later this summer, up to 2 TB). Our review unit came outfitted with the highest-end Core i7-8665U SoC, 16 GB of LPDDR3 RAM, and a 512 GB NVMe SSD.
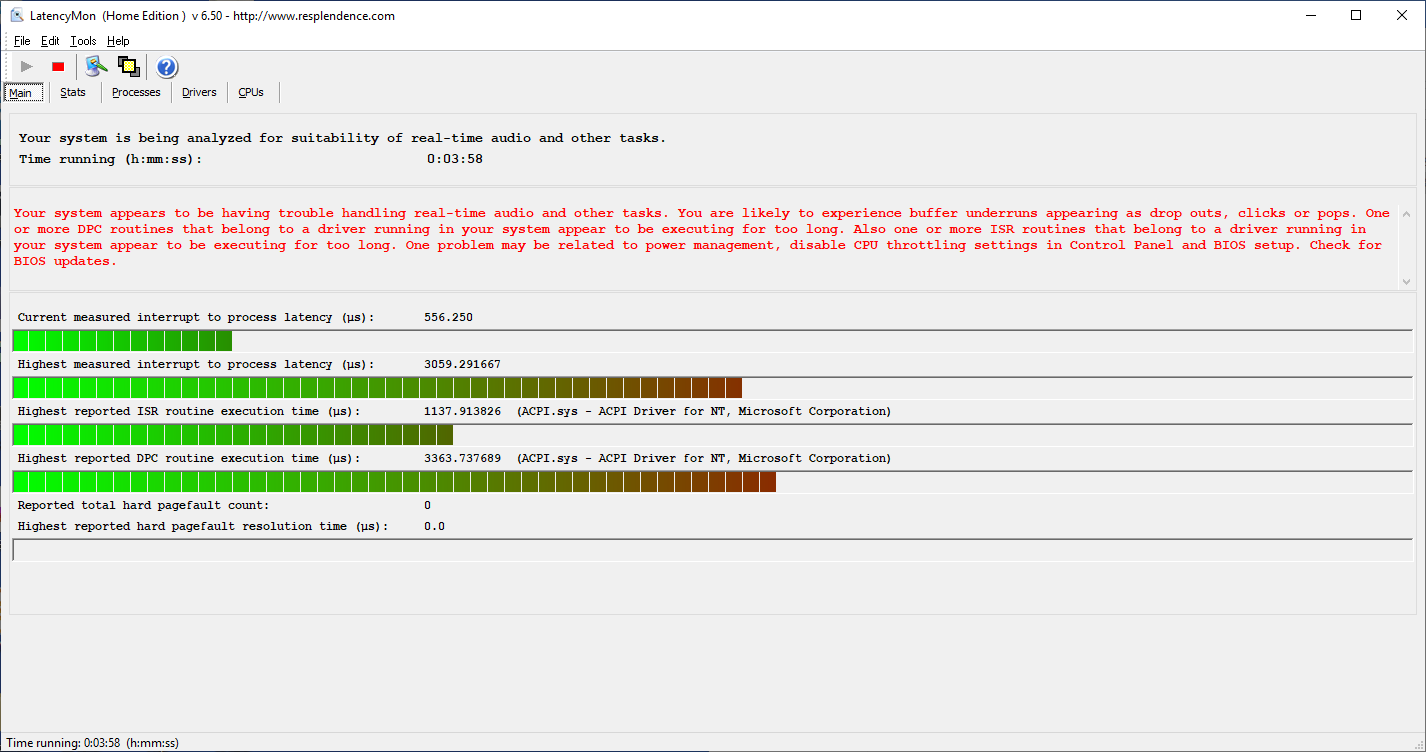
LatencyMon detects some pretty immediate spikes in DPC Latencies on the machine; these persist regardless of the state of the wireless radios (WLAN, Bluetooth). It is possible that a driver update elsewhere might resolve this in the future.

Processor
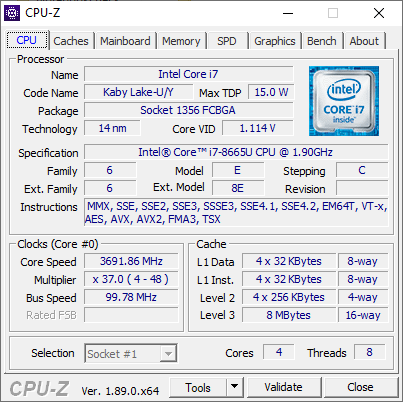
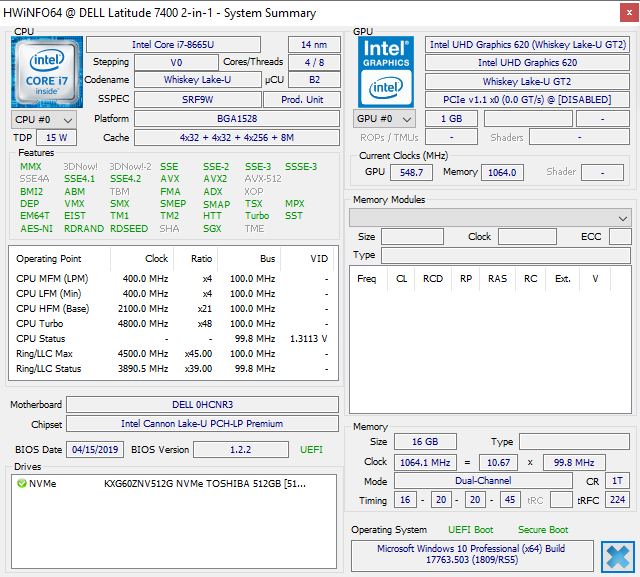
The Intel Core i7-8665U SoC is the newest addition to the eighth-gen Intel lineup, announced in April 2019. It’s a Whiskey Lake generation chip manufactured using an improved 14 nm process (14 nm++) and offering very high potential Turbo boost rates of up to 4.8 GHz. The latter is due to a new feature called Thermal Velocity Boost, which, as Intel puts it, “opportunistically and automatically increase[s] core frequency whenever processor temperature and turbo budget allows.”
If that sounds an awful lot like Turbo Boost, that’s because it is—but it’s more sensitive to system parameters, not unlike (for instance) NVIDIA’s Max-Q design... but sort of in reverse, if you will. Basically, it allows for a short-term increase of CPU clock rate by up to a few hundred MHz on top of Turbo Boost provided the requisite conditions are in play. The theory is that this should lead to a snappier user experience, since most everyday workloads consist of short-term burst sequences anyway.
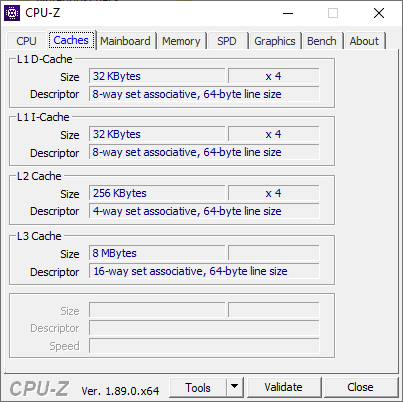
The i7-8665U is configured for a theoretical absolute maximum clock rate of 4.8 GHz under this new TVB functionality. Elsewhere, the numbers remain the same: it still carries a 15 W TDP and is paired with Intel UHD Graphics 620 @ 300 – 1150 MHz. This is the first chance we’ve had to test the i7-8665U, but we should expect performance hopefully exceeding that of the Core i7-8565U, since hypothetically the clock rate should be able to reach 200 MHz higher limits if conditions are ideal.
* ... smaller is better
The single-threaded wPrime 2.0 1024m benchmark finishes in 429 s, which is 55% longer than the Dell Inspiron 14 5000 2-in-1 took to complete. Cooldowns make very little difference here thanks to the lengthy duration of the benchmark, which helps to average out the wrinkles statistically speaking. No matter how you slice it, the problem with the Latitude’s CPU performance is clearly confined to sustained load situations—and in particular, those lasting longer than several seconds and, equally importantly, separated by cooldown periods of shorter than a few minutes apiece. Sure, it’s a quiet machine, but at the great expense of its overall processing capability and, as we’ll see later, also its surface temperatures.
Our Cinebench R15 multi-CPU loop test helps to visualize the challenges the laptop faces with sustained computing loads. Even in the initial runs, performance is below many lesser-equipped competitors, such as the Asus Zenbook 14 (i5-8265U) and Dell Latitude 7490 (i7-8650U). After the first several runs, however, performance plummets even further toward territory occupied by the Zenbook Flip (i5-8250U) and ThinkPad X1 Carbon G6 (i5-8350U).
None of this is to say that the Latitude 7400’s performance is bad—just that it’s disappointing given the SoC’s pedigree and the performance of related Core i5 variants. It’s been a lengthy analysis, but in conclusion: we’d recommend that you absolutely skip the Core i7 options for this machine. Quite clearly, we can’t expect them to perform much (or any) better than their lower-end and considerably more affordable counterparts.
September 2, 2019 update: The i5-8265U is the entry point into the world of Latitude 7000 convertibles. This configuration of the device can be purchased for as little as 1,500 Euros and includes a 512 GB SSD. Since the features are otherwise identical, the high premium for a Core i7 is questionable. How big is the performance discrepancy in reality? Is the Core i5 able to work together more efficiently with the cooling solution? In CineBench's R15 Multi-Thread test, the Core i7 only beats the i5-8265U by 15%. In the R15 Single-Thread test, the difference is only 11%. The base clock of the i5-8265U is 1,600 MHz, while single cores can reach a frequency of up to 3,900 MHz. This also works in real-world scenarios, with a single core running at 3,800 MHz during CineBench's single-thread test. The multi-thread test paints another picture, of course and here, the cores run at 2,300 MHz. These values lie comfortably within the Turbo Boost clock range.
Under prolonged stress, the difference between Core i5 and i7 is only 75 points, with 475 and 550 points, respectively, for the two Latitude 7400 variants during the R15 loop. While the Core i7's performance already drops by 9% after the first loop, the i5 does not throttle at all and even performs marginally faster in the second loop. See also our R15 loop comparison, where the results from both of the Latitude SKUs are listed one after the other.
In conclusion, our previous observations still stand: A Core i7 is definitely not worth the high premium, since an i5 is almost as fast with no throttling under load.
In other words: The Core i5 does not overpower the cooling solution. Our R15 log file also confirms this: While the clock speed is at 2,3 GHz on average, the core temperature consistently stays at just below 90 °C.
Please note: After our initial testing had been completed, we reinstalled the Dell Power Manager software and switched the thermal profile from Optimized to Ultra Performance. Although Ultra Performance warns of higher possible surface temperatures, we didn’t notice this in the case of our review unit. However, what we did witness was stronger sustained performance from certain CPU benchmarks against a backdrop of slightly higher noise levels. The problem is that the results, while better on the average, were still far from consistent. One run would produce values consistently above 500, whereas the next would fluctuate between ~520 and ~480. This is still better than our initial run on the default Optimized profile, but it’s far from a silver bullet. Cooldown periods did not seem to make a difference here.
Our test results remain focused on the initial, default values against which temperature and noise levels were measured as well, but it’s worth noting that if you’re considering investing in this machine, immediately updating Power Manager and switching to Ultra Performance permanently could help to at least mitigate some of the performance constraints we reference in this review.
Apart from the separate secondary Cinebench R15 loop results we display below, other benchmarks improved slightly as well. For example, wPrime 1024m completion time dropped marginally to 411 seconds (from 429), an improvement of 4%. There was no statistical difference in single-core or shorter-term benchmarks such as Super Pi.
System Performance
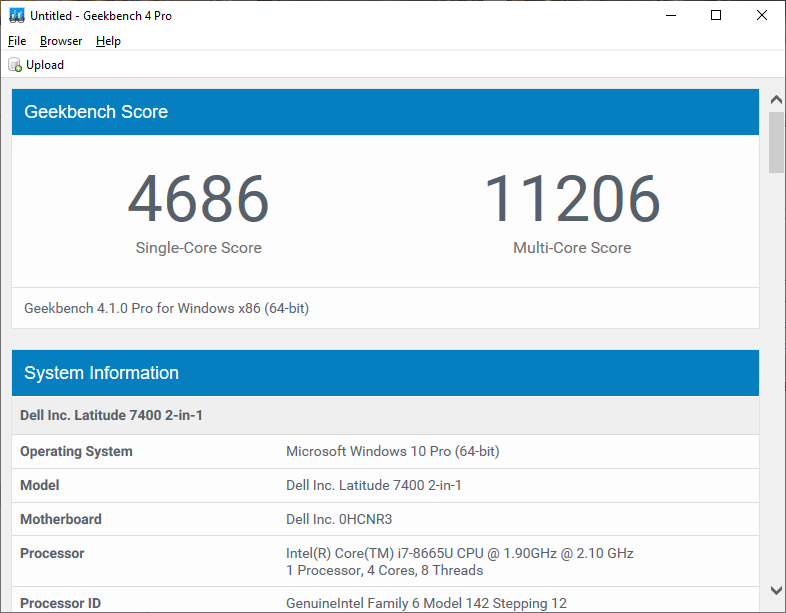
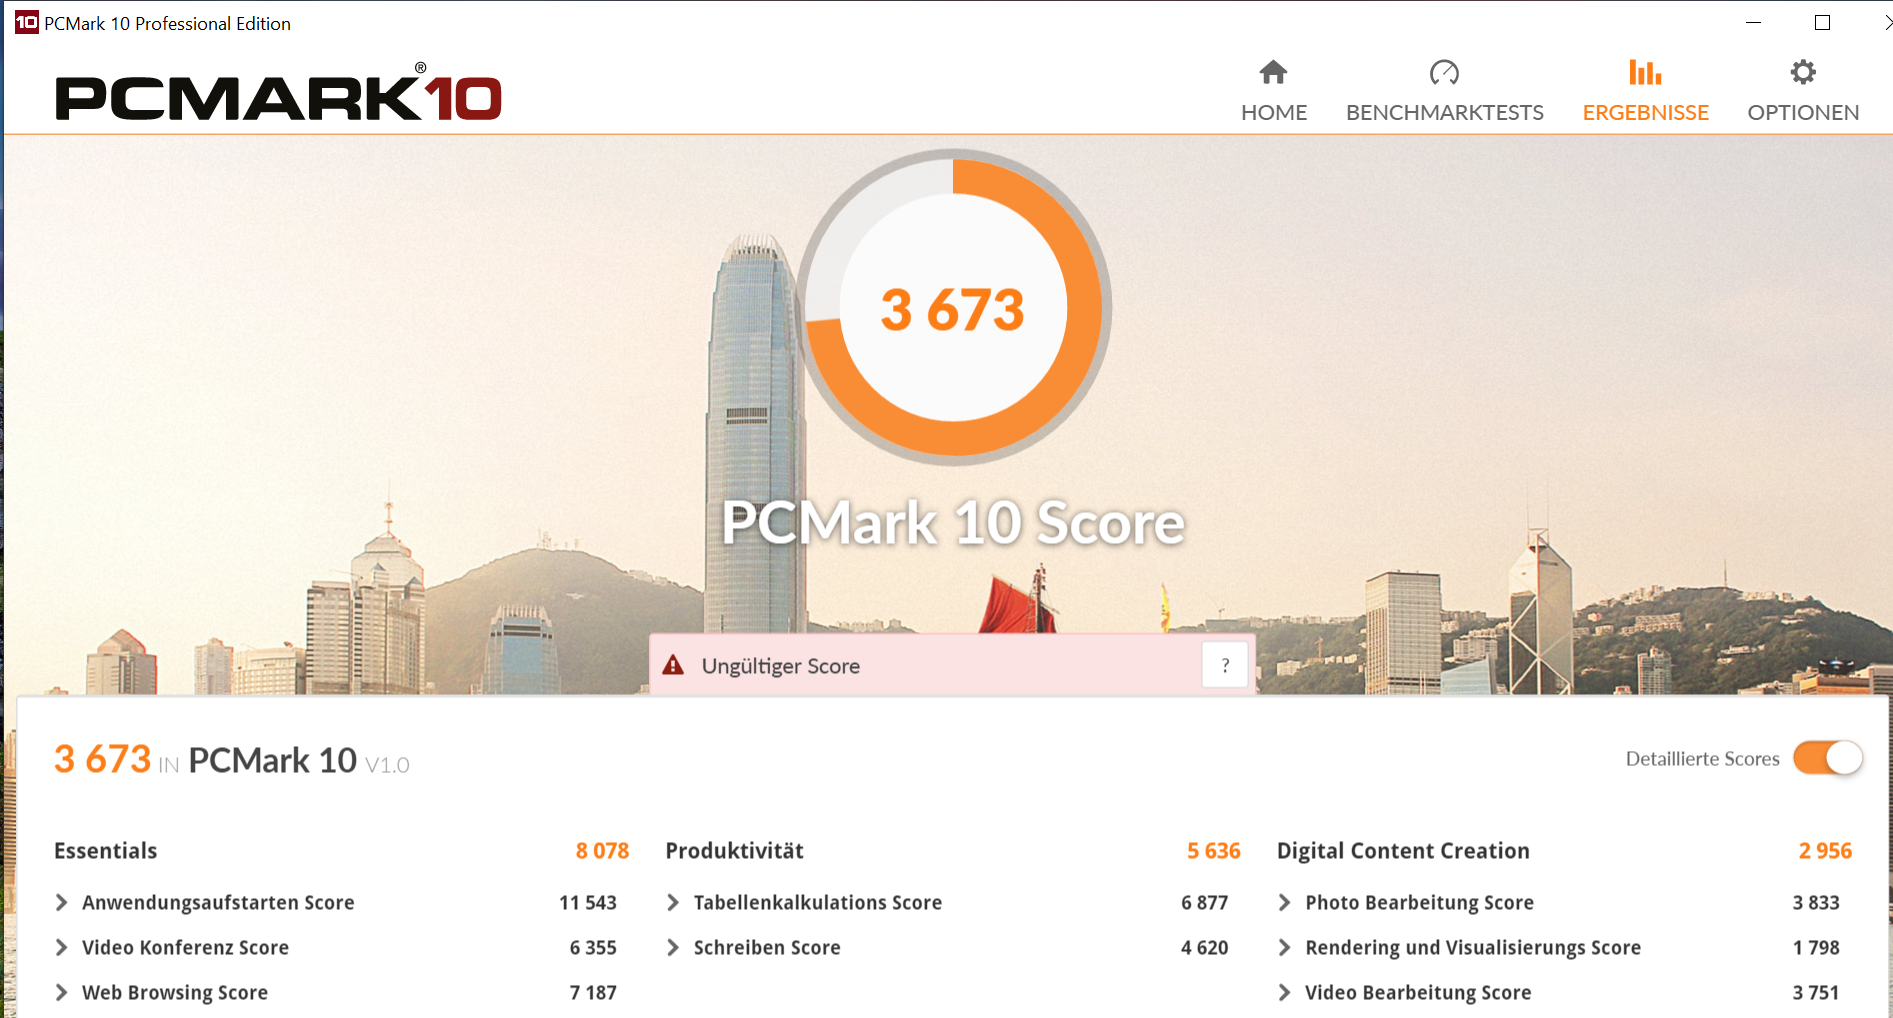
What does all of this mean for overall system performance though? The Latitude 7400 2-in-1 is performing where we'd expect it to be given the CPU. PCMark 10 provides an overall score of 4060 points, which is in line with the the EliteBook x360 1040 G5 and slightly above the w the ThinkPad X1 Yoga. PCMark 8 returns similar results against the competing machines apart from last year’s Latitude 7490 (which leads by 9%).
(June 6, 2019 update: Reran PCMark 10 with the new results included below. Scores are now in line with what we were expecting based on the CPU and notebook category.)
September 2, 2019 update: We once again ran PCMark 10 on the i5 SKU and added our new findings to the test results below. While the overall score of the i5 is 10 % lower than that of the Core i7, the i5 barely manages to outperform the i7 in the digital content creation benchmark.

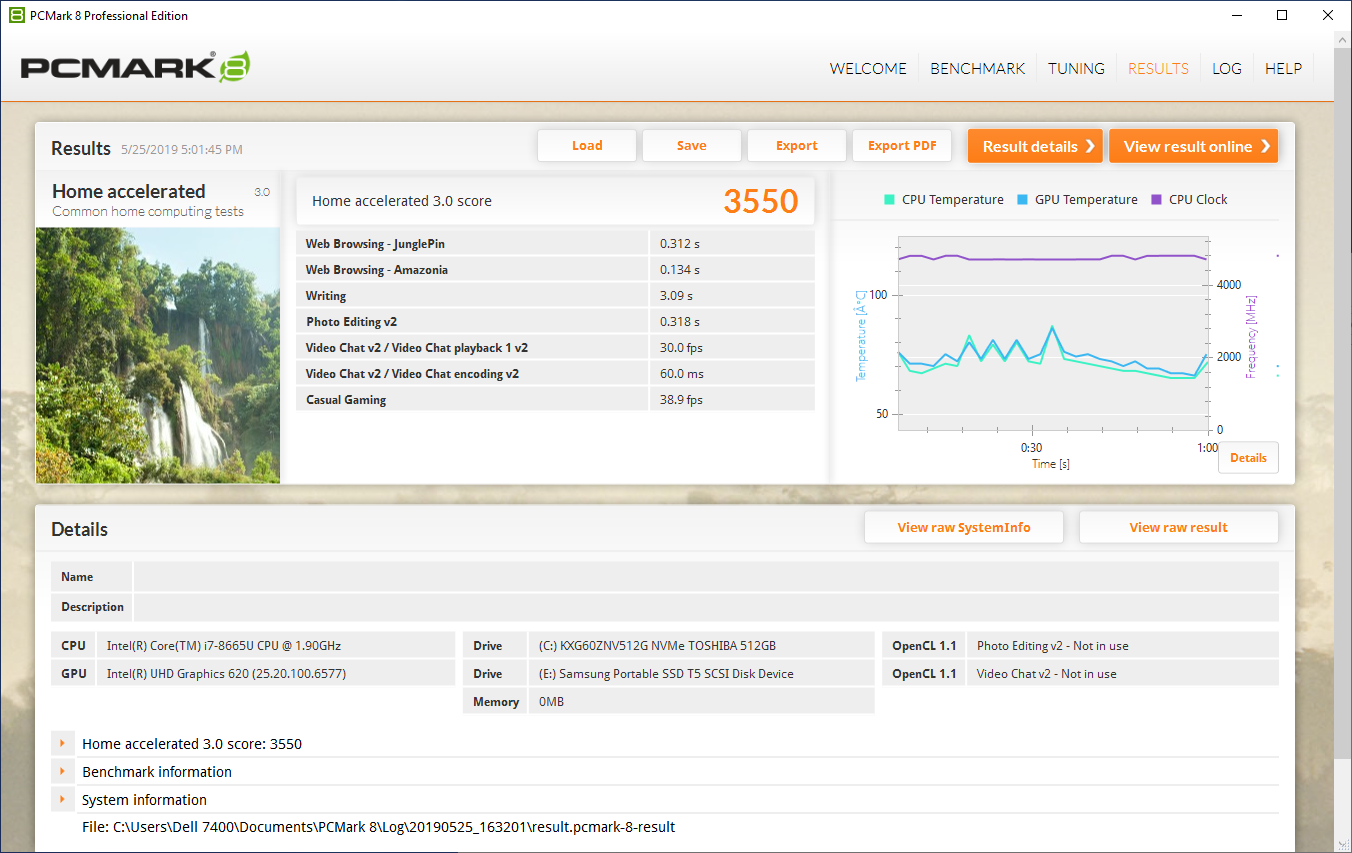
| PCMark 8 Home Score Accelerated v2 | 3550 points | |
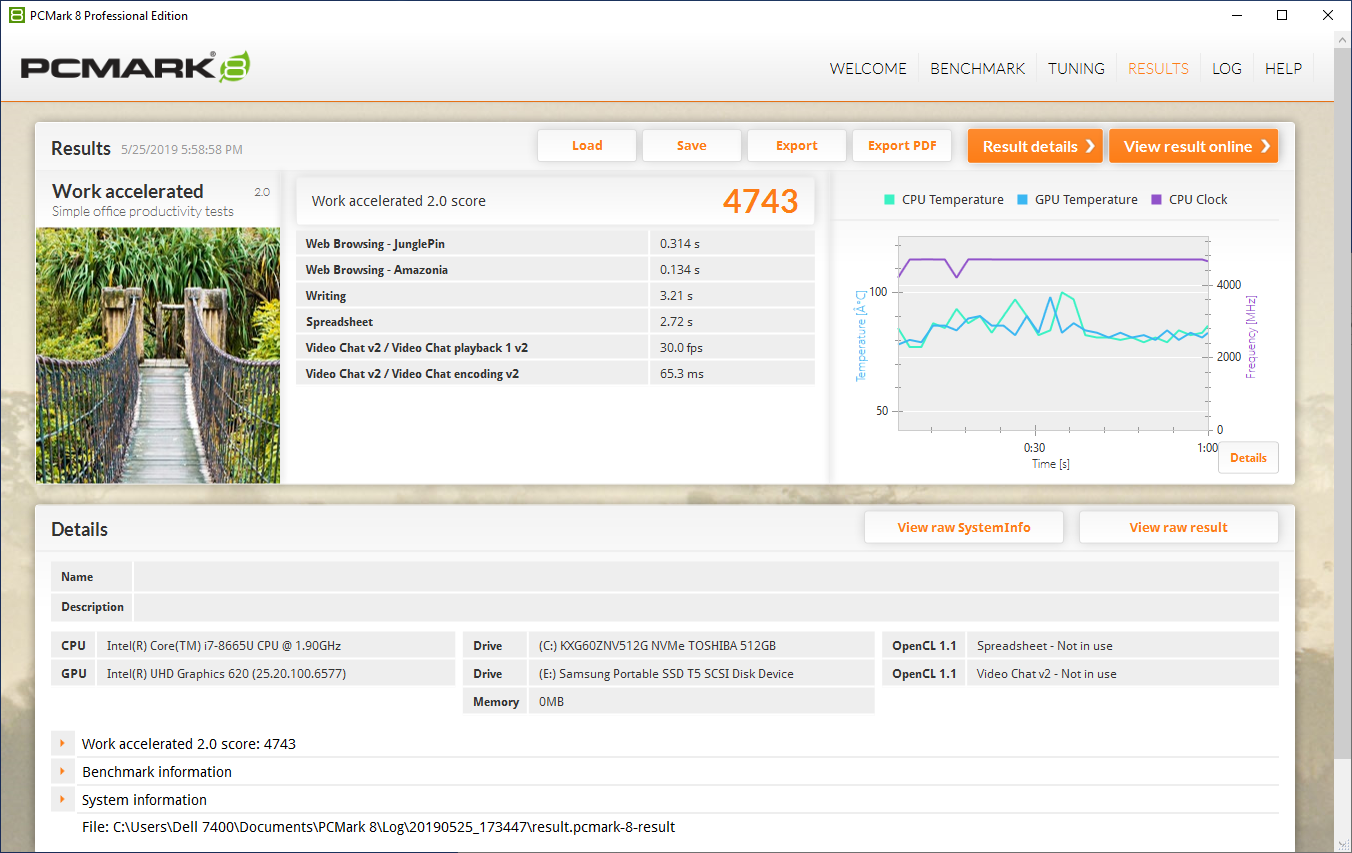
| PCMark 8 Work Score Accelerated v2 | 4743 points | |
| PCMark 10 Score | 4060 points | |
Help | ||
Storage Devices
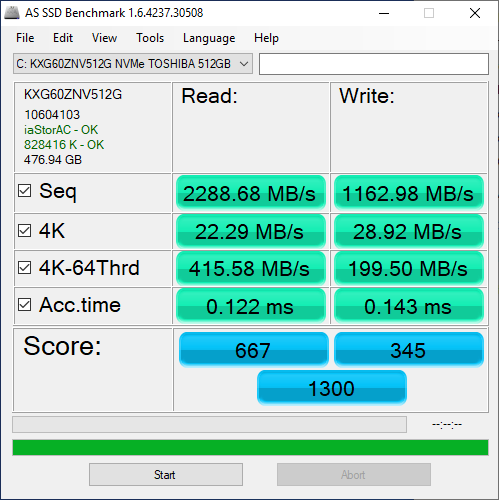
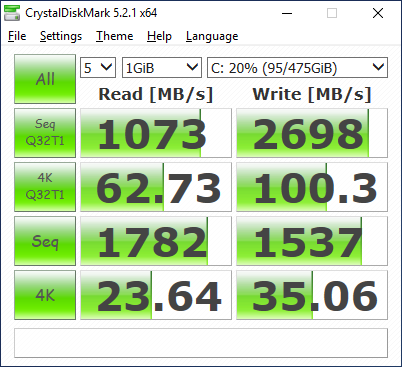
As previously mentioned, the Latitude 7400 2-in-1 can be equipped with an array of NVMe solid-state drives from the factory ranging in capacity from 256 GB up to 1 TB (and, soon, 2 TB). Our review unit includes a 512 GB Toshiba KXG60ZNV512G M.2 NVMe SSD, which is a new model in our testing database that we’ve not yet evaluated.
Sequential speeds from the SSD are very good, with AS SSD turning in 2288 MB/s and 1163 MB/s in the seq read/write tests respectively. 4K QD32 performance, however, is well below the PM981 (which powers the HP EliteBook x360)—and so that will have a bearing on overall perceived system performance.
The drive is relatively easy to access and replace, so if users wish to choose a lower capacity option and upgrade aftermarket to the drive of their choice, it shouldn’t be too much of a hassle.
| Dell Latitude 7400 2-in-1 Toshiba XG6 KXG60ZNV512G | Asus ZenBook Flip 14 UX461UA SanDisk SD8SN8U256G1002 | HP Elitebook x360 1040 G5 Samsung SSD PM981 MZVLB512HAJQ | Lenovo ThinkPad X1 Carbon G6-20KG0025UK Lenovo LENSE20256GMSP34MEAT2TA | |
|---|---|---|---|---|
| AS SSD | -27% | 136% | 29% | |
| Seq Read (MB/s) | 2289 | 459.9 -80% | 1816 -21% | 2365 3% |
| Seq Write (MB/s) | 1163 | 388.2 -67% | 1270 9% | 1220 5% |
| 4K Read (MB/s) | 22.29 | 26.93 21% | 46.25 107% | 35.67 60% |
| 4K Write (MB/s) | 28.92 | 50.7 75% | 104.1 260% | 87.6 203% |
| 4K-64 Read (MB/s) | 415.6 | 368.3 -11% | 1342 223% | 446.1 7% |
| 4K-64 Write (MB/s) | 199.5 | 146.4 -27% | 1209 506% | 195.8 -2% |
| Access Time Read * (ms) | 0.122 | 0.123 -1% | 0.043 65% | 0.108 11% |
| Access Time Write * (ms) | 0.143 | 0.086 40% | 0.035 76% | 0.144 -1% |
| Score Read (Points) | 667 | 441 -34% | 1569 135% | 718 8% |
| Score Write (Points) | 345 | 236 -32% | 1440 317% | 405 17% |
| Score Total (Points) | 1300 | 908 -30% | 3790 192% | 1443 11% |
| Copy ISO MB/s (MB/s) | 1767 | 324.1 -82% | 2034 15% | |
| Copy Program MB/s (MB/s) | 379.4 | 118.6 -69% | 450.3 19% | |
| Copy Game MB/s (MB/s) | 1055 | 186.1 -82% | 1024 -3% | |
| CrystalDiskMark 5.2 / 6 | 30% | 168% | 122% | |
| Write 4K (MB/s) | 35.06 | 52.4 49% | 122.7 250% | 116.4 232% |
| Read 4K (MB/s) | 23.64 | 27.91 18% | 46.57 97% | 45.75 94% |
| Write Seq (MB/s) | 1537 | 428.2 -72% | 1725 12% | 455.1 -70% |
| Read Seq (MB/s) | 1782 | 435.9 -76% | 2392 34% | 1818 2% |
| Write 4K Q32T1 (MB/s) | 100.3 | 246 145% | 470.6 369% | 248.9 148% |
| Read 4K Q32T1 (MB/s) | 62.7 | 255.6 308% | 313.2 400% | 358 471% |
| Write Seq Q32T1 (MB/s) | 2698 | 455.6 -83% | 1869 -31% | 1191 -56% |
| Read Seq Q32T1 (MB/s) | 1073 | 554 -48% | 3380 215% | 2755 157% |
| Total Average (Program / Settings) | 2% /
-6% | 152% /
148% | 76% /
68% |
* ... smaller is better

GPU Performance
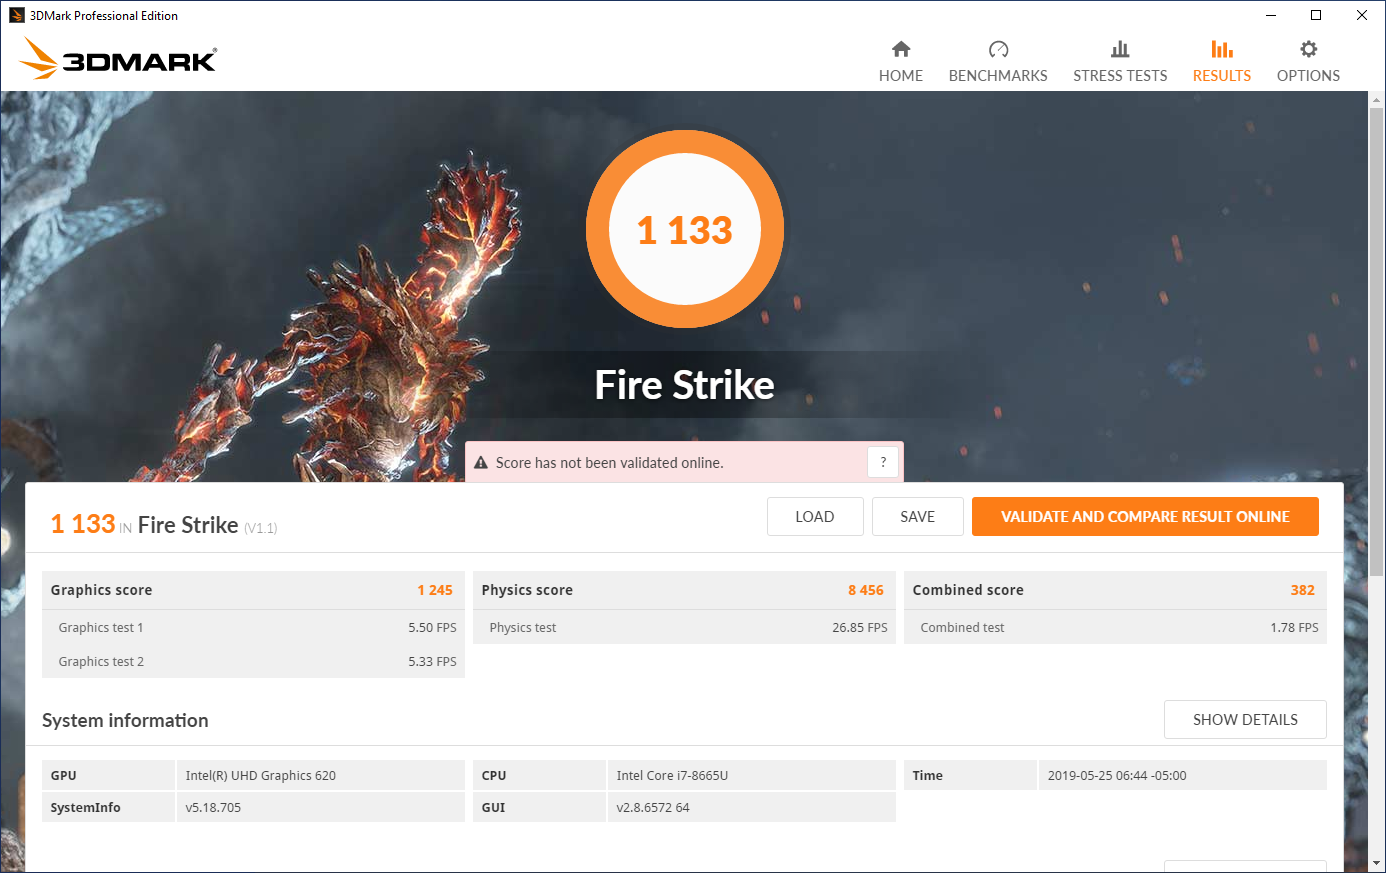
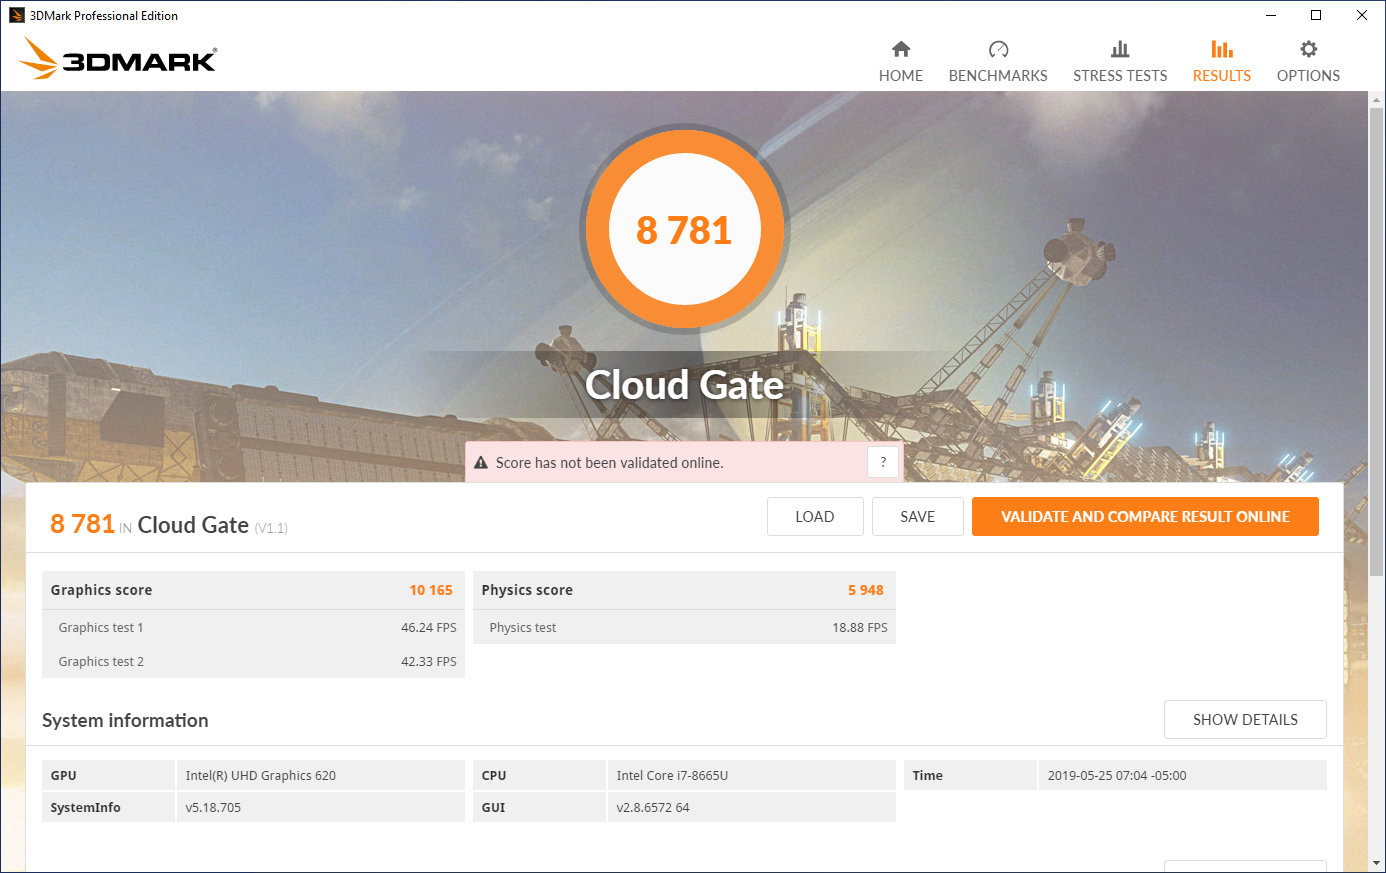
The Latitude is powered by integrated Intel UHD Graphics 620, which is fine for everyday office use and battery-friendly, to boot. While GPU performance remains acceptable, no real gains have been made over the Core i7-8550U/i5-8350U crowd. 3DMark Fire Strike turns in a score of 1245 points, just 3% below the Lenovo X1 Yoga’s 1288 (i7-8550U) and the X1 Carbon’s 1283 (i5-8350U). Results are somewhat more pronounced in the Cloud Gate and 3DMark 11 Graphics benchmarks (see below), with margins widening to the 6 to 7 percentage points mark. Of course, in the case of combined and overall scores, where CPU performance is also taken heavily into account, the 7400 struggles quite a bit more.
Graphical performance is sufficient to run only basic and older games at lower settings smoothly. Especially with its thermal limitations, the Latitude 7400 2-in-1 is not meant to be used for gaming.

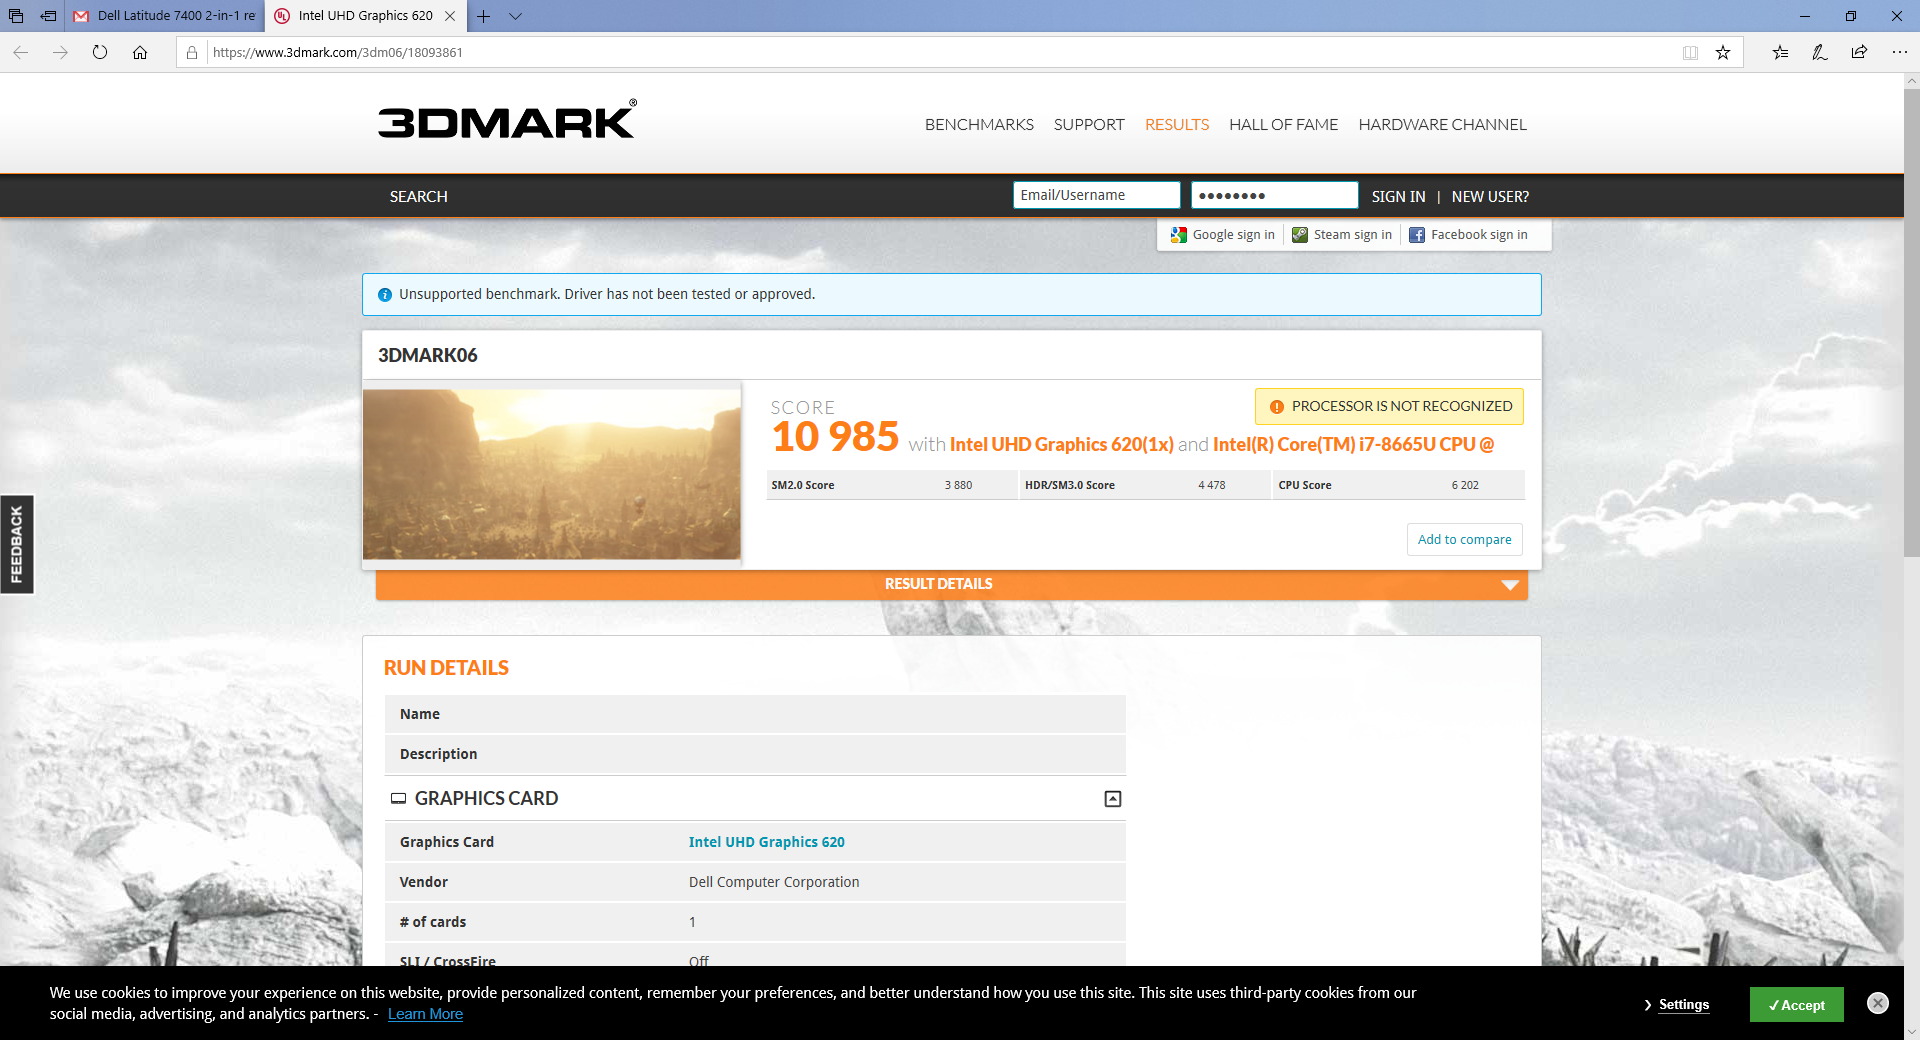
| 3DMark 06 Standard Score | 10985 points | |
| 3DMark 11 Performance | 1964 points | |
| 3DMark Cloud Gate Standard Score | 8781 points | |
| 3DMark Fire Strike Score | 1133 points | |
Help | ||
| low | med. | high | ultra | |
|---|---|---|---|---|
| BioShock Infinite (2013) | 56 | 34 | 28 | 17 |
Emissions
System Noise
Is it quiet? Absolutely. The laptop is completely silent while idling, and we measured only a tiny increase over environmental noise levels—28.8 dB(A) versus 28.2 dB(A)—under load. Given the high chip temperatures that we’ll witness the fruits of in the next section, this suggests heavily (low) noise-biased firmware balancing.
Adjusting the settings in the Dell Power Manager application doesn’t seem to affect this much either; although slightly more fan noise is noticeable under the "Cool" and "Ultra Performance" profiles, it's not really that noticeable in general use. CPU clock rates can be artificially/electively limited by choosing the “Cool” profile, which keeps the case cooler overall (and which you’ll probably find yourself using if you’re planning on traveling with the machine and using it lap-borne). We feel like a firmware update from Dell to increase fan RPMs at lower temperature thresholds on the default “Optimized” setting could help to balance this out a bit better. While low noise levels are nice, it’s preferable to be able to choose when they’re prioritized, especially when the inherent bias is affecting surface temperatures and performance so severely in practice.
There is a bit of electrical noise from the charging port area while the machine is on AC power, but it’s only noticeable at pretty close range and it manifests primarily as a muted static of sorts. Most people probably won’t find it bothersome except in the quietest of environments.
September 2, 2019 update: Our impression of the i5 mode's fan behavior is positive through and through. On the ultra performance setting, the fan spins with consistent speeds and creates a subtle background noise. While it does become louder and more noticeable under load, it never becomes distracting. Unlike on our i7, we did not notice any electrical noise coming from the area around the charging port on the i5.
Noise level
| Idle |
| 28.2 / 28.2 / 28.3 dB(A) |
| Load |
| 28.2 / 28.8 dB(A) |
 | ||
30 dB silent 40 dB(A) audible 50 dB(A) loud |
||
min: | ||
Temperature
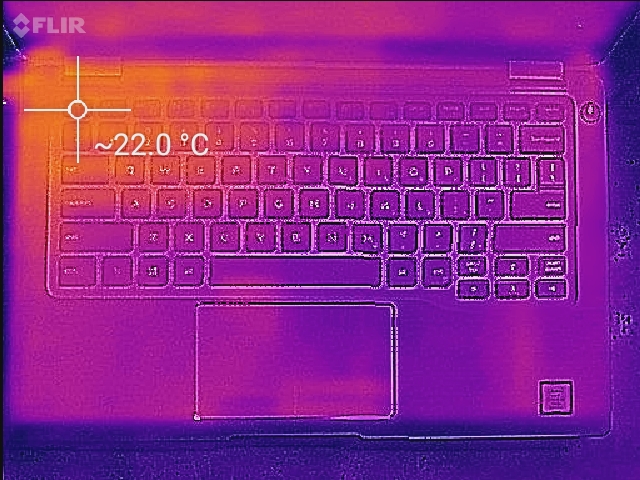
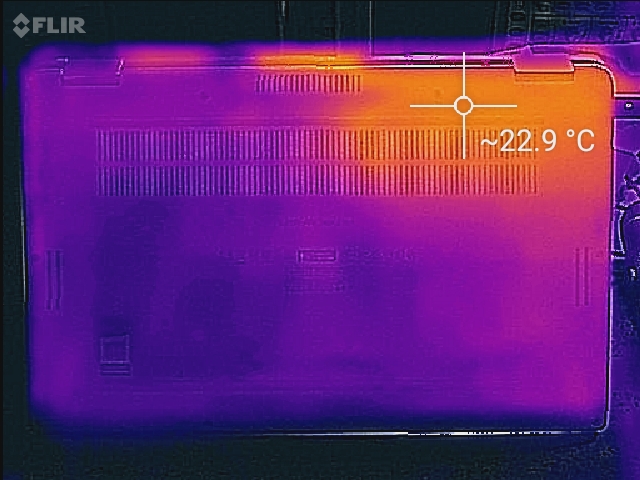
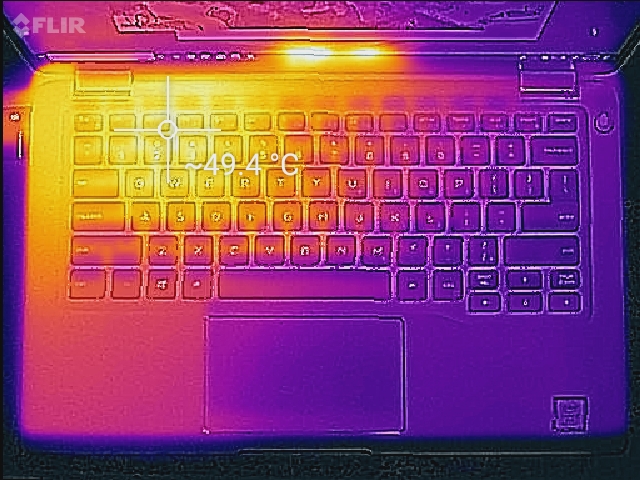
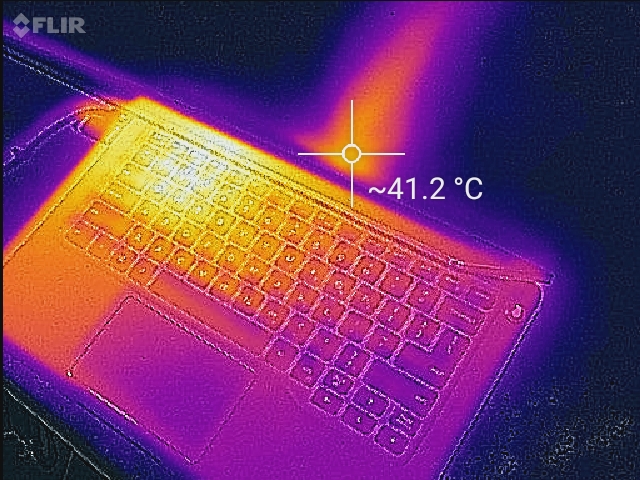
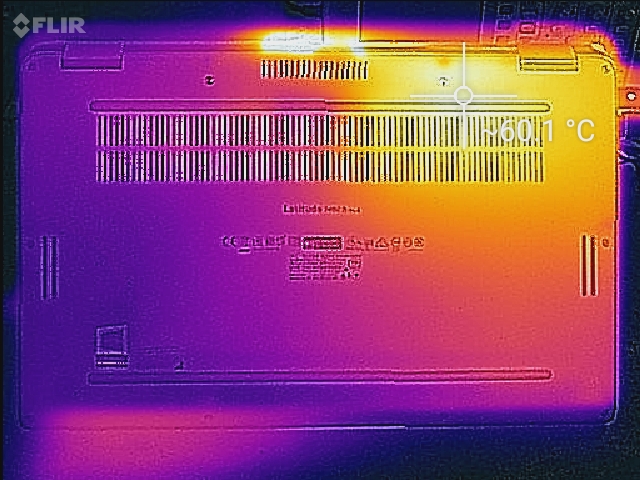
It’s nothing new, but the Latitude 7400 2-in-1 gets pretty hot under load. Average temperatures aren’t too far from those of the 7490 before it—35.4 °C / 37.6 °C on top/bottom—but that doesn’t tell the whole story. The heat is more heavily concentrated in just a couple of quadrants; whereas before, hot spots on the top and bottom were 45.2 °C / 51.6 °C, now, the temperatures in the hottest quadrants have risen to a blistering 49.6 °C and 60.2 °C. The Dell Power Manager profile selection doesn’t appear to affect this situation much.
Idle temperatures have dropped considerably however. We measure averages only a degree or two above ambient temperatures (21.5 °C / 22 °C on top/bottom) here, which is a big improvement over the previous generation.
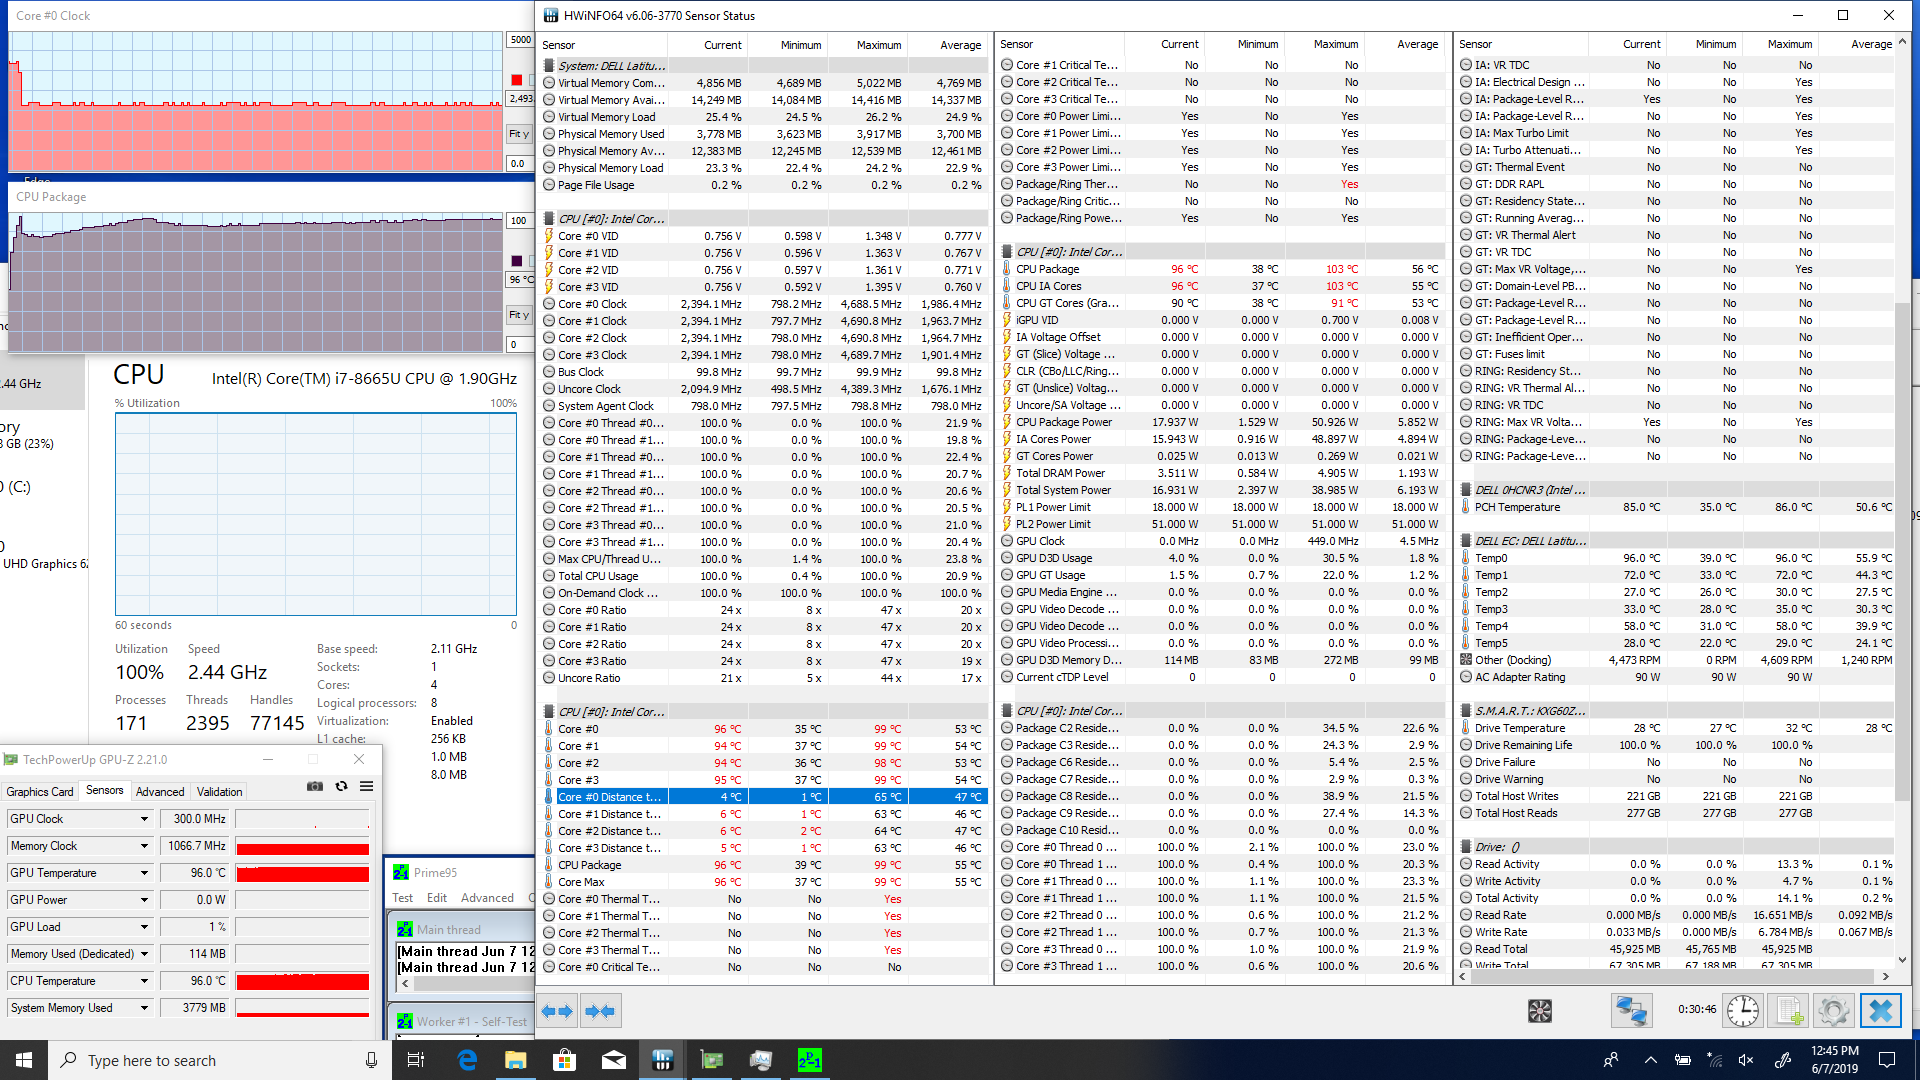
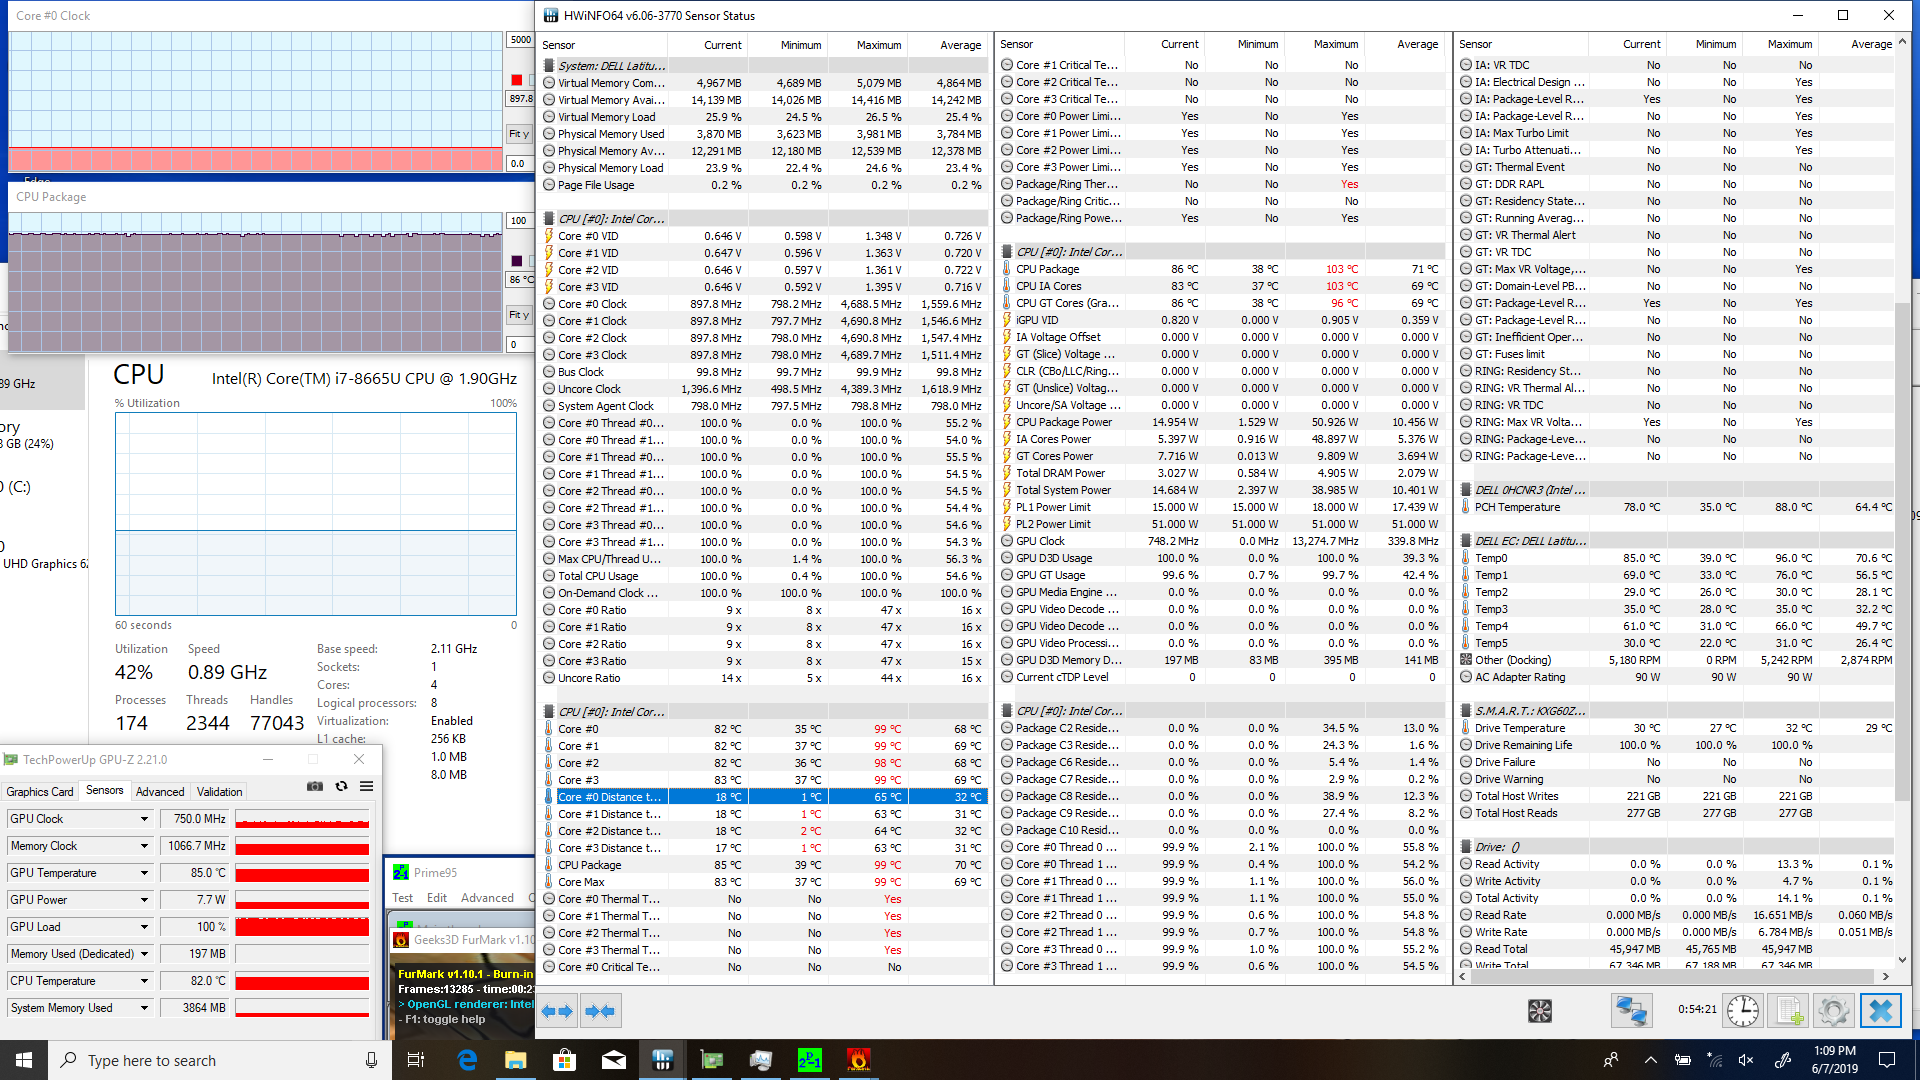
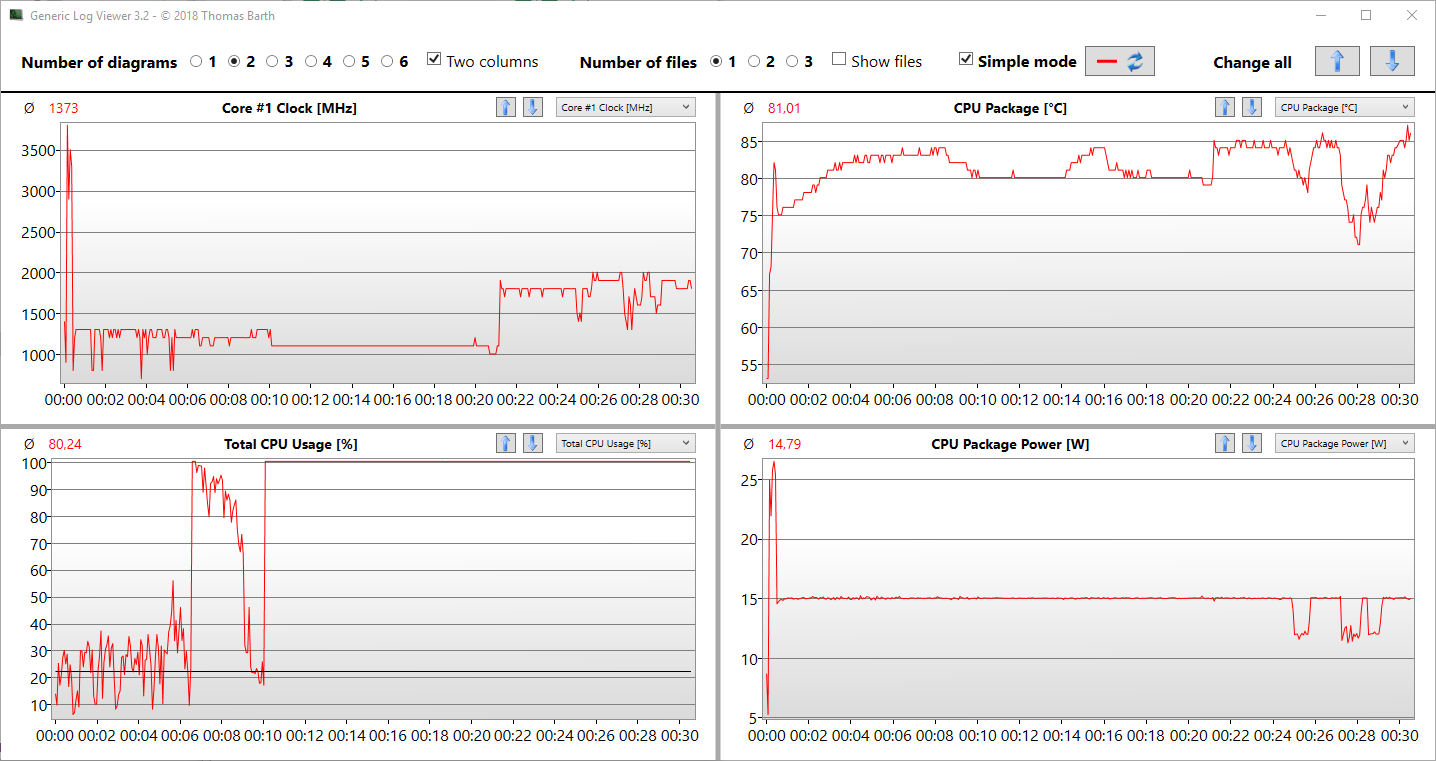
Stress Test
Under full CPU stress using Prime95, the Latitude 7400 2-in-1 rockets up to 100 °C CPU temperature within seconds, at which point clock rates drop from roughly 4.2 GHz down to 2.4 GHz, where it remains permanently thereafter. Temperatures at this point remain stable at 89 °C. GPU stress with FurMark results in GPU clock rates of 950 MHz and temperatures at 95 °C.
Combined stress sees a jump up to the 80s °C, after which a slow climb into the 90s °C follows. Throughout this entire stretch, CPU clock rates are pinned at just 1.2 GHz, which is below the base clock rate of the CPU. GPU clock rates slip gradually downward to 700 MHz, where they remain for some time before rebounding to 2.0-2.1 GHz later on.
Running on battery power does not decrease the performance of the system; a secondary run of 3DMark 11 produced a marginally higher score than our original value—2004 versus 1964 in the first run.
(June 7, 2019 update: We reran the Prime95 and FurMark stress tests on a second test unit which produced more stable results than our first test unit. CPU clock rate becomes stable at 2.5 GHz when running Prime95 albeit at a very warm core temperature of over 90 C as shown by our revised screenshots below.)
How does the i5-8265U fare in a stress test?
September 2, 2019 update: Prime95 stress is a lot to handle for the i5 and reduces the sustainable clock speeds to 1,700-1,900 MHz on all cores. This is still above the base clock and faster than the i7. The processor only dips below its base clock, if FurMark is run simultaneously in order to stress the integrated graphics card.
Our R15 log file shows: At just below 85 °C, the CPU temperature remains at a decent value, allowing the processor to consistently exceed its base clock.
| CPU Clock (GHz) | GPU Clock (MHz) | Average CPU Temperature (°C) | Average GPU Temperature (°C) | |
| Prime95 Stress | 2.5 - 2.6 | - | 96 | - |
| FurMark Stress | - | 950 | - | 95 |
| Prime95 + FurMark Stress | 0.9 | 750 | 86 | 86 |
(-) The maximum temperature on the upper side is 49.6 °C / 121 F, compared to the average of 35.4 °C / 96 F, ranging from 19.6 to 60 °C for the class Convertible.
(-) The bottom heats up to a maximum of 60.2 °C / 140 F, compared to the average of 36.9 °C / 98 F
(+) In idle usage, the average temperature for the upper side is 21.5 °C / 71 F, compared to the device average of 30.3 °C / 87 F.
(+) The palmrests and touchpad are reaching skin temperature as a maximum (33.8 °C / 92.8 F) and are therefore not hot.
(-) The average temperature of the palmrest area of similar devices was 28 °C / 82.4 F (-5.8 °C / -10.4 F).
Speakers

The speakers have vastly improved over the previous few generations of Dell Latitude 7000-series laptops. One of our major complaints about the Latitude 7490/7390 machines is that the audio system was weak and even just downright bad. Volume levels were low, frequency response was poor, and bass was essentially nonexistent. This wasn’t a deal-breaker because ultimately these are business machines—tools, if you will, first and foremost—but the luxury of higher-quality speakers is still something users appreciate over the life of any machine.
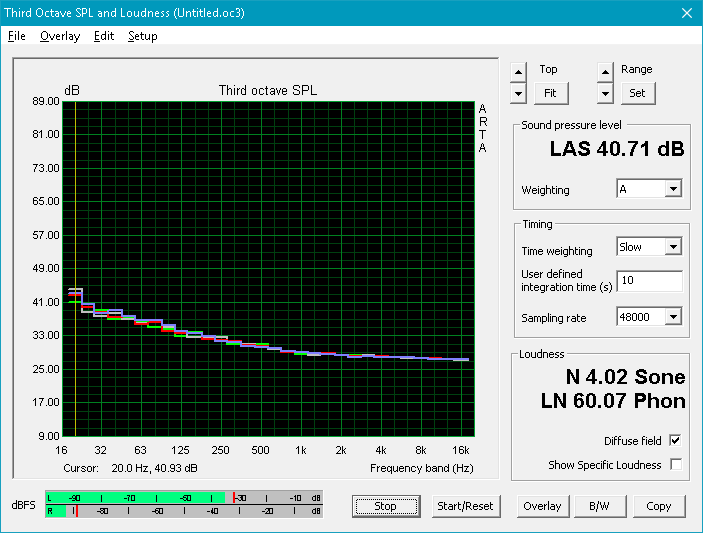
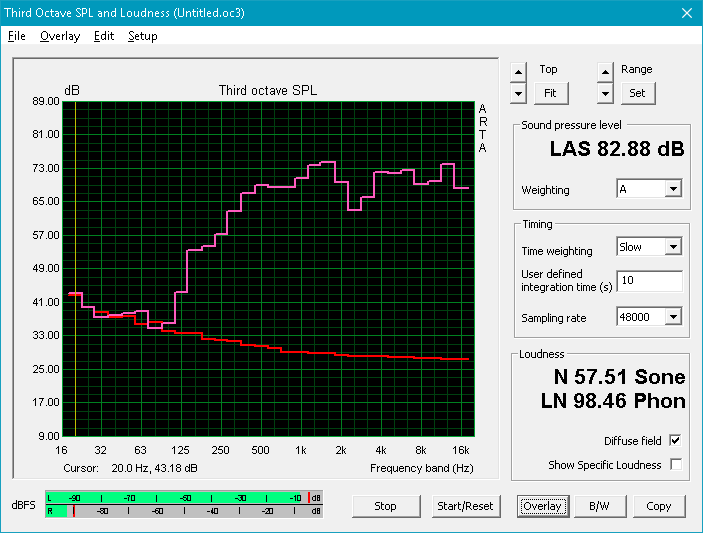
With the Latitude 7400 2-in-1, the speakers have been moved from the bottom front of the machine (where they were previously crammed into a tiny space and couldn’t physically be large enough to result in any sort of reasonably good audio experience) to the sides of the bottom. This allows for larger drivers that produce a much louder volume level. The case materials and reverberation also are leveraged better on this new model for a quality of audio much closer to that of an XPS 15. Low frequencies are still mostly absent, but it isn’t nearly as bad as it was previously. The overall linearity of the sound is now average, with balanced mids and highs and a total result better than 76% of machines we’ve tested.
Dell Latitude 7400 2-in-1 audio analysis
(+) | speakers can play relatively loud (82.9 dB)
Bass 100 - 315 Hz
(-) | nearly no bass - on average 17.3% lower than median
(±) | linearity of bass is average (11.7% delta to prev. frequency)
Mids 400 - 2000 Hz
(+) | balanced mids - only 2% away from median
(+) | mids are linear (5.3% delta to prev. frequency)
Highs 2 - 16 kHz
(+) | balanced highs - only 2.9% away from median
(±) | linearity of highs is average (7.3% delta to prev. frequency)
Overall 100 - 16.000 Hz
(±) | linearity of overall sound is average (17.3% difference to median)
Compared to same class
» 33% of all tested devices in this class were better, 8% similar, 59% worse
» The best had a delta of 6%, average was 20%, worst was 57%
Compared to all devices tested
» 33% of all tested devices were better, 8% similar, 59% worse
» The best had a delta of 4%, average was 23%, worst was 134%
HP Elitebook x360 1040 G5 audio analysis
(±) | speaker loudness is average but good (80.9 dB)
Bass 100 - 315 Hz
(±) | reduced bass - on average 11.3% lower than median
(±) | linearity of bass is average (13.7% delta to prev. frequency)
Mids 400 - 2000 Hz
(+) | balanced mids - only 3.2% away from median
(+) | mids are linear (4.8% delta to prev. frequency)
Highs 2 - 16 kHz
(+) | balanced highs - only 3.6% away from median
(±) | linearity of highs is average (7.2% delta to prev. frequency)
Overall 100 - 16.000 Hz
(+) | overall sound is linear (13.1% difference to median)
Compared to same class
» 7% of all tested devices in this class were better, 2% similar, 91% worse
» The best had a delta of 7%, average was 21%, worst was 53%
Compared to all devices tested
» 13% of all tested devices were better, 3% similar, 84% worse
» The best had a delta of 4%, average was 23%, worst was 134%
Energy Management
Power Consumption
Undoubtedly thanks in part to its weaker screen brightness and more efficient panel overall, the 7400 posts great power consumption values that are superior to that of every machine against which we’re comparing today. An idle average of just 4.3 W suggests a very efficient machine, and even the load average of 32 W is reasonable. The load maximum of 78.8 W is comparably high (this occurs right at the start of initiating Prime 95 and is surely a product of Thermal Velocity Boost), but since the laptop spends most of its time toying with CPU frequencies well below their theoretical boost maximums (and at low fan RPMs), we hardly ever see such high consumption. It’s a gift and a curse we suppose.
| Off / Standby | |
| Idle | |
| Load |
|
Key:
min: | |
| Dell Latitude 7400 2-in-1 i7-8665U, UHD Graphics 620, Toshiba XG6 KXG60ZNV512G, IPS, 1920x1080, 14" | Lenovo ThinkPad X1 Yoga 2018-20LES01W00 i5-8550U, UHD Graphics 620, Samsung SSD PM981 MZVLB512HAJQ, IPS Dolby Vision HDR, 2560x1440, 14" | Asus ZenBook Flip 14 UX461UA i5-8250U, UHD Graphics 620, SanDisk SD8SN8U256G1002, IPS, 1920x1080, 14" | HP Elitebook x360 1040 G5 i7-8650U, UHD Graphics 620, Samsung SSD PM981 MZVLB512HAJQ, IPS, 1920x1080, 14" | Lenovo ThinkPad X1 Carbon G6-20KG0025UK i5-8350U, UHD Graphics 620, Lenovo LENSE20256GMSP34MEAT2TA, IPS, 1920x1080, 14" | |
|---|---|---|---|---|---|
| Power Consumption | -60% | -23% | -30% | -29% | |
| Idle Minimum * (Watt) | 2.6 | 3.4 -31% | 3.3 -27% | 2.7 -4% | 4.7 -81% |
| Idle Average * (Watt) | 4.3 | 8.8 -105% | 6.3 -47% | 6.5 -51% | 7.3 -70% |
| Idle Maximum * (Watt) | 5.5 | 11.9 -116% | 11 -100% | 11.5 -109% | 9.4 -71% |
| Load Average * (Watt) | 32 | 50.4 -58% | 30 6% | 38.7 -21% | 28 12% |
| Load Maximum * (Watt) | 78.8 | 71.2 10% | 35.4 55% | 50.5 36% | 28.2 64% |
* ... smaller is better
Battery Life
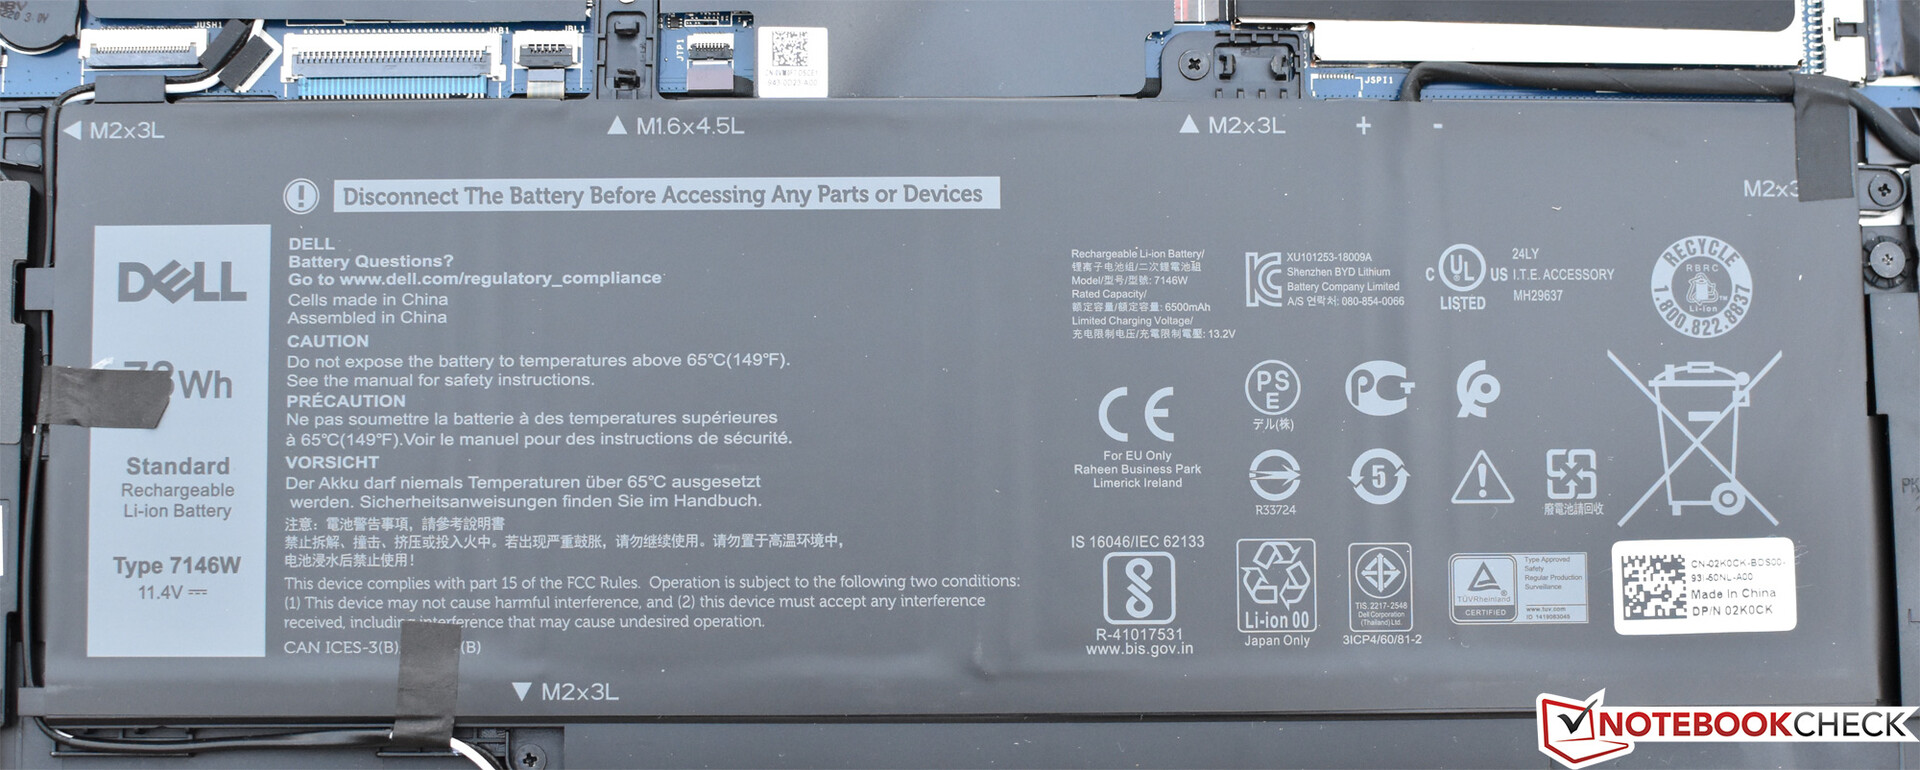
Unsurprisingly, with its low power consumption numbers coupled with the massive 6-cell, 78 Wh battery supplied with our review unit, the Latitude 7400 2-in-1 manages impressive battery runtimes. Our standardized wi-fi web-surfing benchmark ran for 12 hours and 12 minutes on the device before it finally shut down, which is well beyond that of most competitors.
Dell also offers options for 4-cell 52 Wh batteries, which are also probably quite a bit lighter in weight (and less expensive). At 33% lower capacity, we should still expect runtimes above 8 hours on a battery of that size—more than acceptable, and perhaps preferable given the circumstances.
While a small battery will save weight, by the way, it won't provide for additional storage slots (as is the case with some machines).
| Dell Latitude 7400 2-in-1 i7-8665U, UHD Graphics 620, 78 Wh | HP Pavilion x360 14-cd0002ng i3-8130U, UHD Graphics 620, 41 Wh | Lenovo ThinkPad X1 Yoga 2018-20LES01W00 i5-8550U, UHD Graphics 620, 54 Wh | Asus ZenBook Flip 14 UX461UA i5-8250U, UHD Graphics 620, 57 Wh | HP Elitebook x360 1040 G5 i7-8650U, UHD Graphics 620, 56 Wh | Lenovo ThinkPad X1 Carbon G6-20KG0025UK i5-8350U, UHD Graphics 620, 57 Wh | |
|---|---|---|---|---|---|---|
| Battery runtime | -39% | -30% | -23% | -15% | -15% | |
| WiFi v1.3 (h) | 12.2 | 7.4 -39% | 8.6 -30% | 9.4 -23% | 10.4 -15% | 10.4 -15% |
| Reader / Idle (h) | 12.7 | 20.1 | 18.9 | 27.9 | 24.5 | |
| Load (h) | 2.1 | 1.5 | 2.1 | 3.1 | 1.9 |
Pros
Cons
Verdict
The Dell Latitude 7400 2-in-1 ($2,800 as tested) represents a substantial step toward a different design philosophy for the manufacturer’s convertible business laptops. Let’s begin with the overall pros: arguably, this is the most attractive Latitude to date, with its beautiful brushed aluminum casing, expertly CNC-chamfered edges and corners, and super-slim bezels. It could easily be mistaken for something out of the XPS line of machines.
But throughout its transition, the Latitude seeks to retain many of the practical business-grade sensibilities that have long been critical to the success of the brand: easy maintenance, durable construction, long battery runtimes, quiet operation, and premium input devices. Port selection has taken a bit of a hit with the adoption of USB Type-C/ThunderBolt 3 charging ports and the omission of the mainstay Ethernet port, but for the most part the average business user will have more than they care to work with at their disposal here. The audio is vastly improved over the previous Latitude machines. And finally, battery runtimes on our 78 Wh-equipped review unit are terrific, easily lasting a full workday without any need for a charger on hand.
The Latitude 7400 2-in-1 is an ambitious revision within a market where typically conservative and incremental are the default philosophies. In some ways, it’s a breath of fresh (hot!) air, but it’s not without its problems.
While aesthetically and haptically pleasing, however, the results are far from universally positive in this case. The display, while attractive in an indoor setting, suffers a weak brightness and it's highly reflective, rendering outdoor usage uncomfortable and in many cases simply implausible. While the transition to a glass touchpad is nice, some business users will lament the switch from physical separate buttons to an integrated “clickpad” design. The system RAM is now fully soldered to the mainboard, meaning upgrades and replacements are impossible (though the M.2 NVMe SSD can still be replaced).
But the most glaring shortfall of all is our review unit’s penchant for high internal chip temperatures, which quickly overwhelm the subpar cooling system and result in blistering surface hot spots on the casing and potential for CPU performance reductions. It calls into question the practicality of stuffing a hungry and hot Core i7 Whiskey Lake SoC into such a small case with a tiny, conservatively-tuned cooling system.
We’d happily trade some more fan noise for better sustained performance and lower case temperatures, and fortunately this can be partially approximated via a switch to the Ultra Performance thermal profile within the Dell Power Manager—which results in at least marginally improved sustained results in our Cinebench R15 loop test (hopefully a future firmware update might render this step, which the average uninformed user isn’t likely to undertake, unnecessary). Regardless, however, we think it makes more sense to save your money and invest in a less-expensive Core i5 CPU configuration instead, where temperatures are sure to be lower and you aren’t paying for performance increases that are marginal at best.
Top-ranked competitors include the HP EliteBook x360 1040 G5 and the Lenovo ThinkPad X1 Yoga. The Asus Zenbook Flip 14 is also available, but it didn’t fare as well as those previous two machines in our testing. Alternatively, it might be worth waiting for a bit to see if and how Dell revises the firmware on the 7400 2-in-1 to address these issues. It’s a great machine in a lot of ways—just a little too ambitious for its cooling system to handle.
September 2, 2019 update: Our measurements from the Core i5 SKU confirm our previous suspicions: The i7 version does not offer a significant performance boost and thus is not worth a higher premium. The much cheaper i5 SKU performs more efficiently in conjunction with the small cooling solution without throttling. Additionally, the surface temperatures under load are noticeably cooler.
Dell Latitude 7400 2-in-1
- 10/17/2019 v7 (old)
Steve Schardein
