Dell Latitude 7410 Laptop Review: The Lenovo X1 Carbon Has Met Its Match
As a direct successor to the 14-inch 2019 Latitude 7400, the 2020 latitude 7410 brings a host of changes both inside and out including even a new chassis design. It's an upper mid-range subnotebook for business users sitting in between the lesser Latitude 5000 series and the flagship Latitude 9000 series.
Dell offers a very wide selection of 7410 clamshell and 7410 2-in-1 SKUs ranging from $1600 USD all the way up to $3200 USD each with Intel 10th gen Comet Lake-U CPUs and optional vPro, 8 GB to 32 GB of soldered RAM, M.2 PCIe SSDs, and 768p to 4K touchscreens. Our specific test unit is a higher-end clamshell SKU equipped with the Core i7-10610U CPU and 4K UHD display for about $2100.
Direct competitors to the Latitude 7410 include other high-end business subnotebooks like the Lenovo ThinkPad X1 Carbon, HP Elitebook x360 1040, MSI Modern 14, and the Surface Laptop series.
More Dell reviews:
Rating | Date | Model | Weight | Height | Size | Resolution | Price |
|---|---|---|---|---|---|---|---|
| 88.9 % v7 (old) | 07 / 2020 | Dell Latitude 7410 i7-10610U, UHD Graphics 620 | 1.4 kg | 19.3 mm | 14.00" | 3840x2160 | |
| 87.2 % v7 (old) | 09 / 2019 | Dell Latitude 7400-8N6DH i7-8665U, UHD Graphics 620 | 1.5 kg | 18.9 mm | 14.00" | 1920x1080 | |
| 90.2 % v7 (old) | 07 / 2020 | Lenovo ThinkPad X1 Carbon 2020-20UAS04T00 i7-10510U, UHD Graphics 620 | 1.1 kg | 14.9 mm | 14.00" | 1920x1080 | |
| 80.9 % v7 (old) | 01 / 2020 | MSI Modern 14 A10RB-459US i5-10210U, GeForce MX250 | 1.2 kg | 16 mm | 14.00" | 1920x1080 | |
| 90.5 % v7 (old) | 02 / 2019 | HP Elitebook x360 1040 G5 i7-8650U, UHD Graphics 620 | 1.4 kg | 16.9 mm | 14.00" | 1920x1080 |
Case
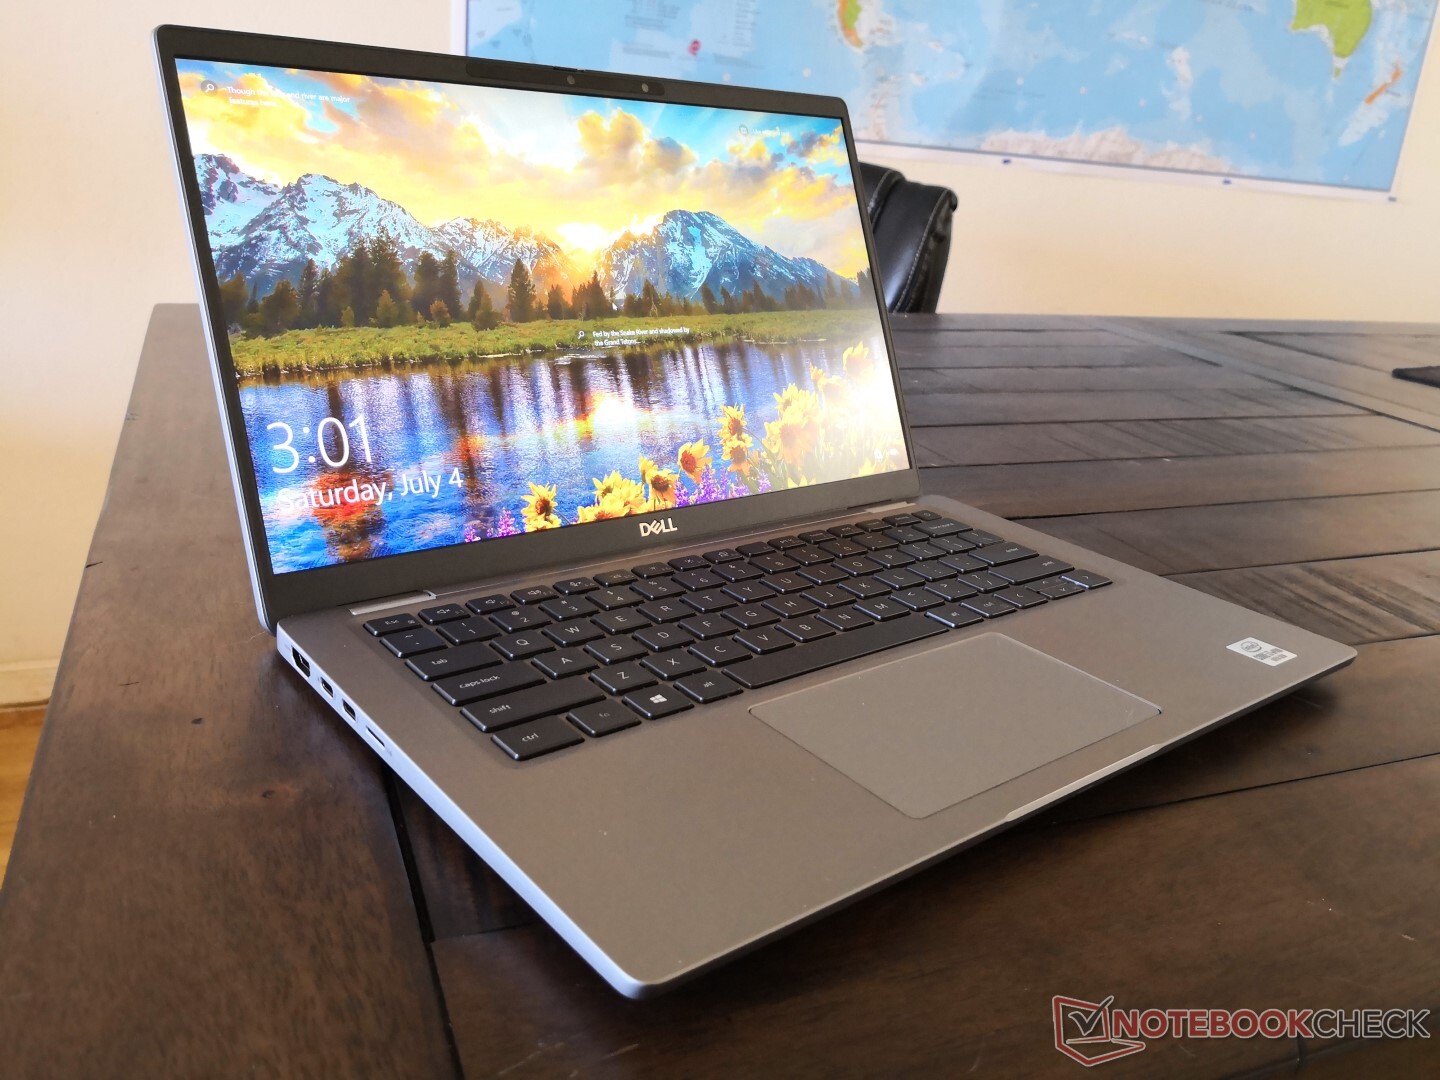
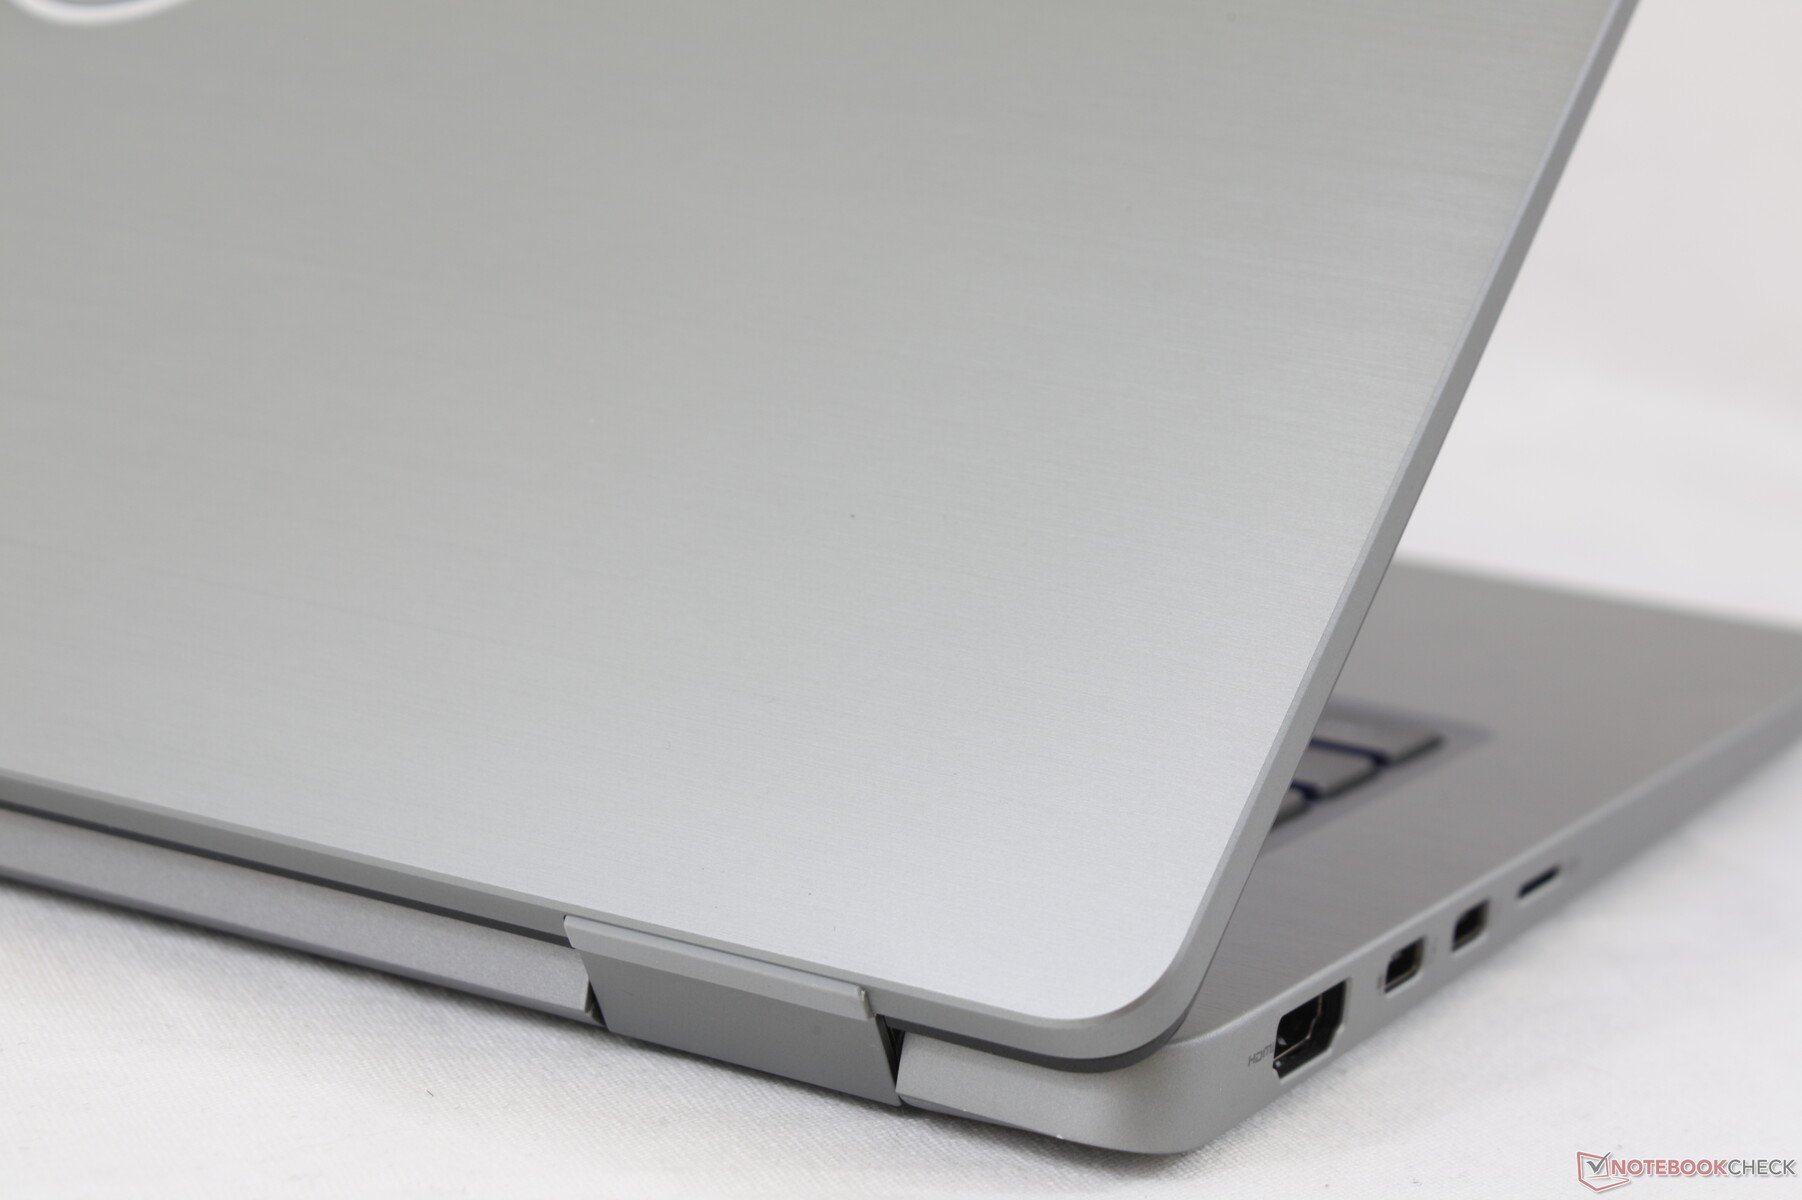
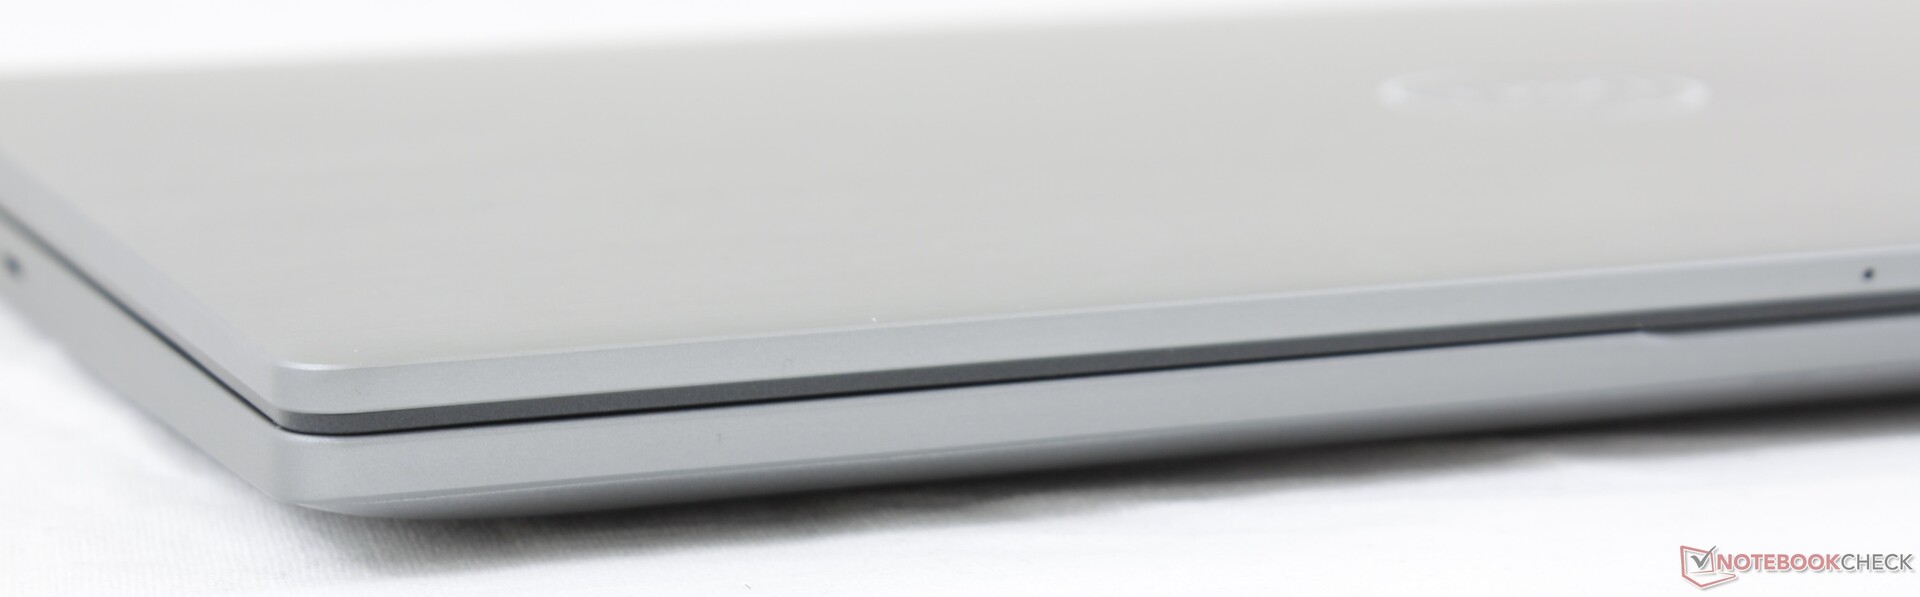
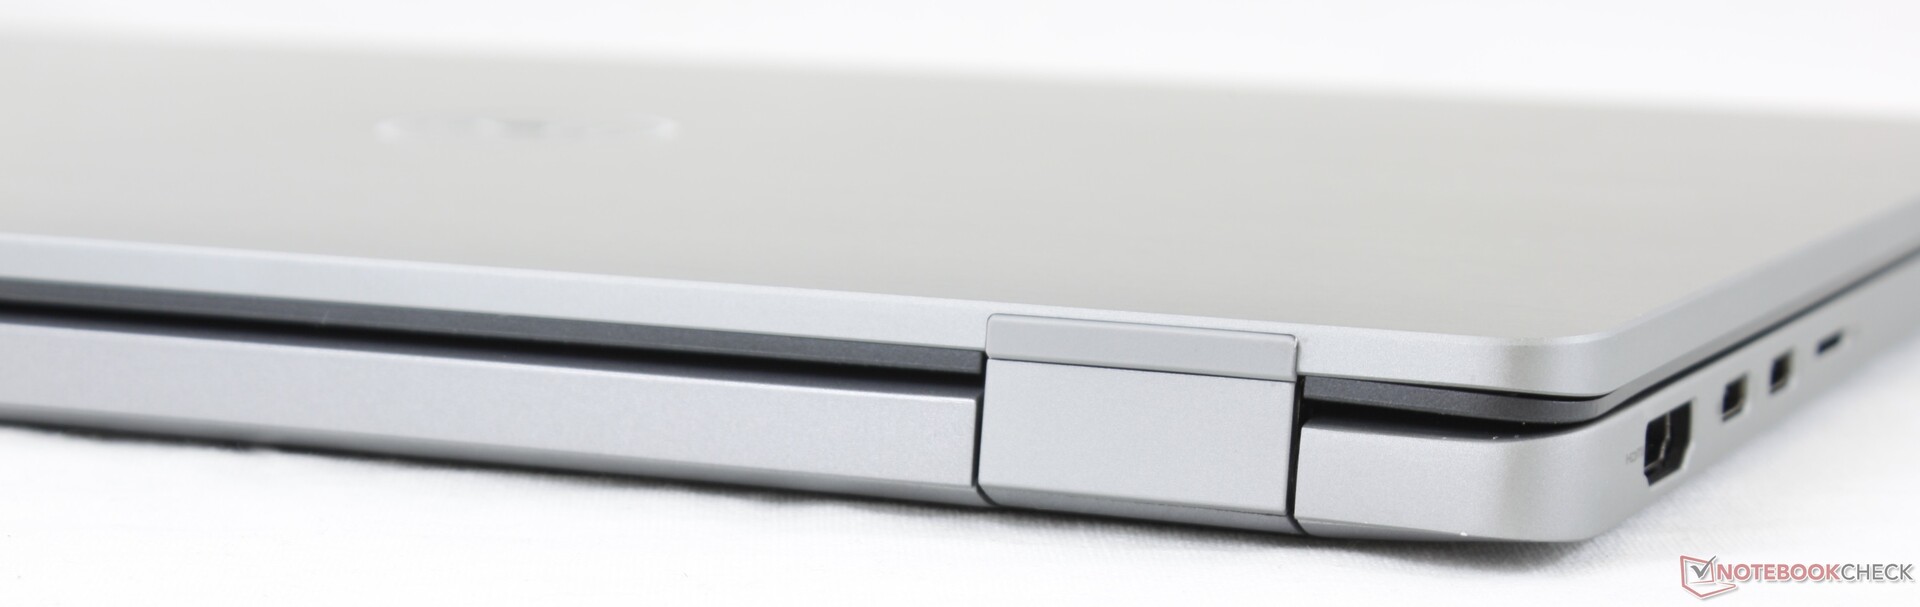
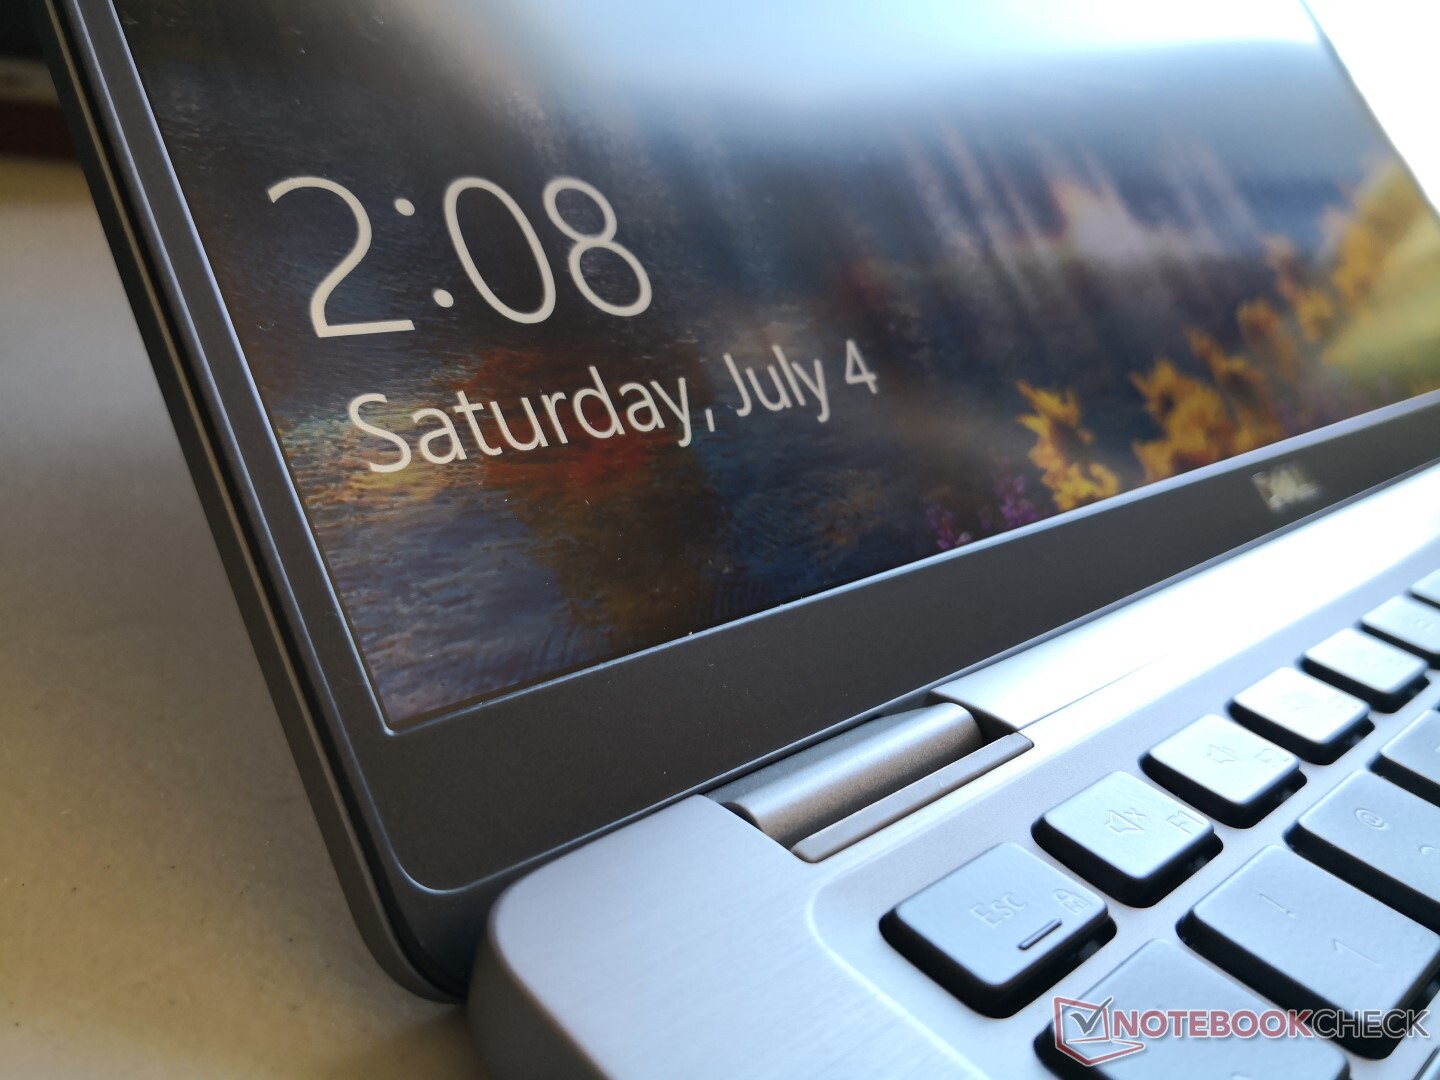
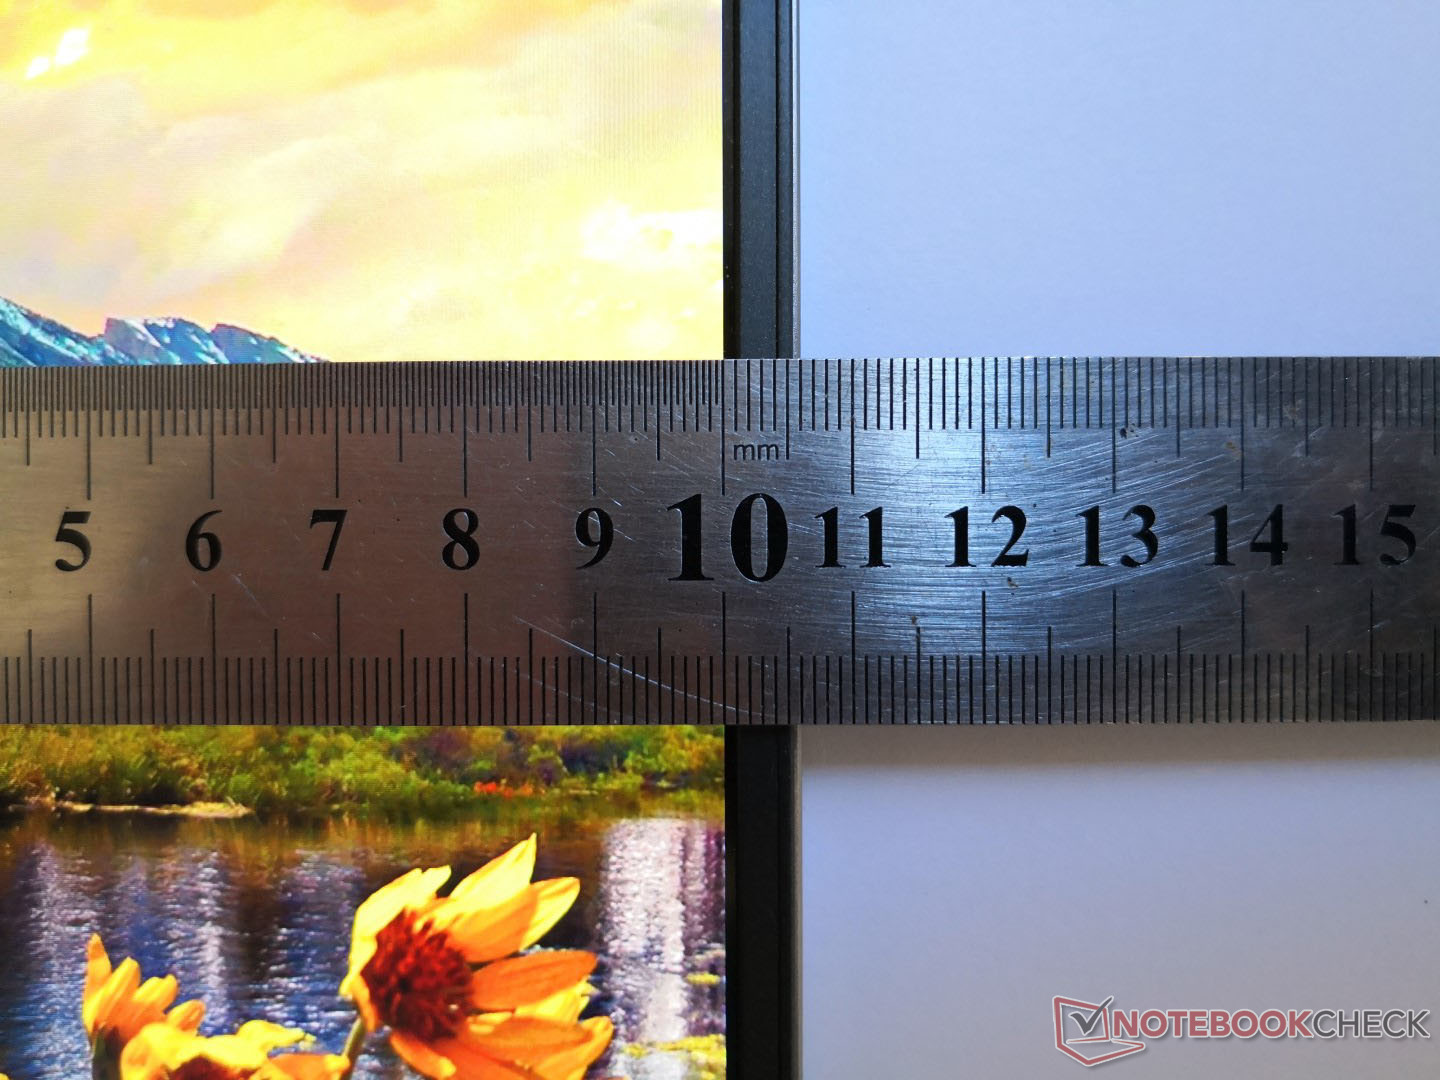
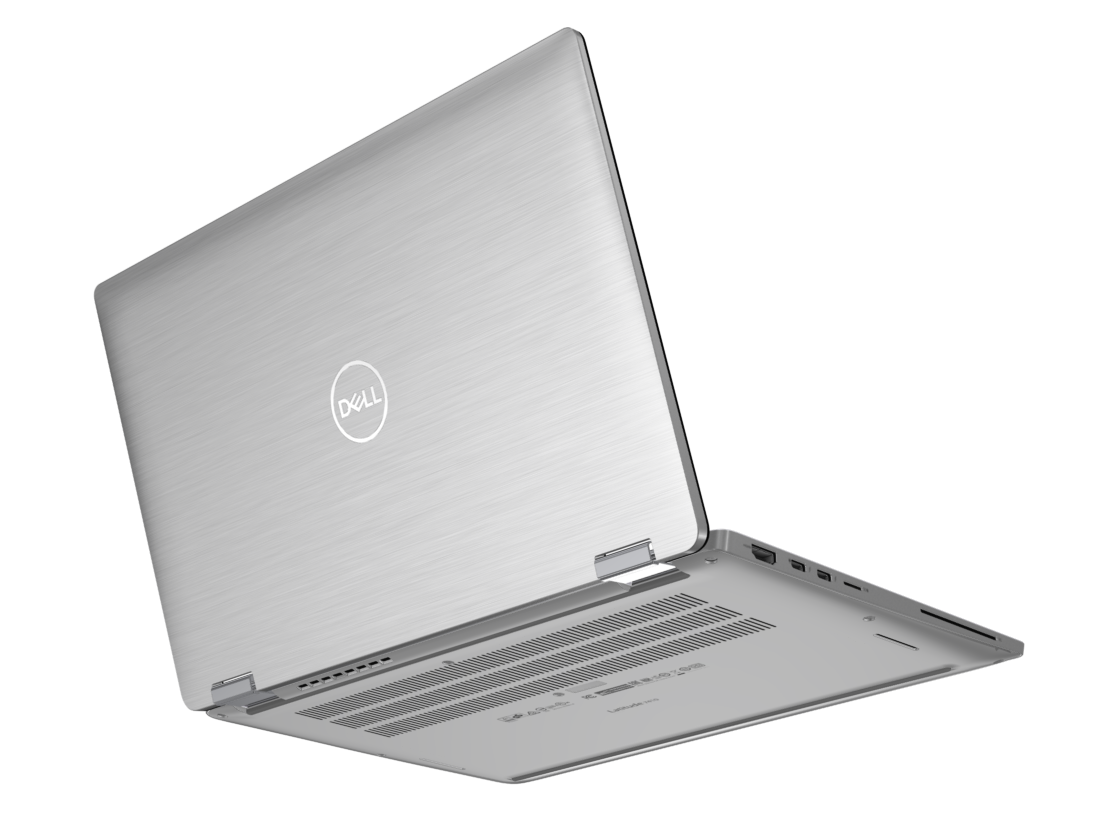
Chassis quality and rigidity remain top-notch especially since the Latitude 7000 series isn't blindly chasing after ultra-thin designs for the sake of sexy product shots or visual flair. When compared to last year's model, the bottom display bezel and hinges have been redesigned to be smaller and stronger, respectively, without impacting the rest of the system.
The same aluminum body materials return for similar impressions and texture as the Latitude 7400. Twisting its corners or applying pressure on the keyboard center or outer lid would result in just minimal warping and almost no creaking.
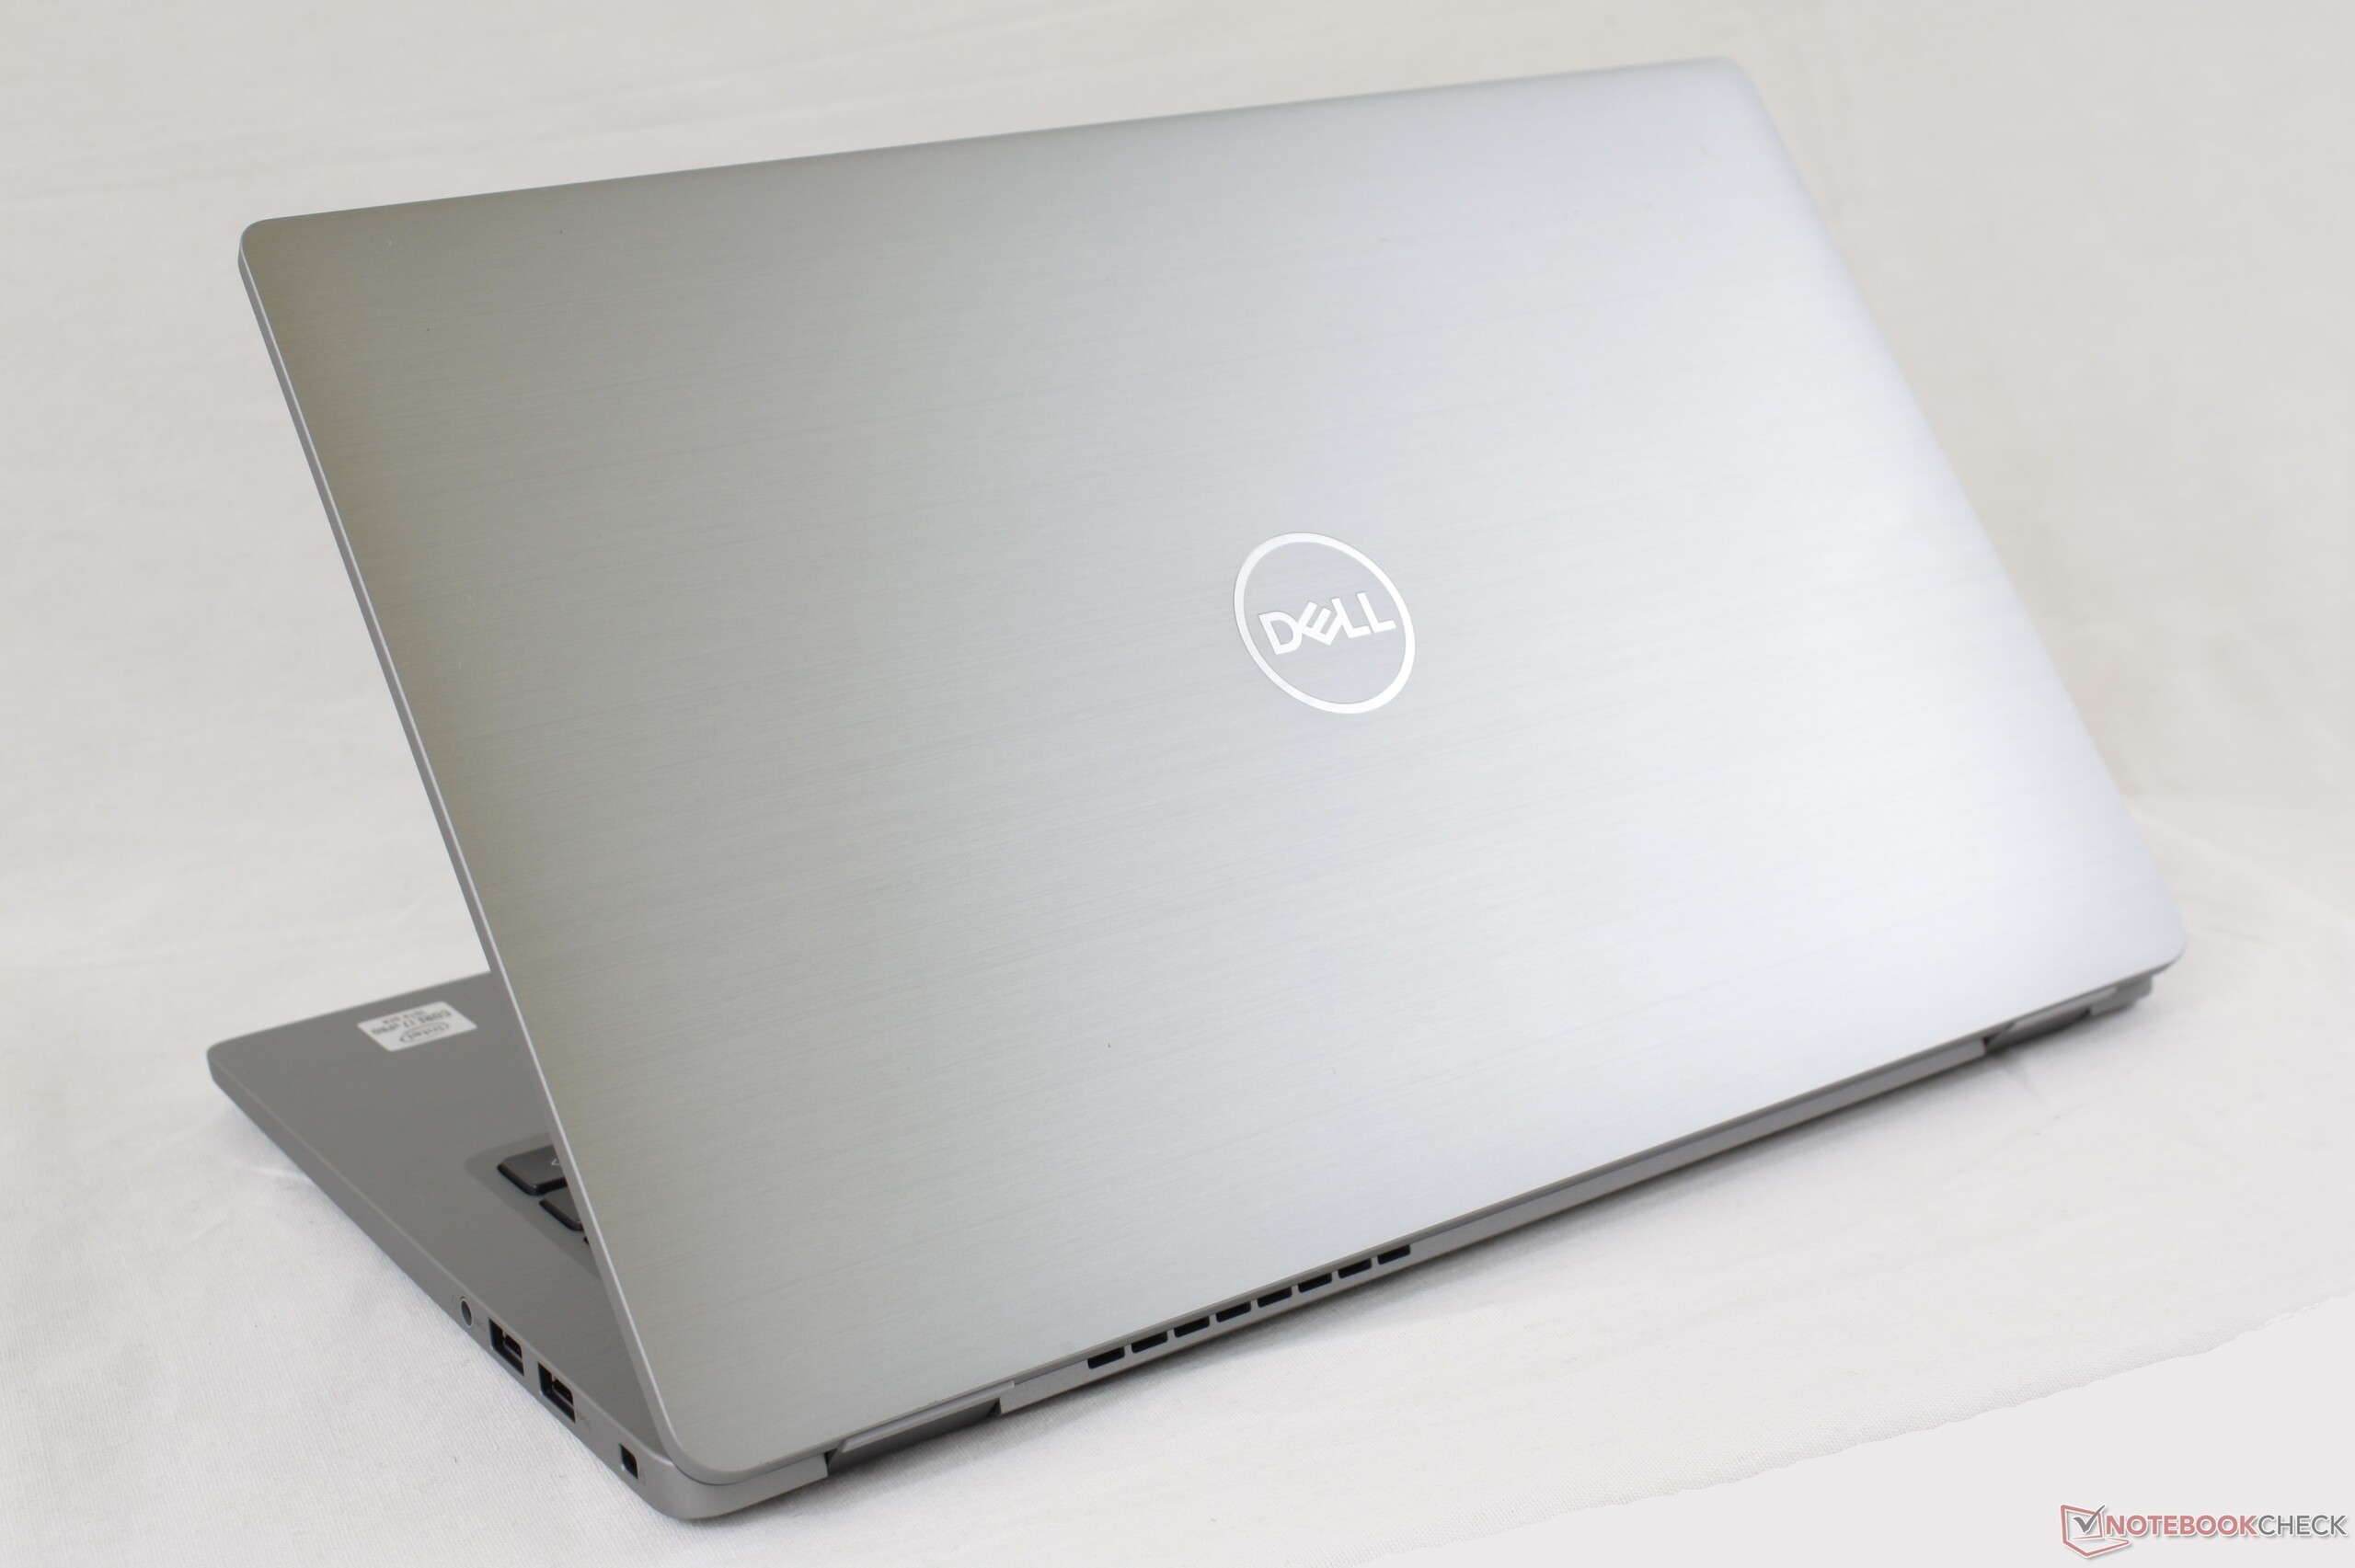
The Latitude 7410 is slightly smaller in length than last year's Latitude 7400 since the bottom bezel is now narrower. Likely because of its stronger chassis, however, the system is also a bit thicker and heavier than other 14-inch subnotebooks including the Lenovo ThinkPad X1 Carbon or Huawei MateBook X Pro.
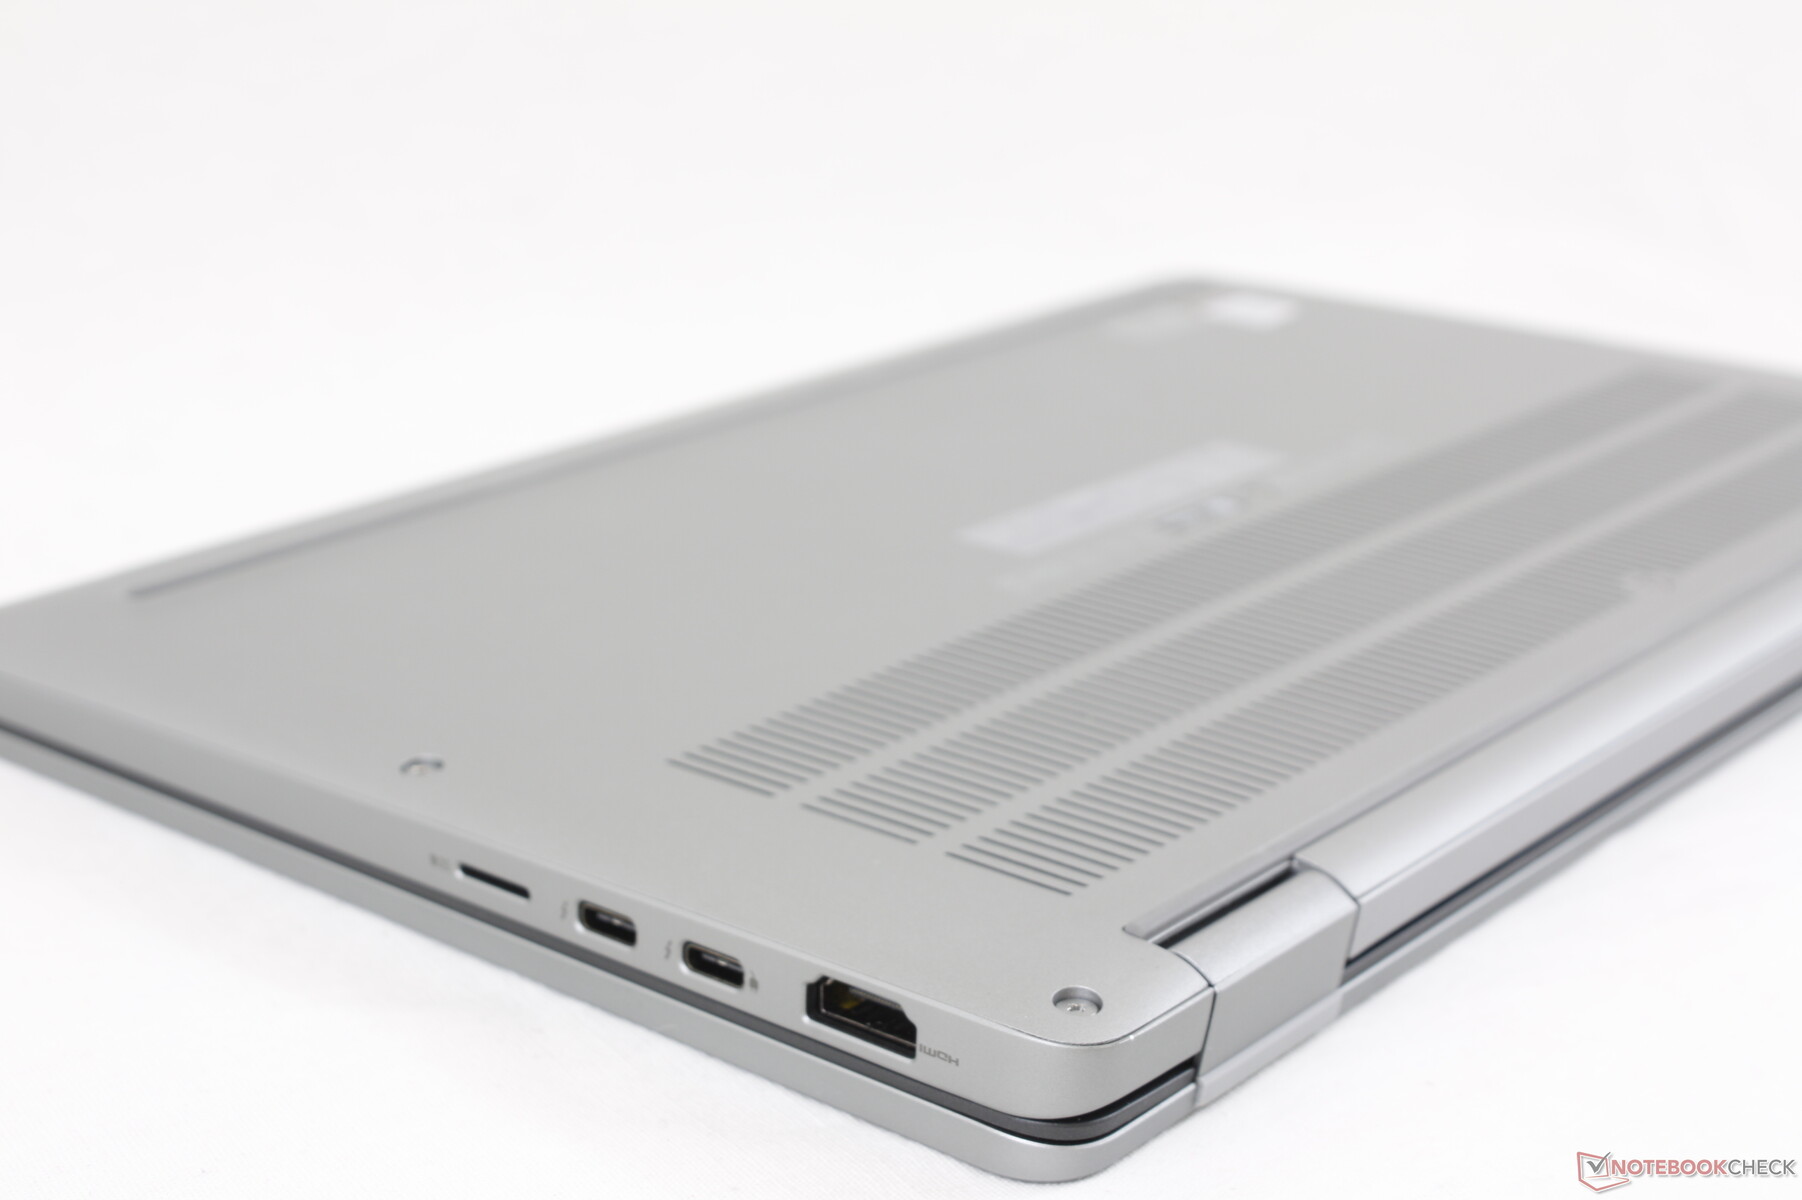
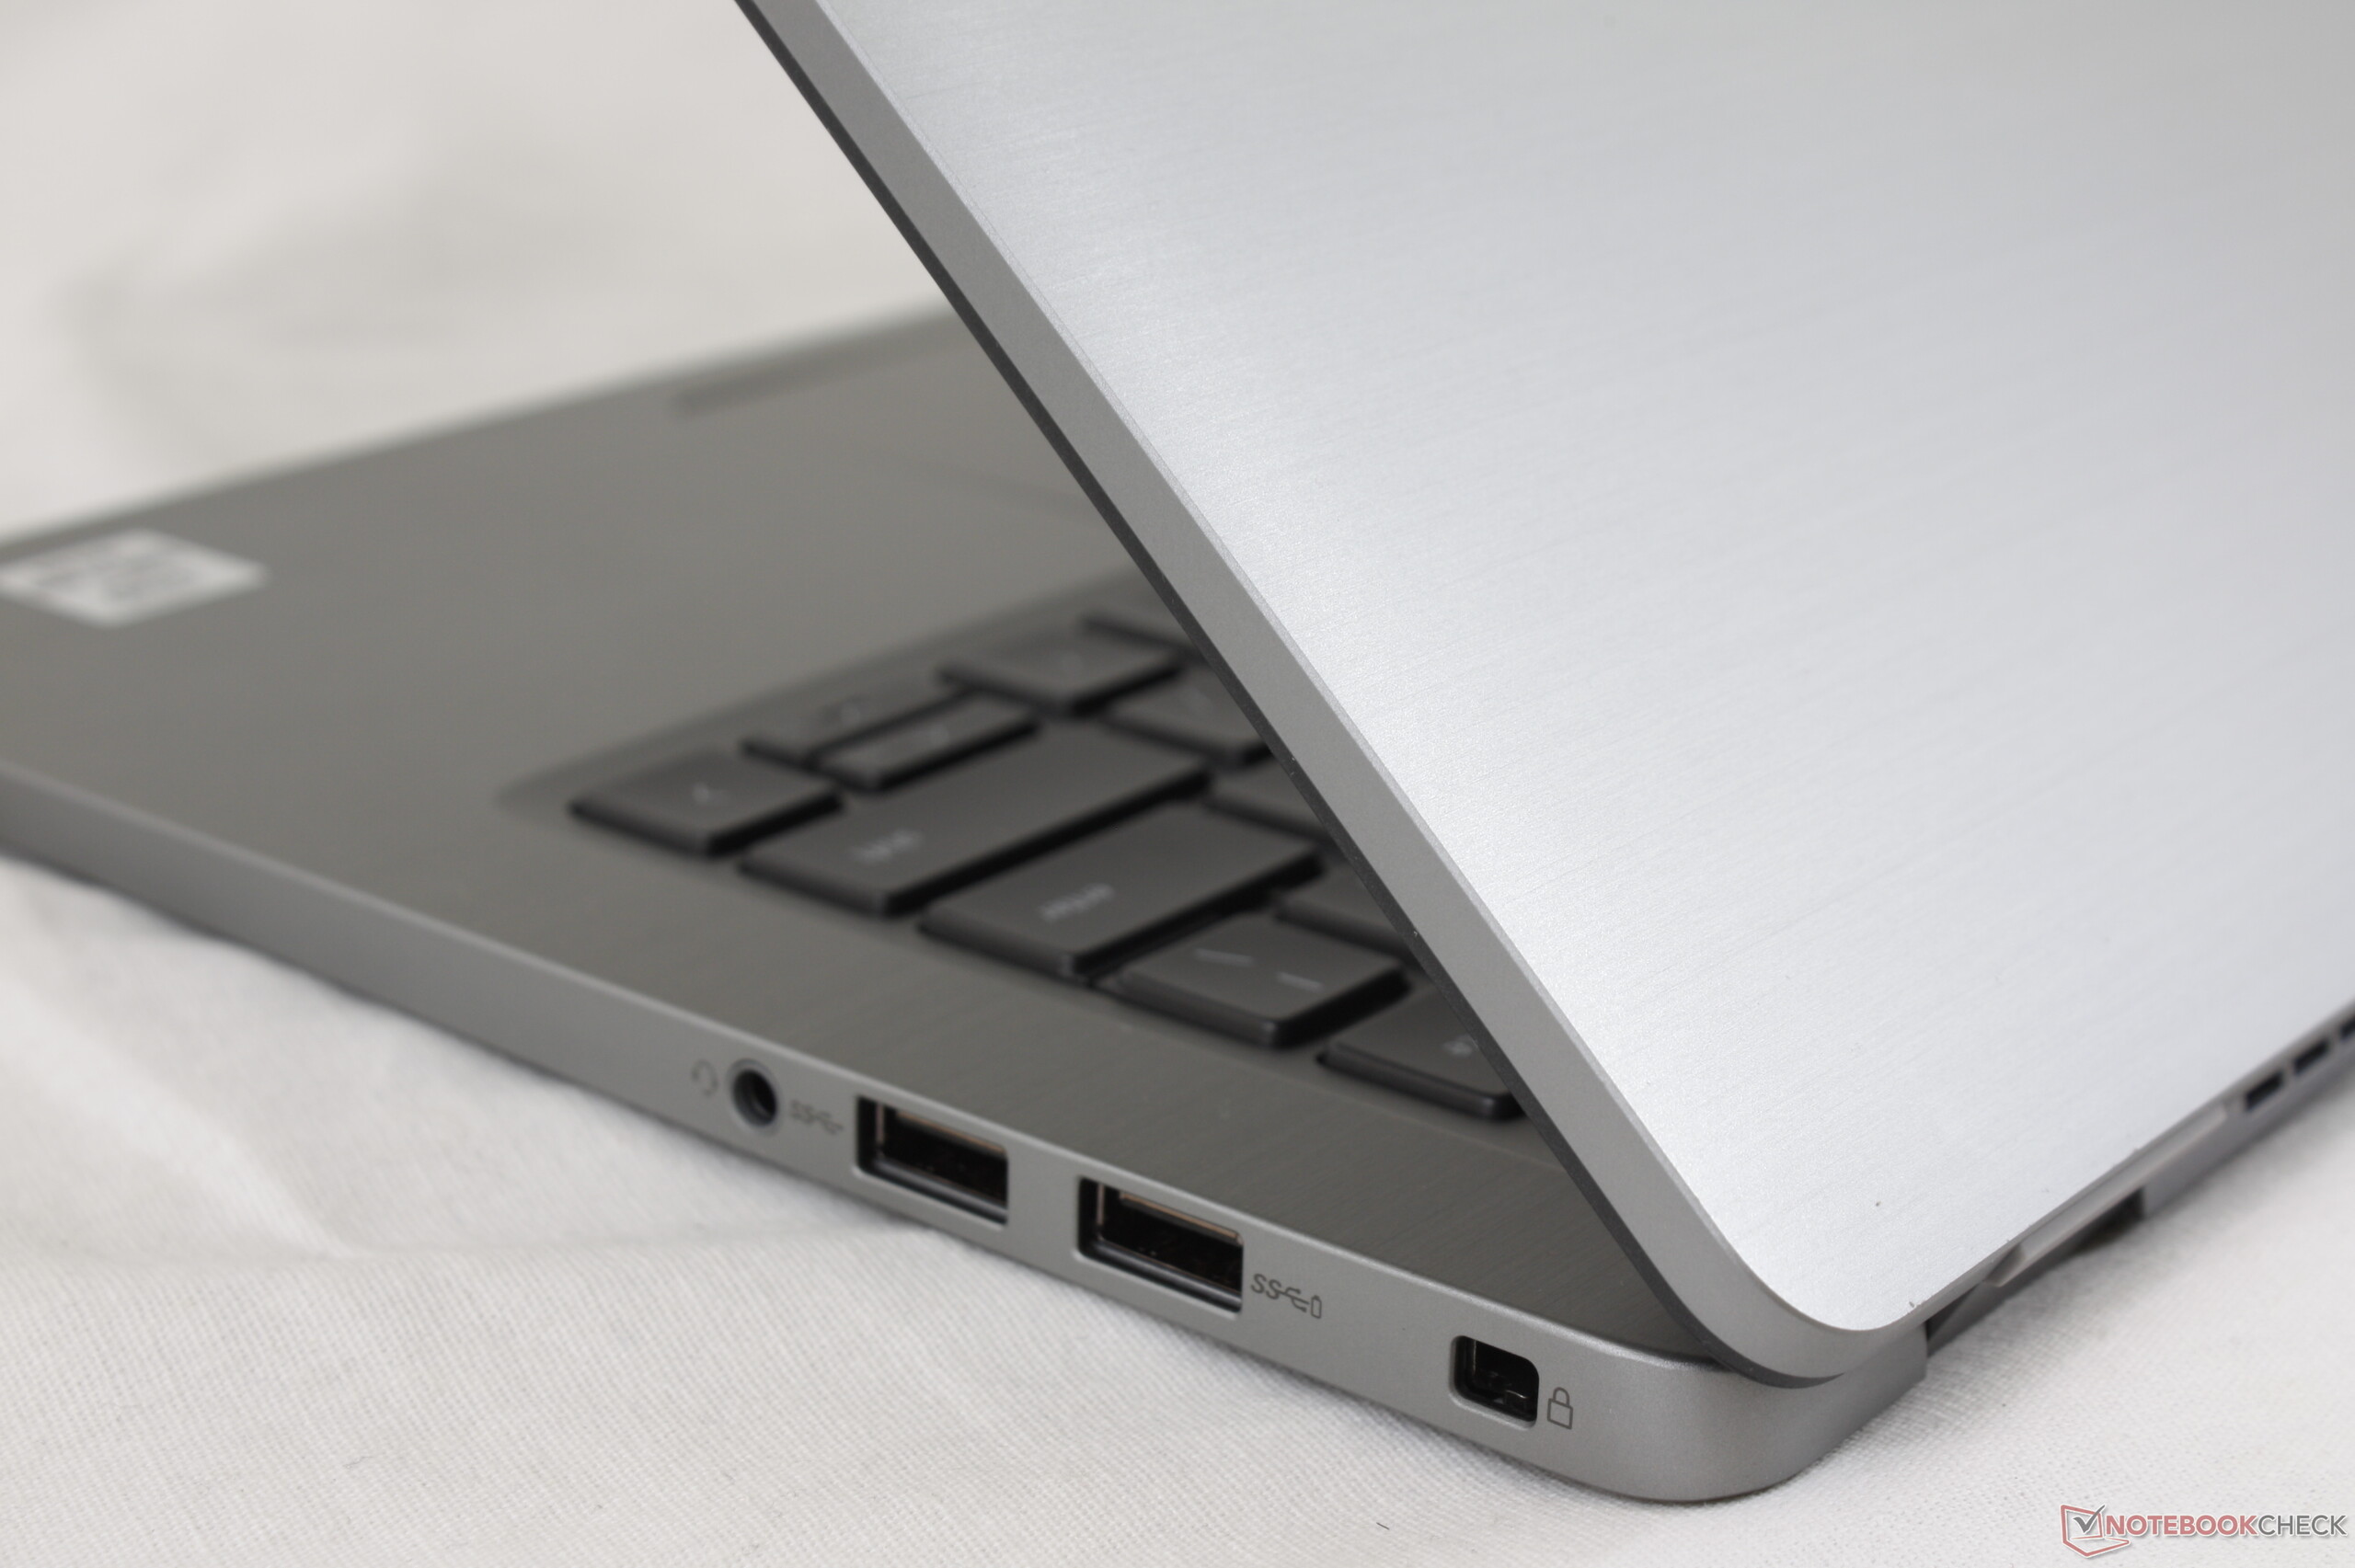
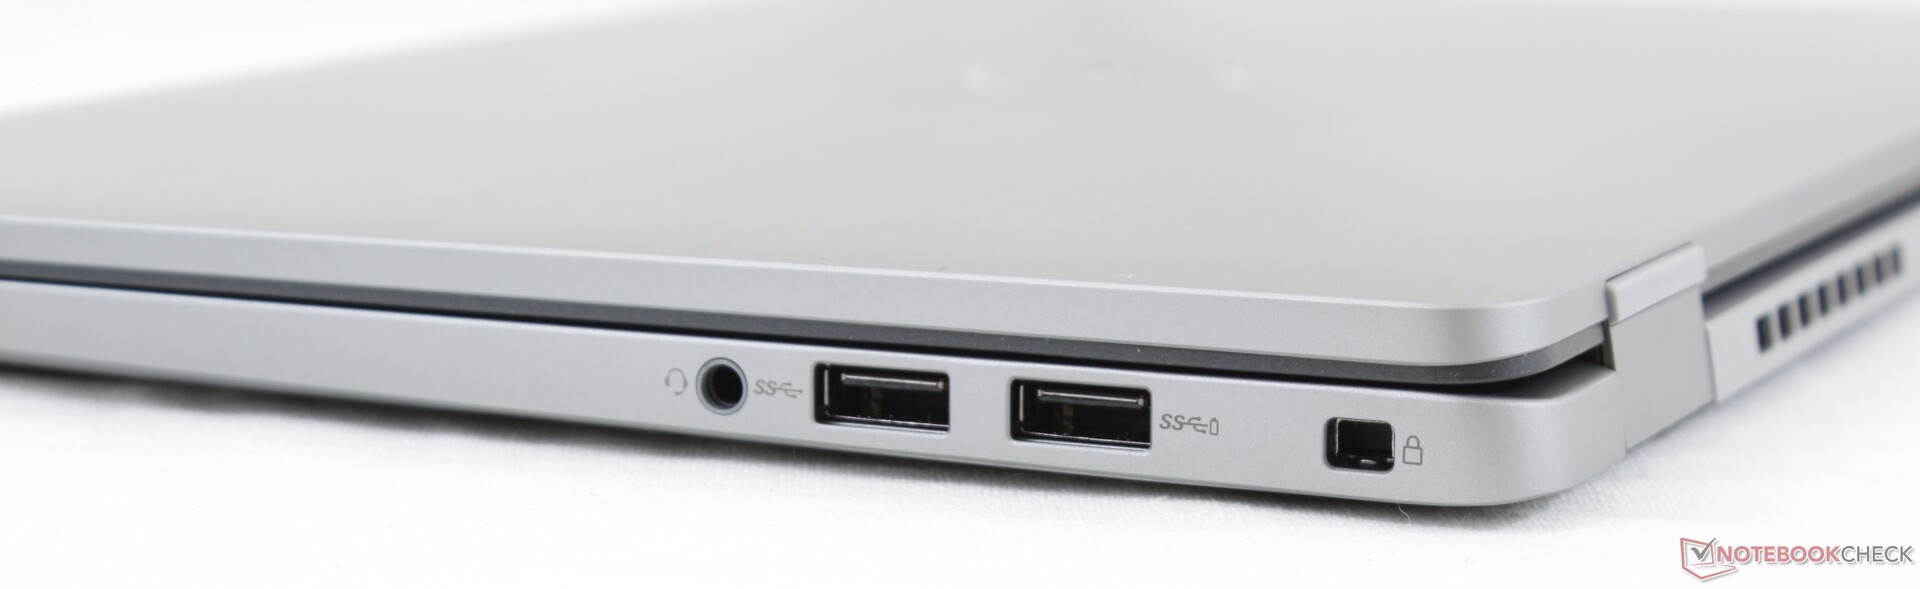
Connectivity
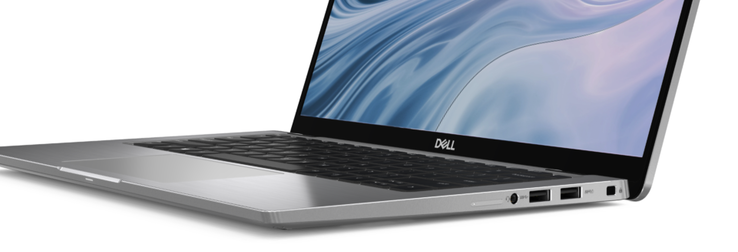
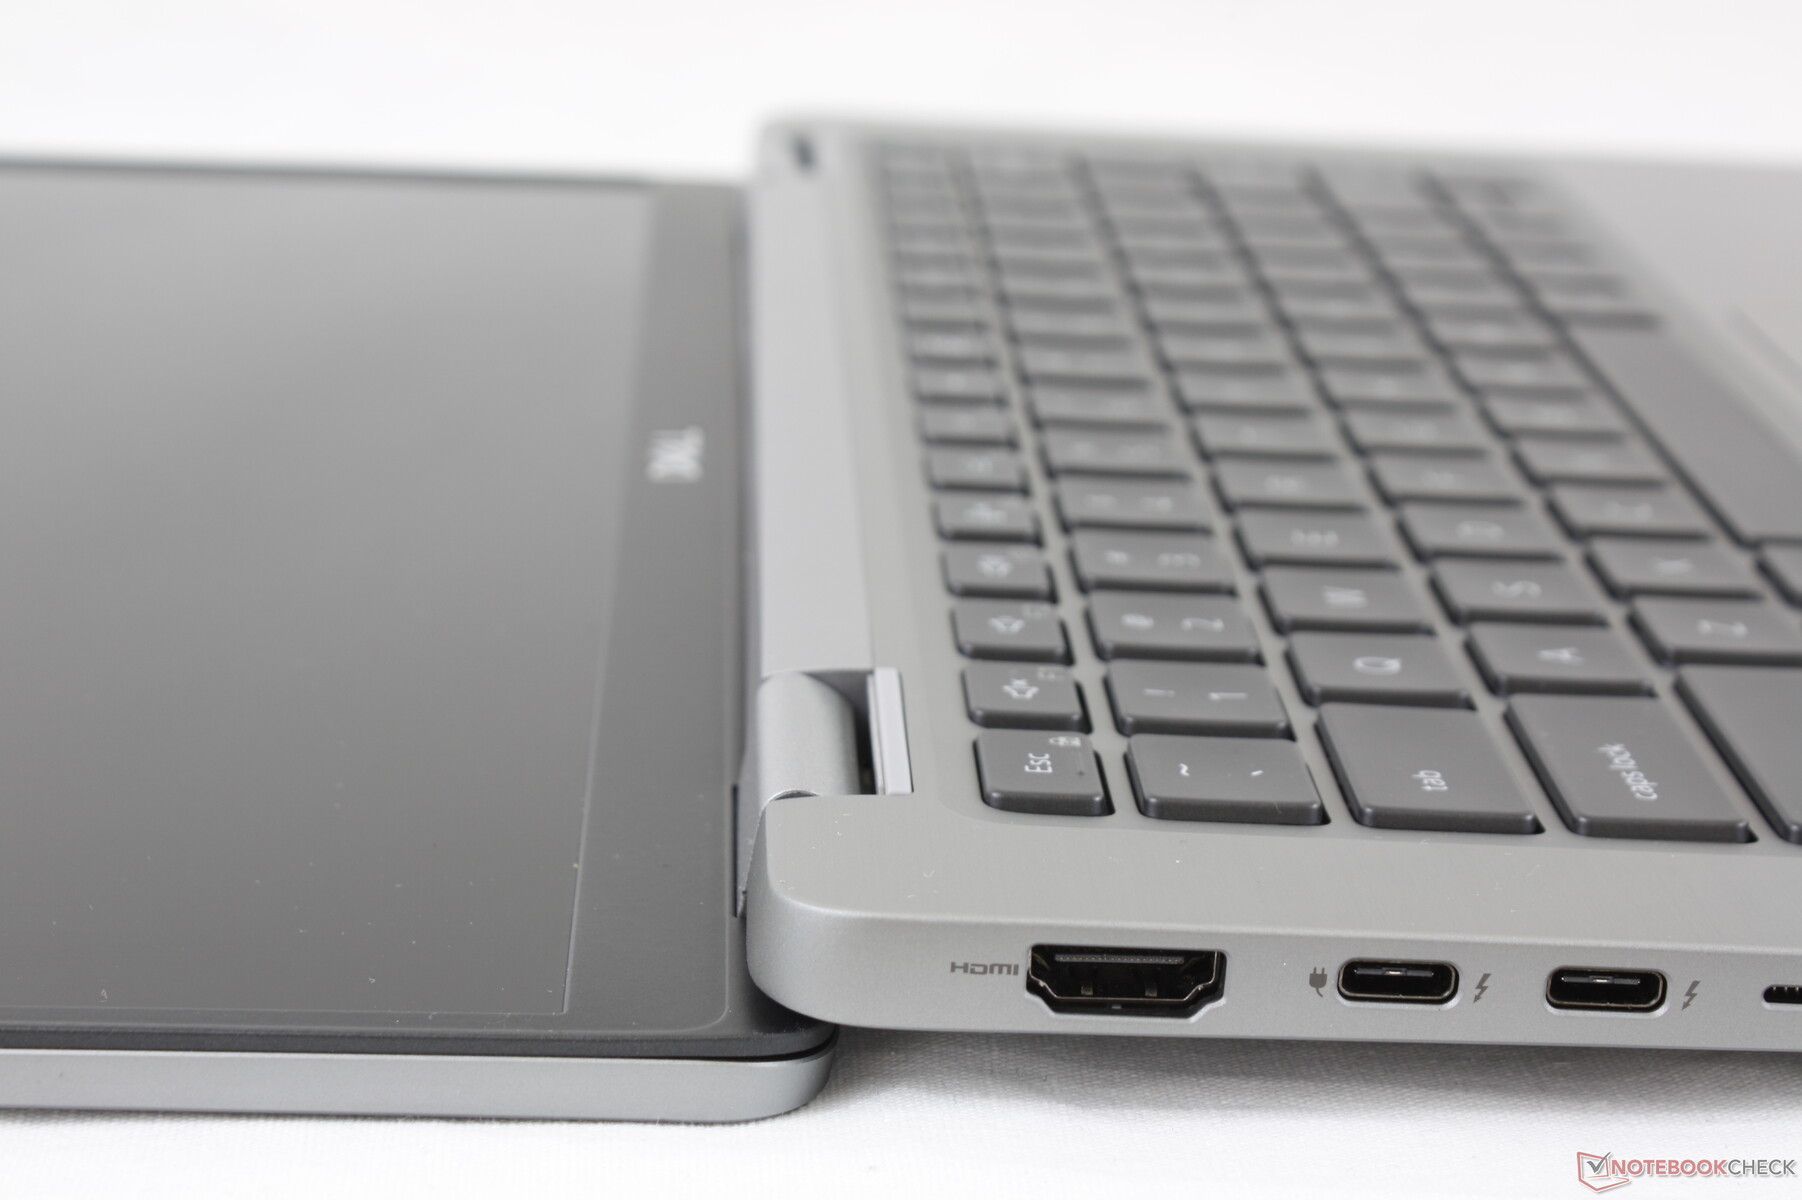
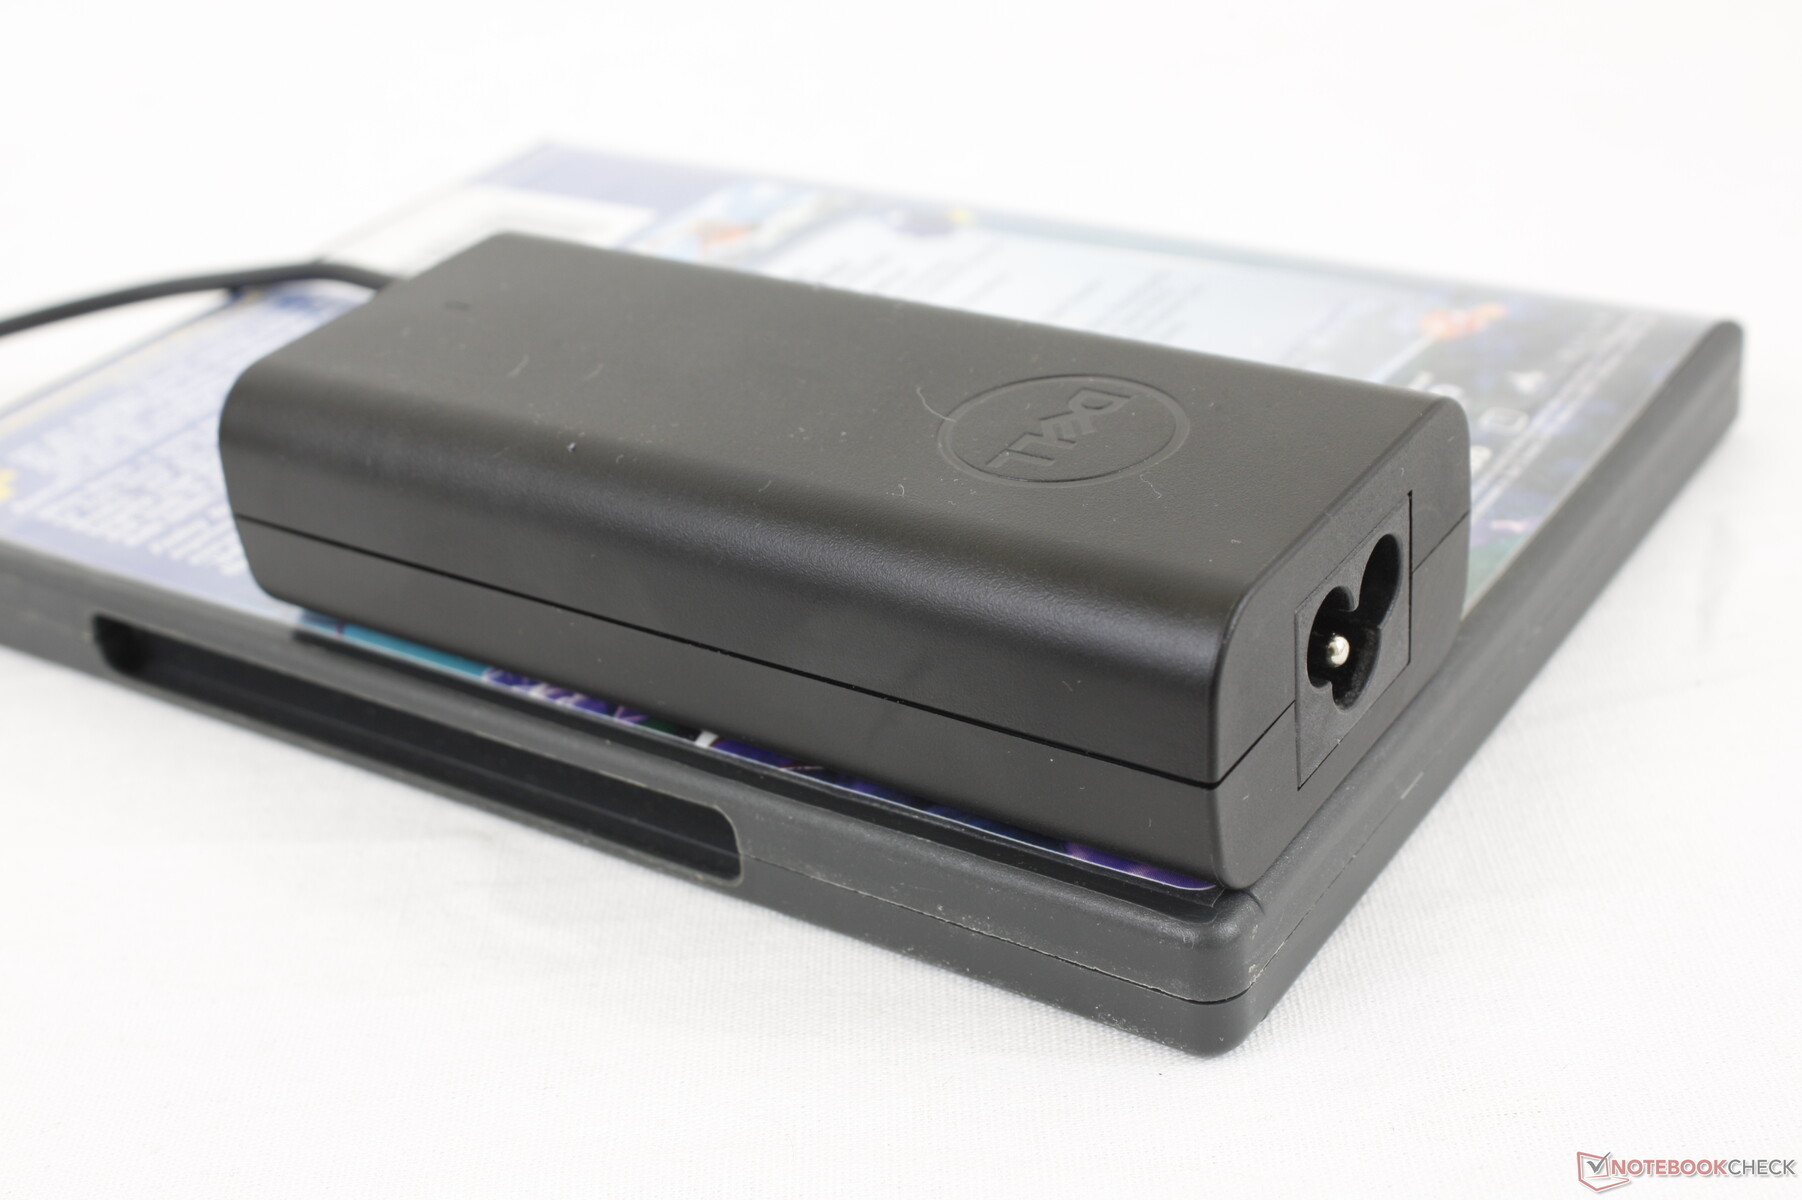
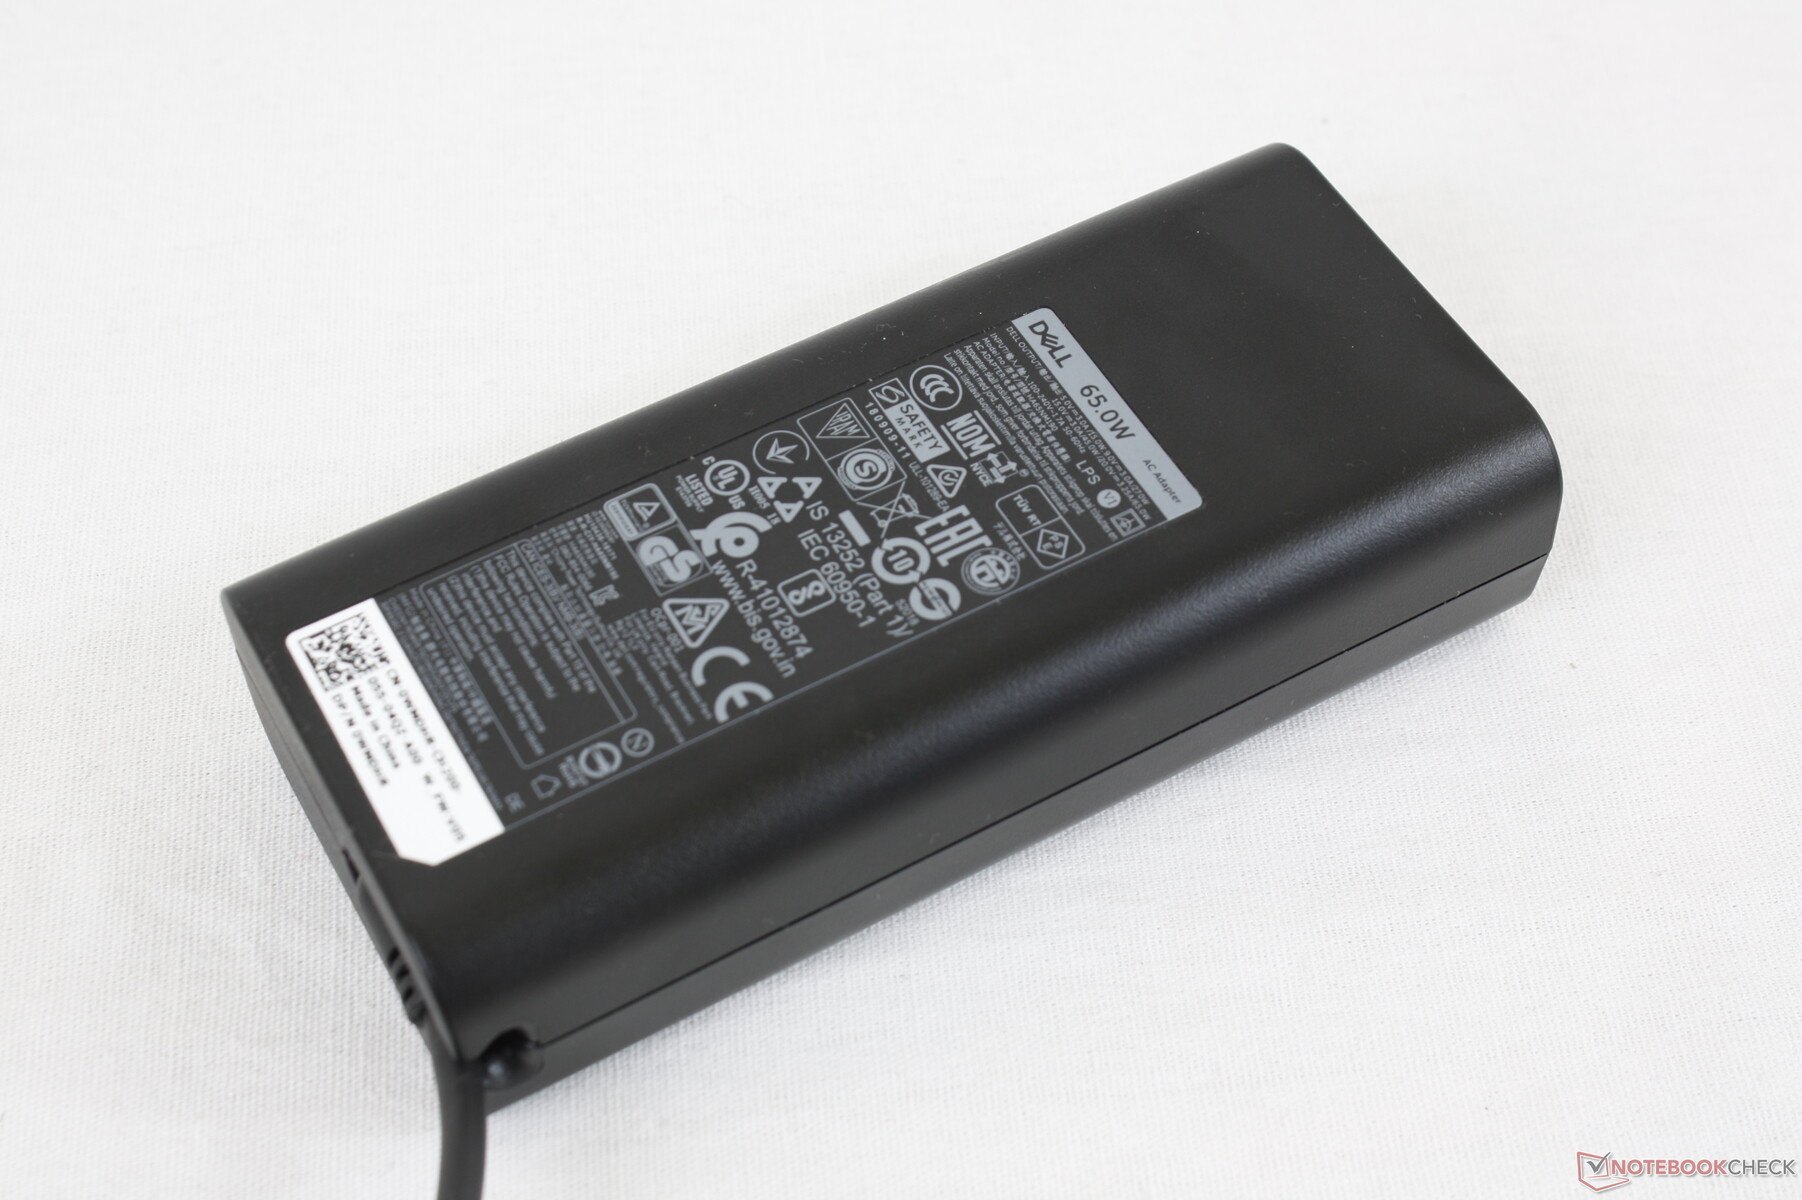
Dell has dropped the proprietary barrel AC adapter port for a second Thunderbolt 3 port when compared to the Latitude 7400. This means that the system has moved to USB-C charging only much like on the XPS 13 series and most other newer Ultrabooks. Additionally, ports have been rearranged while both the SmartCard and uSIM readers continue to be optional.
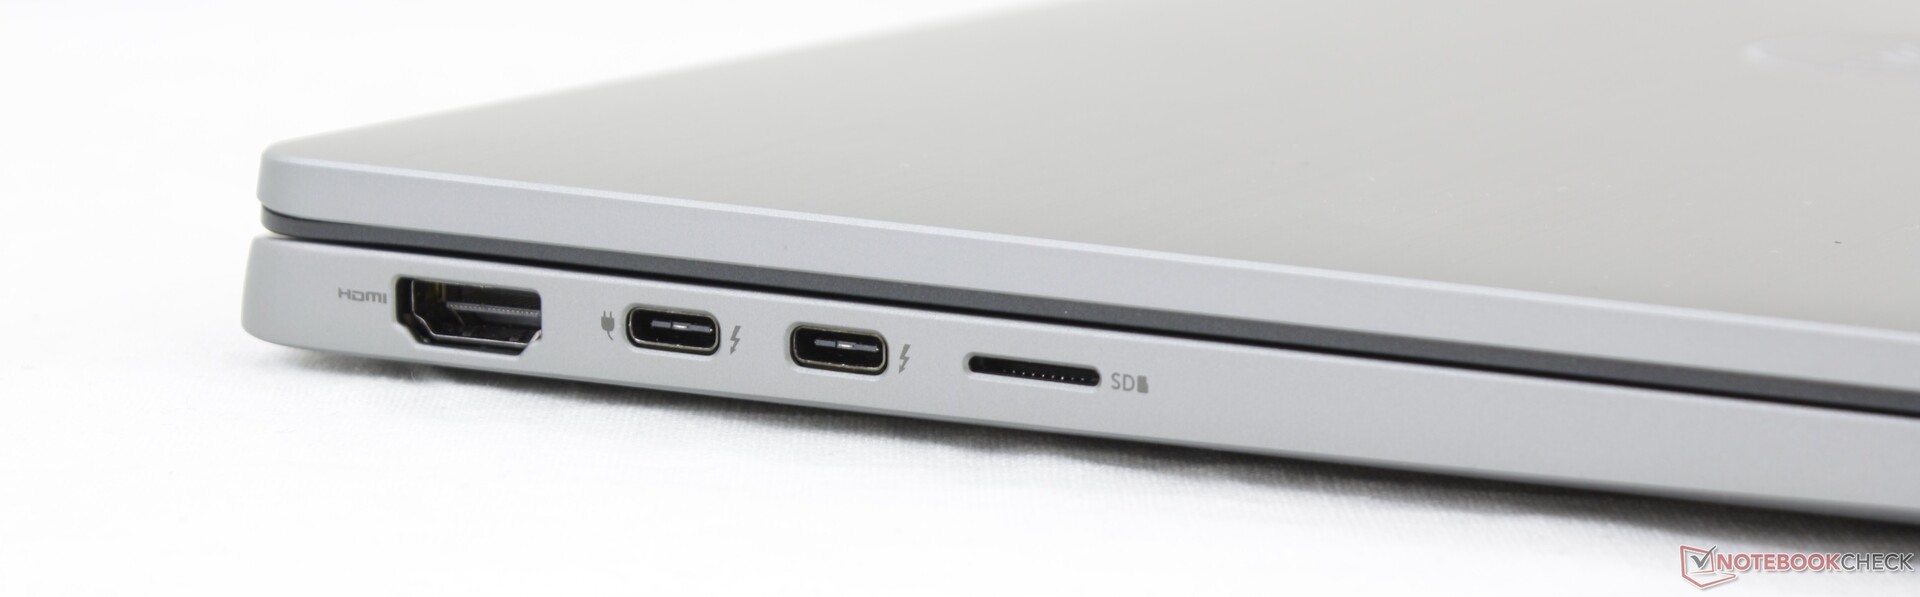
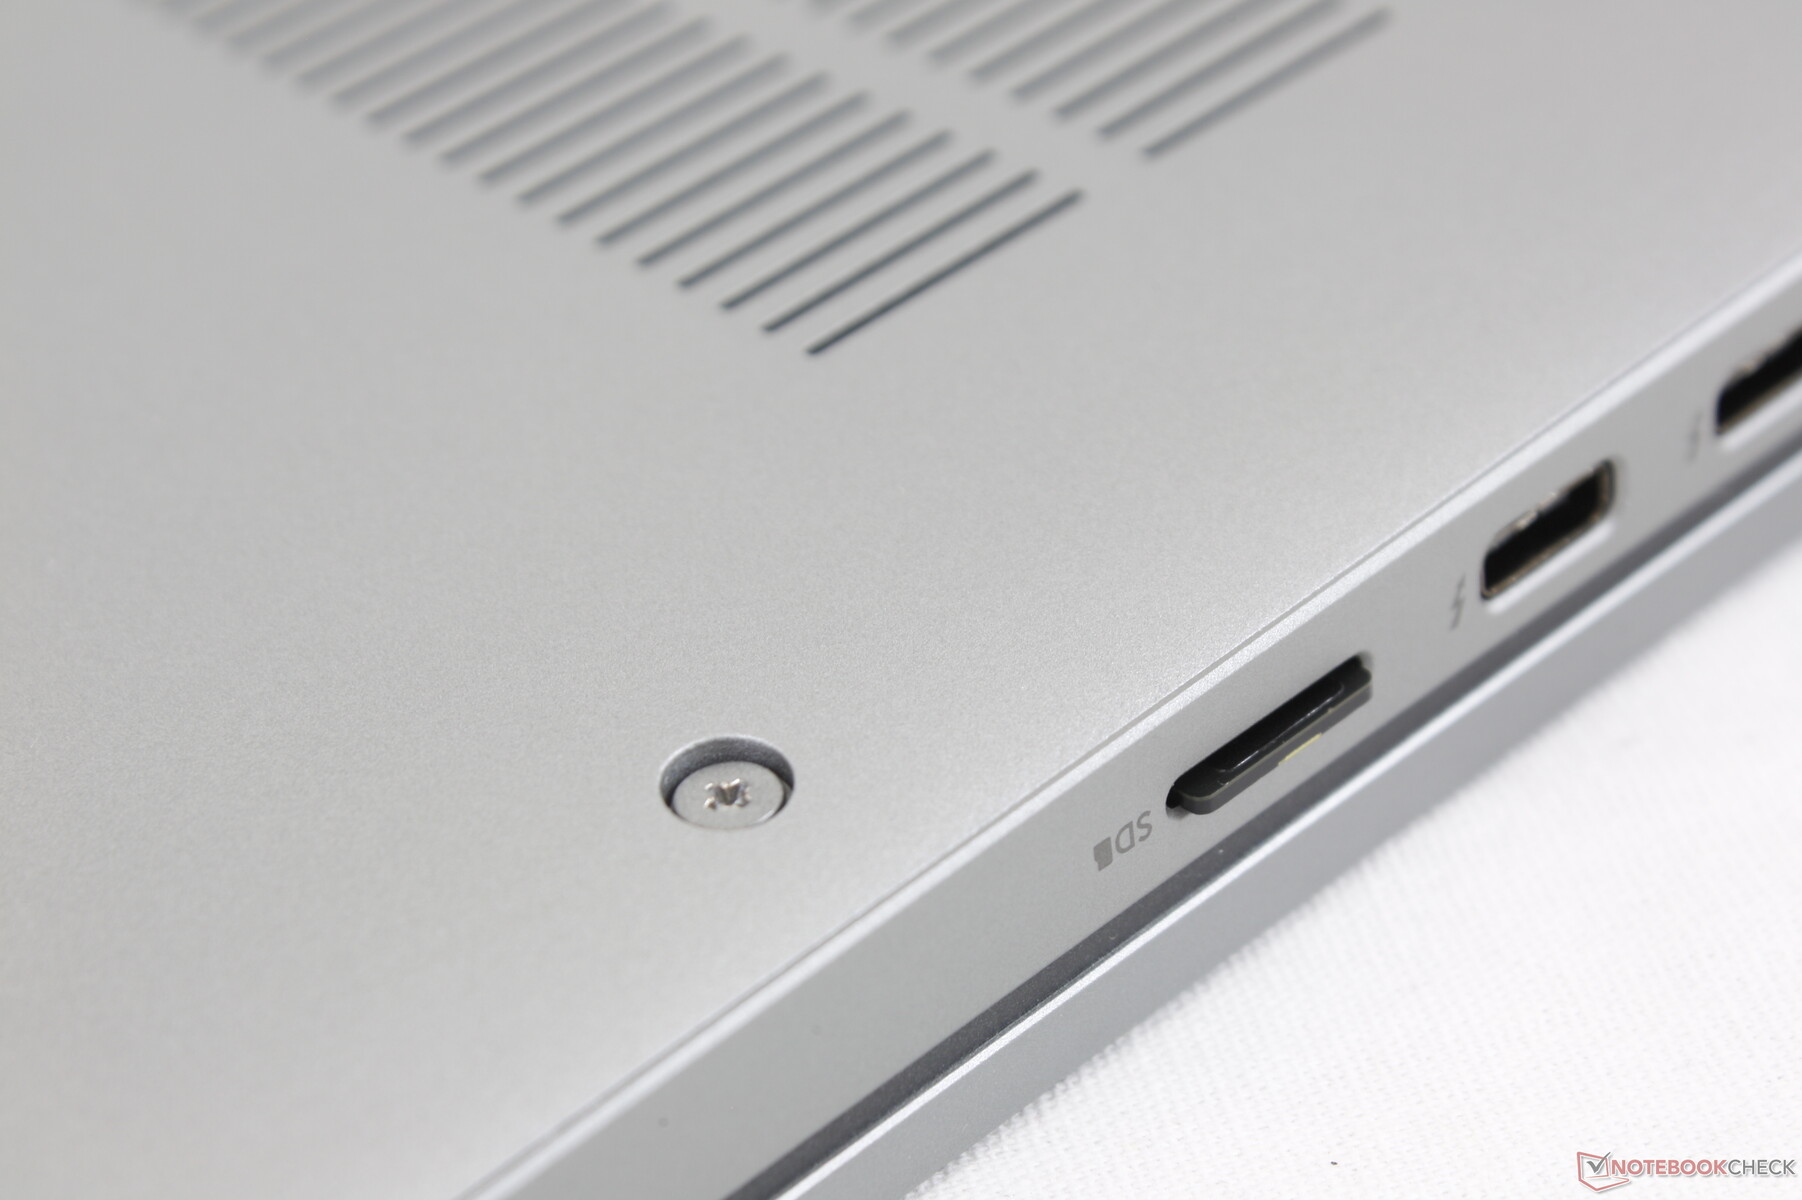
SD Card Reader
The spring-loaded MicroSD card reader returns with fast transfer rates. Moving 1 GB of pictures from our UHS-II test card to desktop takes about 7 seconds much like on the XPS 13.
| SD Card Reader | |
| average JPG Copy Test (av. of 3 runs) | |
| Dell Latitude 7400-8N6DH (Toshiba Exceria Pro M501 64 GB UHS-II) | |
| Dell Latitude 7410 (Toshiba Exceria Pro M501 64 GB UHS-II) | |
| Dell XPS 13 9300 4K UHD (Toshiba Exceria Pro M501 64 GB UHS-II) | |
| MSI Modern 14 A10RB-459US (Toshiba Exceria Pro SDXC 64 GB UHS-II) | |
| Asus VivoBook S14 S433FL (Toshiba Exceria Pro M501 microSDXC 64GB) | |
| maximum AS SSD Seq Read Test (1GB) | |
| Dell Latitude 7400-8N6DH (Toshiba Exceria Pro M501 64 GB UHS-II) | |
| Dell XPS 13 9300 4K UHD (Toshiba Exceria Pro M501 64 GB UHS-II) | |
| Dell Latitude 7410 (Toshiba Exceria Pro M501 64 GB UHS-II) | |
| MSI Modern 14 A10RB-459US (Toshiba Exceria Pro SDXC 64 GB UHS-II) | |
| Asus VivoBook S14 S433FL (Toshiba Exceria Pro M501 microSDXC 64GB) | |
Communication
Dell offers Intel 9560 or AX201 options for Wi-Fi 5 and Wi-Fi 6 connectivity, respectively. We experienced no issues on our AX201-equipped unit when connected to a Netgear RAX200 router.
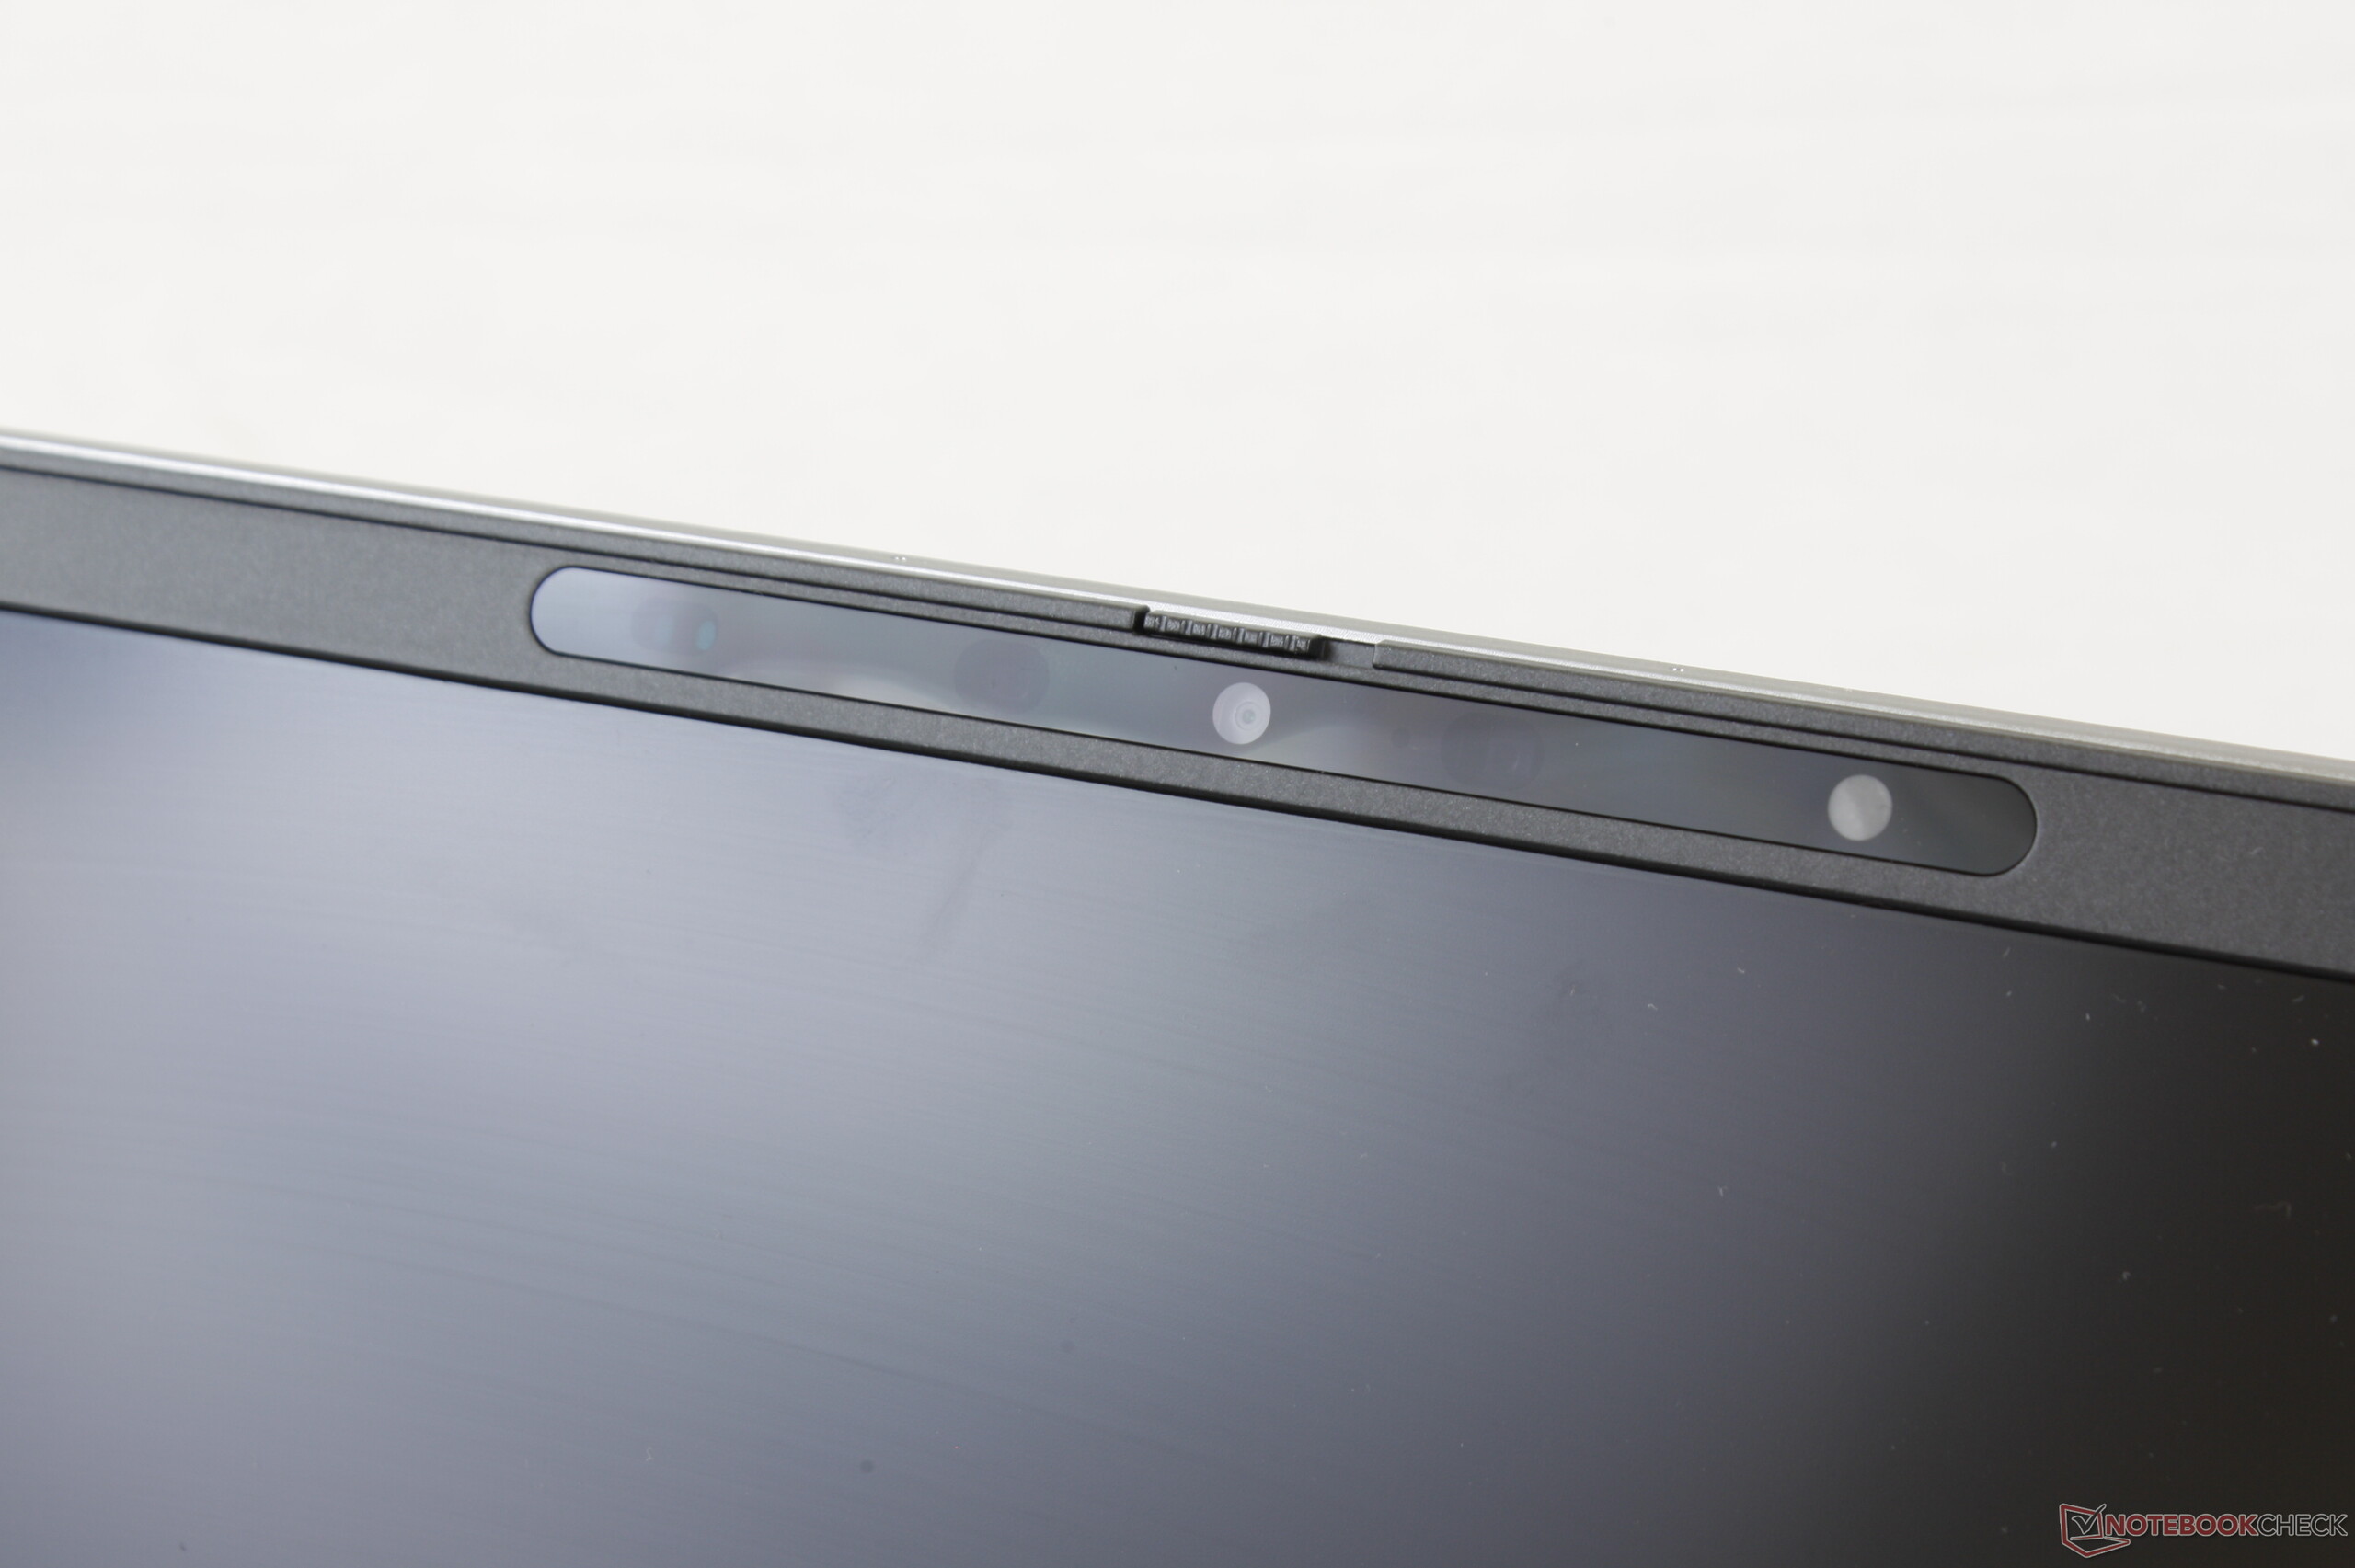
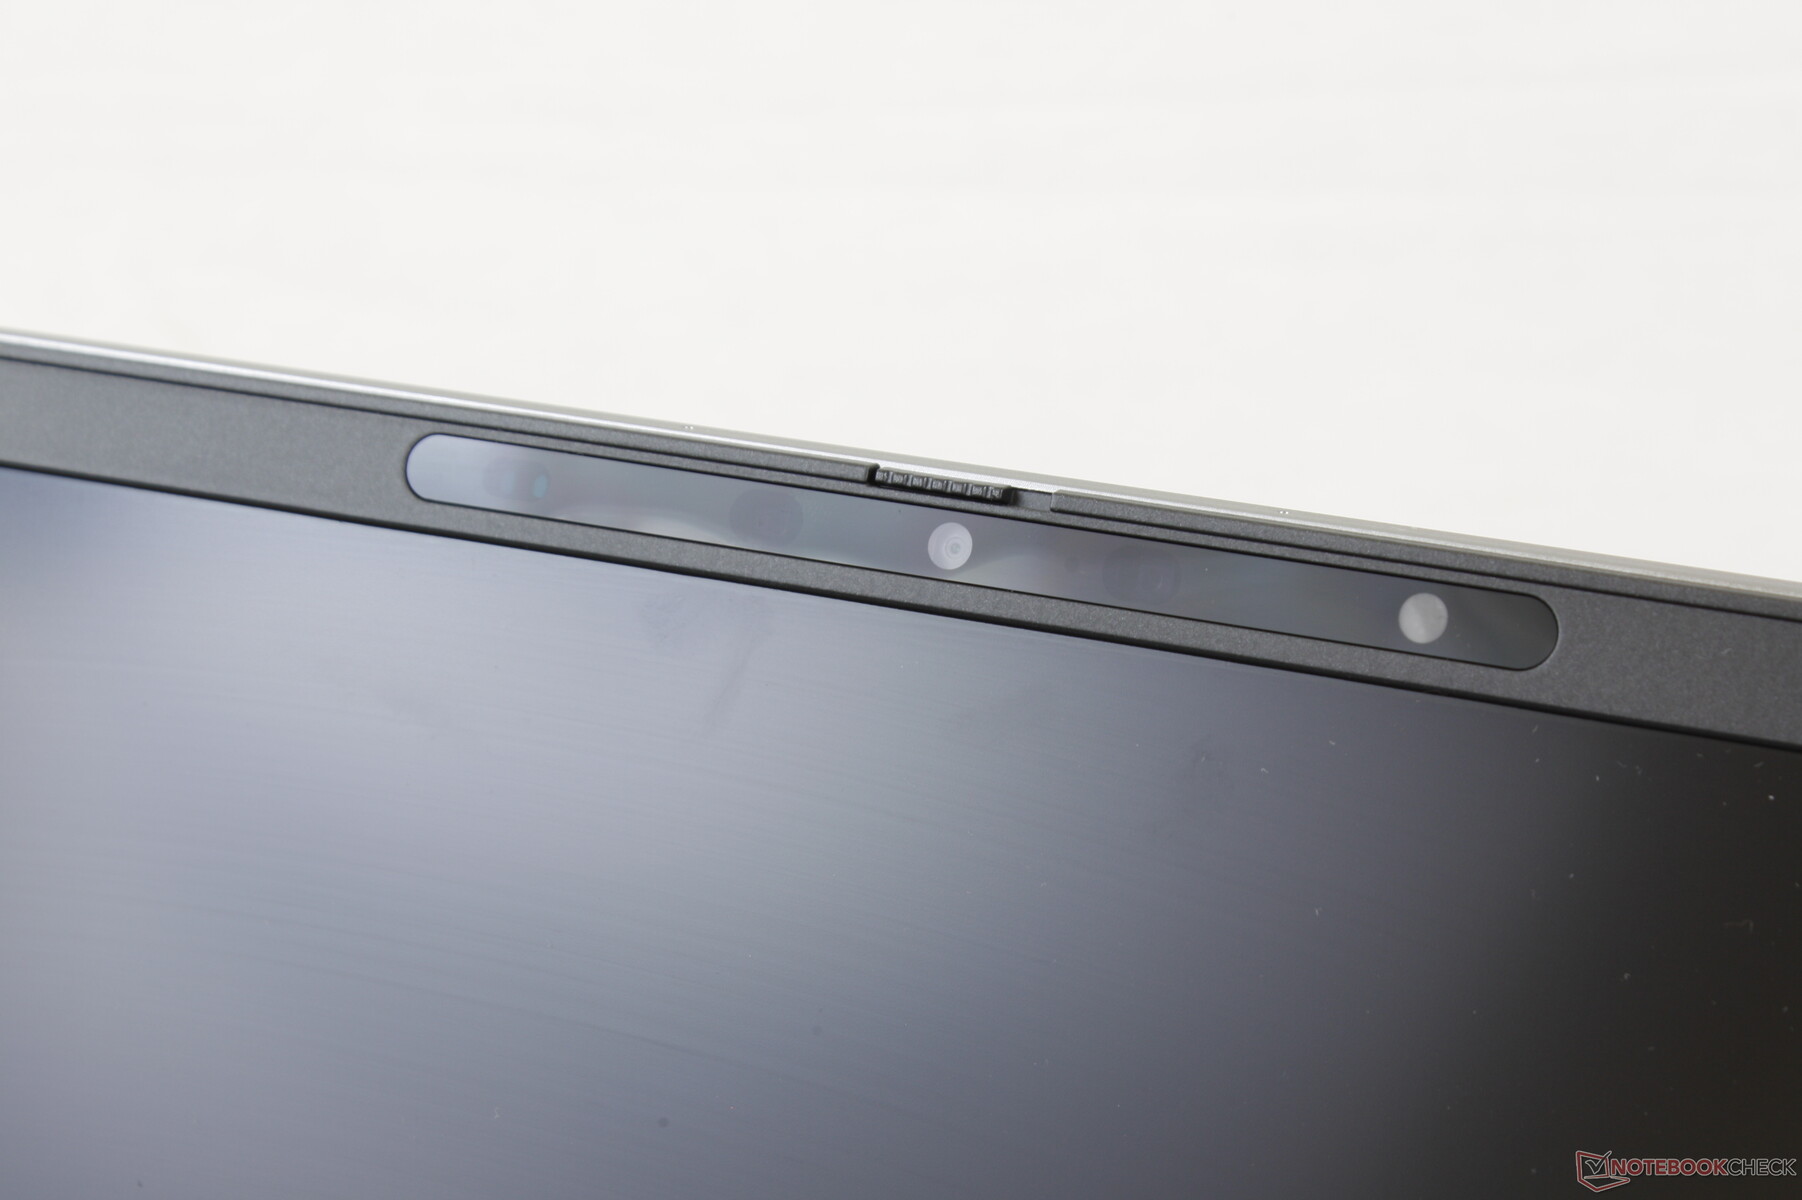
Webcam


Security
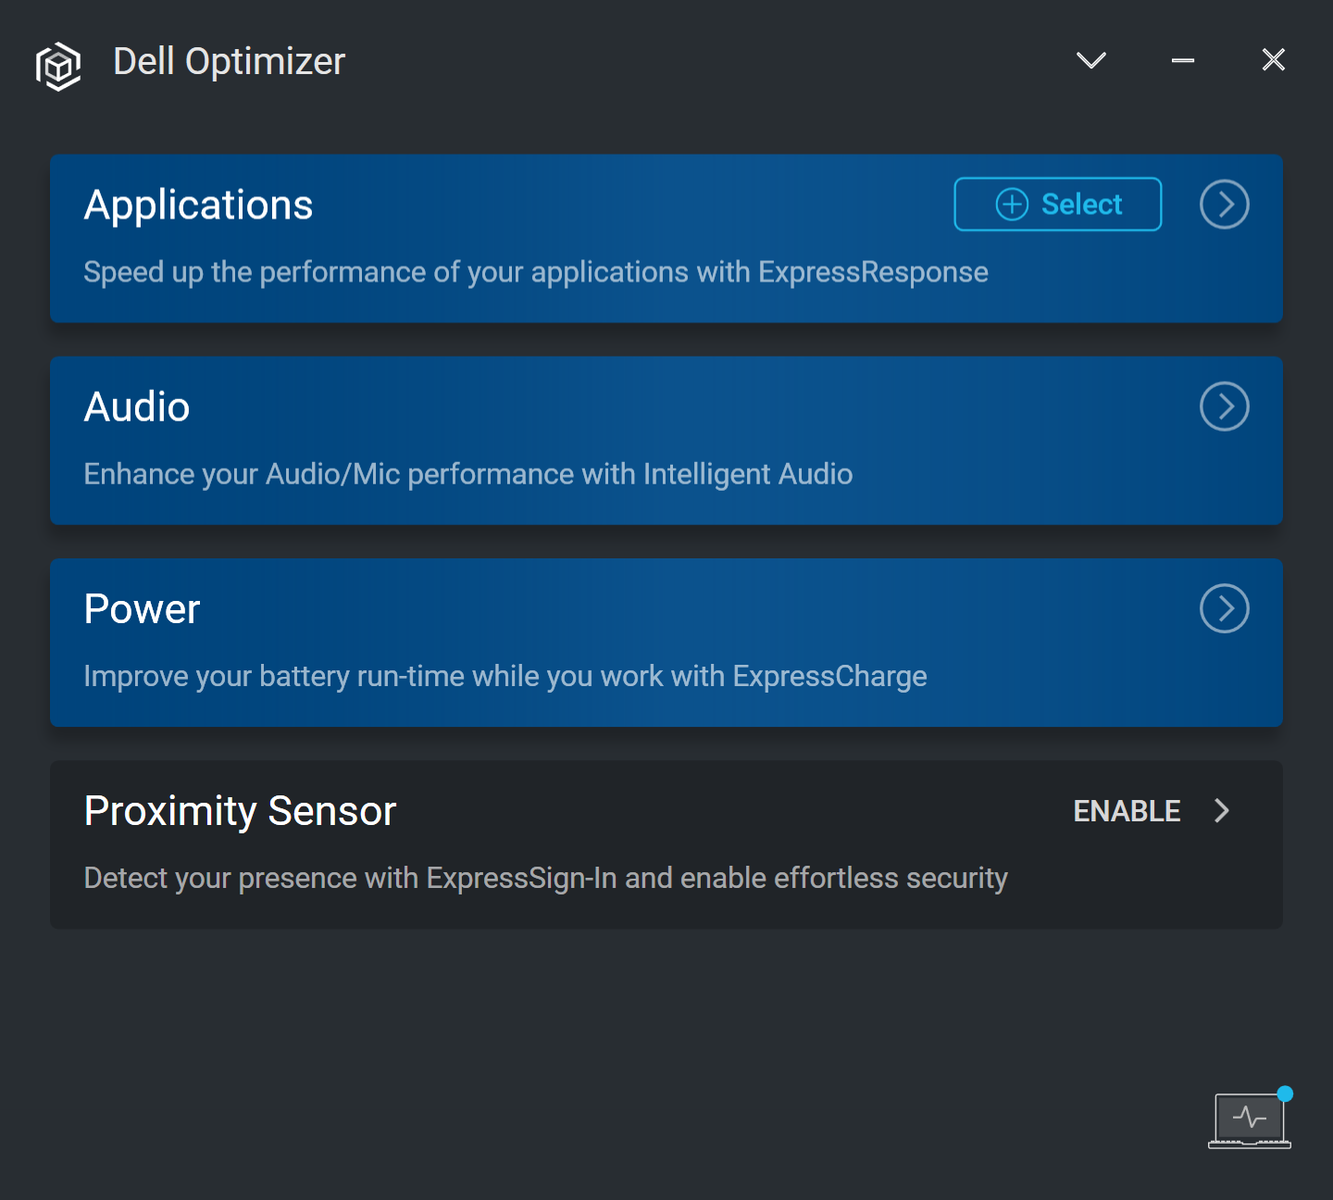
The webcam shutter comes standard while vPro, fingerprint reader, proximity sensor, and IR camera are all optional. The proximity sensor is unique to higher-end Latitude laptops as it allows the system to automatically sign off if nobody is nearby or even sign on if it detects the user (ExpressSign-In).
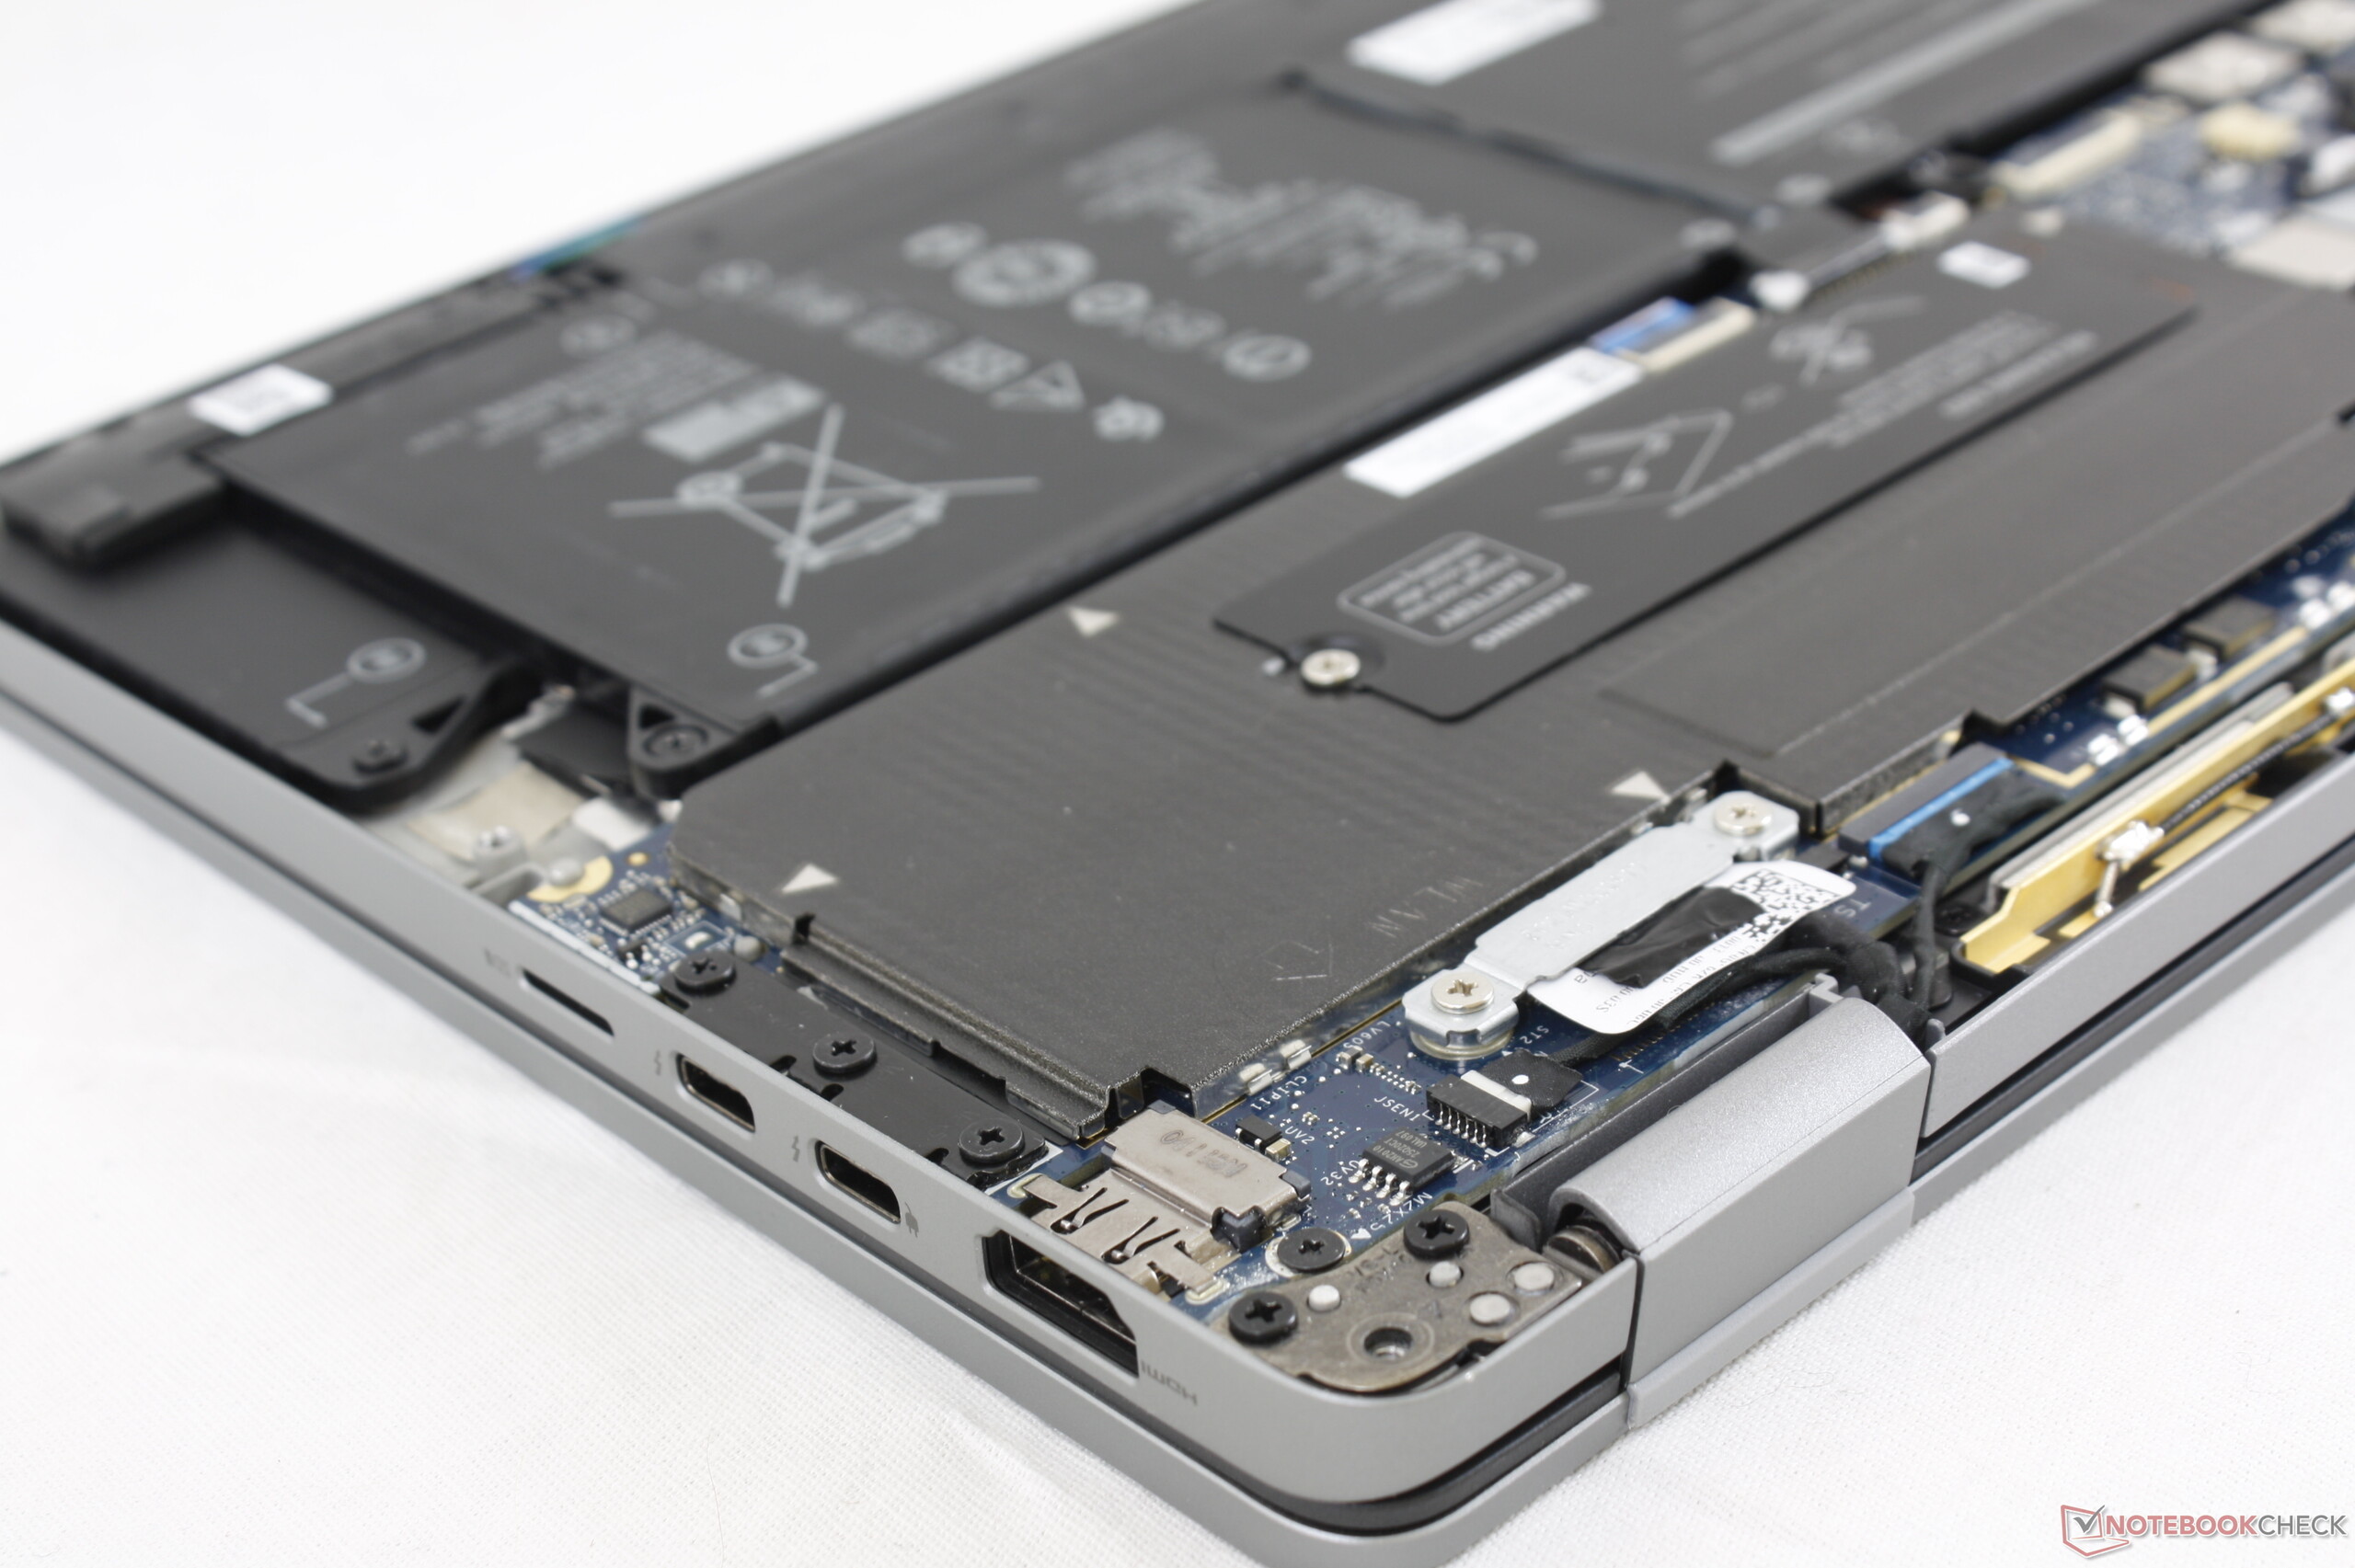
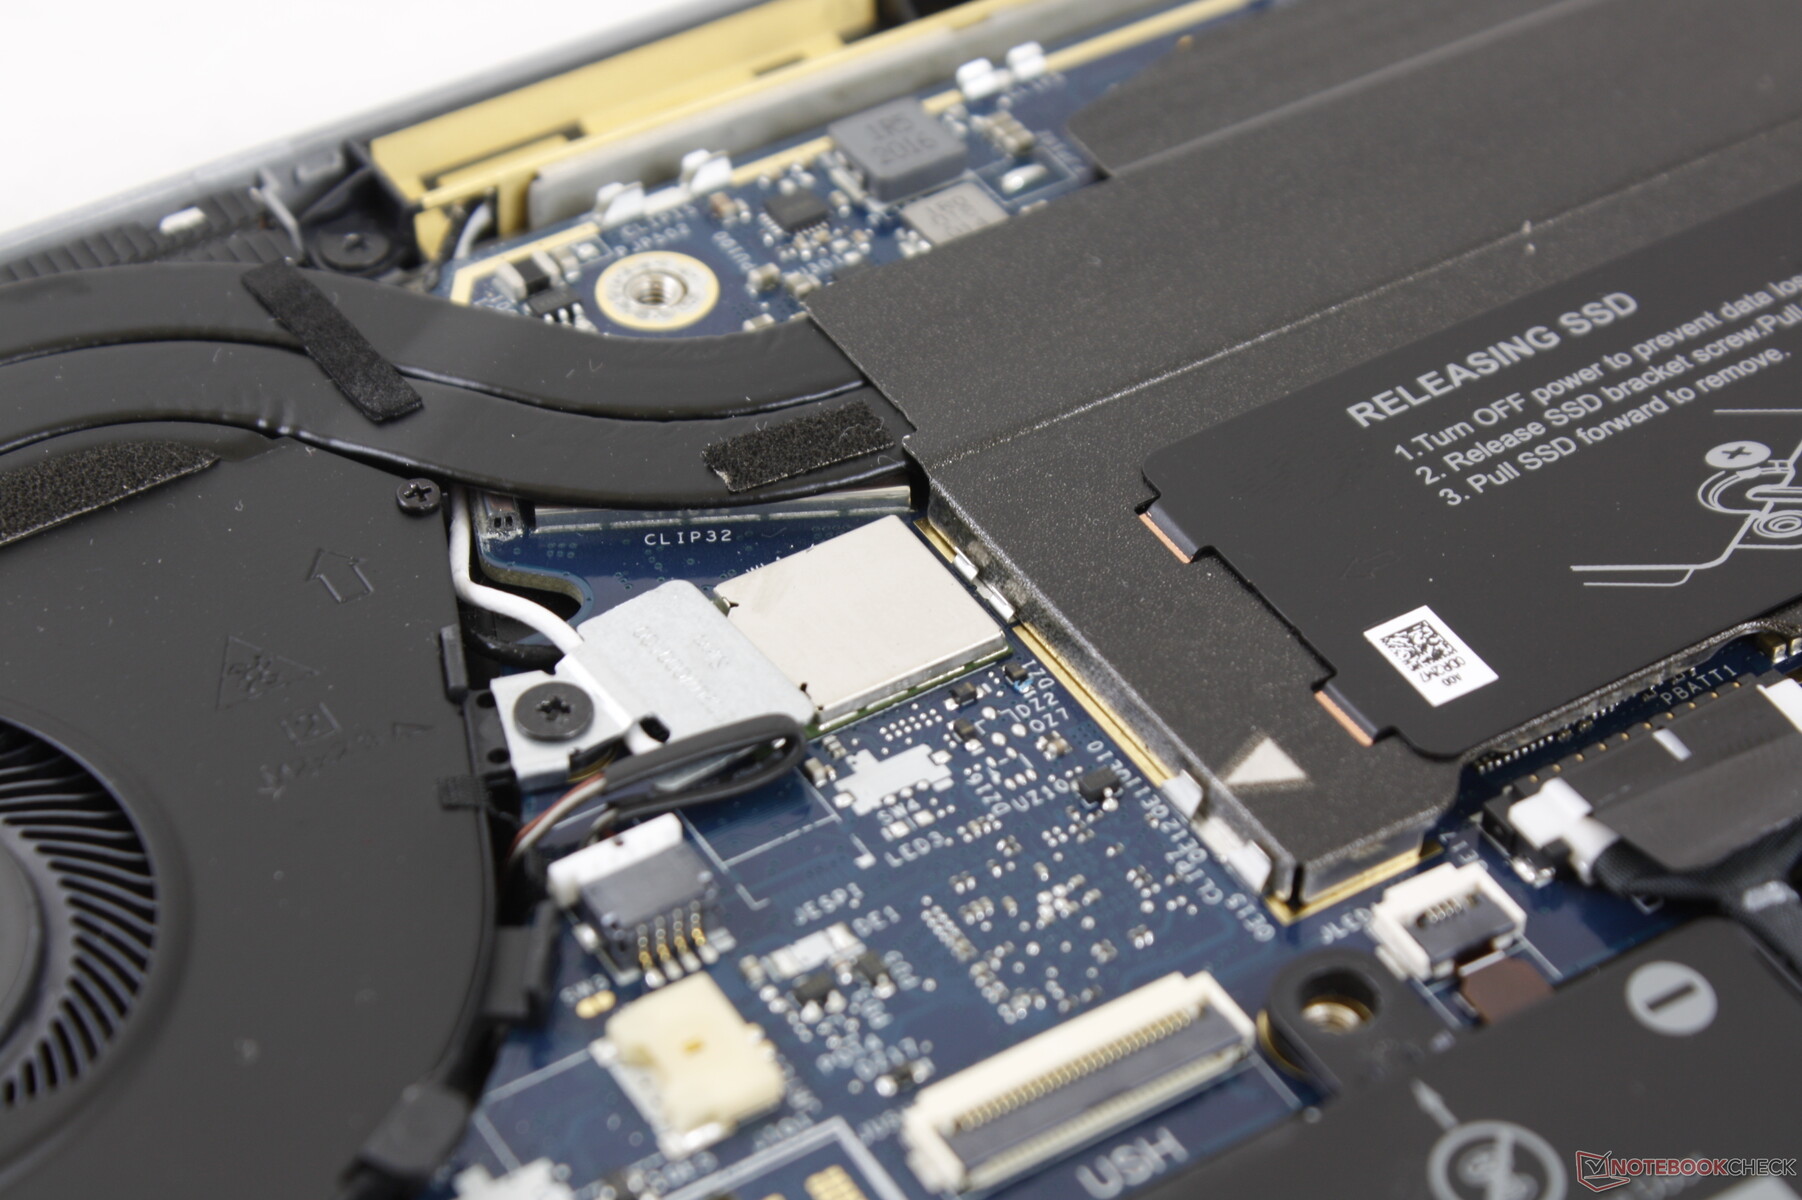
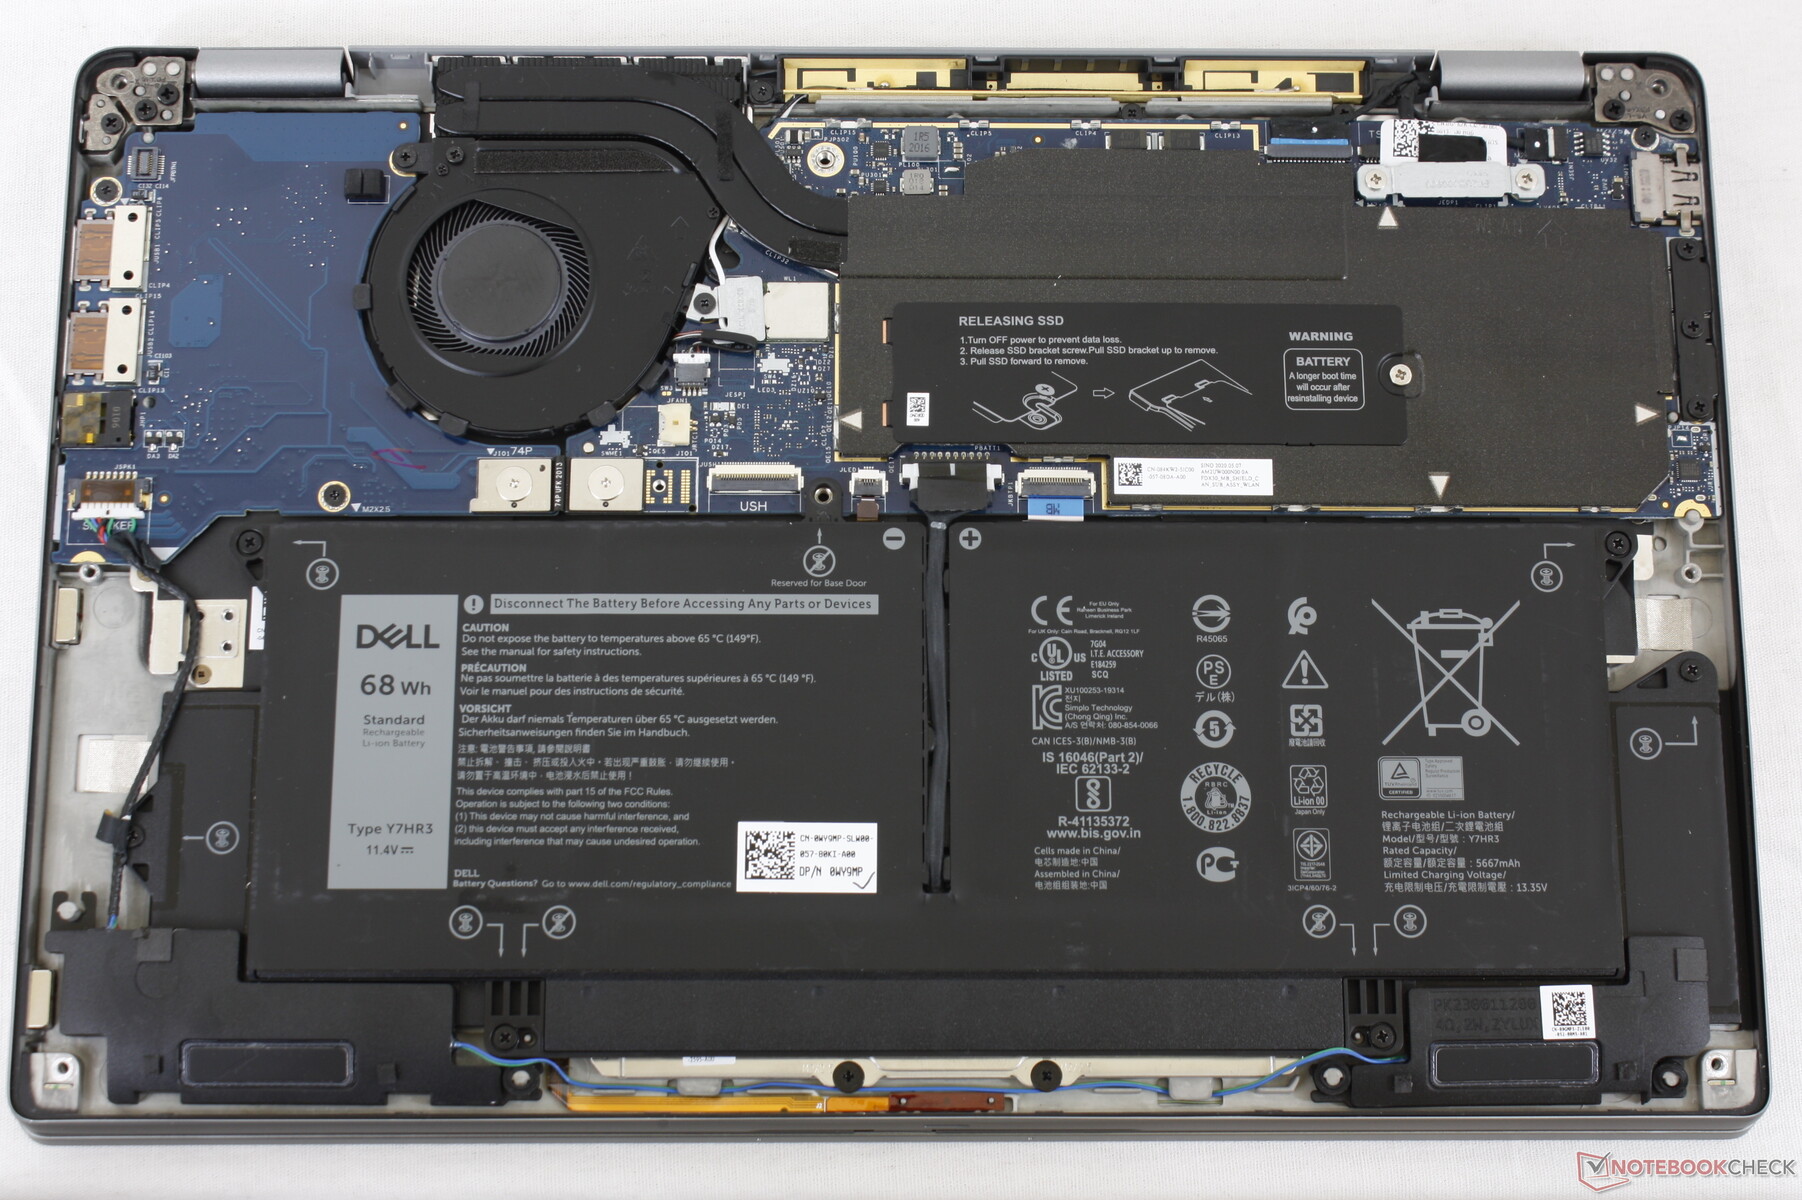
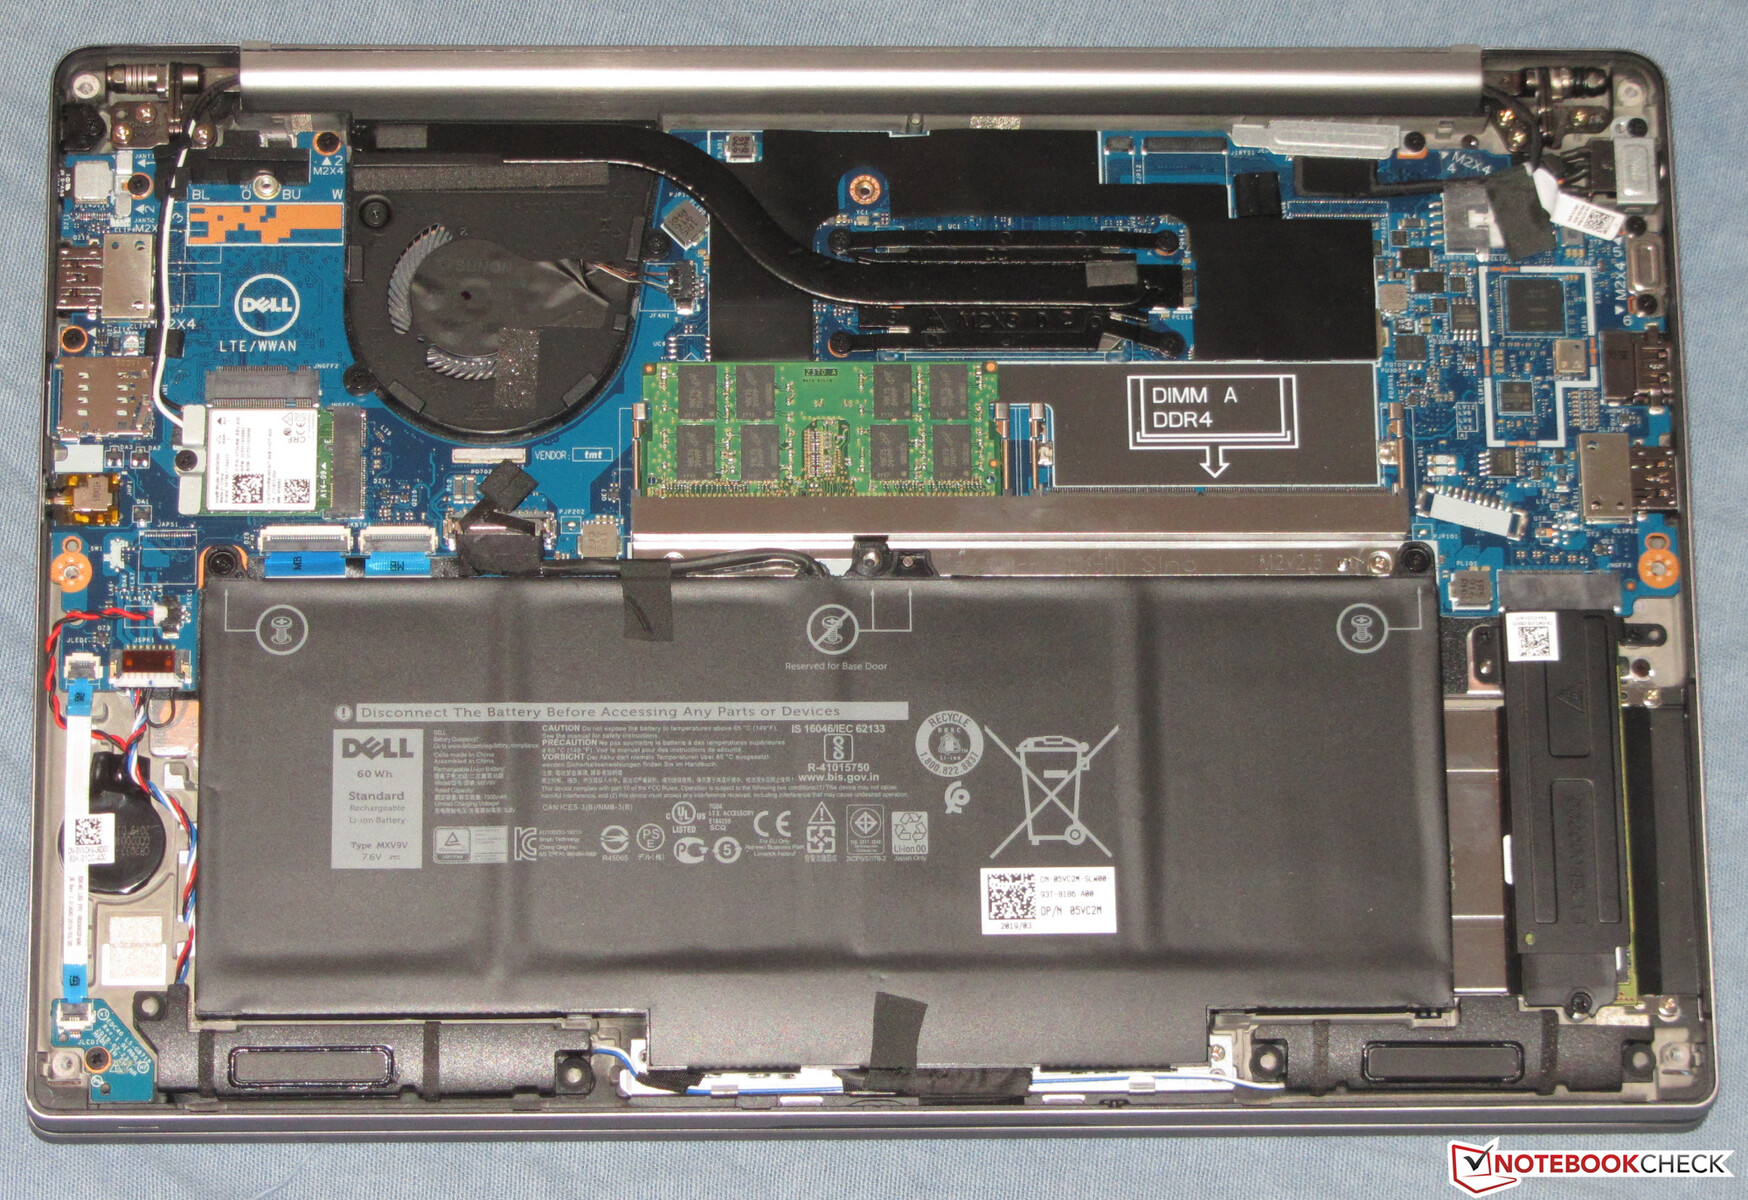
Maintenance
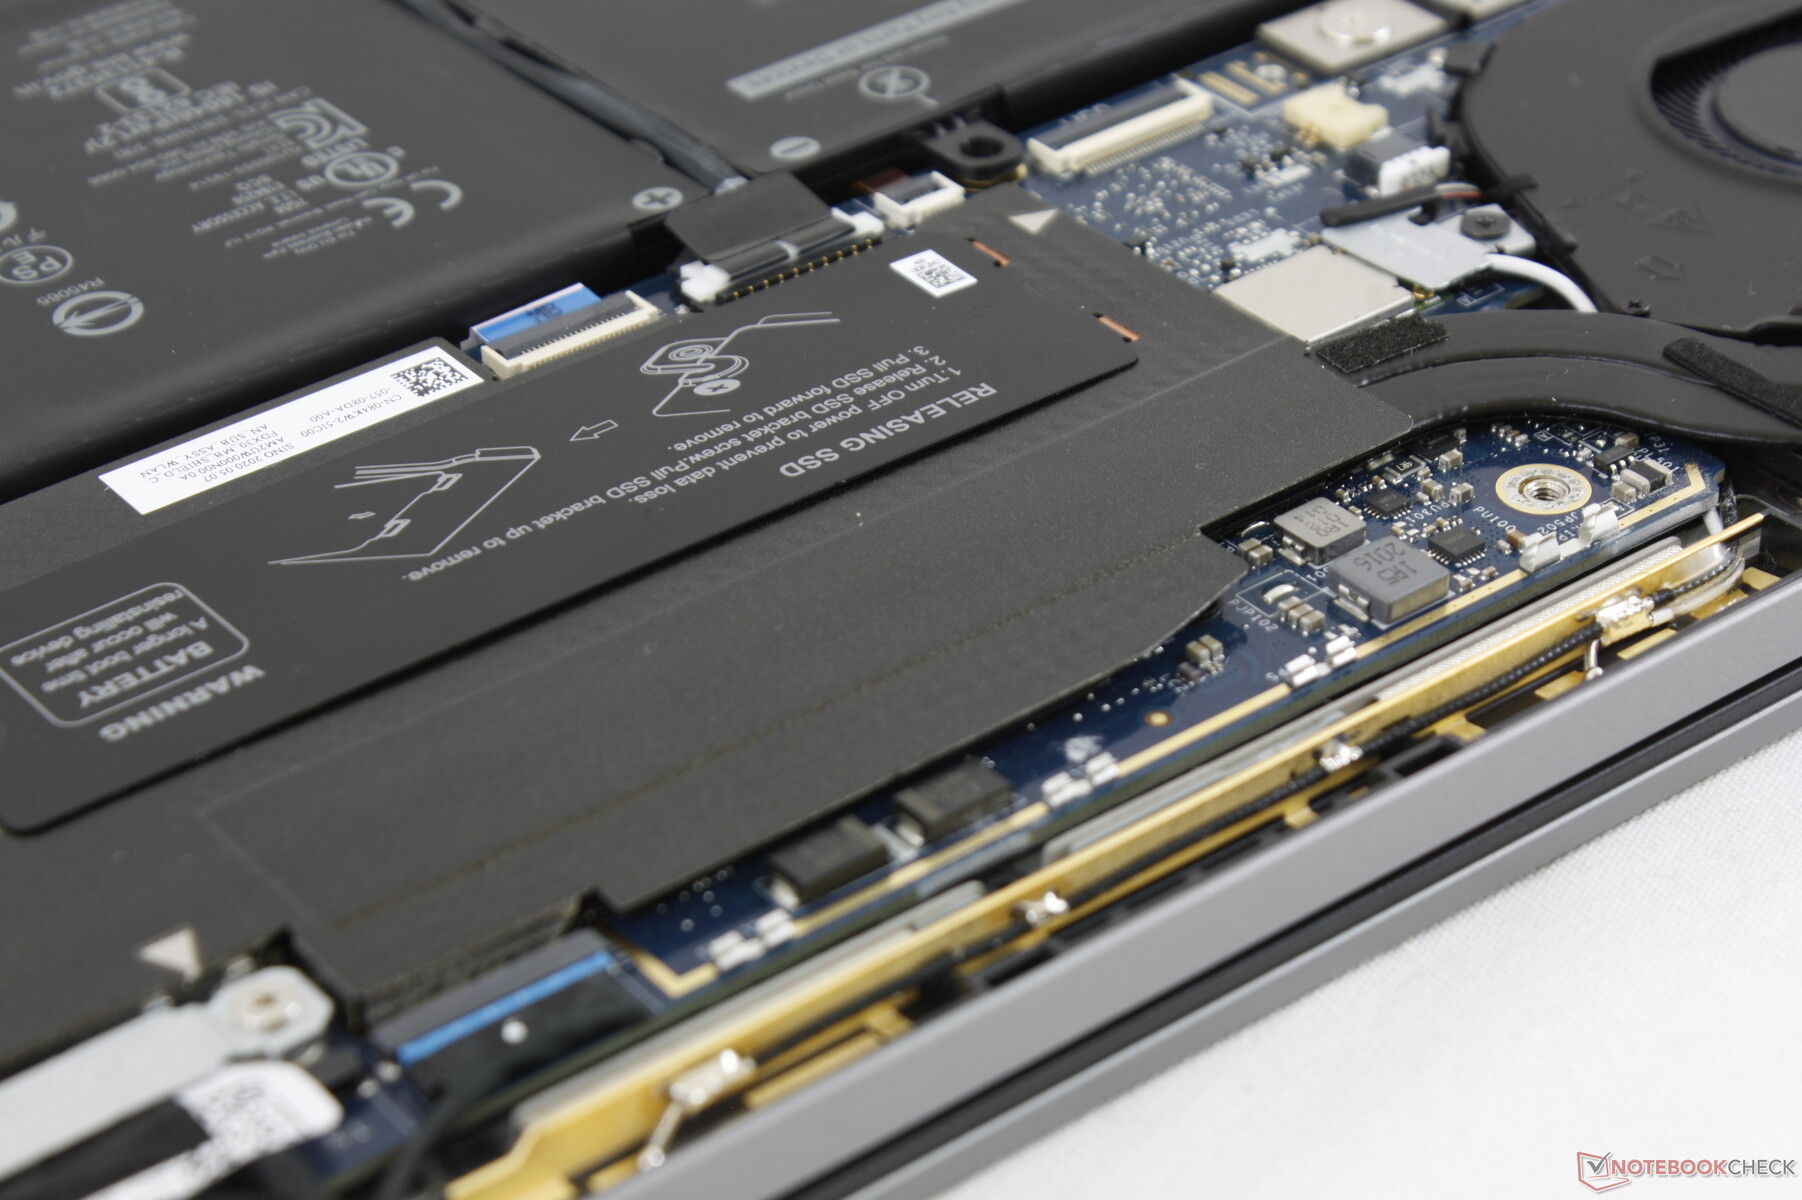
The bottom panel is secured by 8 Philips screws for relatively easy serviceability. Even so, owners will have little to actually upgrade since RAM and WLAN are soldered and there is no secondary storage bay.
Accessories and Warranty
There are no extras in the box other than the USB-C AC adapter and paperwork. Dell offers a range of Thunderbolt 3 docking stations and external monitors that are all compatible with the Latitude 7410.
A three-year warranty comes standard with options to extend up to 5 years total.
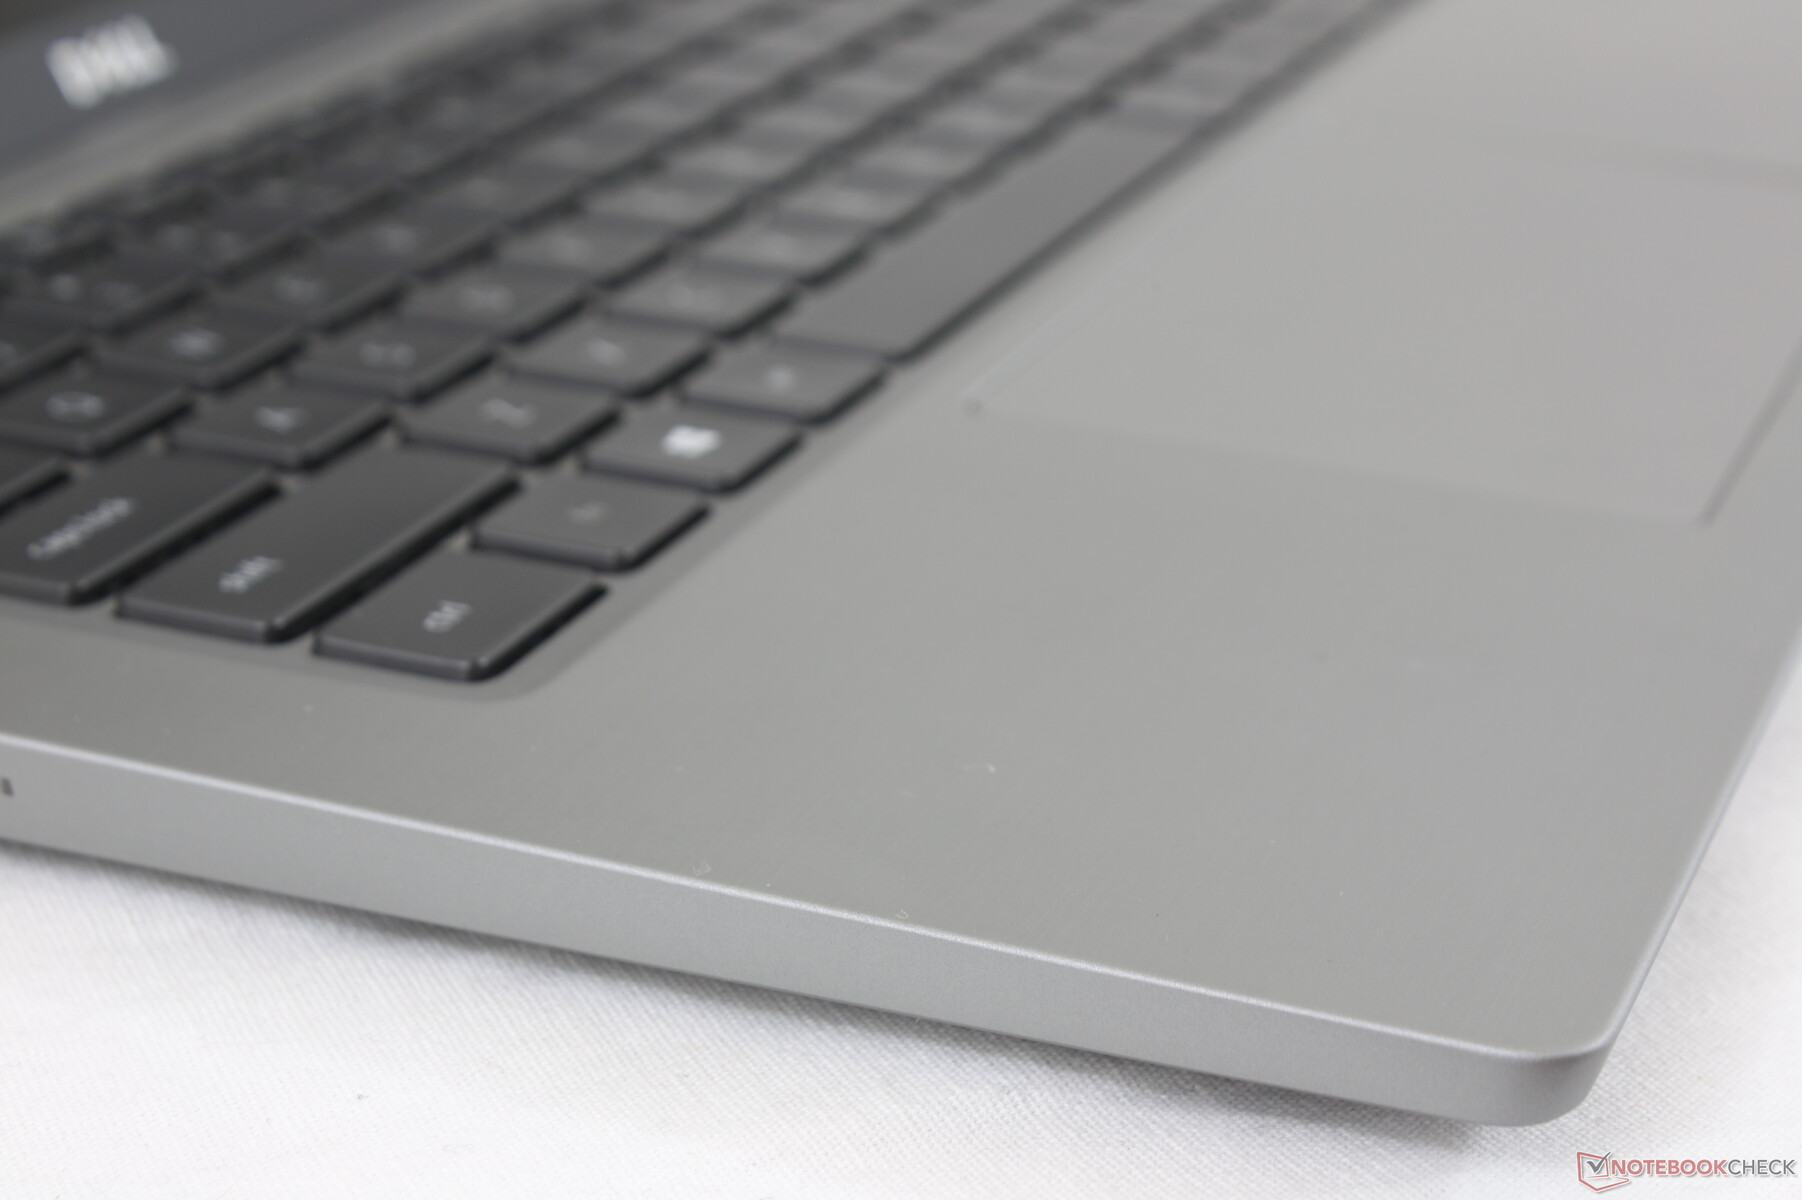
Input Devices
Keyboard
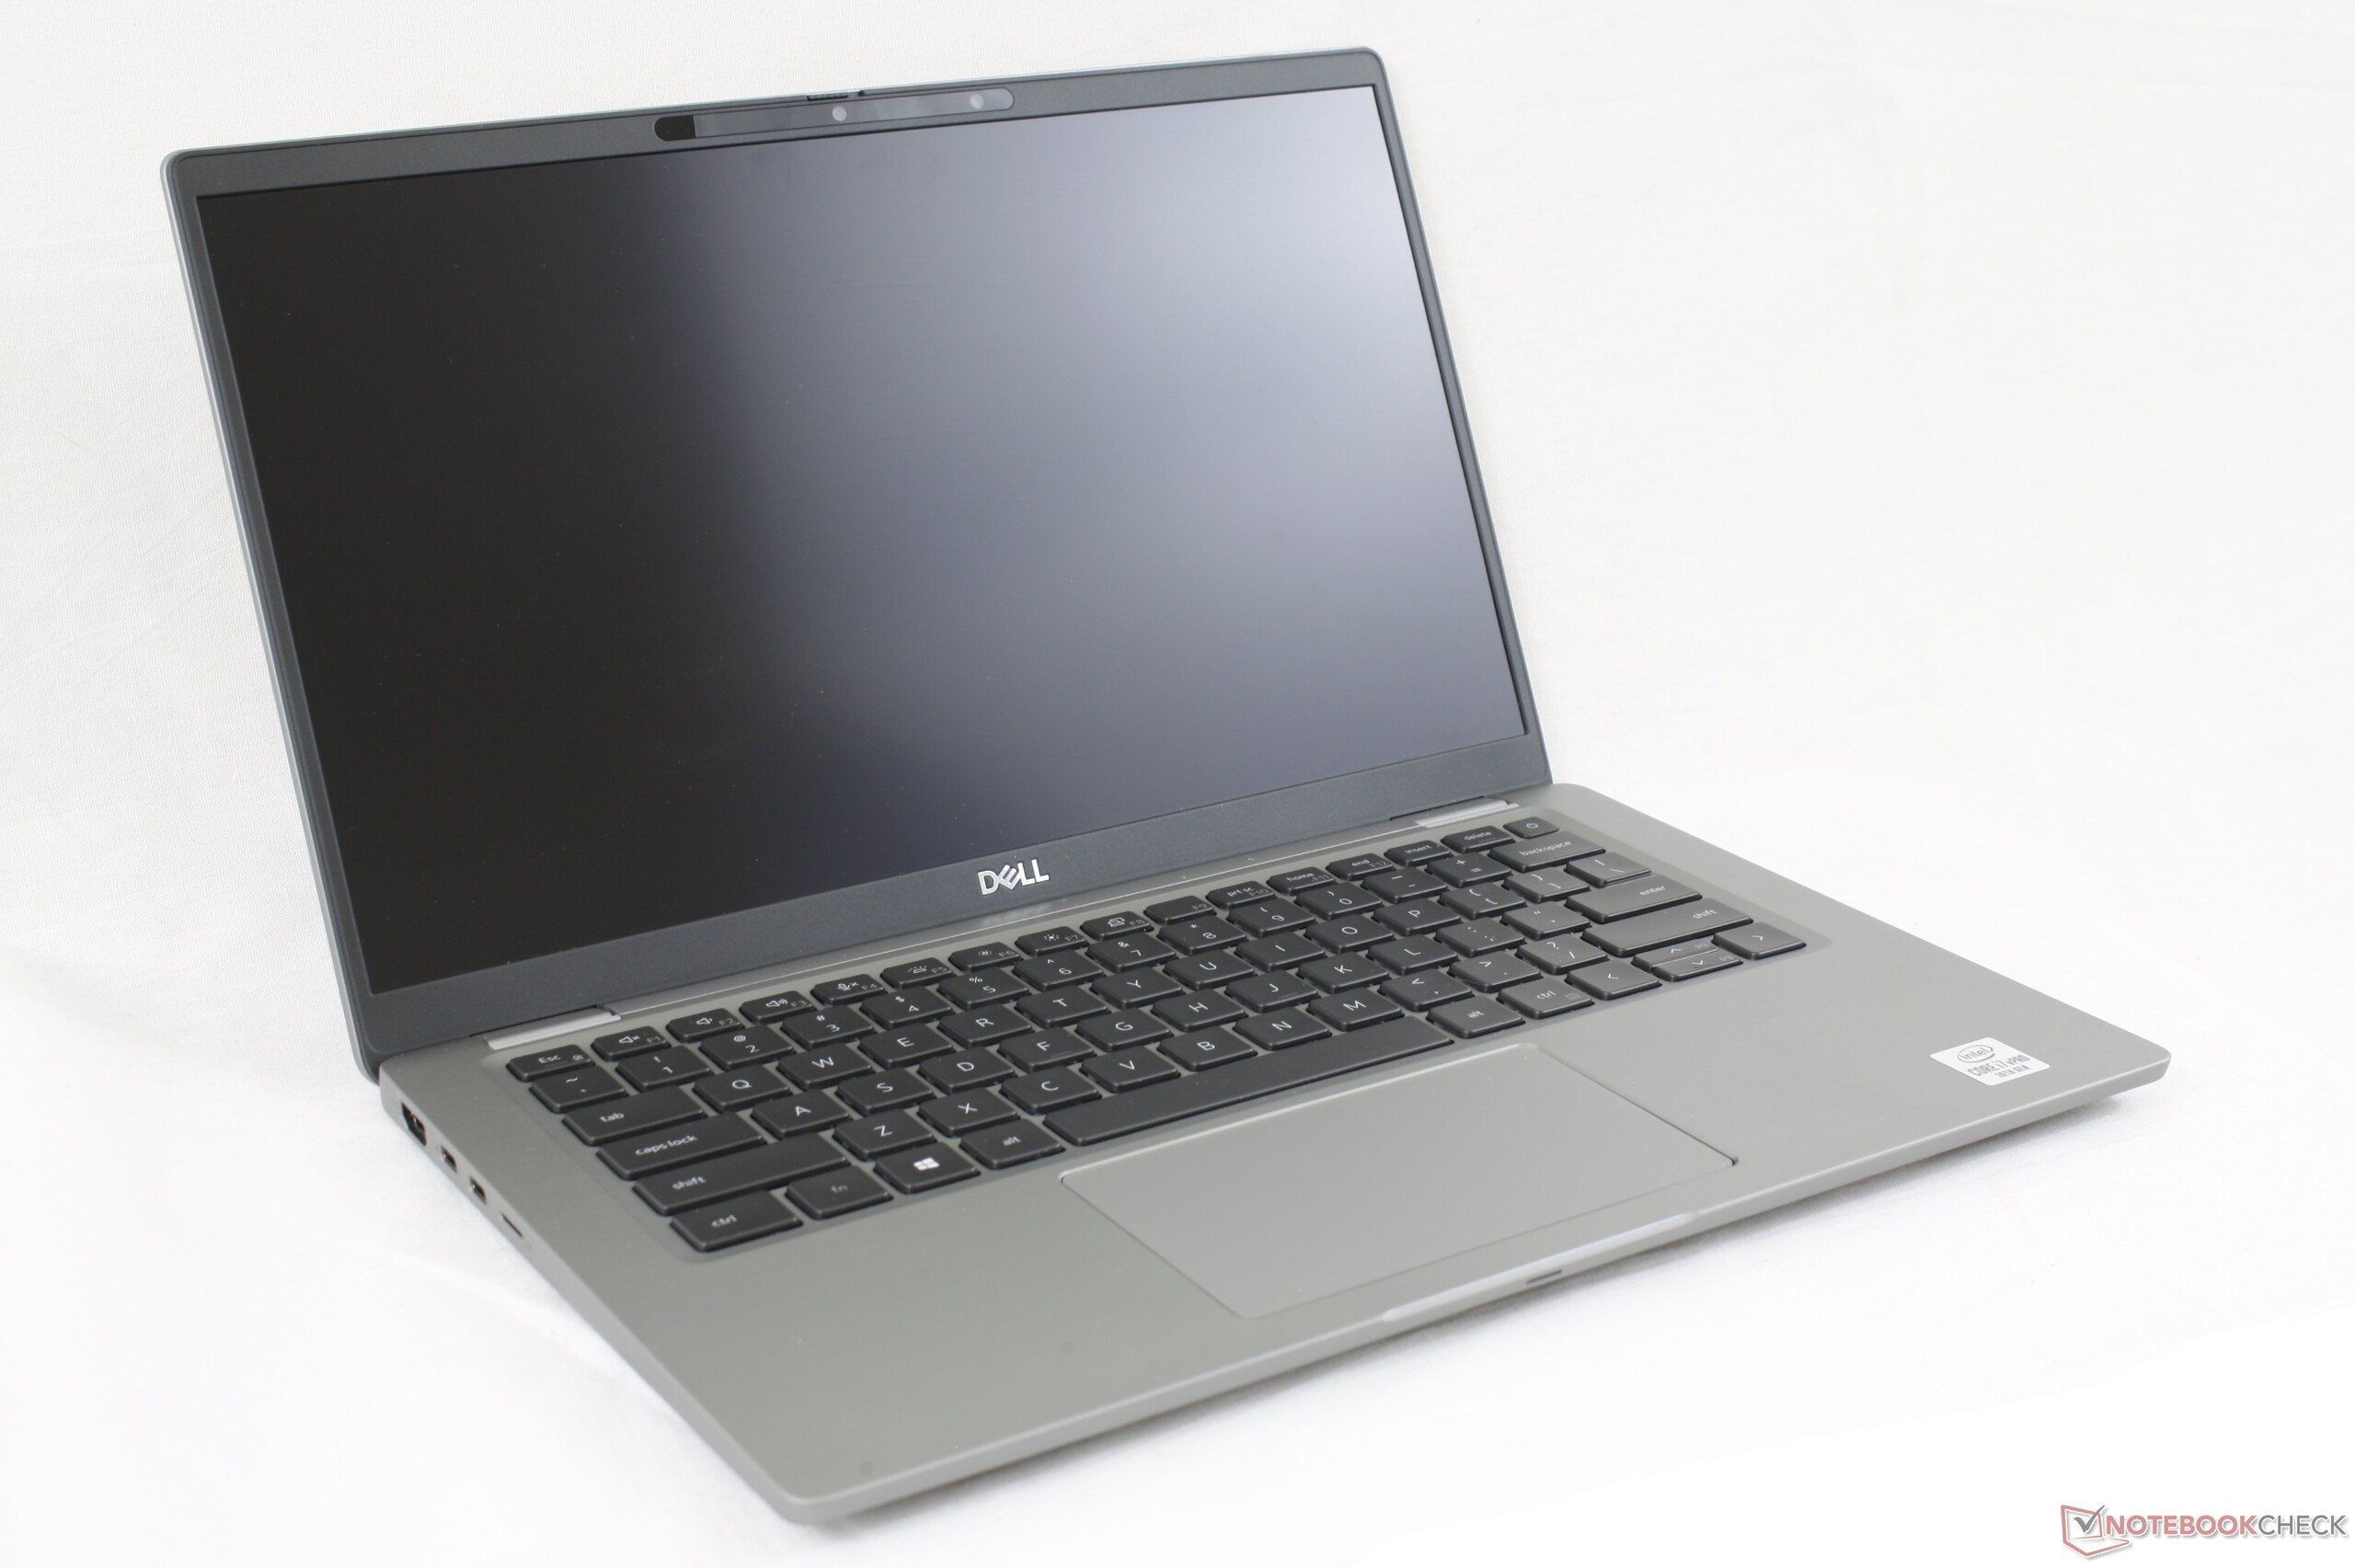
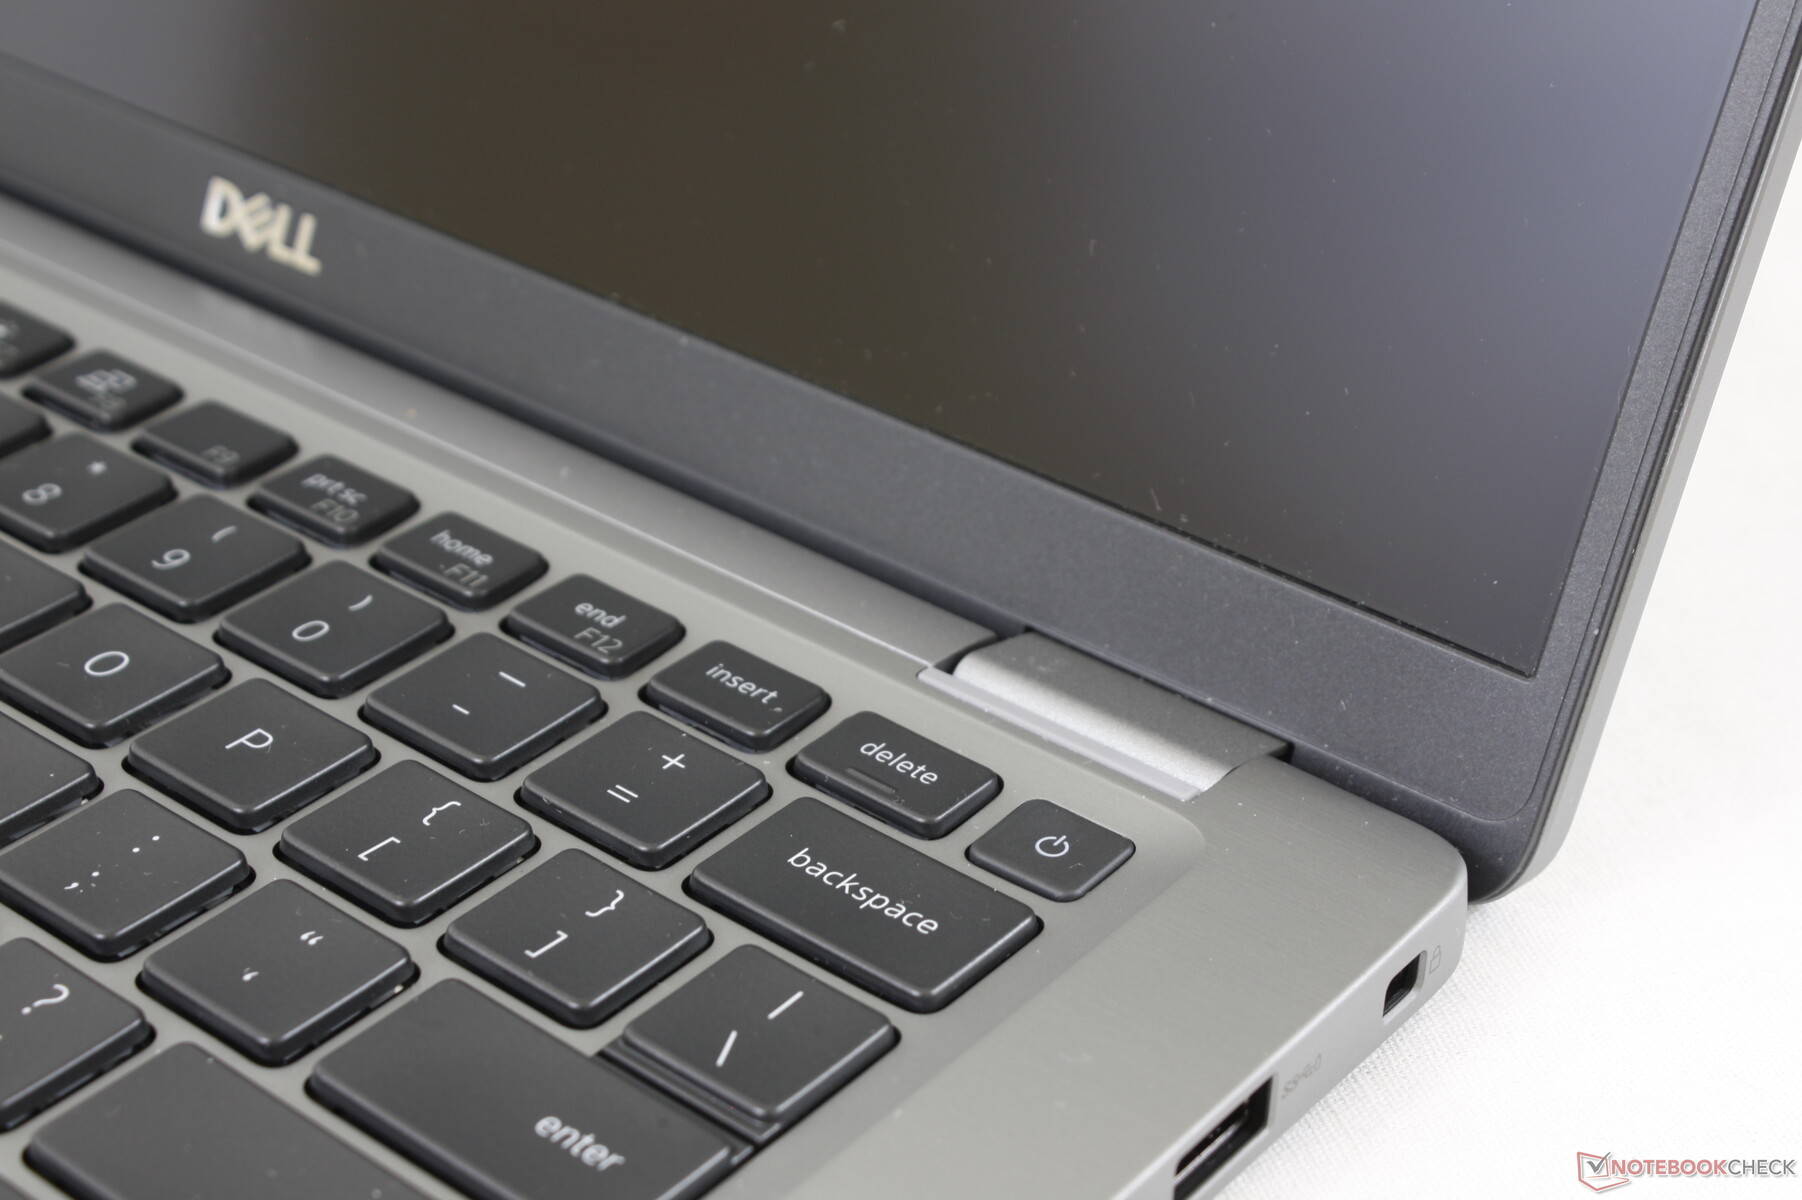
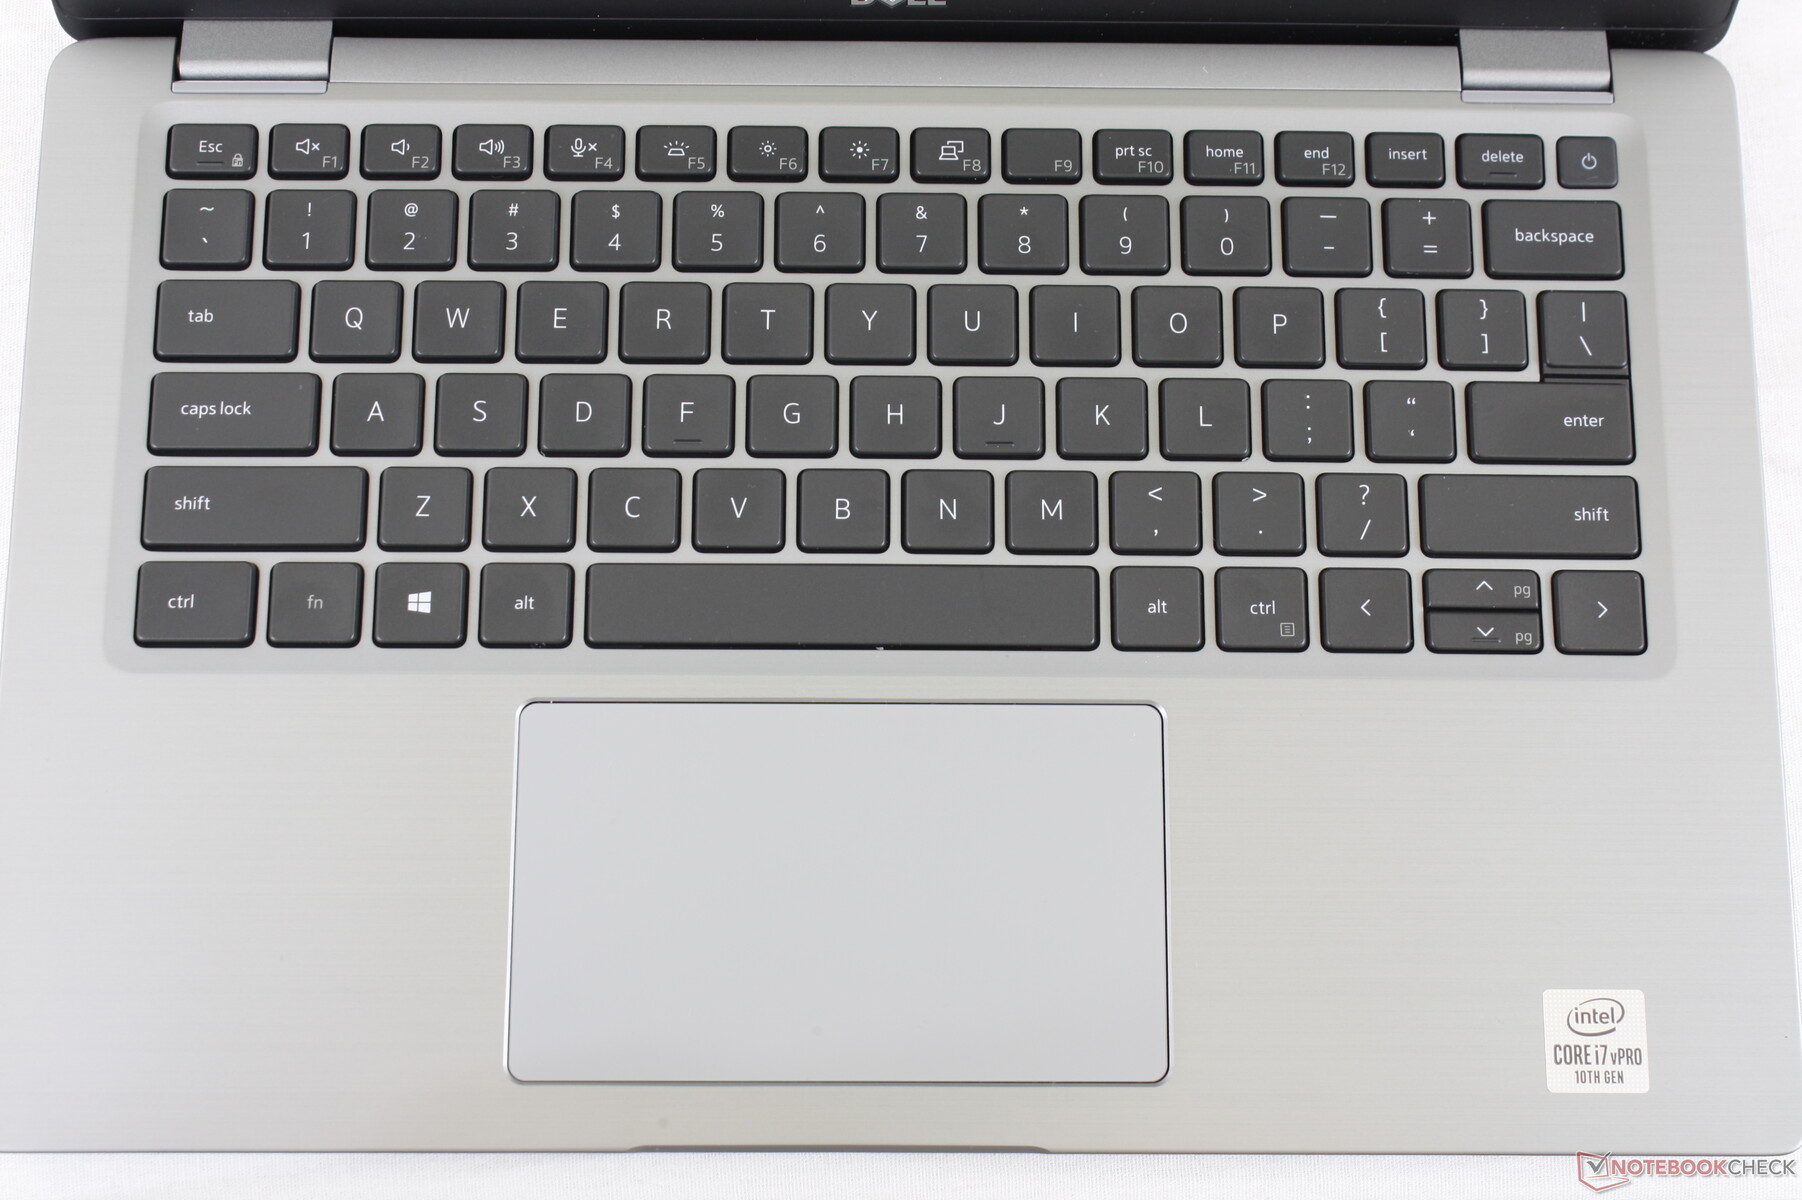
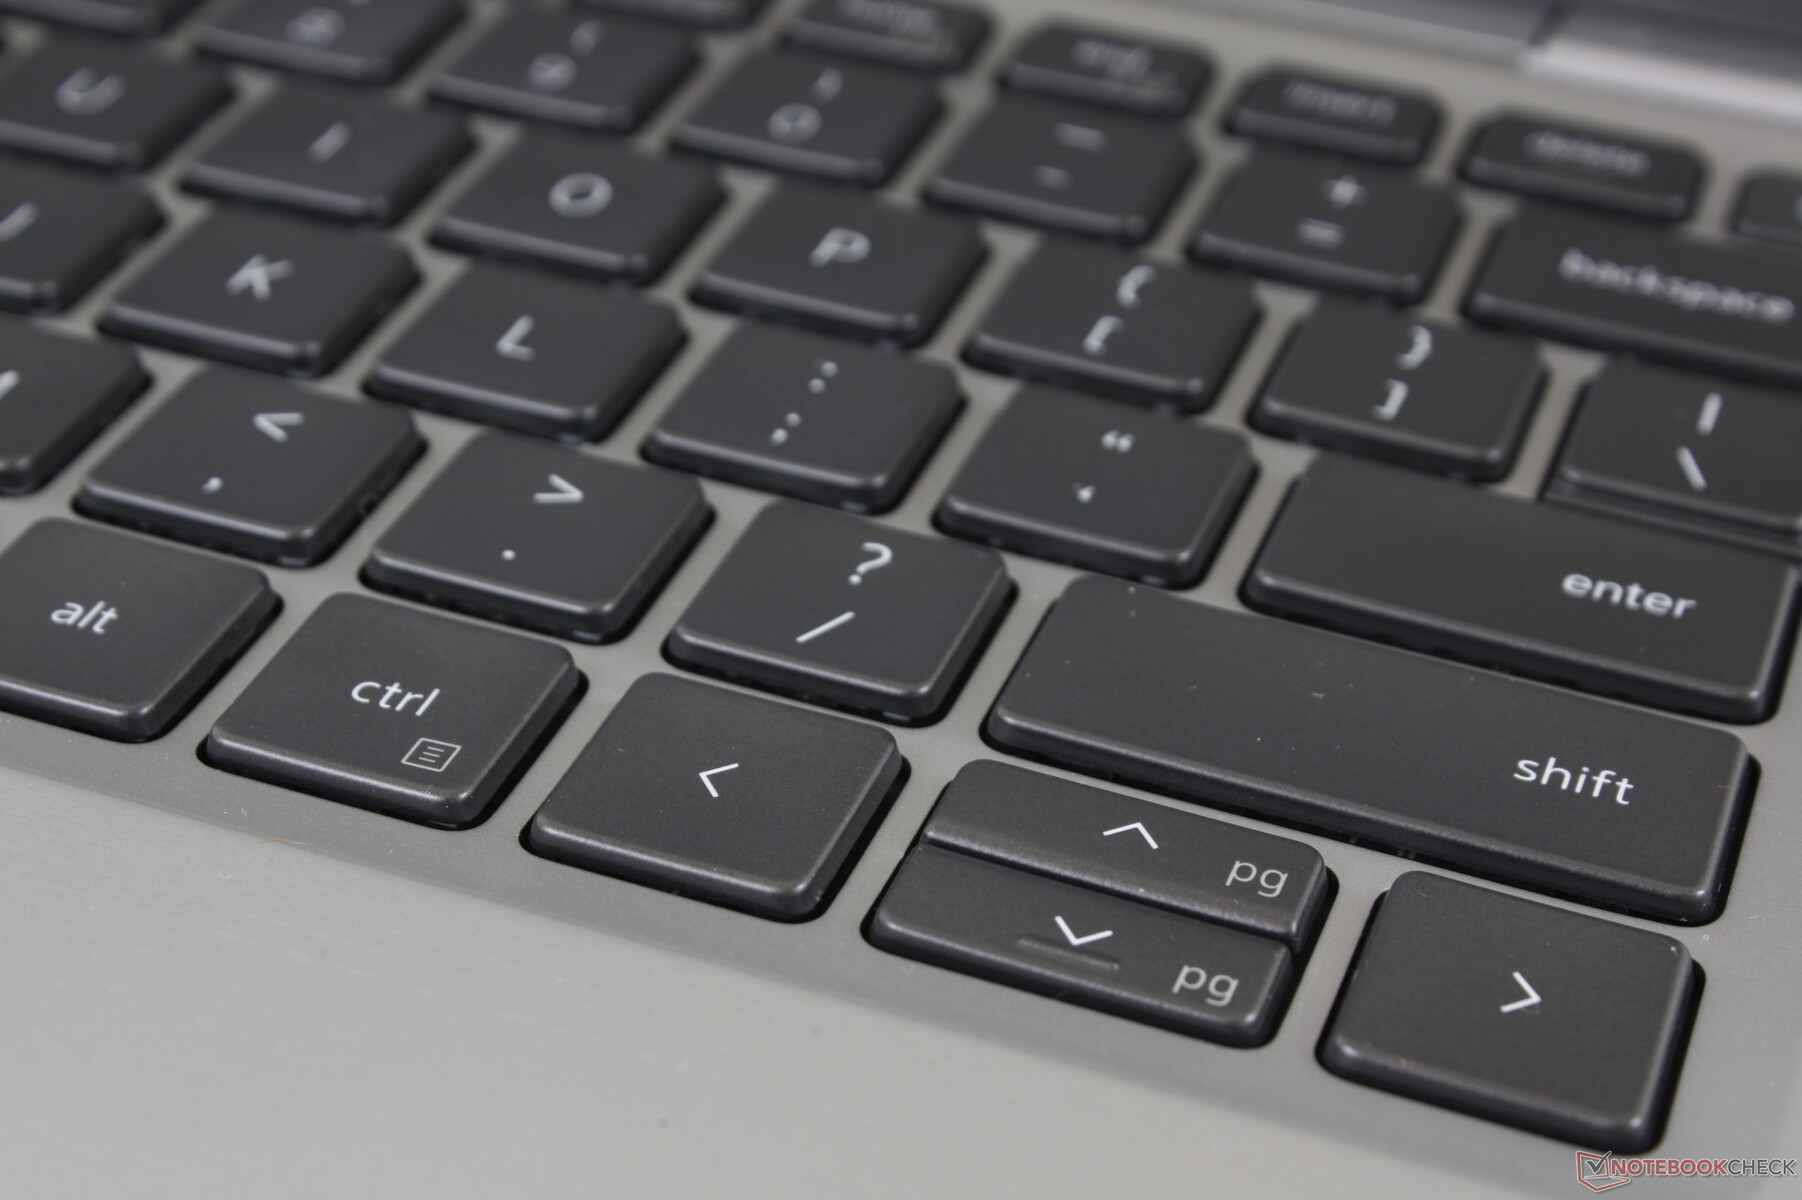
Key layout is mostly the same as last year's model with some changes to the Arrow keys and Power button. Key feedback is otherwise the same which is not a bad thing since we enjoyed the clear pressure point and quiet clatter of the Latitude 7400. Keys on the HP EliteBook series feel lighter but not as spongy in terms of feedback.
The bottom left Ctrl key on our test unit feels a bit stiffer and more difficult to depress when compared to all the other keys. We recommend checking this after purchasing just in case of any abnormalities.
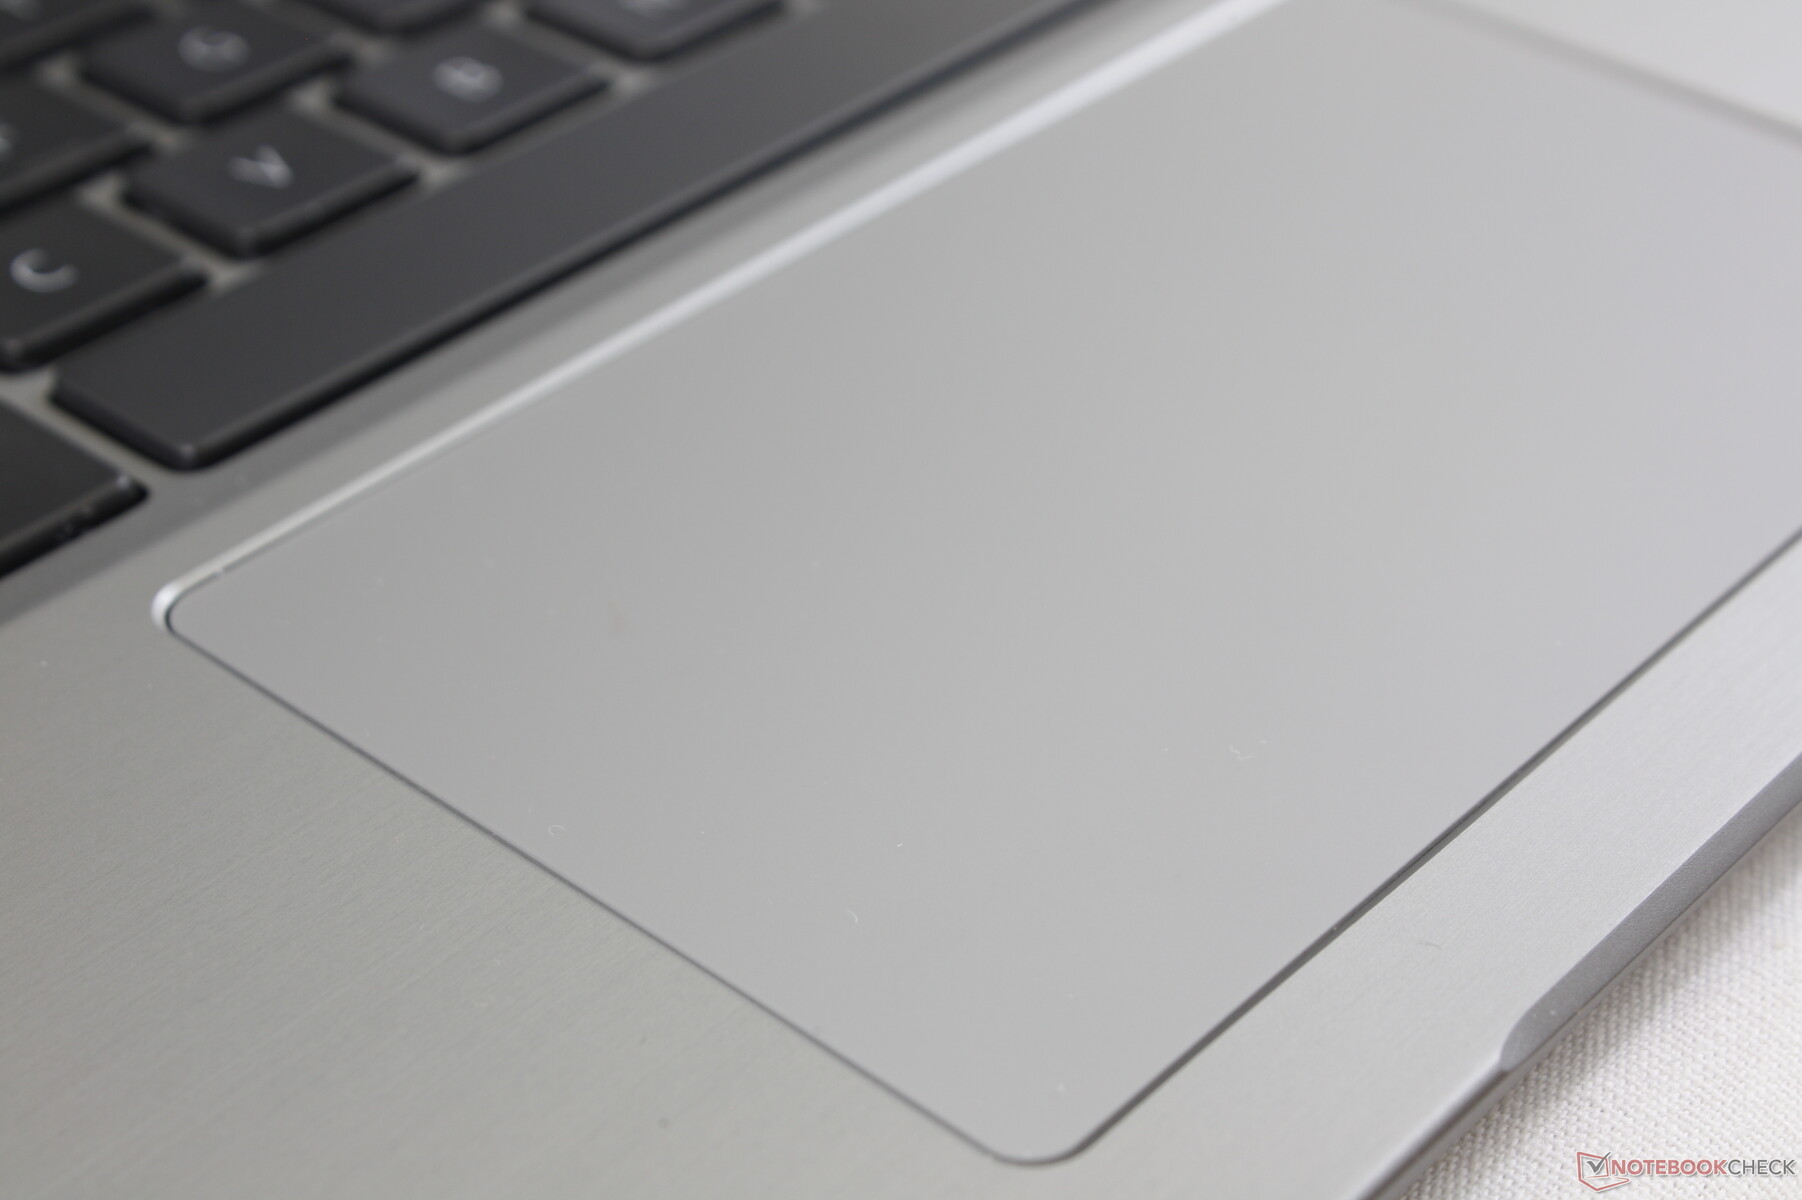
Touchpad
Dell has removed the dedicated mouse keys in favor of a larger clickpad (11.5 x 6.8 cm). While great for multi-touch inputs and cursor control, drag-and-drop actions are more difficult and less accurate as a result. The new clickpad keys feel spongy when depressed and could have benefited from firmer feedback.

Display
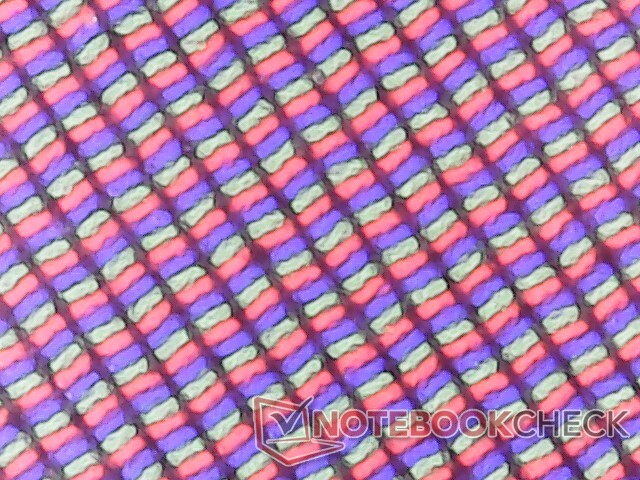
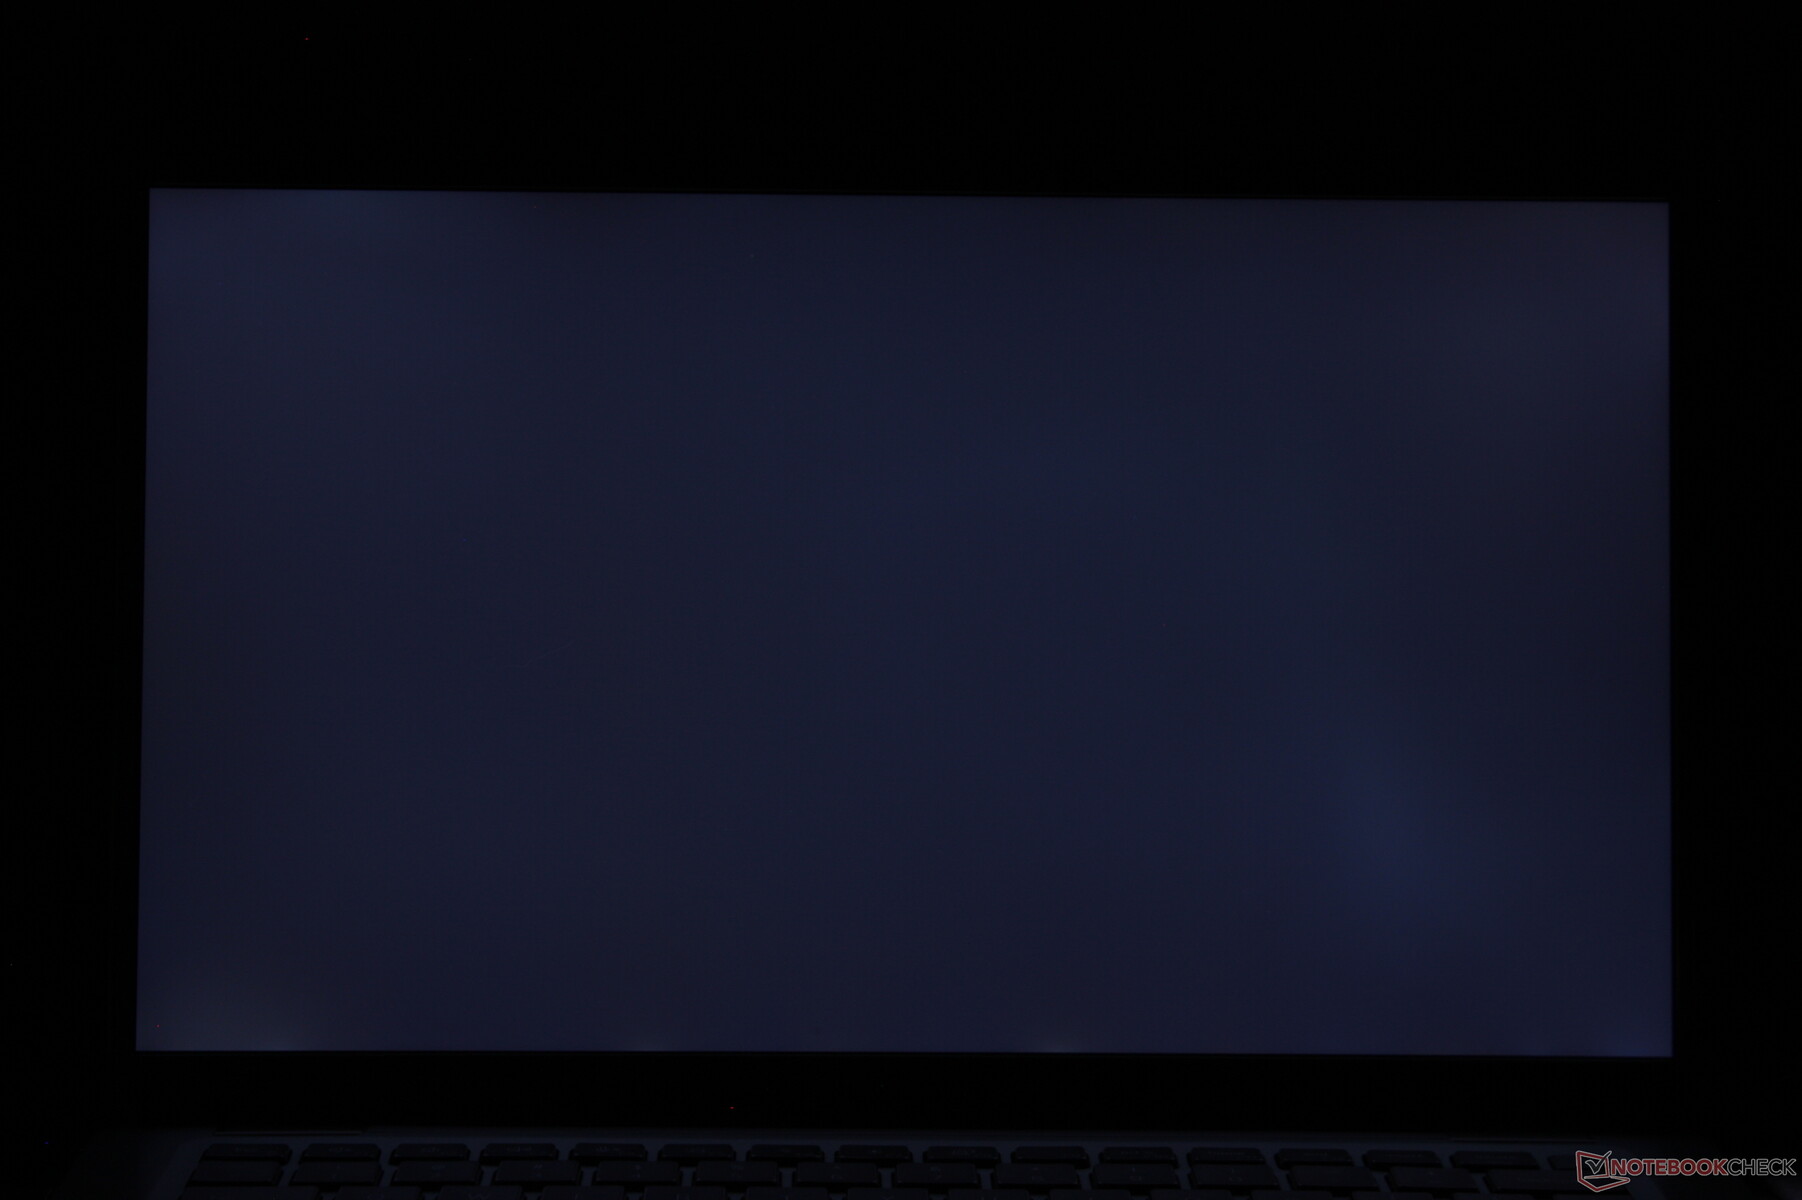
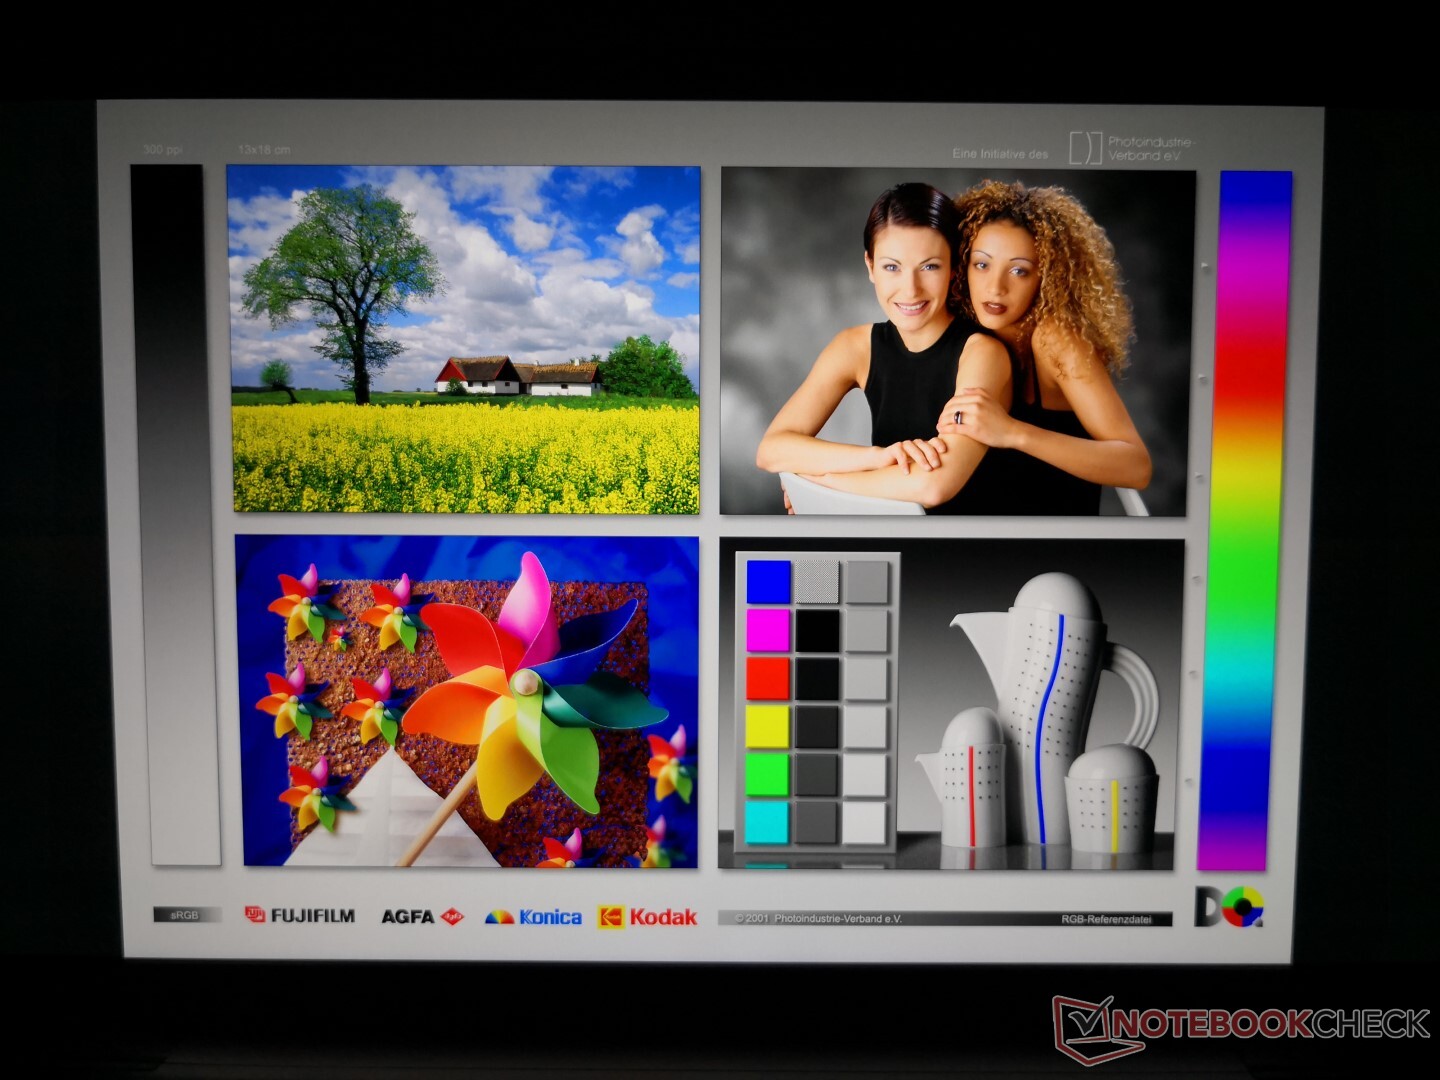
New to the 14-inch Latitude 7000 series is the 4K UHD panel as all previous Latitude 7400 SKUs are limited to 1080p. The high quality AU Optronics B140ZAN 4K panel on our test unit is the first to appear in our database. Surprisingly, it is able to offer both faster response times and a brighter backlight than the 1080p panel on the Latitude 7400, but this seems to come at the cost of a lower contrast ratio.
The 4K panel comes with a low blue light feature to reduce eyestrain as introduced at Computex 2019. Dell calibrates the display to reduce blue light emissions without impacting overall color quality.
Dell offers 1080p and even 768p options for those who have no desire for 4K. We recommend avoiding the 768p option.
| |||||||||||||||||||||||||
Brightness Distribution: 82 %
Center on Battery: 388.6 cd/m²
Contrast: 1110:1 (Black: 0.35 cd/m²)
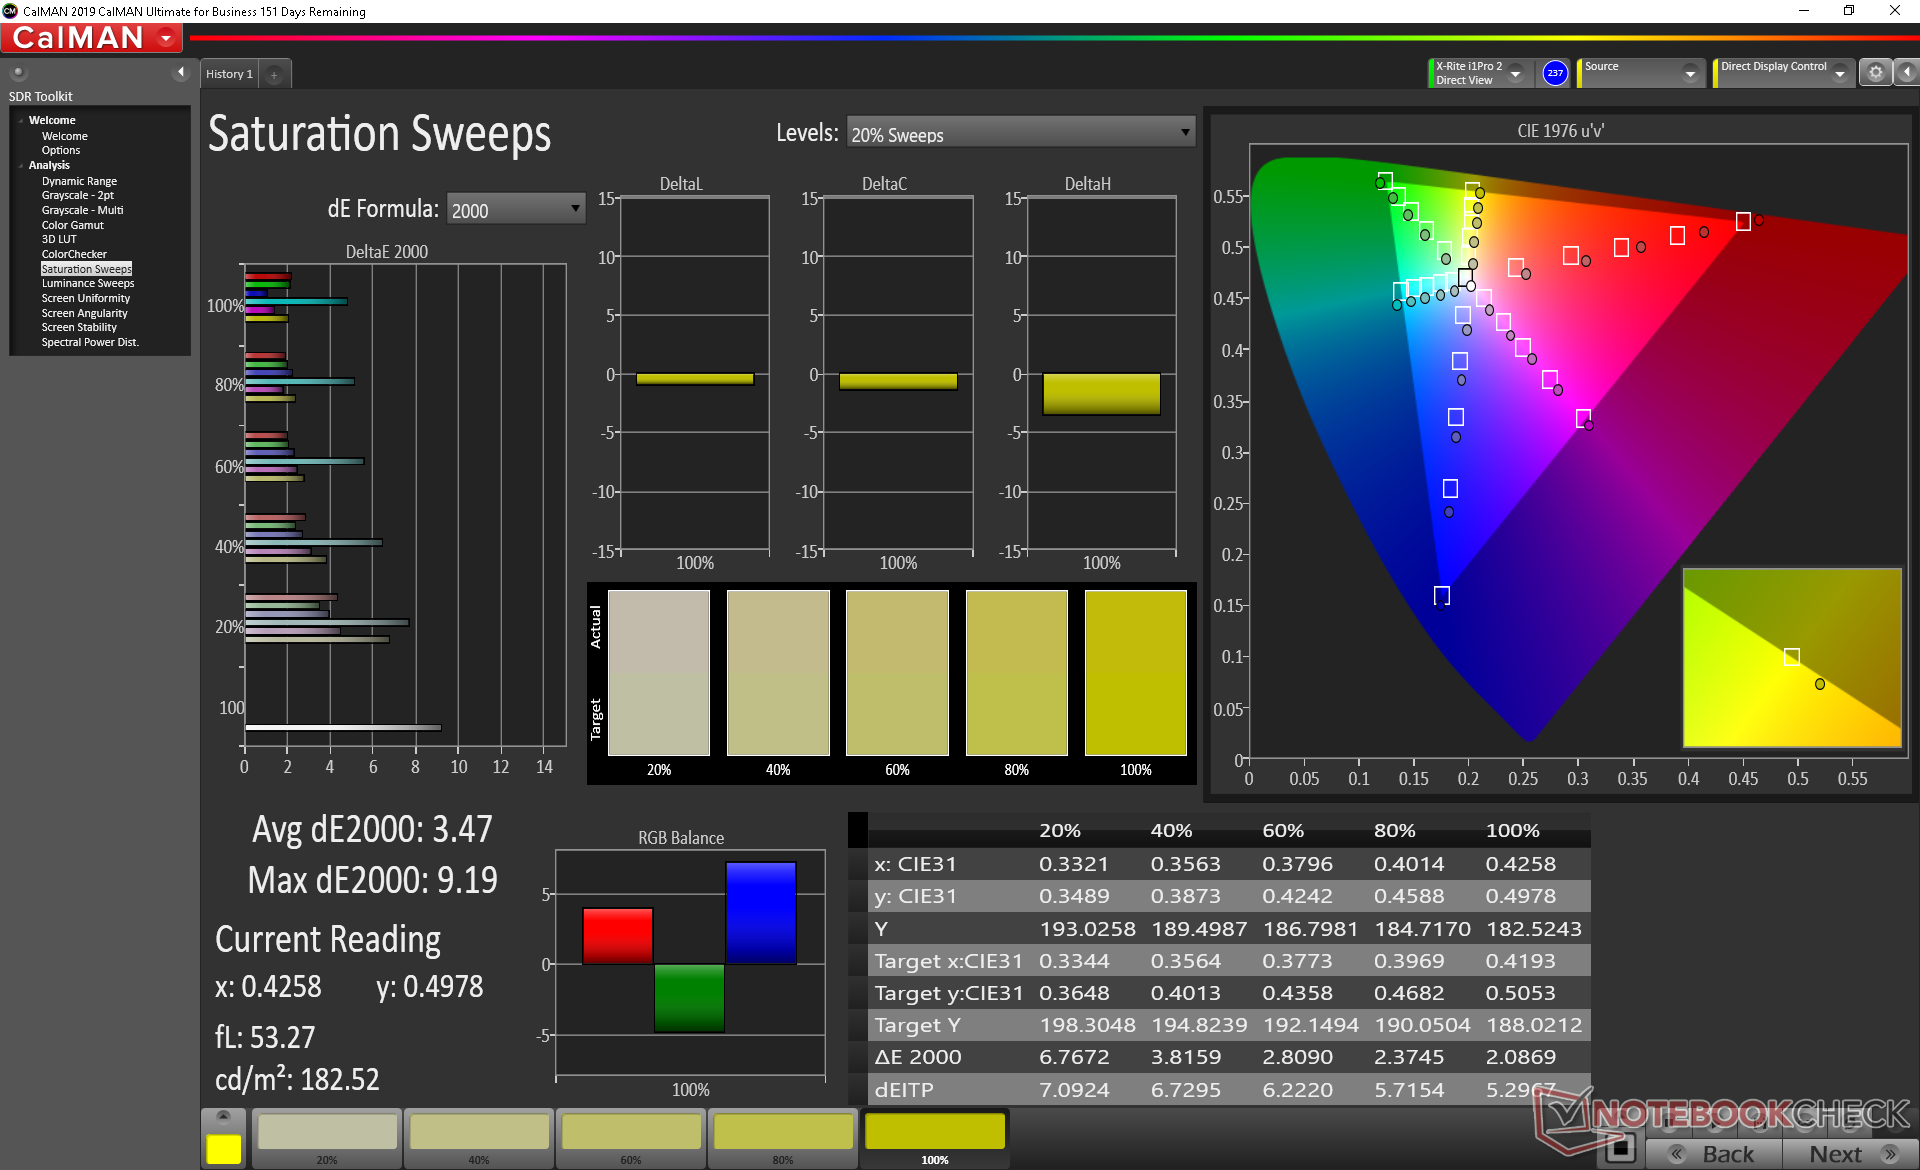
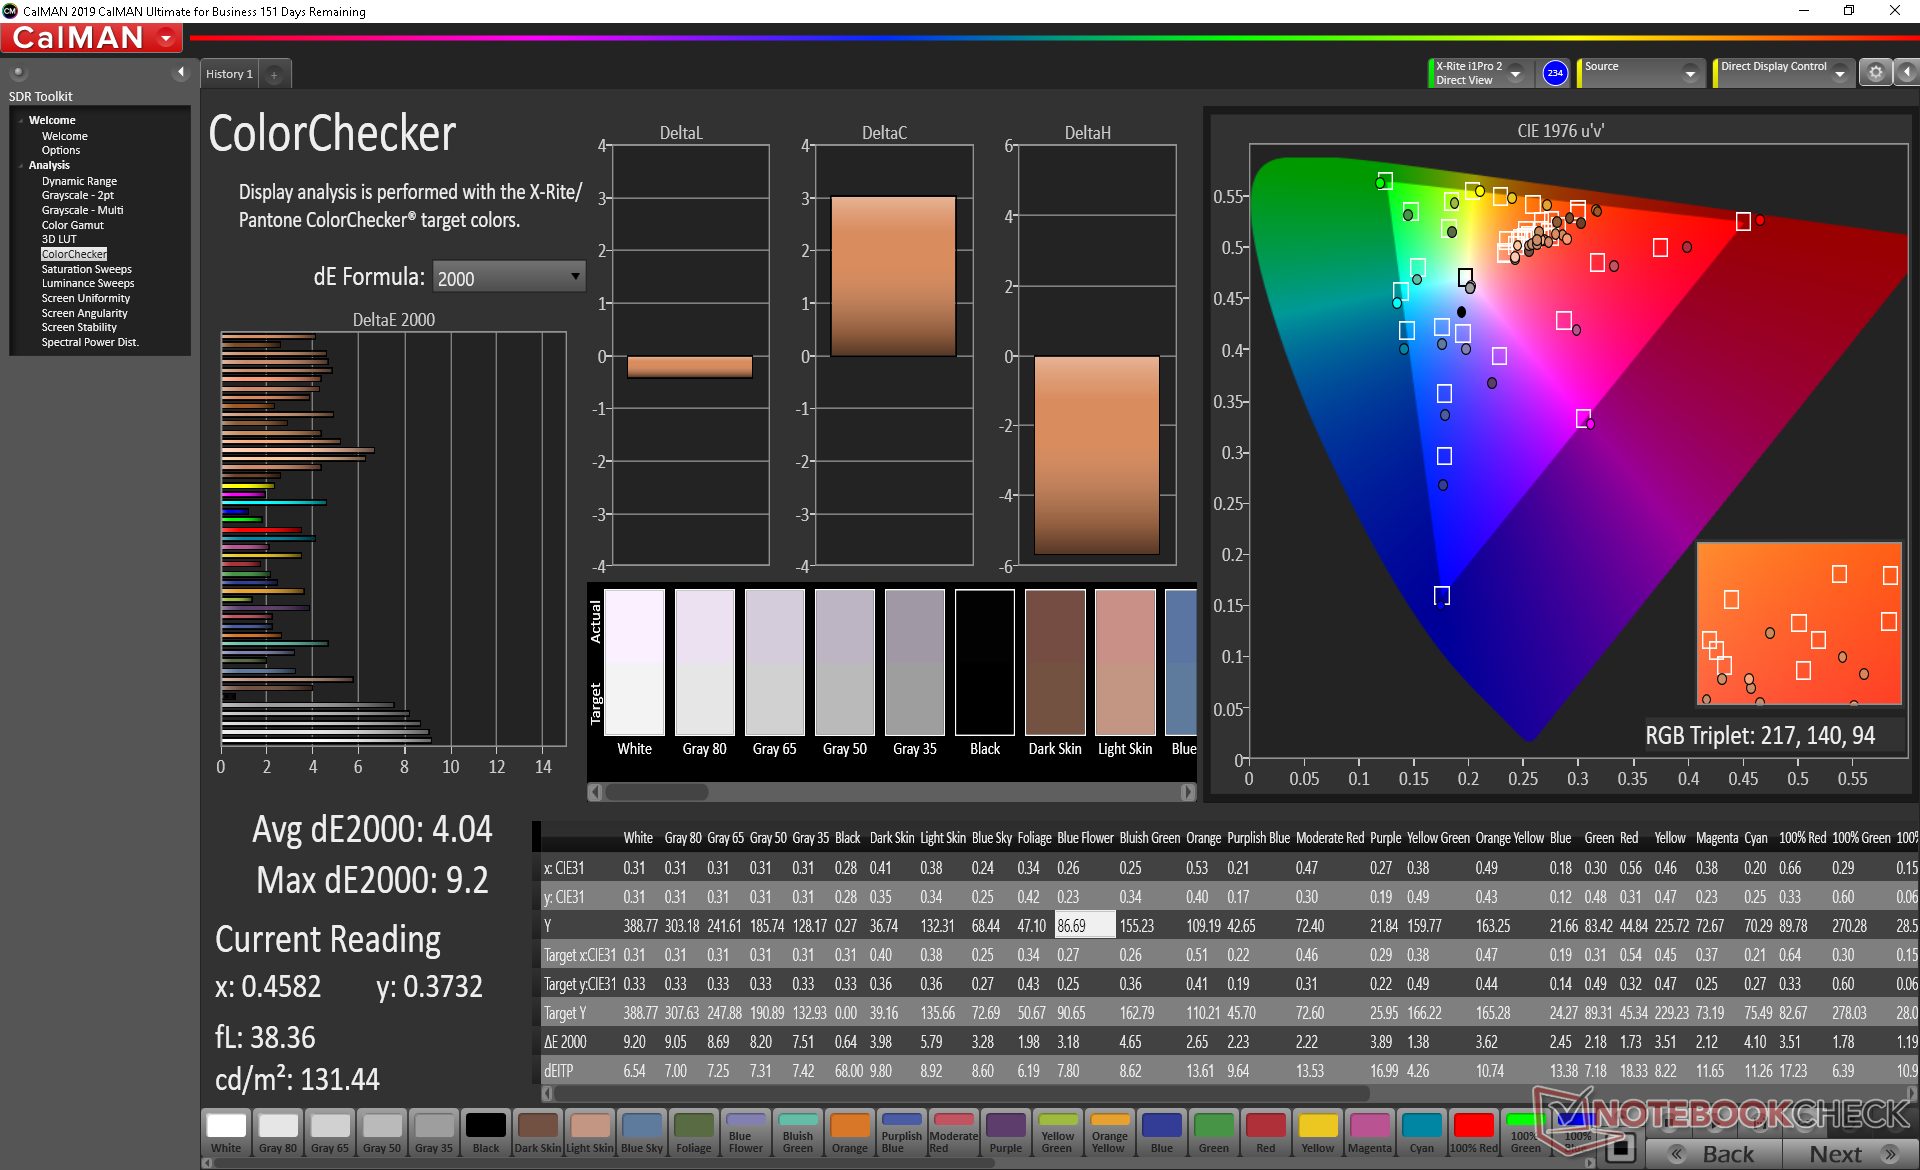
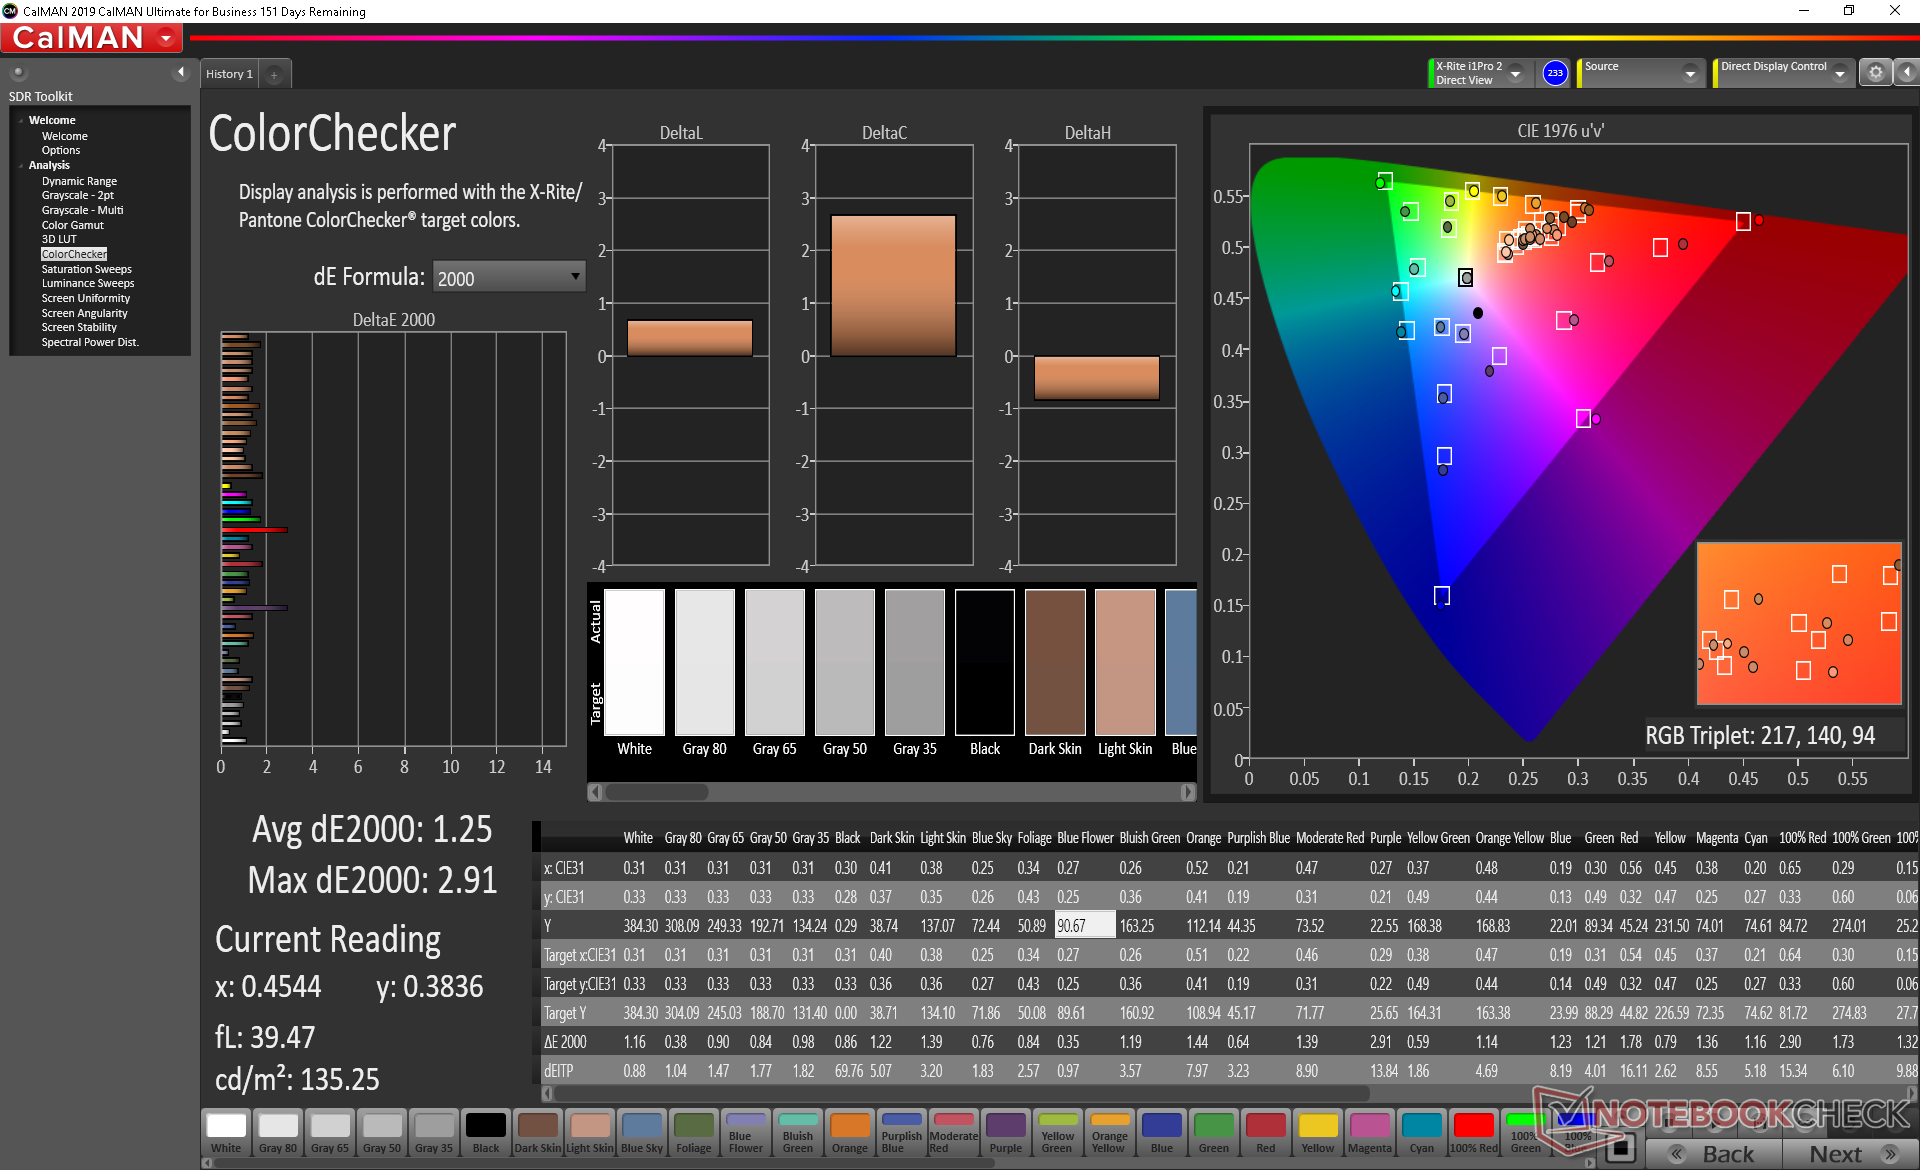
ΔE ColorChecker Calman: 4.04 | ∀{0.5-29.43 Ø4.73}
calibrated: 1.25
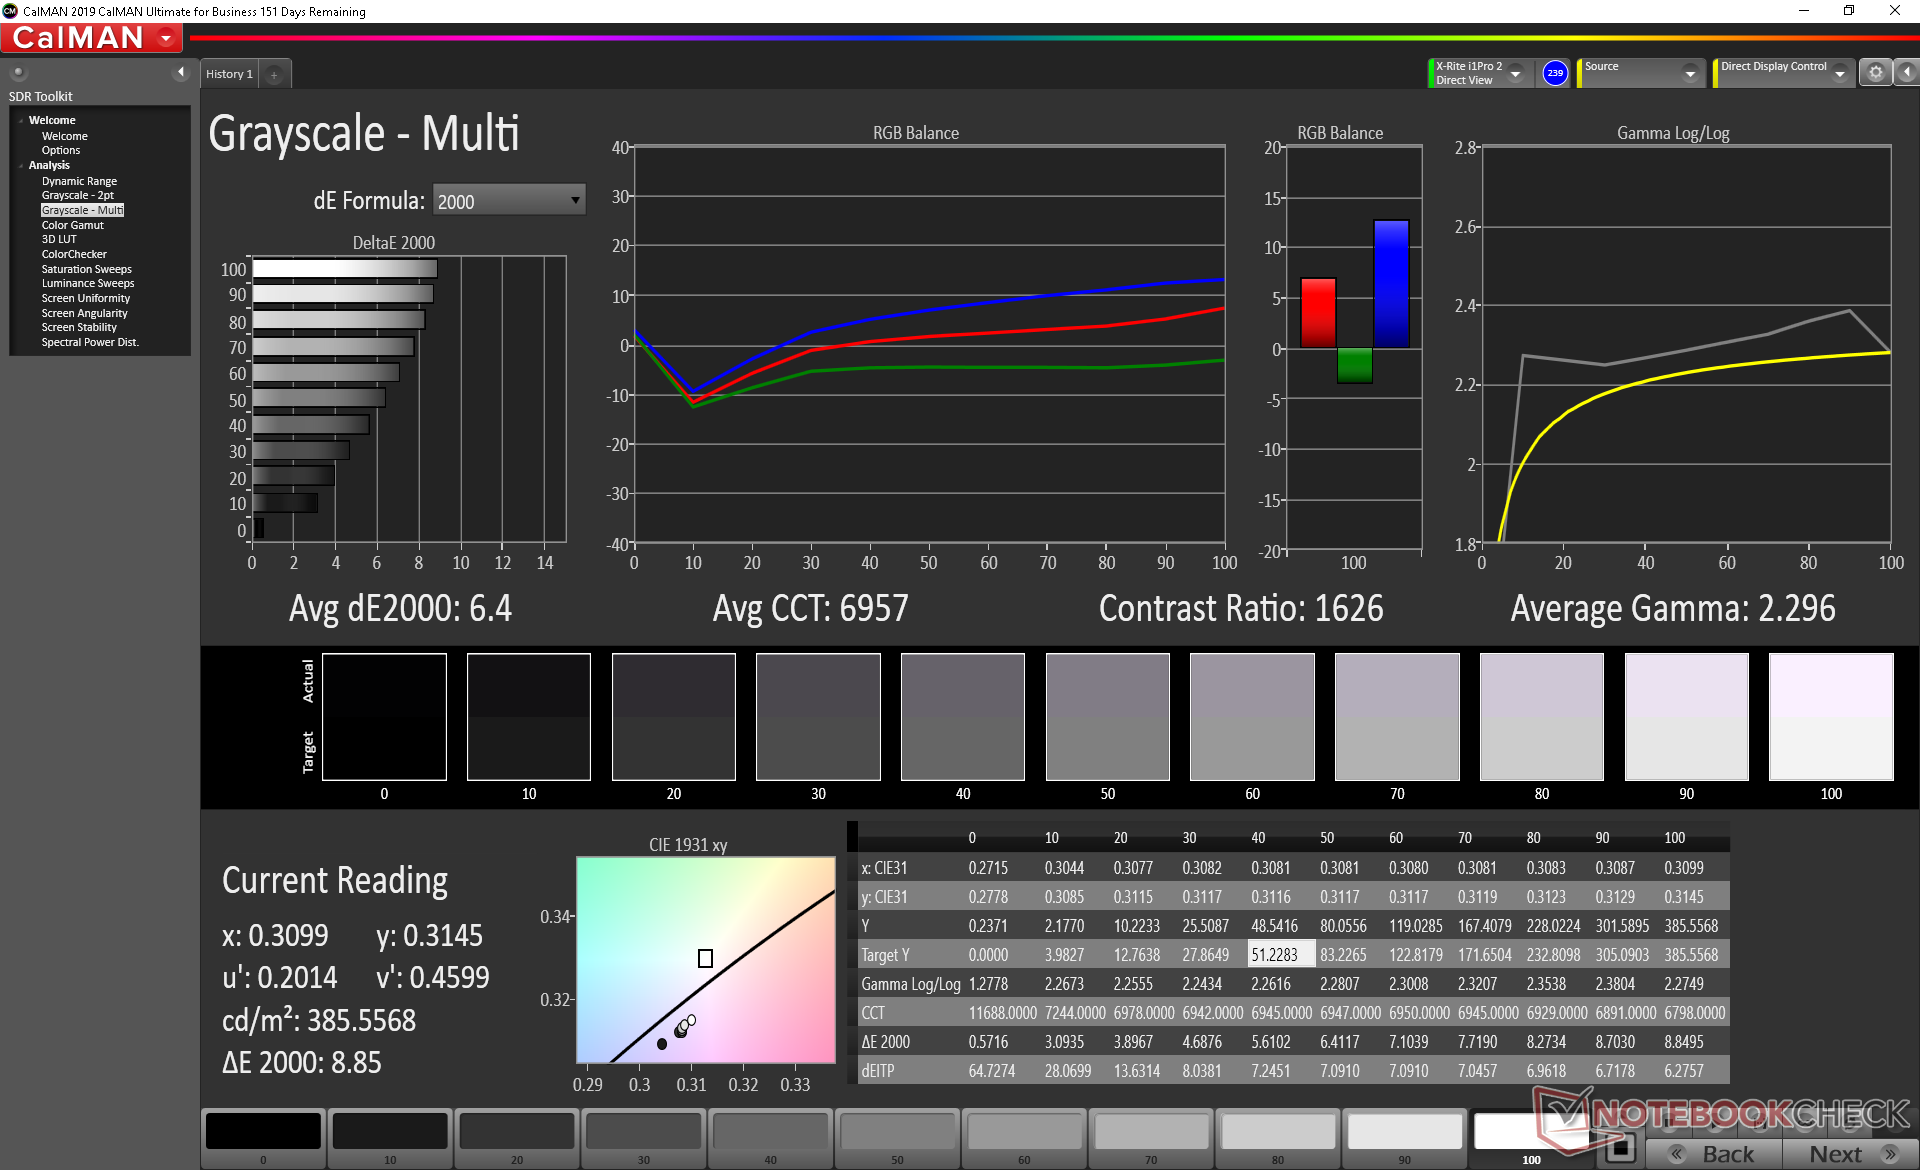
ΔE Greyscale Calman: 6.4 | ∀{0.09-98 Ø4.97}
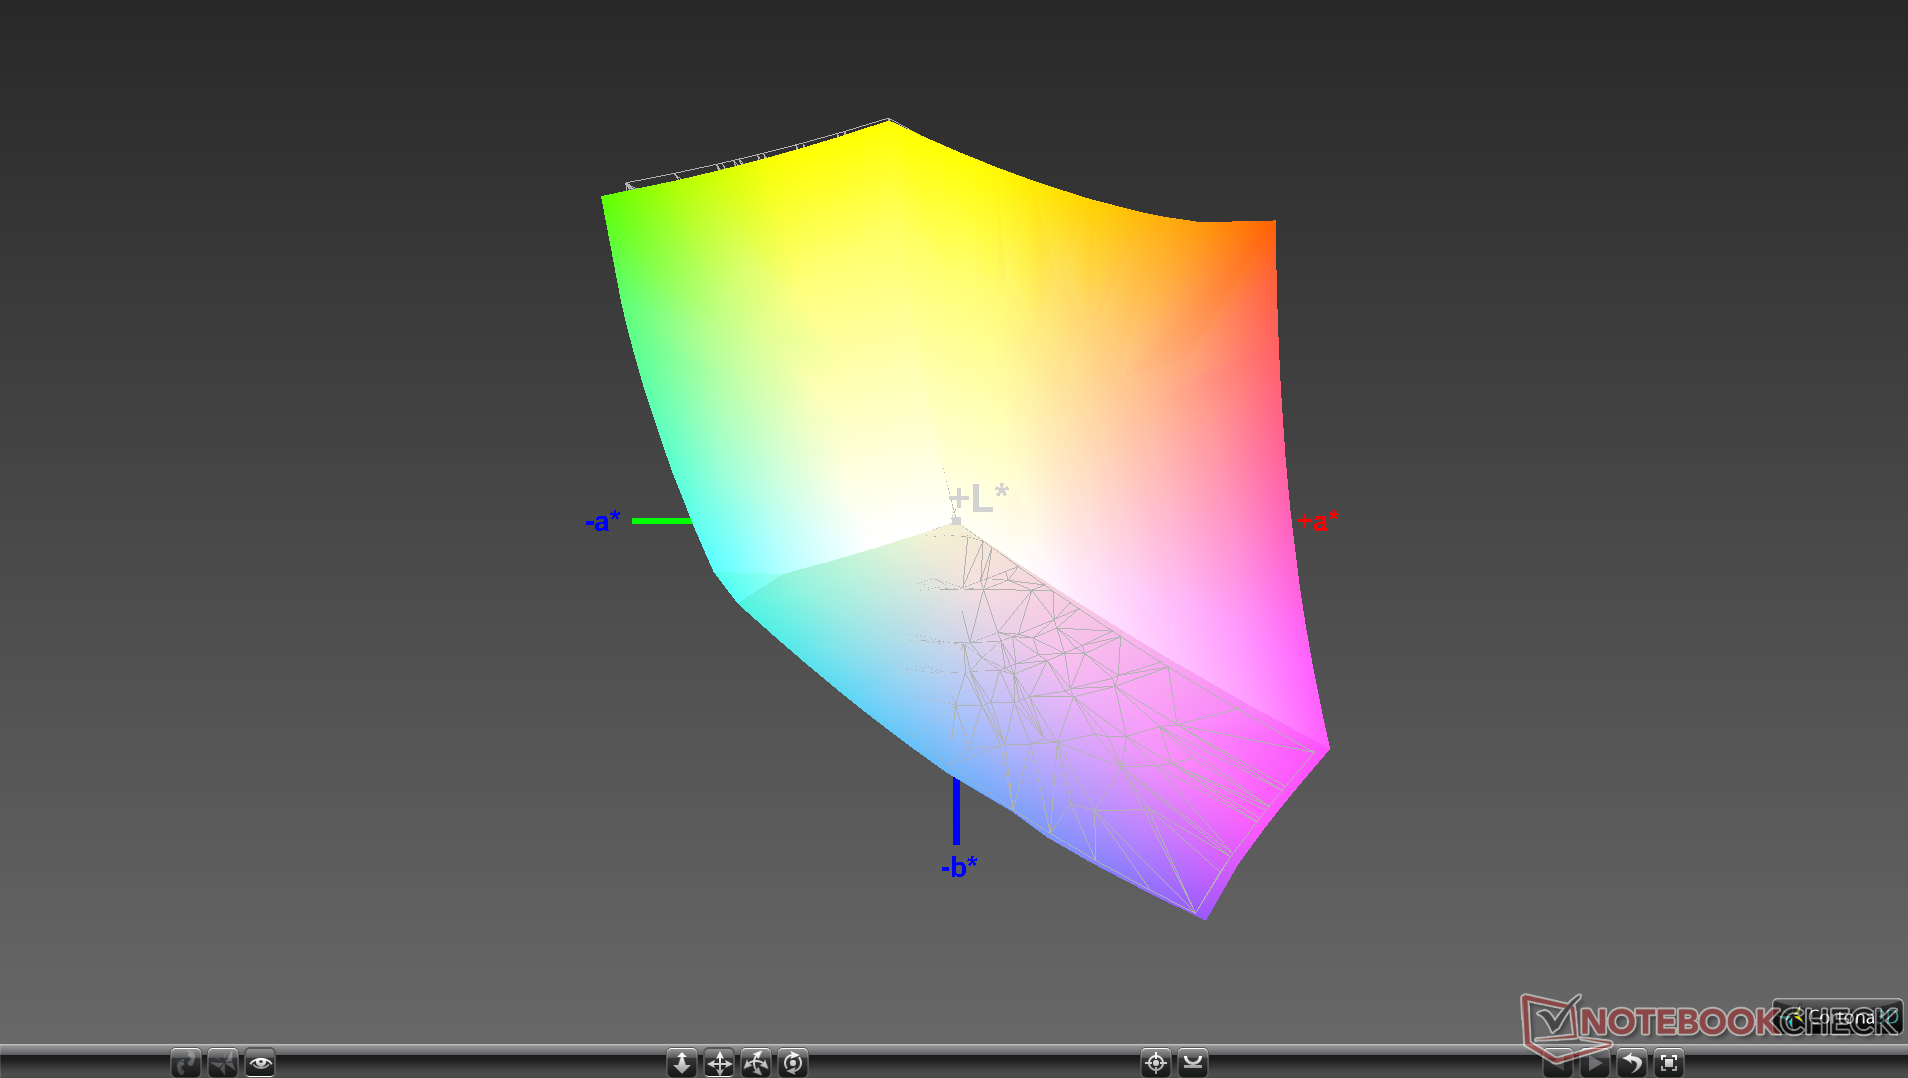
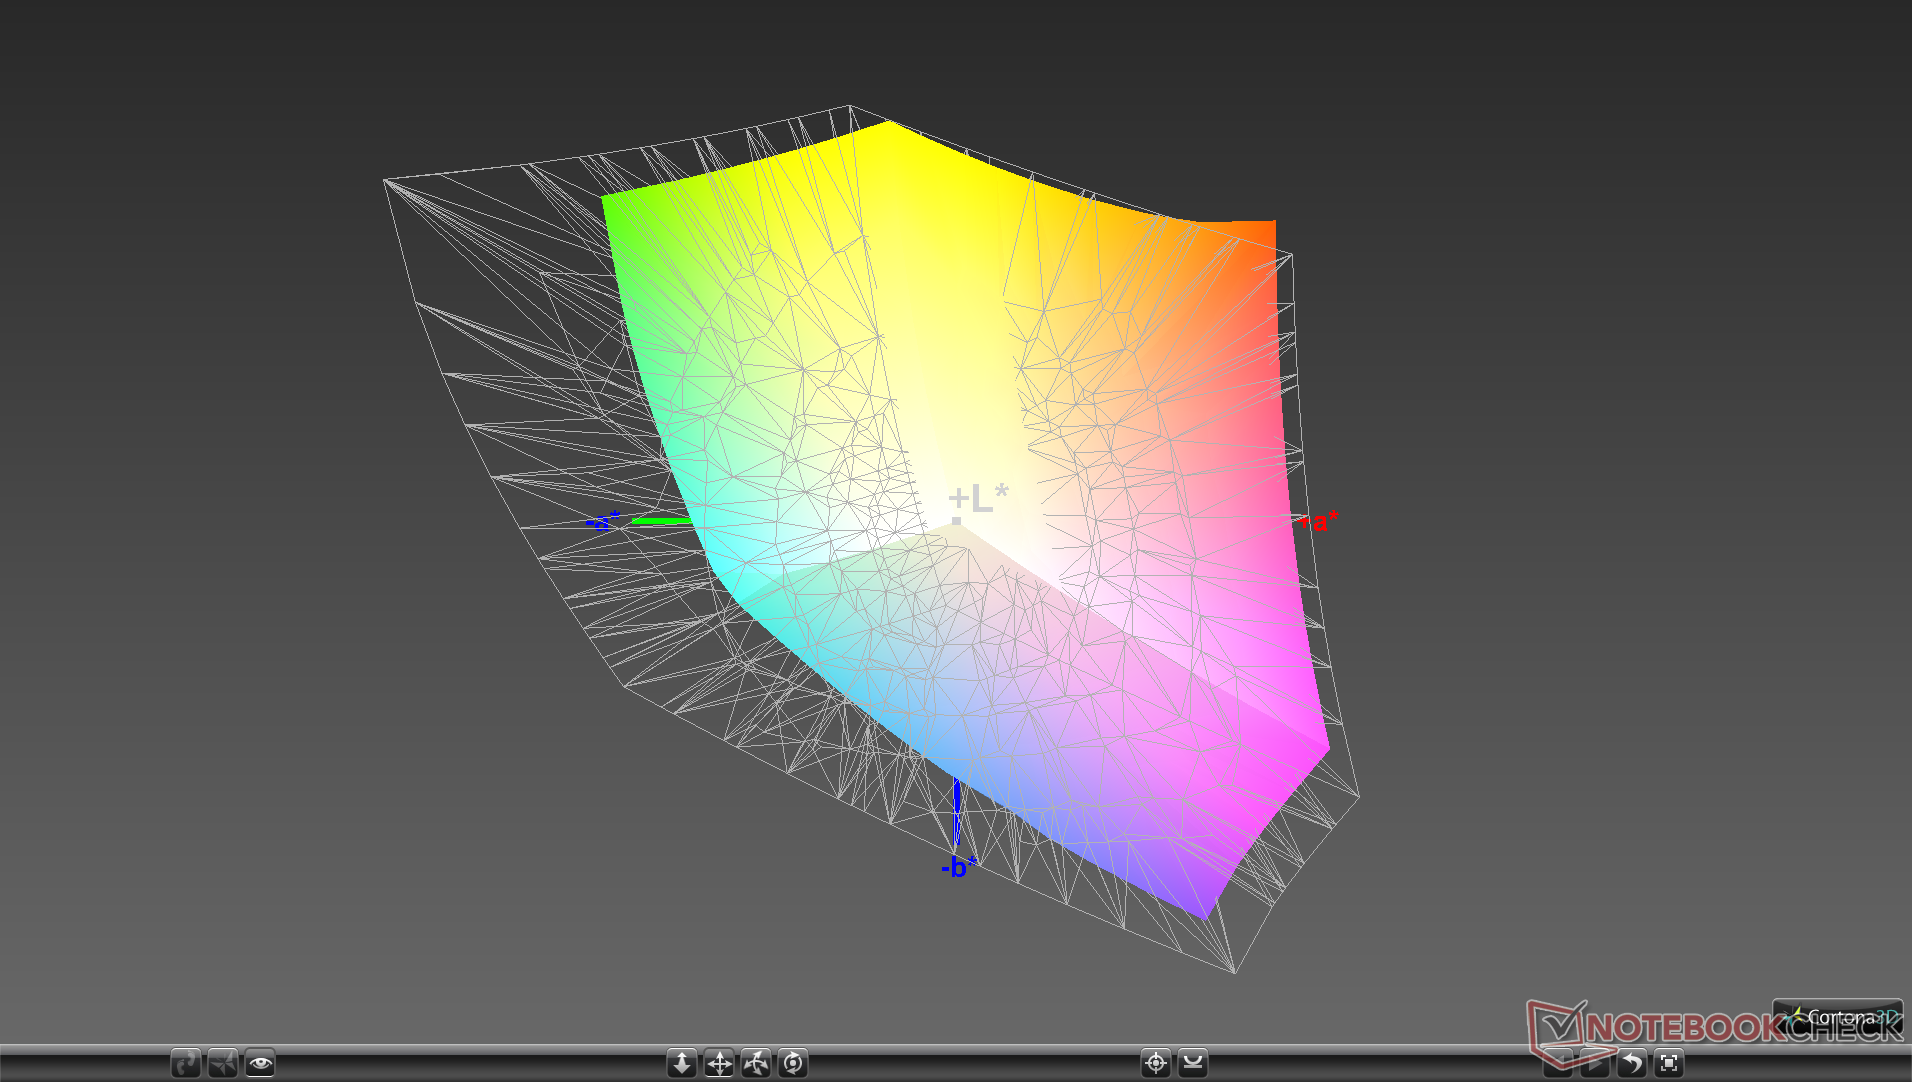
99.4% sRGB (Argyll 1.6.3 3D)
66.4% AdobeRGB 1998 (Argyll 1.6.3 3D)
72.4% AdobeRGB 1998 (Argyll 3D)
99.3% sRGB (Argyll 3D)
71.8% Display P3 (Argyll 3D)
Gamma: 2.3
CCT: 6957 K
| Dell Latitude 7410 AU Optronics B140ZAN, IPS, 14", 3840x2160 | Dell Latitude 7400-8N6DH AU Optronics B140HAN, IPS, 14", 1920x1080 | Huawei MateBook X Pro 2020 i7 JDI LPM139M422A, LTPS, 13.9", 3000x2000 | Lenovo ThinkPad X1 Carbon 2020-20UAS04T00 BOE NE140FHM-N61, IPS, 14", 1920x1080 | MSI Modern 14 A10RB-459US Chi Mei N140HCE-EN2, IPS, 14", 1920x1080 | HP Elitebook x360 1040 G5 AU Optronics AUO533D, IPS, 14", 1920x1080 | |
|---|---|---|---|---|---|---|
| Display | -6% | -4% | -6% | -9% | -8% | |
| Display P3 Coverage (%) | 71.8 | 66.1 -8% | 66.6 -7% | 68.9 -4% | 64.2 -11% | 64.3 -10% |
| sRGB Coverage (%) | 99.3 | 95.3 -4% | 99.4 0% | 91.6 -8% | 94.8 -5% | 94.1 -5% |
| AdobeRGB 1998 Coverage (%) | 72.4 | 67.5 -7% | 68.6 -5% | 67.1 -7% | 65.4 -10% | 65.5 -10% |
| Response Times | -63% | -33% | -51% | -30% | -68% | |
| Response Time Grey 50% / Grey 80% * (ms) | 39.2 ? | 62 ? -58% | 49.6 ? -27% | 64.8 ? -65% | 39.2 ? -0% | 70.8 ? -81% |
| Response Time Black / White * (ms) | 22.4 ? | 37.6 ? -68% | 30.8 ? -38% | 30.4 ? -36% | 35.6 ? -59% | 34.4 ? -54% |
| PWM Frequency (Hz) | 29070 ? | 2404 ? | 25000 ? | 735 ? | ||
| Screen | 5% | 36% | -1% | 18% | 11% | |
| Brightness middle (cd/m²) | 388.6 | 289 -26% | 557 43% | 422 9% | 324.1 -17% | 416.3 7% |
| Brightness (cd/m²) | 365 | 286 -22% | 532 46% | 395 8% | 301 -18% | 400 10% |
| Brightness Distribution (%) | 82 | 91 11% | 87 6% | 90 10% | 87 6% | 89 9% |
| Black Level * (cd/m²) | 0.35 | 0.16 54% | 0.33 6% | 0.27 23% | 0.22 37% | 0.29 17% |
| Contrast (:1) | 1110 | 1806 63% | 1688 52% | 1563 41% | 1473 33% | 1436 29% |
| Colorchecker dE 2000 * | 4.04 | 4.7 -16% | 1.4 65% | 4.7 -16% | 1.63 60% | 2.69 33% |
| Colorchecker dE 2000 max. * | 9.2 | 8.7 5% | 2.5 73% | 10 -9% | 4.25 54% | 4.95 46% |
| Colorchecker dE 2000 calibrated * | 1.25 | 1.3 -4% | 0.7 44% | 2 -60% | 1.42 -14% | 2.13 -70% |
| Greyscale dE 2000 * | 6.4 | 6.4 -0% | 2 69% | 6.4 -0% | 2.2 66% | 2.9 55% |
| Gamma | 2.3 96% | 2.54 87% | 2.14 103% | 2.12 104% | 2.26 97% | 2.4 92% |
| CCT | 6957 93% | 5977 109% | 6689 97% | 7106 91% | 6887 94% | 6623 98% |
| Color Space (Percent of AdobeRGB 1998) (%) | 66.4 | 61.2 -8% | 62.5 -6% | 59.5 -10% | 60.2 -9% | 60.1 -9% |
| Color Space (Percent of sRGB) (%) | 99.4 | 95.1 -4% | 99.5 0% | 91.5 -8% | 95 -4% | 94.5 -5% |
| Total Average (Program / Settings) | -21% /
-6% | -0% /
20% | -19% /
-8% | -7% /
7% | -22% /
-2% |
* ... smaller is better
Color space covers sRGB entirely and 66 percent of AdobeRGB which is similar to most Ultrabooks with FHD panels. OLED and certain 4K Sharp IGZO panels are able to offer even deeper colors.
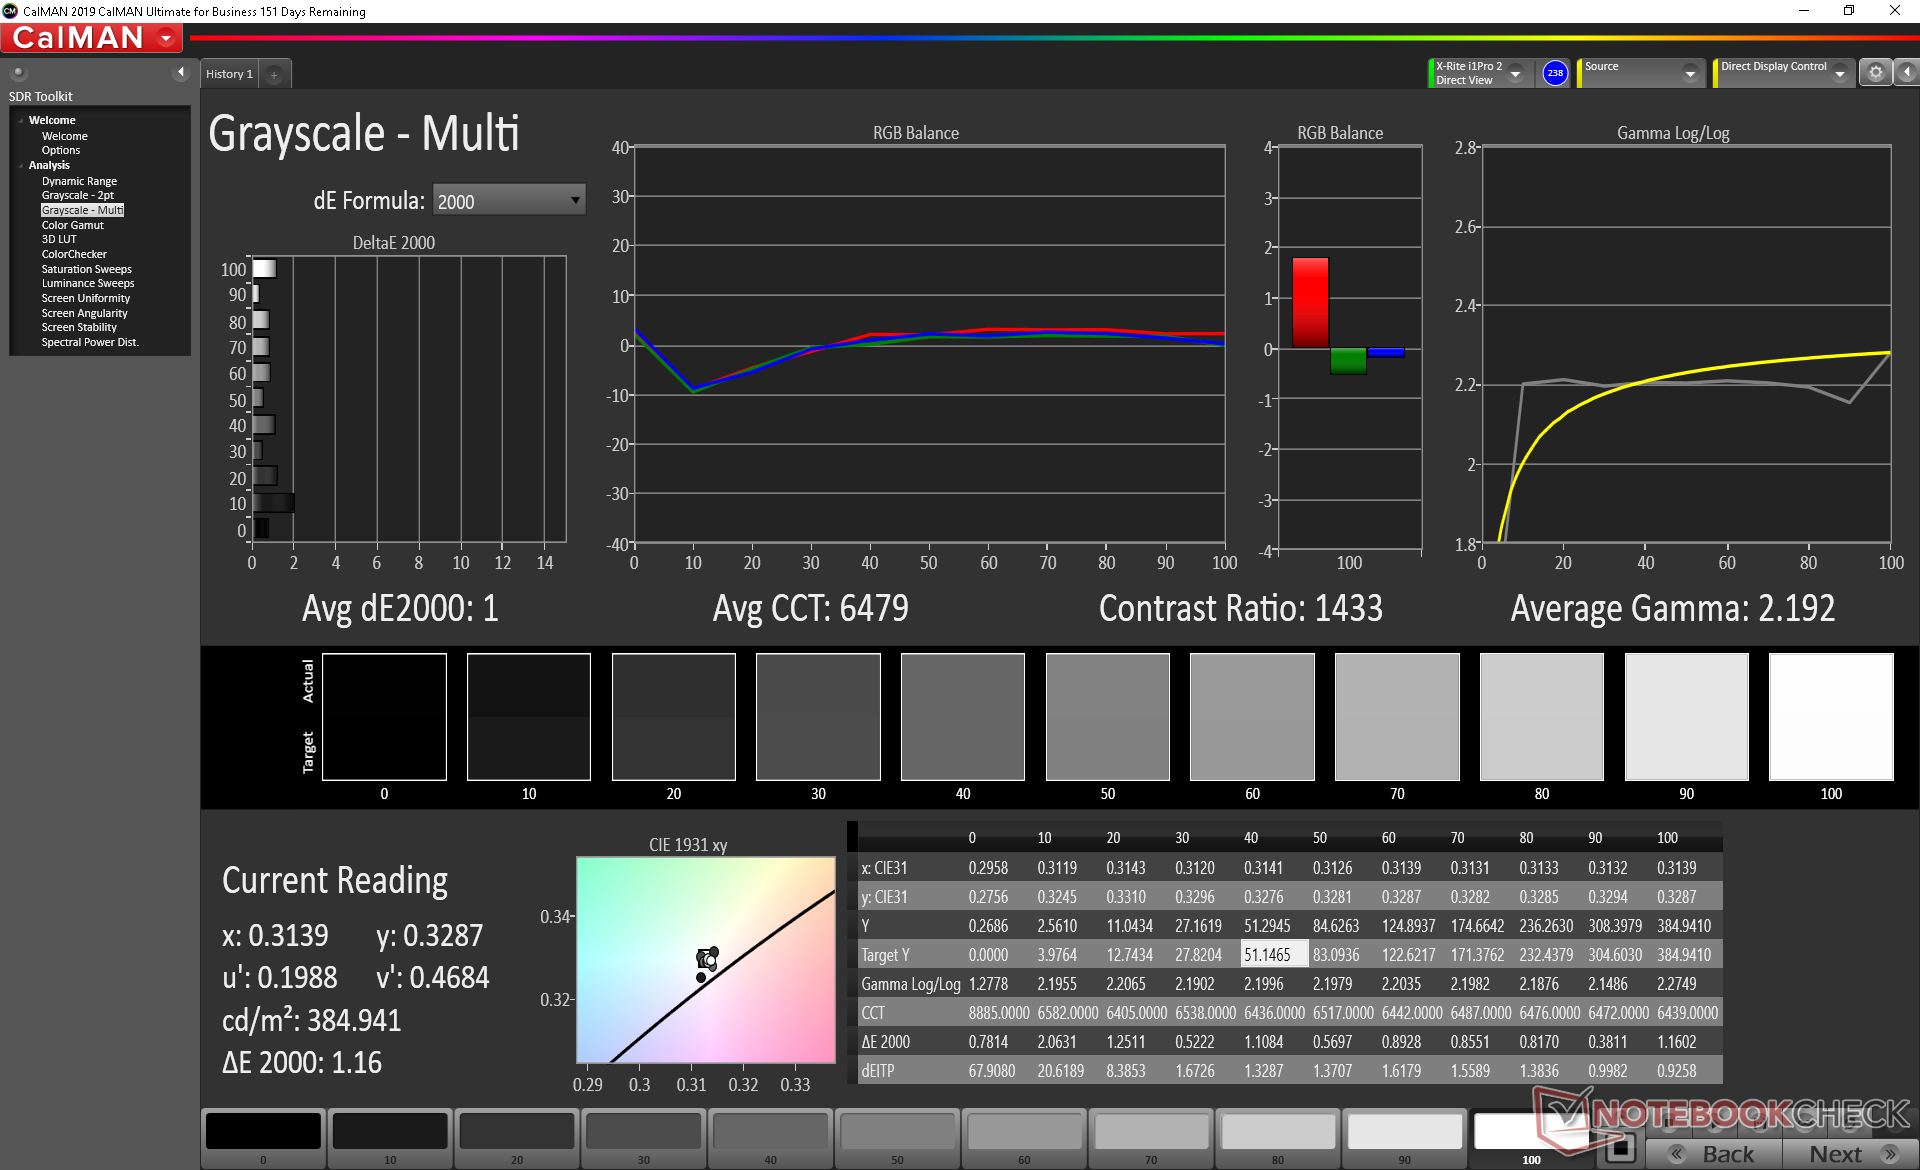
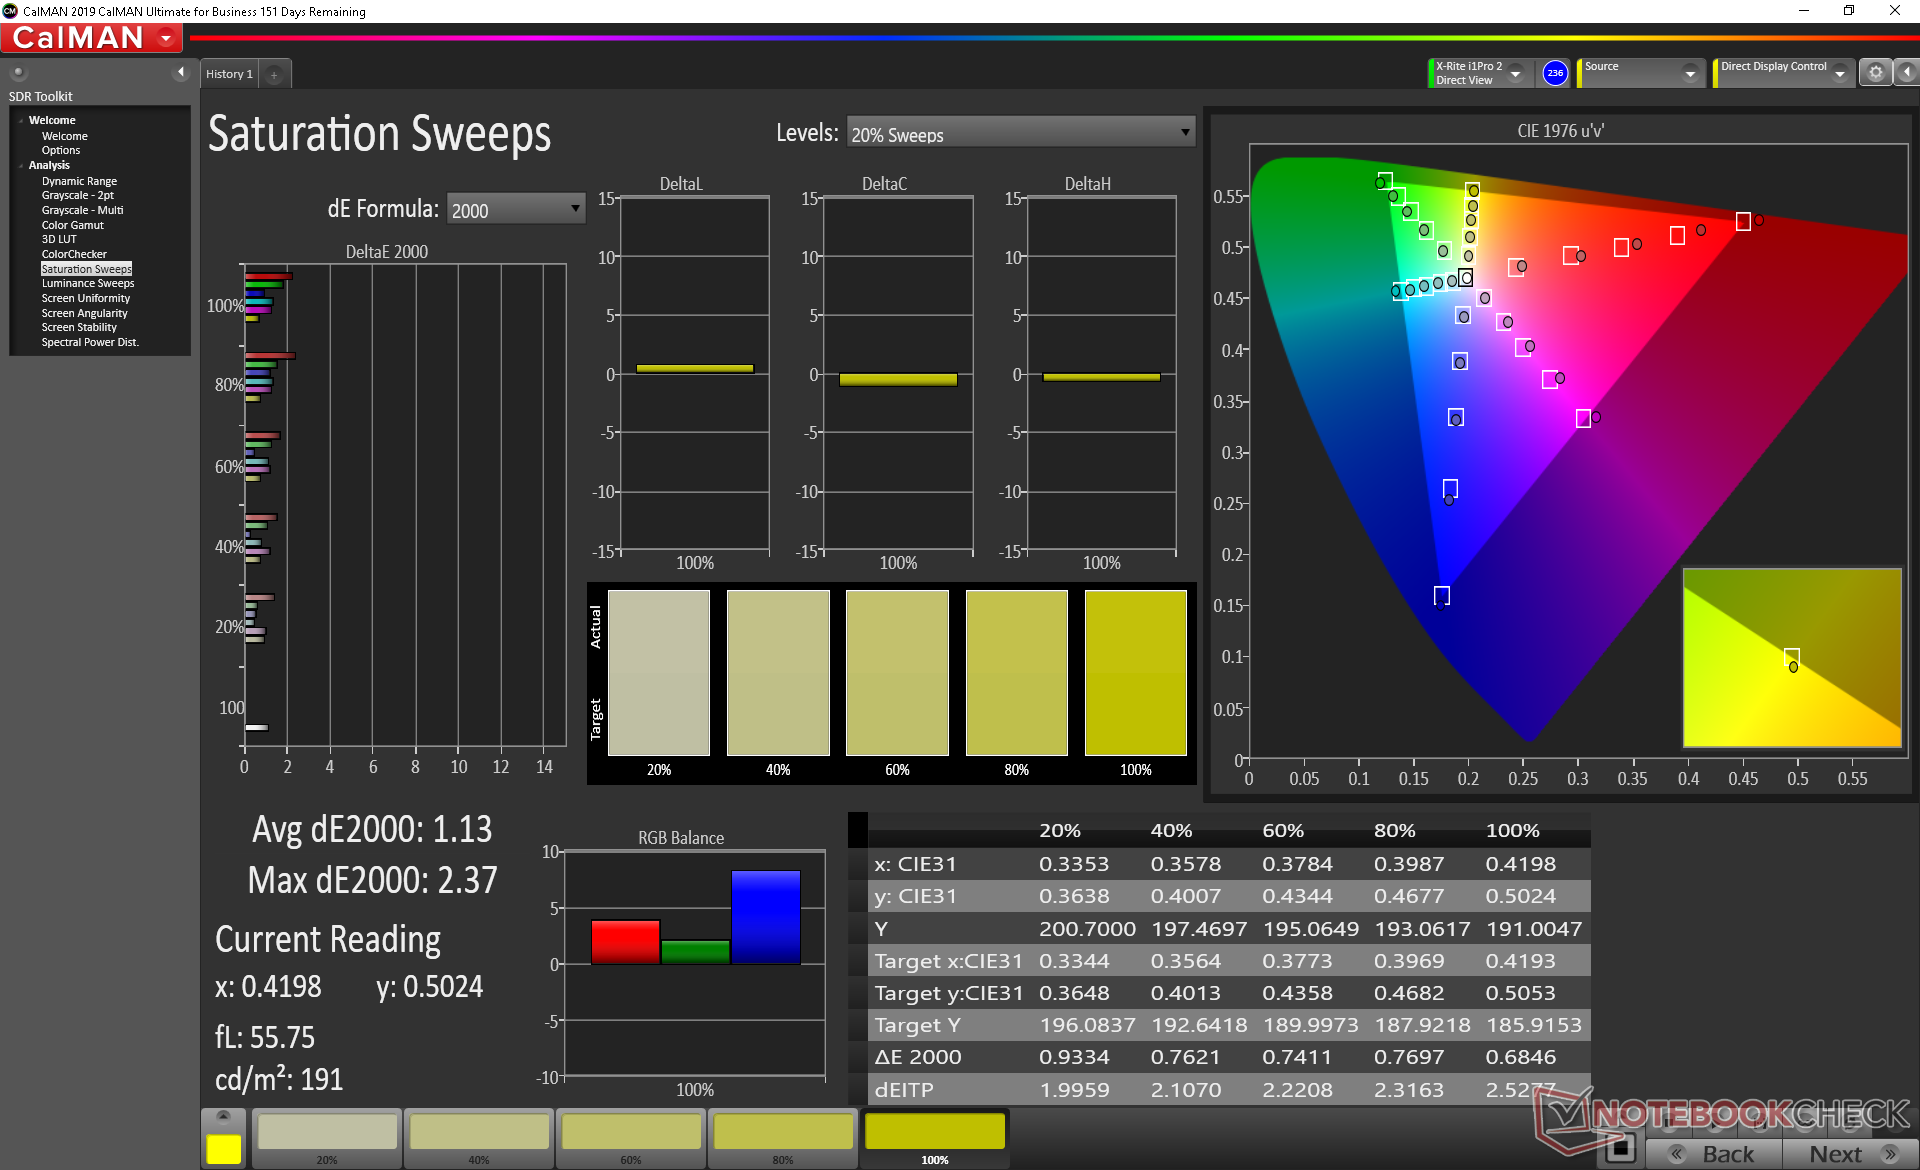
Color temperature is slightly too cool out of the box for a mediocre deltaE grayscale value of 6.4. After calibrating the panel ourselves, colors and grayscale would improve significantly to be much closer to the sRGB standard. We recommend applying our ICM profile above to get the most out of the display.
Display Response Times
| ↔ Response Time Black to White | ||
|---|---|---|
| 22.4 ms ... rise ↗ and fall ↘ combined | ↗ 12.4 ms rise | 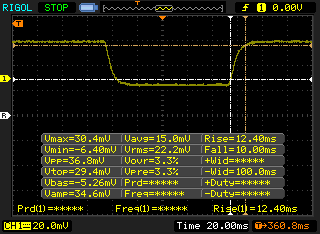 |
| ↘ 10 ms fall | ||
| The screen shows good response rates in our tests, but may be too slow for competitive gamers. In comparison, all tested devices range from 0.1 (minimum) to 240 (maximum) ms. » 50 % of all devices are better. This means that the measured response time is worse than the average of all tested devices (19.9 ms). | ||
| ↔ Response Time 50% Grey to 80% Grey | ||
| 39.2 ms ... rise ↗ and fall ↘ combined | ↗ 20.4 ms rise | 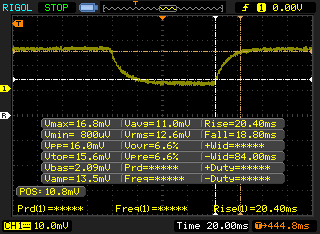 |
| ↘ 18.8 ms fall | ||
| The screen shows slow response rates in our tests and will be unsatisfactory for gamers. In comparison, all tested devices range from 0.165 (minimum) to 636 (maximum) ms. » 60 % of all devices are better. This means that the measured response time is worse than the average of all tested devices (31.1 ms). | ||
Screen Flickering / PWM (Pulse-Width Modulation)
| Screen flickering / PWM not detected | 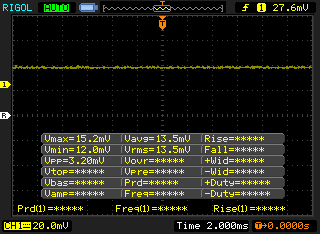 | ||
In comparison: 52 % of all tested devices do not use PWM to dim the display. If PWM was detected, an average of 7798 (minimum: 5 - maximum: 343500) Hz was measured. | |||
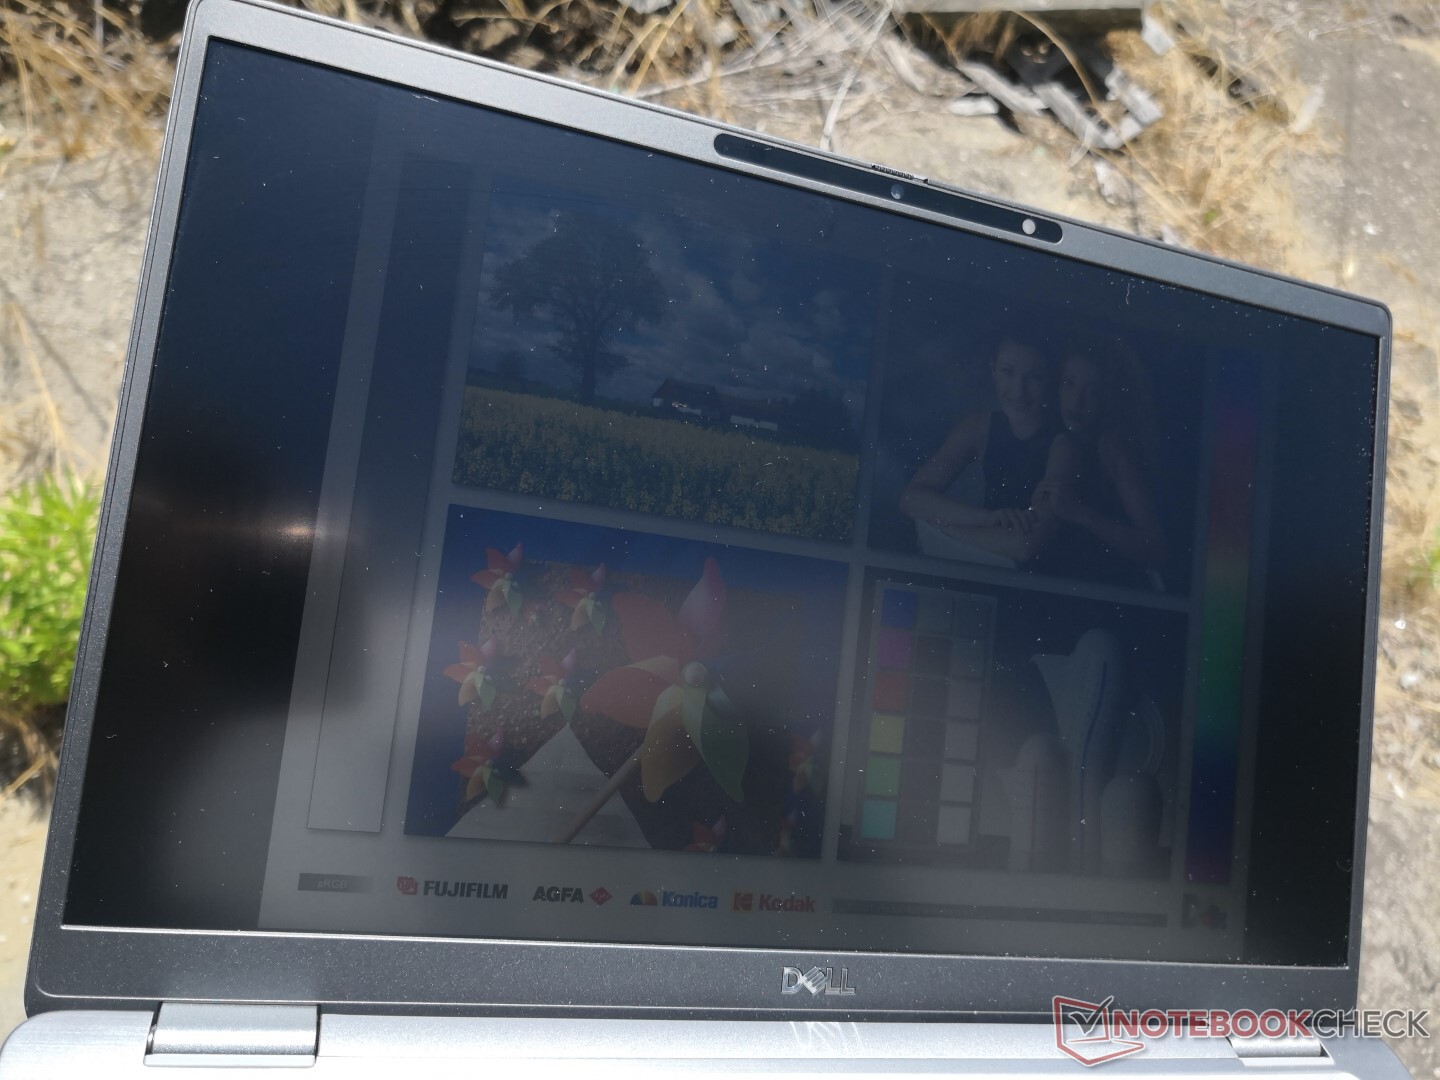
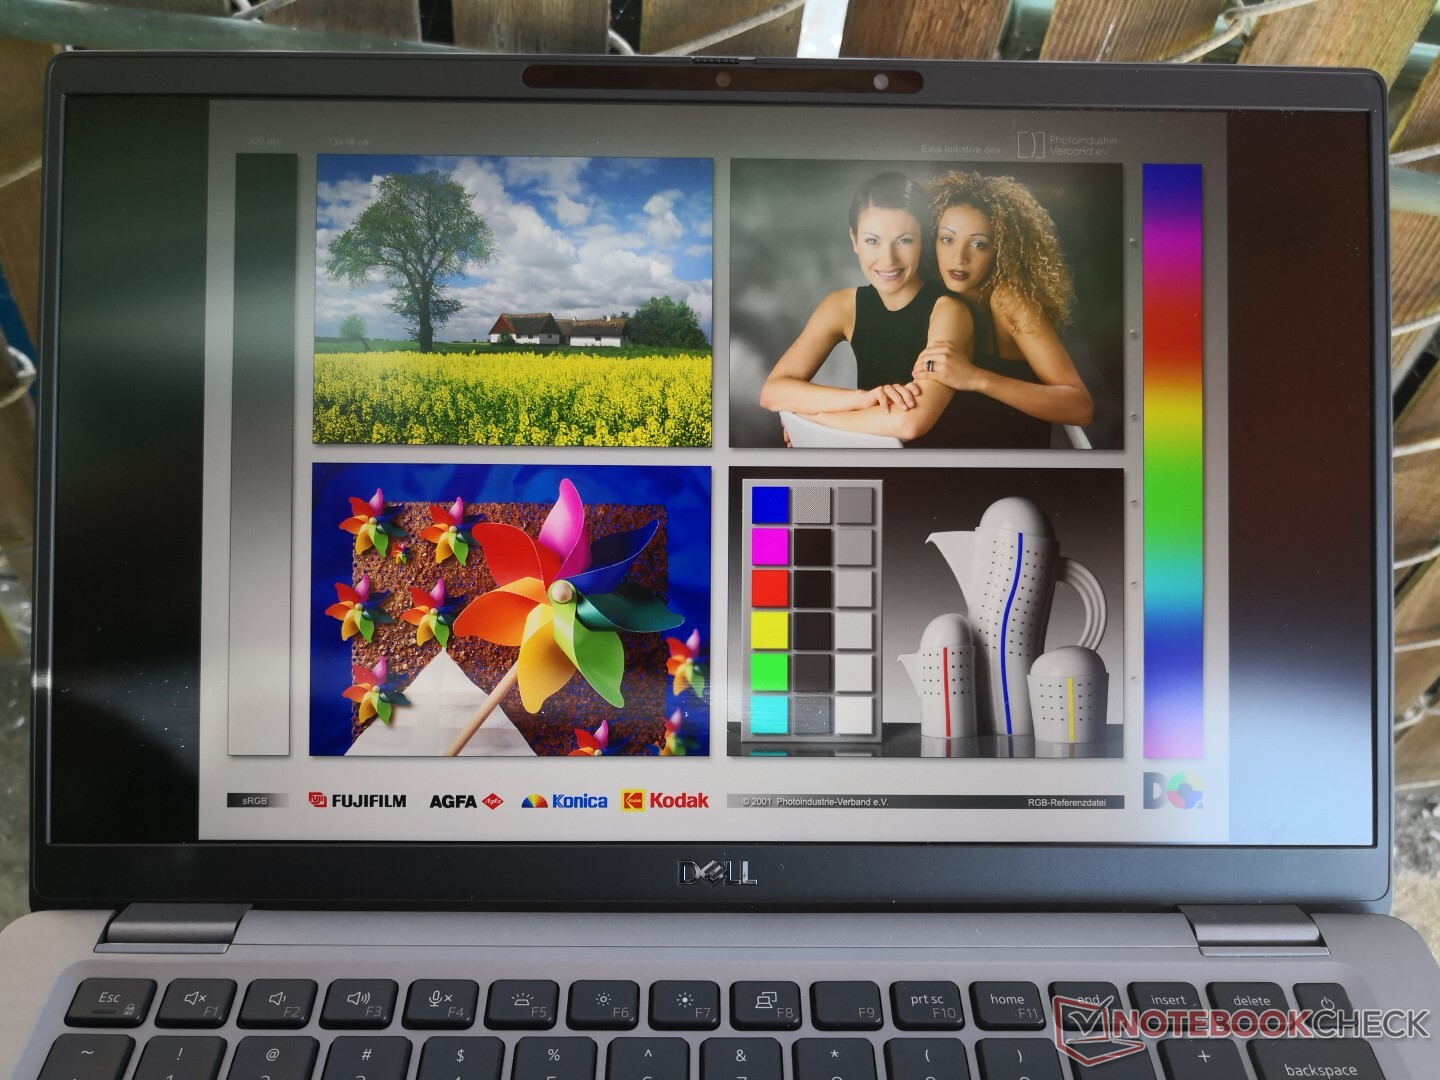
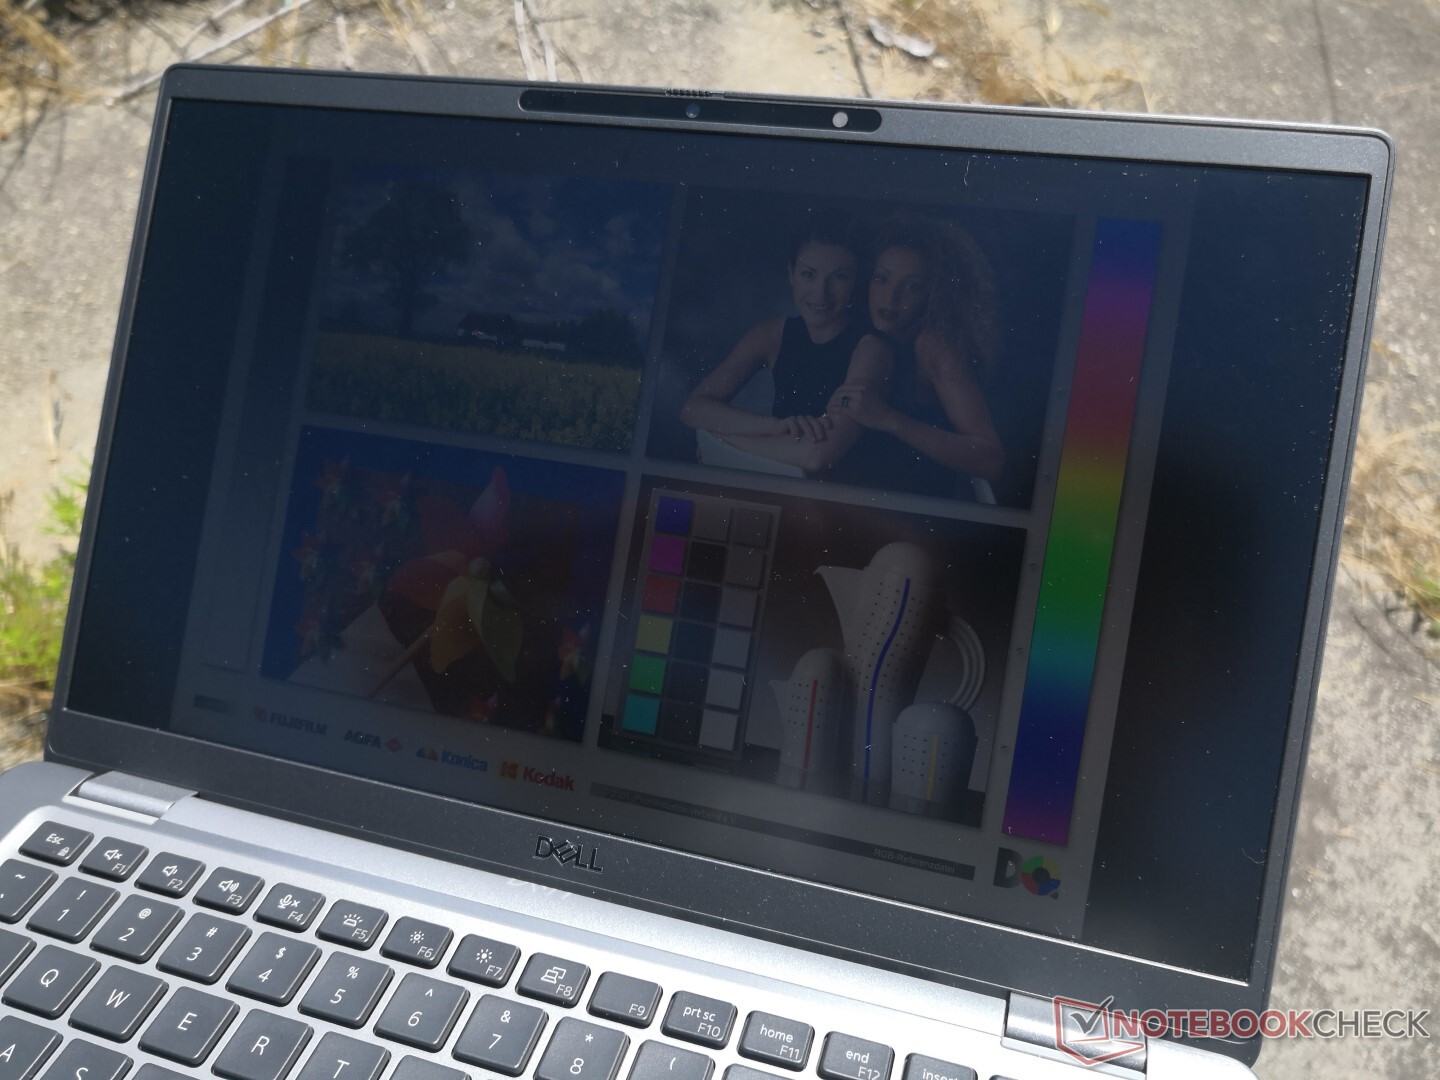
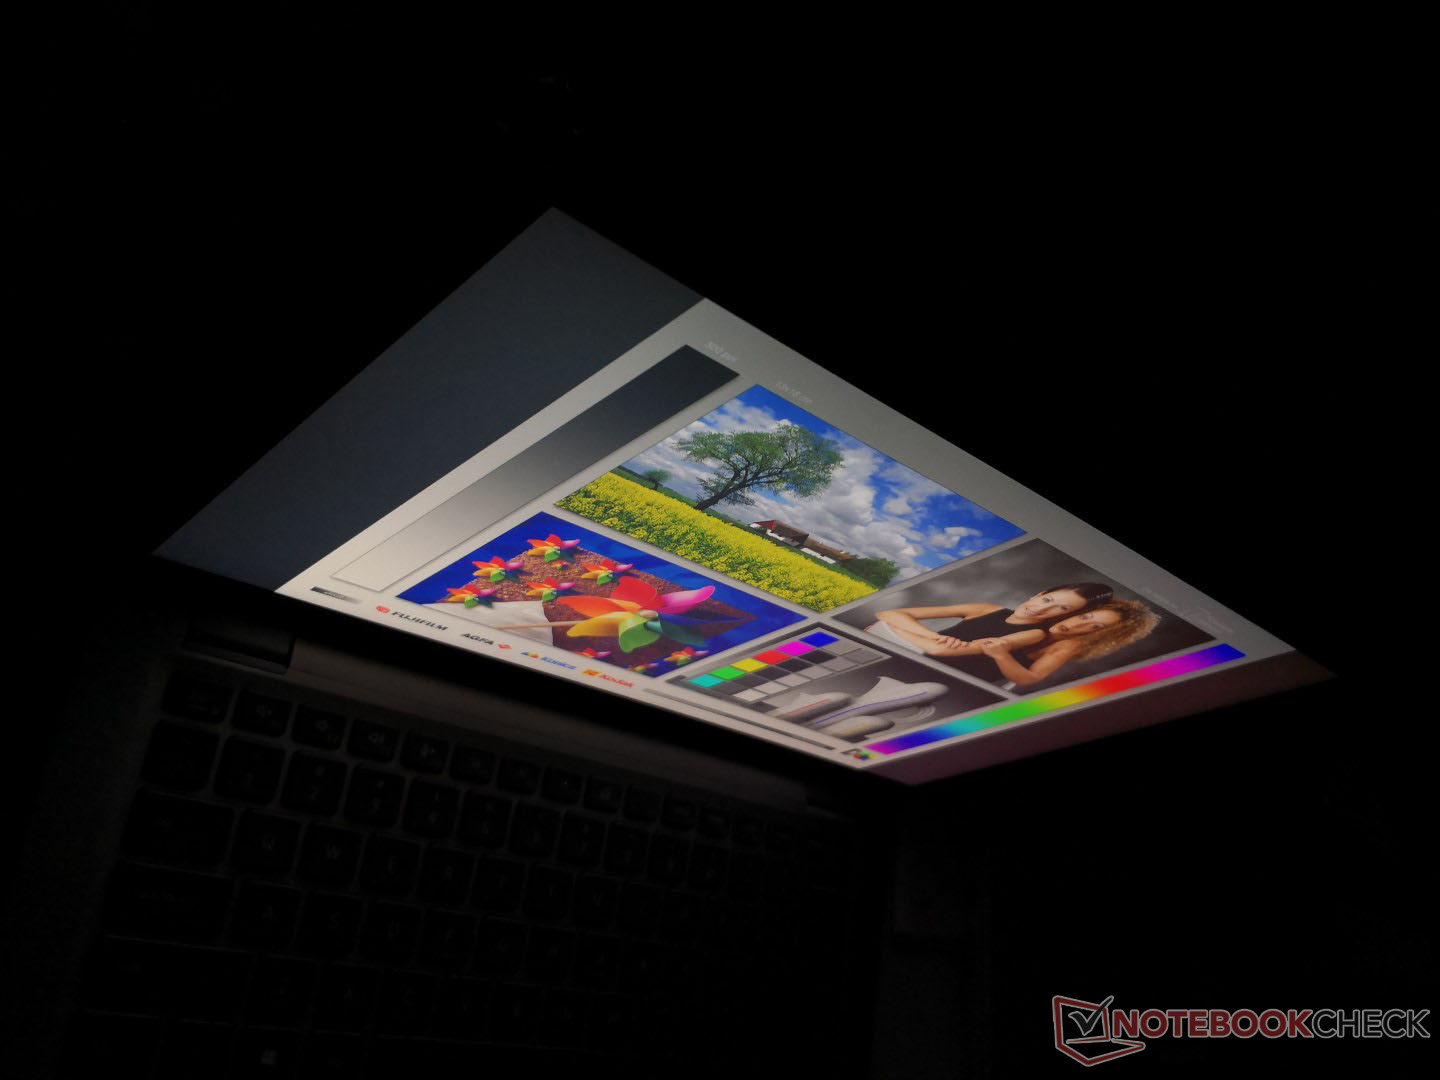
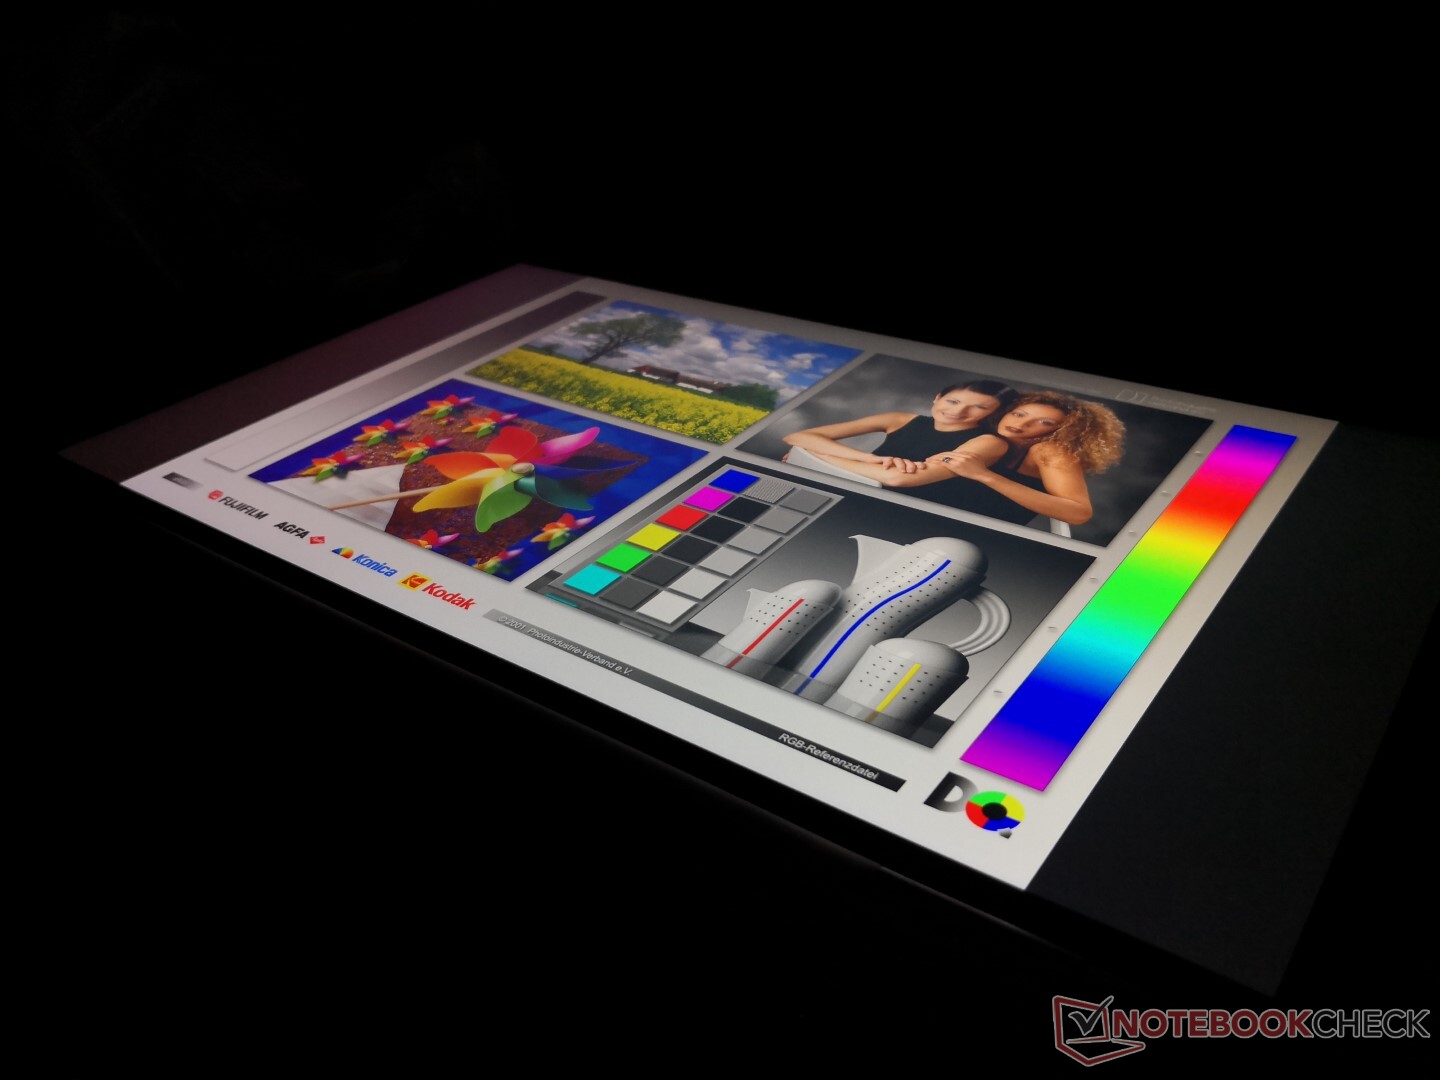
Outdoor visibility is average as the display is not bright enough to overcome direct sunlight or a bright cloudy day. Stay under shade and take advantage of the wide hinge angles and matte screen for a better viewing experience.
Performance
Processor options range from the quad-core Core i5-10210U with no vPro up to the Core i5-10310U or i7-10610U with vPro. Sadly, there are no hexa-core options, Ryzen options, or dedicated graphics to choose from meaning owners will be stuck with the UHD Graphics 620. Users looking for a more graphically capable subnotebook will have to look at the XPS series with Iris graphics or a Ryzen-powered Lenovo.
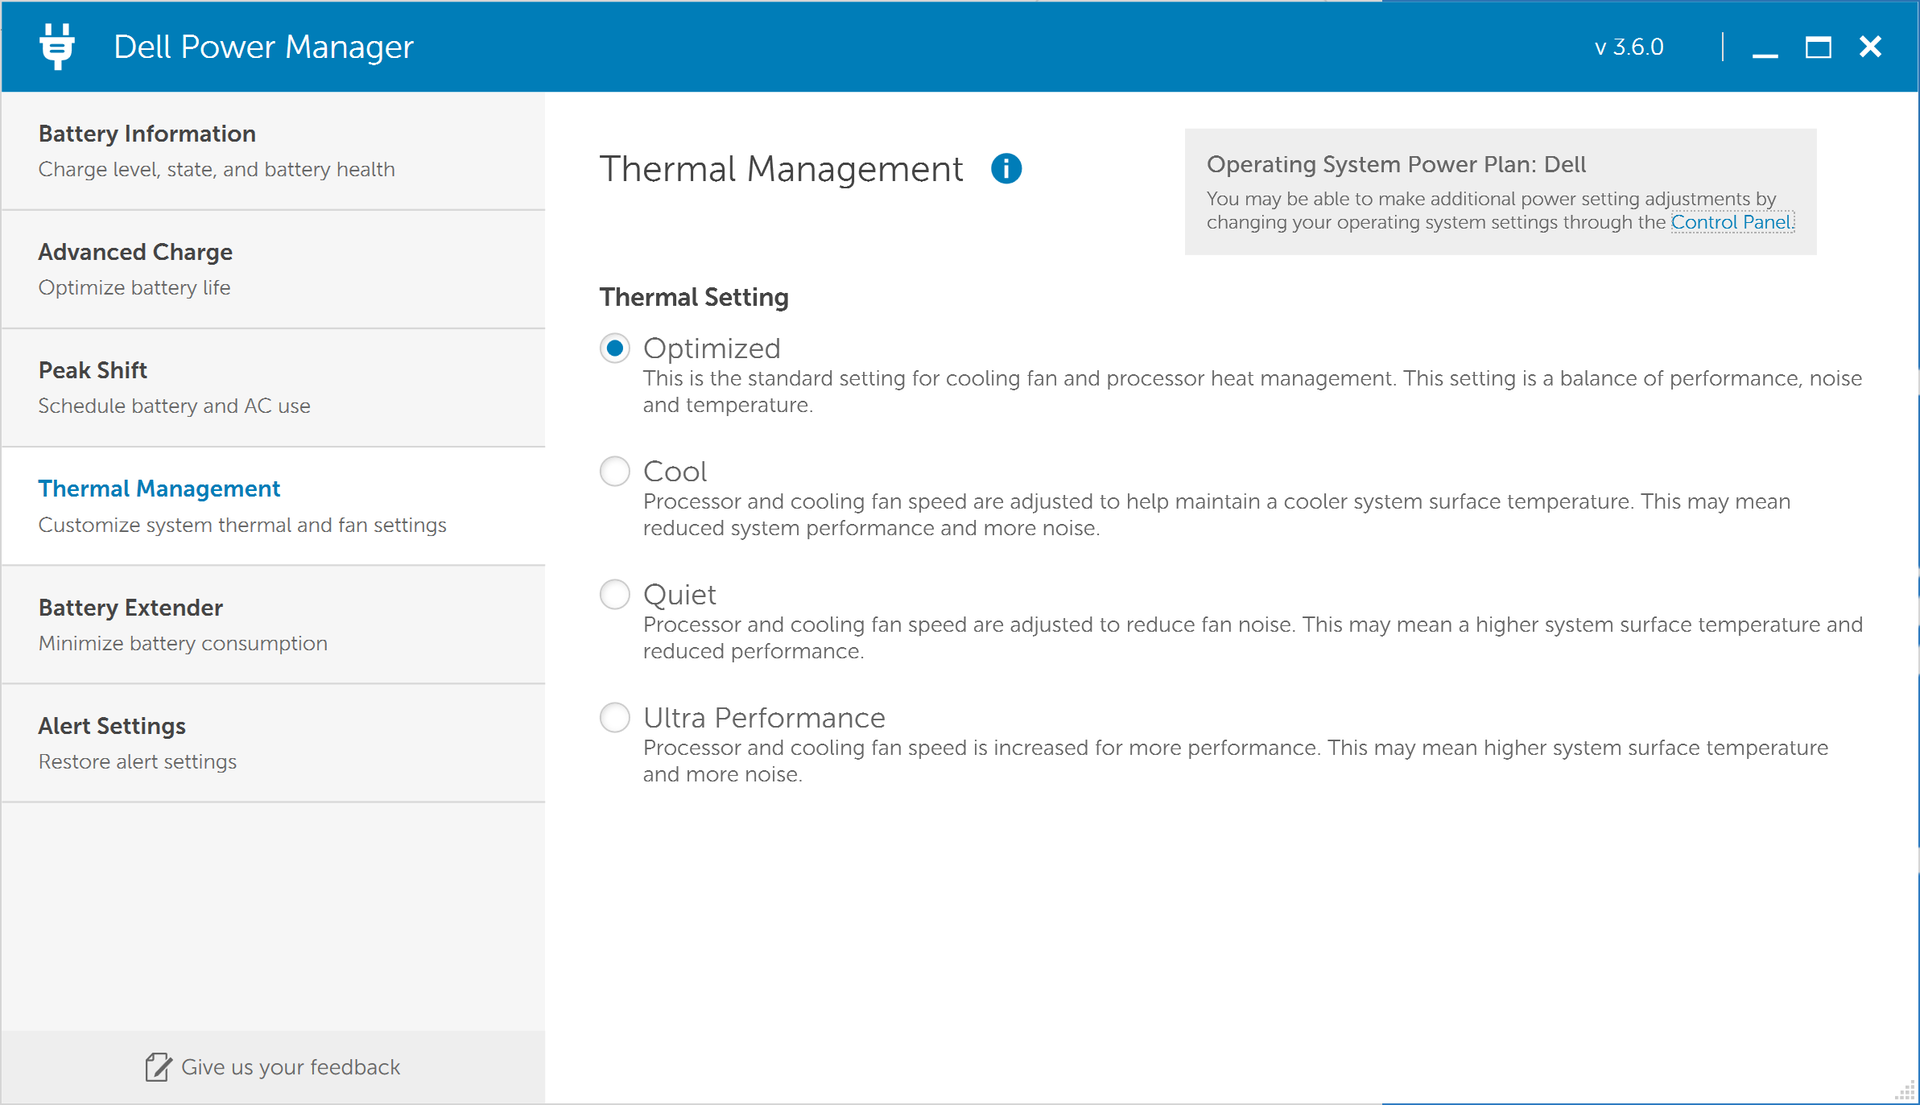
All performance benchmarks below were performed on Dell's Ultra Performance mode to get the highest scores possible.
Processor
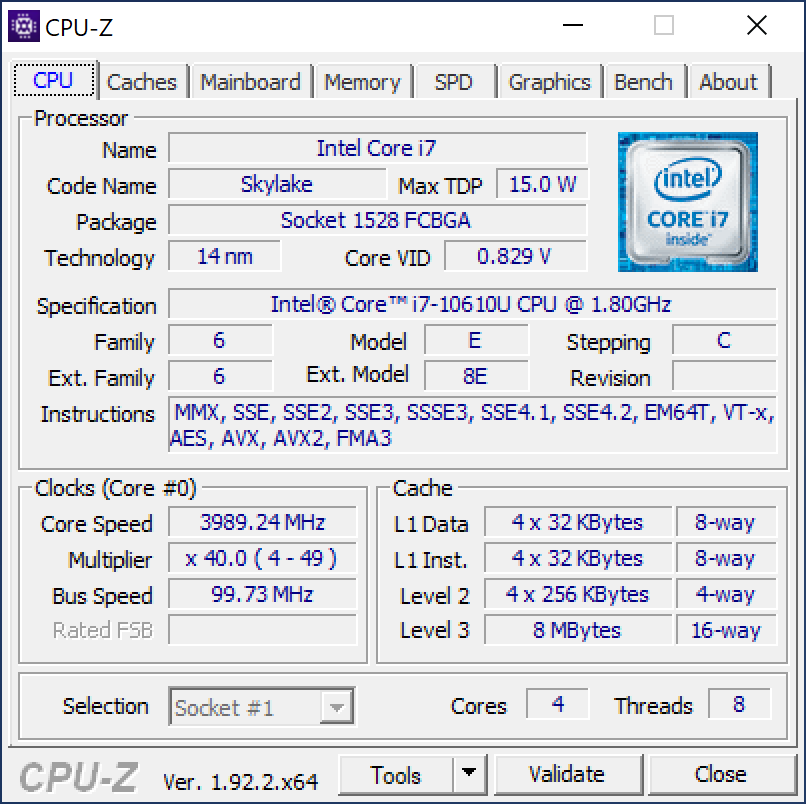
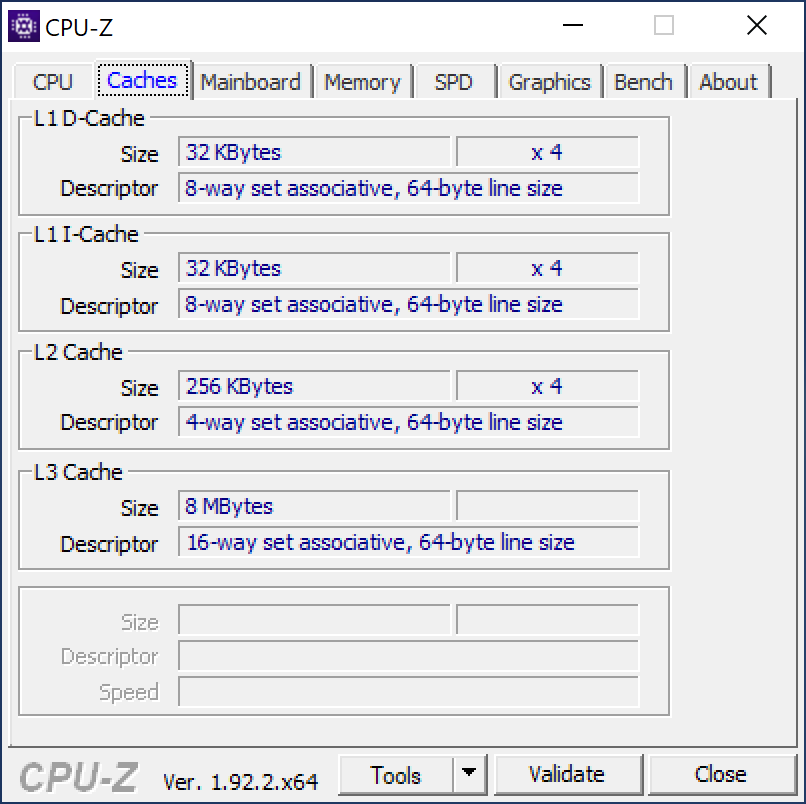
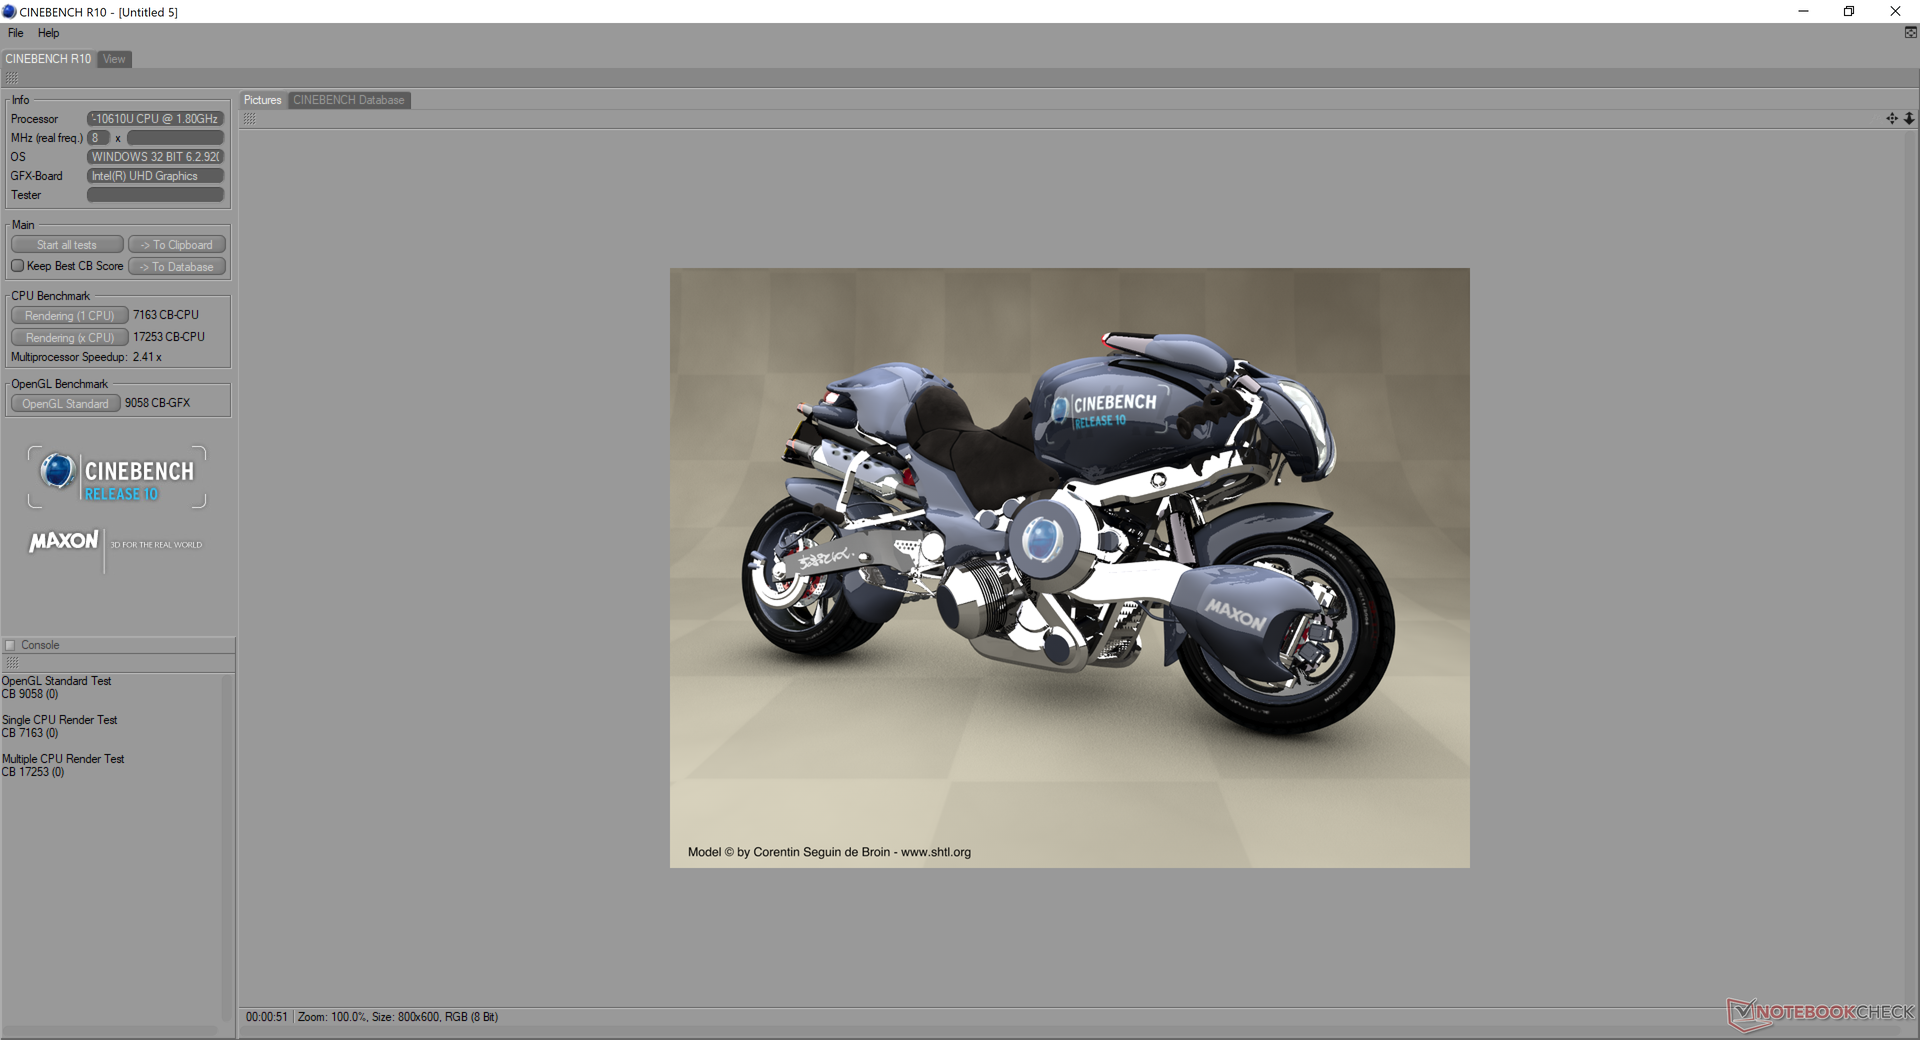
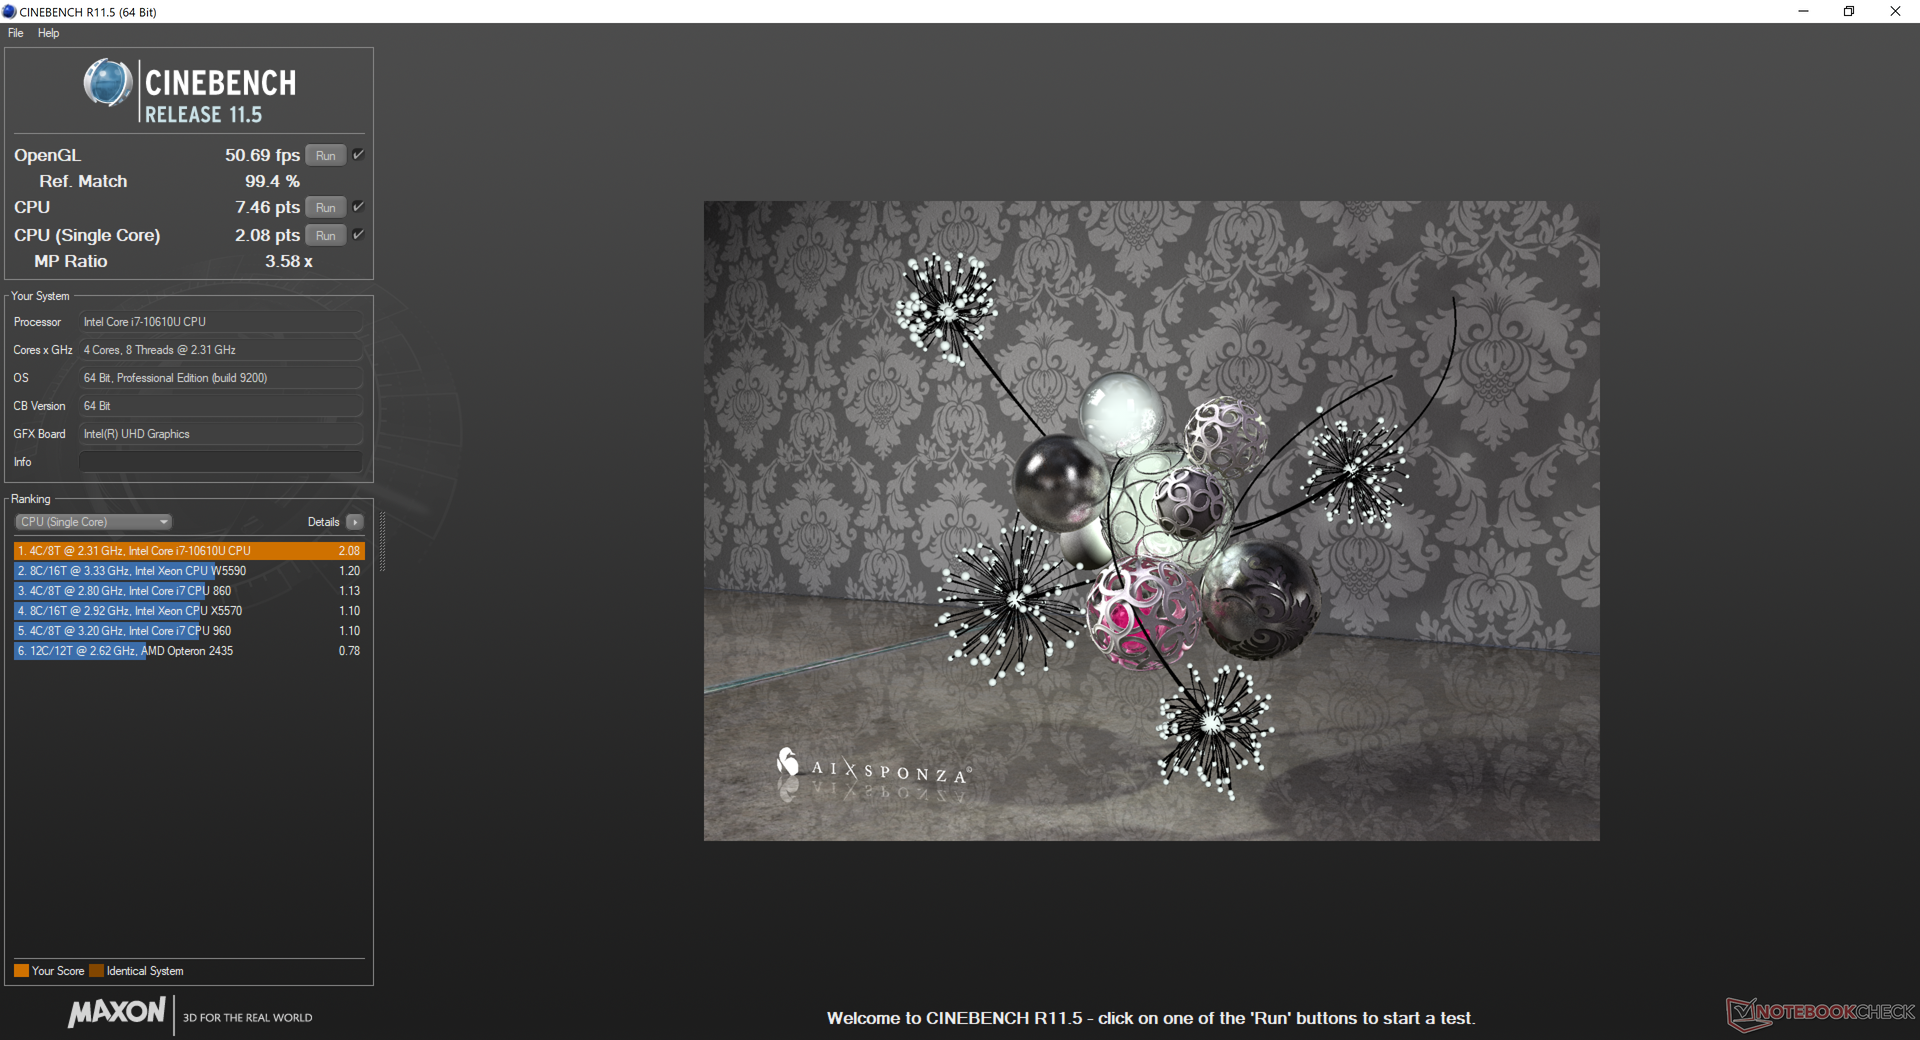
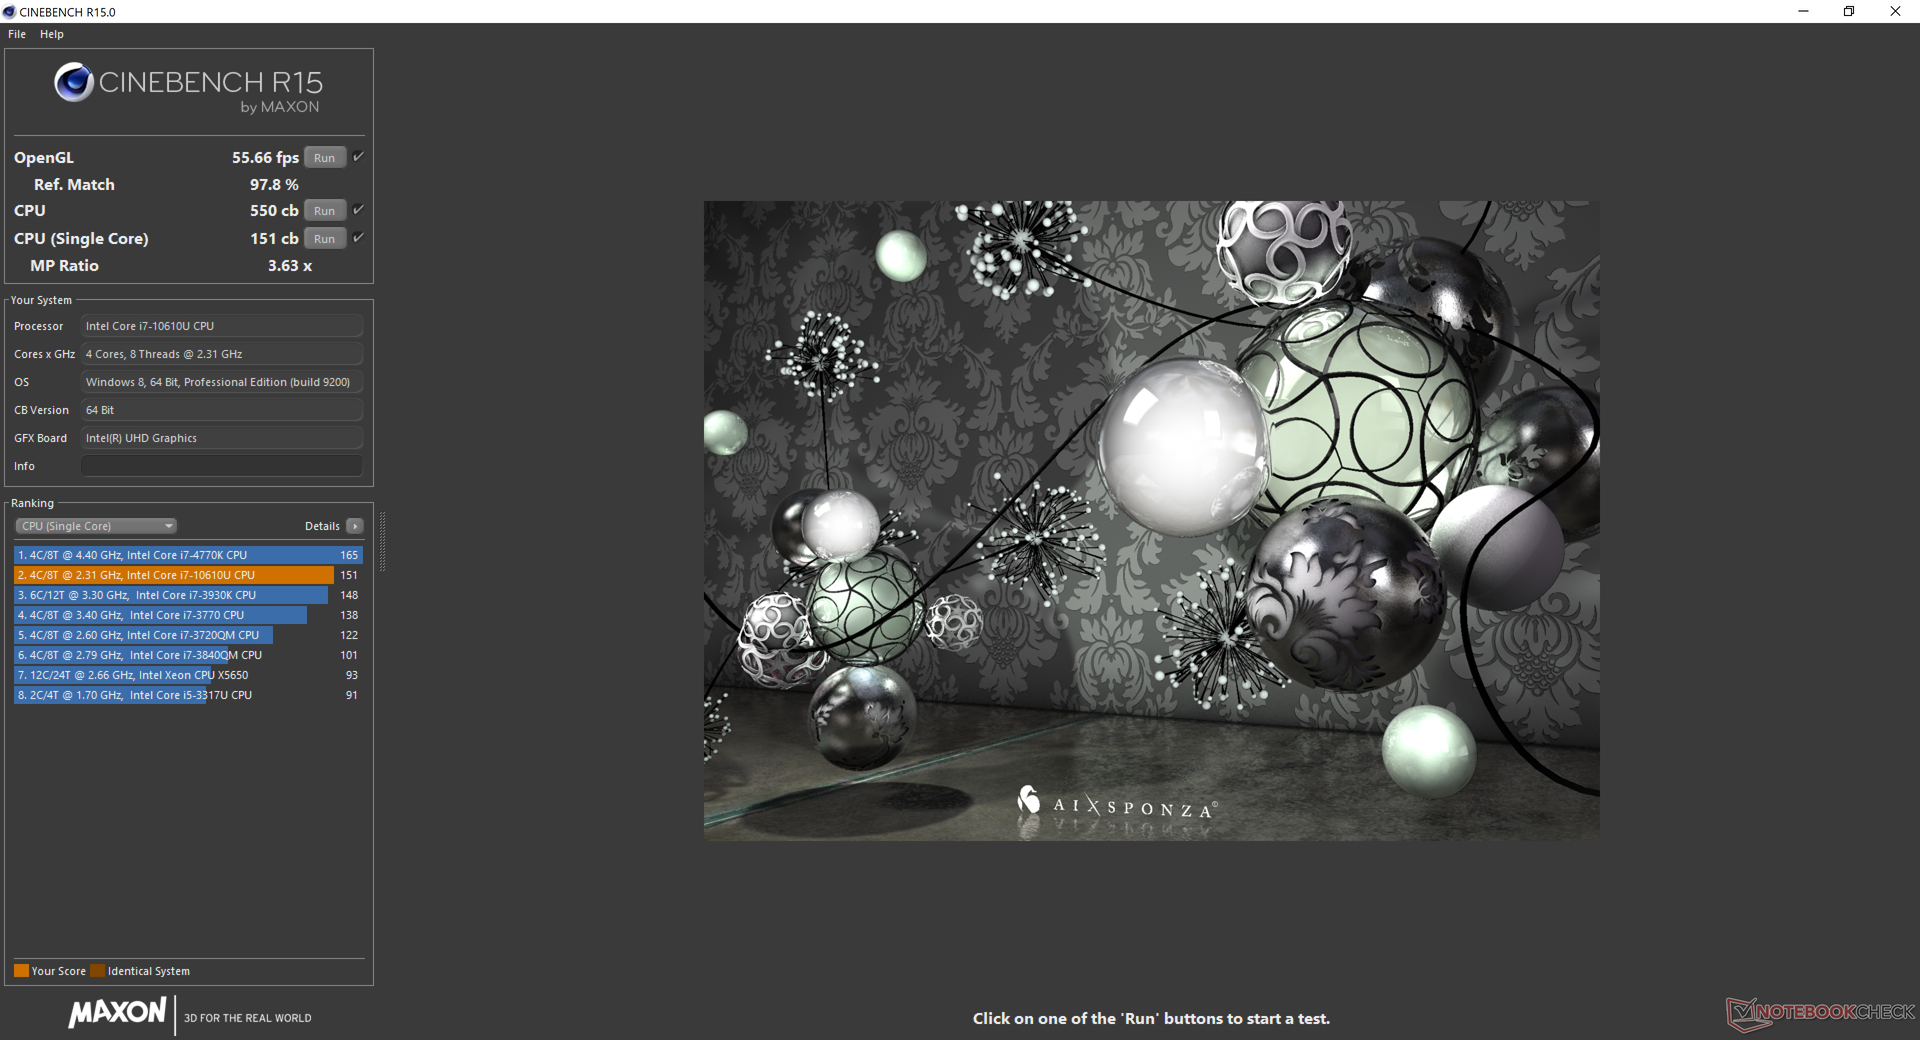
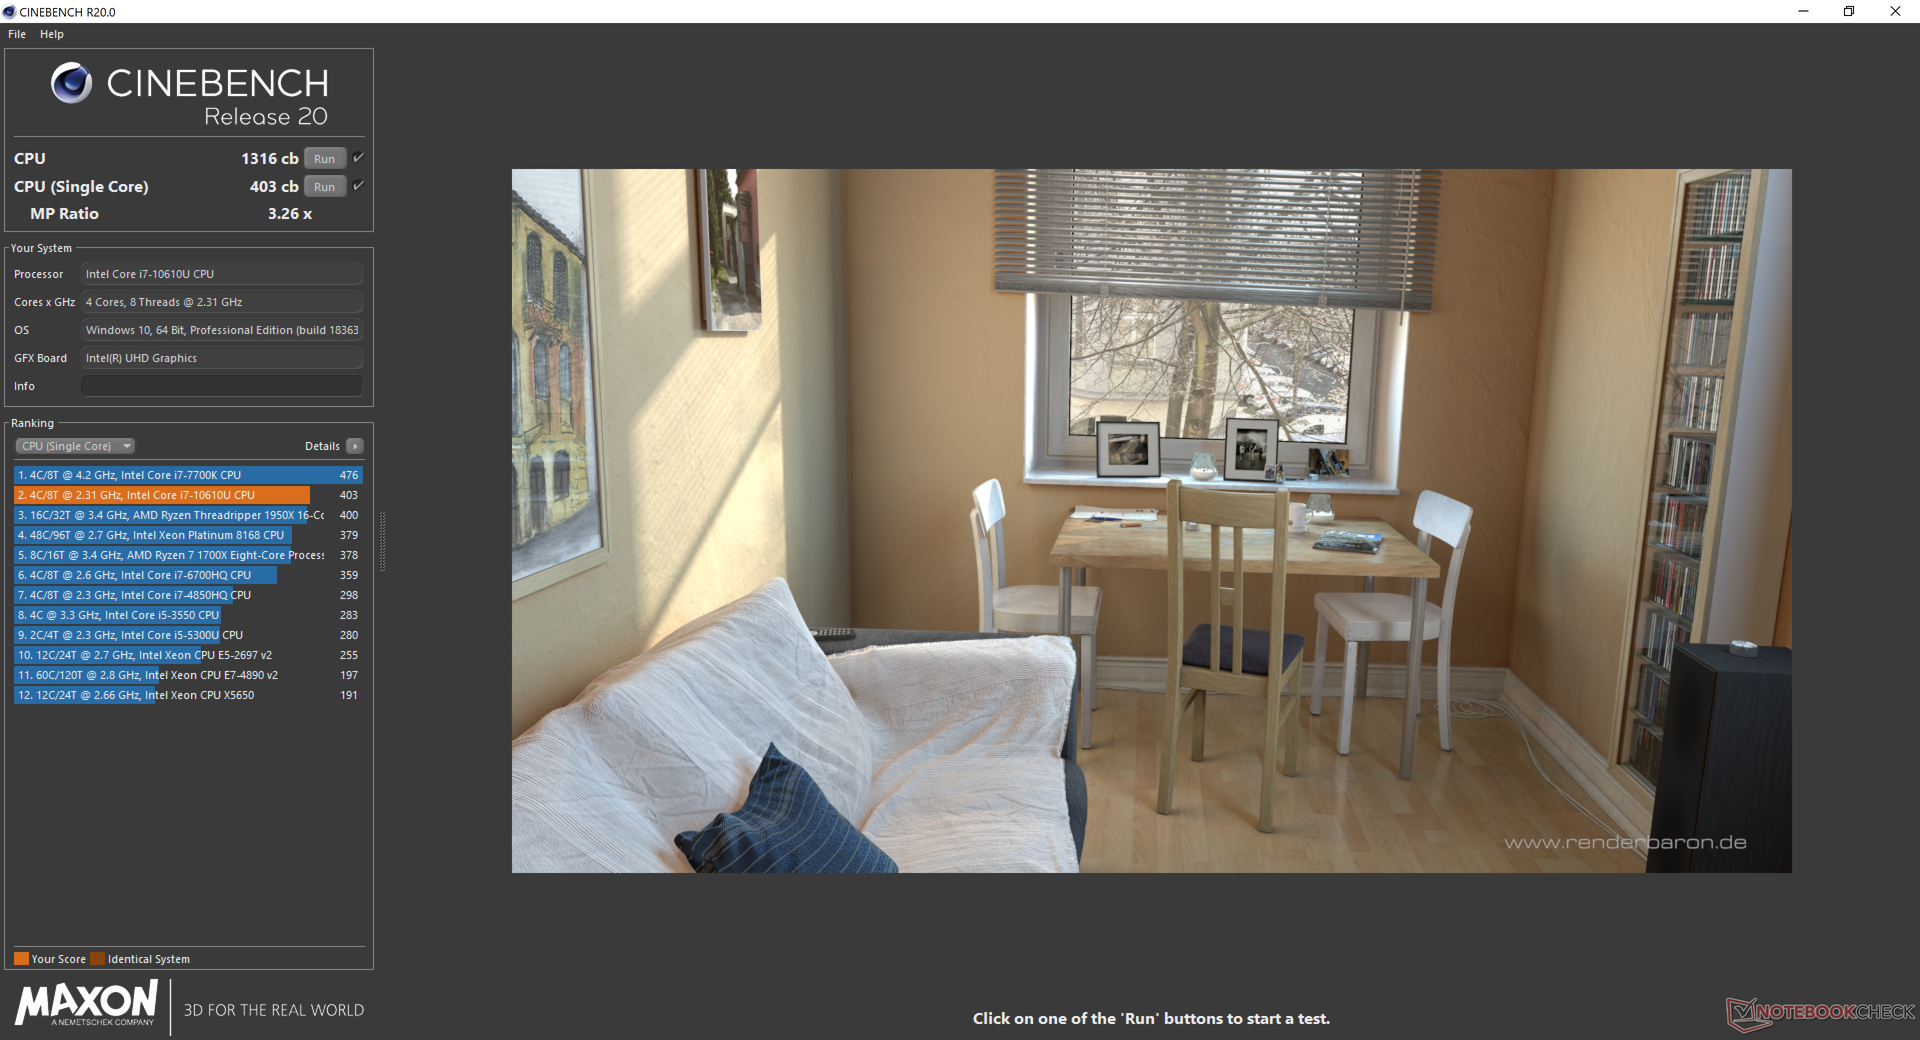
The Core i7-10610U is about 10 percent slower than the Core i7-10510U in the Lenovo ThinkPad X1 Carbon likely due in part to overhead for its integrated vPro features. Overall performance is still somewhat disappointing since it's barely any faster than the last generation Whiskey Lake-U series. Even the Core i7-8665U in the older Latitude 7400, for example, is able to outperform it according to CineBench benchmarks. It's too bad that series doesn't incorporate any AMD Ryzen options which would have boosted processor performance significantly.
See our dedicated page on the Core i7-10610U for more technical information and benchmark comparisons.
Cinebench R15: CPU Multi 64Bit | CPU Single 64Bit
Blender: v2.79 BMW27 CPU
7-Zip 18.03: 7z b 4 -mmt1 | 7z b 4
Geekbench 5.5: Single-Core | Multi-Core
HWBOT x265 Benchmark v2.2: 4k Preset
LibreOffice : 20 Documents To PDF
R Benchmark 2.5: Overall mean
| Geekbench 5.5 / Single-Core | |
| Dell XPS 13 9300 4K UHD | |
| Dell Latitude 7410 | |
| Lenovo ThinkPad X1 Carbon 2020-20UAS04T00 | |
| HP ProBook 455 G7-175W8EA | |
| HP ProBook 445 G7 175W4EA | |
| Acer Swift 3 SF314-42-R27B | |
| Geekbench 5.5 / Multi-Core | |
| Dell XPS 13 9300 4K UHD | |
| HP ProBook 455 G7-175W8EA | |
| HP ProBook 445 G7 175W4EA | |
| Lenovo ThinkPad X1 Carbon 2020-20UAS04T00 | |
| Dell Latitude 7410 | |
| Acer Swift 3 SF314-42-R27B | |
| LibreOffice / 20 Documents To PDF | |
| HP ProBook 455 G7-175W8EA | |
| Dell XPS 13 9300 4K UHD | |
| HP ProBook 445 G7 175W4EA | |
| Acer Swift 3 SF314-42-R27B | |
| Dell Latitude 7410 | |
| Lenovo ThinkPad X1 Carbon 2020-20UAS04T00 | |
| R Benchmark 2.5 / Overall mean | |
| Acer Swift 3 SF314-42-R27B | |
| Dell XPS 13 9300 4K UHD | |
| Lenovo ThinkPad X1 Carbon 2020-20UAS04T00 | |
| Dell Latitude 7410 | |
| HP ProBook 455 G7-175W8EA | |
Cinebench R15: CPU Multi 64Bit | CPU Single 64Bit
Blender: v2.79 BMW27 CPU
7-Zip 18.03: 7z b 4 -mmt1 | 7z b 4
Geekbench 5.5: Single-Core | Multi-Core
HWBOT x265 Benchmark v2.2: 4k Preset
LibreOffice : 20 Documents To PDF
R Benchmark 2.5: Overall mean
* ... smaller is better
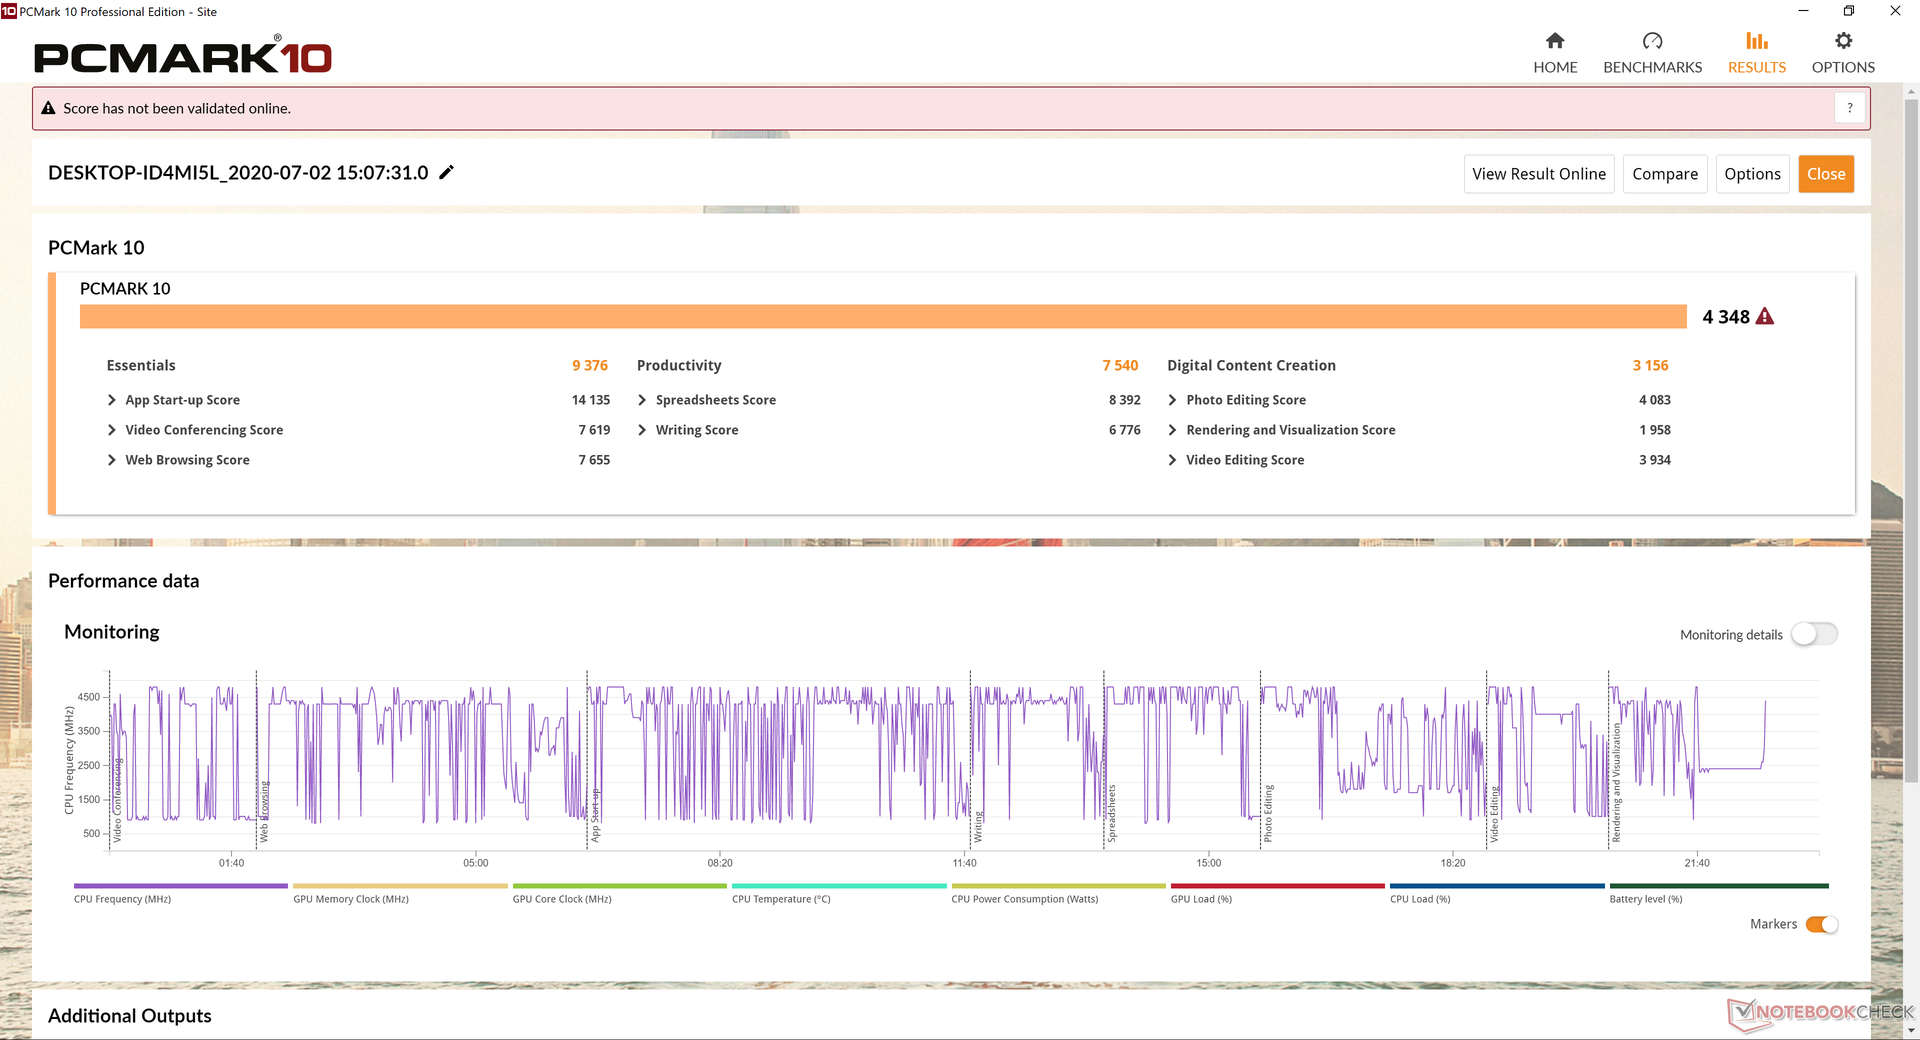
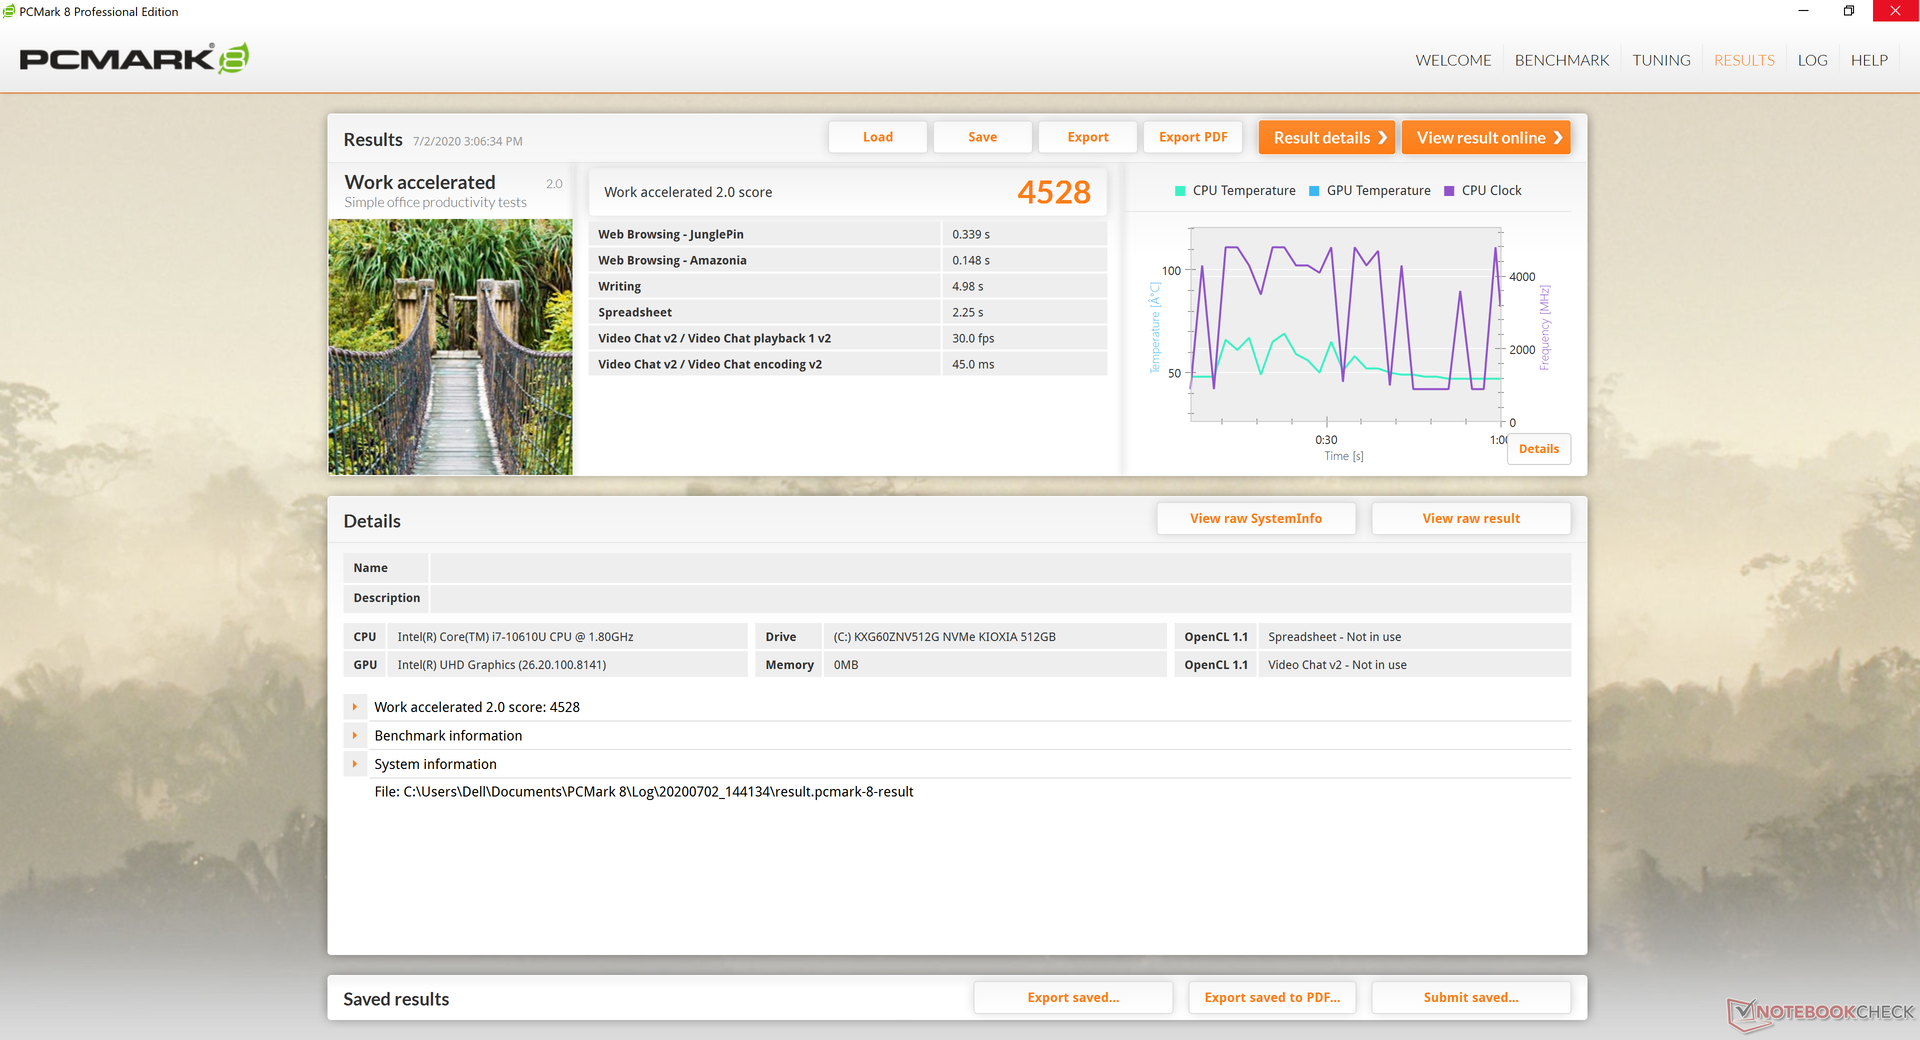
System Performance
Despite the underwhelming CPU performance mentioned above, PCMark benchmarks are still consistently ahead of last year's Latitude 7400 albeit just marginally. We experienced no software or hardware issues during our time with the unit, but we recommend that owners become familiar with the pre-installed Dell Optimizer, Update, Power Manager, and Command applications as system performance and special features are tied to these software packages from Dell.
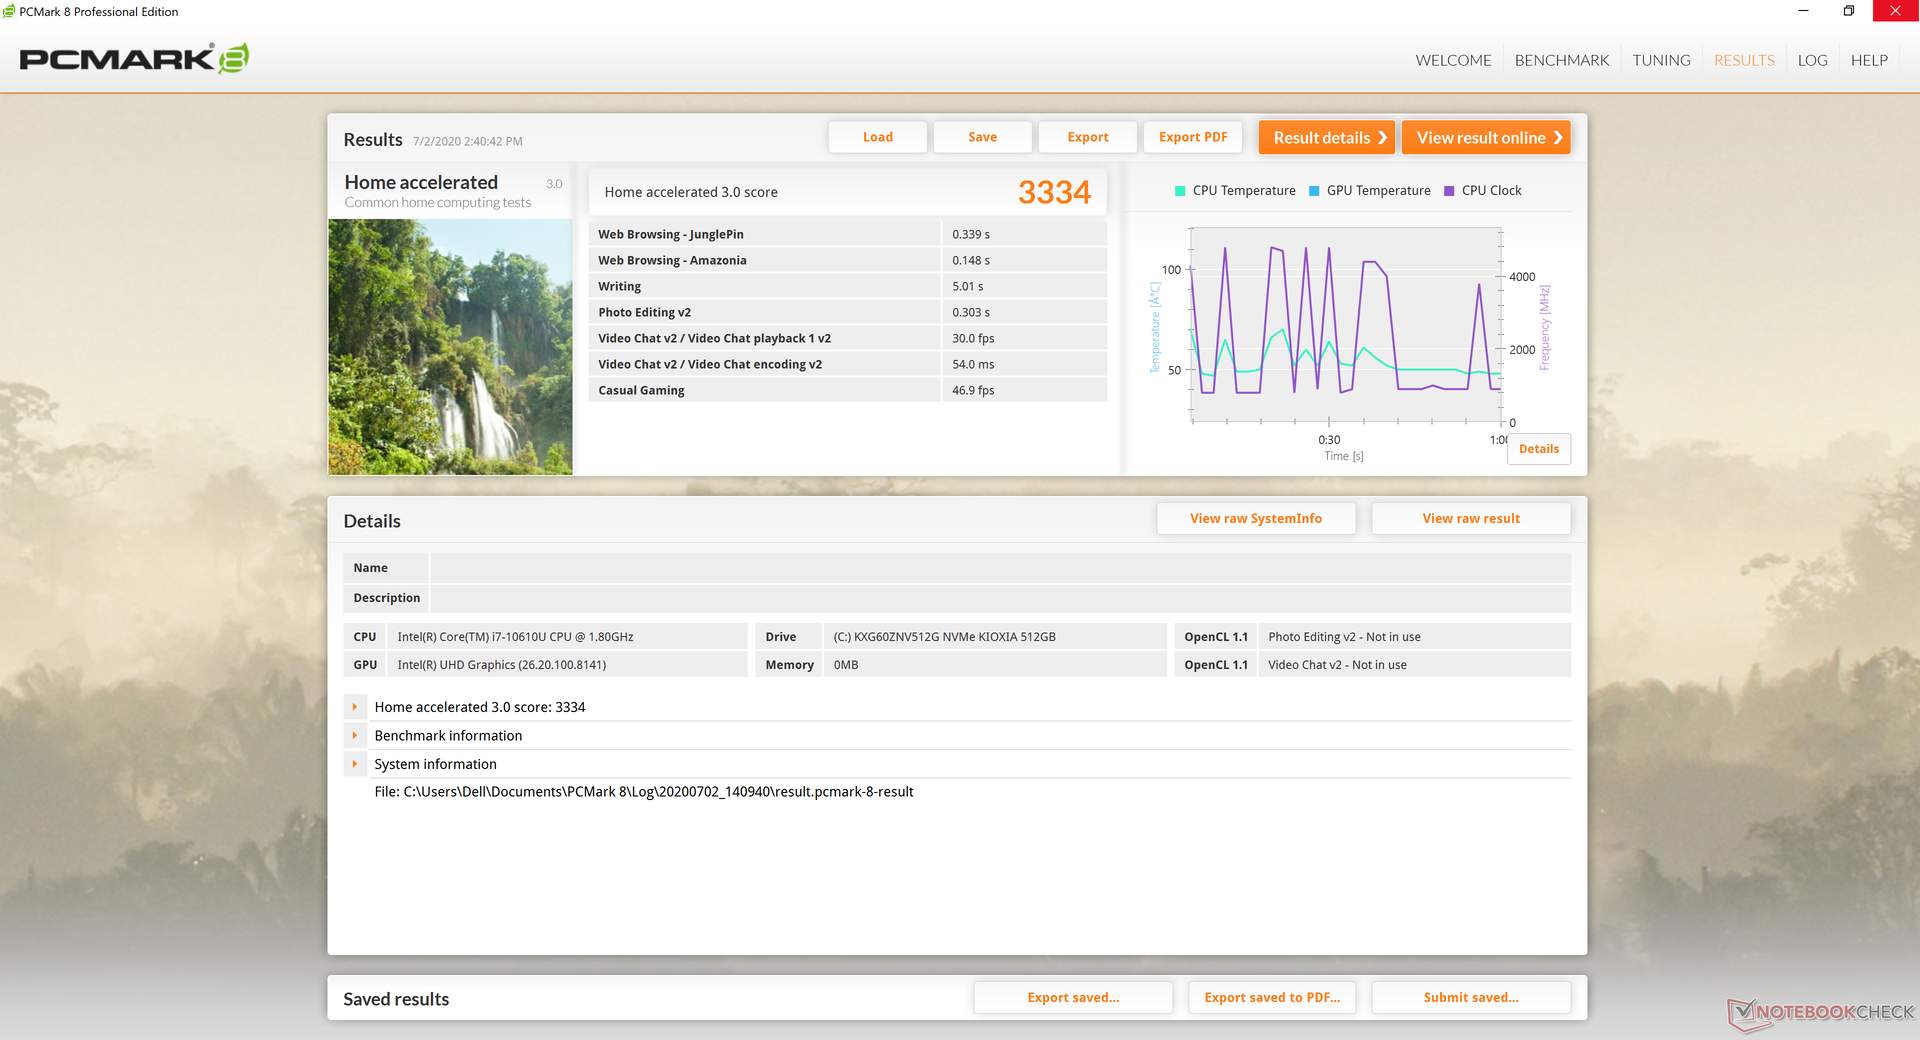
| PCMark 8 Home Score Accelerated v2 | 3334 points | |
| PCMark 8 Work Score Accelerated v2 | 4528 points | |
| PCMark 10 Score | 4348 points | |
Help | ||
DPC Latency
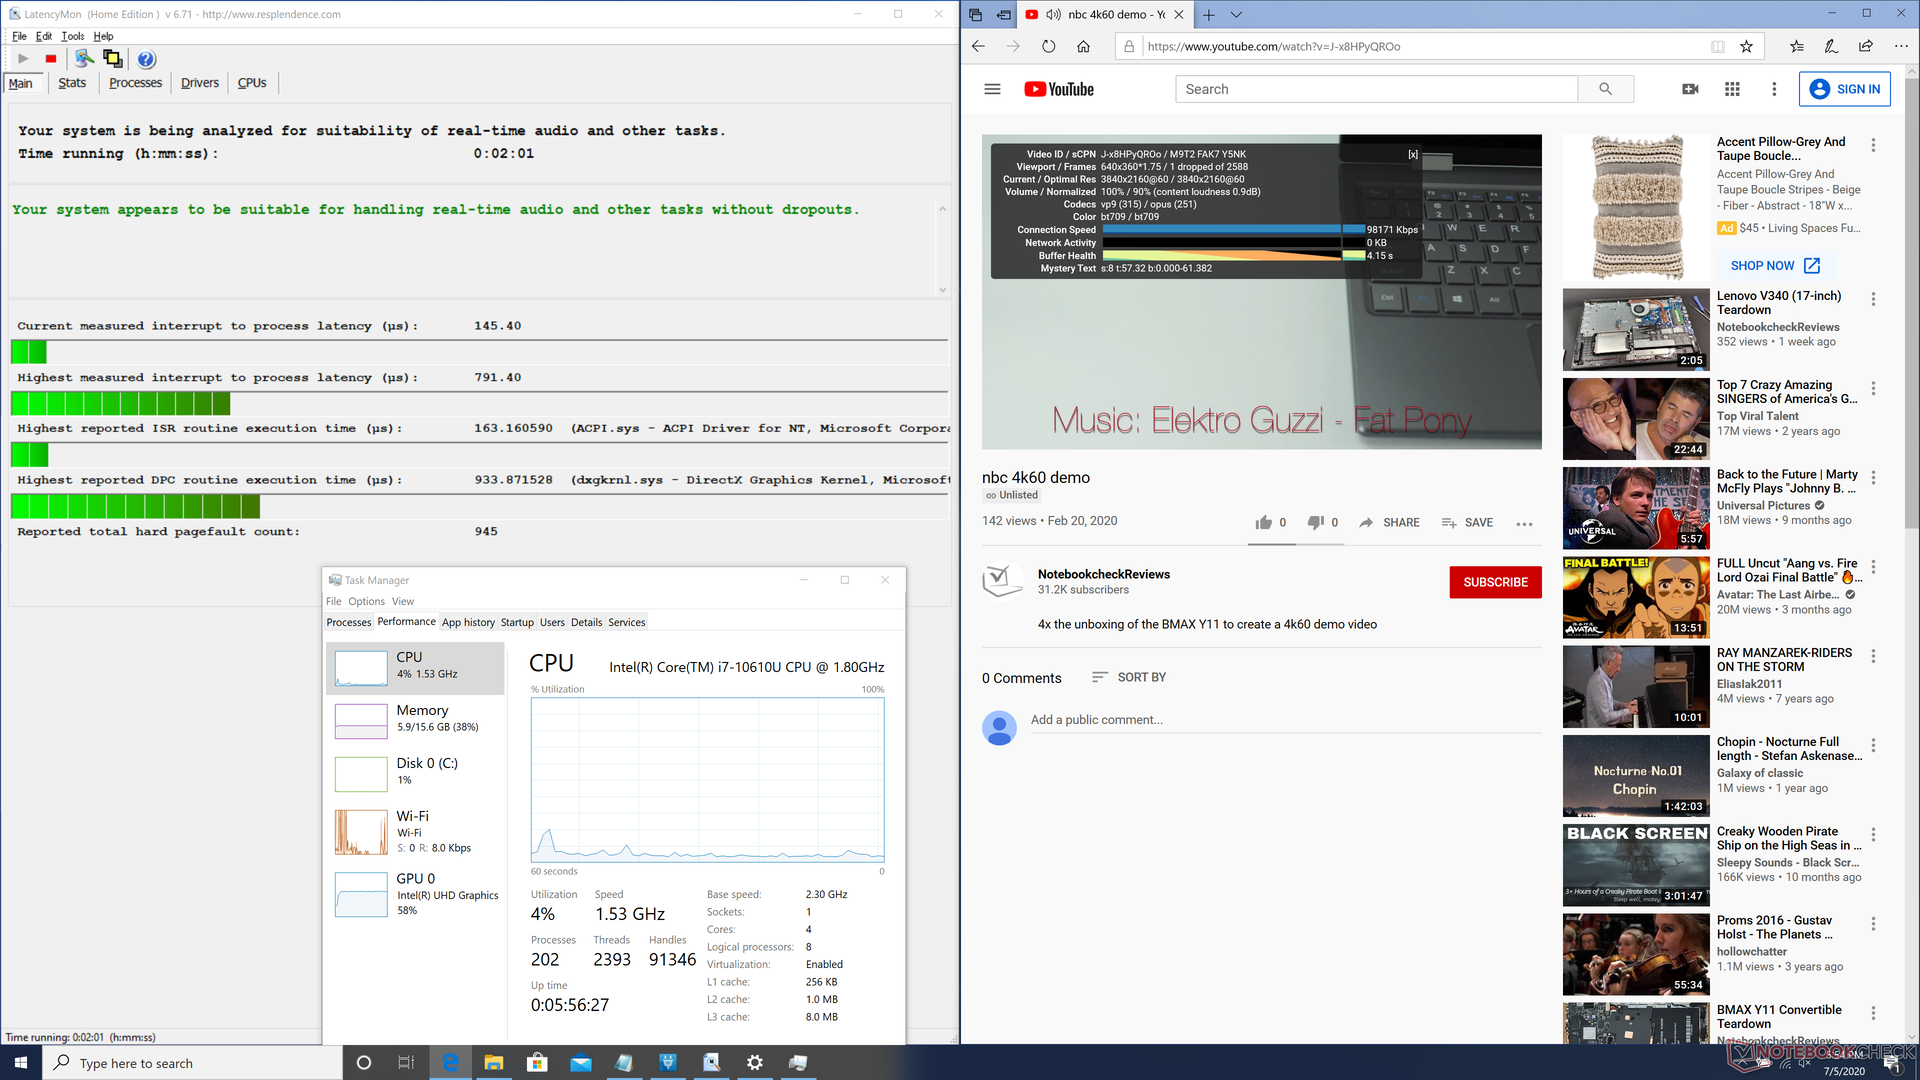
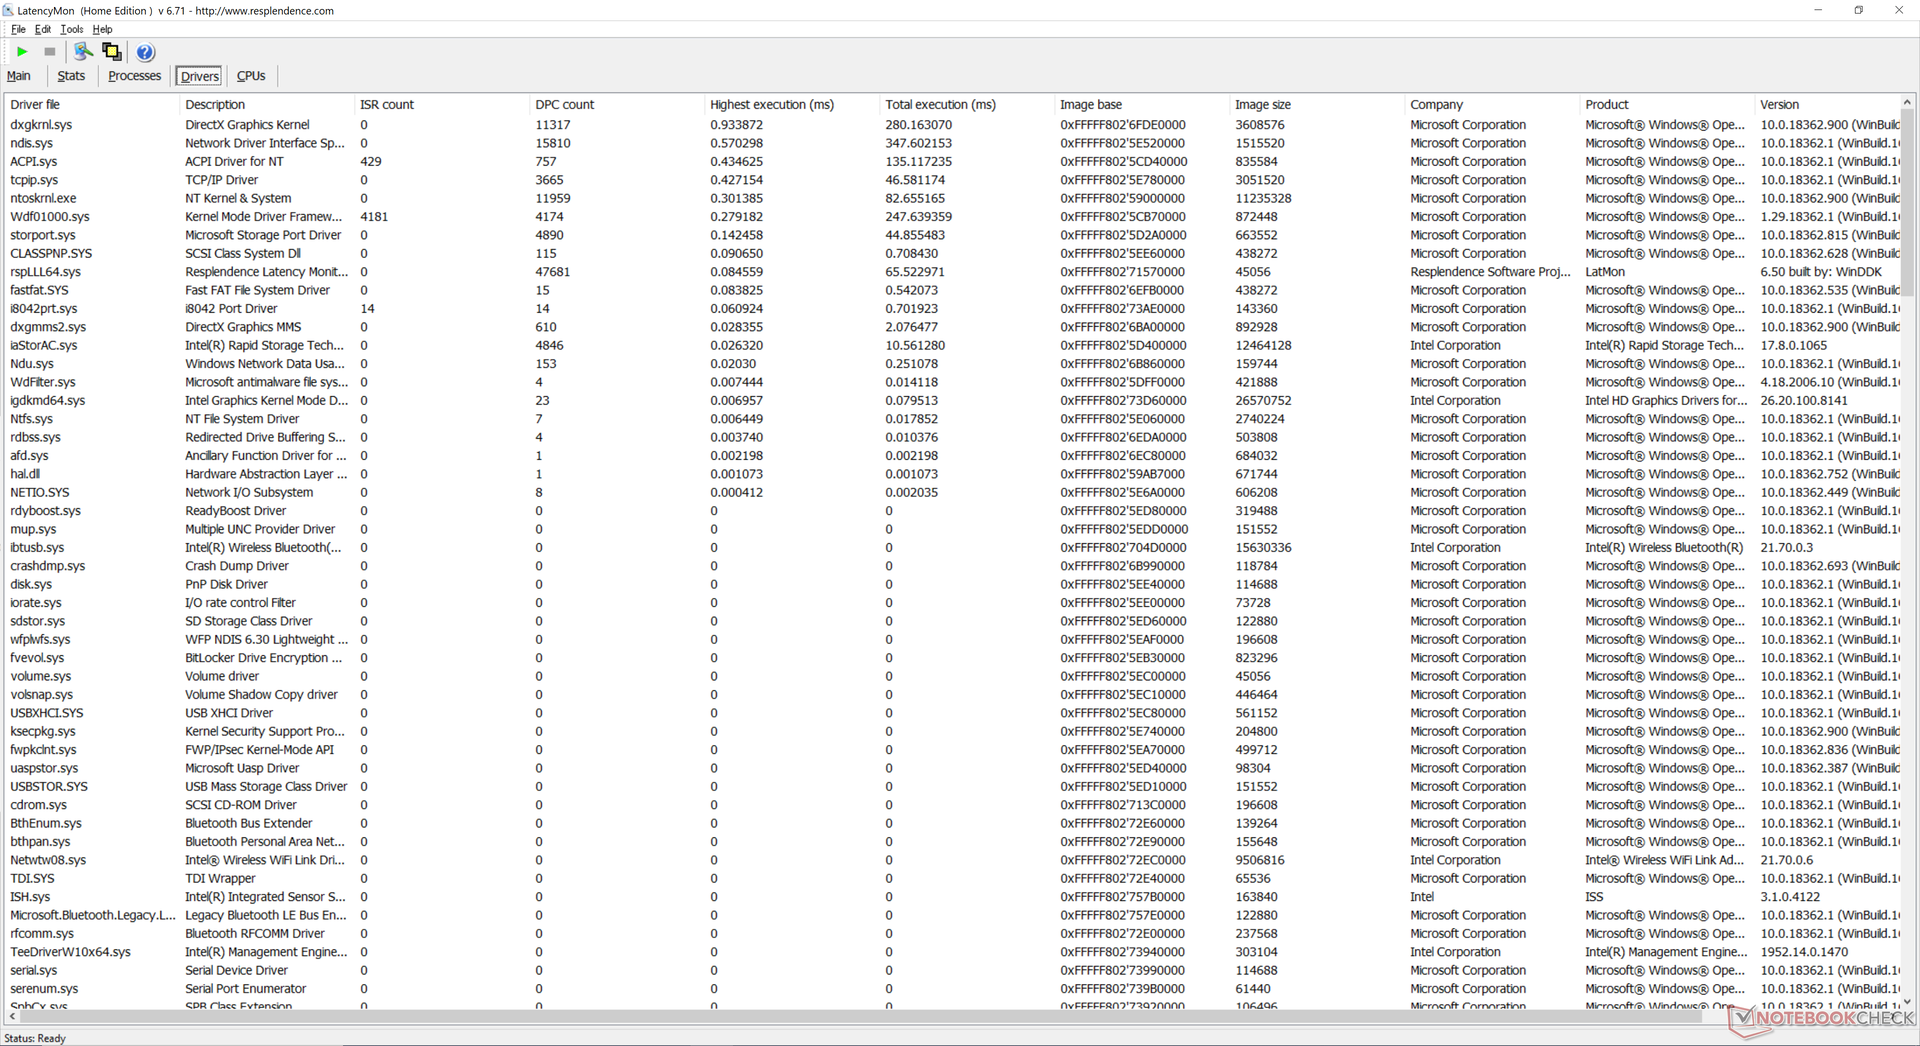
LatencyMon reveals no major DPC latency issues when opening multiple browser tabs on our homepage. 4K video playback on YouTube is also smooth with just one dropped frame during our minute-long test video.
| DPC Latencies / LatencyMon - interrupt to process latency (max), Web, Youtube, Prime95 | |
| Dell XPS 13 9300 4K UHD | |
| Lenovo ThinkPad X1 Yoga 20SA000GUS | |
| HP ProBook 455 G7-175W8EA | |
| HP ProBook 445 G7 175W4EA | |
| Acer Swift 3 SF314-42-R27B | |
| Dell Latitude 7410 | |
| Lenovo ThinkPad X1 Carbon 2020-20UAS04T00 | |
| Asus VivoBook S14 S433FL | |
* ... smaller is better
Storage Devices
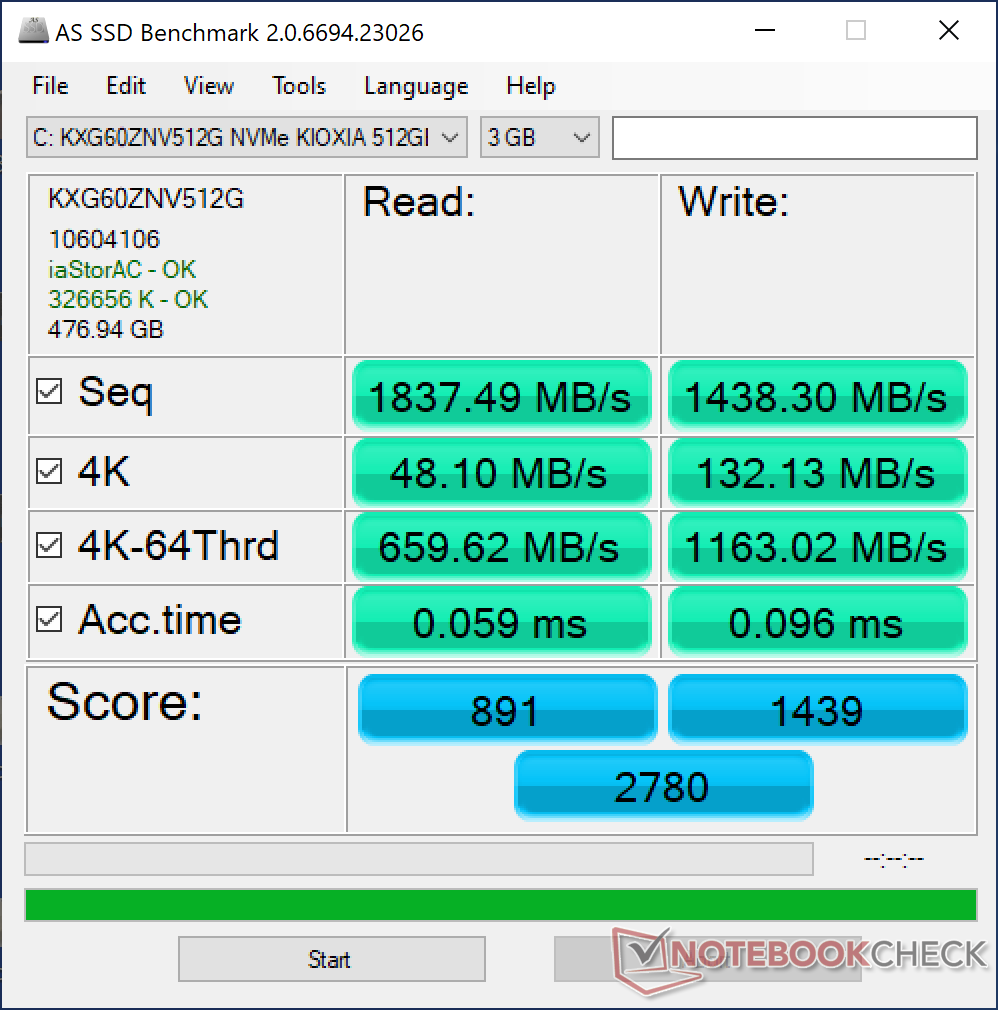
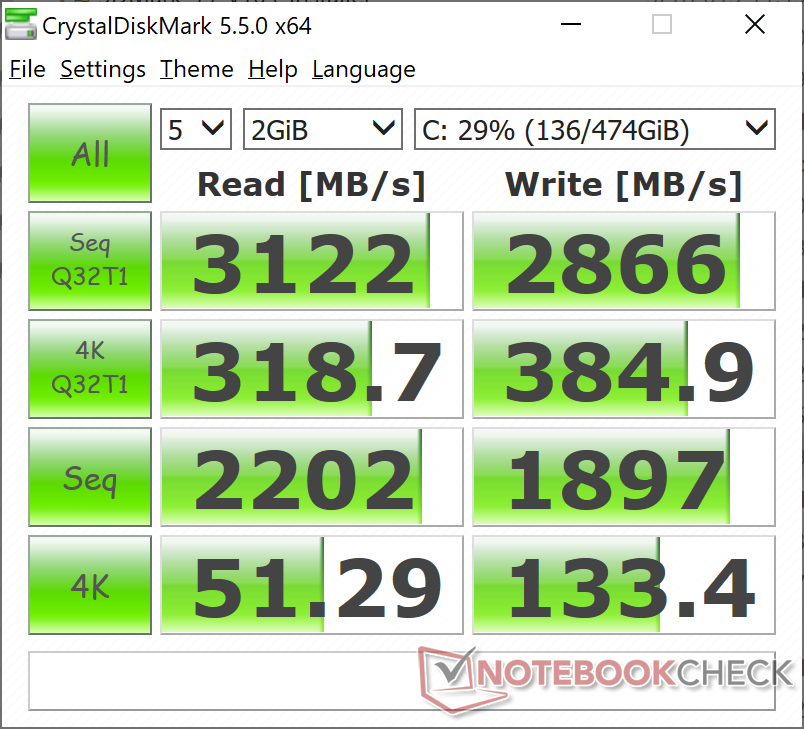
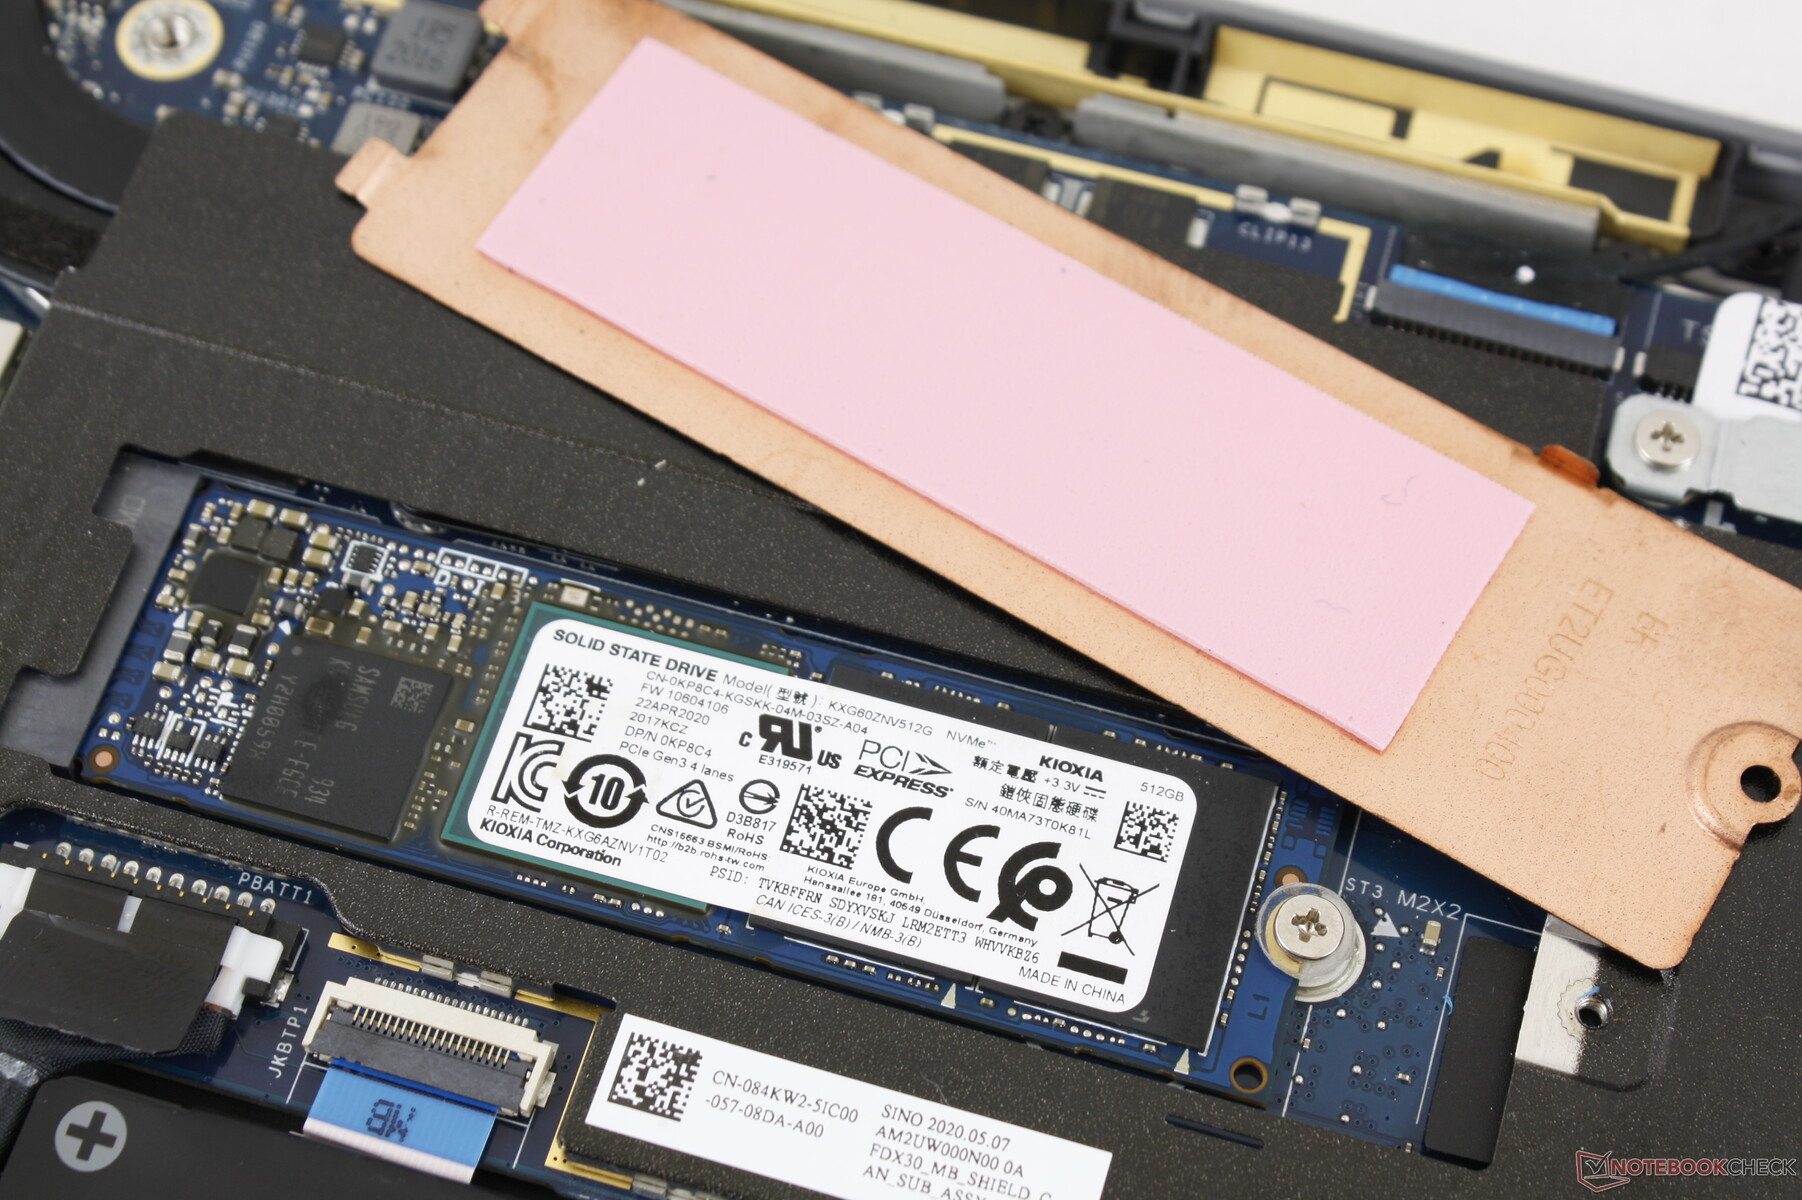
Whereas our Latitude 7400 shipped with a 512 GB Samsung PM981, our Latitude 7410 would come with a 512 GB Toshiba XG6 SSD instead. Average transfer rates are still extremely fast since both are high-end NVMe PCIe x4 SSDs.
See our table of HDDs and SSDs for more benchmark comparisons.
| Dell Latitude 7410 Toshiba XG6 KXG60ZNV512G | Dell Latitude 7400-8N6DH Samsung SSD PM981 MZVLB512HAJQ | Huawei MateBook X Pro 2020 i7 Samsung PM981a MZVLB1T0HBLR | MSI Modern 14 A10RB-459US Kingston RBUSNS8154P3512GJ | HP Elitebook x360 1040 G5 Samsung SSD PM981 MZVLB512HAJQ | |
|---|---|---|---|---|---|
| AS SSD | 3% | 63% | -27% | 17% | |
| Seq Read (MB/s) | 1837 | 2381 30% | 2737 49% | 1061 -42% | 1816 -1% |
| Seq Write (MB/s) | 1438 | 1290 -10% | 2530 76% | 953 -34% | 1270 -12% |
| 4K Read (MB/s) | 48.1 | 52 8% | 54 12% | 35.59 -26% | 46.25 -4% |
| 4K Write (MB/s) | 132.1 | 134.8 2% | 152.5 15% | 87 -34% | 104.1 -21% |
| 4K-64 Read (MB/s) | 660 | 530 -20% | 2011 205% | 769 17% | 1342 103% |
| 4K-64 Write (MB/s) | 1163 | 1177 1% | 1260 8% | 733 -37% | 1209 4% |
| Access Time Read * (ms) | 0.059 | 0.05 15% | 0.066 -12% | 0.084 -42% | 0.043 27% |
| Access Time Write * (ms) | 0.096 | 0.032 67% | 0.024 75% | 0.136 -42% | 0.035 64% |
| Score Read (Points) | 891 | 820 -8% | 2339 163% | 911 2% | 1569 76% |
| Score Write (Points) | 1439 | 1441 0% | 1666 16% | 916 -36% | 1440 0% |
| Score Total (Points) | 2780 | 2652 -5% | 5191 87% | 2294 -17% | 3790 36% |
| Copy ISO MB/s (MB/s) | 2089 | 1719 -18% | 956 -54% | 2034 -3% | |
| Copy Program MB/s (MB/s) | 548 | 499.6 -9% | 496.5 -9% | 450.3 -18% | |
| Copy Game MB/s (MB/s) | 1226 | 1091 -11% | 872 -29% | 1024 -16% | |
| CrystalDiskMark 5.2 / 6 | -7% | 12% | -27% | -3% | |
| Write 4K (MB/s) | 133.4 | 118.6 -11% | 165.6 24% | 107.7 -19% | 122.7 -8% |
| Read 4K (MB/s) | 51.3 | 44.68 -13% | 50.2 -2% | 39.73 -23% | 46.57 -9% |
| Write Seq (MB/s) | 1897 | 1866 -2% | 1905 0% | 926 -51% | 1725 -9% |
| Read Seq (MB/s) | 2202 | 2173 -1% | 1669 -24% | 1014 -54% | 2392 9% |
| Write 4K Q32T1 (MB/s) | 384.9 | 330.9 -14% | 474.6 23% | 343.6 -11% | 470.6 22% |
| Read 4K Q32T1 (MB/s) | 318.7 | 343.1 8% | 508 59% | 499.1 57% | 313.2 -2% |
| Write Seq Q32T1 (MB/s) | 2866 | 1927 -33% | 3007 5% | 1033 -64% | 1869 -35% |
| Read Seq Q32T1 (MB/s) | 3122 | 3528 13% | 3556 14% | 1604 -49% | 3380 8% |
| Total Average (Program / Settings) | -2% /
-1% | 38% /
42% | -27% /
-27% | 7% /
10% |
* ... smaller is better

Disk Throttling: DiskSpd Read Loop, Queue Depth 8
GPU Performance
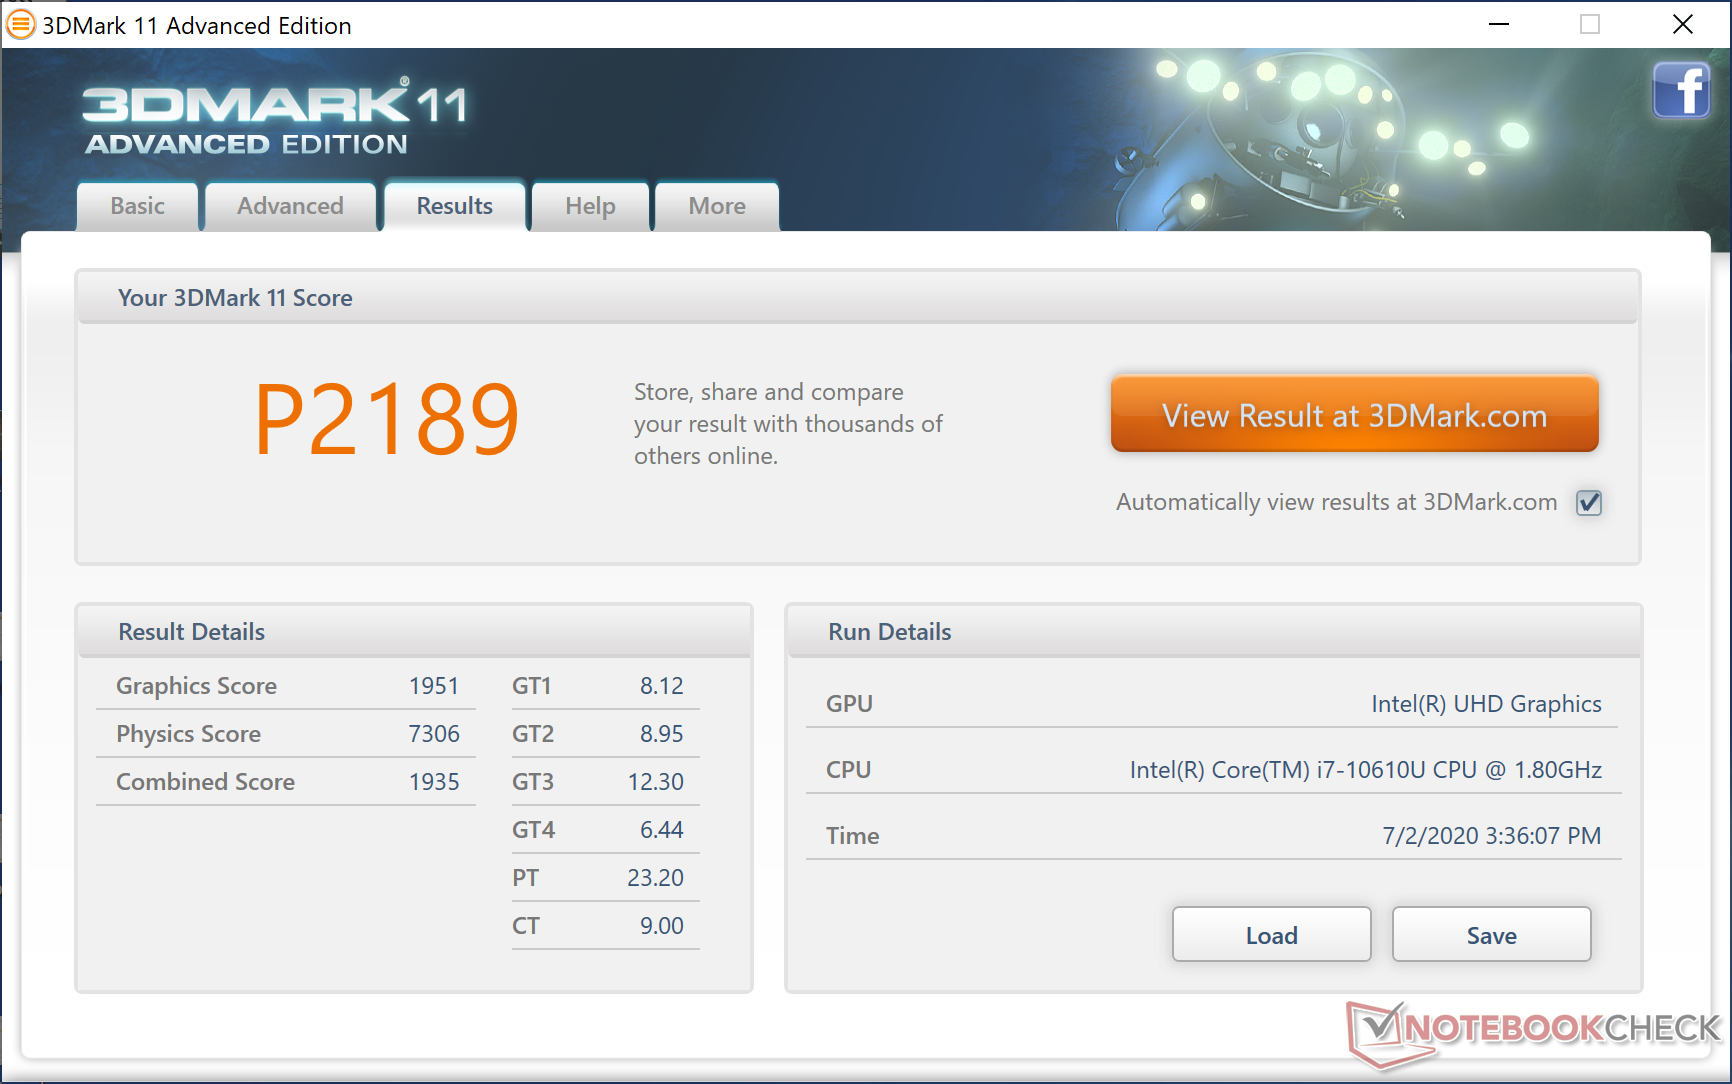
The integrated UHD Graphics 620 is terribly outdated at this point as even the budget Ryzen 3 4300U is able to offer almost two times the graphics performance of the Intel. Still, this shouldn't be a huge issue considering the target audience.
See our page on the UHD Graphics 620 for more technical information and benchmark comparisons.
| 3DMark 06 Standard Score | 13918 points | |
| 3DMark 11 Performance | 2189 points | |
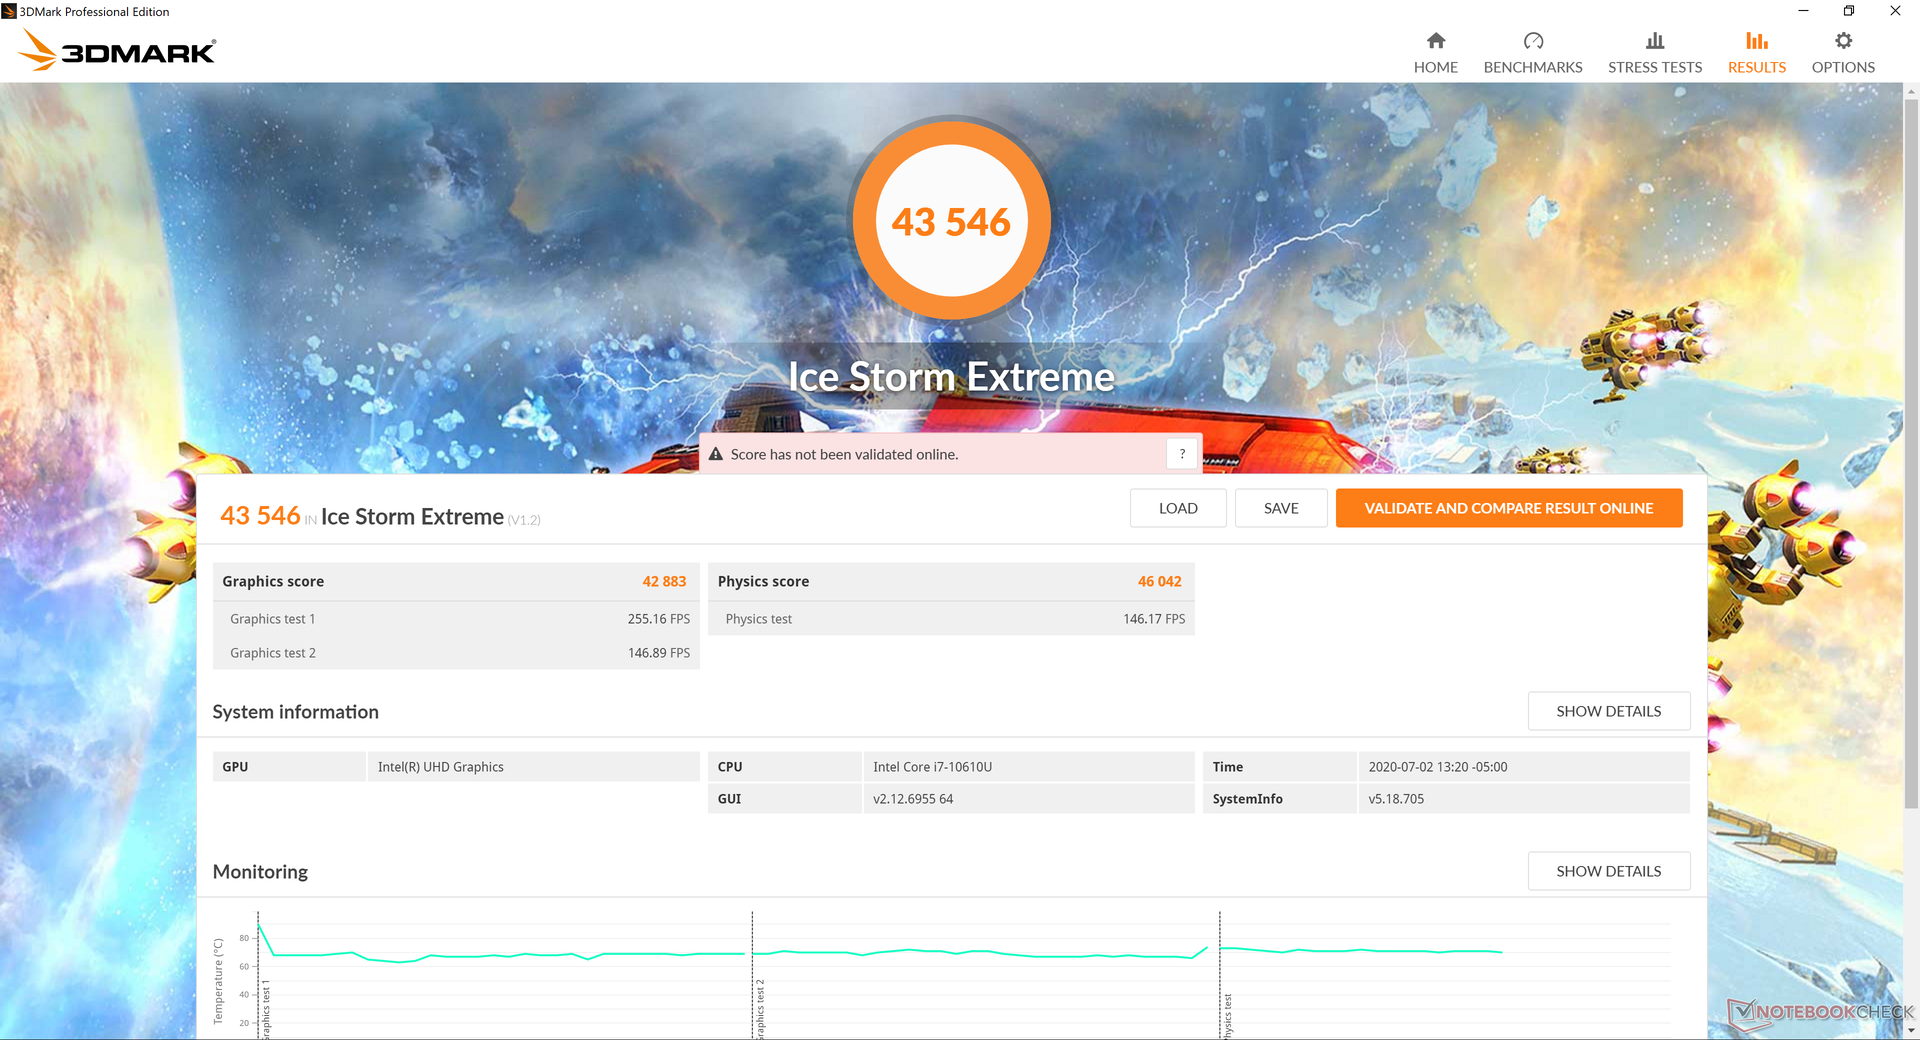
| 3DMark Ice Storm Standard Score | 43546 points | |
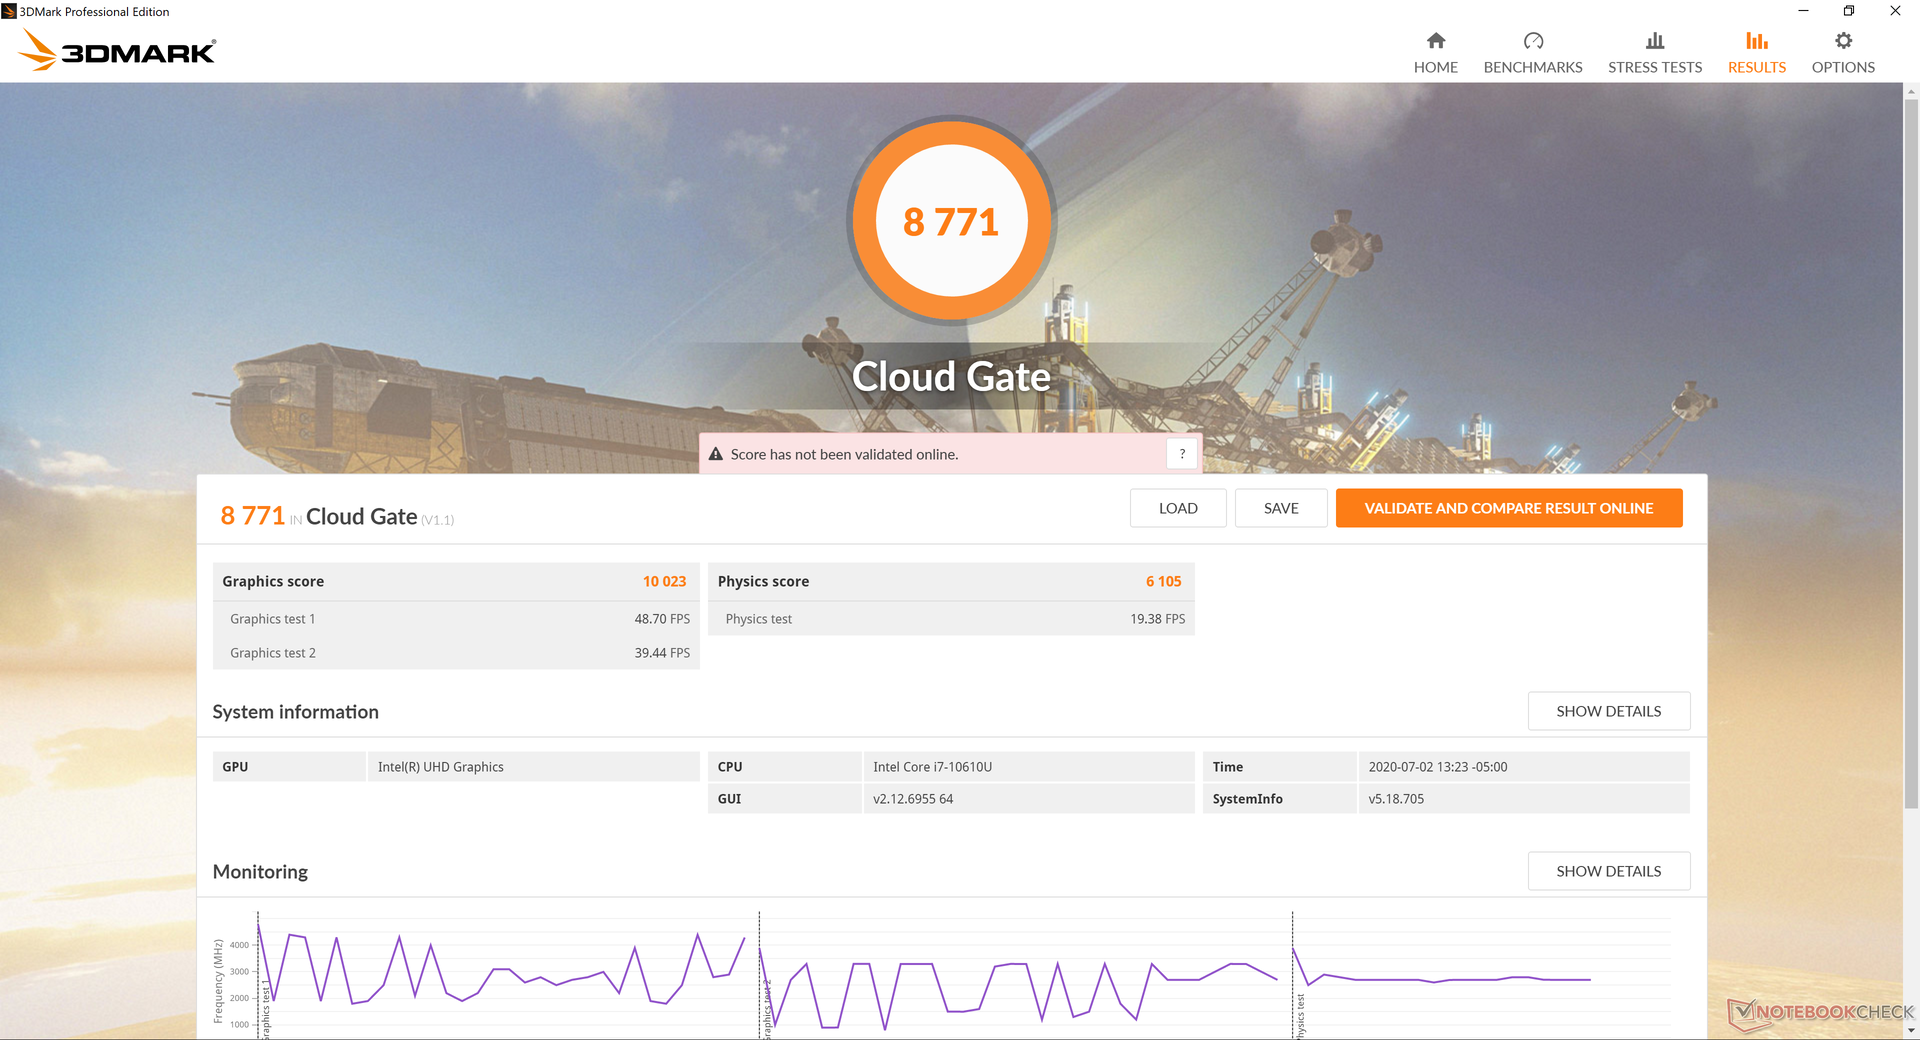
| 3DMark Cloud Gate Standard Score | 8771 points | |
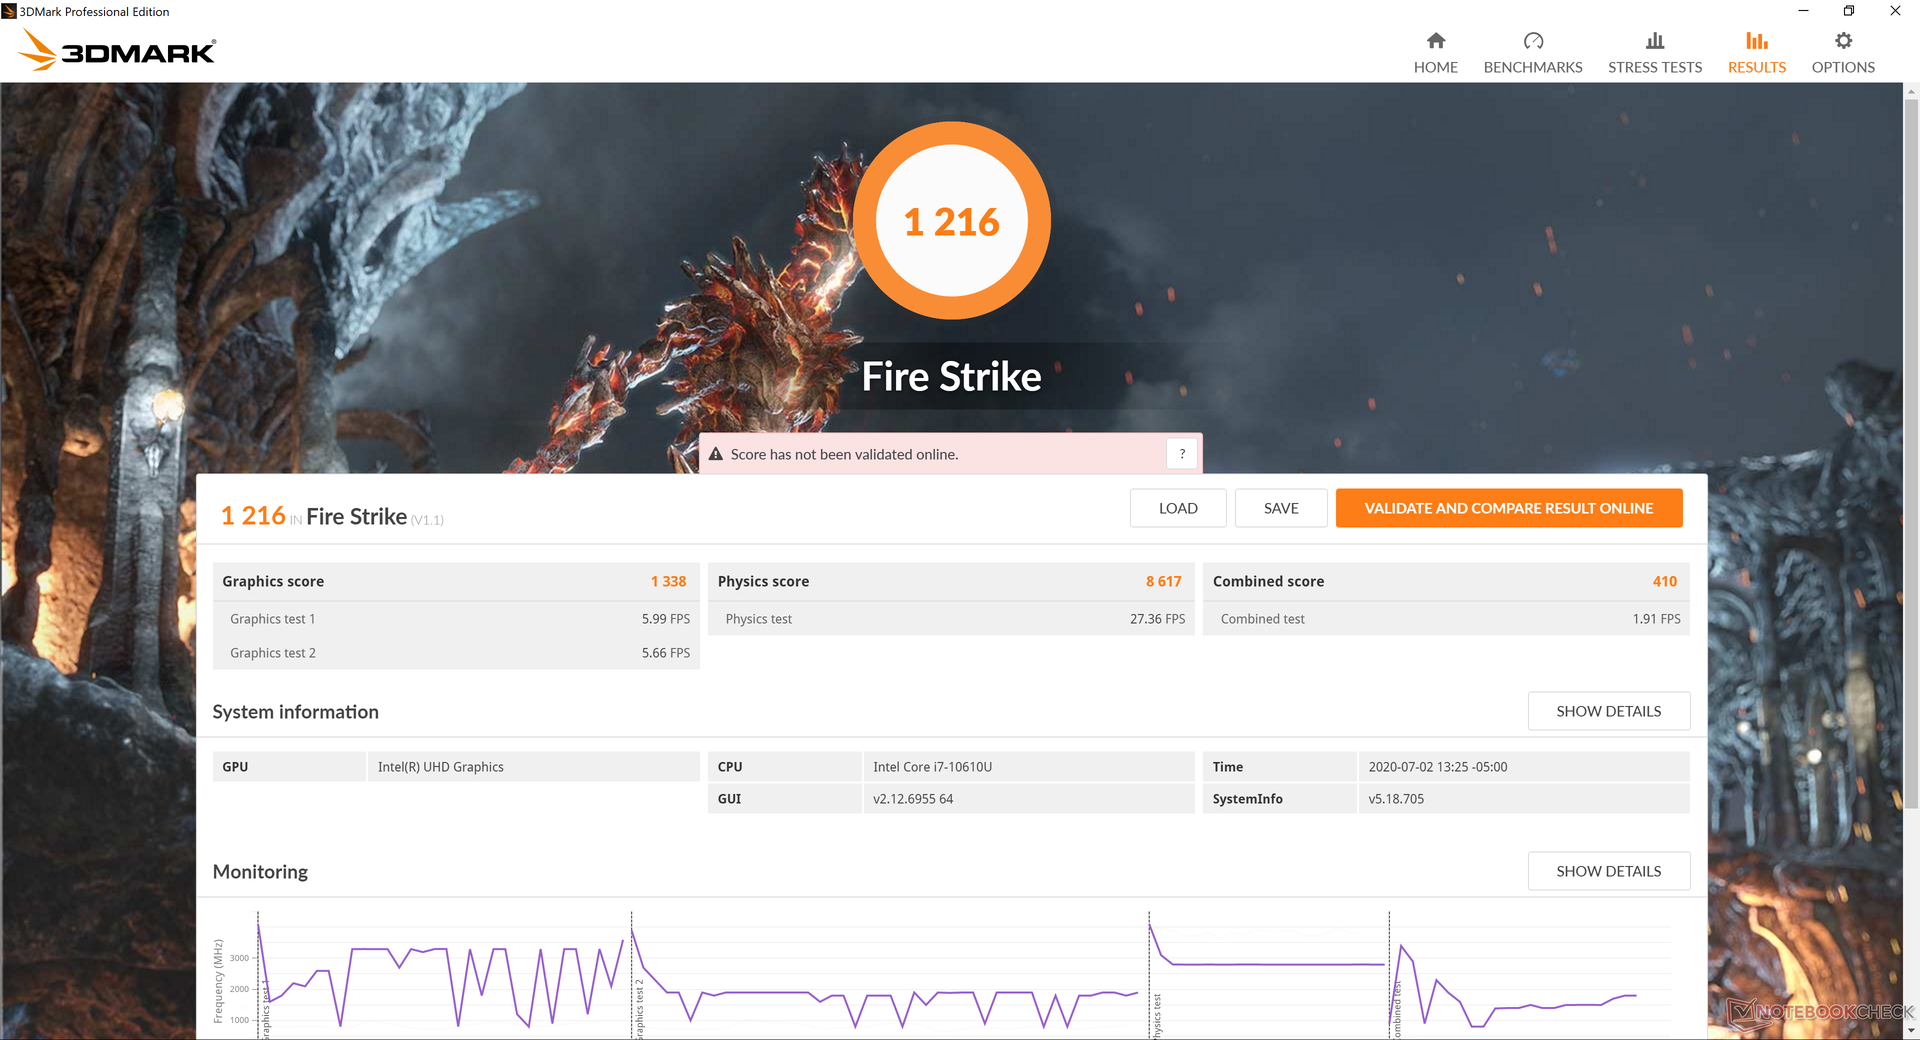
| 3DMark Fire Strike Score | 1216 points | |
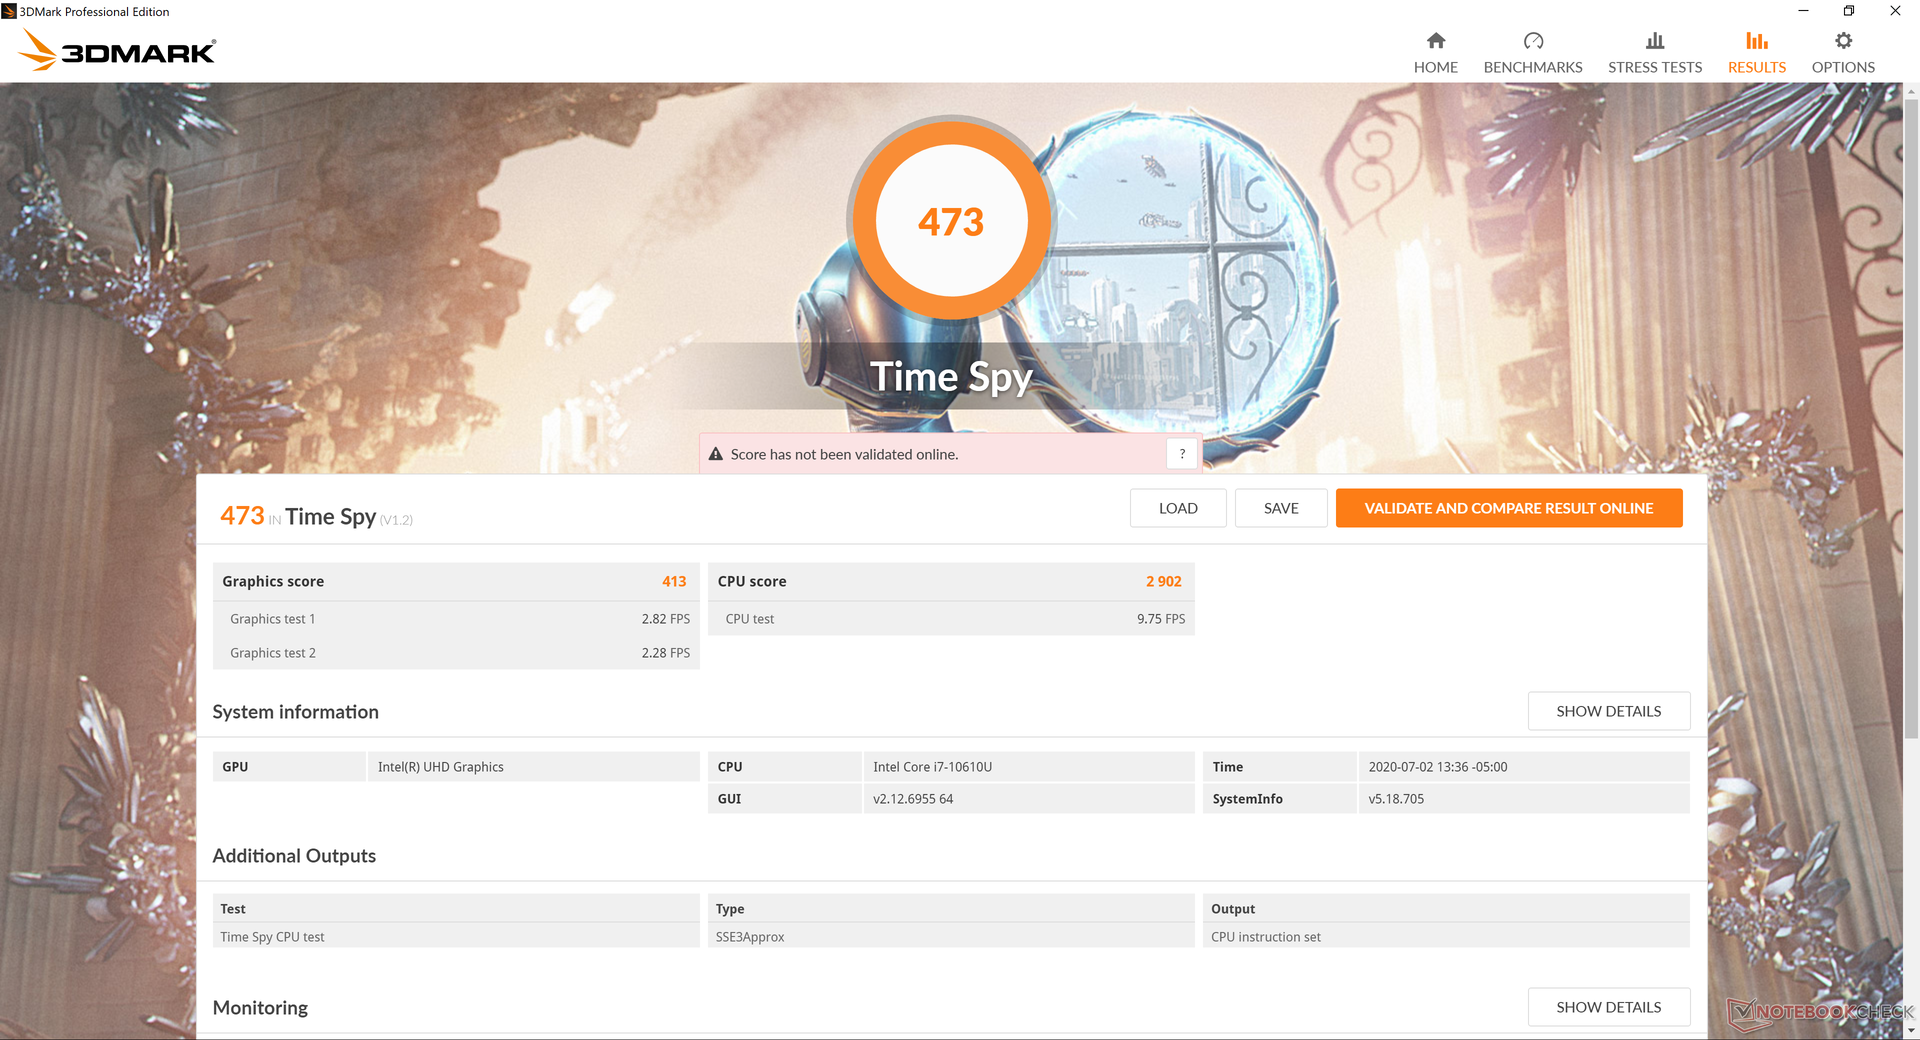
| 3DMark Time Spy Score | 473 points | |
Help | ||
| low | med. | high | ultra | |
|---|---|---|---|---|
| Dota 2 Reborn (2015) | 82.4 | 50.6 | 22.6 | 20 |
| X-Plane 11.11 (2018) | 12.1 | 10.3 | 13.8 |
Emissions
System Noise
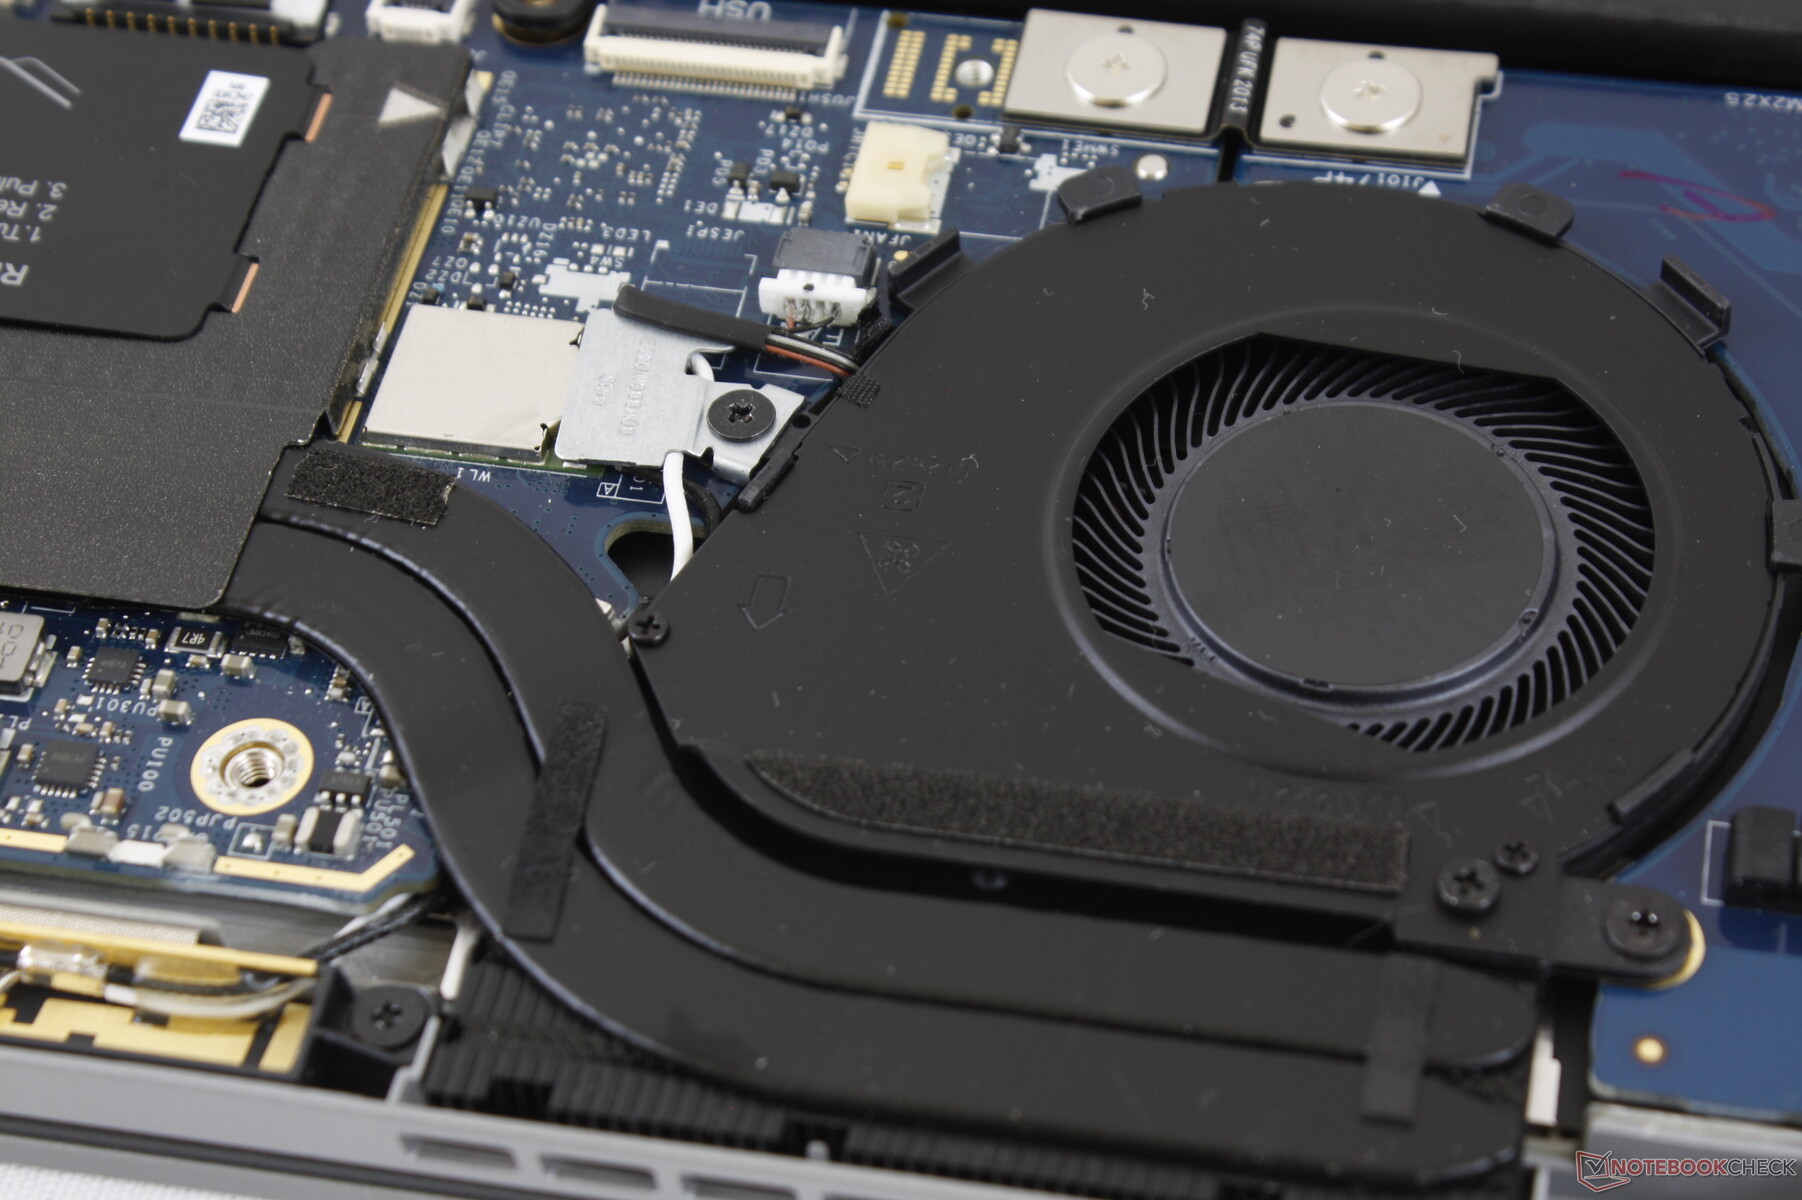
Fan noise hasn't changed very much from the Latitude 7400 as this is still a quiet system when under most common processing loads. High loads like 3DMark 06 will bump fan noise to just 30 dB(A) after 90 seconds to be barely audible in a typical office environment. At worst, we're able to measure a fan noise of 39.3 dB(A) after a few minutes of extreme Prime95 and FurMark stress.
| Dell Latitude 7410 UHD Graphics 620, i7-10610U, Toshiba XG6 KXG60ZNV512G | Dell Latitude 7400-8N6DH UHD Graphics 620, i7-8665U, Samsung SSD PM981 MZVLB512HAJQ | Huawei MateBook X Pro 2020 i7 GeForce MX250, i7-10510U, Samsung PM981a MZVLB1T0HBLR | Lenovo ThinkPad X1 Carbon 2020-20UAS04T00 UHD Graphics 620, i7-10510U, Samsung SSD PM981a MZVLB512HBJQ | MSI Modern 14 A10RB-459US GeForce MX250, i5-10210U, Kingston RBUSNS8154P3512GJ | HP Elitebook x360 1040 G5 UHD Graphics 620, i7-8650U, Samsung SSD PM981 MZVLB512HAJQ | |
|---|---|---|---|---|---|---|
| Noise | -2% | -8% | -2% | -5% | -1% | |
| off / environment * (dB) | 28.1 | 28.6 -2% | 29.6 -5% | 29.5 -5% | 28.7 -2% | 28.3 -1% |
| Idle Minimum * (dB) | 28.1 | 28.6 -2% | 29.6 -5% | 29.5 -5% | 29.5 -5% | 28.3 -1% |
| Idle Average * (dB) | 28.1 | 28.6 -2% | 29.6 -5% | 29.5 -5% | 29.5 -5% | 28.3 -1% |
| Idle Maximum * (dB) | 28.1 | 29.1 -4% | 30.3 -8% | 29.5 -5% | 29.5 -5% | 28.3 -1% |
| Load Average * (dB) | 30 | 31.5 -5% | 38 -27% | 31.6 -5% | 33.4 -11% | 32.6 -9% |
| Load Maximum * (dB) | 39.3 | 36.9 6% | 38 3% | 33.9 14% | 40.5 -3% | 36.6 7% |
| Witcher 3 ultra * (dB) | 38 | 37.9 |
* ... smaller is better
Noise level
| Idle |
| 28.1 / 28.1 / 28.1 dB(A) |
| Load |
| 30 / 39.3 dB(A) |
 | ||
30 dB silent 40 dB(A) audible 50 dB(A) loud |
||
min: | ||
Temperature
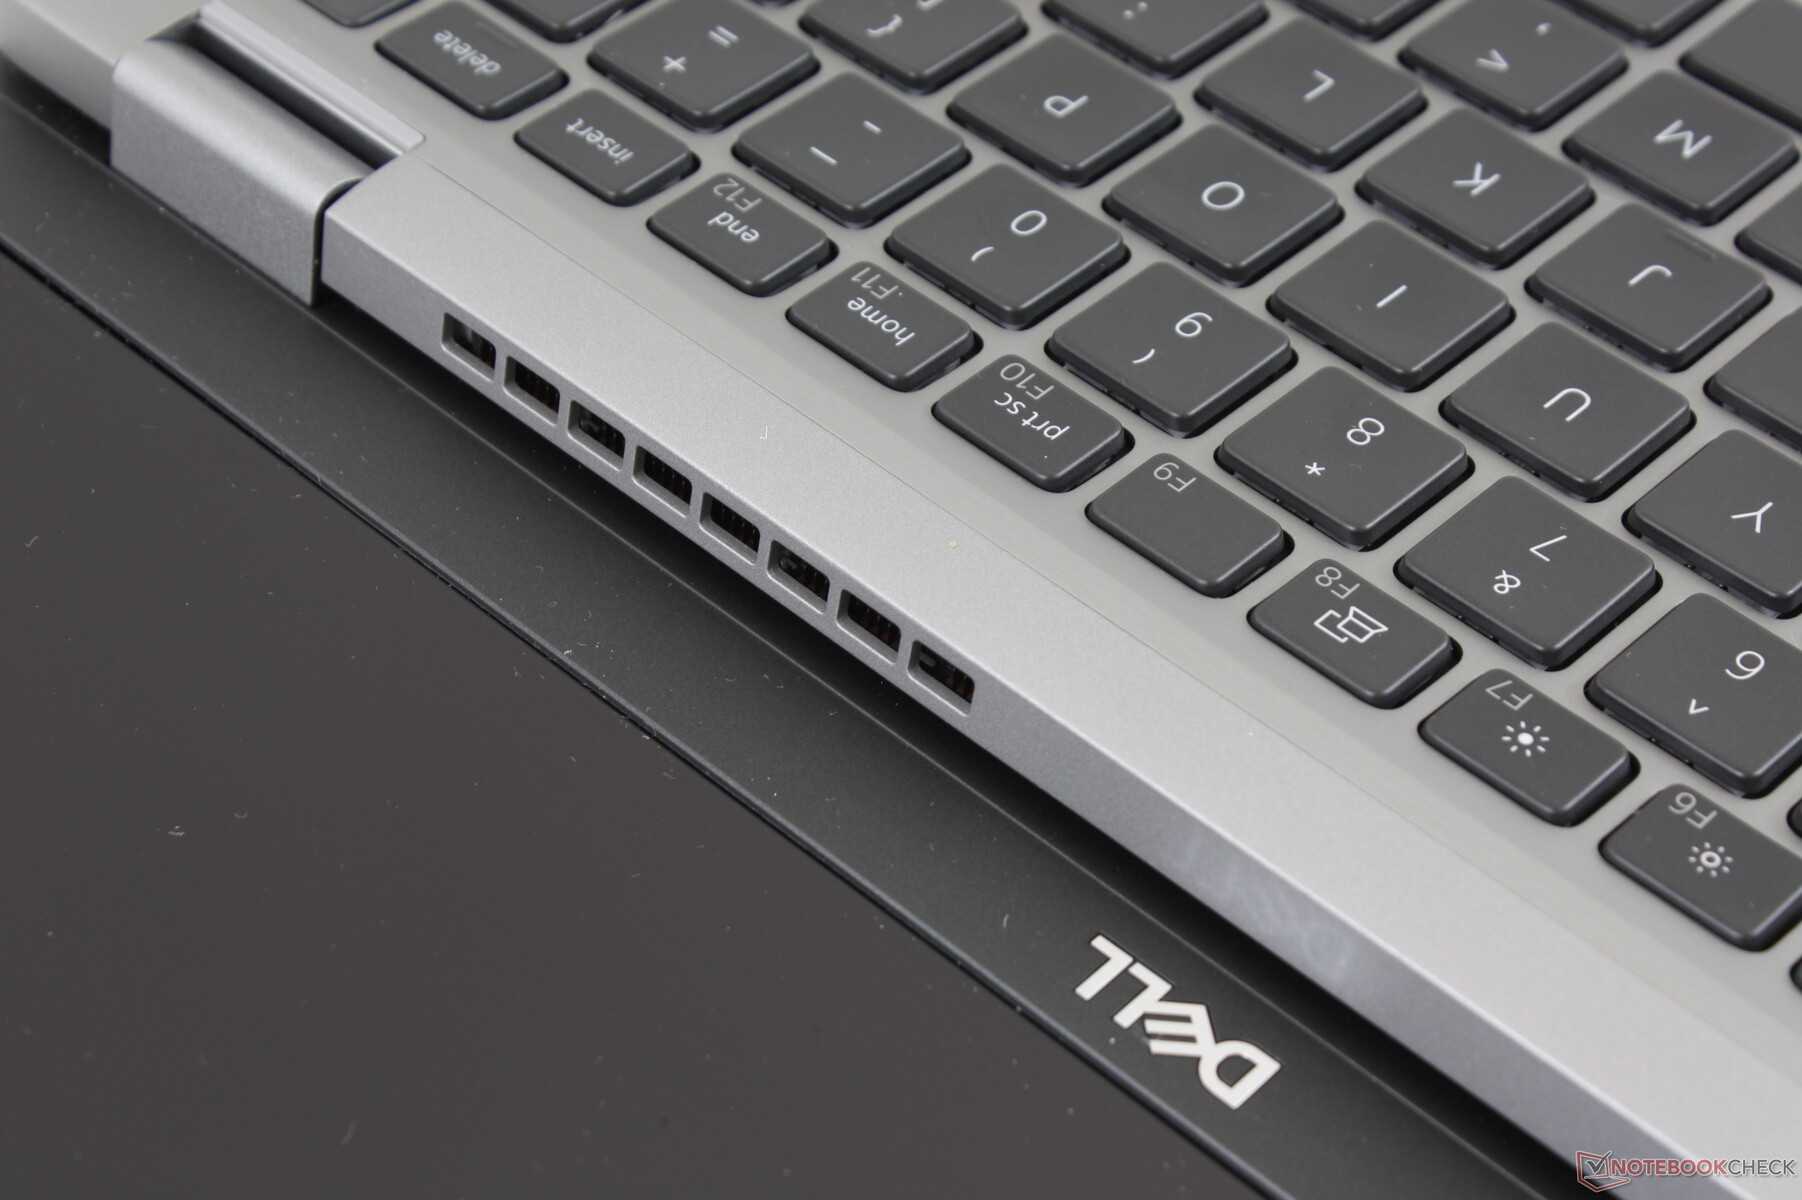
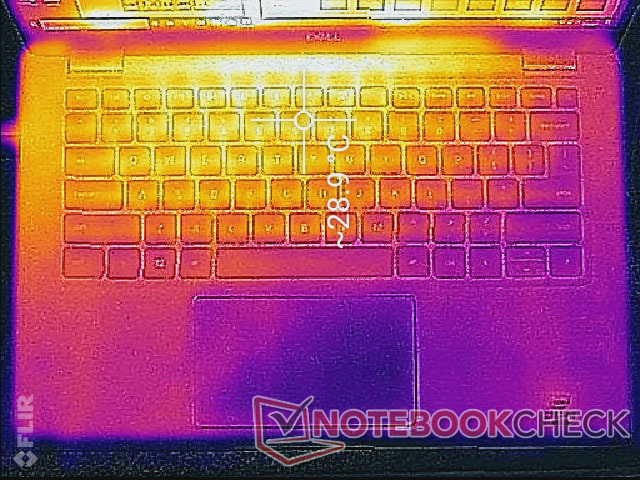
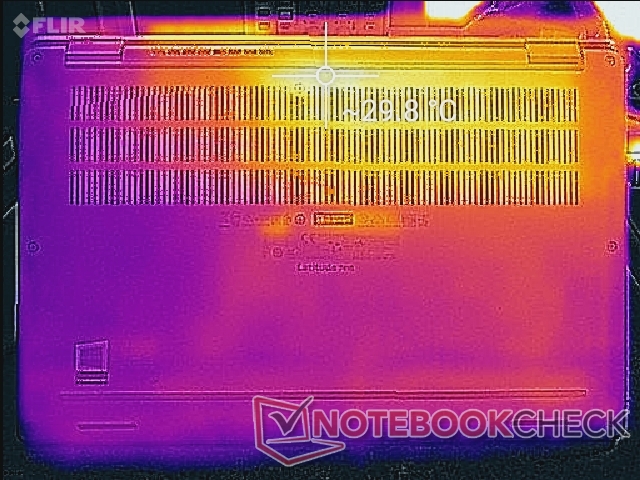
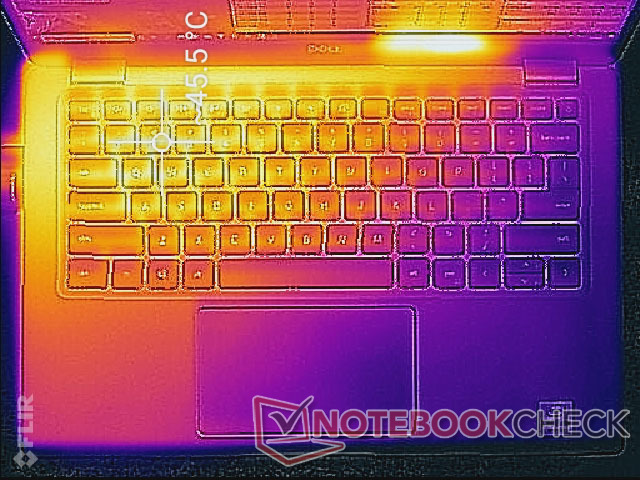
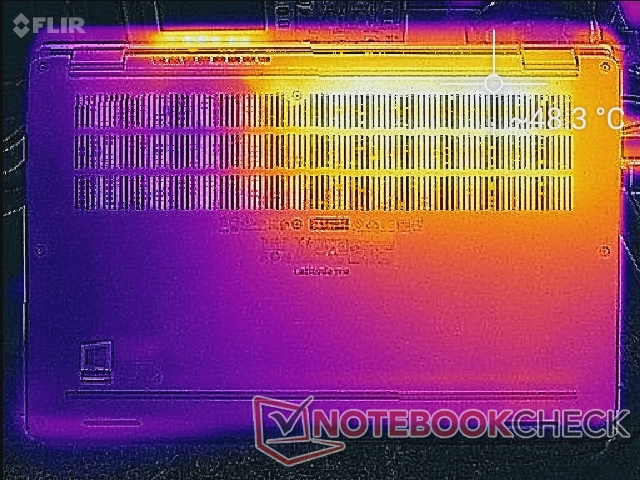
Surface temperatures will always be warmer on the left half of the laptop than the right due to the positioning of the processor inside in contrast to what we observed on the Latitude 7400. The difference isn't an issue when simply browsing to web or running other light loads, but extreme loads can cause hot spots of up to 45 to 48 C on the left half of the keyboard as shown by the temperature maps below. The left palm rest can become as warm as 36 C compared to just 29 C on the right palm rest.
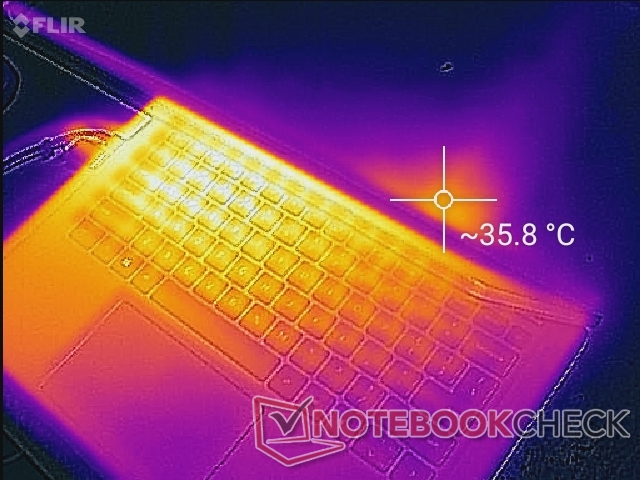
(±) The maximum temperature on the upper side is 44.6 °C / 112 F, compared to the average of 34.3 °C / 94 F, ranging from 21.2 to 62.5 °C for the class Office.
(-) The bottom heats up to a maximum of 48.4 °C / 119 F, compared to the average of 36.8 °C / 98 F
(+) In idle usage, the average temperature for the upper side is 27.2 °C / 81 F, compared to the device average of 29.5 °C / 85 F.
(±) The palmrests and touchpad can get very hot to the touch with a maximum of 36 °C / 96.8 F.
(-) The average temperature of the palmrest area of similar devices was 27.5 °C / 81.5 F (-8.5 °C / -15.3 F).
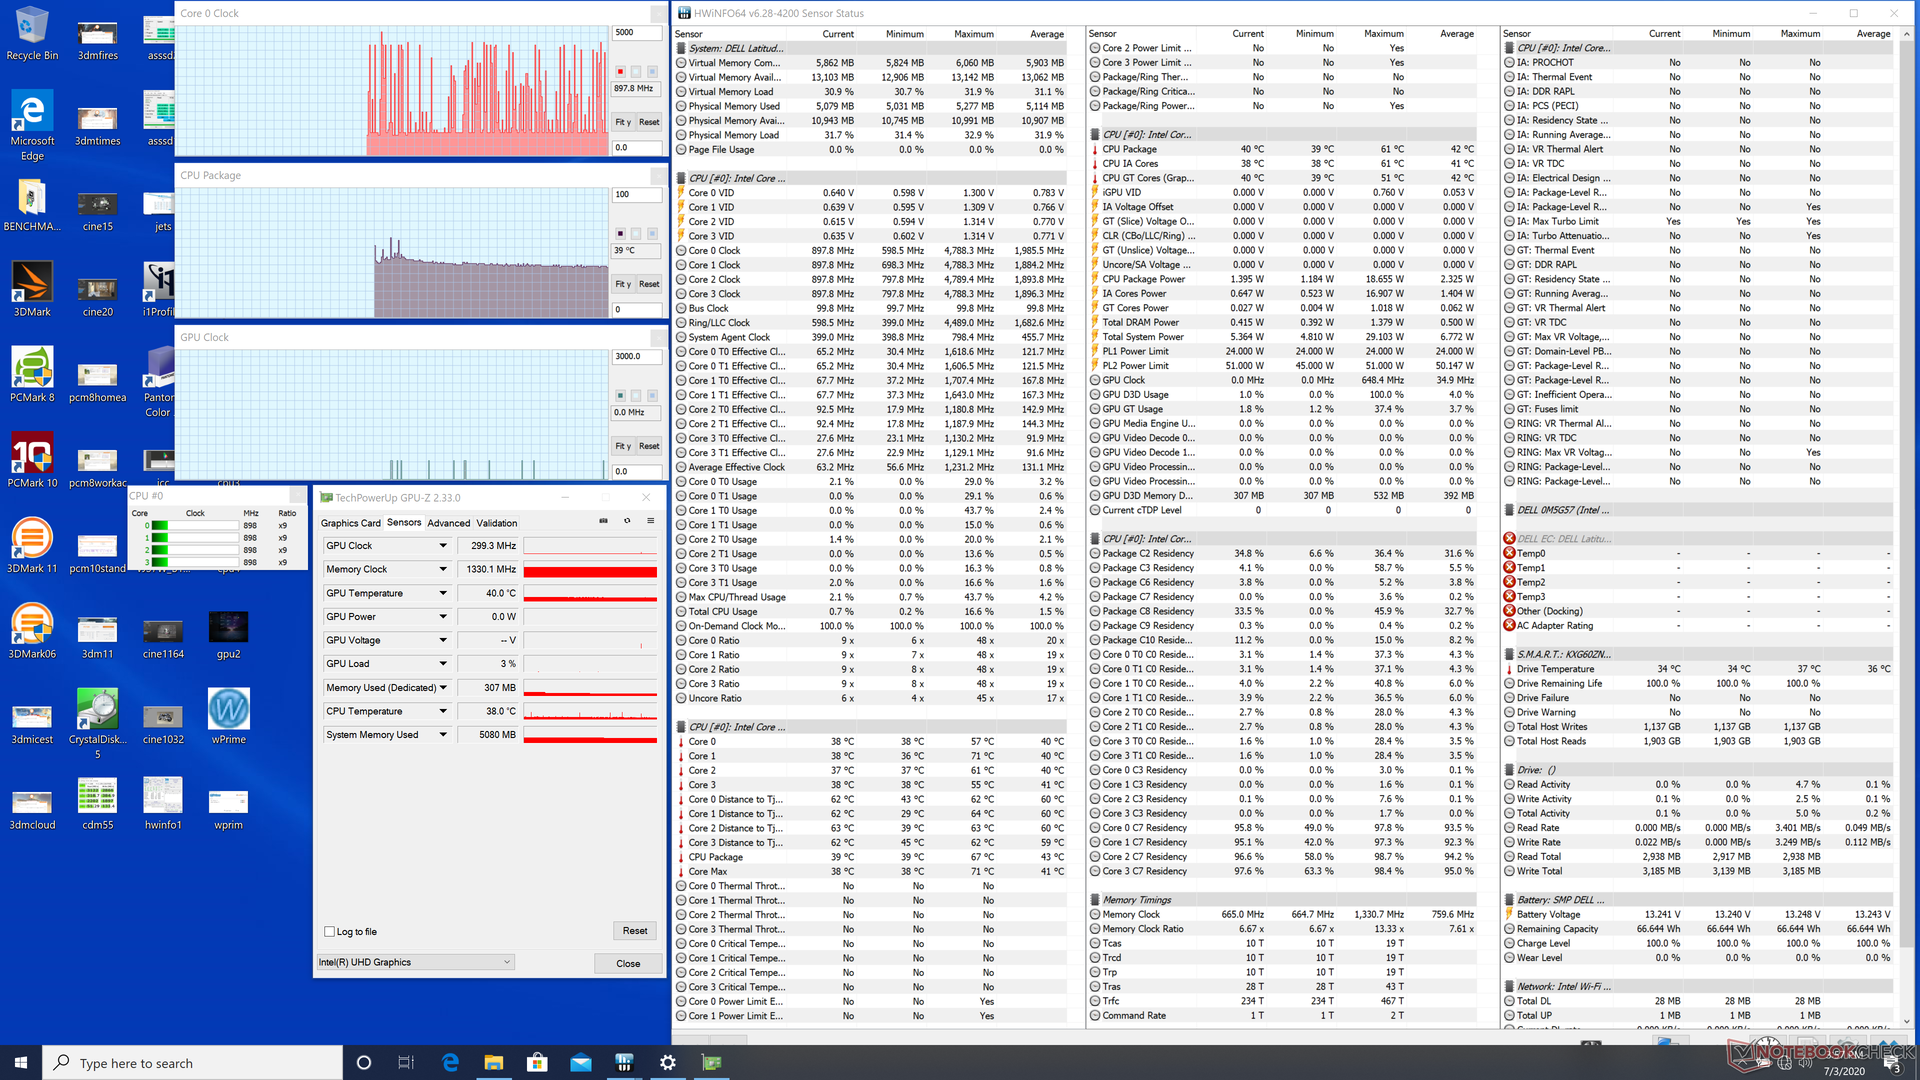
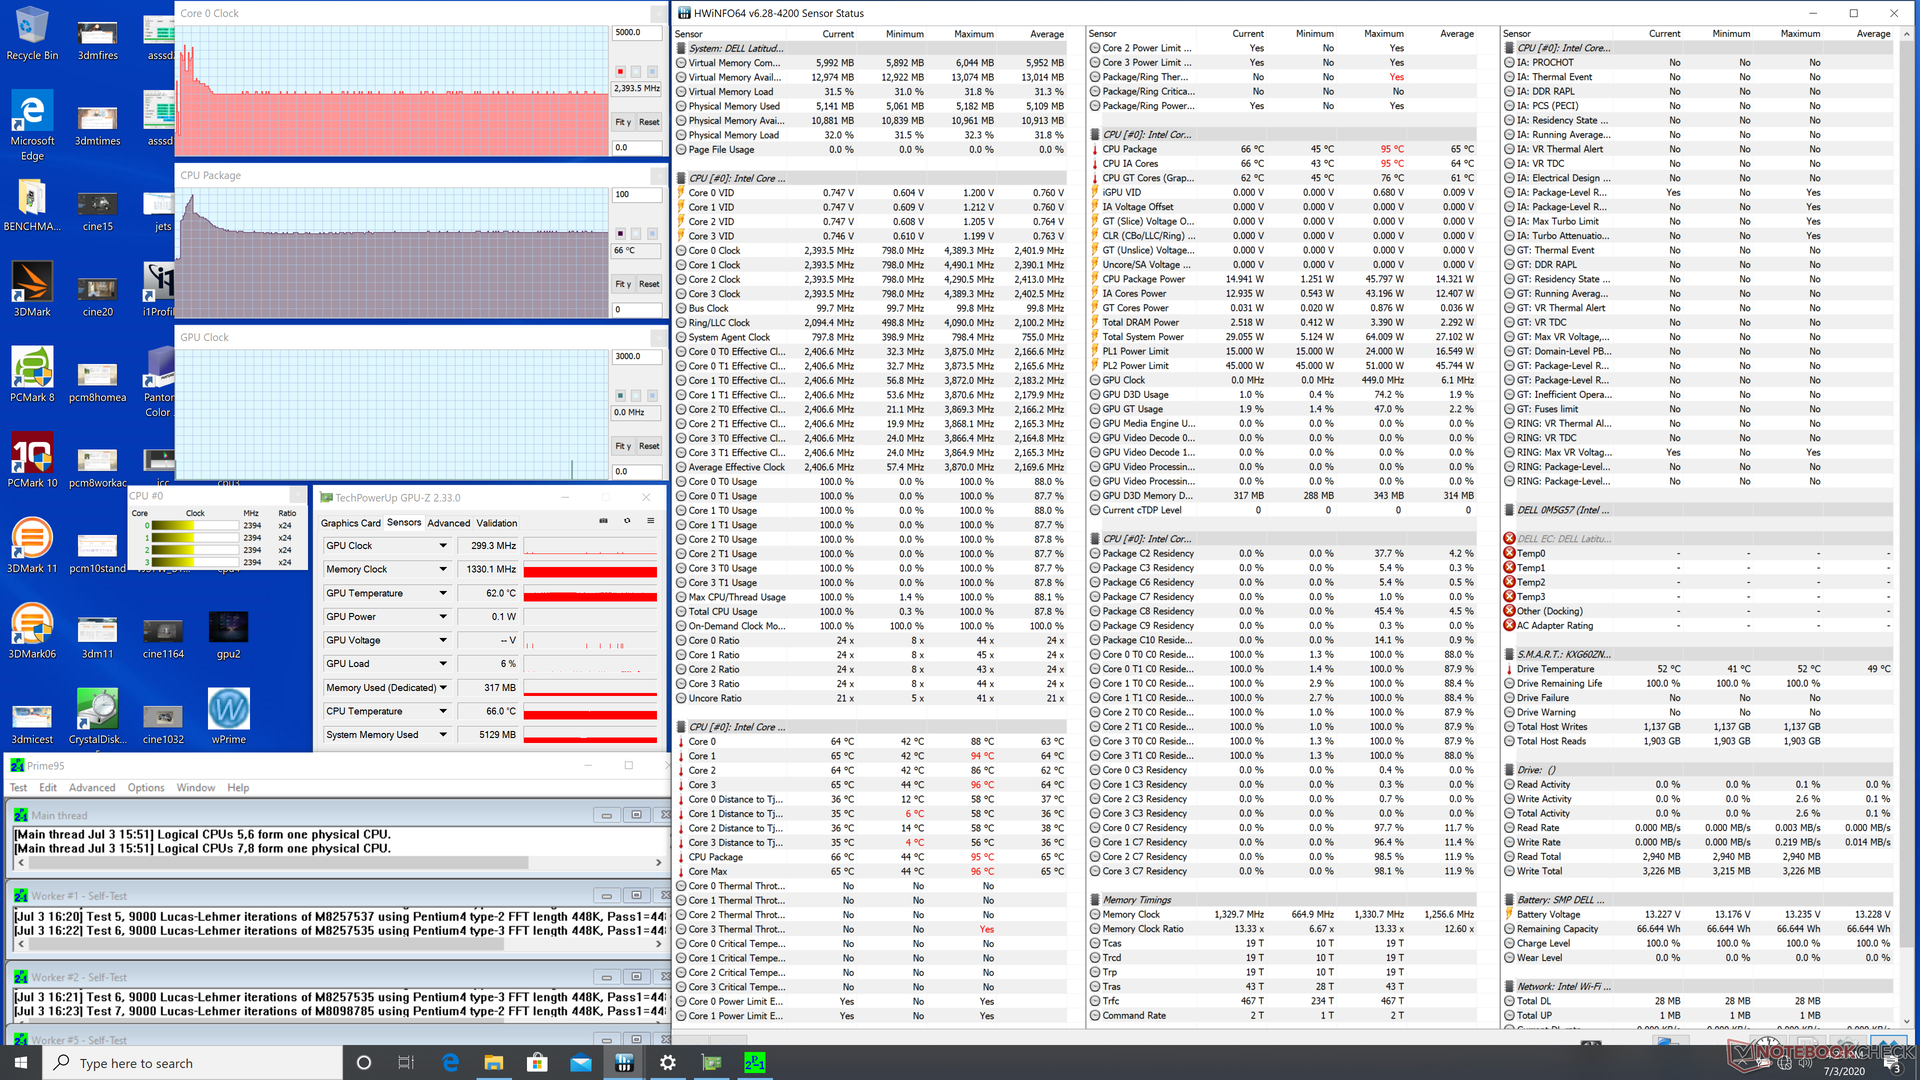
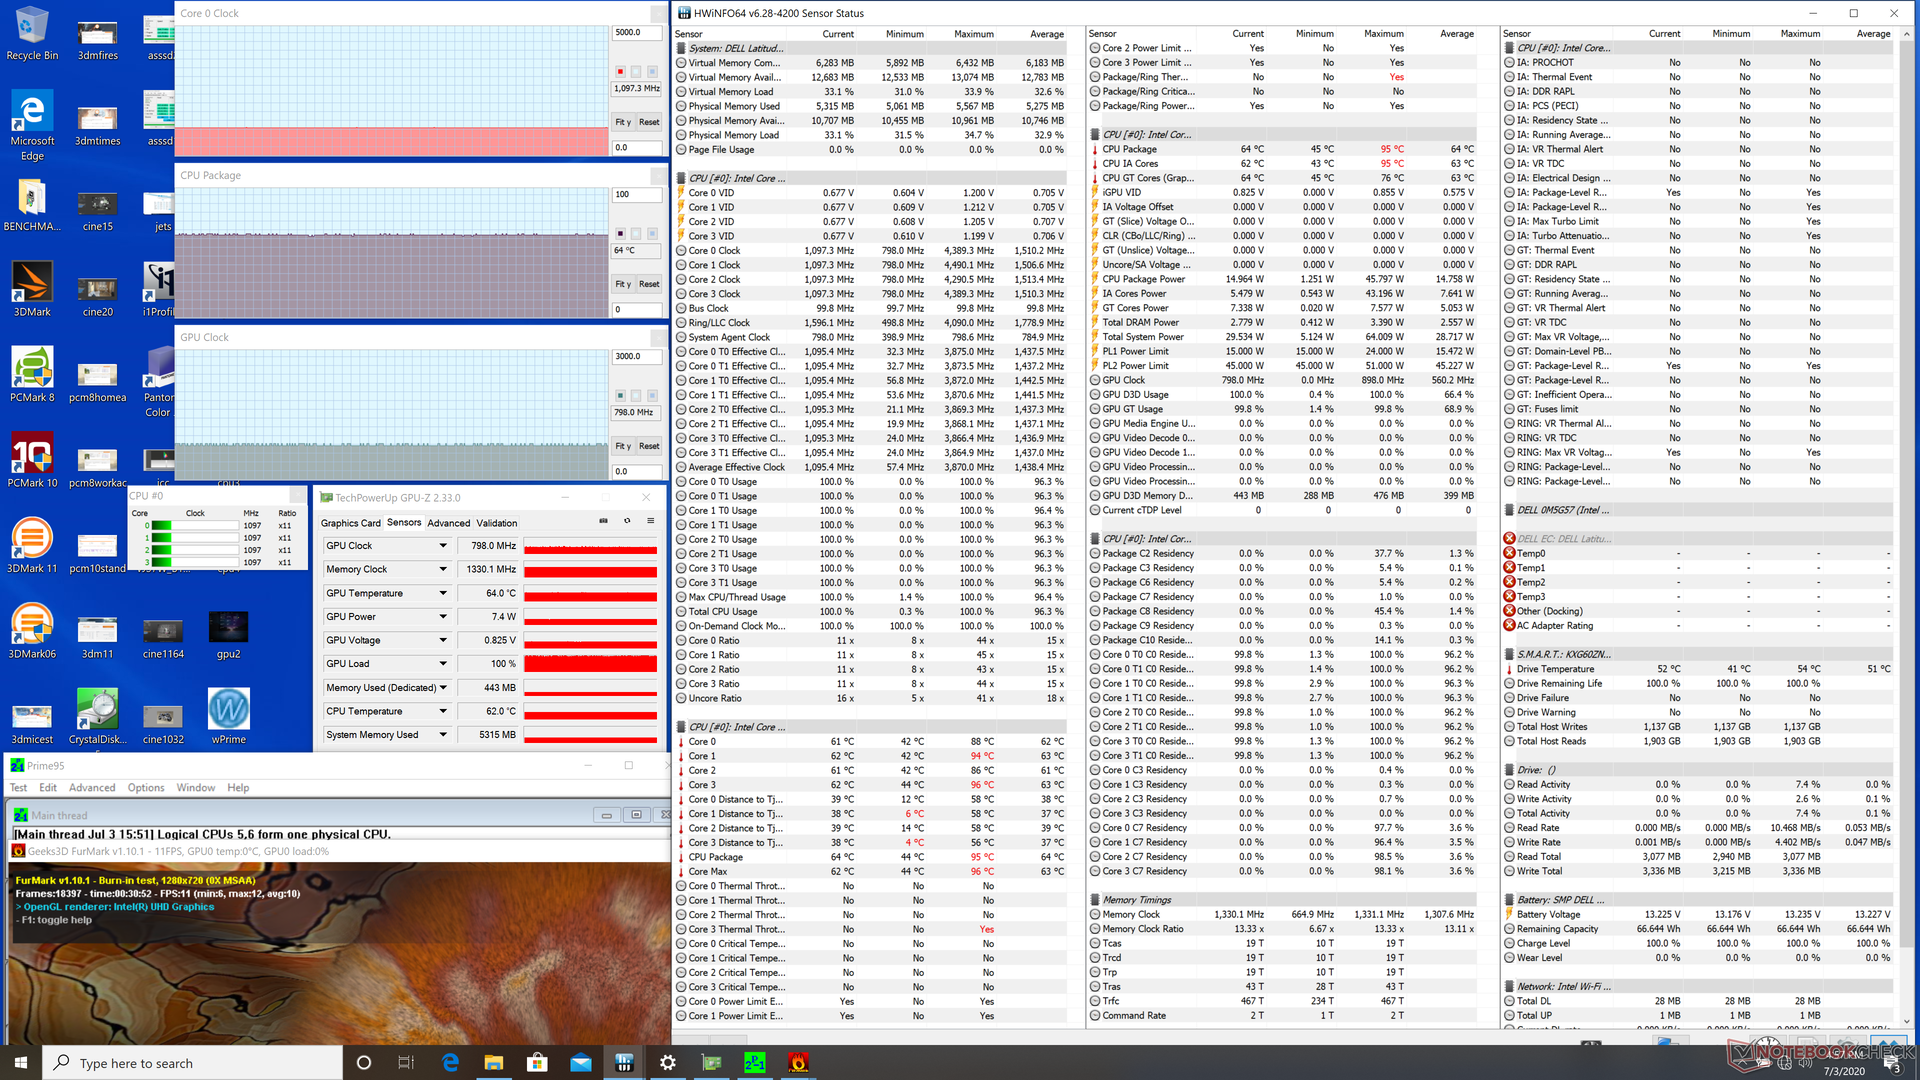
Stress Test
When running Prime95 to stress the CPU, clock rates would spike to the 3.8 to 4.2 GHz range for about 15 seconds until reaching a core temperature of 95 C. Thereafter, clock rates would drop and stabilize at 2.5 GHz in order to maintain a cooler core temperature of 66 C even when set to Dell's Ultra Performance mode. For reference, the processor in last year's Latitude 7400 would stabilize at around 76 C when under similar conditions. This behavior is unlike on the XPS 13 series where running CPU temperatures of 90 C or greater are common when under high processing stress.
Running on batteries will not limit performance as 3DMark 11 scores are nearly identical when running on battery power or AC adapter power.
| CPU Clock (GHz) | GPU Clock (MHz) | Average CPU Temperature (°C) | |
| Prime95 Stress | 2.4 | -- | 66 |
| System Idle | -- | -- | 39 |
| Prime95 + FurMark Stress | 1.1 | 800 | 64 |
Speakers


Energy Management
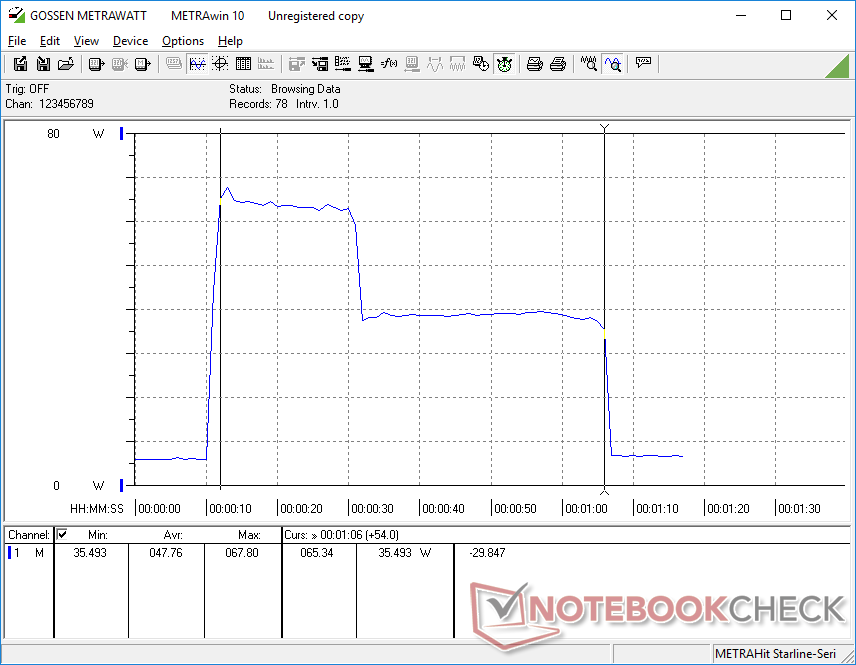
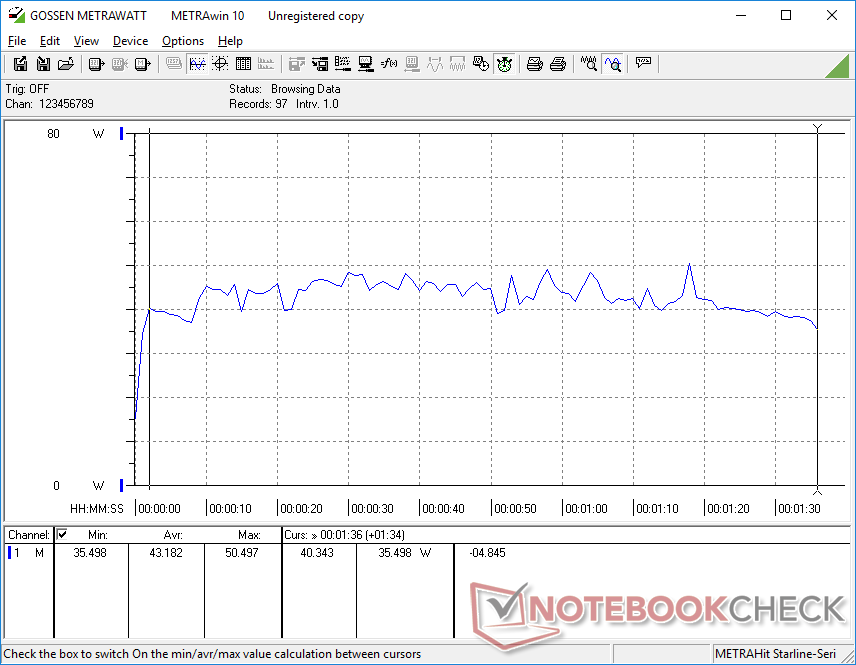
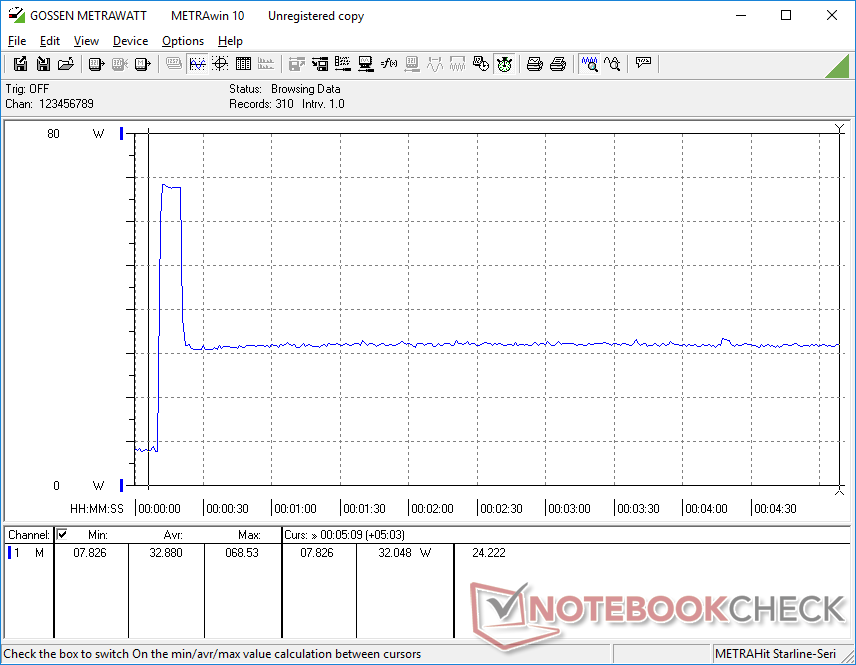
Power Consumption
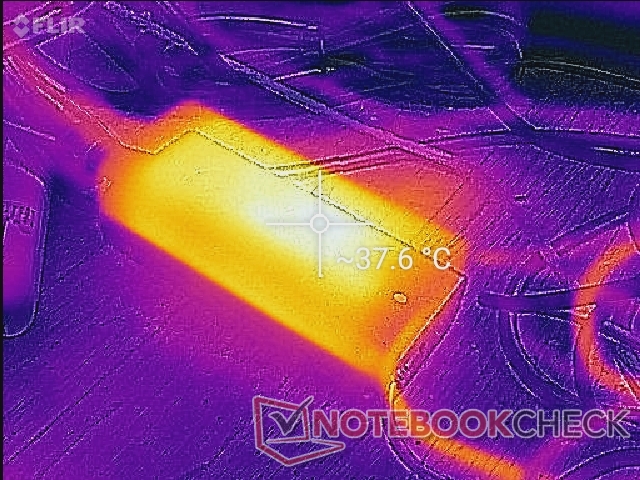
Idling on desktop demands between 3 W and 7 W depending on the power profile and brightness setting to be nearly identical to the Latitude 7400 despite our higher resolution 4K panel. We're able to measure a maximum draw of 68.6 W from the small-medium (~11.1 x 5.1 x 2.8 cm) 65 W AC adapter when running extreme processing loads, but this is only temporary as shown by our graphs below due to thermal Turbo Boost limitations.

| Off / Standby | |
| Idle | |
| Load |
|
Key:
min: | |
| Dell Latitude 7410 i7-10610U, UHD Graphics 620, Toshiba XG6 KXG60ZNV512G, IPS, 3840x2160, 14" | Dell Latitude 7400-8N6DH i7-8665U, UHD Graphics 620, Samsung SSD PM981 MZVLB512HAJQ, IPS, 1920x1080, 14" | Huawei MateBook X Pro 2020 i7 i7-10510U, GeForce MX250, Samsung PM981a MZVLB1T0HBLR, LTPS, 3000x2000, 13.9" | Lenovo ThinkPad X1 Carbon 2020-20UAS04T00 i7-10510U, UHD Graphics 620, Samsung SSD PM981a MZVLB512HBJQ, IPS, 1920x1080, 14" | MSI Modern 14 A10RB-459US i5-10210U, GeForce MX250, Kingston RBUSNS8154P3512GJ, IPS, 1920x1080, 14" | HP Elitebook x360 1040 G5 i7-8650U, UHD Graphics 620, Samsung SSD PM981 MZVLB512HAJQ, IPS, 1920x1080, 14" | |
|---|---|---|---|---|---|---|
| Power Consumption | -3% | -28% | 1% | -11% | -1% | |
| Idle Minimum * (Watt) | 3.7 | 3.9 -5% | 4.3 -16% | 2.96 20% | 4.2 -14% | 2.7 27% |
| Idle Average * (Watt) | 6.2 | 6.1 2% | 8.5 -37% | 5.9 5% | 5.9 5% | 6.5 -5% |
| Idle Maximum * (Watt) | 7 | 8.2 -17% | 12 -71% | 9.1 -30% | 7.2 -3% | 11.5 -64% |
| Load Average * (Watt) | 43.2 | 41 5% | 54.8 -27% | 42.1 3% | 63.4 -47% | 38.7 10% |
| Load Maximum * (Watt) | 68.6 | 69.7 -2% | 61.5 10% | 65.1 5% | 67.4 2% | 50.5 26% |
| Witcher 3 ultra * (Watt) | 47.1 | 53.5 |
* ... smaller is better
Battery Life
Users can configure between a 39 Wh, 52 Wh, or 68 Wh internal battery. Higher capacities come with both higher prices and heavier weight. Last year's Latitude 7400 capped out at "only" 60 Wh.
Battery life remains similar to the Latitude 7400 at around 11 hours of real-world WLAN use even though our Latitude 7410 has a much higher resolution display. Charging from empty to full capacity takes about 2 hours and we suspect this to be even faster on the smaller 39 Wh or 52 Wh options.
| Dell Latitude 7410 i7-10610U, UHD Graphics 620, 68 Wh | Dell Latitude 7400-8N6DH i7-8665U, UHD Graphics 620, 60 Wh | Huawei MateBook X Pro 2020 i7 i7-10510U, GeForce MX250, 57.4 Wh | Lenovo ThinkPad X1 Carbon 2020-20UAS04T00 i7-10510U, UHD Graphics 620, 51 Wh | MSI Modern 14 A10RB-459US i5-10210U, GeForce MX250, 50 Wh | HP Elitebook x360 1040 G5 i7-8650U, UHD Graphics 620, 56 Wh | |
|---|---|---|---|---|---|---|
| Battery runtime | -6% | -11% | -27% | -36% | -3% | |
| Reader / Idle (h) | 31.3 | 16.4 -48% | 27.9 -11% | |||
| WiFi v1.3 (h) | 11 | 11.6 5% | 10.4 -5% | 10.1 -8% | 8.6 -22% | 10.4 -5% |
| Load (h) | 2.9 | 2.4 -17% | 2.4 -17% | 1.6 -45% | 1.8 -38% | 3.1 7% |
Pros
Cons
Verdict
The Latitude 7410 is a solid no-frills business clamshell. Its chassis and hinges feel stronger than what Lenovo and HP have to offer in this size category for a better first impression. We can see this system lasting for years in a business environment with ease.
The main drawback to the system is that it might be a little too vanilla for the price and weight. As a business laptop, it could certainly use some more auxiliary features to better cater to its audience. The Lenovo X1 Carbon and HP EliteBook series, for example, come with TrackPoint or dedicated keys for video conferencing and both are noticeably lighter than the Dell as well. If you want the Latitude 7410, then you'll be trading away a few features for a heavier and stronger chassis.
CPU and graphics are also a bit underwhelming which limit the system to mostly light office loads. Performance-per-dollar is not a strong point especially when last year's Core i7-8665U can run just as fast as the Core i7-10610U. Alternatives like the new Lenovo ThinkBook 14 are offering Ryzen 4000U options for more power-hungry business users.
If you don't mind the slightly thicker and heavier profile, then the sturdy Dell Latitude 7410 will be a reliable, no-frills business companion that's built to last.
Dell Latitude 7410
- 07/07/2020 v7 (old)
Allen Ngo
Price comparison
