Lenovo ThinkPad X1 Yoga 4th Gen Core i7 Convertible Review: A ThinkPad X1 Carbon in Disguise
The latest ThinkPad X1 Yoga convertible is the Comet Lake-U update to last year's Whiskey Lake-U series. It targets professionals who want something more versatile than the typical ThinkPad T series or X1 Carbon clamshell. Our unit in review comes from Computer Upgrade King with the Core i7-10510U CPU, 16 GB of soldered RAM, WQHD (1440p) touchscreen, and removable 512 GB PCIe NVMe SSD for $2000, but other SKUs are available with different CPUs, display resolutions, optional 4G LTE, and more.
The 2020 ThinkPad X1 Yoga shares the same chassis design as the 2019 model and so we recommend checking out our existing review on the 2019 FHD model here. This design replaces the older 2018 model which is approximately 8 percent heavier, 10 percent thicker, and 19 percent larger in volume.
Direct competitors to the ThinkPad X1 Yoga include other high-end 2-in-1 subnotebooks like the Dell Latitude 7400 2-in-1, HP EliteBook x360 1040, Asus ZenBook Flip 14, and the Microsoft Surface Book series.
More Lenovo reviews:
Rating | Date | Model | Weight | Height | Size | Resolution | Price |
|---|---|---|---|---|---|---|---|
| 89.8 % v7 (old) | 04 / 2020 | Lenovo ThinkPad X1 Yoga 20SA000GUS i7-10510U, UHD Graphics 620 | 1.3 kg | 15.5 mm | 14.00" | 2560x1440 | |
| 90.5 % v7 (old) | 02 / 2019 | HP Elitebook x360 1040 G5 i7-8650U, UHD Graphics 620 | 1.4 kg | 16.9 mm | 14.00" | 1920x1080 | |
| 88.5 % v7 (old) | 03 / 2020 | Lenovo ThinkPad X1 Carbon G7 20R1-000YUS i7-10510U, UHD Graphics 620 | 1.2 kg | 15.4 mm | 14.00" | 3840x2160 | |
| 87.8 % v7 (old) | 06 / 2019 | Dell Latitude 7400 2-in-1 i7-8665U, UHD Graphics 620 | 1.5 kg | 15 mm | 14.00" | 1920x1080 | |
| 81.2 % v7 (old) | 09 / 2019 | Asus ZenBook Flip 14 UM462DA-AI023T R7 3700U, Vega 10 | 1.6 kg | 18.9 mm | 14.00" | 1920x1080 | |
| 88 % v6 (old) | 06 / 2017 | Lenovo ThinkPad X1 Yoga 2017 20JES03T00 i7-7600U, HD Graphics 620 | 1.4 kg | 17.4 mm | 14.00" | 2560x1440 |
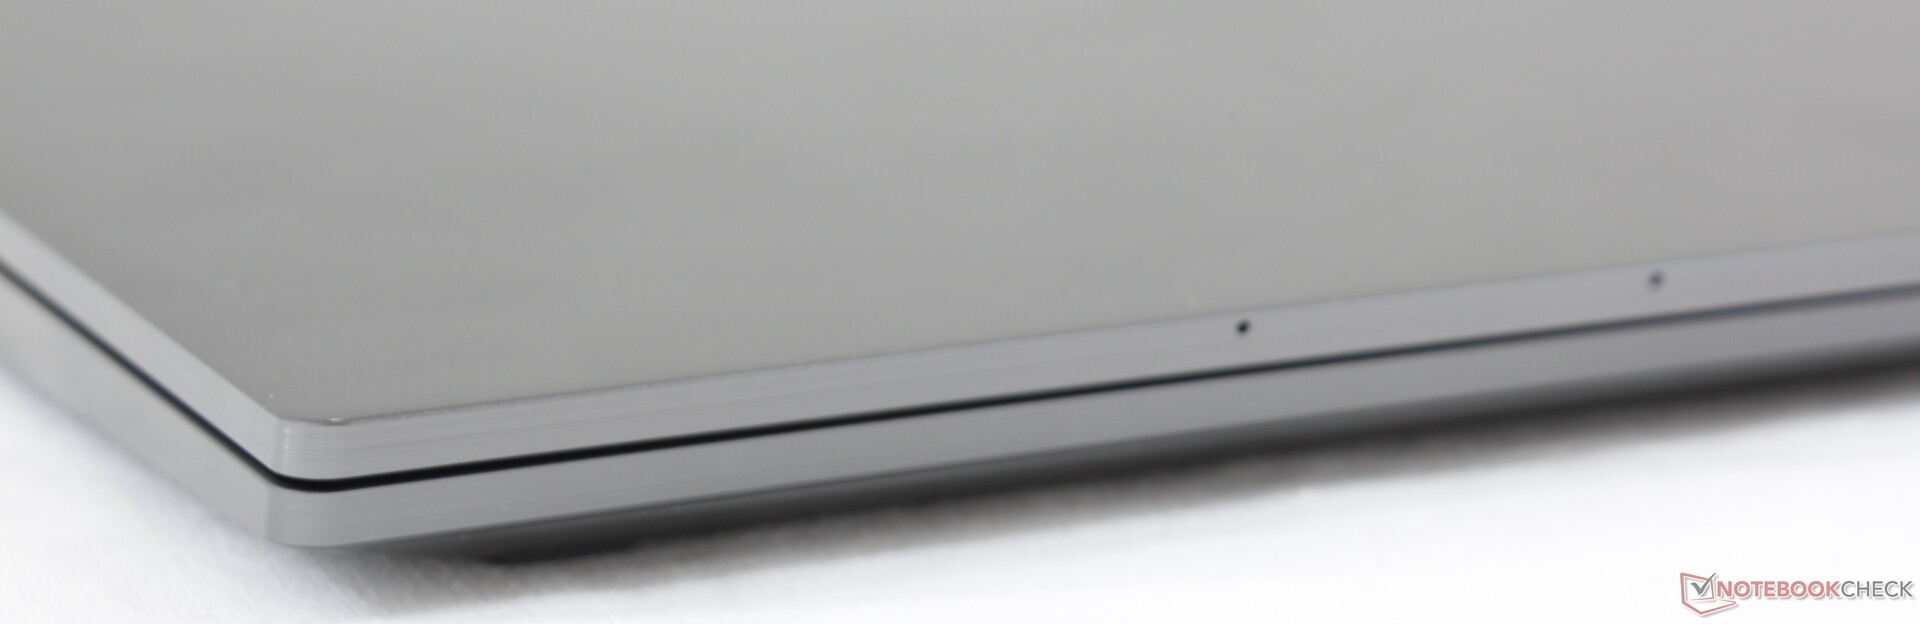
Case
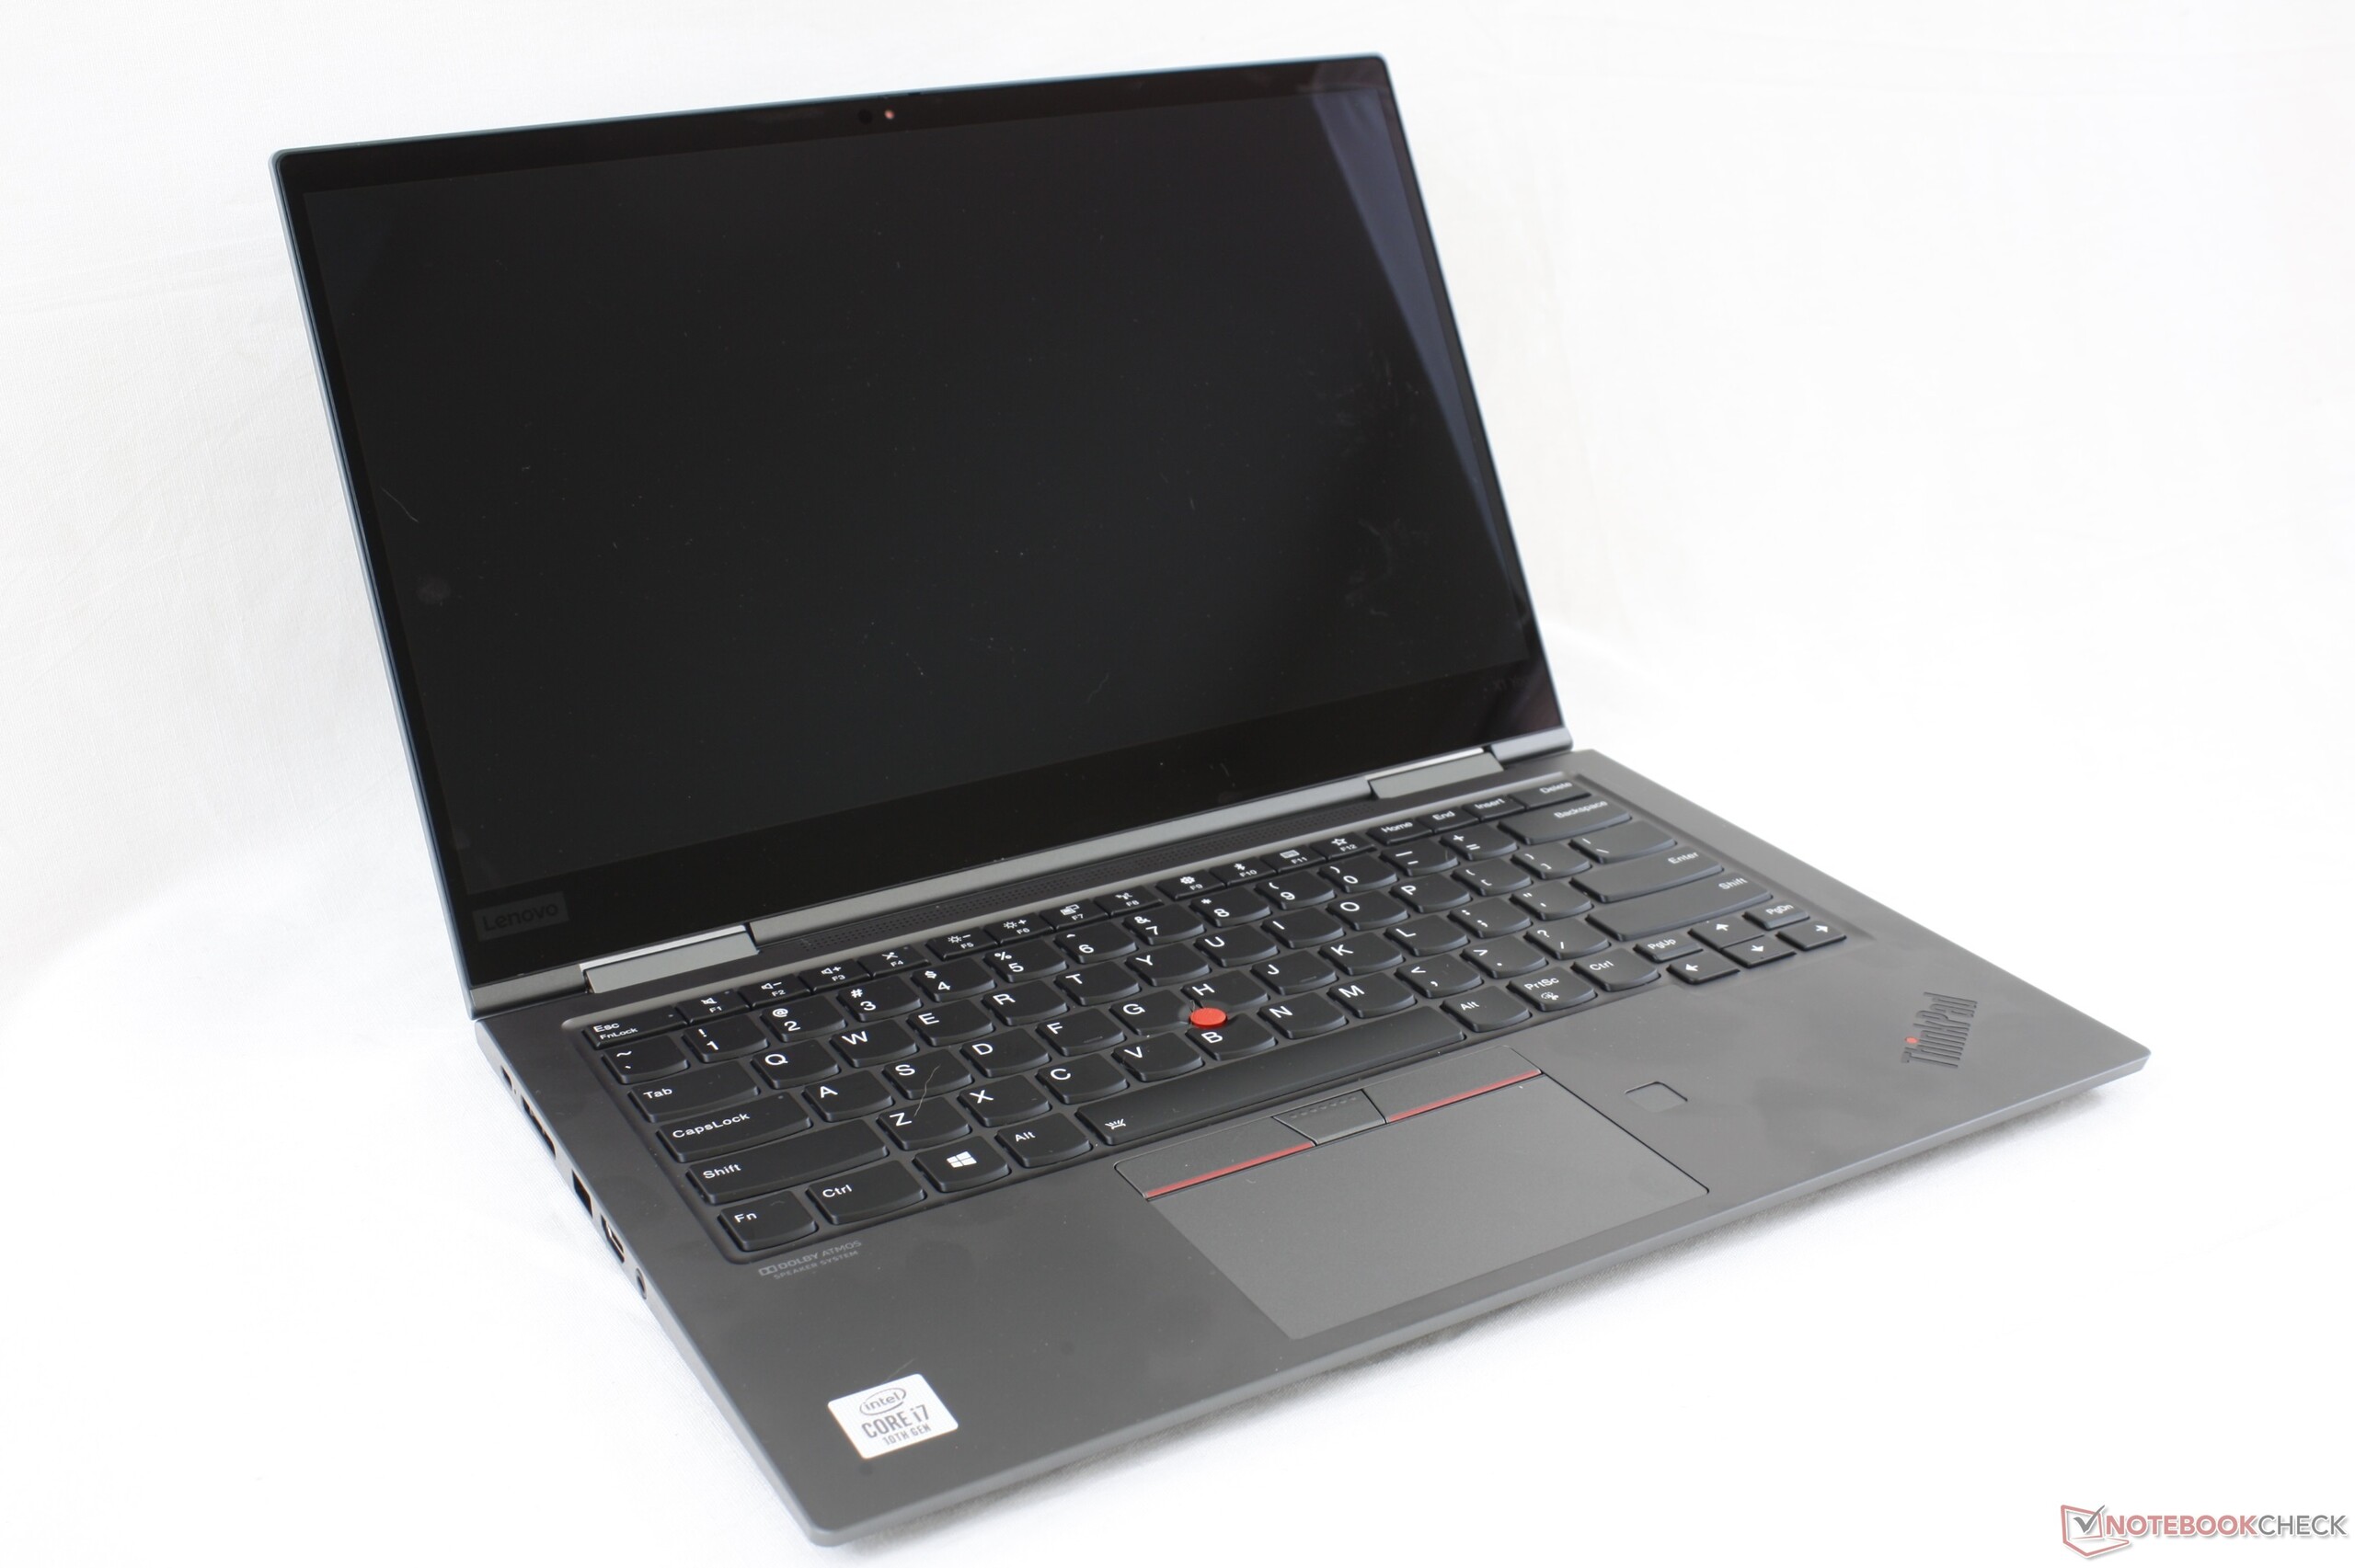
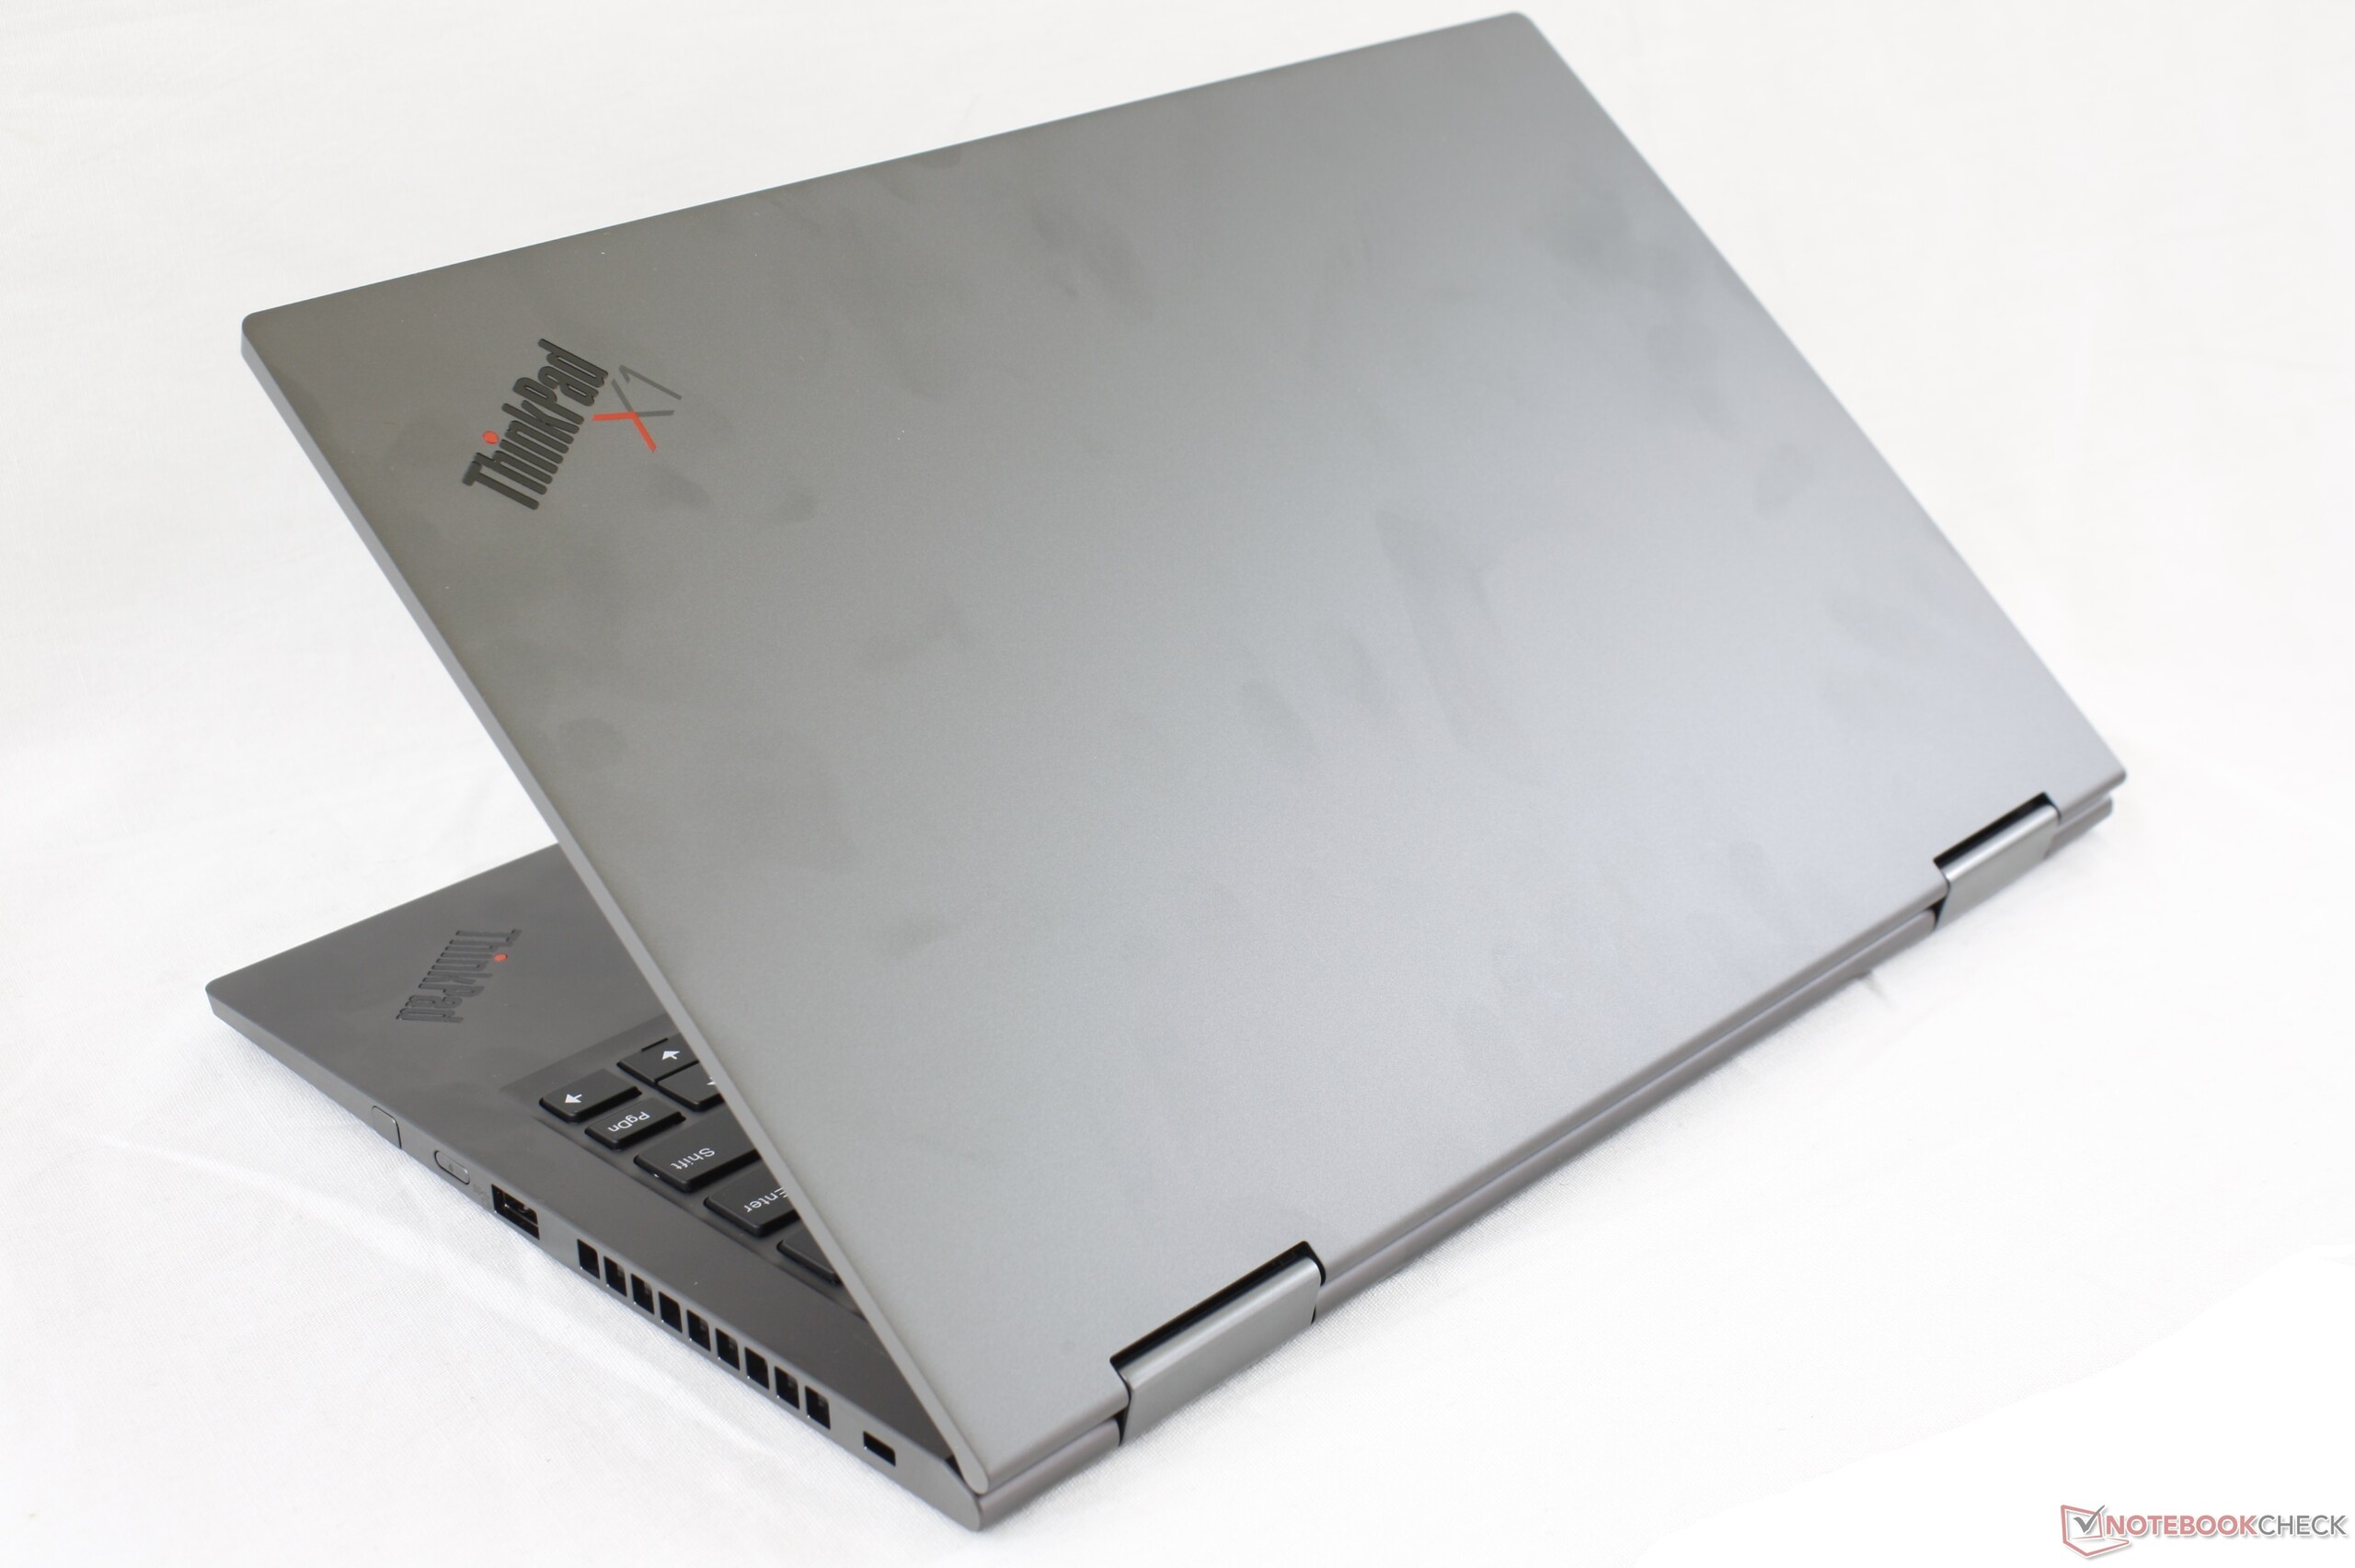
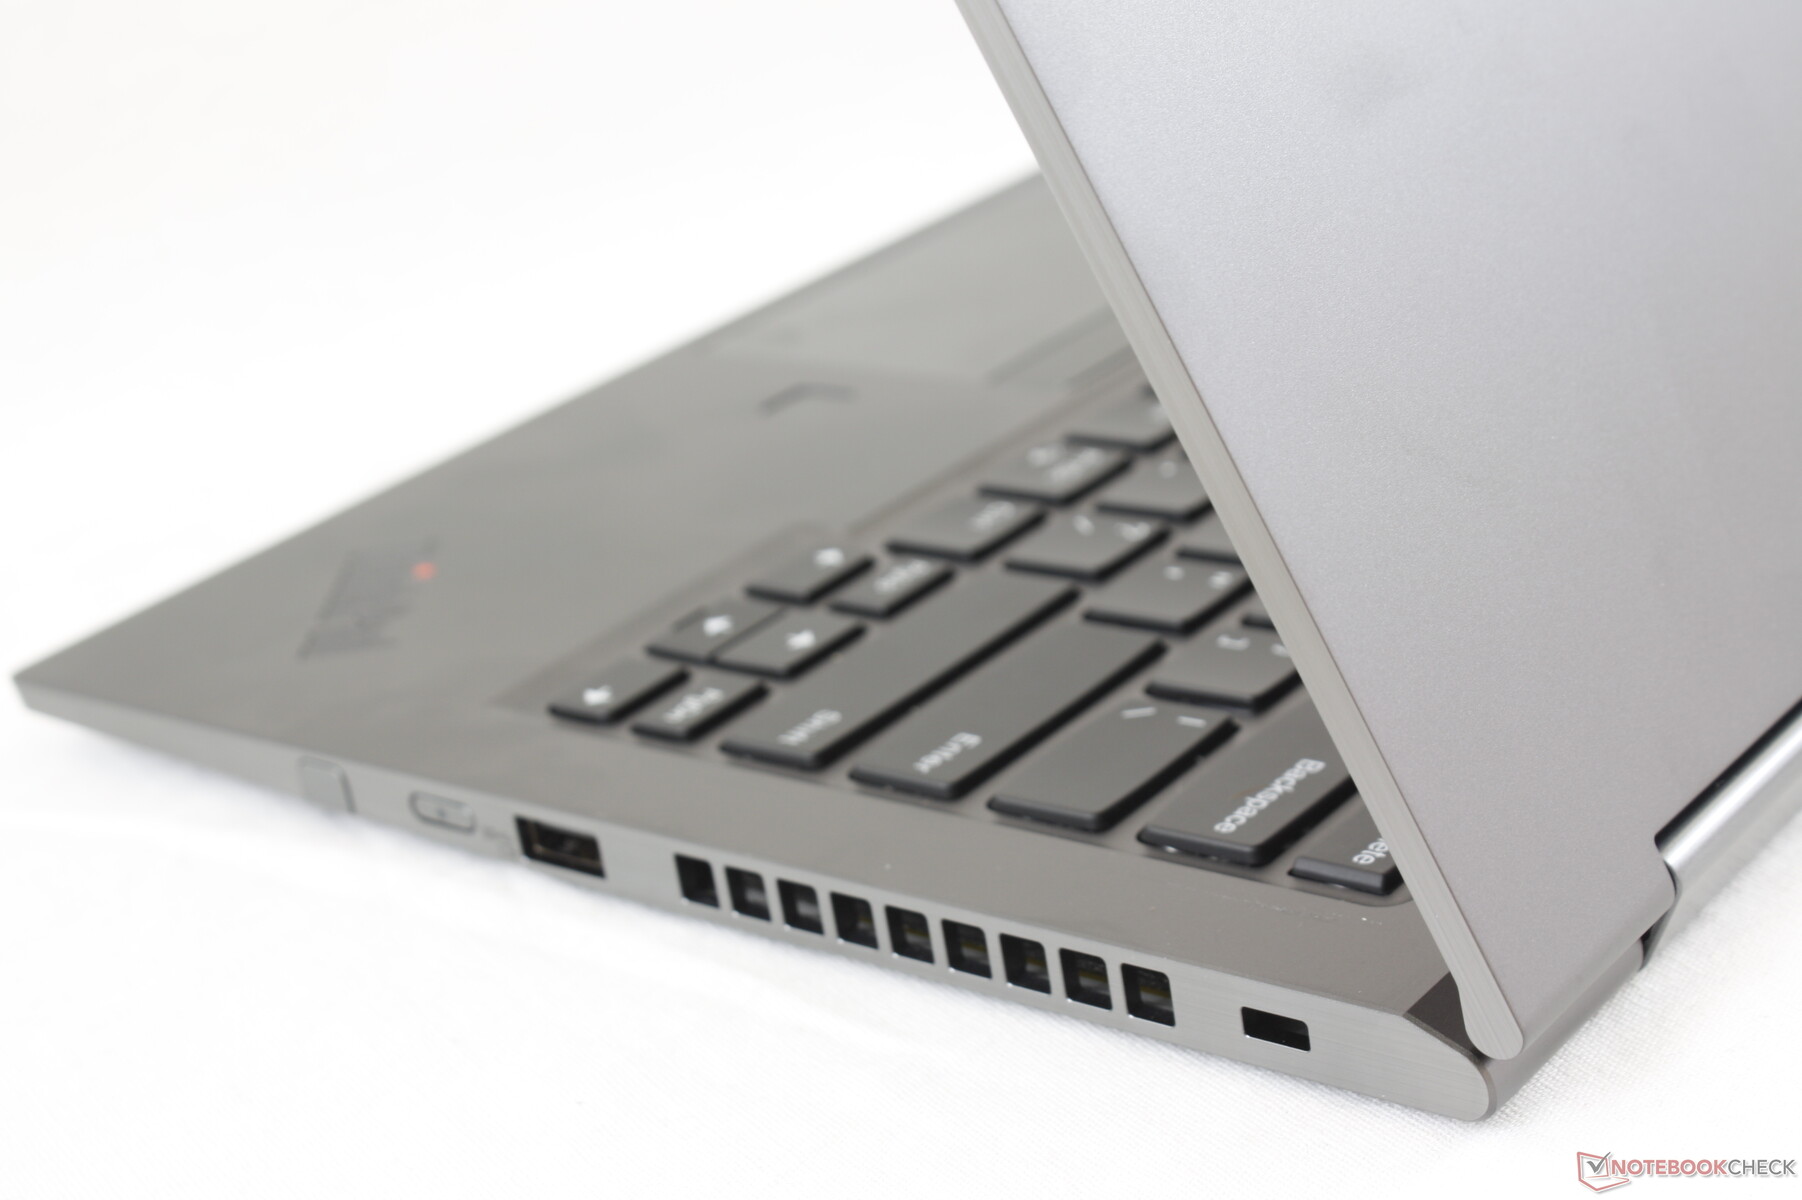
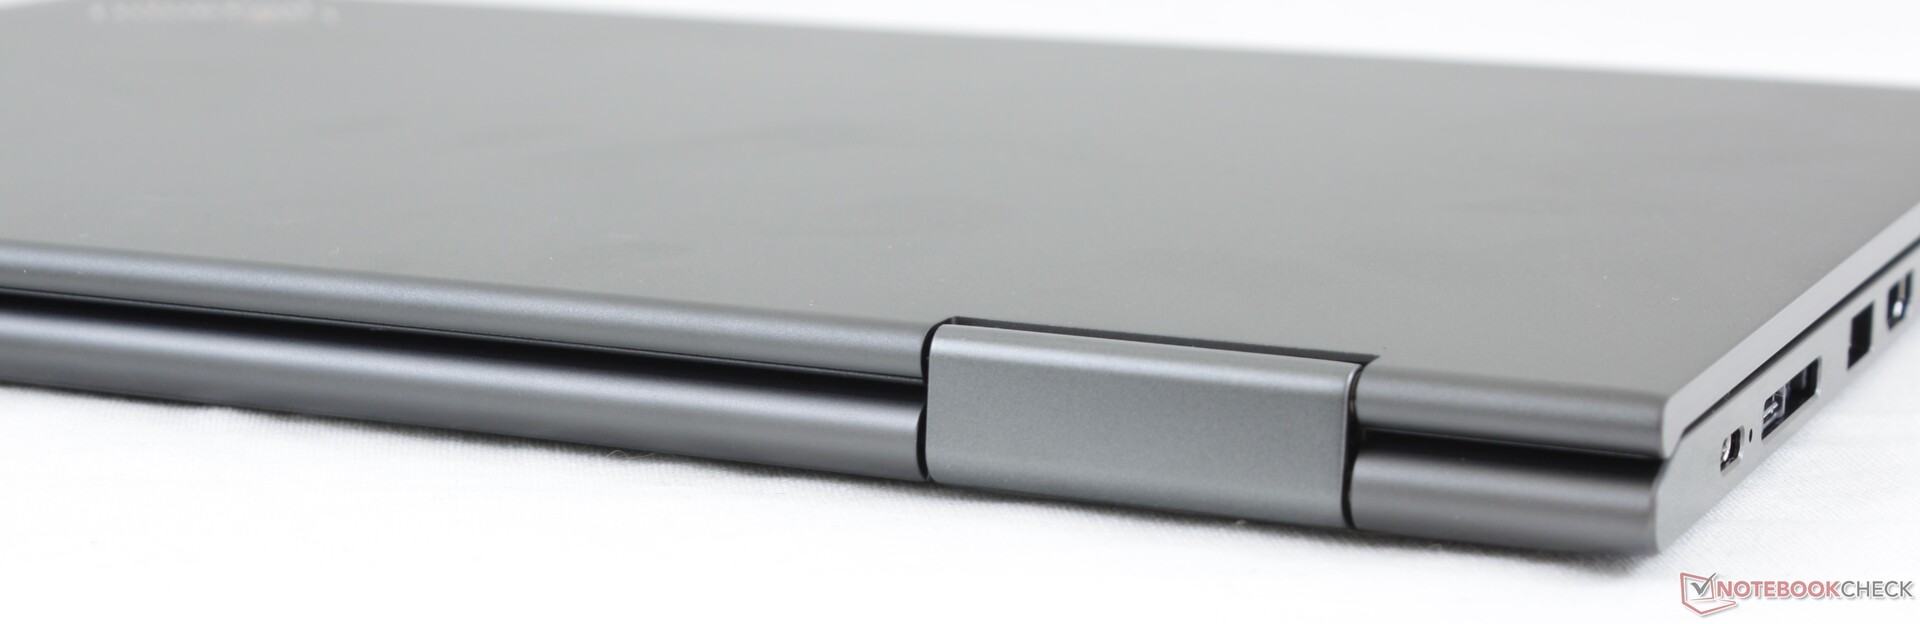
If you've had hands-on time with the Yoga C930 or Yoga C940, then you'll have a good idea of how the ThinkPad X1 Yoga feels. Lenovo uses very similar magnesium and aluminum materials between its flagship consumer convertible and flagship business convertible down to their matte luster and smooth texture. Visually, the system trades out the traditional business look of the black ThinkPad X1 Carbon in favor of a more luxurious Ultrabook look. It's a fair exchange since the skeleton is still rigid and of high quality. Attempting to twist the base or lid results in only minimal warping or creaking.
Hinge rigidity is stronger than what we've experienced on the XPS 13 2-in-1 or HP EliteBook x360 1040. Tapping on the screen in laptop mode, for example, will teeter the display much less when compared to most other touchscreen laptops. This shows that Lenovo really didn't have to make those flashy "watchband" hinges as found on the Yoga Book or the older Yoga 920 if these regular hinges can be even stronger.
Dimensions are nearly 1:1 with the ThinkPad X1 Carbon. However, our ThinkPad X1 Yoga is the heavier model by about 100 g due to the glass touchscreen and metal chassis compared to the carbon fiber makeup of the X1 Carbon. The system is still one of the lighter 14-inch convertibles in the market as the HP EliteBook x360 1040, Asus ZenBook Flip 14, and the Dell Latitude 7400 2-in-1 are all heavier.
A noticeable drawback to the X1 Yoga is its long length due to the thick chin bezel. The smaller Latitude 7400 2-in-1 is easier to carry while offering the same size 14-inch display.
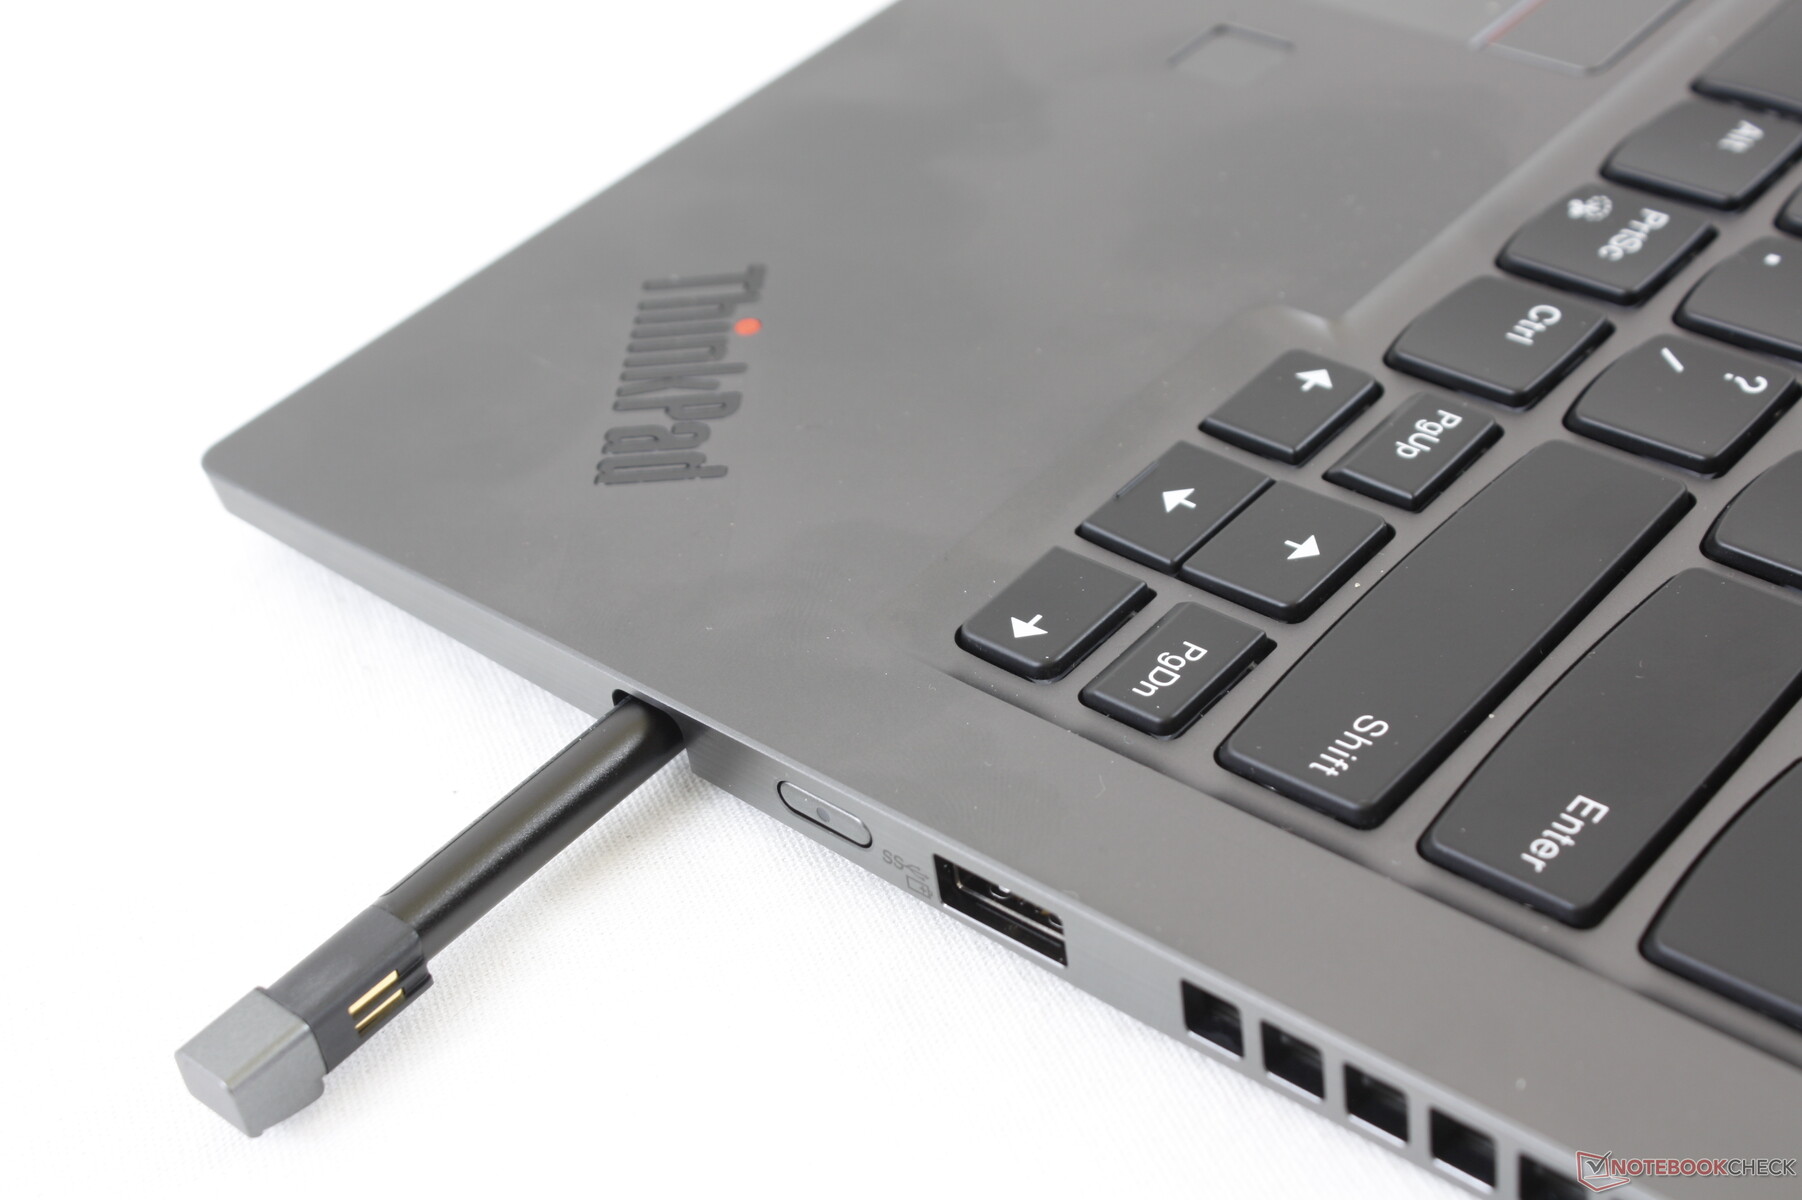
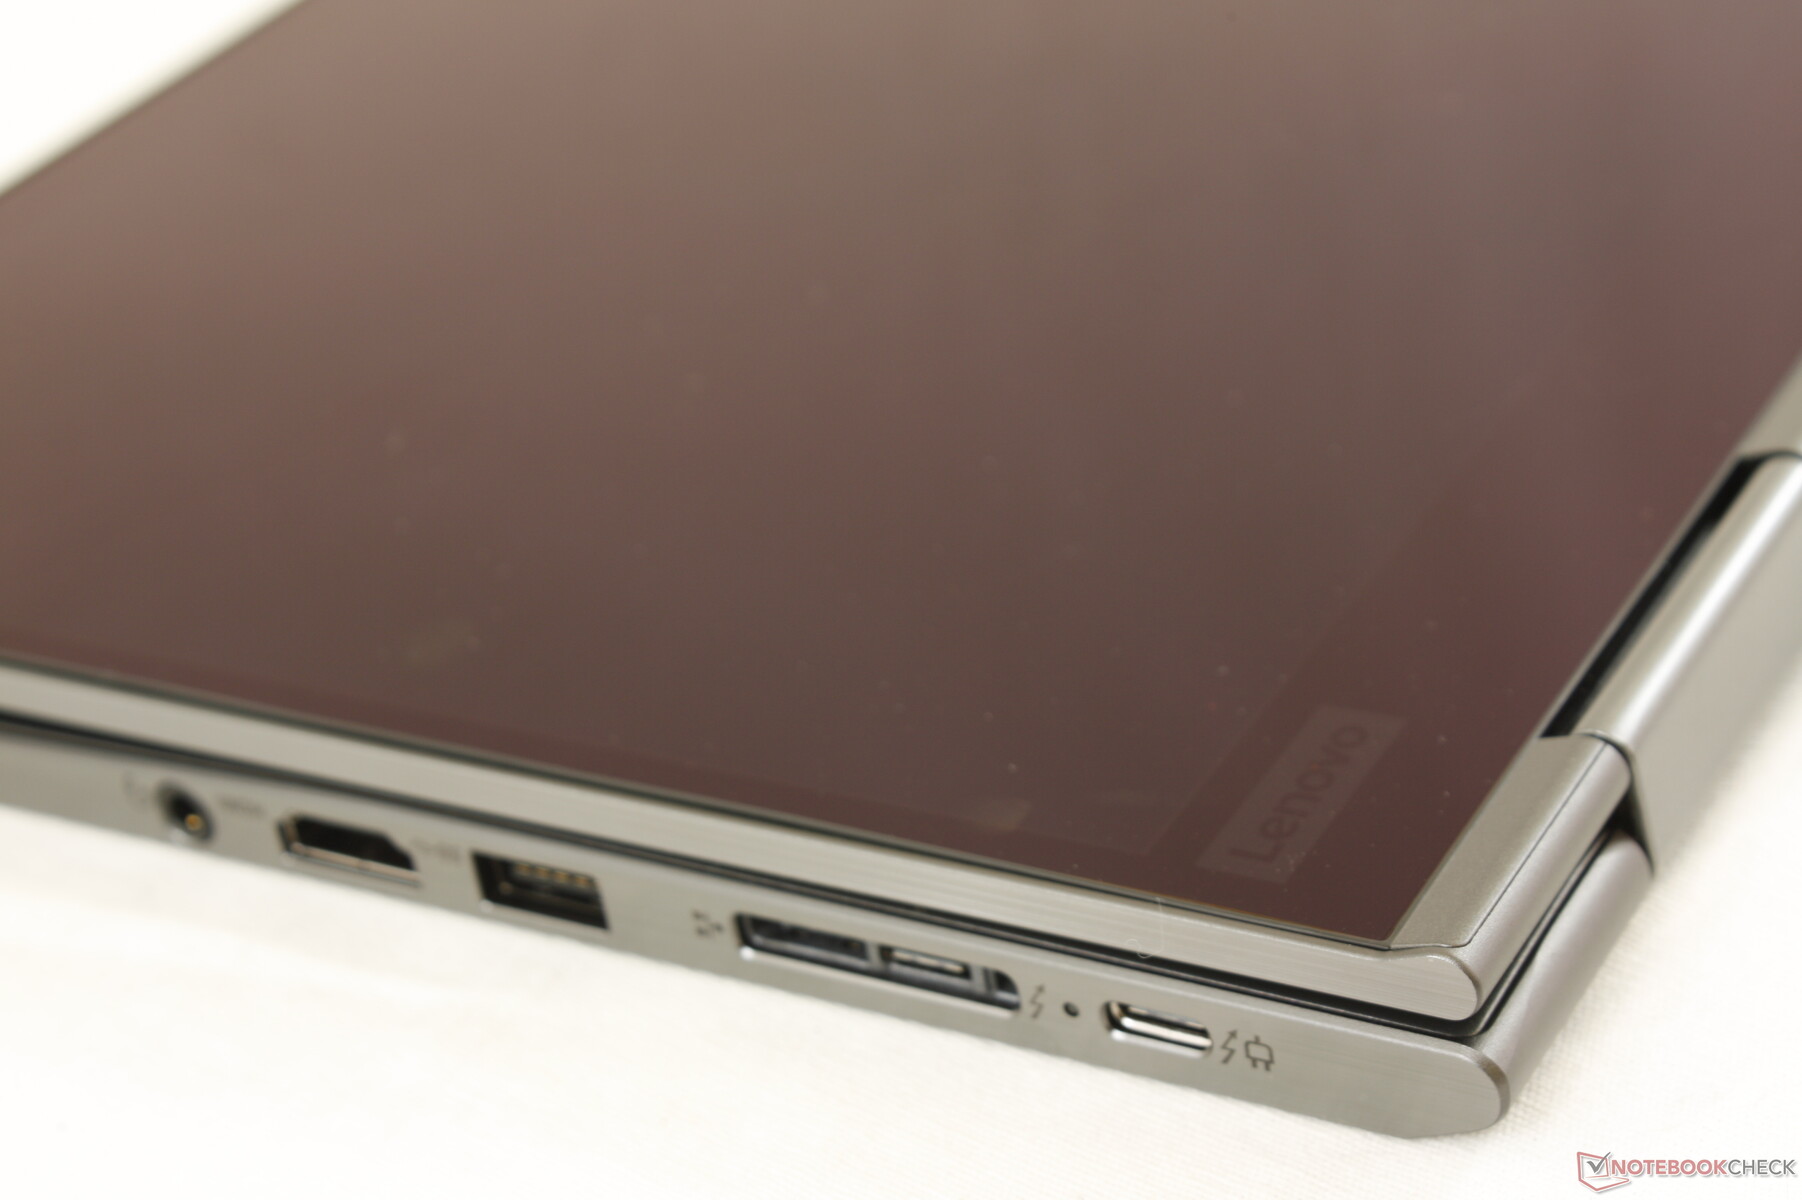
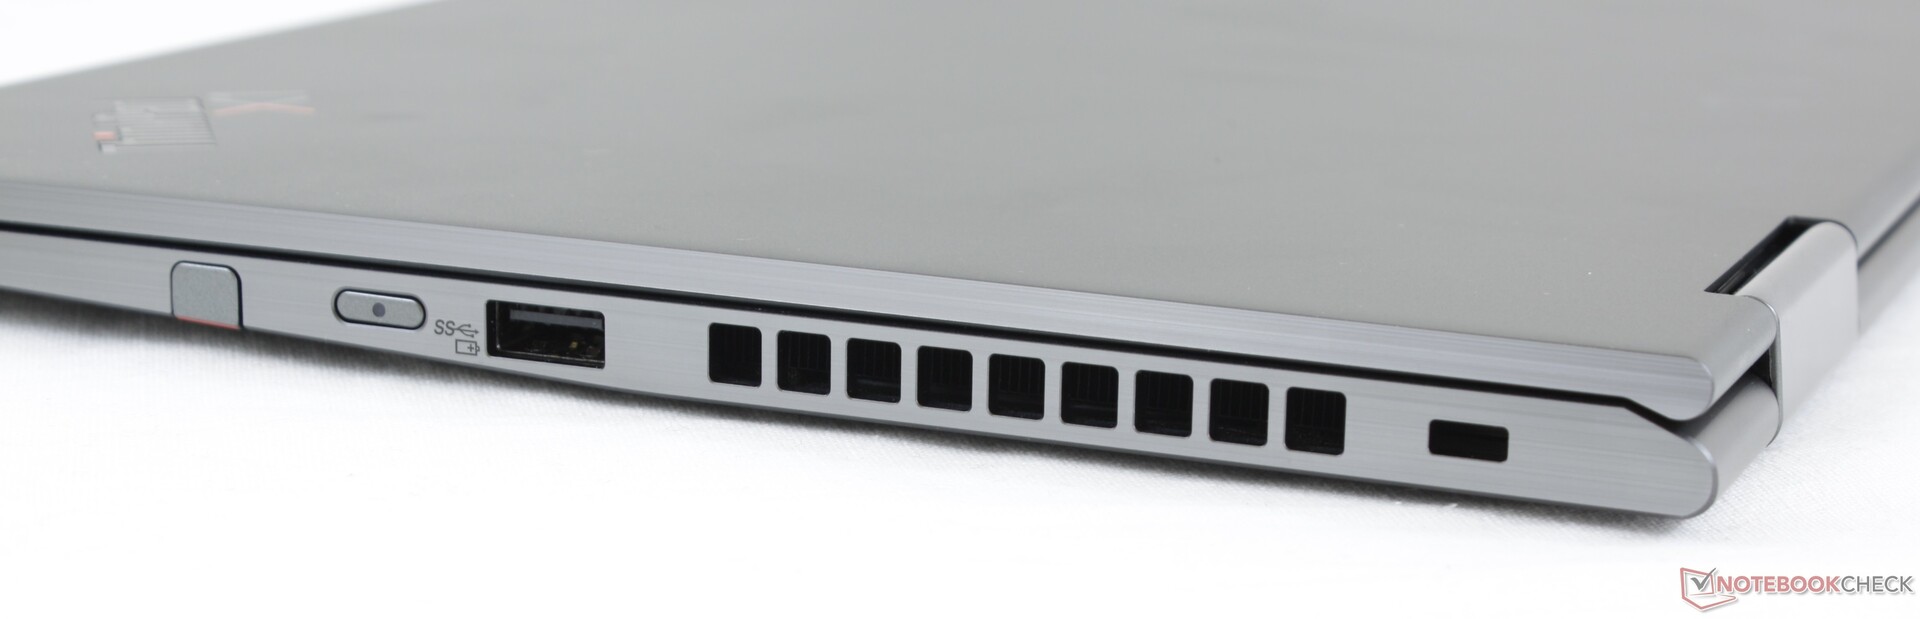
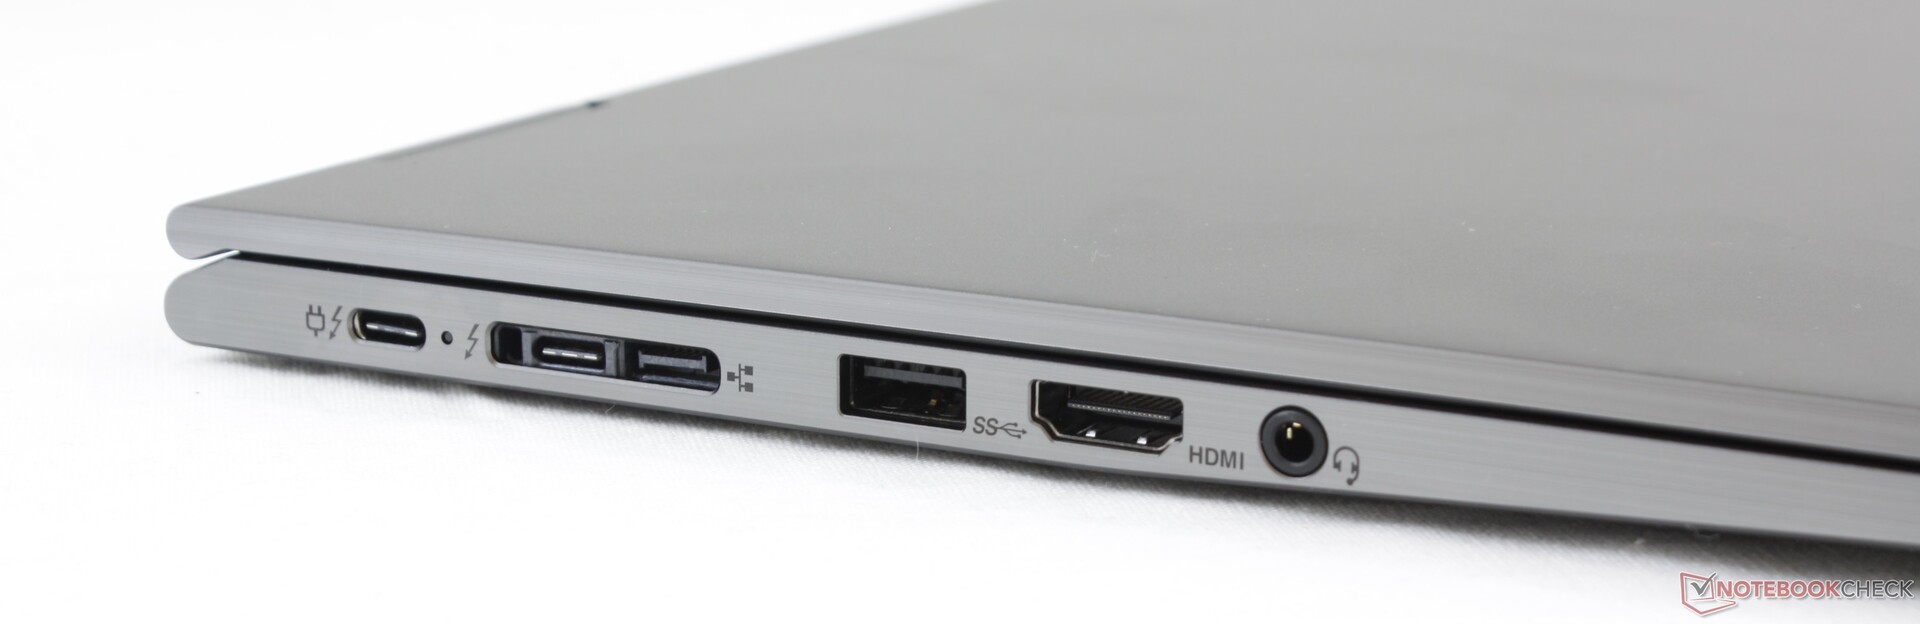
Connectivity
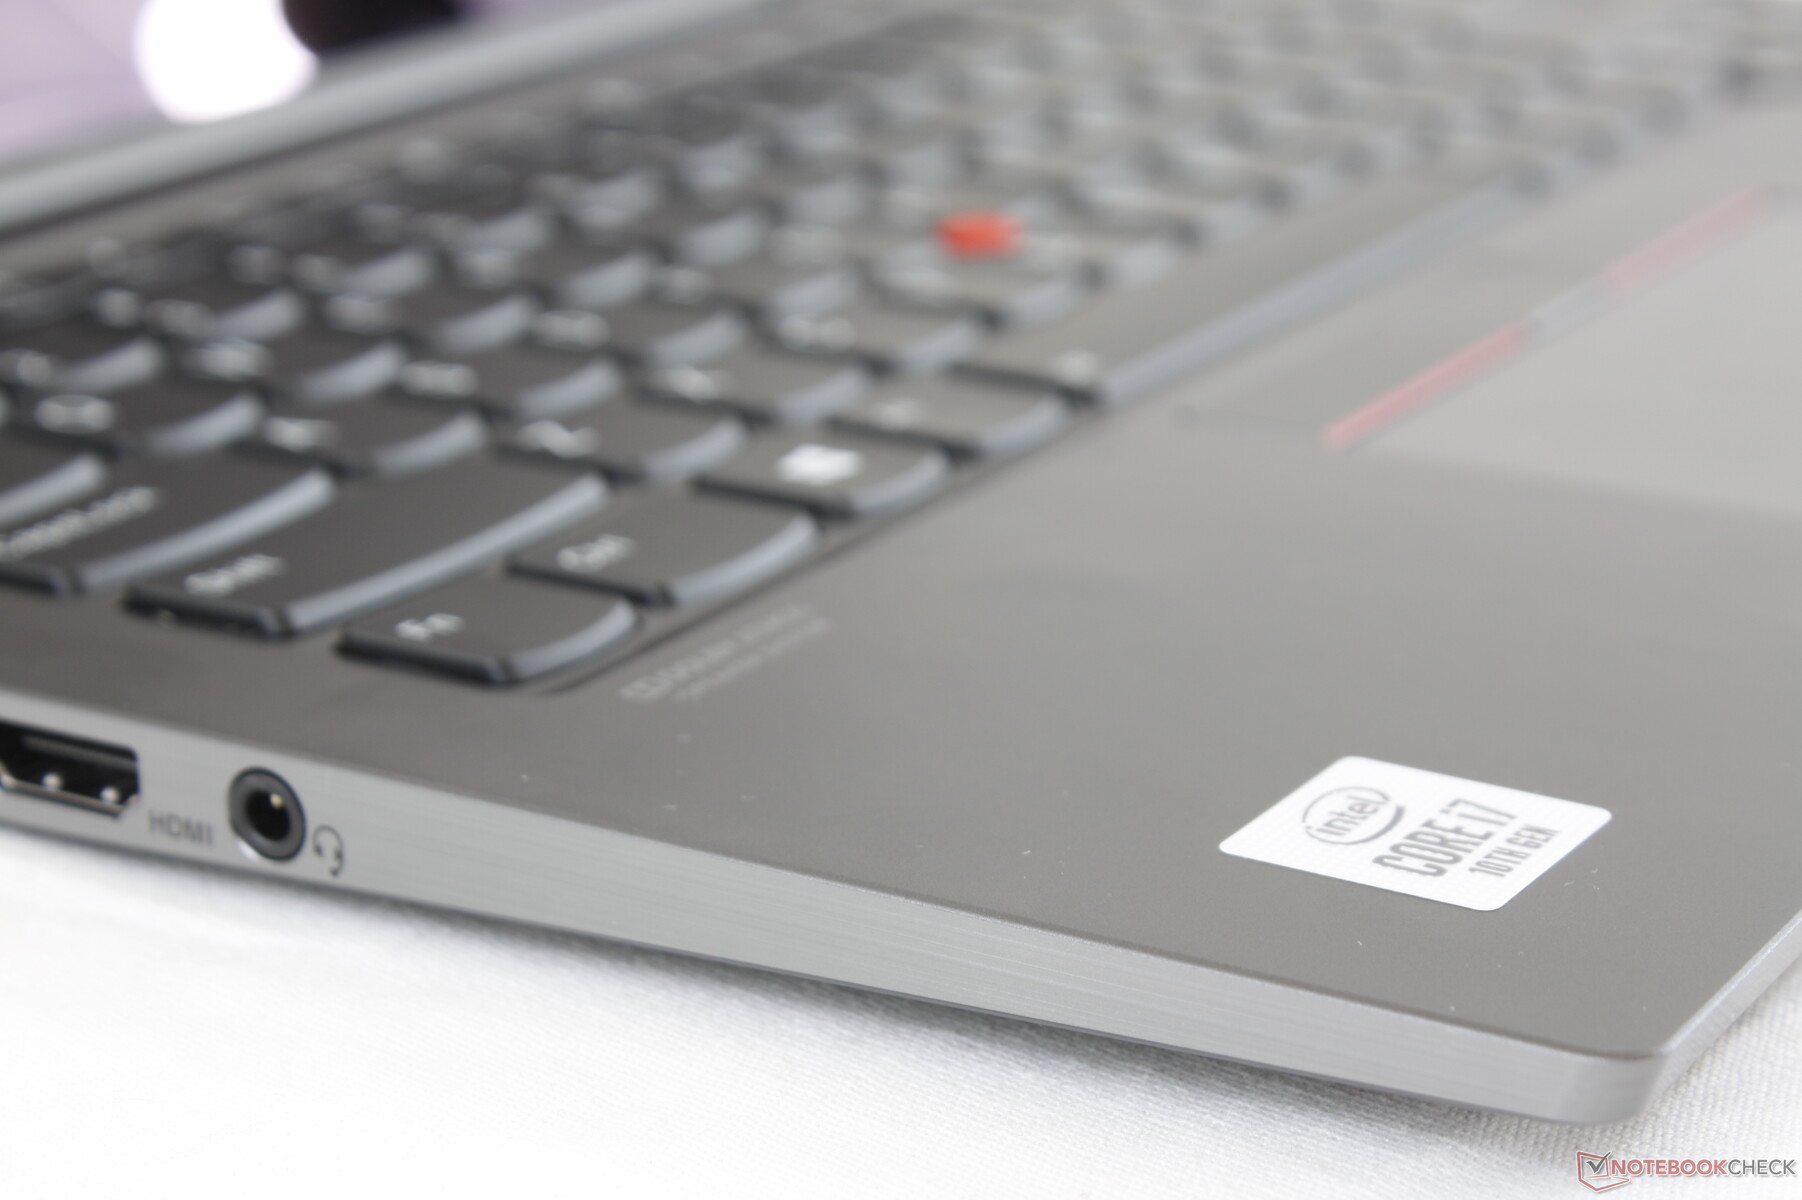
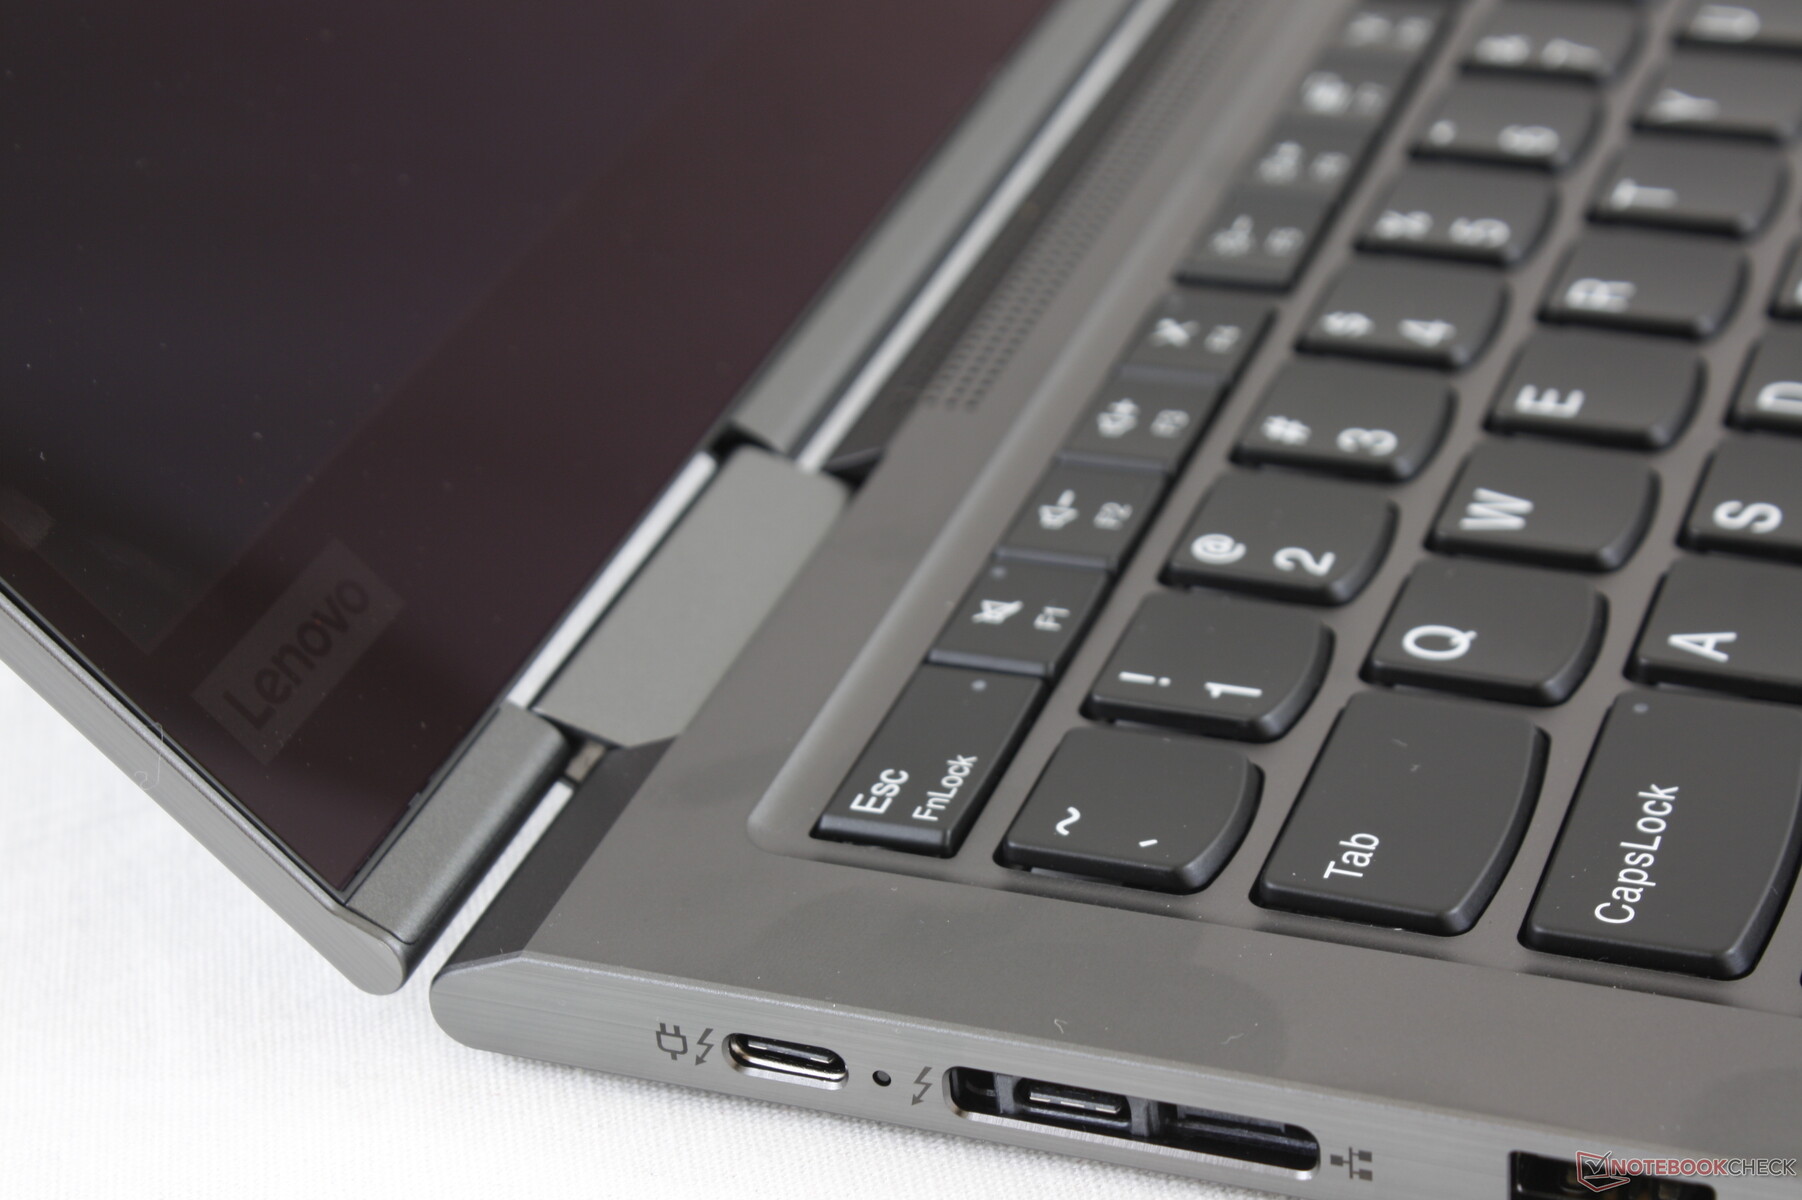
Port options are identical to the ThinkPad X1 Carbon since the X1 Yoga utilizes a similar motherboard. The most notable feature is its proprietary Side Dock for compatibility with specific docking stations from Lenovo. Combine this with the dual Thunderbolt 3 ports and owners have a much wider selection of accessories than most other laptops.
Initially, the USB Type-C ports on our unit would not recognize any connected adapters, keyboards, or external drives. Updating the system via Lenovo Vantage seemed to have addressed the issue.
Communication
An Intel 9560 comes standard on all SKUs for Wi-Fi 5 or 802.11ac connectivity. There are no Intel AX200/201 options meaning no Wi-Fi 6 connectivity despite the high asking price. We experienced no wireless issues when paired with our Netgear RAX200 router.
Webcam


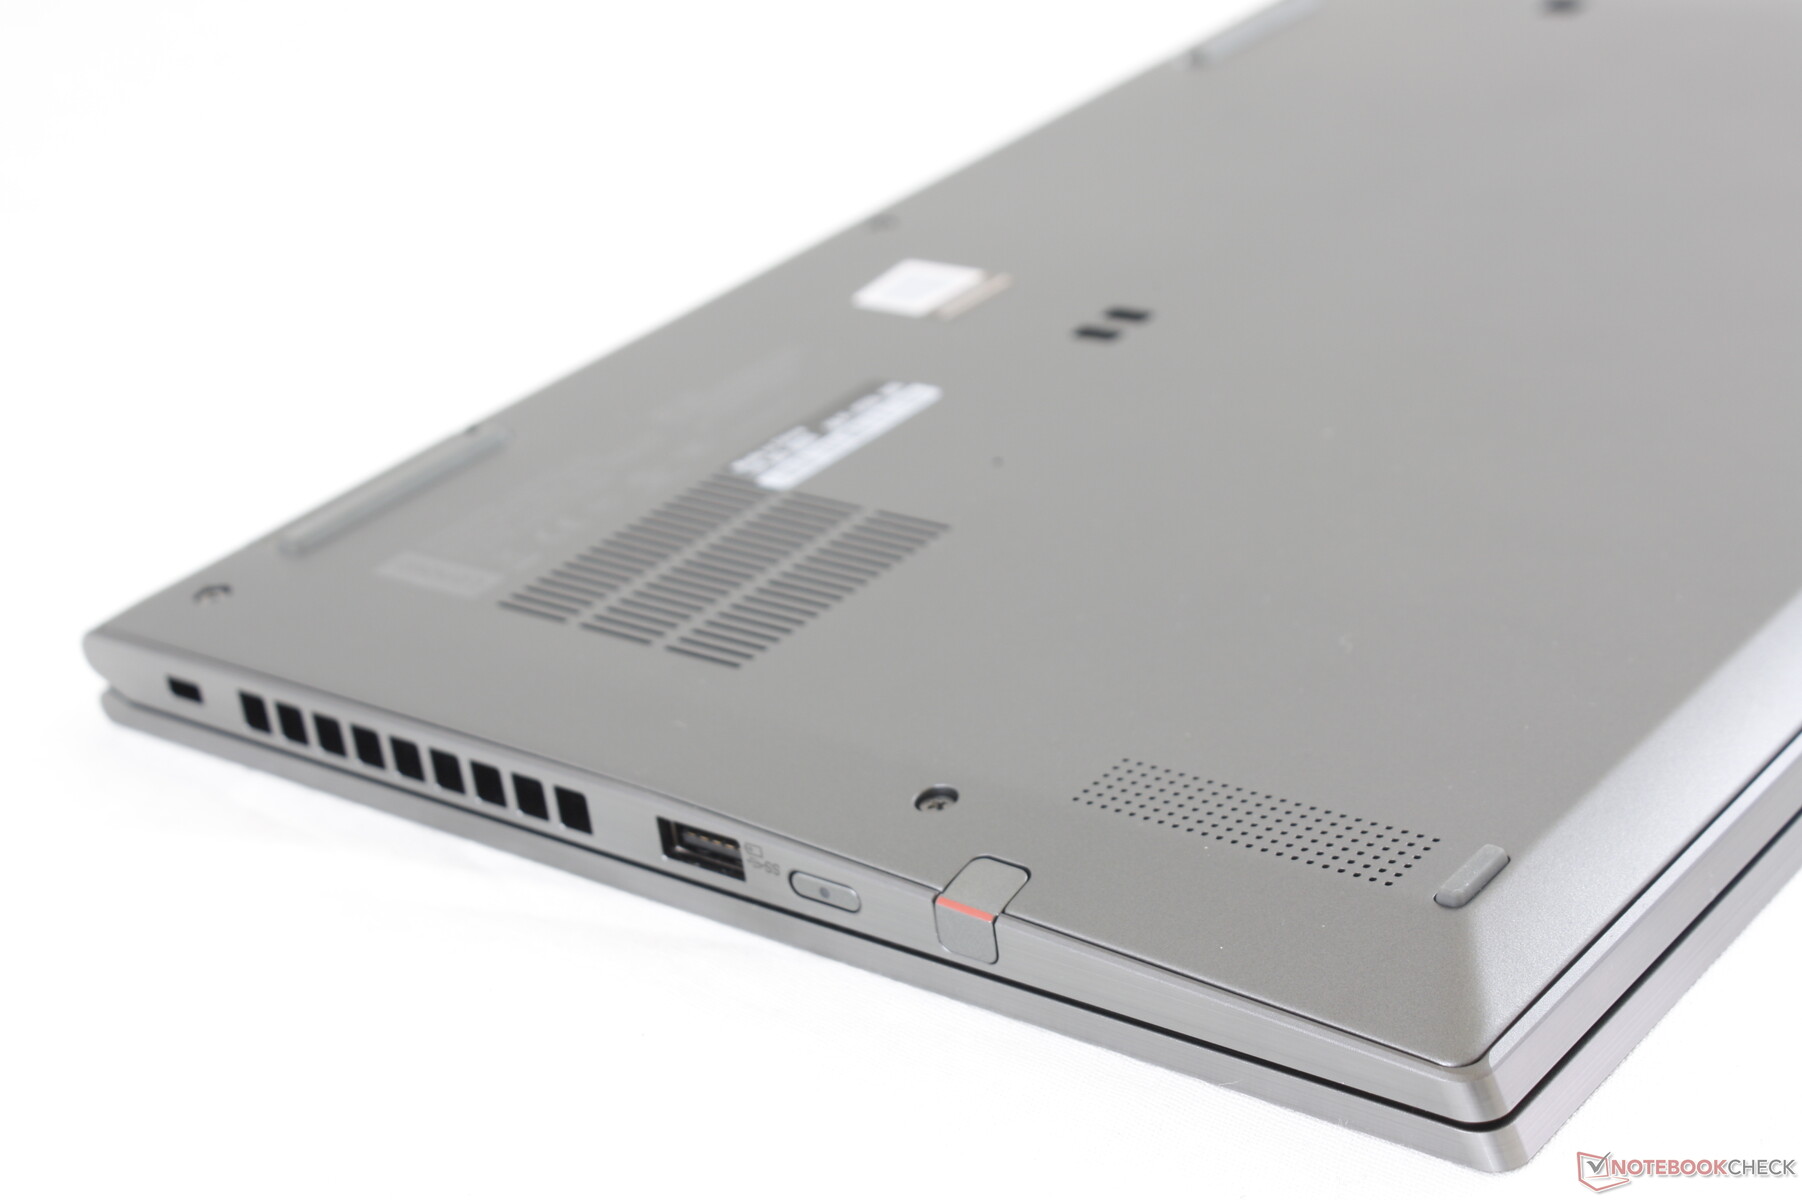
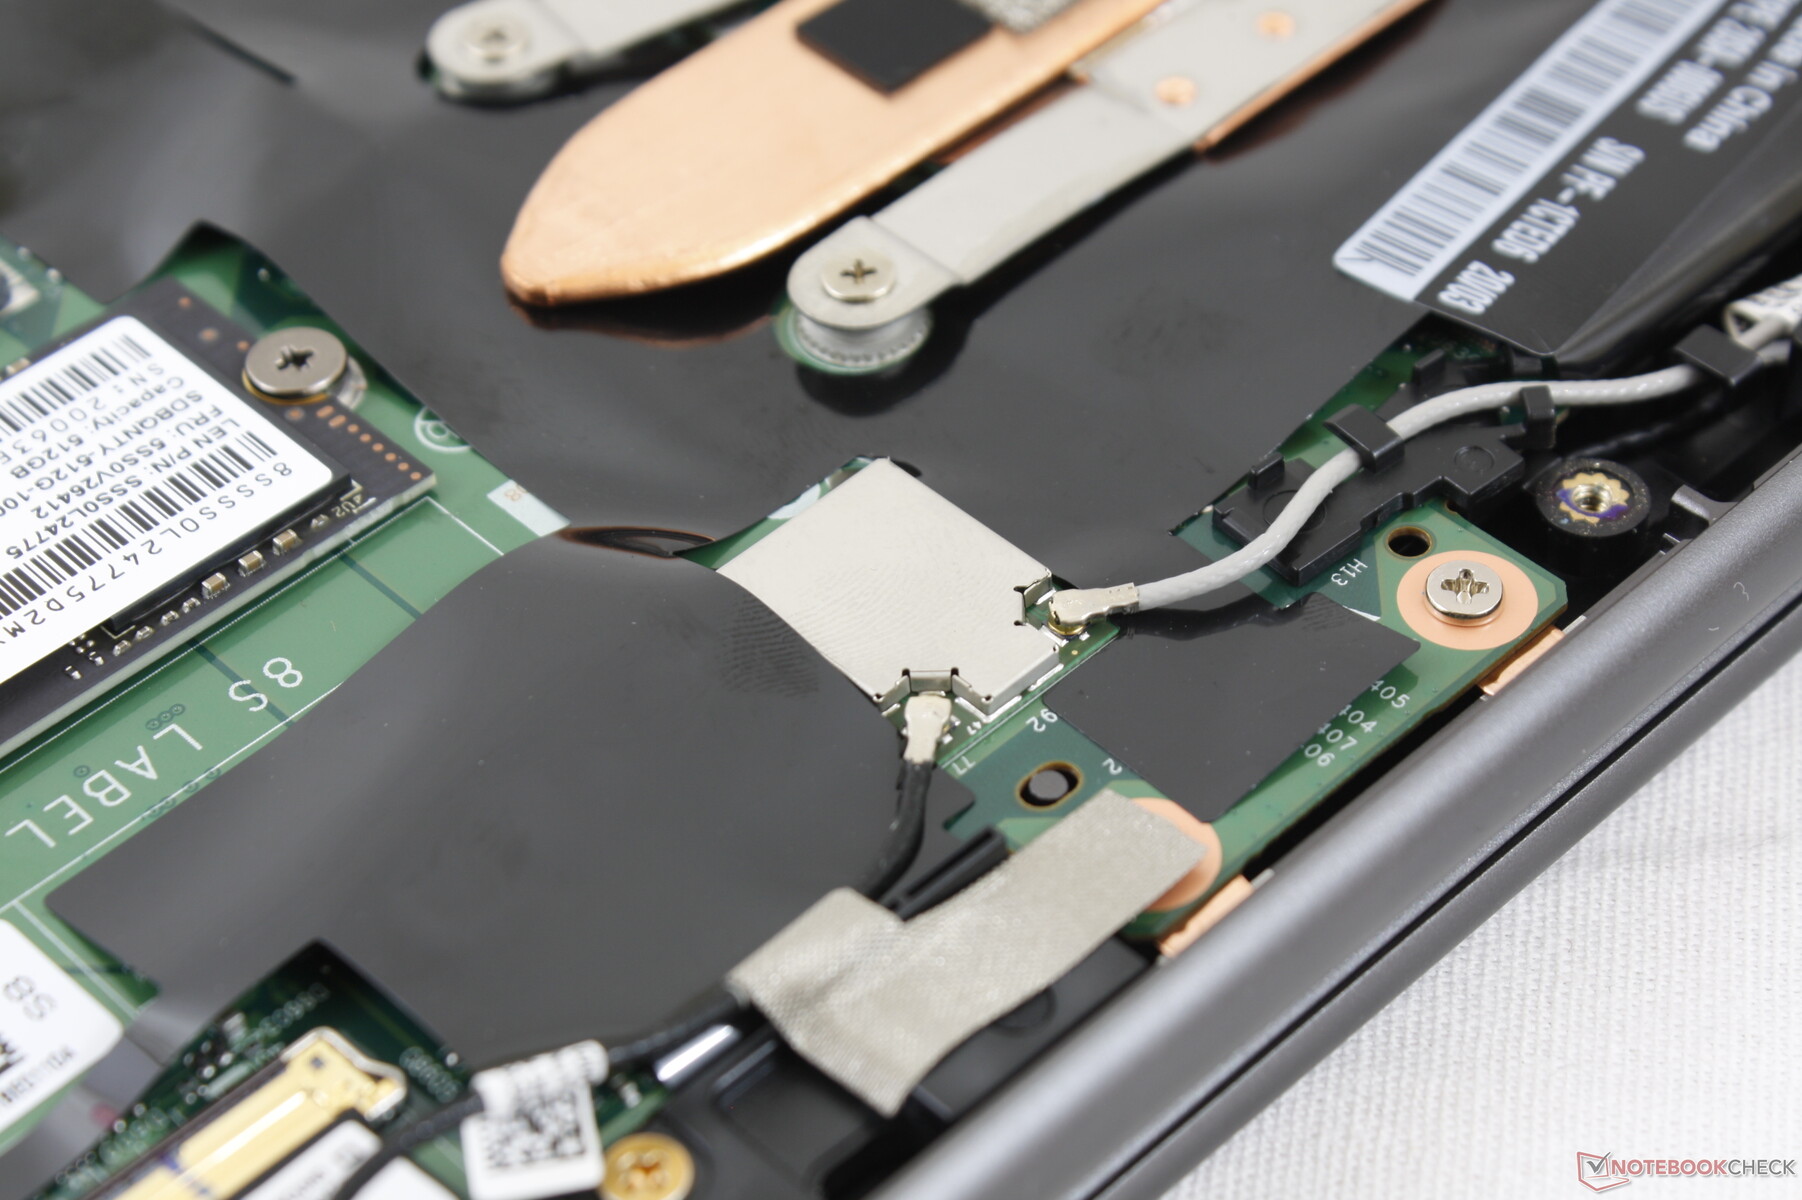
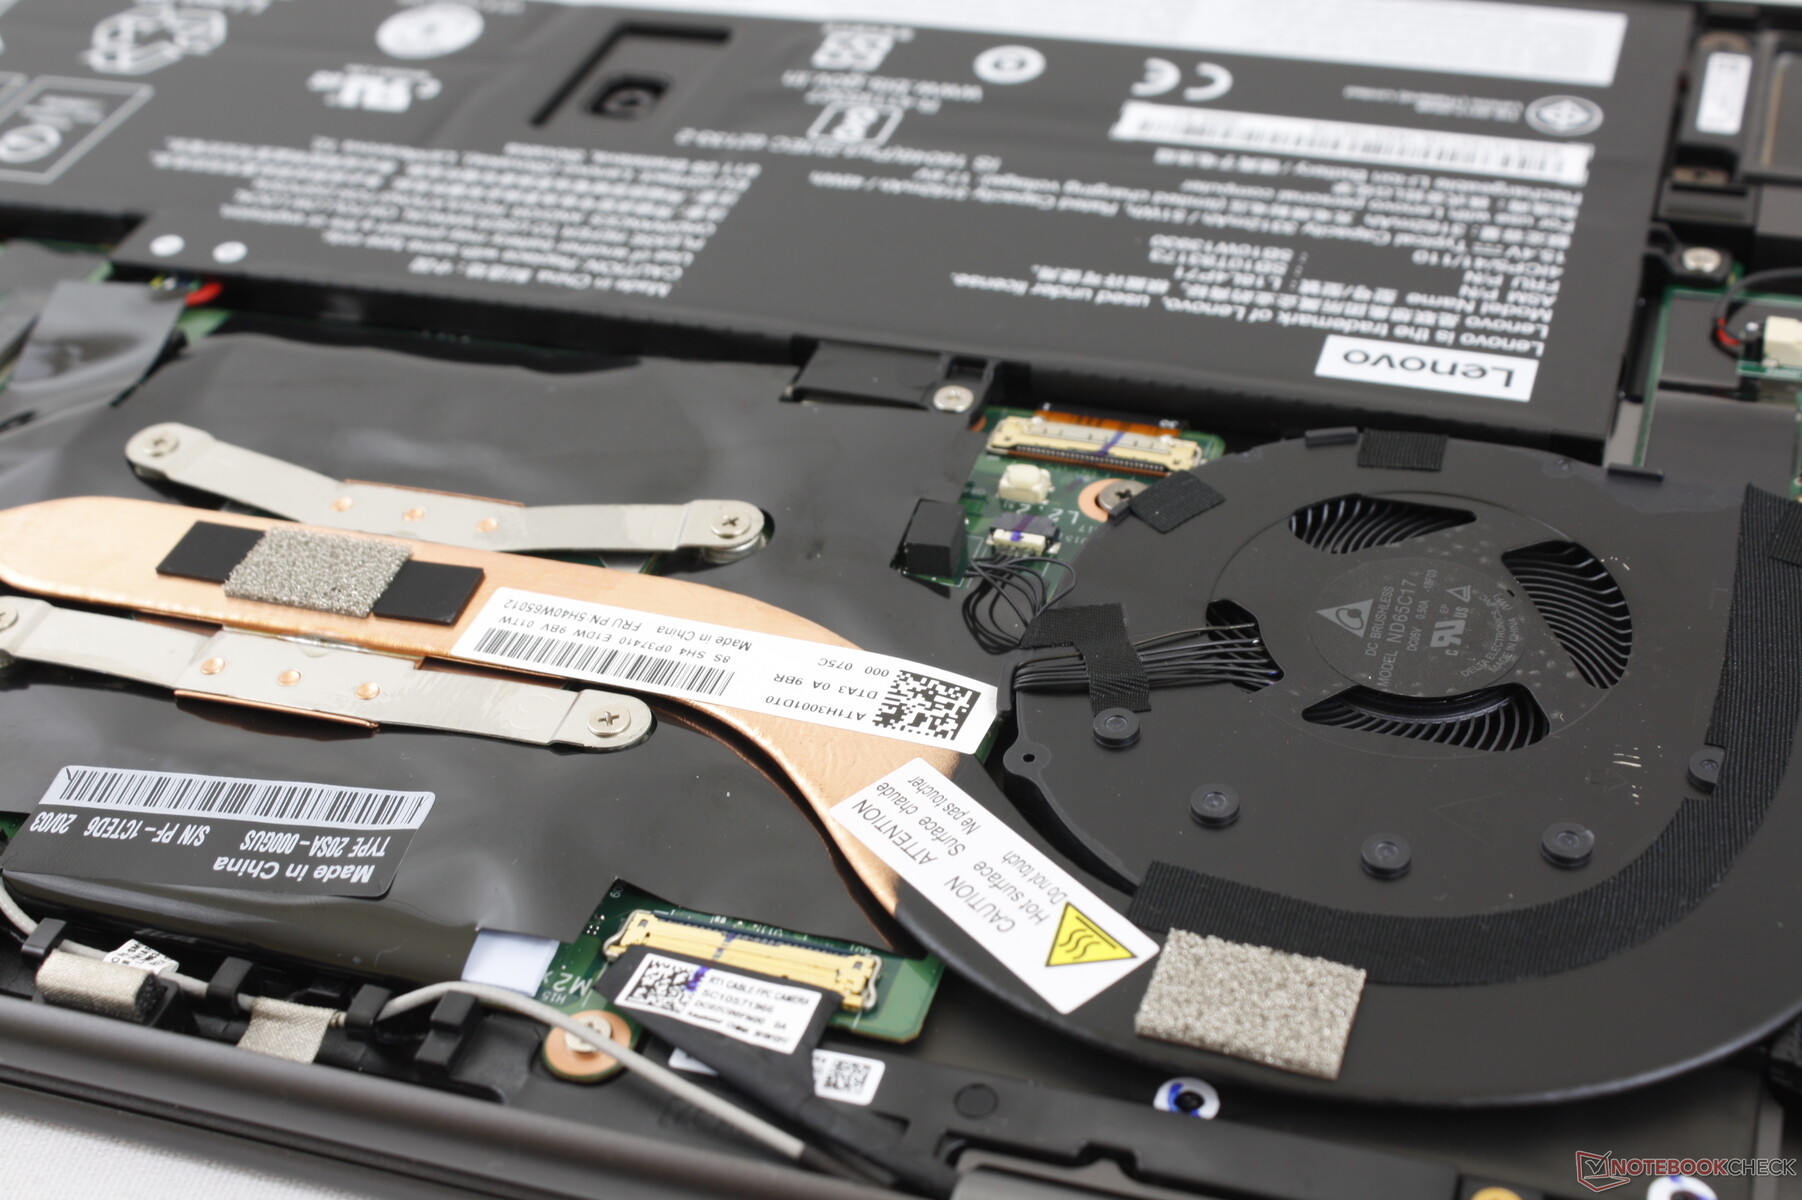
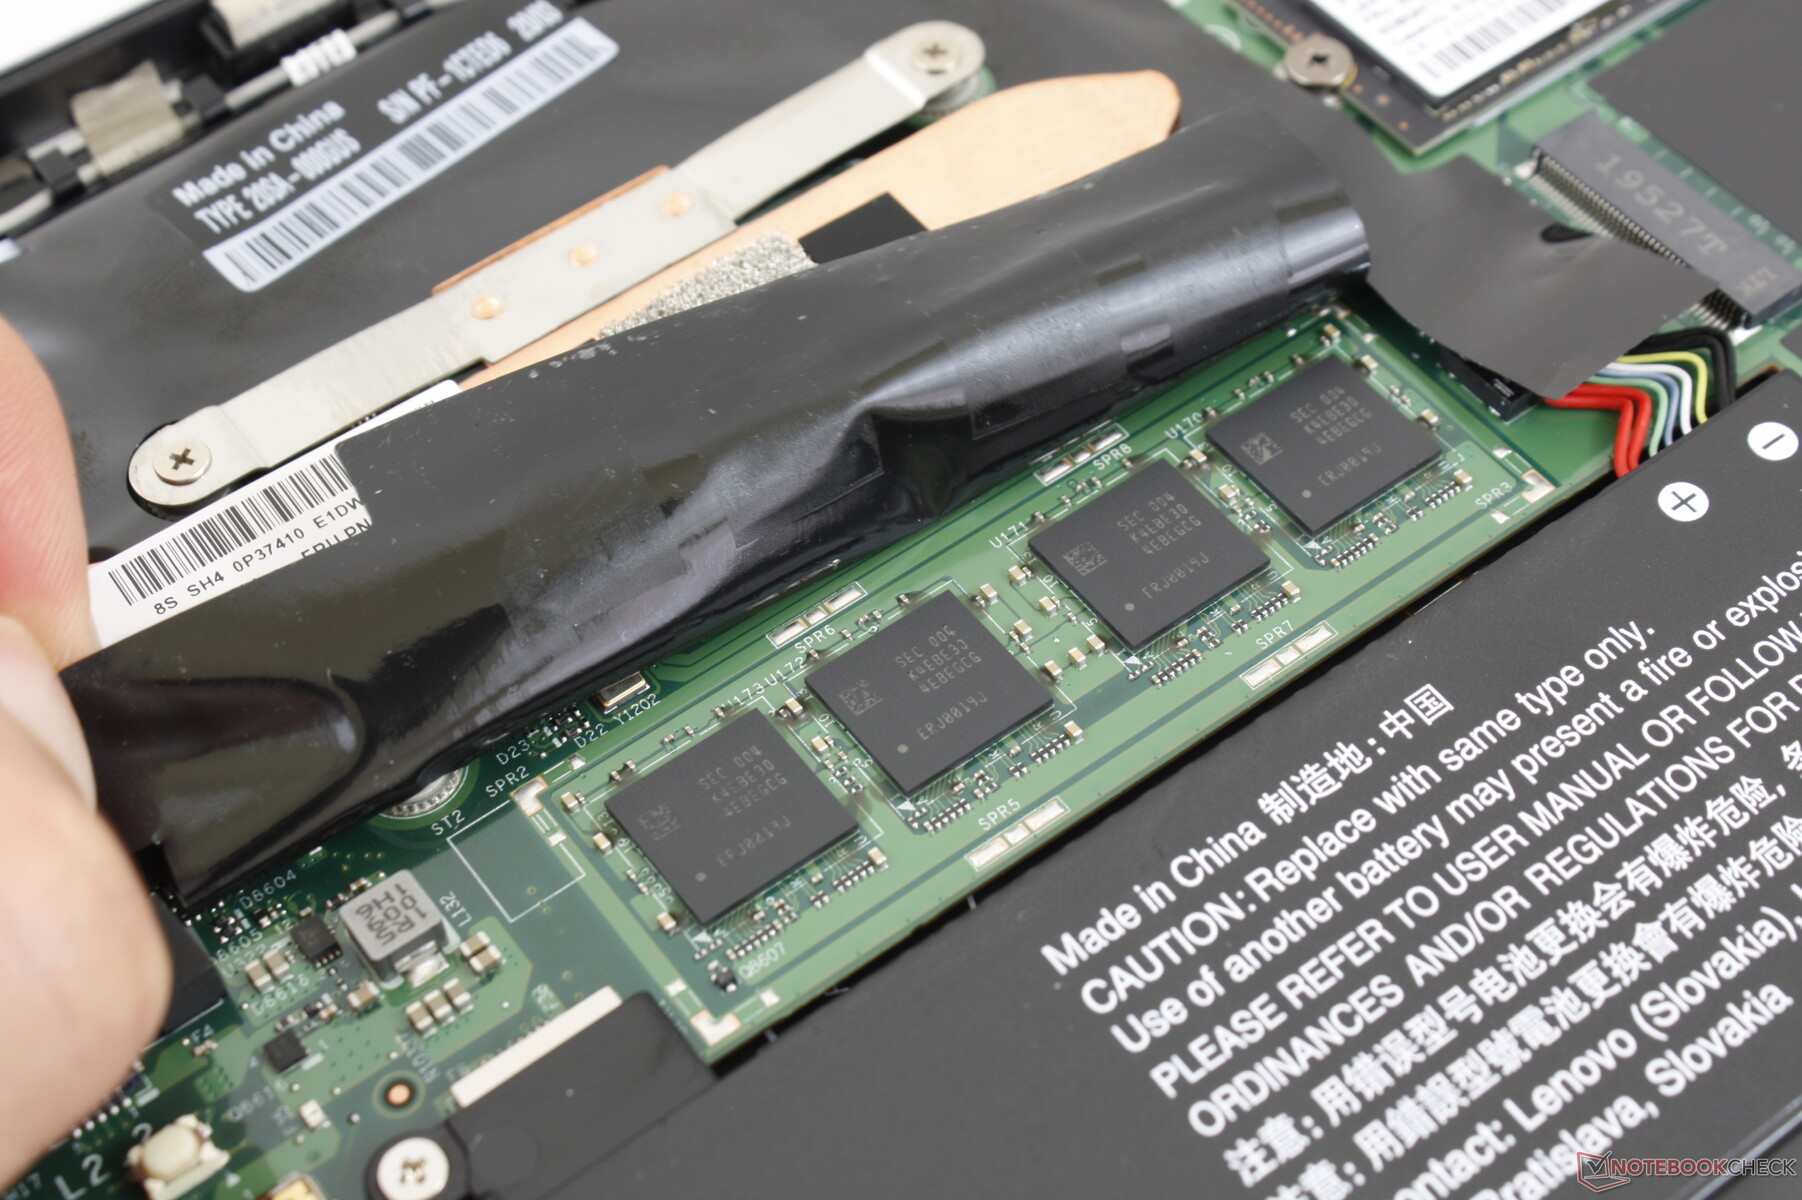
Maintenance
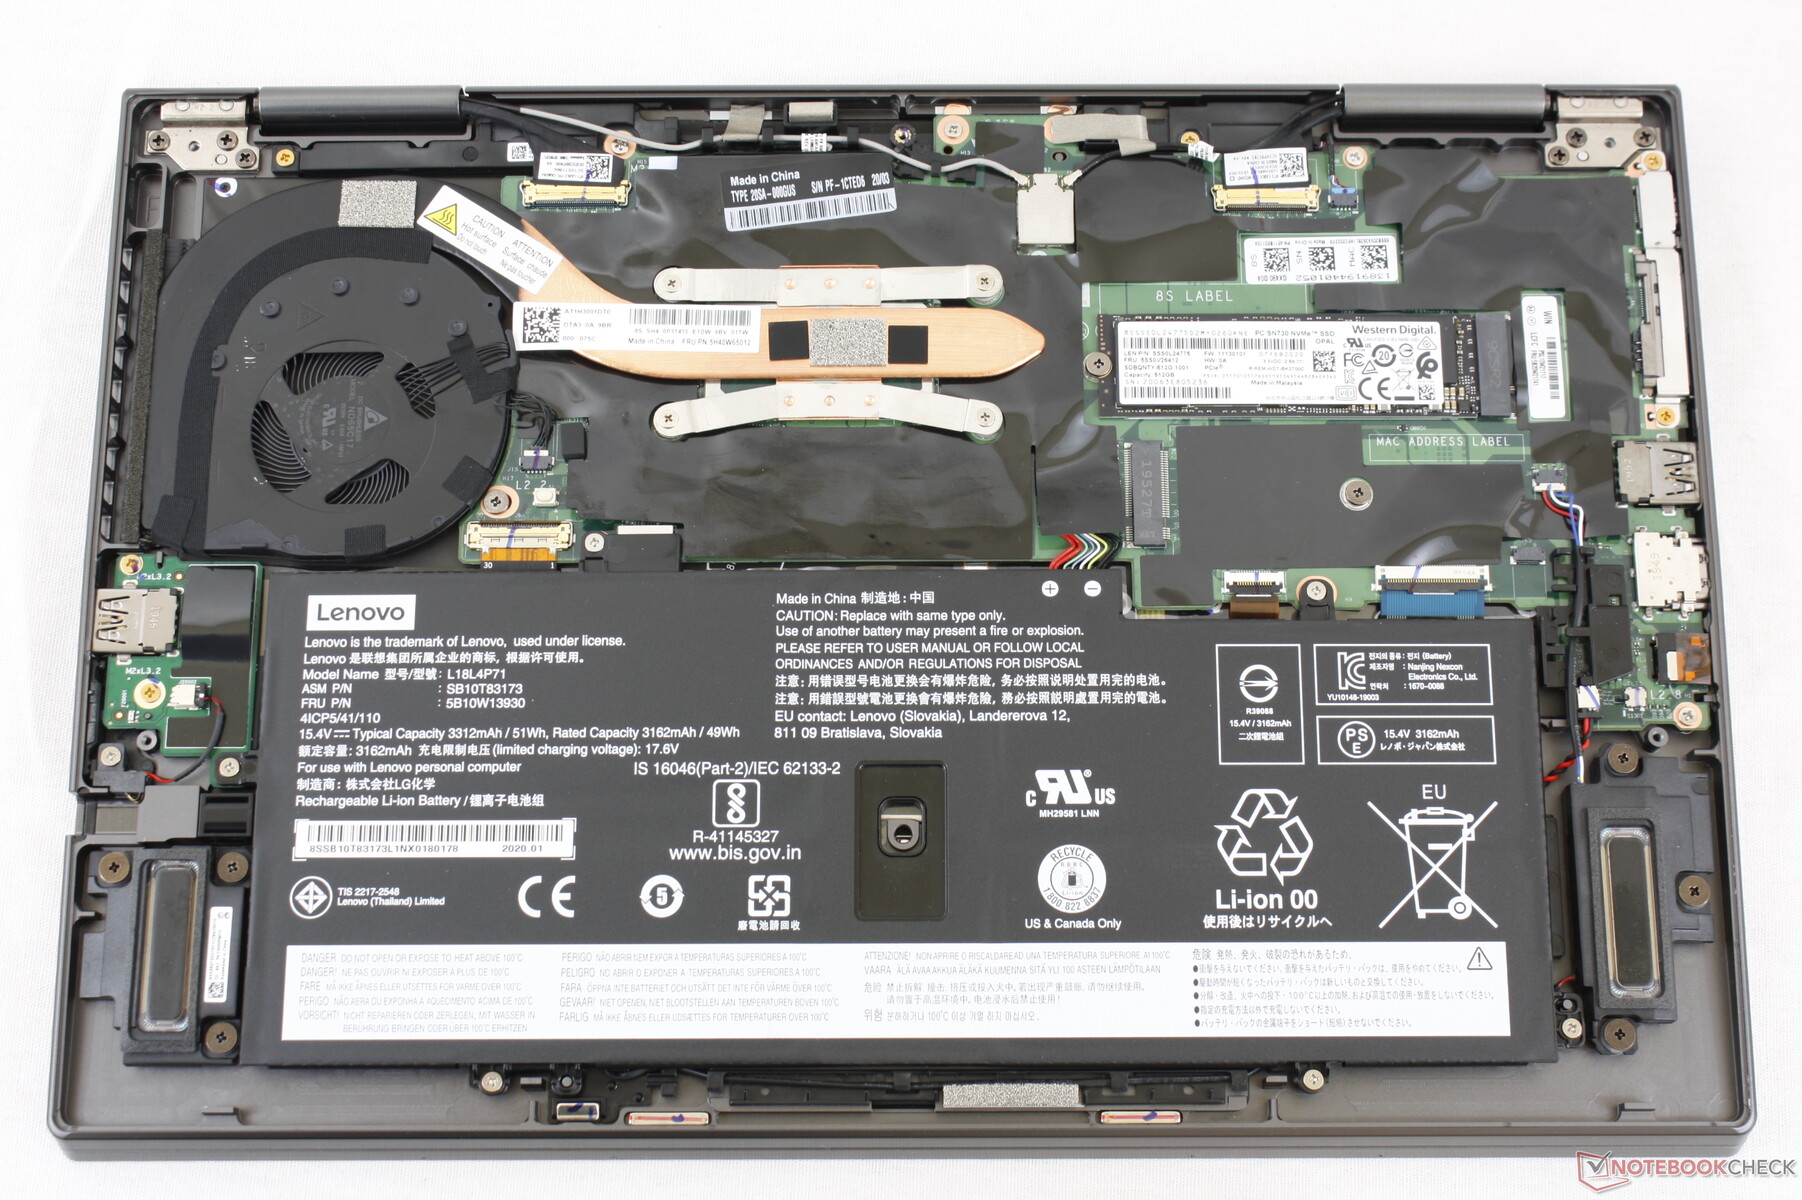
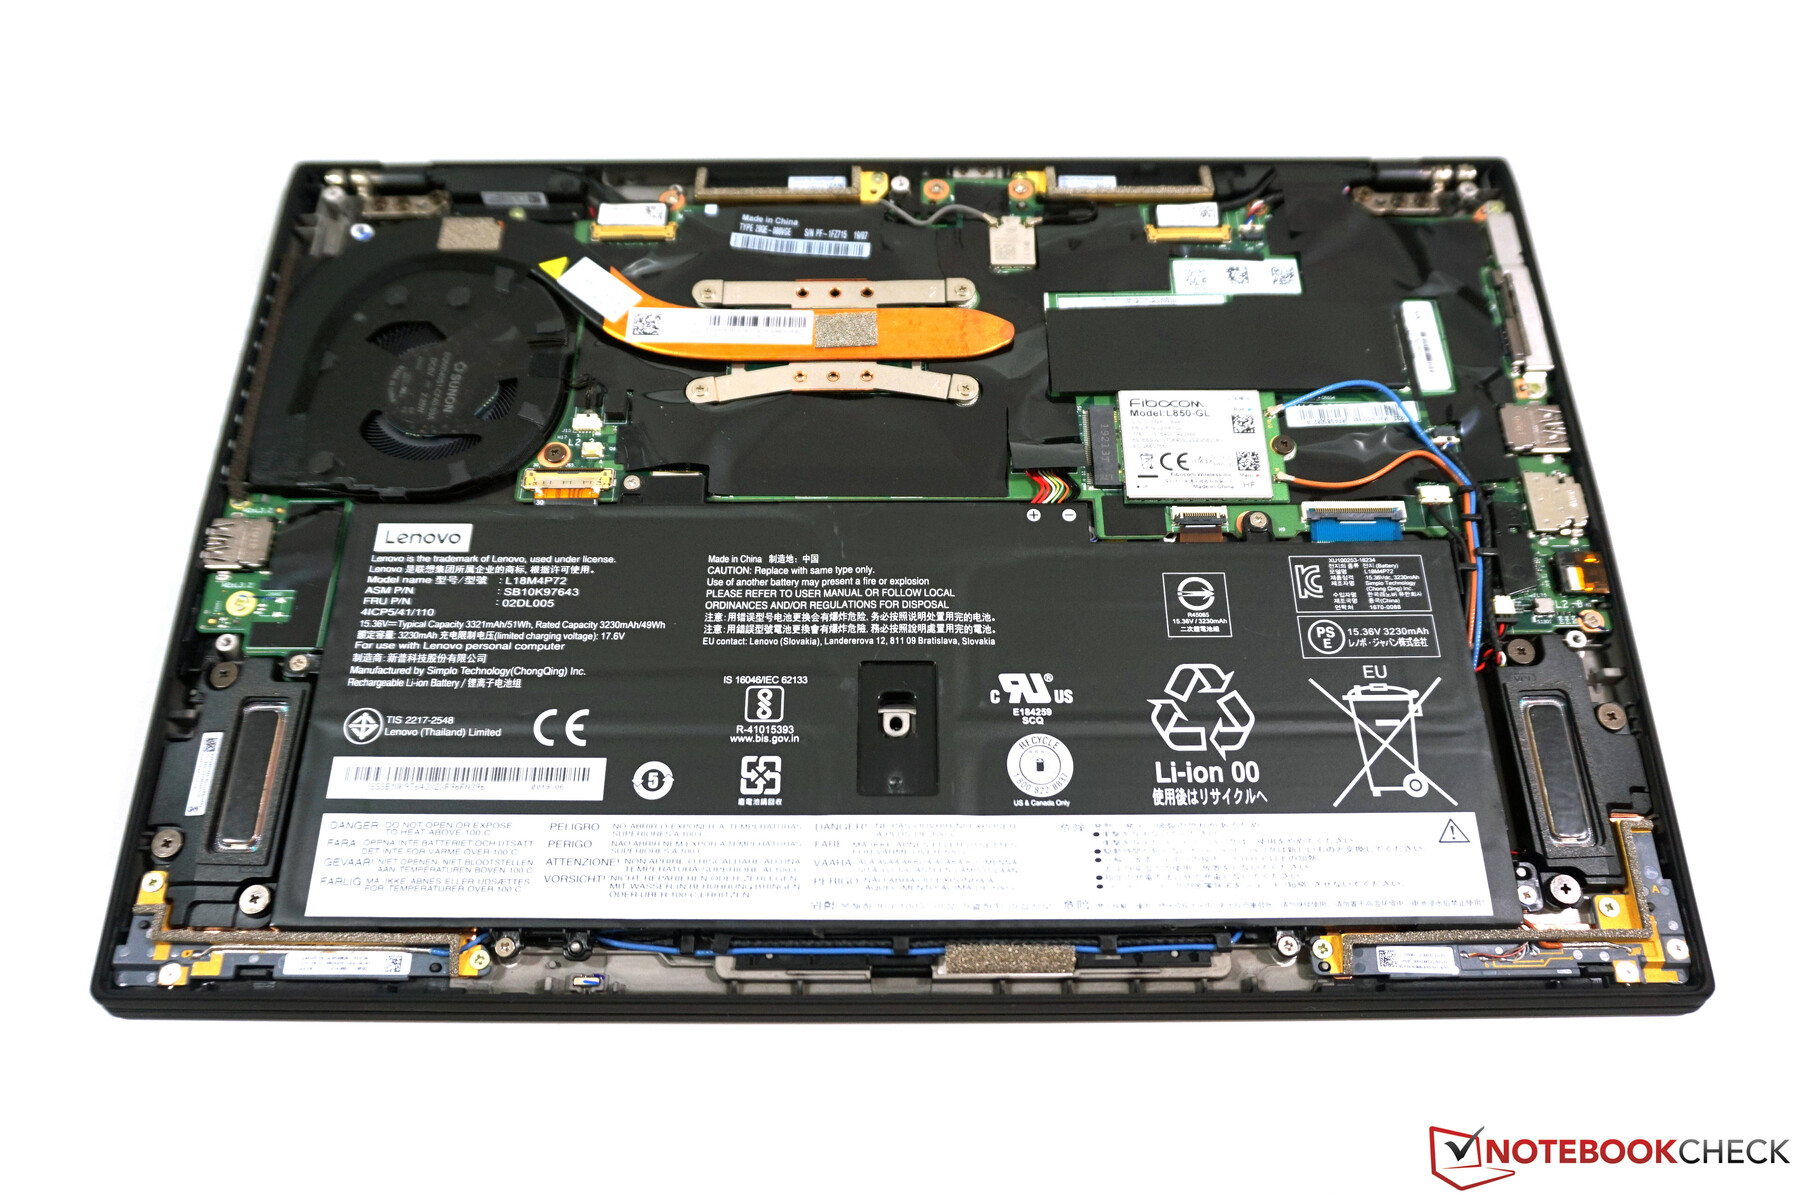
The bottom panel pops off easily with just a Philips screwdriver and a sharp edge. Putting it back on, however, can be finicky because the latches along the front edge are very tight with almost no leeway.
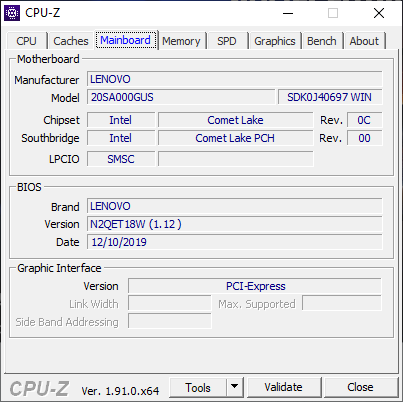
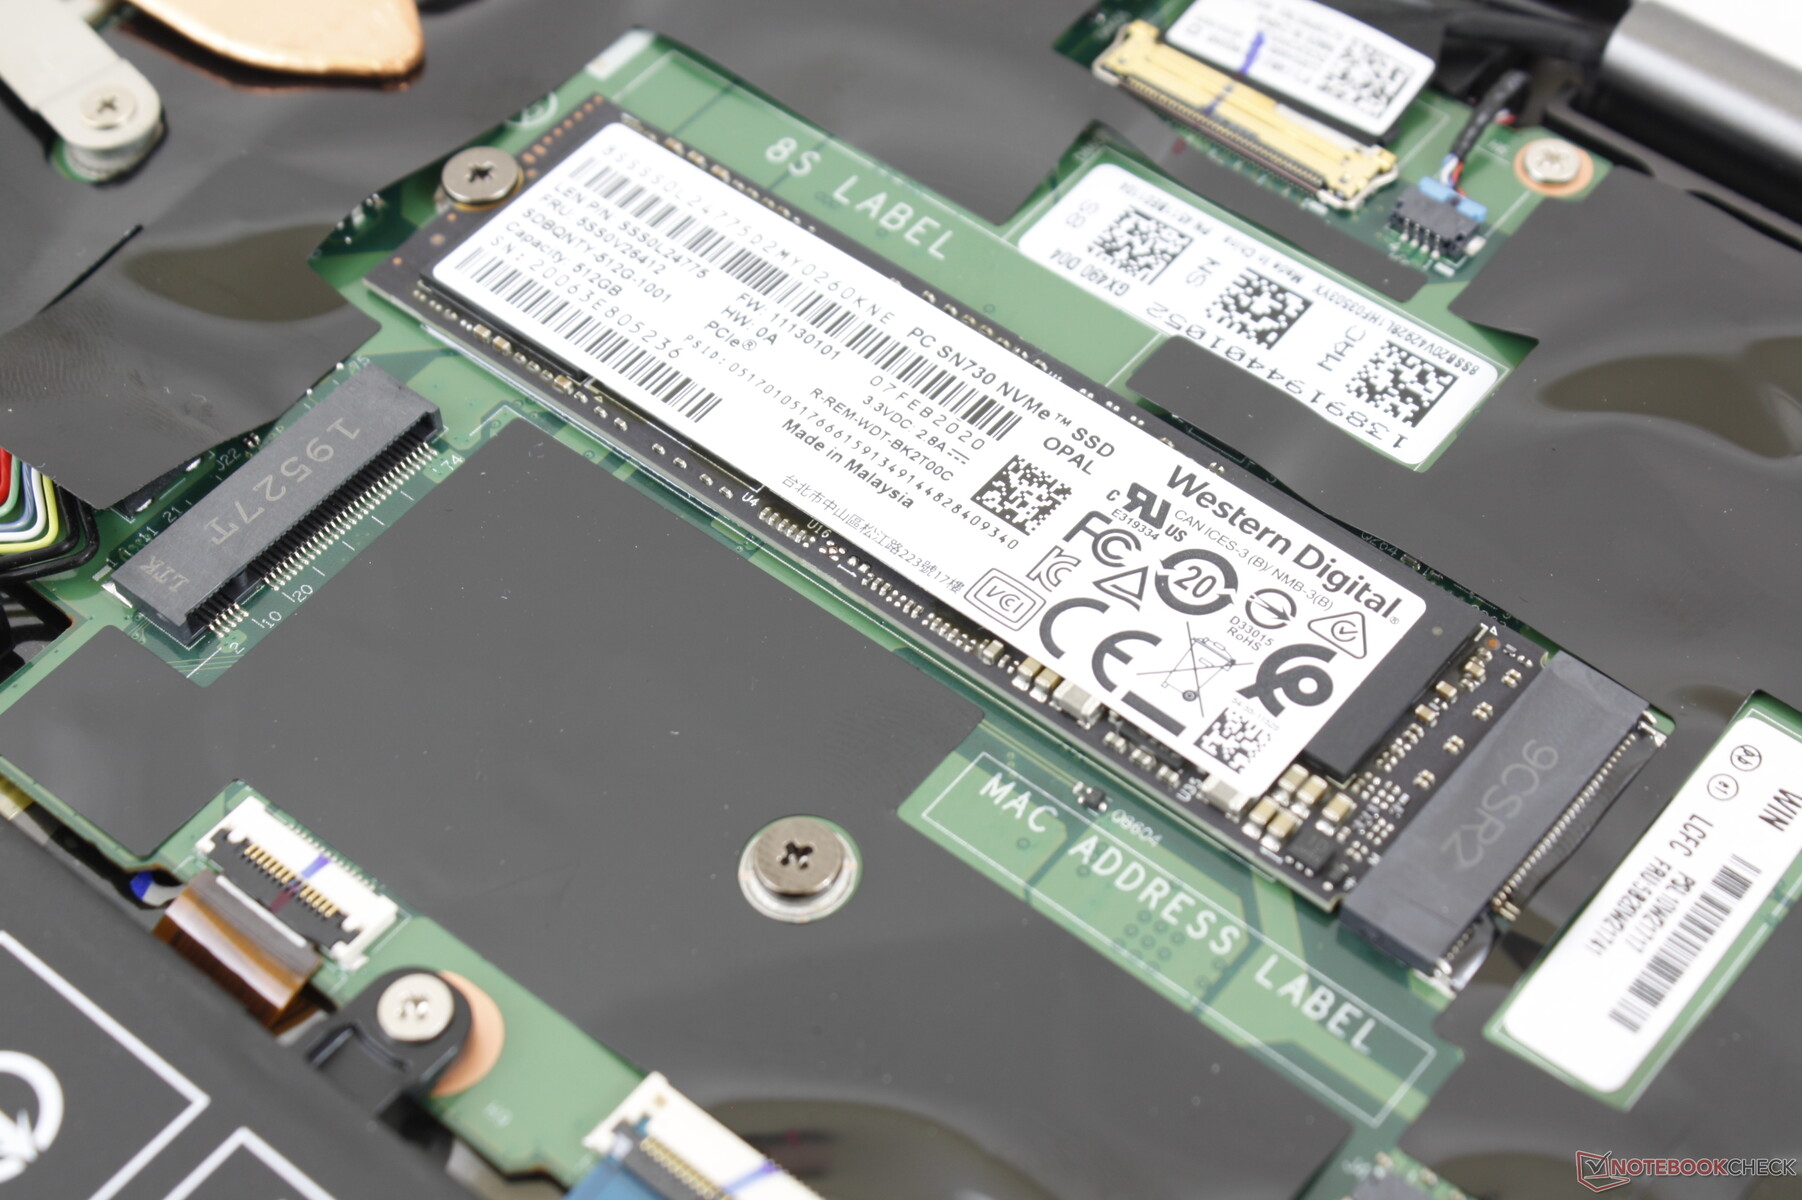
Internal motherboard and layout are essentially identical to the ThinkPad X1 Carbon as shown below.
Accessories and Warranty
There are no included extras in the box outside of the usual paperwork and AC adapter. Instead, official adapters and docking stations are sold separately.
The usual one-year limited warranty applies with plenty of extension options. We're disappointed to not see two-year warranty as standard considering the high price and flagship category of this laptop.
Input Devices
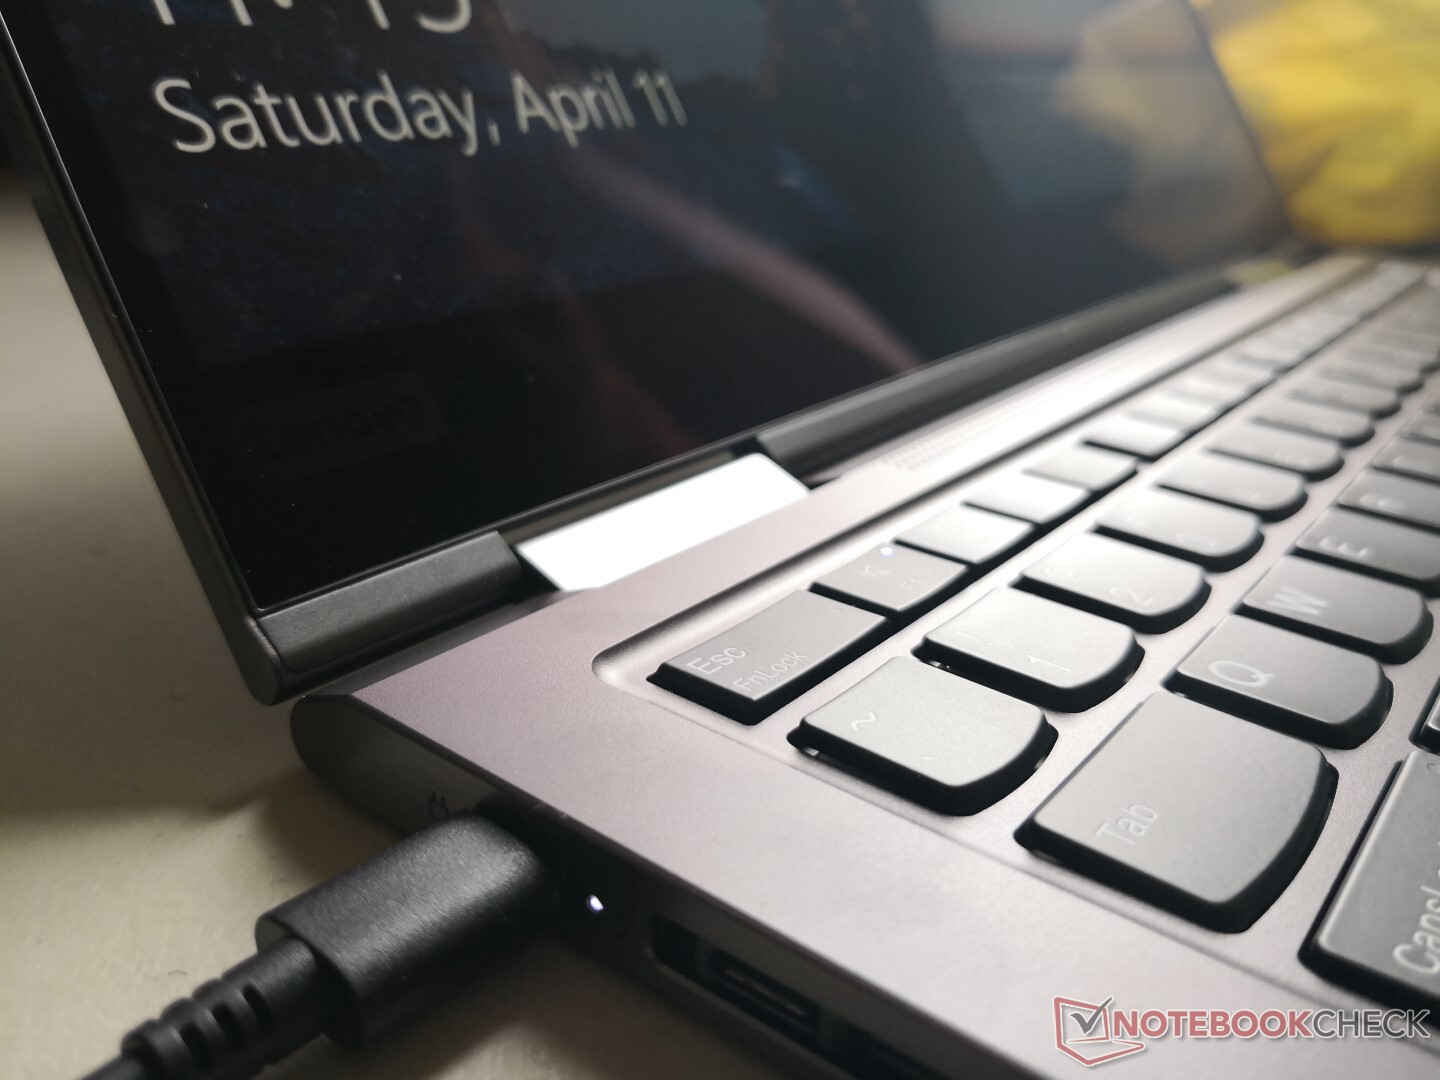
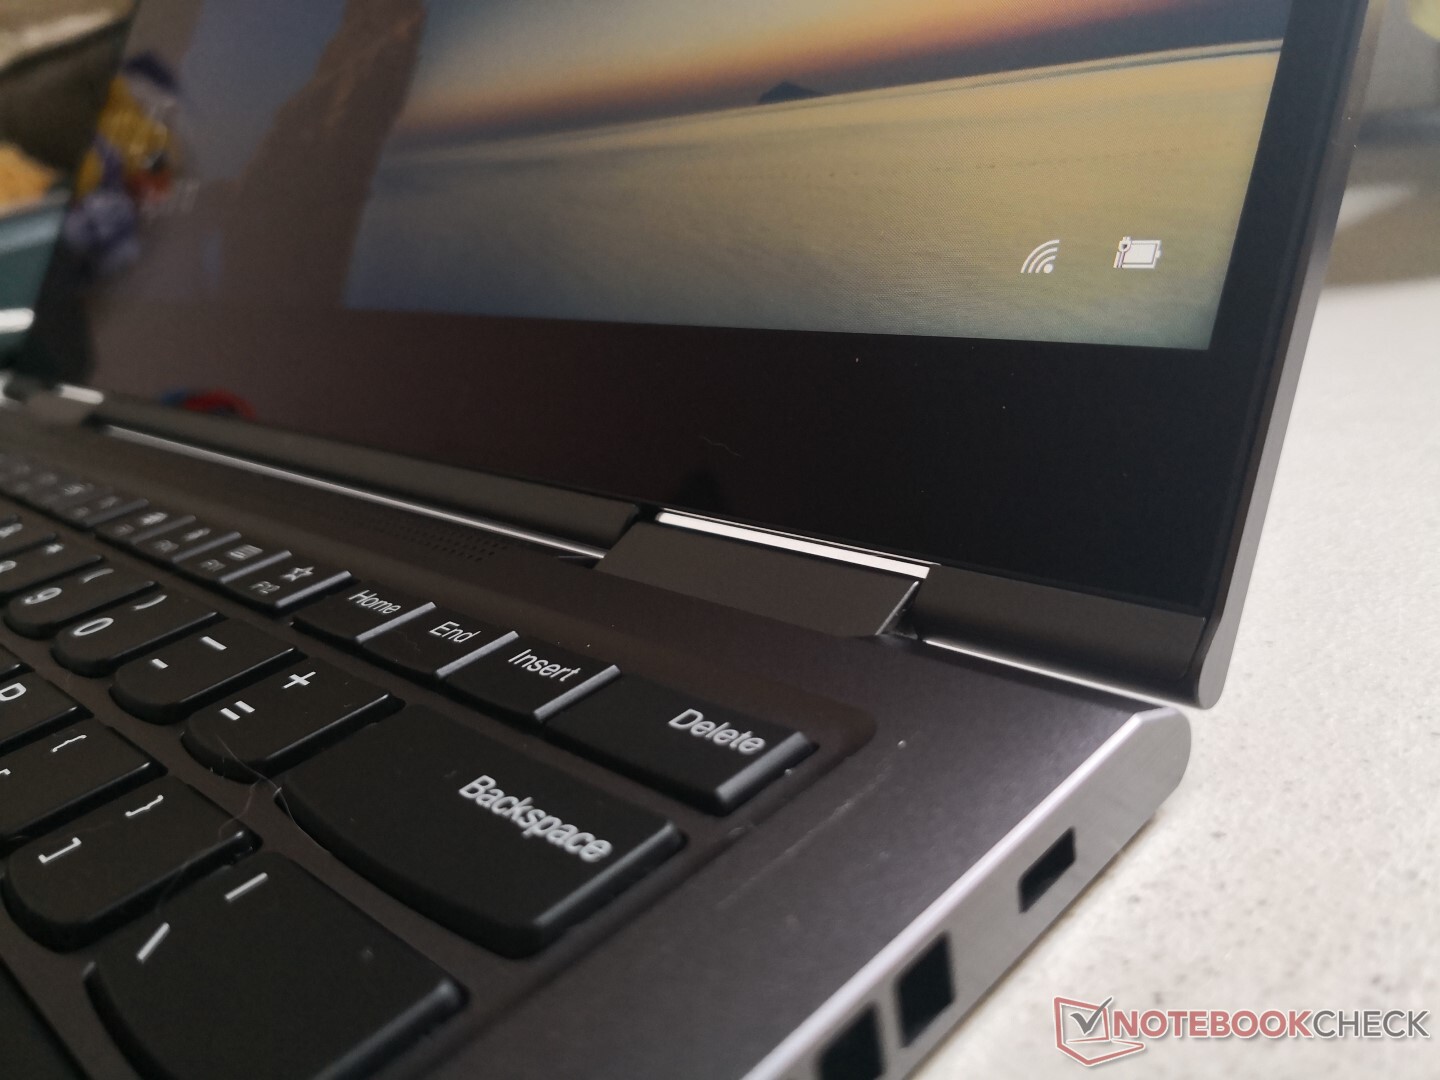
Keyboard
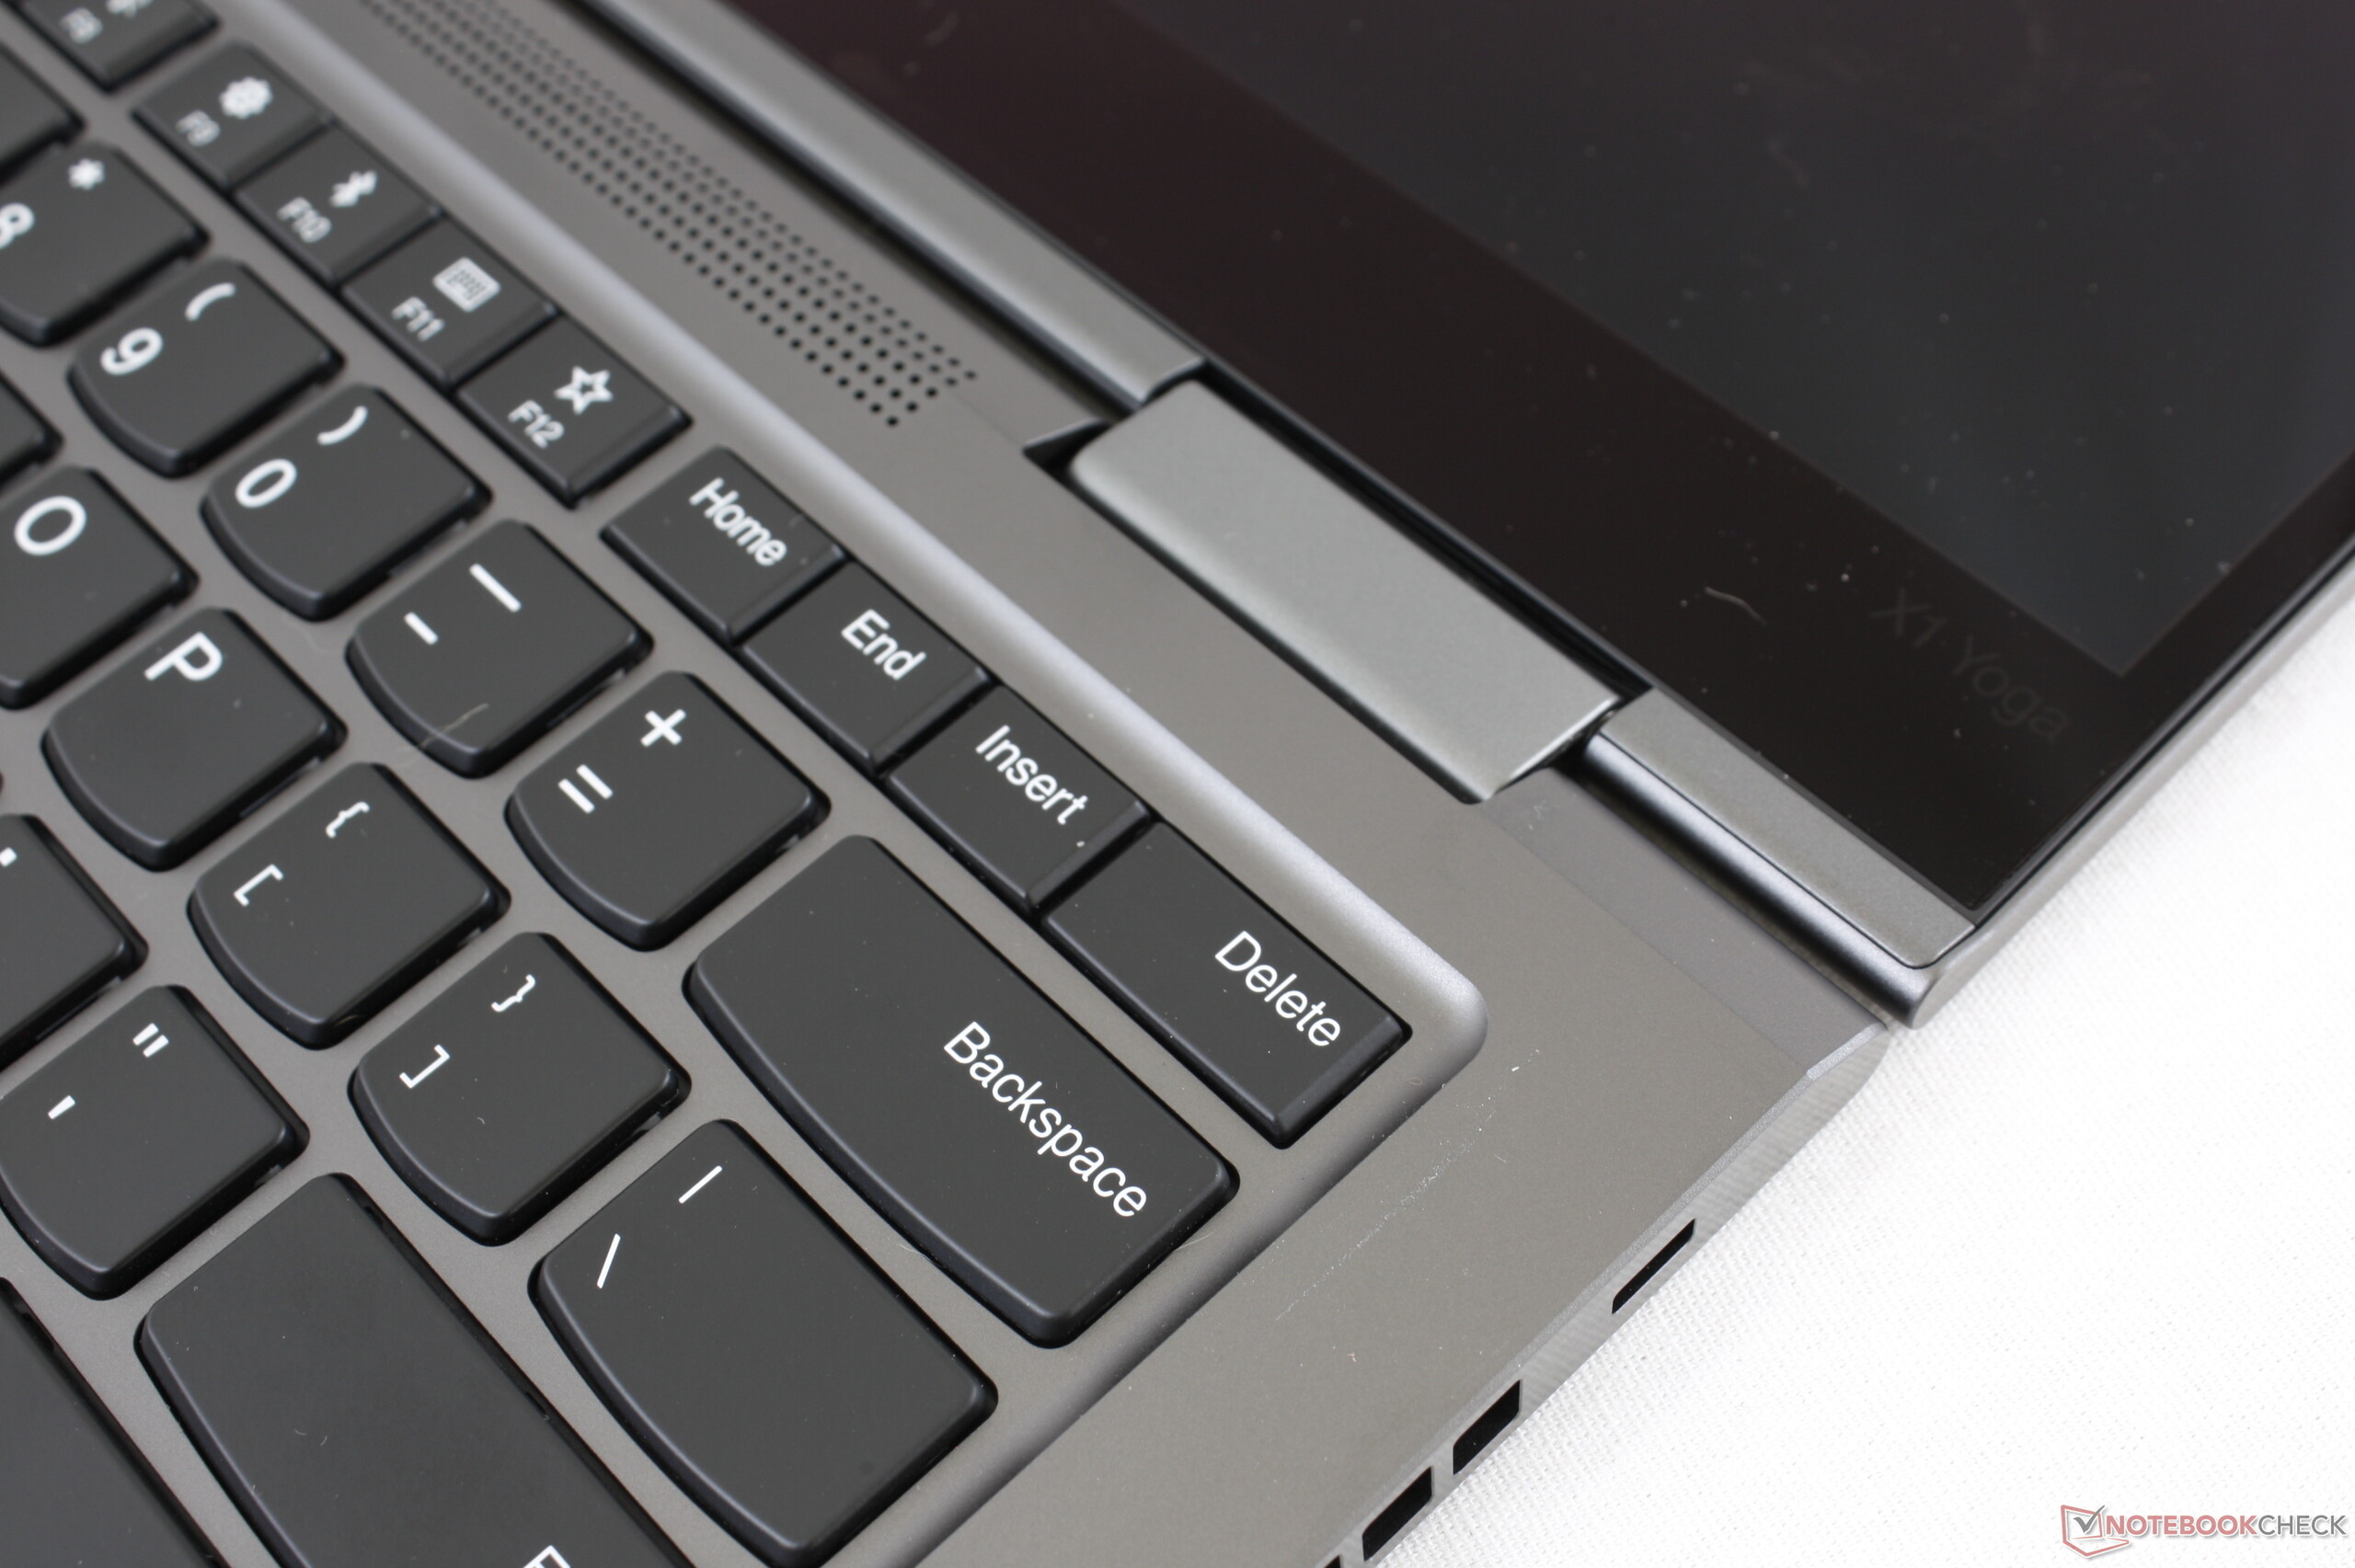
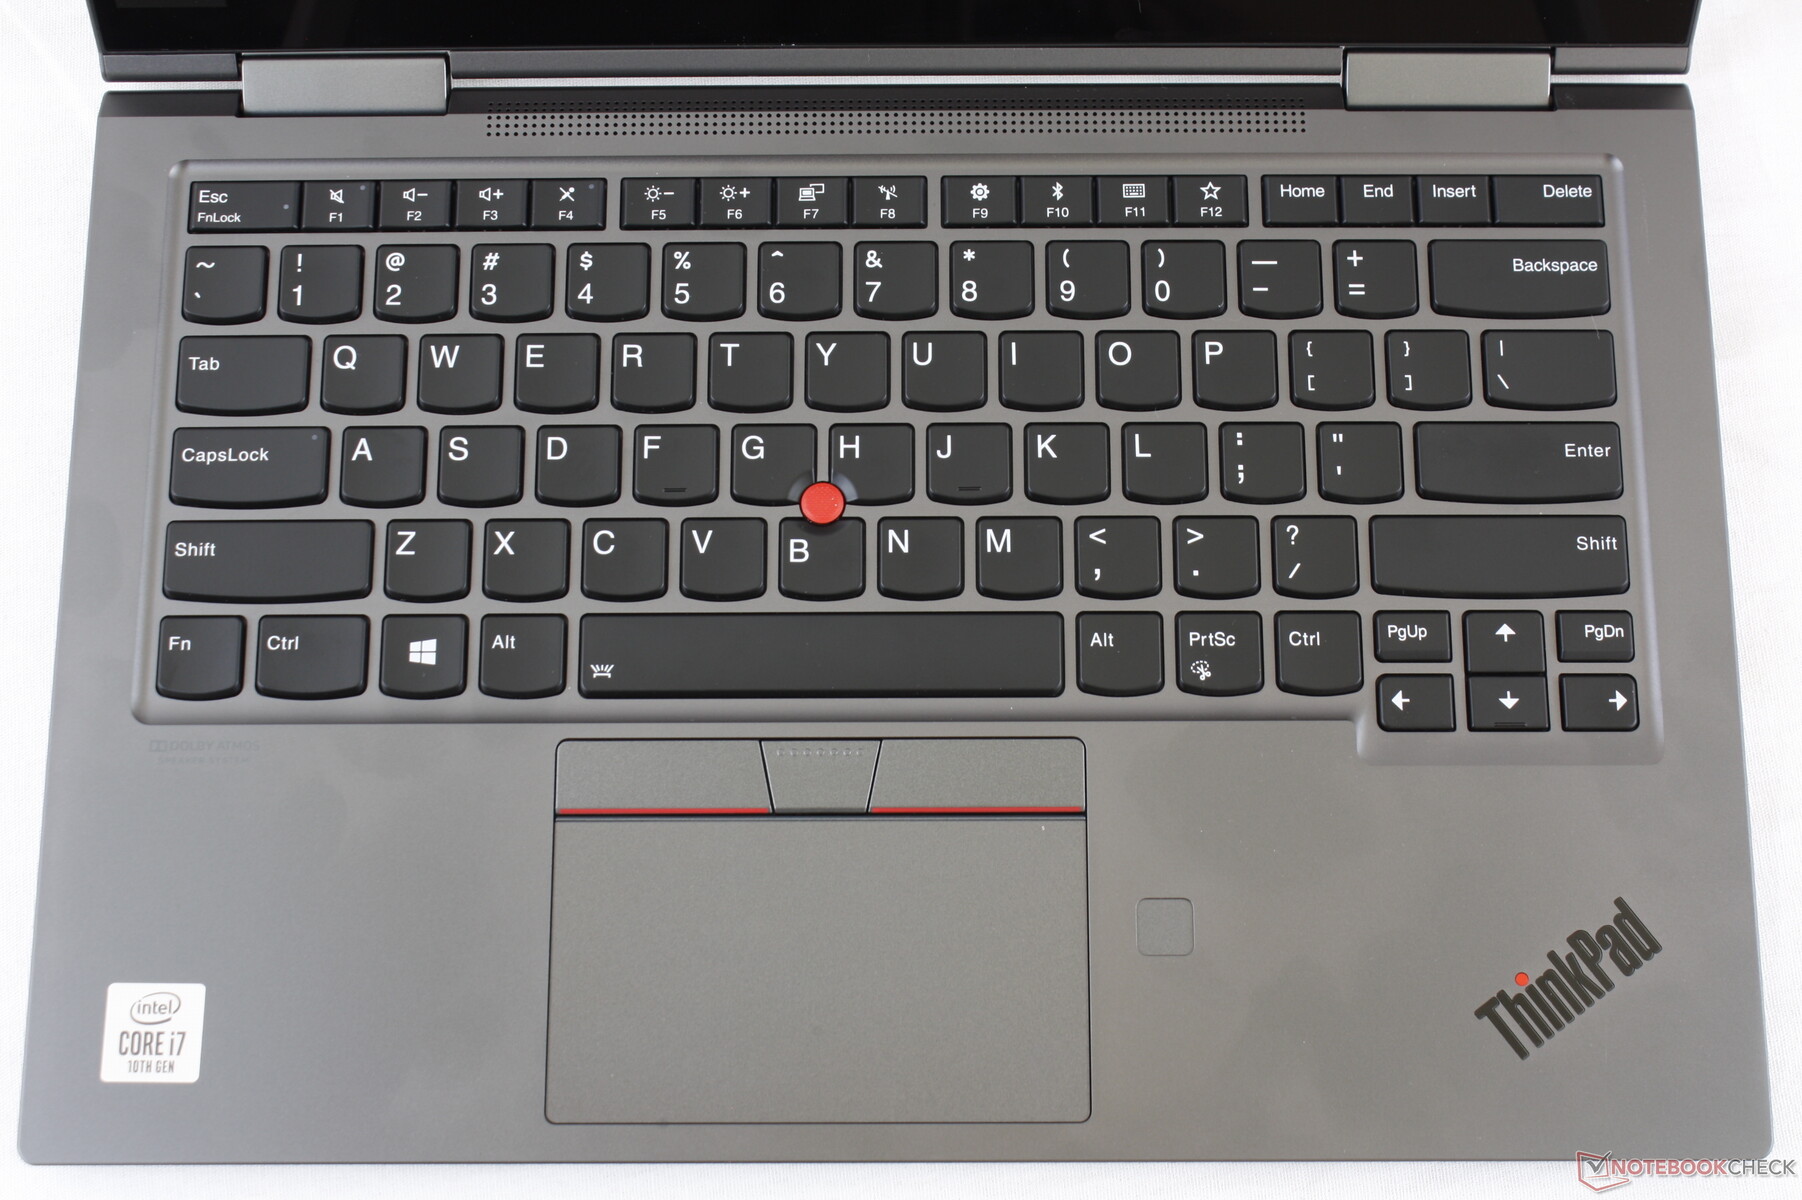
The backlit keyboard is exactly as it appears on the ThinkPad X1 Carbon down to key size and feedback. ThinkPad keyboards are still some of our favorites to type on due to their consistency between models relative to the always-changing keyboards of the Dell XPS series or less expensive mid-range alternatives. Even the keyboard on Lenovo's own Yoga C940 feels shallower and spongier than our ThinkPad. Keys here are firm, do not wiggle in place, and have uniform feedback. Our main complaints are that the PgUp, PgDn, and Arrow keys are too small and cramped and that the keyboard itself cannot be replaced unlike on the ThinkPad T series.
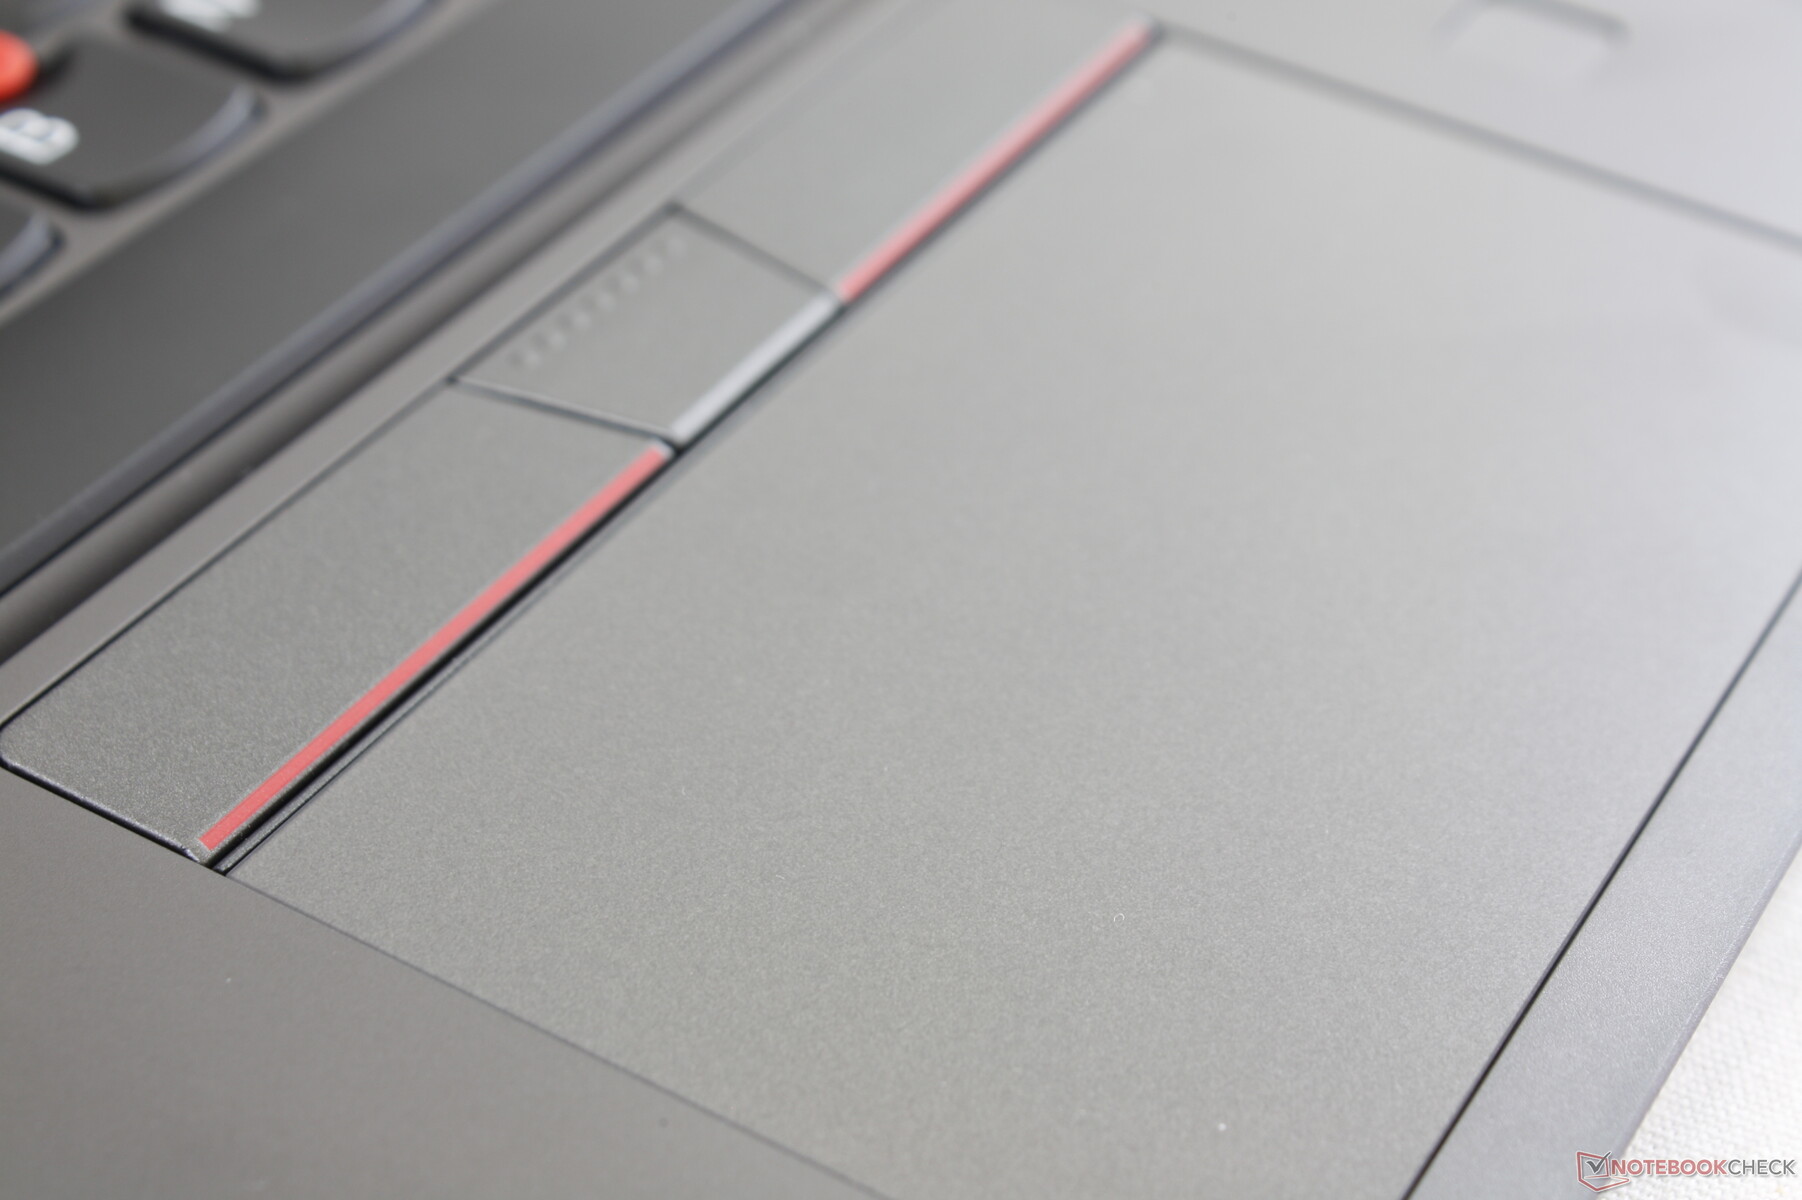
Touchpad
The Precision-enabled clickpad (~10 x 5.6 cm) is smaller than the clickpads on both the EliteBook x360 1040 (~11.1 x 6.5 cm) and XPS 13 9300 (11.2 x 6.5 cm) even though the latter is on a 13.3-inch form factor laptop. To make up for this size deficit, the ThinkPad X1 Yoga includes the familiar dedicated mouse keys and TrackPoint that traditional ThinkPad users have grown accustomed to. Common multi-touch inputs like drag and dropping or highlighting text should therefore easier on the X1 Yoga.
Unfortunately on our test unit, the clickpad would frequently pause for a split second and not respond to any movement. This would sometimes occur when clicking on a dedicated mouse key whilst moving the cursor on the clickpad simultaneously. It's an annoying and inconsistent phenomenon that we recommend owners to try for themselves as we cannot confirm if the behavior is intentional or not.

Display
The WQHD AU Optronics B140QAN02.2 IPS panel can be found on no other laptops in our database. However, the B140QAN02.0 and B140QAN02.3 can be found on a handful of other 14-inch Lenovo laptops like the 2018 ThinkPad X1 Carbon, ThinkPad T490, IdeaPad 530s, and the 2018 ThinkPad X1 Yoga. All of these panels share the same native 1440p resolution with similar gamuts.
Lenovo advertises a brightness of 300 nits for its WQHD panel whereas our independent measurements show an average of 269 nits. Even if we had recorded 300 nits, however, this would have still been dimmer than many flagship subnotebooks like the XPS 13, MacBook Pro 13, or the Samsung Notebook 9 where 500 nits or higher is standard.
Black-white and gray-gray response times are fast for a business laptop for less noticeable ghosting and we can observe no pulse-width modulation, either. The infamous OLED option that was present on the 2017 ThinkPad X1 Yoga is no longer available here due to supply issues according to Lenovo.
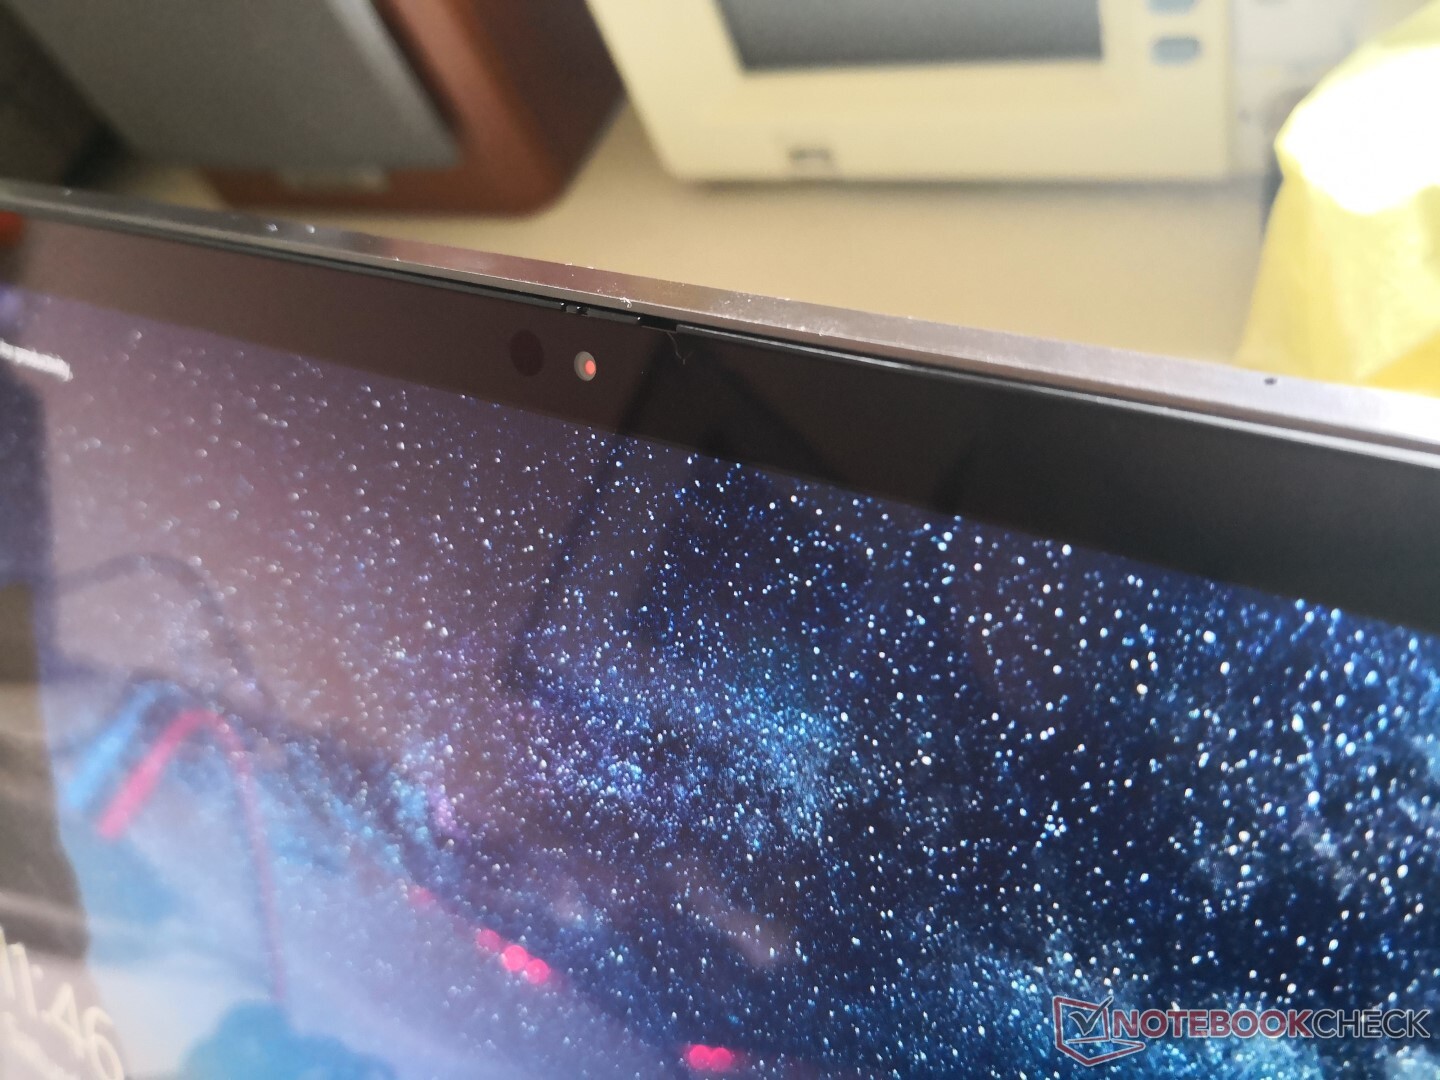
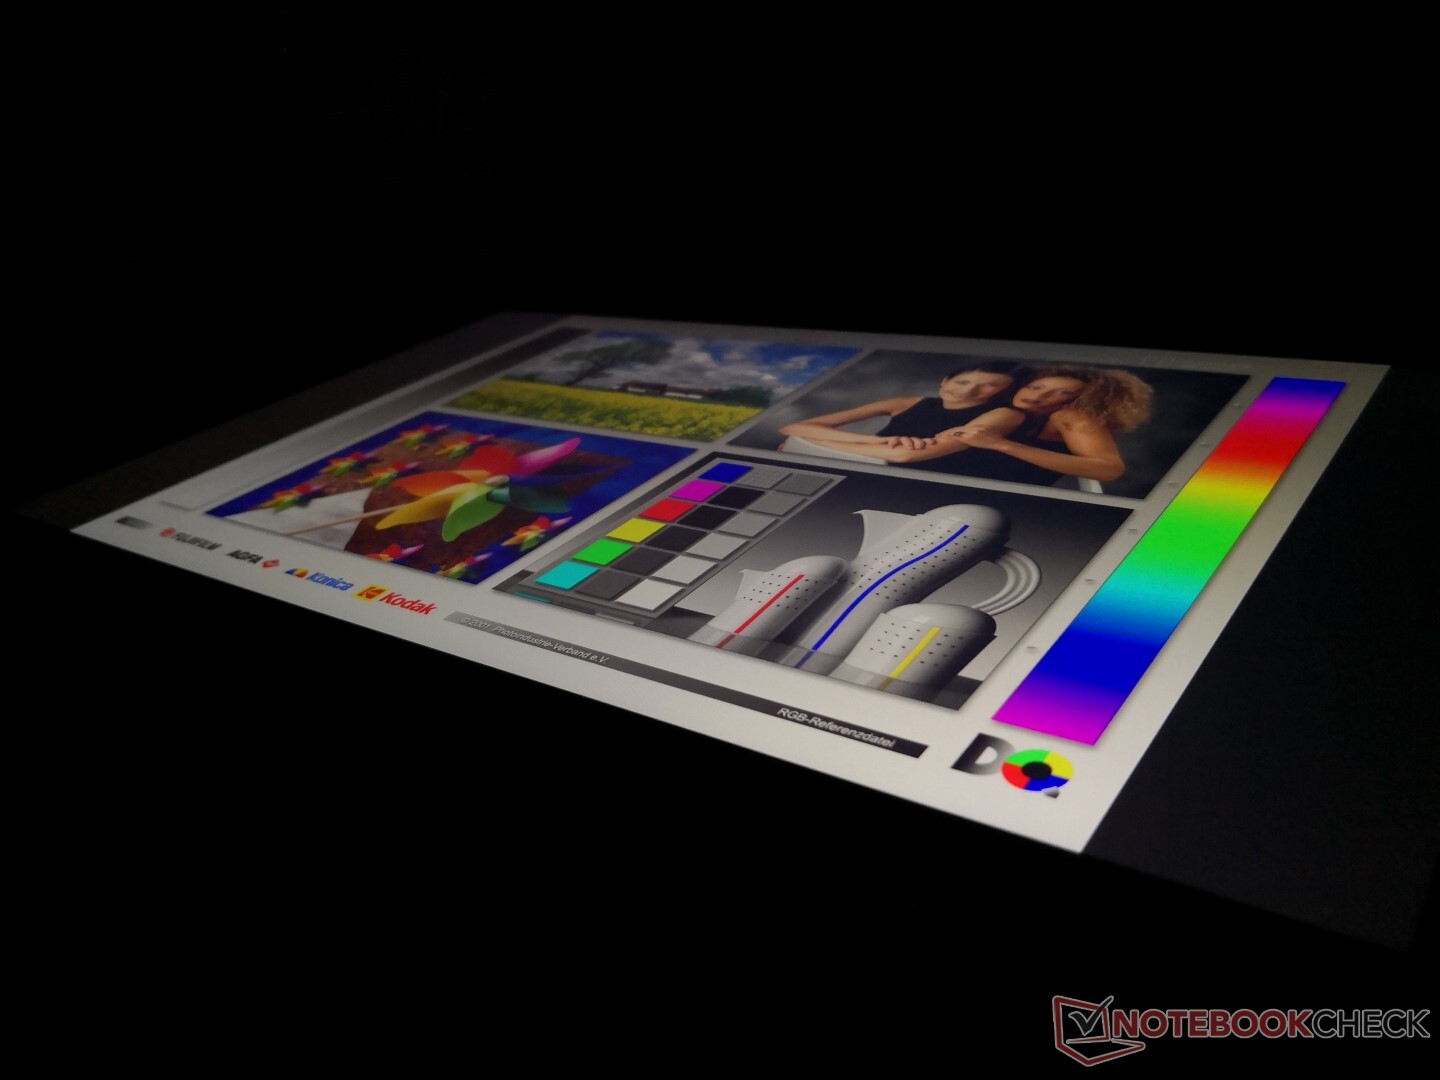
The WQHD panel suffers from moderate-heavy backlight bleeding and even a dead pixel on our spefici test unit as shown by our picture below. While some light bleeding is not abnormal, it's disappointing to see it so noticeably here on a high-end ThinkPad model.


| |||||||||||||||||||||||||
Brightness Distribution: 86 %
Center on Battery: 284.6 cd/m²
Contrast: 1016:1 (Black: 0.28 cd/m²)
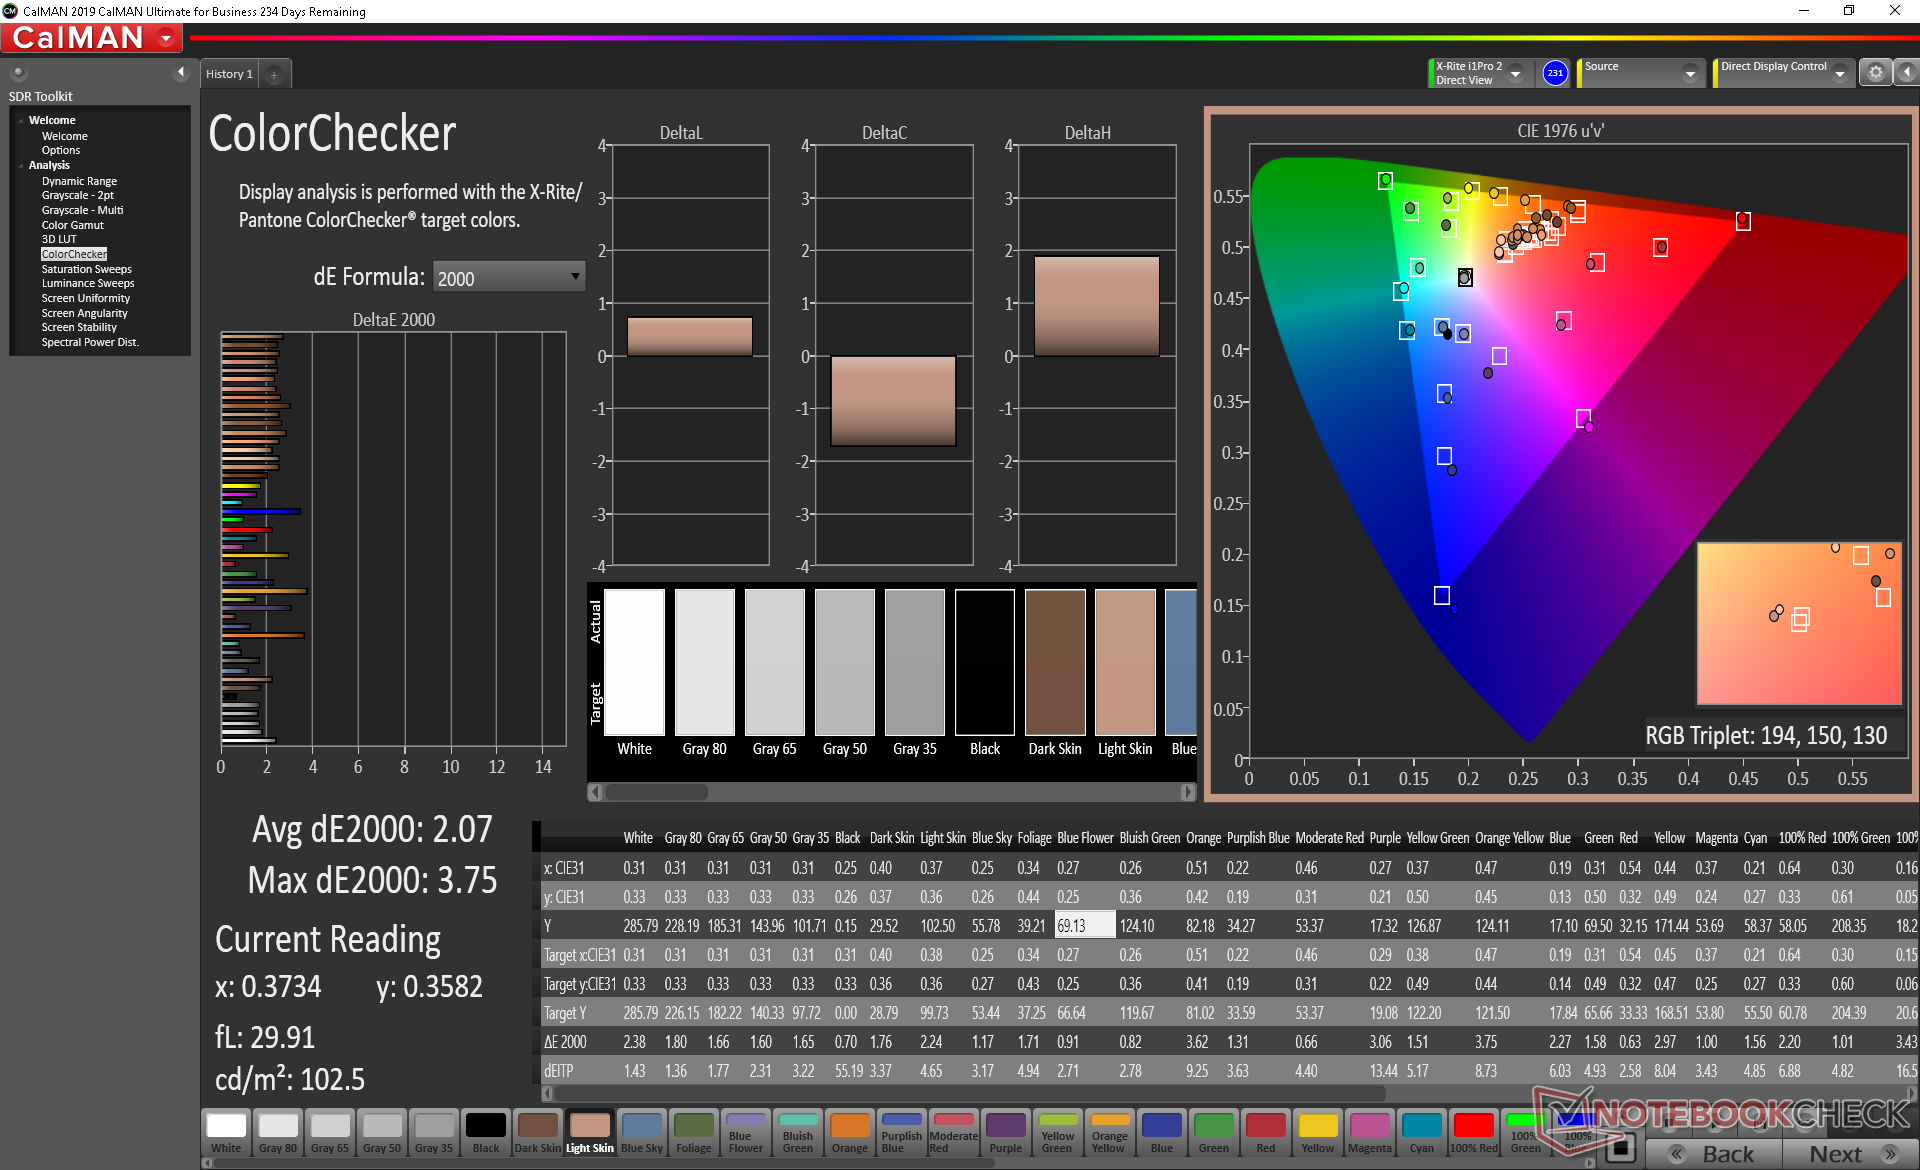
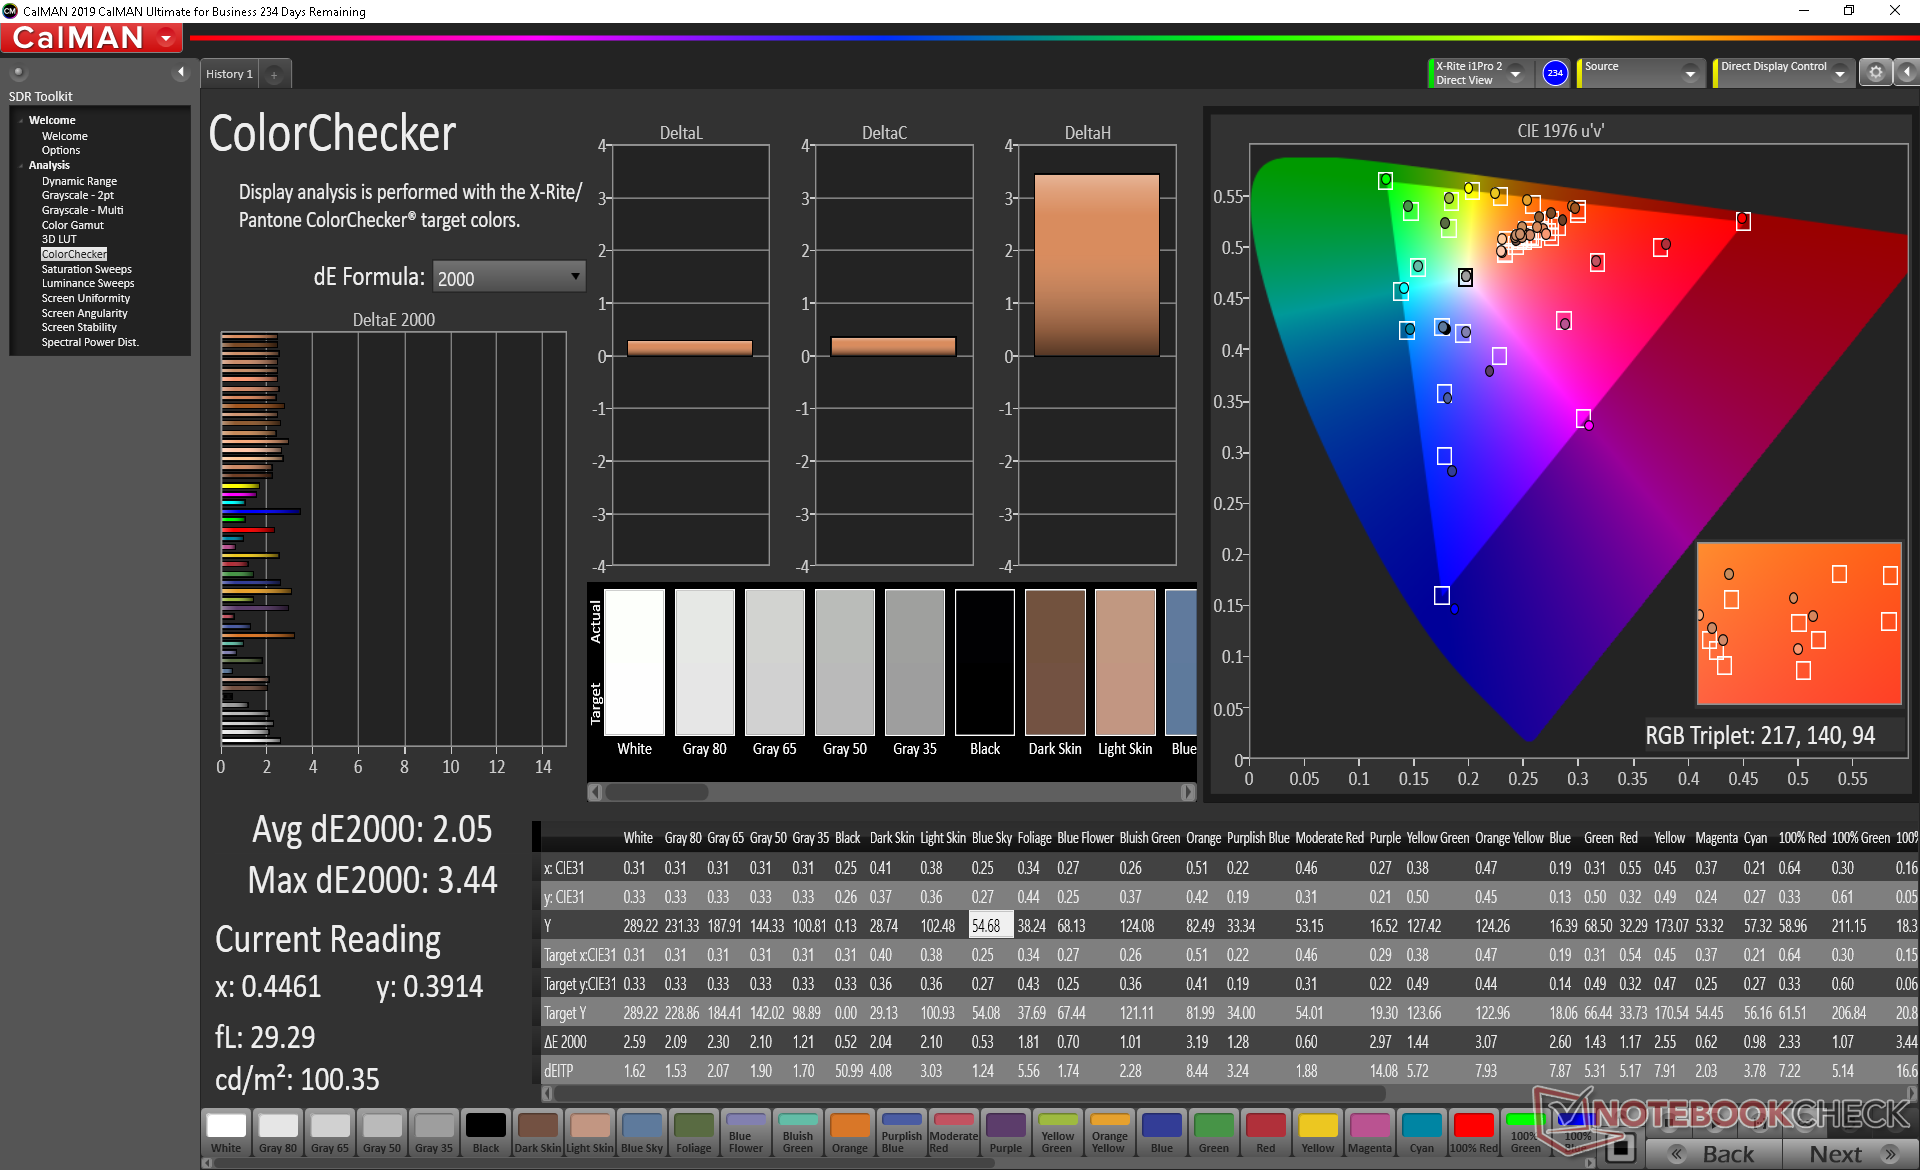
ΔE ColorChecker Calman: 2.07 | ∀{0.5-29.43 Ø4.72}
calibrated: 2.05
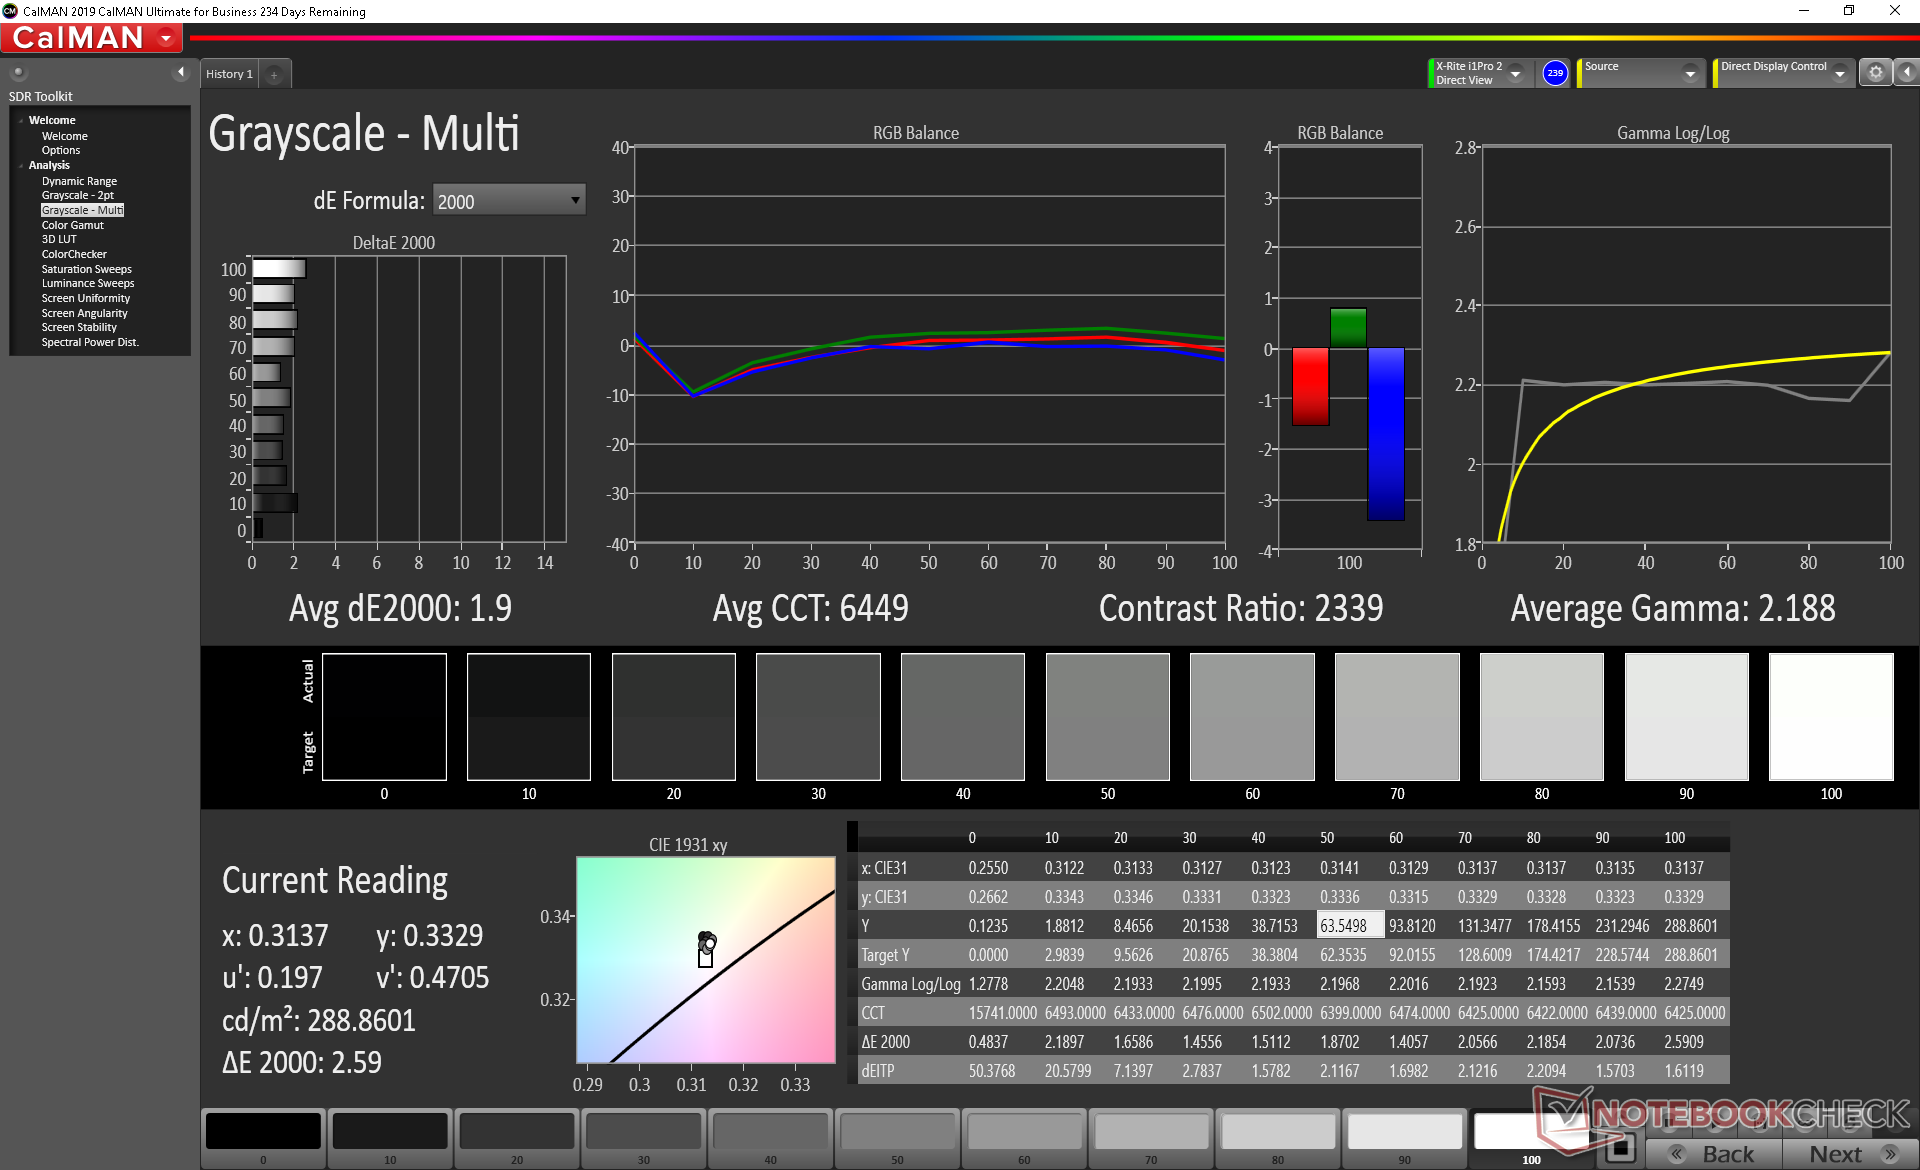
ΔE Greyscale Calman: 1.7 | ∀{0.09-98 Ø4.97}
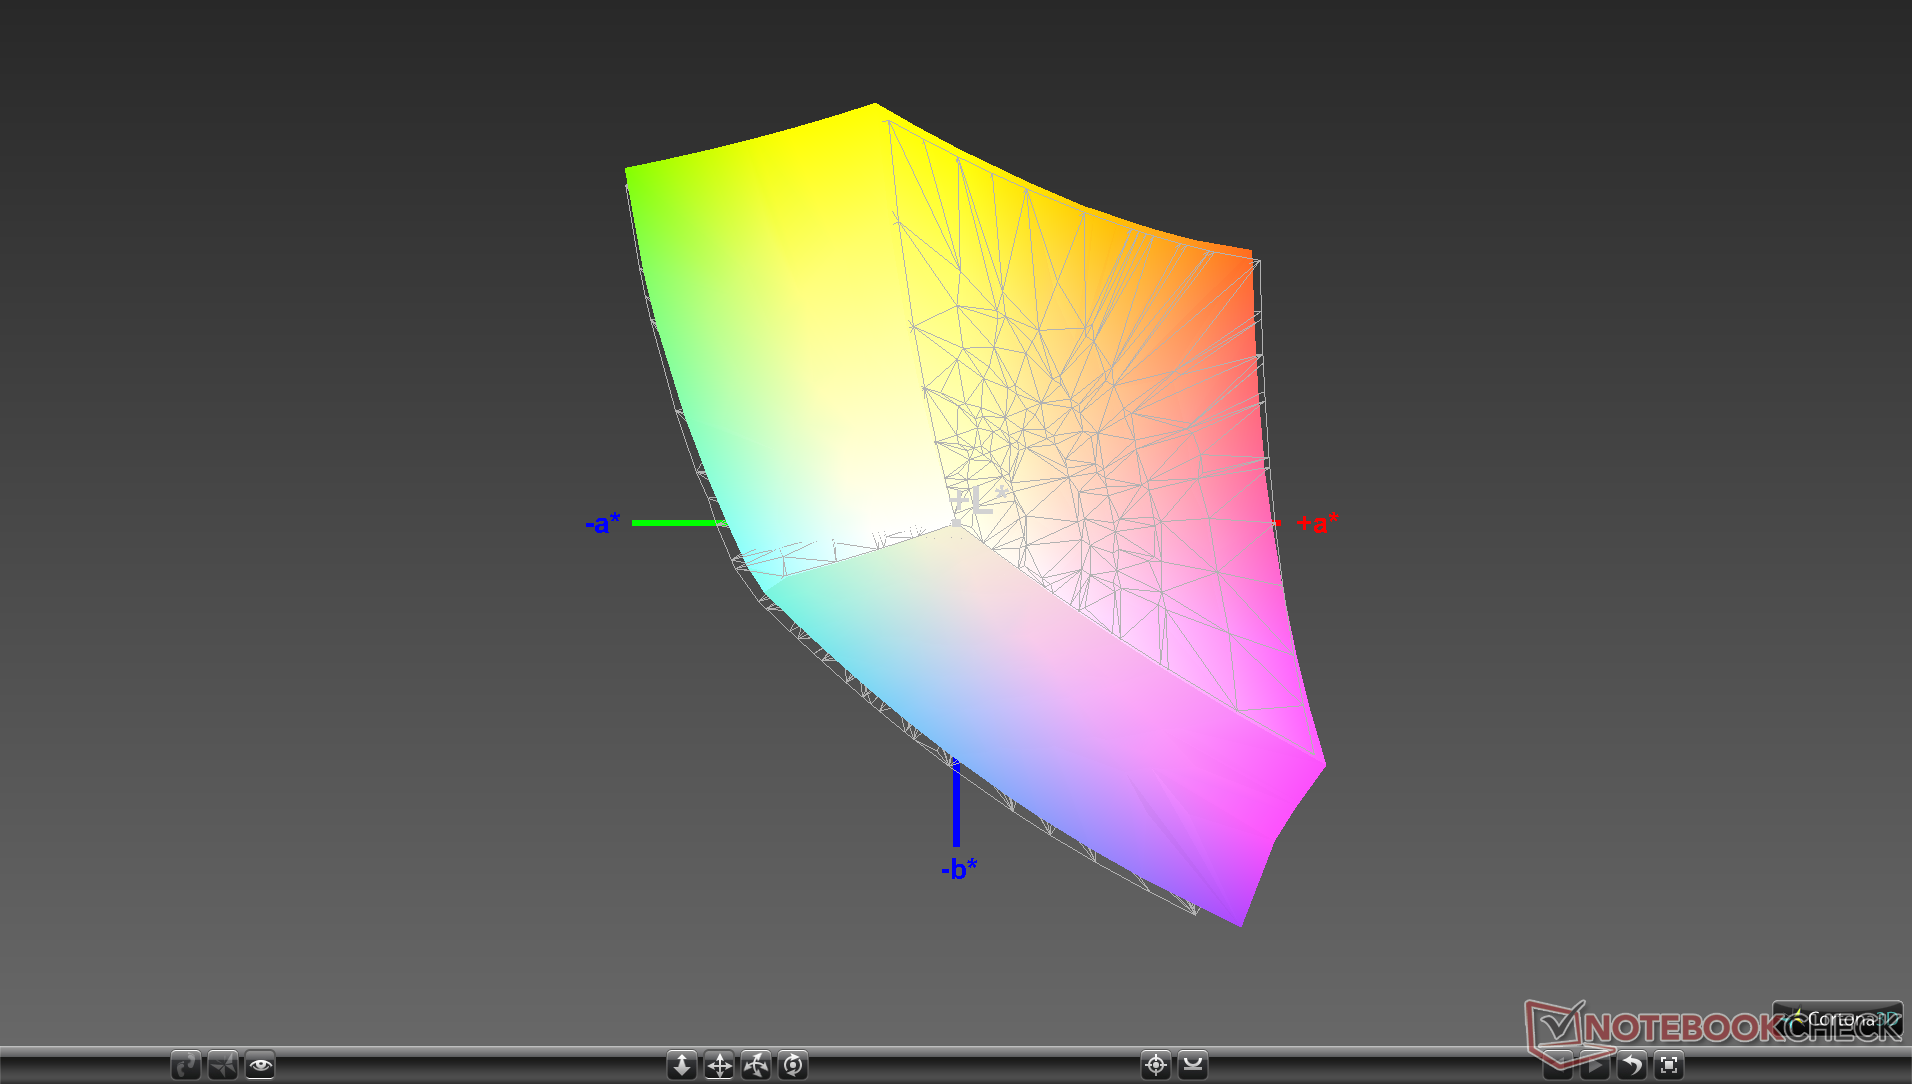
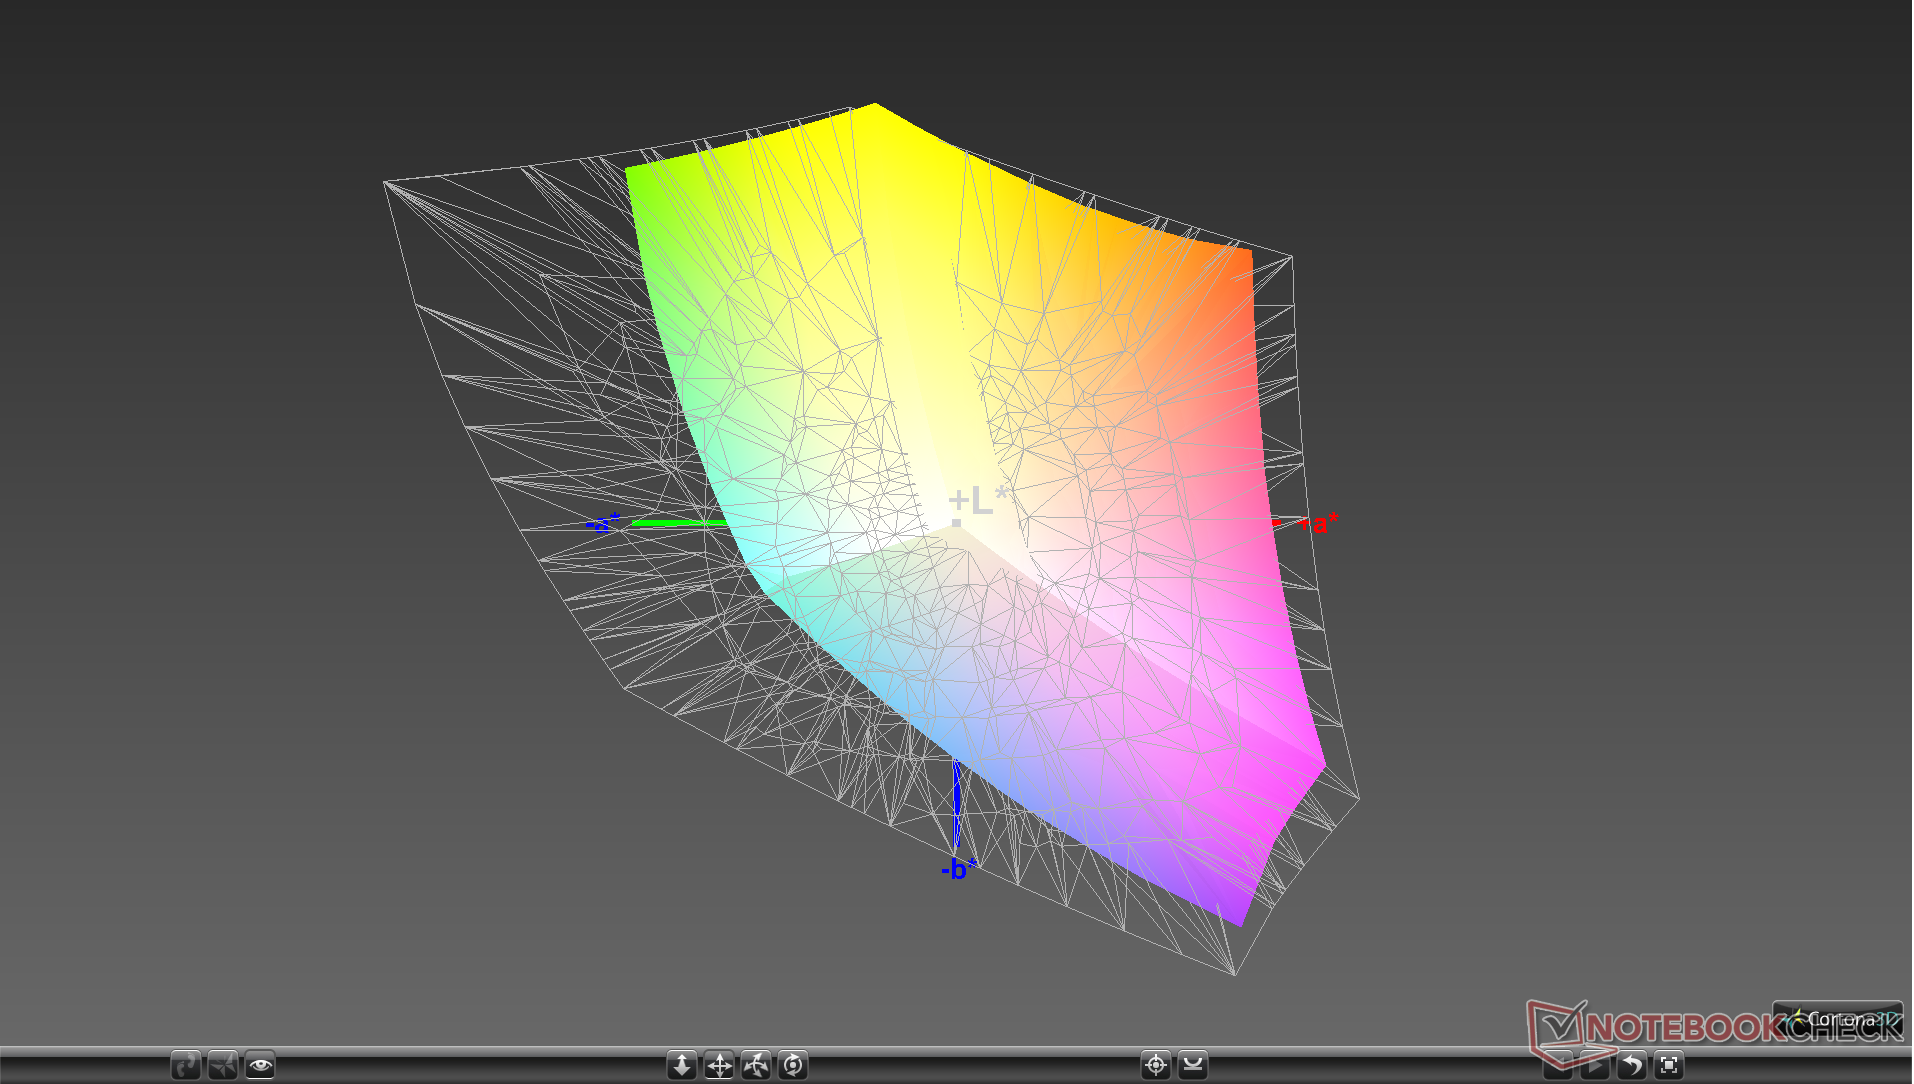
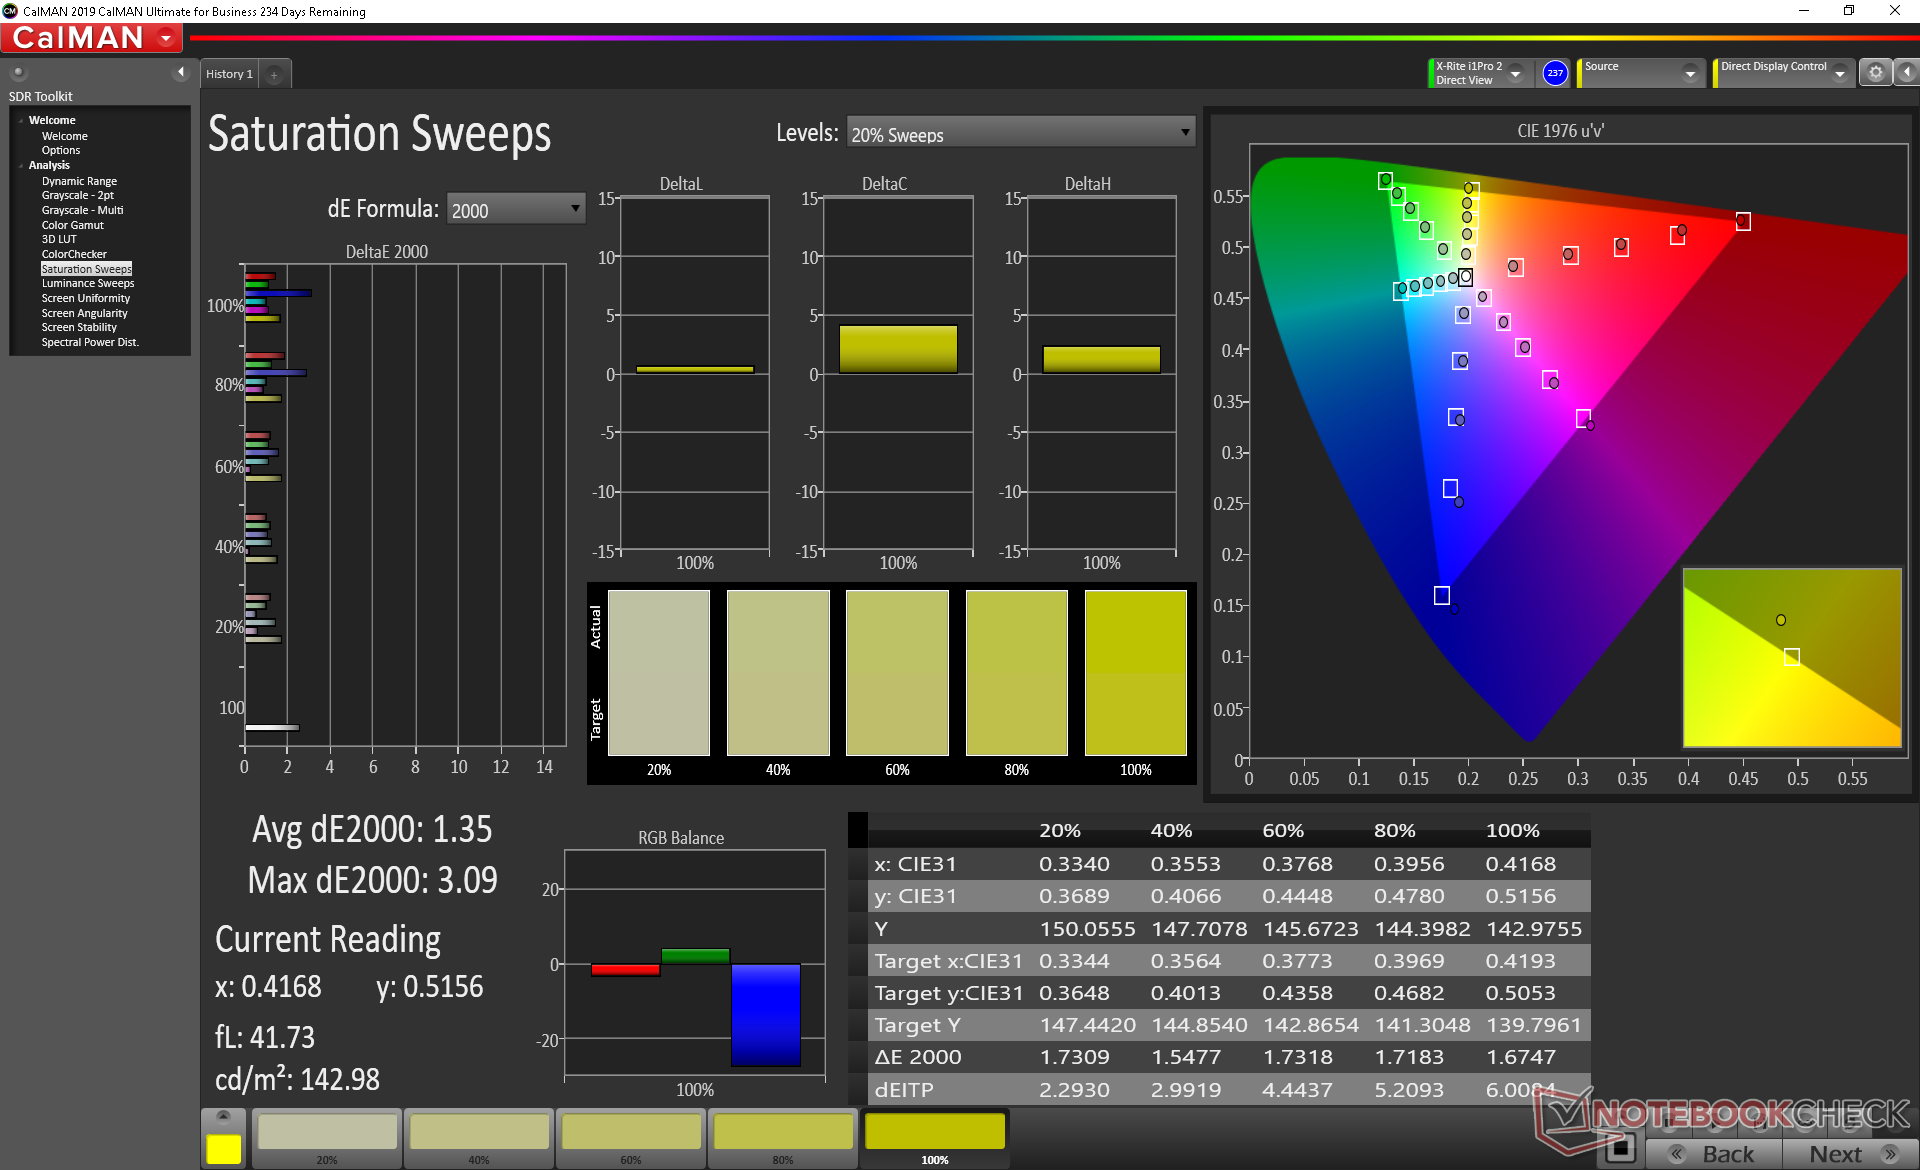
95.8% sRGB (Argyll 1.6.3 3D)
61.7% AdobeRGB 1998 (Argyll 1.6.3 3D)
67.5% AdobeRGB 1998 (Argyll 3D)
95.9% sRGB (Argyll 3D)
66.6% Display P3 (Argyll 3D)
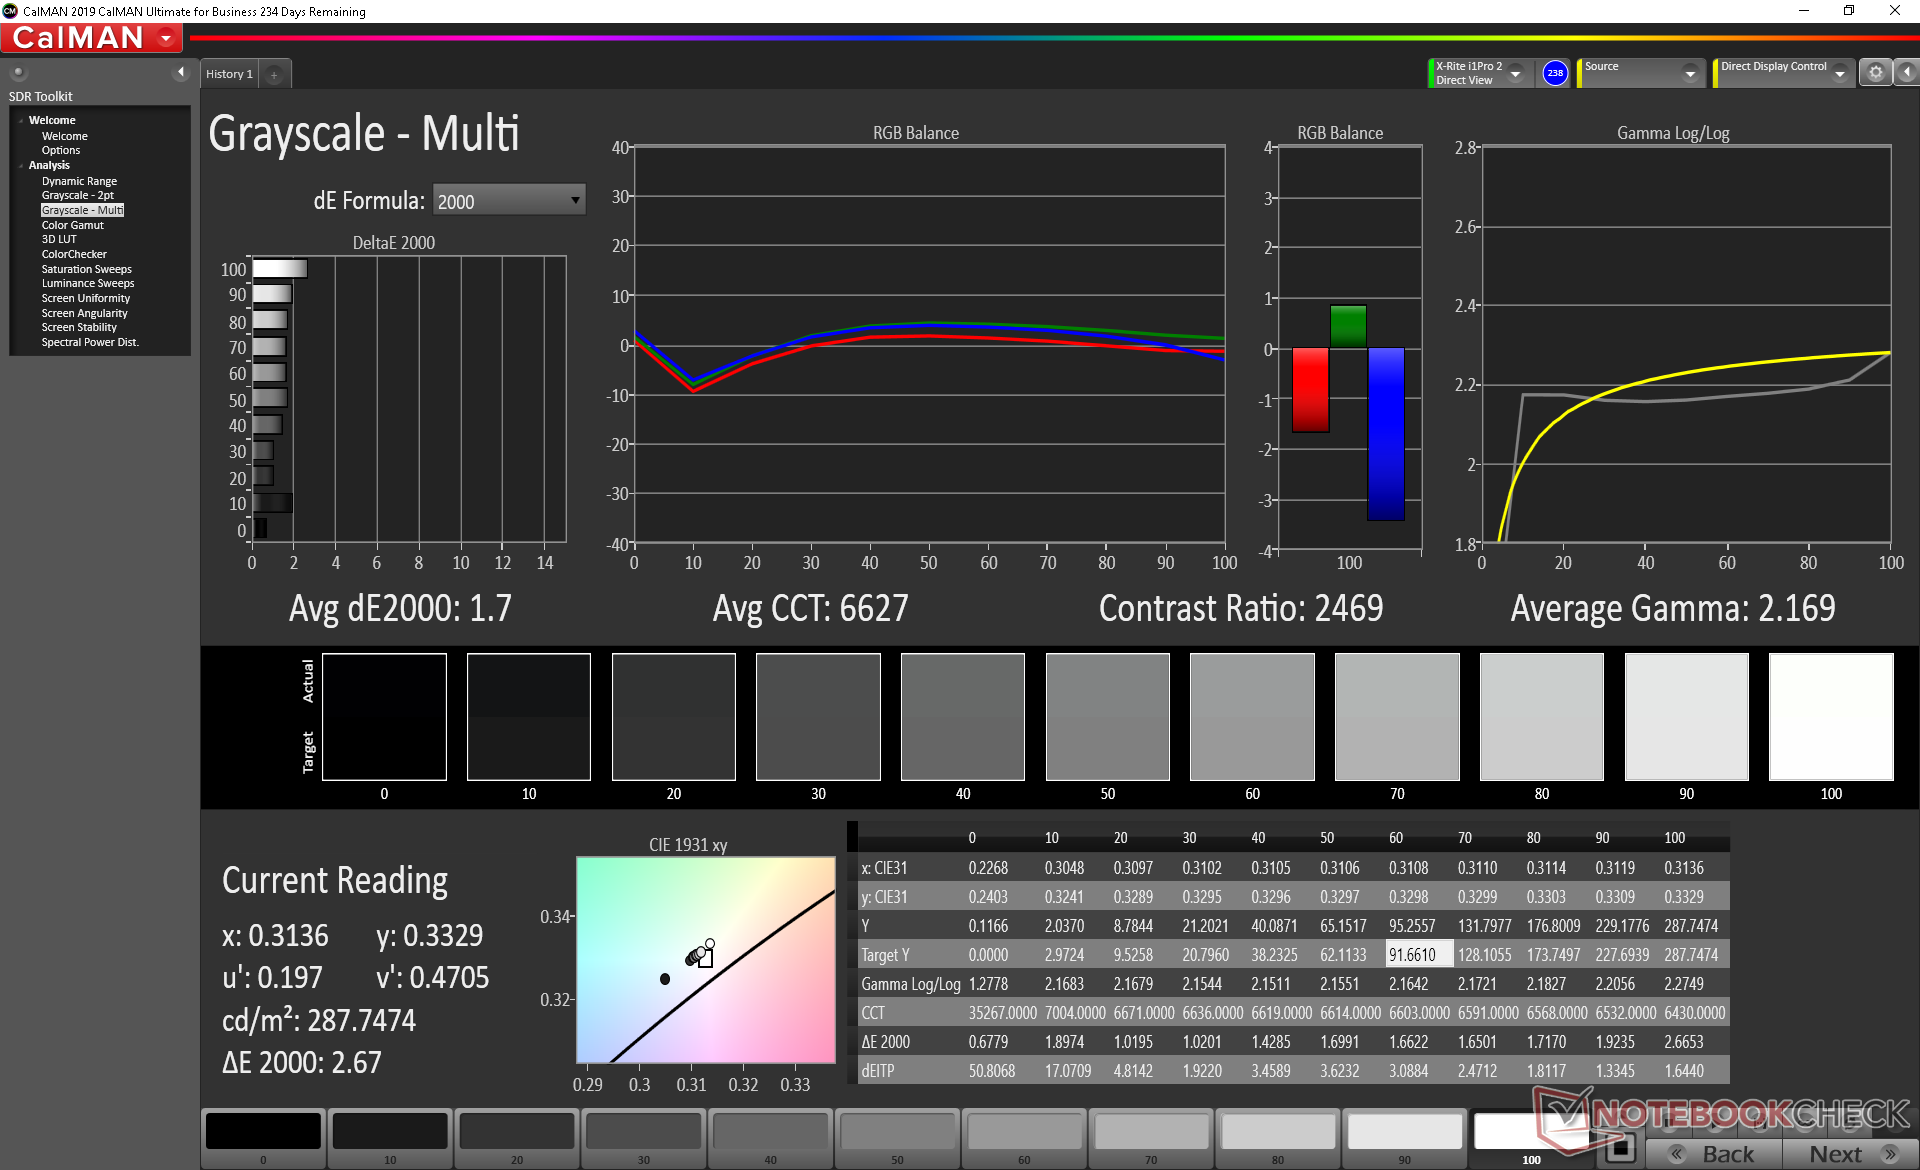
Gamma: 2.17
CCT: 6627 K
| Lenovo ThinkPad X1 Yoga 20SA000GUS AU Optronics B140QAN02.2, IPS, 14", 2560x1440 | HP Elitebook x360 1040 G5 AU Optronics AUO533D, IPS, 14", 1920x1080 | Lenovo ThinkPad X1 Carbon G7 20R1-000YUS BOE NV140QUM-N53, IPS, 14", 3840x2160 | Dell Latitude 7400 2-in-1 SHP14A2, IPS, 14", 1920x1080 | Asus ZenBook Flip 14 UM462DA-AI023T IPS, 14", 1920x1080 | Lenovo ThinkPad X1 Yoga 2017 20JES03T00 LEN4140, OLED, 14", 2560x1440 | |
|---|---|---|---|---|---|---|
| Display | -3% | 17% | 4% | -7% | ||
| Display P3 Coverage (%) | 66.6 | 64.3 -3% | 83 25% | 68.6 3% | 65.5 -2% | |
| sRGB Coverage (%) | 95.9 | 94.1 -2% | 99.7 4% | 99.6 4% | 85.2 -11% | |
| AdobeRGB 1998 Coverage (%) | 67.5 | 65.5 -3% | 83.1 23% | 70 4% | 62.2 -8% | |
| Response Times | -84% | -45% | -68% | -38% | 88% | |
| Response Time Grey 50% / Grey 80% * (ms) | 32 ? | 70.8 ? -121% | 49.2 ? -54% | 56 ? -75% | 42 ? -31% | 3.6 ? 89% |
| Response Time Black / White * (ms) | 23.6 ? | 34.4 ? -46% | 32.2 ? -36% | 38 ? -61% | 34 ? -44% | 3.2 ? 86% |
| PWM Frequency (Hz) | 735 ? | 201.6 ? | 1667 ? | 240.4 ? | ||
| Screen | -1% | -75% | -4% | -62% | -48% | |
| Brightness middle (cd/m²) | 284.6 | 416.3 46% | 532 87% | 277.2 -3% | 306 8% | 243 -15% |
| Brightness (cd/m²) | 269 | 400 49% | 513 91% | 263 -2% | 294 9% | 240 -11% |
| Brightness Distribution (%) | 86 | 89 3% | 90 5% | 83 -3% | 81 -6% | 95 10% |
| Black Level * (cd/m²) | 0.28 | 0.29 -4% | 0.41 -46% | 0.2 29% | 0.39 -39% | |
| Contrast (:1) | 1016 | 1436 41% | 1298 28% | 1386 36% | 785 -23% | |
| Colorchecker dE 2000 * | 2.07 | 2.69 -30% | 6.88 -232% | 2.1 -1% | 5.16 -149% | 5.3 -156% |
| Colorchecker dE 2000 max. * | 3.75 | 4.95 -32% | 12.65 -237% | 5.91 -58% | 9.9 -164% | 8.9 -137% |
| Colorchecker dE 2000 calibrated * | 2.05 | 2.13 -4% | 2.52 -23% | 1.03 50% | 3.07 -50% | |
| Greyscale dE 2000 * | 1.7 | 2.9 -71% | 10.5 -518% | 3.4 -100% | 5.86 -245% | 3.7 -118% |
| Gamma | 2.17 101% | 2.4 92% | 1.98 111% | 2.241 98% | 2.31 95% | 1.78 124% |
| CCT | 6627 98% | 6623 98% | 7394 88% | 6030 108% | 6349 102% | 6202 105% |
| Color Space (Percent of AdobeRGB 1998) (%) | 61.7 | 60.1 -3% | 74.1 20% | 64 4% | 56 -9% | 84.8 37% |
| Color Space (Percent of sRGB) (%) | 95.8 | 94.5 -1% | 99.7 4% | 100 4% | 85 -11% | 100 4% |
| Total Average (Program / Settings) | -29% /
-11% | -34% /
-54% | -23% /
-11% | -36% /
-48% | 20% /
-21% |
* ... smaller is better
Color space covers approximately 62 percent and 96 percent of AdobeRGB and sRGB, respectively, to be nearly identical to most FHD panels on other flagship Ultrabooks. OLED panels like the one of the 2017 ThinkPad X1 Yoga are able to cover more of AdobeRGB for deeper and more accurate colors than our WQHD IPS panel.
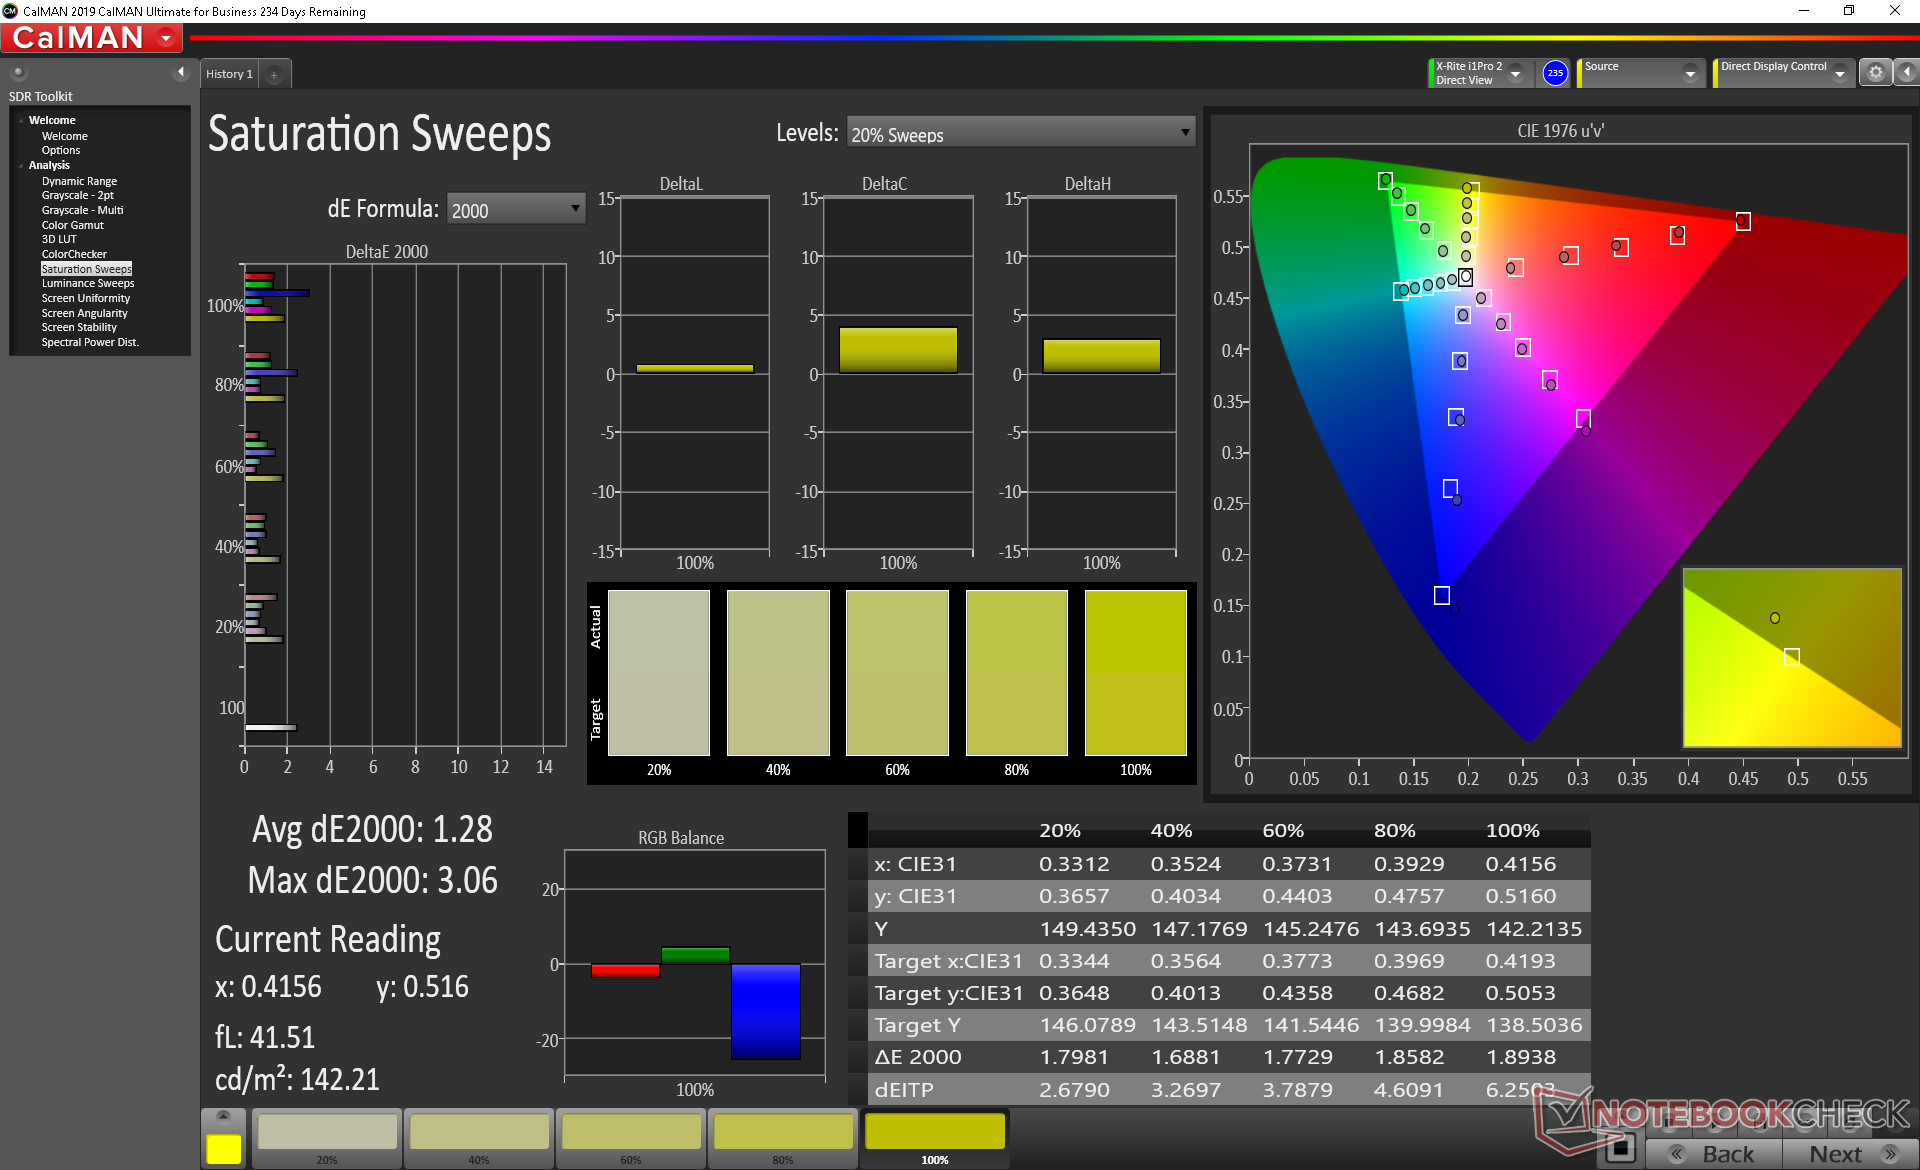
Further measurements with an X-Rite colorimeter reveal a well-calibrated display out of the box with average grayscale and color deltaE values of just 1.7 and 2.07, respectively. Attempting to calibrate the display even further ourselves would result in any major improvements.
Display Response Times
| ↔ Response Time Black to White | ||
|---|---|---|
| 23.6 ms ... rise ↗ and fall ↘ combined | ↗ 12.8 ms rise | 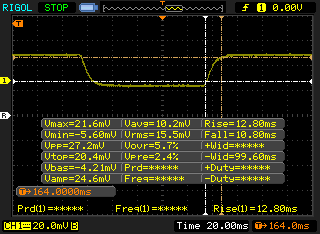 |
| ↘ 10.8 ms fall | ||
| The screen shows good response rates in our tests, but may be too slow for competitive gamers. In comparison, all tested devices range from 0.1 (minimum) to 240 (maximum) ms. » 54 % of all devices are better. This means that the measured response time is worse than the average of all tested devices (19.8 ms). | ||
| ↔ Response Time 50% Grey to 80% Grey | ||
| 32 ms ... rise ↗ and fall ↘ combined | ↗ 16.4 ms rise | 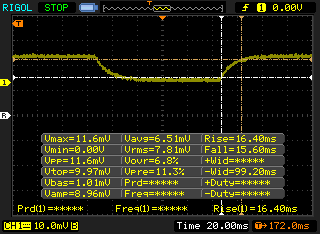 |
| ↘ 15.6 ms fall | ||
| The screen shows slow response rates in our tests and will be unsatisfactory for gamers. In comparison, all tested devices range from 0.165 (minimum) to 636 (maximum) ms. » 43 % of all devices are better. This means that the measured response time is similar to the average of all tested devices (31 ms). | ||
Screen Flickering / PWM (Pulse-Width Modulation)
| Screen flickering / PWM not detected | 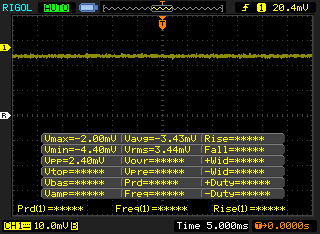 | ||
In comparison: 52 % of all tested devices do not use PWM to dim the display. If PWM was detected, an average of 7750 (minimum: 5 - maximum: 343500) Hz was measured. | |||
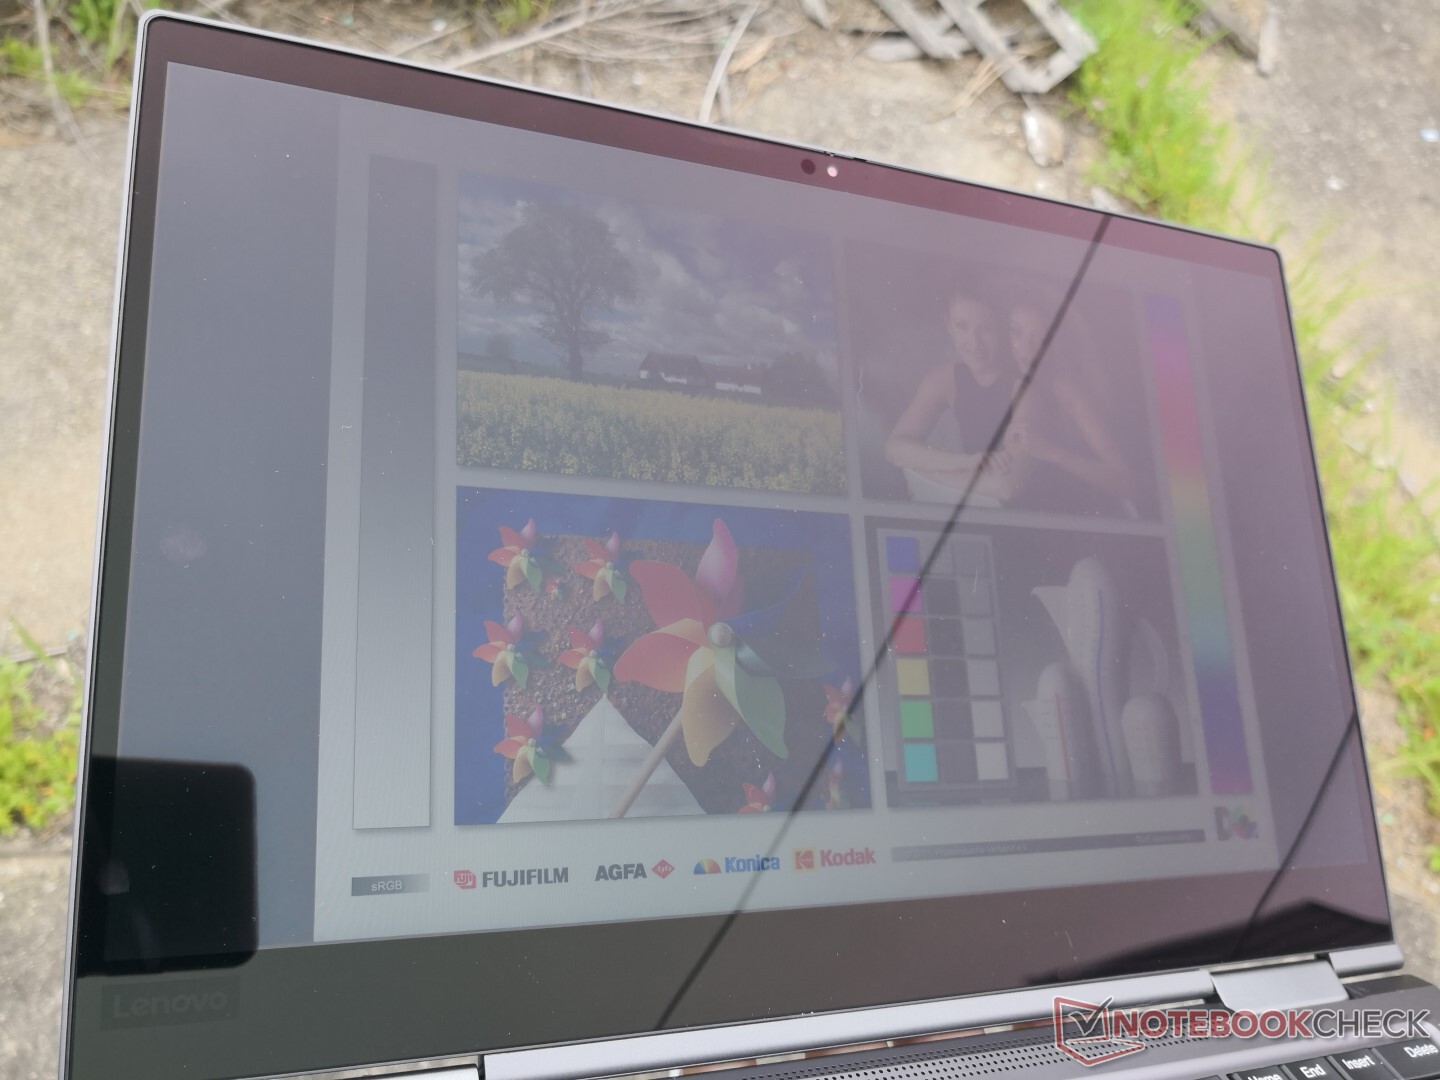
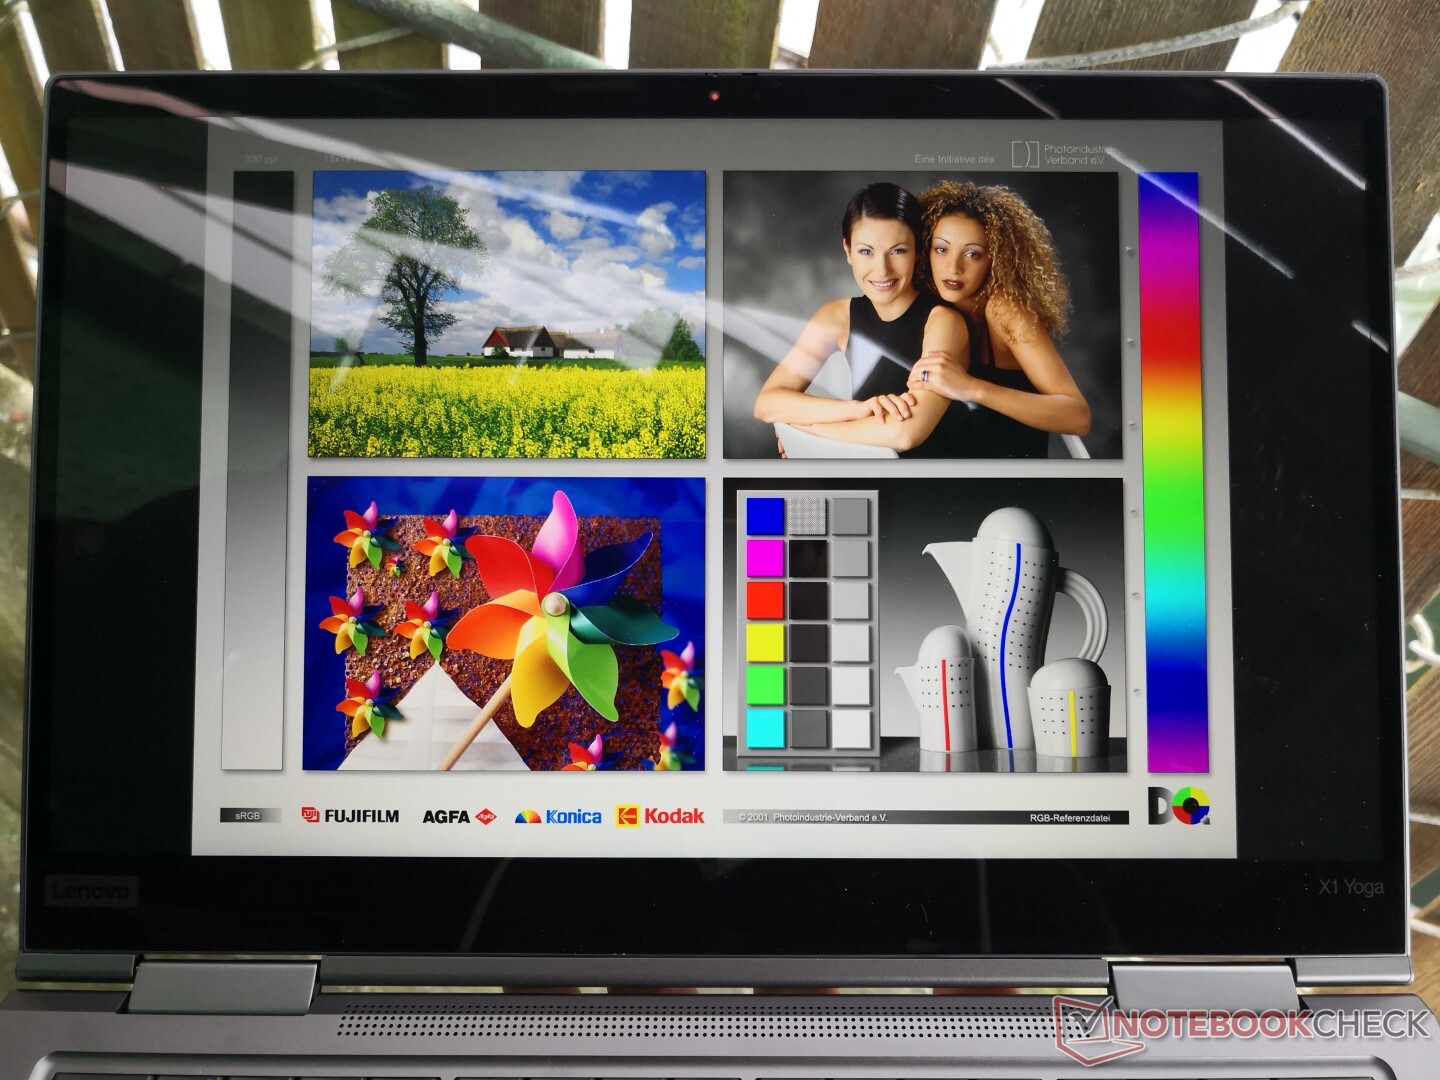
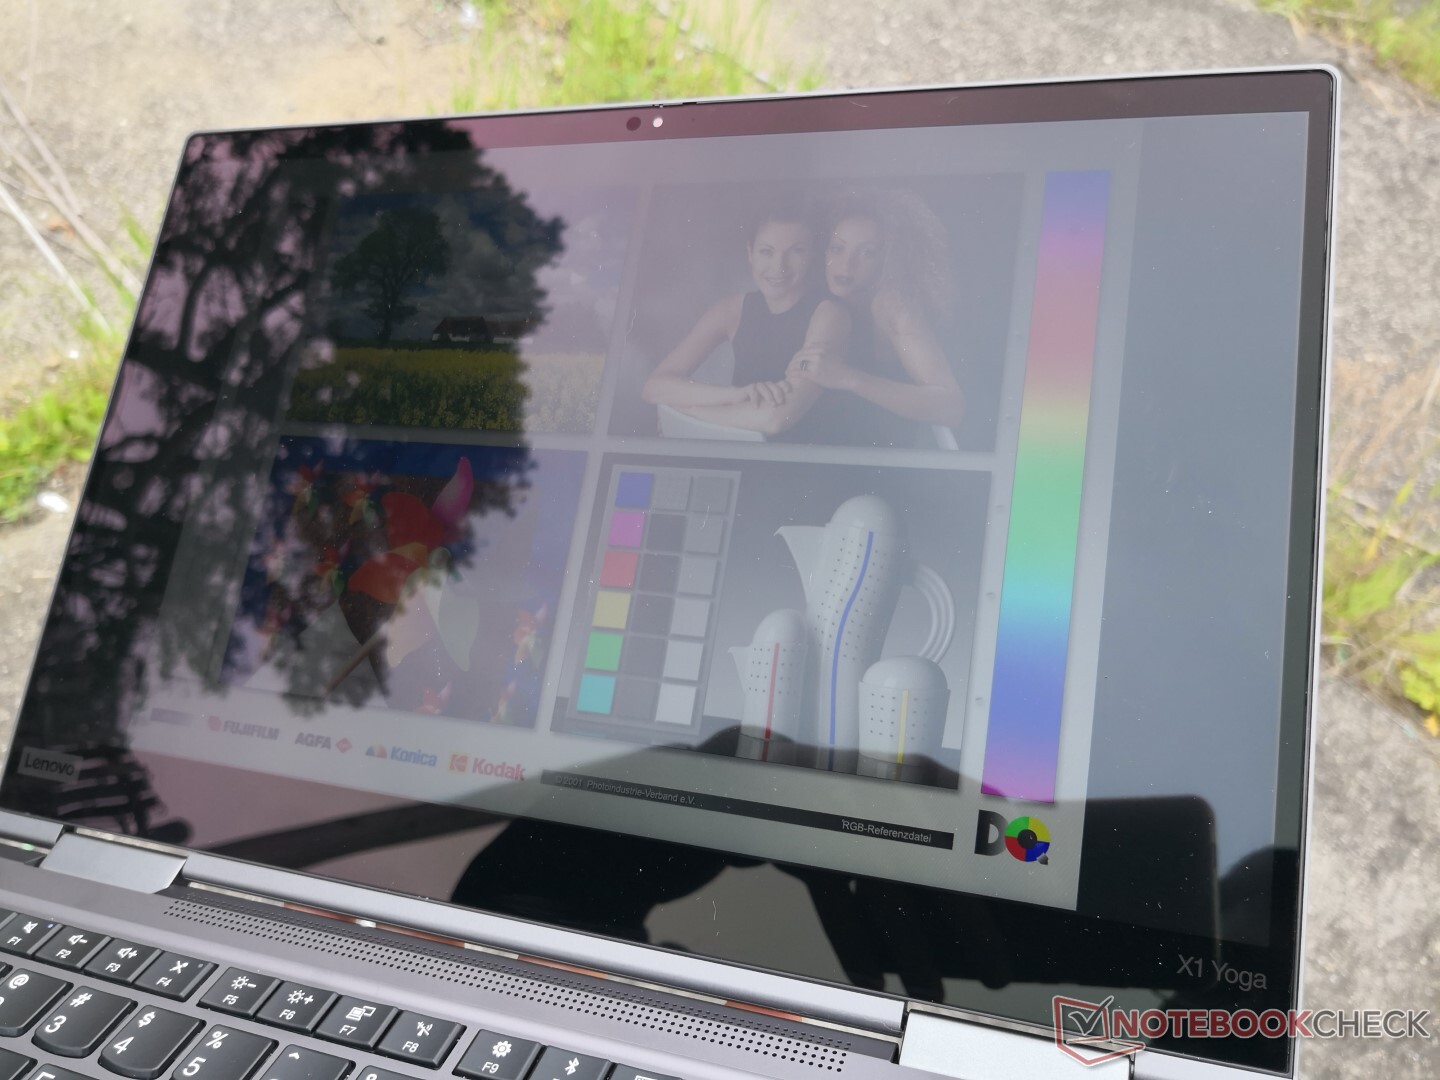
Outdoor visibility is poor which is a shame because the convertible form factor will likely encourage owners to work outside of home more frequently. Expect glare and washed out colors on the glossy panel even if working under shade. The wide IPS viewing angles can also only do so much to lessen glare when the backlight is only half as bright as some competitors.
Performance
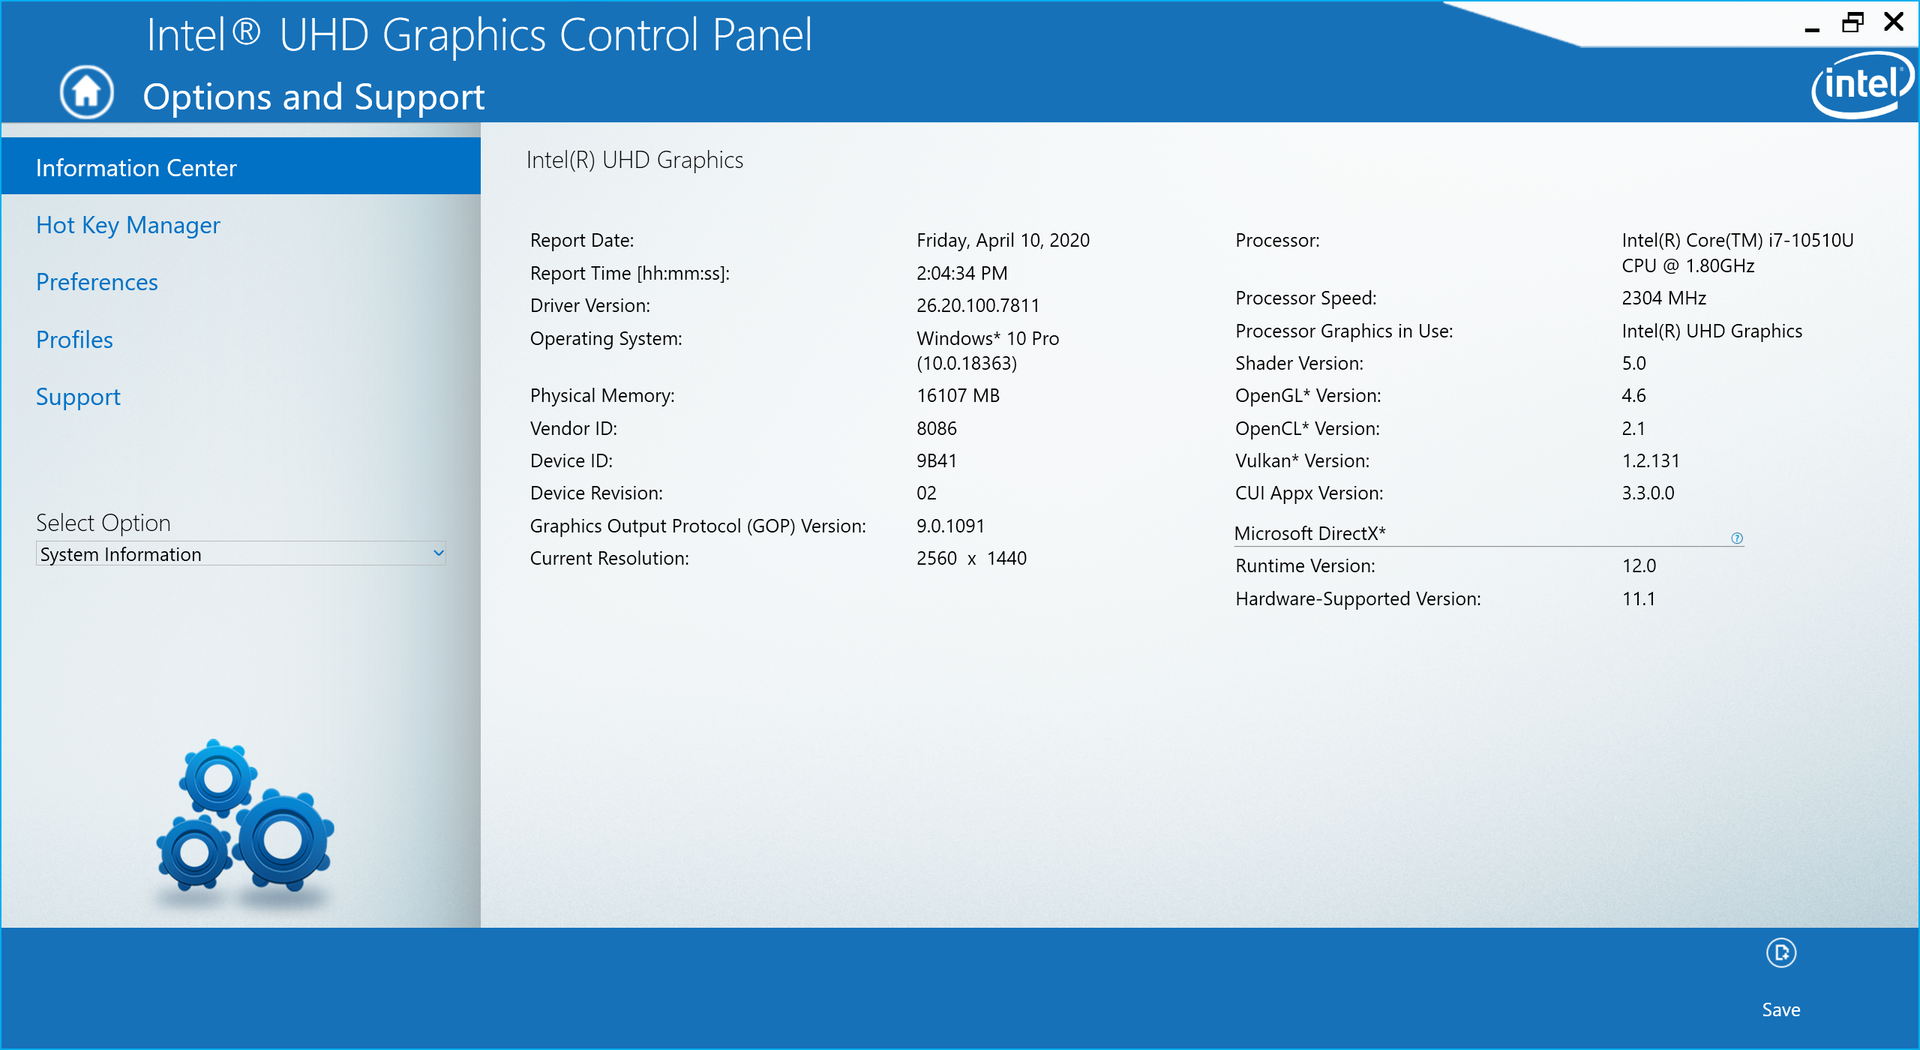
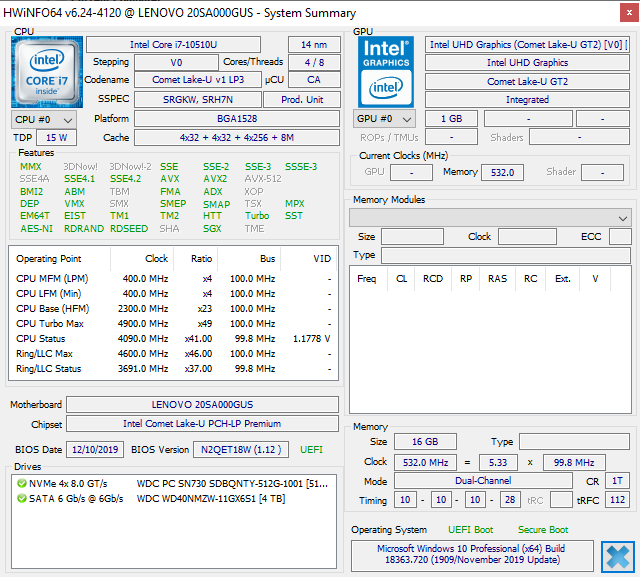
The new Intel Comet Lake-U CPU options separate this latest model from last year's Whiskey Lake-U configurations. In this case, our Core i7-10510U directly replaces the Core i7-8565U for roughly 20 percent faster multi-thread performance over the 2019 ThinkPad X1 Yoga at best. Users can move lower for the Core i5-10210U option or higher for the hexa-core Core i7-10710U option. The UHD Graphics 620, however, remains fixed with no Iris or GeForce to be found.
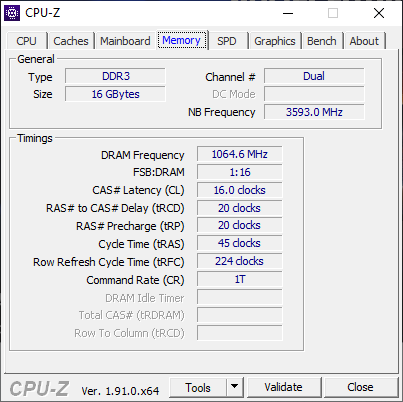
RAM is fixed and non-upgradeable at 8 GB to 16 GB of LPDDR3-2133. We recommend the 16 GB option to extend the life and multi-tasking abilities of the system.
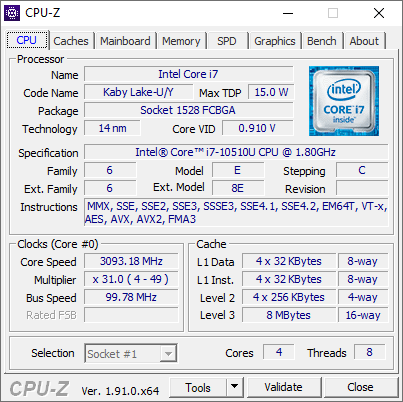
Processor
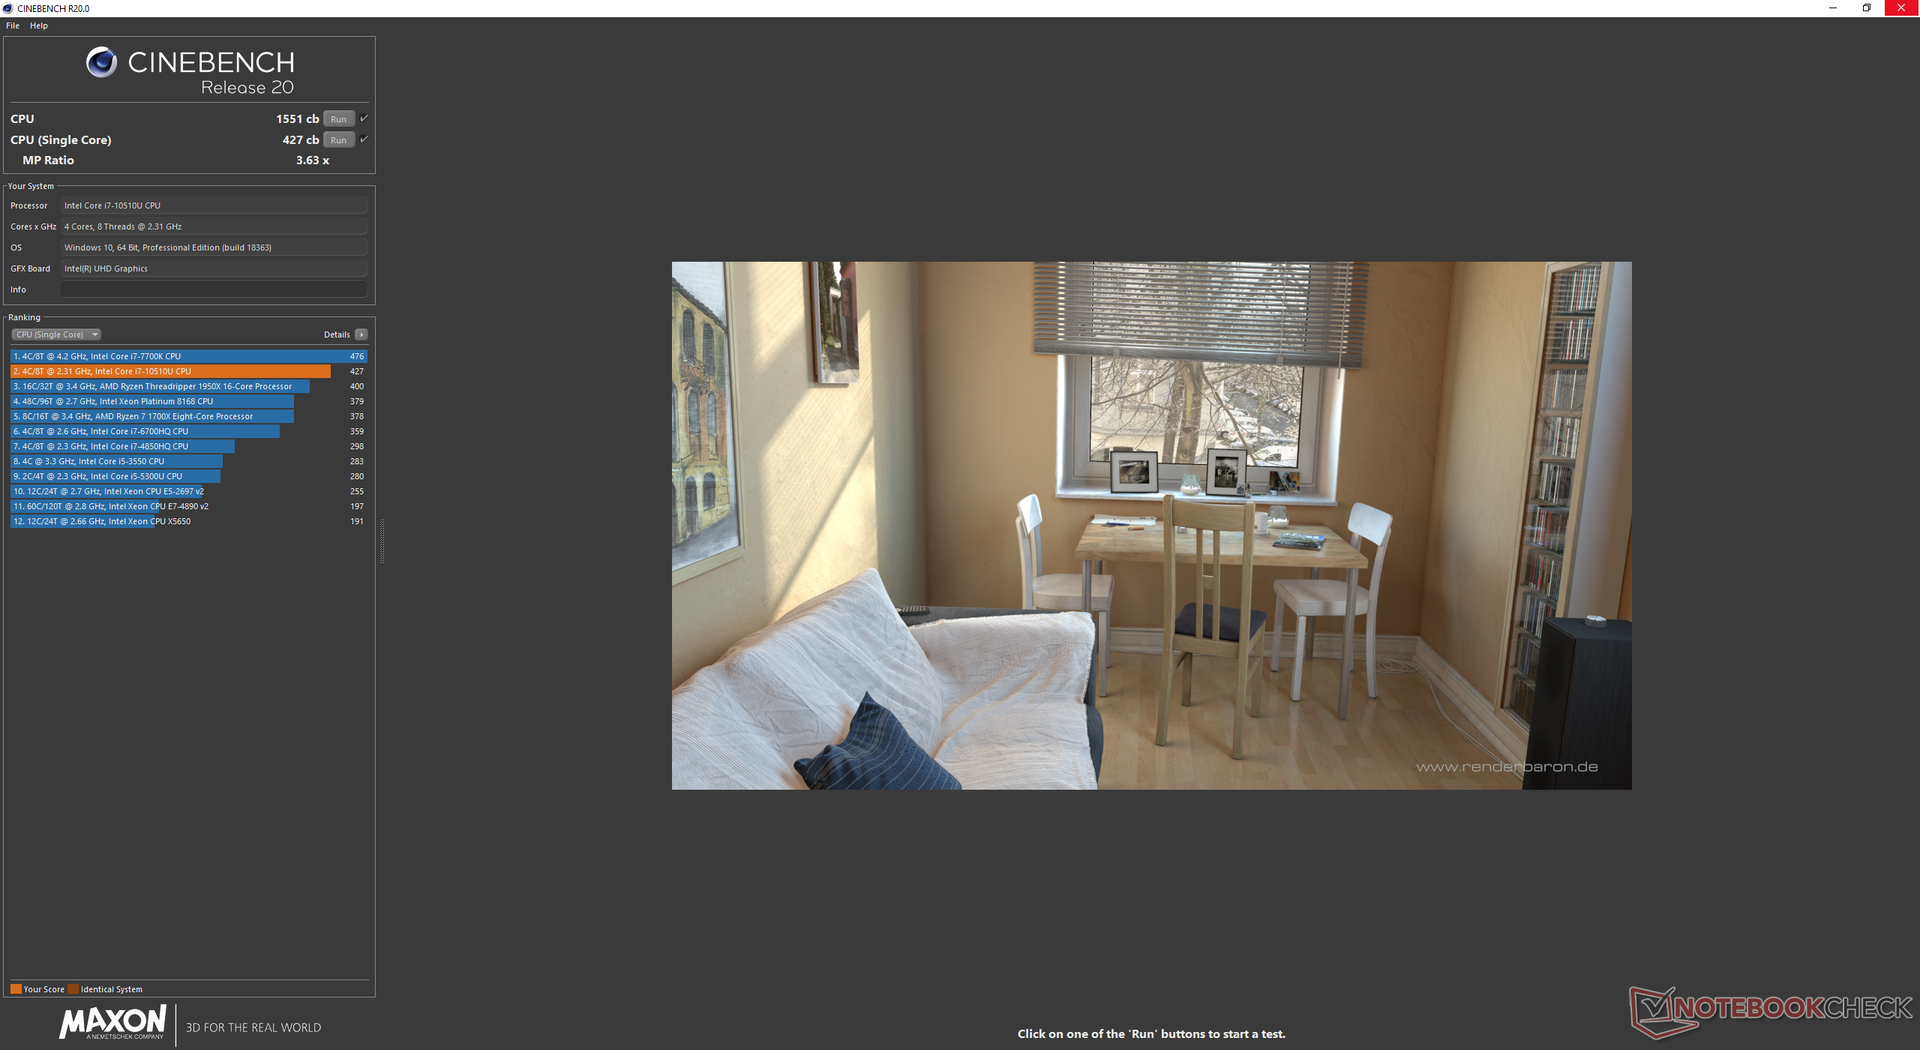
CPU performance is where we expect it to be relative to other laptops equipped with the same Core i7-10510U processor. It's not all that different from the Ryzen 7 3700U or Core i7-1065G7 in this regard. Jumping to the higher-end hexa-core Core i7-10710U SKU will net a 40 percent increase in multi-thread performance assuming that the system won't throttle by too much.
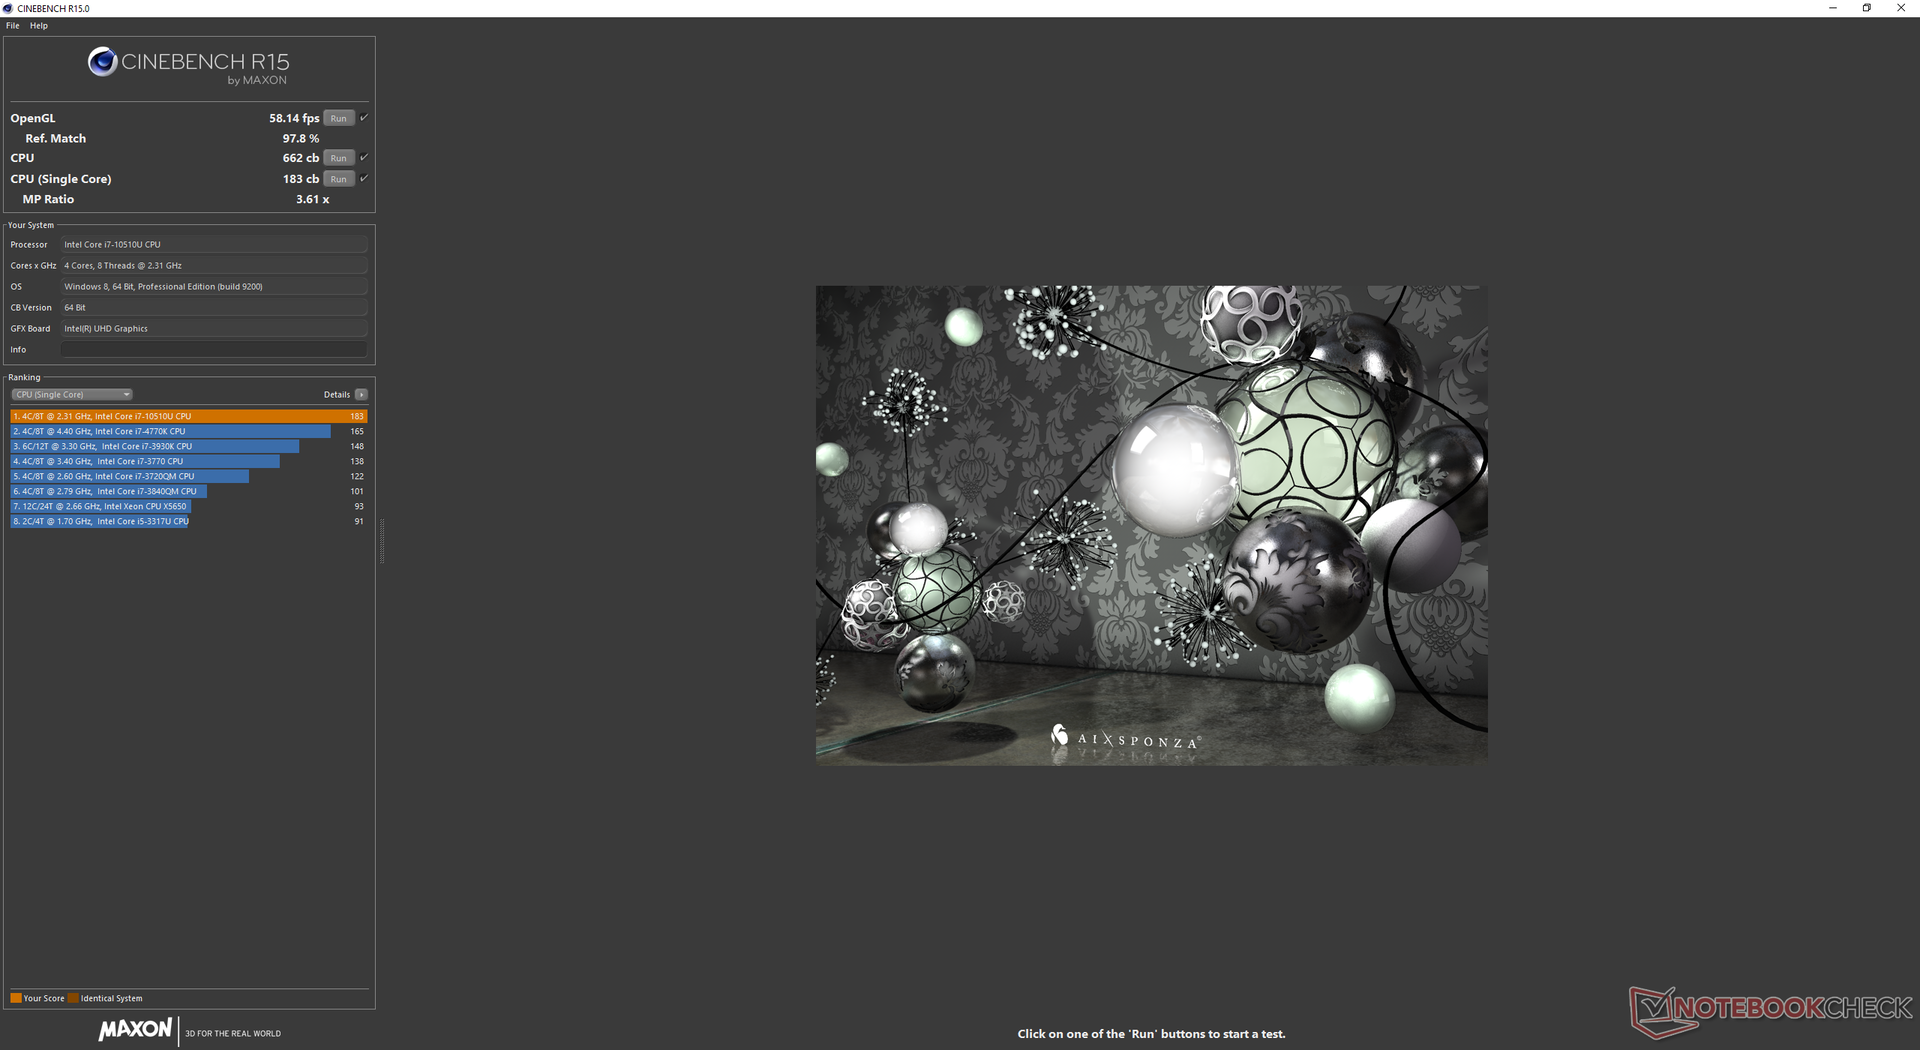
Clock rates will cycle when under prolonged stress much like what we discovered on the recent ThinkPad X1 Carbon equipped with the exact same processor. Our CineBench R15 Multi-Thread loop graph below shows processor performance cycling between 500 points and 660 points whereas the Yoga C940 or HP EliteBook would run slower but more stably. This is explored further in our Stress Test section below.
See our dedicated page on the Core i7-10510U for more technical information and benchmarks.
| wPrime 2.10 - 1024m | |
| Lenovo ThinkPad 13 20J1005TPB | |
| Microsoft Surface Laptop 3 13 Core i5-1035G7 | |
| Dell XPS 13 7390 Core i7-10710U | |
* ... smaller is better
System Performance
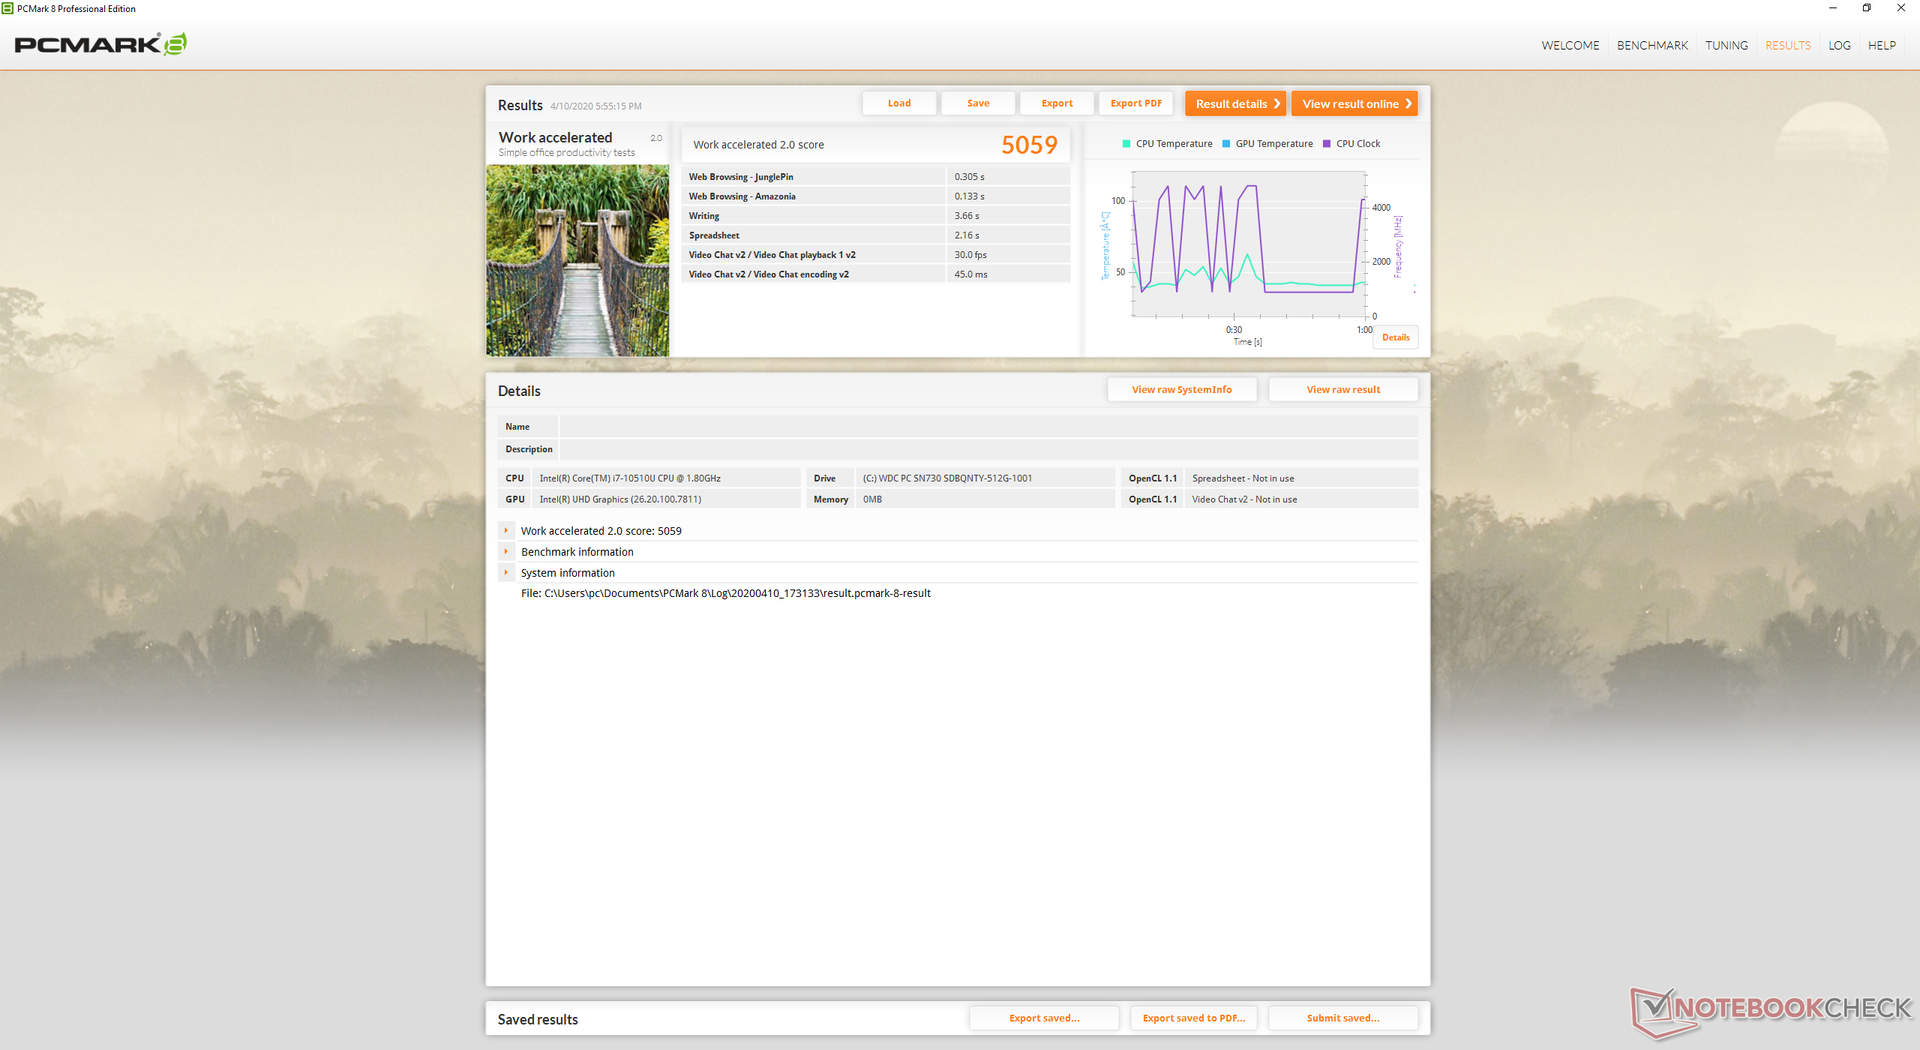
PCMark results are consistently higher than competitors even though the margins are small. This suggests that performance during real-world workloads can be slightly faster than usual despite the fluctuating clock rates mentioned above. Day-to-day applications benefit the most from short-lived Turbo Boost speeds that the ThinkPad X1 Yoga excels at.
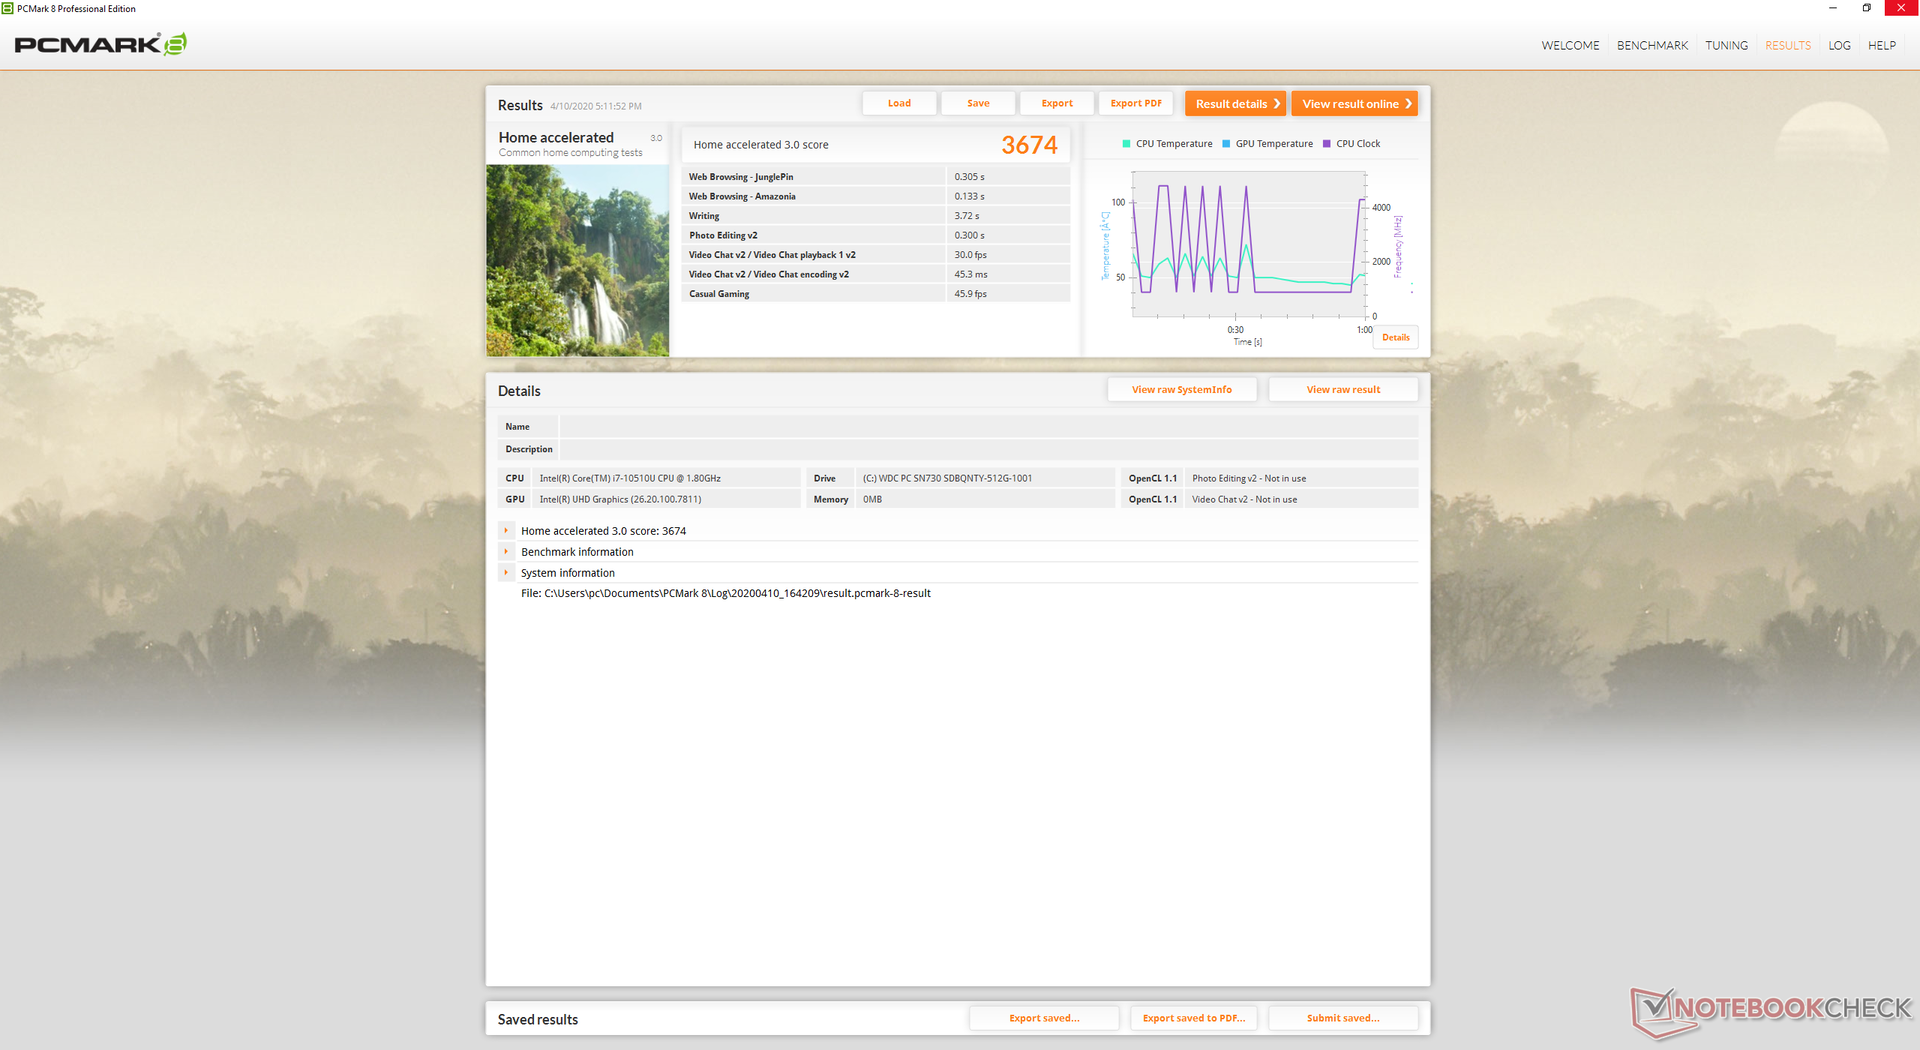
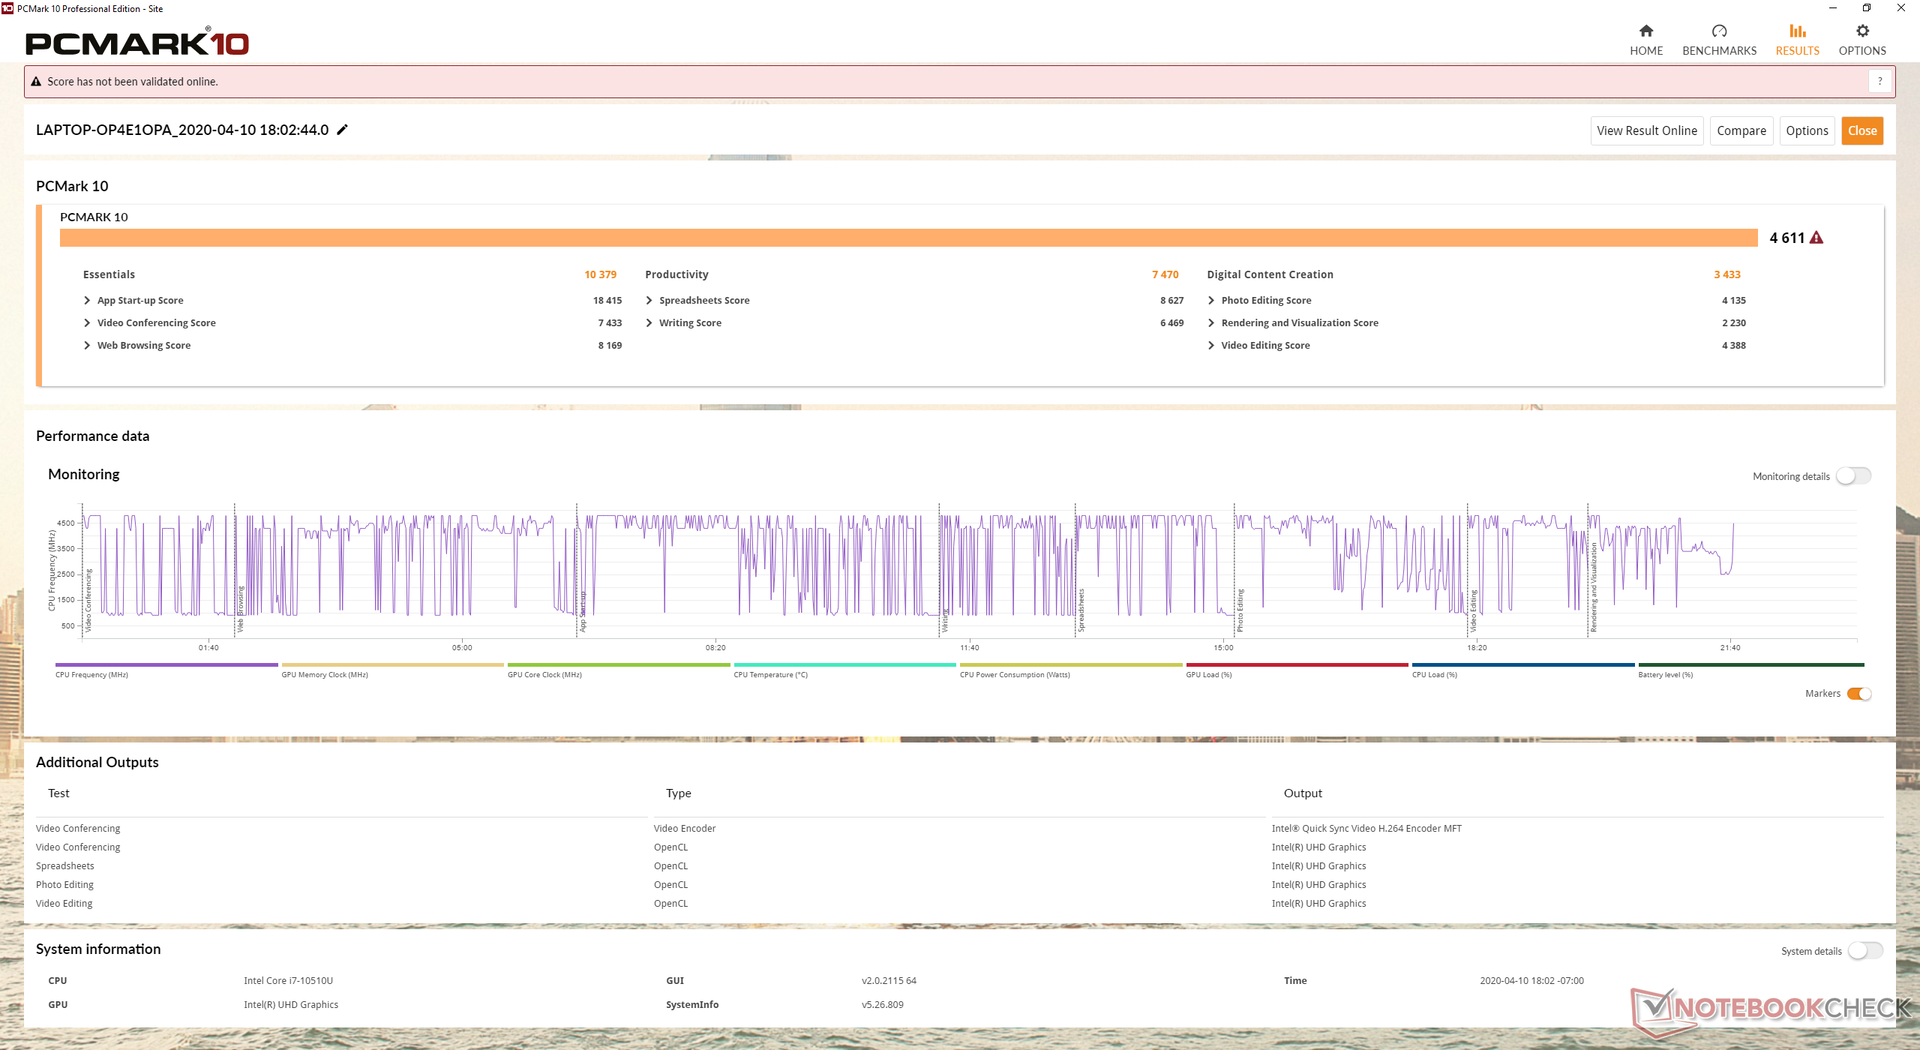
| PCMark 8 Home Score Accelerated v2 | 3674 points | |
| PCMark 8 Work Score Accelerated v2 | 5059 points | |
| PCMark 10 Score | 4611 points | |
Help | ||
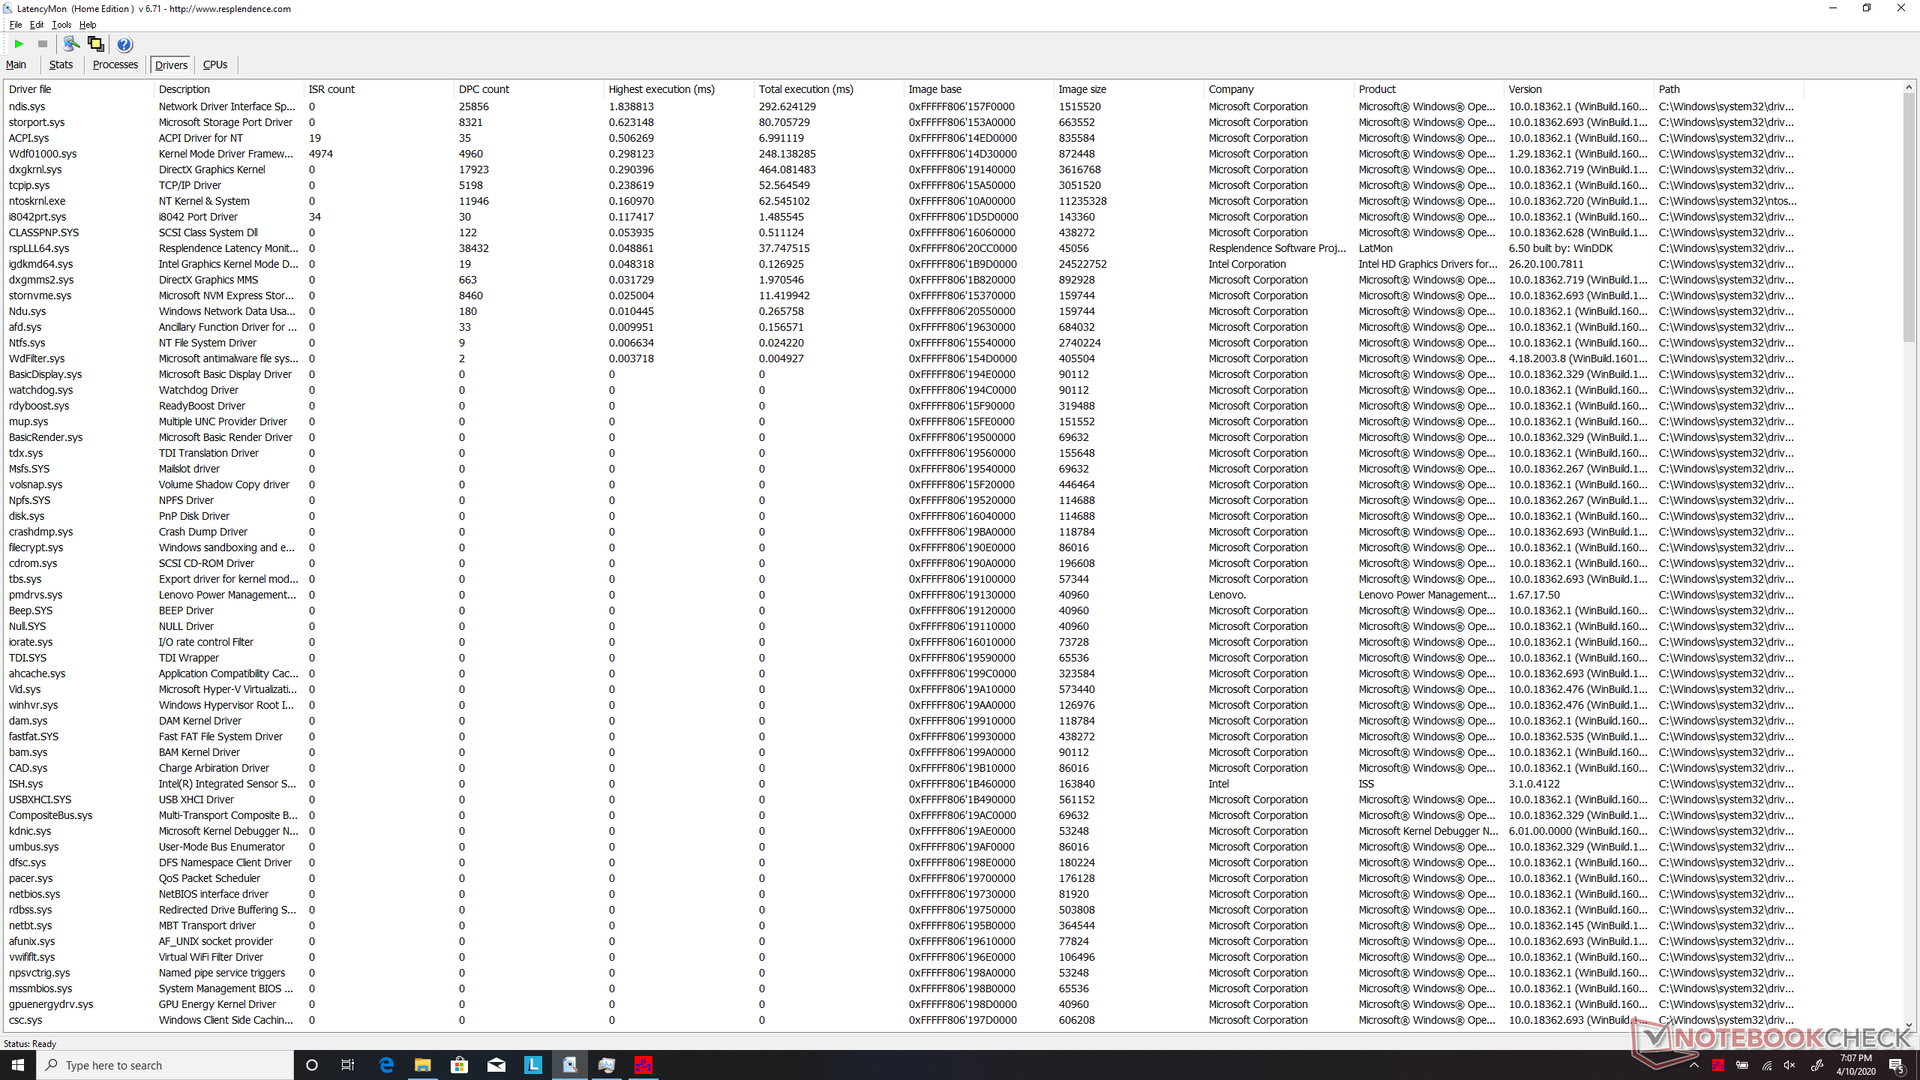
DPC Latency
The system exhibits DPC latency issues when opening multiple tabs, playing 4K video, and running Prime95 in sequence. Nonetheless, 4K video will play smoothly with no dropped frames.
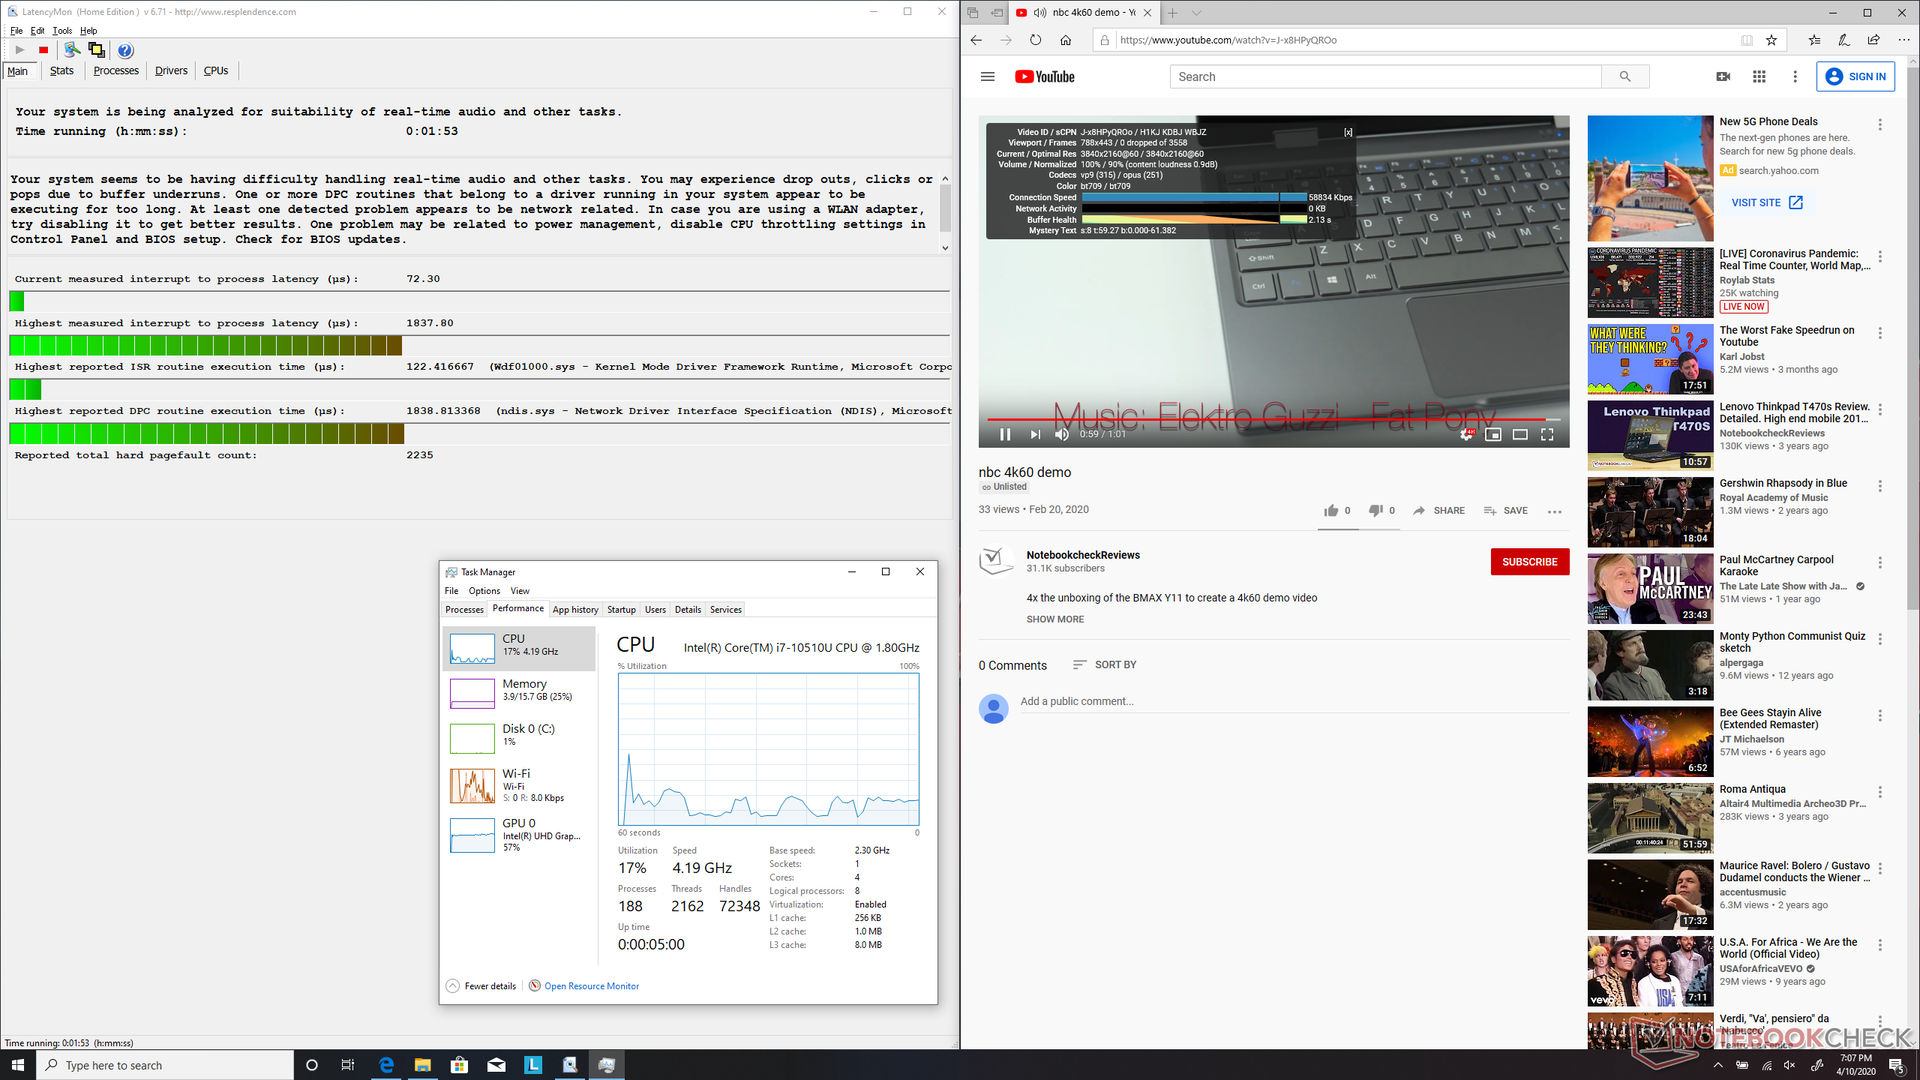
| DPC Latencies / LatencyMon - interrupt to process latency (max), Web, Youtube, Prime95 | |
| Lenovo ThinkPad X1 Yoga 20SA000GUS | |
* ... smaller is better
Storage Devices
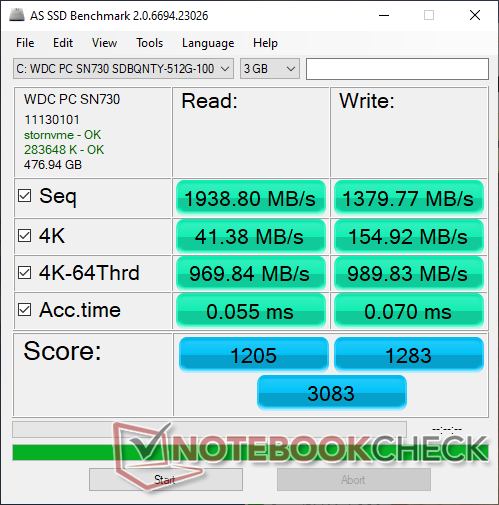
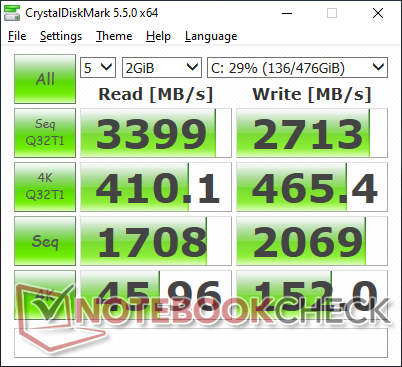
Our test unit comes with the same 512 GB Western Digital SN730 SDBQNTY NVMe drive as found on our recent ThinkPad X1 Carbon. Unsurprisingly, their AS SSD and CrystalDiskMark results are also quite similar between them. There is no guarantee that all ThinkPad X1 Yoga SKUs will come with drives from WD as Lenovo sources drives from multiple suppliers.
See our table of HDDs and SSDs for more benchmark comparisons.
| Lenovo ThinkPad X1 Yoga 20SA000GUS WDC PC SN730 SDBQNTY-512GB | HP Elitebook x360 1040 G5 Samsung SSD PM981 MZVLB512HAJQ | Lenovo ThinkPad X1 Carbon G7 20R1-000YUS WDC PC SN730 SDBPNTY-512G | Dell Latitude 7400 2-in-1 Toshiba XG6 KXG60ZNV512G | Lenovo ThinkPad X1 Yoga 2017 20JES03T00 Samsung SSD PM961 1TB M.2 PCIe 3.0 x4 NVMe (MZVLW1T0) | |
|---|---|---|---|---|---|
| AS SSD | 8% | -9% | -53% | 36% | |
| Seq Read (MB/s) | 1939 | 1816 -6% | 1786 -8% | 2289 18% | 2783 44% |
| Seq Write (MB/s) | 1380 | 1270 -8% | 1259 -9% | 1163 -16% | 1734 26% |
| 4K Read (MB/s) | 41.38 | 46.25 12% | 45.86 11% | 22.29 -46% | 56.4 36% |
| 4K Write (MB/s) | 154.9 | 104.1 -33% | 147.9 -5% | 28.92 -81% | 158.1 2% |
| 4K-64 Read (MB/s) | 970 | 1342 38% | 885 -9% | 415.6 -57% | 2140 121% |
| 4K-64 Write (MB/s) | 990 | 1209 22% | 950 -4% | 199.5 -80% | 1196 21% |
| Access Time Read * (ms) | 0.055 | 0.043 22% | 0.058 -5% | 0.122 -122% | 0.029 47% |
| Access Time Write * (ms) | 0.07 | 0.035 50% | 0.074 -6% | 0.143 -104% | 0.023 67% |
| Score Read (Points) | 1205 | 1569 30% | 1110 -8% | 667 -45% | 2475 105% |
| Score Write (Points) | 1283 | 1440 12% | 1224 -5% | 345 -73% | 1527 19% |
| Score Total (Points) | 3083 | 3790 23% | 2885 -6% | 1300 -58% | 5215 69% |
| Copy ISO MB/s (MB/s) | 2074 | 2034 -2% | 1384 -33% | 1767 -15% | 1807 -13% |
| Copy Program MB/s (MB/s) | 630 | 450.3 -29% | 525 -17% | 379.4 -40% | 444.3 -29% |
| Copy Game MB/s (MB/s) | 1326 | 1024 -23% | 1008 -24% | 1055 -20% | 1237 -7% |
| CrystalDiskMark 5.2 / 6 | -6% | 2% | -48% | ||
| Write 4K (MB/s) | 152 | 122.7 -19% | 151.5 0% | 35.06 -77% | |
| Read 4K (MB/s) | 45.96 | 46.57 1% | 45.83 0% | 23.64 -49% | |
| Write Seq (MB/s) | 2069 | 1725 -17% | 2060 0% | 1537 -26% | |
| Read Seq (MB/s) | 1708 | 2392 40% | 1973 16% | 1782 4% | |
| Write 4K Q32T1 (MB/s) | 465.4 | 470.6 1% | 489.8 5% | 100.3 -78% | |
| Read 4K Q32T1 (MB/s) | 410.1 | 313.2 -24% | 386.2 -6% | 62.7 -85% | |
| Write Seq Q32T1 (MB/s) | 2713 | 1869 -31% | 2703 0% | 2698 -1% | |
| Read Seq Q32T1 (MB/s) | 3399 | 3380 -1% | 3376 -1% | 1073 -68% | |
| Total Average (Program / Settings) | 1% /
3% | -4% /
-5% | -51% /
-51% | 36% /
36% |
* ... smaller is better

GPU Performance
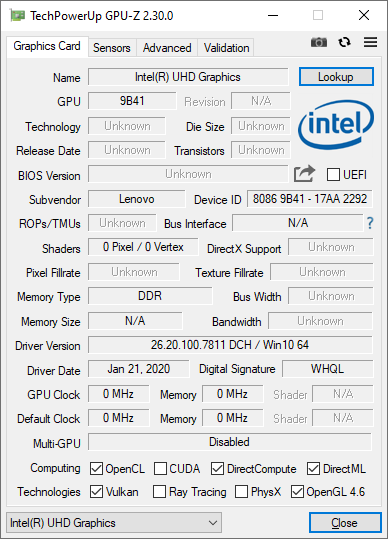
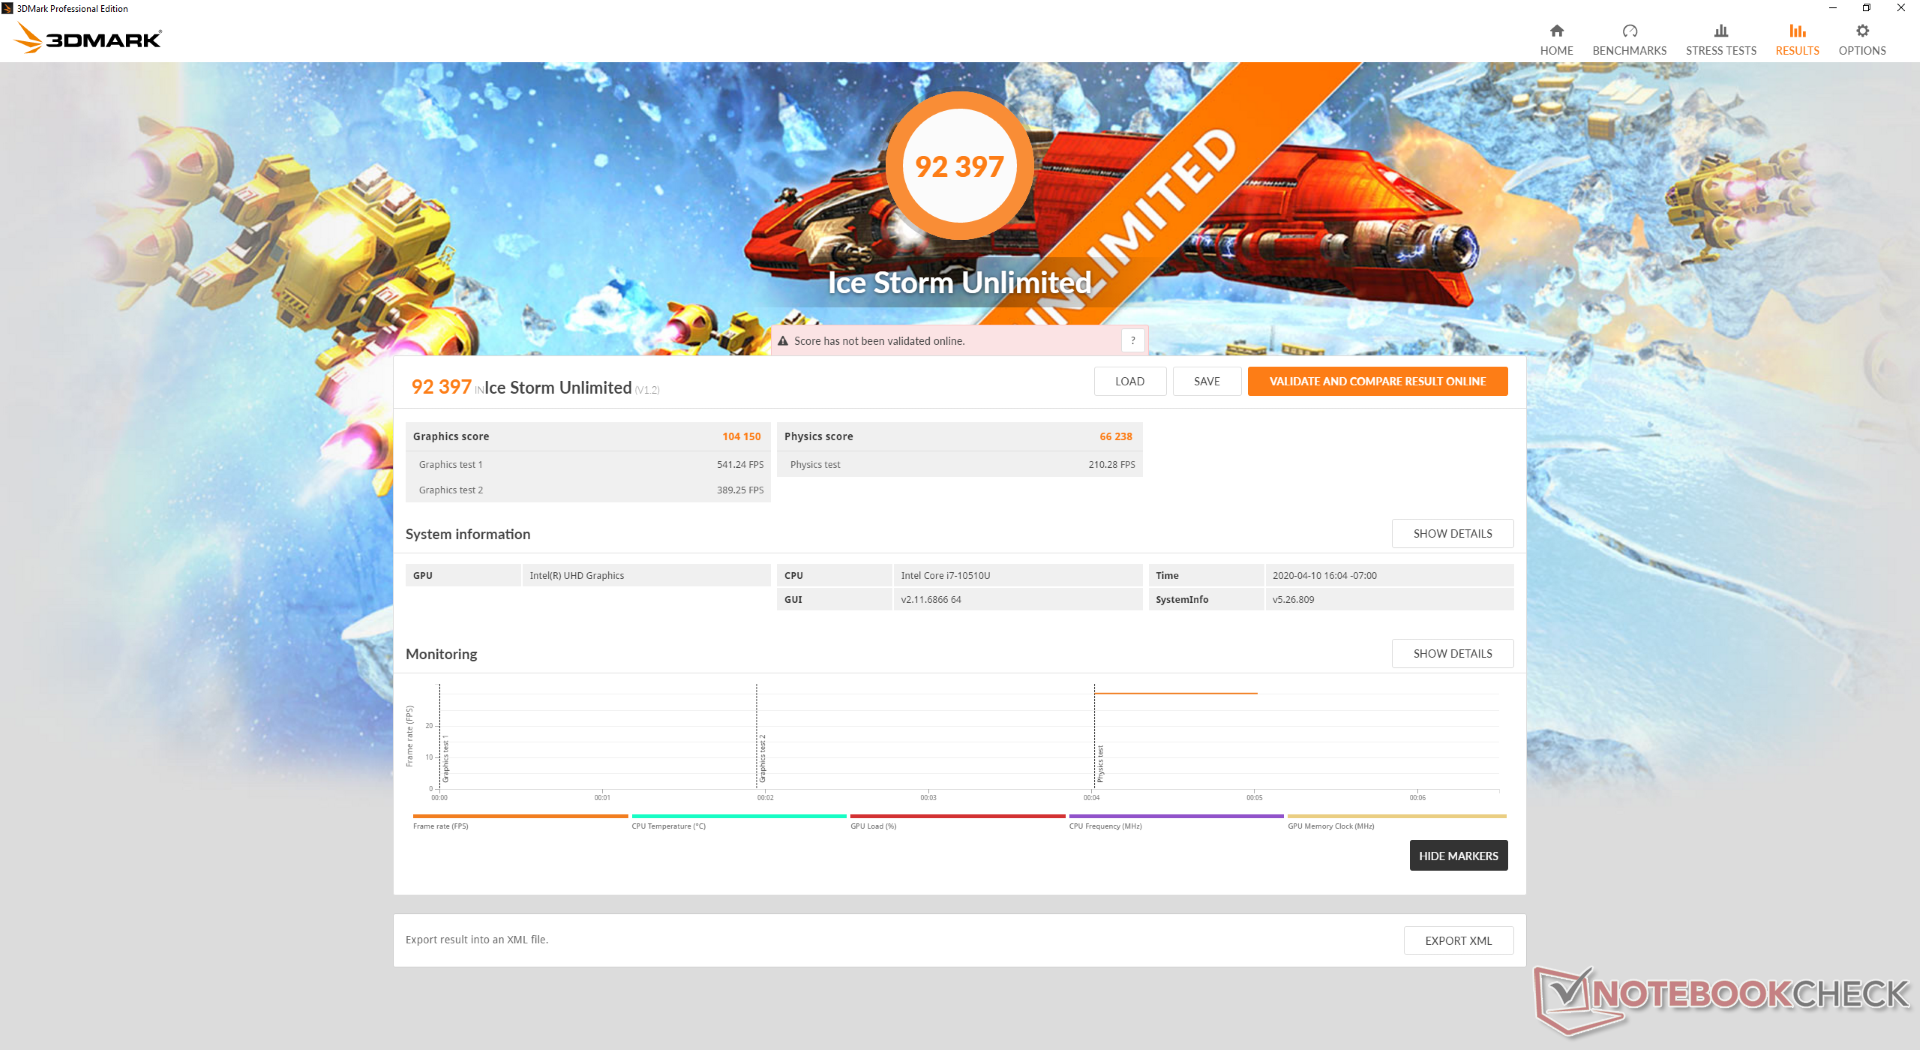
Our integrated UHD Graphics 620 is about 16 to 18 percent faster than the average UHD Graphics 620 in our database taken from over 50 other laptops. Even so, the system is unfit for most games or media editing. For more graphics horsepower, consider laptops with the Ice Lake Core i7-1065G7, Ryzen 7 3700U, or GeForce MX150 or MX250.
See our dedicated page on the UHD Graphics 620 for more technical information and benchmarks.
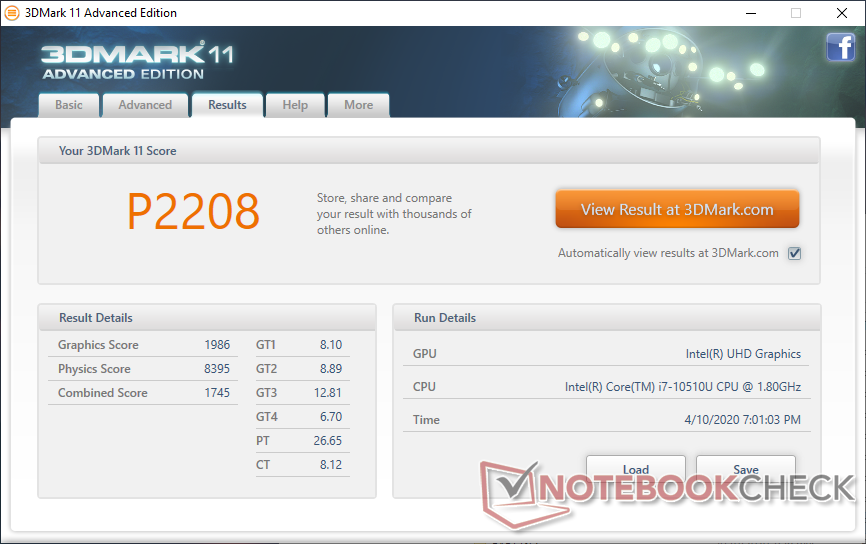
| 3DMark 11 Performance | 2208 points | |
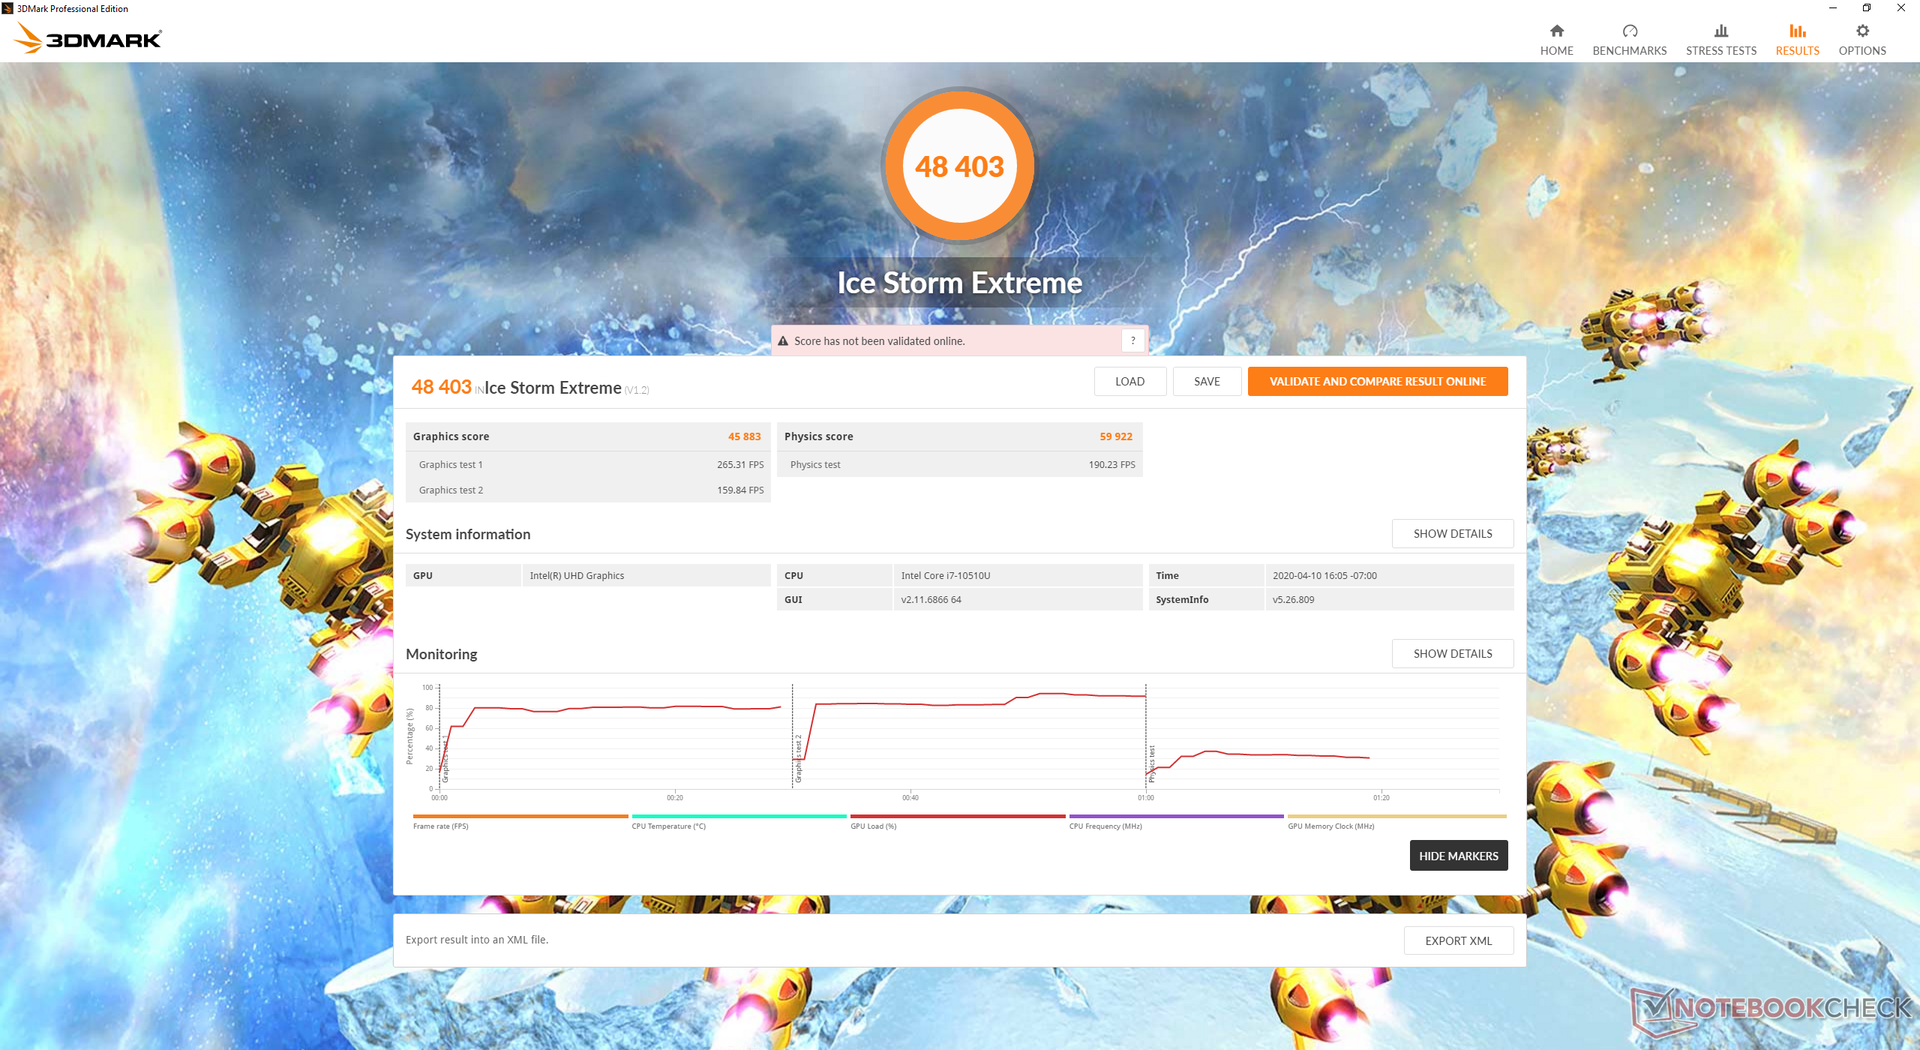
| 3DMark Ice Storm Standard Score | 70296 points | |
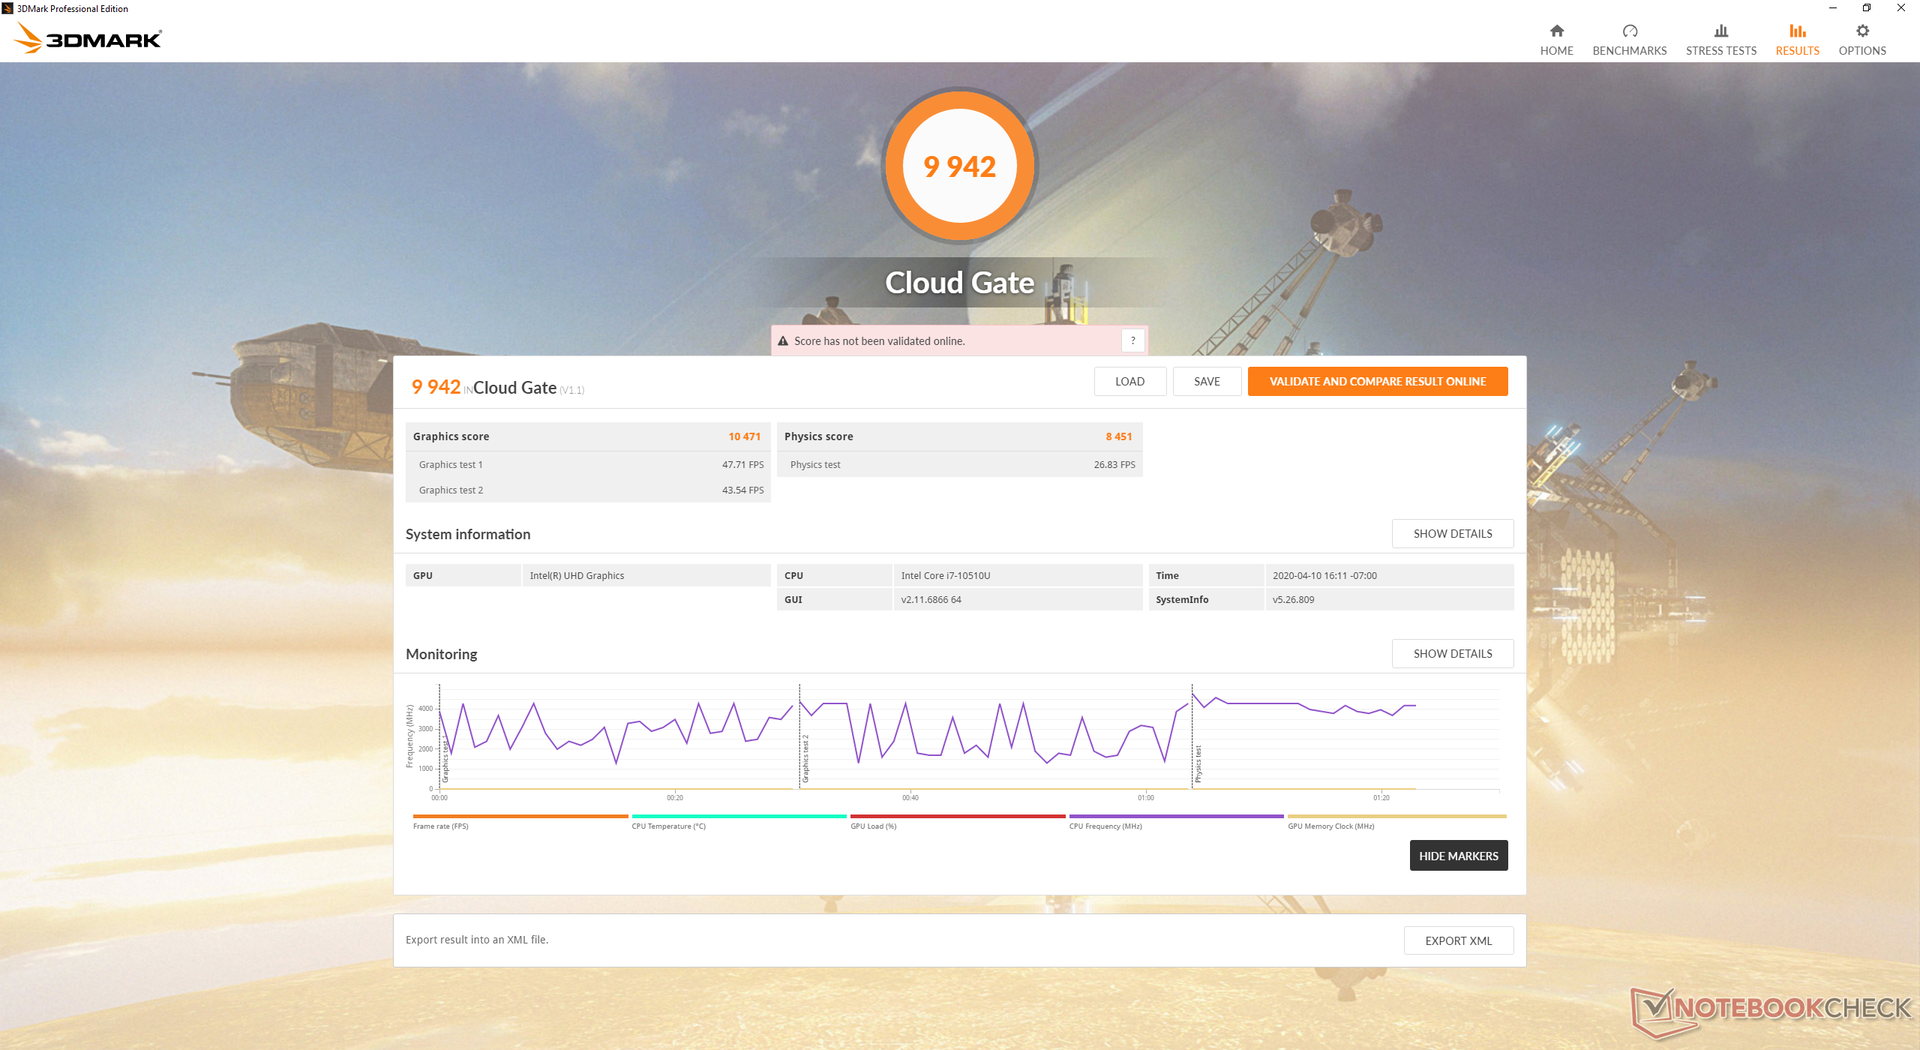
| 3DMark Cloud Gate Standard Score | 9942 points | |
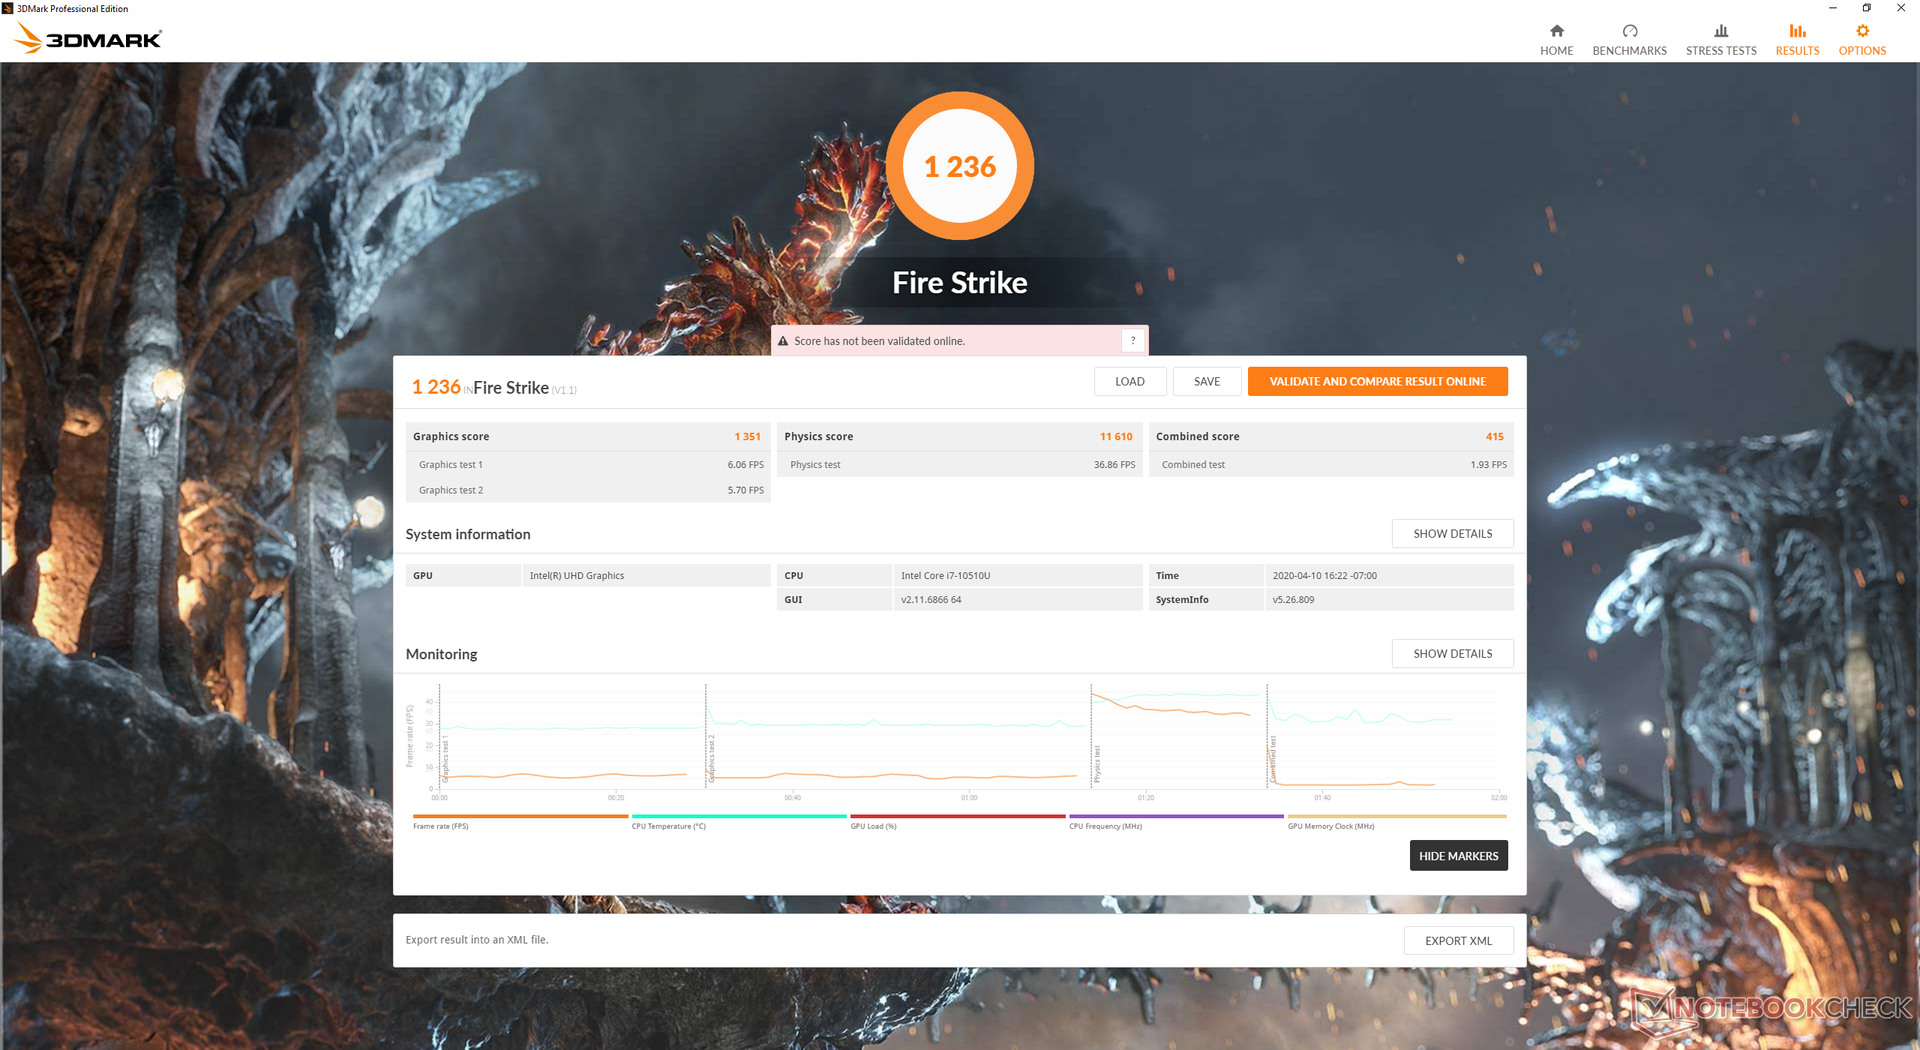
| 3DMark Fire Strike Score | 1236 points | |
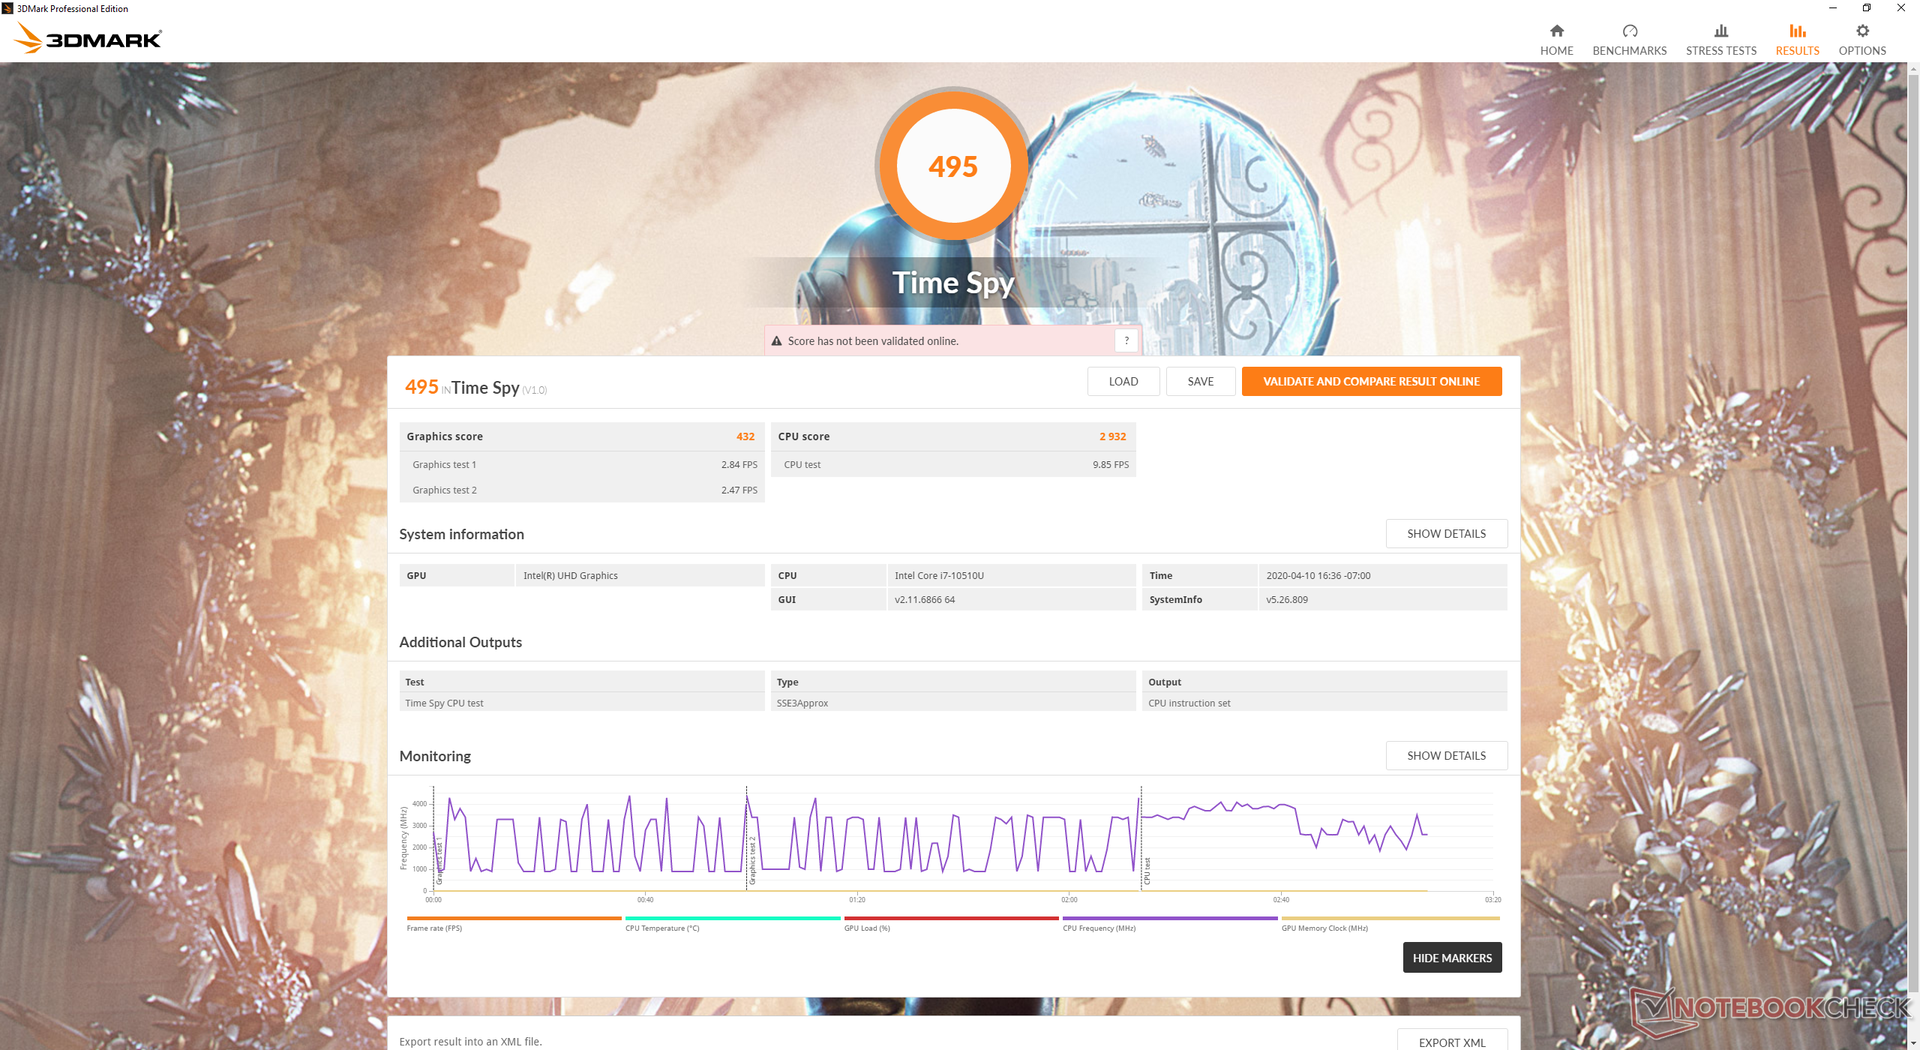
| 3DMark Time Spy Score | 495 points | |
Help | ||
| low | med. | high | ultra | |
|---|---|---|---|---|
| The Witcher 3 (2015) | 16 | |||
| Dota 2 Reborn (2015) | 78.2 | 52.6 | 22.4 | 19.9 |
| X-Plane 11.11 (2018) | 12.2 | 10.6 | 9.46 |
Emissions
System Noise
The fan will idle when running low loads on the Power Saver or Balanced profile. When on High Performance, the fan kicks into gear at just 29.3 dB(A) against a background of 28.4 dB(A) to be essentially unnoticeable when video streaming or conferencing. In fact, the fan is able to maintain this noise level throughout the entire first benchmark scene of 3DMark 06 for a quiet experience overall not unlike what we found on the ThinkPad X1 Carbon or older ThinkPad X1 Yoga systems.
At worst, we're able to record a fan noise of 38.2 to 39.2 dB(A) when running Prime95. Fan RPM remains constant despite the fact that CPU clock rates will fluctuate when under such conditions.
We can notice no electronic noise or coil whine from our test unit.
| Lenovo ThinkPad X1 Yoga 20SA000GUS UHD Graphics 620, i7-10510U, WDC PC SN730 SDBQNTY-512GB | HP Elitebook x360 1040 G5 UHD Graphics 620, i7-8650U, Samsung SSD PM981 MZVLB512HAJQ | Lenovo ThinkPad X1 Carbon G7 20R1-000YUS UHD Graphics 620, i7-10510U, WDC PC SN730 SDBPNTY-512G | Dell Latitude 7400 2-in-1 UHD Graphics 620, i7-8665U, Toshiba XG6 KXG60ZNV512G | Asus ZenBook Flip 14 UM462DA-AI023T Vega 10, R7 3700U | Lenovo ThinkPad X1 Yoga 2017 20JES03T00 HD Graphics 620, i7-7600U, Samsung SSD PM961 1TB M.2 PCIe 3.0 x4 NVMe (MZVLW1T0) | |
|---|---|---|---|---|---|---|
| Noise | -1% | -2% | 6% | -6% | -8% | |
| off / environment * (dB) | 28.4 | 28.3 -0% | 28.2 1% | 28.2 1% | 30 -6% | 29.3 -3% |
| Idle Minimum * (dB) | 28.4 | 28.3 -0% | 28.2 1% | 28.2 1% | 30 -6% | 29.3 -3% |
| Idle Average * (dB) | 28.4 | 28.3 -0% | 28.2 1% | 28.2 1% | 30 -6% | 31.1 -10% |
| Idle Maximum * (dB) | 29.3 | 28.3 3% | 29.4 -0% | 28.3 3% | 30 -2% | 33.3 -14% |
| Load Average * (dB) | 29.3 | 32.6 -11% | 31.5 -8% | 28.2 4% | 34.2 -17% | 33.3 -14% |
| Load Maximum * (dB) | 38.2 | 36.6 4% | 41.2 -8% | 28.8 25% | 37.5 2% | 38.9 -2% |
* ... smaller is better
Noise level
| Idle |
| 28.4 / 28.4 / 29.3 dB(A) |
| Load |
| 29.3 / 38.2 dB(A) |
 | ||
30 dB silent 40 dB(A) audible 50 dB(A) loud |
||
min: | ||
Temperature
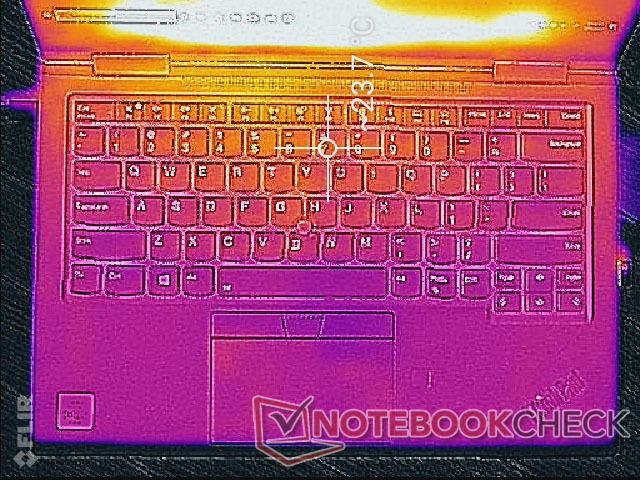
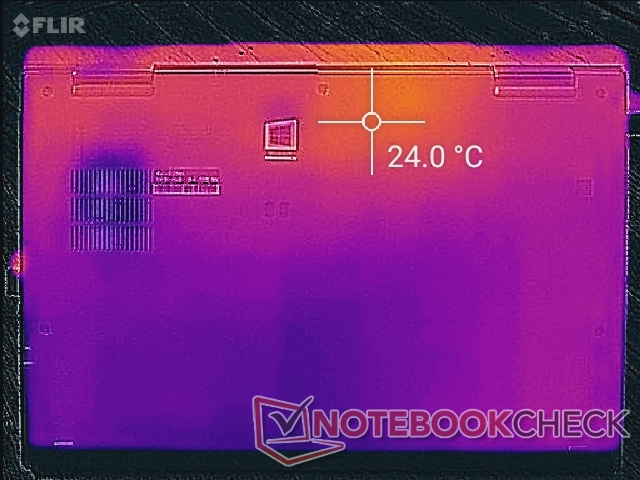
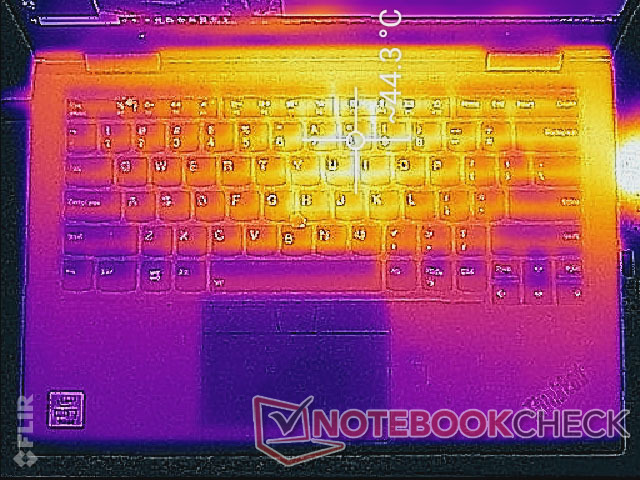
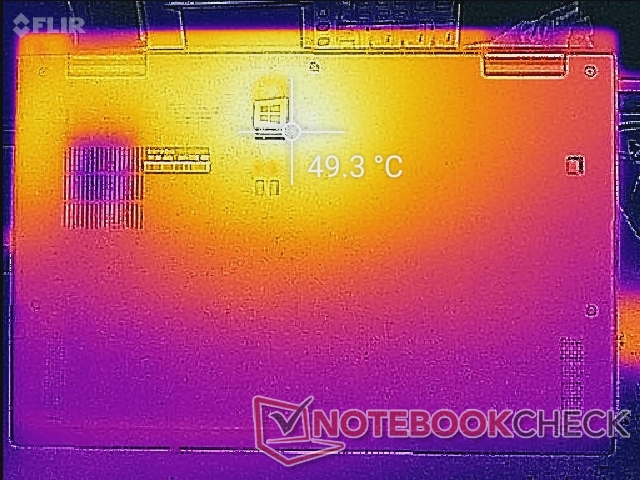
Surface temperatures are flat when idling while extreme loads can cause hot spots of 44 C to 50 C. Results are cooler than what we recorded on the Dell Latitude 7400 2-in-1 while being warmer than the HP EliteBook x360 1040 when subjected to similar loads. Perhaps some larger ventilation grilles on the bottom panel could have reduced surface temperatures even further. The convertible never becomes uncomfortably warm to to use since the hot spots are toward the rear of the system and not on the palm rests as shown by the temperature maps below.
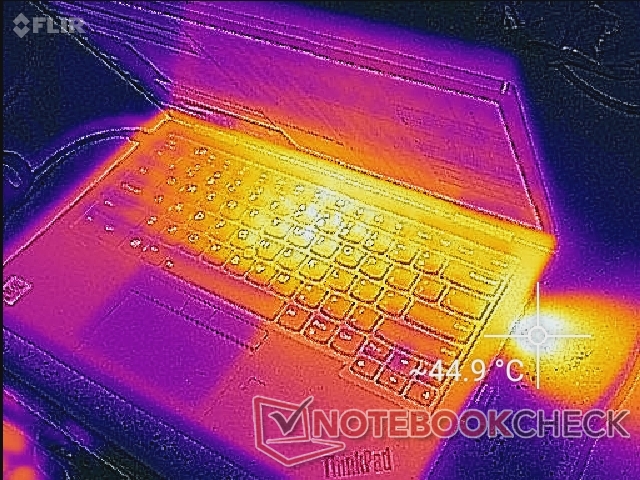
(±) The maximum temperature on the upper side is 42.4 °C / 108 F, compared to the average of 35.4 °C / 96 F, ranging from 19.6 to 60 °C for the class Convertible.
(-) The bottom heats up to a maximum of 49.4 °C / 121 F, compared to the average of 36.9 °C / 98 F
(+) In idle usage, the average temperature for the upper side is 23 °C / 73 F, compared to the device average of 30.3 °C / 87 F.
(+) The palmrests and touchpad are reaching skin temperature as a maximum (32.6 °C / 90.7 F) and are therefore not hot.
(-) The average temperature of the palmrest area of similar devices was 28 °C / 82.4 F (-4.6 °C / -8.3 F).
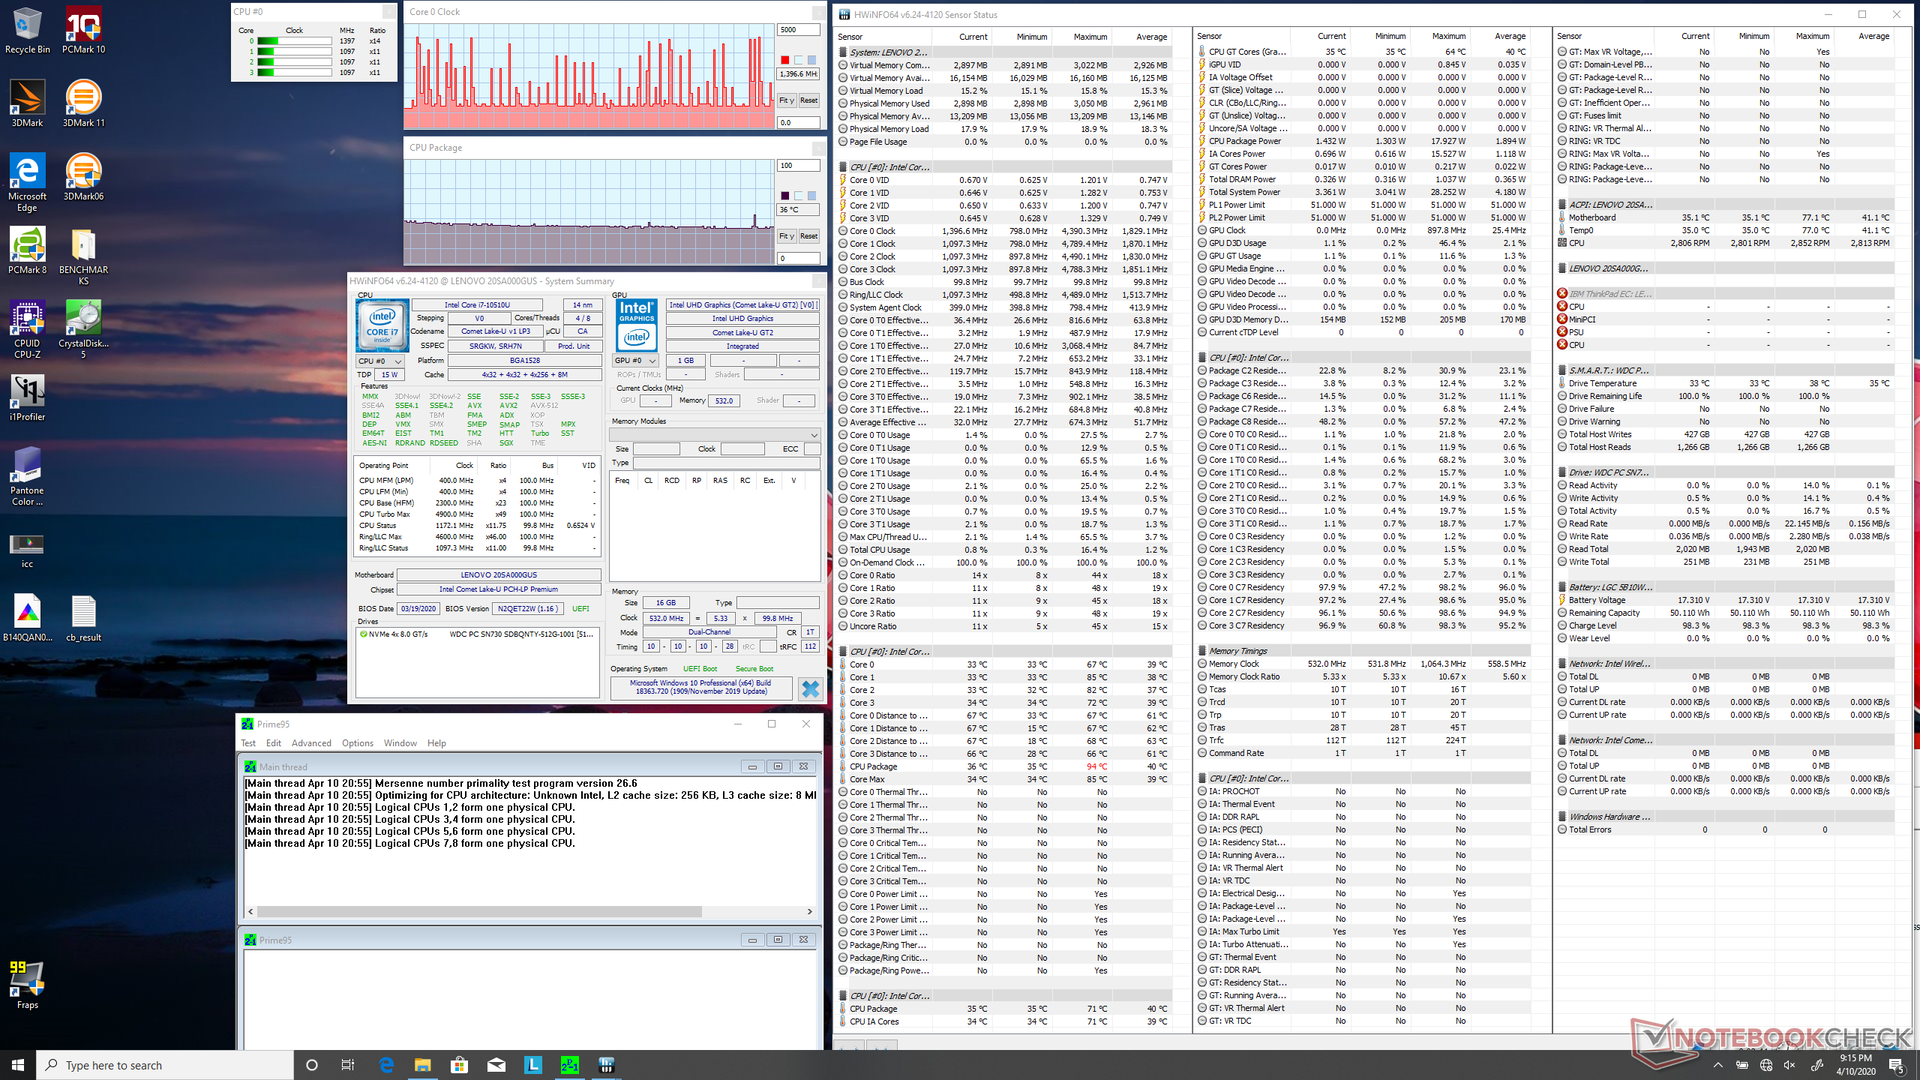
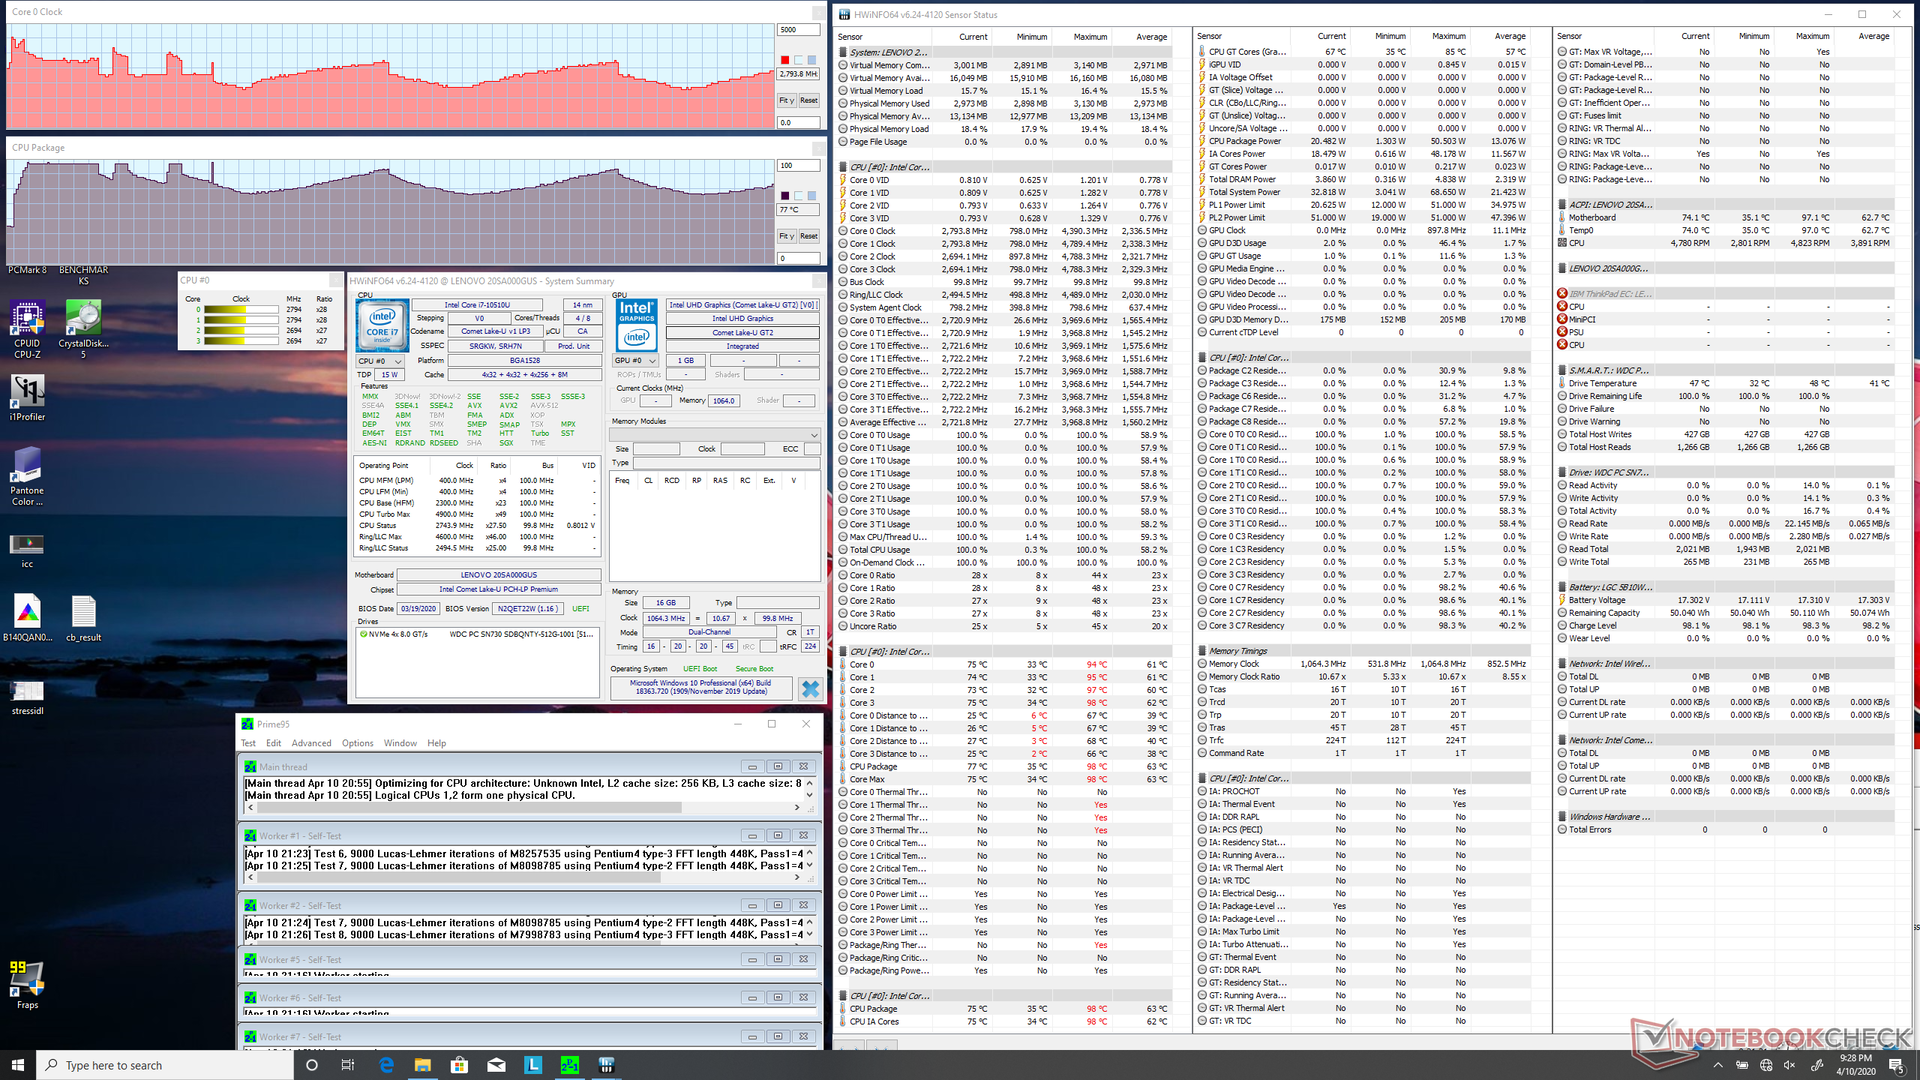
Stress Test
We stress the system to identify for any potential throttling or stability issues. When under Prime95 stress, the CPU clock rate cycling behavior mentioned earlier can be observed. Clock rates would boost up to 4.2 GHz for the first few seconds until hitting a core temperature of 97 C. Thereafter, clock rates eventually cycle indefinitely between 2.0 GHz and 3.2 GHz with a cycling core temperature of 69 C to 92 C. This behavior is unlike most other laptops where CPU clock rates and temperatures are fixed when subjected to such extreme loads. The strategy allows Lenovo to squeeze out more performance from the CPU at short bursts albeit at the cost of more unsteady clock rates over time.
Running on battery power will not limit performance. A 3DMark 11 test on batteries returns similar Physics and Graphics scores as the same test on mains.
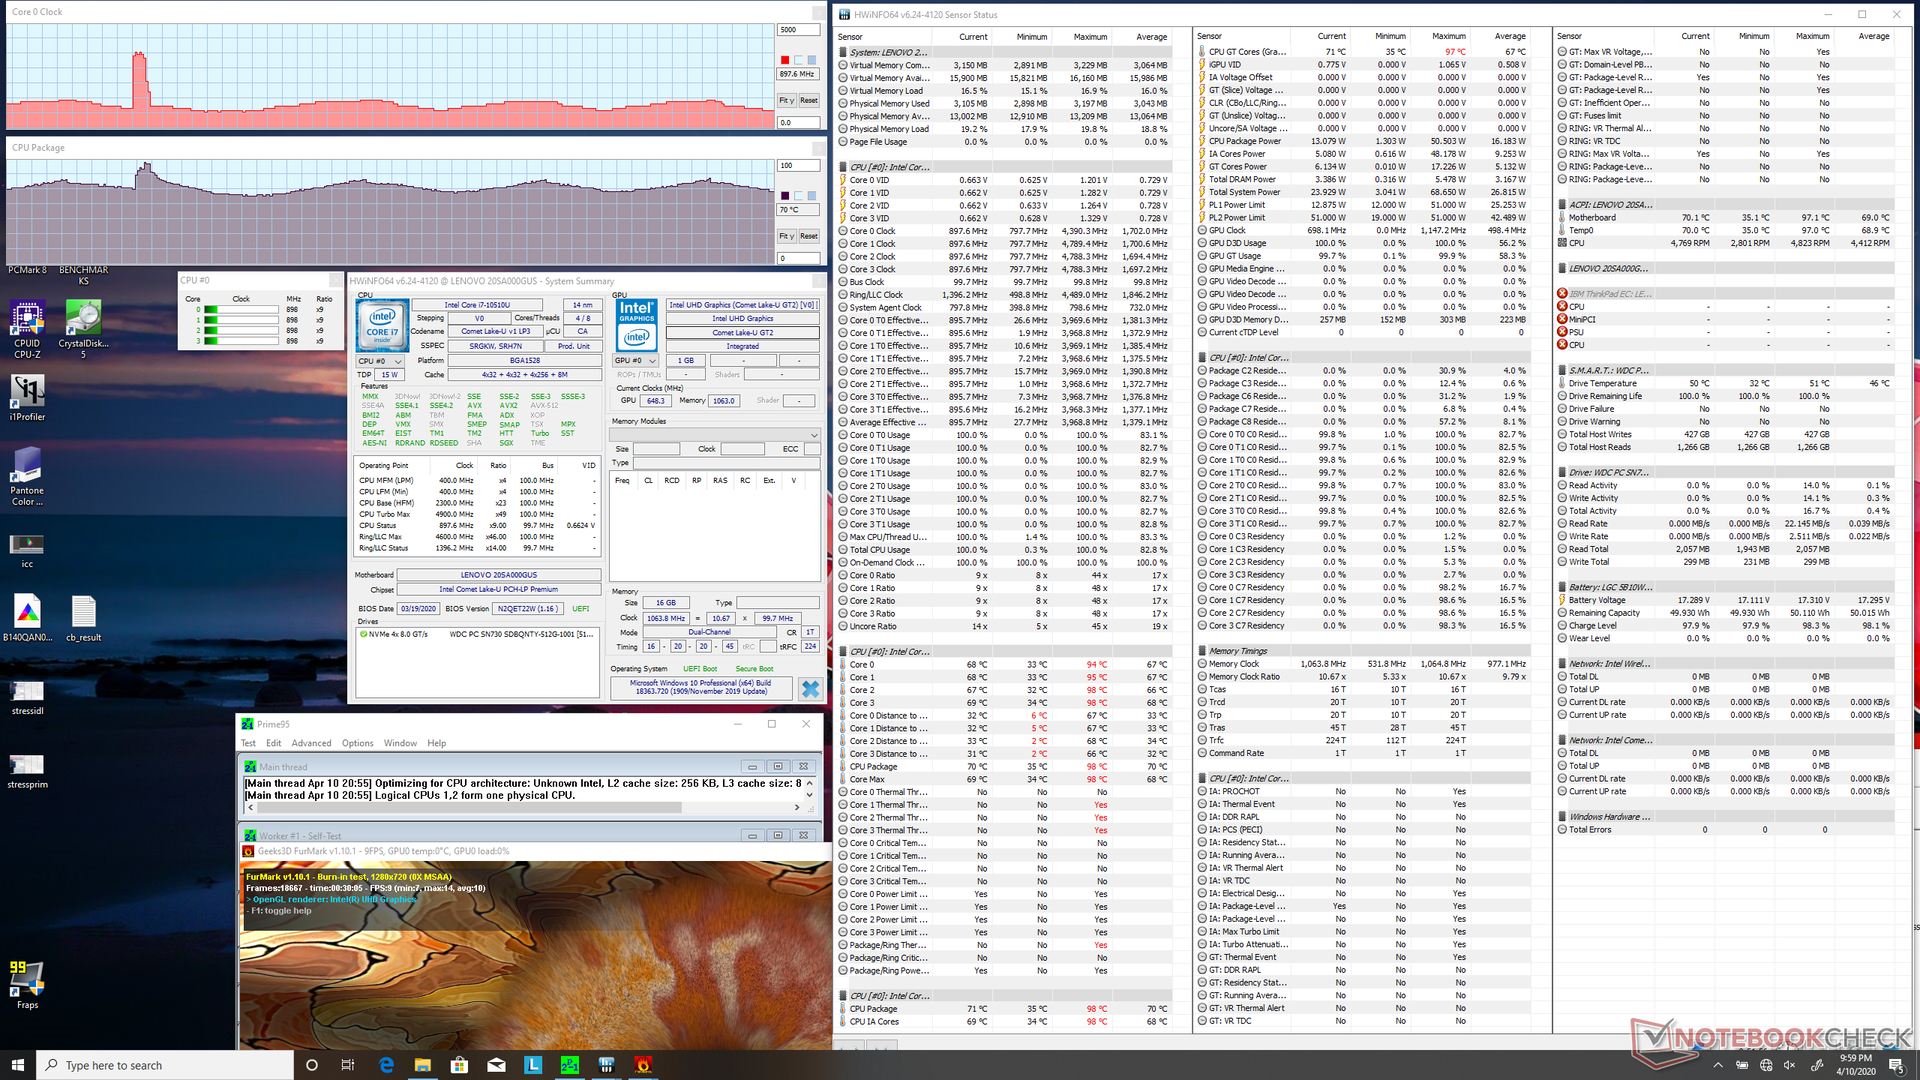
| CPU Clock (GHz) | GPU Clock (MHz) | Average CPU Temperature (°C) | |
| System Idle | -- | -- | 36 |
| Prime95 Stress | 2.0 - 3.2 | -- | 69 - 92 |
| Prime95 + FurMark Stress | 0.9 - 2.4 | -- | 66 - 82 |
Speakers

Pink noise measurements reveal similar sound pressure levels to the ThinkPad X1 Carbon (85.95 dB vs. 85.07 dB) since they share the same speakers. Bass is poor as one might expect from a business laptop, but audio is crisp and loud enough for the occasional video conference. The palm rests will vibrate just slightly to the touch when on the maximum volume setting.
Energy Management
Power Consumption
Idling on desktop demands between 3 W and 7 W compared to 4 W and 14 W on the OLED-equipped 2017 ThinkPad X1 Carbon or 3 W and 13 W on the 4K UHD ThinkPad X1 Carbon. Higher loads like gaming will demand around 43 W to be slightly more than expected for a convertible subnotebook which corroborates with the higher-than-average 3DMark benchmark scores.
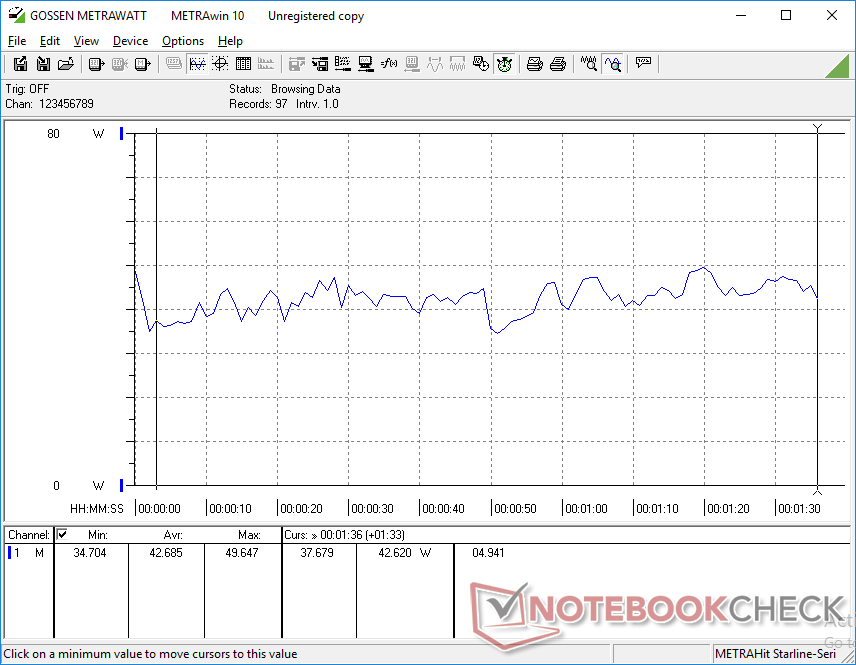
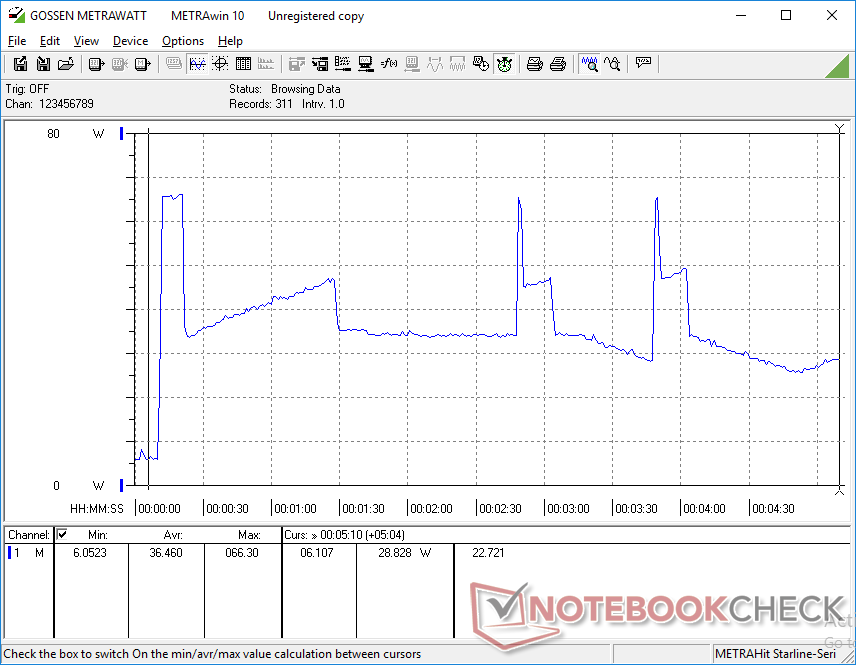
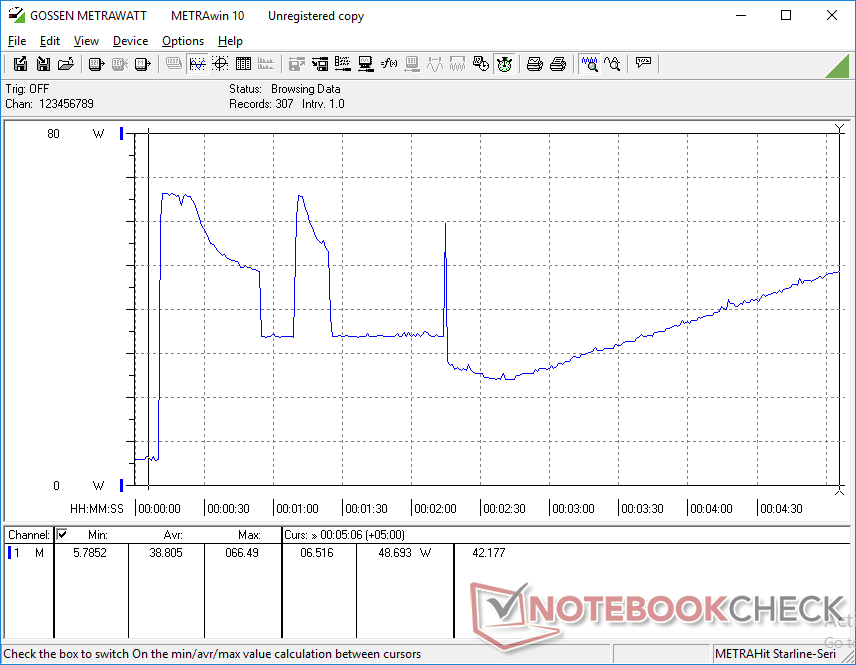
The cycling CPU performance has resulted in cycling and unsteady power consumption as shown by our graphs below. When running Prime95, for example, consumption can be as high as 66.5 W or as low as 25 W within a span of just two minutes.
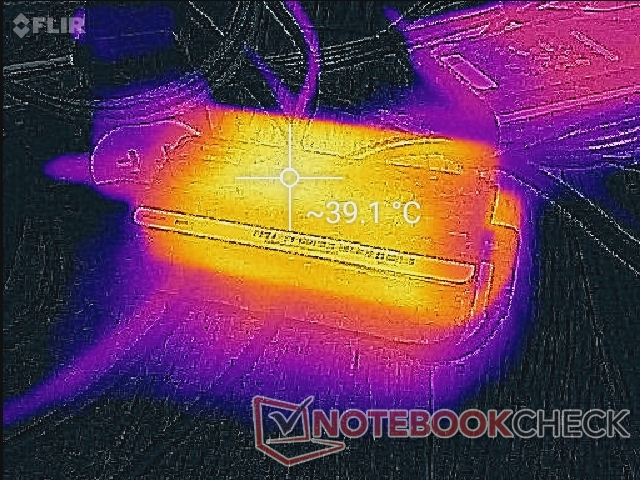
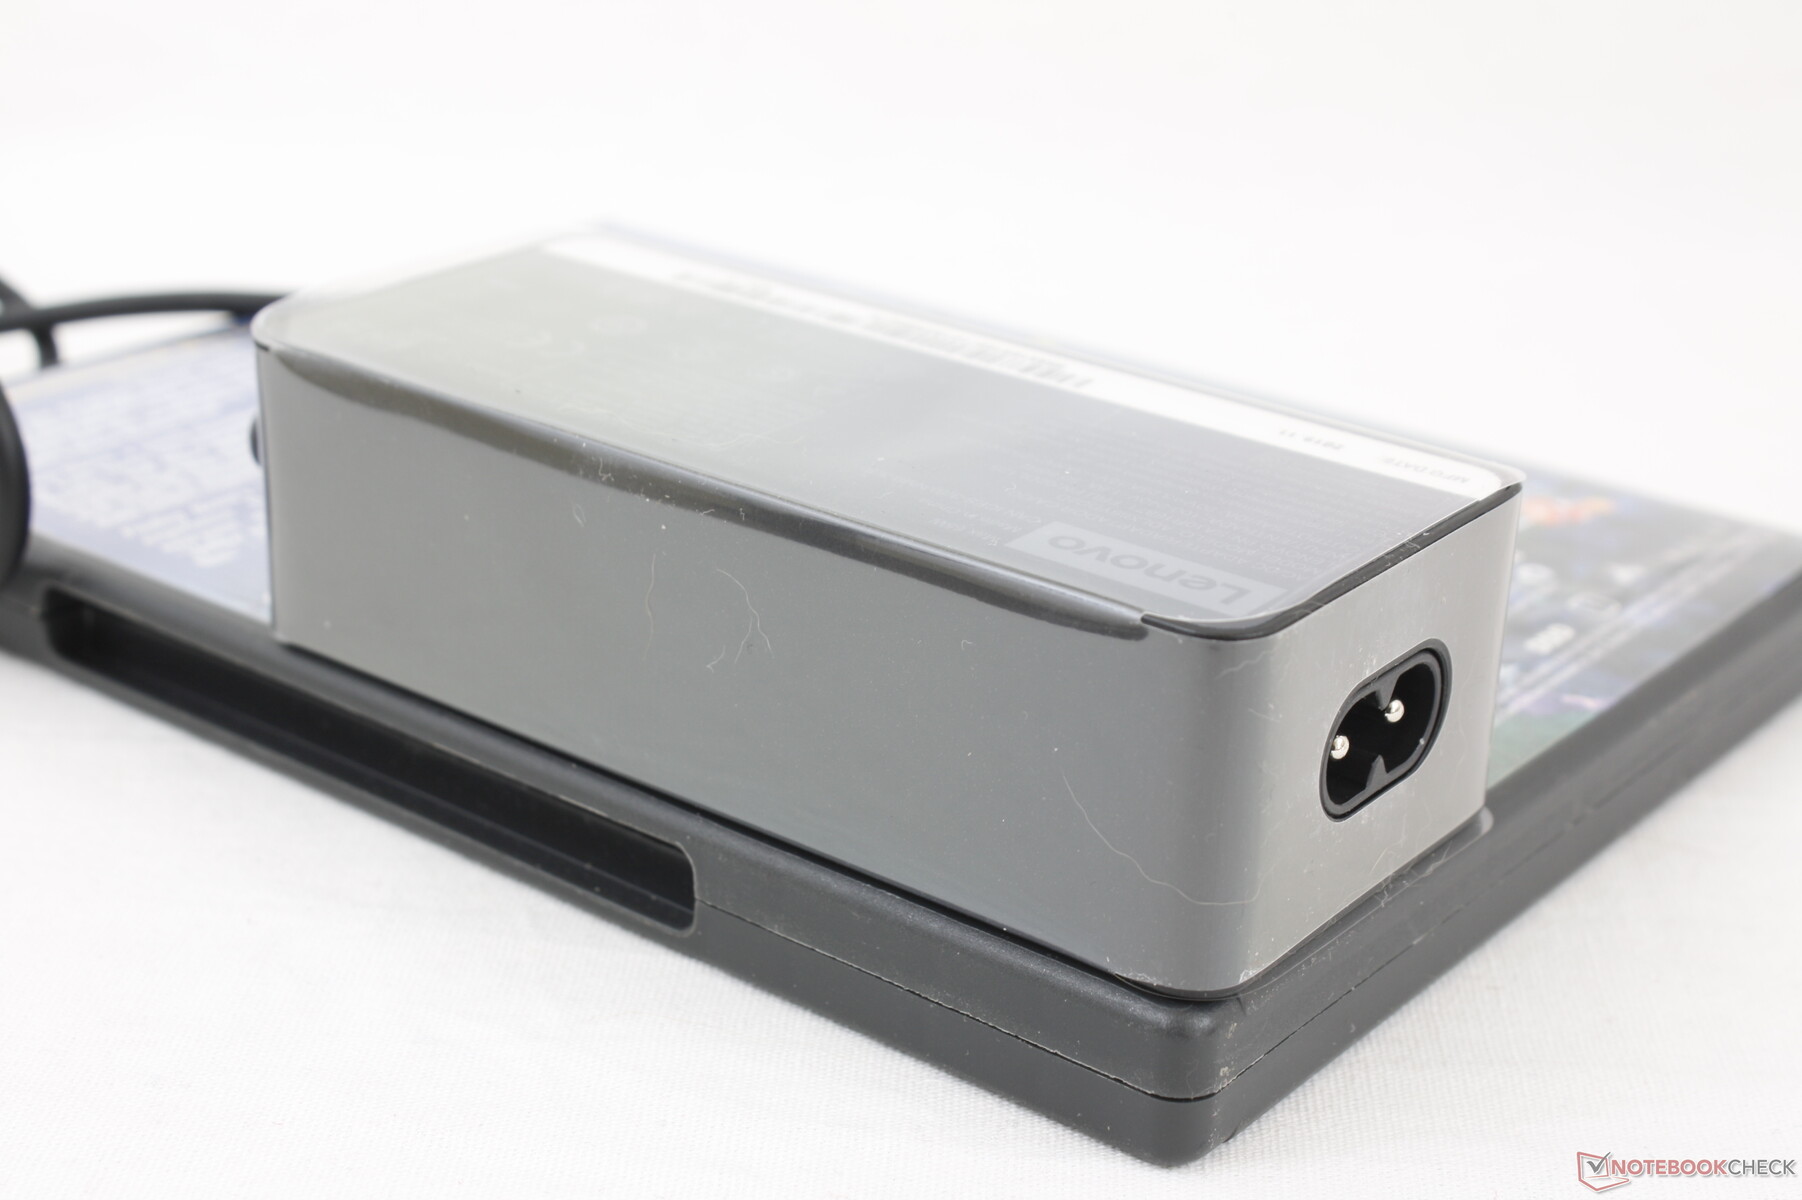
We're able to measure a temporary maximum draw of 66.5 W from the small (~11 x 4.8 x 3 cm) 65 W AC adapter. This AC adapter can be used to charge other USB Type-C devices including laptops and smartphones.
| Off / Standby | |
| Idle | |
| Load |
|
Key:
min: | |
| Lenovo ThinkPad X1 Yoga 20SA000GUS i7-10510U, UHD Graphics 620, WDC PC SN730 SDBQNTY-512GB, IPS, 2560x1440, 14" | HP Elitebook x360 1040 G5 i7-8650U, UHD Graphics 620, Samsung SSD PM981 MZVLB512HAJQ, IPS, 1920x1080, 14" | Lenovo ThinkPad X1 Carbon G7 20R1-000YUS i7-10510U, UHD Graphics 620, WDC PC SN730 SDBPNTY-512G, IPS, 3840x2160, 14" | Dell Latitude 7400 2-in-1 i7-8665U, UHD Graphics 620, Toshiba XG6 KXG60ZNV512G, IPS, 1920x1080, 14" | Asus ZenBook Flip 14 UM462DA-AI023T R7 3700U, Vega 10, , IPS, 1920x1080, 14" | Lenovo ThinkPad X1 Yoga 2017 20JES03T00 i7-7600U, HD Graphics 620, Samsung SSD PM961 1TB M.2 PCIe 3.0 x4 NVMe (MZVLW1T0), OLED, 2560x1440, 14" | |
|---|---|---|---|---|---|---|
| Power Consumption | -7% | -40% | 14% | -4% | -27% | |
| Idle Minimum * (Watt) | 3.5 | 2.7 23% | 3.5 -0% | 2.6 26% | 3.7 -6% | 4.9 -40% |
| Idle Average * (Watt) | 5.6 | 6.5 -16% | 10.8 -93% | 4.3 23% | 6.9 -23% | 7.6 -36% |
| Idle Maximum * (Watt) | 6.5 | 11.5 -77% | 12.5 -92% | 5.5 15% | 9.4 -45% | 13.8 -112% |
| Load Average * (Watt) | 42.7 | 38.7 9% | 47.2 -11% | 32 25% | 34 20% | 33.4 22% |
| Load Maximum * (Watt) | 66.5 | 50.5 24% | 68.8 -3% | 78.8 -18% | 44 34% | 46.5 30% |
* ... smaller is better
Battery Life
WLAN runtime is about 40 to 50 minutes shorter than the ThinkPad X1 Carbon equipped with the more demanding 4K UHD display. Still, having over nine hours of real-world battery life should be more than enough for most daily activities. Recharging from empty to full capacity is fast at about 1.5 hours assuming you update to the latest firmware.
The competing Dell Latitude 7400 2-in-1 is able to last three hours longer than our X1 Yoga largely due to its much higher capacity battery pack.
| Lenovo ThinkPad X1 Yoga 20SA000GUS i7-10510U, UHD Graphics 620, 51 Wh | HP Elitebook x360 1040 G5 i7-8650U, UHD Graphics 620, 56 Wh | Lenovo ThinkPad X1 Carbon G7 20R1-000YUS i7-10510U, UHD Graphics 620, 51 Wh | Dell Latitude 7400 2-in-1 i7-8665U, UHD Graphics 620, 78 Wh | Asus ZenBook Flip 14 UM462DA-AI023T R7 3700U, Vega 10, 42 Wh | Lenovo ThinkPad X1 Yoga 2017 20JES03T00 i7-7600U, HD Graphics 620, 56 Wh | |
|---|---|---|---|---|---|---|
| Battery runtime | 49% | 9% | 33% | -18% | -14% | |
| Reader / Idle (h) | 19.9 | 27.9 40% | 13.1 -34% | |||
| WiFi v1.3 (h) | 9.2 | 10.4 13% | 10 9% | 12.2 33% | 7.5 -18% | 6.1 -34% |
| Load (h) | 1.6 | 3.1 94% | 2 25% |
Pros
Cons
Verdict

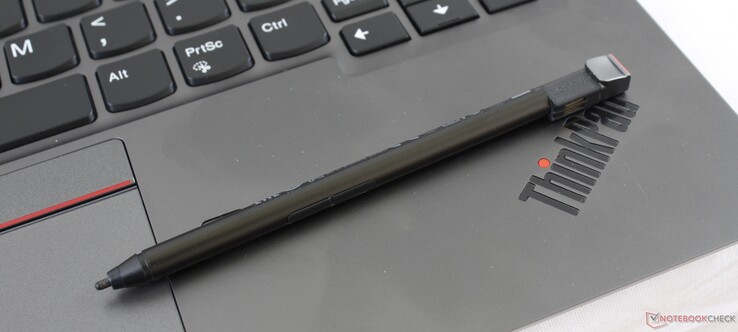
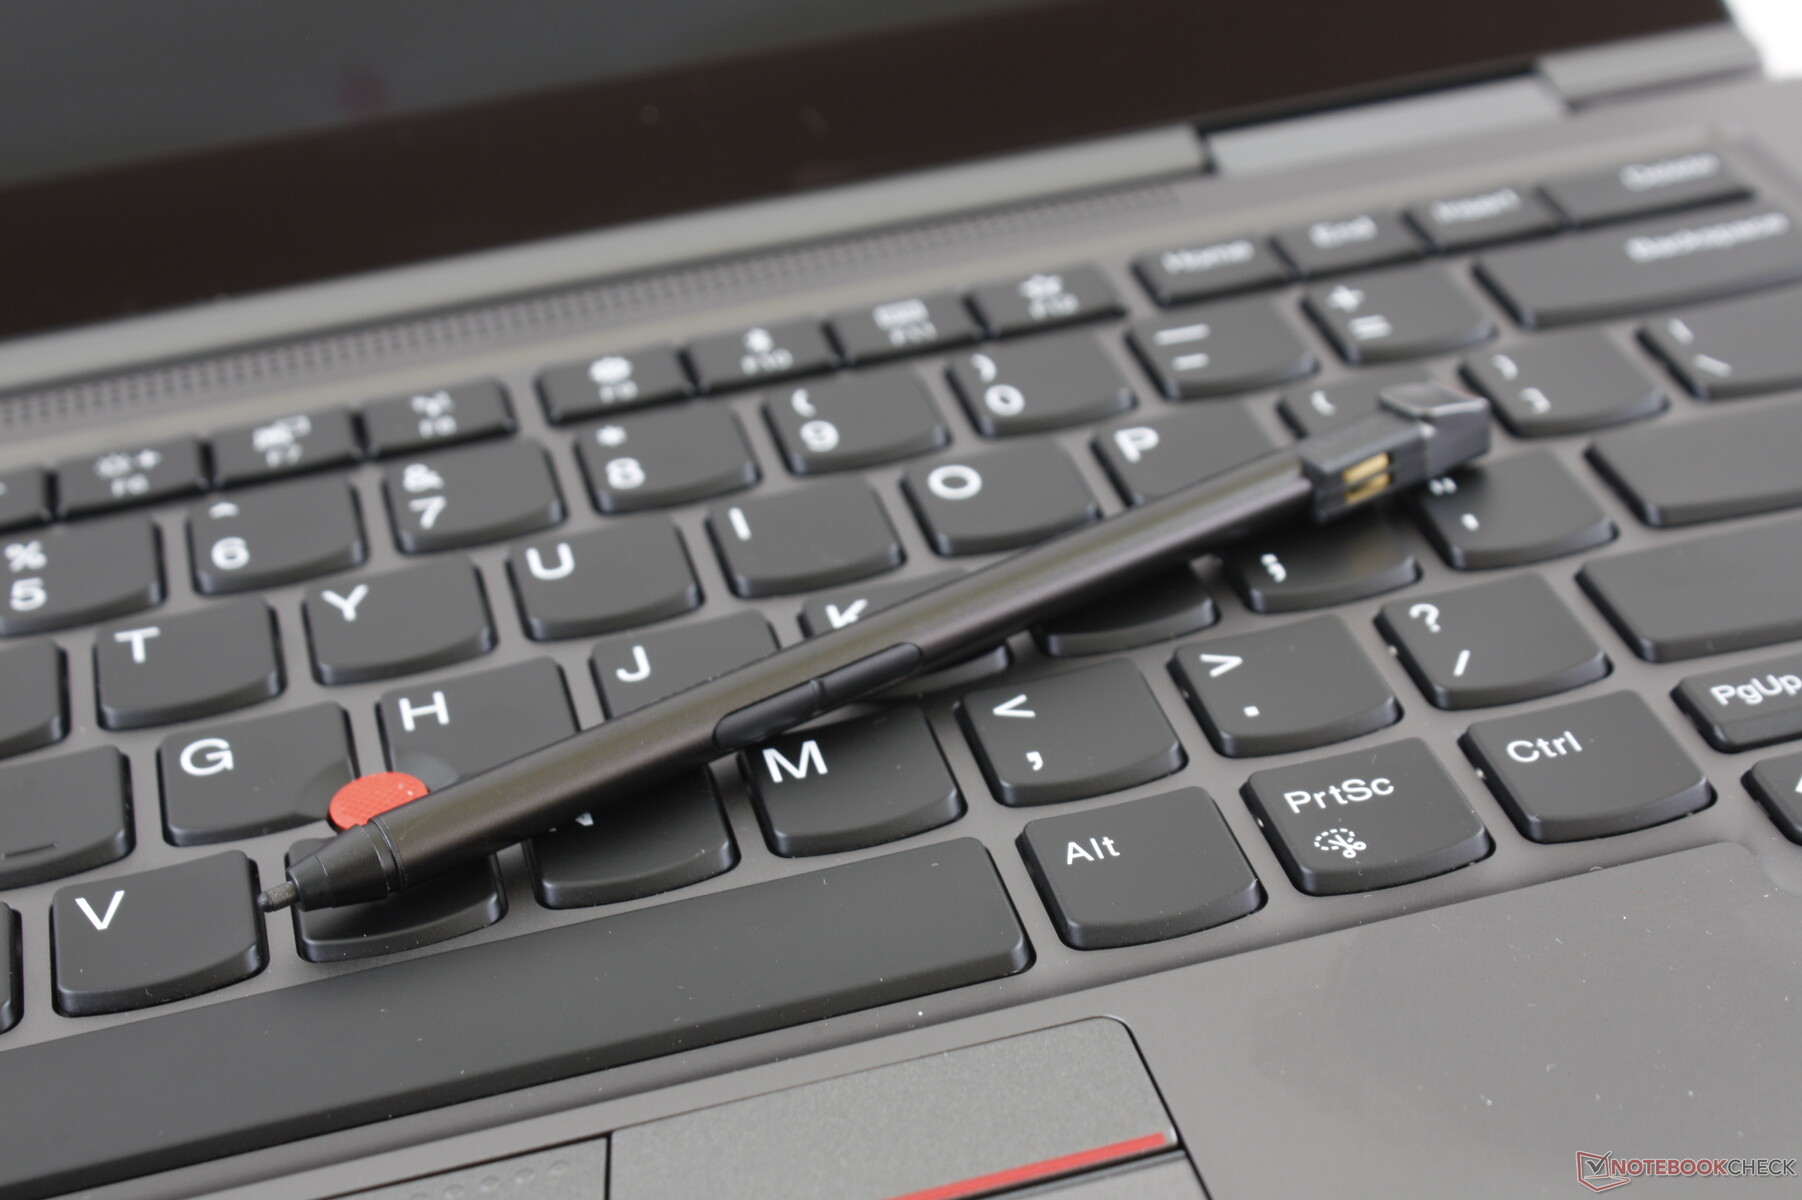
If you already own a 2019 Whiskey Lake-U model, then there is little reason to jump aboard the Comet Lake-U model as it is only a minor year-over-year performance refresh. If you're an owner of a much older business laptop, however, then now would be a great time to consider the ThinkPad convertible. Its wide port selection, long battery life, comfortable keyboard, integrated stylus, optional WAN, and low weight make it almost perfect for word processing and office work while traveling.
We have to say "almost perfect" because the system has two major drawbacks. The first is display brightness as the 300-nit panel is half as bright as other flagships from Dell, Apple, Samsung, or HP. You'll find yourself squinting through a lot of glare if you plan on using the system outdoors. Lenovo offers a brighter 500-nit option which will cost you extra. Secondly, GPU performance is lackluster. While we're not expecting top-tier graphics from a business convertible, the UHD Graphics 620 has become outdated in the face of AMD Ryzen and Ice Lake alternatives. Video or graphic editors will have to give up the 2-in-1 form factor for a traditional Lenovo ThinkPad T490 (i7, MX250, Low Power FHD) Laptop ReviewLenovo ThinkPad T490s (i5, Low Power FHD) Laptop ReviewThinkPad T490/T495 instead where GeForce and Radeon options are available.
For future models, we would like to see Wi-Fi 6, 600 to 1000 nit panel options, a smaller chin bezel, a thicker stylus for easier gripping, AMD Ryzen 4000U options, and even a 16:10 display. These features would make the ThinkPad X1 Yoga an easier recommendation over competitors in this ~$2000 price range.
The performance difference between the Core i7-8565U and Core i7-10510U models are minimal meaning that the 2019 model will save you hundreds without sacrificing all that much CPU power. To make the most of the latest model, consider the higher-end Core i7-10710U or the brighter 500-nit 4K UHD option.
Lenovo ThinkPad X1 Yoga 20SA000GUS
- 04/13/2020 v7 (old)
Allen Ngo
Price comparison
