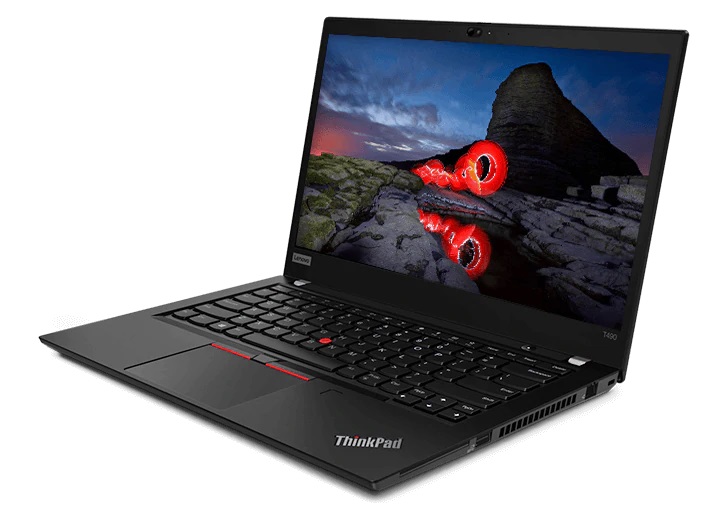
Lenovo ThinkPad T490 Laptop Review: The Comet Lake-U Update
Early last month, Lenovo unveiled the ThinkPad T14 and ThinkPad T15 as successors to the ThinkPad T490 and ThinkPad T590, respectively. We've already reviewed the T490 in multiple Whiskey Lake-U SKUs over the past year. Now, this latest Comet Lake-U configuration will likely be the last refresh before the aforementioned ThinkPad T14/15 series hits the market.
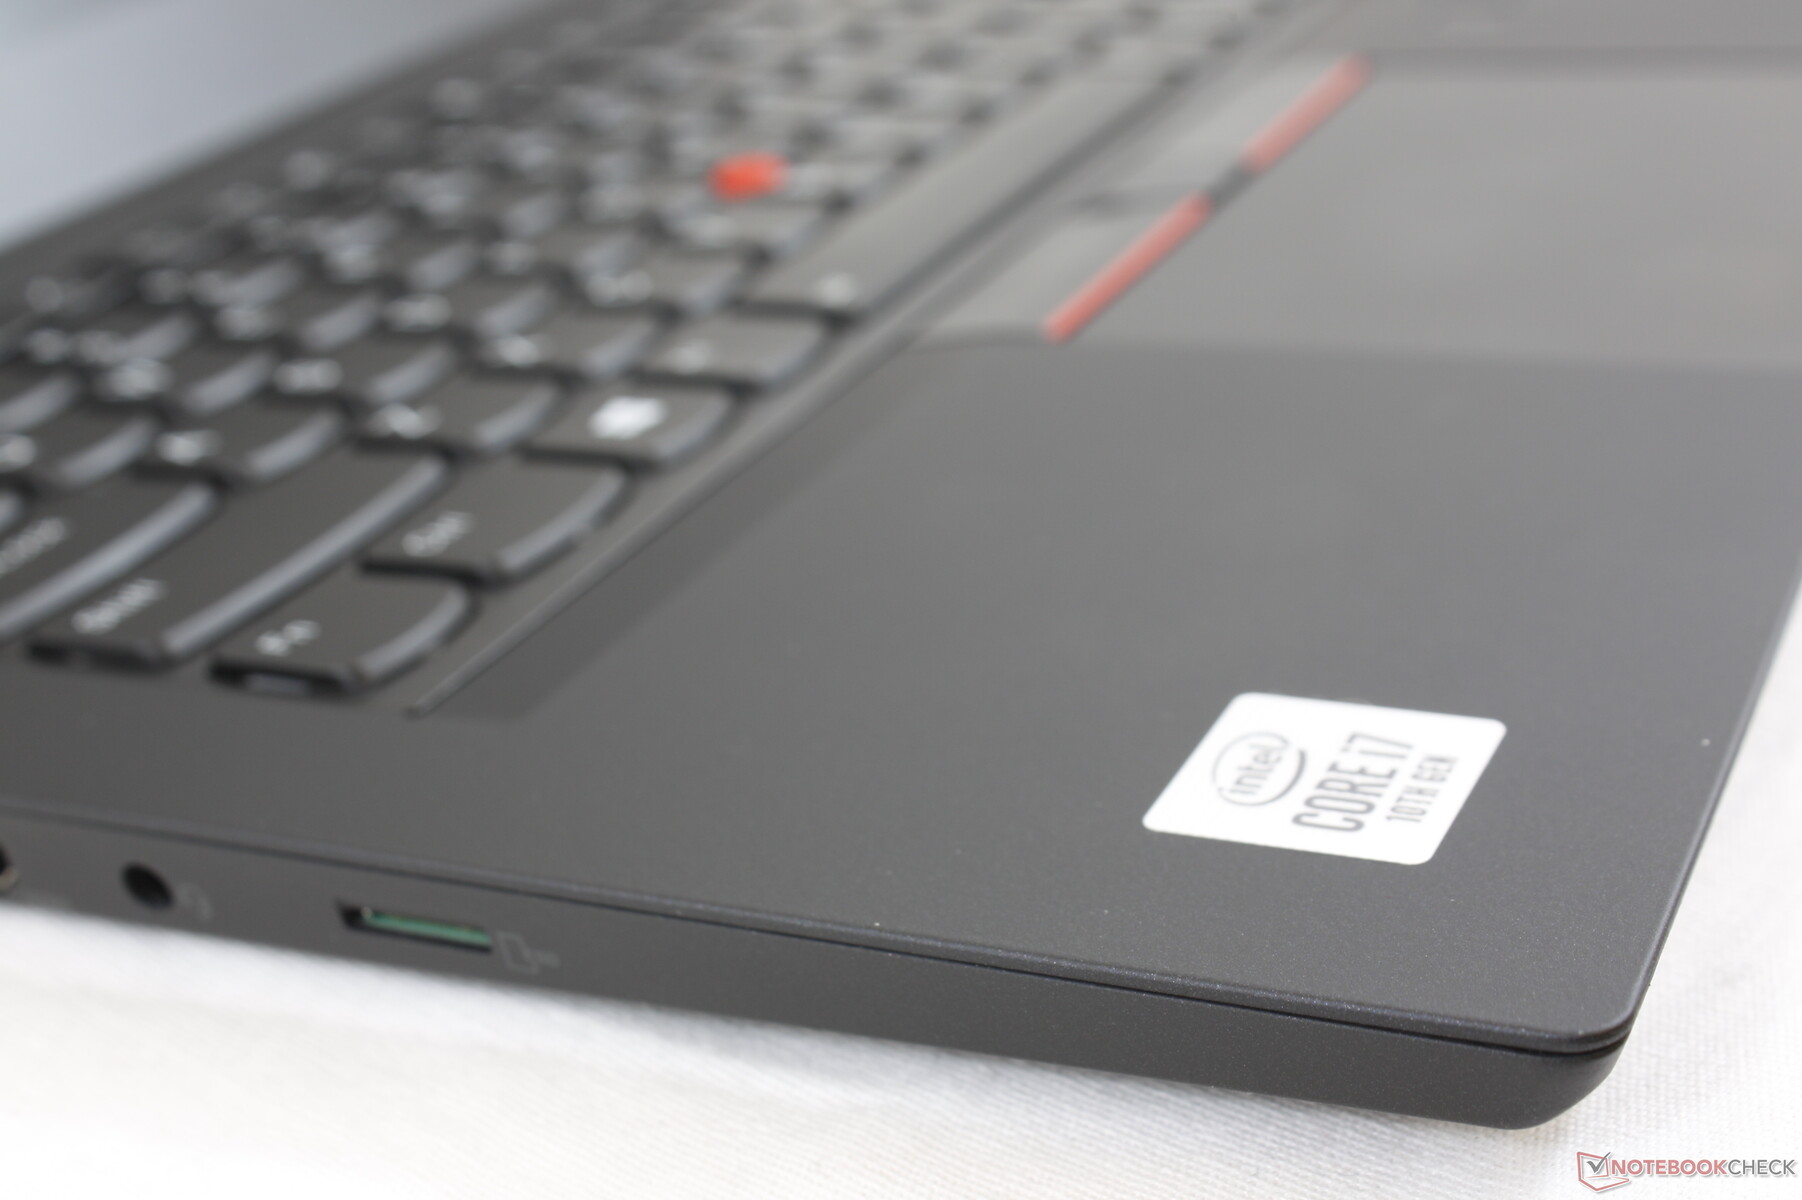
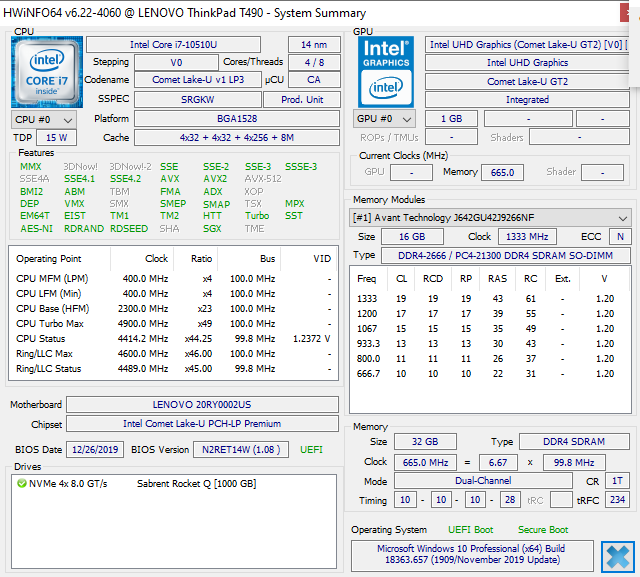
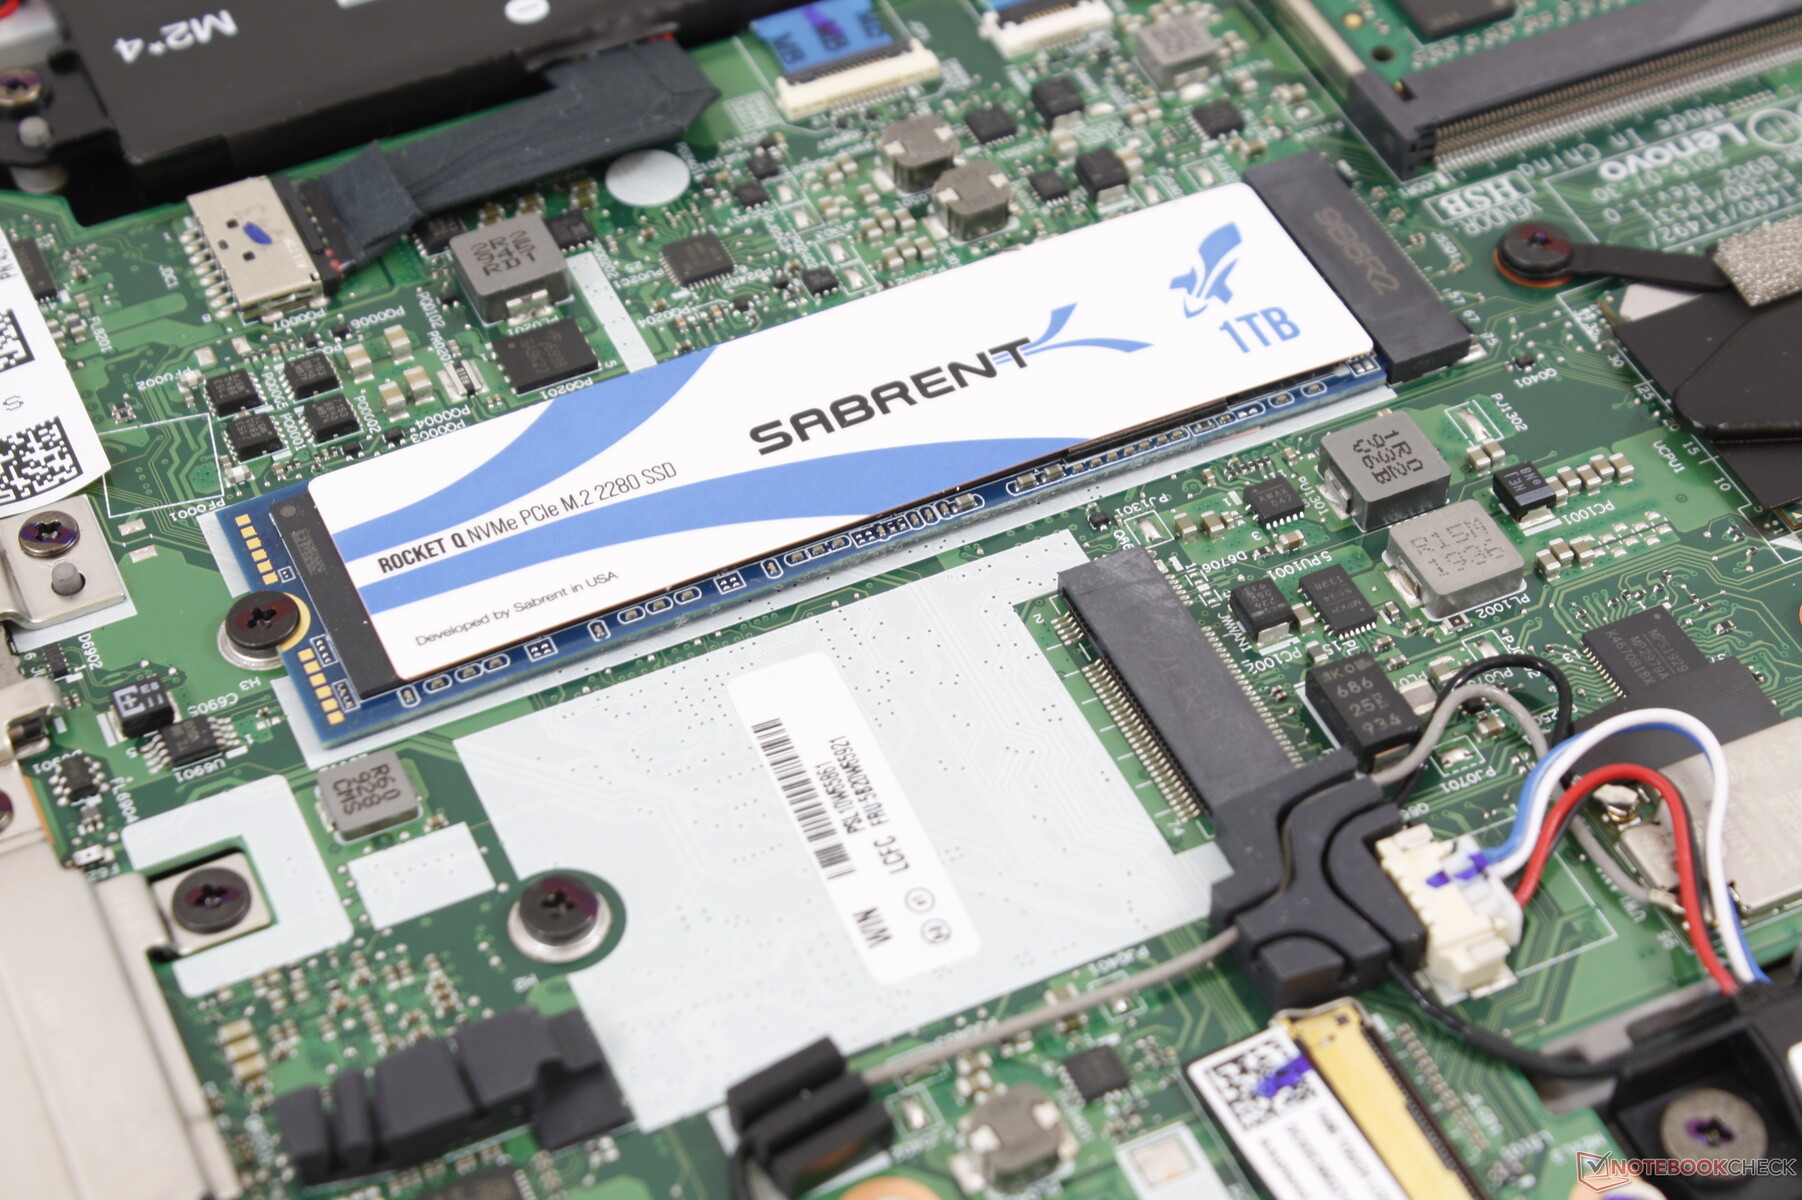
The unit here comes equipped with the Core i7-10510U CPU, 32 GB of RAM, and a FHD touchscreen for a retail price of $1600 USD on CUKUSA.com. Its aftermarket Sabrent Rocket Q NVMe SSD is courtesy of our reseller and so users shouldn't expect this same brand if purchasing the T490 directly from Lenovo. See our existing reviews on the ThinkPad T490 to learn more about the chassis and its features as this page will instead focus on the display and new CPU.
More Lenovo ThinkPad reviews:
Rating | Date | Model | Weight | Height | Size | Resolution | Price |
|---|---|---|---|---|---|---|---|
| 86.3 % v7 (old) | 03 / 2020 | Lenovo ThinkPad T490 20RY0002US i7-10510U, UHD Graphics 620 | 1.5 kg | 17.9 mm | 14.00" | 1920x1080 | |
| 89.6 % v6 (old) | 03 / 2018 | Lenovo ThinkPad T480-20L6S01V00 i5-8550U, GeForce MX150 | 1.8 kg | 20 mm | 14.00" | 1920x1080 | |
| 79.7 % v6 (old) | 08 / 2019 | Dell Inspiron 15 5000 5585 R7 3700U, Vega 10 | 1.8 kg | 19.5 mm | 15.60" | 1920x1080 | |
| 88.4 % v7 (old) | 09 / 2019 | Lenovo ThinkPad T495s-20QKS01E00 R7 PRO 3700U, Vega 10 | 1.3 kg | 16.1 mm | 14.00" | 1920x1080 | |
| 81.8 % v7 (old) | 02 / 2020 | Lenovo ThinkBook 15 i5-10210U, UHD Graphics 620 | 1.9 kg | 18.9 mm | 15.60" | 1920x1080 |
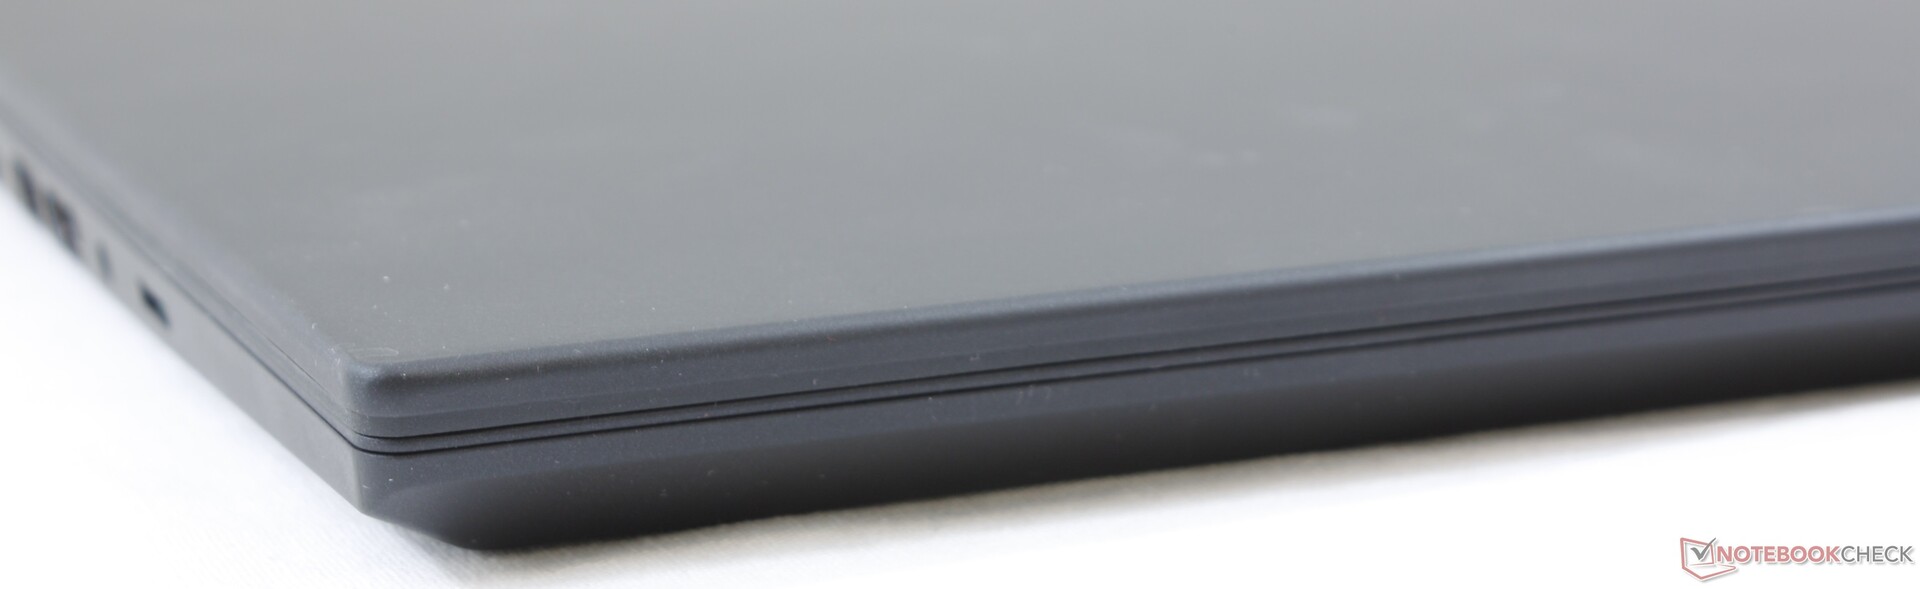
Case
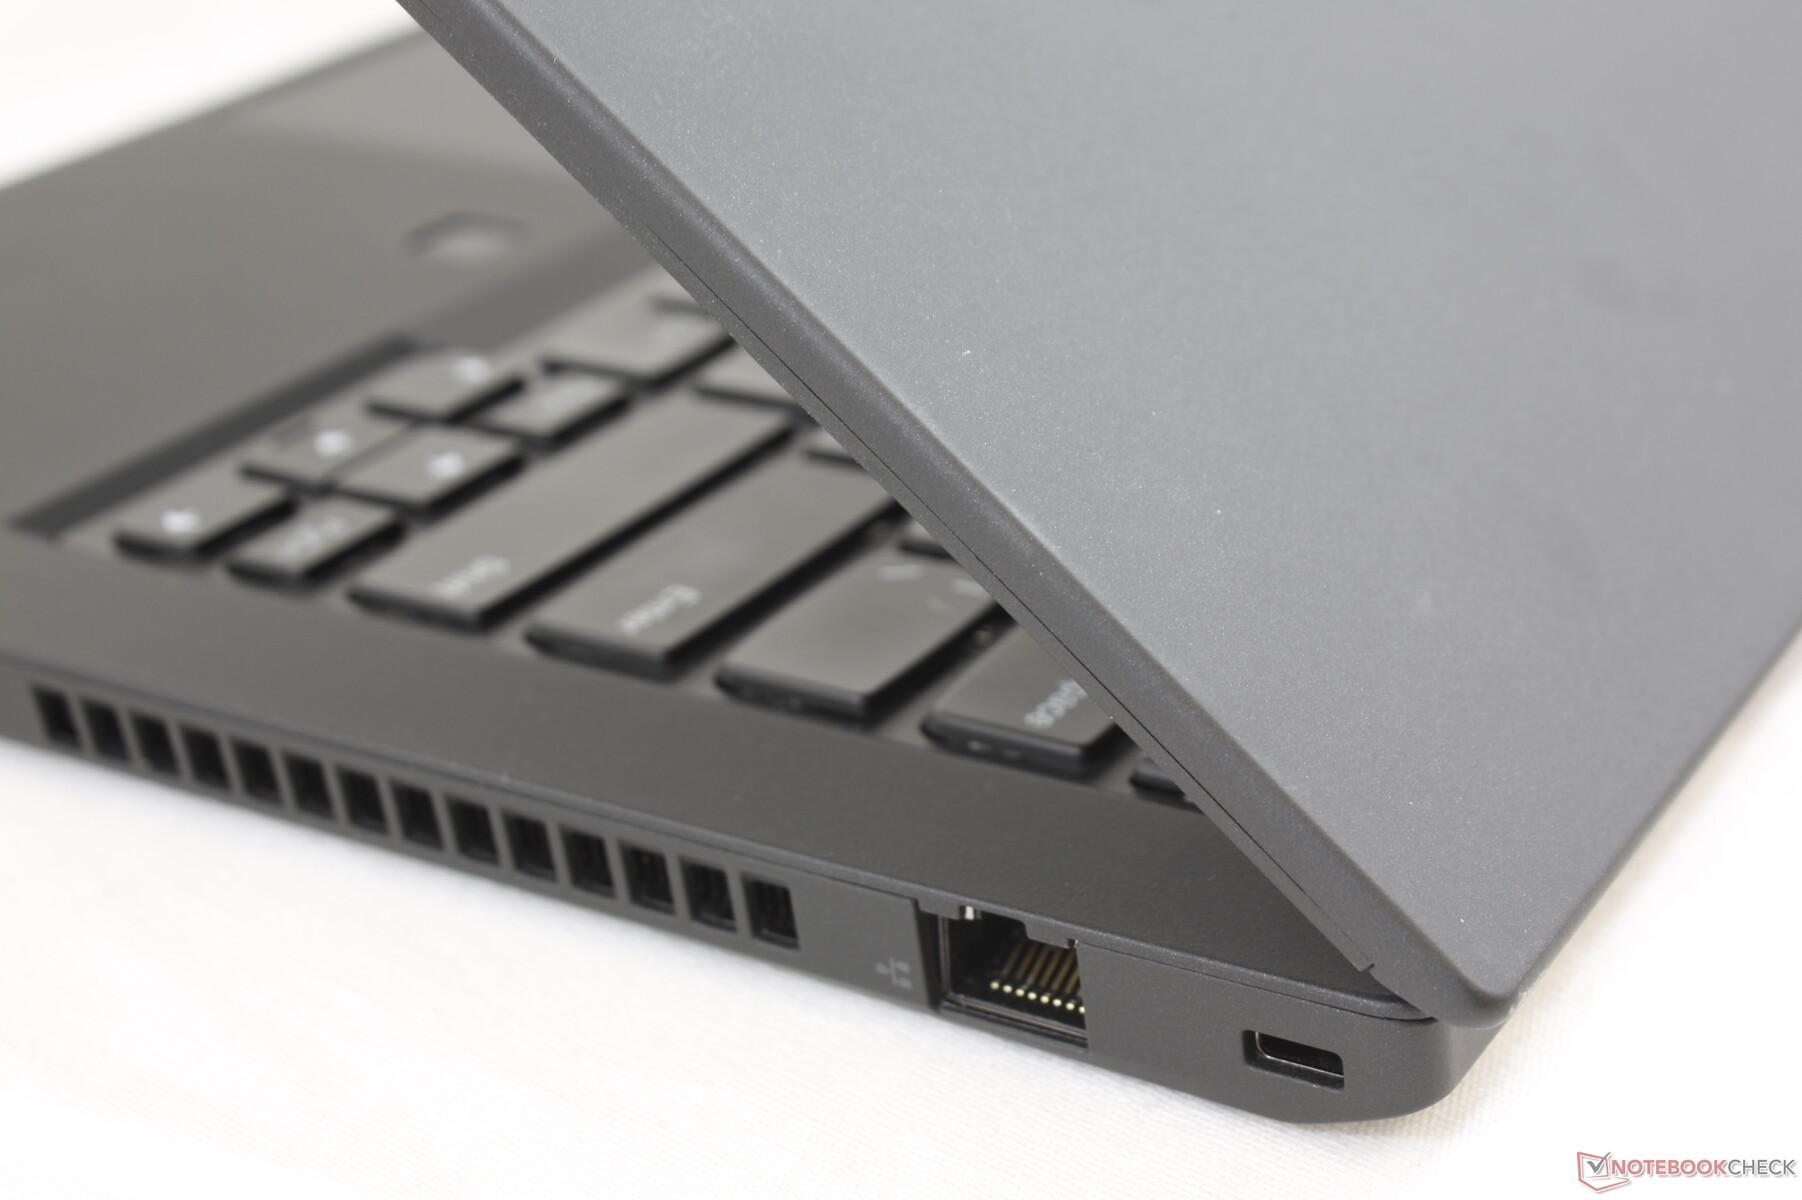
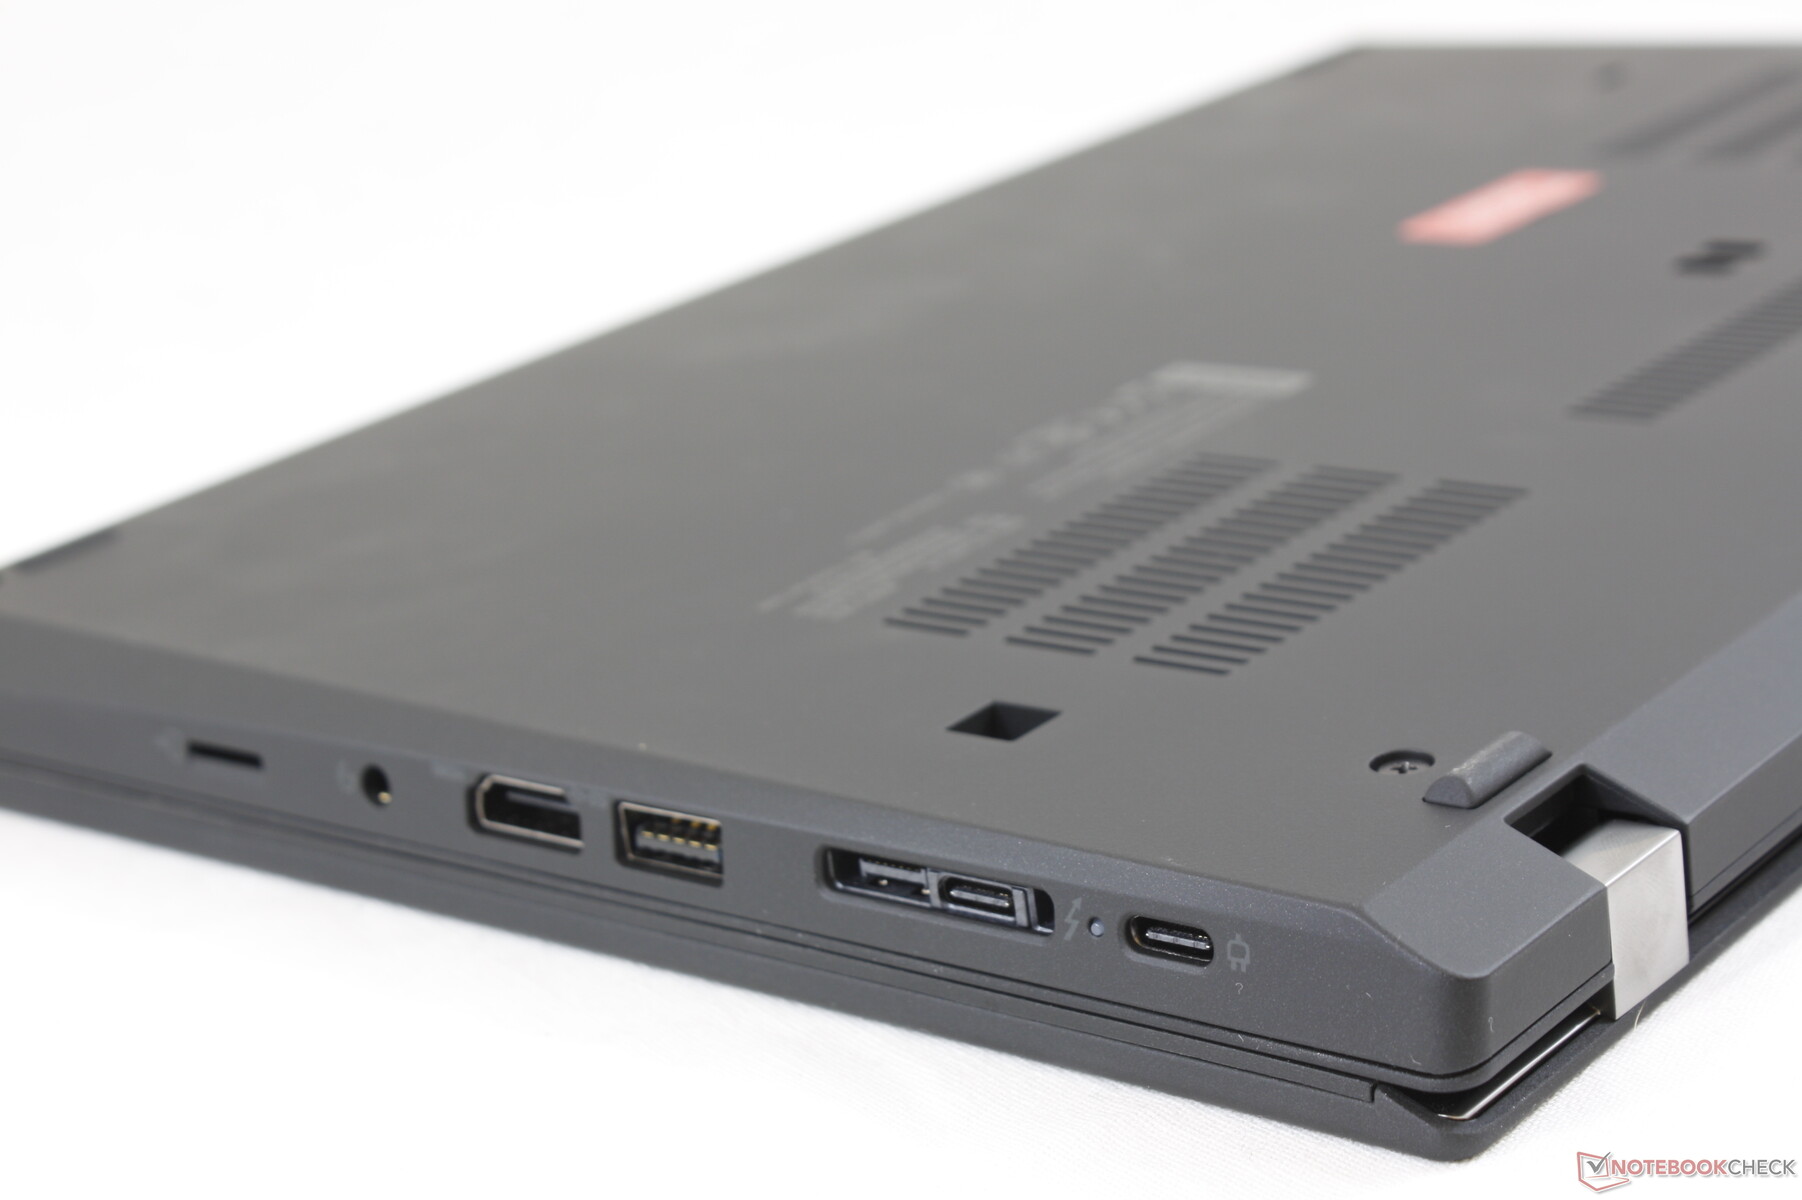
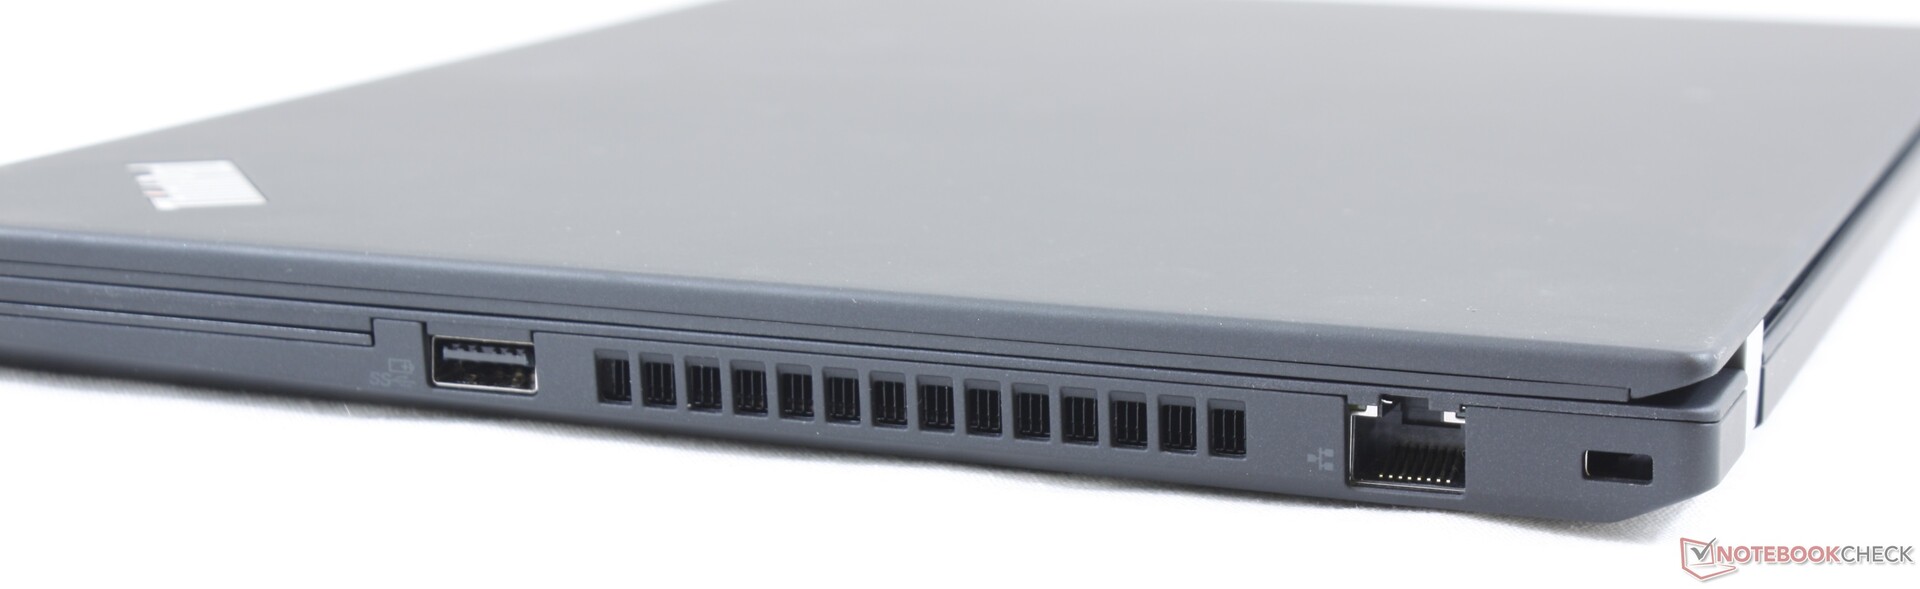
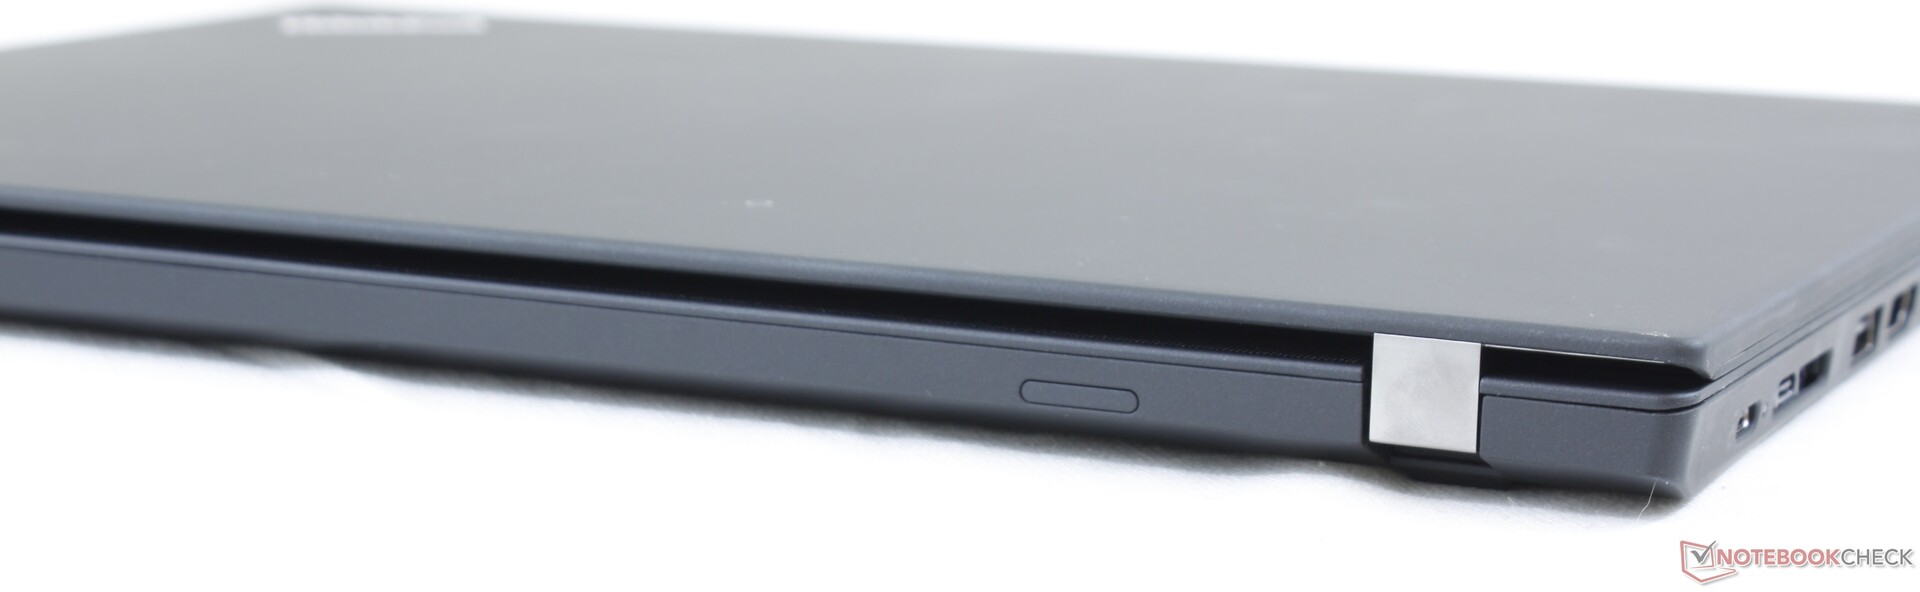
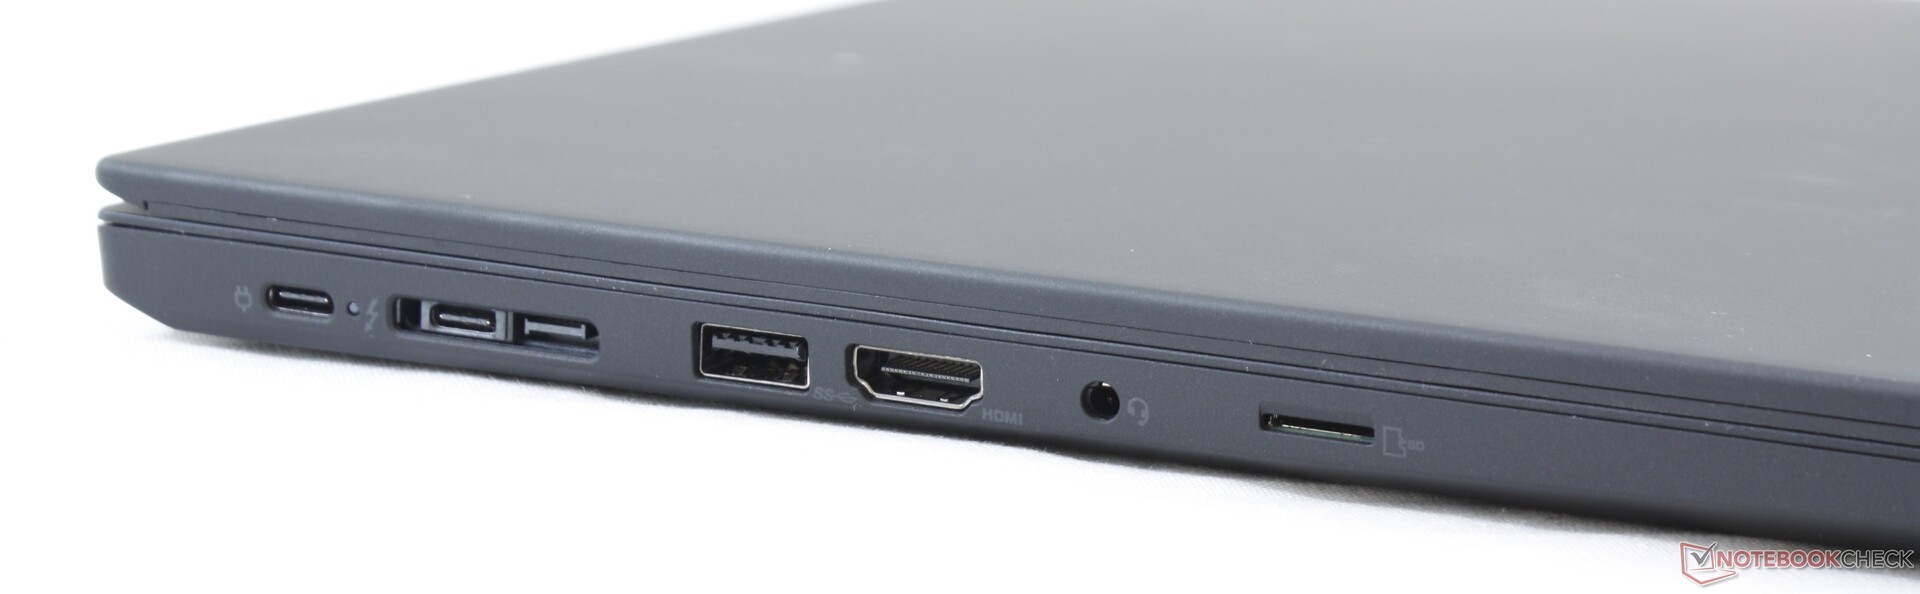
Connectivity
SD Card Reader
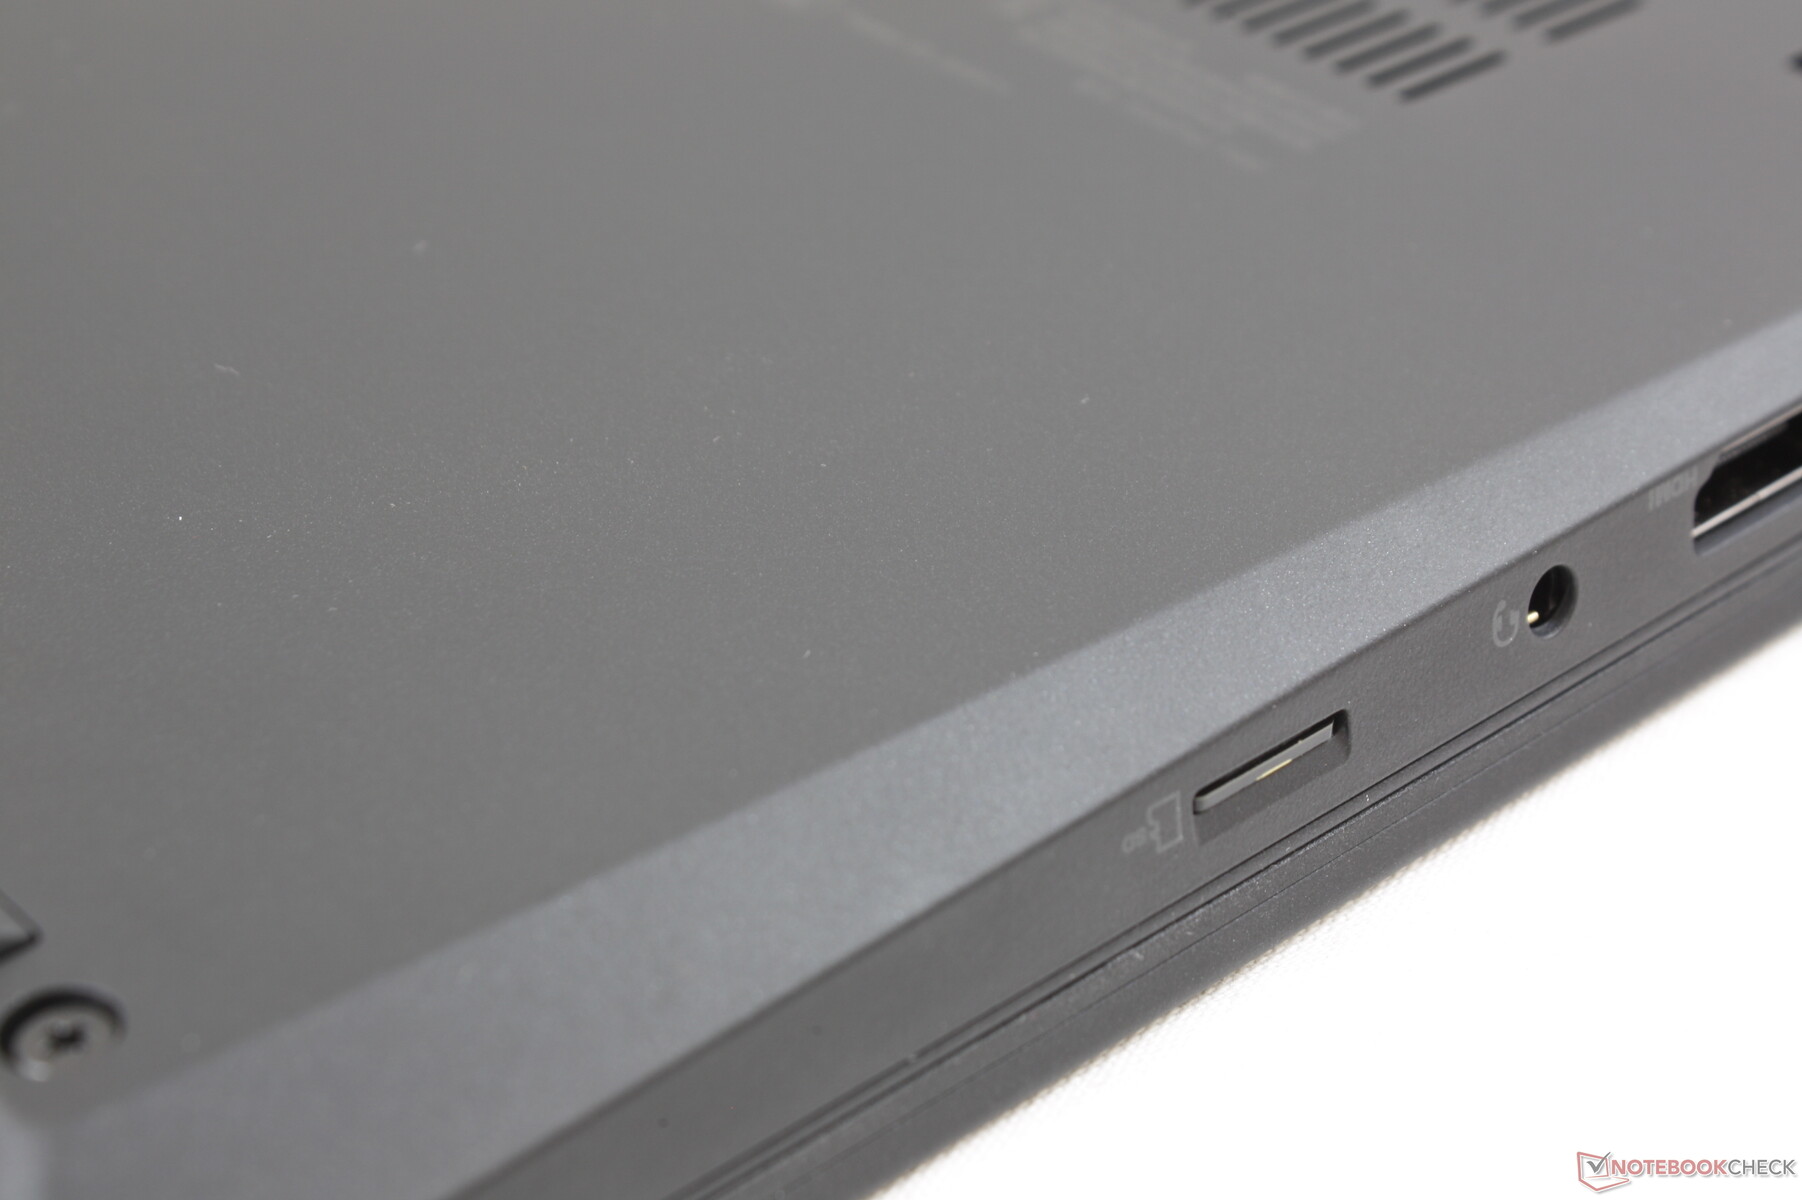
| SD Card Reader | |
| average JPG Copy Test (av. of 3 runs) | |
| Lenovo ThinkPad T495s-20QKS01E00 (Toshiba Exceria Pro M501 64 GB UHS-II) | |
| Lenovo ThinkPad T480-20L6S01V00 (Toshiba Exceria Pro SDXC 64 GB UHS-II) | |
| Lenovo ThinkPad T470-20HD002HGE (Toshiba Exceria Pro SDXC 64 GB UHS-II) | |
| Lenovo ThinkPad T490 20RY0002US (Toshiba Exceria Pro M501 64 GB UHS-II) | |
| Lenovo ThinkPad T460-20FN003LGE | |
| maximum AS SSD Seq Read Test (1GB) | |
| Lenovo ThinkPad T495s-20QKS01E00 (Toshiba Exceria Pro M501 64 GB UHS-II) | |
| Lenovo ThinkPad T470-20HD002HGE (Toshiba Exceria Pro SDXC 64 GB UHS-II) | |
| Lenovo ThinkPad T480-20L6S01V00 (Toshiba Exceria Pro SDXC 64 GB UHS-II) | |
| Lenovo ThinkPad T460-20FN003LGE | |
| Lenovo ThinkPad T490 20RY0002US (Toshiba Exceria Pro M501 64 GB UHS-II) | |
Communication
Wireless has been updated from the Intel 9560 Wi-Fi 5 to the newer Intel AX201 Wi-Fi 6. We're able to record average transfer rates ranging from 1300 Mbps to 1700 Mbps when connected to a Netgear RAX200 router and 2.5 Gbps server line.
| Networking | |
| iperf3 transmit AX12 | |
| Lenovo ThinkPad T490 20RY0002US | |
| Acer Aspire 5 A514-52 | |
| Lenovo Yoga C740-14IML | |
| Alienware m17 R2 P41E | |
| iperf3 receive AX12 | |
| Lenovo ThinkPad T490 20RY0002US | |
| Acer Aspire 5 A514-52 | |
| Lenovo Yoga C740-14IML | |
| Alienware m17 R2 P41E | |
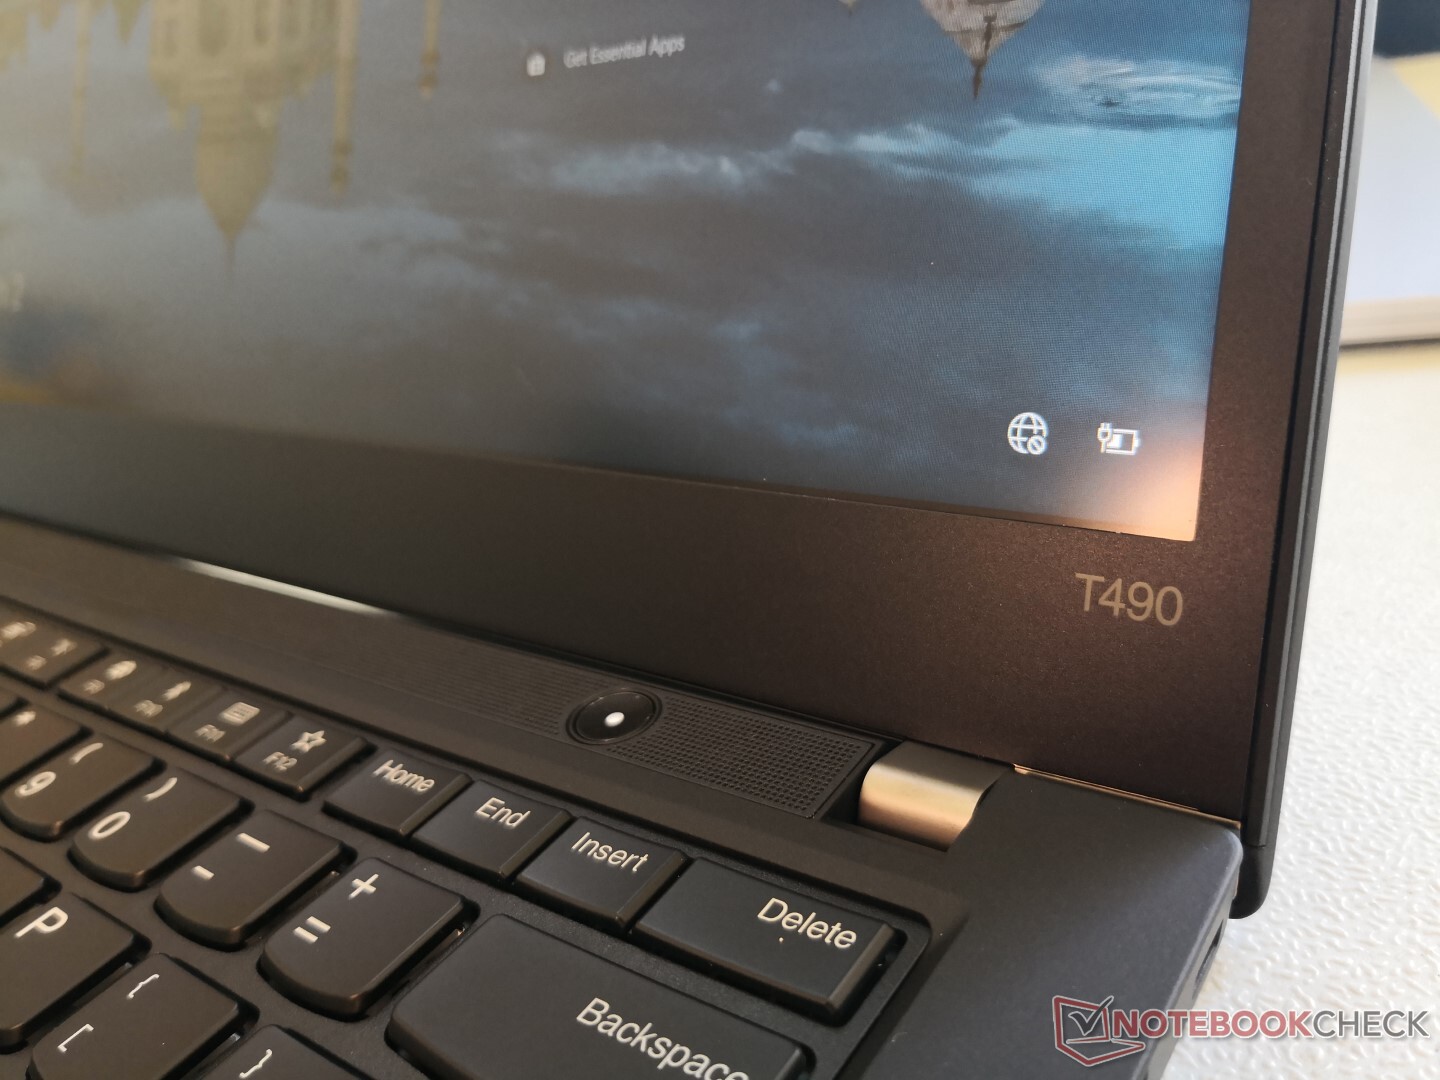
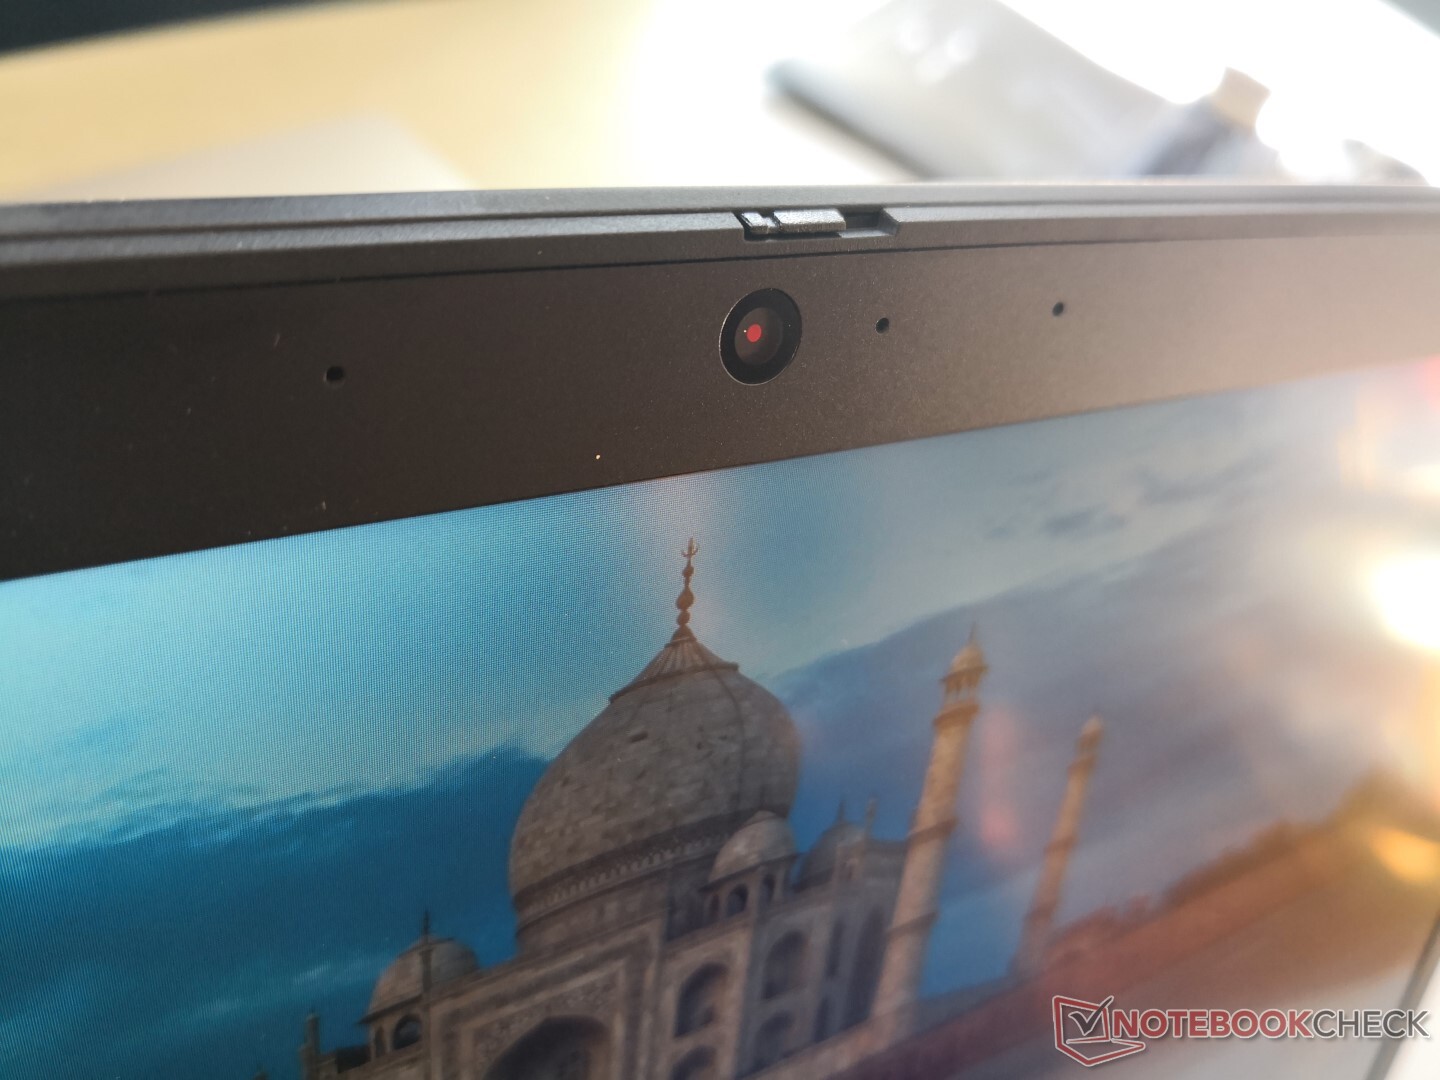
Webcam

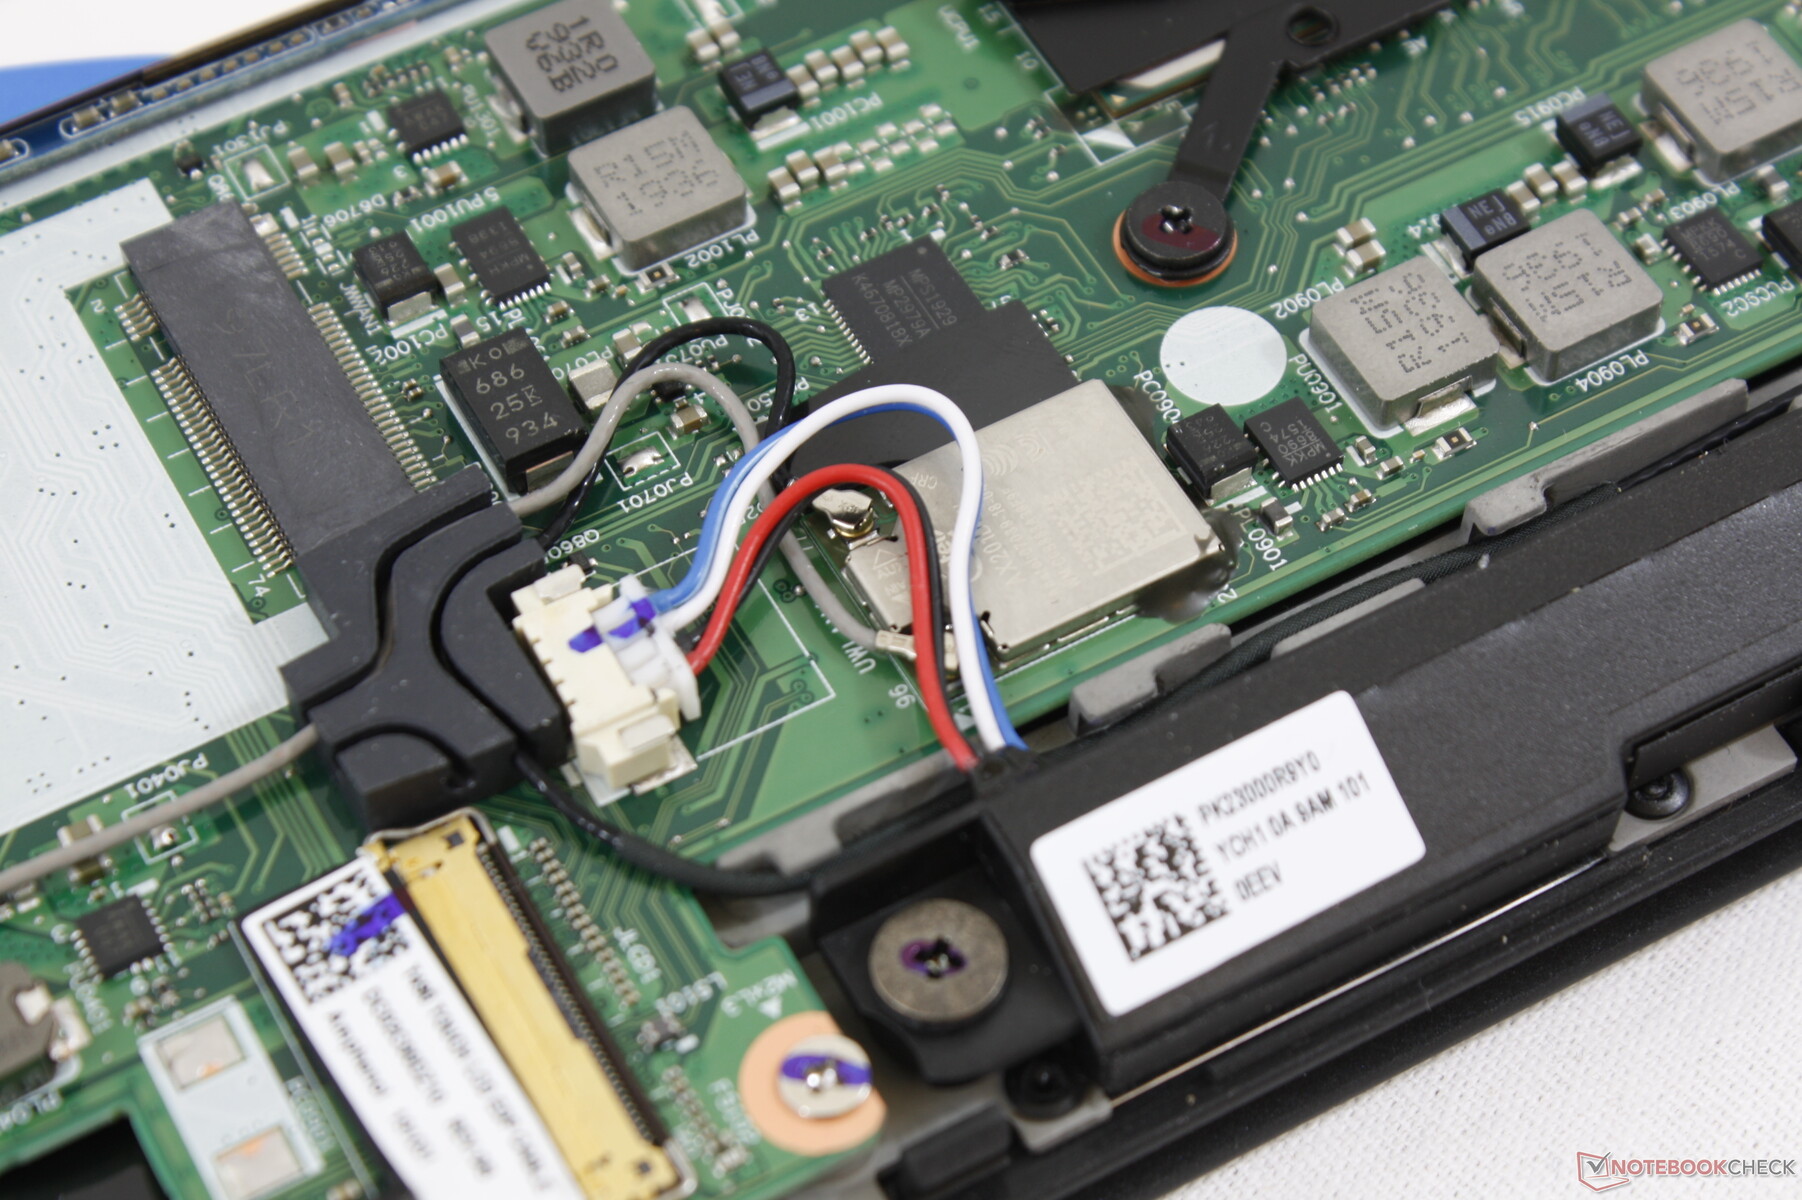
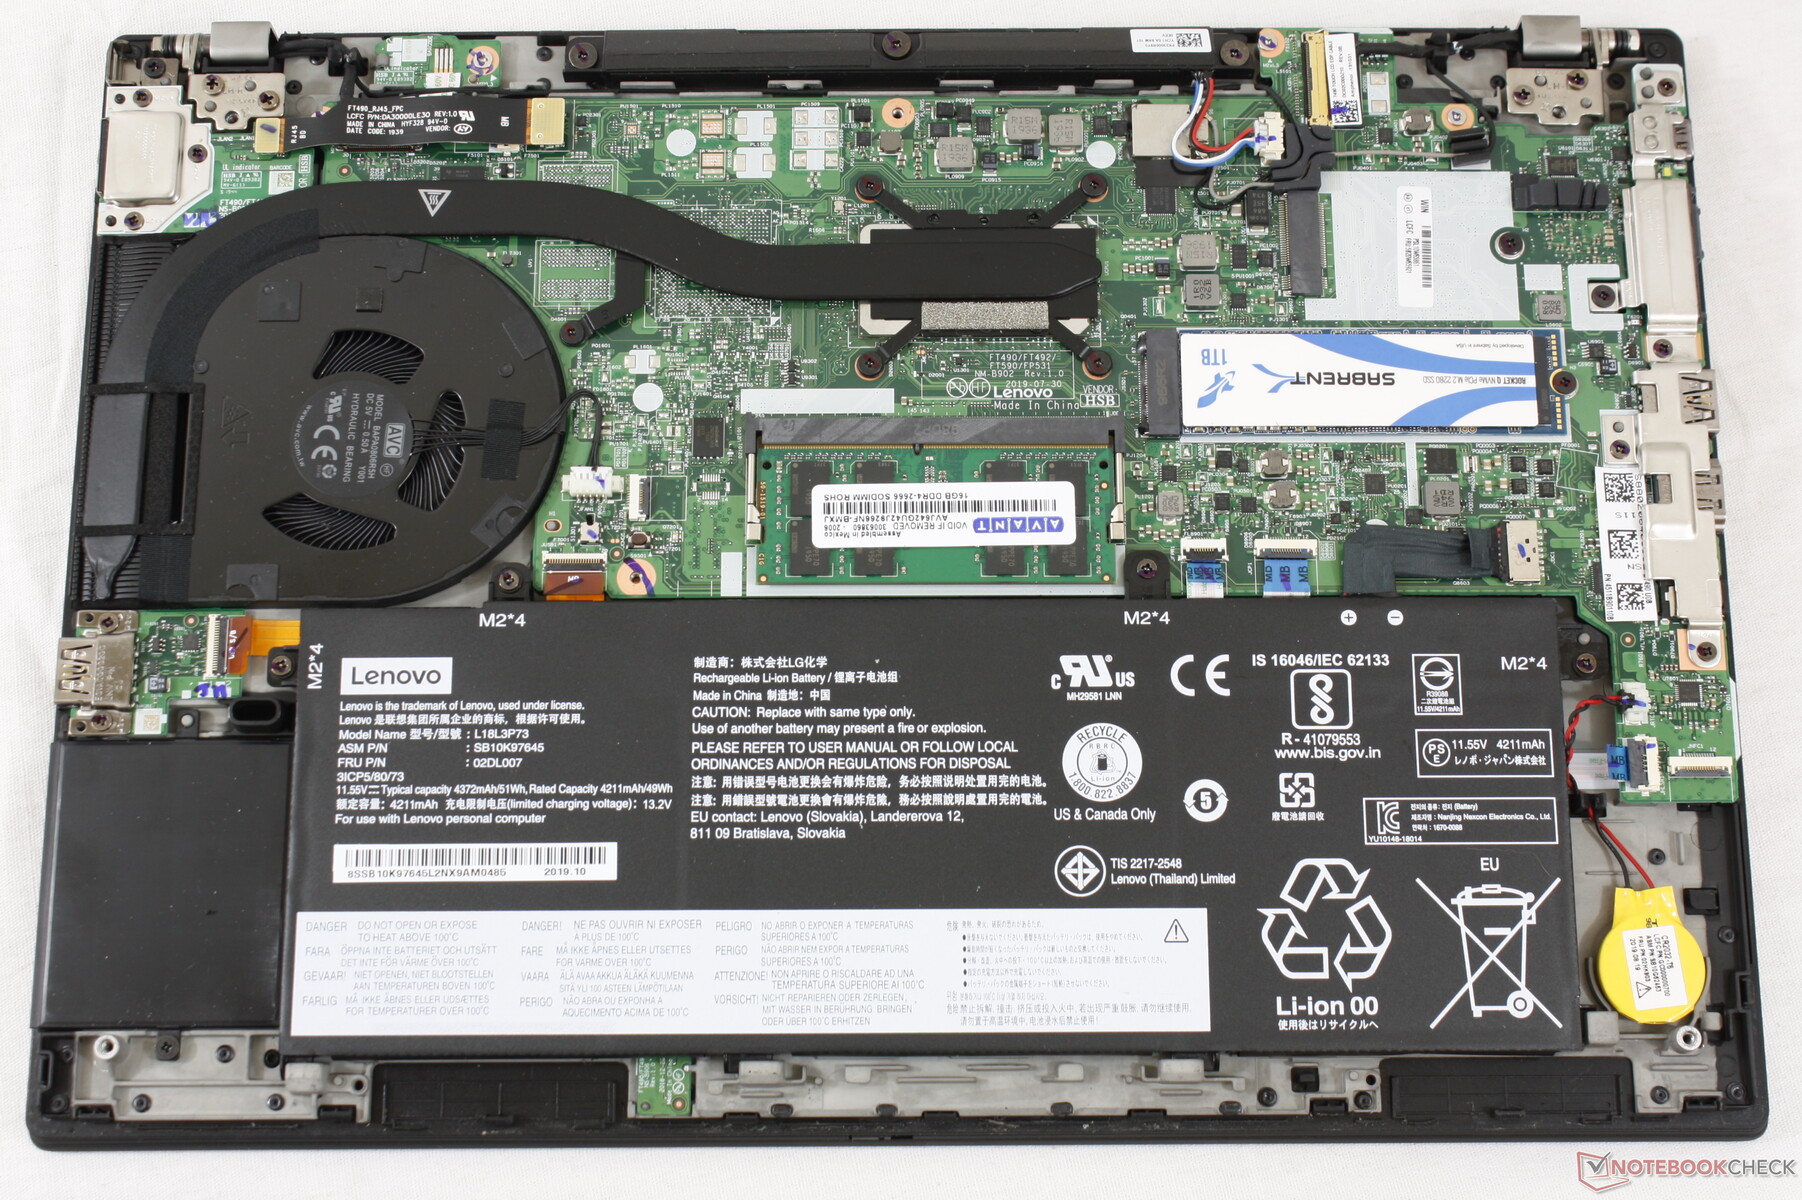
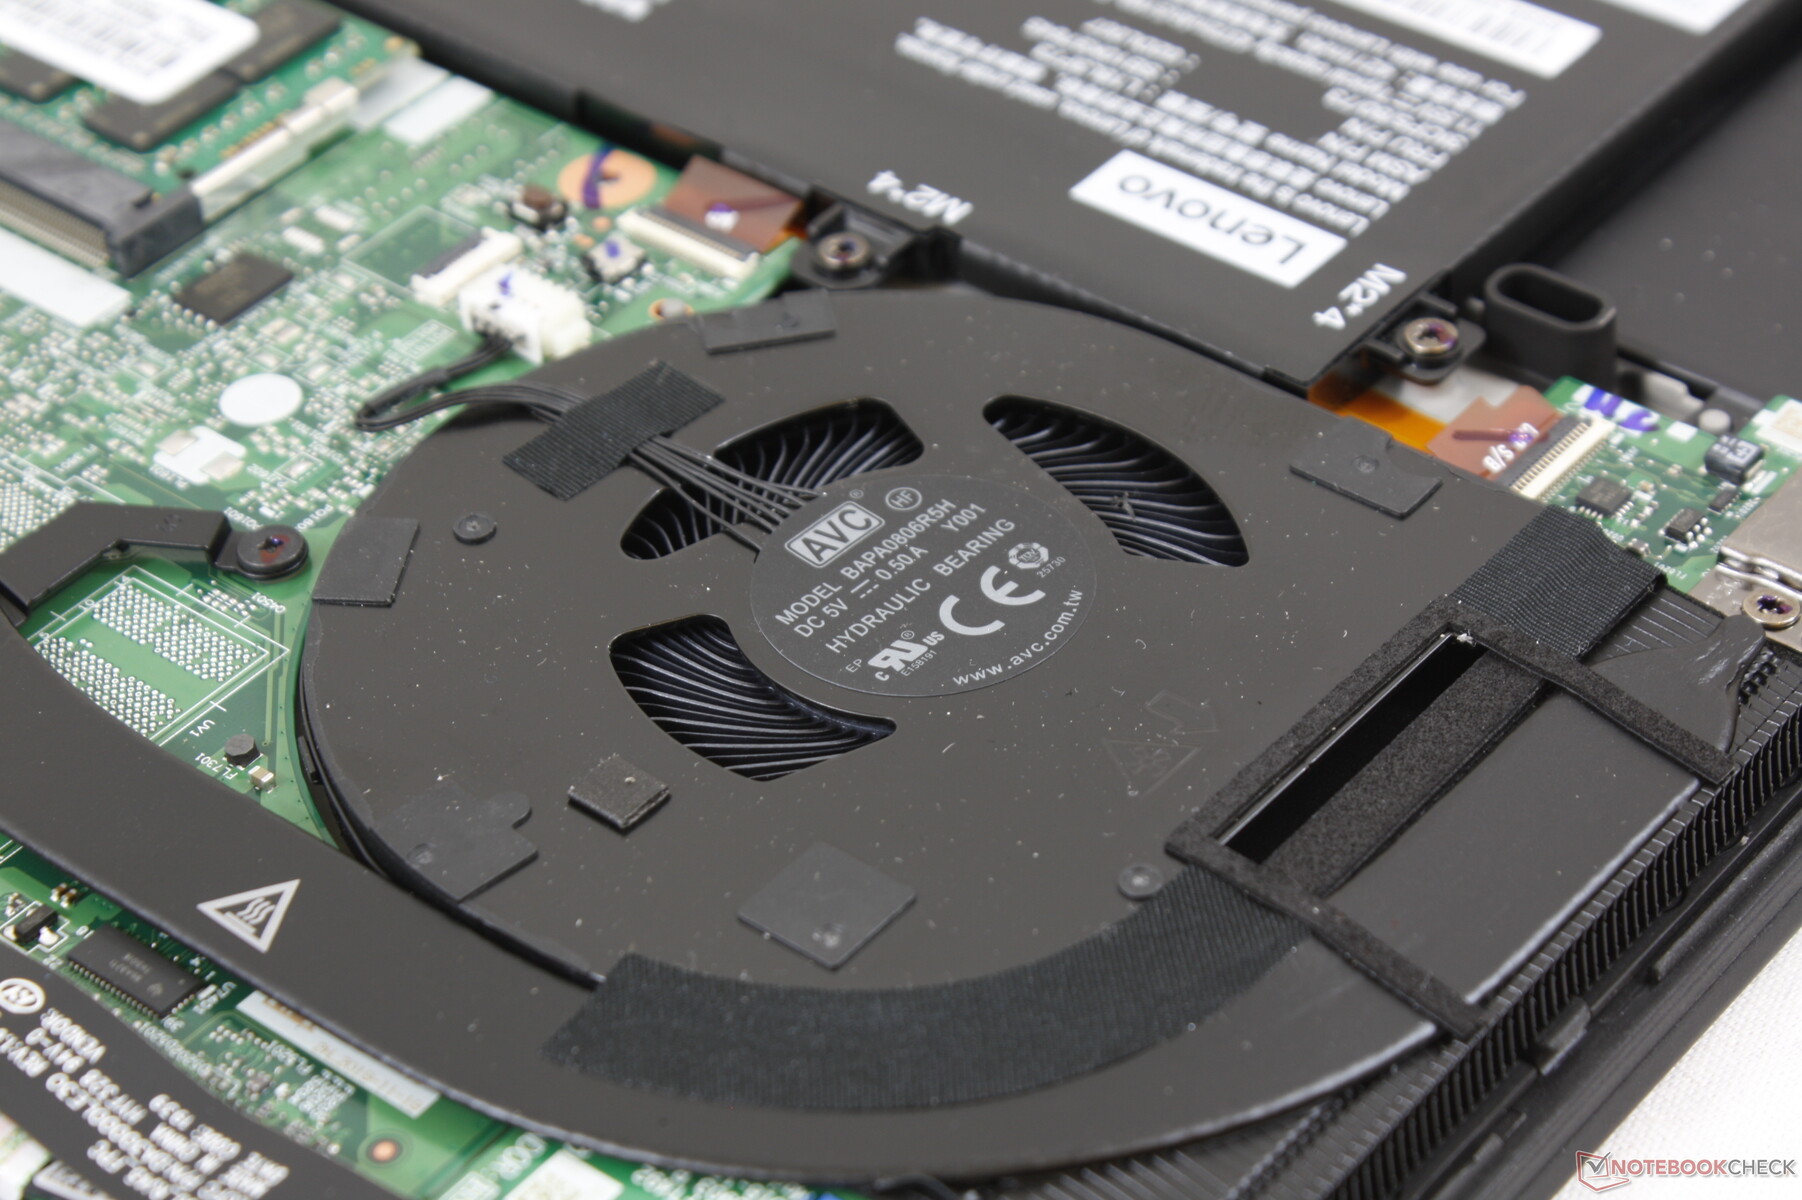
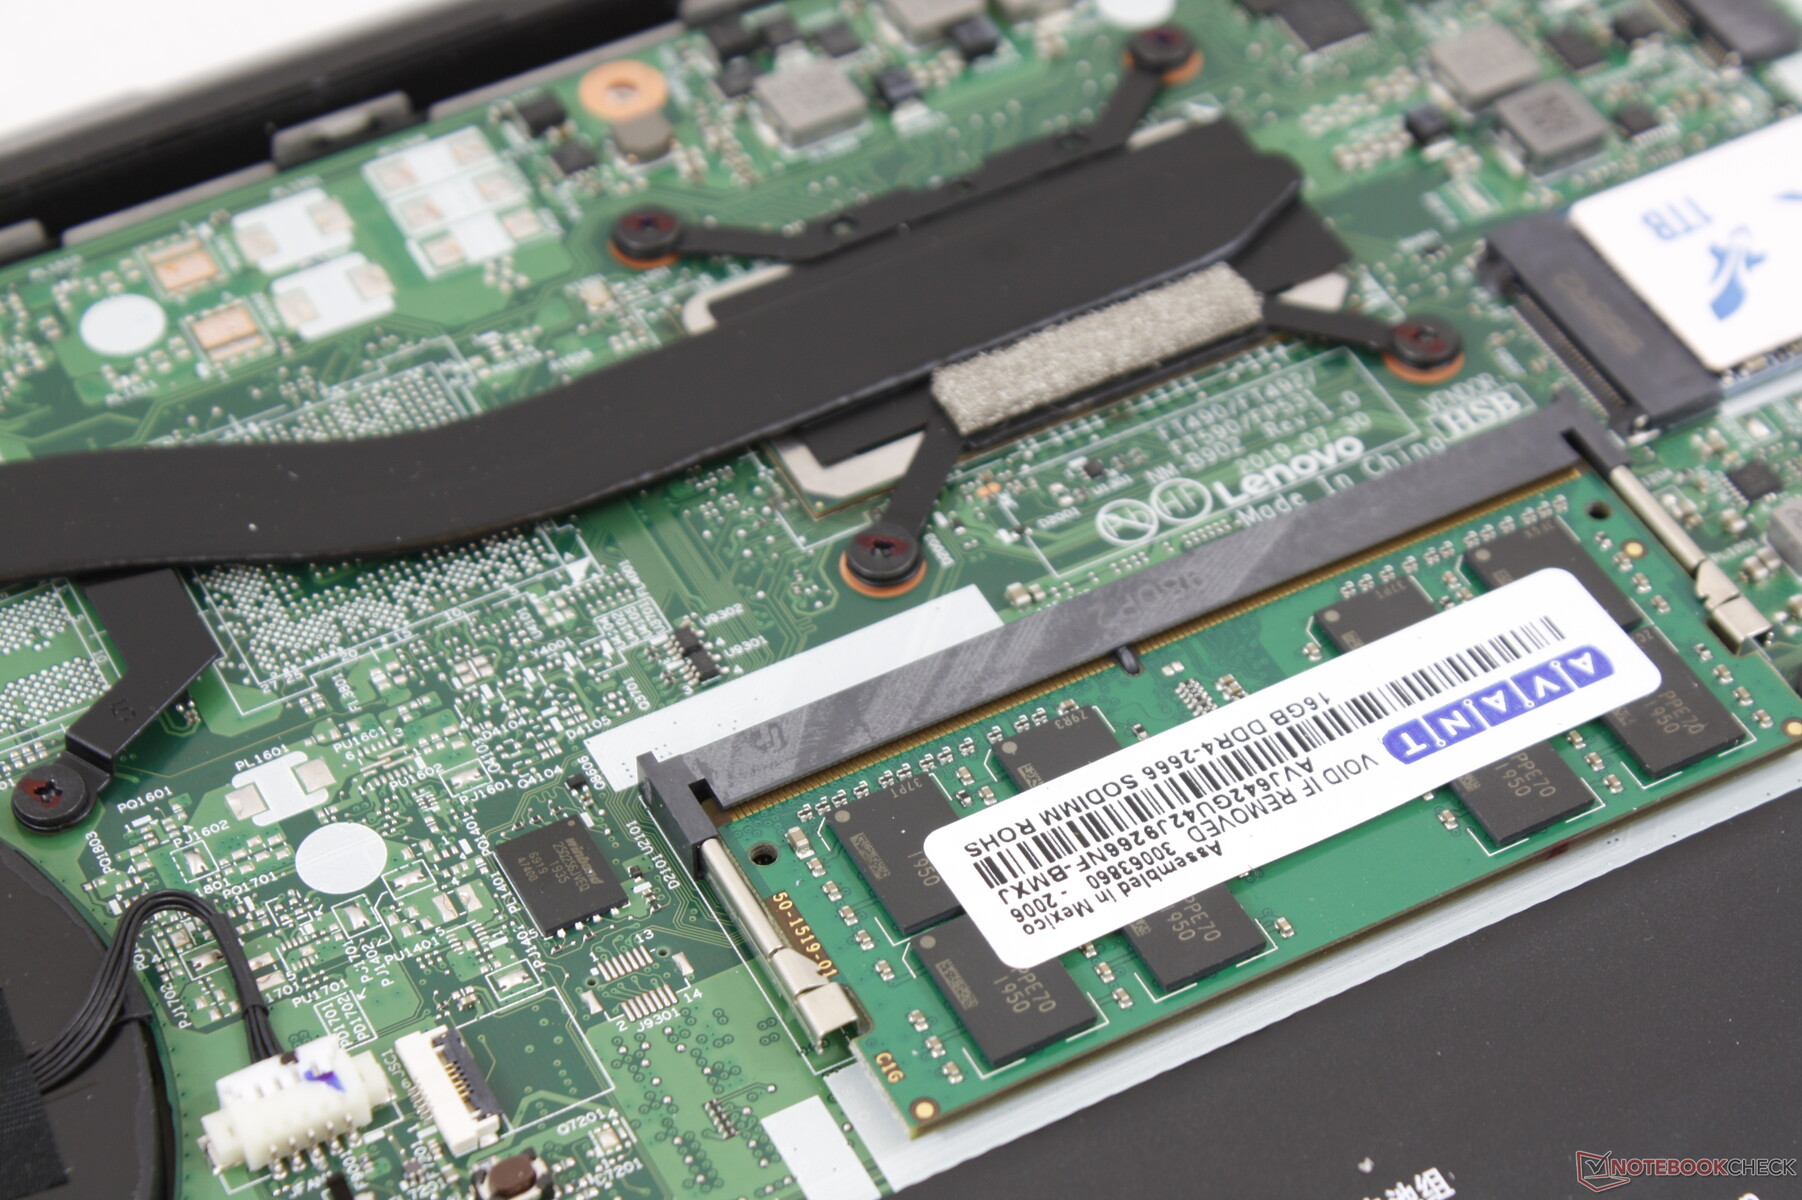
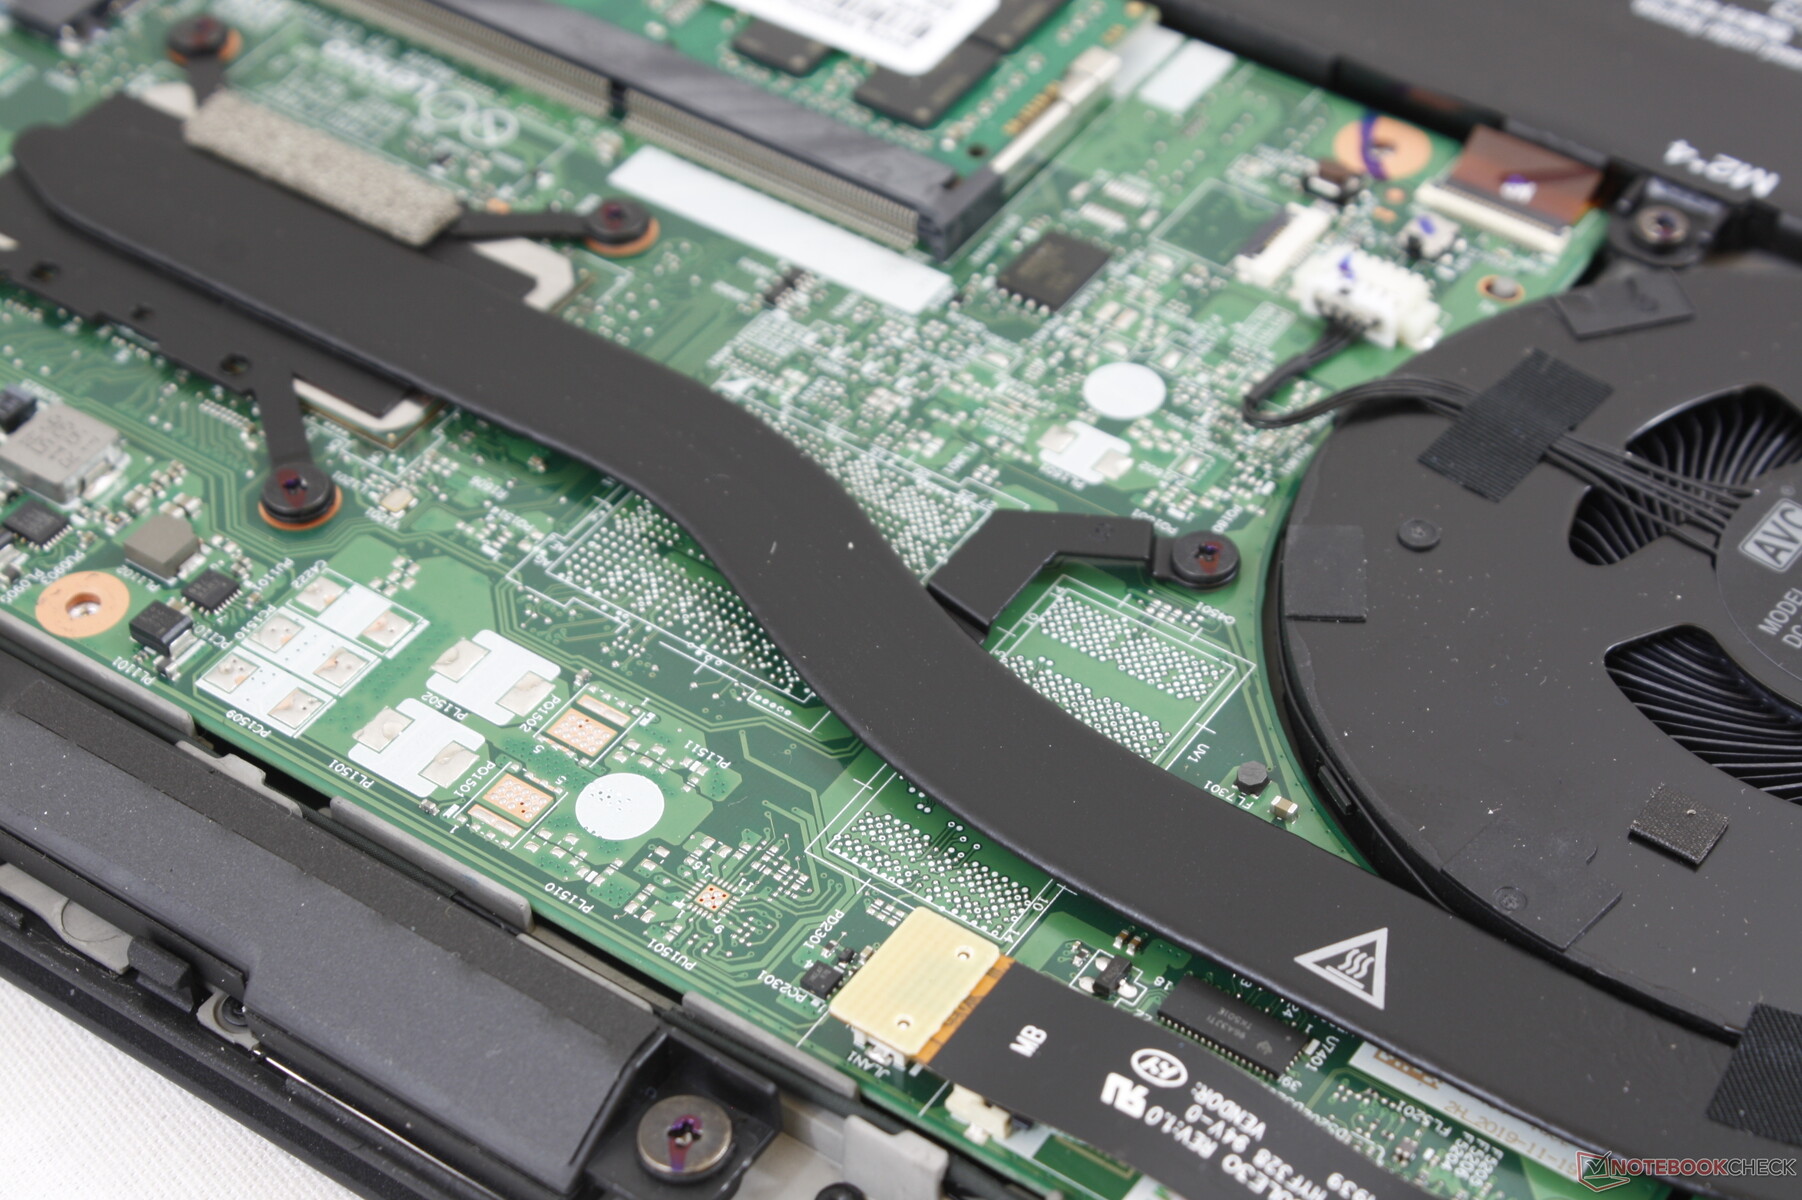
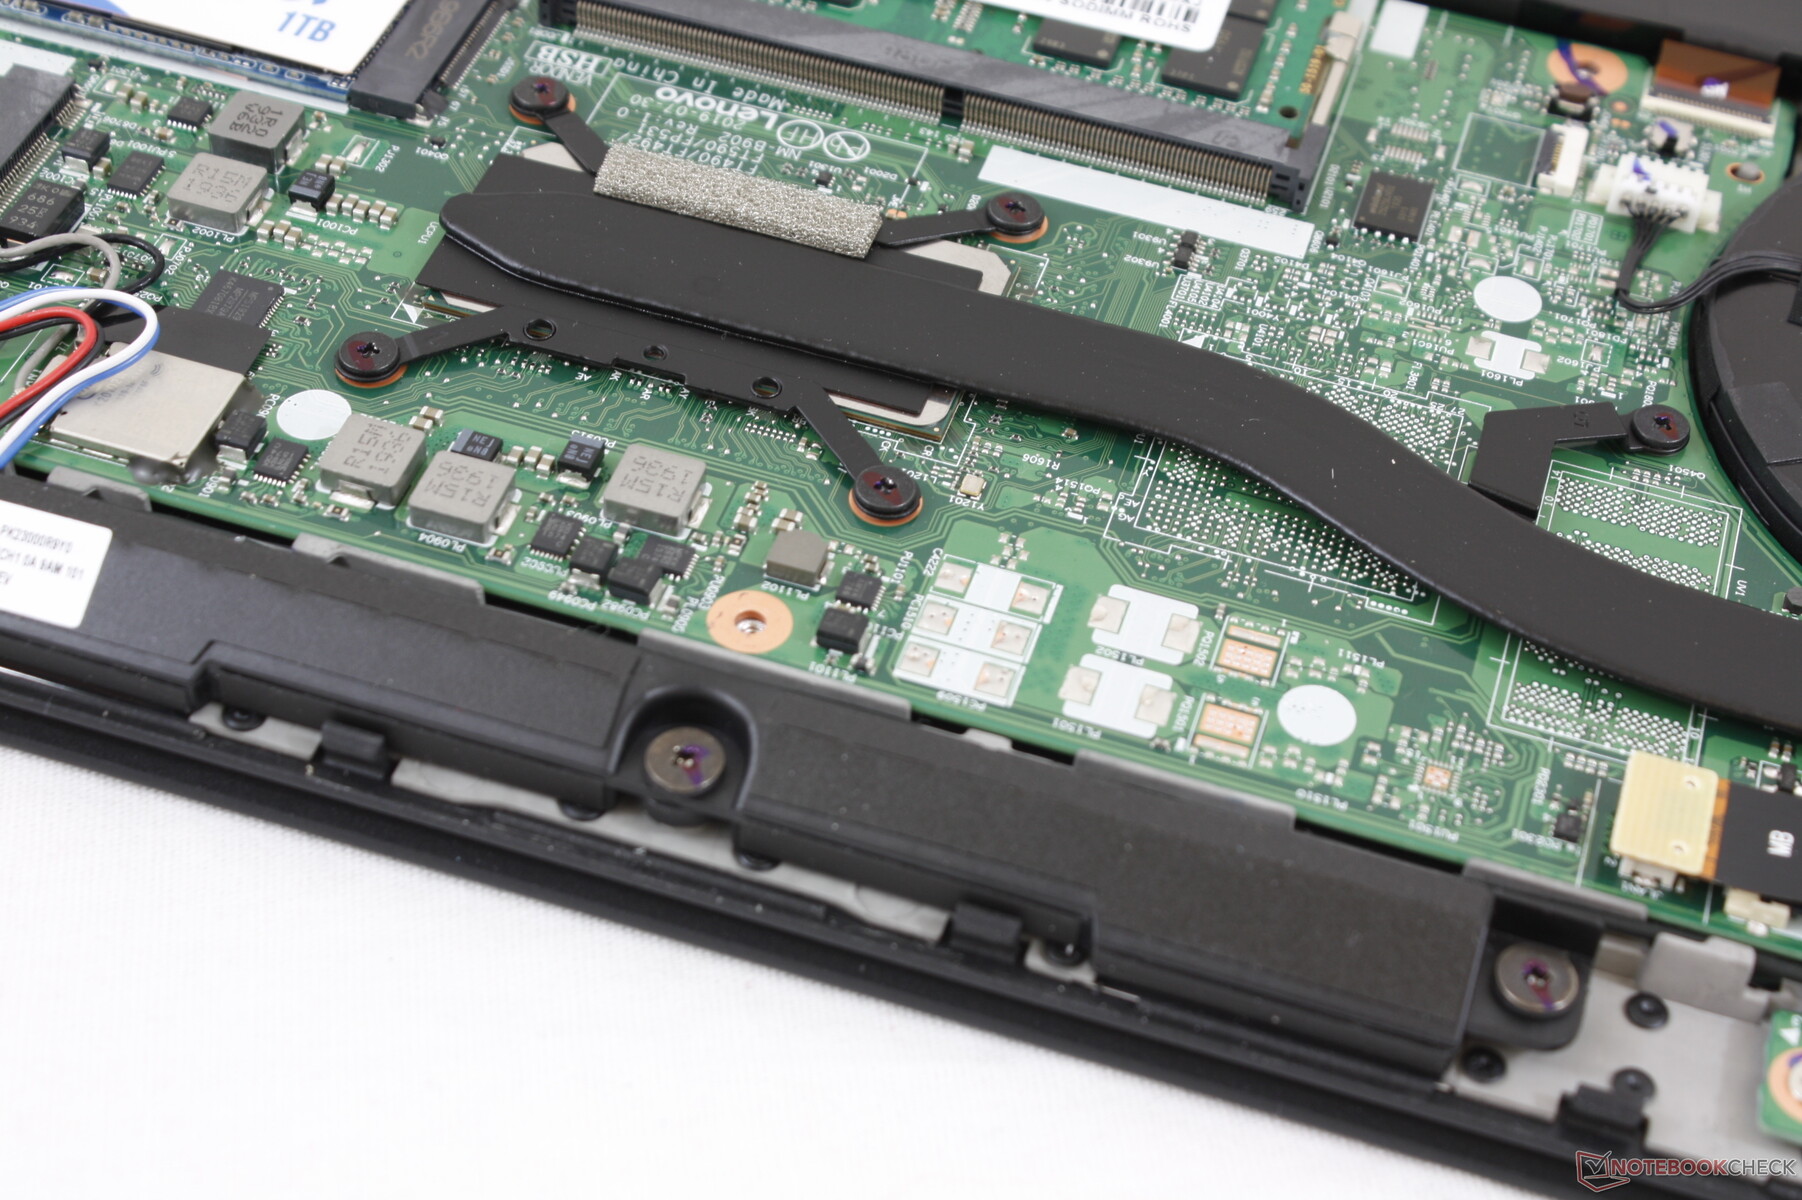
Maintenance
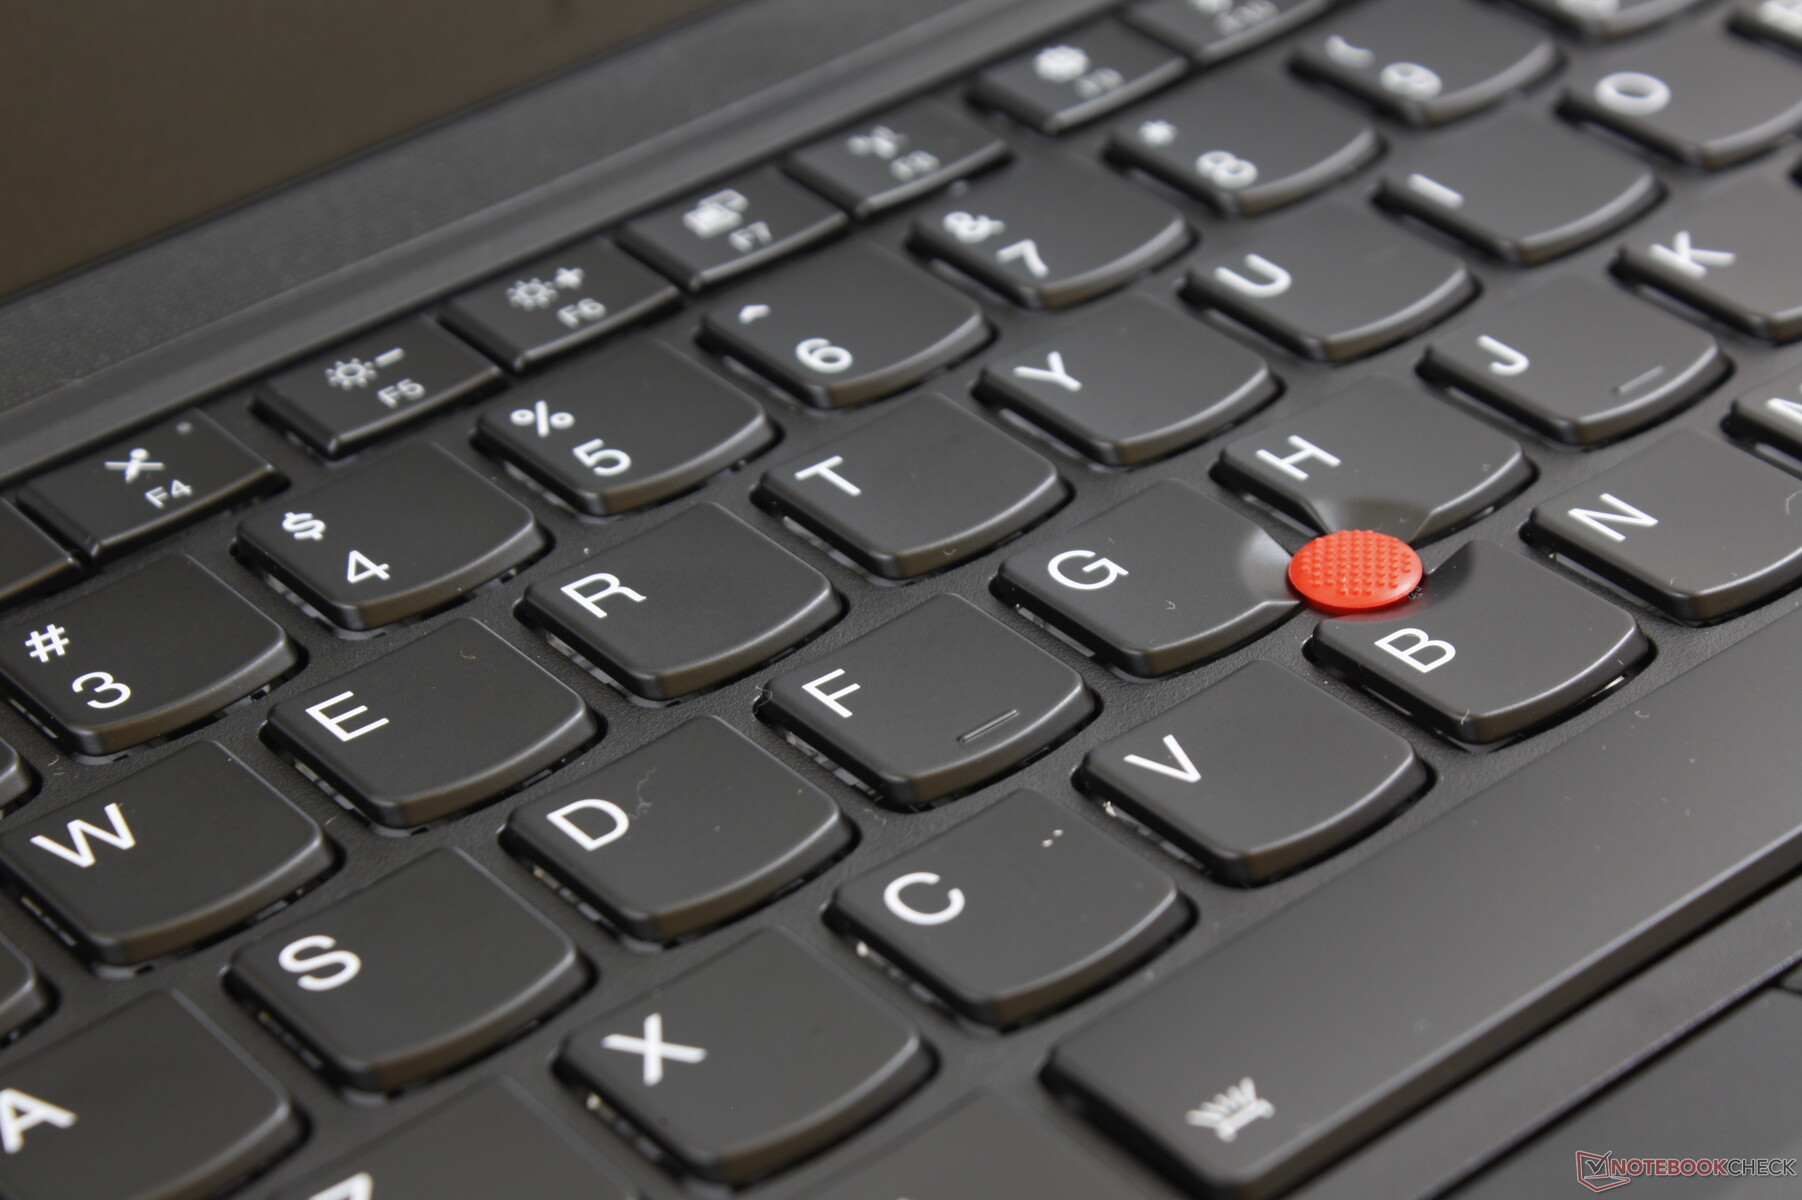
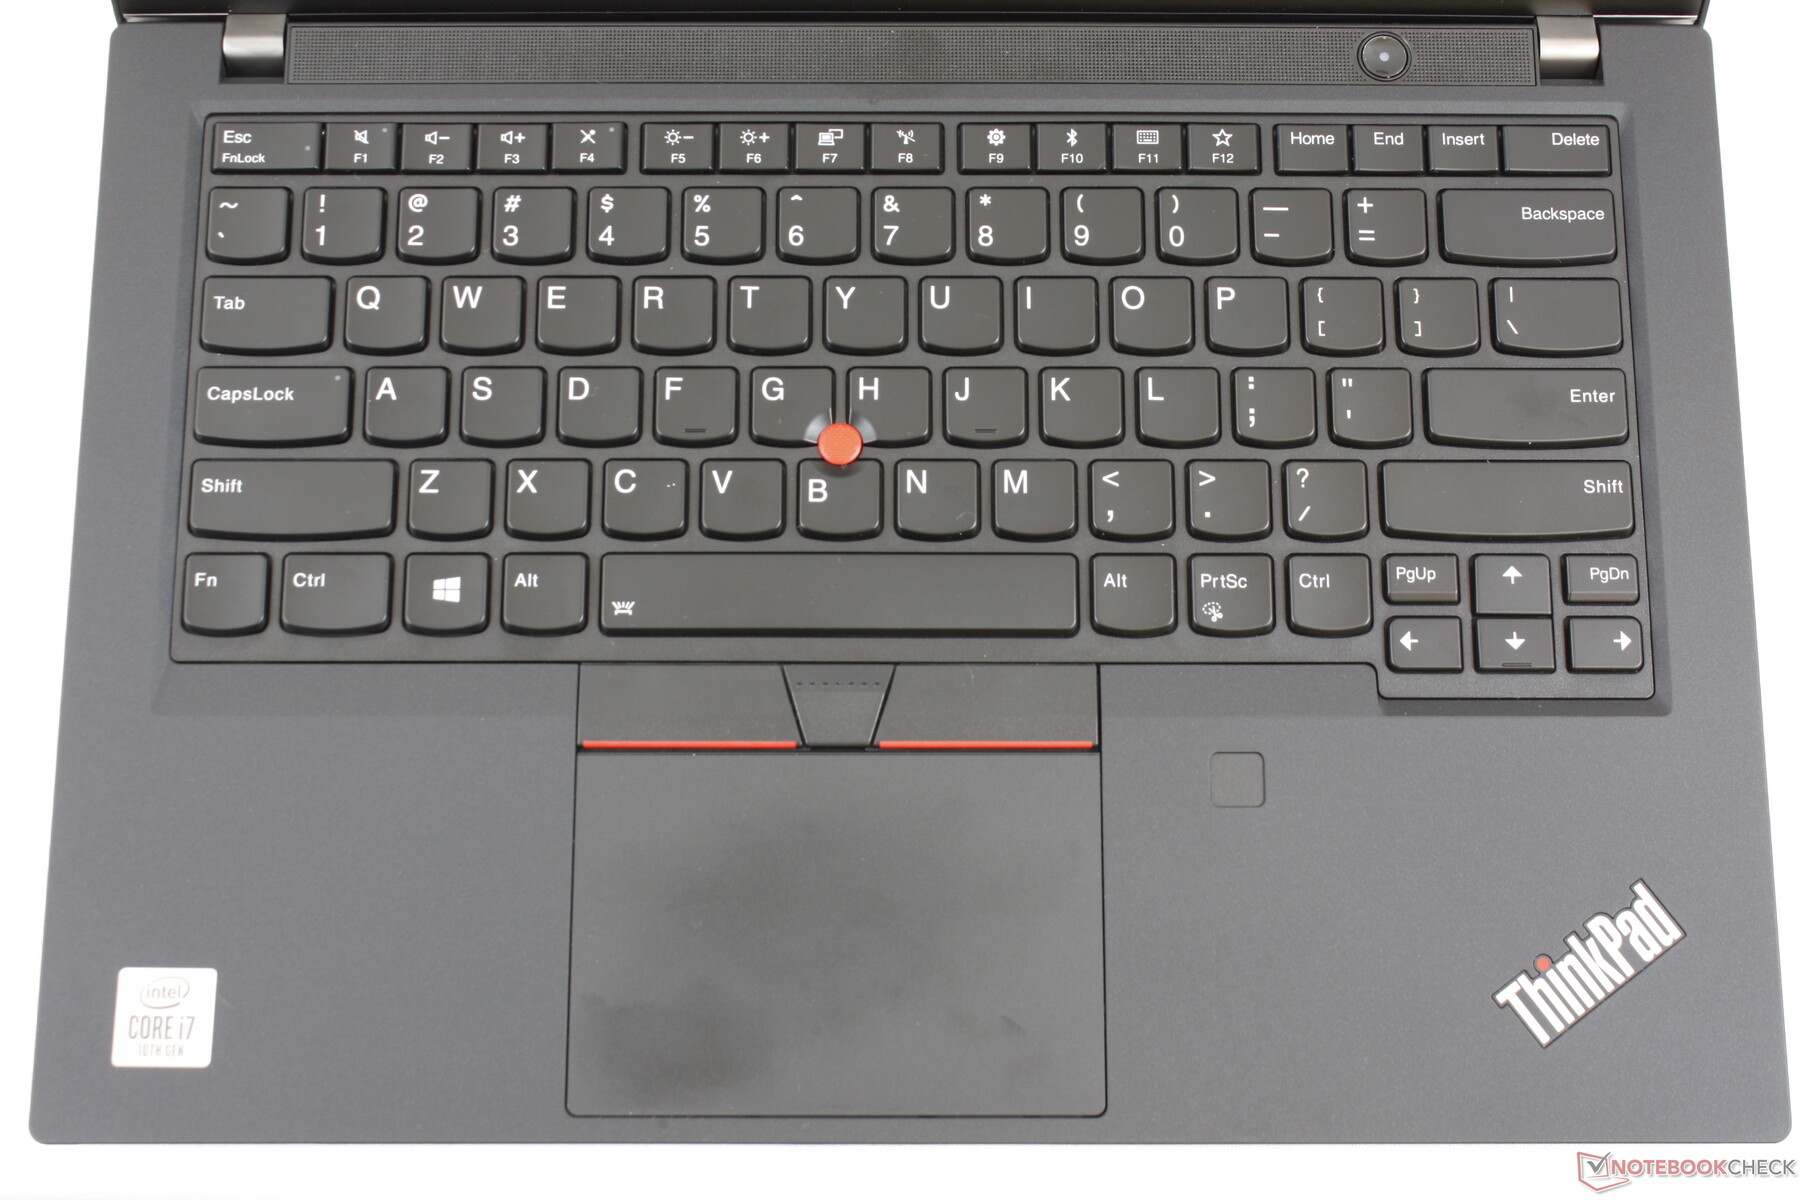
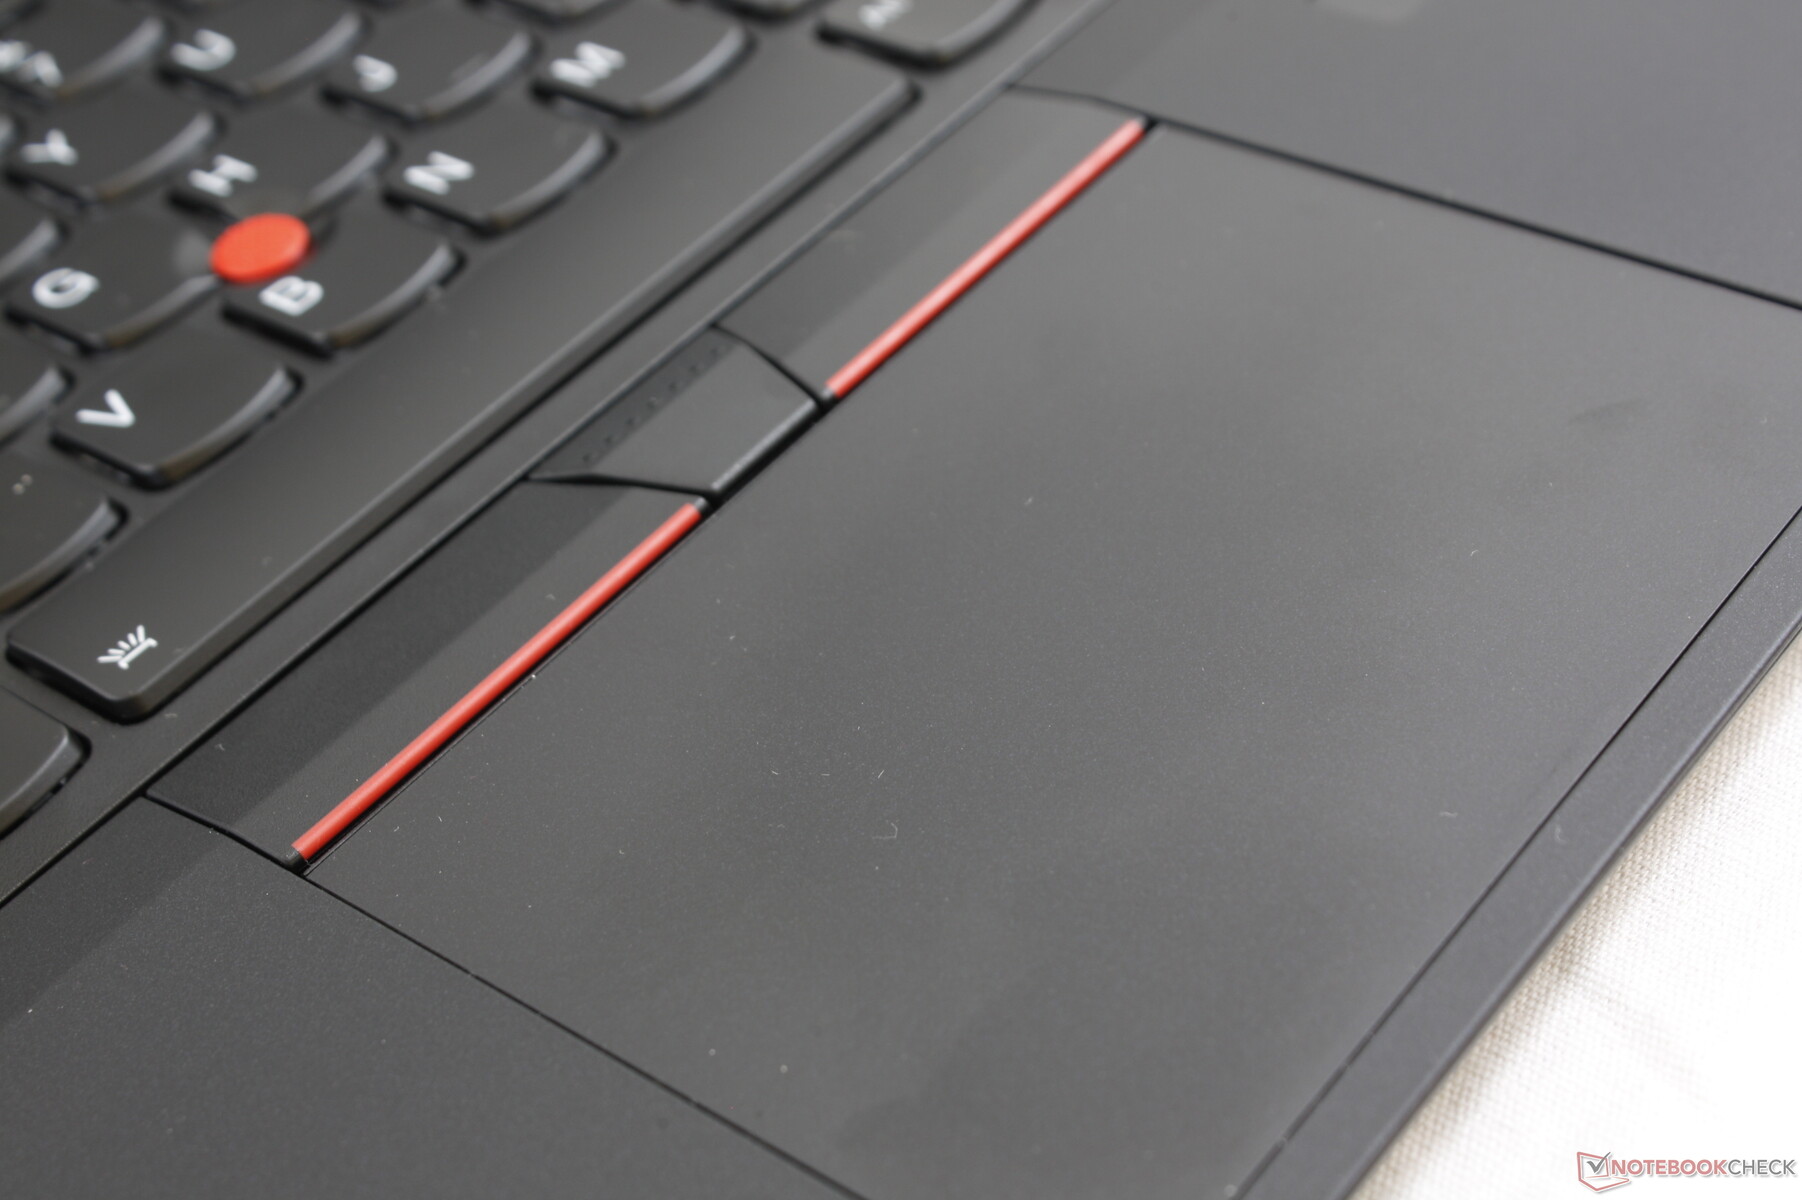
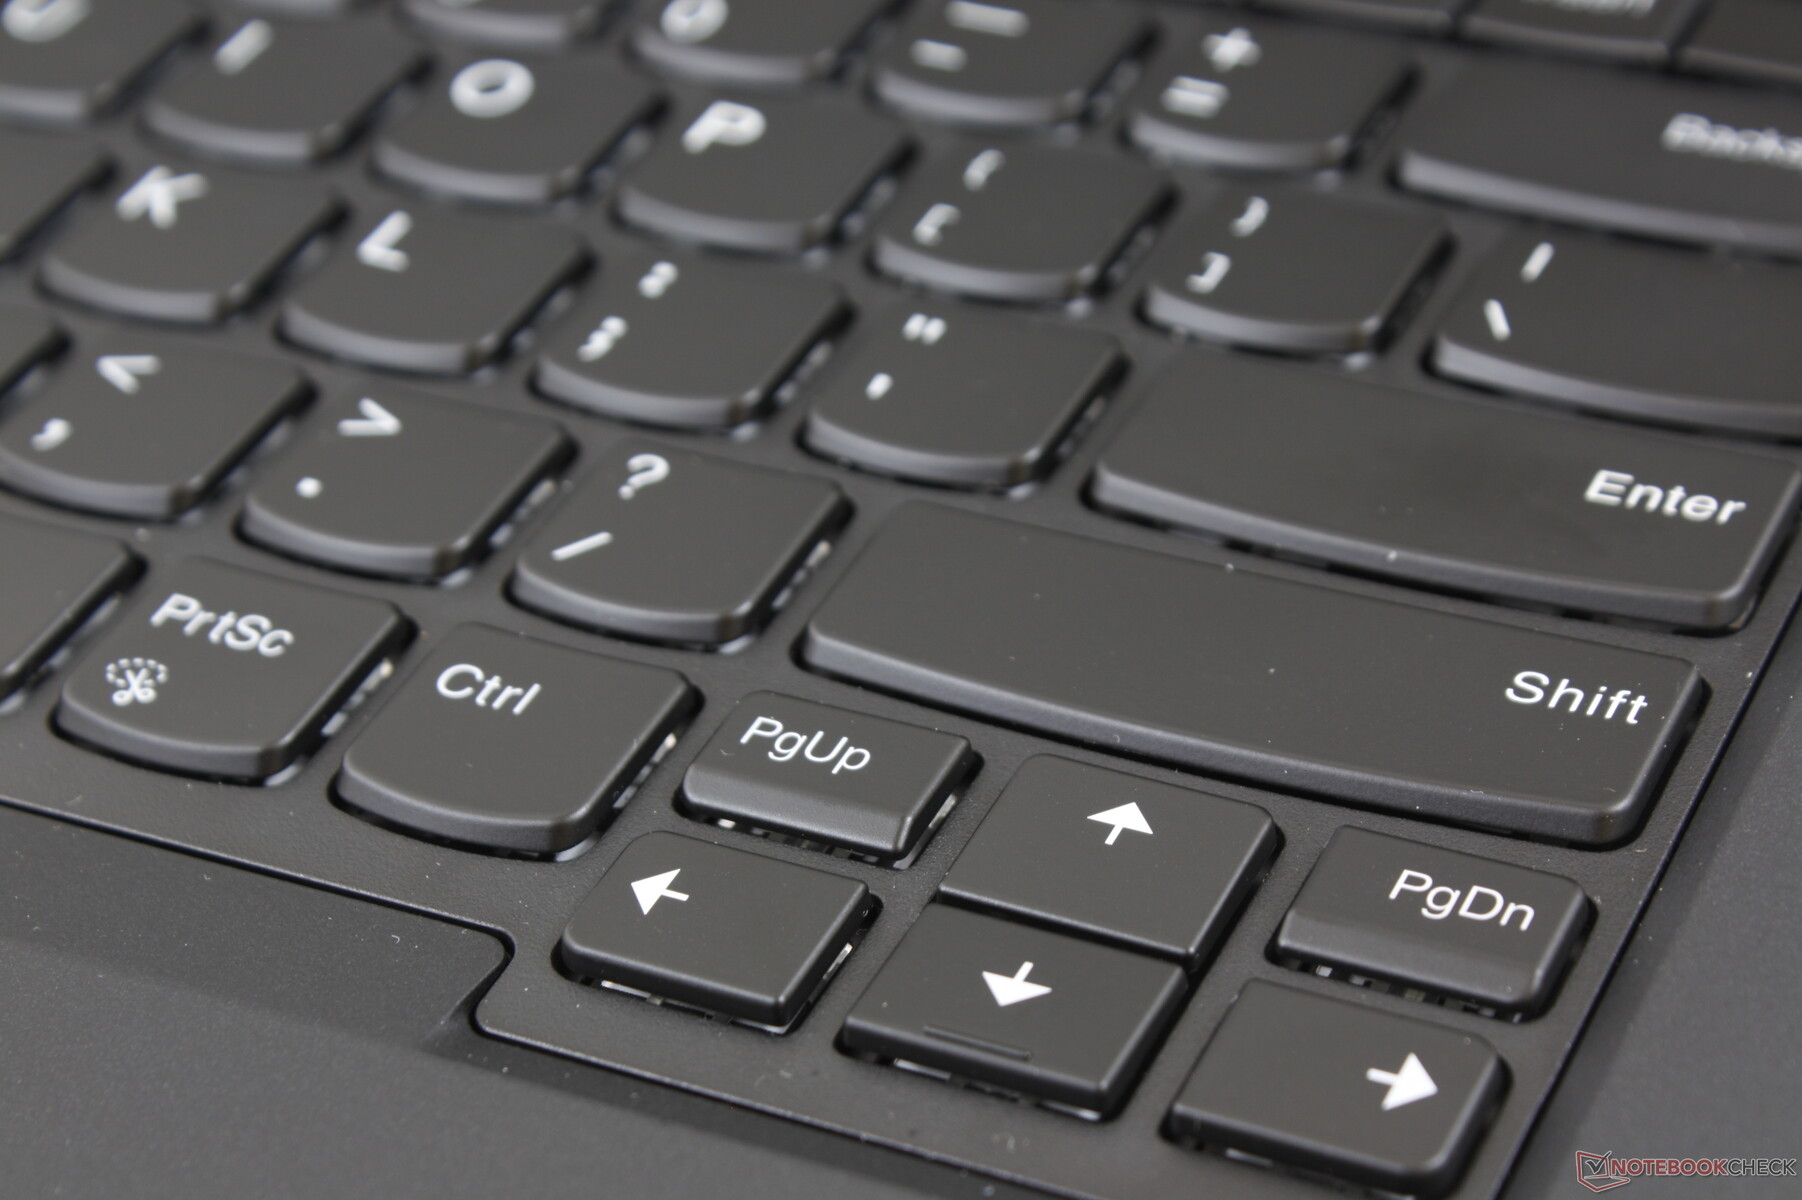
Input Devices
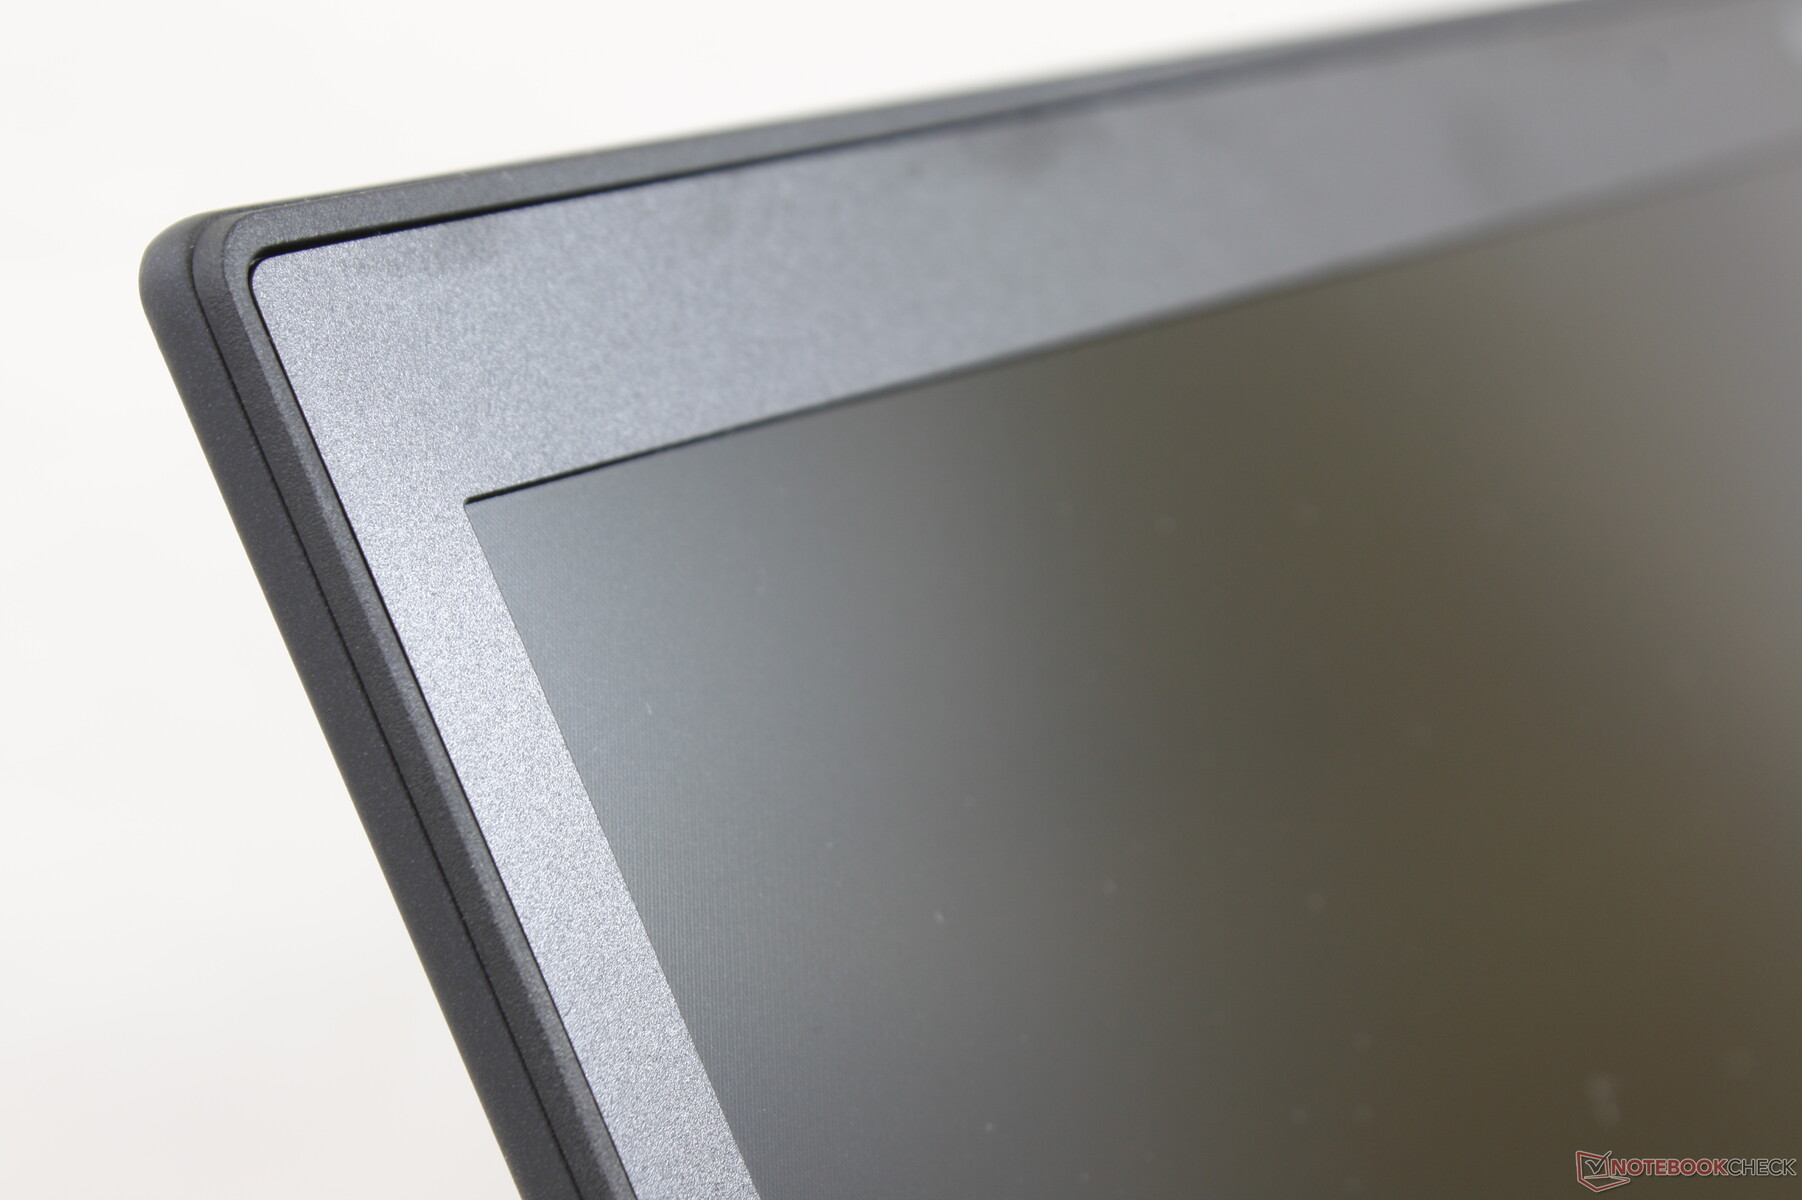
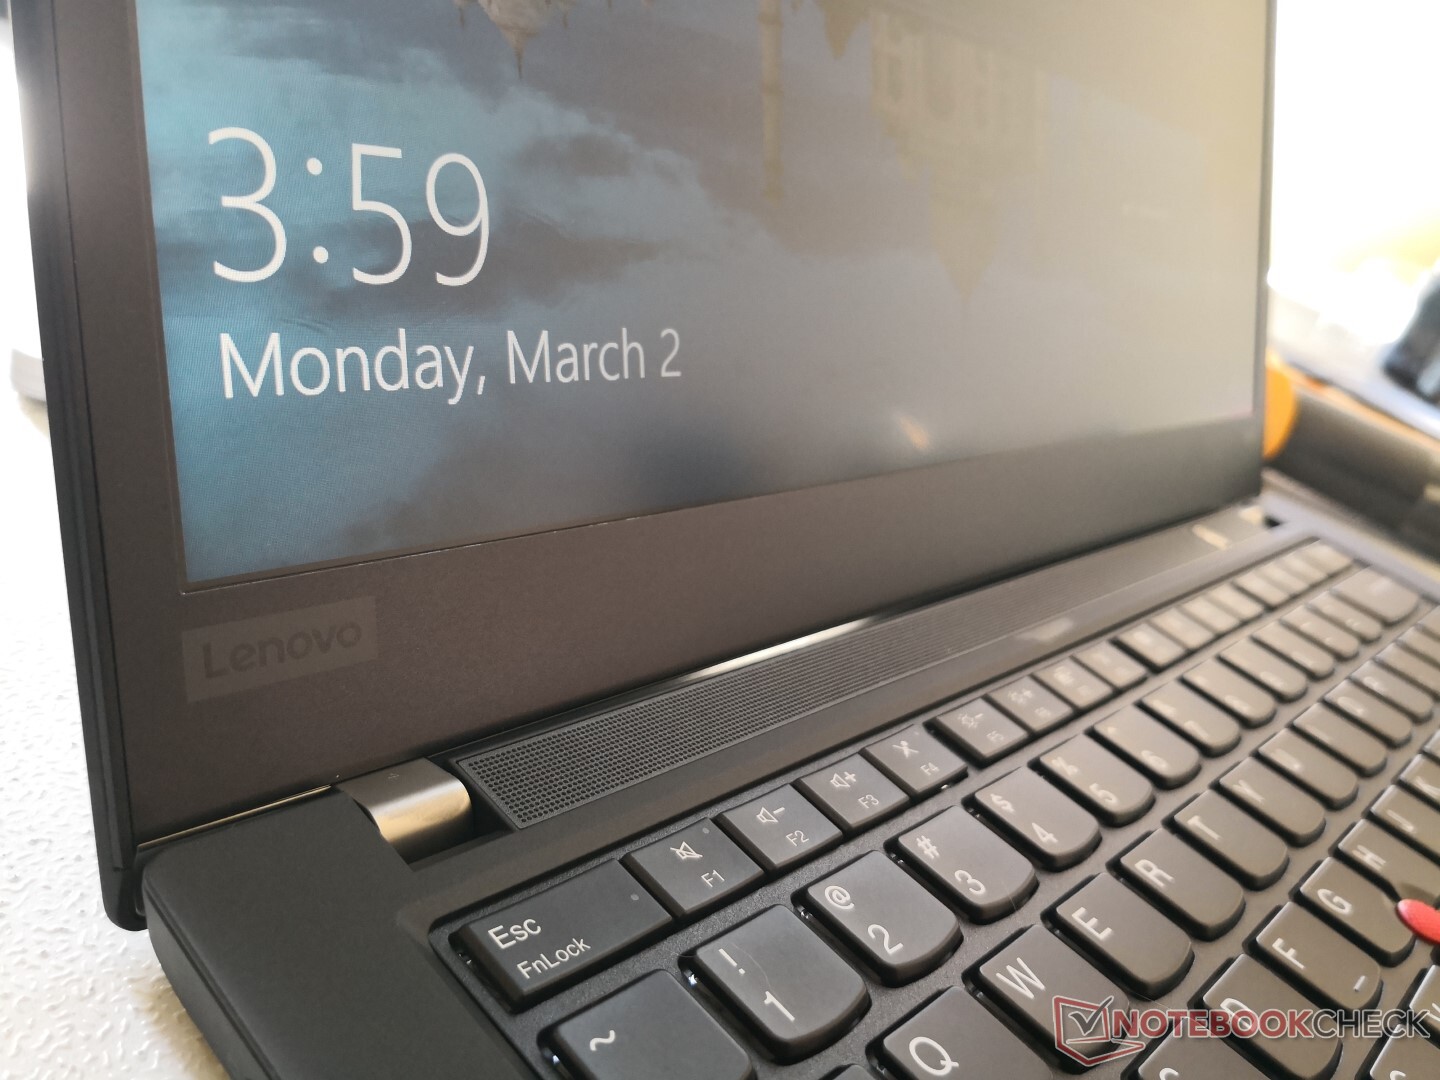
Display
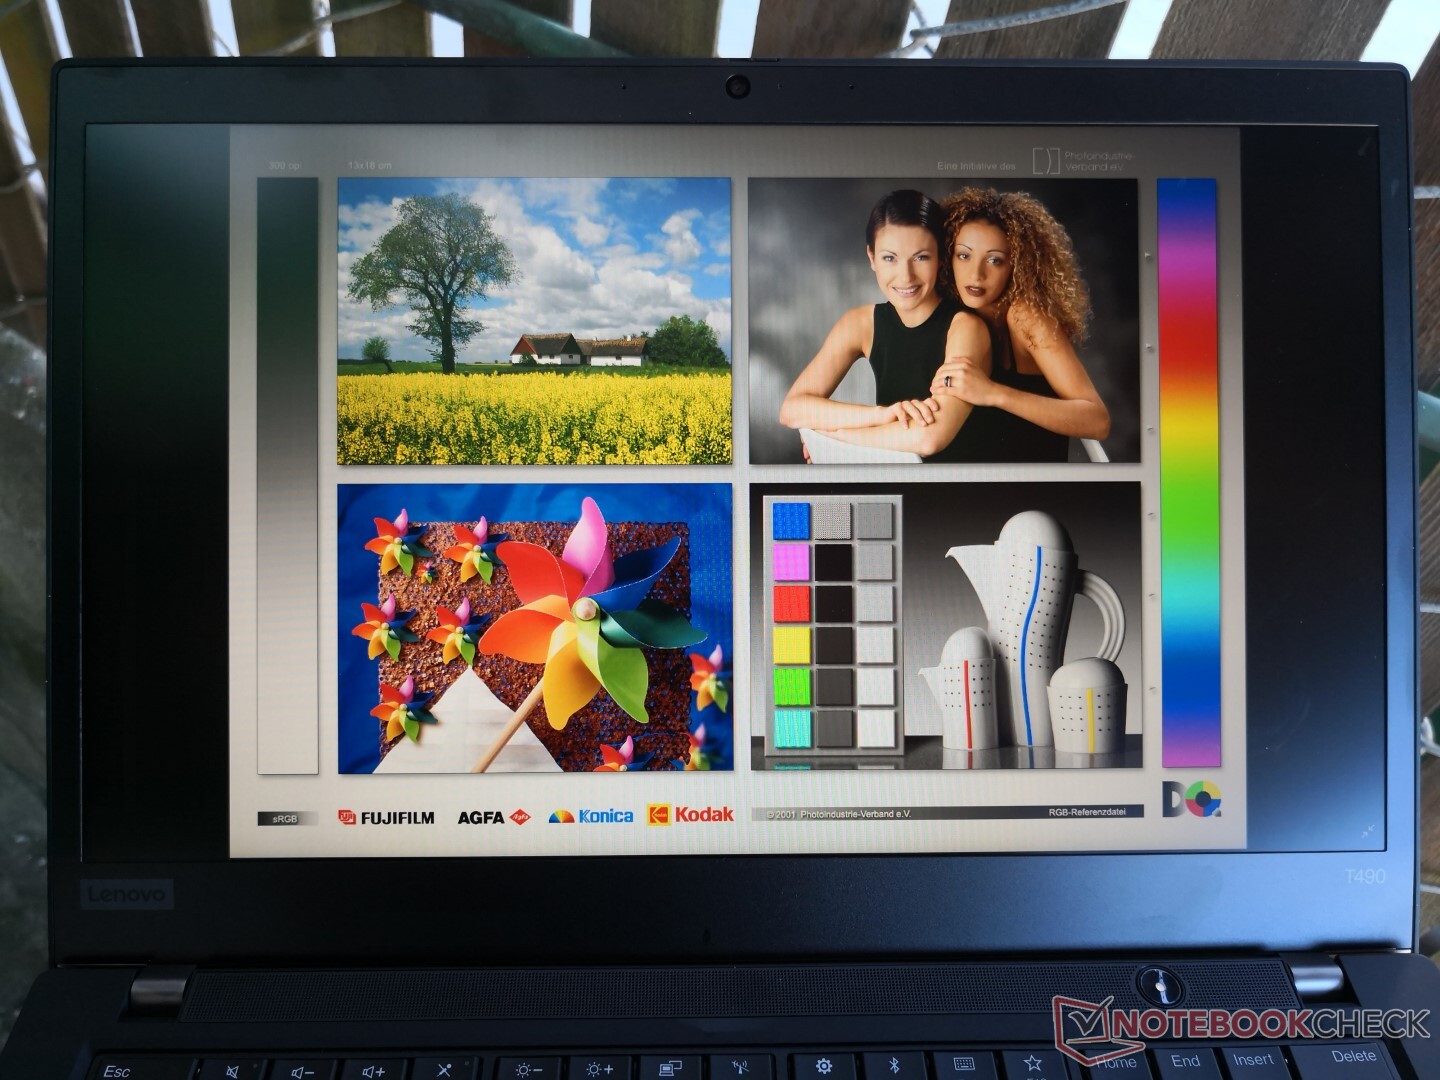
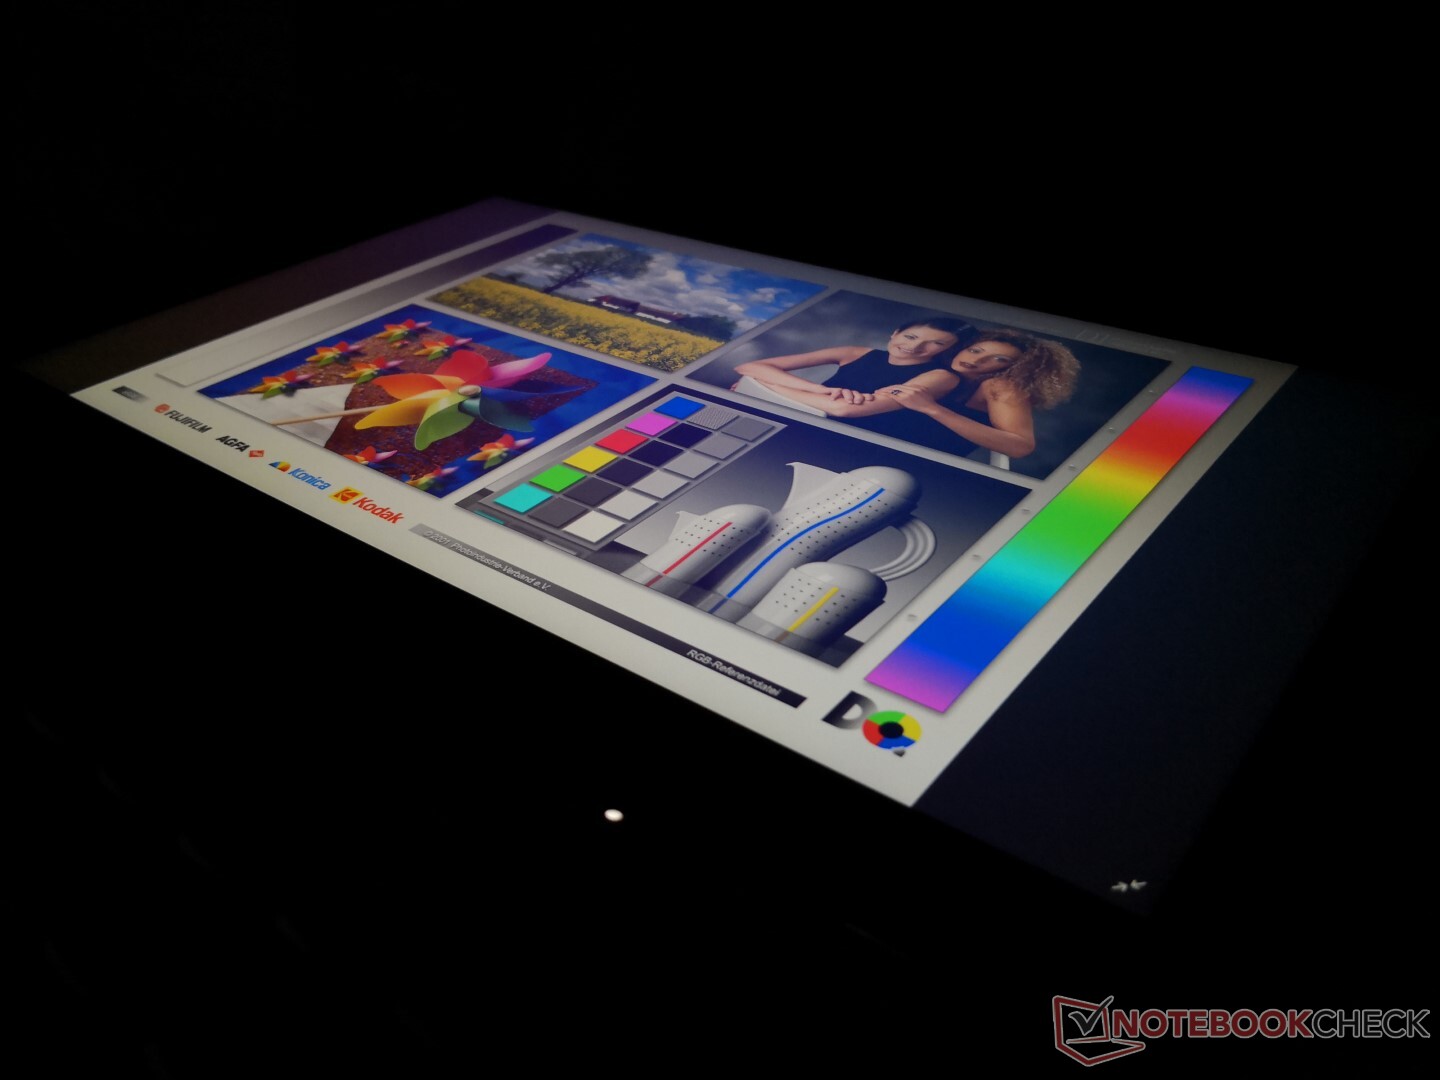
Our latest T490 unit uses a different panel than all the other T490 units that we've tested thus far. Whereas the other units had QHD B140QAN02.0 or FHD NE140FHM-N61 panels, the unit here uses an FHD R140NWF5 RA panel. This panel is the inferior FHD option as it is dimmer (300 nits vs 400 nits) and with more limited colors (61 percent sRGB vs 92 percent sRGB) than on the NE140FHM-N61. Pulse-width modulation is also now present on nearly all brightness levels. On the other hand, response times are faster this time around for less noticeable ghosting.
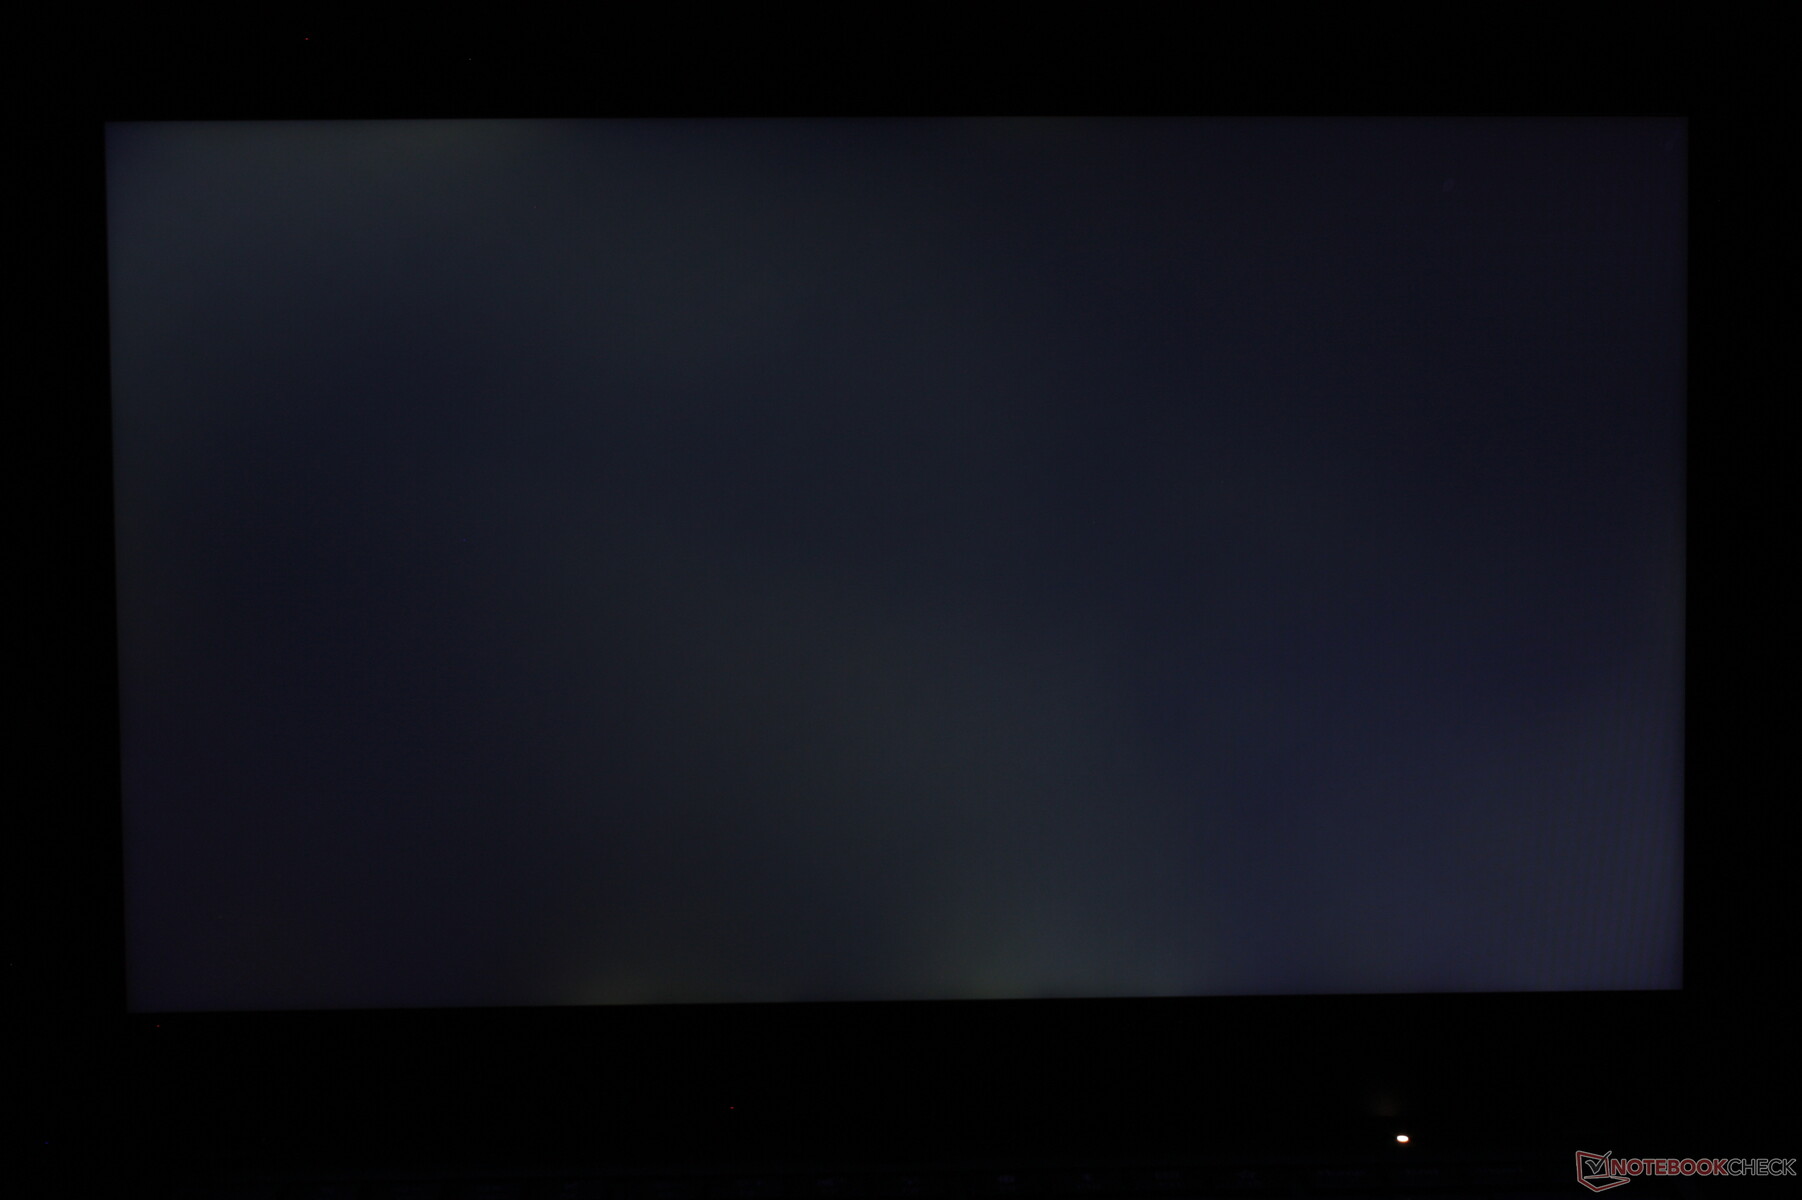
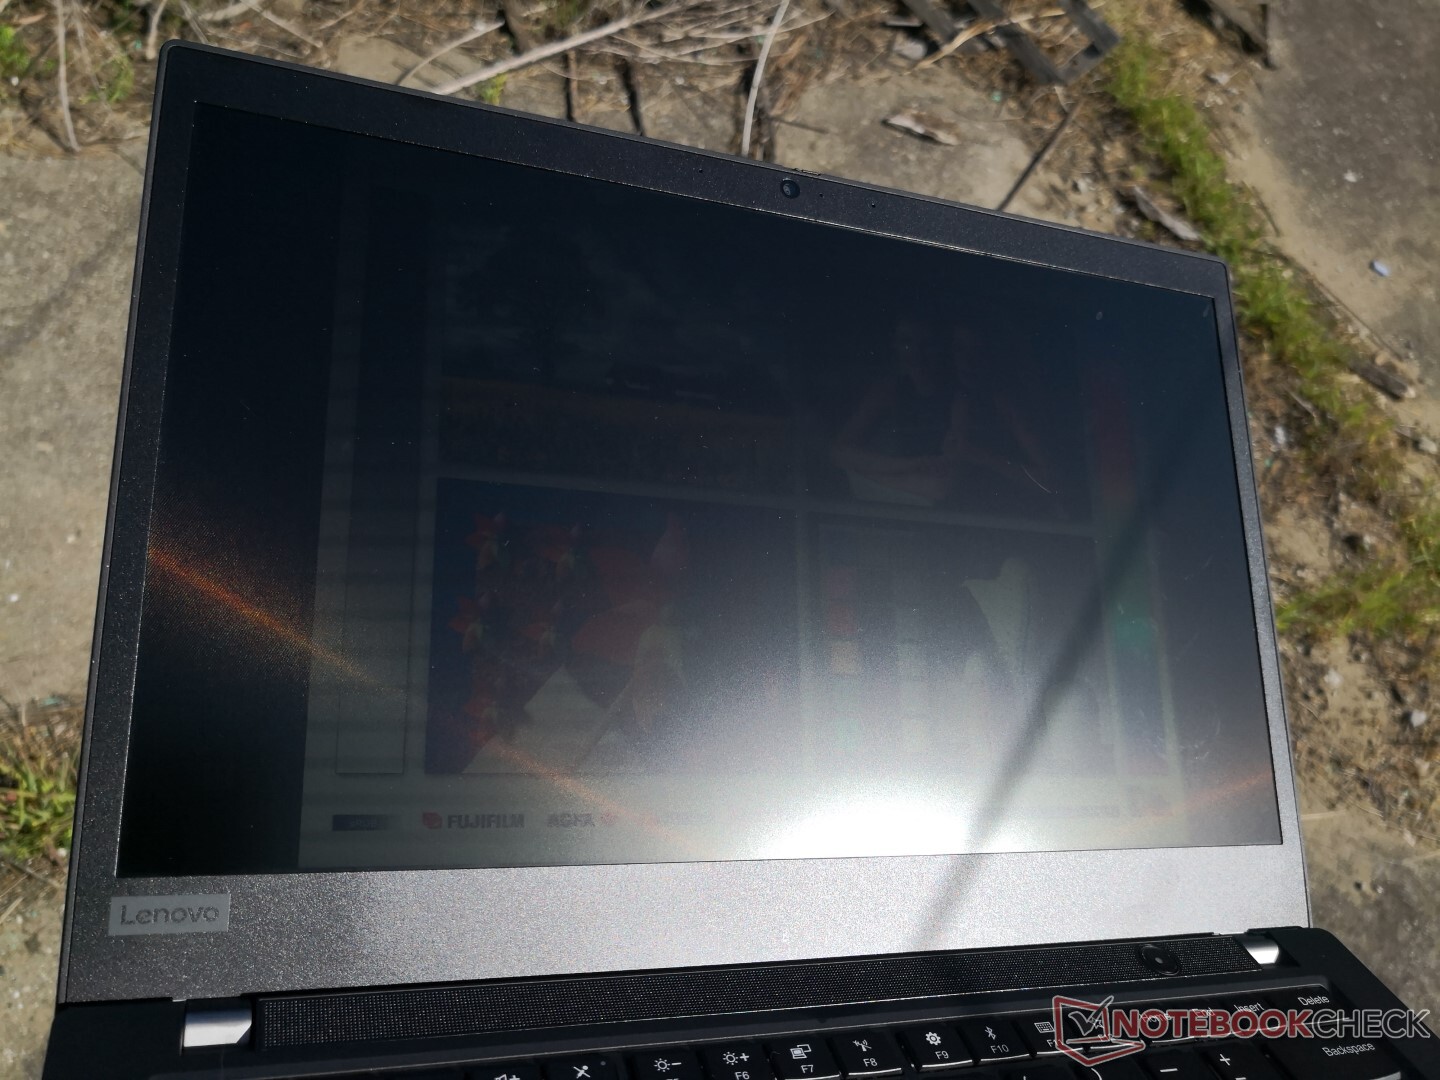
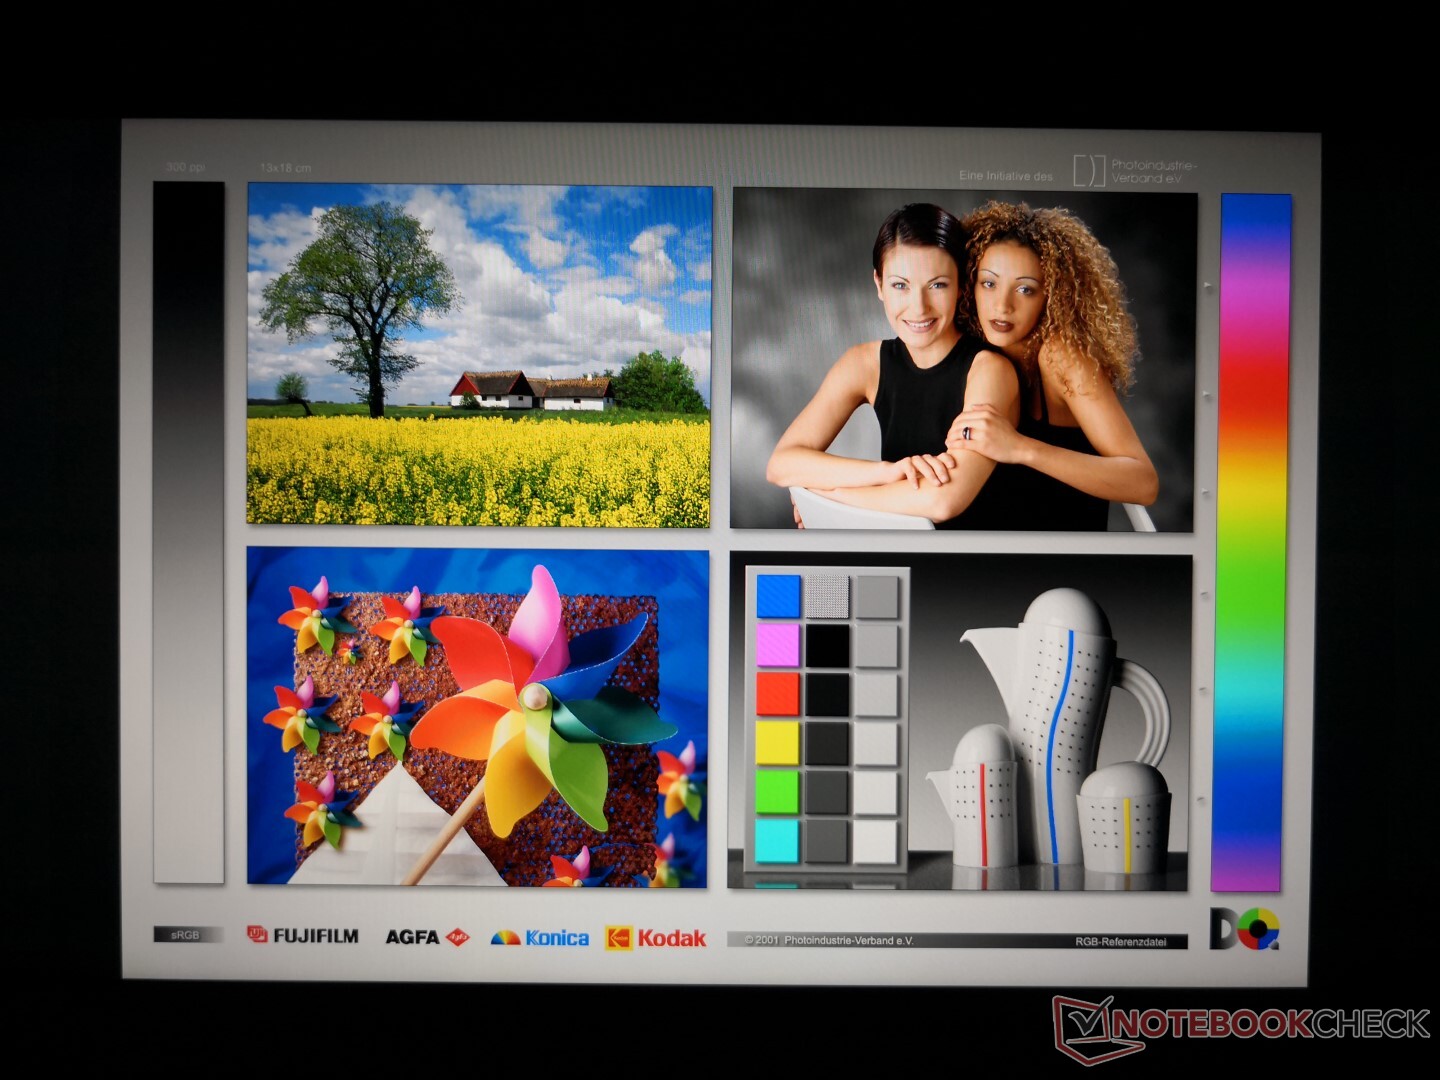
There is slight-moderate uneven backlight bleeding on our test unit as shown by the picture below. Thankfully, it is unnoticeable during day-to-day browsing or word processing.

| |||||||||||||||||||||||||
Brightness Distribution: 91 %
Center on Battery: 305.6 cd/m²
Contrast: 1528:1 (Black: 0.2 cd/m²)
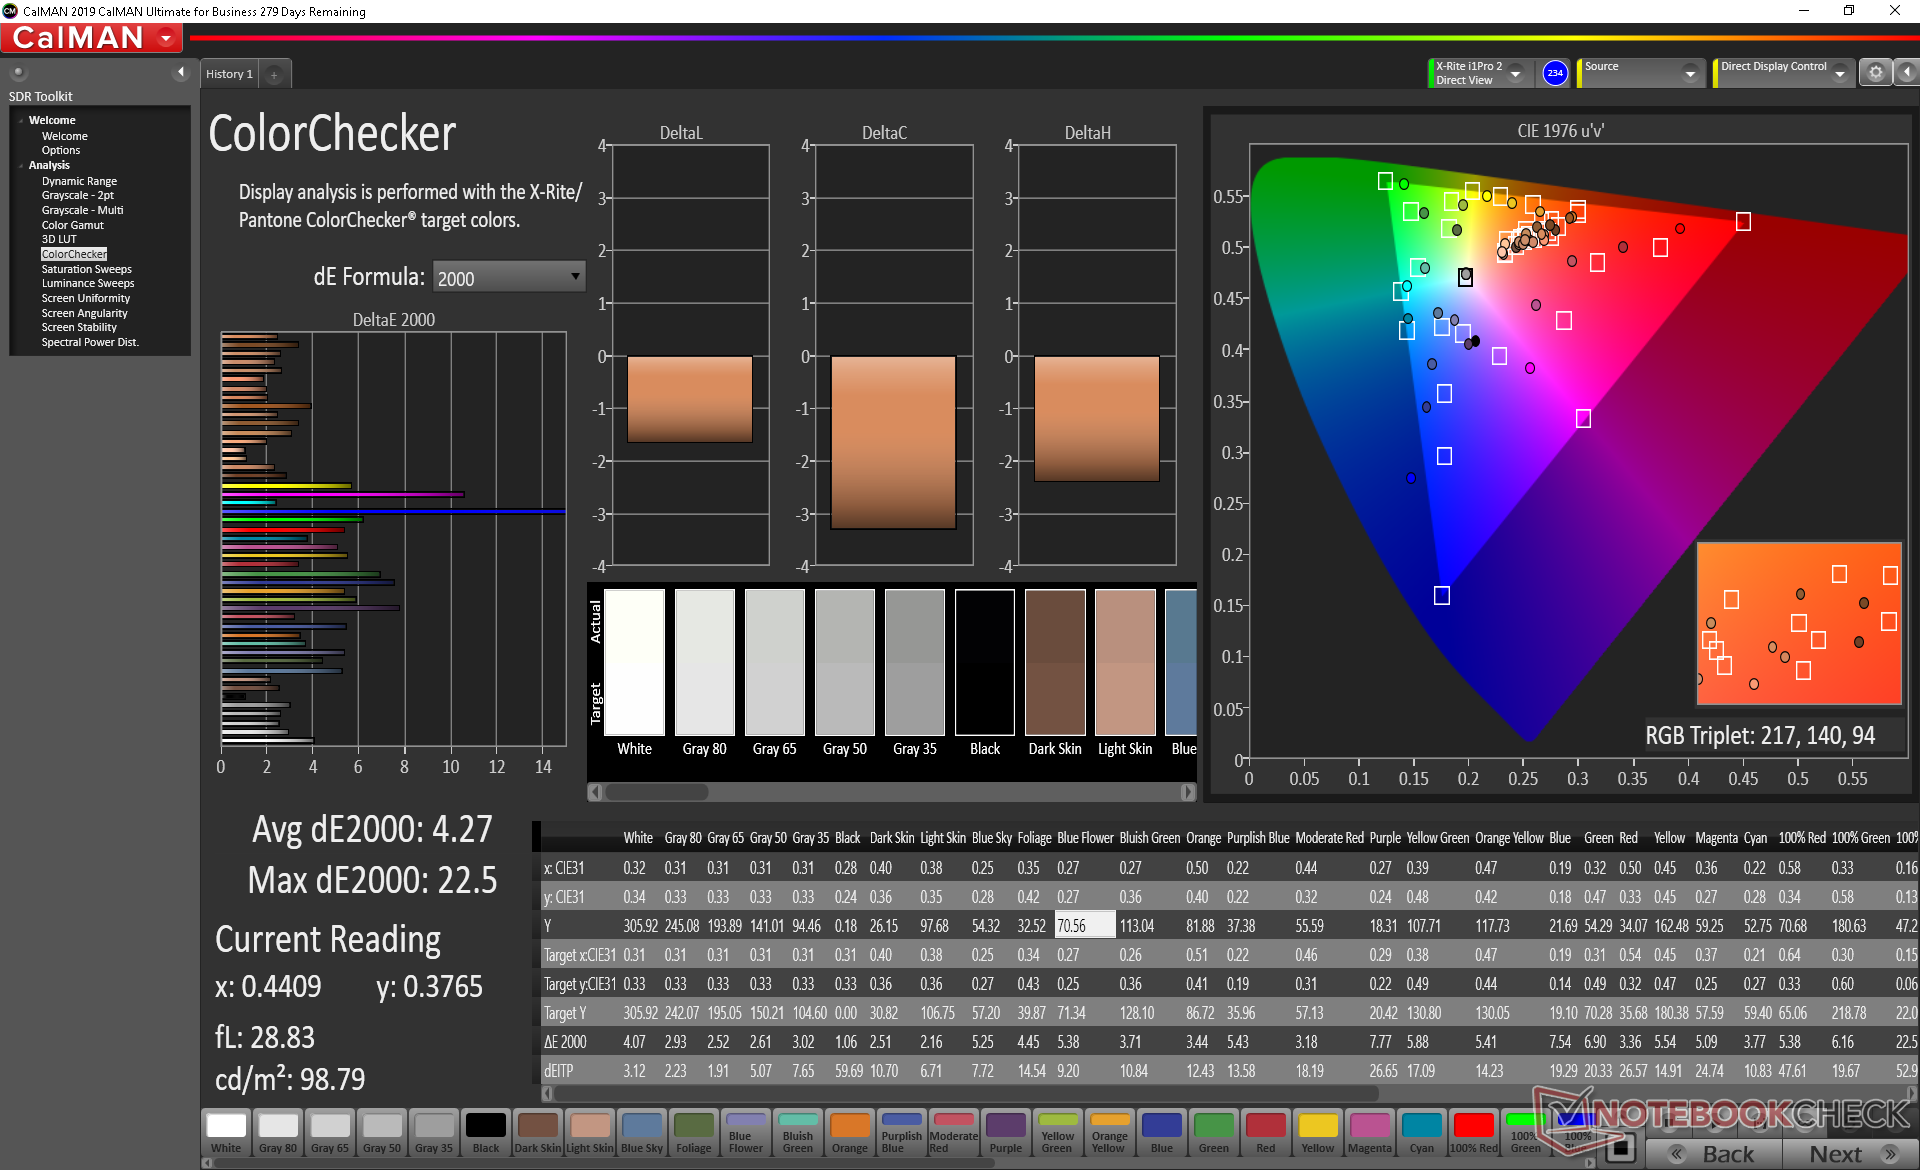
ΔE ColorChecker Calman: 4.27 | ∀{0.5-29.43 Ø4.73}
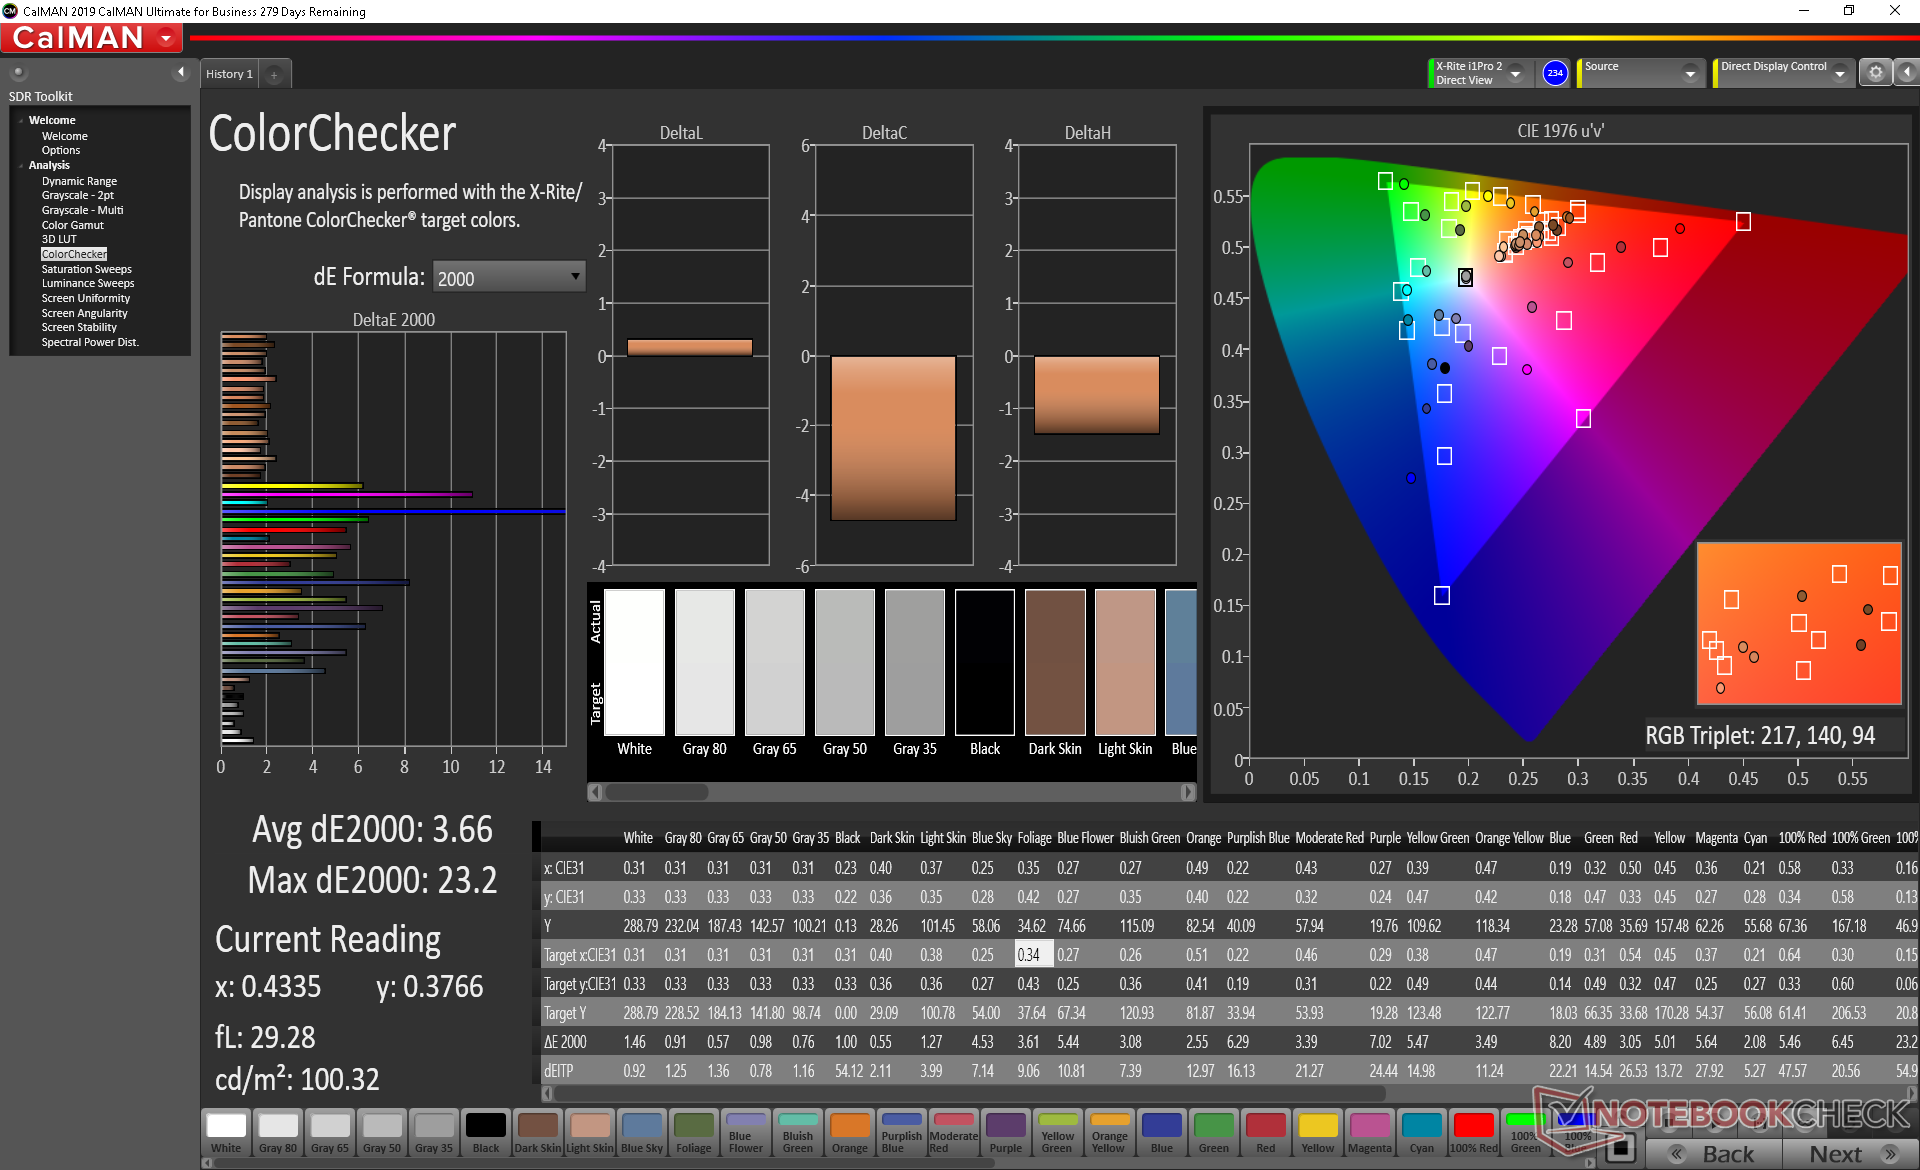
calibrated: 3.66
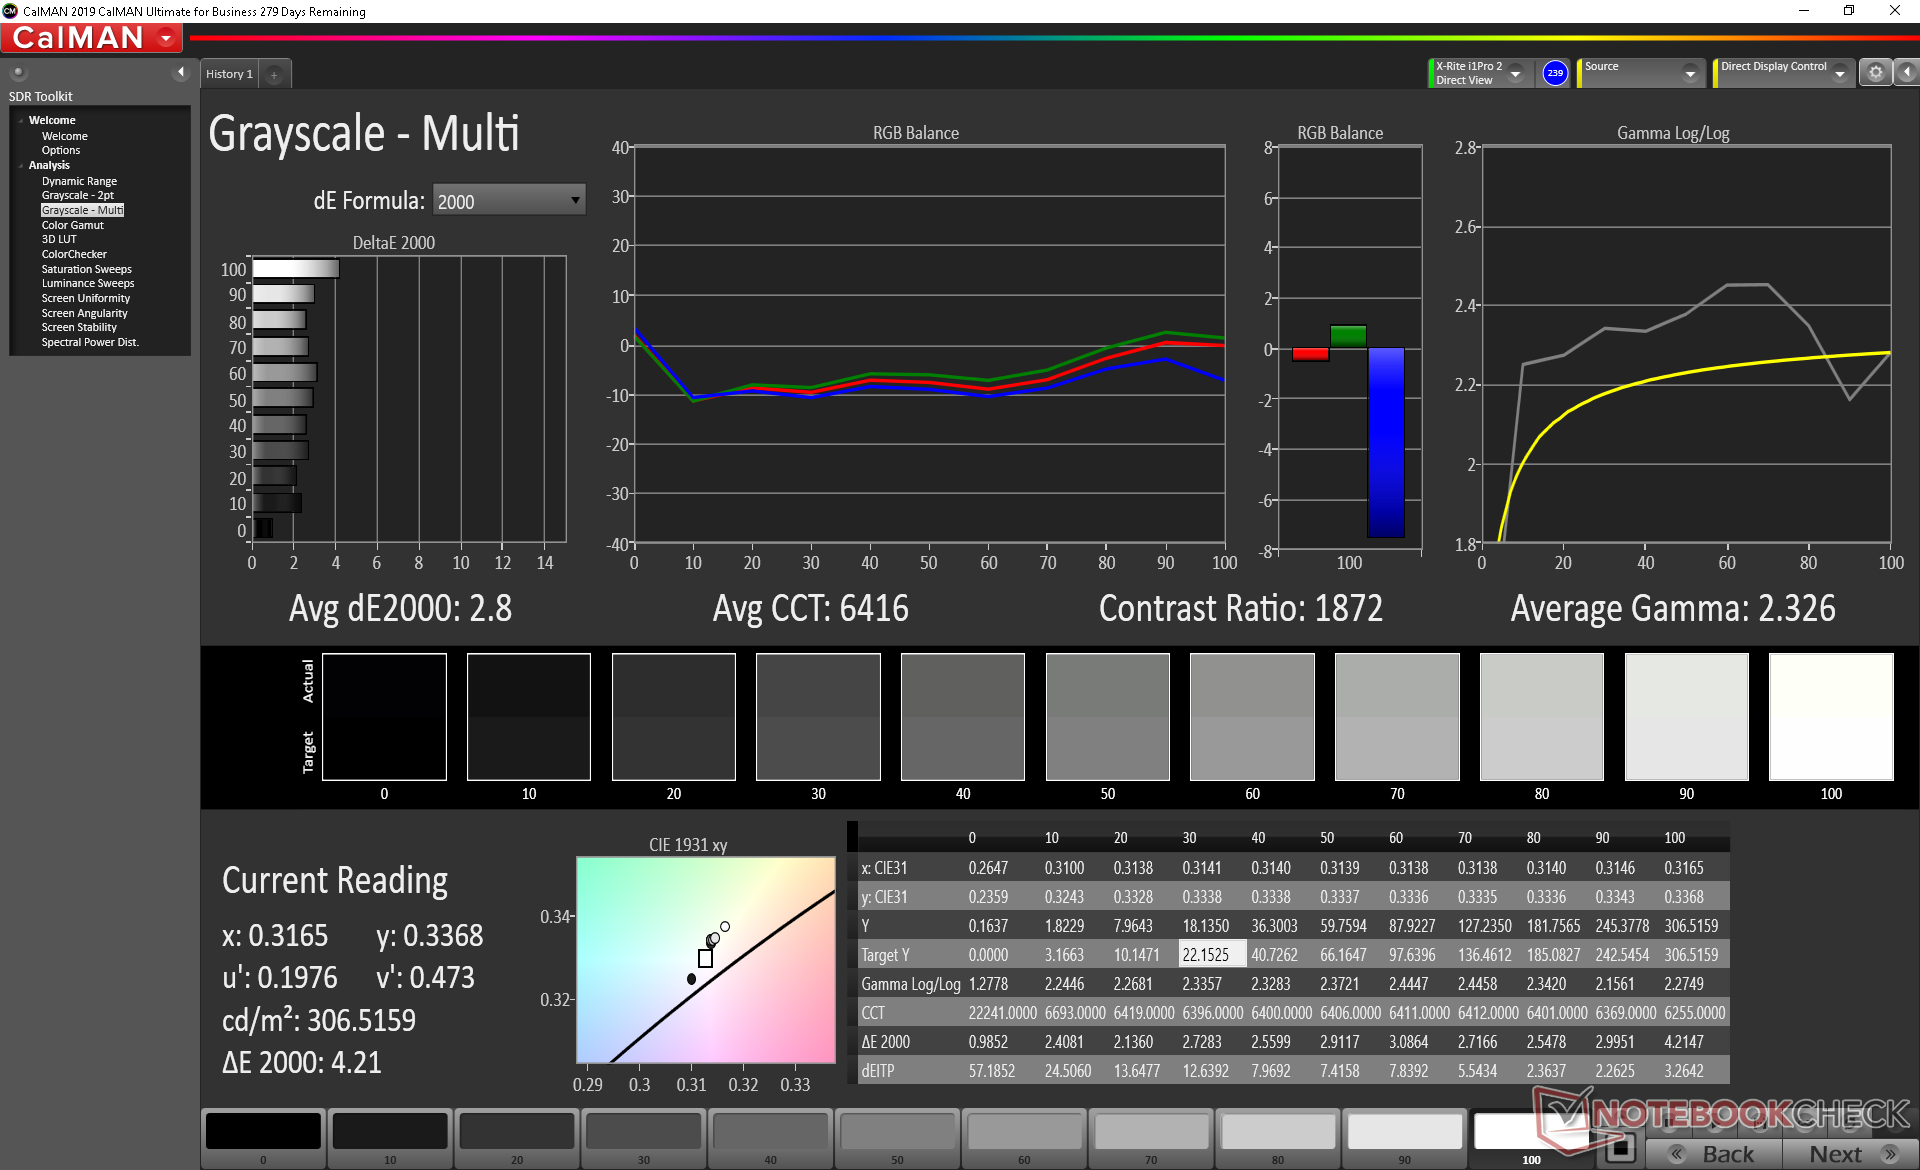
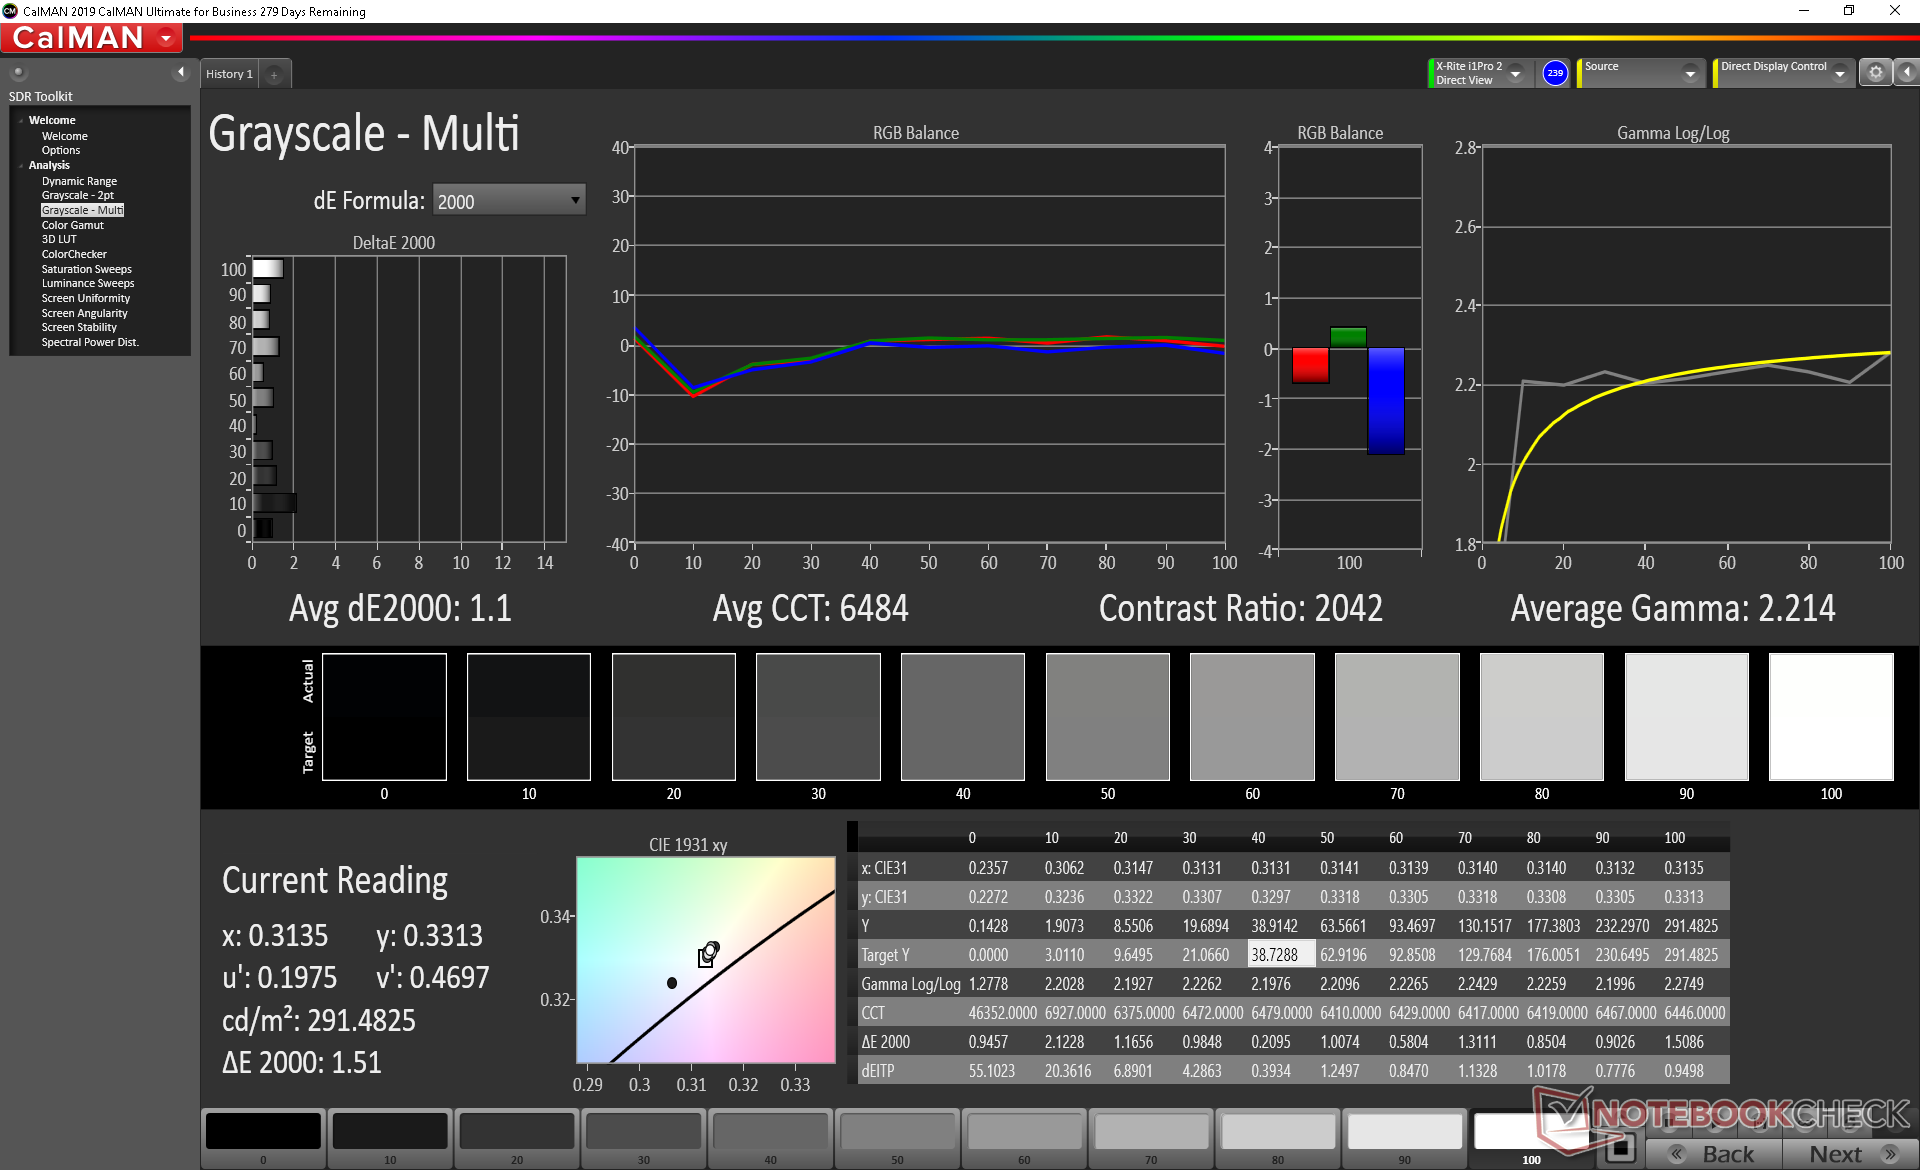
ΔE Greyscale Calman: 2.8 | ∀{0.09-98 Ø4.97}
61.1% sRGB (Argyll 1.6.3 3D)
39.1% AdobeRGB 1998 (Argyll 1.6.3 3D)
42.37% AdobeRGB 1998 (Argyll 3D)
61.3% sRGB (Argyll 3D)
40.99% Display P3 (Argyll 3D)
Gamma: 2.33
CCT: 6416 K
| Lenovo ThinkPad T490 20RY0002US R140NWF5 RA, IPS, 14", 1920x1080 | Lenovo ThinkPad T480-20L6S01V00 Lenovo LP140WF6-SPB7, IPS, 14", 1920x1080 | Lenovo ThinkPad T470-20HD002HGE N140HCA-EAB, IPS, 14", 1920x1080 | Lenovo ThinkPad T460-20FN003LGE Lenovo LEN40A9 / N140HCE-EAA, IPS, 14", 1920x1080 | Lenovo ThinkPad T450-20BV001VGE Samsung LTN140KT14401, TN-Panel, 14", 1600x900 | Lenovo ThinkPad T495s-20QKS01E00 B140HAN05.7, IPS, 14", 1920x1080 | |
|---|---|---|---|---|---|---|
| Display | -4% | 1% | 2% | -3% | 61% | |
| Display P3 Coverage (%) | 40.99 | 39.24 -4% | 41.6 1% | 42.09 3% | 39.62 -3% | 67 63% |
| sRGB Coverage (%) | 61.3 | 58.8 -4% | 61.9 1% | 62 1% | 59.6 -3% | 96.8 58% |
| AdobeRGB 1998 Coverage (%) | 42.37 | 40.56 -4% | 43.06 2% | 43.6 3% | 40.94 -3% | 68.3 61% |
| Response Times | 18% | -5% | 11% | -32% | ||
| Response Time Grey 50% / Grey 80% * (ms) | 47.2 ? | 35.6 ? 25% | 41.6 ? 12% | 42.4 ? 10% | 60.8 ? -29% | |
| Response Time Black / White * (ms) | 28 ? | 24.8 ? 11% | 34 ? -21% | 24.8 ? 11% | 37.6 ? -34% | |
| PWM Frequency (Hz) | 980 ? | |||||
| Screen | -13% | -20% | -33% | -87% | 24% | |
| Brightness middle (cd/m²) | 305.6 | 307 0% | 306 0% | 230 -25% | 166 -46% | 380 24% |
| Brightness (cd/m²) | 293 | 295 1% | 287 -2% | 216 -26% | 163 -44% | 381 30% |
| Brightness Distribution (%) | 91 | 90 -1% | 88 -3% | 85 -7% | 68 -25% | 87 -4% |
| Black Level * (cd/m²) | 0.2 | 0.25 -25% | 0.3 -50% | 0.26 -30% | 0.71 -255% | 0.22 -10% |
| Contrast (:1) | 1528 | 1228 -20% | 1020 -33% | 885 -42% | 234 -85% | 1727 13% |
| Colorchecker dE 2000 * | 4.27 | 5.7 -33% | 6.2 -45% | 7.32 -71% | 7.16 -68% | 4 6% |
| Colorchecker dE 2000 max. * | 22.5 | 21.3 5% | 13.6 40% | 18.14 19% | 5.7 75% | |
| Colorchecker dE 2000 calibrated * | 3.66 | 4.7 -28% | 1.2 67% | |||
| Greyscale dE 2000 * | 2.8 | 3.7 -32% | 5.8 -107% | 6.98 -149% | 7.62 -172% | 4.4 -57% |
| Gamma | 2.33 94% | 2.11 104% | 2.04 108% | 2.5 88% | 2.25 98% | 2.54 87% |
| CCT | 6416 101% | 7353 88% | 6277 104% | 6683 97% | 9371 69% | 6963 93% |
| Color Space (Percent of AdobeRGB 1998) (%) | 39.1 | 37.4 -4% | 39.62 1% | 39.97 2% | 37.8 -3% | 62.2 59% |
| Color Space (Percent of sRGB) (%) | 61.1 | 58.7 -4% | 61.44 1% | 61.55 1% | 96.6 58% | |
| Total Average (Program / Settings) | 0% /
-7% | -8% /
-14% | -7% /
-20% | -45% /
-64% | 18% /
24% |
* ... smaller is better
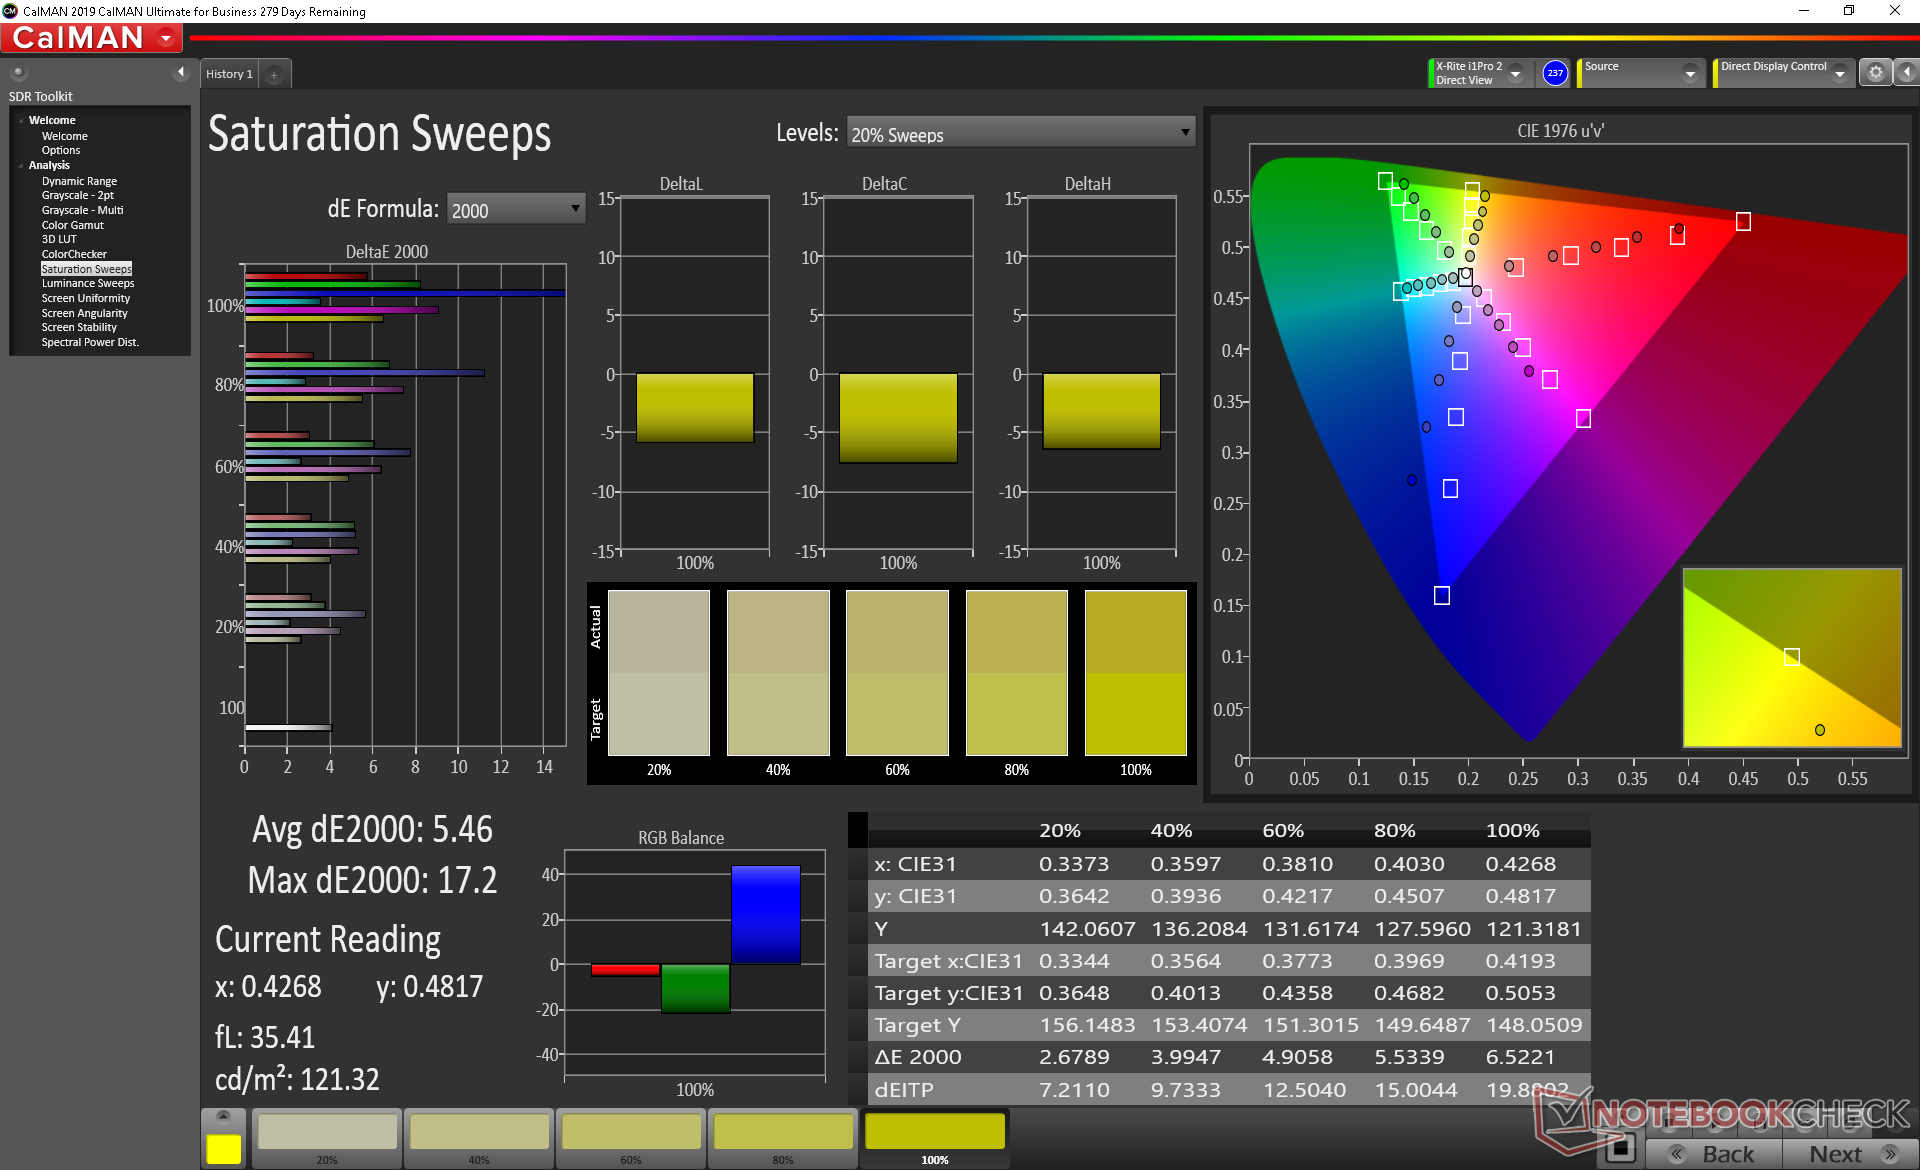
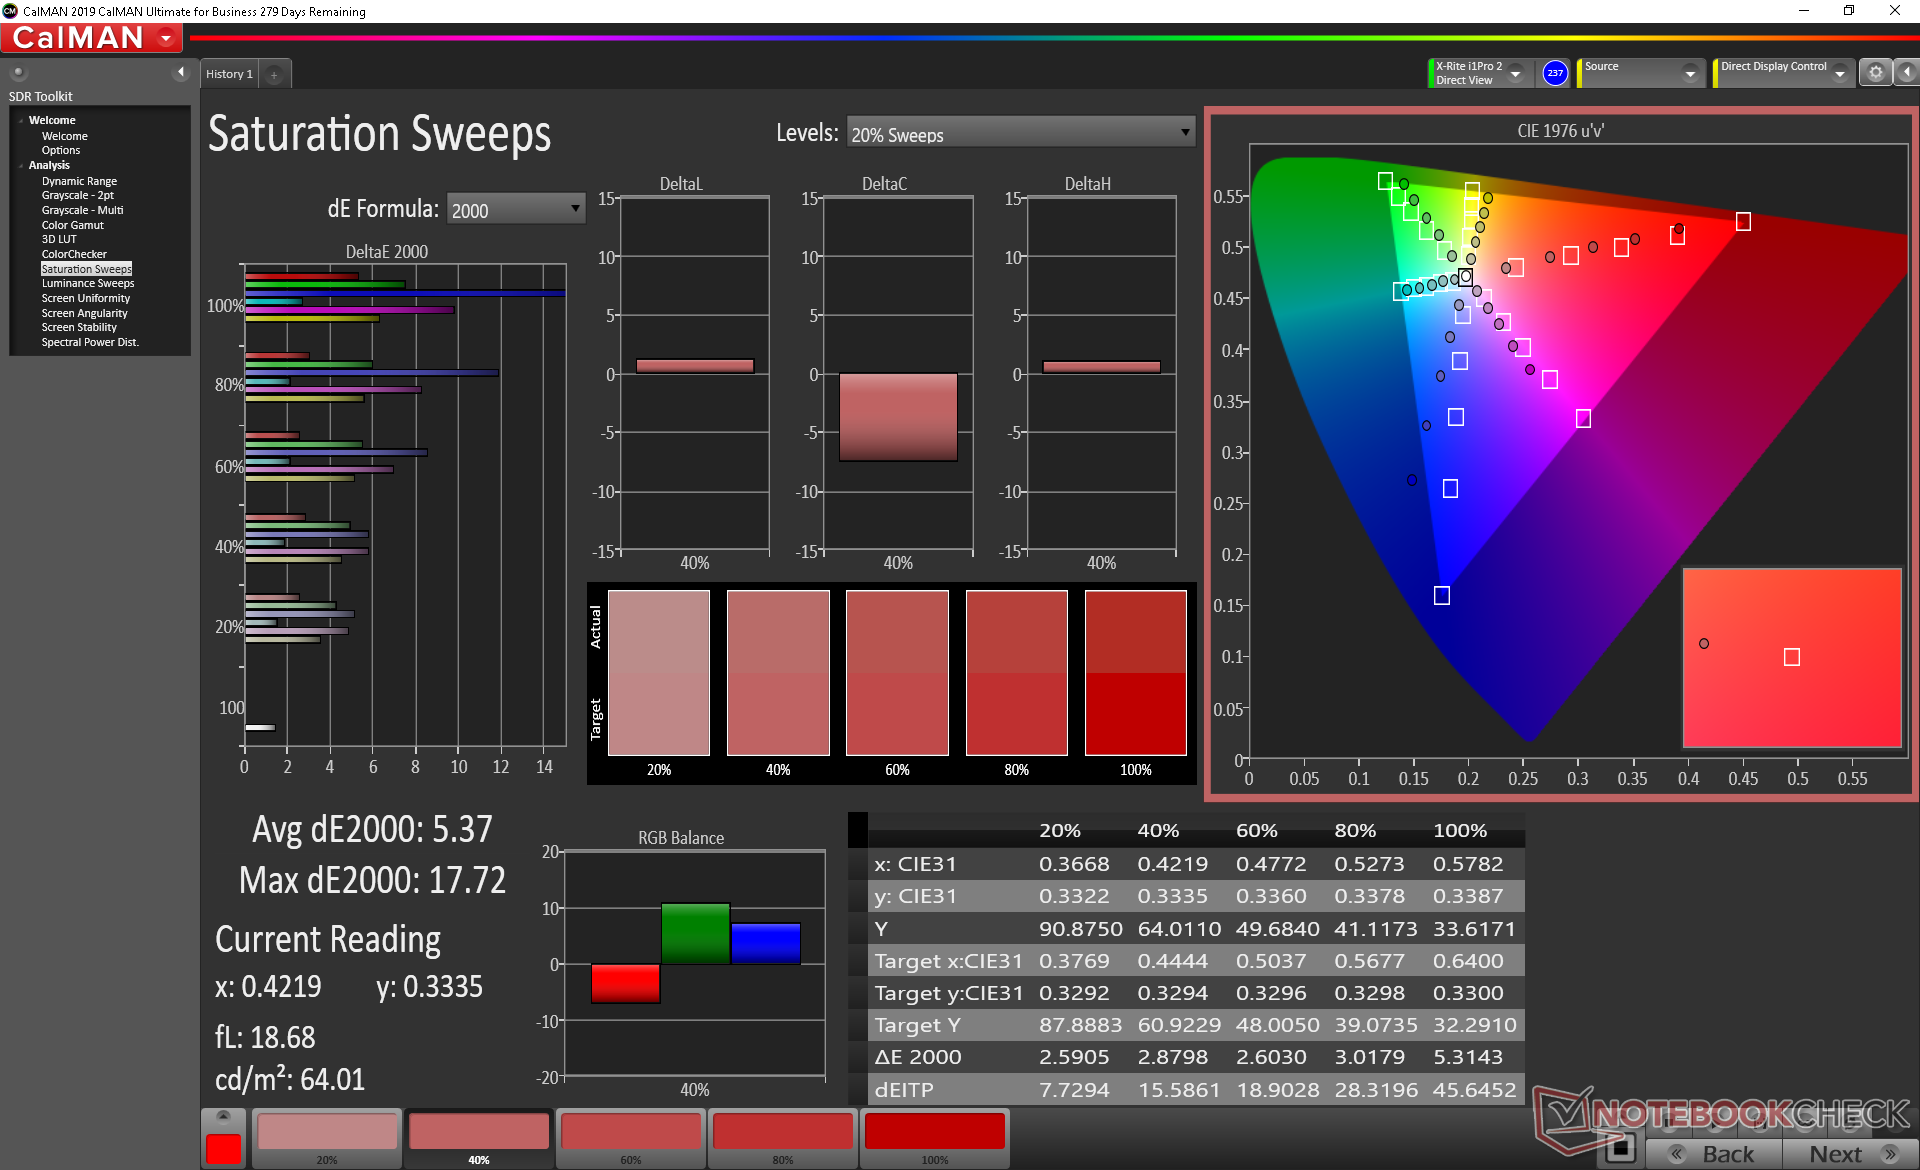
Color space is limited to just 61 percent of sRGB compared to >95 percent on high-end Ultrabooks like the ZenBook S13 or HP Spectre 13. Users will have to configure the ThinkPad T490 with higher-end panel options for deeper and more accurate colors.
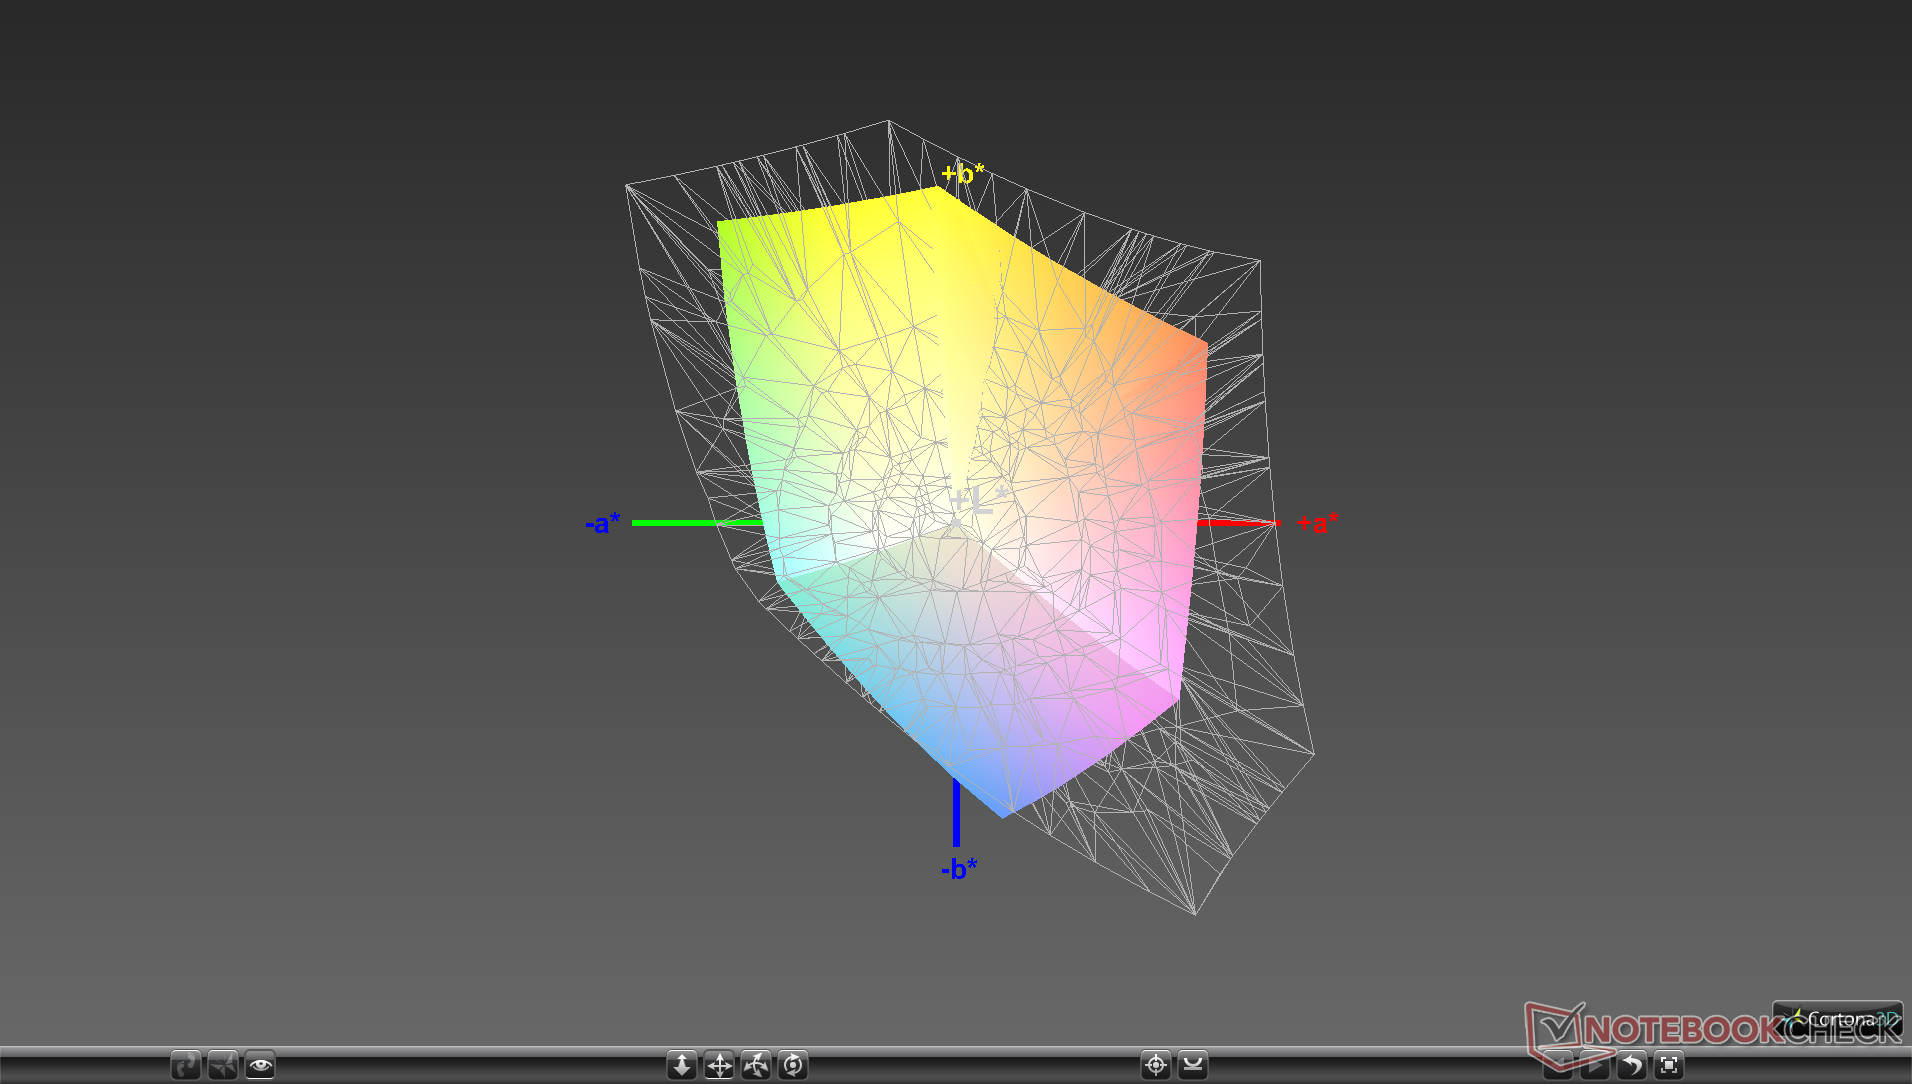
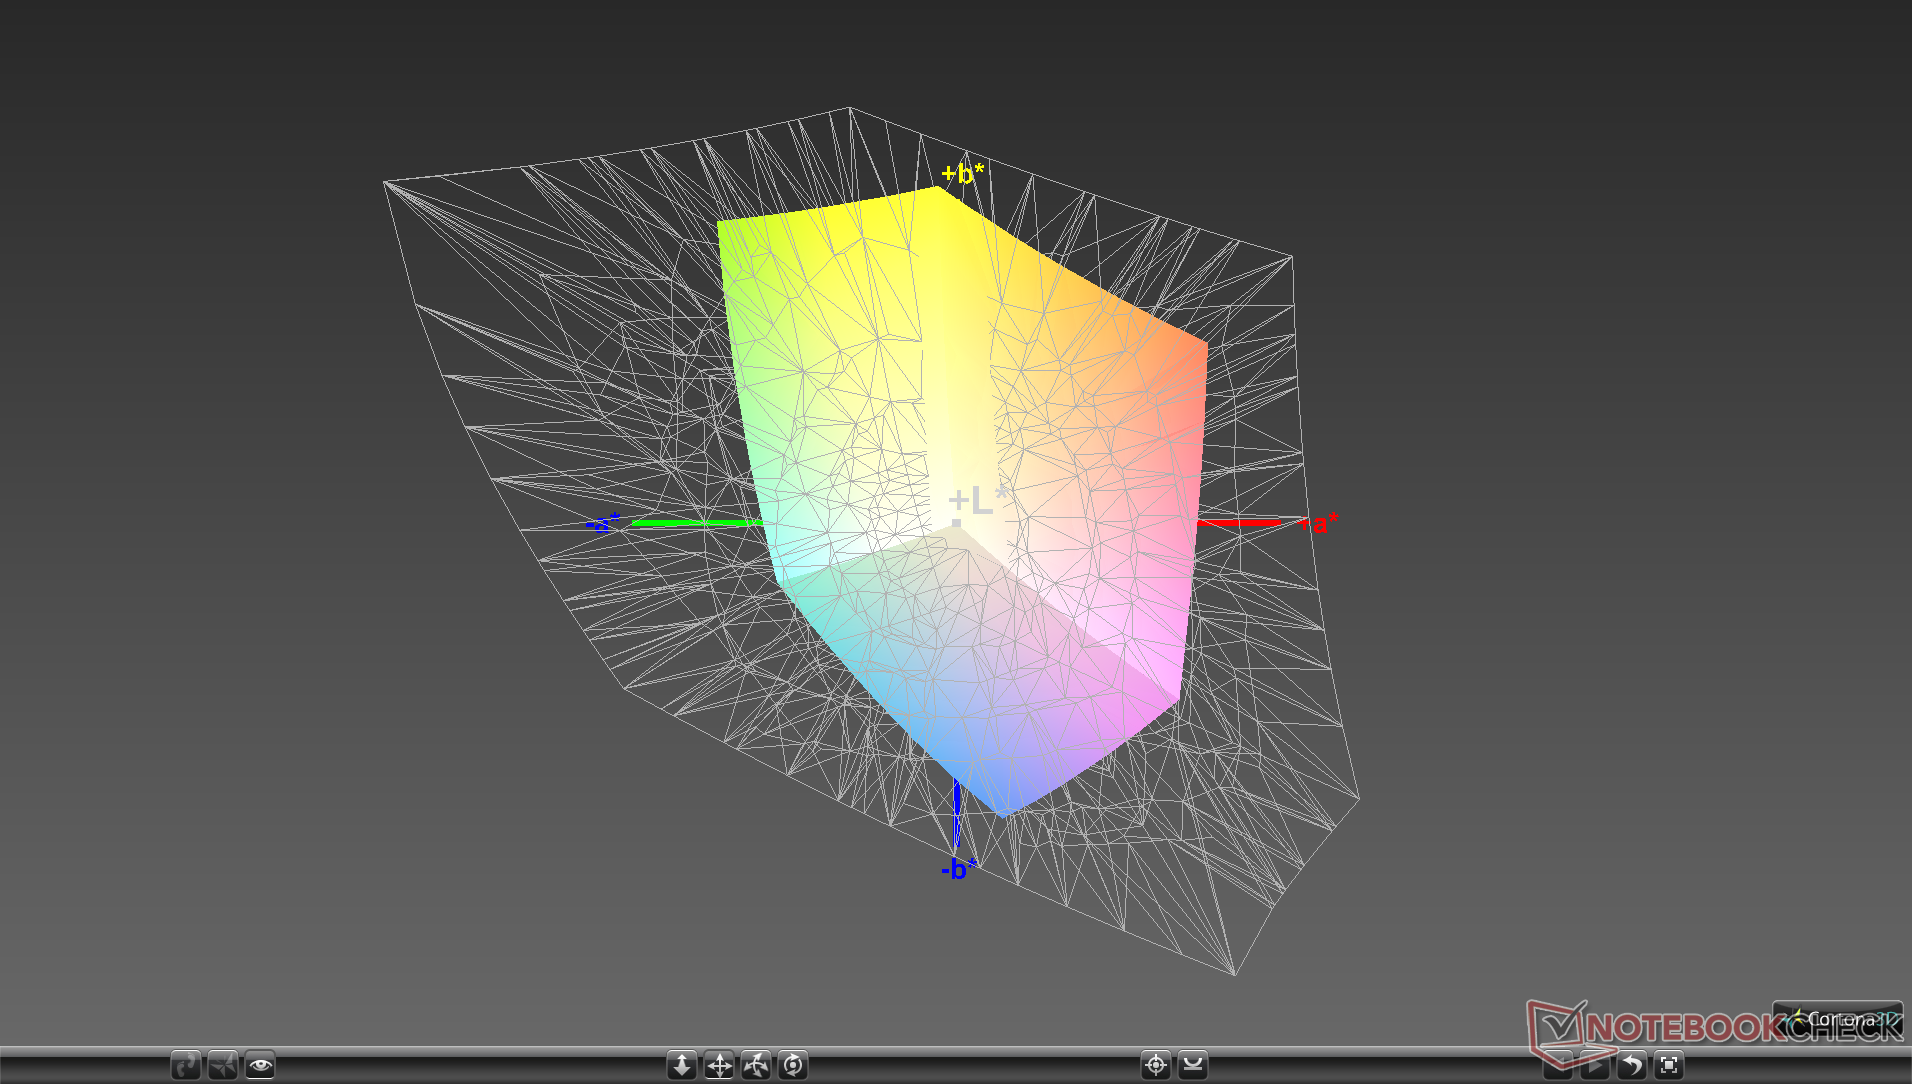
Further measurements with an X-Rite colorimeter reveal an accurate grayscale out of the box. Calibrating the panel ourselves improves the average grayscale DeltaE even further from 2.8 to 1.1. Color accuracy, however, remains average at best due to the limited color coverage mentioned above. Blue is especially inaccurate relative to the other colors tested.
Display Response Times
| ↔ Response Time Black to White | ||
|---|---|---|
| 28 ms ... rise ↗ and fall ↘ combined | ↗ 14.8 ms rise | 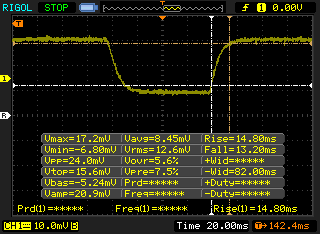 |
| ↘ 13.2 ms fall | ||
| The screen shows relatively slow response rates in our tests and may be too slow for gamers. In comparison, all tested devices range from 0.1 (minimum) to 240 (maximum) ms. » 71 % of all devices are better. This means that the measured response time is worse than the average of all tested devices (19.9 ms). | ||
| ↔ Response Time 50% Grey to 80% Grey | ||
| 47.2 ms ... rise ↗ and fall ↘ combined | ↗ 26 ms rise | 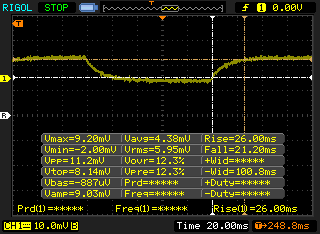 |
| ↘ 21.2 ms fall | ||
| The screen shows slow response rates in our tests and will be unsatisfactory for gamers. In comparison, all tested devices range from 0.165 (minimum) to 636 (maximum) ms. » 81 % of all devices are better. This means that the measured response time is worse than the average of all tested devices (31.1 ms). | ||
Screen Flickering / PWM (Pulse-Width Modulation)
| Screen flickering / PWM detected | 980 Hz | ≤ 99 % brightness setting | 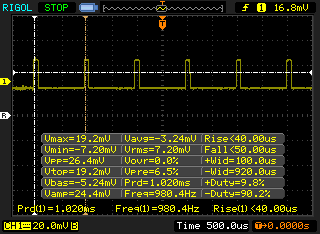 |
The display backlight flickers at 980 Hz (worst case, e.g., utilizing PWM) Flickering detected at a brightness setting of 99 % and below. There should be no flickering or PWM above this brightness setting. The frequency of 980 Hz is quite high, so most users sensitive to PWM should not notice any flickering. In comparison: 52 % of all tested devices do not use PWM to dim the display. If PWM was detected, an average of 7801 (minimum: 5 - maximum: 343500) Hz was measured. | |||
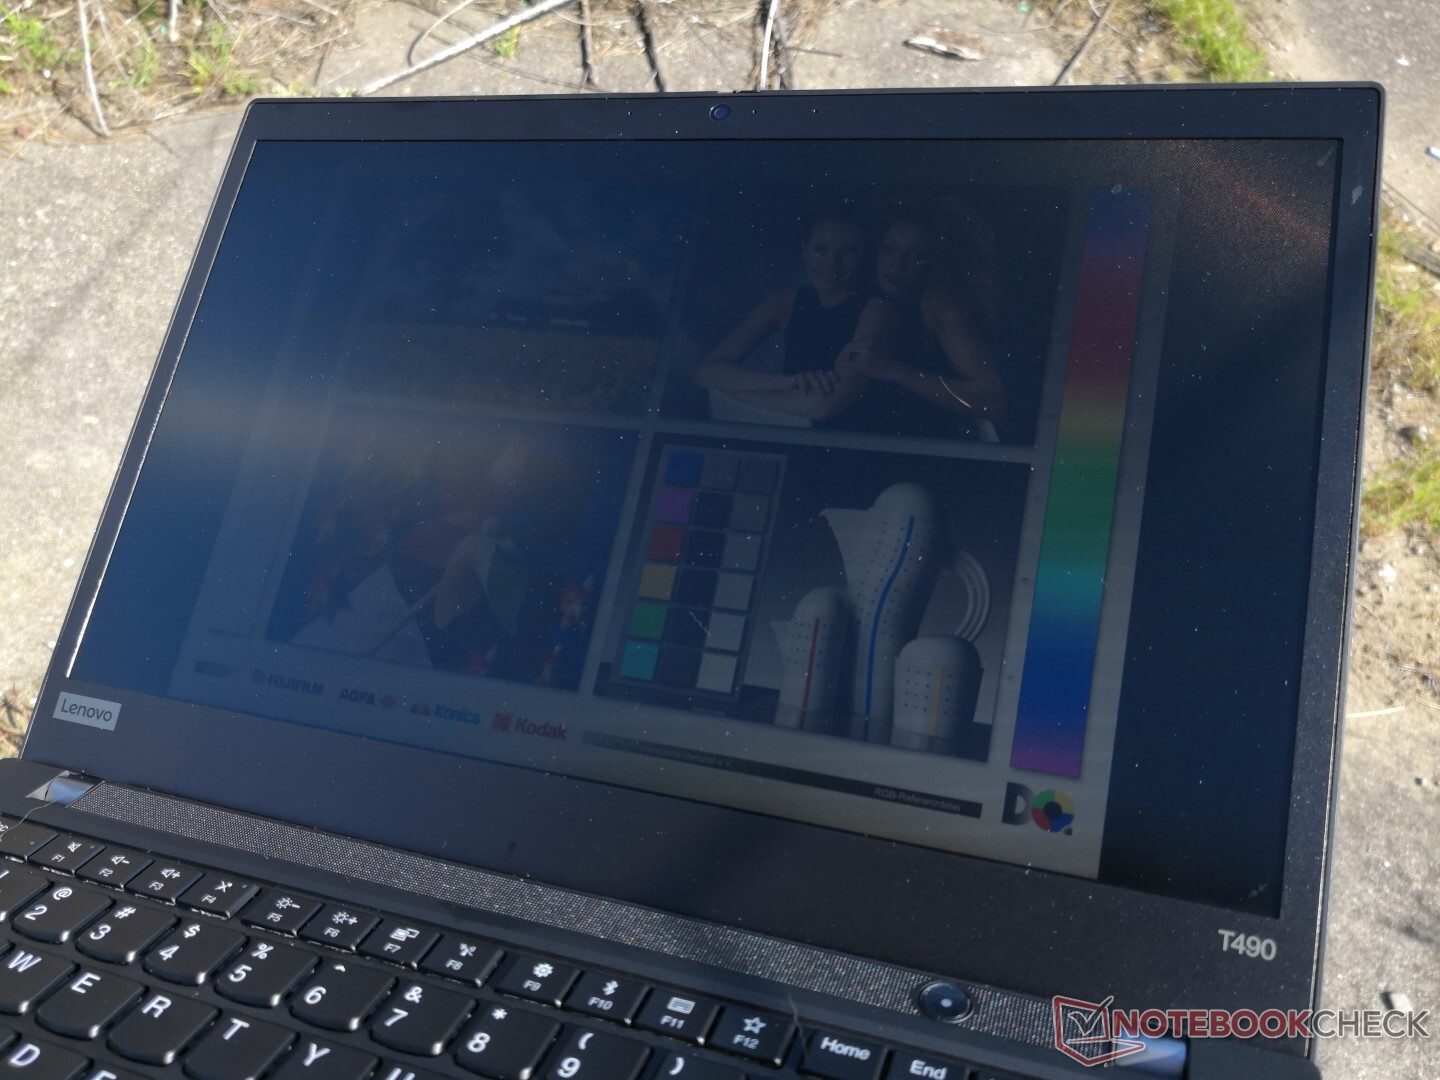
Outdoors visibility is worse than the other T490 laptops we've tested since the screen is dimmer this time around. We recommend opting for the 400-nit option or even alternatives like the XPS 13 or HP EliteBook x360 1040 G5 which have much brighter displays.
Performance
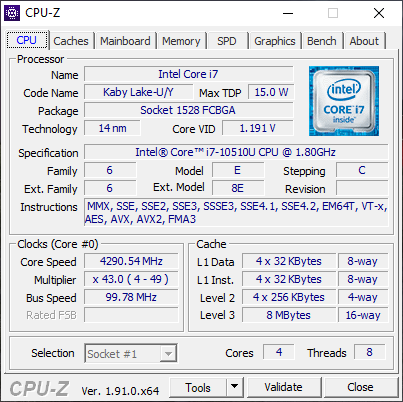
Lenovo offers the 10th gen Core i5-10210U or Core i7-10510U CPU to replace the older 8th gen Core i5-8265U or Core i7-8565U, respectively. While RAM is now faster (DDR4-2666), the optional GeForce MX250 graphics remain the same. It's a shame that there is no Core i7-10710U option as that would have have boosted the multi-thread performance of the system much further. AMD Ryzen options are reserved for the ThinkPad T495 or T495s series.
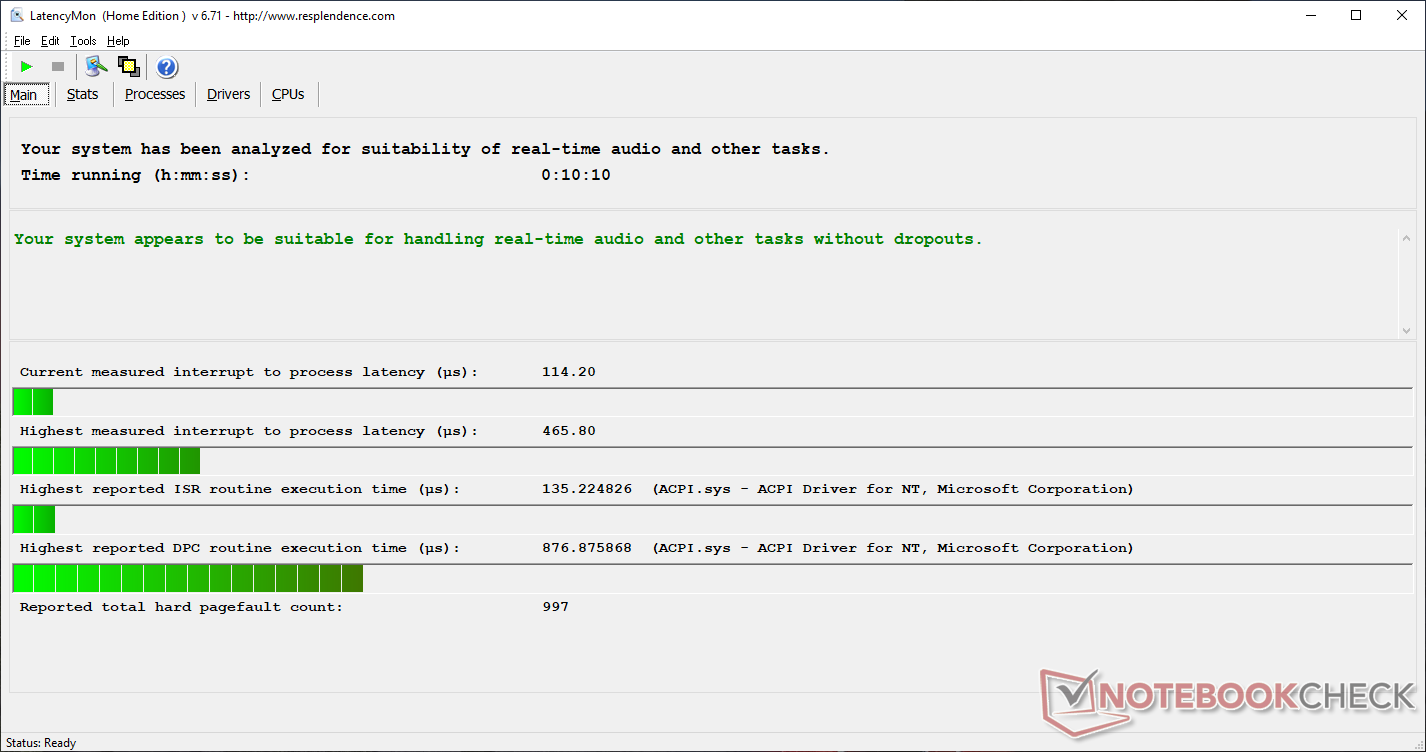
LatencyMon shows no recurring DPC latency issues even with Wi-Fi enabled.
Processor
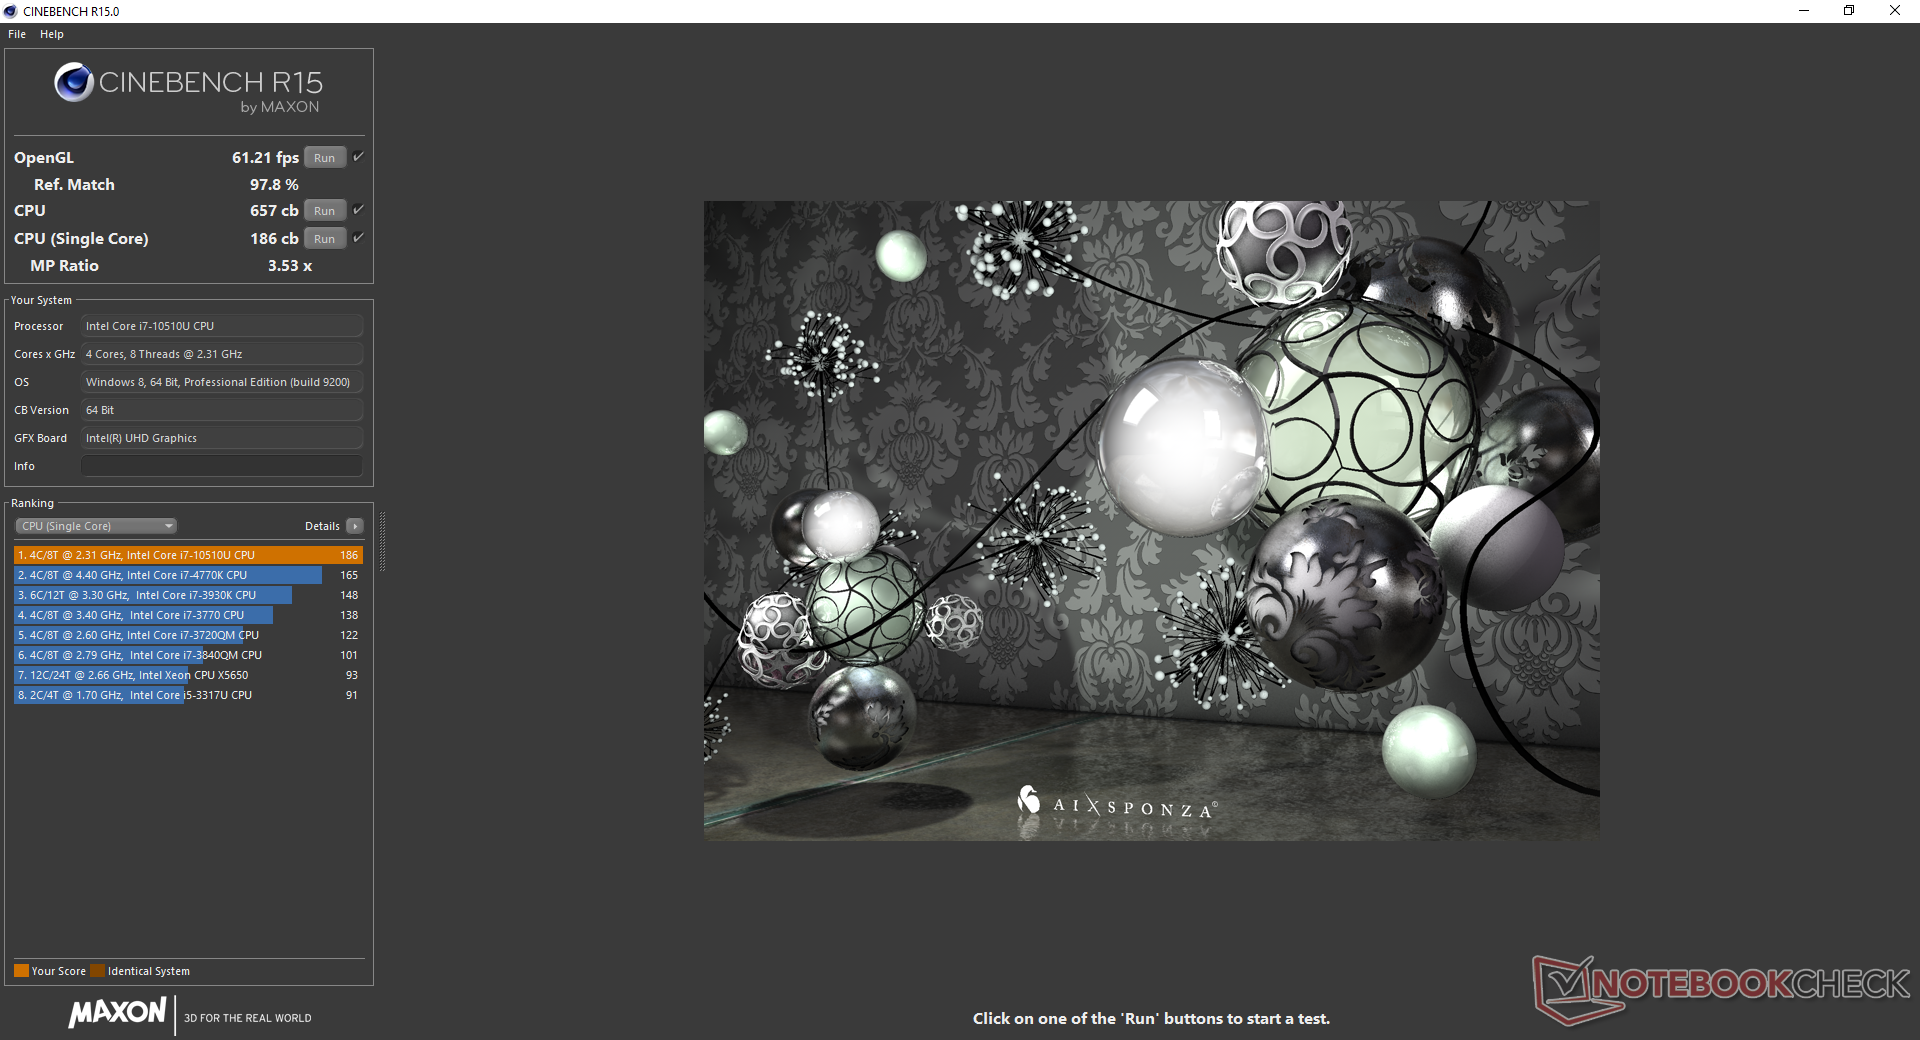
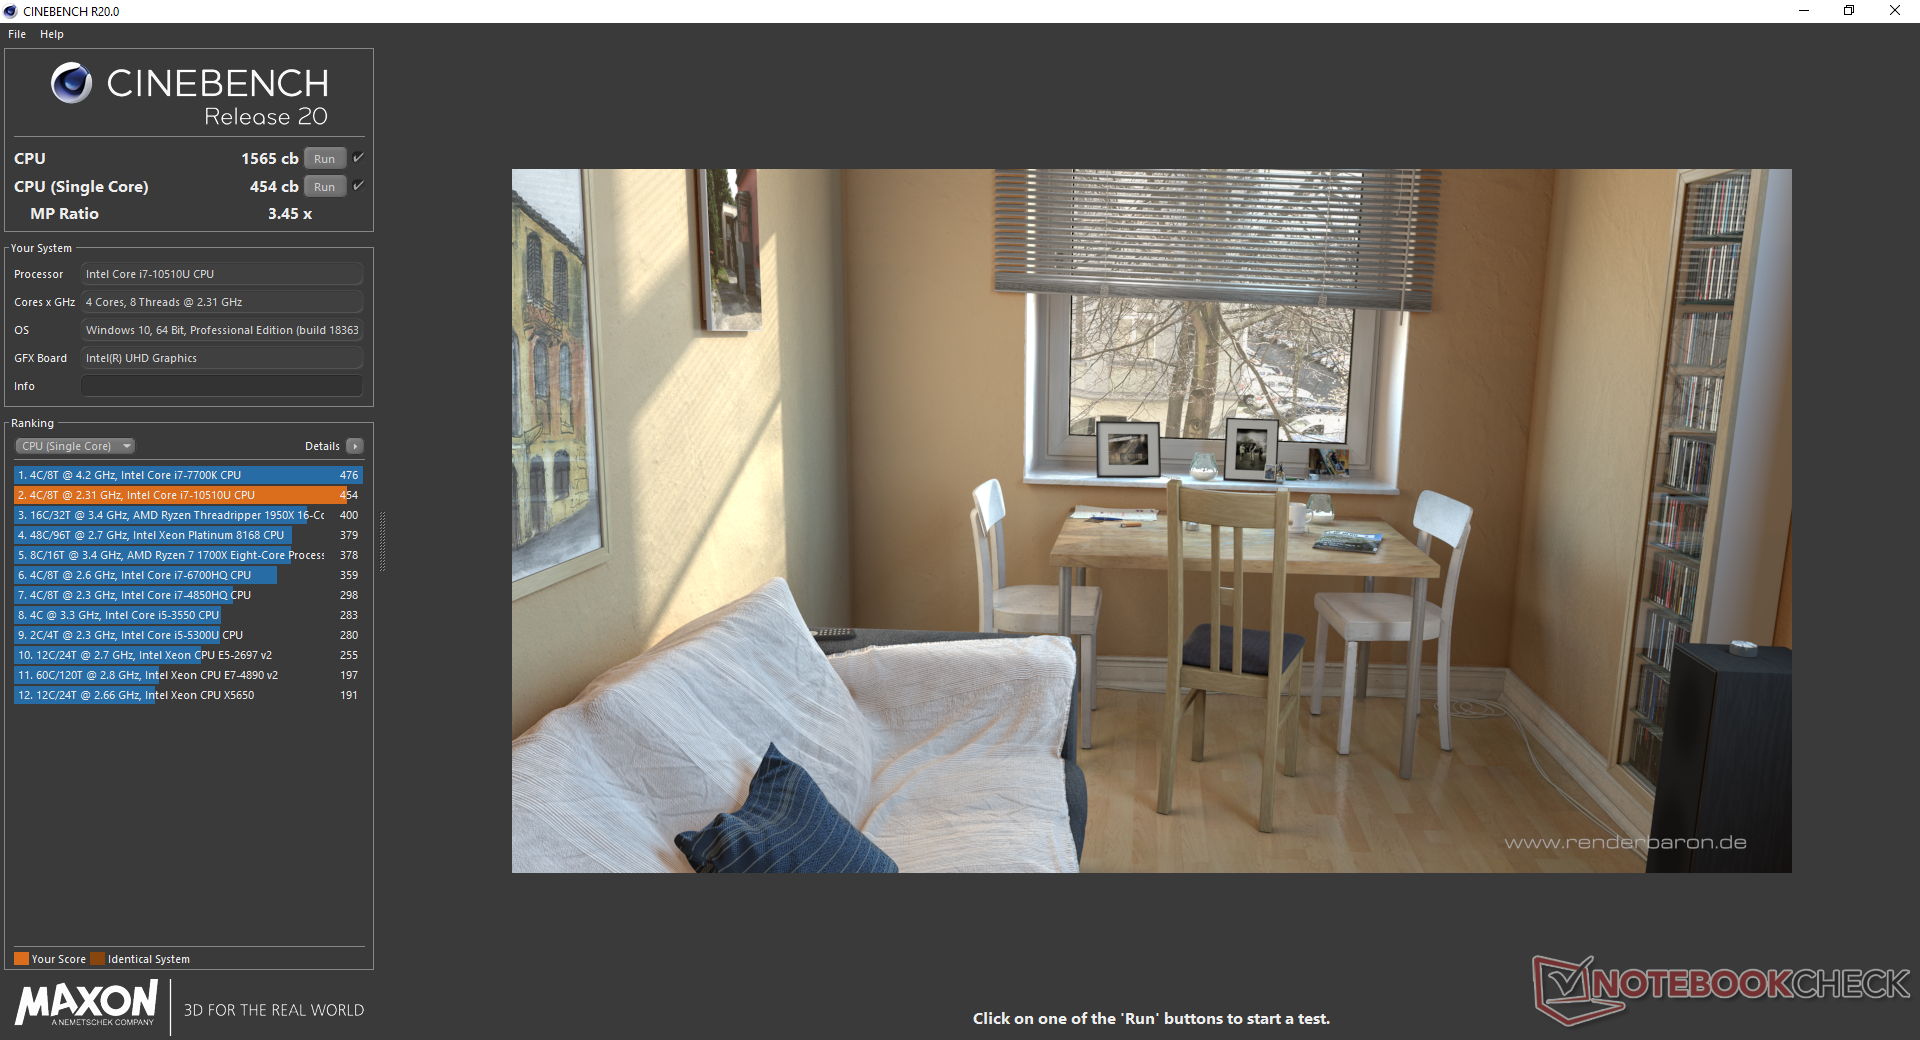
CPU performance is where we expect it to be at within 3 percent of the average Core i7-10510U in our database. Unfortunately, the actual processor itself is underwhelming as it's only marginally faster than the last generation Core i7-8565U or Core i7-8550U at best. AMD's competing Ryzen 7 3700U is also comparable in multi-threaded workloads while costing less. A Core i7-10710U option would have offered a more significant gen-to-gen performance boost.
See our dedicated page on the Core i7-10510U for more technical information and benchmark comparisons.
| Cinebench R10 | |
| Rendering Multiple CPUs 32Bit | |
| Microsoft Surface Laptop 3 13 Core i5-1035G7 | |
| Average Intel Core i7-10510U (6763 - 26265, n=3) | |
| Rendering Single 32Bit | |
| Average Intel Core i7-10510U (5740 - 7748, n=3) | |
| Microsoft Surface Laptop 3 13 Core i5-1035G7 | |
| wPrime 2.10 - 1024m | |
| Microsoft Surface Laptop 3 13 Core i5-1035G7 | |
* ... smaller is better
System Performance
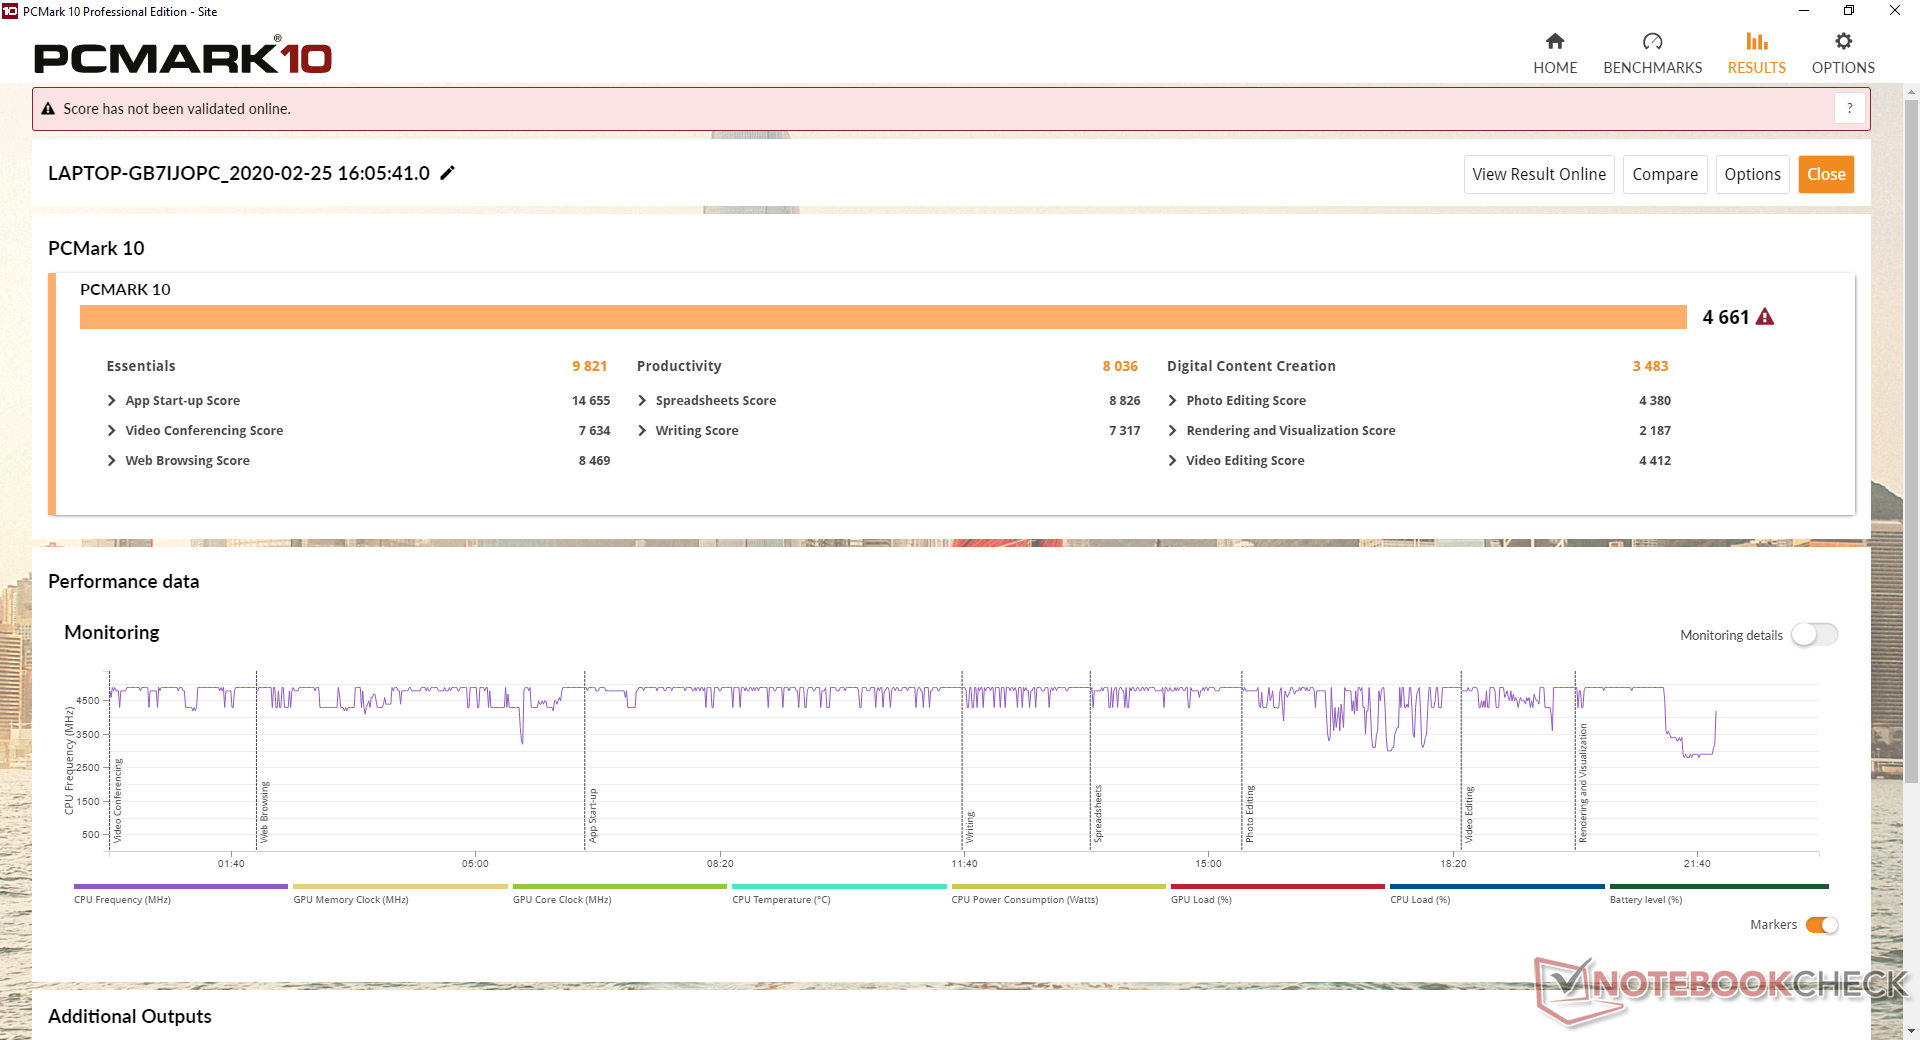
Average PCMark results are higher than than every 14-inch ThinkPad T series laptop thus far including last year's Whiskey Lake-U SKU equipped with faster GeForce MX250 graphics. This is likely partly attributed to the aftermarket Sabrent Rocket Q NVMe SSD that CUKUSA has outfitted onto our test unit.
We experienced no notable software or hardware glitches during our time with the unit.
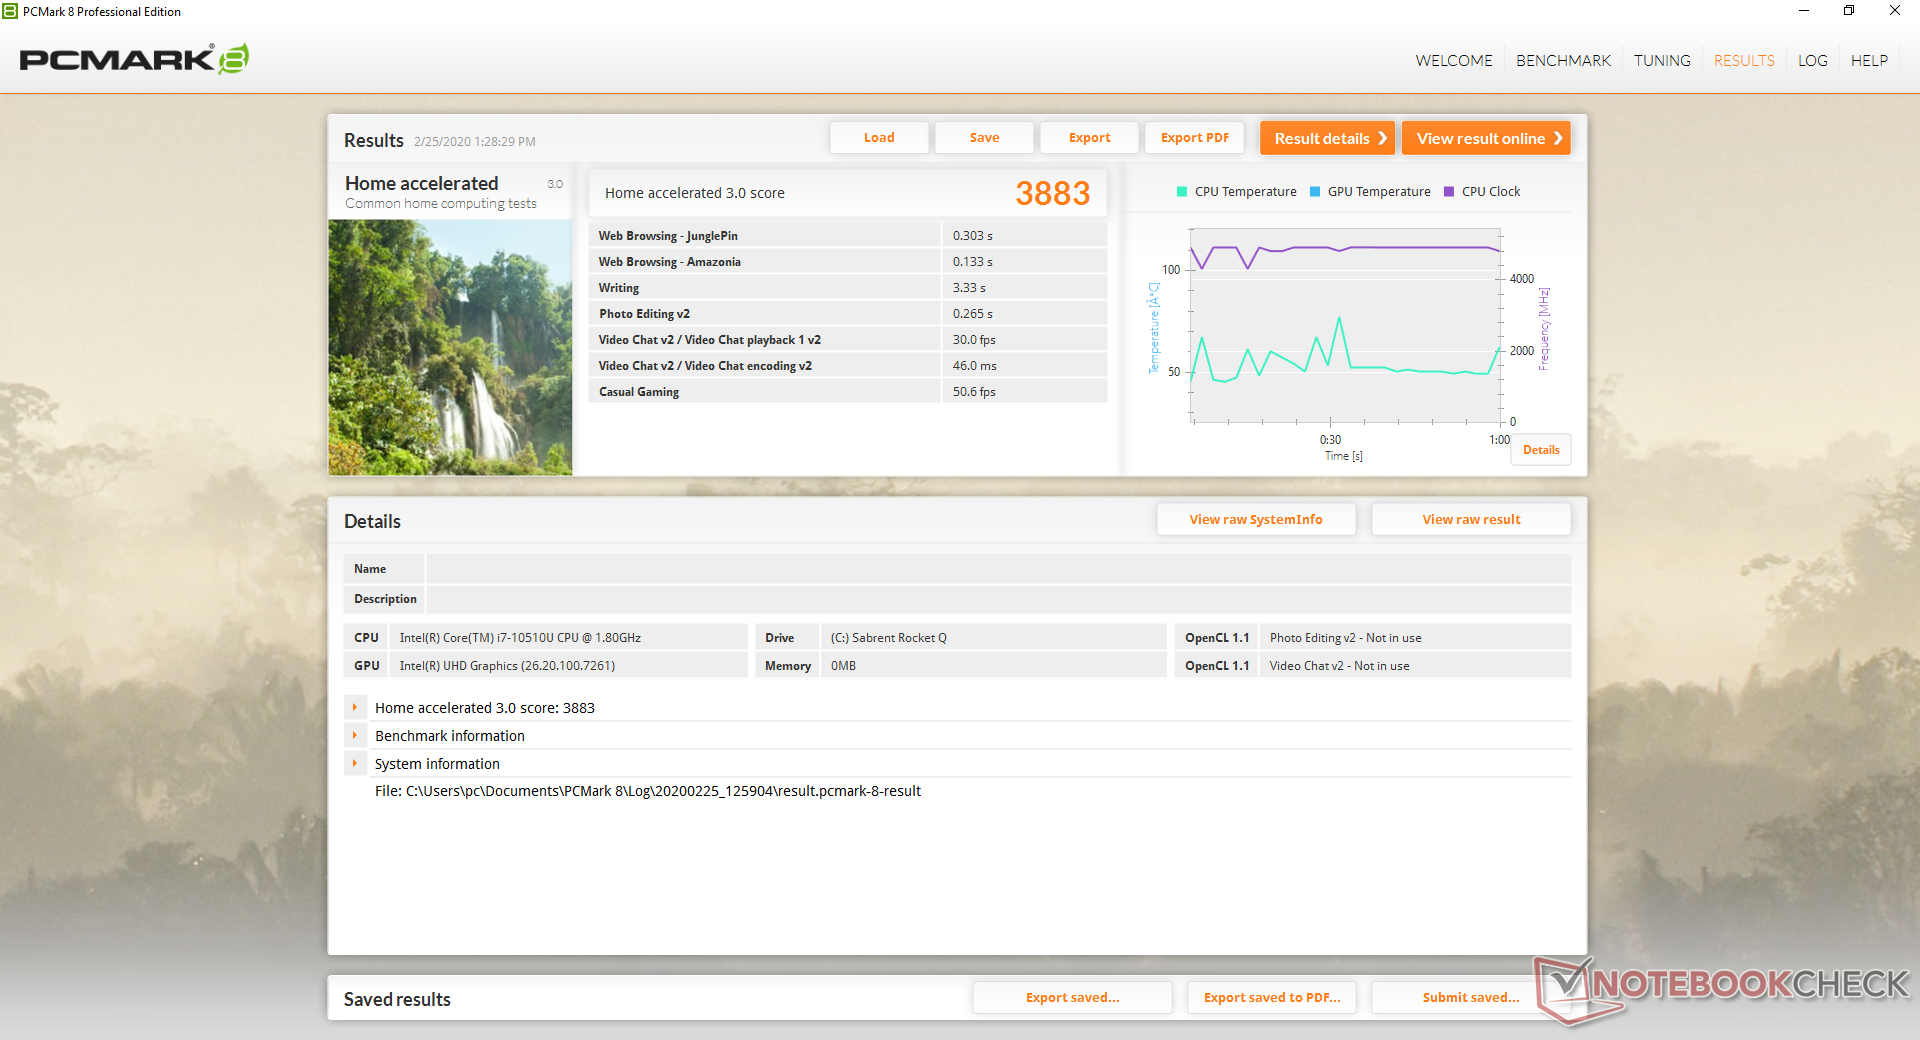
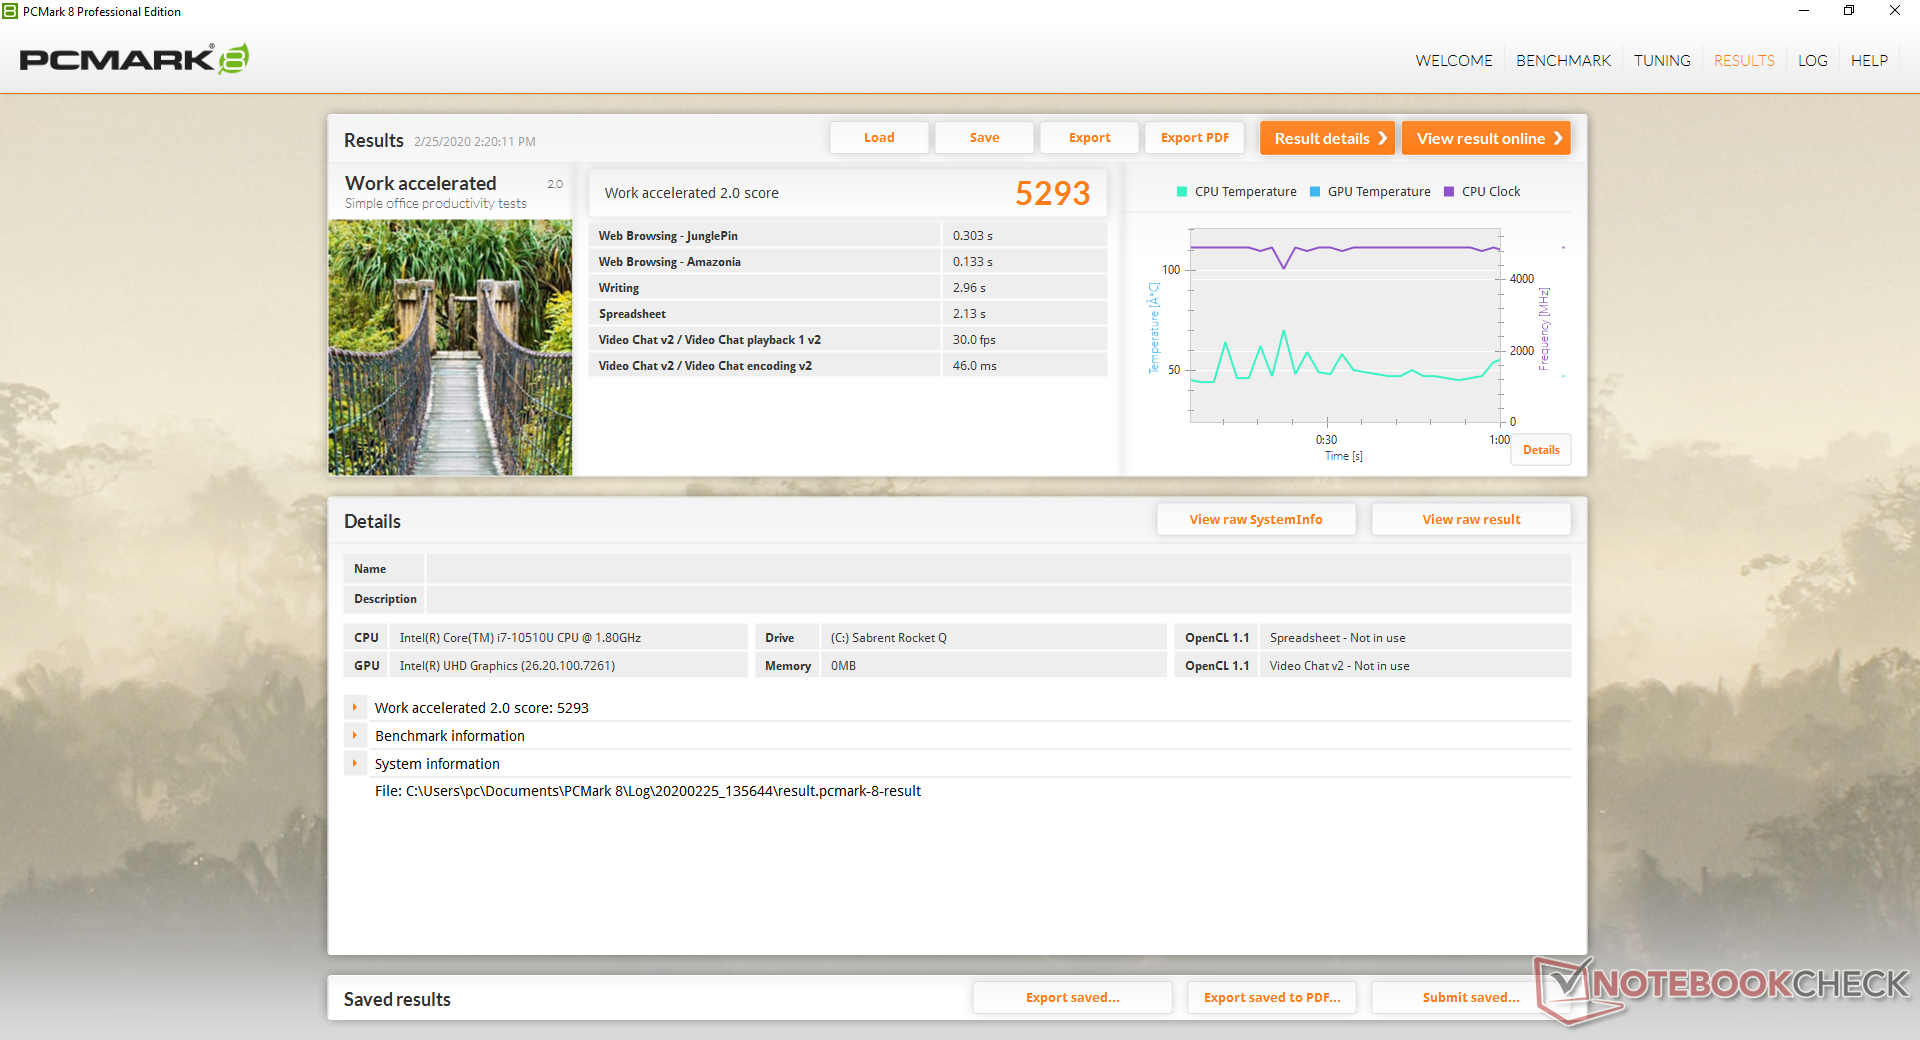
| PCMark 8 Home Score Accelerated v2 | 3883 points | |
| PCMark 8 Work Score Accelerated v2 | 5293 points | |
| PCMark 10 Score | 4661 points | |
Help | ||
Storage Devices
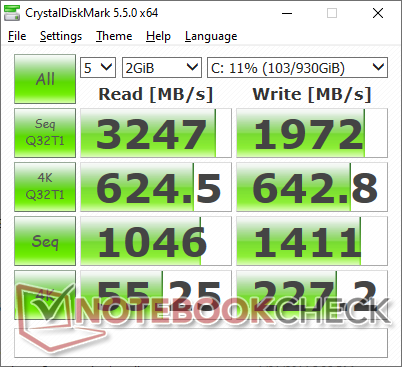
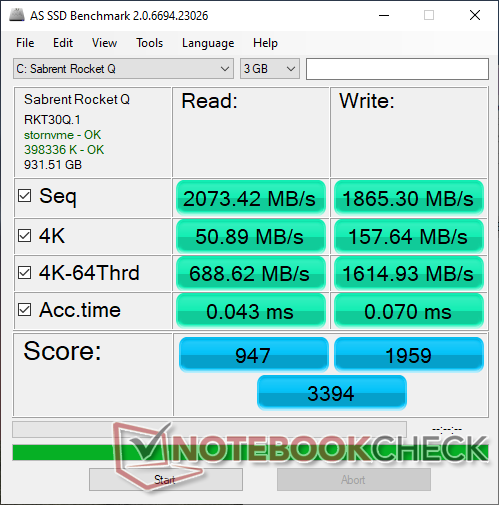
Only one internal M.2 2280 slot is available whereas the older ThinkPad T480 has a secondary 2.5-inch SATA III bay. The Sabrent Rocket Q SSD is more comparable to the Samsung PM981a rather than the slower SK Hynix PC501 or the Toshiba HG6 series.
| Lenovo ThinkPad T490 20RY0002US Sabrent Rocket Q 1TB RKT30Q.1 | Lenovo ThinkPad T480-20L6S01V00 Samsung SSD PM981 MZVLB512HAJQ | Lenovo ThinkPad T460-20FN003LGE Toshiba HG6 THNSFJ256GCSU | Lenovo ThinkPad T470s-20HF0012US Samsung PM961 MZVLW256HEHP | Lenovo ThinkPad T450-20BV001VGE Samsung SSD PM851 256 GB MZ7TE256HMHP | Lenovo ThinkPad T495s-20QKS01E00 Samsung PM981a MZVLB1T0HBLR | |
|---|---|---|---|---|---|---|
| AS SSD | -282% | -76% | -3% | -60% | 15% | |
| Seq Read (MB/s) | 2073 | 1441 -30% | 503 -76% | 2691 30% | 508 -75% | 2661 28% |
| Seq Write (MB/s) | 1865 | 487.1 -74% | 432.8 -77% | 1170 -37% | 230 -88% | 2314 24% |
| 4K Read (MB/s) | 50.9 | 58 14% | 19.57 -62% | 48.84 -4% | 33.9 -33% | 45.52 -11% |
| 4K Write (MB/s) | 157.6 | 1.76 -99% | 62.6 -60% | 147.9 -6% | 98.7 -37% | 105.3 -33% |
| 4K-64 Read (MB/s) | 689 | 1278 85% | 347 -50% | 1765 156% | 362.7 -47% | 1806 162% |
| 4K-64 Write (MB/s) | 1615 | 96.2 -94% | 114.5 -93% | 538 -67% | 184.2 -89% | 1650 2% |
| Access Time Read * (ms) | 0.043 | 0.041 5% | 0.133 -209% | 0.06 -40% | 0.04 7% | |
| Access Time Write * (ms) | 0.07 | 2.515 -3493% | 0.061 13% | 0.025 64% | 0.033 53% | 0.041 41% |
| Score Read (Points) | 947 | 1480 56% | 417 -56% | 2083 120% | 447 -53% | 2118 124% |
| Score Write (Points) | 1959 | 147 -92% | 220 -89% | 803 -59% | 306 -84% | 1986 1% |
| Score Total (Points) | 3394 | 2348 -31% | 852 -75% | 3875 14% | 980 -71% | 5169 52% |
| Copy ISO MB/s (MB/s) | 3024 | 921 -70% | 797 -74% | 225.8 -93% | 1131 -63% | |
| Copy Program MB/s (MB/s) | 715 | 254.8 -64% | 291 -59% | 153.3 -79% | 267.1 -63% | |
| Copy Game MB/s (MB/s) | 1650 | 676 -59% | 309.9 -81% | 191.2 -88% | 691 -58% | |
| CrystalDiskMark 5.2 / 6 | -28% | -15% | ||||
| Write 4K (MB/s) | 227.2 | 153.1 -33% | 142.3 -37% | |||
| Read 4K (MB/s) | 55.3 | 48.3 -13% | 46.69 -16% | |||
| Write Seq (MB/s) | 1411 | 866 -39% | ||||
| Read Seq (MB/s) | 1046 | 904 -14% | ||||
| Write 4K Q32T1 (MB/s) | 643 | 424.6 -34% | 268.3 -58% | |||
| Read 4K Q32T1 (MB/s) | 625 | 403.2 -35% | 359.6 -42% | |||
| Write Seq Q32T1 (MB/s) | 1972 | 1725 -13% | 3033 54% | |||
| Read Seq Q32T1 (MB/s) | 3247 | 1780 -45% | 3561 10% | |||
| Write 4K Q8T8 (MB/s) | 1491 | |||||
| Read 4K Q8T8 (MB/s) | 1499 | |||||
| Total Average (Program / Settings) | -155% /
-190% | -76% /
-76% | -3% /
-3% | -60% /
-60% | 0% /
6% |
* ... smaller is better

GPU Performance
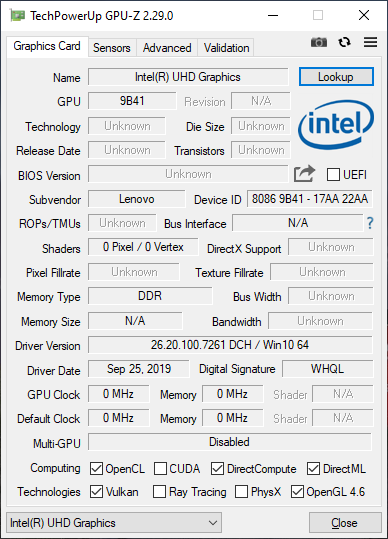
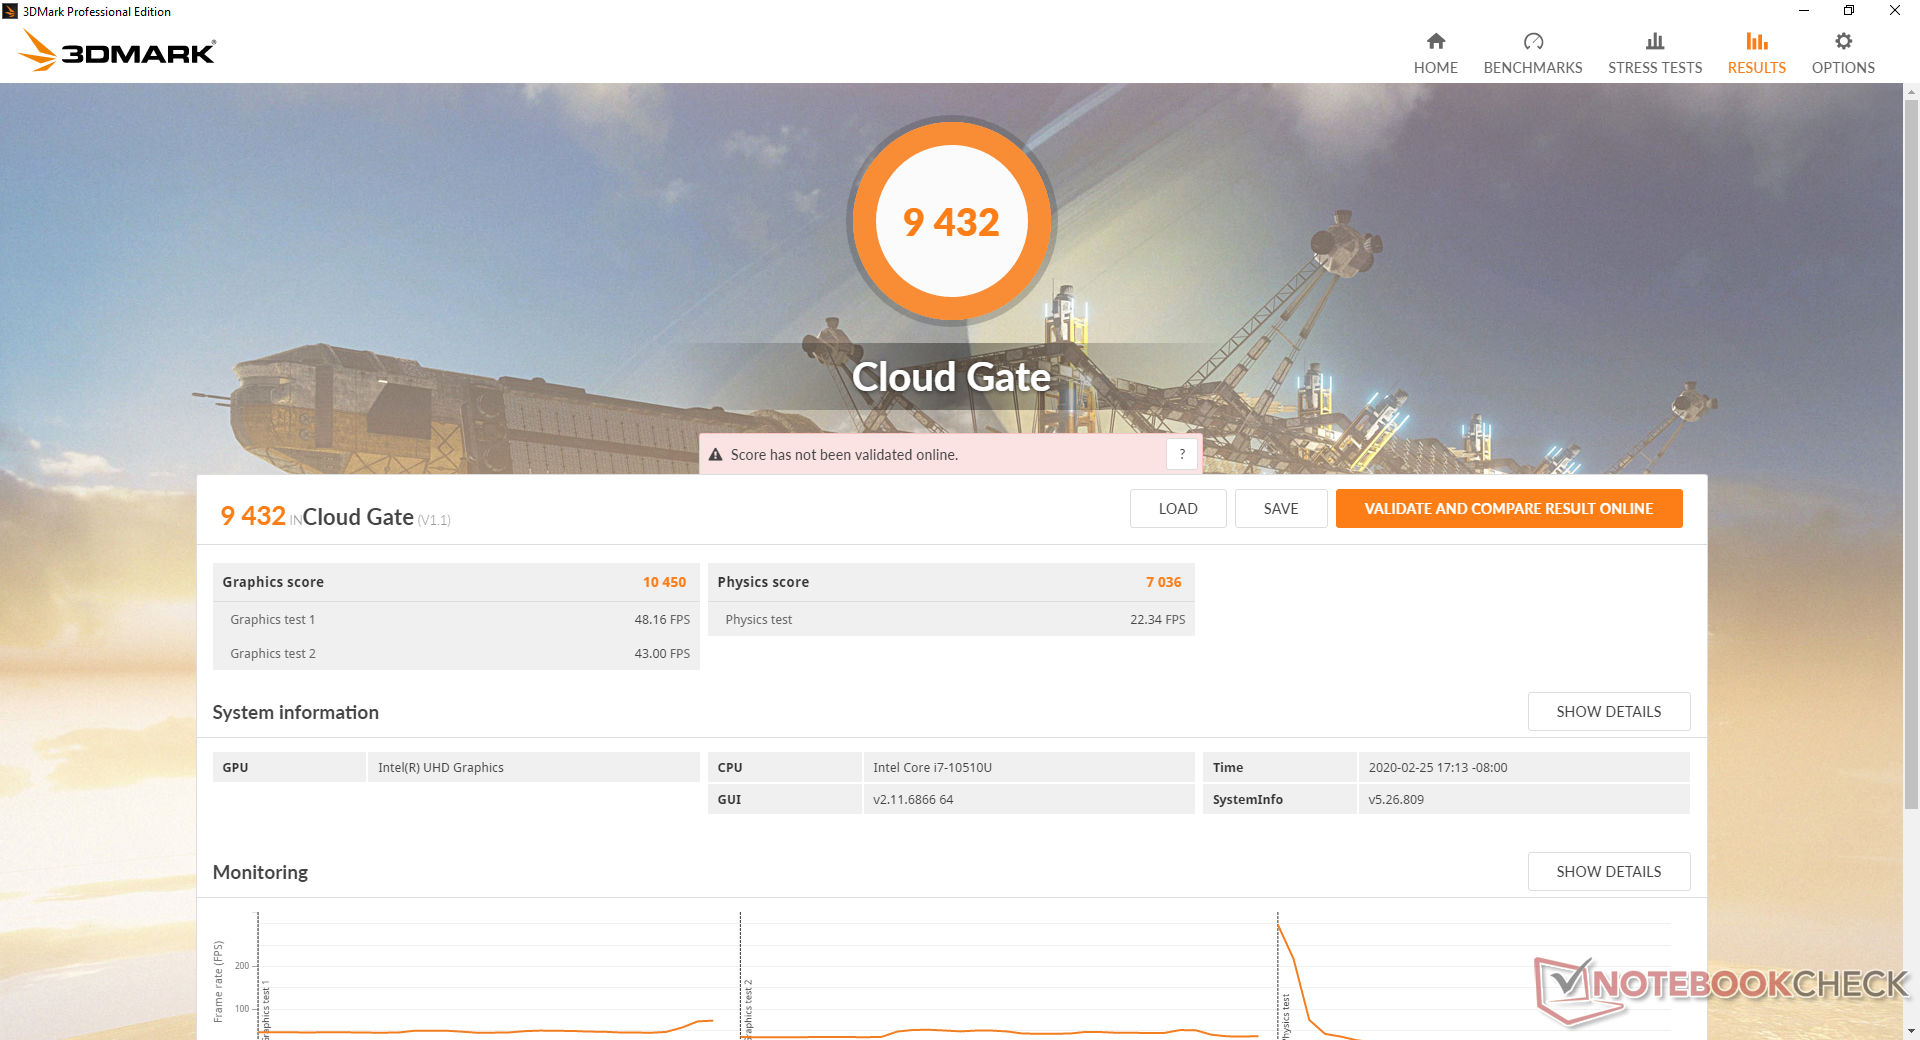
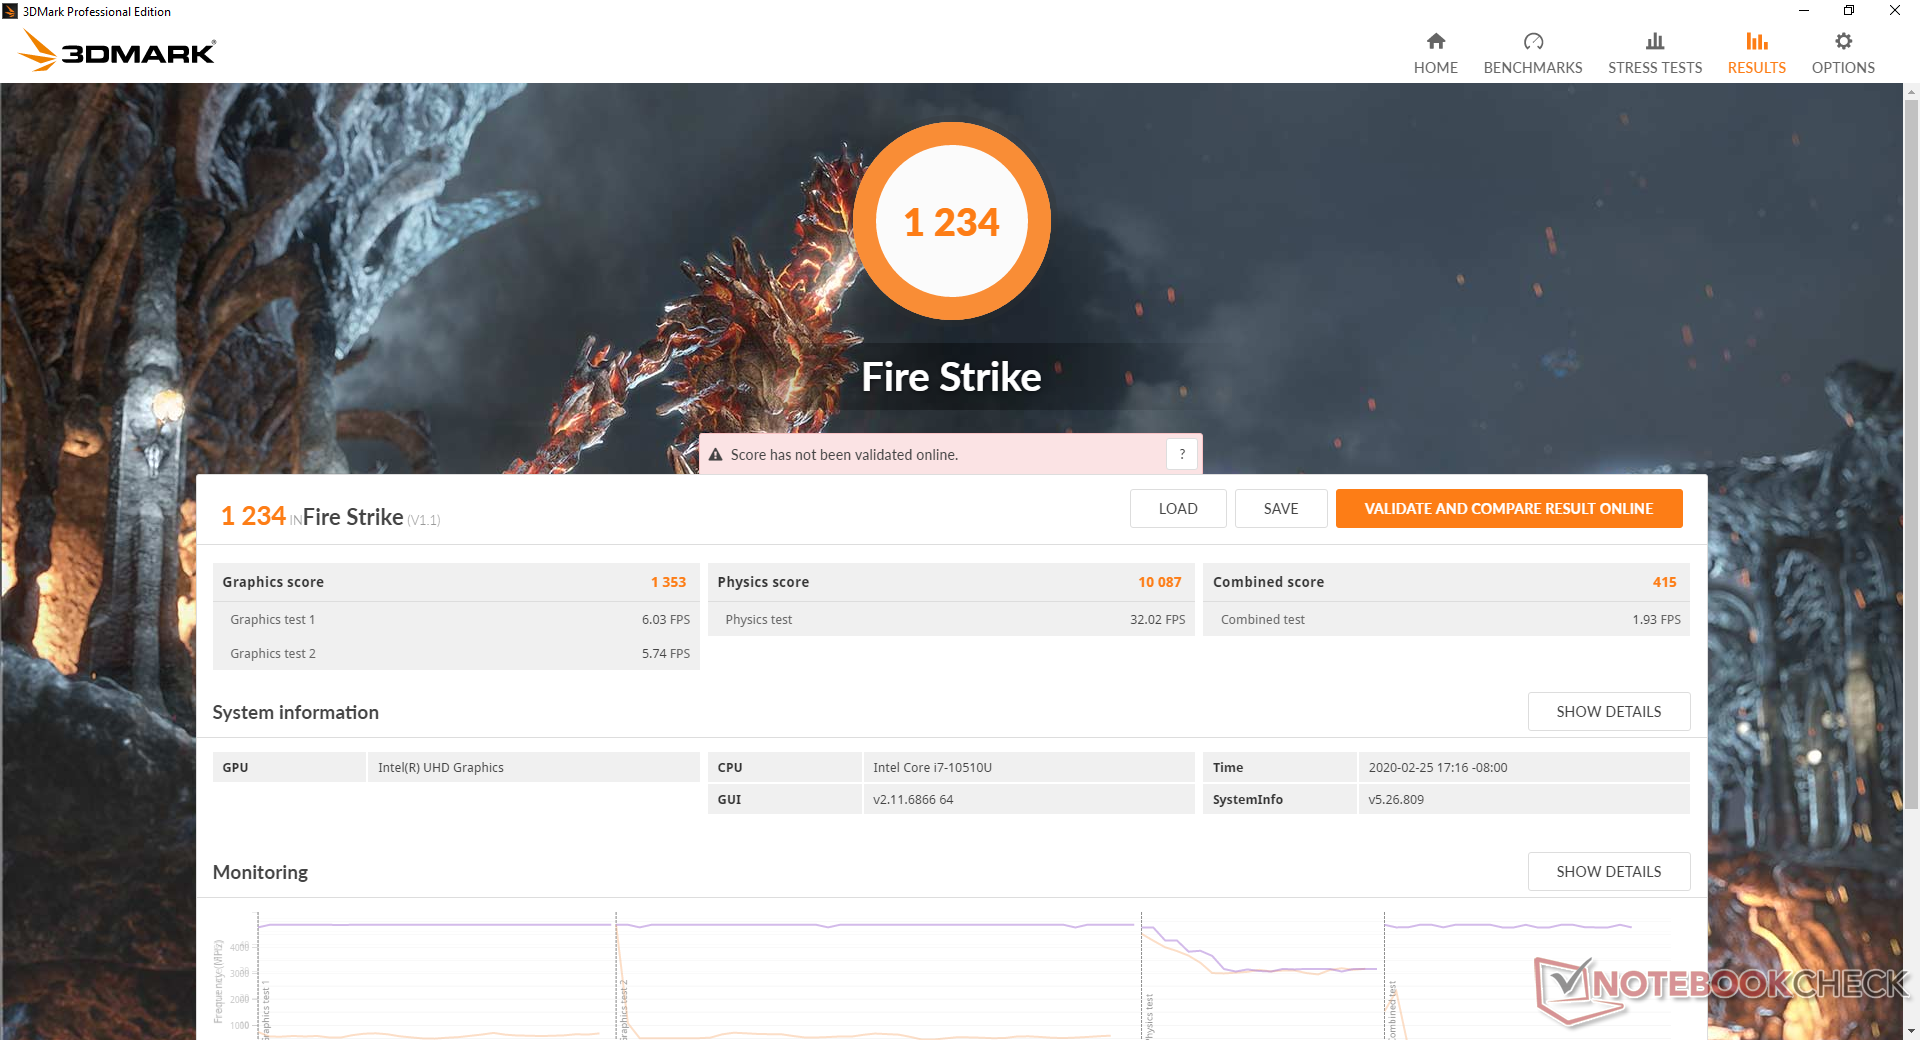
Despite being a sparkly new Intel 10th gen CPU, the Comet Lake-U series still uses the years old UHD Graphics 620. Graphics performance is only about 15 to 20 percent faster than the average UHD Graphics 620 in our database which is essentially unnoticeable during real-world loads. You'll have to consider SKUs with the GeForce MX250 or the RX Vega 10 if you want tangible graphics boosts.
See our page on the UHD Graphics 620 for more benchmark comparisons.
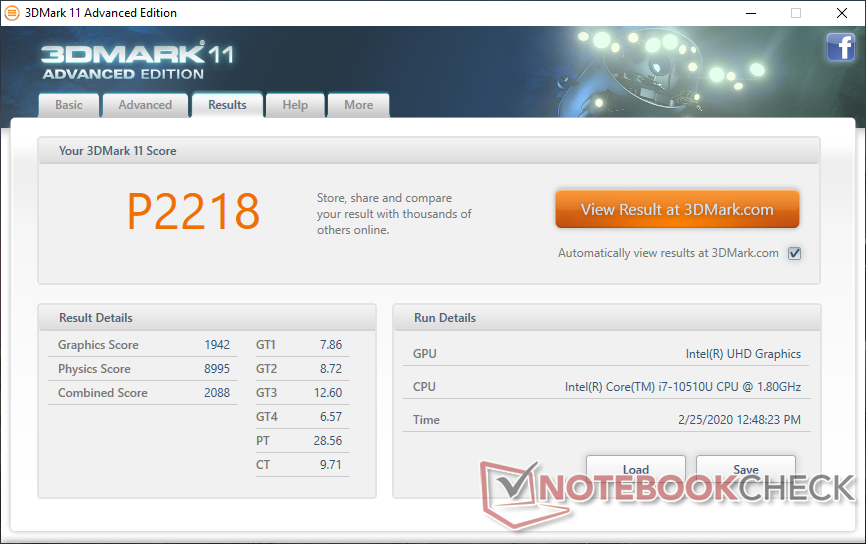
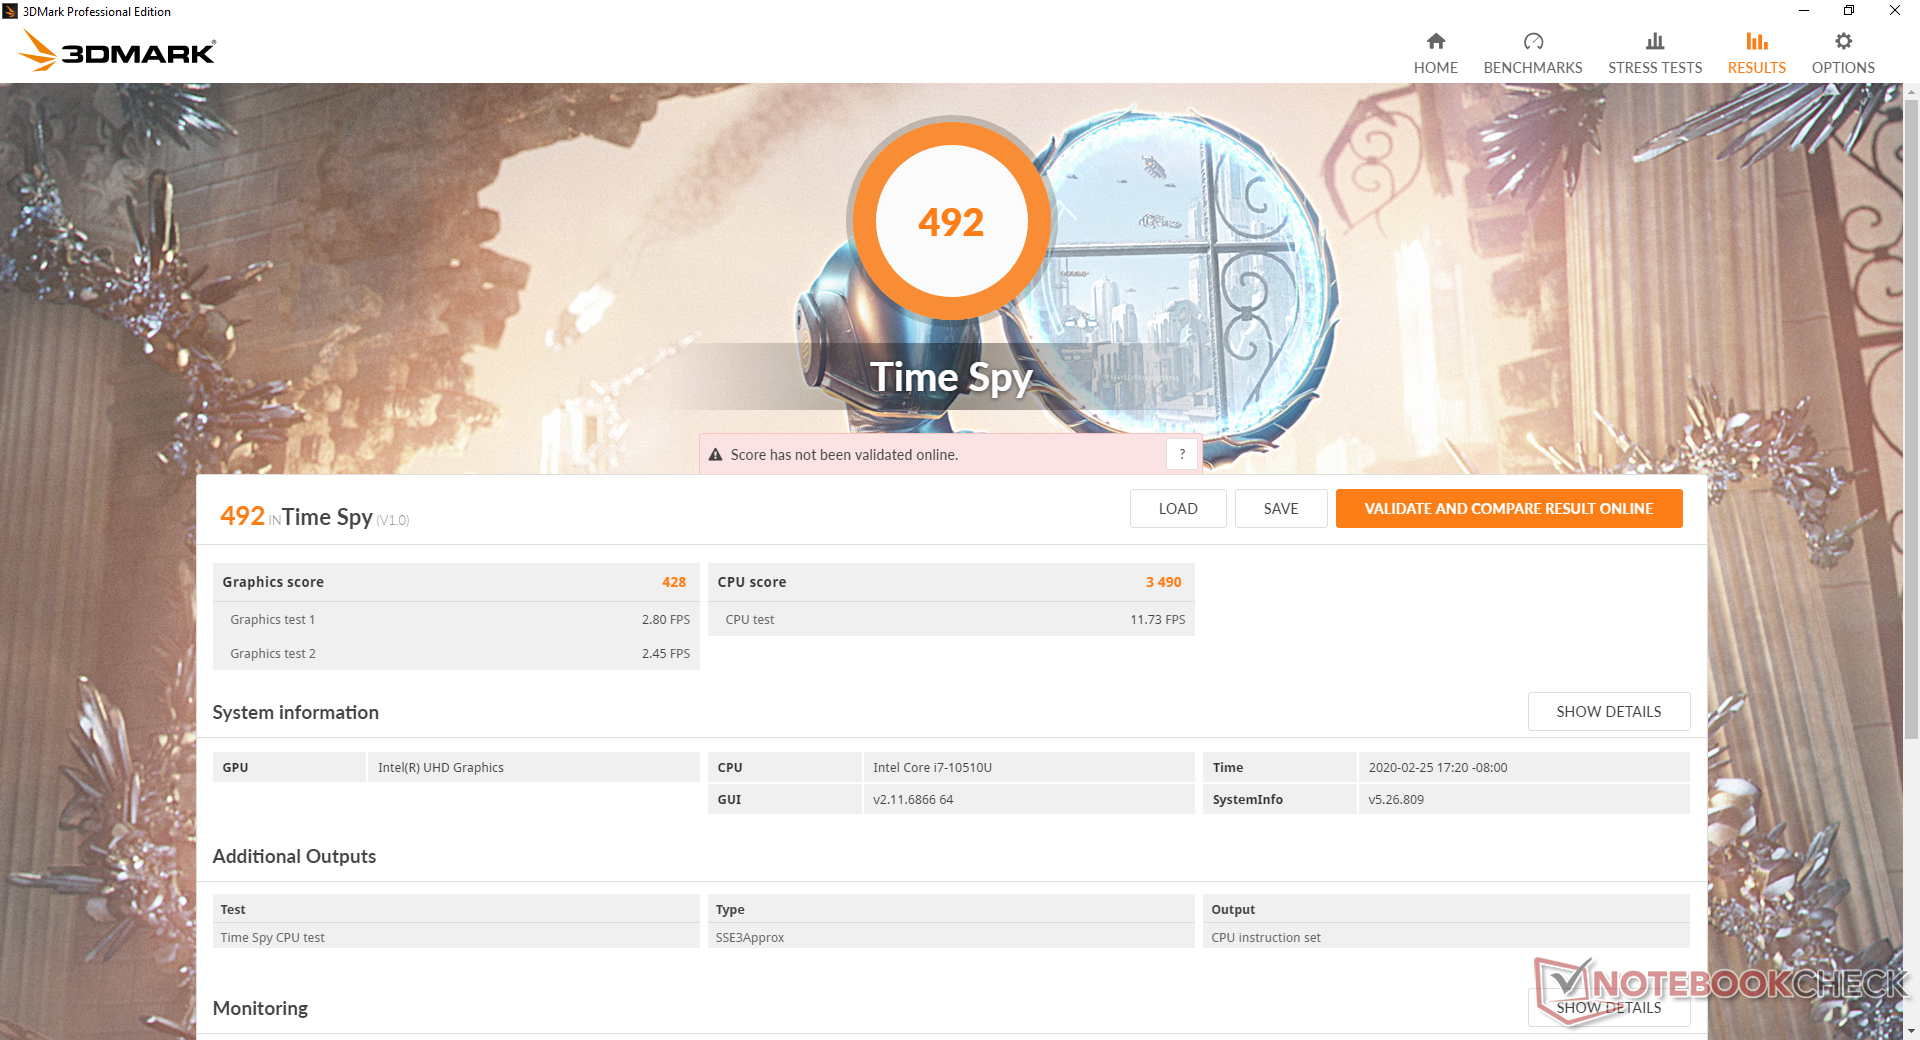
| 3DMark 11 Performance | 2218 points | |
| 3DMark Cloud Gate Standard Score | 9432 points | |
| 3DMark Fire Strike Score | 1234 points | |
| 3DMark Time Spy Score | 492 points | |
Help | ||
| low | med. | high | ultra | |
|---|---|---|---|---|
| BioShock Infinite (2013) | 87 | 41.5 | 34.5 | 10.8 |
Emissions
System Noise
As expected, fan noise is close to what we recorded on the Whiskey Lake-U version of the ThinkPad T490 and even the older ThinkPad T480. Running the first benchmark scene of 3DMark 06 would top out at about 35.5 dB(A) while higher loads like Prime95 would cause fan noise to spike temporarily to 38 dB(A). Otherwise, the system will almost always be completely silent or at least very quiet at only 29.2 dB(A) during undemanding loads like browsing or video streaming.
We can notice no electronic noise or coil whine from our test unit.
| Lenovo ThinkPad T490 20RY0002US UHD Graphics 620, i7-10510U, Sabrent Rocket Q 1TB RKT30Q.1 | Lenovo ThinkPad T480-20L6S01V00 GeForce MX150, i5-8550U, Samsung SSD PM981 MZVLB512HAJQ | Lenovo ThinkPad T470-20HD002HGE HD Graphics 620, i5-7200U, Samsung PM961 NVMe MZVLW512HMJP | Lenovo ThinkPad T460-20FN003LGE HD Graphics 520, 6200U, Toshiba HG6 THNSFJ256GCSU | Lenovo ThinkPad T450-20BV001VGE HD Graphics 5500, 5200U, Samsung SSD PM851 256 GB MZ7TE256HMHP | Lenovo ThinkPad T495s-20QKS01E00 Vega 10, R7 PRO 3700U, Samsung PM981a MZVLB1T0HBLR | |
|---|---|---|---|---|---|---|
| Noise | -0% | 4% | -1% | 0% | 3% | |
| off / environment * (dB) | 28.2 | 29 -3% | 28 1% | 29 -3% | 28.9 -2% | |
| Idle Minimum * (dB) | 28.2 | 29 -3% | 28 1% | 29 -3% | 29.2 -4% | 28.9 -2% |
| Idle Average * (dB) | 28.2 | 29 -3% | 28 1% | 29 -3% | 29.2 -4% | 28.9 -2% |
| Idle Maximum * (dB) | 29.2 | 29 1% | 29.4 -1% | 29 1% | 29.2 -0% | 28.9 1% |
| Load Average * (dB) | 35.5 | 35.6 -0% | 31.4 12% | 34.2 4% | 34.9 2% | 31.5 11% |
| Load Maximum * (dB) | 38 | 35.6 6% | 34.6 9% | 37.8 1% | 35.1 8% | 33.8 11% |
| Witcher 3 ultra * (dB) | 32.5 |
* ... smaller is better
Noise level
| Idle |
| 28.2 / 28.2 / 29.2 dB(A) |
| Load |
| 35.5 / 38 dB(A) |
 | ||
30 dB silent 40 dB(A) audible 50 dB(A) loud |
||
min: | ||
Temperature
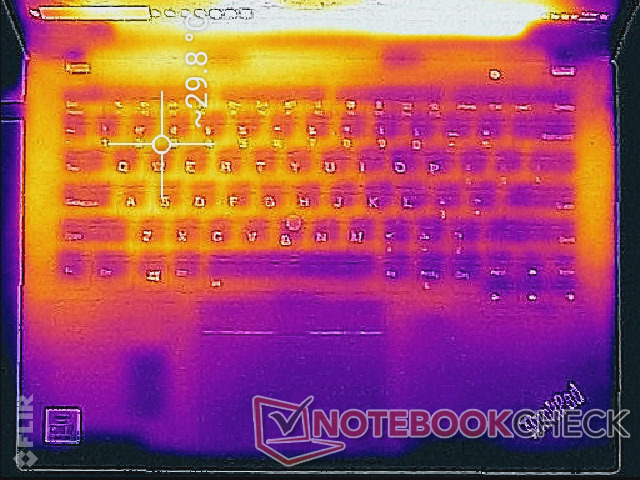
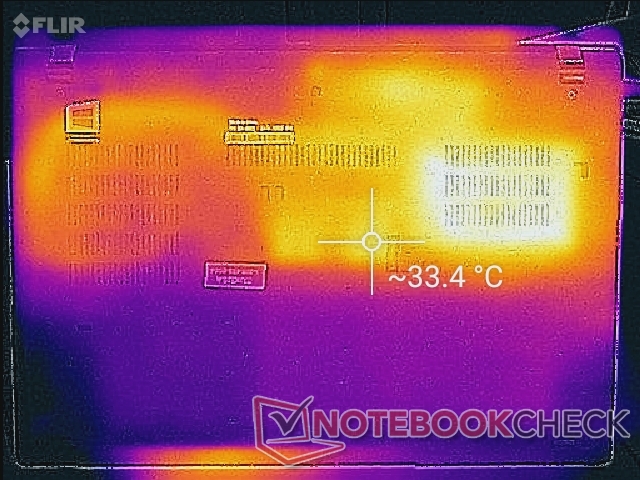
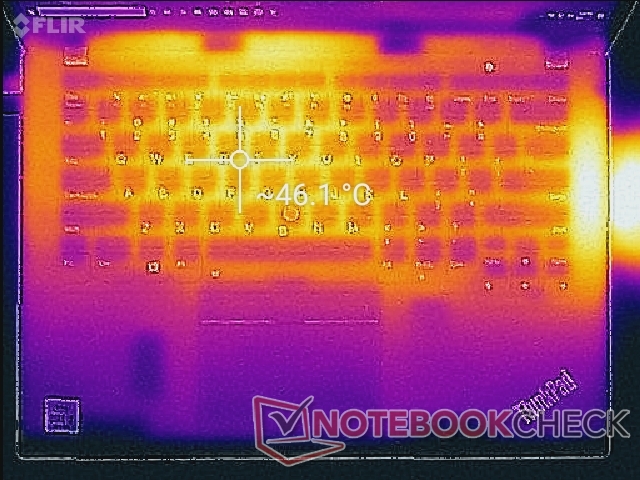
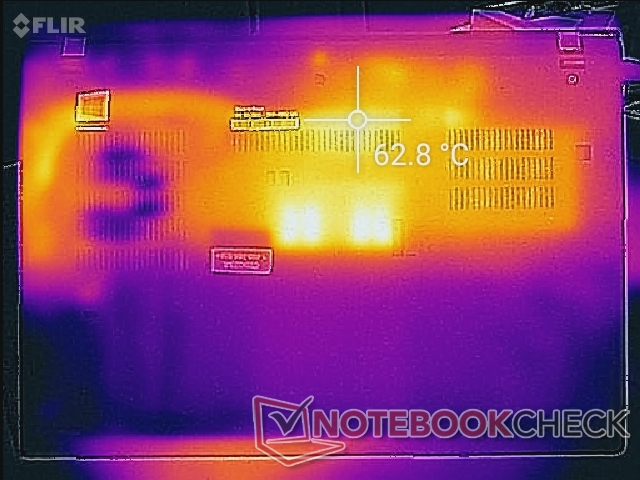
Hot spots when idling range from 30 C to 34 C or 46 C to 64 C when under extreme processing loads. We don't recommend running demanding loads for long periods without a nearby table because the bottom of the laptop can become very warm.
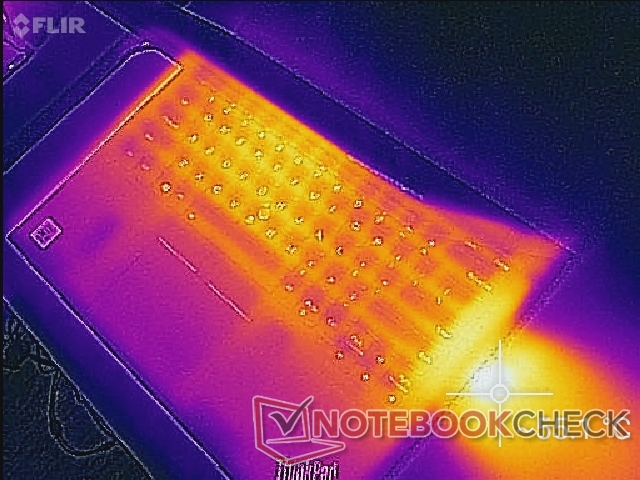
(-) The maximum temperature on the upper side is 50.8 °C / 123 F, compared to the average of 34.3 °C / 94 F, ranging from 21.2 to 62.5 °C for the class Office.
(-) The bottom heats up to a maximum of 61.6 °C / 143 F, compared to the average of 36.8 °C / 98 F
(+) In idle usage, the average temperature for the upper side is 29.1 °C / 84 F, compared to the device average of 29.5 °C / 85 F.
(+) The palmrests and touchpad are reaching skin temperature as a maximum (32.4 °C / 90.3 F) and are therefore not hot.
(-) The average temperature of the palmrest area of similar devices was 27.5 °C / 81.5 F (-4.9 °C / -8.8 F).
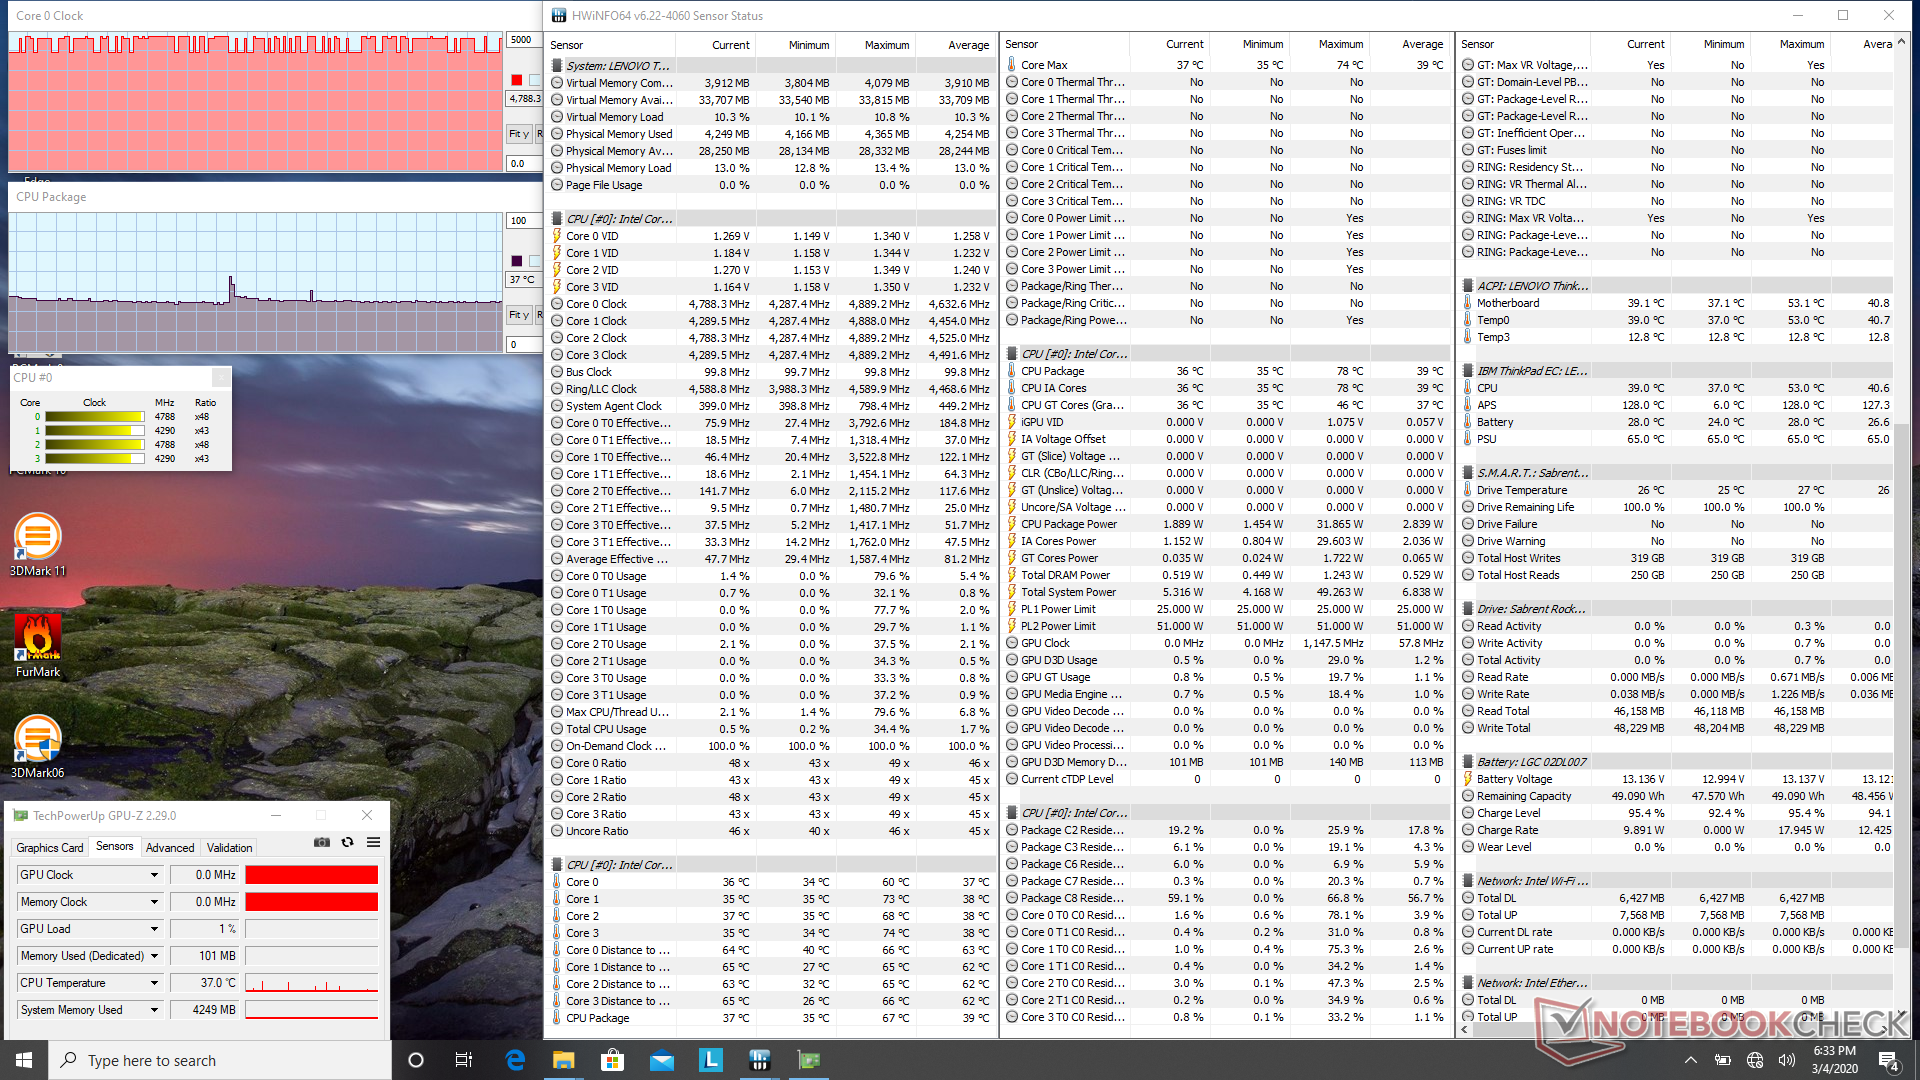
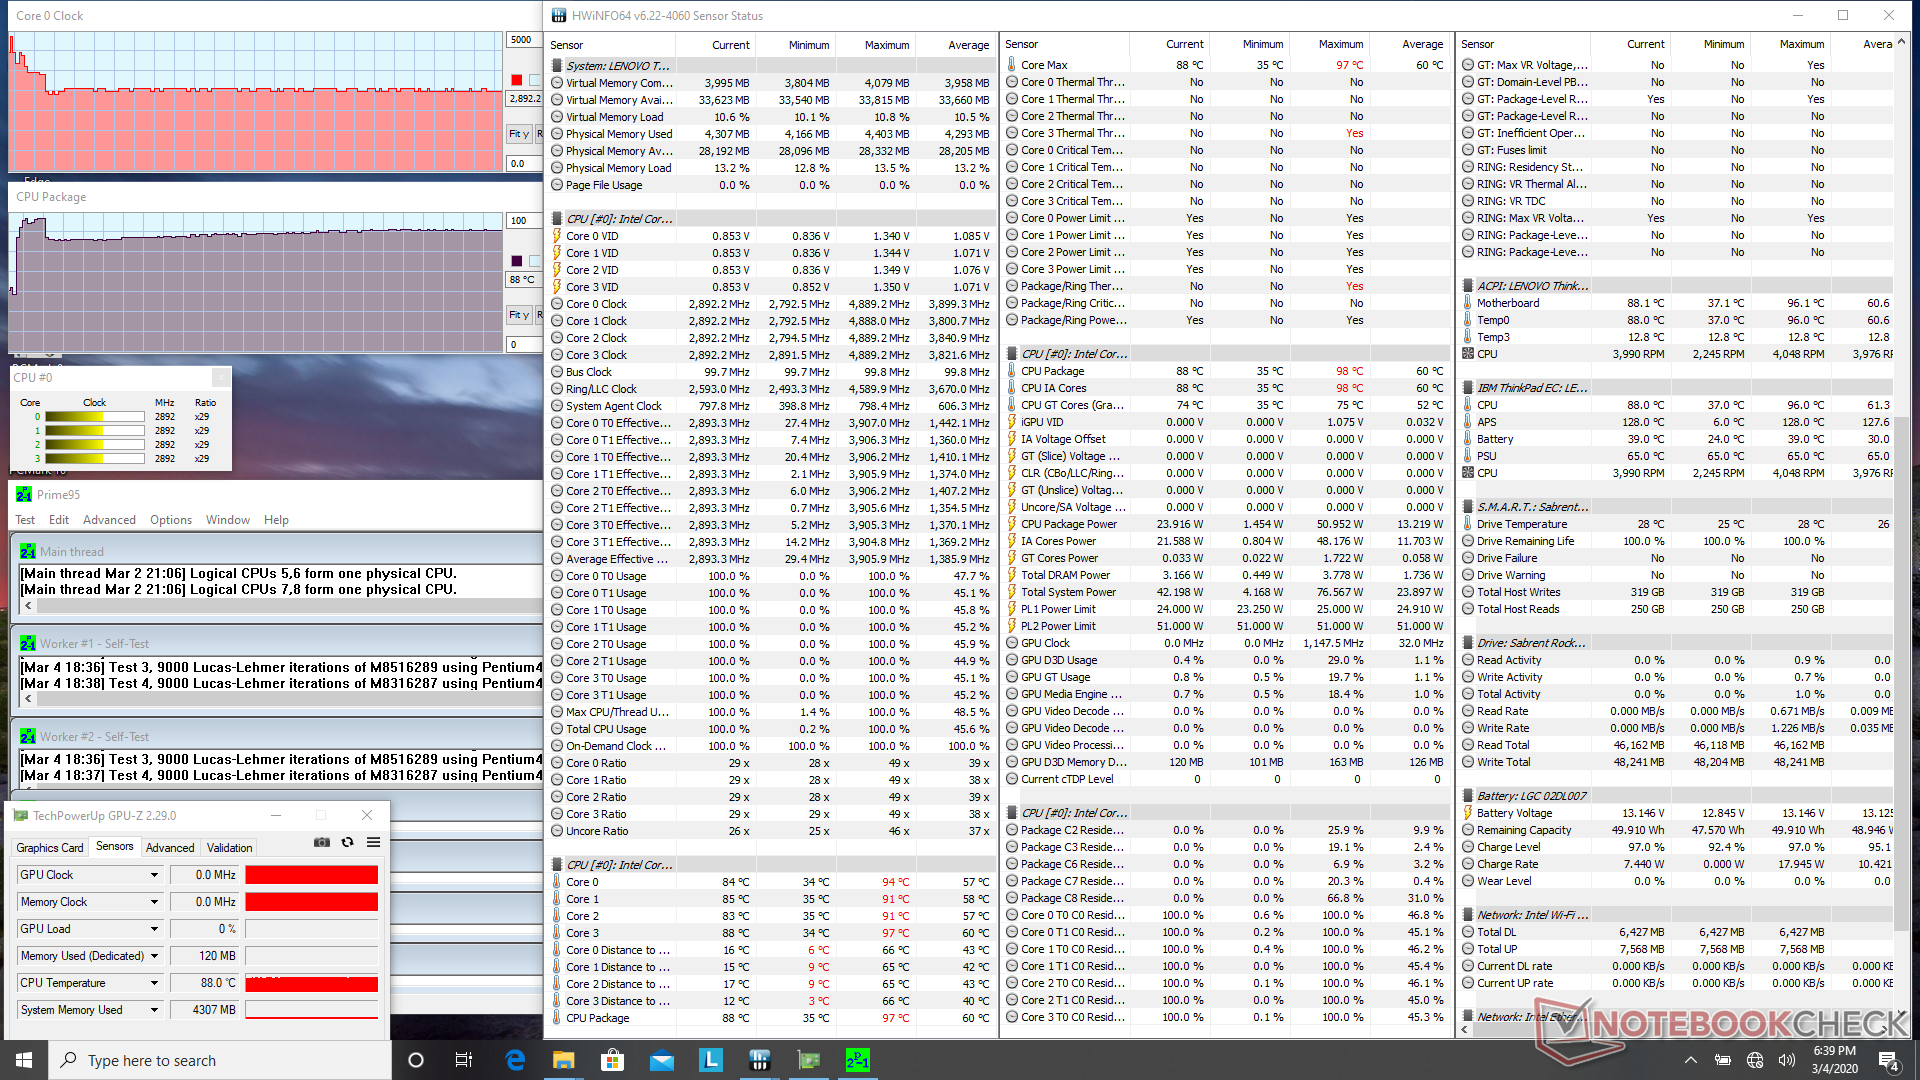
Stress Test
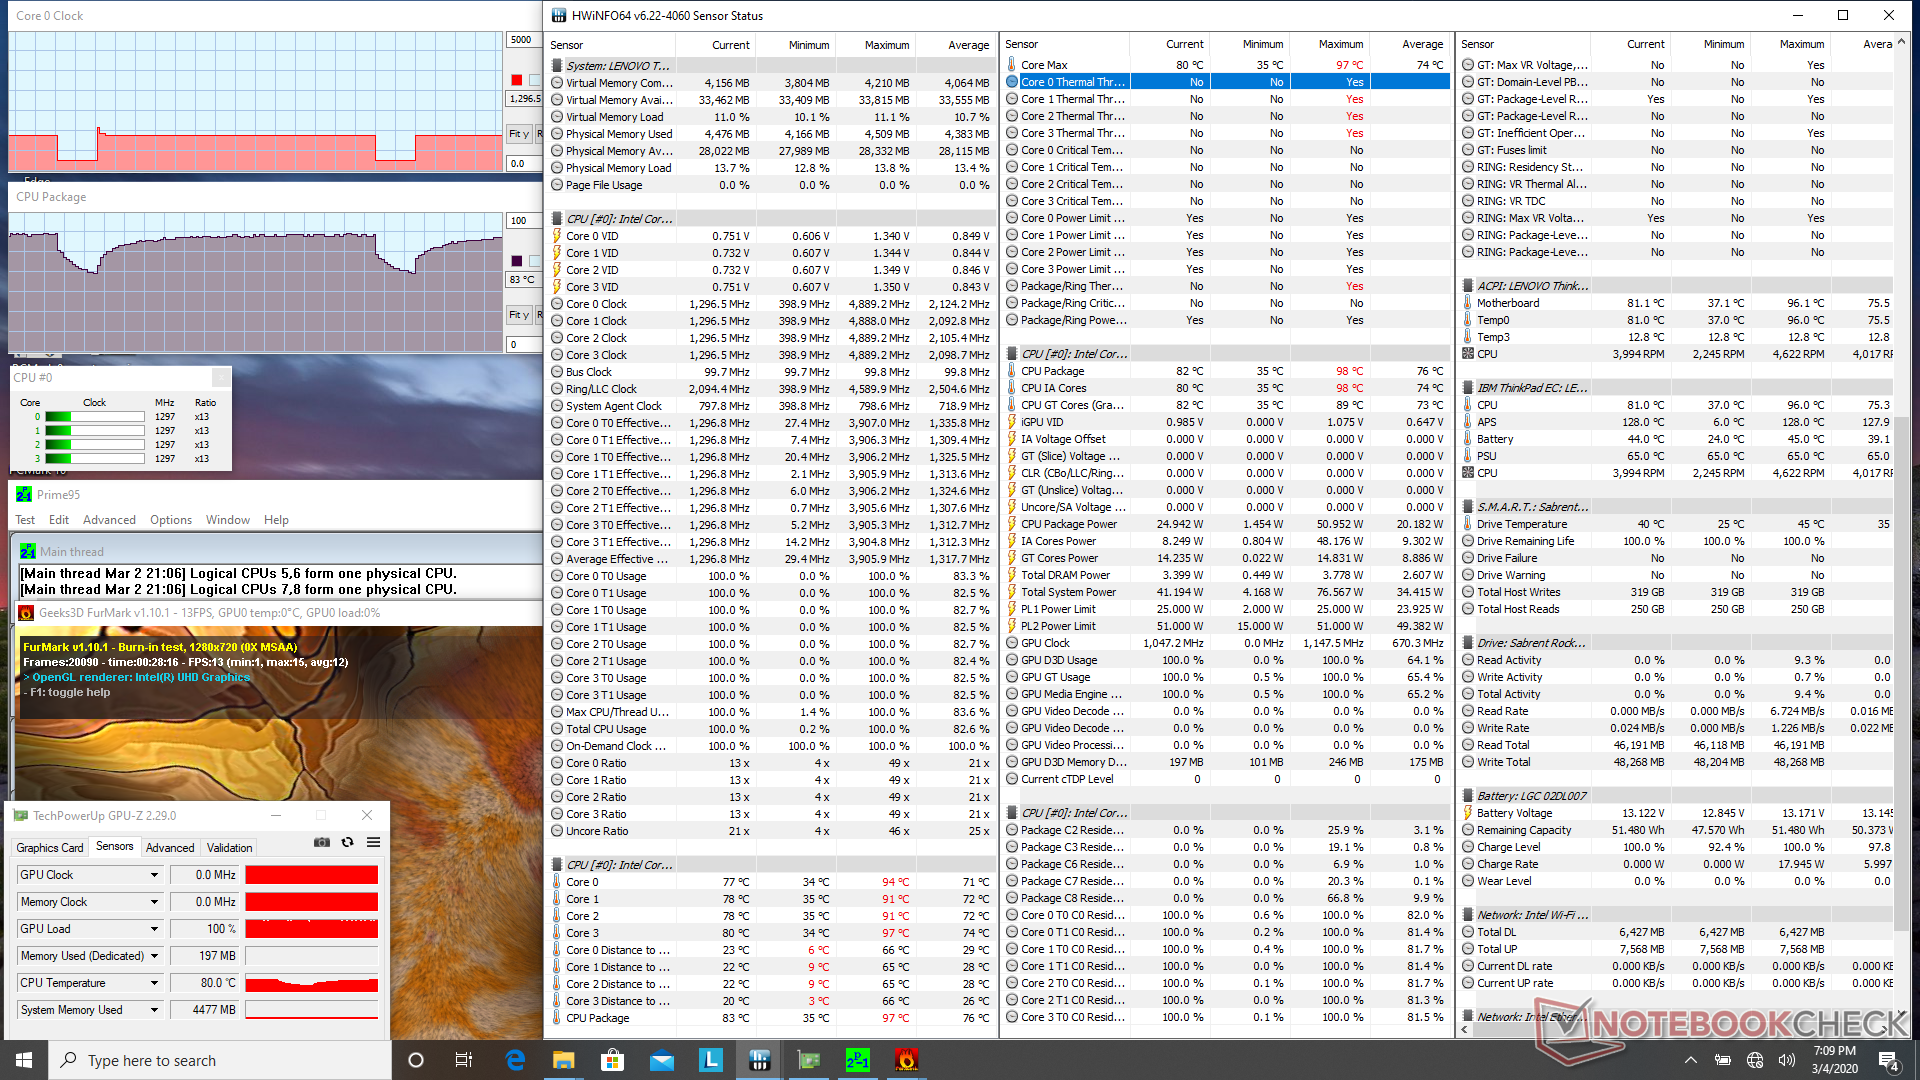
Running Prime95 causes the CPU to spike to 4.2 GHz for just a couple of seconds before falling to 3.5 GHz and at a core temperature of 97 C. After about 20 seconds, performance drops even further before stabilizing at 3 GHz and 90 C. Running both Prime95 and FurMark simultaneously will throttle the CPU down to 1.3 GHz with periodic dips to just 400 MHz. These high core temperatures definitely explain the warmer-than-expected surface temperatures recorded above.
Running on battery power will not limit performance. A 3DMark 11 run on batteries returns Physics and Graphics scores of 8799 and 1947 points, respectively, compared to 8995 and 1942 points when on mains.
| CPU Clock (GHz) | GPU Clock (MHz) | Average CPU Temperature (°C) | |
| System Idle | -- | -- | 37 |
| Prime95 Stress | 2.9 - 3.0 | -- | 90 |
| Prime95 + FurMark Stress | 0.4 - 1.3 | -- | 54 - 85 |
Speakers

Energy Management
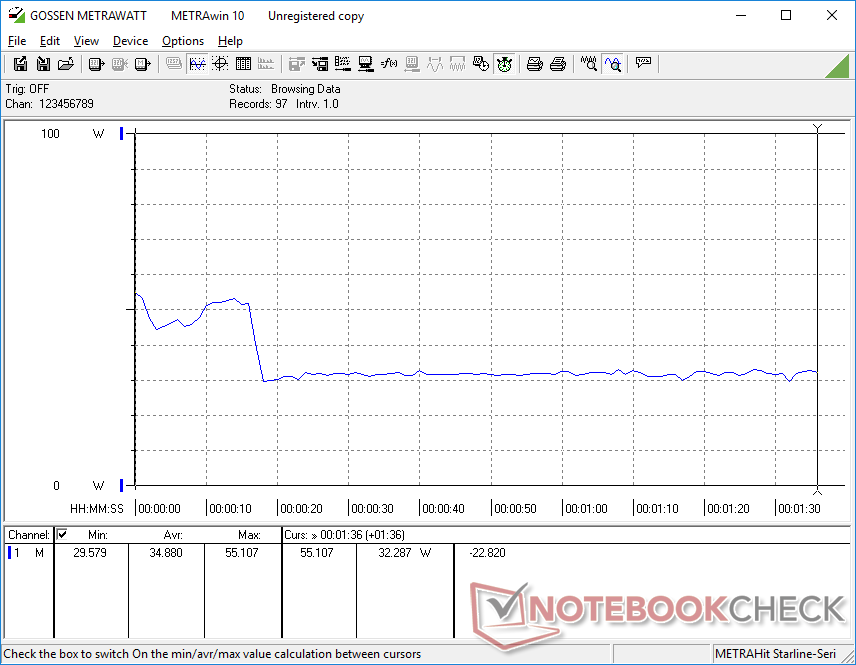
Power Consumption
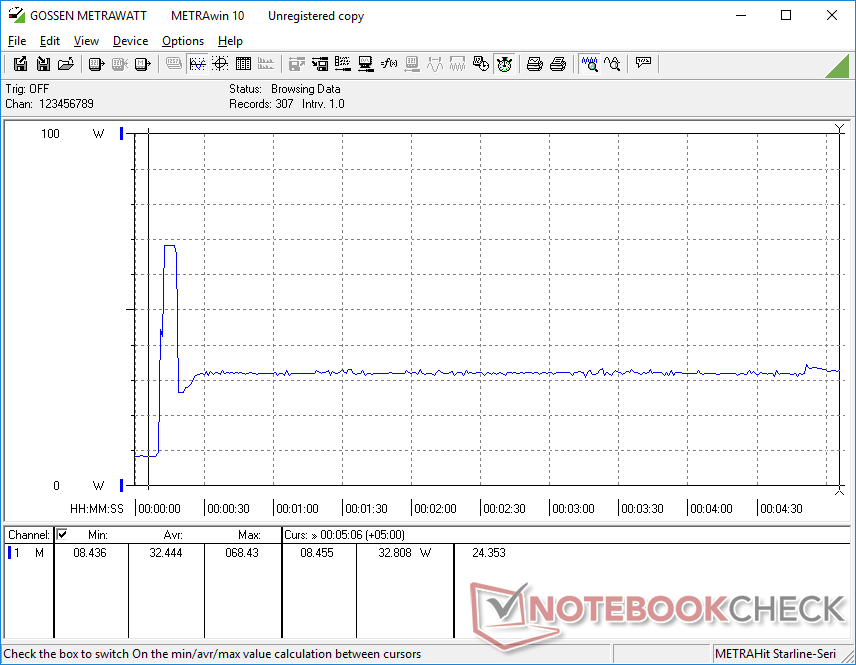
Running the first benchmark scene of 3DMark 06 consumes an average of 35 W to be similar to what we recorded on the ThinkPad T495s with the Ryzen 7 Pro 3700U. This is notable because the RX Vega 10 GPU in the Ryzen 7 3700U is able to offer roughly two times the graphics performance of our UHD Graphics 620 without consuming more power.
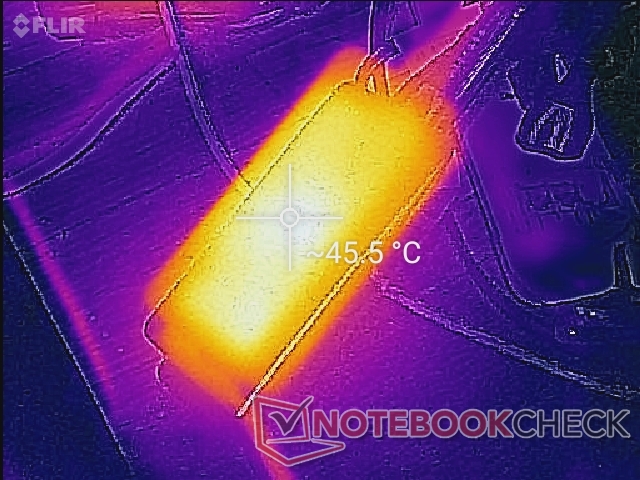
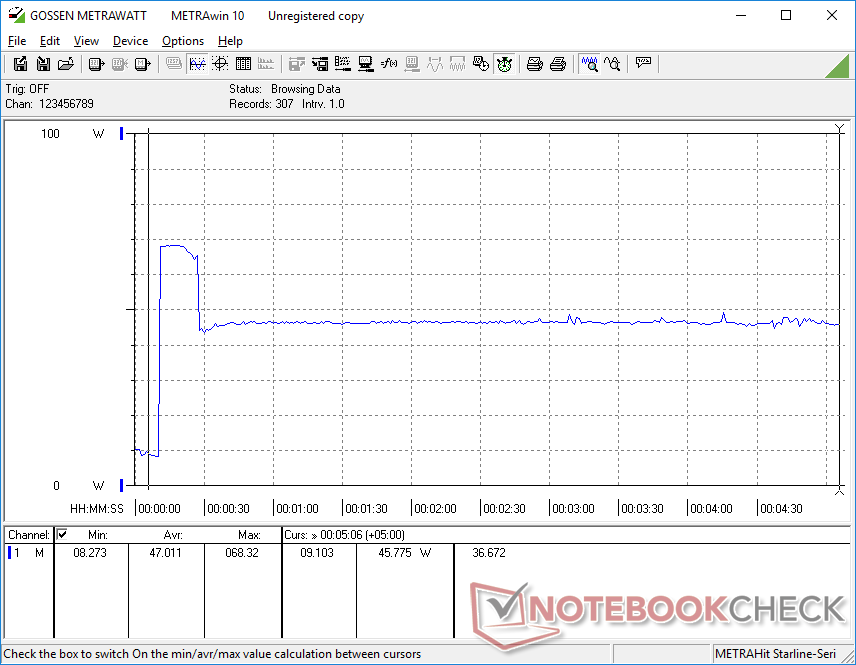
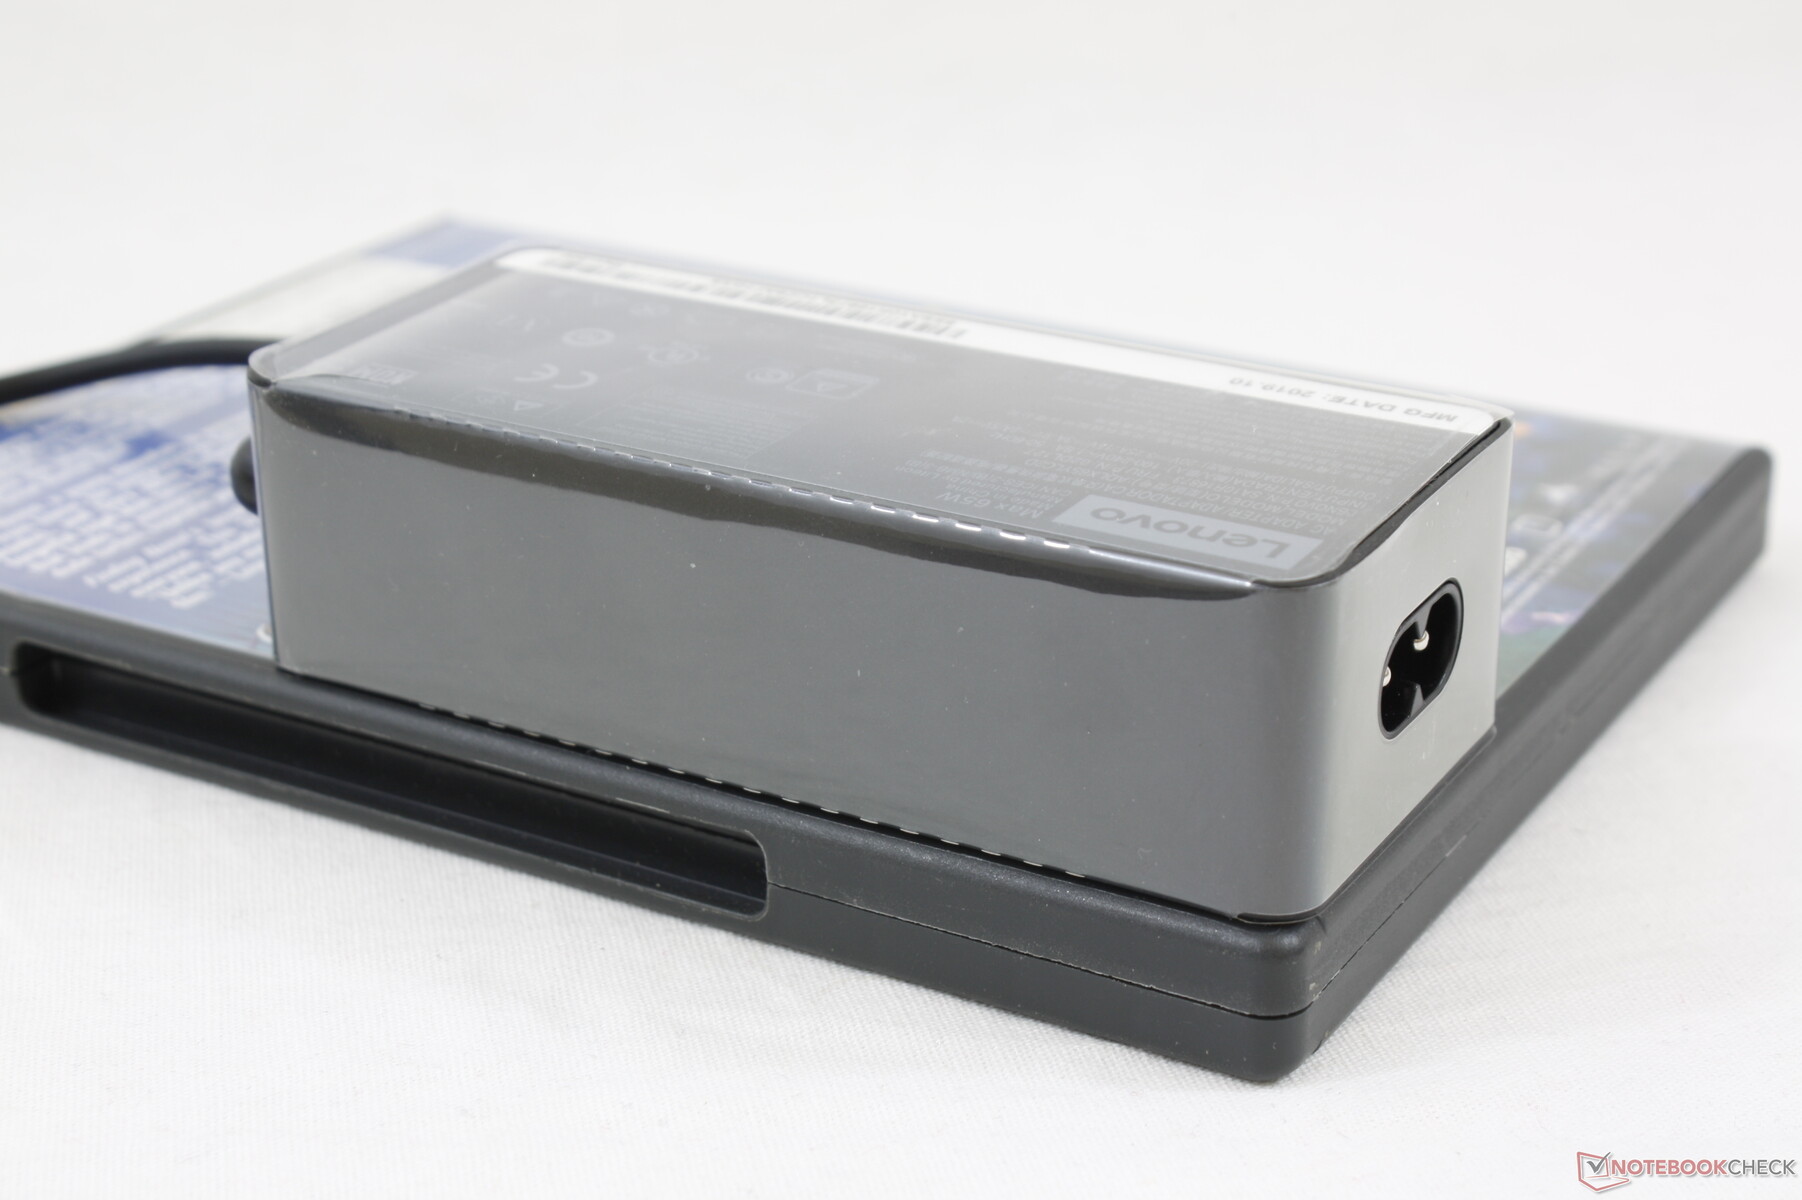
We're able to measure a high of 68 W from the small (~10.4 x 4.8 x 3 cm) 65 W AC adapter when initiating both Prime95 and FurMark simultaneously. The high consumption rate is only temporary as shown by the graphs below.
| Off / Standby | |
| Idle | |
| Load |
|
Key:
min: | |
| Lenovo ThinkPad T490 20RY0002US i7-10510U, UHD Graphics 620, Sabrent Rocket Q 1TB RKT30Q.1, IPS, 1920x1080, 14" | Lenovo ThinkPad T480-20L6S01V00 i5-8550U, GeForce MX150, Samsung SSD PM981 MZVLB512HAJQ, IPS, 1920x1080, 14" | Lenovo ThinkPad T470-20HD002HGE i5-7200U, HD Graphics 620, Samsung PM961 NVMe MZVLW512HMJP, IPS, 1920x1080, 14" | Lenovo ThinkPad T460-20FN003LGE 6200U, HD Graphics 520, Toshiba HG6 THNSFJ256GCSU, IPS, 1920x1080, 14" | Lenovo ThinkPad T450-20BV001VGE 5200U, HD Graphics 5500, Samsung SSD PM851 256 GB MZ7TE256HMHP, TN-Panel, 1600x900, 14" | Lenovo ThinkPad T495s-20QKS01E00 R7 PRO 3700U, Vega 10, Samsung PM981a MZVLB1T0HBLR, IPS, 1920x1080, 14" | |
|---|---|---|---|---|---|---|
| Power Consumption | -20% | 22% | 18% | 24% | -5% | |
| Idle Minimum * (Watt) | 4.3 | 3.6 16% | 3.21 25% | 3.5 19% | 3 30% | 4.7 -9% |
| Idle Average * (Watt) | 7 | 7.1 -1% | 6.15 12% | 6.7 4% | 5.5 21% | 7.28 -4% |
| Idle Maximum * (Watt) | 7.2 | 9.5 -32% | 6.82 5% | 7.3 -1% | 6.4 11% | 9.48 -32% |
| Load Average * (Watt) | 34.9 | 63.9 -83% | 28.5 18% | 28.2 19% | 28.4 19% | 35.3 -1% |
| Load Maximum * (Watt) | 68.4 | 67.3 2% | 34.5 50% | 34.6 49% | 40.7 40% | 55.5 19% |
| Witcher 3 ultra * (Watt) | 53.9 |
* ... smaller is better
Battery Life
Battery capacity has dropped from 72 Wh on the ThinkPad T480 to just 50 Wh on the T490. Consequently, WLAN runtimes are about five hours shorter on the T490 for a total of "only" 8.5 hours. While still excellent, don't expect ridiculously long runtimes unless if a secondary battery is attached.
Recharging from empty to full capacity with the included AC adapter takes approximately 1.5 hours.
| Lenovo ThinkPad T490 20RY0002US i7-10510U, UHD Graphics 620, 50 Wh | Lenovo ThinkPad T480-20L6S01V00 i5-8550U, GeForce MX150, 72 Wh | Lenovo ThinkPad T470-20HD002HGE i5-7200U, HD Graphics 620, 48 Wh | Lenovo ThinkPad T460-20FN003LGE 6200U, HD Graphics 520, 46 Wh | Lenovo ThinkPad T450-20BV001VGE 5200U, HD Graphics 5500, 48 Wh | Lenovo ThinkPad T495s-20QKS01E00 R7 PRO 3700U, Vega 10, 57 Wh | |
|---|---|---|---|---|---|---|
| Battery runtime | 57% | -13% | -33% | -36% | 35% | |
| WiFi v1.3 (h) | 8.4 | 13.2 57% | 7.3 -13% | 5.6 -33% | 5.4 -36% | 11.3 35% |
| Reader / Idle (h) | 27.9 | 15.9 | 15.6 | |||
| Load (h) | 2.7 | 1.8 | 1.6 | 1.6 |
Pros
Cons
Verdict

As noted in our initial overview of the series, the raw performance benefits of Comet Lake-U over Whiskey Lake-U are marginal save for the hexa-core Core i7-10710U which is unfortunately not available on the ThinkPad T490. Instead, users can only configure up to the quad-core Core i7-10510U.
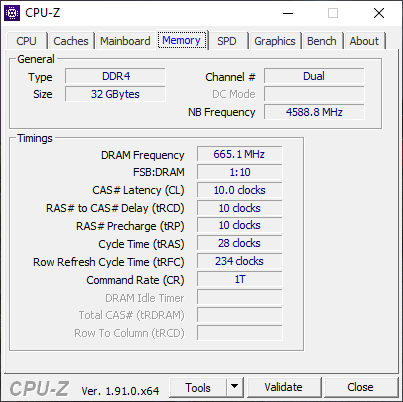
Aside from the CPU update, the Comet Lake-U ThinkPad T490 SKUs have faster RAM (DDR4-2400 to DDR4-2666) and Wi-Fi (802.11ac to 802.11ax) than the older Whiskey Lake-U SKUs. The gen-to-gen differences, however, are again marginal at best.
To maximize value, we recommend an older Whiskey Lake-U configuration with one of Lenovo's brighter display options. The T490 offers 400-nit FHD and 500-nit WQHD panels to be brighter than the 300-nit display we have here. Investing in a better display will be much more noticeable than the jump from Intel 8th gen to 10th gen in this regard.
The CPU, RAM, and WLAN changes are minor upgrades over last year's model. If you want a 14-inch T series ThinkPad, then wait for the ThinkPad T14 or just go with a Whiskey Lake-U T490 configuration.
Lenovo ThinkPad T490 20RY0002US
- 03/06/2020 v7 (old)
Allen Ngo
Price comparison
