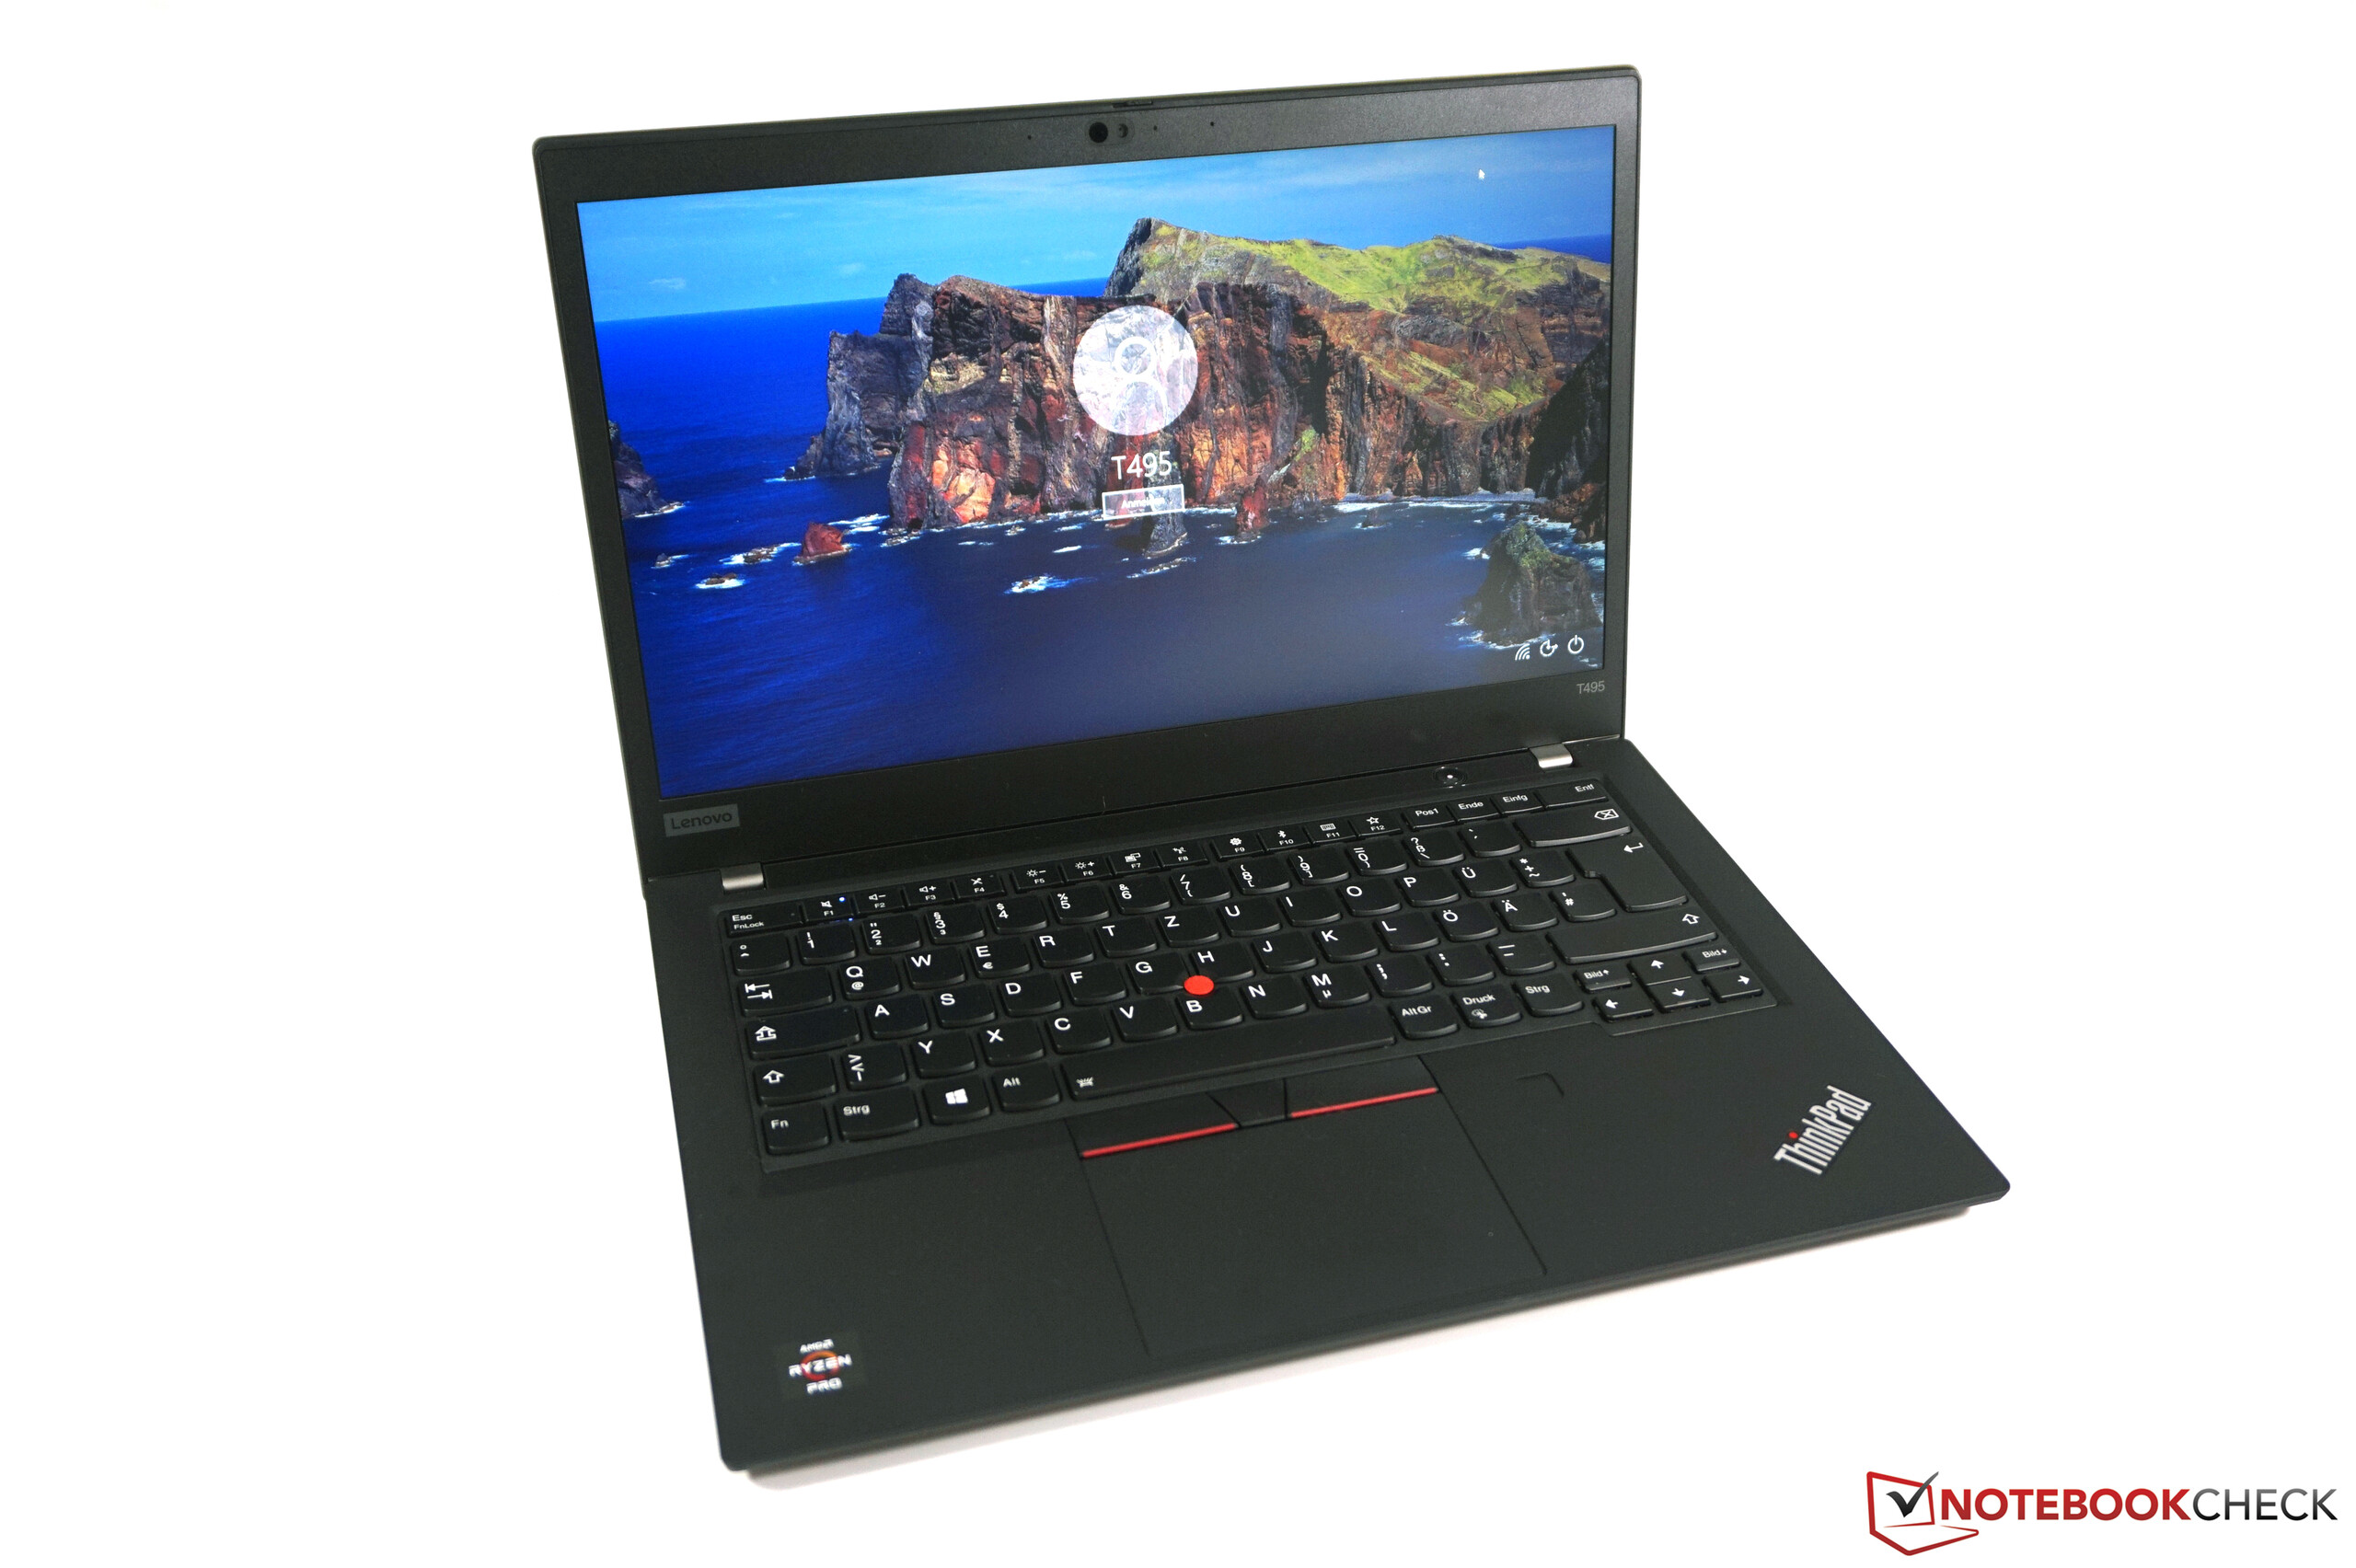
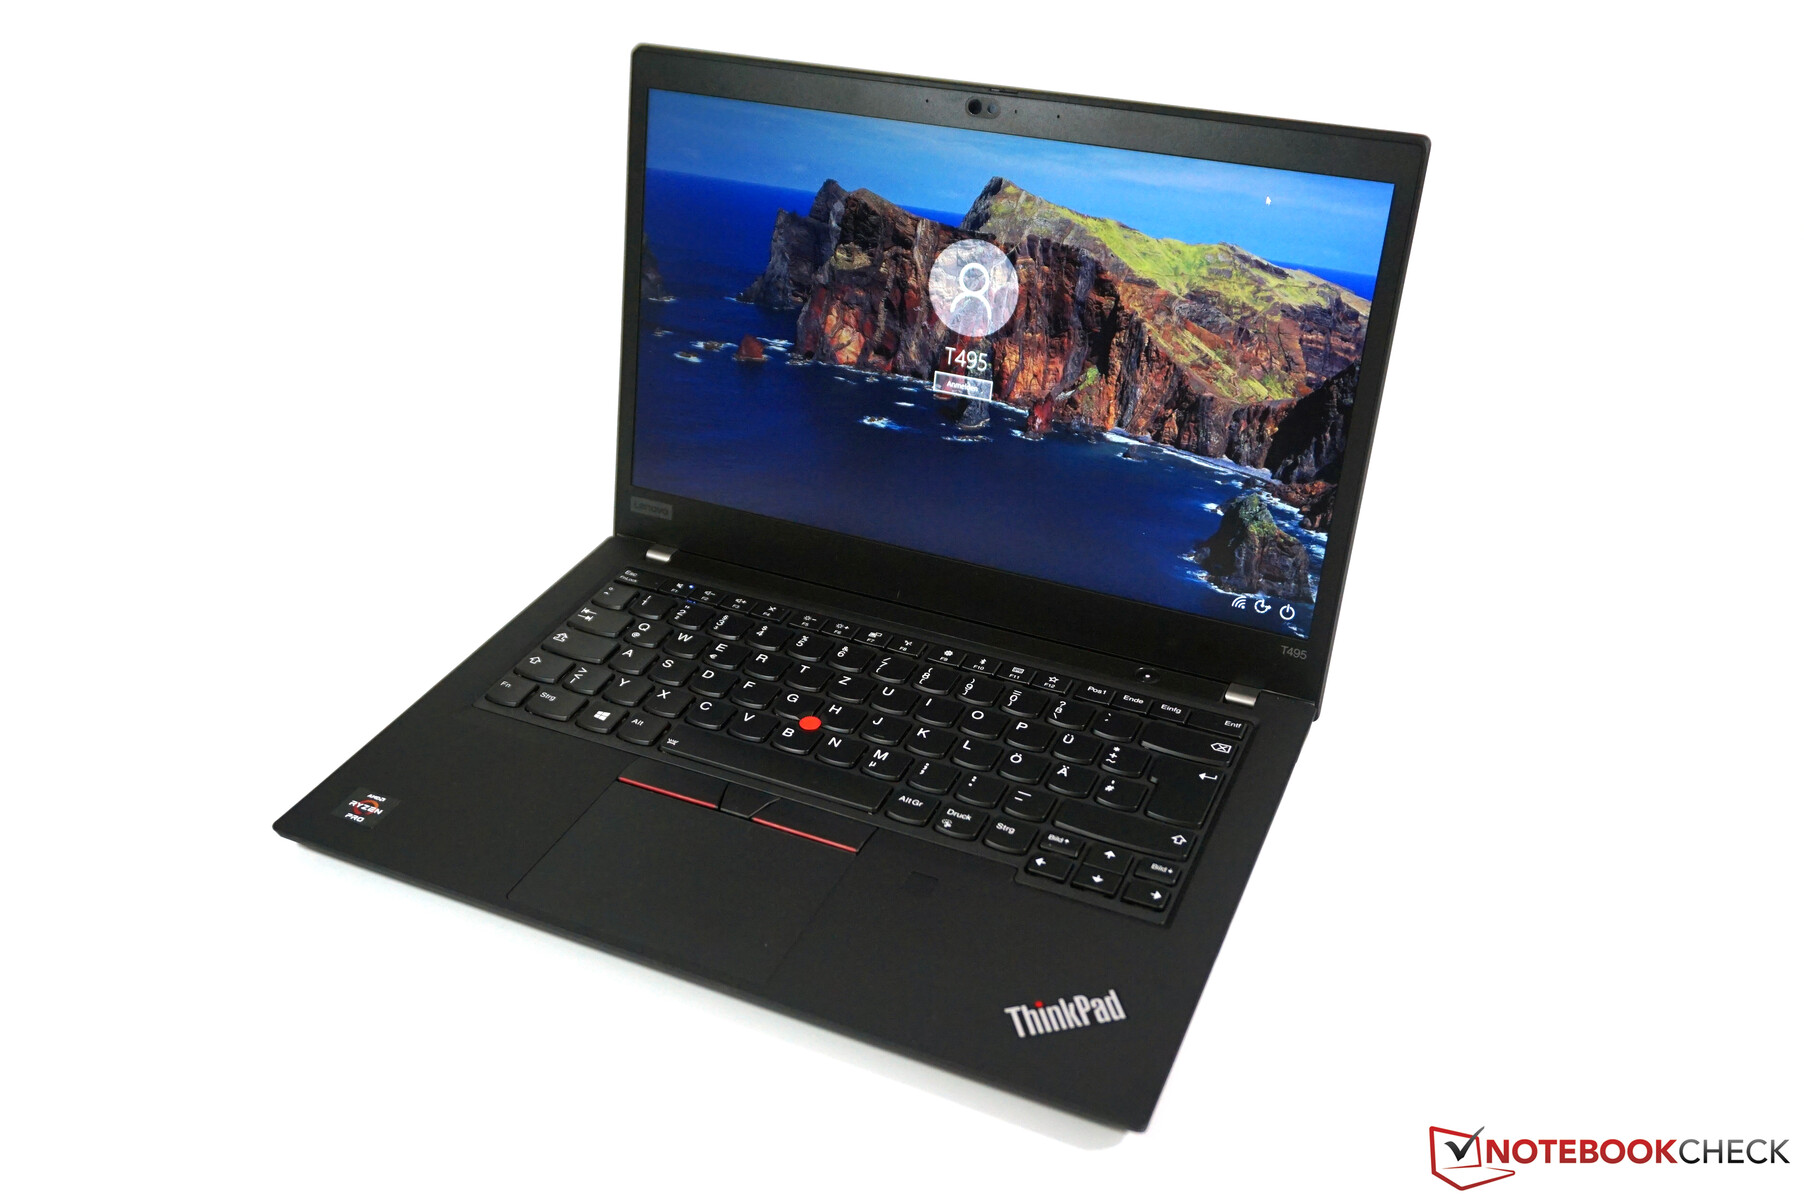
Lenovo ThinkPad T495 Review: business laptop with AMD processor, long battery life, and good display
Lenovo’s 14-inch ThinkPad T490 is a typical office notebook, and we liked both the SKU with dedicated Nvidia GeForce MX250 and the one with just the integrated Intel UHD Graphics 620. For the first time Lenovo is now also offering an AMD-powered model dubbed the ThinkPad T495, and unlike previously there are no obvious glaring flaws and disadvantages when compared to the Intel SKU this time around. Naturally, we are inclined to find out whether or not there are any limitations that you simply will have to live with, or whether the T495 will turn out to be the better choice of the two thanks to its lower price.
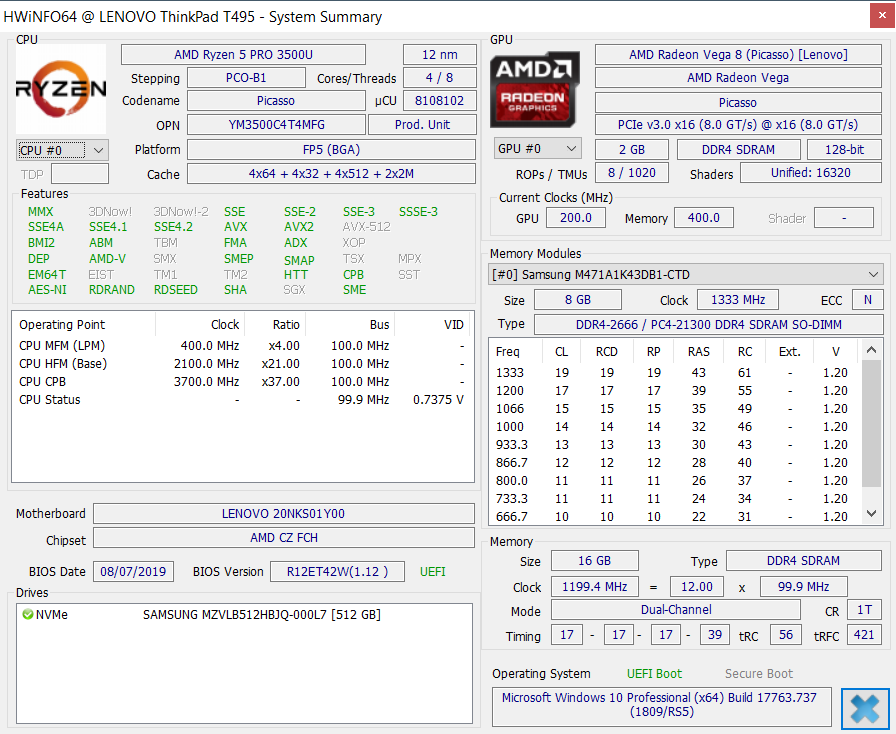
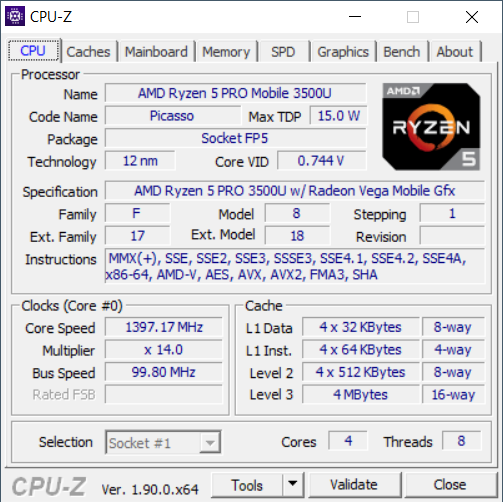
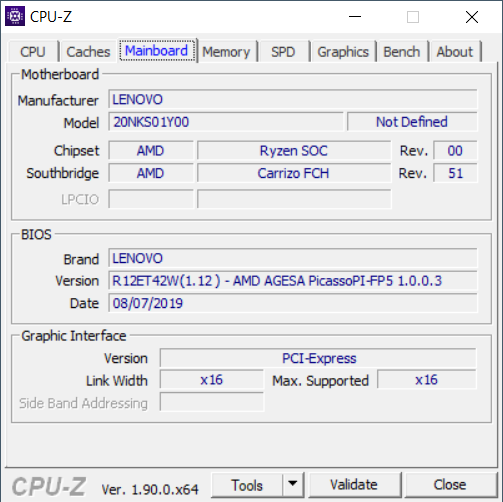
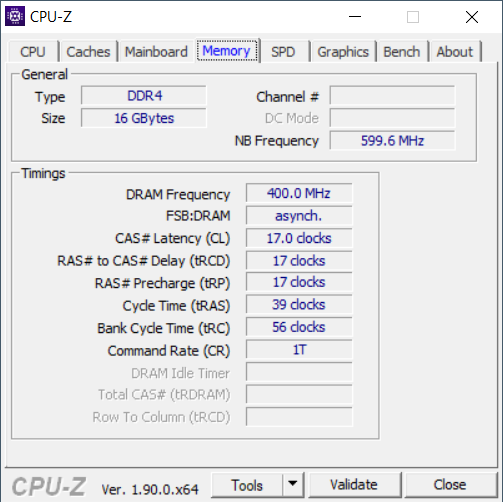
Today’s review unit is a ThinkPad T495 20NKS01Y00, which is available through Lenovo’s Campus program for 999 Euros without operating system. It is equipped with an AMD Ryzen 5 Pro 3500U processor, 16 GB of RAM, a 400 nits FHD display, and a 512 GB PCIe SSD. A similar model can be configured on Lenovo’s website for around $1,400, and thus nearly $250 cheaper than a similarly fast Intel-equipped T490.
Given the overall similarities between the T490 and the T495, we are not going to cover case, input devices, and speakers in this review. Instead, we would like to refer you to our previous T490 reviews:
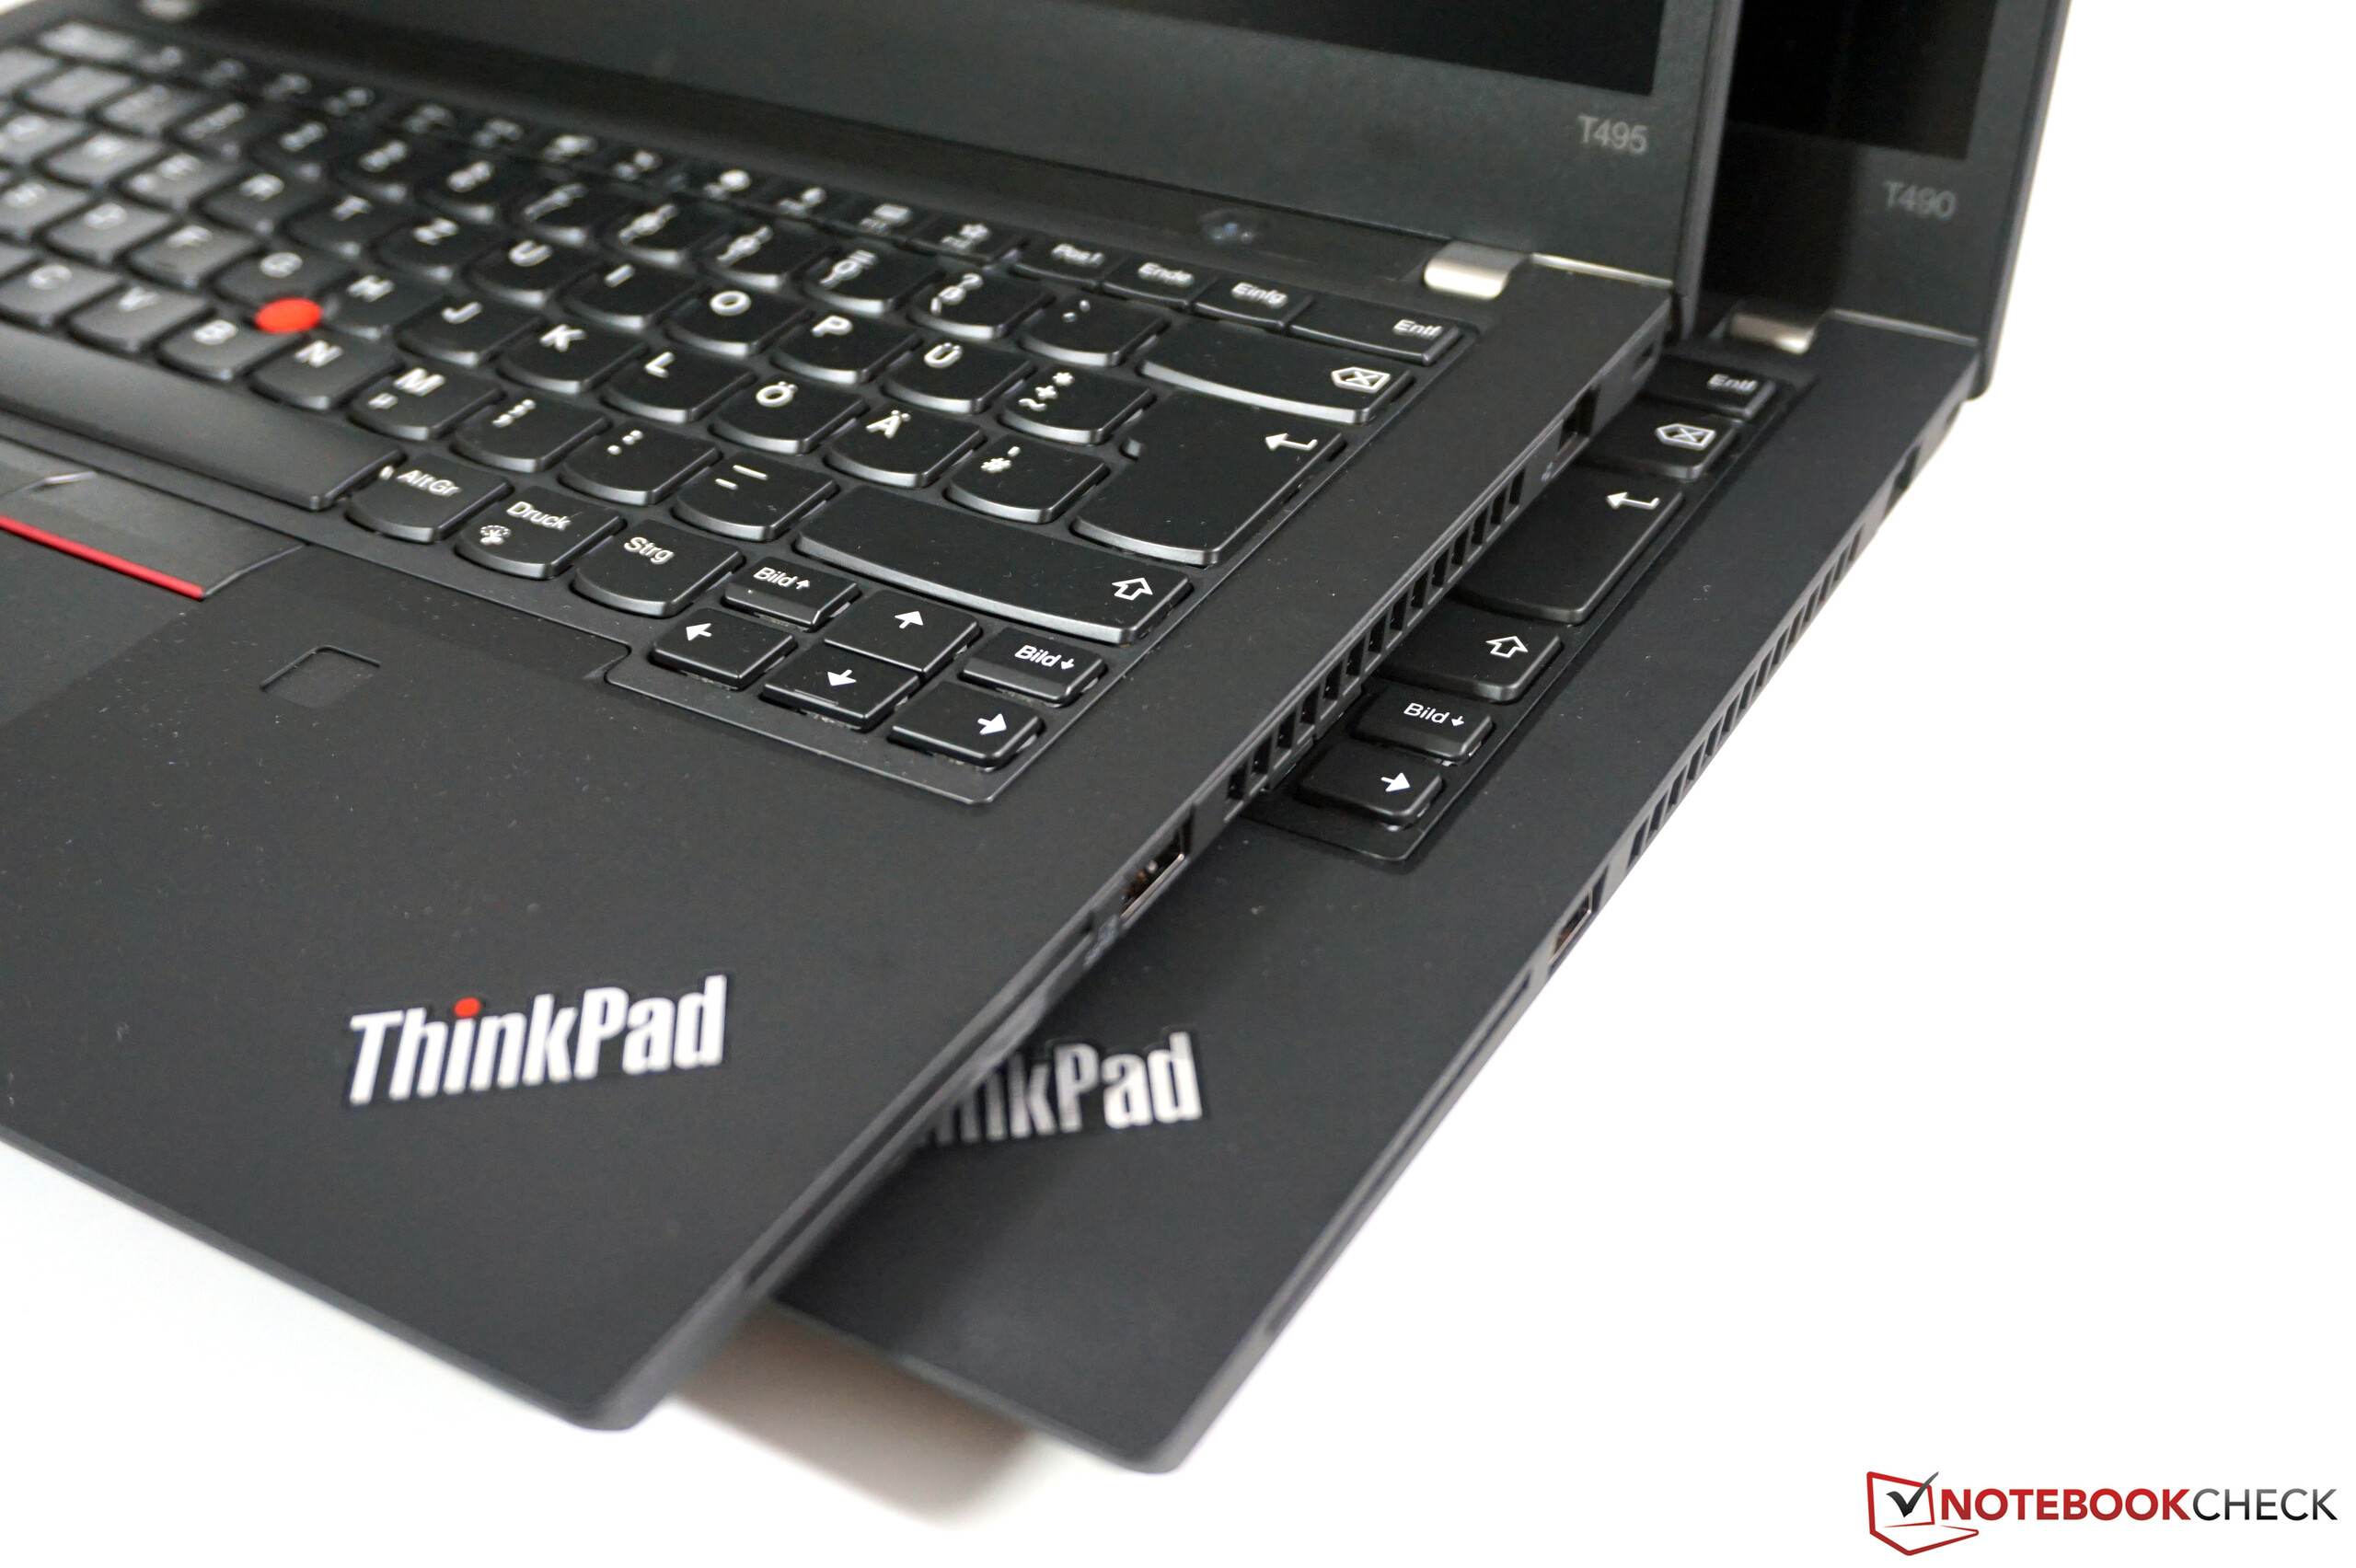
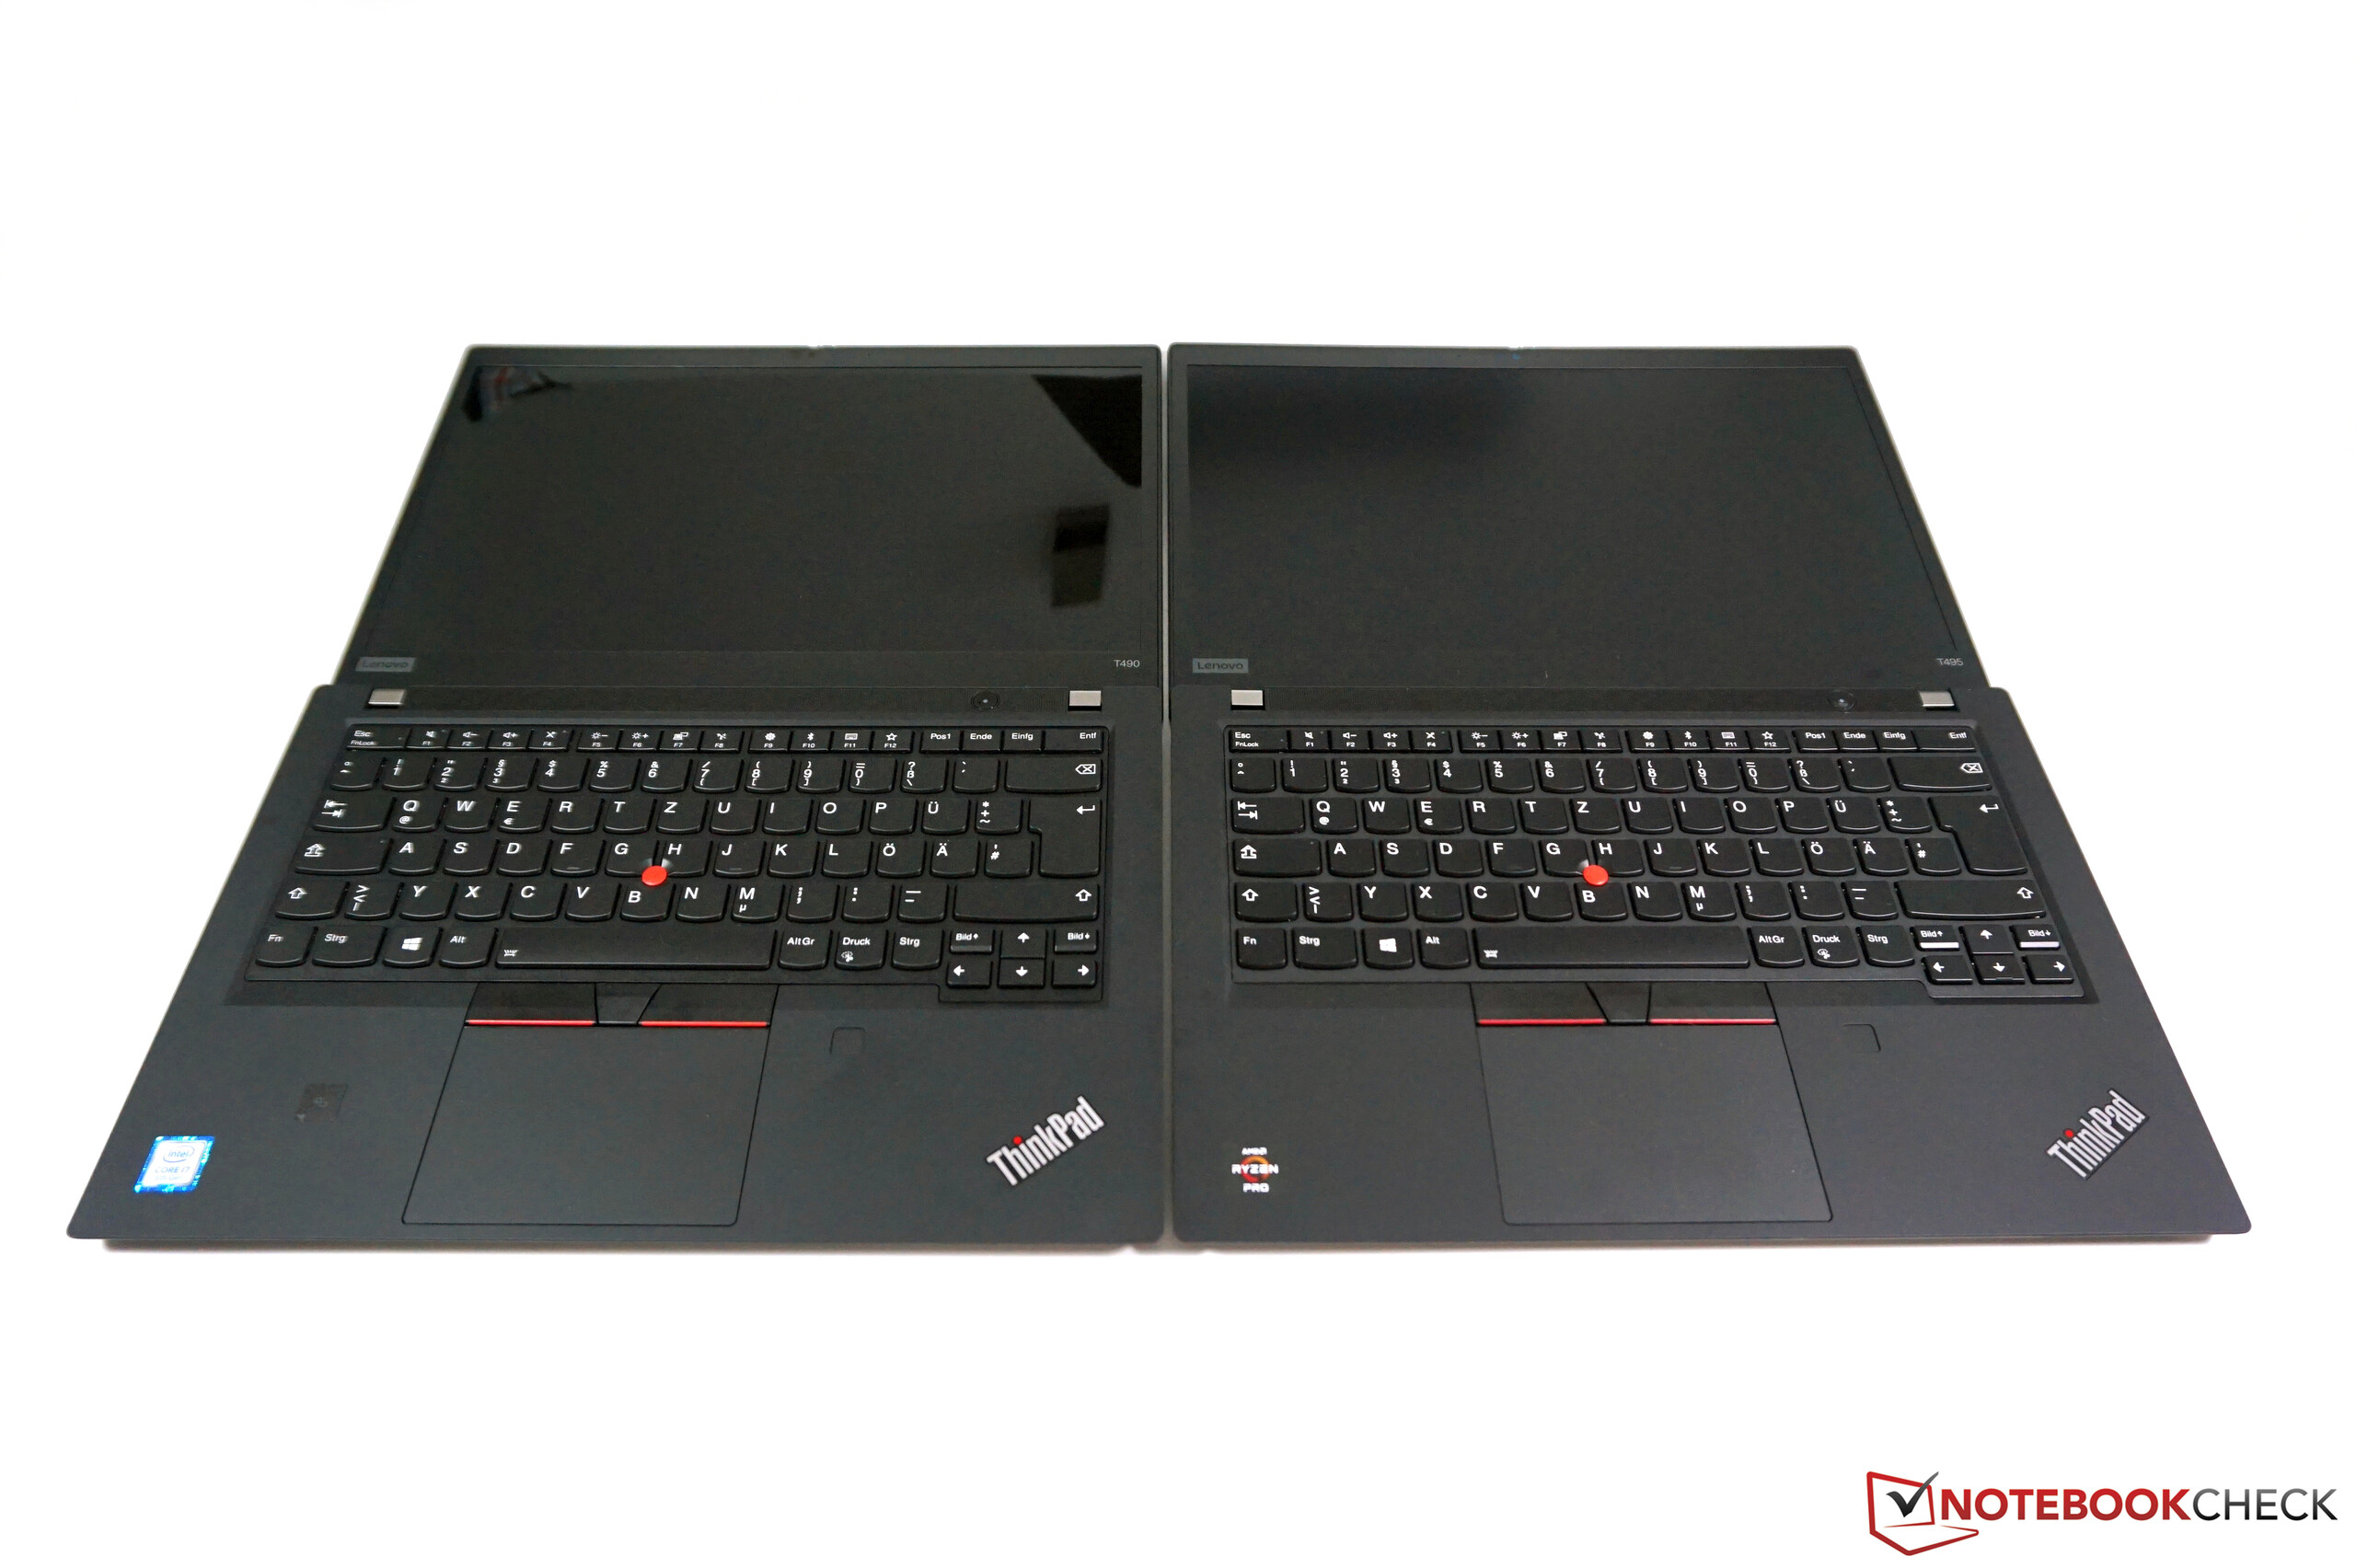
Differences between the ThinkPad T490 and T495
Both case and material are identical between the two models, and at first glance the only visible difference are the stickers on the palm rests. Upon closer inspection, however, we also noticed a few connectivity discrepancies. Namely, the T495 lacks Thunderbolt 3 entirely but does offer a HDMI 2.0 port in return. Unlike the HDMI 1.4b port on the T490 the AMD-powered ThinkPad is capable of 4K@60 Hz via HDMI. Both USB-C ports (USB 3.2 Gen. 2) carry a DisplayPort signal and support for PowerDelivery, and thus both can be used for charging or connecting to external displays via DisplayPort dongle. In total, the T495 supports up to four displays. Unique to the AMD model is its support for AMD’s FreeSync technology, which synchronizes frames to the display’s refresh rate to avoid tearing during gaming. That said the usefulness of this feature is somewhat limited by the comparatively slow GPU and the 48-60 Hz display itself.
| SD Card Reader | |
| average JPG Copy Test (av. of 3 runs) | |
| Dell Latitude 7490 (Toshiba Exceria Pro M501 UHS-II) | |
| Lenovo ThinkPad T495-20NKS01Y00 (Toshiba Exceria Pro M501 64 GB UHS-II) | |
| Lenovo ThinkPad T490-20N3S02L00 (Toshiba Exceria Pro M501) | |
| Lenovo ThinkPad T490s-20NYS02A00 (Toshiba Exceria Pro M501) | |
| Average of class Office (19.8 - 198.5, n=22, last 2 years) | |
| maximum AS SSD Seq Read Test (1GB) | |
| Dell Latitude 7490 (Toshiba Exceria Pro M501 UHS-II) | |
| Lenovo ThinkPad T495-20NKS01Y00 (Toshiba Exceria Pro M501 64 GB UHS-II) | |
| Lenovo ThinkPad T490s-20NYS02A00 (Toshiba Exceria Pro M501) | |
| Lenovo ThinkPad T490-20N3S02L00 (Toshiba Exceria Pro M501) | |
| Average of class Office (27.4 - 249, n=21, last 2 years) | |
Display
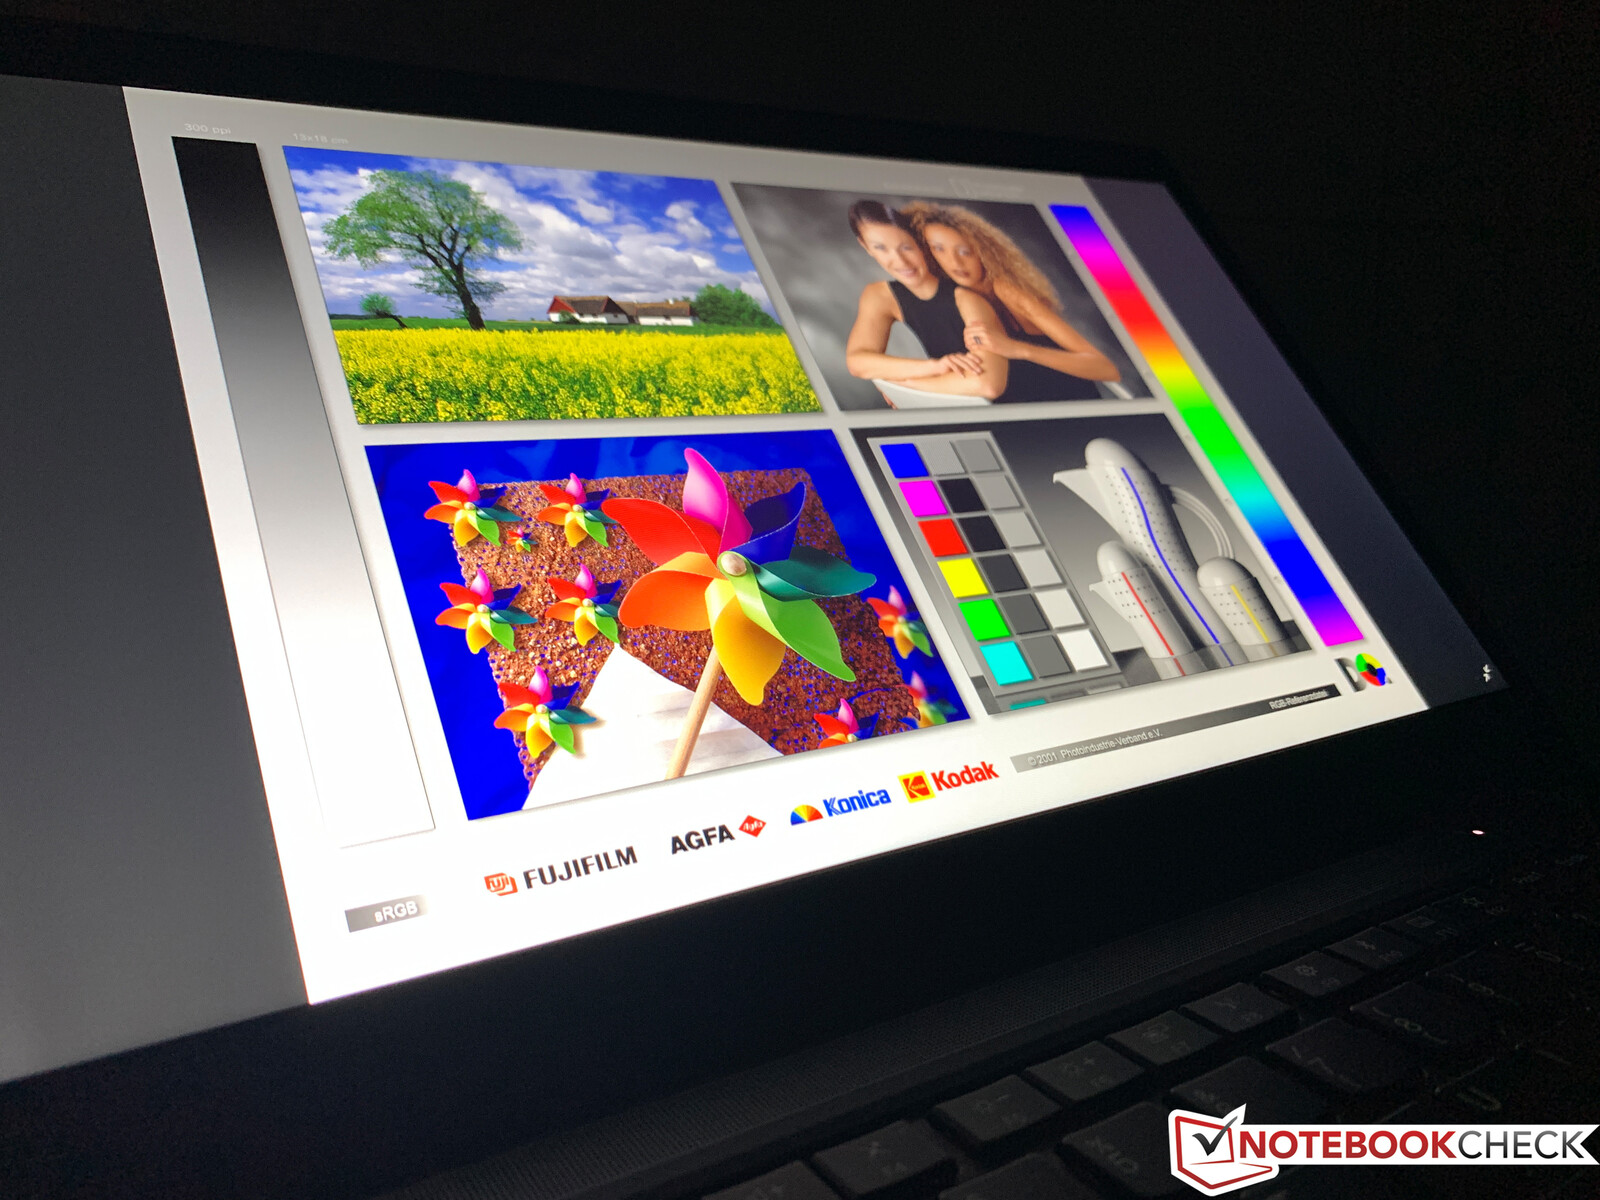
Unlike the T490, the T495 is not available with the high-resolution WQHD HDR display and limited to no more than FHD resolution. Considering the T495’s 14-inch display and its calling as business and office workhorse we would not necessarily consider resolutions higher than FHD essential. Our review unit was equipped with the tantalizing 400 nits LowPower display manufactured by Innolux. As previously reported there are a total of four different 1080p LowPower panels in use by Lenovo, and there is no way of knowing which one you are going to get.
Subjectively, image quality was superb. Average brightness was measured at 390 nits with an acceptable black level of 0.29 nits resulting in an excellent contrast ratio of 1.400:1. In the past, we had quite a few bones to pick with Lenovo’s choice of display for their business notebooks, but the new LowPower FHD display is excellent. We found the display to flicker at a very high frequency of 26 kHz at brightness levels of 50% and below, however this was not traditional PWM. Given the high frequency it should not be an issue even for sensitive users. Screen bleeding was minor and only found around the vertical edges, and it was only visible on completely black backgrounds with brightness cranked (almost) all the way up.
The following table contains all four available LowPower FHD panels. Overall quality between the four is very similar. The biggest differences lie in response times – the BOE and AU Optronics panels are much slower and thus more susceptible to ghosting.
| |||||||||||||||||||||||||
Brightness Distribution: 88 %
Center on Battery: 423 cd/m²
Contrast: 1448:1 (Black: 0.29 cd/m²)
ΔE ColorChecker Calman: 2.1 | ∀{0.5-29.43 Ø4.71}
calibrated: 0.7
ΔE Greyscale Calman: 3.4 | ∀{0.09-98 Ø4.96}
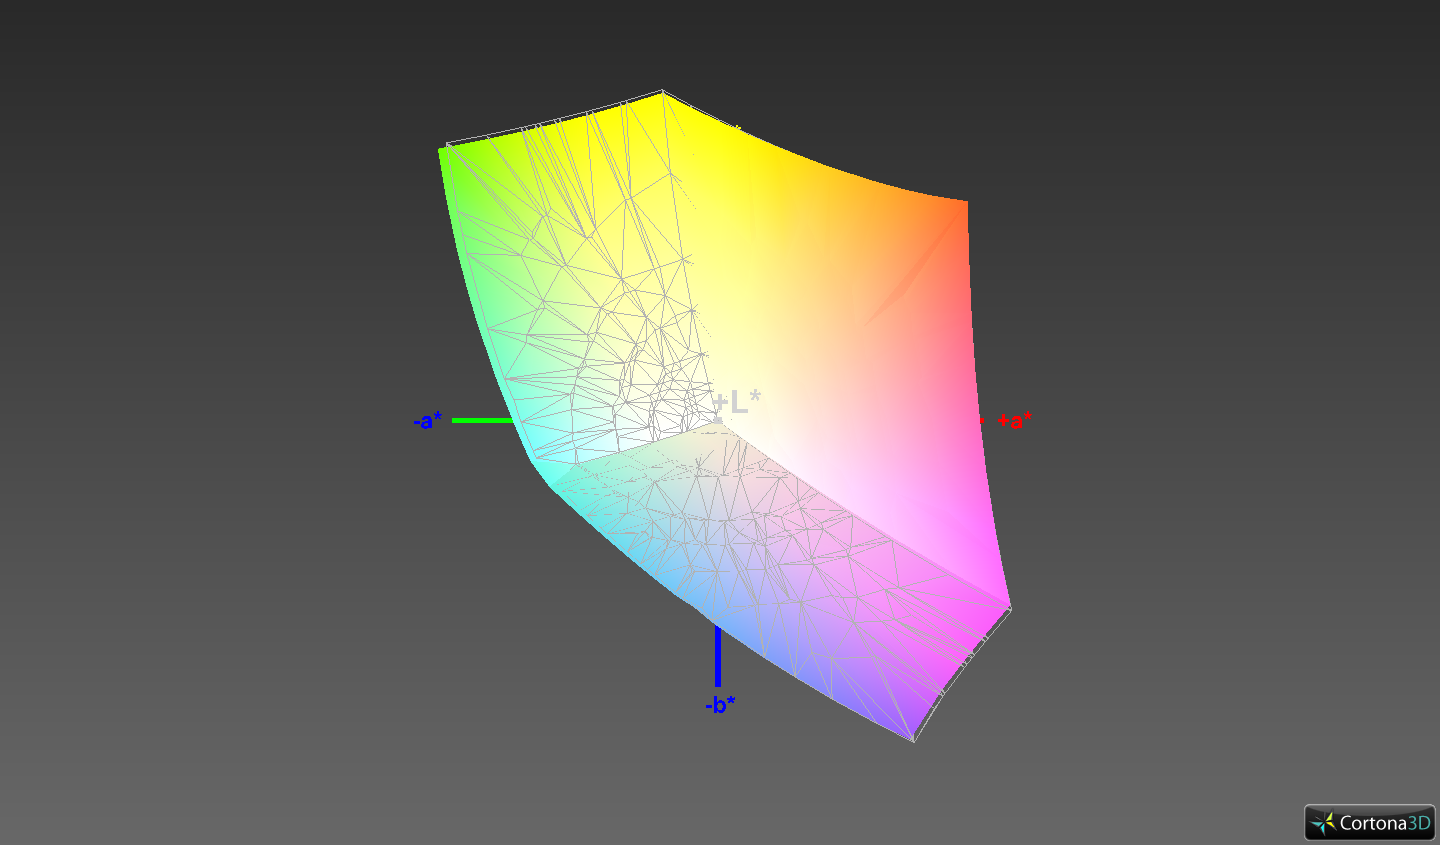
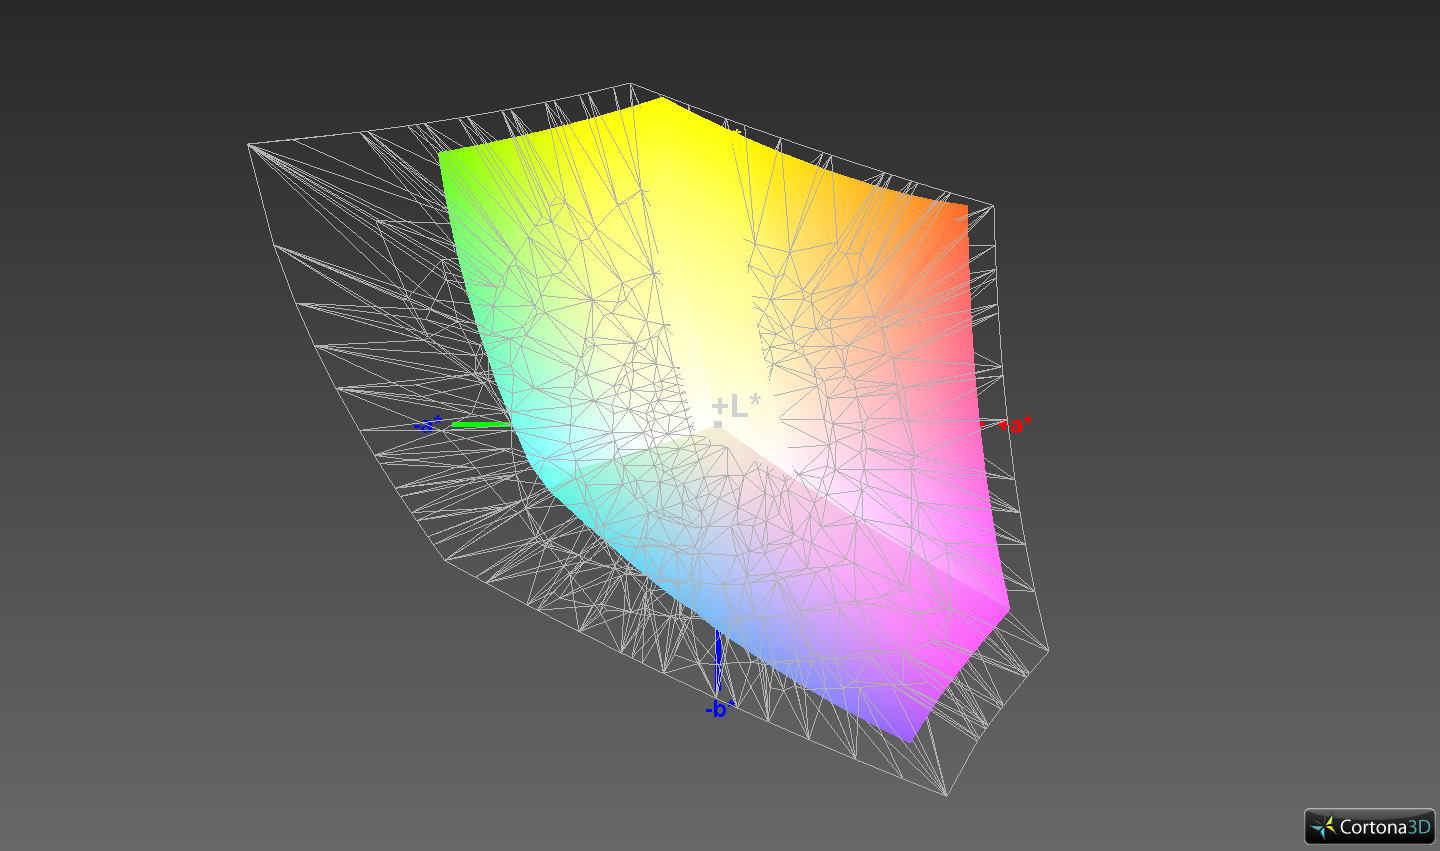
98.6% sRGB (Argyll 1.6.3 3D)
63.5% AdobeRGB 1998 (Argyll 1.6.3 3D)
69.2% AdobeRGB 1998 (Argyll 3D)
98.5% sRGB (Argyll 3D)
67% Display P3 (Argyll 3D)
Gamma: 2.22
CCT: 7168 K
| Lenovo ThinkPad T495-20NKS01Y00 N140HCG-GQ2, , 1920x1080, 14" | Lenovo ThinkPad T490-20N3S02L00 NE140FHM-N61, , 1920x1080, 14" | Lenovo ThinkPad T490s-20NYS02A00 B140HAN05.7, , 1920x1080, 14" | Lenovo ThinkPad X1 Carbon 2019-20QES01L00 LP140WF9_SPF1, , 1920x1080, 14" | |
|---|---|---|---|---|
| Display | -2% | -1% | -4% | |
| Display P3 Coverage (%) | 67 | 69.3 3% | 67.1 0% | 64.5 -4% |
| sRGB Coverage (%) | 98.5 | 92.2 -6% | 97.6 -1% | 95.8 -3% |
| AdobeRGB 1998 Coverage (%) | 69.2 | 67.4 -3% | 68.5 -1% | 65.7 -5% |
| Response Times | -164% | -123% | -60% | |
| Response Time Grey 50% / Grey 80% * (ms) | 32.4 ? | 74 ? -128% | 61.6 ? -90% | 44.8 ? -38% |
| Response Time Black / White * (ms) | 15.2 ? | 45.6 ? -200% | 38.8 ? -155% | 27.6 ? -82% |
| PWM Frequency (Hz) | 26040 ? | 2451 ? | ||
| Screen | -39% | -9% | -26% | |
| Brightness middle (cd/m²) | 420 | 418 0% | 391 -7% | 381 -9% |
| Brightness (cd/m²) | 391 | 400 2% | 389 -1% | 375 -4% |
| Brightness Distribution (%) | 88 | 88 0% | 87 -1% | 94 7% |
| Black Level * (cd/m²) | 0.29 | 0.24 17% | 0.23 21% | 0.24 17% |
| Contrast (:1) | 1448 | 1742 20% | 1700 17% | 1588 10% |
| Colorchecker dE 2000 * | 2.1 | 4.7 -124% | 3.4 -62% | 4.6 -119% |
| Colorchecker dE 2000 max. * | 5.5 | 8.7 -58% | 4.7 15% | 8.5 -55% |
| Colorchecker dE 2000 calibrated * | 0.7 | 2.1 -200% | 1.1 -57% | 1.2 -71% |
| Greyscale dE 2000 * | 3.4 | 5.9 -74% | 4 -18% | 5.1 -50% |
| Gamma | 2.22 99% | 2.06 107% | 2.49 88% | 2.52 87% |
| CCT | 7168 91% | 7350 88% | 6809 95% | 7052 92% |
| Color Space (Percent of AdobeRGB 1998) (%) | 63.5 | 59.9 -6% | 62.4 -2% | 60.7 -4% |
| Color Space (Percent of sRGB) (%) | 98.6 | 92.1 -7% | 97.4 -1% | 95.7 -3% |
| Total Average (Program / Settings) | -68% /
-48% | -44% /
-21% | -30% /
-26% |
* ... smaller is better
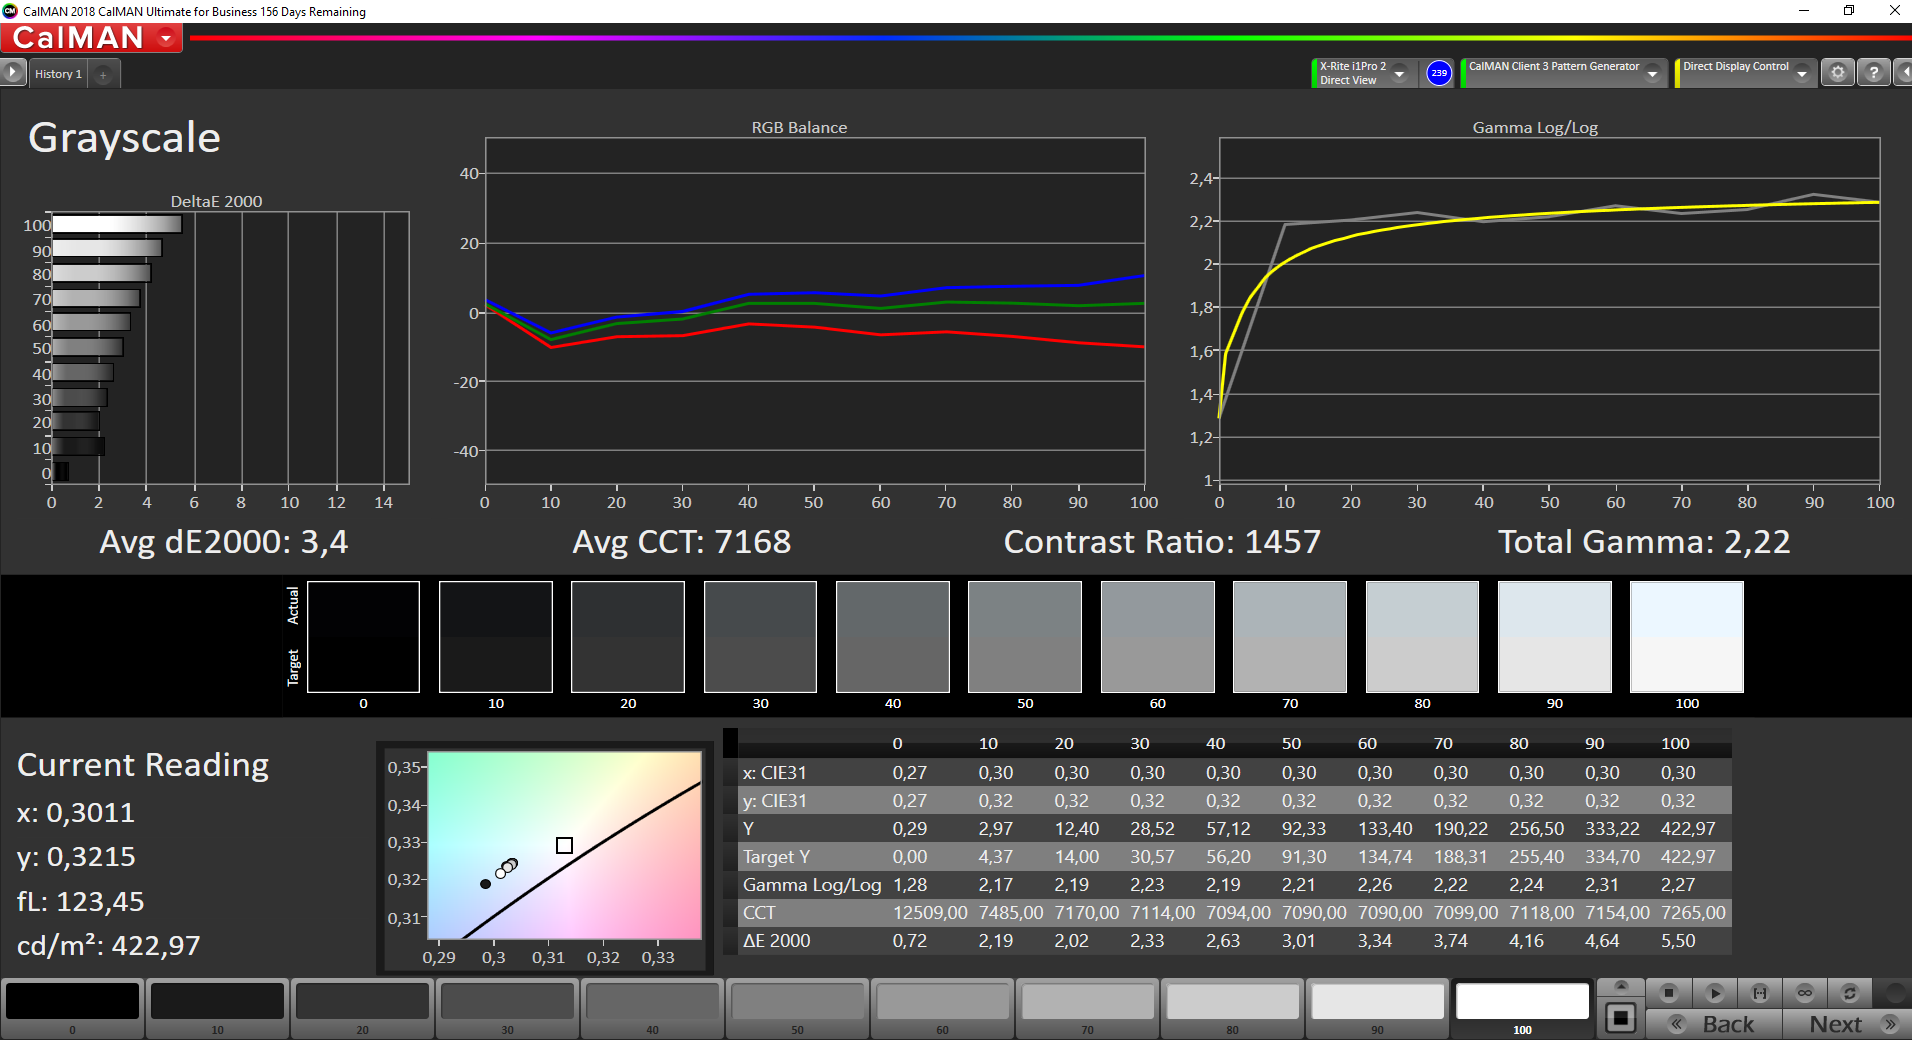
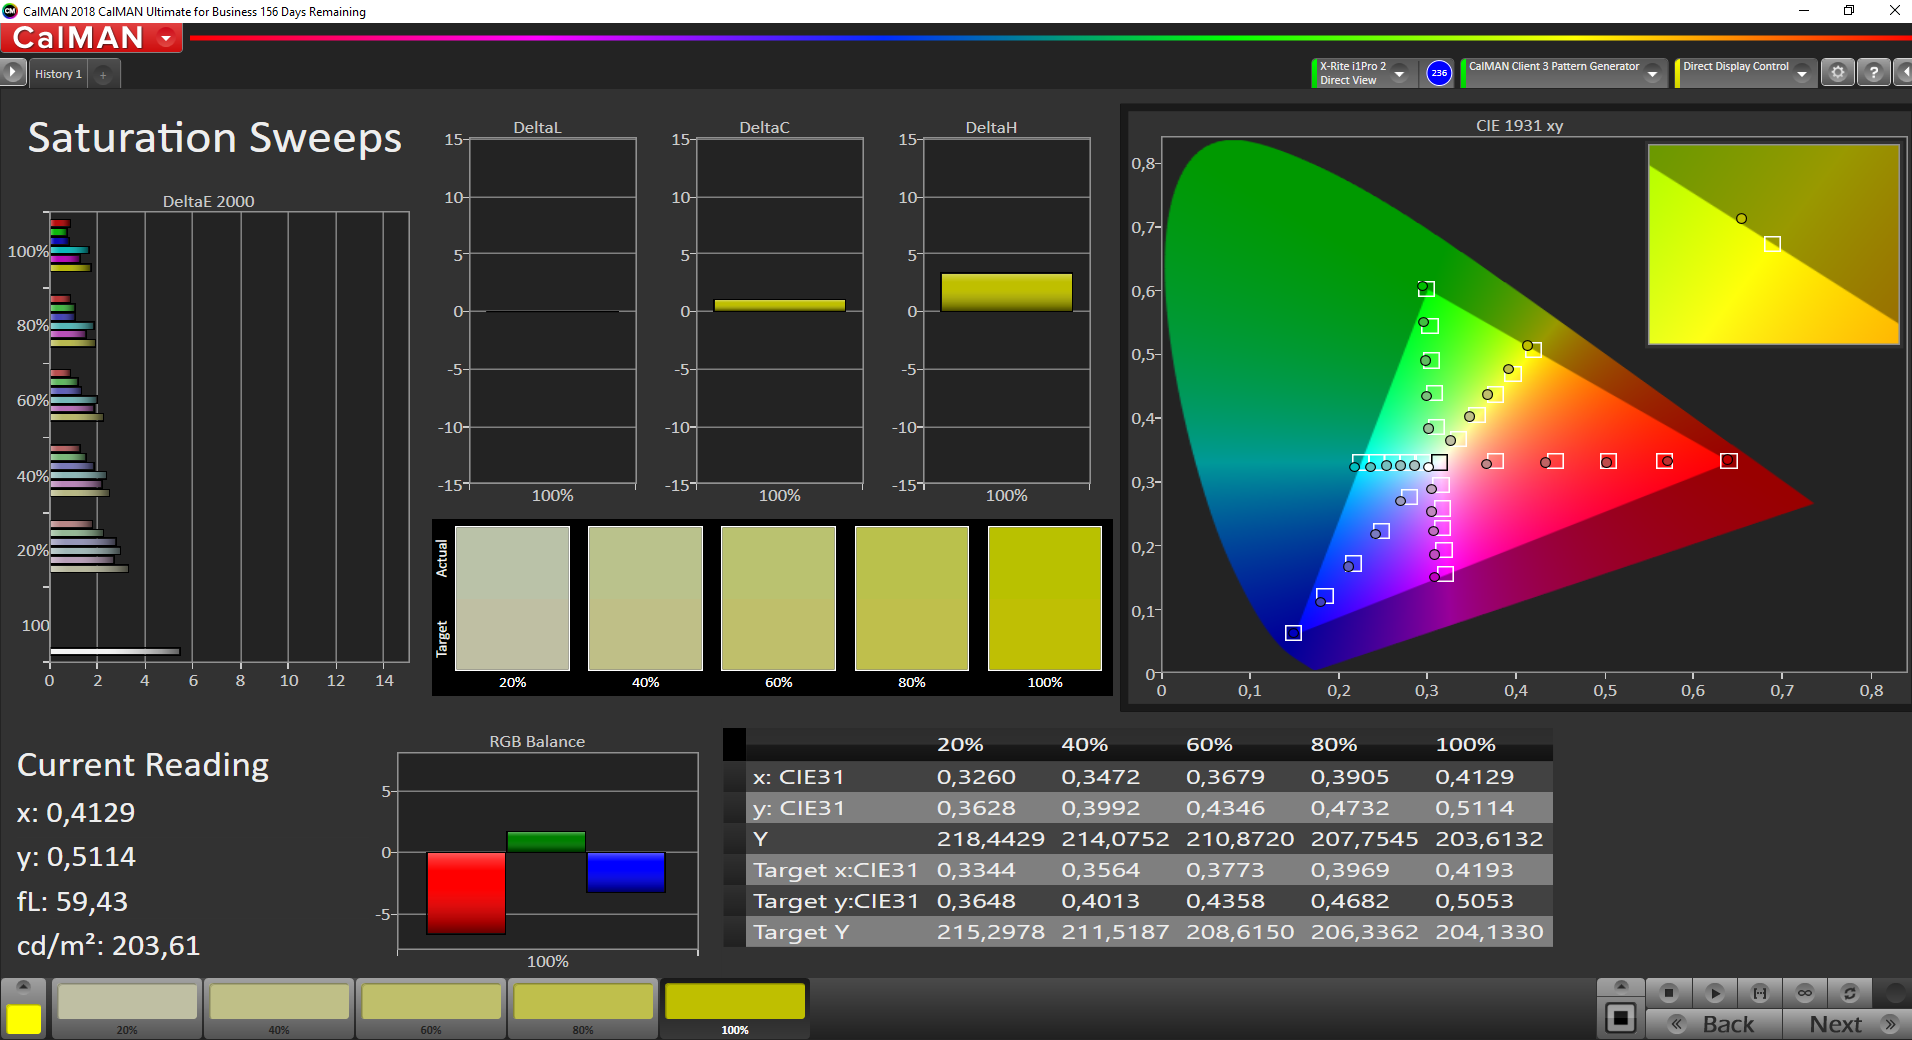
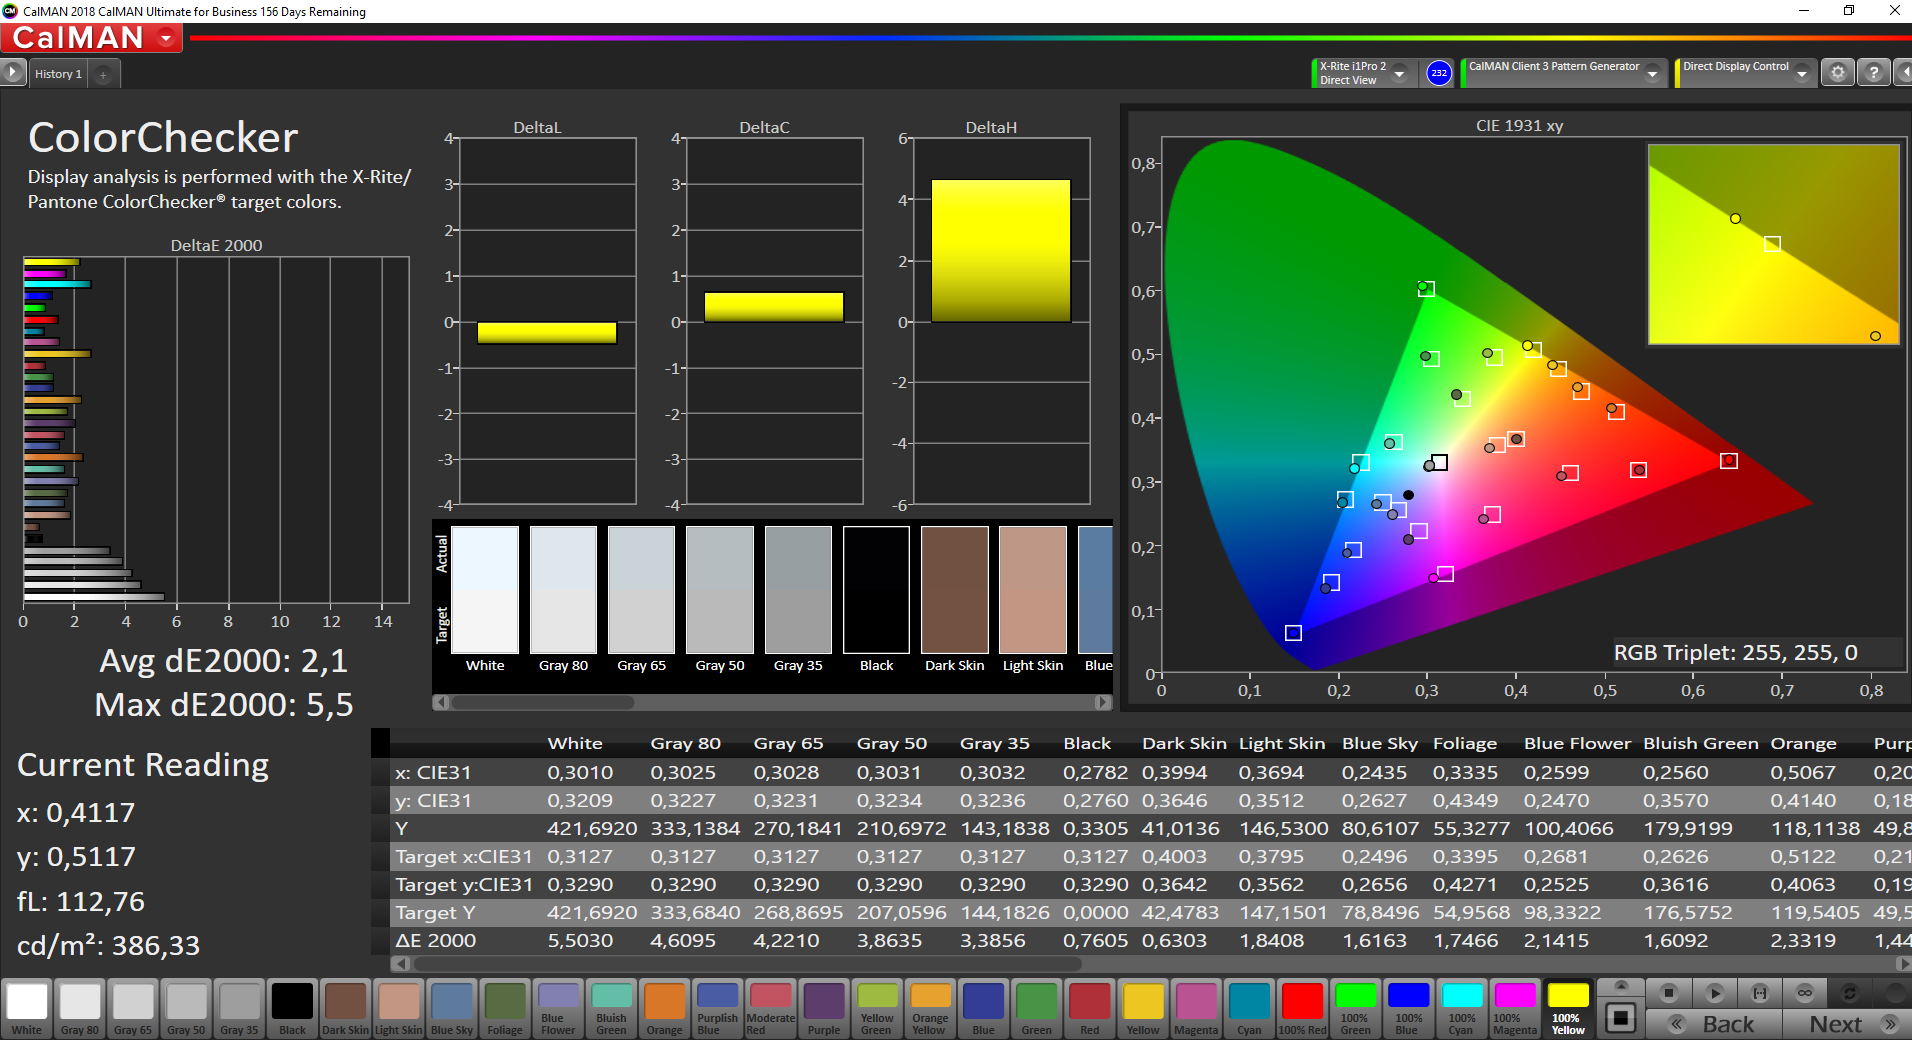
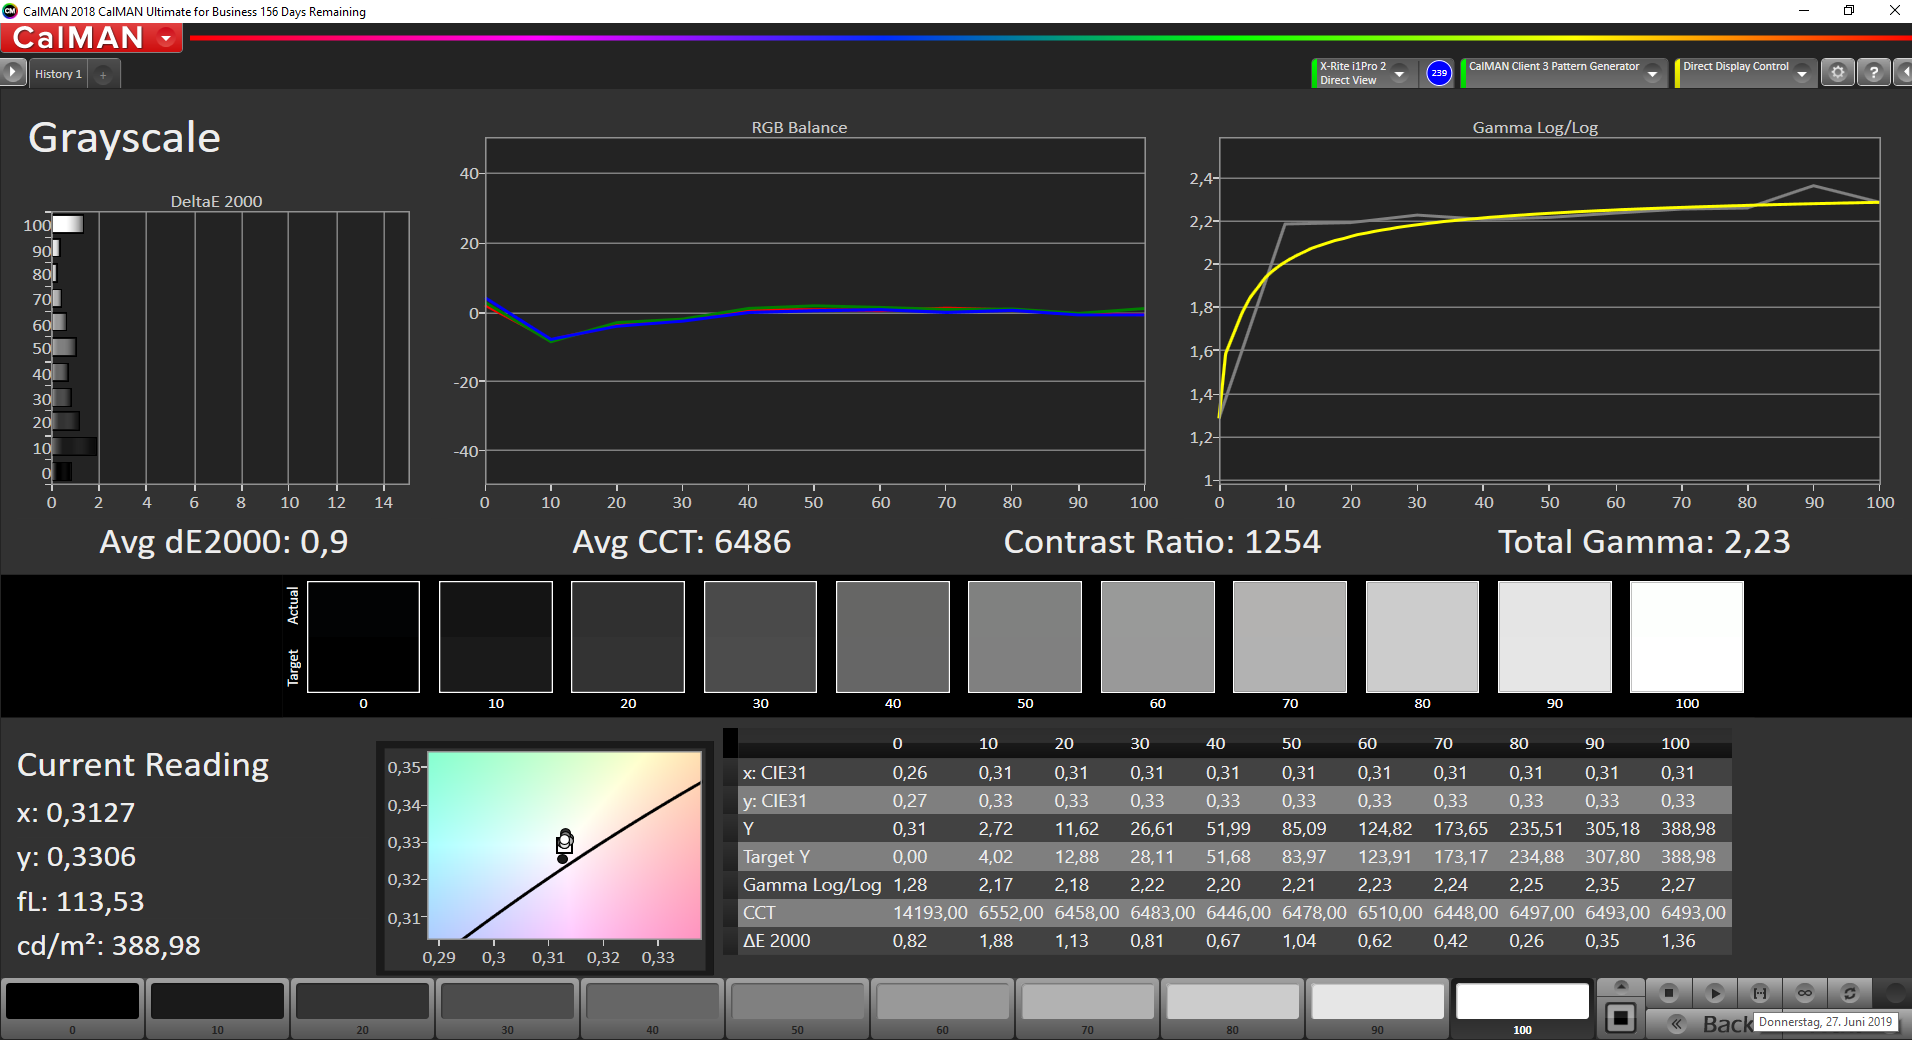
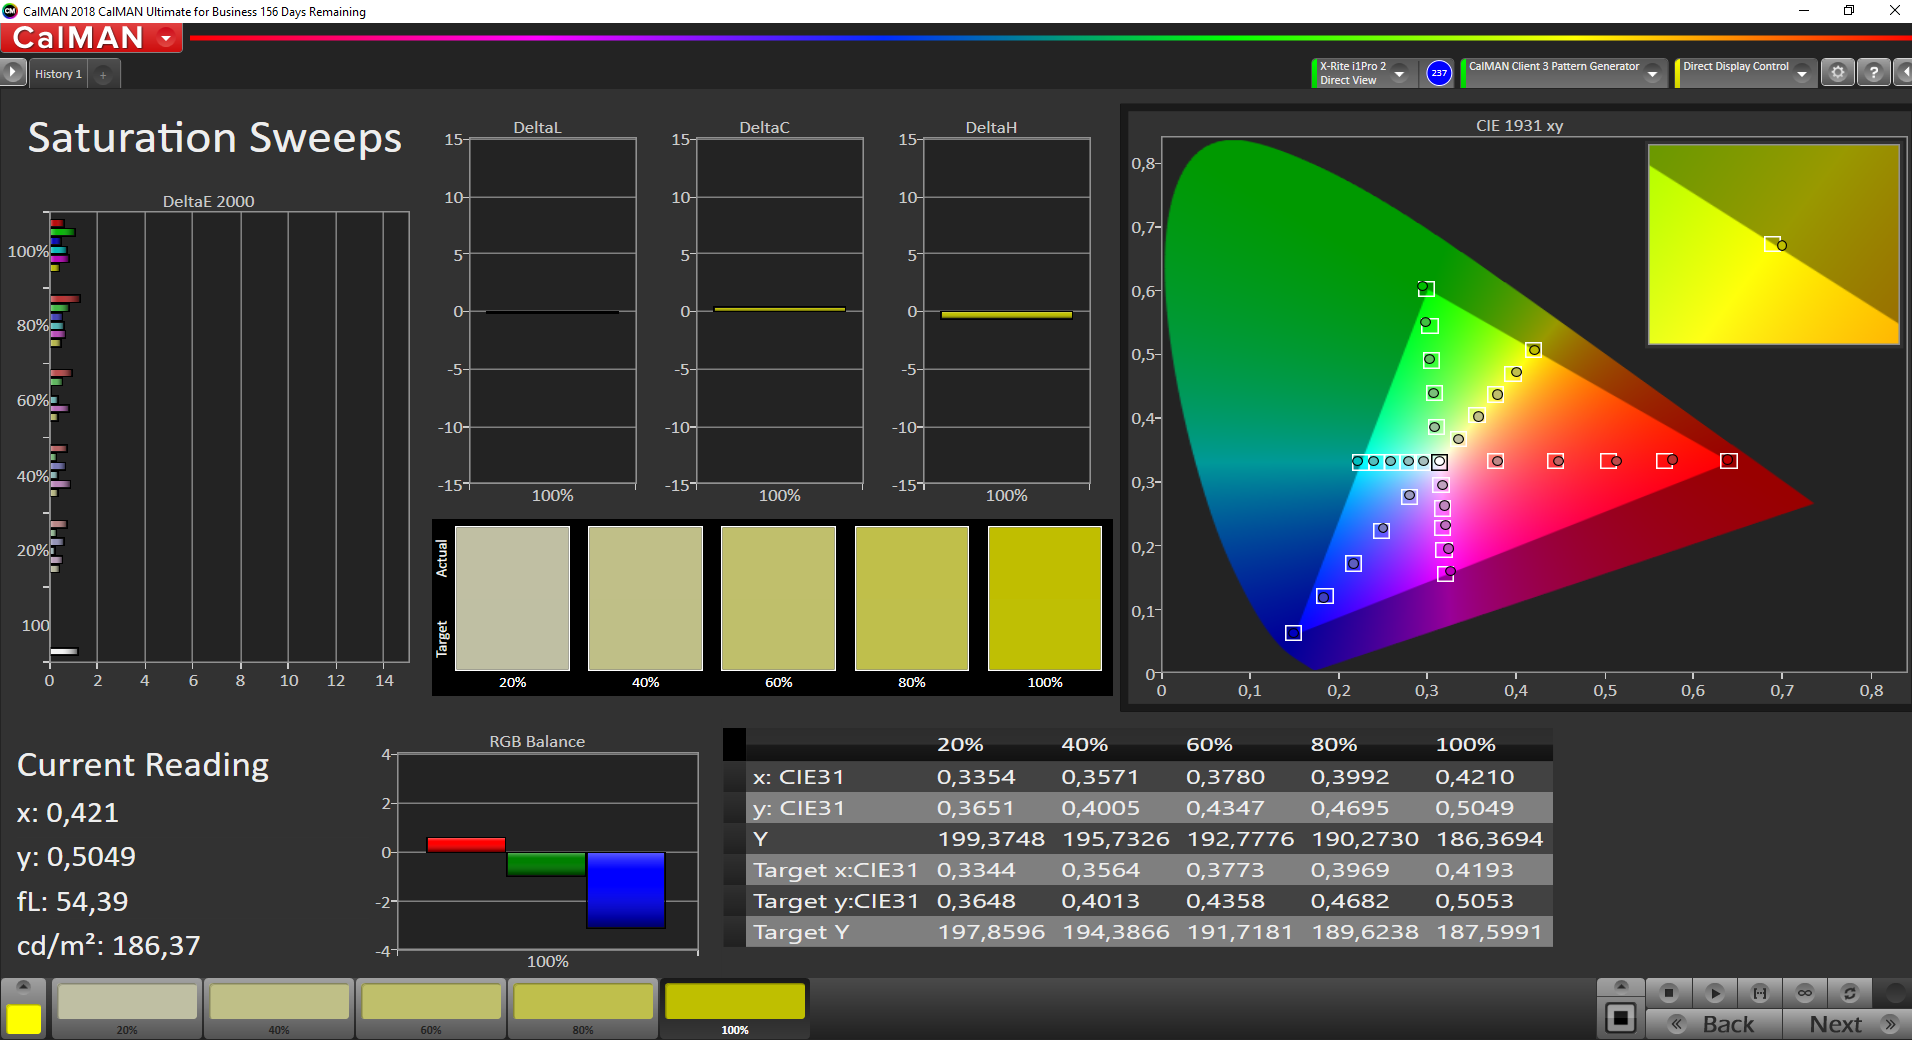
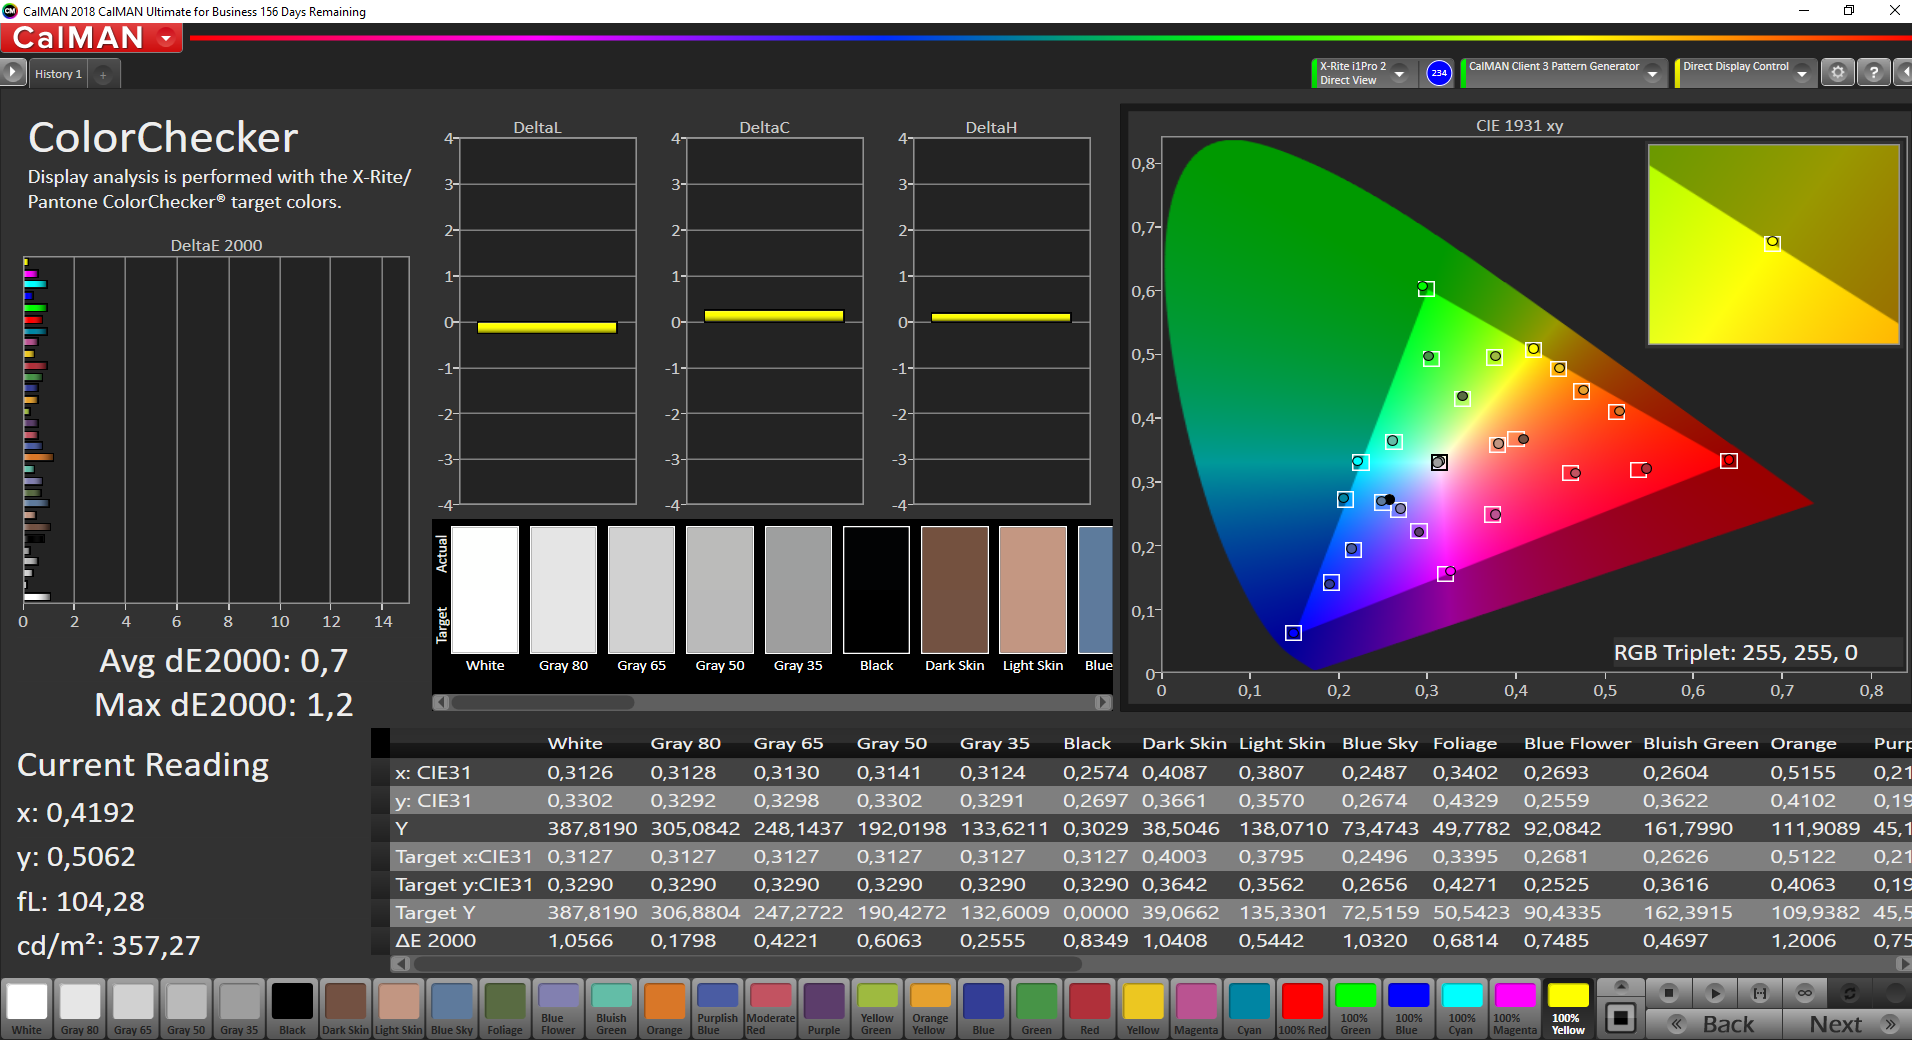
Color and grayscale accuracy were perfectly fine for a business laptop out of the box already. We were particularly surprised by the high color accuracy with all measurements reading less than 3, which is ideal. After calibration, we were able to achieve the same level of accuracy for grayscale, and were also able to improve upon the slightly increased color temperature.
Thanks to an almost complete coverage of sRGB the panel is well-suited for photo and video editing in the sRGB color space.
Display Response Times
| ↔ Response Time Black to White | ||
|---|---|---|
| 15.2 ms ... rise ↗ and fall ↘ combined | ↗ 6.8 ms rise | 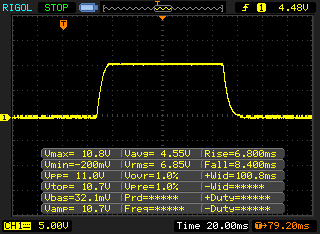 |
| ↘ 8.4 ms fall | ||
| The screen shows good response rates in our tests, but may be too slow for competitive gamers. In comparison, all tested devices range from 0.1 (minimum) to 240 (maximum) ms. » 37 % of all devices are better. This means that the measured response time is better than the average of all tested devices (19.8 ms). | ||
| ↔ Response Time 50% Grey to 80% Grey | ||
| 32.4 ms ... rise ↗ and fall ↘ combined | ↗ 16.4 ms rise | 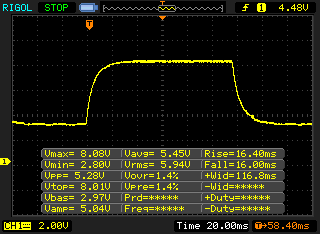 |
| ↘ 16 ms fall | ||
| The screen shows slow response rates in our tests and will be unsatisfactory for gamers. In comparison, all tested devices range from 0.165 (minimum) to 636 (maximum) ms. » 44 % of all devices are better. This means that the measured response time is similar to the average of all tested devices (30.9 ms). | ||
Screen Flickering / PWM (Pulse-Width Modulation)
| Screen flickering / PWM detected | 26040 Hz | ≤ 50 % brightness setting | 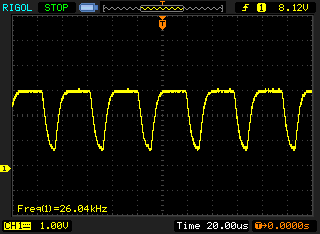 |
The display backlight flickers at 26040 Hz (worst case, e.g., utilizing PWM) Flickering detected at a brightness setting of 50 % and below. There should be no flickering or PWM above this brightness setting. The frequency of 26040 Hz is quite high, so most users sensitive to PWM should not notice any flickering. In comparison: 52 % of all tested devices do not use PWM to dim the display. If PWM was detected, an average of 7744 (minimum: 5 - maximum: 343500) Hz was measured. | |||
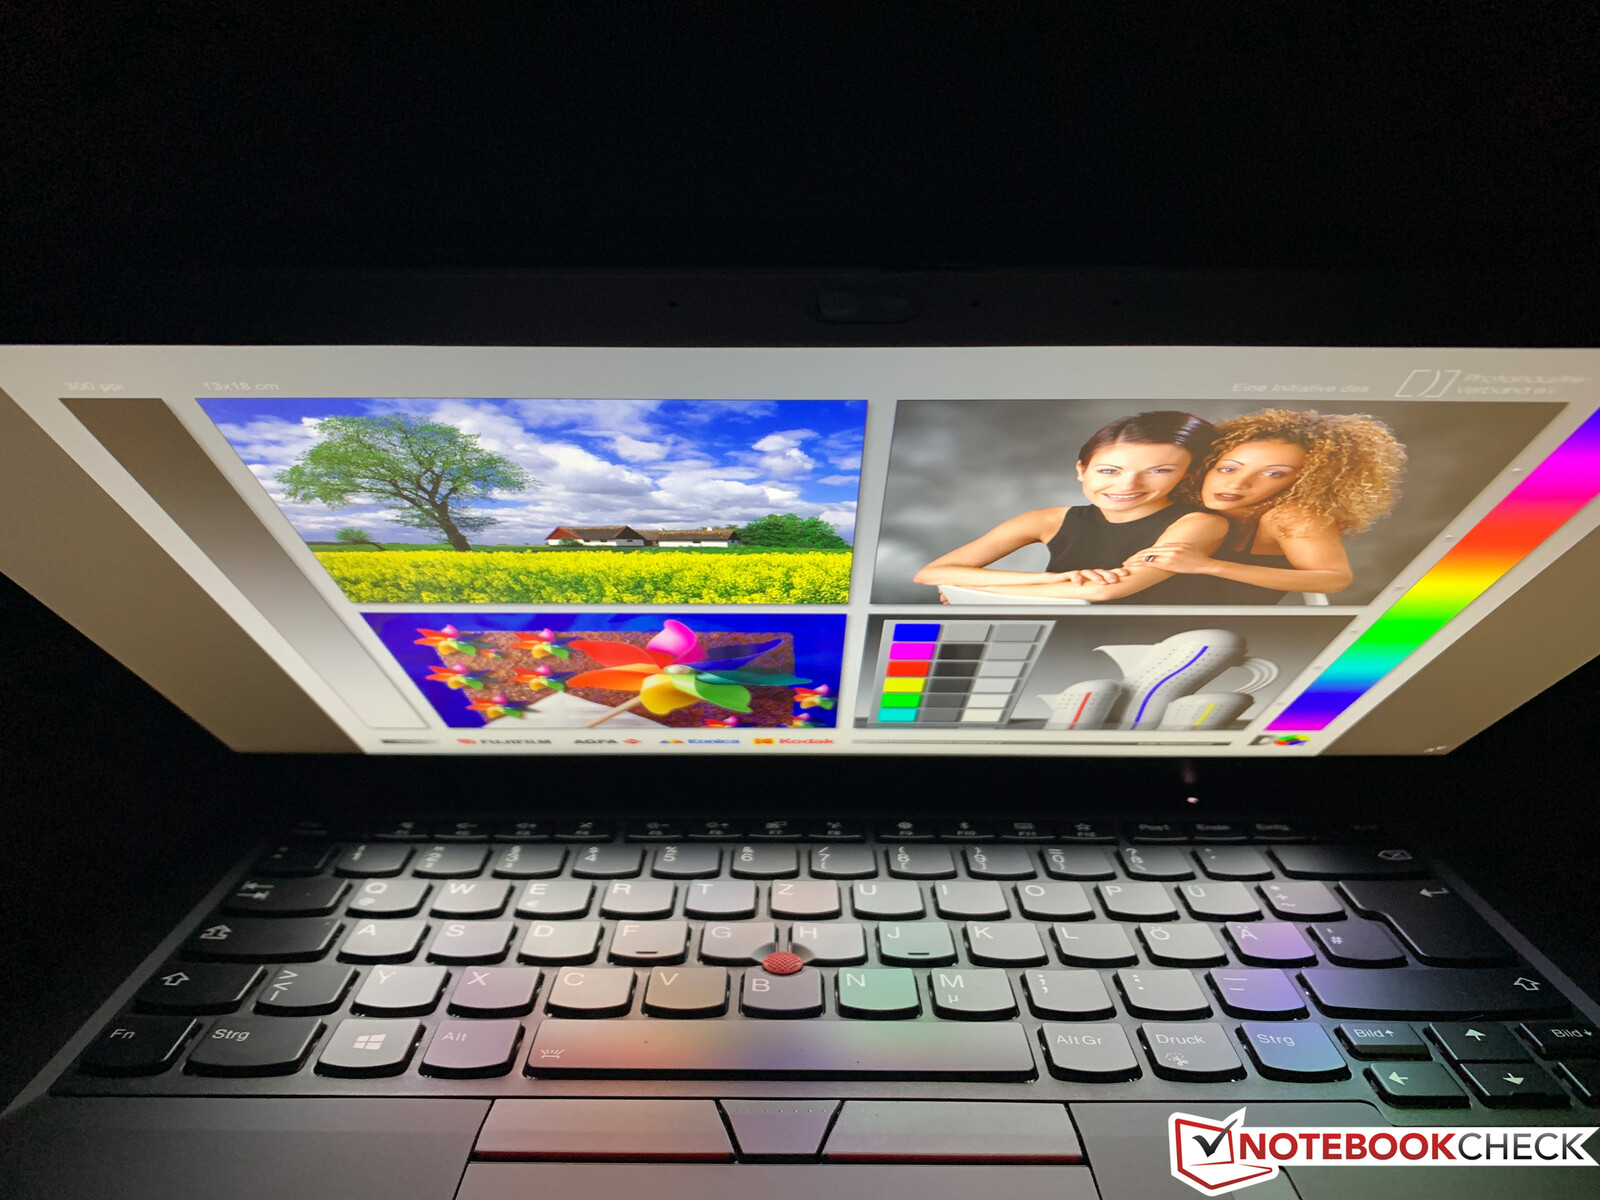
By default, brightness was slightly reduced on battery. However, this power saving feature can be disabled in AMD’s driver settings. Outdoors, the T495 benefitted from the bright panel combined with its matte coating. As long as you avoid direct sunlight the T495 will remain very well usable even in bright outdoor environments.
As expected of an IPS panel viewing angles were superb and very wide, and the image remained easily recognizable from all angles.
Performance
Processor
The ThinkPad T495 is available with AMD’s Ryzen Pro processors. Unlike the consumer series these support additional security and management features in the same way as Intel’s vPro processors. Our review unit was equipped with an AMD Ryzen 5 Pro 3500U with four cores (eight threads) running at up to 3.7 GHz. And while the Ryzen 5 Pro lags a bit behind Intel’s CPUs in both single and multi-core benchmarks it still offers more than enough oomph for a business laptop.
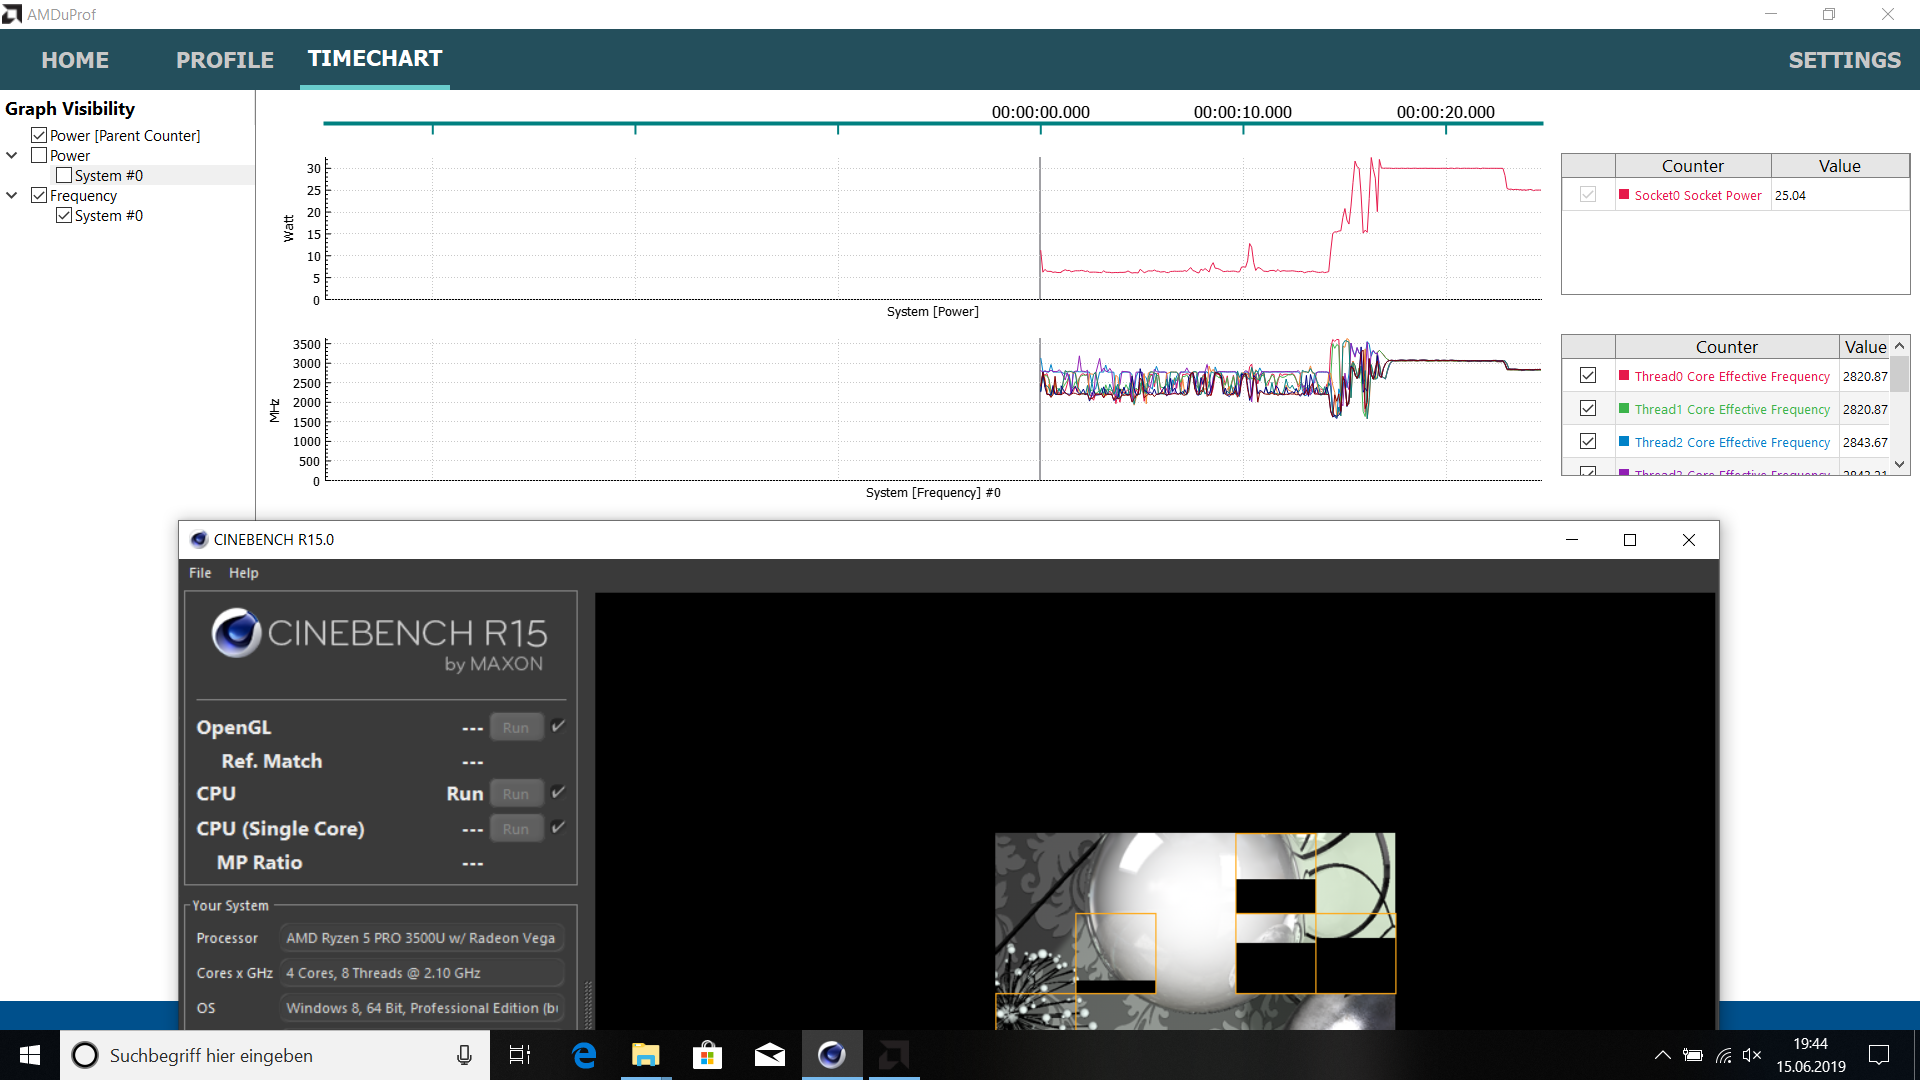
The ThinkPad T495’s thermal envelope is more or less identical to the ThinkPad T490’s. The processor can draw up to 30 W for short periods of time but no more than 25 W under sustained long-term load, and our CineBench R15 multi-thread test reflects these specs. The differences in the first four iterations of our CineBench loop are due to minor differences in the exact amount of time that the CPU is allowed to draw up to 30 W. At its long-term TDP level of 25 W the CPU ran at 4x 2.8-2.9 GHz, and was thus slightly slower than both the Core i7-8565U and Core i5-8265U-equipped T490. Compared to the older ThinkPad A485 the T495 is around 15% faster.
Full CPU performance is available on battery as well, however not immediately. CPU power consumption peaks at 16 W for a few seconds before rising to 30 W and eventually settling at 25 W.
To be honest we were pretty disappointed by these findings, especially when comparing them to the ThinkPad E495 with the Ryzen 5 3500U consumer-grade processor, and we were able to identify two culprits for the ThinkPad T495’s degraded performance. First of all, there seem to be quality differences between the two chips. We cannot say whether we received a particularly good copy of the Ryzen 5 or a particularly bad copy of the Ryzen 5 Pro but regardless, both devices were regular retail products that everybody could have ended up with. The same is obviously also true for Intel CPUs.
The Ryzen 5 3500U in aforementioned ThinkPad E495 ran at 4x 3.0-3.1 GHz while transforming 25 W of energy into heat. The T495’s Ryzen 5 Pro 3500U ran only at 4x 2.8-2.9 GHz. This may be due to yet another difference in the TDP configuration. In addition to short- and long-term power consumption AMD processors also use another thermal threshold called STAPM, which stands for “skin temperature aware power management”. This setting is supposed to prevent overly hot surface temperatures. Think of this as a big jar that keeps on filling up continuously under load until it reaches its specified limit. For the T495, this limit is set to 22 W and reached after the fourth run of CineBench R15 multi-thread. Only then does this STAPM limit take effect and throttle the CPU to 22 W. Now let us take a look at the ThinkPad E495. It, too, has a STAPM thermal limit. However, unlike the T495’s the E495’s is set to 25 W and thus coincides with the processor’s long-term TDP limit. Accordingly, we did not notice a sudden performance drop during our CineBench R15 multi-thread loop.
According to Lenovo, this all works as designed. The ThinkPad T495 is slightly thinner than the E495, and thus potentially less capable of cooling the CPU under load. This, in turn, begs the question why the Intel CPU in the T490 is allowed to consume a full 25 W of power...
System Performance
Subjectively, the Lenovo ThinkPad T495’s system performance was excellent, and we did not encounter any issues during our review period whatsoever. This is reflected in its great PCMark benchmark scores, where the T495 was only bested by the T490 with dedicated MX250 GPU.
| PCMark 8 Home Score Accelerated v2 | 4072 points | |
| PCMark 8 Creative Score Accelerated v2 | 4947 points | |
| PCMark 8 Work Score Accelerated v2 | 4880 points | |
| PCMark 10 Score | 3818 points | |
Help | ||
Storage Devices
Our ThinkPad T495 review unit was equipped with a 512 GB Samsung P981 NVMe SSD, which performed exceptionally well in our benchmarks. As mentioned before Lenovo sources its storage devices from various manufacturers, and there is no way of knowing which one you are going to end up with. A secondary M.2-2242 slot can be used for either an additional SSD or a WWAN modem. It is connected to the system bus via PCIe x2. Further benchmarks can be found here.
| Lenovo ThinkPad T495-20NKS01Y00 Samsung SSD PM981 MZVLB512HAJQ | Lenovo ThinkPad T490-20N3S02L00 Toshiba XG5 KXG50ZNV512G | Lenovo ThinkPad A485-20MU000CGE Samsung SSD PM981 MZVLB256HAHQ | Dell Latitude 7490 Toshiba KSG60ZMV256G | HP EliteBook 745 G5 3UN74EA Toshiba XG5 KXG50ZNV256G | |
|---|---|---|---|---|---|
| CrystalDiskMark 5.2 / 6 | -12% | -33% | -61% | -34% | |
| Write 4K (MB/s) | 137.7 | 126.6 -8% | 114.8 -17% | 79.4 -42% | 119.5 -13% |
| Read 4K (MB/s) | 44.11 | 43.61 -1% | 41.33 -6% | 27.37 -38% | 31.9 -28% |
| Write Seq (MB/s) | 2714 | 1342 -51% | 1271 -53% | 343.9 -87% | 351.1 -87% |
| Read Seq (MB/s) | 2665 | 1251 -53% | 1171 -56% | 472.7 -82% | 1665 -38% |
| Write 4K Q32T1 (MB/s) | 251.2 | 297.7 19% | 218.4 -13% | 206 -18% | 268.4 7% |
| Read 4K Q32T1 (MB/s) | 336.6 | 376.4 12% | 308.5 -8% | 188.3 -44% | 333.1 -1% |
| Write Seq Q32T1 (MB/s) | 2994 | 2969 -1% | 1460 -51% | 343.3 -89% | 351.8 -88% |
| Read Seq Q32T1 (MB/s) | 3547 | 3228 -9% | 1529 -57% | 533 -85% | 2705 -24% |
| Write 4K Q8T8 (MB/s) | 1246 | 1208 | 356 | ||
| Read 4K Q8T8 (MB/s) | 1397 | 983 | 453.2 | ||
| AS SSD | 5% | -51% | -74% | -79% | |
| Seq Read (MB/s) | 2661 | 2571 -3% | 1224 -54% | 486.2 -82% | 1682 -37% |
| Seq Write (MB/s) | 2330 | 2294 -2% | 1118 -52% | 294.9 -87% | 189 -92% |
| 4K Read (MB/s) | 48.28 | 52.8 9% | 42.46 -12% | 26.66 -45% | 26.77 -45% |
| 4K Write (MB/s) | 94.7 | 154.1 63% | 77.4 -18% | 79.2 -16% | 85.3 -10% |
| 4K-64 Read (MB/s) | 1475 | 1464 -1% | 559 -62% | 316.1 -79% | 420.5 -71% |
| 4K-64 Write (MB/s) | 1494 | 1350 -10% | 378.1 -75% | 248.1 -83% | 321.5 -78% |
| Access Time Read * (ms) | 0.046 | 0.061 -33% | 0.081 -76% | 0.112 -143% | 0.172 -274% |
| Access Time Write * (ms) | 0.041 | 0.026 37% | 0.049 -20% | 0.056 -37% | 0.061 -49% |
| Score Read (Points) | 1790 | 1773 -1% | 724 -60% | 391 -78% | 615 -66% |
| Score Write (Points) | 1822 | 1733 -5% | 567 -69% | 357 -80% | 426 -77% |
| Score Total (Points) | 4514 | 4406 -2% | 1669 -63% | 947 -79% | 1288 -71% |
| Copy ISO MB/s (MB/s) | 1963 | 812 | 282.5 | ||
| Copy Program MB/s (MB/s) | 440.5 | 209.4 | 212.2 | ||
| Copy Game MB/s (MB/s) | 1173 | 356.1 | 302.9 | ||
| Total Average (Program / Settings) | -4% /
-2% | -42% /
-43% | -68% /
-68% | -57% /
-60% |
* ... smaller is better

GPU Performance
All things graphics are handled by an AMD Radeon Vega 8 GPU. It is highly dependent on system RAM performance, which can be seen very clearly in our benchmarks. The T495’s Vega 8 with access to dual-channel RAM actually outperformed the nominally faster Vega 10 in the ThinkPad E595 with access to single-channel RAM only. If you end up purchasing a T495 with a single RAM module running in single-channel mode you can always add a second module. More details about AMD’s Vega 8 can be found here.
Performance-wise, the T495’s Vega 8 sits in-between the UHD Graphics 620-powered T490 and the GeForce MX250-powered T490.
Our 3DMark Fire Strike stress test is completed without any issues at 99%, which means that performance does not degrade after long periods of sustained load. Just like the CPU the GPU is also throttled slightly on battery (3,535 vs. 2,843 points in 3DMark 11 Graphics). More benchmarks can be found hMobile Graphics Cards - Benchmark List.
| 3DMark 11 Performance | 3670 points | |
| 3DMark Ice Storm Standard Score | 76723 points | |
| 3DMark Cloud Gate Standard Score | 12398 points | |
| 3DMark Fire Strike Score | 2141 points | |
| 3DMark Time Spy Score | 779 points | |
Help | ||
Gaming Performance
As expected, gaming performance was somewhere between the Intel-equipped T490 with iGPU and the Intel-equipped T490 with MX250. AMD’s Vega 8 is great for older and less demanding games. Keep in mind that unlike the T490 the T495 does not support Thunderbolt 3, and does thus not support eGPUs. Further gaming benchmarks for AMD’s Vega 8 can be found here.
| BioShock Infinite | |
| 1920x1080 Ultra Preset, DX11 (DDOF) | |
| Lenovo ThinkPad T490-20N3S02L00 | |
| Lenovo ThinkPad T495-20NKS01Y00 | |
| 1366x768 High Preset | |
| Lenovo ThinkPad T490-20N3S02L00 | |
| Lenovo ThinkPad T495-20NKS01Y00 | |
| Lenovo ThinkPad T490-20N2004EGE | |
| 1366x768 Medium Preset | |
| Lenovo ThinkPad T490-20N3S02L00 | |
| Lenovo ThinkPad T495-20NKS01Y00 | |
| Lenovo ThinkPad T490-20N2004EGE | |
| 1280x720 Very Low Preset | |
| Lenovo ThinkPad T490-20N3S02L00 | |
| Lenovo ThinkPad T495-20NKS01Y00 | |
| Lenovo ThinkPad T490-20N2004EGE | |
| low | med. | high | ultra | |
|---|---|---|---|---|
| BioShock Infinite (2013) | 107.1 | 70.8 | 59.3 | 19.7 |
| Dota 2 Reborn (2015) | 69 | 64 | 38 | 35.2 |
| X-Plane 11.11 (2018) | 26.8 | 19.9 | 18.6 |
Emissions
System Noise
The flip side of lower performance and slightly elevated temperatures is a quiet and seldom running fan. Even under load it never manages to emit more than an inconspicuous and quiet hum. Even better, it can take several minutes of low to medium load to even trigger the fan to start spinning in the first place. The result is a very quiet and often completely silent office notebook. We found no evidence of coil whine or other electrical noise whatsoever.
Noise level
| Idle |
| 28.4 / 28.4 / 29.4 dB(A) |
| Load |
| 29.9 / 31.4 dB(A) |
 | ||
30 dB silent 40 dB(A) audible 50 dB(A) loud |
||
min: | ||
Temperature
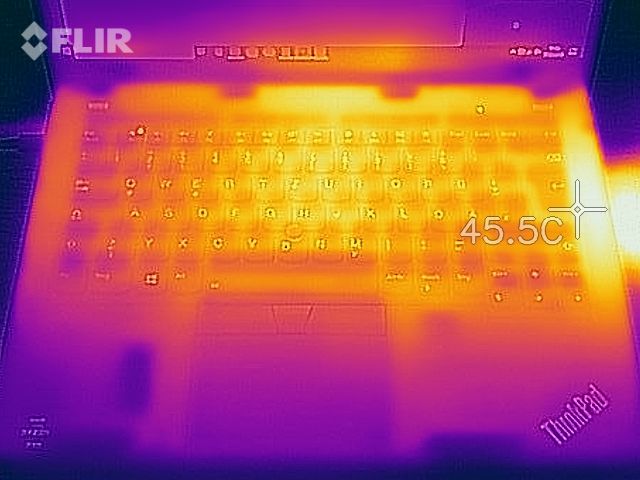
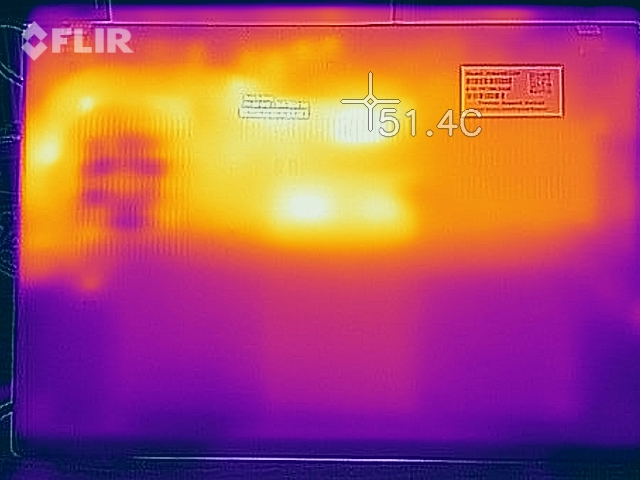
Overall temperatures remained far from critical. When idle, the device remained cool and unnoticeable. Under load, we found no more than two hotspots with more than 47 °C (116.6 °F). Nevertheless, we would not advise anyone to use this laptop on their lap under load. Compared with the ThinkPad T490 the AMD-powered T495 does get a little bit warmer than the T490 with iGPU but nowhere near as hot as the T490 with dedicated GeForce MX250 GPU.
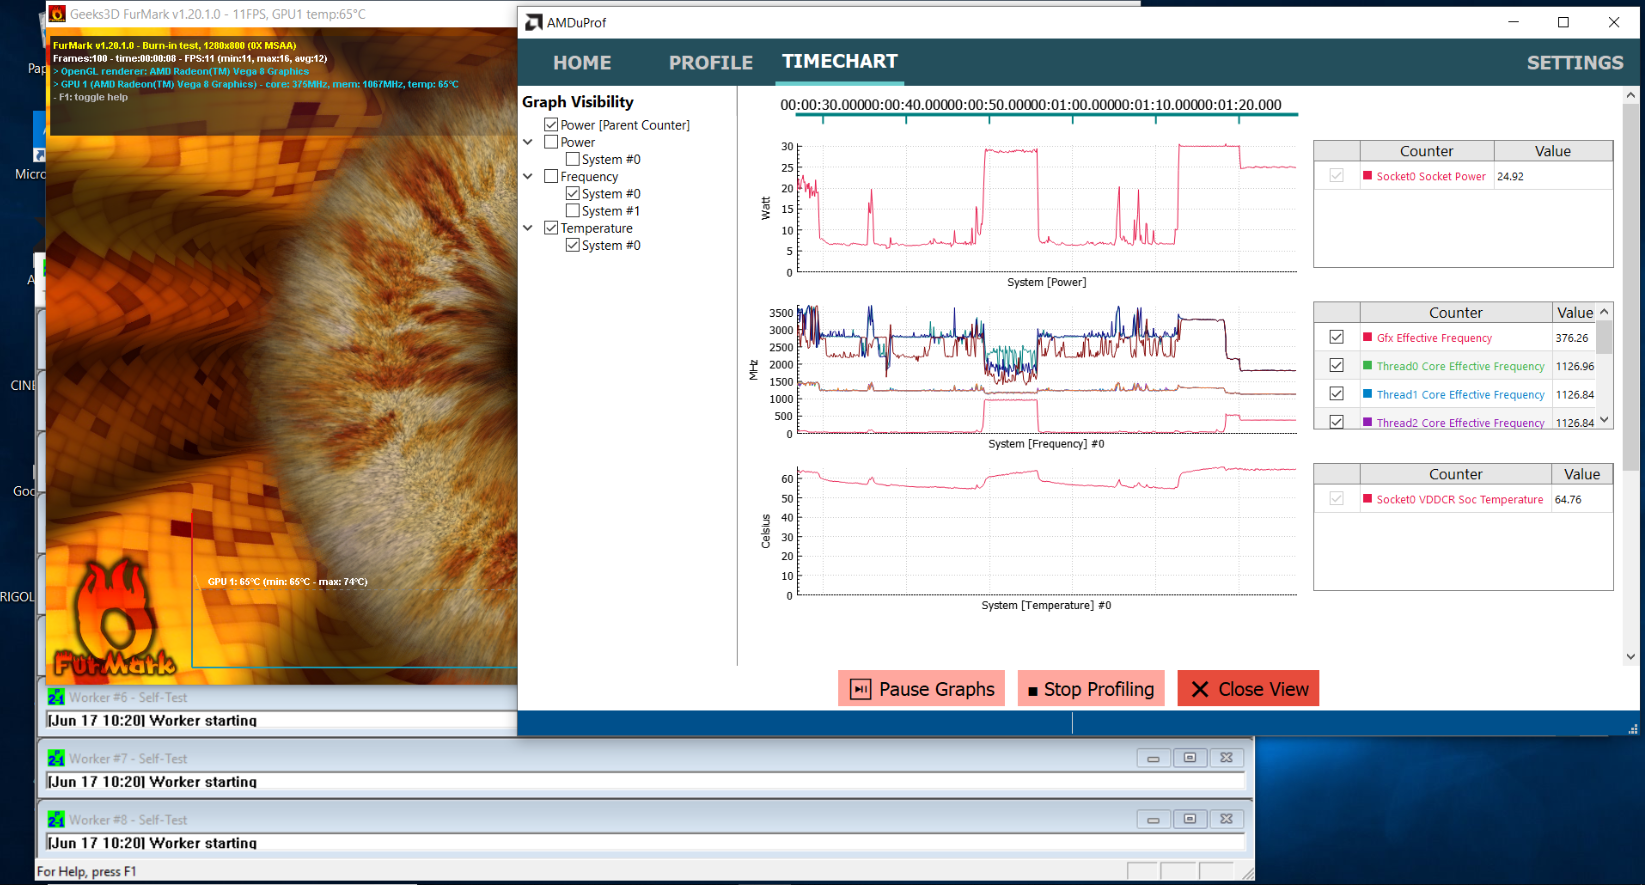
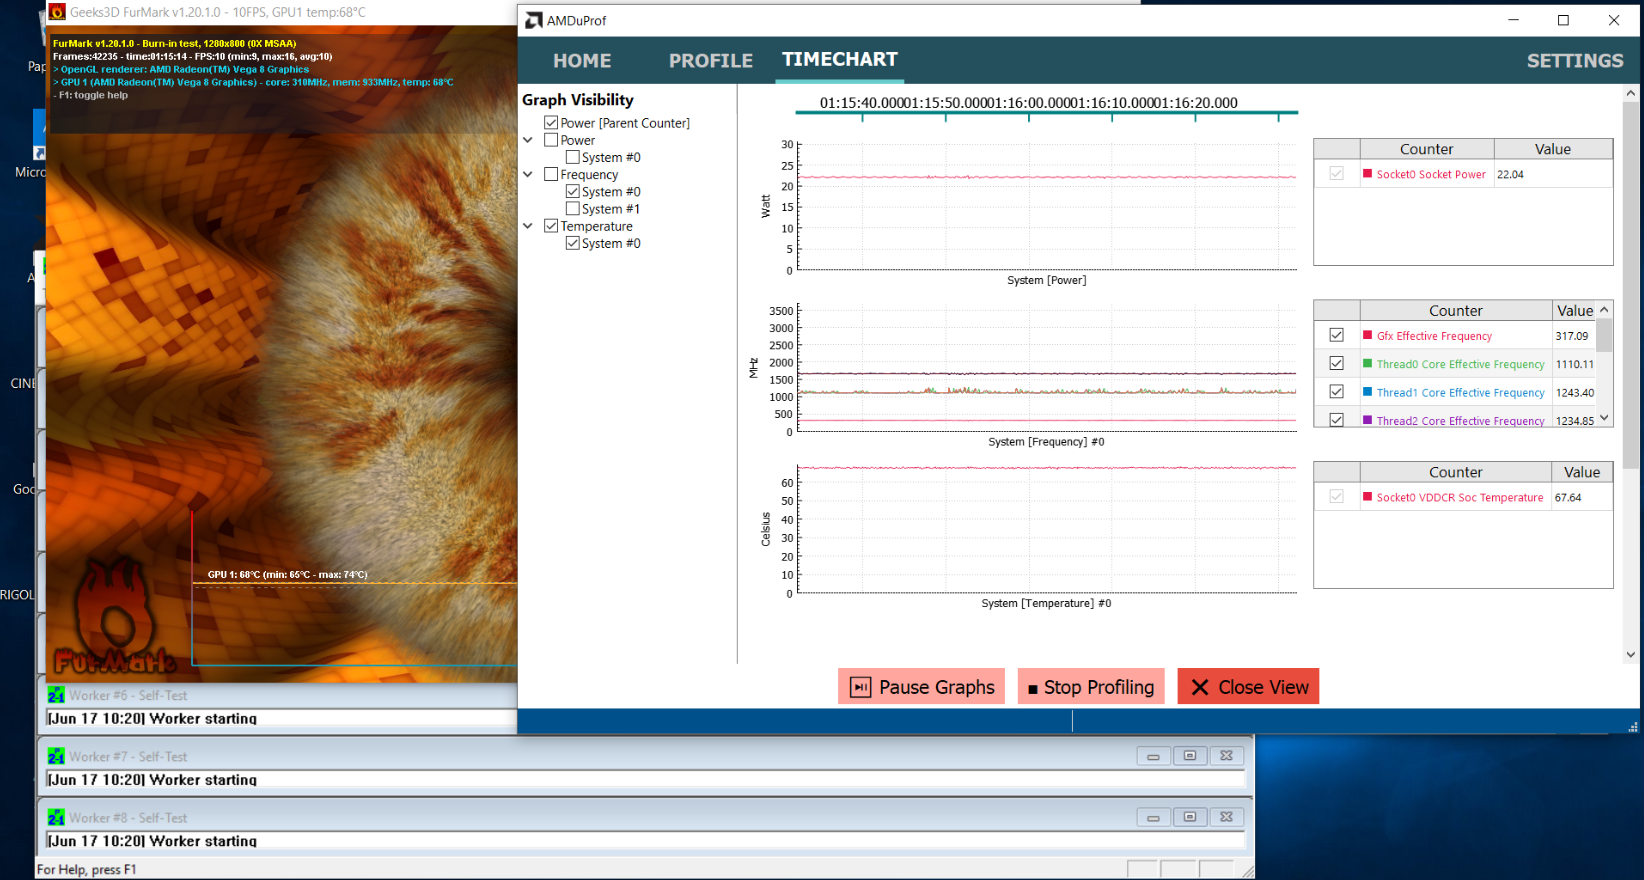
The results of our stress test are reflective of those obtained during our CPU benchmarks. After an initial drop to 25 W we see another decrease to just 22 W. Since these 22 W are shared between CPU and GPU clock speeds are comparatively low, accordingly. The CPU runs at 1.1-1.3 GHz, and the GPU at just 320 MHz.
(±) The maximum temperature on the upper side is 43.9 °C / 111 F, compared to the average of 34.3 °C / 94 F, ranging from 21.2 to 62.5 °C for the class Office.
(-) The bottom heats up to a maximum of 49.6 °C / 121 F, compared to the average of 36.8 °C / 98 F
(+) In idle usage, the average temperature for the upper side is 25.9 °C / 79 F, compared to the device average of 29.5 °C / 85 F.
(+) The palmrests and touchpad are reaching skin temperature as a maximum (32 °C / 89.6 F) and are therefore not hot.
(-) The average temperature of the palmrest area of similar devices was 27.6 °C / 81.7 F (-4.4 °C / -7.9 F).
Energy Management
Power Consumption
When idle, AMD’s SoC requires a little bit more energy than Intel’s equivalent. However, we can clearly see the benefits of the LowPower 1080p panel when comparing the T495’s power consumption to that of the ThinkPad A485. Despite the latter’s significantly dimmer display its power consumption was actually noticeably higher.
Power consumption during our stress test reflected that of the CPU alone. After an initial 43.2 W (30 W TDP) it drops to 37 W (25 W TDP) for a few minutes, and eventually settles at 34 W (22 W TDP). The 345 g (0.75 lbs) power supply is rated at 65 W, and is thus more than sufficiently dimensioned.
| Off / Standby | |
| Idle | |
| Load |
|
Key:
min: | |
| Lenovo ThinkPad T495-20NKS01Y00 R5 PRO 3500U, Vega 8, Samsung SSD PM981 MZVLB512HAJQ, IPS, 1920x1080, 14" | Lenovo ThinkPad T490-20N3S02L00 i7-8565U, GeForce MX250, Toshiba XG5 KXG50ZNV512G, IGZO IPS LED, 1920x1080, 14" | Lenovo ThinkPad T490-20N2004EGE i5-8265U, UHD Graphics 620, Toshiba KXG5AZNV256G, IGZO IPS LED, 1920x1080, 14" | Lenovo ThinkPad A485-20MU000CGE R5 PRO 2500U, Vega 8, Samsung SSD PM981 MZVLB256HAHQ, IPS LED, 1920x1080, 14" | Dell Latitude 7490 i5-8350U, UHD Graphics 620, Toshiba KSG60ZMV256G, IPS, 1920x1080, 14" | HP EliteBook 745 G5 3UN74EA R7 2700U, Vega 10, Toshiba XG5 KXG50ZNV256G, IPS LED, 1920x1080, 14" | Average AMD Radeon RX Vega 8 (Ryzen 2000/3000) | Average of class Office | |
|---|---|---|---|---|---|---|---|---|
| Power Consumption | -4% | 19% | -10% | 30% | 2% | -6% | -6% | |
| Idle Minimum * (Watt) | 5.1 | 2.16 58% | 2.34 54% | 5.3 -4% | 2 61% | 4.9 4% | 5.68 ? -11% | 4.25 ? 17% |
| Idle Average * (Watt) | 7.7 | 5.04 35% | 5.22 32% | 8.3 -8% | 4.7 39% | 8.1 -5% | 8.75 ? -14% | 7.3 ? 5% |
| Idle Maximum * (Watt) | 10.7 | 8.64 19% | 8.82 18% | 11.4 -7% | 5.7 47% | 10.6 1% | 10.1 ? 6% | 8.57 ? 20% |
| Load Average * (Watt) | 35.8 | 63.2 -77% | 35.8 -0% | 42 -17% | 38.4 -7% | 32.2 10% | 37.8 ? -6% | 43.8 ? -22% |
| Load Maximum * (Watt) | 43.2 | 67.5 -56% | 47.3 -9% | 48.8 -13% | 38.9 10% | 42.3 2% | 46.2 ? -7% | 64.5 ? -49% |
| Witcher 3 ultra * (Watt) | 50 |
* ... smaller is better
Battery Life
Previously, AMD laptops very often suffered from very poor battery life when compared to their Intel-equipped siblings. However, the ThinkPad T495 is finally different, and not only ran comparably long to its Intel-sibling in our Wi-Fi test but even managed to outlast the T490 in our video test with up to 12 hours of battery life. At maximum brightness, battery life in the Wi-Fi test dropped from 9 to 7:20 hours, which is once again similar to the T490’s results.
| Lenovo ThinkPad T495-20NKS01Y00 R5 PRO 3500U, Vega 8, 50 Wh | Lenovo ThinkPad T490-20N3S02L00 i7-8565U, GeForce MX250, 50 Wh | Lenovo ThinkPad T490-20N2004EGE i5-8265U, UHD Graphics 620, 50 Wh | Lenovo ThinkPad A485-20MU000CGE R5 PRO 2500U, Vega 8, 48 Wh | Dell Latitude 7490 i5-8350U, UHD Graphics 620, 60 Wh | HP EliteBook 745 G5 3UN74EA R7 2700U, Vega 10, 50 Wh | Average of class Office | |
|---|---|---|---|---|---|---|---|
| Battery runtime | -17% | 20% | -41% | 0% | -24% | 27% | |
| H.264 (h) | 11.8 | 8.7 -26% | 11.3 -4% | 6.1 -48% | 7.1 -40% | 15.4 ? 31% | |
| WiFi v1.3 (h) | 9.1 | 9.1 0% | 9.5 4% | 5.5 -40% | 9.1 0% | 6.6 -27% | 13.2 ? 45% |
| Load (h) | 1.7 | 1.3 -24% | 2.7 59% | 1.1 -35% | 1.6 -6% | 1.808 ? 6% |
Pros
Cons
Verdict
The ThinkPad T495 is Lenovo’s first AMD-equipped business notebook. Unlike the A-series, it does not come with a huge set of compromises when compared to its Intel-siblings. Case and display are identical, save for the lack of the WQHD HDR option, and battery life is finally on a par as well.
The only real downside is the lack of Thunderbolt 3 and a slightly reduced overall CPU performance. Unfortunately, the latter seems to be an artificial restriction imposed by the manufacturer, especially considering that the Intel-equipped T490 is allowed to consume more energy. Nevertheless, the T495’s quad-core remains powerful and fast enough, especially for an office laptop.
Great display, long battery life, and good performance. Given its lower price, the ThinkPad T495 is a great alternative to the Intel-equipped ThinkPad T490. The only real downside is the missing Thunderbolt 3 port. Whether or not this is important to you depends on how you intend to use it, but it is definitely not a must-have for an office laptop.
We also very much liked the LowPower FHD display. With its bright high-contrast panel and its high ex-factory color accuracy it is very well suited for photo editing in the sRGB color space. We also consider FHD to be a sufficiently high resolution for a 14-inch panel, and it helps minimizing scaling issues.
Overall, we have to admit that the ThinkPad T495 is the better T490, especially considering its lower price.
Please note that we have recently updated our scoring system, see here for details. With the new V7 scoring system the ThinkPad T495 scored 89%. With the old V6 scoring system it would have scored 90%.
Lenovo ThinkPad T495-20NKS01Y00
- 09/12/2019 v7 (old)
Andreas Osthoff
Price comparison

