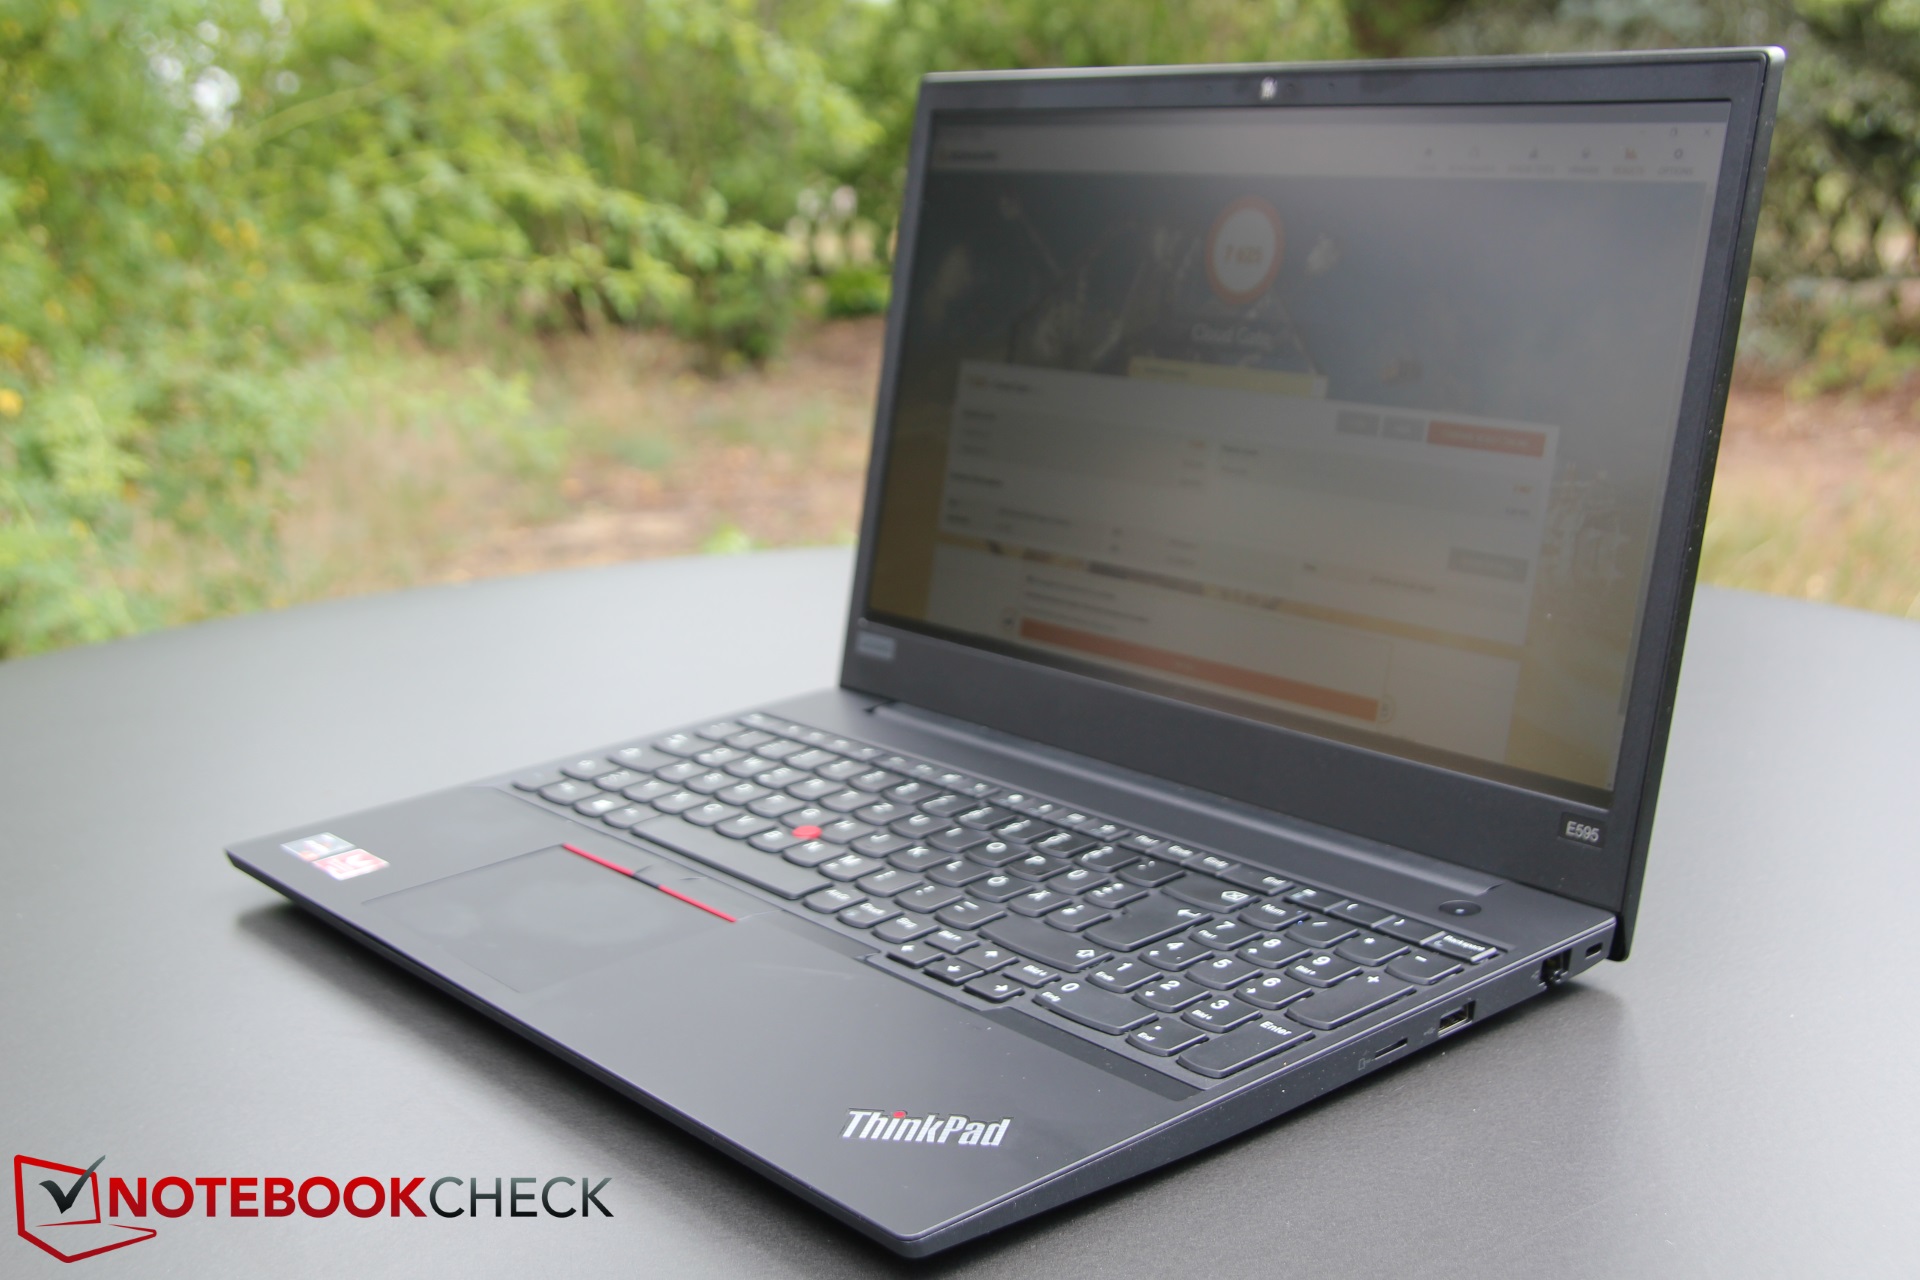
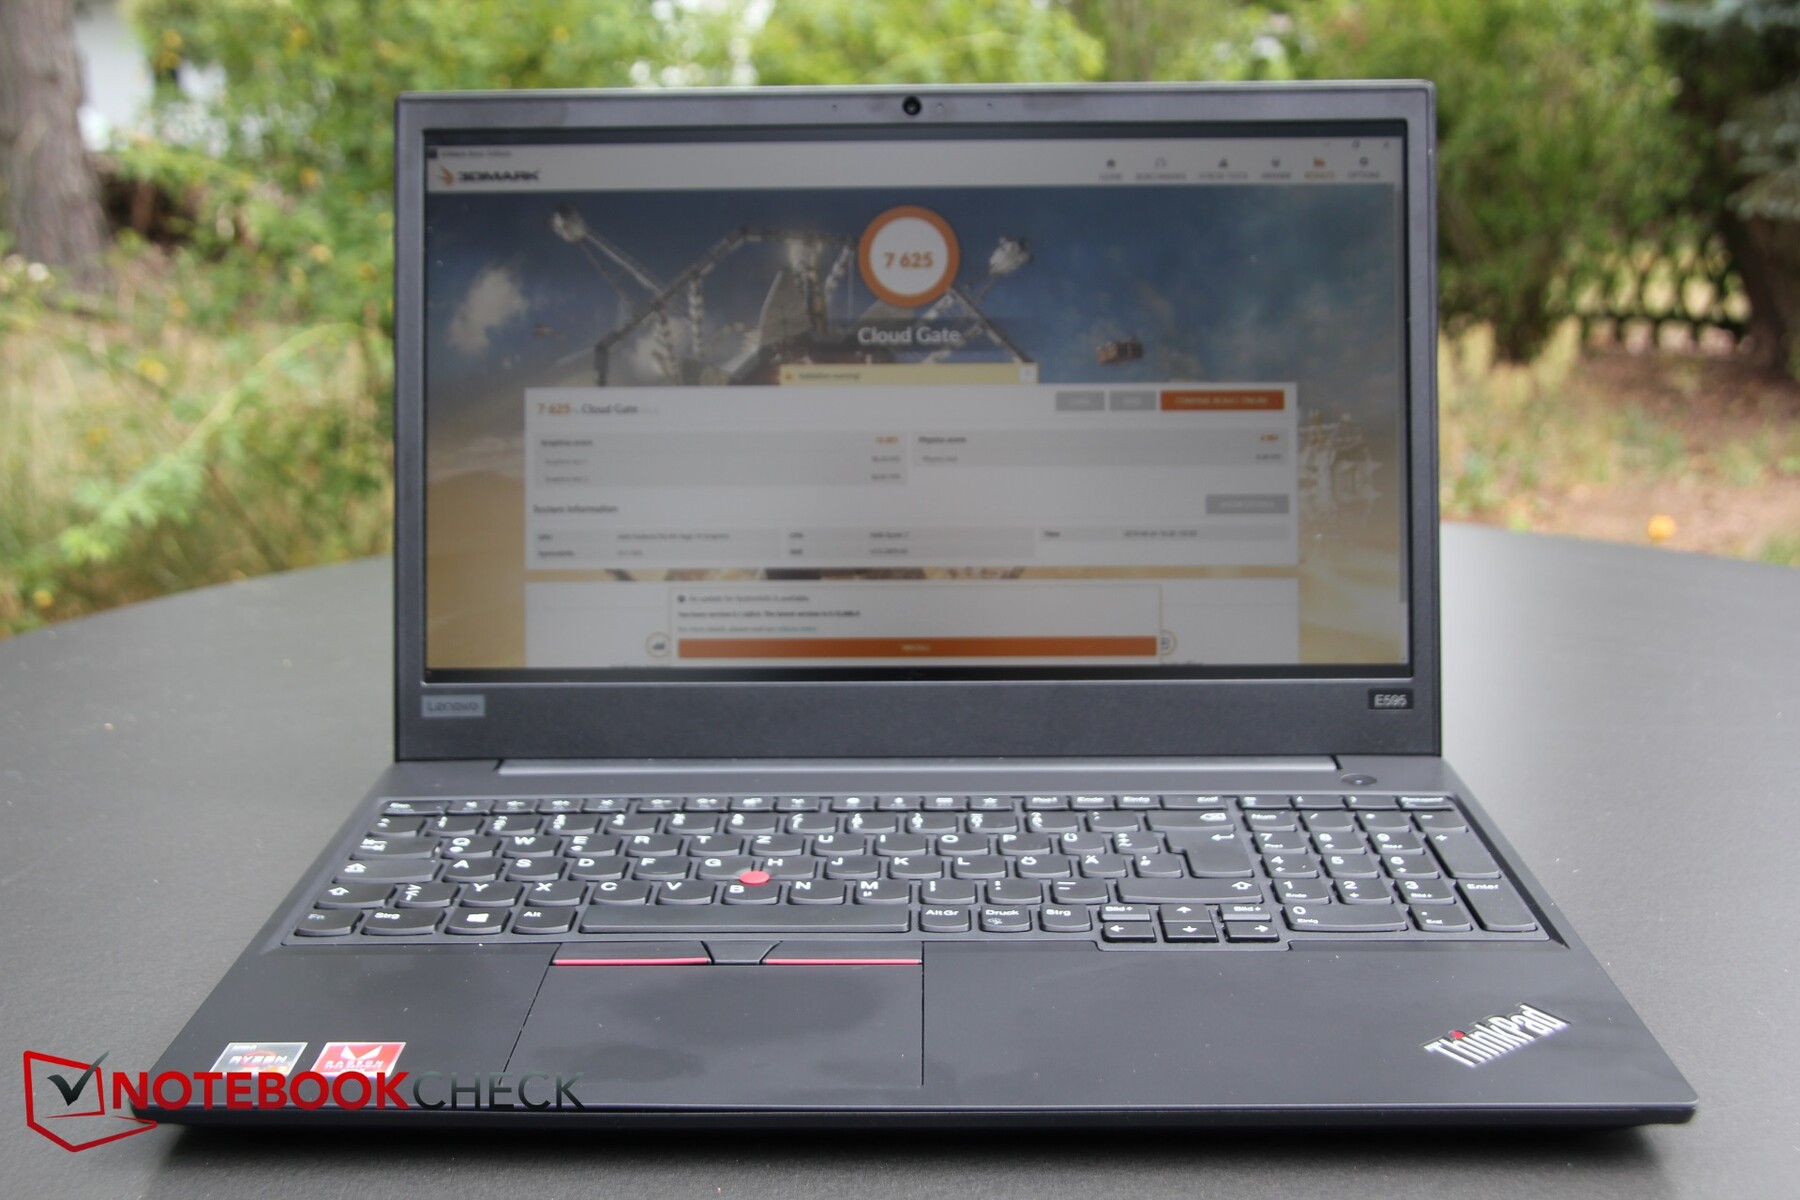
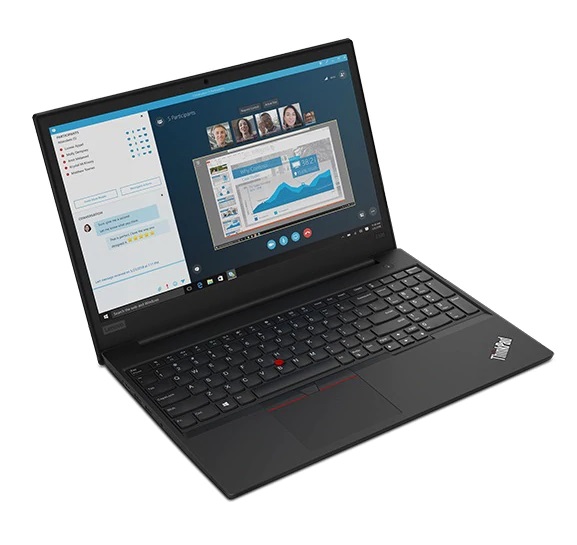
Lenovo ThinkPad E595 laptop review: AMD laptop better than its Intel counterpart?
We reviewed the ThinkPad E590 with an Intel processor a few months ago, and we did this twice: Once for the version with integrated UHD graphics and a second time for the one with the AMD RX 550X. Lenovo now follows up with the E595 with an AMD CPU and integrated Vega 10 graphics. We are particularly interested in the comparison between the Intel and the AMD processor. Or does the combination of Intel CPU and AMD GPU result in the best device?
Alongside the E590 with Intel UHD graphics and the E590 with the RX 550X, we will also add the HP14 since it features almost the same configuration and the Acer TravelMate P2510 (i5-8250U, MX130) to our comparison.
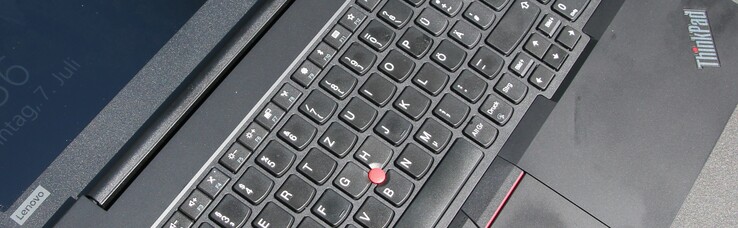
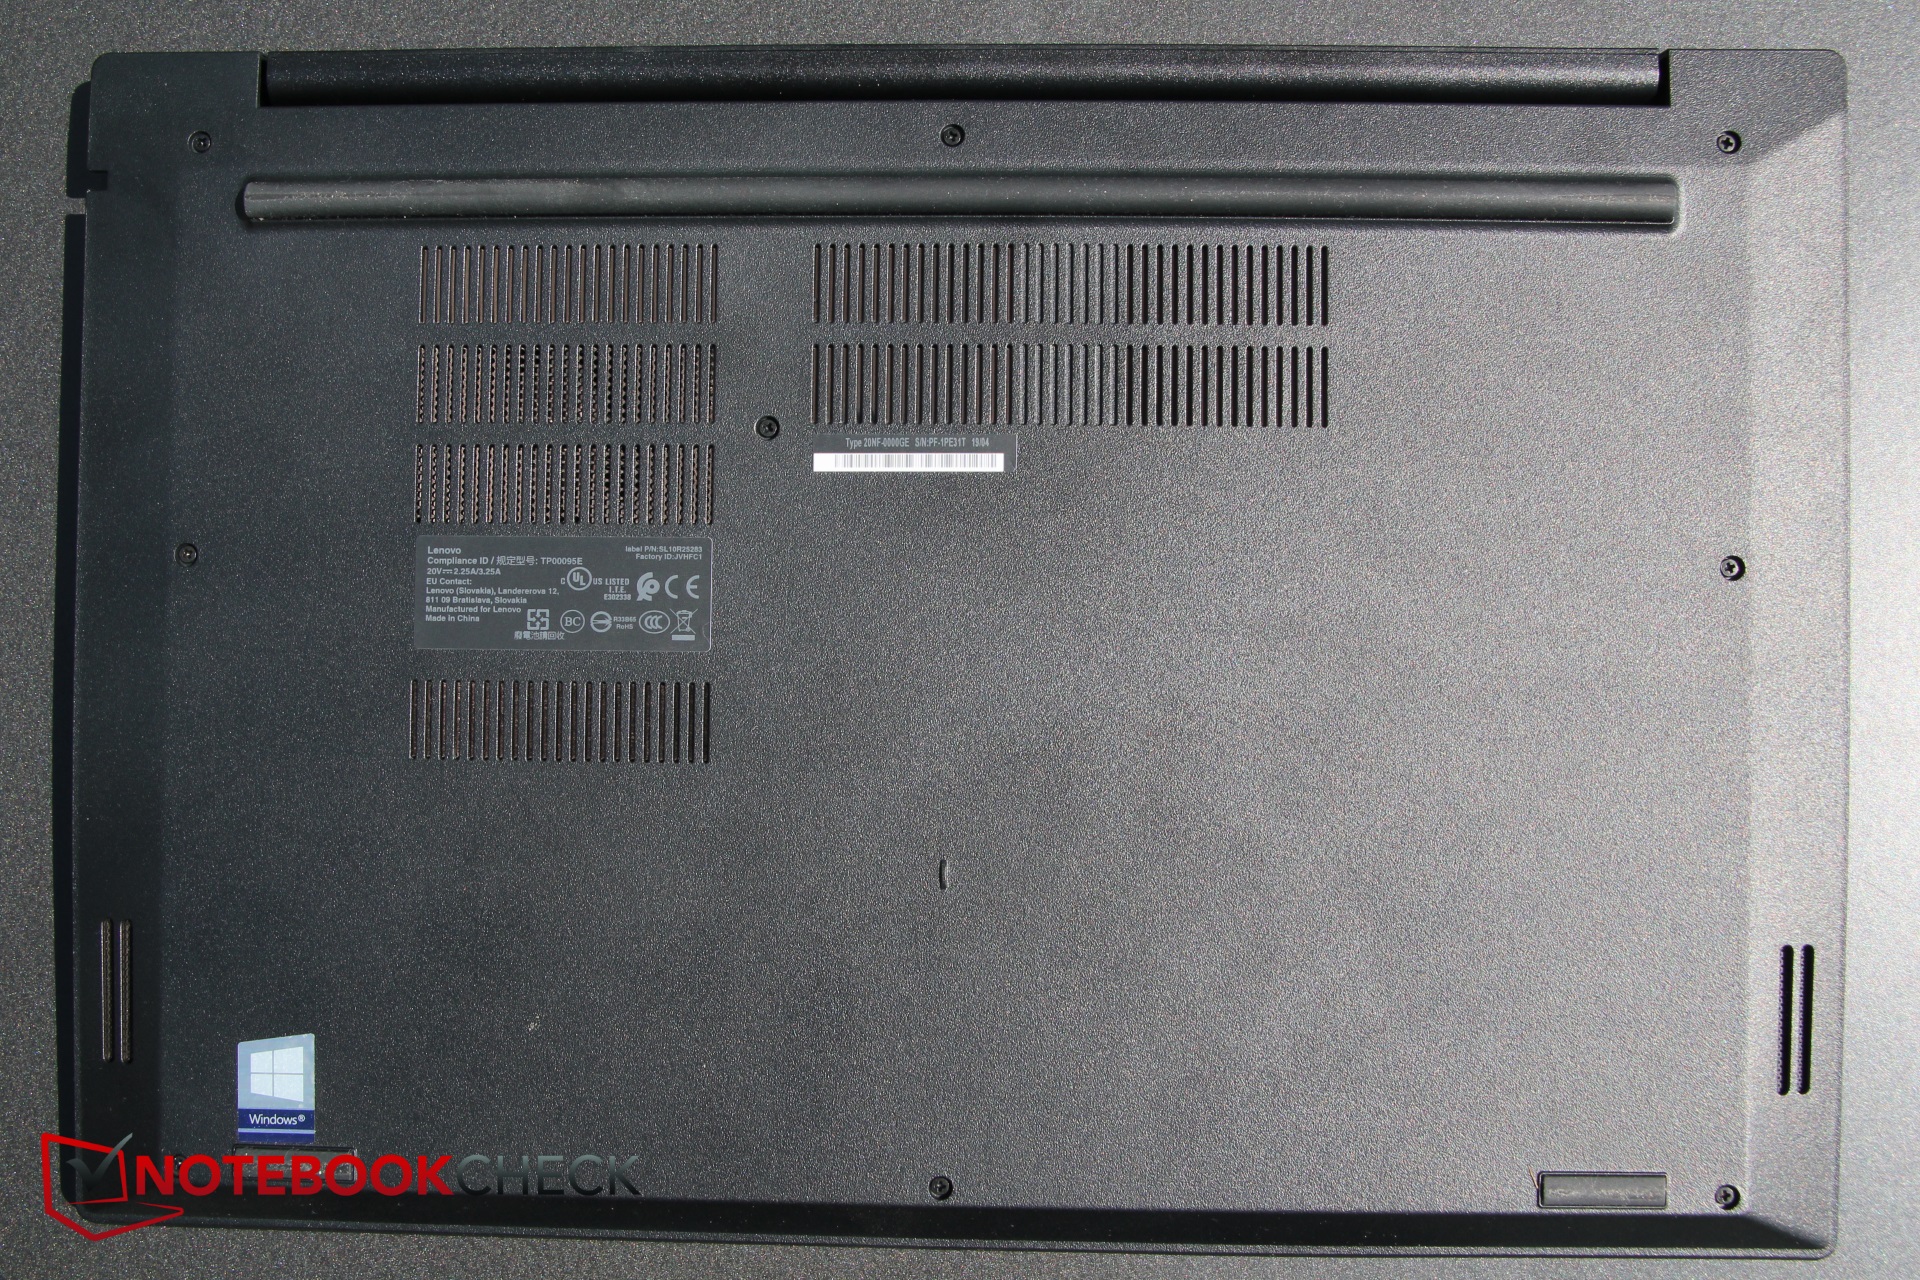
Since this is a review update to the E590, we will skip the sections relating to the case, the connectivity, the input devices and the speakers. These have remained almost identical since the "real" E580 predecessor and can be found in our thorough review of the ThinkPad E580 pre-predecessor. The only difference: Our model does not have a fingerprint scanner.

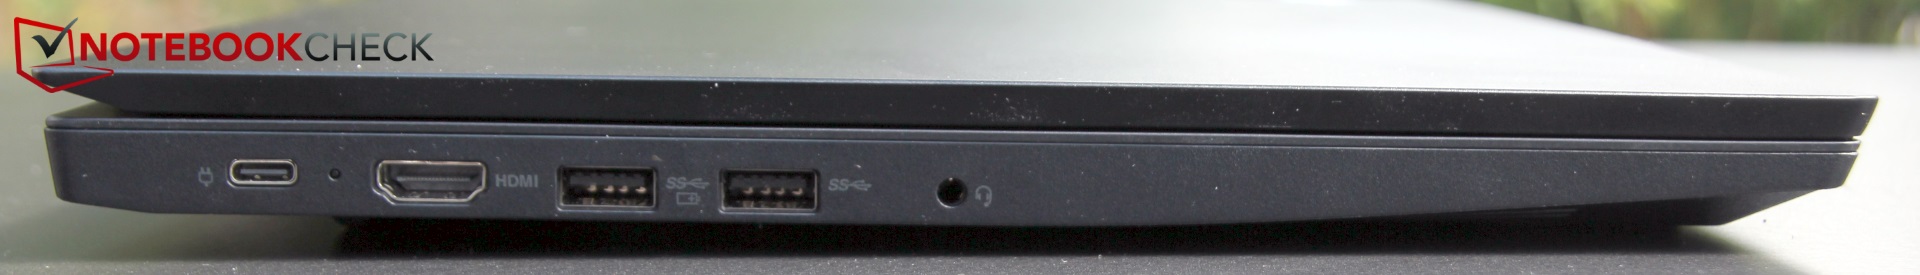
Connectivity - Lenovo laptop with fast Wi-Fi
| SD Card Reader | |
| average JPG Copy Test (av. of 3 runs) | |
| Lenovo ThinkPad E590-20NC0003GE (Toshiba Exceria Pro M501 64 GB UHS-II) | |
| Lenovo ThinkPad E595-20NF0000GE (Toshiba Exceria Pro M501 64 GB UHS-II) | |
| Lenovo ThinkPad E590-20NB0012GE (Toshiba Exceria Pro M501) | |
| Average of class Office (22.4 - 198.5, n=21, last 2 years) | |
| HP 14-dk0008ng (Toshiba Exceria Pro SDXC 64 GB UHS-II) | |
| Acer TravelMate P2510-G2-MG-50WE (Toshiba Exceria Pro SDXC 64 GB UHS-II) | |
| maximum AS SSD Seq Read Test (1GB) | |
| Lenovo ThinkPad E595-20NF0000GE (Toshiba Exceria Pro M501 64 GB UHS-II) | |
| Lenovo ThinkPad E590-20NB0012GE (Toshiba Exceria Pro M501) | |
| Lenovo ThinkPad E590-20NC0003GE (Toshiba Exceria Pro M501 64 GB UHS-II) | |
| Average of class Office (27.4 - 249, n=20, last 2 years) | |
| HP 14-dk0008ng (Toshiba Exceria Pro SDXC 64 GB UHS-II) | |
| Acer TravelMate P2510-G2-MG-50WE (Toshiba Exceria Pro SDXC 64 GB UHS-II) | |
Display - Contrast-rich Lenovo ThinkPad
Lenovo is using their in-house matte Full HD IPS panel, which is different from the displays of the E590 that have been reviewed so far. The panel lottery from Lenovo appears to be taking place here too, and there is no way to read the ID in advance. The average brightness is approximately 300 nits; the brightness distribution is also good at 89 percent. All competitors are a bit darker in this regard.
Also positive: We were not able to identify screen bleeding or pronounced halos. However, the display flickers at a brightness of 99 percent and lower (PWM). The frequency of 1220 Hz should be high enough though, in order to avoid bothering sensitive users.
An E595 model with the low resolution of 1366x768 pixels is sold in the USA, but this is not listed in the German Lenovo website; only models with a Full HD display are available.
| |||||||||||||||||||||||||
Brightness Distribution: 89 %
Center on Battery: 319 cd/m²
Contrast: 1871:1 (Black: 0.17 cd/m²)
ΔE ColorChecker Calman: 5.5 | ∀{0.5-29.43 Ø4.73}
calibrated: 5.1
ΔE Greyscale Calman: 1.8 | ∀{0.09-98 Ø4.97}
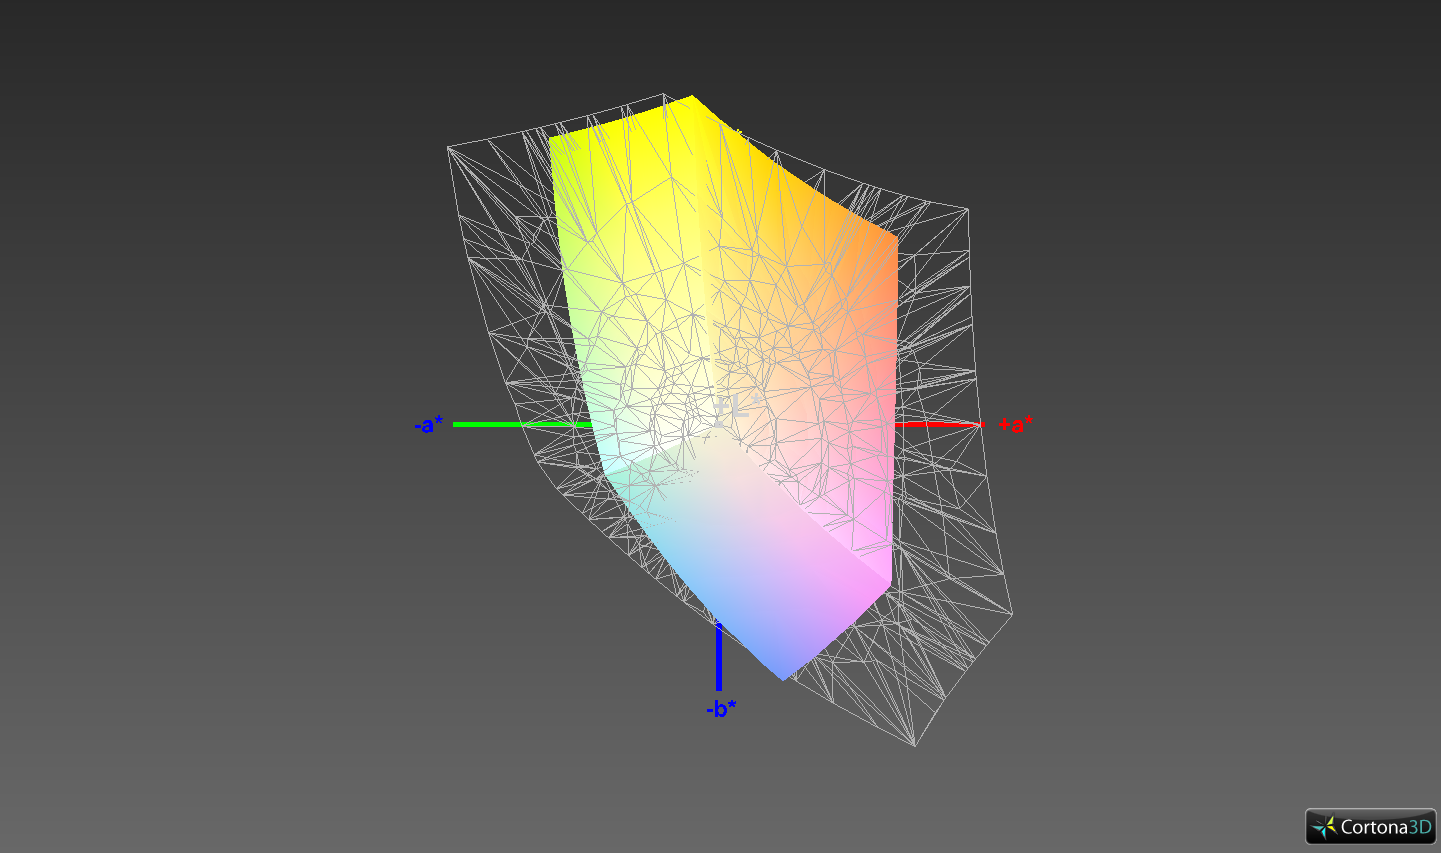
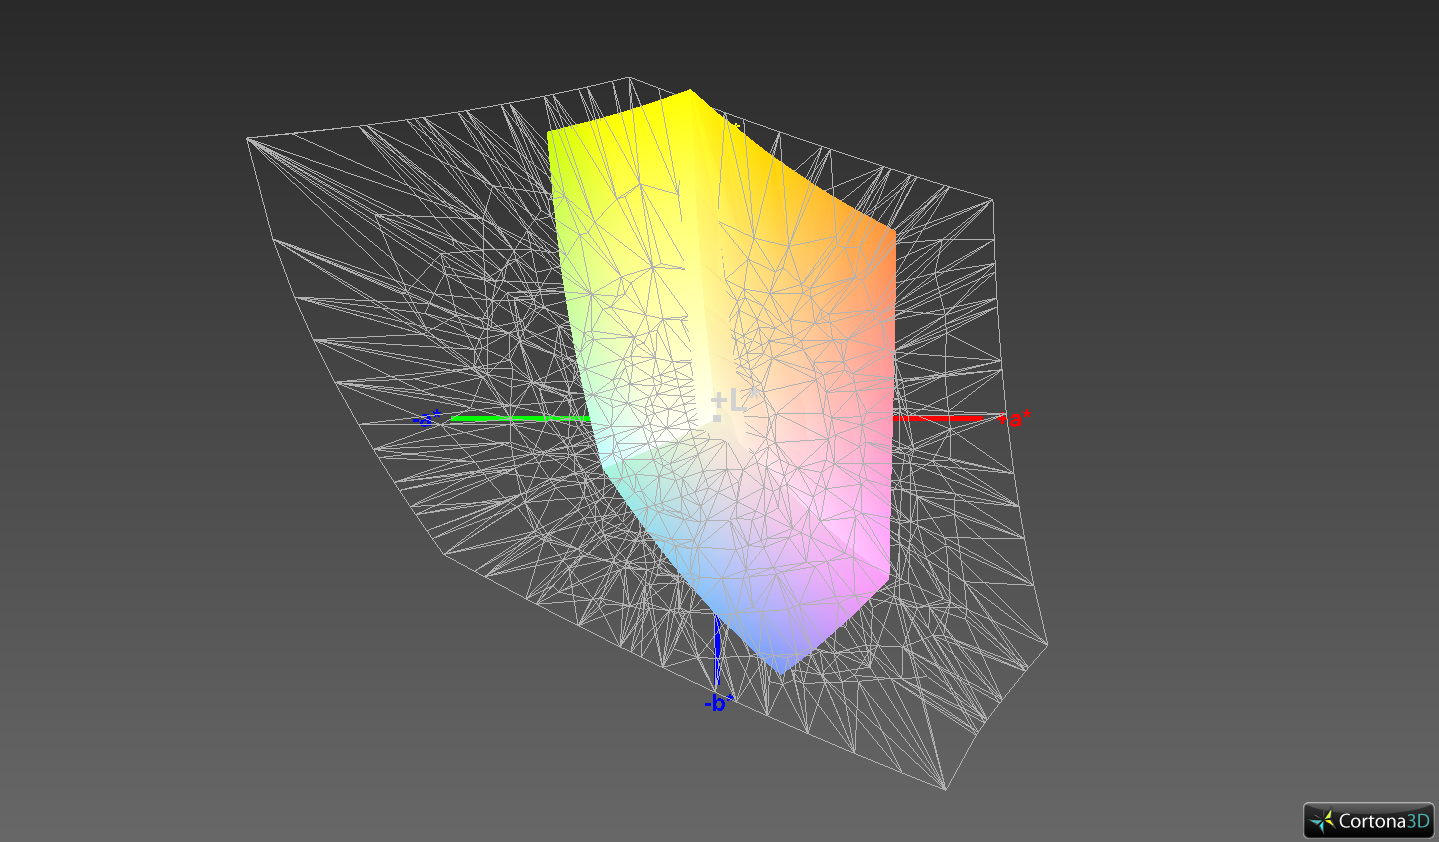
58.2% sRGB (Argyll 1.6.3 3D)
37.6% AdobeRGB 1998 (Argyll 1.6.3 3D)
41.2% AdobeRGB 1998 (Argyll 3D)
58.6% sRGB (Argyll 3D)
39.88% Display P3 (Argyll 3D)
Gamma: 2.12
CCT: 6257 K
| Lenovo ThinkPad E595-20NF0000GE NV156FHM-N49, , 1920x1080, 15.6" | Lenovo ThinkPad E590-20NC0003GE LP156WFC-SPDB, , 1920x1080, 15.6" | Lenovo ThinkPad E590-20NB0012GE Lenovo B156HAN02.1, , 1920x1080, 15.6" | HP 14-dk0008ng AU Optronics AUO403D, , 1920x1080, 14" | Acer TravelMate P2510-G2-MG-50WE Chi Mei CMN15D3, , 1920x1080, 15.6" | |
|---|---|---|---|---|---|
| Display | -3% | 1% | -0% | 7% | |
| Display P3 Coverage (%) | 39.88 | 38.21 -4% | 39.88 0% | 39.53 -1% | 42.27 6% |
| sRGB Coverage (%) | 58.6 | 57.5 -2% | 59.9 2% | 59.1 1% | 63.5 8% |
| AdobeRGB 1998 Coverage (%) | 41.2 | 39.47 -4% | 41.21 0% | 40.84 -1% | 43.69 6% |
| Response Times | 10% | -8% | 13% | 3% | |
| Response Time Grey 50% / Grey 80% * (ms) | 41.2 ? | 40 ? 3% | 47.2 ? -15% | 38 ? 8% | 40 ? 3% |
| Response Time Black / White * (ms) | 32.8 ? | 27.6 ? 16% | 32.8 ? -0% | 27 ? 18% | 32 ? 2% |
| PWM Frequency (Hz) | 1220 ? | 25000 ? | |||
| Screen | -12% | -10% | 3% | 8% | |
| Brightness middle (cd/m²) | 318 | 254 -20% | 284 -11% | 269 -15% | 259 -19% |
| Brightness (cd/m²) | 297 | 251 -15% | 272 -8% | 257 -13% | 230 -23% |
| Brightness Distribution (%) | 89 | 90 1% | 92 3% | 89 0% | 82 -8% |
| Black Level * (cd/m²) | 0.17 | 0.2 -18% | 0.21 -24% | 0.2 -18% | 0.19 -12% |
| Contrast (:1) | 1871 | 1270 -32% | 1352 -28% | 1345 -28% | 1363 -27% |
| Colorchecker dE 2000 * | 5.5 | 5.6 -2% | 5.3 4% | 3.68 33% | 3.13 43% |
| Colorchecker dE 2000 max. * | 21 | 15.4 27% | 18.9 10% | 7.36 65% | 7.81 63% |
| Colorchecker dE 2000 calibrated * | 5.1 | 4.9 4% | 4.4 14% | 4.8 6% | 3.09 39% |
| Greyscale dE 2000 * | 1.8 | 3.1 -72% | 3.2 -78% | 1.69 6% | 1.42 21% |
| Gamma | 2.12 104% | 2.22 99% | 2.41 91% | 2.49 88% | 2.36 93% |
| CCT | 6257 104% | 6450 101% | 6736 96% | 6406 101% | 6391 102% |
| Color Space (Percent of AdobeRGB 1998) (%) | 37.6 | 36.3 -3% | 37.9 1% | 38 1% | 40 6% |
| Color Space (Percent of sRGB) (%) | 58.2 | 57.1 -2% | 59.7 3% | 59 1% | 63 8% |
| Total Average (Program / Settings) | -2% /
-8% | -6% /
-8% | 5% /
4% | 6% /
7% |
* ... smaller is better
The good black level as well as the very good contrast of 1871:1 should also be praised; the panel of the E595 comes out on top with both values. Only the color deviations are extremely high at 21. After a calibration, the value can be decreased to a still sub-optimal value of 5.
The color-space coverage is not above average; around 58 percent of sRGB and 37.6 percent of AdobeRGB will not entice any professional photographer to purchase.
However, the display can be satisfactory on the whole. Good color-space coverage barely plays any role for most buyers, and the Lenovo display scores points in terms of brightness, black value and contrast in return.
Thanks to its good brightness and strong contrast, the ThinkPad can be used outdoors without issues to the greatest possible extent. Subjectively, the display could still be a little brighter though.
Display Response Times
| ↔ Response Time Black to White | ||
|---|---|---|
| 32.8 ms ... rise ↗ and fall ↘ combined | ↗ 18 ms rise | 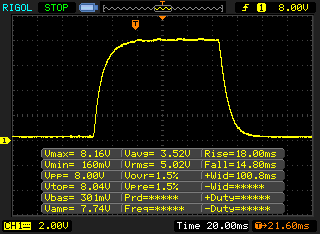 |
| ↘ 14.8 ms fall | ||
| The screen shows slow response rates in our tests and will be unsatisfactory for gamers. In comparison, all tested devices range from 0.1 (minimum) to 240 (maximum) ms. » 88 % of all devices are better. This means that the measured response time is worse than the average of all tested devices (19.9 ms). | ||
| ↔ Response Time 50% Grey to 80% Grey | ||
| 41.2 ms ... rise ↗ and fall ↘ combined | ↗ 22 ms rise | 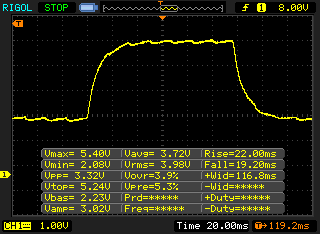 |
| ↘ 19.2 ms fall | ||
| The screen shows slow response rates in our tests and will be unsatisfactory for gamers. In comparison, all tested devices range from 0.165 (minimum) to 636 (maximum) ms. » 66 % of all devices are better. This means that the measured response time is worse than the average of all tested devices (31.1 ms). | ||
Screen Flickering / PWM (Pulse-Width Modulation)
| Screen flickering / PWM detected | 1220 Hz | ≤ 99 % brightness setting | 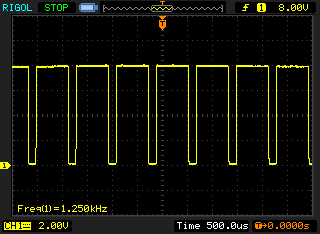 |
The display backlight flickers at 1220 Hz (worst case, e.g., utilizing PWM) Flickering detected at a brightness setting of 99 % and below. There should be no flickering or PWM above this brightness setting. The frequency of 1220 Hz is quite high, so most users sensitive to PWM should not notice any flickering. In comparison: 52 % of all tested devices do not use PWM to dim the display. If PWM was detected, an average of 7794 (minimum: 5 - maximum: 343500) Hz was measured. | |||
There is hardly anything to complain about in regard to the stability of the viewing angles due to the built-in IPS panel. Especially when being viewed from the sides, content on the display is still quite readable. The view from above and below is naturally somewhat more associated with brightness variations, but that is hardly worth mentioning when it comes to the display in the ThinkPad.

Performance - E595 with fast CPU and so-so GPU
On paper, the ThinkPad E595 is equipped with fast hardware: A Ryzen 7 3700U powers the computer and integrates Vega 10 graphics, which are currently among the strongest integrated GPUs. This is joined by 16 GB RAM and a 512 GB SSD as the storage device. With this configuration, the ThinkPad should theoretically be able to tackle any office or Internet task without effort and therefore targets all office customers, who do not always need to have Intel hardware installed. We say "theoretically" because in previous reviews of laptops with AMD hardware we detected in part extreme throttling by the manufacturer. Whether this is also the case with the E595, we will clarify below.
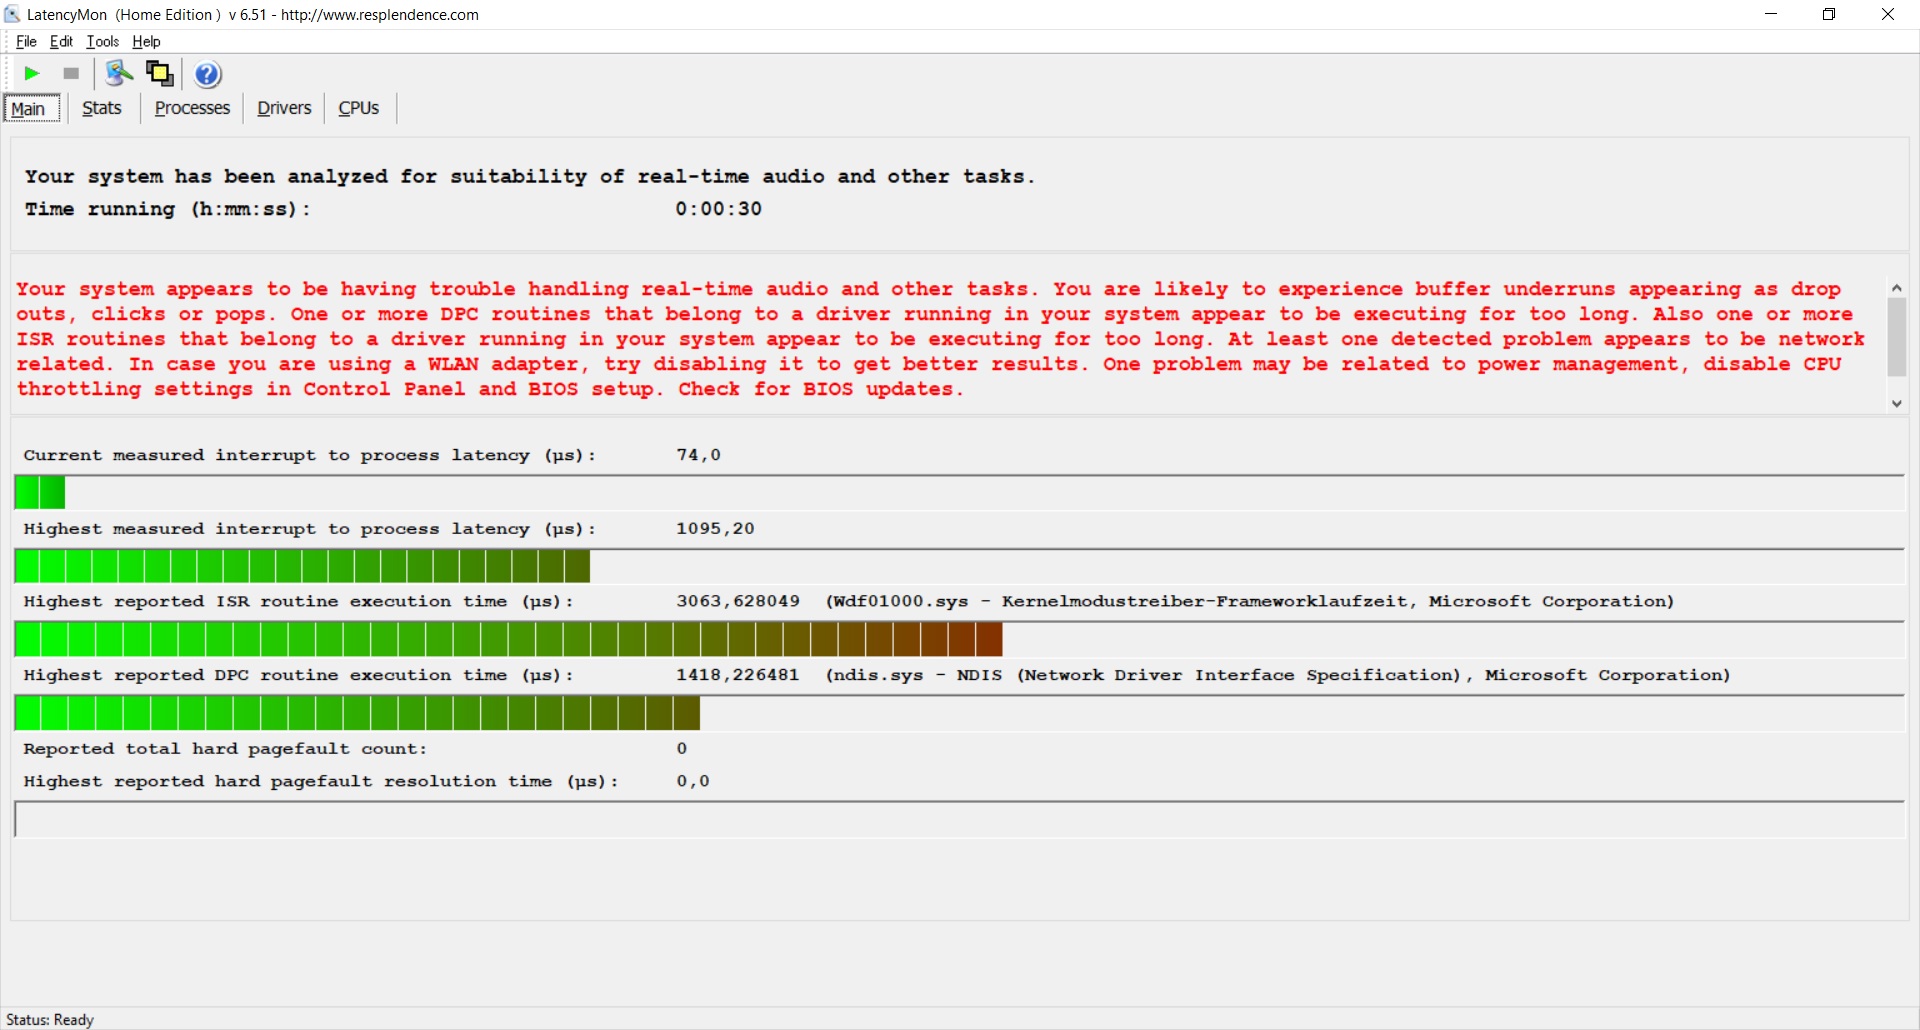
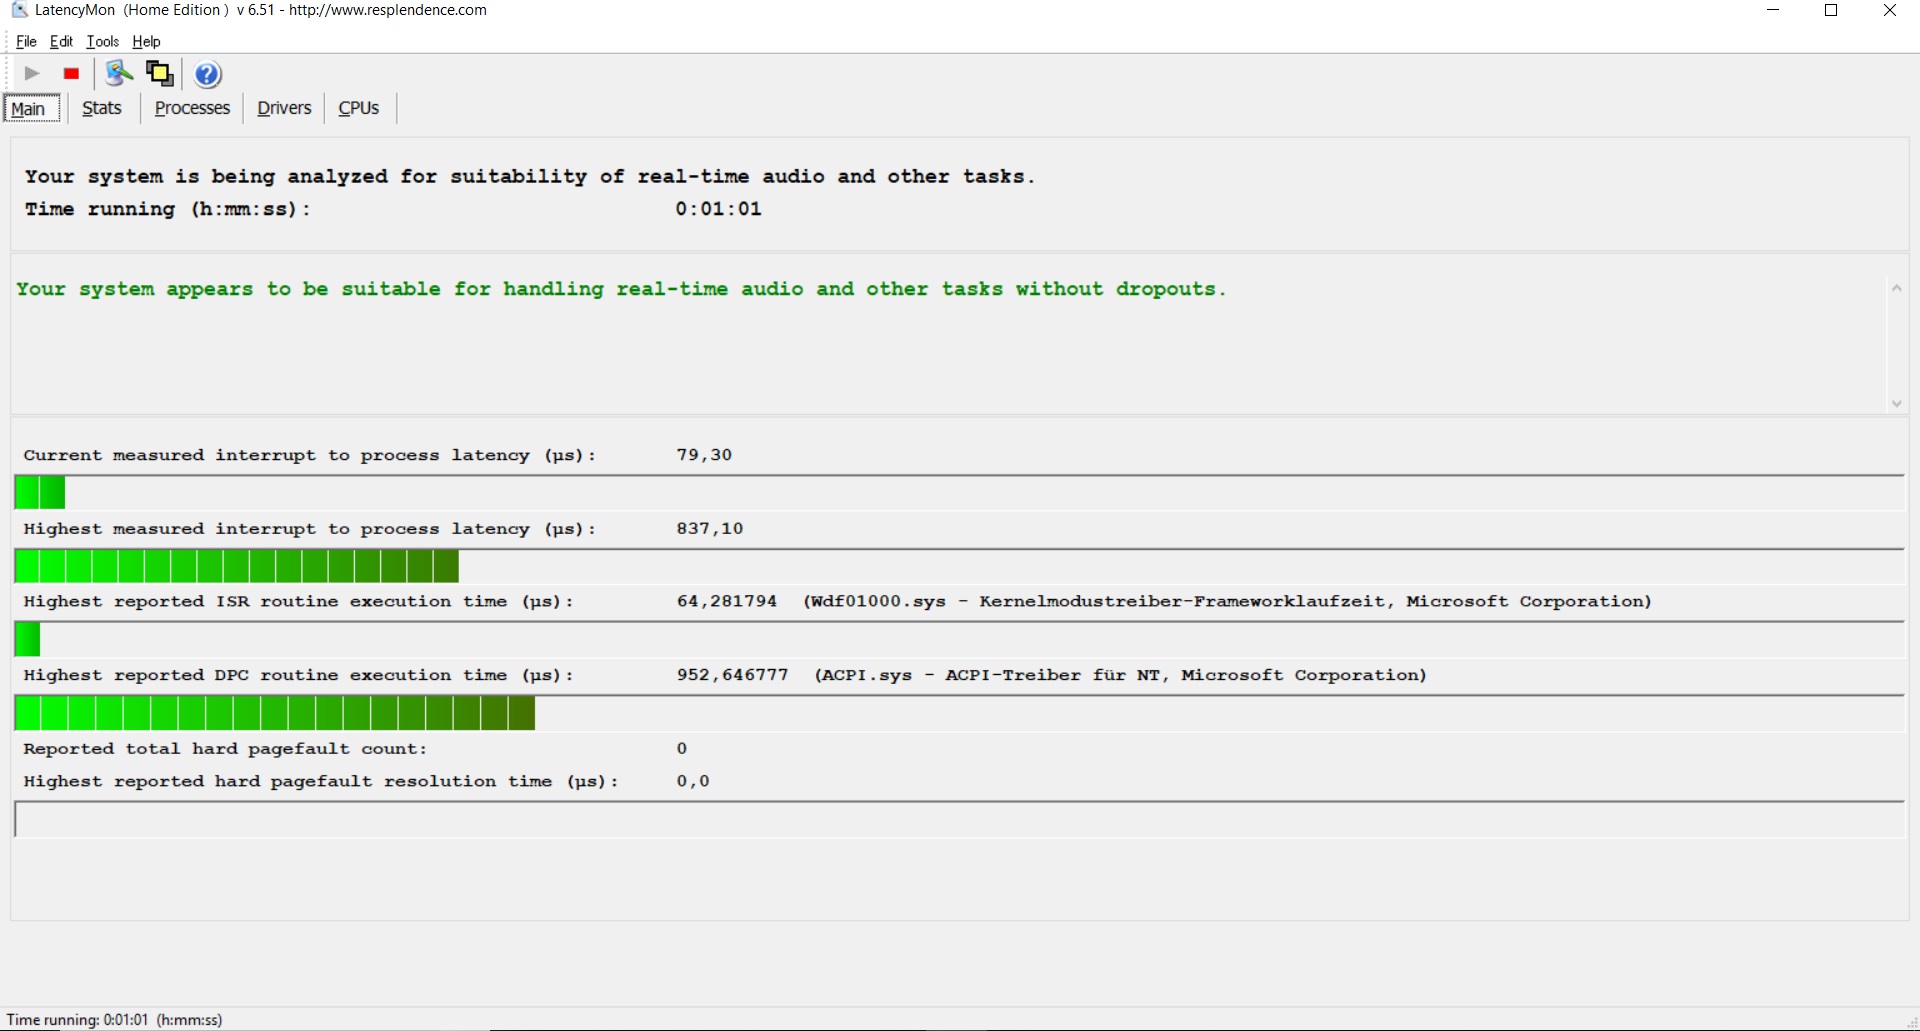
Unfortunately, the LatencyMon tool detected several drivers that slow down the system in the first run. However, after a few updates and a new run, the problem appeared to have been solved, and the ThinkPad seemed largely latency-free.
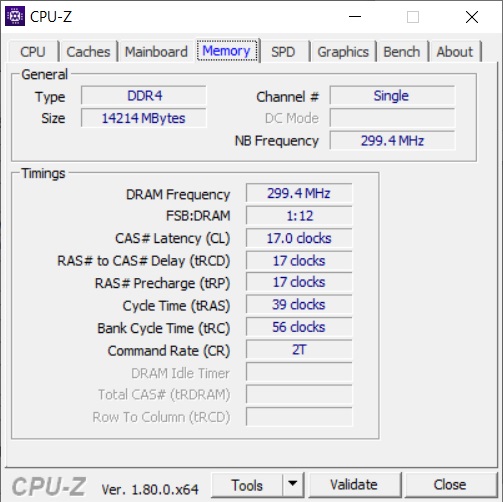
The Vega 10 graphics would incidentally be benefited from dual-channel RAM. Unfortunately, the 16 GB in the E595 is configured as single channel.
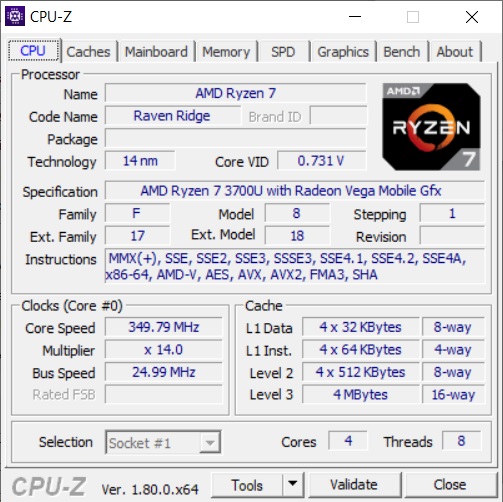
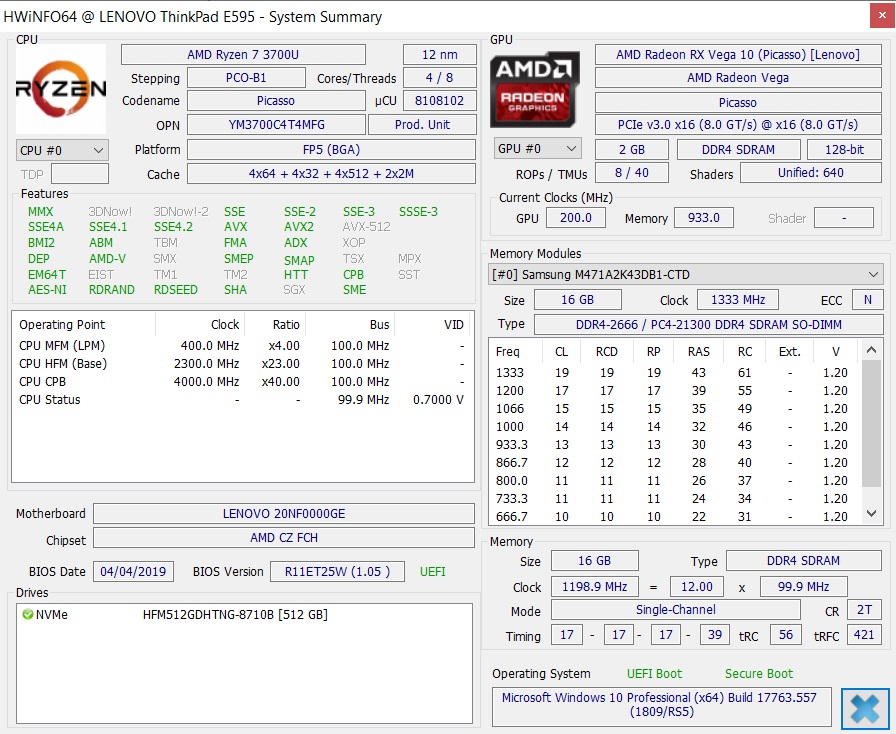
Processor
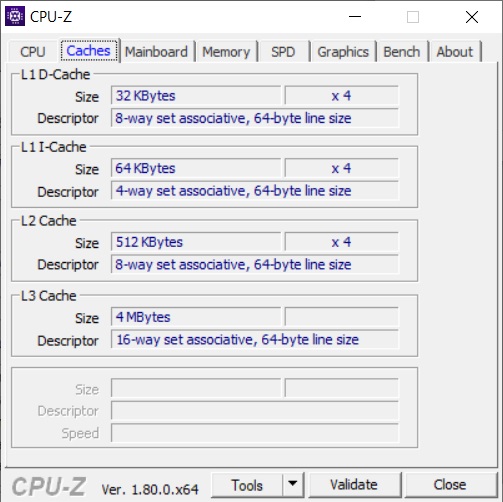
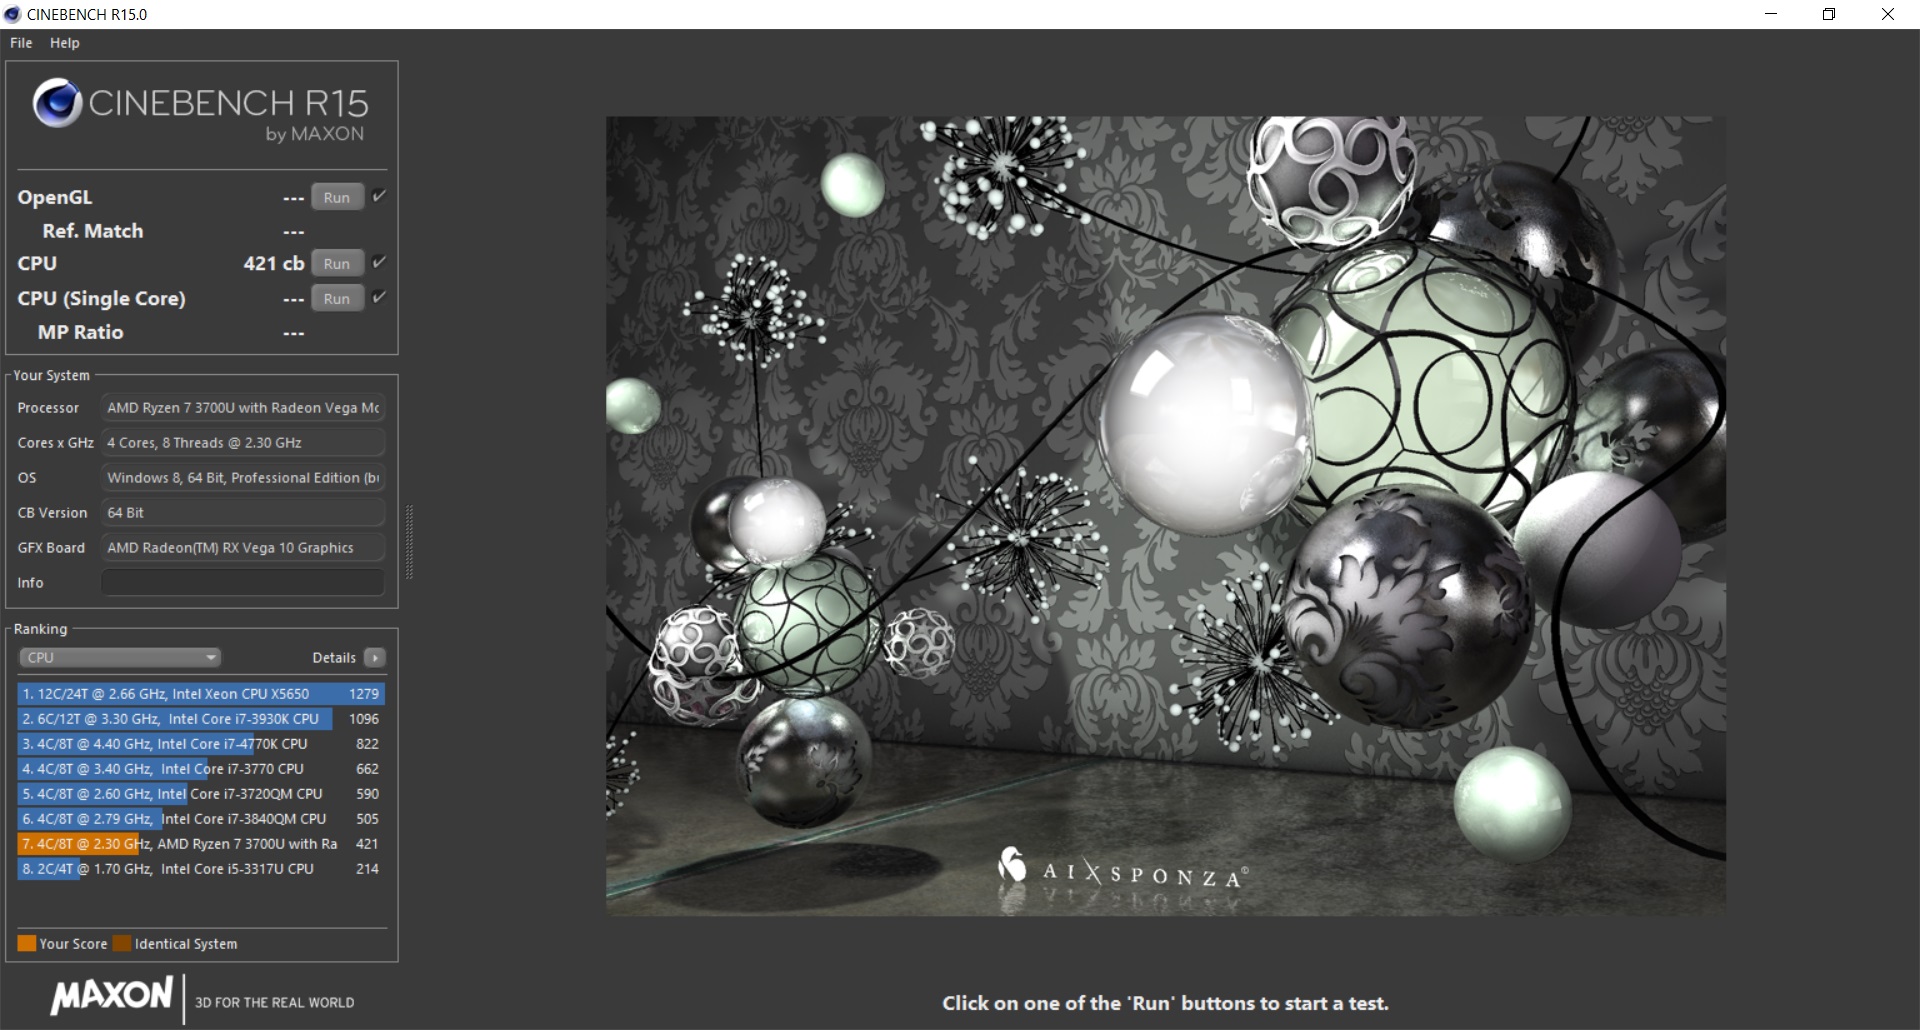
The processor used here is the AMD Ryzen 7 3700U, which has 4 Zen+ cores that potentially clocks between 2.3 and 4 GHz.
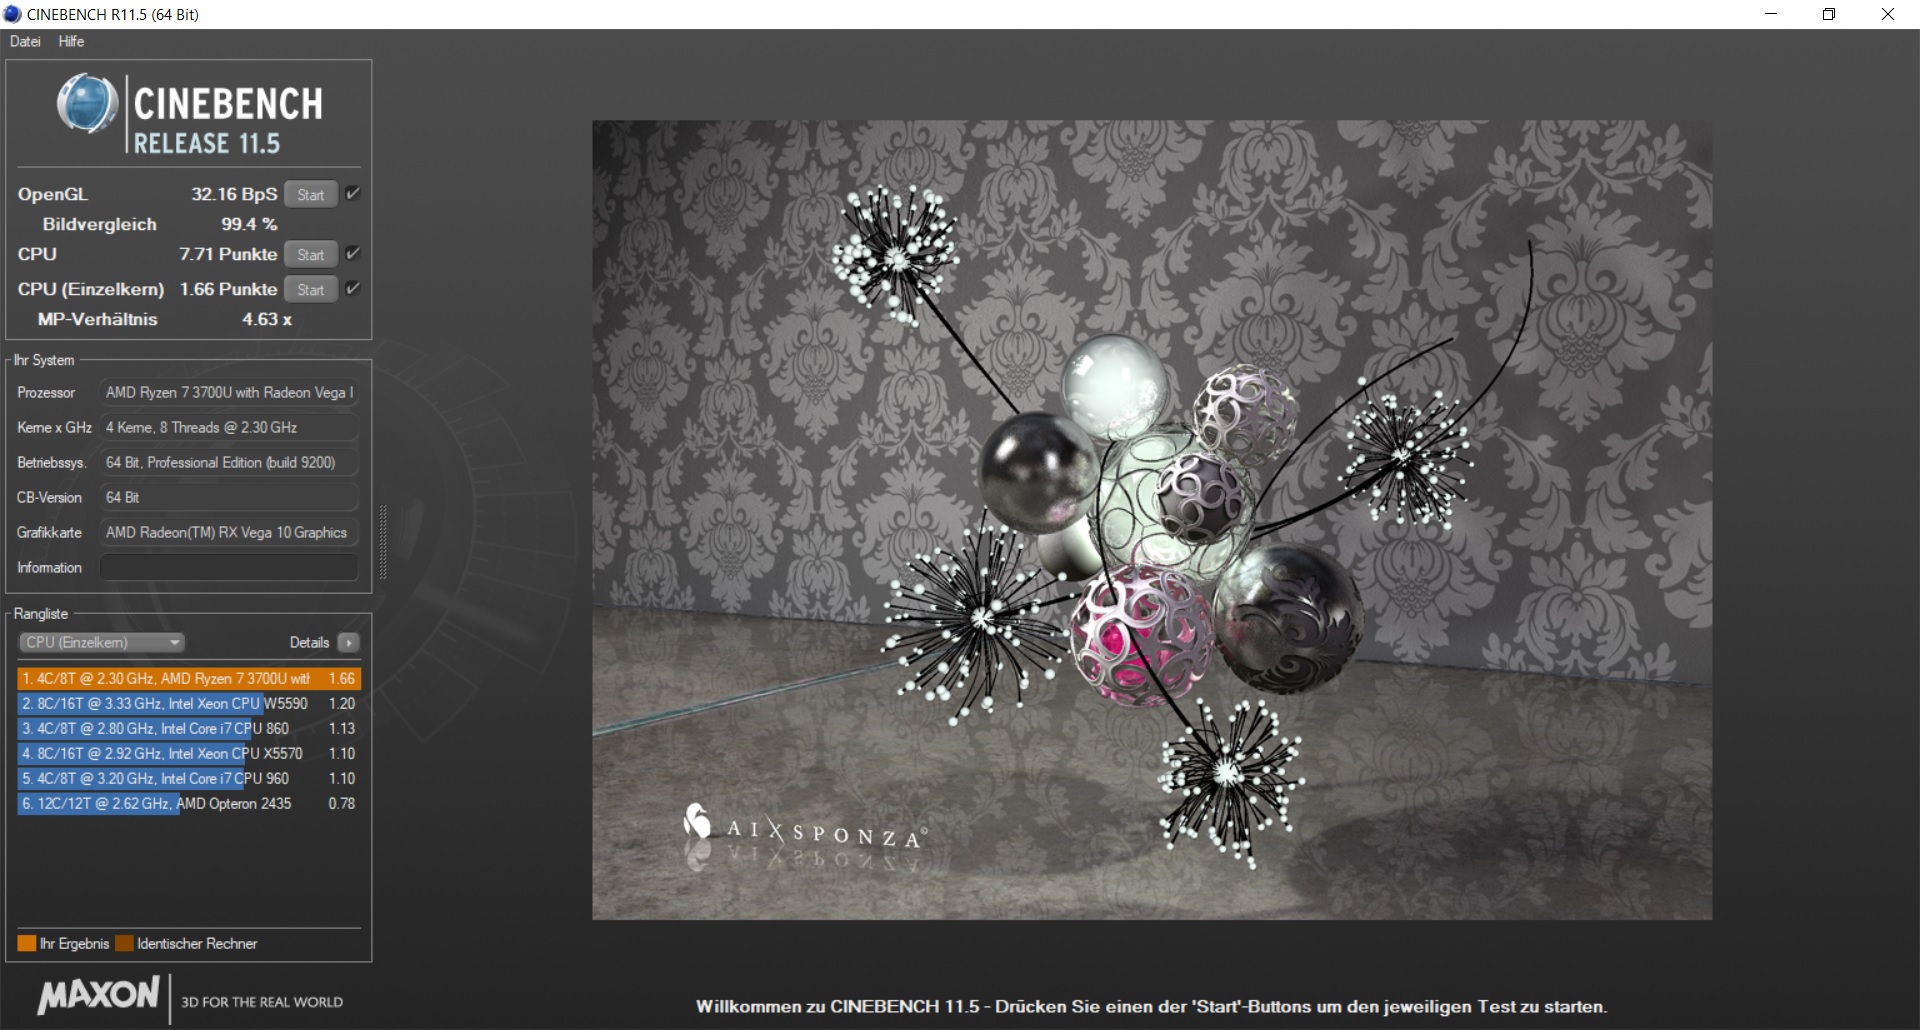
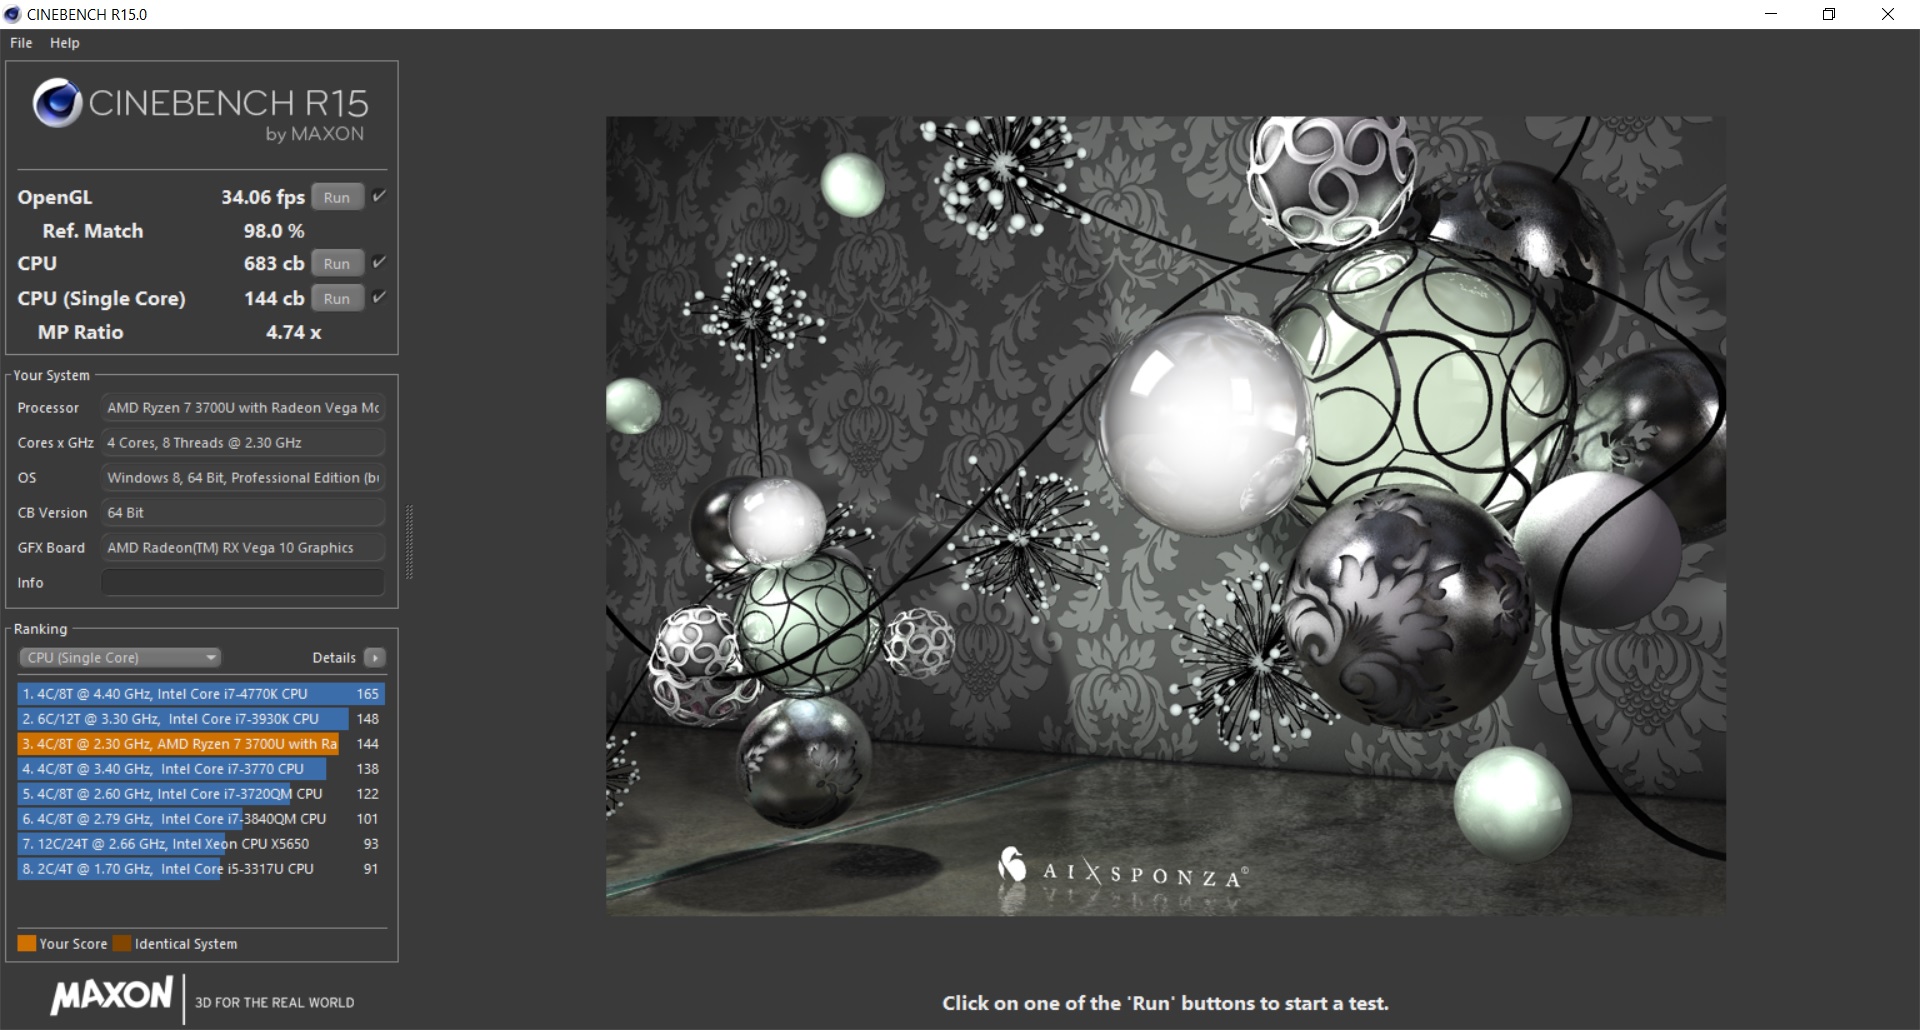
In our thirty-minute loop of the Cinebench R15 (multi-CPU), the ThinkPad exhibited a very a constant and also very high CPU performance. The performance drop observed with the competing models after the first one to three runs is virtually nonexistent with the E595. In addition, performance is consistently higher than with the competition, which is partly equipped in a similar way. For example, the ThinkPad is 27 percent faster than the evidently throttled HP 14, which uses the same processor. Very good, the E595 seems to finally be an AMD laptop without extreme throttling.
In Cinebench R15's multi-core test, it can also outperform both E590 models with Intel CPUs (Intel Core i7-8565U) by strong 24 to 30 percent. On the other hand, these are 24 to 26 percent above in the single-core measurements. The Ryzen 7 3700U behaves more like an Intel Core i5-8250U in this case.
The high (multi-core) output only goes away when unplugging the ThinkPad. It loses around 38 percent of CPU performance in the multi-core test.

| Cinebench R10 | |
| Rendering Single CPUs 64Bit | |
| Average of class Office (11106 - 15443, n=6, last 2 years) | |
| Average AMD Ryzen 7 3700U (7765 - 7769, n=2) | |
| Lenovo ThinkPad E595-20NF0000GE | |
| Rendering Multiple CPUs 64Bit | |
| Average of class Office (48700 - 76704, n=6, last 2 years) | |
| Average AMD Ryzen 7 3700U (27166 - 27244, n=2) | |
| Lenovo ThinkPad E595-20NF0000GE | |
System performance
Our measurements of overall system performance using PCMark 8 and 10 result in an insightful picture. The E590 with RX-550X graphics clearly takes the lead here (around 20 - 40 percent). The Acer TravelMate is also above the E595 due to its dedicated card but only marginally at around 4 percent. Consequently, our review model with Vega 10 almost reaches the performance of the TravelMate with the GeForce MX130. Meanwhile, the ThinkPad E590 with Intel UHD graphics does not stand a chance; the E595 is in the PCMark tests about 30 to 50 percent faster! Everything works very smoothly in everyday use, and we did not identify any noticeable stutters or delays.
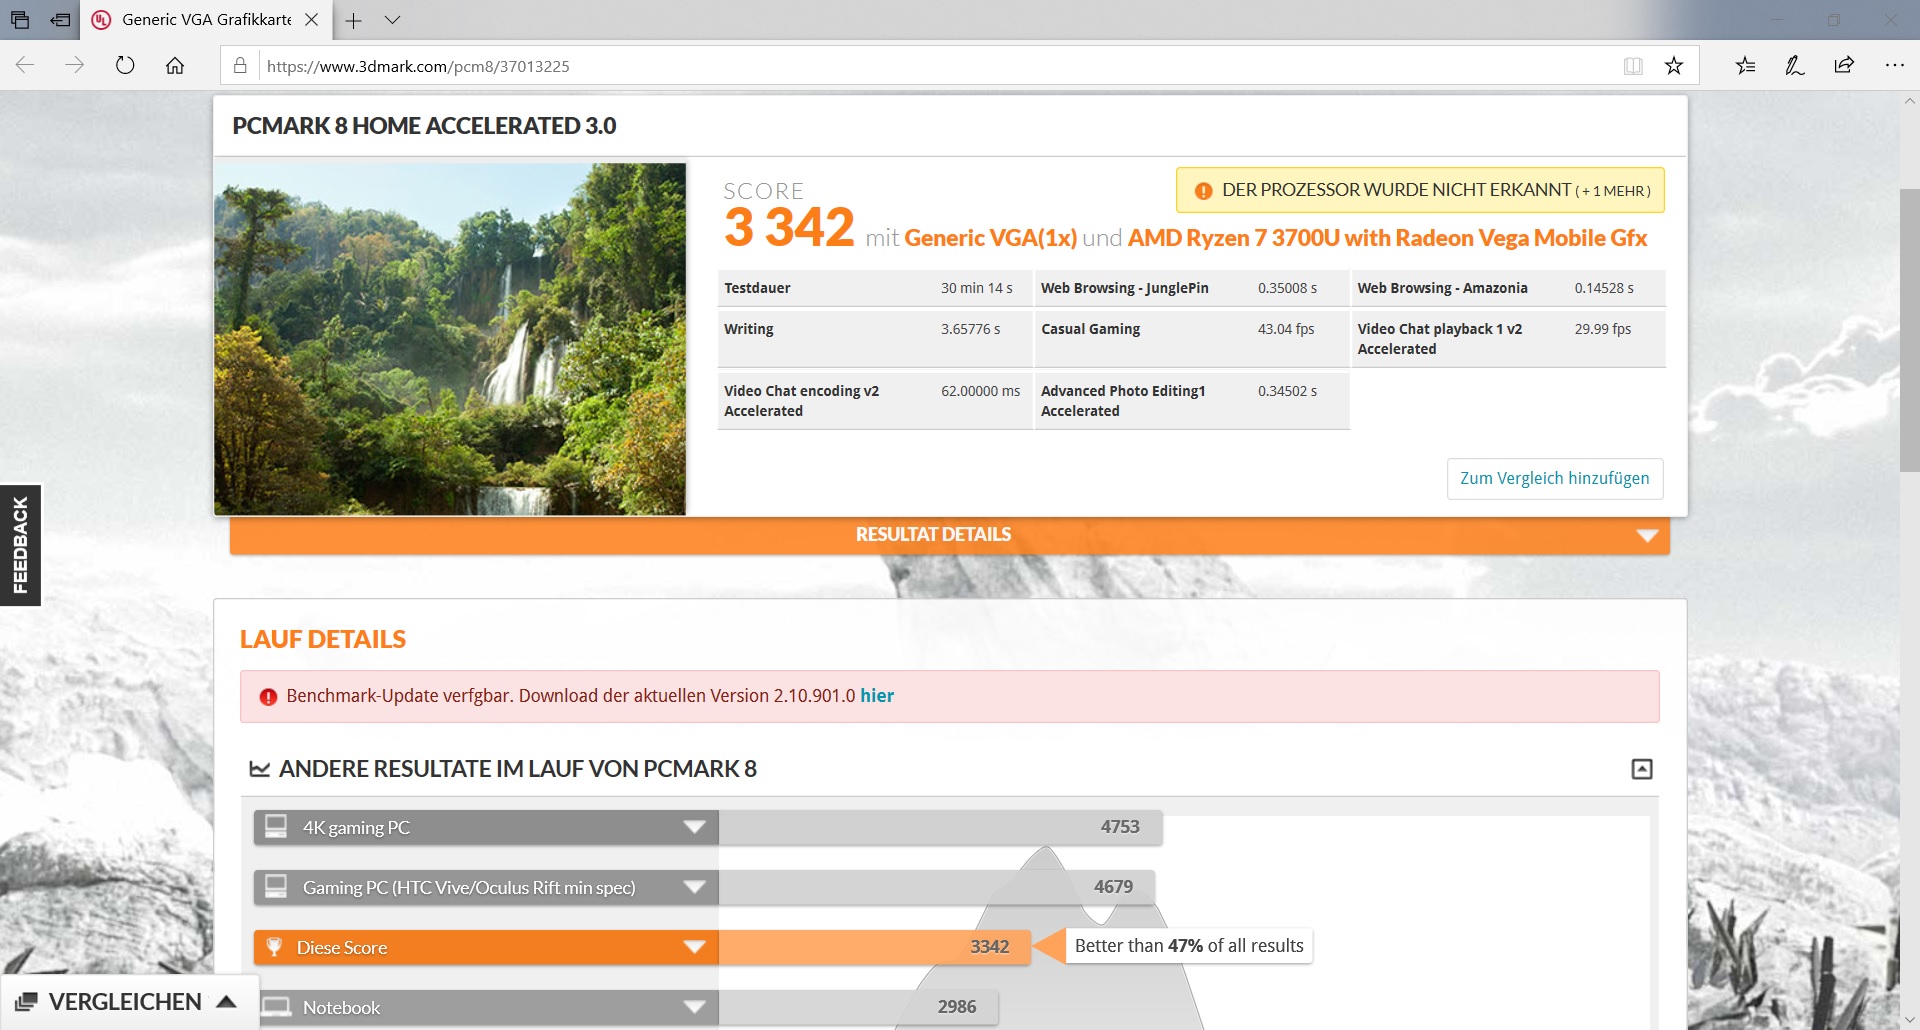
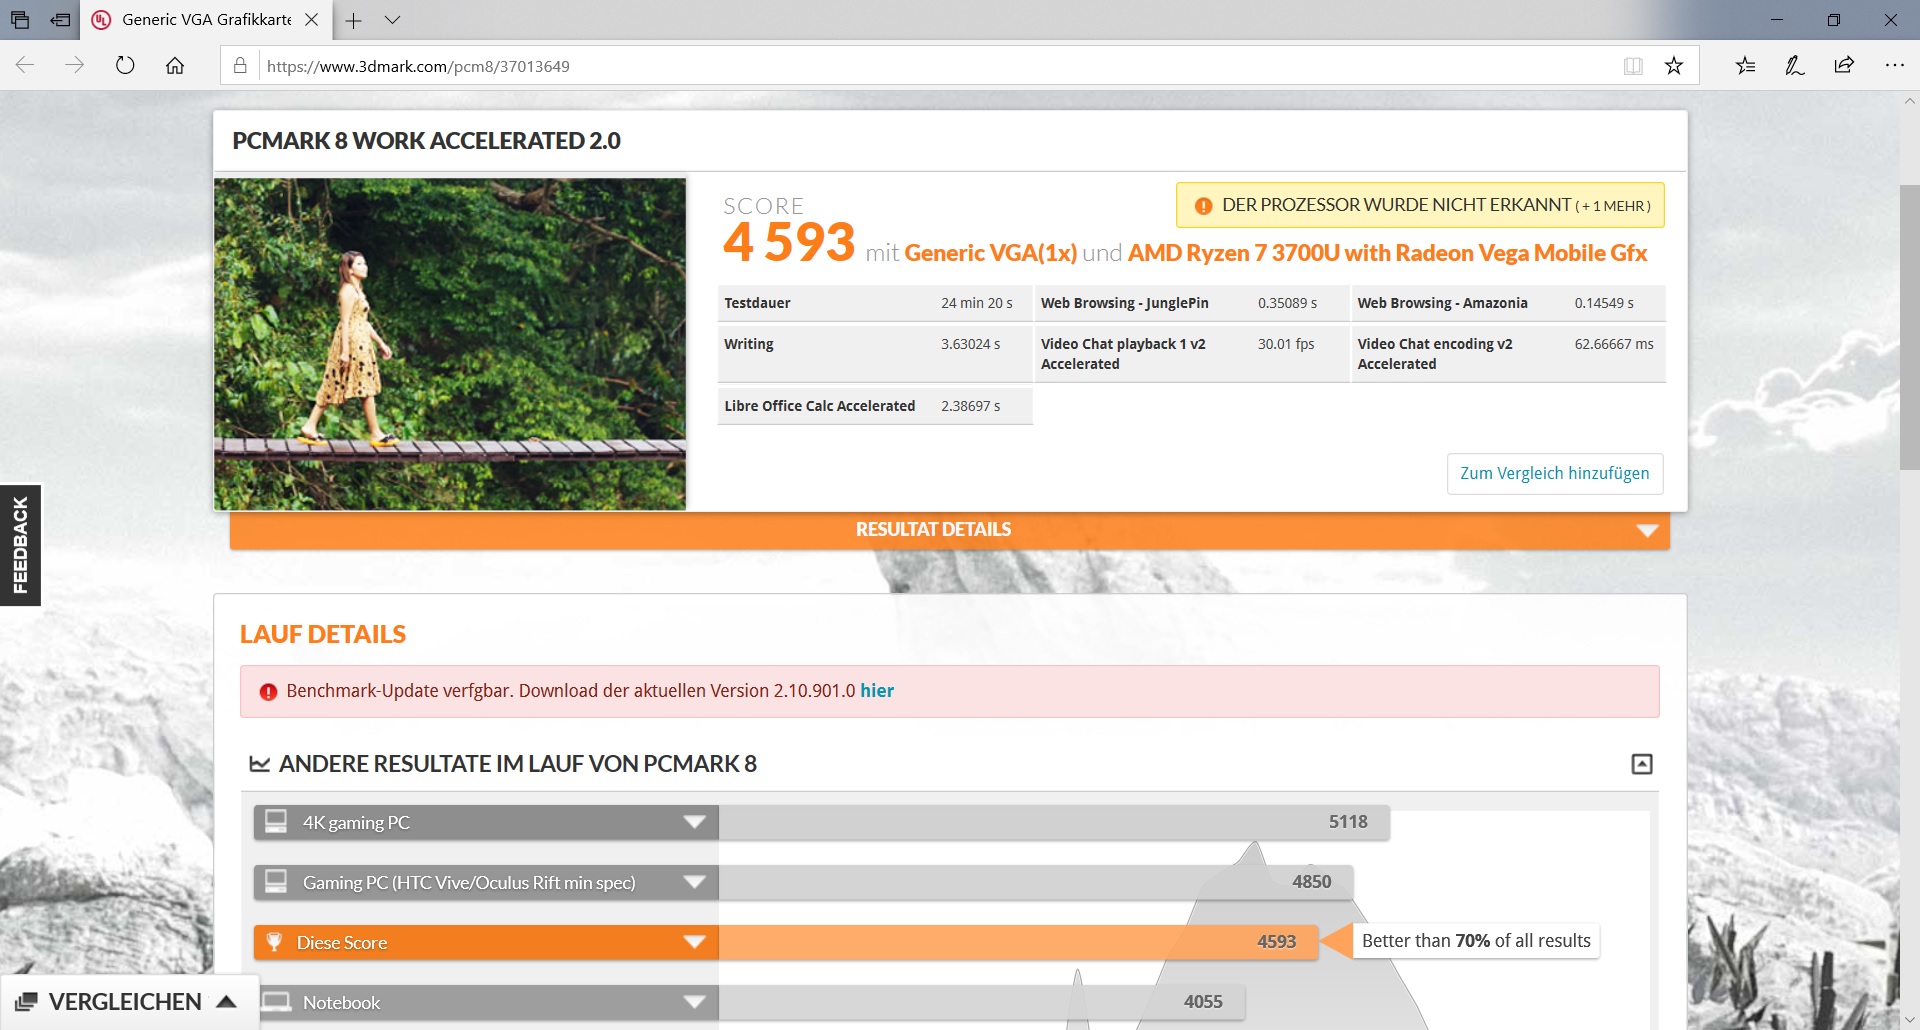
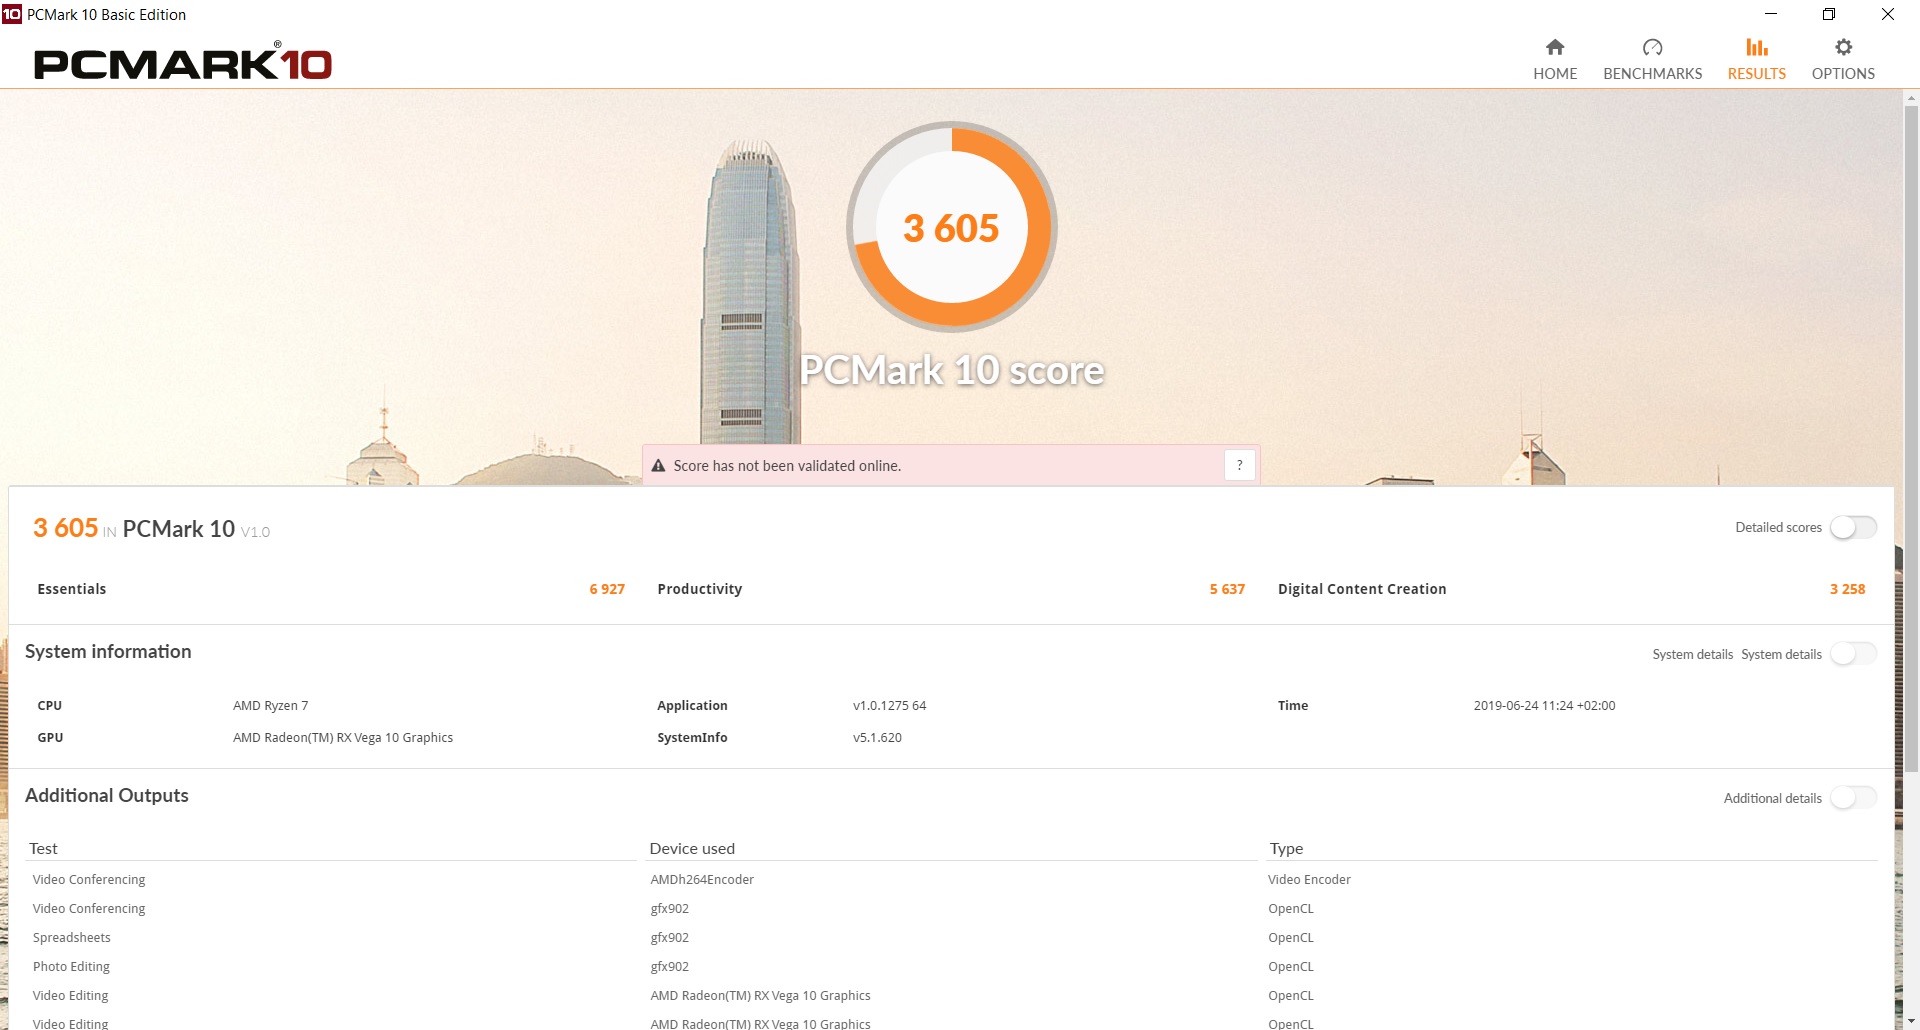
| PCMark 8 Home Score Accelerated v2 | 3342 points | |
| PCMark 8 Work Score Accelerated v2 | 4593 points | |
| PCMark 10 Score | 3605 points | |
Help | ||
Storage
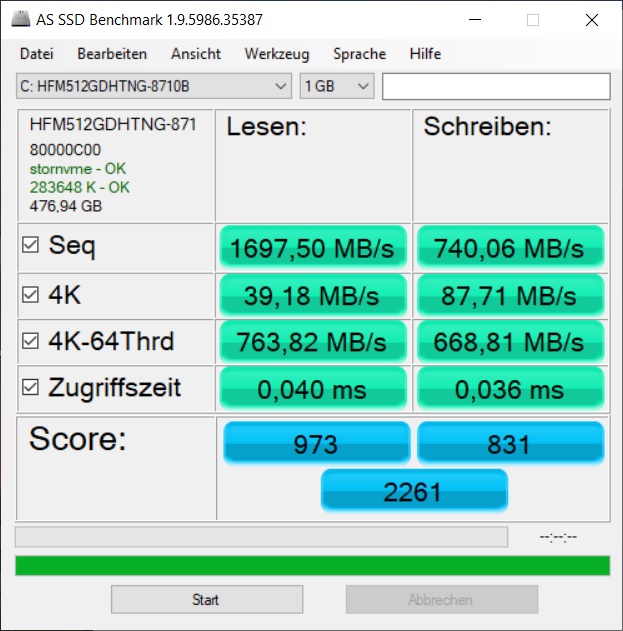
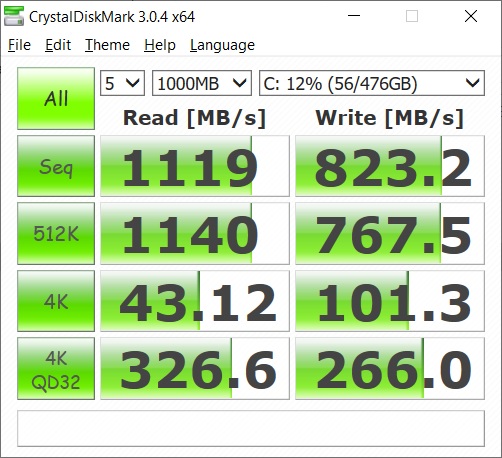
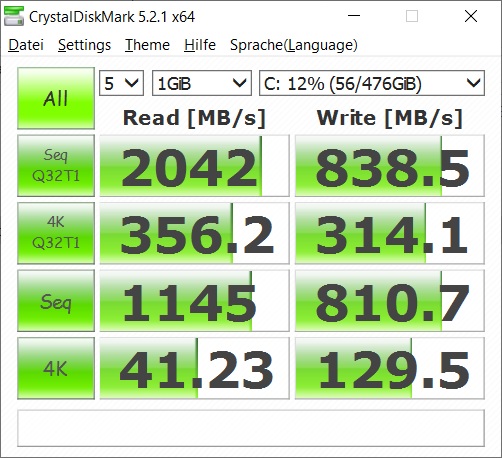
Lenovo has used a 512 GB SSD as storage device, which can be found in the 74th place of our laptop HDD and SSD benchmarks list. Therefore, it is not the fastest model, but the SSD reaches very decent transfer speeds, the best even, when directly compared to the competition. It certainly contributes to the good system performance.
| Lenovo ThinkPad E595-20NF0000GE SK Hynix BC501 HFM512GDJTNG | Lenovo ThinkPad E590-20NC0003GE Toshiba KBG30ZMT512G | HP 14-dk0008ng Samsung PM871b MZNLN128HAHQ | Lenovo ThinkPad E590-20NB0012GE Toshiba KBG30ZMT256G | Acer TravelMate P2510-G2-MG-50WE SK Hynix HFS256G39TND-N210A | Average SK Hynix BC501 HFM512GDJTNG | |
|---|---|---|---|---|---|---|
| CrystalDiskMark 5.2 / 6 | -36% | -43% | -8% | -52% | -9% | |
| Write 4K (MB/s) | 129.5 | 53.4 -59% | 90.6 -30% | 111.2 -14% | 71.8 -45% | 95.5 ? -26% |
| Read 4K (MB/s) | 41.23 | 33.03 -20% | 33.17 -20% | 49.01 19% | 21.23 -49% | 38.3 ? -7% |
| Write Seq (MB/s) | 811 | 624 -23% | 483 -40% | 586 -28% | 257.1 -68% | 759 ? -6% |
| Read Seq (MB/s) | 1145 | 835 -27% | 511 -55% | 783 -32% | 476.3 -58% | 1022 ? -11% |
| Write 4K Q32T1 (MB/s) | 314.1 | 87.4 -72% | 170.7 -46% | 263 -16% | 202.6 -35% | 303 ? -4% |
| Read 4K Q32T1 (MB/s) | 356.2 | 135.9 -62% | 235 -34% | 481.5 35% | 282 -21% | 317 ? -11% |
| Write Seq Q32T1 (MB/s) | 839 | 784 -7% | 496.5 -41% | 784 -7% | 265.6 -68% | 885 ? 5% |
| Read Seq Q32T1 (MB/s) | 2042 | 1623 -21% | 534 -74% | 1602 -22% | 559 -73% | 1803 ? -12% |
| AS SSD | -54% | -72% | -90% | -103% | -9% | |
| Seq Read (MB/s) | 1698 | 1348 -21% | 491.6 -71% | 1316 -22% | 487.3 -71% | 1323 ? -22% |
| Seq Write (MB/s) | 740 | 789 7% | 473.9 -36% | 735 -1% | 250.6 -66% | 697 ? -6% |
| 4K Read (MB/s) | 39.18 | 38.82 -1% | 26.82 -32% | 47.61 22% | 27.61 -30% | 40.4 ? 3% |
| 4K Write (MB/s) | 87.7 | 81.8 -7% | 57.8 -34% | 90.3 3% | 72.1 -18% | 100.8 ? 15% |
| 4K-64 Read (MB/s) | 764 | 825 8% | 244.3 -68% | 643 -16% | 375.9 -51% | 686 ? -10% |
| 4K-64 Write (MB/s) | 669 | 488 -27% | 154.9 -77% | 314.1 -53% | 202.1 -70% | 660 ? -1% |
| Access Time Read * (ms) | 0.04 | 0.081 -103% | 0.119 -197% | 0.162 -305% | 0.08 -100% | 0.06071 ? -52% |
| Access Time Write * (ms) | 0.036 | 0.188 -422% | 0.062 -72% | 0.228 -533% | 0.233 -547% | 0.037 ? -3% |
| Score Read (Points) | 973 | 999 3% | 320 -67% | 822 -16% | 452 -54% | 858 ? -12% |
| Score Write (Points) | 831 | 649 -22% | 260 -69% | 478 -42% | 299 -64% | 830 ? 0% |
| Score Total (Points) | 2261 | 2139 -5% | 753 -67% | 1706 -25% | 980 -57% | 2107 ? -7% |
| Copy ISO MB/s (MB/s) | 876 | 171.1 | 532 | 802 ? | ||
| Copy Program MB/s (MB/s) | 209.7 | 93.2 | 165.4 | 265 ? | ||
| Copy Game MB/s (MB/s) | 599 | 140.6 | 405 | 487 ? | ||
| Total Average (Program / Settings) | -45% /
-46% | -58% /
-59% | -49% /
-55% | -78% /
-81% | -9% /
-9% |
* ... smaller is better

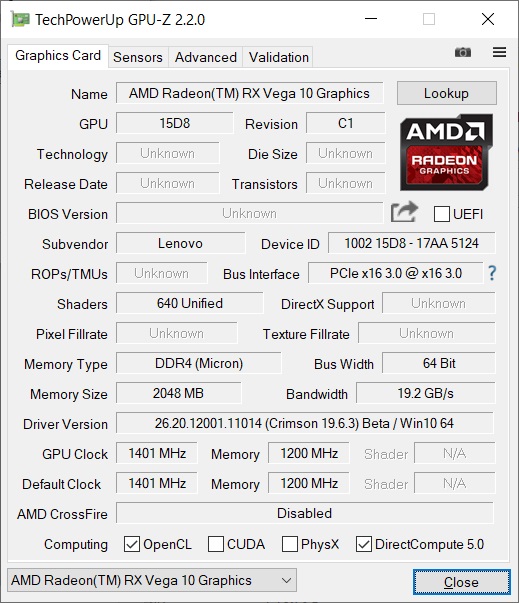
Graphics card
The Ryzen 7 is also joined by the integrated Vega 10 graphics unit. It is currently probably one of the most powerful integrated models and can even compete with weaker dedicated cards (GeForce MX150, GeForce 940MX) to some extent. This depends on the clock speeds allowed by the manufacturer and the cooling system in use.
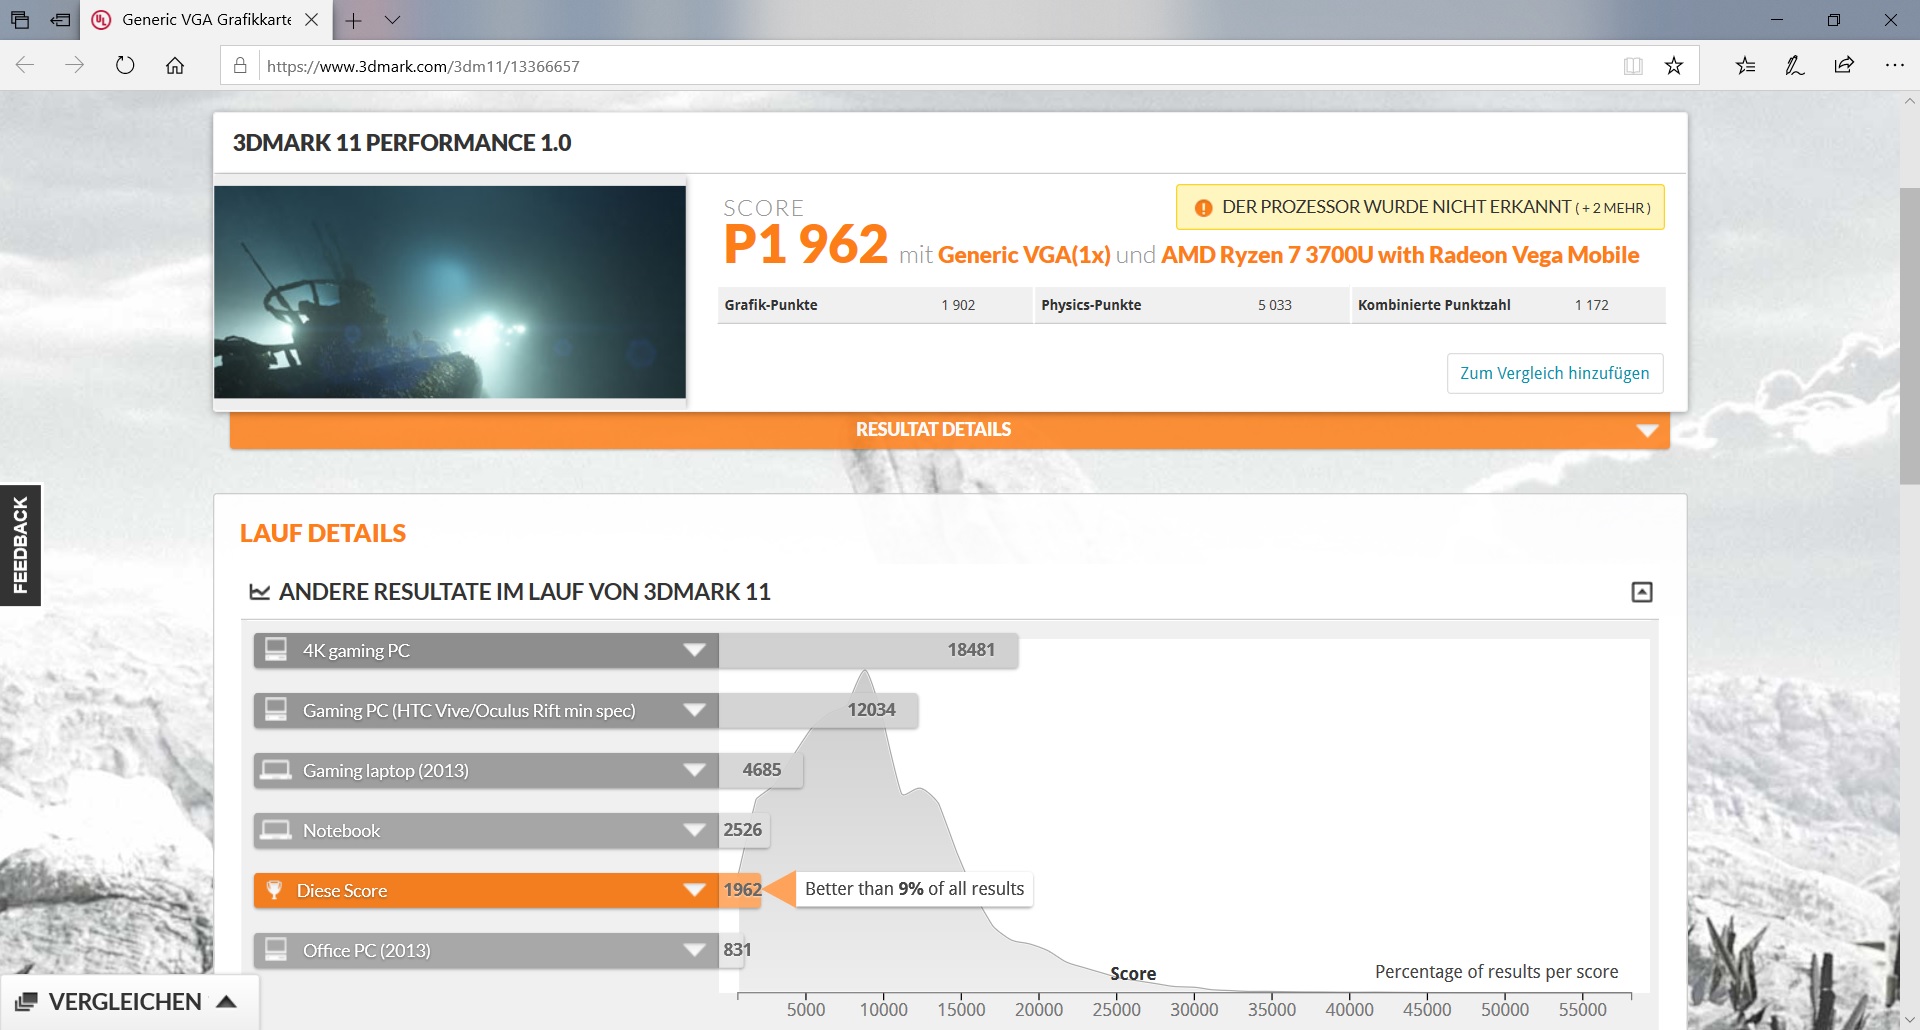
The E595 is a bit disappointing in the synthetic 3DMark tests. The HP 14, which is configured with the same CPU and GPU, is for the first time considerably faster here (around 20 - 30 percent). Lenovo is apparently slightly weakening the biggest advantage of AMD hardware with the E595, namely the theoretically more powerful graphics unit. Nonetheless, it is still able to beat the TravelMate with the GeForce MX130 depending on the test. The UHD graphics from Intel sit defeated in the last place.
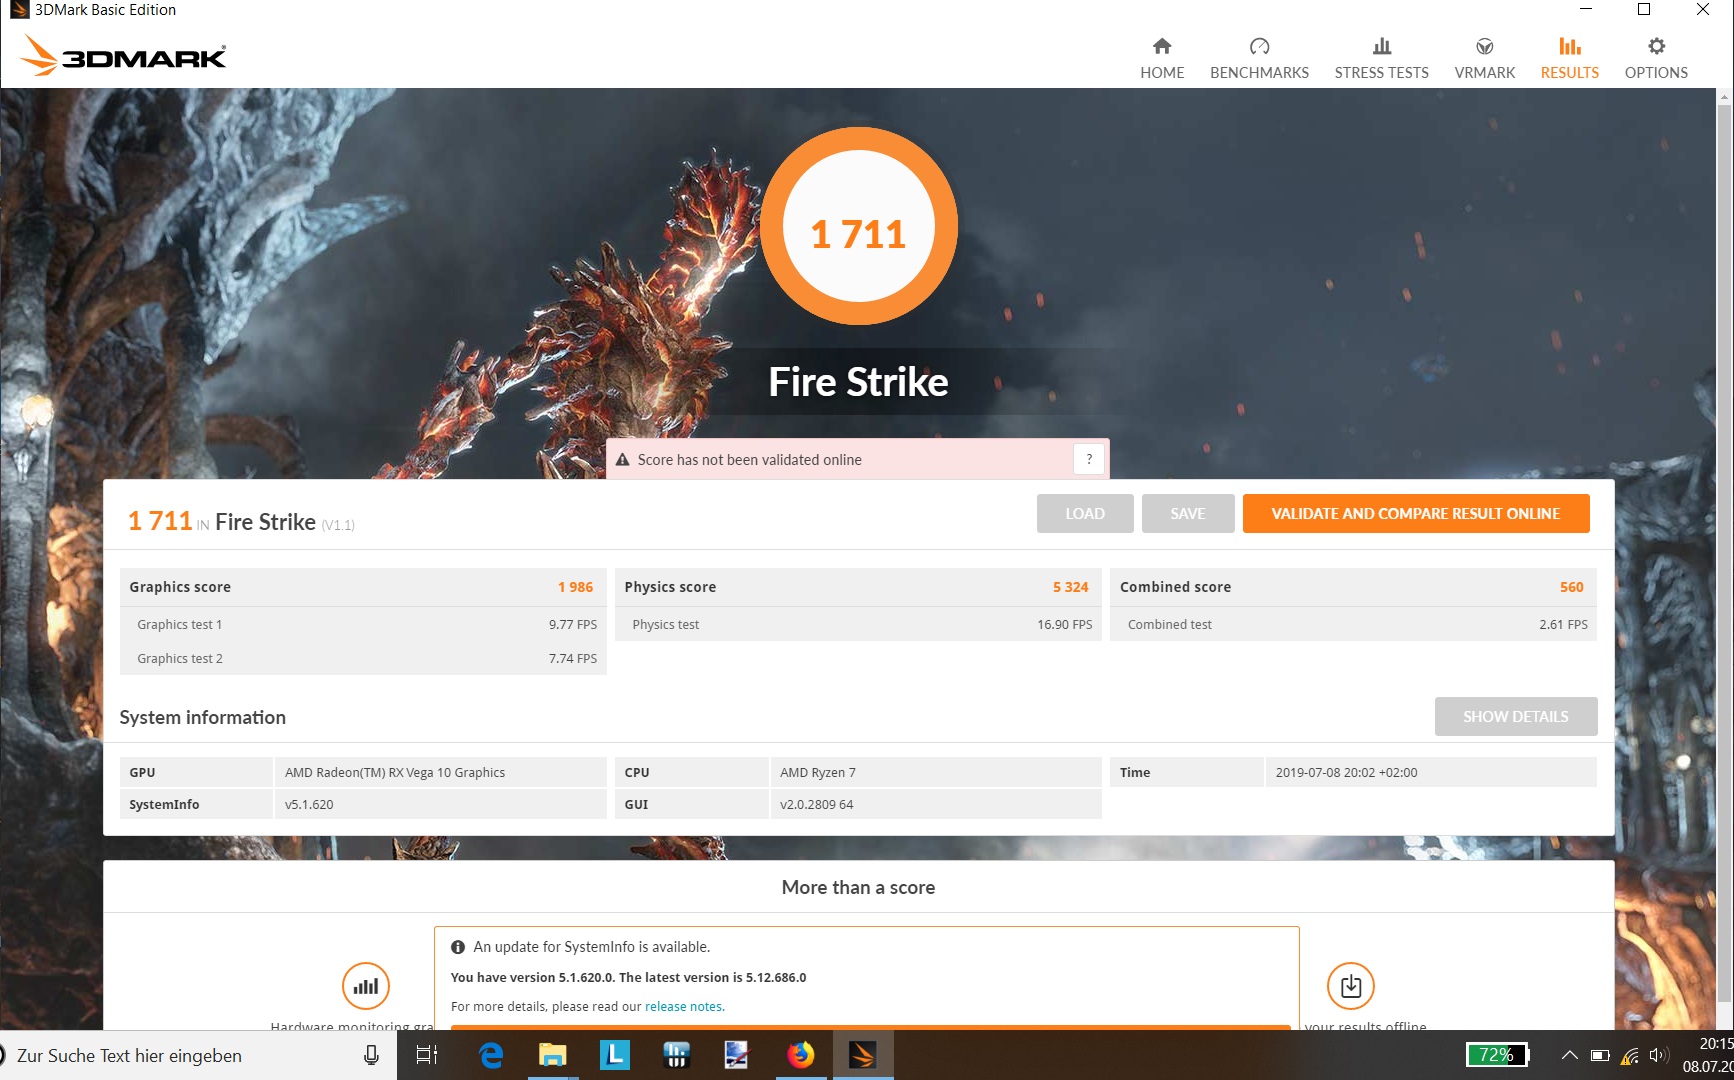
If we conduct one of the 3DMark tests in battery mode, there is barely a decrease in performance to be perceived, contrary to what was observed with the Cinebench test. However, 3DMark 11 always crashed so that our comparison refers to 3DMark 2003 Fire Strike.
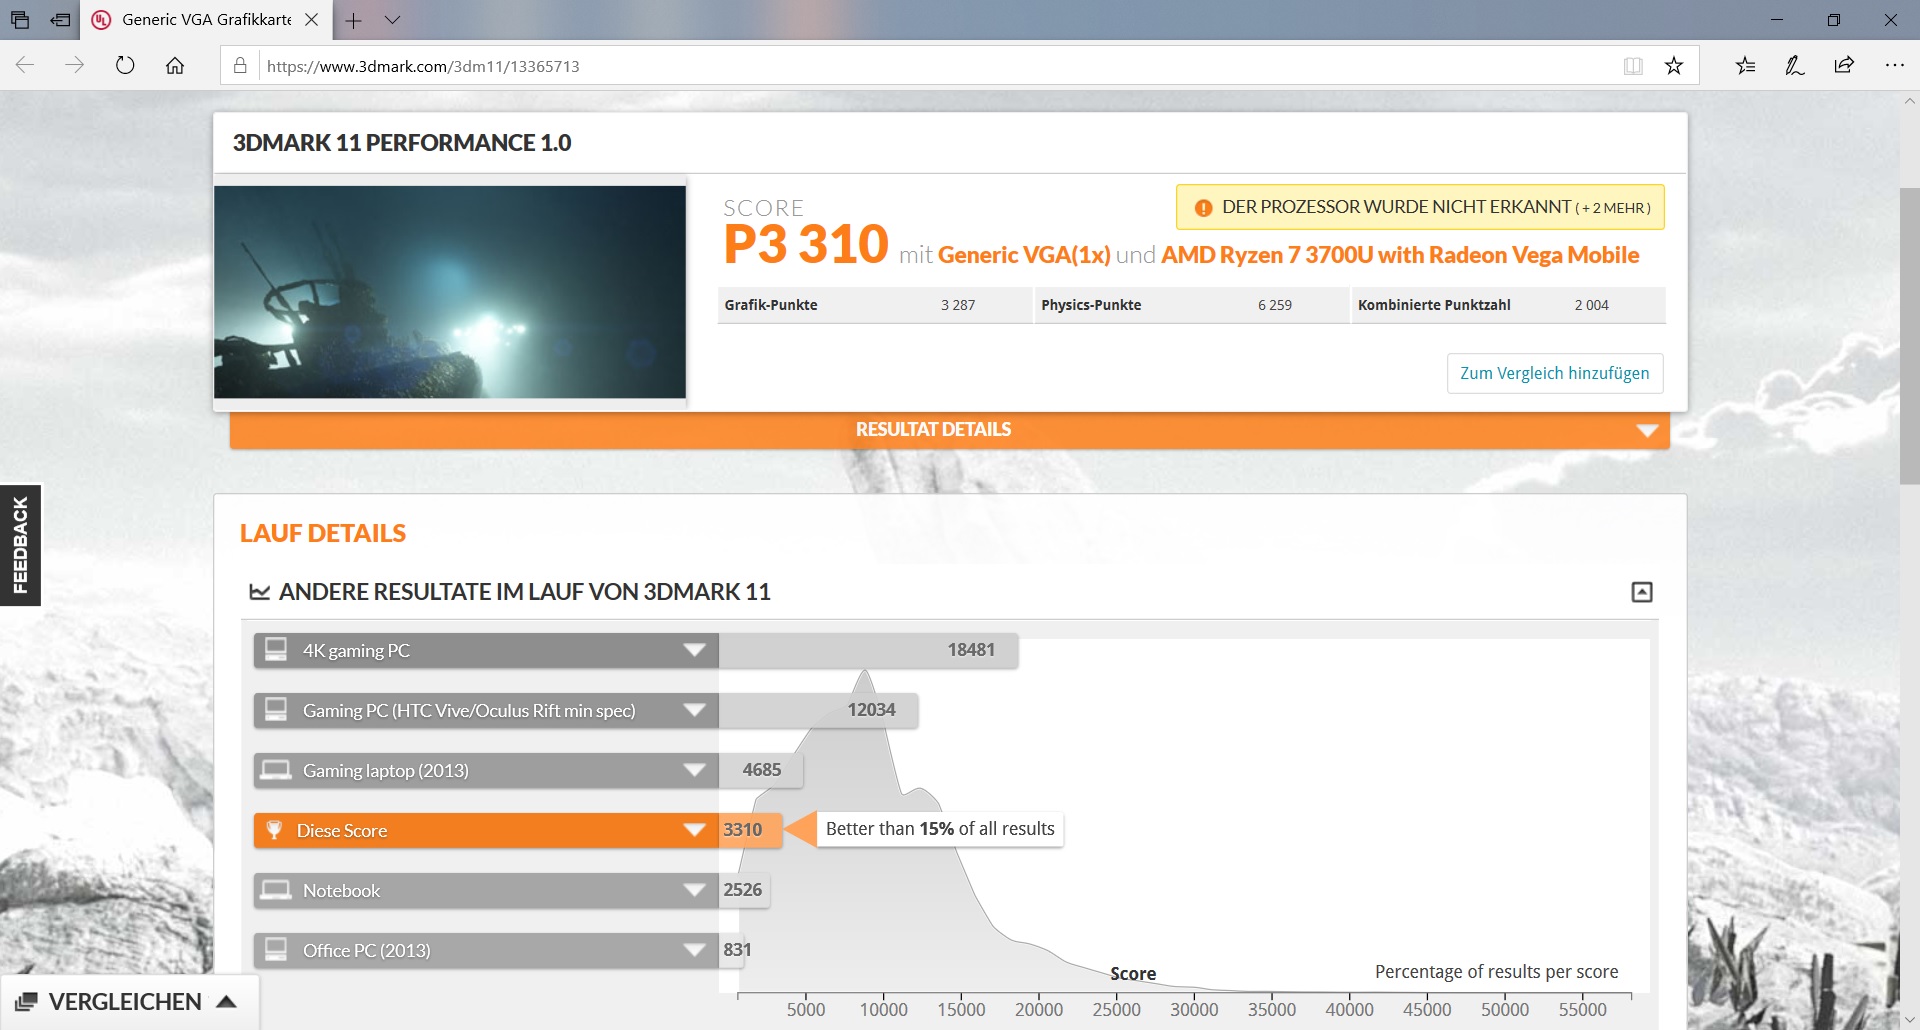

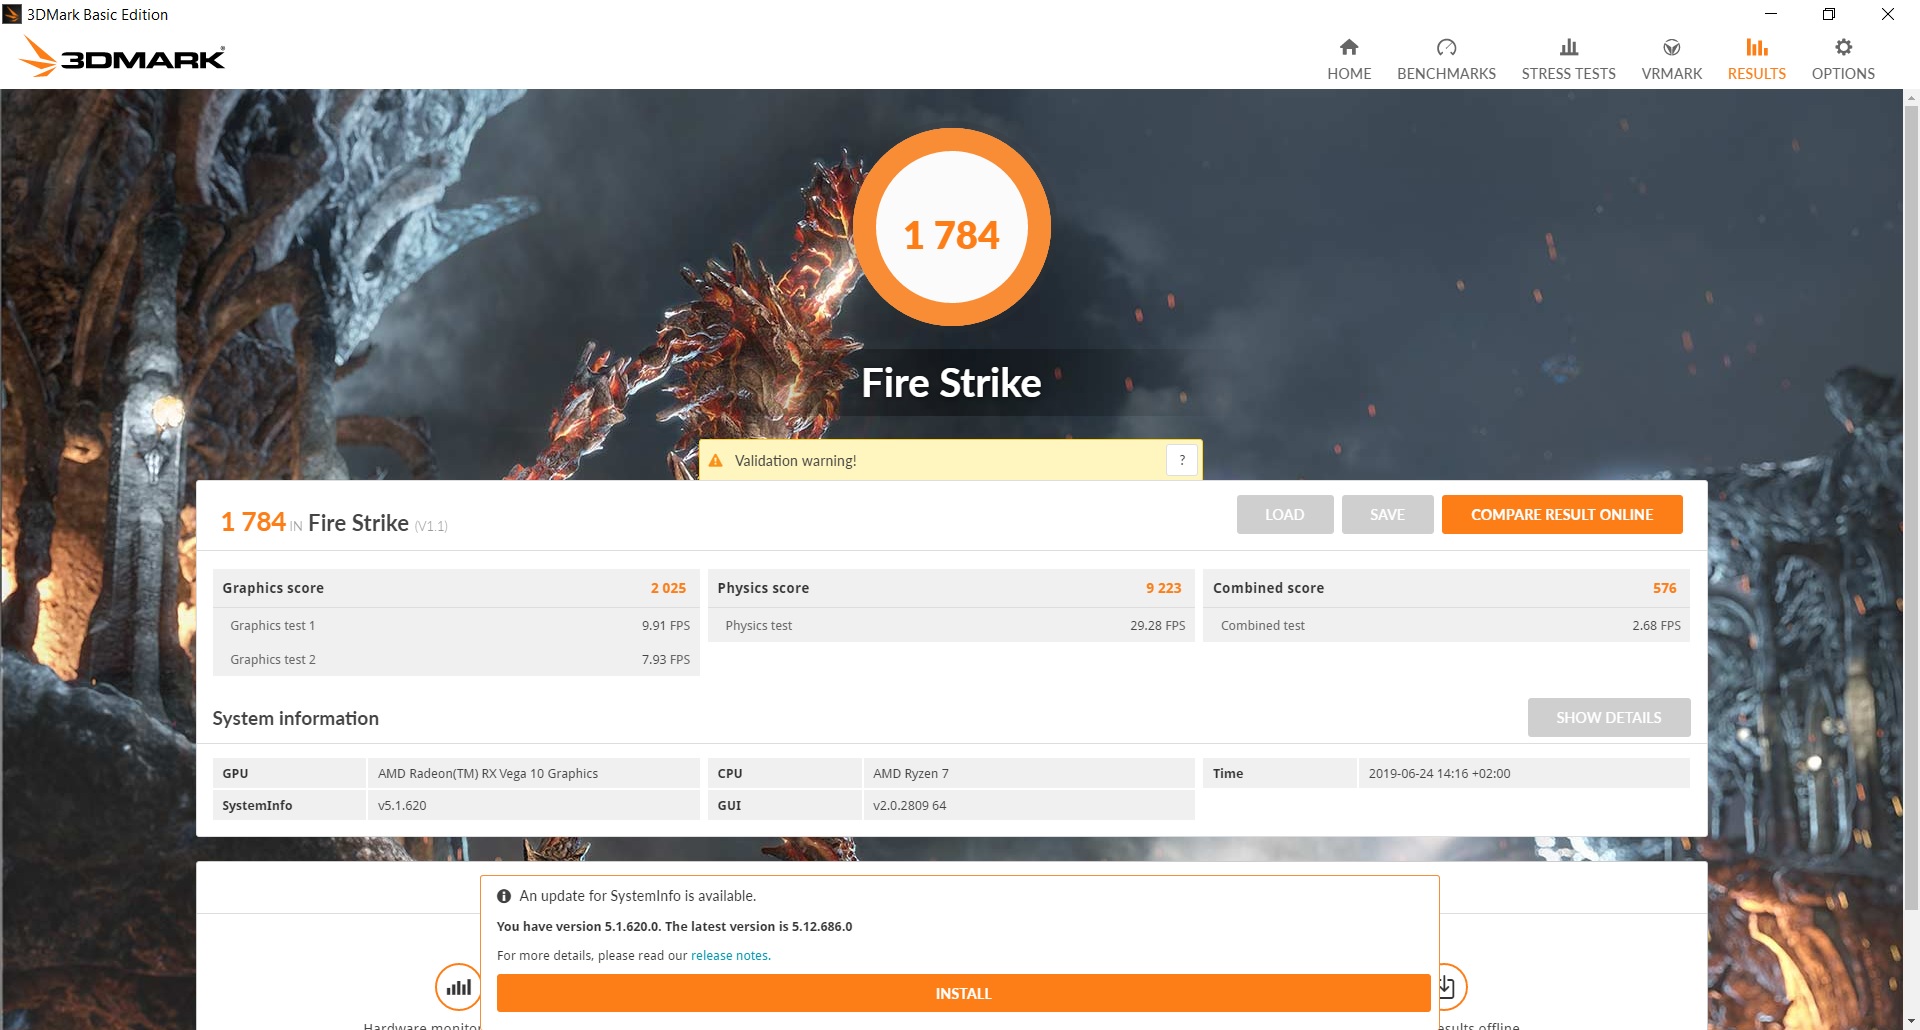
| 3DMark 11 Performance | 3310 points | |
| 3DMark Cloud Gate Standard Score | 7625 points | |
| 3DMark Fire Strike Score | 1784 points | |
Help | ||
Gaming performance
The ThinkPad is fundamentally not geared towards games, yet gaming is possible, even above the absolute bottom of the performance scale. The classic gaming tests confirm what was unfortunately already evident with the synthetic tests: The E595 is unable to utilize the Vega 10 graphics unit to its full potential. The comparison to the HP 14 with the same processor is still interesting here.
For example, this showed with "The Witcher 3", depending on the graphics settings, a lead of 19 to 44 percent! And it is precisely with "The Witcher 3" where this makes the difference between the game being playable and unplayable since the ThinkPad barely reaches 30 FPS even at the lowest resolution and graphic details; this is too little for more demanding scenes. The HP 14 reaches here a more comfortable 39 FPS.
The differences are similarly big with the somewhat older title "BioShock Infinite", but the game is at least playable with the ThinkPad at medium settings. Intel's UHD graphics lag about 30 to 45 percent behind in all games.
The ThinkPad is naturally rather aimed at office tasks so that the graphics throttling will be acceptable for most customers; after all, the throttling of the processor is not noticeable. Nonetheless, this throttling is a bit of a shame since the AMD processor has through its theoretical performance the potential to be considerably more all-rounder than the manufacturers allow it to be. A dual-channel RAM configuration would be helpful here too.
| The Witcher 3 | |
| 1024x768 Low Graphics & Postprocessing | |
| Average of class Office (32.2 - 103.7, n=4, last 2 years) | |
| Lenovo ThinkPad E590-20NB0012GE | |
| HP 14-dk0008ng | |
| Average AMD Radeon RX Vega 10 (29.7 - 53.8, n=8) | |
| Lenovo ThinkPad E595-20NF0000GE | |
| Lenovo ThinkPad E590-20NC0003GE | |
| 1366x768 Medium Graphics & Postprocessing | |
| Average of class Office (44.7 - 63.9, n=4, last 2 years) | |
| Lenovo ThinkPad E590-20NB0012GE | |
| HP 14-dk0008ng | |
| Average AMD Radeon RX Vega 10 (20.4 - 24.2, n=5) | |
| Lenovo ThinkPad E595-20NF0000GE | |
| 1920x1080 High Graphics & Postprocessing (Nvidia HairWorks Off) | |
| Average of class Office (23.7 - 39.9, n=4, last 2 years) | |
| Lenovo ThinkPad E590-20NB0012GE | |
| Average AMD Radeon RX Vega 10 (8.4 - 18.8, n=8) | |
| HP 14-dk0008ng | |
| Lenovo ThinkPad E595-20NF0000GE | |
| Sims 4 | |
| 1024x768 Low Preset | |
| HP 14-dk0008ng | |
| Average AMD Radeon RX Vega 10 (89.7 - 114.4, n=2) | |
| Lenovo ThinkPad E595-20NF0000GE | |
| 1366x768 Medium Preset | |
| HP 14-dk0008ng | |
| Average AMD Radeon RX Vega 10 (44 - 47.5, n=2) | |
| Lenovo ThinkPad E595-20NF0000GE | |
| 1920x1080 High Preset | |
| HP 14-dk0008ng | |
| Average AMD Radeon RX Vega 10 (22 - 32, n=2) | |
| Lenovo ThinkPad E595-20NF0000GE | |
In order to determine how constant the ThinkPad's gaming performance is, we let "The Witcher 3" run for an hour at ultra settings. This shows that the E595 has a very constant performance despite it not being able to use the Vega 10 to its full potential. The graph does not show dips over time due to rising temperatures and subsequently lowered clock speeds - very good.
| low | med. | high | ultra | |
|---|---|---|---|---|
| BioShock Infinite (2013) | 86.9 | 53.2 | 39.1 | 14.2 |
| Sims 4 (2014) | 89.7 | 44 | 22 | |
| The Witcher 3 (2015) | 29.9 | 20.4 | 8.4 | 8 |
| Dota 2 Reborn (2015) | 66 | 55.2 | 29.7 | 27.6 |
| X-Plane 11.11 (2018) | 23 | 17.7 | 16.3 |
Emissions - Quiet Lenovo E595
Noise emissions
The new ThinkPad is fairly unobtrusive in terms of noise emissions. In a cold state, the fans are fairly silent. Otherwise, the volume level is moderate. The fans do not turn up disproportionately even under heavy load. The E590 with Intel UHD graphics largely remains equally loud under all load conditions, but it performs significantly worse. Only under maximum load is the E595 a bit louder; there is barely any difference in average though.
| Lenovo ThinkPad E595-20NF0000GE Vega 10, R7 3700U, SK Hynix BC501 HFM512GDJTNG | Lenovo ThinkPad E590-20NC0003GE UHD Graphics 620, i7-8565U, Toshiba KBG30ZMT512G | Lenovo ThinkPad E590-20NB0012GE Radeon RX 550X (Laptop), i7-8565U, Toshiba KBG30ZMT256G | HP 14-dk0008ng Vega 10, R7 3700U, Samsung PM871b MZNLN128HAHQ | Acer TravelMate P2510-G2-MG-50WE GeForce MX130, i5-8250U, SK Hynix HFS256G39TND-N210A | |
|---|---|---|---|---|---|
| Noise | 3% | -1% | -3% | -6% | |
| off / environment * (dB) | 29.3 | 29.3 -0% | 29.4 -0% | 30.6 -4% | 30.3 -3% |
| Idle Minimum * (dB) | 29.3 | 29.3 -0% | 29.4 -0% | 31.4 -7% | 30.3 -3% |
| Idle Average * (dB) | 29.3 | 29.3 -0% | 29.4 -0% | 31.4 -7% | 30.3 -3% |
| Idle Maximum * (dB) | 30.1 | 29.3 3% | 29.4 2% | 31.4 -4% | 31 -3% |
| Load Average * (dB) | 30.9 | 30.6 1% | 33.9 -10% | 32.5 -5% | 35.6 -15% |
| Load Maximum * (dB) | 35.2 | 30.6 13% | 33.9 4% | 32.5 8% | 38.6 -10% |
| Witcher 3 ultra * (dB) | 33.9 |
* ... smaller is better
Noise level
| Idle |
| 29.3 / 29.3 / 30.1 dB(A) |
| Load |
| 30.9 / 35.2 dB(A) |
 | ||
30 dB silent 40 dB(A) audible 50 dB(A) loud |
||
min: | ||
Temperature
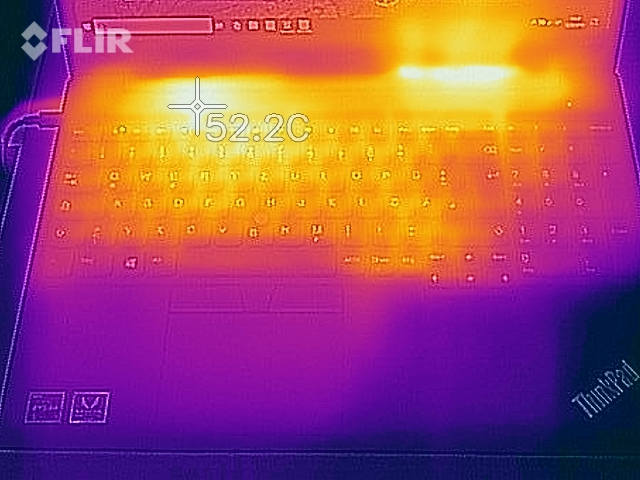
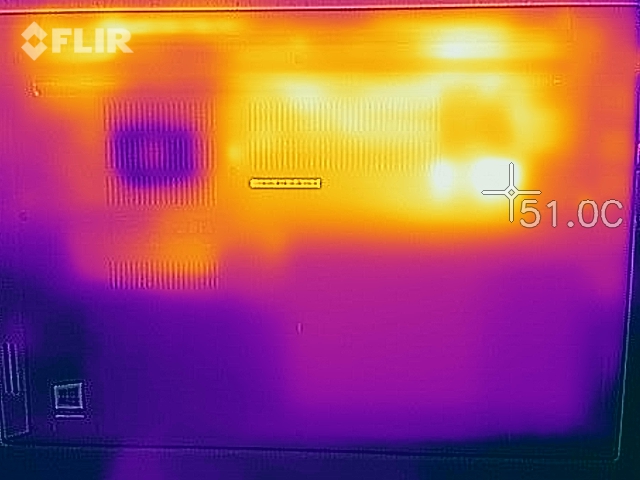
The ThinkPad is a bit less moderate when it comes to temperatures, but it still remains within the limits. The top and the bottom can reach up to 48 °C (~118 °F) under heavy load. Most competitors do it considerably better; even the HP 14 with the same hardware and higher gaming performance manages to remain around 10 °C (~18 °F) colder under load! However, considering that the office laptop will probably face these kinds of load scenarios rather infrequently, this should not pose any problems. After all, the cooling system is fairly quiet. We find this to be the better compromise, and the TravelMate gets equally hot with its MX130.
| Lenovo ThinkPad E595-20NF0000GE Vega 10, R7 3700U, SK Hynix BC501 HFM512GDJTNG | Lenovo ThinkPad E590-20NC0003GE UHD Graphics 620, i7-8565U, Toshiba KBG30ZMT512G | Lenovo ThinkPad E590-20NB0012GE Radeon RX 550X (Laptop), i7-8565U, Toshiba KBG30ZMT256G | HP 14-dk0008ng Vega 10, R7 3700U, Samsung PM871b MZNLN128HAHQ | Acer TravelMate P2510-G2-MG-50WE GeForce MX130, i5-8250U, SK Hynix HFS256G39TND-N210A | |
|---|---|---|---|---|---|
| Heat | 11% | 0% | 18% | 6% | |
| Maximum Upper Side * (°C) | 48.8 | 43.8 10% | 56.7 -16% | 39.6 19% | 49 -0% |
| Maximum Bottom * (°C) | 48.4 | 43.9 9% | 58.1 -20% | 37.1 23% | 47.4 2% |
| Idle Upper Side * (°C) | 29.1 | 25.5 12% | 23.4 20% | 25.8 11% | 26.6 9% |
| Idle Bottom * (°C) | 31 | 27 13% | 25.9 16% | 25.3 18% | 26.7 14% |
* ... smaller is better
The E595 gets warmer indeed, but the palm rests remain quite cool. The surface heat develops further in the middle and in the back on the keyboard; the left side is particularly affected.
(-) The maximum temperature on the upper side is 48.8 °C / 120 F, compared to the average of 34.3 °C / 94 F, ranging from 21.2 to 62.5 °C for the class Office.
(-) The bottom heats up to a maximum of 48.4 °C / 119 F, compared to the average of 36.8 °C / 98 F
(+) In idle usage, the average temperature for the upper side is 27 °C / 81 F, compared to the device average of 29.5 °C / 85 F.
(+) The palmrests and touchpad are cooler than skin temperature with a maximum of 26.1 °C / 79 F and are therefore cool to the touch.
(±) The average temperature of the palmrest area of similar devices was 27.5 °C / 81.5 F (+1.4 °C / 2.5 F).
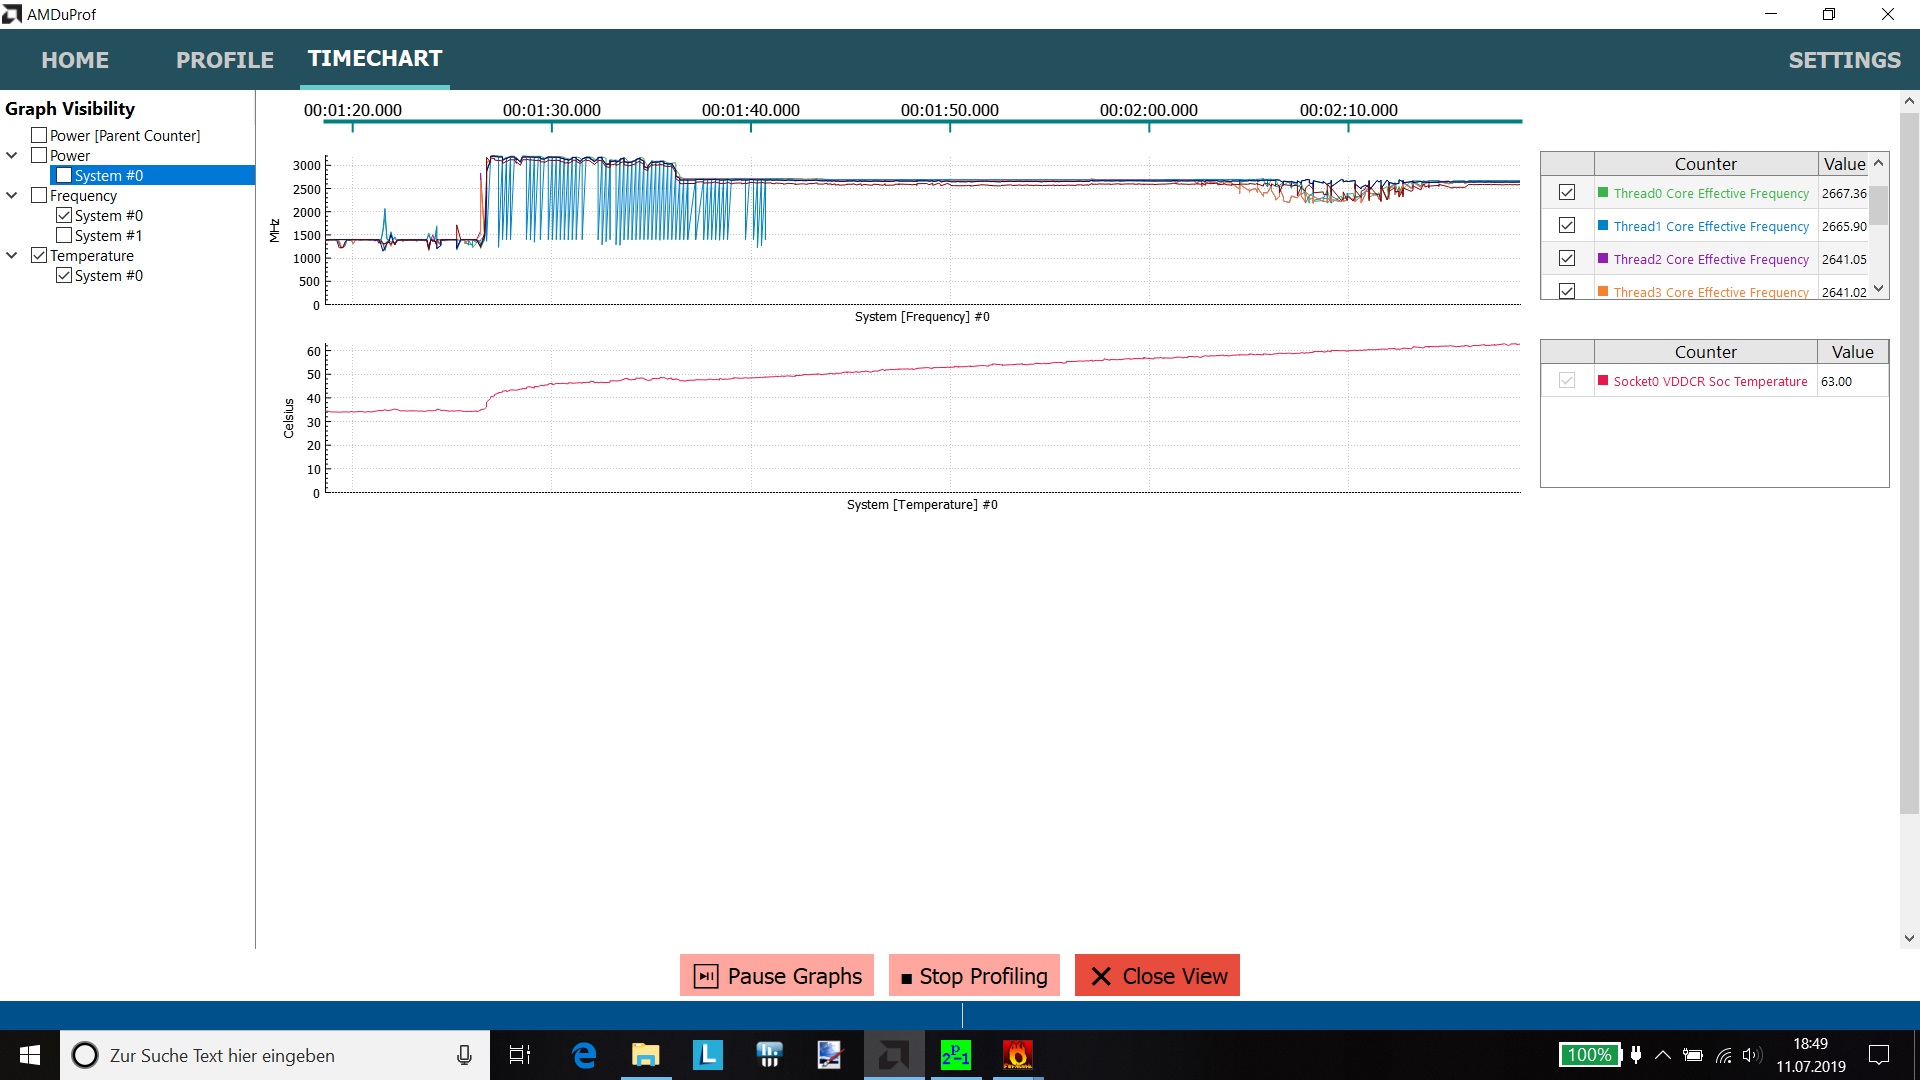
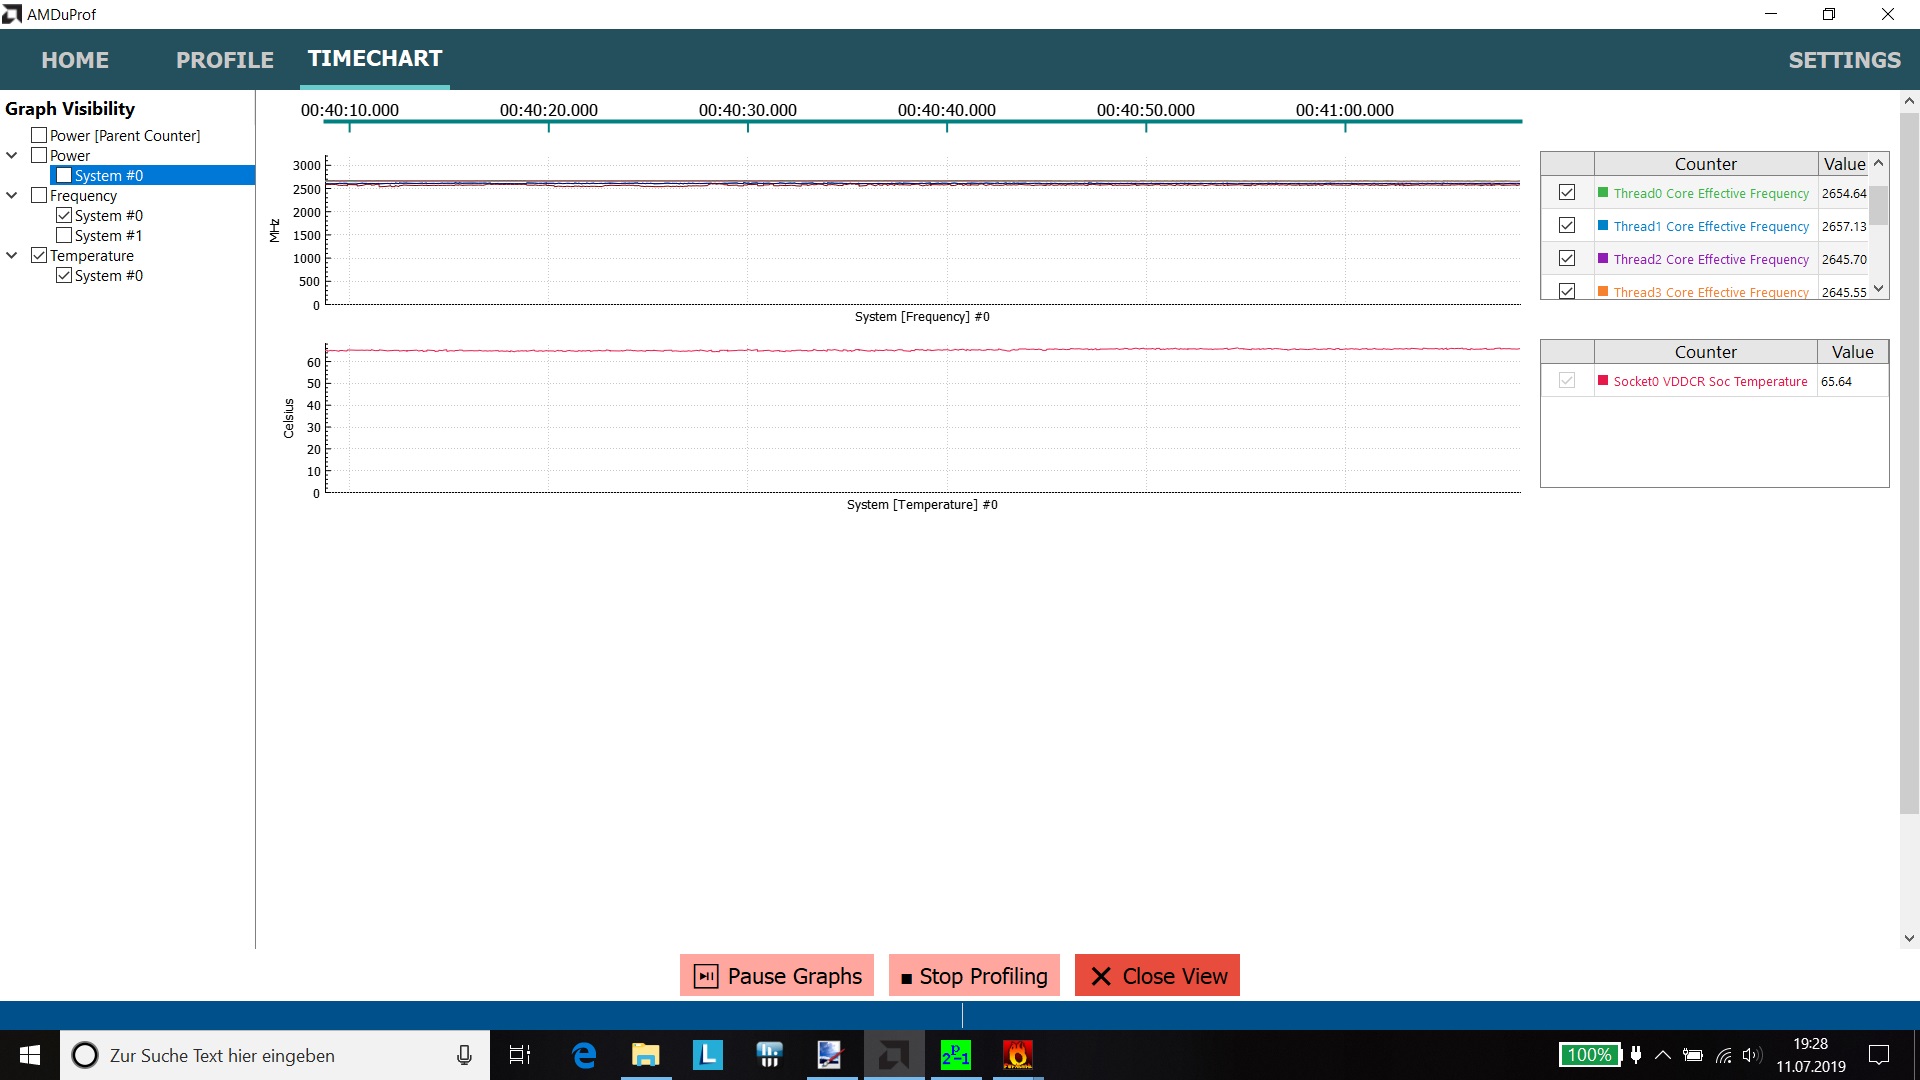
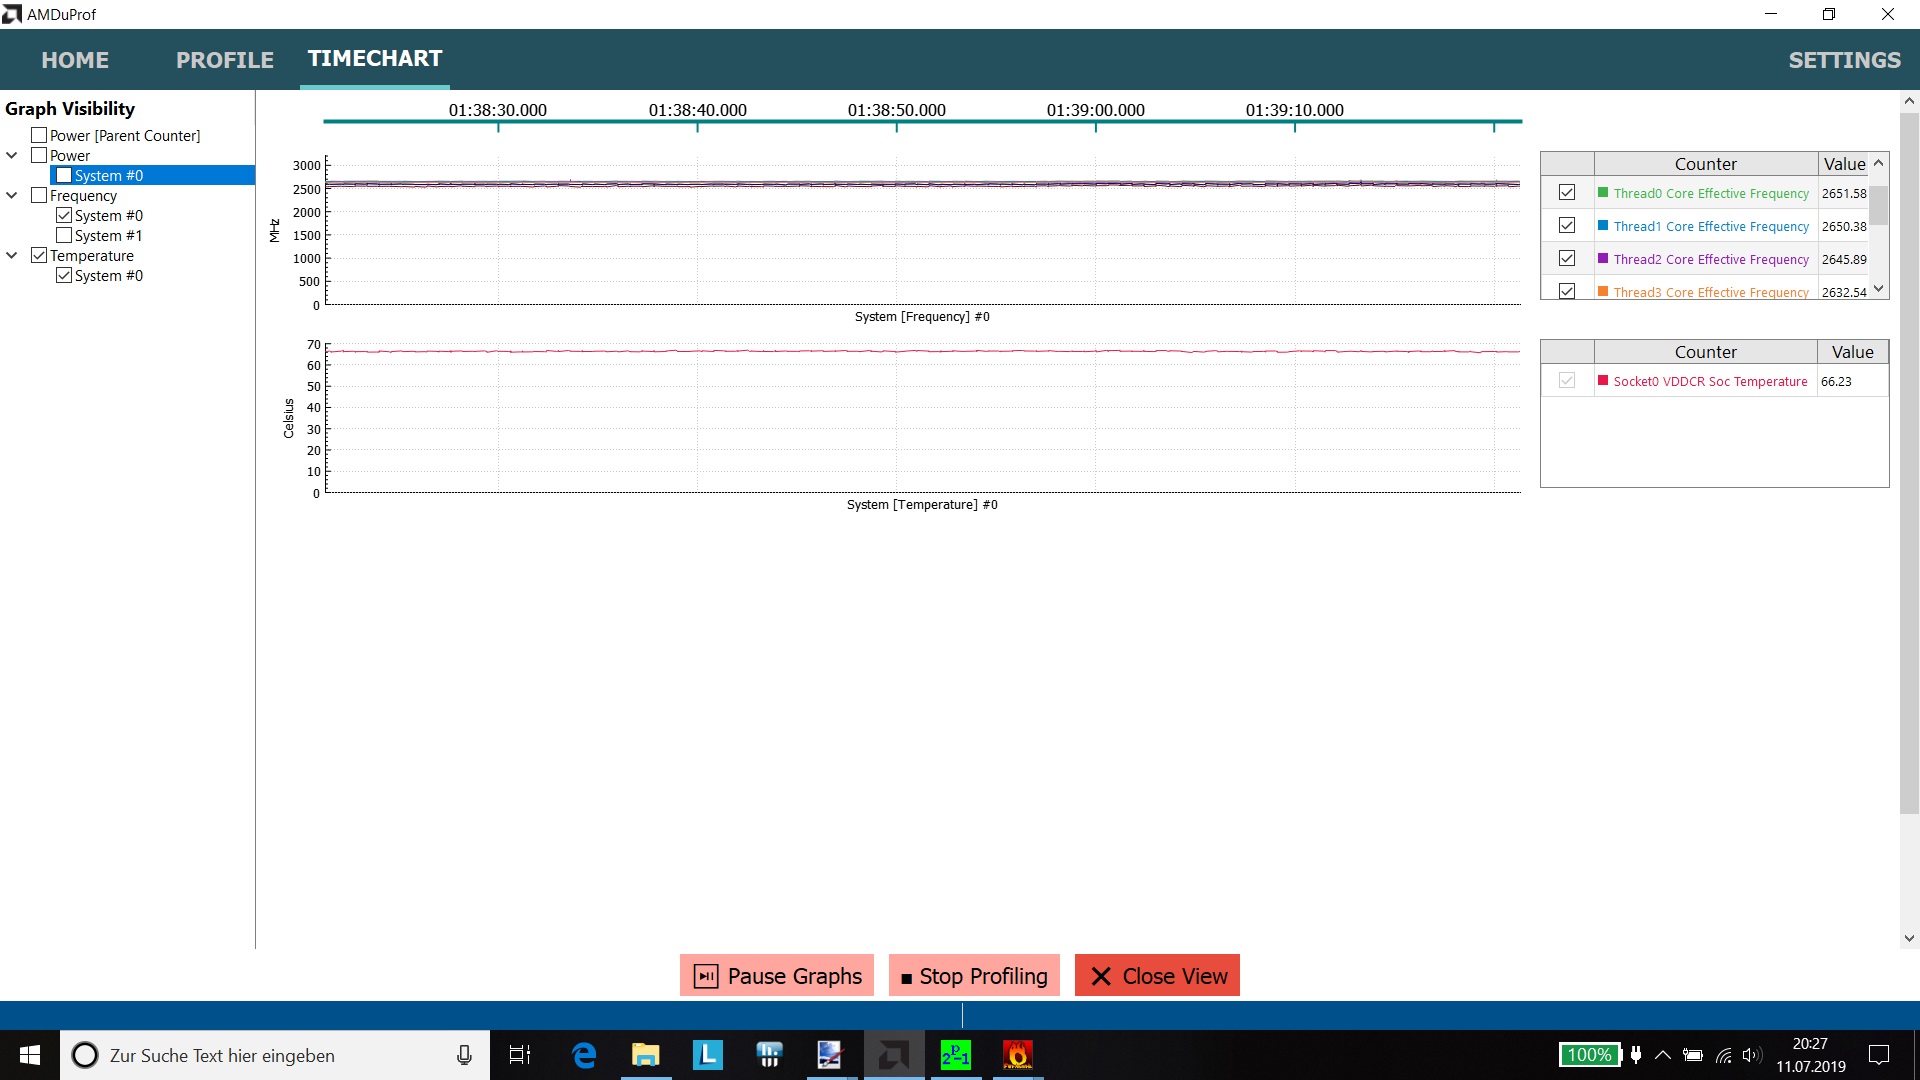
The stress test shows once again the comfortably constant performance achieved by the CPU/GPU team. Even after an hour, the base speed of the CPU is not undercut permanently; it sits at about 2.6 GHz. The same goes for the speed of the graphics unit, which has a lower base level than necessary but remains quite constant.
Immediately after that, we started the 3DMark 11 test again in order to determine the performance differences due to the previous strong load. And as expected, performance in the 3DMark test drops to only about 60 percent of the output observed in a cold state.

Speakers
We are still waiting for a business laptop with outstanding sound properties. This does not change with the ThinkPad. We have heard worse speakers before, but for what is typically expected in this class, the volume is a bit too low, and there is clearly too little bass. Users looking for more sound range should use headphones or an external system with the E595. In addition to the HDMI, there is only one combined headphone/microphone port available.
Lenovo ThinkPad E595-20NF0000GE audio analysis
(±) | speaker loudness is average but good (75.3 dB)
Bass 100 - 315 Hz
(-) | nearly no bass - on average 19.7% lower than median
(±) | linearity of bass is average (14.4% delta to prev. frequency)
Mids 400 - 2000 Hz
(±) | higher mids - on average 8.7% higher than median
(+) | mids are linear (5.9% delta to prev. frequency)
Highs 2 - 16 kHz
(+) | balanced highs - only 1.9% away from median
(±) | linearity of highs is average (8.9% delta to prev. frequency)
Overall 100 - 16.000 Hz
(±) | linearity of overall sound is average (24.4% difference to median)
Compared to same class
» 71% of all tested devices in this class were better, 8% similar, 21% worse
» The best had a delta of 7%, average was 21%, worst was 53%
Compared to all devices tested
» 74% of all tested devices were better, 6% similar, 20% worse
» The best had a delta of 4%, average was 24%, worst was 134%
Lenovo ThinkPad E590-20NC0003GE audio analysis
(-) | not very loud speakers (70 dB)
Bass 100 - 315 Hz
(-) | nearly no bass - on average 19.7% lower than median
(±) | linearity of bass is average (13.6% delta to prev. frequency)
Mids 400 - 2000 Hz
(+) | balanced mids - only 4.1% away from median
(+) | mids are linear (6.3% delta to prev. frequency)
Highs 2 - 16 kHz
(+) | balanced highs - only 3.5% away from median
(±) | linearity of highs is average (14.5% delta to prev. frequency)
Overall 100 - 16.000 Hz
(±) | linearity of overall sound is average (24.7% difference to median)
Compared to same class
» 73% of all tested devices in this class were better, 7% similar, 20% worse
» The best had a delta of 7%, average was 21%, worst was 53%
Compared to all devices tested
» 75% of all tested devices were better, 5% similar, 20% worse
» The best had a delta of 4%, average was 24%, worst was 134%
Energy consumption - Frugal office ThinkPad
Energy requirement
The AMD ThinkPad is surprisingly economical when it comes to energy consumption. It requires around the same amount as the E590 with an Intel processor and significantly weaker UHD graphics and considerably less than the TravelMate with the MX130. On the other hand, the consumption is equal to the one of the HP 14, which offers more graphics performance but gets more throttled on the processor side in return. Overall, we are surprised with the requirement results in comparison to the Intel hardware. In the past, AMD was clearly lagging behind here; it seems like a lot has been done in this regard.
The maximum consumption under heavy load is about 42 watts, but it is normally only 29 watts in average load scenarios. The 65-watt power adapter with a USB-C port is more than enough and should be able to deliver sufficient energy to the ThinkPad in every situation.
| Off / Standby | |
| Idle | |
| Load |
|
Key:
min: | |
| Lenovo ThinkPad E595-20NF0000GE R7 3700U, Vega 10, SK Hynix BC501 HFM512GDJTNG, IPS, 1920x1080, 15.6" | Lenovo ThinkPad E590-20NC0003GE i7-8565U, UHD Graphics 620, Toshiba KBG30ZMT512G, IPS LED, 1920x1080, 15.6" | Lenovo ThinkPad E590-20NB0012GE i7-8565U, Radeon RX 550X (Laptop), Toshiba KBG30ZMT256G, IPS, 1920x1080, 15.6" | HP 14-dk0008ng R7 3700U, Vega 10, Samsung PM871b MZNLN128HAHQ, IPS, 1920x1080, 14" | Acer TravelMate P2510-G2-MG-50WE i5-8250U, GeForce MX130, SK Hynix HFS256G39TND-N210A, IPS, 1920x1080, 15.6" | Average AMD Radeon RX Vega 10 | Average of class Office | |
|---|---|---|---|---|---|---|---|
| Power Consumption | -4% | -32% | -3% | -16% | -10% | -21% | |
| Idle Minimum * (Watt) | 4.2 | 3.72 11% | 3.48 17% | 4.8 -14% | 3.3 21% | 4.73 ? -13% | 4.44 ? -6% |
| Idle Average * (Watt) | 7.92 | 7.8 2% | 7.2 9% | 7.1 10% | 5.6 29% | 7.61 ? 4% | 7.38 ? 7% |
| Idle Maximum * (Watt) | 8.16 | 10.32 -26% | 10.2 -25% | 7.3 11% | 7.8 4% | 9.63 ? -18% | 8.59 ? -5% |
| Load Average * (Watt) | 29 | 30.24 -4% | 59.6 -106% | 34 -17% | 54 -86% | 33.3 ? -15% | 43 ? -48% |
| Load Maximum * (Watt) | 42.2 | 44 -4% | 65.1 -54% | 45 -7% | 63 -49% | 45.1 ? -7% | 64.5 ? -53% |
| Witcher 3 ultra * (Watt) | 49 |
* ... smaller is better
Battery life
If you put almost no load on the Lenovo laptop, it can last for a maximum of 15 hours and 41 minutes with every energy saving option activated. Under very heavy load and with all energy guzzlers activated, the E595 shuts down after around 1.5 hours.
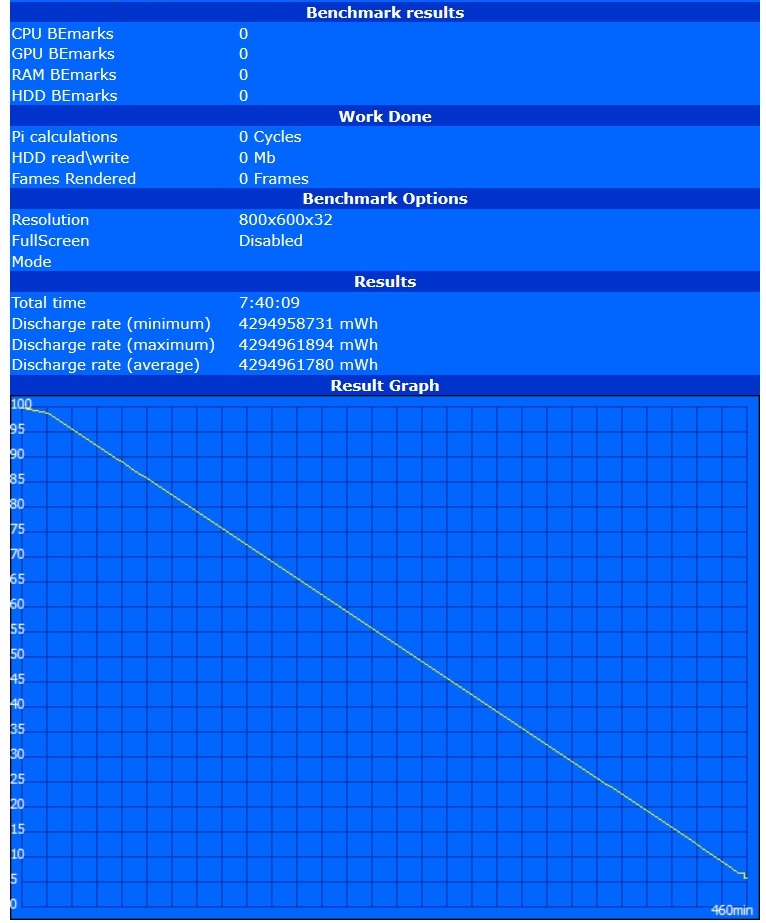
So much for extremes. Our Wi-Fi test and Movie test are clearly more relevant in practice and therefore more meaningful. For the former we reduce the brightness to 150 nits, we set the Windows performance regulator to three fourths and surf the web with an automated script. The laptop lasts a bit beyond 7.5 hours on battery power. In the video test we run a movie in a loop with all radio modules turned off; the performance level is minimized to a smooth reproduction. You can schedule your video evening for around 8.5 hours.
In comparison to both sister models with the E590 model designation, battery life has almost remained the same. The different devices are separated by only a few percentage points despite having different hardware and equally large batteries. That is definitely a positive trend since battery life was quite a big weakness in AMD laptops in the past. The HP 14 achieves about 25 percent shorter run times with its slightly smaller battery; the TravelMate is marginally better.
| Lenovo ThinkPad E595-20NF0000GE R7 3700U, Vega 10, 45 Wh | Lenovo ThinkPad E590-20NC0003GE i7-8565U, UHD Graphics 620, 45 Wh | Lenovo ThinkPad E590-20NB0012GE i7-8565U, Radeon RX 550X (Laptop), 45 Wh | HP 14-dk0008ng R7 3700U, Vega 10, 41.04 Wh | Acer TravelMate P2510-G2-MG-50WE i5-8250U, GeForce MX130, 48 Wh | Average of class Office | |
|---|---|---|---|---|---|---|
| Battery runtime | 5% | 9% | -25% | 14% | 53% | |
| Reader / Idle (h) | 15.7 | 18.3 17% | 18.9 20% | 11.8 -25% | 23.7 ? 51% | |
| H.264 (h) | 8.6 | 8.4 -2% | 9 5% | 6.9 -20% | 8.6 0% | 15 ? 74% |
| WiFi v1.3 (h) | 7.7 | 6.4 -17% | 7.1 -8% | 7.2 -6% | 8.4 9% | 12.9 ? 68% |
| Load (h) | 1.5 | 1.8 20% | 1.8 20% | 0.8 -47% | 2 33% | 1.807 ? 20% |
Pros
Cons
Verdict - Decent ThinkPad laptop
With the ThinkPad E595, Lenovo appears to have responded to some of the criticism given to the E590 models and slightly improved the model. Overall, it would actually seem like our review device results in a more well-rounded package. It offers more performance than the E590 with an Intel CPU and integrated UHD graphics both in terms of CPU and GPU performance. It does not quite reach the complete gaming performance found in the E590 with the AMD RX 550X, but it remains considerably more constant in its performance and also noticeably cooler than the hotter sister model. Furthermore, the CPU performance is significantly higher since the Ryzen being used here does not get throttled, in absolute contrast to the Intel CPU in the E590 with RX 550X.
Lenovo also dealt with the problem regarding the slow SSD in the E590 models. Finally a model is built which can at least keep up with the competition and that does not slow down the laptop any longer. Whether this same model is also used in all variants (the E595 is also available with 256 or 128 GB) is not guaranteed though.
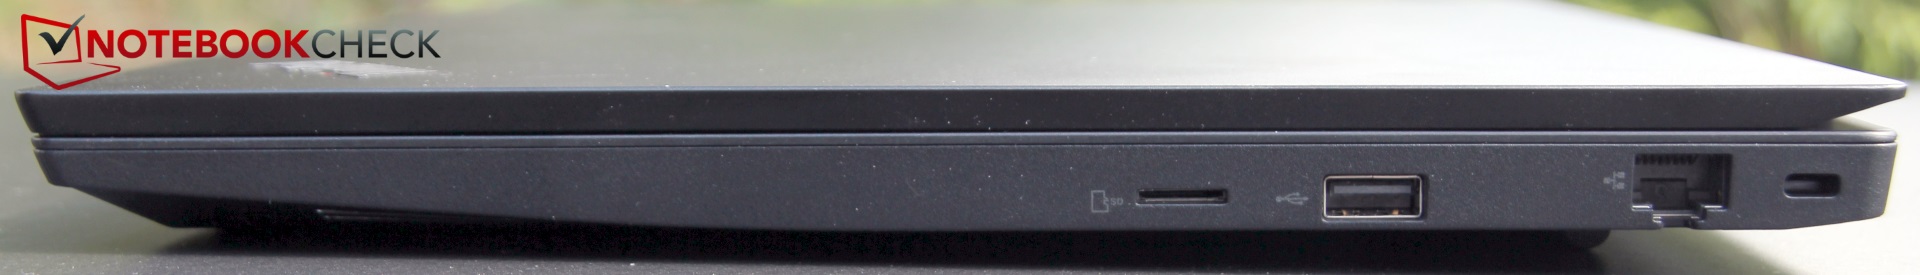
Since Lenovo uses in addition a nice, contrast-rich and also bright IPS display, and it also provides very good input devices, only minimal points of criticism actually remain : That there is no full-fledged SD card reader but only a microSD reader instead is one of these; the old USB 2.0 slot on the right side should soon be replaced with a current USB 3 port. Otherwise, the E595 is convincing, even if the GPU should be a little less throttled. The price for the smaller model with the Ryzen 5 and 128 GB SSD starts at around 600 Euros (~$677).
Overall, Lenovo has raised the entry-level ThinkPad to an even higher level with the E595, leaving little to be desired in this price class in terms of improvements.
Lenovo ThinkPad E595-20NF0000GE
- 07/11/2019 v6 (old)
Christian Hintze
Price comparison
