Lenovo ThinkPad T480 (Core i7-8650U, FHD) Laptop Review

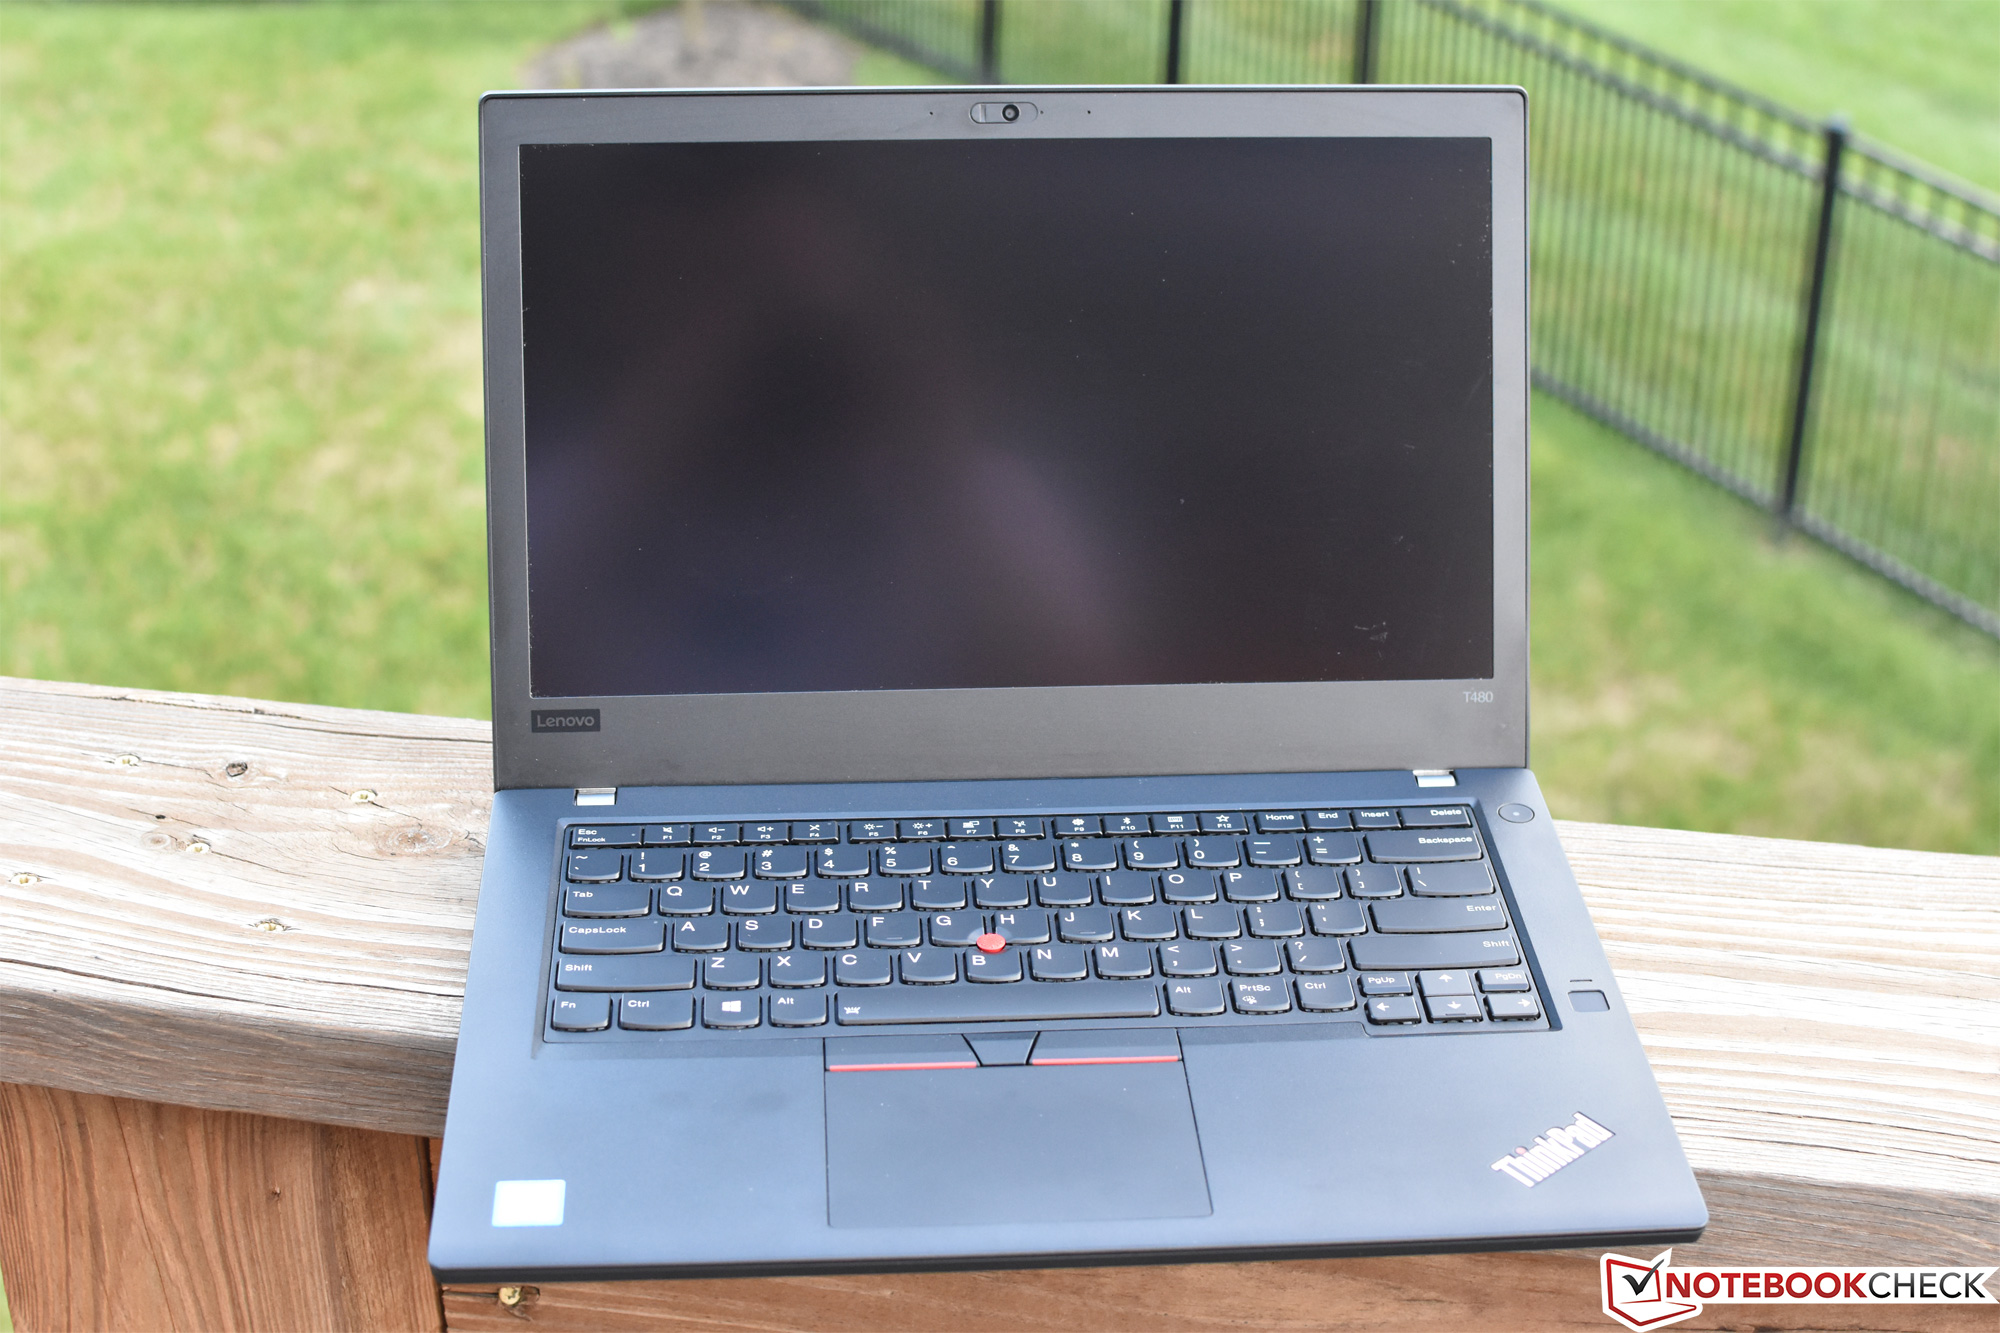
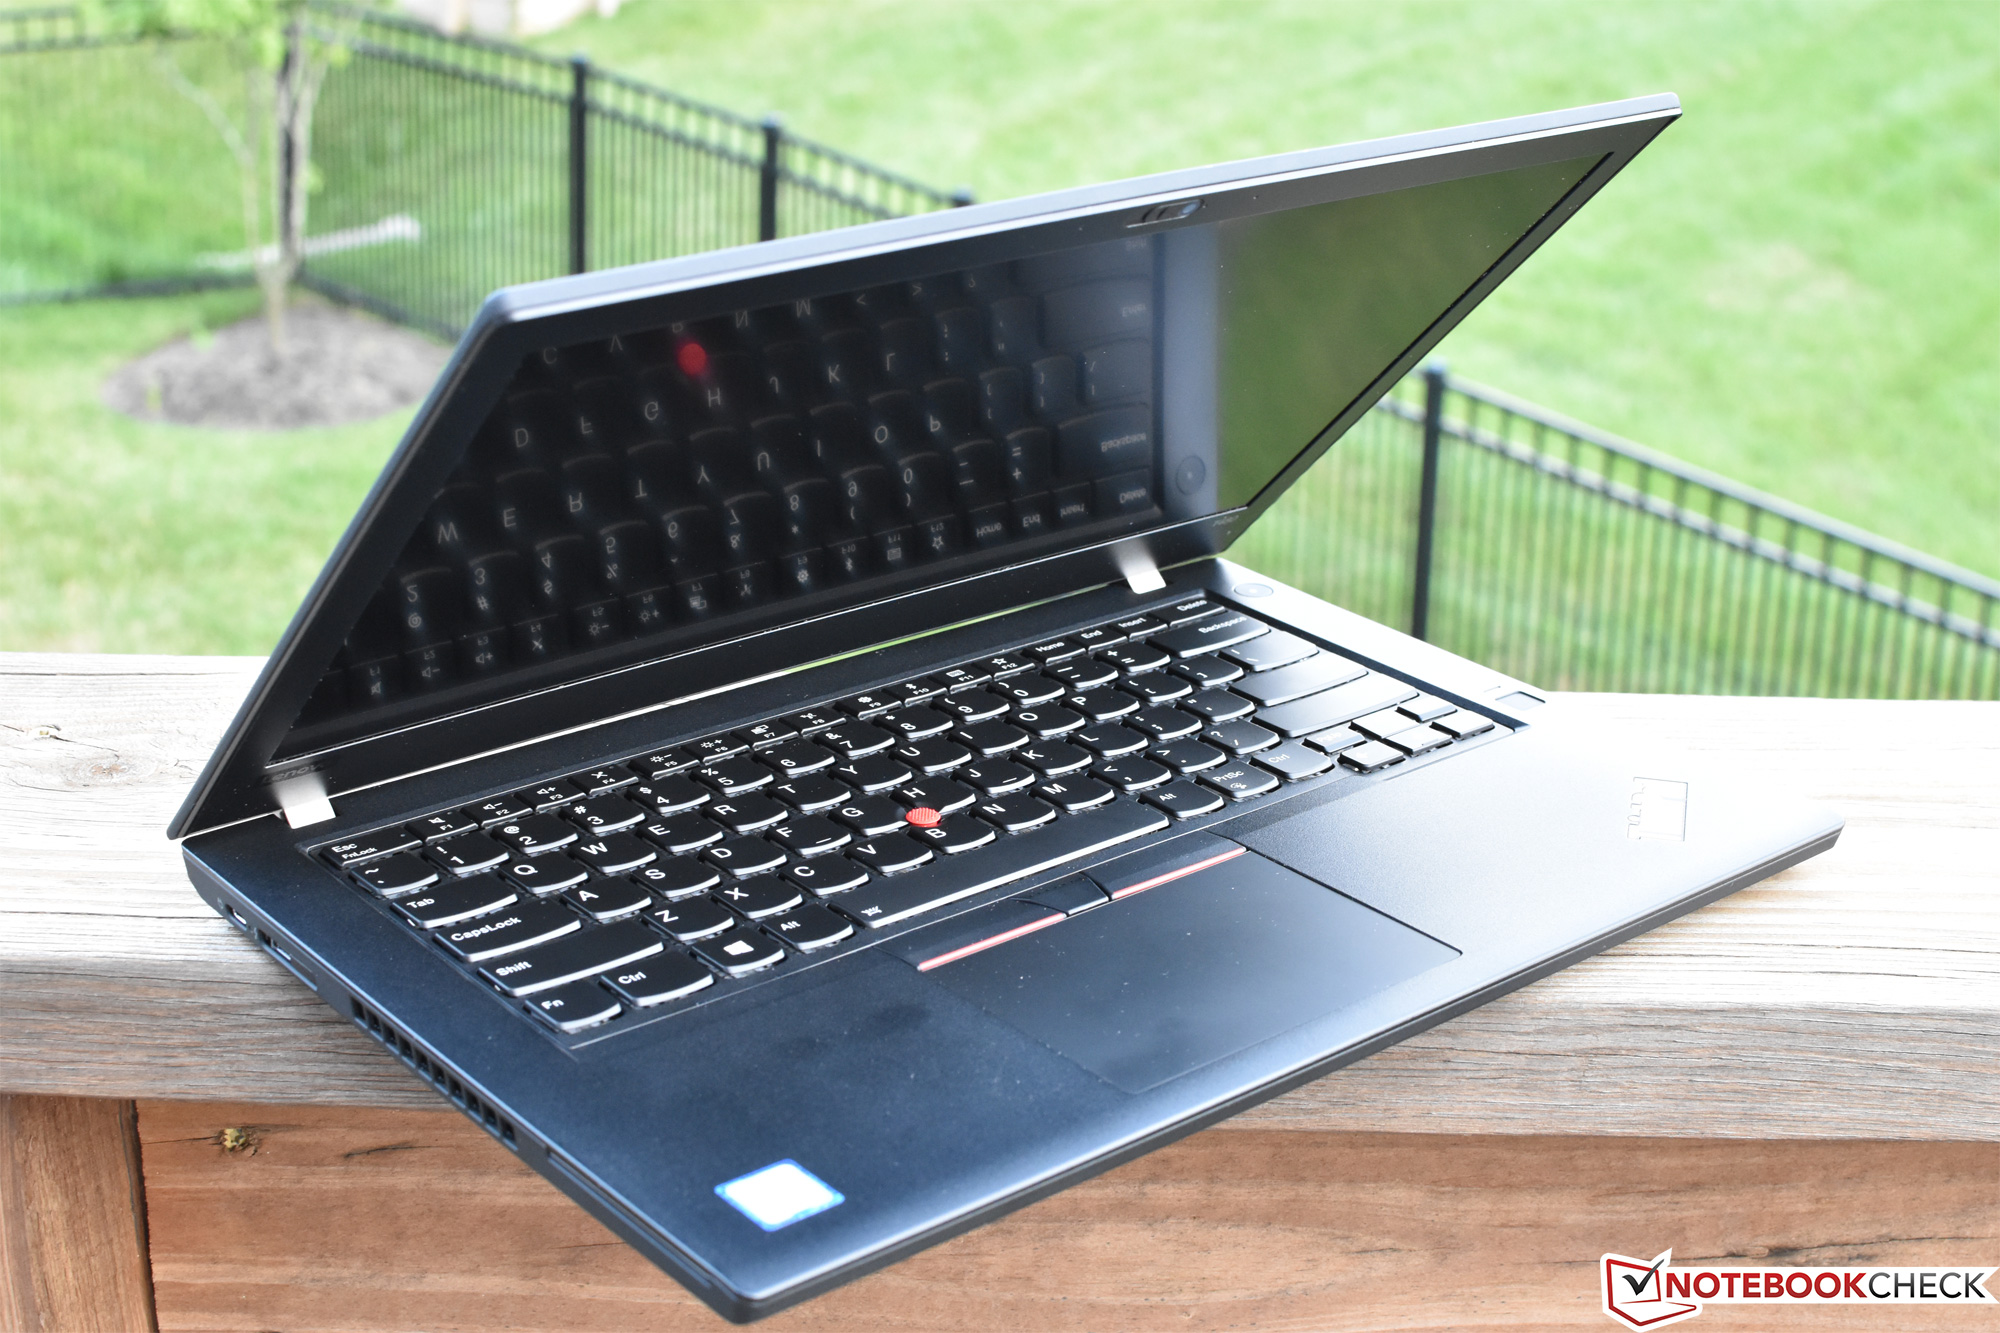
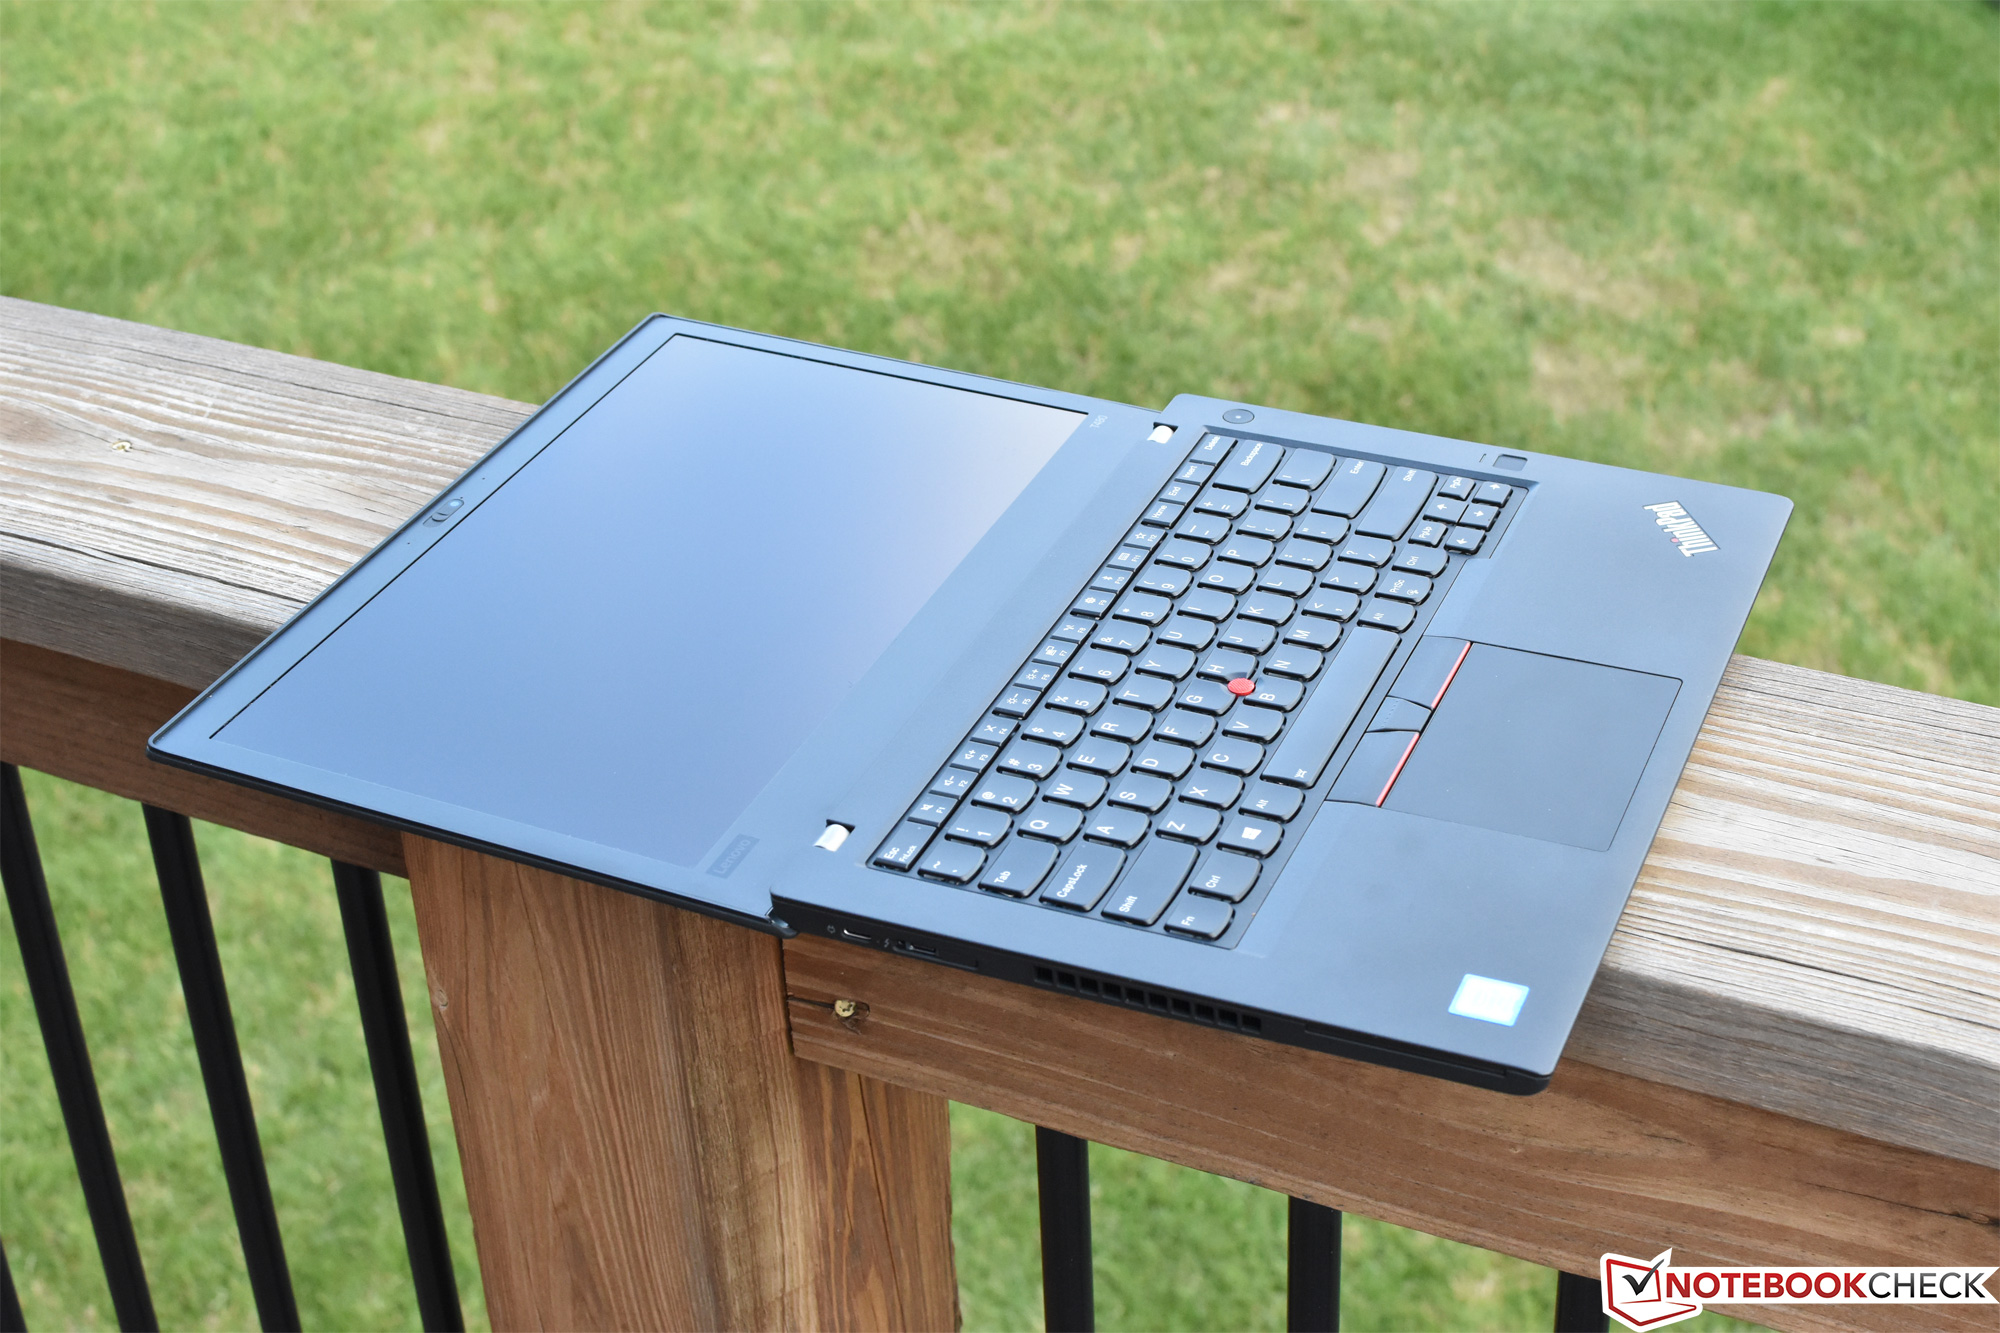
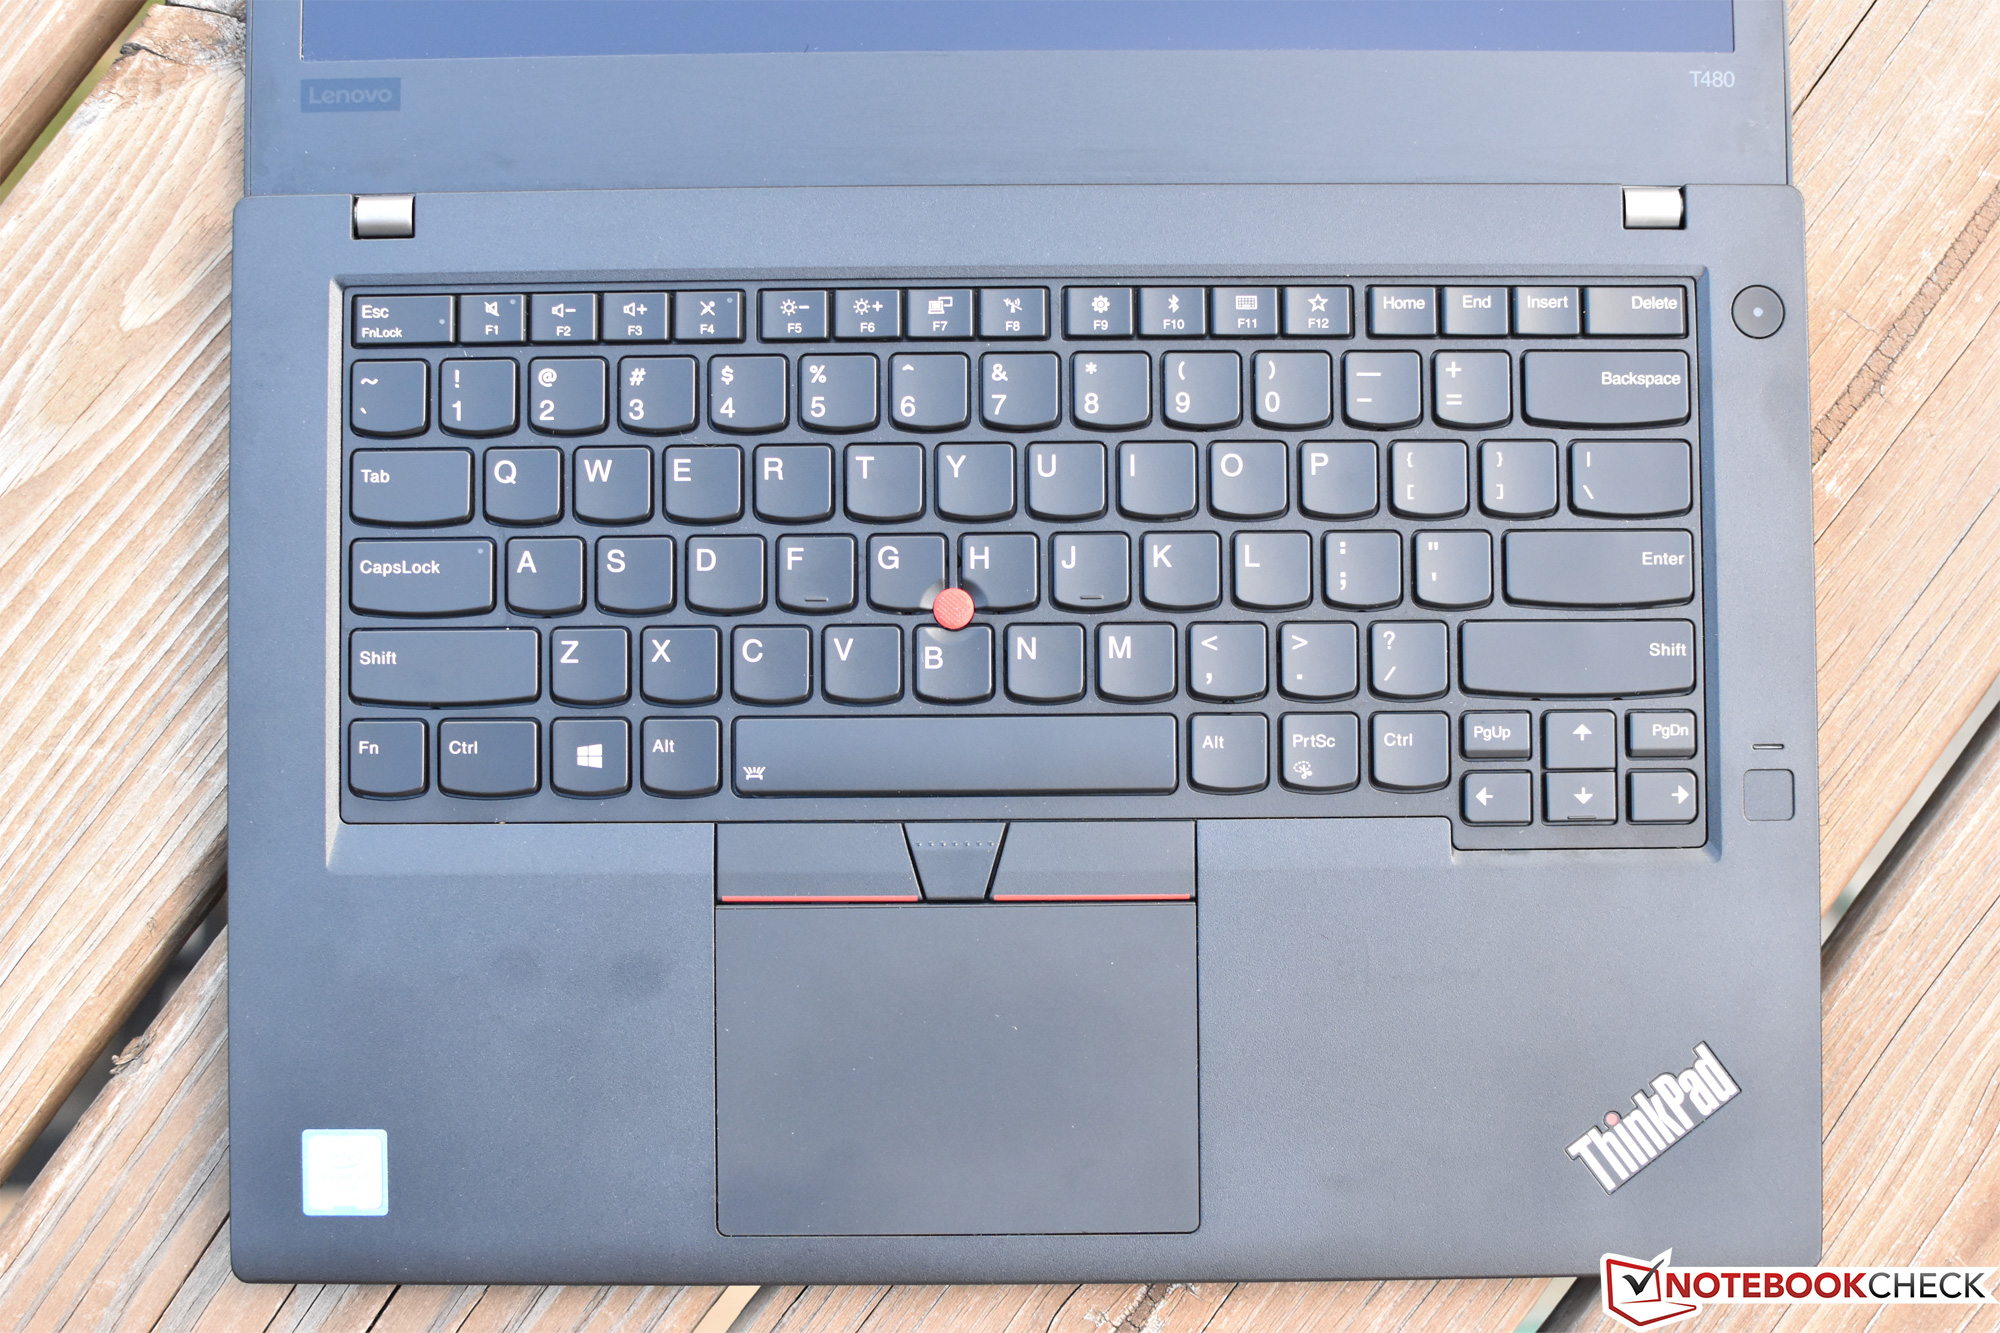
Hot on the heels of the T480s we reviewed just last week, the Lenovo ThinkPad T480 is in our labs again. The bigger brother of the T480s, this is Lenovo’s more conventional 14-inch laptop, with (most) of the familiar amenities to which business professionals have grown accustomed. We first encountered this machine back in March, a configuration which included a Core i7-8550U CPU and GeForce MX150 dedicated graphics (and which sold for around $1848). Today, the CPU has been further upgraded to a Core i7-8650U, but the GPU is back to traditional integrated Intel UHD Graphics 620. Such a configuration would be more sensible for those disinterested in GPU-heavy activities, as power consumption and heat are likely lower—and, of course, so is the price: $1,712 currently at Amazon.
Because the fundamentals haven’t changed since our previous review, we’ll be skipping the initial case, connectivity, and other design-oriented sections and jumping directly into what’s new with this configuration. For much more information on any of those items, check out our original review from a few months back.


| SD Card Reader | |
| average JPG Copy Test (av. of 3 runs) | |
| Lenovo ThinkPad X1 Carbon 2018-20KGS03900 (Toshiba Exceria Pro M501) | |
| Dell Latitude 7490 (Toshiba Exceria Pro M501 UHS-II) | |
| Lenovo ThinkPad T480s-20L7002AUS (Toshiba Exceria Pro SDXC 64 GB UHS-II) | |
| Lenovo ThinkPad T480-20L50010US (Toshiba Exceria Pro SDXC 64 GB UHS-II) | |
| Average of class Office (19.8 - 198.5, n=22, last 2 years) | |
| maximum AS SSD Seq Read Test (1GB) | |
| Lenovo ThinkPad X1 Carbon 2018-20KGS03900 (Toshiba Exceria Pro M501) | |
| Dell Latitude 7490 (Toshiba Exceria Pro M501 UHS-II) | |
| Lenovo ThinkPad T480s-20L7002AUS (Toshiba Exceria Pro SDXC 64 GB UHS-II) | |
| Lenovo ThinkPad T480-20L50010US (Toshiba Exceria Pro SDXC 64 GB UHS-II) | |
| Average of class Office (27.4 - 249, n=21, last 2 years) | |
Display
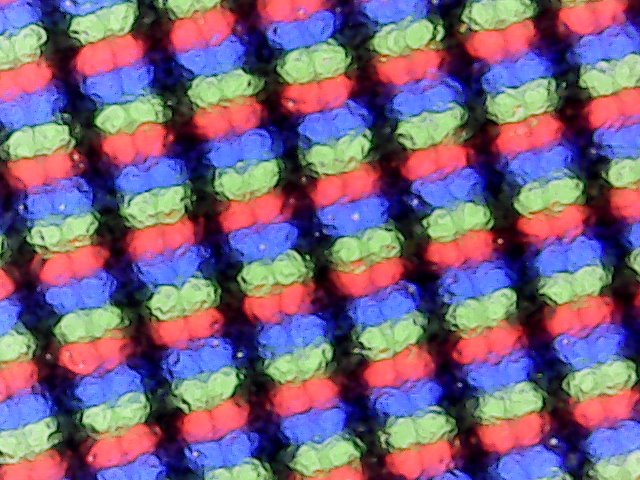
The T480 we’re reviewing today actually includes the same panel we evaluated in the previous model, except today’s also features embedded touch. It’s a 14-inch FHD (1920x1080) matte TFT-LCD display, and while brightness and contrast subjectively seem to be decent, it conspicuously lacks vividness (suggesting poor color coverage).

| |||||||||||||||||||||||||
Brightness Distribution: 90 %
Center on Battery: 276.7 cd/m²
Contrast: 1318:1 (Black: 0.21 cd/m²)
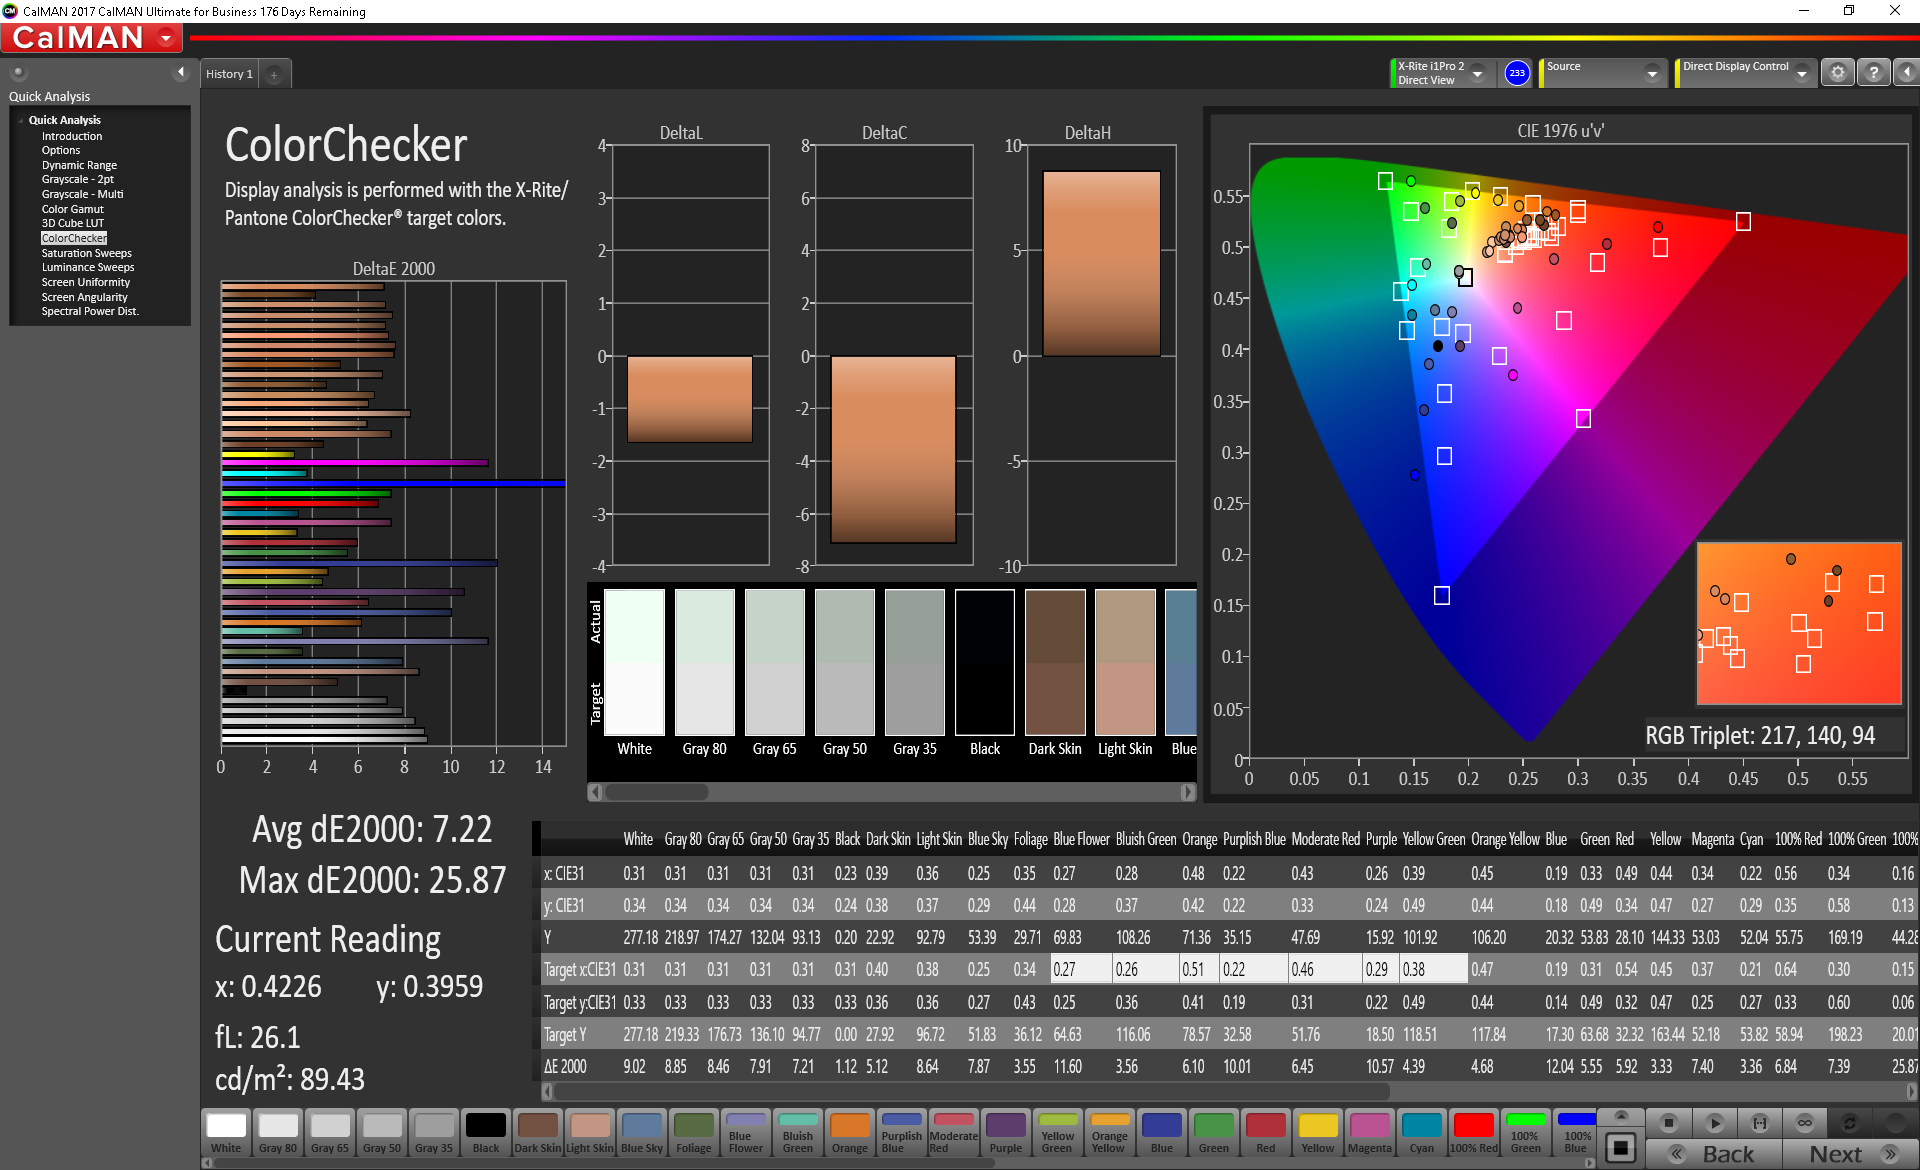
ΔE ColorChecker Calman: 7.22 | ∀{0.5-29.43 Ø4.71}
calibrated: 5.01
ΔE Greyscale Calman: 6.7 | ∀{0.09-98 Ø4.96}
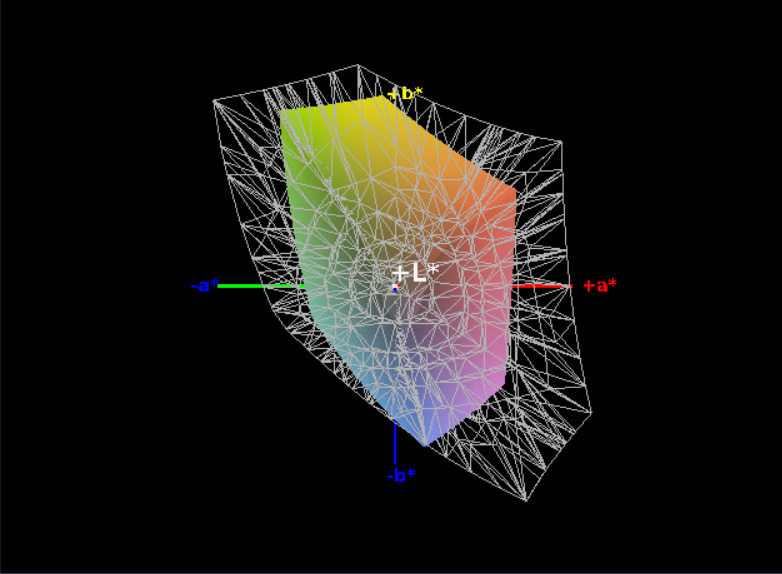
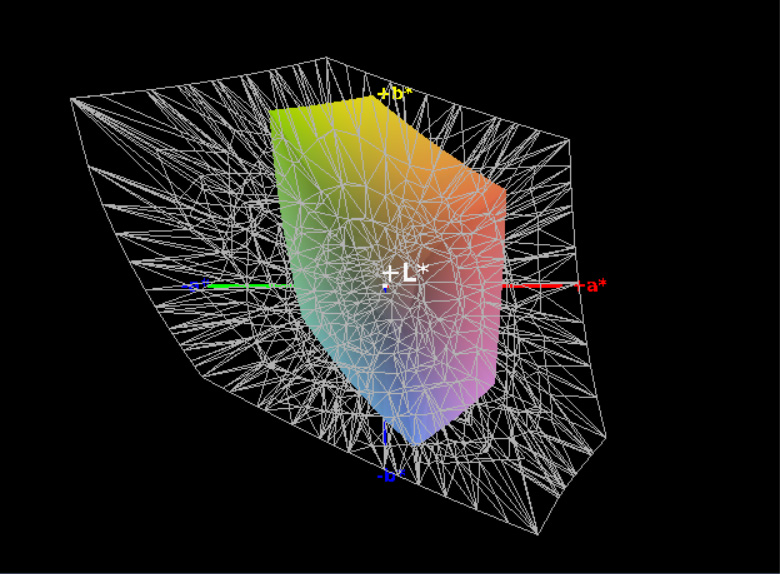
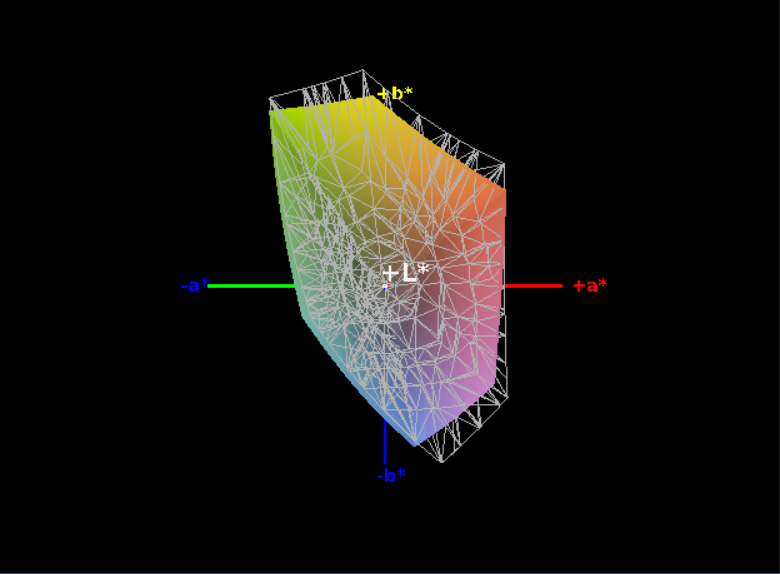
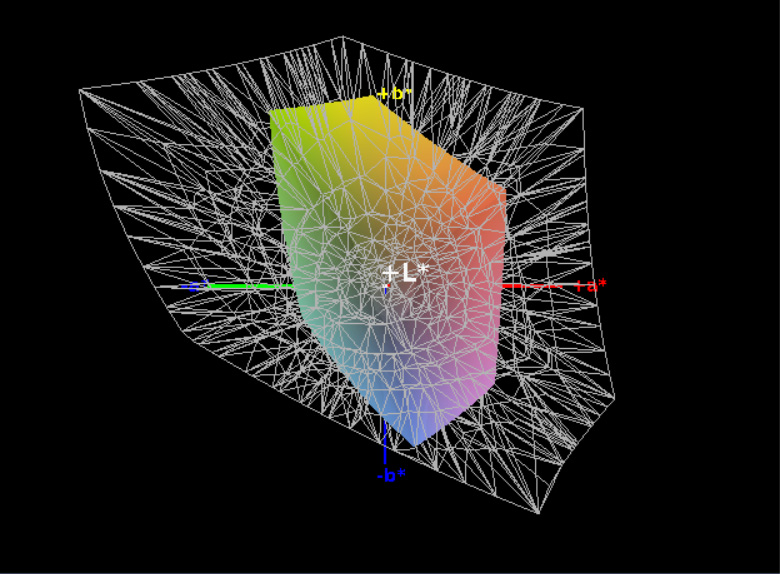
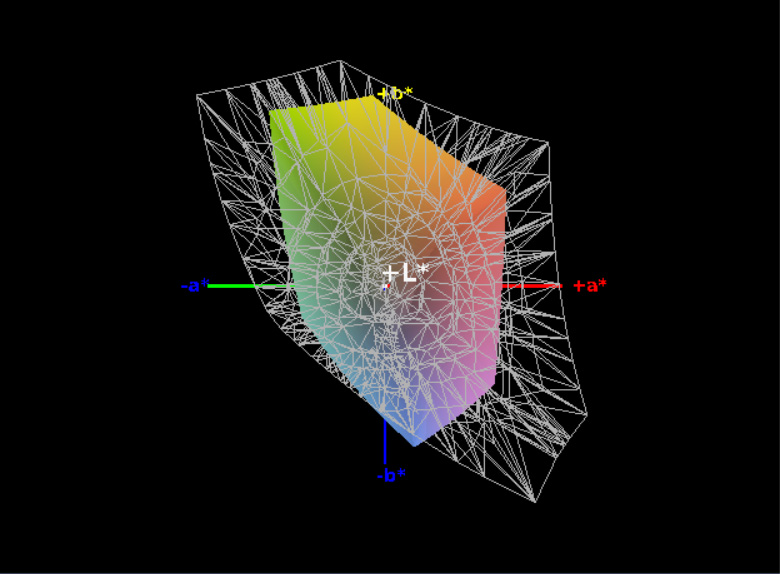
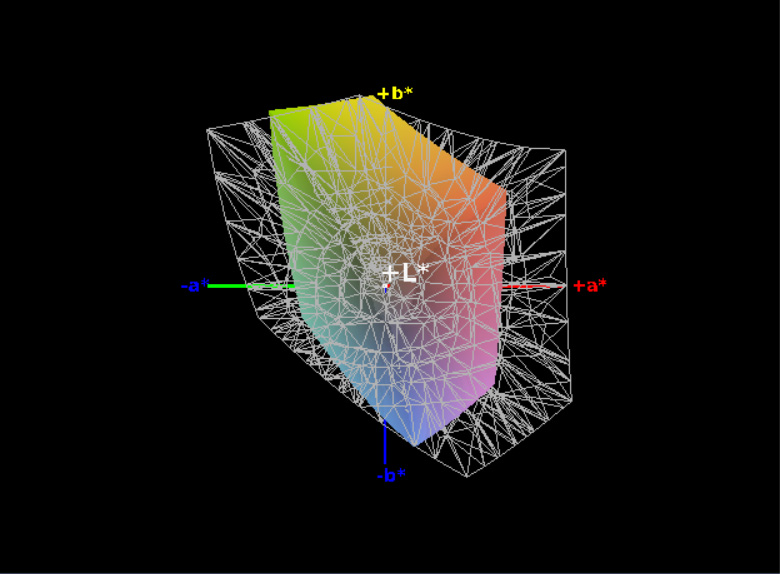
54% sRGB (Argyll 1.6.3 3D)
34% AdobeRGB 1998 (Argyll 1.6.3 3D)
37.51% AdobeRGB 1998 (Argyll 3D)
54.5% sRGB (Argyll 3D)
36.31% Display P3 (Argyll 3D)
Gamma: 2.321
CCT: 6656 K
| Lenovo ThinkPad T480-20L50010US B140HAK01.0, TFT-LCD, 14", 1920x1080 | Lenovo ThinkPad T480s-20L7002AUS NV140FHM-N46, TFT-LCD, 14", 1920x1080 | Dell Latitude 7490 AU Optronics AU0223D, IPS, 14", 1920x1080 | HP EliteBook 840 G5-3JX61EA IVO M140NVF7 R0, IPS, 14", 1920x1080 | Lenovo ThinkPad X1 Carbon 2018-20KGS03900 B140QAN02.0, IPS, 14", 2560x1440 | |
|---|---|---|---|---|---|
| Display | 9% | 70% | 65% | 130% | |
| Display P3 Coverage (%) | 36.31 | 39.69 9% | 63.6 75% | 61 68% | 87.7 142% |
| sRGB Coverage (%) | 54.5 | 59.2 9% | 88.8 63% | 87.7 61% | 100 83% |
| AdobeRGB 1998 Coverage (%) | 37.51 | 41 9% | 64.8 73% | 62.1 66% | 99.9 166% |
| Response Times | -11% | -14% | 16% | -32% | |
| Response Time Grey 50% / Grey 80% * (ms) | 39.2 ? | 44 ? -12% | 48.4 ? -23% | 33 ? 16% | 59.2 ? -51% |
| Response Time Black / White * (ms) | 30.8 ? | 34 ? -10% | 32.4 ? -5% | 26 ? 16% | 34.4 ? -12% |
| PWM Frequency (Hz) | 990 | 3125 ? | |||
| Screen | 8% | 24% | 41% | 61% | |
| Brightness middle (cd/m²) | 276.7 | 288.3 4% | 328.2 19% | 655 137% | 578 109% |
| Brightness (cd/m²) | 272 | 281 3% | 305 12% | 630 132% | 533 96% |
| Brightness Distribution (%) | 90 | 86 -4% | 87 -3% | 93 3% | 84 -7% |
| Black Level * (cd/m²) | 0.21 | 0.21 -0% | 0.37 -76% | 0.56 -167% | 0.38 -81% |
| Contrast (:1) | 1318 | 1373 4% | 887 -33% | 1170 -11% | 1521 15% |
| Colorchecker dE 2000 * | 7.22 | 6.16 15% | 3.82 47% | 3.27 55% | 1.9 74% |
| Colorchecker dE 2000 max. * | 25.87 | 18.99 27% | 5.58 78% | 5.92 77% | 3.8 85% |
| Colorchecker dE 2000 calibrated * | 5.01 | 4.51 10% | 3.5 30% | 3.22 36% | 0.8 84% |
| Greyscale dE 2000 * | 6.7 | 6.3 6% | 3 55% | 2.85 57% | 3 55% |
| Gamma | 2.321 95% | 2.517 87% | 2.36 93% | 2.45 90% | 2.14 103% |
| CCT | 6656 98% | 6886 94% | 6962 93% | 6065 107% | 6377 102% |
| Color Space (Percent of AdobeRGB 1998) (%) | 34 | 37.67 11% | 58 71% | 57 68% | 88.8 161% |
| Color Space (Percent of sRGB) (%) | 54 | 58.9 9% | 88 63% | 88 63% | 100 85% |
| Total Average (Program / Settings) | 2% /
6% | 27% /
28% | 41% /
42% | 53% /
63% |
* ... smaller is better
We measured a mediocre average brightness of 272 cd/m² with a mostly-consistent 90% distribution. Contrast is good at 1318:1, a product of a low black value of 0.21 cd/m².
Color coverage is indeed woefully inadequate for all purposes but the most basic of office use—and even for that, the dreary, washed-out color palette disappoints. The panel only manages 54% of sRGB and 35% of AdobeRGB, and it pales in comparison to all competitors apart from the similarly disappointing T480s. As an example of how far off the mark the T480 is here, the Latitude 7490 (a direct competitor) provides roughly double the coverage. Ditto with the EliteBook 840 G5, whose results are similar to the Latitude.
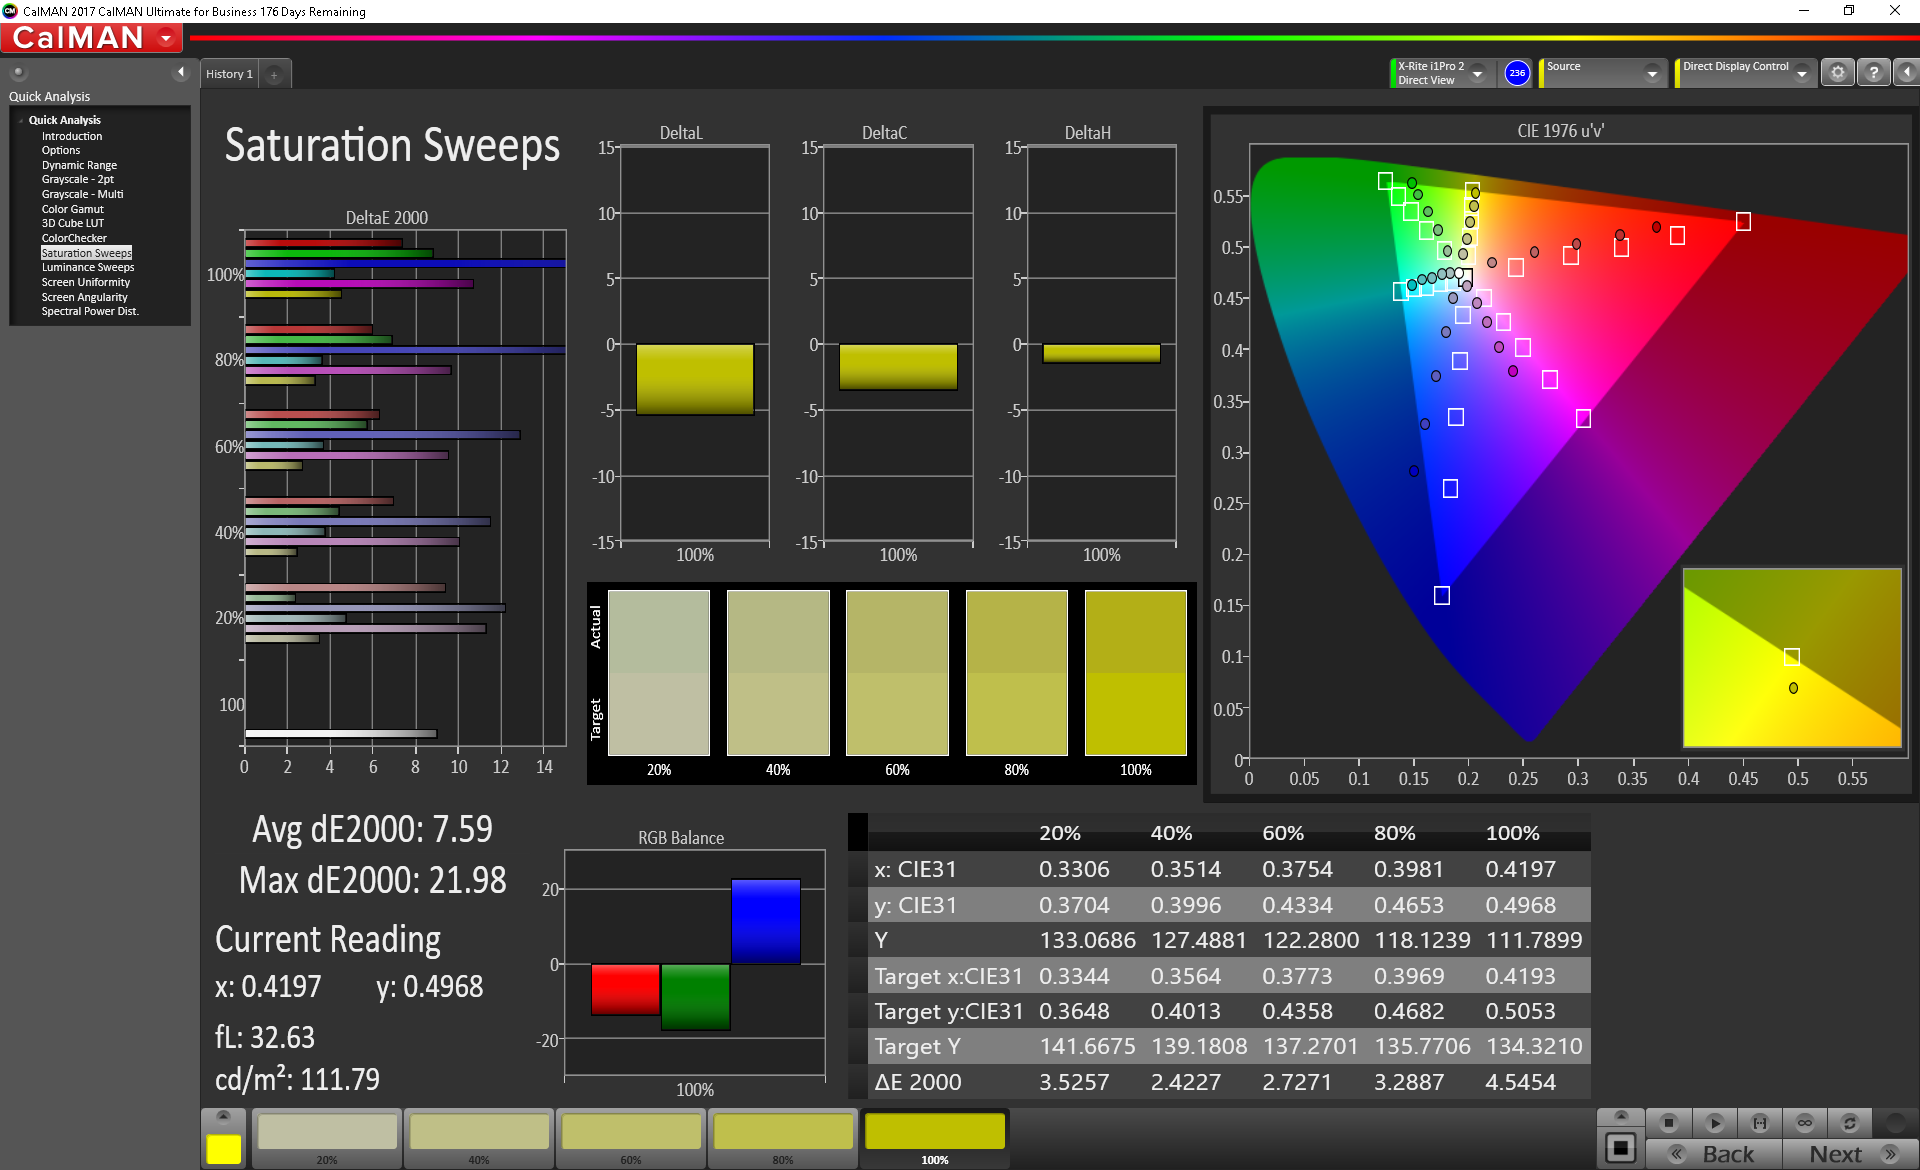
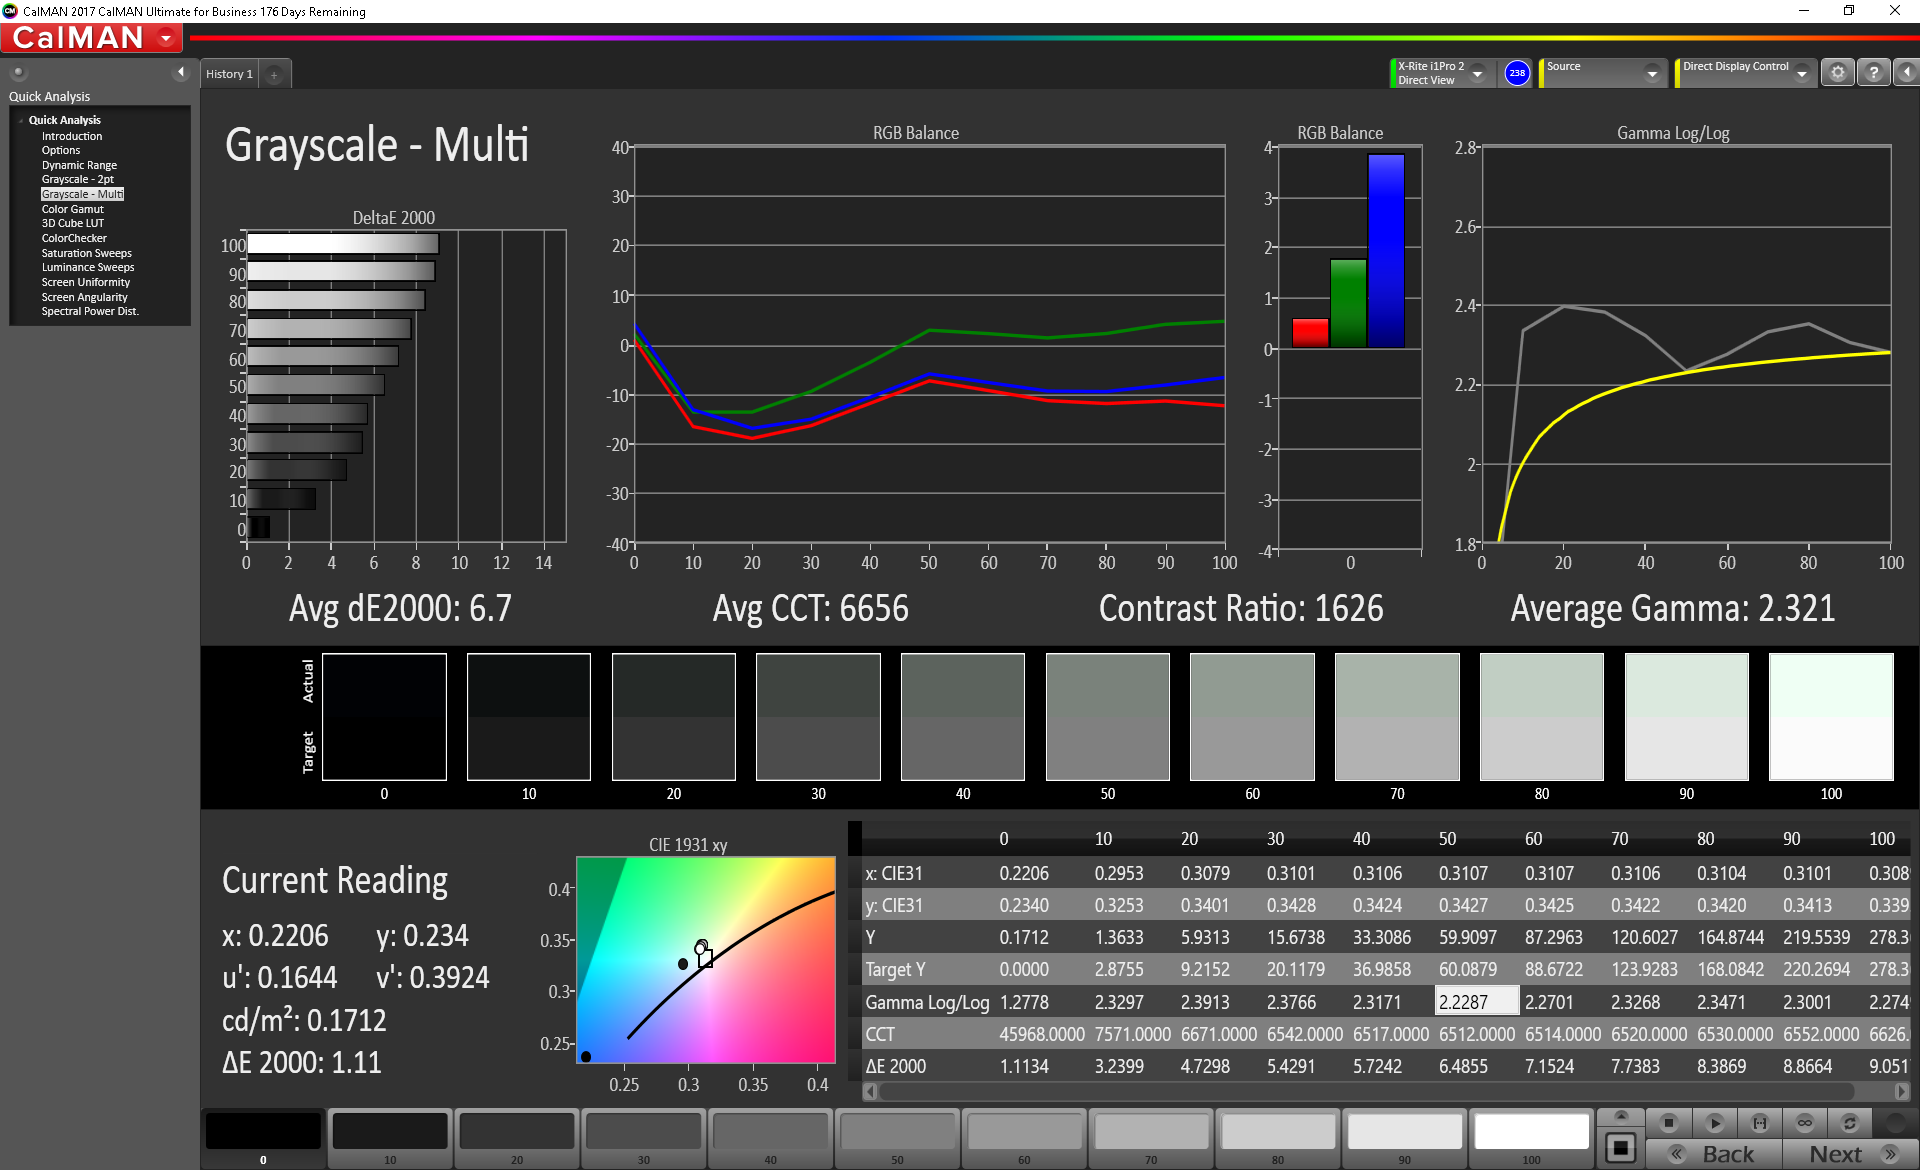
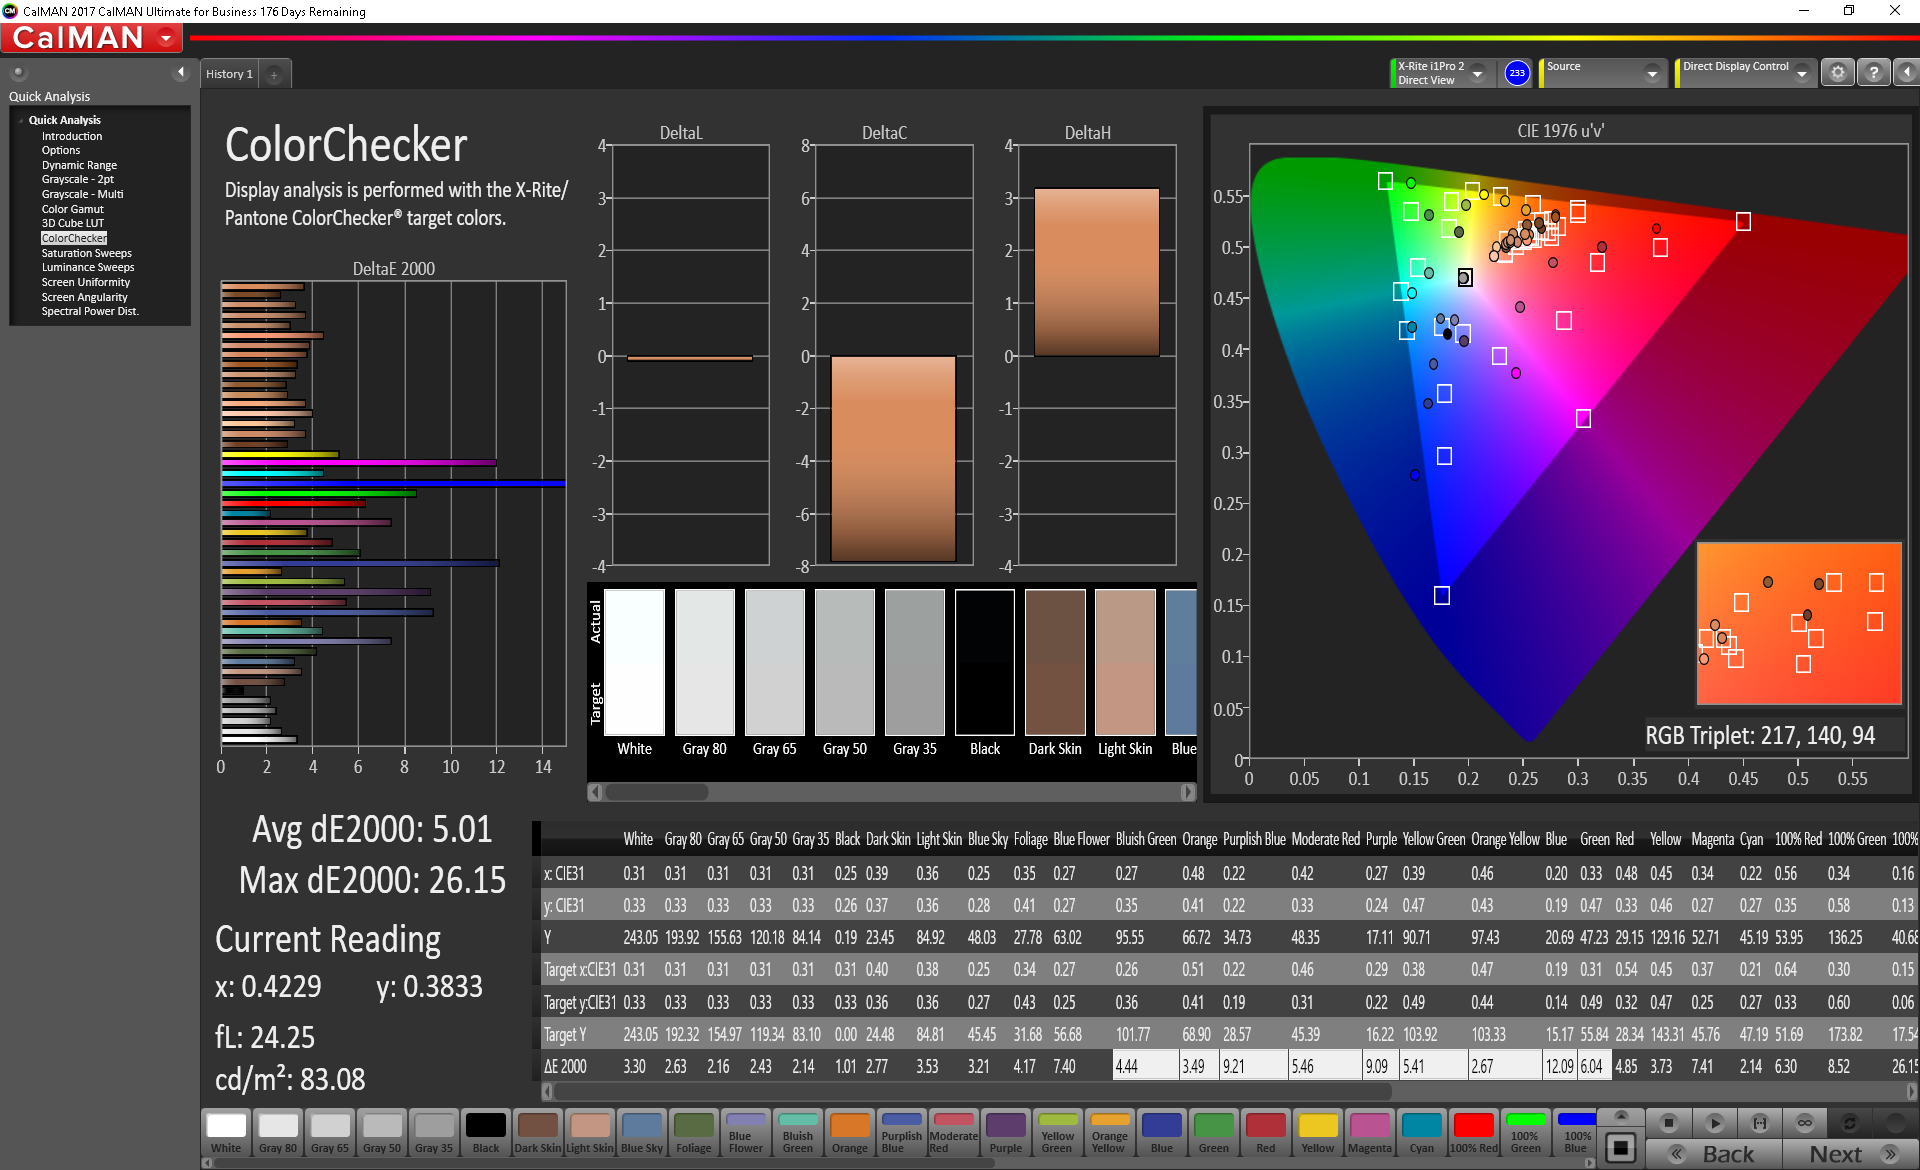
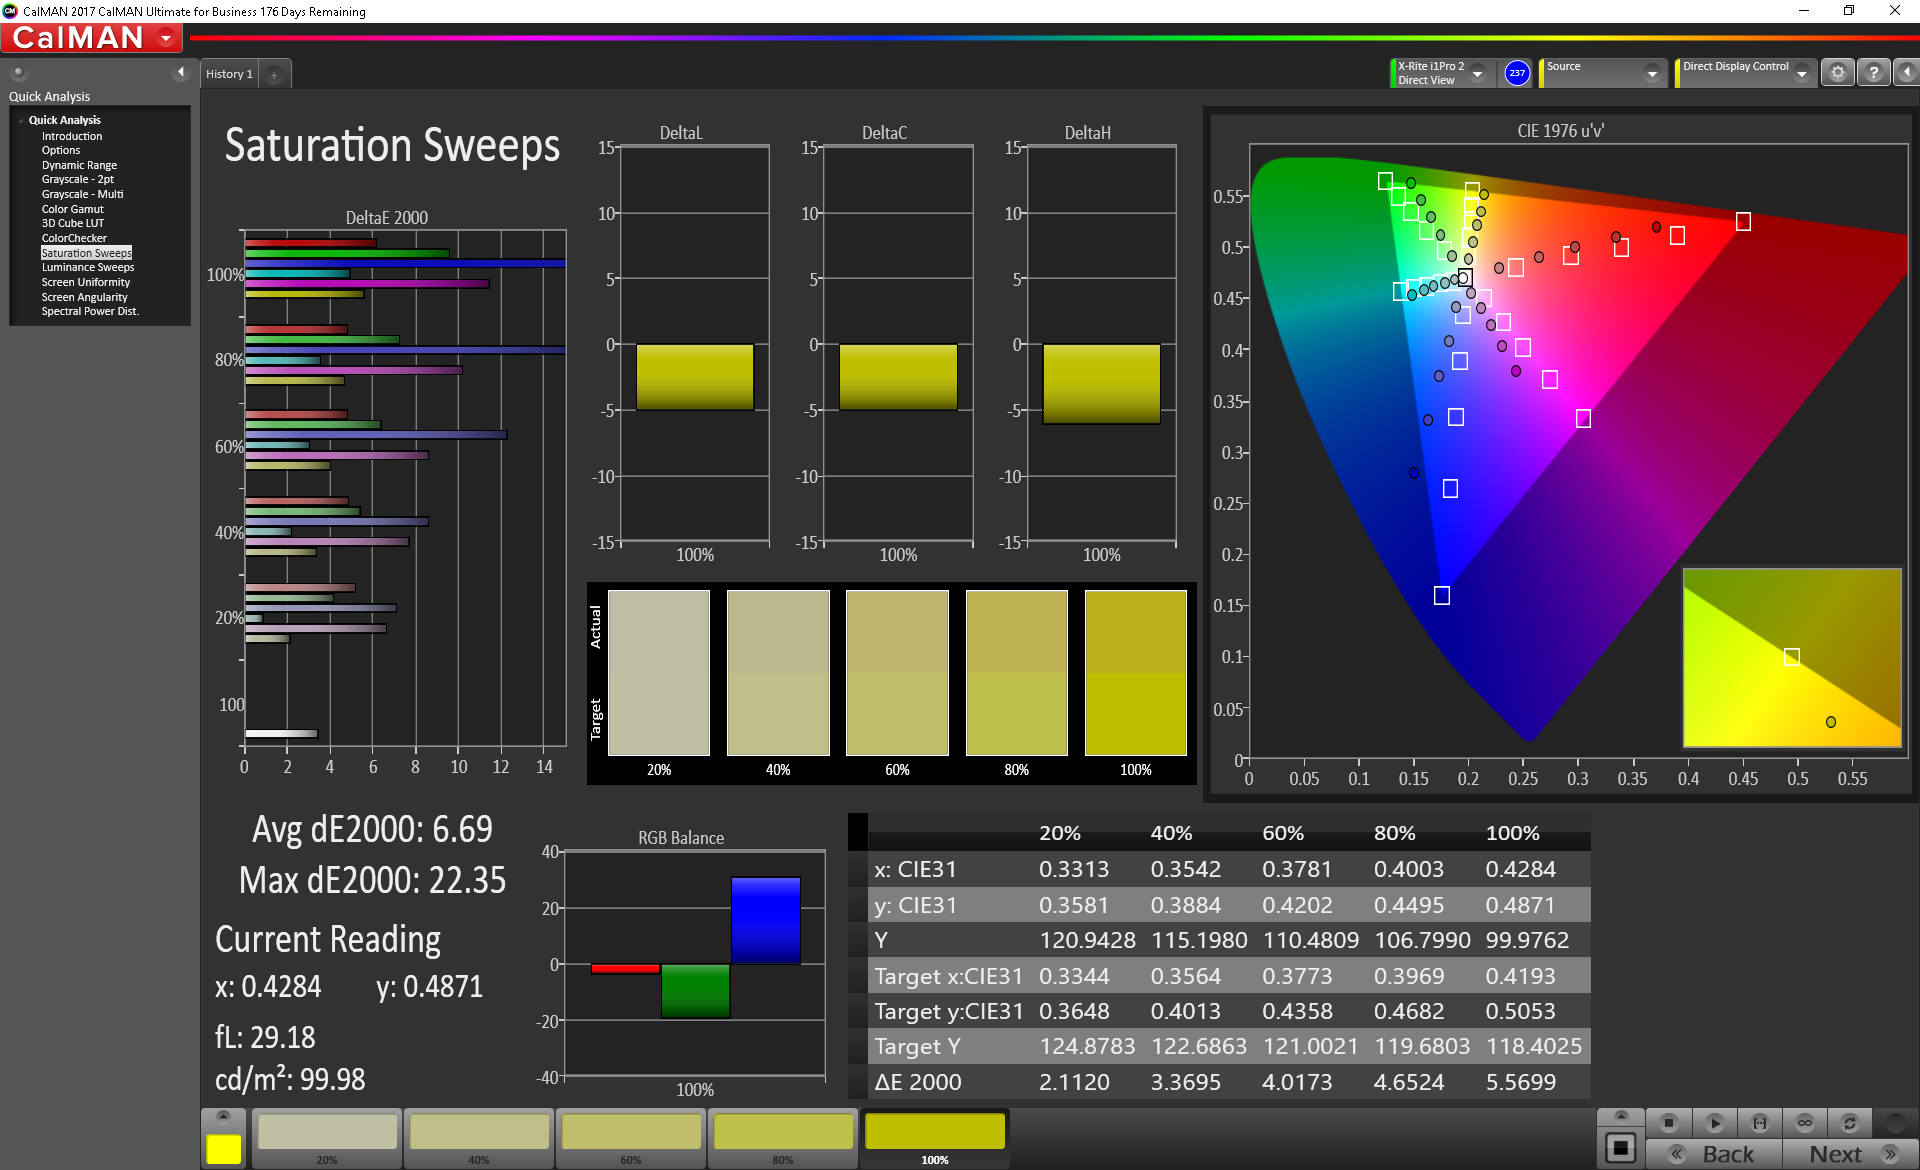
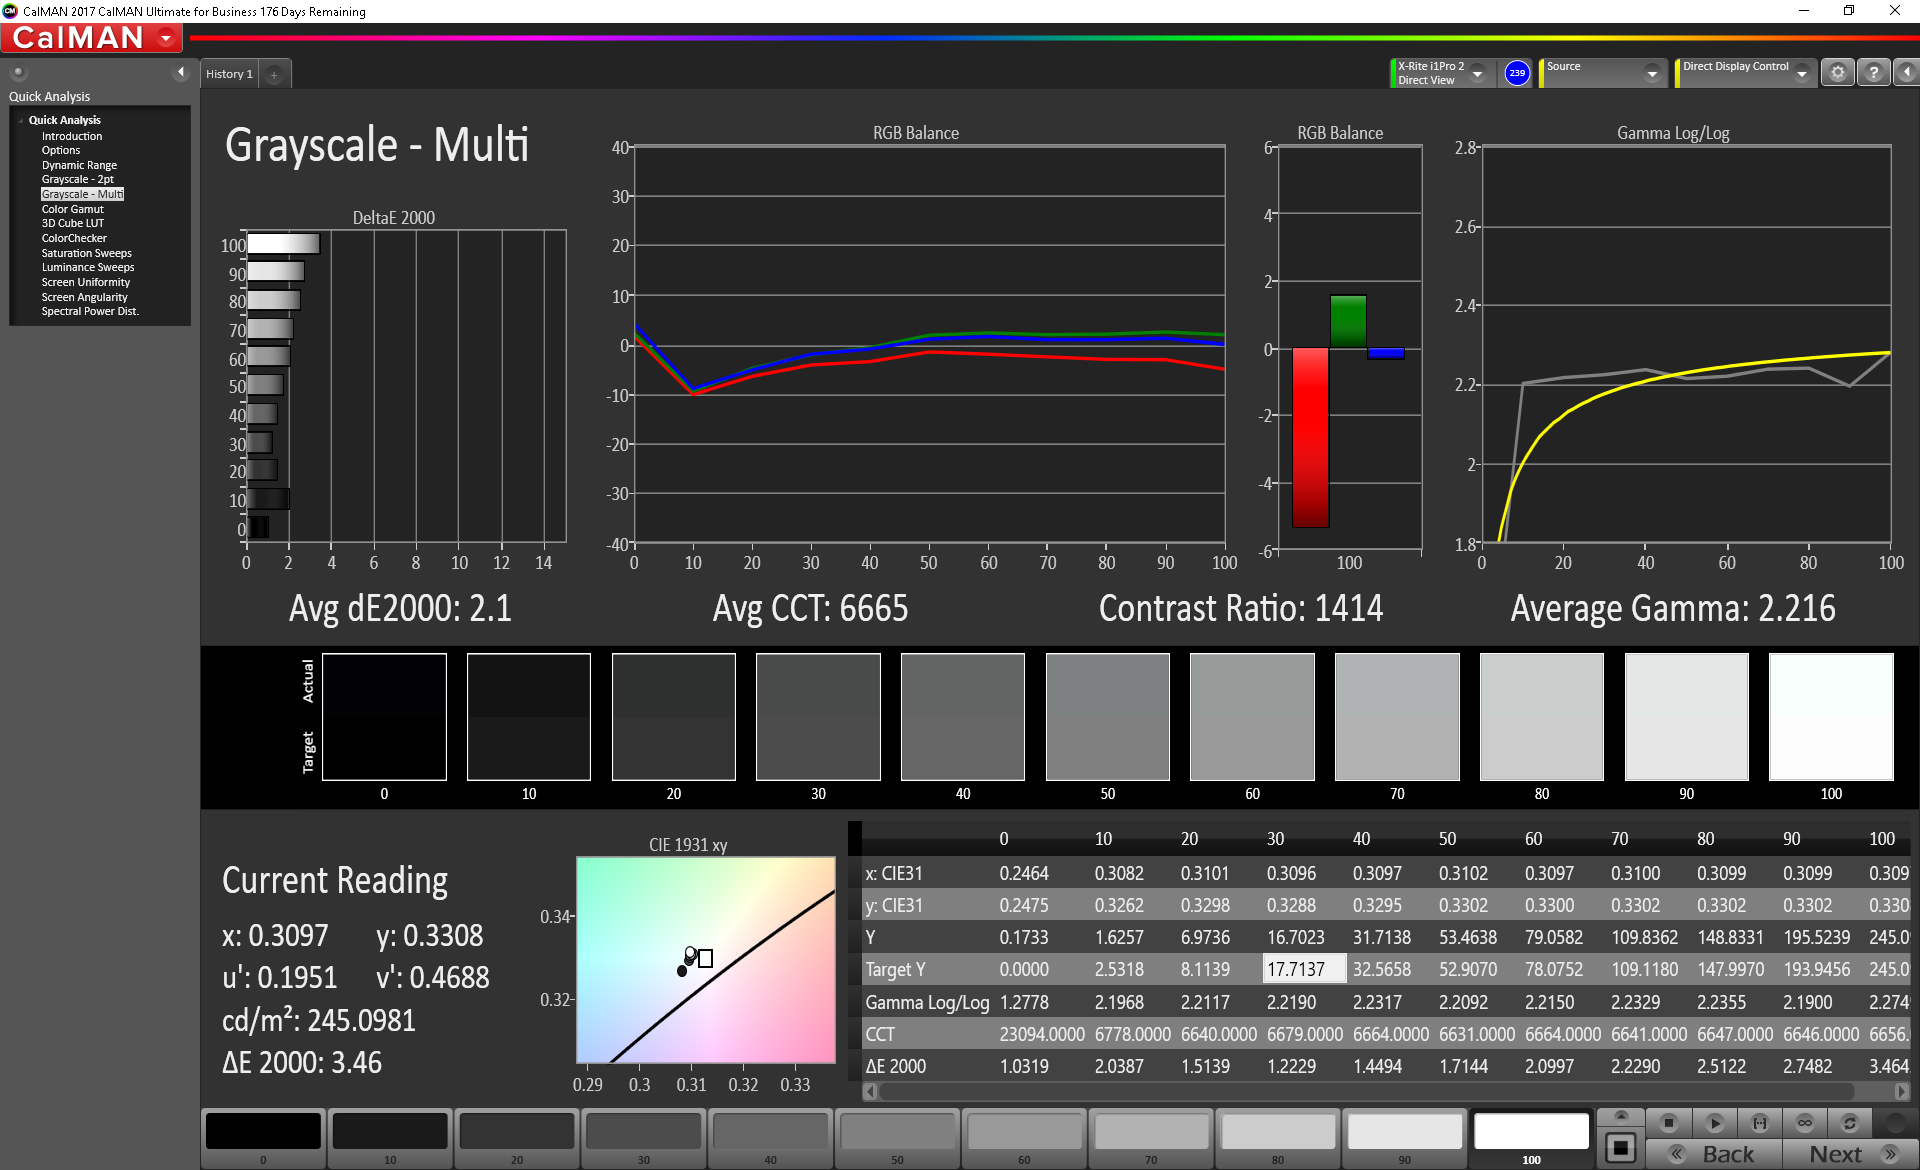
The display isn’t just lacking in saturation, it’s also well off the mark as it applies to color accuracy. Our CalMAN measurements turned up an initial ColorChecker average DeltaE of 7.22 (Blue being the most deviant color at a whopping 25.87) and a Greyscale average DeltaE of 6.7. These values dropped to 5.01 / 2.1 post-calibration, but Blue (and magenta, to a lesser extent) remains highly inaccurate. Other readings, such as the Average CCT of 6656 and average gamma of 2.321 (pre-calibration) are much better overall.
Display Response Times
| ↔ Response Time Black to White | ||
|---|---|---|
| 30.8 ms ... rise ↗ and fall ↘ combined | ↗ 18 ms rise | 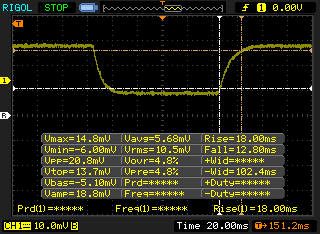 |
| ↘ 12.8 ms fall | ||
| The screen shows slow response rates in our tests and will be unsatisfactory for gamers. In comparison, all tested devices range from 0.1 (minimum) to 240 (maximum) ms. » 83 % of all devices are better. This means that the measured response time is worse than the average of all tested devices (19.8 ms). | ||
| ↔ Response Time 50% Grey to 80% Grey | ||
| 39.2 ms ... rise ↗ and fall ↘ combined | ↗ 22 ms rise | 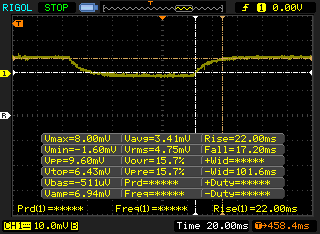 |
| ↘ 17.2 ms fall | ||
| The screen shows slow response rates in our tests and will be unsatisfactory for gamers. In comparison, all tested devices range from 0.165 (minimum) to 636 (maximum) ms. » 60 % of all devices are better. This means that the measured response time is worse than the average of all tested devices (30.9 ms). | ||
Screen Flickering / PWM (Pulse-Width Modulation)
| Screen flickering / PWM not detected | 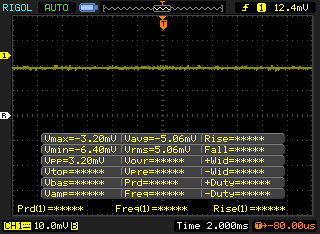 | ||
In comparison: 52 % of all tested devices do not use PWM to dim the display. If PWM was detected, an average of 7741 (minimum: 5 - maximum: 343500) Hz was measured. | |||
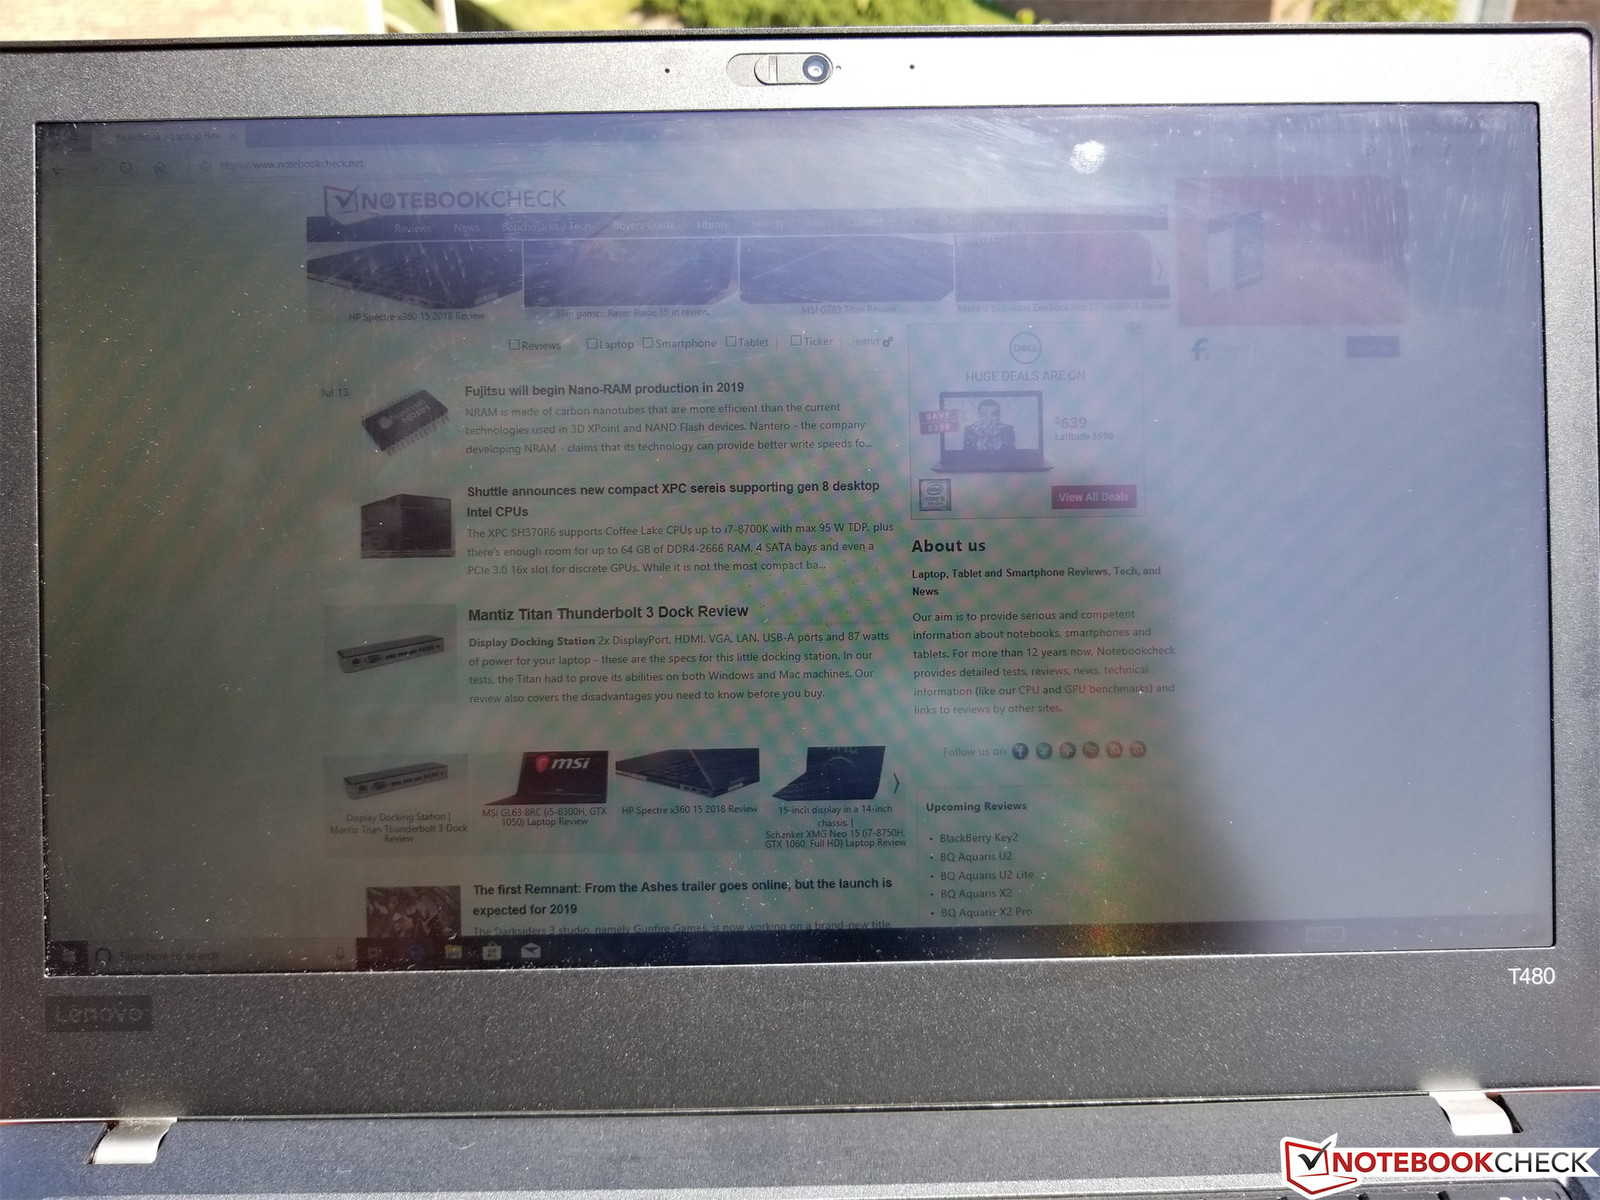
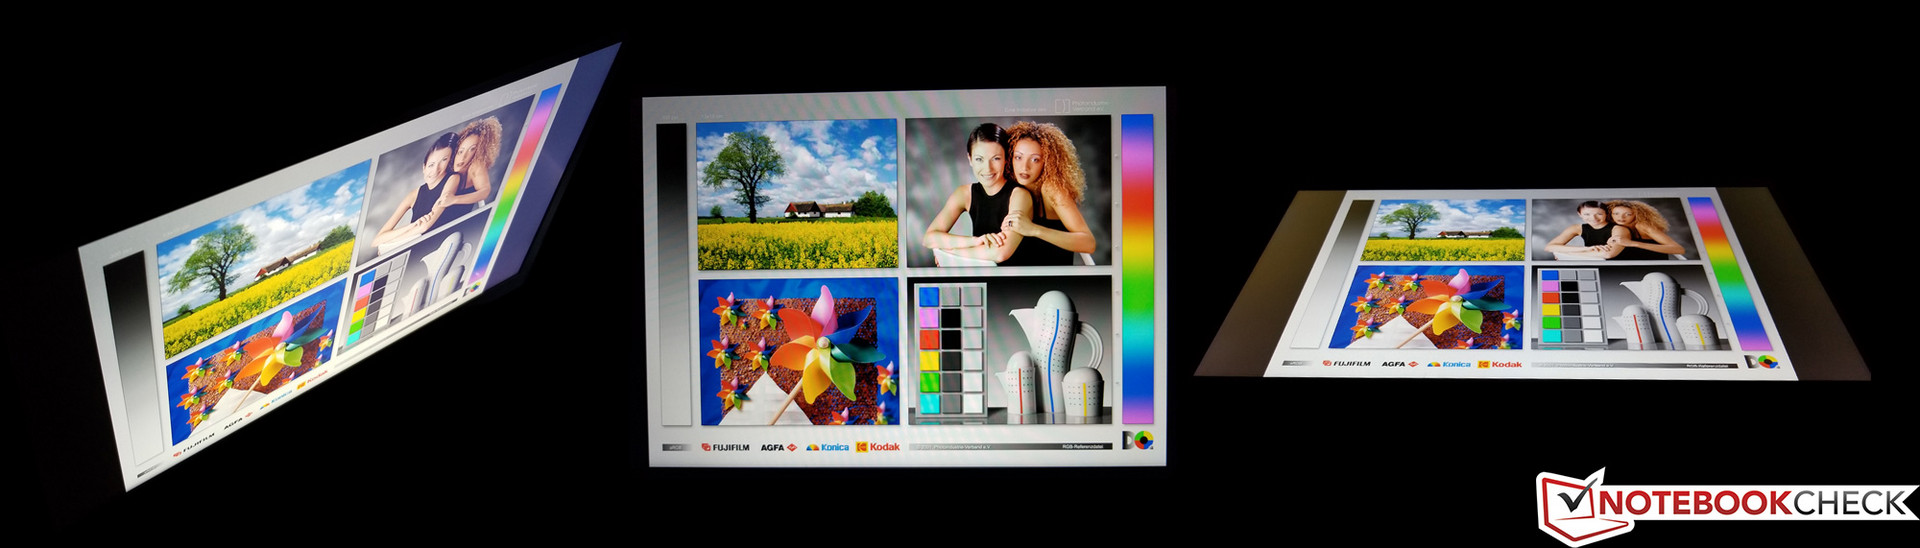
Unlike the T480s, the T480 display exhibits no PWM at any brightness setting, which is a plus. Viewing angles are wide from every vantage point, and outdoor use—while not ideal due to the low brightness—is comfortable enough in shaded areas.
Performance
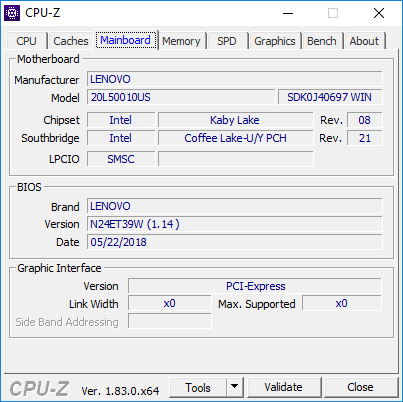
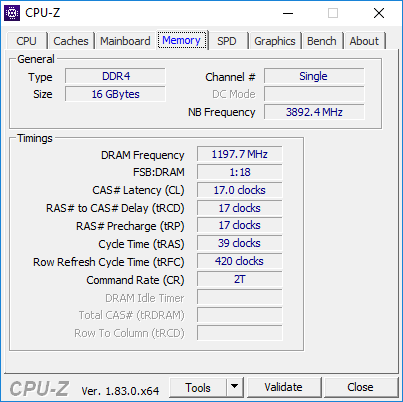
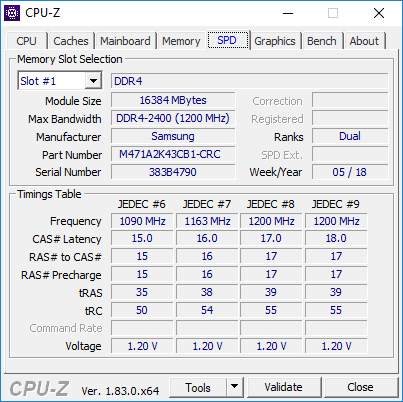
The T480 is available preconfigured with a range of different 7th and 8th-generation Intel Core i5/i7 CPUs, DDR4 RAM configurations maxing out at 32 GB dual-channel, and storage drives (both mechanical and solid-state). While our previous T480 test unit was packed with an Intel Core i7-8550U and NVIDIA GeForce MX150 graphics, today’s machine foregoes the dedicated GPU and instead opts for the less expensive integrated Intel UHD Graphics 620. However, the CPU has been bumped up to a Core i7-8650U. Is it worth spending the extra money for the top-end Core i7 option?
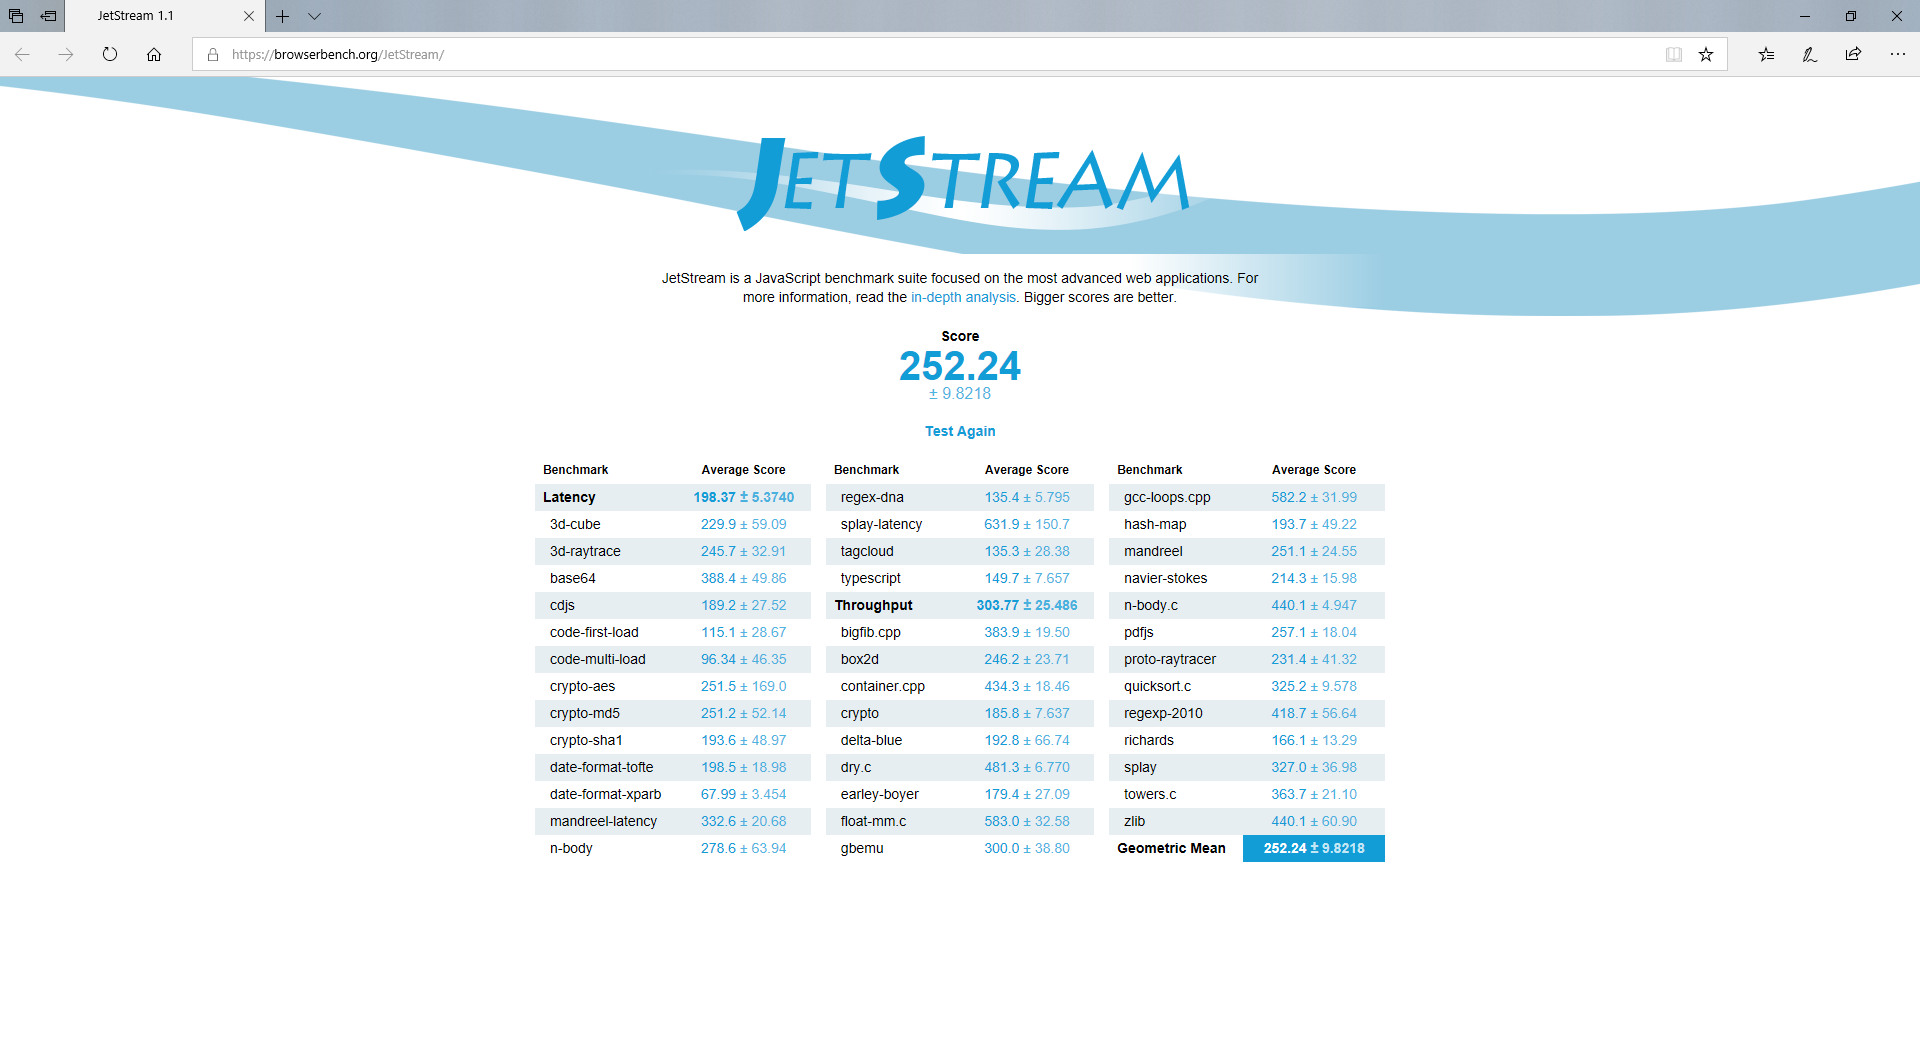
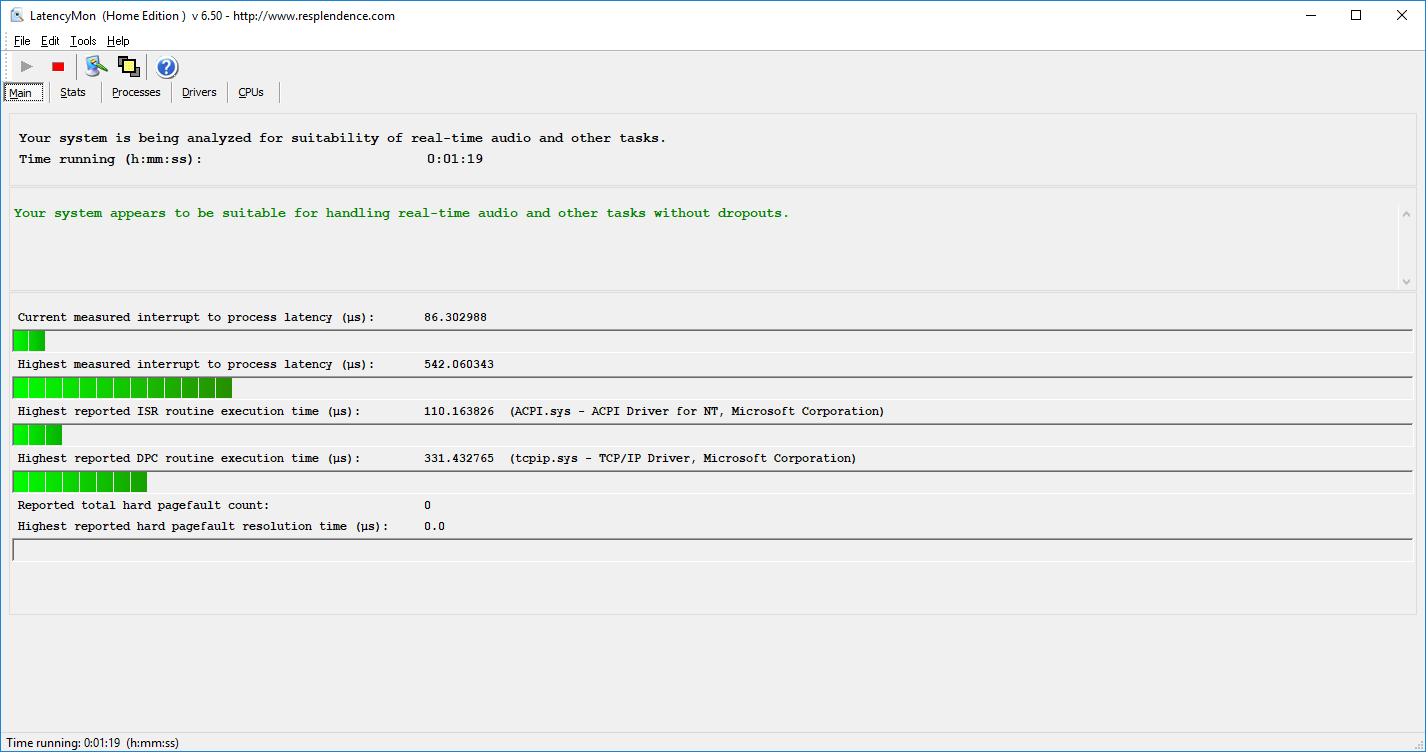
Before we dive in, we should mention that performance unplugged is mostly unchanged (as confirmed by a secondary run of 3DMark 11: 1896). Also, LatencyMon reports no issues with DPC Latencies and thus no trouble streaming real-time audio and video, even with all wireless devices enabled.
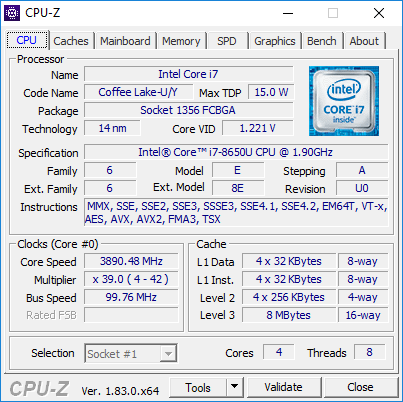
Processor
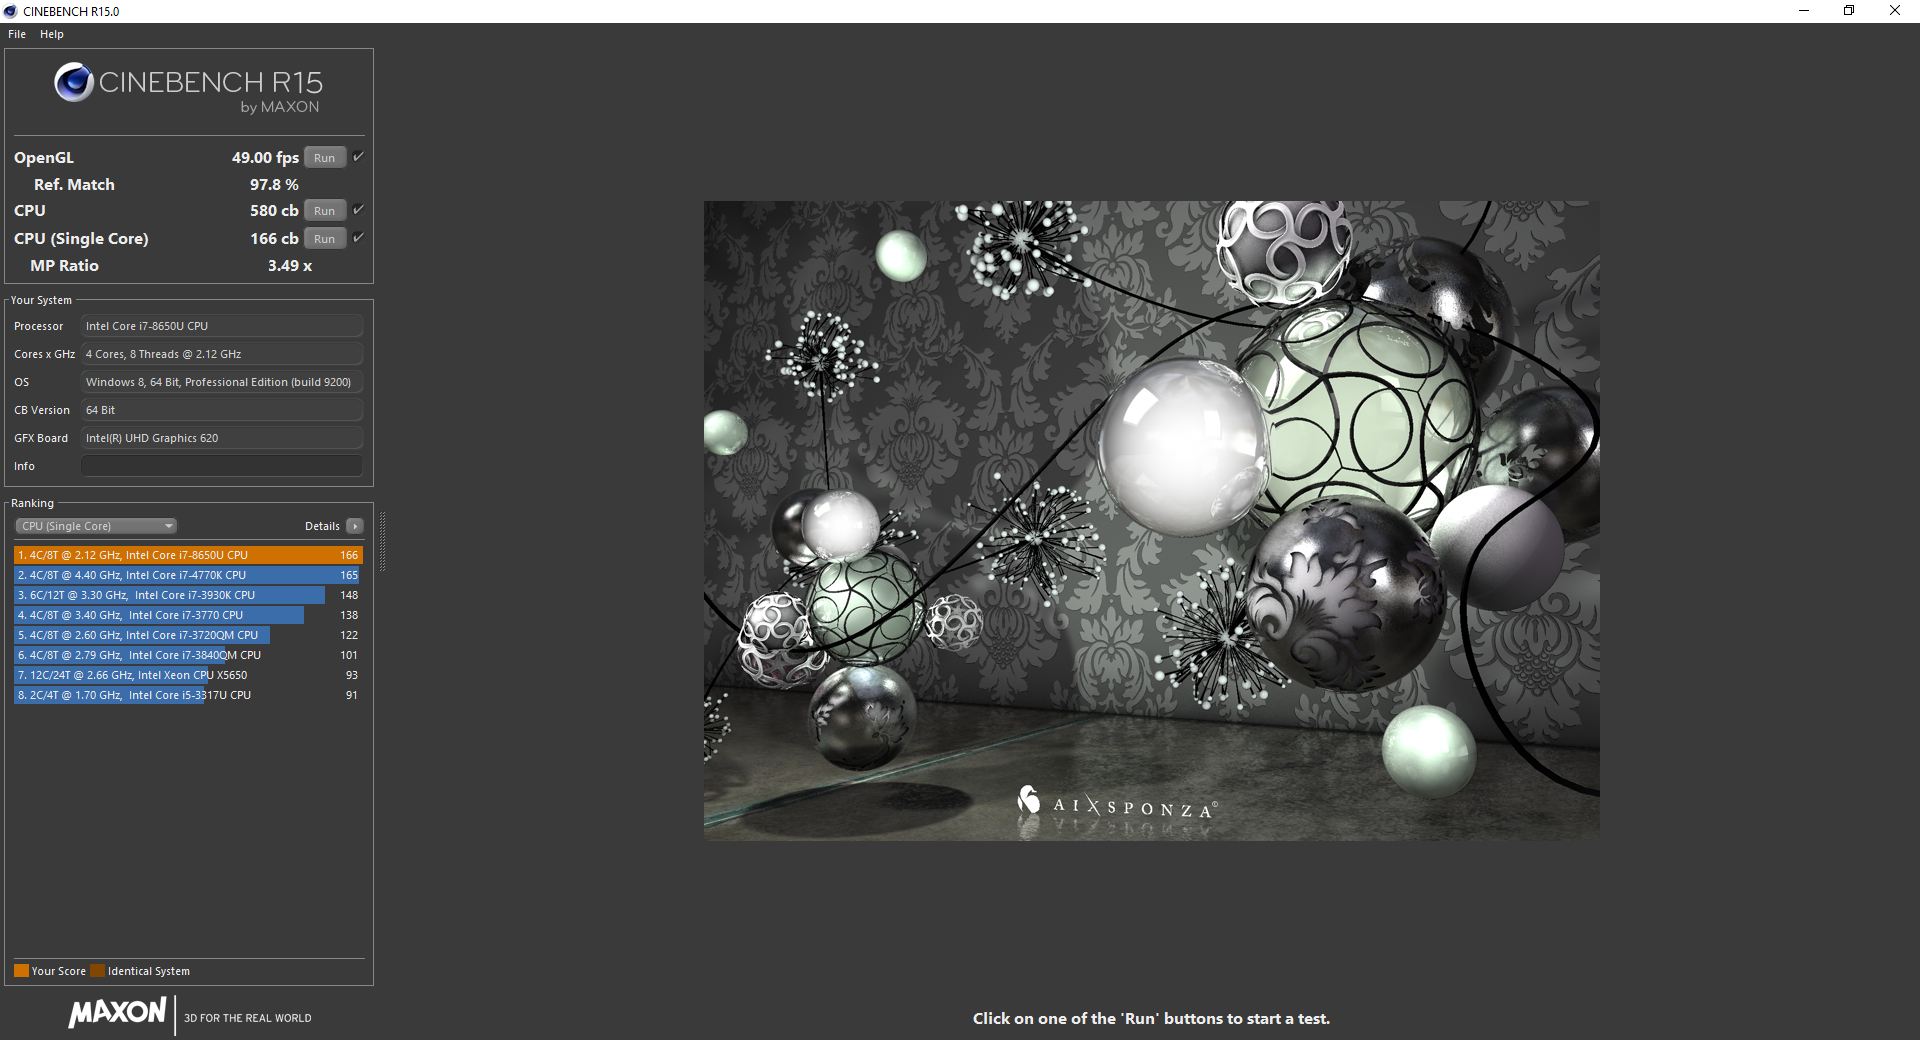
The Intel Core i7-8650U SoC looks great on paper, and it’s certainly quite a bit faster in multi-core operations than its 7th-generation predecessors (as shown in the table below, where our current machine beats the T470s in Cinebench R15 multi-CPU by some 58%). But is it really worth the upgrade over the Core i7-8550U?
Oddly enough, today’s test unit—even after updating to the latest BIOS, tweaking power settings, and plenty of other preparatory measures—consistently scored below the previous T480 review unit we evaluated. This is quite obviously a firmware limitation, and it could probably be resolved via some power tweaking with specialized utilities (possibly in peril of warranty voidance), but it shouldn’t have to be. Unfortunately, as a result, our Core i5-8250U T480s review unit which we tested last week actually scored above today’s larger T480—much higher; some 23%—which suggests that those in search of raw performance should actually opt for the T480s instead (since it also beats the previous T480 and all other units in today’s comparison field).
In spite of this disappointment, today’s T480 actually isn’t too far off the category average for the i7-8650U. The 580 points we received as an initial result in Cinebench R15 multi-CPU is around 6% below the current average of 612 for that CPU, and only 7% below the Dell Latitude 7490. Moreover, in the Cinebench loop test, the first result was actually an even higher 604 (before later dropping permanently in the second and all subsequent runs to the 558 – 569 range). What this means is that, in general, performance is actually not too far below what we’d expect to see for a machine equipped as such—and it’s still well above what we saw from the 7th-generation Intel chipsets (T470 et al). But regardless, given the results we saw from the less expensive i7-8550U setup, we can’t really recommend springing for the i7-8650U unless a corrective firmware build rolls out to address the discrepancy.
System Performance
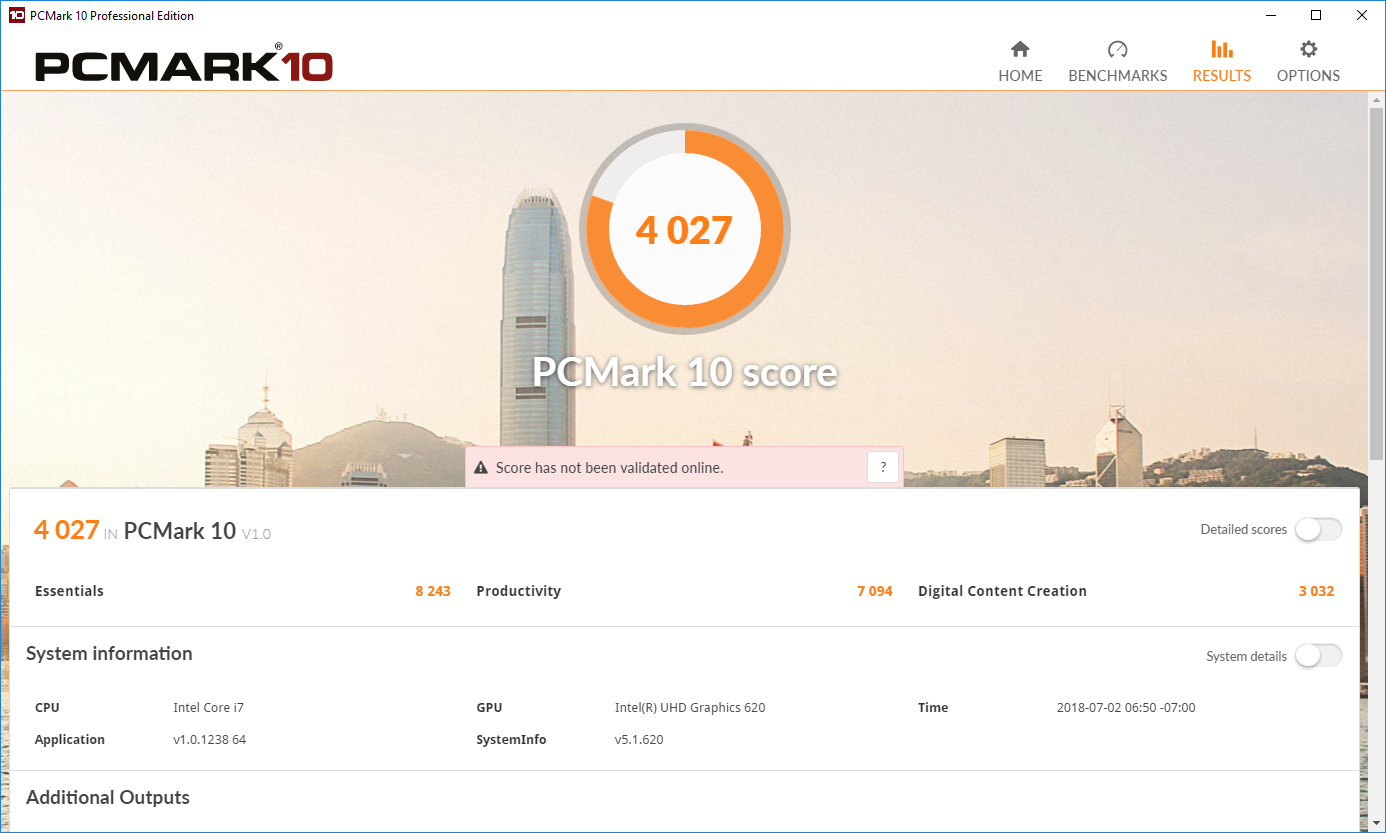
Today’s T480 configuration excels in our general system performance tests, scoring 4027 points in PCMark 10 and 3846 points in PCMark 8 Home Accelerated. The former is at the top of the list, and the latter is just 5% below the peak performer, the Dell Latitude 7490 (with 4029). Anecdotally, our time using the machine was smooth and operation was consistently fast.
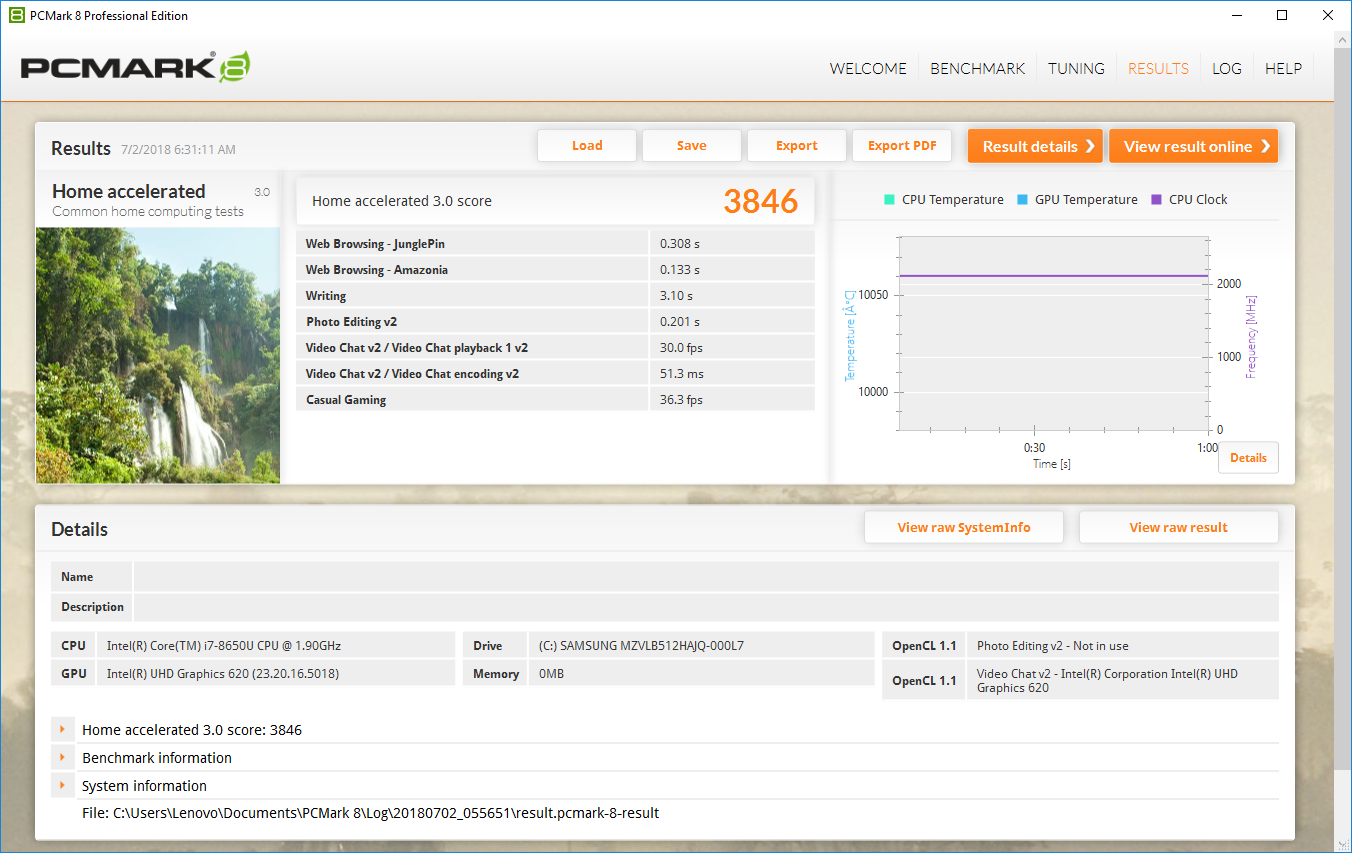
| PCMark 8 Home Score Accelerated v2 | 3846 points | |
| PCMark 10 Score | 4027 points | |
Help | ||
Storage Devices
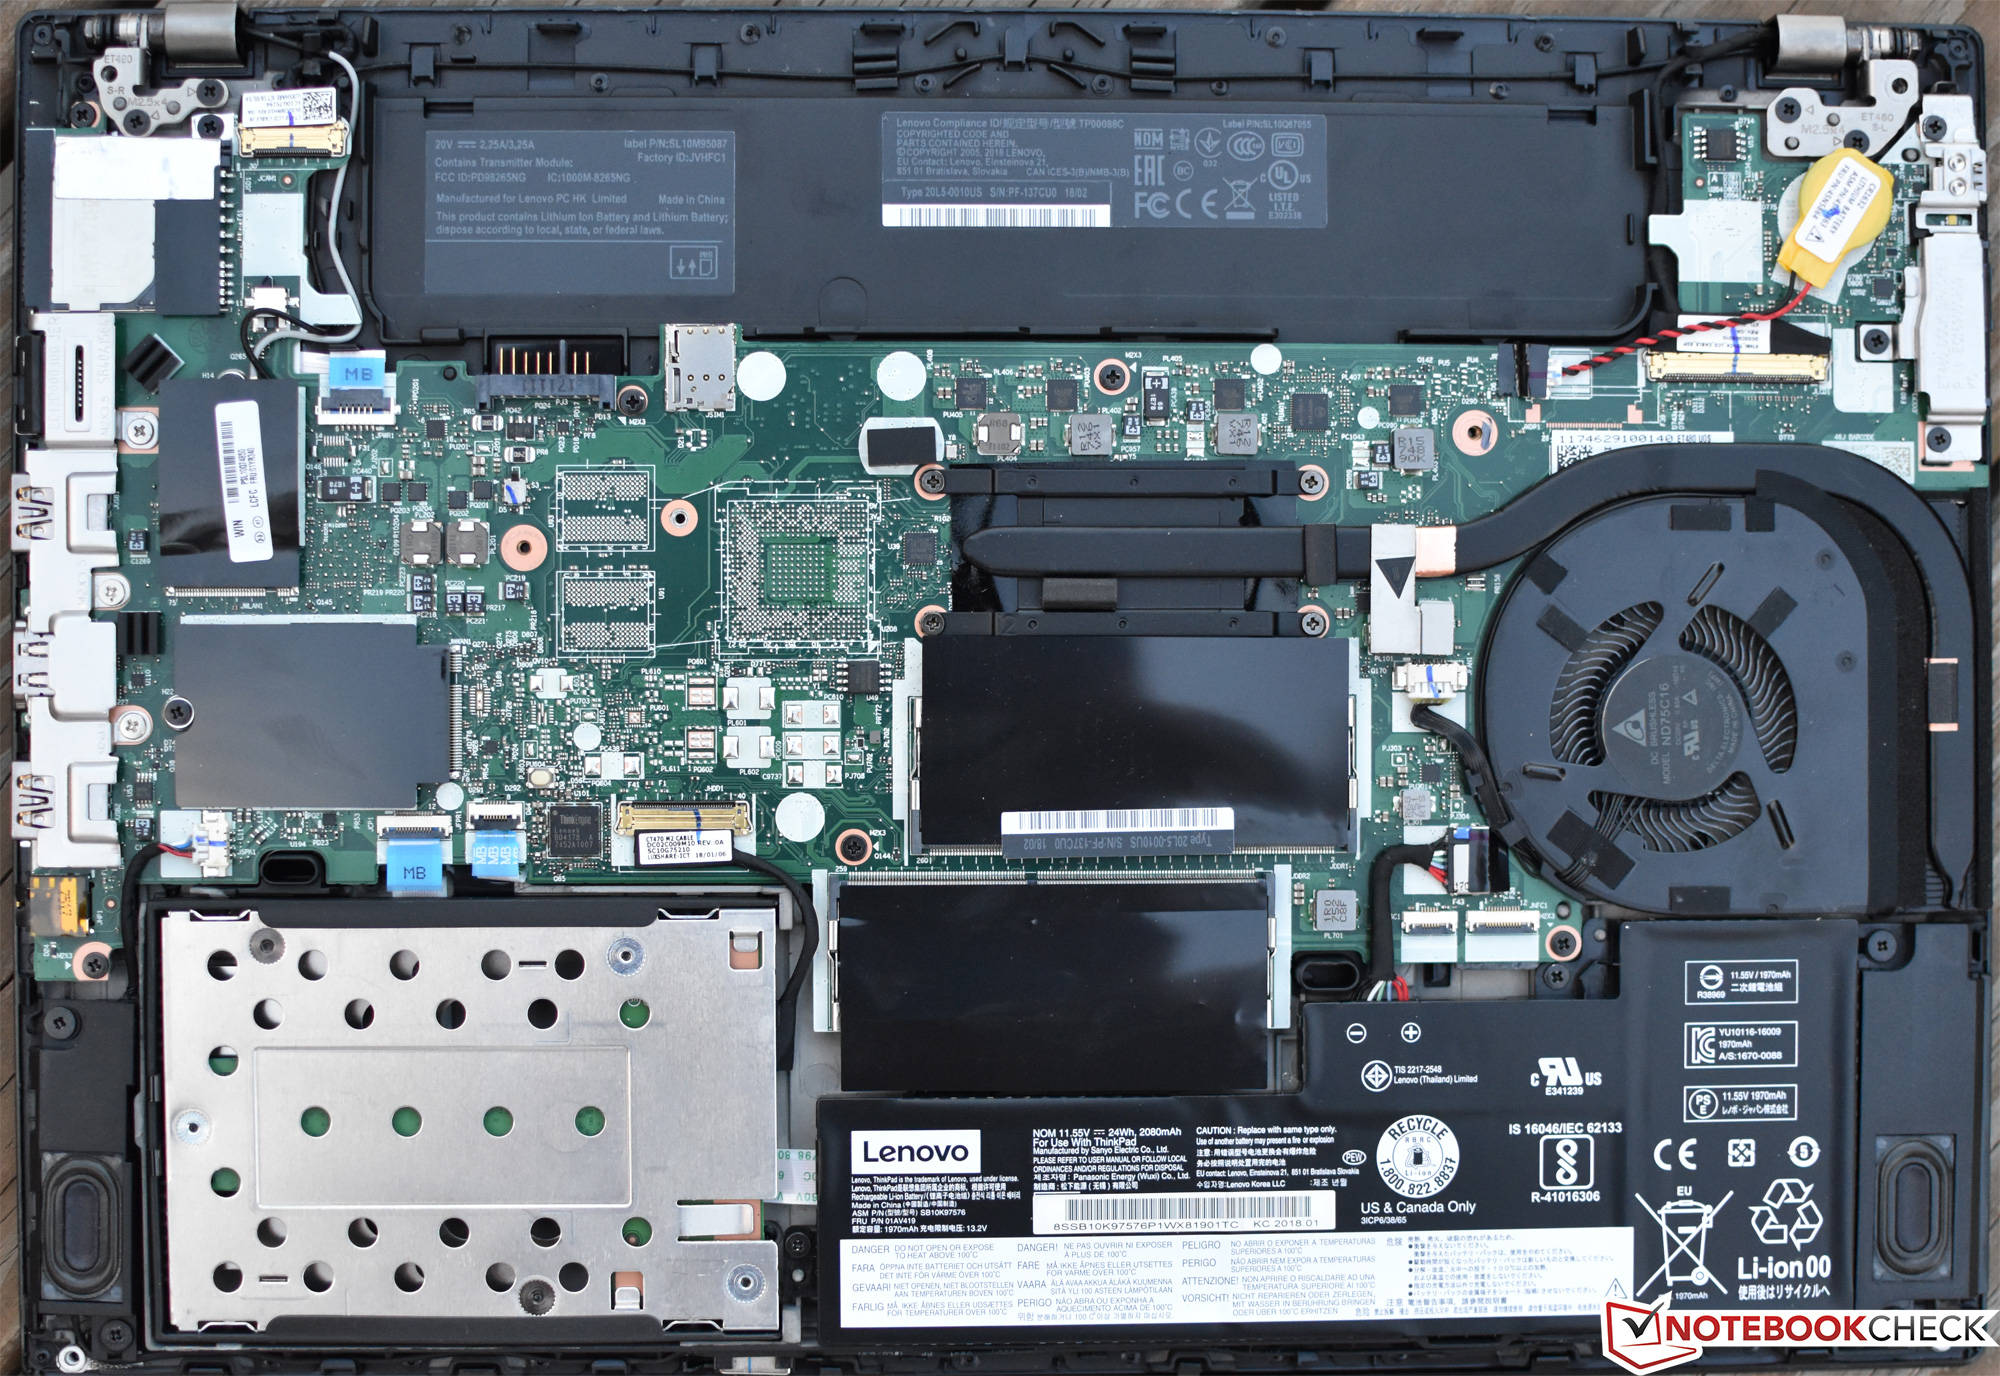
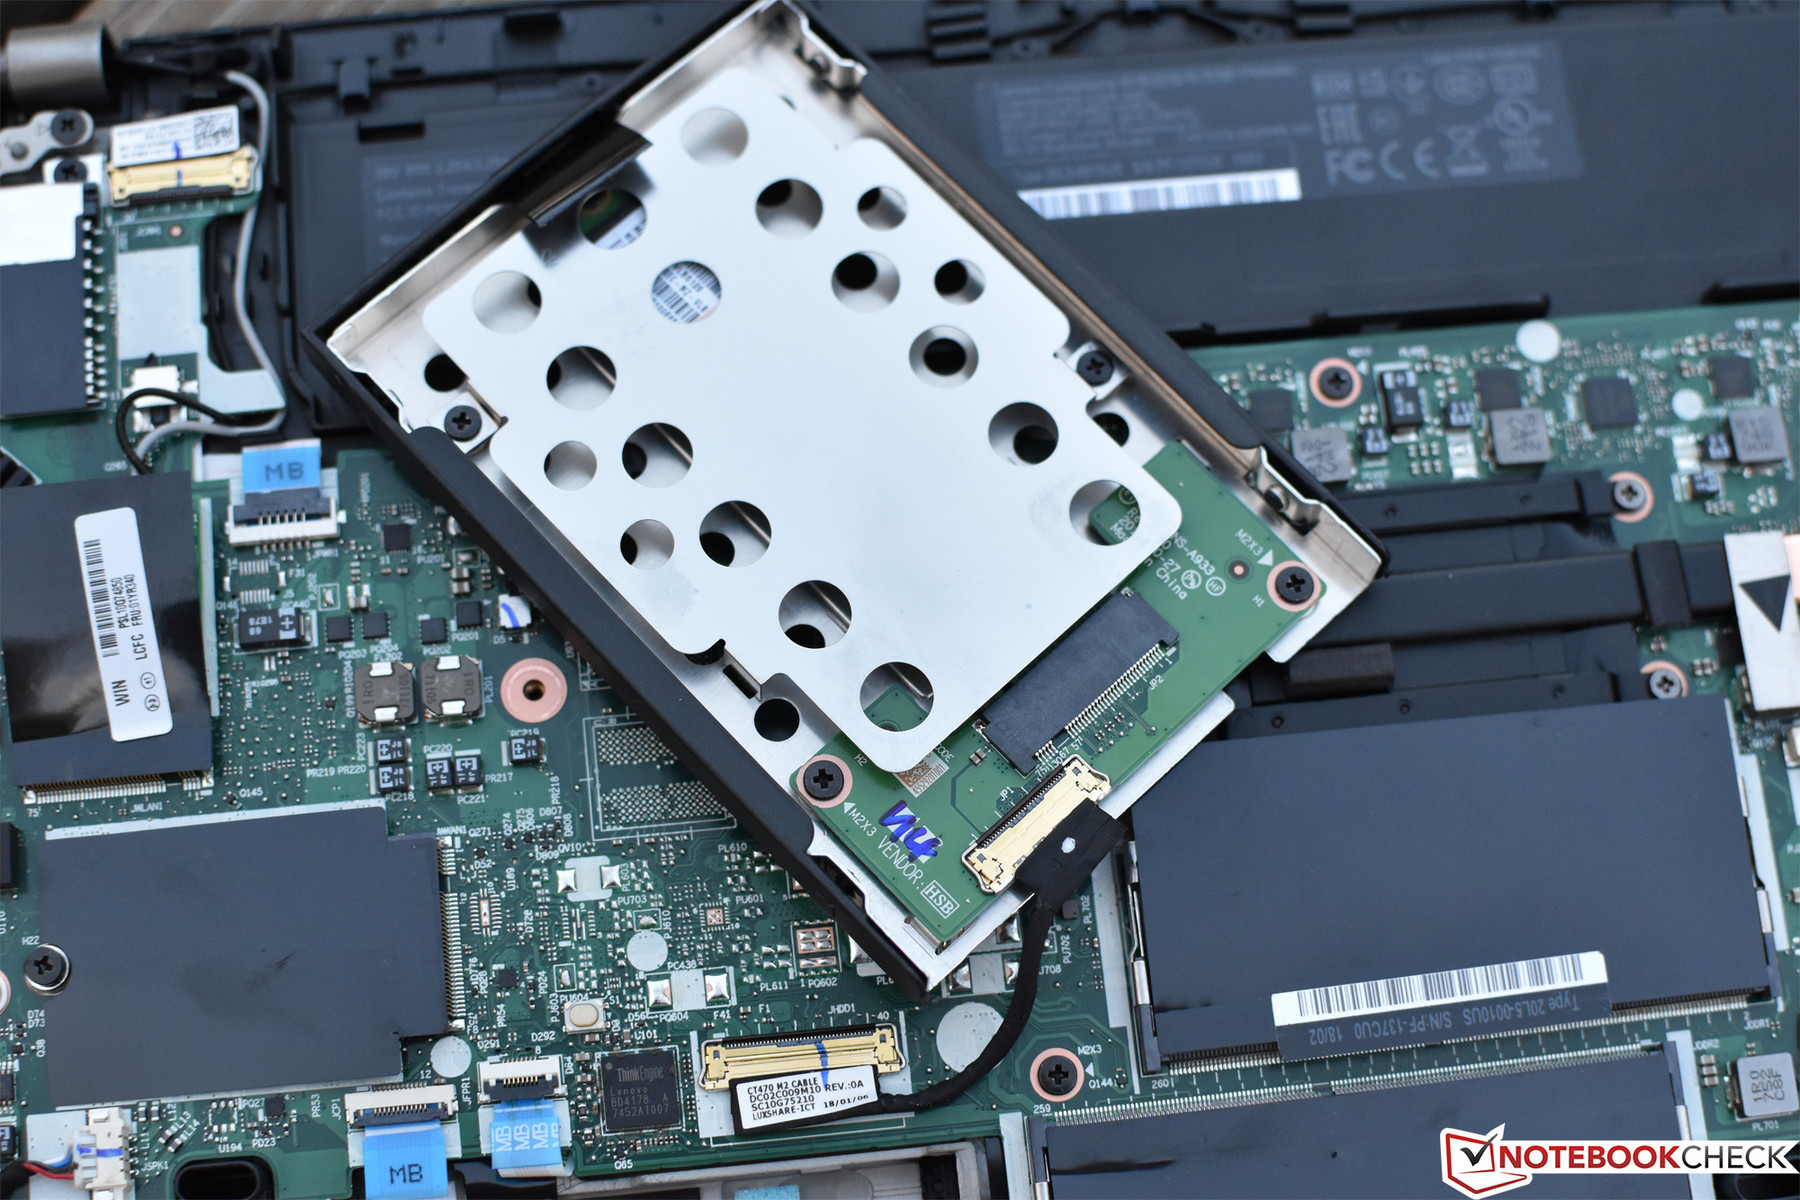
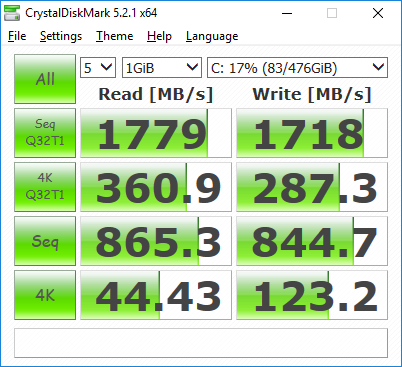
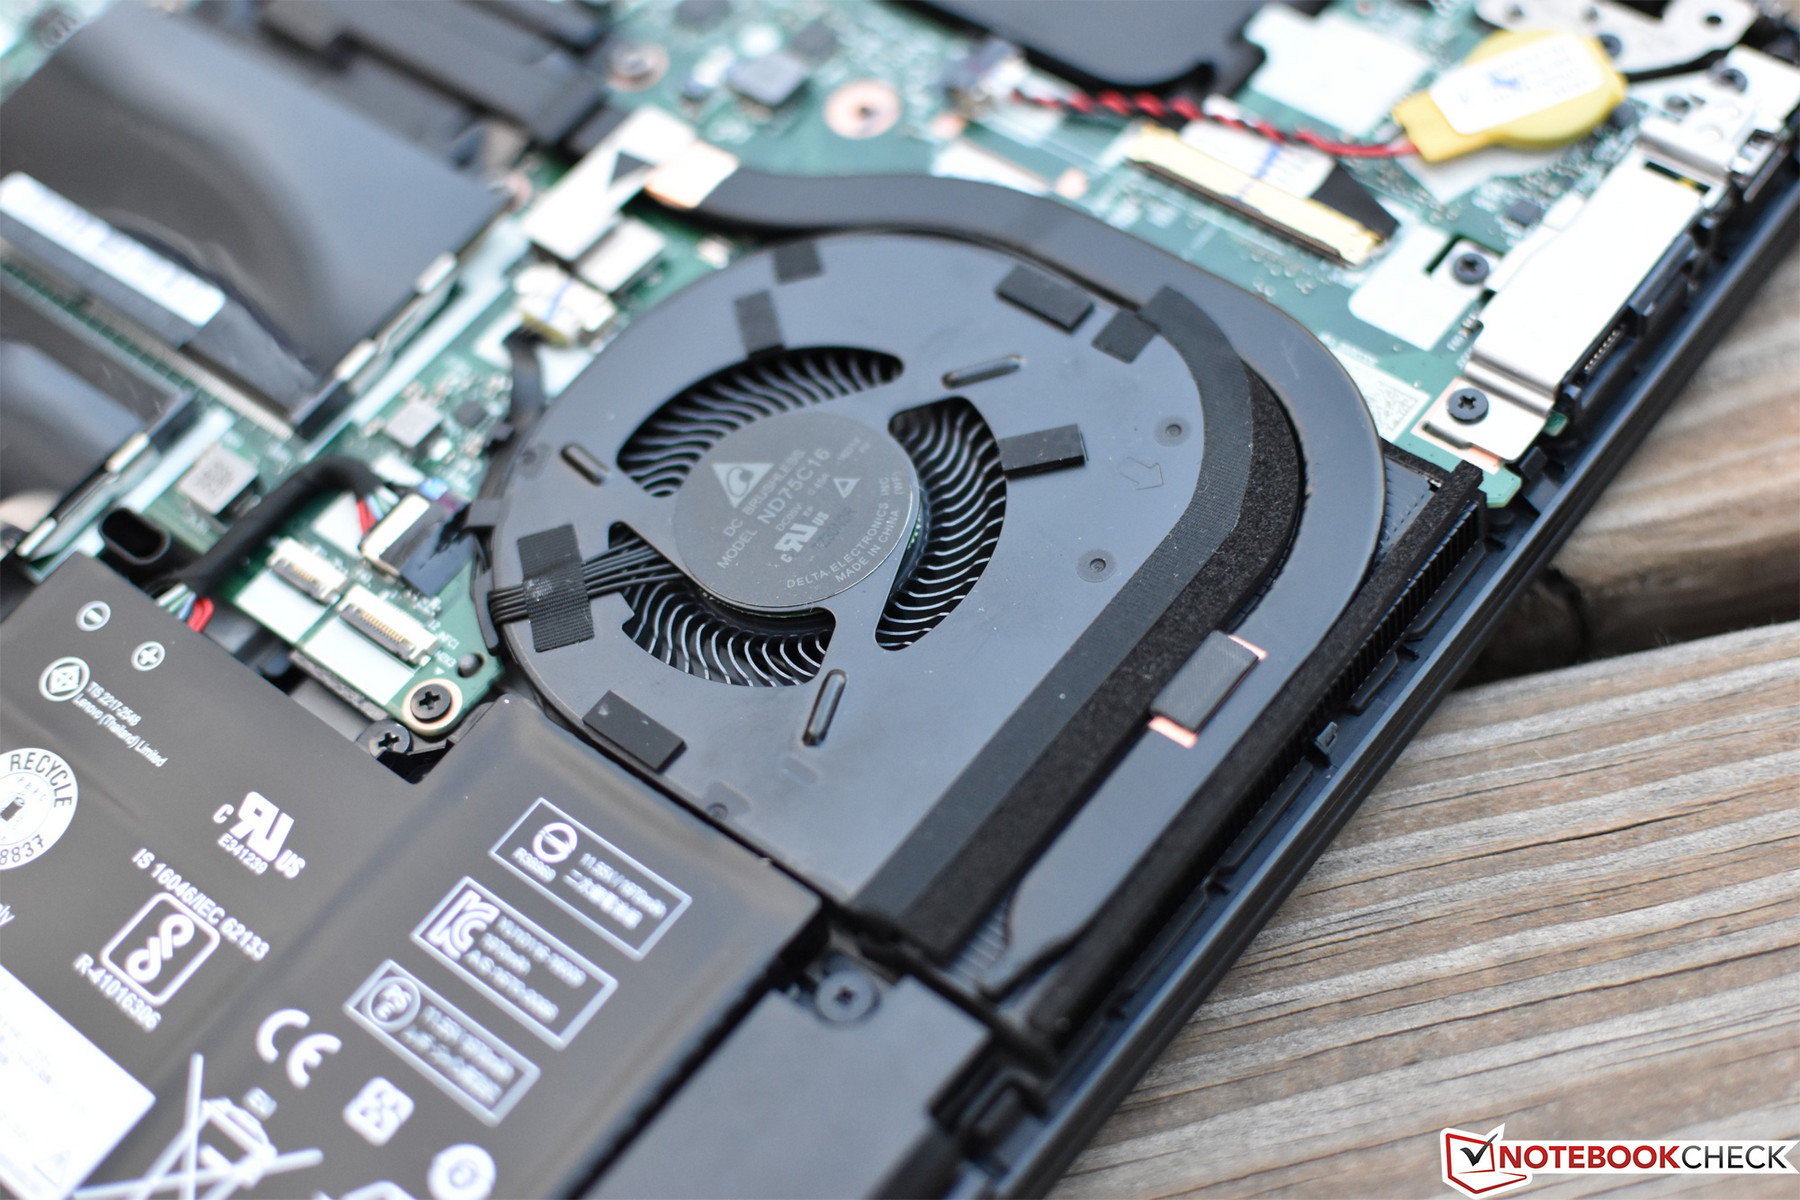
While the T480 is among a dying breed of laptops this size which still support mechanical hard drives (standard slim 7mm height), our test unit shipped with an adapter installed in that same bay—and within the adapter was the formidable Samsung PM981, an extremely fast NVMe SSD that consistently tops our benchmark charts. It does so here as well, nearly matching the speeds of the same drive installed in our X1 Carbon review unit, and dominating the rest of the field by double-digit margins.
It’s worth mentioning that, while there is no NVMe/M.2 slot on the T480’s board, the WWAN slot can be tapped to accommodate a second M.2 SSD, though the form factor is small, and this option is obviously mutually exclusive with the inclusion of a WWAN adapter. All such configurations direct from Lenovo only include 2-lane PCIe capability from the primary 7mm drive bay SSD (within the adapter) as well, which is curious. Another example of the latter limitation is our review unit from March, which only managed speeds consistent with 2-lane operation. Today’s unit suffers no such limitations and wholeheartedly embraces 4-lane speeds.
| Lenovo ThinkPad T480-20L50010US Samsung SSD PM981 MZVLB512HAJQ | Lenovo ThinkPad T480s-20L7002AUS Samsung PM961 MZVLW256HEHP | Dell Latitude 7490 Samsung PM961 MZVLW256HEHP | HP EliteBook 840 G5-3JX61EA Toshiba KXG50ZNV1T02 | Lenovo ThinkPad X1 Carbon 2018-20KGS03900 Samsung SSD PM981 MZVLB512HAJQ | Average Samsung SSD PM981 MZVLB512HAJQ | |
|---|---|---|---|---|---|---|
| AS SSD | -18% | -18% | -31% | 5% | -13% | |
| Copy Game MB/s (MB/s) | 382.3 | 905 | 1107 | 1057 ? | ||
| Copy Program MB/s (MB/s) | 227.1 | 326.2 | 460.2 | 454 ? | ||
| Copy ISO MB/s (MB/s) | 872 | 1688 | 1247 | 1755 ? | ||
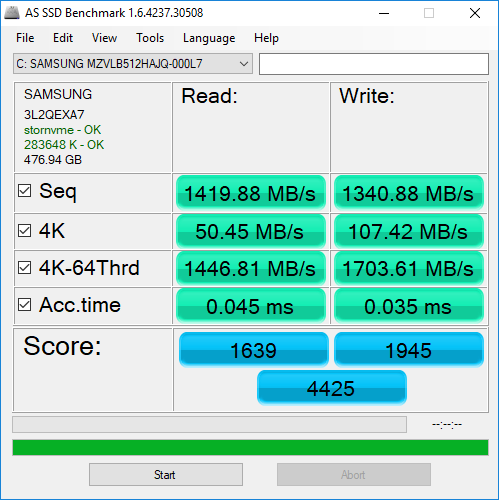
| Score Total (Points) | 4425 | 3048 -31% | 2350 -47% | 2630 -41% | 3529 -20% | 3966 ? -10% |
| Score Write (Points) | 1945 | 921 -53% | 536 -72% | 1084 -44% | 1801 -7% | 1780 ? -8% |
| Score Read (Points) | 1639 | 1435 -12% | 1242 -24% | 1070 -35% | 1168 -29% | 1451 ? -11% |
| Access Time Write * (ms) | 0.035 | 0.038 -9% | 0.03 14% | 0.055 -57% | 0.027 23% | 0.08337 ? -138% |
| Access Time Read * (ms) | 0.045 | 0.055 -22% | 0.04 11% | 0.059 -31% | 0.029 36% | 0.05092 ? -13% |
| 4K-64 Write (MB/s) | 1704 | 706 -59% | 329.6 -81% | 908 -47% | 1529 -10% | 1504 ? -12% |
| 4K-64 Read (MB/s) | 1447 | 1183 -18% | 955 -34% | 813 -44% | 876 -39% | 1203 ? -17% |
| 4K Write (MB/s) | 107.4 | 97.8 -9% | 114.9 7% | 90 -16% | 134.3 25% | 112 ? 4% |
| 4K Read (MB/s) | 50.5 | 42.09 -17% | 48.13 -5% | 26.75 -47% | 52.4 4% | 50.5 ? 0% |
| Seq Write (MB/s) | 1341 | 1172 -13% | 919 -31% | 856 -36% | 1376 3% | 1637 ? 22% |
| Seq Read (MB/s) | 1420 | 2094 47% | 2385 68% | 2300 62% | 2396 69% | 1976 ? 39% |
* ... smaller is better

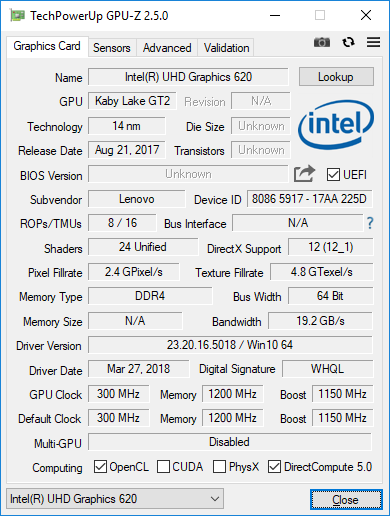
GPU Performance
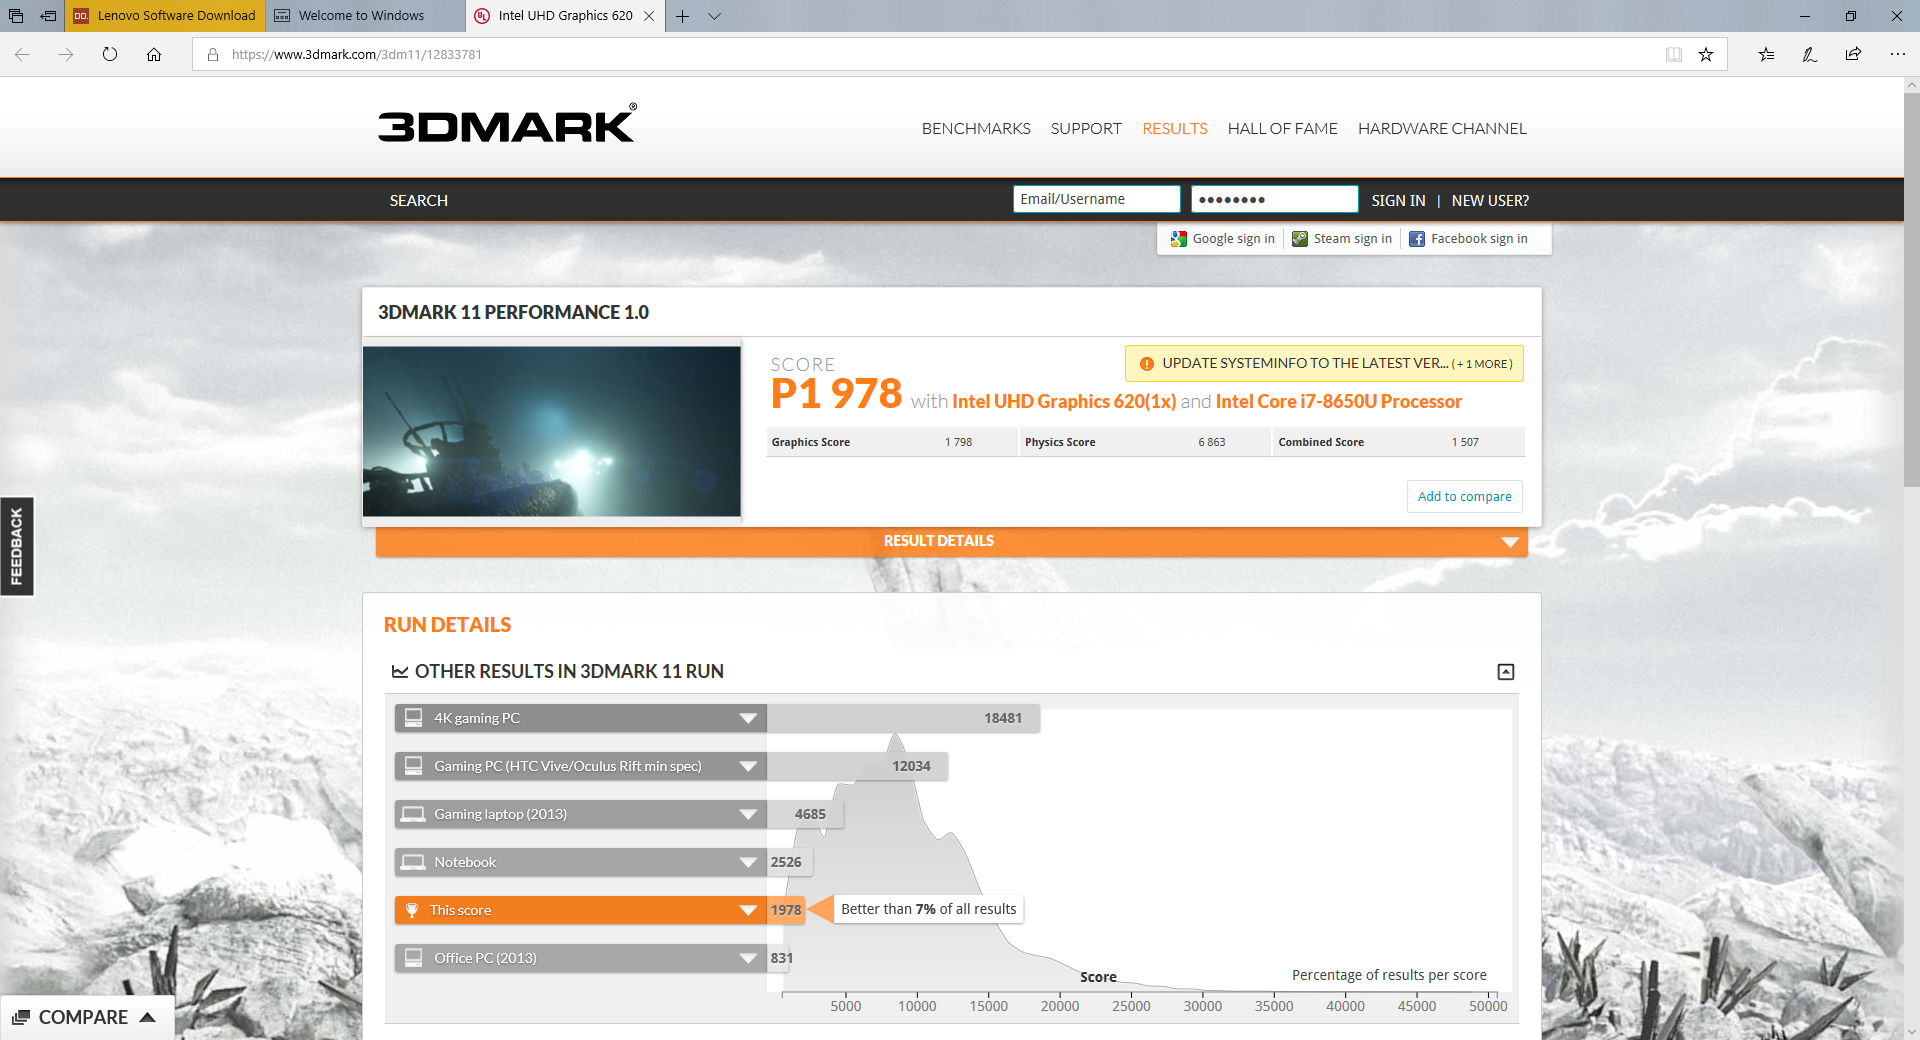
Our previous T480 test candidate featured NVIDIA GeForce MX150 dedicated graphics, which (while decidedly low-end within the realm of dedicated GPUs) can actually manage many games at low settings and lower resolutions. Today’s unit dials that back to the more budget-friendly (and power-efficient) Intel UHD Graphics 620, which by contrast absolutely cannot handle gaming, of course. The immense gap between the benchmark scores of the two machines is evidence of this (e.g., 1507 vs. 4211 in 3DMark 11).
| 3DMark 11 Performance | 1978 points | |
Help | ||
| low | med. | high | ultra | |
|---|---|---|---|---|
| BioShock Infinite (2013) | 63 | 31 | 27 | 9 |
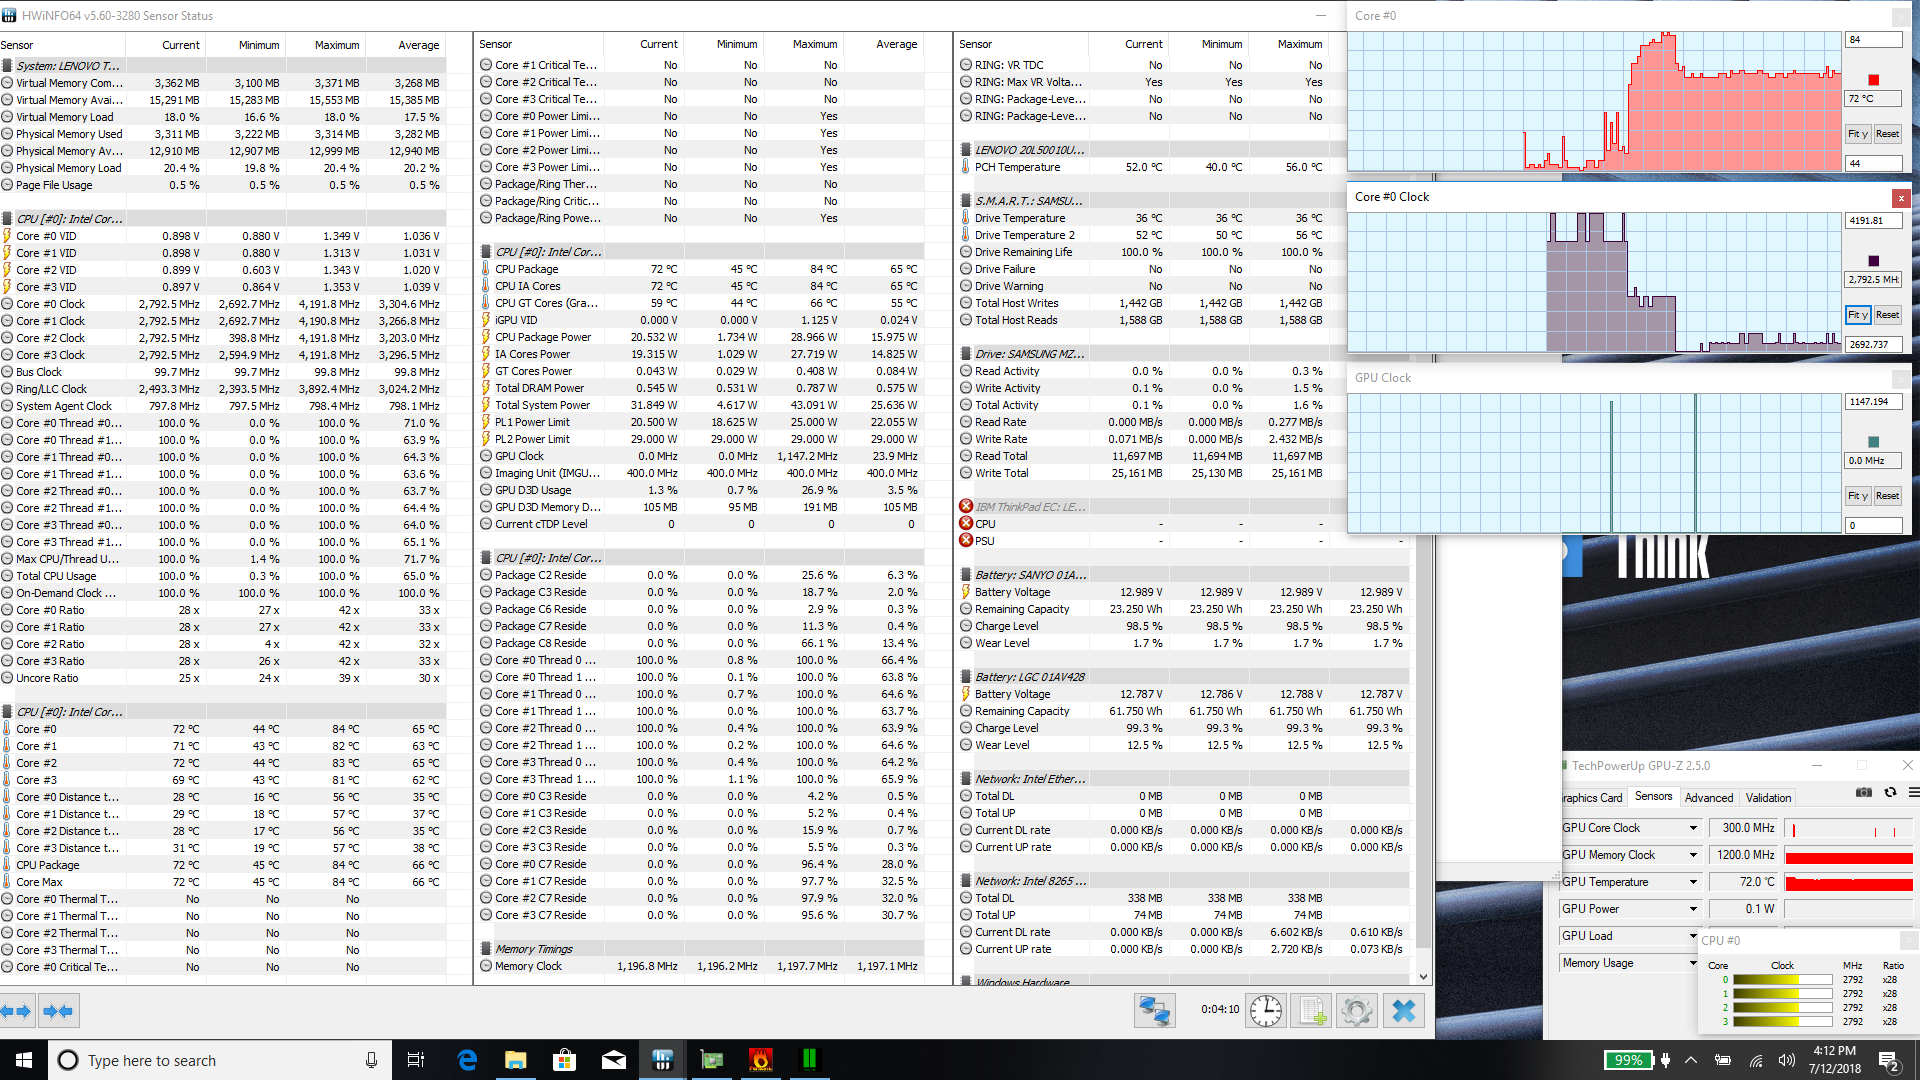
Stress Test
Under full CPU stress, the T480 manages clock rates of 3.2 – 3.4 for 20 seconds or so before temperatures reach 83 °C and clock rates subsequently permanently plummet to the 2.7 – 2.9 range. Temperatures afterward are stable at 72 °C.
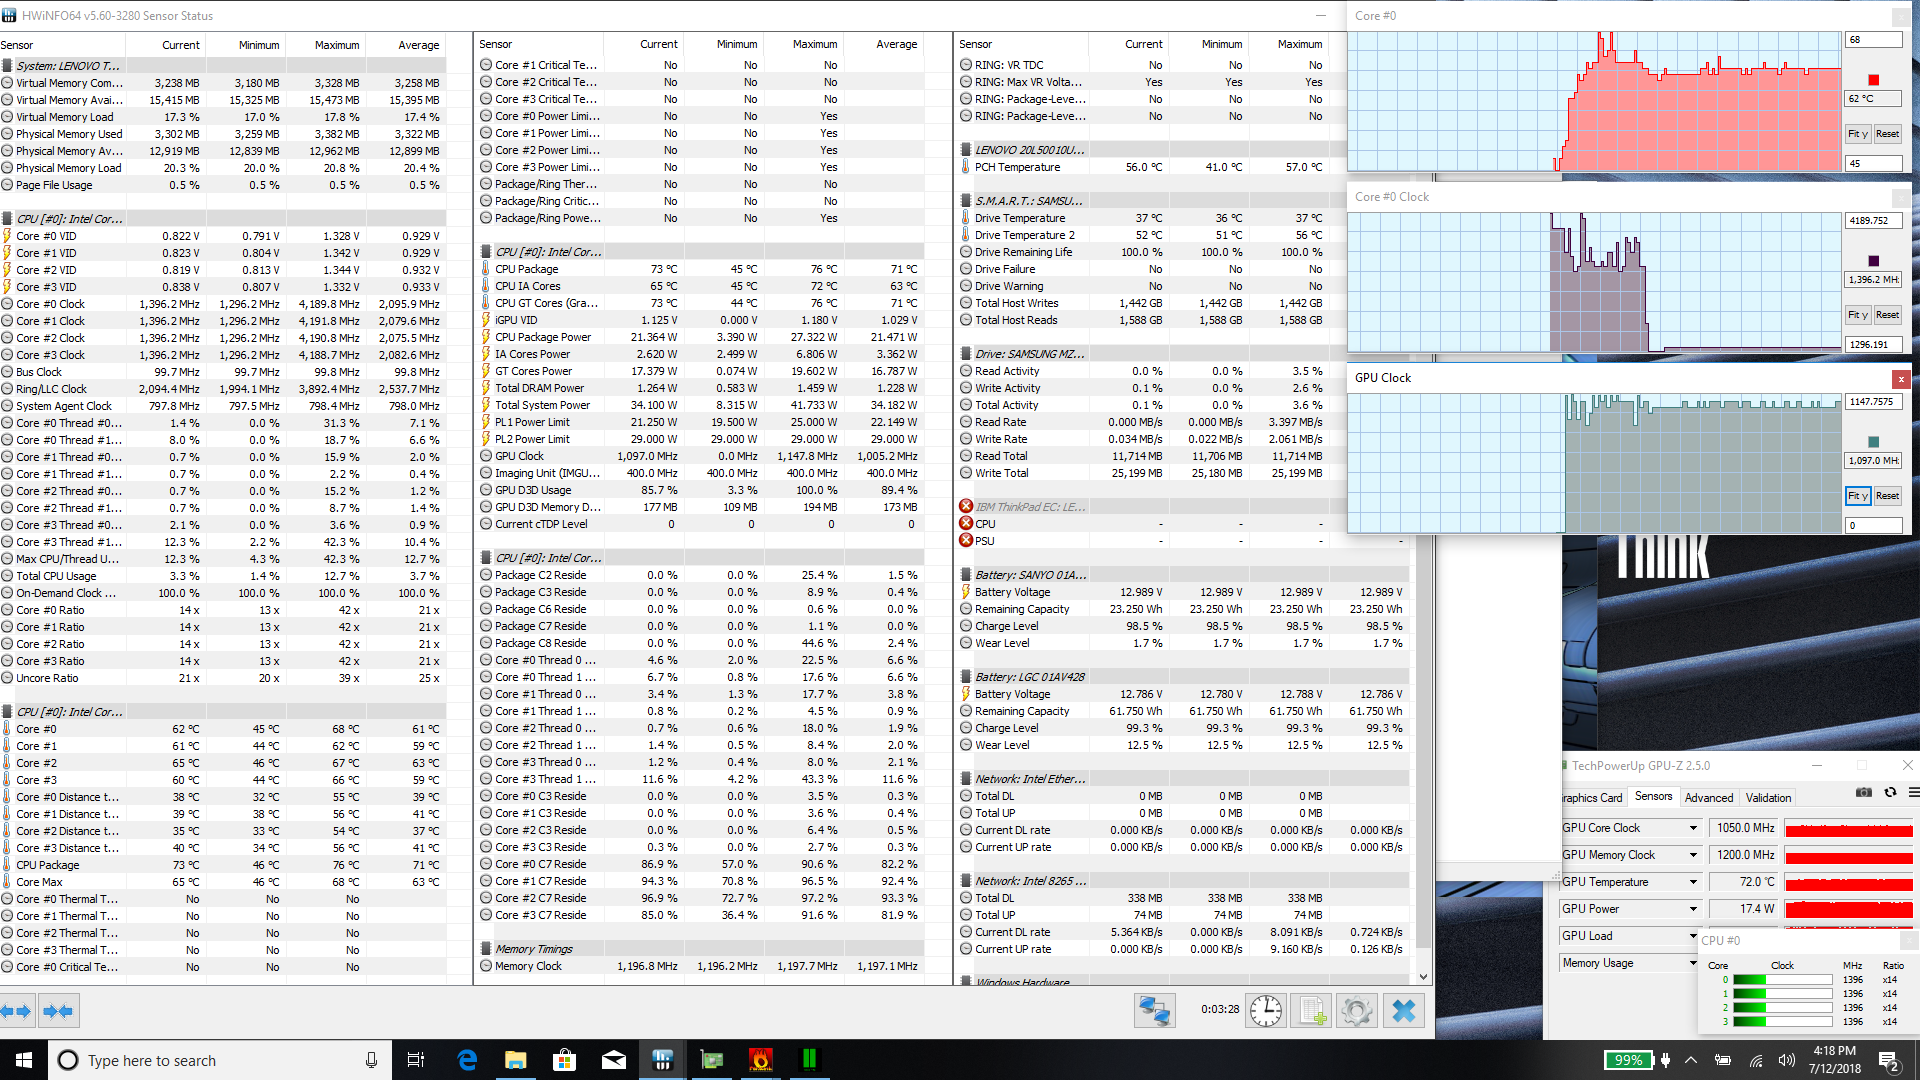
During GPU stress, GPU clock rates are initially 850 MHz – 1000 MHz with spikes to 1150 MHz, alongside temperatures in the 60s °C and climbing toward a max of 68 °C. Shortly after the maximum is reached, however, the CPU clock rate drops all the way to 1.4 GHz, creating thermal (and TDP) headroom for the GPU to jump up to a (mostly) stable 1050 – 1100 MHz frequency with temperatures consistently 62 °C.
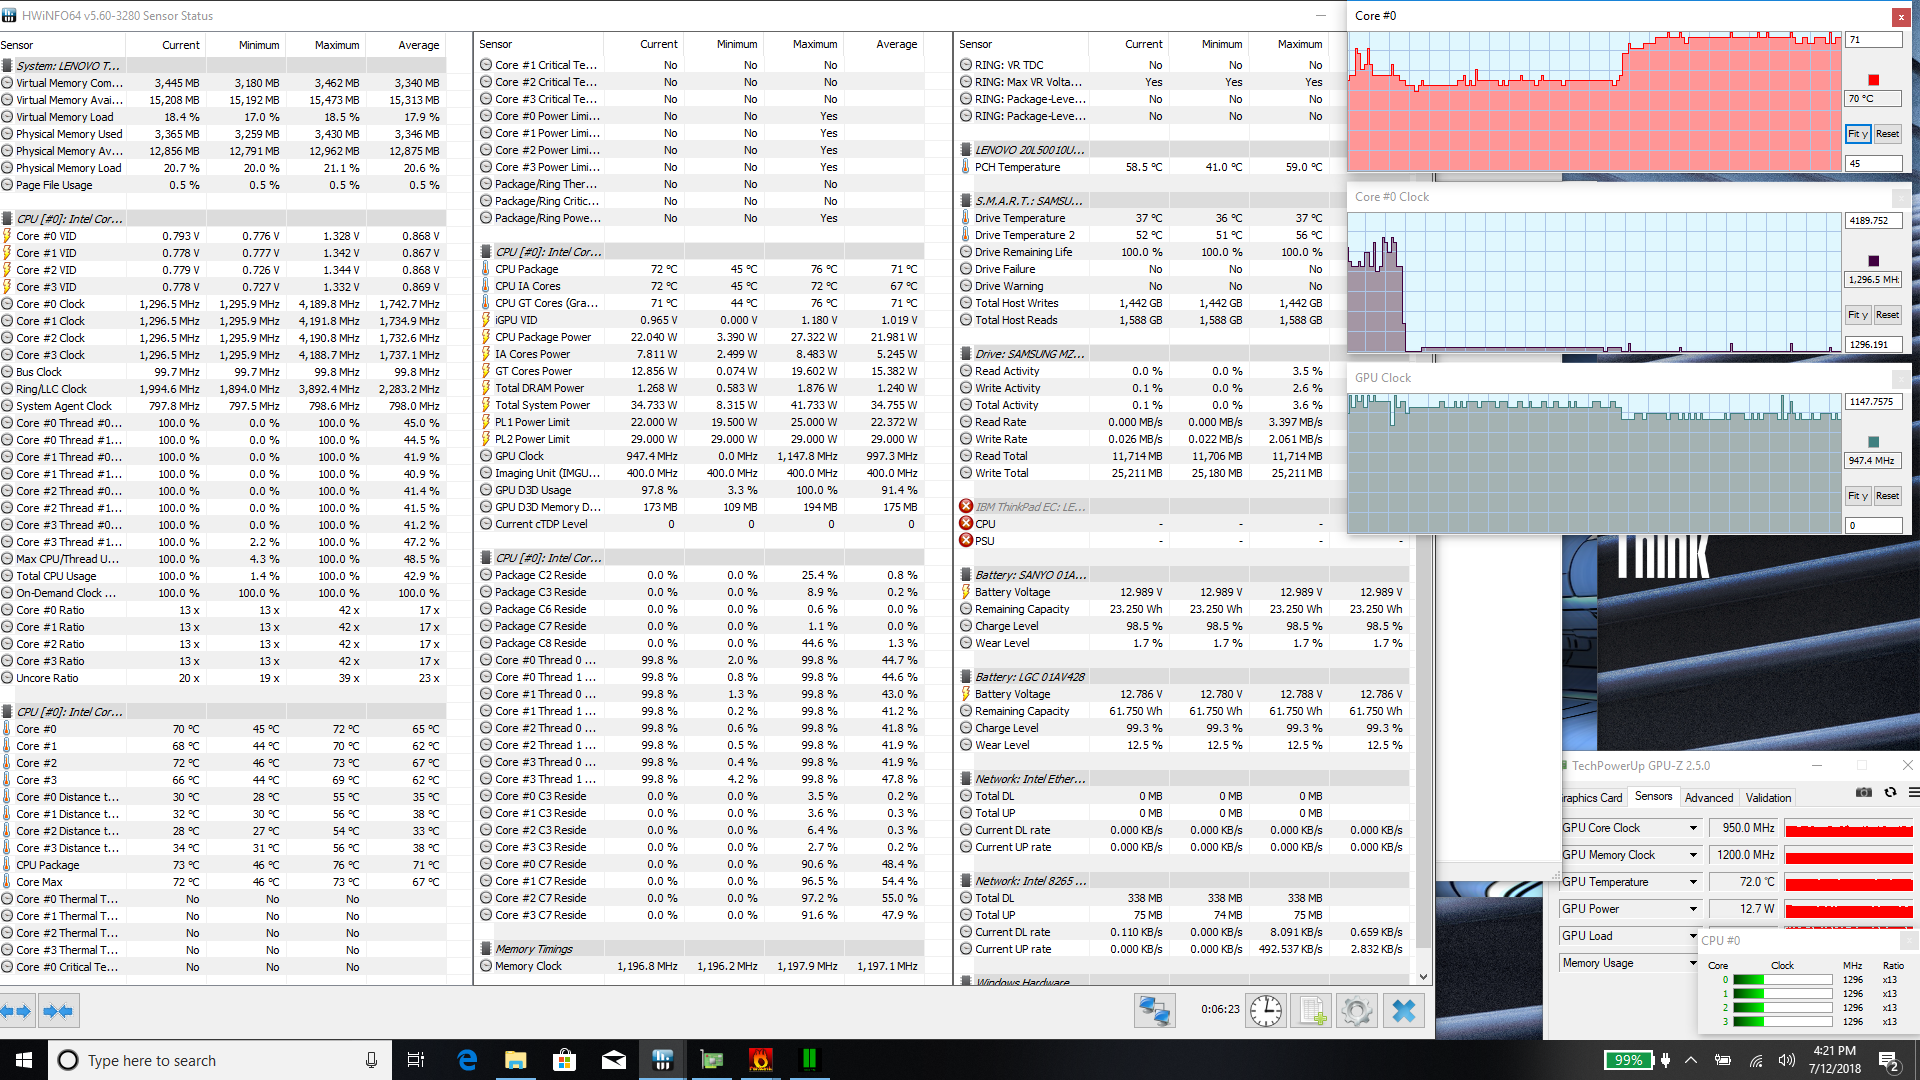
Adding back in CPU stress on top of the full GPU load does nothing to budge CPU frequencies at this point, which now subside even further to just 1.3 GHz. The GPU retreats also to 950 – 1000 MHz, and temperatures reach an absolute maximum here of 71 °C (stable at closer to 70 °C in the end).
| CPU Clock (GHz) | GPU Clock (MHz) | Average CPU Temperature (°C) | Average GPU Temperature (°C) | |
| Prime95 Stress | 2.8 | - | 72 | - |
| FurMark Stress | - | 1050 | - | 62 |
| Prime95 + FurMark Stress | 1.3 | 950 | 70 | 70 |
Emissions
System Noise
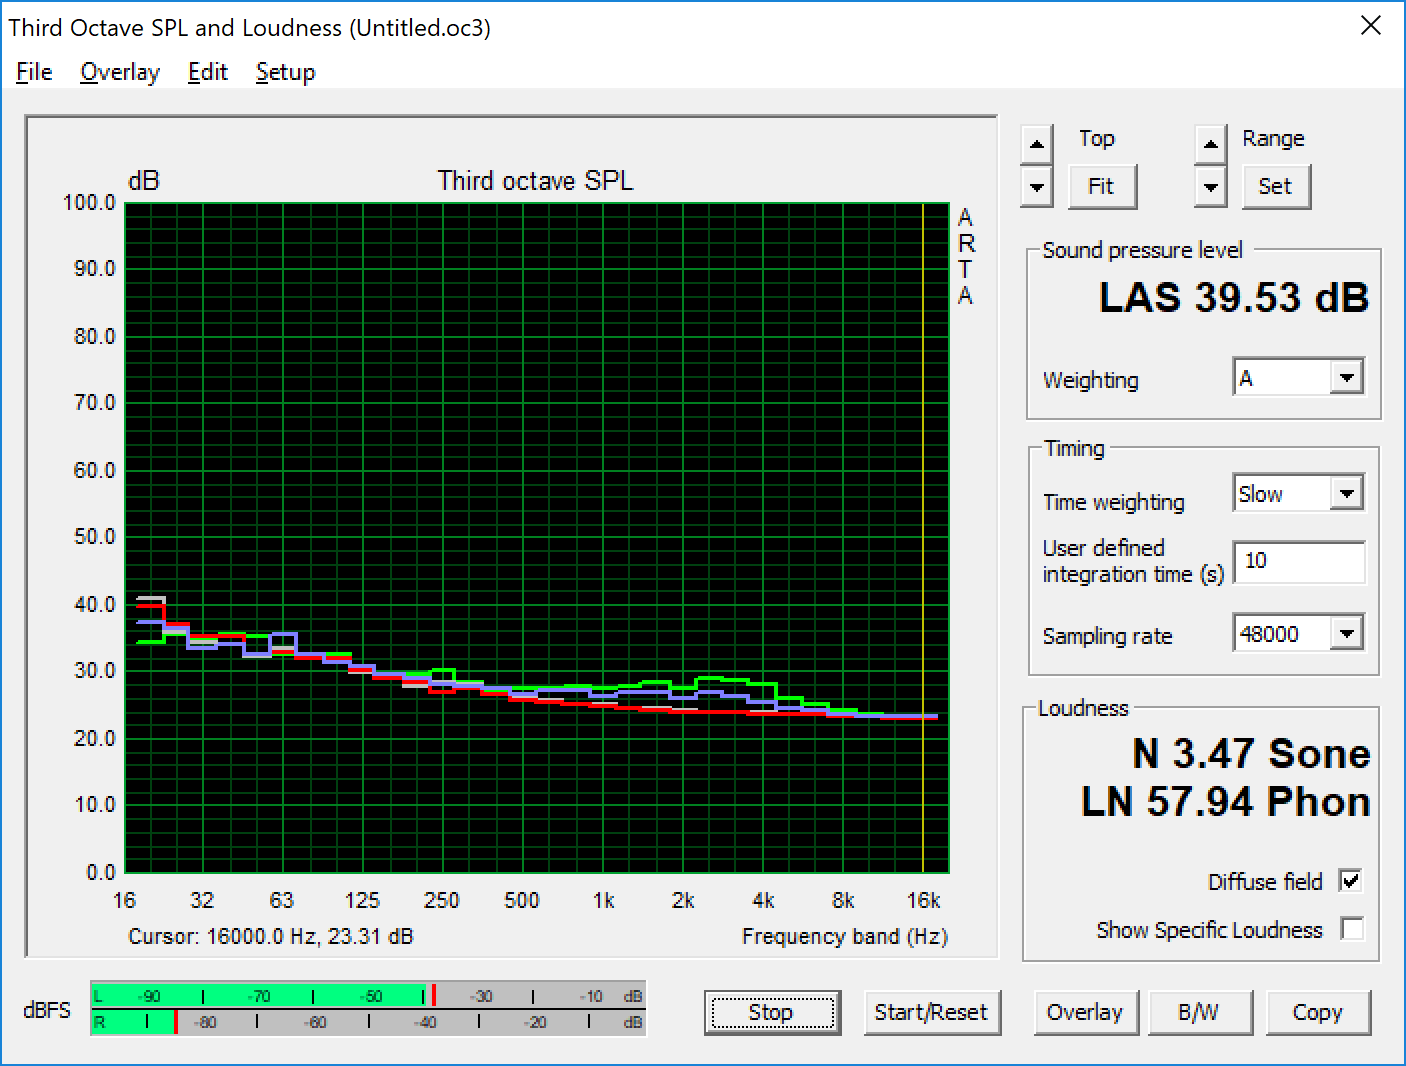
Noise levels are roughly in line with those of the previous MX150-equipped T480 review unit—which is to say, as unobtrusive and quiet as the best business PCs are expected to be. The device is totally silent while idling (the fan doesn’t run, and we couldn’t detect any electrical noise from the machine), and it’s not that much louder even under load, with an average level of 35.7 dB(A) and an overall maximum of just 38.8 dB(A).
Noise level
| Idle |
| 28.3 / 28.3 / 28.3 dB(A) |
| Load |
| 35.7 / 38.8 dB(A) |
 | ||
30 dB silent 40 dB(A) audible 50 dB(A) loud |
||
min: | ||
| Lenovo ThinkPad T480-20L50010US UHD Graphics 620, i7-8650U, Samsung SSD PM981 MZVLB512HAJQ | Lenovo ThinkPad T480s-20L7002AUS UHD Graphics 620, i5-8250U, Samsung PM961 MZVLW256HEHP | Lenovo ThinkPad T480-20L6S01V00 GeForce MX150, i5-8550U, Samsung SSD PM981 MZVLB512HAJQ | Dell Latitude 7490 UHD Graphics 620, i7-8650U, Samsung PM961 MZVLW256HEHP | HP EliteBook 840 G5-3JX61EA UHD Graphics 620, i5-8550U, Toshiba KXG50ZNV1T02 | Lenovo ThinkPad X1 Carbon 2018-20KGS03900 UHD Graphics 620, i5-8550U, Samsung SSD PM981 MZVLB512HAJQ | |
|---|---|---|---|---|---|---|
| Noise | -0% | 0% | -1% | -2% | -2% | |
| off / environment * (dB) | 28.3 | 28.1 1% | 29 -2% | 28.2 -0% | 30.3 -7% | 28.9 -2% |
| Idle Minimum * (dB) | 28.3 | 28.1 1% | 29 -2% | 28.2 -0% | 30.3 -7% | 28.9 -2% |
| Idle Average * (dB) | 28.3 | 28.1 1% | 29 -2% | 28.2 -0% | 30.3 -7% | 28.9 -2% |
| Idle Maximum * (dB) | 28.3 | 28.1 1% | 29 -2% | 31.4 -11% | 30.3 -7% | 32.5 -15% |
| Load Average * (dB) | 35.7 | 35.5 1% | 35.6 -0% | 31.7 11% | 33.8 5% | 35.1 2% |
| Load Maximum * (dB) | 38.8 | 41.5 -7% | 35.6 8% | 41.2 -6% | 33.8 13% | 35.1 10% |
| Witcher 3 ultra * (dB) | 32.5 |
* ... smaller is better
Temperature
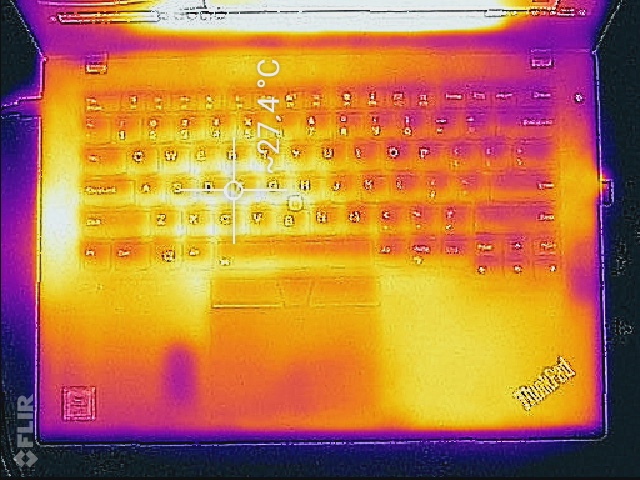
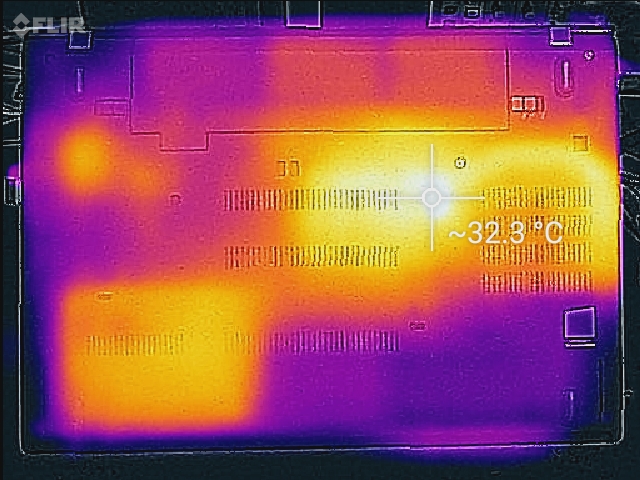
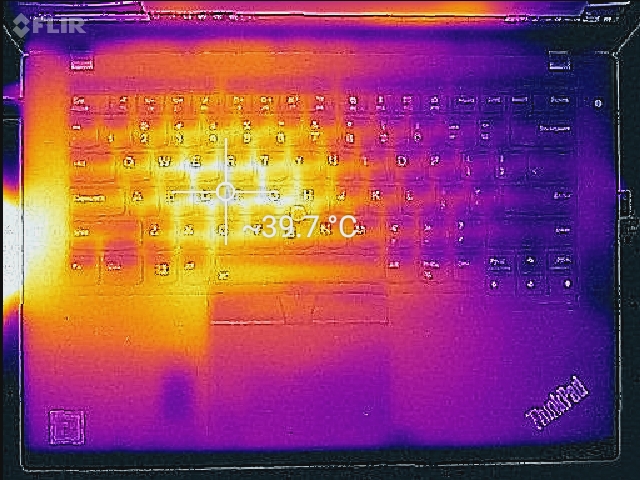
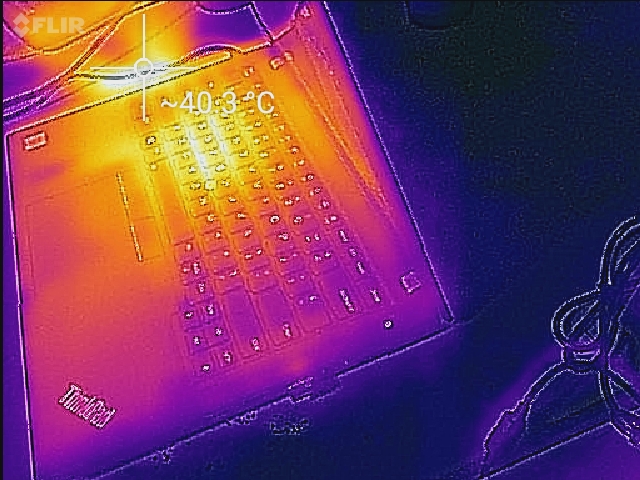
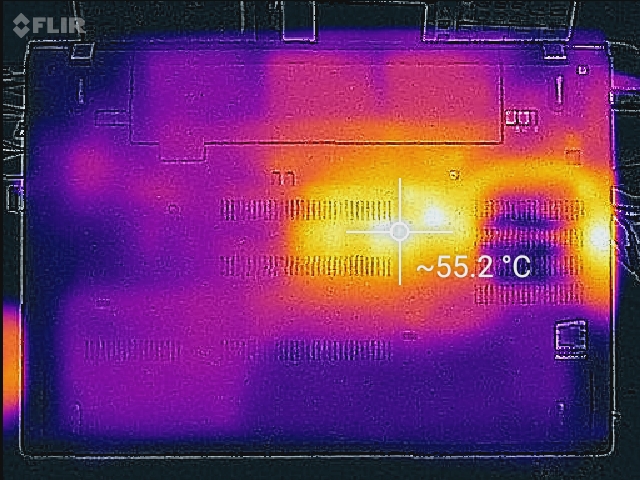
Fortunately, temperatures are still very reasonable even in spite of the low noise levels. Under load, today’s T480 (again, with its weaker integrated graphics) is much cooler than the previous MX150-equipped review unit. We measured average temperatures of 31.3 °C / 34.5 °C on top/bottom of the base unit respectively, with hot spots directly in center of 40.2 °C / 54.6 °C. One other hot spot in the right center quadrant underneath of 50 °C, however, might prove uncomfortable if the machine is resting on the lap during sustained processing loads.
Idle temperatures aren’t a problem either, but on today’s machine, they’re perhaps more of a problem than the load values. With averages of 26.2 °C / 28 °C on top/bottom, these readings are some 6 – 8 °C above ambient temperatures, which could be irritating during daily use in some environments. Fortunately, Lenovo’s Power Manager software offers options to fine-tune cooling and fan operation, so it should be able to be mitigated if the proper steps are taken.
(±) The maximum temperature on the upper side is 40.2 °C / 104 F, compared to the average of 34.3 °C / 94 F, ranging from 21.2 to 62.5 °C for the class Office.
(-) The bottom heats up to a maximum of 54.6 °C / 130 F, compared to the average of 36.8 °C / 98 F
(+) In idle usage, the average temperature for the upper side is 26.2 °C / 79 F, compared to the device average of 29.5 °C / 85 F.
(+) The palmrests and touchpad are cooler than skin temperature with a maximum of 30.4 °C / 86.7 F and are therefore cool to the touch.
(-) The average temperature of the palmrest area of similar devices was 27.5 °C / 81.5 F (-2.9 °C / -5.2 F).
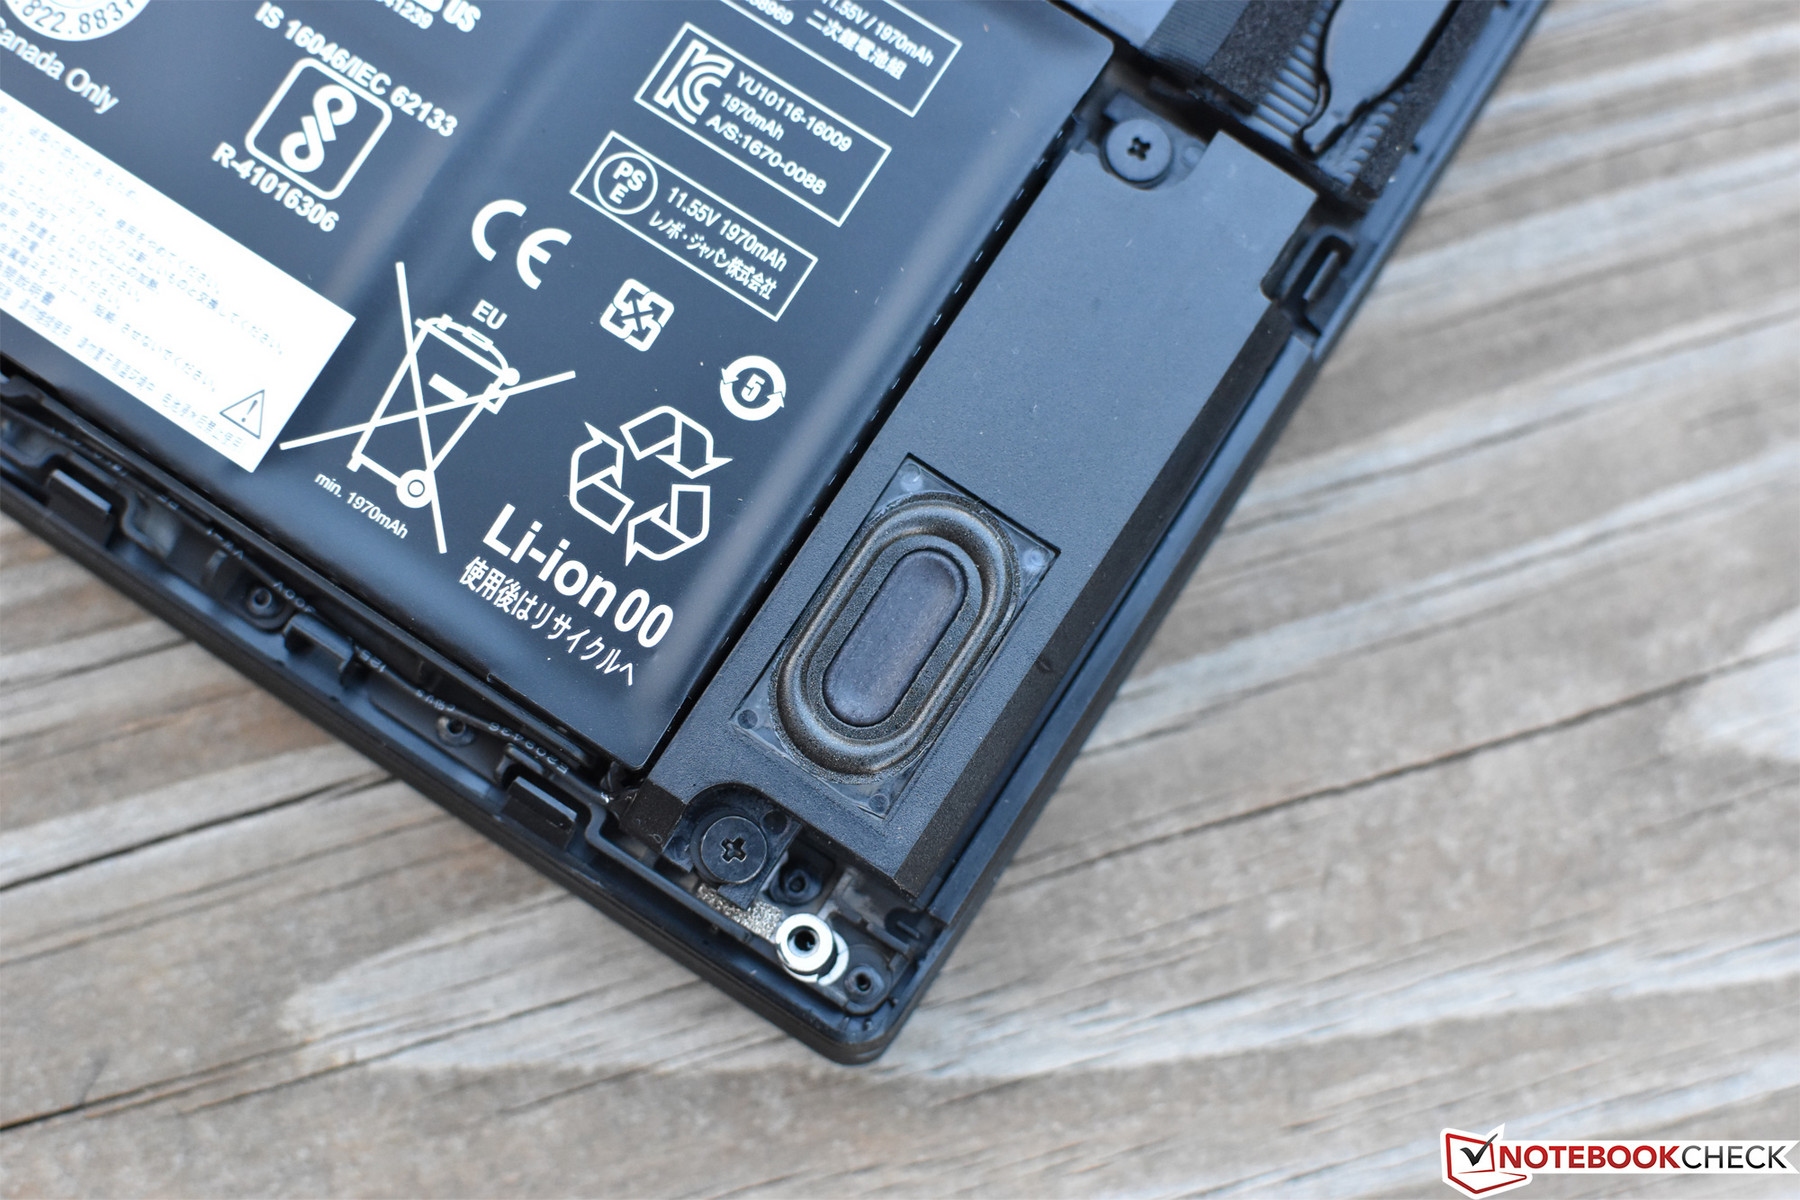
Speakers
The T480 speakers haven’t changed since the previous unit—but to recap, they’re average overall, with moderate volume and almost no bass reproduction. Mids and highs aren’t too bad, and the speakers should be sufficient for the typical phone call or voice conferencing session. For anything more, we recommend headphones or Bluetooth speakers.
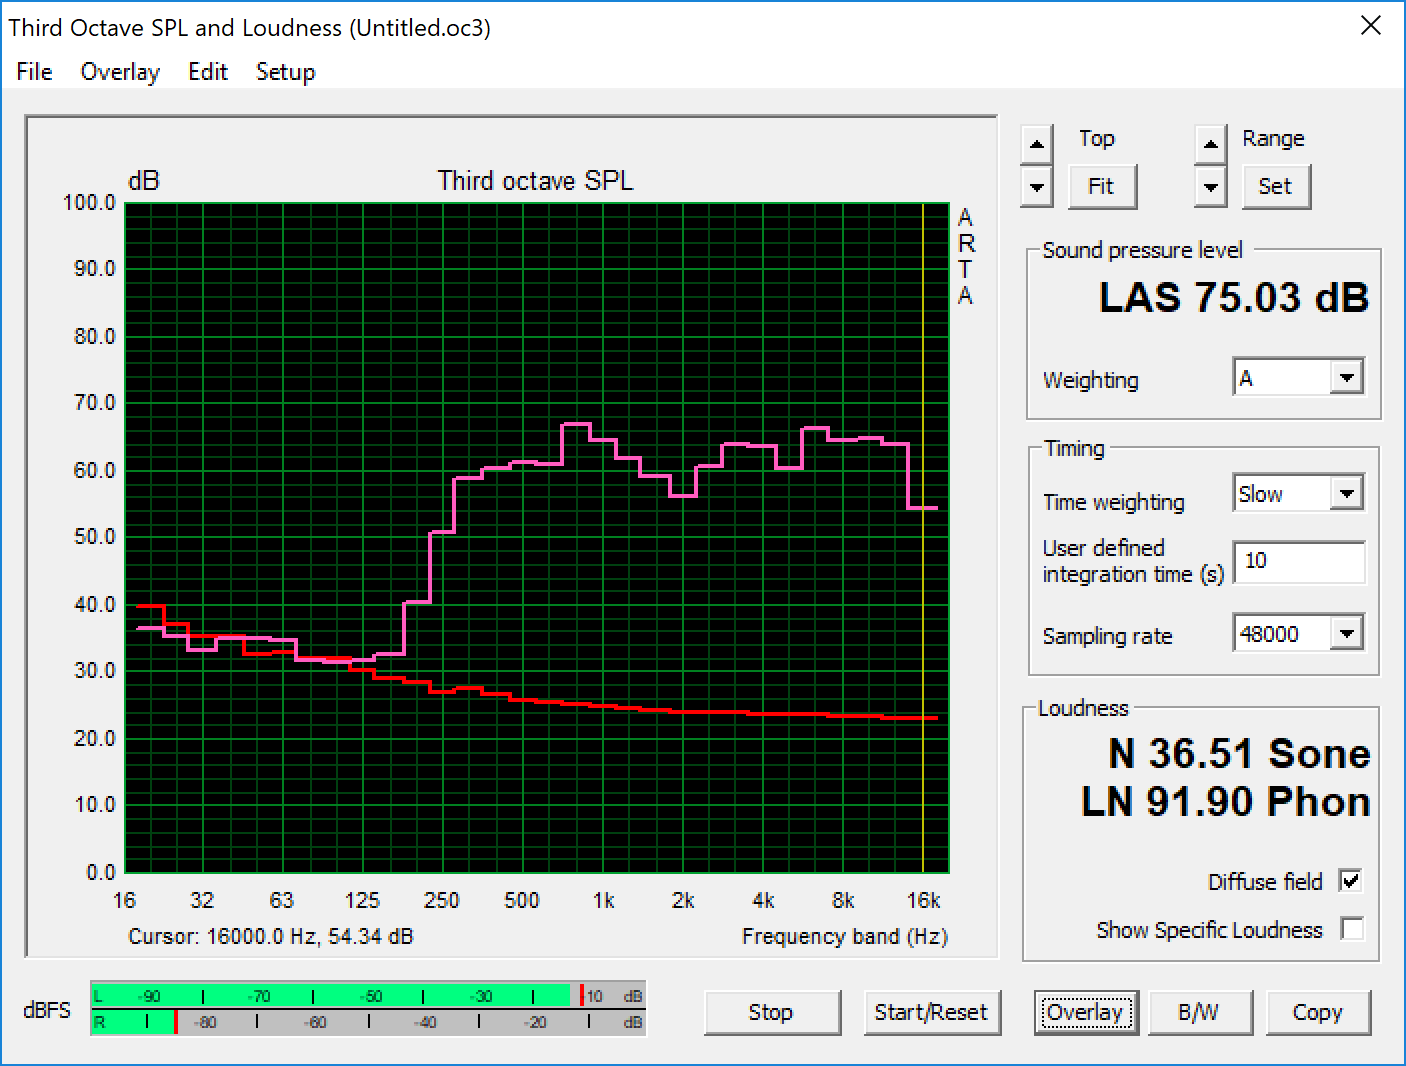
Lenovo ThinkPad T480-20L50010US audio analysis
(±) | speaker loudness is average but good (75 dB)
Bass 100 - 315 Hz
(-) | nearly no bass - on average 19.8% lower than median
(±) | linearity of bass is average (12.7% delta to prev. frequency)
Mids 400 - 2000 Hz
(+) | balanced mids - only 2.3% away from median
(+) | mids are linear (6.7% delta to prev. frequency)
Highs 2 - 16 kHz
(+) | balanced highs - only 2.8% away from median
(±) | linearity of highs is average (7.4% delta to prev. frequency)
Overall 100 - 16.000 Hz
(±) | linearity of overall sound is average (22.6% difference to median)
Compared to same class
» 61% of all tested devices in this class were better, 8% similar, 31% worse
» The best had a delta of 7%, average was 21%, worst was 53%
Compared to all devices tested
» 67% of all tested devices were better, 6% similar, 28% worse
» The best had a delta of 4%, average was 23%, worst was 134%
Dell Latitude 7490 audio analysis
(±) | speaker loudness is average but good (73.8 dB)
Bass 100 - 315 Hz
(±) | reduced bass - on average 14.8% lower than median
(±) | linearity of bass is average (9.4% delta to prev. frequency)
Mids 400 - 2000 Hz
(+) | balanced mids - only 4.4% away from median
(±) | linearity of mids is average (8% delta to prev. frequency)
Highs 2 - 16 kHz
(+) | balanced highs - only 4.4% away from median
(±) | linearity of highs is average (8.2% delta to prev. frequency)
Overall 100 - 16.000 Hz
(±) | linearity of overall sound is average (19.9% difference to median)
Compared to same class
» 42% of all tested devices in this class were better, 9% similar, 49% worse
» The best had a delta of 7%, average was 21%, worst was 53%
Compared to all devices tested
» 51% of all tested devices were better, 7% similar, 41% worse
» The best had a delta of 4%, average was 23%, worst was 134%
Energy Management
Power Consumption
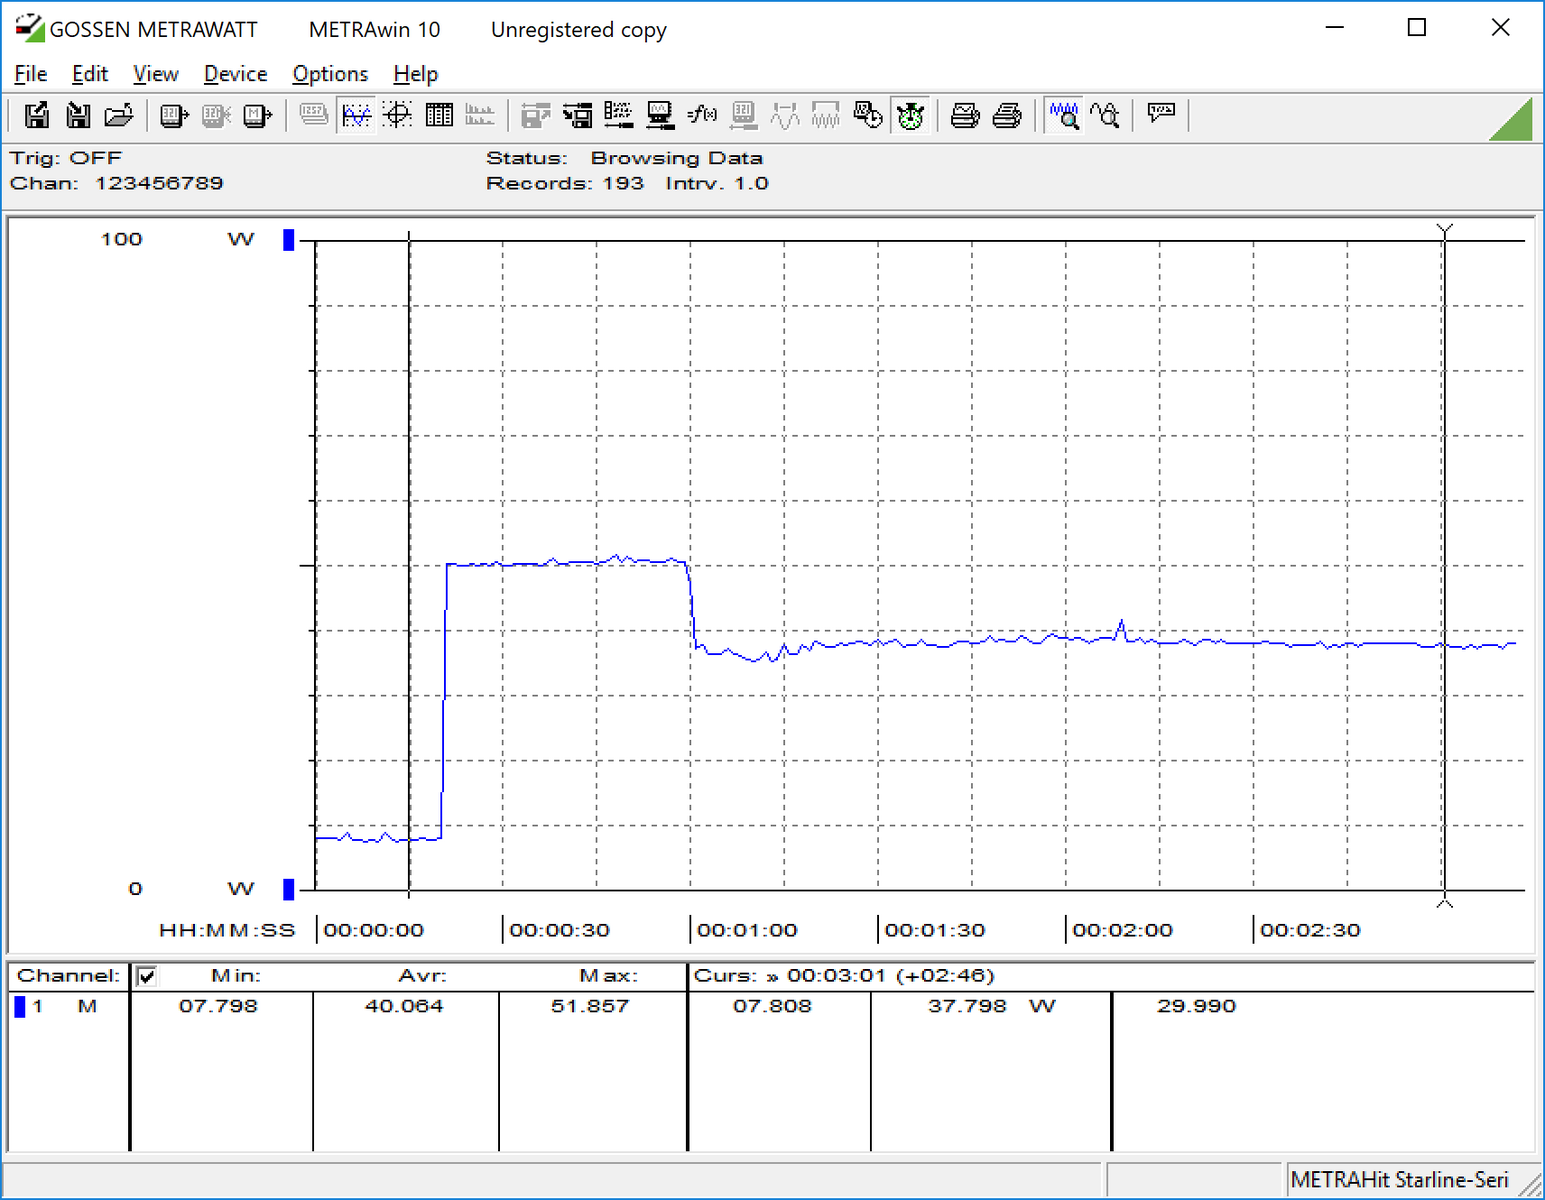
In direct correlation with the differences in heat development between the two machines, today’s T480 also manages vastly lower load power consumption—just 45.7 W on average (versus 63.9 W from its MX150-equipped counterpart). Idle numbers haven’t changed much: 7.7 W average with a maximum of 9.3 W.
| Off / Standby | |
| Idle | |
| Load |
|
Key:
min: | |
| Lenovo ThinkPad T480-20L50010US i7-8650U, UHD Graphics 620, Samsung SSD PM981 MZVLB512HAJQ, TFT-LCD, 1920x1080, 14" | Lenovo ThinkPad T480s-20L7002AUS i5-8250U, UHD Graphics 620, Samsung PM961 MZVLW256HEHP, TFT-LCD, 1920x1080, 14" | Lenovo ThinkPad T480-20L6S01V00 i5-8550U, GeForce MX150, Samsung SSD PM981 MZVLB512HAJQ, IPS, 1920x1080, 14" | Dell Latitude 7490 i7-8650U, UHD Graphics 620, Samsung PM961 MZVLW256HEHP, IPS, 1920x1080, 14" | HP EliteBook 840 G5-3JX61EA i5-8550U, UHD Graphics 620, Toshiba KXG50ZNV1T02, IPS, 1920x1080, 14" | Lenovo ThinkPad X1 Carbon 2018-20KGS03900 i5-8550U, UHD Graphics 620, Samsung SSD PM981 MZVLB512HAJQ, IPS, 2560x1440, 14" | |
|---|---|---|---|---|---|---|
| Power Consumption | 20% | -15% | 13% | 4% | -12% | |
| Idle Minimum * (Watt) | 3.8 | 3.1 18% | 3.6 5% | 3.1 18% | 3.8 -0% | 3.8 -0% |
| Idle Average * (Watt) | 7.7 | 6.4 17% | 7.1 8% | 6.5 16% | 8.3 -8% | 8.9 -16% |
| Idle Maximum * (Watt) | 9.3 | 9.4 -1% | 9.5 -2% | 7.6 18% | 10.7 -15% | 11.9 -28% |
| Load Average * (Watt) | 45.7 | 29.8 35% | 63.9 -40% | 43 6% | 35.5 22% | 47.5 -4% |
| Load Maximum * (Watt) | 46.1 | 31.2 32% | 67.3 -46% | 43.8 5% | 37 20% | 52.5 -14% |
| Witcher 3 ultra * (Watt) | 53.9 |
* ... smaller is better
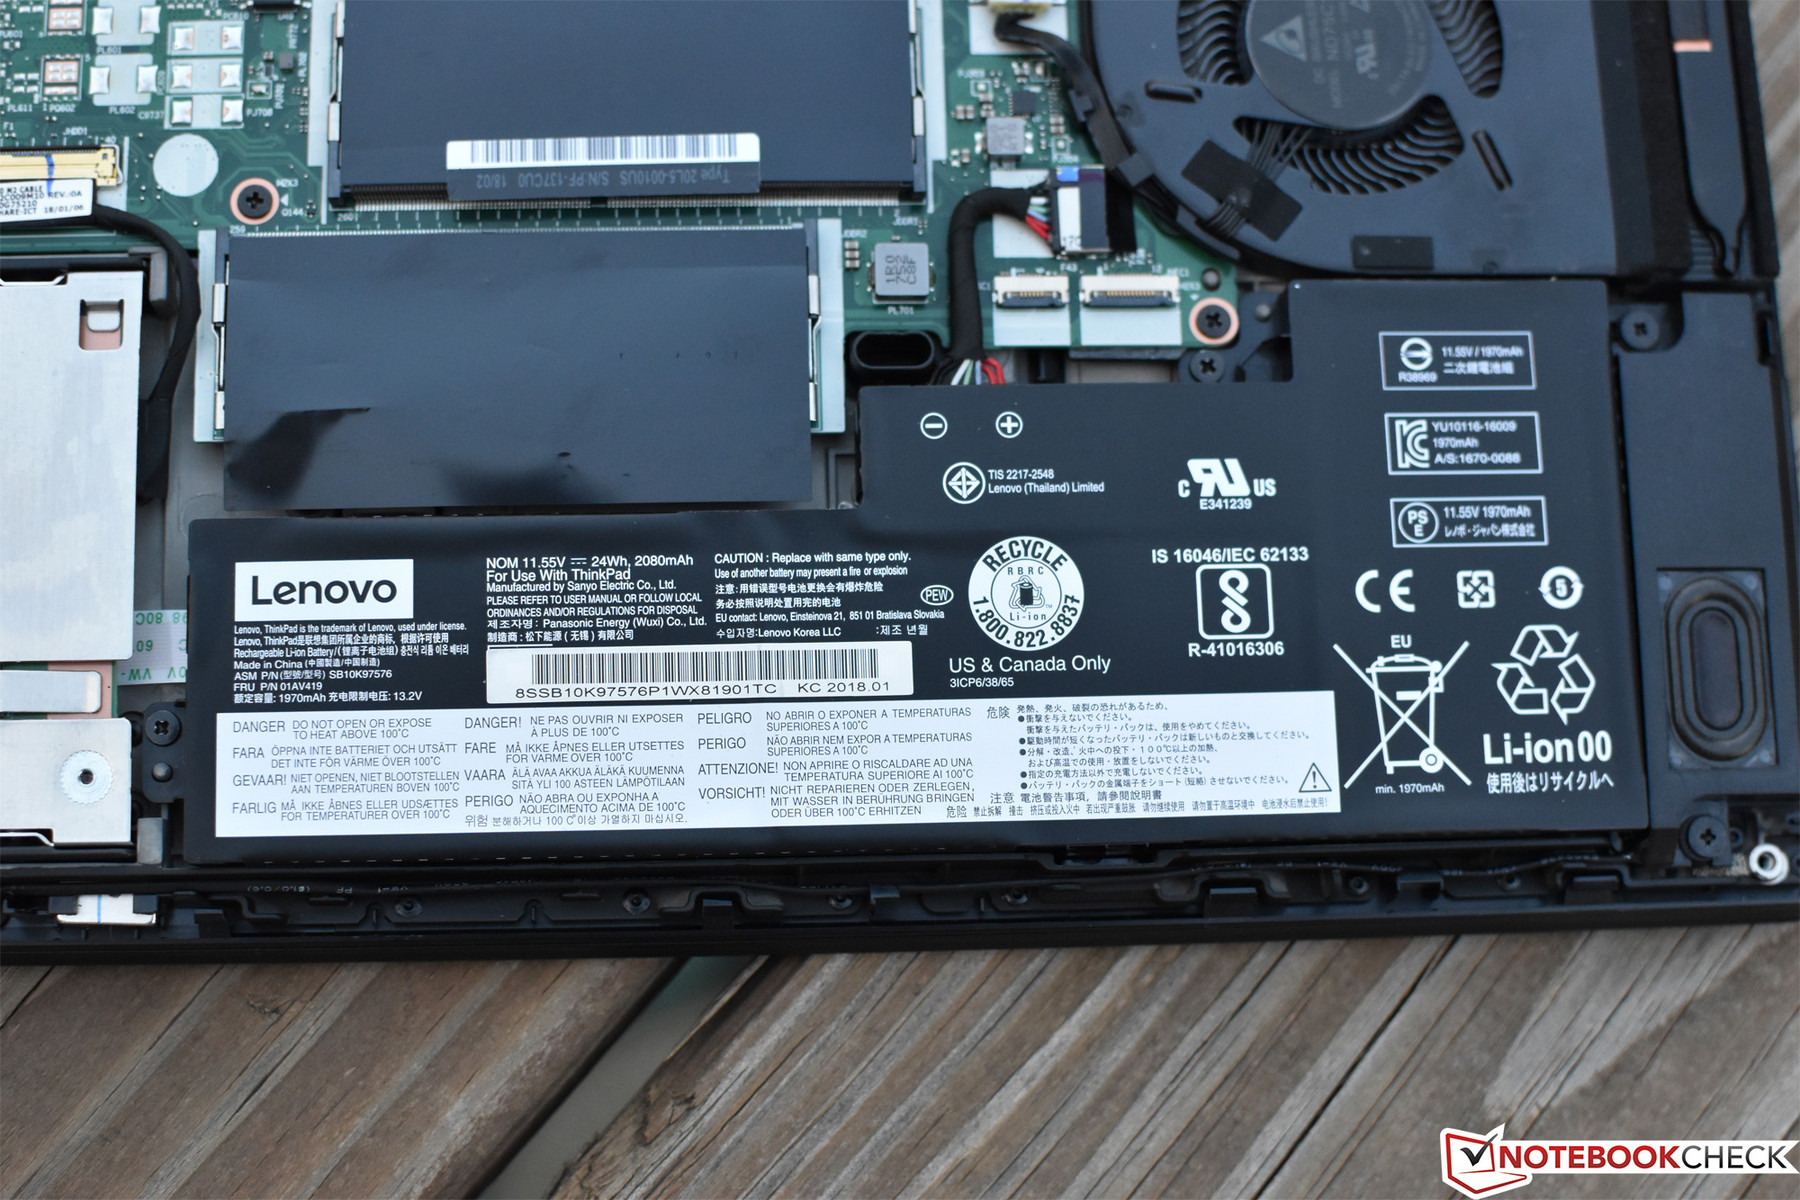
Battery Life
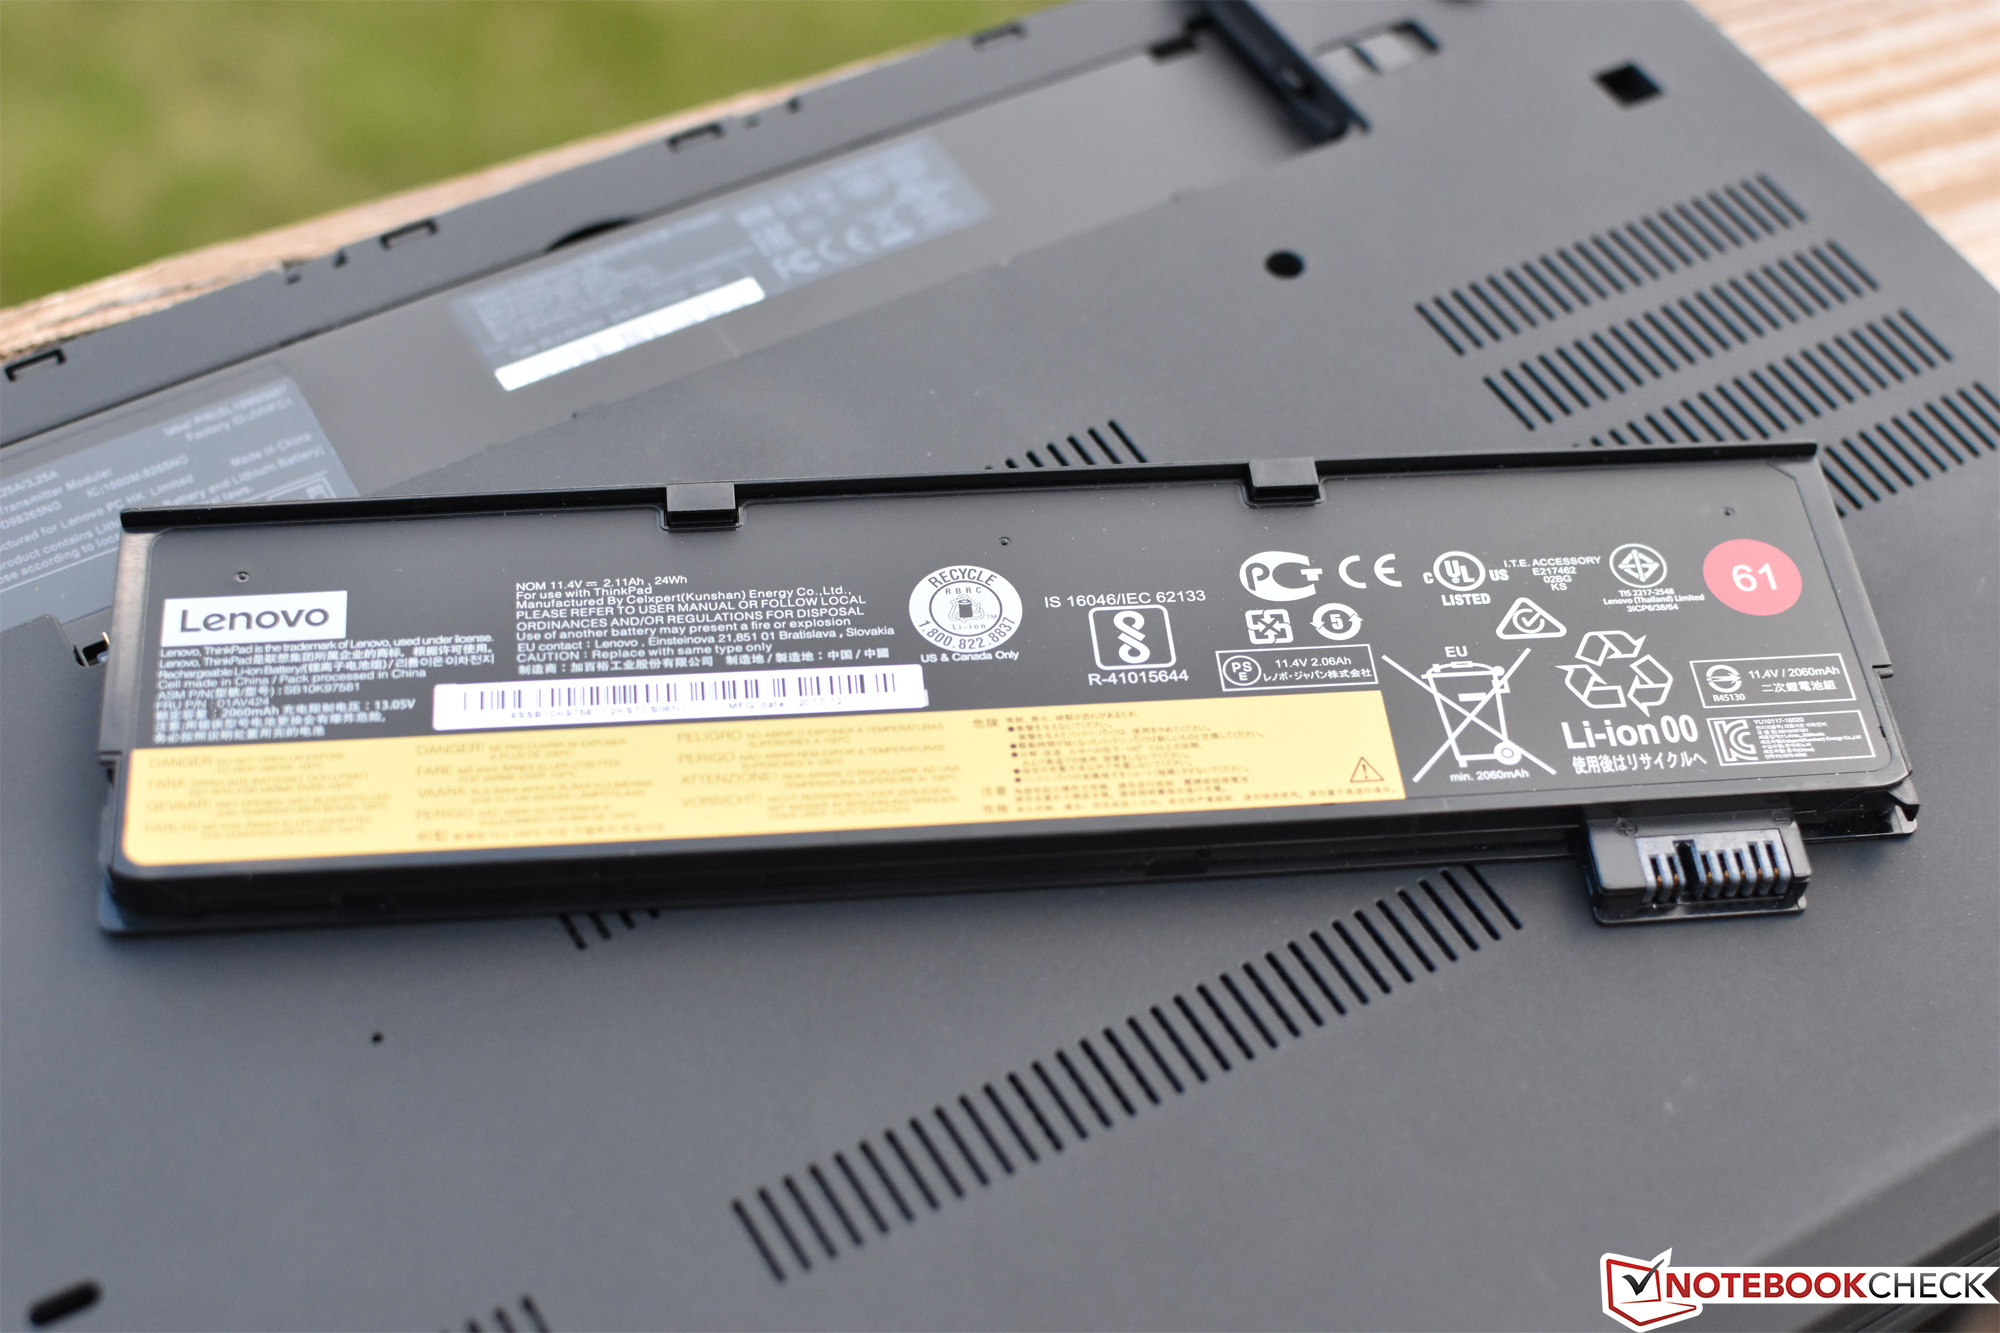
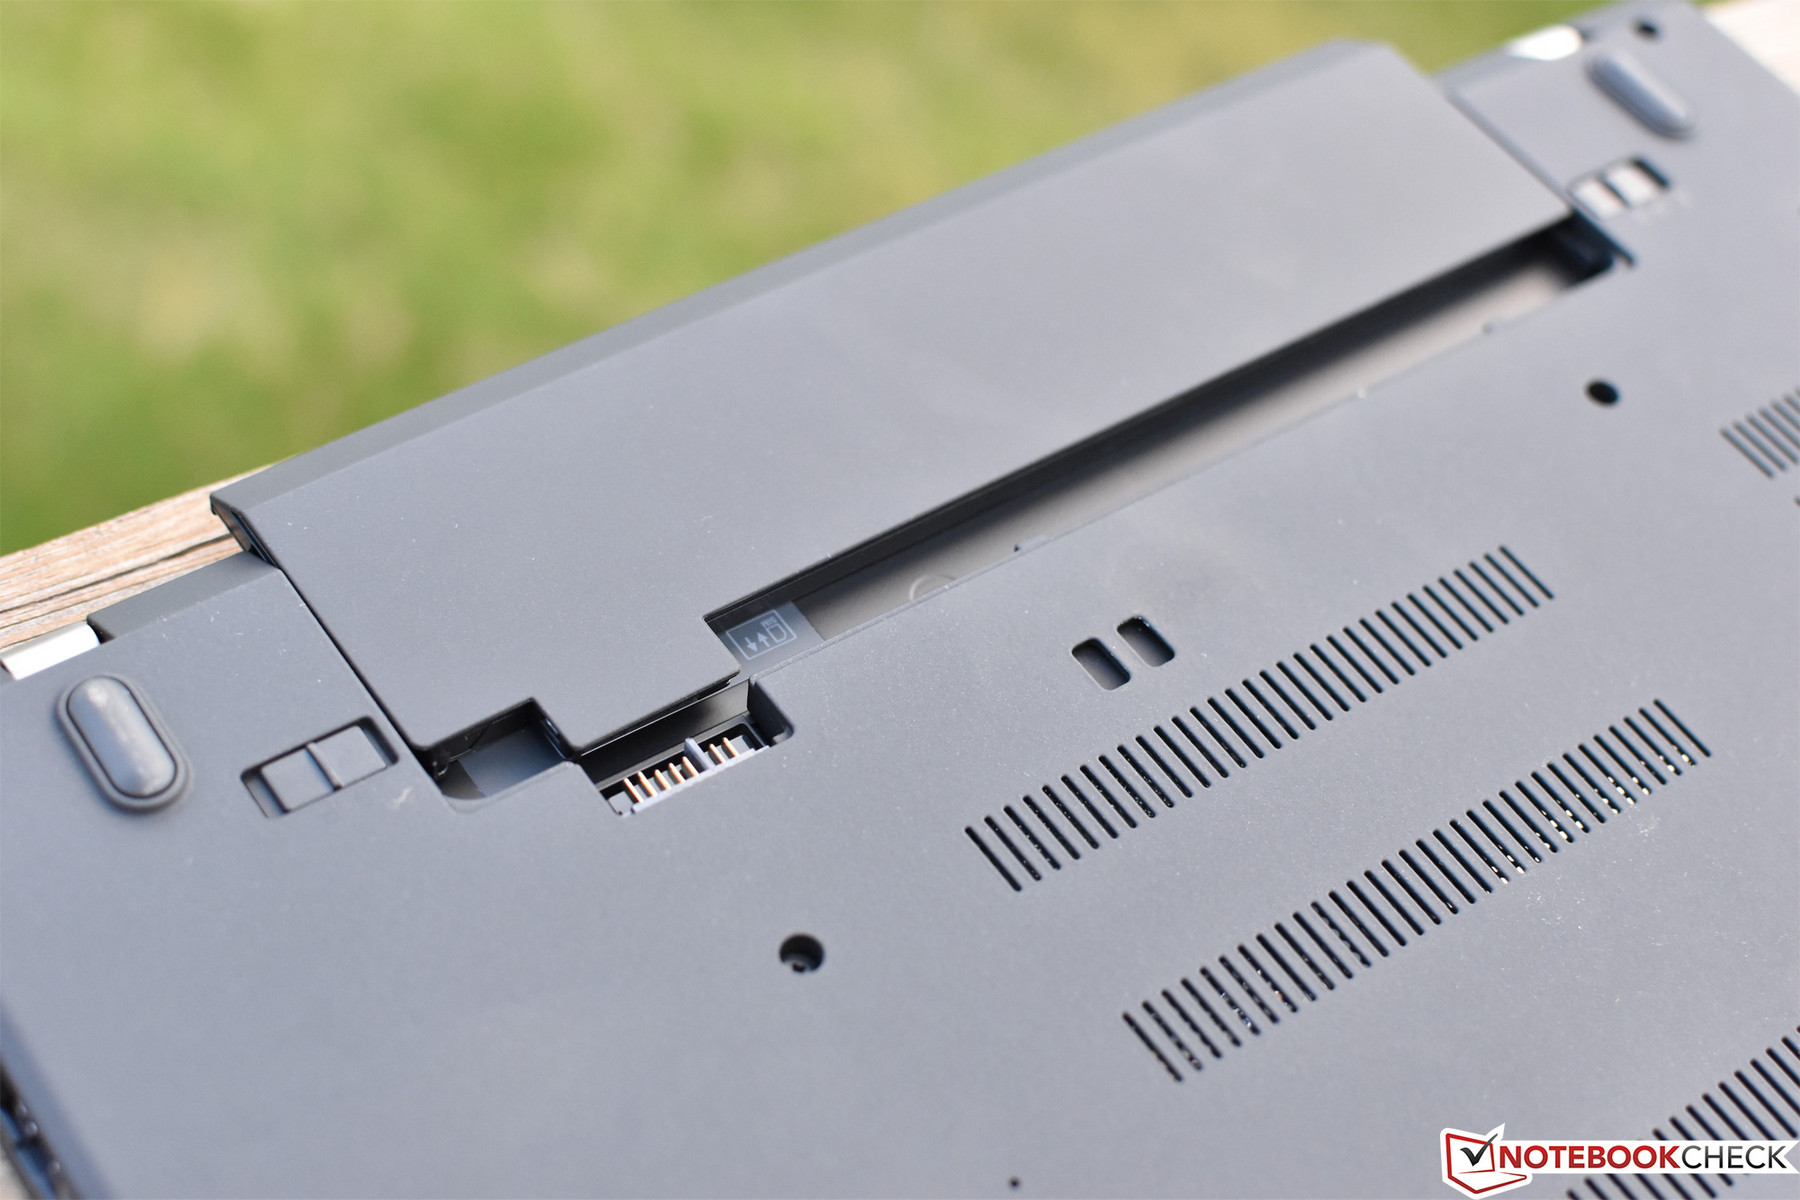
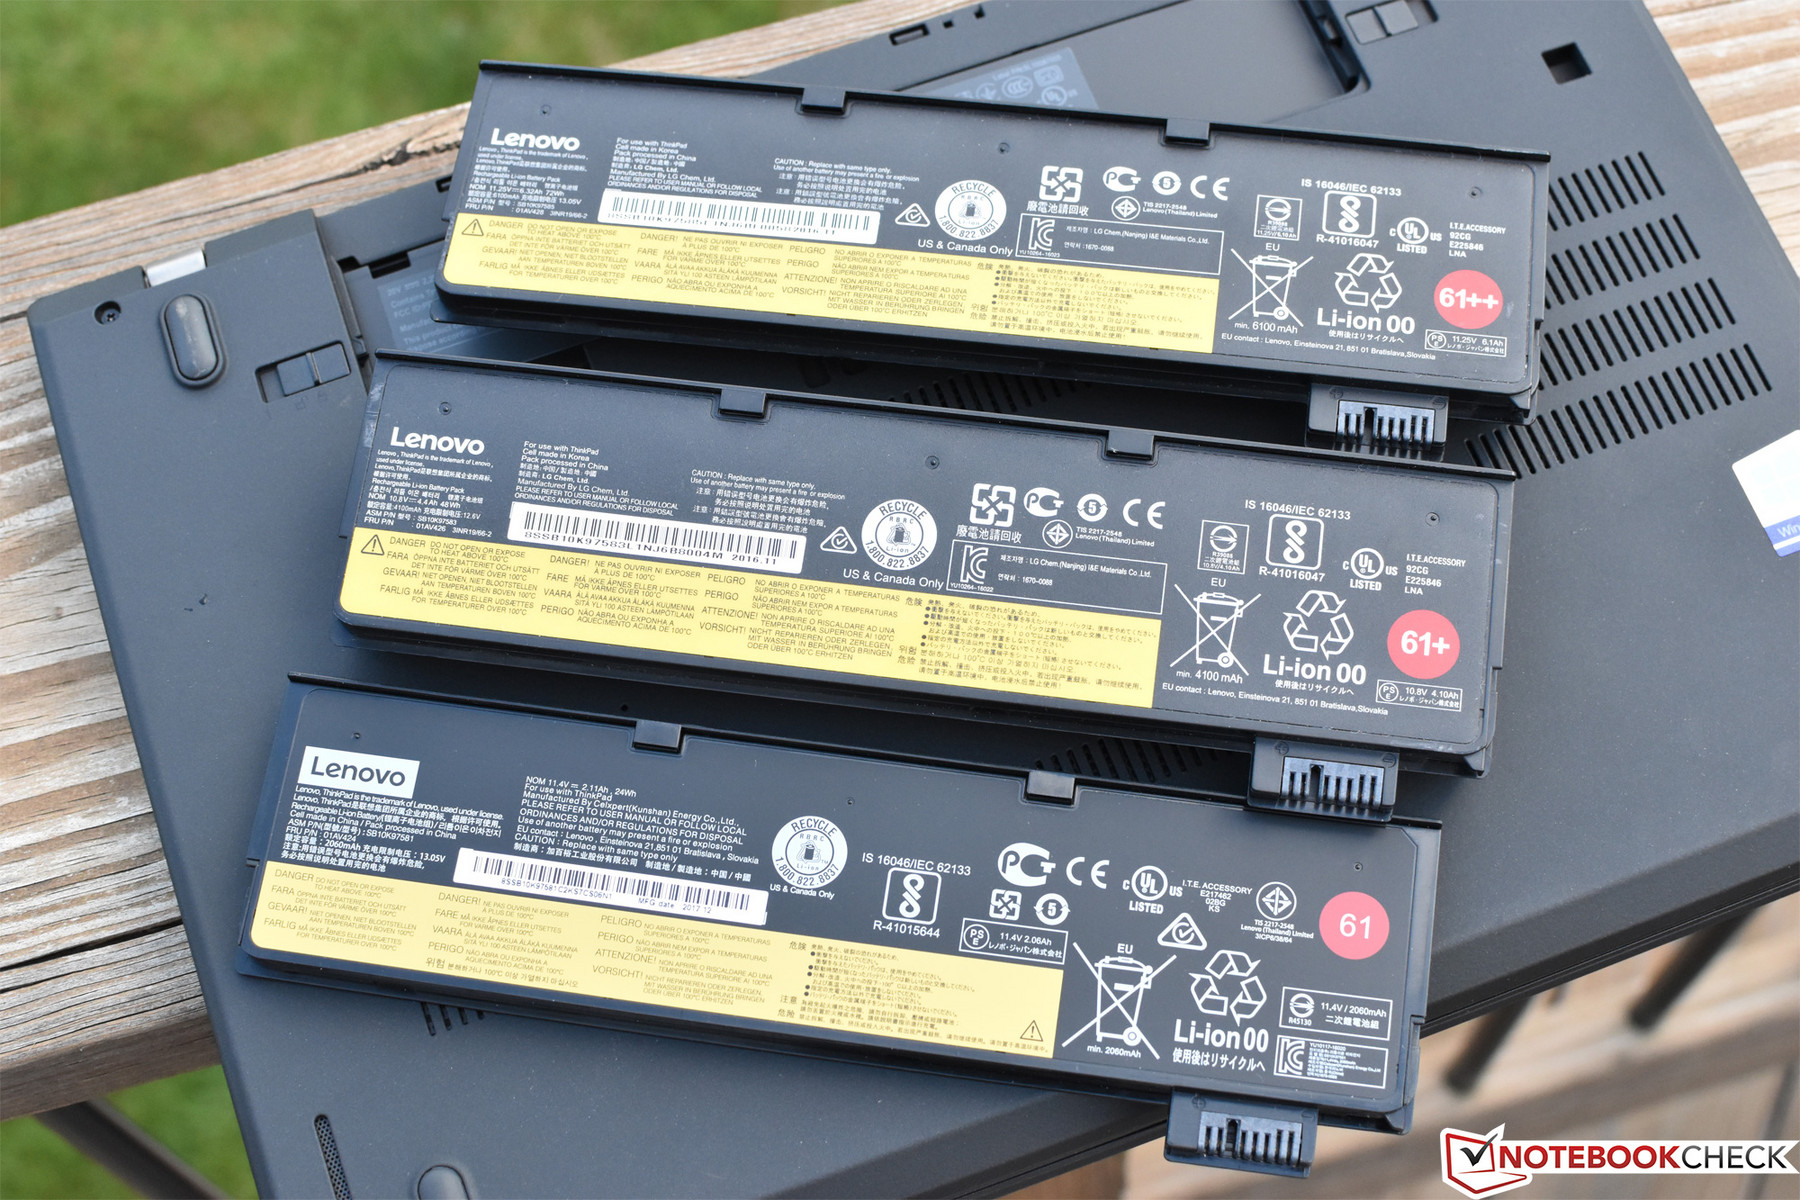
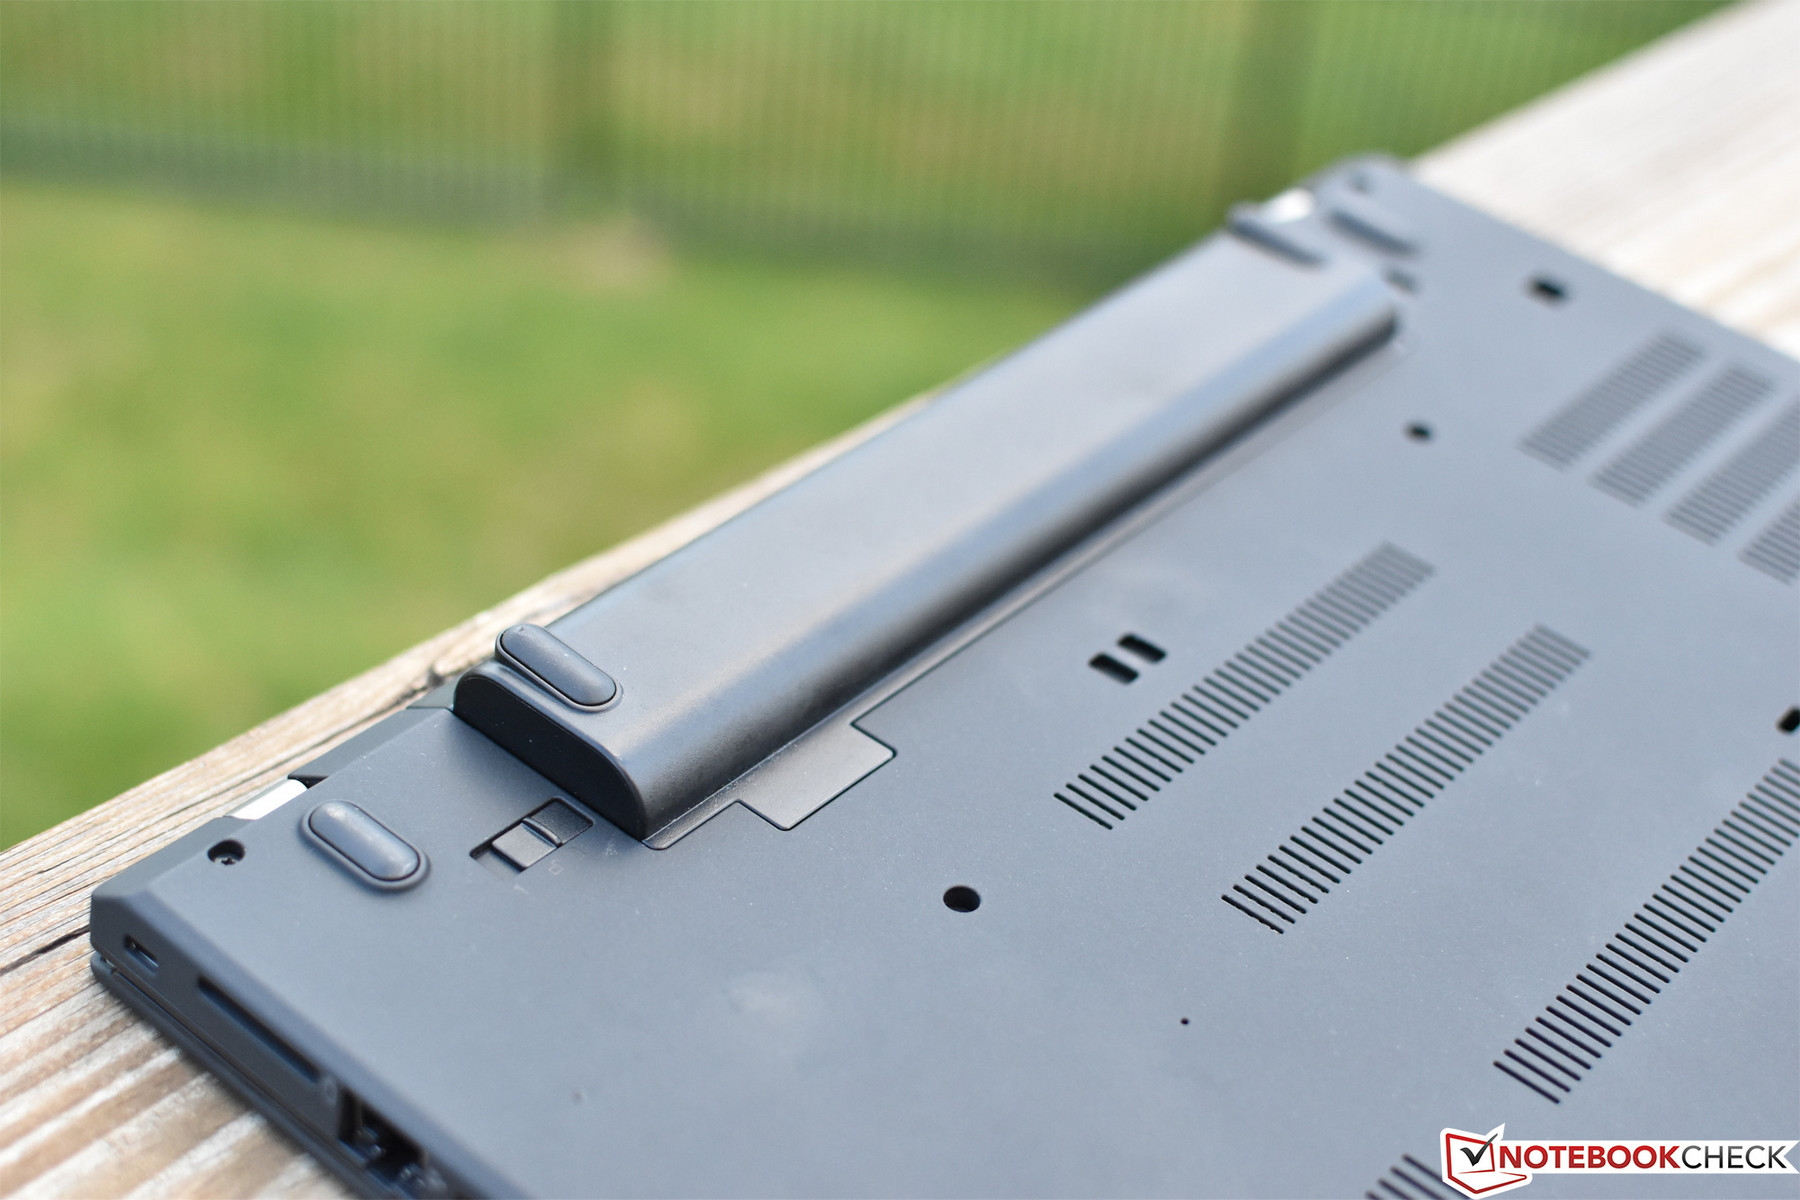
The T480 preserves the dual-battery approach of its predecessors, which in this case constitutes a 24 Wh internal battery paired up with an external (hot-swappable) battery of the user’s choice. We received all three battery options for review today: the Lenovo 61 (24 Wh), 61+ (48 Wh), and 61++ (72 Wh). We performed separate battery life tests for each of the three options, but the result shown in the table below is based on the smallest of the three (24 Wh + 24 Wh)—so keep that in mind when comparing.
Regardless, for whatever reason, we actually measured better battery life from our previous review unit while using the same set of battery options (even in spite of the hypothetically higher power consumption, which may not necessarily apply during web surfing depending on a variety of factors). Still, today’s machine manages very good battery results, with even the super-slim, incredibly light 24 Wh + 24 Wh configuration lasting 7 hours and 17 minutes—nearly enough for an entire workday for the average person.
| Lenovo ThinkPad T480-20L50010US i7-8650U, UHD Graphics 620, 24 Wh | Lenovo ThinkPad T480s-20L7002AUS i5-8250U, UHD Graphics 620, 57 Wh | Lenovo ThinkPad T480-20L6S01V00 i5-8550U, GeForce MX150, 72 Wh | Dell Latitude 7490 i7-8650U, UHD Graphics 620, 60 Wh | HP EliteBook 840 G5-3JX61EA i5-8550U, UHD Graphics 620, 50 Wh | Lenovo ThinkPad X1 Carbon 2018-20KGS03900 i5-8550U, UHD Graphics 620, 57 Wh | |
|---|---|---|---|---|---|---|
| Battery runtime | 23% | 81% | 29% | 1% | 19% | |
| WiFi v1.3 (h) | 7.3 | 9 23% | 13.2 81% | 9.4 29% | 7.4 1% | 8.7 19% |
| Reader / Idle (h) | 27.9 | 18.6 | 22.1 | |||
| Load (h) | 2.7 | 1.5 | 1.8 |
Pros
Cons
Verdict
As before, Lenovo’s venerable ThinkPad T480 remains a top competitor within the business market. It is a product of years of refinement and careful revision, rivaled only by a handful of truly top-notch machines. As we said during our last review, its construction is mostly very solid, the design is ever-practical (and immediately familiar), and there’s a good selection of ports on board. The input devices are also very good, the machine is quiet under operation, and it’s fast, too—at least, for general application performance, and in context with category averages for CPU performance.
What’s improved with today’s model versus the previous starts with the price, which is currently around $1,712 (at Amazon). Beyond that, since this configuration lacks dedicated graphics, temperatures and power consumption are also well below the values we measured from the previous model—though there are still a couple of bothersome hot spots on the bottom of the machine under load. The display remains bright and features good contrast, but as before, the color coverage is woefully inadequate, which leads to drearily washed-out colors and lackadaisical picture quality.
Though it falters in the realm of display color quality and a few other sparse categories, Lenovo’s venerable ThinkPad T480 remains a top competitor within the business market. It is a product of years of refinement and careful revision, rivaled only by a handful of truly top-notch machines.
Unlike the MX150 setup, this machine (of course) can’t really handle any sort of heavy GPU operation such as even light gaming. That’s expected—but what was unexpected is the lower CPU performance we received from the Core i7-8650U in our test unit versus the cheaper Core i7-8550U in March’s model. Perhaps most puzzling of all is the CPU performance ravine separating the T480s and today’s T480; even with the latest BIOS and all power settings properly configured, we couldn’t provoke scores anywhere close to what we saw from our Core i5-equipped T480s last week.
Still, though it falters in the realm of display color quality and a few other sparse categories, the T480 remains mentionable amongst the respected ranks of such competitors as Dell’s Latitude 7490, HP’s Elitebook 840 G5, and Lenovo’s own X1 Carbon. The real choice is whether the T480 or T480s makes more sense for your particular application—but apart from the aforementioned quibbles, it’s hard to find major fault in any of these options.
Lenovo ThinkPad T480-20L50010US
- 07/16/2018 v6 (old)
Steve Schardein
Price comparison
