Lenovo ThinkPad T480s (i5-8250U, FHD) Laptop Review
Today’s ThinkPad T480s is the third variation we’ve reviewed since our initial encounter back in February. We’ve previously evaluated configurations featuring everything from the WQHD display to the NVIDIA GeForce MX150 Max-Q graphics, both of which we determined to be valuable options for those who stand to benefit from them. Today, we dispense with the complications and dial it back to basics: a Core i5-8250U CPU, integrated Intel UHD Graphics 620, and a matte FHD display. Although this exact configuration doesn’t appear to be available currently, a close CTO option direct from Lenovo sells for around $1,600—which is anywhere from $400-$600 less than the previous two systems we tested.
Despite minor niggles (such as the poor speakers, high surface temperatures, weak webcam, and the questionable value of the i7 upgrade), we came away from both of our previous reviews with overwhelmingly positive conclusions. Can today’s configuration uphold the overall excellence of the previous candidates—and could it possibly resolve any of these other items?
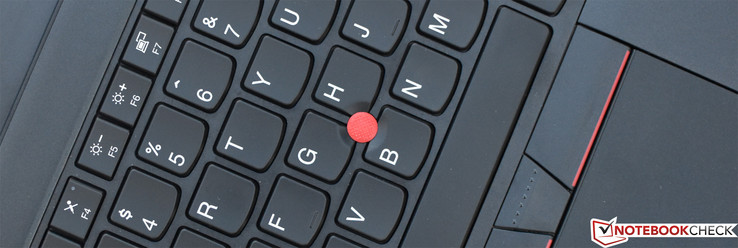
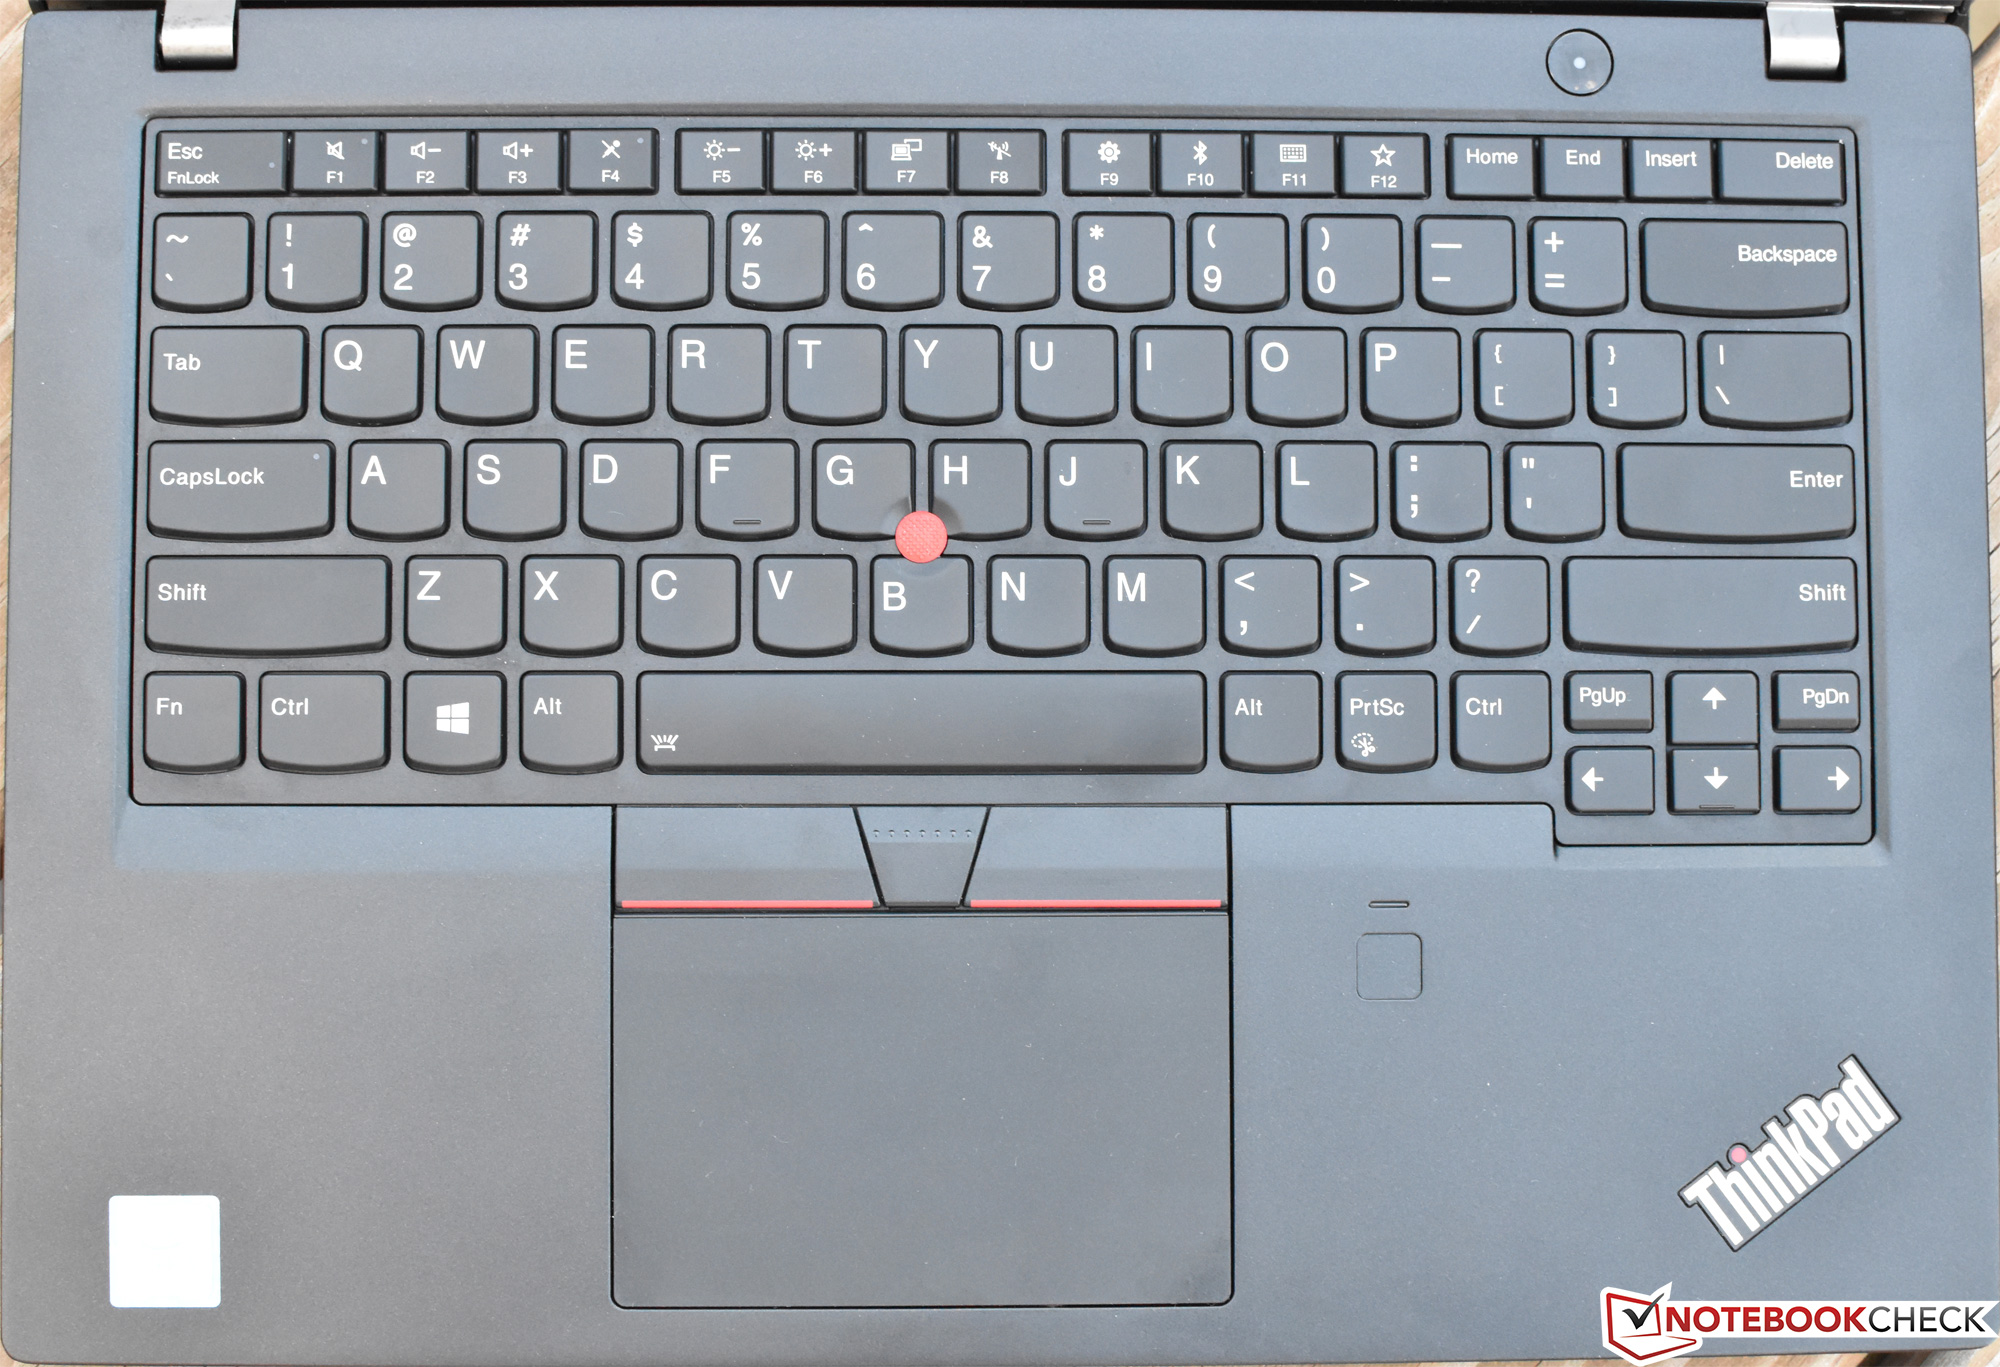
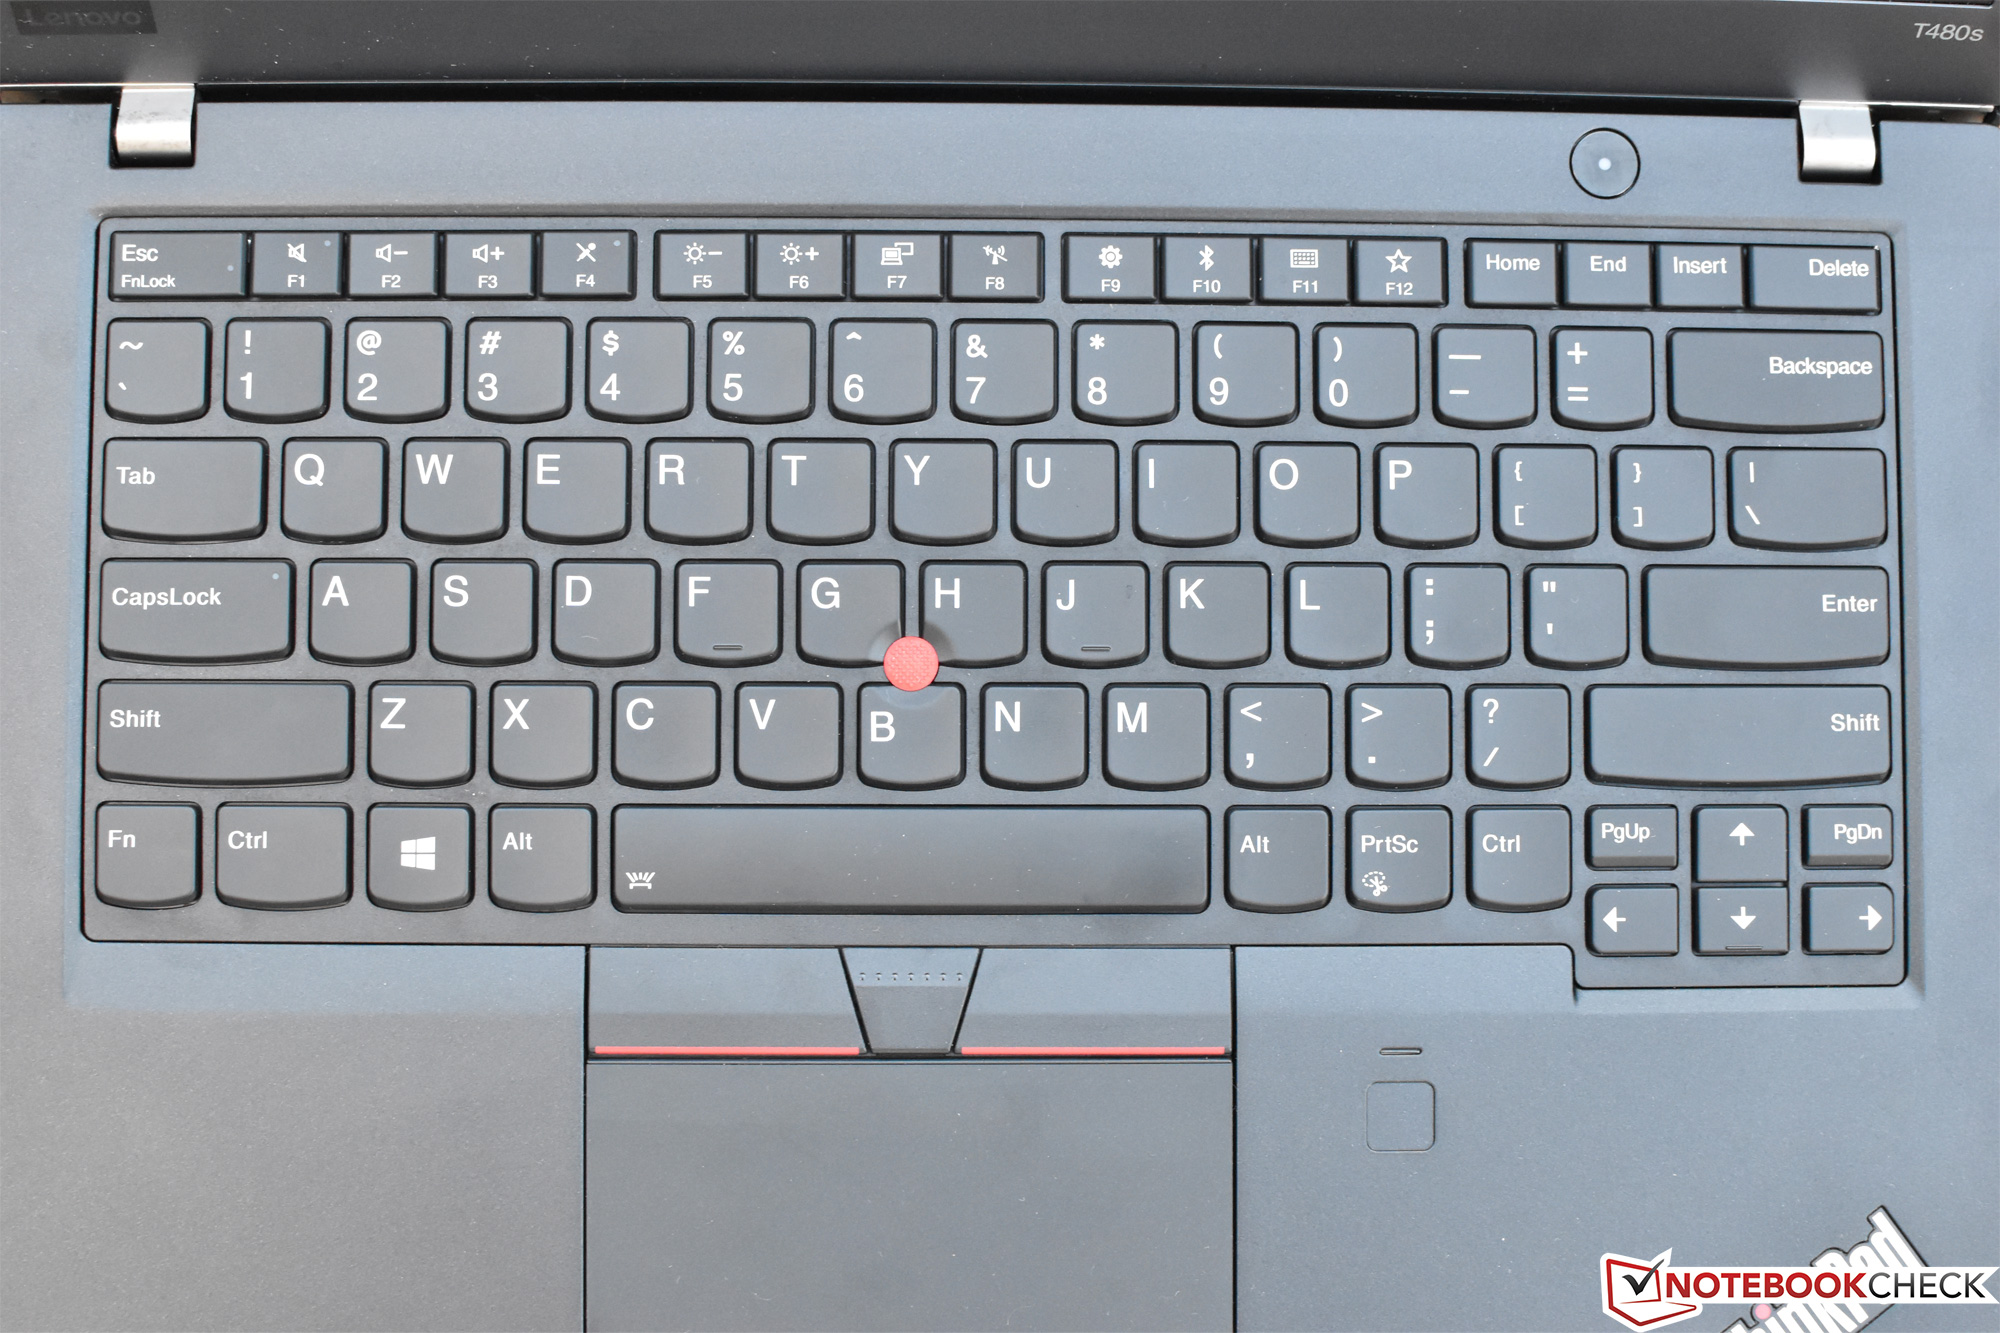
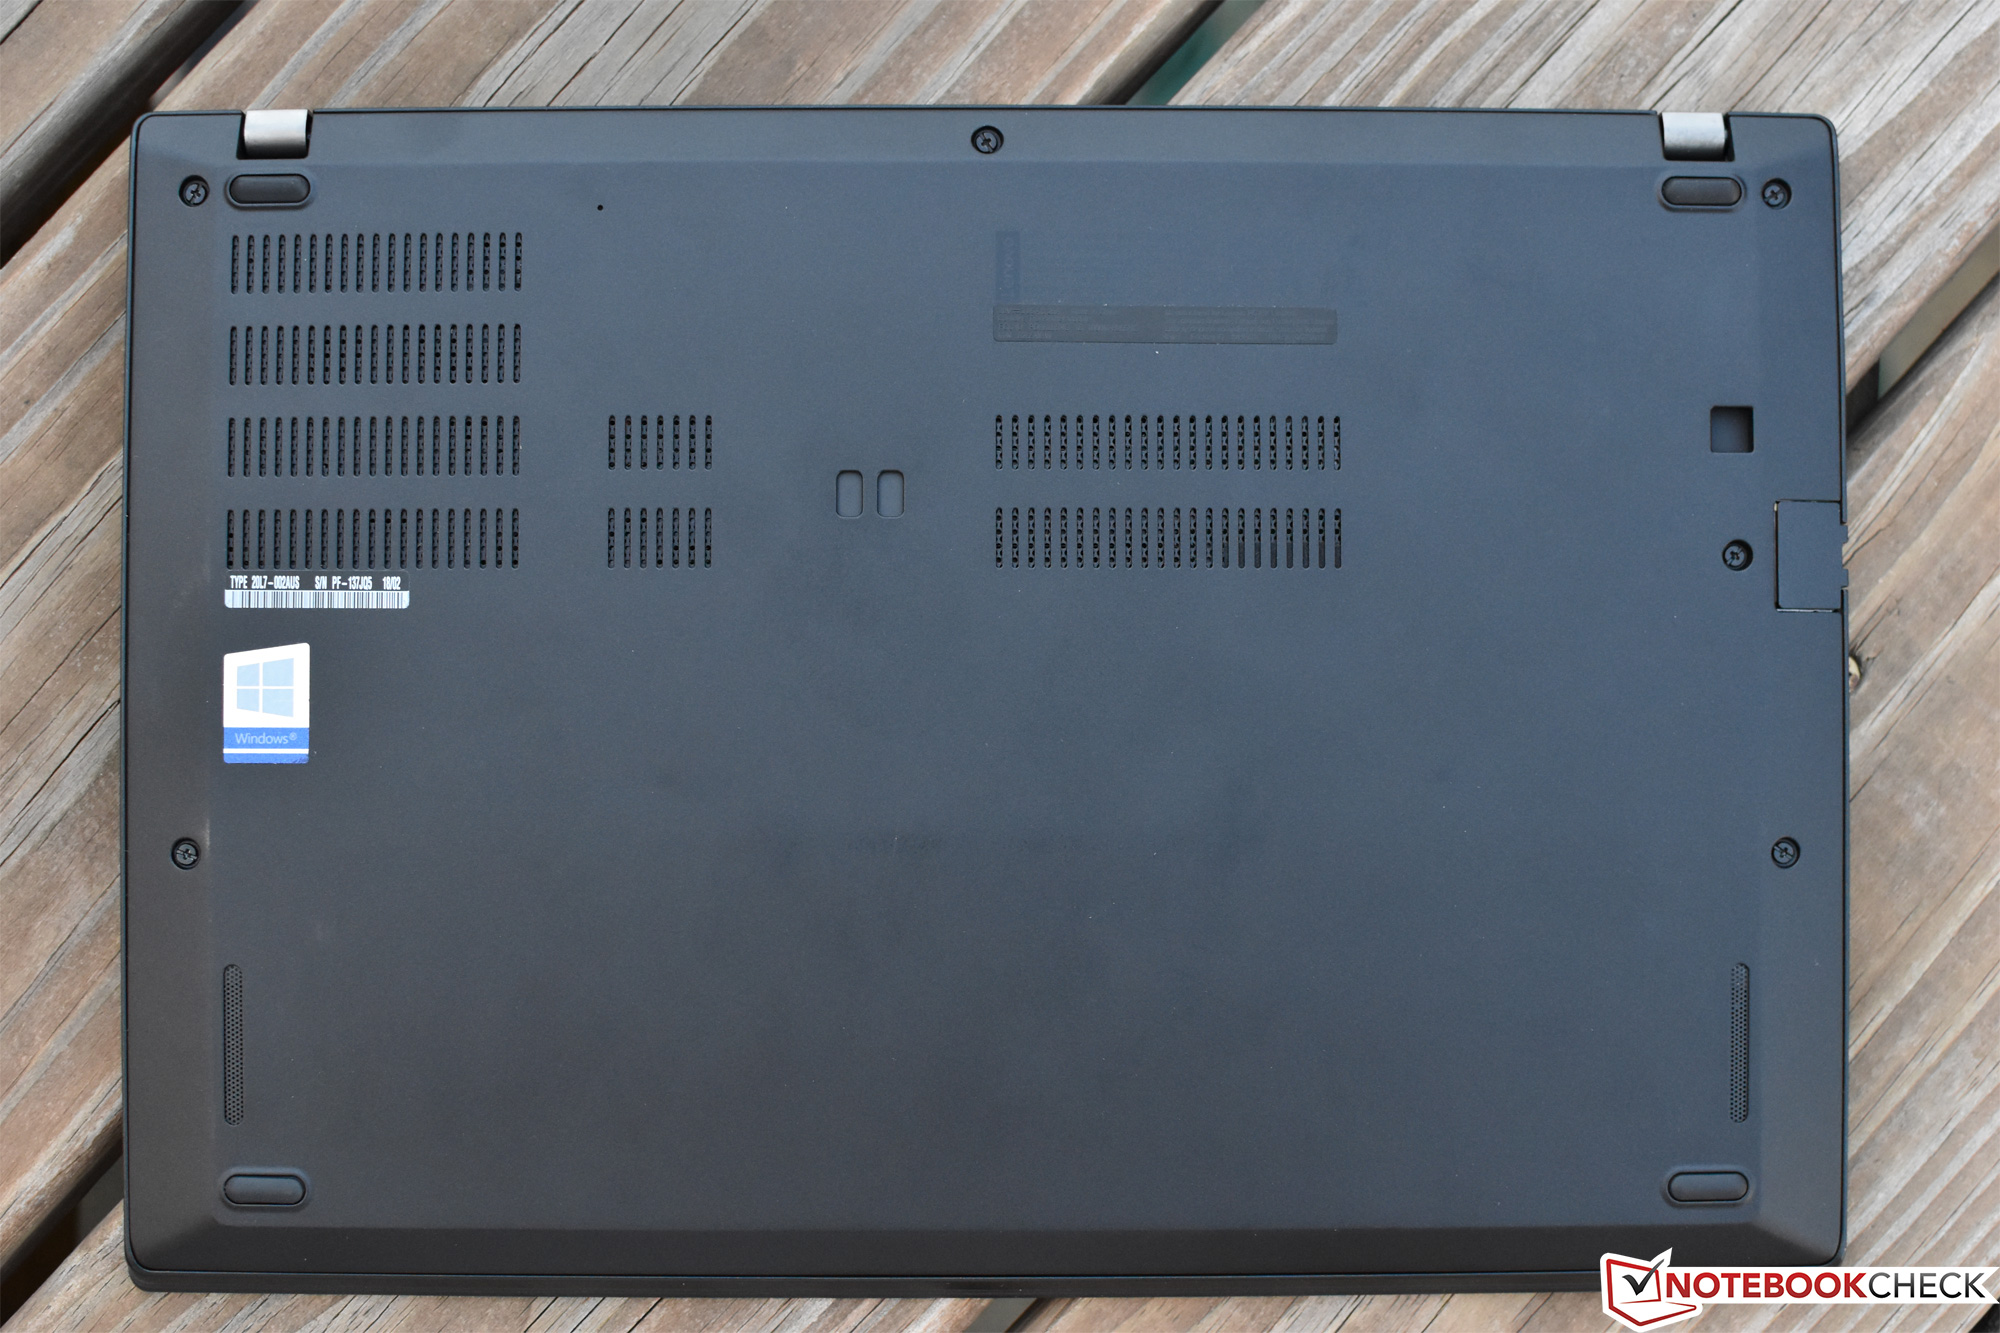
Today’s review is an update to the previous two, since the fundamentals—case, connections, input devices, etc.—have not changed. As a result, we’ll be skipping those sections and jumping straight into what’s new. For much more detail on any of those items, please refer to our initial T480s full review.

Display
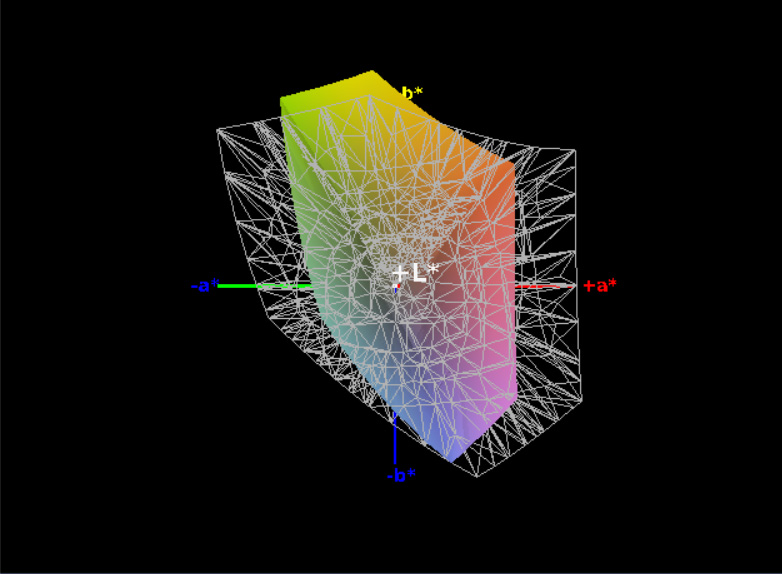
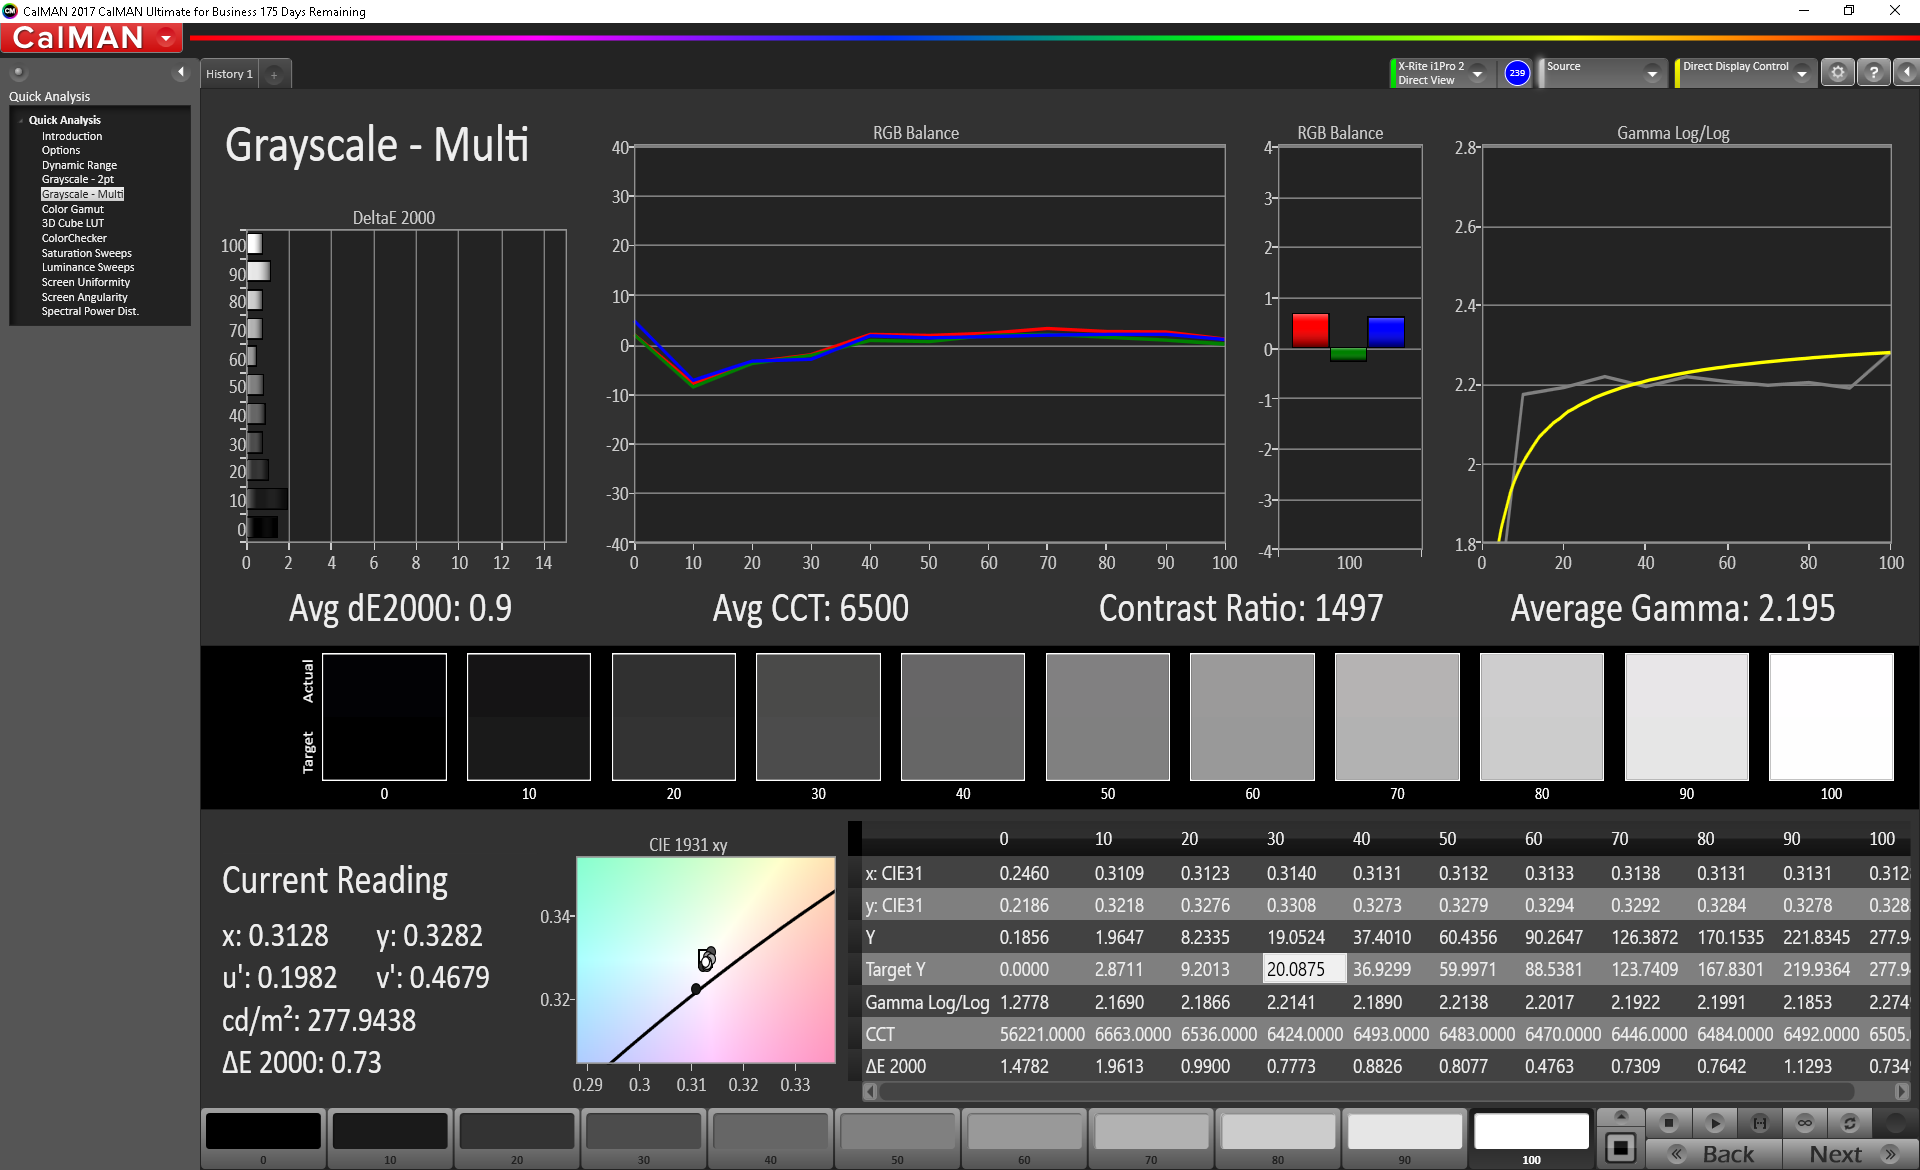
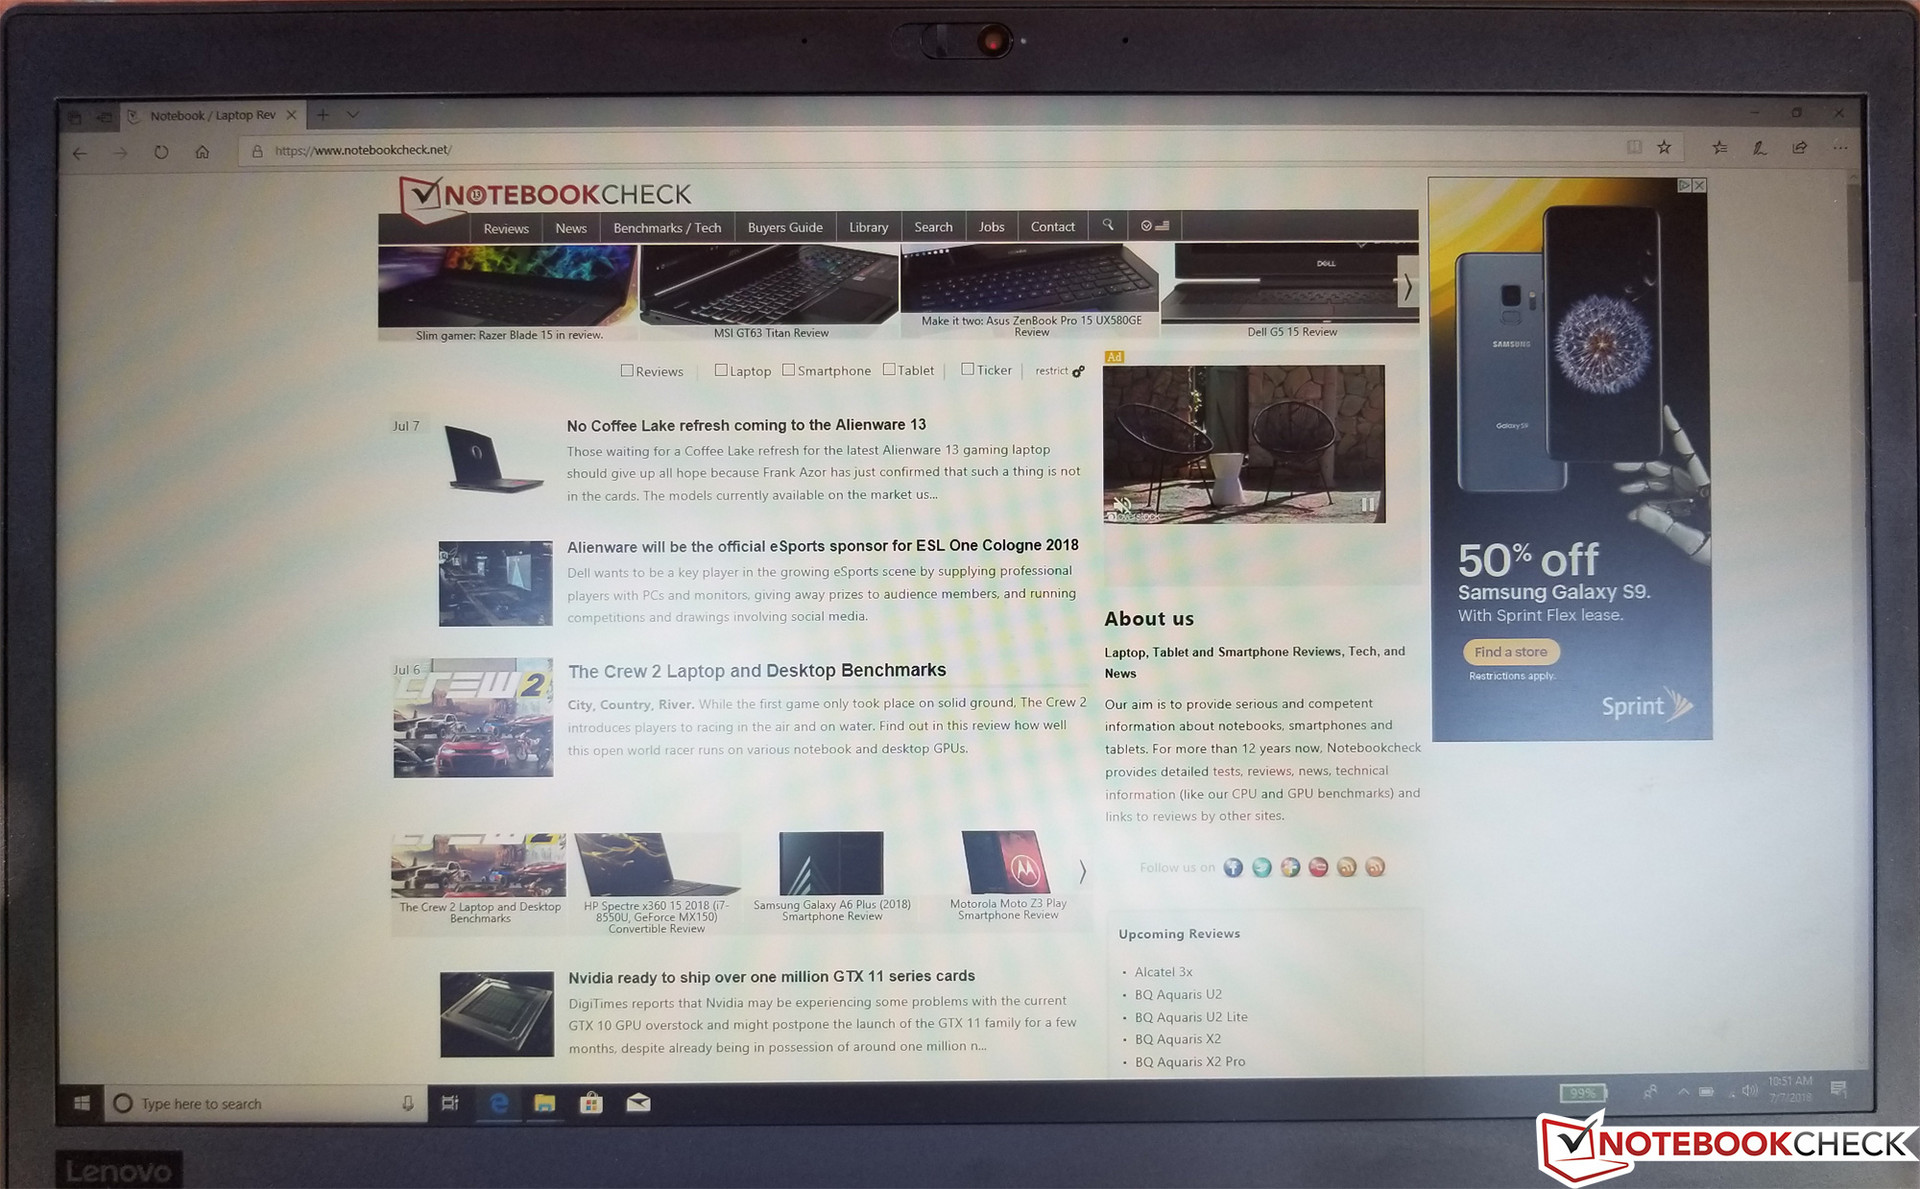
As compared to the WQHD panels in our previous two units, the less expensive matte FHD (1920x1080) 14-inch display in today’s review configuration sacrifices a bit in terms of brightness and saturation. It’s hardly inappropriate for general office use, however, and despite these technical insufficiencies it should be fine for most businesses. Backlight bleed is only a very minor problem on the T480 (see pictured).


| |||||||||||||||||||||||||
Brightness Distribution: 86 %
Center on Battery: 288.3 cd/m²
Contrast: 1373:1 (Black: 0.21 cd/m²)
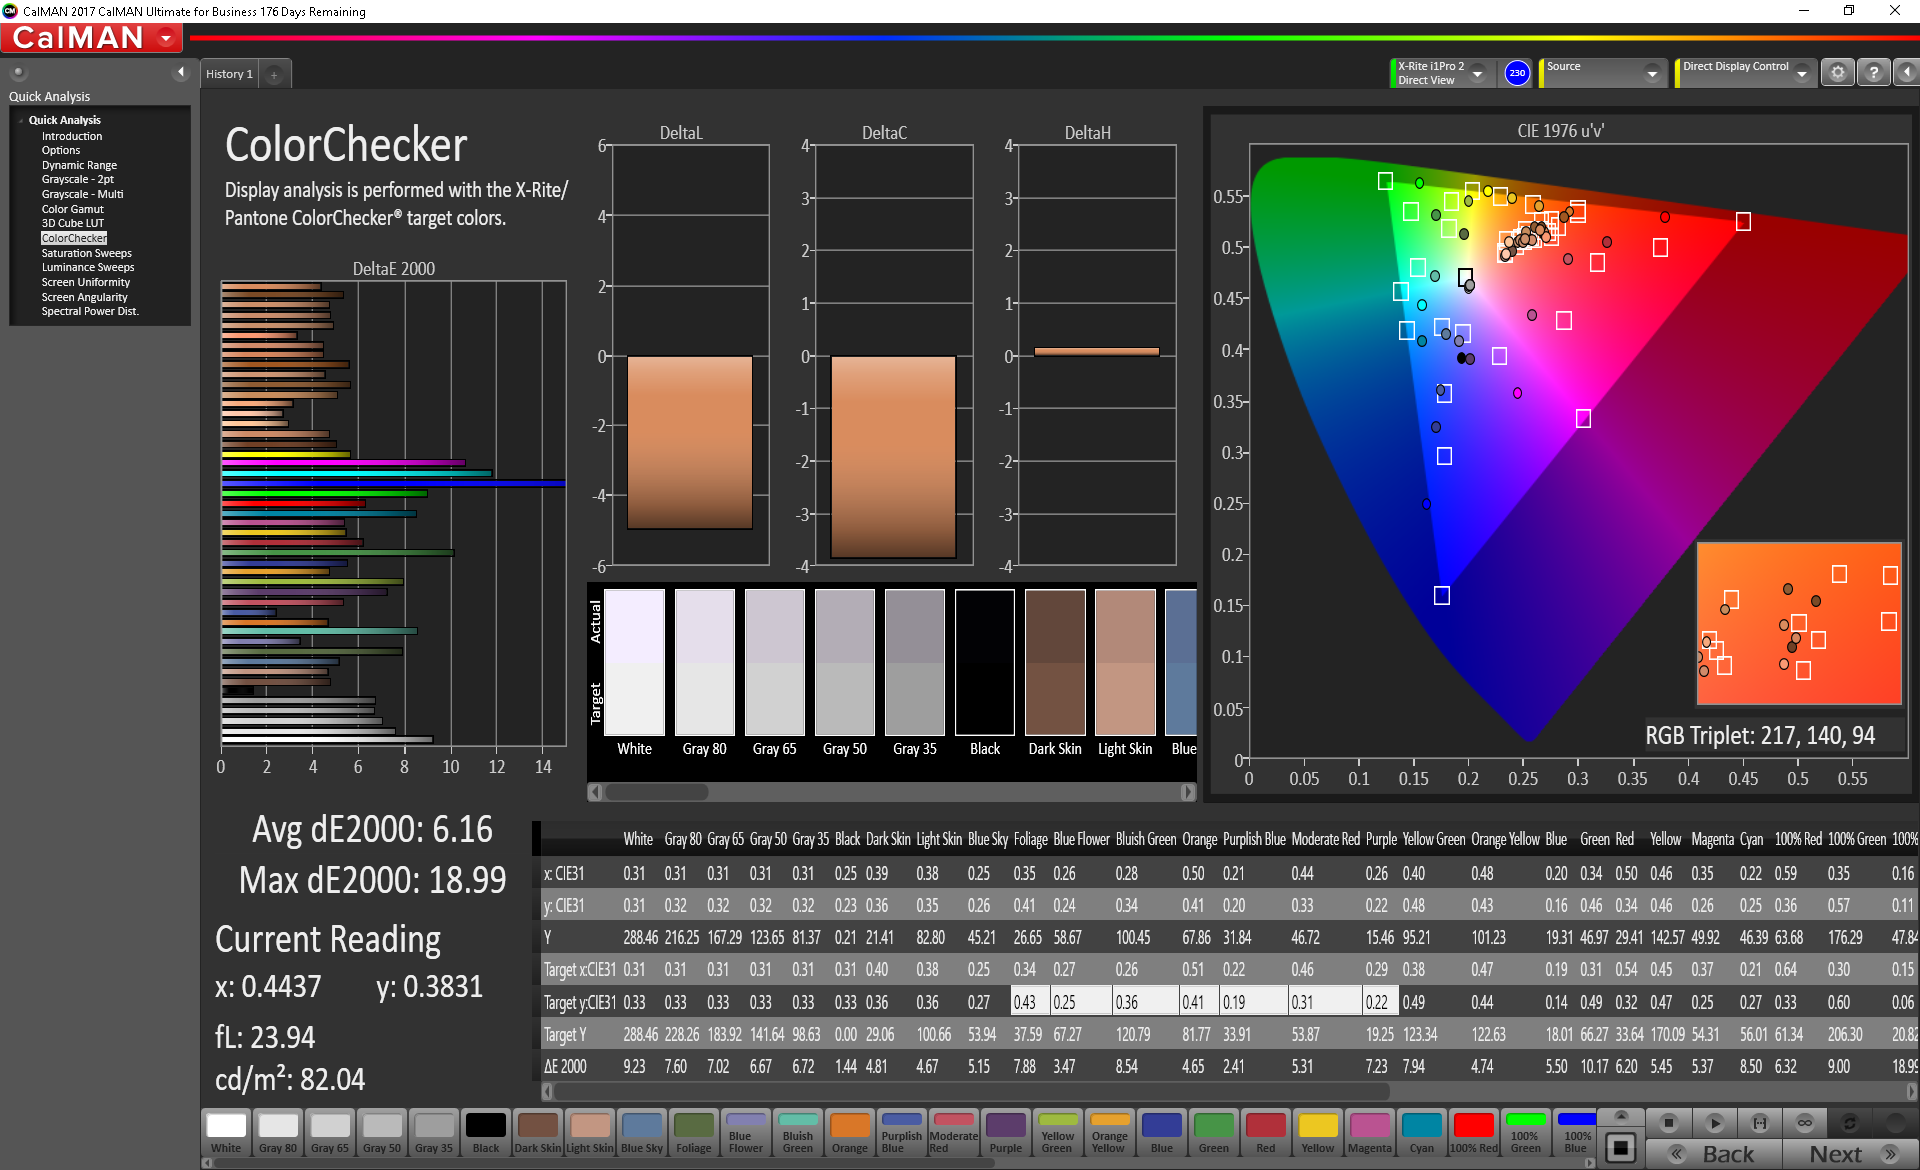
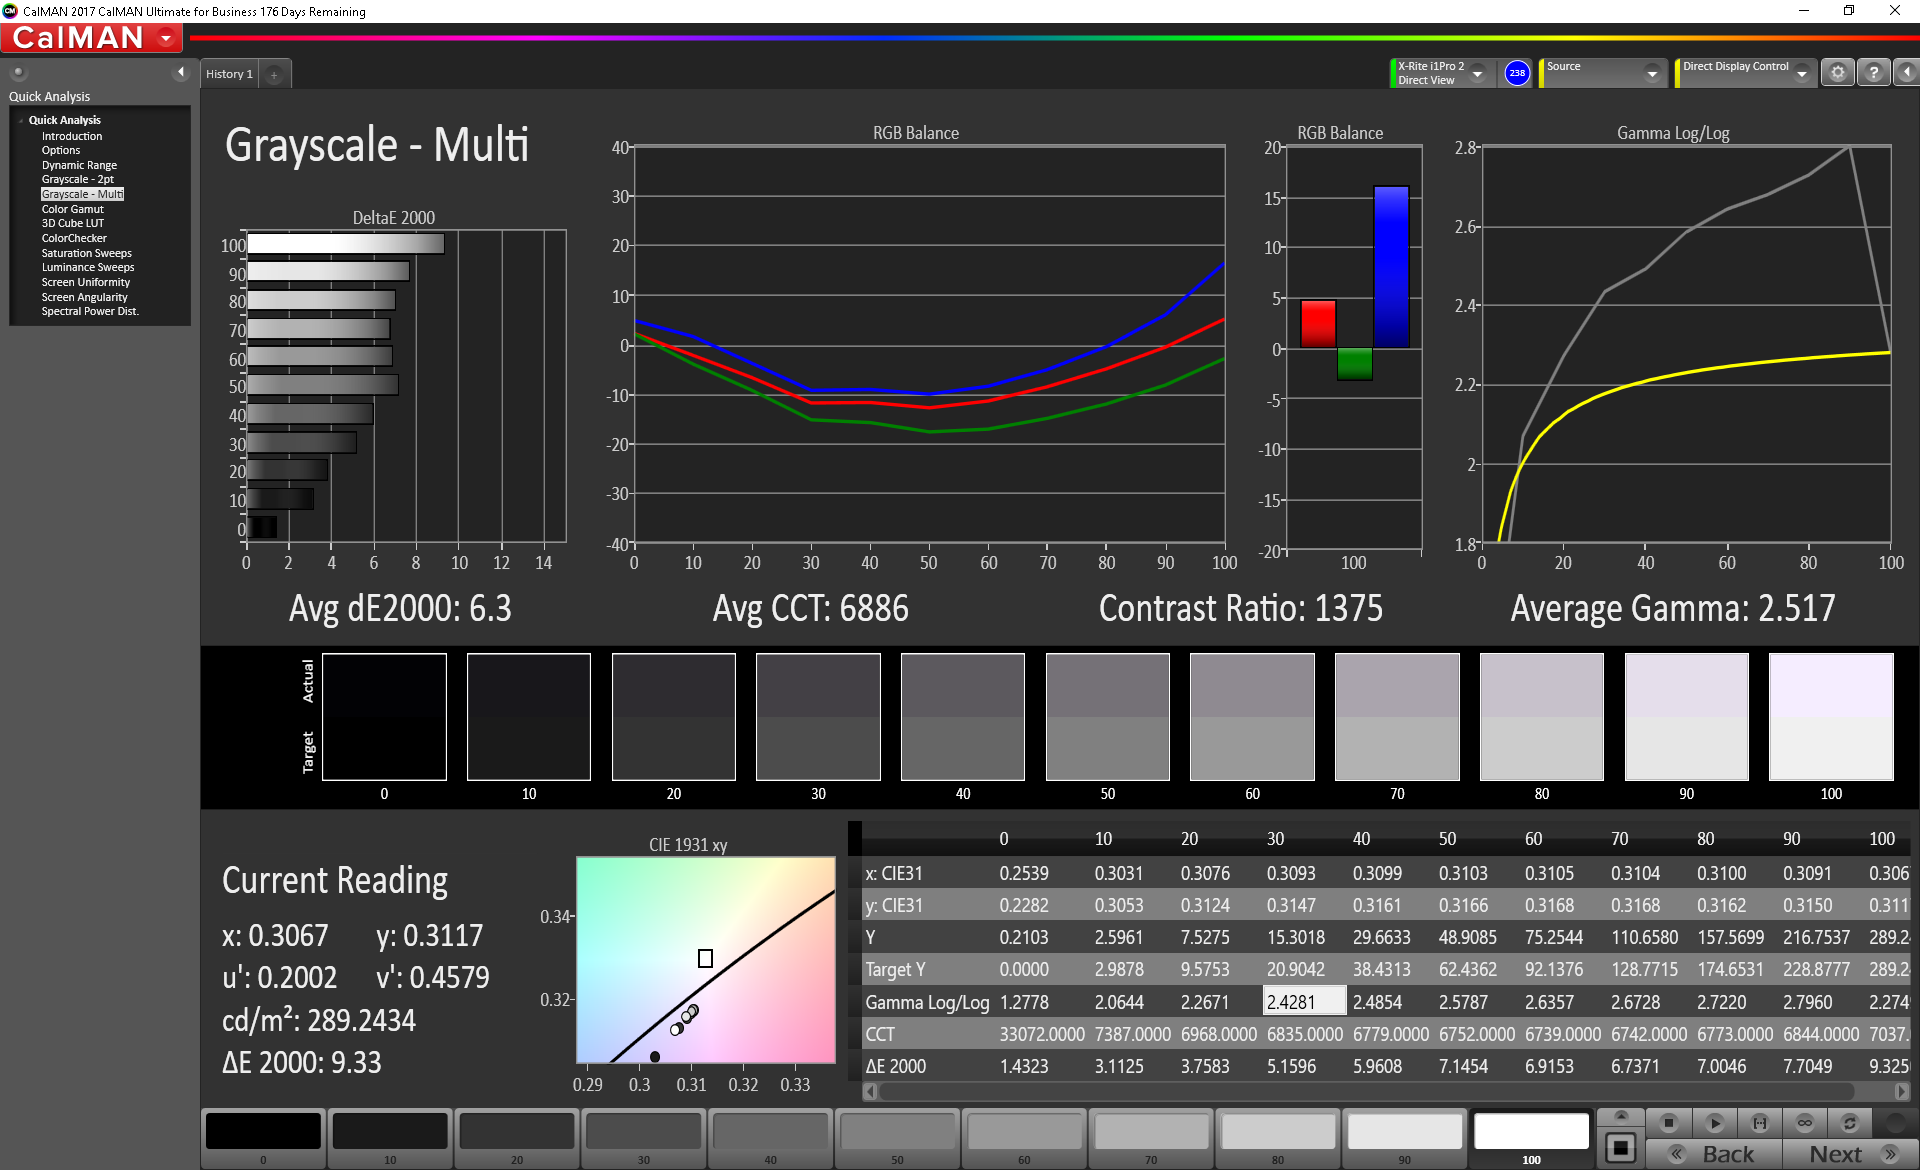
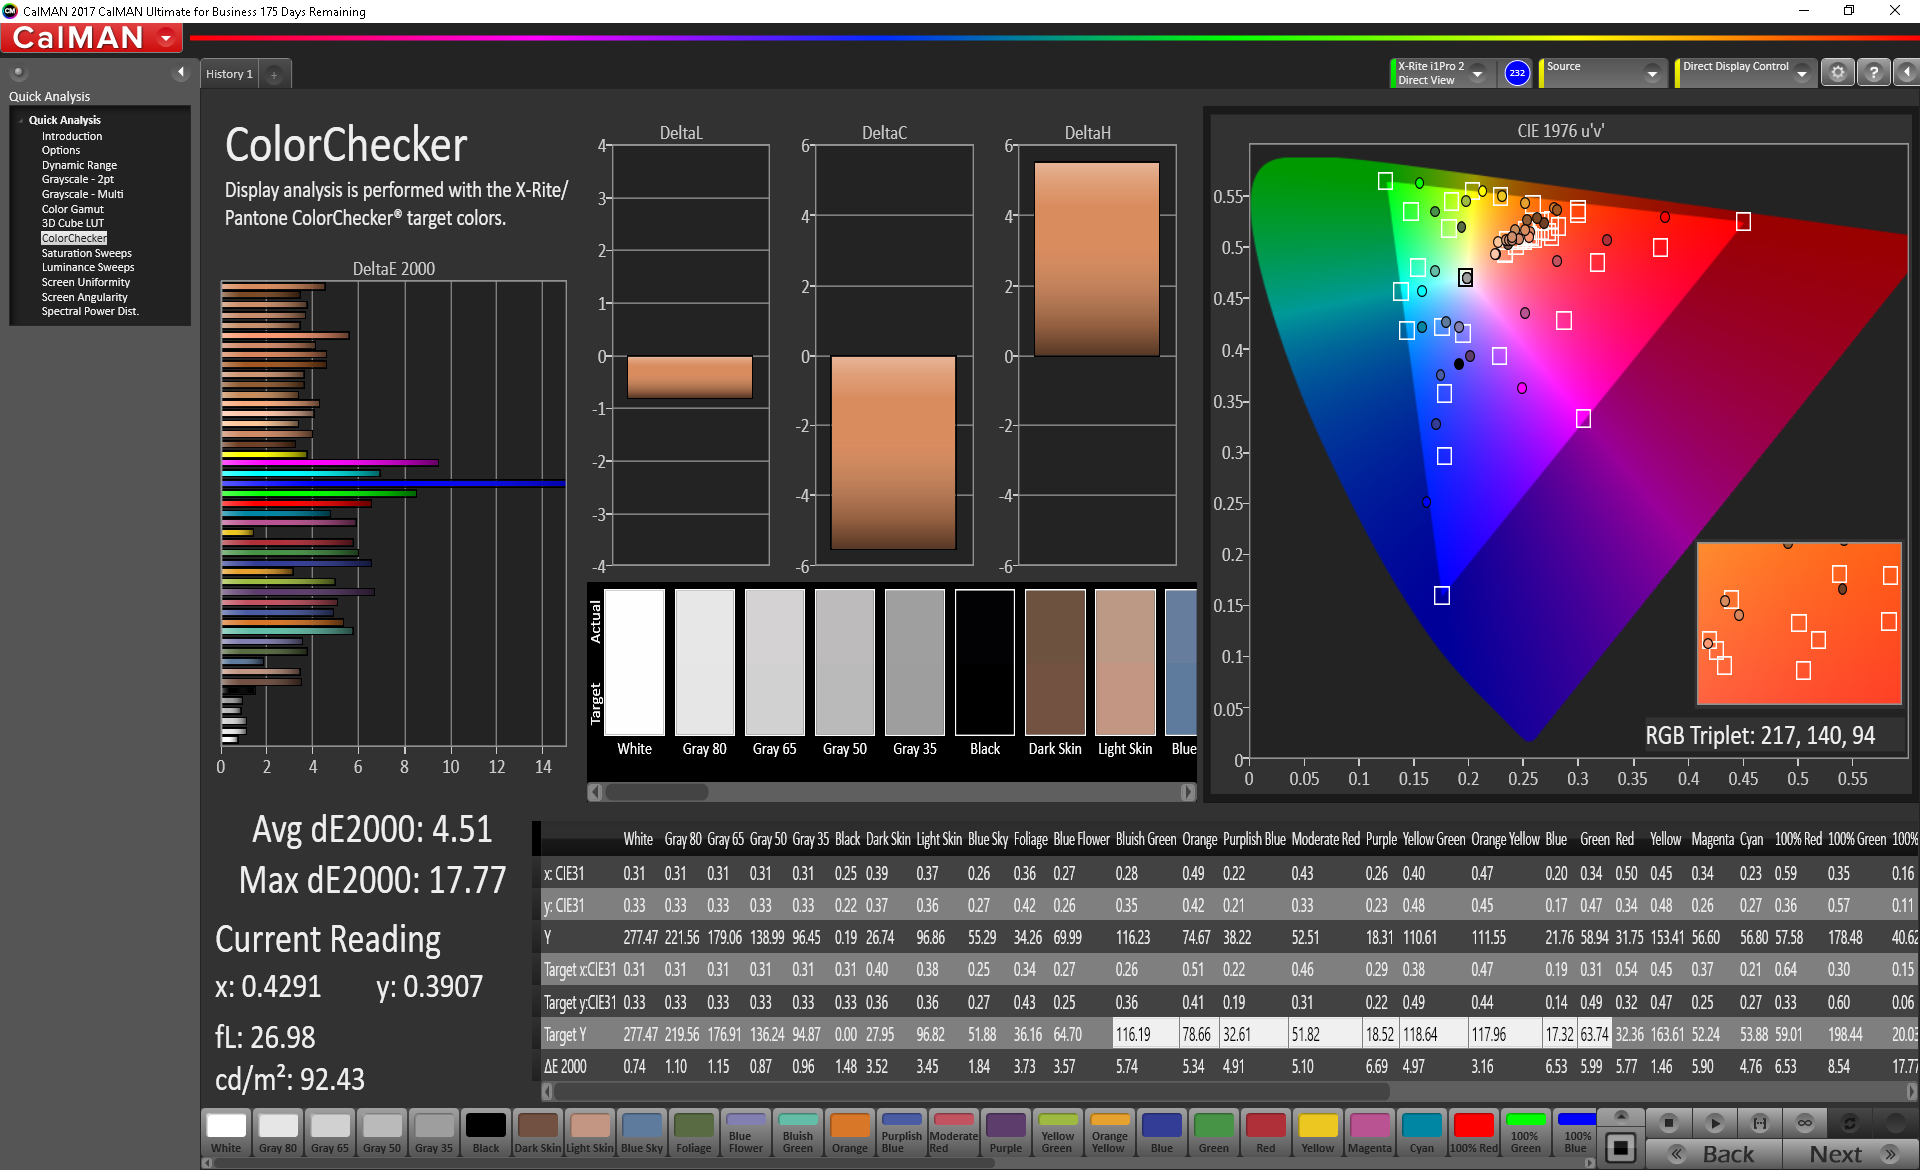
ΔE ColorChecker Calman: 6.16 | ∀{0.5-29.43 Ø4.71}
calibrated: 4.51
ΔE Greyscale Calman: 6.3 | ∀{0.09-98 Ø4.96}
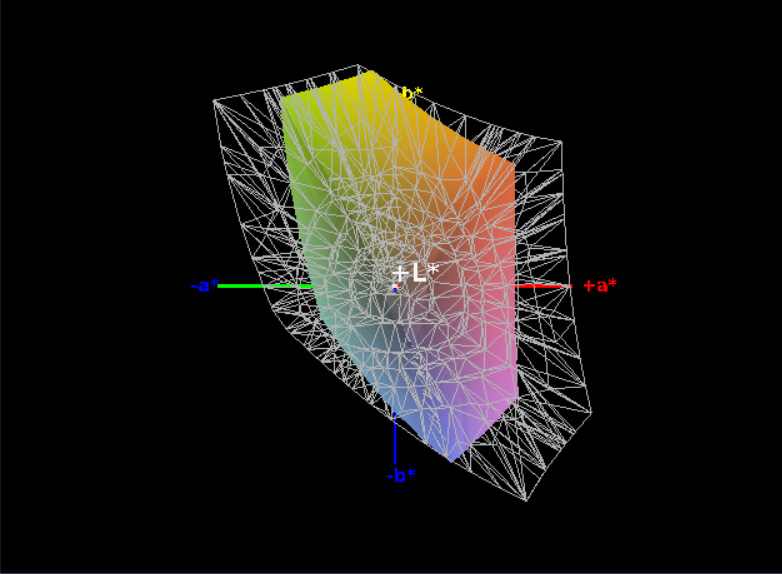
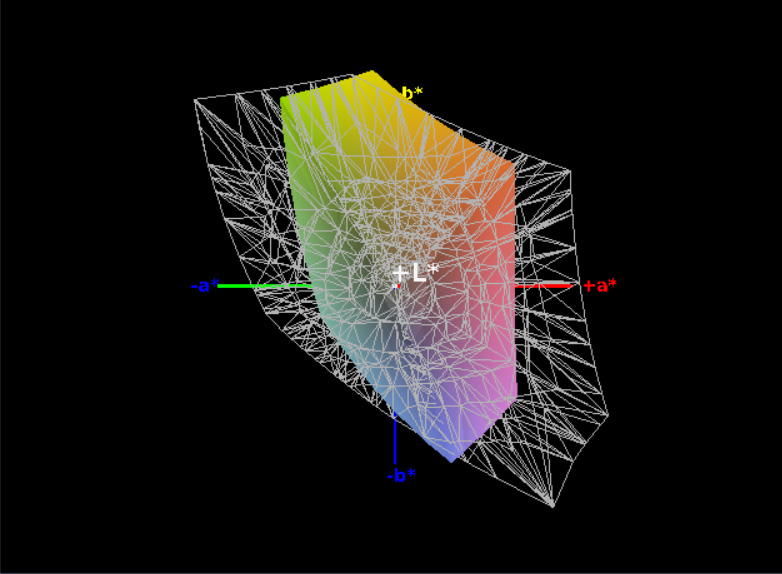
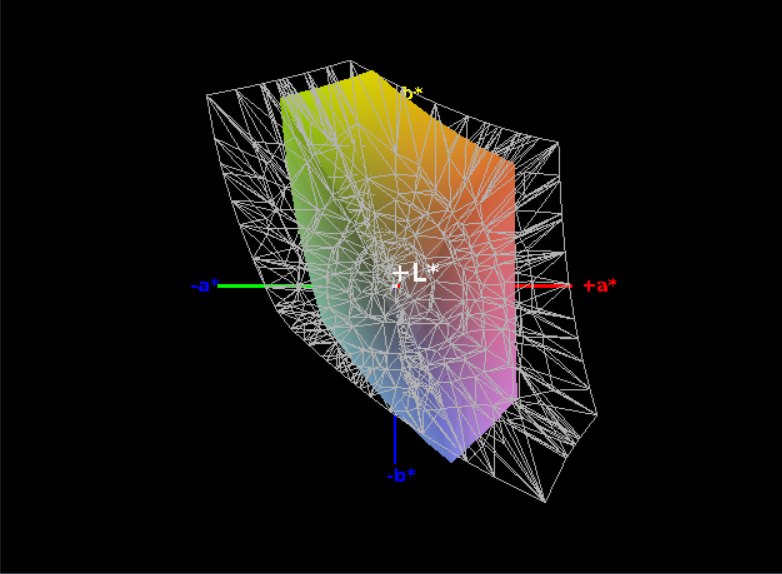
58.9% sRGB (Argyll 1.6.3 3D)
37.67% AdobeRGB 1998 (Argyll 1.6.3 3D)
41% AdobeRGB 1998 (Argyll 3D)
59.2% sRGB (Argyll 3D)
39.69% Display P3 (Argyll 3D)
Gamma: 2.517
CCT: 6886 K
| Lenovo ThinkPad T480s-20L7002AUS NV140FHM-N46, TFT-LCD, 14", 1920x1080 | Lenovo ThinkPad X1 Carbon 2018-20KGS03900 B140QAN02.0, IPS, 14", 2560x1440 | Dell Latitude 7490 AUO503D (D04YD_B140HAN), IPS, 14", 1920x1080 | Dell Latitude 7390 LGD059B, IPS, 13.3", 1920x1080 | HP EliteBook 840 G5-3JX61EA IVO M140NVF7 R0, IPS, 14", 1920x1080 | Lenovo ThinkPad T480s-20L8S02D00 LP140QH2-SPB1, IPS, 14", 2560x1440 | |
|---|---|---|---|---|---|---|
| Display | 111% | 66% | 66% | 51% | 76% | |
| Display P3 Coverage (%) | 39.69 | 87.7 121% | 66.6 68% | 67.8 71% | 61 54% | 72.8 83% |
| sRGB Coverage (%) | 59.2 | 100 69% | 96.8 64% | 95.1 61% | 87.7 48% | 97.9 65% |
| AdobeRGB 1998 Coverage (%) | 41 | 99.9 144% | 67.9 66% | 67.8 65% | 62.1 51% | 74.1 81% |
| Response Times | -18% | 6% | 14% | 25% | 15% | |
| Response Time Grey 50% / Grey 80% * (ms) | 44 ? | 59.2 ? -35% | 41.6 ? 5% | 36.8 ? 16% | 33 ? 25% | 38.4 ? 13% |
| Response Time Black / White * (ms) | 34 ? | 34.4 ? -1% | 32 ? 6% | 30.4 ? 11% | 26 ? 24% | 28.4 ? 16% |
| PWM Frequency (Hz) | 990 | 3125 ? | ||||
| Screen | 55% | 20% | 26% | 34% | 16% | |
| Brightness middle (cd/m²) | 288.3 | 578 100% | 308.6 7% | 303.8 5% | 655 127% | 352 22% |
| Brightness (cd/m²) | 281 | 533 90% | 294 5% | 289 3% | 630 124% | 343 22% |
| Brightness Distribution (%) | 86 | 84 -2% | 89 3% | 86 0% | 93 8% | 91 6% |
| Black Level * (cd/m²) | 0.21 | 0.38 -81% | 0.23 -10% | 0.31 -48% | 0.56 -167% | 0.46 -119% |
| Contrast (:1) | 1373 | 1521 11% | 1342 -2% | 980 -29% | 1170 -15% | 765 -44% |
| Colorchecker dE 2000 * | 6.16 | 1.9 69% | 6.07 1% | 2.9 53% | 3.27 47% | 3.3 46% |
| Colorchecker dE 2000 max. * | 18.99 | 3.8 80% | 10.58 44% | 5.79 70% | 5.92 69% | 7.3 62% |
| Colorchecker dE 2000 calibrated * | 4.51 | 0.8 82% | 1.67 63% | 1.72 62% | 3.22 29% | |
| Greyscale dE 2000 * | 6.3 | 3 52% | 7.3 -16% | 3.7 41% | 2.85 55% | 5.3 16% |
| Gamma | 2.517 87% | 2.14 103% | 2.061 107% | 2.118 104% | 2.45 90% | 2.22 99% |
| CCT | 6886 94% | 6377 102% | 7269 89% | 6323 103% | 6065 107% | 6452 101% |
| Color Space (Percent of AdobeRGB 1998) (%) | 37.67 | 88.8 136% | 62 65% | 63 67% | 57 51% | 68.4 82% |
| Color Space (Percent of sRGB) (%) | 58.9 | 100 70% | 97 65% | 95 61% | 88 49% | 98 66% |
| Total Average (Program / Settings) | 49% /
57% | 31% /
27% | 35% /
32% | 37% /
36% | 36% /
28% |
* ... smaller is better
We measured an average brightness of 281 cd/m² with a distribution of 86%, 22% below the 343 cd/m² of the WQHD panel, and just a bit below the two Dell Latitude models in our comparison field. It’s also far below the premium panels in the X1 Carbon (533 cd/m²) and HP EliteBook (655 cd/m²). Contrast, on the other hand, is quite good with a measured 1373:1 beating every competitor apart from the stellar X1 Carbon (1521:1)—thanks to a black value of just 0.21 cd/m².
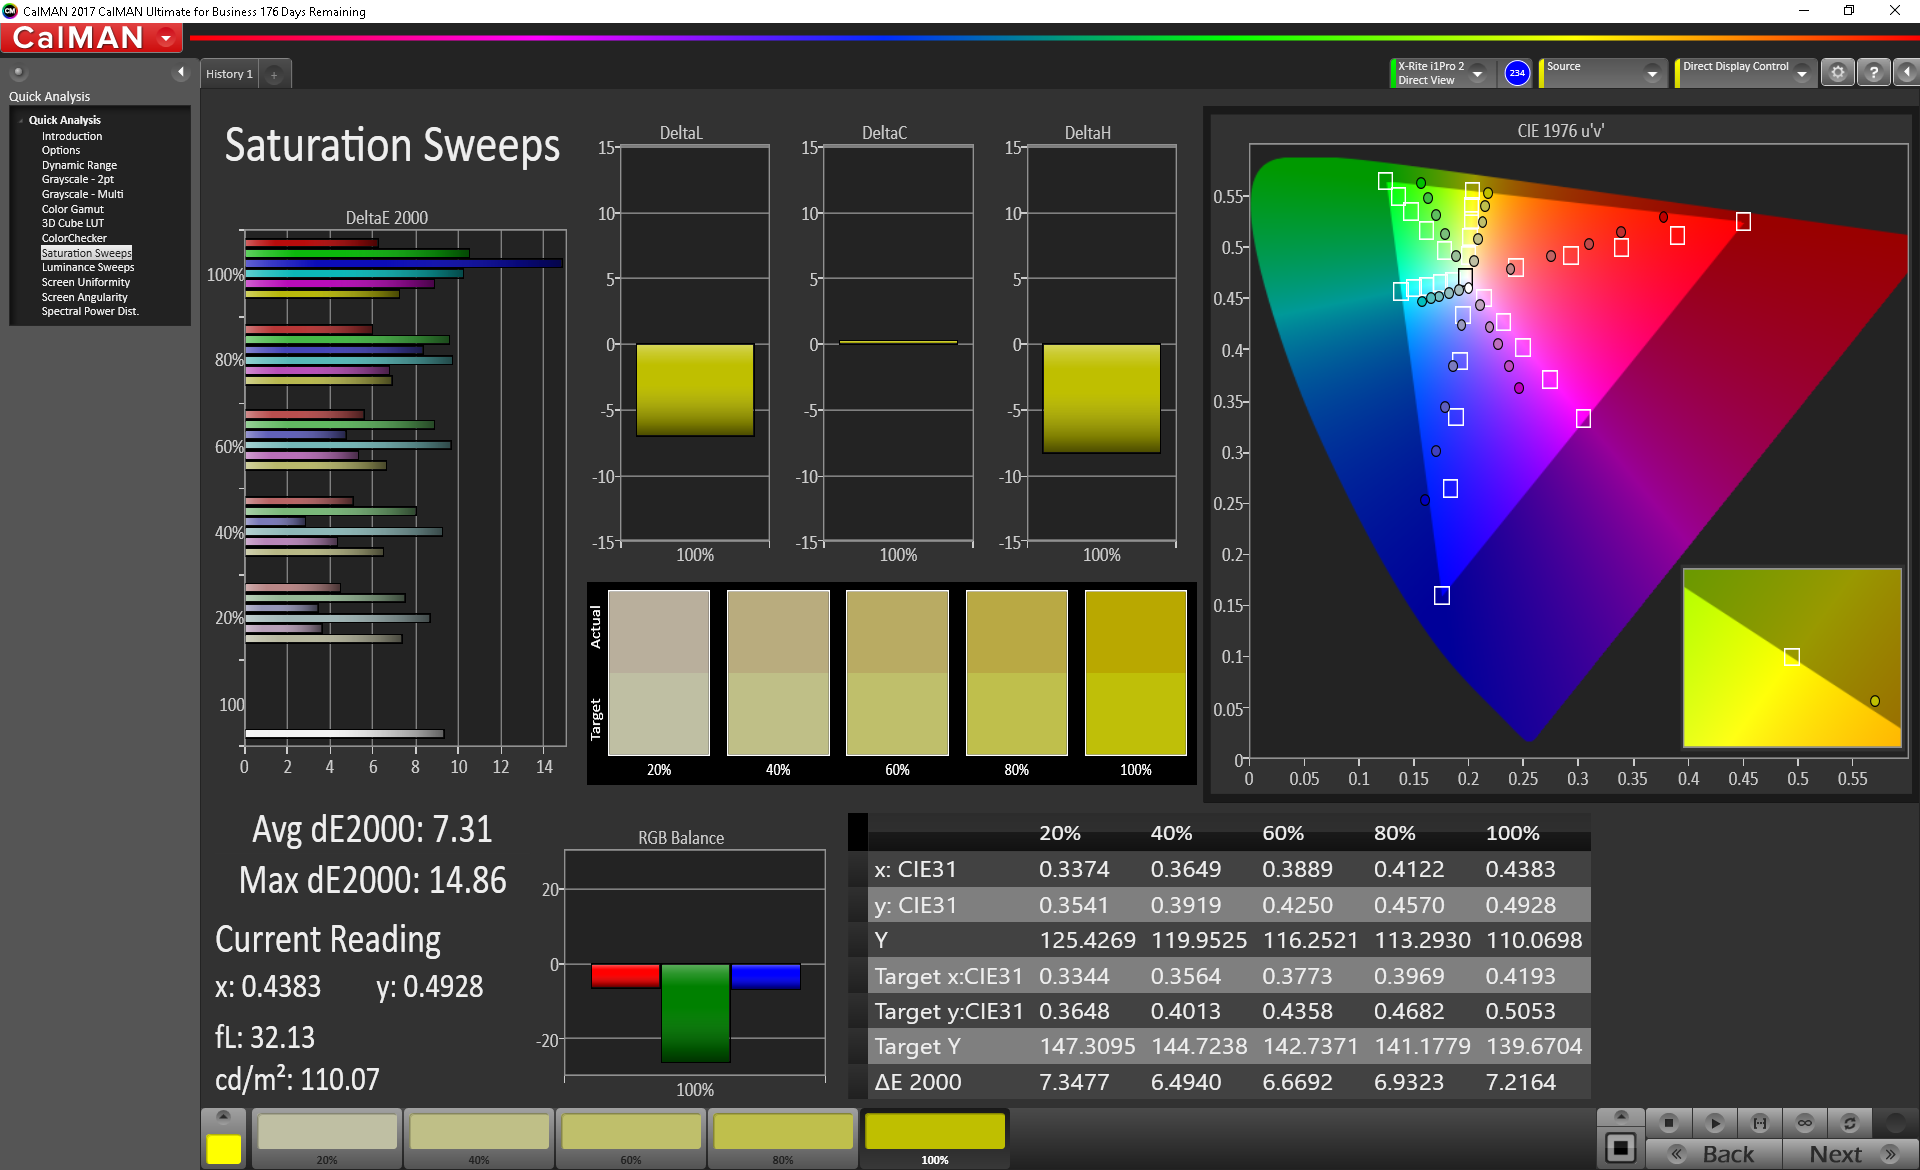
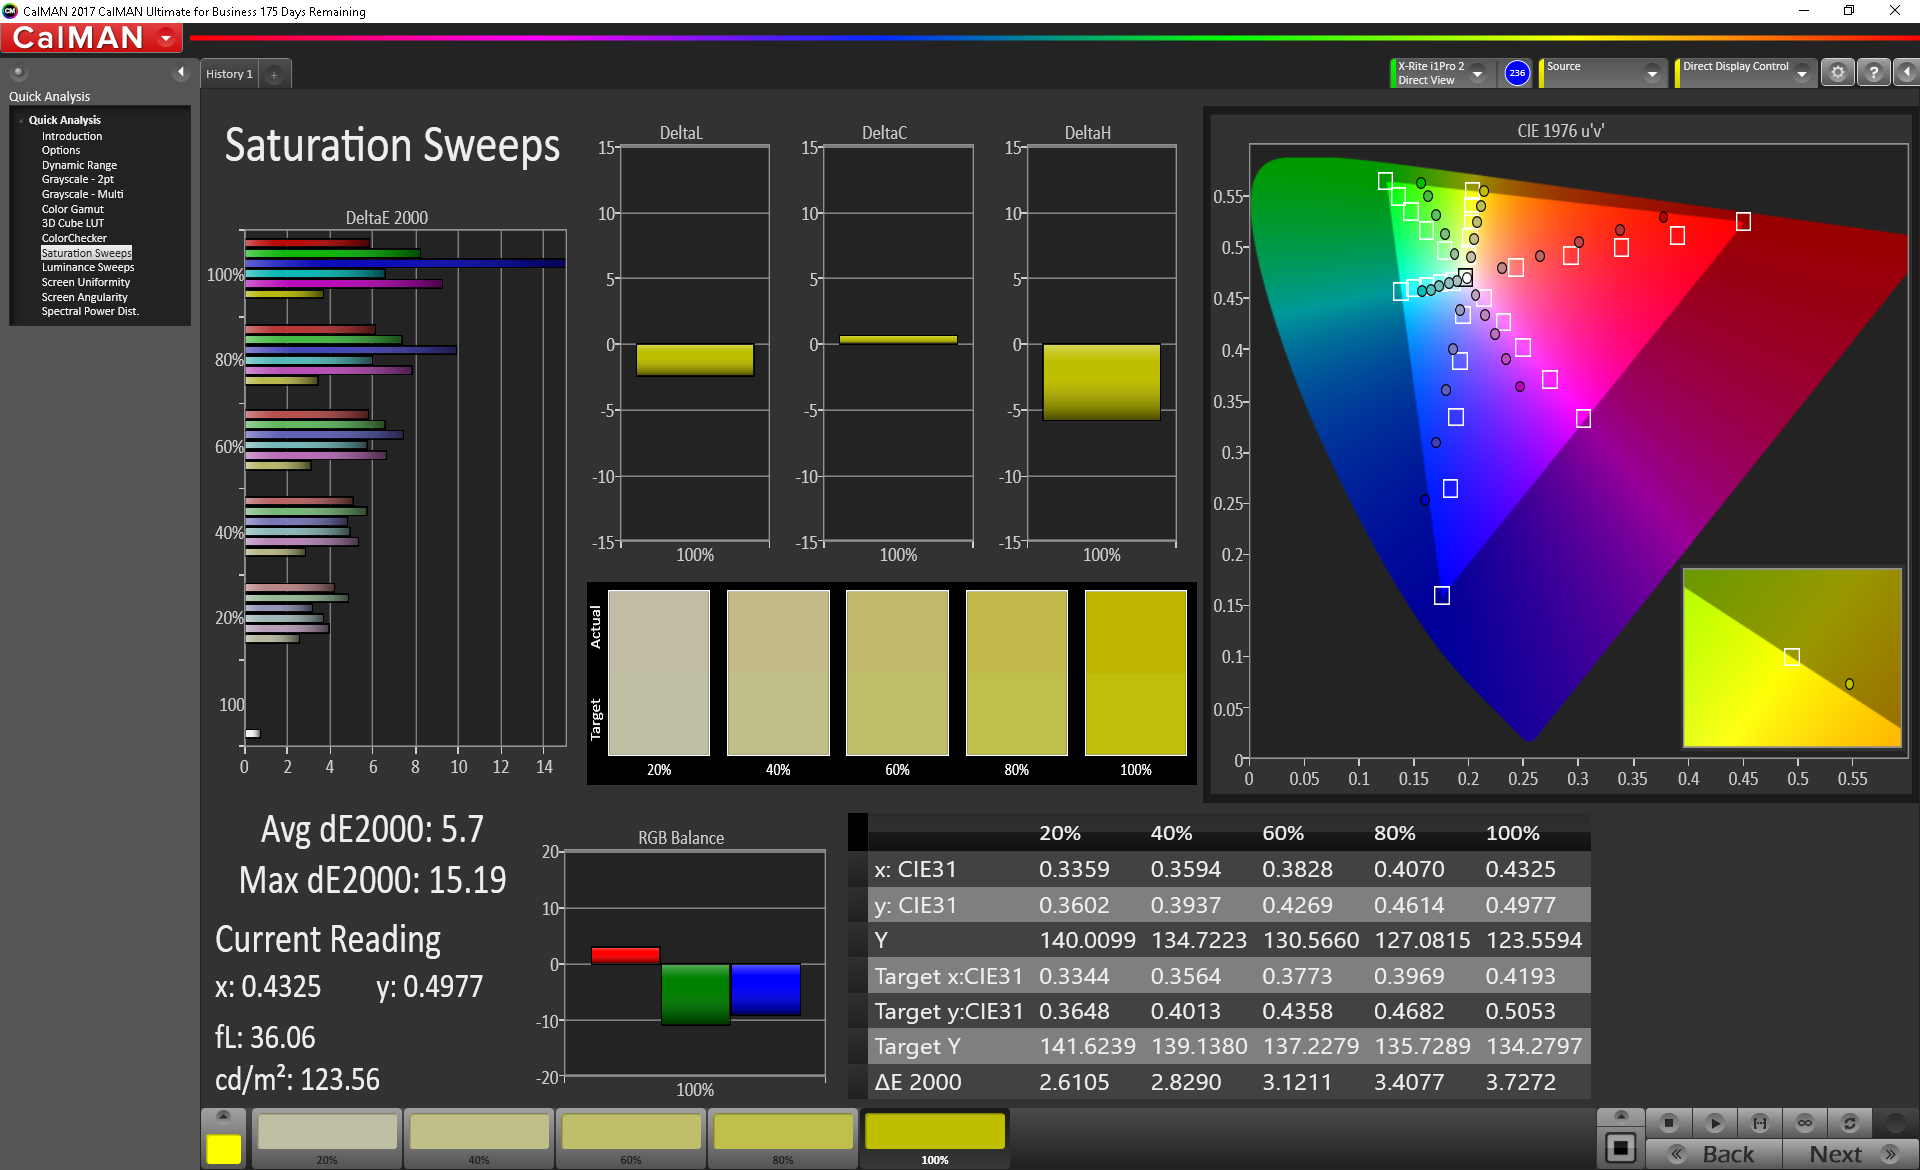
Apart from brightness, where the display truly falters, however, is in color coverage. The apparent lack of vibrancy exhibited by the display is corroborated by readings of just 58.9% and 37.67% of the sRGB / AdobeRGB spectrums, respectively—poor by any measure and far, far below every other machine we’re comparing against today. Despite their similarly middling brightness, the two Latitudes, for instance, still manage to cover nearly 100% of sRGB, which results in a palpably richer appearance.
Accuracy, likewise, leaves a lot to be desired, with ColorChecker / Greyscale DeltaE measurements of 6.16 / 6.3, and a maximum deviation of 18.99 (Blue). Post-calibration, things settle down to averages of 4.51 / 0.9 in these same tests (and the CCT Average and Gamma are both very close to ideal), but Blue remains highly deviant (17.77).
Display Response Times
| ↔ Response Time Black to White | ||
|---|---|---|
| 34 ms ... rise ↗ and fall ↘ combined | ↗ 18.8 ms rise | 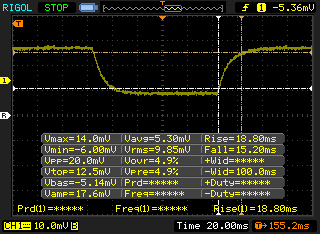 |
| ↘ 15.2 ms fall | ||
| The screen shows slow response rates in our tests and will be unsatisfactory for gamers. In comparison, all tested devices range from 0.1 (minimum) to 240 (maximum) ms. » 91 % of all devices are better. This means that the measured response time is worse than the average of all tested devices (19.8 ms). | ||
| ↔ Response Time 50% Grey to 80% Grey | ||
| 44 ms ... rise ↗ and fall ↘ combined | ↗ 26 ms rise | 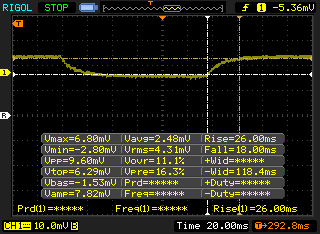 |
| ↘ 18 ms fall | ||
| The screen shows slow response rates in our tests and will be unsatisfactory for gamers. In comparison, all tested devices range from 0.165 (minimum) to 636 (maximum) ms. » 73 % of all devices are better. This means that the measured response time is worse than the average of all tested devices (31 ms). | ||
Screen Flickering / PWM (Pulse-Width Modulation)
| Screen flickering / PWM detected | 990 Hz | 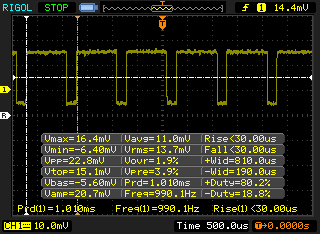 | |
The display backlight flickers at 990 Hz (worst case, e.g., utilizing PWM) . The frequency of 990 Hz is quite high, so most users sensitive to PWM should not notice any flickering. In comparison: 52 % of all tested devices do not use PWM to dim the display. If PWM was detected, an average of 7754 (minimum: 5 - maximum: 343500) Hz was measured. | |||
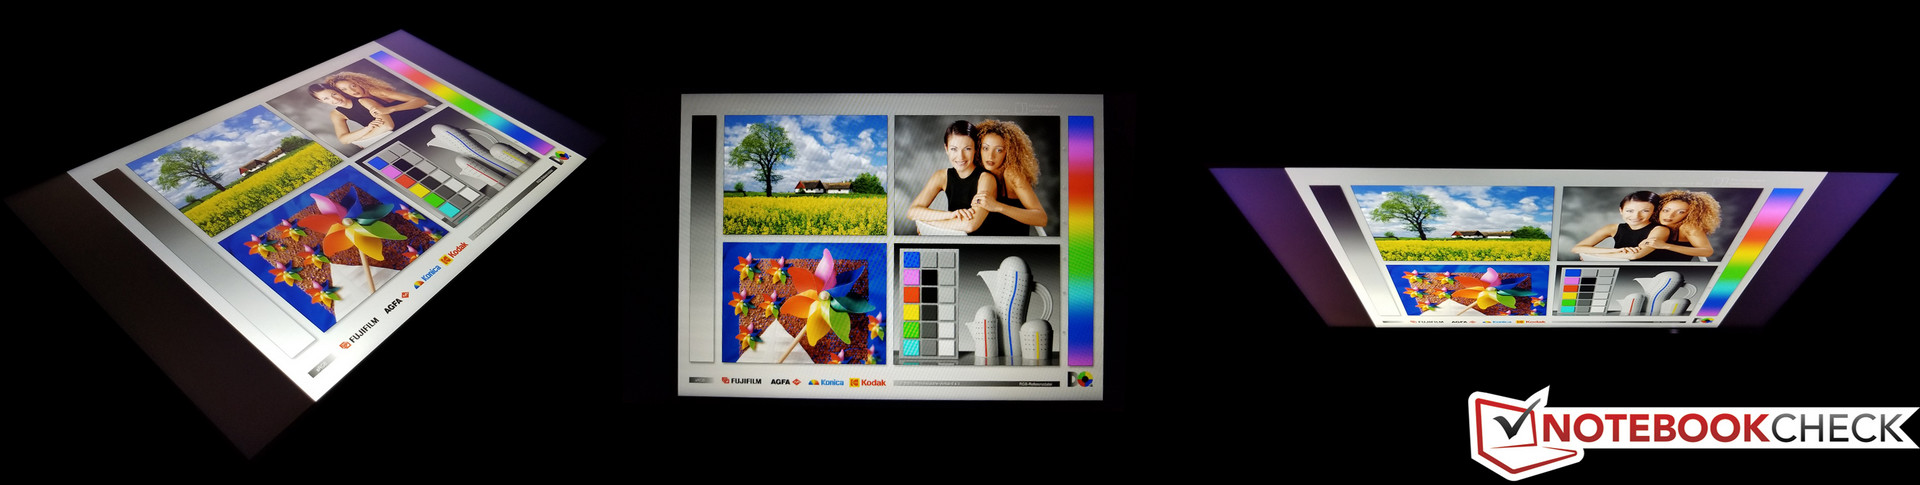
We measured PWM at all brightness levels below 100%, which is disappointing—but fortunately, the frequency of 990.1 Hz is relatively high, so it’s unlikely most sensitive users will find this bothersome. Viewing angles of the panel are comfortable and wide from all sides. Finally, outdoor use is possible in shaded areas, but more difficult in brighter light thanks to the low luminosity of the display.
Performance
The T480s is available in a wide range of configurations spanning CPU options from Core i5 up to Core i7 chips, up to 24 GB of RAM (with 4 or 8 GB soldered to the board), and either Intel UHD Graphics 620 or NVIDIA GeForce MX150 graphics. Today’s review unit features the same Core i5-8250U SoC that we reviewed back in February, so we should expect comparable performance to what we received from that model.

Processor
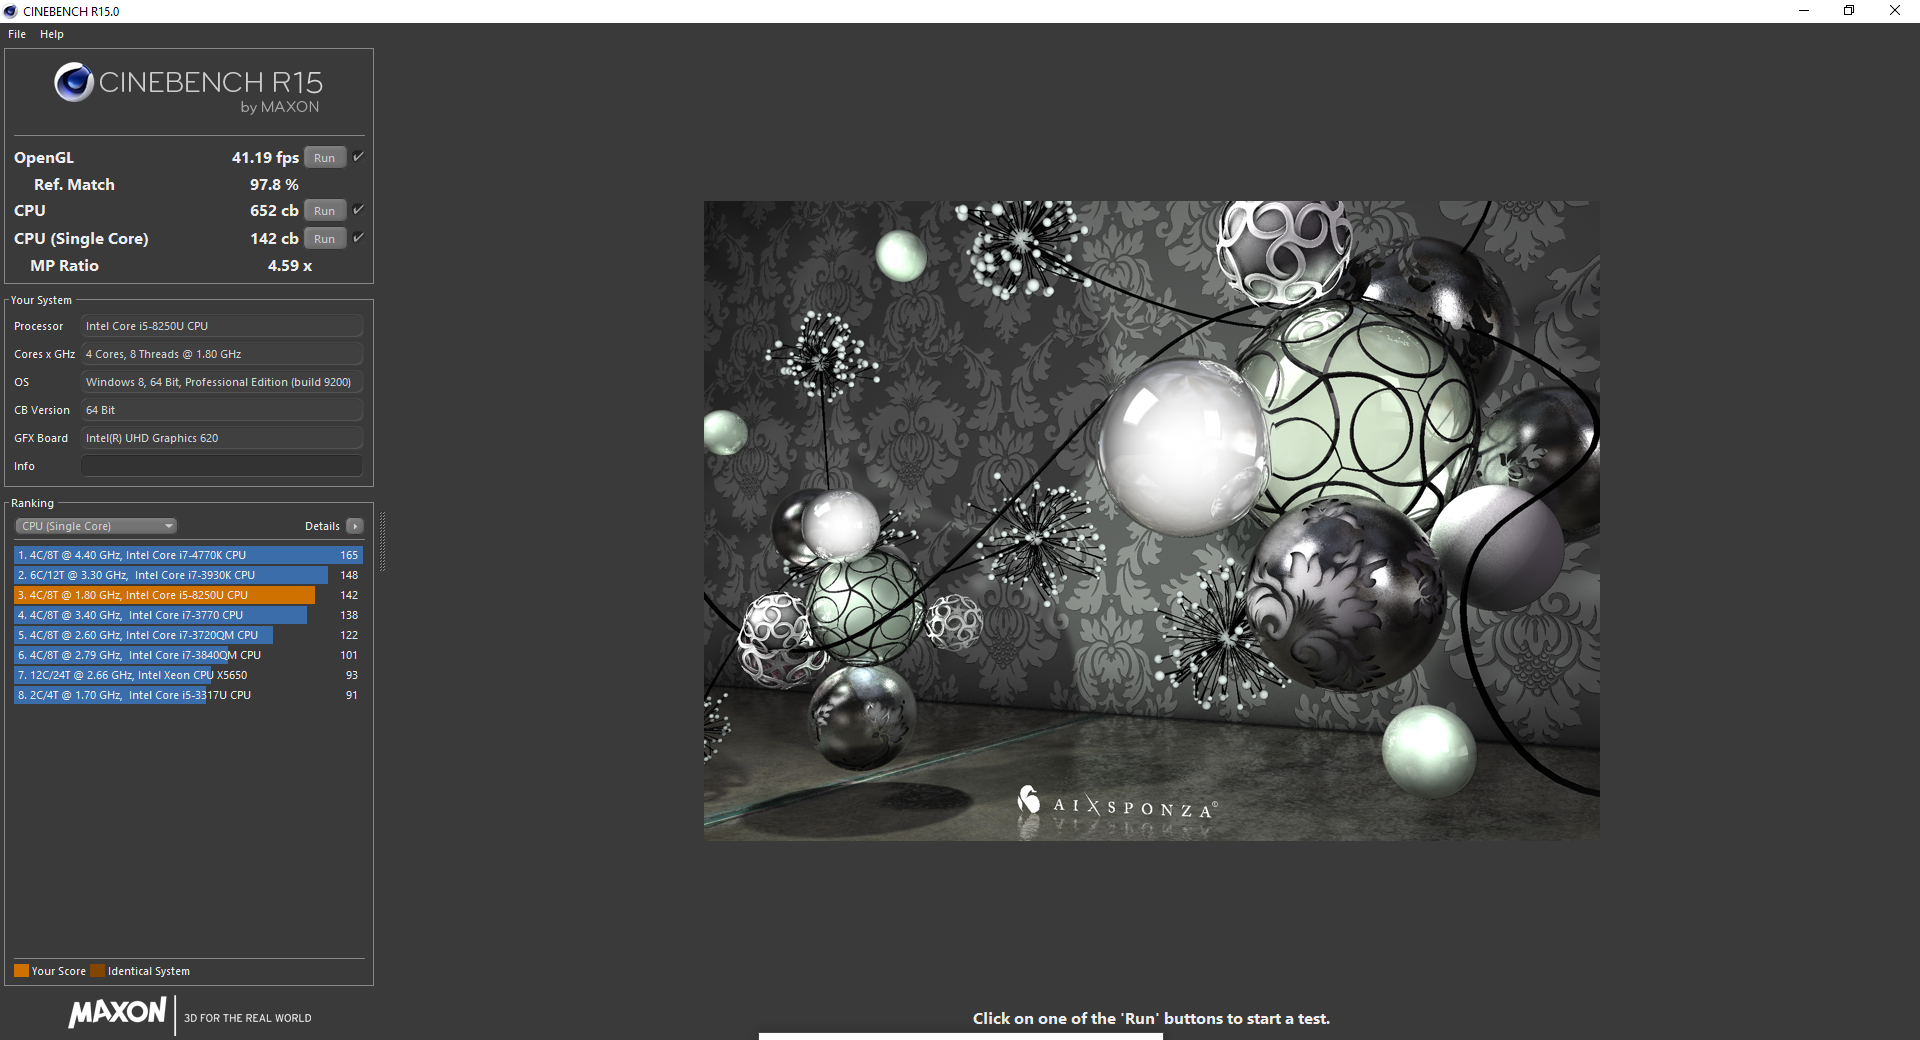
Our initial run of Cinebench R15 produced a roughly 10% lower score than the previous Core i5-8250U review unit (possibly because we didn’t take steps to revoke any power limits during today’s review) but the discrepancy didn’t last, as we later witnessed a higher initial score in our Cinebench loop test which was closer to that of the original review (703, followed next by 707). These are good results at any rate when you take into account the average score for this CPU of 576 (as of this writing). Single-core performance, meanwhile, is right on the money at 142 points. As compared to other competitors, the T480s Core i5-8250U actually manages to decisively beat the Core i7-equipped HP EliteBook and Dell Latitude 7490, and it also edges out the Core i7 Latitude 7390 by some 5%. Accounting for the even higher (by approximately 50 points) initial score from the Cinebench loop test sees this margin widen even further. Needless to say, these results are impressive.
A second retest of Cinebench R15 within the usual scope of testing did repeatedly produce a higher score (716 in multi-core CPU). As a result, we’ve updated the score accordingly in our database for this notebook.
Stability of performance does suffer just a bit under sustained load, however. Following the first six runs of Cinebench R15 multi-CPU, scores begin fluctuating between values in the 635-660 range up to “normal” scores around 700, which translates to a lower average sustained performance score in this test of approximately 672. This is still well above the scores of similarly-equipped competitors, however, so we can hardly complain. For those interested, undervolting (as explained in our initial T480s review) does help to mitigate (and, in fact, all but eliminate) this inconsistency.
System Performance
Although it ranks near the bottom of today’s comparison charts, the ThinkPad T480s is just a stone’s throw away from the category leaders at the top. Scores of 3672 in PCMark 8 Home and 3771 in PCMark 10 Overall aren’t bad results; they’re 8% and 7% below the top-ranked machines in those tests respectively, and just ever-so-slightly below the heavily-praised X1 Carbon. Perhaps more importantly, we witnessed no notable hiccups or other general performance detriments during our time with the machine.
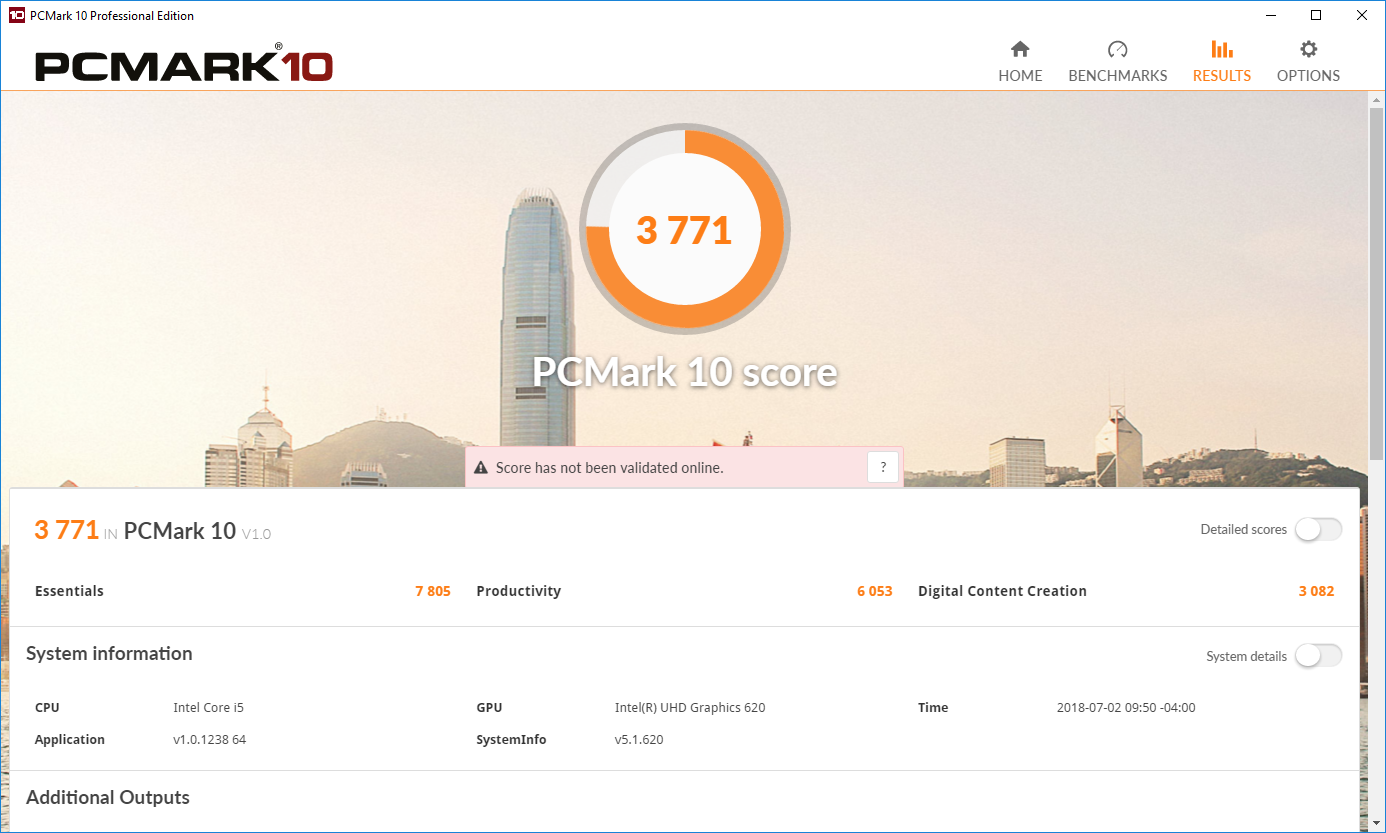
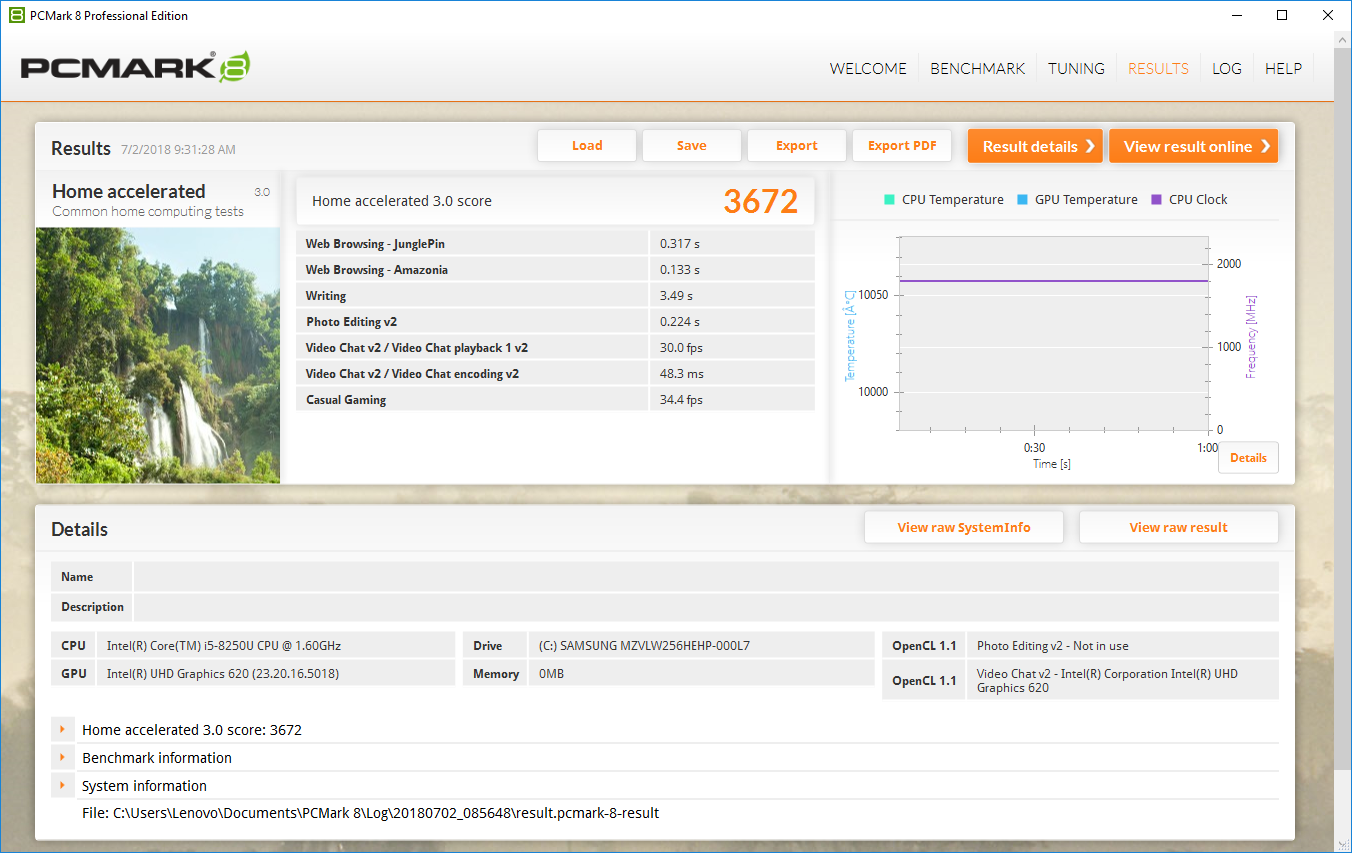
| PCMark 8 Home Score Accelerated v2 | 3672 points | |
| PCMark 10 Score | 3771 points | |
Help | ||
Storage Devices
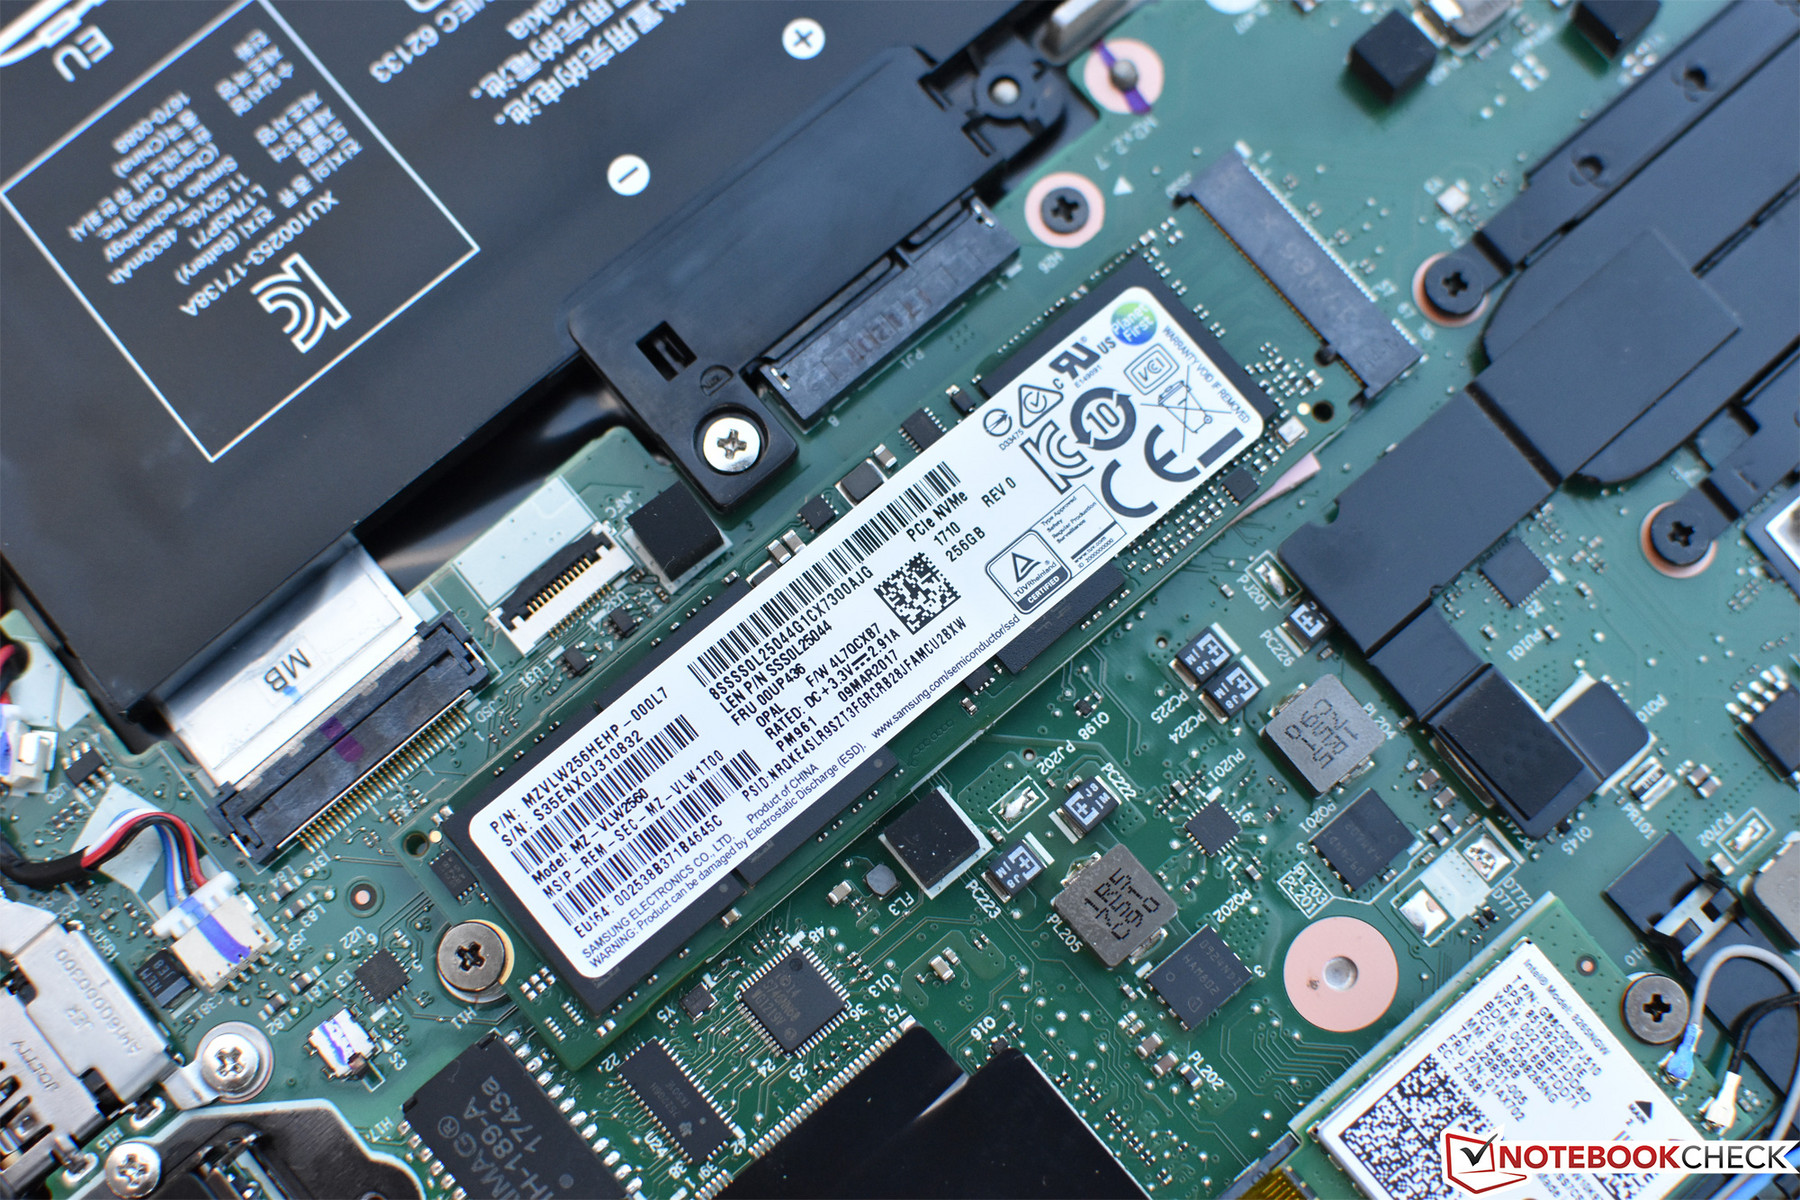
The PM961 can’t hold a candle to the PM981 found in the X1 Carbon review unit, of course, but it’s still no pushover. The capacity of ours today is 256 GB, and it posts favorable performance results in our storage tests, with 4K-64 read/write speeds of 1183.23 MB/s and 706.33 MB/s and sequential speeds within 17% of its PM981 superior. Interestingly, these scores are well above those we received during our tests of the Latitude 7390, which featured the same SSD.
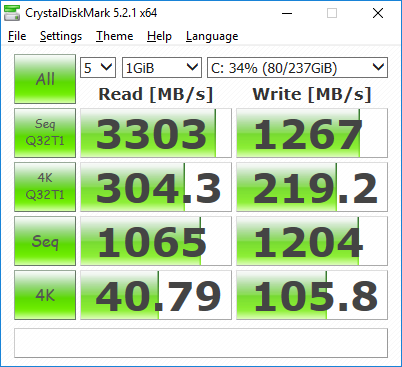
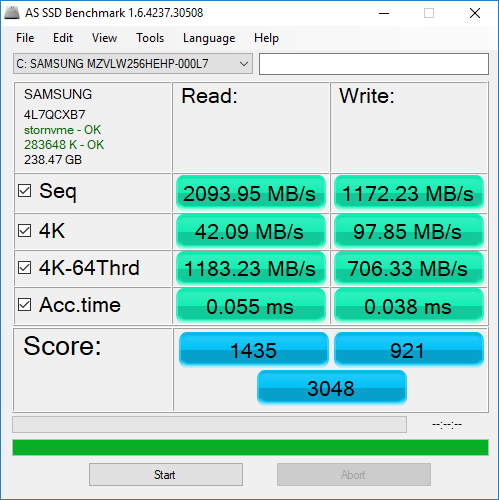
| Lenovo ThinkPad T480s-20L7002AUS Samsung PM961 MZVLW256HEHP | Lenovo ThinkPad X1 Carbon 2018-20KGS03900 Samsung SSD PM981 MZVLB512HAJQ | Dell Latitude 7490 Toshiba KSG60ZMV256G | Dell Latitude 7390 Samsung PM961 MZVLW256HEHP | HP EliteBook 840 G5-3JX61EA Toshiba KXG50ZNV1T02 | Lenovo ThinkPad T480s-20L8S02E00 Samsung SSD PM981 MZVLB512HAJQ | Average Samsung PM961 MZVLW256HEHP | |
|---|---|---|---|---|---|---|---|
| AS SSD | 32% | -64% | -16% | -12% | 32% | -115% | |
| Copy Game MB/s (MB/s) | 1107 | 352 | 905 | 1110 | 537 ? | ||
| Copy Program MB/s (MB/s) | 460.2 | 247.4 | 326.2 | 387.5 | 343 ? | ||
| Copy ISO MB/s (MB/s) | 1247 | 818 | 1688 | 1412 | 1004 ? | ||
| Score Total (Points) | 3048 | 3529 16% | 947 -69% | 2215 -27% | 2630 -14% | 4115 35% | 2565 ? -16% |
| Score Write (Points) | 921 | 1801 96% | 357 -61% | 501 -46% | 1084 18% | 1708 85% | 587 ? -36% |
| Score Read (Points) | 1435 | 1168 -19% | 391 -73% | 1158 -19% | 1070 -25% | 1623 13% | 1378 ? -4% |
| Access Time Write * (ms) | 0.038 | 0.027 29% | 0.056 -47% | 0.032 16% | 0.055 -45% | 0.033 13% | 0.4637 ? -1120% |
| Access Time Read * (ms) | 0.055 | 0.029 47% | 0.112 -104% | 0.063 -15% | 0.059 -7% | 0.045 18% | 0.06777 ? -23% |
| 4K-64 Write (MB/s) | 706 | 1529 117% | 248.1 -65% | 302.4 -57% | 908 29% | 1456 106% | 419 ? -41% |
| 4K-64 Read (MB/s) | 1183 | 876 -26% | 316.1 -73% | 932 -21% | 813 -31% | 1329 12% | 1112 ? -6% |
| 4K Write (MB/s) | 97.8 | 134.3 37% | 79.2 -19% | 115.2 18% | 90 -8% | 114.4 17% | 91.6 ? -6% |
| 4K Read (MB/s) | 42.09 | 52.4 24% | 26.66 -37% | 49.43 17% | 26.75 -36% | 49.81 18% | 45.1 ? 7% |
| Seq Write (MB/s) | 1172 | 1376 17% | 294.9 -75% | 830 -29% | 856 -27% | 1382 18% | 960 ? -18% |
| Seq Read (MB/s) | 2094 | 2396 14% | 486.2 -77% | 1761 -16% | 2300 10% | 2440 17% | 2019 ? -4% |
* ... smaller is better

GPU Performance
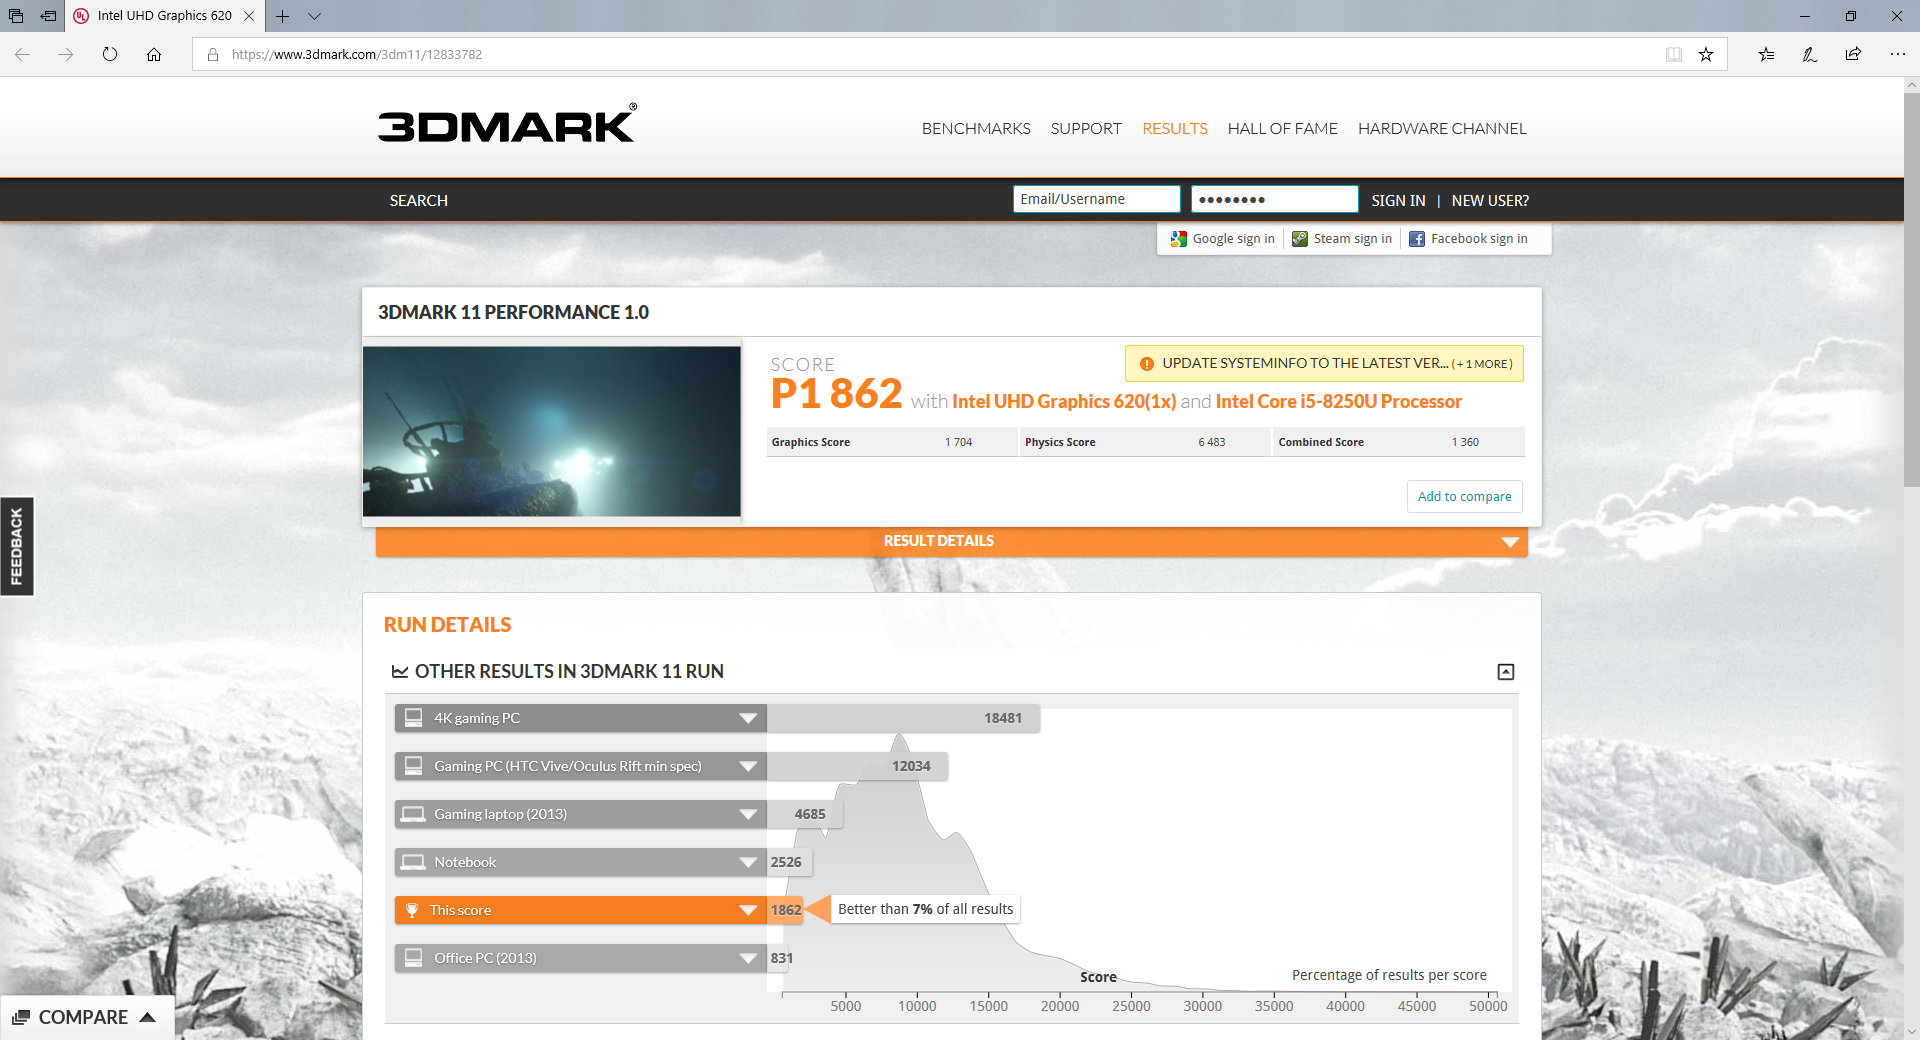
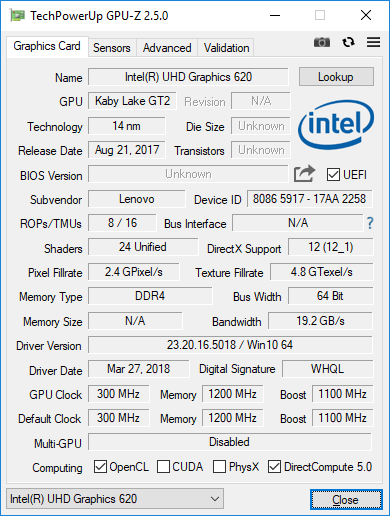
Unlike the GeForce MX150-equipped variation of the T480s, today’s more conventional review unit features merely integrated Intel UHD Graphics 620. As usual, that renders the machine fully incapable of handling any sort of moderately heavy graphical endeavors, but for the average office worker, this is probably not a problem.
| 3DMark 11 Performance | 1862 points | |
Help | ||
| low | med. | high | ultra | |
|---|---|---|---|---|
| BioShock Infinite (2013) | 55 | 30 | 24 | 8 |
Stress Test
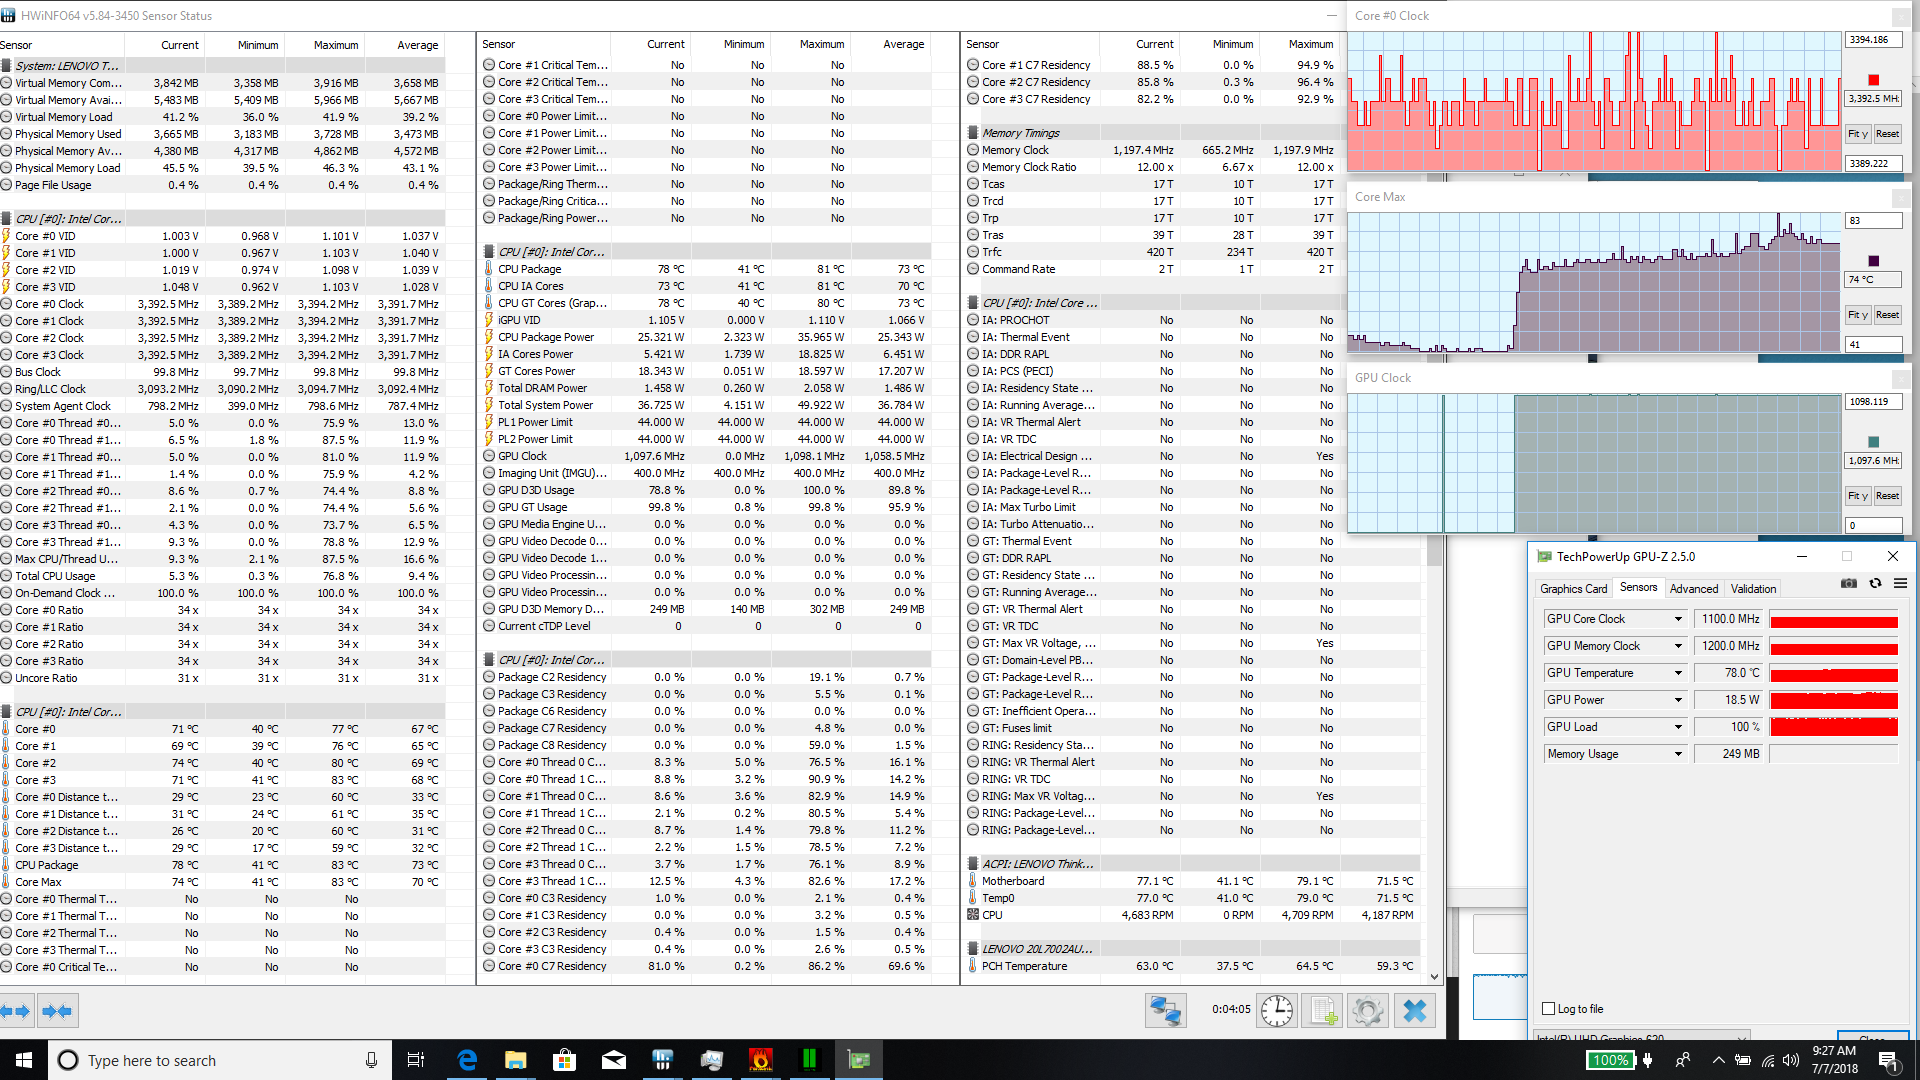
Despite being a very quiet machine (as we’ll see in the next section), the T480s has no problems maintaining high Turbo clock rates across all four cores in our full CPU stress test over sustained periods. Even after several minutes, the machine’s temperatures remain stable at (high) values of 97 °C to 98 °C, with frequencies shuffling between 3.3 and 3.4 GHz, the max turbo values possible. Full GPU stress, likewise, achieves a full 1100 MHz stable clock rate with temperatures of just 78 °C.
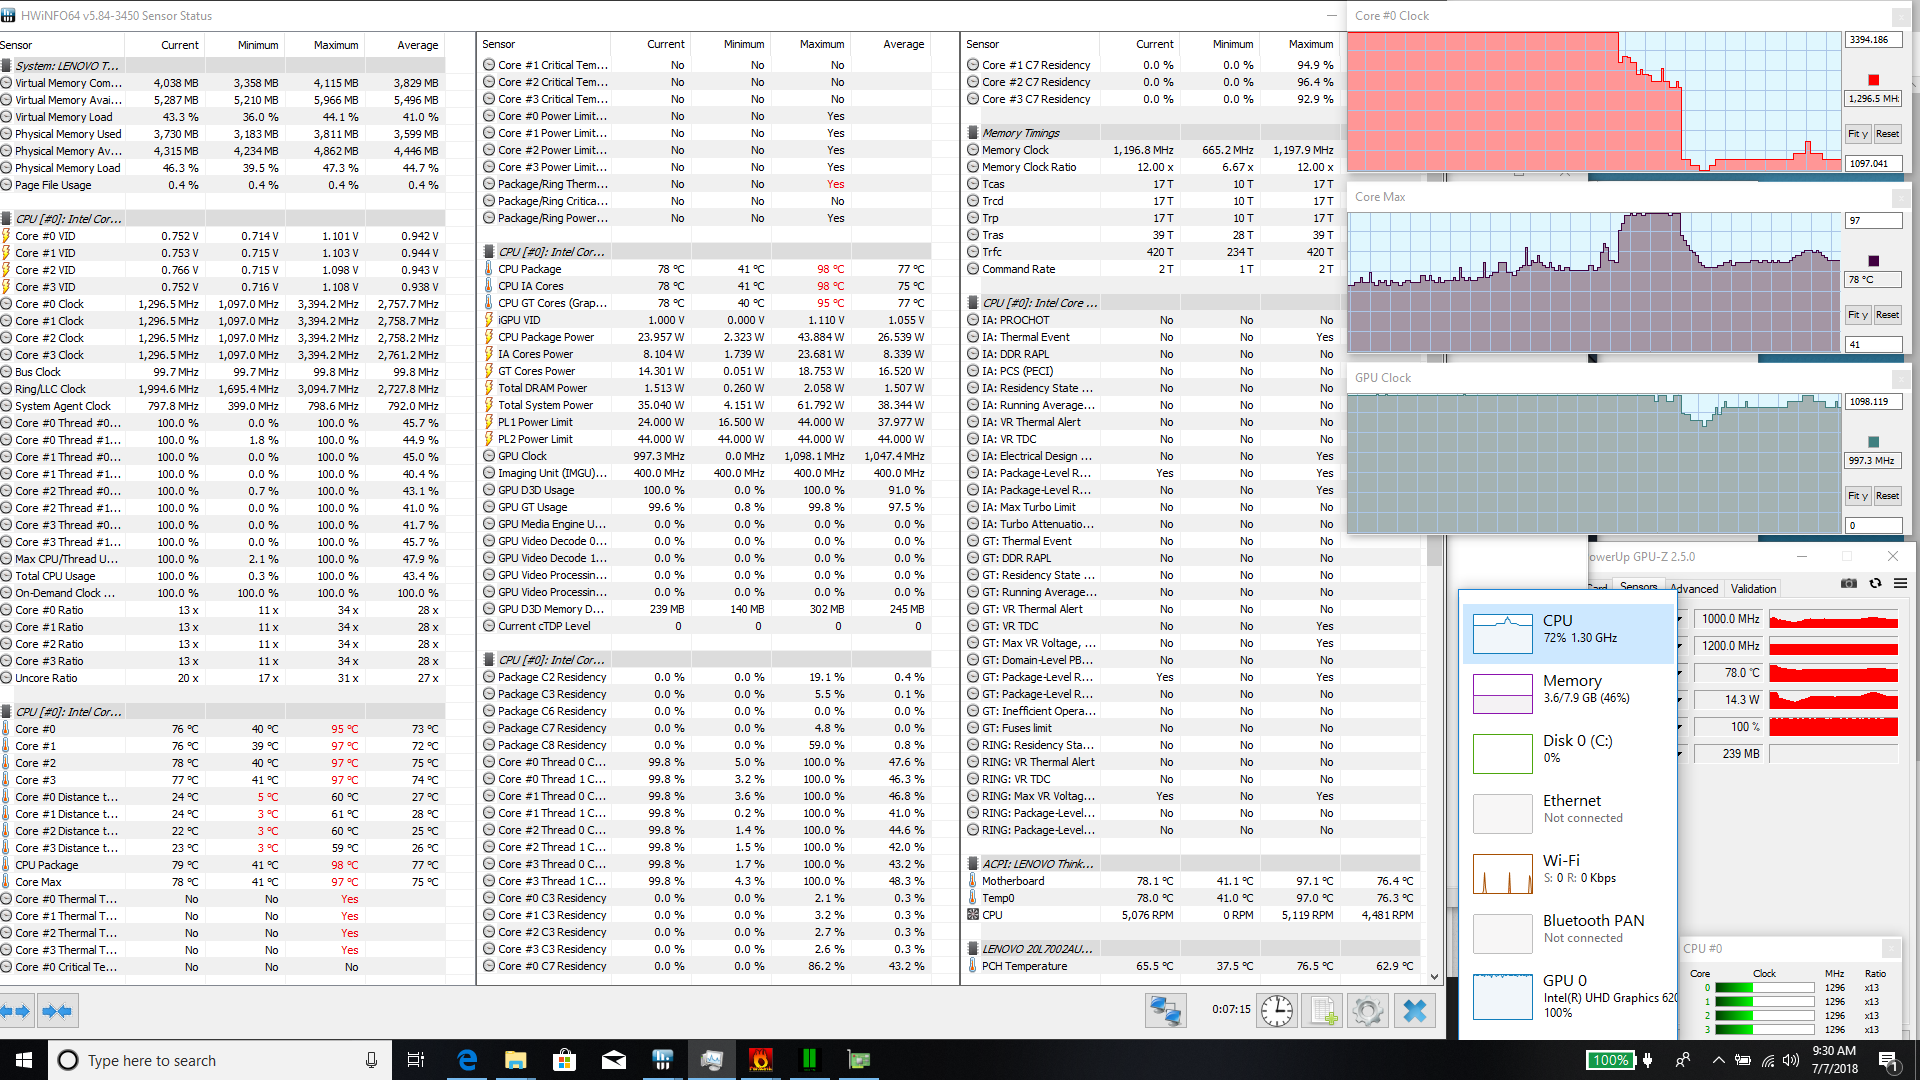
Full CPU + GPU combined stress at first produces max clock rates across both CPU and GPU of 3.4 GHz/1100 MHz, but after a few minutes, the GPU clock rate subsides to 1 GHz and the CPU clock rate plummets to just 1.3 GHz. Core temperatures at this point stabilize at around 78 °C, but performance never recovers to Turbo frequency levels even after thermals are stable again.
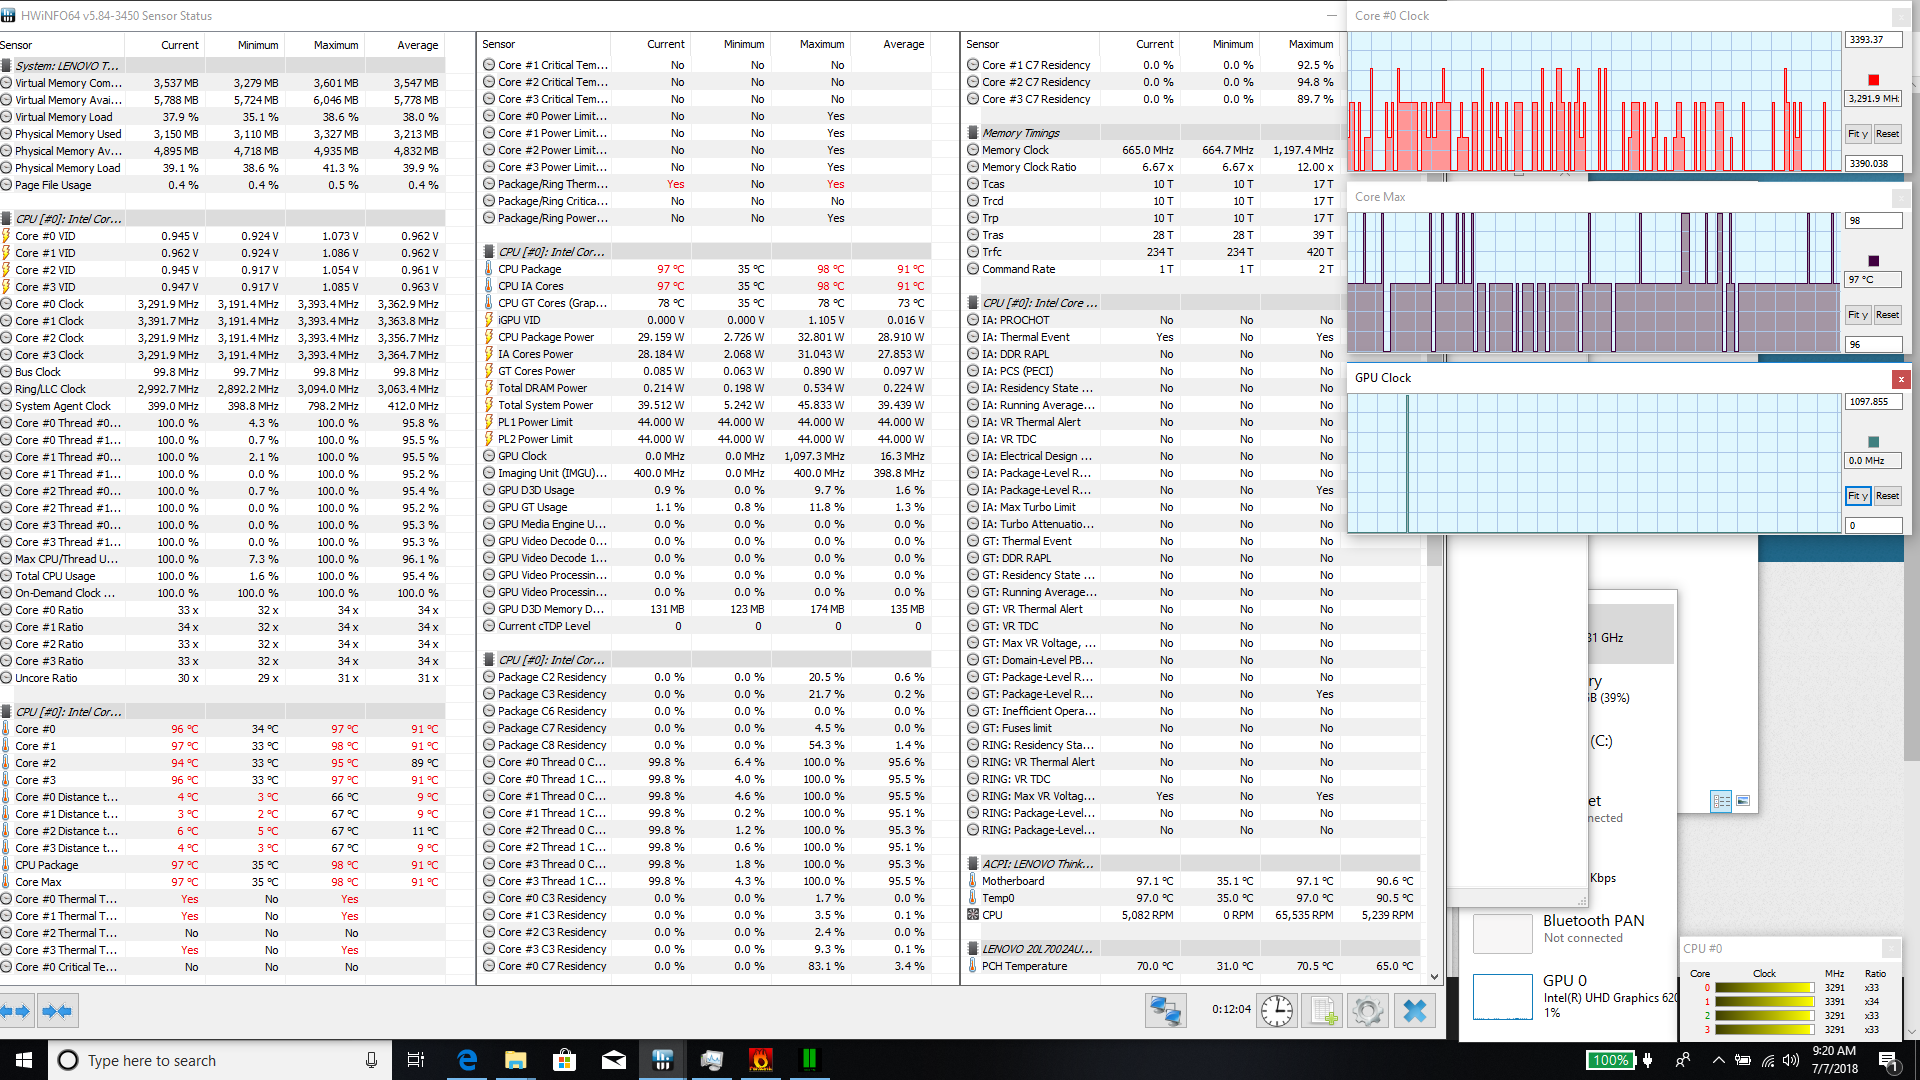
| CPU Clock (GHz) | GPU Clock (MHz) | Average CPU Temperature (°C) | Average GPU Temperature (°C) | |
| Prime95 Stress | 3.3 | - | 98 | - |
| FurMark Stress | - | 1100 | - | 78 |
| Prime95 + FurMark Stress | 1.3 | 1000 | 78 | 78 |
Emissions
System Noise
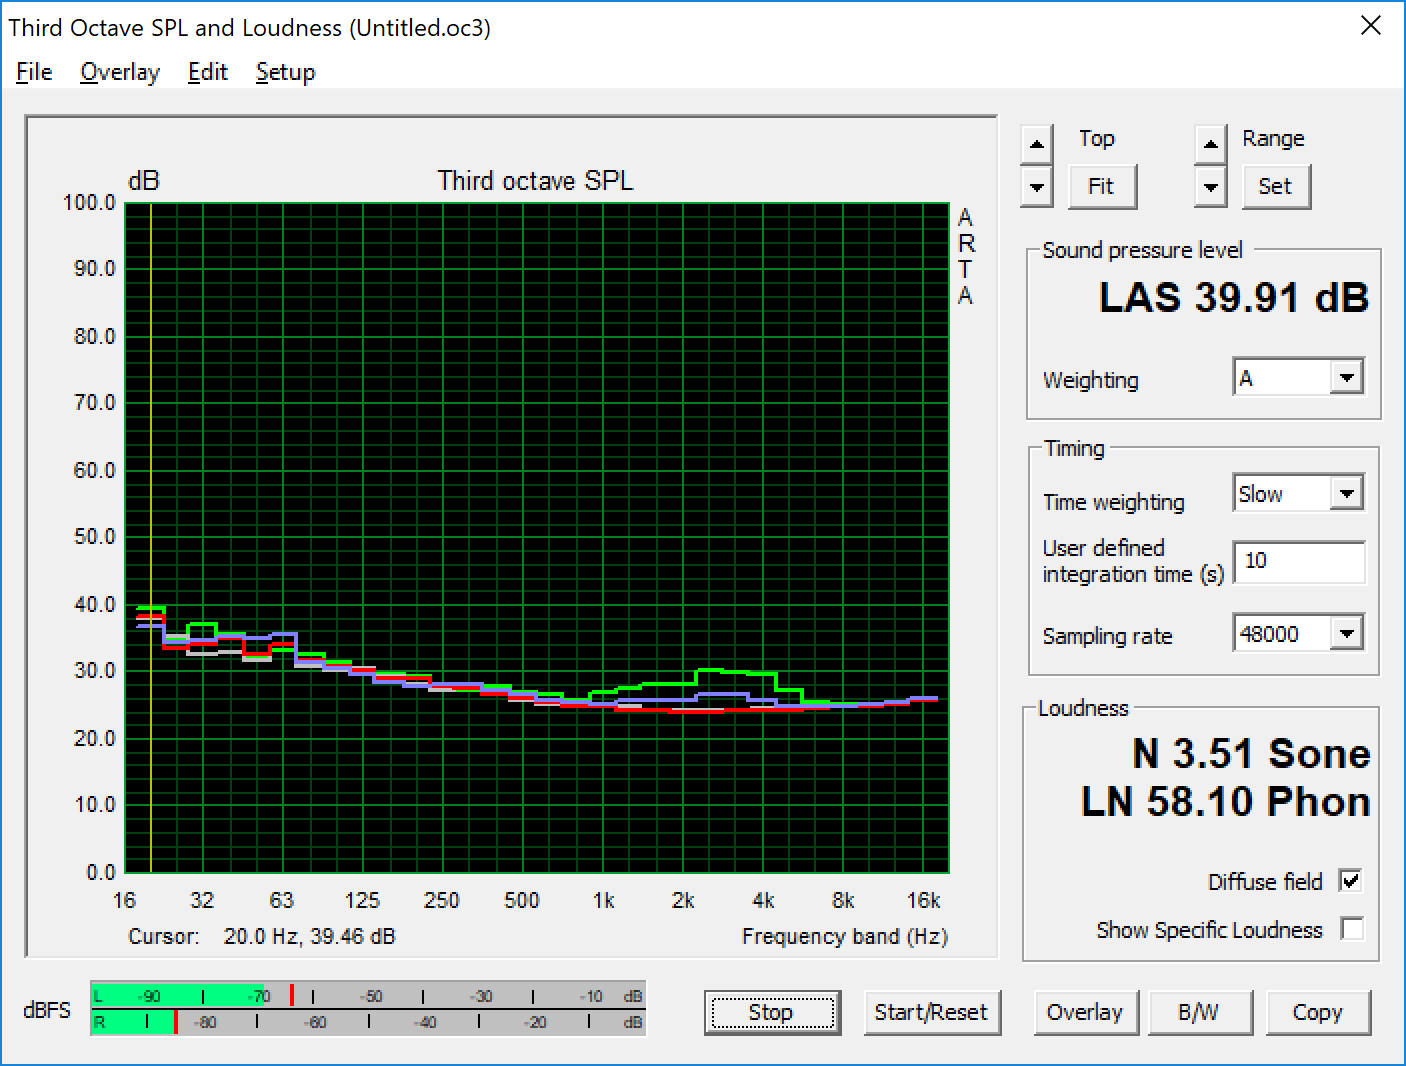
As before, the T480s fulfills its cardinal obligations as an acceptable office companion by avoiding obtrusive fan noise under nearly all circumstances. While idling, the fan is completely off (and the notebook is thus silent, devoid also of any detectable electrical noise). Under load, the average is still just 35.5 dB(A), with a maximum reading of 41.5 dB(A). None of these readings is troubling in the least.
Noise level
| Idle |
| 28.1 / 28.1 / 28.1 dB(A) |
| Load |
| 35.5 / 41.5 dB(A) |
 | ||
30 dB silent 40 dB(A) audible 50 dB(A) loud |
||
min: | ||
| Lenovo ThinkPad T480s-20L7002AUS UHD Graphics 620, i5-8250U, Samsung PM961 MZVLW256HEHP | Lenovo ThinkPad X1 Carbon 2018-20KGS03900 UHD Graphics 620, i5-8550U, Samsung SSD PM981 MZVLB512HAJQ | Dell Latitude 7490 UHD Graphics 620, i5-8350U, Toshiba KSG60ZMV256G | Dell Latitude 7390 UHD Graphics 620, i7-8650U, Samsung PM961 MZVLW256HEHP | HP EliteBook 840 G5-3JX61EA UHD Graphics 620, i5-8550U, Toshiba KXG50ZNV1T02 | Lenovo ThinkPad T480s-20L8S02E00 GeForce MX150, i5-8550U, Samsung SSD PM981 MZVLB512HAJQ | |
|---|---|---|---|---|---|---|
| Noise | -2% | 3% | 1% | -1% | -1% | |
| off / environment * (dB) | 28.1 | 28.9 -3% | 28.2 -0% | 28.2 -0% | 30.3 -8% | 29 -3% |
| Idle Minimum * (dB) | 28.1 | 28.9 -3% | 28.2 -0% | 28.2 -0% | 30.3 -8% | 29 -3% |
| Idle Average * (dB) | 28.1 | 28.9 -3% | 28.2 -0% | 28.2 -0% | 30.3 -8% | 29 -3% |
| Idle Maximum * (dB) | 28.1 | 32.5 -16% | 28.7 -2% | 28.2 -0% | 30.3 -8% | 29 -3% |
| Load Average * (dB) | 35.5 | 35.1 1% | 29.9 16% | 31.5 11% | 33.8 5% | 36.5 -3% |
| Load Maximum * (dB) | 41.5 | 35.1 15% | 40.2 3% | 42.7 -3% | 33.8 19% | 38.2 8% |
| Witcher 3 ultra * (dB) | 32.8 |
* ... smaller is better
Temperature
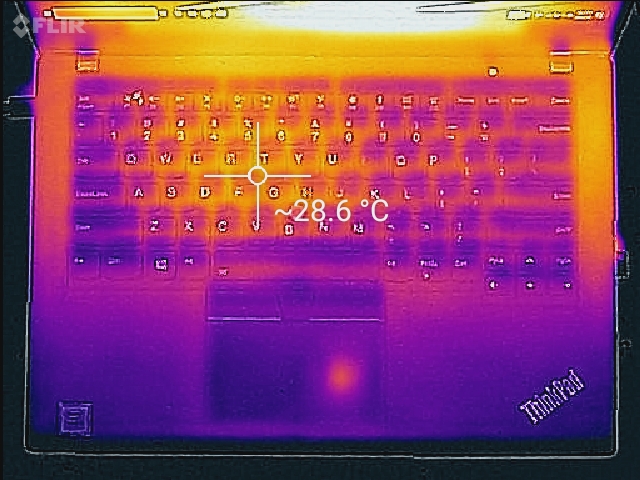
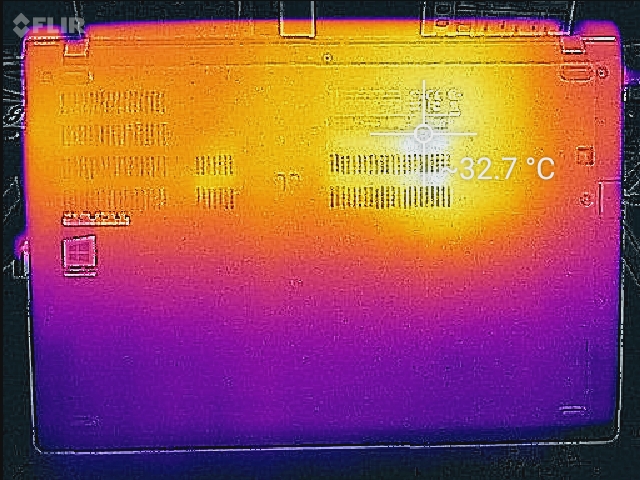
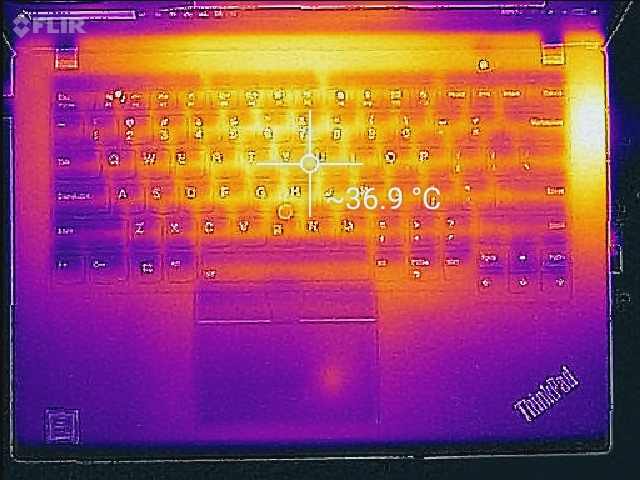
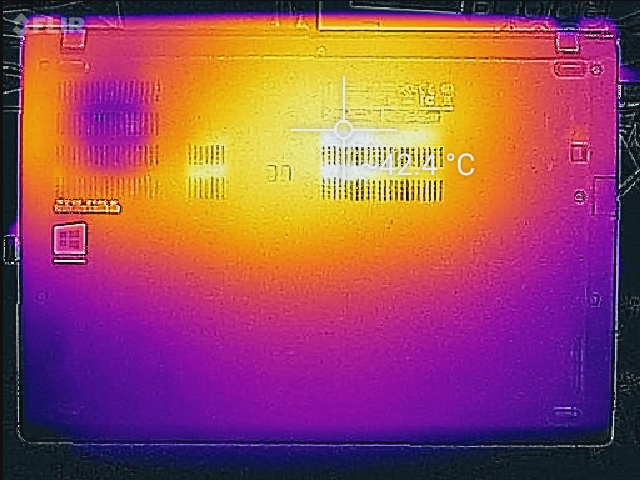
What about thermals then? While idling, the machine does gather a bit of warmth, which could prove irritating to some users: we measured an average of 29 °C on the underside, which is 9 °C above room temperatures (the top side is a bit cooler). However, Lenovo’s Power Manager can be employed to adjust parameters as desired and help reduce the temperatures somewhat. Under full stress, we see absolutely no reasons for concern, with averages of just 31 °C / 34.7 °C on top/bottom and a hot spot of 41 °C in the center of the underside—not really problematic.
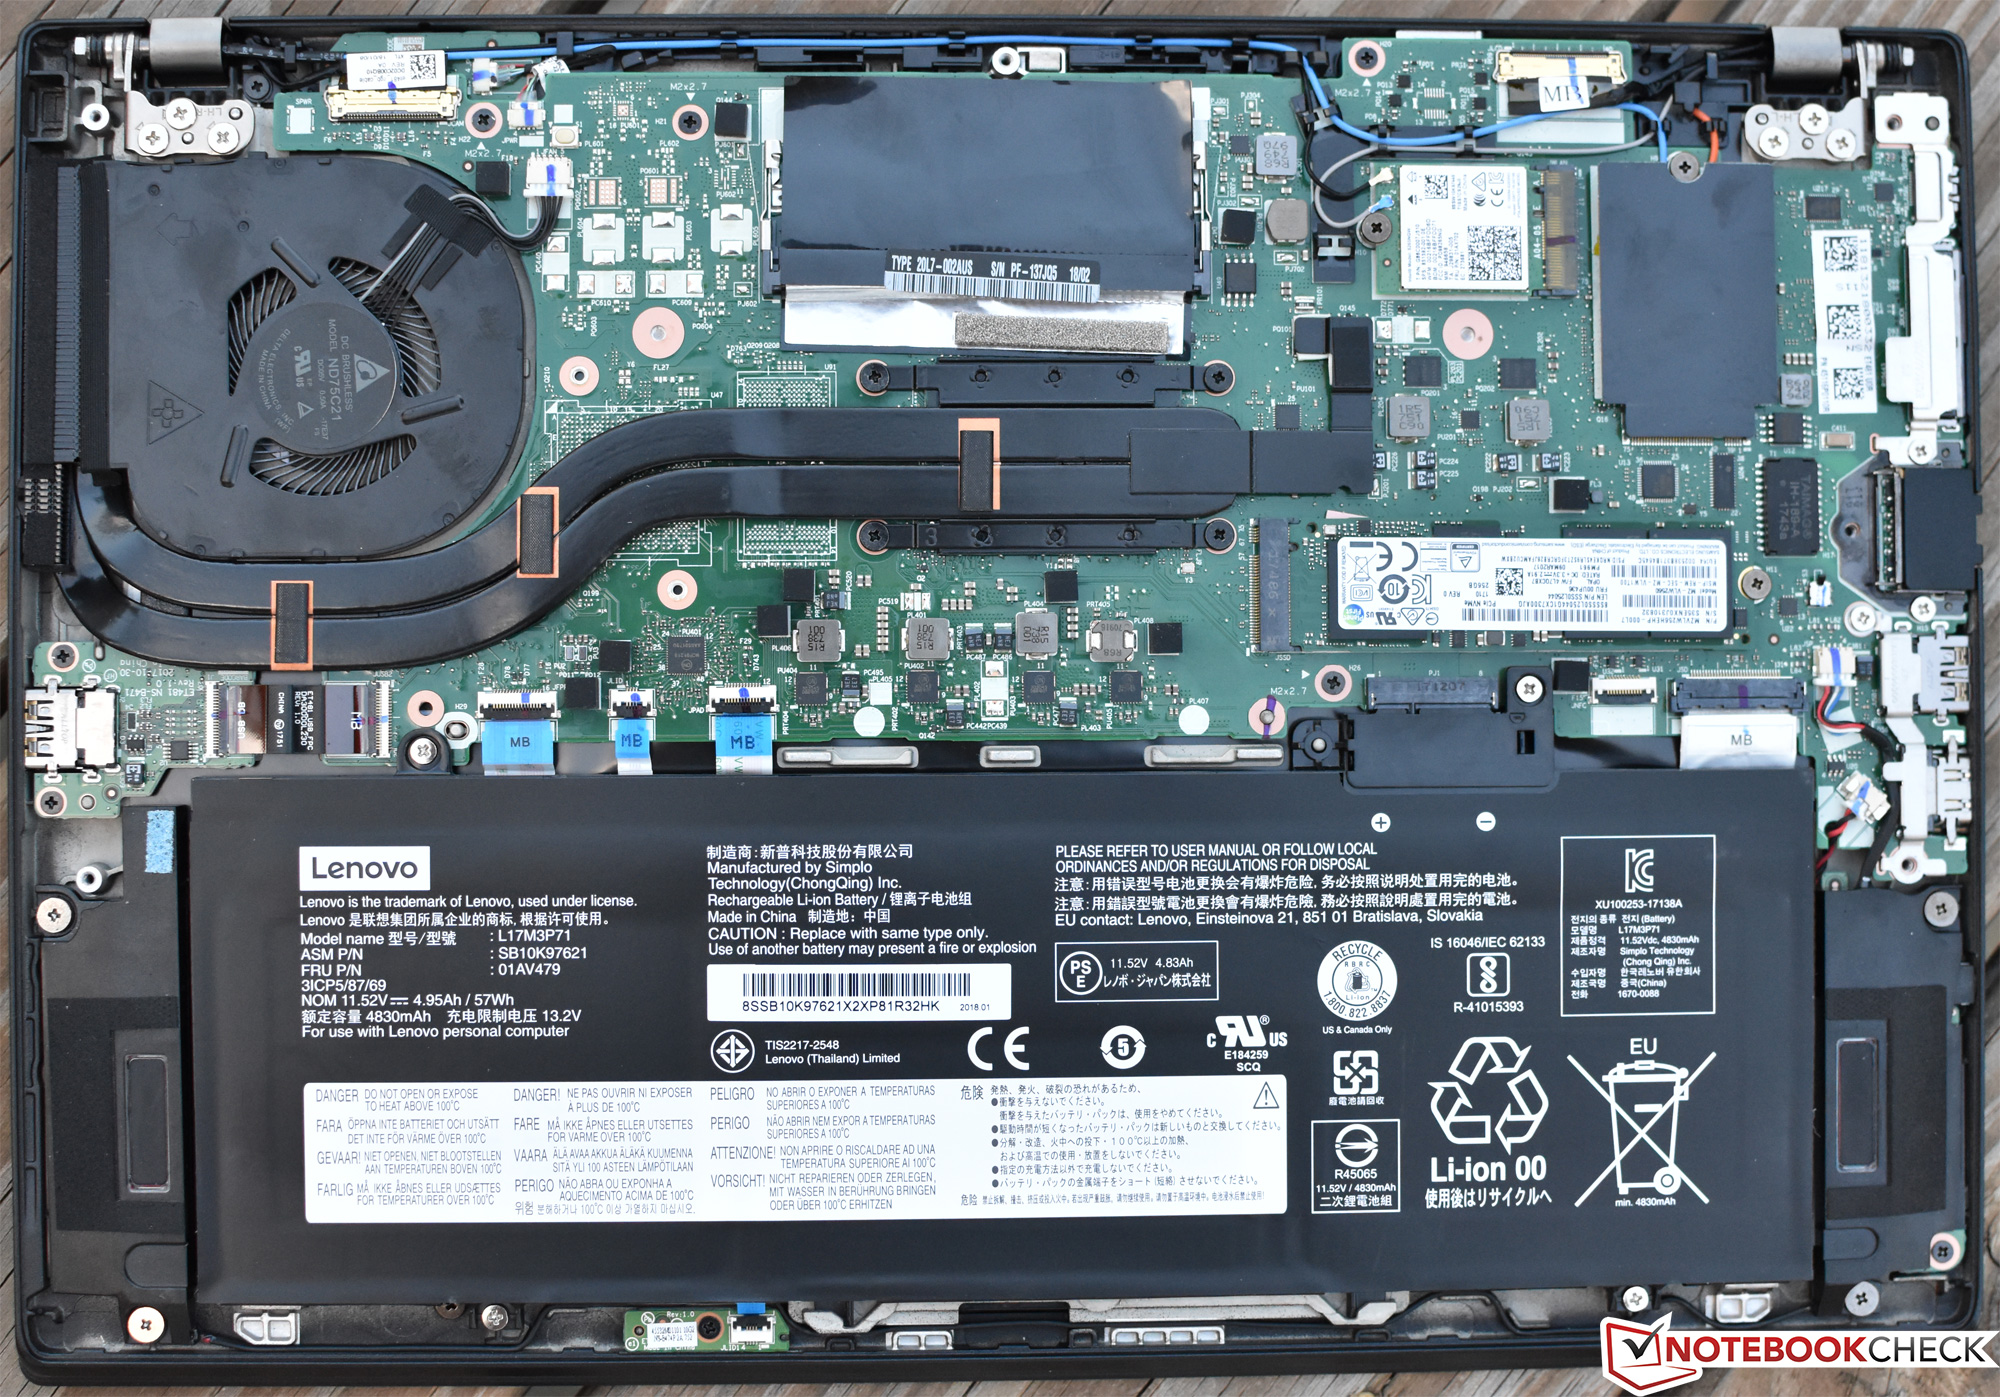
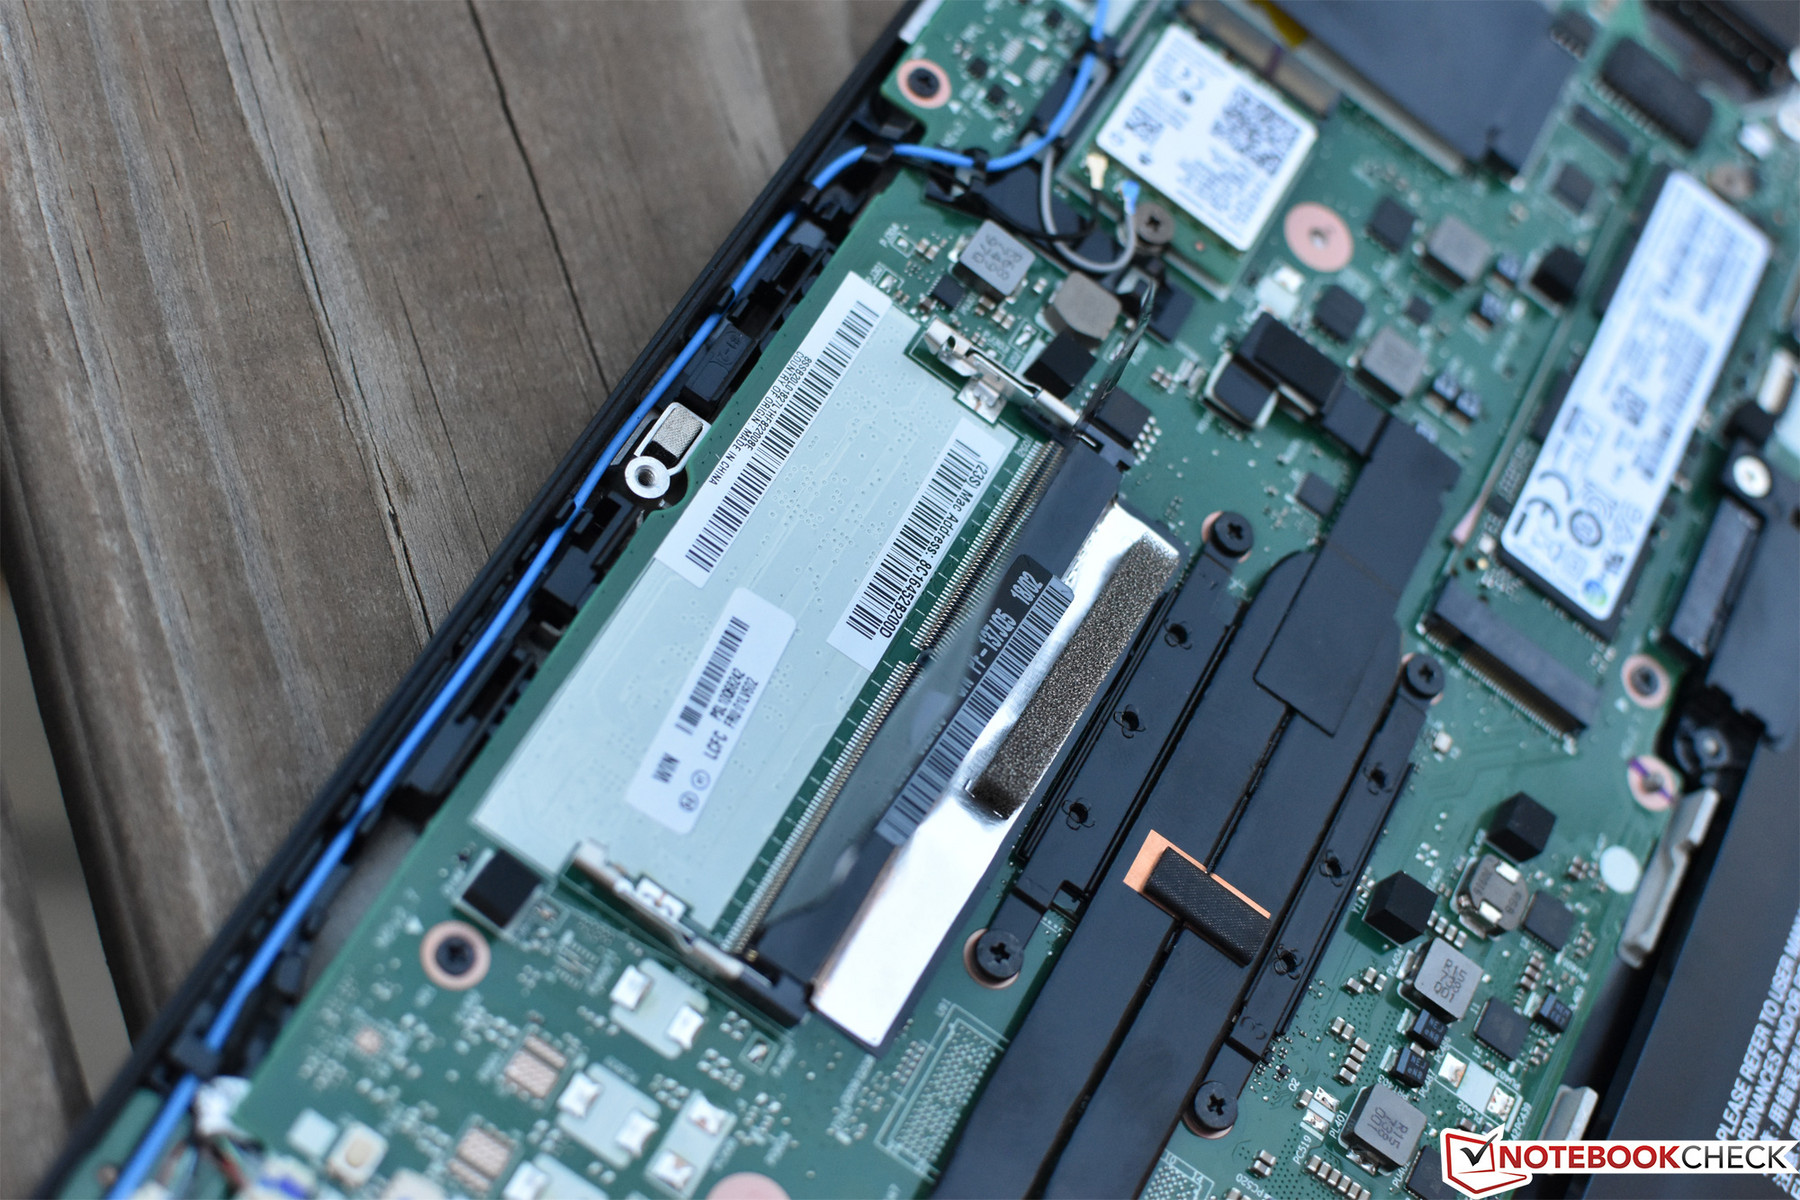
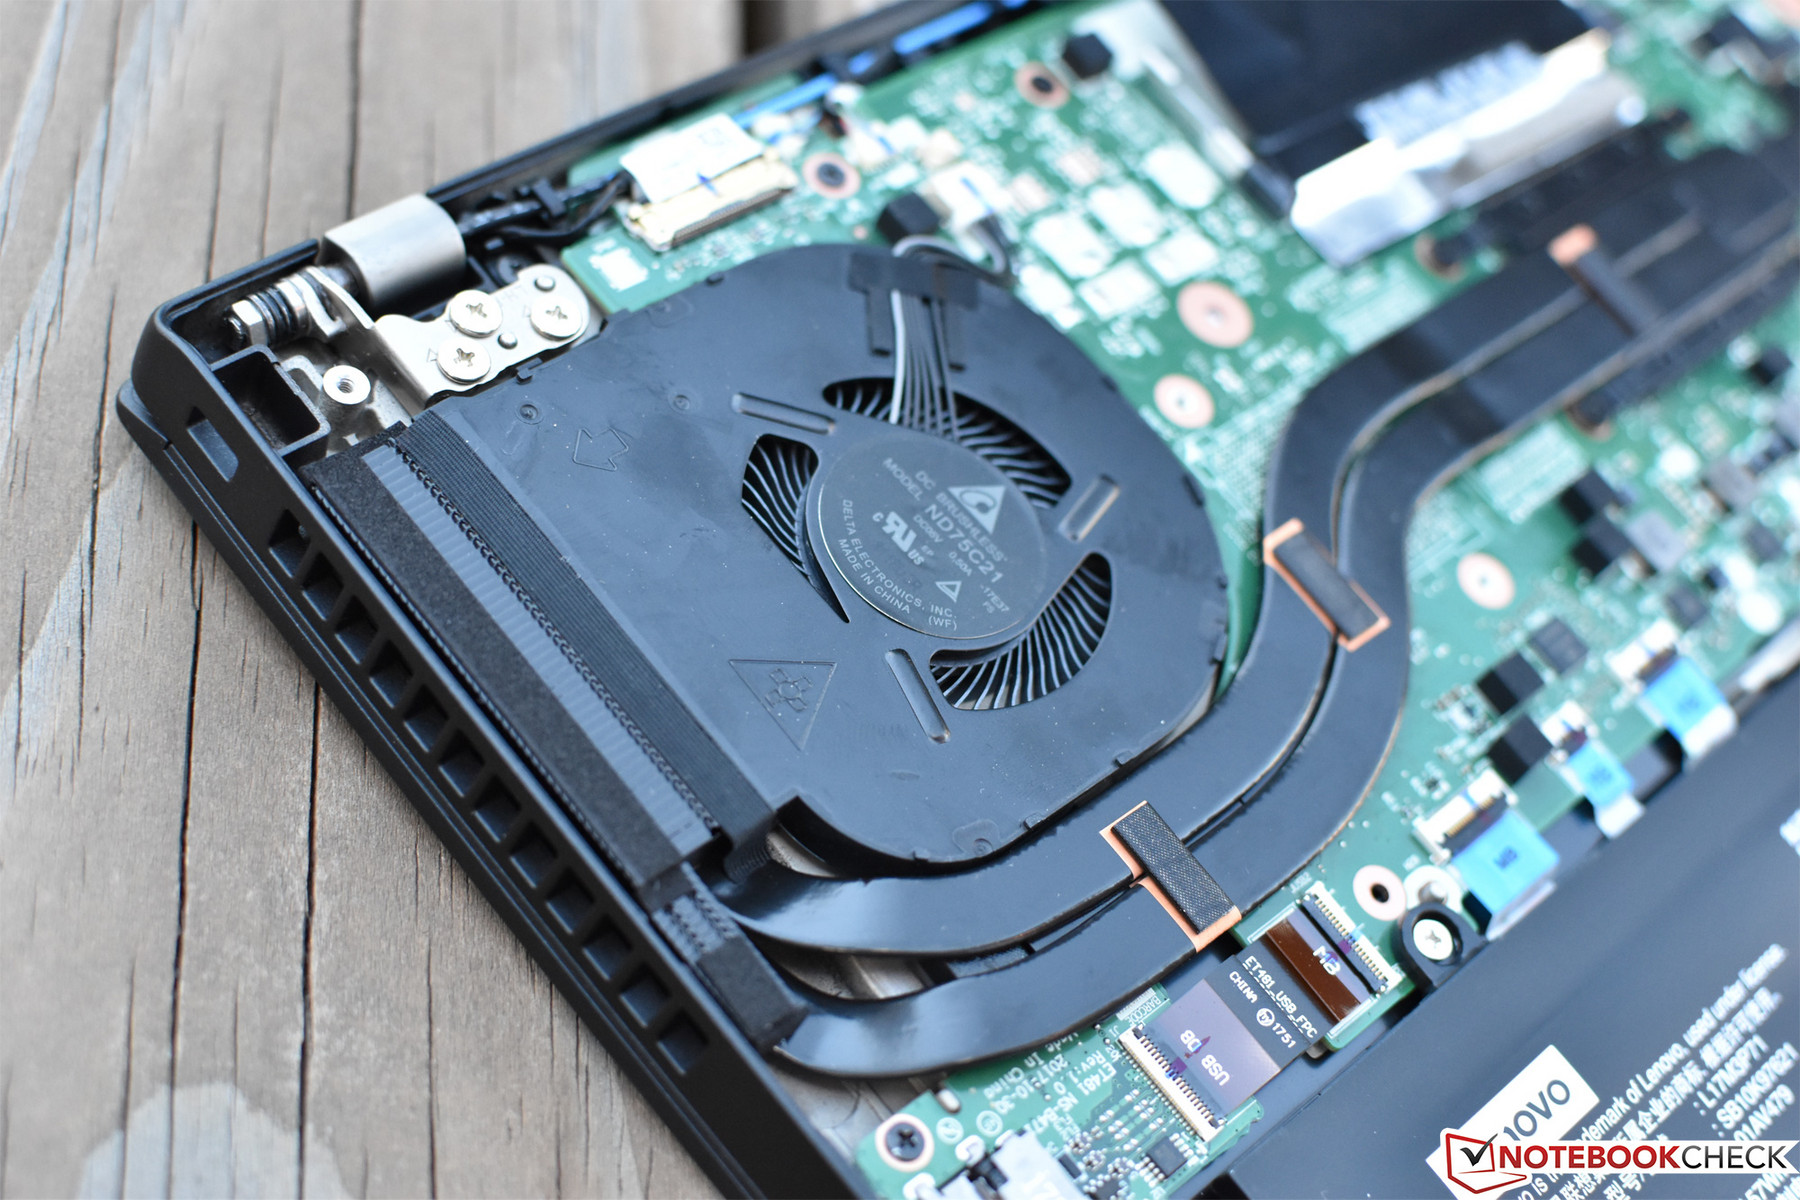
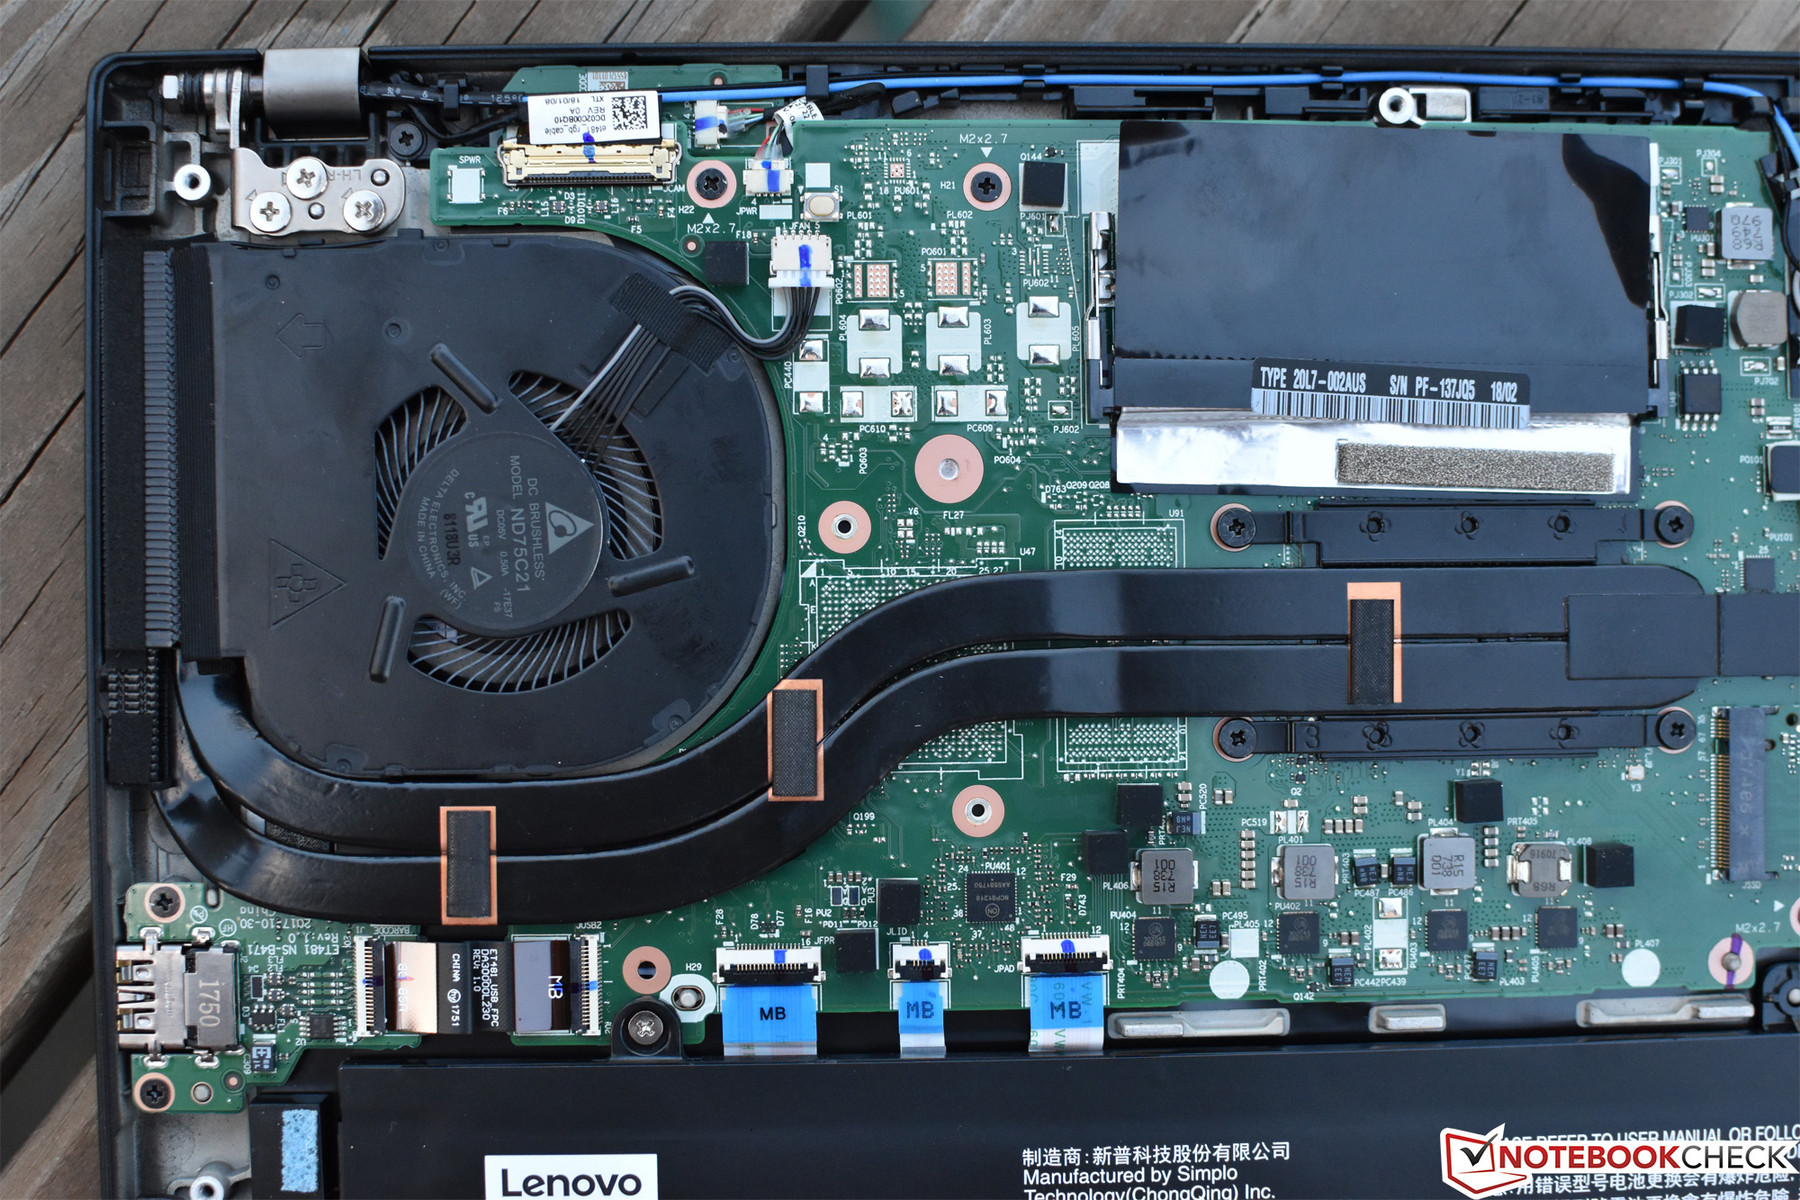
One likely reason for these positive thermal results is the presence of the extra heat pipe within the T480s which is presumably designed for units featuring MX150 graphics. By leaving the extra pipe in configurations powering integrated graphics, Lenovo manages uncommonly effective heat dissipation even under heavy processing loads.
(+) The maximum temperature on the upper side is 38.6 °C / 101 F, compared to the average of 34.3 °C / 94 F, ranging from 21.2 to 62.5 °C for the class Office.
(+) The bottom heats up to a maximum of 39.4 °C / 103 F, compared to the average of 36.8 °C / 98 F
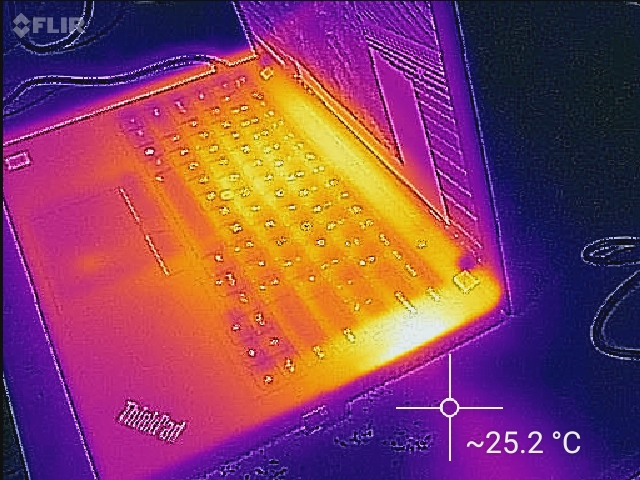
(+) In idle usage, the average temperature for the upper side is 27.4 °C / 81 F, compared to the device average of 29.5 °C / 85 F.
(+) The palmrests and touchpad are cooler than skin temperature with a maximum of 28 °C / 82.4 F and are therefore cool to the touch.
(±) The average temperature of the palmrest area of similar devices was 27.5 °C / 81.5 F (-0.5 °C / -0.9 F).
Speakers
One of the few complaints we fielded regarding the previous two T480s review units was with regard to the poor speakers, and of course, nothing has changed with today’s configuration. The speakers not only struggle to produce anything beyond moderate volume levels, but they also suffer from a complete lack of bass and churn out tinny audio that is truly only appropriate for basic voice conferencing and the like. Headphones or external speakers are recommended for any other form of audio playback.

Lenovo ThinkPad T480s-20L7002AUS audio analysis
(-) | not very loud speakers (71.8 dB)
Bass 100 - 315 Hz
(-) | nearly no bass - on average 19.3% lower than median
(±) | linearity of bass is average (11.9% delta to prev. frequency)
Mids 400 - 2000 Hz
(+) | balanced mids - only 4.2% away from median
(±) | linearity of mids is average (9.3% delta to prev. frequency)
Highs 2 - 16 kHz
(+) | balanced highs - only 1.4% away from median
(±) | linearity of highs is average (7.8% delta to prev. frequency)
Overall 100 - 16.000 Hz
(±) | linearity of overall sound is average (26.2% difference to median)
Compared to same class
» 80% of all tested devices in this class were better, 6% similar, 13% worse
» The best had a delta of 7%, average was 21%, worst was 53%
Compared to all devices tested
» 81% of all tested devices were better, 4% similar, 15% worse
» The best had a delta of 4%, average was 23%, worst was 134%
Dell Latitude 7490 audio analysis
(±) | speaker loudness is average but good (77.3 dB)
Bass 100 - 315 Hz
(±) | reduced bass - on average 13.6% lower than median
(±) | linearity of bass is average (10.5% delta to prev. frequency)
Mids 400 - 2000 Hz
(+) | balanced mids - only 3.9% away from median
(±) | linearity of mids is average (7.3% delta to prev. frequency)
Highs 2 - 16 kHz
(+) | balanced highs - only 3.4% away from median
(±) | linearity of highs is average (8.8% delta to prev. frequency)
Overall 100 - 16.000 Hz
(±) | linearity of overall sound is average (18.8% difference to median)
Compared to same class
» 35% of all tested devices in this class were better, 7% similar, 58% worse
» The best had a delta of 7%, average was 21%, worst was 53%
Compared to all devices tested
» 43% of all tested devices were better, 8% similar, 49% worse
» The best had a delta of 4%, average was 23%, worst was 134%
Energy Management
Power Consumption
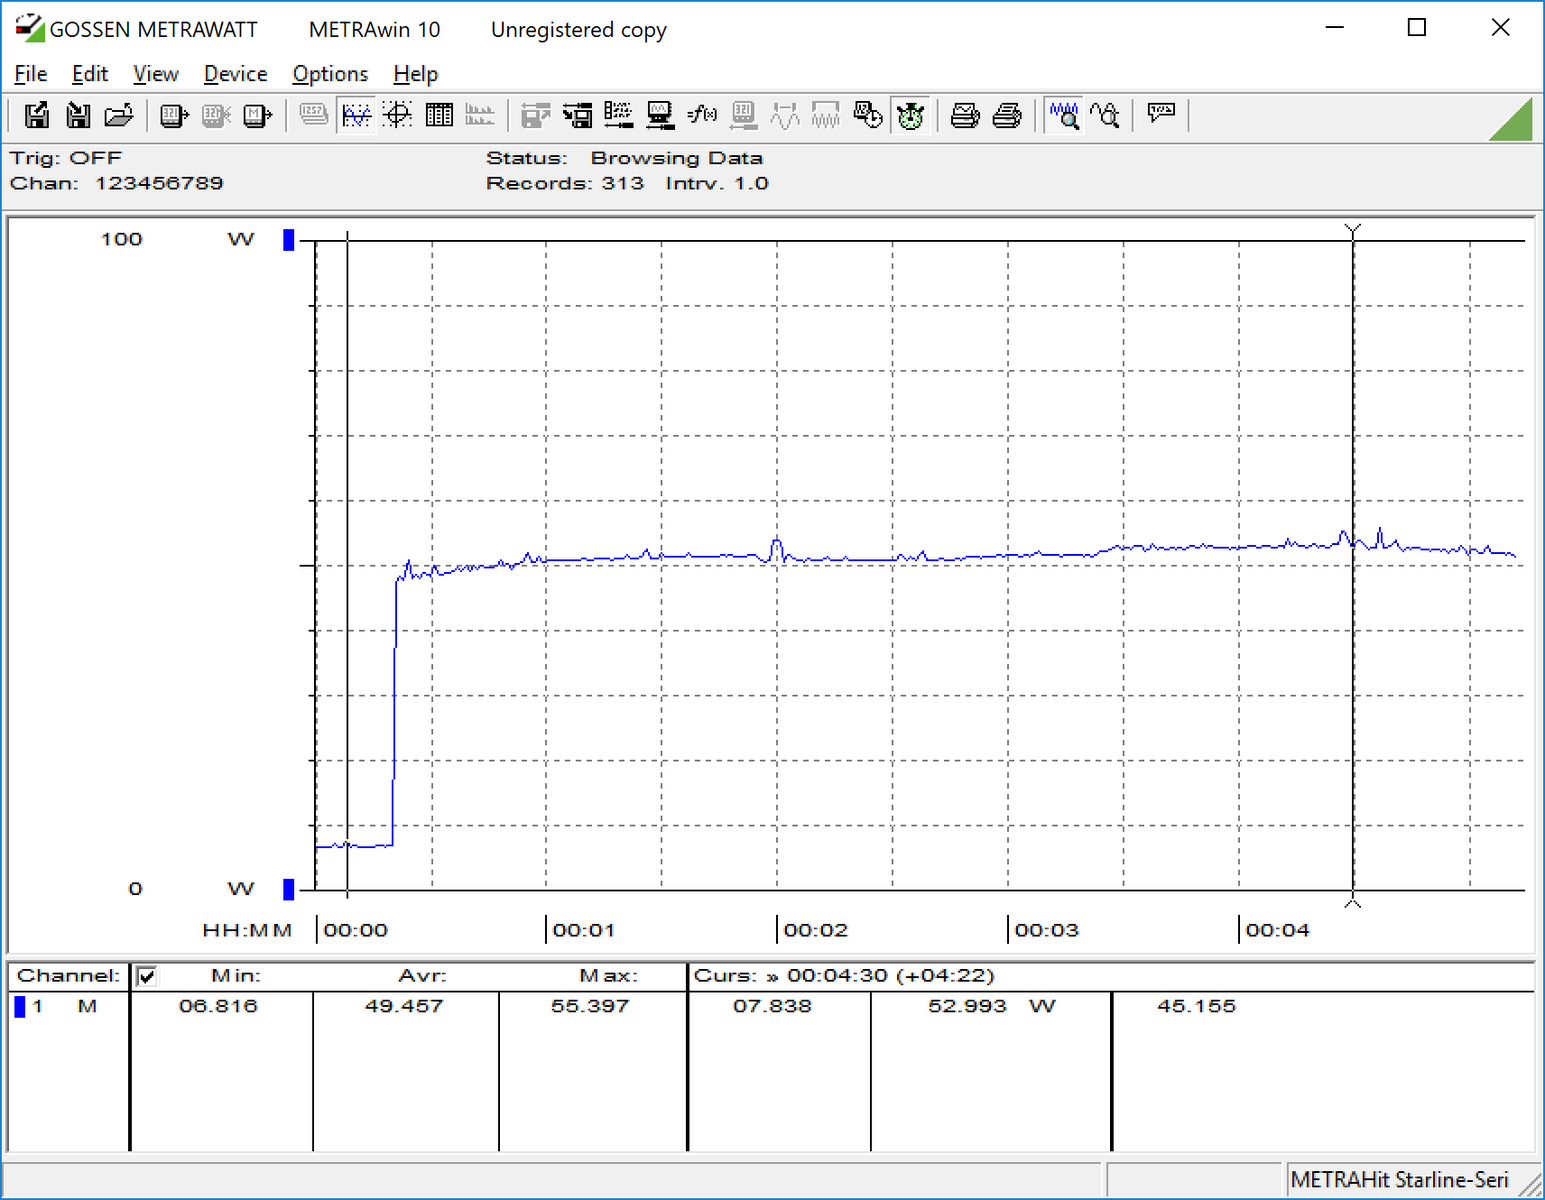
Power consumption remains well within normal ranges, averaging below every other machine in our comparison field apart from the Latitude 7490—which benefits from lower idle values. Still, today’s T480s idle average consumption of 6.4 W is perfectly appropriate given the hardware, and the load average of 29.8 W is below what we might have expected given its similarly-equipped competitors. Here, we also witness the tangible differences introduced by the MX150 dedicated graphics and WQHD display while under load; although the machine is far more powerful graphically, the load average of 55.4 W is also nearly double that of today’s configuration.
| Off / Standby | |
| Idle | |
| Load |
|
Key:
min: | |
| Lenovo ThinkPad T480s-20L7002AUS i5-8250U, UHD Graphics 620, Samsung PM961 MZVLW256HEHP, TFT-LCD, 1920x1080, 14" | Lenovo ThinkPad X1 Carbon 2018-20KGS03900 i5-8550U, UHD Graphics 620, Samsung SSD PM981 MZVLB512HAJQ, IPS, 2560x1440, 14" | Dell Latitude 7490 i5-8350U, UHD Graphics 620, Toshiba KSG60ZMV256G, IPS, 1920x1080, 14" | Dell Latitude 7390 i7-8650U, UHD Graphics 620, Samsung PM961 MZVLW256HEHP, IPS, 1920x1080, 13.3" | HP EliteBook 840 G5-3JX61EA i5-8550U, UHD Graphics 620, Toshiba KXG50ZNV1T02, IPS, 1920x1080, 14" | Lenovo ThinkPad T480s-20L8S02E00 i5-8550U, GeForce MX150, Samsung SSD PM981 MZVLB512HAJQ, IPS LED, 2560x1440, 14" | |
|---|---|---|---|---|---|---|
| Power Consumption | -43% | 9% | -11% | -21% | -51% | |
| Idle Minimum * (Watt) | 3.1 | 3.8 -23% | 2 35% | 3.3 -6% | 3.8 -23% | 3.4 -10% |
| Idle Average * (Watt) | 6.4 | 8.9 -39% | 4.7 27% | 5.9 8% | 8.3 -30% | 7.5 -17% |
| Idle Maximum * (Watt) | 9.4 | 11.9 -27% | 5.7 39% | 6.2 34% | 10.7 -14% | 10.8 -15% |
| Load Average * (Watt) | 29.8 | 47.5 -59% | 38.4 -29% | 43.2 -45% | 35.5 -19% | 55.4 -86% |
| Load Maximum * (Watt) | 31.2 | 52.5 -68% | 38.9 -25% | 45.2 -45% | 37 -19% | 70.3 -125% |
| Witcher 3 ultra * (Watt) | 34 |
* ... smaller is better
Battery Life
How do these results affect battery life? In fact, not much under normal use if our test results are any indication. We recorded 9 hours and 1 minute of operation before the machine eventually shut down during our standardized web-surfing battery test. That’s a good achievement—essentially equivalent with the results we received from the Latitude 7490 and previous T480s—and it beats the X1 Carbon and especially the HP EliteBook 840 G5. However, the Latitude 7390 easily takes the crown here with a life of over 11 hours.
As a final note, like most of its competitors, the T480s features rapid charge capability.
| Lenovo ThinkPad T480s-20L7002AUS i5-8250U, UHD Graphics 620, 57 Wh | Lenovo ThinkPad X1 Carbon 2018-20KGS03900 i5-8550U, UHD Graphics 620, 57 Wh | Dell Latitude 7490 i5-8350U, UHD Graphics 620, 60 Wh | Dell Latitude 7390 i7-8650U, UHD Graphics 620, 60 Wh | HP EliteBook 840 G5-3JX61EA i5-8550U, UHD Graphics 620, 50 Wh | Lenovo ThinkPad T480s-20L8S02E00 i5-8550U, GeForce MX150, 57 Wh | |
|---|---|---|---|---|---|---|
| Battery runtime | -3% | 1% | 23% | -18% | -2% | |
| WiFi v1.3 (h) | 9 | 8.7 -3% | 9.1 1% | 11.1 23% | 7.4 -18% | 8.8 -2% |
| Reader / Idle (h) | 22.1 | 22.8 | ||||
| Load (h) | 1.8 | 1.3 |
Pros
Cons
Verdict
Like any good ThinkPad (or, more broadly, any successful business machine), it’s the fundamentals which are the bedrock of the T480s’ success. Still present in today’s configuration, of course, are all the basics we applauded during our last two reviews: rock-solid CFRP Hybrid/magnesium construction, top-quality input devices, plenty of ports, and robust security options. The T480s is indeed one of the premier office laptops currently available, rivaled by few in it class.
But for those who might have previously found a nearly $2,000 price tag difficult to swallow, today’s (roughly) $1,600 configuration only sees minor sacrifices in terms of general performance. The Core i5-8250U CPU ranks above most identically-equipped competitors, and the still-NVMe SSD—while below the level of the ultra-fast PM981—remains very fast nonetheless. The MX150 GPU option does make sense for those interested in faster graphical performance, the Core i7 does provide marginally better performance (both single- and multi-core), and—perhaps most significantly—the WQHD display is leagues ahead of today’s FHD panel, which severely lacks in color saturation and manages only middling brightness. But for a basic, very fast, reliable office laptop, today’s T480s configuration fits the profile perfectly.
The T480s is indeed one of the premier office laptops currently available, rivaled by few in it class. And for those who might have previously found a nearly $2,000 price tag difficult to swallow, today’s (roughly) $1,600 configuration only sees minor sacrifices in terms of general performance.
Competitors such as Dell’s venerable Latitude 7000 series machines (specifically in this case the 7490 and 7390), the HP EliteBook 840 G5, and Lenovo’s own terrific X1 Carbon all offer their own unique sets of benefits—not to mention standard 3-year on-site warranties versus the one-year depot warranty of the T480s—but few can match the performance of the T480s. From our tests, a T480s equipped with a Core i5 can be as capable as (or more capable than) a Dell Latitude 7000 or HP EliteBook 840 equipped with an i7. It’s hard to go wrong with any of these devices, but with the T480s, Lenovo clearly has a winner on their hands.
Lenovo ThinkPad T480s-20L7002AUS
- 07/07/2018 v6 (old)
Steve Schardein
Price comparison
