Dell Latitude 13 5300 2-in-1 Convertible Review: A ThinkPad X390 Yoga Alternative
Dell unveiled the 13.3-inch Latitude 5300 series at Dell Technologies World 2019 to replace last year's 12-inch Latitude 5290 series. While the display may be larger, the PC maker is promising that both weight and size will remain about the same because of the new narrow-bezel chassis design of the Latitude 5300 series. The mid-range family sits comfortably in between the entry-level Latitude 3000 series and higher-end Latitude 7000 series to ultimately offer a combination of both extremes.
The Latitude 5300 series comes in both clamshell and 2-in-1 options, but we'll be looking more closely at the 5300 2-in-1 for today. Current SKUs range from the Core i5-8265U up to the Core i7-8665U with 8 GB to 16 GB of RAM and 256 GB to 512 GB of NVMe storage. The 1080p IPS touchscreen and integrated UHD Graphics 620 come standard on all configurations. The test unit we have here is the middle SKU consisting of the Core i5-8365U CPU with 8 GB of RAM and 256 GB SSD retailing for about $1400 USD.
The Latitude 5300 2-in-1 competes directly with other 13-inch business convertibles including the Lenovo ThinkPad X390 Yoga, Microsoft Surface Book 2, and HP EliteBook x360 1030 as well as the consumer-centric Samsung Notebook 9 Pen, Asus ZenBook Flip S, and the Acer Switch 7.
More Dell Latitude reviews:
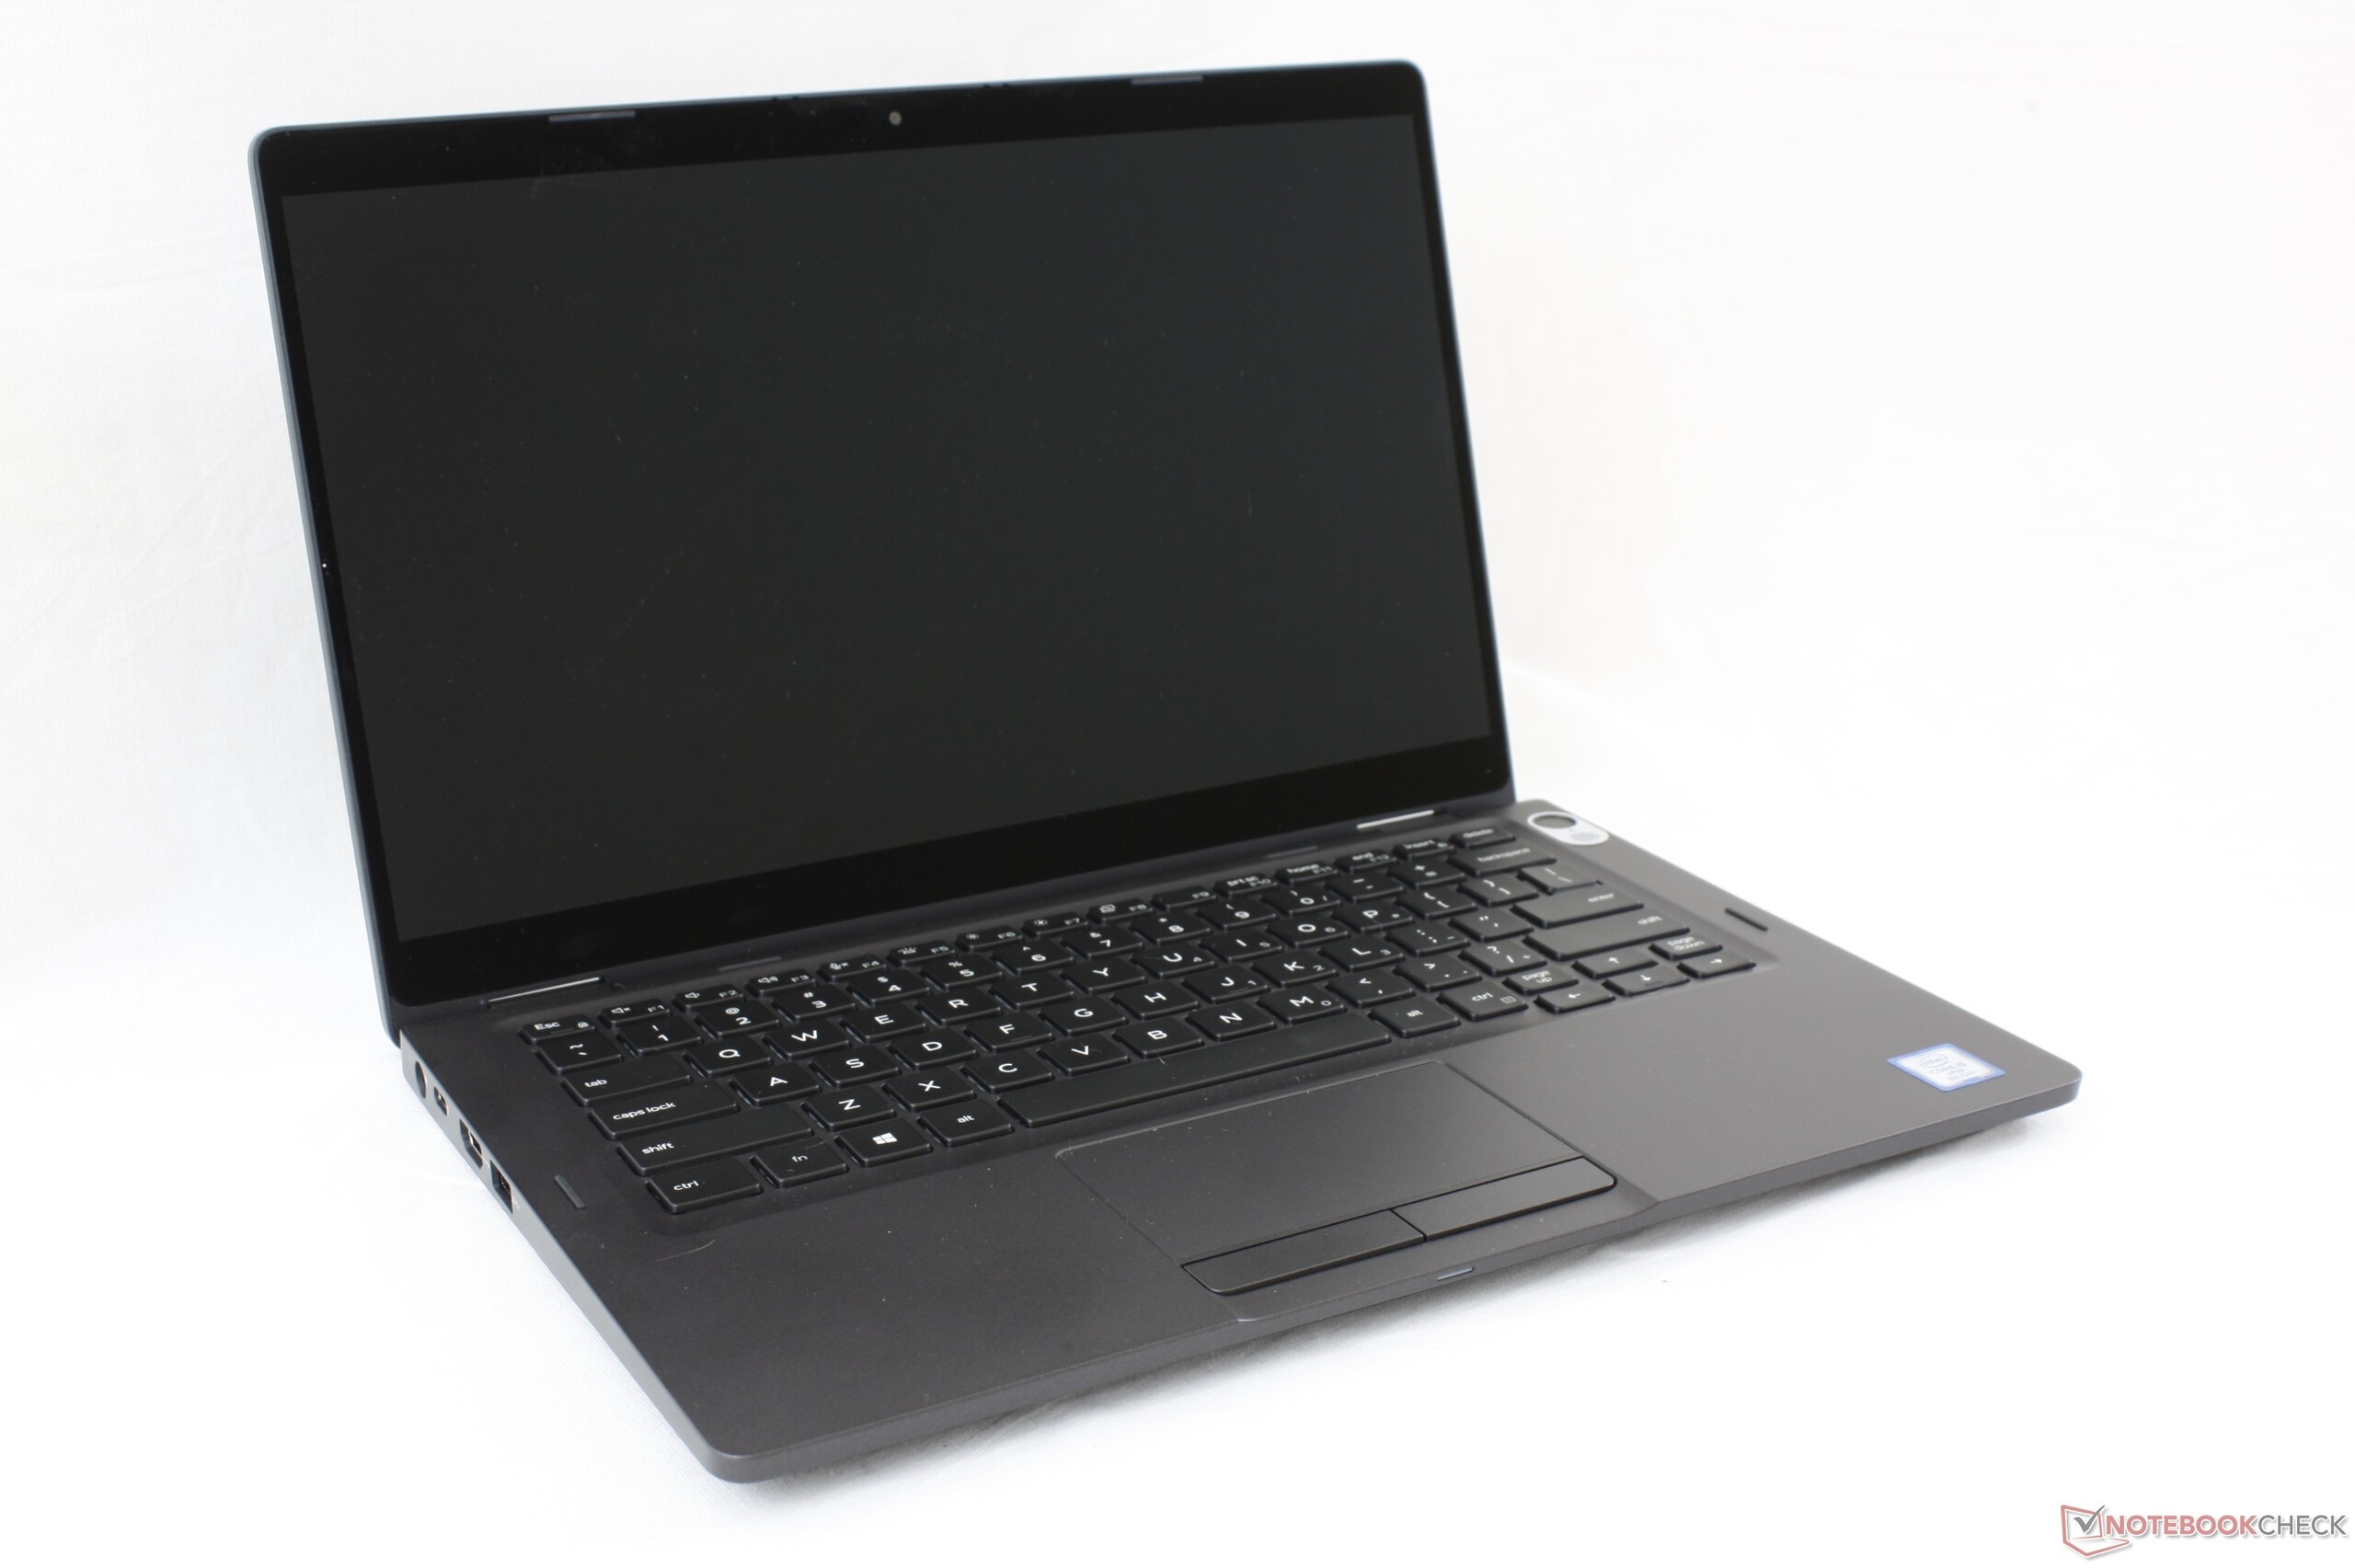
Case
As is typical amongst Latitude laptops, The 5300 2-in-1 is MIL-STD 810G certified for several tests including shock, vibration, pressure, and sand and dust. Chassis rigidity is slightly weaker with more flexing and creaking than the magnesium alloy skeletons of higher-end Latitude 7000 and XPS laptops. The center of the keyboard, for example, is more susceptible to warping when applying pressure with a finger whereas a tougher Latitude 7000 would be more rigid around these weaker areas. The system was made to look like a pricier Latitude 7000 down to the smooth matte texture without necessarily using the same metal alloy materials. The difference is noticeable in the hand but not significant enough to impact usability or the core user experience.
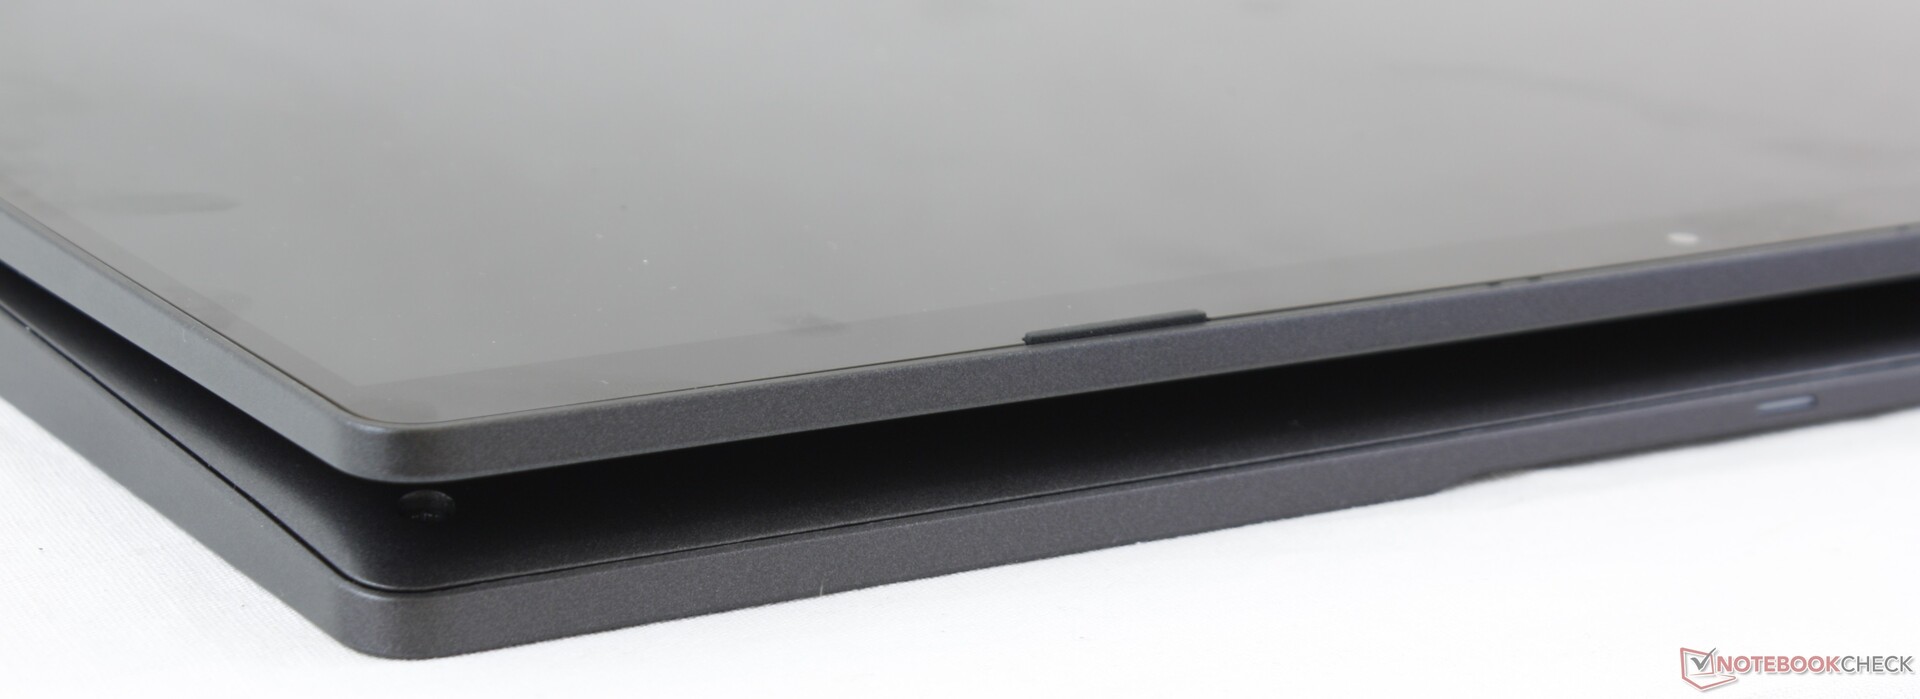
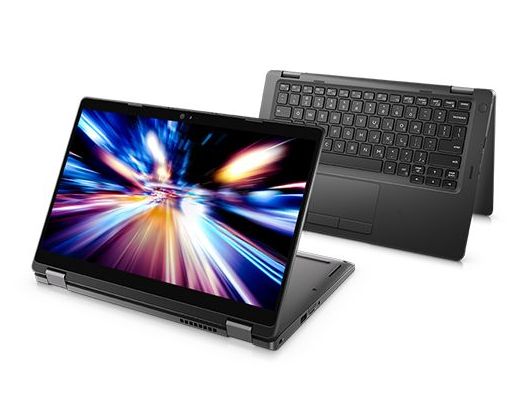
The lid is relatively stiff especially when compared to the flimsier lids of the LG Gram 13 or Samsung Notebook 9 Pen and the hinges are firm with no teetering up to the maximum of 360 degrees. Thus, we find the process of switching between different modes seamless despite the system being a mid-range Latitude offering. Our main complaint is the somewhat heavy weight of the system which makes one-handed presentation or operation more difficult than lighter alternatives.
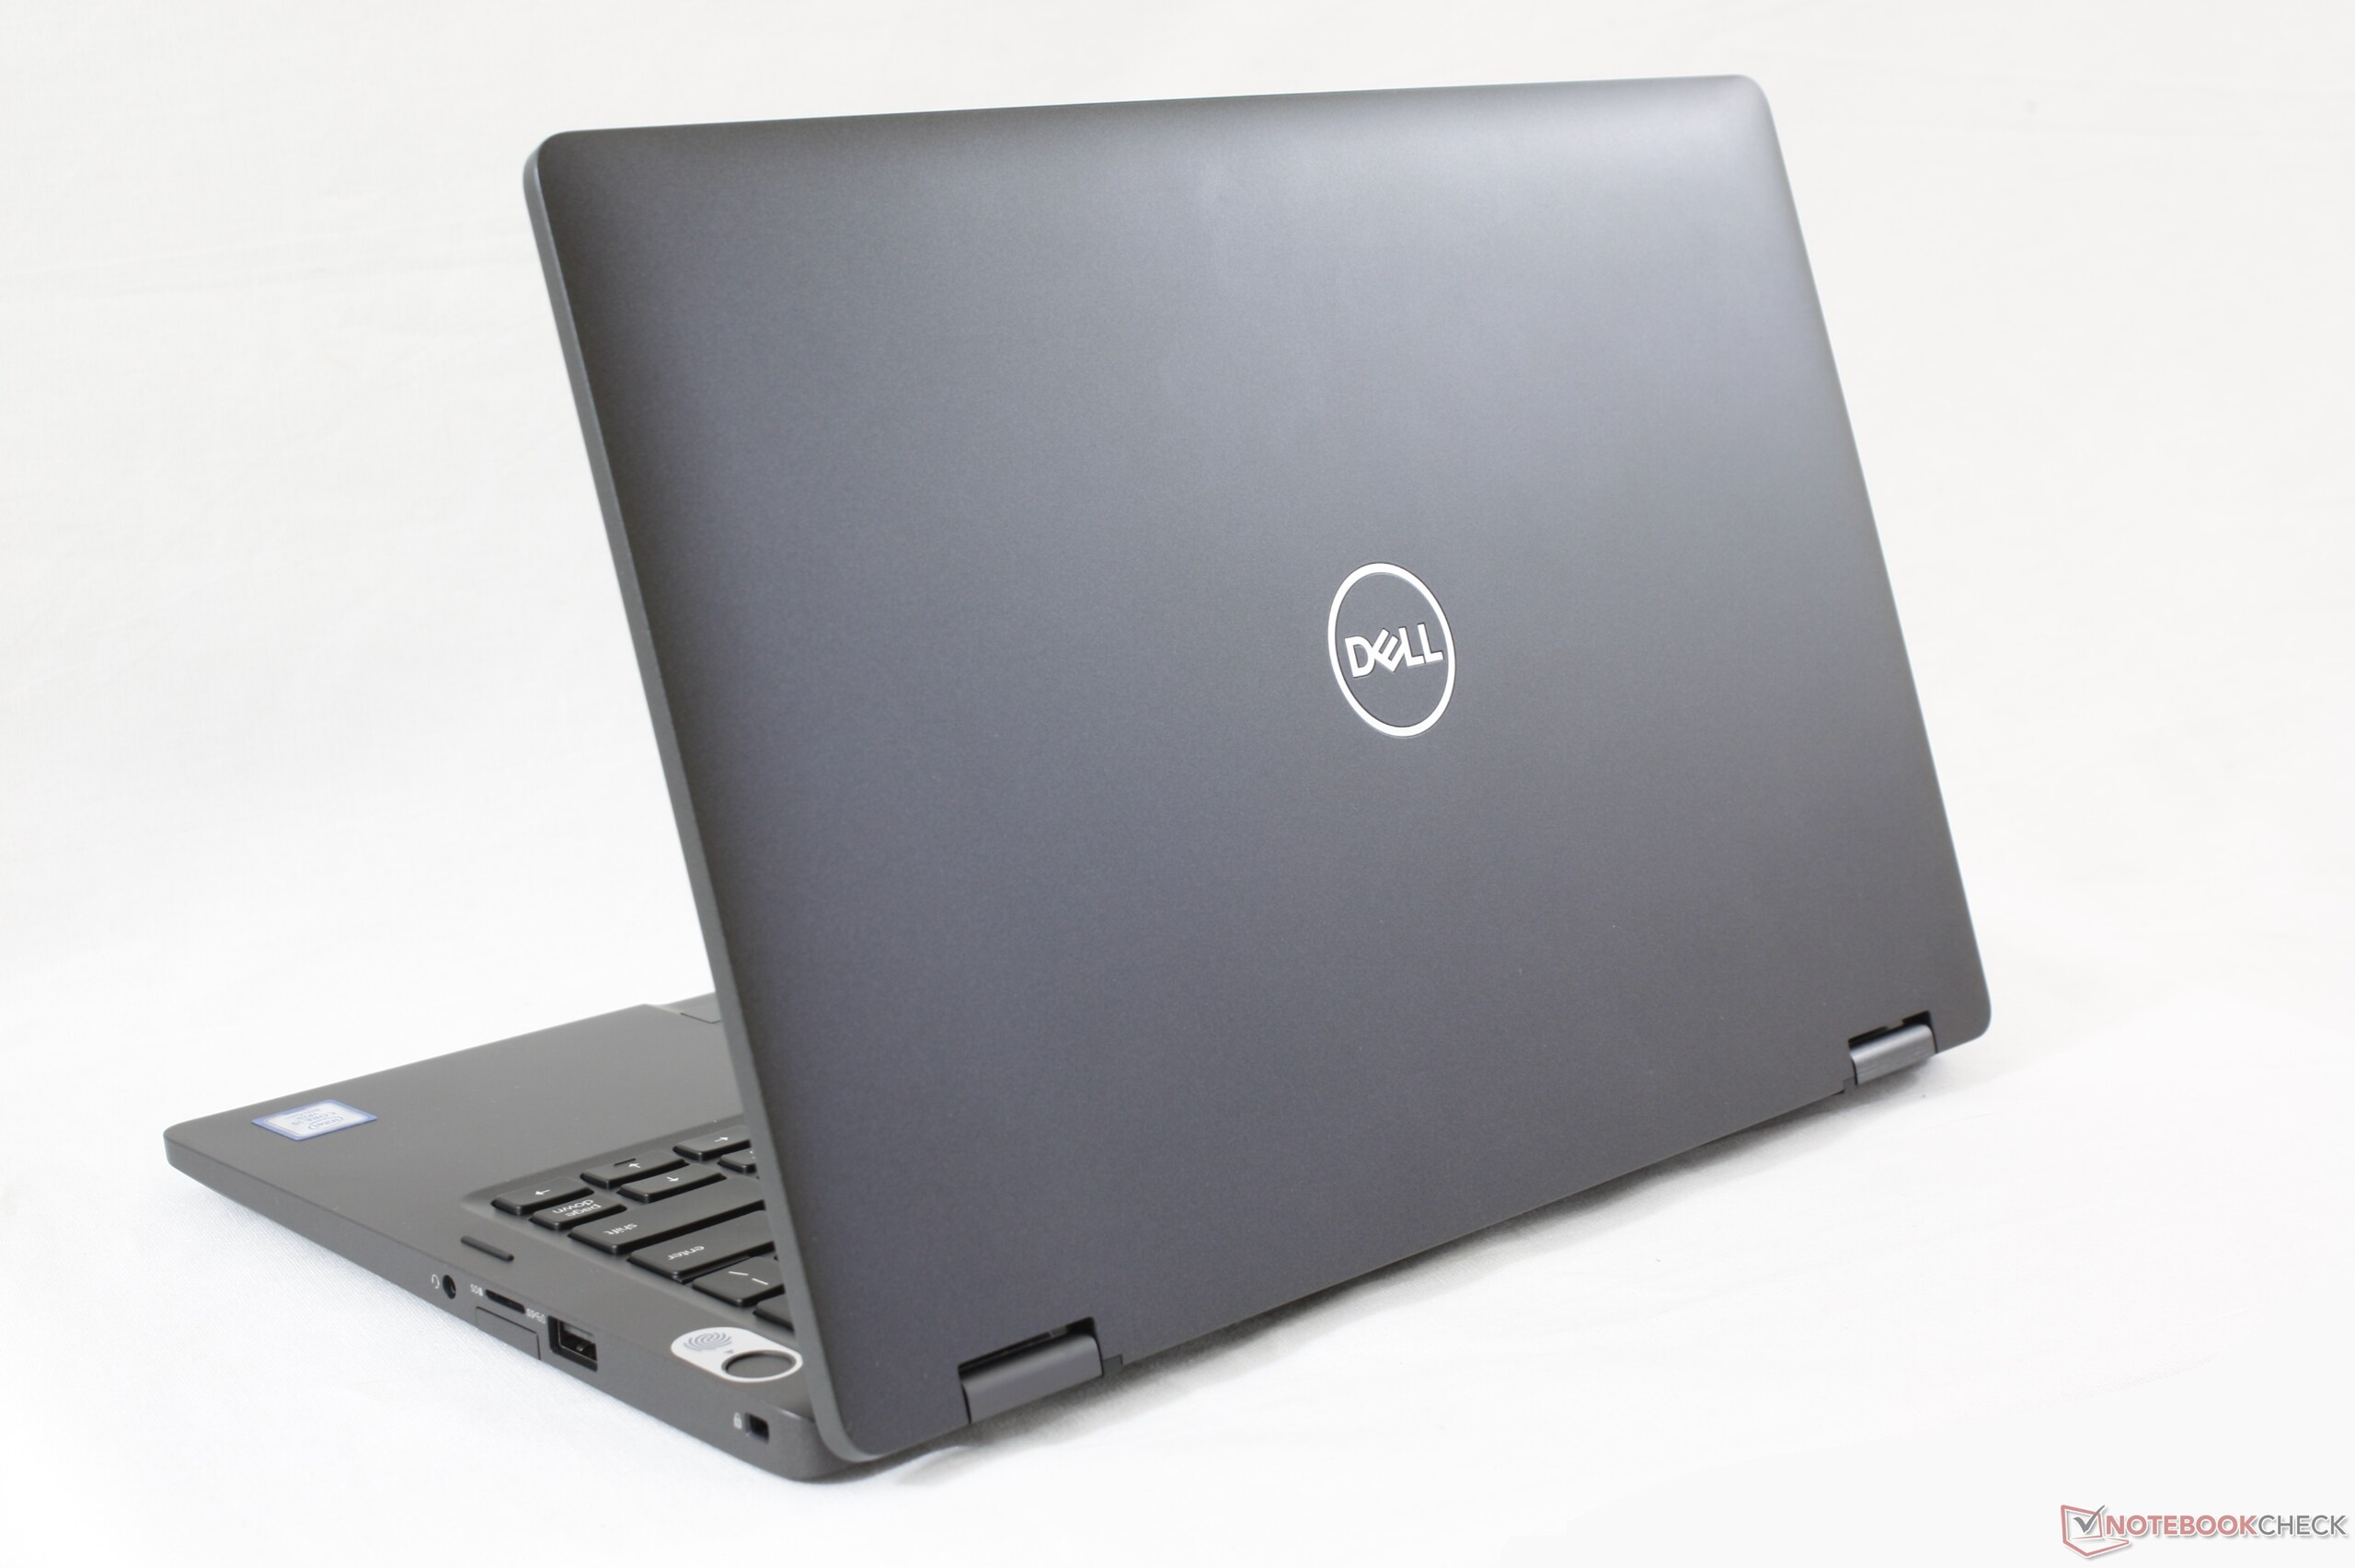
Speaking of weight, the Latitude 5300 2-in-1 is one of the smaller but heavier 13-inch business convertibles available. The competing ThinkPad X390 Yoga, for example, has a larger footprint even though it is slightly lighter by about 100 g while the HP EliteBook x360 1030 G3 is both marginally smaller and lighter. The Samsung Notebook 9 Pen continues to be the lightest 13-inch convertible with a 15 W Intel ULV CPU at just under 1 kg. Users who want a more Surface Pro-like experience can consider the thinner Latitude 5290 2-in-1 instead.
Connectivity
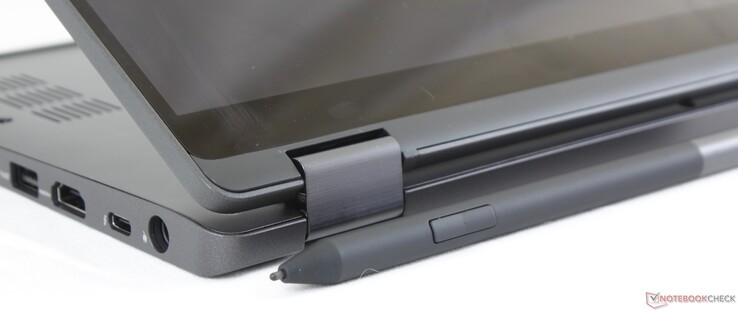
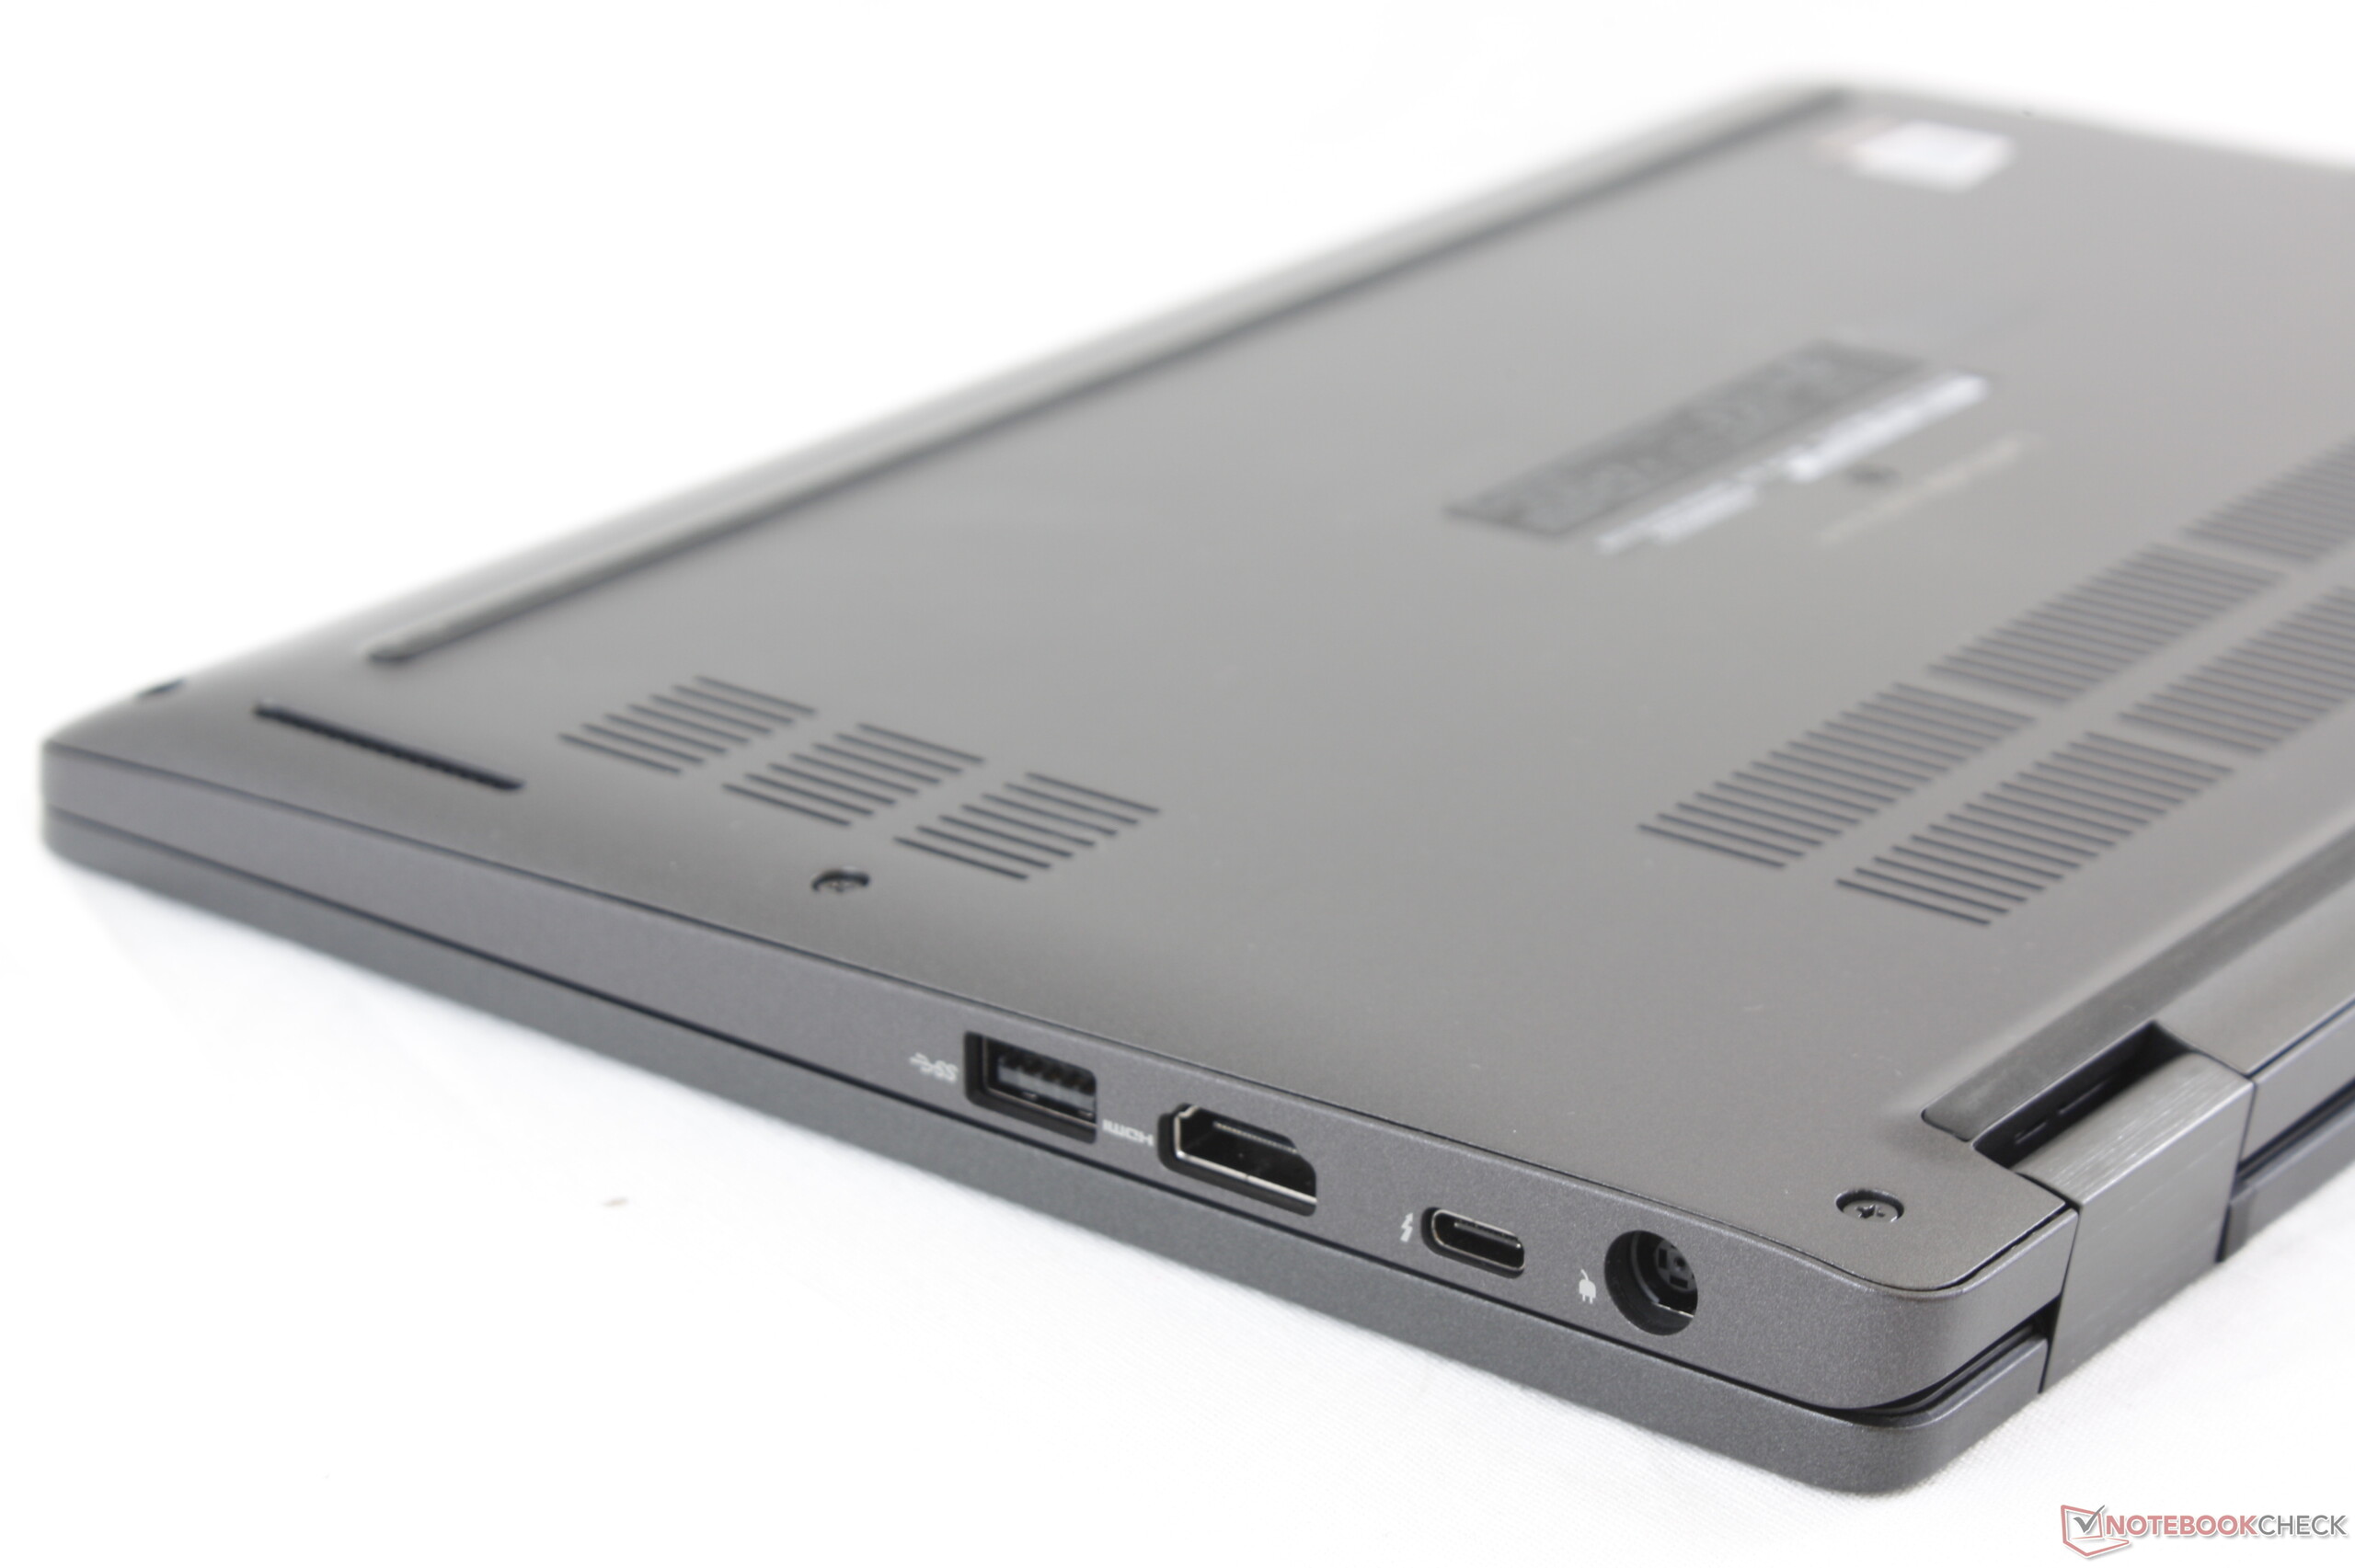
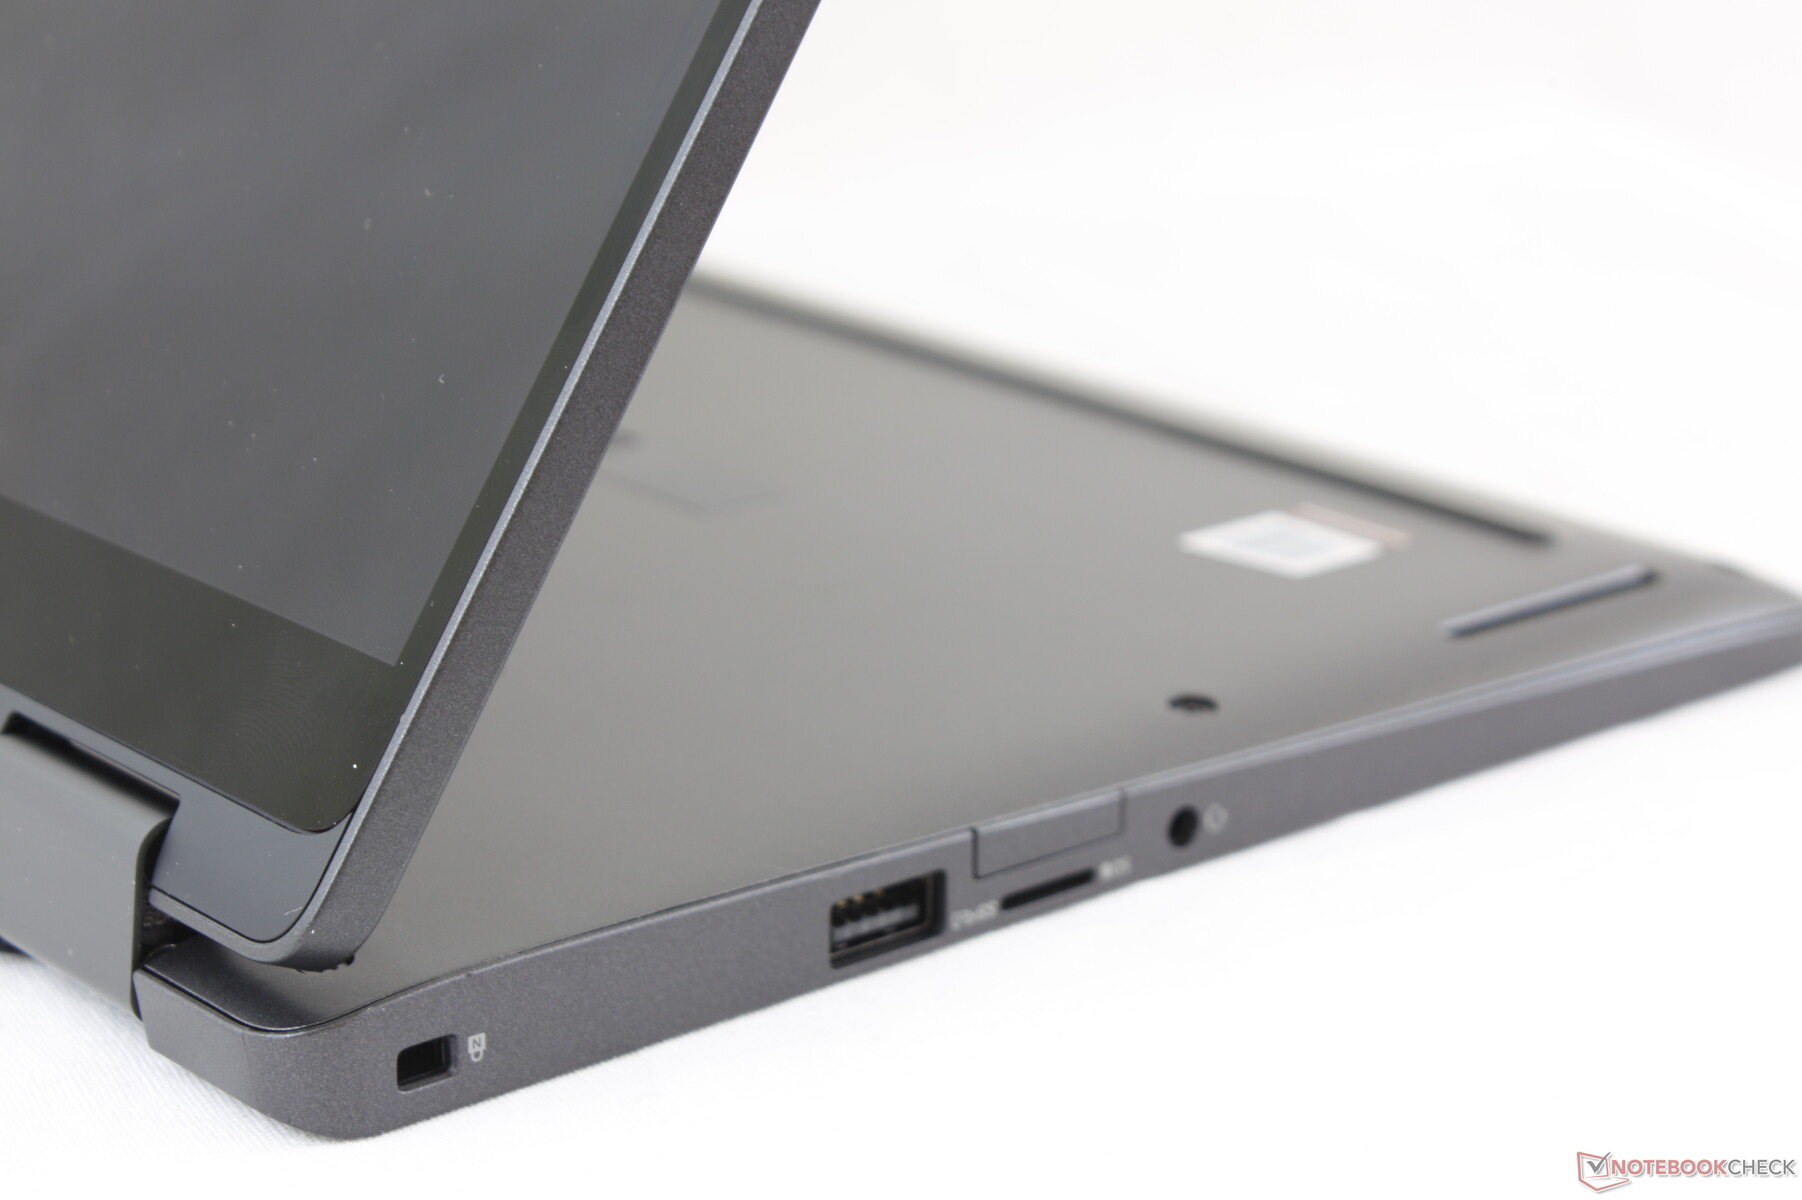
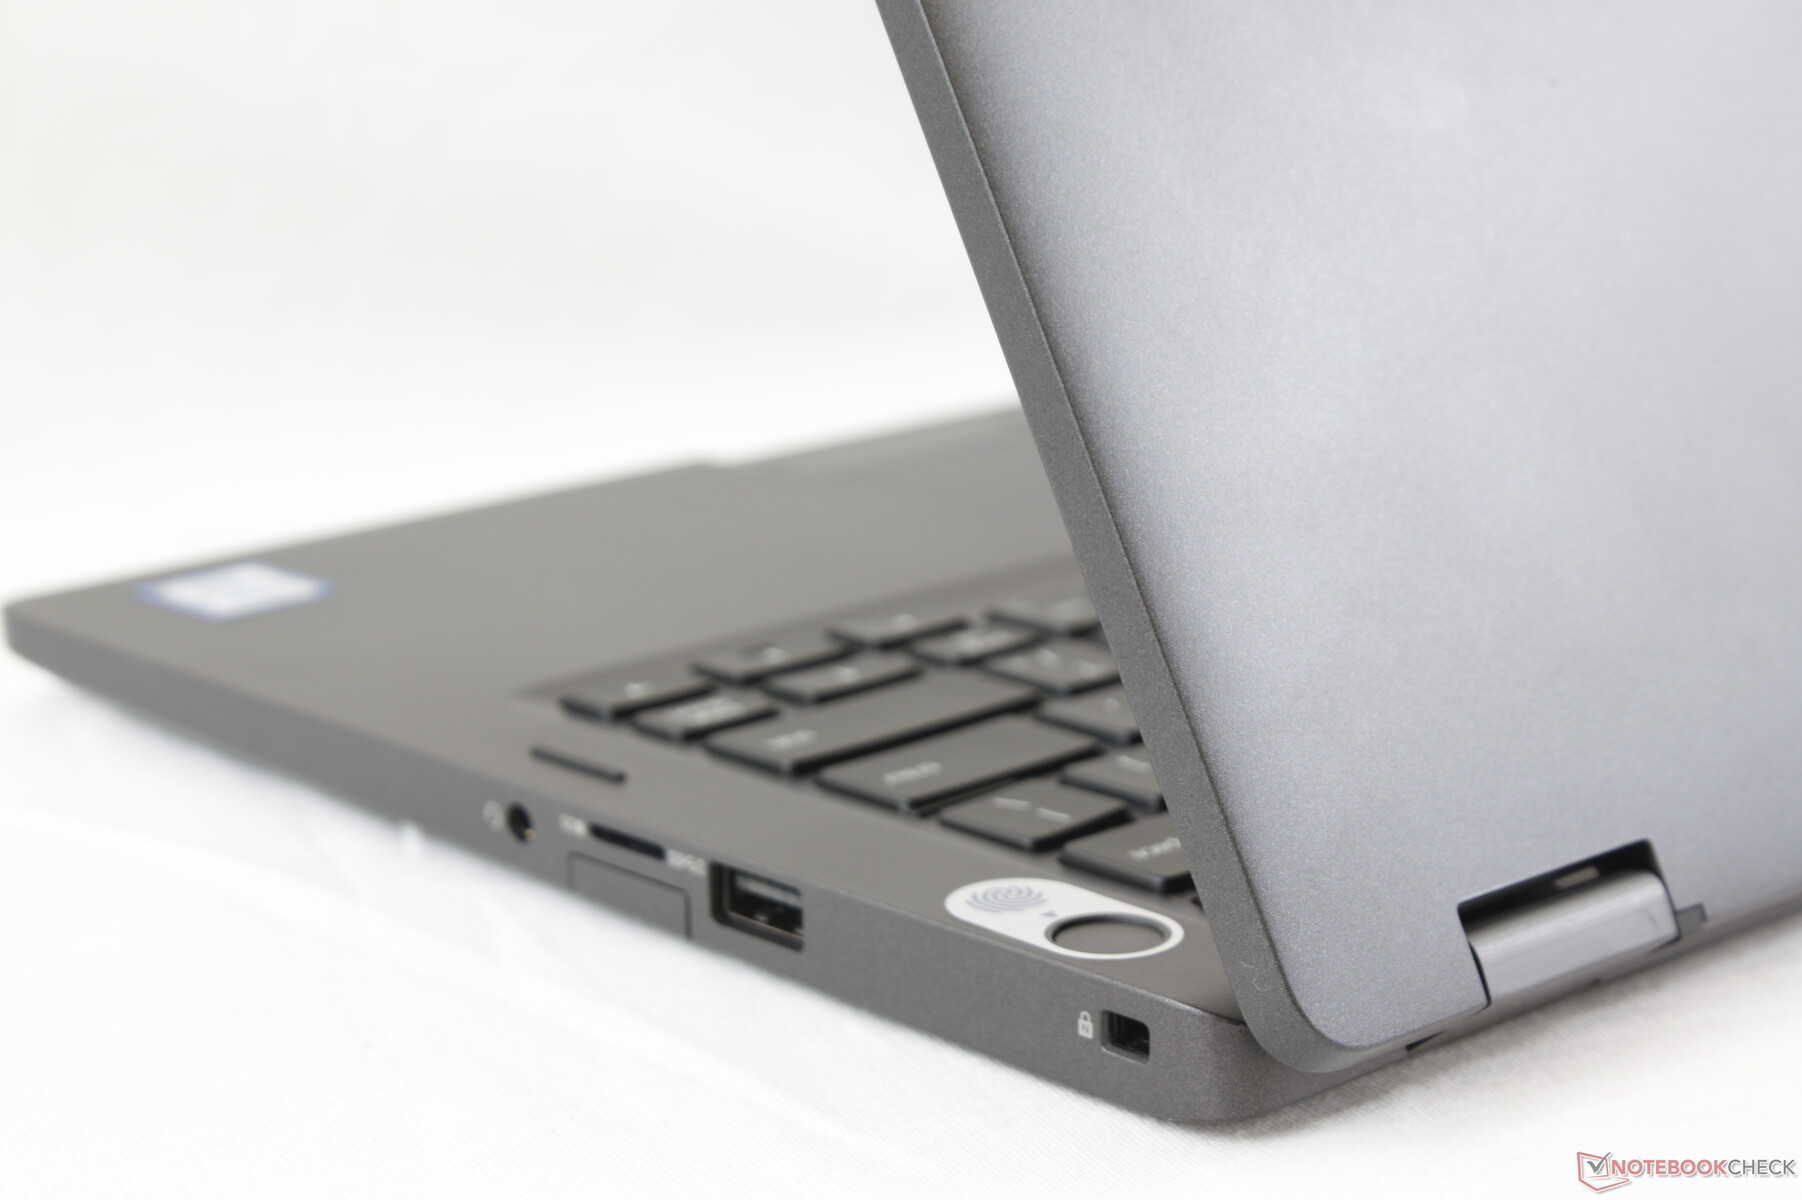
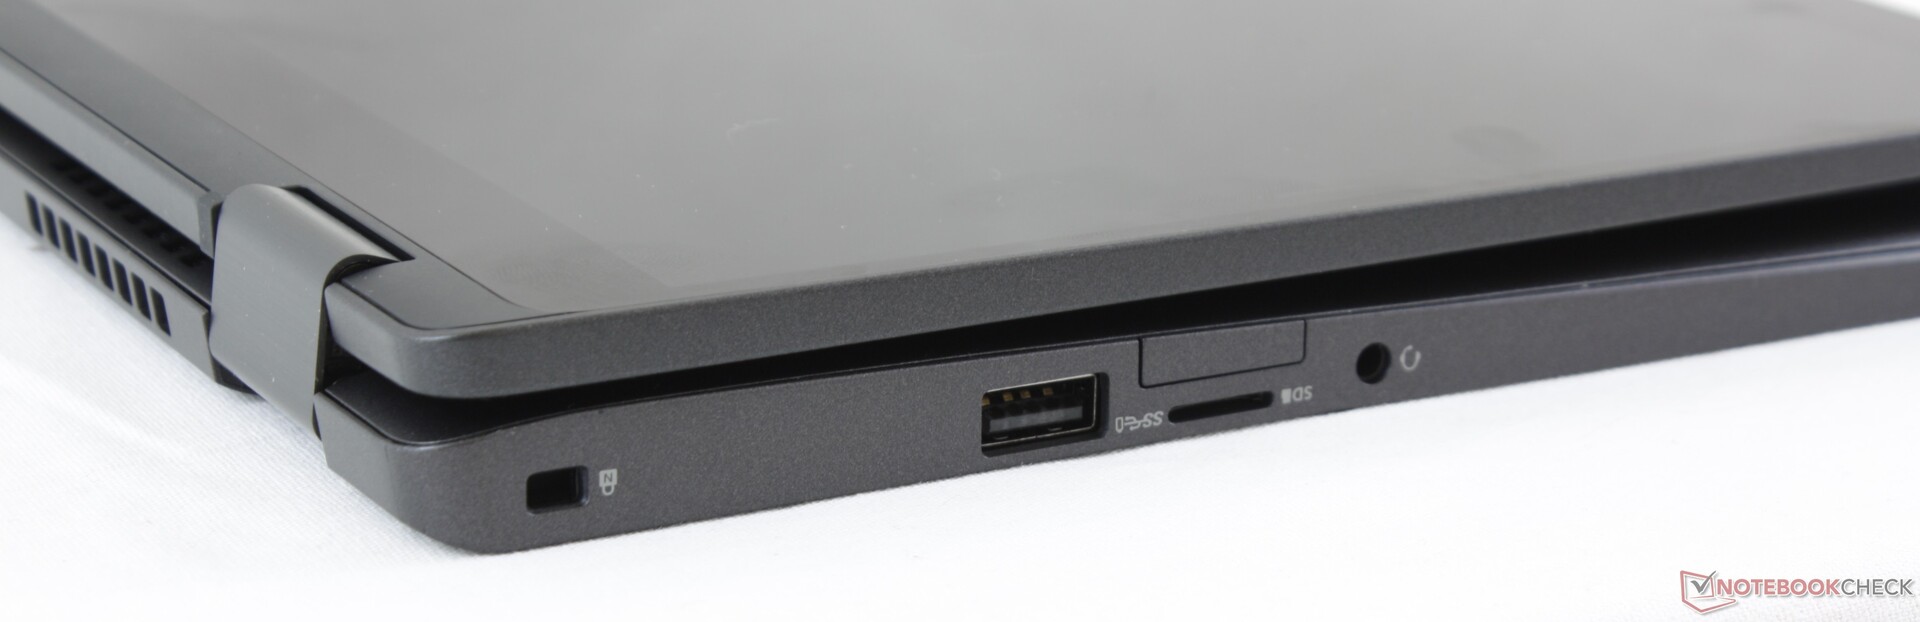
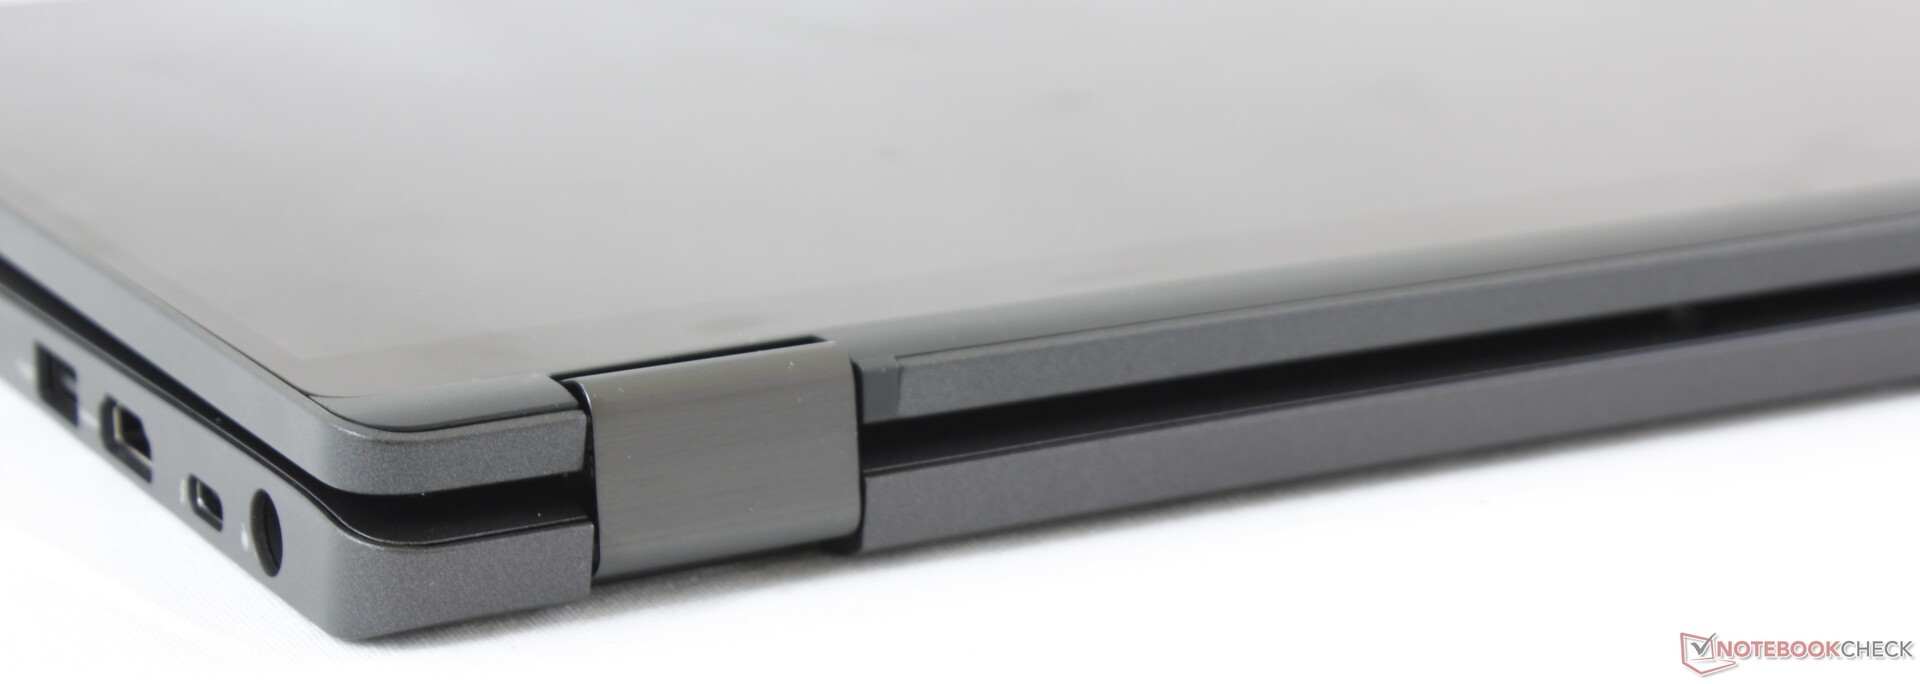
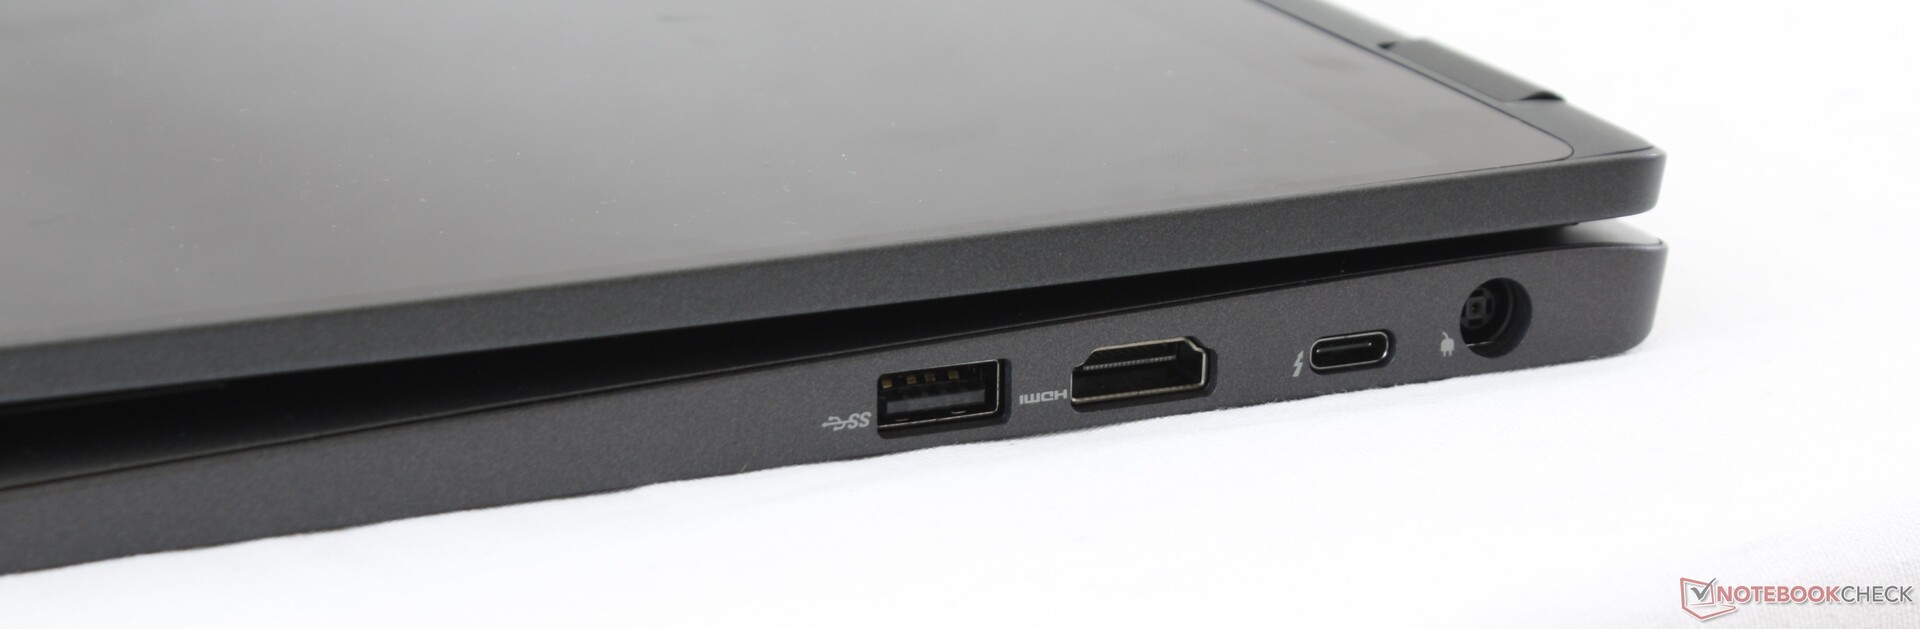
Port options and positioning are respectable albeit some are optional including Thunderbolt 3, WWAN, and the Smart Card reader. Users will have to rely on the Thunderbolt 3 port for all their docking needs now that Dell has been slowly phasing out its proprietary E-Port dock.
It's strange that the Latitude continues to include a proprietary AC adapter for charging when competitors like the EliteBook X360 1030 or aforementioned ThinkPad X390 Yoga have already made the full transition to USB Type-C charging only. Dell could have made the 5300 2-in-1 even lighter and potentially slimmer had it dropped its AC adapter port or replace it with a second USB Type-C port. To Dell's credit, the Latitude 5300 2-in-1 can accept both AC adapter and USB Type-C charging and so owners will have two charging options.
SD Card Reader
Dell integrates a faster MicroSD card reader than most competing systems. Transferring 1 GB worth of pictures from our UHS-II test card to desktop takes about 7 seconds compared to twice that on the ThinkPad X390.
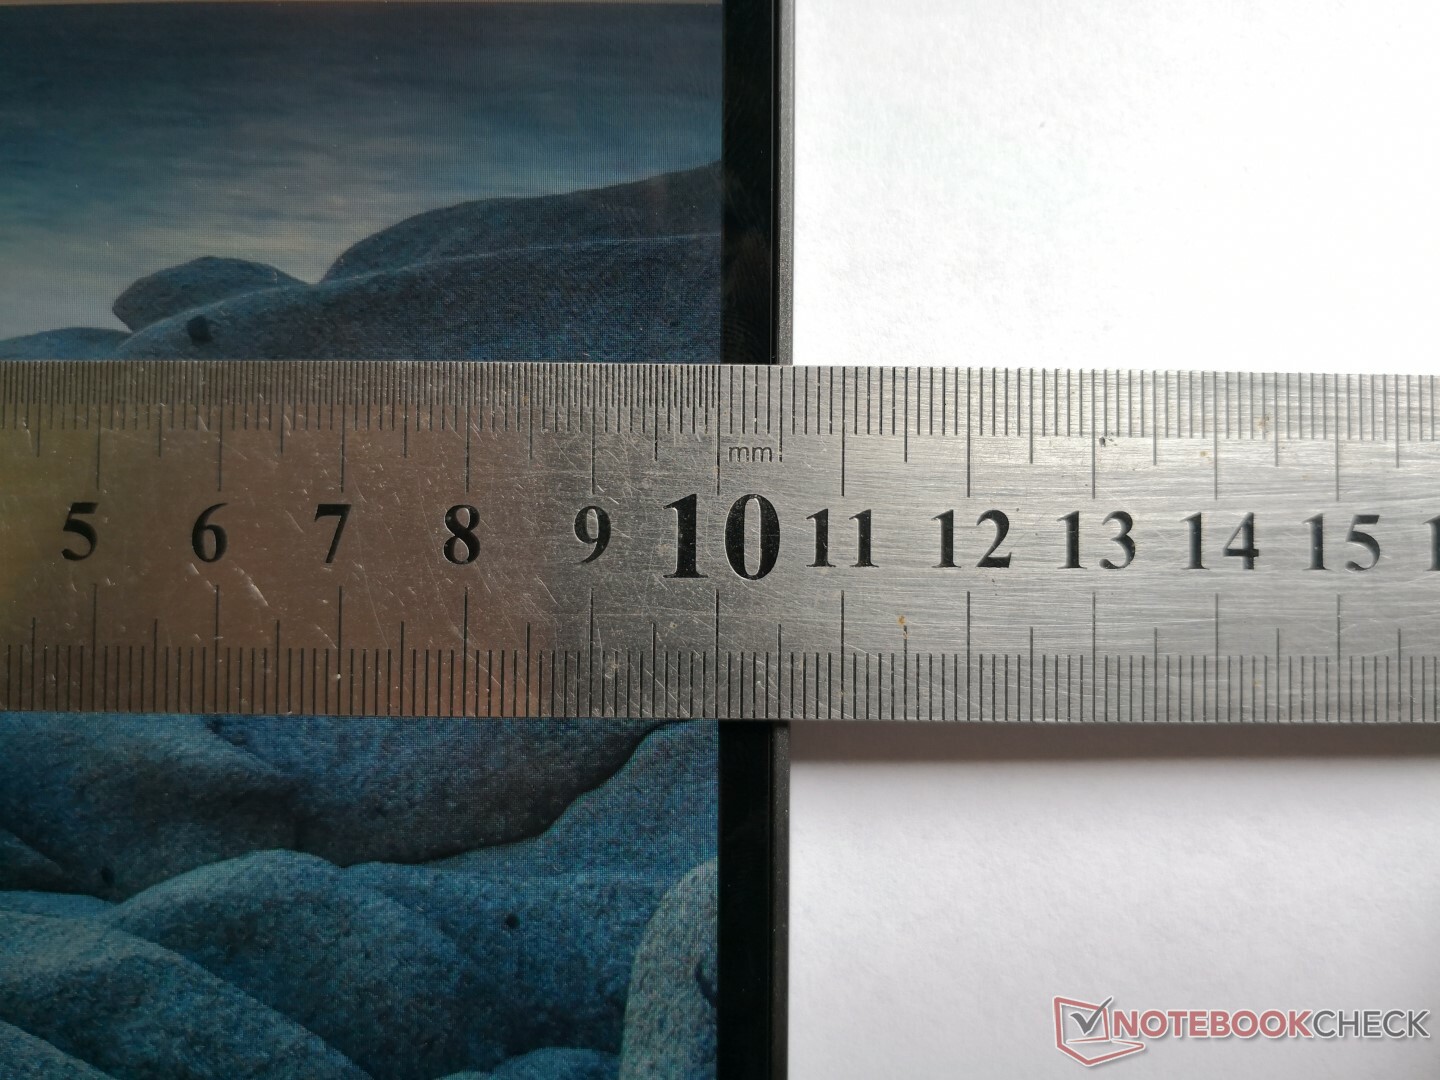
A fully inserted MicroSD card protrudes about 1 mm for easy transporting and ejecting.
| SD Card Reader | |
| average JPG Copy Test (av. of 3 runs) | |
| Dell XPS 13 9380 2019 (Toshiba Exceria Pro SDXC 64 GB UHS-II) | |
| Dell Latitude 13 5300 2-in-1 (Toshiba Exceria Pro M501) | |
| Samsung Notebook 9 NP930QAA (Toshiba Exceria Pro M501 microSDXC 64GB) | |
| Lenovo ThinkPad X390-20Q1S02M00 (Toshiba Exceria Pro M501) | |
| HP ProBook 430 G6-5TJ89EA (Toshiba Exceria Pro SDXC 64 GB UHS-II) | |
| maximum AS SSD Seq Read Test (1GB) | |
| Dell XPS 13 9380 2019 (Toshiba Exceria Pro SDXC 64 GB UHS-II) | |
| Dell Latitude 13 5300 2-in-1 (Toshiba Exceria Pro M501) | |
| Samsung Notebook 9 NP930QAA (Toshiba Exceria Pro M501 microSDXC 64GB) | |
| Lenovo ThinkPad X390-20Q1S02M00 (Toshiba Exceria Pro M501) | |
| HP ProBook 430 G6-5TJ89EA (Toshiba Exceria Pro SDXC 64 GB UHS-II) | |
Communication
The Intel 9560 comes standard with integrated Bluetooth 5 and 802.11ac connectivity up to a theoretical 1.73 Gbps. Note that performance can be higher than what we've recorded below since our server setup is limited by a 1 Gbps line. Users can upgrade to Intel AX200 wireless for Wi-Fi 6 connectivity much like on the upcoming XPS 13 7390 2-in-1.
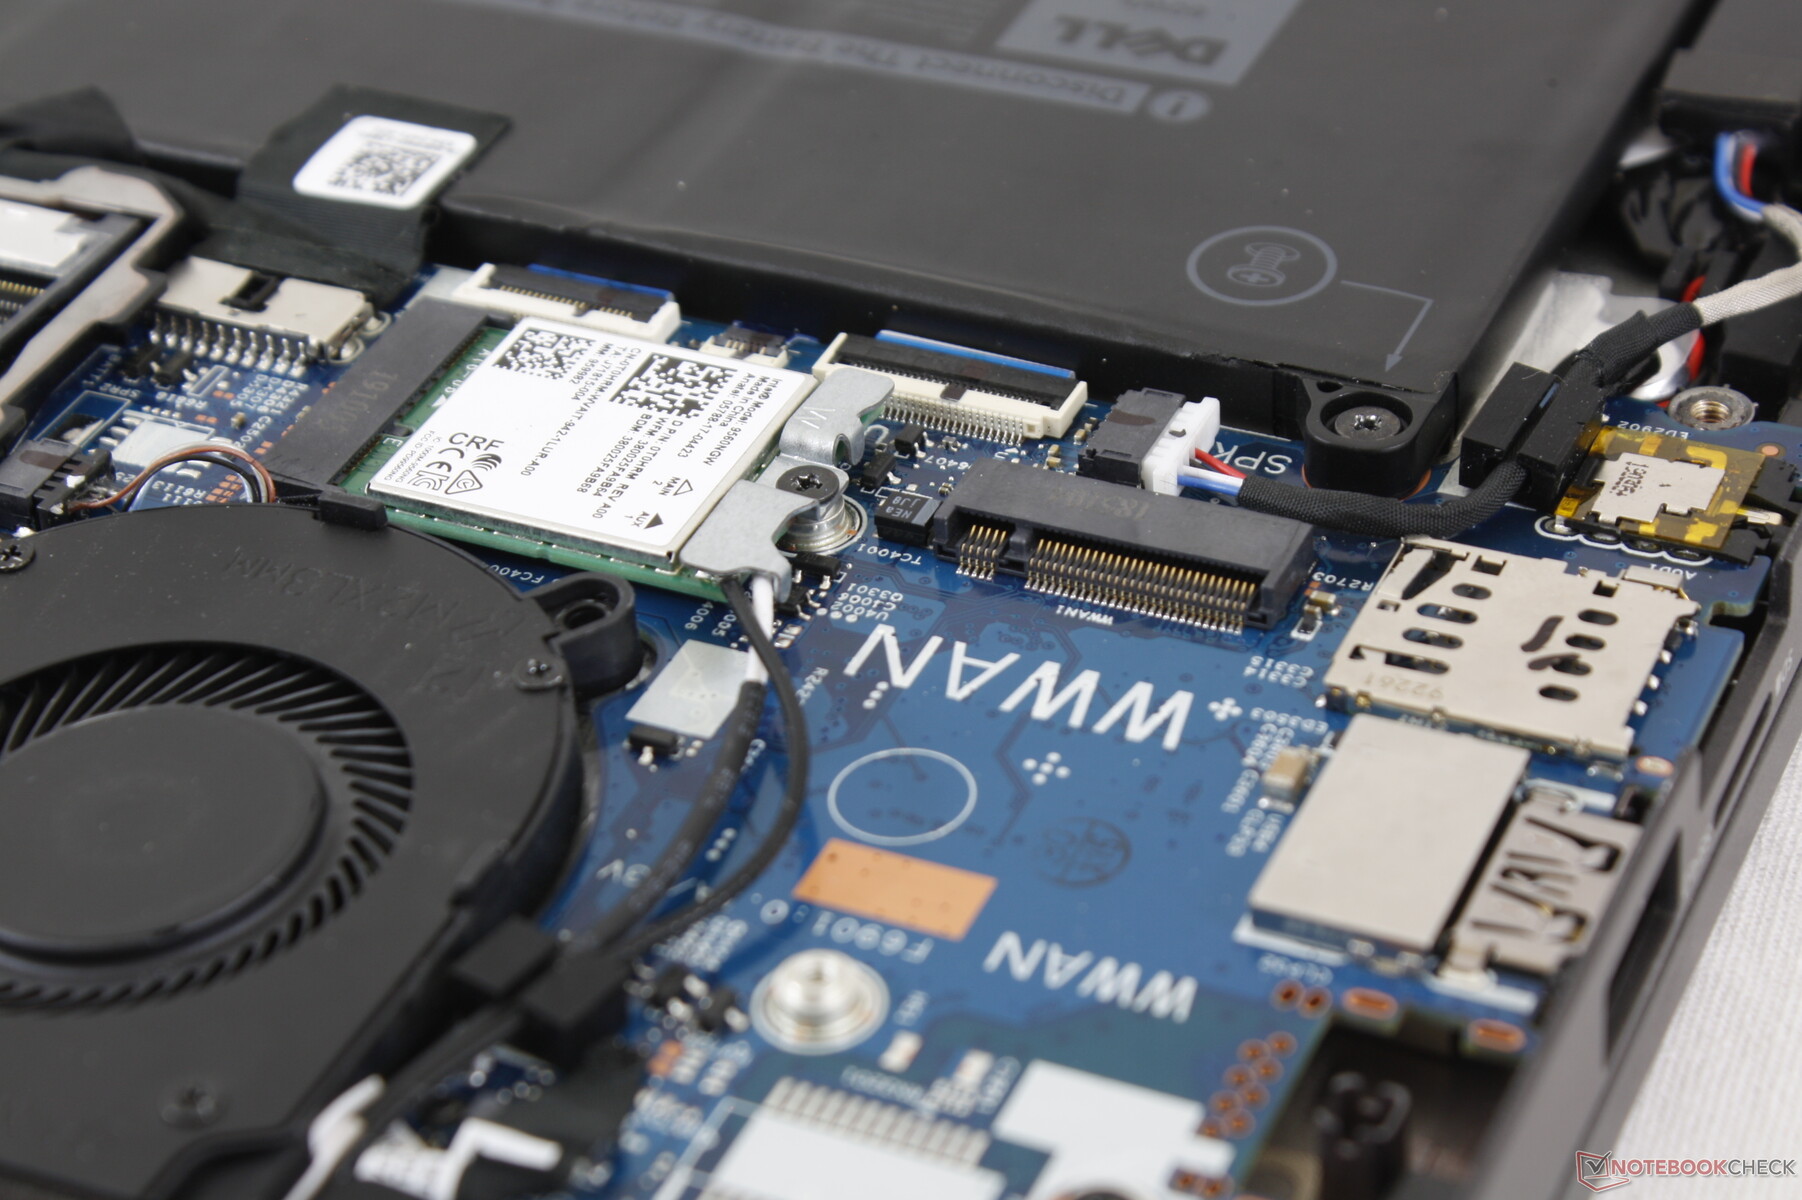
Although our test unit doesn't support them, WWAN and Micro-SIM LTE are available on some configurations. Unfortunately, the WWAN slot on our unit lacks the necessary antenna meaning that users will have to purchase WWAN-specific SKUs to use this feature.
Security
Dell Command comes pre-installed as well as TPM, a power button fingerprint reader, and optional Windows Hello. A webcam shutter slider or camera "kill switch" is not available unlike on the HP Spectre x360 15. Users who want a hands-free sign-in experience may want to consider the higher-end Latitude 7400 2-in-1.
It's worth noting that current configurations offer IR camera or WWAN but not both simultaneously.
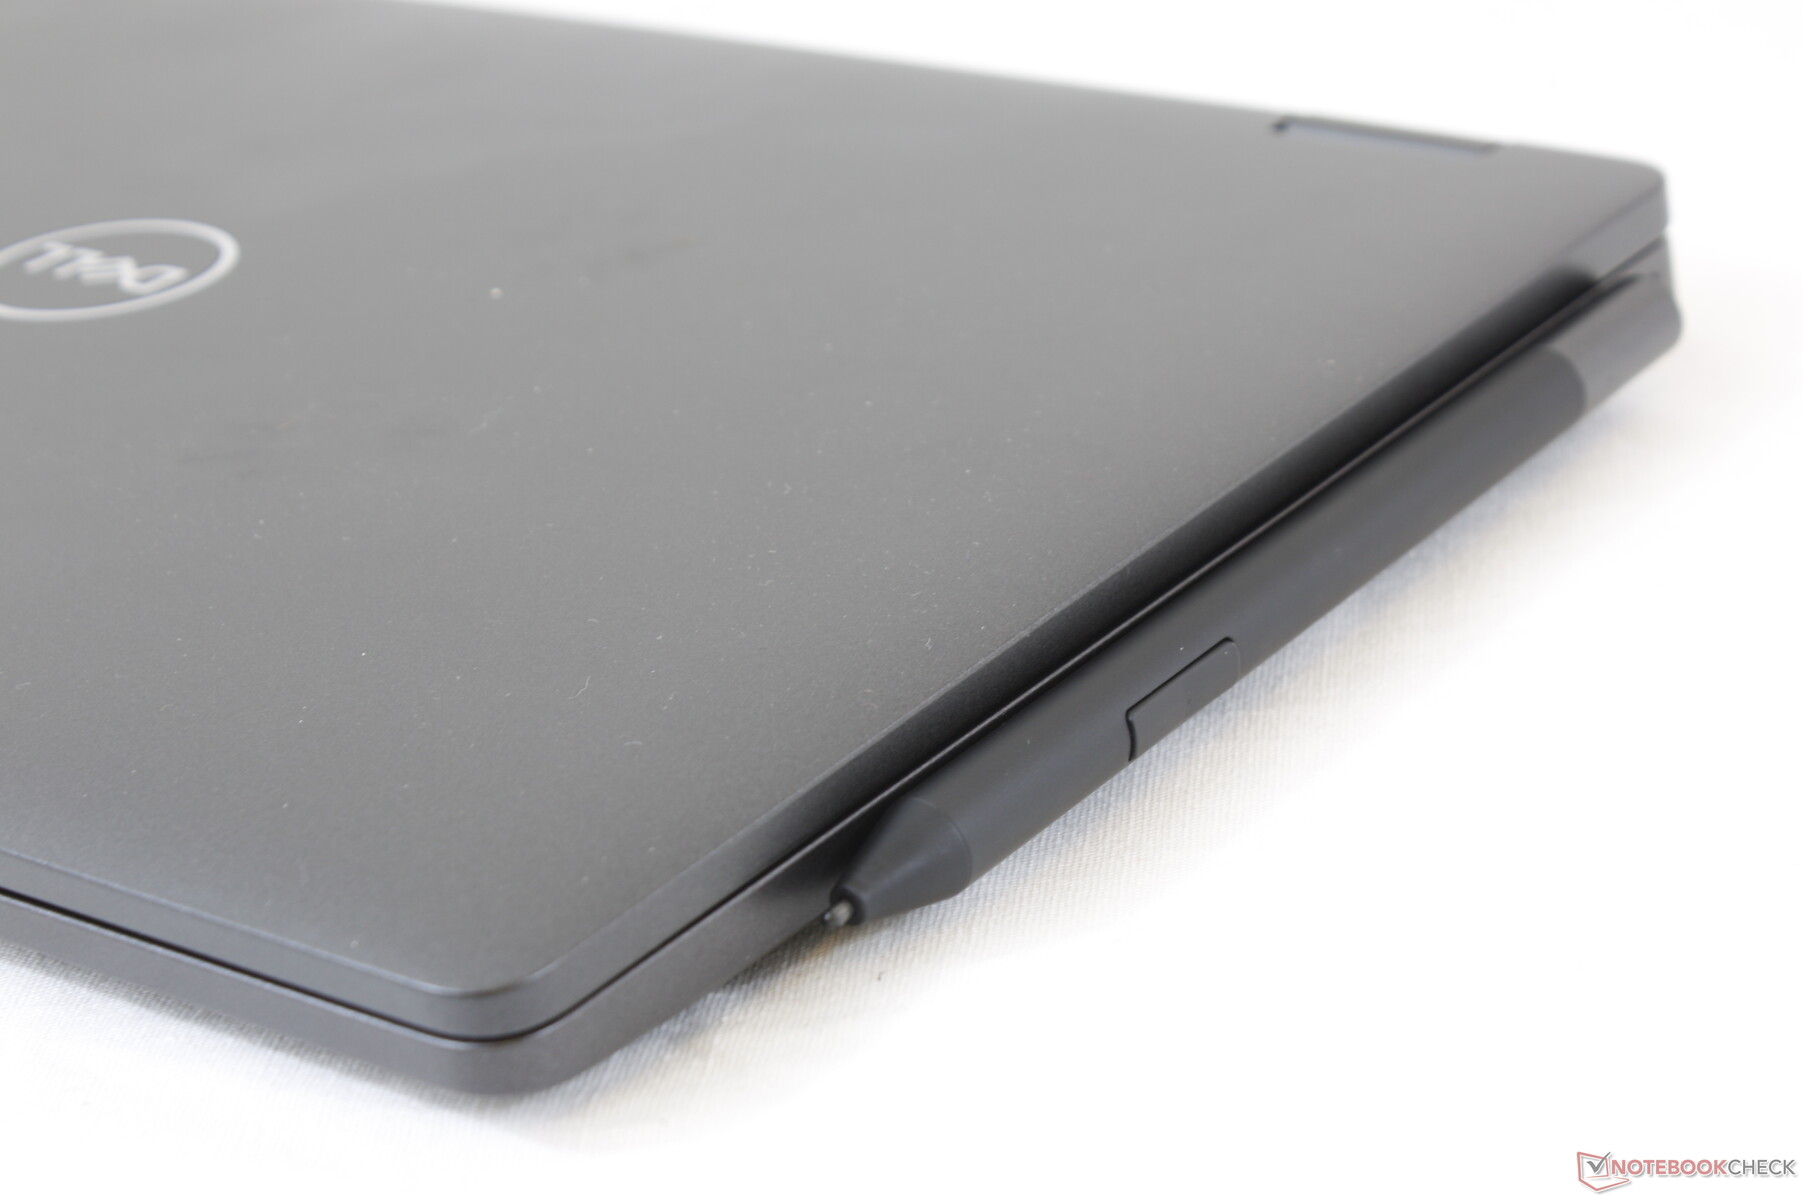
Accessories
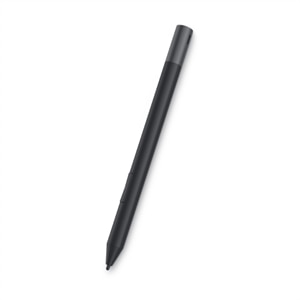
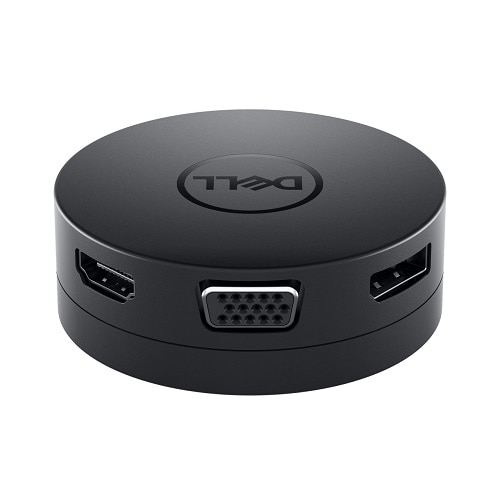
There are no included extras in the box other than the usual Quick Start paperwork. Dell offers plenty of optional accessories including the PN579X Active Pen stylus and the very handy DA300 USB Type-C docking station that provides extras ports like VGA, DisplayPort, and RJ-45. Competing alternatives like the Surface Pro or ThinkPad X390 Yoga ship with active pens at no extra cost.
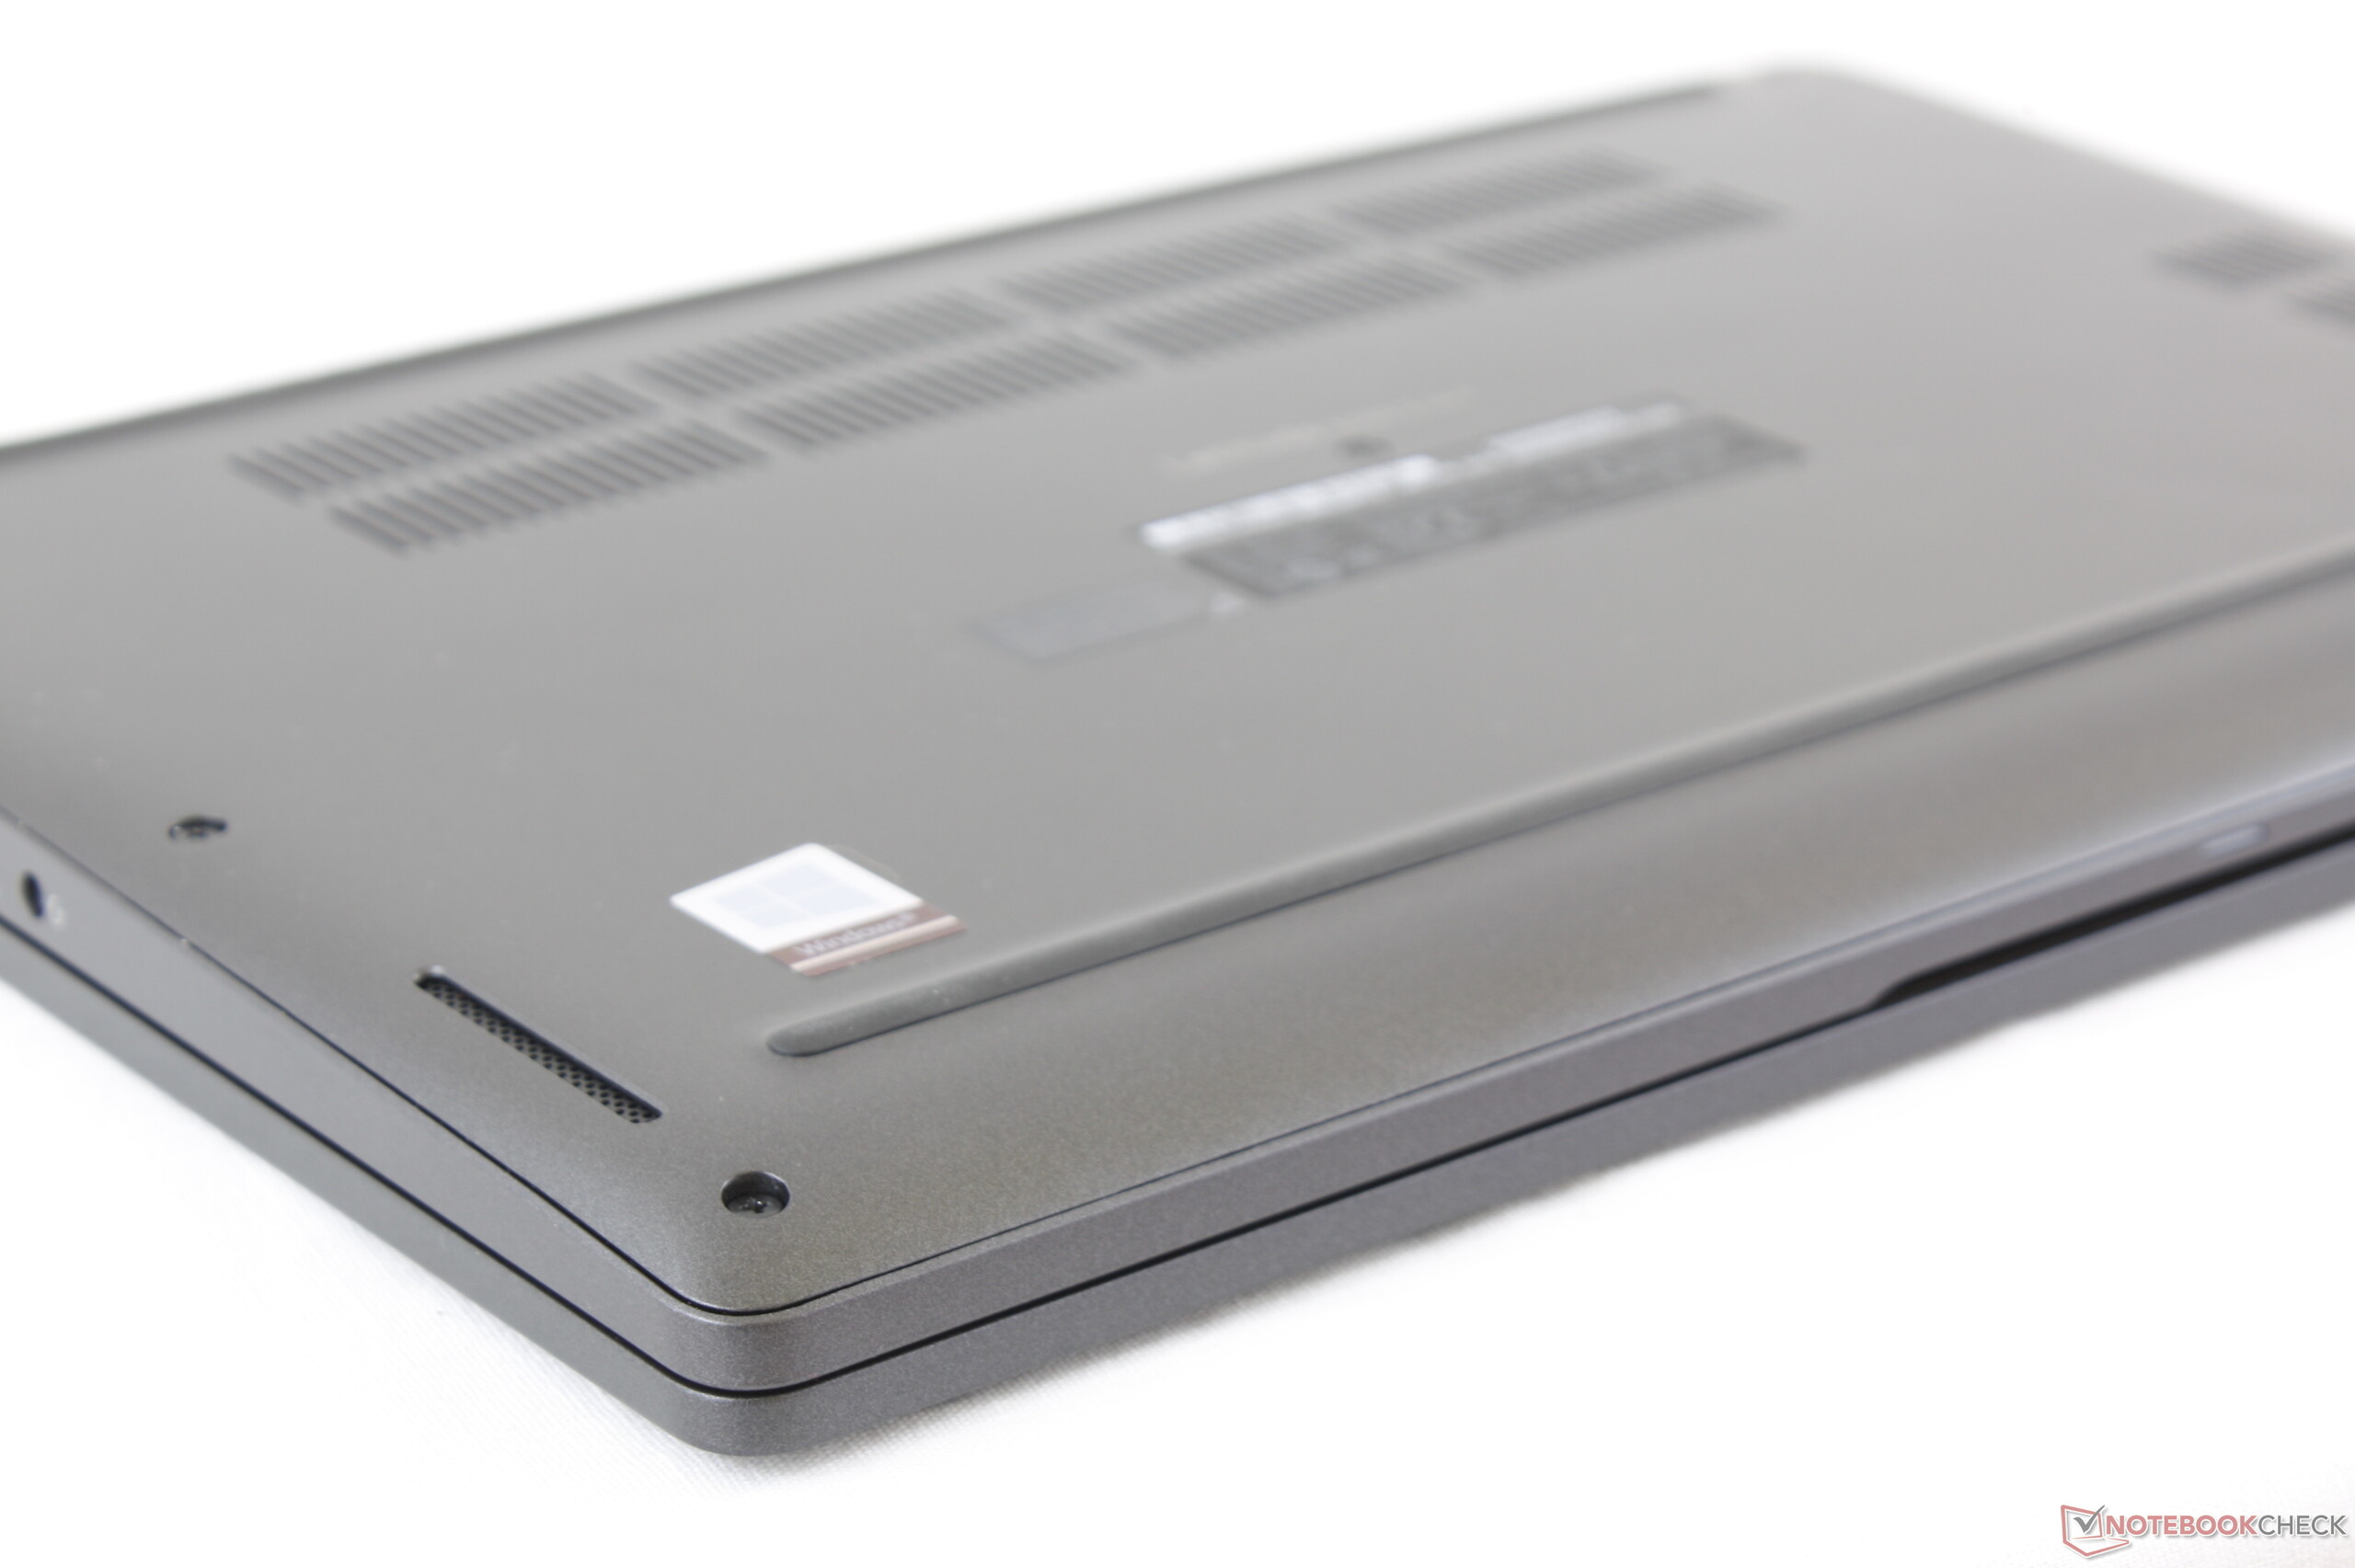
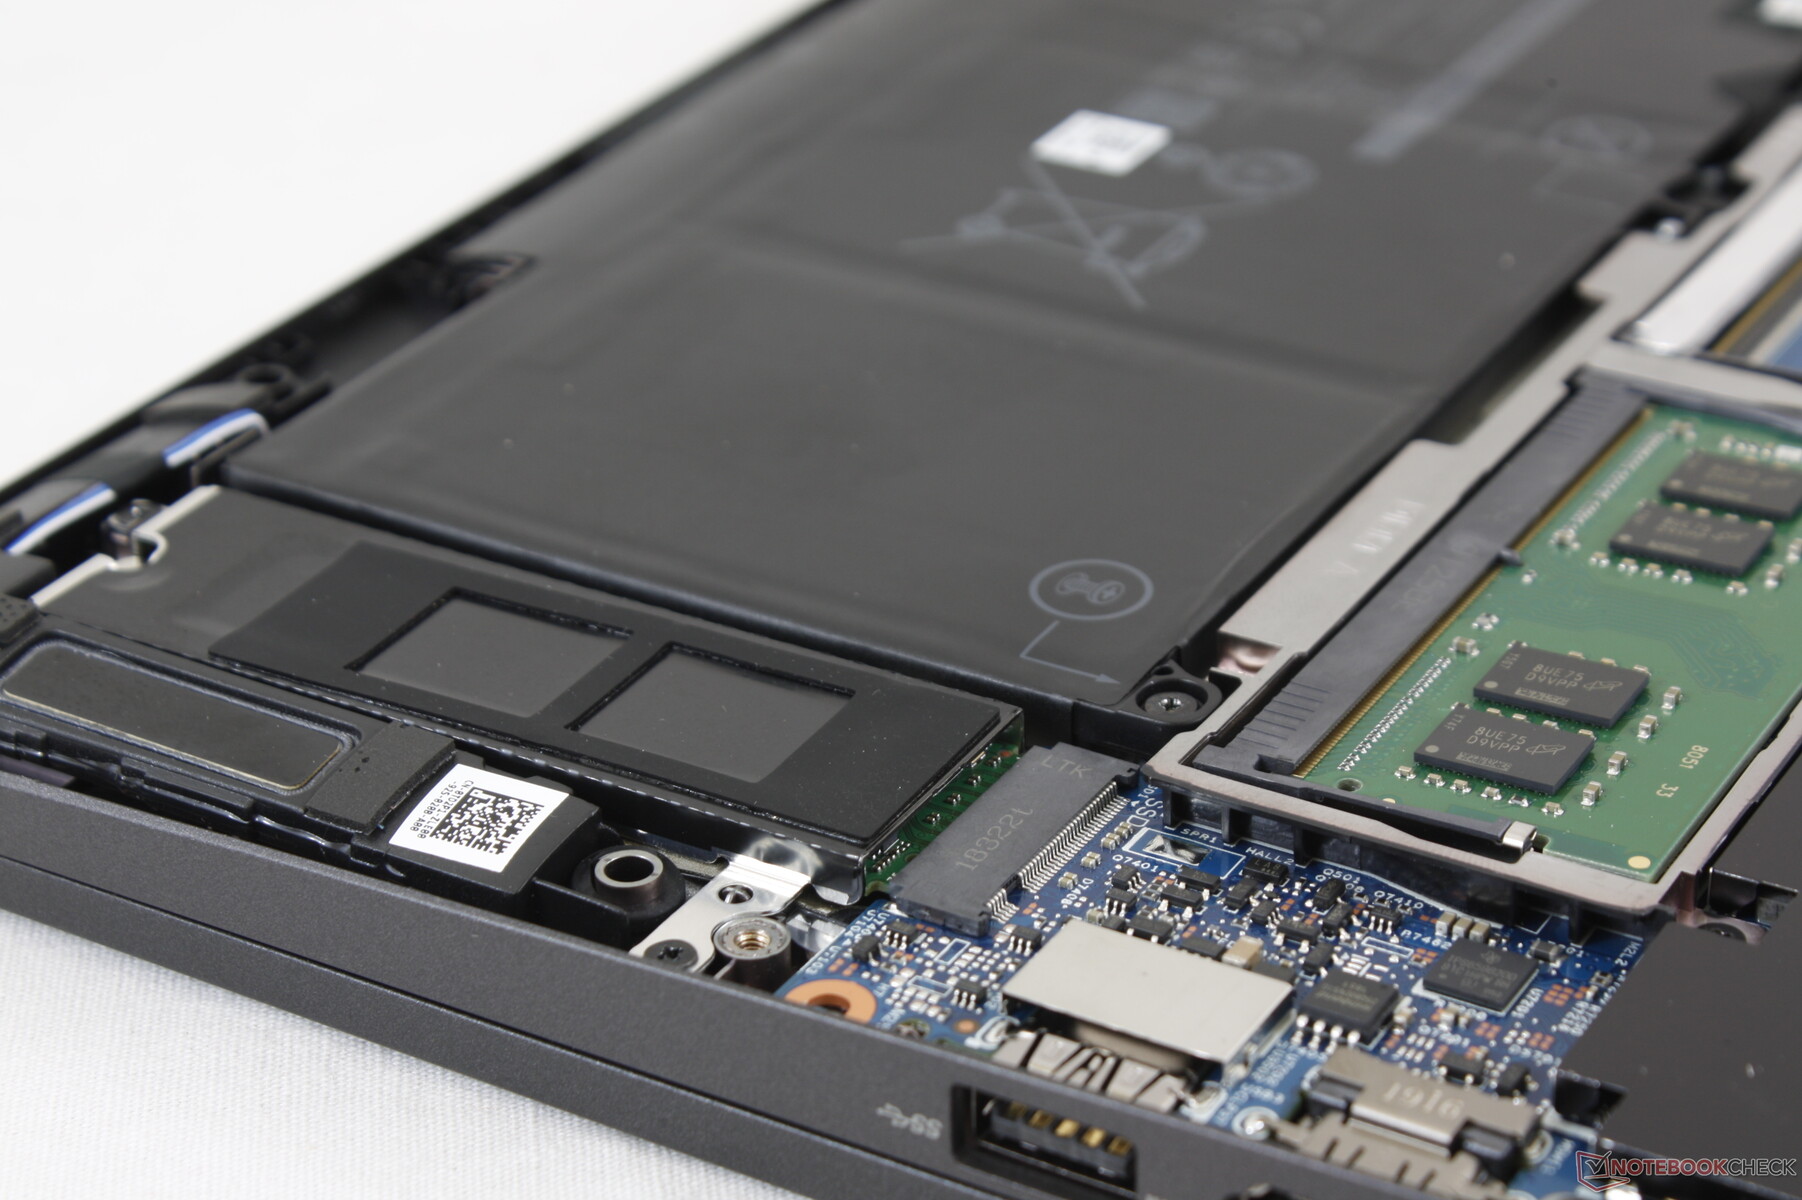
Maintenance
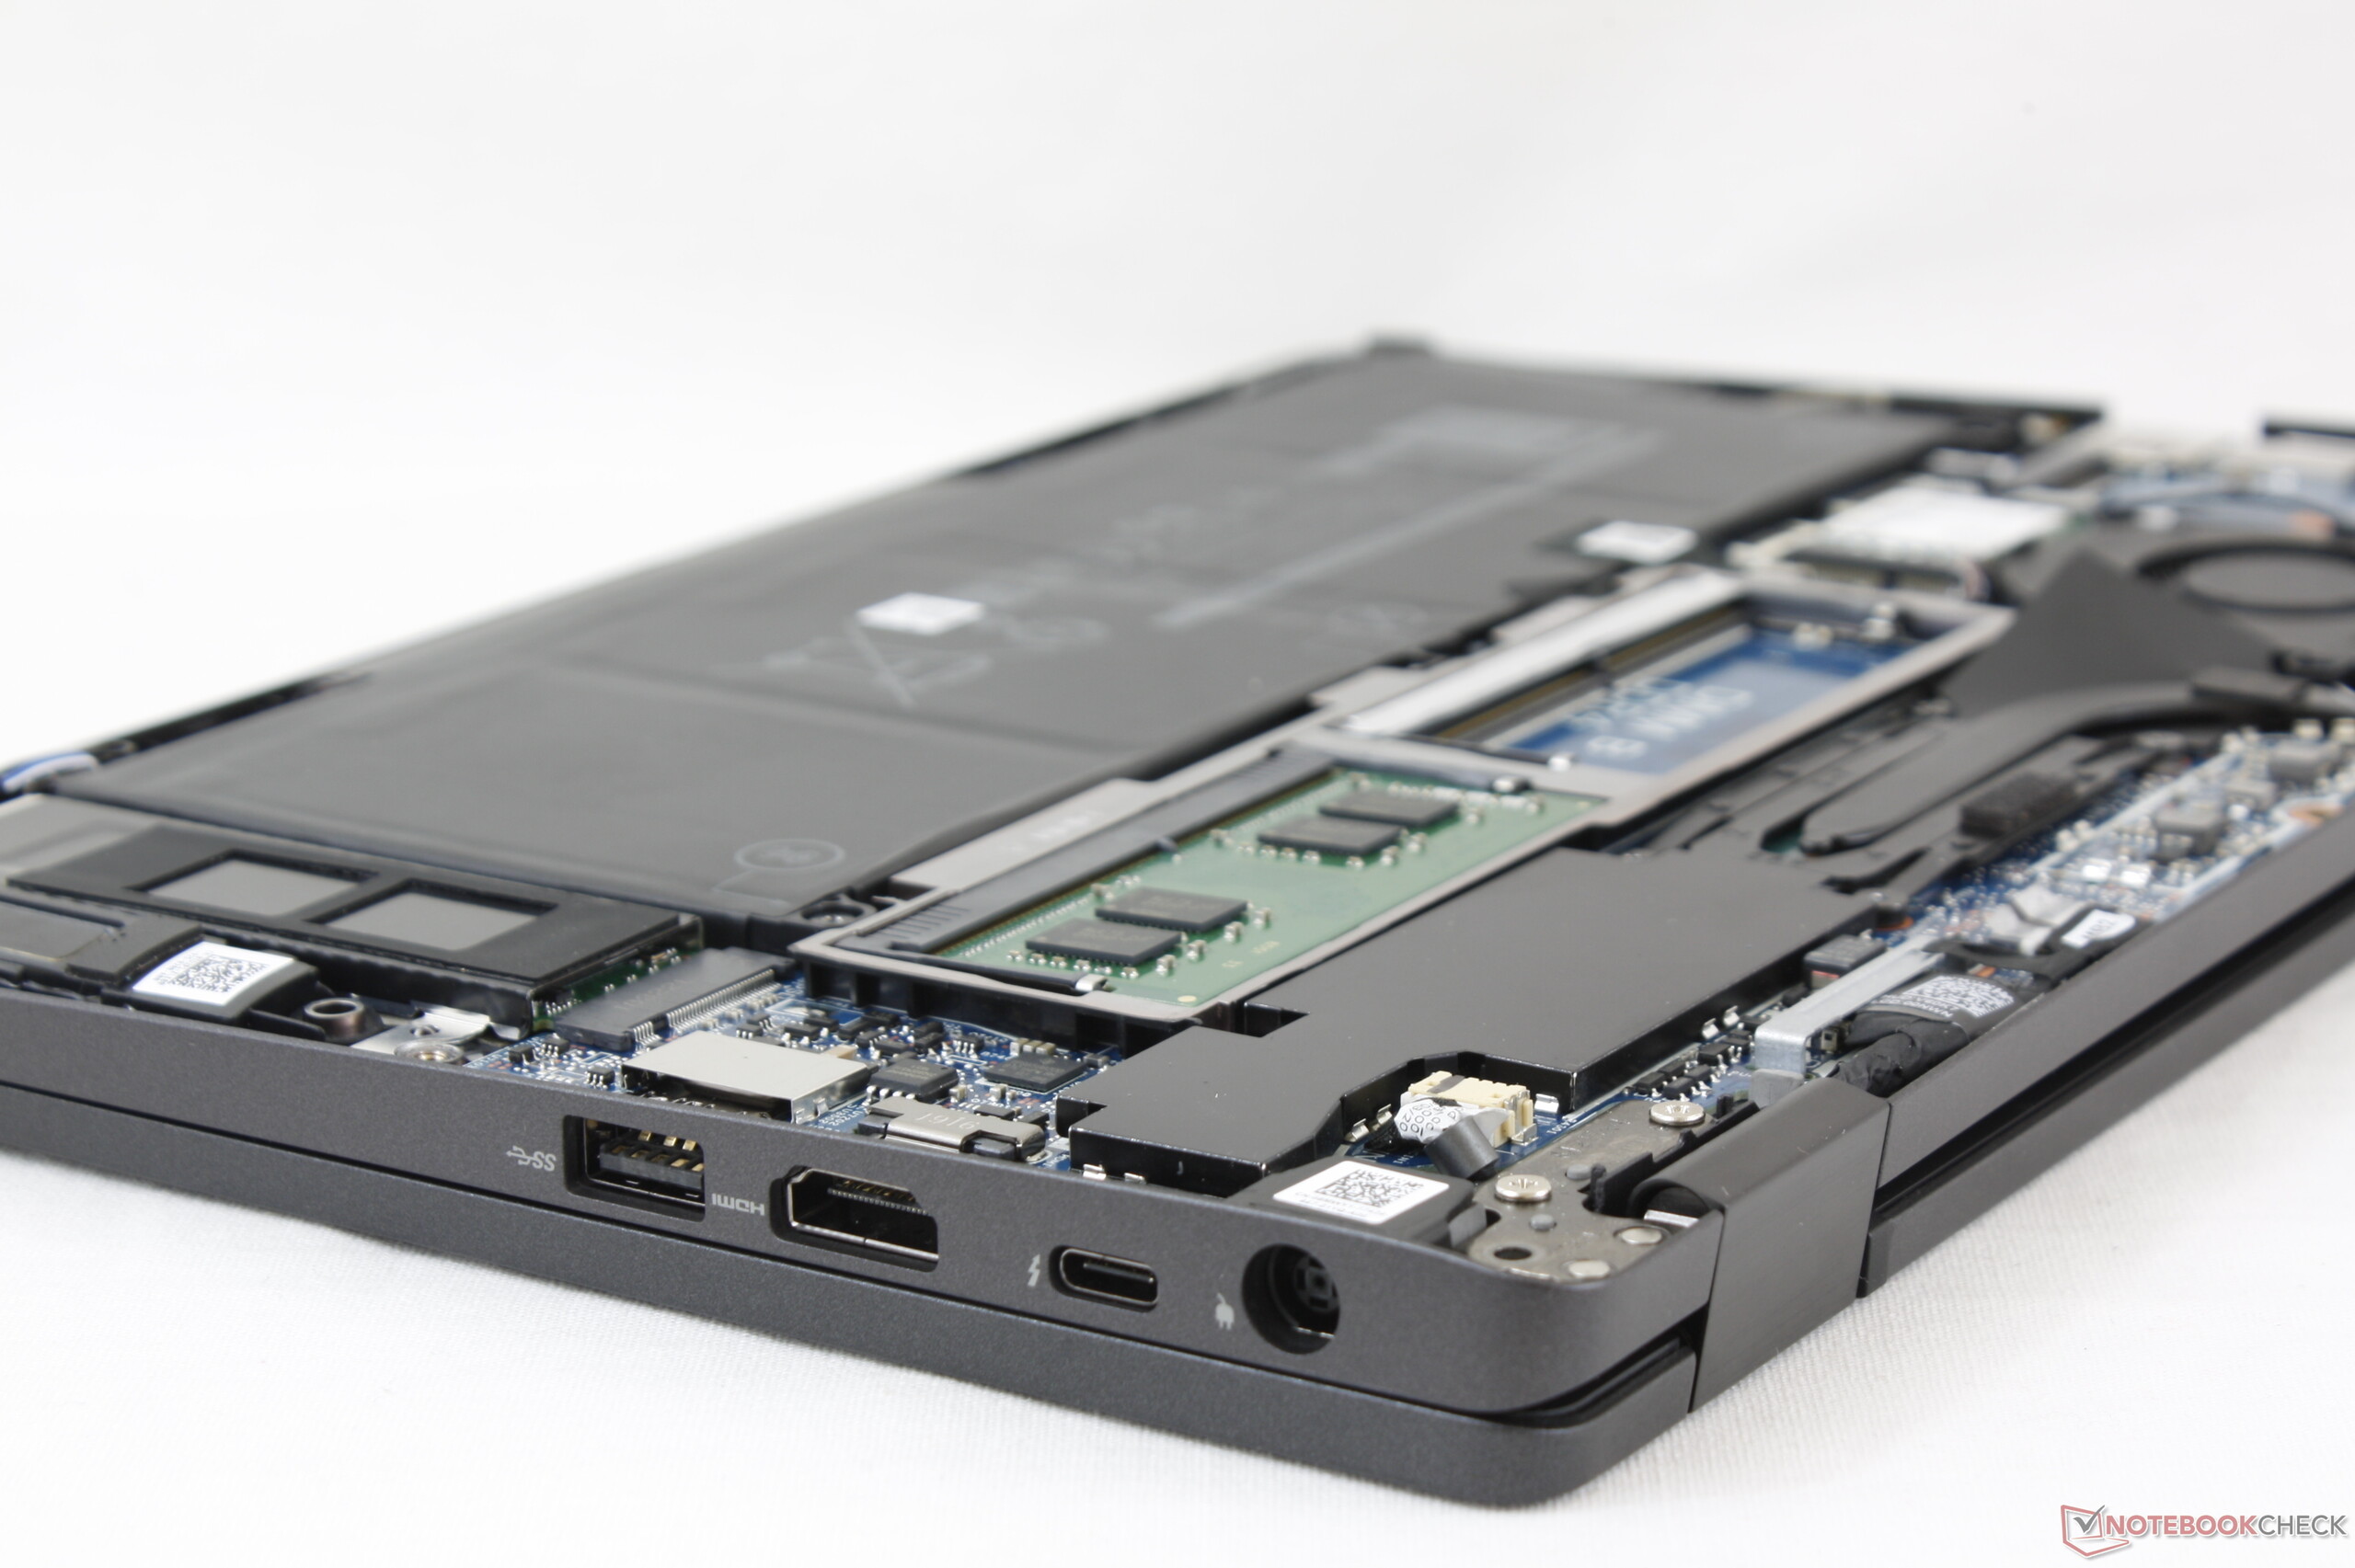
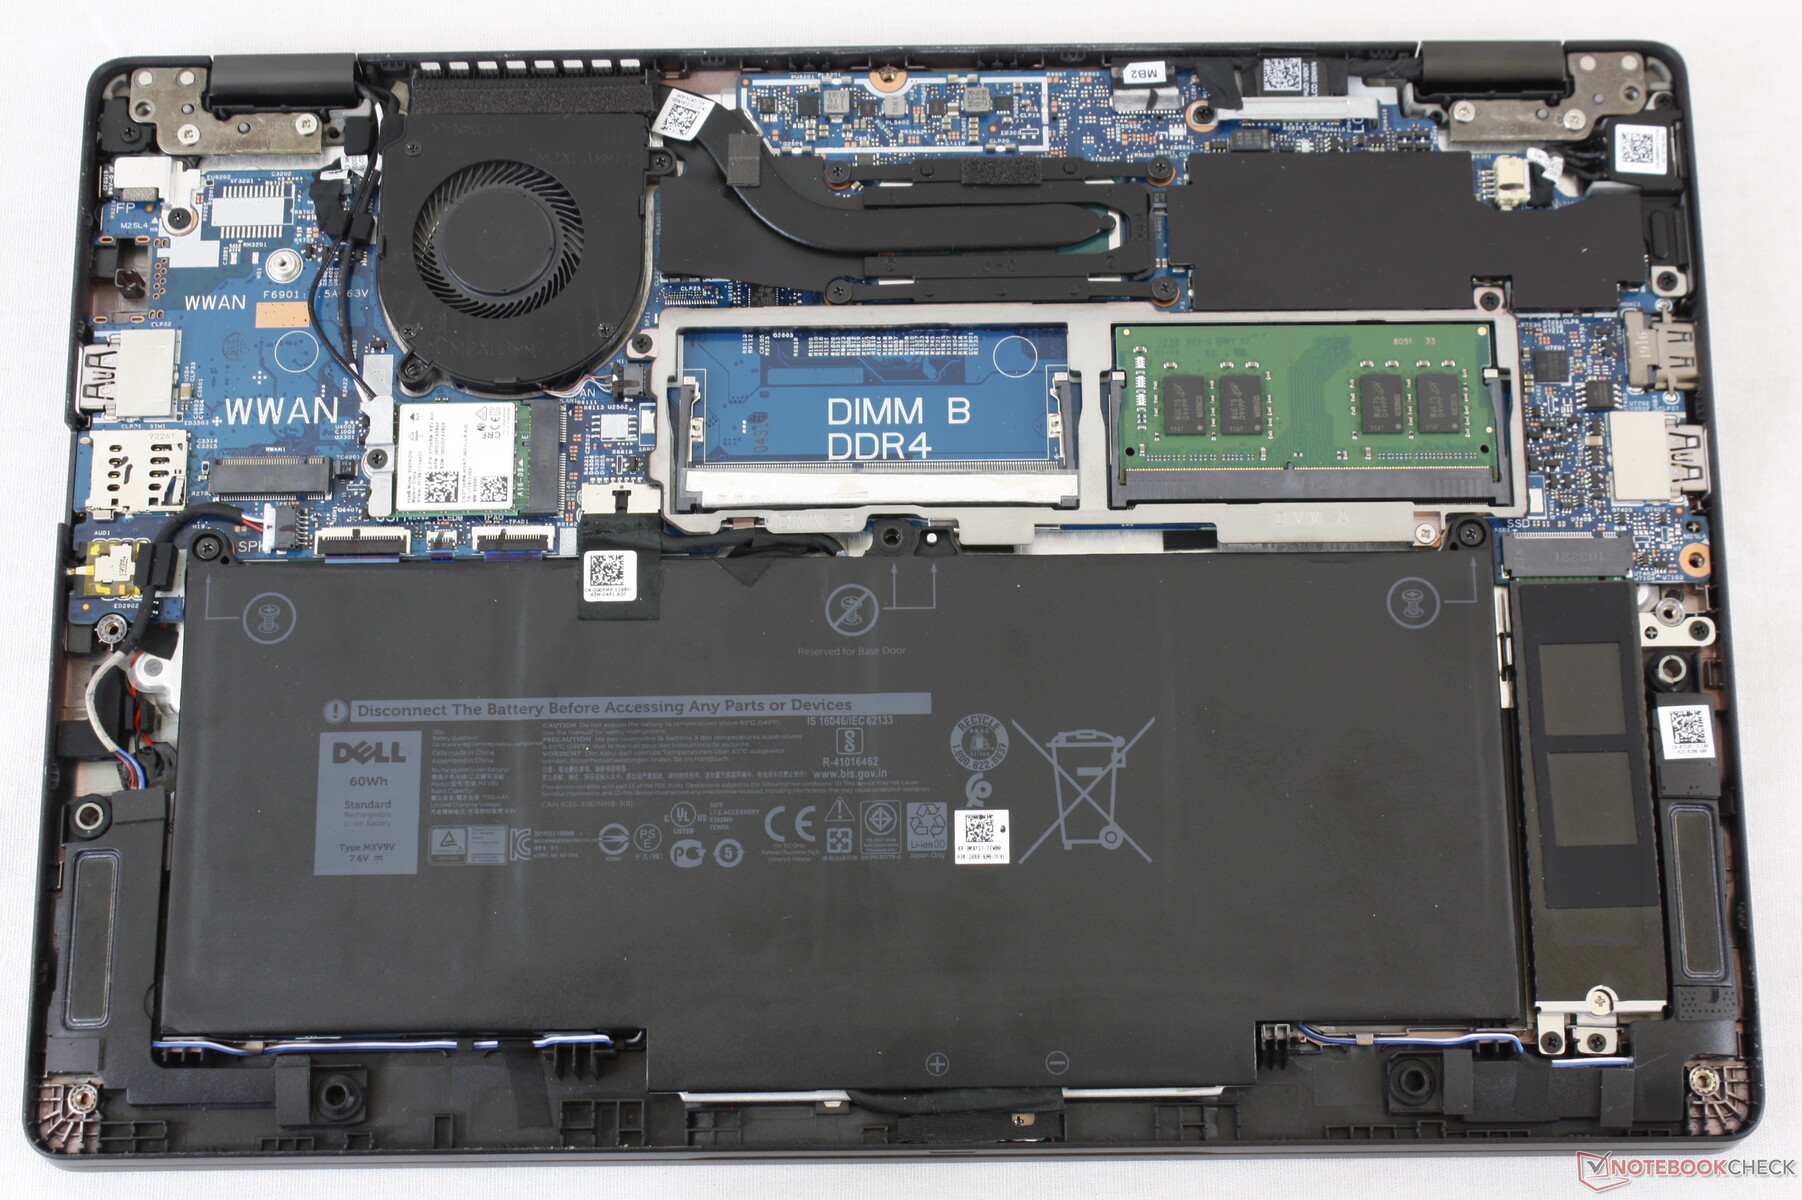
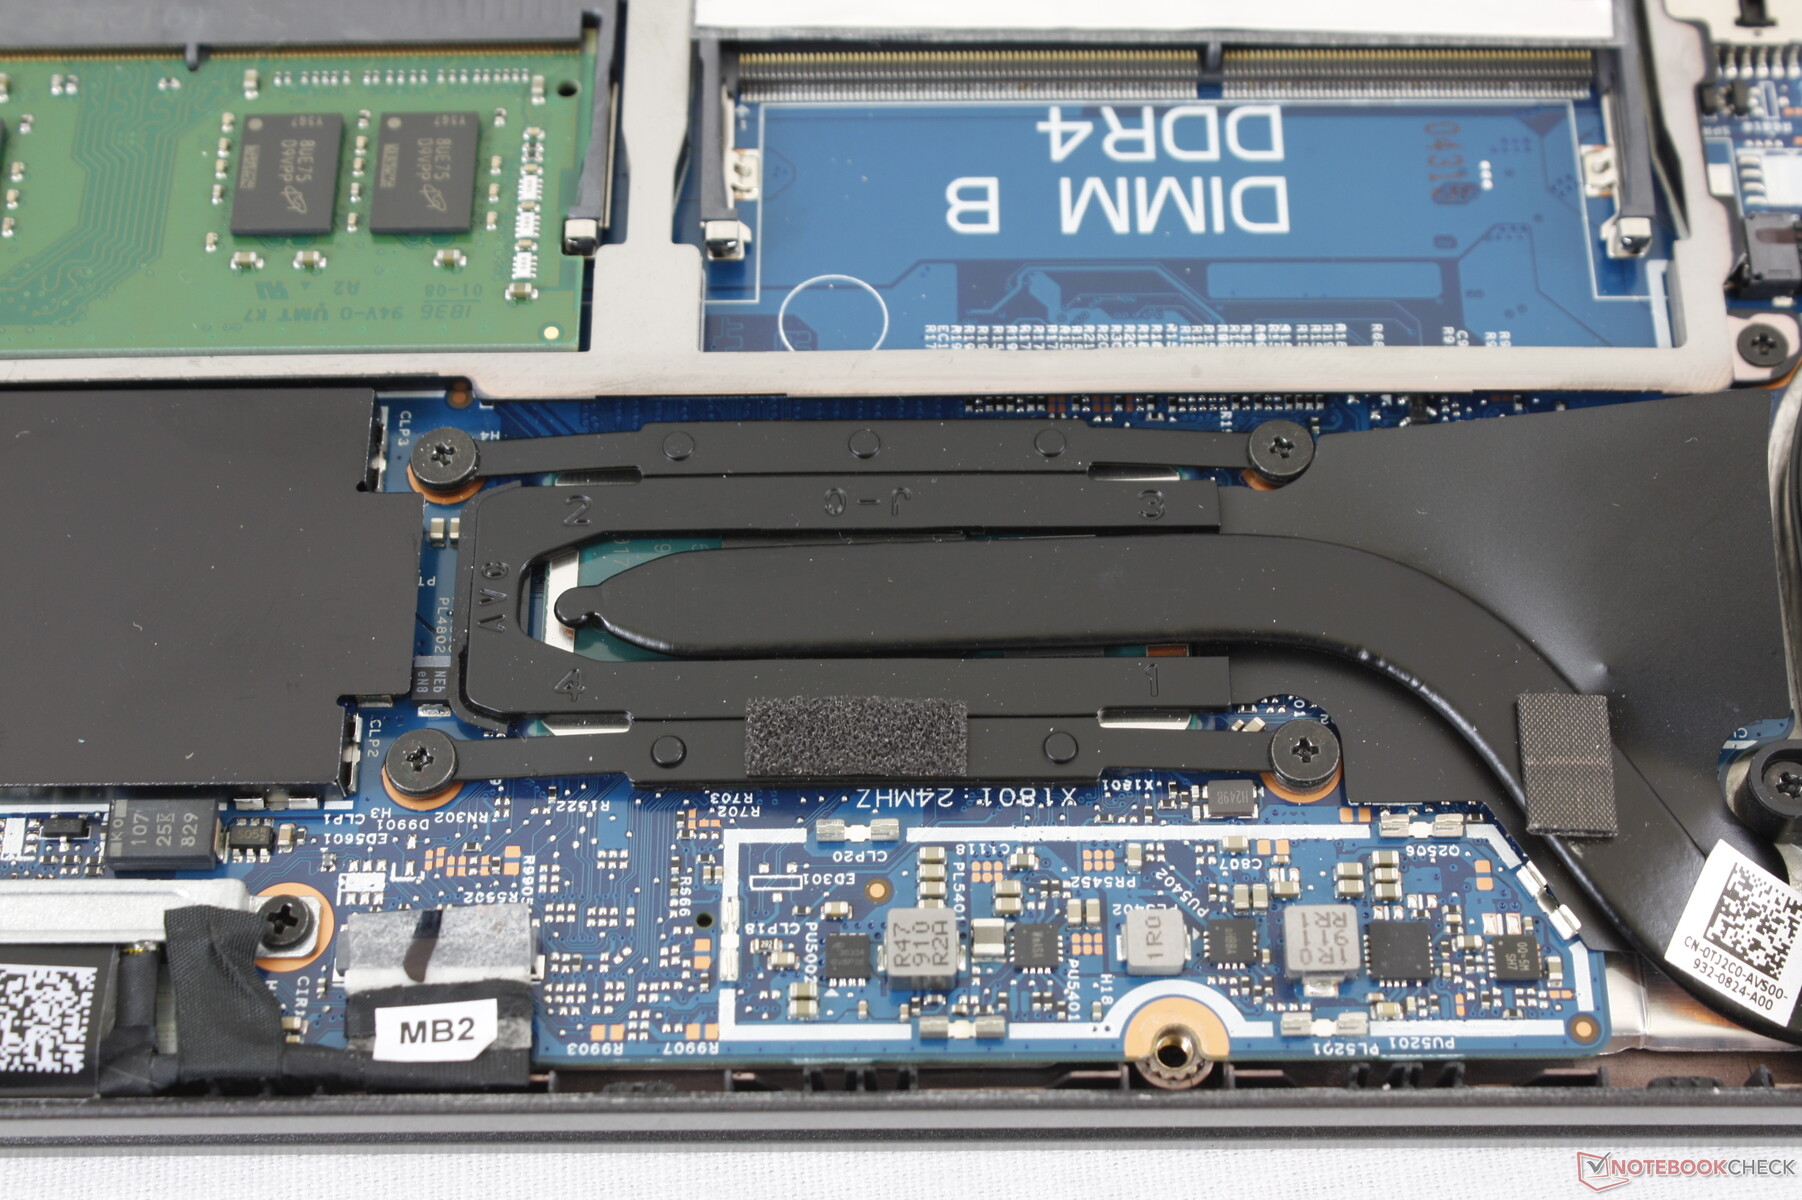
The bottom panel is secured by just 8 Philips screws for easy servicing. Users will have direct access to the M.2 2280 storage slot, both SODIMM slots, both WLAN and WWAN slots, and internal battery. We find the system easier to service and upgrade when compared to other convertible notebooks like the Asus ZenBook Flip S or EliteBook x360 1030.
Warranty
The standard one-year limited warranty applies with options to extend up to five years. Dell offers a wider variety of warranty options than most since it is one of the world's largest OEMs.
Input Devices
Keyboard
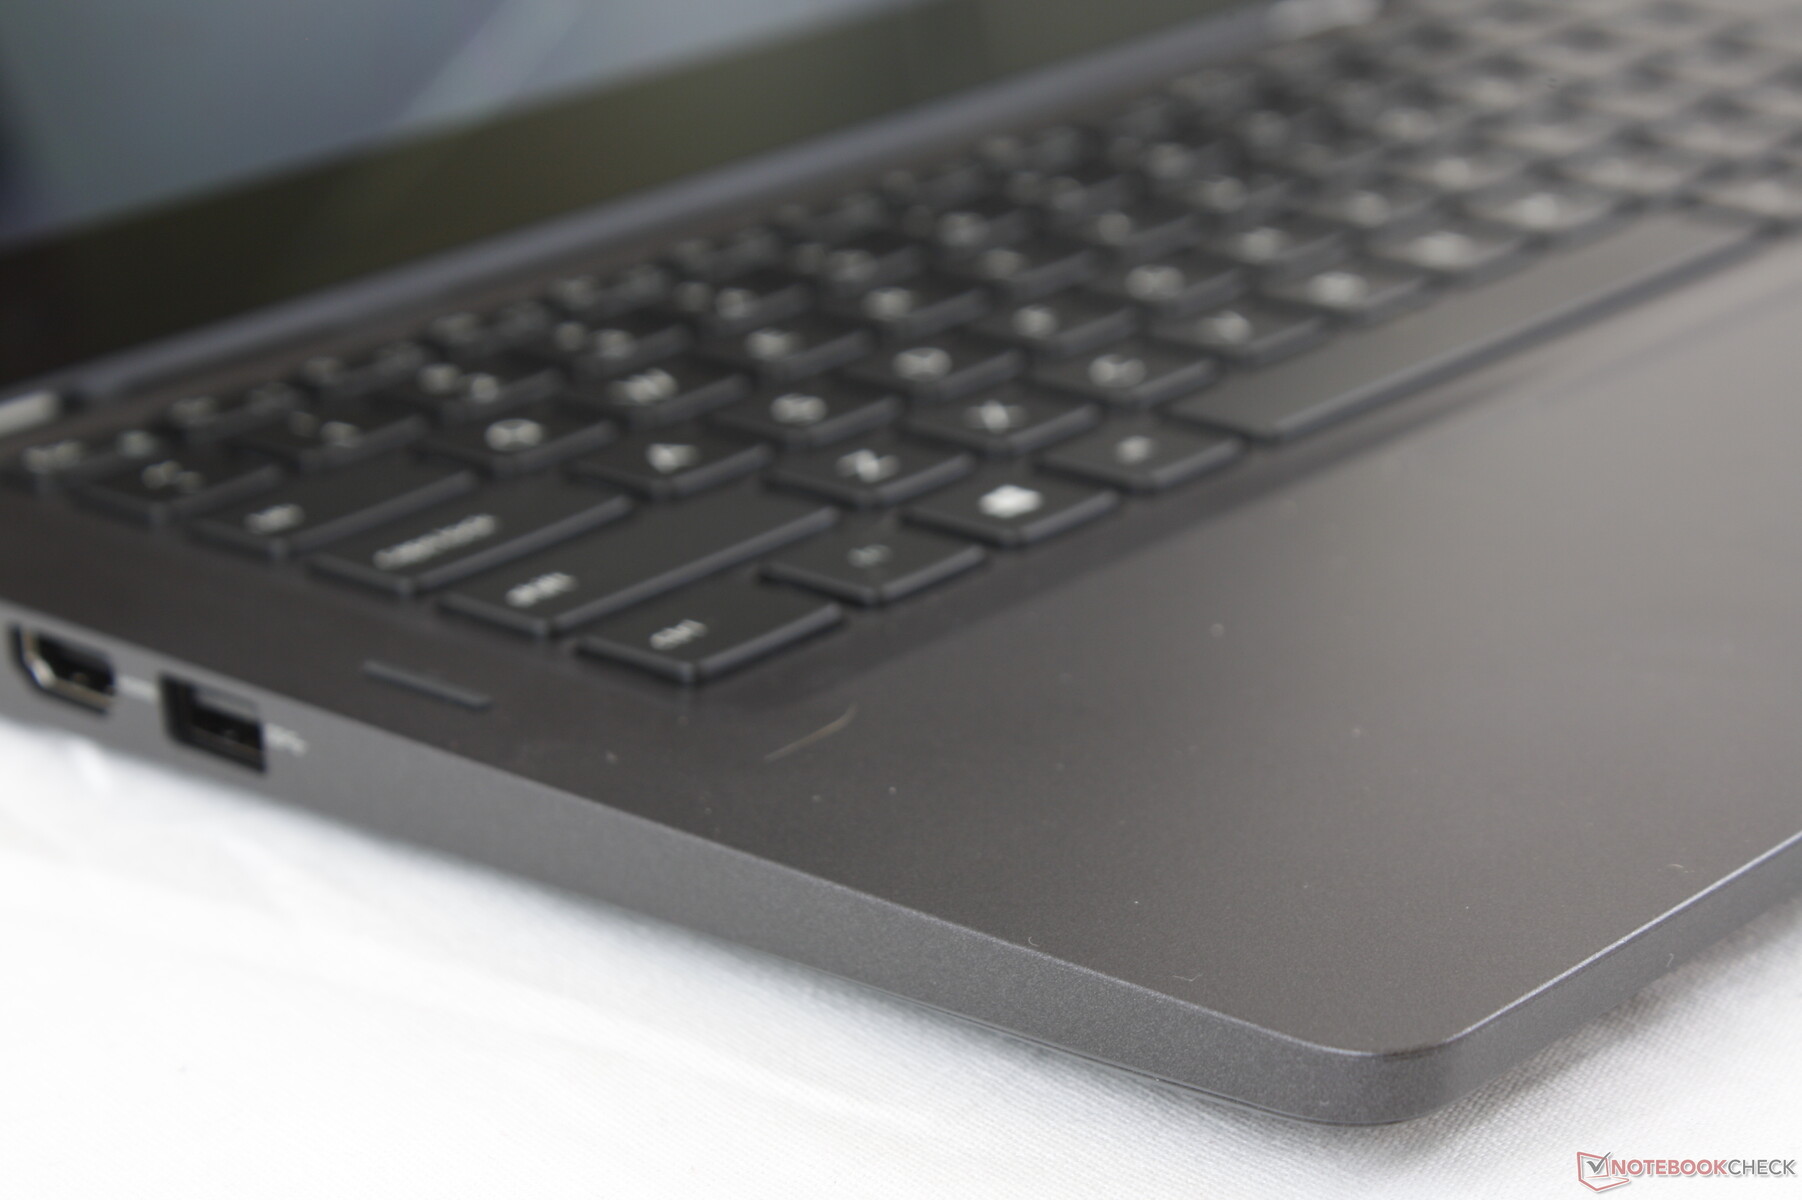
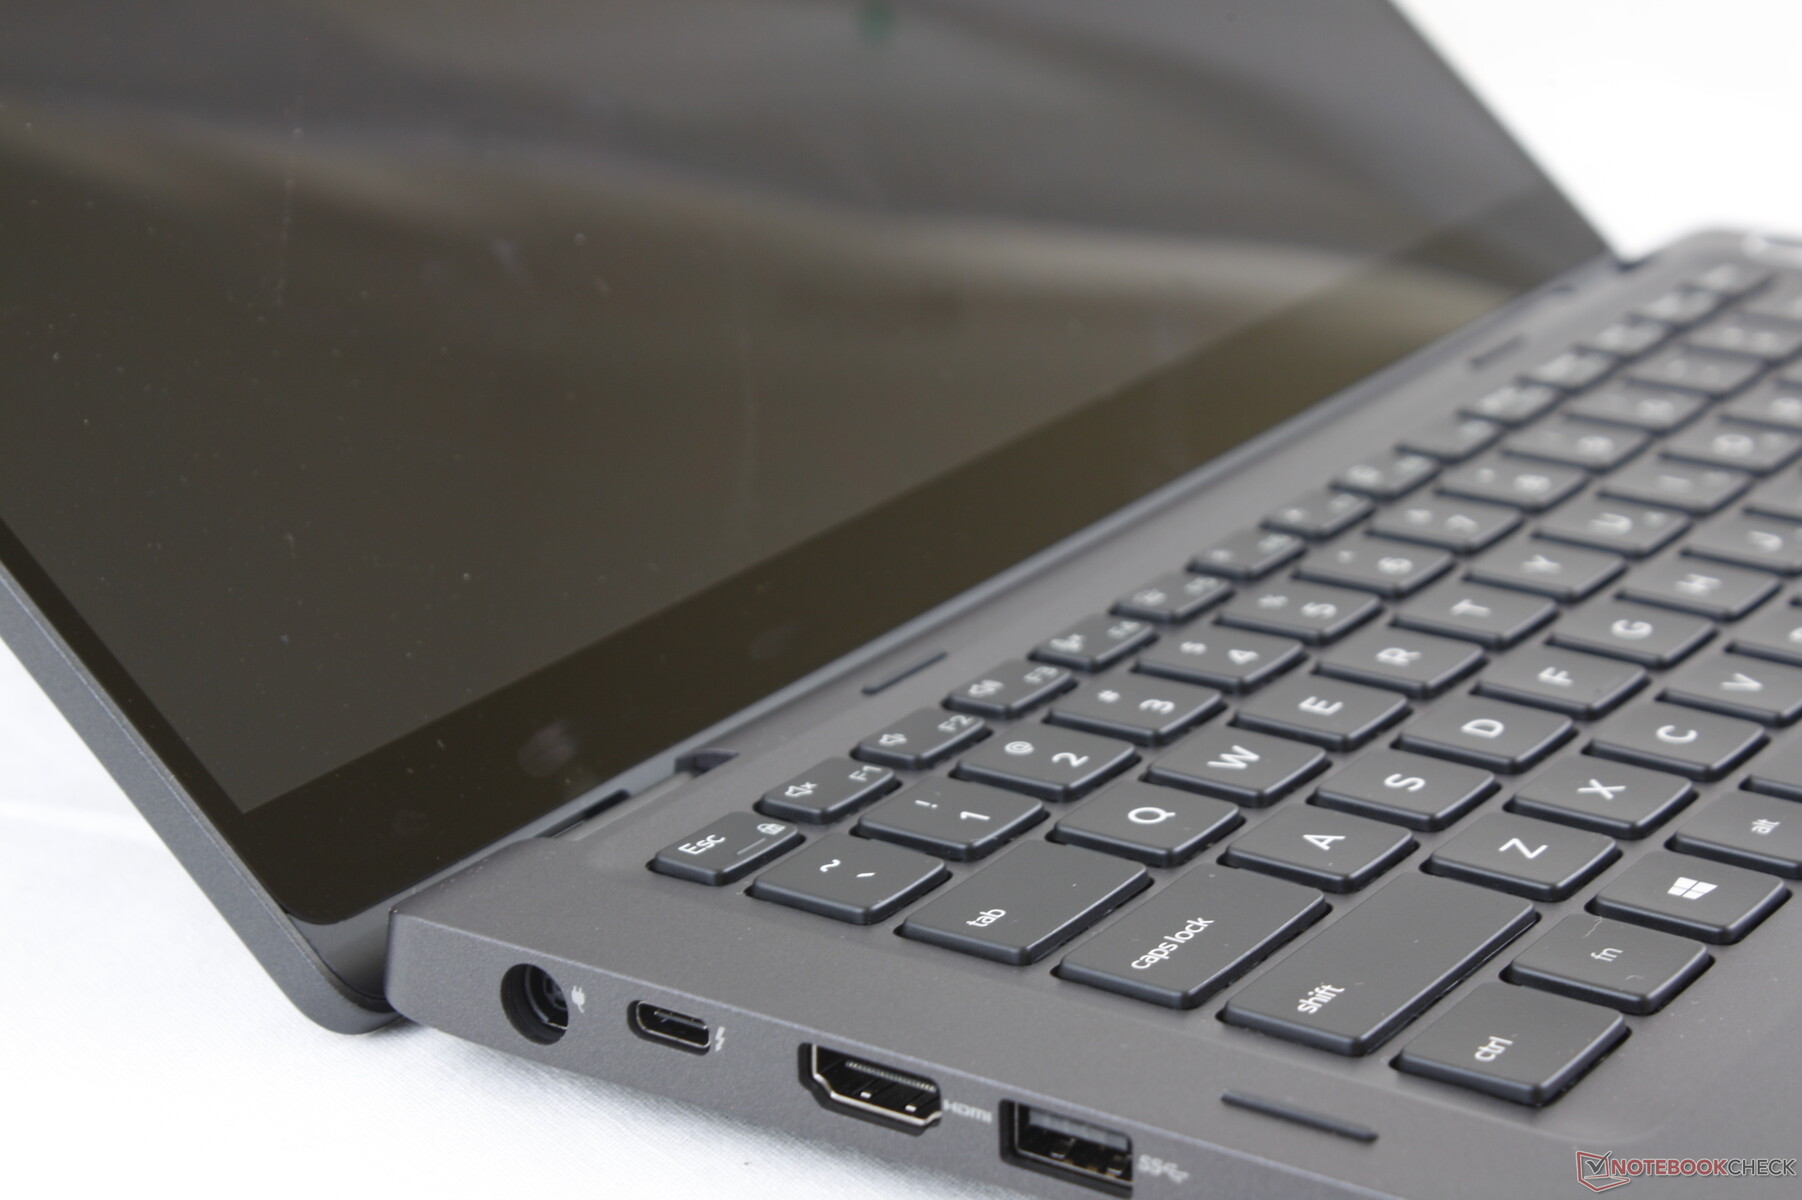
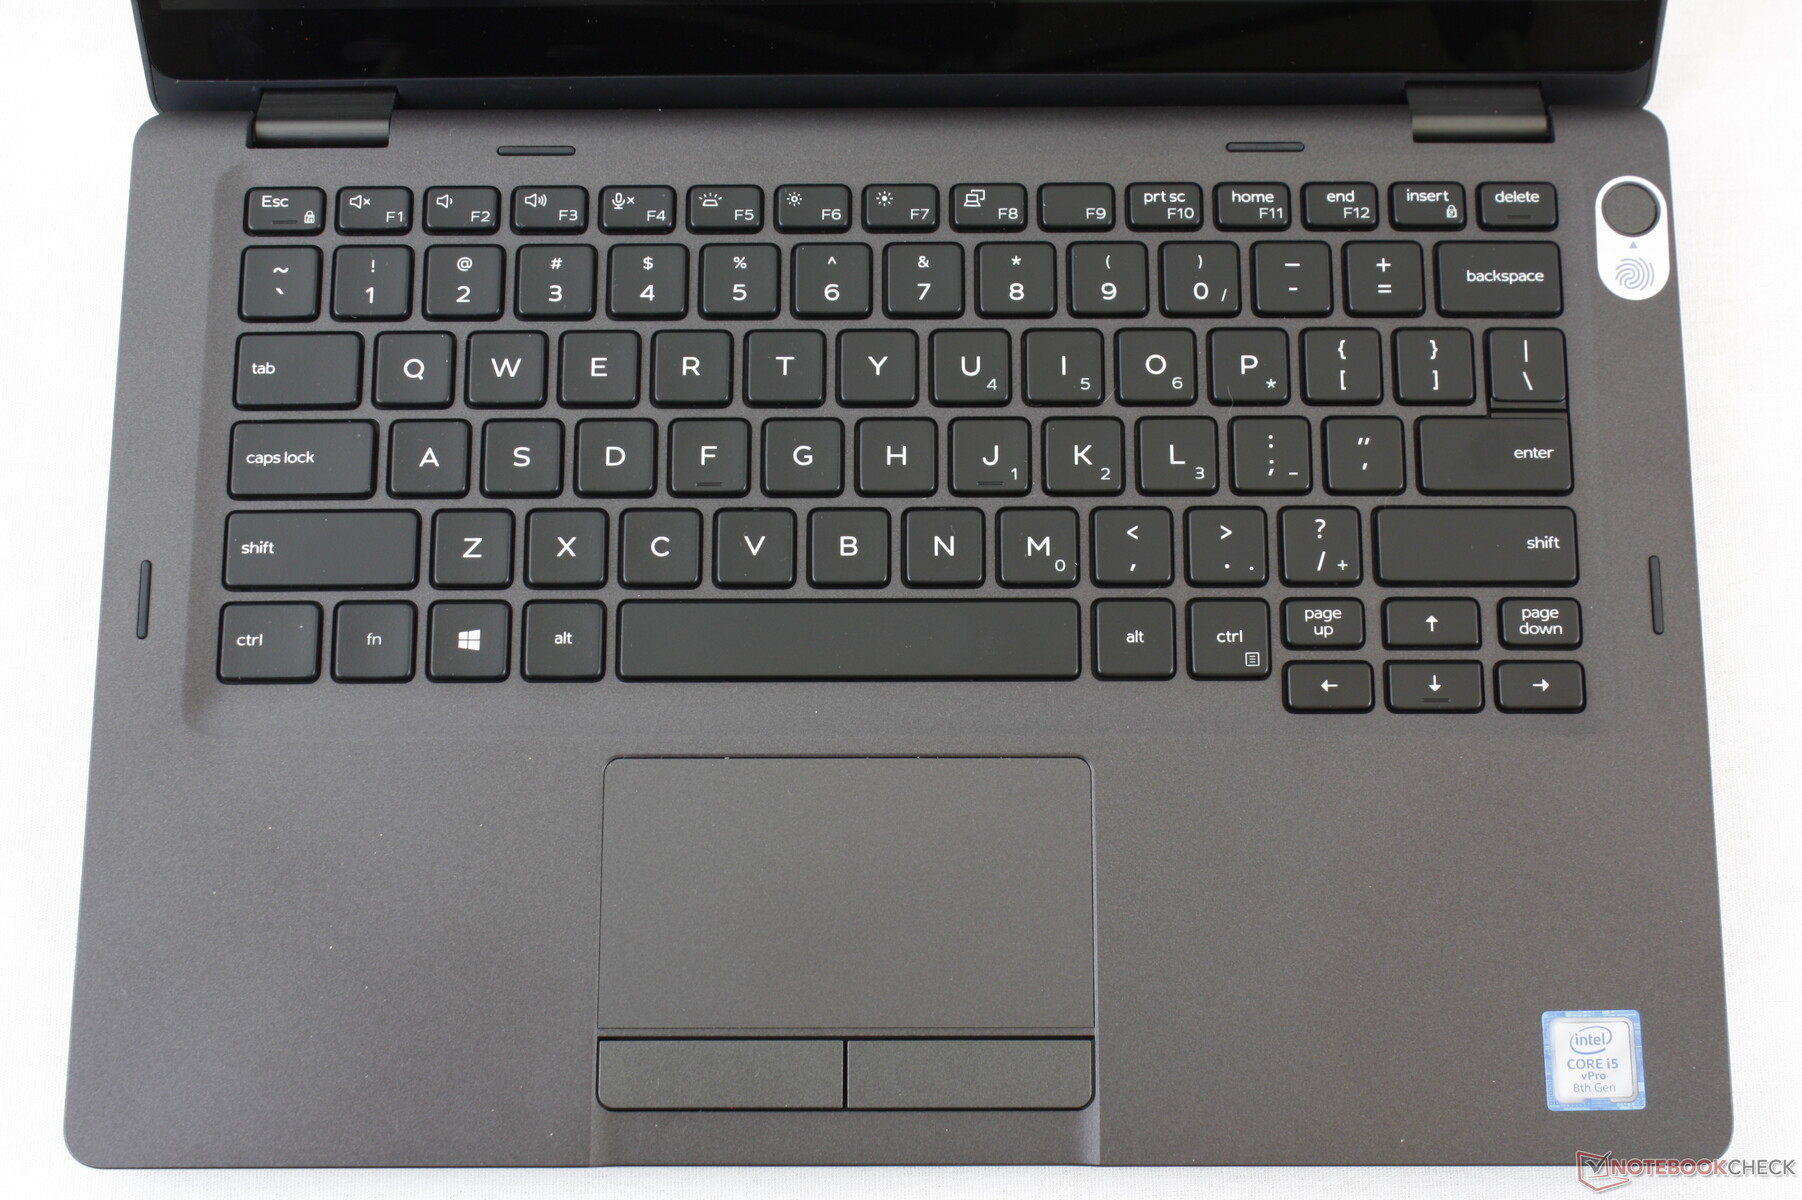
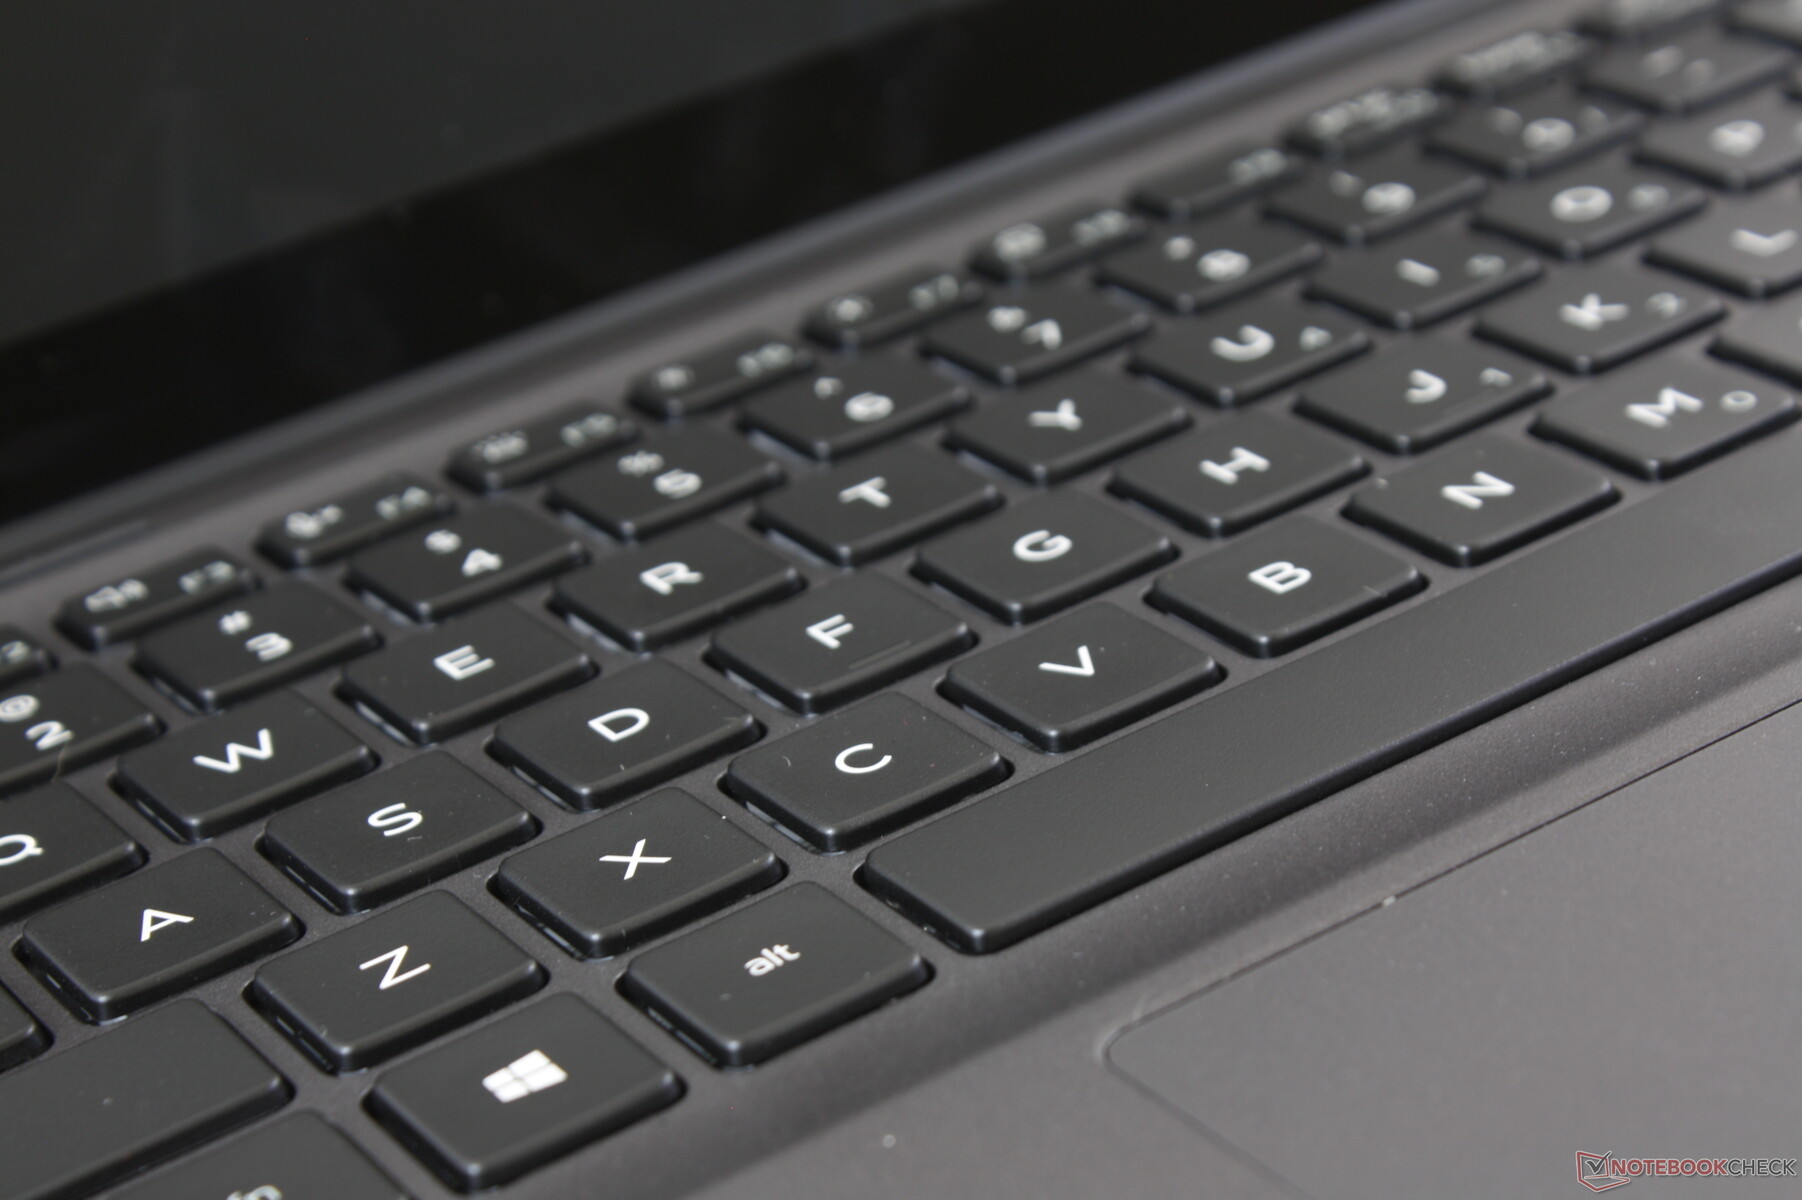
The backlit chiclet keyboard keys offer low clatter, moderate travel, and soft feedback for a generally quiet typing experience. Users who prefer firmer or crisper keys will find the keyboards on the HP Spectre 13 or EliteBook x360 1030 to be the better option.
A notable drawback relates to its layout of the keyboard. The Arrow keys, Page Up key, and Page Down key are half the size of the main QWERTY keys for a spongier and less satisfying feedback when pressed. Furthermore, these smaller keys are grouped together very closely and so accidental inputs can an issue especially for users with larger fingers. There's nothing more annoying that trying to scroll left or right on an Excel sheet only to accidentally jump up or down the entire page instead.
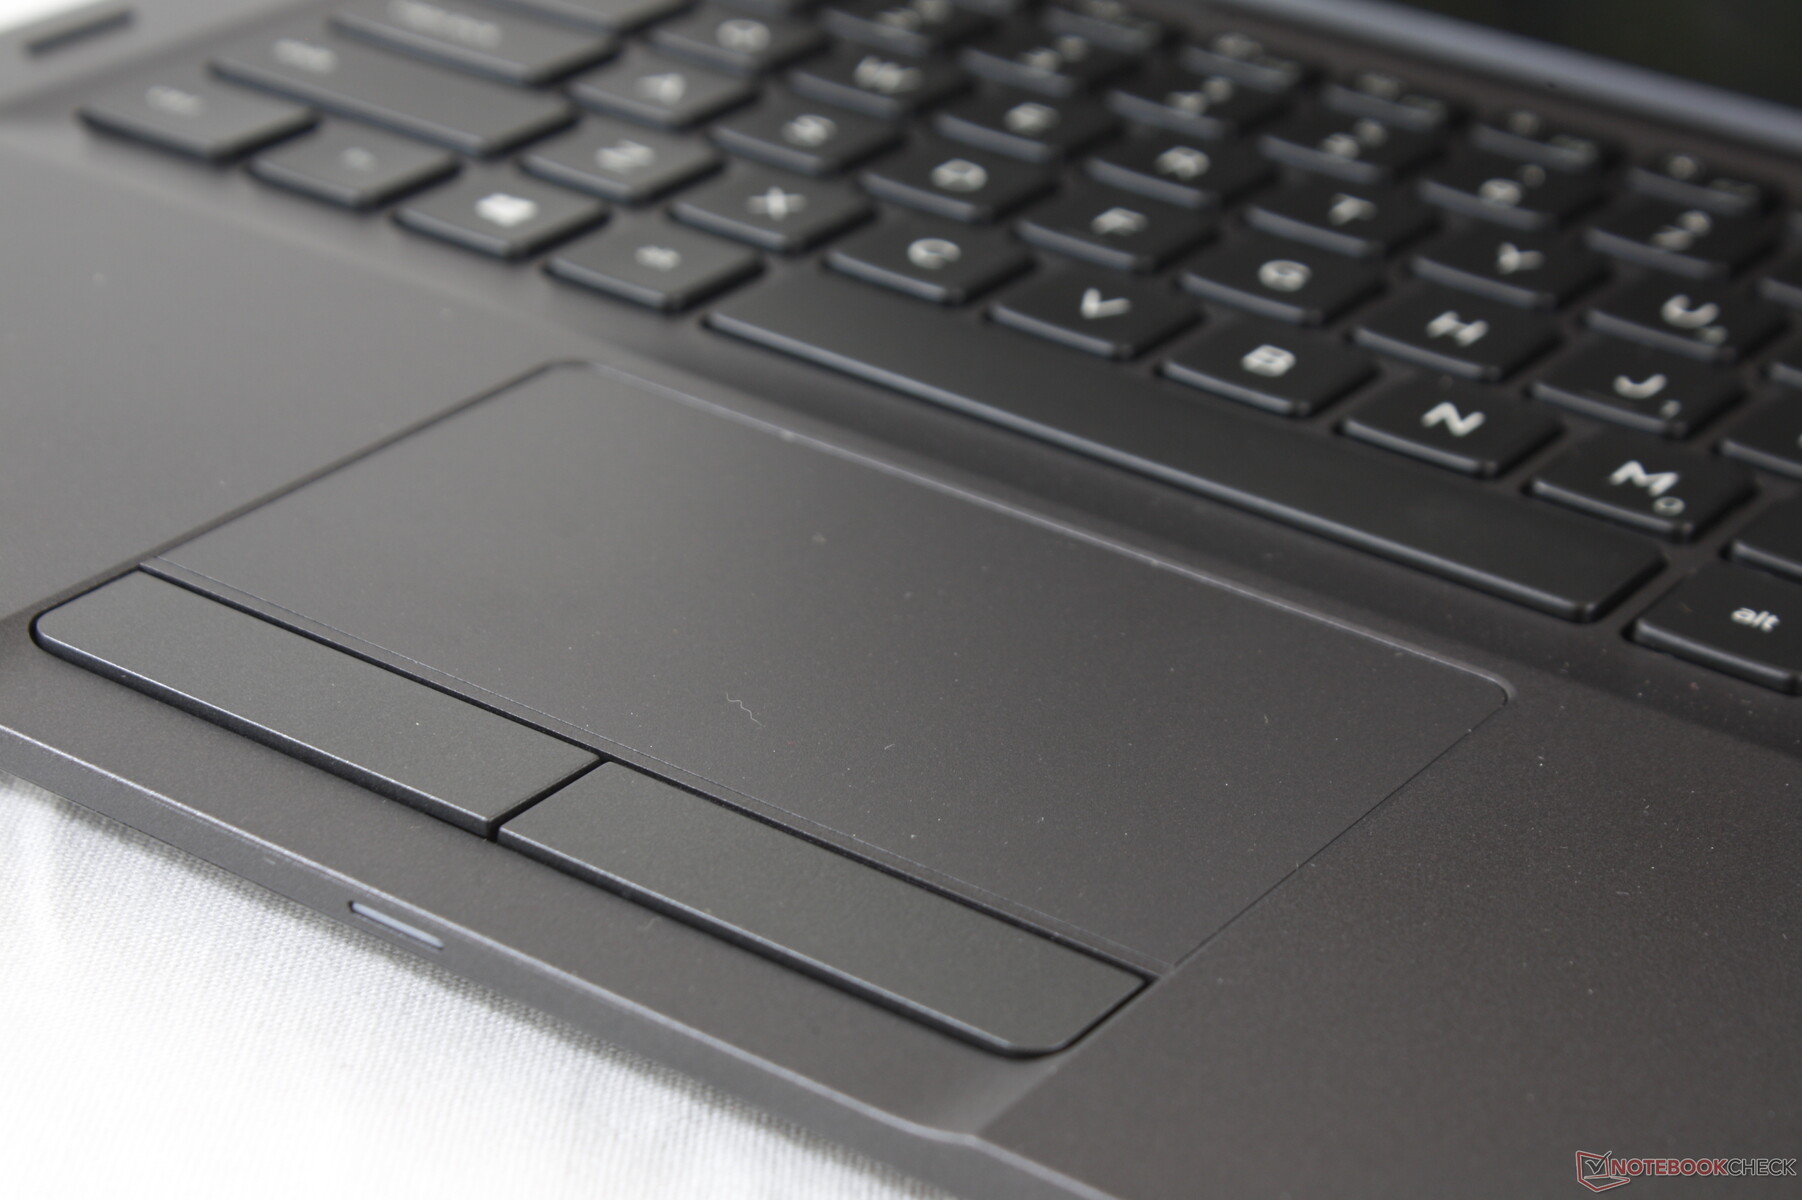
Touchpad
The trackpad is small (~9.2 x 5.1 cm) when compared to the trackpads of the XPS 13 (~10.5 x 6.0 cm) or Elitebook x360 1030 G3 (11.1 x 6.5 cm). Even so, we still prefer the trackpad on the Latitude 5300 2-in-1 because of its dedicated mouse keys. Clicks are more accurate and reliable than integrated clickpad keys which have a tendency to make dragging and dropping more difficult. The mouse keys here are actually quieter than expected with moderate travel and soft feedback.
Gliding on the slightly roughened trackpad surface is smooth when moving at fast or moderate speeds. There is slight sticking if moving at slower speeds, but we don't find it to be distracting during use.
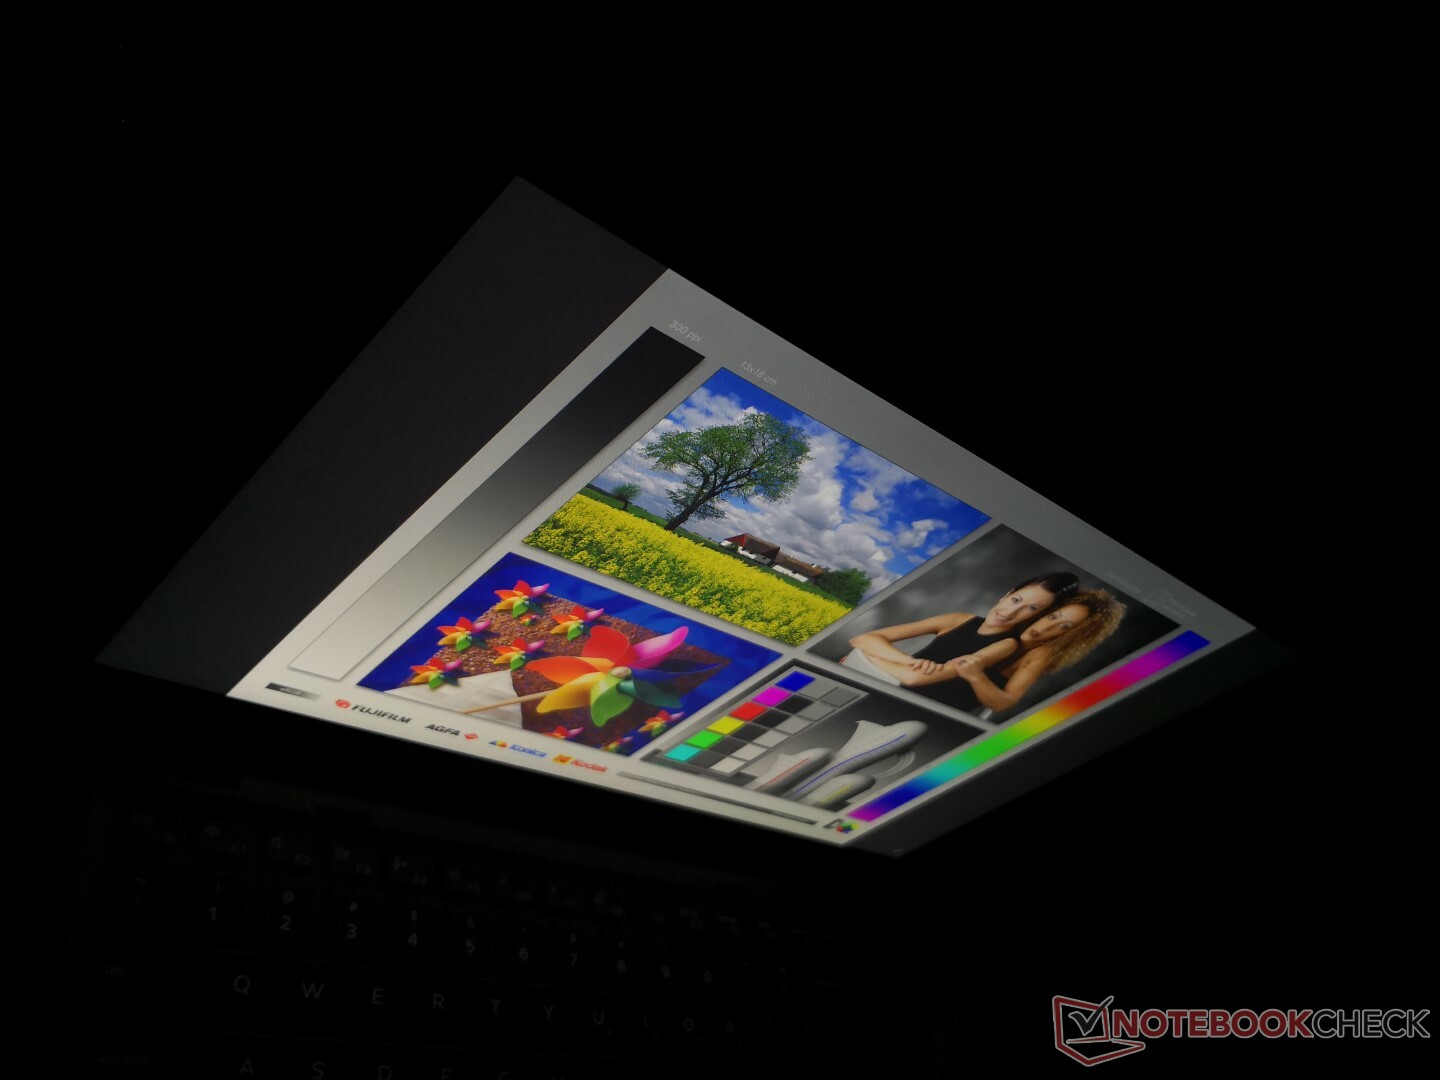
Display
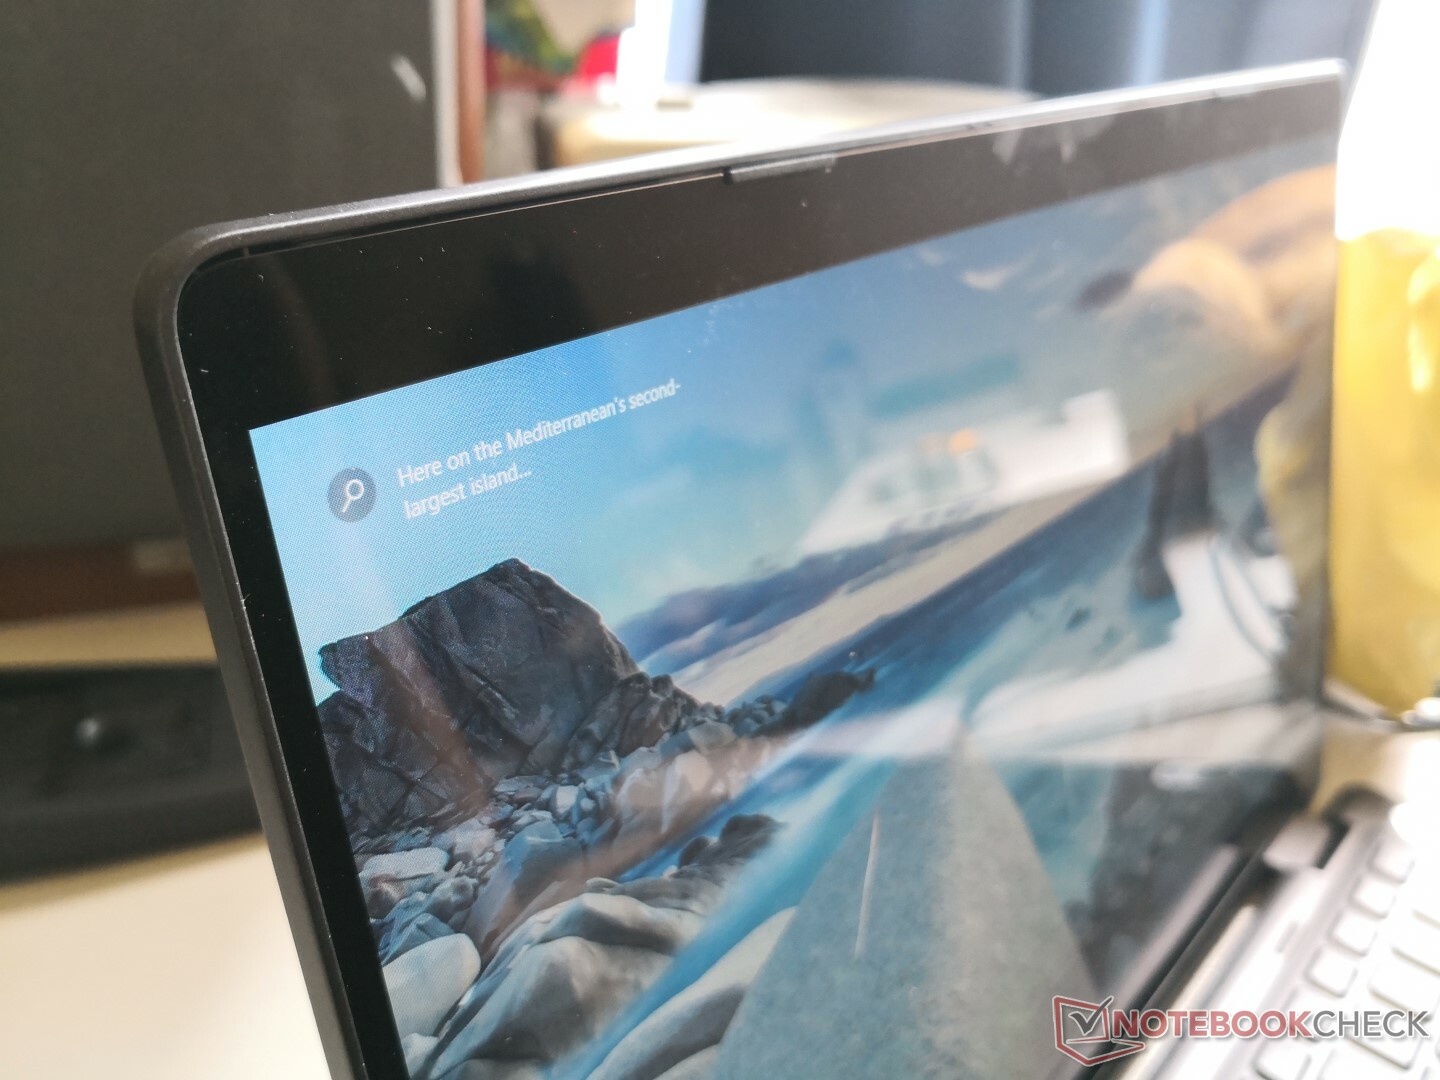
The Latitude 5300 2-in-1 uses an LG Philips LGD05DC IPS panel in contrast to the AU Optronics panel on the XPS 13 9380. Results are mixed because while black-white response times are faster for reduced ghosting, the backlight is dimmer at only about 300 nits. The competing Samsung Notebook 9 Pen and EliteBook x360 1030 G3 are both significantly brighter by almost 50 percent each. Having a very bright display is especially important for a convertible notebook as users are more likely to do work outdoors or on-the-go.
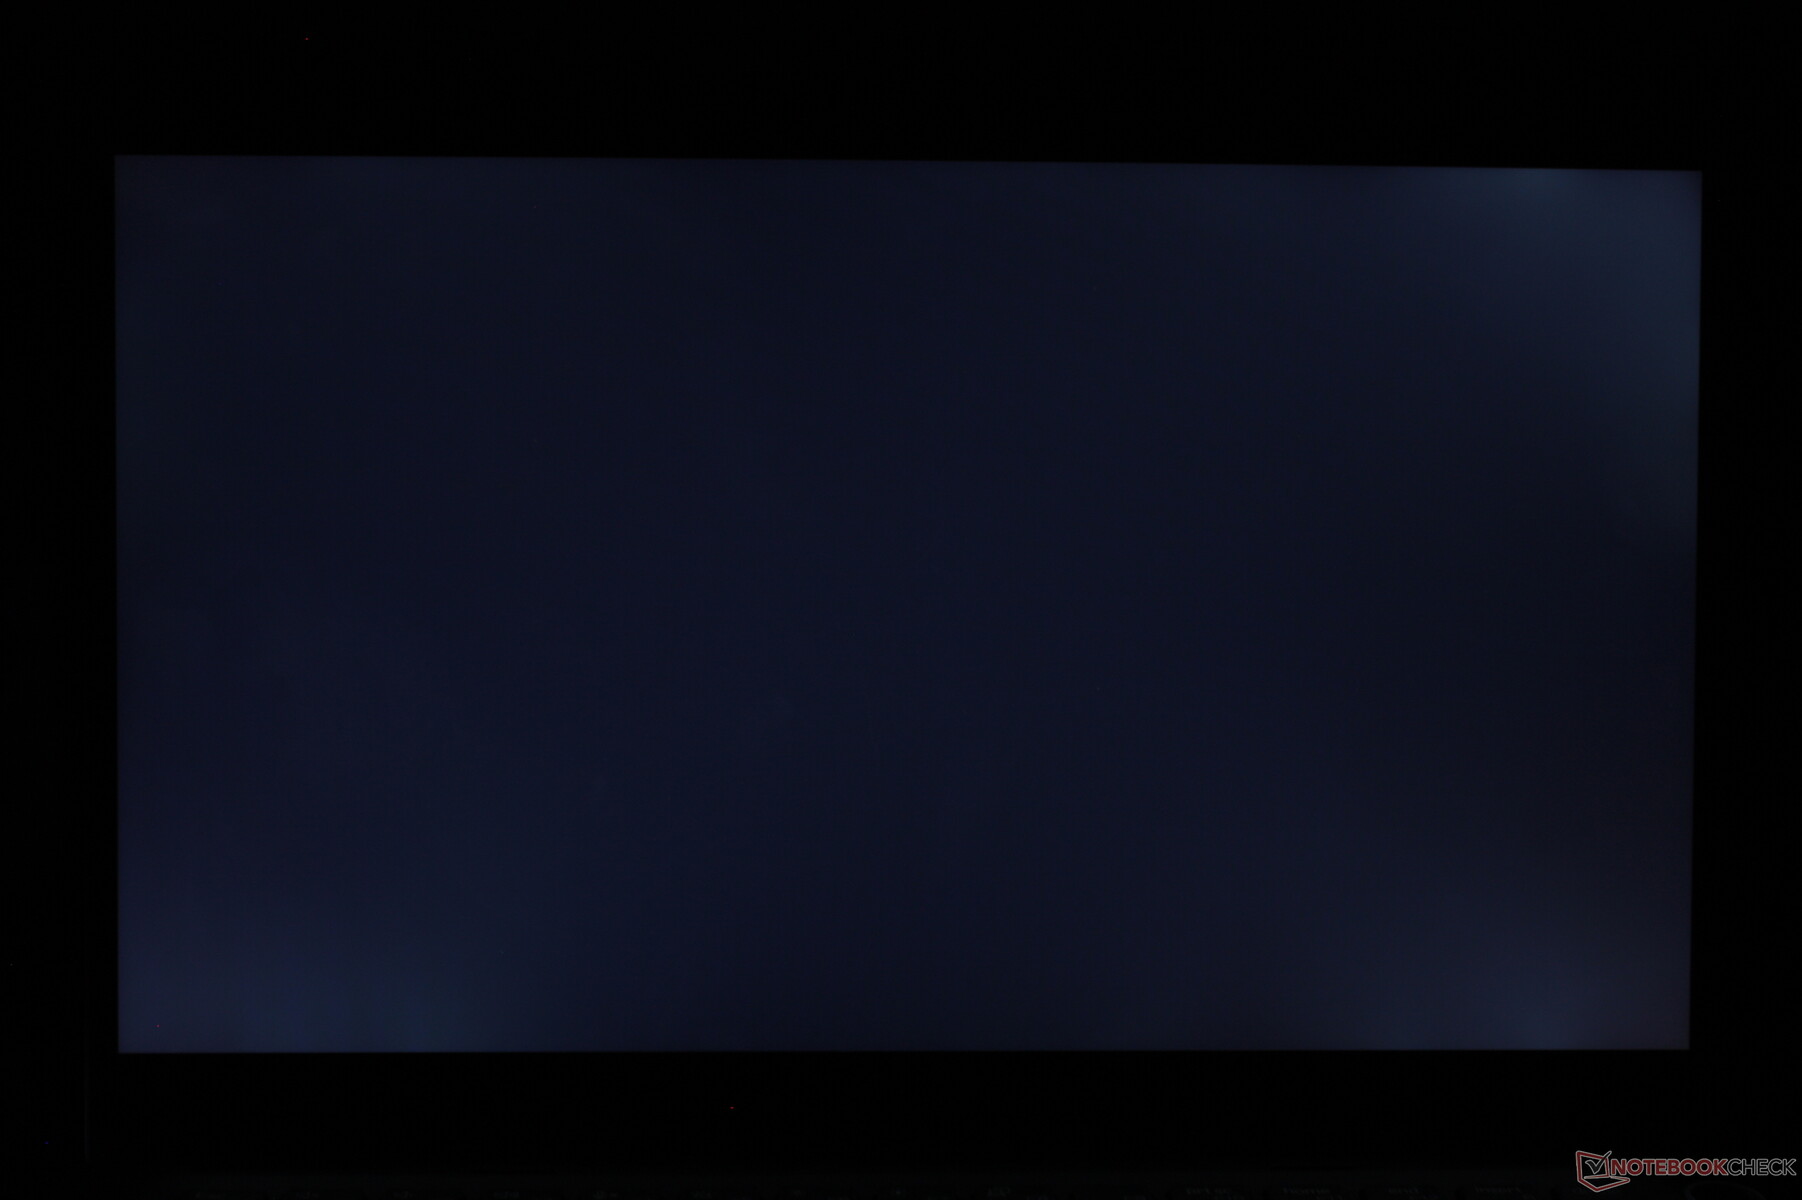
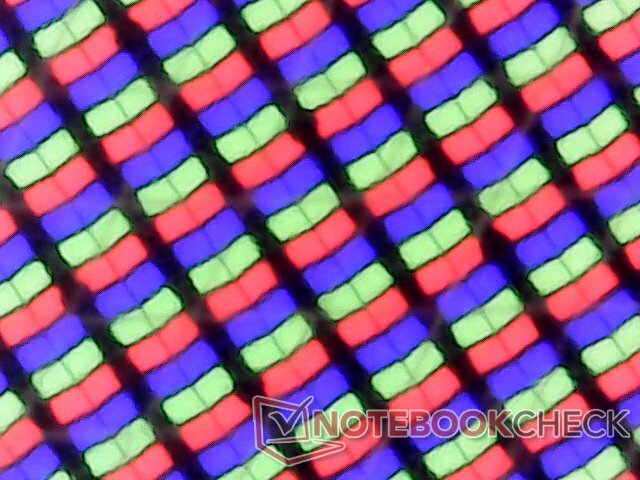
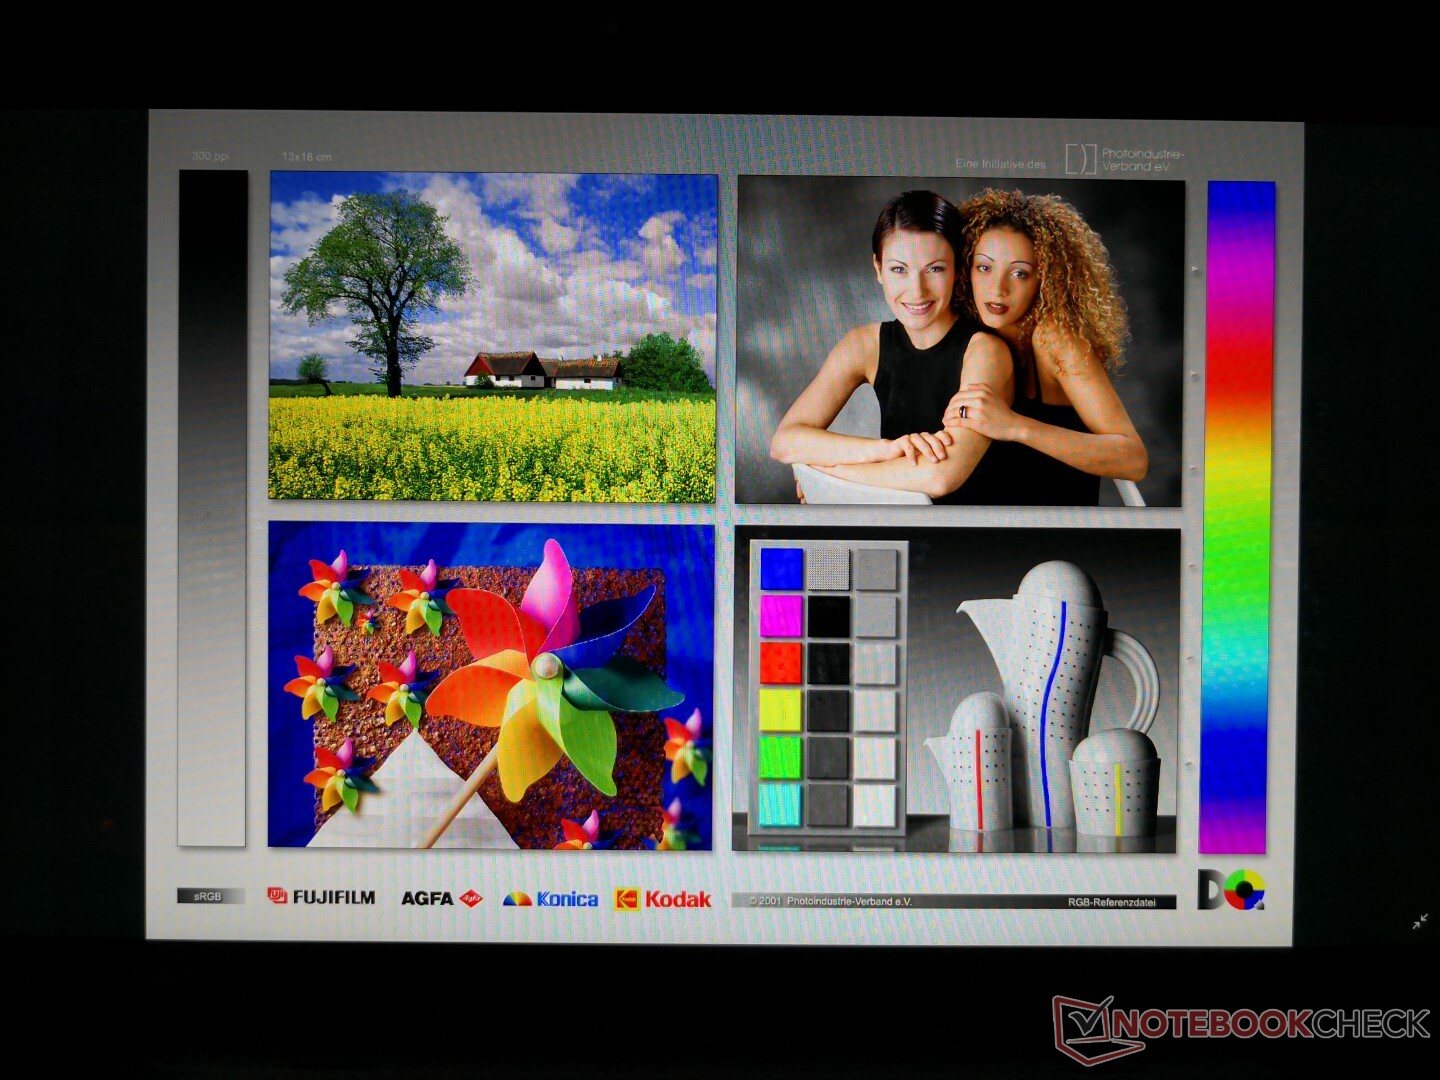
Onscreen content is crisp with no graininess issues as one would expect from a glossy panel. Our test unit exhibits slight uneven backlight bleeding around the corners that only becomes noticeable during video playback with black borders.
| |||||||||||||||||||||||||
Brightness Distribution: 89 %
Center on Battery: 316.2 cd/m²
Contrast: 1171:1 (Black: 0.27 cd/m²)
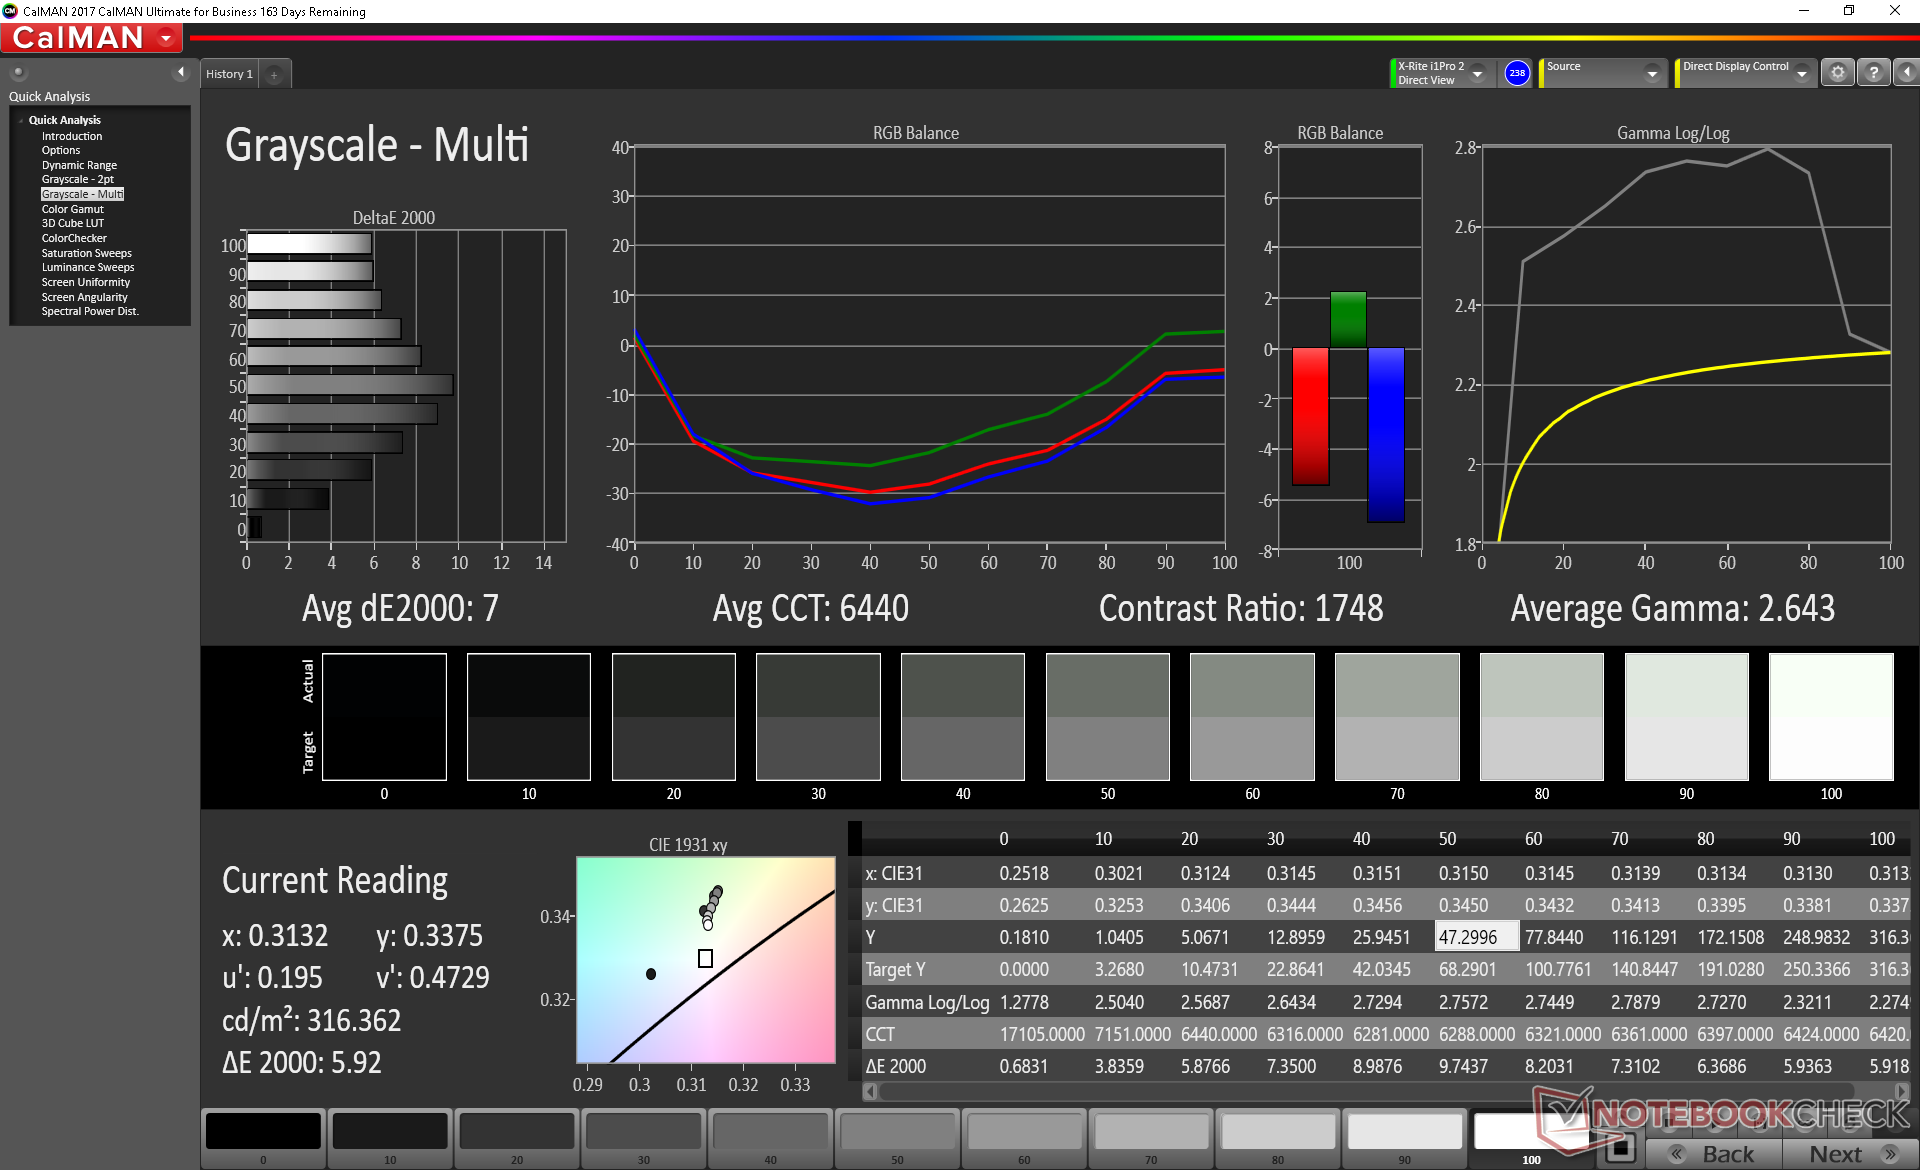
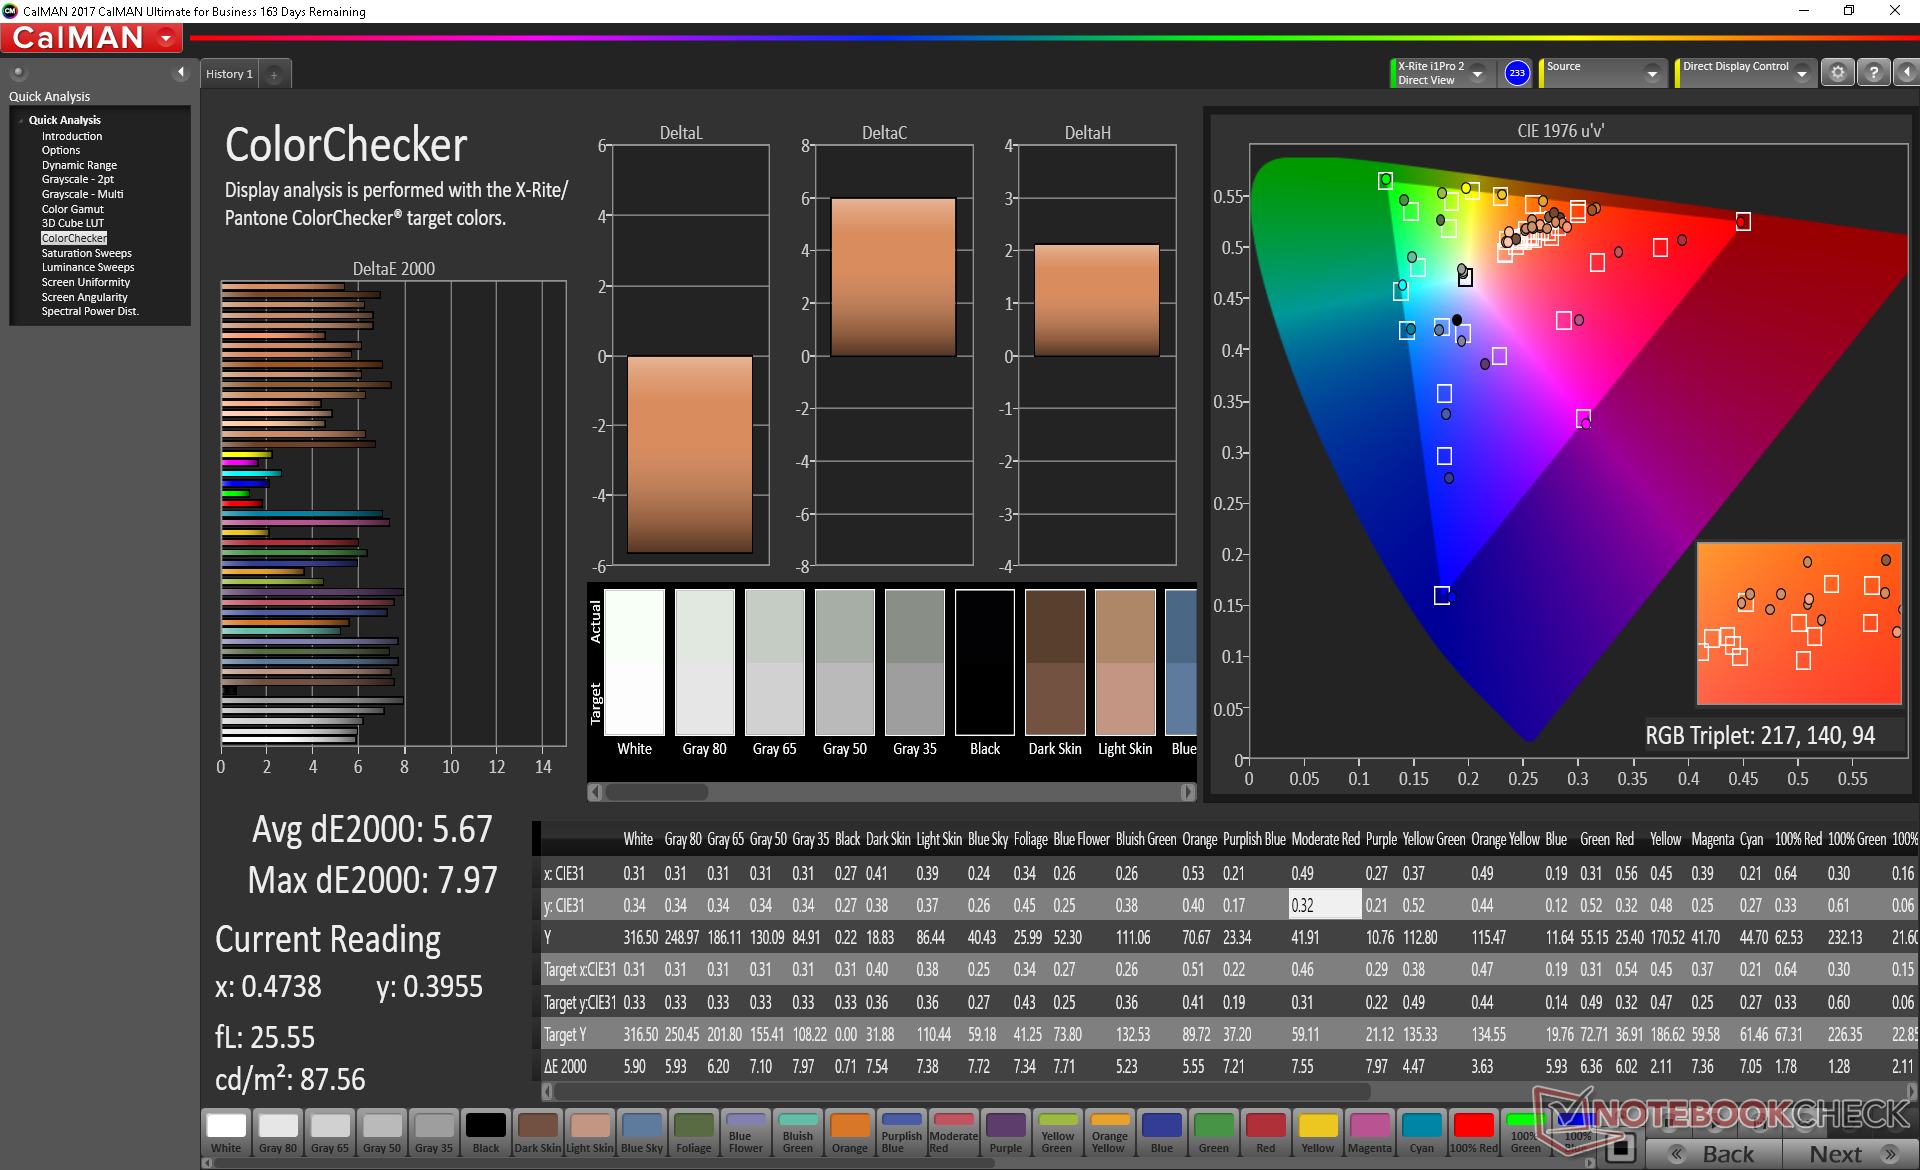
ΔE ColorChecker Calman: 5.67 | ∀{0.5-29.43 Ø4.71}
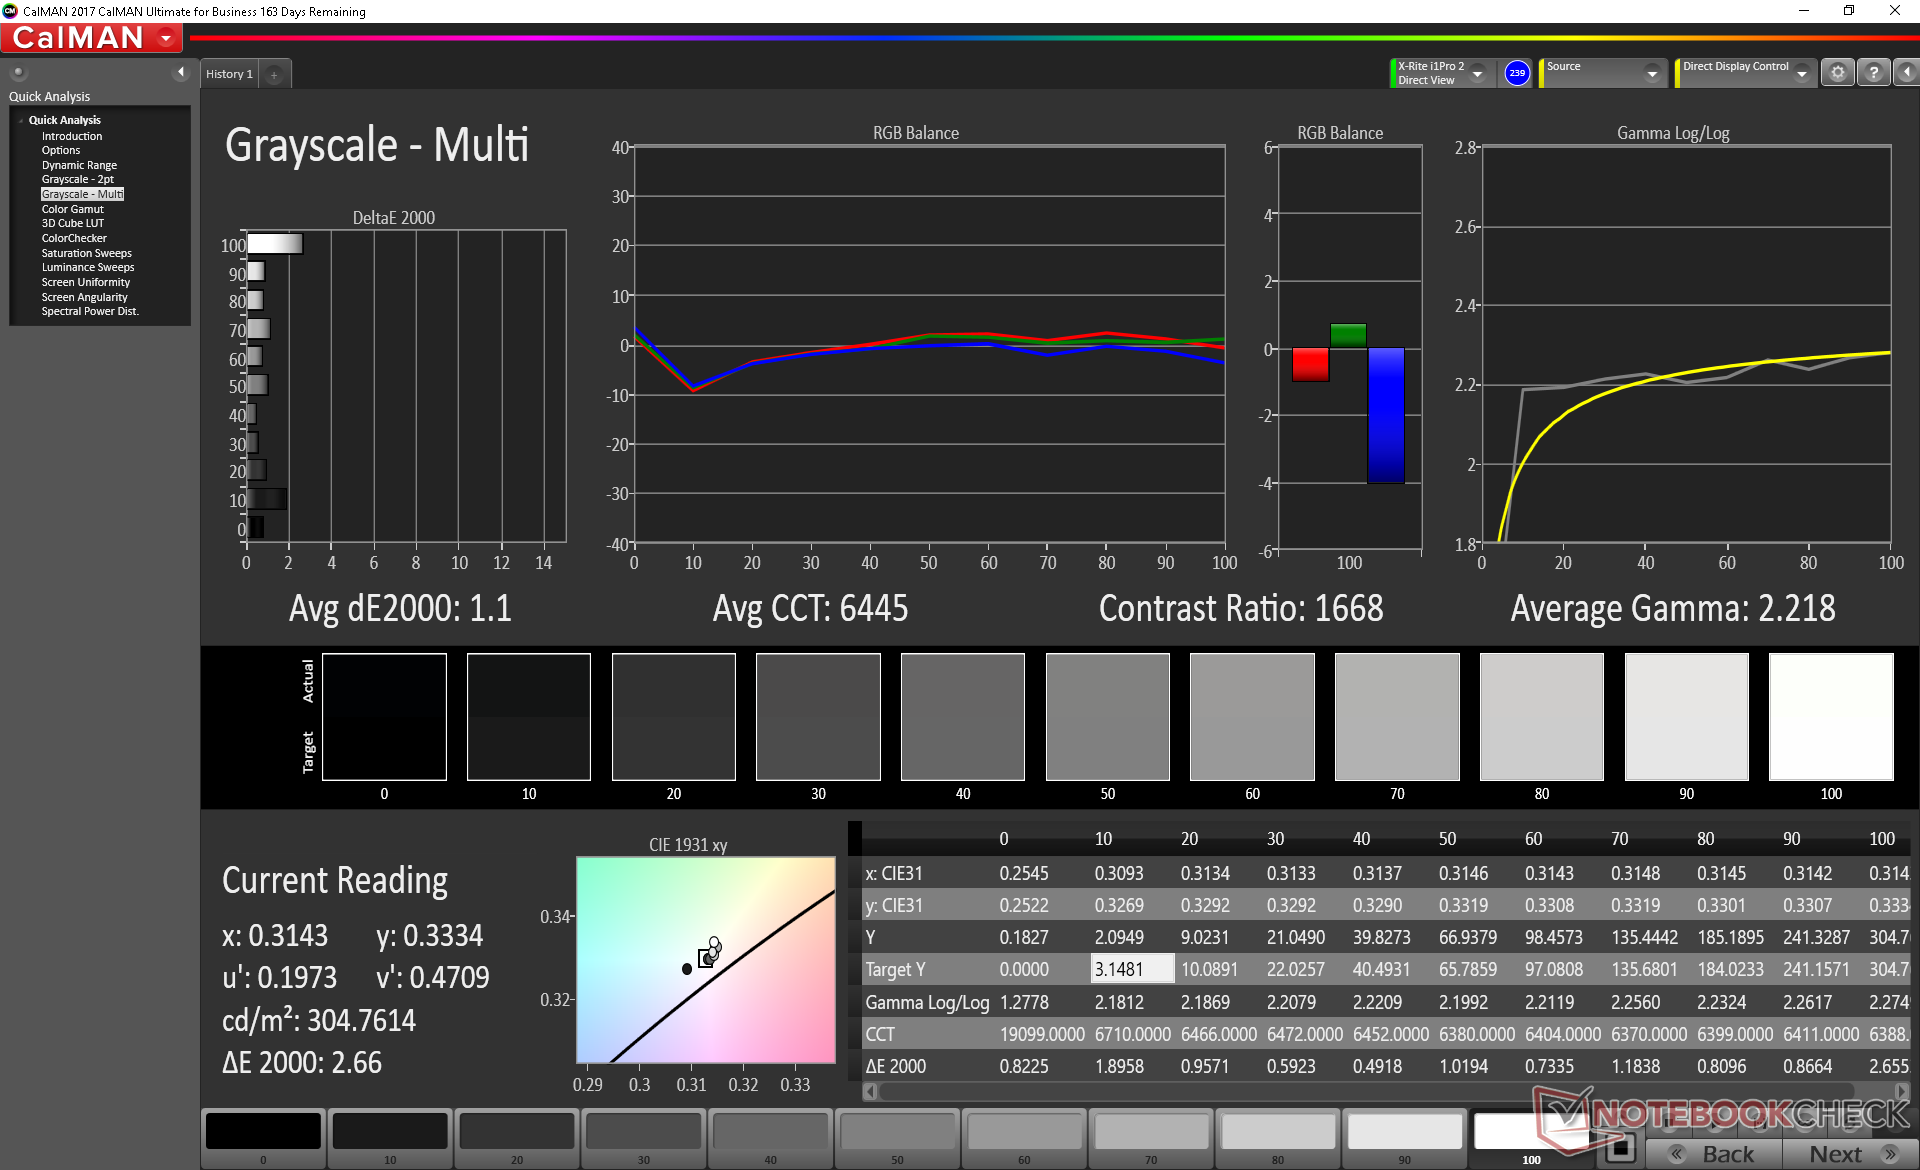
calibrated: 1.26
ΔE Greyscale Calman: 7 | ∀{0.09-98 Ø4.96}
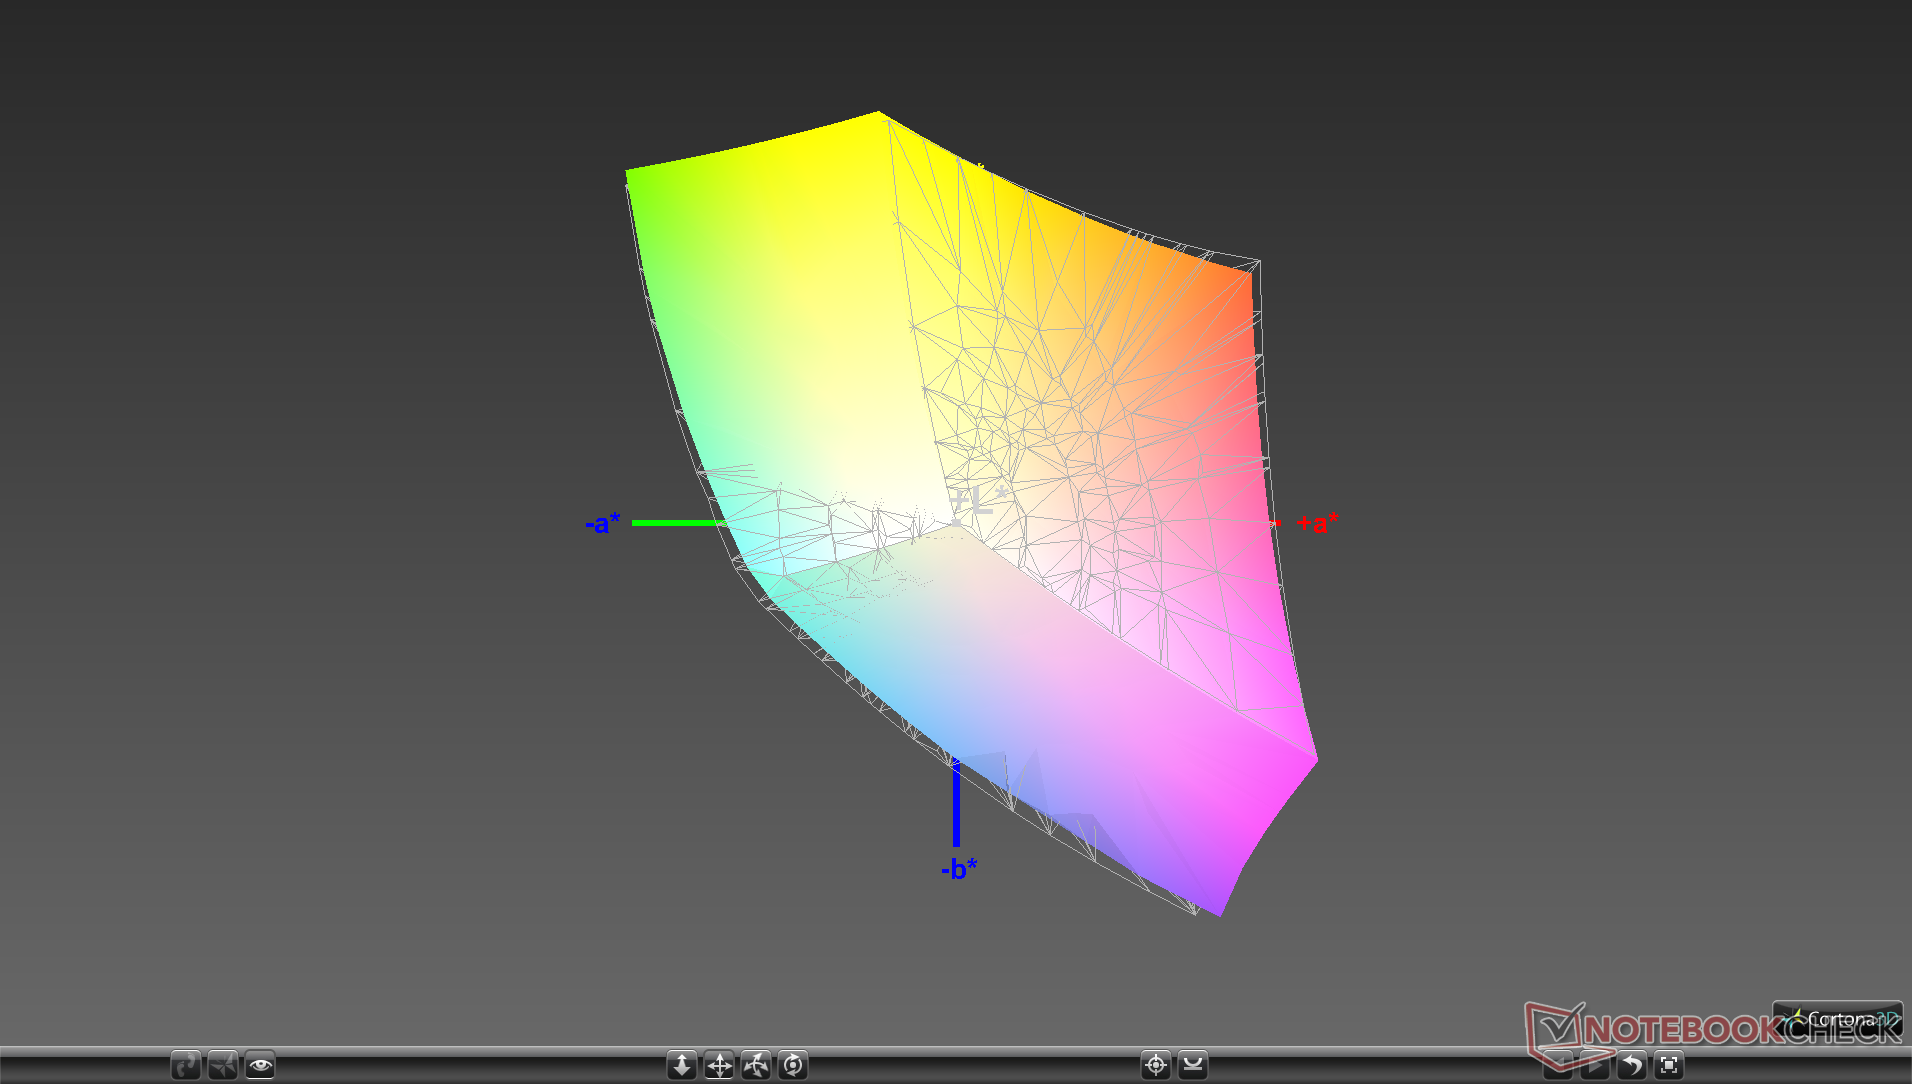
95.7% sRGB (Argyll 1.6.3 3D)
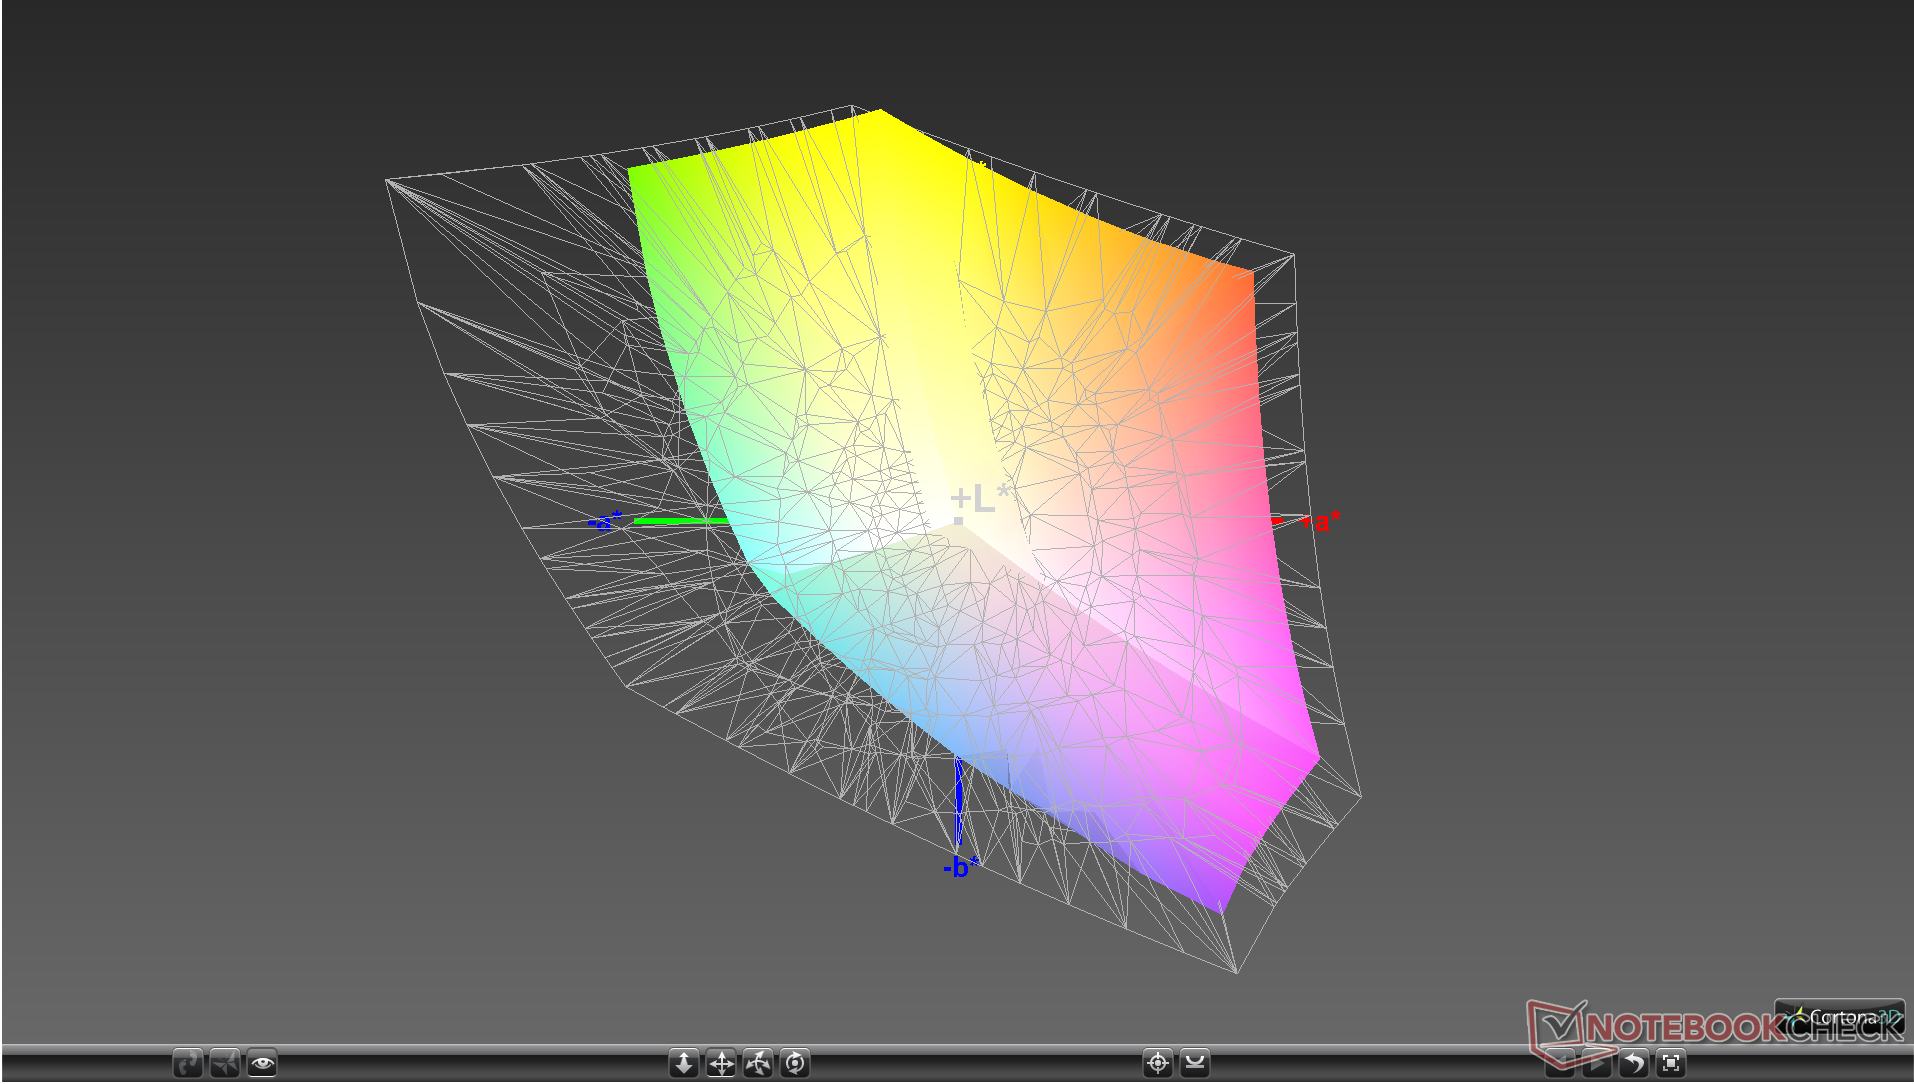
61.4% AdobeRGB 1998 (Argyll 1.6.3 3D)
66.5% AdobeRGB 1998 (Argyll 3D)
95.7% sRGB (Argyll 3D)
64.9% Display P3 (Argyll 3D)
Gamma: 2.64
CCT: 6440 K
| Dell Latitude 13 5300 2-in-1 LG Philips LGD05DC, IPS, 13.3", 1920x1080 | Lenovo ThinkPad X390-20Q1S02M00 LP133WF7-SPB1, IPS LED, 13.3", 1920x1080 | Samsung Notebook 9 NP930QAA BOE075E, IPS, 13.3", 1920x1080 | Dell XPS 13 9380 2019 ID: AUO 282B B133ZAN Dell: 90NTH, IPS, 13.3", 3840x2160 | HP Spectre x360 13t-ae000 LGD0588, IPS, 13.3", 3840x2160 | HP EliteBook x360 1030 G3 45X96UT Chi Mei CMN1380, IPS, 13.3", 1920x1080 | |
|---|---|---|---|---|---|---|
| Display | 0% | -1% | -2% | 8% | 3% | |
| Display P3 Coverage (%) | 64.9 | 65.3 1% | 65.4 1% | 64.7 0% | 71.9 11% | 66.7 3% |
| sRGB Coverage (%) | 95.7 | 95.9 0% | 91.5 -4% | 93.1 -3% | 98.1 3% | 98.6 3% |
| AdobeRGB 1998 Coverage (%) | 66.5 | 66.6 0% | 66.2 0% | 65.3 -2% | 73.1 10% | 68.7 3% |
| Response Times | -48% | -23% | -52% | -36% | -9% | |
| Response Time Grey 50% / Grey 80% * (ms) | 37.6 ? | 57.6 ? -53% | 49.2 ? -31% | 58 ? -54% | 51.6 ? -37% | 39.6 ? -5% |
| Response Time Black / White * (ms) | 24 ? | 34 ? -42% | 27.6 ? -15% | 36 ? -50% | 32.4 ? -35% | 27.2 ? -13% |
| PWM Frequency (Hz) | 3049 ? | 26040 ? | ||||
| Screen | 25% | -5% | 2% | 19% | 17% | |
| Brightness middle (cd/m²) | 316.2 | 356 13% | 473 50% | 404 28% | 329.8 4% | 467.2 48% |
| Brightness (cd/m²) | 298 | 336 13% | 441 48% | 389 31% | 318 7% | 445 49% |
| Brightness Distribution (%) | 89 | 88 -1% | 88 -1% | 85 -4% | 74 -17% | 91 2% |
| Black Level * (cd/m²) | 0.27 | 0.16 41% | 0.57 -111% | 0.37 -37% | 0.25 7% | 0.4 -48% |
| Contrast (:1) | 1171 | 2225 90% | 830 -29% | 1092 -7% | 1319 13% | 1168 0% |
| Colorchecker dE 2000 * | 5.67 | 3.6 37% | 3.72 34% | 3.72 34% | 2.37 58% | 2.41 57% |
| Colorchecker dE 2000 max. * | 7.97 | 5.5 31% | 7.83 2% | 7.38 7% | 4.08 49% | 5.58 30% |
| Colorchecker dE 2000 calibrated * | 1.26 | 1.1 13% | 2.14 -70% | 2.06 -63% | 1.33 -6% | |
| Greyscale dE 2000 * | 7 | 4.7 33% | 5.1 27% | 4.44 37% | 2.8 60% | 3.7 47% |
| Gamma | 2.64 83% | 2.48 89% | 2.31 95% | 2.34 94% | 2.145 103% | 2.37 93% |
| CCT | 6440 101% | 6374 102% | 7569 86% | 7095 92% | 6441 101% | 7158 91% |
| Color Space (Percent of AdobeRGB 1998) (%) | 61.4 | 61.3 0% | 58.9 -4% | 60 -2% | 67 9% | 62.5 2% |
| Color Space (Percent of sRGB) (%) | 95.7 | 95.7 0% | 90.8 -5% | 93 -3% | 98 2% | 99.6 4% |
| Total Average (Program / Settings) | -8% /
11% | -10% /
-7% | -17% /
-6% | -3% /
10% | 4% /
11% |
* ... smaller is better
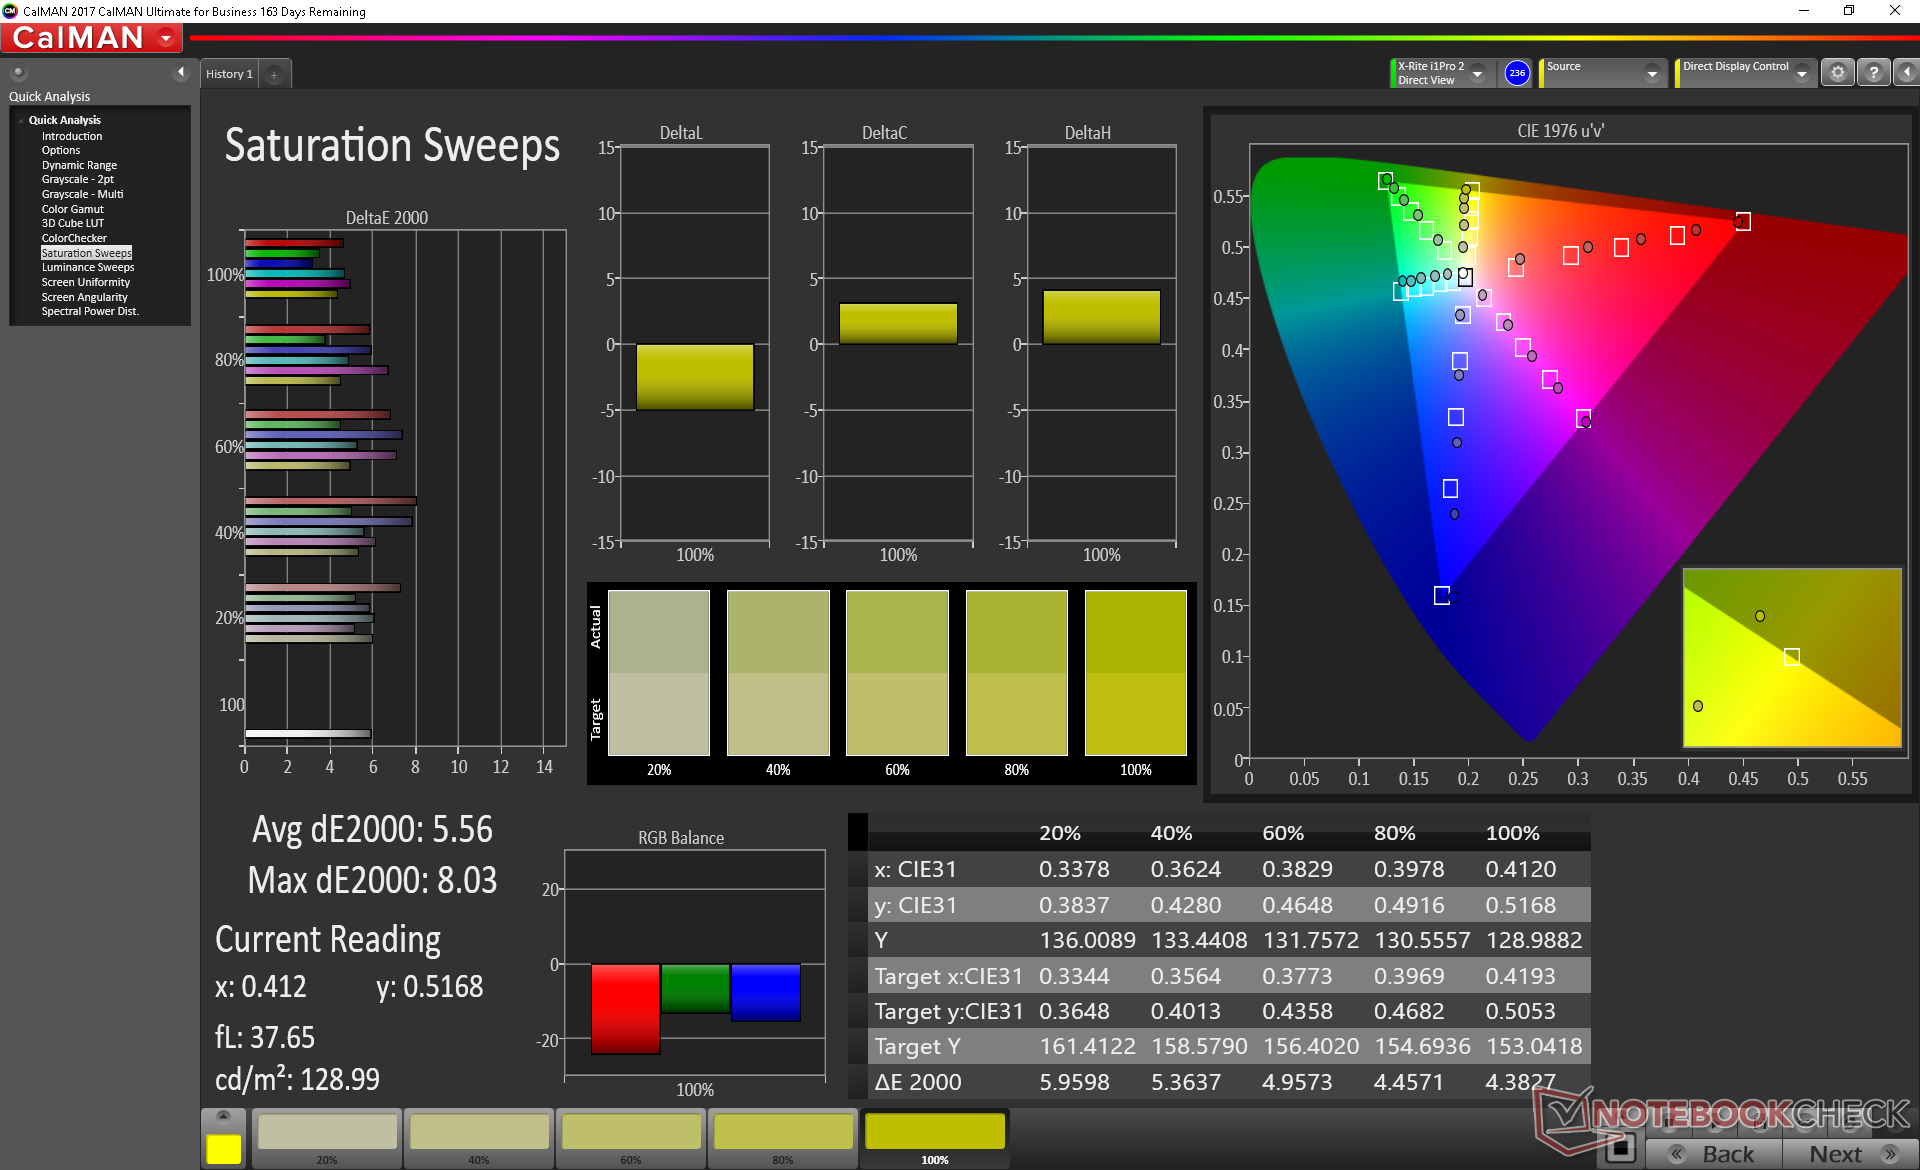
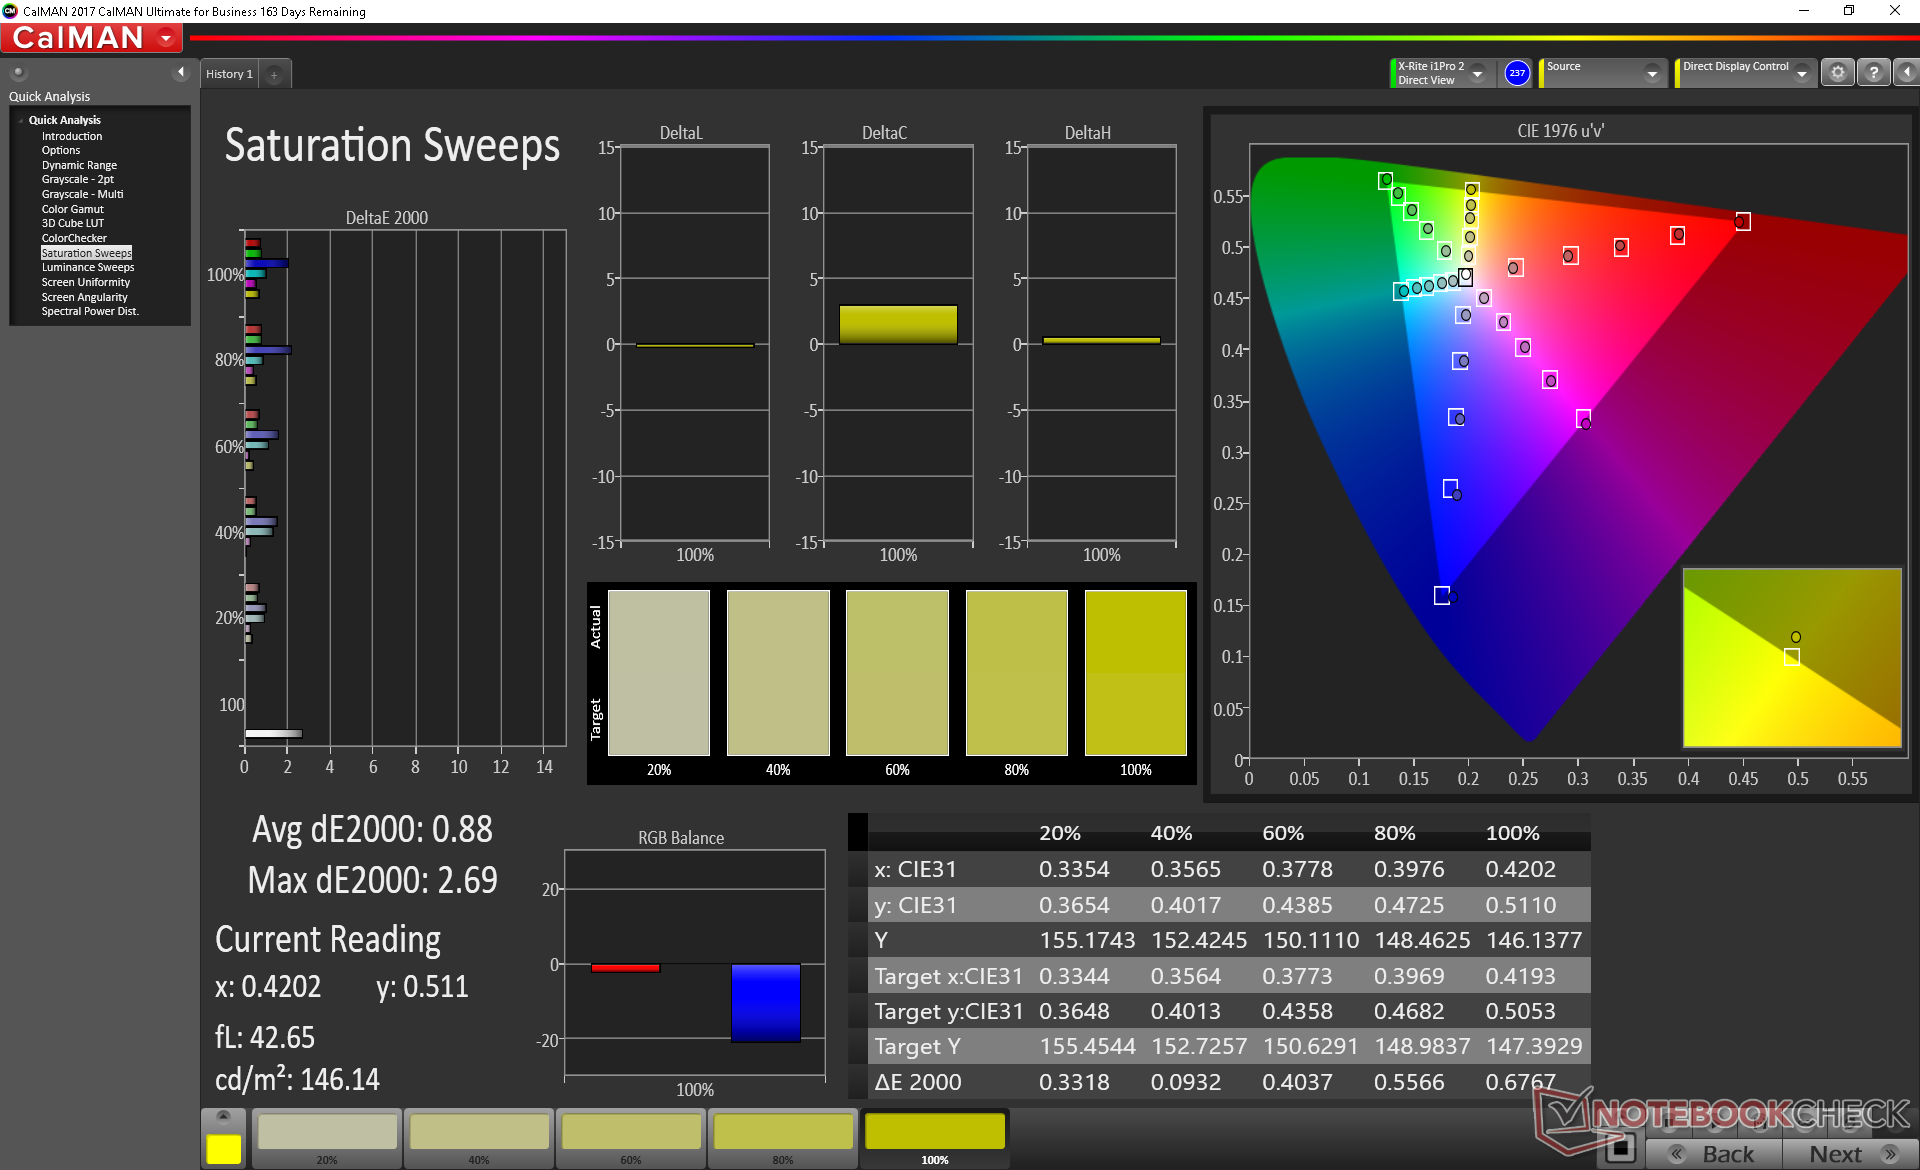
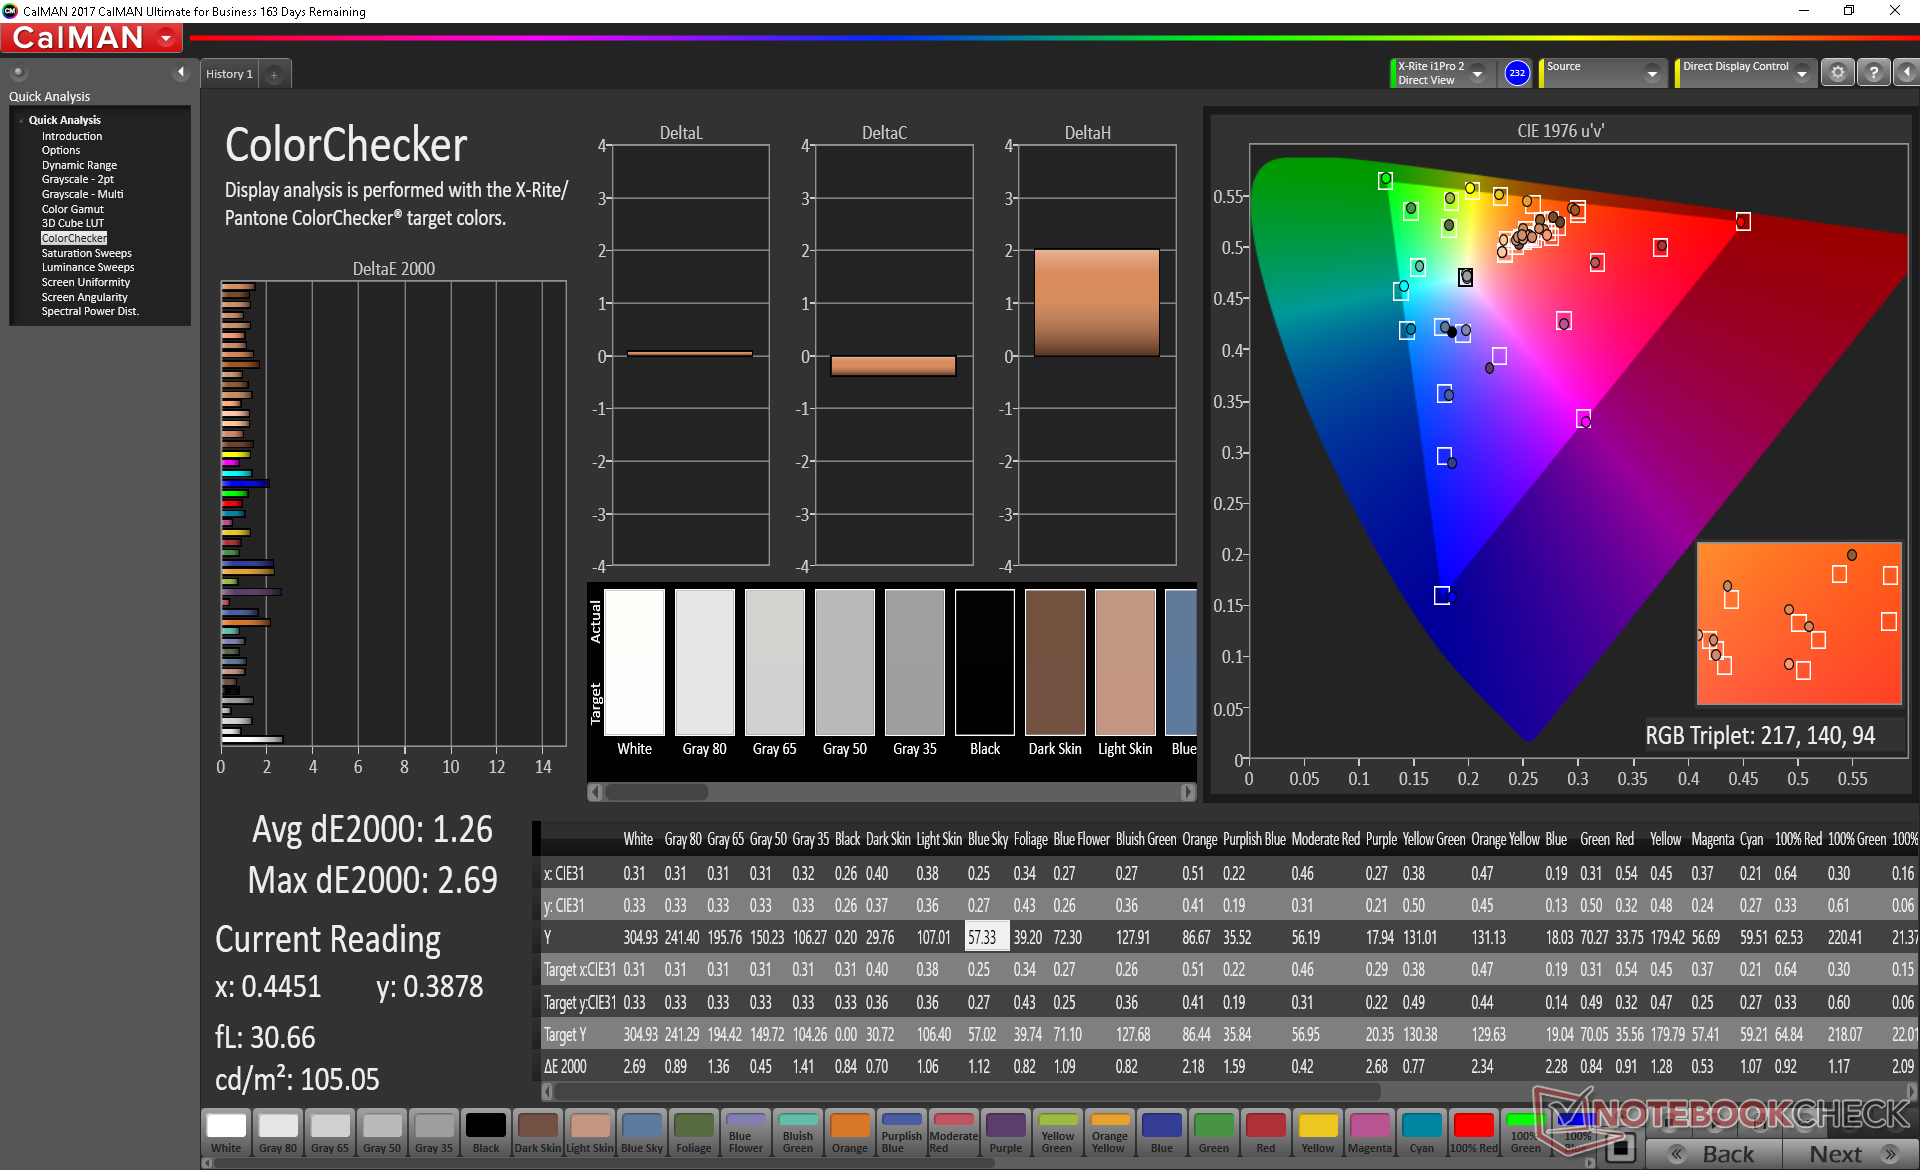
Color space covers sRGB almost in its entirety to be comparable to most flagship consumer Ultrabooks including Dell's own XPS 13. For a business subnotebook, colors are deeper than many others in the same category including the new HP ProBook 430 G6.
Further measurements with an X-Rite colorimeter reveal inaccurate grayscale and colors out of the box which is disappointing considering the wide color gamut of the panel. A calibration addresses these shortcomings for a significantly more accurate display; grayscale and ColorChecker deltaE values drop from 7 and 5.67 to just 1.1 and 1.26, respectively. We recommend an end-user calibration if possible to get the most out of the display.
Display Response Times
| ↔ Response Time Black to White | ||
|---|---|---|
| 24 ms ... rise ↗ and fall ↘ combined | ↗ 13.2 ms rise | 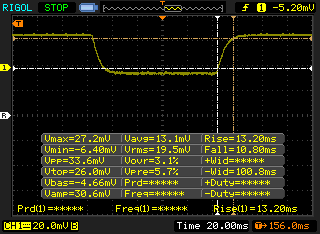 |
| ↘ 10.8 ms fall | ||
| The screen shows good response rates in our tests, but may be too slow for competitive gamers. In comparison, all tested devices range from 0.1 (minimum) to 240 (maximum) ms. » 54 % of all devices are better. This means that the measured response time is worse than the average of all tested devices (19.8 ms). | ||
| ↔ Response Time 50% Grey to 80% Grey | ||
| 37.6 ms ... rise ↗ and fall ↘ combined | ↗ 18.8 ms rise | 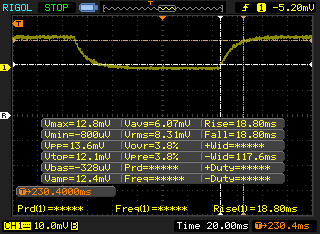 |
| ↘ 18.8 ms fall | ||
| The screen shows slow response rates in our tests and will be unsatisfactory for gamers. In comparison, all tested devices range from 0.165 (minimum) to 636 (maximum) ms. » 55 % of all devices are better. This means that the measured response time is worse than the average of all tested devices (31 ms). | ||
Screen Flickering / PWM (Pulse-Width Modulation)
| Screen flickering / PWM not detected |  | ||
In comparison: 52 % of all tested devices do not use PWM to dim the display. If PWM was detected, an average of 7757 (minimum: 5 - maximum: 343500) Hz was measured. | |||
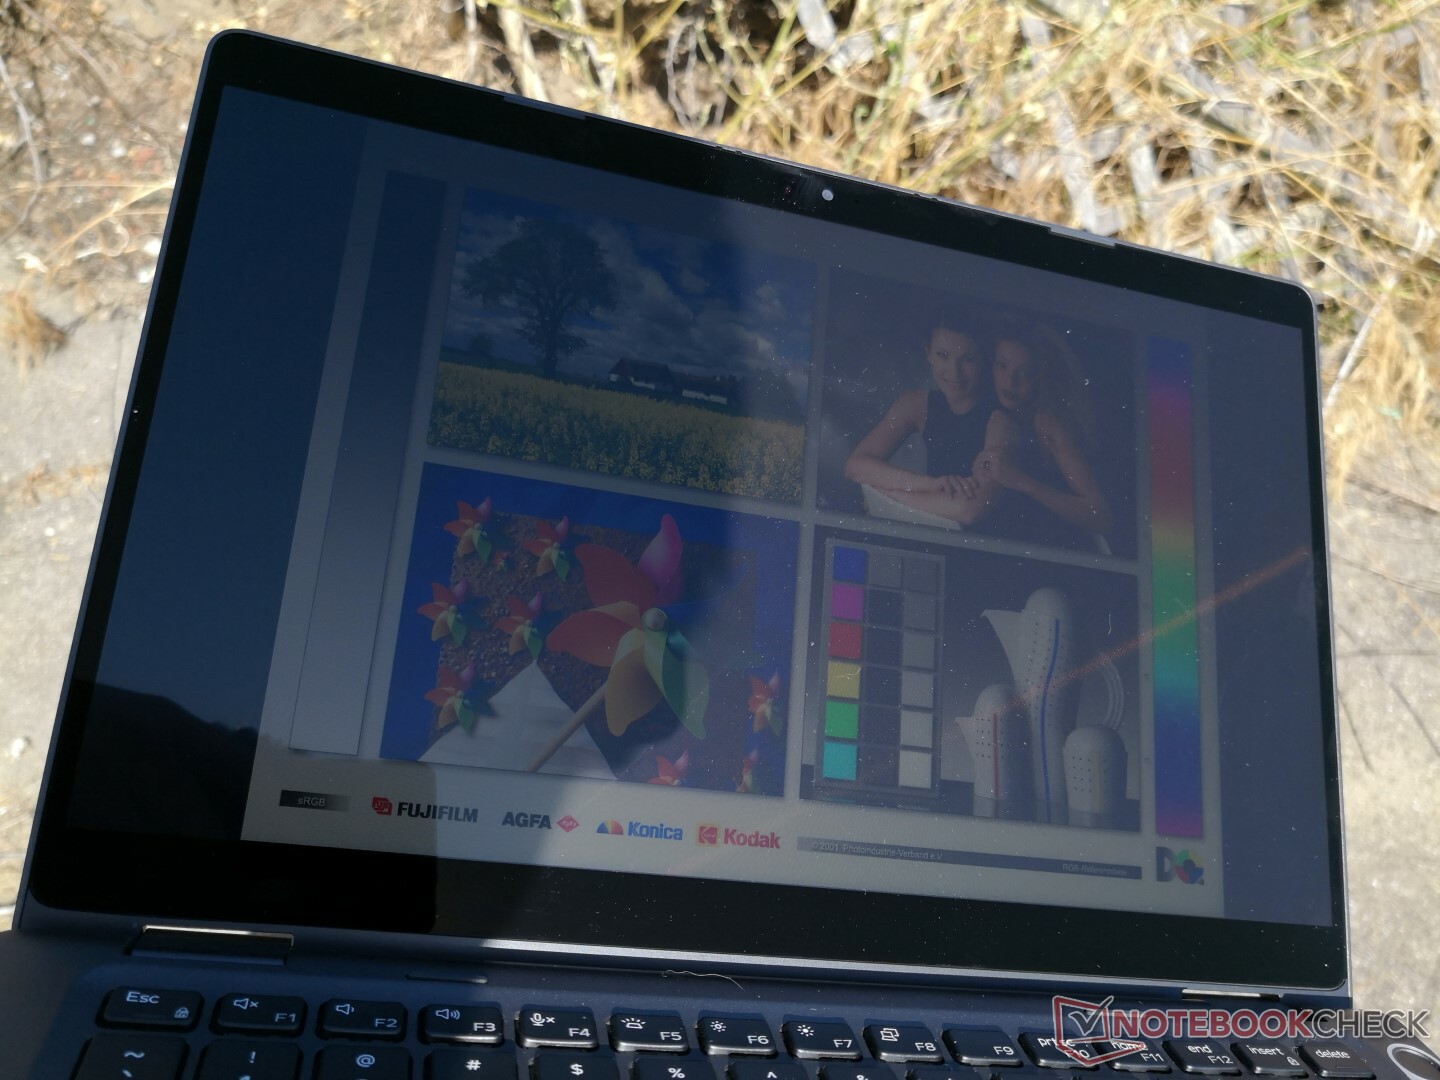
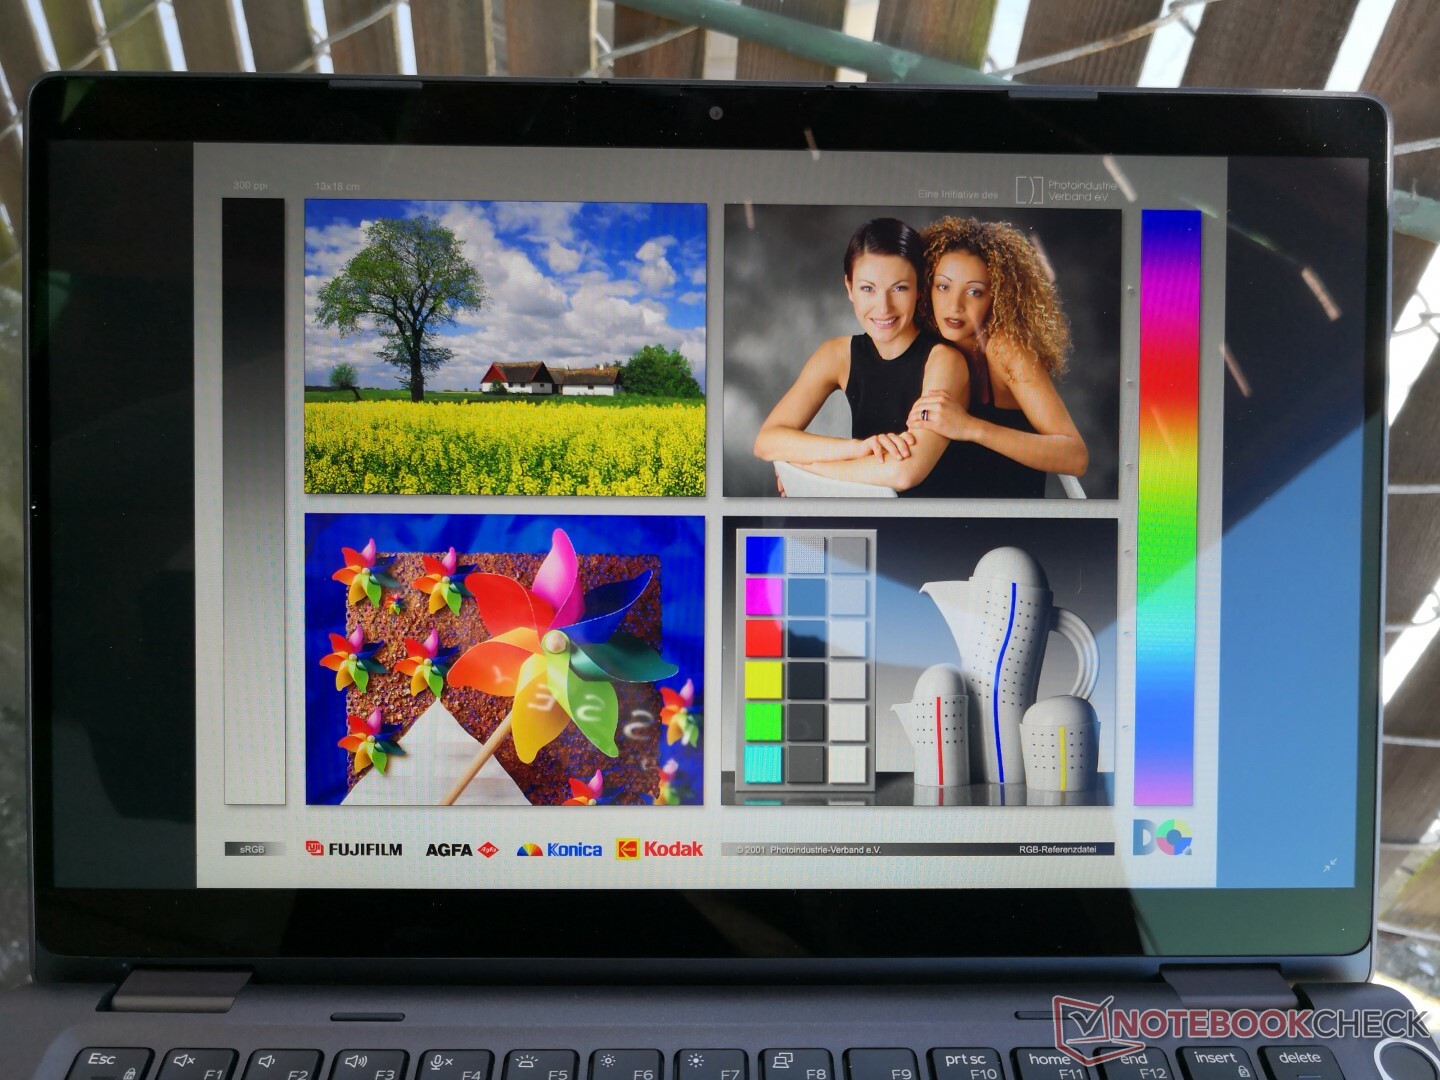
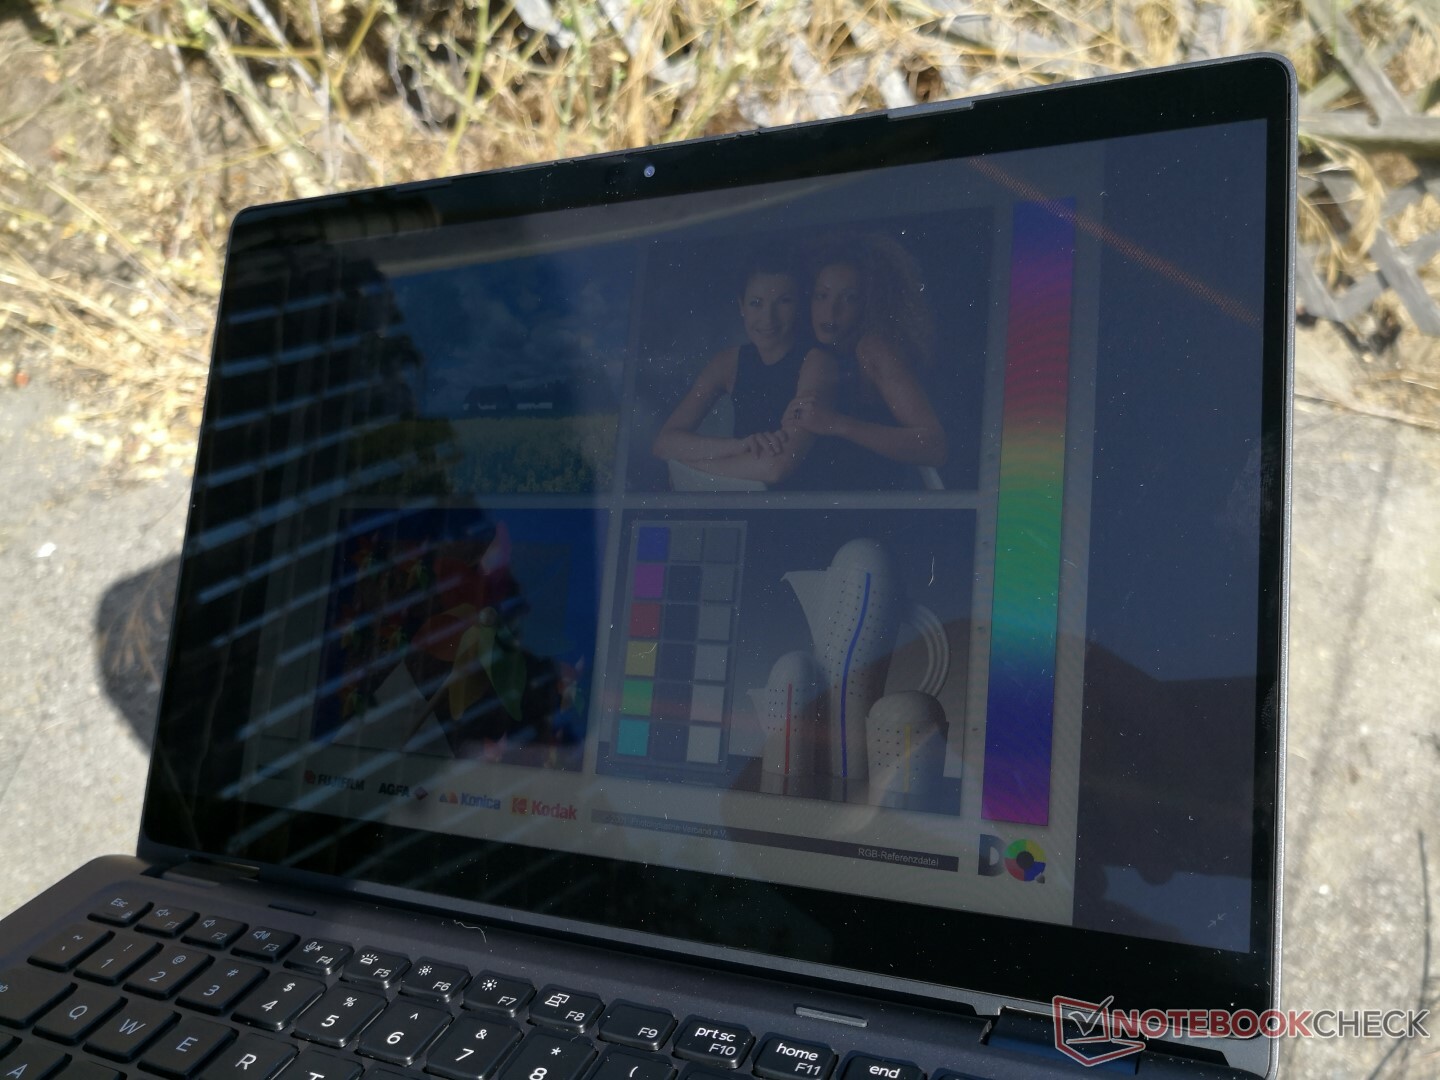
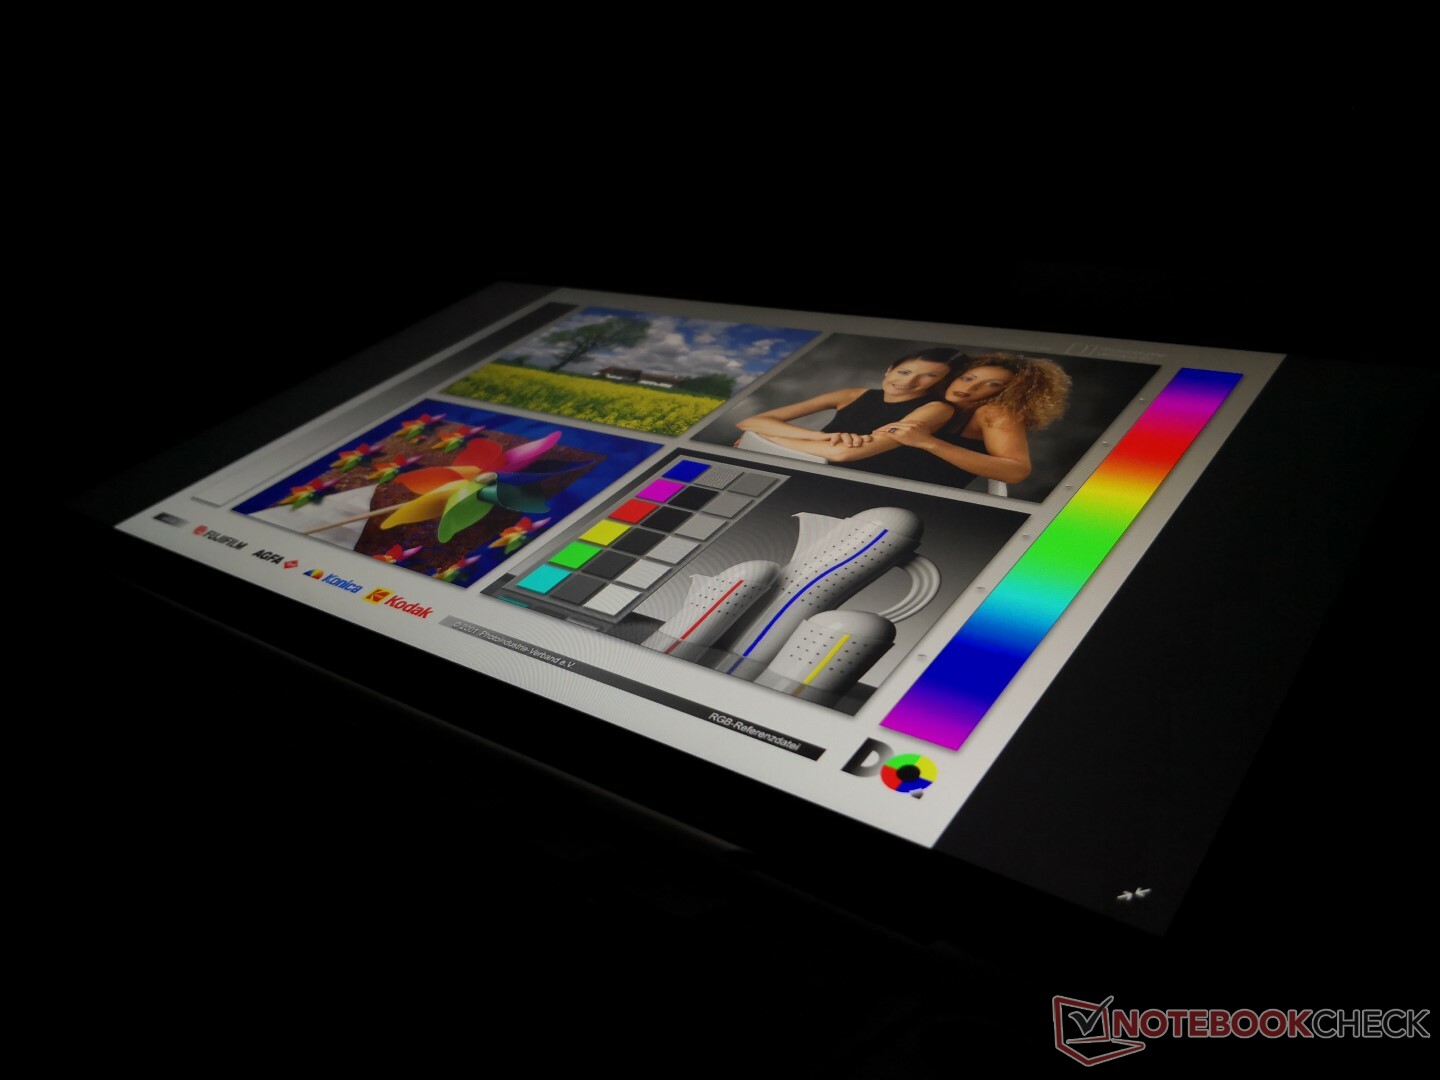
Outdoor visibility is average at best and poorer than on the XPS 13, EliteBook x360 1030 G3, MacBook Pro 13, or Samsung Notebook 9 Pen as all these alternatives have brighter displays than our Latitude. Glare is inevitable even if working under shade and anything brighter will immediately wash out the screen. The wide viewing angles can only do so much to make up for the relatively dim backlight.
Performance
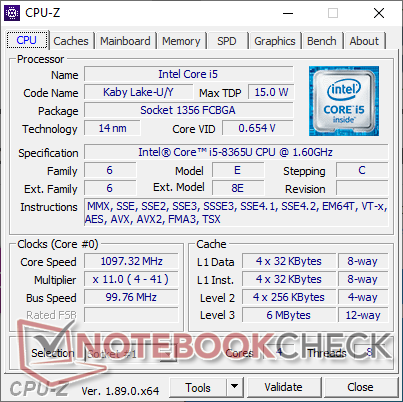
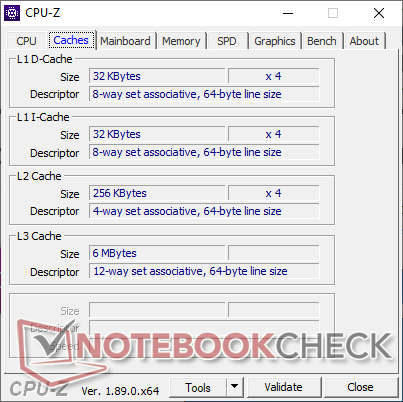
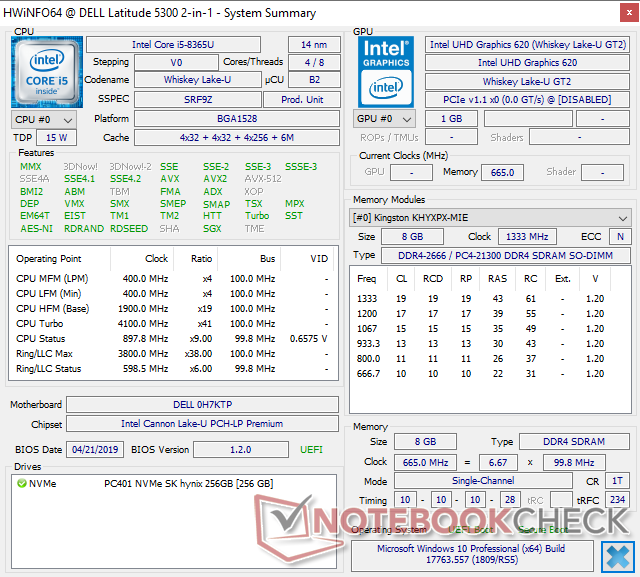
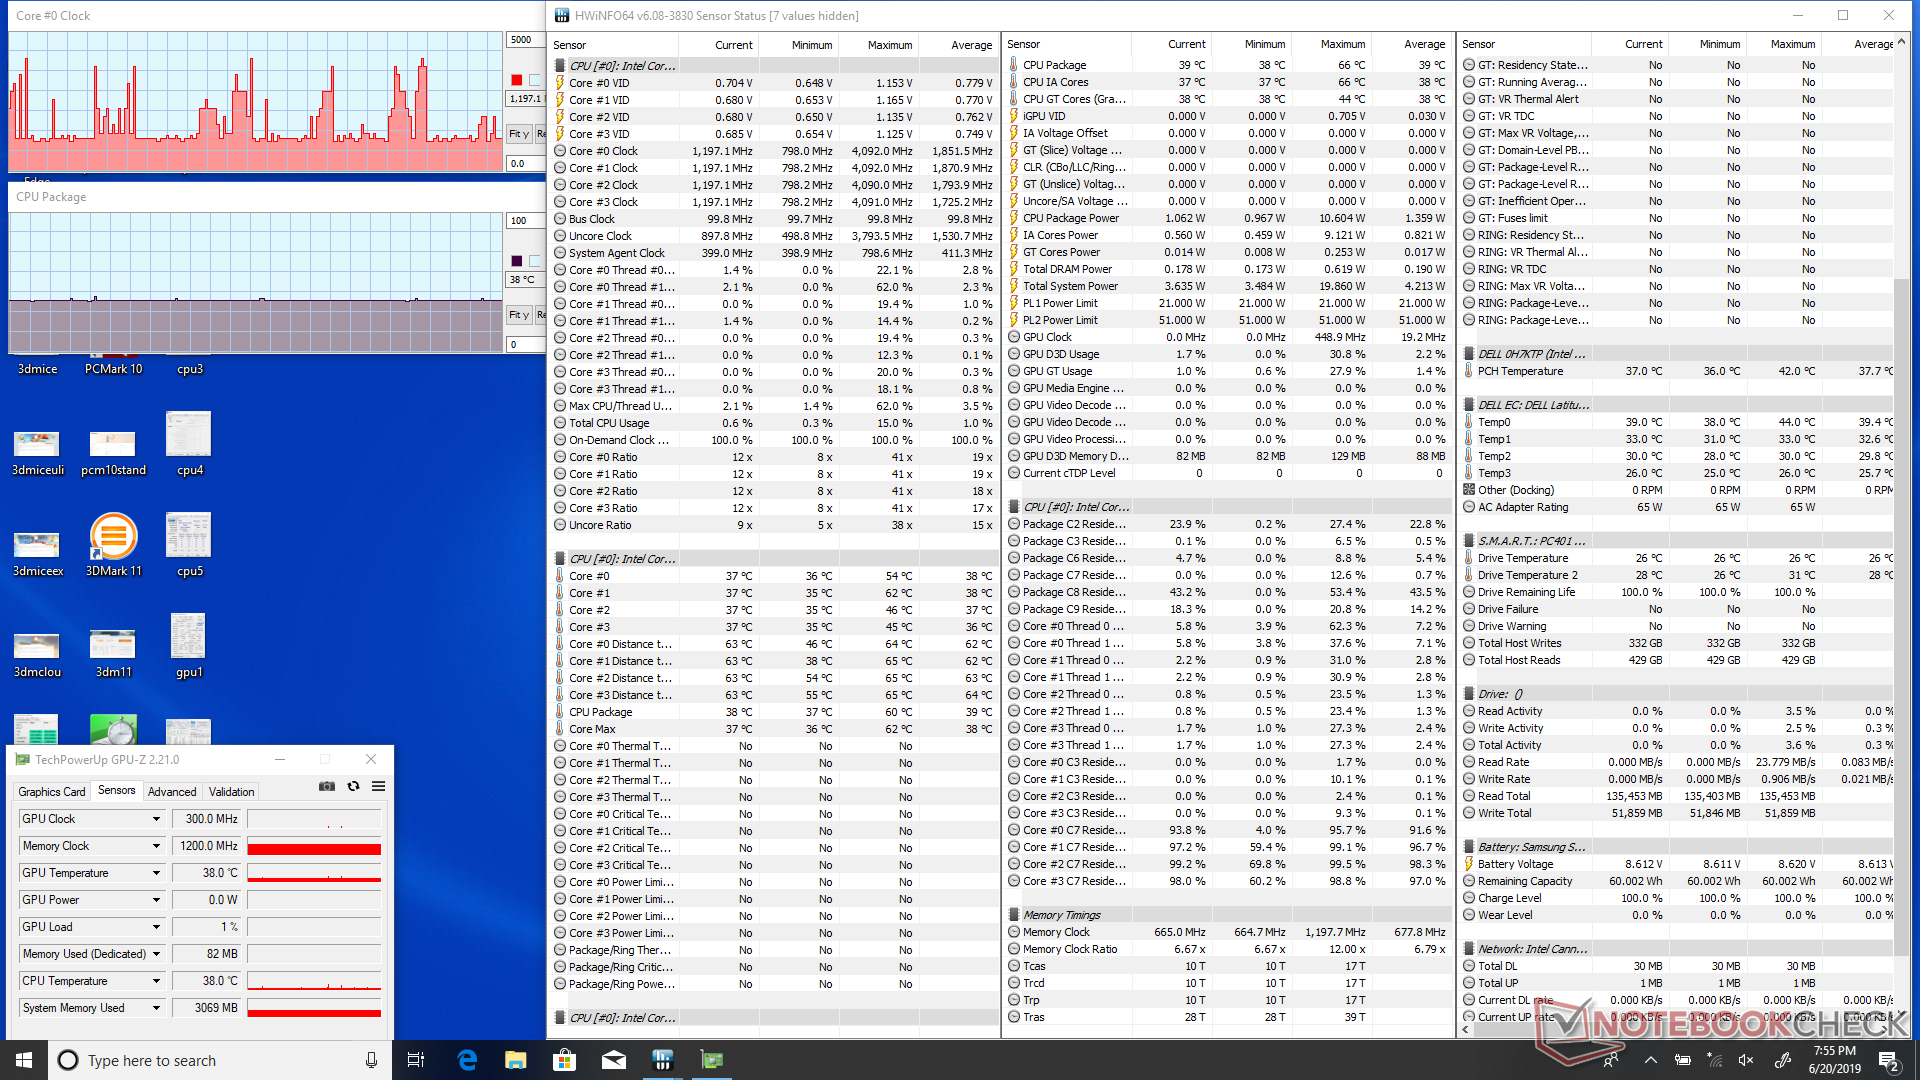
Our unit comes equipped with the uncommon Whiskey Lake-U Core i5-8365U. When compared to the Core i5-8265U, their base clock rates (1.6 GHz), cache sizes, and integrated UHD Graphics 620 GPUs are all identical. The only notable difference is that the i5-8365U offers 5 percent faster maximum Turbo Boost clock rates than the i5-8265U (4.1 GHz vs. 3.9 GHz), but our benchmarks below will show that this makes essentially no difference in practice.
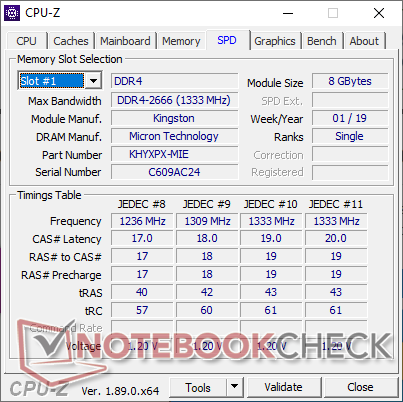
RAM is expandable up to 32 GB across two SODIMM slots. It's too bad that there are no Ryzen options for users who want something faster than the integrated UHD Graphics 620 since the Latitude 5300 series offers no dedicated GPU options.
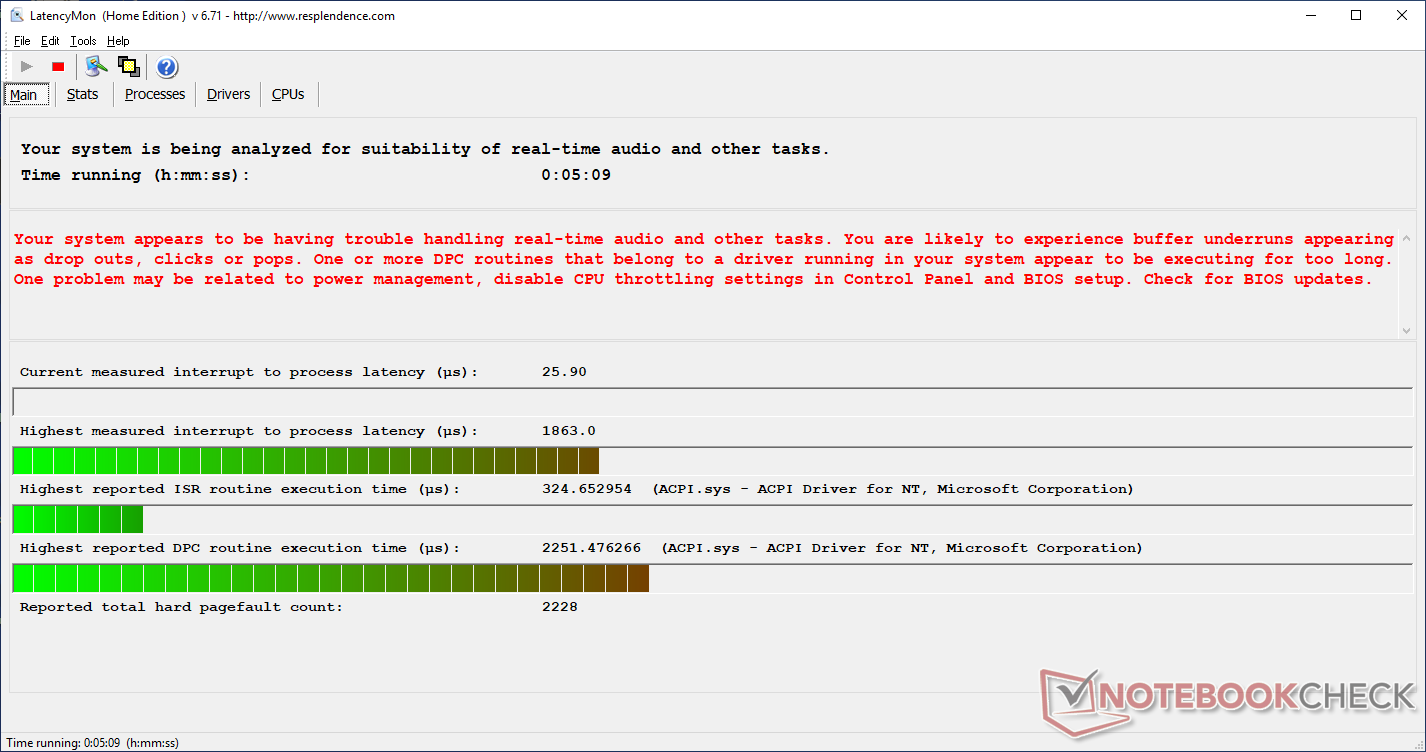
Latencymon shows poor suitability of real-time audio recording even when running on Power Saver mode with the wireless radio disabled.
Processor
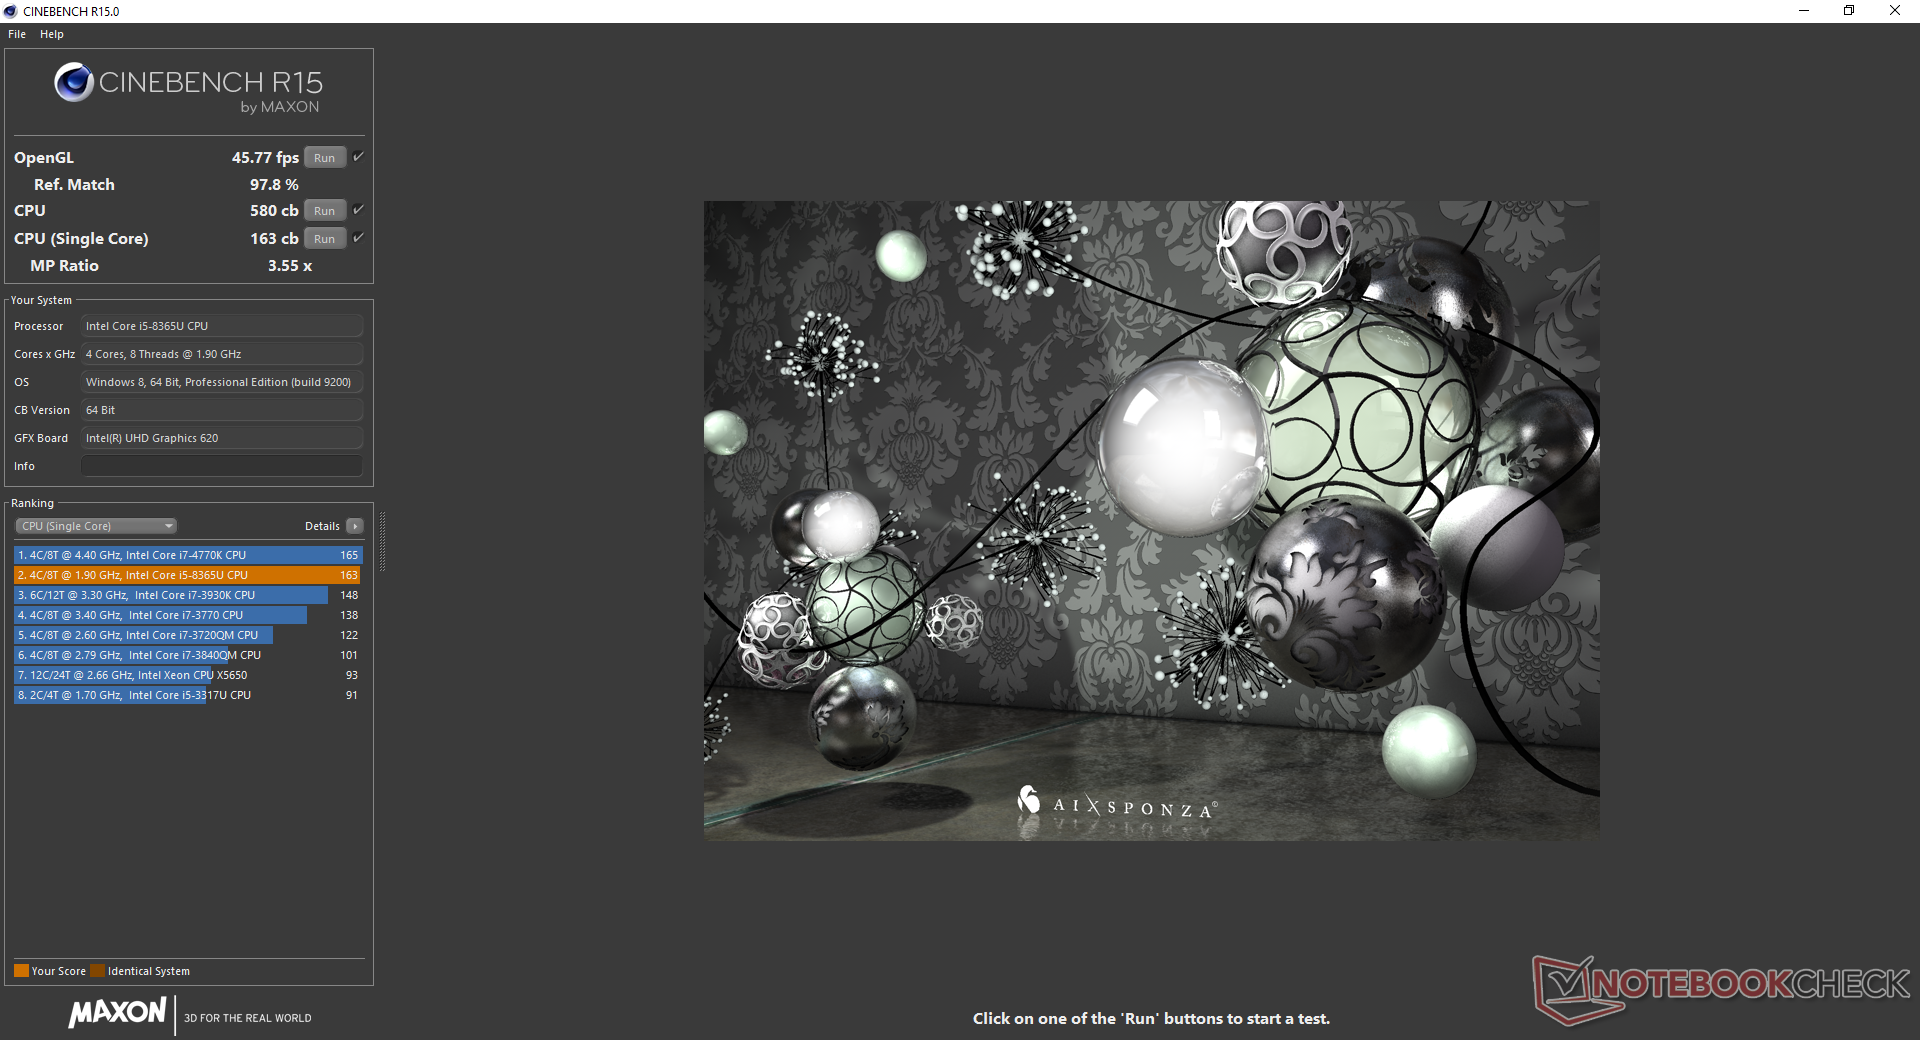
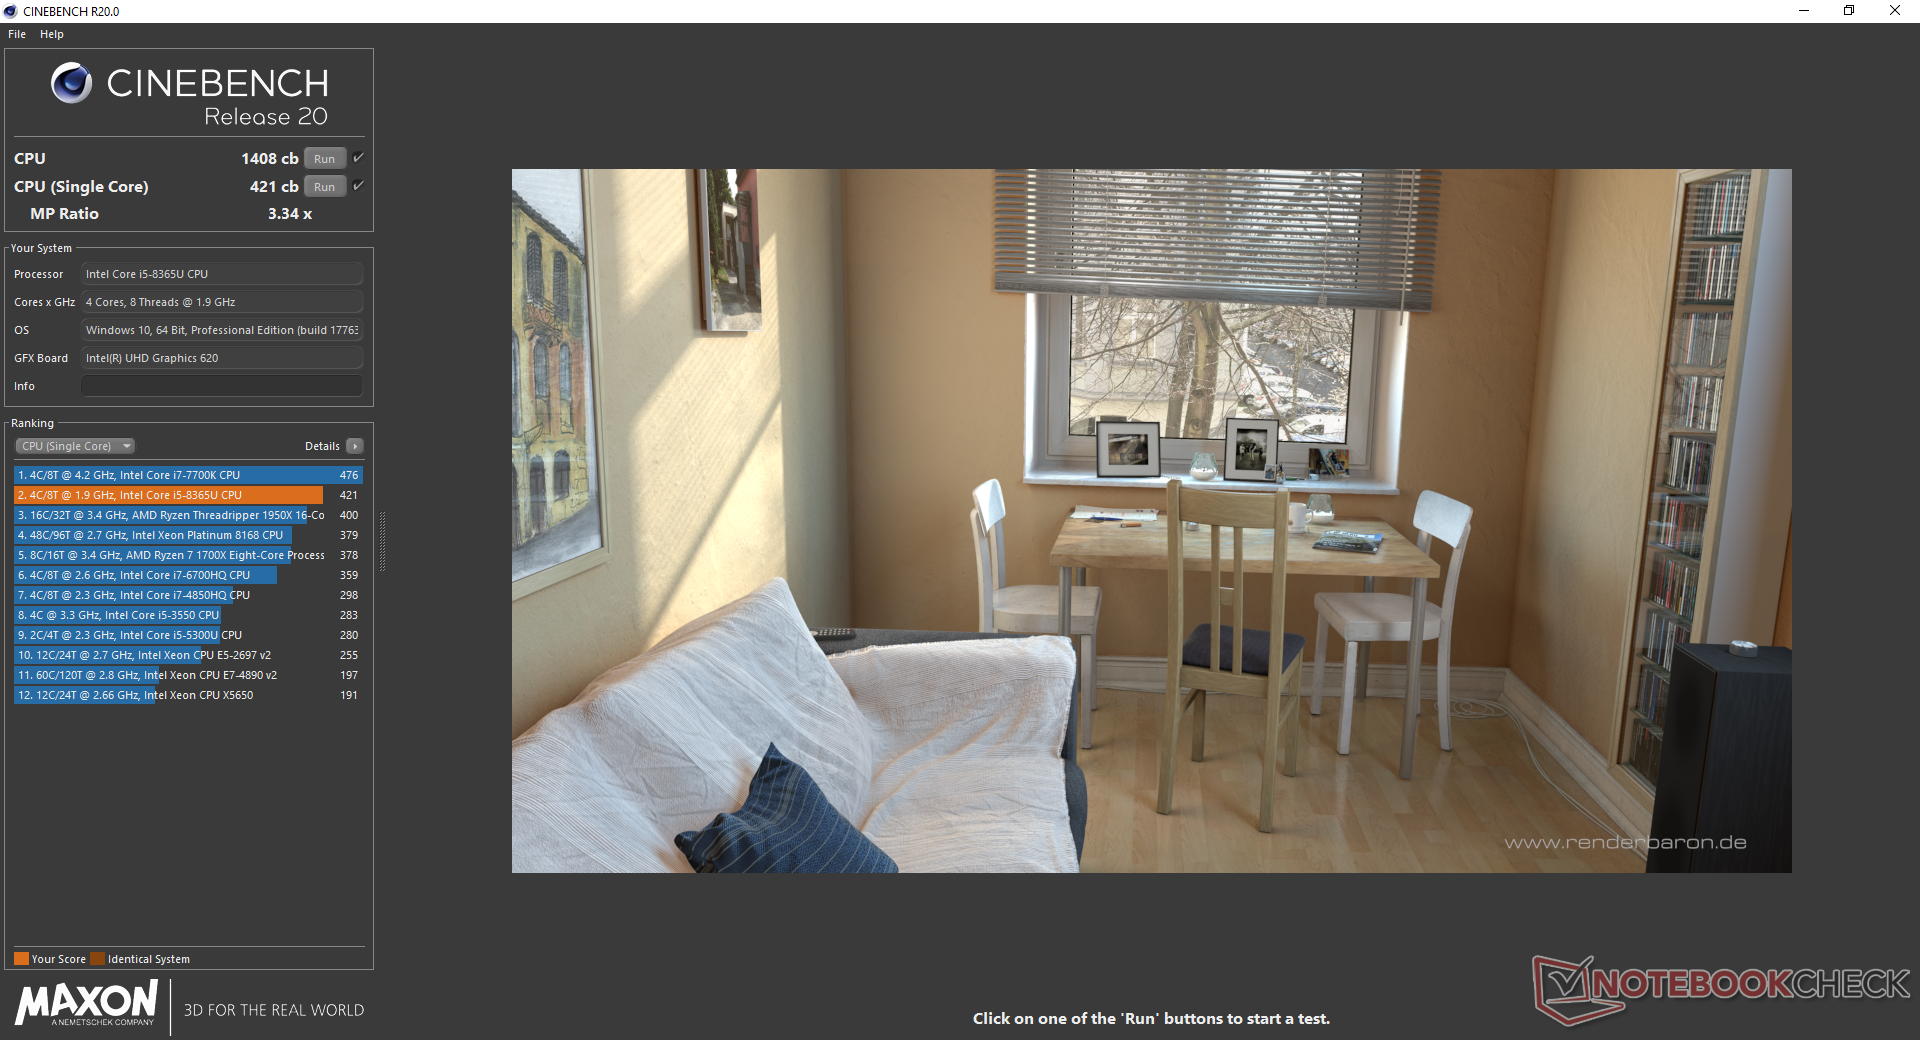
The performance delta between Kaby Lake-R and Whiskey Lake-U is generally marginal including even the Core i5 and Core i7 SKUs. As shown by our CineBench R15 benchmarks below, the i5-8365U is within 5 percent of the Core i5-8250U in the Latitude 3390 and 10 percent of the Core i7-8550U in the XPS 13 9370. Real-world performance between the less expensive Core i5-8265U and more expensive Core i7-8665U configurations will be almost identical in all scenarios as a result.
We're able to observe Turbo Boost sustainability over time by running CineBench R15 Multi-Thread in a loop. The initial score of 626 points steadily drops over time before stabilizing at about 540 points to represent a performance dip of almost 14 percent. Business convertibles like our Latitude 5300 2-in-1 are not designed to maintain maximum Turbo Boost clock rates indefinitely and so the performance drop is to be expected. The ThinkPad X390 Yoga, Samsung Notebook 9 Pen, and Ryzen-powered Lenovo Yoga 530 all exhibit similar dips when subjected to the same test.
See our dedicated page on the Core i5-8365U for more technical information and benchmark comparisons.
System Performance
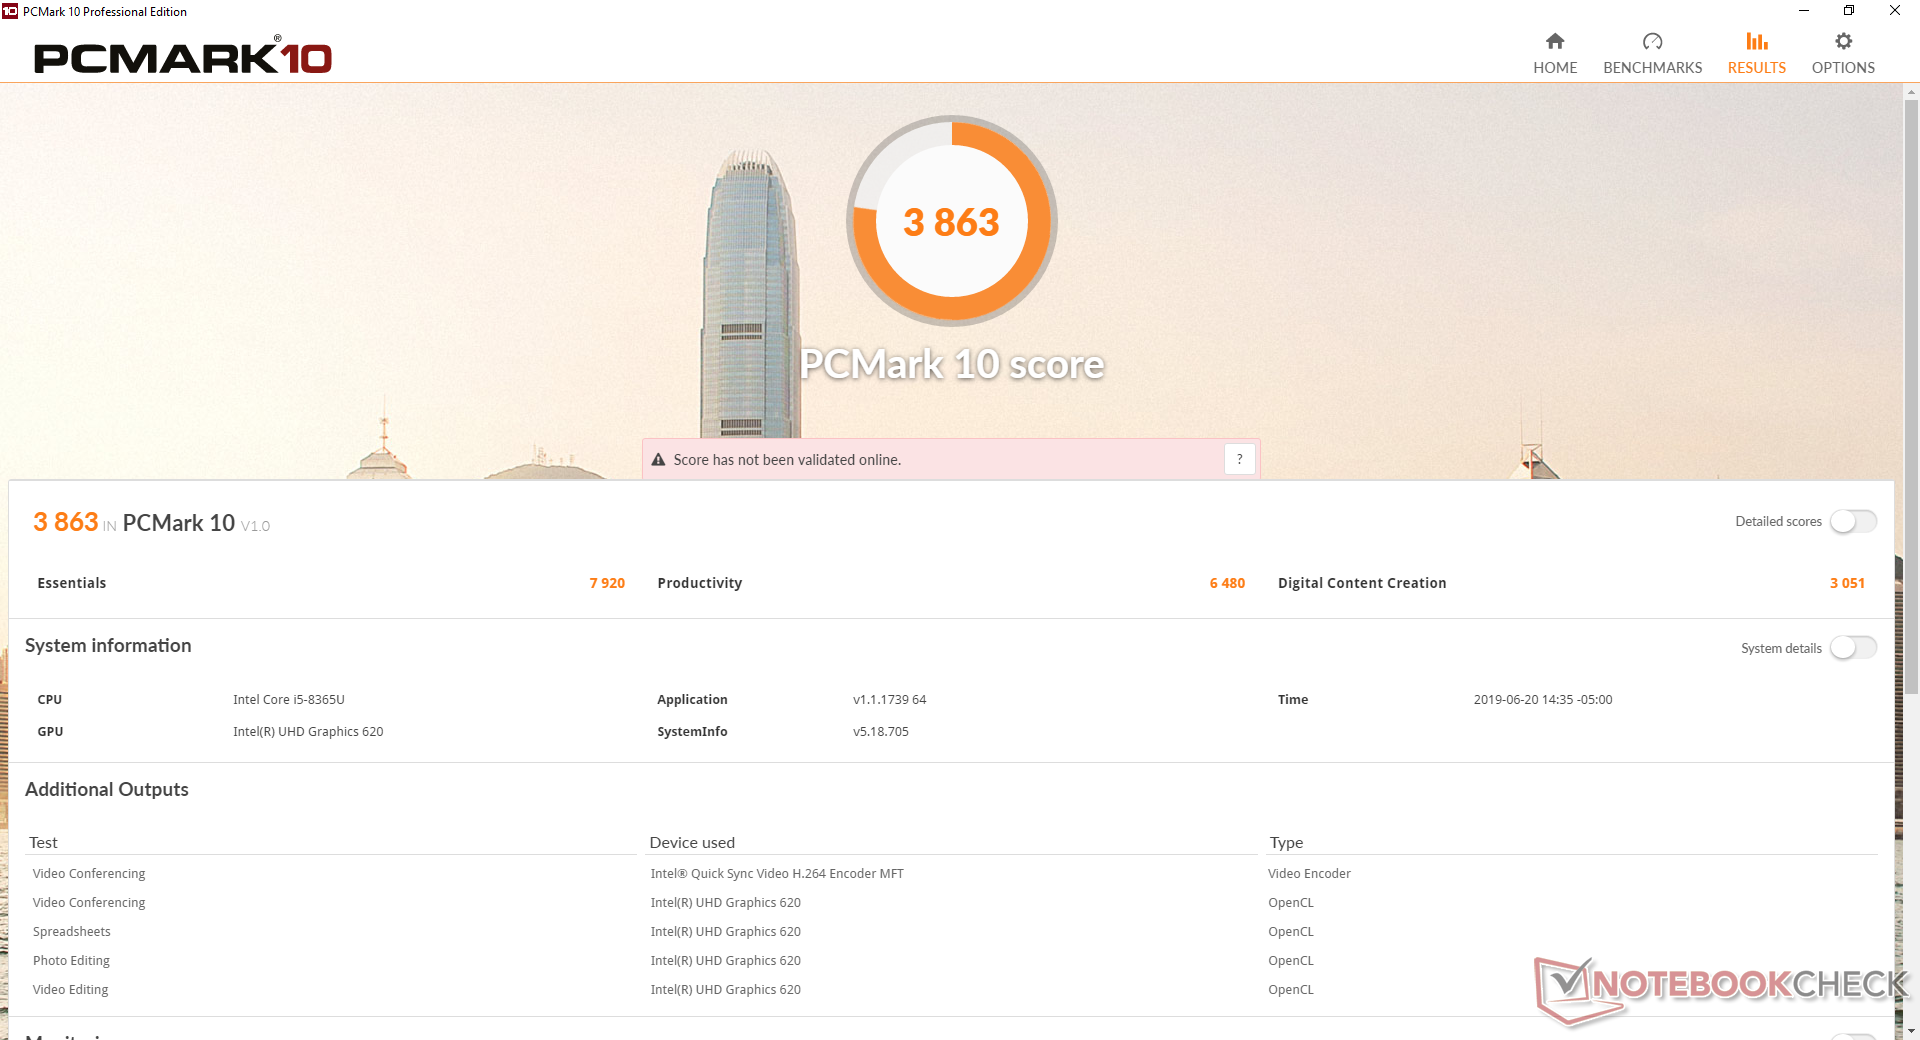
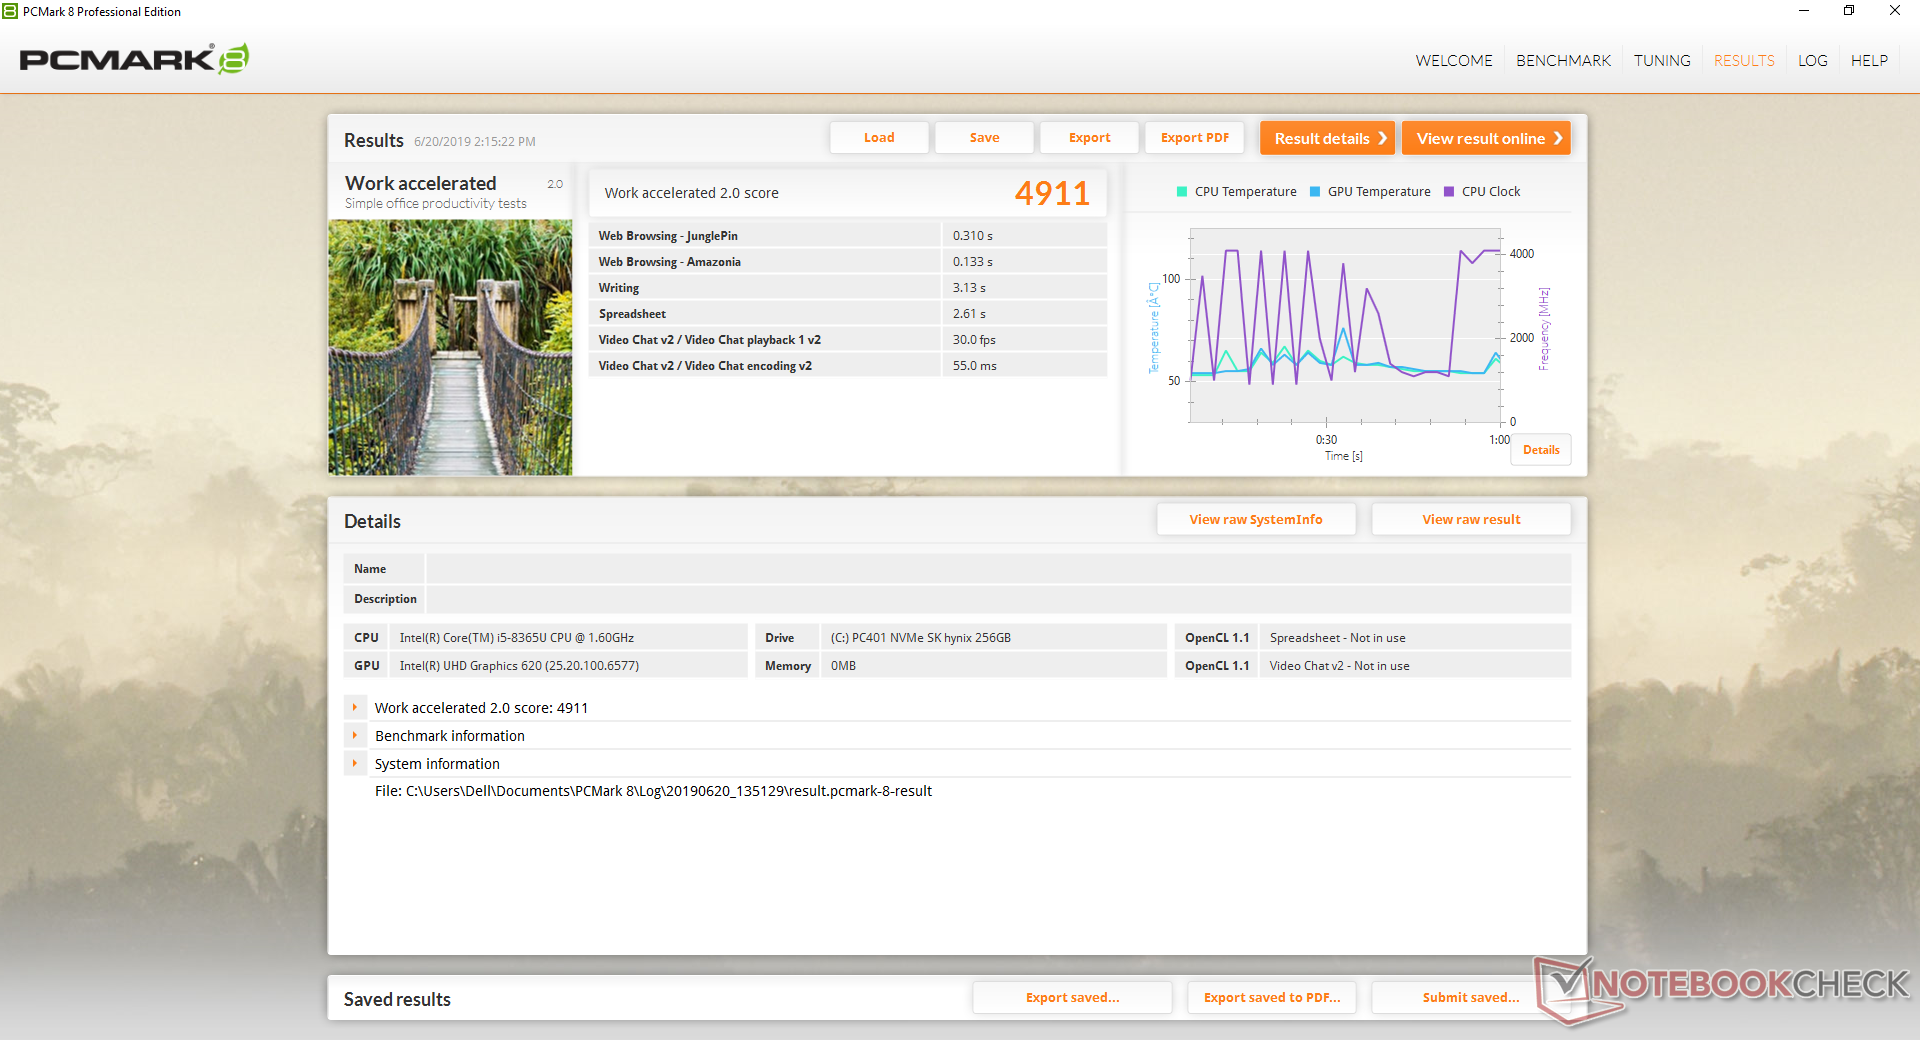
PCMark benchmarks are comparable to the XPS 13 9380 to suggest that users can expect the Latitude 13 5300 2-in-1 to perform similarly to its consumer counterpart during day-to-day loads. Alternatives with dedicated GPUs like the Huawei MateBook 13 are able to outscore our Latitude especially in Digital Content Creation where graphics horsepower is more relevant.
We did not experience any hardware or software hiccups during our time with the test unit.
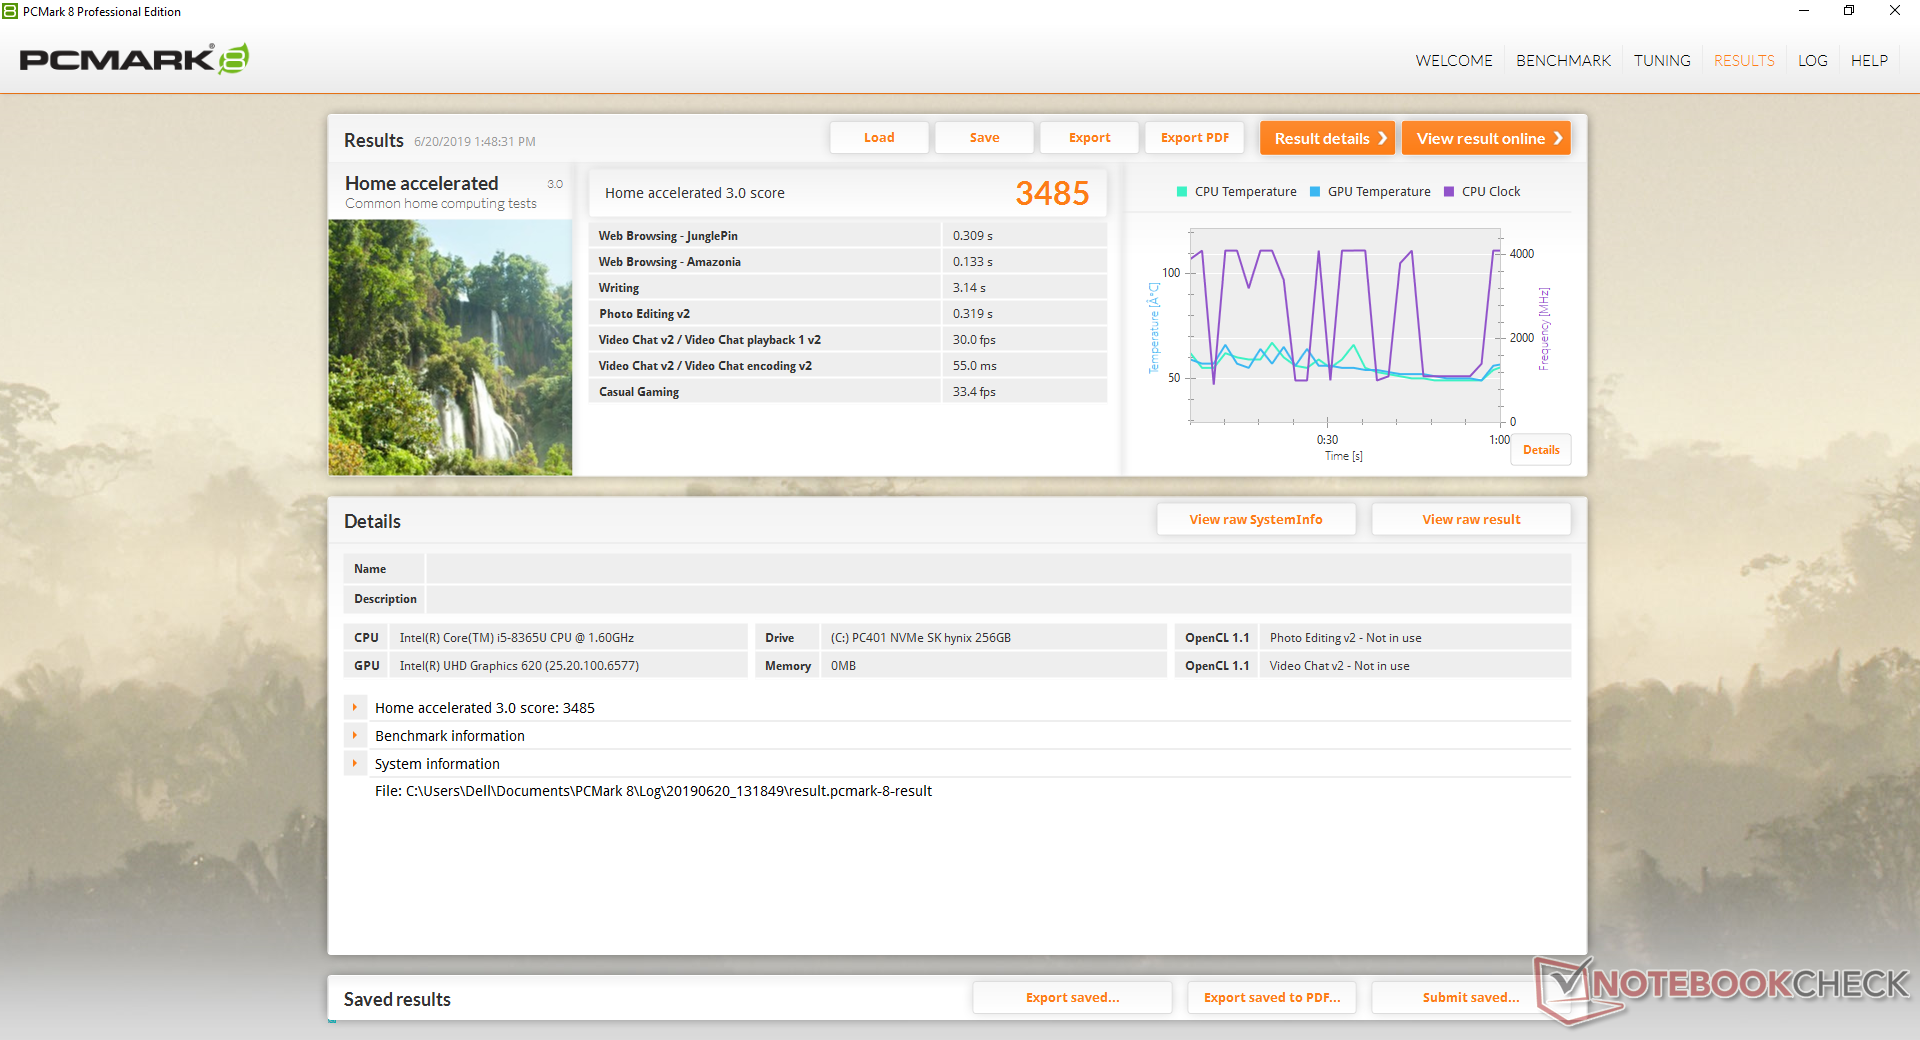
| PCMark 8 Home Score Accelerated v2 | 3485 points | |
| PCMark 8 Work Score Accelerated v2 | 4911 points | |
| PCMark 10 Score | 3863 points | |
Help | ||
Storage Devices
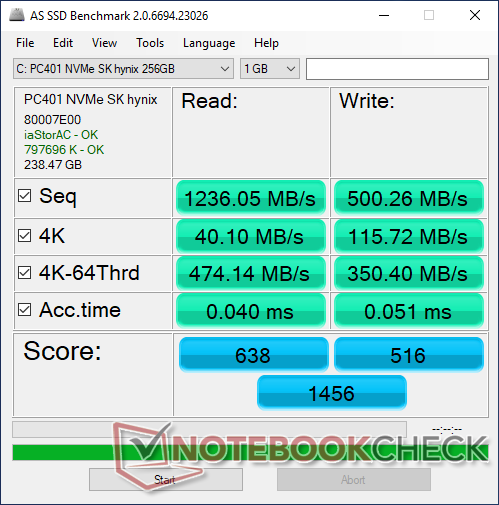
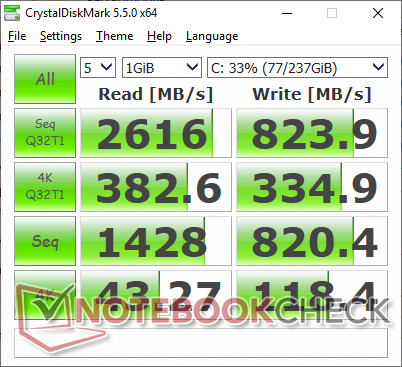
Only a single internal M.2 2280 slot is available for storage. Our particular test unit comes equipped with an entry-level 256 GB SK hynix PC401 NVMe SSD in contrast to the Toshiba XG6 on the Latitude 7400 2-in-1. Transfer rates from the SK Hynix drive are slow when compared to the Intel SSD Pro and Samsung PM981 as found on the ThinkPad X390 and MateBook 13, respectively. Sequential write rates in particular top out at just 500 MB/s according to AS SSD to be less than one-third the speed of the aforementioned Samsung. For general word processing and office purposes, however, the performance deficit will have almost no impact on real-world performance.
See our table of HDDs and SSDs for more benchmark comparisons.
| Dell Latitude 13 5300 2-in-1 SK hynix PC401 HFS256GD9TNG | Lenovo ThinkPad X390-20Q1S02M00 Intel SSD Pro 7600p SSDPEKKF512G8L | Huawei MateBook 13 i7 Samsung SSD PM981 MZVLB512HAJQ | HP Spectre x360 13t-ae000 Lite-On CA1-8D256-HP | HP EliteBook x360 1030 G3 45X96UT Samsung SSD PM981 MZVLB512HAJQ | |
|---|---|---|---|---|---|
| AS SSD | 93% | 123% | 5% | 89% | |
| Seq Read (MB/s) | 1236 | 2689 118% | 1889 53% | 2133 73% | 1798 45% |
| Seq Write (MB/s) | 500 | 1462 192% | 1812 262% | 945 89% | 1374 175% |
| 4K Read (MB/s) | 40.1 | 63.8 59% | 55.5 38% | 29.84 -26% | 46.05 15% |
| 4K Write (MB/s) | 115.7 | 139.8 21% | 118.4 2% | 91.4 -21% | 104.3 -10% |
| 4K-64 Read (MB/s) | 474.1 | 865 82% | 1257 165% | 725 53% | 1408 197% |
| 4K-64 Write (MB/s) | 350.4 | 1041 197% | 1571 348% | 404.1 15% | 790 125% |
| Access Time Read * (ms) | 0.04 | 0.037 7% | 0.041 -2% | 0.121 -203% | 0.041 -2% |
| Access Time Write * (ms) | 0.051 | 0.024 53% | 0.032 37% | 0.13 -155% | 0.036 29% |
| Score Read (Points) | 638 | 1198 88% | 1502 135% | 968 52% | 1634 156% |
| Score Write (Points) | 516 | 1328 157% | 1871 263% | 590 14% | 1032 100% |
| Score Total (Points) | 1456 | 3095 113% | 4147 185% | 1998 37% | 3484 139% |
| Copy ISO MB/s (MB/s) | 818 | 1290 58% | 1800 120% | 1492 82% | 1947 138% |
| Copy Program MB/s (MB/s) | 395.5 | 436.5 10% | 385.6 -3% | 300.9 -24% | 453.9 15% |
| Copy Game MB/s (MB/s) | 452.5 | 1147 153% | 982 117% | 839 85% | 990 119% |
* ... smaller is better

GPU Performance
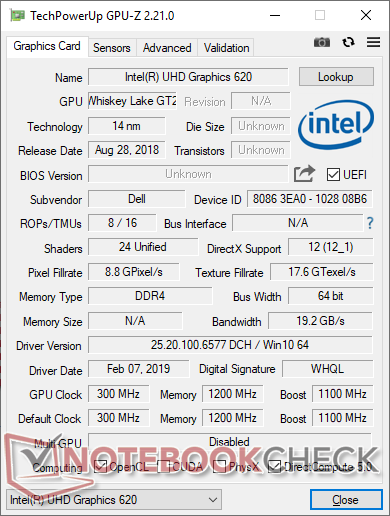
The integrated UHD Graphics 620 in the Dell performs exactly where we expect it to be when compared to the average UHD Graphics 620 in our database. Intel hasn't updated its integrated graphics solution in years and so overall GPU performance has remained essentially unchanged since the early Kaby Lake or even Skylake days. Users who want more graphics horsepower should consider the Dell latitude 14 5495 with RX Vega 10 graphics or Asus ZenBook S13 with dedicated GeForce MX150 graphics instead. If you're willing to wait about a year, then the upcoming Ice Lake Iris solution will offer a significant upgrade over the UHD Graphics 620.
See our dedicated page on the UHD Graphics 620 for more technical information and benchmark comparison.
| 3DMark 06 Standard Score | 10108 points | |
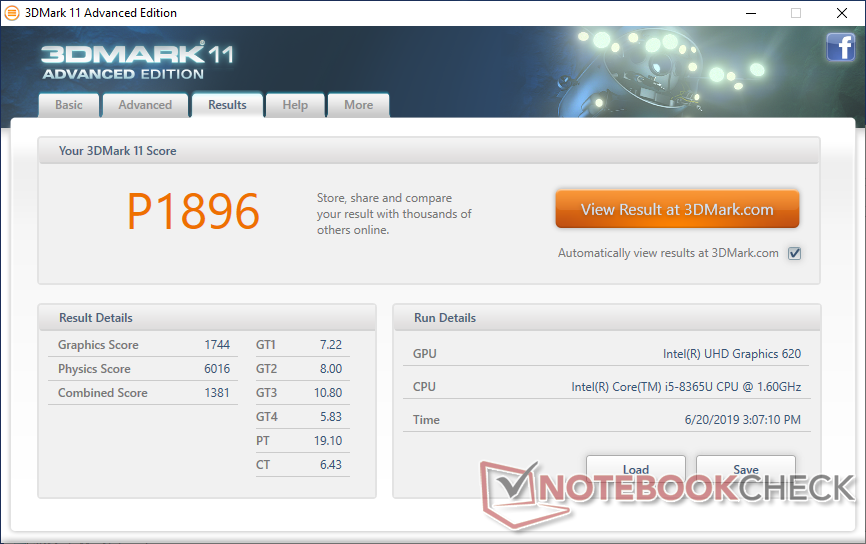
| 3DMark 11 Performance | 1896 points | |
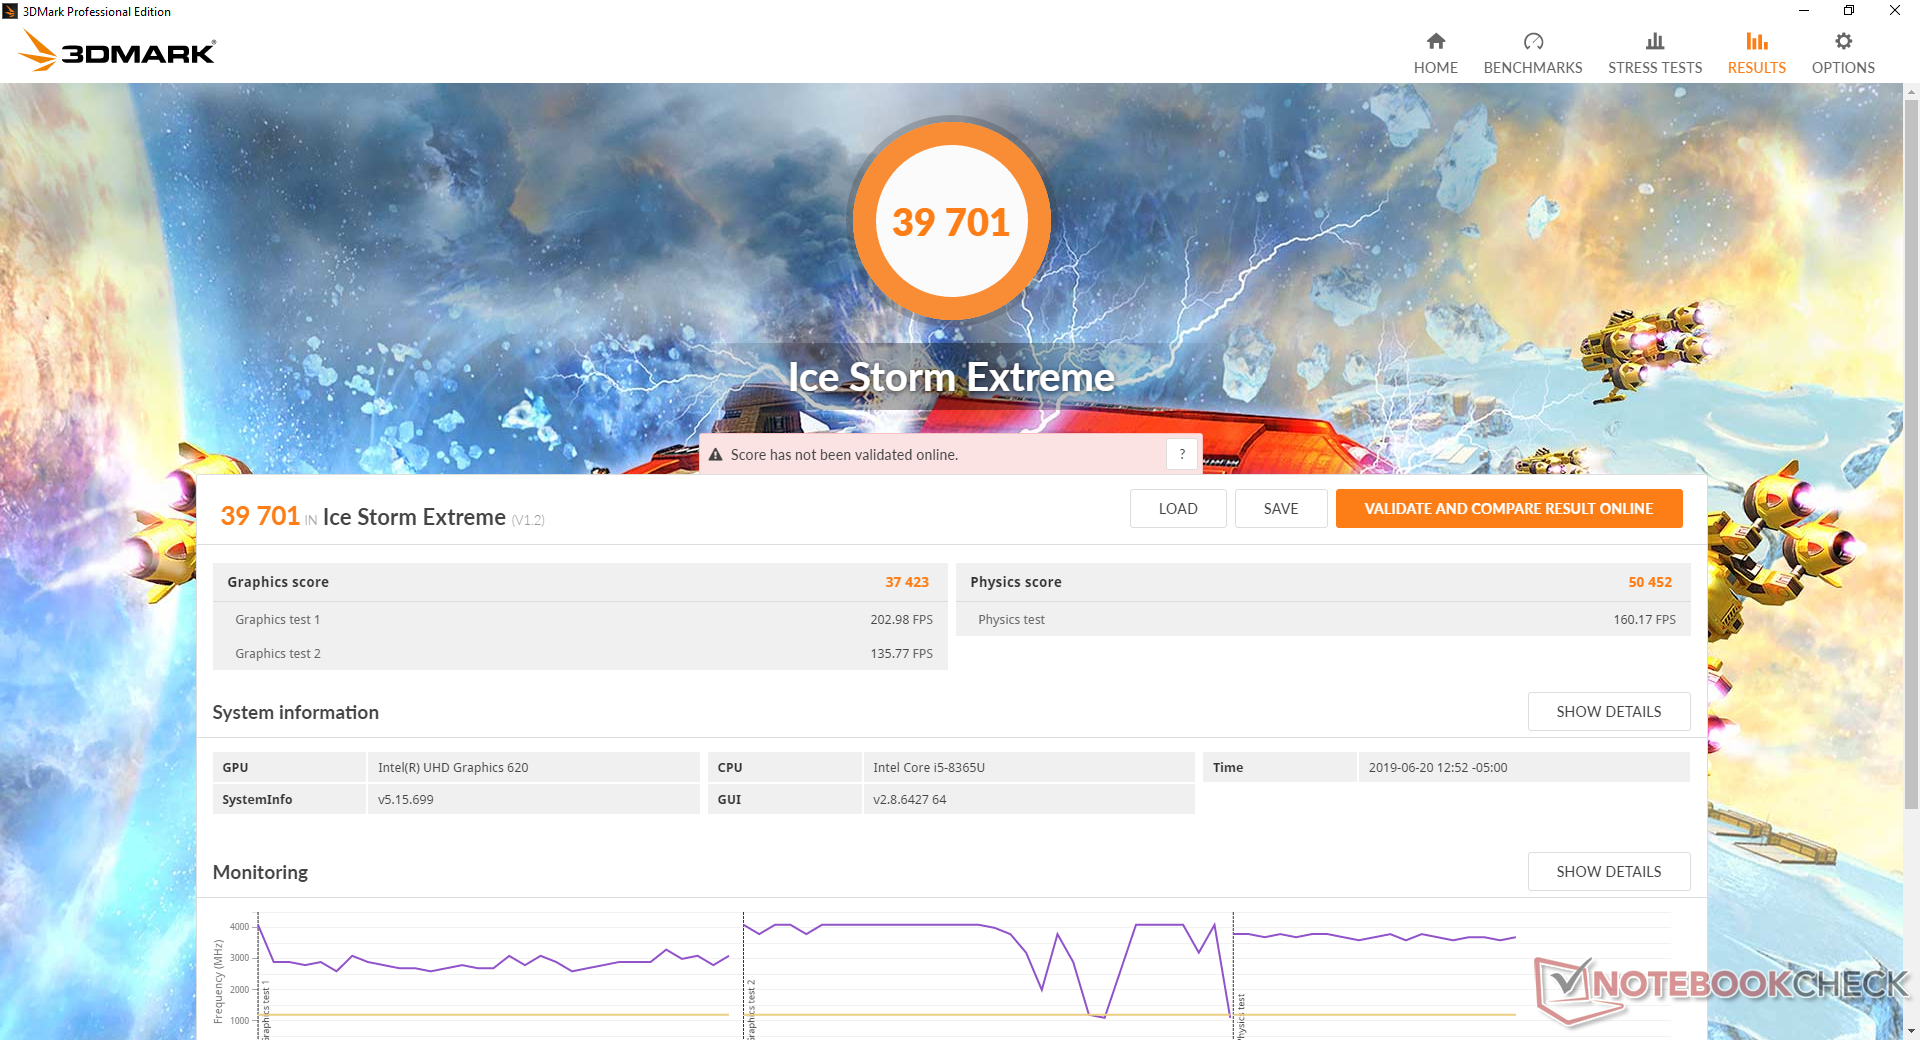
| 3DMark Ice Storm Standard Score | 51629 points | |
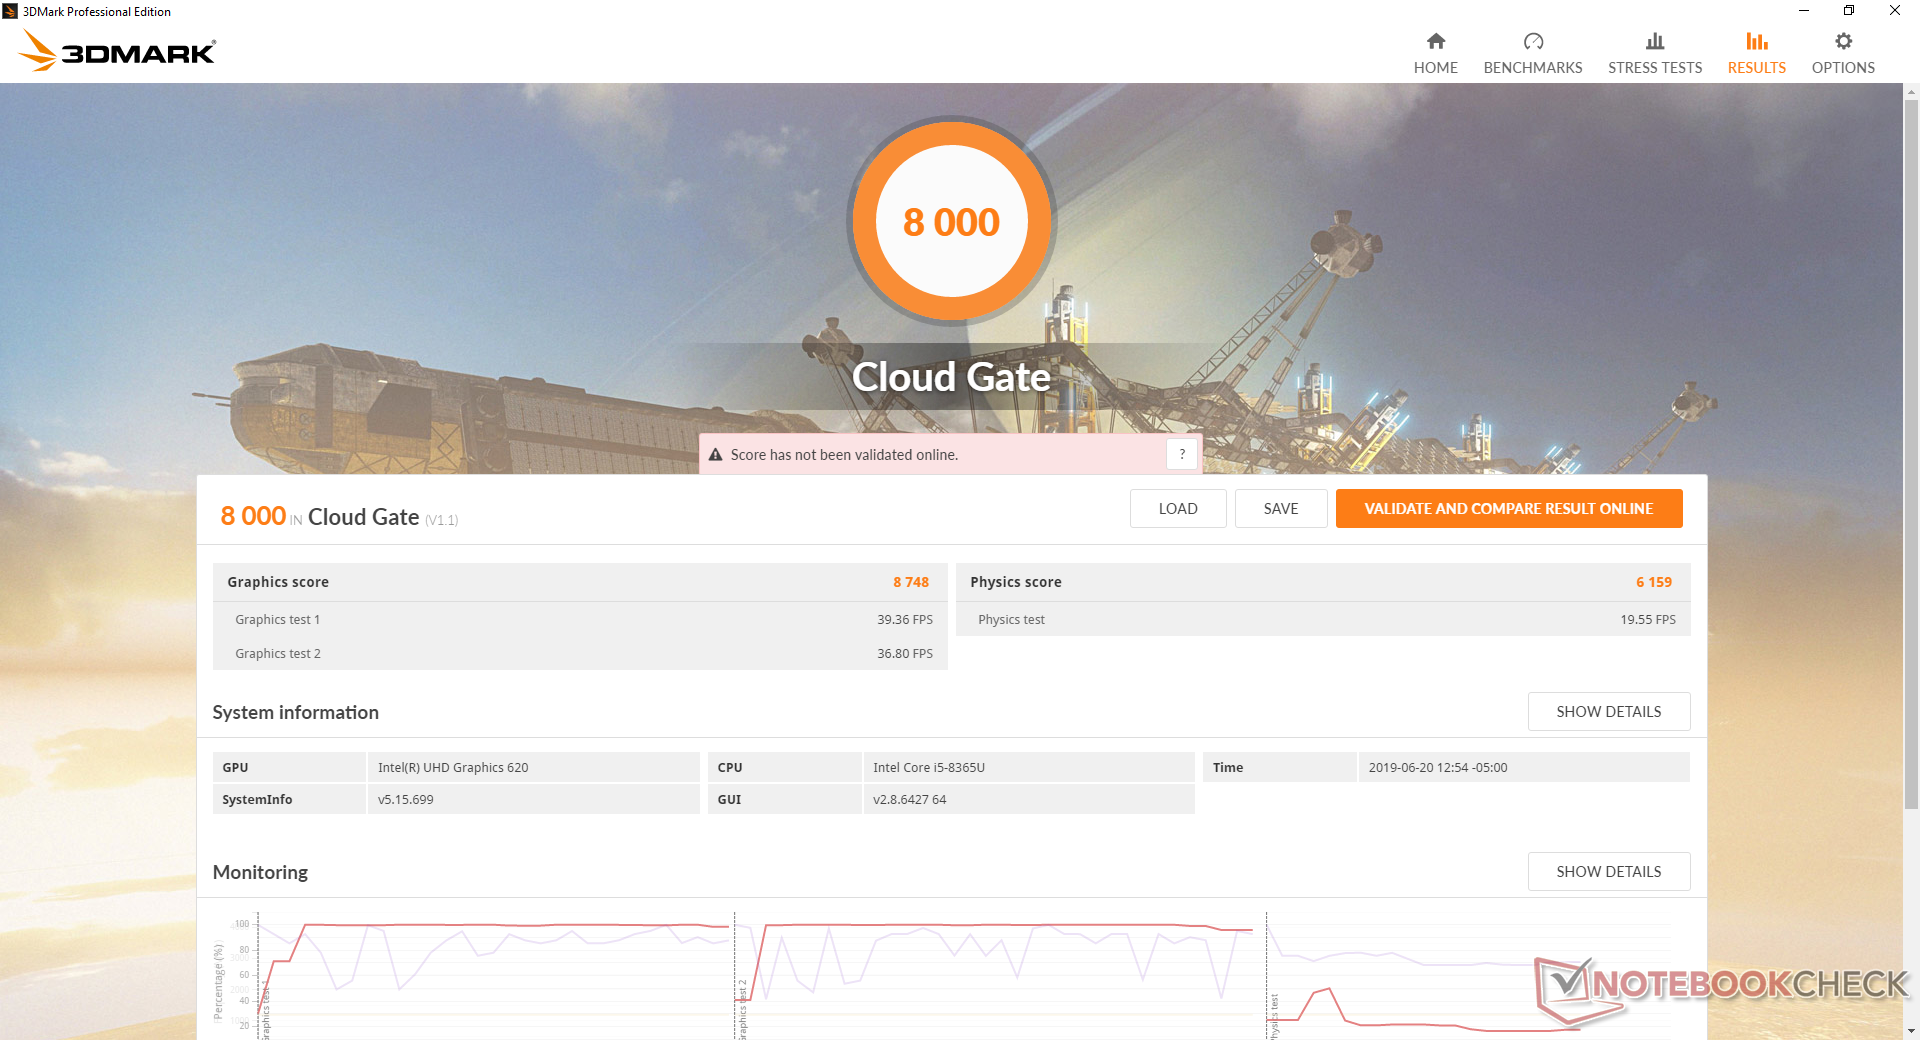
| 3DMark Cloud Gate Standard Score | 8000 points | |
Help | ||
Emissions
System Noise
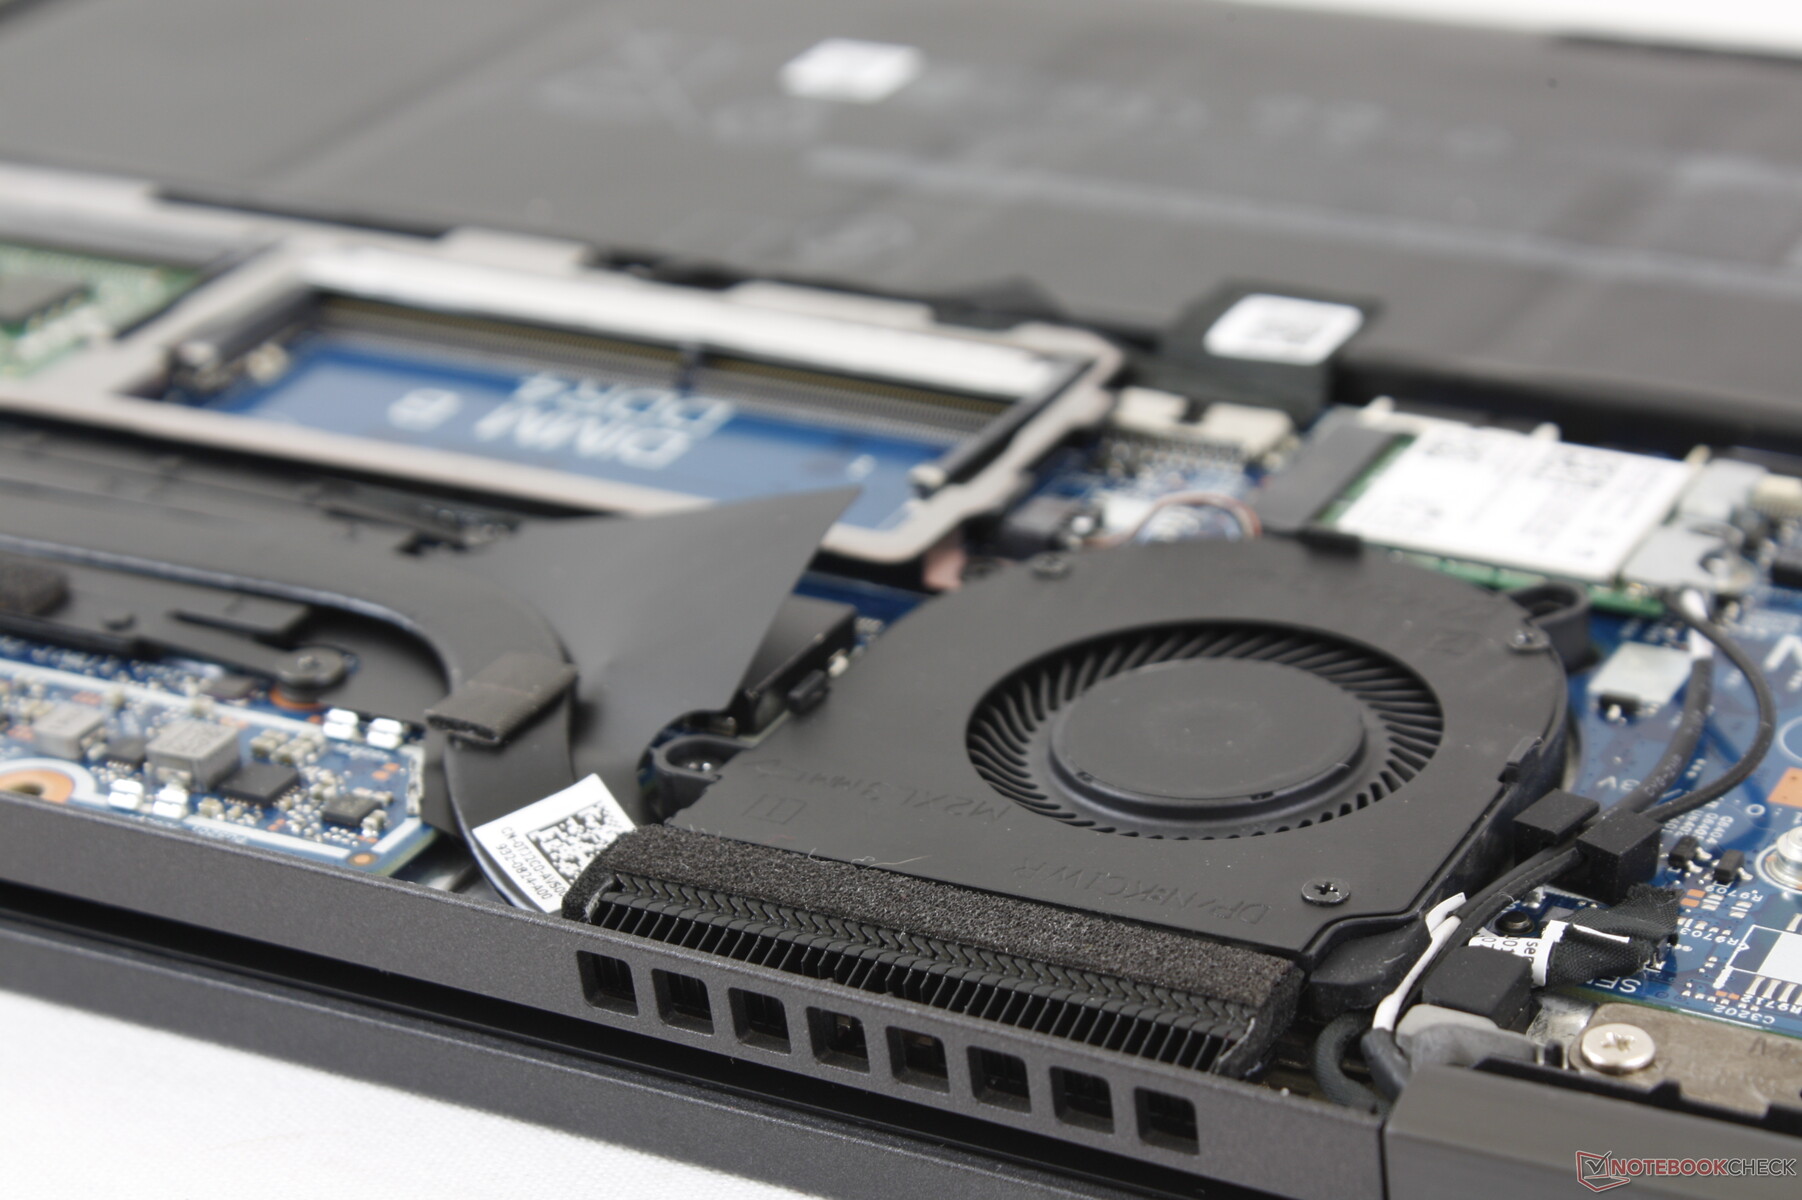
The cooling solution consists of a single fan and a short heat pipe extending over the CPU. The fan will idle during low loads like word processing or video streaming for a silent experience. If running consistently heavy loads, background updates or installations, however, expect fan noise to jump to 35 dB(A) which is about normal for most subnotebooks with ULV CPUs. The fan will power down again almost immediately once the high processing load has ended.
At worst, we're able to record a fan noise of 42 dB(A) when toggling Ultra Performance mode via the Dell Power Manager software to be louder than the ThinkPad X390 or EliteBook x360 13. This mode will not be necessary for most usage scenarios and anyone needing the extra horsepower should really consider a proper clamshell like the Latitude 5491 with Core H series CPUs.
We're able to notice very slight coil whine from our unit when placing an ear near the keyboard keys. It is otherwise inaudible when sitting at a normal distance from the notebook.
| Dell Latitude 13 5300 2-in-1 UHD Graphics 620, i5-8365U, SK hynix PC401 HFS256GD9TNG | Lenovo ThinkPad X390-20Q1S02M00 UHD Graphics 620, i5-8265U, Intel SSD Pro 7600p SSDPEKKF512G8L | Huawei MateBook 13 i7 GeForce MX150, i7-8565U, Samsung SSD PM981 MZVLB512HAJQ | Samsung Notebook 9 NP930QAA UHD Graphics 620, i5-8550U, Samsung PM961 MZVLW256HEHP | HP Spectre x360 13t-ae000 UHD Graphics 620, i5-8550U, Lite-On CA1-8D256-HP | HP EliteBook x360 1030 G3 45X96UT UHD Graphics 620, i7-8650U, Samsung SSD PM981 MZVLB512HAJQ | |
|---|---|---|---|---|---|---|
| Noise | 2% | -1% | 2% | 7% | 6% | |
| off / environment * (dB) | 28.5 | 29.2 -2% | 28.6 -0% | 29 -2% | 28.2 1% | 28.5 -0% |
| Idle Minimum * (dB) | 28.5 | 29.2 -2% | 28.6 -0% | 29 -2% | 28.2 1% | 28.5 -0% |
| Idle Average * (dB) | 28.5 | 29.2 -2% | 28.6 -0% | 29 -2% | 28.2 1% | 28.5 -0% |
| Idle Maximum * (dB) | 28.5 | 29.2 -2% | 28.6 -0% | 29 -2% | 28.2 1% | 28.5 -0% |
| Load Average * (dB) | 35.5 | 34.8 2% | 34.2 4% | 32.6 8% | 30.7 14% | 30.8 13% |
| Load Maximum * (dB) | 42.1 | 34.8 17% | 47 -12% | 36.7 13% | 32.9 22% | 32.8 22% |
| Witcher 3 ultra * (dB) | 43 |
* ... smaller is better
Noise level
| Idle |
| 28.5 / 28.5 / 28.5 dB(A) |
| Load |
| 35.5 / 42.1 dB(A) |
 | ||
30 dB silent 40 dB(A) audible 50 dB(A) loud |
||
min: | ||
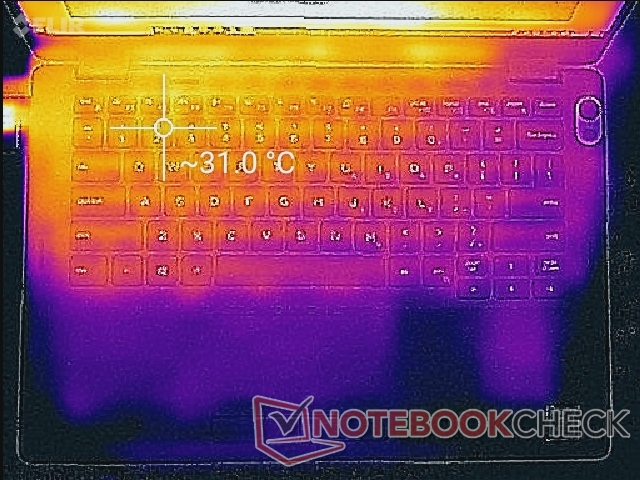
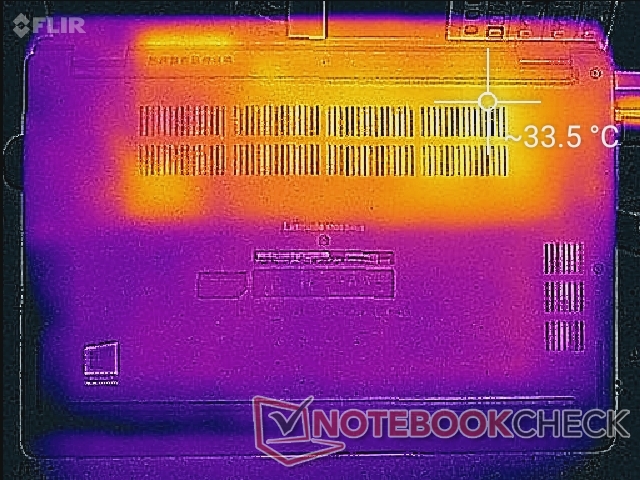
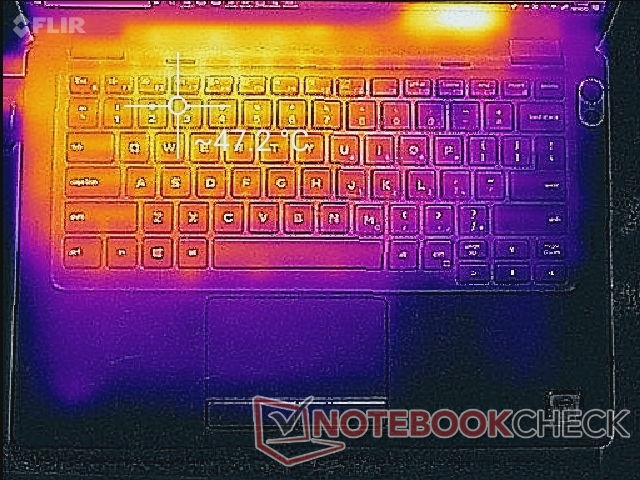
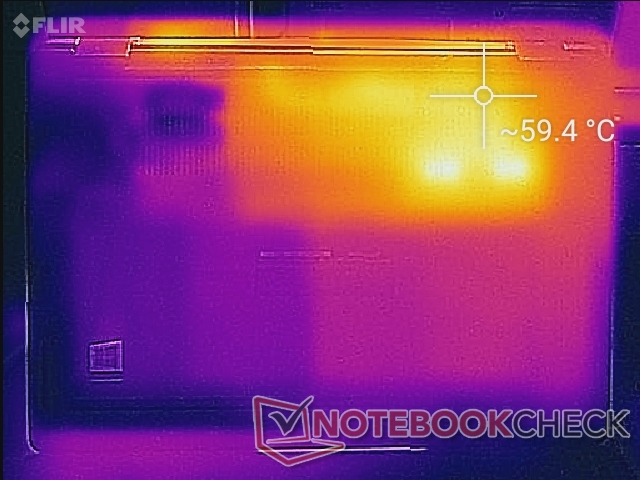
Temperature
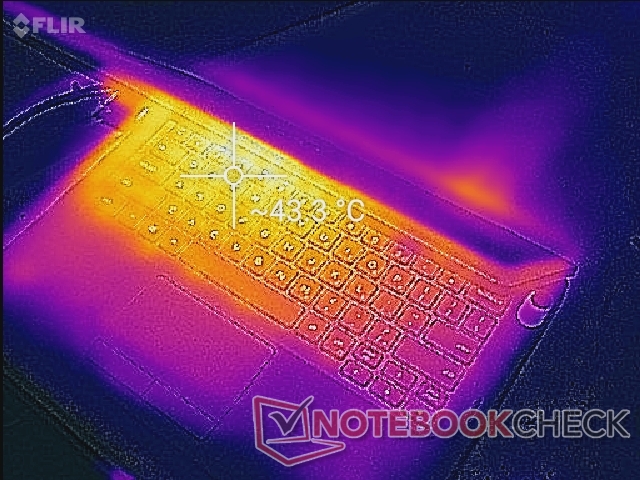
Surface temperatures are generally warmer on the left half of the system when compared to the right half due to the positioning of the CPU and cooling solution underneath. The difference is more noticeable when handling the system in tablet mode as you are more likely to be touching the warmer areas. When running extreme loads, the hot spots can be as warm as 47 C or even 60 C as shown by our temperature maps below. While this isn't an issue when using the system in laptop mode, it's definitely advisable to avoid running heavy processing loads for extended periods in tablet mode to keep surface temperatures more comfortable.
Temperatures are warmer on the Dell when compared to the ThinkPad X390 Yoga or Samsung Notebook 9 Pen where surfaces top out in the low-to-mid 40 C range at worst.
Stress Test
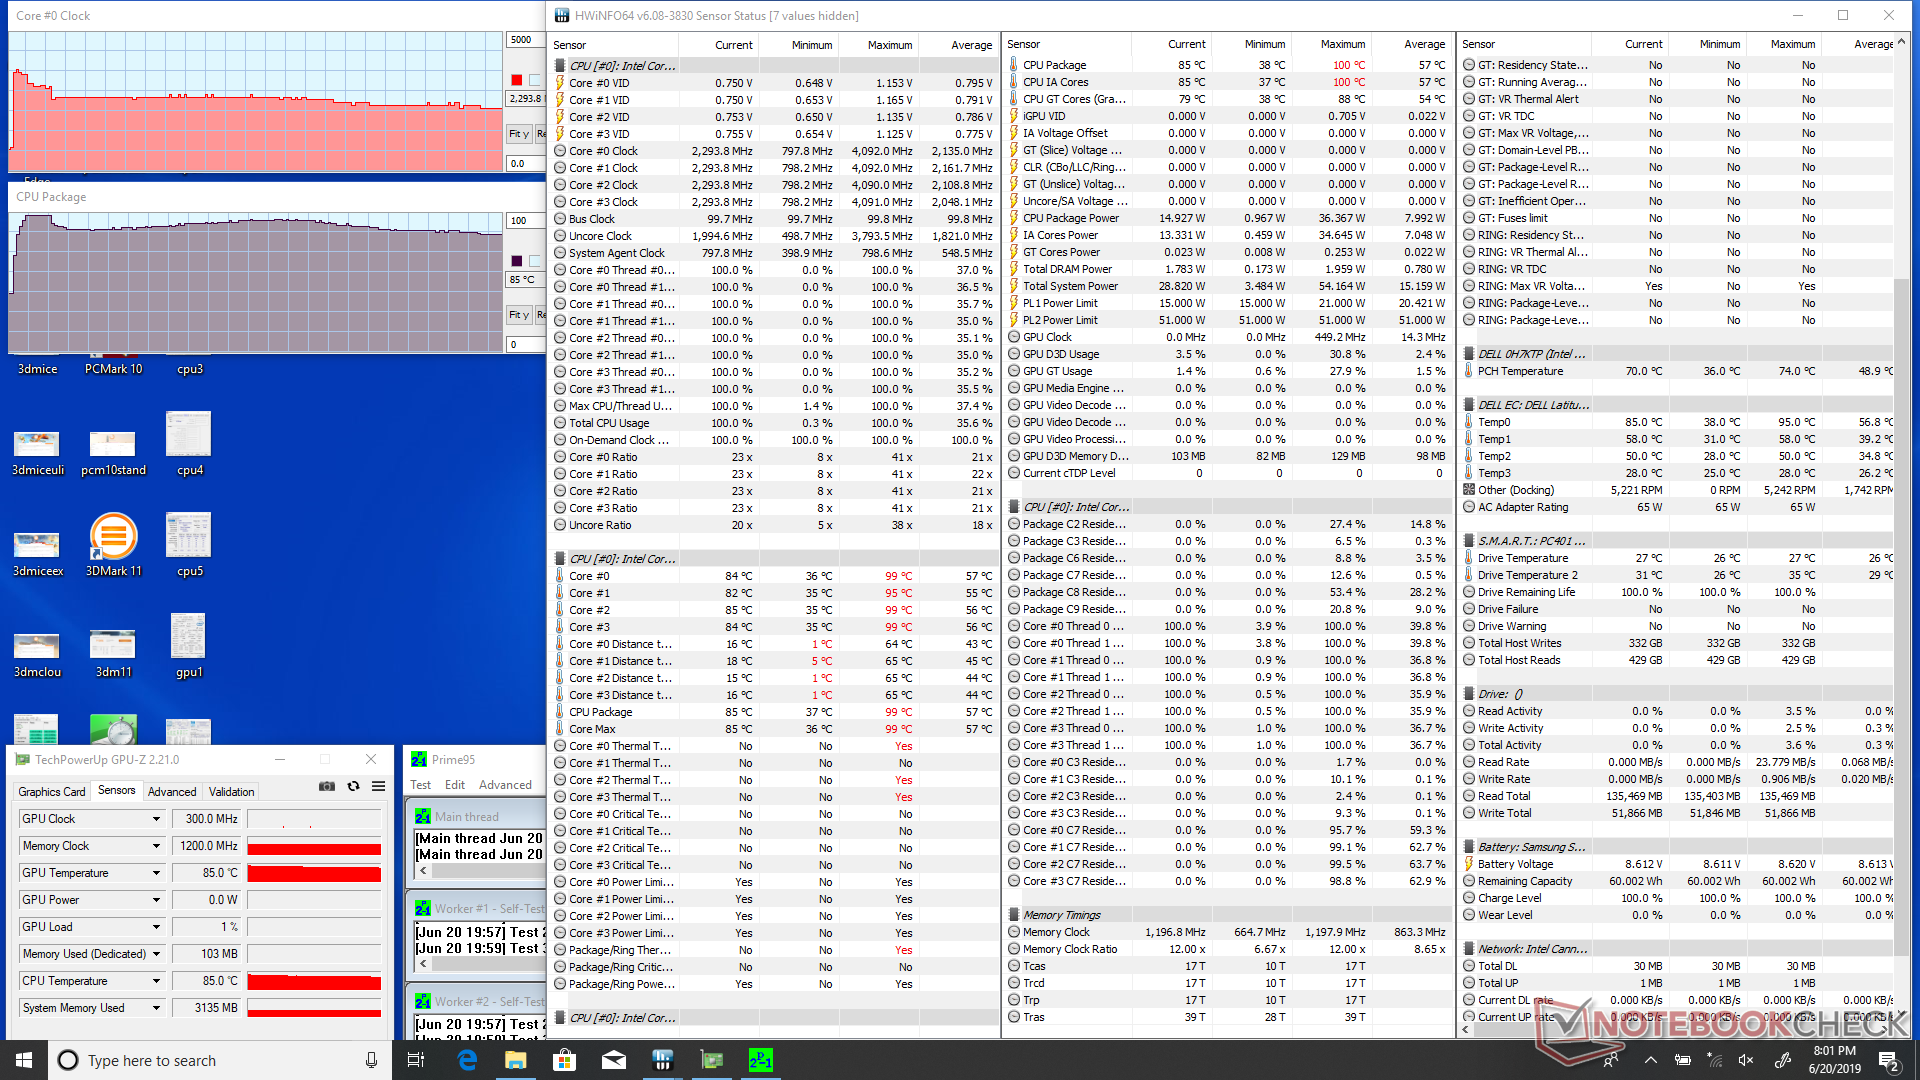
We stress the system with synthetic loads to identify for any potential throttling or stability issues. When running Prime95, the CPU can be observed operating as high as 3.7 GHz for the first few seconds at a very warm core temperature of 99 C. Clock rates steadily decrease to 2.3 GHz in order to maintain a cooler and more manageable core temperature of 85 C. When considering that the base clock rate of the Core i5-8365U is 1.6 GHz, it's impressive that a convertible subnotebook can maintain a Turbo Boost of +700 MHz albeit at the cost of high core temperatures. The Core i7 CPU in the Samsung Notebook 9 Pen, for example, settles at both a slower clock rate and cooler 77 C when subjected to the same conditions.
Running on batteries will impact performance. A 3DMark 11 run on battery power returns Physics and Graphics scores of 2561 and 1119 points, respectively, compared to 6016 and 1744 points when on mains.

| CPU Clock (GHz) | GPU Clock (MHz) | Average CPU Temperature (°C) | |
| System Idle | -- | -- | 38 |
| Prime95 Stress | 2.3 | -- | 85 |
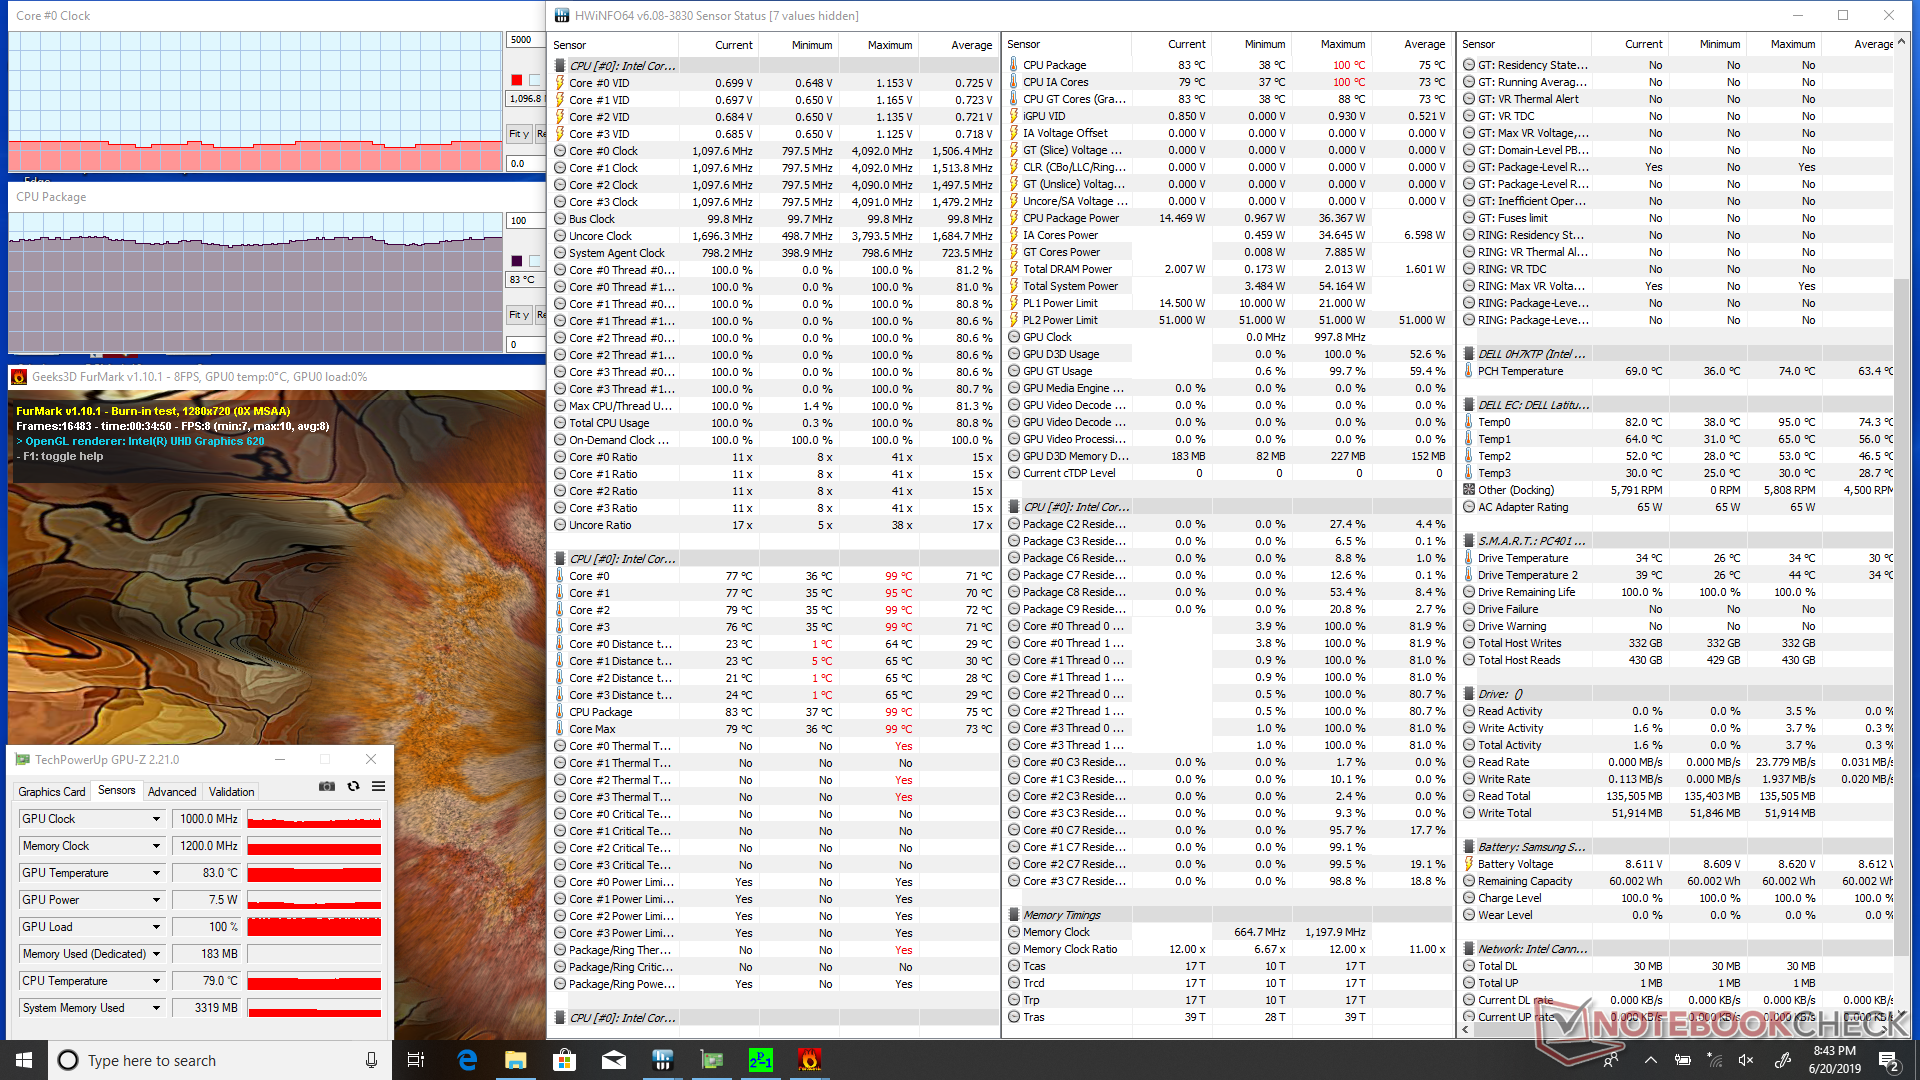
| Prime95 + FurMark Stress | 0.9 - 1.1 | 1000 | 78 - 83 |
(-) The maximum temperature on the upper side is 47.2 °C / 117 F, compared to the average of 34.3 °C / 94 F, ranging from 21.2 to 62.5 °C for the class Office.
(-) The bottom heats up to a maximum of 60 °C / 140 F, compared to the average of 36.8 °C / 98 F
(+) In idle usage, the average temperature for the upper side is 28.7 °C / 84 F, compared to the device average of 29.5 °C / 85 F.
(+) The palmrests and touchpad are cooler than skin temperature with a maximum of 31.2 °C / 88.2 F and are therefore cool to the touch.
(-) The average temperature of the palmrest area of similar devices was 27.5 °C / 81.5 F (-3.7 °C / -6.7 F).
Speakers
Most business laptops have middling speakers and the Latitude 5300 2-in-1 is no exception. Bass is weak with a roll off at about 1k Hz compared to 500 Hz on many larger laptops. In other words, the Latitude shouldn't be your first choice for multimedia or music playback.
For Skype calls and the like, however, the integrated speakers are sufficiently loud and clear as it introduces no static or heavy imbalances at higher volume settings. Note that the palm rests will vibrate to the touch since the speakers are so close to the front corners of the chassis.


Dell Latitude 13 5300 2-in-1 audio analysis
(+) | speakers can play relatively loud (83.7 dB)
Bass 100 - 315 Hz
(±) | reduced bass - on average 12.5% lower than median
(±) | linearity of bass is average (10.6% delta to prev. frequency)
Mids 400 - 2000 Hz
(+) | balanced mids - only 3.9% away from median
(+) | mids are linear (6.8% delta to prev. frequency)
Highs 2 - 16 kHz
(+) | balanced highs - only 1.6% away from median
(+) | highs are linear (4.9% delta to prev. frequency)
Overall 100 - 16.000 Hz
(+) | overall sound is linear (14.5% difference to median)
Compared to same class
» 12% of all tested devices in this class were better, 4% similar, 84% worse
» The best had a delta of 7%, average was 21%, worst was 53%
Compared to all devices tested
» 18% of all tested devices were better, 4% similar, 77% worse
» The best had a delta of 4%, average was 23%, worst was 134%
Apple MacBook 12 (Early 2016) 1.1 GHz audio analysis
(+) | speakers can play relatively loud (83.6 dB)
Bass 100 - 315 Hz
(±) | reduced bass - on average 11.3% lower than median
(±) | linearity of bass is average (14.2% delta to prev. frequency)
Mids 400 - 2000 Hz
(+) | balanced mids - only 2.4% away from median
(+) | mids are linear (5.5% delta to prev. frequency)
Highs 2 - 16 kHz
(+) | balanced highs - only 2% away from median
(+) | highs are linear (4.5% delta to prev. frequency)
Overall 100 - 16.000 Hz
(+) | overall sound is linear (10.2% difference to median)
Compared to same class
» 7% of all tested devices in this class were better, 2% similar, 90% worse
» The best had a delta of 5%, average was 18%, worst was 53%
Compared to all devices tested
» 5% of all tested devices were better, 1% similar, 94% worse
» The best had a delta of 4%, average was 23%, worst was 134%
Energy Management
Power Consumption
Idling on desktop demands anywhere between 3 W and 7 W depending on the Power profile and brightness setting. The Dell is generally more power efficient during low loads than competing 13-inch systems which contributes to the long WLAN runtimes below.
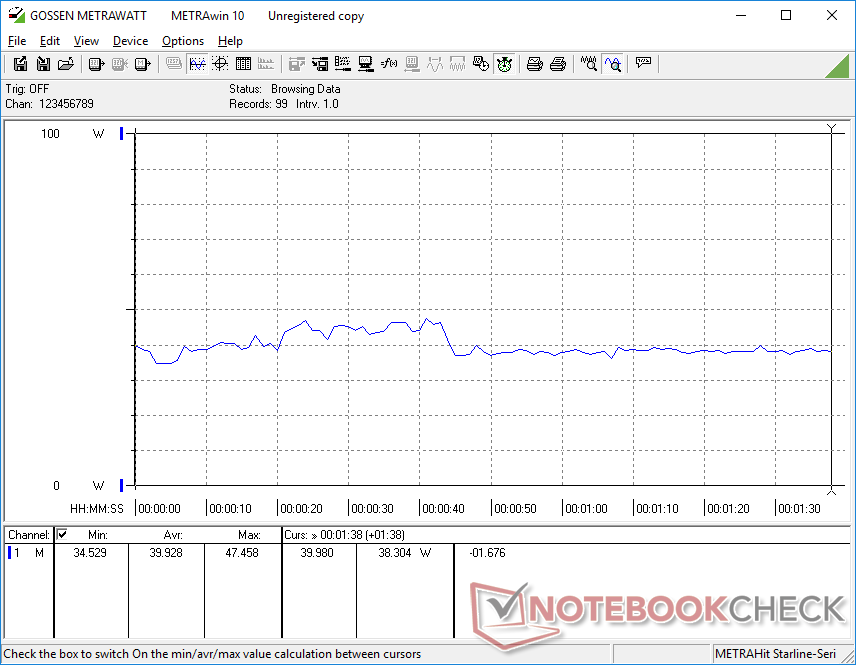
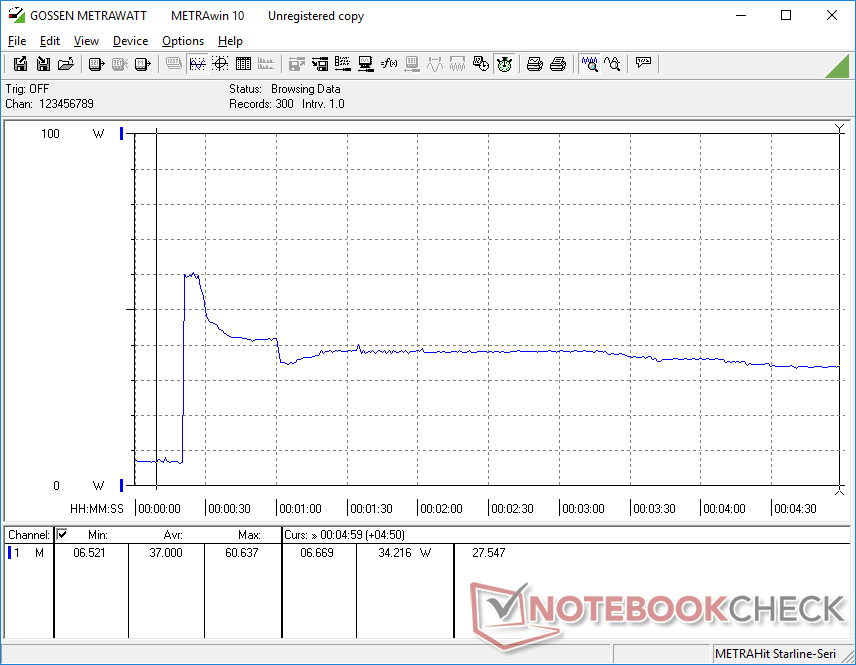
We're able to record a maximum draw of 60 W from the small (~10.5 x 6.5 x 2.3 cm) 65 W AC adapter when running Prime95. As shown by our graph, however, this high of a consumption lasts for only a few seconds before inevitably falling and stabilizing at about 34 W. The behavior mirrors our stress test observations above where Turbo Boost is highest only during the first few seconds of the test.
Dell offers a larger 90 W AC adapter for an additional charge, but we don't find this to be necessary based on our measurements with the standard 65 W adapter.
| Off / Standby | |
| Idle | |
| Load |
|
Key:
min: | |
| Dell Latitude 13 5300 2-in-1 i5-8365U, UHD Graphics 620, SK hynix PC401 HFS256GD9TNG, IPS, 1920x1080, 13.3" | Lenovo ThinkPad X390-20Q1S02M00 i5-8265U, UHD Graphics 620, Intel SSD Pro 7600p SSDPEKKF512G8L, IPS LED, 1920x1080, 13.3" | Huawei MateBook 13 i7 i7-8565U, GeForce MX150, Samsung SSD PM981 MZVLB512HAJQ, IPS, 2160x1440, 13" | Samsung Notebook 9 NP930QAA i5-8550U, UHD Graphics 620, Samsung PM961 MZVLW256HEHP, IPS, 1920x1080, 13.3" | HP Spectre x360 13t-ae000 i5-8550U, UHD Graphics 620, Lite-On CA1-8D256-HP, IPS, 3840x2160, 13.3" | HP EliteBook 735 G5 3UN62EA R7 2700U, Vega 10, Toshiba KBG30ZMV256G, IPS, 1920x1080, 13.3" | HP EliteBook x360 1030 G3 45X96UT i7-8650U, UHD Graphics 620, Samsung SSD PM981 MZVLB512HAJQ, IPS, 1920x1080, 13.3" | |
|---|---|---|---|---|---|---|---|
| Power Consumption | -14% | -43% | -53% | -40% | -43% | -21% | |
| Idle Minimum * (Watt) | 2.8 | 3.4 -21% | 3.5 -25% | 4.4 -57% | 5.9 -111% | 5.5 -96% | 3.4 -21% |
| Idle Average * (Watt) | 5.1 | 5.6 -10% | 7.5 -47% | 11.8 -131% | 9.8 -92% | 9.4 -84% | 7.6 -49% |
| Idle Maximum * (Watt) | 7.1 | 8.7 -23% | 12.4 -75% | 15.5 -118% | 10.6 -49% | 11.6 -63% | 11.5 -62% |
| Load Average * (Watt) | 39.9 | 43.6 -9% | 64.2 -61% | 38 5% | 36.6 8% | 39 2% | 35.4 11% |
| Load Maximum * (Watt) | 60.3 | 65 -8% | 65.7 -9% | 39.8 34% | 34.3 43% | 45.6 24% | 51.9 14% |
| Witcher 3 ultra * (Watt) | 52.5 |
* ... smaller is better
Battery Life
The system carries a large 60 Wh battery for a 13-inch convertible compared to 48 Wh and 39 Wh on the ThinkPad X390 Yoga and Samsung Notebook 9 Pen, respectively. Expect almost 10.5 hours of real-world WLAN use to be one of the longer-lasting business subnotebooks we've tested.
Recharging from empty to full capacity with the included AC adapter still takes the normal 1.5 to 2 hours despite the higher capacity.
| Dell Latitude 13 5300 2-in-1 i5-8365U, UHD Graphics 620, 60 Wh | Lenovo ThinkPad X390-20Q1S02M00 i5-8265U, UHD Graphics 620, 48 Wh | Huawei MateBook 13 i7 i7-8565U, GeForce MX150, 41.7 Wh | Samsung Notebook 9 NP930QAA i5-8550U, UHD Graphics 620, 39 Wh | HP Spectre x360 13t-ae000 i5-8550U, UHD Graphics 620, 60 Wh | HP EliteBook x360 1030 G3 45X96UT i7-8650U, UHD Graphics 620, 56.2 Wh | |
|---|---|---|---|---|---|---|
| Battery runtime | -22% | -43% | -43% | -19% | -6% | |
| Reader / Idle (h) | 28.3 | 15.4 -46% | 14.6 -48% | |||
| WiFi v1.3 (h) | 10.4 | 8.3 -20% | 7.6 -27% | 6.6 -37% | 7.1 -32% | 9.8 -6% |
| Load (h) | 2.1 | 1.6 -24% | 0.9 -57% | 1.2 -43% | 2 -5% |
Pros
Cons
Verdict
The Dell Latitude 13 5300 2-in-1 gets the job done, but it doesn't do it any better or worse to set itself apart from other business subnotebooks. Its 360-degree hinges are handy, but it also weighs a bit more than those from Lenovo or HP. It supports an active stylus, but the magnetic holder is less secure than a built-in recess or physical strap. Its battery life is long, but it still ships with a proprietary AC adapter by default instead of the leaner and more universal USB Type-C.
The best aspect of the Latitude convertible continues to be serviceability. Dell makes it very easy for end users to upgrade core components without anything more than a Philips screwdriver. Higher-end features like Thunderbolt 3, Smart Card reader, and WWAN are all optional instead of mandatory to keep prices low for users who may not need those extras. Mid-range models should always be about options and there are certainly plenty for the Latitude 5000 series for users to buy exactly what they want.
If you're willing to spend a little more, then the HP EliteBook x360 1030 G3 is the lighter and brighter option with firmer keyboard keys. Otherwise, the Latitude 13 5300 2-in-1 is a fair alternative to the similarly priced ThinkPad X390 Yoga as it is the slightly stronger and longer-lasting model. We recommend skipping the Core i7 CPU and instead investing in a Core i5 SKU with more tangible extras like WWAN, Thunderbolt 3, higher storage, or extended protection.
It's all about service, options, and connectivity. The Latitude 13 5300 2-in-1 has all three pillars covered for the typical office and out-of-office scenarios. It could still be a little lighter and brighter for improved outdoor usability and to further exploit its convertible form factor.
Dell Latitude 13 5300 2-in-1
- 10/17/2019 v7 (old)
Allen Ngo
Price comparison
