Microsoft Surface Pro 6 (2018) (i5, 128 GB, 8 GB) Convertible Review
 - the i5 model is cheaper and fanless")
The i5 model of Microsoft’s Surface Pro 6 (2018) is the affordable entry-level model of the series starting at $900. It is less powerful, features just 8 GB of RAM, and a 128 GB SSD, 53 GB of which was available out of the box on our review unit.
How high is the performance delta when compared to the i7 model? Is it relevant to everyday office and web application use?
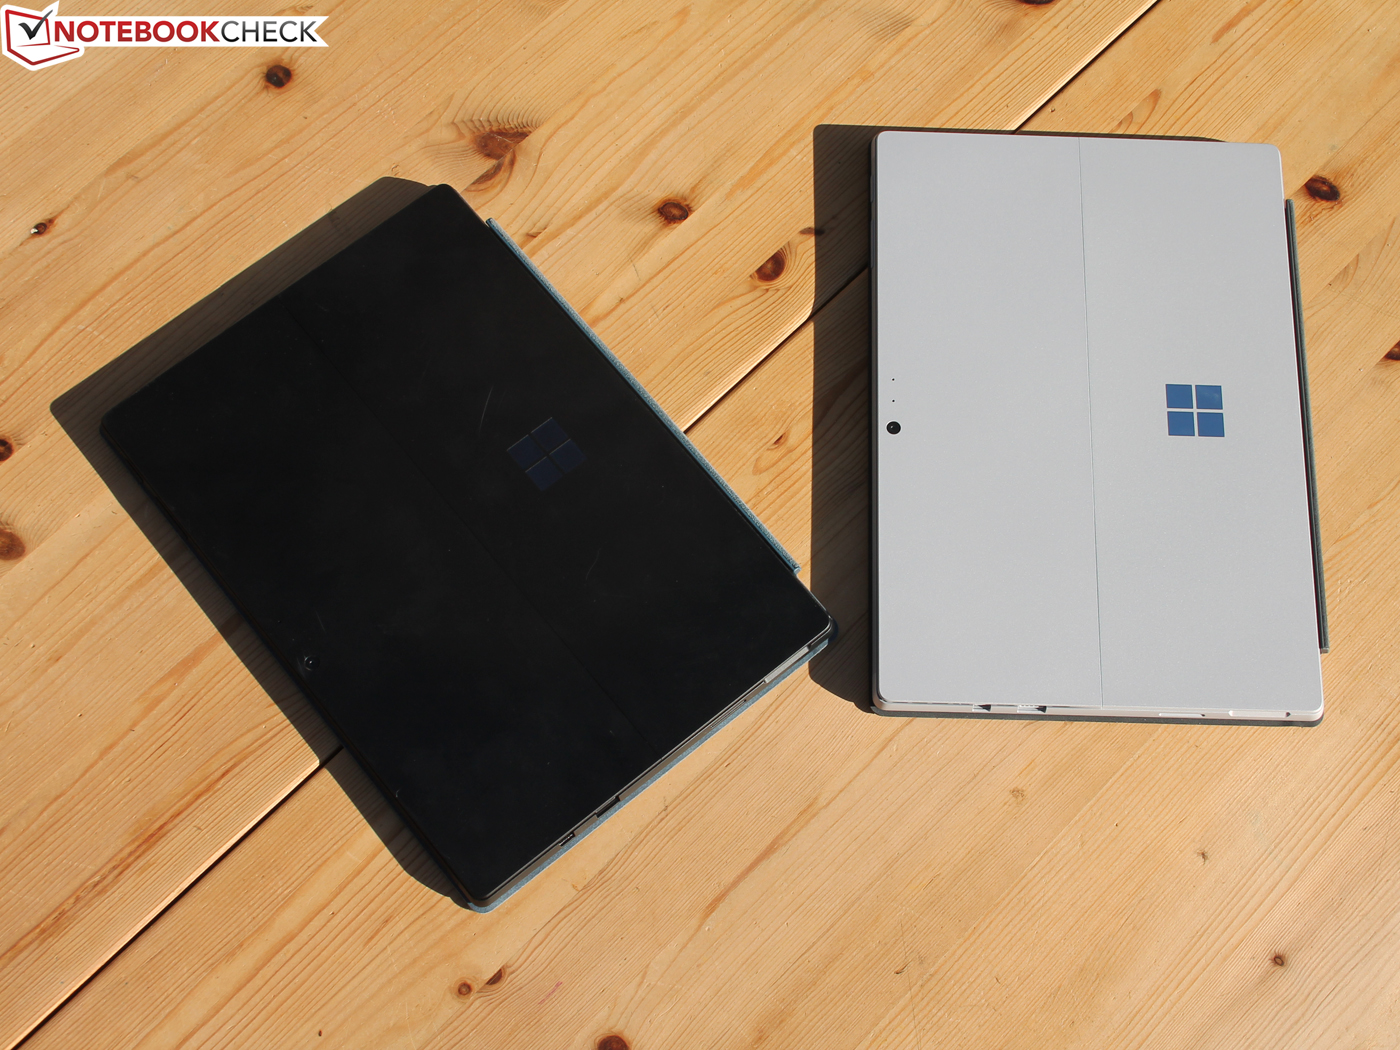
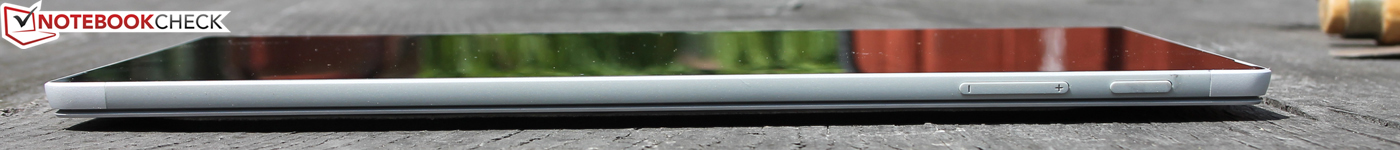
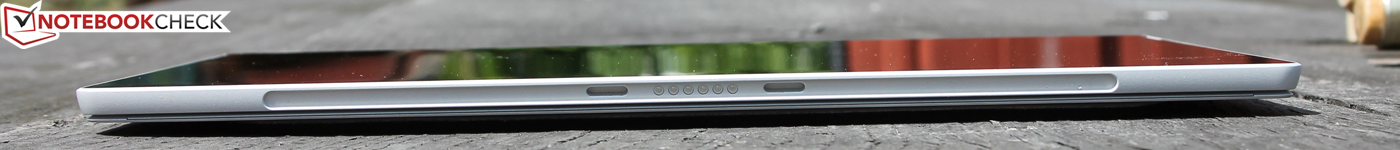
The Surface Pro 6 i7 and i5 are absolutely identical regarding case, connectivity, and display. The only difference lies in the cooling system: The i5 model is fanless while the i7 model requires active cooling. This is the primary reason for the i7’s much higher performance. For details, see our Surface Pro 6 (2018) i7 review.
Given their similarity, we are not going to discuss build quality, connectivity, cameras, input devices, and speakers as part of this review but will include our display measurements. Our review of last year’s i5/256 2017 model can be found here.
Update 11/7/2018: 256 GB SSD is faster
We were able to also take a look at the i5 model with a 256 GB SSD that is also made by Toshiba (KBG30ZPZ256G). On average, this SSD turned out to be roughly 30 % faster than the 128 GB SKU. Accordingly, PCMark 8 and 10 scores were around 10 % higher.
| 2017 i5 | 2018 entry level | 2018 mid-range | 2018 mid-range | 2018 mid-range | 2018 high-end | 2018 high-end |
|---|---|---|---|---|---|---|
| i5-7300U | Core m3-7Y30 (fanless) | i5-8250U (fanless) | i5-8250U (fanless) | i7-8650U | i7-8650U | i7-8650U |
| 8 GB RAM | 4 GB RAM | 8 GB RAM | 8 GB RAM | 8 GB RAM | 16 GB RAM | 16 GB RAM |
| 256 GB | 128 GB | 128 GB | 256 GB | 256 GB | 512 GB | 1 TB |
| 1200 Euros | 900 Euros | 1049 Euros | 1349 Euros | 1649 Euros | 2049 Euros | 2449 Euros |
| i5/256 2017 review | soon | this test | awaiting SSD measurements | - | i7/512 2018 review | - |
Connectivity
SD Card Reader
As always we ran the card reader benchmarks with our 64 GB Toshiba Exceria SDXC UHS-II reference card. Today’s review unit peaked at 86 MB/s copying large blocks of data (AS SSD) and at 75 MB/s transferring JPEG files of around 5 MB each. This may sound decent, but it is in fact only mediocre - Microsoft’s own Surface Book 2 and Dell’s Latitude were much faster. The i7 model’s performance was identical.
| SD Card Reader | |
| average JPG Copy Test (av. of 3 runs) | |
| Microsoft Surface Book 2 (Toshiba Exceria Pro SDXC 64 GB UHS-II) | |
| Dell Latitude 5290 2-in-1 (Toshiba Exceria Pro M501 UHS-II) | |
| Microsoft Surface Pro 6, Core i5, 128 GB (Toshiba Exceria Pro M501 microSDXC 64GB) | |
| Average of class Convertible (28.1 - 197, n=23, last 2 years) | |
| Microsoft Surface Pro (2017) i7 (Toshiba Exceria Pro M401 64 GB) | |
| maximum AS SSD Seq Read Test (1GB) | |
| Microsoft Surface Book 2 (Toshiba Exceria Pro SDXC 64 GB UHS-II) | |
| Dell Latitude 5290 2-in-1 (Toshiba Exceria Pro M501 UHS-II) | |
| Average of class Convertible (28.9 - 254, n=22, last 2 years) | |
| Microsoft Surface Pro (2017) i7 (Toshiba Exceria Pro M401 64 GB) | |
| Microsoft Surface Pro 6, Core i5, 128 GB (Toshiba Exceria Pro M501 microSDXC 64GB) | |
Display

The 12.3-inch 3:2 PixelSense display is identical as well, and features a resolution of 2736x1824 with a resulting pixel density of 267 dpi. Its contrast ratio is an astonishingly high 1,447:1 measured at a high resolution of 463 nits.
As in 2017, we were able to detect PWM flickering at a very high and imperceptible frequency of 20,800 Hz at brightness levels of 50% and below. This is also identical to the i7 model; differences are within margin of error and due to manufacturing tolerance.
| |||||||||||||||||||||||||
Brightness Distribution: 83 %
Center on Battery: 463 cd/m²
Contrast: 1447:1 (Black: 0.32 cd/m²)
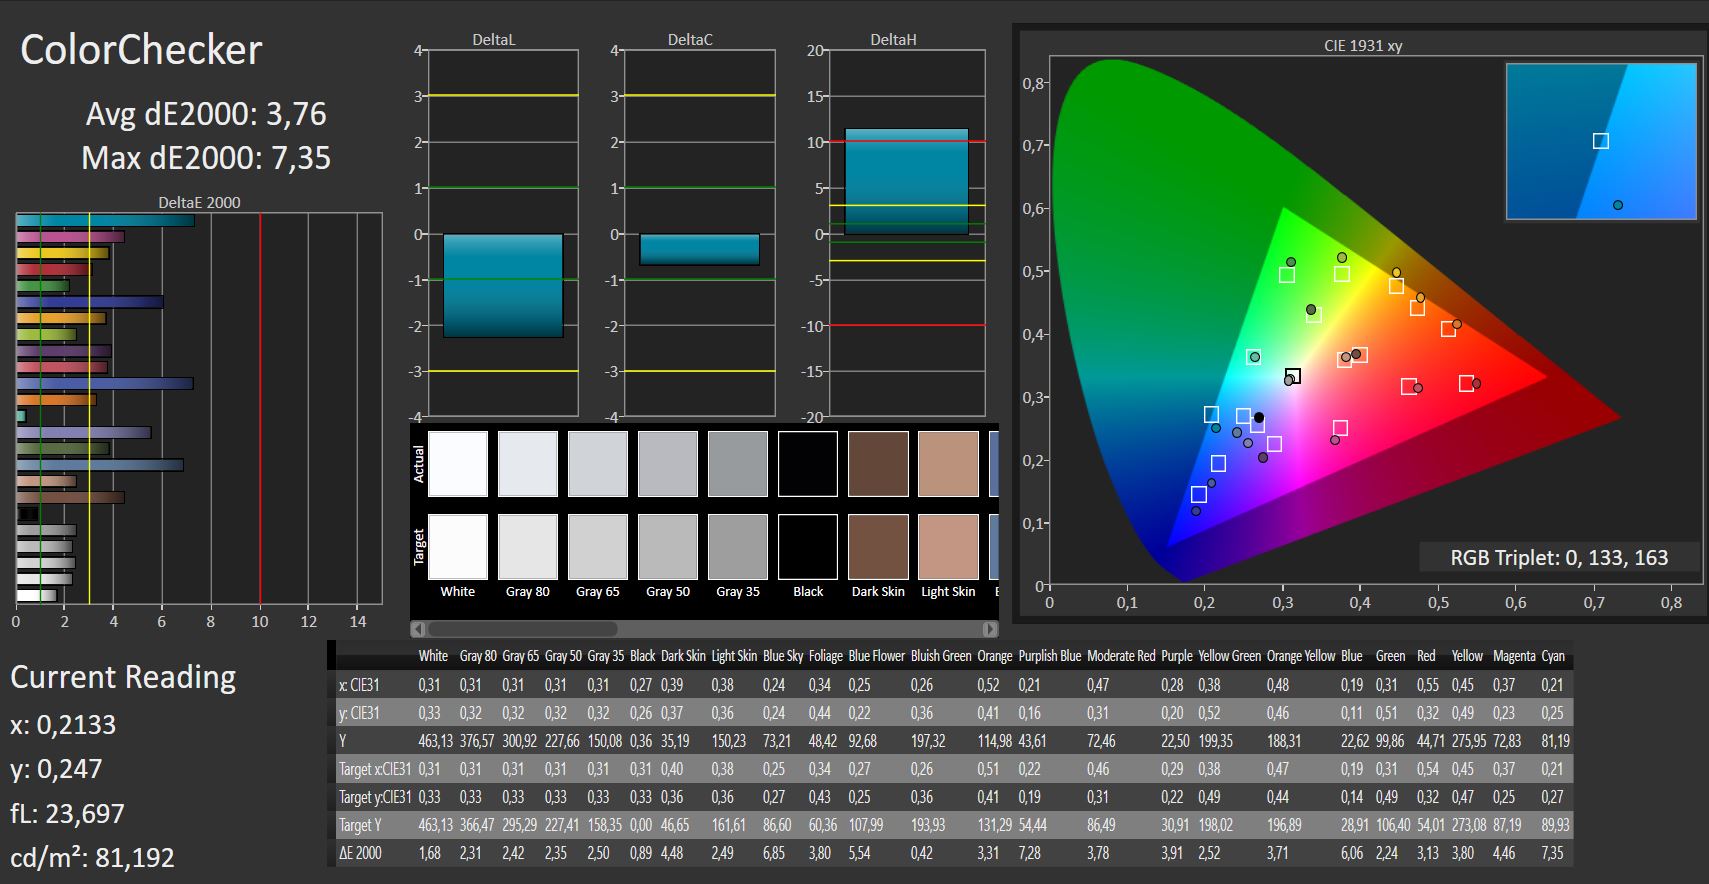
ΔE ColorChecker Calman: 3.76 | ∀{0.5-29.43 Ø4.72}
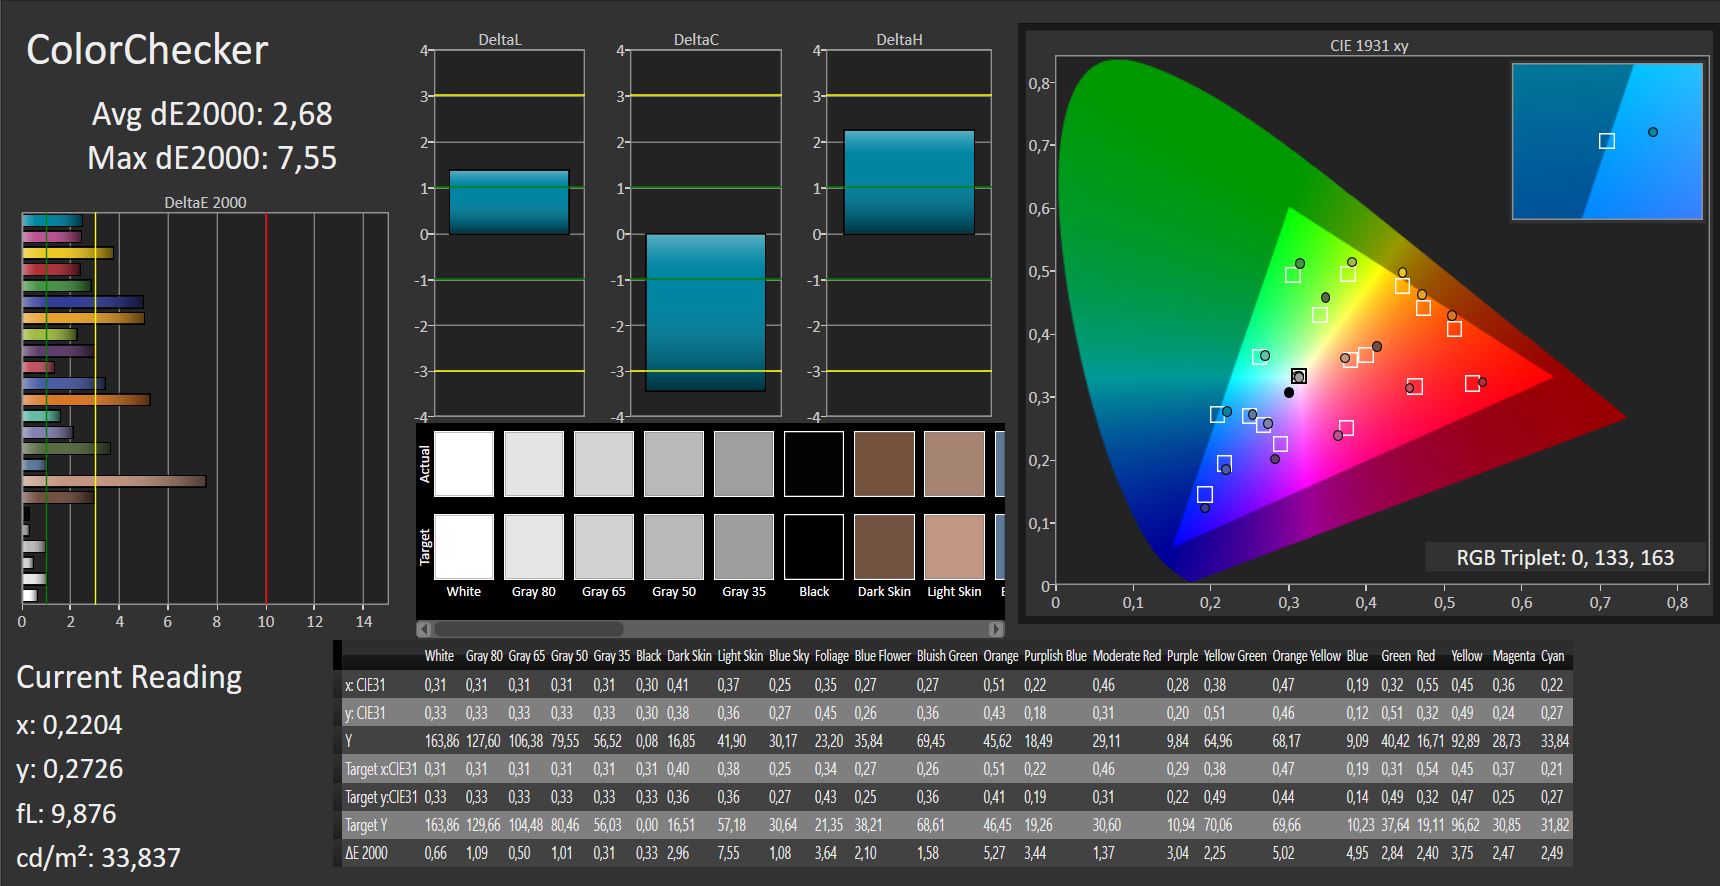
calibrated: 2.68
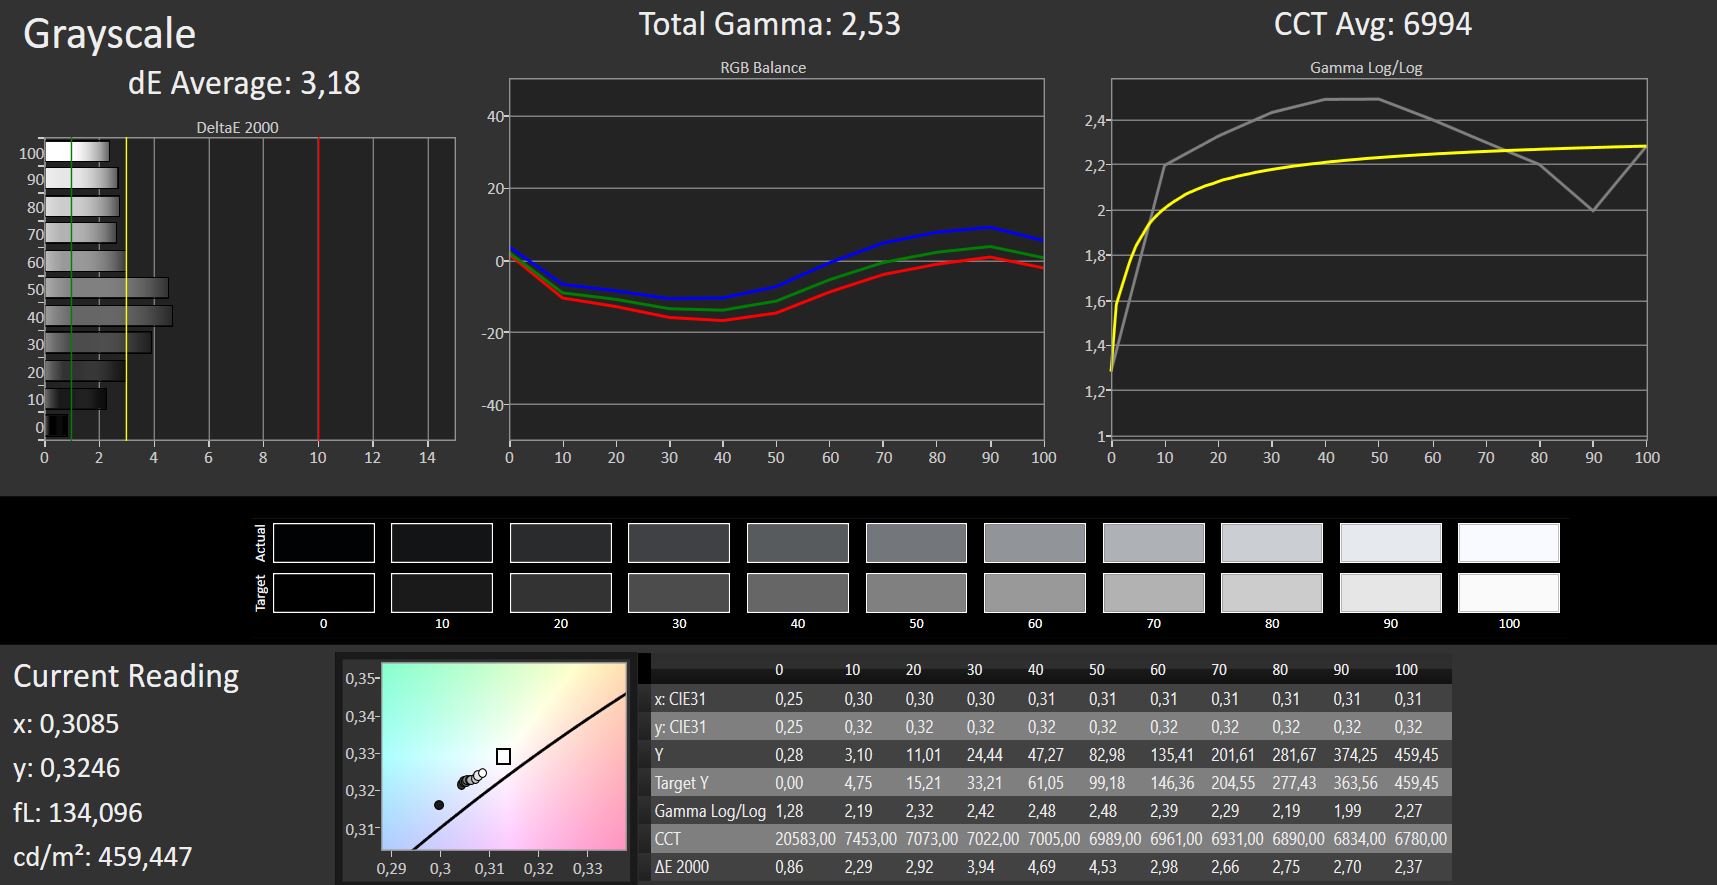
ΔE Greyscale Calman: 3.18 | ∀{0.09-98 Ø4.97}
90% sRGB (Argyll 1.6.3 3D)
59% AdobeRGB 1998 (Argyll 1.6.3 3D)
65.6% AdobeRGB 1998 (Argyll 3D)
90.4% sRGB (Argyll 3D)
65.5% Display P3 (Argyll 3D)
Gamma: 2.53
CCT: 6994 K
| Microsoft Surface Pro 6, Core i5, 128 GB LGPhilips LP123WQ112604, , 2736x1834, 12.3" | Microsoft Surface Pro (2017) i5 LG Display LP123WQ112604, , 2736x1824, 12.3" | Microsoft Surface Book 2 Panasonic MEI96A2 , , 3000x2000, 13.5" | Microsoft Surface Go MHN-00003 Sharp SHP14A6, , 1800x1200, 10" | Dell Latitude 5290 2-in-1 SHP1479, , 1920x1280, 12.3" | HP Elite x2 1013 G3-2TT14EA AU Optronics AUO101A, , 3000x2000, 13" | Lenovo ThinkPad X1 Tablet G3-20KJ001NGE LP130QP1-SPA1, , 3000x2000, 13" | Samsung Galaxy Book 12 SM-W728 Samsung SDCA029, , 2160x1440, 12" | Huawei Matebook E Chi Mei CMN7801, , 2160x1440, 12" | Lenovo Miix 520-12IKB 20M3000LGE Unbekannt, , 1920x1200, 12.2" | |
|---|---|---|---|---|---|---|---|---|---|---|
| Display | 6% | 5% | 4% | 9% | 5% | 7% | 16% | 21% | 1% | |
| Display P3 Coverage (%) | 65.5 | 67.6 3% | 67.9 4% | 66.5 2% | 70.5 8% | 67.5 3% | 68.1 4% 67.8 4% | 77.3 18% | 84.9 30% | 66.1 1% |
| sRGB Coverage (%) | 90.4 | 99 10% | 95.7 6% | 97.5 8% | 98.6 9% | 96.7 7% | 99.4 10% 99.1 10% | 92.8 3% | 99.8 10% | 91.6 1% |
| AdobeRGB 1998 Coverage (%) | 65.6 | 69.1 5% | 69.4 6% | 67.5 3% | 71.5 9% | 68.2 4% | 69.9 7% 69.3 6% | 83.1 27% | 79.9 22% | 66.7 2% |
| Response Times | -8% | -23% | -4% | -40% | -8% | -41% | 55% | 25% | 11% | |
| Response Time Grey 50% / Grey 80% * (ms) | 42 ? | 42 ? -0% | 52.8 ? -26% | 44 ? -5% | 56.8 ? -35% | 47 ? -12% | 47.2 ? -12% | 4 ? 90% | 26 ? 38% | 36 ? 14% |
| Response Time Black / White * (ms) | 25 ? | 29 ? -16% | 30 ? -20% | 25.6 ? -2% | 36 ? -44% | 26 ? -4% | 42.4 ? -70% | 20 ? 20% | 22 ? 12% | 23 ? 8% |
| PWM Frequency (Hz) | 20800 ? | 21000 | 1020 ? | 1852 ? | 250 ? | 200 ? | ||||
| Screen | 5% | 20% | 23% | -5% | -8% | 5% | 85% | -11% | -32% | |
| Brightness middle (cd/m²) | 463 | 417 -10% | 385 -17% | 456 -2% | 548 18% | 452 -2% | 474 2% | 376 -19% | 439 -5% | 384 -17% |
| Brightness (cd/m²) | 450 | 401 -11% | 372 -17% | 426 -5% | 545 21% | 412 -8% | 418 -7% | 378 -16% | 428 -5% | 355 -21% |
| Brightness Distribution (%) | 83 | 88 6% | 89 7% | 88 6% | 86 4% | 85 2% | 76 -8% | 91 10% | 92 11% | 80 -4% |
| Black Level * (cd/m²) | 0.32 | 0.29 9% | 0.21 34% | 0.31 3% | 0.51 -59% | 0.48 -50% | 0.33 -3% | 0.03 91% | 0.35 -9% | 0.56 -75% |
| Contrast (:1) | 1447 | 1438 -1% | 1833 27% | 1471 2% | 1075 -26% | 942 -35% | 1436 -1% | 12533 766% | 1254 -13% | 686 -53% |
| Colorchecker dE 2000 * | 3.76 | 3.63 3% | 1.6 57% | 1.3 65% | 3.65 3% | 4.05 -8% | 3.2 15% | 4.1 -9% | 5.17 -38% | 4.58 -22% |
| Colorchecker dE 2000 max. * | 7.35 | 6.74 8% | 4.5 39% | 3 59% | 7.15 3% | 6.64 10% | 6.1 17% | 6.45 12% | 7.68 -4% | 11.63 -58% |
| Colorchecker dE 2000 calibrated * | 2.68 | 1.1 59% | 1.81 32% | 1.56 42% | 0.9 66% | |||||
| Greyscale dE 2000 * | 3.18 | 2.18 31% | 1.5 53% | 1.4 56% | 5.5 -73% | 4.87 -53% | 4.5 -42% | 3.64 -14% | 5.69 -79% | 5.63 -77% |
| Gamma | 2.53 87% | 3.09 71% | 2.22 99% | 2.24 98% | 2.154 102% | 2.71 81% | 2.07 106% | 2.58 85% | 2.42 91% | 2.45 90% |
| CCT | 6994 93% | 6767 96% | 6502 100% | 6687 97% | 7052 92% | 7160 91% | 5881 111% | 7113 91% | 7999 81% | 7571 86% |
| Color Space (Percent of AdobeRGB 1998) (%) | 59 | 63 7% | 64 8% | 62.3 6% | 65.2 11% | 62 5% | 64 8% | 74 25% | 71 20% | 60 2% |
| Color Space (Percent of sRGB) (%) | 90 | 99 10% | 95.9 7% | 96.8 8% | 99.1 10% | 97 8% | 99.4 10% | 93 3% | 100 11% | 92 2% |
| Total Average (Program / Settings) | 1% /
4% | 1% /
11% | 8% /
16% | -12% /
-7% | -4% /
-6% | -10% /
1% | 52% /
67% | 12% /
0% | -7% /
-20% |
* ... smaller is better

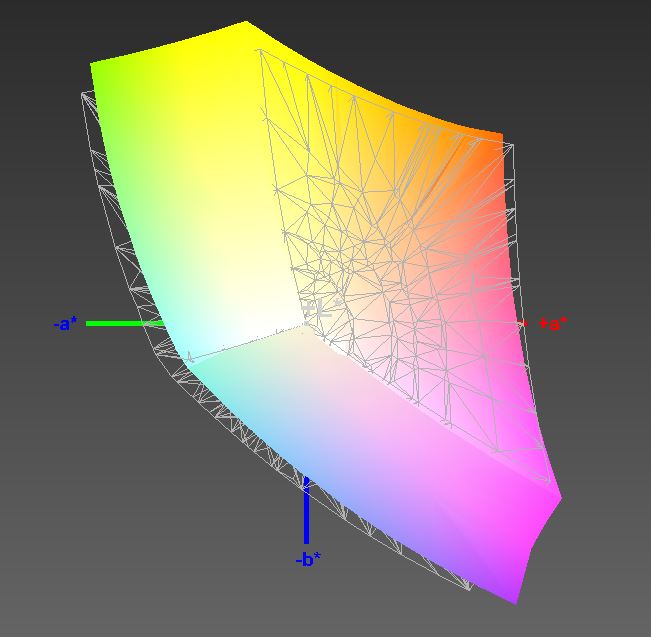
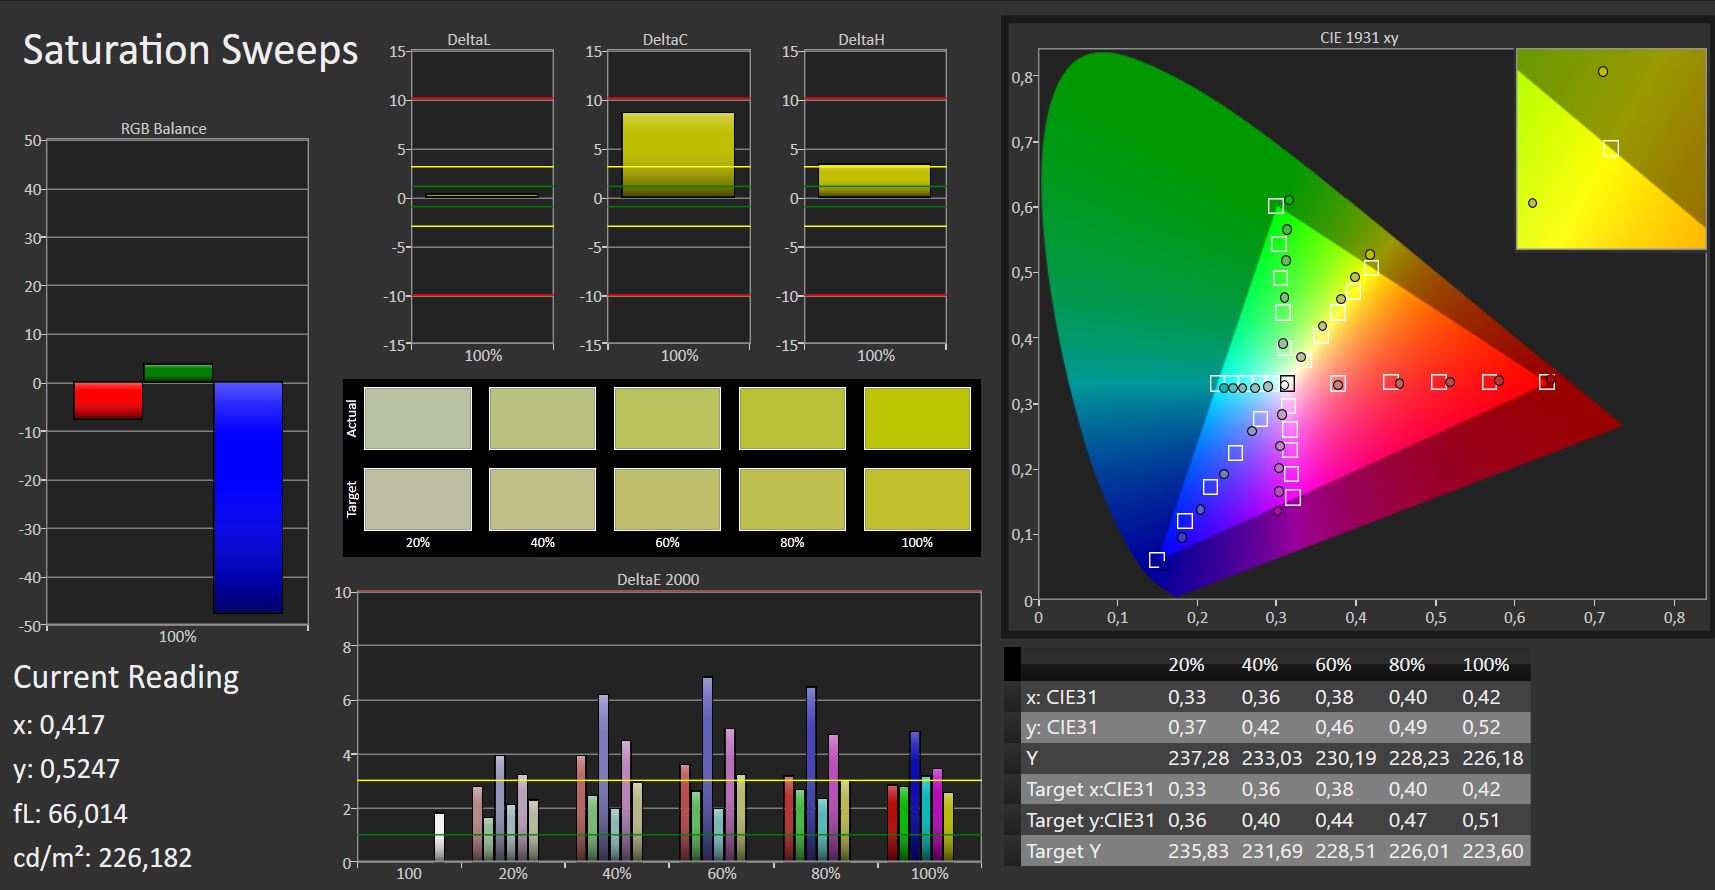
Color-space coverage, on the other hand, was somewhat lower than before, and the Surface Pro went from 99% sRGB in 2017 to just 90% sRGB today. Given that the panel was identical this too is most likely due to manufacturing tolerance.
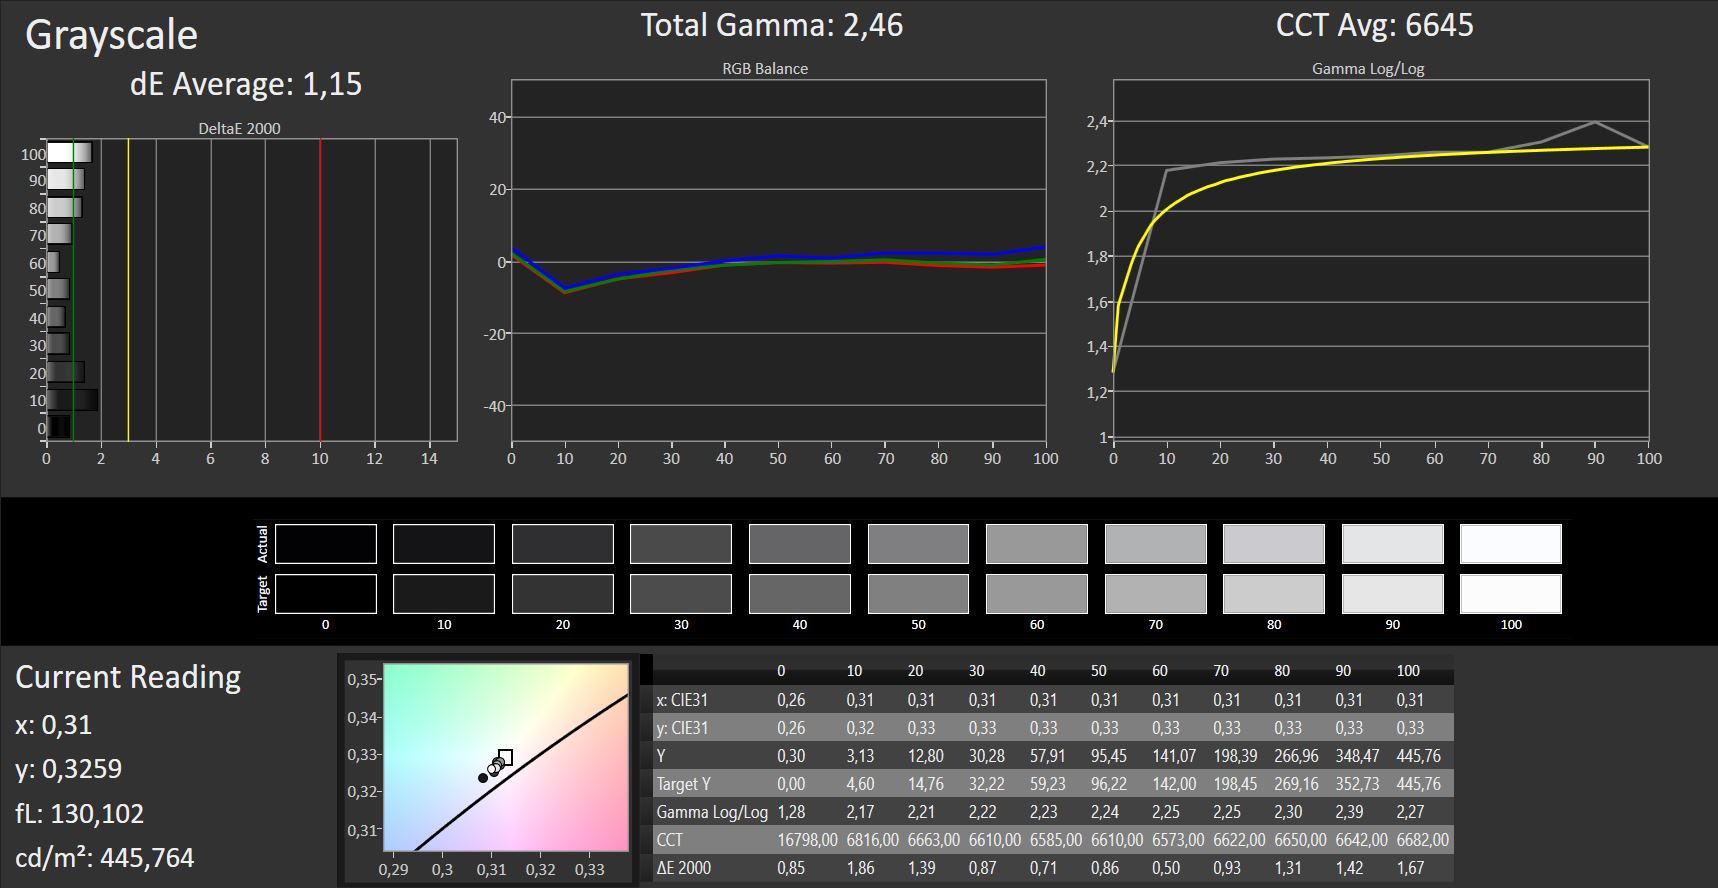
Out of the box DeltaE deviation was determined to be just 3.2, which should look nigh perfect to the untrained eye and render the minor blue tint all but unnoticeable. We were able to lower DeltaE for grayscale to 1.15 and DeltaE for colors from 3.8 to 2.7 through calibration. Ideally, you want these to be less than 3.

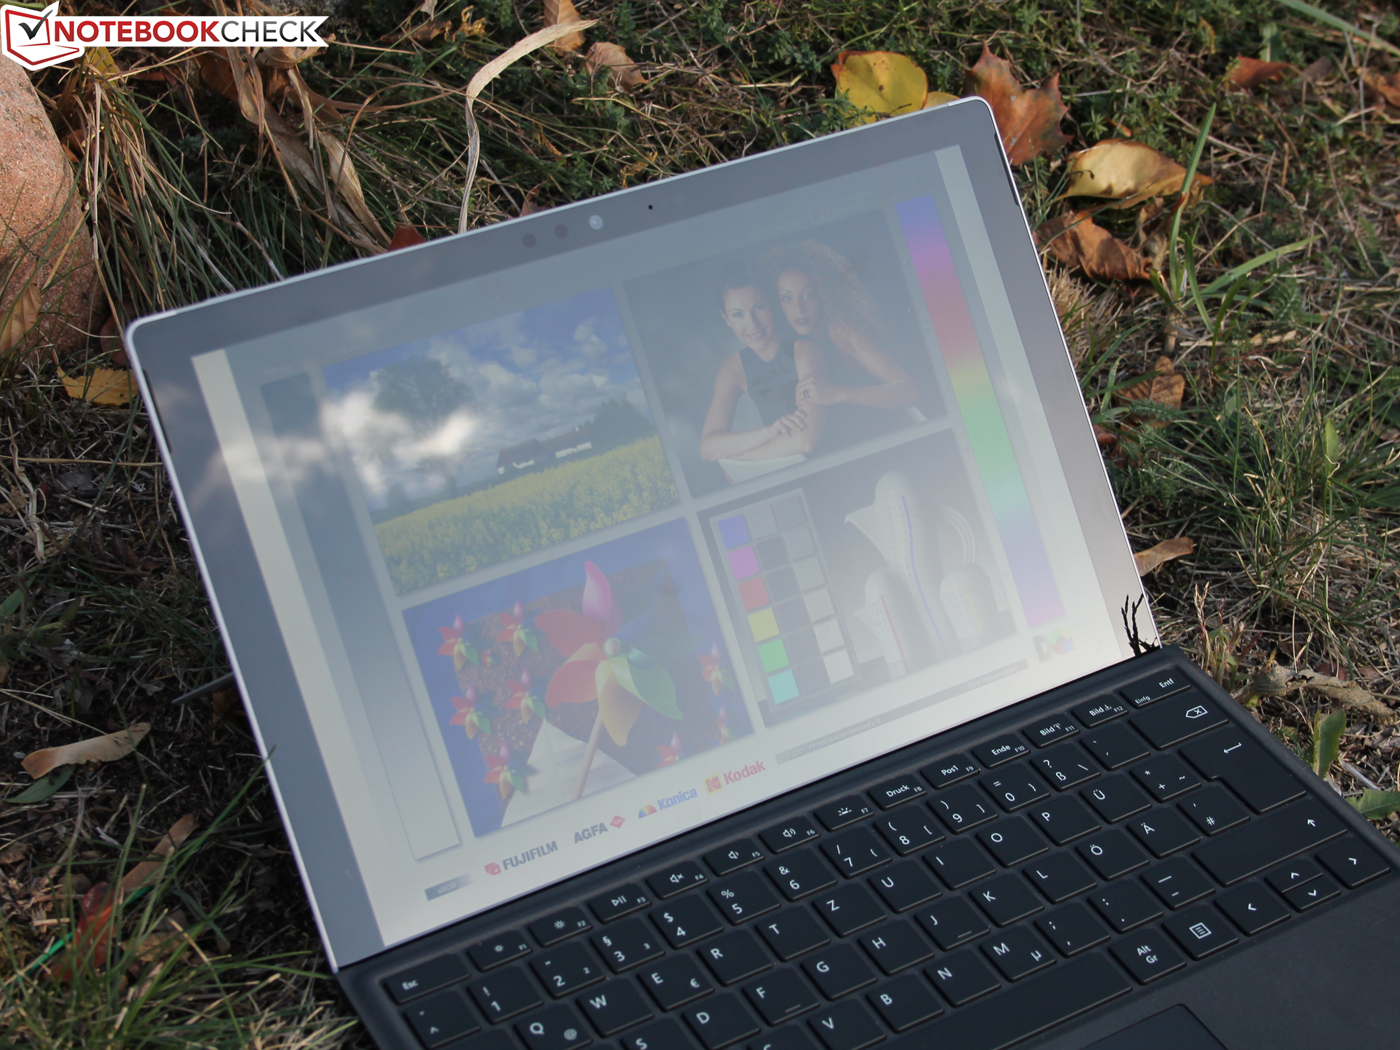
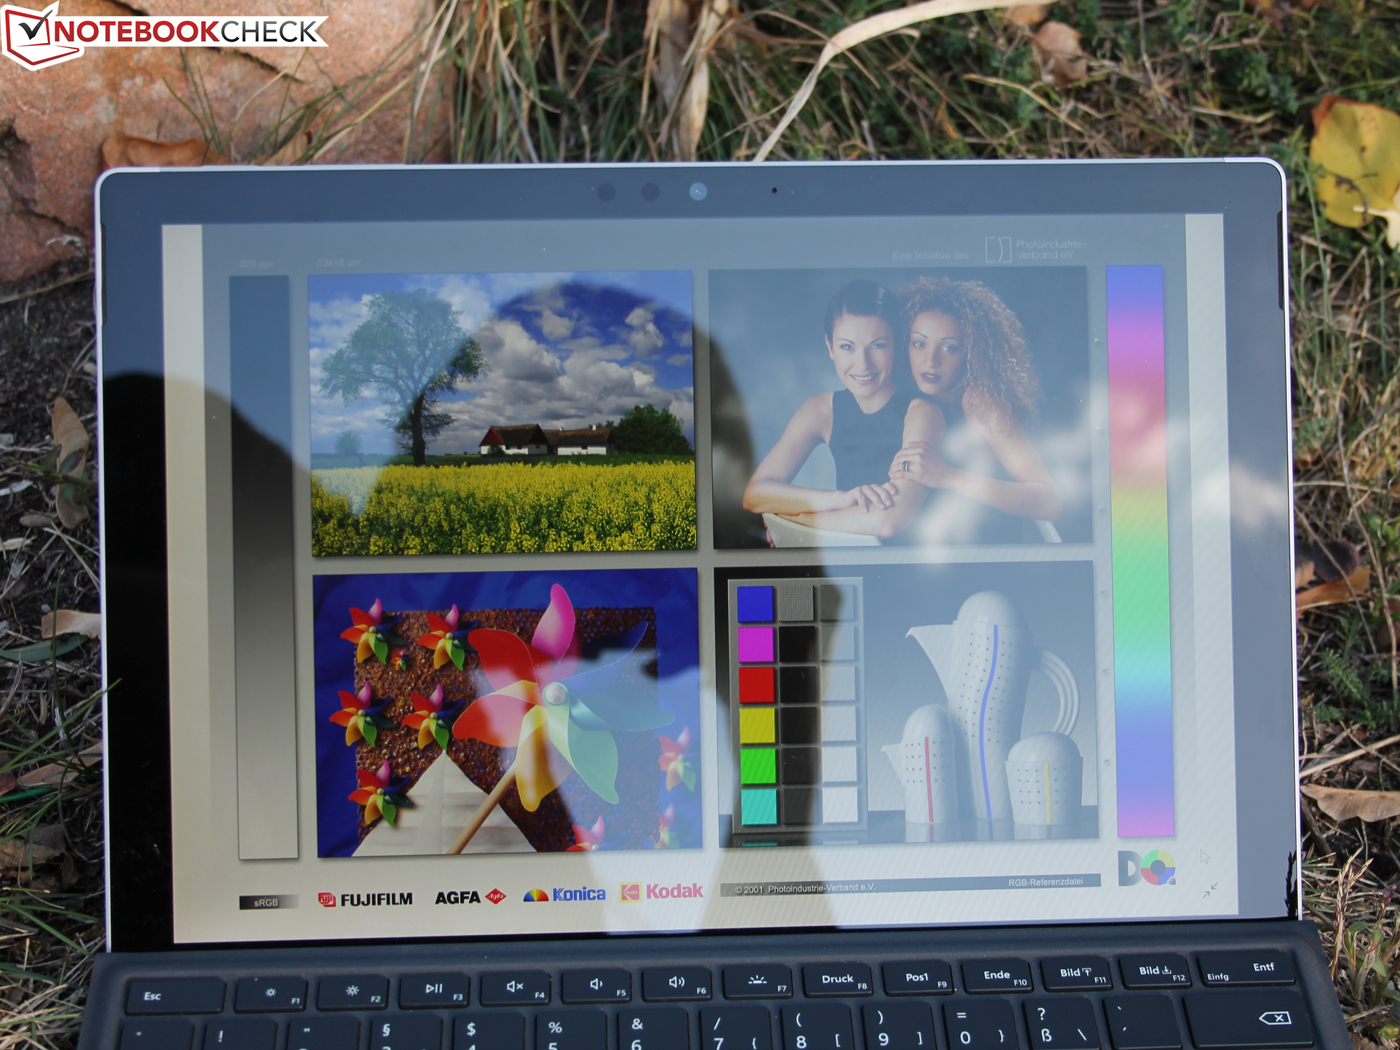
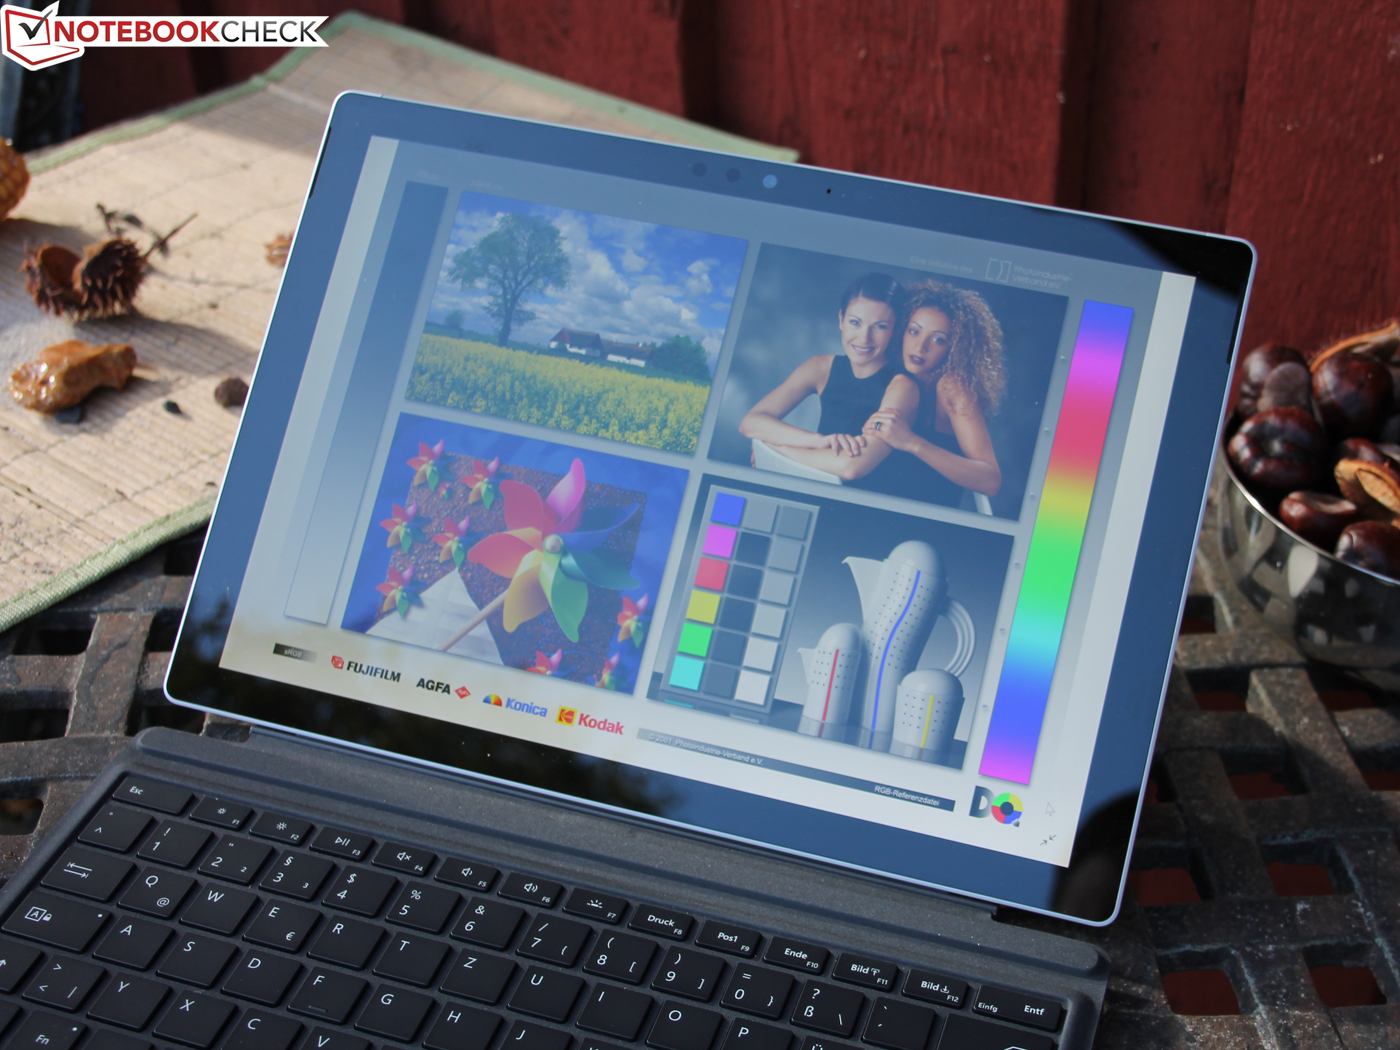
Outdoor usability was pretty decent thanks to the display’s very high maximum brightness. Unfortunately, it was foiled by its highly reflective cover, and it suffered the most in direct sunlight.
Display Response Times
| ↔ Response Time Black to White | ||
|---|---|---|
| 25 ms ... rise ↗ and fall ↘ combined | ↗ 14 ms rise | 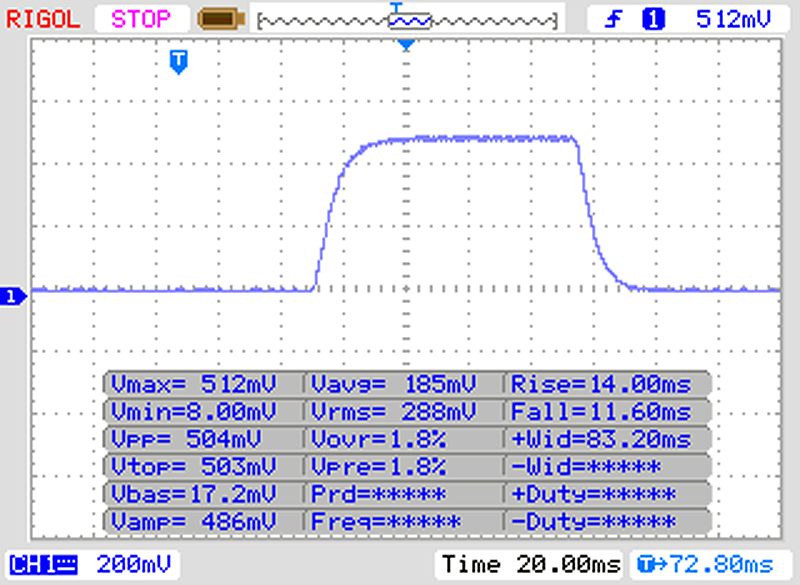 |
| ↘ 11 ms fall | ||
| The screen shows relatively slow response rates in our tests and may be too slow for gamers. In comparison, all tested devices range from 0.1 (minimum) to 240 (maximum) ms. » 59 % of all devices are better. This means that the measured response time is worse than the average of all tested devices (19.8 ms). | ||
| ↔ Response Time 50% Grey to 80% Grey | ||
| 42 ms ... rise ↗ and fall ↘ combined | ↗ 22 ms rise | 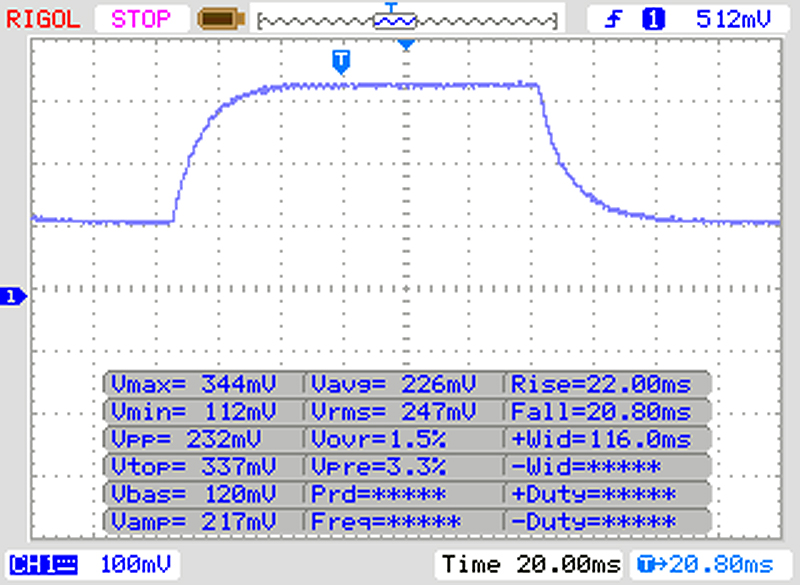 |
| ↘ 20 ms fall | ||
| The screen shows slow response rates in our tests and will be unsatisfactory for gamers. In comparison, all tested devices range from 0.165 (minimum) to 636 (maximum) ms. » 67 % of all devices are better. This means that the measured response time is worse than the average of all tested devices (31 ms). | ||
Screen Flickering / PWM (Pulse-Width Modulation)
| Screen flickering / PWM detected | 20800 Hz | ≤ 50 % brightness setting | 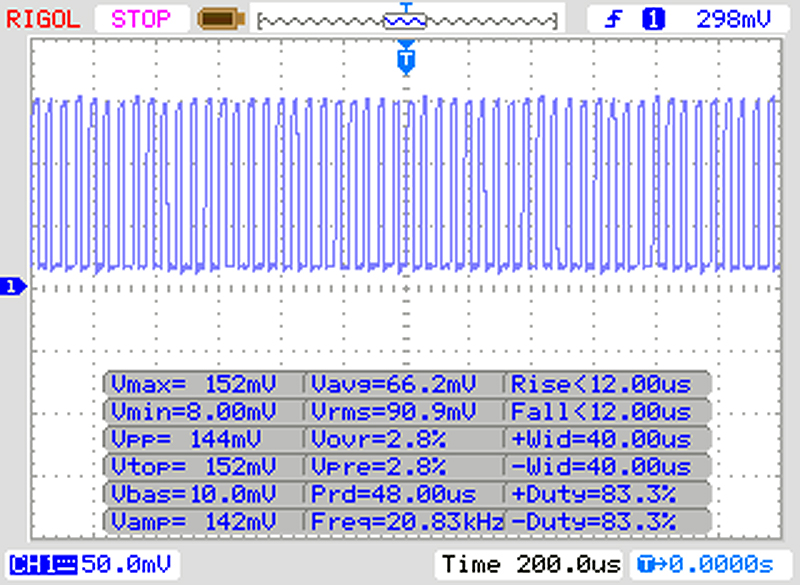 |
The display backlight flickers at 20800 Hz (worst case, e.g., utilizing PWM) Flickering detected at a brightness setting of 50 % and below. There should be no flickering or PWM above this brightness setting. The frequency of 20800 Hz is quite high, so most users sensitive to PWM should not notice any flickering. In comparison: 52 % of all tested devices do not use PWM to dim the display. If PWM was detected, an average of 7769 (minimum: 5 - maximum: 343500) Hz was measured. | |||
The viewing angles remained very wide, and the display was readable from all sides without any color distortions or decrease in brightness, regardless of angle.

Performance
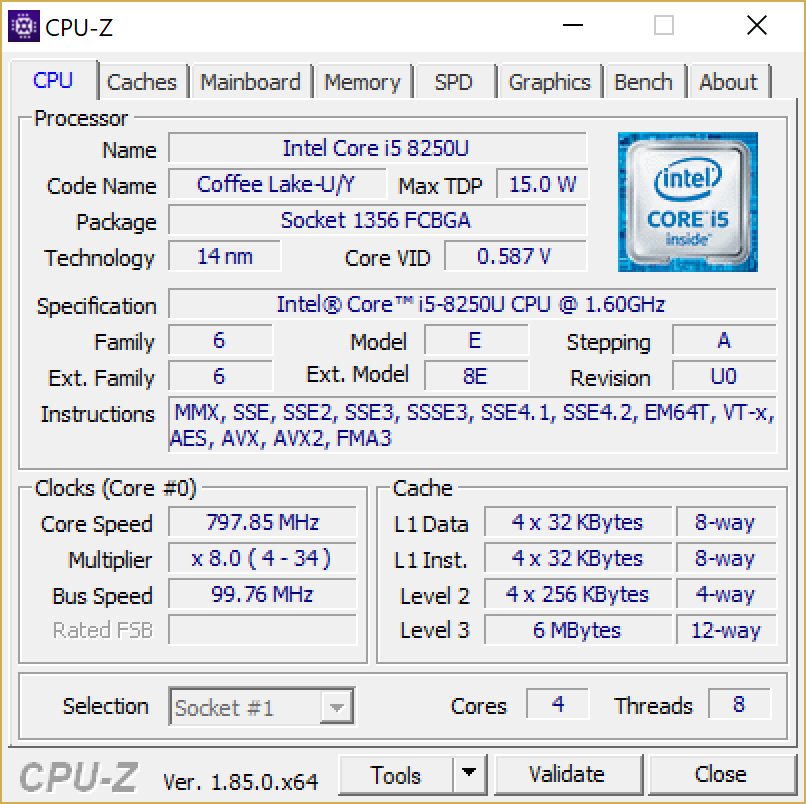
Microsoft’s mid-range Surface is equipped with an Intel Core i5-8250U. Like the i7 SoC (Core i7-8550U) it is part of the Kaby Lake Refresh generation of processors and features four physical cores. An entry-level m3-7Y30 is also available, and both it and the i5 model are fanless. The m3-7Y30 model was already introduced last year, and we expect just a name change and updated preloaded software for this year’s model.
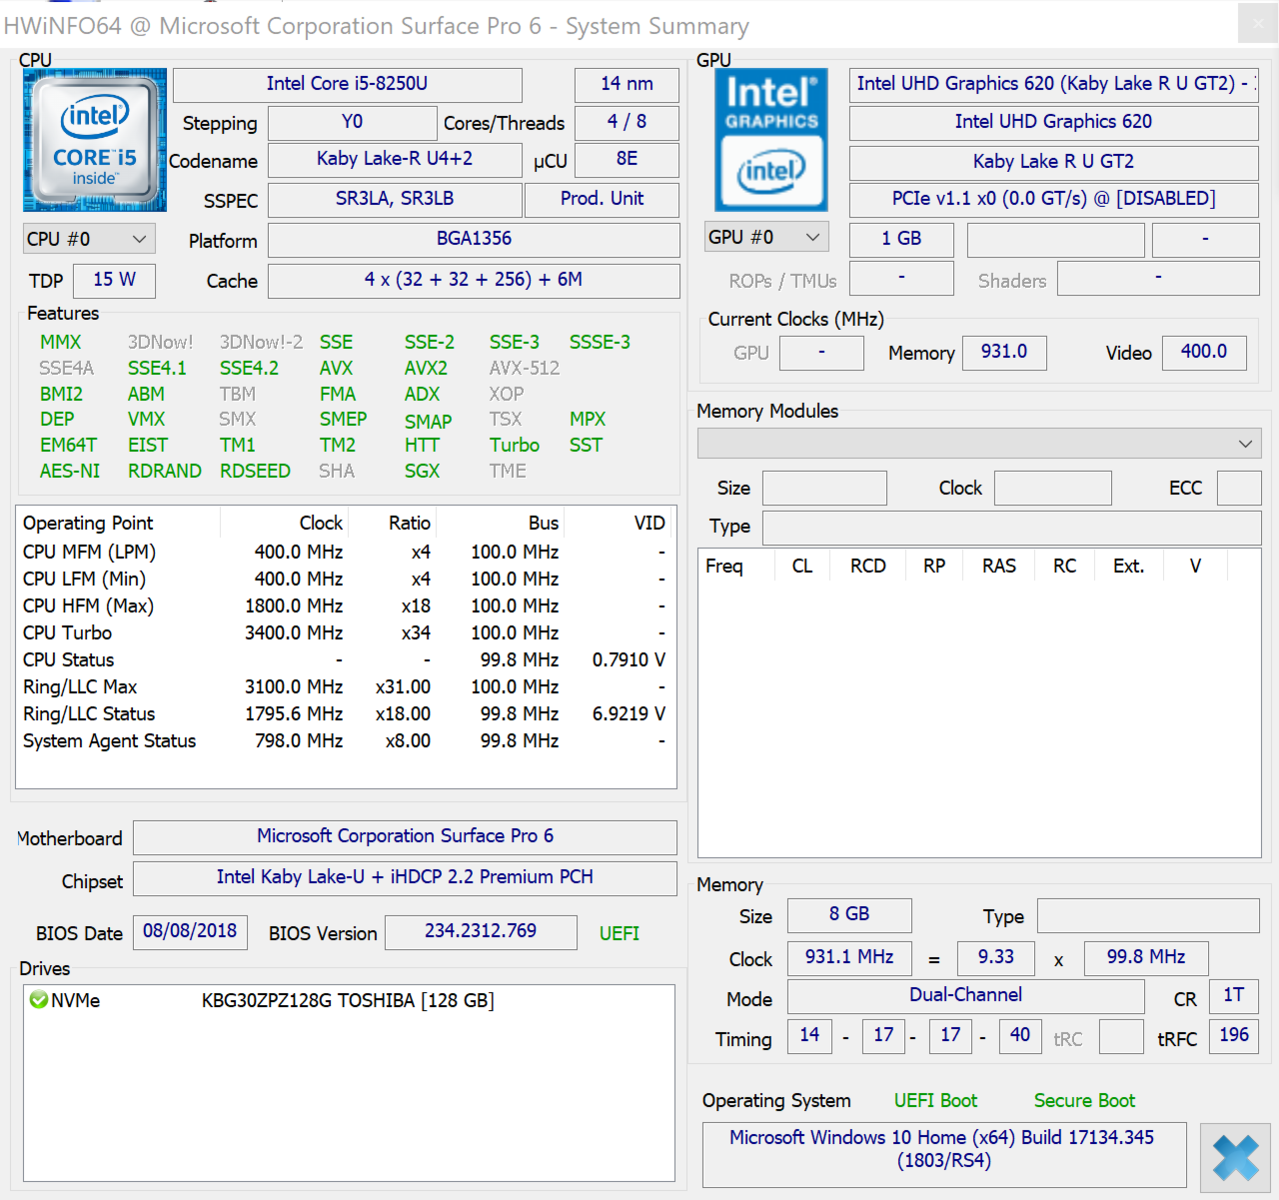
The SoC has access to 8 GB of RAM, which is soldered onto the motherboard, and a 128 GB Toshiba SSD (KBG30ZPZ128G). Optionally, the Surface Pro 6 can also be equipped with a 256, 512, or 1,024 GB SSD.


Processor
The Core i7 model surprised us with outstanding laptop CPU performance, and the air-cooled i7 quad-core managed to draw level with much thicker 20 mm 14-inch laptops. For details, see our Surface Pro (2018) i7 review.
How did the fanless i5 model do in comparison? Let’s look at the Cinebench R15 loop first. In the first run, the i5 scored 584 points, which quickly decreased to around 553 points during iterations two to four. The fifth iteration yielded just 437 points, a level at which the scores remained for the next 20 runs. Accordingly, total performance decrease was 25%.
Compare that to the 11% decrease of the i7 model. Under sustained load, the i5 model was around 23% slower than the i7 model.
For the first few seconds of our Cinebench R15 loop the i5 runs at 3.4 GHz, which is then subsequently reduced to 2.8 GHz, and then just 2.6 GHz for iterations 2 to 4. Afterwards, clock speeds were reduced even further to just 2 GHz.
Power consumption dropped from its initial 22 W to 16.5 W, and then to around 10 W around the sixth iteration. Due to temperatures above and beyond 70 °C (too much for a fanless design) the CPU was forced to throttle, and temperatures eventually settled at around 62-64 °C. The i7 model was allowed to run at a higher 71-74 °C and accordingly also able to run faster (2.5-2.6 GHz).
On battery, the device ran at just 2.2-2.3 GHz and never reached that 70 °C threshold. In other words: Performance on battery was slower than on mains, with a loss of 18 and 27% for multi and single-core benchmarks, respectively.
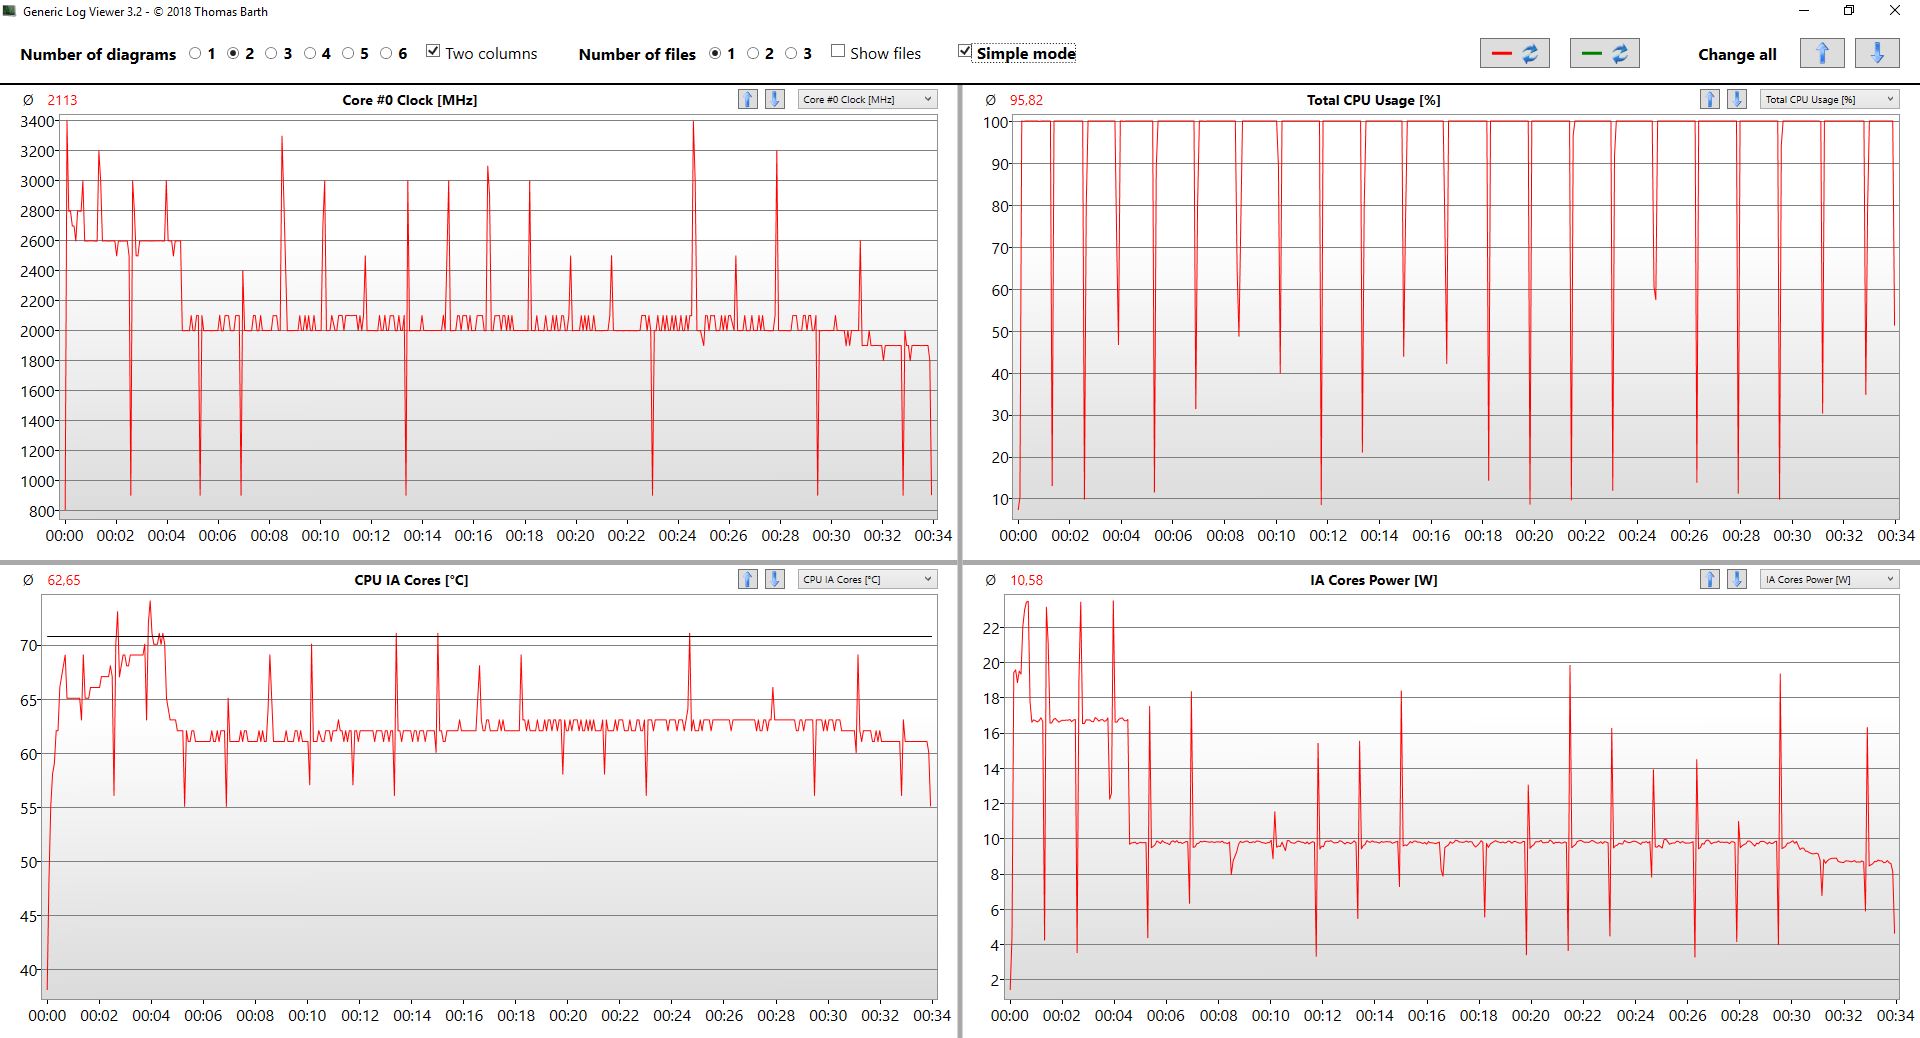
Despite the fact that the observed throttling behavior may be noteworthy, it is also important to remember that even under sustained load the i5 (2018) was around 47% faster in Cinebench than its Kaby Lake 7300U 2017 predecessor. This is a phenomenon we have already observed with the i7 model as well.
The competition throttled a lot less (Dell Latitude 5290) or even not at all (HP Elite x2 1013 G3). Both also feature a nominally faster CPU (Core i5-8350U), and 3-6% higher initial Cinebench scores in return. Sustained performance was 9% (Dell) and 10% (HP) higher.
Given that this particular Core i5-8250U SoC is a favorite among manufacturers, it can be found in many laptops, from the very low-end to the business high-end. Lenovo’s T480s (slim 14-inch laptop) was 35% faster under sustained load, and even the much smaller ThinkPad X280 (12-inch) throttled 22% at first but ended up being 17% faster in the end. Both notebooks feature a fan.
In other words: Subnotebooks with fans are not immune to throttling but are still around 15-20% faster under sustained load thanks to their active cooling solutions. A laptop with ideal cooling is way out of the Surface Pro 6 (2018) i5’s league as the latter was only around 65% as fast.
The following Cinebench scores (single and multi) were taken immediately after a cold boot. The processor was able to fully utilize its turbo boost potential as thermal limits were not yet prohibitive thereto. In the single-thread test the 2017 and 2018 models performed almost identically. However, the 2018 model was 75% faster in the multi-core test, which was expected given the increase in CPU cores from two to four. Overall, the 2018 i5’s score was slightly above average for a Core i5-8250U. The 2018 i7 was 9% faster in the multithread test.
The competition (Lenovo Miix 520-12IKB, HP Elite x2 1013 G3, and Dell Latitude 5290 2-in-1) were around 10-12% slower in the multithread test. However, as stated above this was only the case for the first few runs of Cinebench, and their sustained performance was higher than our review unit’s.
System Performance
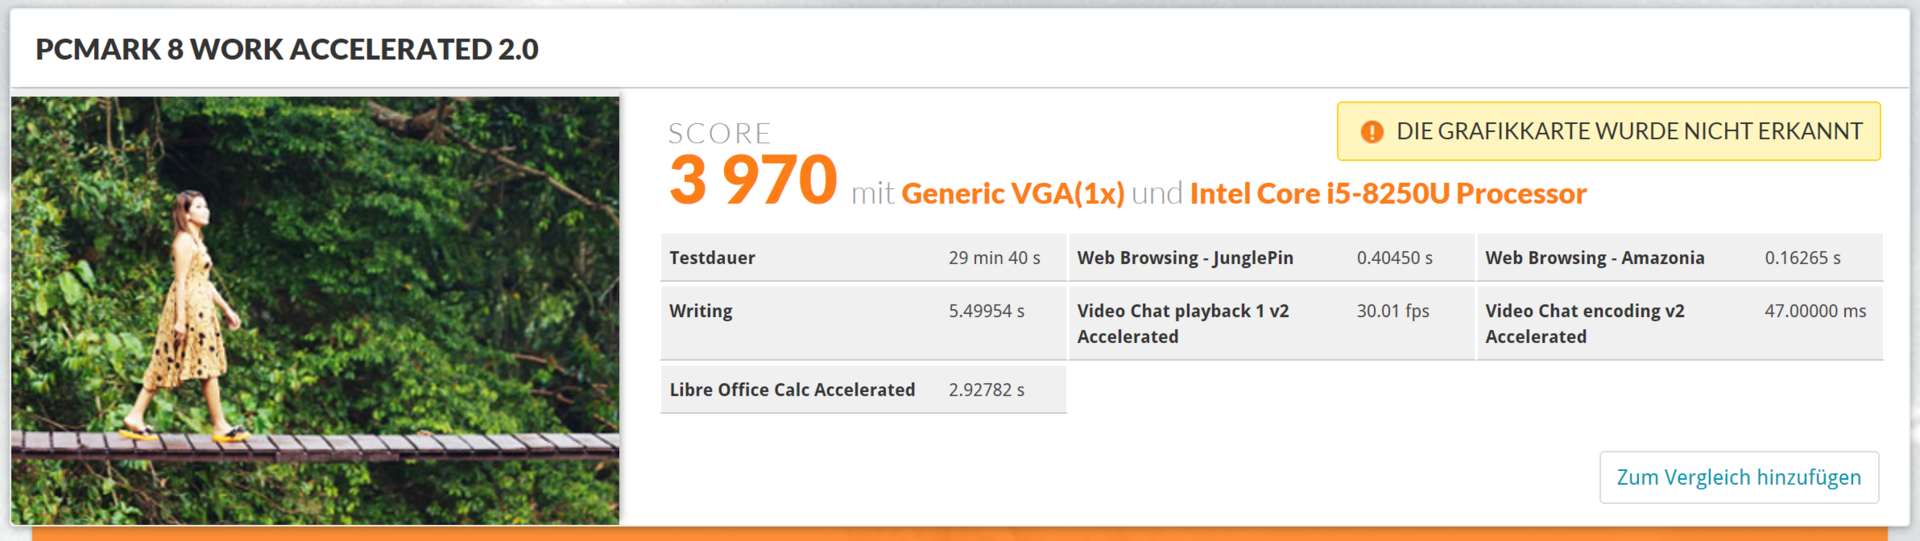
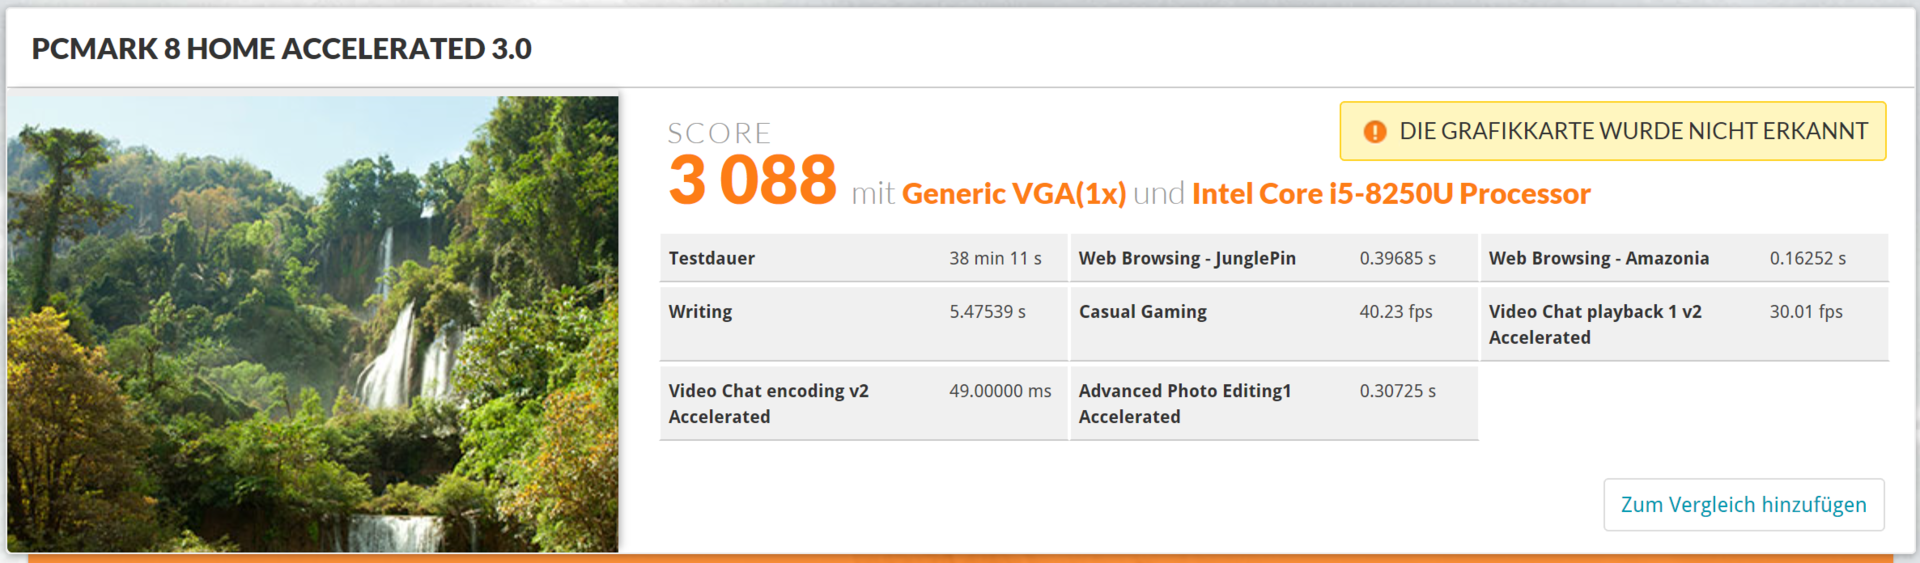
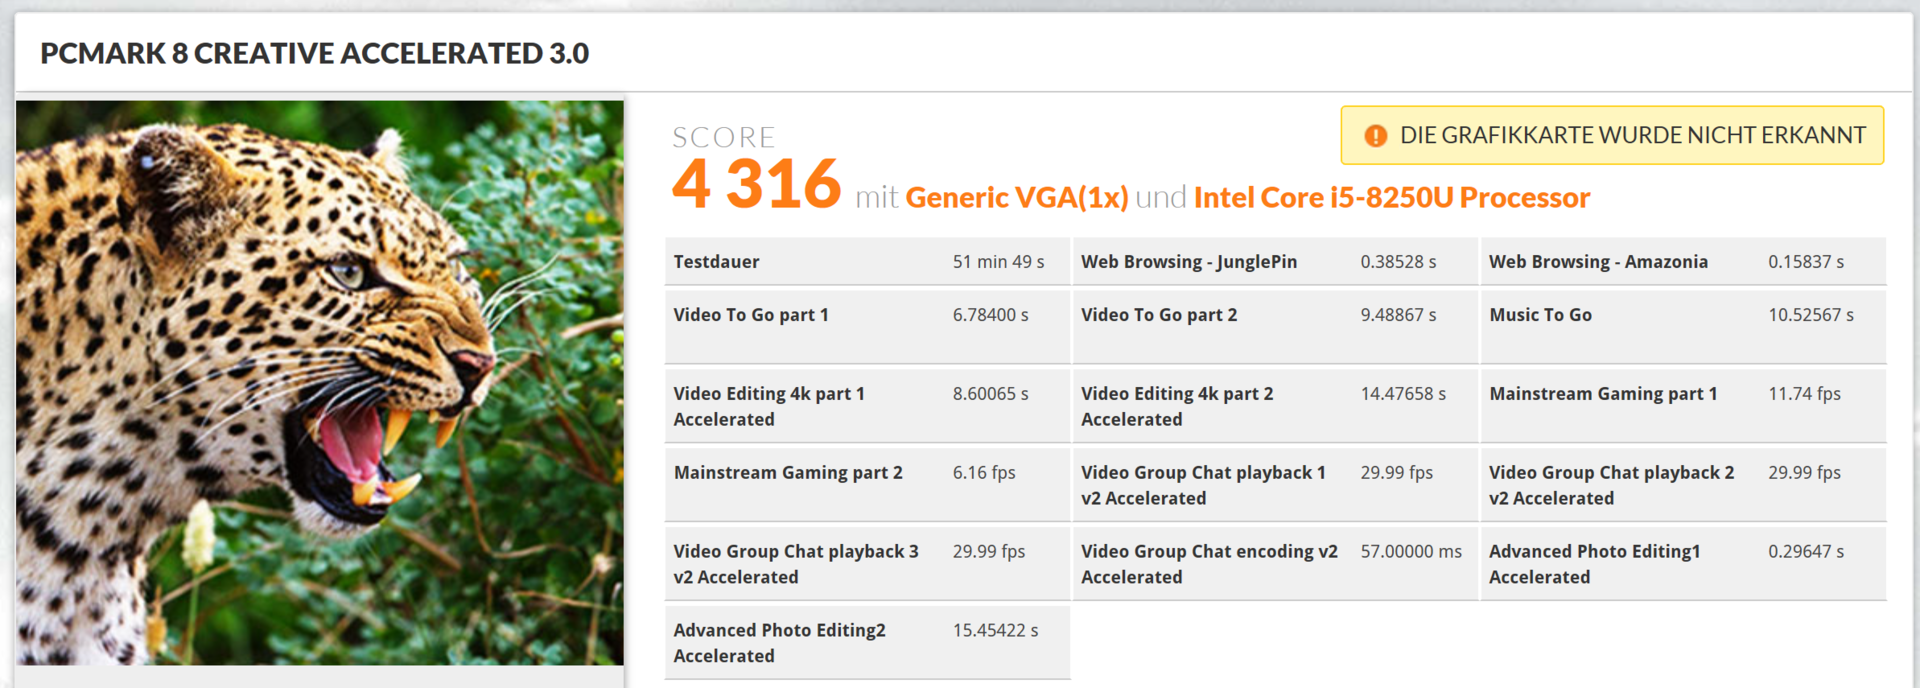
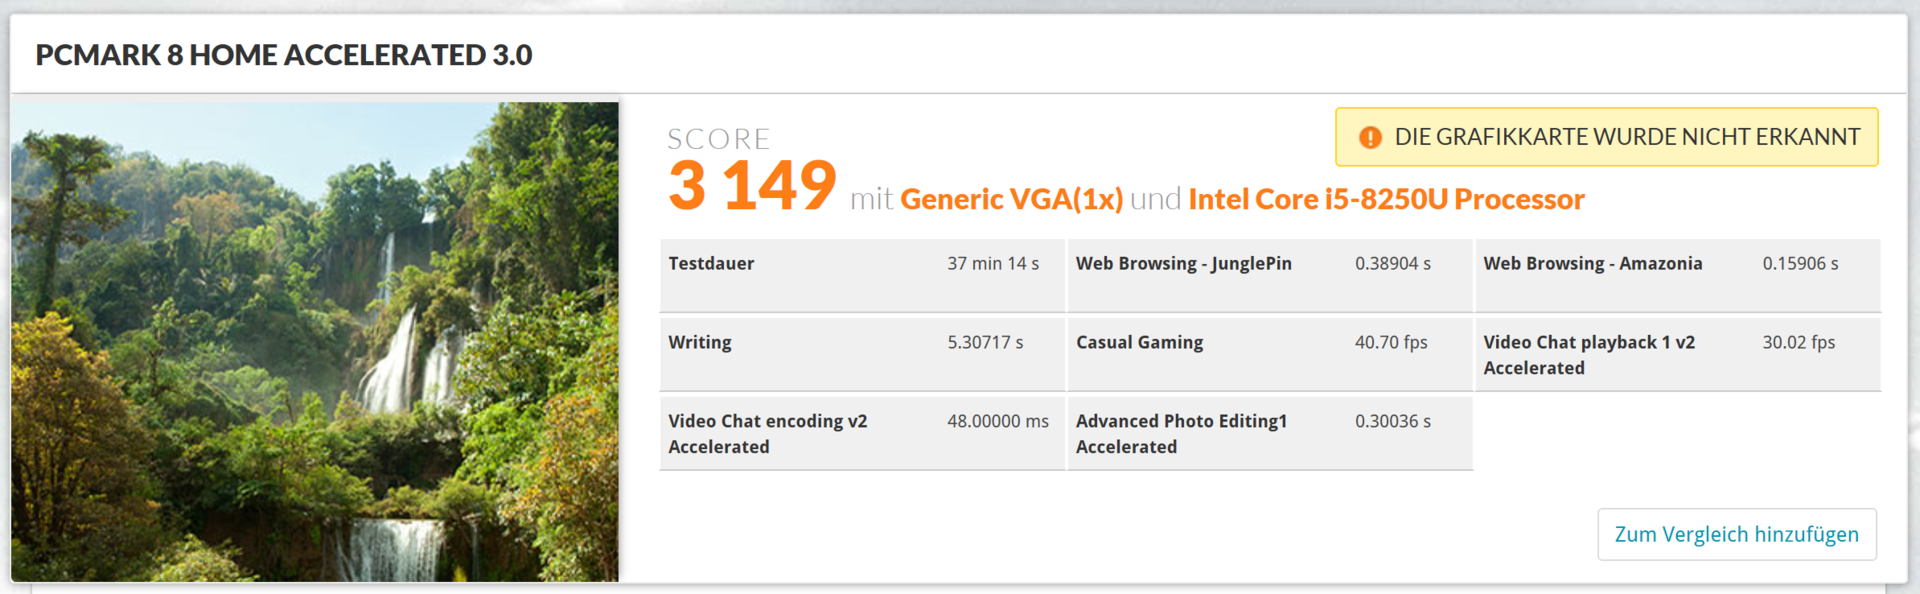
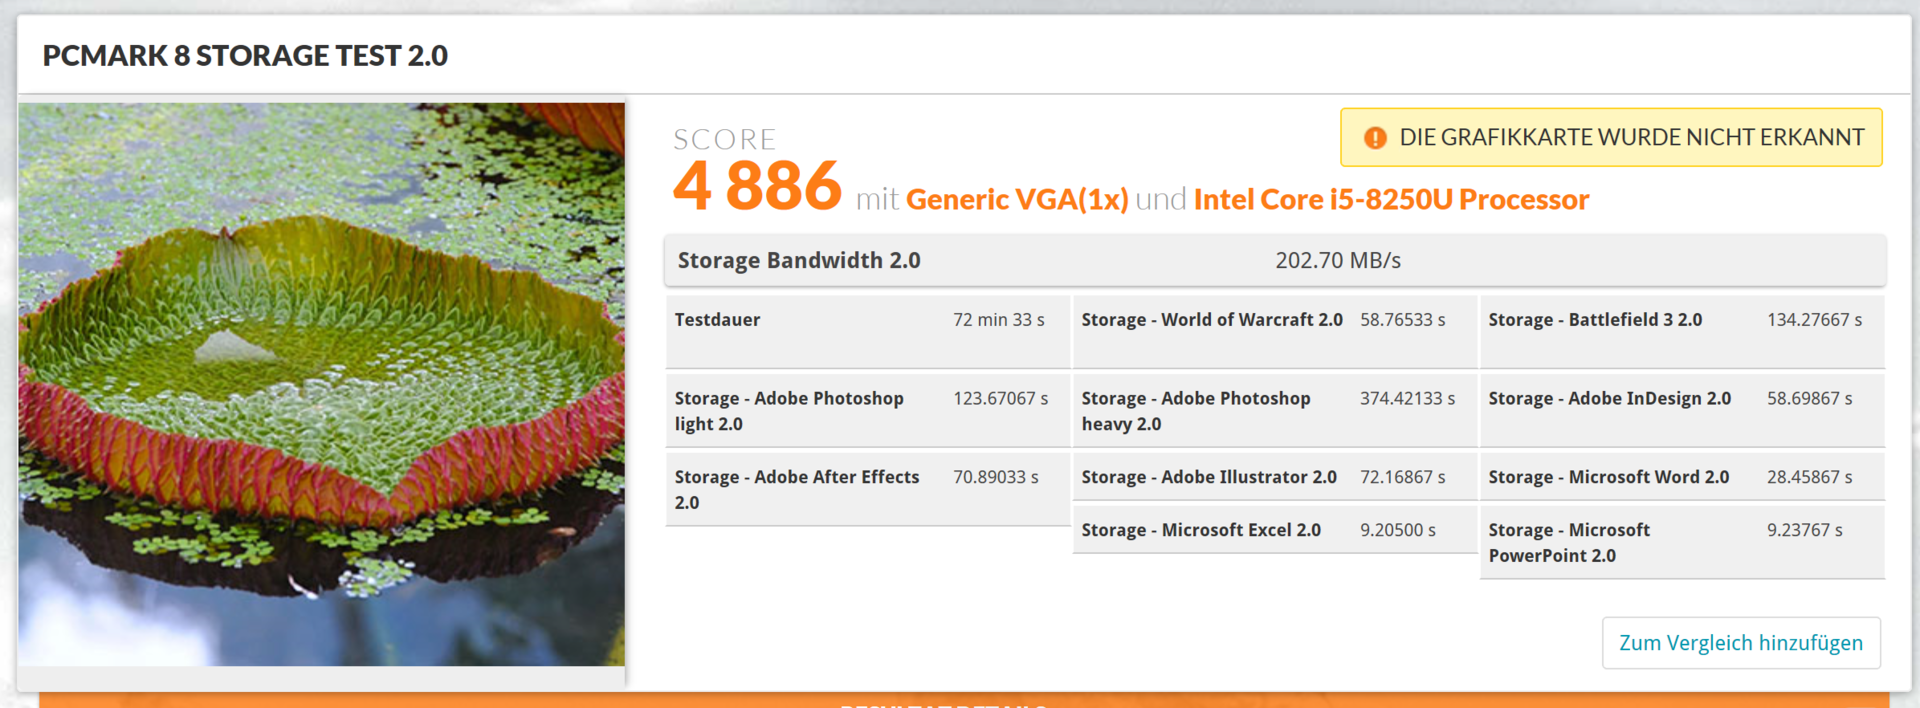
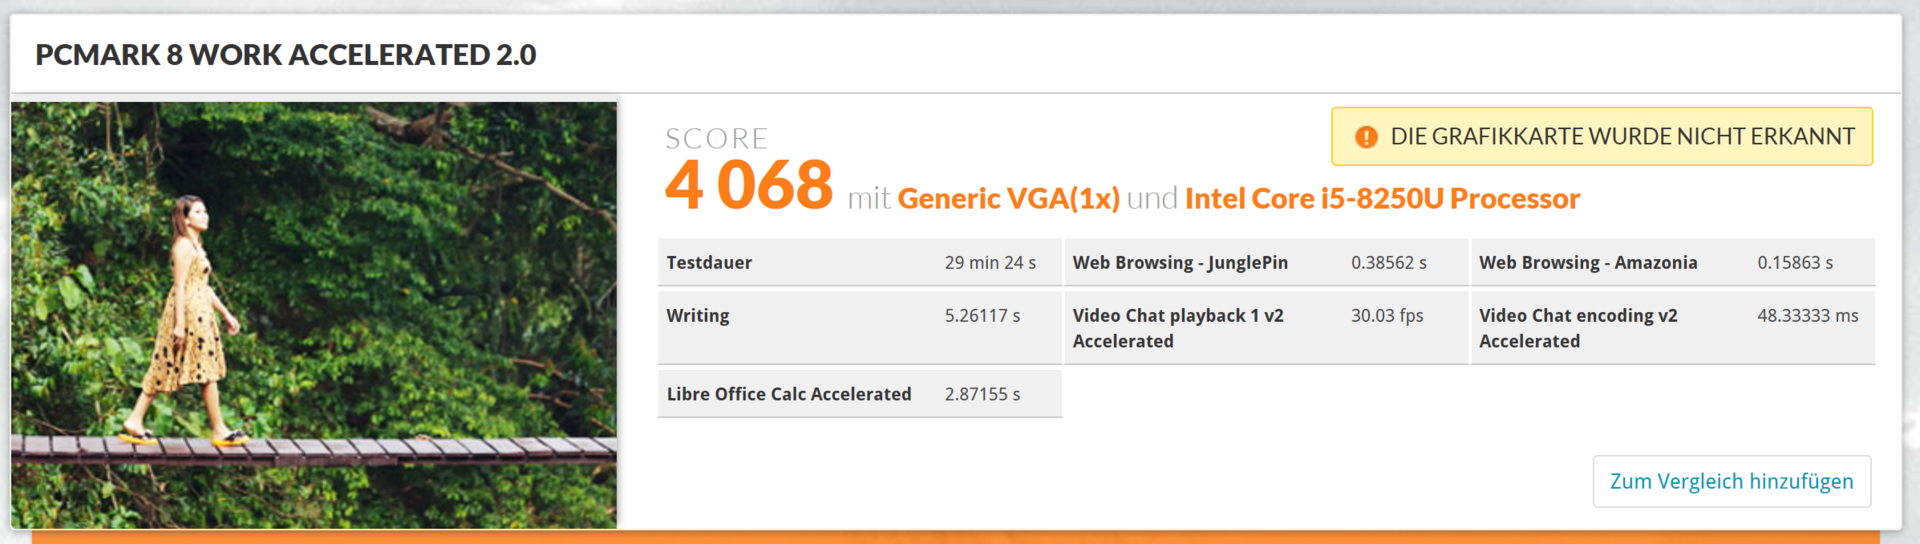
Overall application performance is determined by running FutureMark’s PCMark. The i7 model disappointed with its slow Toshiba SSD and was unable to perform as fast as we would have expected of an i7 system. Unfortunately, the same must be said about the i5 model, and Microsoft’s choice pro Toshiba and against Samsung (PM971 2017) backfired once more. Accordingly, the 2018 i5 model sometimes performed worse than the 2017 i5 model.
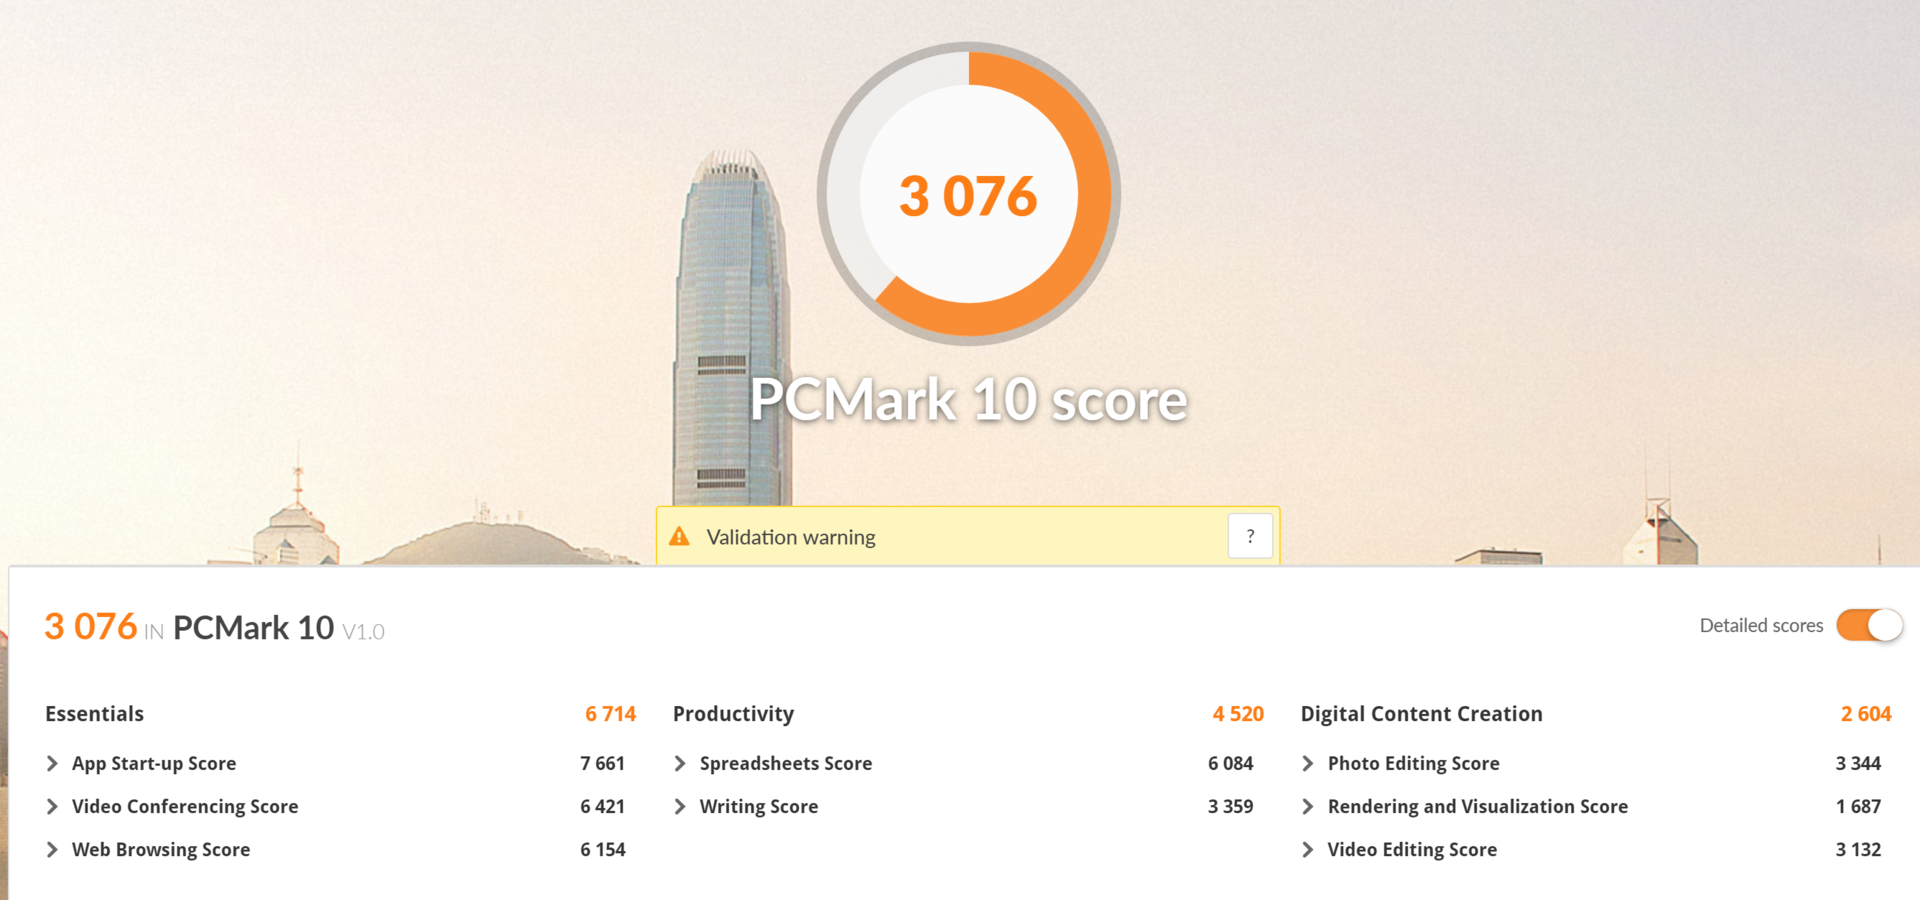
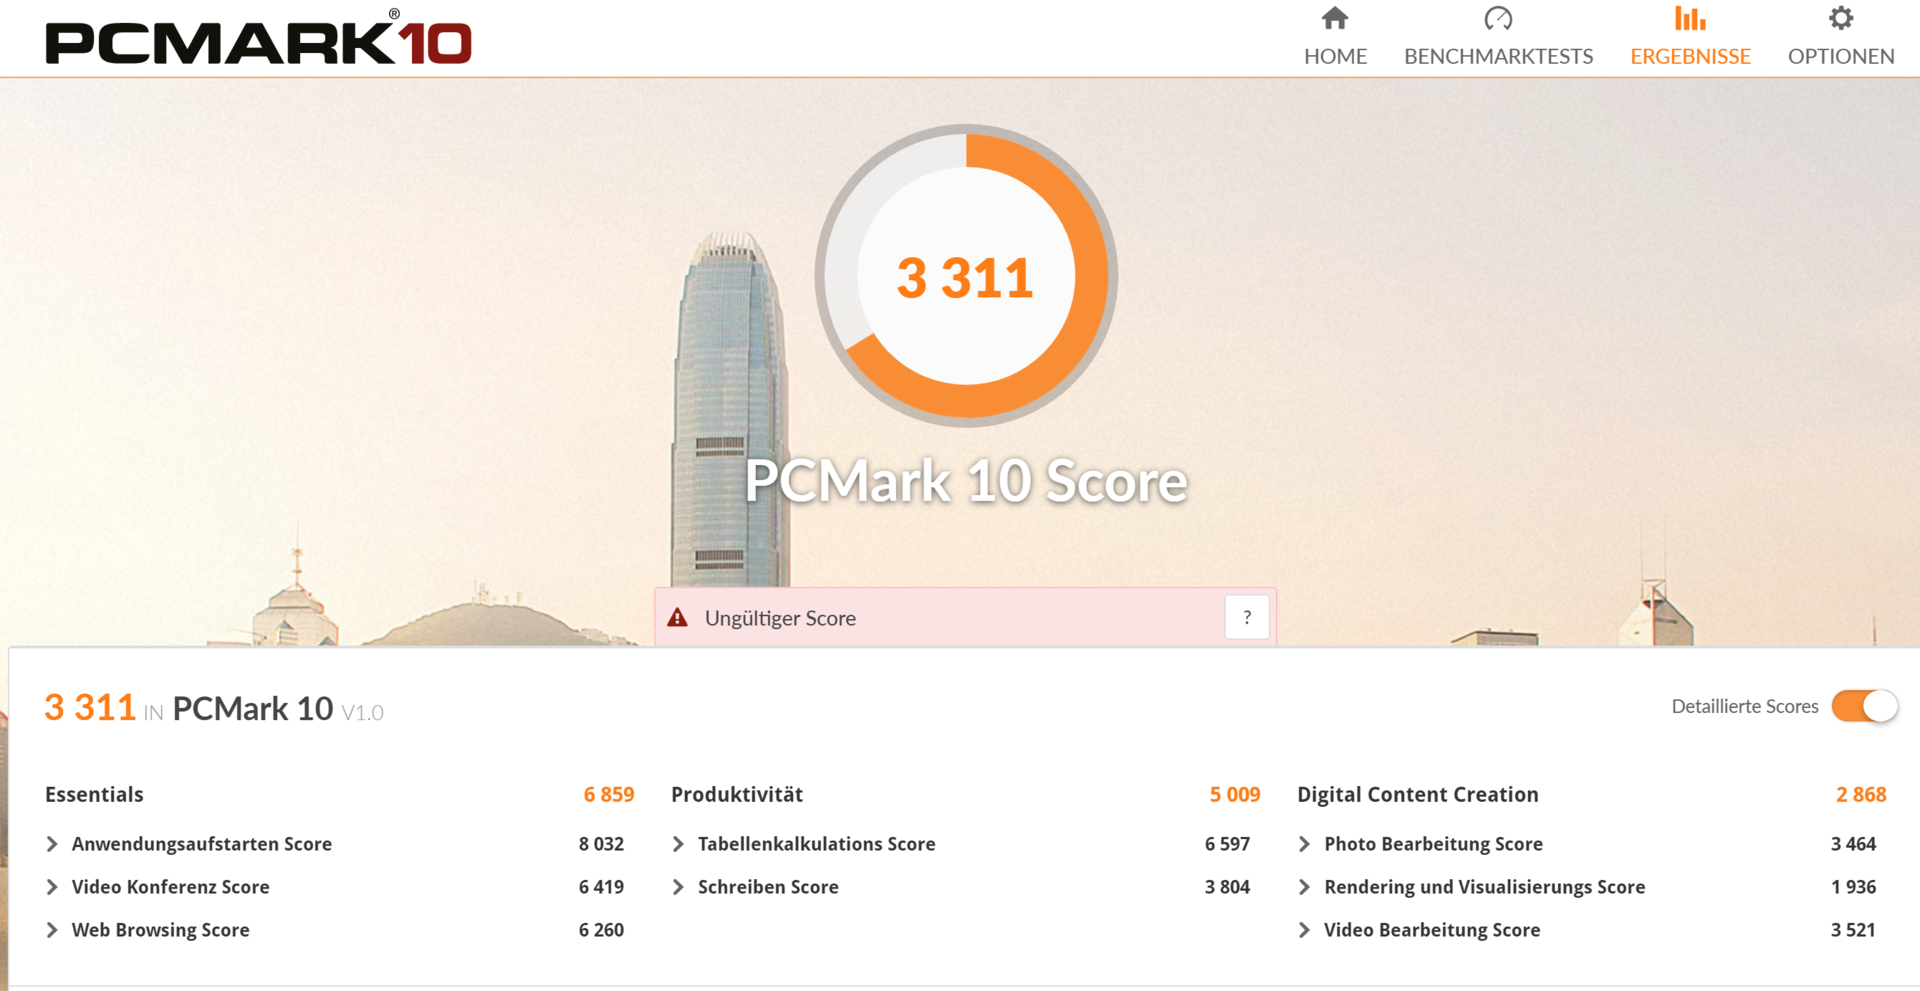
PCMark 10 productivity scores were lower for the 2018 model than the 2017 model. In the Essential and Digital Content category as well as in overall performance the 2018 model was 4-18% faster. Similar results can be observed in PCMark 8: The 2017 and 2018 models performed almost identically in the Work tests and the 2018 model outperformed the 2017 model by around 5% in the Home test.
Long story short: The i7 2018 was just 5-18% (PCMark 10) and 7-8% (PCMark 8) faster.
Update 11/7/2018: higher system performance thanks to 256 GB SSD
The 256 GB SSD performed 8 % faster in PCMark 10 and was thus just 12 % slower than the top model (i7, 512 GB). However, it was just 2-8 % faster in the respective sub categories of PCMark 10.
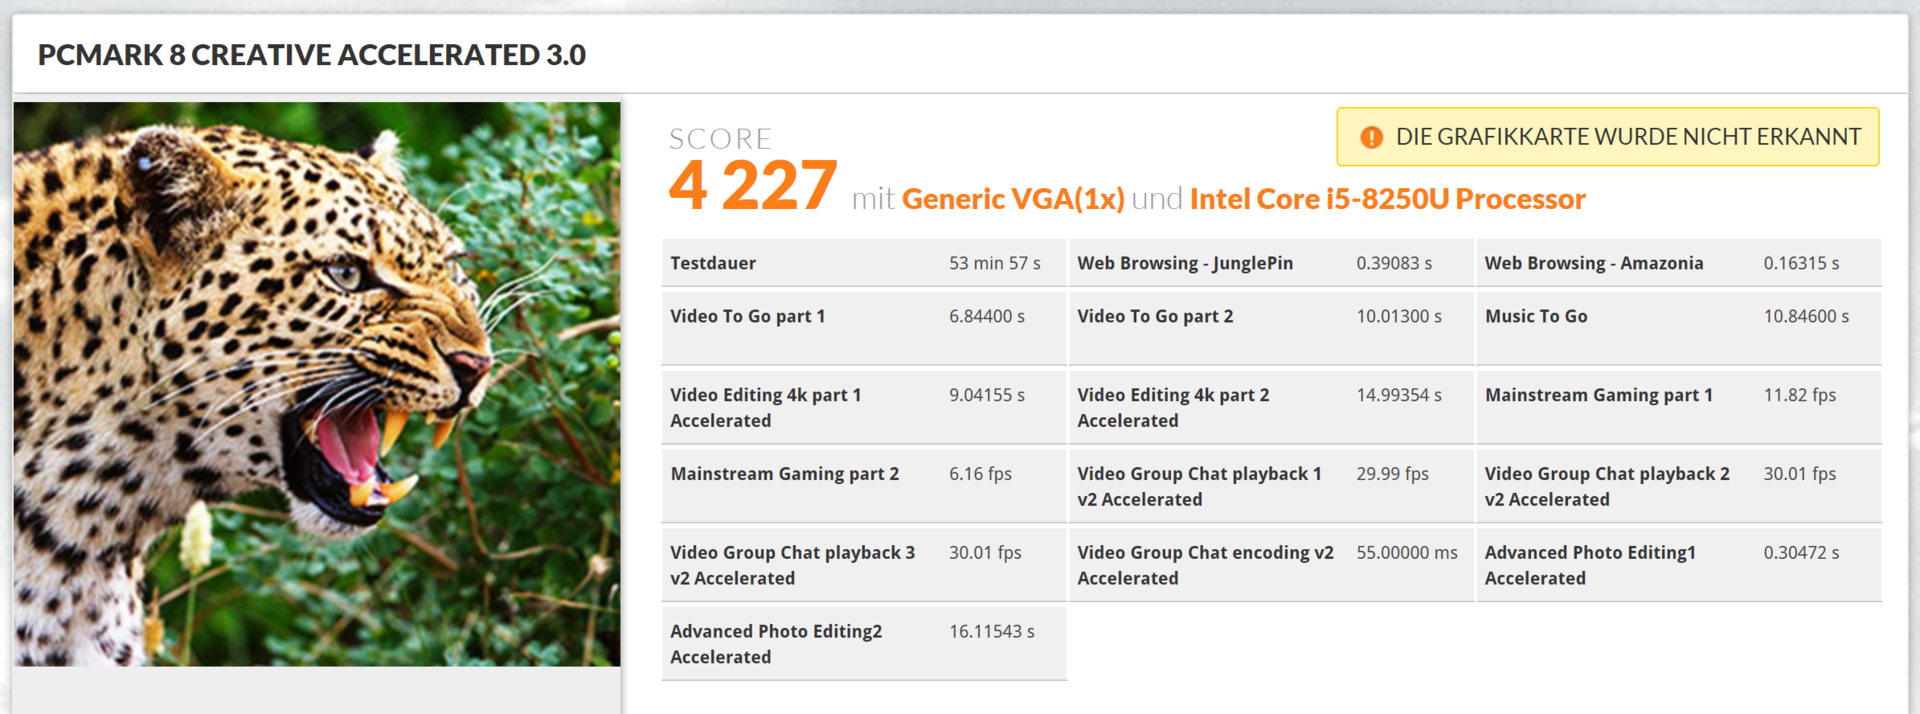
| PCMark 8 Home Score Accelerated v2 | 3088 points | |
| PCMark 8 Creative Score Accelerated v2 | 4227 points | |
| PCMark 8 Work Score Accelerated v2 | 3970 points | |
| PCMark 10 Score | 3076 points | |
Help | ||
Storage Devices
The main culprit for this poor PCMark performance is the 128 GB Toshiba SSD. It was significantly slower than the 2017’s PM971. The model of Microsoft’s choosing is an NVMe BG3 SSD, BG standing for ball grid array (BGA). In other words: The M.2 1620-S2 single package TLC chip is soldered onto the motherboard, and it is connected via PCIe 3.1a (NVMe Rev. 1.2.1). Toshiba promises up to 1,200 MB/s sequential read and up to 550 MB/s sequential write speeds, however we were only able to confirm 748 MB/s read and 127 MB/s write in CrystalDiskMark.
The 2017 model featured Samsung’s PM971, which was faster in every single category. Even the 512 GB Toshiba SSD from the i7 model was a whopping 240% faster. Microsoft made a poor decision with this particular 128 GB SSD.
Update 11/7/2018: the 256 GB SSD performed much faster
The 256 GB SKU achieved higher read and write speeds than the 128 GB model. On average, it performed around 30 % better. That said the 512 GB SSD still plays in its own league and was 130 % faster than the 128 GB SSD.
Compared to the 128 GB model, the 256 GB SSD was faster in almost every category, from 4K write to sequential read and write. The sole exception was reading medium-sized files (Read 512), where the 128 GB SSD actually outperformed its counterpart. AS SSD reported a significantly smaller performance advantage, and the 256 GB SSD was just 6 % faster.
| Microsoft Surface Pro 6, Core i5, 128 GB Toshiba KBG30ZPZ128G | Microsoft Surface Pro (2017) i5 Samsung PM971 KUS030202M | Microsoft Surface Pro 6, Core i7, 512 GB Toshiba KBG30ZPZ512G | Microsoft Surface Book 2 Samsung PM961 MZVLW256HEHP | Microsoft Surface Go MHN-00003 64 GB eMMC Flash | HP Elite x2 1013 G3-2TT14EA Samsung PM961 MZVLW256HEHP | Samsung Galaxy Book 12 SM-W728 Samsung SSD PM871a MZNLN256HMHQ | Huawei Matebook E SanDisk SD8SN8U256G1027 | Lenovo Miix 520-12IKB 20M3000LGE Samsung SSD PM961 1TB M.2 PCIe 3.0 x4 NVMe (MZVLW1T0) | Average Toshiba KBG30ZPZ128G | |
|---|---|---|---|---|---|---|---|---|---|---|
| CrystalDiskMark 3.0 | 240% | 212% | 202% | -39% | 312% | 148% | 106% | 336% | 0% | |
| Read Seq (MB/s) | 748 | 723 -3% | 651 -13% | 1370 83% | 259.6 -65% | 1786 139% | 511 -32% | 506 -32% | 883 18% | 748 ? 0% |
| Write Seq (MB/s) | 127.6 | 853 568% | 792 521% | 341.2 167% | 122.4 -4% | 1209 847% | 473.7 271% | 461 261% | 932 630% | 127.6 ? 0% |
| Read 512 (MB/s) | 385.3 | 225 -42% | 388.2 1% | 654 70% | 190.6 -51% | 717 86% | 443.7 15% | 341.9 -11% | 586 52% | 385 ? 0% |
| Write 512 (MB/s) | 115.8 | 445 284% | 575 397% | 337.9 192% | 107.1 -8% | 798 589% | 395.4 241% | 294.7 154% | 627 441% | 115.8 ? 0% |
| Read 4k (MB/s) | 29.93 | 46 54% | 43.75 46% | 43.64 46% | 19.06 -36% | 49.66 66% | 40.46 35% | 32.46 8% | 54.8 83% | 29.9 ? 0% |
| Write 4k (MB/s) | 39.77 | 125 214% | 97.2 144% | 148.5 273% | 24.27 -39% | 104.2 162% | 91.9 131% | 65.3 64% | 139.3 250% | 39.8 ? 0% |
| Read 4k QD32 (MB/s) | 192.7 | 423 120% | 241.2 25% | 465.5 142% | 34.45 -82% | 286 48% | 289.1 50% | 381.8 98% | 607 215% | 192.7 ? 0% |
| Write 4k QD32 (MB/s) | 45.38 | 373 722% | 304.9 572% | 337.1 643% | 33.64 -26% | 298.4 558% | 260.7 474% | 184.4 306% | 498.5 999% | 45.4 ? 0% |

GPU Performance
Intel’s UHD Graphics 620 is solely responsible for all things graphics. This Kaby Lake-R generation GPU is an update of the 2016 Intel HD Graphics 620, and just like its predecessor it features 24 execution units (EUs).
RAM configuration has a noticeable influence on GPU performance, and fortunately Microsoft opted for dual-channel mode even in the 128 GB i5 model. Dual-channel mode increases GPU performance significantly, and accordingly the Surface Pro 6 i5 performed above average for its UHD Graphics 620 GPU.
In the 3DMark benchmarks the i5 model was just 5% slower than the i7 model. However, our review unit was up to 17% faster than the HP Elite x2 1013 G3 even though the latter was also running in dual-channel mode.
| 3DMark 11 Performance | 2048 points | |
| 3DMark Cloud Gate Standard Score | 8748 points | |
Help | ||
Gaming Performance
Gaming performance was a bit lower than for the i7 model, albeit the difference was small. In reality it does not really make a difference whether a game is running at 18 or 23 FPS (Middle Earth: Shadow of War, low 1280). The game is still unplayable or barely playable with reduced details and resolution. In some games, the difference can be up to 50% (Rise of the Tomb Raider - low preset).
| Thief - 1024x768 Very Low Preset | |
| Microsoft Surface Pro 6, Core i7, 512 GB | |
| Average Intel UHD Graphics 620 (16.3 - 34.3, n=10) | |
| Microsoft Surface Pro 6, Core i5, 128 GB | |
| Microsoft Surface Pro (2017) i5 | |
| Civilization 6 - 1024x768 Minimum Preset | |
| Microsoft Surface Pro 6, Core i7, 512 GB | |
| Microsoft Surface Pro 6, Core i5, 128 GB | |
| Average Intel UHD Graphics 620 (27.8 - 54.4, n=13) | |
| Farming Simulator 17 - 1366x768 Medium Preset | |
| Microsoft Surface Pro 6, Core i7, 512 GB | |
| Average Intel UHD Graphics 620 (8 - 67.9, n=12) | |
| Microsoft Surface Pro 6, Core i5, 128 GB | |
| Samsung Galaxy Book 12 SM-W728 | |
| Middle-earth: Shadow of War - 1280x720 Lowest Preset | |
| Microsoft Surface Pro 6, Core i7, 512 GB | |
| Average Intel UHD Graphics 620 (18 - 23, n=3) | |
| Microsoft Surface Pro 6, Core i5, 128 GB | |
| F1 2018 - 1280x720 Ultra Low Preset | |
| Microsoft Surface Pro 6, Core i5, 128 GB | |
| Average Intel UHD Graphics 620 (31 - 35.8, n=5) | |
| Microsoft Surface Pro 6, Core i7, 512 GB | |
| Shadow of the Tomb Raider - 1280x720 Lowest Preset | |
| Average of class Convertible (24 - 180, n=2, last 2 years) | |
| Microsoft Surface Pro 6, Core i5, 128 GB | |
| Microsoft Surface Pro 6, Core i7, 512 GB | |
| Average Intel UHD Graphics 620 (12 - 21.7, n=13) | |
| low | med. | high | ultra | |
|---|---|---|---|---|
| BioShock Infinite (2013) | 70.2 | 38 | 31.9 | 8.6 |
| Thief (2014) | 23.7 | 10.4 | 8.5 | |
| Dota 2 Reborn (2015) | 72.9 | 46.3 | 20.6 | 18.3 |
| Rise of the Tomb Raider (2016) | 14.1 | 8.9 | ||
| Civilization 6 (2016) | 38.8 | 14.1 | 5.9 | |
| Farming Simulator 17 (2016) | 58.1 | 47.8 | 19 | |
| Middle-earth: Shadow of War (2017) | 18 | 10 | ||
| X-Plane 11.11 (2018) | 30.3 | 22.7 | 19.1 | |
| F1 2018 (2018) | 35.8 | 11 | 9 | 4 |
| Shadow of the Tomb Raider (2018) | 21.7 | 5.4 |
Emissions
System Noise
Since our review unit did not have a fan it did not emit any noise whatsoever.
Temperature
When idle, the i5 and i7 models performed very similarly: Both sides heated up to 30 °C on average, and the i7’s fan was completely off. Under load the Core i5 model warmed up to 38 °C on average on both sides and had hot spots of up to 44 °C. The differences were thus pretty minor.
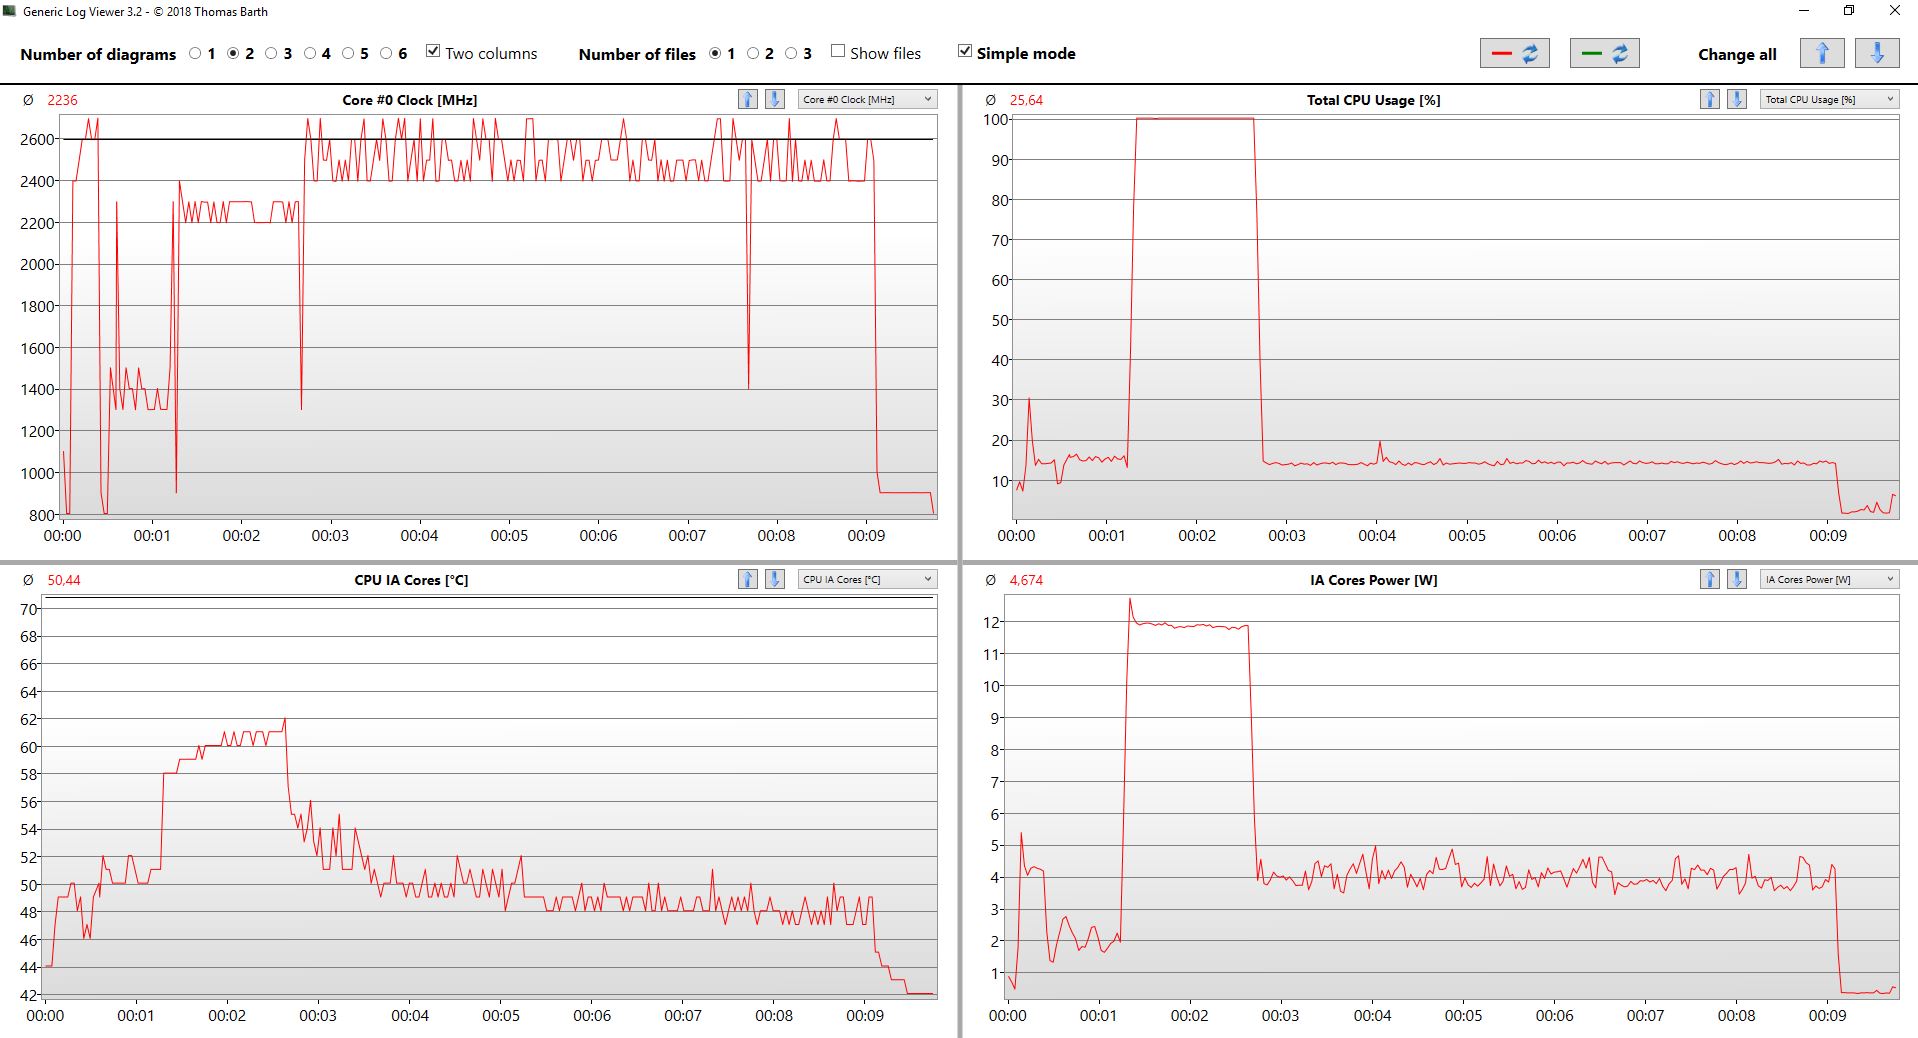
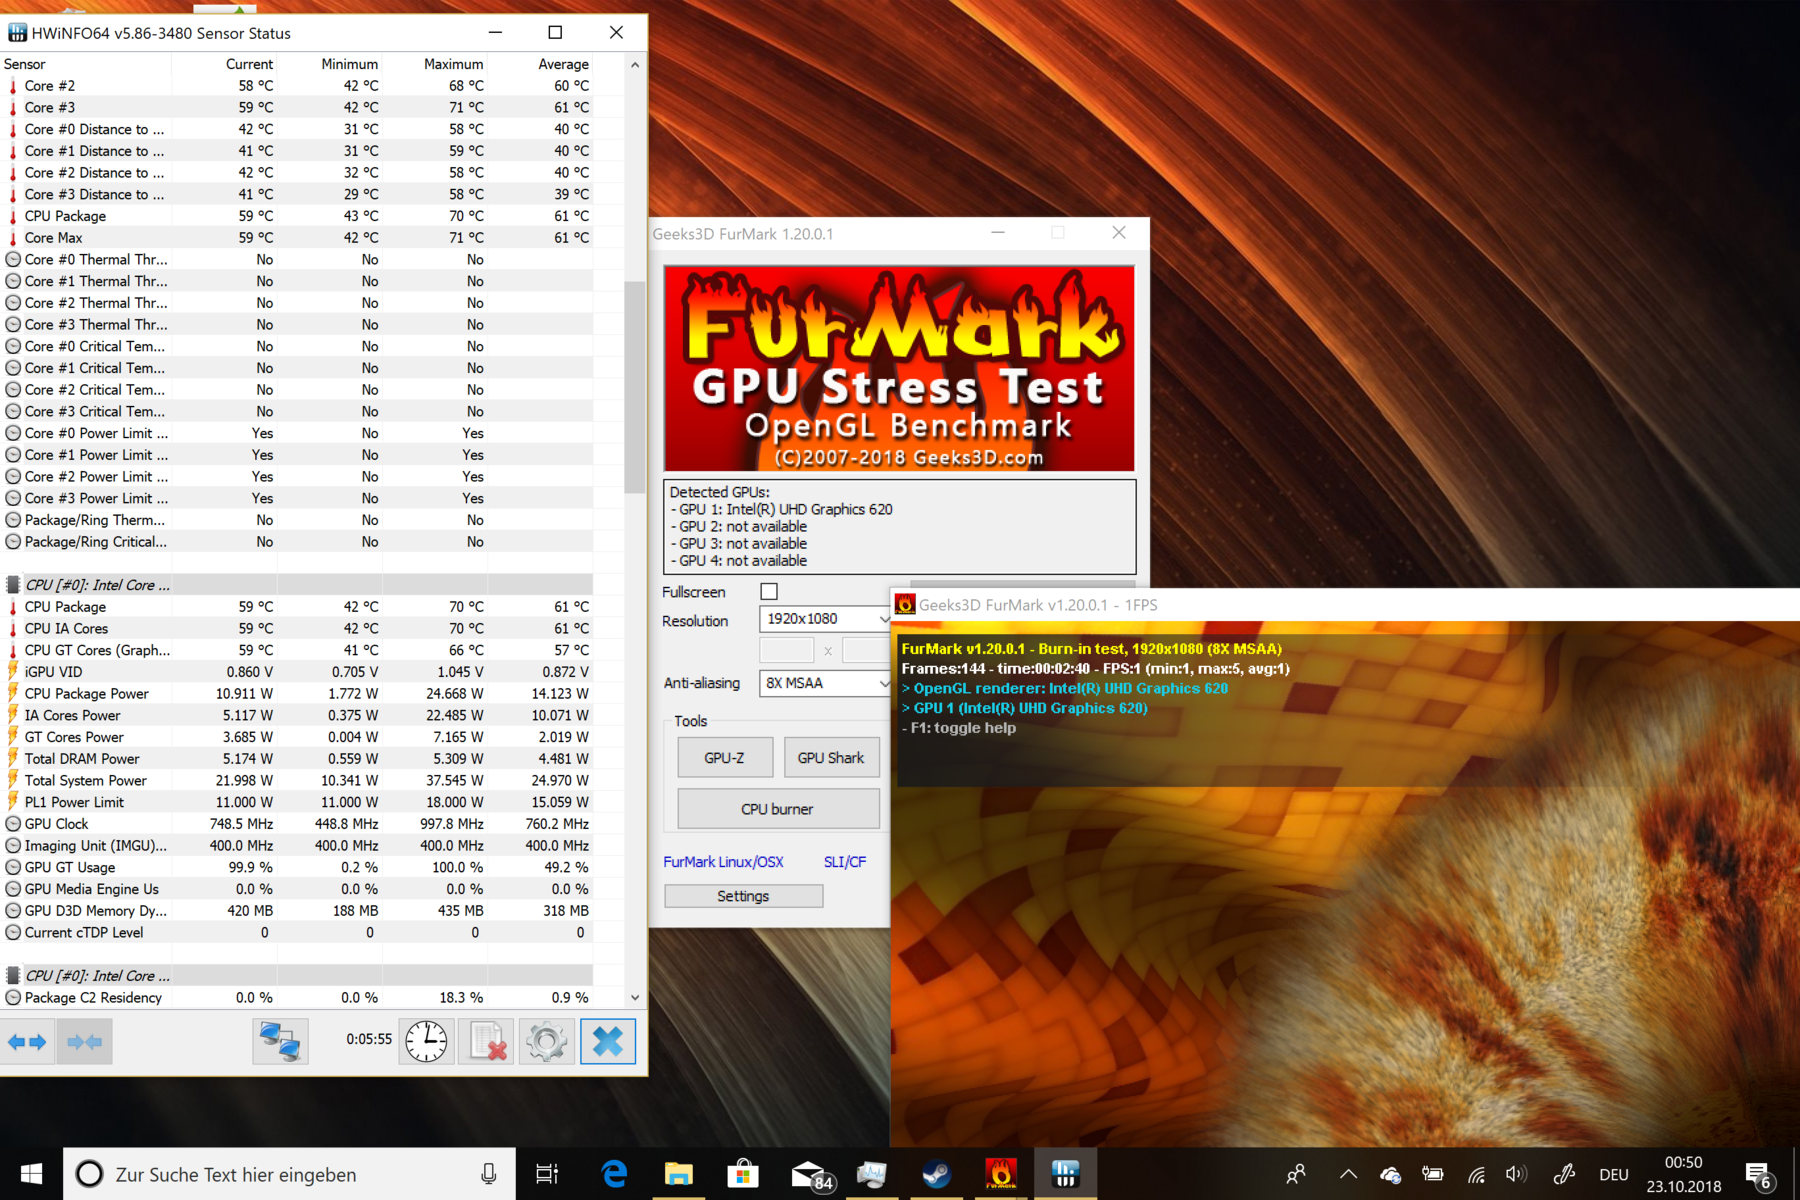
The i5 performed similarly to the i7 in our stress test, albeit at much lower frequencies. Running Prime95 and FurMark simultaneously resulted in just 900 MHz and a temperature of 59 °C.
The first minute we ran just Prime95 solo on our device. Once temperatures reached 70 °C, clock speeds were reduced from 2.9 to 2.5-2.6 GHz.
After a minute, we launched FurMark and added GPU stress to the system. Consequently, clock frequency was reduced to 2.2 GHz and subsequently just 900 MHz (three minutes). Power consumption peaked at 22 W (IA Cores Power) but decreased to first 16 and then 5.5 W.
During this test, the GPU ran at 750 MHz, and thus significantly slower than its maximum of 1,100 MHz. Keep in mind that our stress test is an extreme load scenario that is rarely ever encountered in the real world.

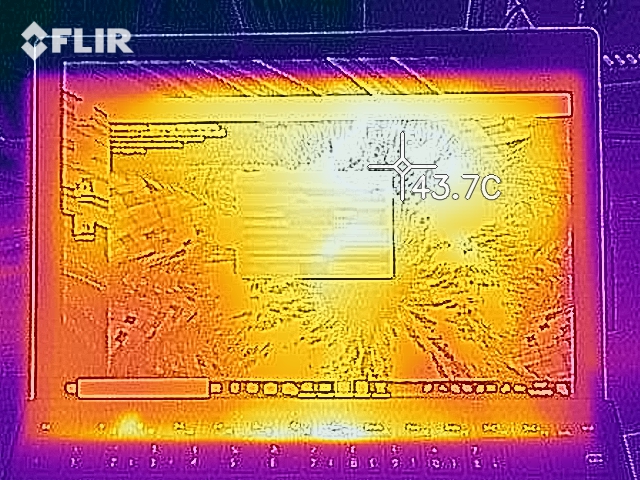
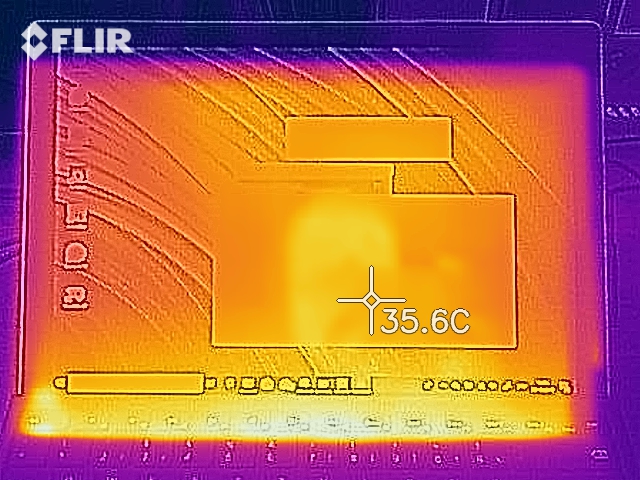
(+) The maximum temperature on the upper side is 39.7 °C / 103 F, compared to the average of 35.4 °C / 96 F, ranging from 19.6 to 60 °C for the class Convertible.
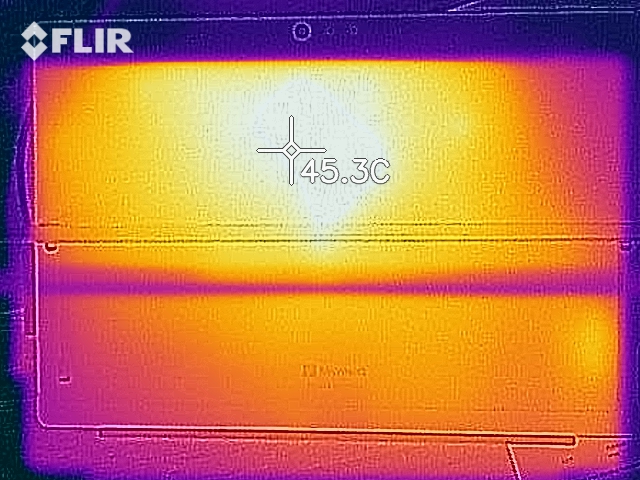
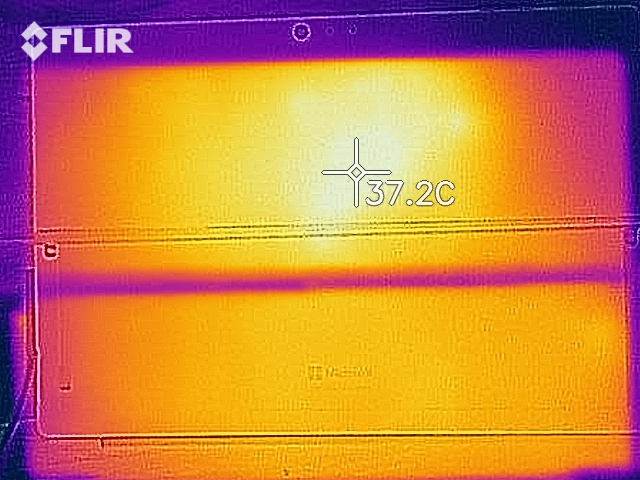
(±) The bottom heats up to a maximum of 41.1 °C / 106 F, compared to the average of 36.9 °C / 98 F
(+) In idle usage, the average temperature for the upper side is 31.2 °C / 88 F, compared to the device average of 30.3 °C / 87 F.
(±) The palmrests and touchpad can get very hot to the touch with a maximum of 39.1 °C / 102.4 F.
(-) The average temperature of the palmrest area of similar devices was 28 °C / 82.4 F (-11.1 °C / -20 F).
Energy Management
Power Consumption
The difference in power consumption between the i5 and the i7 model was around 4 W. The 2017 dual-core i5 was more efficient, although we have to remember that its 23.5 W was measured after throttling during our stress test. Idle power consumption was practically identical between the i5 and the i7 model, which resulted in nearly identical idle battery life.
Under average load, the HP Elite x2 1013 G3 consumed more energy but also offered a much higher sustained performance in our R15 loop in return.
| Off / Standby | |
| Idle | |
| Load |
|
Key:
min: | |
| Microsoft Surface Pro 6, Core i5, 128 GB i5-8250U, UHD Graphics 620, Toshiba KBG30ZPZ128G, IPS, 2736x1834, 12.3" | Microsoft Surface Pro (2017) i5 i5-7300U, HD Graphics 620, Samsung PM971 KUS030202M, IPS, 2736x1824, 12.3" | Microsoft Surface Pro 6, Core i7, 512 GB i7-8650U, UHD Graphics 620, Toshiba KBG30ZPZ512G, IPS, 2736x1824, 12.3" | Microsoft Surface Book 2 i7-8650U, GeForce GTX 1050 Mobile, Samsung PM961 MZVLW256HEHP, IPS, 3000x2000, 13.5" | Microsoft Surface Go MHN-00003 Pentium 4415Y, UHD Graphics 615, 64 GB eMMC Flash, IPS, 1800x1200, 10" | Dell Latitude 5290 2-in-1 i5-8350U, UHD Graphics 620, Toshiba XG5 KXG50ZNV256G, IPS, 1920x1280, 12.3" | HP Elite x2 1013 G3-2TT14EA i5-8350U, UHD Graphics 620, Samsung PM961 MZVLW256HEHP, IPS, 3000x2000, 13" | Samsung Galaxy Book 12 SM-W728 i5-7200U, HD Graphics 620, Samsung SSD PM871a MZNLN256HMHQ, Super AMOLED, 2160x1440, 12" | Huawei Matebook E i5-7Y54, HD Graphics 615, SanDisk SD8SN8U256G1027, IPS, 2160x1440, 12" | Lenovo Miix 520-12IKB 20M3000LGE i5-8550U, UHD Graphics 620, Samsung SSD PM961 1TB M.2 PCIe 3.0 x4 NVMe (MZVLW1T0), IPS, 1920x1200, 12.2" | Average Intel UHD Graphics 620 | Average of class Convertible | |
|---|---|---|---|---|---|---|---|---|---|---|---|---|
| Power Consumption | 12% | -3% | -94% | 33% | -3% | -13% | -2% | 14% | 4% | -7% | -27% | |
| Idle Minimum * (Watt) | 4.3 | 3.6 16% | 3.2 26% | 4.7 -9% | 2.88 33% | 3 30% | 4.9 -14% | 3.9 9% | 3.9 9% | 3.9 9% | 3.81 ? 11% | 4.22 ? 2% |
| Idle Average * (Watt) | 8.7 | 8.1 7% | 8.7 -0% | 10.6 -22% | 4.8 45% | 7.2 17% | 8.9 -2% | 9 -3% | 8.8 -1% | 8.2 6% | 6.94 ? 20% | 6.97 ? 20% |
| Idle Maximum * (Watt) | 9.4 | 8.7 7% | 10.4 -11% | 12.3 -31% | 7.5 20% | 10 -6% | 11 -17% | 11.9 -27% | 8.9 5% | 8.4 11% | 8.75 ? 7% | 8.63 ? 8% |
| Load Average * (Watt) | 24.5 | 25.5 -4% | 29.2 -19% | 81 -231% | 16.9 31% | 37.1 -51% | 32 -31% | 27.3 -11% | 20 18% | 25.2 -3% | 35 ? -43% | 43.9 ? -79% |
| Load Maximum * (Watt) | 36 | 23.5 35% | 40.8 -13% | 100.3 -179% | 23.8 34% | 38.2 -6% | 36 -0% | 27.9 23% | 21.8 39% | 37 -3% | 47.5 ? -32% | 67.1 ? -86% |
| Witcher 3 ultra * (Watt) | 97 |
* ... smaller is better
Battery Life
Microsoft opted for a 45 Wh battery once again, and the i5’s battery life turned out to be slightly better than the i7’s. For example, it ran for around 30 minutes longer in our Wi-Fi test and turned itself off after 9 hours. However, the 2017 dual-core i5 lasted for around 12 hours in the same test.
Under load (Battery Eater Classic) the system ran for around 118 minutes, which is 15 minutes less than the i7 model. The 2017 i5 model lasted 50 minutes longer.
All things considered, battery life suffered compared to the 2017 model, and the new model lasted 37 % shorter in our Wi-Fi test than before. This is the price you pay for having four instead of two cores, and Microsoft failed to incorporate a larger battery to compensate for the higher power consumption.
The competition performed similarly, if not even worse. The Latitude 5290 2-in-1 lasted for just 5 hours, Lenovo’s Miix 520-12IKB around 5.5 hours, and HP’s Elite x2 1013 G3 ran out of power after 8 hours thanks to its larger 50 Wh battery.
| Microsoft Surface Pro 6, Core i5, 128 GB i5-8250U, UHD Graphics 620, 45 Wh | Microsoft Surface Pro (2017) i5 i5-7300U, HD Graphics 620, 45 Wh | Microsoft Surface Pro 6, Core i7, 512 GB i7-8650U, UHD Graphics 620, 45 Wh | Microsoft Surface Book 2 i7-8650U, GeForce GTX 1050 Mobile, 75 Wh | Microsoft Surface Go MHN-00003 Pentium 4415Y, UHD Graphics 615, 28 Wh | Dell Latitude 5290 2-in-1 i5-8350U, UHD Graphics 620, 42 Wh | HP Elite x2 1013 G3-2TT14EA i5-8350U, UHD Graphics 620, 50 Wh | Samsung Galaxy Book 12 SM-W728 i5-7200U, HD Graphics 620, 39 Wh | Huawei Matebook E i5-7Y54, HD Graphics 615, 33.7 Wh | Lenovo Miix 520-12IKB 20M3000LGE i5-8550U, UHD Graphics 620, 38 Wh | Average of class Convertible | |
|---|---|---|---|---|---|---|---|---|---|---|---|
| Battery runtime | 25% | 2% | 40% | 1% | -38% | -9% | -3% | -25% | -38% | 26% | |
| Reader / Idle (h) | 17.8 | 17.6 -1% | 18.1 2% | 24.5 38% | 12.9 -28% | 13 -27% | 17.2 -3% | 27.7 ? 56% | |||
| WiFi v1.3 (h) | 9.1 | 12.4 36% | 8.5 -7% | 11.1 22% | 7.5 -18% | 5 -45% | 7.7 -15% | 6.8 -25% | 5.6 -38% | 12.1 ? 33% | |
| Load (h) | 2 | 2.8 40% | 2.2 10% | 3.2 60% | 3 50% | 1.4 -30% | 2.3 15% | 1.779 ? -11% | |||
| H.264 (h) | 15.6 | 6.4 | 6.5 | 6.8 | 15.3 ? | ||||||
| Witcher 3 ultra (h) | 3.8 |
Verdict
Pros
Cons
Microsoft’s 2018 Surface Pro is still one of the best Windows tablets available: excellent quality, excellent display, good cameras, enjoyable input devices (even though Type Cover and Pen are optional and have to be purchased separately), and a very good microphone.
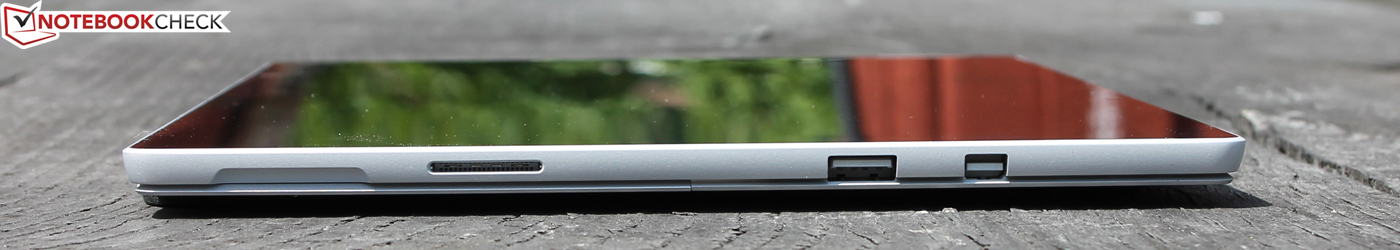
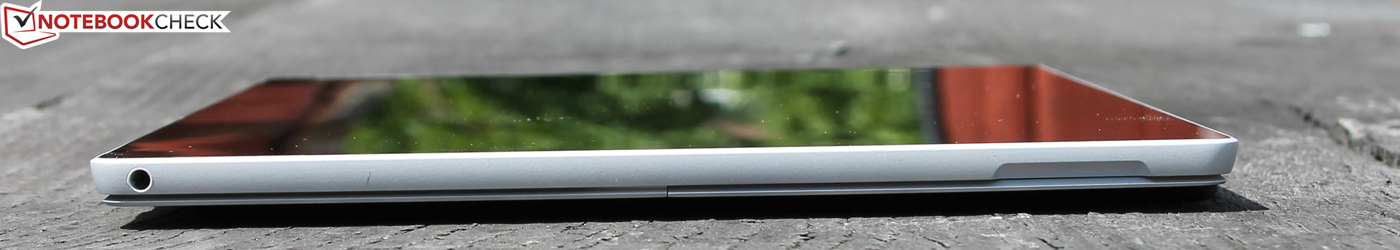
However, it is still not the best of its class in every single category. Connectivity remains rather limited, and USB-C should be available on any 2018 device - preferably Gen 2 with Thunderbolt 3. Yet Microsoft failed to implement Thunderbolt 3 even on its Surface Book 2 creative workstation.
With its identical case, display, input devices, and connectivity it is no surprise the Surface Pro i5 (2018)’s rating of 91% is identical to that of the i7 model. The differences between the two are quite obvious: While battery life is largely comparable raw performance is not. The i7 turned out to be up to 22% faster under sustained load and did not throttle as much as the i5. The latter reduced its clock speeds by 25% under load, the former by just 11%.
If it is performance you are looking for the i7 [click here for our review] is the better choice. Everyone else will be fine with the i5, which is more than fast enough for office and web applications.
Unfortunately, Microsoft opted for a comparatively slow Toshiba NVMe SSD (128 GB) - the 512 GB model that our i7 review unit was equipped with performed much faster. The slow SSD was the main culprit for the device’s poor PCMark performance.
The i5 and i7 model may differ quite significantly in terms of raw computing prowess, but their respective application performance (PCMark) only differed by 5-18% despite the 512 GB SSD’s much better performance.
The small difference in application performance raises the question whether or not the i7 model is really worth its high premium. Performance junkies will profit from the i7, which turned out to be 22% faster under sustained load.
In our opinion the i7 is overkill for users looking primarily for an office and web application device. The i5 is much better suited for these tasks.
Unfortunately, battery life decreased from 12 hours (i5 2017) to just 9 hours (i5 2018). That said it is still longer than what the competition is capable of squeezing out of the Kaby Lake R platform.
The HP Elite x2 1013 G3 is an excellent alternative to the Surface Pro with performance comparable to the i7 model and a slightly shorter battery life. To compensate, it features two Thunderbolt 3 ports and a 3:2 3K display.
We have yet another competitor in review at the time of writing. Lenovo’s ThinkPad X1 Tablet Gen. 3 costs around the same but features a stylus, a higher 3000x2000 resolution display, and an LTE modem. In return, the 13-inch tablet is slightly larger and heavier (1,270 g including dock). Just like the Surface Pro it features a 3:2 display, but in addition it also has two Thunderbolt 3 ports. Thus, at least on paper it should be the better choice. Our test will be finished and published soon.
Update 11/7/2018: Faster with the 256 GB SSD
Not only does the 256 GB model offer twice the storage space, it also turned out to be significantly faster. On average, Toshiba’s KBG30ZPZ256G was 30 % faster than the 128 GB model, which resulted in 2-10 % higher system performance benchmark scores (PCMark).
Whether or not the premium of $300 is worth it depends on your individual situation. After all, you might not even require the extra storage space. Whether unintentional or not, with the 256 GB SKU Microsoft is selling a slightly faster version of its Surface Pro 6.
Microsoft Surface Pro 6, Core i5, 128 GB
- 02/17/2020 v7 (old)
Sebastian Jentsch
Price comparison

