HP Elite x2 1013 G3 (i5-8350U, SSD, 3k) 2-in-1 Review

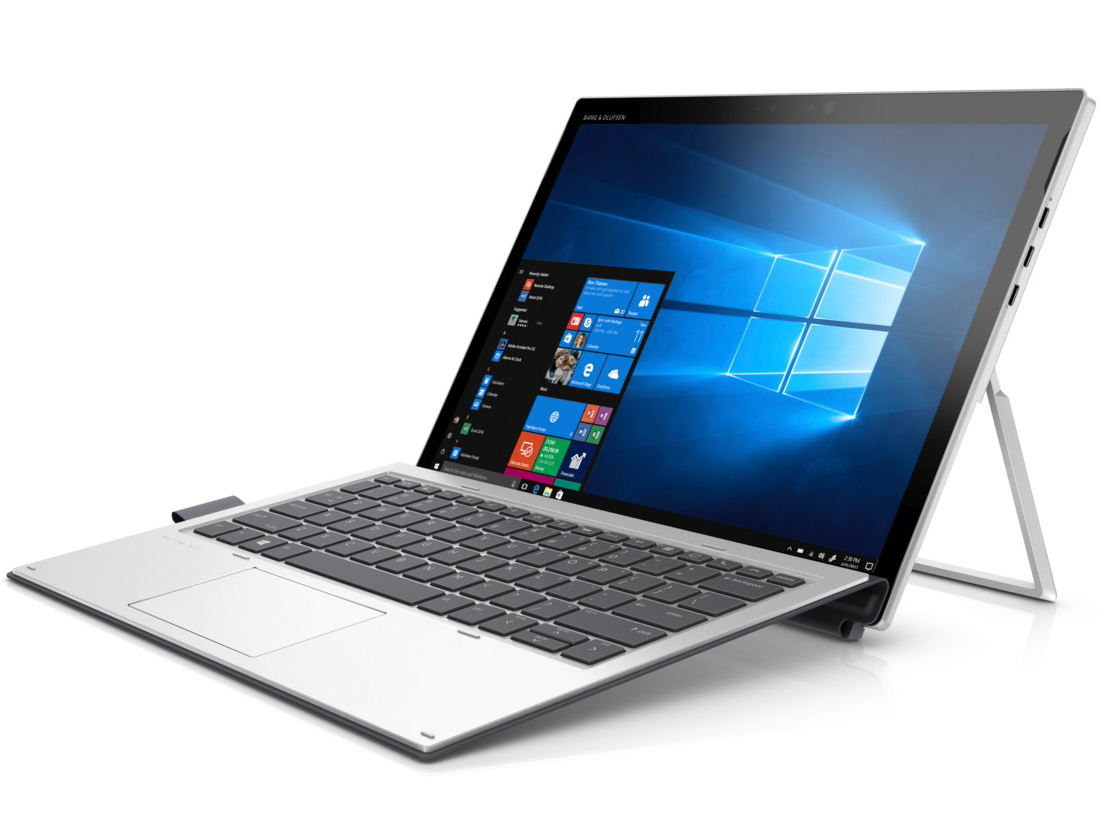
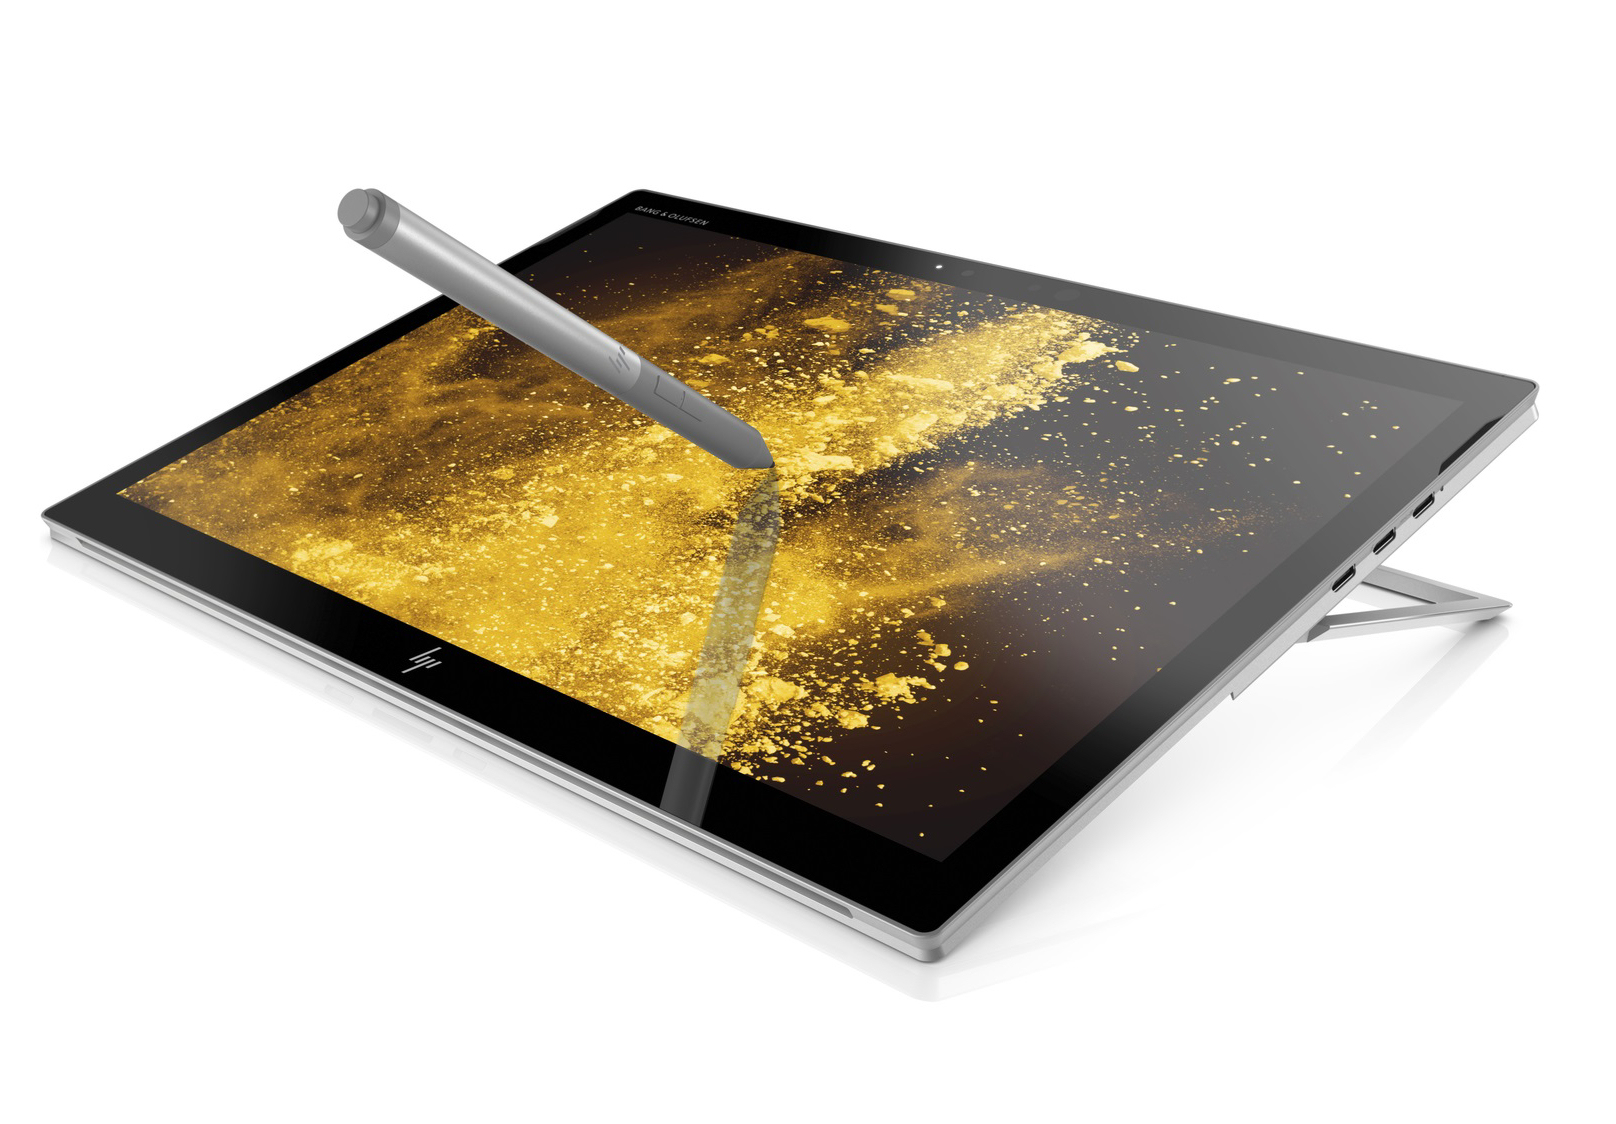
In HP’s world, Elite stands for its upper-class business models. Accordingly, today’s review unit named Elite x2 1013 G3 will set you back around $1,800. What you get in return is a nicely equipped 2-in-1 device with a 3:2 display. This particular model is the successor to the Elite x2 1012 G2. HP has included a number of improvements and changes, such as for example the larger display. Its competitors are devices like the Dell Latitude 12 5285 2-in-1, the Lenovo Miix 520-12IKB, and the Microsoft Surface Pro (2017). Find out whether or not this latest incarnation of an HP detachable is worth taking a closer look at in our extensive review.
Case
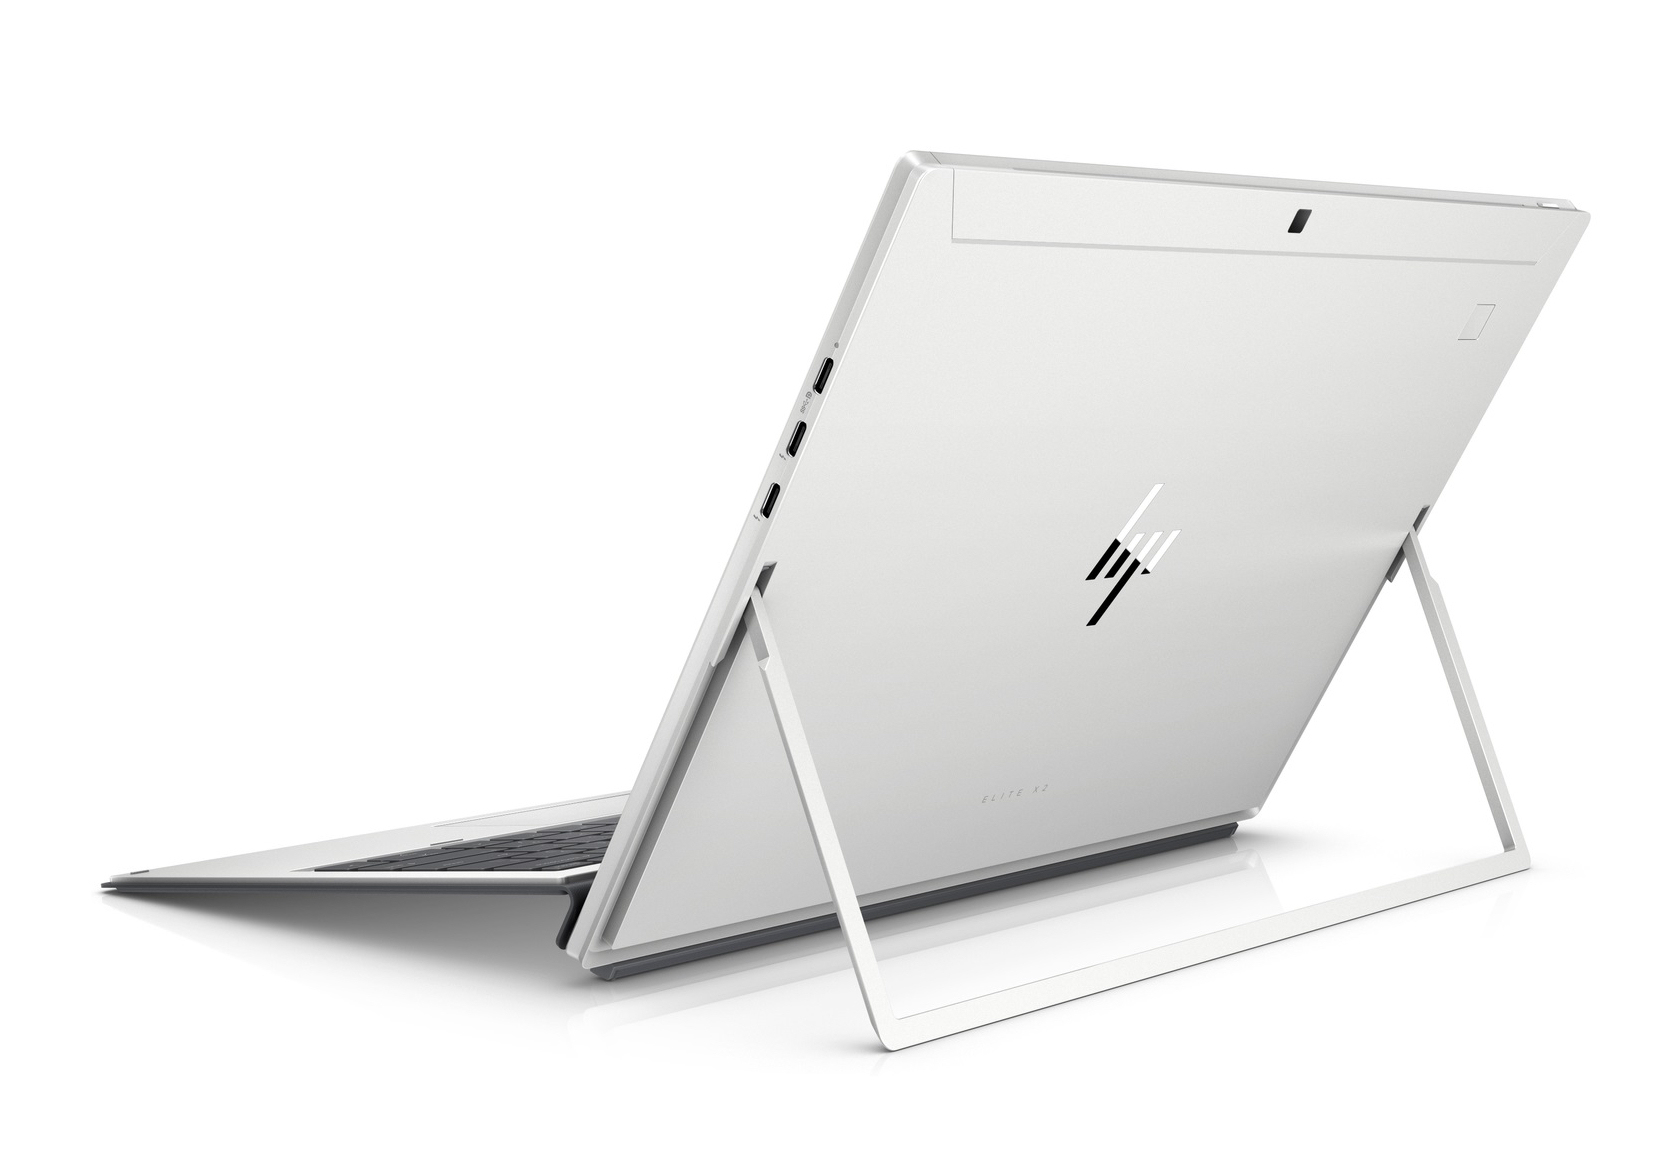
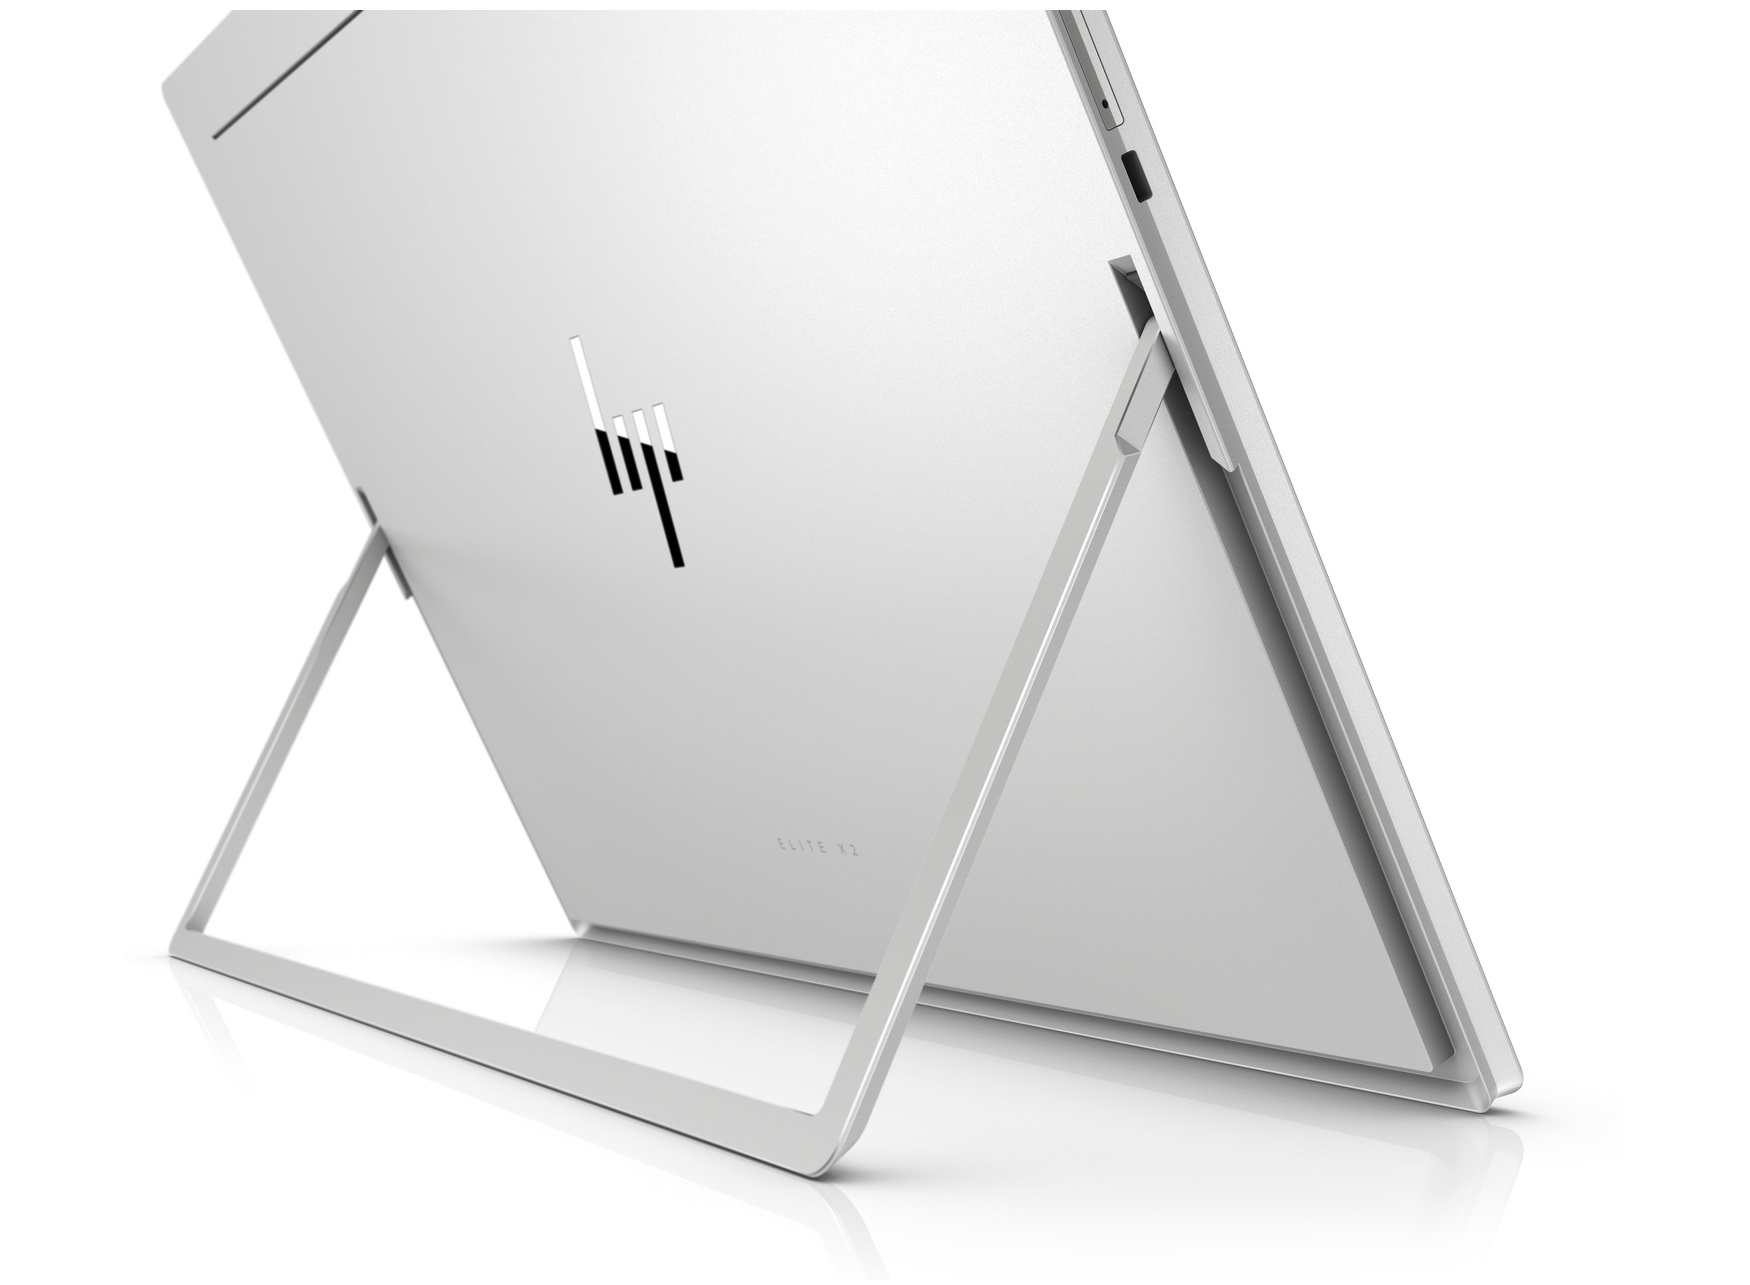
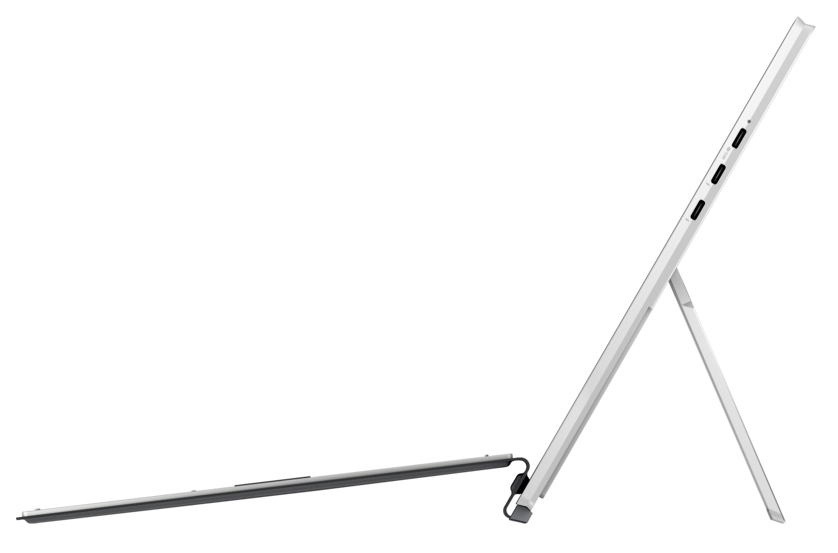
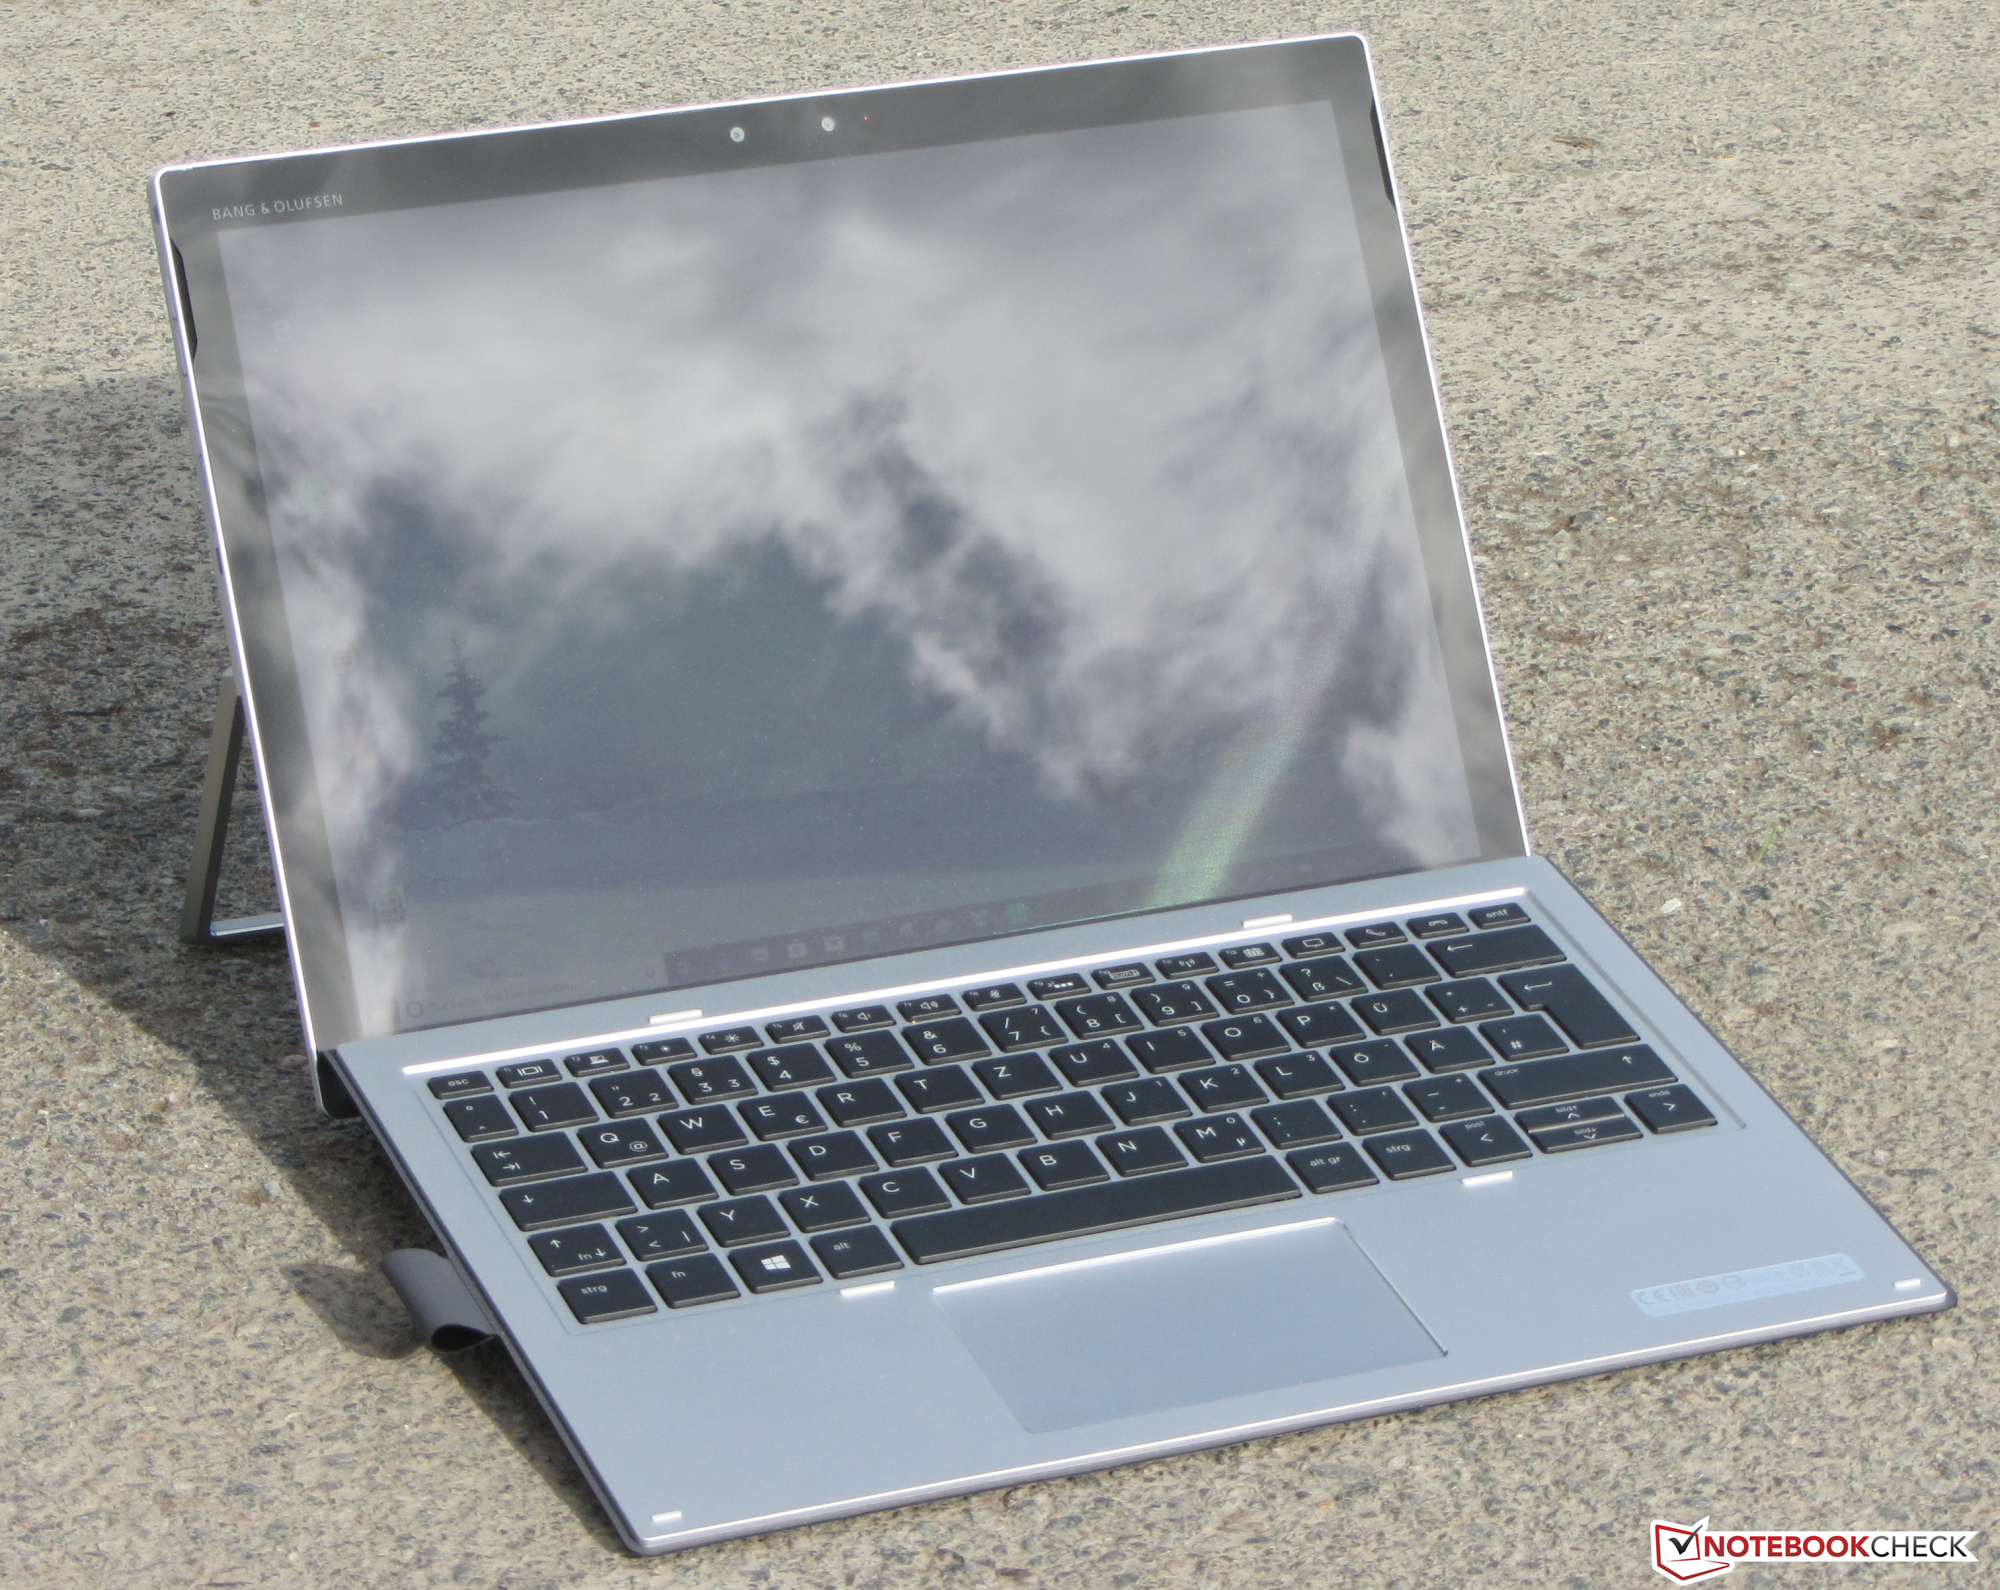
The latest generation is very easily recognizable as successor to the Elite x2 1012 G1 and Elite x2 1012 G2. It still features the same sleek metal case and flip stand. Unlike Microsoft, HP’s designers decided against a metal plate and went with a 6 mm thick metal frame instead. That is all when it comes to similarities - the Elite x2 1013 G3 represents much more than a simple CPU swap. Instead, it is a completely redesigned device.
One of the first things we noticed were the significantly thinner display bezels thanks to which the previously used 12.3-inch display has now been replaced with a 13-inch display. Subjectively, the new case seems to be thinner even though at 7.9 mm it is slightly thicker than the G2’s 7.62 mm. Contributing factors for this illusion are the thinner display bezels and the beveled edges. The design has also been updated and is now much more chiseled and edged than before.
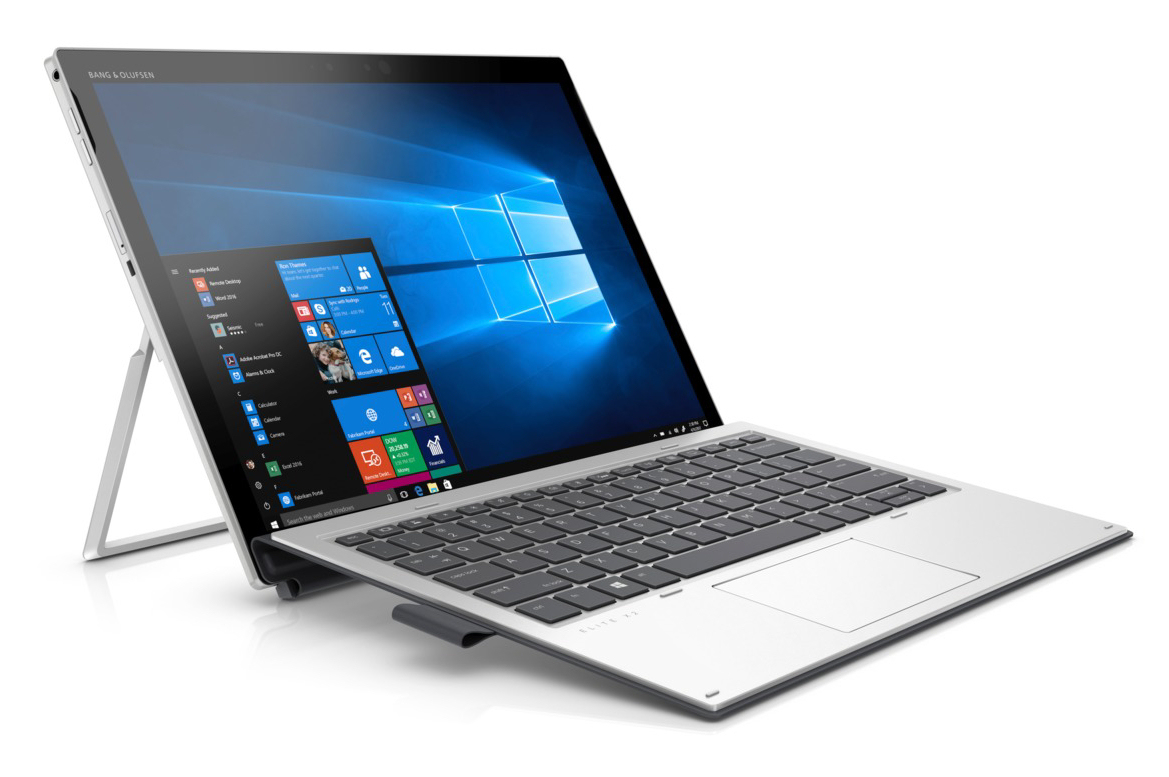
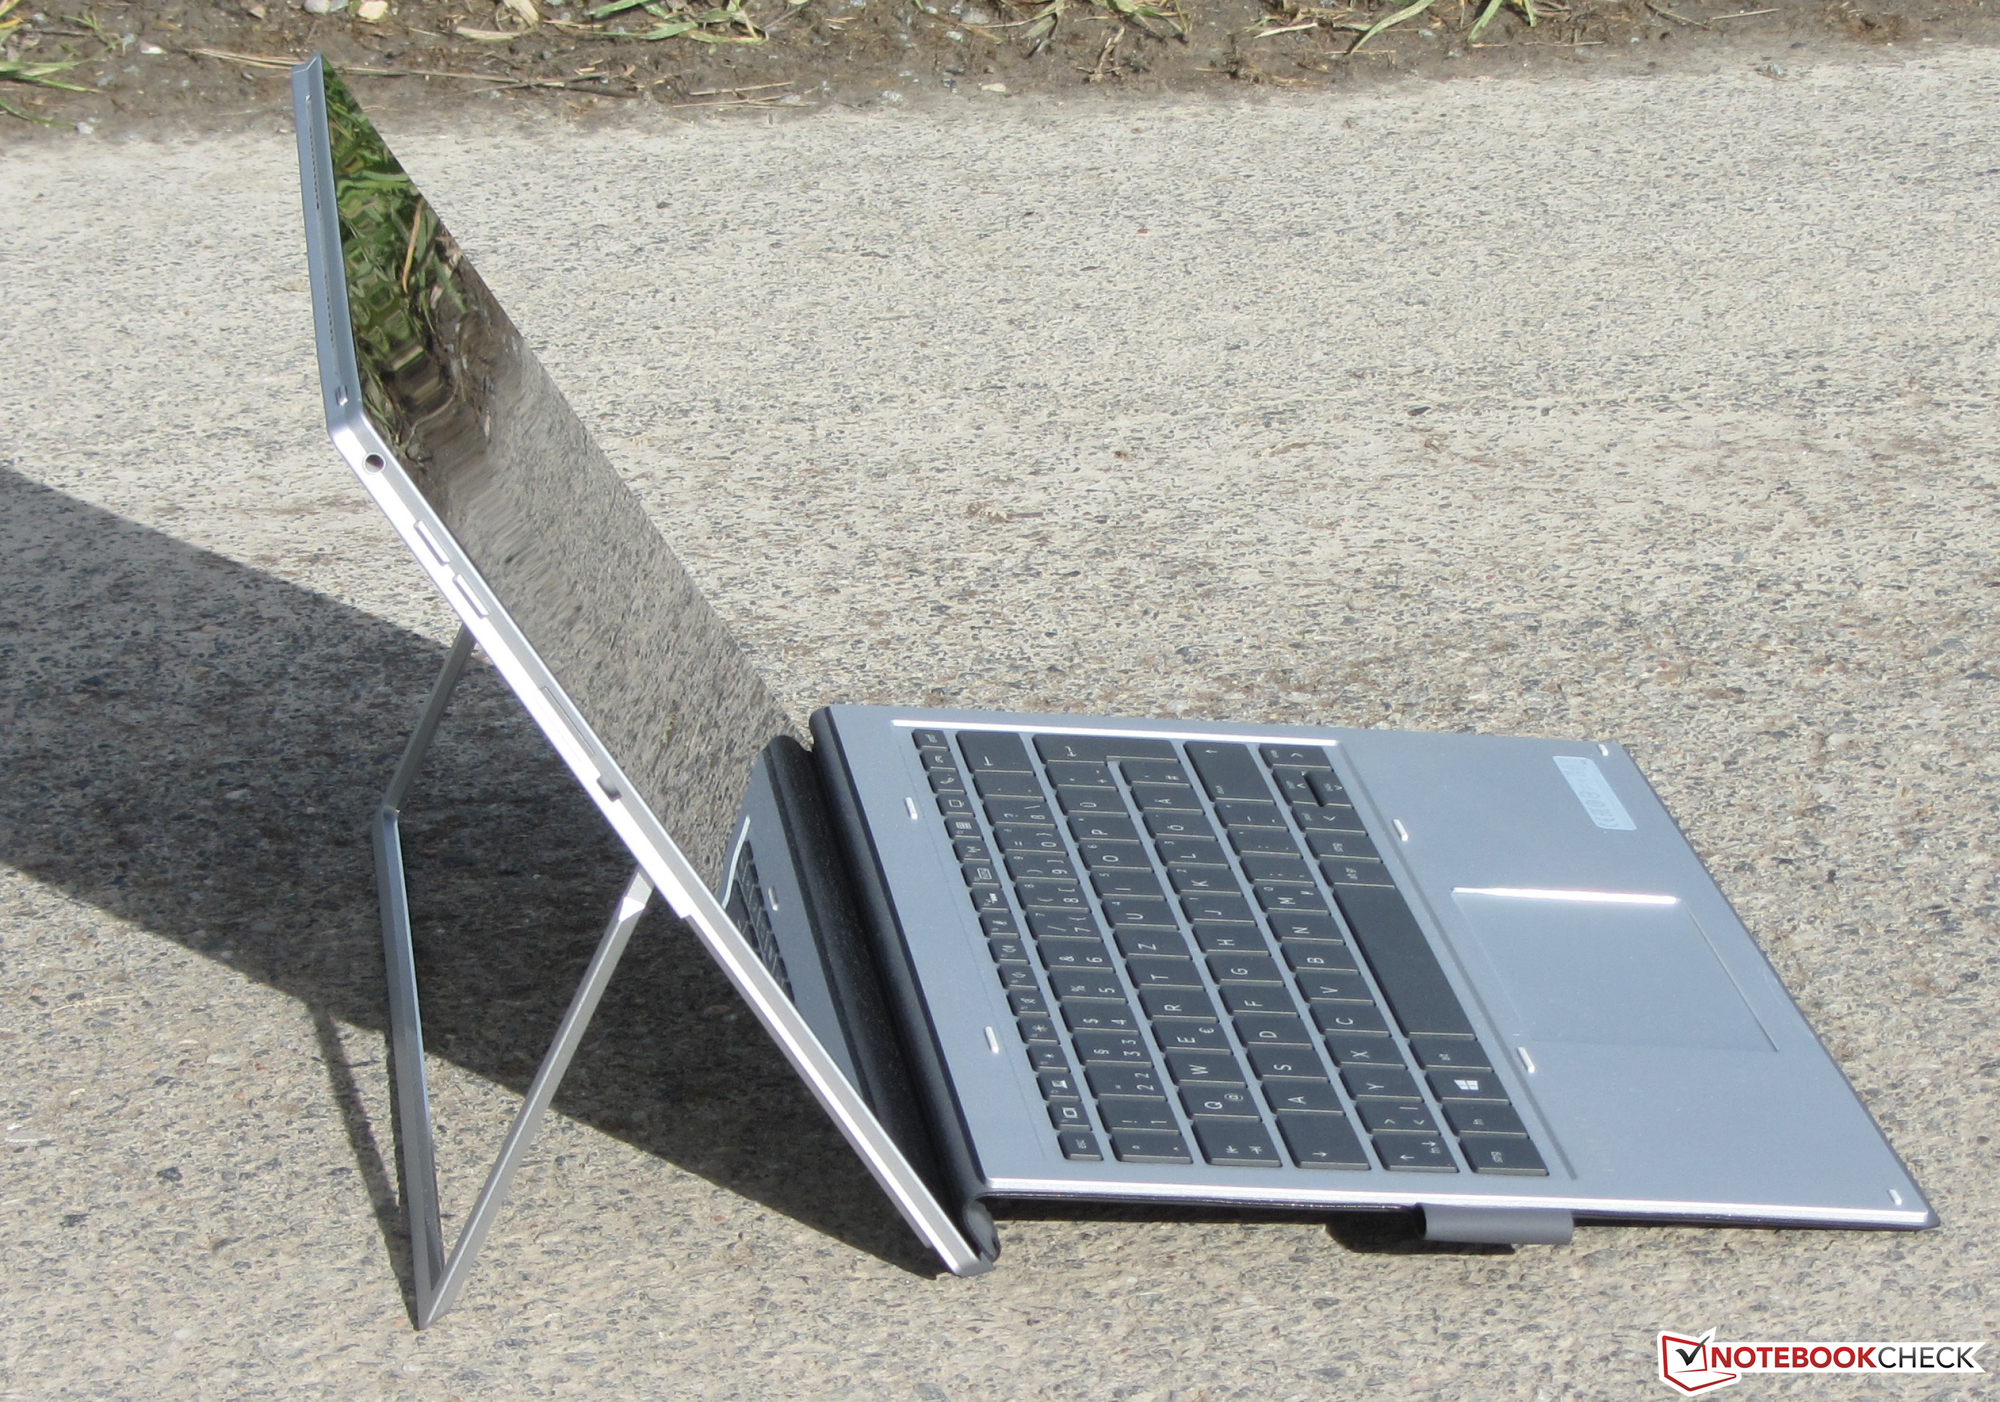
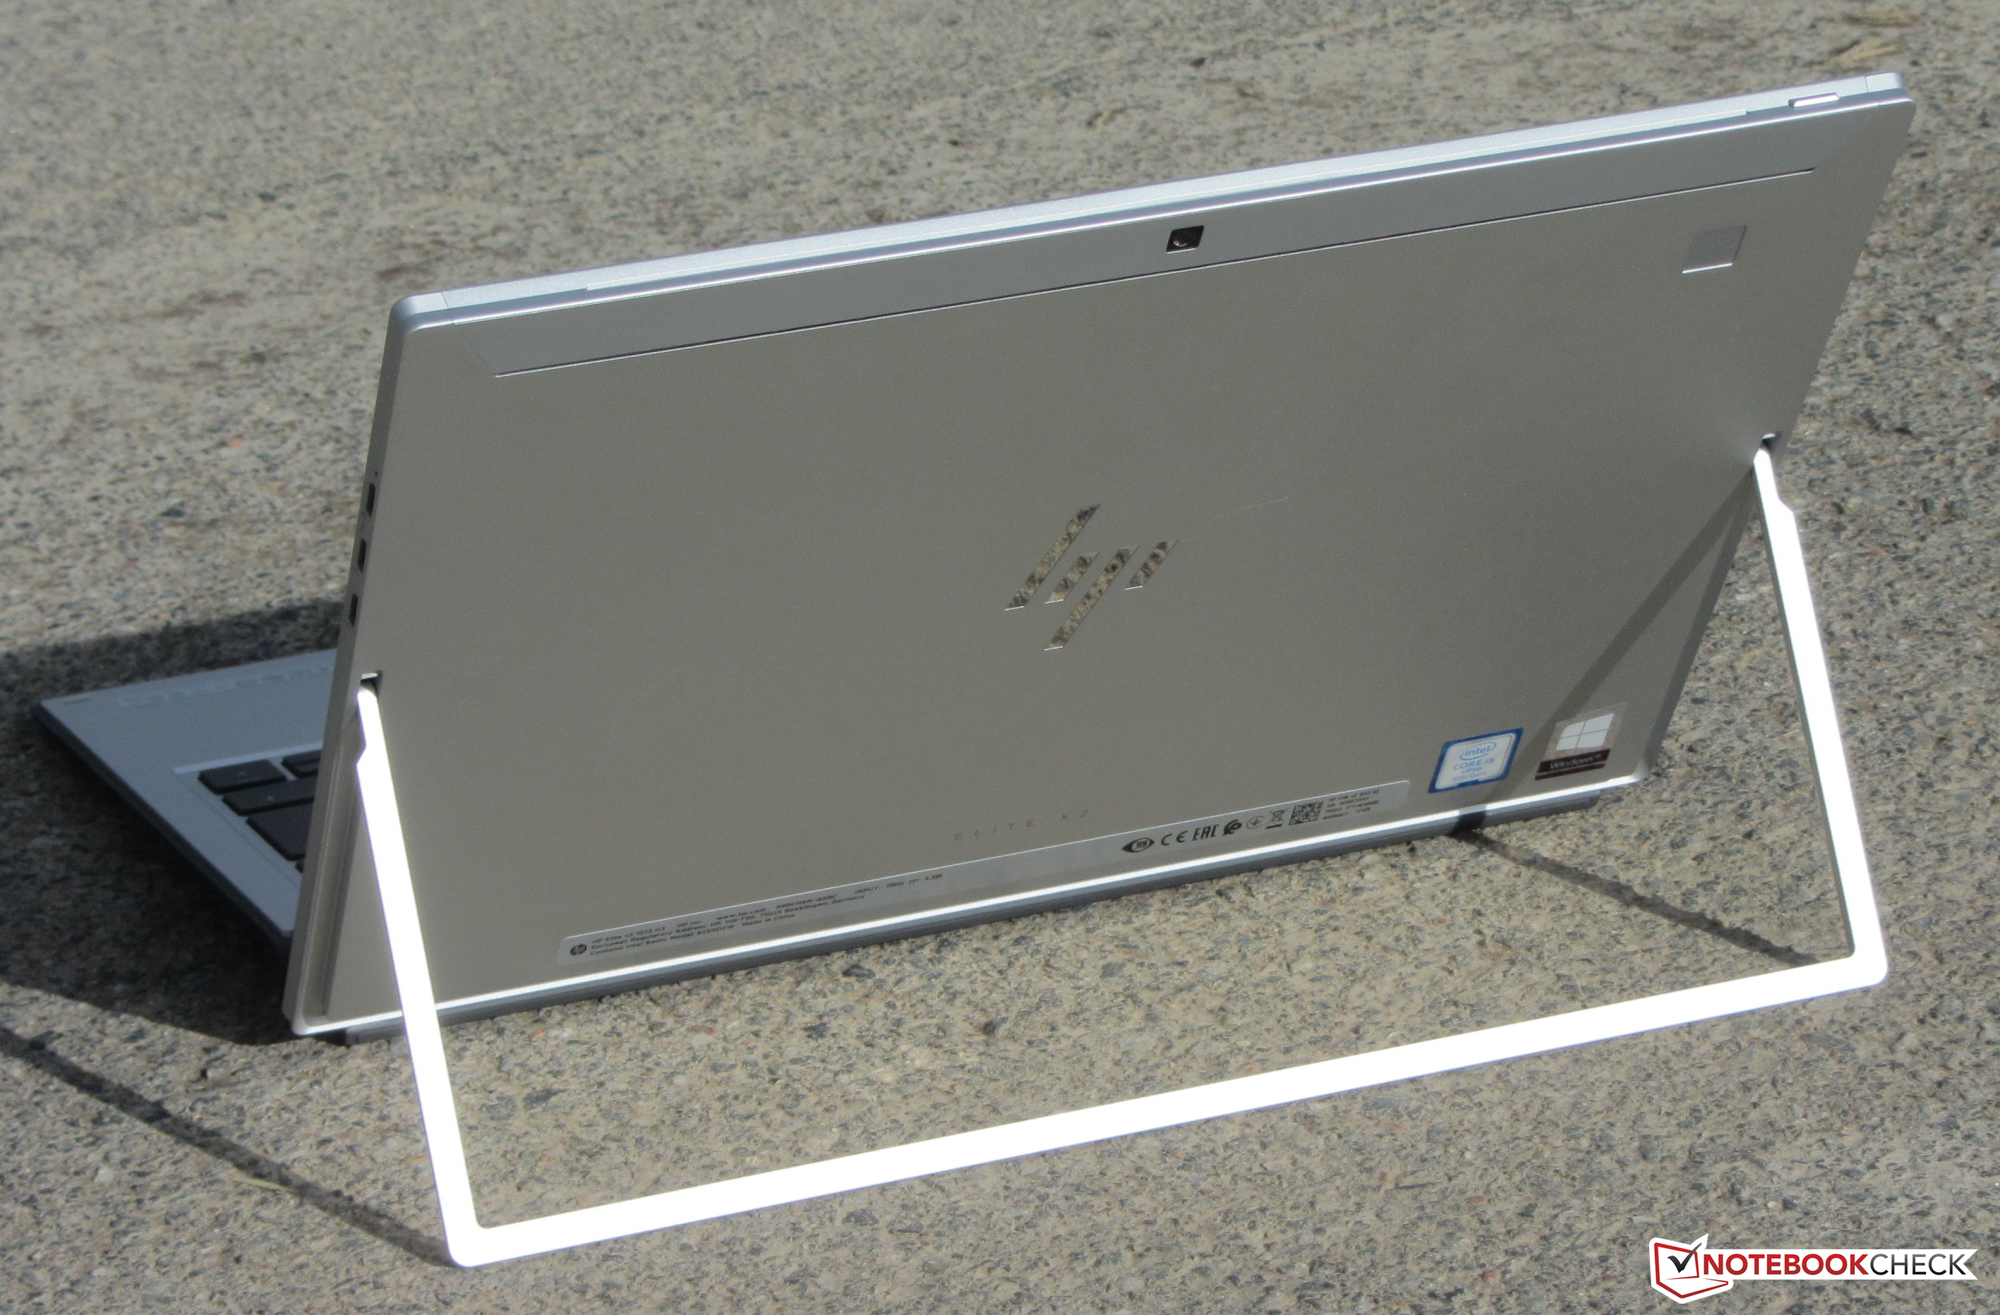
Overall build quality was immaculate. The device was well-made with no obvious weaknesses. Gaps are consistent, and we found no overhanging parts or burred edges. Stability was somewhat lacking, and we were able to warp the device slightly. We would have expected a better rigidity. The flip stand was very firm and held the tablet in place very steadily. The continuous hinges were rather firm and stiff, and the flip stand is thus highly unlikely to flip open unexpectedly. The maximum opening angle is 155 degrees.

All of the devices in our test group reported a similar weight. Their footprints differed significantly due to the differences in aspect ratios.
Connectivity
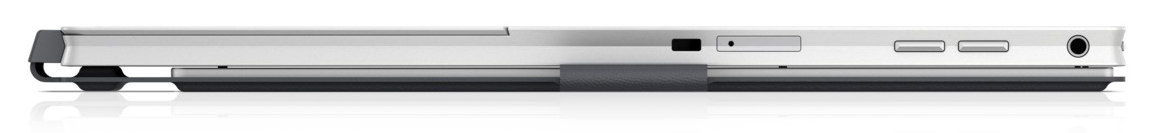
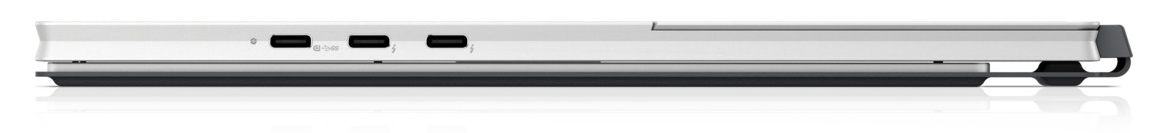
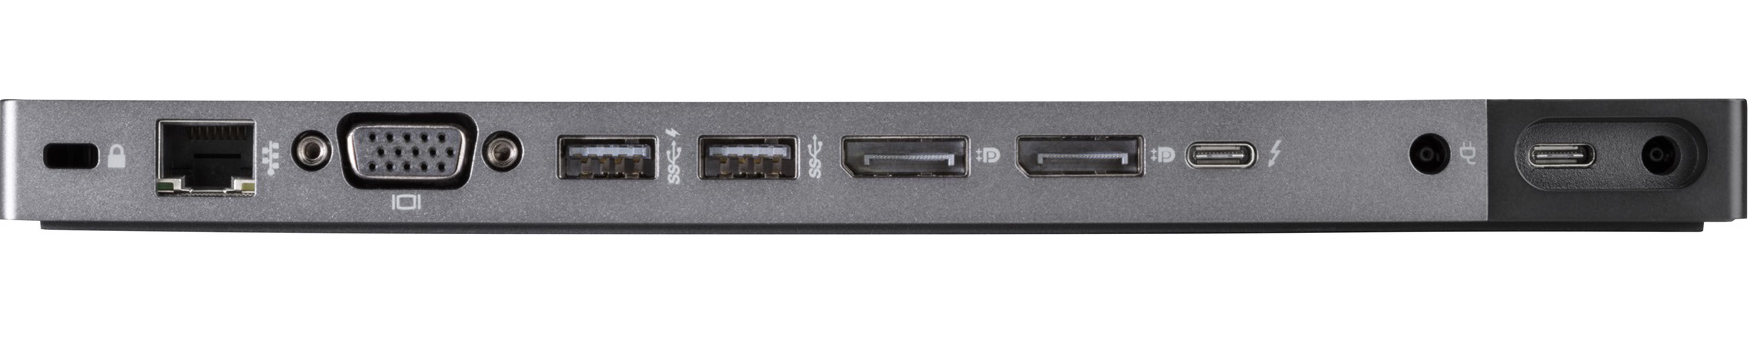
The ports have also undergone a major overhaul. Gone is the USB-A port, and we found three USB-C ports instead, two of which were connected to a Thunderbolt 3 and the remaining one to a USB 3.1 Gen 1 controller. All three carry a DisplayPort signal and can be used accordingly with a matching USB-C to DisplayPort adapter or cable. Unfortunately, HP has also scrapped the microSD card reader.
Communication
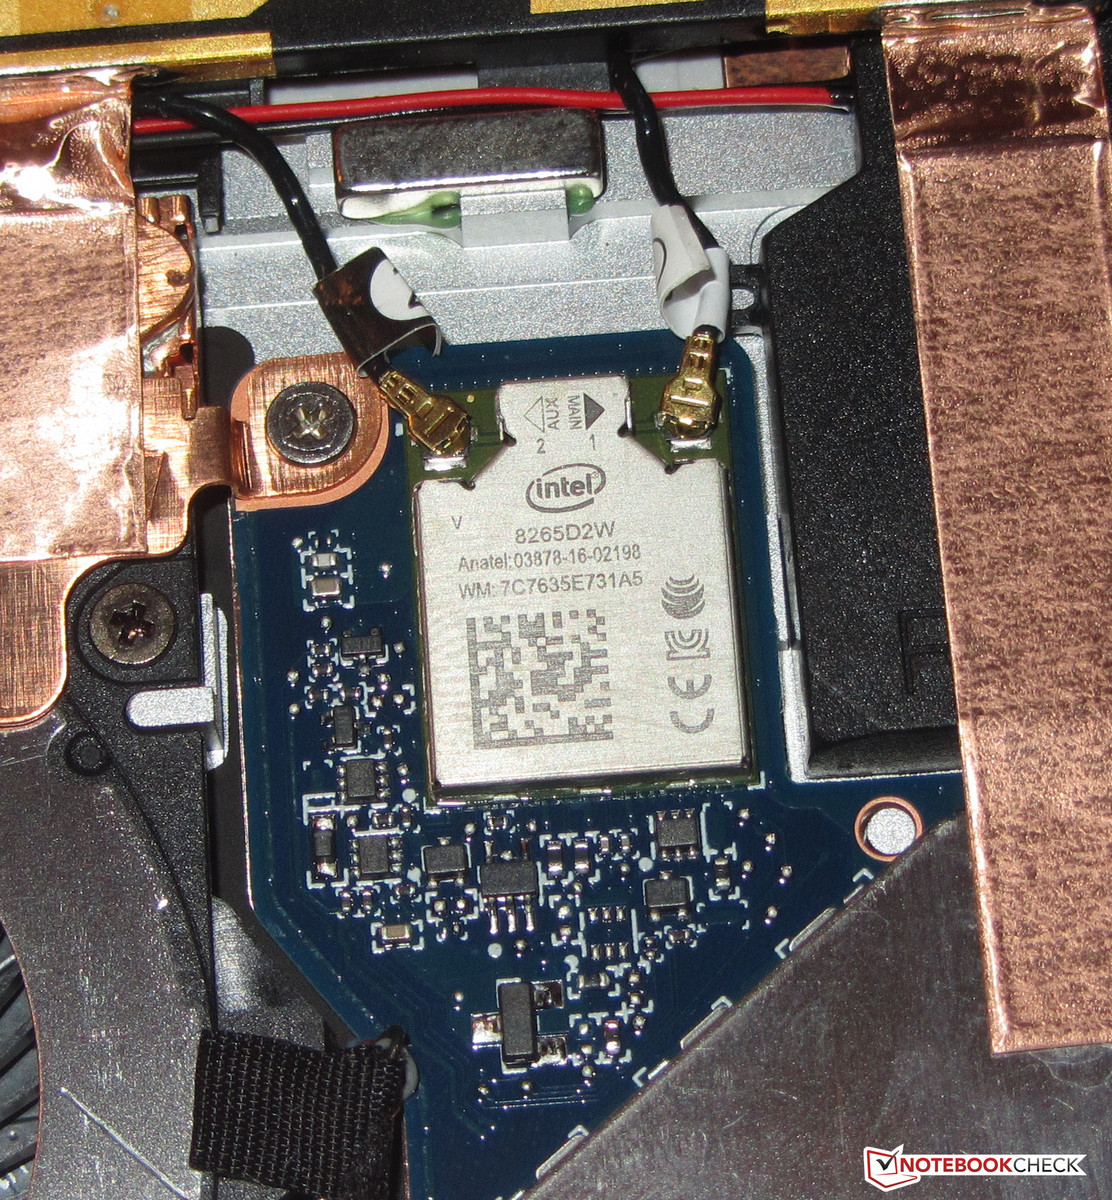
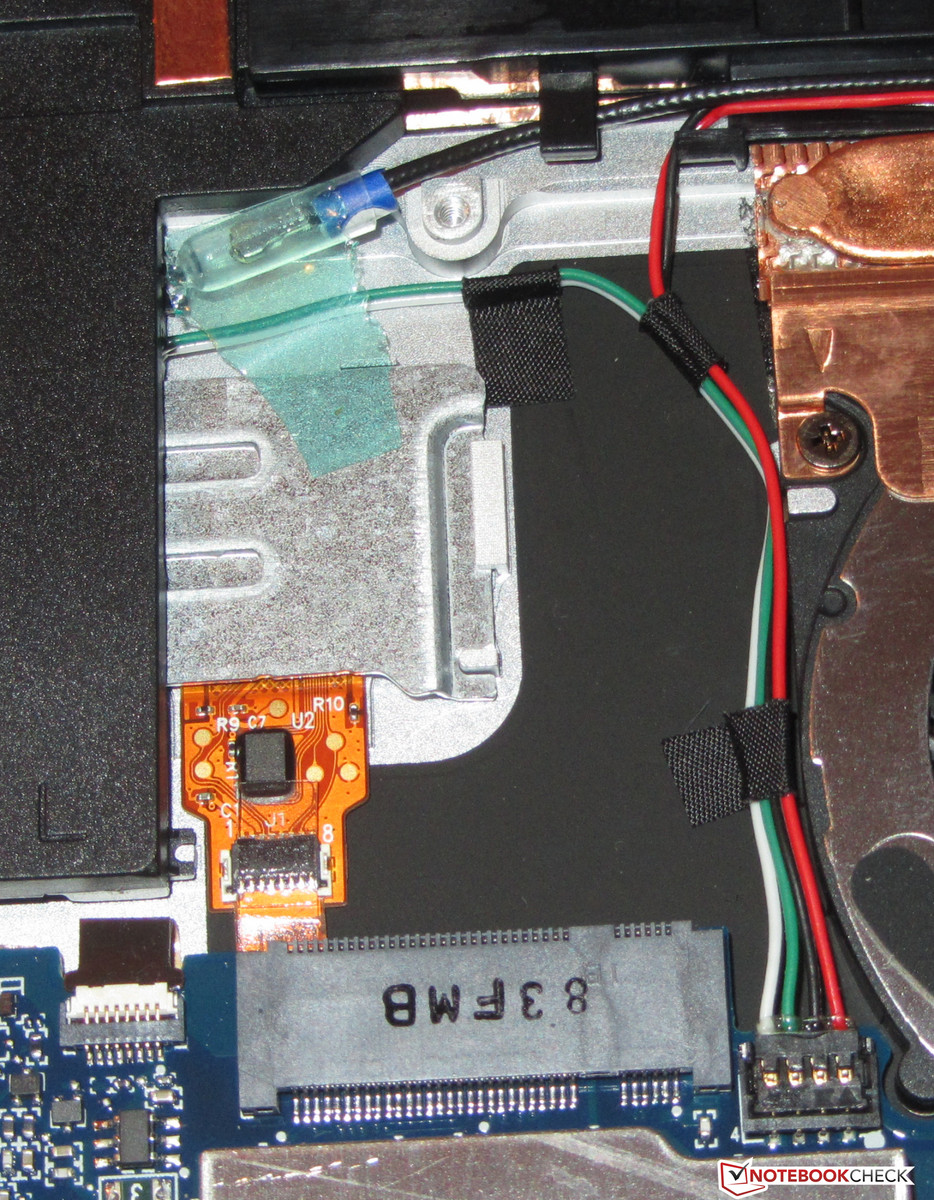
HP’s latest 2-in-1 device features an Intel Dual Band Wireless-AC 8265 Wi-Fi modem with support for 802.11 a/b/g/n/ac. Under ideal conditions (no other Wi-Fi devices nearby, low distance between sender and receiver) it performed admirably. The Elite x2 is WWAN-ready as well and comes with all necessary peripherals such as WWAN slot, antennas, and a SIM-card slot.
Cameras
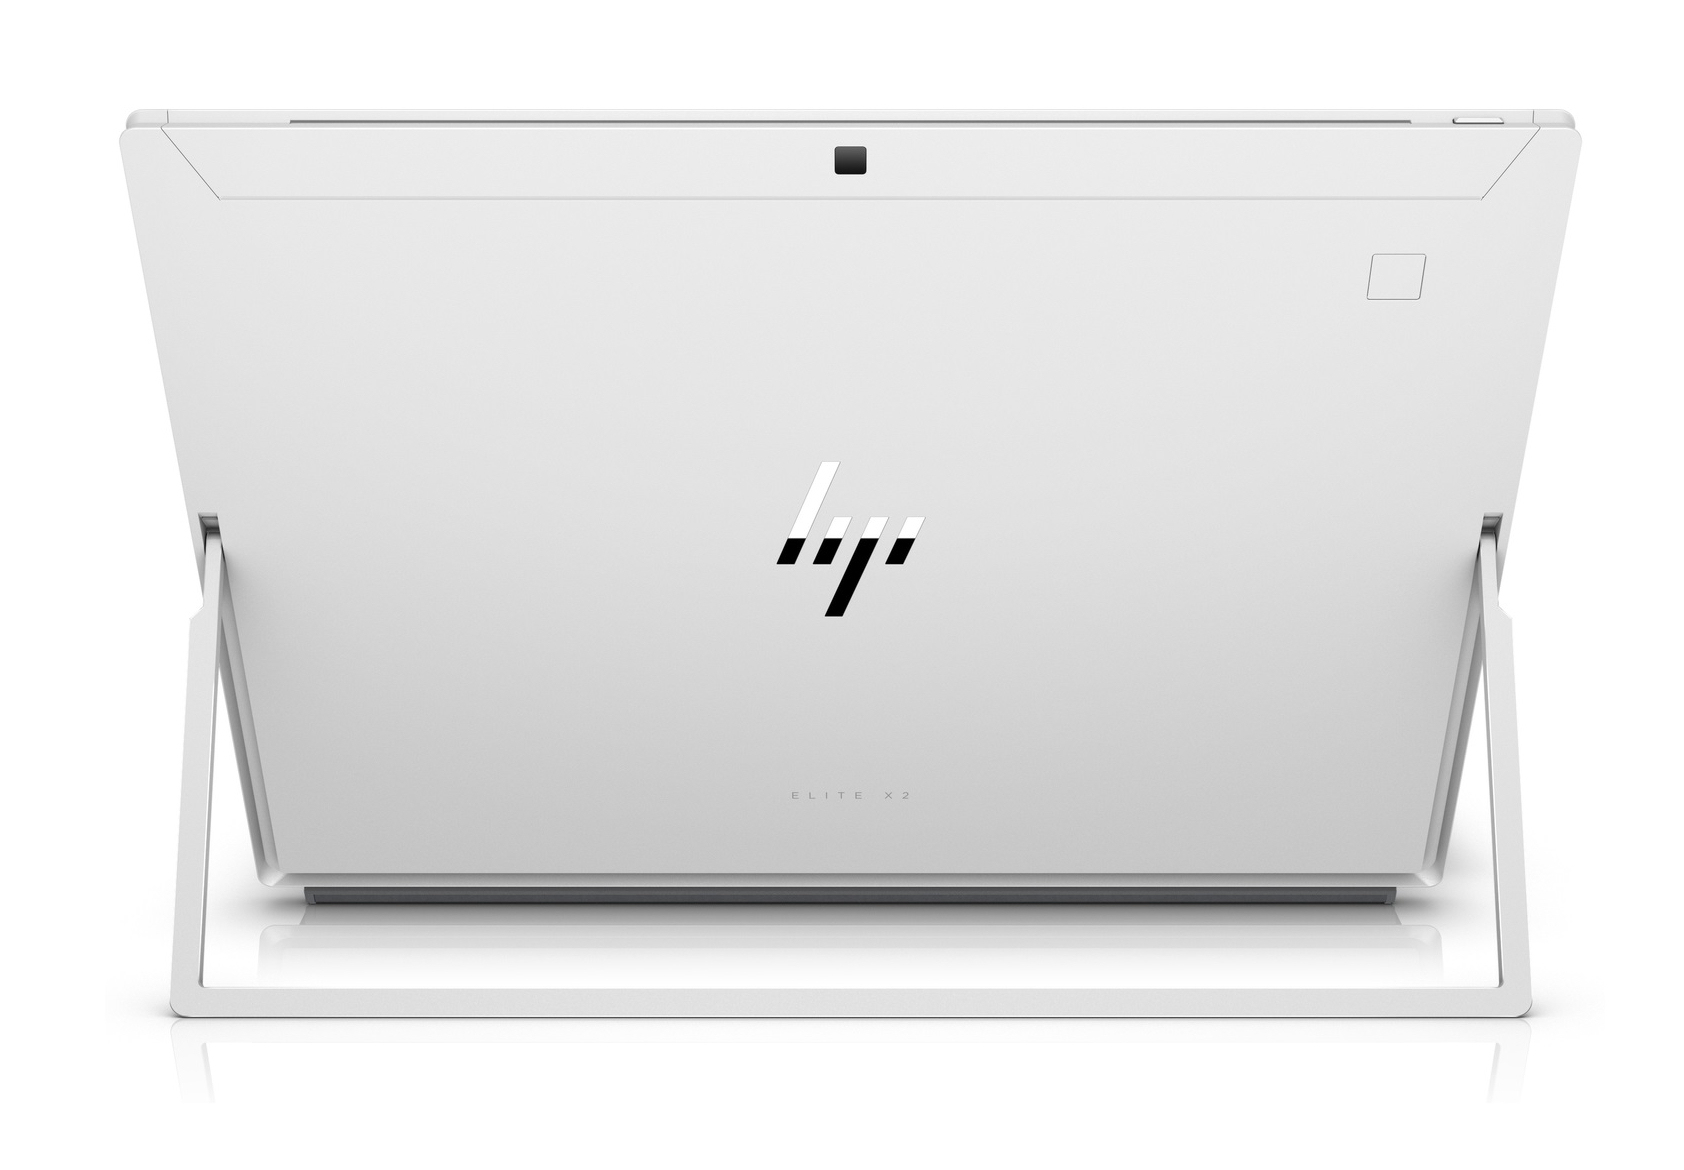
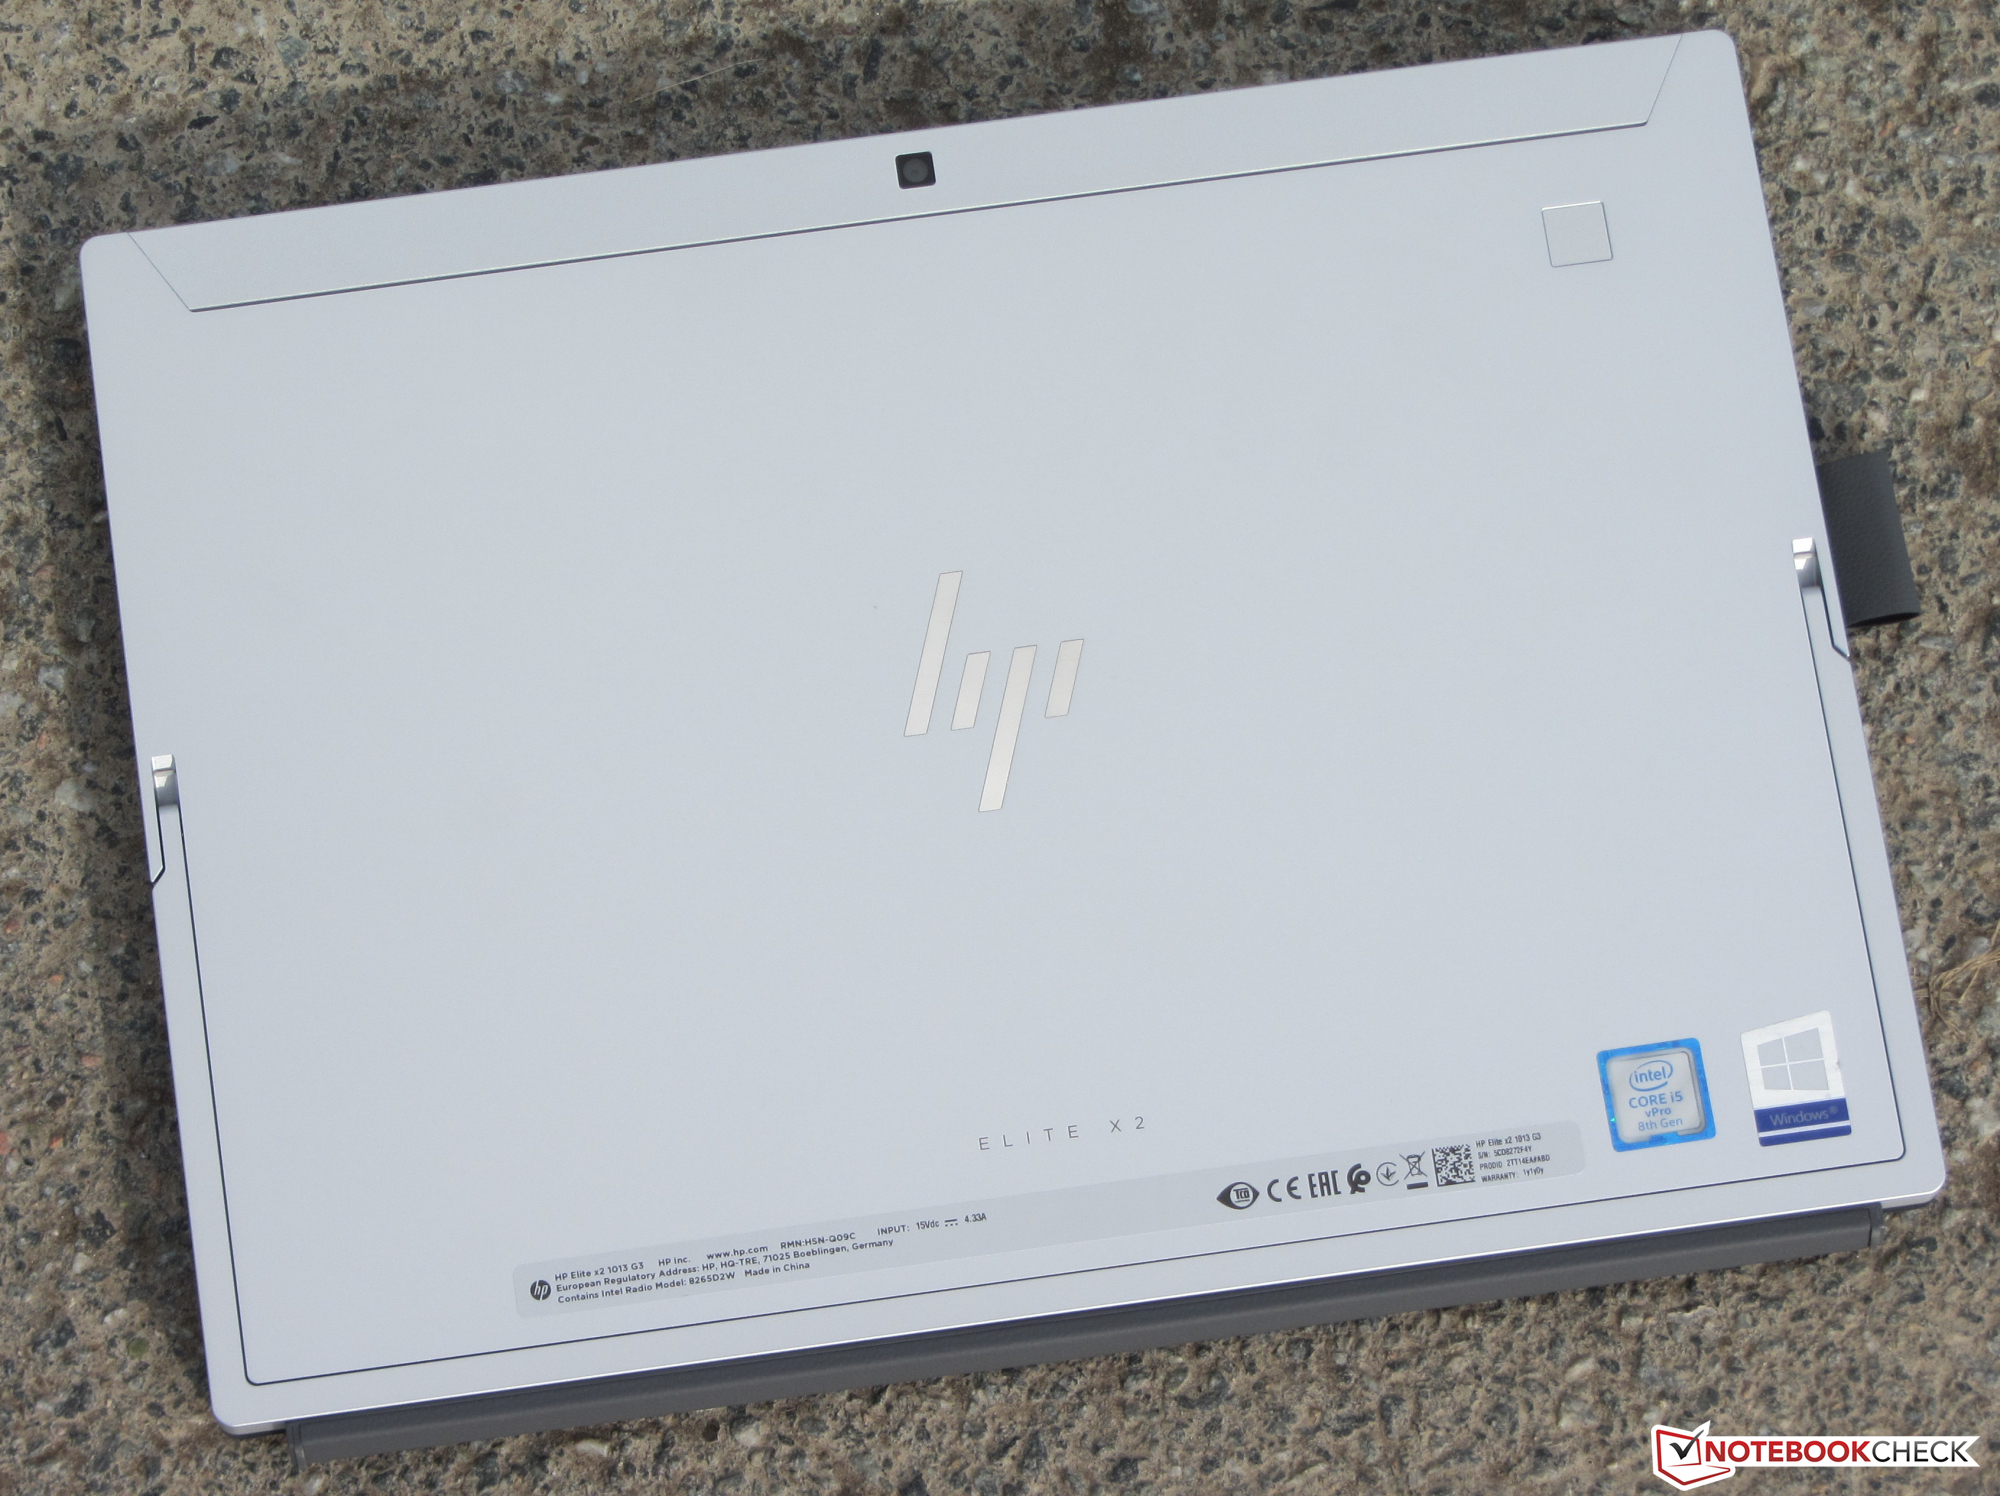
The Elite x2 is equipped with two cameras, a 5 MP front-facing webcam and an 8 MP shooter at the back. It lacks a flash. In addition, our review unit was also equipped with a front-facing infrared camera with support for Windows Hello. This IR camera is optional and not included on every Elite x2 SKU.
The webcam did not do a particularly good job at capturing photos. They turned out crisp but somewhat noisy. The rear-facing camera did a much better job.
Security
The Elite x2 includes a fingerprint reader and allows for biometric access control. The fingerprint reader is located at the back of the tablet. In addition, the device also includes a TPM 2.0 chip as well as HP’s own Client Security software.
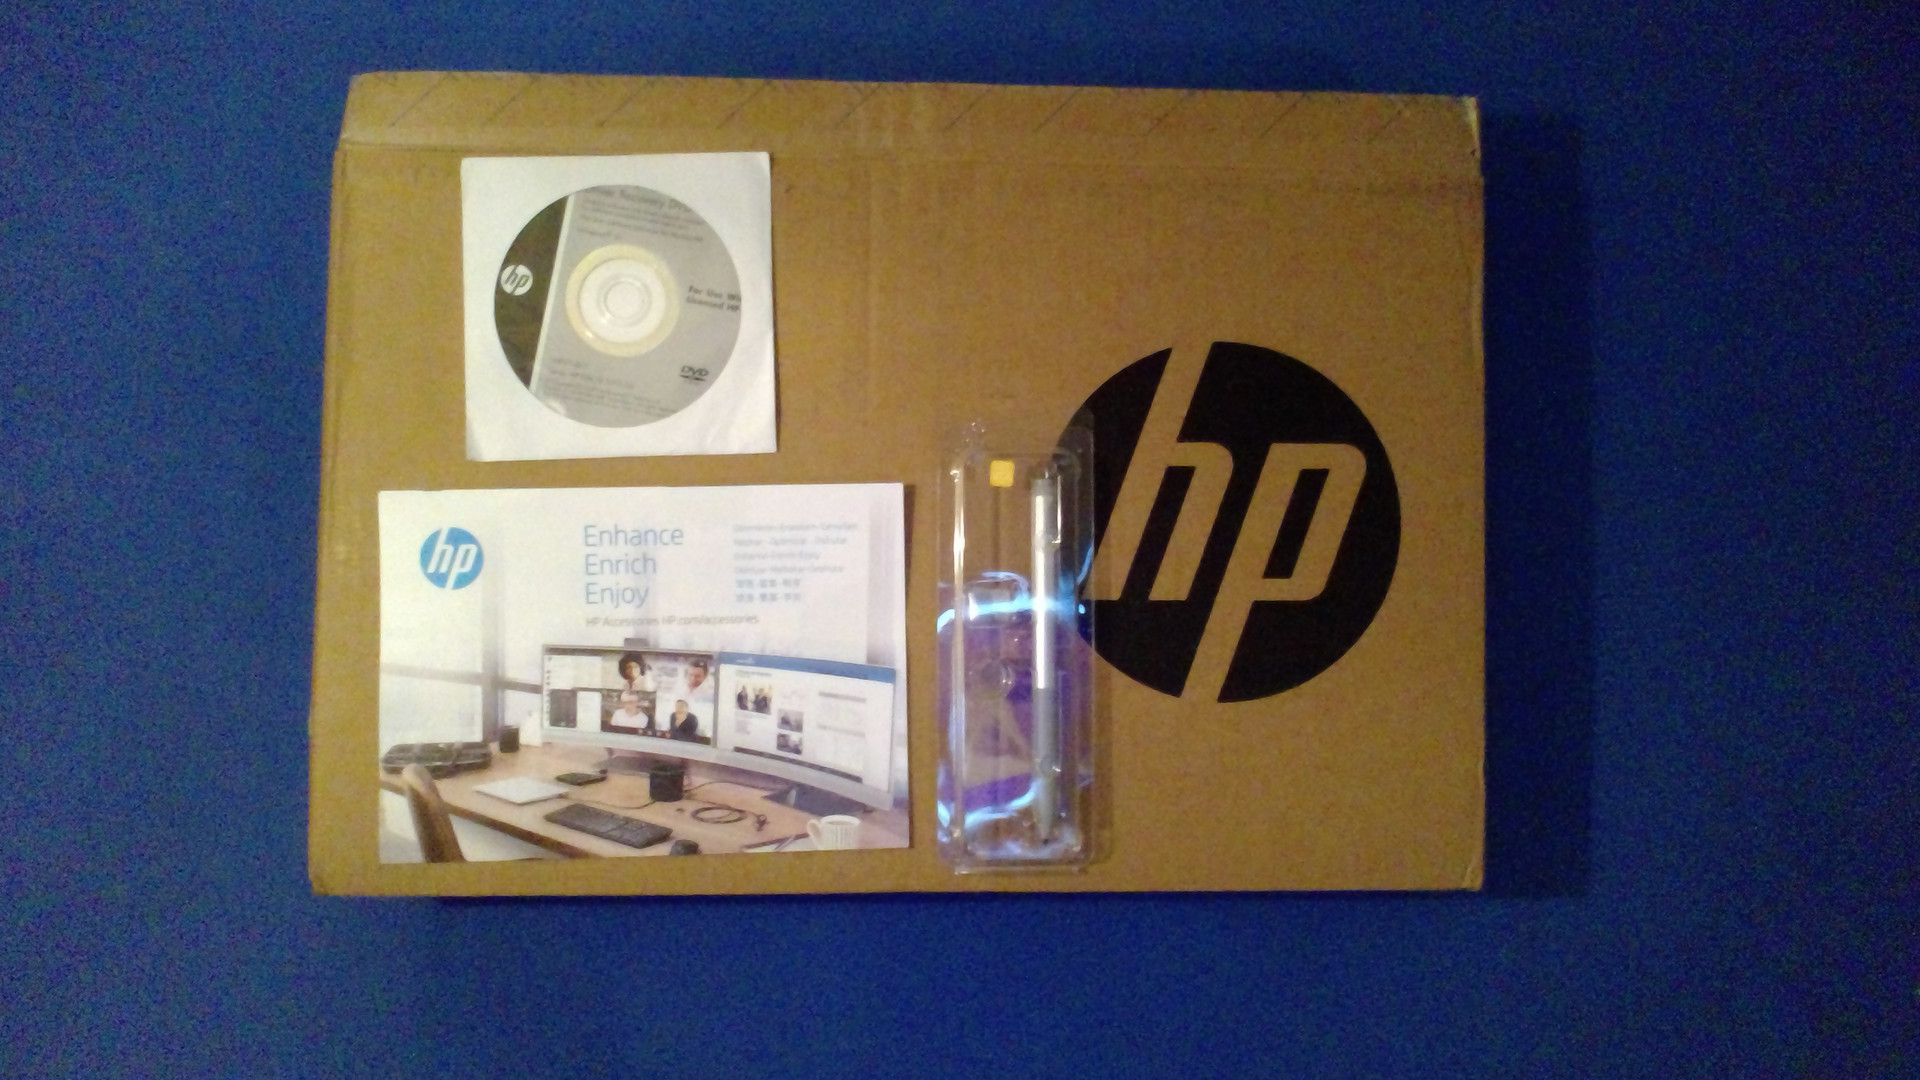
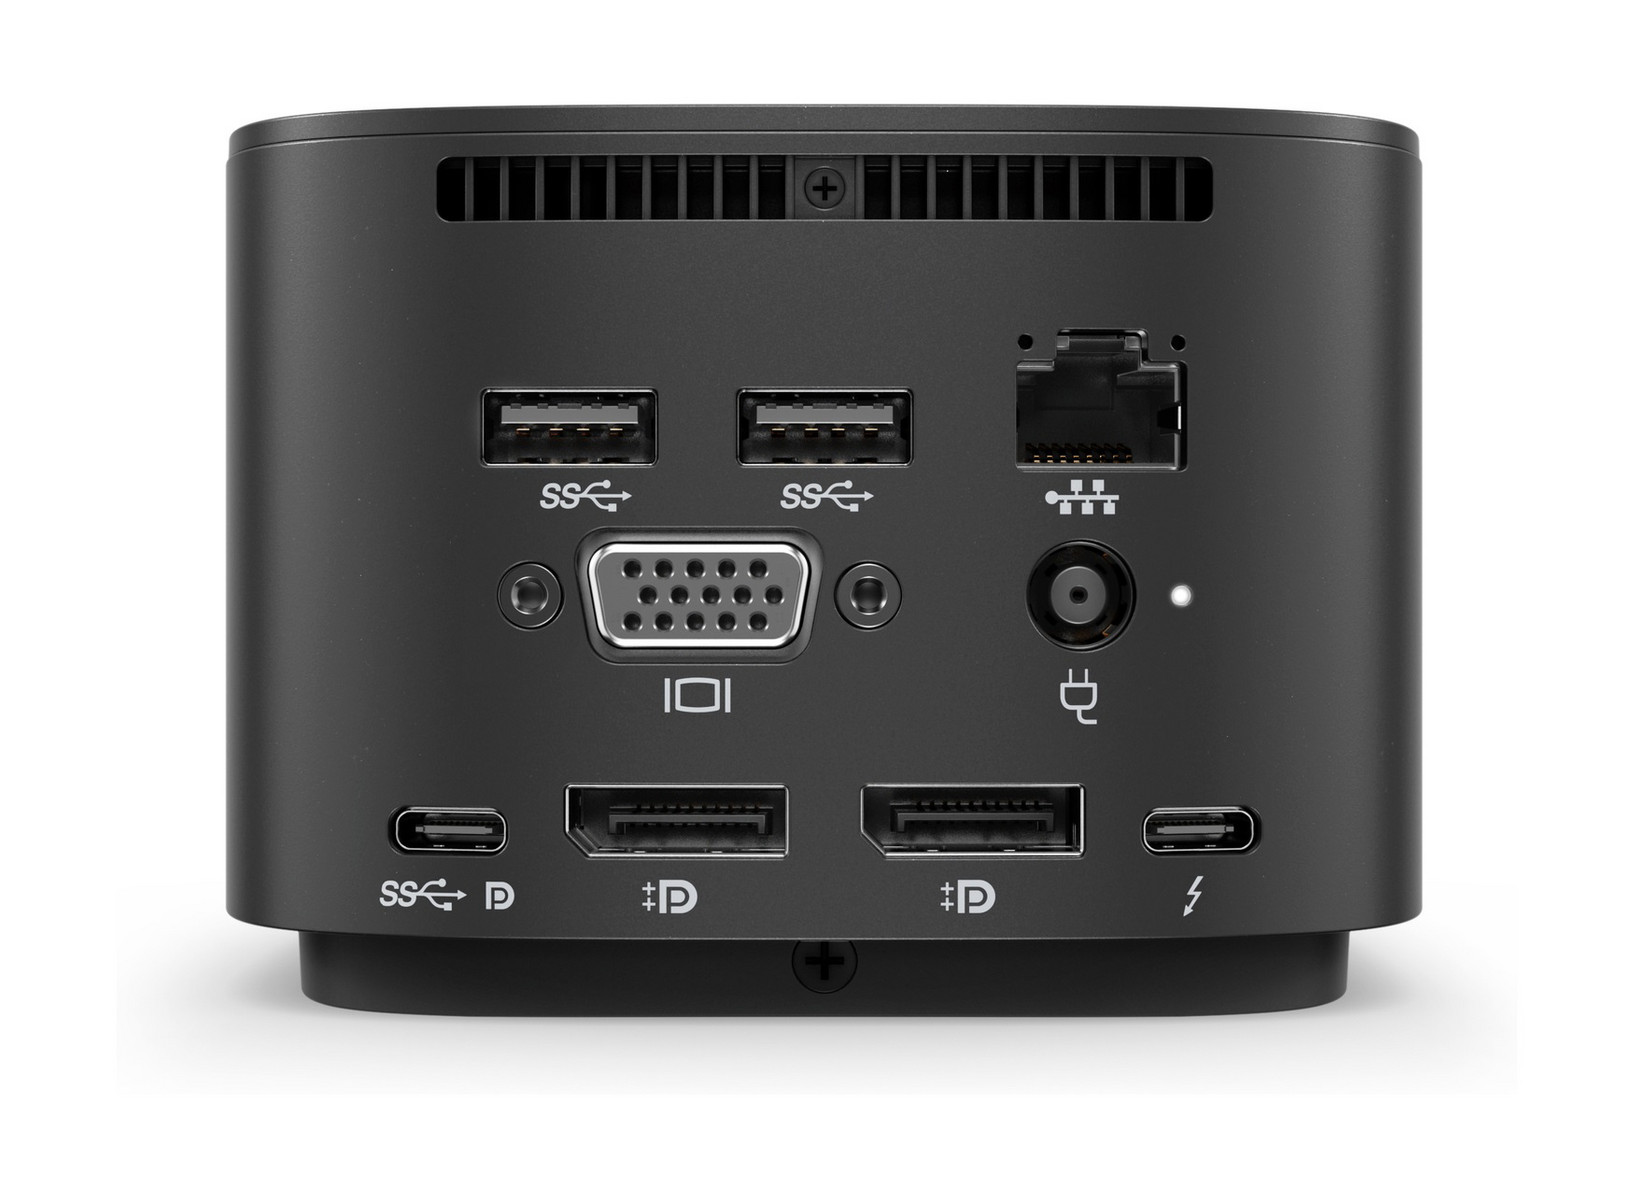
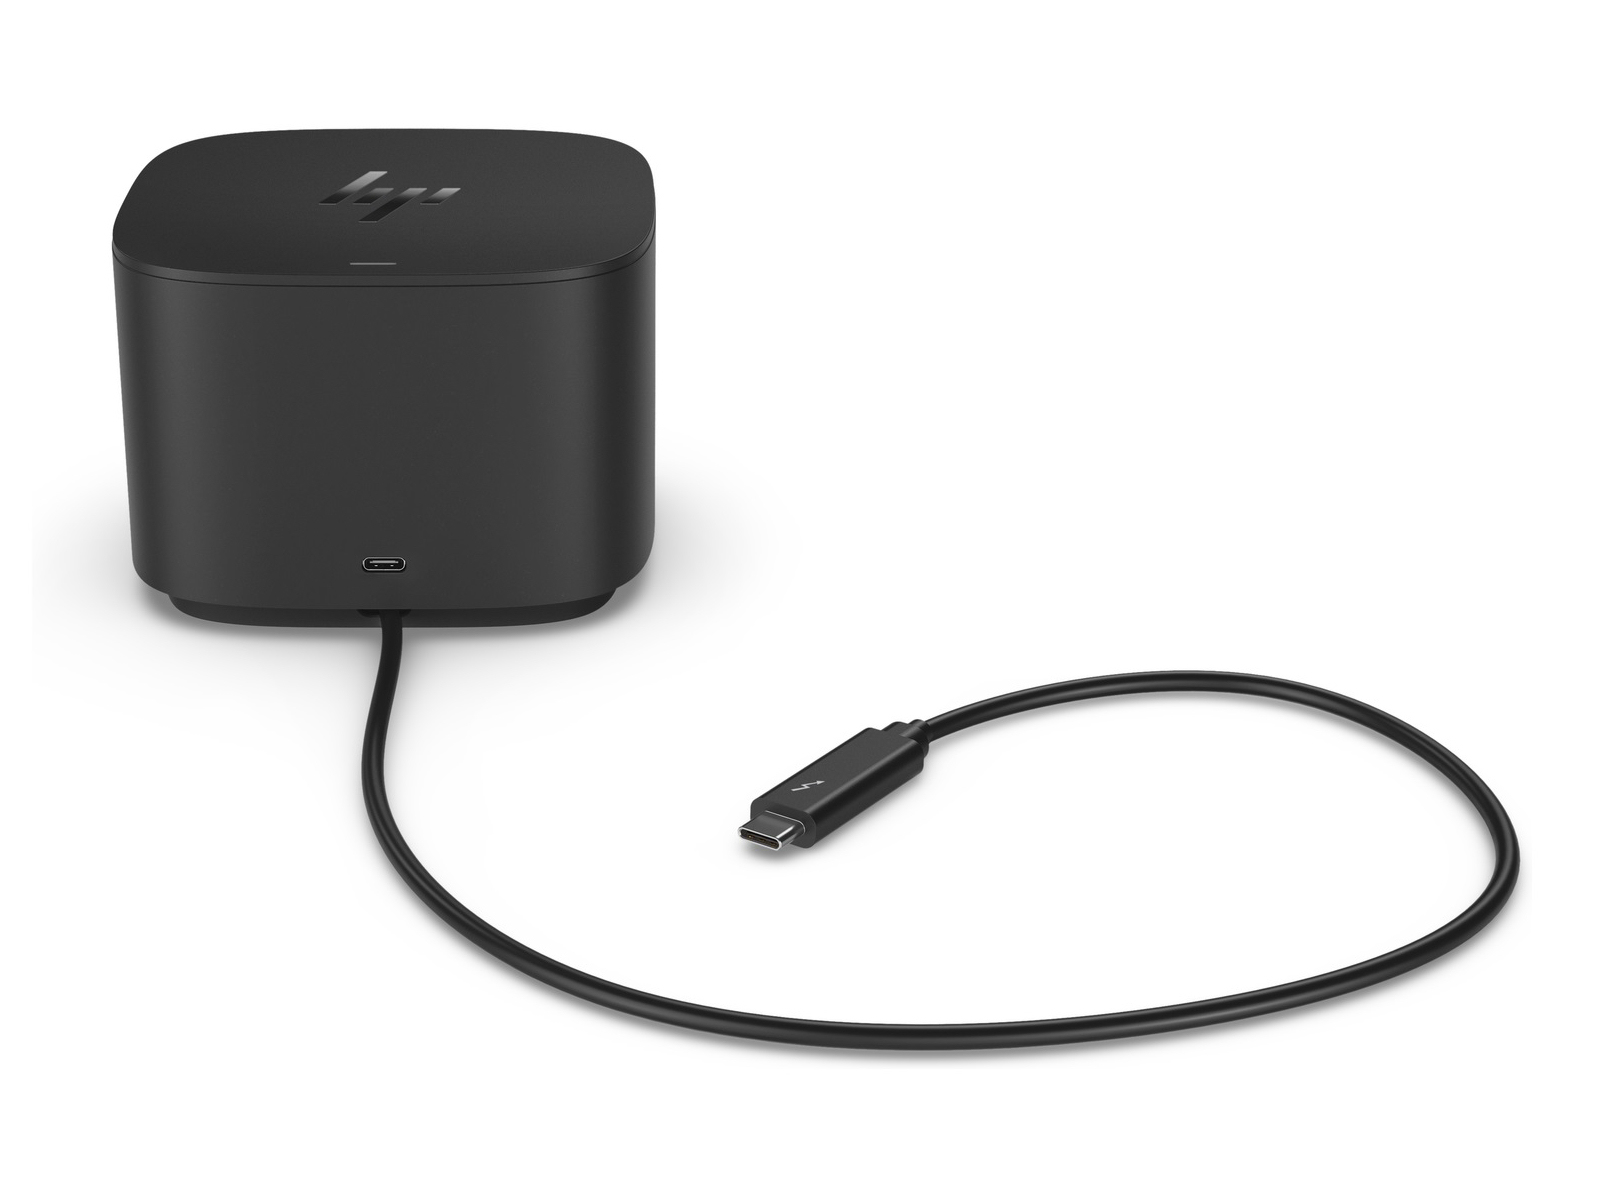
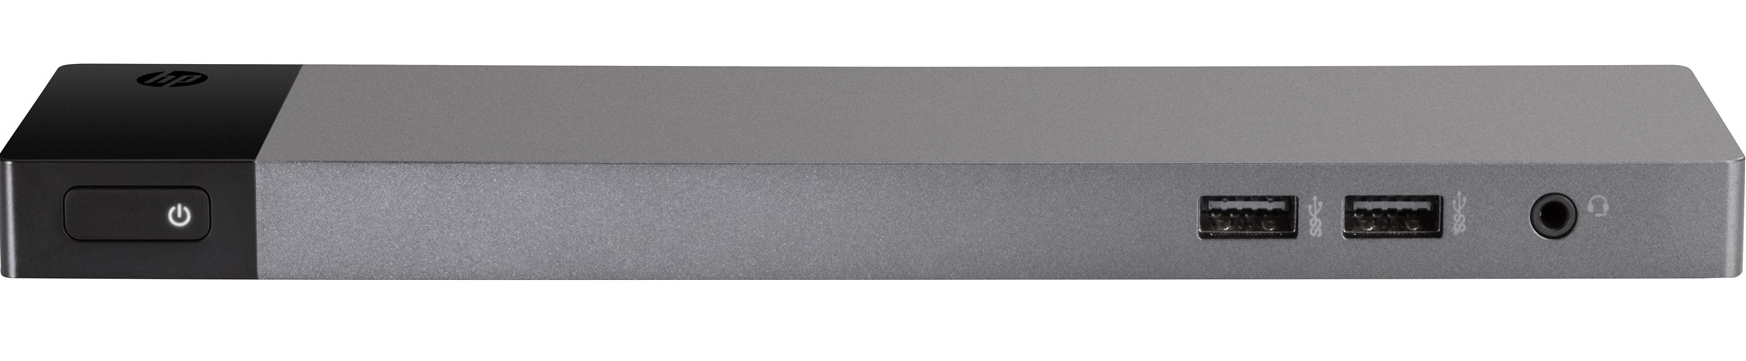
Accessories
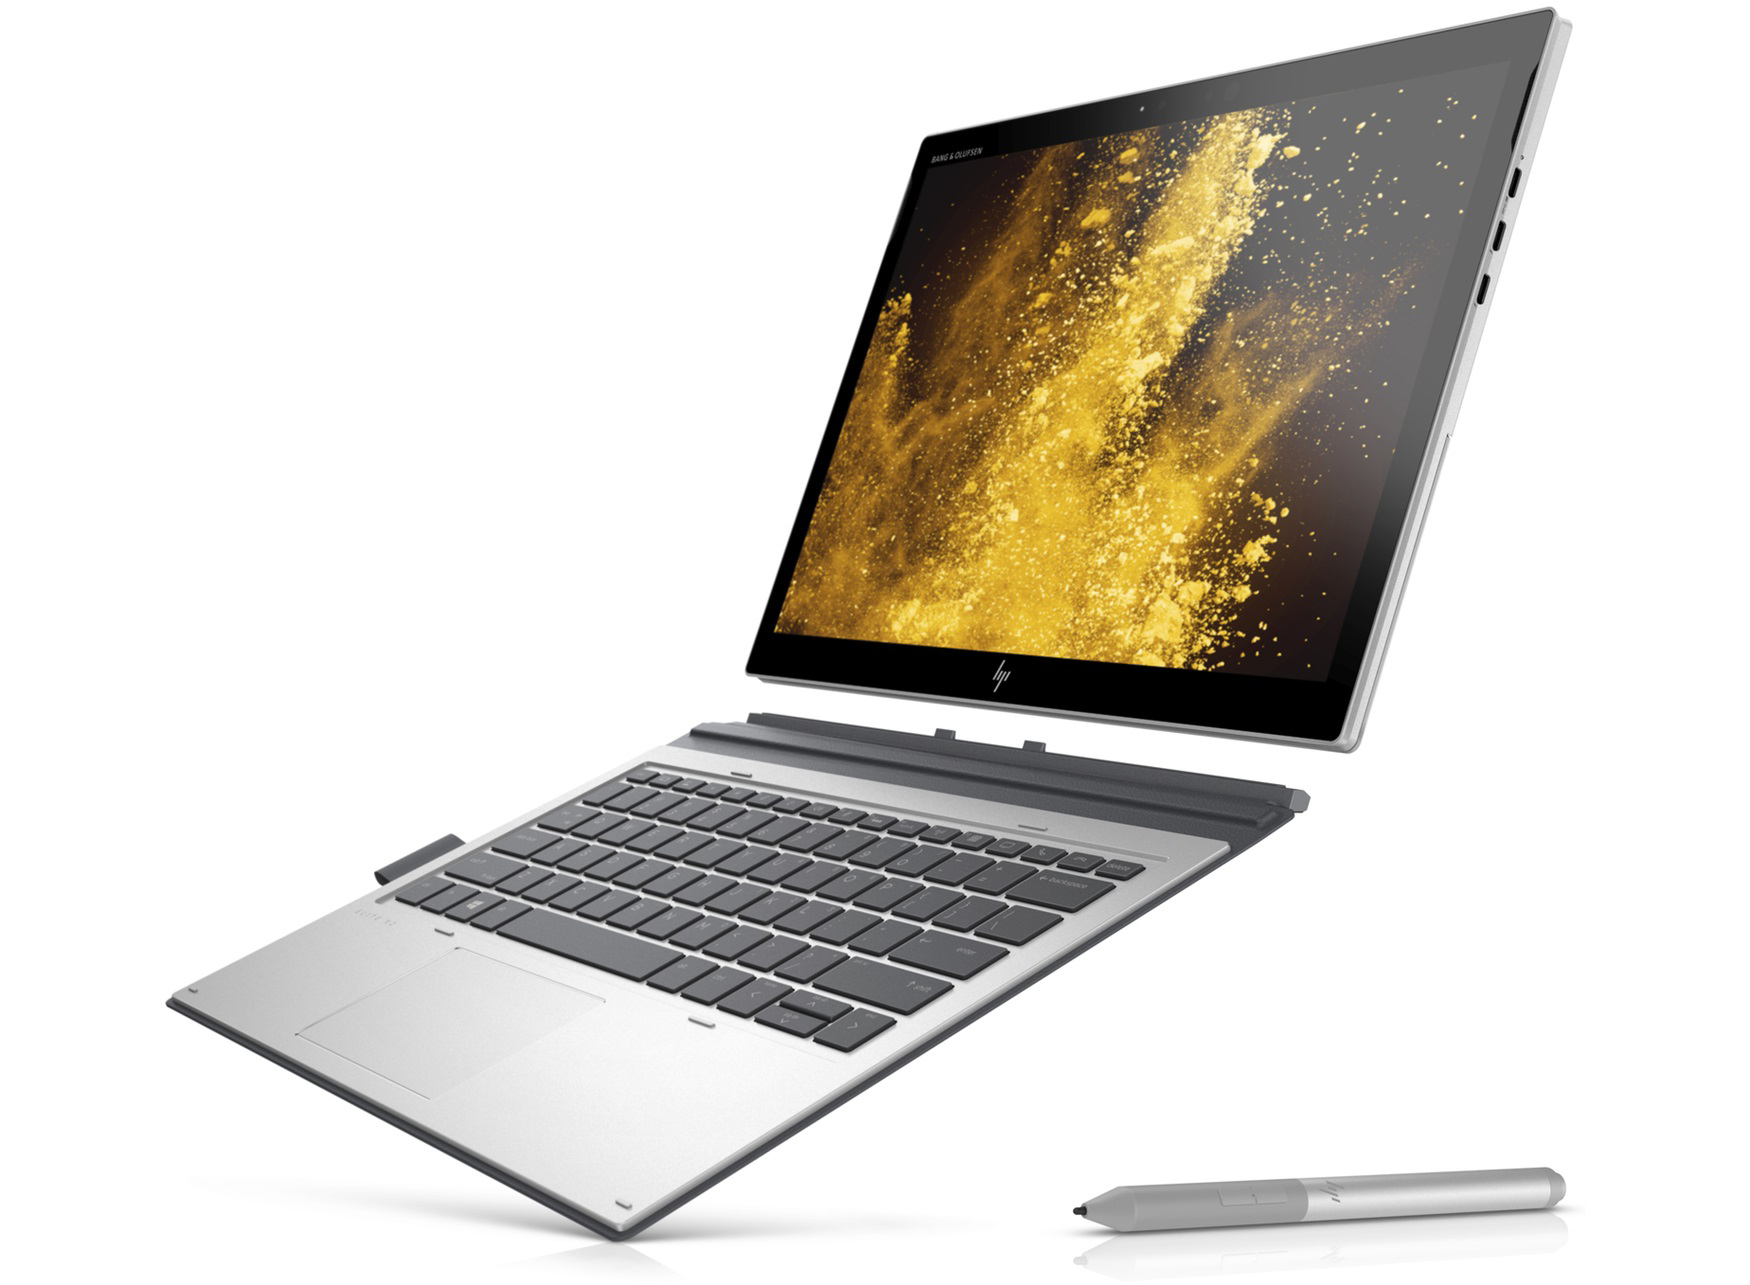
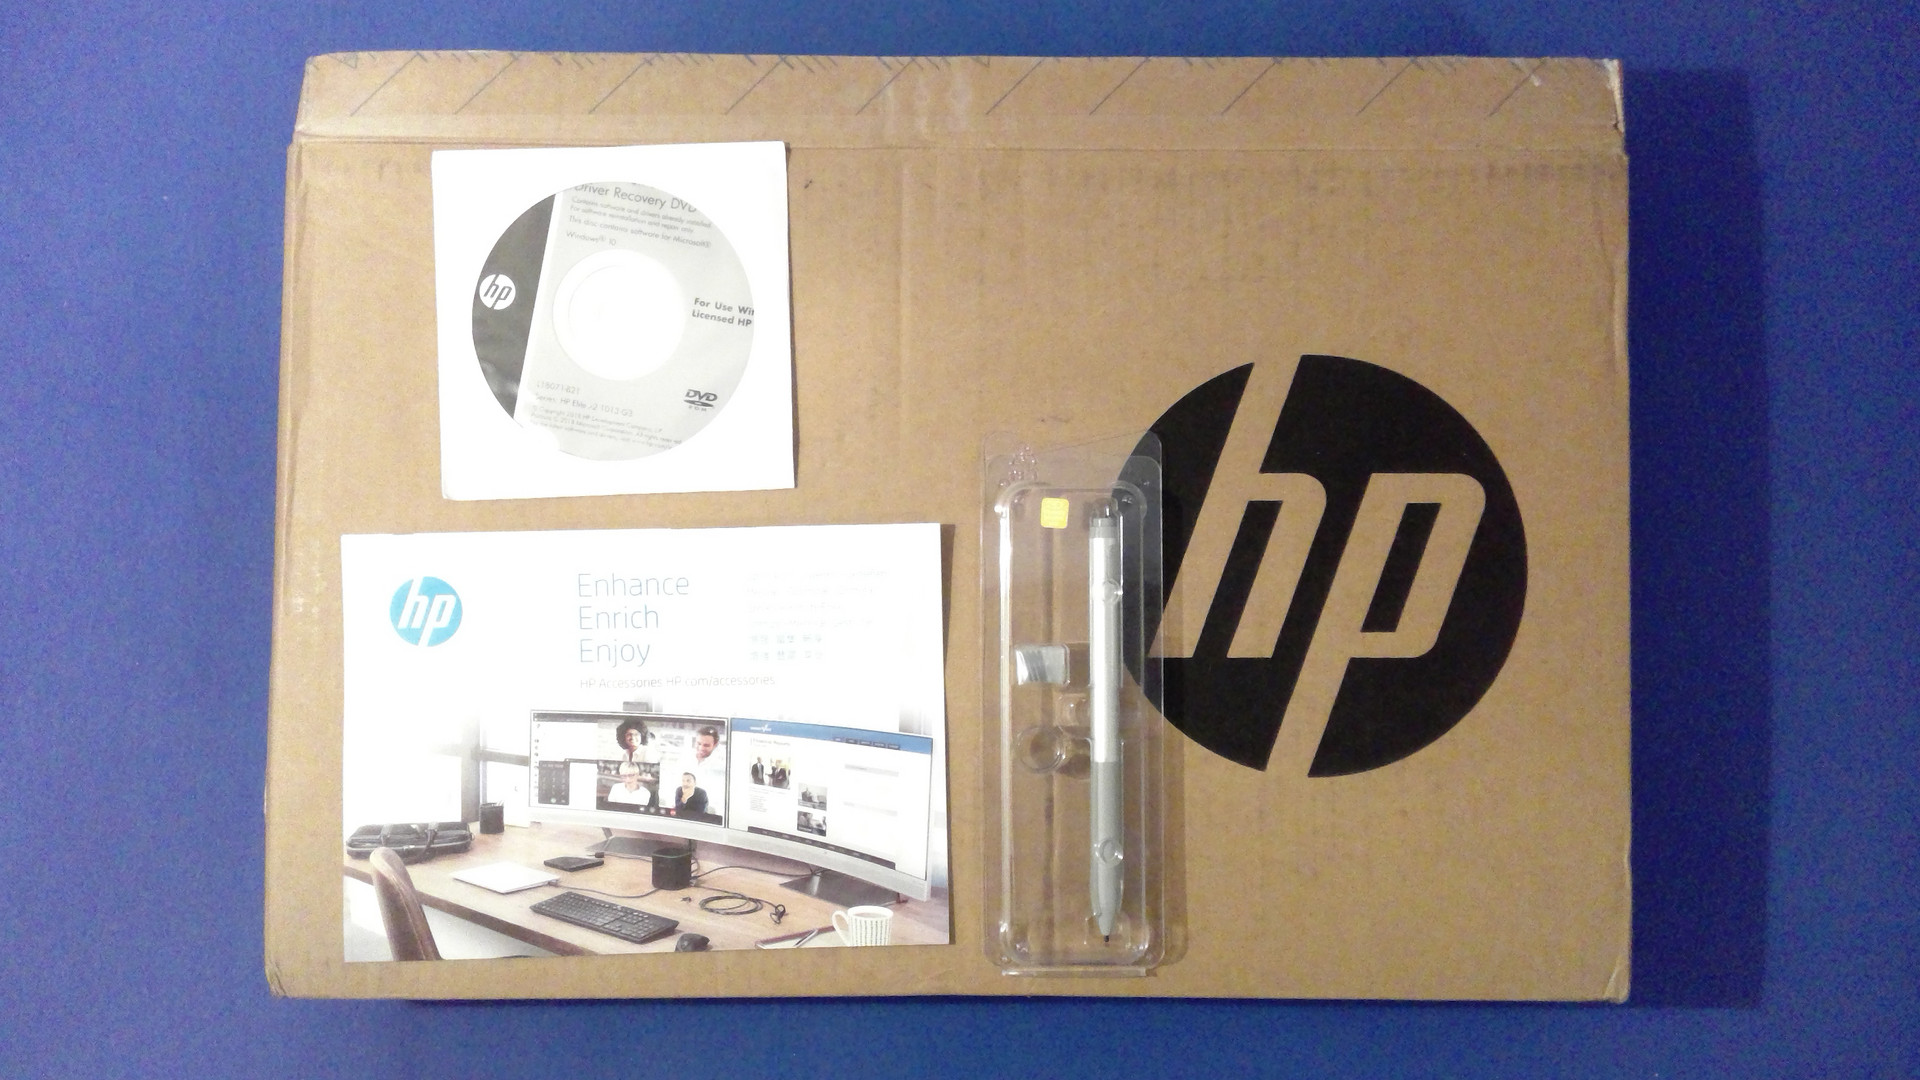
In addition to the usual (quick-start guide, warranty booklet) our review unit also came with an active stylus and a Windows 10 Pro DVD. Additional accessories, such as the two Thunderbolt 3 docking stations, can be purchased separately. The HP Elite Thunderbolt 3 Dock (90 W) and the HP Thunderbolt Dock 120 W G2 will each set you back around $150.
Maintenance
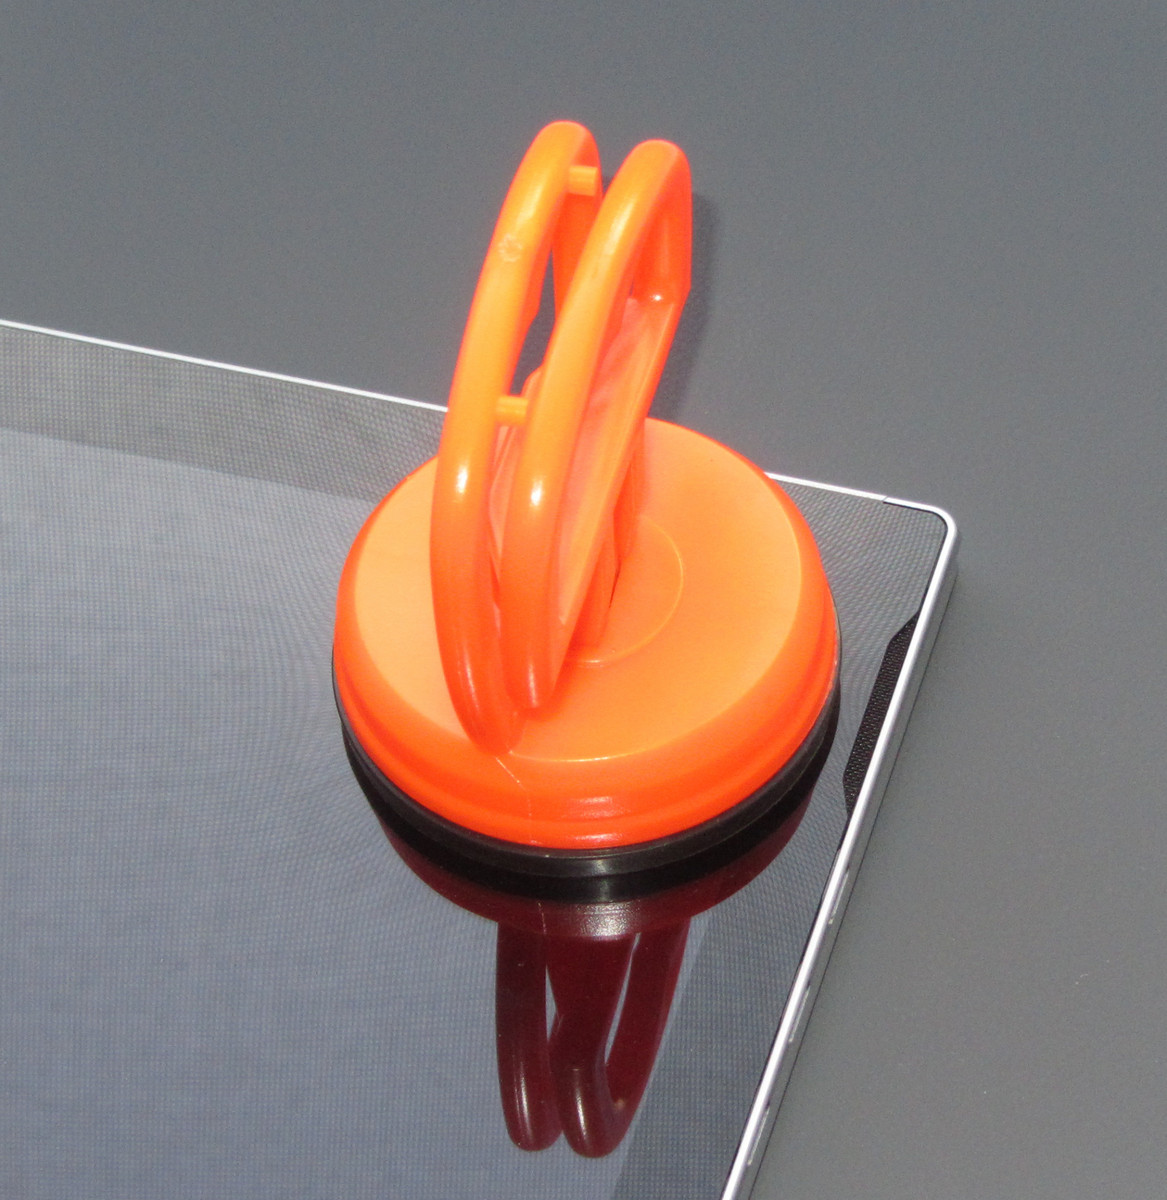
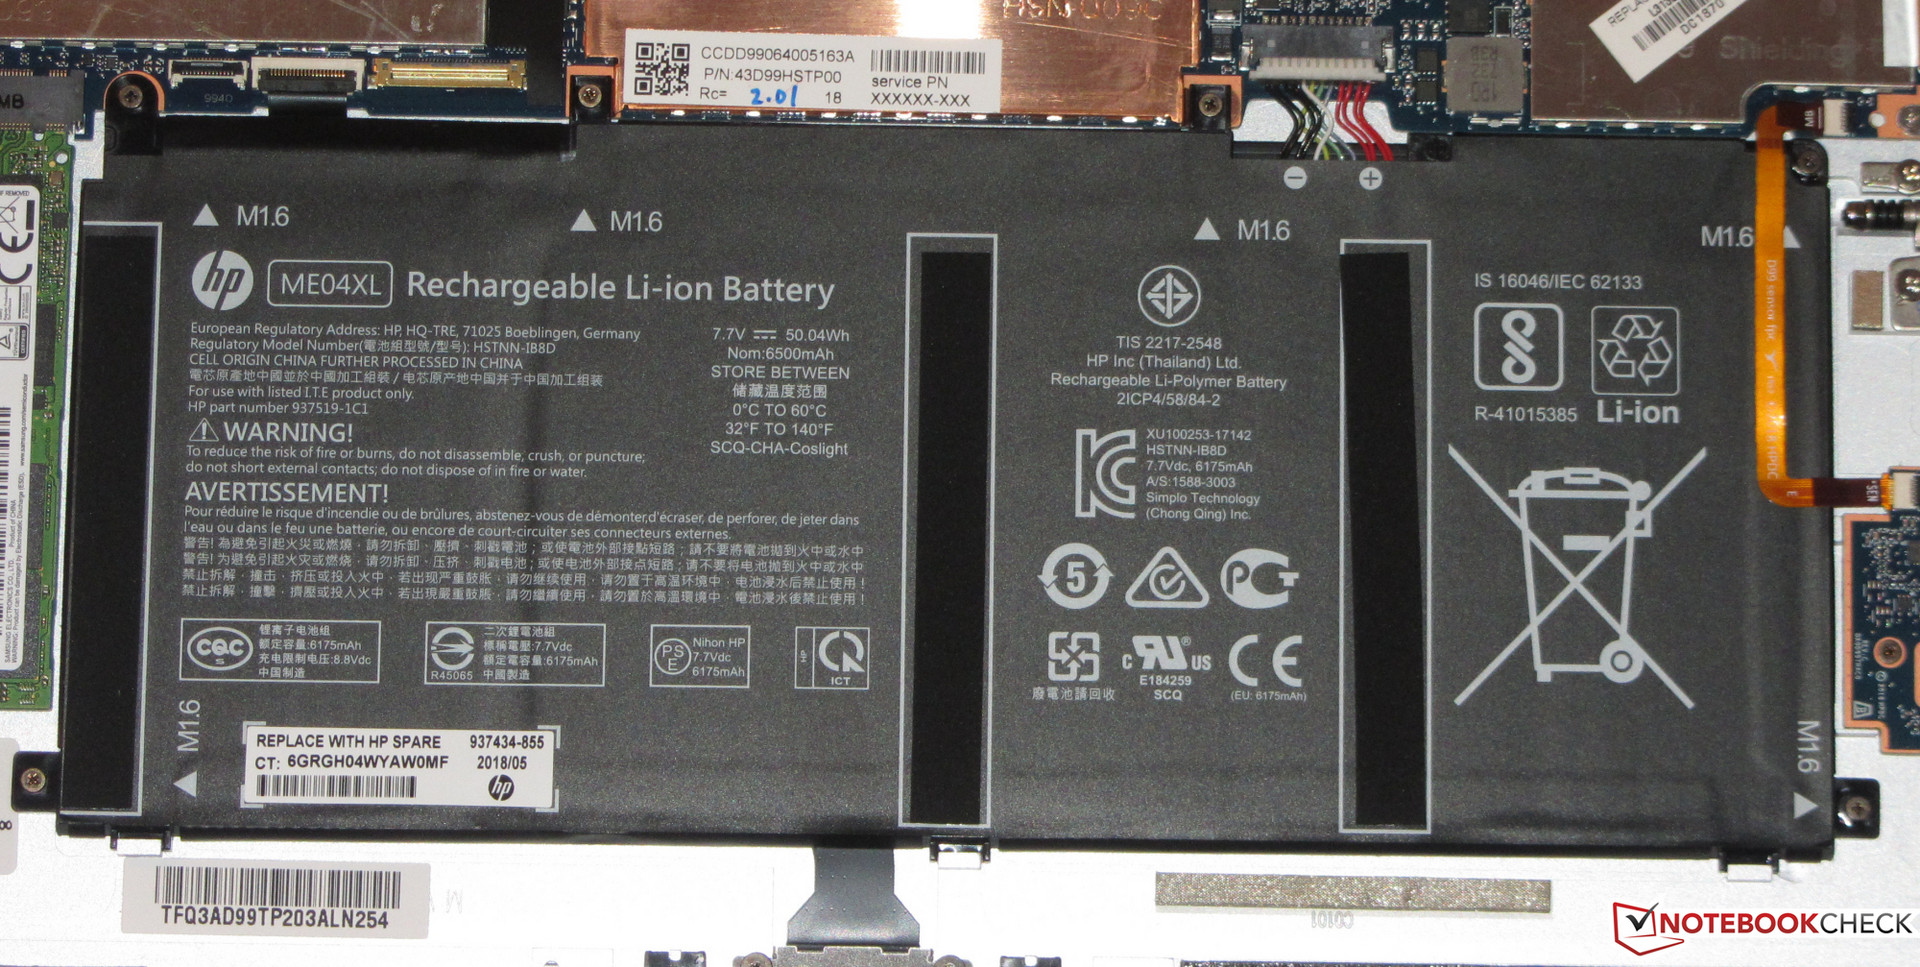
The device must be opened in order to perform any sort of maintenance. More specifically, the display must be removed. This turned out to be fairly simple if you have the right tools. Most important helper: a simple suction cup.
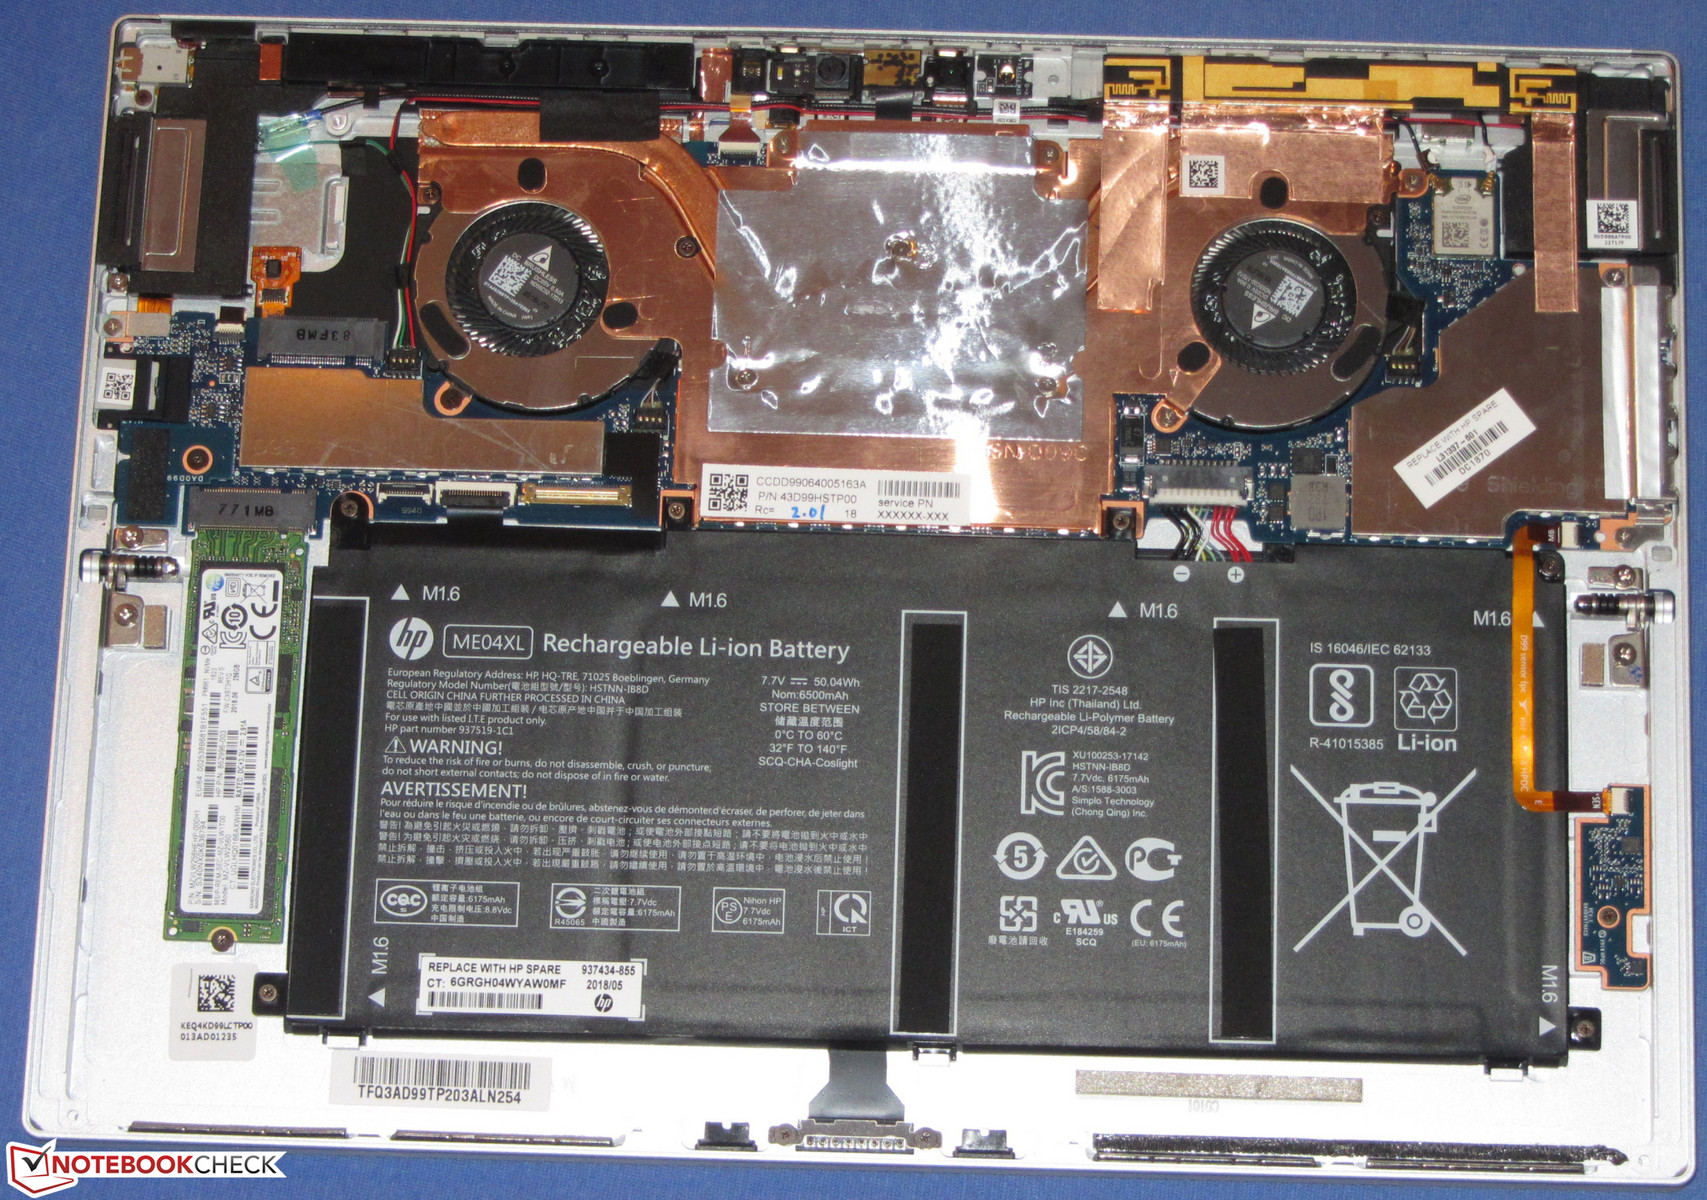
First, the stand needs to be flipped back. The four Torx screws underneath need to be removed next. Then, the tablet has to be propped up and the suction cup attached to the top right corner of the display. The display can now be carefully removed. You need to be very careful. The display is connected to the motherboard with two ribbon cables and can be easily damaged in the process. After the cables have been removed the display can be set aside. The internal hardware is now readily accessible.
Warranty
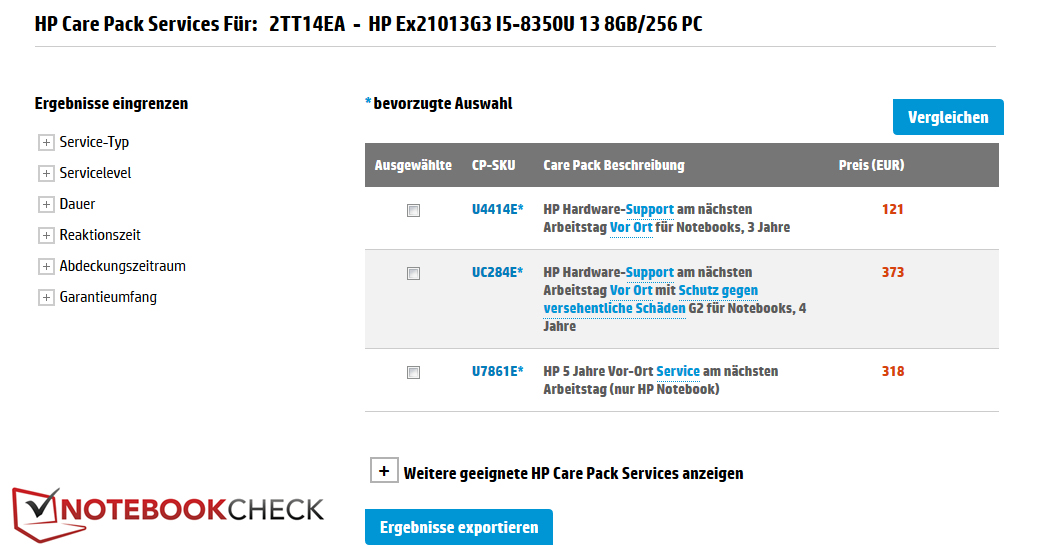
By default, the Elite x2 ships with a three-year limited warranty on parts and labor, which can be extended if so desired. At the time of writing $270 will get you a five-year NBD on-site warranty. Please see our Guarantees, Return policies and Warranties FAQ for country-specific information.
Input Devices
Keyboard
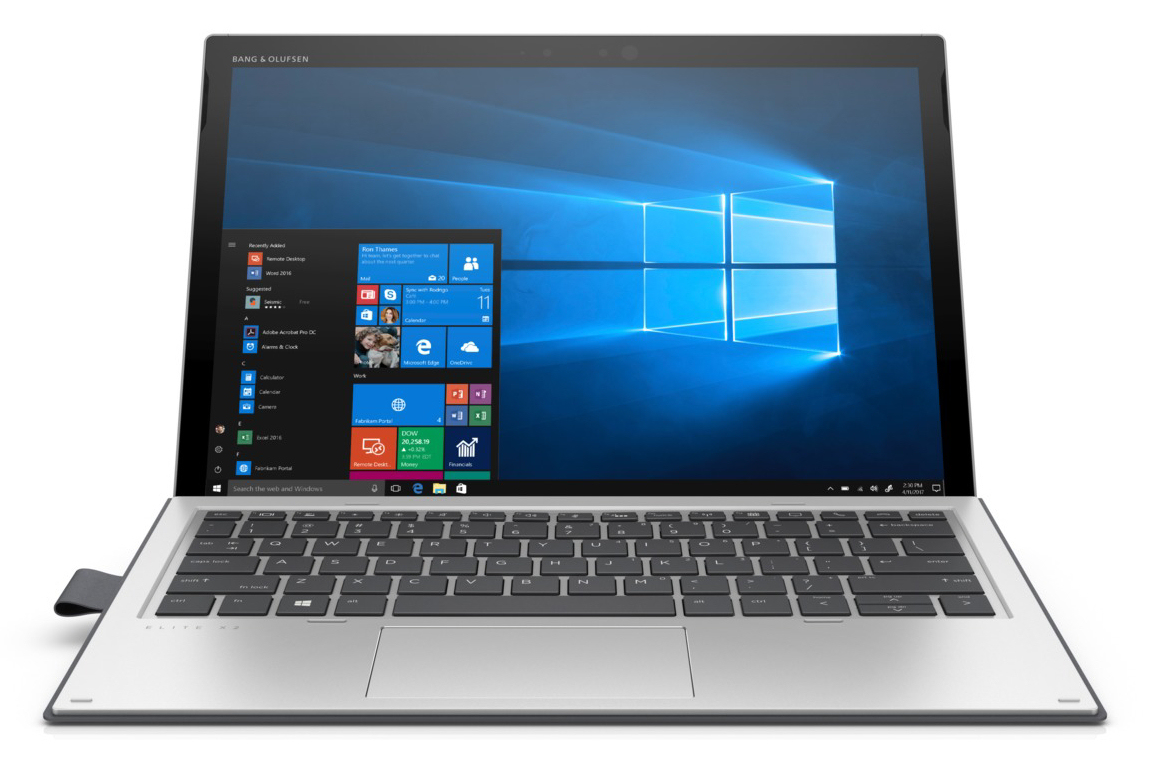
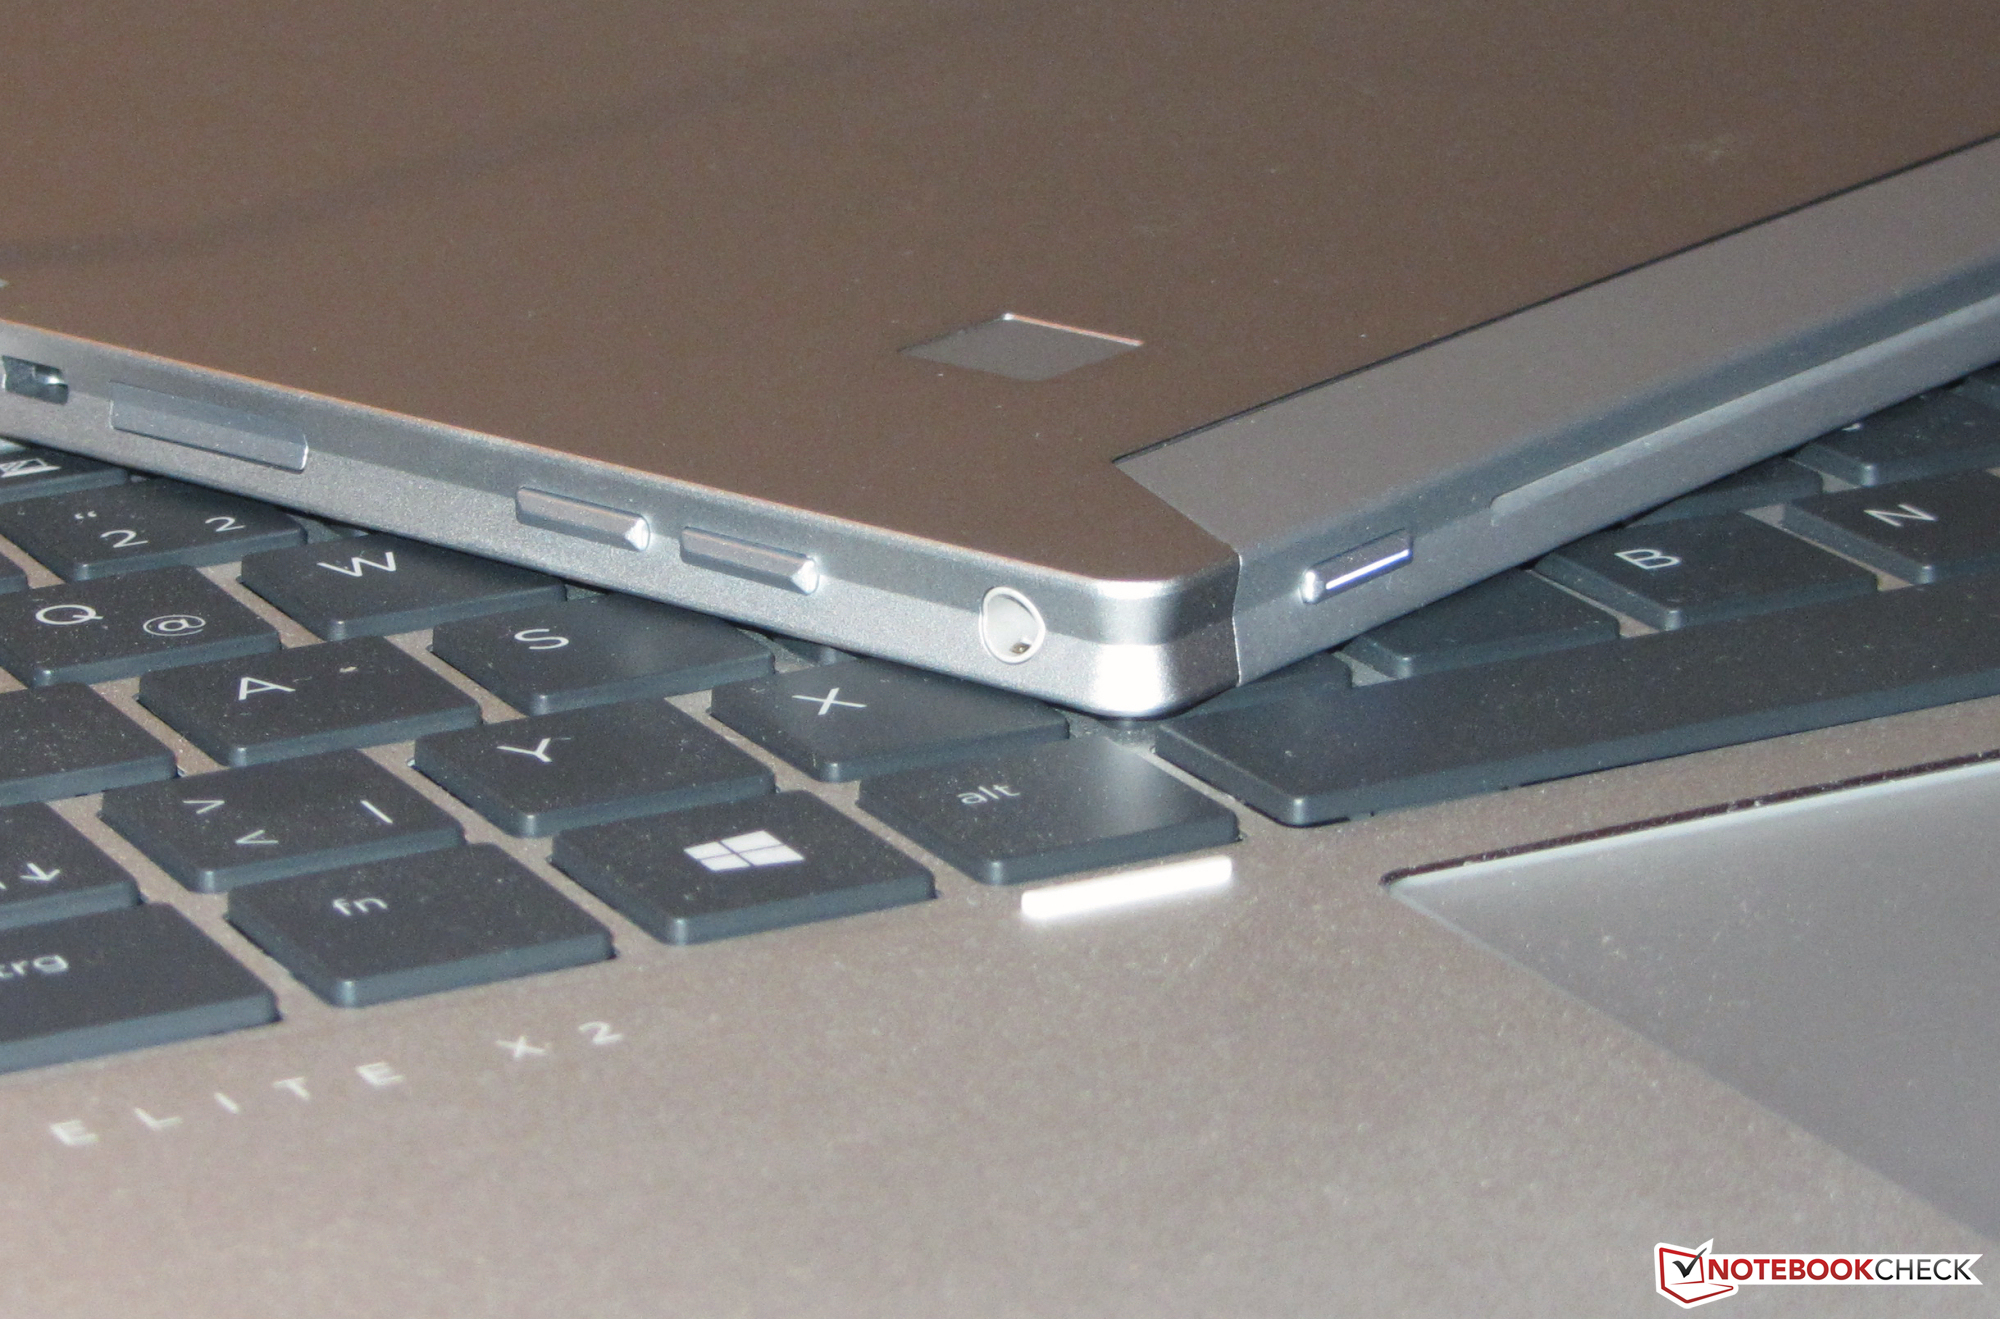
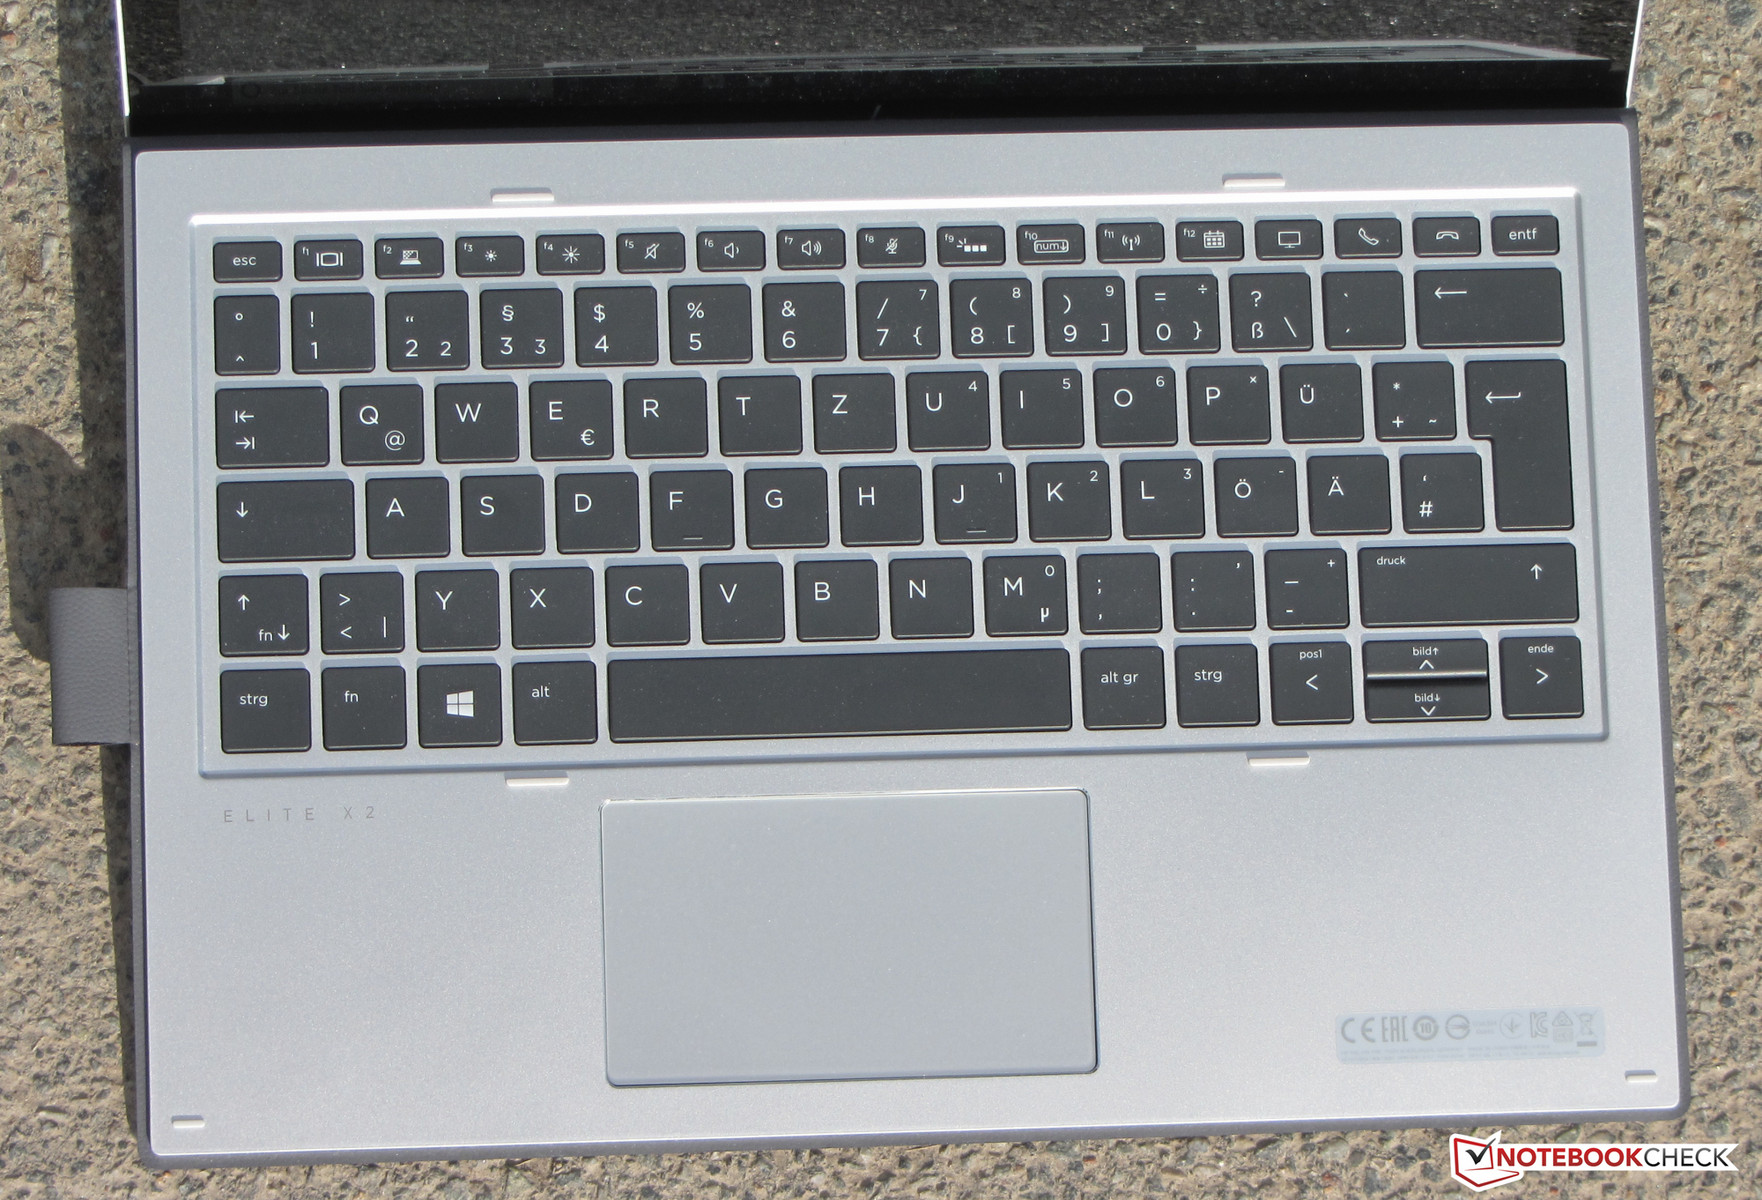
Our review unit was equipped with HP’s detachable keyboard. The connection between the tablet and its keyboard dock is magnetic, and the keyboard can be attached in two positions: flat down on the table or angled upwards towards the user. As before, the keyboard’s top case is made of a single piece of metal while the bottom shell is made of plastic. The shallow and smooth key caps featured a pretty short travel with a very distinct feedback. We liked the accentuation point. A two stage backlight controlled via a function key is also included. All things considered, the keyboard was suitable for everyday use.
Touchpad
The multitouch-capable ClickPad measured around 9.4 x 5.5 cm (3.7 x 2.2 inches). It was large enough for gesture input. Its smooth surface was a pleasure to use. It worked very well right up to its edges. Its button travel was very short and offered a considerably audible and palpable accentuation point.
Touchscreen
The touchscreen supports finger input as well as the included ActivePen stylus. The display is 10-point multitouch-capable and responded very quickly to our inputs. It did not cause any problems.
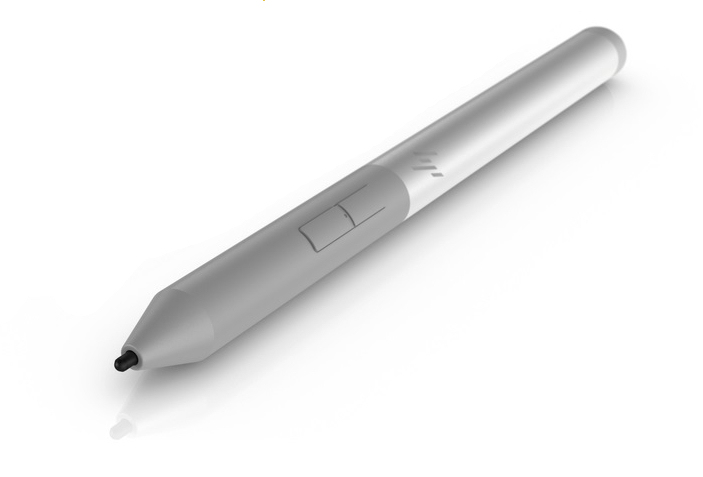
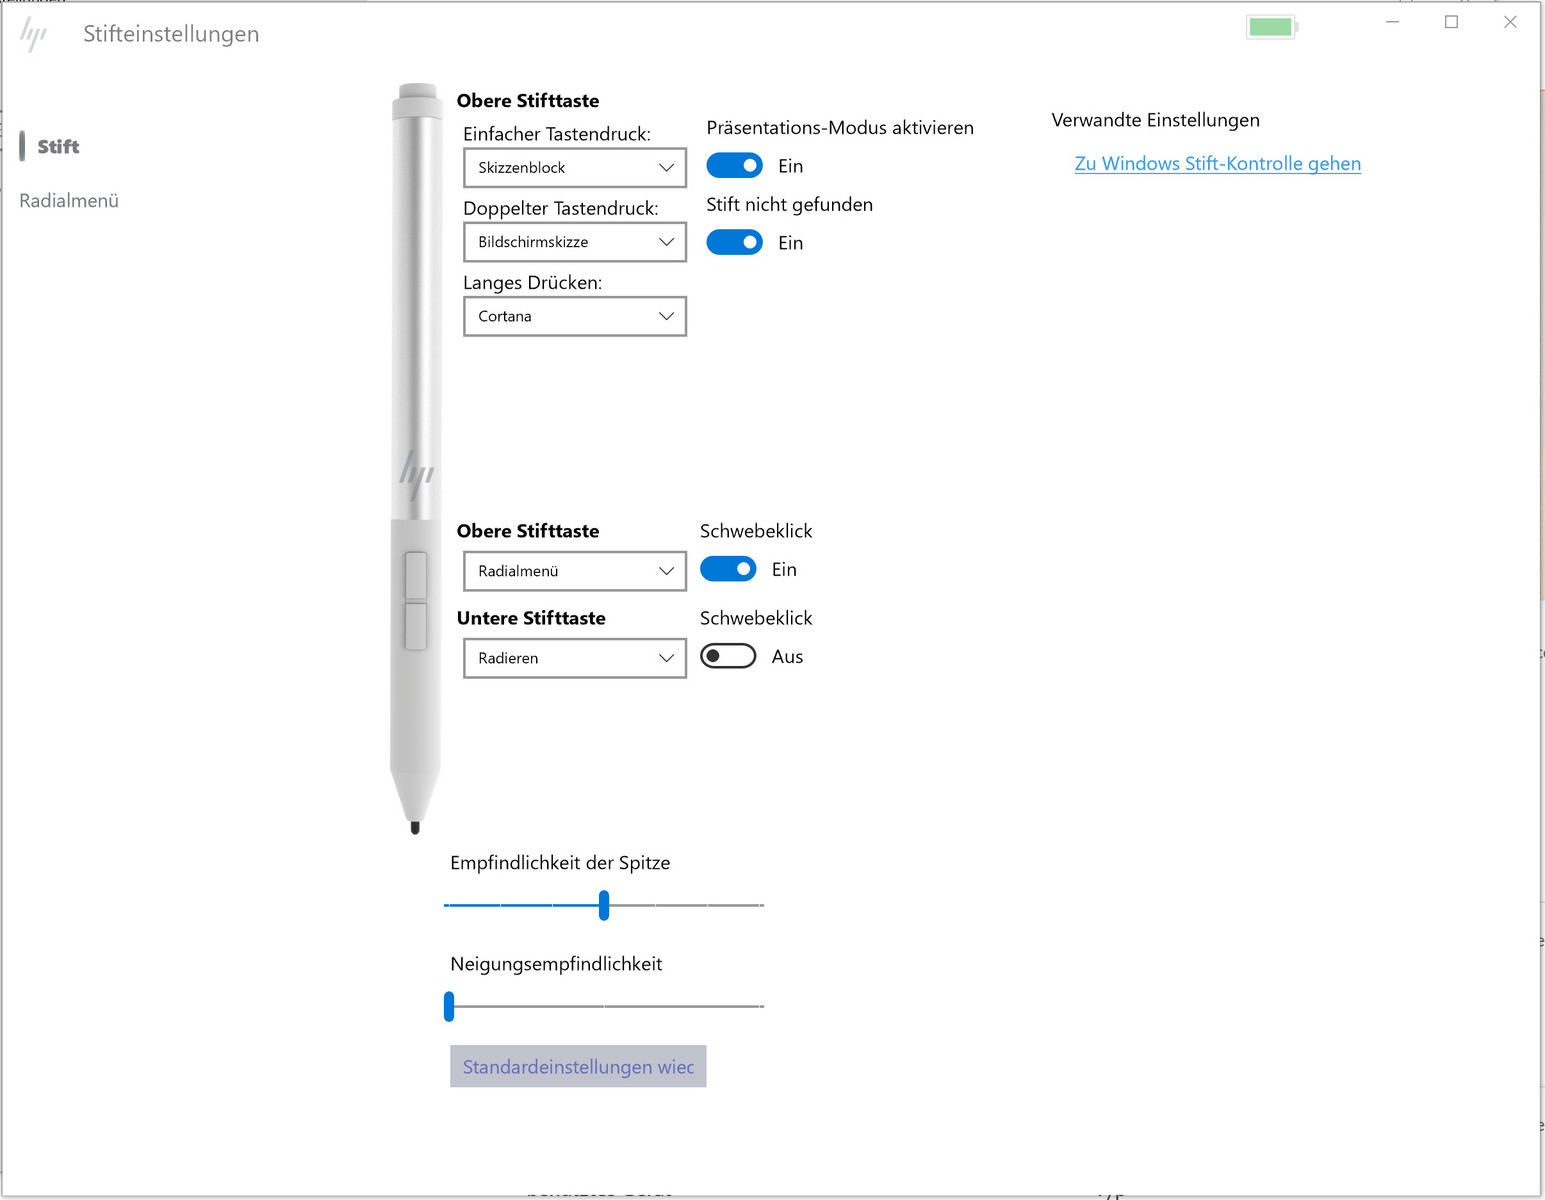
According to HP, the stylus supports up to 4,096 pressure points. It was very lightweight (15 g) and comfortable to hold. Handwriting and drawing worked flawlessly and quickly. The pen has a total of three buttons: two at the bottom and one at the top. All three can be individually configured. The stylus is connected to the tablet via Bluetooth.
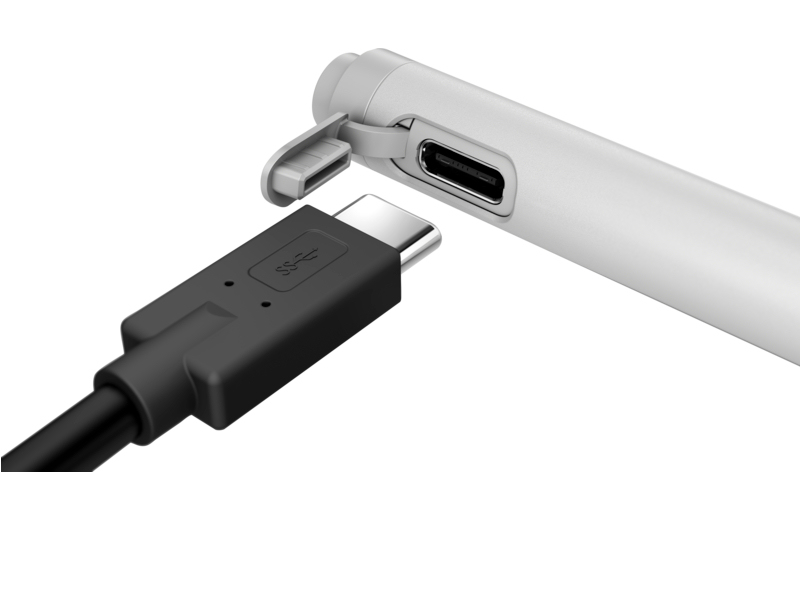
The pen’s battery is not user-replaceable and is charged via a USB-C port. In other words: the Elite x2’s included power supply can be used for the stylus as well. According to HP the pen should charge from near empty to full in 30 minutes. We can confirm this claim. The pen’s battery charge level is displayed in the configuration utility.
Display
HP has not just increased the display’s size; the company has also increased the resolution from the previous 12.3-inch display’s 2716x1824 to 3000x2000 now. Brightness (411.8 nits) and contrast ratio (942:1) were very decent. However, considering the Elite x2’s high price, the contrast ratio could have been better. We would have preferred a measurement in the magnitude north of 1,000:1. In terms of brightness, Microsoft’s 2017 Surface Pro devices were pretty much on a par with the HP Elite x2. They offered a higher contrast ratio. The Dell Latitude 12 5285 was much brighter than the entire competition. Positive side note: We found no evidence of PWM.
Alternatively, the Elite x2 can also be ordered with a WUXGA+ panel (1920x1280) with support for HP’s SureView technology that prevents bystanders from reading the display from the side. This feature can be enabled with the push of a button. To find out more about SureView and see this effect in action, take a look at our HP EliteBook 850 G5 review.

| |||||||||||||||||||||||||
Brightness Distribution: 85 %
Center on Battery: 456 cd/m²
Contrast: 942:1 (Black: 0.48 cd/m²)
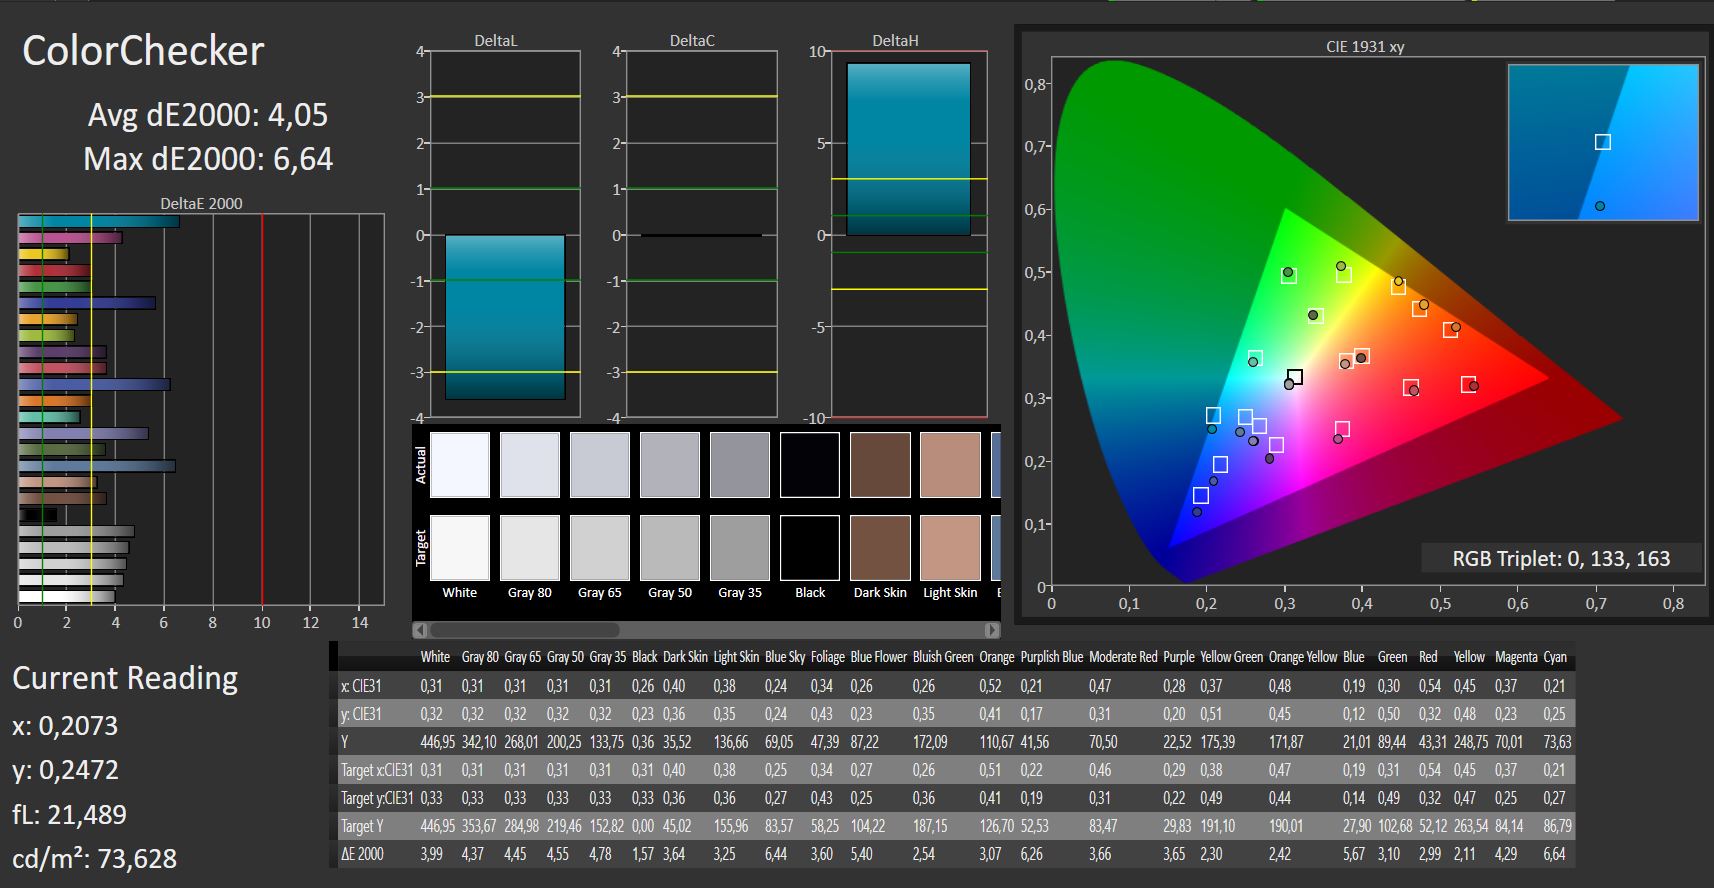
ΔE ColorChecker Calman: 4.05 | ∀{0.5-29.43 Ø4.71}
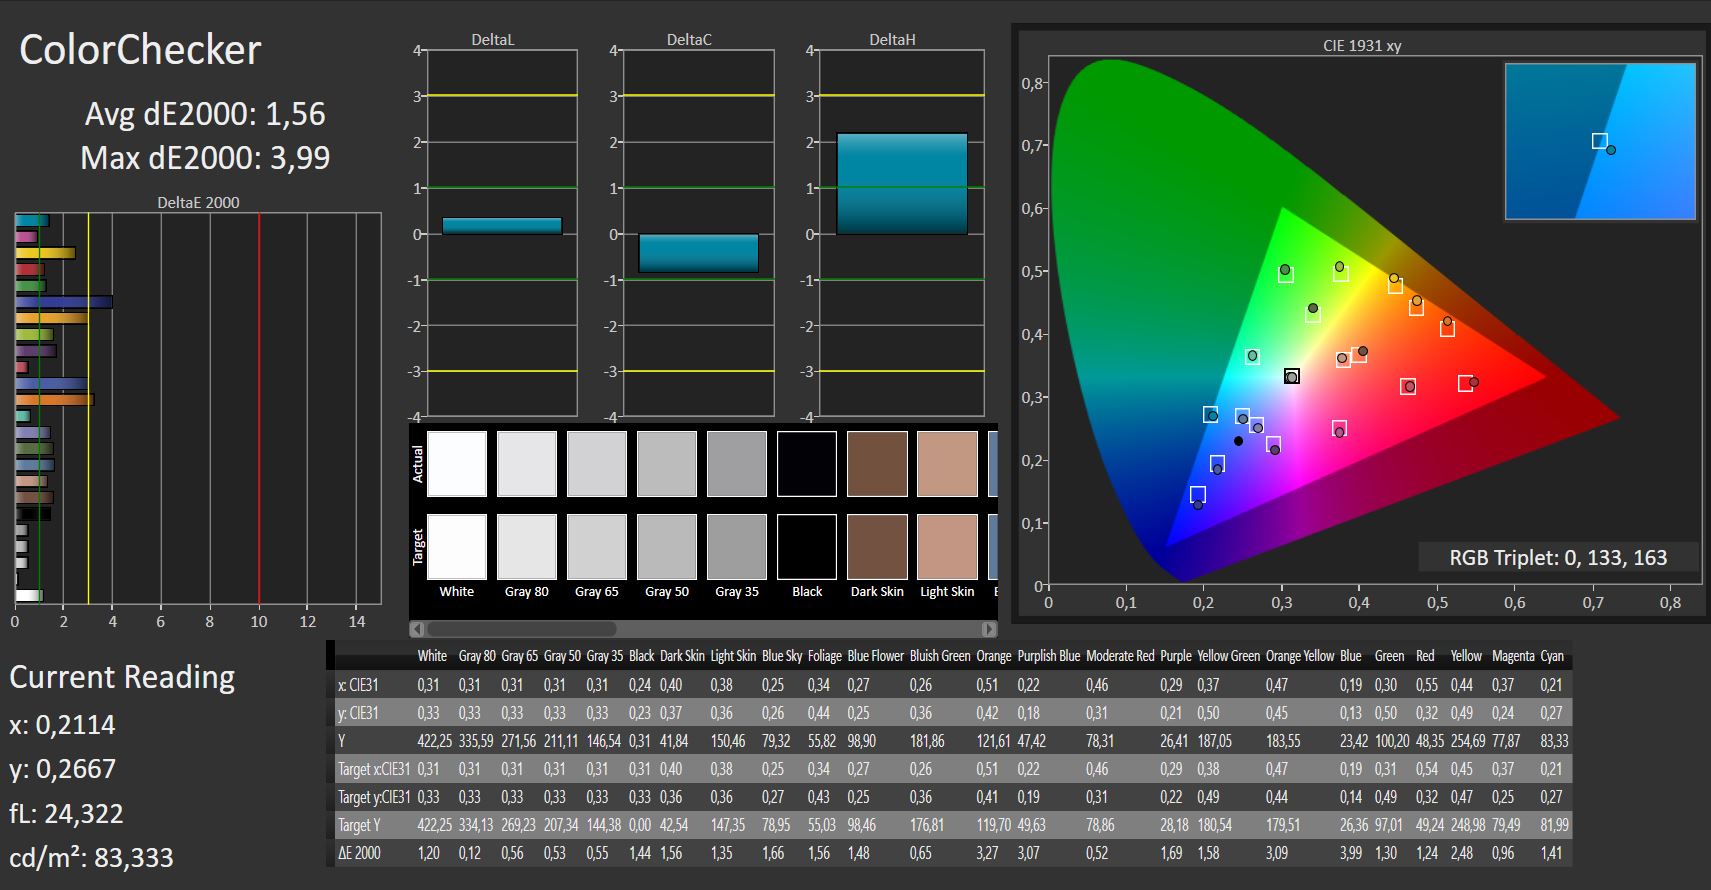
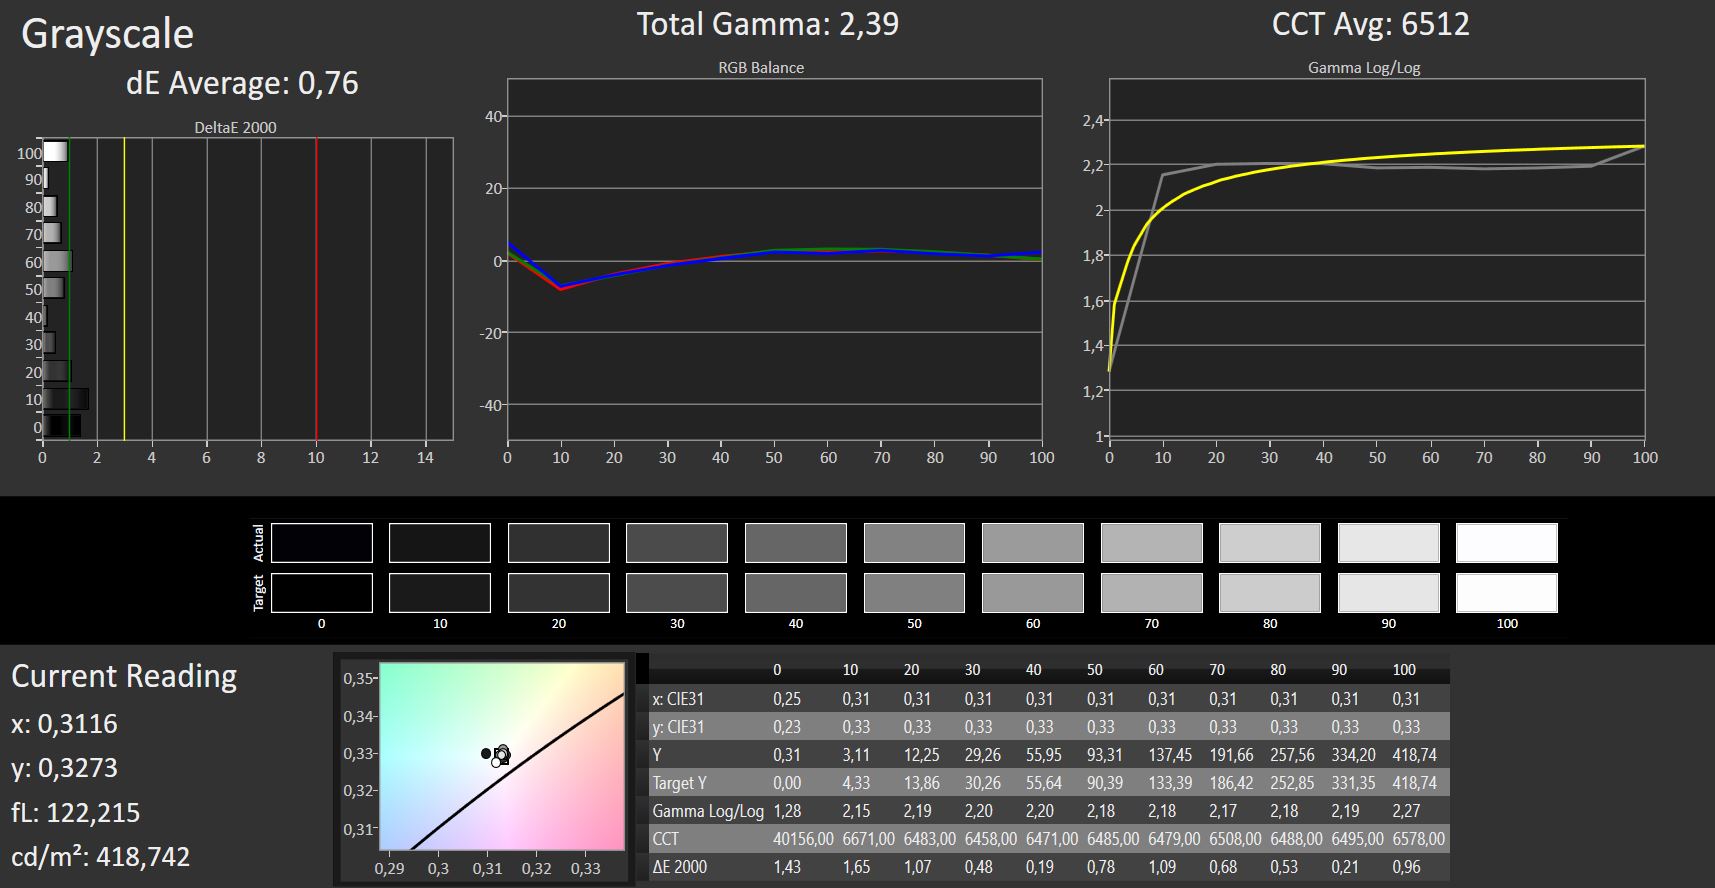
calibrated: 1.56
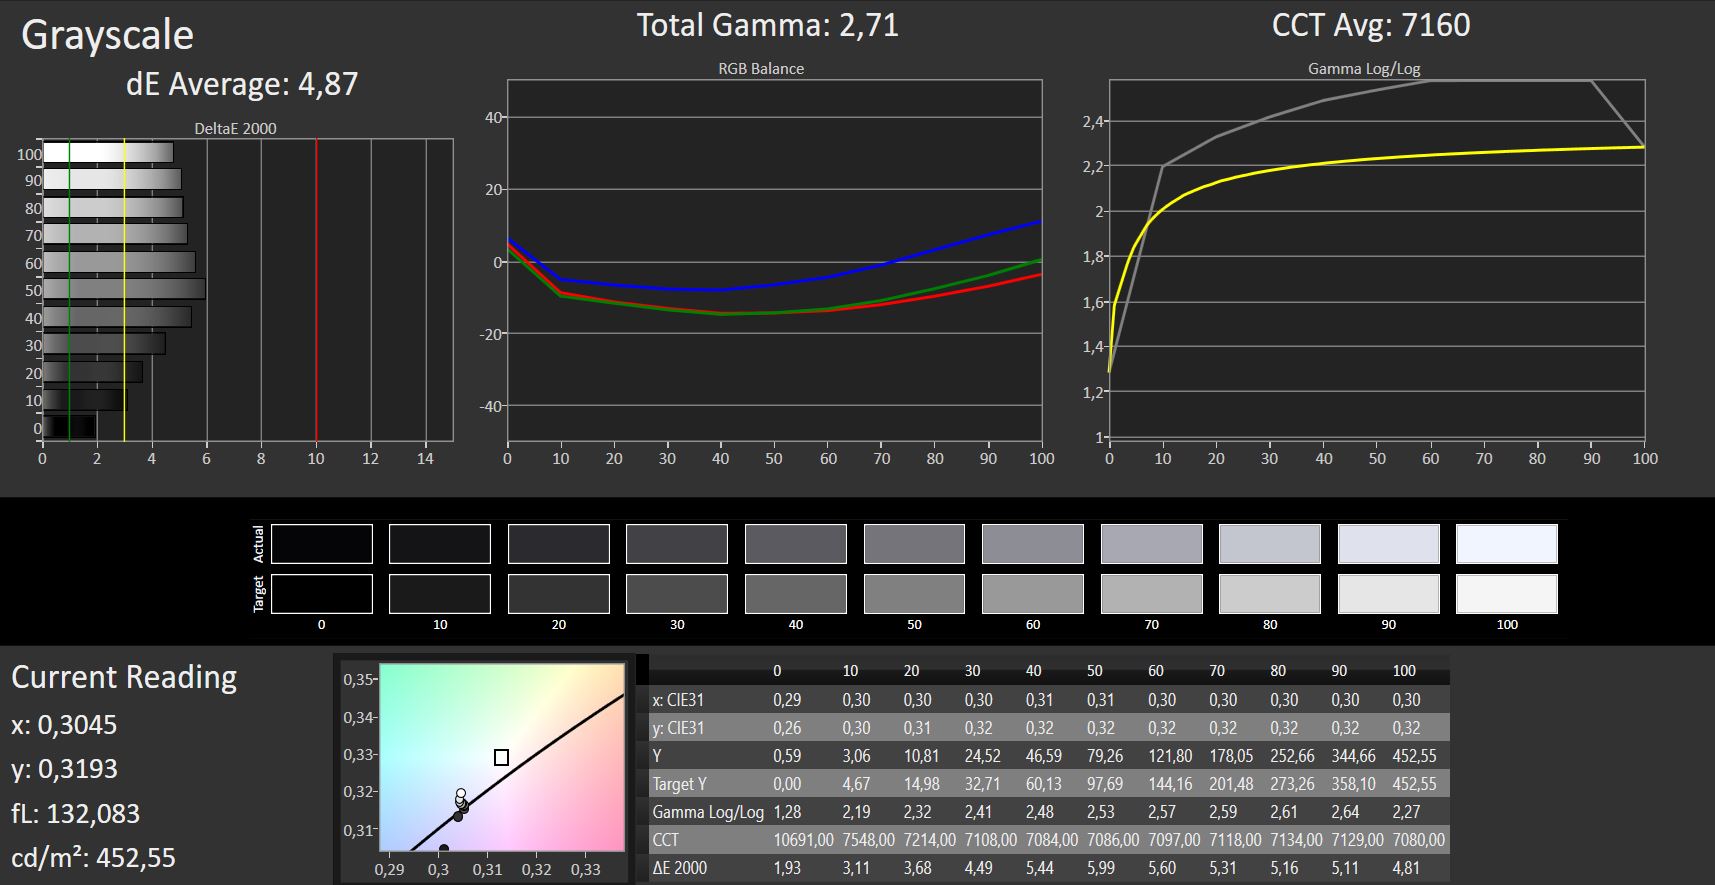
ΔE Greyscale Calman: 4.87 | ∀{0.09-98 Ø4.96}
97% sRGB (Argyll 1.6.3 3D)
62% AdobeRGB 1998 (Argyll 1.6.3 3D)
68.2% AdobeRGB 1998 (Argyll 3D)
96.7% sRGB (Argyll 3D)
67.5% Display P3 (Argyll 3D)
Gamma: 2.71
CCT: 7160 K
| HP Elite x2 1013 G3-2TT14EA IPS, 3000x2000, 13" | HP Elite x2 1012 G2-1LV76EA IPS, 2716x1824, 12.3" | Lenovo Miix 520-12IKB 20M3000LGE IPS, 1920x1200, 12.2" | Dell Latitude 12 5285 2-in-1 IPS, 1920x1280, 12.3" | Asus Transformer 4 Pro (i7-7500U, HD620) IPS, 2160x1440, 12.6" | Microsoft Surface Pro (2017) i7 IPS, 2736x1824, 12.3" | Microsoft Surface Pro (2017) i5 IPS, 2736x1824, 12.3" | |
|---|---|---|---|---|---|---|---|
| Display | 0% | -3% | -5% | -2% | -1% | 1% | |
| Display P3 Coverage (%) | 67.5 | 66.7 -1% | 66.1 -2% | 62.8 -7% | 69.6 3% | 66.6 -1% | 67.6 0% |
| sRGB Coverage (%) | 96.7 | 98 1% | 91.6 -5% | 94 -3% | 90 -7% | 96.5 0% | 99 2% |
| AdobeRGB 1998 Coverage (%) | 68.2 | 68.7 1% | 66.7 -2% | 64.7 -5% | 65.9 -3% | 67.8 -1% | 69.1 1% |
| Response Times | 10% | 18% | -4% | 3% | 13% | -1% | |
| Response Time Grey 50% / Grey 80% * (ms) | 47 ? | 45.6 ? 3% | 36 ? 23% | 42.4 ? 10% | 41 ? 13% | 37 ? 21% | 42 ? 11% |
| Response Time Black / White * (ms) | 26 ? | 21.6 ? 17% | 23 ? 12% | 30.8 ? -18% | 28 ? -8% | 25 ? 4% | 29 ? -12% |
| PWM Frequency (Hz) | 2119 ? | 200 ? | 210.1 ? | 22130 ? | 21000 | ||
| Screen | 16% | -19% | 5% | 1% | 5% | 15% | |
| Brightness middle (cd/m²) | 452 | 443 -2% | 384 -15% | 523.2 16% | 262 -42% | 482 7% | 417 -8% |
| Brightness (cd/m²) | 412 | 446 8% | 355 -14% | 522 27% | 254 -38% | 466 13% | 401 -3% |
| Brightness Distribution (%) | 85 | 88 4% | 80 -6% | 88 4% | 89 5% | 92 8% | 88 4% |
| Black Level * (cd/m²) | 0.48 | 0.41 15% | 0.56 -17% | 0.42 12% | 0.26 46% | 0.395 18% | 0.29 40% |
| Contrast (:1) | 942 | 1080 15% | 686 -27% | 1246 32% | 1008 7% | 1220 30% | 1438 53% |
| Colorchecker dE 2000 * | 4.05 | 2.6 36% | 4.58 -13% | 4 1% | 3.34 18% | 4 1% | 3.63 10% |
| Colorchecker dE 2000 max. * | 6.64 | 4 40% | 11.63 -75% | 8.6 -30% | 7.12 -7% | 7.2 -8% | 6.74 -2% |
| Colorchecker dE 2000 calibrated * | 1.56 | ||||||
| Greyscale dE 2000 * | 4.87 | 3 38% | 5.63 -16% | 5.5 -13% | 3.28 33% | 5.7 -17% | 2.18 55% |
| Gamma | 2.71 81% | 2.38 92% | 2.45 90% | 2.16 102% | 2.47 89% | 2.28 96% | 3.09 71% |
| CCT | 7160 91% | 6780 96% | 7571 86% | 7546 86% | 7180 91% | 7950 82% | 6767 96% |
| Color Space (Percent of AdobeRGB 1998) (%) | 62 | 62.6 1% | 60 -3% | 64.86 5% | 59 -5% | 62 0% | 63 2% |
| Color Space (Percent of sRGB) (%) | 97 | 98 1% | 92 -5% | 93.97 -3% | 90 -7% | 96 -1% | 99 2% |
| Total Average (Program / Settings) | 9% /
12% | -1% /
-11% | -1% /
2% | 1% /
1% | 6% /
5% | 5% /
10% |
* ... smaller is better
Screen Flickering / PWM (Pulse-Width Modulation)
| Screen flickering / PWM not detected | 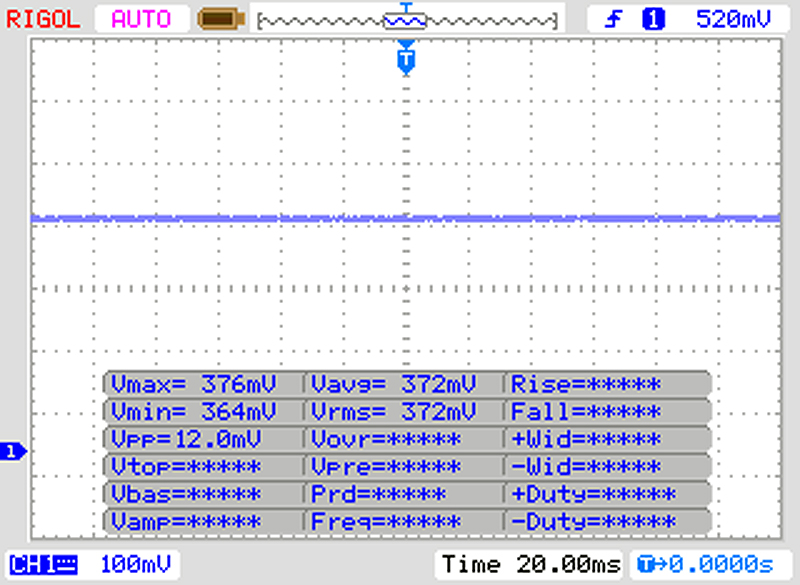 | ||
In comparison: 52 % of all tested devices do not use PWM to dim the display. If PWM was detected, an average of 7748 (minimum: 5 - maximum: 343500) Hz was measured. | |||
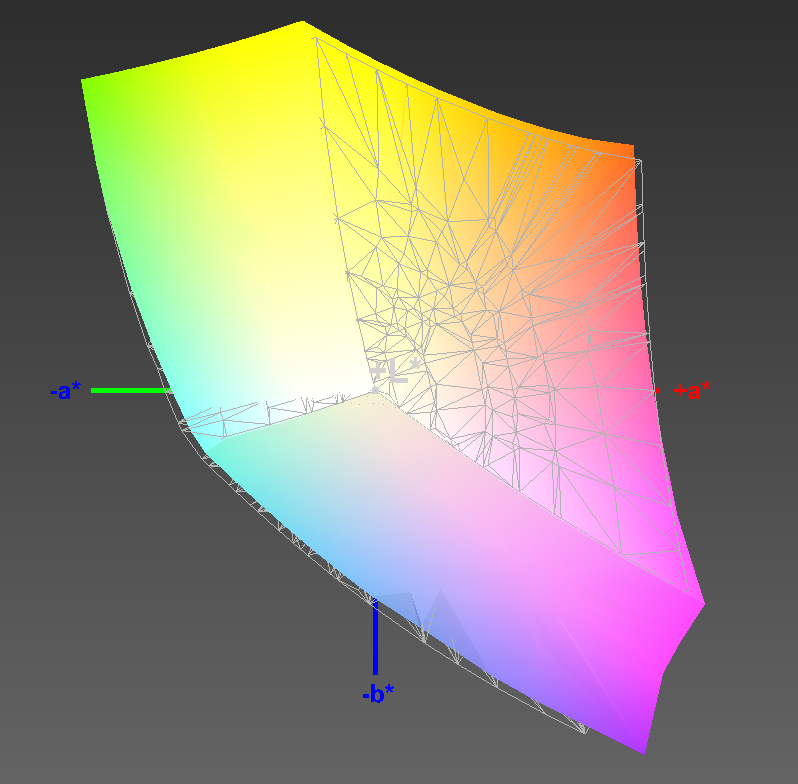
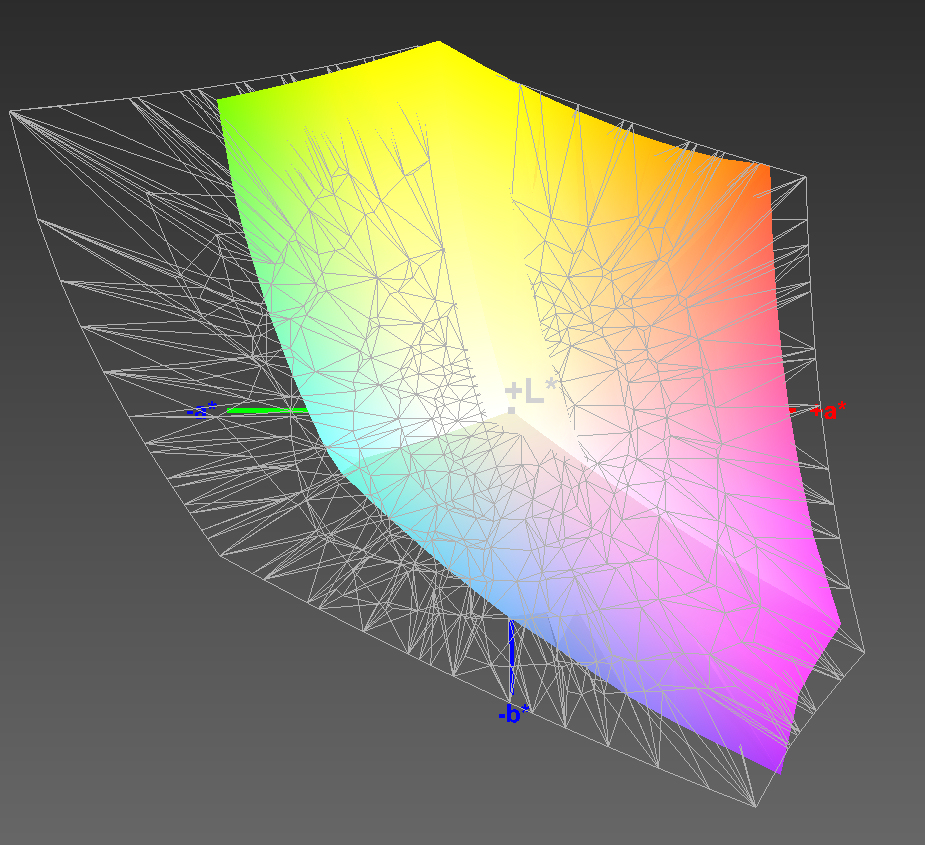
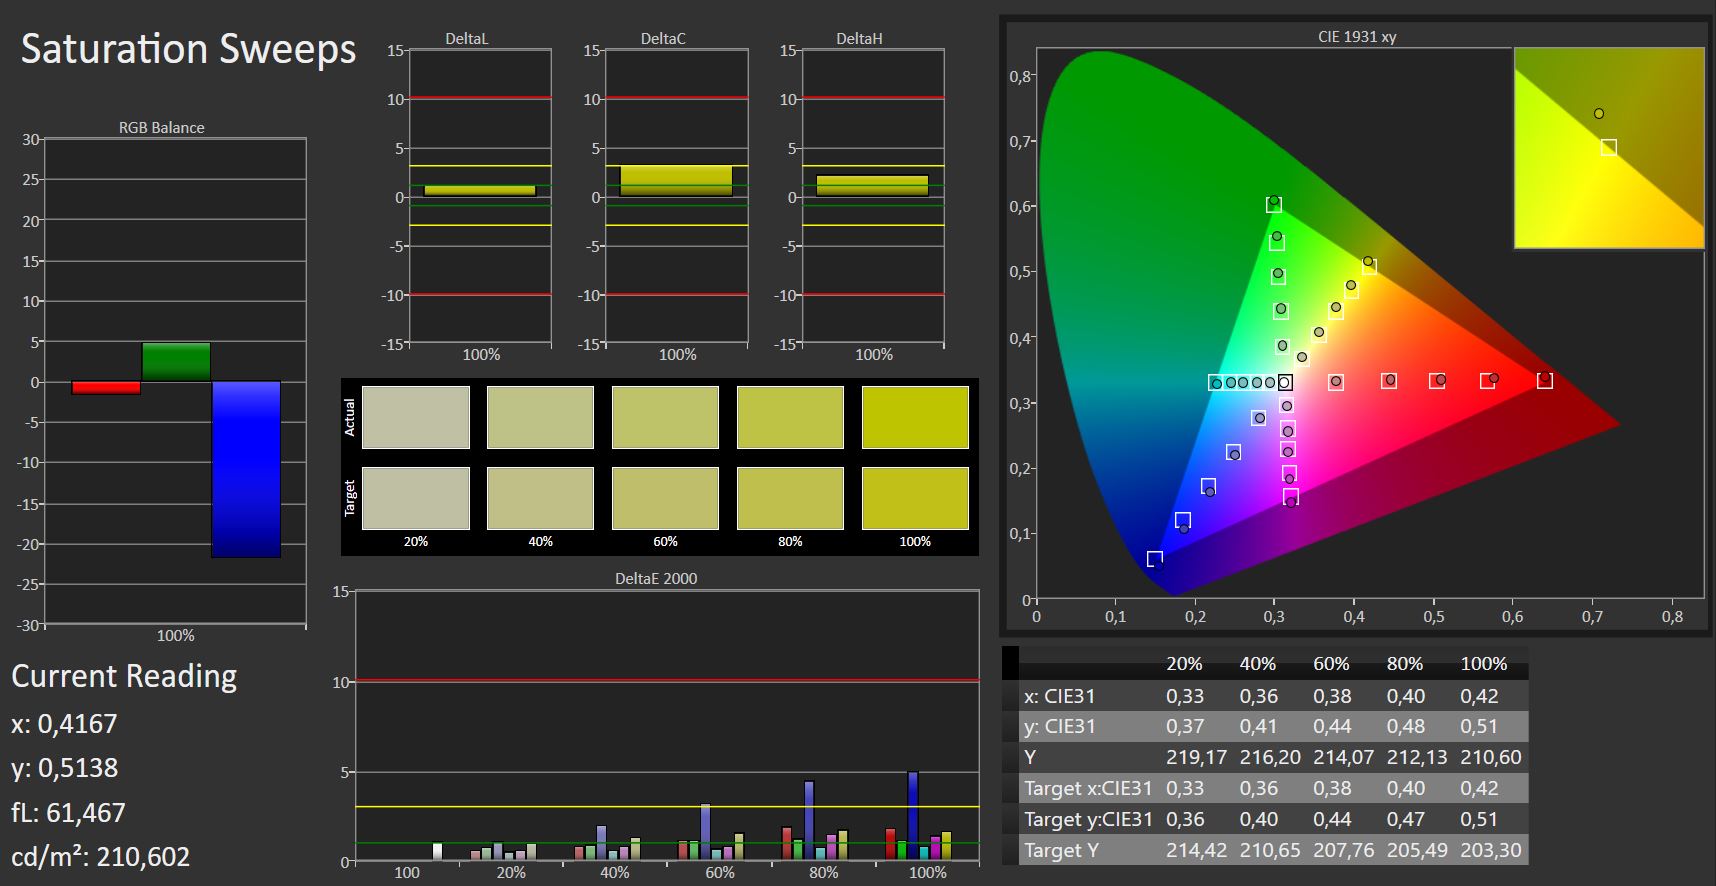
The display’s color accuracy was pretty decent out of the box. Its DeltaE 2000 deviation of 4.05 for colors was just slightly above the ideal of less than 3. The display did not suffer from a blue tint. We were able to improve color accuracy somewhat through calibration and not only decrease DeltaE for colors to 1.56 but also improve upon grayscale balance. The display does not cover AdobeRGB. It only covered 62%. On the plus side, sRGB was almost completely covered (97%).
Our ICC profile that can be found for download in the box above can improve color accuracy. Please make sure to check whether your display is identical to ours before you start using the profile. Otherwise, your color accuracy might worsen instead of improving. Manufacturers often use several different display panels from different sources within the same series.

Display Response Times
| ↔ Response Time Black to White | ||
|---|---|---|
| 26 ms ... rise ↗ and fall ↘ combined | ↗ 14 ms rise | 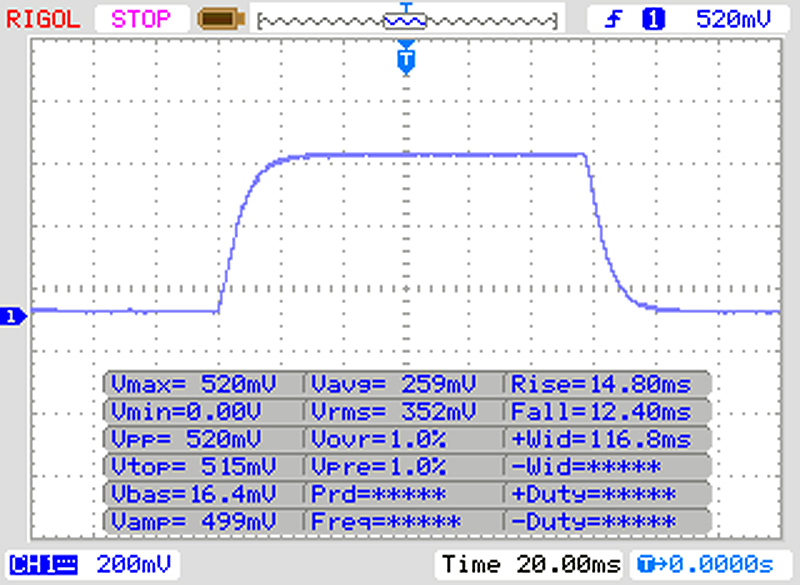 |
| ↘ 12 ms fall | ||
| The screen shows relatively slow response rates in our tests and may be too slow for gamers. In comparison, all tested devices range from 0.1 (minimum) to 240 (maximum) ms. » 63 % of all devices are better. This means that the measured response time is worse than the average of all tested devices (19.8 ms). | ||
| ↔ Response Time 50% Grey to 80% Grey | ||
| 47 ms ... rise ↗ and fall ↘ combined | ↗ 23 ms rise | 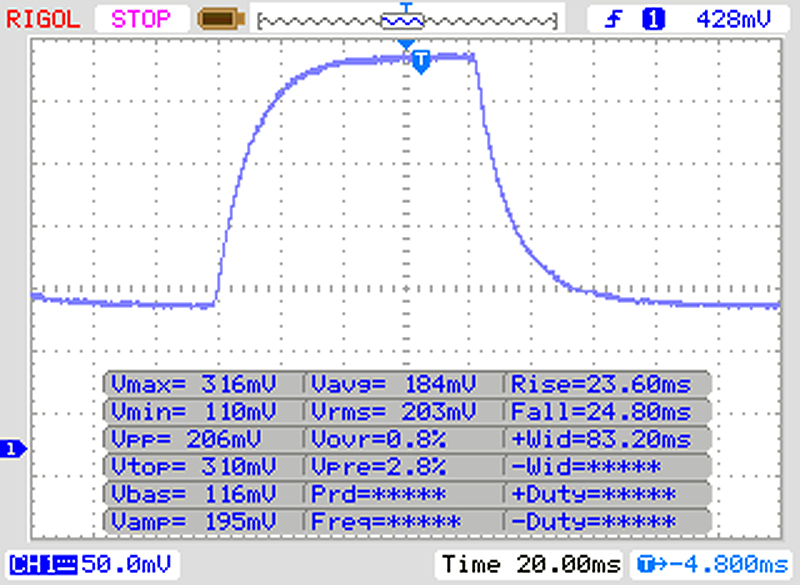 |
| ↘ 24 ms fall | ||
| The screen shows slow response rates in our tests and will be unsatisfactory for gamers. In comparison, all tested devices range from 0.165 (minimum) to 636 (maximum) ms. » 81 % of all devices are better. This means that the measured response time is worse than the average of all tested devices (30.9 ms). | ||
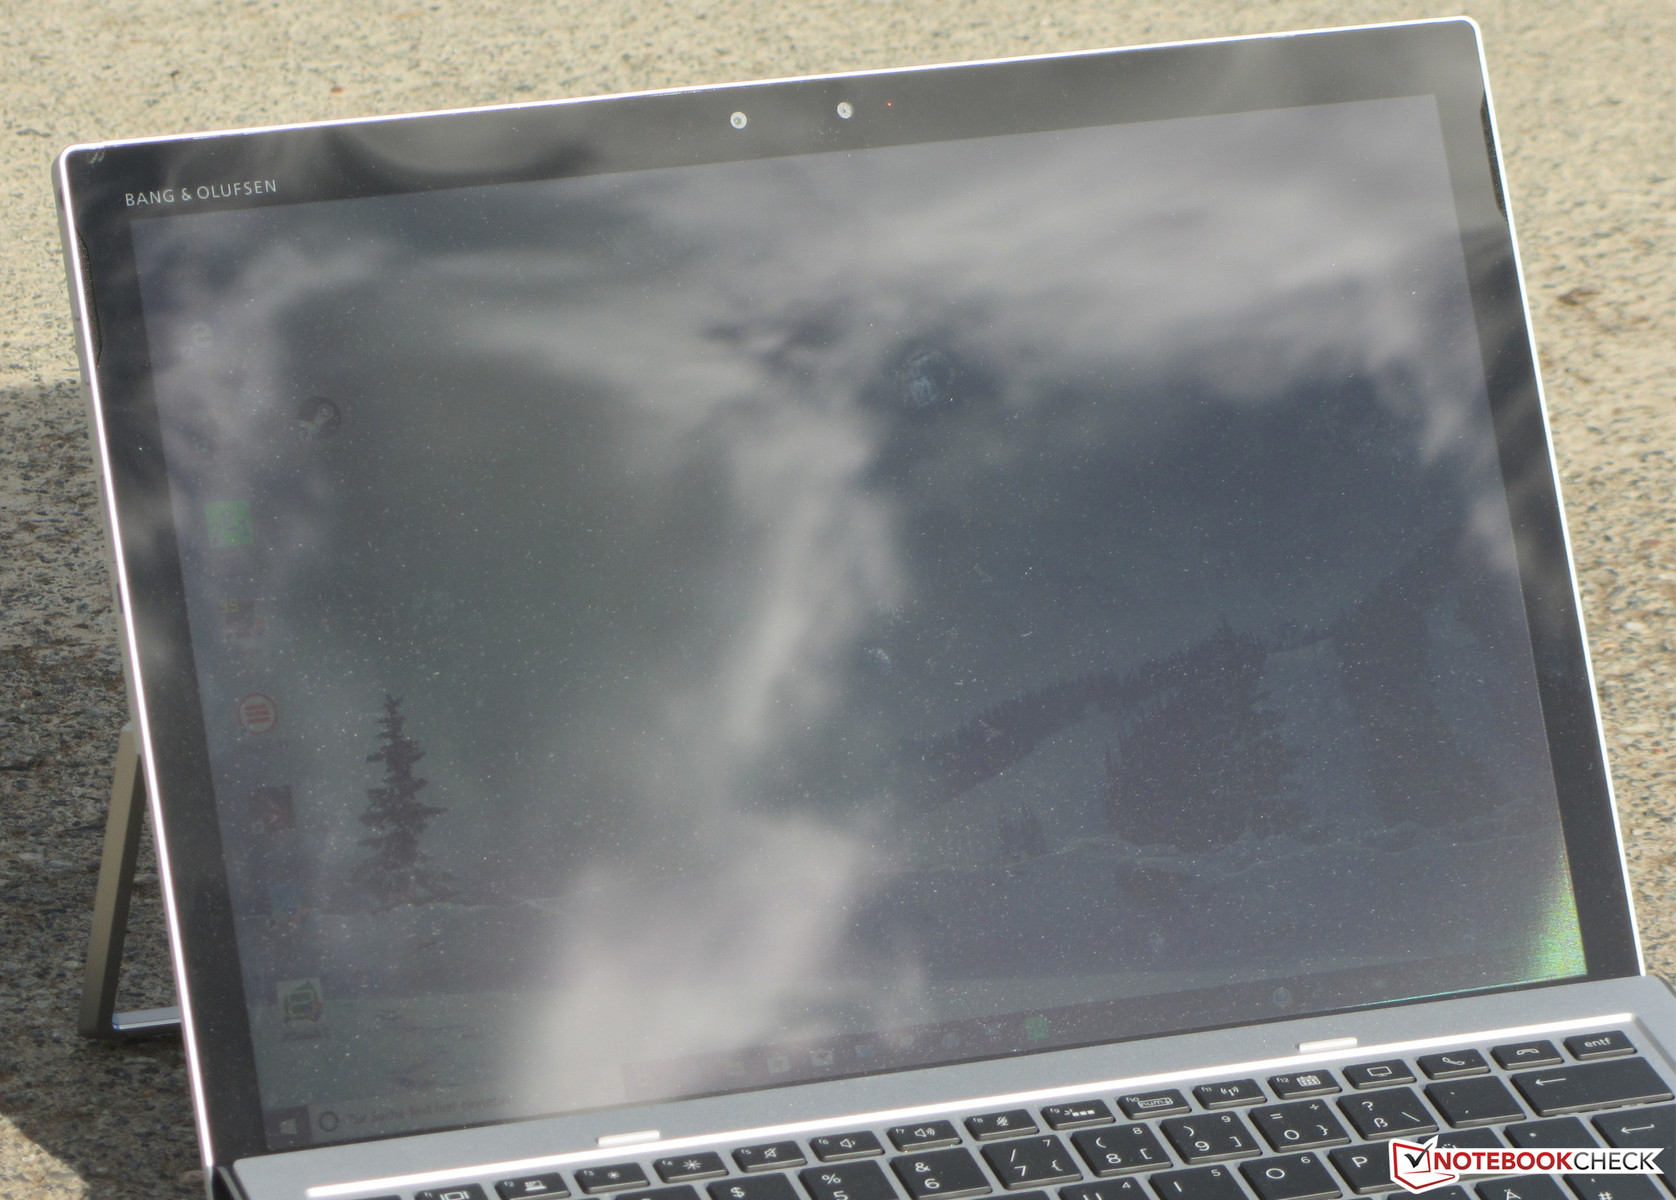
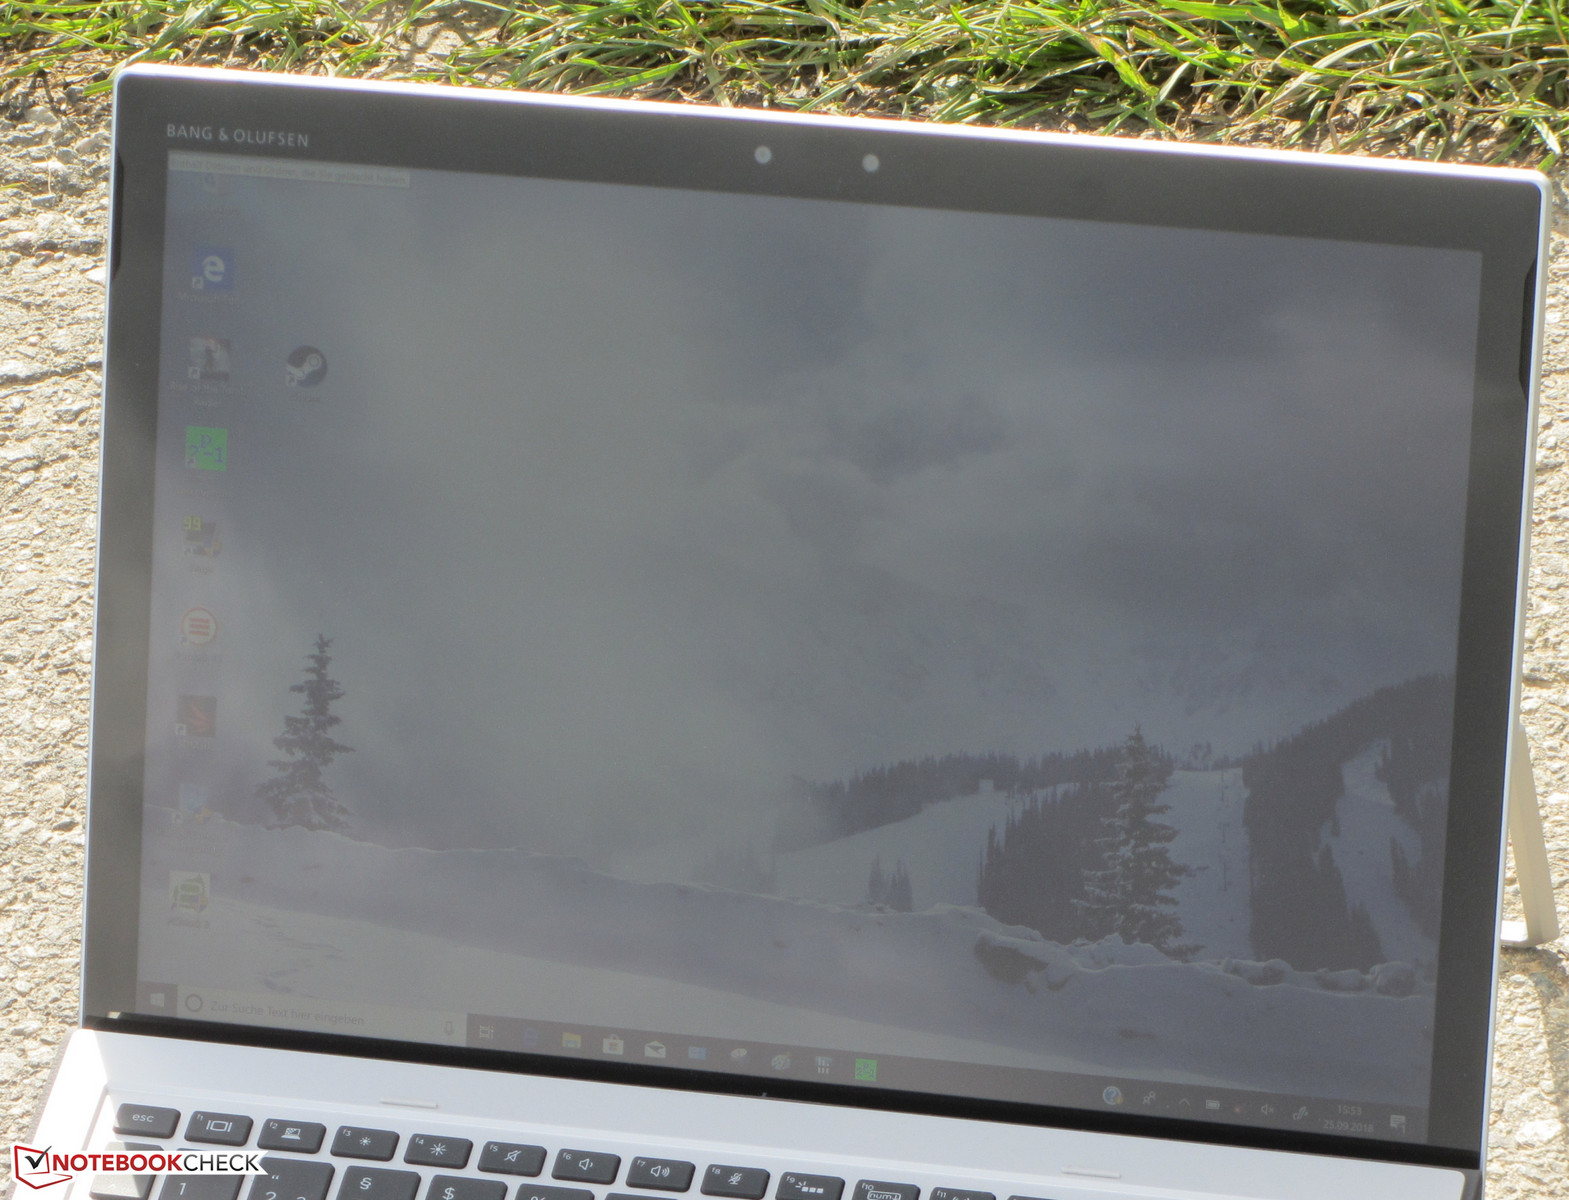
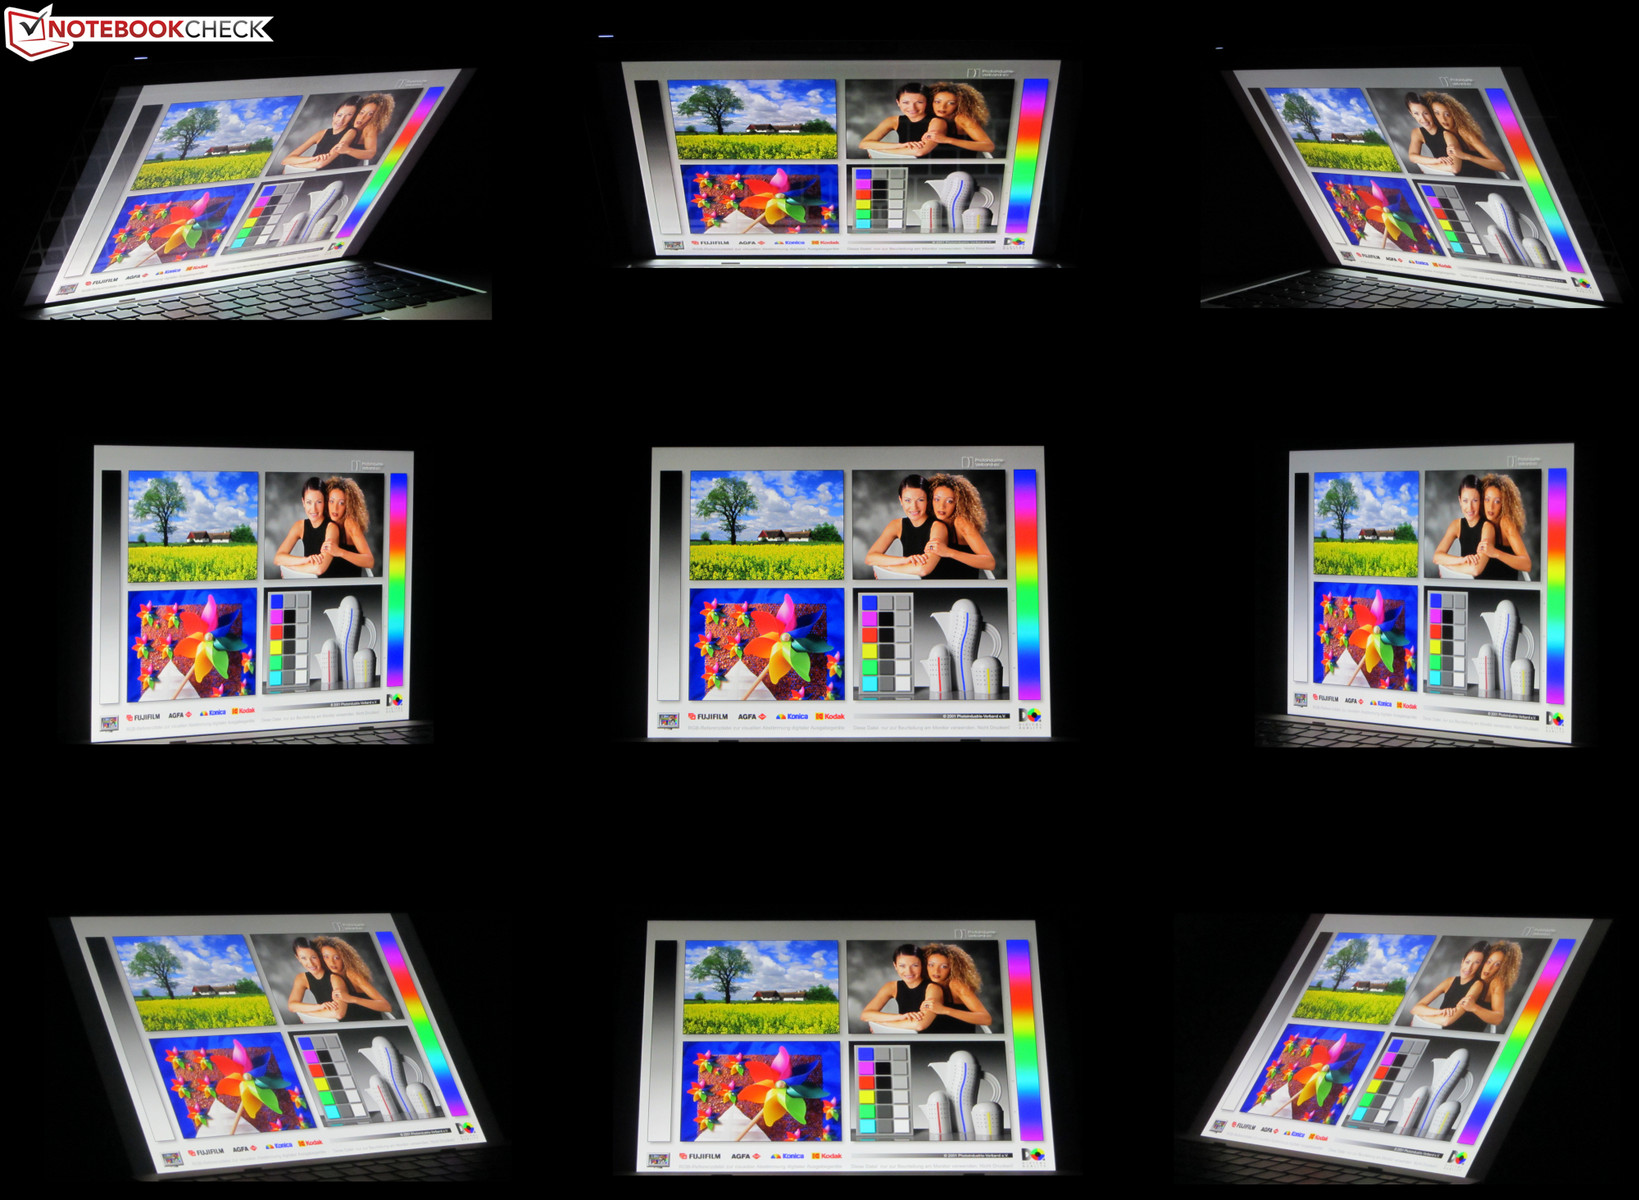
The device is equipped with an IPS display with great viewing angles. Accordingly, it can be viewed and used from all angles. Even though it was very bright it turned out to be all but unusable outdoors due to its highly reflective display coating. We found it easier to use outdoors in the shade or on overcast days.
Performance
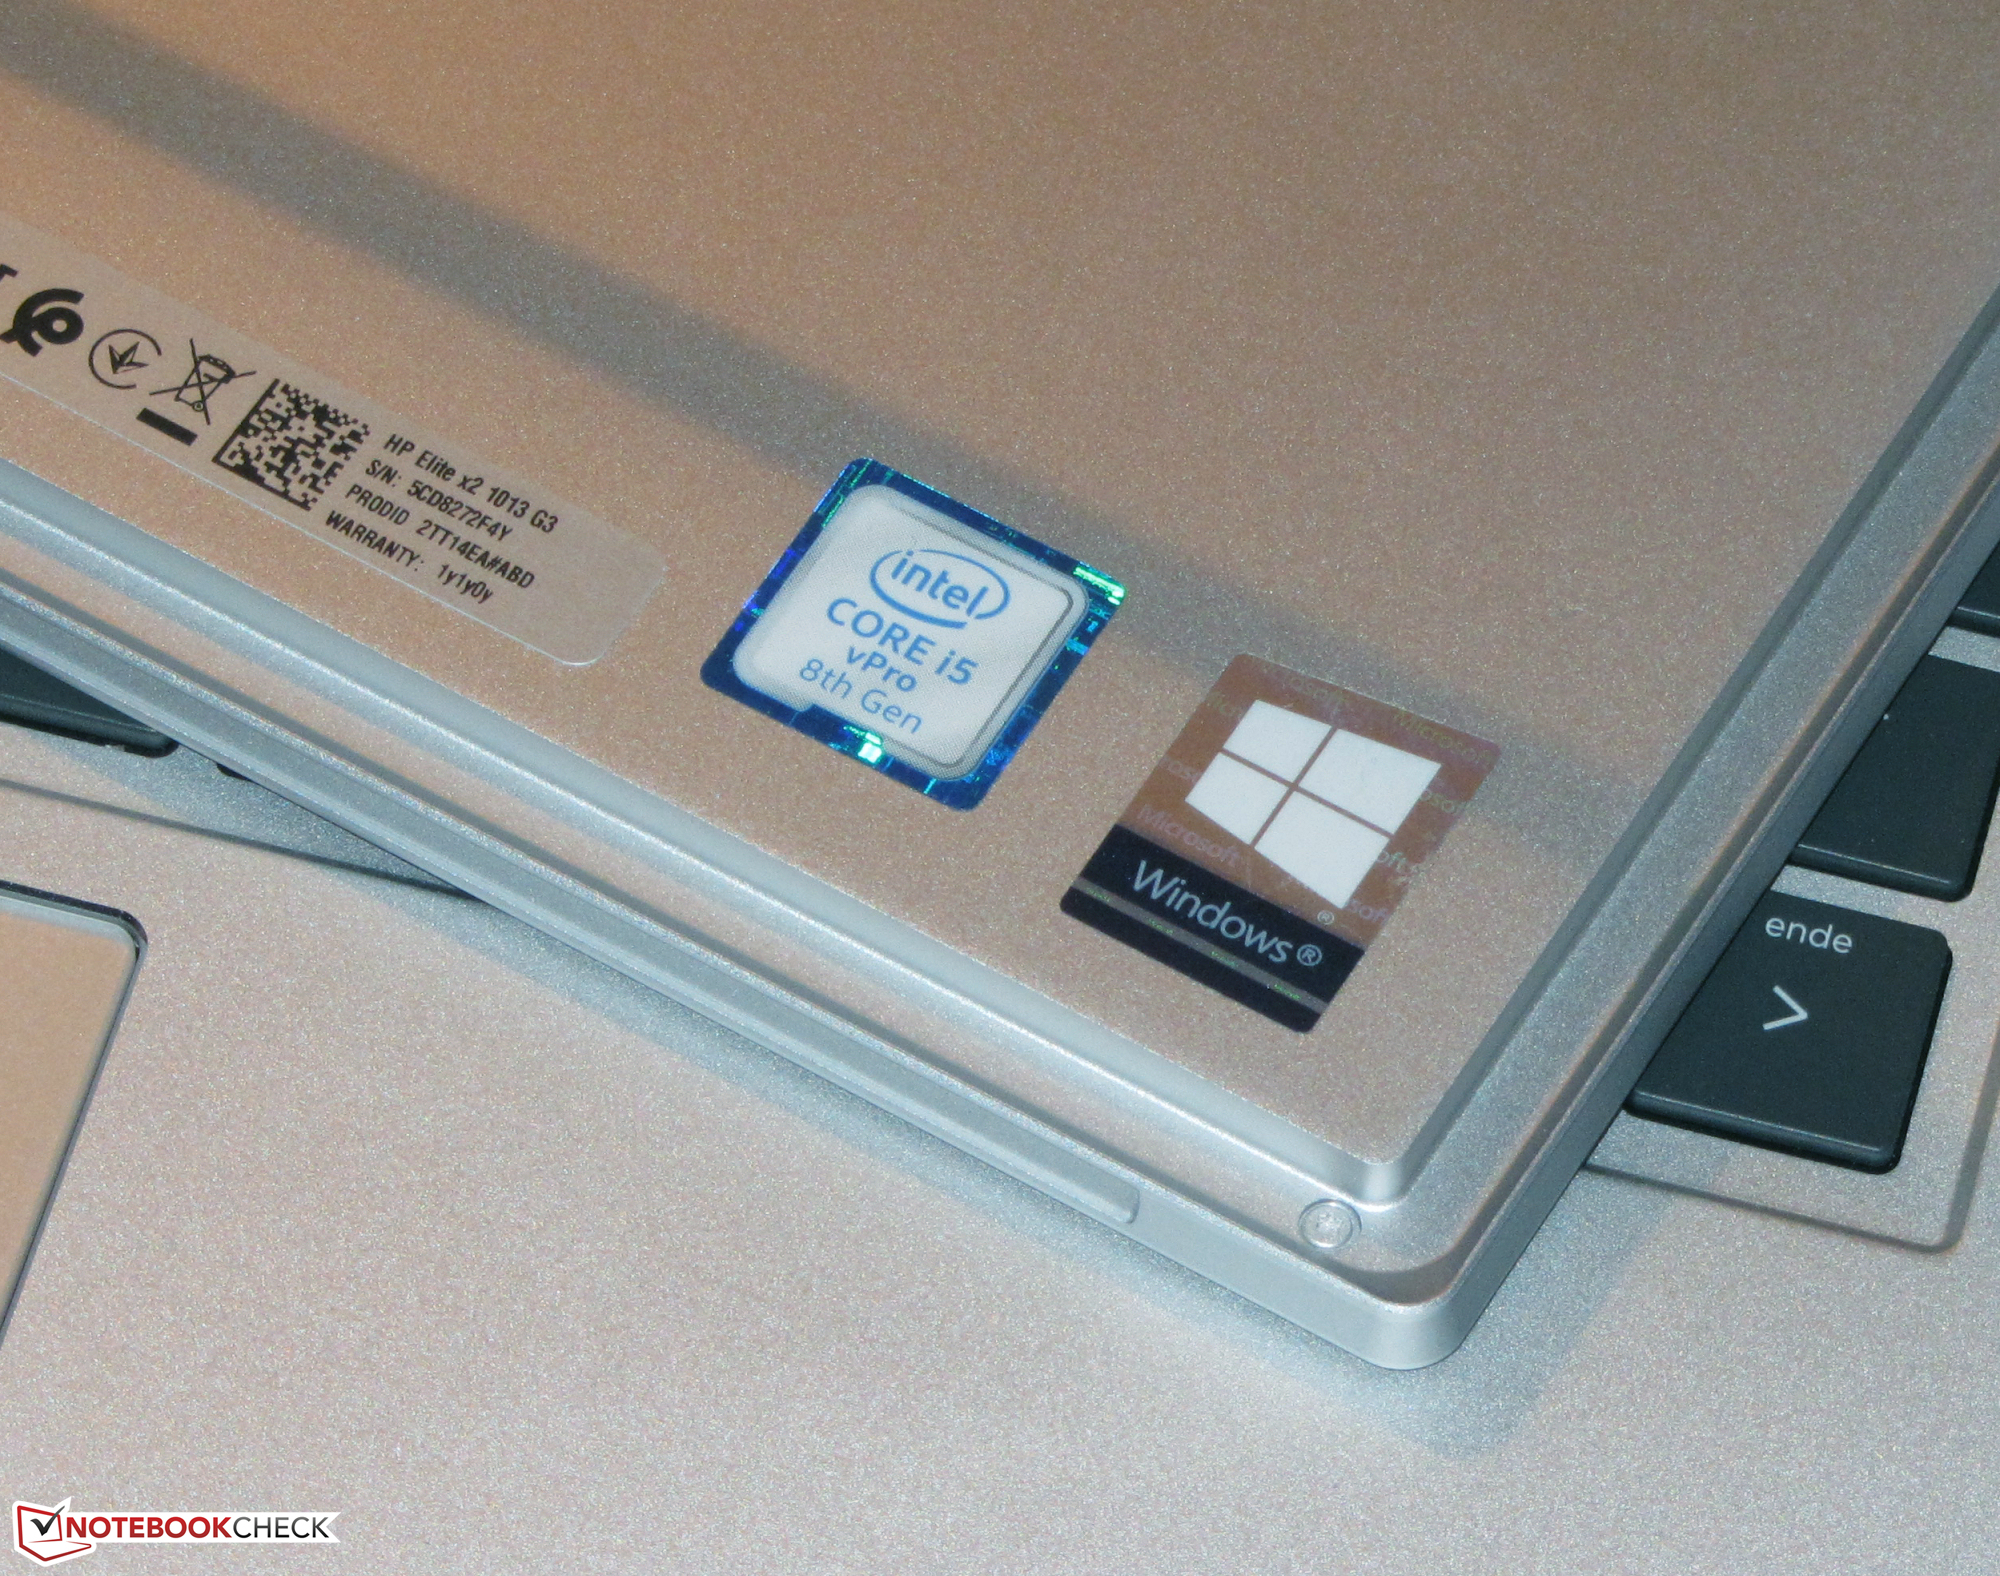
The HP Elite x2 1013 G3 is a 2-in-1 device with a 3:2 13-inch display. It offers plenty of performance for everyday tasks. The device includes business features such as a TPM chip, a fingerprint reader, and extensive warranty options. An LTE modem can be fitted retroactively. At the time of writing, our review unit sold for around $1,800 plus tax. Other SKUs are available as well.


Test Conditions
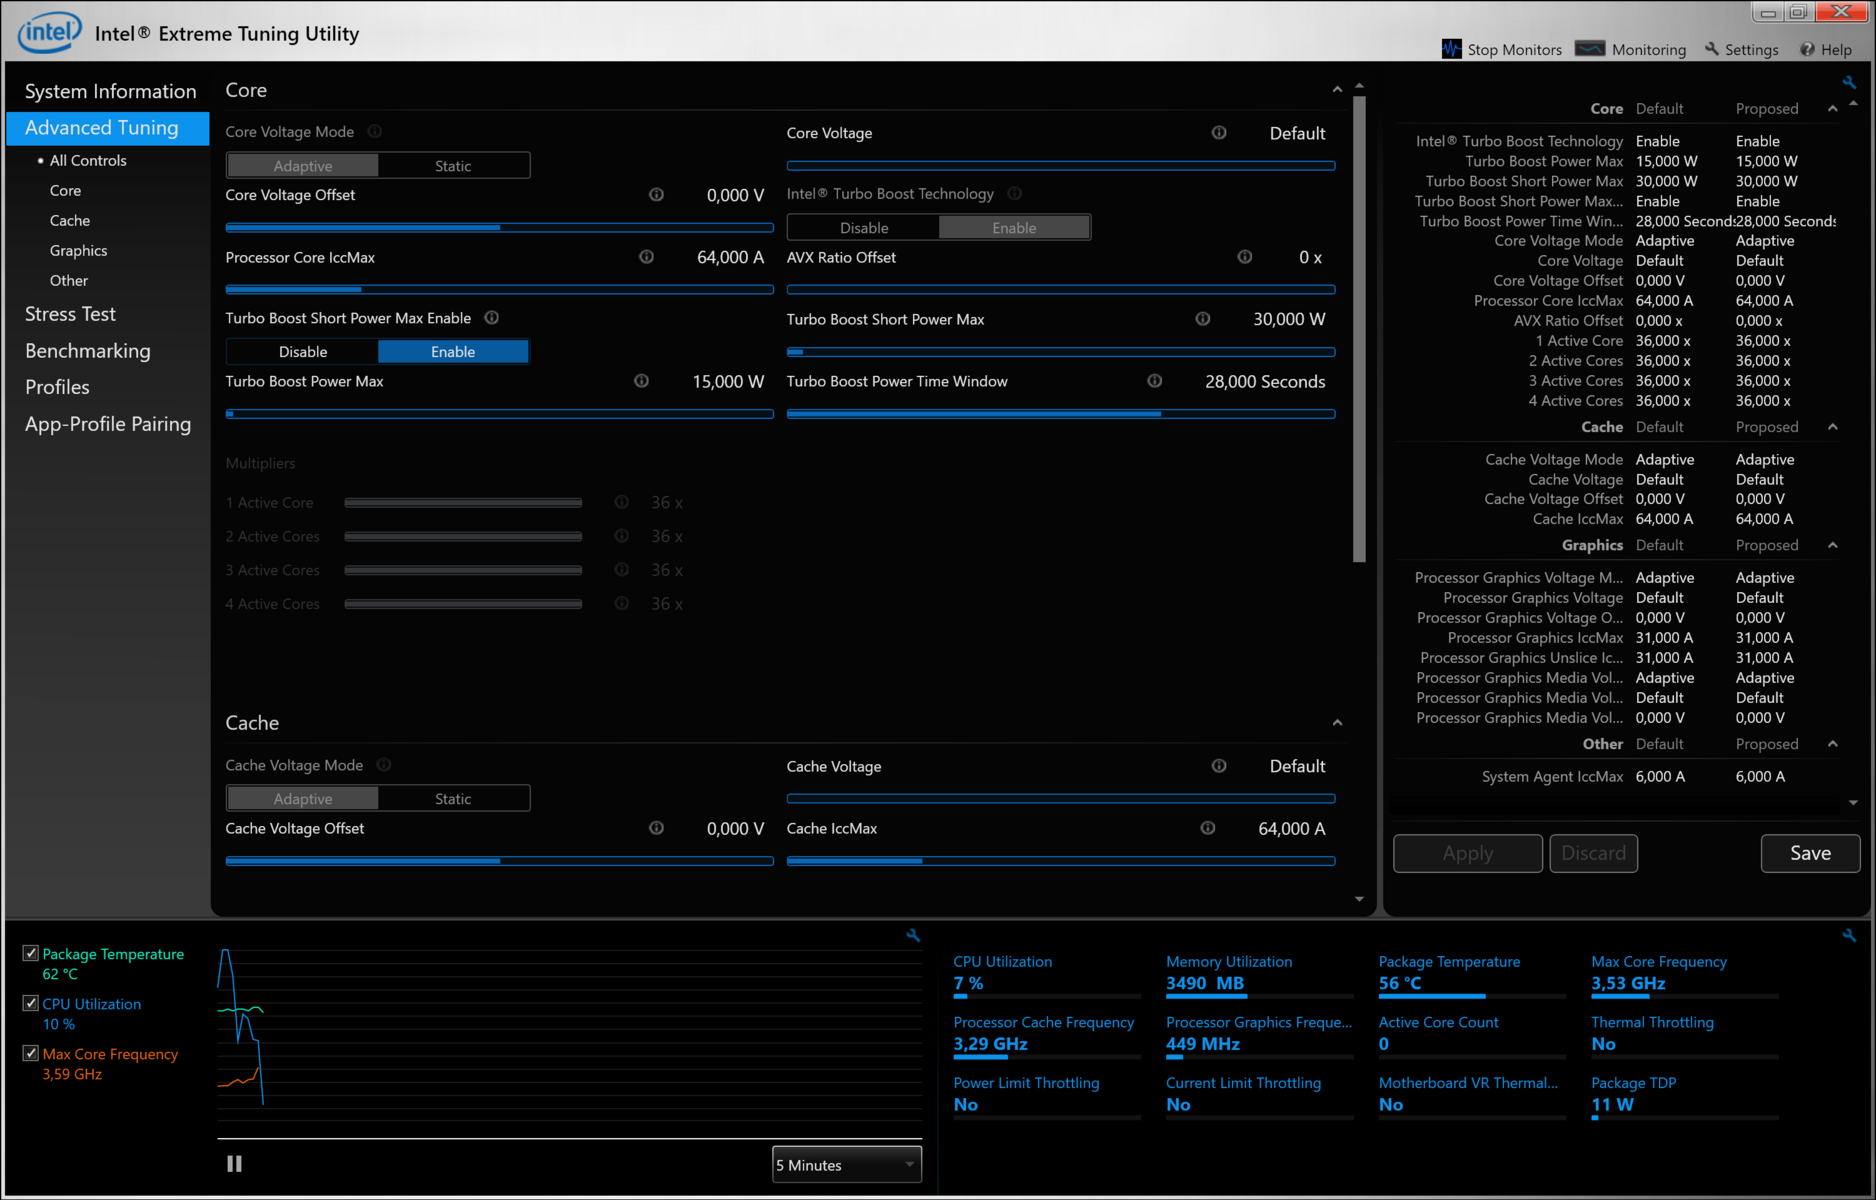
The tablet’s BIOS setup included an option called “Enable Turbo Boost on DC”. This can be used to activate/deactivate the CPU’s turbo boost on battery. Since it was disabled by default, we left it as-is and ran our benchmarks accordingly.
Processor
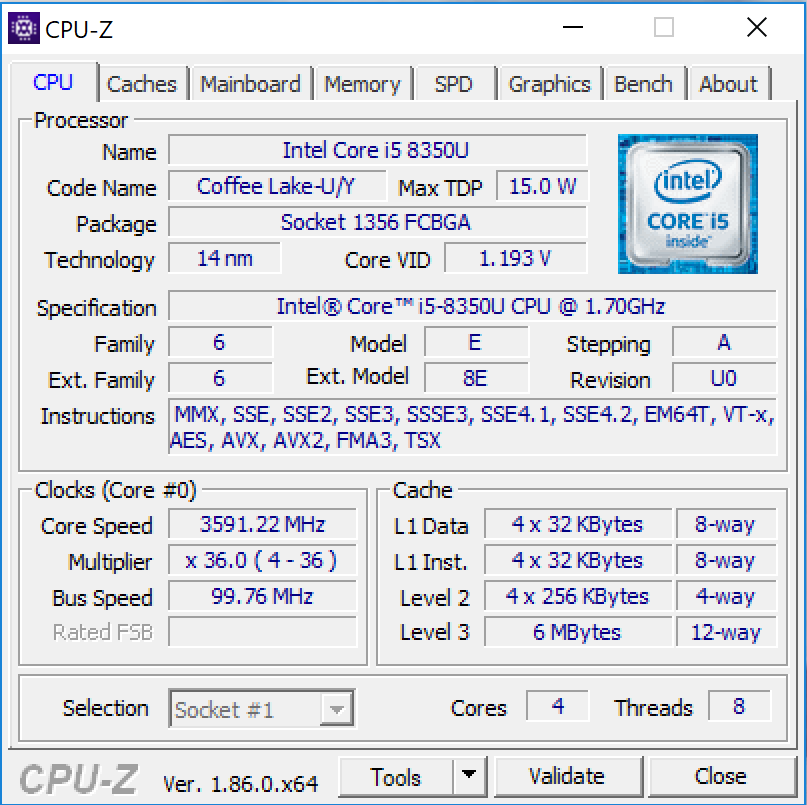
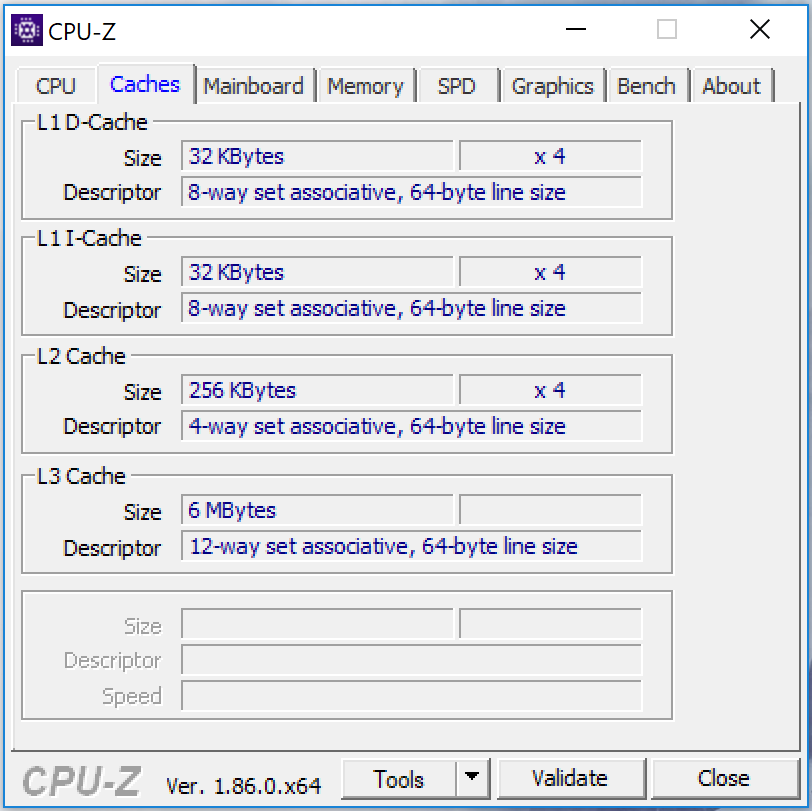
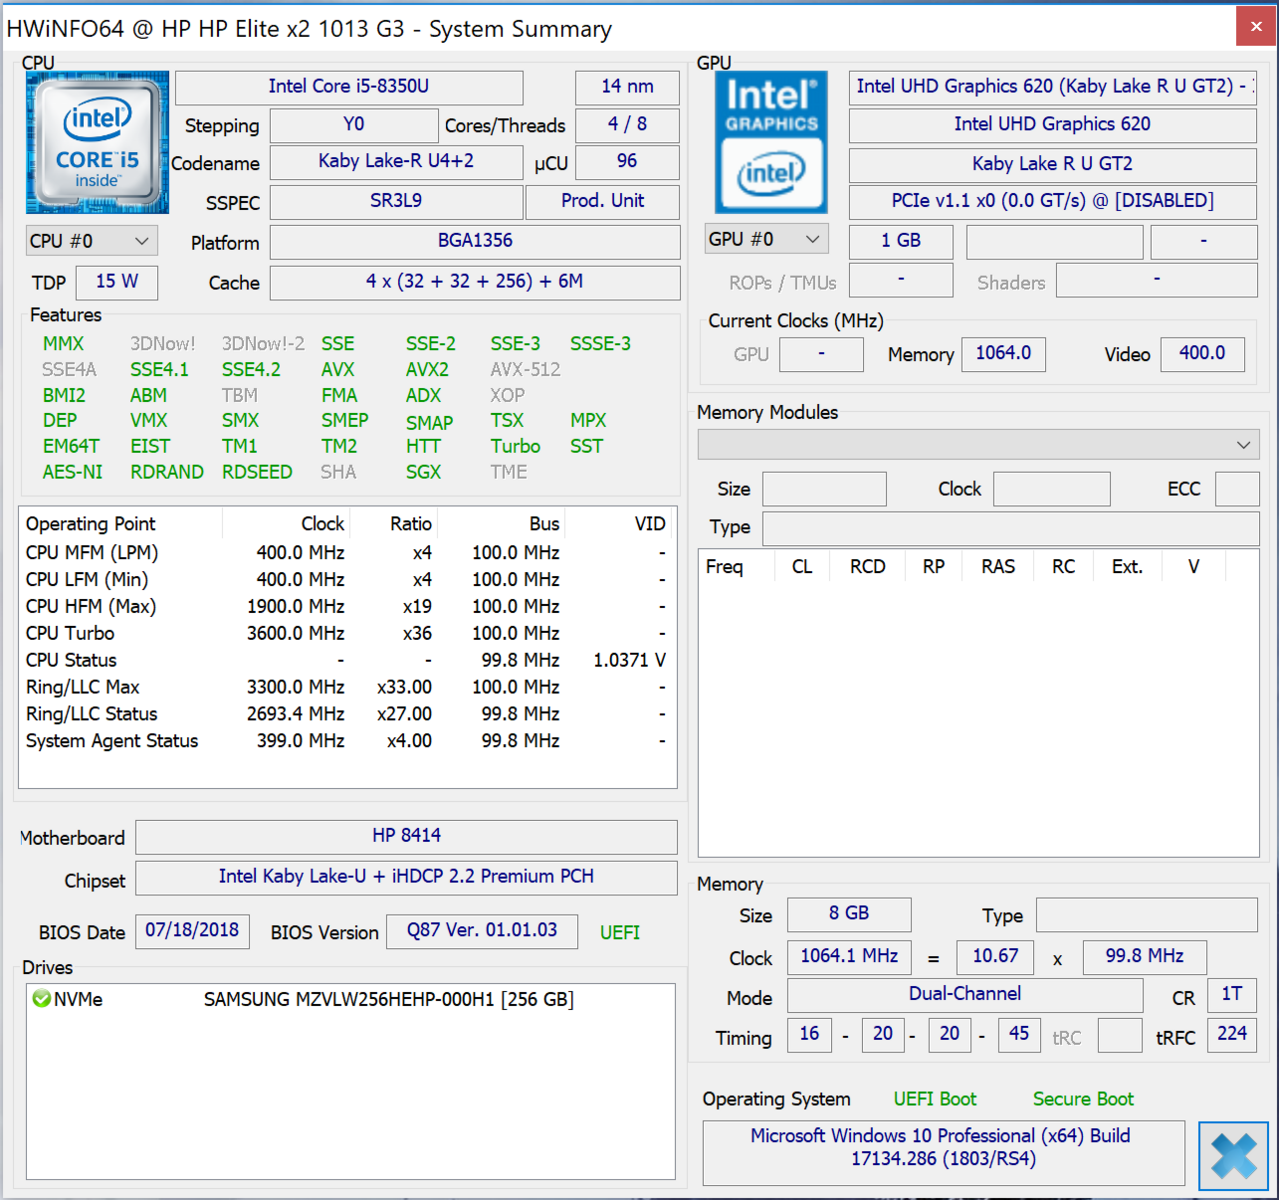
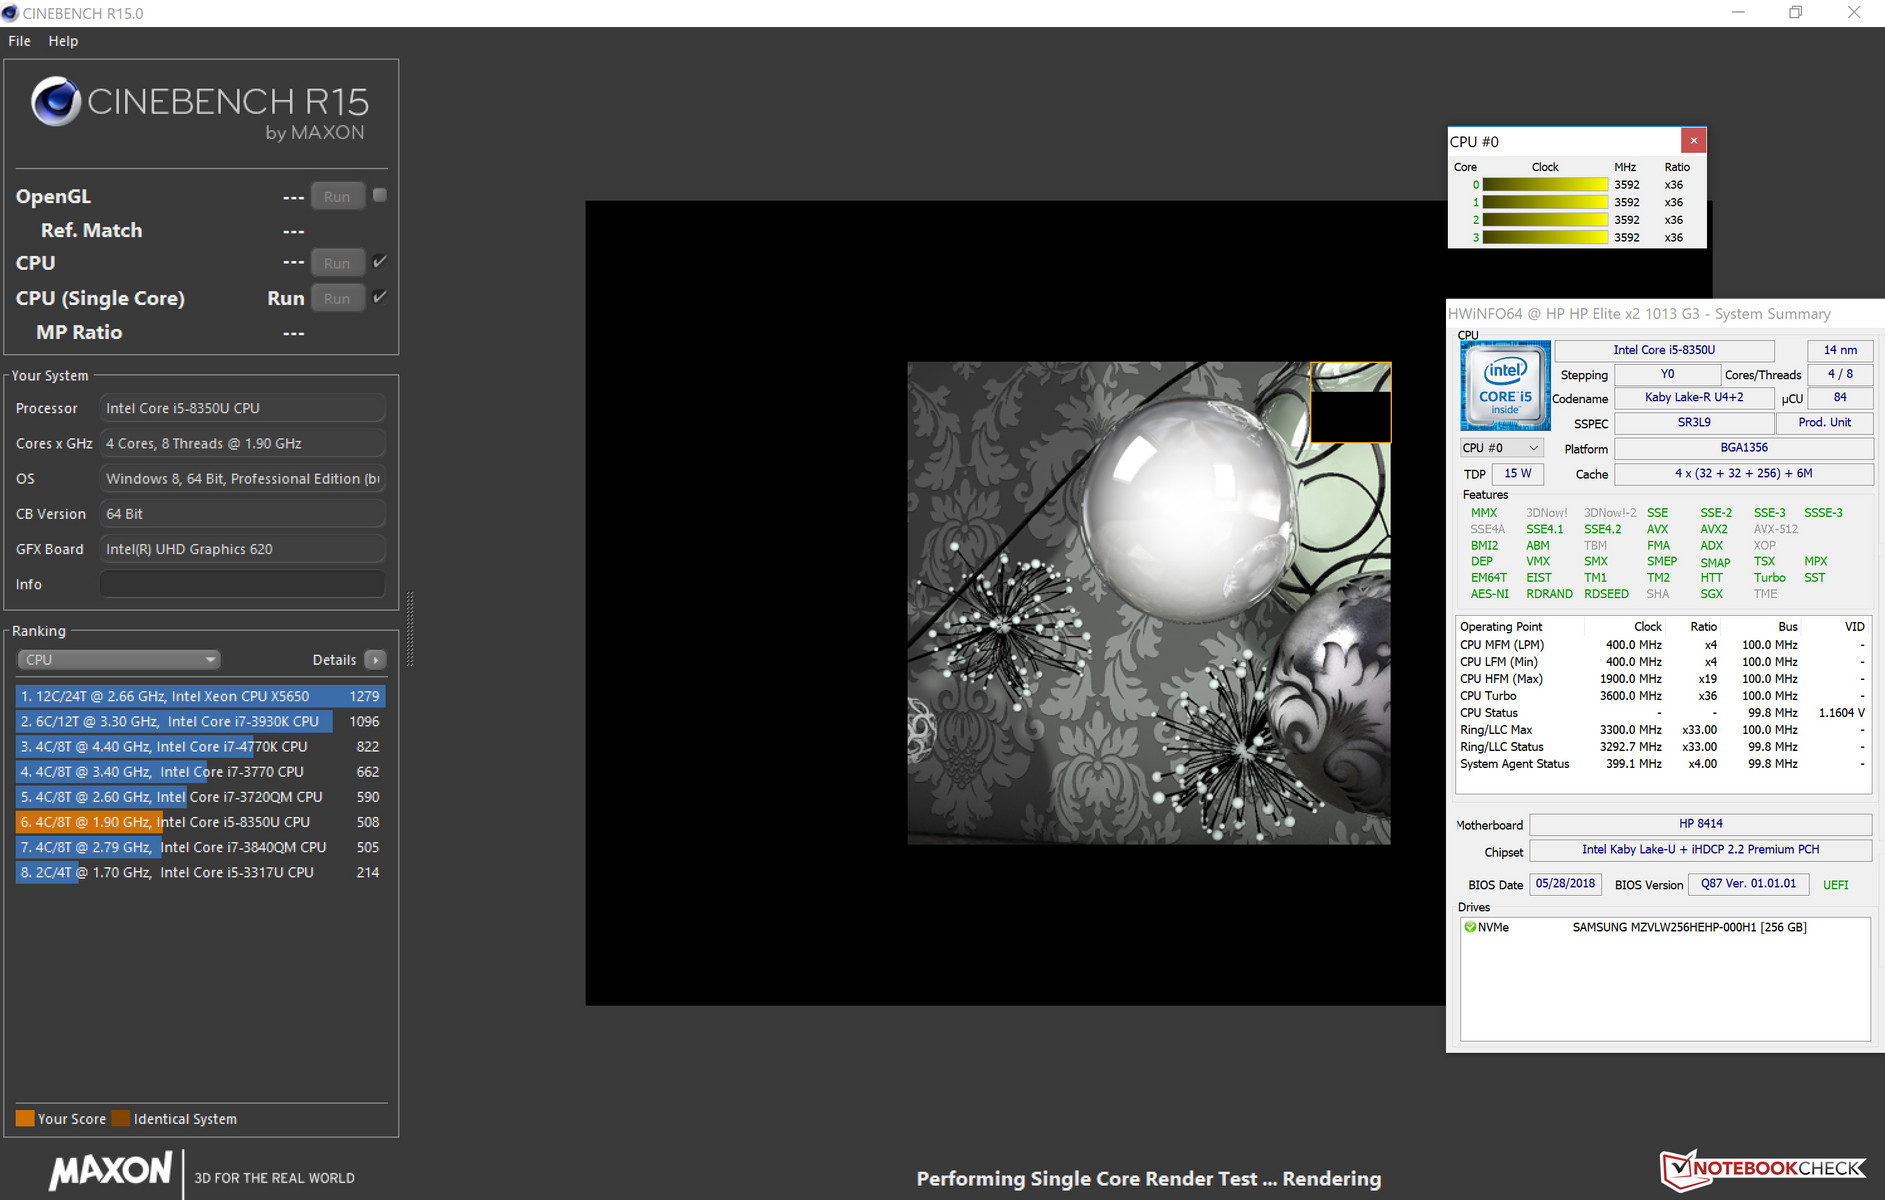
The Elite x2 is equipped with a Core i5-8350U quad-core CPU from Intel’s Kaby Lake Refresh generation. The ULV model with a TDP of 15 W offers more than enough performance for most everyday tasks. It runs at a base clock of 1.7 GHz and a turbo boost of up to 3.6 GHz.
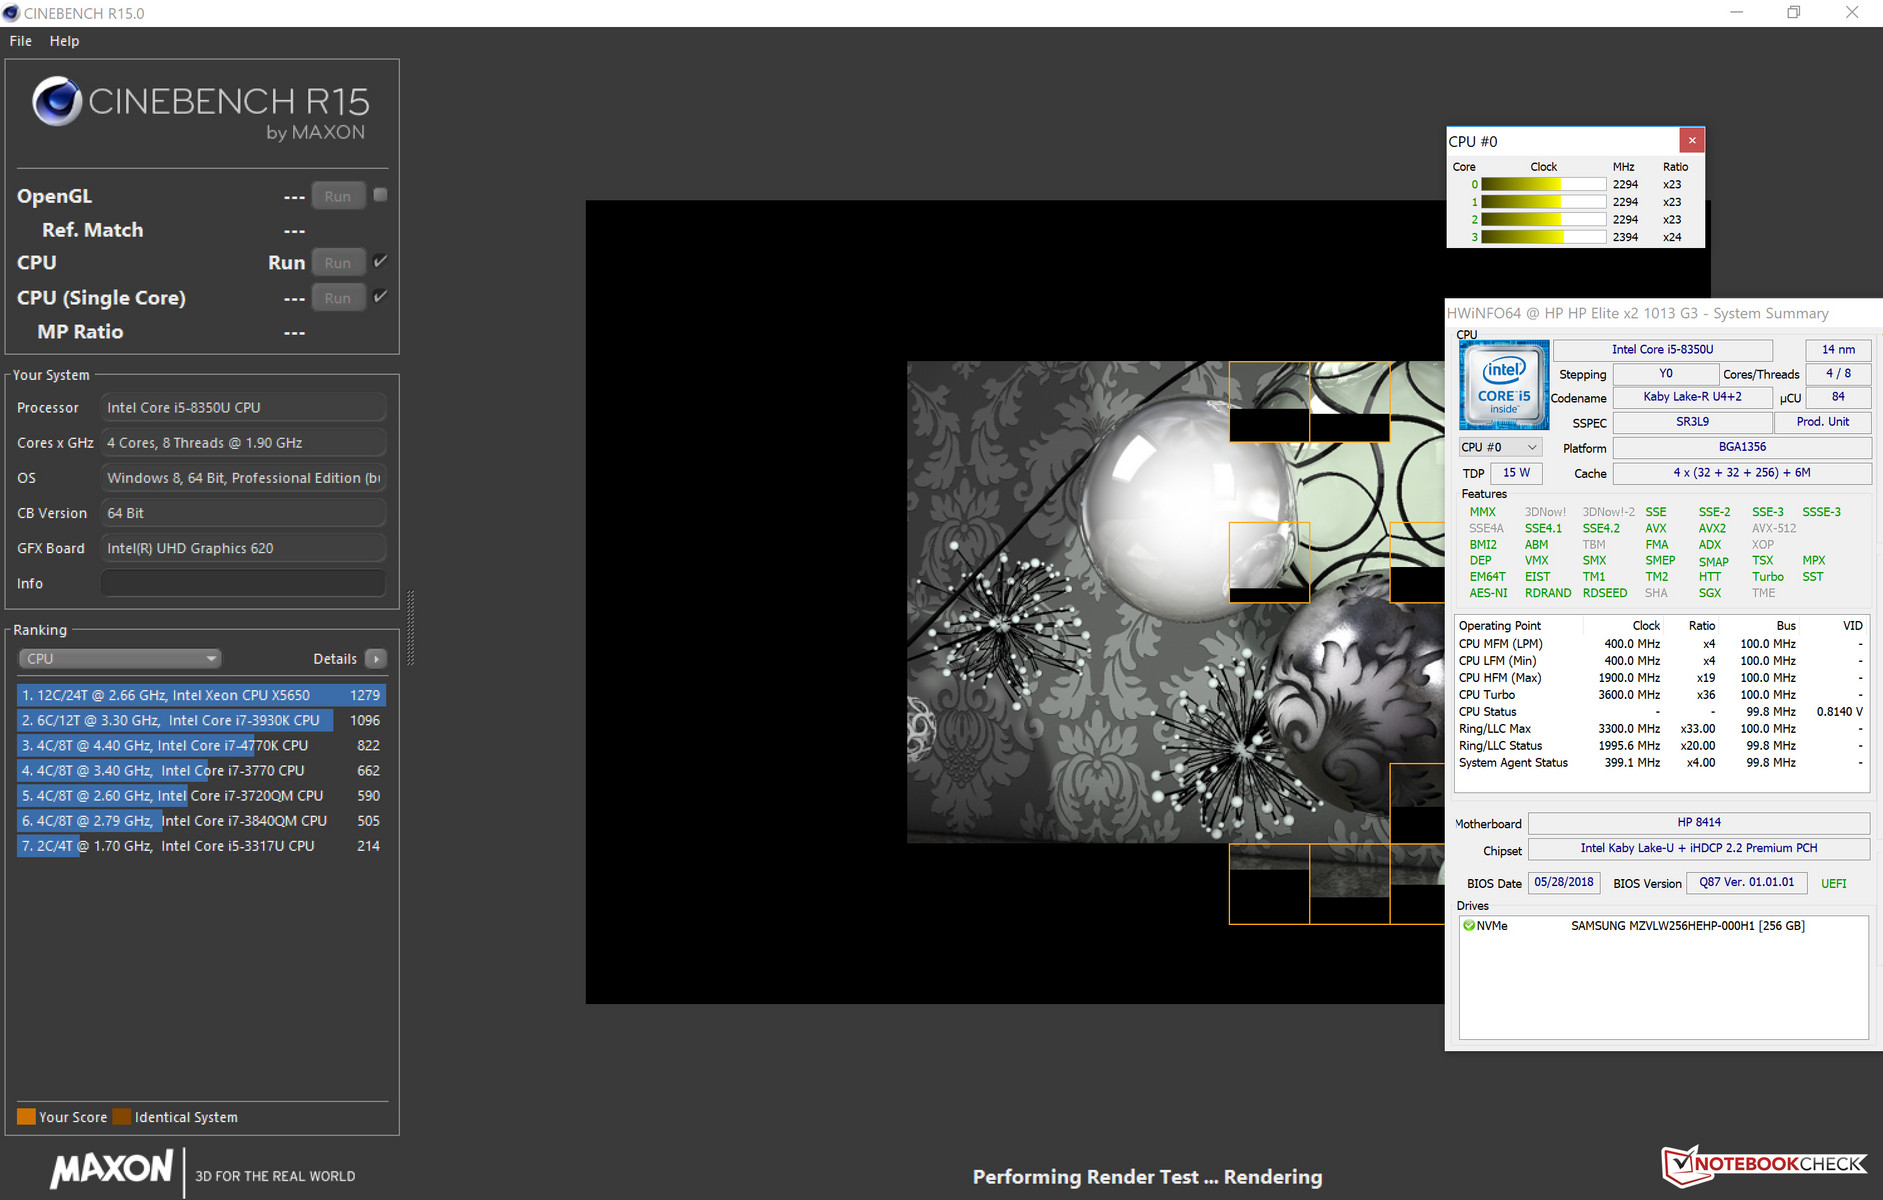
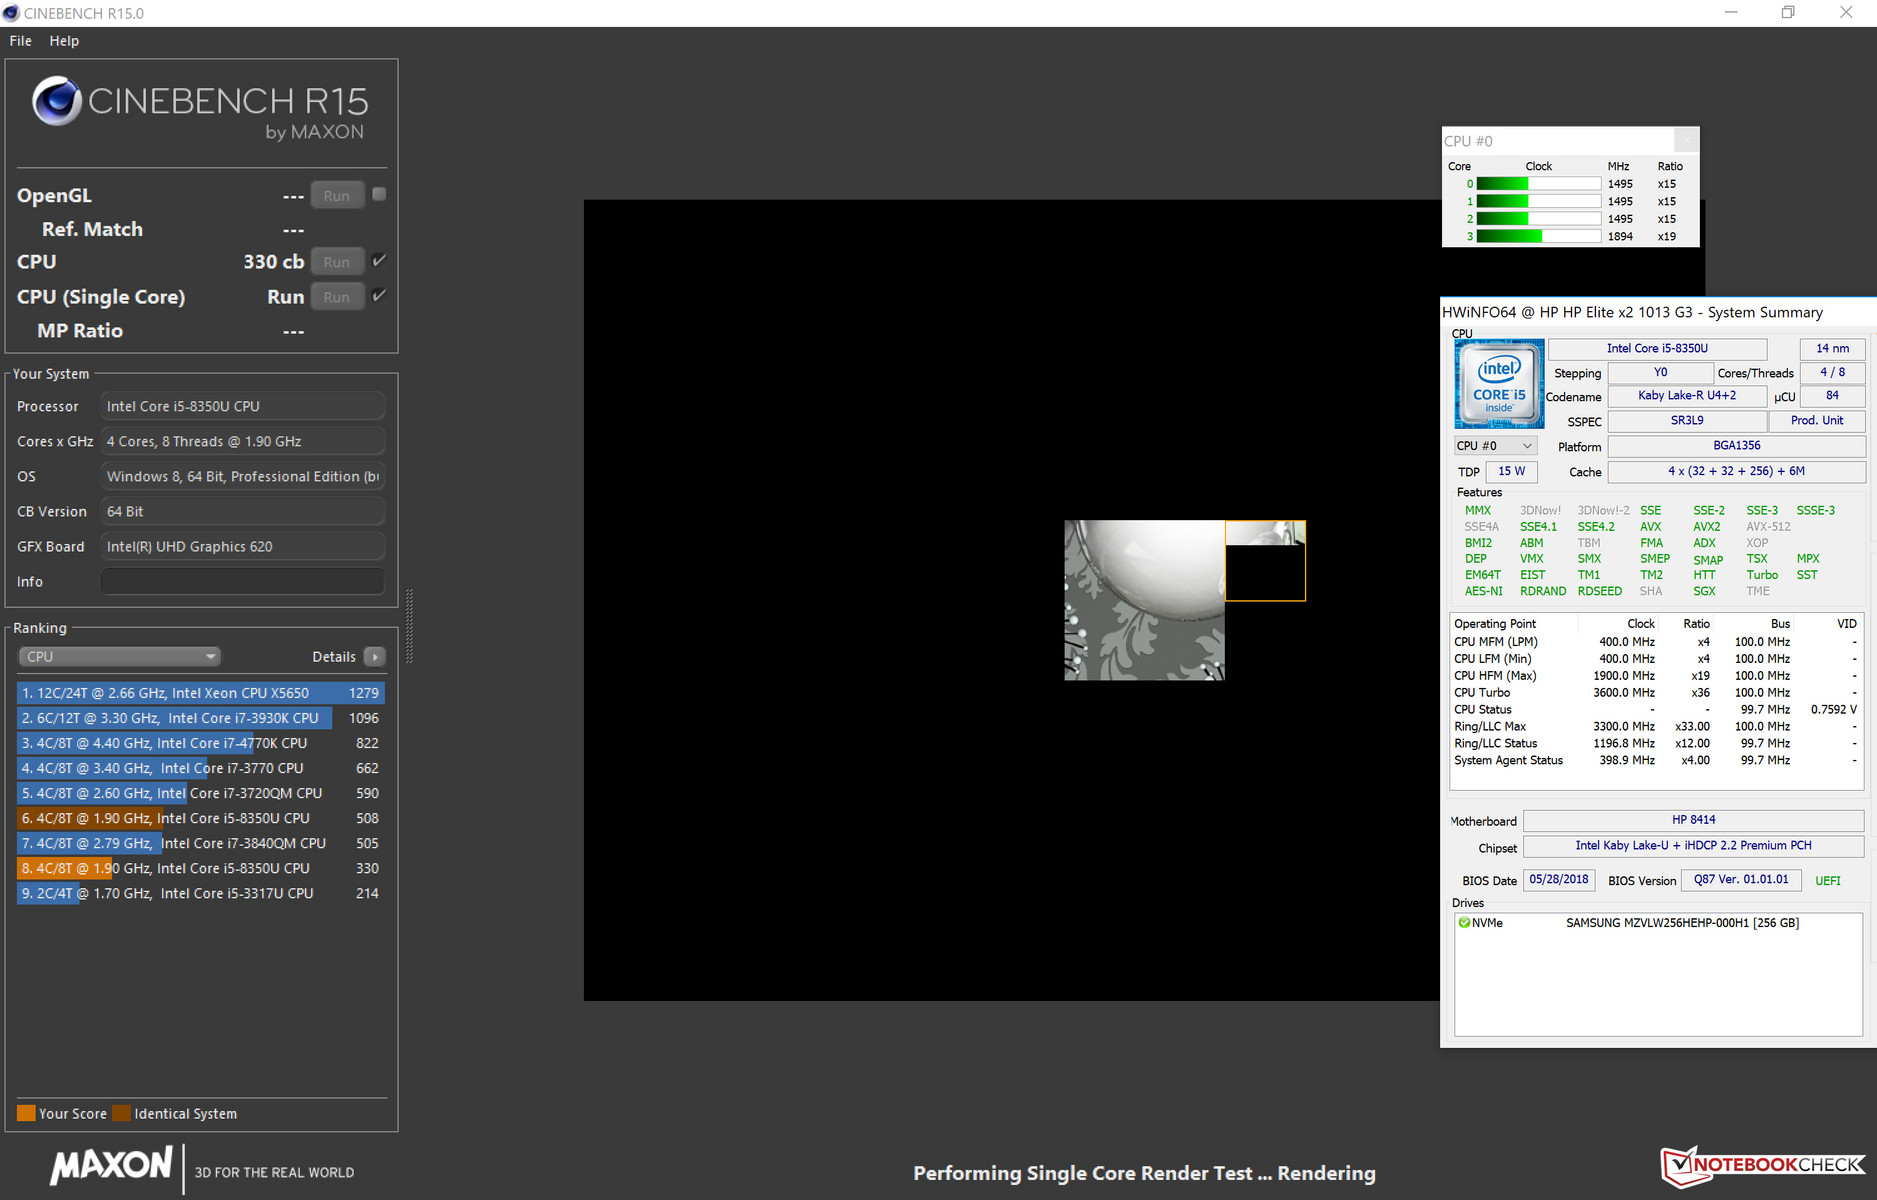
In our multithread tests with Cinebench the CPU peaked at 3-3.3 GHz for a few seconds, after which its clock speeds were reduced to 2.3-2.4 GHz. The single-thread tests were performed at 3.6 GHz end-to-end. At least when connected to mains. On battery, the CPU ran much slower and reached between 1.5-1.9 GHz in the single-thread test and 1.9-2.2 GHz in the multithread test.
Activating “Enable Turbo Boost on DC” had no significant effect. Rarely did a CPU core run faster than before. The Cinebench R15 multithread score bears witness to this oddity: It only improved from 330 to 336 points.

We determine whether or not a device is capable of maintaining high turbo boost speeds under sustained load by running the Cinebench R15 multithread test in a 30-minute loop. The score dropped between the first and second iteration but remained consistent afterwards. Clock speeds were between 2.3-2.4 GHz throughout the remainder of the test.
The results of our CPU benchmarks were at a level expected of this particular CPU.
| Geekbench 3 | |
| 32 Bit Multi-Core Score | |
| Lenovo Miix 520-12IKB 20M3000LGE | |
| HP Elite x2 1013 G3-2TT14EA | |
| Average Intel Core i5-8350U (n=1) | |
| 32 Bit Single-Core Score | |
| Lenovo Miix 520-12IKB 20M3000LGE | |
| HP Elite x2 1013 G3-2TT14EA | |
| Average Intel Core i5-8350U (n=1) | |
| Mozilla Kraken 1.1 - Total | |
| HP Elite x2 1013 G3-2TT14EA (Edge 42) | |
| HP Elite x2 1012 G2-1LV76EA (Edge 40.15063.0.0) | |
| Average Intel Core i5-8350U (1017 - 1289, n=5) | |
| Asus Transformer 4 Pro (i7-7500U, HD620) | |
| Microsoft Surface Pro (2017) i7 (Edge 40) | |
| Average of class Convertible (386 - 1089, n=52, last 2 years) | |
| Octane V2 - Total Score | |
| Average of class Convertible (50984 - 123023, n=13, last 2 years) | |
| Microsoft Surface Pro (2017) i7 (Edge 40) | |
| Microsoft Surface Pro (2017) i5 | |
| Average Intel Core i5-8350U (28223 - 38722, n=5) | |
| Asus Transformer 4 Pro (i7-7500U, HD620) | |
| HP Elite x2 1013 G3-2TT14EA (Edge 42) | |
| HP Elite x2 1012 G2-1LV76EA (Edge 40.15063.0.0) | |
| JetStream 1.1 - 1.1 Total | |
| Lenovo Miix 520-12IKB 20M3000LGE (Edge 41) | |
| Microsoft Surface Pro (2017) i7 (Edge 40) | |
| HP Elite x2 1013 G3-2TT14EA (Edge 42) | |
| Microsoft Surface Pro (2017) i5 | |
| HP Elite x2 1012 G2-1LV76EA (Edge 40.15063.0.0) | |
| Average Intel Core i5-8350U (173 - 232, n=5) | |
| Asus Transformer 4 Pro (i7-7500U, HD620) | |
| Fujitsu Stylistic Q738 | |
| Huawei Matebook E | |
* ... smaller is better
System Performance
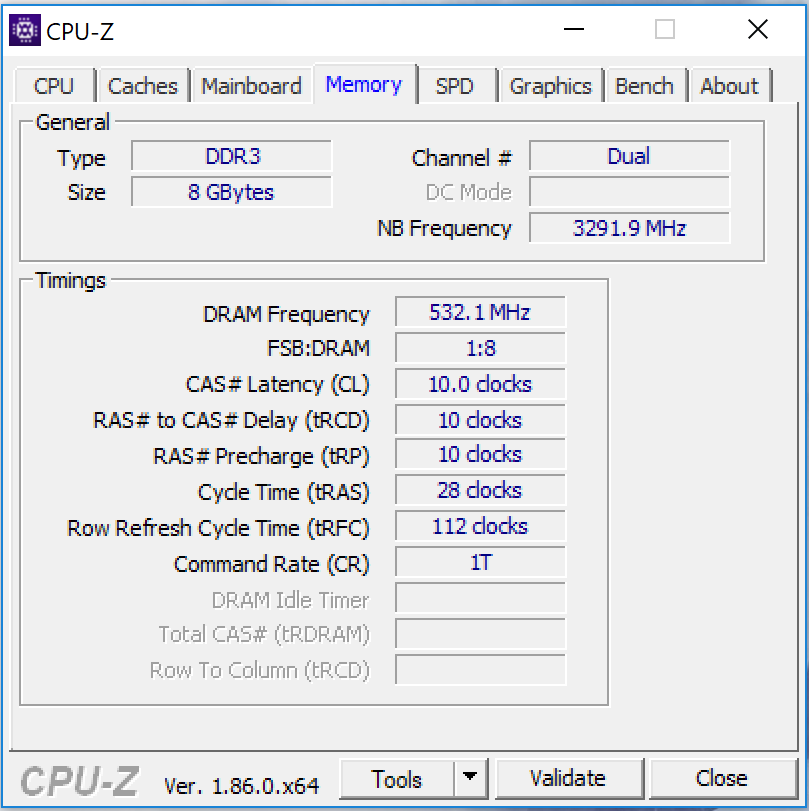
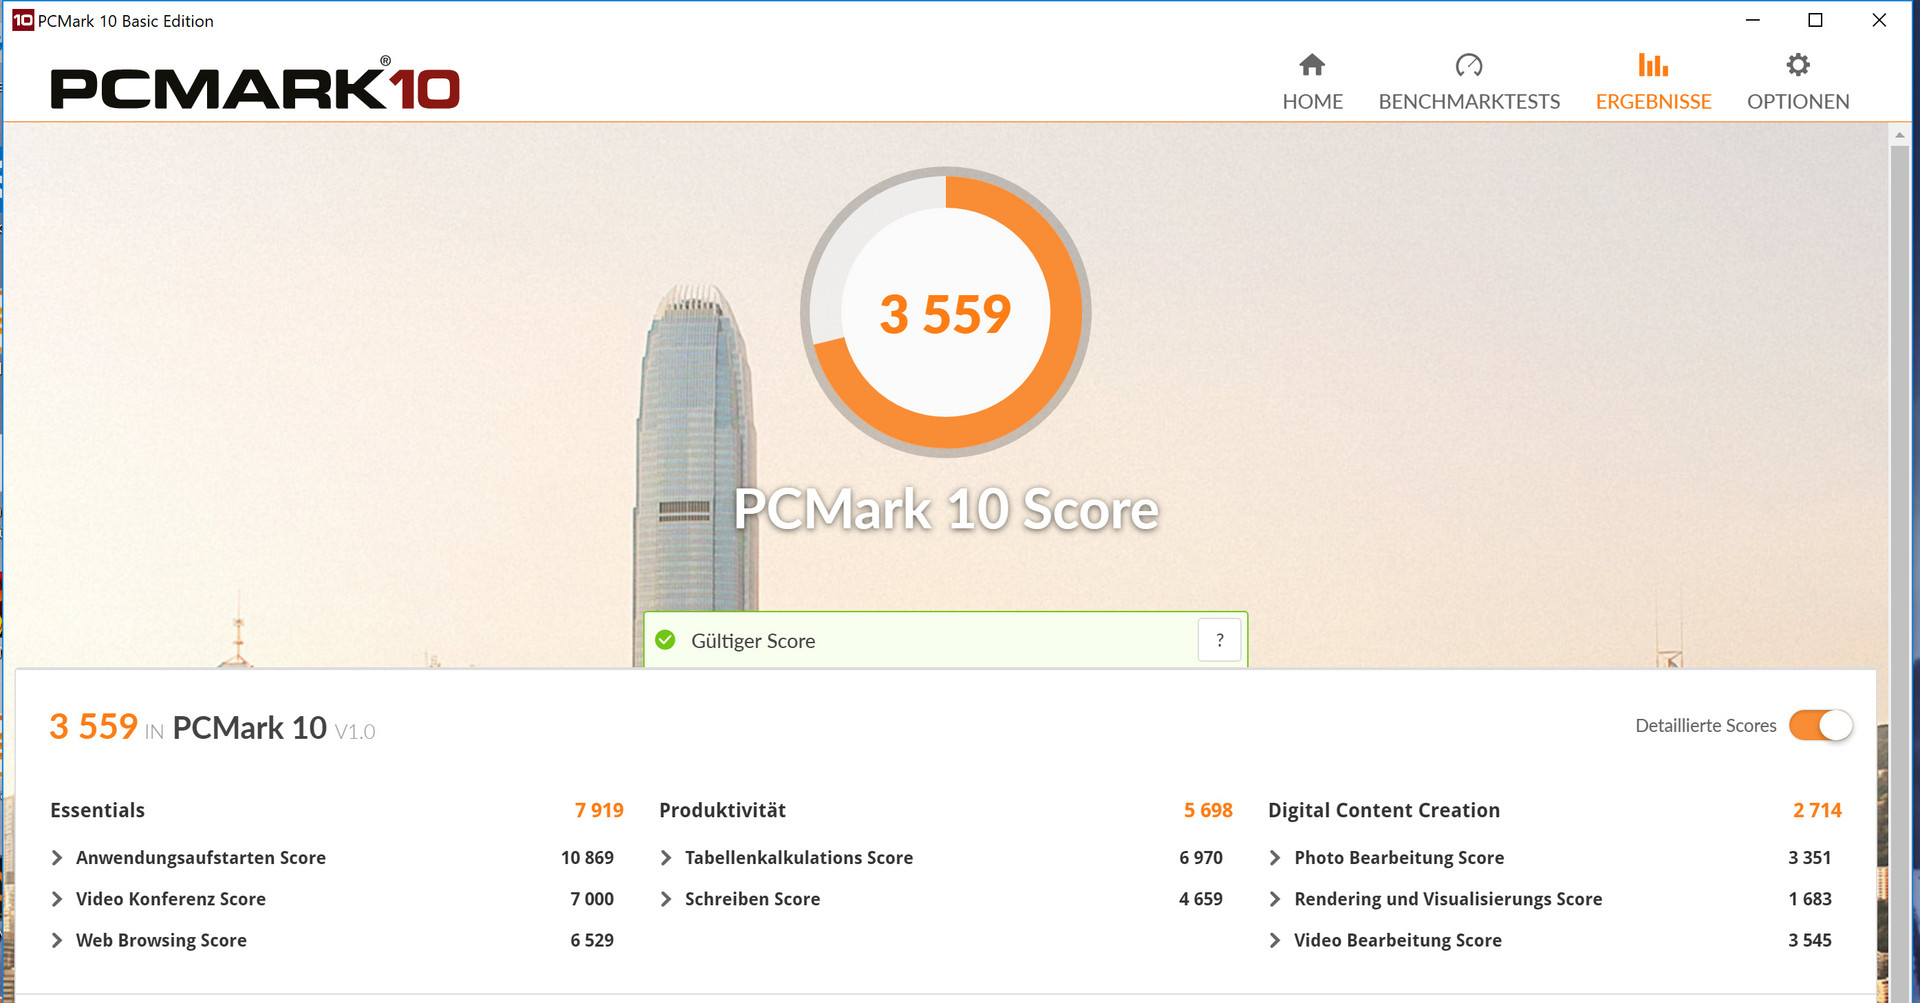
Thanks to the combination of a quad-core CPU, dual-channel RAM, and an NVMe SSD, system performance was more than adequate. We have not encountered any problems. The Elite x2 is more than powerful enough for everyday office and Internet tasks. The decent PCMark scores confirmed as much. In direct comparison with its competitors the x2 was significantly slower than the Lenovo Miix 520-12IKB. This can be attributed to the Miix’s lower display resolution (1920x1200) and higher single-thread performance.
| PCMark 7 Score | 5676 points | |
| PCMark 8 Home Score Accelerated v2 | 3413 points | |
| PCMark 8 Creative Score Accelerated v2 | 4669 points | |
| PCMark 8 Work Score Accelerated v2 | 4200 points | |
| PCMark 10 Score | 3559 points | |
Help | ||
Storage Devices
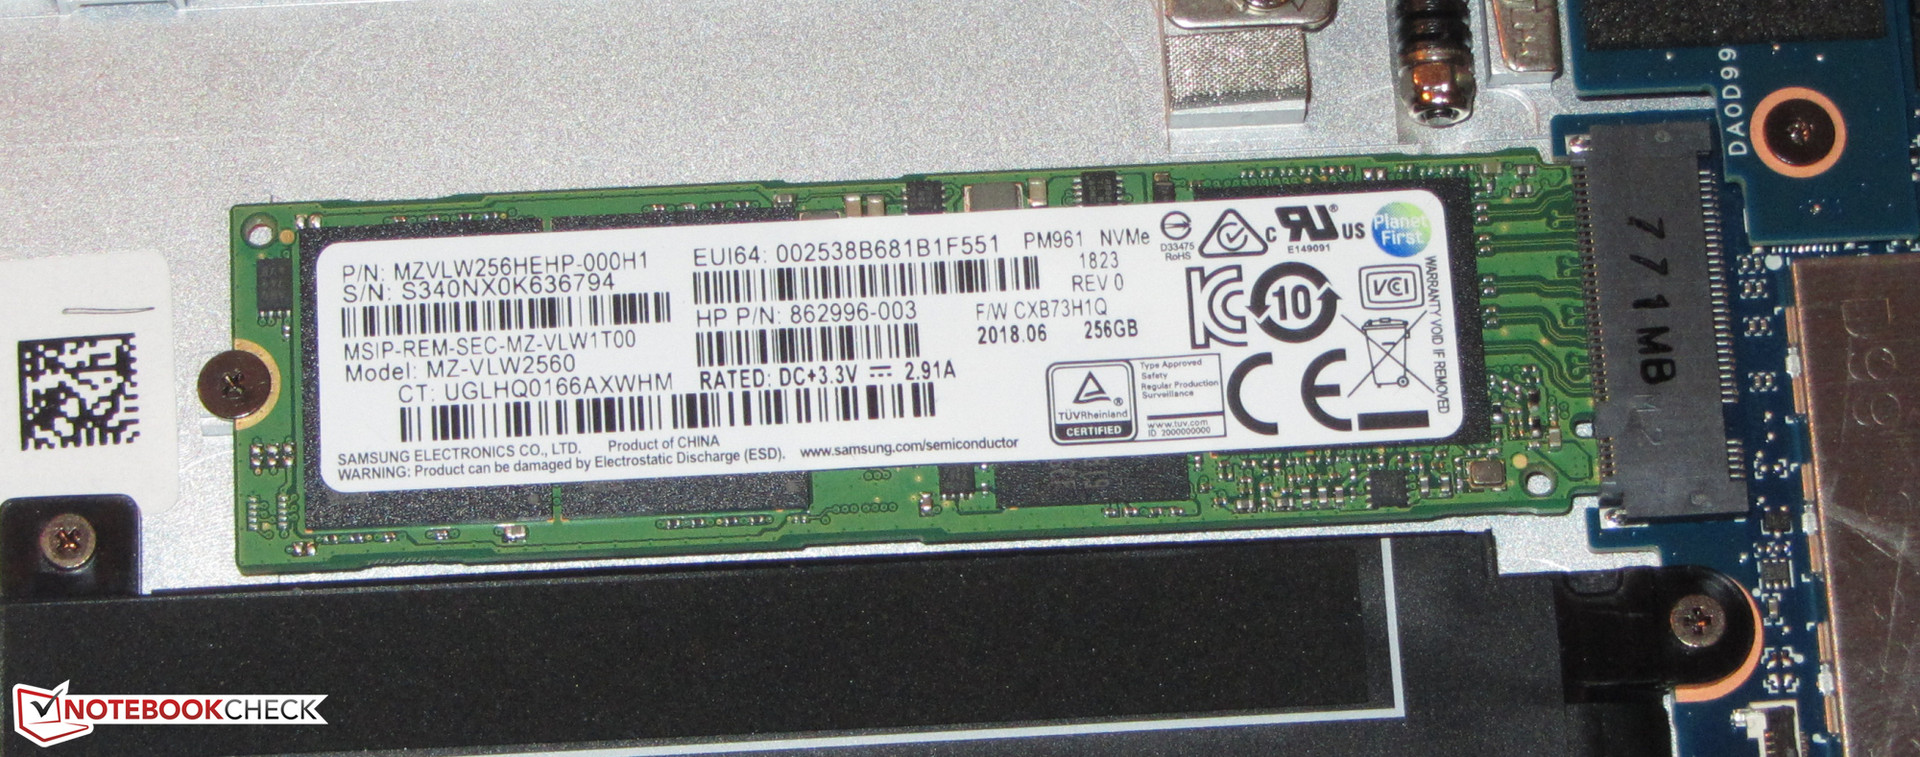
HP opted for a 256 GB M.2-2280 NVMe SSD made by Samsung. Out of the box, around 177 GB was usable with the rest taken up by the Windows installation and the recovery partition. Transfer rates were very high. NVMe SSDs tend to achieve much better results than SATA III SSDs due to their PCI Express 3.0 x4 bus connection. The M.2-2280 slot supports both NVMe and SATA III SSDs.

| HP Elite x2 1013 G3-2TT14EA Samsung PM961 MZVLW256HEHP | HP Elite x2 1012 G2-1LV76EA Samsung PM961 MZVLW256HEHP | Lenovo Miix 520-12IKB 20M3000LGE Samsung SSD PM961 1TB M.2 PCIe 3.0 x4 NVMe (MZVLW1T0) | Dell Latitude 12 5285 2-in-1 Samsung PM961 MZVLW256HEHP | Asus Transformer 4 Pro (i7-7500U, HD620) SK Hynix HFS256G39TND-N210A | Microsoft Surface Pro (2017) i7 Samsung PM971 KUS040202M | Microsoft Surface Pro (2017) i5 Samsung PM971 KUS030202M | Average Samsung PM961 MZVLW256HEHP | |
|---|---|---|---|---|---|---|---|---|
| CrystalDiskMark 3.0 | 30% | 14% | -9% | -45% | 4% | -15% | 14% | |
| Read Seq (MB/s) | 1786 | 1875 5% | 883 -51% | 1294 -28% | 475.3 -73% | 1308 -27% | 723 -60% | 1627 ? -9% |
| Write Seq (MB/s) | 1209 | 1261 4% | 932 -23% | 865 -28% | 260.9 -78% | 961 -21% | 853 -29% | 1136 ? -6% |
| Read 512 (MB/s) | 717 | 1235 72% | 586 -18% | 406 -43% | 289.3 -60% | 227.5 -68% | 225 -69% | 887 ? 24% |
| Write 512 (MB/s) | 798 | 844 6% | 627 -21% | 589 -26% | 260.7 -67% | 792 -1% | 445 -44% | 781 ? -2% |
| Read 4k (MB/s) | 49.66 | 56.9 15% | 54.8 10% | 31.75 -36% | 30.06 -39% | 53.6 8% | 46 -7% | 53 ? 7% |
| Write 4k (MB/s) | 104.2 | 145.4 40% | 139.3 34% | 72.2 -31% | 73.5 -29% | 136.3 31% | 125 20% | 126.7 ? 22% |
| Read 4k QD32 (MB/s) | 286 | 398.3 39% | 607 112% | 493.3 72% | 296.8 4% | 485.6 70% | 423 48% | 419 ? 47% |
| Write 4k QD32 (MB/s) | 298.4 | 472.5 58% | 498.5 67% | 434.5 46% | 239.8 -20% | 421.5 41% | 373 25% | 384 ? 29% |
GPU Performance
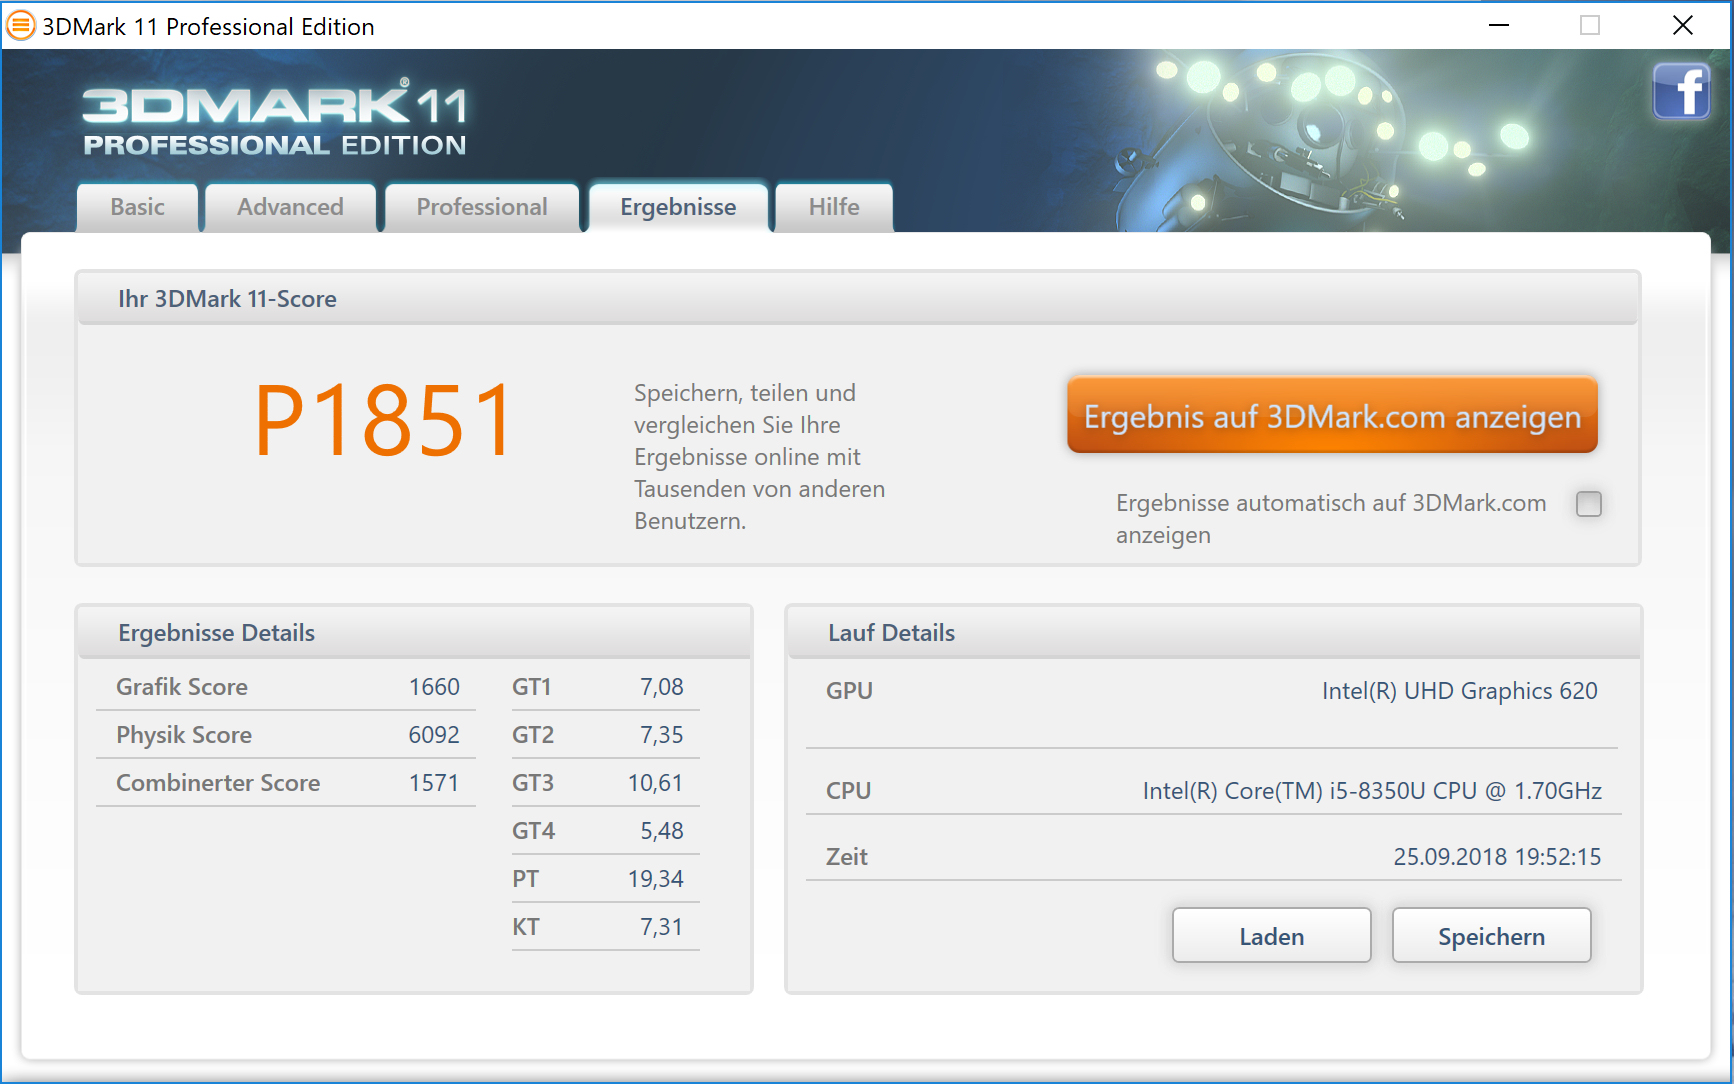
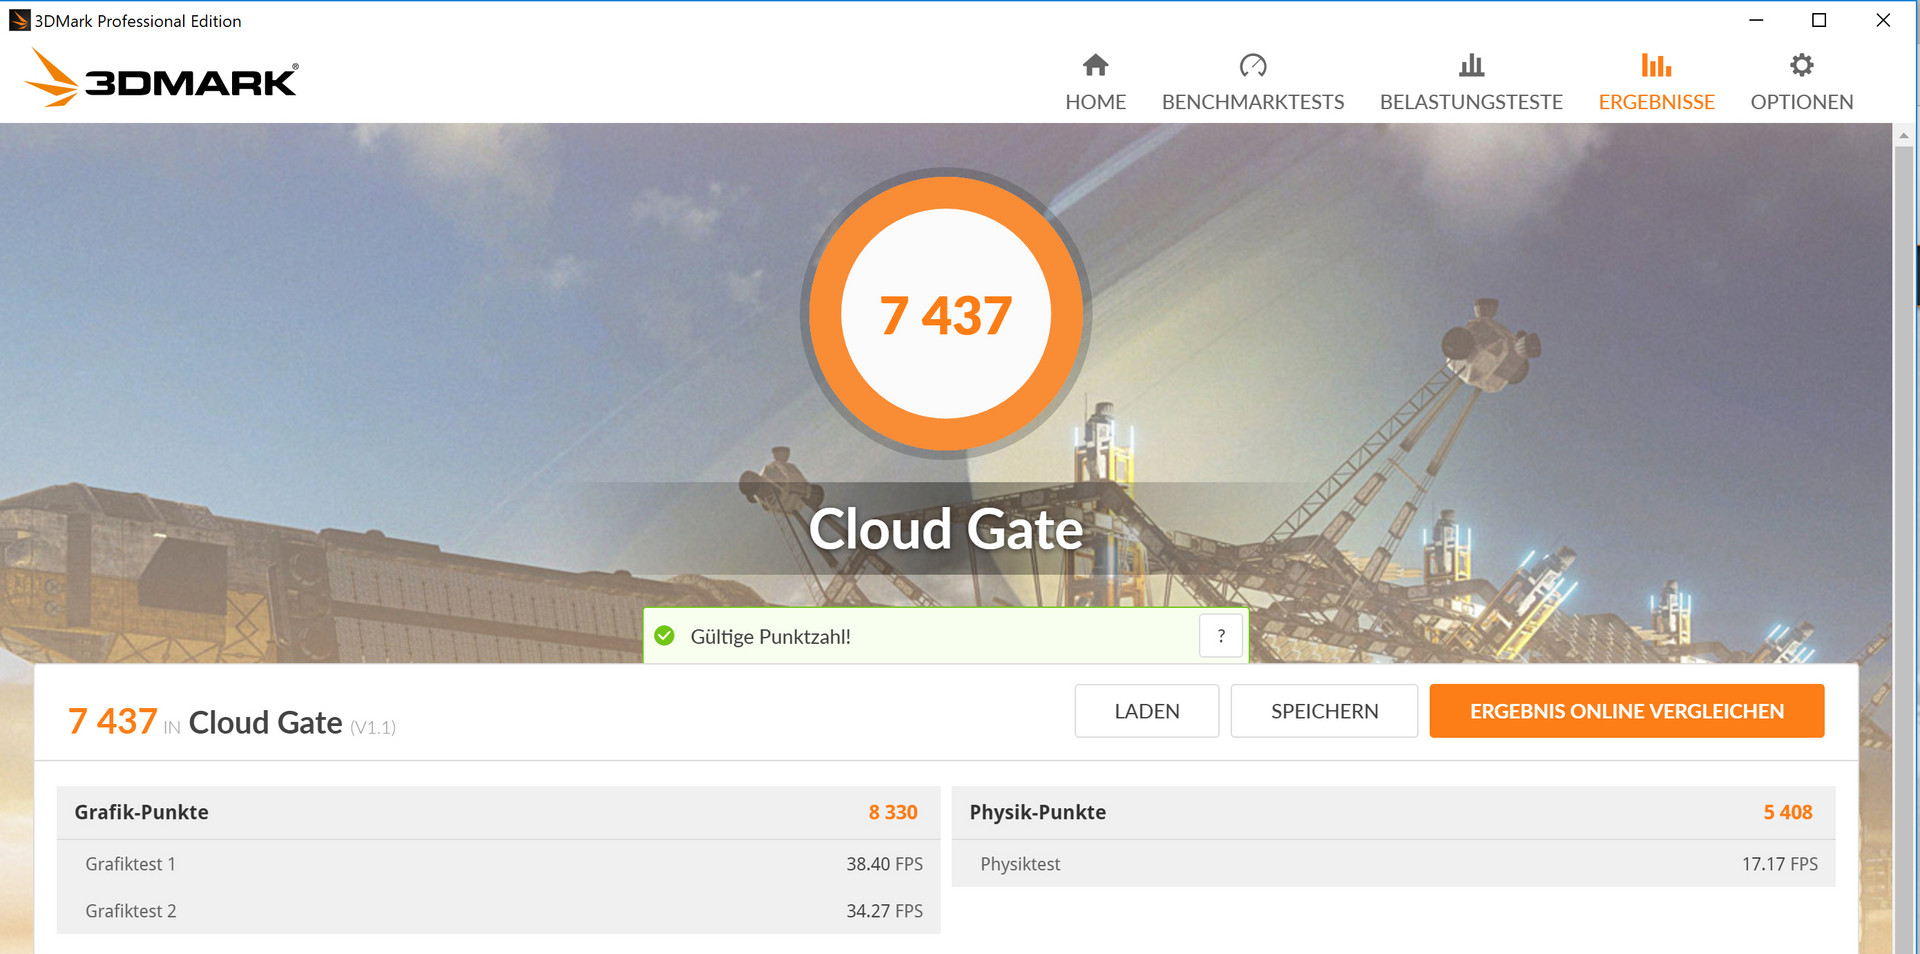
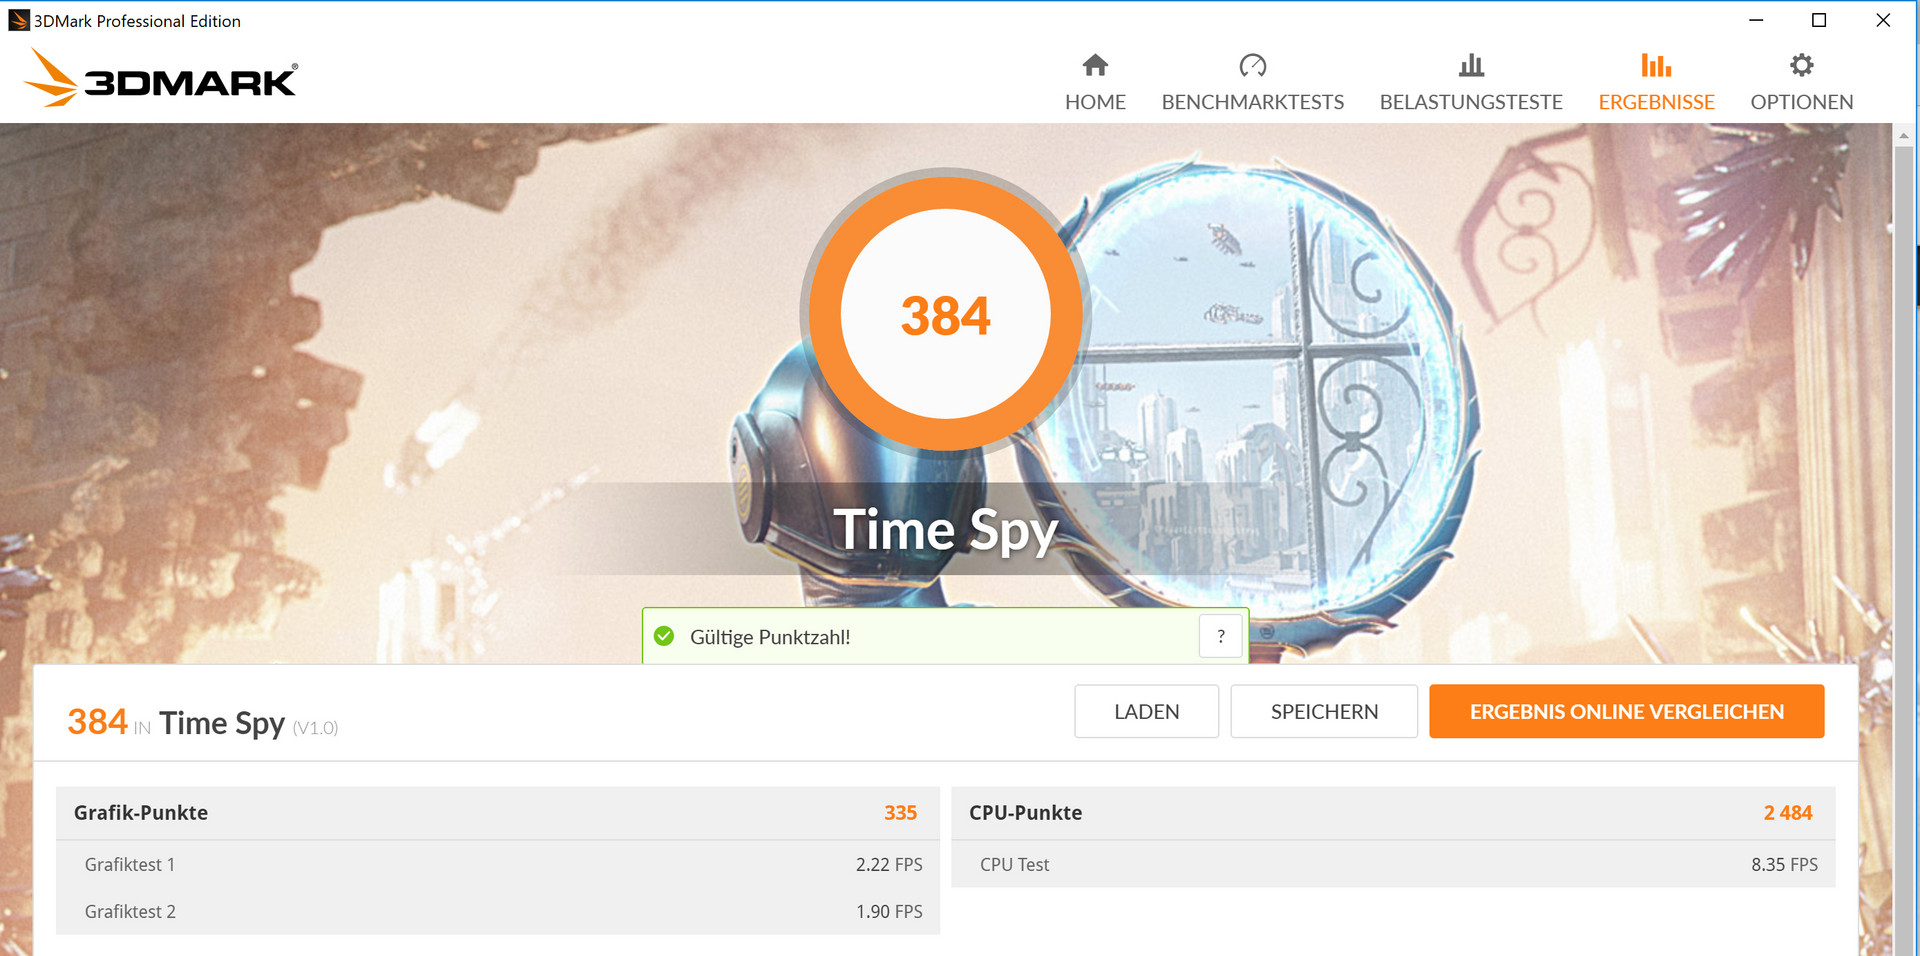
All things graphics are handled by Intel’s UHD Graphics 620. It supports DirectX 12 and runs at between 300 and 1,100 MHz. 3DMark benchmark scores were at a level expected of this GPU. It benefitted from the RAM’s dual-channel mode, which allows for a higher GPU performance.
| 3DMark 06 Standard Score | 10622 points | |
| 3DMark 11 Performance | 1851 points | |
| 3DMark Ice Storm Standard Score | 56649 points | |
| 3DMark Cloud Gate Standard Score | 7437 points | |
| 3DMark Fire Strike Score | 1026 points | |
| 3DMark Time Spy Score | 384 points | |
Help | ||
Gaming Performance
Some games were rendered smoothly by the Elite x2. Mostly those that were less demanding. Either way, lowered resolutions and reduced details were a necessity rather than an option. The enabled dual-channel mode made itself noticeable in higher frame rates than on comparable devices that had RAM running in single-channel mode.
| low | med. | high | ultra | |
|---|---|---|---|---|
| Tomb Raider (2013) | 91.5 | 45 | 28.6 | 12.8 |
| BioShock Infinite (2013) | 60.6 | 31.1 | 26.8 | 8.7 |
| Rise of the Tomb Raider (2016) | 17.2 | 11.4 | 6 | 3.1 |
| Tomb Raider - 1024x768 Low Preset | |
| HP Elite x2 1013 G3-2TT14EA | |
| Dell Latitude 12 5285 2-in-1 | |
| Average Intel UHD Graphics 620 (24.3 - 114.4, n=18) | |
Emissions
System Noise
Overall, the Elite x2 remained comparatively quiet regardless of load. When idle, the fans were off and the device was dead silent. Under load, the fans remained unobtrusive. During our stress test (Prime95 and FurMark simultaneously for at least a full hour) they peaked at just 32.9 dB(A). The noise they made was very discreet.
Noise level
| Idle |
| 30.3 / 30.3 / 31.2 dB(A) |
| Load |
| 32.8 / 32.9 dB(A) |
 | ||
30 dB silent 40 dB(A) audible 50 dB(A) loud |
||
min: | ||
| HP Elite x2 1013 G3-2TT14EA i5-8350U, UHD Graphics 620 | HP Elite x2 1012 G2-1LV76EA i5-7200U, HD Graphics 620 | Lenovo Miix 520-12IKB 20M3000LGE i5-8550U, UHD Graphics 620 | Dell Latitude 12 5285 2-in-1 i7-7600U, HD Graphics 620 | Asus Transformer 4 Pro (i7-7500U, HD620) i7-7500U, HD Graphics 620 | Microsoft Surface Pro (2017) i7 i7-7660U, Iris Plus Graphics 640 | Average Intel UHD Graphics 620 | Average of class Convertible | |
|---|---|---|---|---|---|---|---|---|
| Noise | 4% | -1% | 6% | 1% | 1% | 1% | 7% | |
| off / environment * (dB) | 30.3 | 29.5 3% | 30.2 -0% | 28.2 7% | 30.2 -0% | 29.6 2% | 29 ? 4% | 24.1 ? 20% |
| Idle Minimum * (dB) | 30.3 | 29.5 3% | 30.2 -0% | 28.2 7% | 30.2 -0% | 29.6 2% | 29.1 ? 4% | 24.3 ? 20% |
| Idle Average * (dB) | 30.3 | 29.5 3% | 30.2 -0% | 28.2 7% | 30.2 -0% | 29.6 2% | 29.1 ? 4% | 24.7 ? 18% |
| Idle Maximum * (dB) | 31.2 | 29.5 5% | 30.2 3% | 28.2 10% | 29.6 5% | 29.7 ? 5% | 25.4 ? 19% | |
| Load Average * (dB) | 32.8 | 30.6 7% | 33.4 -2% | 30.4 7% | 30.8 6% | 33.4 -2% | 33.5 ? -2% | 35.2 ? -7% |
| Load Maximum * (dB) | 32.9 | 32.5 1% | 34.2 -4% | 34 -3% | 32.9 -0% | 34.1 -4% | 36.1 ? -10% | 42.5 ? -29% |
| Witcher 3 ultra * (dB) | 33.4 |
* ... smaller is better
Temperature
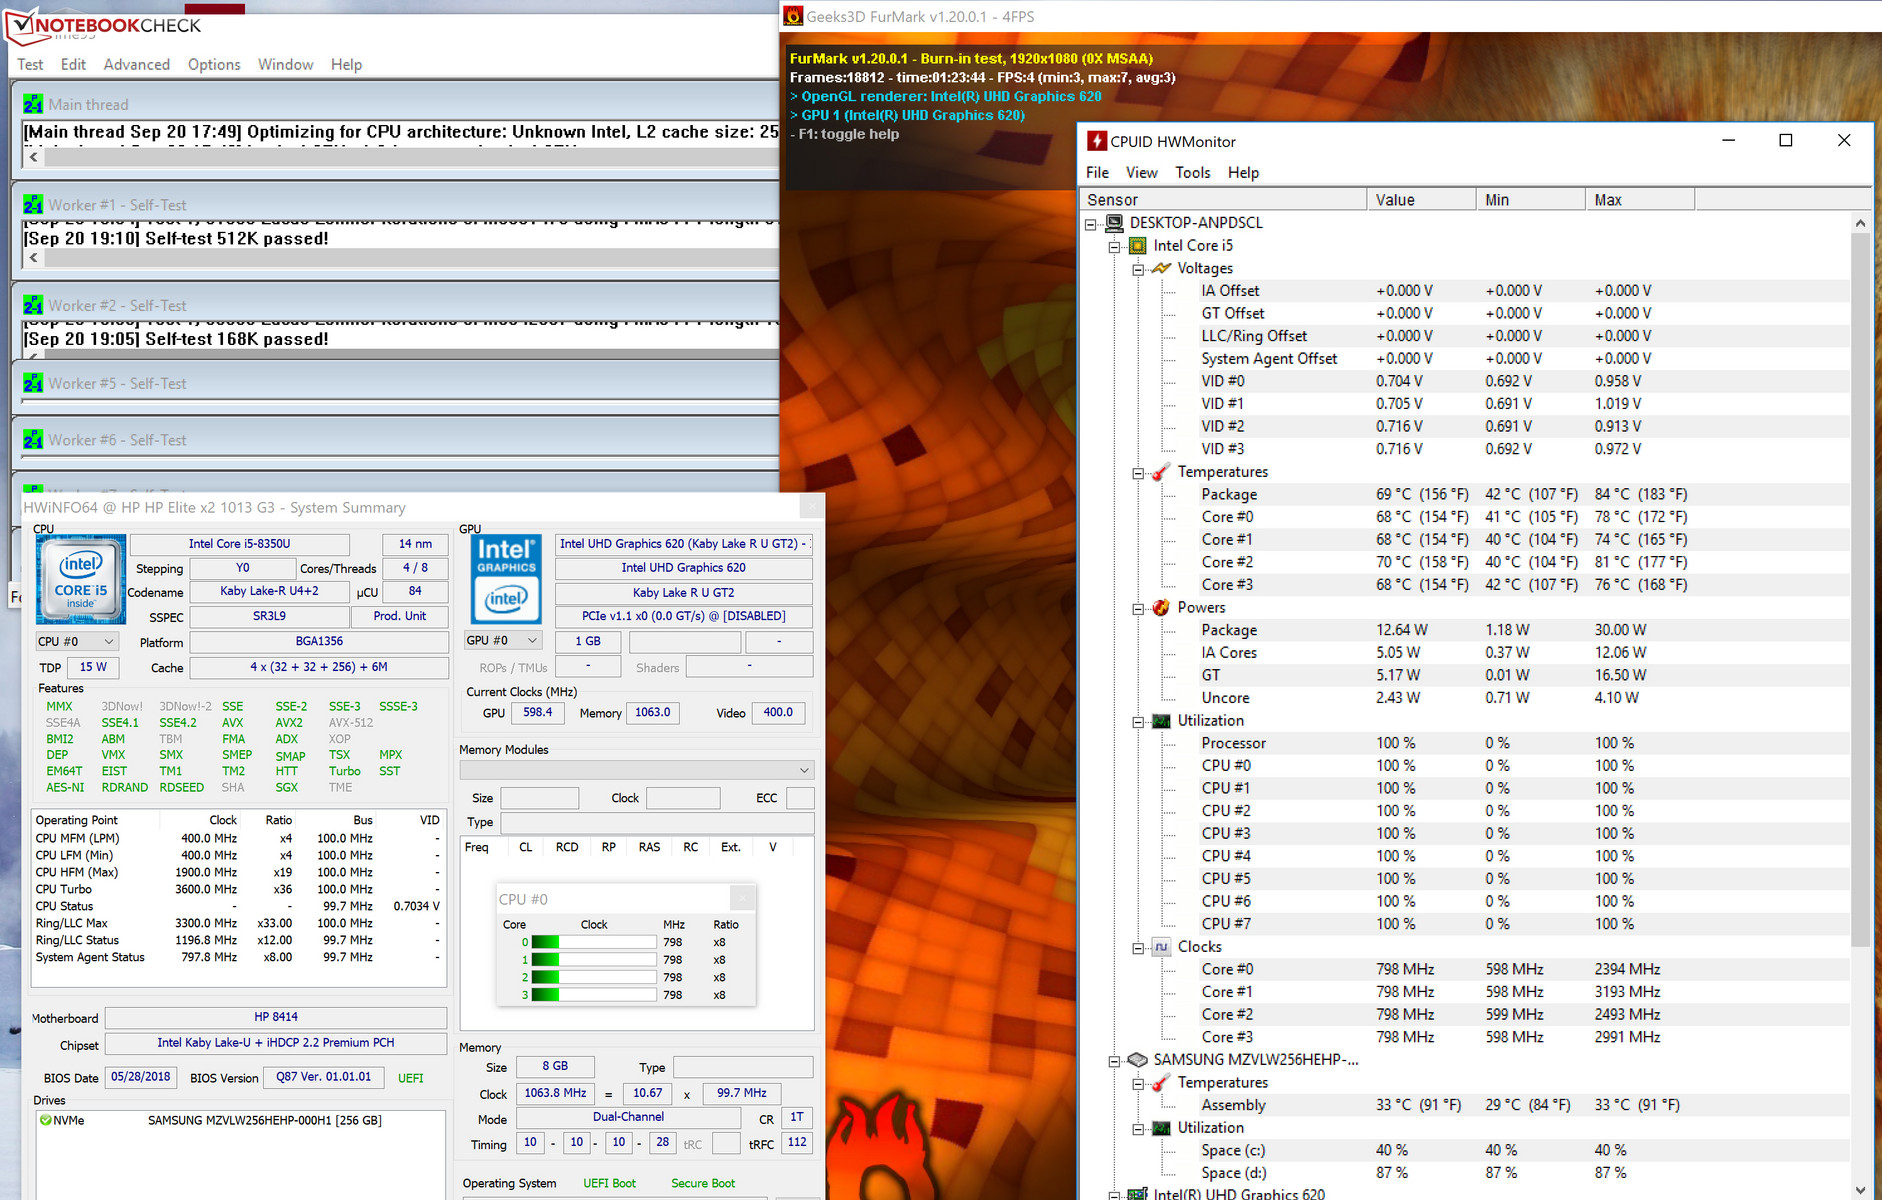
Our stress test (Prime95 and FurMark simultaneously for at least a full hour) was performed differently on battery and on mains. On mains, the CPU ran at 800-900 MHz while the GPU ran at between 600 and 750 MHz. On battery, the CPU ran at 1.3 GHz while the GPU’s clock speeds were reduced even more to just 500-550 MHz. Keep in mind that our stress test is an extreme load scenario that is unlikely to be ever encountered in the wild. We use this test to determine whether or not a system is stable even at extreme loads.
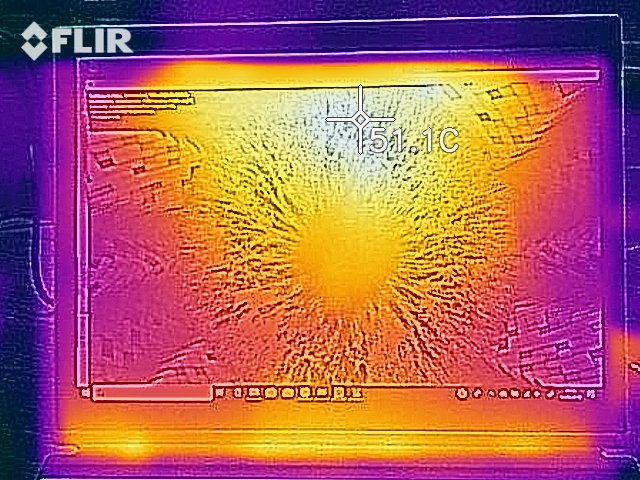
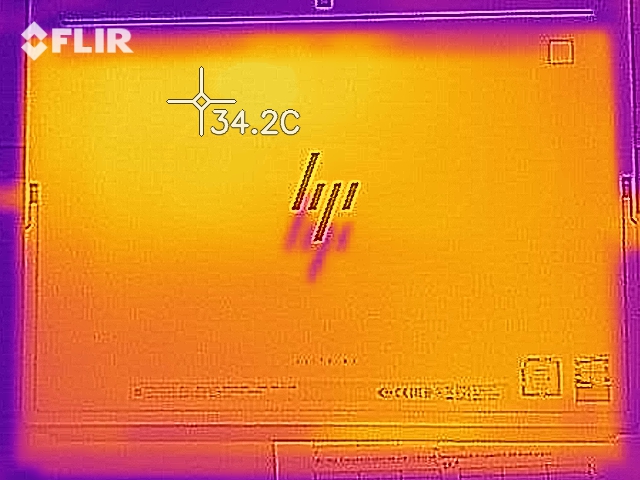
Under maximum load our review unit got pretty warm and crossed the 40 °C threshold in several areas simultaneously. It was warmer than expected when idle as well but still far from annoying or even worrying.
(-) The maximum temperature on the upper side is 49.4 °C / 121 F, compared to the average of 35.4 °C / 96 F, ranging from 19.6 to 60 °C for the class Convertible.
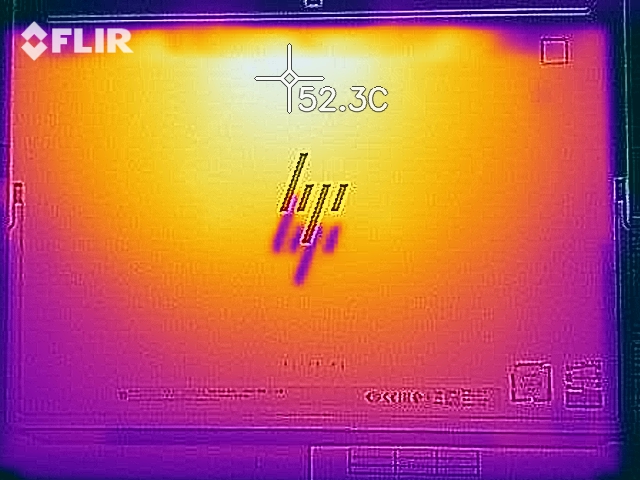
(-) The bottom heats up to a maximum of 47.1 °C / 117 F, compared to the average of 36.9 °C / 98 F
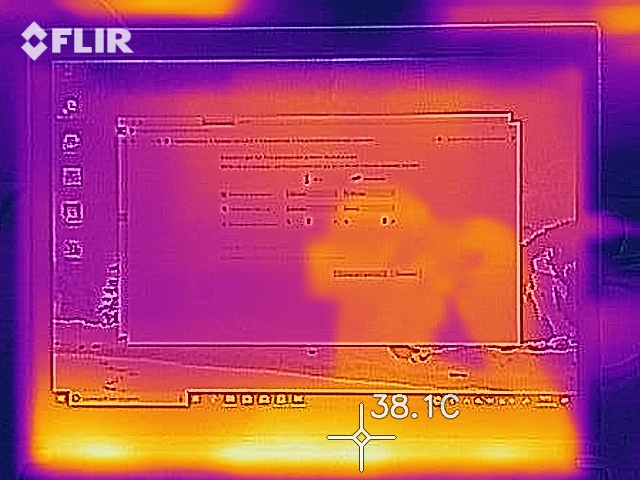
(±) In idle usage, the average temperature for the upper side is 32.2 °C / 90 F, compared to the device average of 30.3 °C / 87 F.
(-) The palmrests and touchpad can get very hot to the touch with a maximum of 41 °C / 105.8 F.
(-) The average temperature of the palmrest area of similar devices was 28 °C / 82.4 F (-13 °C / -23.4 F).
| HP Elite x2 1013 G3-2TT14EA i5-8350U, UHD Graphics 620 | HP Elite x2 1012 G2-1LV76EA i5-7200U, HD Graphics 620 | Lenovo Miix 520-12IKB 20M3000LGE i5-8550U, UHD Graphics 620 | Dell Latitude 12 5285 2-in-1 i7-7600U, HD Graphics 620 | Asus Transformer 4 Pro (i7-7500U, HD620) i7-7500U, HD Graphics 620 | Microsoft Surface Pro (2017) i7 i7-7660U, Iris Plus Graphics 640 | Microsoft Surface Pro (2017) i5 i5-7300U, HD Graphics 620 | Average Intel UHD Graphics 620 | Average of class Convertible | |
|---|---|---|---|---|---|---|---|---|---|
| Heat | 15% | 5% | 12% | 16% | 13% | 8% | 16% | 15% | |
| Maximum Upper Side * (°C) | 49.4 | 42.3 14% | 43.7 12% | 38.2 23% | 40.5 18% | 42 15% | 39.2 21% | 41.1 ? 17% | 42.1 ? 15% |
| Maximum Bottom * (°C) | 47.1 | 44.5 6% | 44.5 6% | 48.6 -3% | 37 21% | 42 11% | 40.3 14% | 44.3 ? 6% | 43.7 ? 7% |
| Idle Upper Side * (°C) | 38 | 29.5 22% | 38 -0% | 29.6 22% | 31.1 18% | 31 18% | 37 3% | 26.8 ? 29% | 27.5 ? 28% |
| Idle Bottom * (°C) | 30.8 | 25.2 18% | 30.8 -0% | 28.8 6% | 28.2 8% | 28 9% | 32.3 -5% | 27.7 ? 10% | 28.4 ? 8% |
* ... smaller is better
Speakers
The device features front-facing stereo speakers that can be found in the upper corners on both sides of the tablet. Their sound characteristic was pleasant and full, and it was good enough for extensive long-term use. The soundscape could use more bass, though. For an improved audio experience we recommend using external speakers or headphones.
HP Elite x2 1013 G3-2TT14EA audio analysis
(±) | speaker loudness is average but good (74.4 dB)
Bass 100 - 315 Hz
(-) | nearly no bass - on average 15.1% lower than median
(±) | linearity of bass is average (10.9% delta to prev. frequency)
Mids 400 - 2000 Hz
(±) | higher mids - on average 7.9% higher than median
(±) | linearity of mids is average (11.3% delta to prev. frequency)
Highs 2 - 16 kHz
(±) | higher highs - on average 5.2% higher than median
(+) | highs are linear (6.8% delta to prev. frequency)
Overall 100 - 16.000 Hz
(±) | linearity of overall sound is average (20.8% difference to median)
Compared to same class
» 55% of all tested devices in this class were better, 10% similar, 35% worse
» The best had a delta of 6%, average was 20%, worst was 57%
Compared to all devices tested
» 56% of all tested devices were better, 8% similar, 36% worse
» The best had a delta of 4%, average was 23%, worst was 134%
Apple MacBook 12 (Early 2016) 1.1 GHz audio analysis
(+) | speakers can play relatively loud (83.6 dB)
Bass 100 - 315 Hz
(±) | reduced bass - on average 11.3% lower than median
(±) | linearity of bass is average (14.2% delta to prev. frequency)
Mids 400 - 2000 Hz
(+) | balanced mids - only 2.4% away from median
(+) | mids are linear (5.5% delta to prev. frequency)
Highs 2 - 16 kHz
(+) | balanced highs - only 2% away from median
(+) | highs are linear (4.5% delta to prev. frequency)
Overall 100 - 16.000 Hz
(+) | overall sound is linear (10.2% difference to median)
Compared to same class
» 7% of all tested devices in this class were better, 2% similar, 90% worse
» The best had a delta of 5%, average was 18%, worst was 53%
Compared to all devices tested
» 5% of all tested devices were better, 1% similar, 94% worse
» The best had a delta of 4%, average was 23%, worst was 134%
Energy Management
Power Consumption
Idle power consumption was measured at 11 W, which is identical to its predecessor. The display was the main culprit for this relatively high power consumption. FHD tablets tend to be more efficient. During our stress test (Prime95 and FurMark running simultaneously for at least a full hour) power consumption peaked at 36 W. With just Prime95, it went even higher and reached a maximum of 55.2 W. The included USB-C power supply is rated at 65 W.
| Off / Standby | |
| Idle | |
| Load |
|
Key:
min: | |
| HP Elite x2 1013 G3-2TT14EA i5-8350U, UHD Graphics 620 | HP Elite x2 1012 G2-1LV76EA i5-7200U, HD Graphics 620 | Lenovo Miix 520-12IKB 20M3000LGE i5-8550U, UHD Graphics 620 | Dell Latitude 12 5285 2-in-1 i7-7600U, HD Graphics 620 | Asus Transformer 4 Pro (i7-7500U, HD620) i7-7500U, HD Graphics 620 | Microsoft Surface Pro (2017) i7 i7-7660U, Iris Plus Graphics 640 | Microsoft Surface Pro (2017) i5 i5-7300U, HD Graphics 620 | Average Intel UHD Graphics 620 | Average of class Convertible | |
|---|---|---|---|---|---|---|---|---|---|
| Power Consumption | -6% | 14% | 19% | 34% | -7% | 22% | 5% | -15% | |
| Idle Minimum * (Watt) | 4.9 | 4.1 16% | 3.9 20% | 2.85 42% | 3.4 31% | 4.2 14% | 3.6 27% | 3.81 ? 22% | 4.28 ? 13% |
| Idle Average * (Watt) | 8.9 | 9.2 -3% | 8.2 8% | 6.76 24% | 5.7 36% | 10.1 -13% | 8.1 9% | 6.94 ? 22% | 6.96 ? 22% |
| Idle Maximum * (Watt) | 11 | 11.1 -1% | 8.4 24% | 6.91 37% | 7.4 33% | 14 -27% | 8.7 21% | 8.75 ? 20% | 8.67 ? 21% |
| Load Average * (Watt) | 32 | 33.8 -6% | 25.2 21% | 32.88 -3% | 15 53% | 37.4 -17% | 25.5 20% | 35 ? -9% | 45.1 ? -41% |
| Load Maximum * (Watt) | 36 | 49.2 -37% | 37 -3% | 37.41 -4% | 29.7 17% | 34 6% | 23.5 35% | 47.5 ? -32% | 67.7 ? -88% |
| Witcher 3 ultra * (Watt) | 38.1 |
* ... smaller is better
Battery Life
In our real-life Wi-Fi battery test, the Elite x2 powered off after 7:39 hours. We use this test to simulate browsing usage by loading various websites with the power profile set to “Balanced” and display brightness set to 150 nits. In the video test, the HP device lasted for 6:29 hours. In this test we determine how long a device lasts during video playback by running the short film Big Buck Bunny (H.264, 1920x1080) in a loop. All radios are disabled, the profile is set to “Balanced”, and display brightness is set to 150 nits. All things considered, the Elite x2 1013 G3 performed very similar to its own predecessor but managed to outlast it in the Wi-Fi test.
Please note that the only energy profile available on the Elite x2 was “Balanced”. Accordingly, we had to run all of our tests with these settings. The profiles “Power Saving” and “High Performance” were not available, and we were unable to create them retroactively.
| HP Elite x2 1013 G3-2TT14EA i5-8350U, UHD Graphics 620, 50 Wh | HP Elite x2 1012 G2-1LV76EA i5-7200U, HD Graphics 620, 47 Wh | Lenovo Miix 520-12IKB 20M3000LGE i5-8550U, UHD Graphics 620, 38 Wh | Dell Latitude 12 5285 2-in-1 i7-7600U, HD Graphics 620, 42 Wh | Asus Transformer 4 Pro (i7-7500U, HD620) i7-7500U, HD Graphics 620, 39 Wh | Microsoft Surface Pro (2017) i7 i7-7660U, Iris Plus Graphics 640, 45 Wh | Microsoft Surface Pro (2017) i5 i5-7300U, HD Graphics 620, 45 Wh | Average of class Convertible | |
|---|---|---|---|---|---|---|---|---|
| Battery runtime | -4% | -27% | 7% | -15% | 15% | 39% | 67% | |
| Reader / Idle (h) | 13 | 13.9 7% | 17.9 38% | 14 8% | 17.6 35% | 26.7 ? 105% | ||
| H.264 (h) | 6.5 | 6.3 -3% | 10.2 57% | 15 ? 131% | ||||
| WiFi v1.3 (h) | 7.7 | 6.3 -18% | 5.6 -27% | 8.1 5% | 4.7 -39% | 8.2 6% | 12.4 61% | 12 ? 56% |
| Load (h) | 2.3 | 2.3 0% | 1.8 -22% | 2 -13% | 1.9 -17% | 2.8 22% | 1.713 ? -26% | |
| Witcher 3 ultra (h) | 1.9 |
Verdict
Pros
Cons
HP’s Elite x2 1013 G3 is a 13-inch 2-in-1 device aimed primarily at business customers. It is the successor to the Elite x2 1012 G2. Given that the 1013 G3 is a complete overhaul these two don’t have a lot in common. Subjectively, the new device is sleeker and thinner than its predecessor.
It is powered by a Core i5-8350U CPU that offers more than enough performance for everyday office and Internet tasks. The device remained very quiet regardless of load and stayed fairly cool during everyday use. It is very fast thanks to its NVMe SSD. The SSD can be replaced.
HP’s Elite x2 1013 G3 is a well-made 2-in-1 device. We found only a few things to criticize. Among others, we would have expected an LTE modem considering the device’s high price of almost $2,000.
The included keyboard dock did a very good job. The keyboard allowed for quick and smooth typing, and it was even suitable for extended and regular typing sessions. It also features a keyboard backlight. Battery life was decent. The Surface Pro (2017) had a lot more to offer in this regard.
The 13-inch 3:2 high-contrast display was very bright and offered wide viewing angles. The touchscreen supports finger as well as stylus input. Our review unit lacked an LTE modem, but it was WWAN-ready. In other words: An LTE modem can be fitted retroactively.
HP Elite x2 1013 G3-2TT14EA
- 10/17/2019 v7 (old)
Sascha Mölck
Price comparison

