Dell Latitude 5290 2-in-1 (i5-8350U) Convertible Review
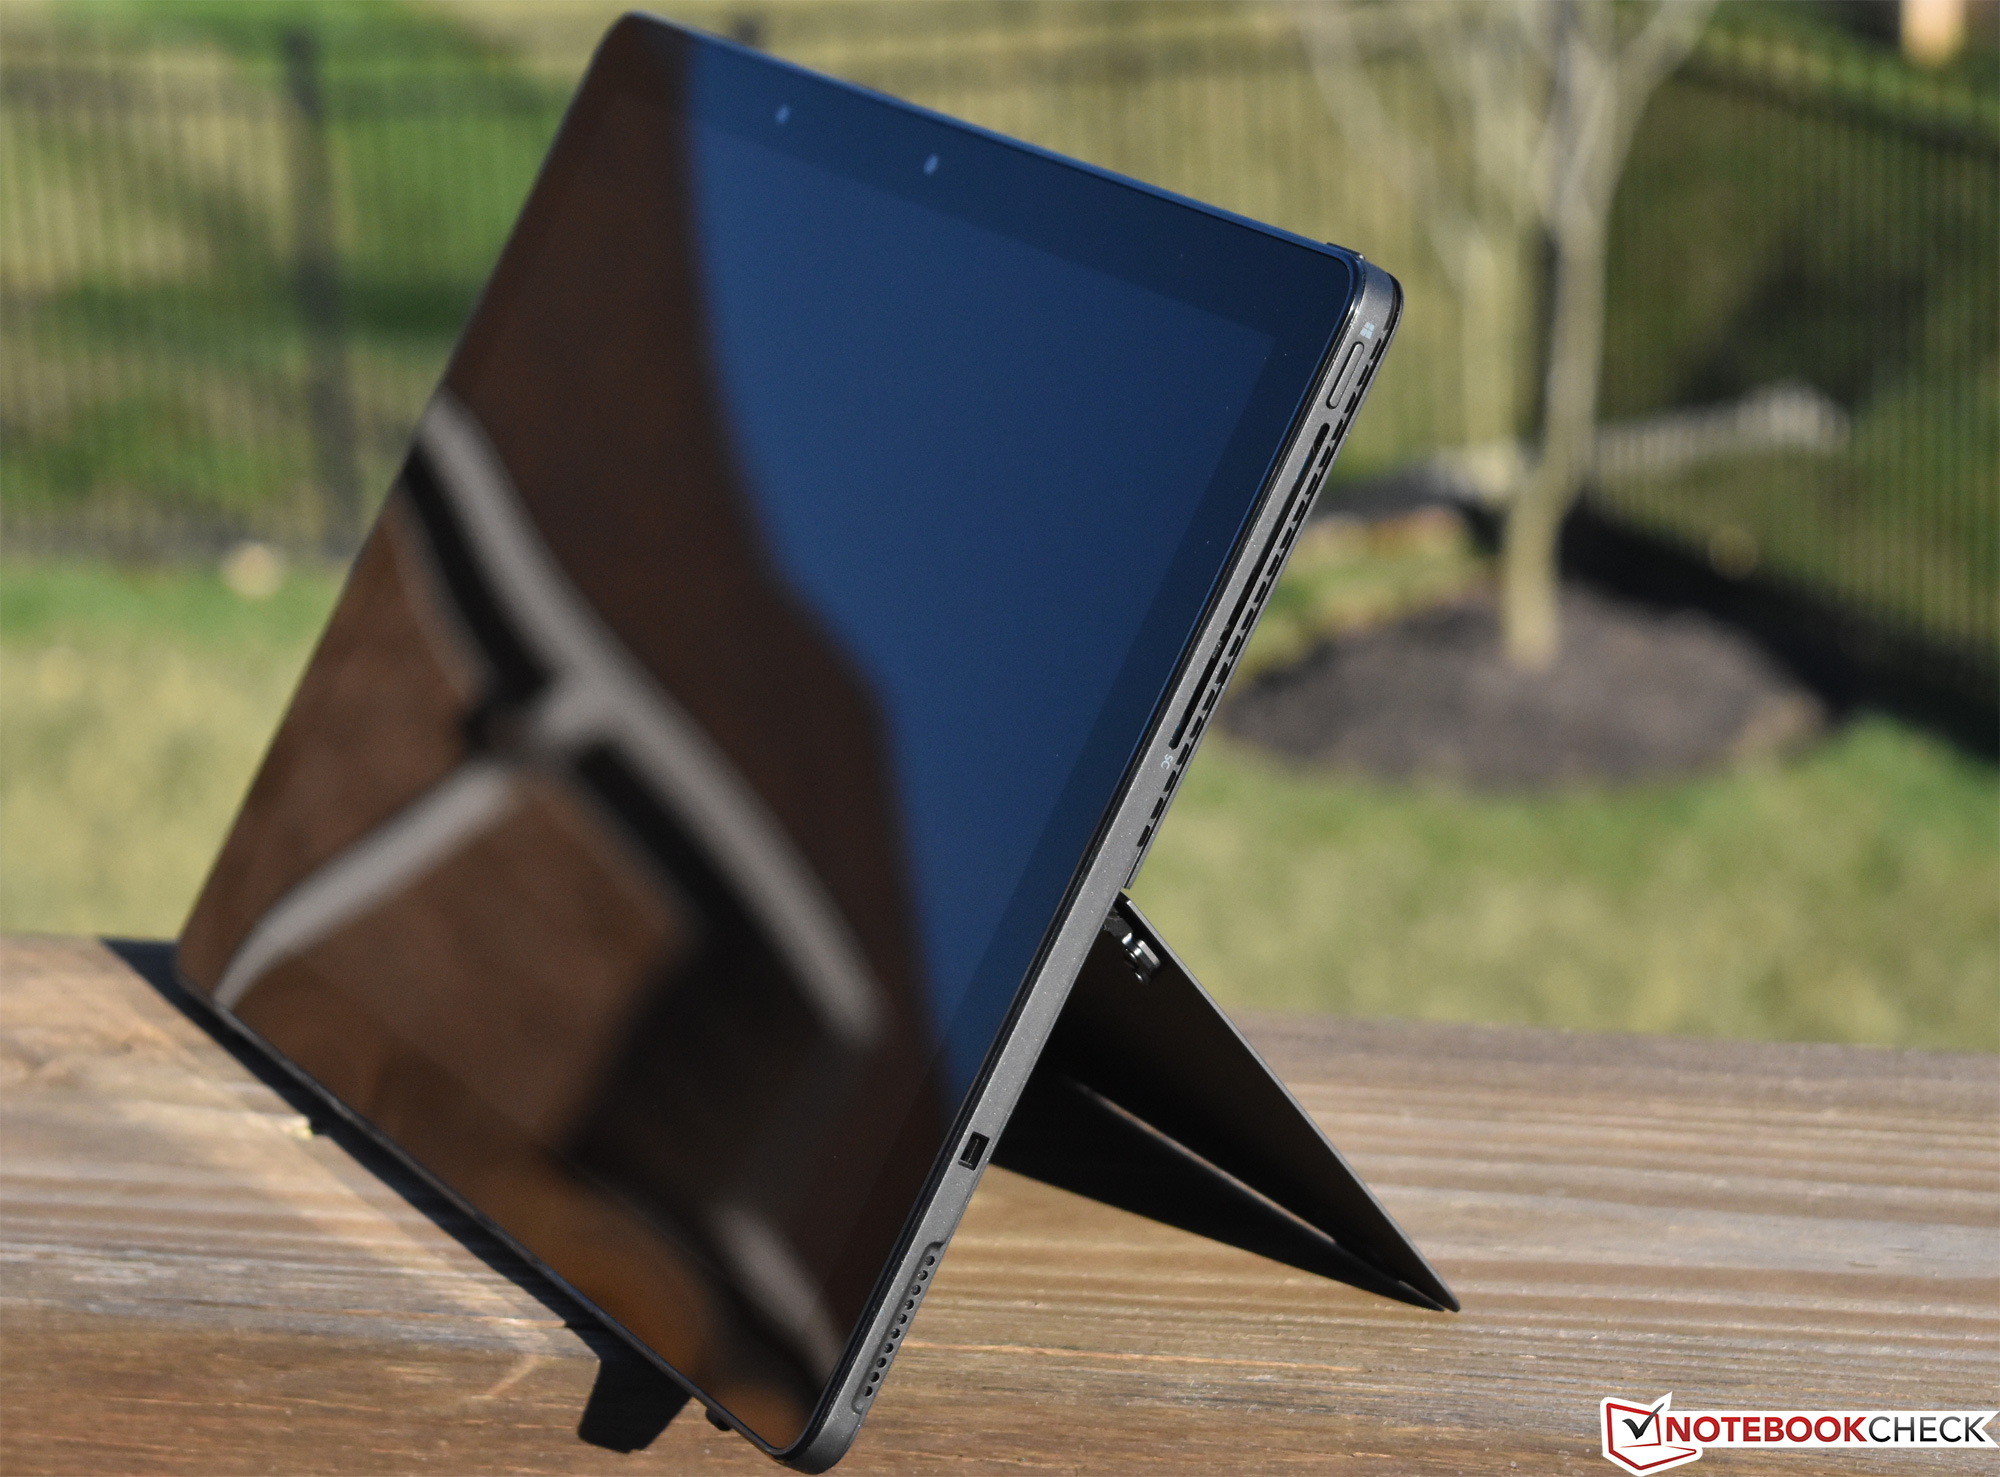
As we continue our romp through the most recent batch of Dell chipset refreshes, our next candidate is arguably the closest thing to a business-grade Microsoft Surface Pro that currently exists. Upon first glance, the two devices are nearly identical in a lot of ways, right down to the fundamental kickstand design and keyboard type cover. The 3:2 aspect ratio is also a common trait, as is the slotted edge-based vent design. However, under the hood, a lot of things are different.
On the other hand, last year’s Latitude 5285 is practically the same device as the 5290 2-in-1; the latter simply introduces an 8th-generation Intel SoC and some (very) minor revisions elsewhere. In our previous review nearly a year ago, we praised the Dell’s solid performance, bright display, quiet operation, and ease of maintenance. Meanwhile, we also lamented its proclivity for extremely hot operation, a lack of Thunderbolt connectivity, relatively heavy weight, disappointing warranty, and high price. At first glance, at least a few of these items haven’t changed since the last review—but our focus today will be on what has improved, and whether or not those improvements can justify the cost of the Latitude in comparison with other business competitors and even the Surface Pro itself.
Today’s review unit features a quad-core Intel Core i5-8350U, 8 GB LPDDR3 RAM, a 256 GB Toshiba NVMe SSD, and a 1920x1280 3:2 aspect ratio touch display. It also includes the keyboard type cover and the Dell Active Pen, all for around $1,932 as of this writing direct from Dell. Does the Latitude 5290 2-in-1 do enough to keep up with its peers?
Case
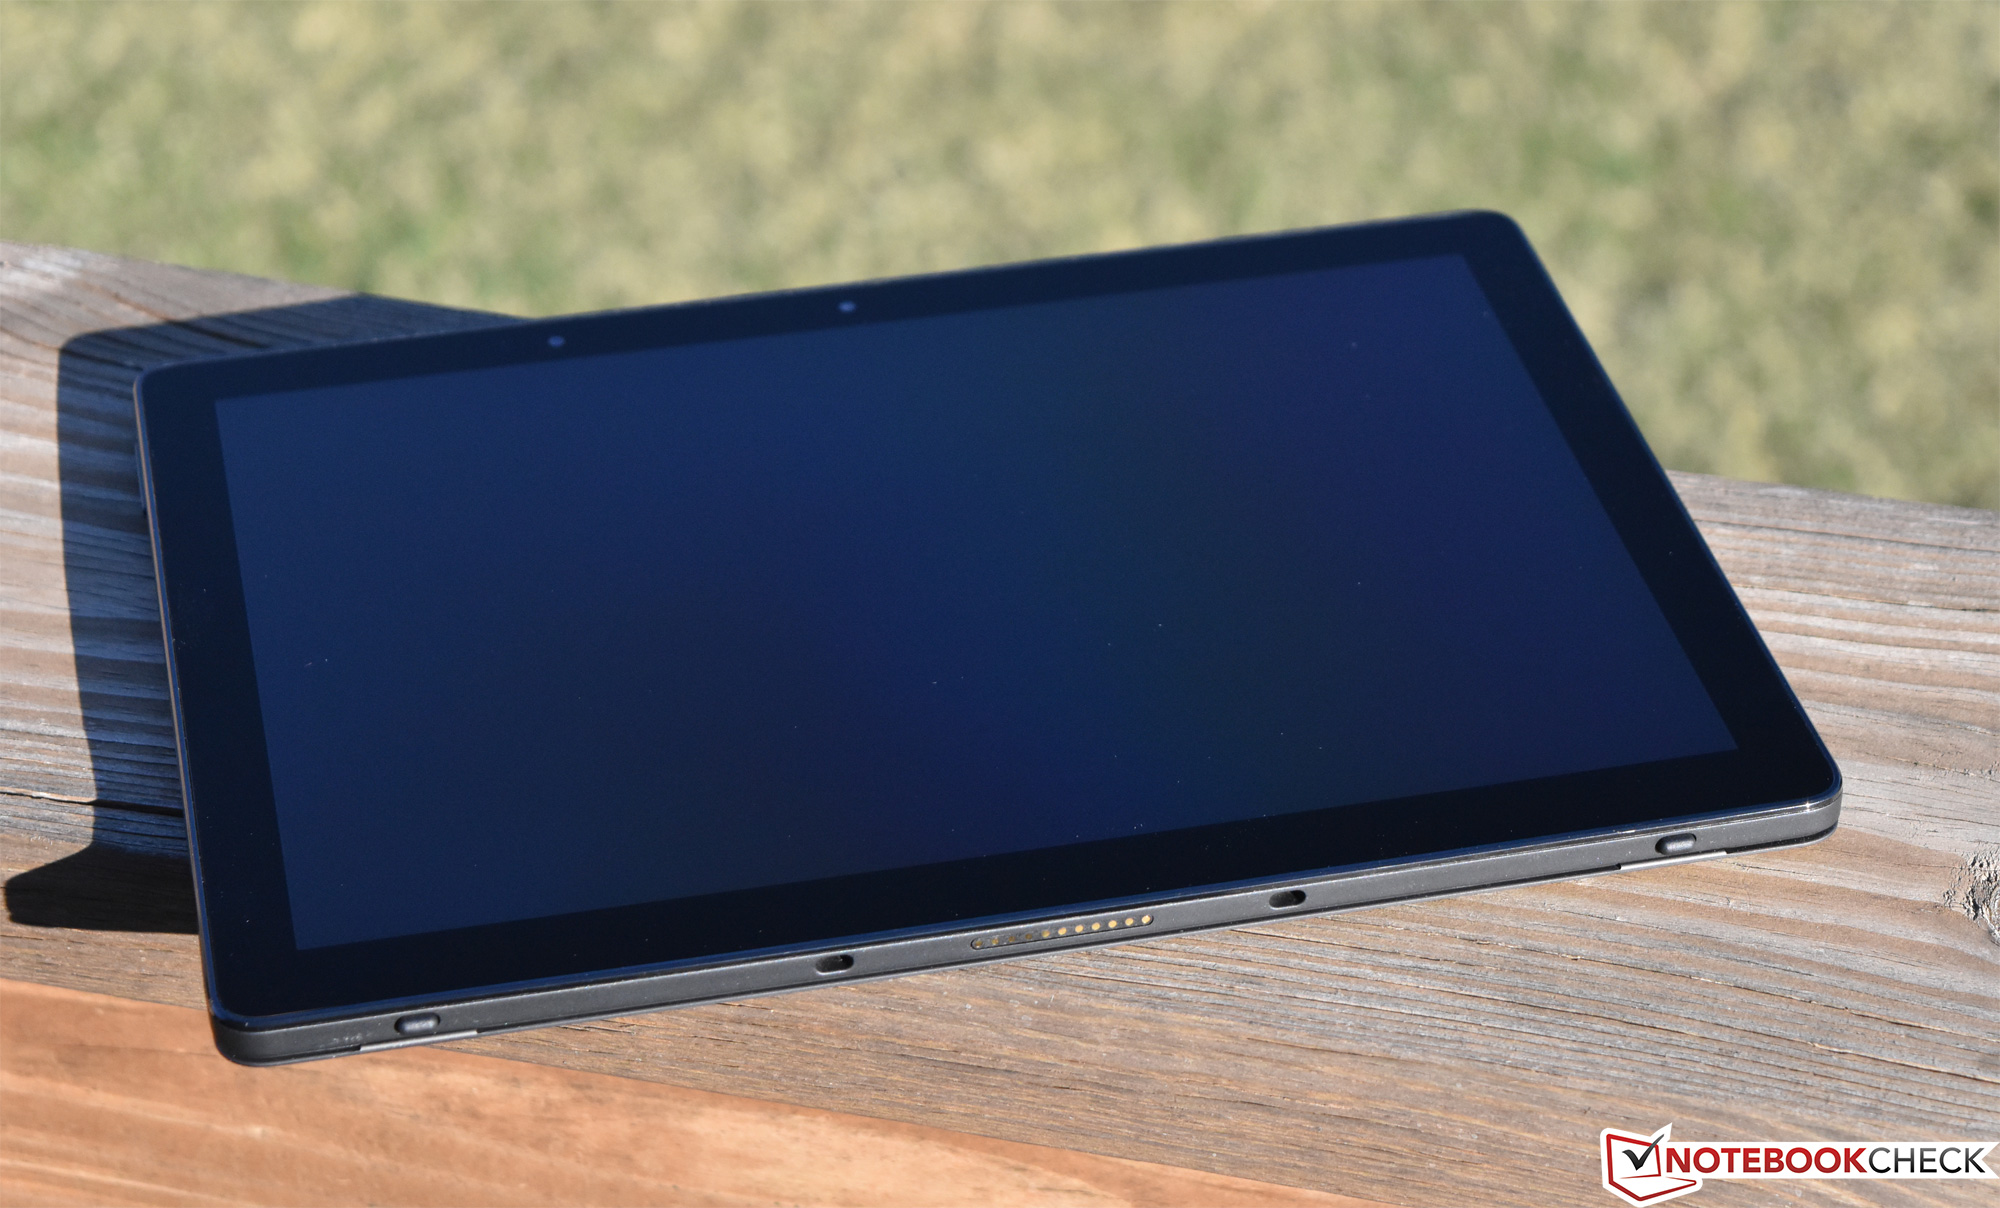
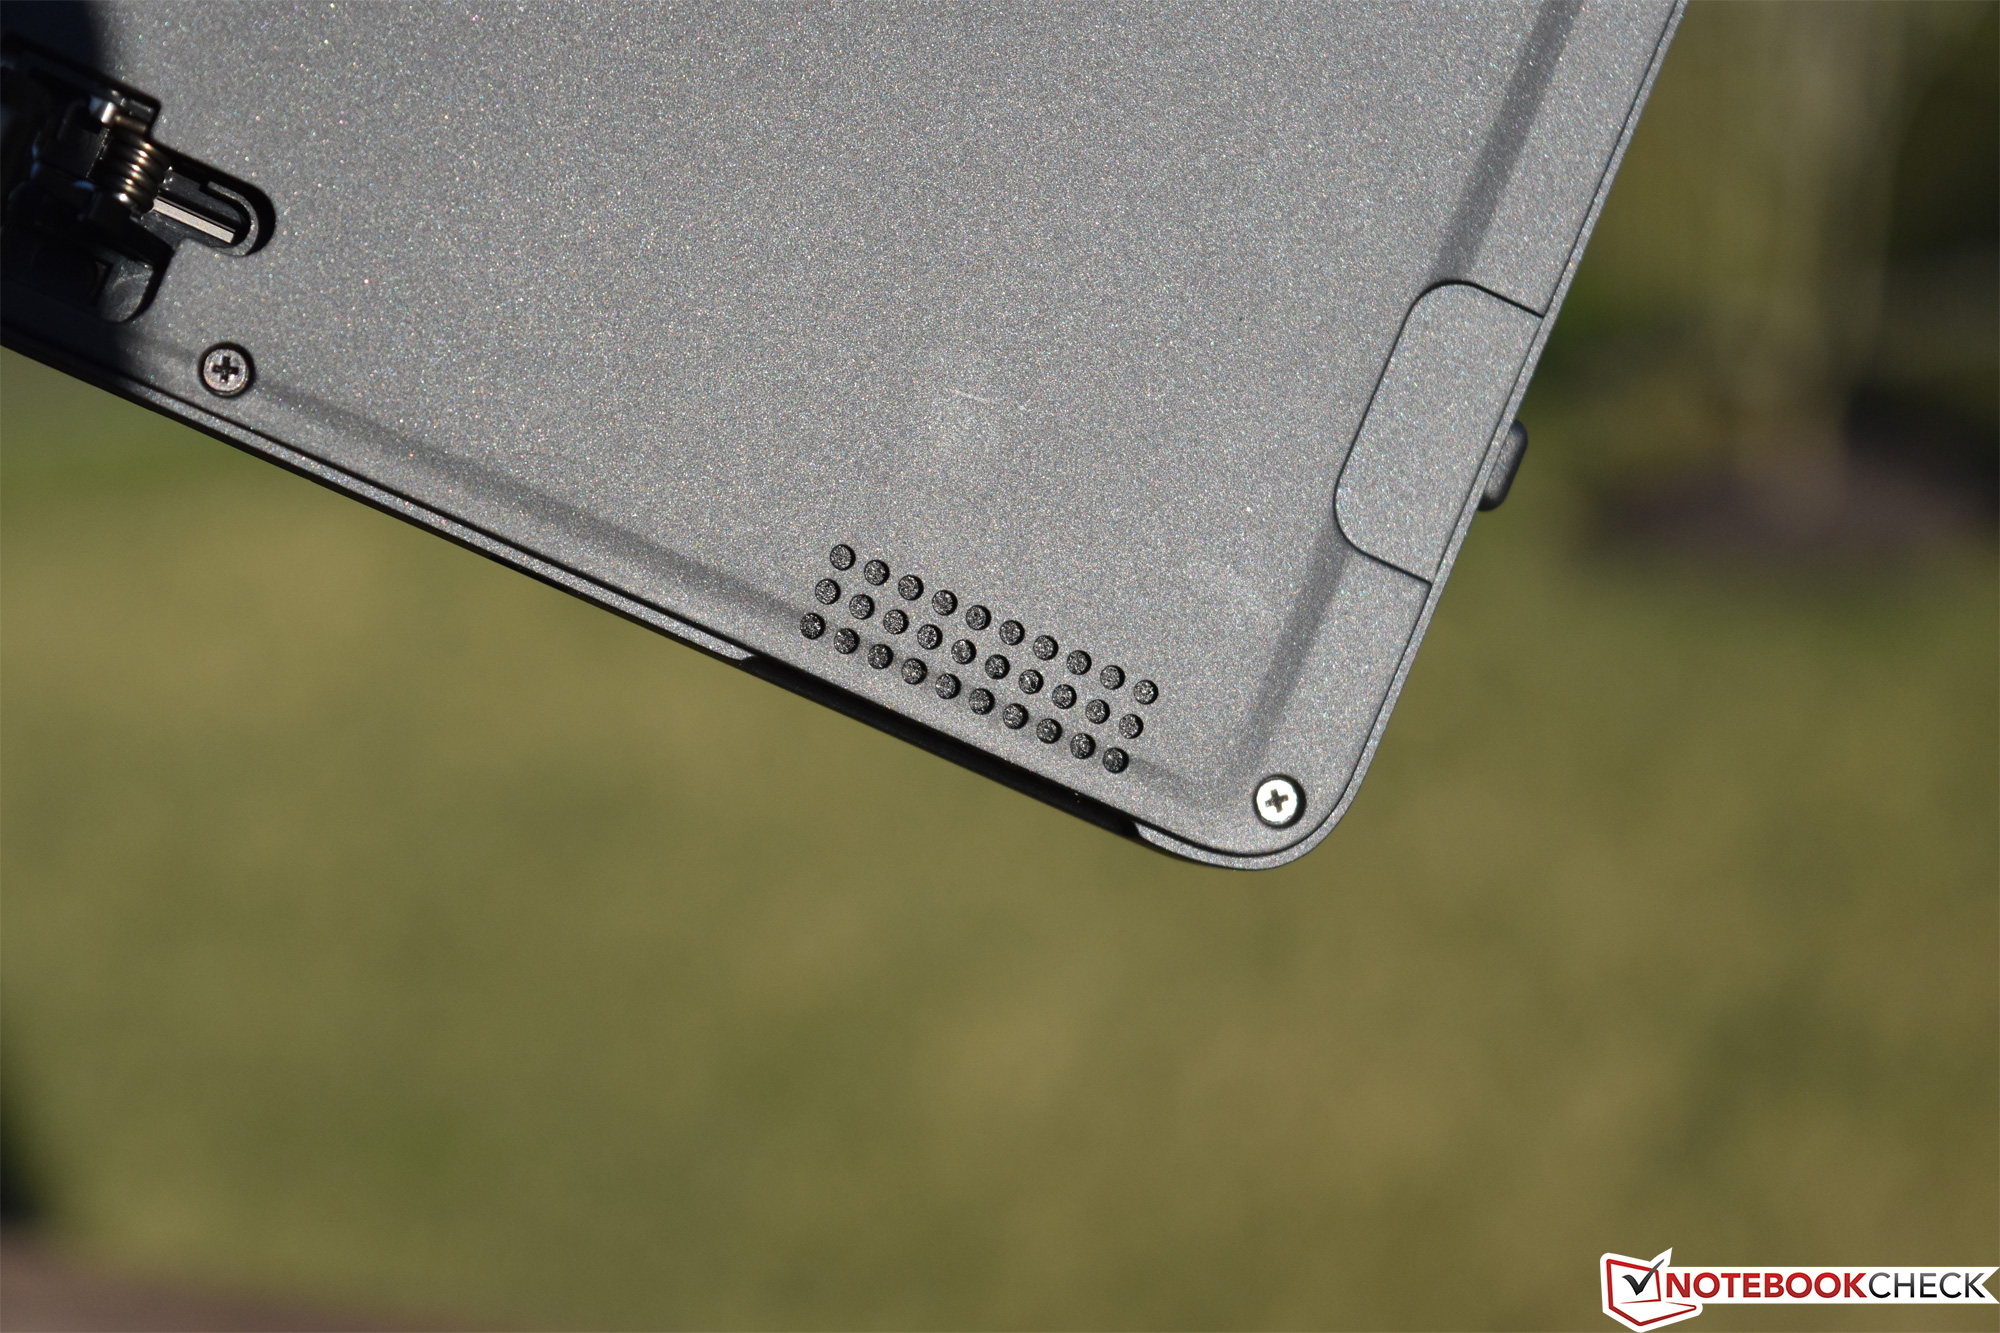
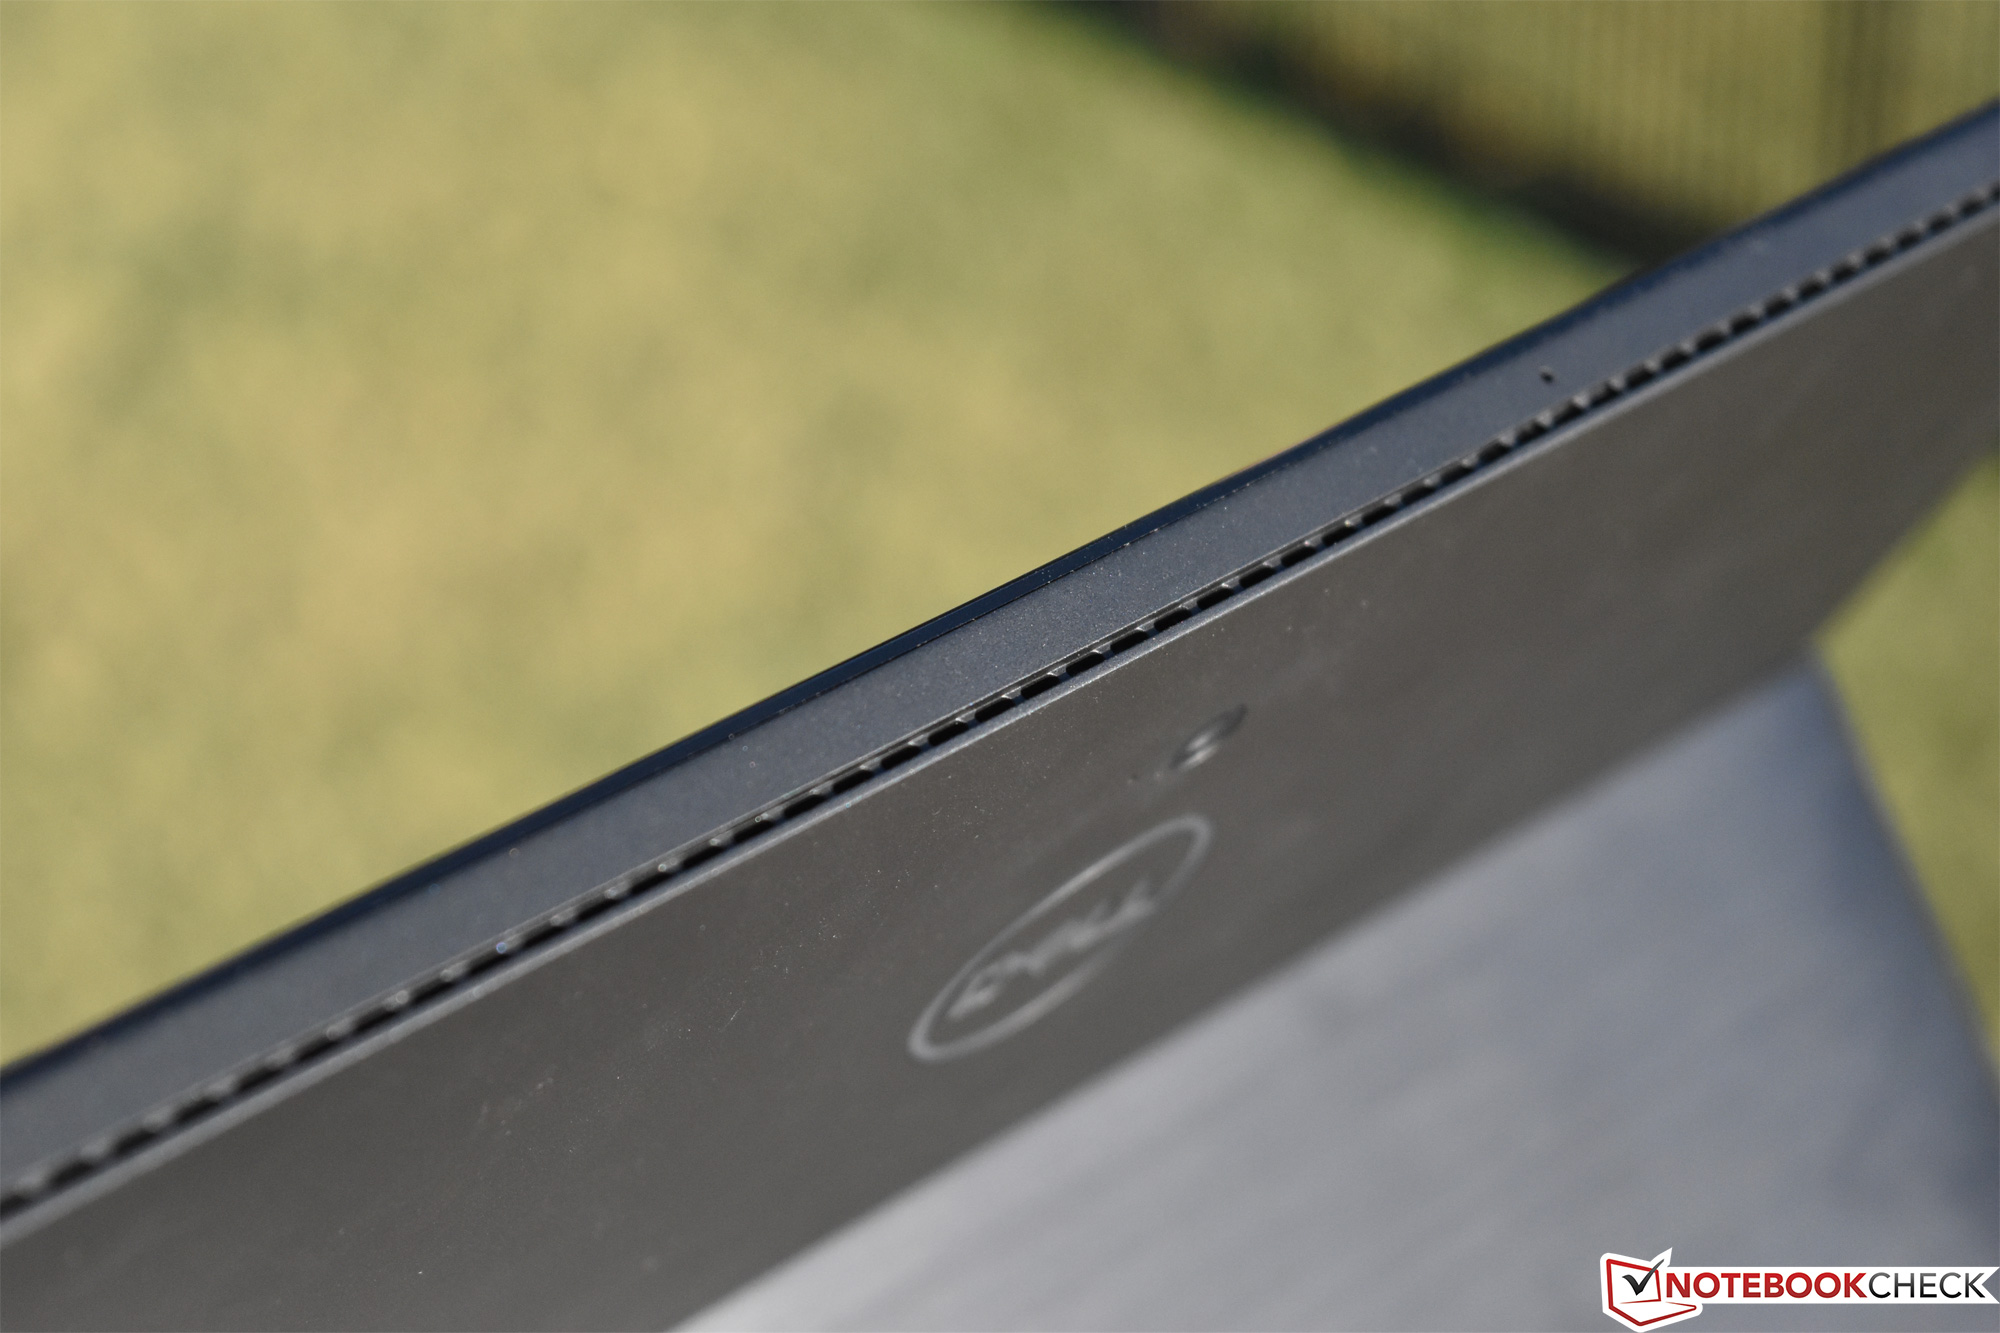
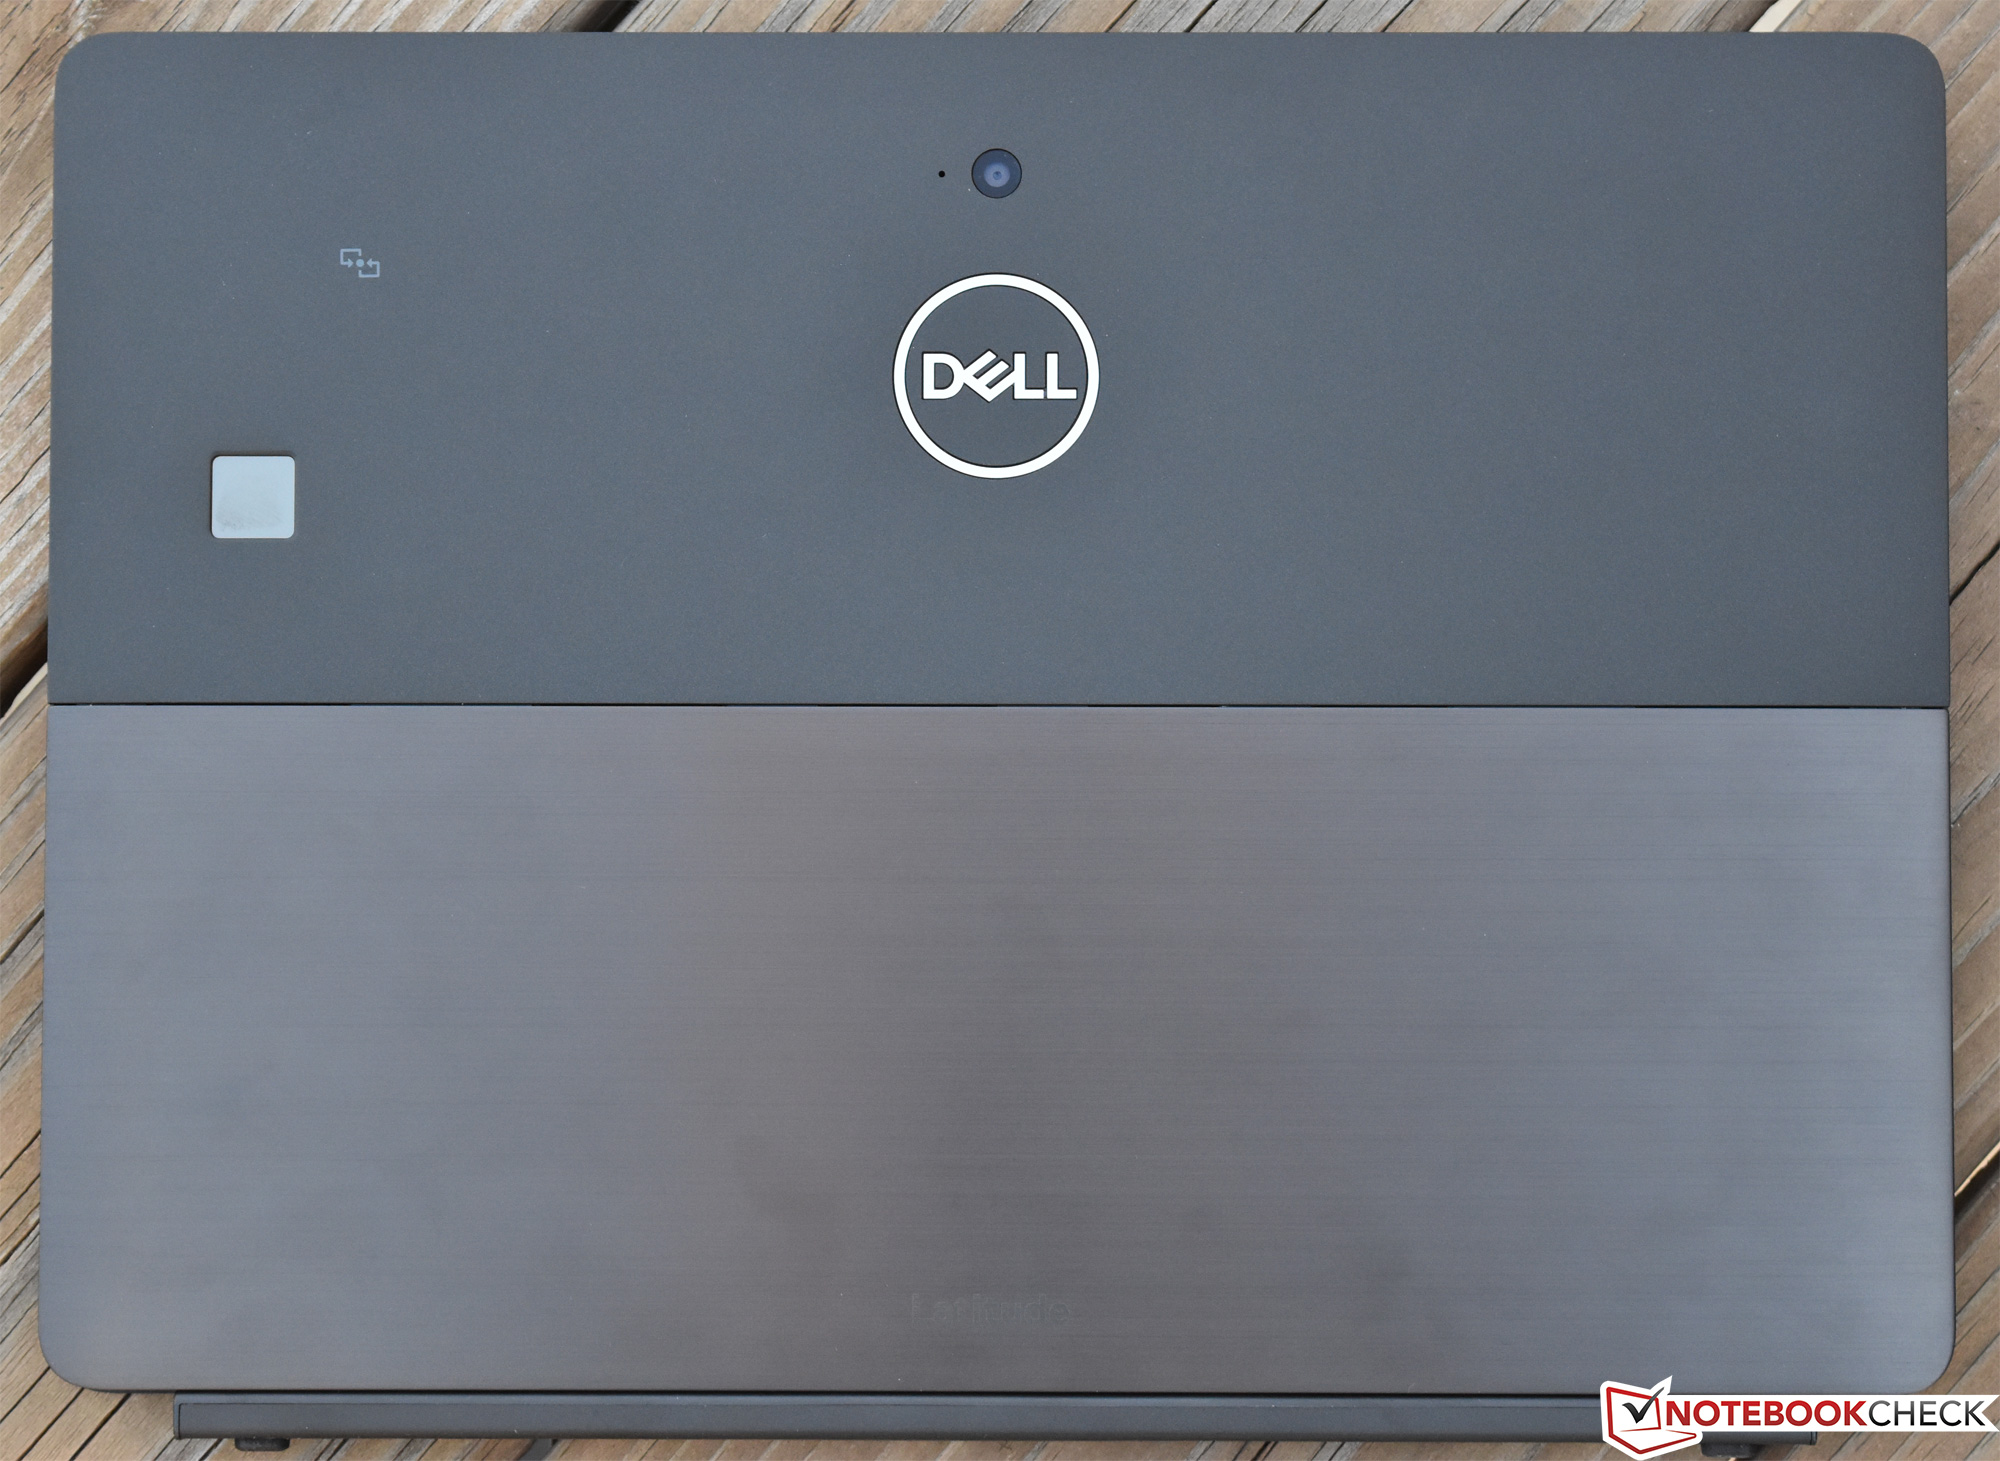
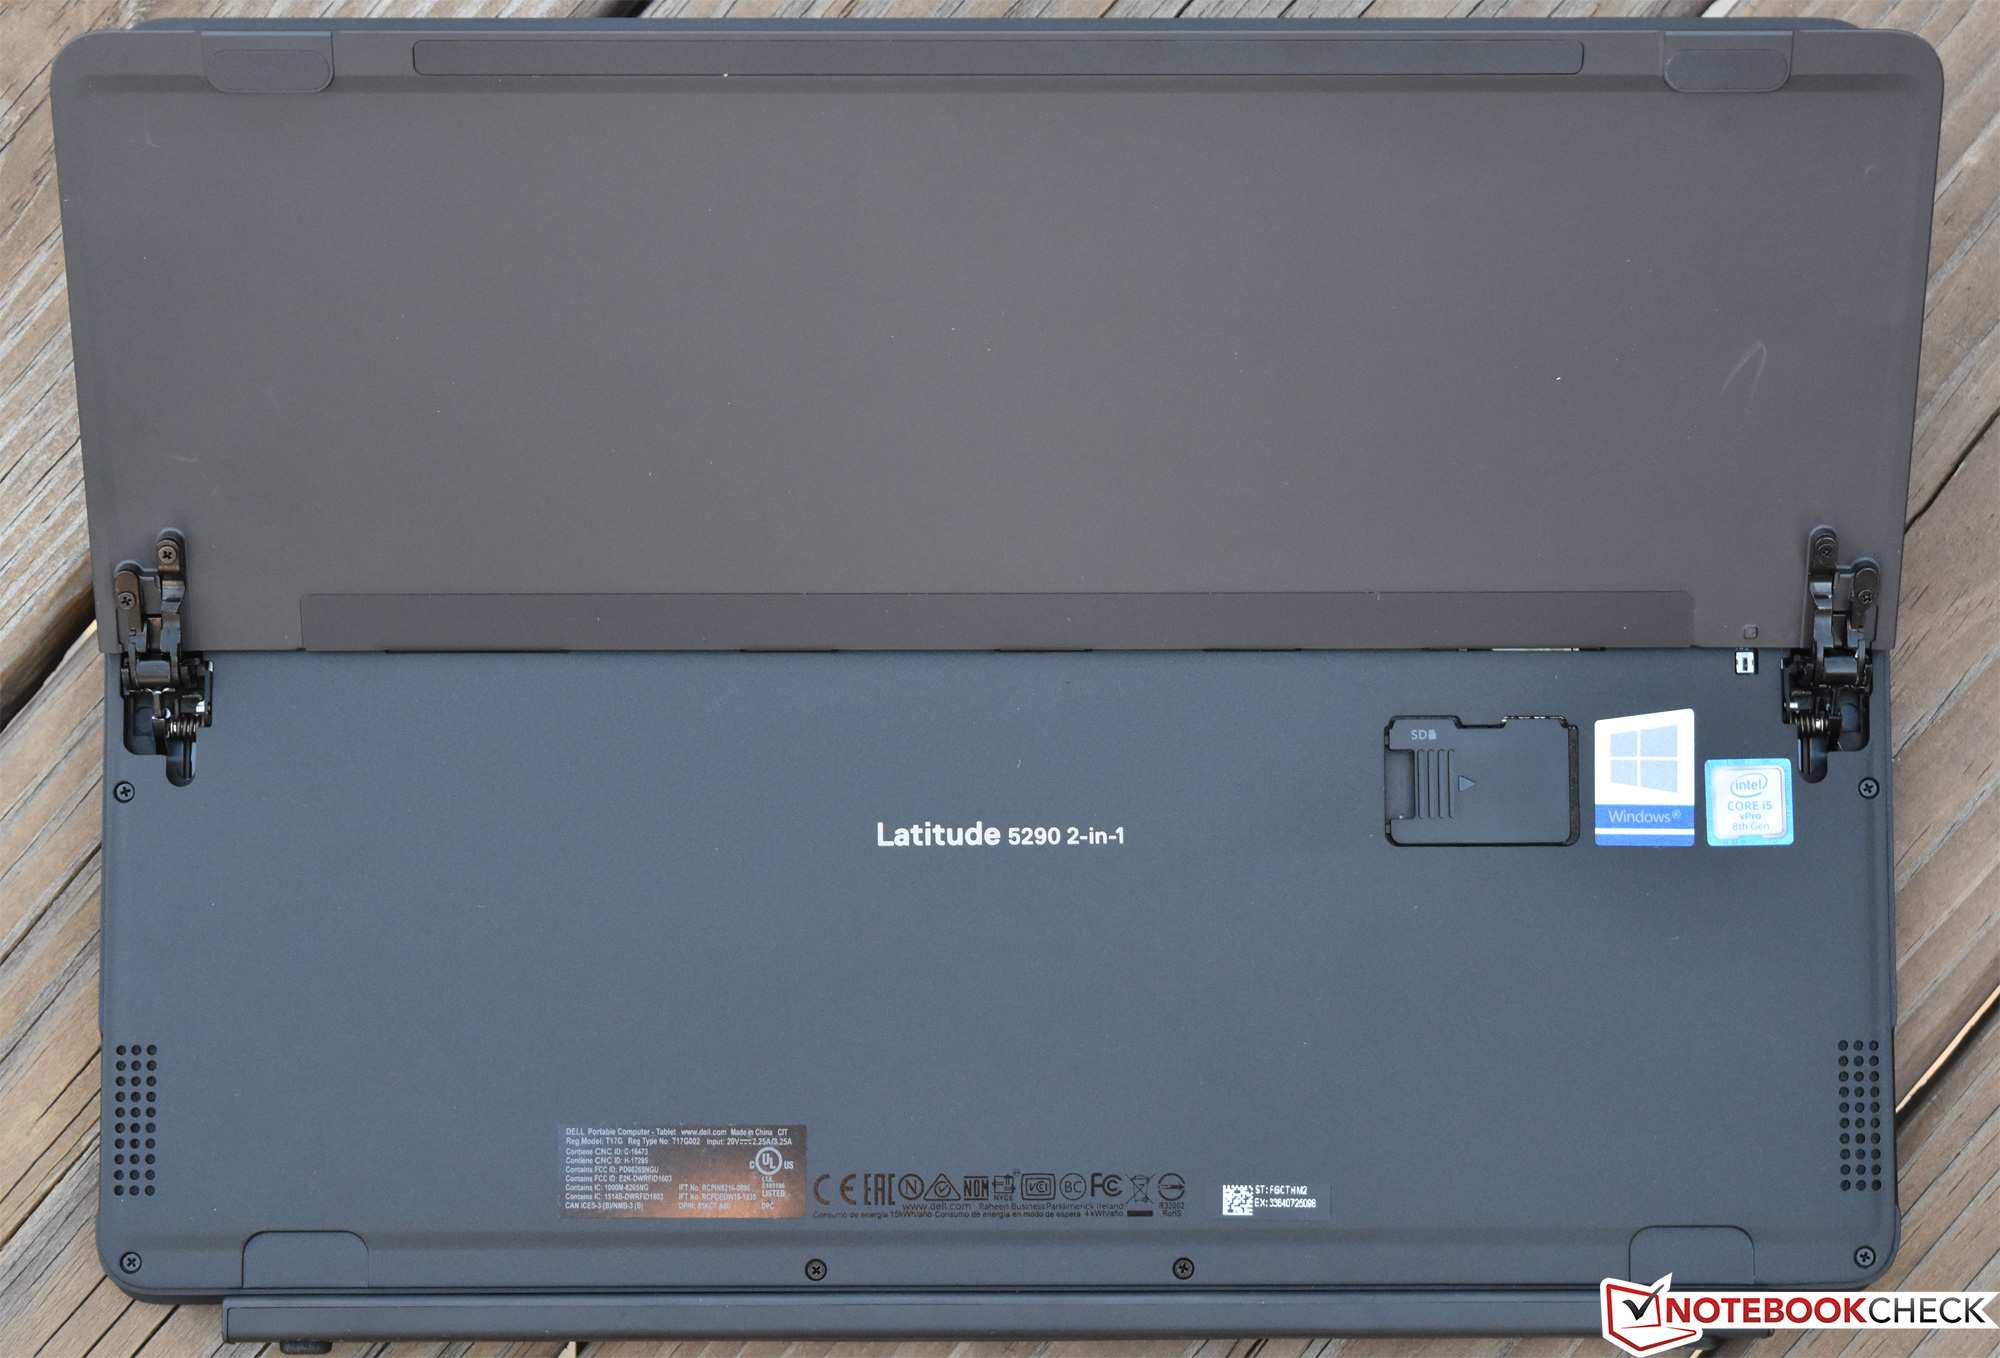
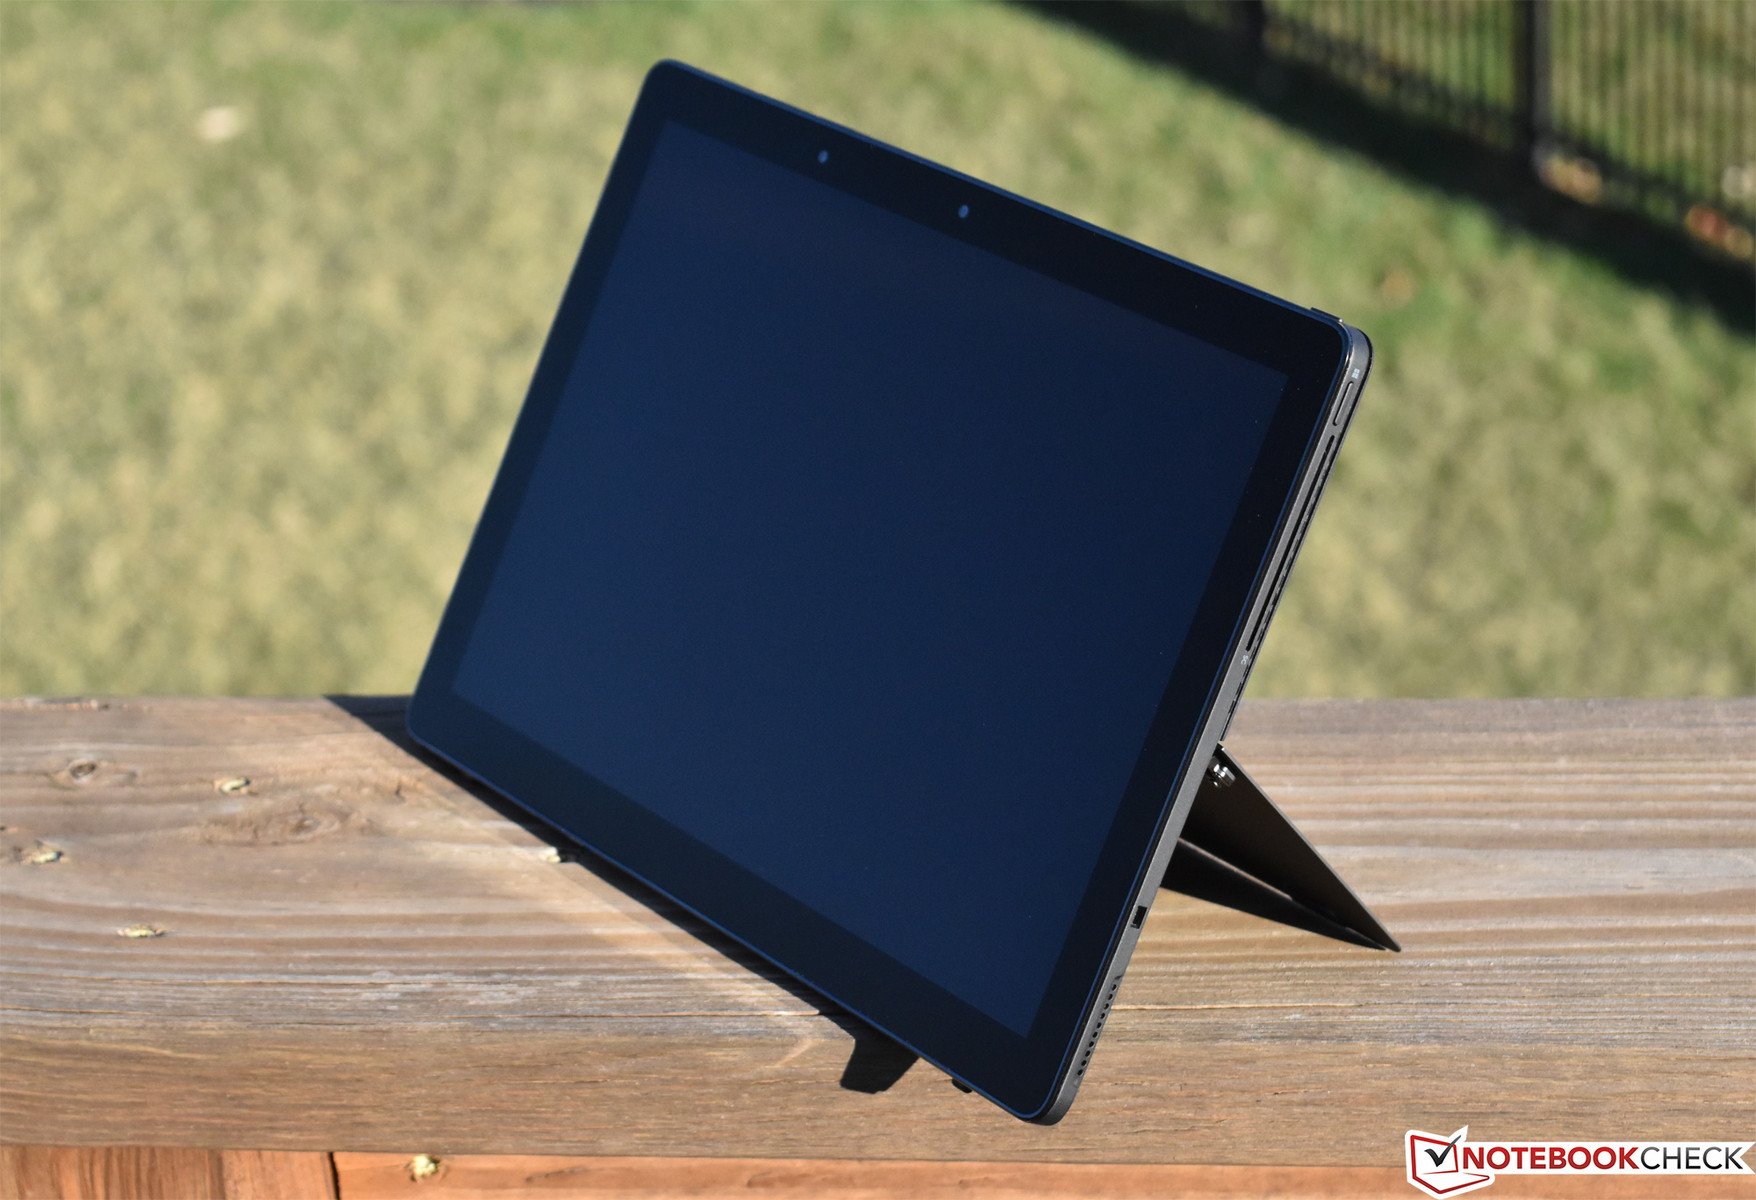
As before with the Latitude 5285, the Latitude 5290’s build quality is top-notch. Construction consists of magnesium-alloy material which is more common among Dell’s 7000 series Latitude notebooks than with the normally primarily plastic 5000 series. The result is an extremely rigid device which resists torsion about as well as the Surface Pro (which is also built out of magnesium) and which seems poised to tackle the everyday rigors of business and travel. The basic aesthetic—matte black, with the exception of the reflective screen finish and bezels—also jives well with the environment of its target market. Much more can be read about the design of the kickstand and keyboard cover in our previous review of the Latitude 5285.
The same MIL-STD 810G tests apply to the 5290, and its dimensions have not changed since our review of the 5285. The device weighs in at 1.278 kg and is 15 mm thick with the keyboard type cover attached (and 9.75 mm thick in tablet form only). The overall size is also nearly identical to that of the Surface Pro 2017, measuring just 1.25 mm thicker and 9 mm wider—almost undetectable in daily use. The latest Surface Pro is lighter, however, by some 200 grams.

The same MIL-STD 810G tests apply to the 5290, and its dimensions have not changed since our review of the 5285. The device weighs in at 1.278 kg and is 15 mm thick with the keyboard type cover attached (and 9.75 mm thick in tablet form only). The overall size is also nearly identical to that of the Surface Pro 2017, measuring just 1.25 mm thicker and 9 mm wider—almost undetectable in daily use. The latest Surface Pro is lighter, however, by some 200 grams.
Connectivity
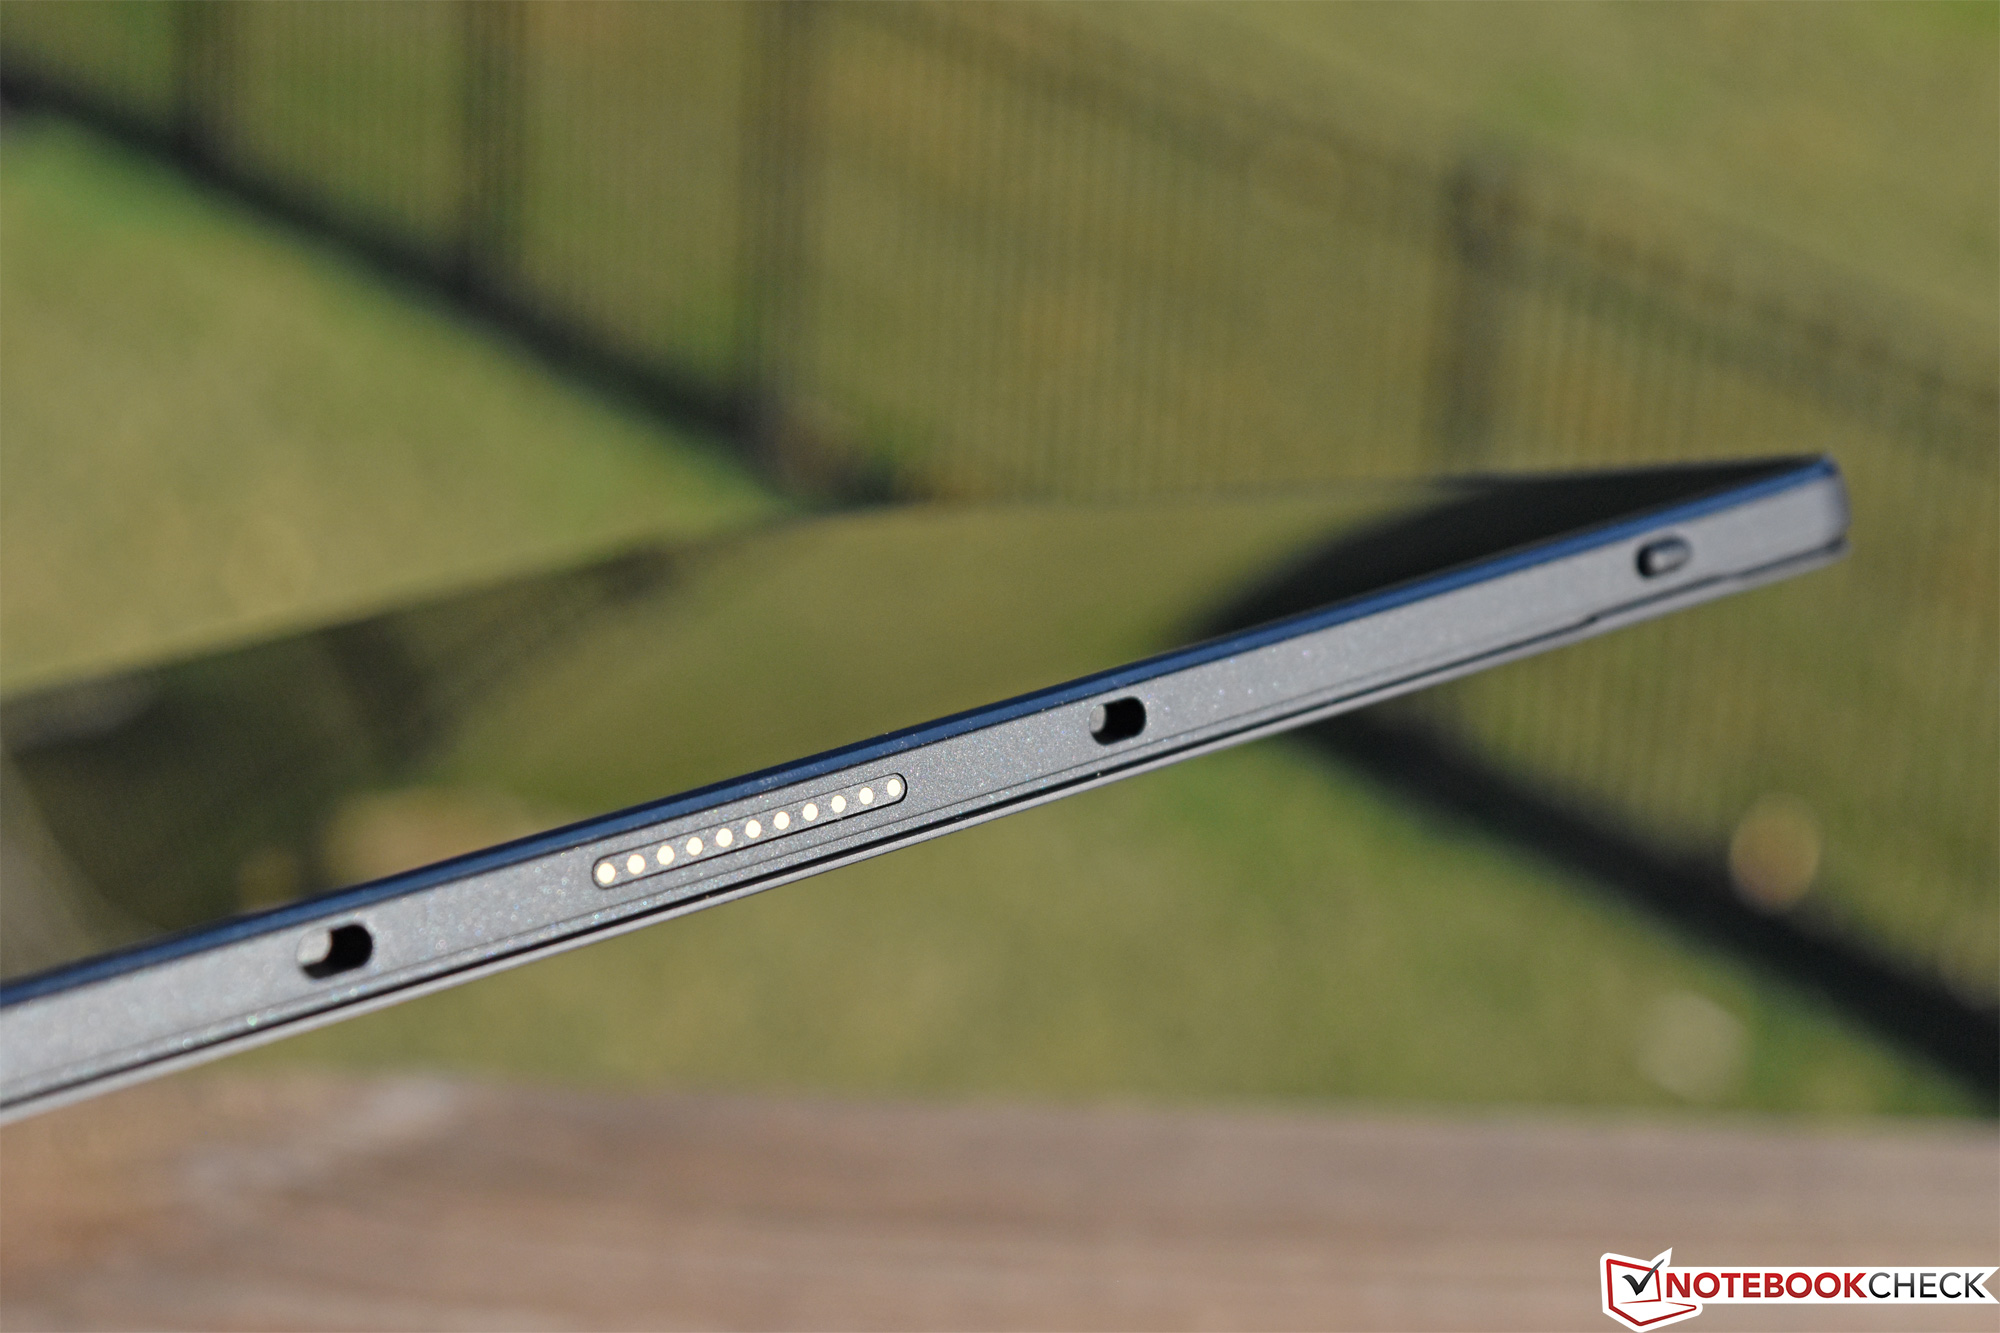
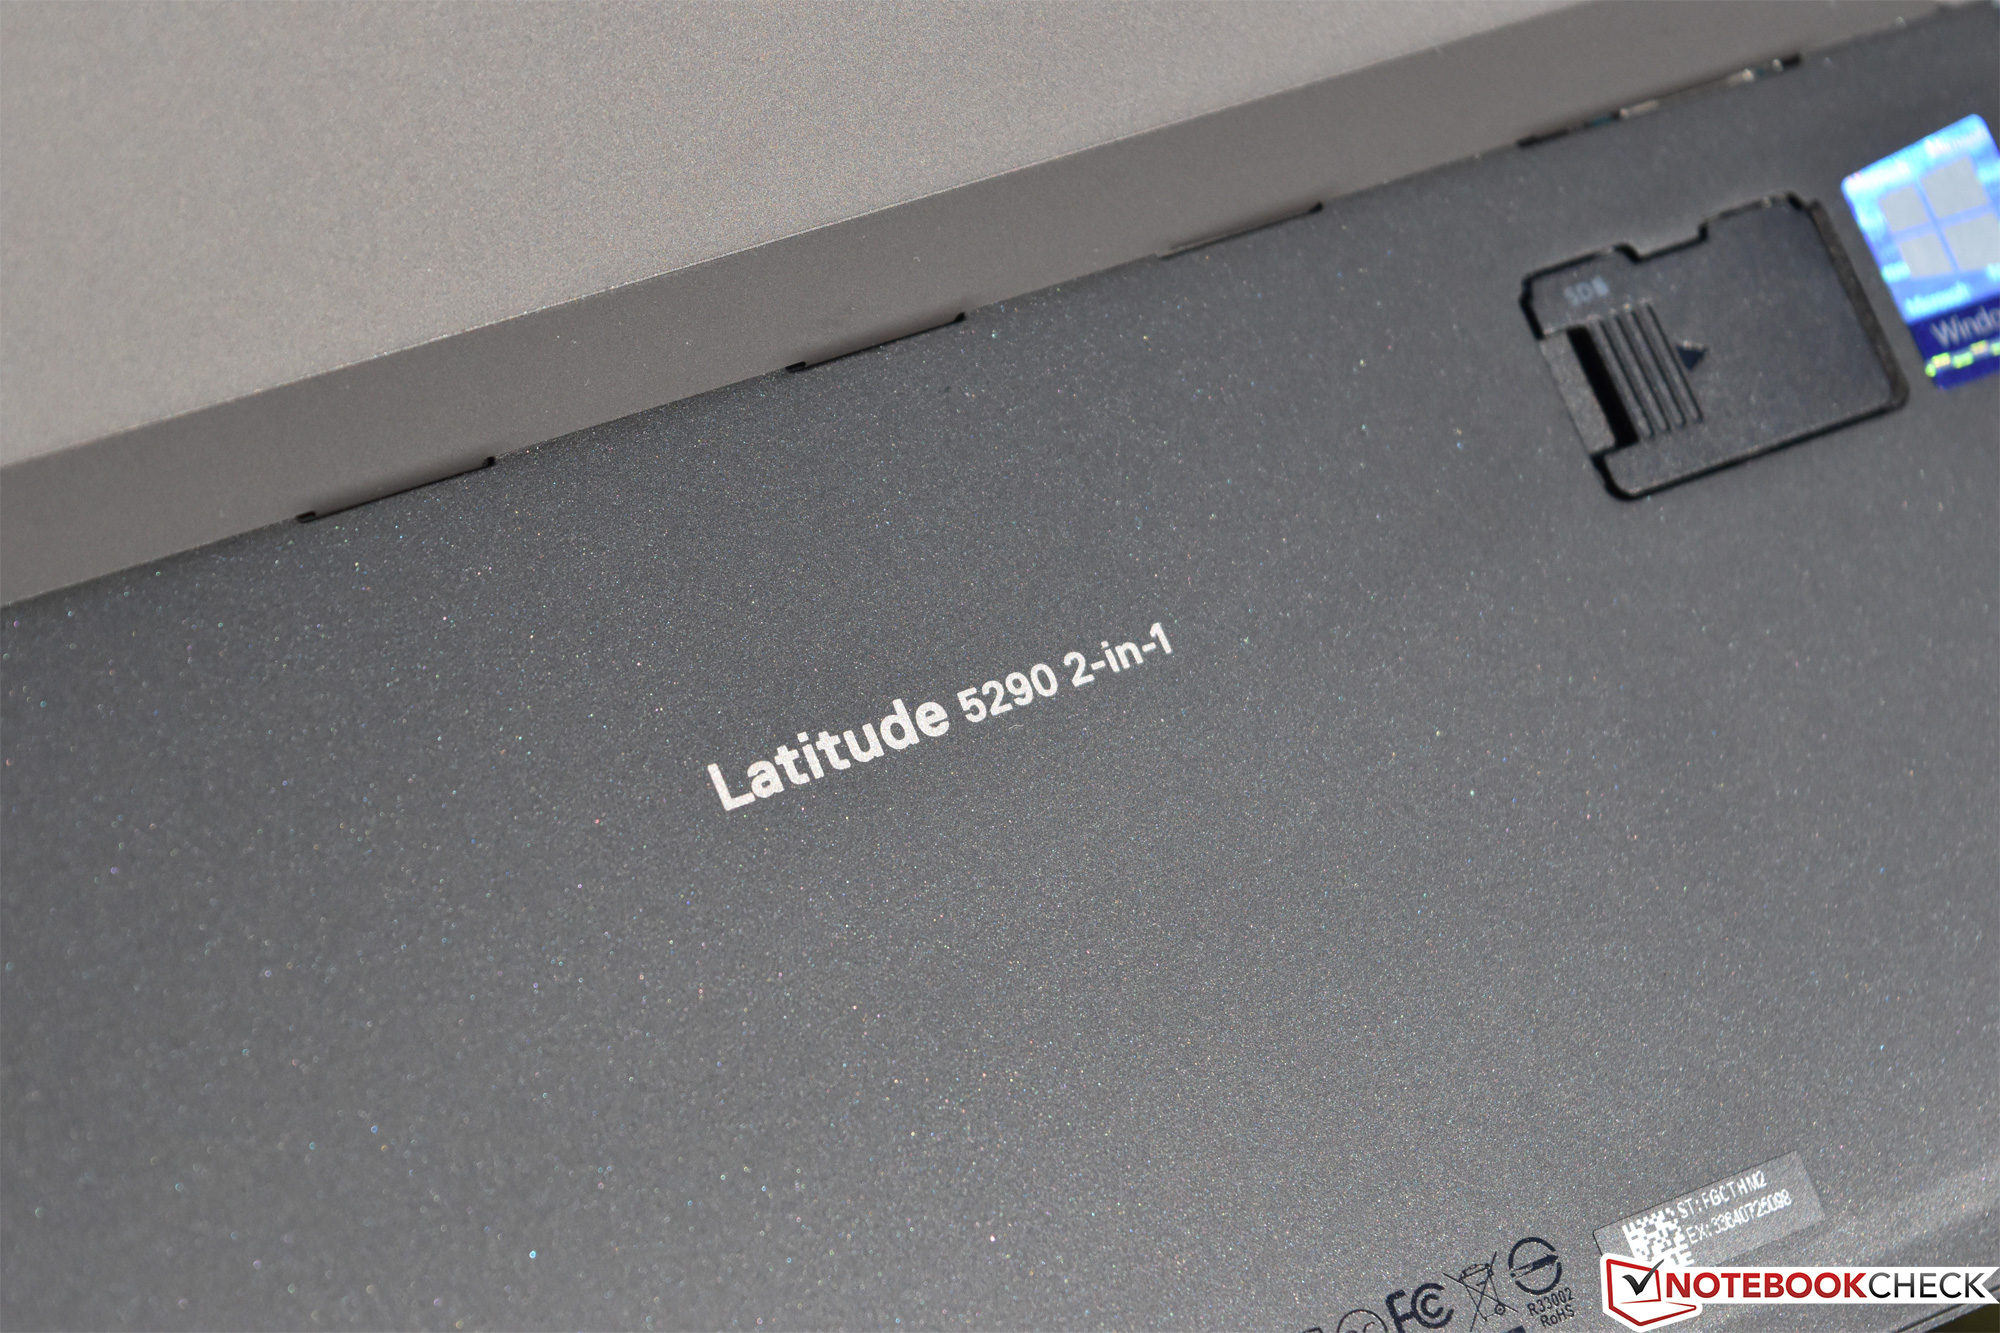
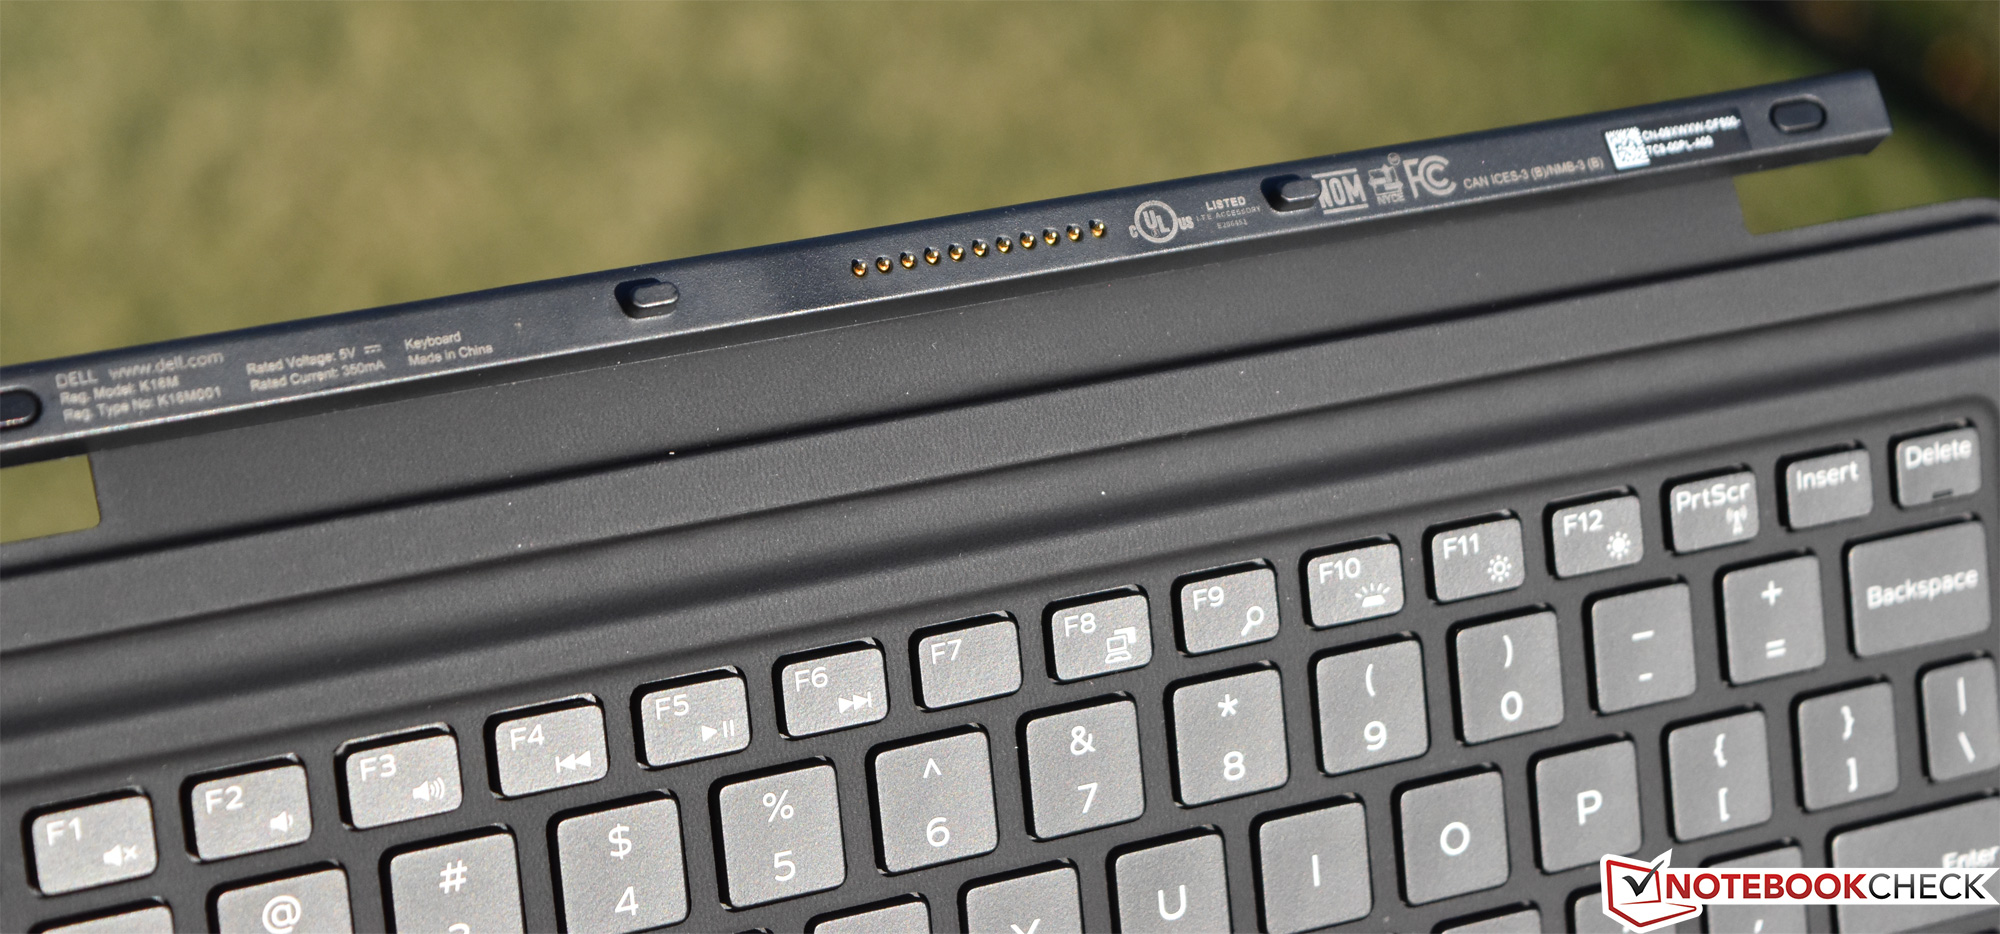
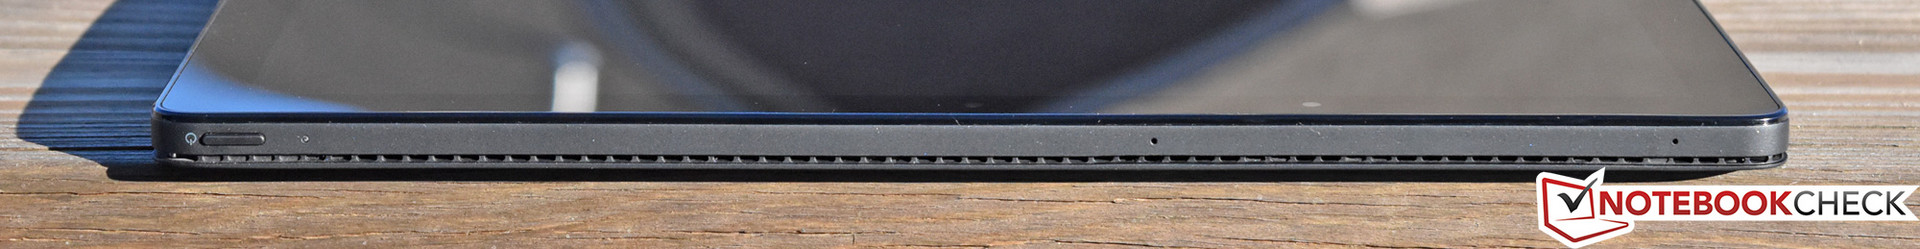
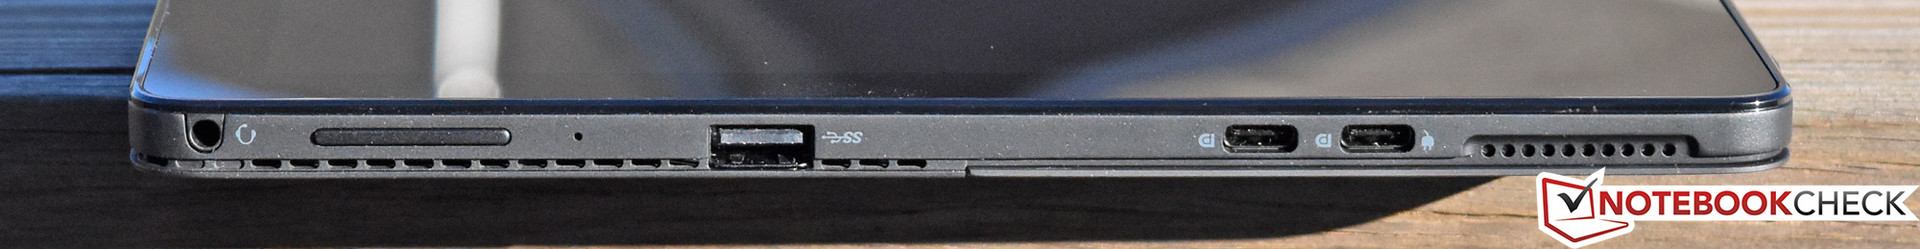
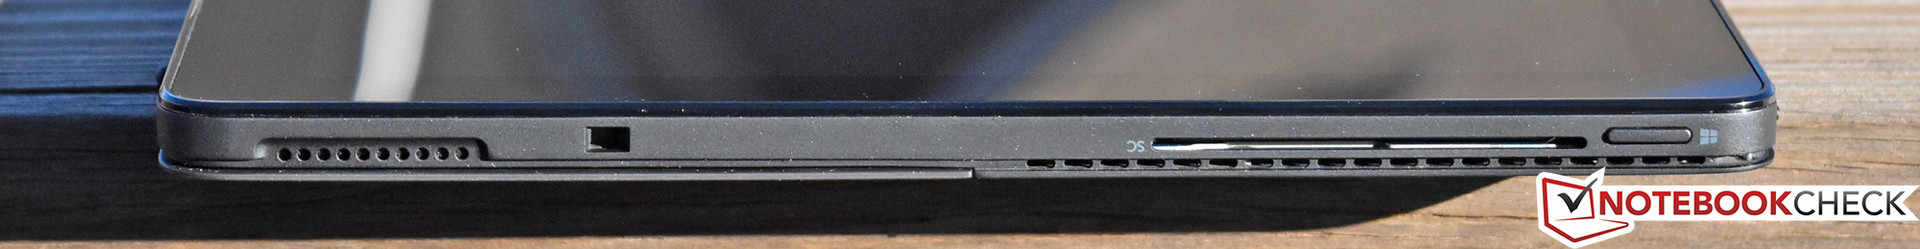
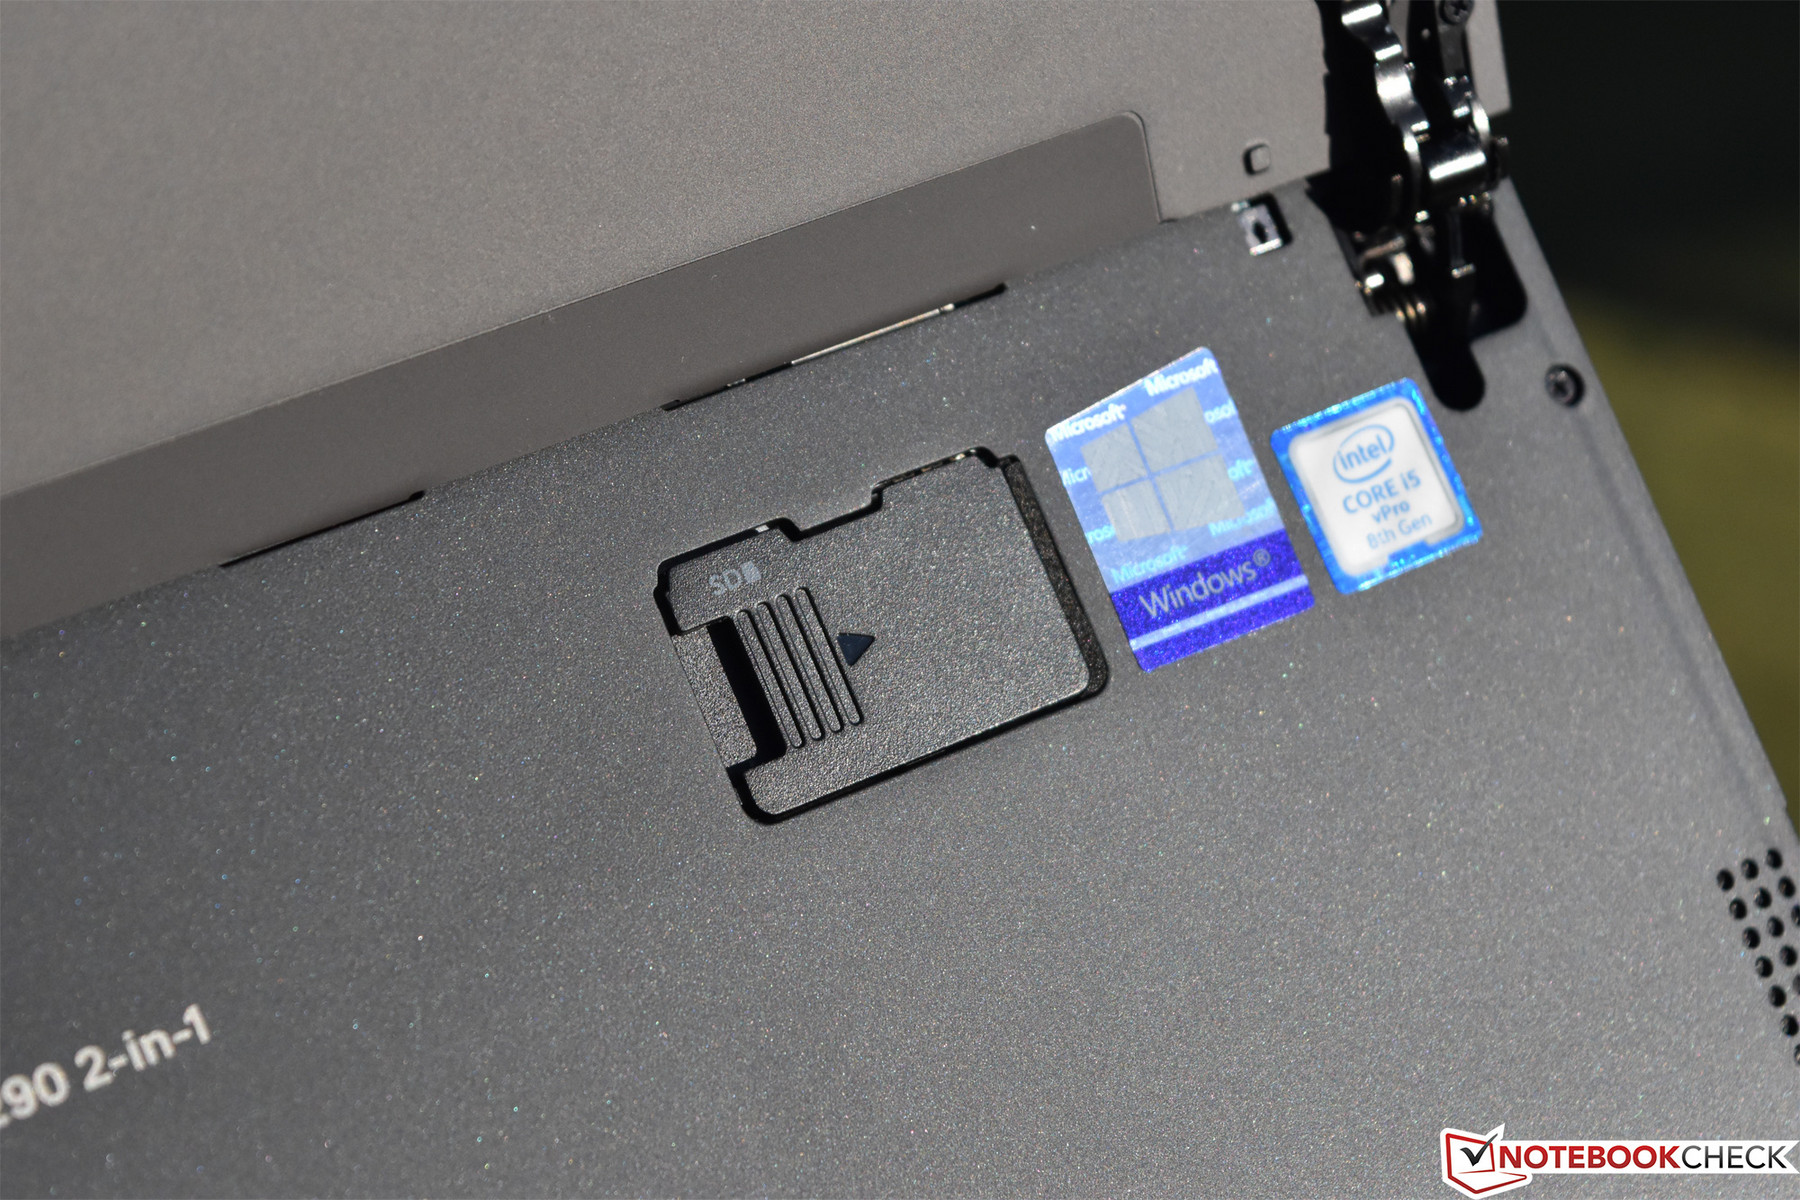
Port selection has not changed since the Latitude 5285, but apart from the conspicuous lack of Thunderbolt, that’s not a bad thing: for starters, users get three total USB ports (one USB Type-A 3.1 Gen 1 port with powershare and two USB Type-C ports, both of which double as DisplayPort and can be used for charging the device). There’s also still a microSD slot and (on WWAN-equipped models) a microSIM slot, both of which are located underneath the kickstand (and so which are convenient for permanently-installed cards). That’s a pretty decent setup for a tablet.
SD Card Reader
The integrated microSD card reader posted greatly improved numbers (over the Latitude 5285) in our tests, but we have also since begun using a faster card, so it isn't clear whether the reader is actually faster or if the speed increases are solely a result of the card choice. Regardless, using a Toshiba Exceria Pro M501 UHS-II as our test media, we recorded an average sequential read speed of 211.8 MB/s, which is easily the fastest of all the devices in our lineup, and some 144% faster than the Latitude 5285. Our standard JPG copy test was equally impressive, with the result of 142.2 MB/s representing a 122% premium over last year’s Latitude.
| SD Card Reader | |
| average JPG Copy Test (av. of 3 runs) | |
| Dell Latitude 5290 2-in-1 (Toshiba Exceria Pro M501 UHS-II) | |
| HP Elite x2 1012 G2-1LV76EA (Toshiba Exceria Pro M501) | |
| Lenovo ThinkPad X1 Tablet Gen 2 (Toshiba Exceria Pro SDXC 64 GB UHS-II) | |
| Dell Latitude 12 5285 2-in-1 (Toshiba THN-M401S0640E2) | |
| Microsoft Surface Pro (2017) i7 (Toshiba Exceria Pro M401 64 GB) | |
| Average of class Office (19.8 - 198.5, n=22, last 2 years) | |
| maximum AS SSD Seq Read Test (1GB) | |
| Dell Latitude 5290 2-in-1 (Toshiba Exceria Pro M501 UHS-II) | |
| Lenovo ThinkPad X1 Tablet Gen 2 (Toshiba Exceria Pro SDXC 64 GB UHS-II) | |
| HP Elite x2 1012 G2-1LV76EA (Toshiba Exceria Pro M501) | |
| Dell Latitude 12 5285 2-in-1 (Toshiba THN-M401S0640E2) | |
| Microsoft Surface Pro (2017) i7 (Toshiba Exceria Pro M401 64 GB) | |
| Average of class Office (27.4 - 249, n=21, last 2 years) | |
Communication
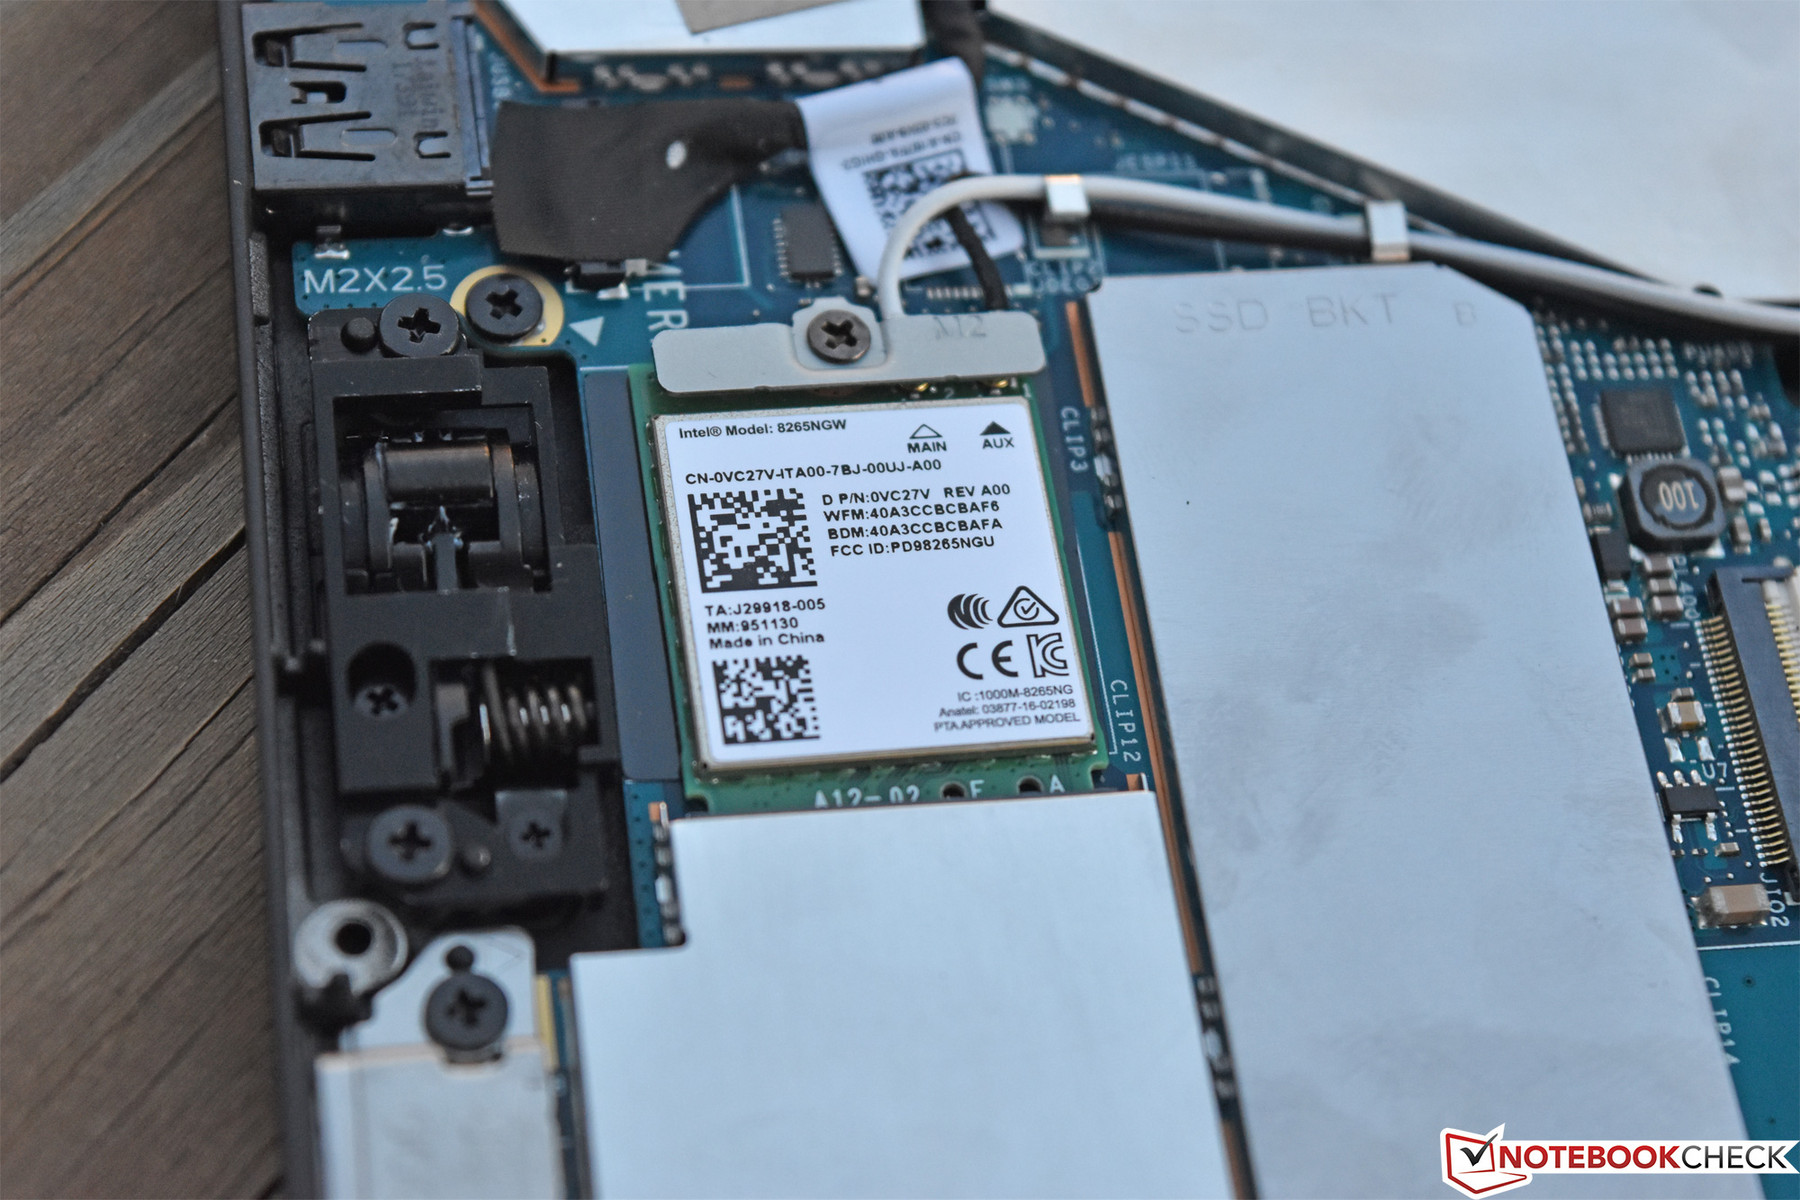
Every device in our lineup leverages the same popular WLAN adapter: the Intel Dual Band Wireless-AC 8265, which has long been a favorite amongst laptop manufacturers. Although the transmit result of 305 Mb/s was lower than average, the results were overall as expected (the receive result was, by contrast, a very fast 653 Mb/s). Given the fact that the antenna design also does not appear to have changed since the Latitude 5285, we should expect similar real-world performance.
The two cameras (5 MP front-facing and 8 MP rear-facing) have not changed since the previous model, so please refer to last year’s review for more information on them.
Security (business devices)
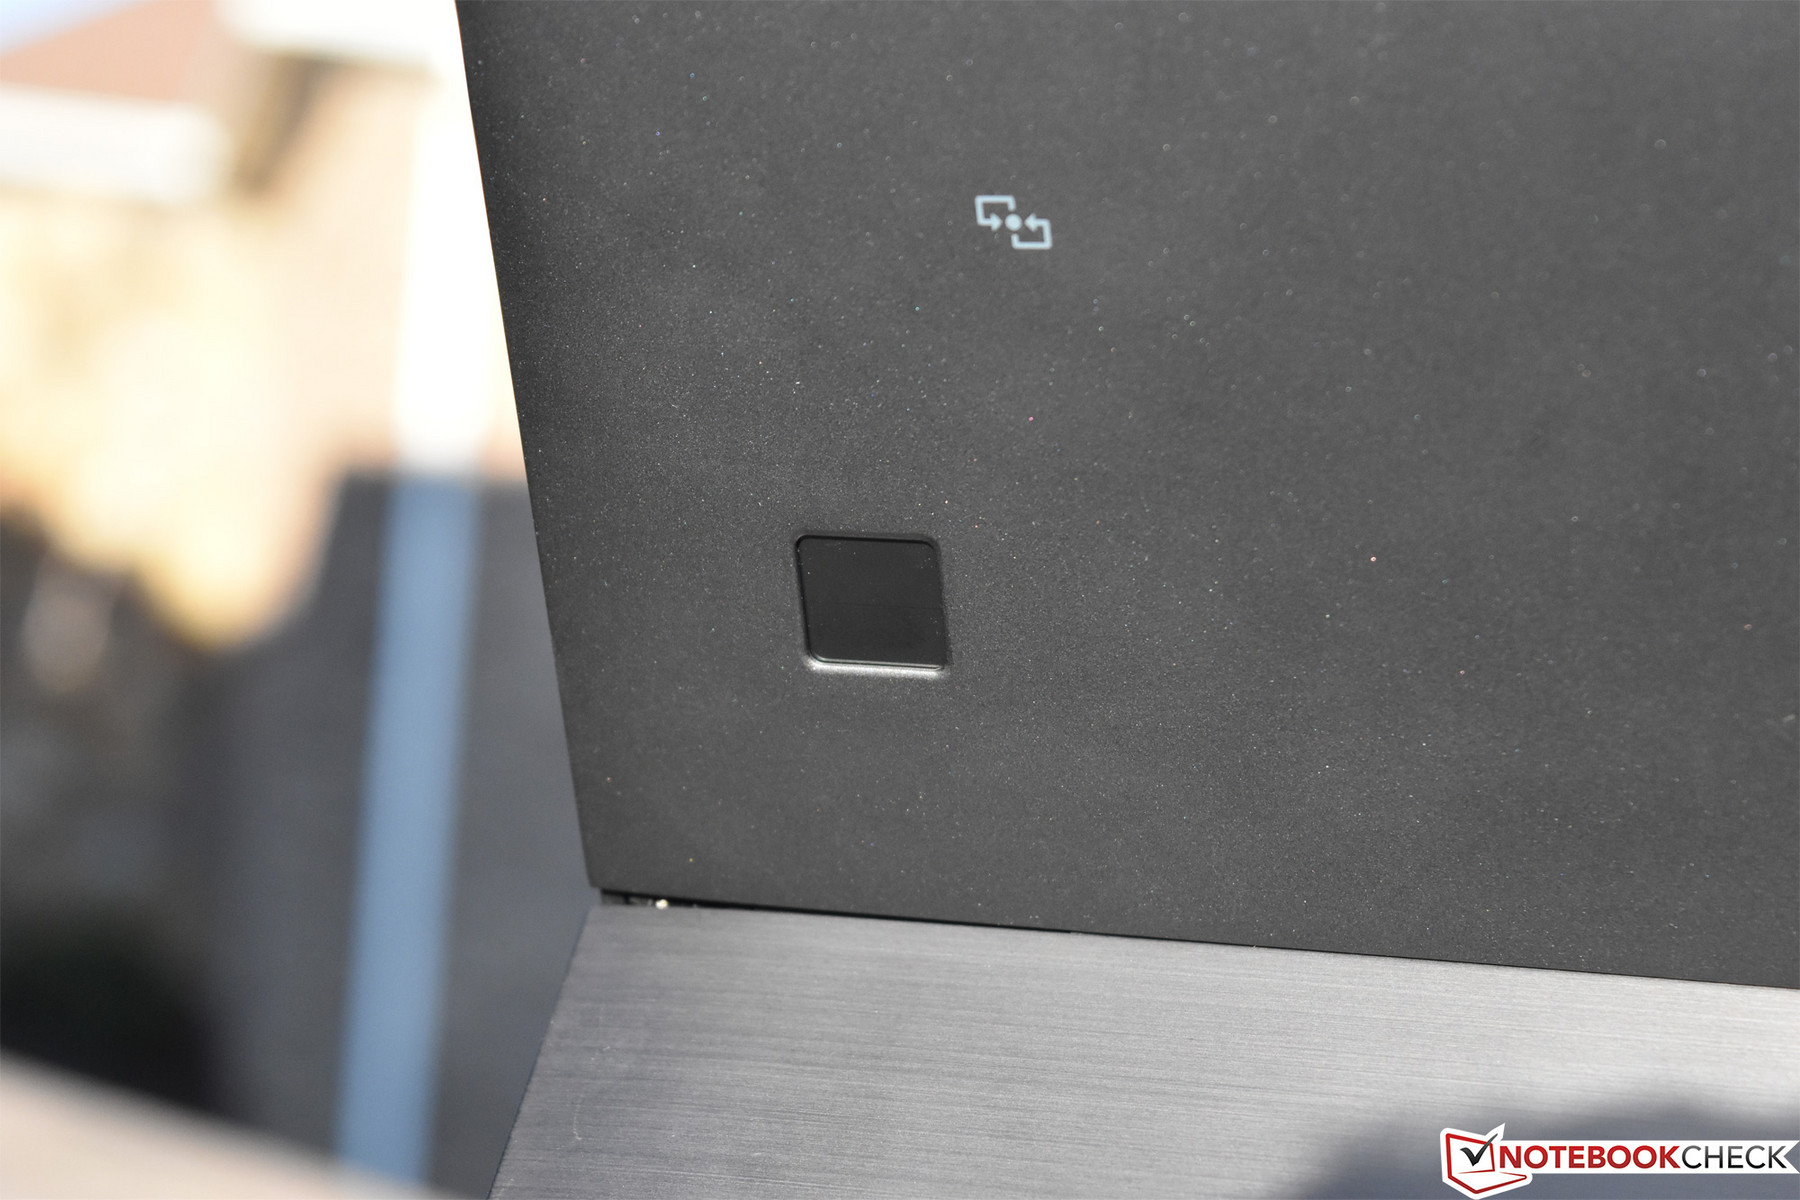
As before, the Latitude 5290 2-in-1 (optionally) features TPM 2.0 along with a rear-mounted touch fingerprint reader, NFC, and a Smart Card reader. There’s also an optional Windows Hello IR camera, The usual security and management software bundles also apply, such as the Dell Data Protection and Endpoint Security Suite. During our testing, the fingerprint reader and Windows Hello worked quickly and conveniently in all situations.
Accessories
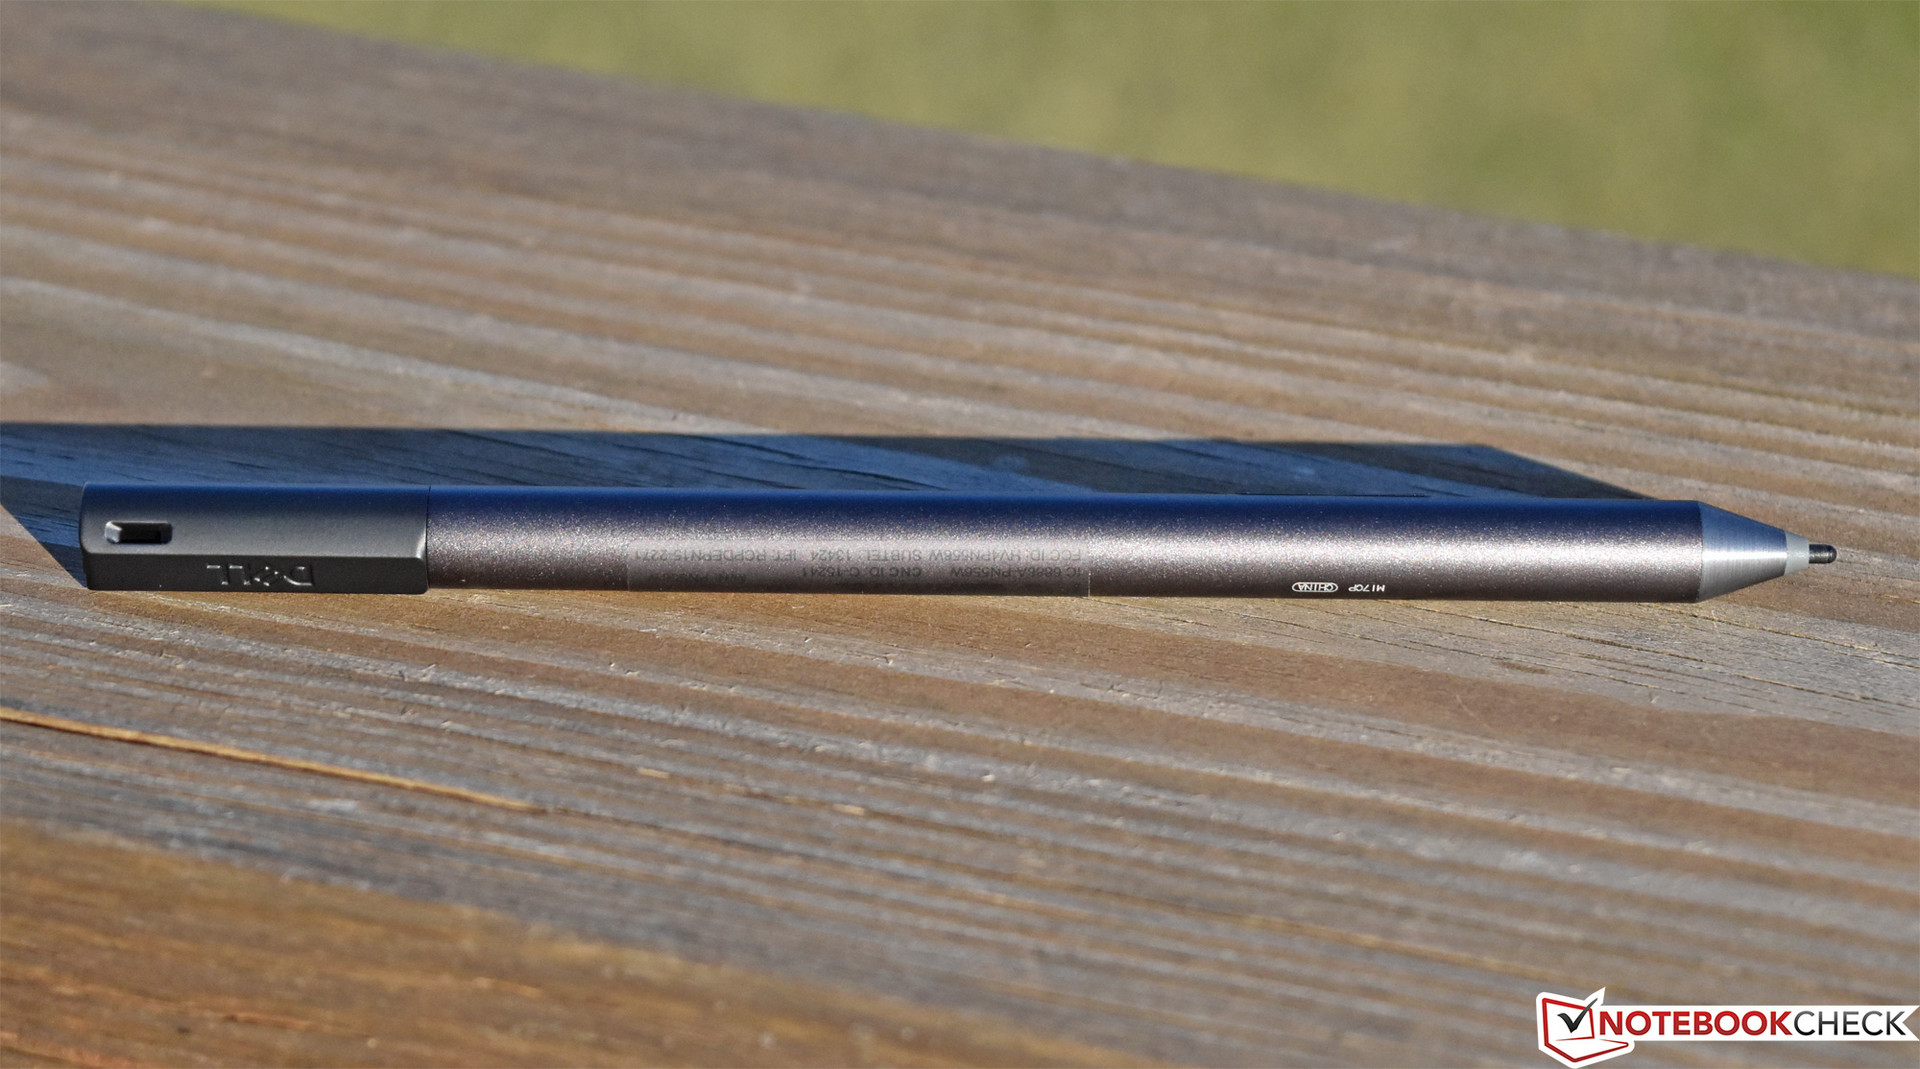
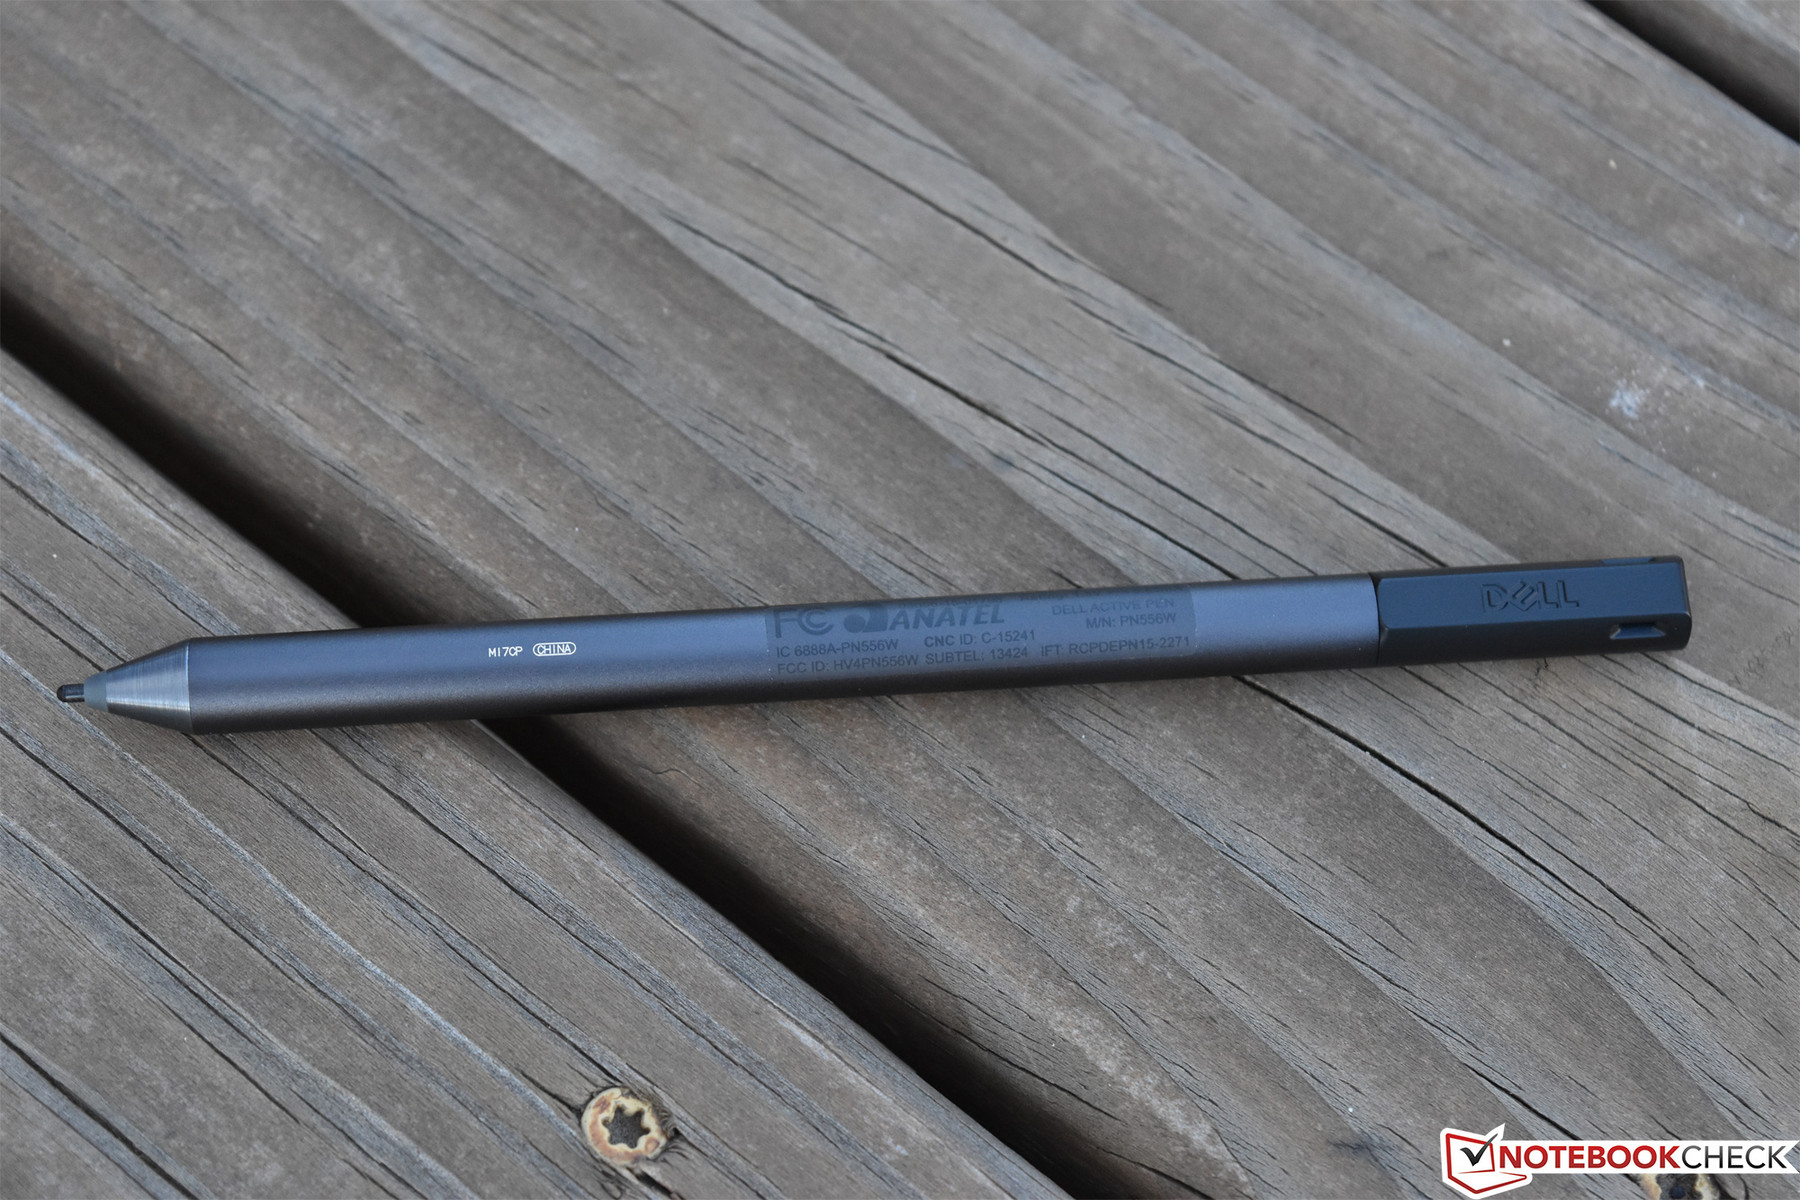
Our particular Latitude 5290 2-in-1 configuration includes the Dell Latitude 2-in-1 Travel Keyboard ($130) and Dell Active Pen ($60), though normally these items are sold separately. The accessories haven’t changed since the Latitude 5285 2-in-1, so businesses which were previously using the versions sold for that model can seamlessly transition to the 5290 without any compatibility repercussions.
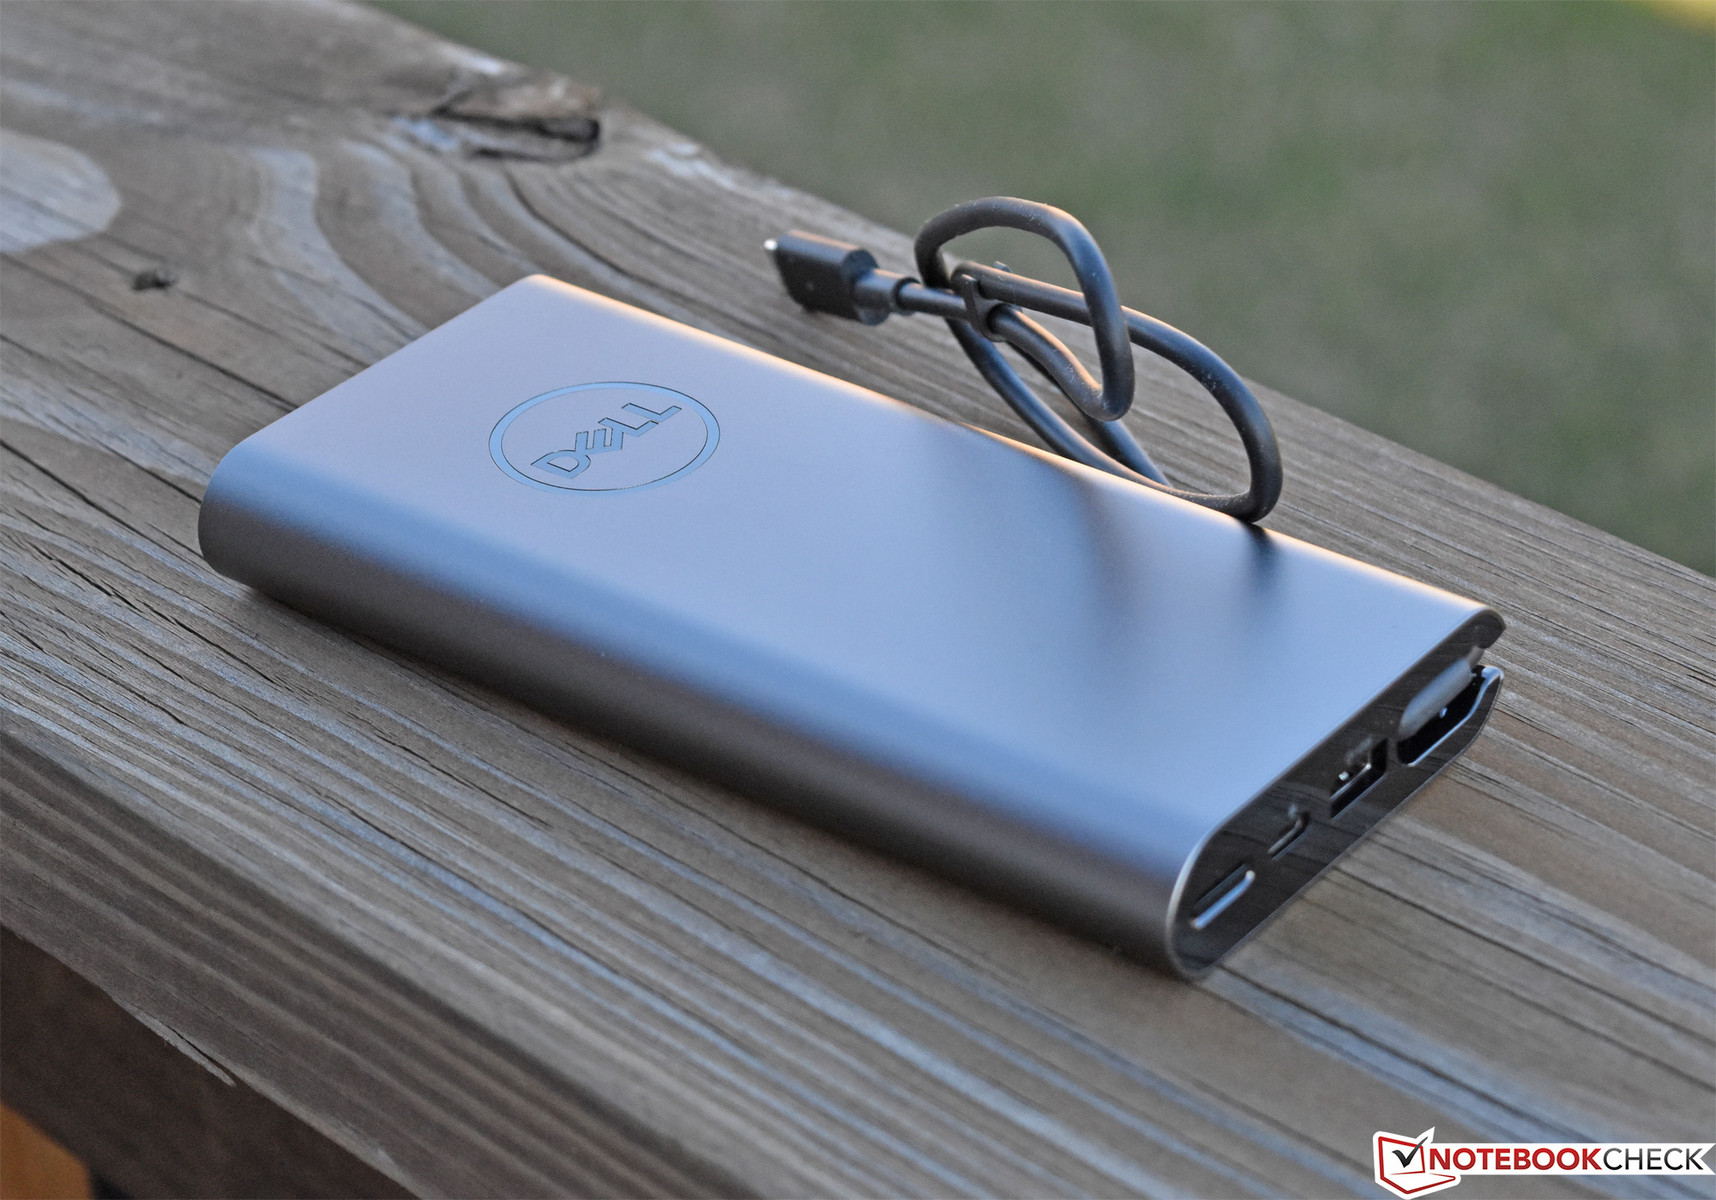
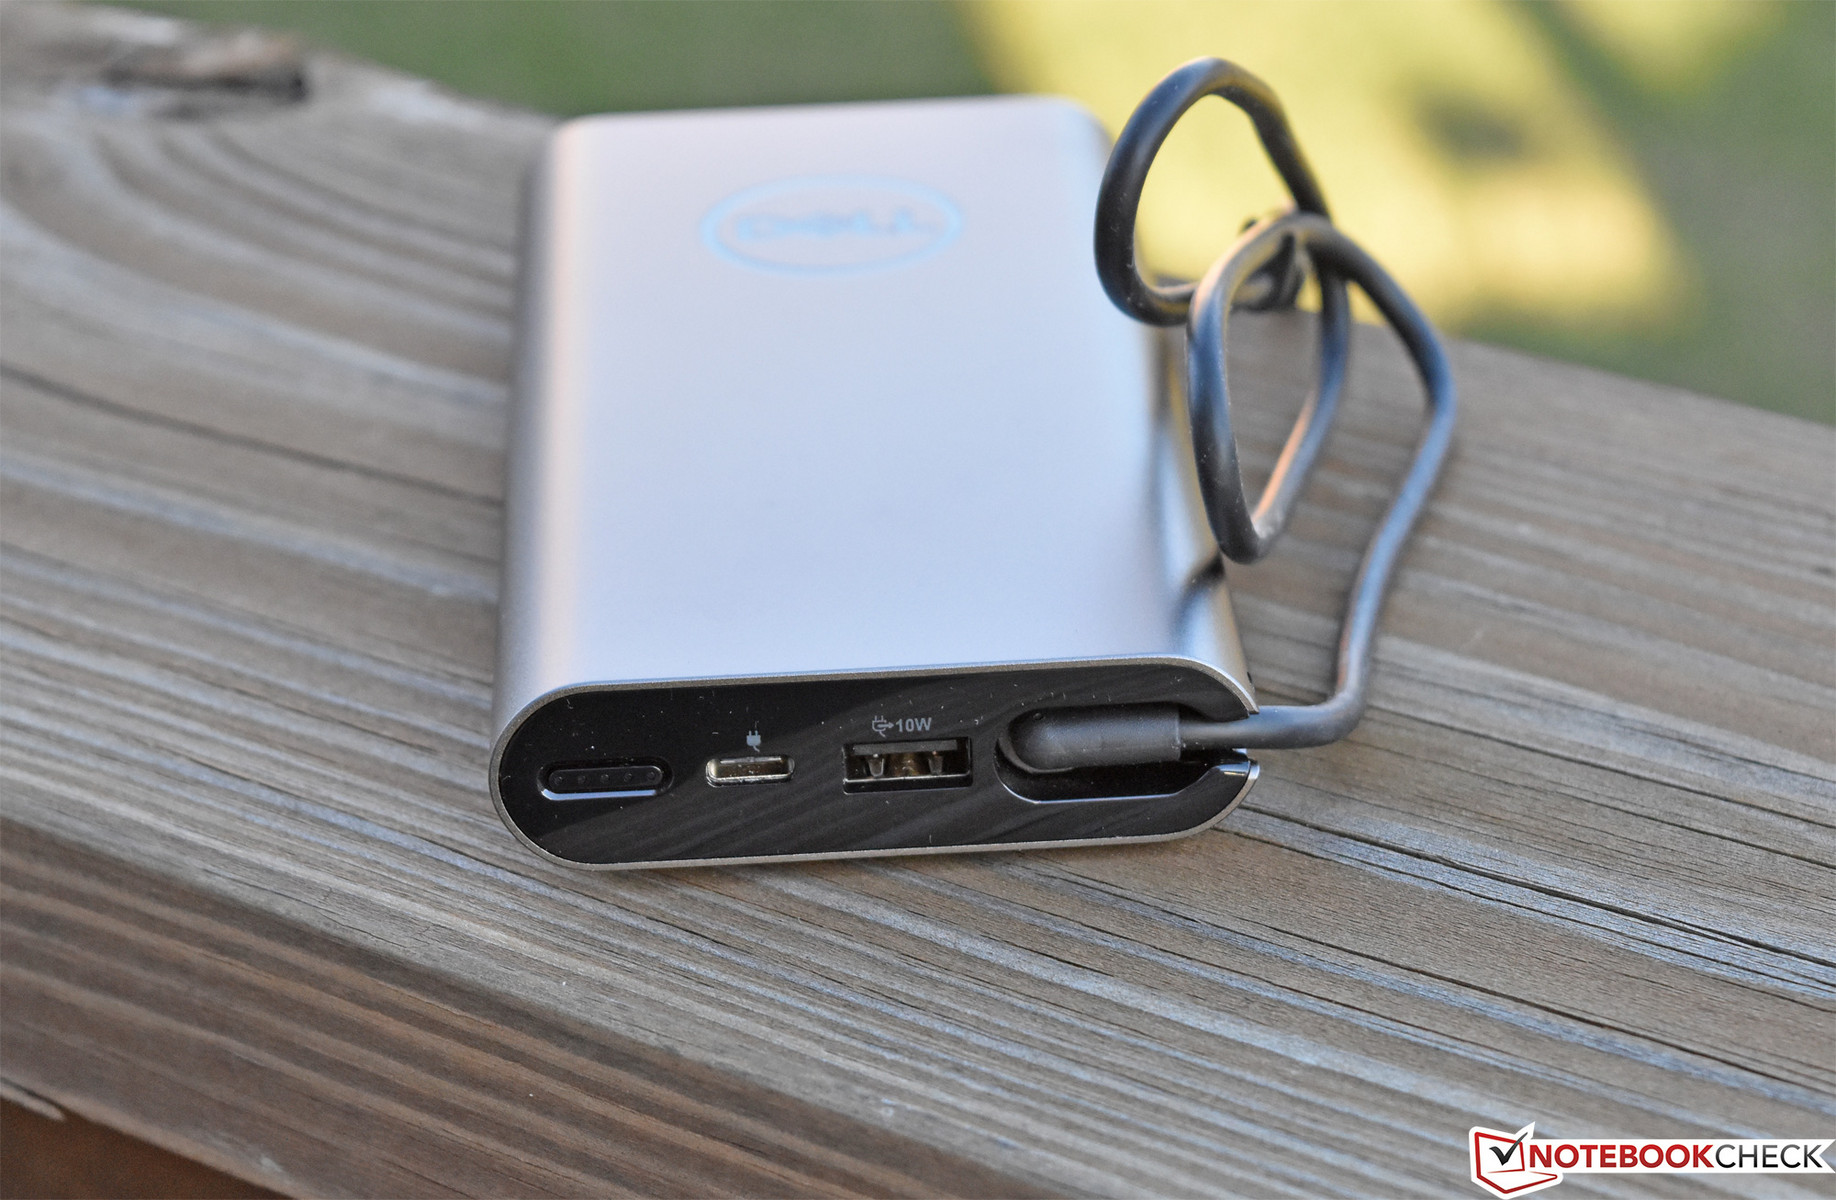
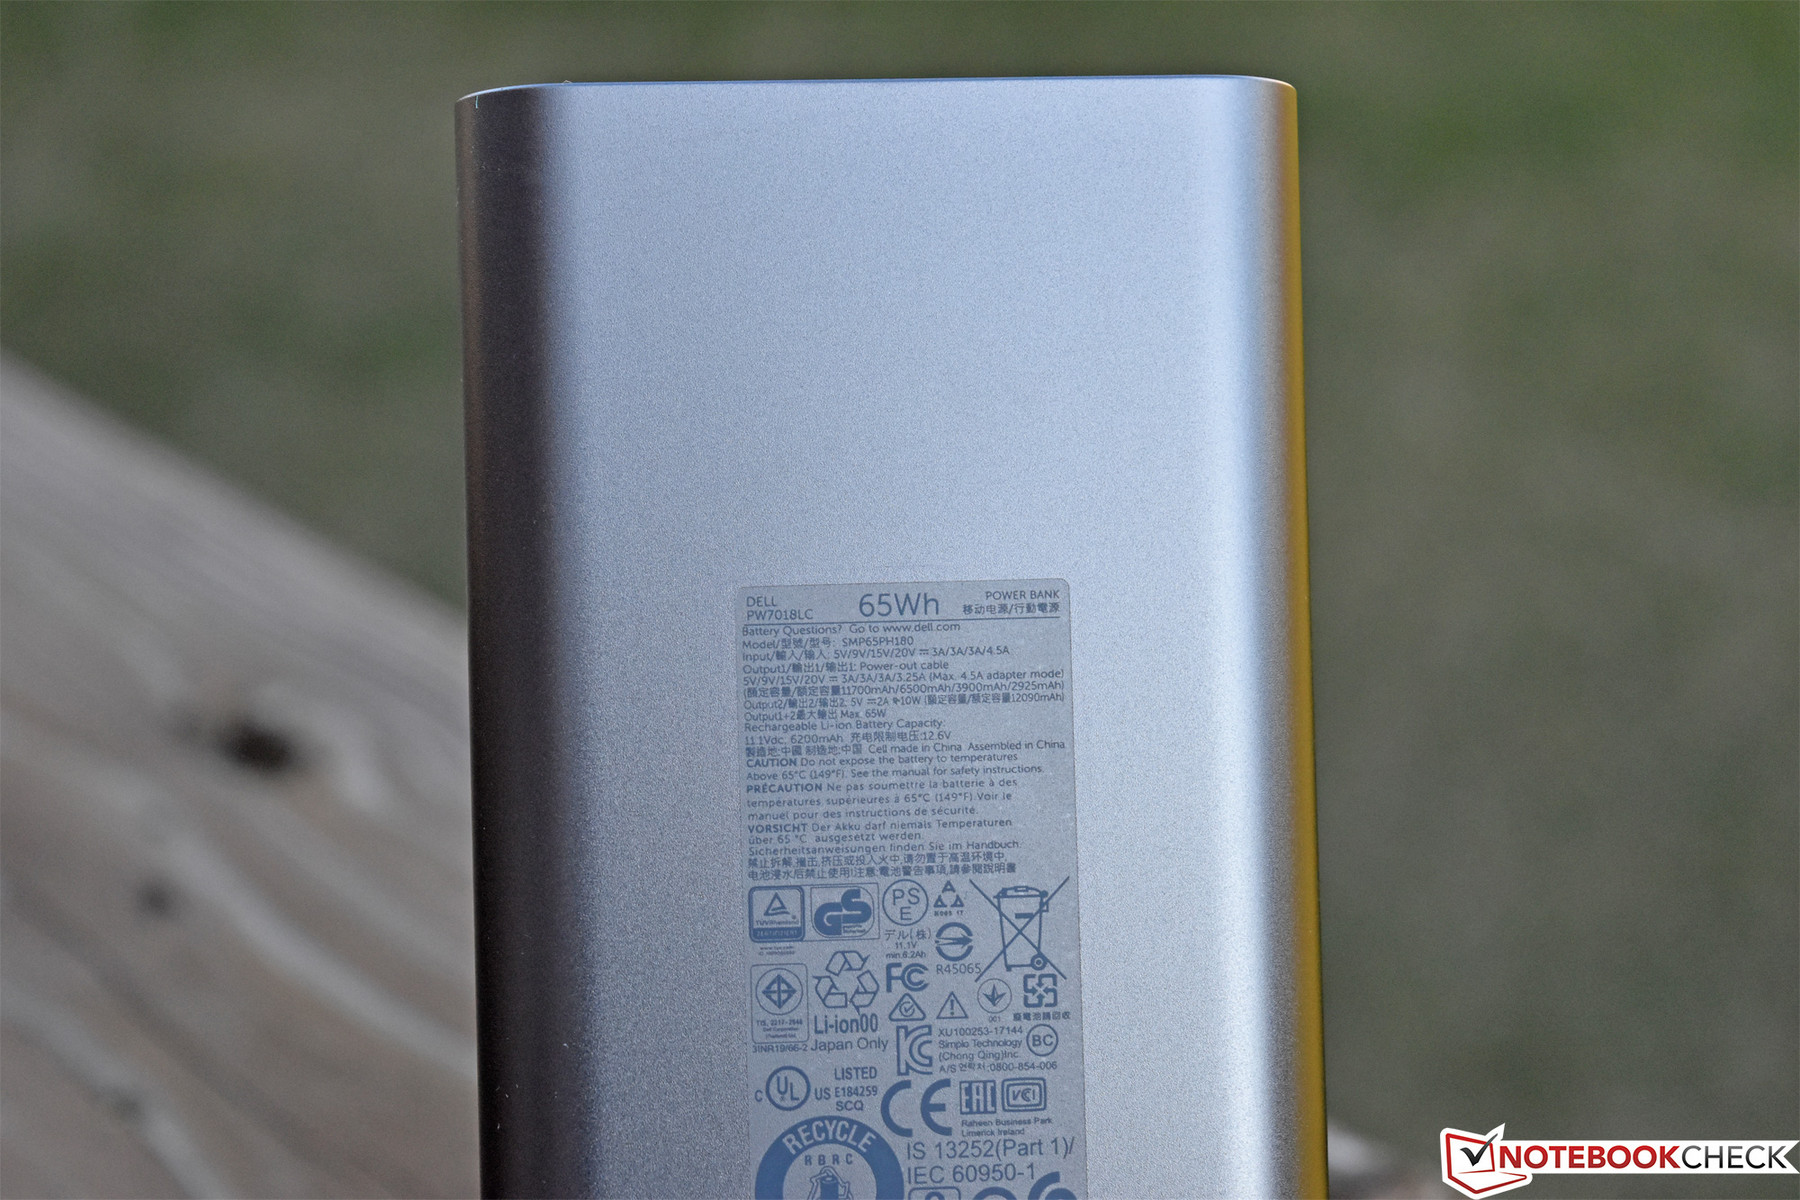
We’d also like to draw attention to the Dell Notebook Power Bank Plus ($150 MSRP), which we covered extensively in our previous review. It’s a very versatile accessory which will likely come in handy for owners of the Latitude 5290 given what we’ll later discuss regarding power consumption and battery runtimes.
Maintenance
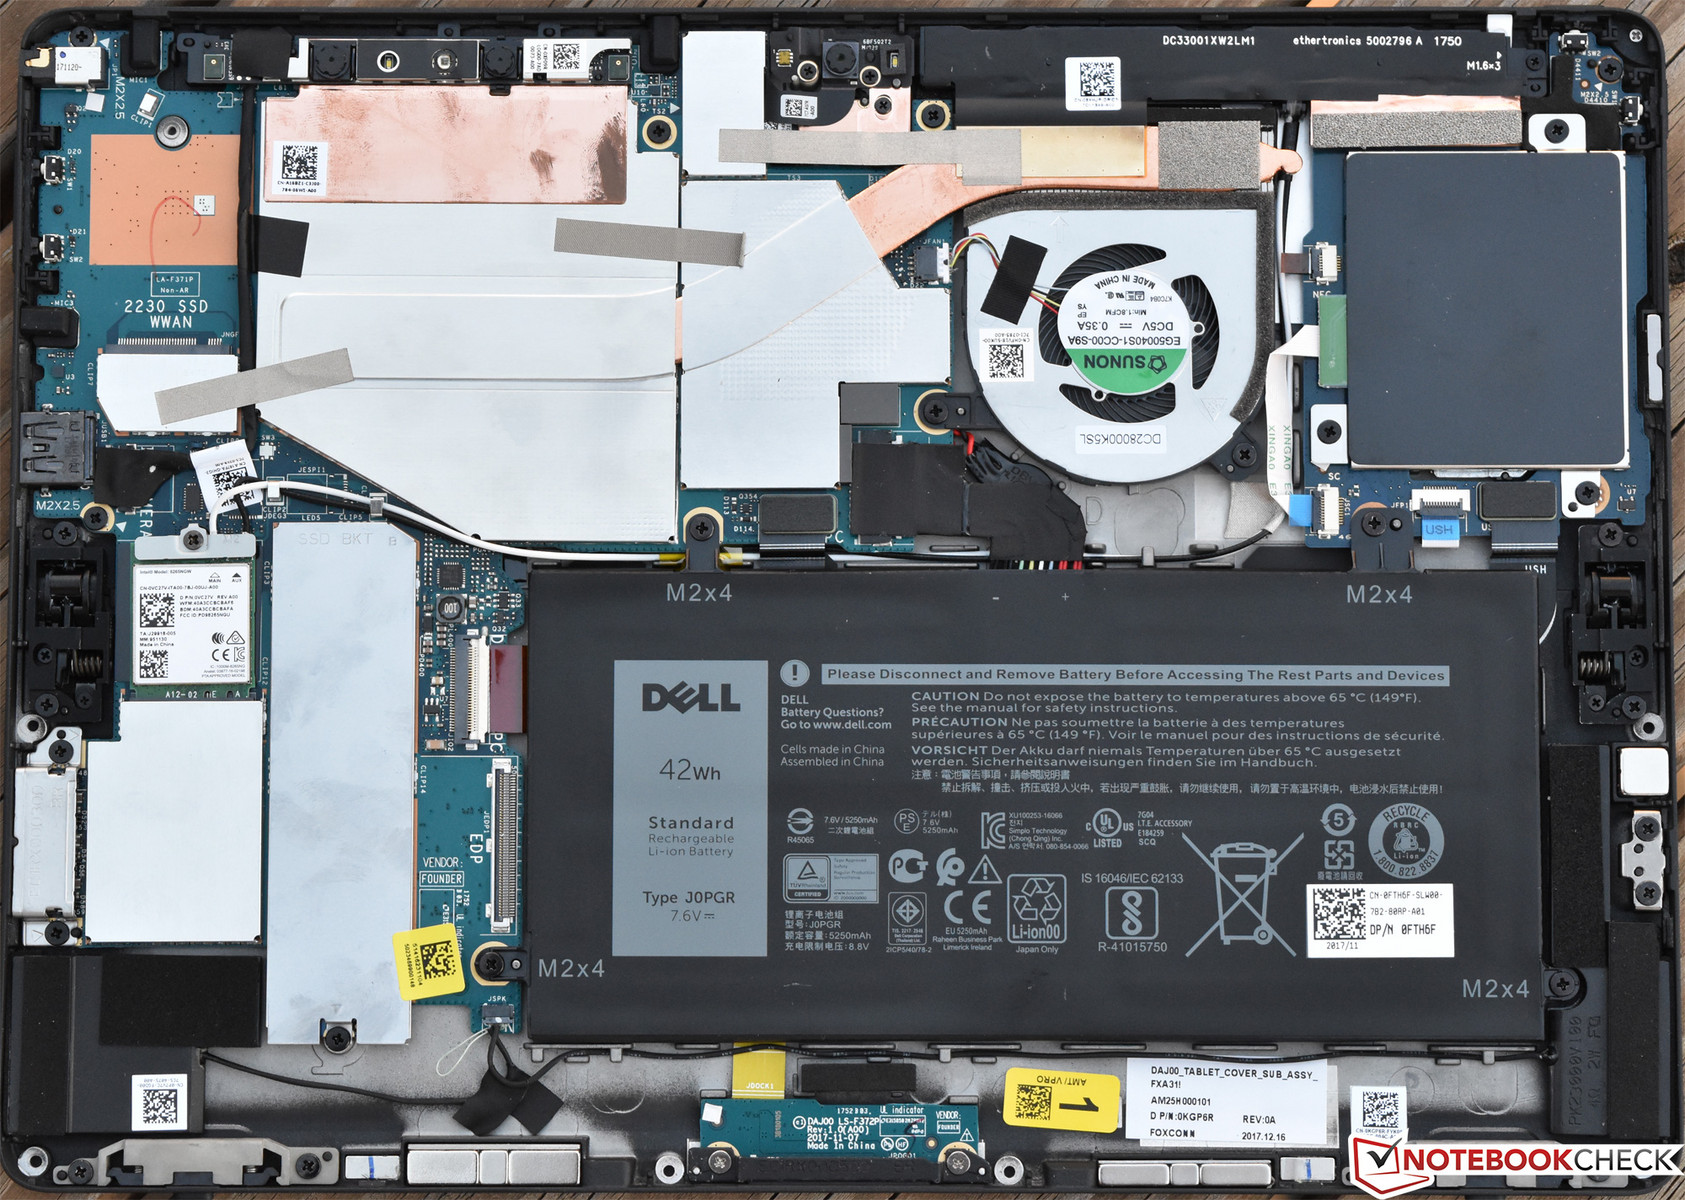
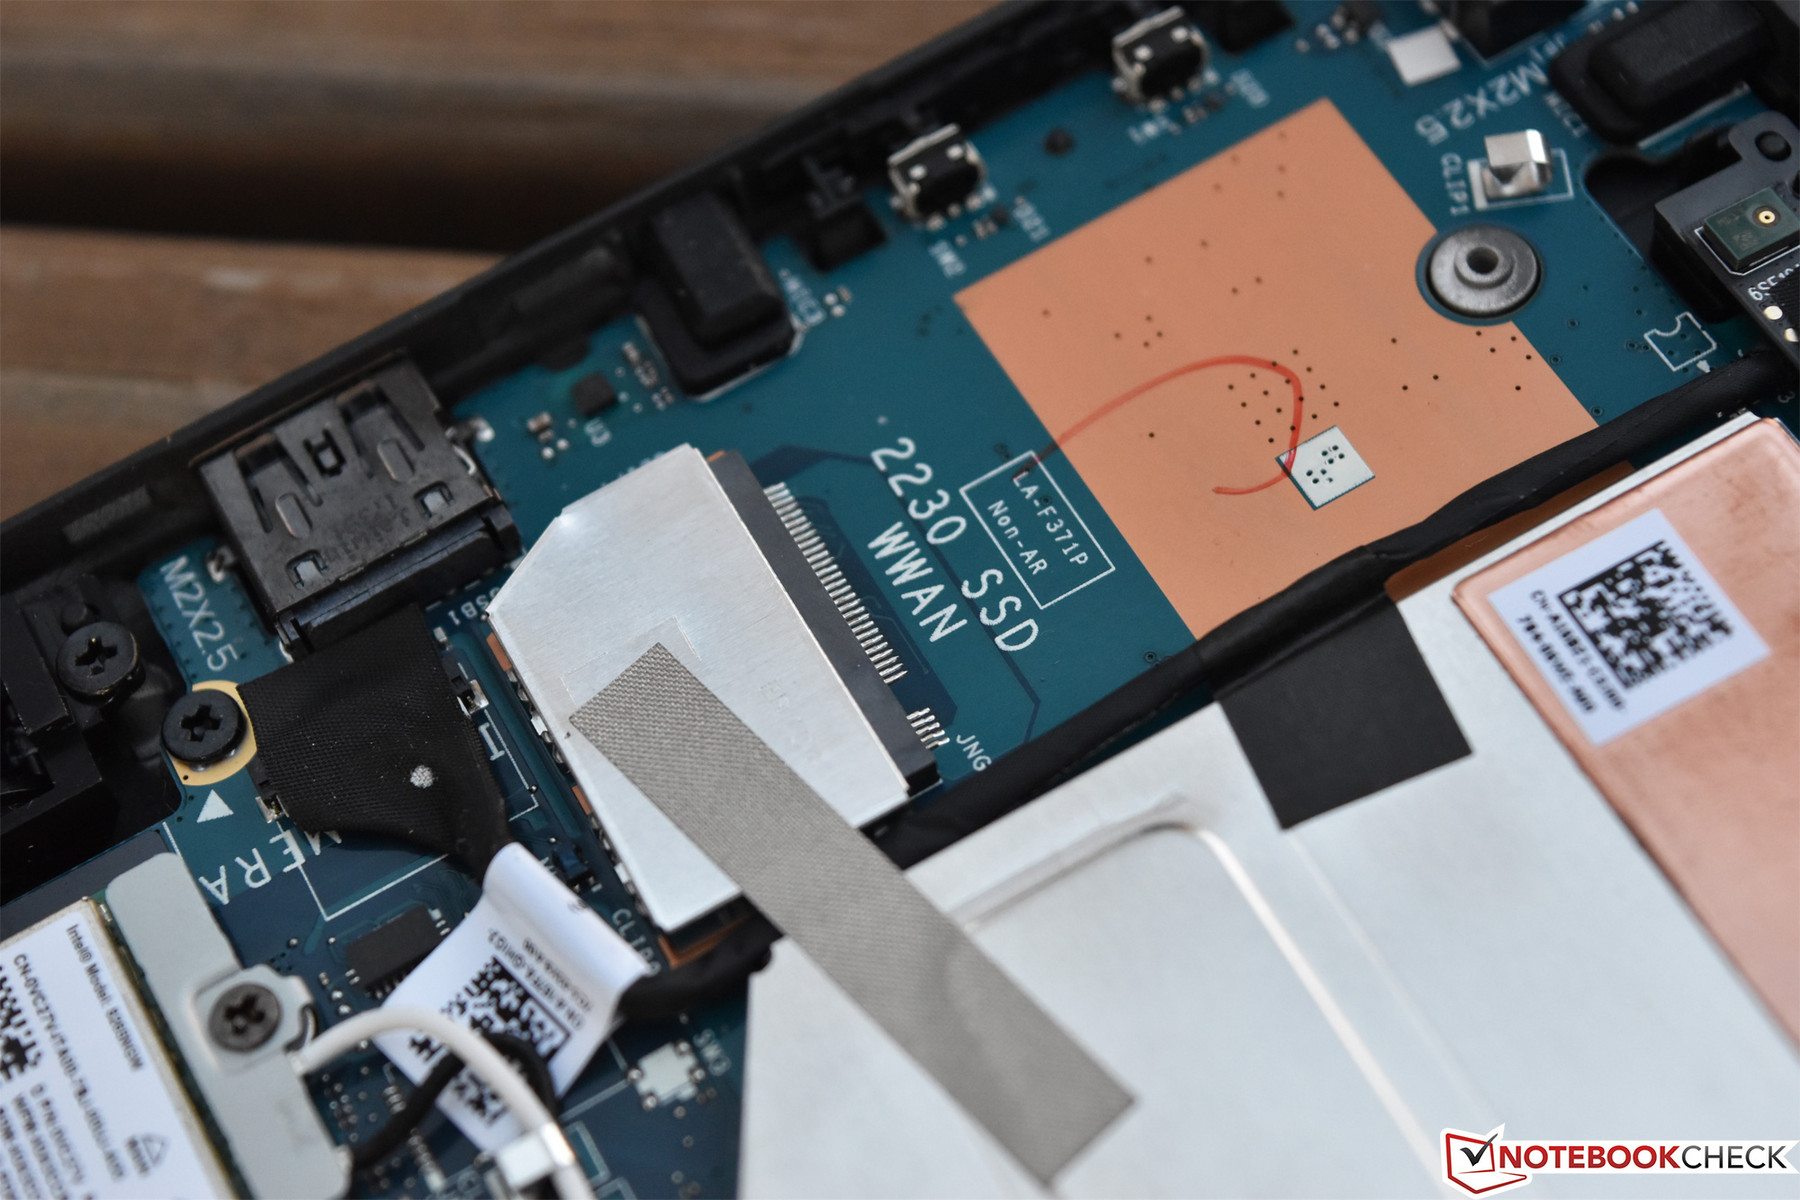
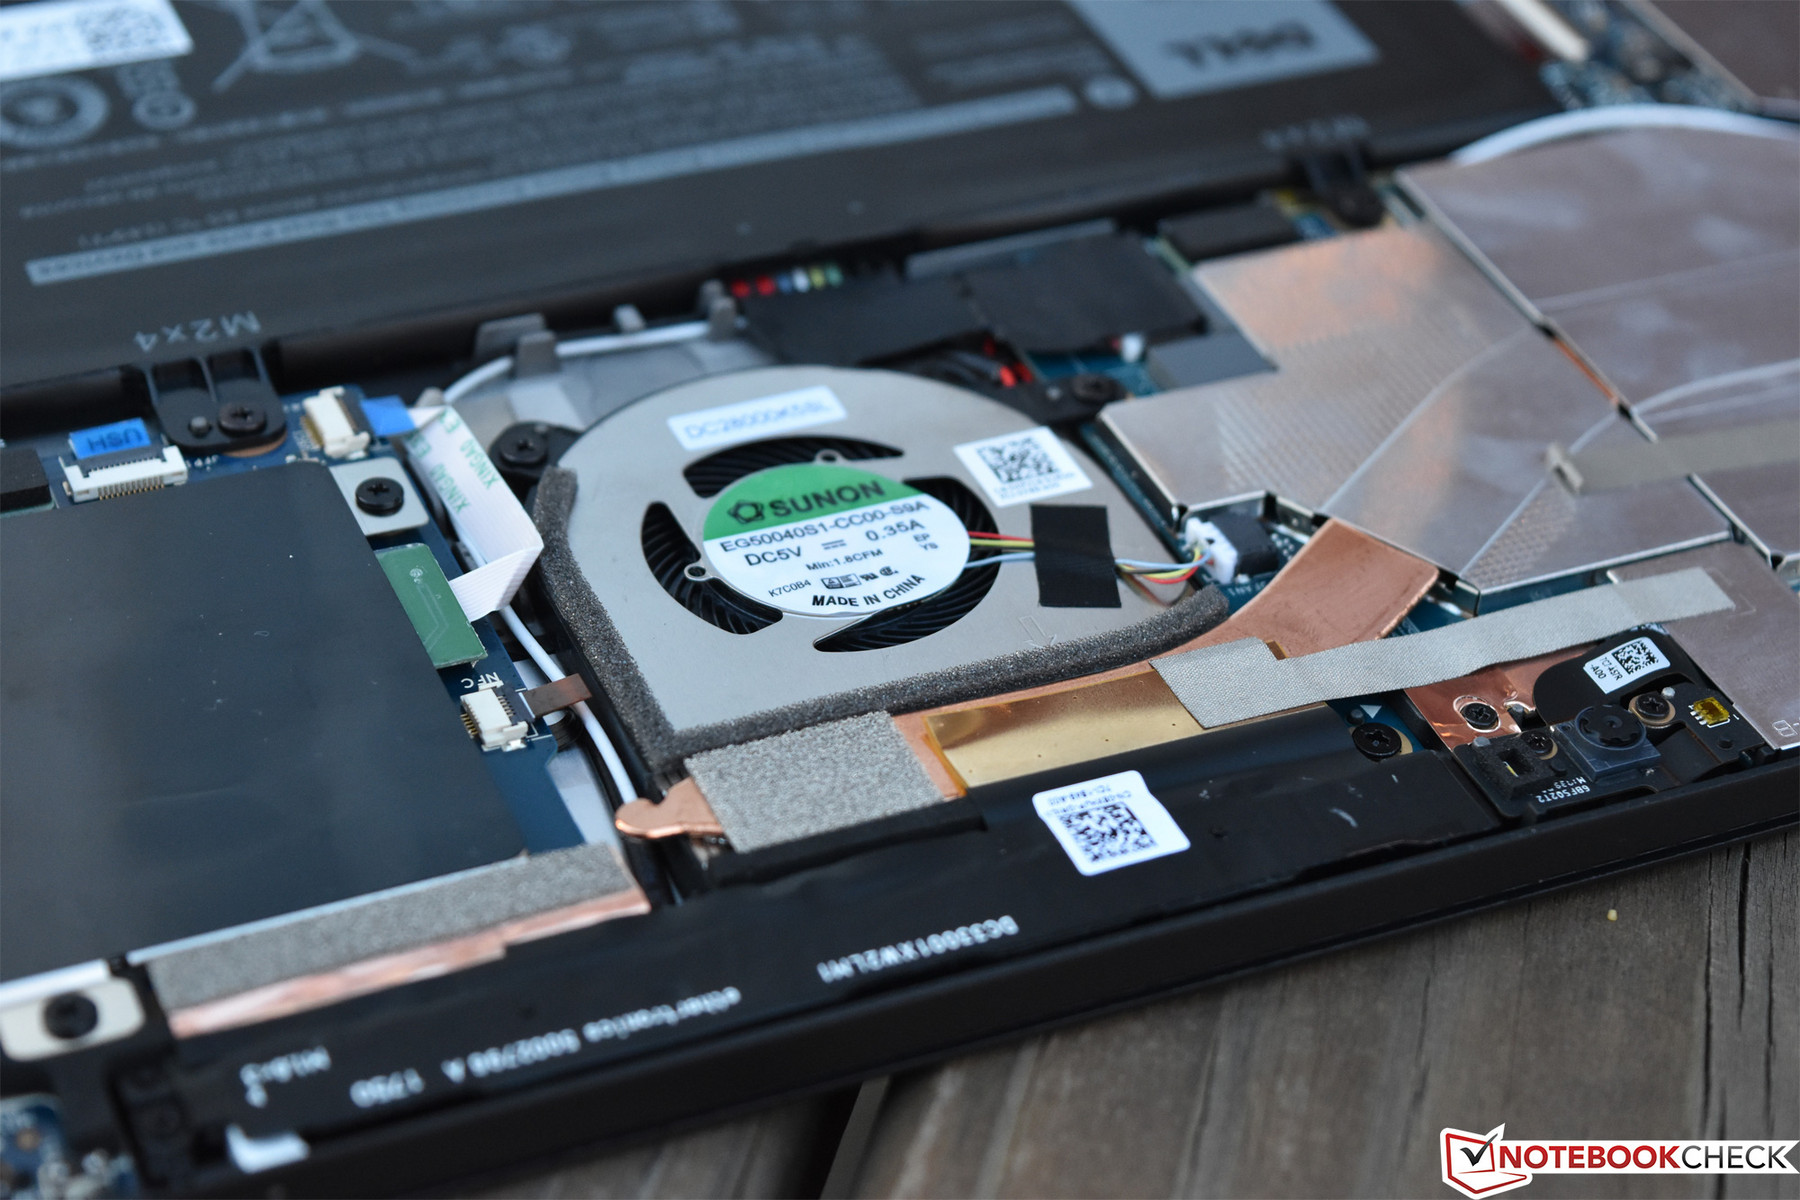
As with the Latitude 5285, maintenance is the big story with the Latitude 5290 2-in-1. Unlike most other tablets, the Latitude is relatively easy to disassemble—provided you’re careful in prying around the perimeter during the screen removal process—and the battery, WLAN adapter, solid-state drive, and cooling fan are all simple to replace. This along with connectivity are probably the two most significant advantages that it boasts over consumer-grade competitors such as the Microsoft Surface Pro (which essentially can’t even be disassembled without destroying something in the process).
Warranty
Dell still only supplies a 1-year on-site warranty (after remote diagnosis) as standard with the Latitude 5290, a deficiency which separates it from its higher-end 7000-series counterparts. Upgrades to longer warranty term periods, ProSupport, and Accidental Damage Protection (among other options) remain available for an additional cost. Please see our Guarantees, Return Policies and Warranties FAQ for country-specific information.
Input Devices
Keyboard, Touchpad, and Touchscreen
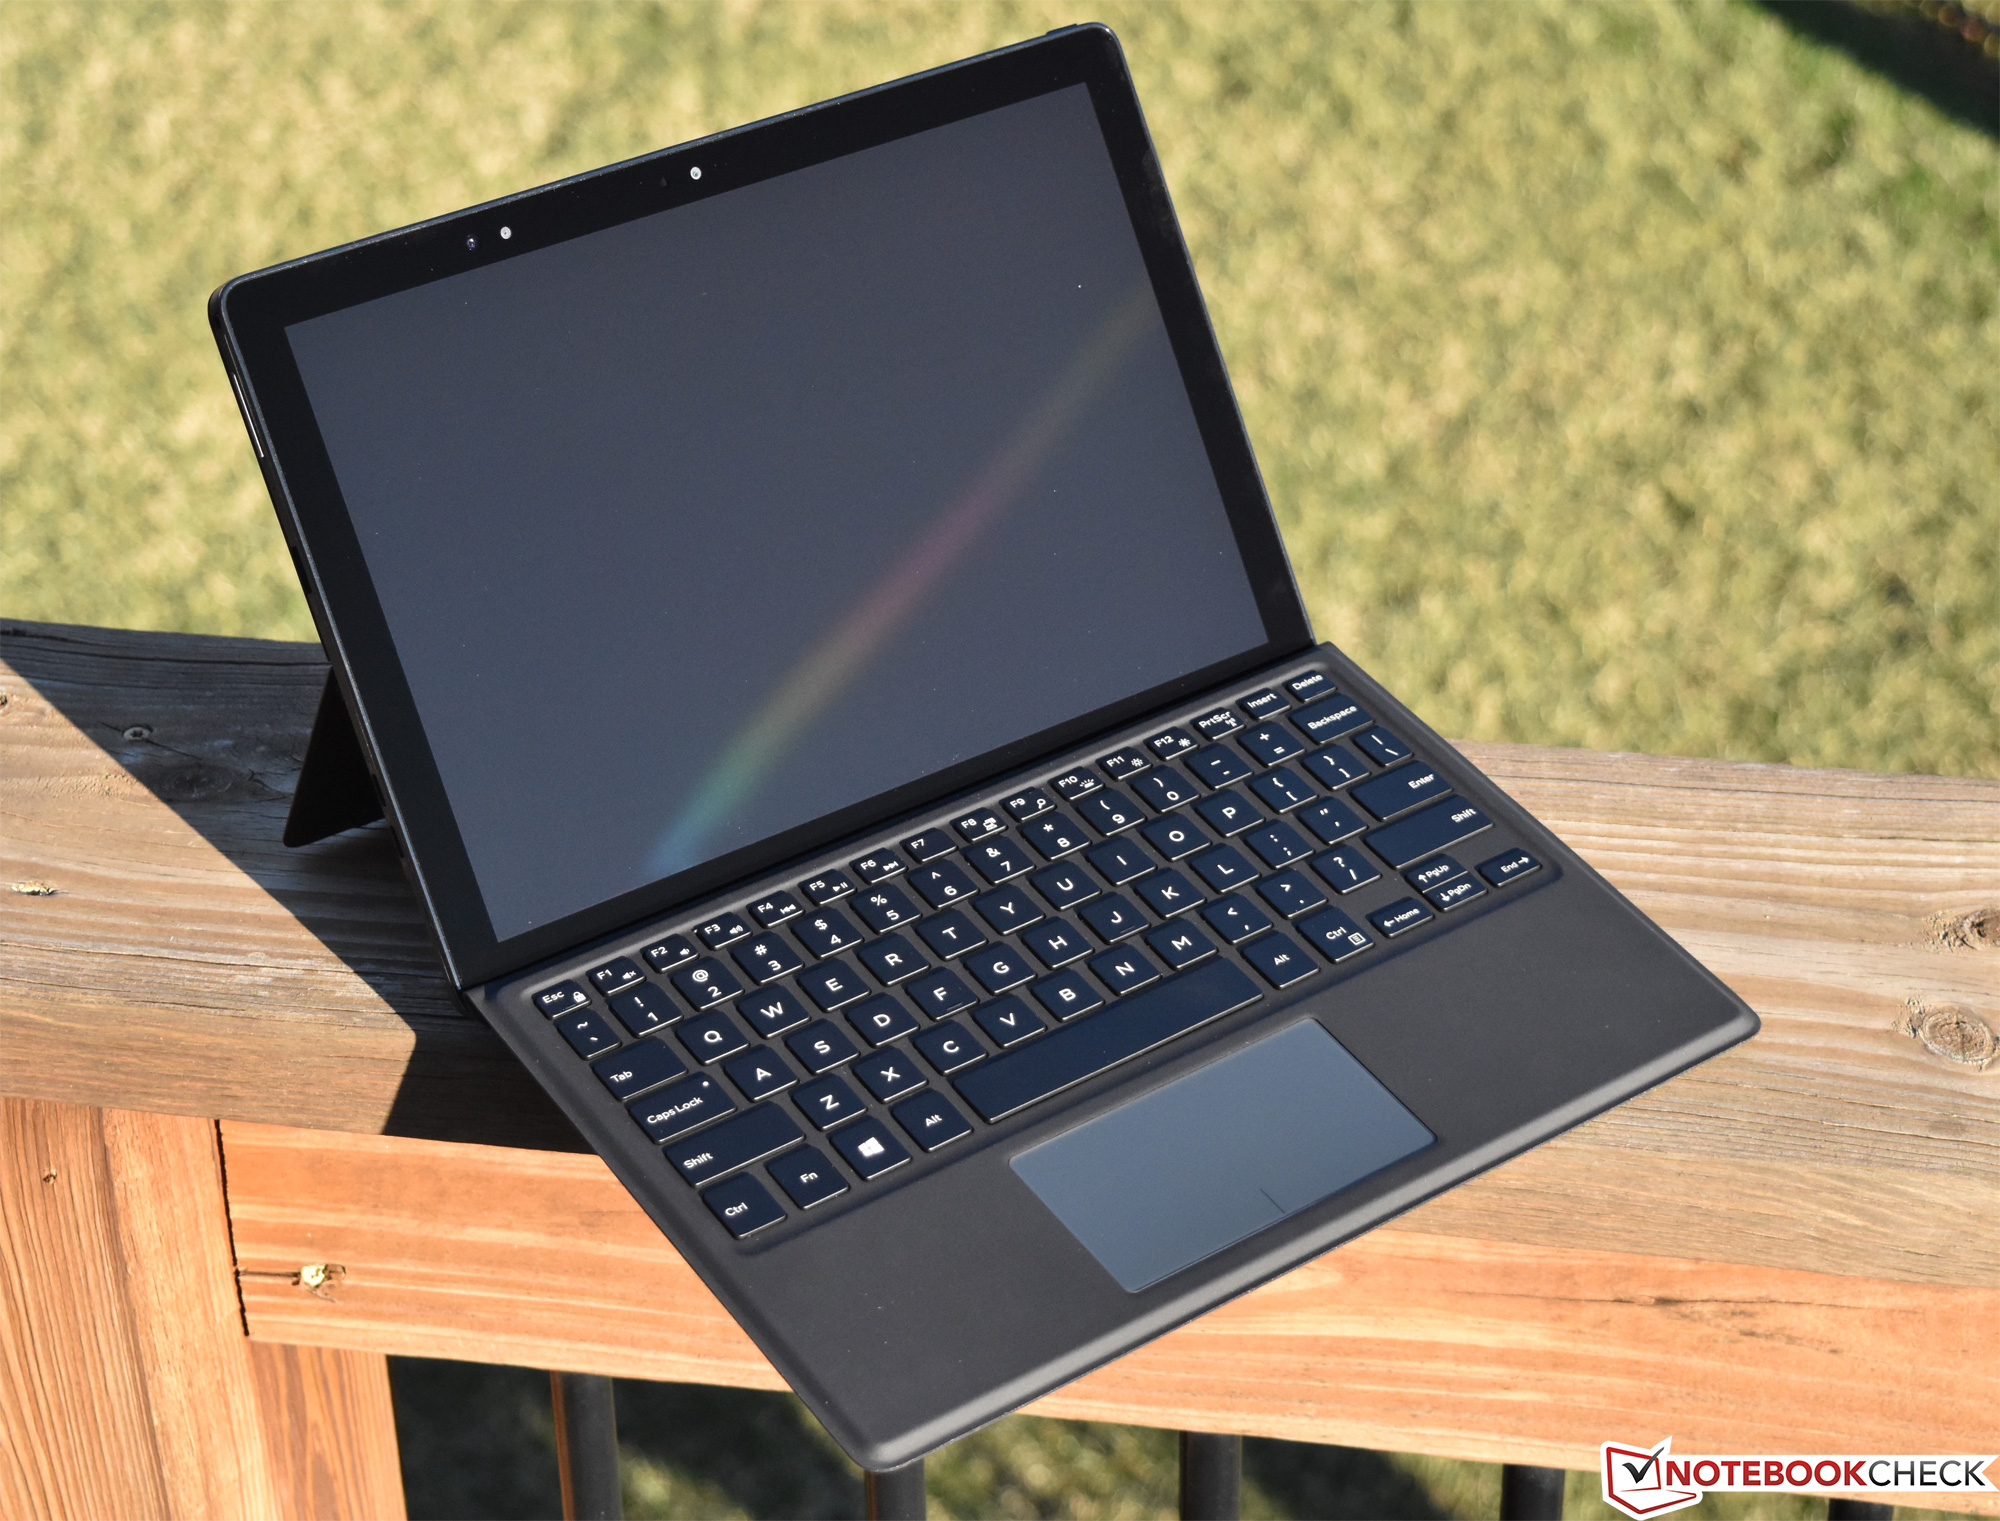
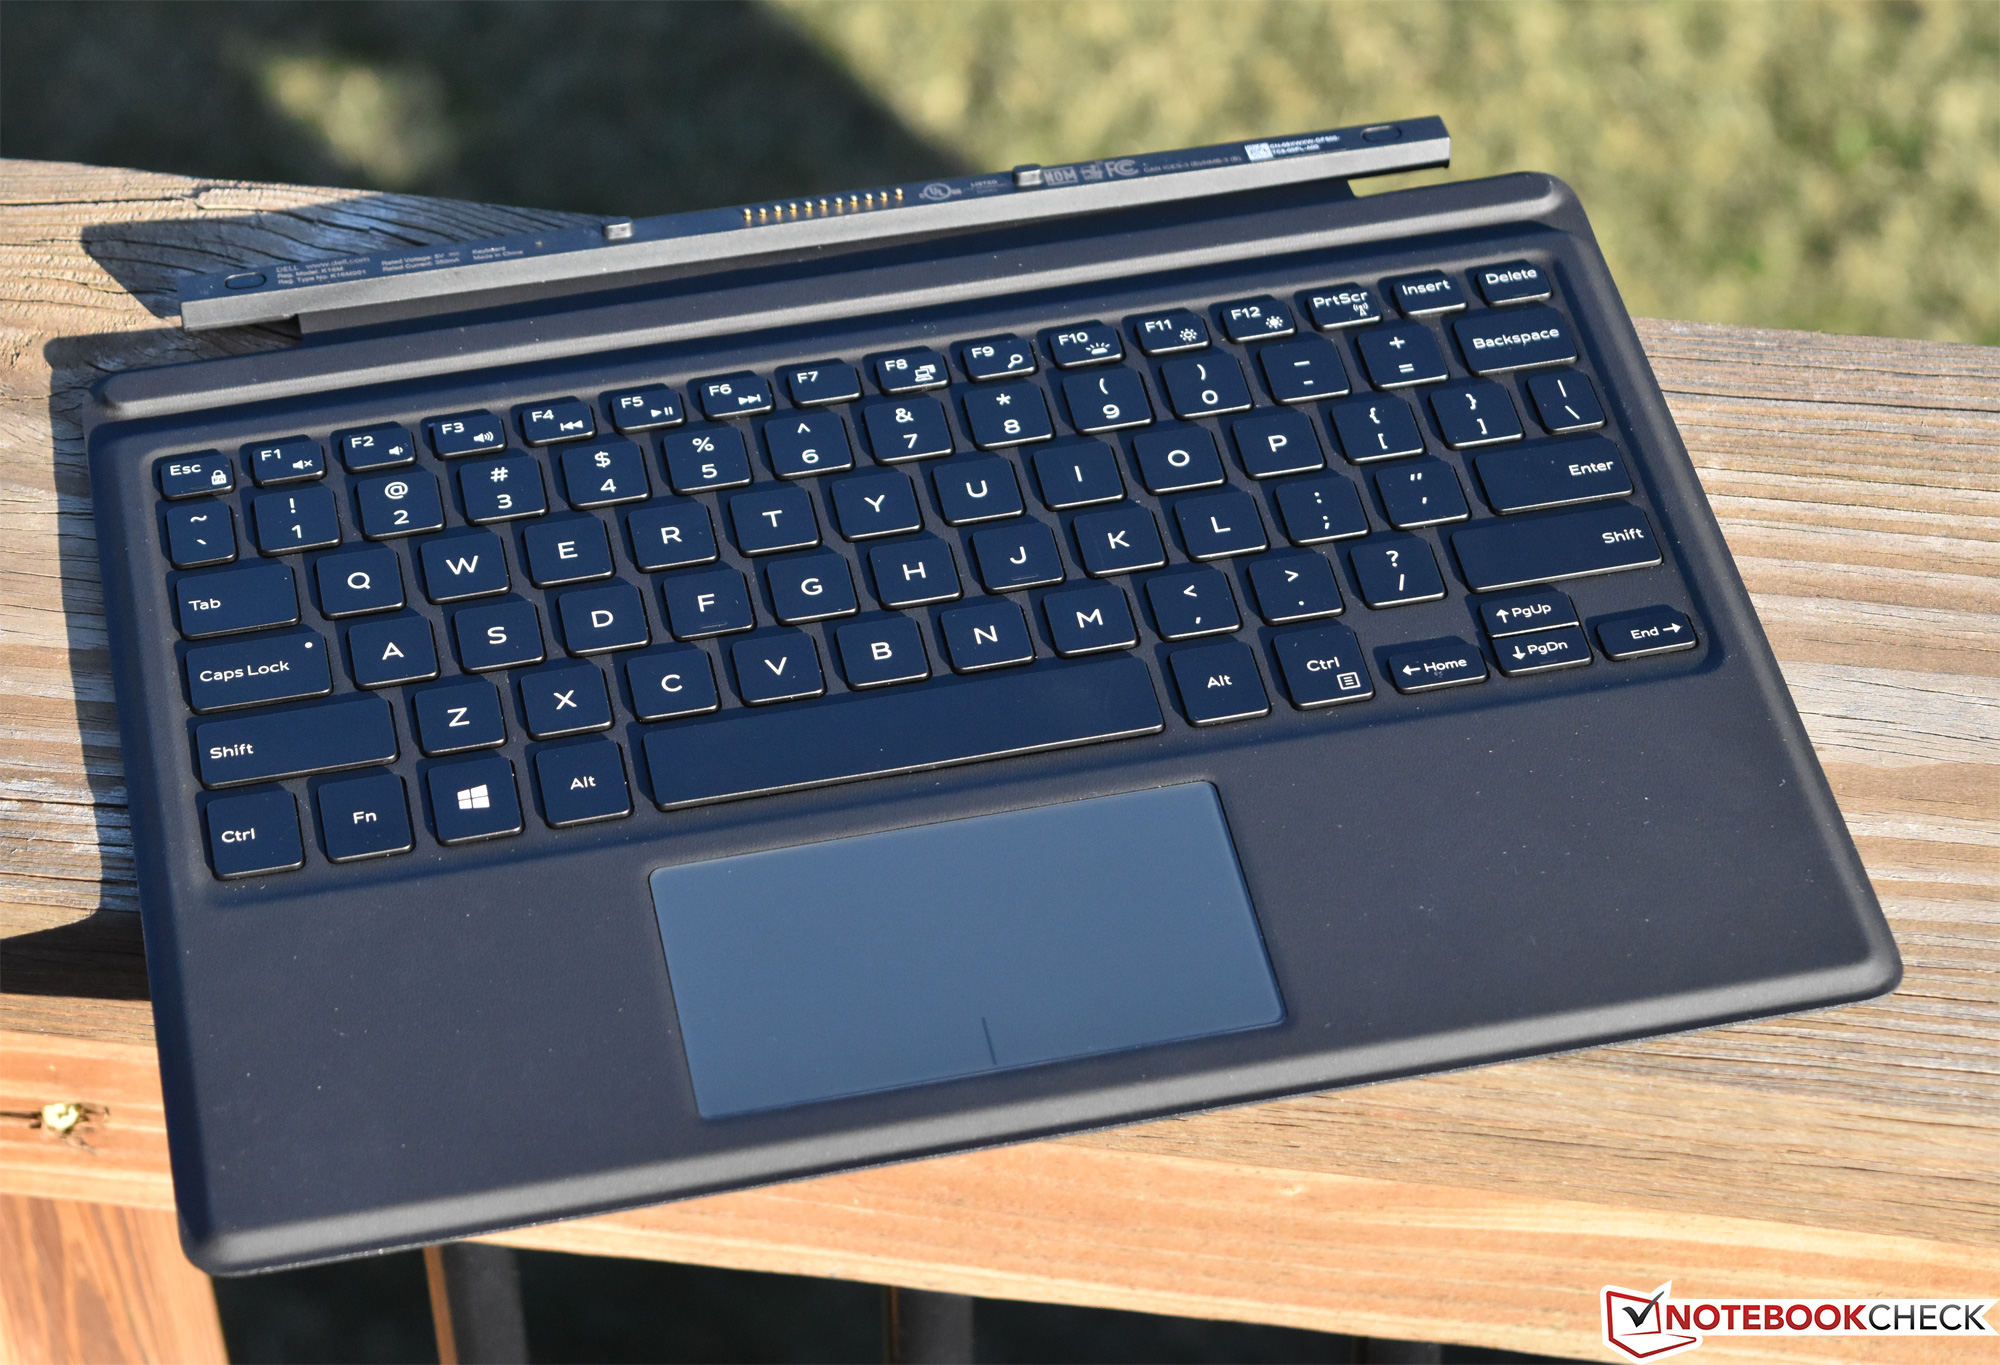
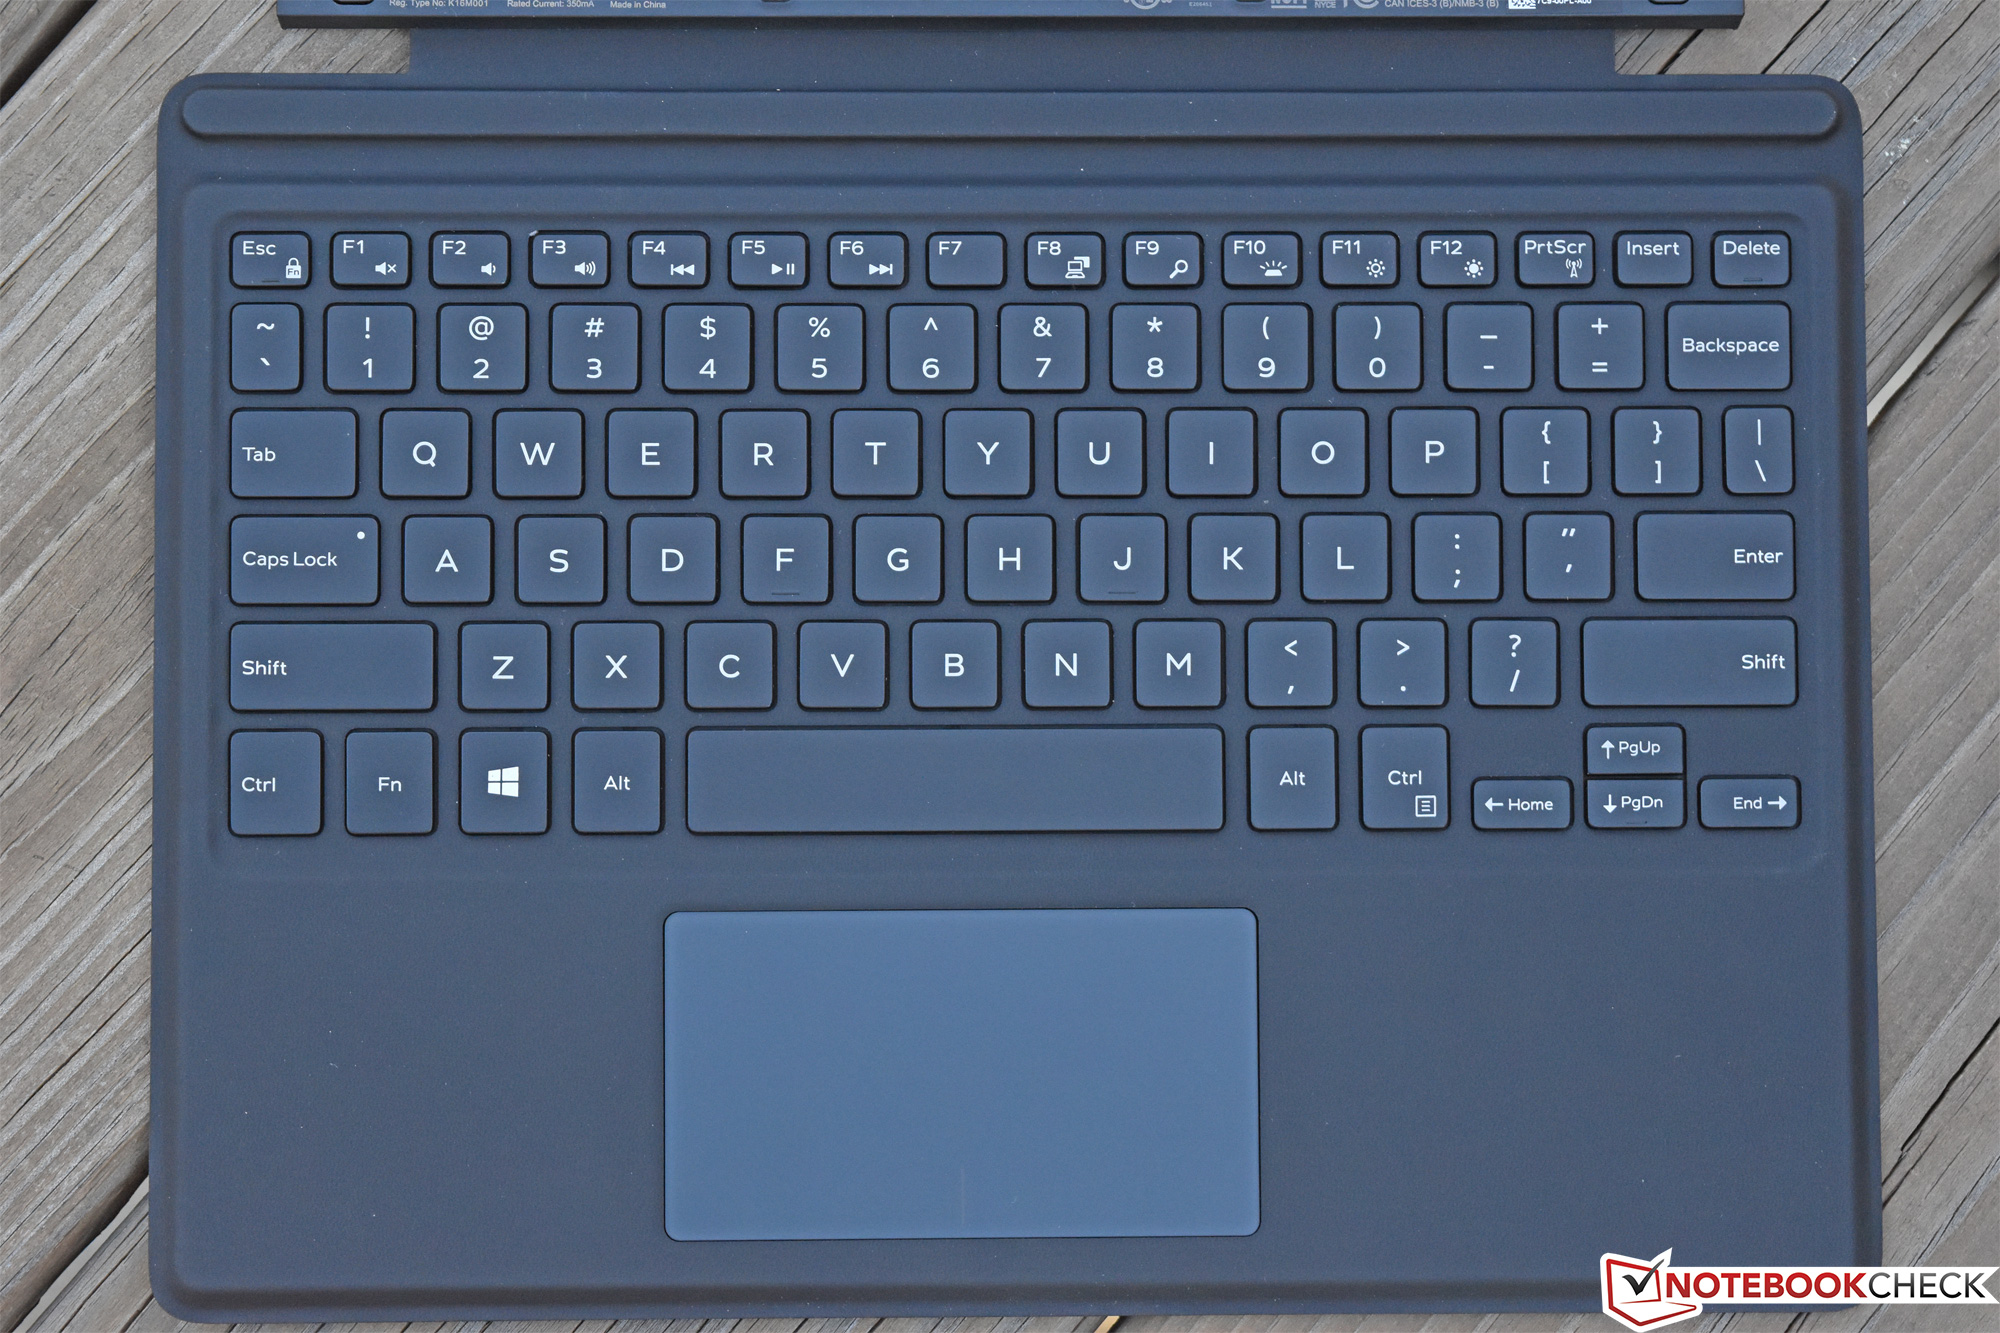
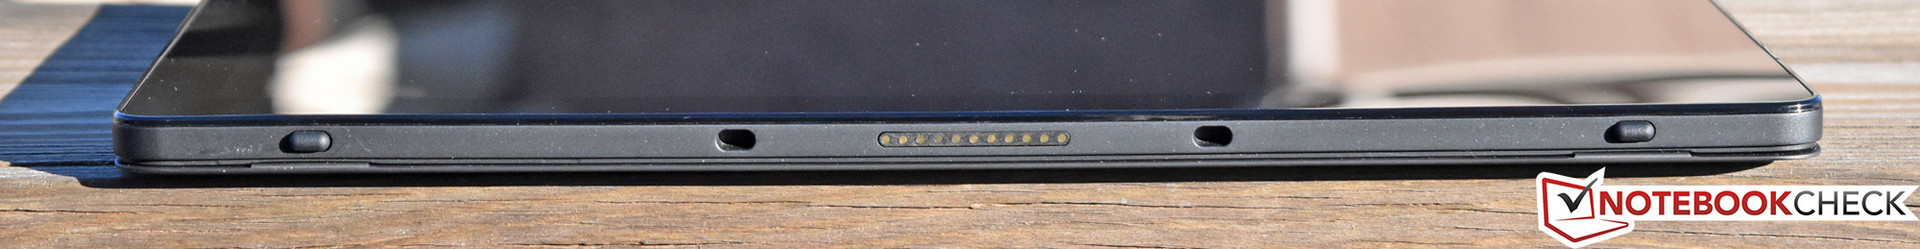
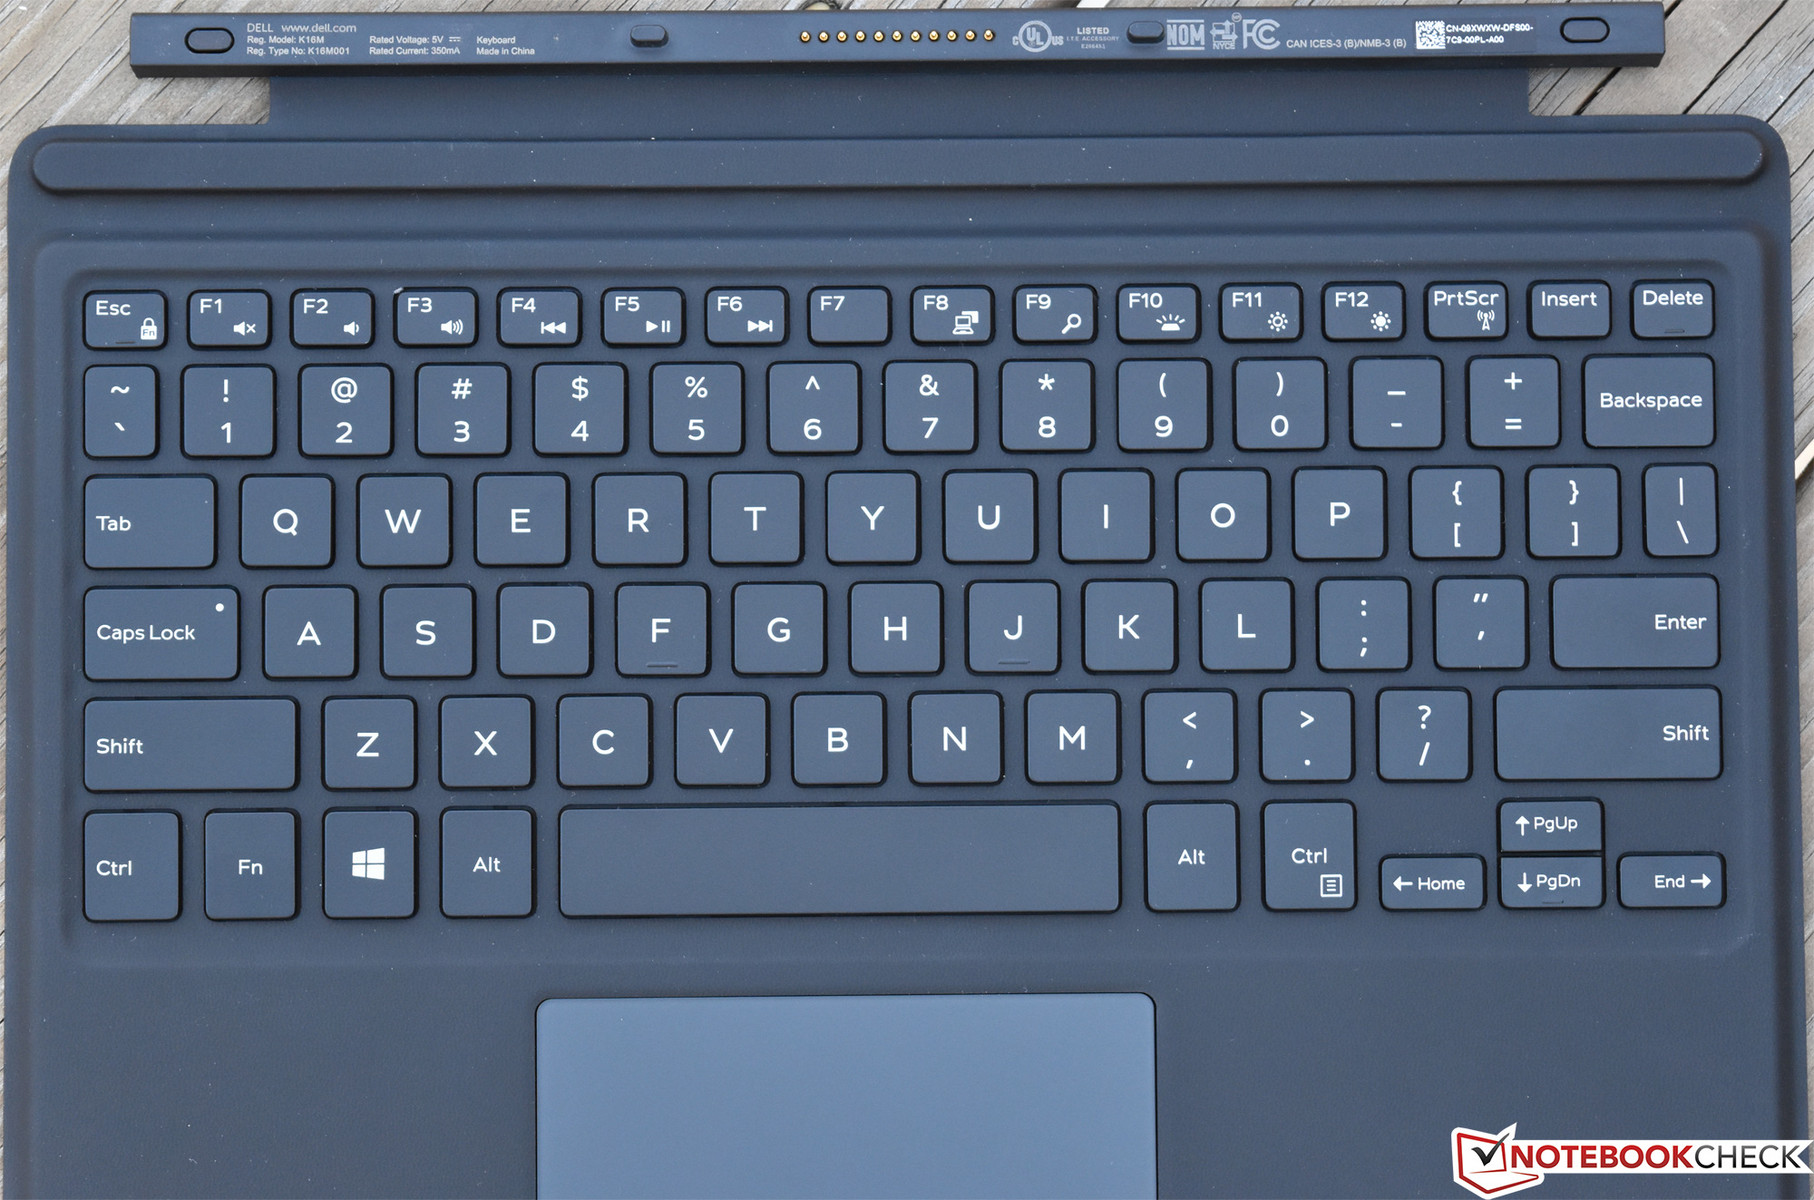
As previously mentioned, the Dell Latitude 2-in-1 Travel Keyboard (sold separately but included with our particular configuration) has not changed since the Latitude 5285. To briefly summarize our thoughts on the keyboard and touchpad, typing is comfortable and on par with that of the Surface Pro Type Cover, though also like the Type Cover, the flex and keystroke noise are both rather obvious when the cover is propped up at an incline (it attaches magnetically along the bottom bezel of the tablet when in this form, again, like the Surface Pro). The keyboard features a two-step backlight for easy viewing in darker environments; we found the backlight to be evenly-distributed and attractive. The Alps clickpad, meanwhile, is probably most closely comparable to that of the XPS 13, with well-defined feedback and excellent gesture interpretation. Finally, the touchscreen remains very good, with edge swipes and gestures flawlessly supported.

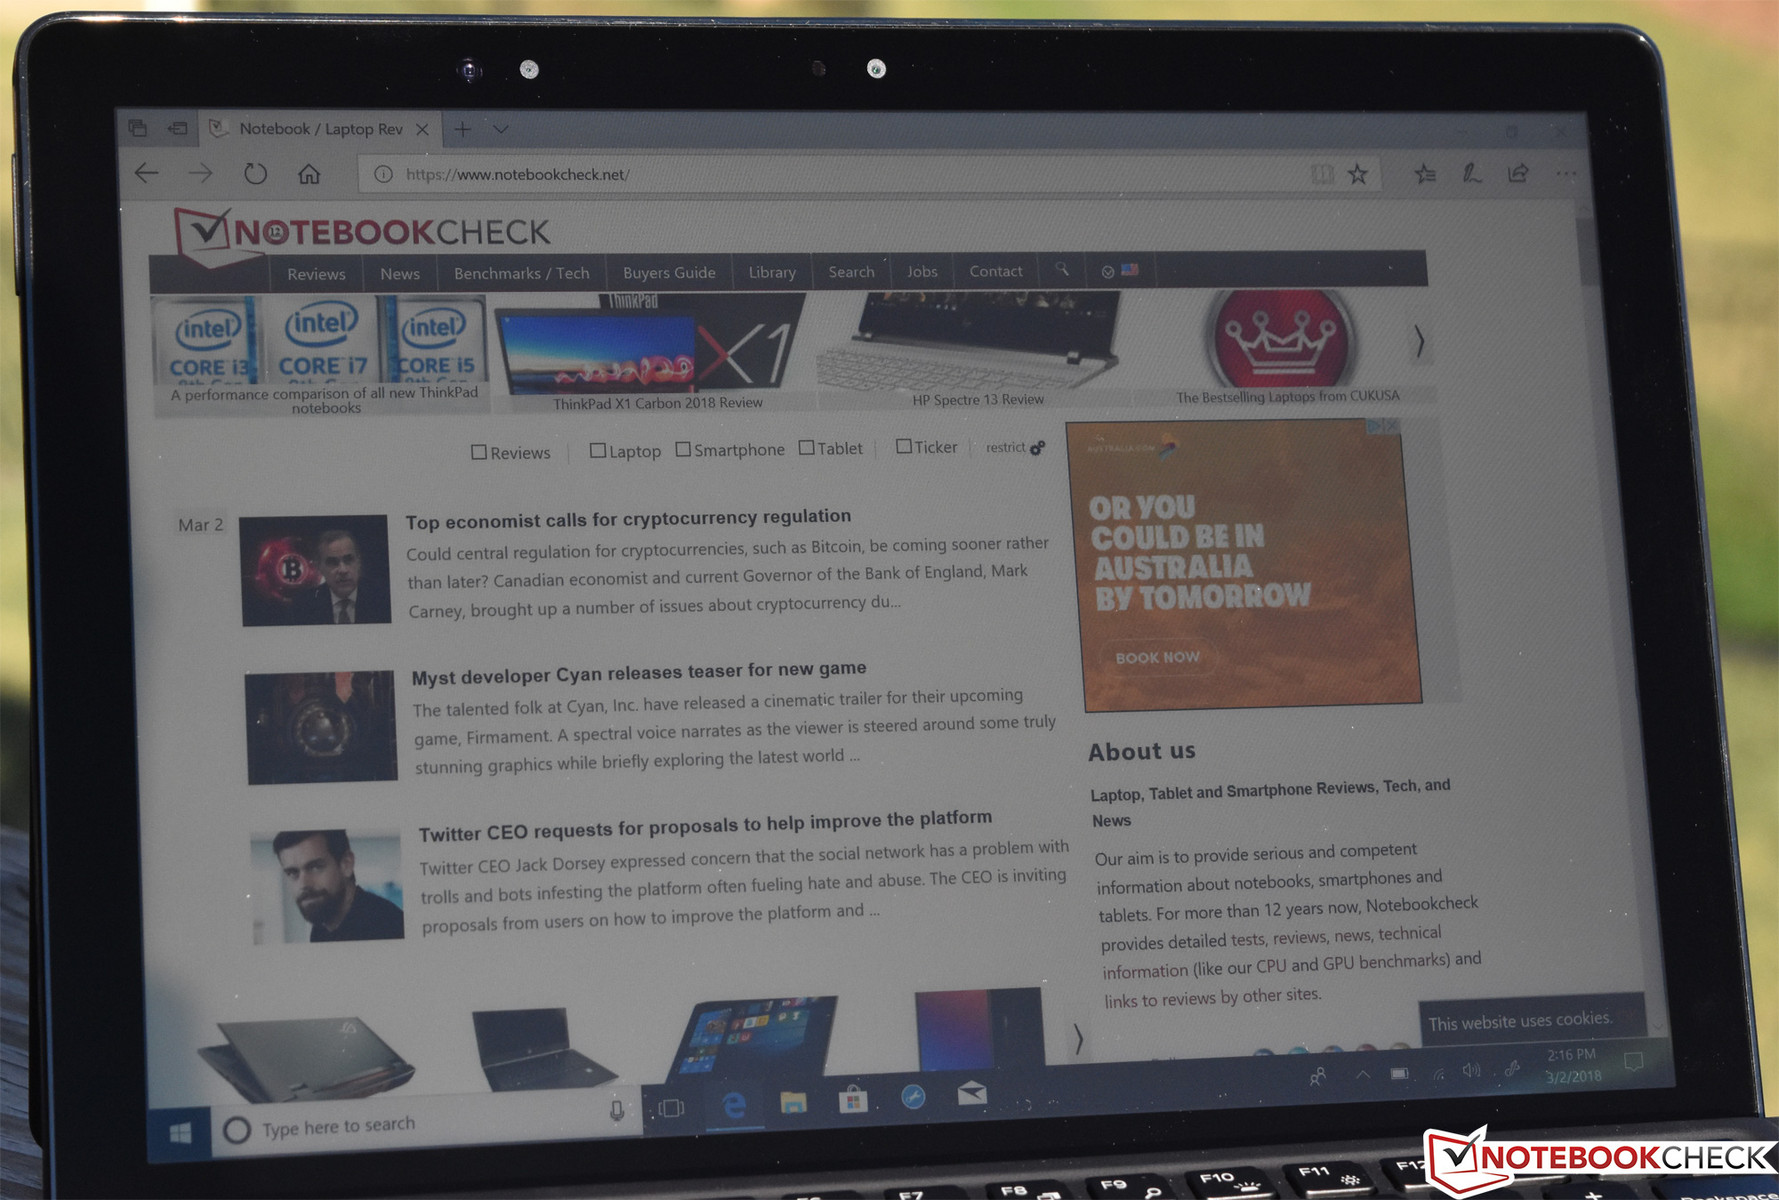
Display
The Latitude 5290 2-in-1 features just a single display option: a 12.3-inch 1920x1280 IPS touchscreen with a 3:2 aspect ratio. Although the screen shares the same aspect ratio as the Surface Pro, the resolution is considerably less—but that’s unlikely to matter much in everyday use, especially for office users. The panel is protected by an edge-to-edge layer of Gorilla Glass 4, which Dell specifies is “anti-reflective and anti-smudge”. Truth be told, we found it to be highly reflective, though it does work to diffuse light sources to some degree.
Dell specifies that the display carries some 340 nits in brightness; our initial (subjective) impressions were that it seems much brighter than this. Color and contrast also seem to be good.
| |||||||||||||||||||||||||
Brightness Distribution: 86 %
Center on Battery: 548 cd/m²
Contrast: 1075:1 (Black: 0.51 cd/m²)
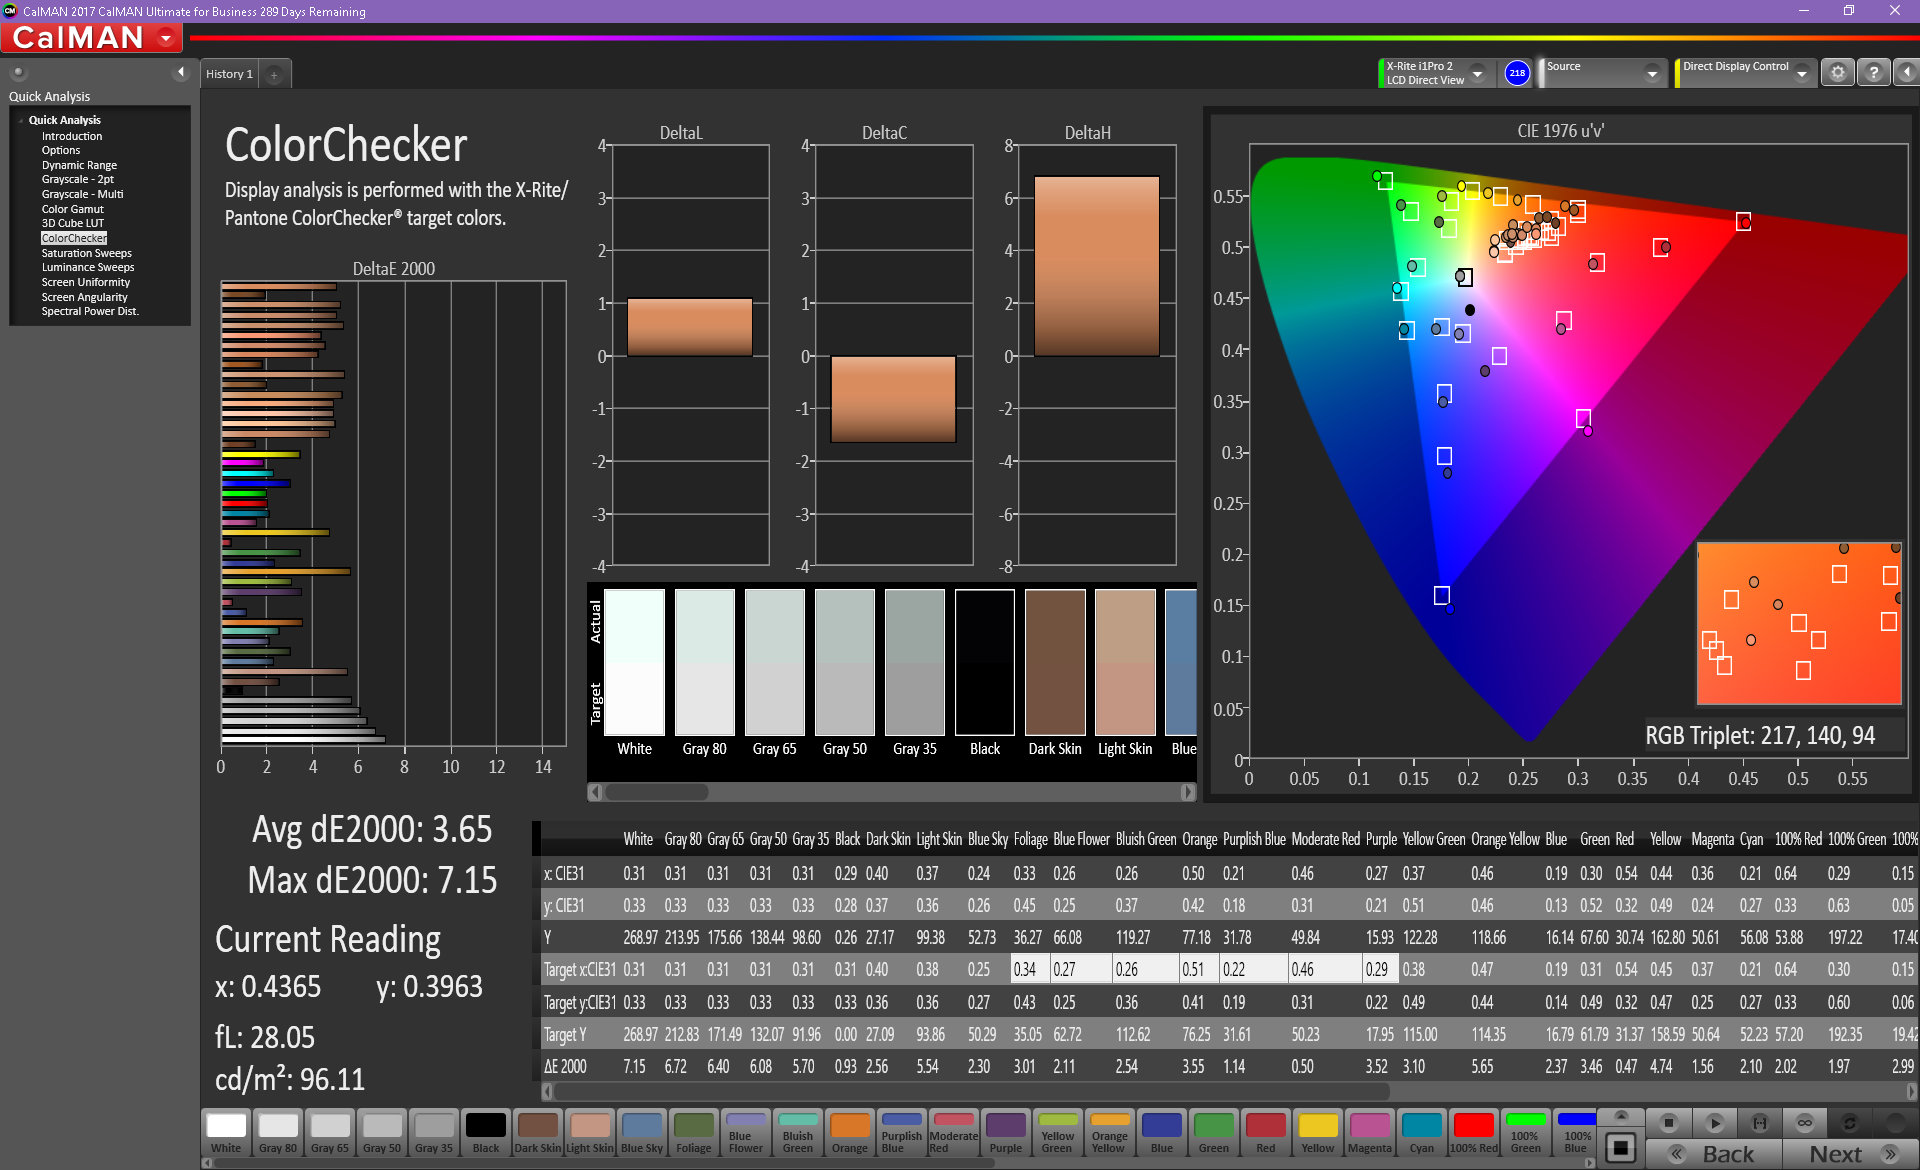
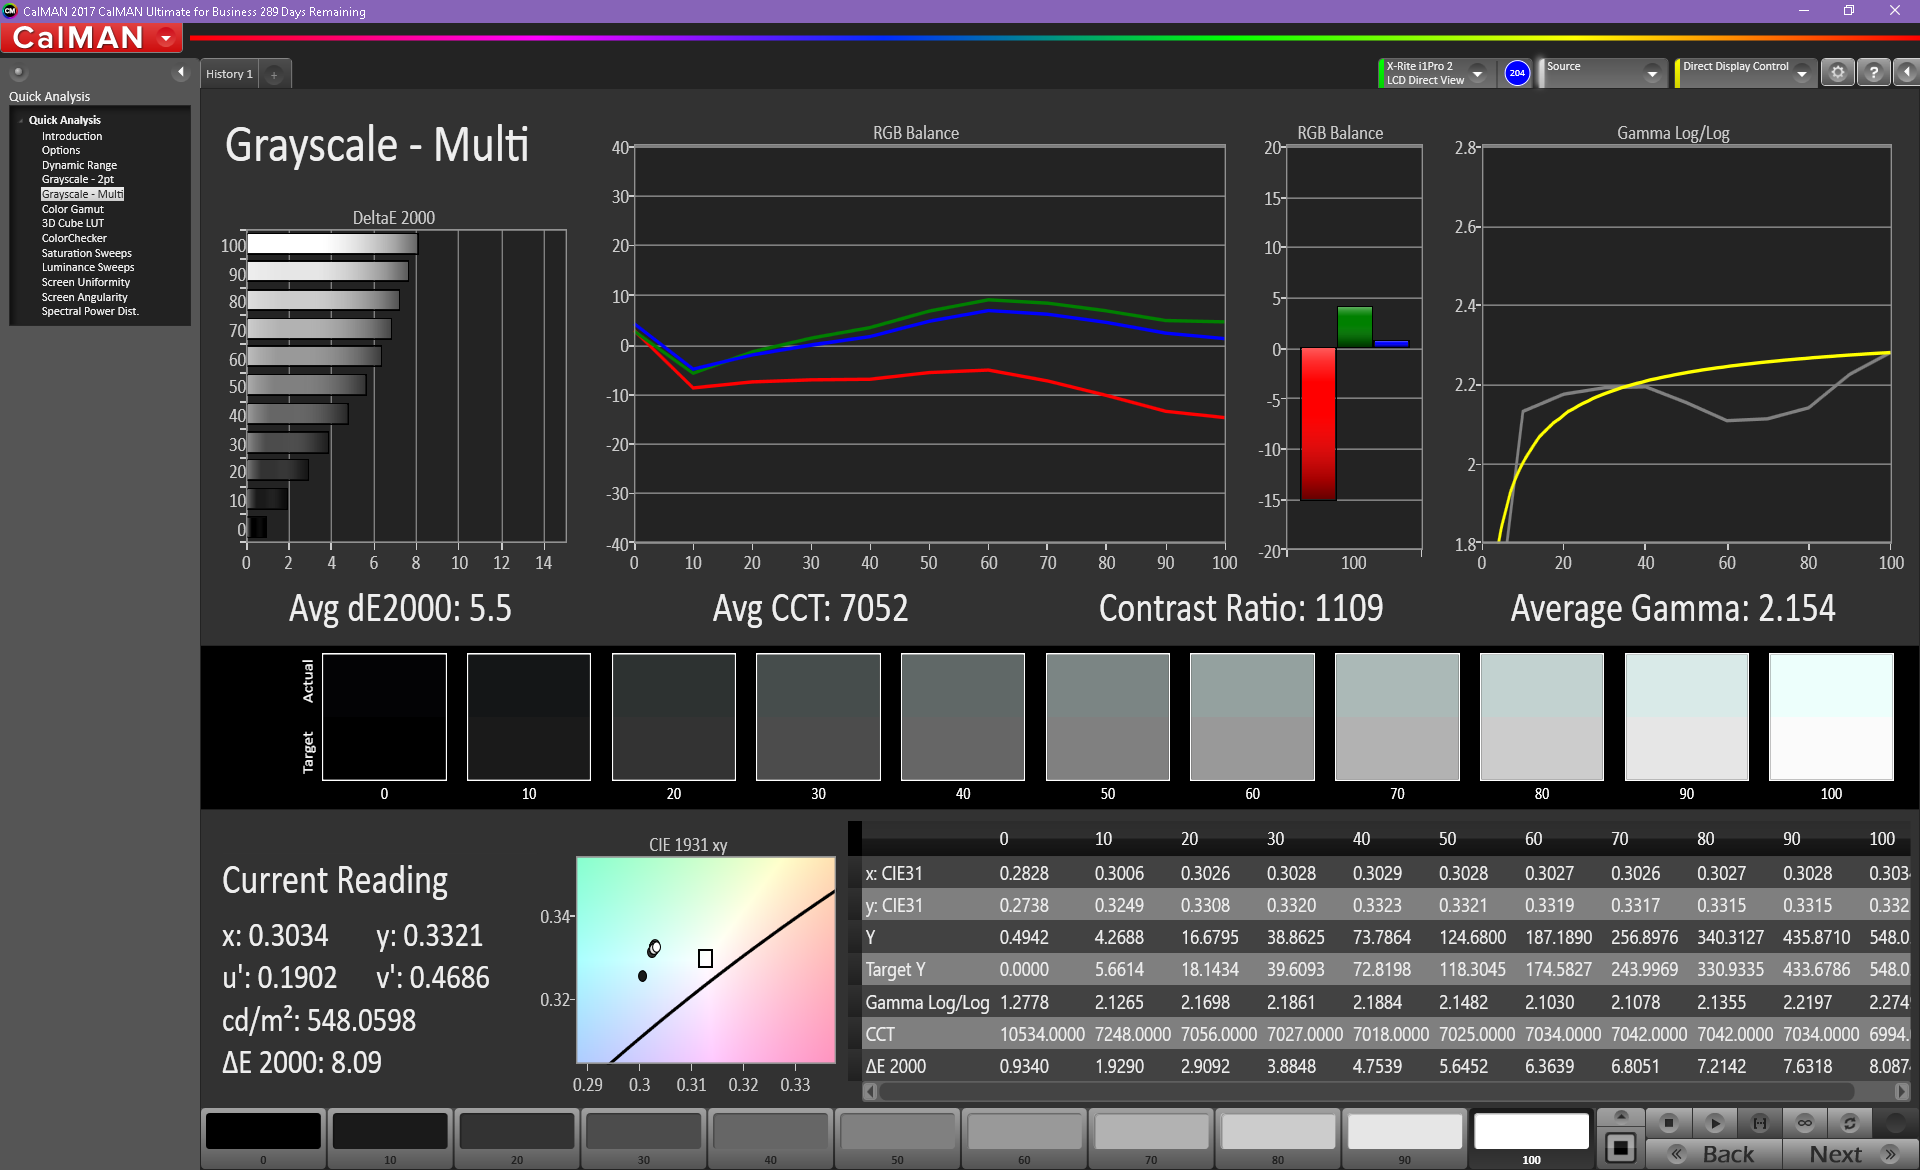
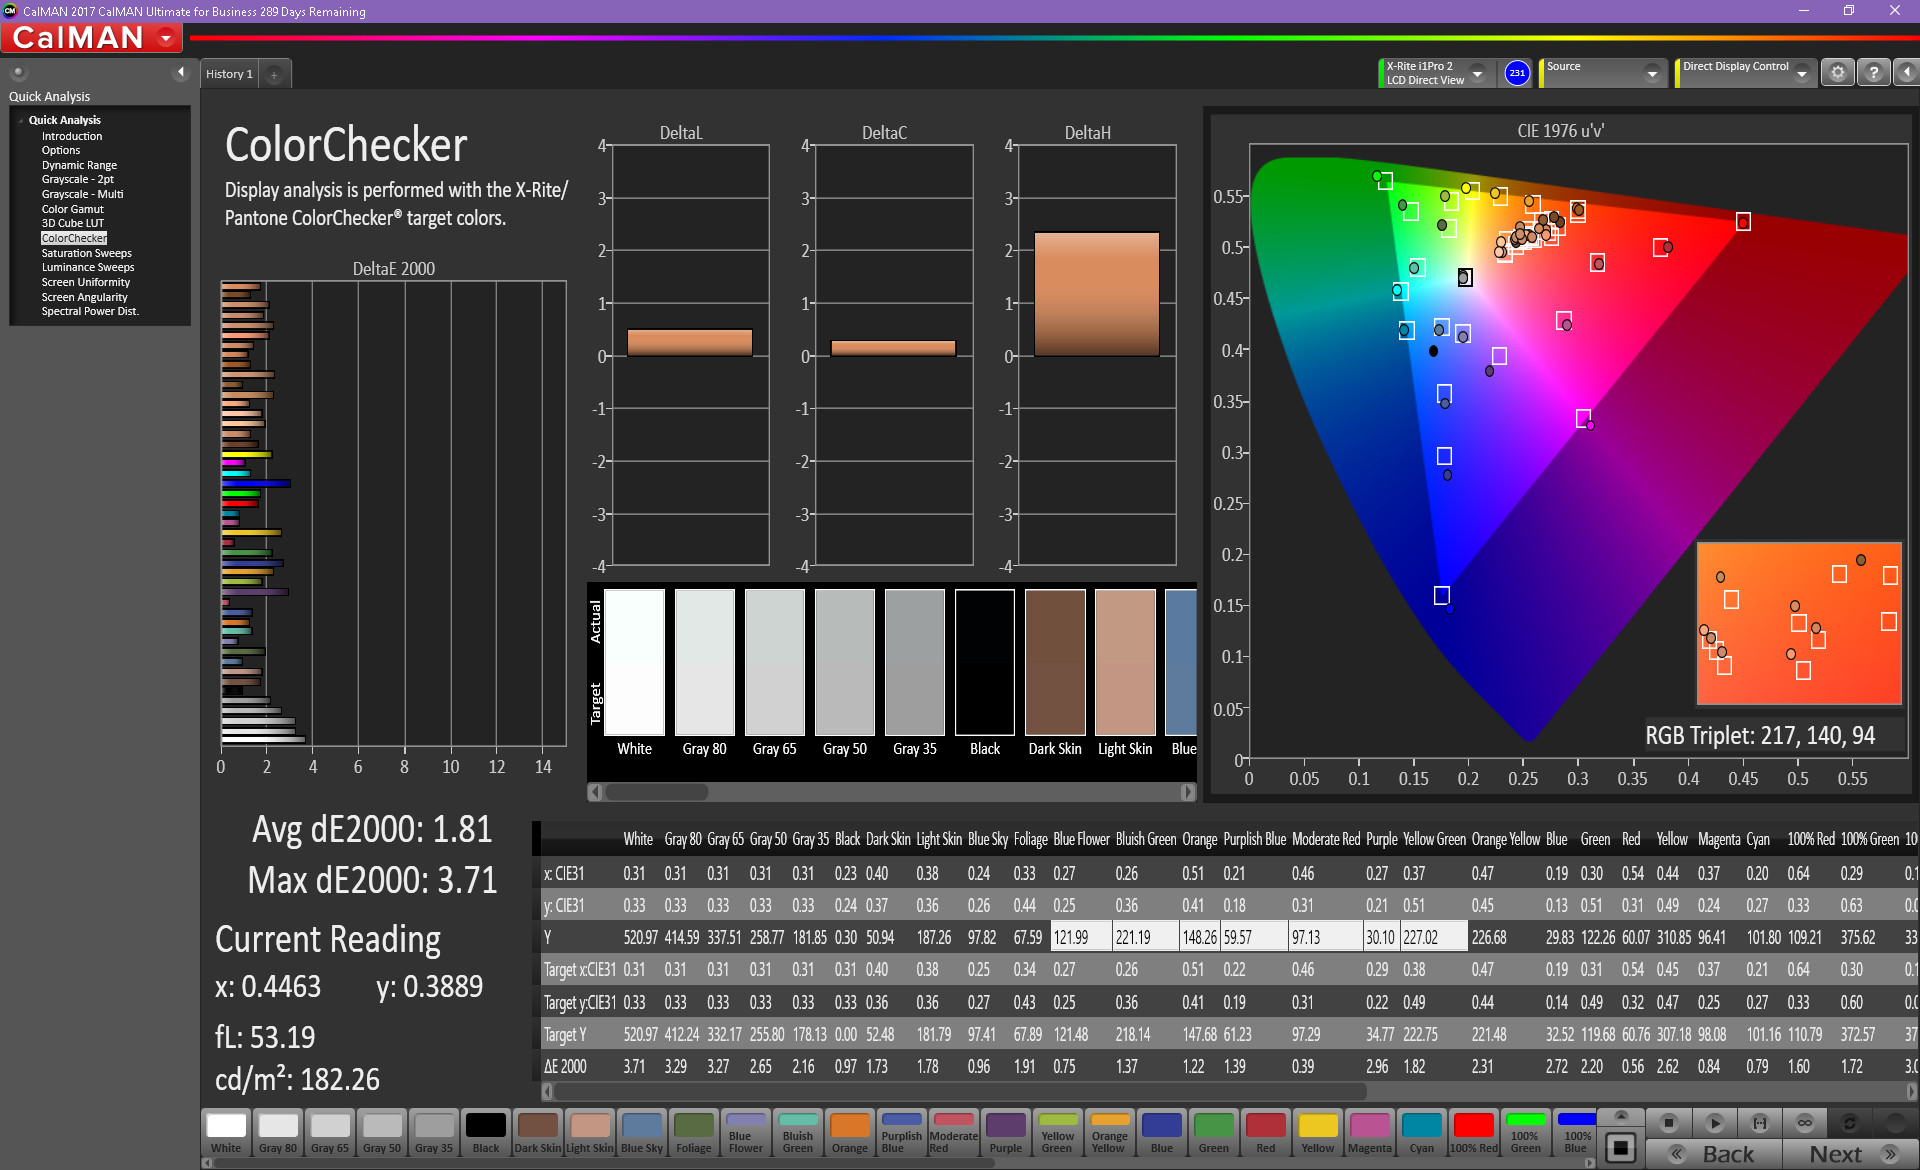
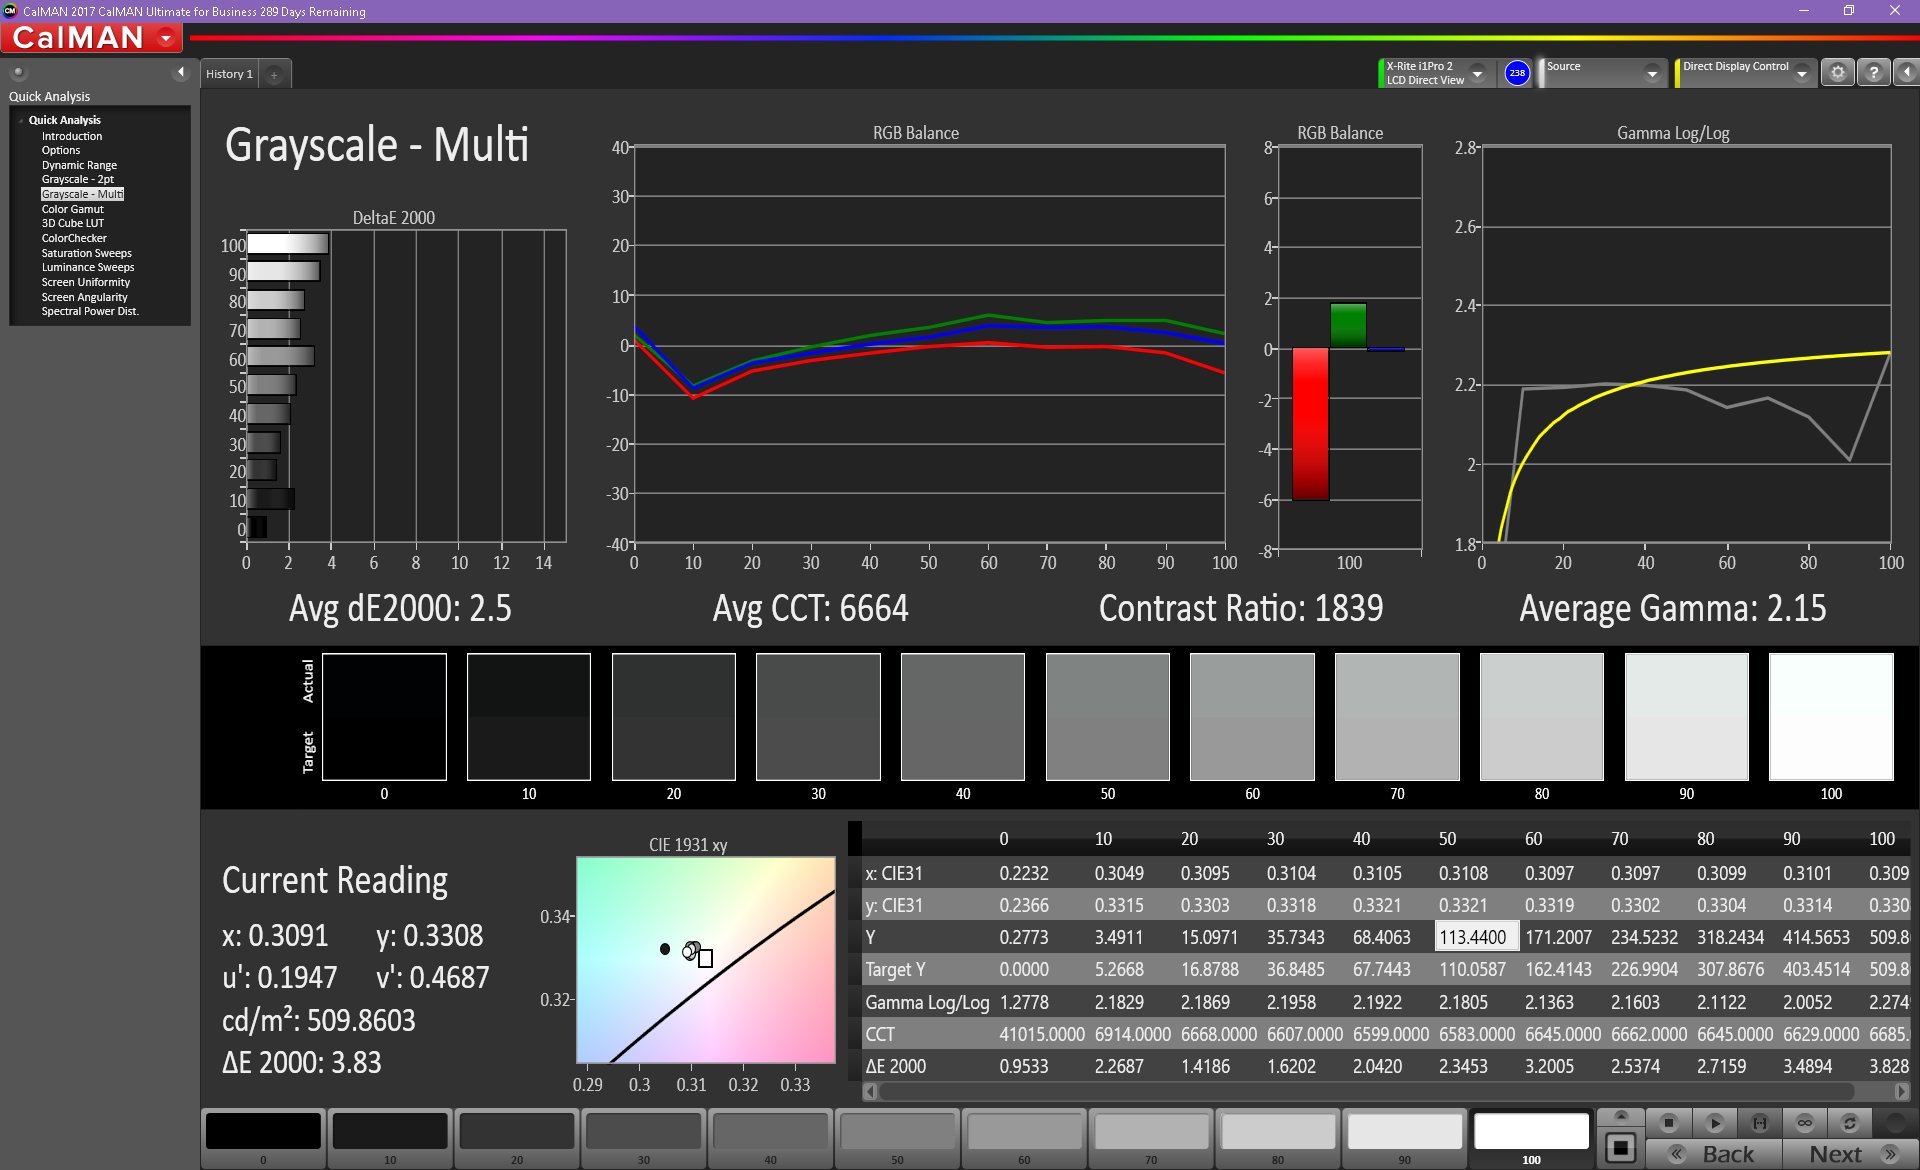
ΔE ColorChecker Calman: 3.65 | ∀{0.5-29.43 Ø4.73}
calibrated: 1.81
ΔE Greyscale Calman: 5.5 | ∀{0.09-98 Ø4.97}
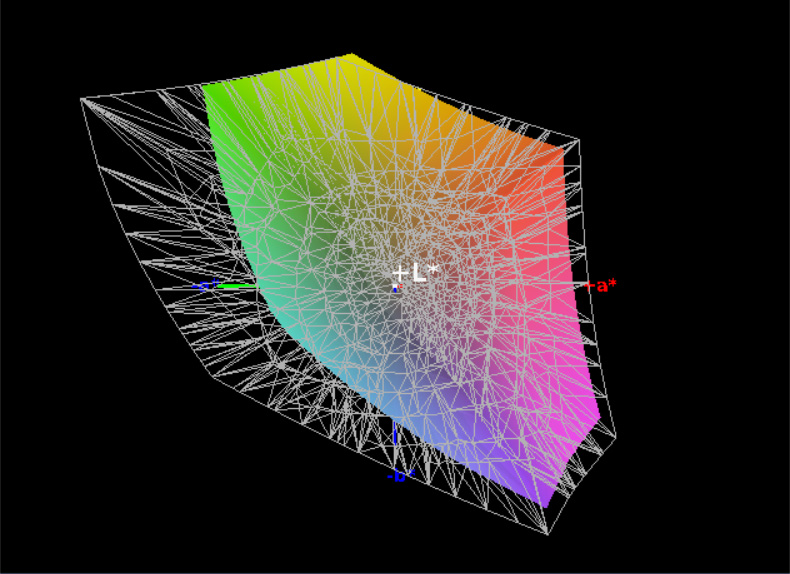
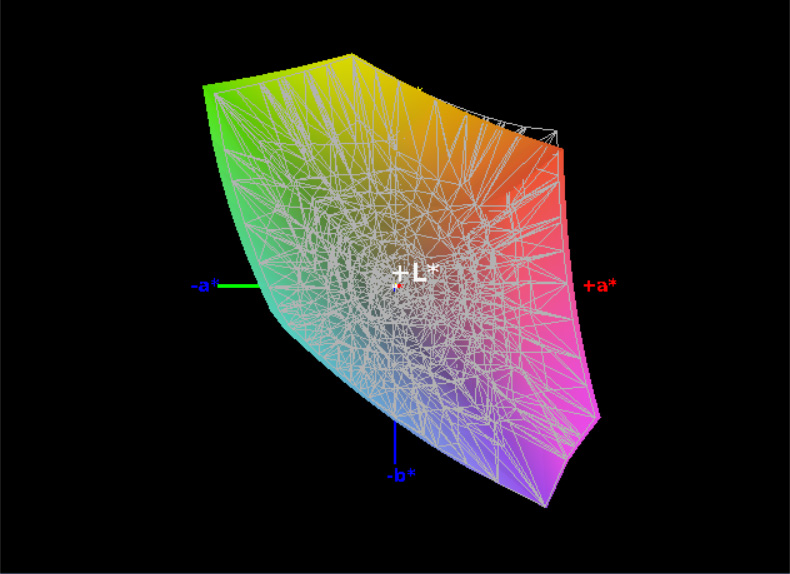
99.1% sRGB (Argyll 1.6.3 3D)
65.2% AdobeRGB 1998 (Argyll 1.6.3 3D)
71.5% AdobeRGB 1998 (Argyll 3D)
98.6% sRGB (Argyll 3D)
70.5% Display P3 (Argyll 3D)
Gamma: 2.154
CCT: 7052 K
| Dell Latitude 5290 2-in-1 SHP1479, IPS, 12.3", 1920x1280 | Dell Latitude 12 5285 2-in-1 BOE06DC, IPS, 12.3", 1920x1280 | Microsoft Surface Pro (2017) i7 LG Display LP123WQ112604, IPS, 12.3", 2736x1824 | HP Elite x2 1012 G2-1LV76EA Samsung SDC4A49, IPS, 12.3", 2716x1824 | Lenovo ThinkPad X1 Tablet Gen 2 LSN120QL01L01, IPS, 12", 2160x1440 | Toshiba Portege Z20t-C-121 Toshiba TOS508F, IPS, 12.5", 1920x1080 | |
|---|---|---|---|---|---|---|
| Display | -9% | -4% | -3% | -38% | ||
| Display P3 Coverage (%) | 70.5 | 62.8 -11% | 66.6 -6% | 66.7 -5% | 42.51 -40% | |
| sRGB Coverage (%) | 98.6 | 94 -5% | 96.5 -2% | 98 -1% | 63.7 -35% | |
| AdobeRGB 1998 Coverage (%) | 71.5 | 64.7 -10% | 67.8 -5% | 68.7 -4% | 43.95 -39% | |
| Response Times | 20% | 33% | 30% | 44% | -4% | |
| Response Time Grey 50% / Grey 80% * (ms) | 56.8 ? | 42.4 ? 25% | 37 ? 35% | 45.6 ? 20% | 28.4 ? 50% | 61 ? -7% |
| Response Time Black / White * (ms) | 36 ? | 30.8 ? 14% | 25 ? 31% | 21.6 ? 40% | 22.8 ? 37% | 36 ? -0% |
| PWM Frequency (Hz) | 1852 ? | 210.1 ? | 22130 ? | 2119 ? | 221.2 ? | |
| Screen | -1% | -1% | 10% | -14% | -49% | |
| Brightness middle (cd/m²) | 548 | 523.2 -5% | 482 -12% | 443 -19% | 388.1 -29% | 354 -35% |
| Brightness (cd/m²) | 545 | 522 -4% | 466 -14% | 446 -18% | 344 -37% | 330 -39% |
| Brightness Distribution (%) | 86 | 88 2% | 92 7% | 88 2% | 78 -9% | 86 0% |
| Black Level * (cd/m²) | 0.51 | 0.42 18% | 0.395 23% | 0.41 20% | 0.39 24% | 0.63 -24% |
| Contrast (:1) | 1075 | 1246 16% | 1220 13% | 1080 0% | 995 -7% | 562 -48% |
| Colorchecker dE 2000 * | 3.65 | 4 -10% | 4 -10% | 2.6 29% | 4.6 -26% | 8.28 -127% |
| Colorchecker dE 2000 max. * | 7.15 | 8.6 -20% | 7.2 -1% | 4 44% | 9.1 -27% | 12.71 -78% |
| Colorchecker dE 2000 calibrated * | 1.81 | |||||
| Greyscale dE 2000 * | 5.5 | 5.5 -0% | 5.7 -4% | 3 45% | 6.1 -11% | 9.15 -66% |
| Gamma | 2.154 102% | 2.16 102% | 2.28 96% | 2.38 92% | 2.07 106% | 2.73 81% |
| CCT | 7052 92% | 7546 86% | 7950 82% | 6780 96% | 7104 91% | 5953 109% |
| Color Space (Percent of AdobeRGB 1998) (%) | 65.2 | 64.86 -1% | 62 -5% | 62.6 -4% | 59 -10% | 40 -39% |
| Color Space (Percent of sRGB) (%) | 99.1 | 93.97 -5% | 96 -3% | 98 -1% | 91 -8% | 63 -36% |
| Total Average (Program / Settings) | 3% /
0% | 9% /
3% | 12% /
10% | 15% /
-4% | -30% /
-41% |
* ... smaller is better
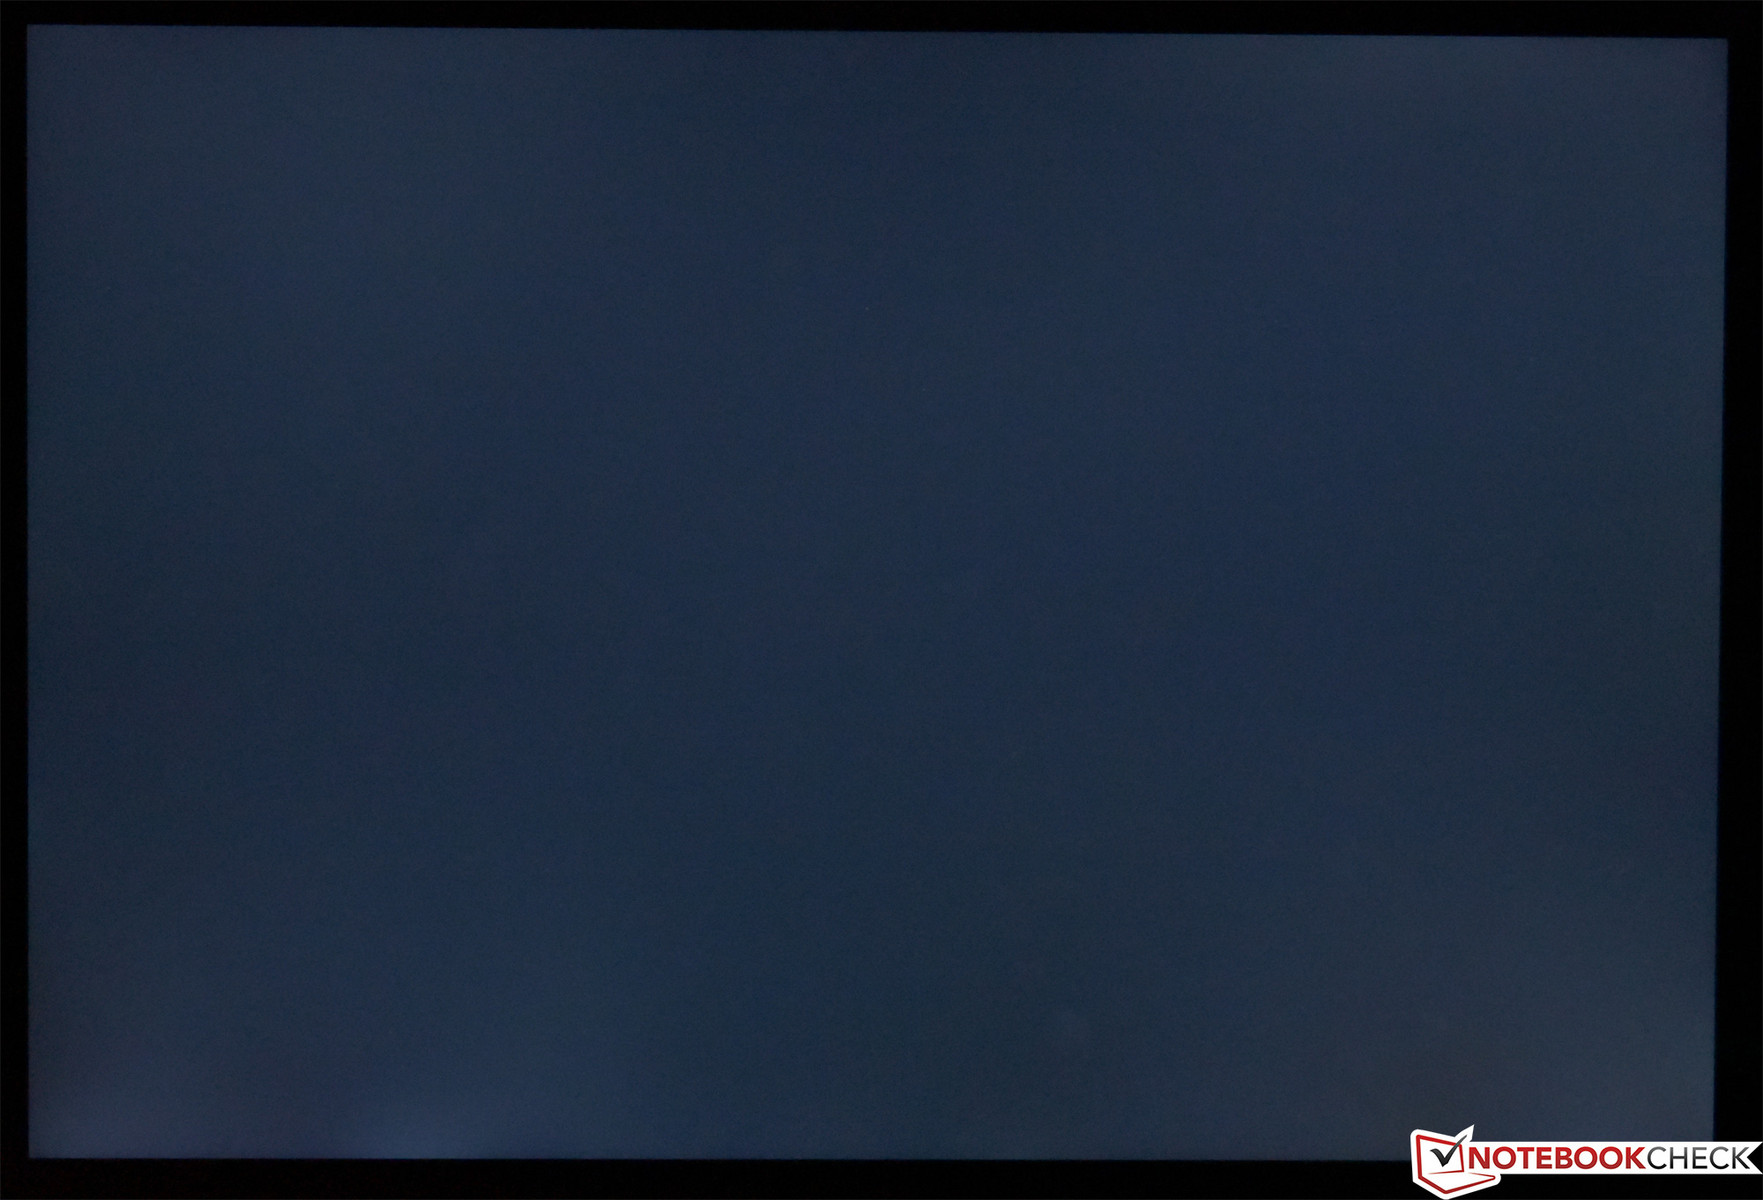
Sure enough, we measured 545 cd/m² average brightness, which is roughly in line with that of the 5285 2-in-1. Thanks to a relatively low black value of 0.51 cd/m², contrast is also very good at 1075:1. Luminosity is fairly evenly-distributed across the surface of the panel; we measured a brightness distribution of 86%.
The display also manages to cover virtually 100 percent of sRGB and 65.2 percent of AdobeRGB; this is roughly in line with the rest of the competition (except for the Toshiba Portege, which barely manages 40 percent of AdobeRGB).


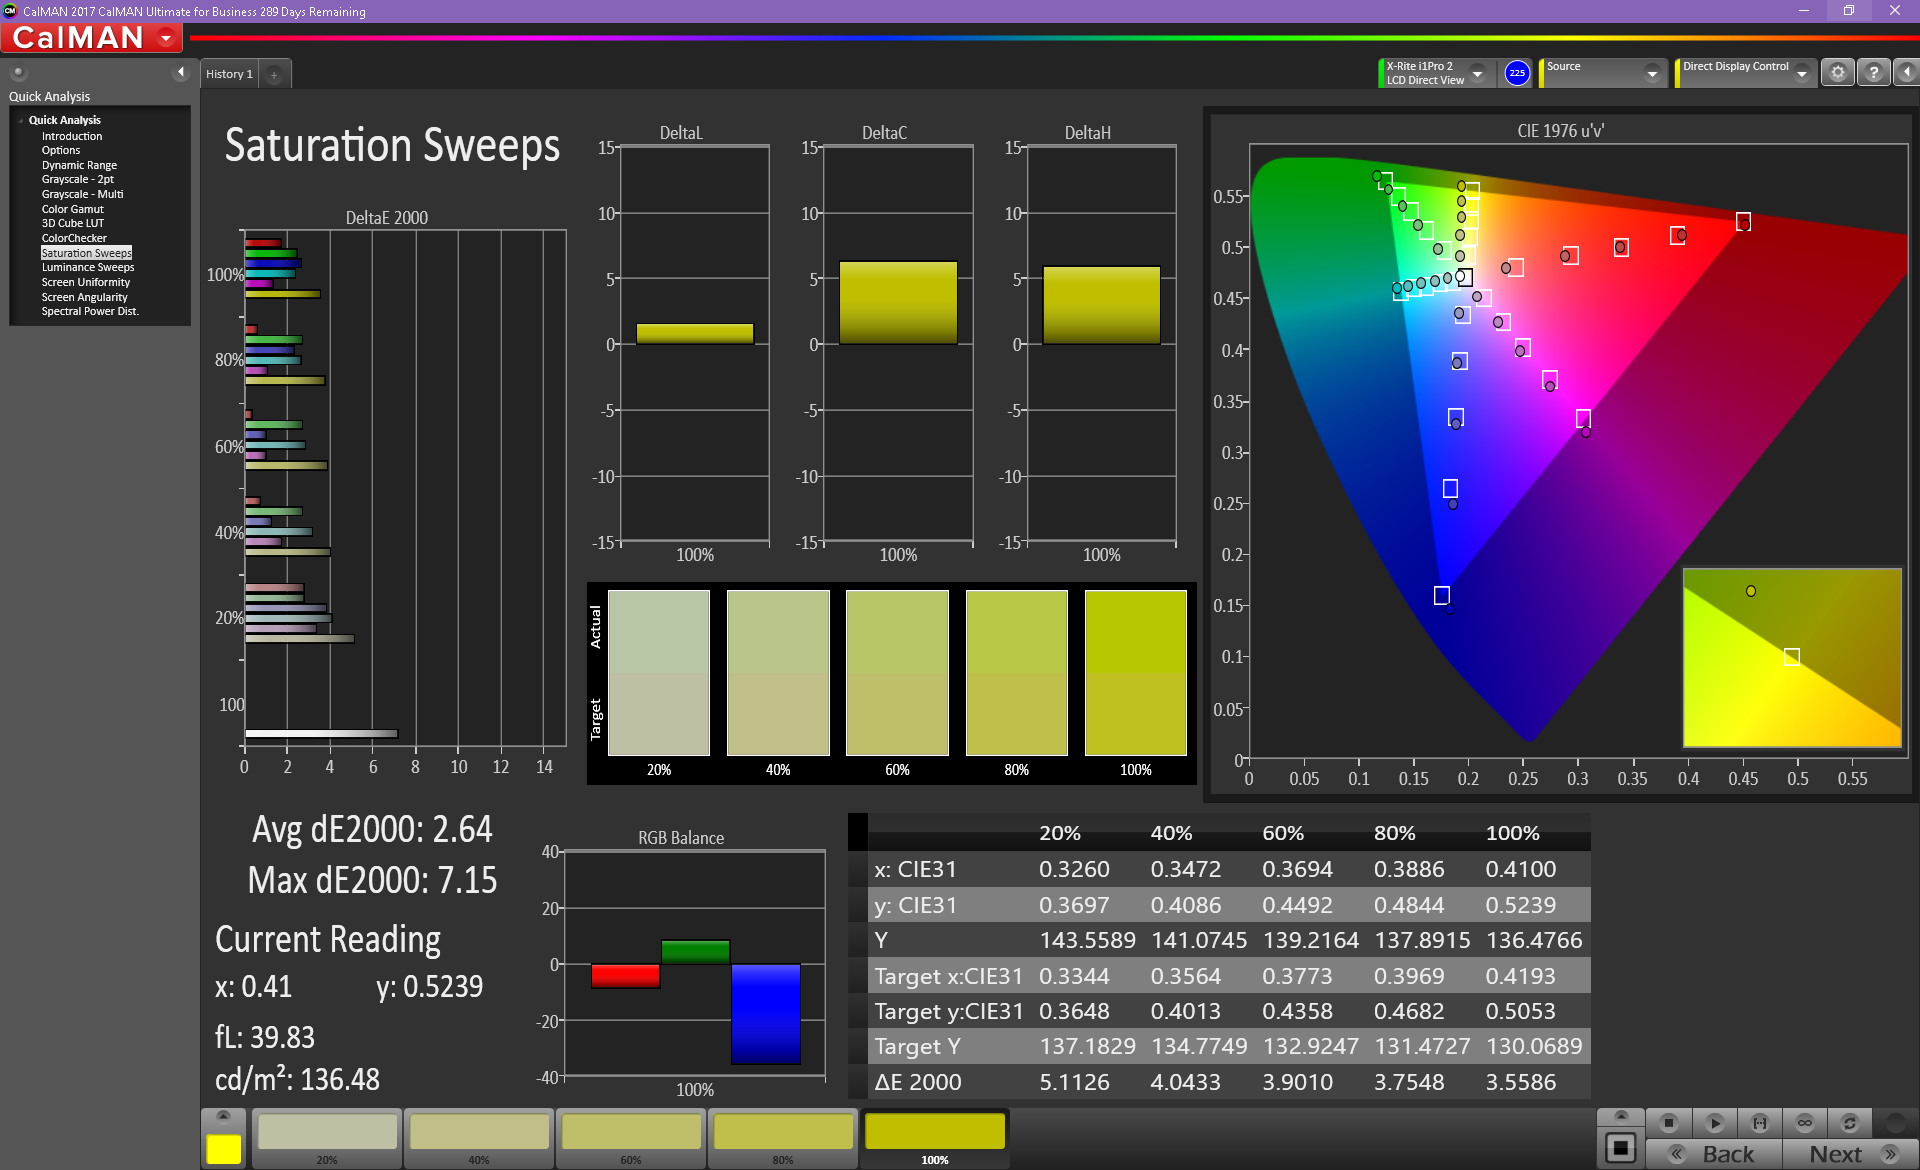
CalMAN measurements reveal decent color accuracy pre-calibration, with ColorChecker/Greyscale DeltaE2000 averages of 3.65 and 5.5 respectively. Total Gamma of 2.154 and a CCT average of 7052 are also reasonably good, so unless professional photo editing or graphic design is on the agenda, users needn’t stress about professional calibration. Having said that, we measured a post-calibration ColorChecker DeltaE average of 1.81, so there are of course benefits to putting in the work.
Display Response Times
| ↔ Response Time Black to White | ||
|---|---|---|
| 36 ms ... rise ↗ and fall ↘ combined | ↗ 19.6 ms rise | 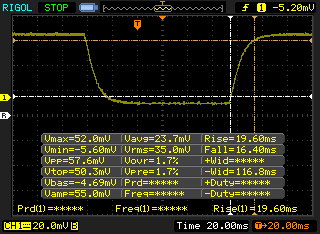 |
| ↘ 16.4 ms fall | ||
| The screen shows slow response rates in our tests and will be unsatisfactory for gamers. In comparison, all tested devices range from 0.1 (minimum) to 240 (maximum) ms. » 94 % of all devices are better. This means that the measured response time is worse than the average of all tested devices (19.9 ms). | ||
| ↔ Response Time 50% Grey to 80% Grey | ||
| 56.8 ms ... rise ↗ and fall ↘ combined | ↗ 26.8 ms rise | 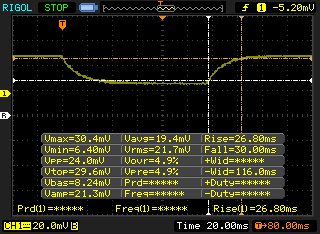 |
| ↘ 30 ms fall | ||
| The screen shows slow response rates in our tests and will be unsatisfactory for gamers. In comparison, all tested devices range from 0.165 (minimum) to 636 (maximum) ms. » 94 % of all devices are better. This means that the measured response time is worse than the average of all tested devices (31.1 ms). | ||
Screen Flickering / PWM (Pulse-Width Modulation)
| Screen flickering / PWM detected | 1852 Hz | ≤ 98 % brightness setting | 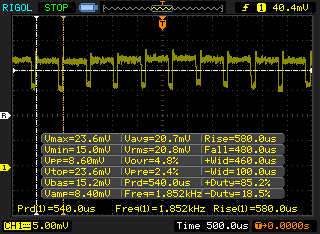 |
The display backlight flickers at 1852 Hz (worst case, e.g., utilizing PWM) Flickering detected at a brightness setting of 98 % and below. There should be no flickering or PWM above this brightness setting. The frequency of 1852 Hz is quite high, so most users sensitive to PWM should not notice any flickering. In comparison: 52 % of all tested devices do not use PWM to dim the display. If PWM was detected, an average of 7794 (minimum: 5 - maximum: 343500) Hz was measured. | |||
Although we did detect PWM flickering from the display at all brightness levels 98% and below, the frequency of 1.852 KHz is very high and therefore unlikely to bother most users.
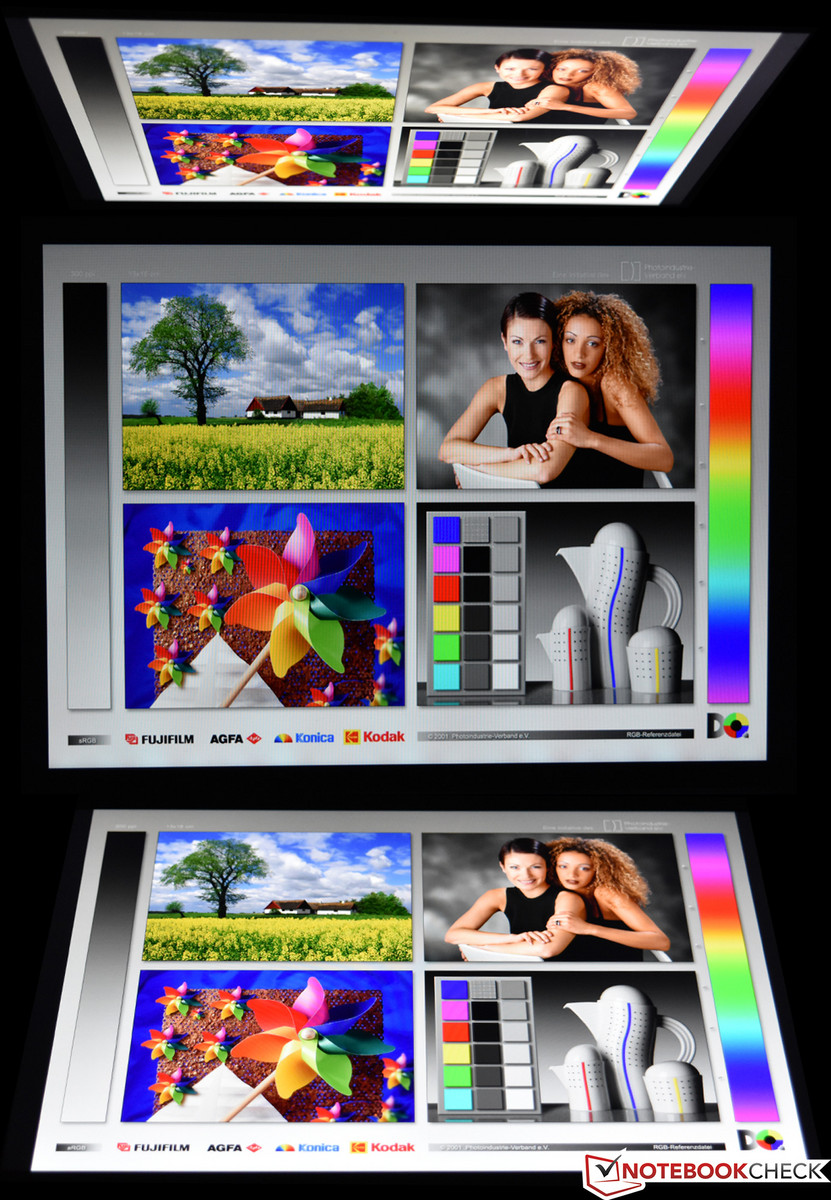
Outdoors, the high brightness does help quite a lot to overpower some of the screen reflections—but the high-gloss panel finish still makes use in the sunlight very difficult. Operation in shaded areas, on the other hand, is mostly comfortable. Viewing angles are excellent as is to be expected.
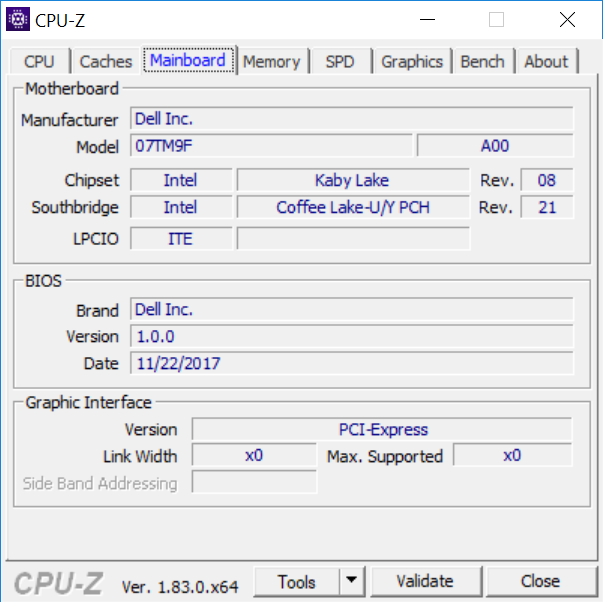
Performance
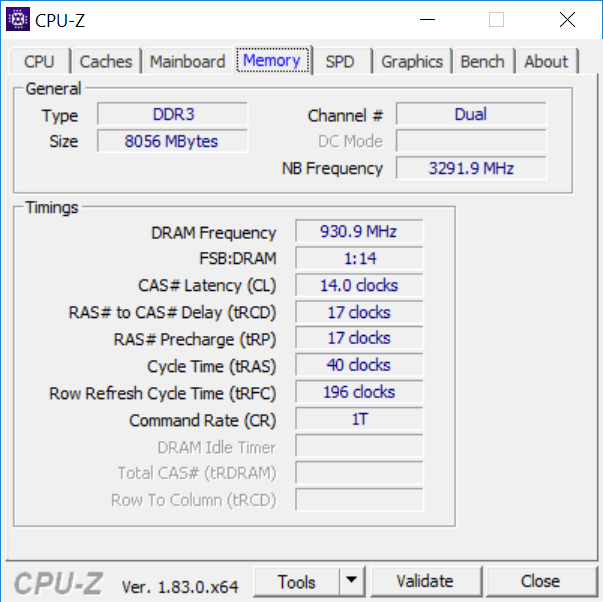
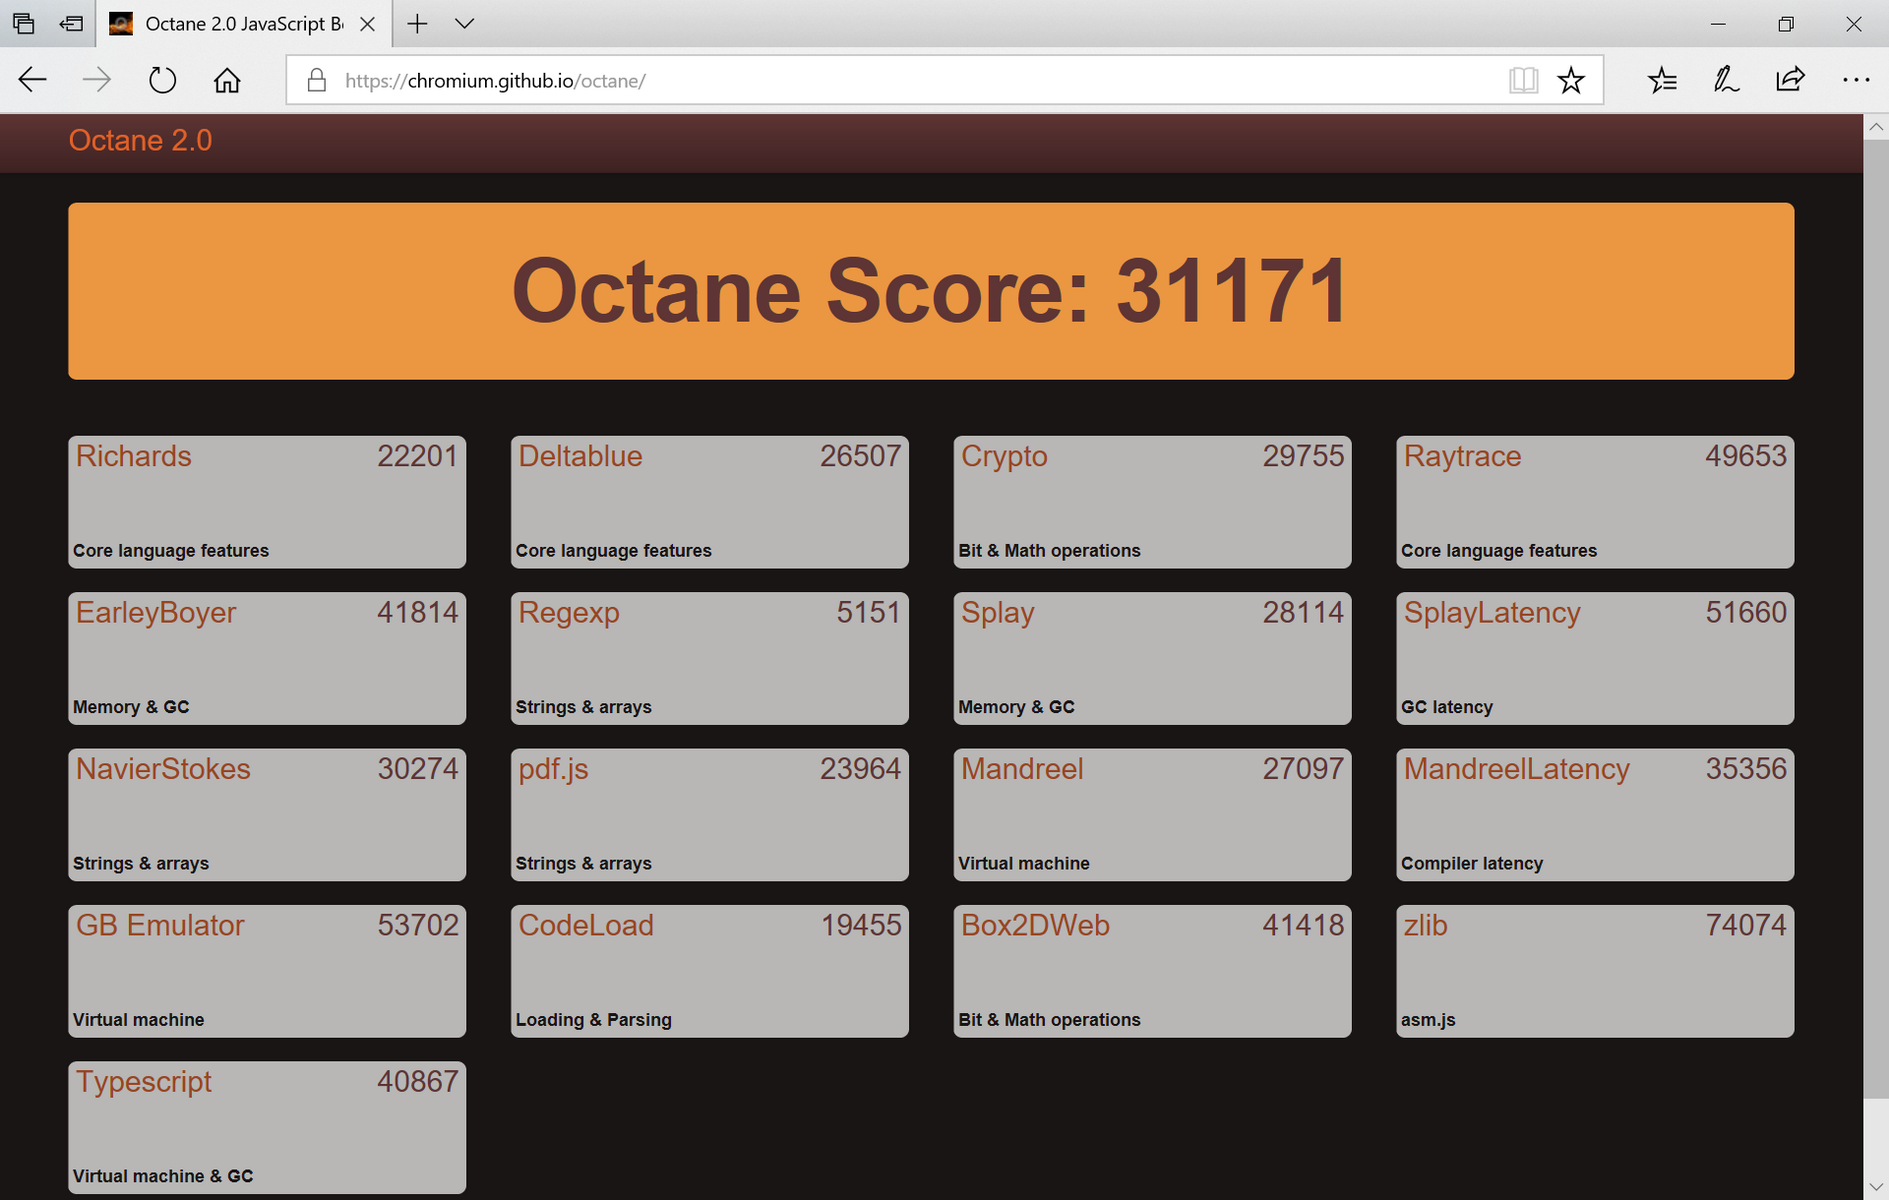
The first truly major difference between the Latitude 5290 2-in-1 and last year’s 5285 is the processor selection; while last year’s model was equipped with 7th-generation Kaby Lake SoCs, the 5290 offers a full range of 8th-generation processors spanning Core i3 all the way up to i7 options. Today’s review configuration includes a Core i5-8350U SoC, which is probably an intelligent option in light of our previous tests (which have shown time and time again that 8th-generation Core i7 models cannot sustain Turbo frequencies long enough to justify the upgrade). The processor is paired with 8 GB of LPDDR3 RAM and a Toshiba NVMe SSD for what ought to be very fast performance.
A second run of 3DMark 11 actually produced a higher score than our original run—1918—thereby confirming that performance is not reduced while running unplugged.
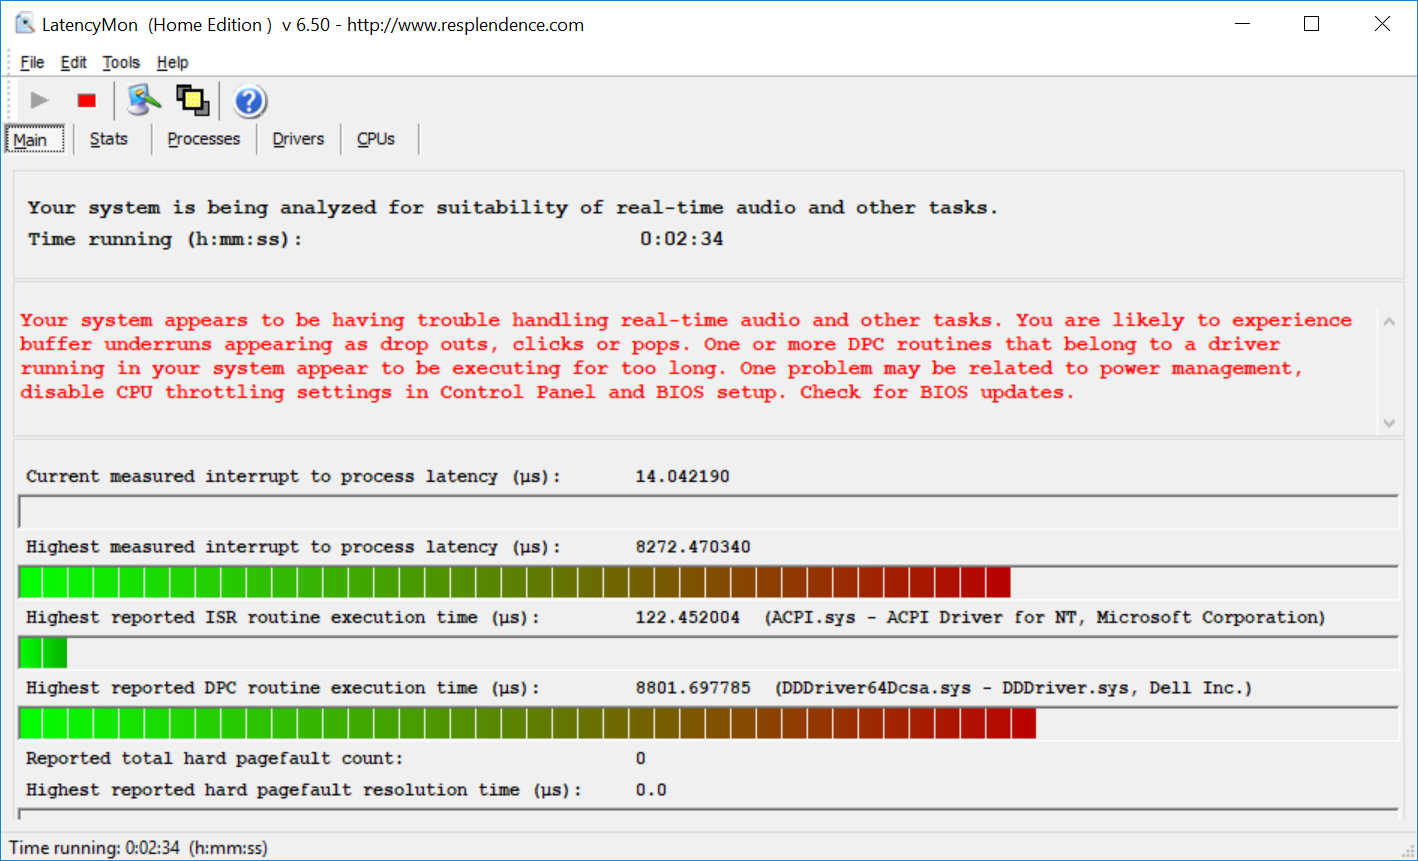
LatencyMon reported some issues with DPC latencies; disabling Wi-Fi and Bluetooth did not resolve these problems.
Processor
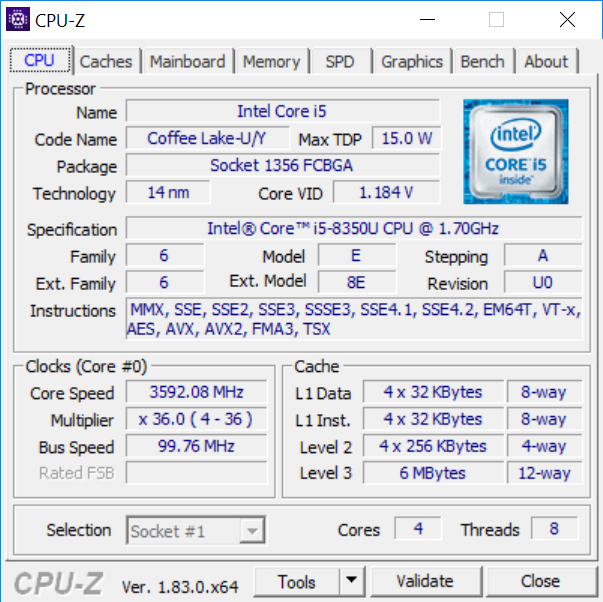
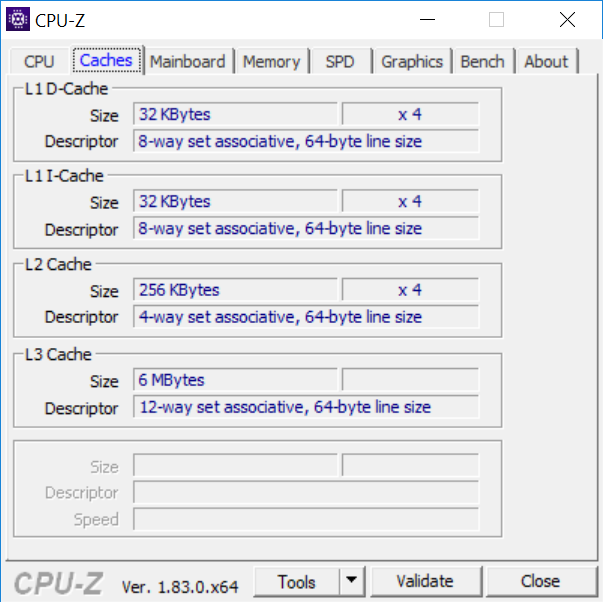
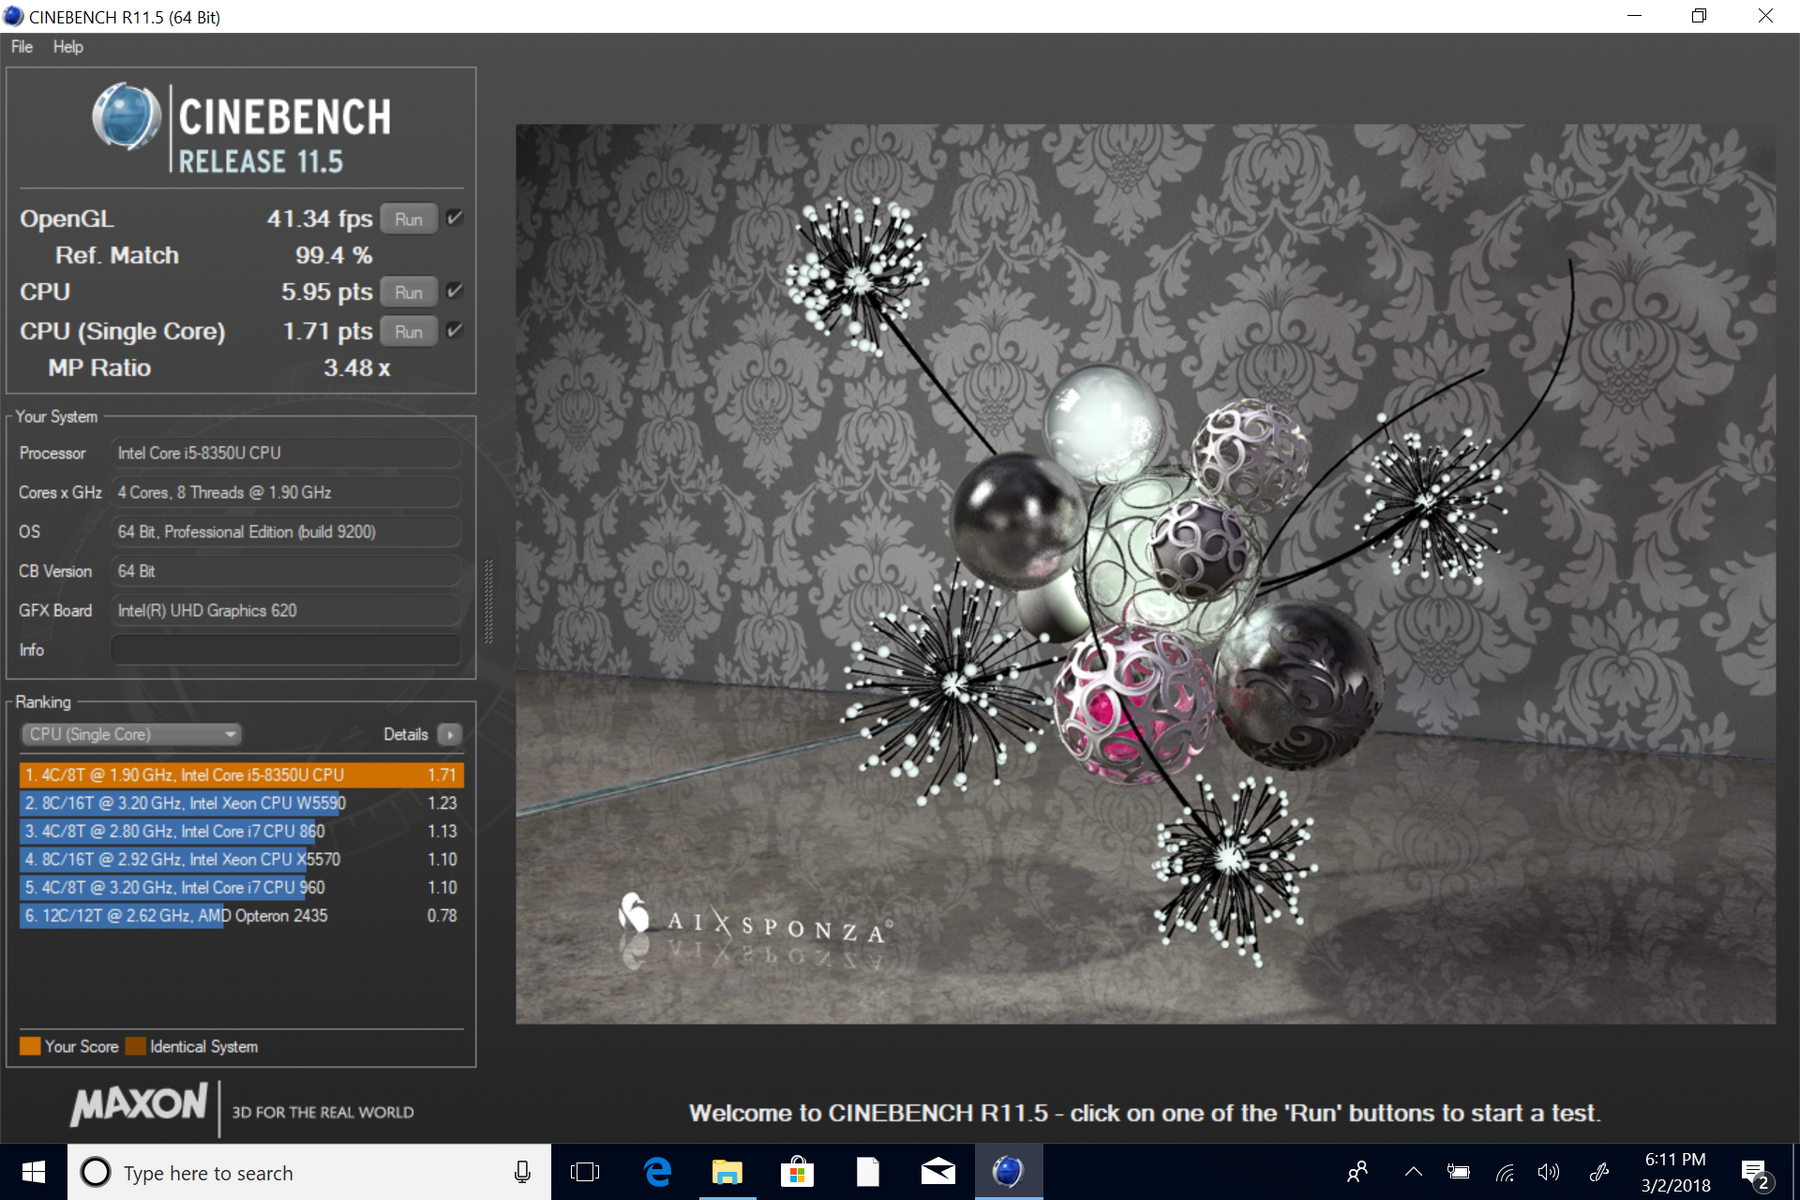
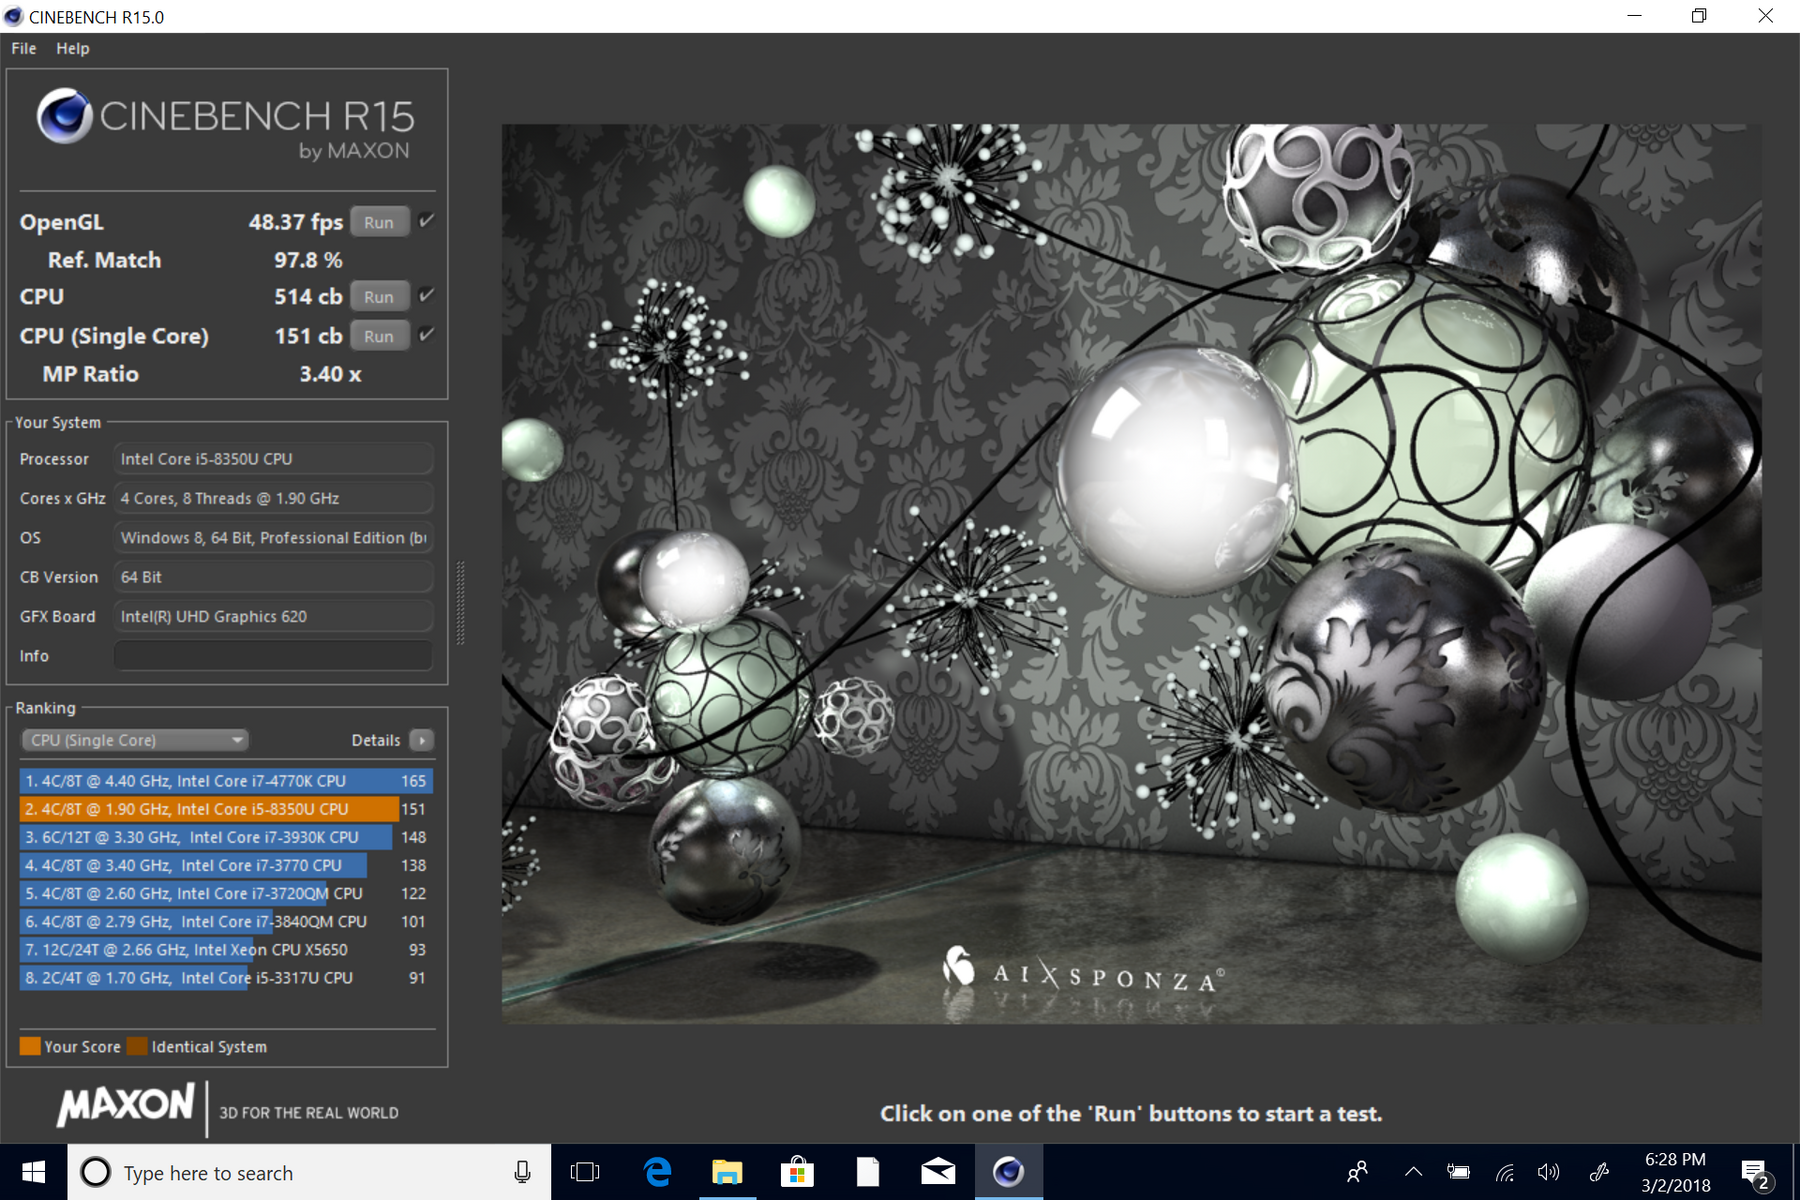
The Intel Core i5-8350U SoC powering our Latitude 5290 is a quad-core processor hailing from the Kaby Lake Refresh generation of chips. Its base frequency of 1.7 GHz can be increased all the way to a max turbo clock rate of 3.6 GHz (provided thermal headroom exists). The TDP of 15 W is extremely low for a quad-core CPU, so provided conditions are favorable, short-term burst performance should be very good for such an efficient machine.
And it is: while single-core performance is roughly equivalent with that of the 5285 2-in-1 (151 points vs. 152 points from the 5285 in Cinebench R15), multi-core performance is vastly improved—some 56% better, with a score of 514. We actually received an even higher score of 569 from the initial run when performing our sustained multi-CPU Cinebench R15 test afterward (probably thanks to the fact that the machine had a longer chance to cool beforehand). The second and third runs dropped to the 520-540 range, runs 3, 4, and 5 fell into the 500 – 510 range, and all subsequent runs were under 500 (with an overall low of 465. This is still admirable performance overall, however, and even the lowest scores are well above the result we received from the 5285 2-in-1 (329). Taking into account the higher score we received from our secondary run of CB R15 multi-CPU, performance is right in line with the category average.
* ... smaller is better
System Performance
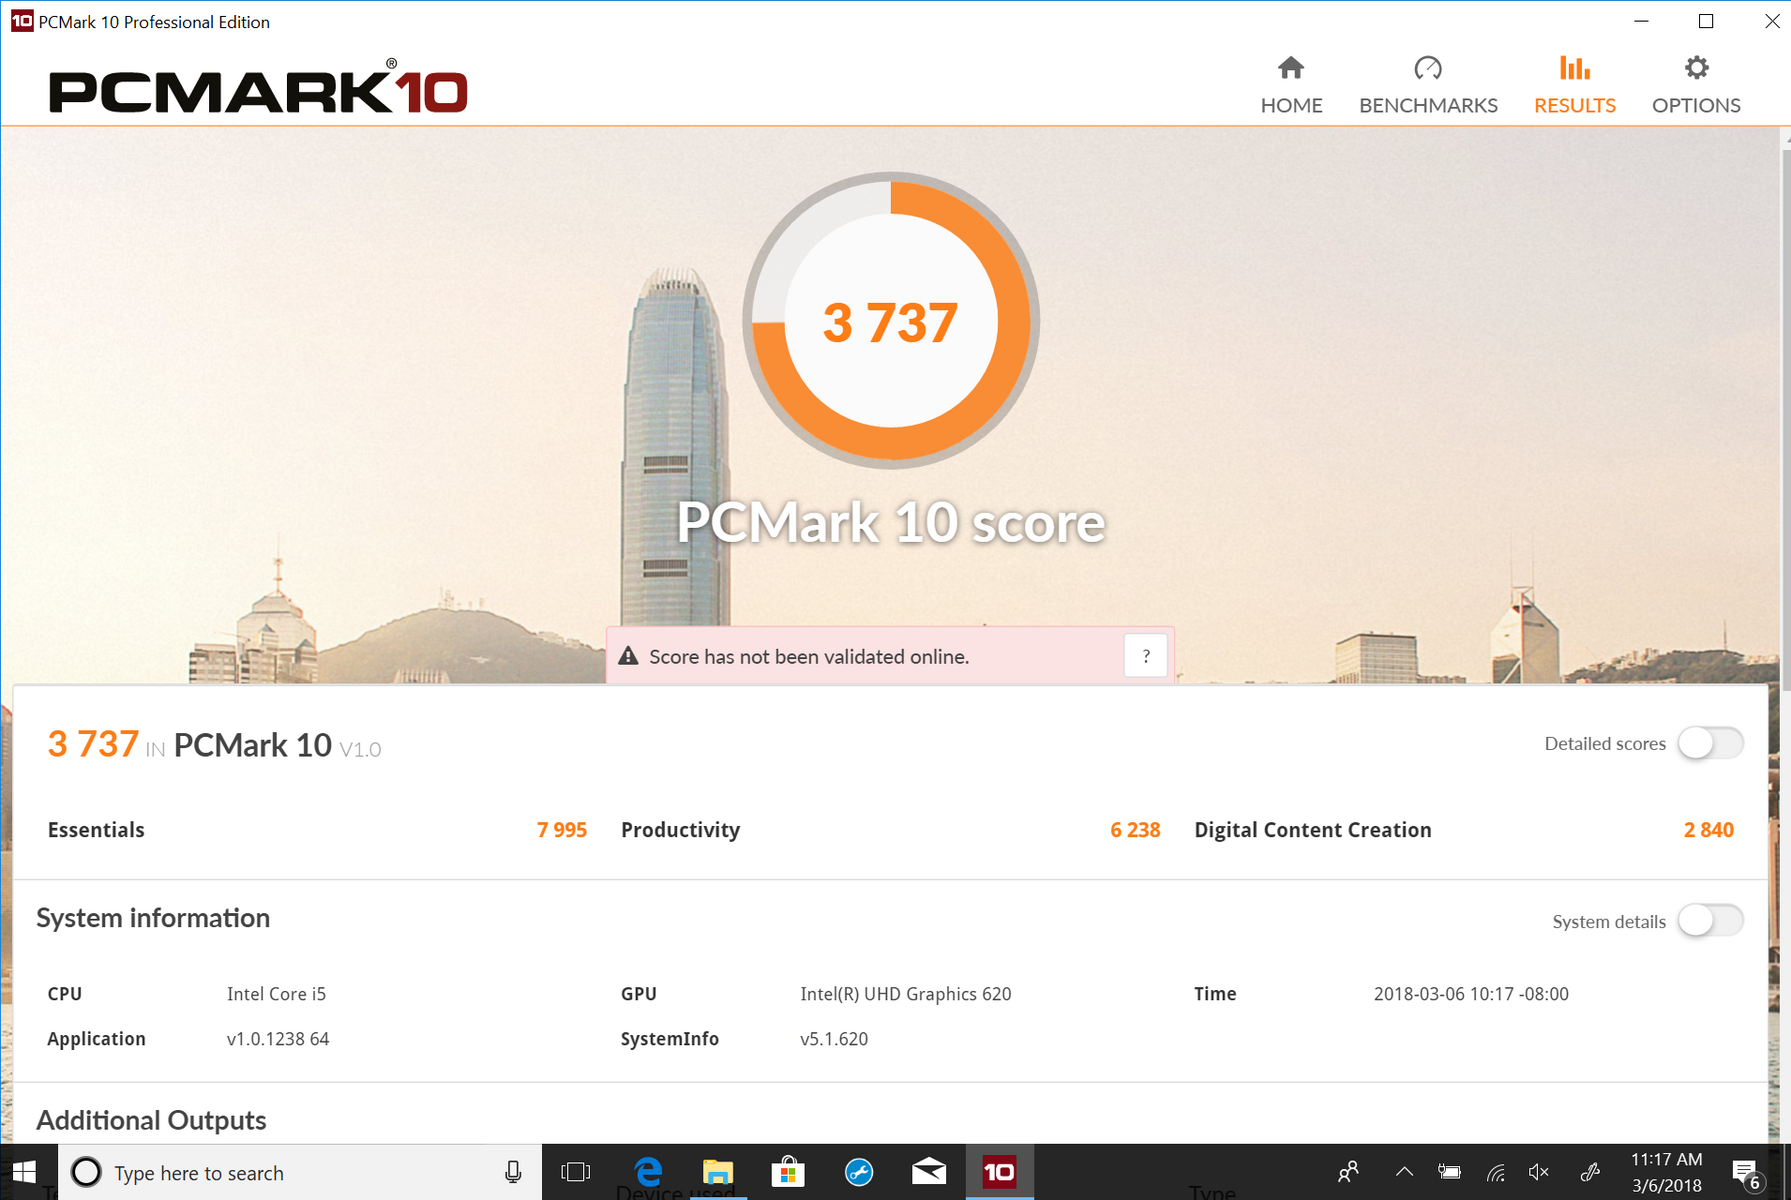
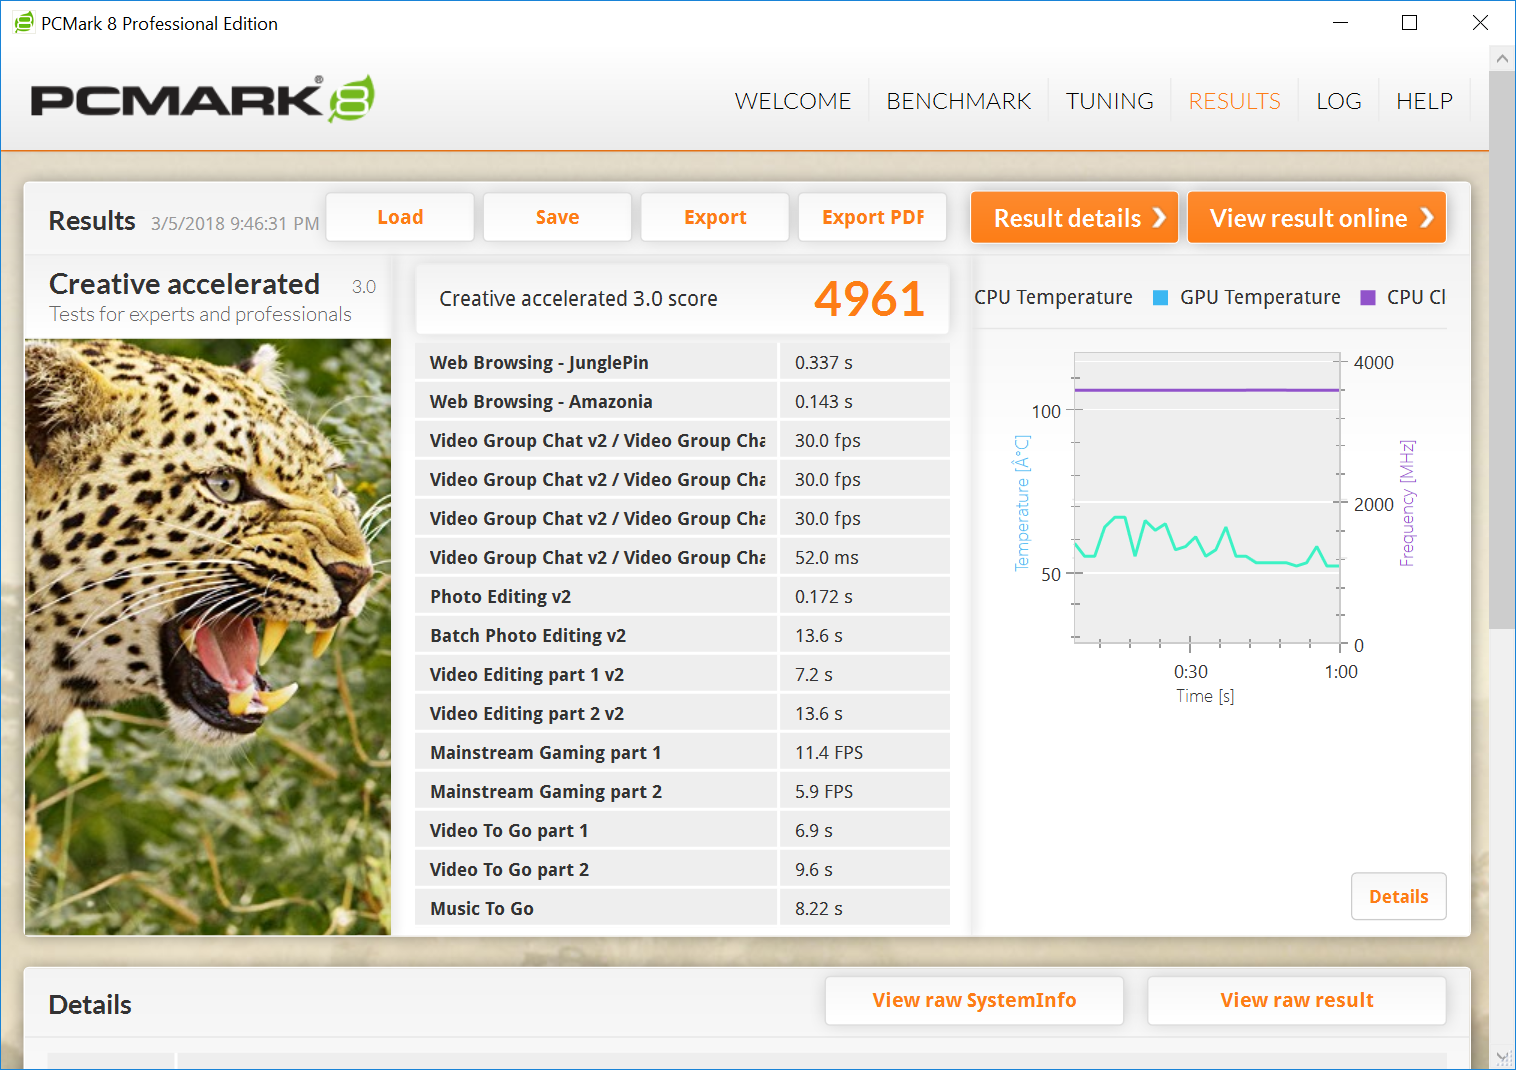
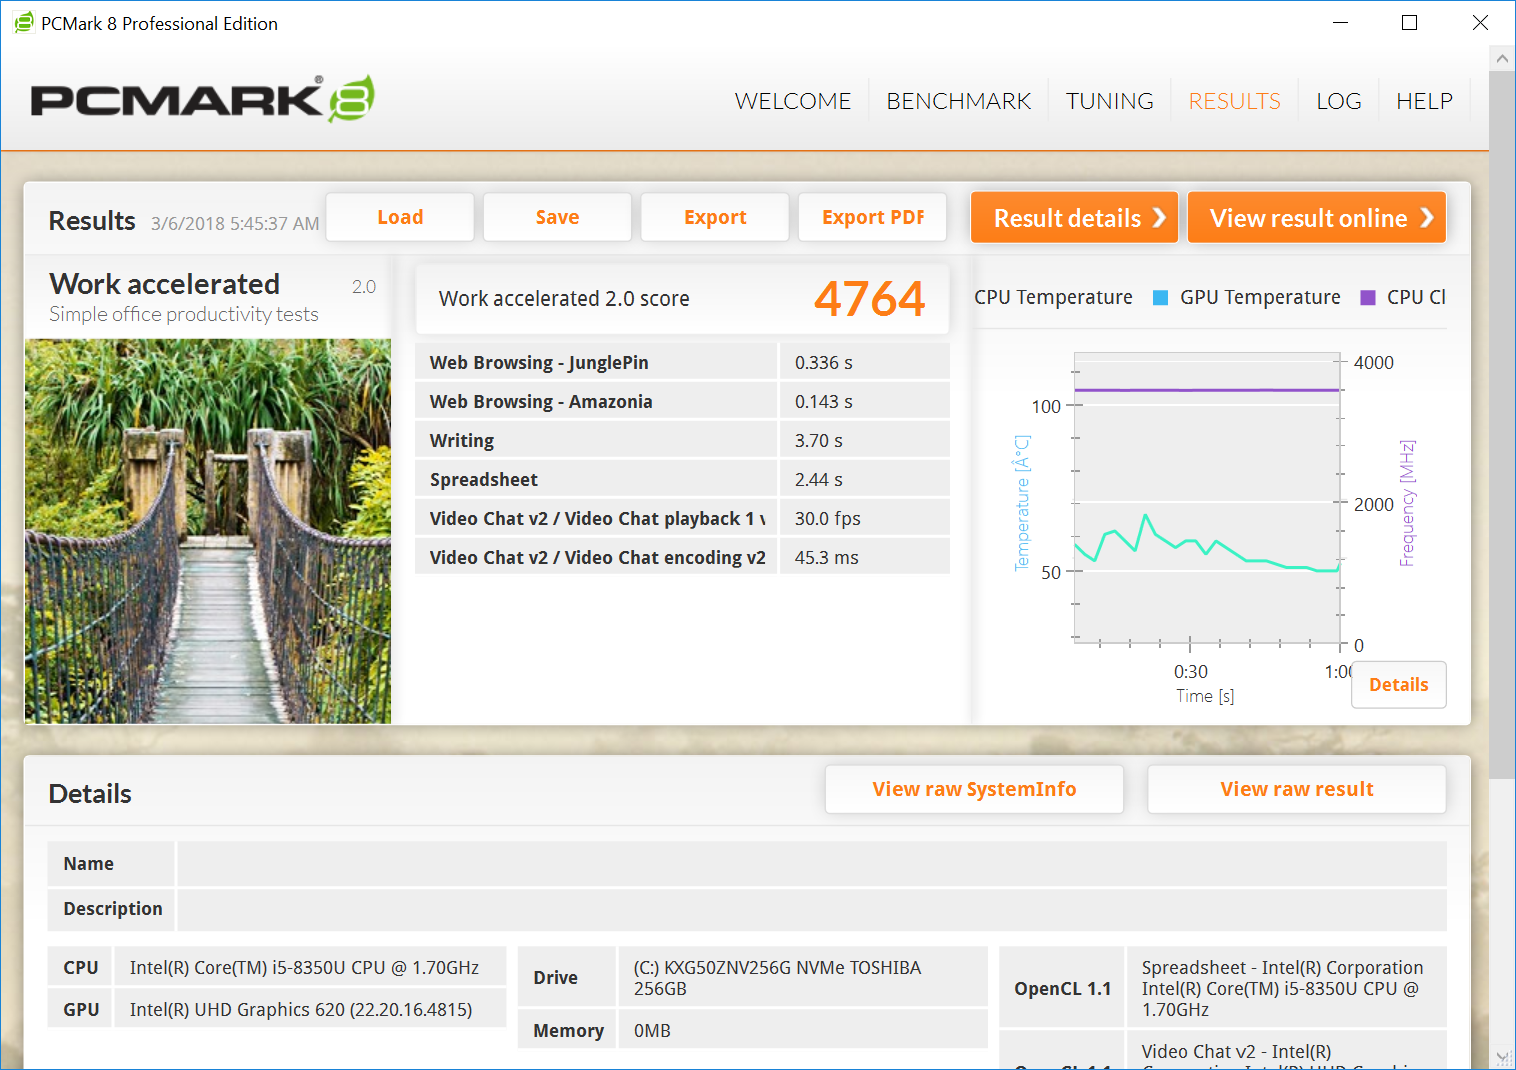
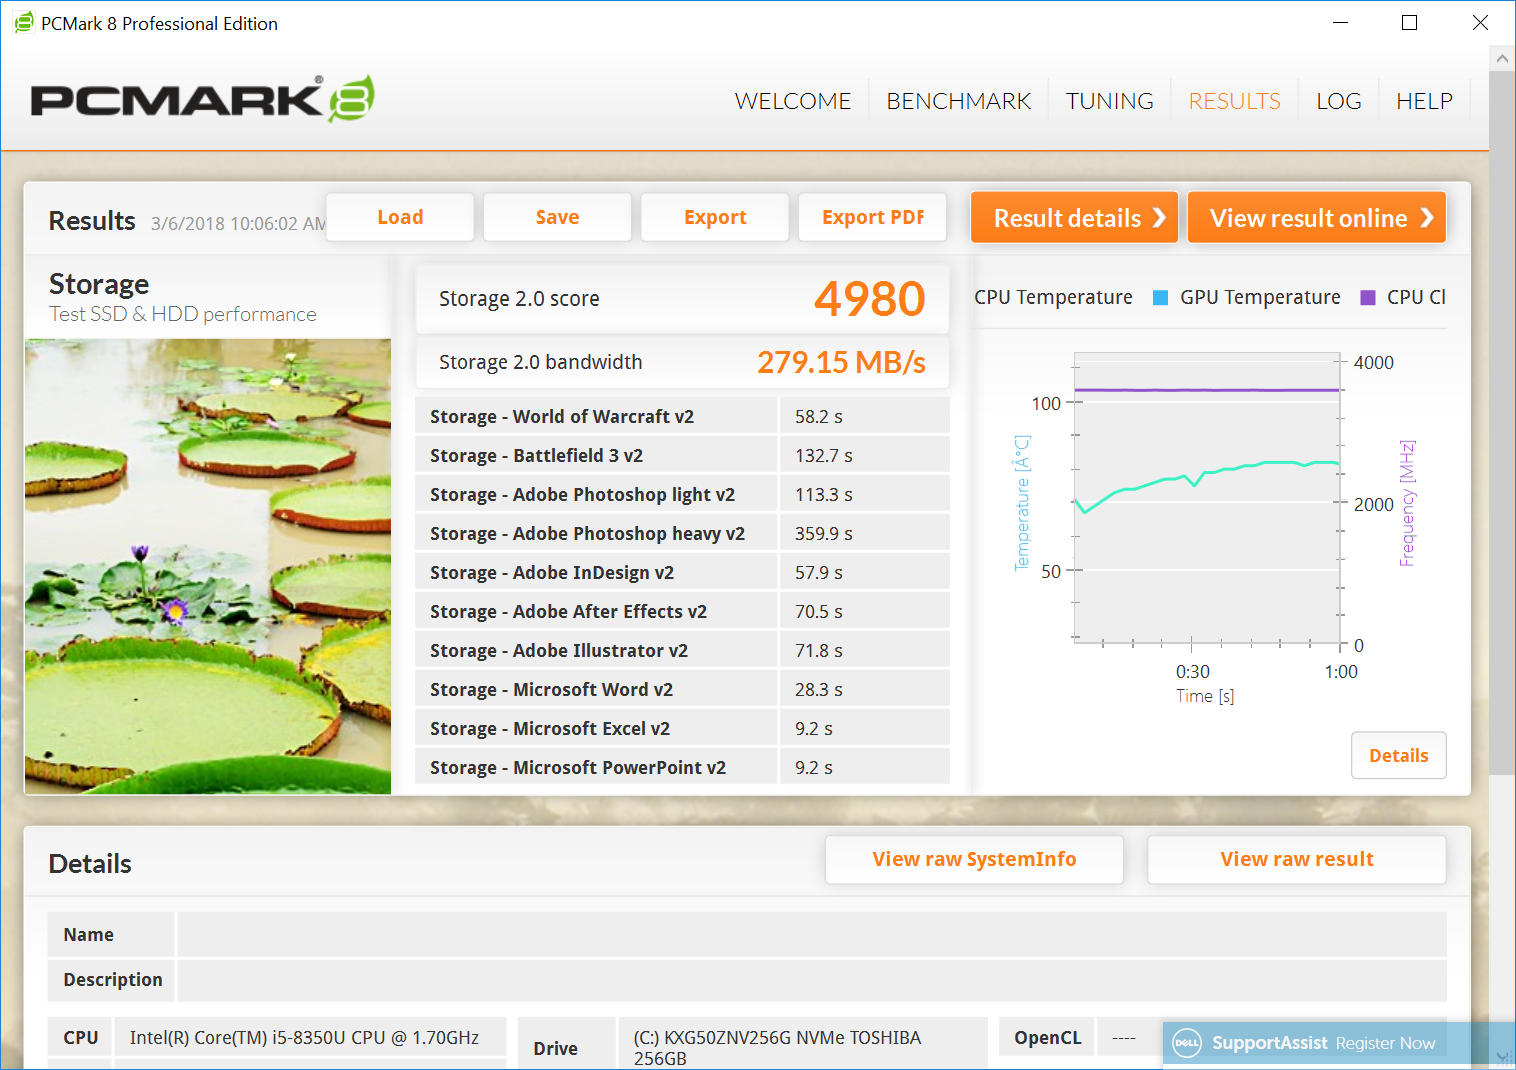
PCMark 8 Work and Creative scores top the charts, along with the Microsoft Surface Pro 2017 i7 configuration (which maintains a slight edge). PCMark 8 Home is considerably lower at just 3776, but all results are well above the class average and comparable to other notebooks with the same SoC/GPU.
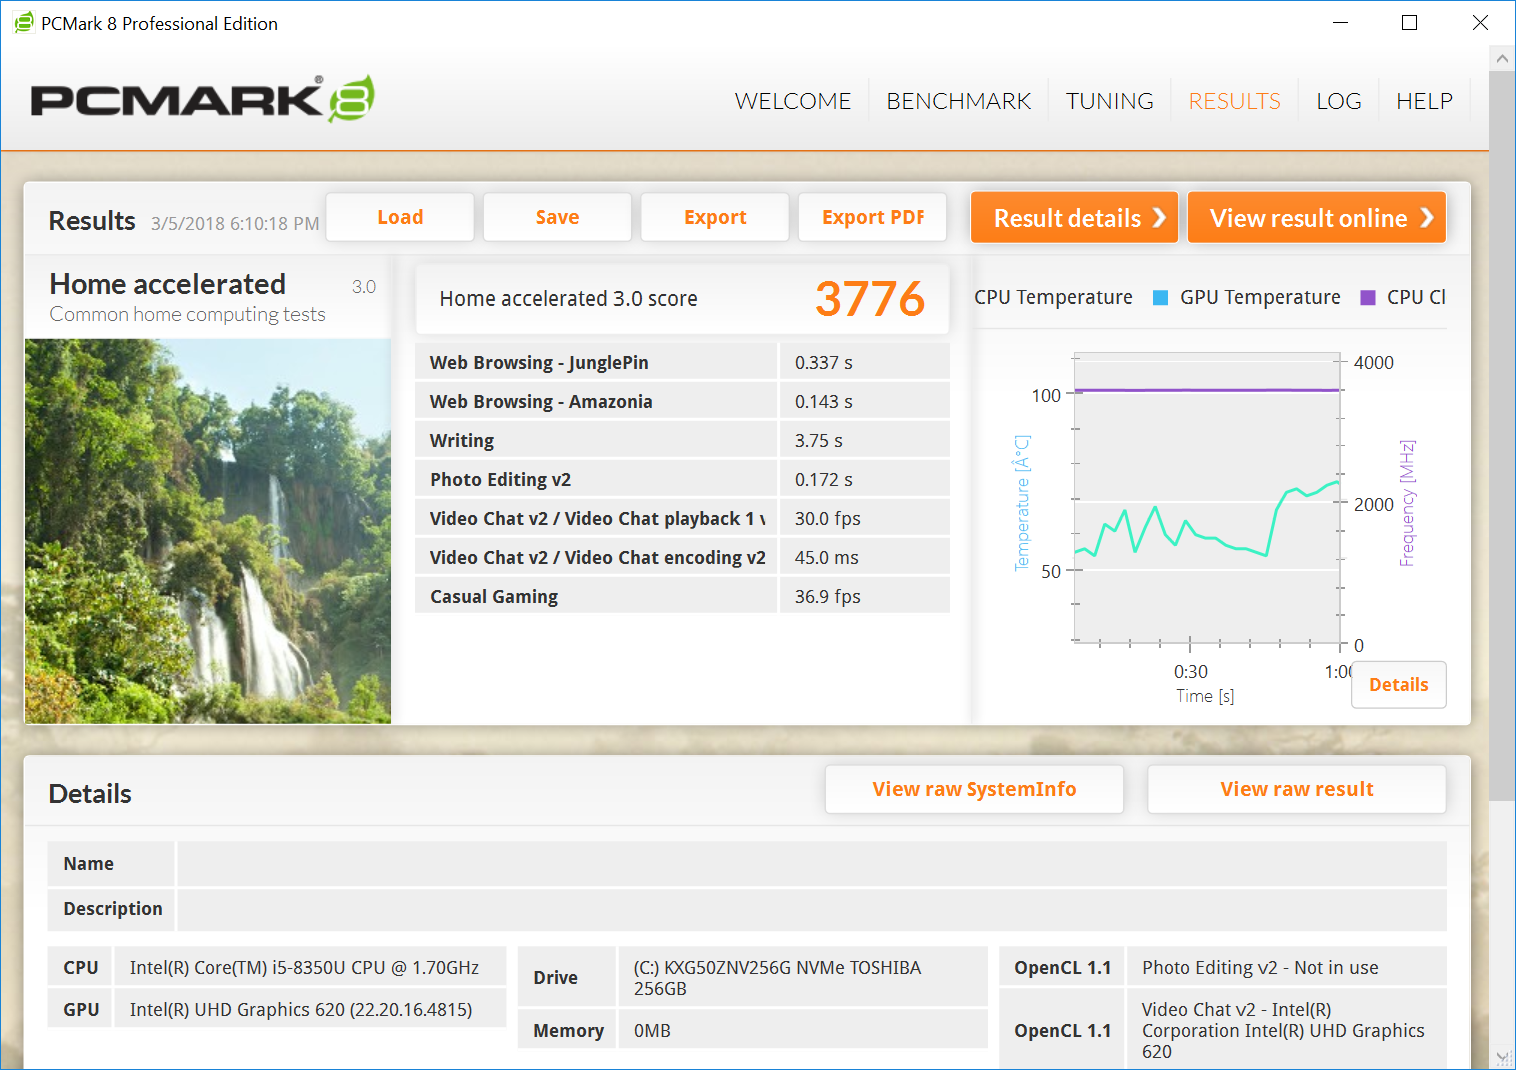
| PCMark 8 Home Score Accelerated v2 | 3776 points | |
| PCMark 8 Creative Score Accelerated v2 | 4961 points | |
| PCMark 8 Work Score Accelerated v2 | 4764 points | |
| PCMark 10 Score | 3737 points | |
Help | ||
Storage Devices
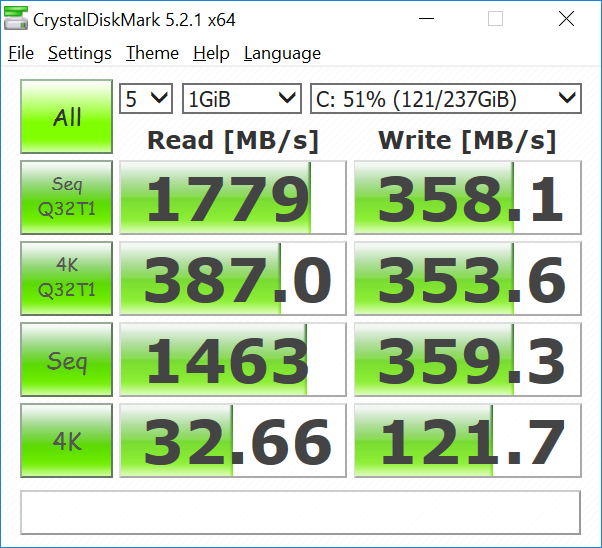
The Toshiba XGS 256 GB NVMe SSD can’t compete with the Samsung drives in our comparison field—including the PM961 of the Latitude 5285 2-in-1—but it’s still pretty nimble in real-world use. With sequential read/write scores of 1385.48 MB/s and 302.06 MB/s, it’s hardly mentionable in the same breath as most NVMe SSDs, but it’s quicker than the average SATA drive. Numerous other configuration options exist as well (ranging up to 1 TB, some supporting Opal encryption), but it’s worth recalling that the drive is also fairly easy to replace aftermarket if the user wishes to upgrade later.
Speaking of which, much like the Latitude 7390 2-in-1 which we recently reviewed, the 5290 2-in-1 includes an empty slot for a second M.2 2230 SSD—which makes dual storage configurations a possibility. That’s an impressive option for a device of this size.

| Dell Latitude 5290 2-in-1 Toshiba XG5 KXG50ZNV256G | Dell Latitude 12 5285 2-in-1 Samsung PM961 MZVLW256HEHP | Microsoft Surface Pro (2017) i7 Samsung PM971 KUS040202M | HP Elite x2 1012 G2-1LV76EA Samsung PM961 MZVLW256HEHP | Average Toshiba XG5 KXG50ZNV256G | |
|---|---|---|---|---|---|
| AS SSD | -239% | -1002% | 108% | -24% | |
| Copy Game MB/s (MB/s) | 317.3 | 585 84% | 582 83% | 379.9 20% | 354 ? 12% |
| Copy Program MB/s (MB/s) | 226.9 | 286.5 26% | 386 70% | 198.2 -13% | 224 ? -1% |
| Copy ISO MB/s (MB/s) | 512 | 1146 124% | 1036 102% | 791 54% | 506 ? -1% |
| Score Total (Points) | 1469 | 2760 88% | 1774 21% | 4653 217% | 1404 ? -4% |
| Score Write (Points) | 544 | 150 -72% | 52 -90% | 879 62% | 479 ? -12% |
| Score Read (Points) | 642 | 1768 175% | 1164 81% | 2545 296% | 650 ? 1% |
| Access Time Write * (ms) | 0.053 | 2.08 -3825% | 7.6 -14240% | 0.027 49% | 0.2029 ? -283% |
| Access Time Read * (ms) | 0.082 | 0.06 27% | 0.04 51% | 0.041 50% | 0.1329 ? -62% |
| 4K-64 Write (MB/s) | 411.2 | 126.1 -69% | 34 -92% | 657 60% | 351 ? -15% |
| 4K-64 Read (MB/s) | 472.7 | 1607 240% | 1015 115% | 2280 382% | 445 ? -6% |
| 4K Write (MB/s) | 102.7 | 1.23 -99% | 0.2 -100% | 132.2 29% | 91 ? -11% |
| 4K Read (MB/s) | 30.97 | 27.6 -11% | 41 32% | 45.24 46% | 28.1 ? -9% |
| Seq Write (MB/s) | 302.1 | 223.1 -26% | 171 -43% | 897 197% | 369 ? 22% |
| Seq Read (MB/s) | 1385 | 1328 -4% | 1070 -23% | 2197 59% | 1768 ? 28% |
* ... smaller is better

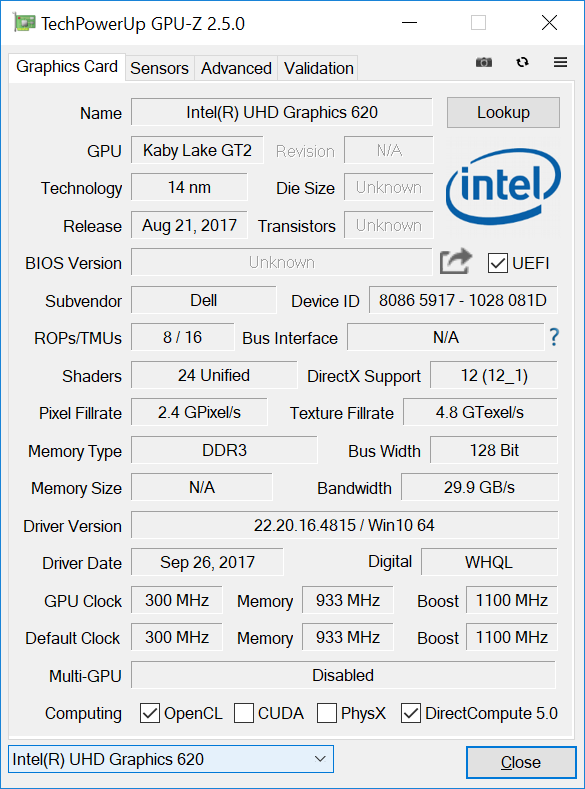
GPU Performance
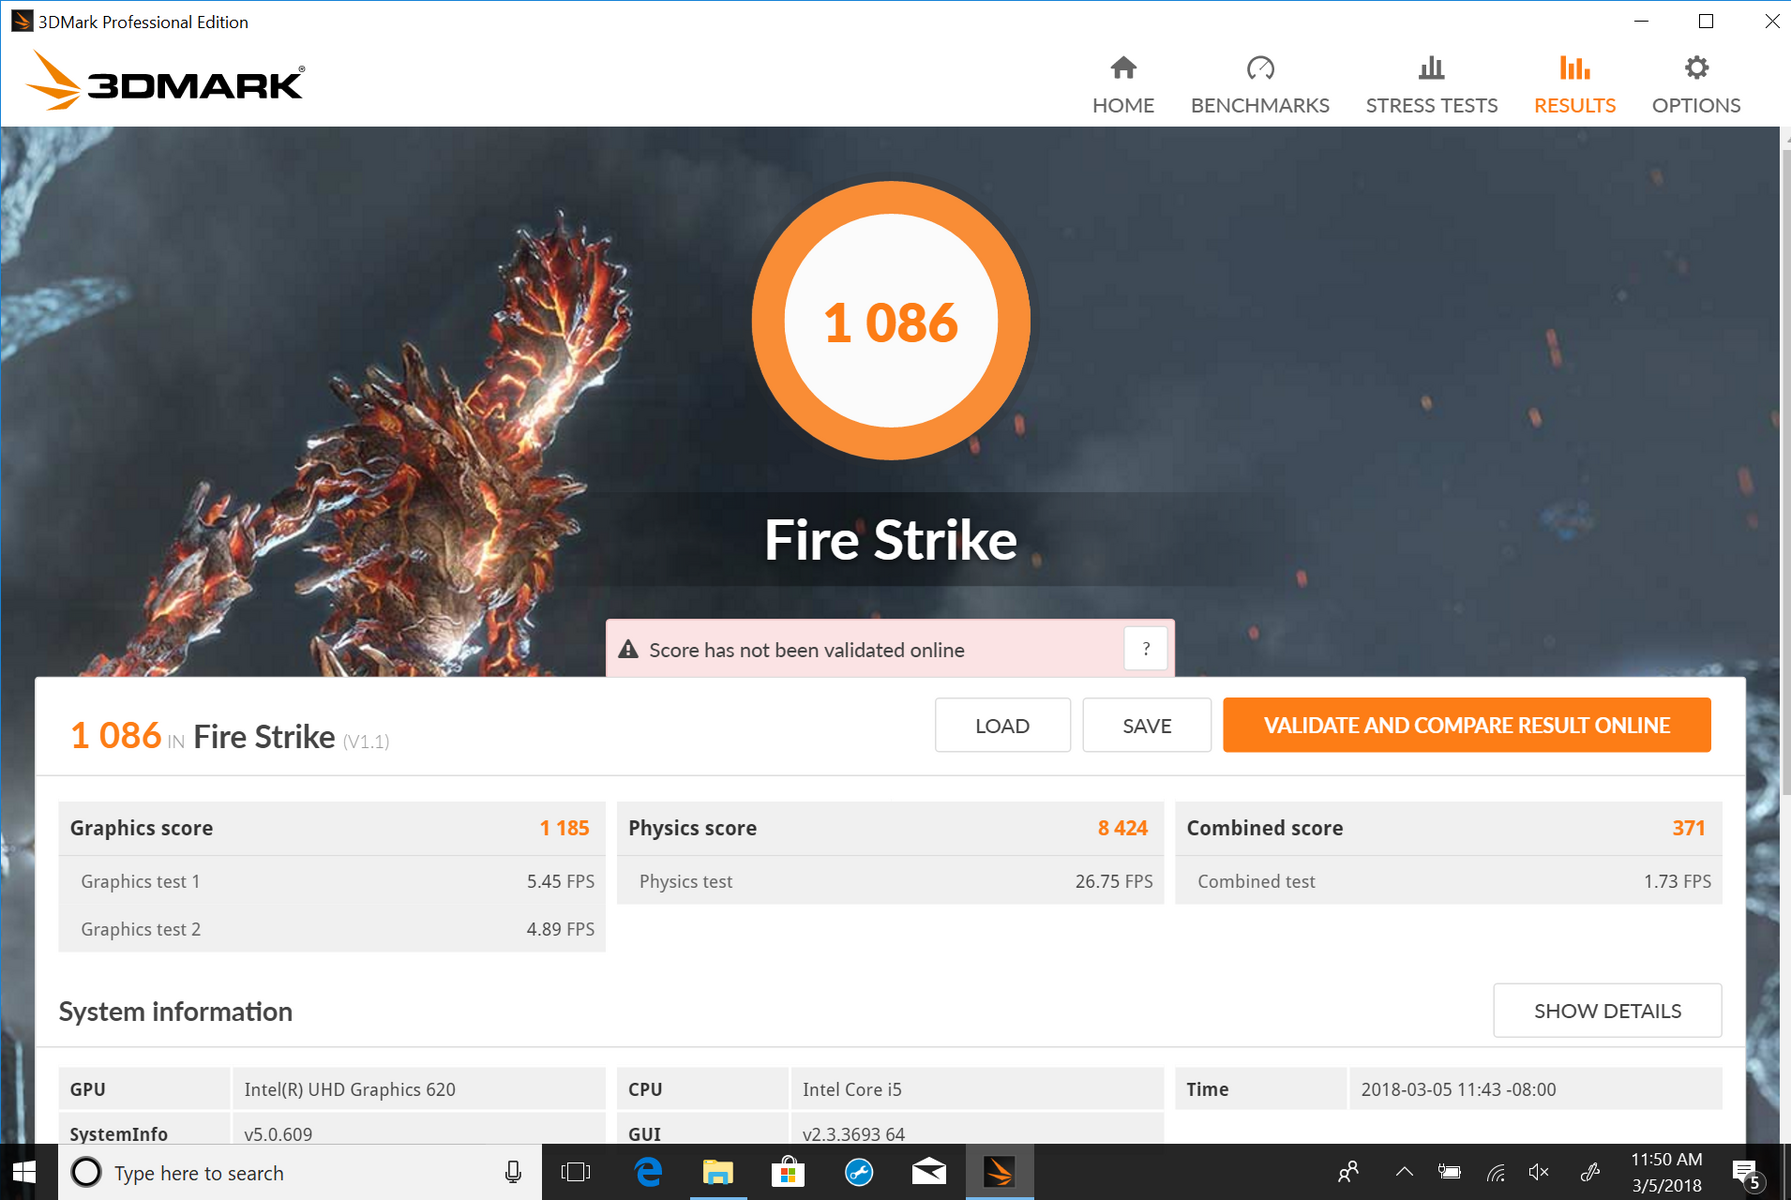
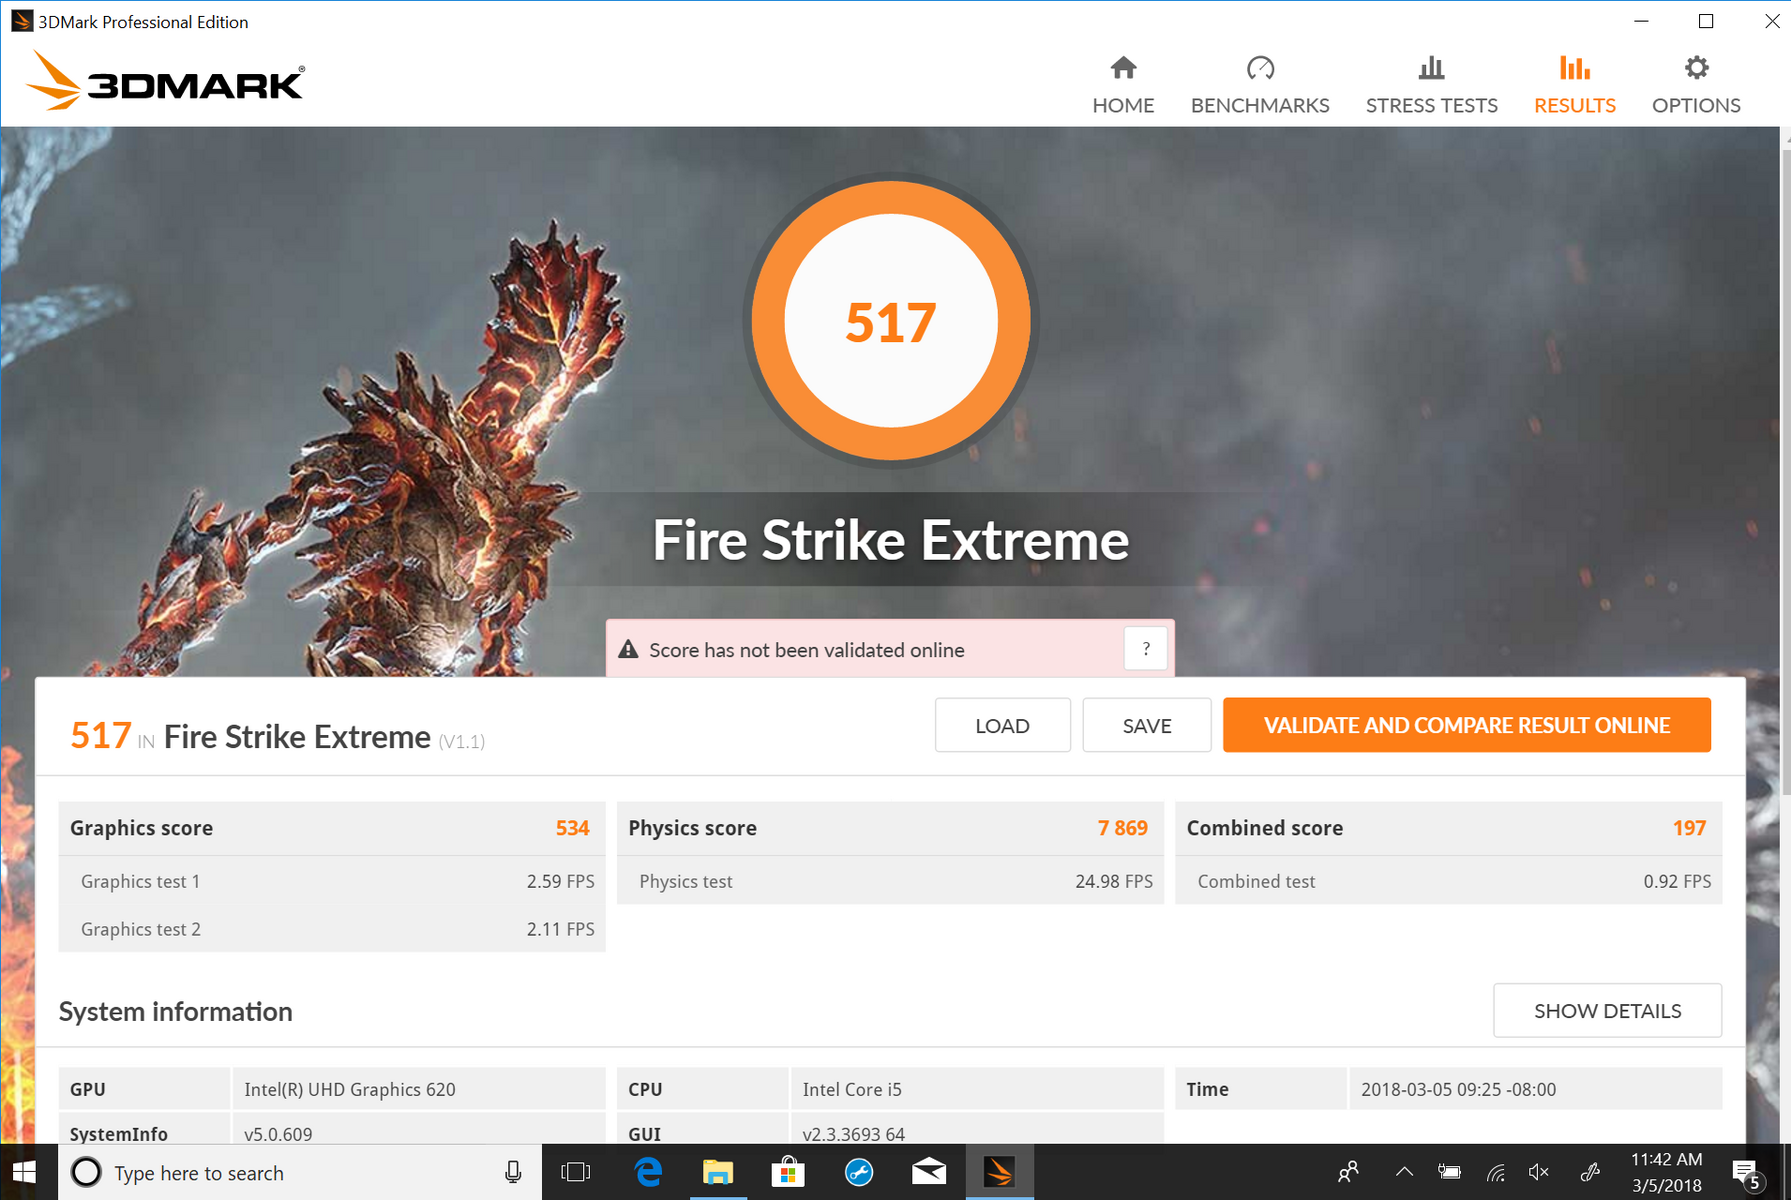
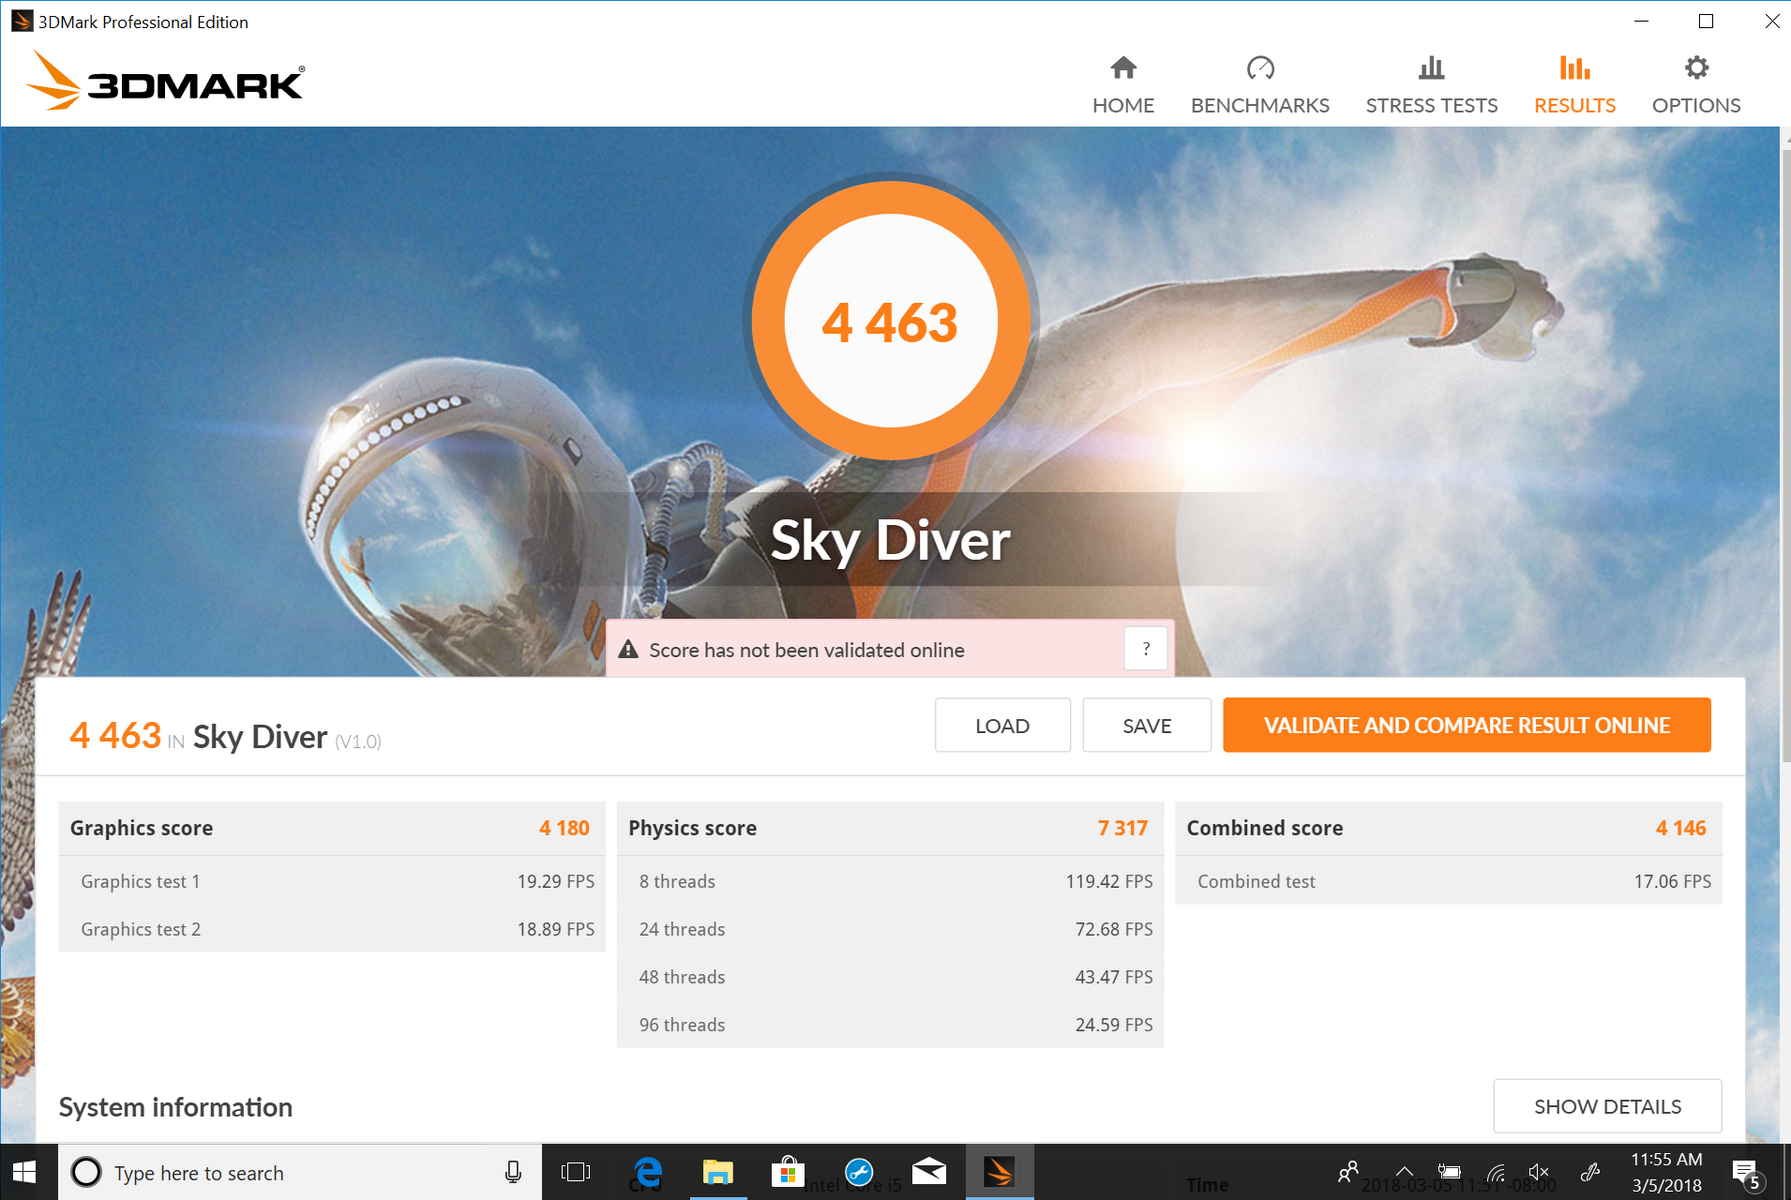
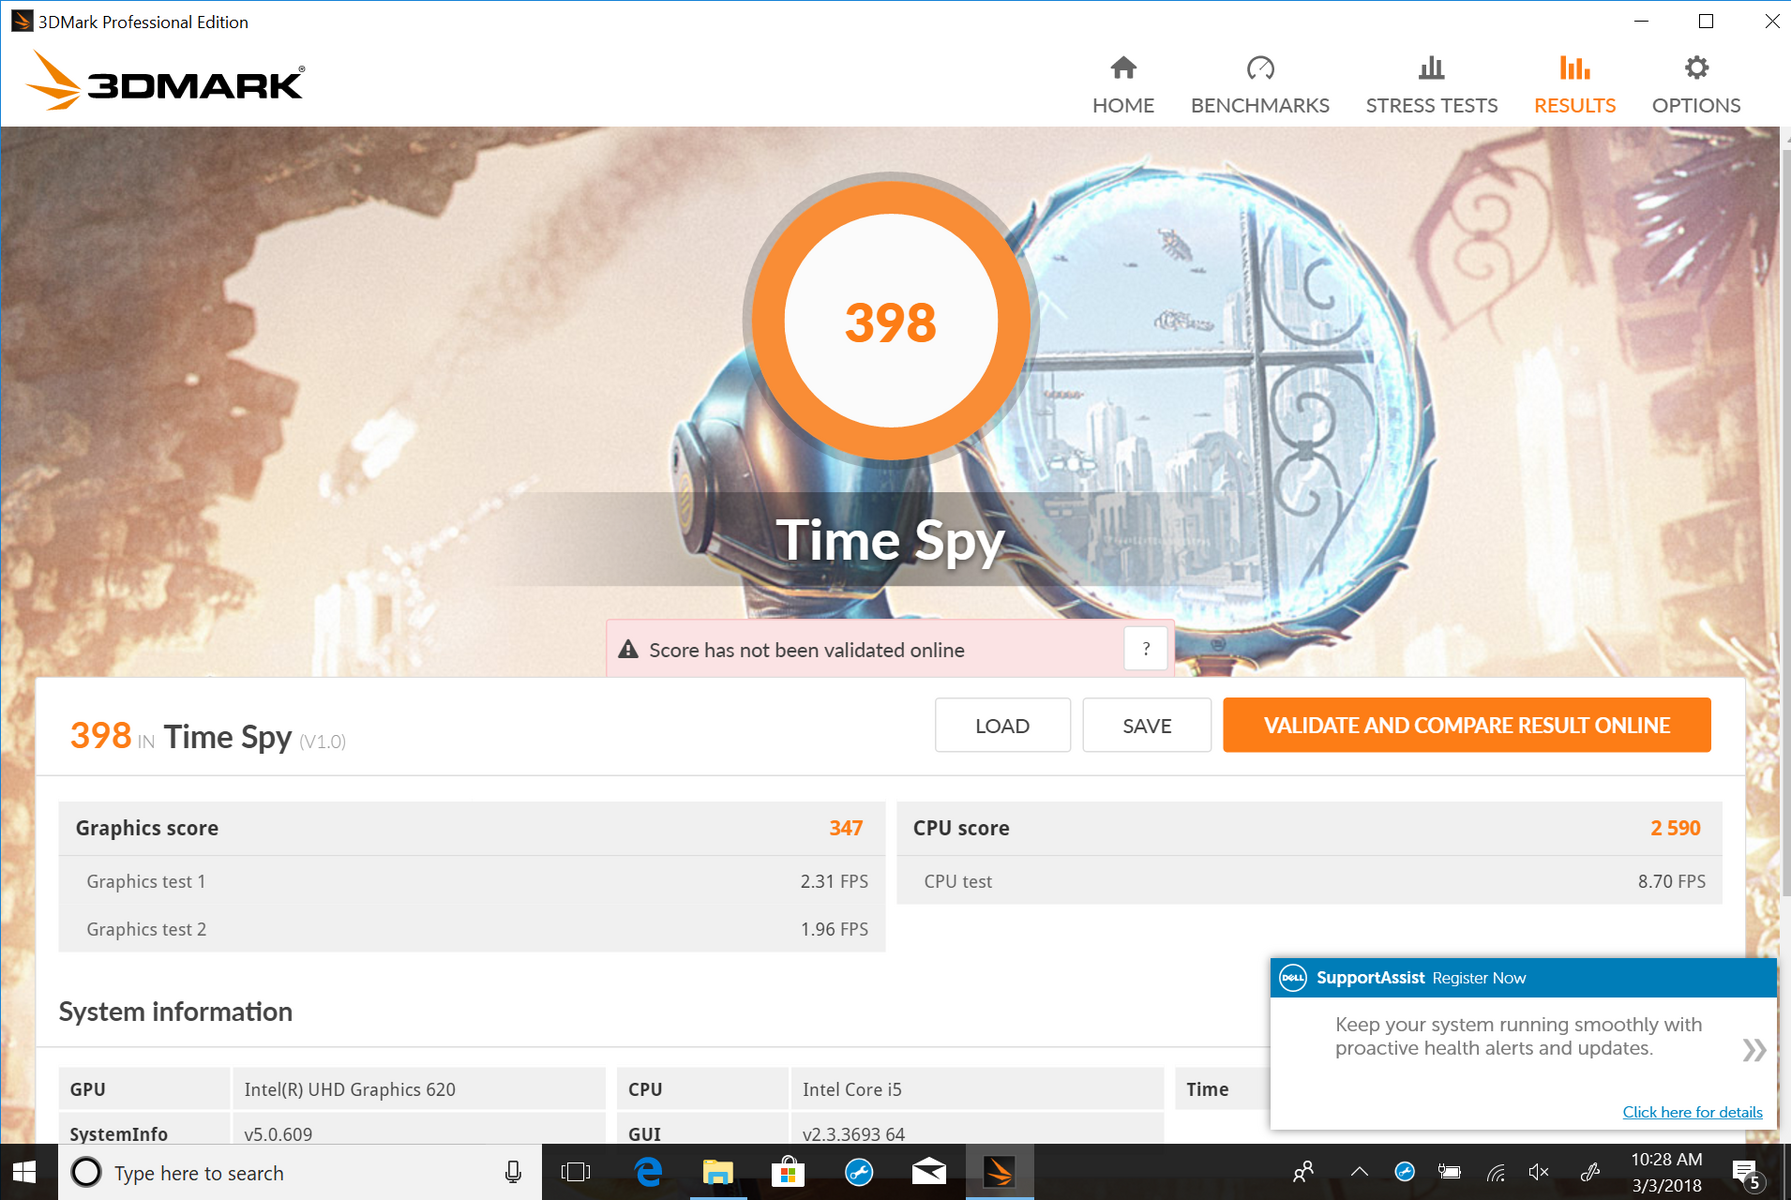
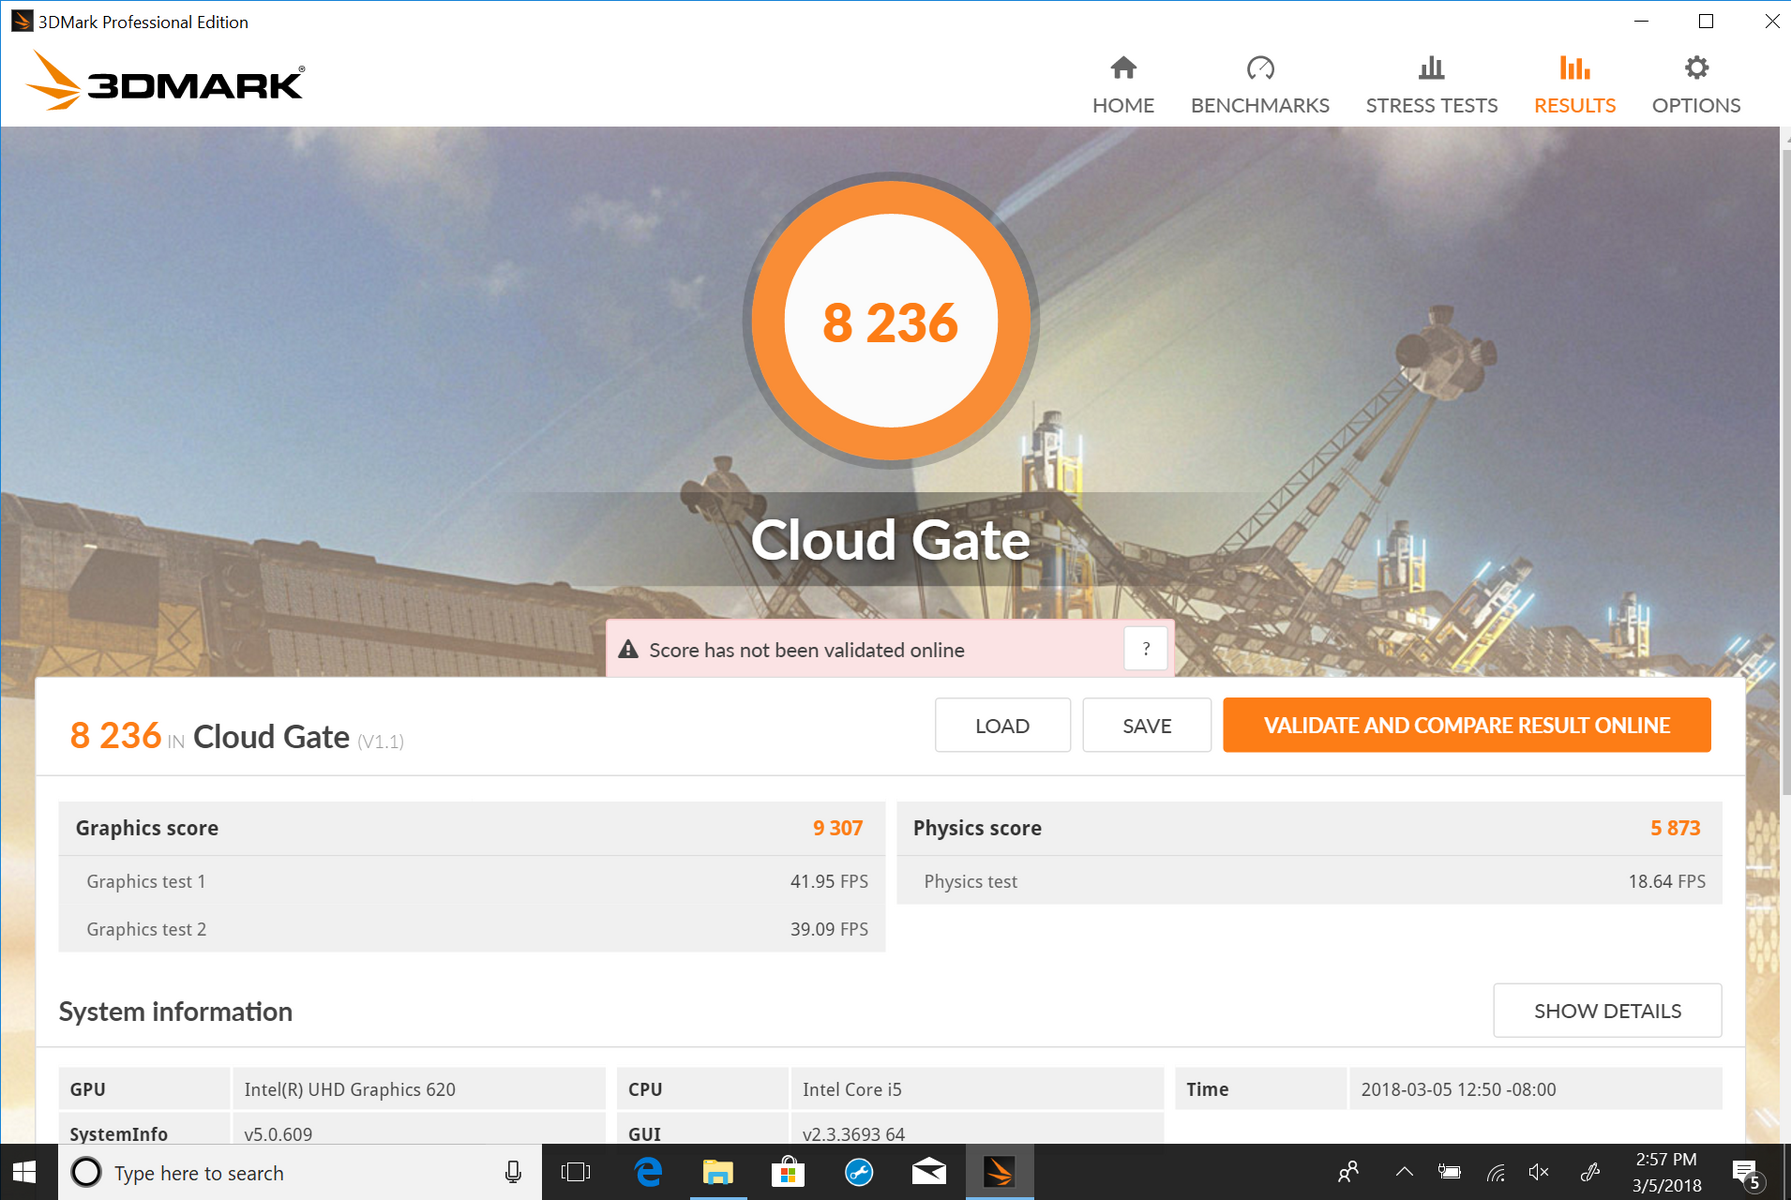
GPU performance has only slightly improved over last year’s model in most cases with premiums ranging from 5% to 16% faster overall. Meanwhile, the Surface Pro 2017 i7 model, equipped with Intel Iris Plus Graphics 640, is a clear winner here by around 20%. The Latitude 5290 still manages respectable performance, however, and it’s above the average for the Intel UHD Graphics 620.
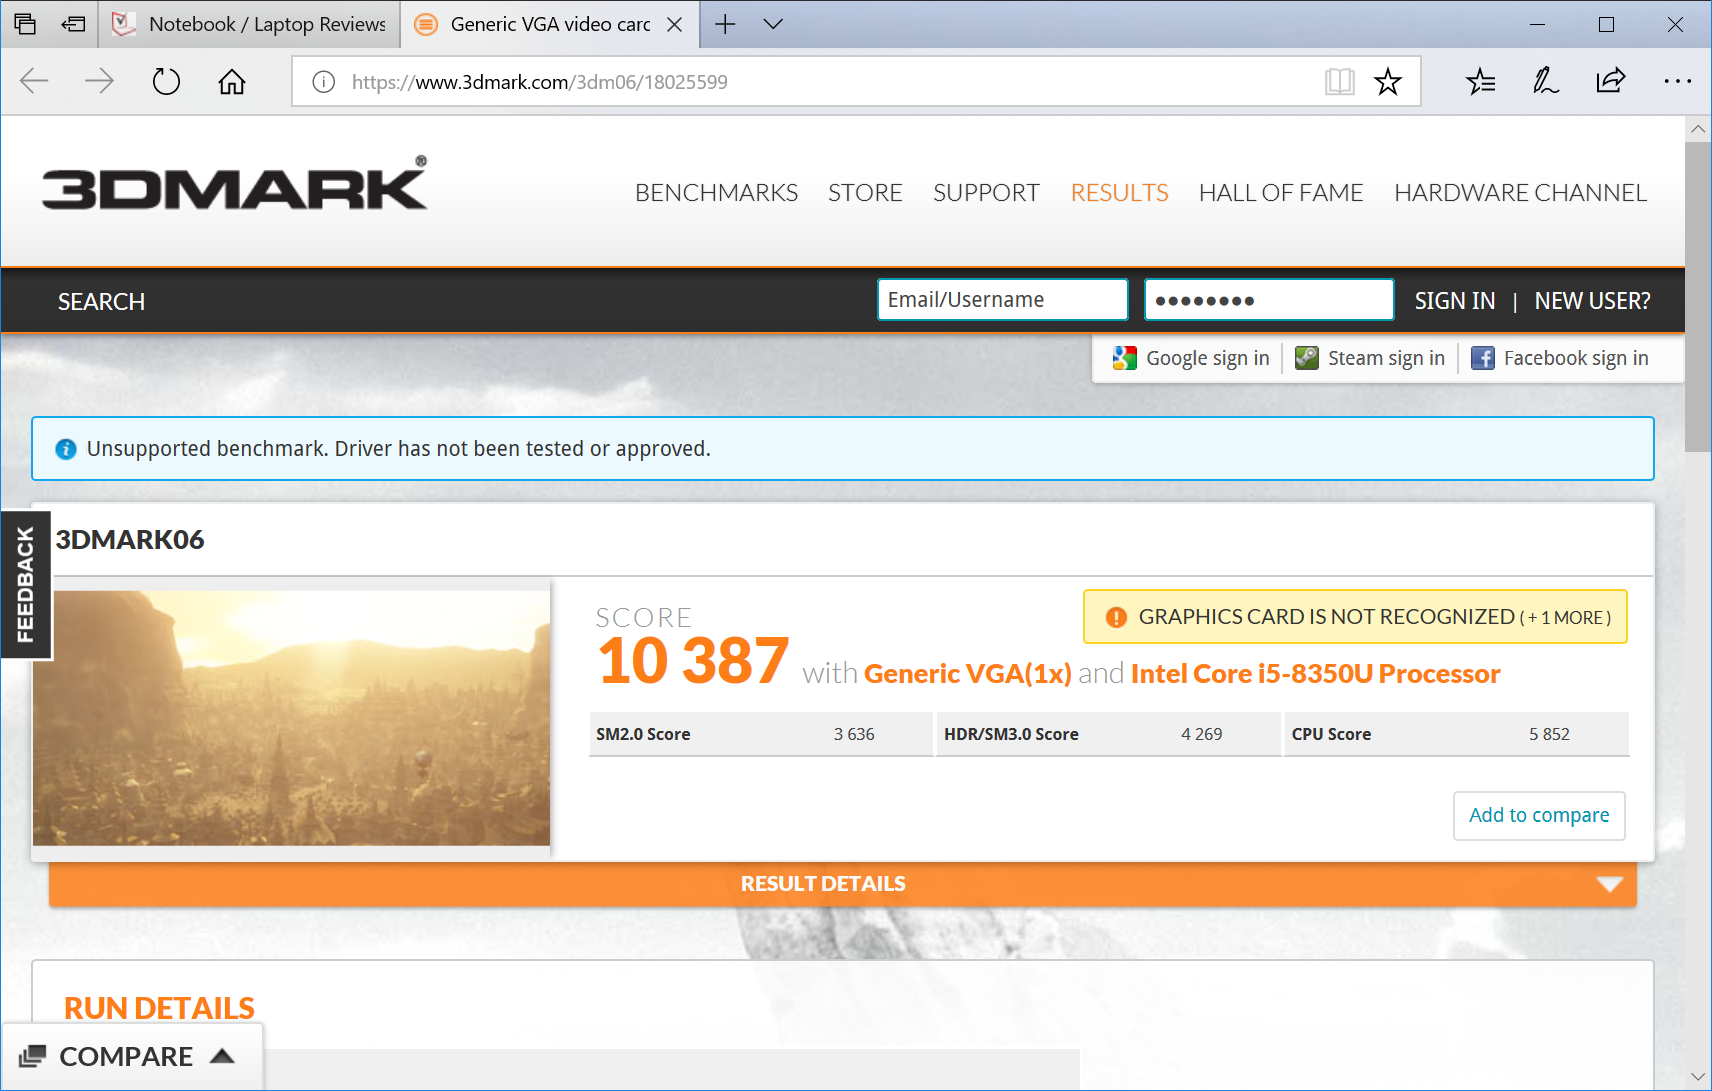
| 3DMark 06 Standard Score | 10387 points | |
| 3DMark 11 Performance | 1847 points | |
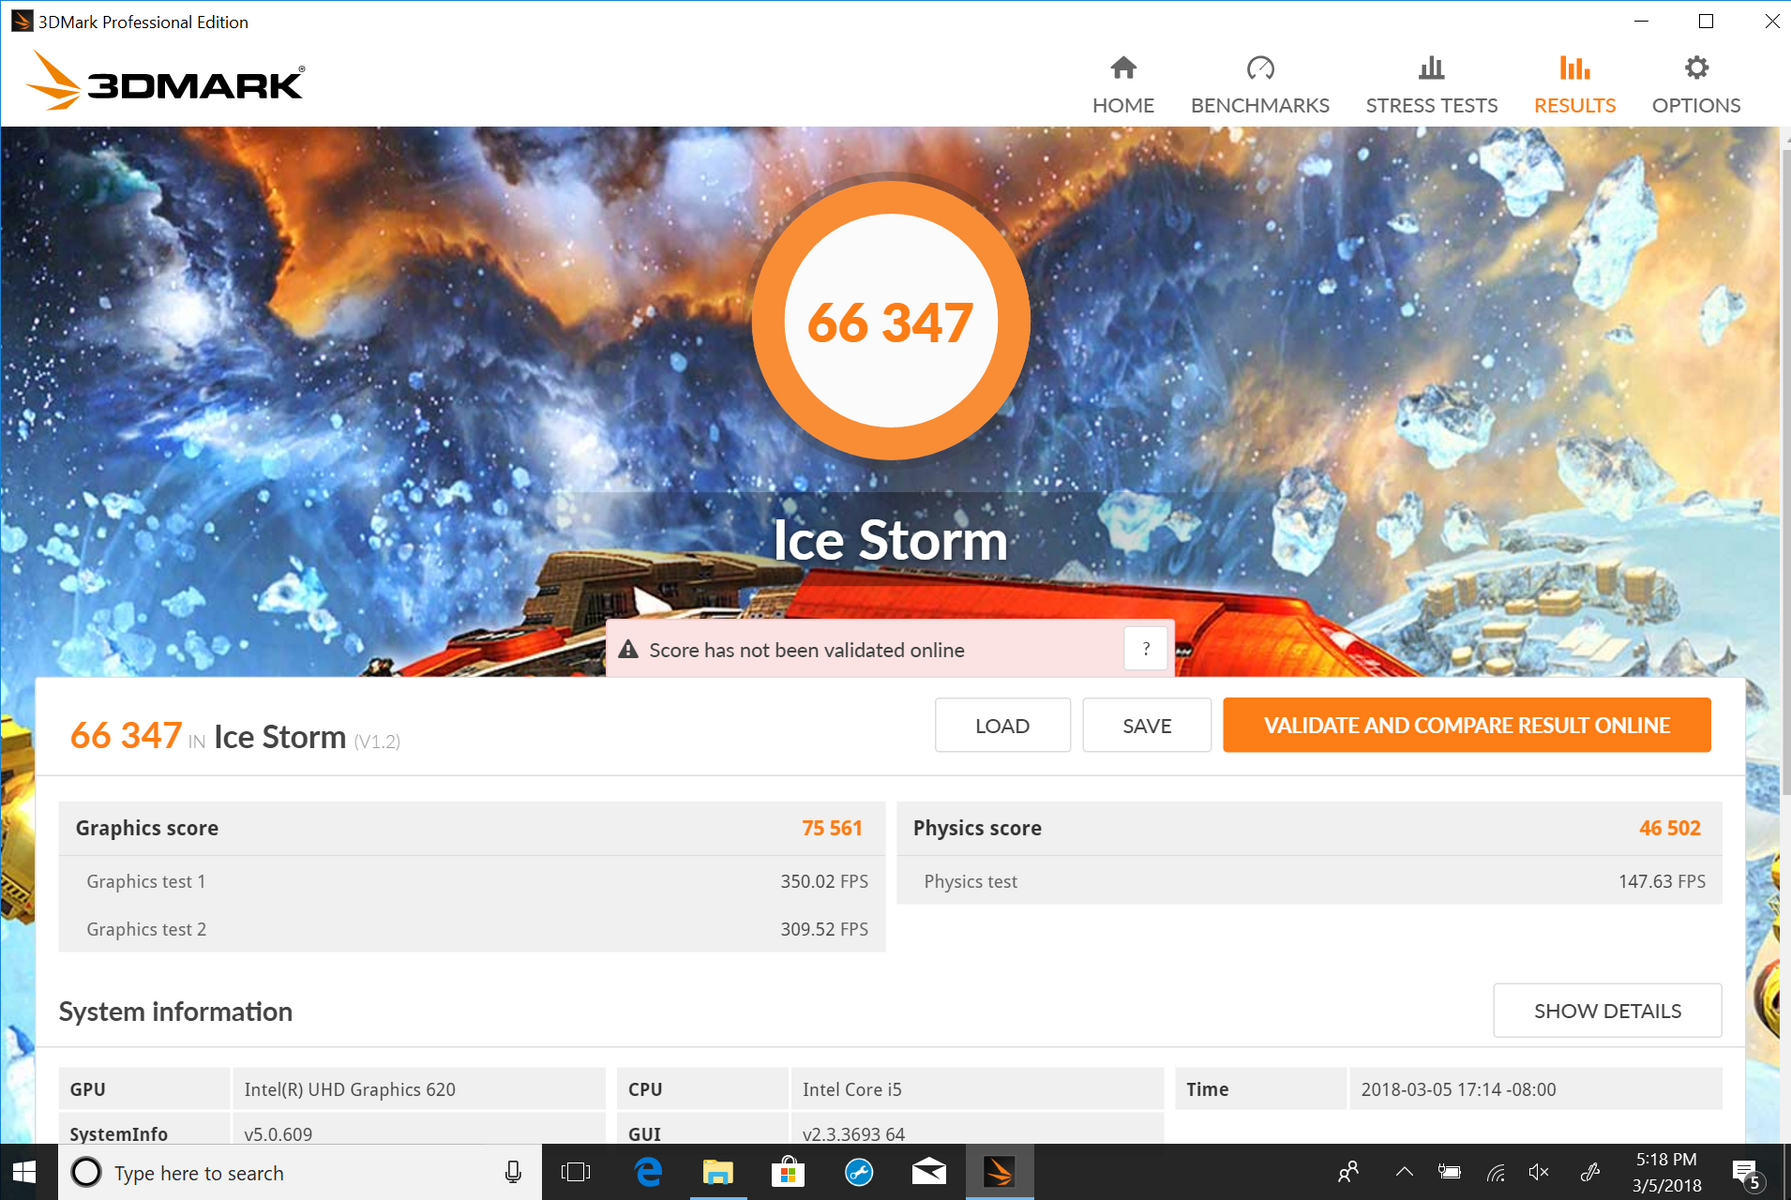
| 3DMark Ice Storm Standard Score | 66347 points | |
| 3DMark Cloud Gate Standard Score | 8236 points | |
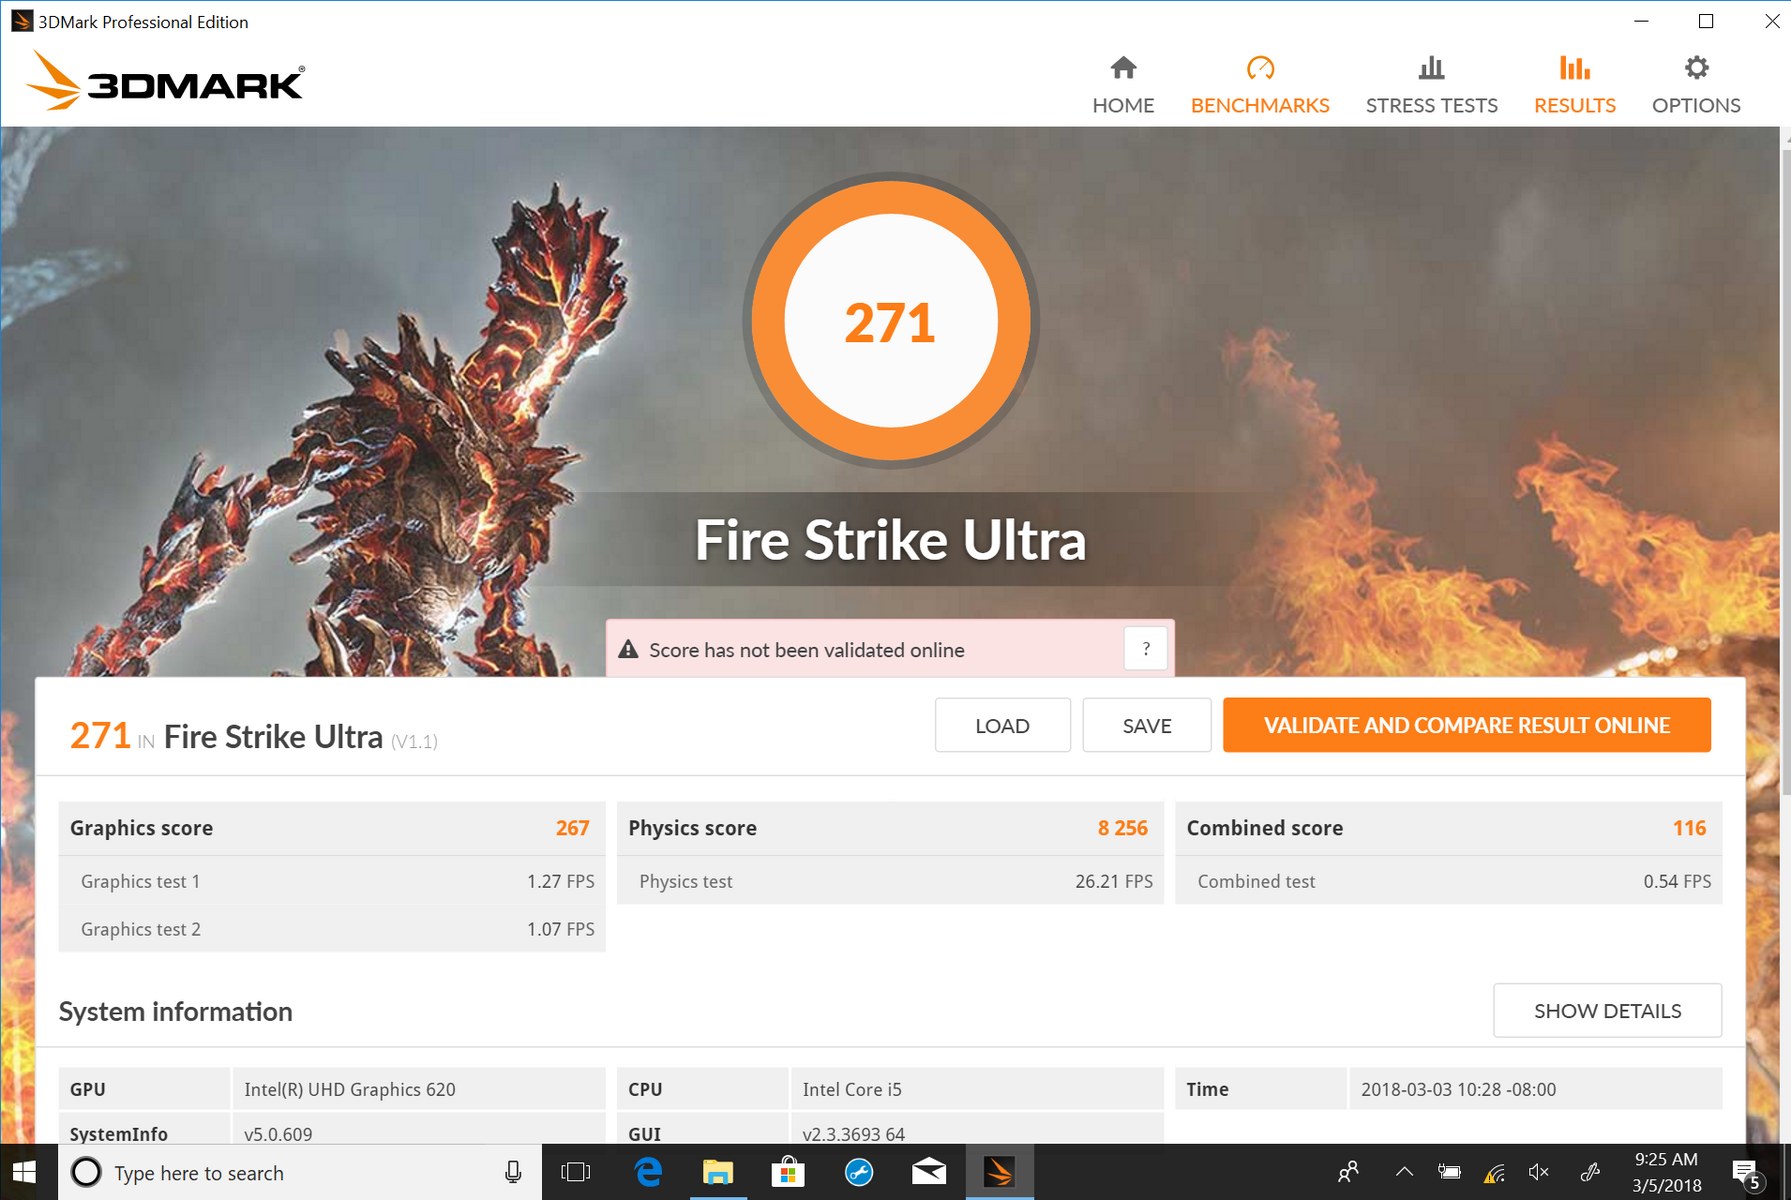
| 3DMark Fire Strike Score | 1086 points | |
| 3DMark Fire Strike Extreme Score | 517 points | |
| 3DMark Time Spy Score | 398 points | |
Help | ||
| low | med. | high | ultra | |
|---|---|---|---|---|
| BioShock Infinite (2013) | 60 | 34 | 28 | 9 |
Stress Test
A critical (and often illuminating) step in our review process is to synthetically stress machines to their limits to see how well they can handle the most torturous of theoretical conditions. Last year’s Latitude 5285 had a penchant for a quick escalation in temperatures shortly after stress was introduced, and as we know from experience, the 8th-generation Kaby Lake Refresh chips are just as prone to rapidly heating up. Some handle it better than others.
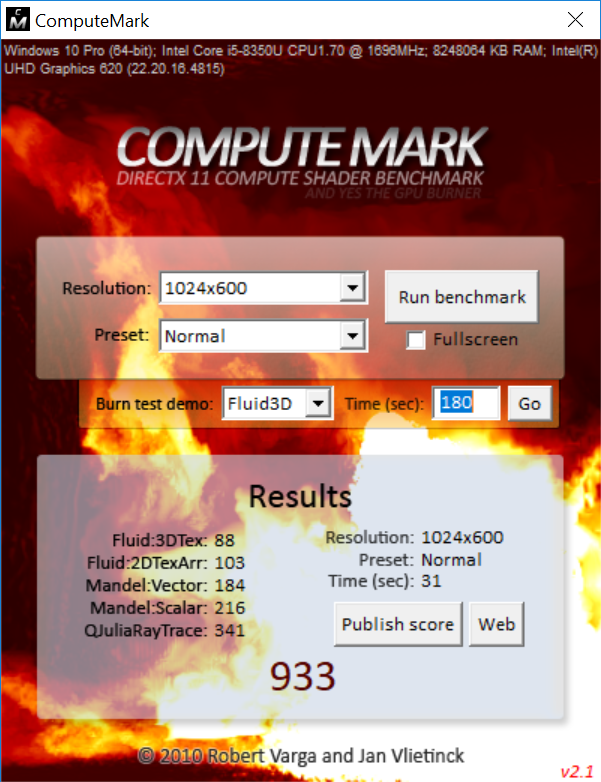
CPU stress immediately provoked an climb into the upper 90s C, after which clock rates stabilized at 2.4 GHz and temperatures remained at 82 °C. GPU stress initially opens with clock rates around the max clock rate of 1100 MHz, but after roughly thirty seconds, the frequency has deflated to around 900 MHz on average. Temperatures once again are stable at 82 °C.
Combined system stress immediately brings the system to its knees with CPU throttling to 1.3 GHz and GPU managing just 750 MHz. Temperatures subside to around 75 °C, where they remain permanently for the duration of the test.
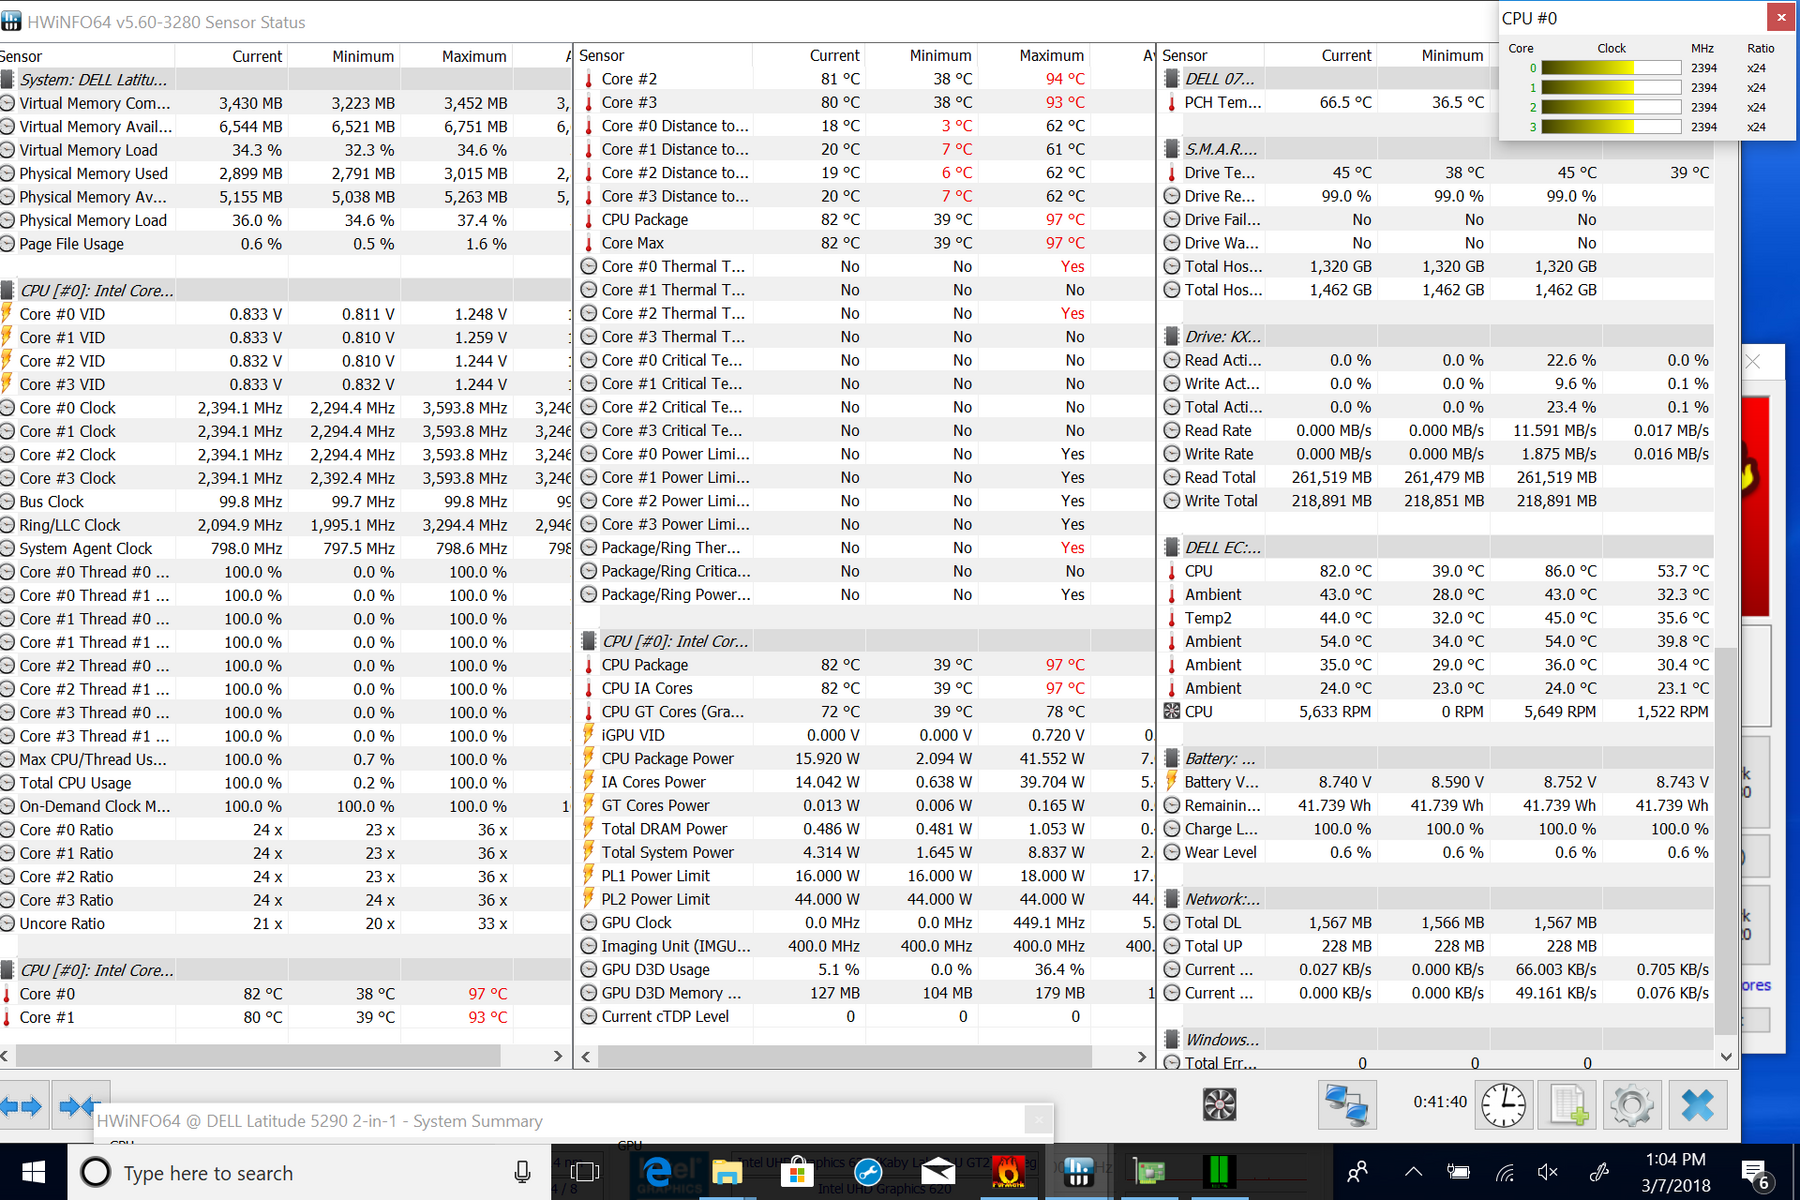
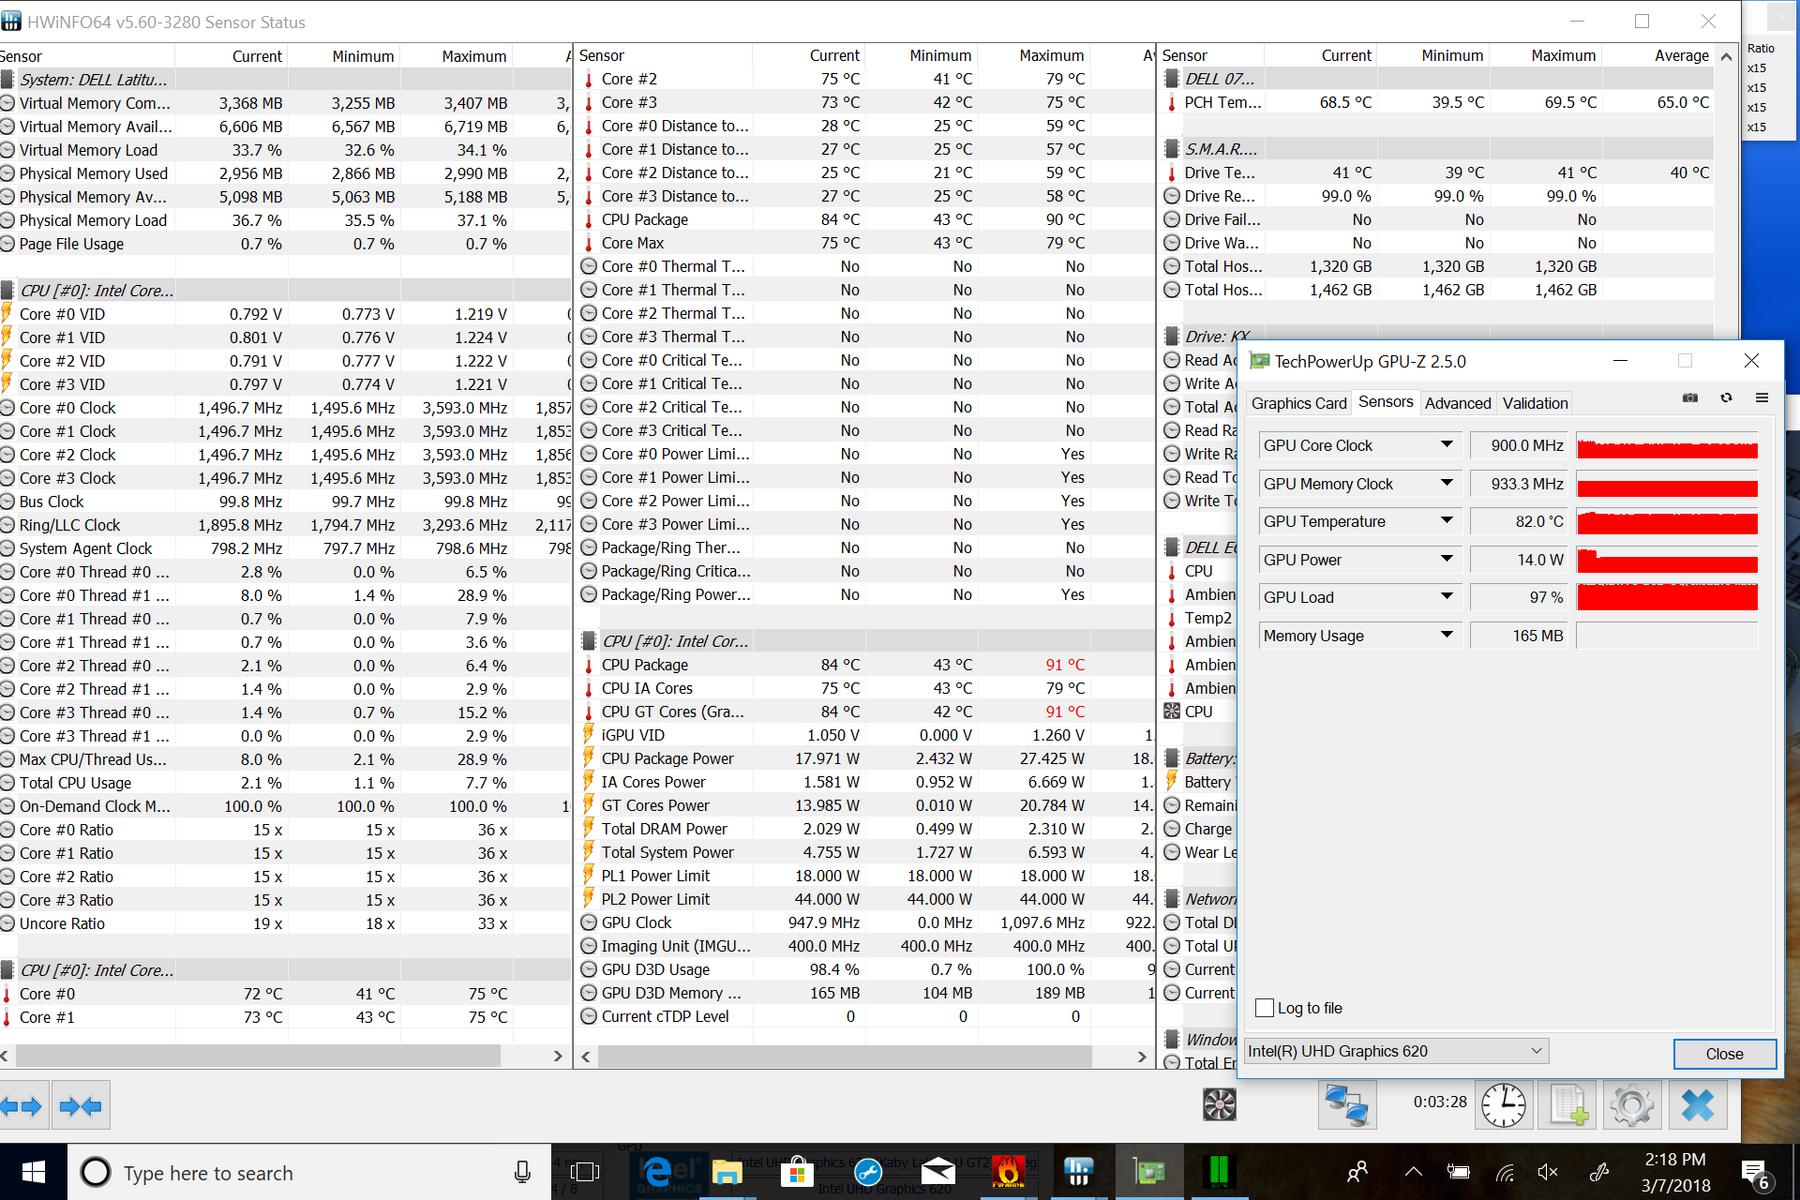
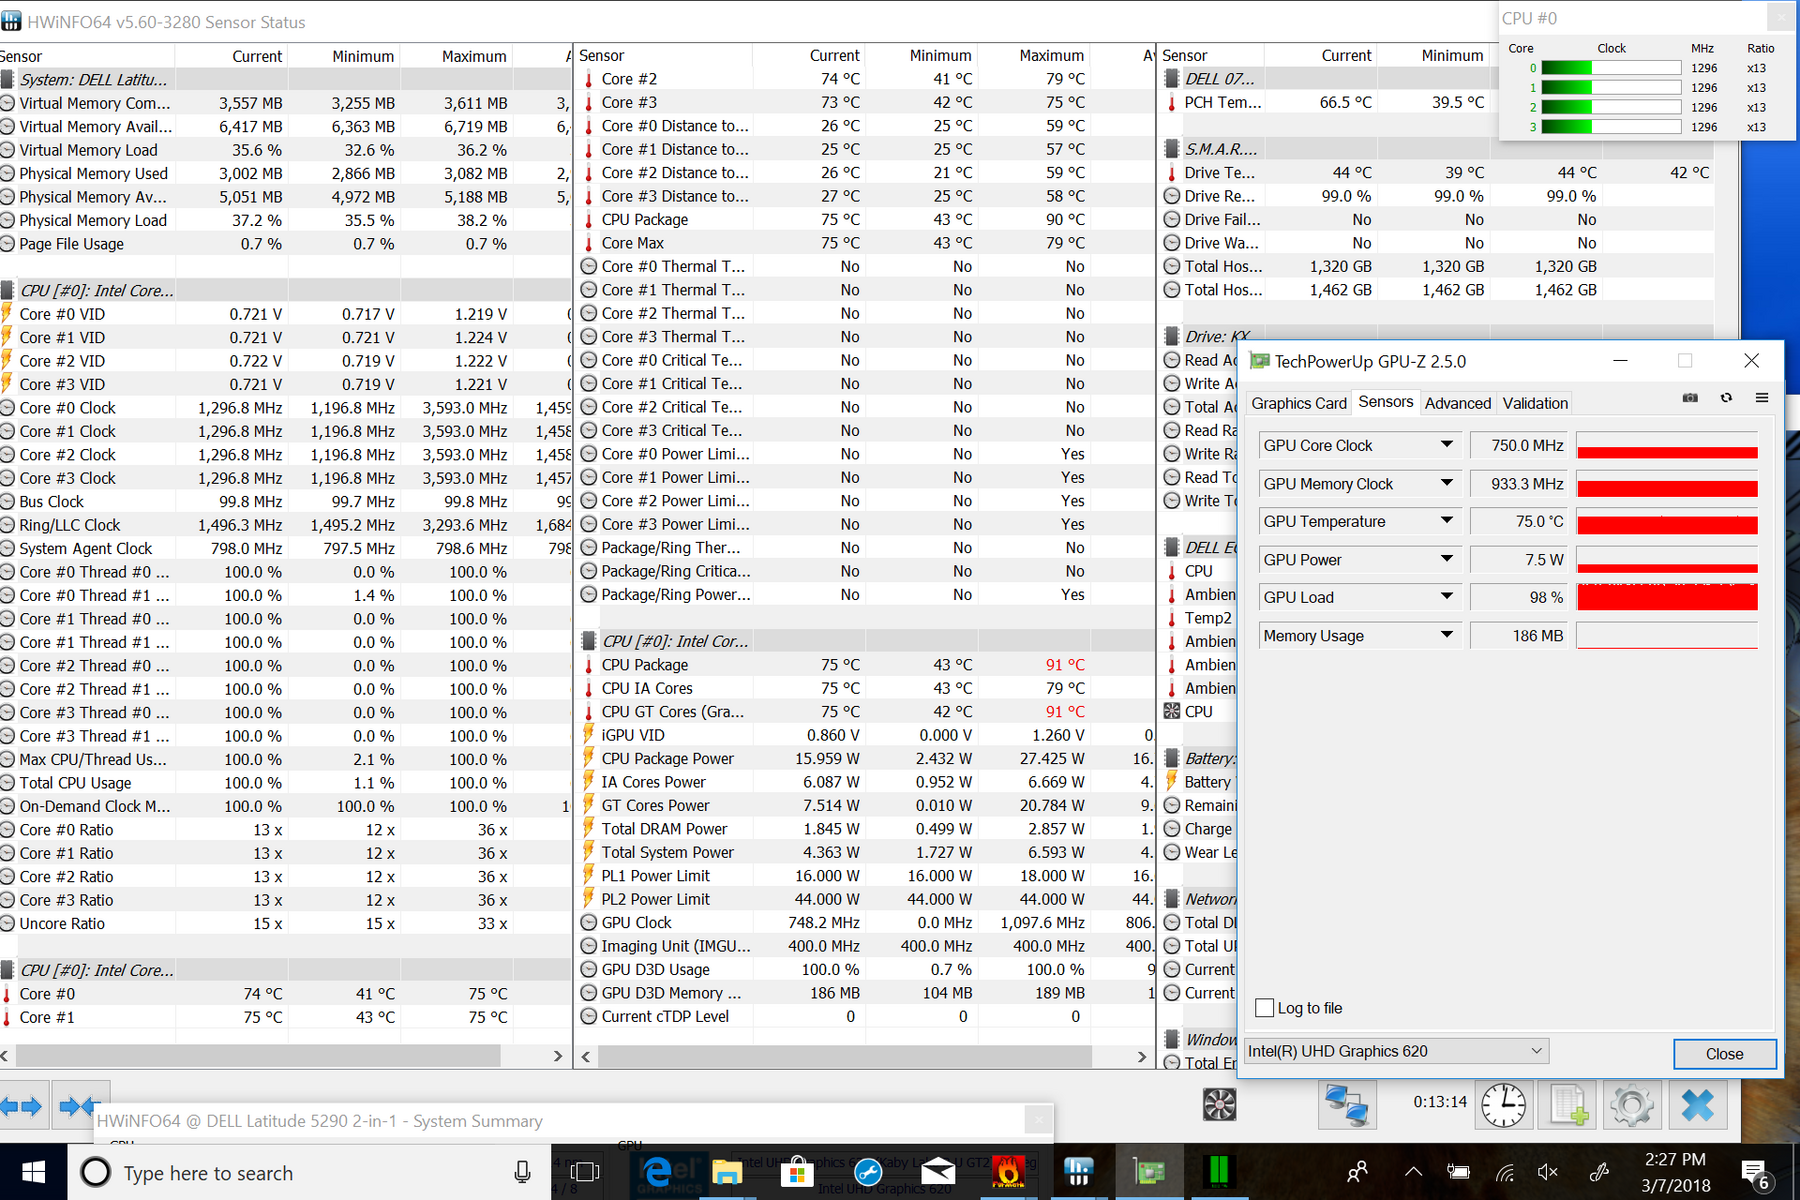
| CPU Clock (GHz) | GPU Clock (MHz) | Average CPU Temperature (°C) | Average GPU Temperature (°C) | |
| Prime95 Stress | 2.4 | - | 82 | - |
| FurMark Stress | - | 1100 | - | 82 |
| Prime95 + FurMark Stress | 1.3 | 750 | 75 | 75 |
Emissions
System Noise
Like its predecessor, the Latitude 5290 2-in-1 is overwhelmingly quiet during normal operation. While idling and even under moderate load, the device is actually entirely silent—the fan doesn’t even run. Only after stressed for longer periods of time does it finally break the silence, and at this point the fan does become quite a bit louder—at 41.6 dB(A)—than what we measured during our time with the 5285. Still, it’s rather uncommon and not all that obtrusive.
Noise level
| Idle |
| 28.5 / 28.5 / 28.5 dB(A) |
| Load |
| 28.5 / 41.6 dB(A) |
 | ||
30 dB silent 40 dB(A) audible 50 dB(A) loud |
||
min: | ||
| Dell Latitude 5290 2-in-1 UHD Graphics 620, i5-8350U, Toshiba XG5 KXG50ZNV256G | Dell Latitude 12 5285 2-in-1 HD Graphics 620, i7-7600U, Samsung PM961 MZVLW256HEHP | Microsoft Surface Pro (2017) i7 Iris Plus Graphics 640, i7-7660U, Samsung PM971 KUS040202M | HP Elite x2 1012 G2-1LV76EA HD Graphics 620, i5-7200U, Samsung PM961 MZVLW256HEHP | |
|---|---|---|---|---|
| Noise | 3% | -3% | -0% | |
| off / environment * (dB) | 28.5 | 28.2 1% | 29.6 -4% | 29.5 -4% |
| Idle Minimum * (dB) | 28.5 | 28.2 1% | 29.6 -4% | 29.5 -4% |
| Idle Average * (dB) | 28.5 | 28.2 1% | 29.6 -4% | 29.5 -4% |
| Idle Maximum * (dB) | 28.5 | 28.2 1% | 29.6 -4% | 29.5 -4% |
| Load Average * (dB) | 28.5 | 30.4 -7% | 33.4 -17% | 30.6 -7% |
| Load Maximum * (dB) | 41.6 | 34 18% | 34.1 18% | 32.5 22% |
| Witcher 3 ultra * (dB) | 33.4 |
* ... smaller is better
Temperature
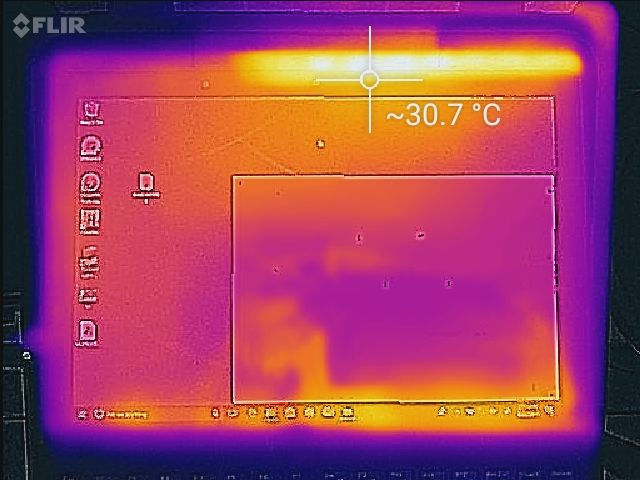
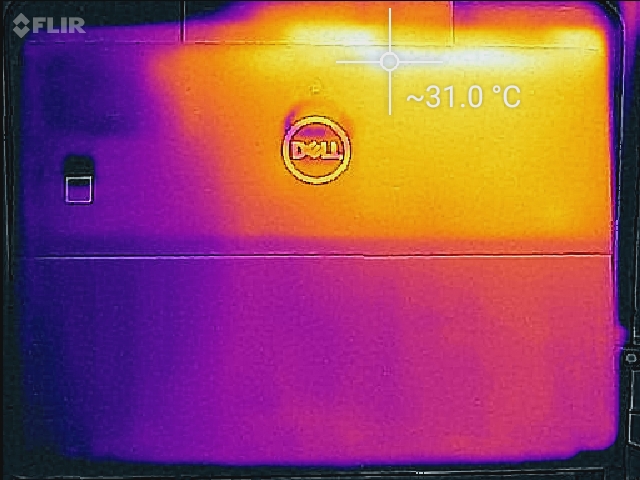
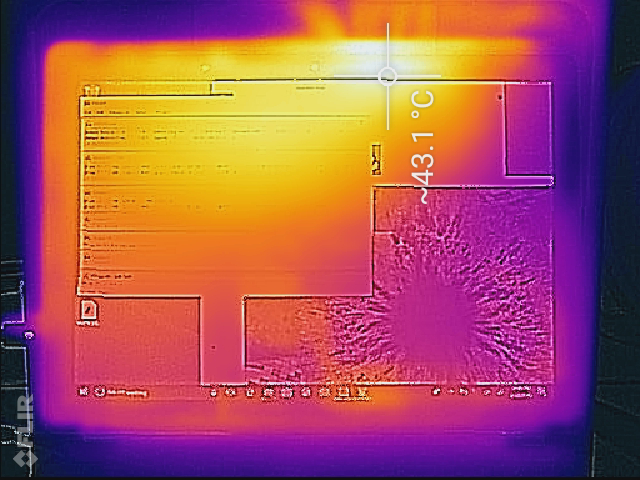
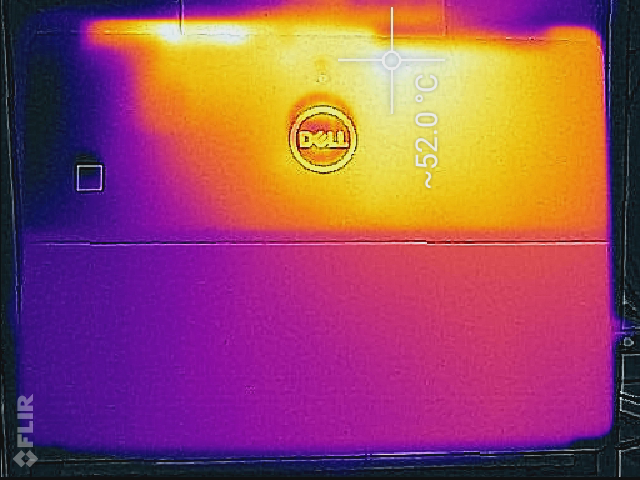
The Latitude 5285 2-in-1 was already a hot device under load, so (after what we’ve seen so far) it’s unreasonable to expect the 5290 to behave much differently. In fact, objectively speaking, it actually doesn’t run any hotter overall than last year’s model—but the heat is instead more concentrated in a few specific regions. The rear center of the machine, for instance, has warmed from 38 °C to 44.4 °C, and the underside has gone from 48.6 °C to 52 °C. Depending on how the device is being held, this might actually serve as an improvement, since some of the heat from the edges of the tablet where the hands would normally rest has migrated toward the center quadrants instead.
(±) The maximum temperature on the upper side is 44.4 °C / 112 F, compared to the average of 34.3 °C / 94 F, ranging from 21.2 to 62.5 °C for the class Office.
(-) The bottom heats up to a maximum of 52 °C / 126 F, compared to the average of 36.8 °C / 98 F
(+) In idle usage, the average temperature for the upper side is 26.3 °C / 79 F, compared to the device average of 29.5 °C / 85 F.
(+) The palmrests and touchpad are cooler than skin temperature with a maximum of 29 °C / 84.2 F and are therefore cool to the touch.
(±) The average temperature of the palmrest area of similar devices was 27.5 °C / 81.5 F (-1.5 °C / -2.7 F).
Speakers

Virtually nothing’s changed with regard to the Latitude 5290’s speakers, which are still pretty good for a tablet/convertible, but which (predictably) lack bass. Pumping up the MaxxBass dial within the included Waves MaxxAudio Pro software (which is actually somewhat useful) does tangibly improve the situation at lower volumes, but when at higher volumes it can result in some distortion. Headphones are therefore recommended for extended media consumption.
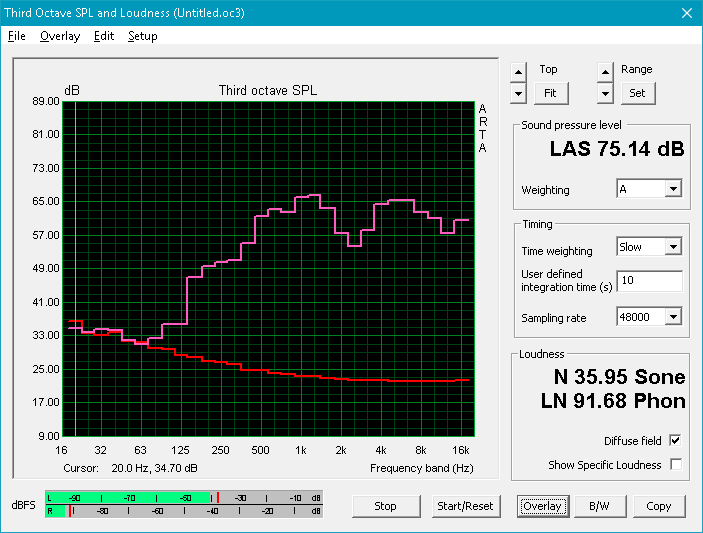
Dell Latitude 5290 2-in-1 audio analysis
(±) | speaker loudness is average but good (75.1 dB)
Bass 100 - 315 Hz
(-) | nearly no bass - on average 15.5% lower than median
(±) | linearity of bass is average (8.5% delta to prev. frequency)
Mids 400 - 2000 Hz
(+) | balanced mids - only 3.6% away from median
(±) | linearity of mids is average (8.7% delta to prev. frequency)
Highs 2 - 16 kHz
(+) | balanced highs - only 3.5% away from median
(±) | linearity of highs is average (7.1% delta to prev. frequency)
Overall 100 - 16.000 Hz
(±) | linearity of overall sound is average (20.4% difference to median)
Compared to same class
» 45% of all tested devices in this class were better, 10% similar, 45% worse
» The best had a delta of 7%, average was 21%, worst was 53%
Compared to all devices tested
» 53% of all tested devices were better, 8% similar, 39% worse
» The best had a delta of 4%, average was 24%, worst was 134%
HP Elite x2 1012 G2-1LV76EA audio analysis
(-) | not very loud speakers (71 dB)
Bass 100 - 315 Hz
(-) | nearly no bass - on average 21.3% lower than median
(±) | linearity of bass is average (10% delta to prev. frequency)
Mids 400 - 2000 Hz
(+) | balanced mids - only 4.2% away from median
(±) | linearity of mids is average (7.9% delta to prev. frequency)
Highs 2 - 16 kHz
(±) | higher highs - on average 8.9% higher than median
(-) | highs are not linear (16.8% delta to prev. frequency)
Overall 100 - 16.000 Hz
(-) | overall sound is not linear (35.1% difference to median)
Compared to same class
» 94% of all tested devices in this class were better, 2% similar, 4% worse
» The best had a delta of 6%, average was 20%, worst was 57%
Compared to all devices tested
» 93% of all tested devices were better, 1% similar, 6% worse
» The best had a delta of 4%, average was 24%, worst was 134%
Energy Management
Power Consumption
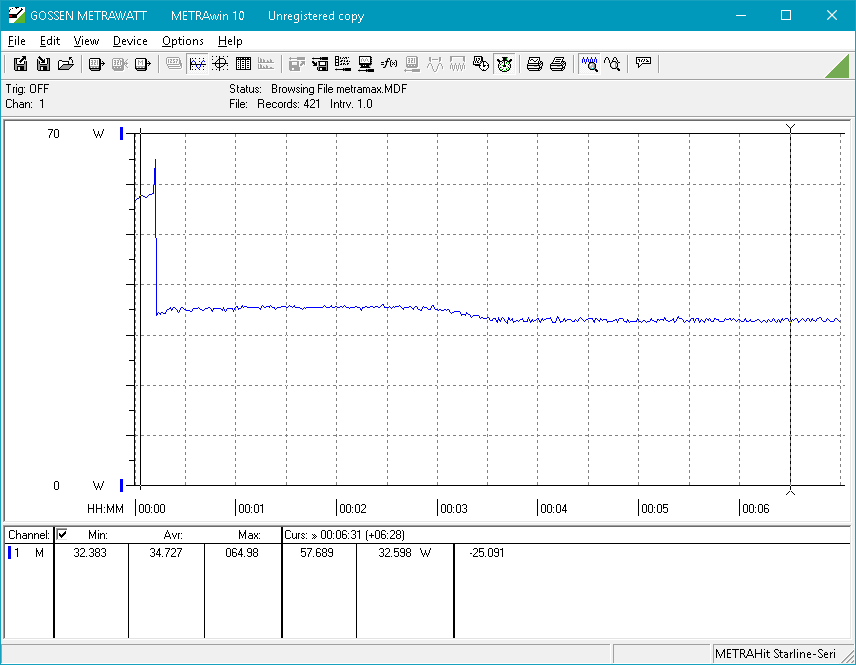
Power consumption has climbed a bit across the board. While idling, we see results which are between 5% minimum (3 W vs. 2.85 W) and 31% maximum (10 W vs. 6.91 W) higher than those of the Latitude 5285, measurements which are likely to negatively affect battery life in our next section. Load values are also higher, with an average of 37.1 W exceeding the 5285’s 32.88 W by 11% and the max of 38.2 W just a bit hungrier than the 37.41 W we measured from last year’s model.
In our graphs below, please note that the Prime95 stress began at the 20 second mark, whereas the Prime95 + FurMark (max load) test started at 0 seconds.

| Off / Standby | |
| Idle | |
| Load |
|
Key:
min: | |
| Dell Latitude 5290 2-in-1 i5-8350U, UHD Graphics 620, Toshiba XG5 KXG50ZNV256G, IPS, 1920x1280, 12.3" | Dell Latitude 12 5285 2-in-1 i7-7600U, HD Graphics 620, Samsung PM961 MZVLW256HEHP, IPS, 1920x1280, 12.3" | Microsoft Surface Pro (2017) i7 i7-7660U, Iris Plus Graphics 640, Samsung PM971 KUS040202M, IPS, 2736x1824, 12.3" | HP Elite x2 1012 G2-1LV76EA i5-7200U, HD Graphics 620, Samsung PM961 MZVLW256HEHP, IPS, 2716x1824, 12.3" | Lenovo ThinkPad X1 Tablet Gen 2 i5-7Y54, HD Graphics 615, Samsung PM961 MZVLW256HEHP, IPS, 2160x1440, 12" | Toshiba Portege Z20t-C-121 6Y75, HD Graphics 515, Samsung SSD PM871 MZNLN512HCJH, IPS, 1920x1080, 12.5" | |
|---|---|---|---|---|---|---|
| Power Consumption | 11% | -22% | -19% | 13% | 18% | |
| Idle Minimum * (Watt) | 3 | 2.85 5% | 4.2 -40% | 4.1 -37% | 5 -67% | 4.3 -43% |
| Idle Average * (Watt) | 7.2 | 6.76 6% | 10.1 -40% | 9.2 -28% | 6.3 12% | 6.1 15% |
| Idle Maximum * (Watt) | 10 | 6.91 31% | 14 -40% | 11.1 -11% | 7.8 22% | 8.9 11% |
| Load Average * (Watt) | 37.1 | 32.88 11% | 37.4 -1% | 33.8 9% | 19.5 47% | 16.3 56% |
| Load Maximum * (Watt) | 38.2 | 37.41 2% | 34 11% | 49.2 -29% | 19.6 49% | 18.6 51% |
| Witcher 3 ultra * (Watt) | 38.1 |
* ... smaller is better
Battery Life
During our testing, battery life declined notably since last year’s model. Load runtimes, for starters, were some 25% below those of the Latitude 5285, whereas our Wi-Fi Websurfing test lasted for just 6 hours. We were a bit surprised at the brevity of this latter result, so we reran the test—and came to similar results the second time around.
Six hours still isn’t bad in the grand scheme of things, but it can’t compete with devices like the Microsoft Surface Pro 2017, which lasted over 8 hours in that same test. The Toshiba Portege Z20t, with its massive 72 Wh battery, manages a ridiculous 13 hours here, though that’s arguably a bit overkill as diminishing returns quickly set in at values above around 8 hours for the average user.
| Dell Latitude 5290 2-in-1 i5-8350U, UHD Graphics 620, 42 Wh | Dell Latitude 12 5285 2-in-1 i7-7600U, HD Graphics 620, 42 Wh | Microsoft Surface Pro (2017) i7 i7-7660U, Iris Plus Graphics 640, 45 Wh | HP Elite x2 1012 G2-1LV76EA i5-7200U, HD Graphics 620, 47 Wh | Lenovo ThinkPad X1 Tablet Gen 2 i5-7Y54, HD Graphics 615, 37 Wh | Toshiba Portege Z20t-C-121 6Y75, HD Graphics 515, 72 Wh | |
|---|---|---|---|---|---|---|
| Battery runtime | 46% | 50% | 45% | 53% | 168% | |
| WiFi v1.3 (h) | 5 | 8.1 62% | 8.2 64% | 6.3 26% | 7.4 48% | 13.4 168% |
| Load (h) | 1.4 | 1.8 29% | 1.9 36% | 2.3 64% | 2.2 57% | |
| Witcher 3 ultra (h) | 1.9 |
Pros
Cons
Verdict
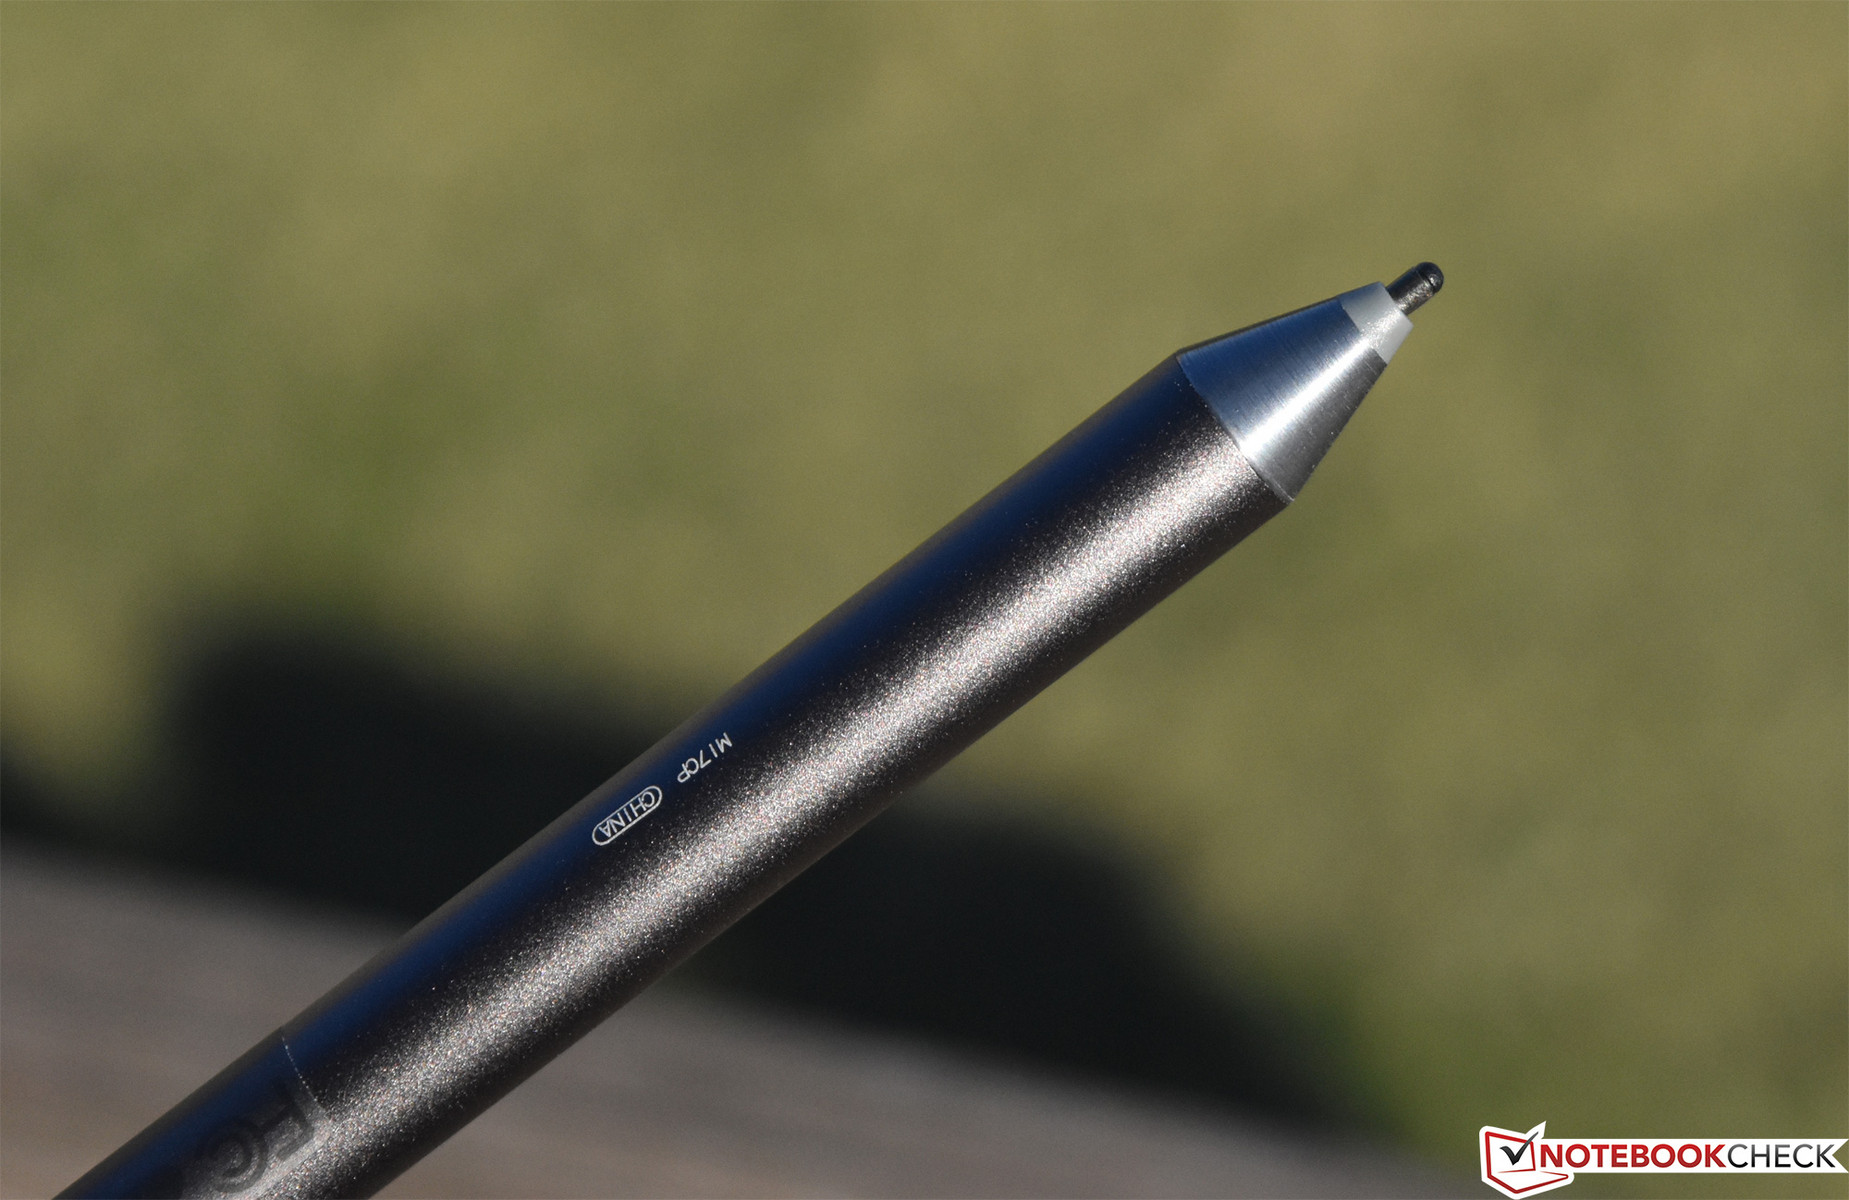
In many ways, the Latitude 5290 2-in-1 is the Surface Pro for the business world. Everything from its understated appearance, relatively convenient maintenance, robust security options, quiet operation, and above-average port selection fits in perfectly with everyday office requirements. Beyond all of that, we still reap the benefits of an extremely sturdy magnesium alloy construction, an uncommonly bright and vivid display, very fast CPU performance, and good keyboard/touchpad (on the separately-sold yet crucial $150 Travel Keyboard accessory). Finally, the optional Dell Active Pen ($60) satisfies the demands of a unique subset of users who require precise Wacom pressure-sensitive active stylus input.
In many ways, the Latitude 5290 2-in-1 is the Surface Pro for the business world; its careful combination of consumer-grade luxury and business-grade sensibility adds up to a unique convertible that meets a very specific set of requirements.
But there are no perfect devices, and the Latitude 5290 does come with its share of notable compromises. Chief among these is battery life, where the Latitude falls sharply behind some recent competitors using Kaby Lake chipset SoCs. It’s also encumbered by high operating temperatures (both surface and internal) under load, though the heat has been redistributed somewhat away from the edges of the device (where the hands would typically rest). The standard warranty is disappointingly short for a device with such a significant price tag. The lack of Thunderbolt will probably irk some users who desire versatile docking solutions. And finally, coming back to the significant price tag we mentioned a moment ago: it’s expensive, at $1,932 for today’s configuration (which, to be fair, does at least include the Travel Keyboard cover and Active Pen).
The top competitors remain last year’s Latitude 5285 (which at least manages far better battery life than the 5290), the Microsoft Surface Pro 2017 (which is very good overall but impossible to upgrade and maintain from a hardware perspective), the HP Elite x2 1012 G2 (which is a very well-rounded device but notably harder to service), and the Lenovo ThinkPad X1 Tablet Gen 2 (which is a good contender but hobbled by the constraints of passive cooling and other annoyances such as PWM). All of these devices feature their own unique sets of strengths and weaknesses, so before deciding on a business convertible, we strongly suggest taking a look at all of them. However, provided that 2-in-1 detachable functionality (and perhaps pressure-sensitive pen input) is an absolute must, there are few devices that manage as strong an overall performance as the Latitude 5290.
Dell Latitude 5290 2-in-1
- 03/30/2018 v6 (old)
Steve Schardein
Price comparison
