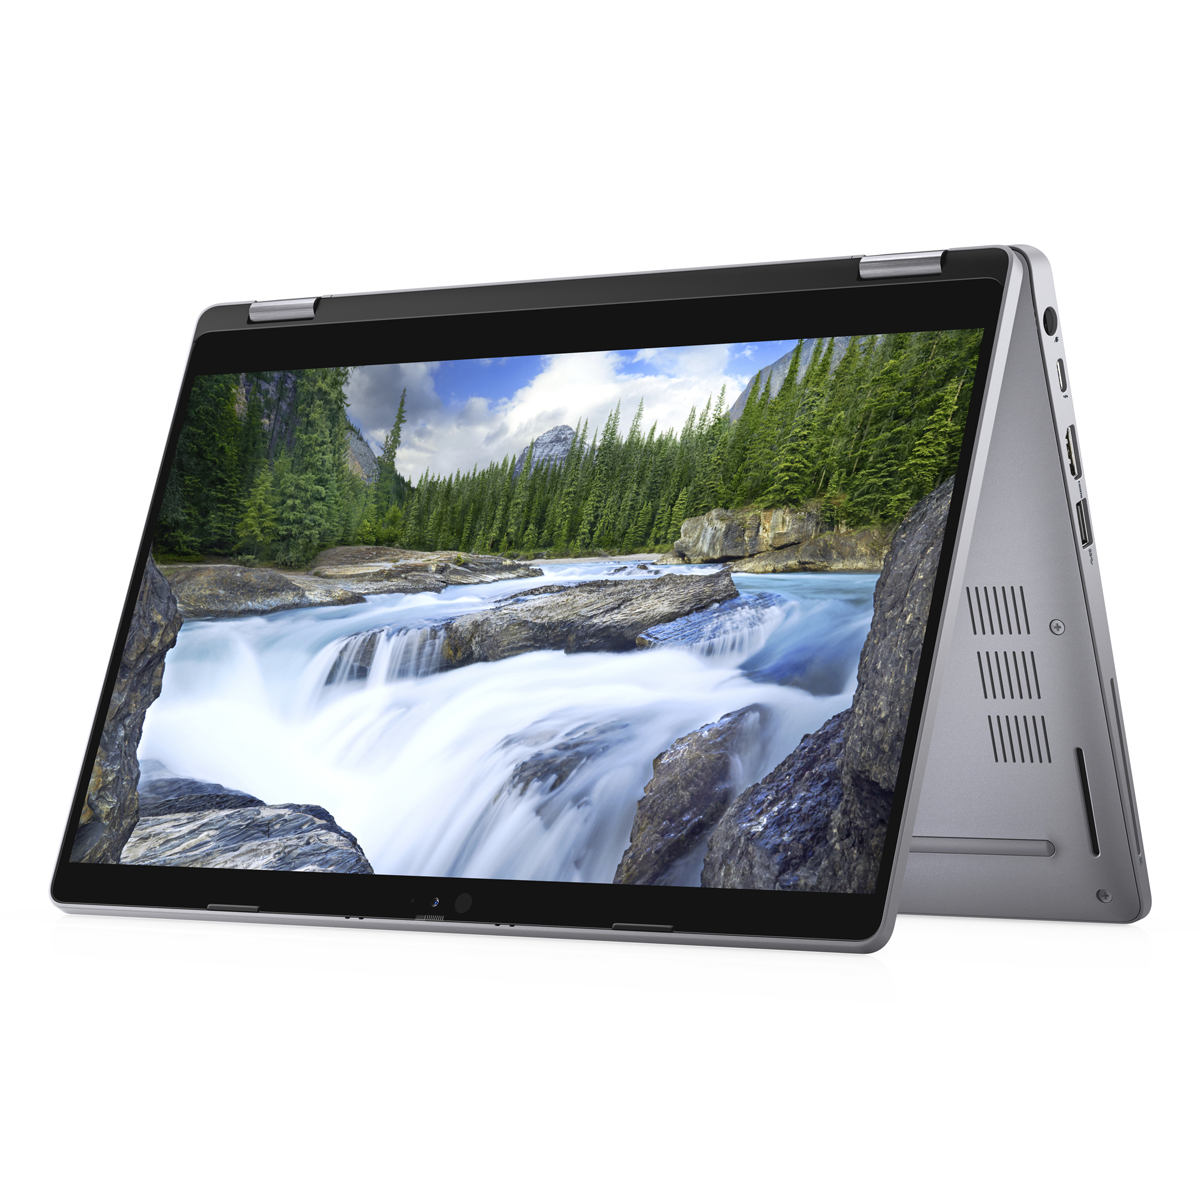
Dell Latitude 5310 2-in-1 convertible in review: 11-hour long-distance runner
Dell's Latitude 5000 series is the solid mid-range between the 7000 high end and the 3000 entry level. Nonetheless, the test device is not cheap as a result. It seamlessly joins the upper class of the HP Spectre, the Lenovo Thinkpad X1, and the Samsung Galaxy Book in terms of price.
What does the Latitude 5310 2-in-1 have to offer? Quite a bit and almost no drawbacks as our review will reveal.
Possible competitors compared
Rating | Date | Model | Weight | Height | Size | Resolution | Price |
|---|---|---|---|---|---|---|---|
| 87.2 % v7 (old) | 12 / 2020 | Dell Latitude 5310-23VP6 i5-10310U, UHD Graphics 620 | 1.3 kg | 19.7 mm | 13.30" | 1920x1080 | |
| 89.4 % v7 (old) | 12 / 2020 | HP Spectre x360 14t-ea000 i7-1165G7, Iris Xe G7 96EUs | 1.3 kg | 17.2 mm | 13.50" | 1920x1280 | |
| 84.4 % v7 (old) | 07 / 2020 | Samsung Galaxy Book Flex 13.3 i5-1035G4, Iris Plus Graphics G4 (Ice Lake 48 EU) | 1.2 kg | 13 mm | 13.30" | 1920x1080 | |
| 89.8 % v7 (old) | 07 / 2020 | Lenovo ThinkPad X1 Yoga 2020-20UCS03S00 i7-10510U, UHD Graphics 620 | 1.3 kg | 15.5 mm | 14.00" | 1920x1080 | |
| 84.3 % v7 (old) | 03 / 2020 | Lenovo Yoga C740-14IML i5-10210U, UHD Graphics 620 | 1.4 kg | 16.9 mm | 14.00" | 1920x1080 |
Case and connectivity: Hardware upgrades are possible
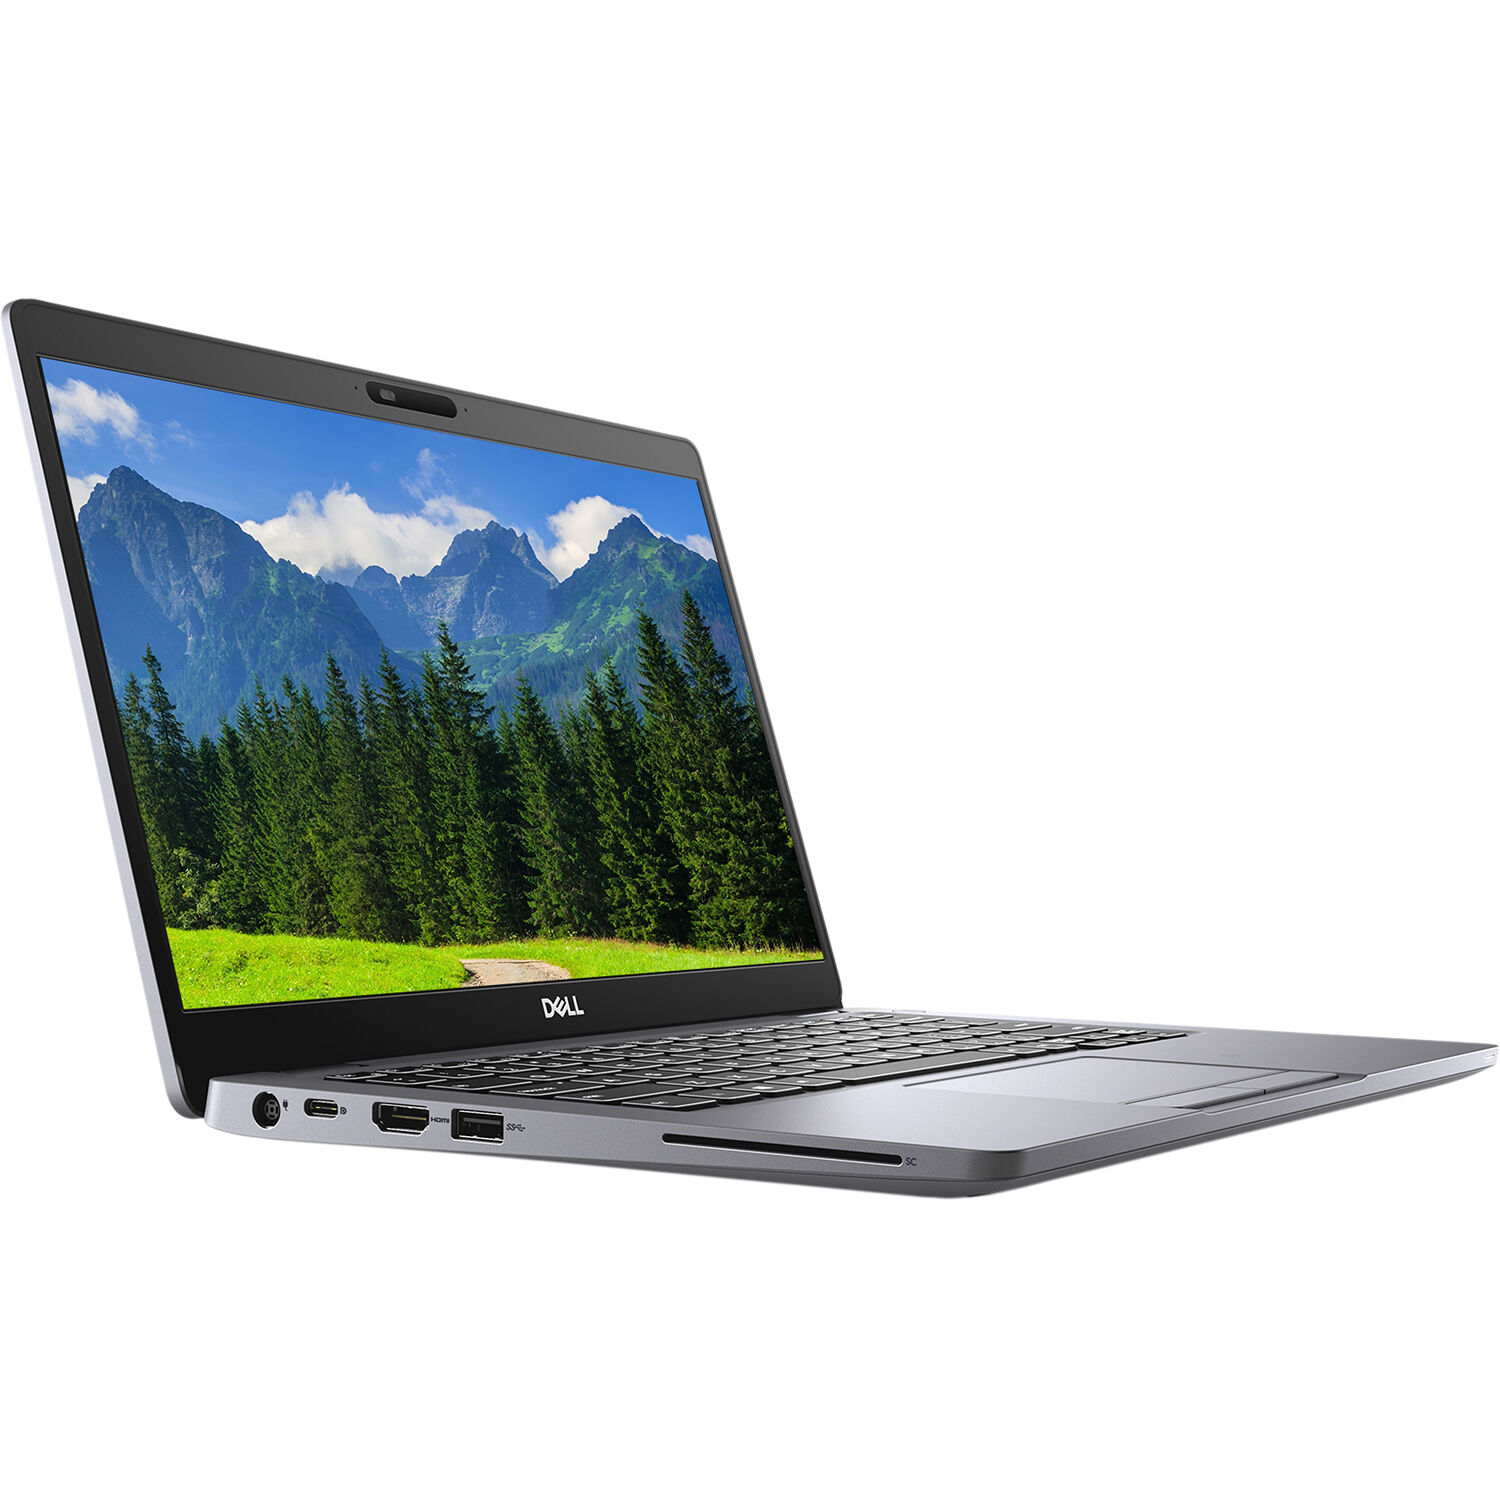
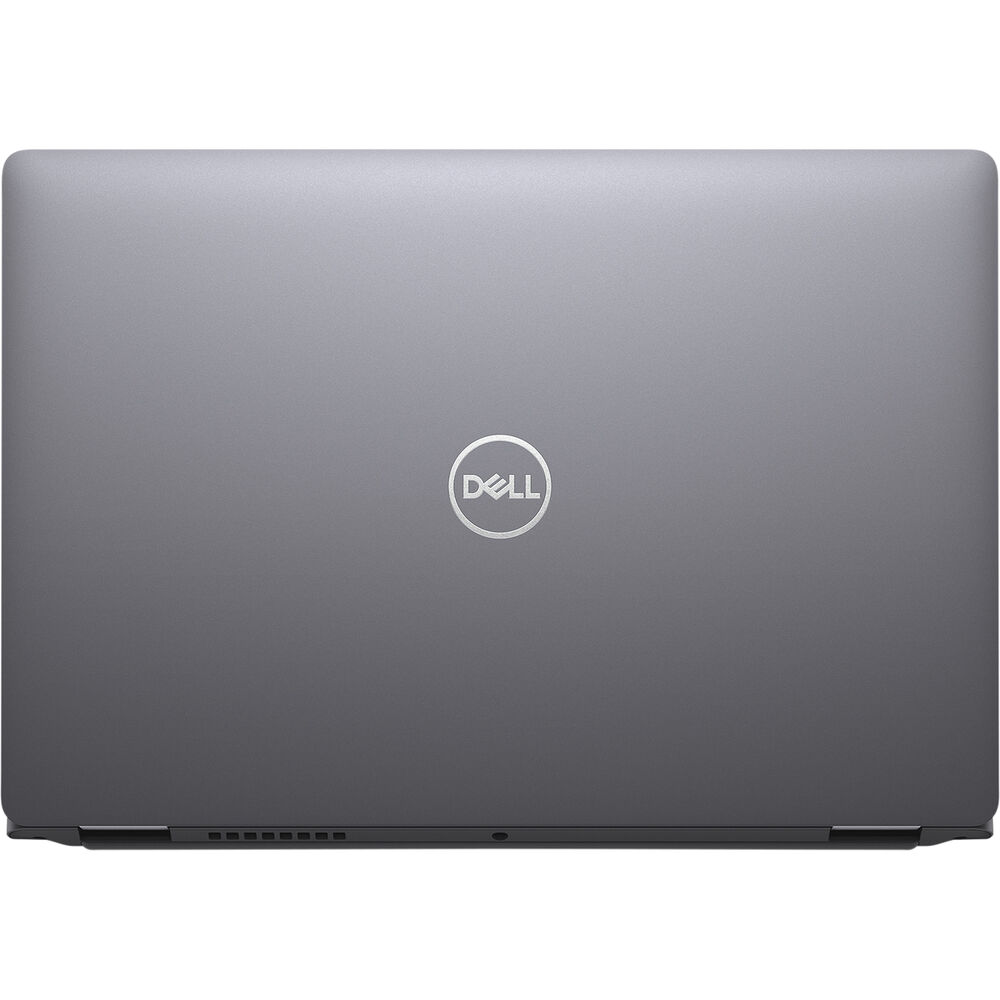
The light magnesium case is very solid, especially the lid and the hinges are uncommonly rigid. The matte, dull finish does not pick up fingerprints and feels grippy in the hand. There's no rubber coating.
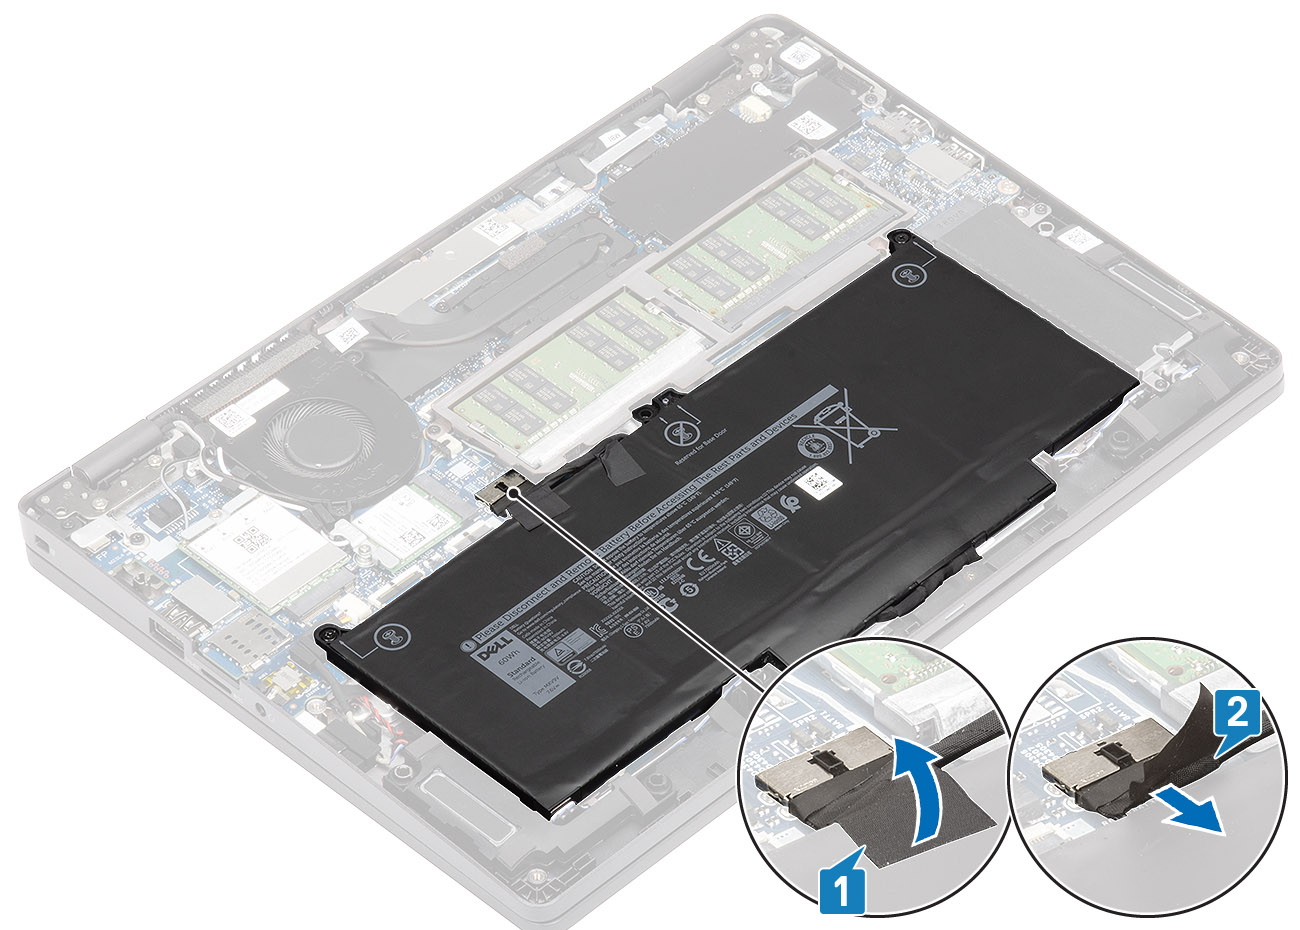
The bottom cover can be easily removed, revealing two RAM slots, the fan, the Wi-Fi module, and the SSD underneath. All of this can be replaced as well as the 60 Wh battery. Dell doesn't use on-board RAM, and one slot is free in our 16 GB test device (single-channel).
The USB Type-C port outputs DisplayPort 1.4 and supports Power Delivery; a corresponding power adapter supplies energy to our test device. Unfortunately, there's only one Type-C port, which is why the simultaneous use of the DisplayPort and the power adapter is not possible.
The card reader supports microSD cards and has very fast read speeds. With the AX201, a modern Wi-Fi 6 chip is on board; its performance is above average in the test but not when receiving.
Dell's standard warranty only covers 12 months, but extensions are available.
| SD Card Reader | |
| average JPG Copy Test (av. of 3 runs) | |
| HP Spectre x360 14t-ea000 (Toshiba Exceria Pro M501 microSDXC 32GB) | |
| Dell Latitude 5310-23VP6 (Toshiba Exceria Pro M501 microSDXC 64GB) | |
| Samsung Galaxy Book Flex 13.3 (Toshiba Exceria Pro M501 microSDXC 64GB) | |
| Average of class Convertible (28.1 - 197, n=23, last 2 years) | |
| maximum AS SSD Seq Read Test (1GB) | |
| HP Spectre x360 14t-ea000 (Toshiba Exceria Pro M501 microSDXC 32GB) | |
| Dell Latitude 5310-23VP6 (Toshiba Exceria Pro M501 microSDXC 64GB) | |
| Average of class Convertible (28.9 - 254, n=22, last 2 years) | |
| Samsung Galaxy Book Flex 13.3 (Toshiba Exceria Pro M501 microSDXC 64GB) | |


, i5-1035G4, Samsung SSD PM981a MZVLB256HBHQ")
, i5-1035G4, Samsung SSD PM981a MZVLB256HBHQ")


Input devices - Stable
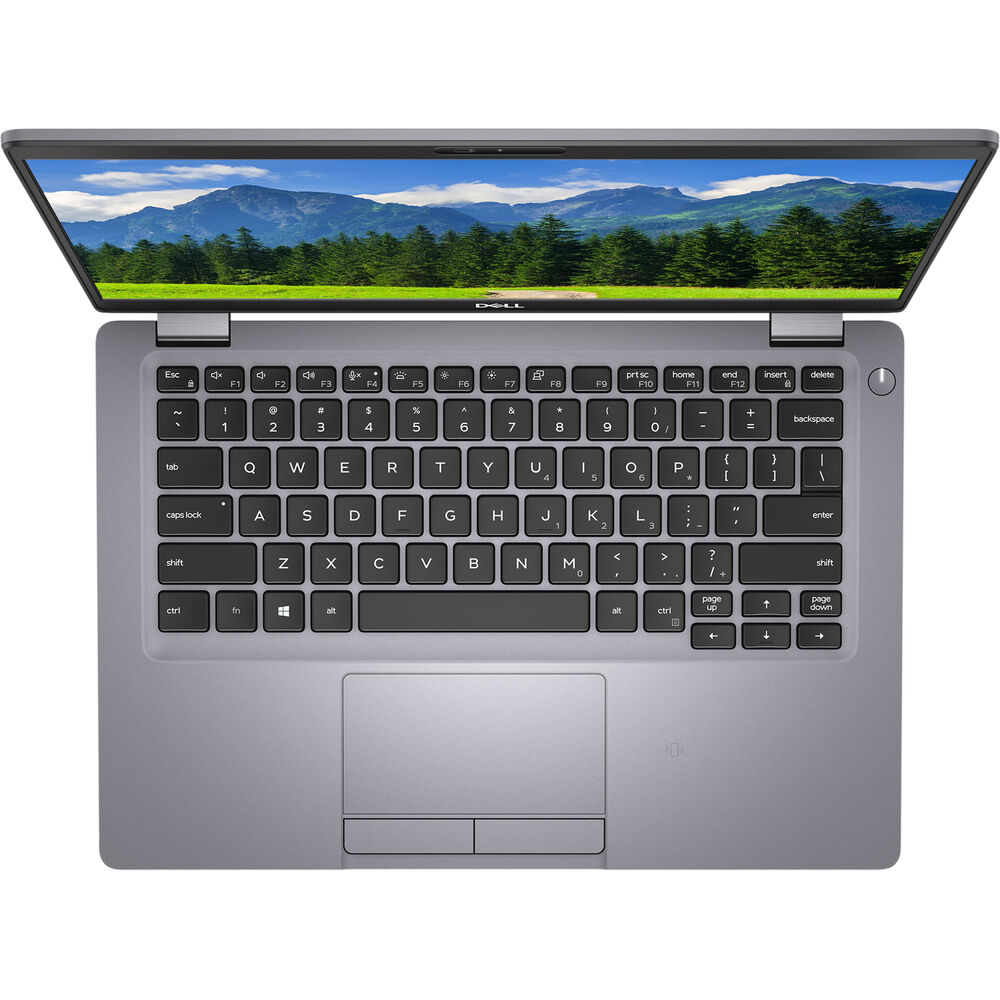
The keys offer a firm stroke, a clear pressure point, and a small conical curvature. This results in a quick and quiet typing experience. The four-millimeter spacing and the separated arrow keys make typing fast, accurate, and easy. Moreover, the keyboard backlighting has two stages.
With its two agile buttons, the ClickPad can be used quickly and unerringly. The buttons have a clear travel, a cushioned stroke, and they are quiet, just like the keyboard keys. As is usual with a Precision touchpad, there are multi-touch and multi-finger gestures.
The touch panel is located under a pane that occupies the entire screen up to the edges. However, the display area is smaller; the screen-to-body ratio is 72%. Fingers glide comfortably on the glass, and actions are implemented without delays.
Display
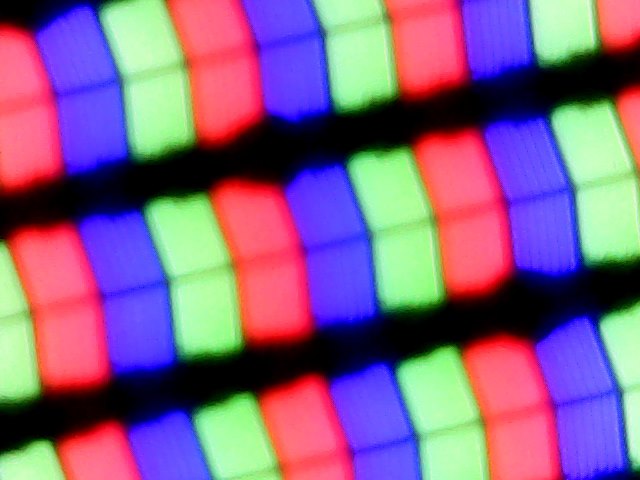
Dell uses an IPS panel from Chi Mei with a resolution of 1920x1080 pixels. The brightness of almost 400 cd/m² is impressive. This makes outdoor use possible as long as there is shade to reduce the reflections of the glossy panel. However, the luminance is limited to 327 cd/m² (center of the display) on battery power.
The competition, unanimously equipped with Full HD displays, can do a better job, at least in terms of brightness. PWM is used to regulate the brightness in this panel; it kicks in at brightness levels of 80% and below. Because the frequency is quite high at 2,500 Hz, the majority of users shouldn't have any complaints about this. Furthermore, with a black background and maximum brightness, you can see screen bleeding at the top and bottom edges of the display. However, this is only noticeable with the naked eye when using a black background.
| |||||||||||||||||||||||||
Brightness Distribution: 84 %
Center on Battery: 327 cd/m²
Contrast: 1126:1 (Black: 0.34 cd/m²)
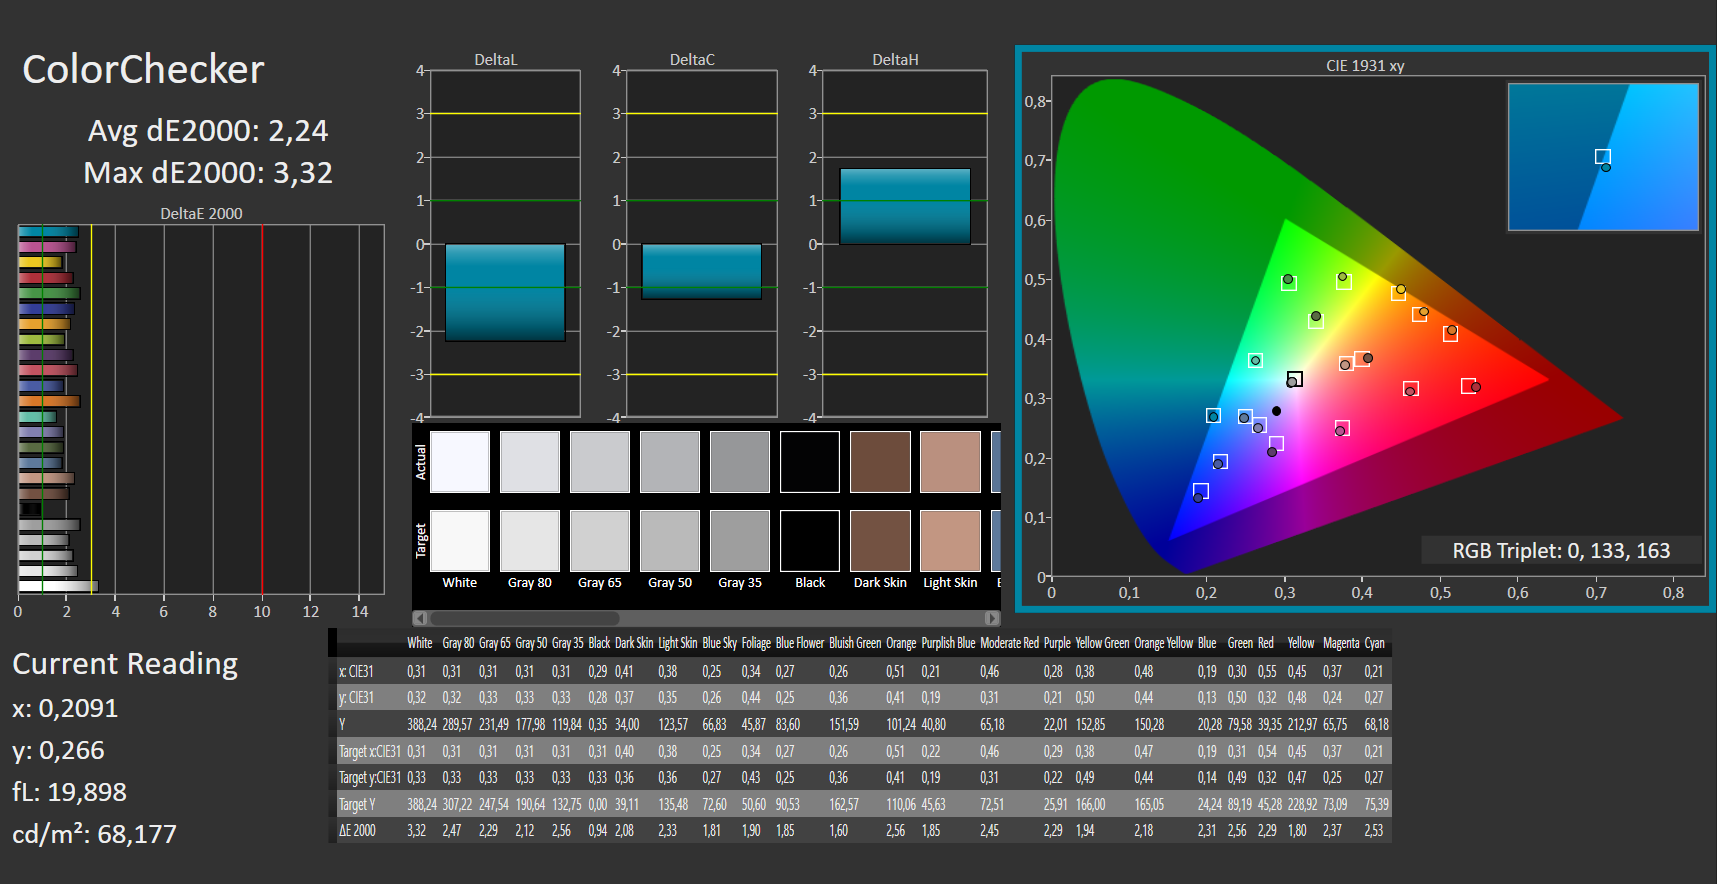
ΔE ColorChecker Calman: 2.24 | ∀{0.5-29.43 Ø4.73}
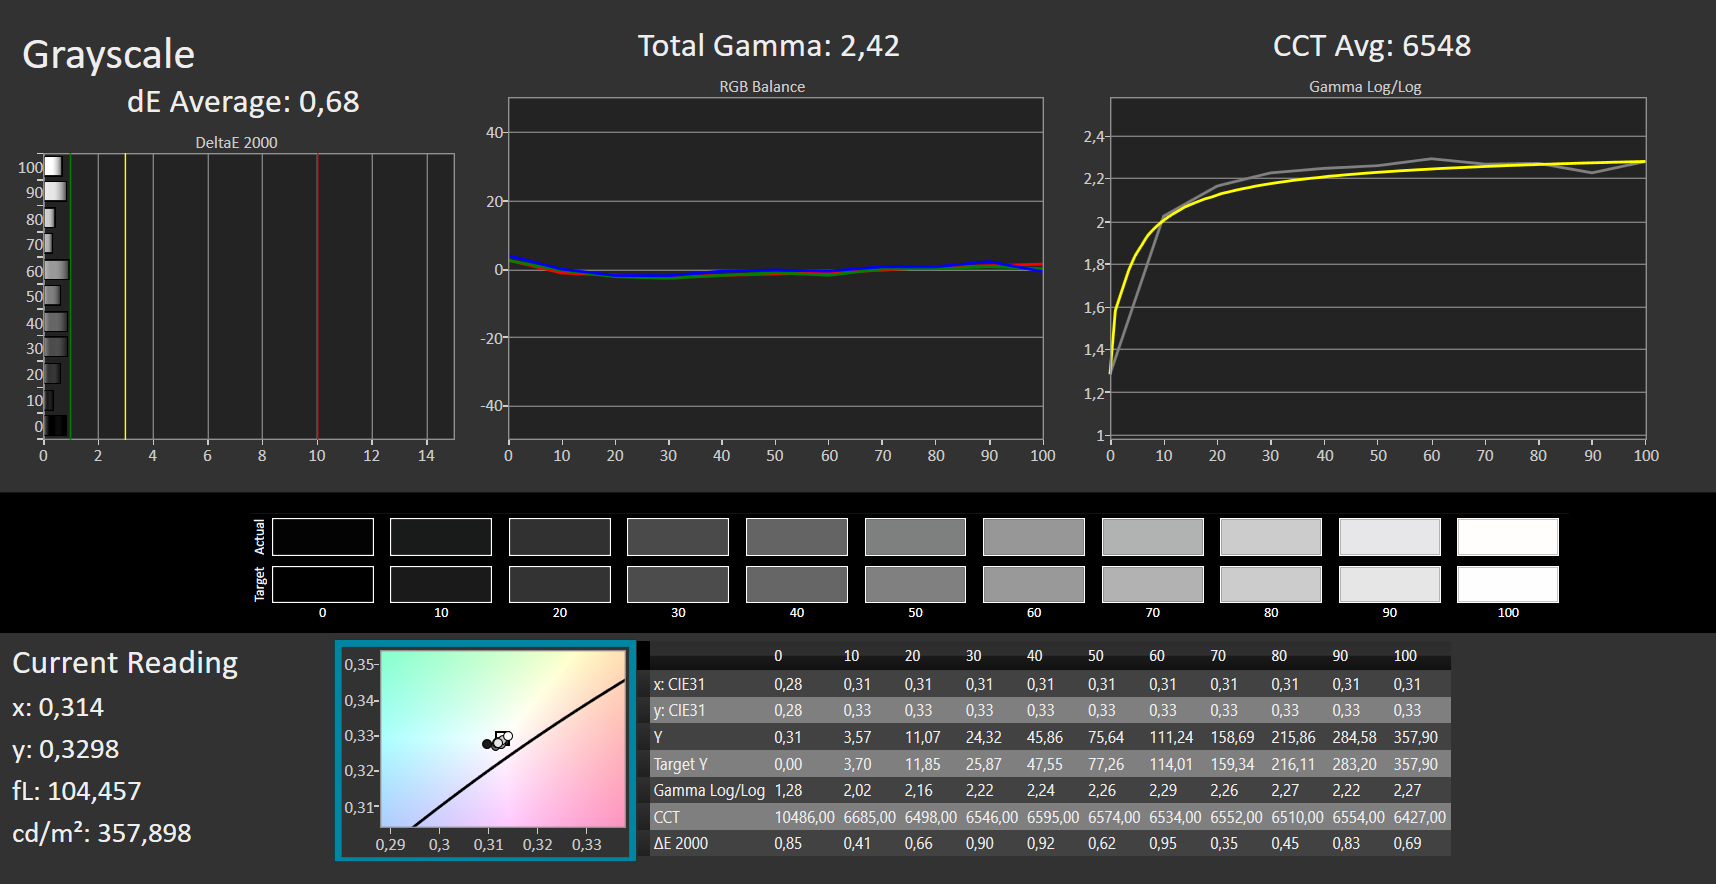
calibrated: 0.72
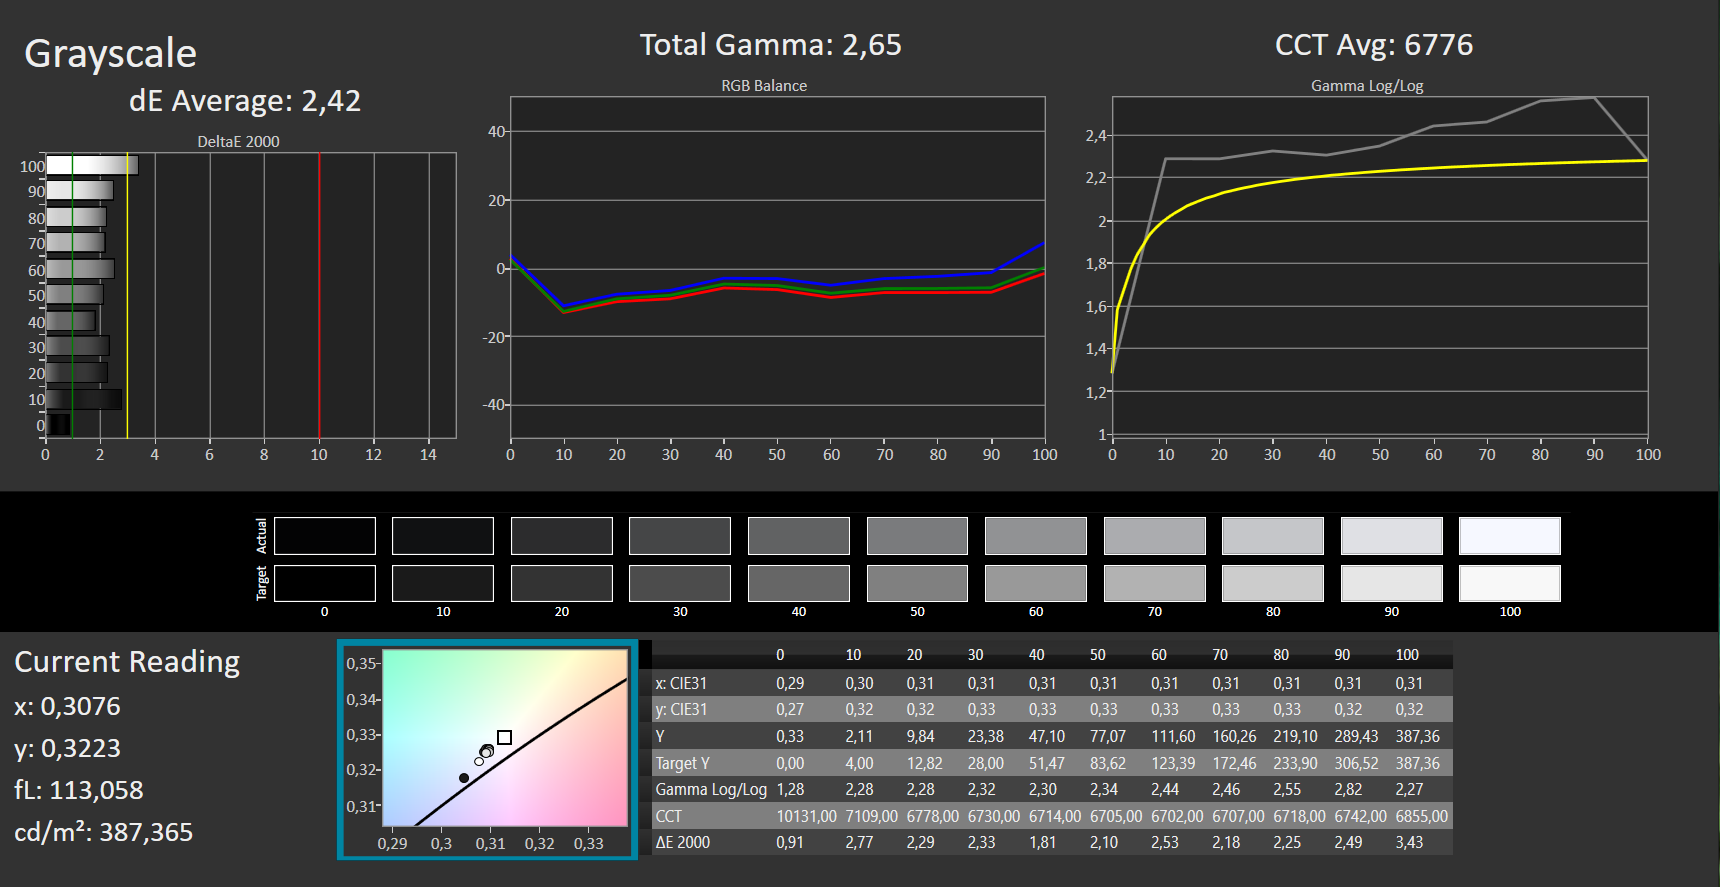
ΔE Greyscale Calman: 2.42 | ∀{0.09-98 Ø4.97}
99% sRGB (Argyll 1.6.3 3D)
56% AdobeRGB 1998 (Argyll 1.6.3 3D)
69.2% AdobeRGB 1998 (Argyll 3D)
99% sRGB (Argyll 3D)
67.5% Display P3 (Argyll 3D)
Gamma: 2.65
CCT: 6776 K
| Dell Latitude 5310-23VP6 Chi Mei CMN1382, IPS, 1920x1080, 13.3" | HP Spectre x360 14t-ea000 LG Philips LGD0663, IPS, 1920x1280, 13.5" | Samsung Galaxy Book Flex 13.3 BOE087A, IPS, 1920x1080, 13.3" | Lenovo ThinkPad X1 Yoga 2020-20UCS03S00 LP140WF9-SPE1, IPS LED, 1920x1080, 14" | Lenovo Yoga C740-14IML CMN N140HCE-ET2, IPS, 1920x1080, 14" | |
|---|---|---|---|---|---|
| Display | -2% | -5% | 0% | ||
| Display P3 Coverage (%) | 67.5 | 65.8 -3% | 64.3 -5% | 67.9 1% | |
| sRGB Coverage (%) | 99 | 98.2 -1% | 95.5 -4% | 98.3 -1% | |
| AdobeRGB 1998 Coverage (%) | 69.2 | 67.9 -2% | 65.6 -5% | 70.1 1% | |
| Response Times | -69% | -18% | -26% | -26% | |
| Response Time Grey 50% / Grey 80% * (ms) | 36 ? | 62 ? -72% | 44 ? -22% | 52 ? -44% | 35.6 ? 1% |
| Response Time Black / White * (ms) | 24 ? | 39.6 ? -65% | 27 ? -13% | 25.6 ? -7% | 36.8 ? -53% |
| PWM Frequency (Hz) | 2500 ? | 27030 ? | |||
| Screen | -13% | -61% | -32% | -38% | |
| Brightness middle (cd/m²) | 383 | 443.5 16% | 473 23% | 409 7% | 329.9 -14% |
| Brightness (cd/m²) | 364 | 394 8% | 434 19% | 405 11% | 315 -13% |
| Brightness Distribution (%) | 84 | 78 -7% | 86 2% | 95 13% | 90 7% |
| Black Level * (cd/m²) | 0.34 | 0.17 50% | 0.39 -15% | 0.21 38% | 0.29 15% |
| Contrast (:1) | 1126 | 2609 132% | 1213 8% | 1948 73% | 1138 1% |
| Colorchecker dE 2000 * | 2.24 | 2.7 -21% | 5.18 -131% | 4.9 -119% | 3.68 -64% |
| Colorchecker dE 2000 max. * | 3.32 | 4.36 -31% | 10.01 -202% | 8.4 -153% | 8.64 -160% |
| Colorchecker dE 2000 calibrated * | 0.72 | 2.61 -263% | 1.3 -81% | 1.03 -43% | |
| Greyscale dE 2000 * | 2.42 | 3.4 -40% | 7.04 -191% | 5.8 -140% | 6.4 -164% |
| Gamma | 2.65 83% | 2.09 105% | 2.35 94% | 2.53 87% | 2.17 101% |
| CCT | 6776 96% | 6144 106% | 6753 96% | 7009 93% | 6195 105% |
| Color Space (Percent of AdobeRGB 1998) (%) | 56 | 62.1 11% | 60.7 8% | 63.6 14% | |
| Color Space (Percent of sRGB) (%) | 99 | 98.5 -1% | 95.3 -4% | 98.4 -1% | |
| Total Average (Program / Settings) | -28% /
-18% | -40% /
-52% | -21% /
-26% | -21% /
-30% |
* ... smaller is better
The contrast of 1,126:1 is not bad in principle, but it lags behind the competition in comparison. At least the colors are accurate out of the box and without calibration. Nevertheless, the effort of performing a calibration with the spectrophotometer is worth it. We were able to reduce the Delta E values of the grayscales and colors from 2.4 to 0.7 and 3.3 to 0.7, respectively.
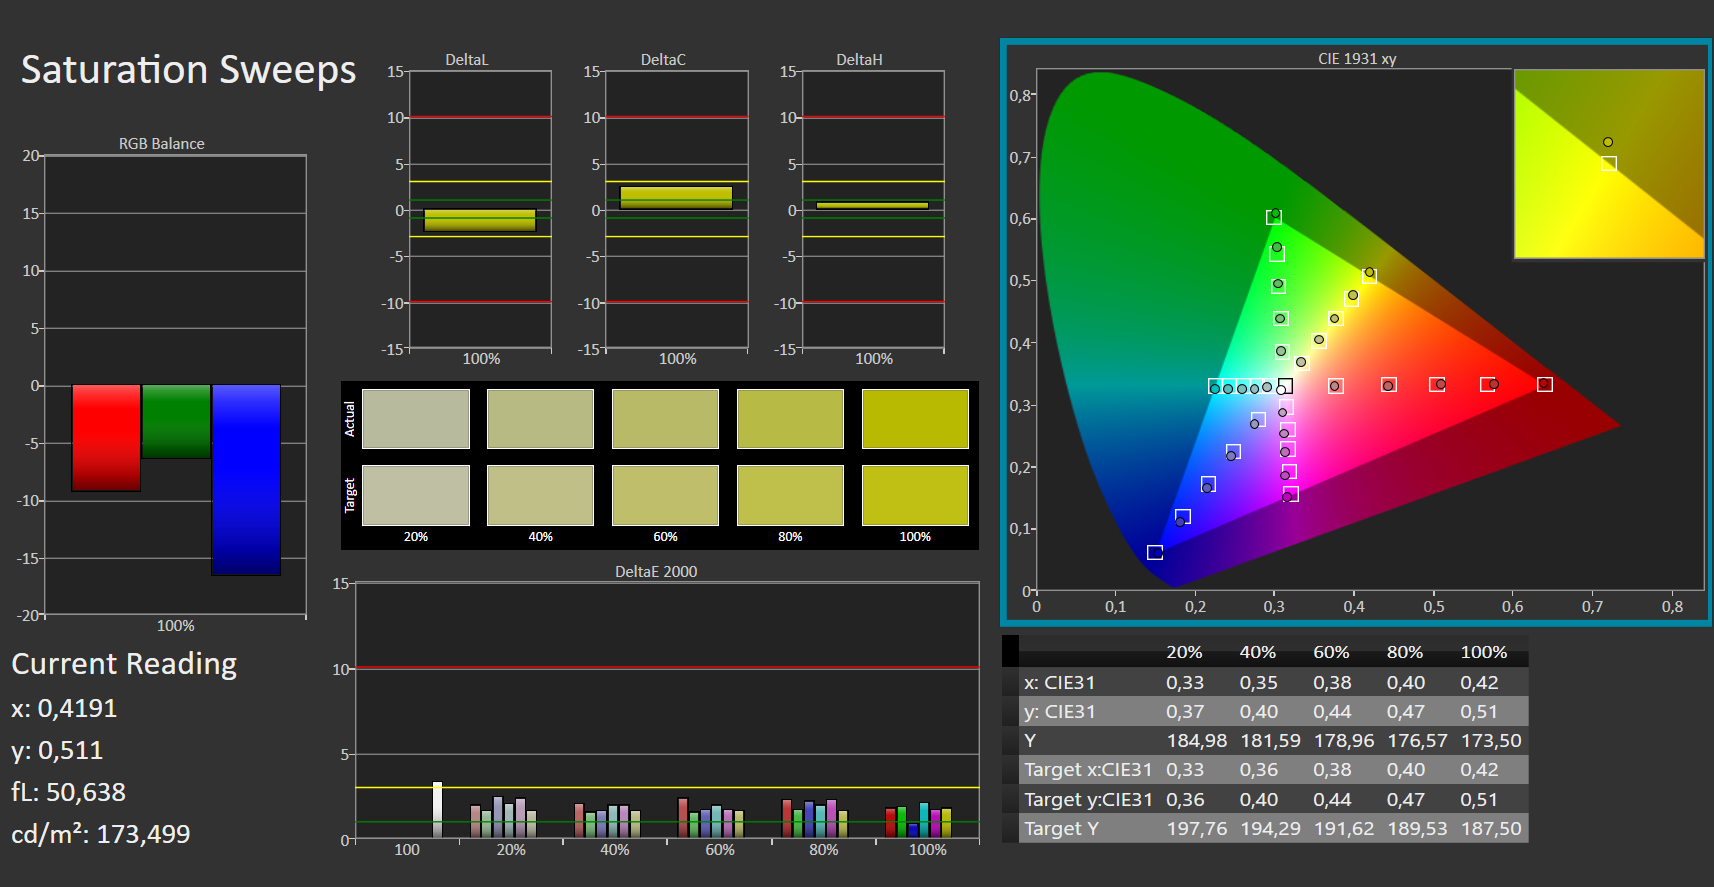
Only 99% of the small sRGB color space is covered, but the competition manages this as well. Therefore, the Latitude is suitable for professional graphic designers and photo editors.


Display Response Times
| ↔ Response Time Black to White | ||
|---|---|---|
| 24 ms ... rise ↗ and fall ↘ combined | ↗ 14 ms rise | 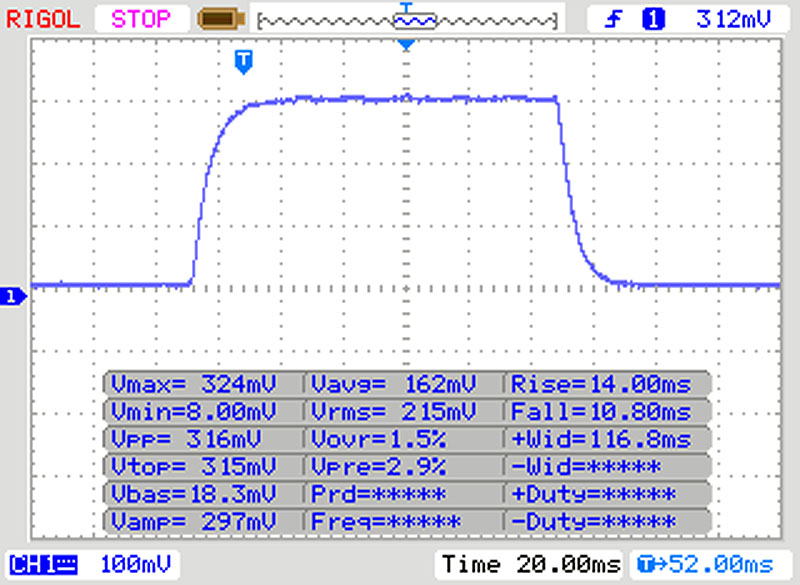 |
| ↘ 10 ms fall | ||
| The screen shows good response rates in our tests, but may be too slow for competitive gamers. In comparison, all tested devices range from 0.1 (minimum) to 240 (maximum) ms. » 54 % of all devices are better. This means that the measured response time is worse than the average of all tested devices (19.9 ms). | ||
| ↔ Response Time 50% Grey to 80% Grey | ||
| 36 ms ... rise ↗ and fall ↘ combined | ↗ 18 ms rise | 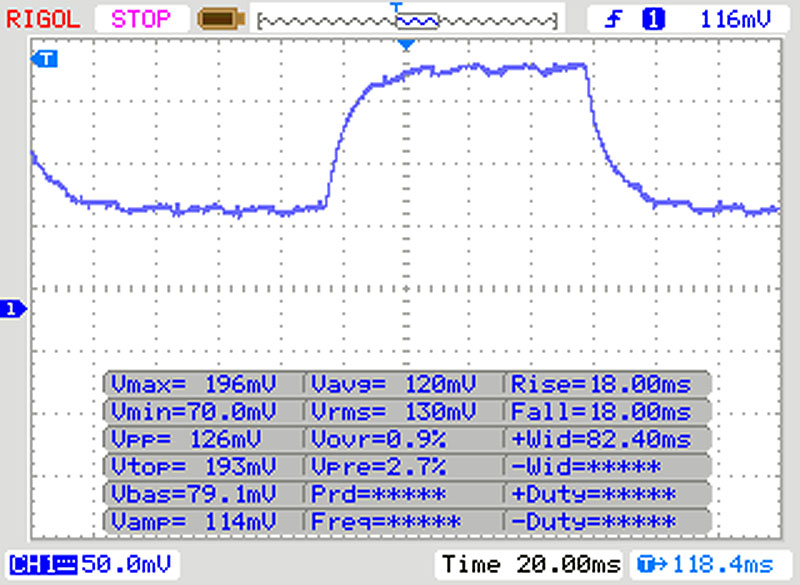 |
| ↘ 18 ms fall | ||
| The screen shows slow response rates in our tests and will be unsatisfactory for gamers. In comparison, all tested devices range from 0.165 (minimum) to 636 (maximum) ms. » 50 % of all devices are better. This means that the measured response time is worse than the average of all tested devices (31.1 ms). | ||
Screen Flickering / PWM (Pulse-Width Modulation)
| Screen flickering / PWM detected | 2500 Hz | ≤ 80 % brightness setting | 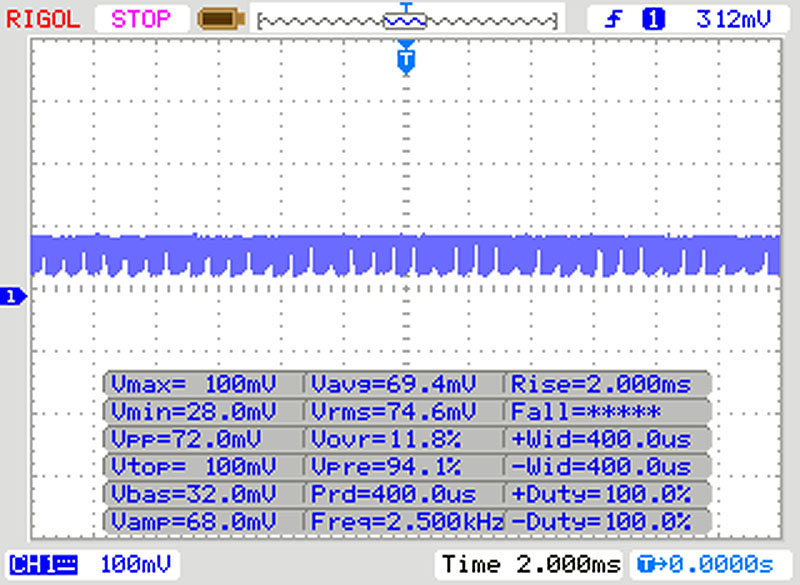 |
The display backlight flickers at 2500 Hz (worst case, e.g., utilizing PWM) Flickering detected at a brightness setting of 80 % and below. There should be no flickering or PWM above this brightness setting. The frequency of 2500 Hz is quite high, so most users sensitive to PWM should not notice any flickering. In comparison: 52 % of all tested devices do not use PWM to dim the display. If PWM was detected, an average of 7794 (minimum: 5 - maximum: 343500) Hz was measured. | |||
Performance
The processor, an Intel Core i5-10310U with four cores (Comet Lake), is a typical all-rounder for small and light laptops that are meant to be enduring but also quiet. The clock rate has a wide range from 1.7 to 1.44 GHz, whereby the latter can only be achieved with a single core.
The processor is supported by 16 GB of RAM in single-channel mode (one module) and a 512 GB SSD from SK hynix.
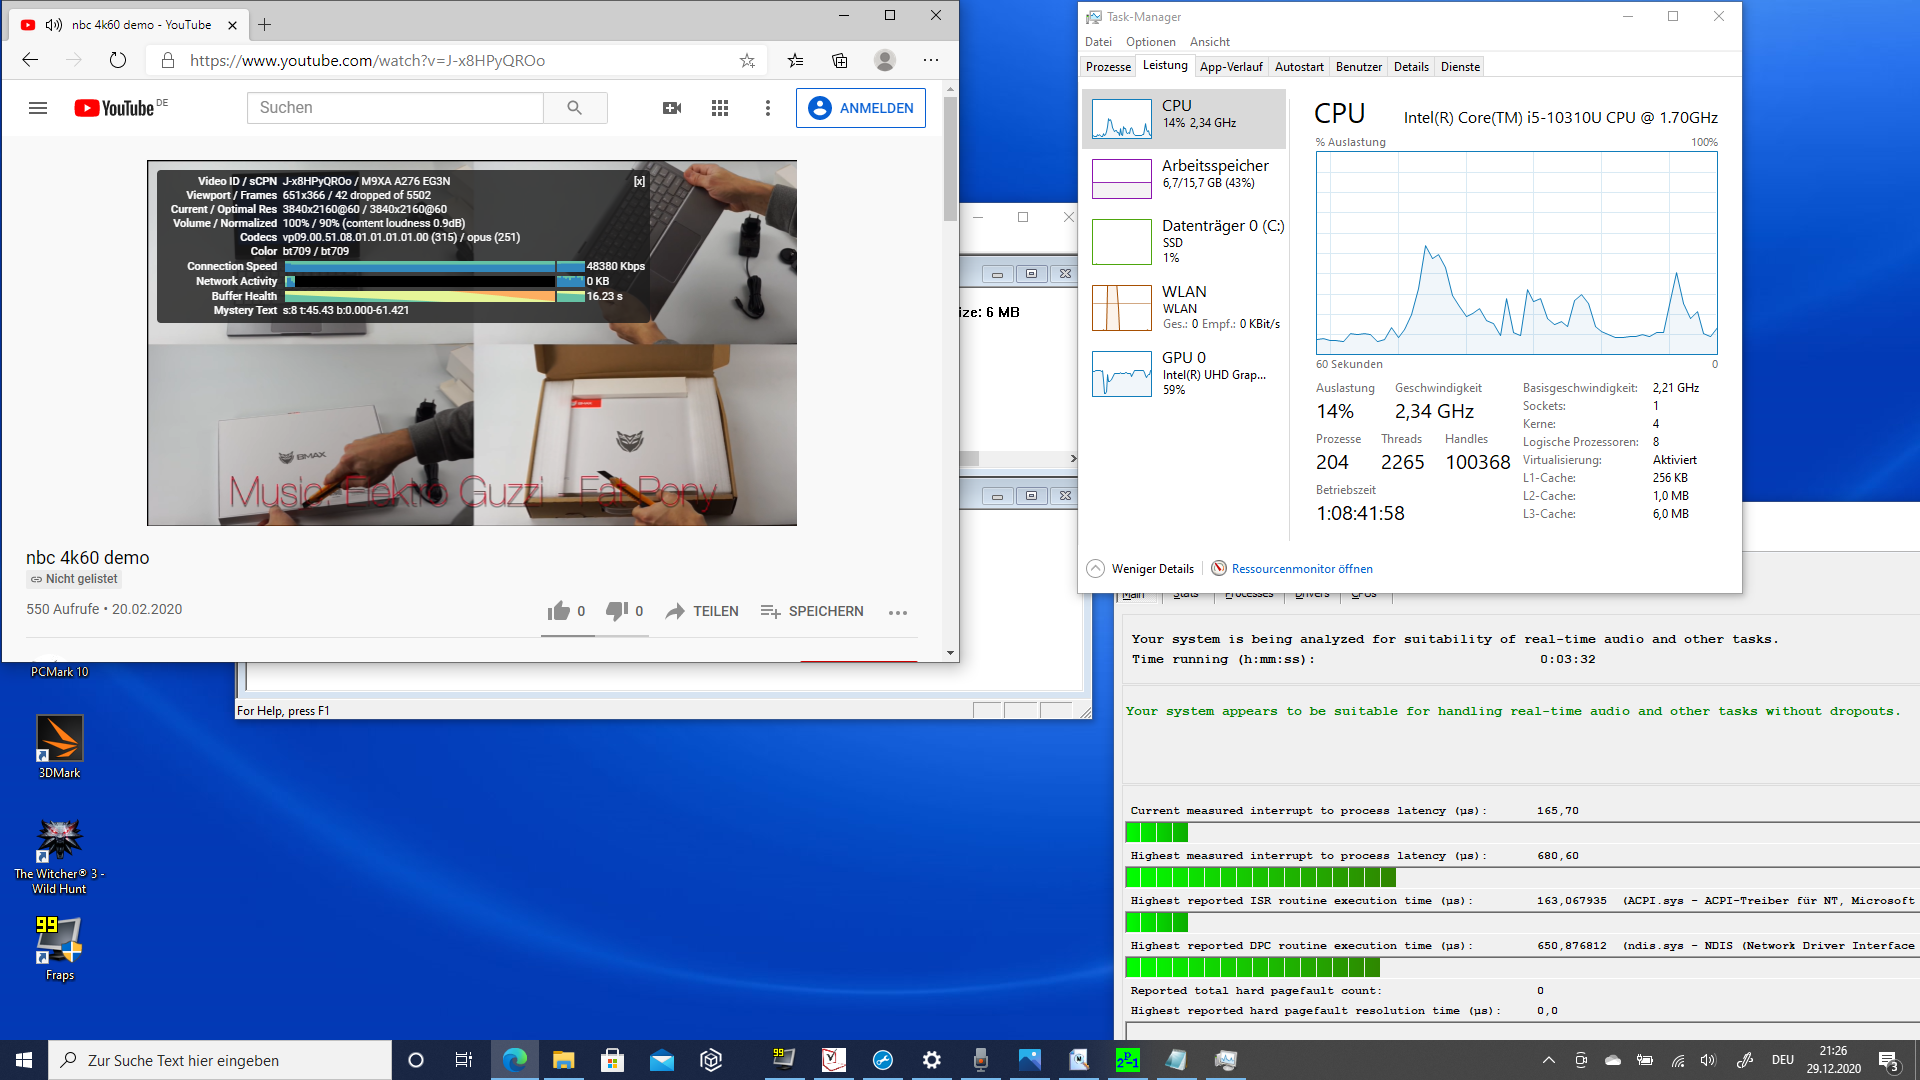
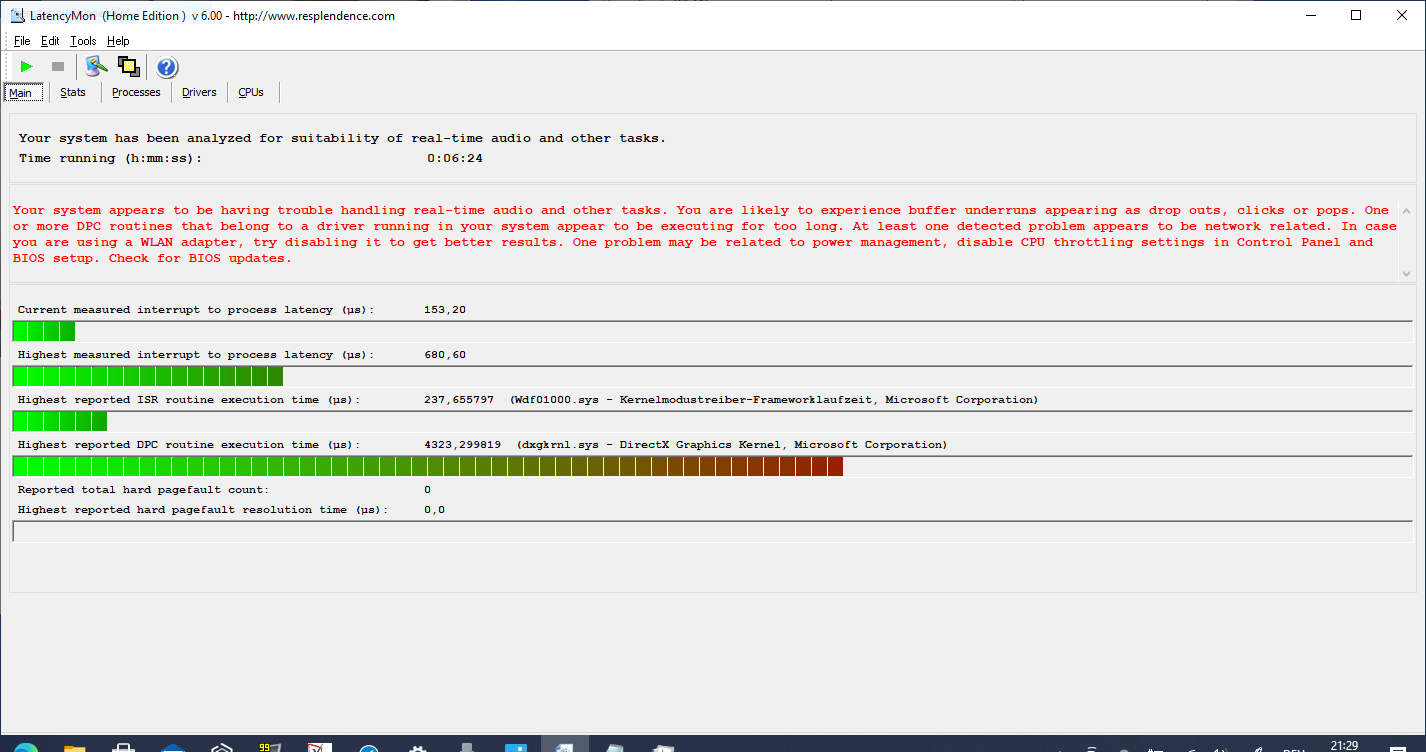
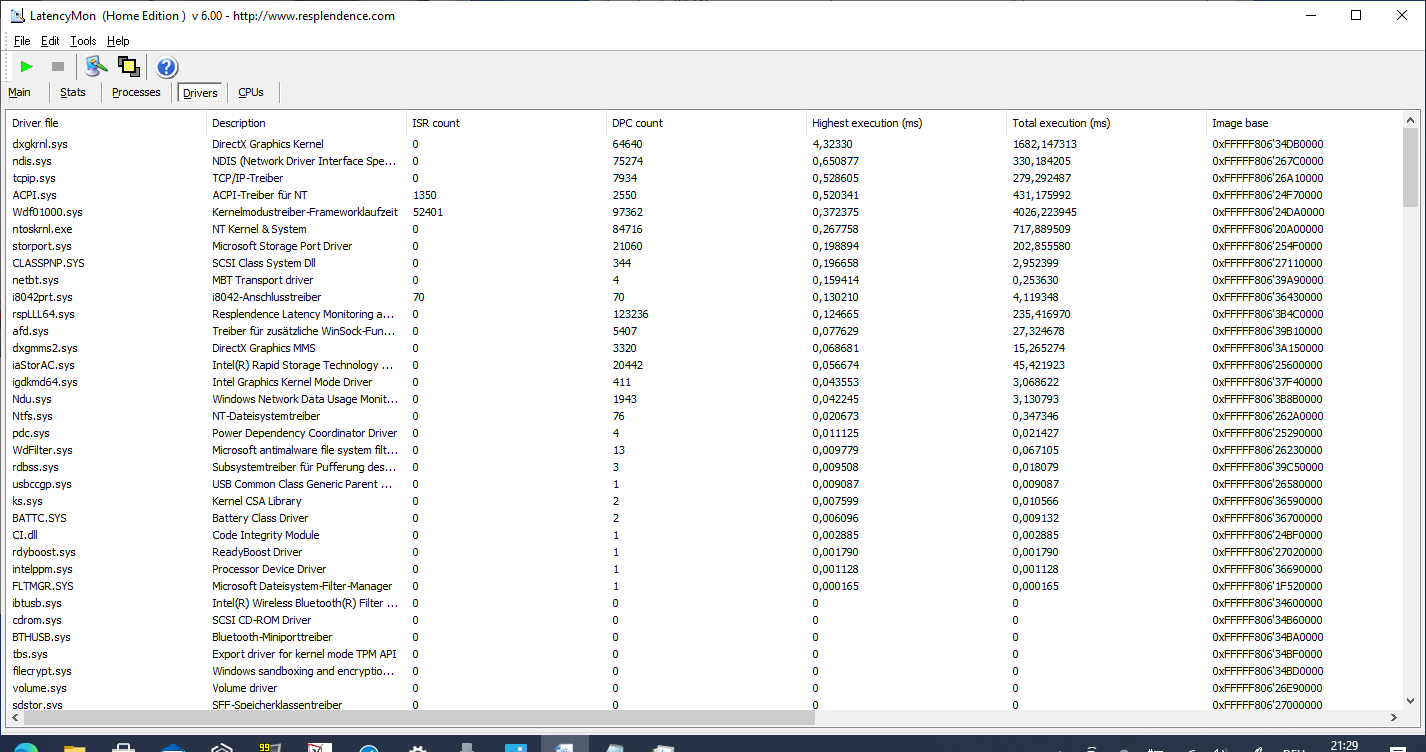
LatencyMon showed us noticeable DPC latencies. Real-time video-editing is not possible based on the available drivers.
Processor
The Core i5-10310U doesn't perform as fast as it could in the Dell laptop. In return, however, it runs consistently, and the score doesn't drop even after 10 passes. The base clock speed is not undercut.
The comparison with other Intel systems using the same or the subsequent higher CPU generation (Tiger Lake) shows that the Latitude is moderately powerful. The chip can't fully exploit its performance in the 5310, probably in favor of a cool surface and a low noise level.
Cinebench R15: CPU Single 64Bit | CPU Multi 64Bit
Blender: v2.79 BMW27 CPU
7-Zip 18.03: 7z b 4 -mmt1 | 7z b 4
Geekbench 5.5: Single-Core | Multi-Core
HWBOT x265 Benchmark v2.2: 4k Preset
LibreOffice : 20 Documents To PDF
R Benchmark 2.5: Overall mean
| Cinebench R20 / CPU (Single Core) | |
| Average of class Convertible (273 - 834, n=50, last 2 years) | |
| HP Spectre x360 14t-ea000 | |
| Average Intel Core i5-10310U (411 - 438, n=5) | |
| Lenovo ThinkPad X1 Yoga 2020-20UCS03S00 | |
| Lenovo Yoga C740-14IML | |
| Samsung Galaxy Book Flex 13.3 | |
| Dell Latitude 5310-23VP6 | |
| Cinebench R20 / CPU (Multi Core) | |
| Average of class Convertible (595 - 12102, n=50, last 2 years) | |
| HP Spectre x360 14t-ea000 | |
| Average Intel Core i5-10310U (1192 - 1588, n=5) | |
| Lenovo Yoga C740-14IML | |
| Lenovo ThinkPad X1 Yoga 2020-20UCS03S00 | |
| Samsung Galaxy Book Flex 13.3 | |
| Dell Latitude 5310-23VP6 | |
| Cinebench R15 / CPU Single 64Bit | |
| Average of class Convertible (149.8 - 317, n=49, last 2 years) | |
| HP Spectre x360 14t-ea000 | |
| Lenovo ThinkPad X1 Yoga 2020-20UCS03S00 | |
| Average Intel Core i5-10310U (164 - 173.8, n=5) | |
| Lenovo Yoga C740-14IML | |
| Dell Latitude 5310-23VP6 | |
| Samsung Galaxy Book Flex 13.3 | |
| Cinebench R15 / CPU Multi 64Bit | |
| Average of class Convertible (478 - 4940, n=49, last 2 years) | |
| HP Spectre x360 14t-ea000 | |
| Lenovo ThinkPad X1 Yoga 2020-20UCS03S00 | |
| Lenovo Yoga C740-14IML | |
| Average Intel Core i5-10310U (499 - 767, n=5) | |
| Samsung Galaxy Book Flex 13.3 | |
| Dell Latitude 5310-23VP6 | |
| Blender / v2.79 BMW27 CPU | |
| Samsung Galaxy Book Flex 13.3 | |
| Dell Latitude 5310-23VP6 | |
| Average Intel Core i5-10310U (683 - 896, n=5) | |
| Lenovo ThinkPad X1 Yoga 2020-20UCS03S00 | |
| HP Spectre x360 14t-ea000 | |
| Average of class Convertible (105 - 1051, n=49, last 2 years) | |
| 7-Zip 18.03 / 7z b 4 -mmt1 | |
| Average of class Convertible (3672 - 6655, n=49, last 2 years) | |
| HP Spectre x360 14t-ea000 | |
| Lenovo ThinkPad X1 Yoga 2020-20UCS03S00 | |
| Dell Latitude 5310-23VP6 | |
| Samsung Galaxy Book Flex 13.3 | |
| Average Intel Core i5-10310U (3615 - 4398, n=5) | |
| 7-Zip 18.03 / 7z b 4 | |
| Average of class Convertible (12977 - 121368, n=49, last 2 years) | |
| HP Spectre x360 14t-ea000 | |
| Lenovo ThinkPad X1 Yoga 2020-20UCS03S00 | |
| Average Intel Core i5-10310U (15976 - 19935, n=5) | |
| Dell Latitude 5310-23VP6 | |
| Samsung Galaxy Book Flex 13.3 | |
| Geekbench 5.5 / Single-Core | |
| Average of class Convertible (806 - 2275, n=49, last 2 years) | |
| HP Spectre x360 14t-ea000 | |
| Samsung Galaxy Book Flex 13.3 | |
| Lenovo ThinkPad X1 Yoga 2020-20UCS03S00 | |
| Dell Latitude 5310-23VP6 | |
| Average Intel Core i5-10310U (1040 - 1128, n=6) | |
| Geekbench 5.5 / Multi-Core | |
| Average of class Convertible (1608 - 22023, n=49, last 2 years) | |
| HP Spectre x360 14t-ea000 | |
| Samsung Galaxy Book Flex 13.3 | |
| Lenovo ThinkPad X1 Yoga 2020-20UCS03S00 | |
| Dell Latitude 5310-23VP6 | |
| Average Intel Core i5-10310U (2821 - 3854, n=6) | |
| HWBOT x265 Benchmark v2.2 / 4k Preset | |
| Average of class Convertible (3.43 - 36.2, n=49, last 2 years) | |
| HP Spectre x360 14t-ea000 | |
| Average Intel Core i5-10310U (3.88 - 5.35, n=5) | |
| Dell Latitude 5310-23VP6 | |
| Lenovo ThinkPad X1 Yoga 2020-20UCS03S00 | |
| Samsung Galaxy Book Flex 13.3 | |
| LibreOffice / 20 Documents To PDF | |
| Average Intel Core i5-10310U (60 - 71.4, n=5) | |
| Dell Latitude 5310-23VP6 | |
| Samsung Galaxy Book Flex 13.3 | |
| Lenovo ThinkPad X1 Yoga 2020-20UCS03S00 | |
| Average of class Convertible (42.5 - 84.3, n=49, last 2 years) | |
| HP Spectre x360 14t-ea000 | |
| R Benchmark 2.5 / Overall mean | |
| Samsung Galaxy Book Flex 13.3 | |
| Average Intel Core i5-10310U (0.703 - 0.806, n=5) | |
| Lenovo ThinkPad X1 Yoga 2020-20UCS03S00 | |
| Dell Latitude 5310-23VP6 | |
| HP Spectre x360 14t-ea000 | |
| Average of class Convertible (0.3915 - 0.84, n=49, last 2 years) | |
* ... smaller is better
System performance
The system performance follows the assessment of the processor: No top scores are achieved here; the competition is usually faster.
| PCMark 10 Score | 3982 points | |
Help | ||
| DPC Latencies / LatencyMon - interrupt to process latency (max), Web, Youtube, Prime95 | |
| HP Spectre x360 14t-ea000 | |
| Samsung Galaxy Book Flex 13.3 | |
| Dell Latitude 5310-23VP6 | |
| Lenovo ThinkPad X1 Yoga 2020-20UCS03S00 | |
* ... smaller is better
Storage
The SK hynix is inferior to the Samsung SSDs of the competition in all disciplines. This does not have an impact on the system's smooth operation, but our benchmarks show slowness in a variety of areas such as sequential reading.
| Dell Latitude 5310-23VP6 SK hynix BC511 HFM512GDHTNI-87A0B | HP Spectre x360 14t-ea000 Samsung SSD PM981a MZVLB512HBJQ | Samsung Galaxy Book Flex 13.3 Samsung SSD PM981a MZVLB256HBHQ | Lenovo ThinkPad X1 Yoga 2020-20UCS03S00 Samsung SSD PM981a MZVLB512HBJQ | Lenovo Yoga C740-14IML Samsung SSD PM981a MZVLB256HBHQ | Average SK hynix BC511 HFM512GDHTNI-87A0B | |
|---|---|---|---|---|---|---|
| CrystalDiskMark 5.2 / 6 | 54% | 62% | 56% | 46% | 9% | |
| Write 4K (MB/s) | 119.1 | 82.2 -31% | 157.9 33% | 158.5 33% | 125.6 5% | 135.9 ? 14% |
| Read 4K (MB/s) | 43.41 | 45.7 5% | 48.37 11% | 49.78 15% | 43.46 0% | 45.3 ? 4% |
| Write Seq (MB/s) | 1077 | 2000 86% | 2196 104% | 1534 42% | 2011 87% | 1057 ? -2% |
| Read Seq (MB/s) | 1071 | 2206 106% | 2064 93% | 1464 37% | 2046 91% | 1144 ? 7% |
| Write 4K Q32T1 (MB/s) | 348.5 | 451.2 29% | 457 31% | 435.5 25% | 375.8 8% | 458 ? 31% |
| Read 4K Q32T1 (MB/s) | 349.4 | 351 0% | 514 47% | 554 59% | 338.1 -3% | 425 ? 22% |
| Write Seq Q32T1 (MB/s) | 1055 | 2982 183% | 2354 123% | 2984 183% | 2346 122% | 1040 ? -1% |
| Read Seq Q32T1 (MB/s) | 2292 | 3529 54% | 3557 55% | 3557 55% | 3562 55% | 2274 ? -1% |
| Write 4K Q8T8 (MB/s) | 1444 | |||||
| Read 4K Q8T8 (MB/s) | 1052 | |||||
| AS SSD | 30% | 21% | 71% | -13% | -3% | |
| Seq Read (MB/s) | 1796 | 2188 22% | 2637 47% | 2724 52% | 1719 -4% | 1601 ? -11% |
| Seq Write (MB/s) | 741 | 1320 78% | 2000 170% | 2344 216% | 1211 63% | 879 ? 19% |
| 4K Read (MB/s) | 48.33 | 53.5 11% | 52.7 9% | 56.8 18% | 53.1 10% | 48.7 ? 1% |
| 4K Write (MB/s) | 123.3 | 123.7 0% | 148.4 20% | 148.3 20% | 131.4 7% | 114.9 ? -7% |
| 4K-64 Read (MB/s) | 731 | 1010 38% | 647 -11% | 1238 69% | 508 -31% | 764 ? 5% |
| 4K-64 Write (MB/s) | 754 | 1808 140% | 865 15% | 1638 117% | 883 17% | 754 ? 0% |
| Access Time Read * (ms) | 0.04 | 0.055 -38% | 0.072 -80% | 0.035 12% | 0.05 -25% | 0.0535 ? -34% |
| Access Time Write * (ms) | 0.031 | 0.076 -145% | 0.026 16% | 0.025 19% | 0.085 -174% | 0.034 ? -10% |
| Score Read (Points) | 959 | 1282 34% | 963 0% | 1567 63% | 733 -24% | 973 ? 1% |
| Score Write (Points) | 952 | 2063 117% | 1214 28% | 2021 112% | 1135 19% | 957 ? 1% |
| Score Total (Points) | 2362 | 3970 68% | 2653 12% | 4381 85% | 2235 -5% | 2405 ? 2% |
| Copy ISO MB/s (MB/s) | 1644 | 2191 | 1636 | 653 ? | ||
| Copy Program MB/s (MB/s) | 920 | 570 | 698 | 326 ? | ||
| Copy Game MB/s (MB/s) | 1725 | 1131 | 1246 | 544 ? | ||
| Total Average (Program / Settings) | 42% /
40% | 42% /
38% | 64% /
65% | 17% /
11% | 3% /
2% |
* ... smaller is better

Continuous load read: DiskSpd Read Loop, Queue Depth 8
Graphics card
The integrated UHD Graphics 620 is Intel's own graphics processor for the simplest hardware support. In this way, the iGPU helps to decode videos like when watching HD or 4K material on YouTube, for example.
The UHD 620 isn't really intended for gaming, unless it's games from the Microsoft Store. The red areas of our small gaming round show that there's not much to get even with older titles. Due to the single-channel memory, the UHD 620 performs a bit worse than usual.
| 3DMark Fire Strike Score | 1079 points | |
Help | ||
| The Witcher 3 | |
| 1024x768 Low Graphics & Postprocessing | |
| Average of class Convertible (22 - 141.5, n=6, last 2 years) | |
| HP Spectre x360 14t-ea000 | |
| Samsung Galaxy Book Flex 13.3 | |
| Average Intel UHD Graphics 620 (8.8 - 50.9, n=64) | |
| Dell Latitude 5310-23VP6 | |
| 1366x768 Medium Graphics & Postprocessing | |
| Average of class Convertible (39 - 81.2, n=5, last 2 years) | |
| HP Spectre x360 14t-ea000 | |
| Samsung Galaxy Book Flex 13.3 | |
| Average Intel UHD Graphics 620 (8 - 27.9, n=29) | |
| Dell Latitude 5310-23VP6 | |
| Strange Brigade | |
| 1280x720 lowest AF:1 | |
| Average of class Convertible (27.6 - 484, n=48, last 2 years) | |
| Average Intel UHD Graphics 620 (17 - 31, n=5) | |
| Dell Latitude 5310-23VP6 | |
| 1920x1080 medium AA:medium AF:4 | |
| Average of class Convertible (14.9 - 224, n=46, last 2 years) | |
| Average Intel UHD Graphics 620 (7 - 12.5, n=5) | |
| Dell Latitude 5310-23VP6 | |
| low | med. | high | ultra | |
|---|---|---|---|---|
| GTA IV - Grand Theft Auto (2008) | 31 | 27 | 6 | |
| The Witcher 3 (2015) | 15.7 | 10.6 | ||
| Dota 2 Reborn (2015) | 71 | 37.6 | 18.4 | 16.8 |
| X-Plane 11.11 (2018) | 8.7 | 7.9 | 7.94 | |
| Strange Brigade (2018) | 18 | 10 |
Emissions: Latitude quiet as a whisper
Noise emissions
The Latitude has a fan? You might certainly find yourself asking this question when using the laptop in the office for web browsing and Word documents, because the small fan hardly ever kicks in. The chances of having a whisper-quiet operation are very good with the 5530. However, we did hear it during continuous load, first at 30 dB(A), then at 36 dB(A) in the stress test.
Noise level
| Idle |
| 24.9 / 24.9 / 24.9 dB(A) |
| Load |
| 30 / 36.3 dB(A) |
 | ||
30 dB silent 40 dB(A) audible 50 dB(A) loud |
||
min: | ||
Temperature
The temperatures rise considerably, up to almost 45 °C (~113 °F) under constant load (at certain points). However, even in this state, the palm rest and the keyboard's center area remain reasonably lukewarm at 25 to 35 °C (~77 to ~95 °F).
(+) The maximum temperature on the upper side is 39 °C / 102 F, compared to the average of 35.4 °C / 96 F, ranging from 19.6 to 60 °C for the class Convertible.
(±) The bottom heats up to a maximum of 44.8 °C / 113 F, compared to the average of 36.9 °C / 98 F
(+) In idle usage, the average temperature for the upper side is 23.2 °C / 74 F, compared to the device average of 30.3 °C / 87 F.
(±) Playing The Witcher 3, the average temperature for the upper side is 33.1 °C / 92 F, compared to the device average of 30.3 °C / 87 F.
(+) The palmrests and touchpad are cooler than skin temperature with a maximum of 29 °C / 84.2 F and are therefore cool to the touch.
(±) The average temperature of the palmrest area of similar devices was 28 °C / 82.4 F (-1 °C / -1.8 F).
Speakers
The small speakers are located on the right and left under the palm rest, and sound bounces off the table top. The sound has balanced mids, but bass is not present in any way.
The good microphone pickup with the dual-array mic next to the webcam is praiseworthy. This is an excellent quality for video conferencing.
Dell Latitude 5310-23VP6 audio analysis
(-) | not very loud speakers (71.1 dB)
Bass 100 - 315 Hz
(±) | reduced bass - on average 14.7% lower than median
(±) | linearity of bass is average (10.5% delta to prev. frequency)
Mids 400 - 2000 Hz
(+) | balanced mids - only 3.7% away from median
(+) | mids are linear (5.7% delta to prev. frequency)
Highs 2 - 16 kHz
(+) | balanced highs - only 2.1% away from median
(+) | highs are linear (5% delta to prev. frequency)
Overall 100 - 16.000 Hz
(+) | overall sound is linear (13.8% difference to median)
Compared to same class
» 19% of all tested devices in this class were better, 4% similar, 77% worse
» The best had a delta of 6%, average was 20%, worst was 57%
Compared to all devices tested
» 15% of all tested devices were better, 4% similar, 81% worse
» The best had a delta of 4%, average was 24%, worst was 134%
Samsung Galaxy Book Flex 13.3 audio analysis
(-) | not very loud speakers (71.6 dB)
Bass 100 - 315 Hz
(-) | nearly no bass - on average 22% lower than median
(±) | linearity of bass is average (11.9% delta to prev. frequency)
Mids 400 - 2000 Hz
(+) | balanced mids - only 2.4% away from median
(+) | mids are linear (5.8% delta to prev. frequency)
Highs 2 - 16 kHz
(+) | balanced highs - only 4.5% away from median
(±) | linearity of highs is average (7.1% delta to prev. frequency)
Overall 100 - 16.000 Hz
(±) | linearity of overall sound is average (22.6% difference to median)
Compared to same class
» 68% of all tested devices in this class were better, 5% similar, 27% worse
» The best had a delta of 6%, average was 20%, worst was 57%
Compared to all devices tested
» 67% of all tested devices were better, 6% similar, 28% worse
» The best had a delta of 4%, average was 24%, worst was 134%
Energy and battery life: 11-hour runtime
Energy consumption
Compared to the laptop's class, power consumption is very low at three to almost seven watts. Under load, it briefly increases to 55 watts and then remains at around 49 watts in the stress test. Moderate load manifests itself in 42 watts. The competition is often power-hungrier in this regard, especially during maximum load. It's shown here that Dell has reduced the short-term maximum TDP (PL1).
| Off / Standby | |
| Idle | |
| Load |
|
Key:
min: | |
| Dell Latitude 5310-23VP6 i5-10310U, UHD Graphics 620, SK hynix BC511 HFM512GDHTNI-87A0B, IPS, 1920x1080, 13.3" | HP Spectre x360 14t-ea000 i7-1165G7, Iris Xe G7 96EUs, Samsung SSD PM981a MZVLB512HBJQ, IPS, 1920x1280, 13.5" | Samsung Galaxy Book Flex 13.3 i5-1035G4, Iris Plus Graphics G4 (Ice Lake 48 EU), Samsung SSD PM981a MZVLB256HBHQ, IPS, 1920x1080, 13.3" | Lenovo ThinkPad X1 Yoga 2020-20UCS03S00 i7-10510U, UHD Graphics 620, Samsung SSD PM981a MZVLB512HBJQ, IPS LED, 1920x1080, 14" | Lenovo Yoga C740-14IML i5-10210U, UHD Graphics 620, Samsung SSD PM981a MZVLB256HBHQ, IPS, 1920x1080, 14" | Average Intel UHD Graphics 620 | Average of class Convertible | |
|---|---|---|---|---|---|---|---|
| Power Consumption | 3% | -7% | -16% | -2% | -12% | -27% | |
| Idle Minimum * (Watt) | 2.9 | 3 -3% | 3.3 -14% | 2.9 -0% | 3 -3% | 3.81 ? -31% | 4.24 ? -46% |
| Idle Average * (Watt) | 5.9 | 5.1 14% | 8.9 -51% | 6 -2% | 3.9 34% | 6.94 ? -18% | 7.03 ? -19% |
| Idle Maximum * (Watt) | 6.7 | 6.4 4% | 10.4 -55% | 9.6 -43% | 7.3 -9% | 8.75 ? -31% | 8.61 ? -29% |
| Load Average * (Watt) | 42 | 39.6 6% | 40 5% | 42.6 -1% | 42.5 -1% | 35 ? 17% | 43.9 ? -5% |
| Witcher 3 ultra * (Watt) | 43 | 39.6 8% | 28 35% | ||||
| Load Maximum * (Watt) | 50 | 56.2 -12% | 32 36% | 67.3 -35% | 65.5 -31% | 47.5 ? 5% | 67.2 ? -34% |
* ... smaller is better
Battery life
The runtime of 11 hours in the Wi-Fi test where web surfing is performed at a brightness of 150 cd/m² outperforms some competing models, except for the Spectre x360 with its 66 watt hours.
| Dell Latitude 5310-23VP6 i5-10310U, UHD Graphics 620, 60 Wh | HP Spectre x360 14t-ea000 i7-1165G7, Iris Xe G7 96EUs, 66 Wh | Samsung Galaxy Book Flex 13.3 i5-1035G4, Iris Plus Graphics G4 (Ice Lake 48 EU), 69.7 Wh | Lenovo ThinkPad X1 Yoga 2020-20UCS03S00 i7-10510U, UHD Graphics 620, 51 Wh | Lenovo Yoga C740-14IML i5-10210U, UHD Graphics 620, 51 Wh | Average of class Convertible | |
|---|---|---|---|---|---|---|
| Battery runtime | 6% | -35% | -2% | -17% | 9% | |
| WiFi v1.3 (h) | 11.1 | 11.8 6% | 7.2 -35% | 10.9 -2% | 9.2 -17% | 12.1 ? 9% |
| Reader / Idle (h) | 36.4 | 11.6 | 21.6 | 18.6 | 27.7 ? | |
| Load (h) | 2.4 | 2.6 | 2 | 1.7 | 1.779 ? | |
| H.264 (h) | 9.3 | 15.3 ? |
Pros
Cons
Verdict
The Dell Latitude 5310 is a 13-inch whisper-quiet 2-in-1 work device that doesn't impress with performance but combines numerous ergonomic and design advantages. While the Core i5-10310U doesn't fully develop its performance, the user benefits from an operation that is mostly whisper-quiet, a long runtime (11 hours in our Wi-Fi test), and moderate heat generation.
The touchscreen is appropriate for its purpose in terms of brightness and contrast, but it's not a highlight. Color reproduction and color-space coverage are better aspects, and the 13-incher beats the competition here.
You have to deal with the glossy touchscreen if you want the 2-in-1 version. Otherwise, there is an alternative Latitude 5310 in clamshell format. The looks and ports are almost identical.
The maintenance options are a success in any case. All components, except for the SoC, can be easily removed and replaced, including the battery. Dell has a service manual online for this.
Price and availability
The Dell Latitude 5310-23VP6 variant that we reviewed is currently available for a good 1,400 Euros (~$1,722) at notebooksbilliger.
The less expensive entry-level model with 256 GB of storage and 8 GB of RAM costs considerably less, just under 1,200 Euros (~$1,476).
Dell Latitude 5310-23VP6
- 12/29/2020 v7 (old)
Sebastian Jentsch
Price comparison

