Dell Latitude 5420 Rugged (i7-8650U, AMD RX 540) Laptop Review
Rugged laptops are designed to survive and work in the most extreme conditions. To that end, most ruggedized notebooks are thick beasts covered in metal, rubber, and plastic. But what would happen if a company were to trim down a rugged laptop without sacrificing much in the way of durability?
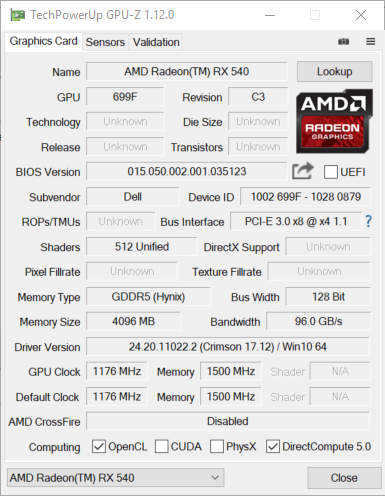
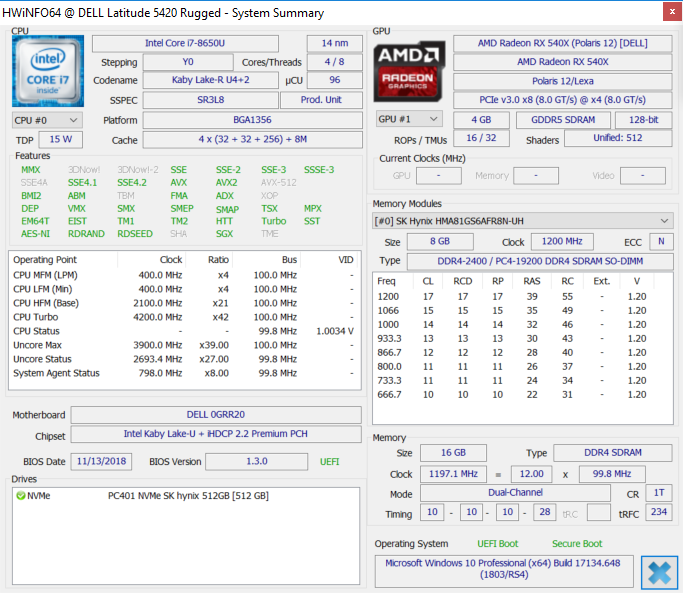
The Latitude 5420 Rugged is Dell's answer to this question. The device is thinner than most rugged laptops but still sturdier than most consumer laptops. The 5420 Rugged doesn't skimp on performance, either. Sporting an 8th Gen Intel Core i7-8650U, 16 GB of RAM, and a 512 GB NVMe SSD, the 5420 Rugged keeps up with most modern premium business-class laptops. The 5420 Rugged also sports an AMD Radeon RX 540 GPU with 4 GB of GDDR5 VRAM, giving it a bit more graphical power than a standard office machine.
We'll see how well the Latitude 5420 Rugged stands up against other ruggedized laptops like the Panasonic Toughbook CF-54 and Getac S410. We'll also compare the Latitude 5420 Rugged to more common office laptops like the Lenovo ThinkPad T480, Dell Latitude 5490, and HP Elitebook 840 G4 to see if the rugged machine keeps up with its more fragile contemporaries.
Case
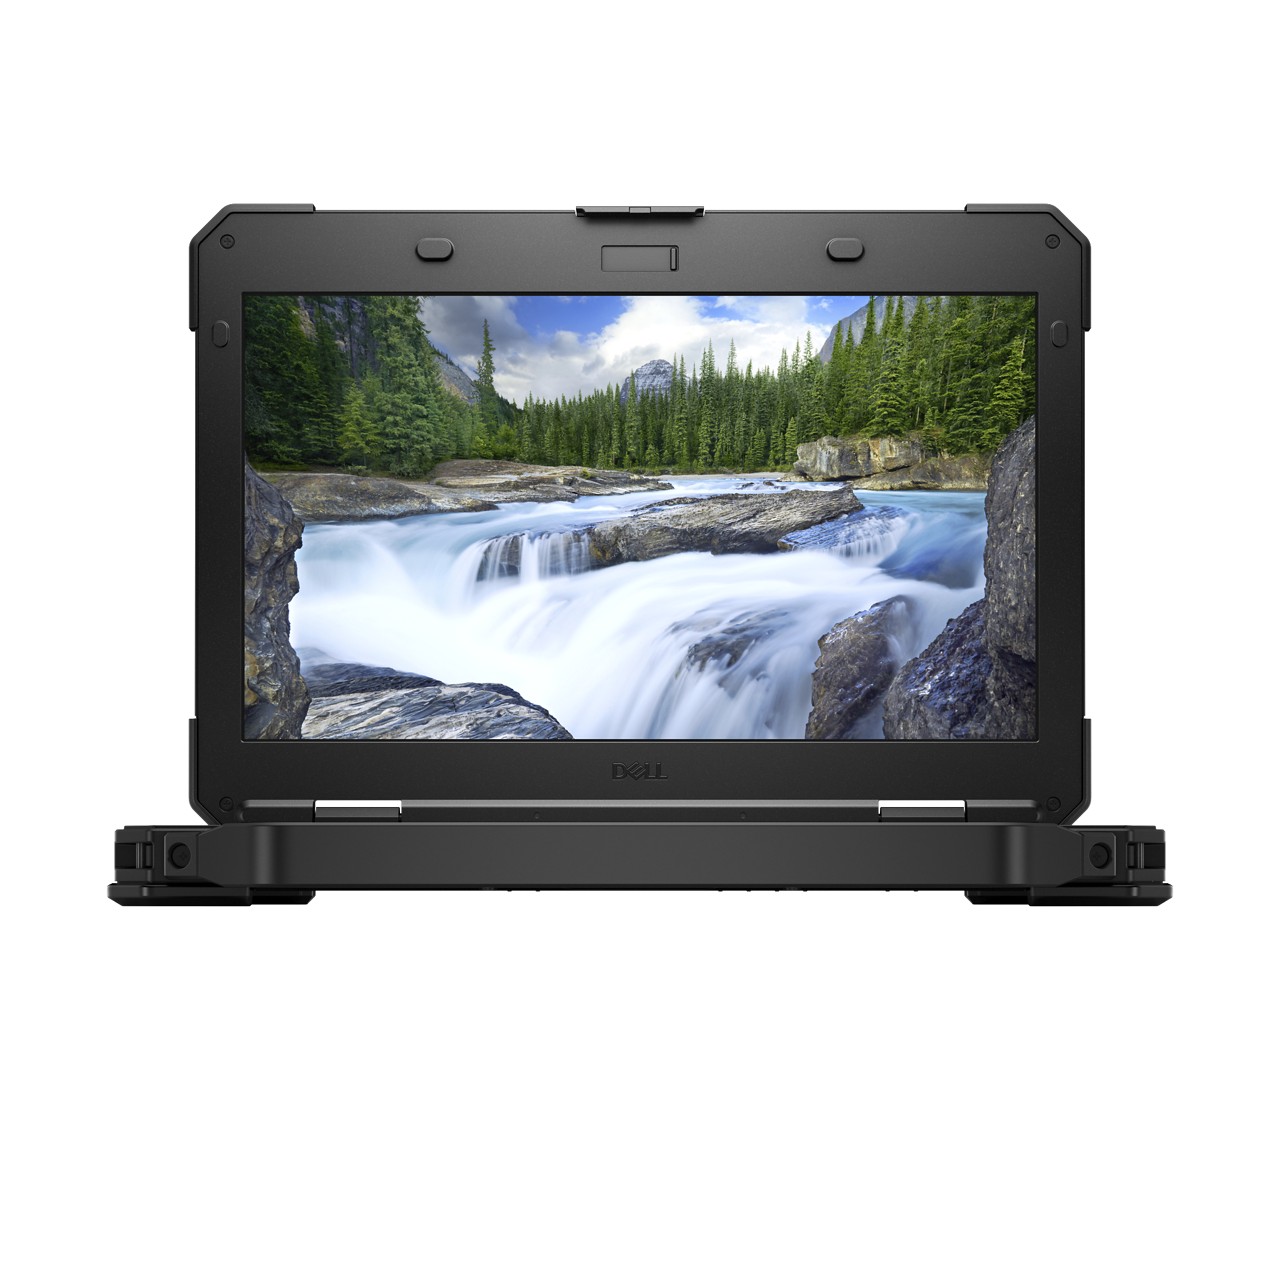
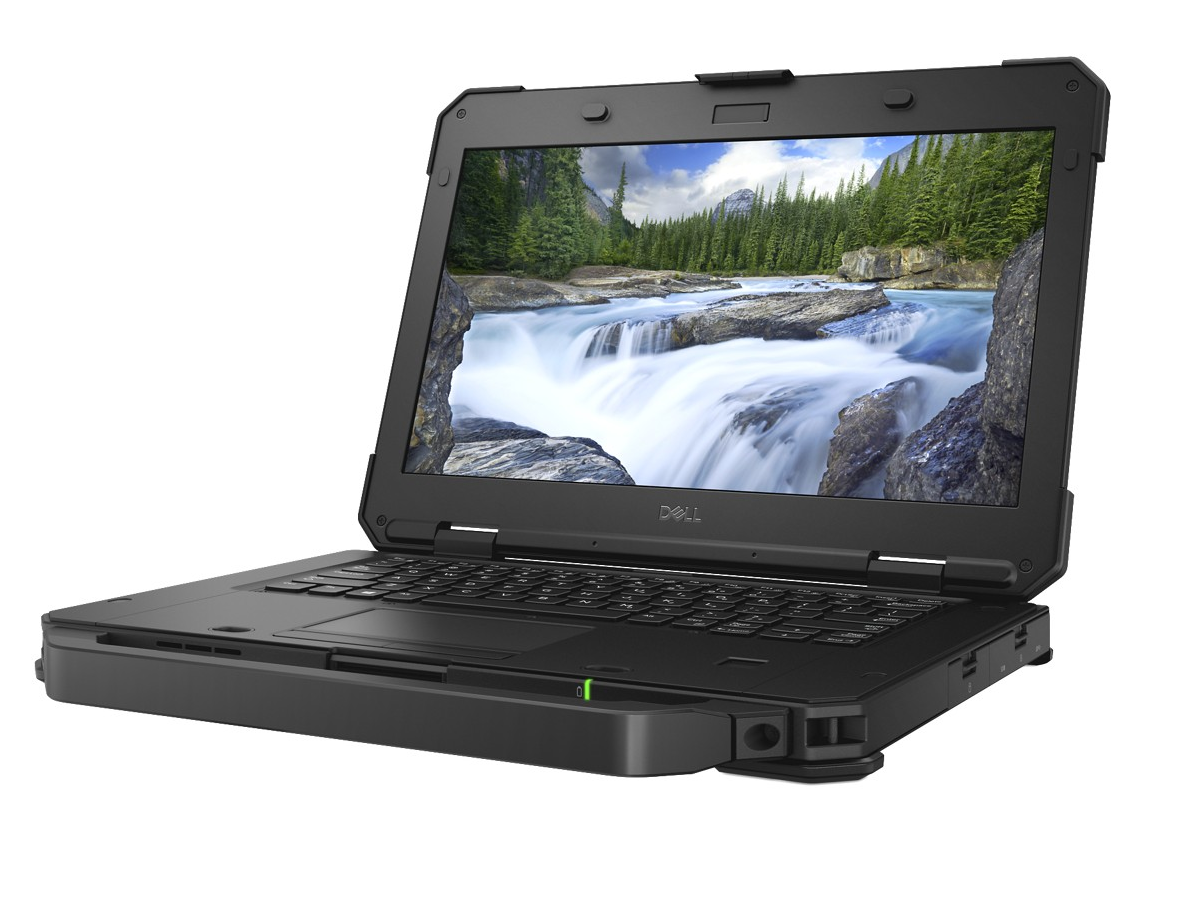
As with most rugged laptops, the case is extremely well-made but is not aesthetically pleasing. Metal, plastic, and rubber are the dominant materials used and make the Latitude 5420 Rugged feel like a tank. The laptop is MIL-STD-810G certified, meaning it has undergone extensive durability testing. Notably, the Latitude 5420 Rugged is rated to survive drops from 1.22 meters (4 feet) in height and continue to operate in temperatures between -29° and 63° C (-20° and 145° F). The case also bears an IP-52 ingress protection rating, meaning it is dust-resistant and protected against drips/splashes of water.
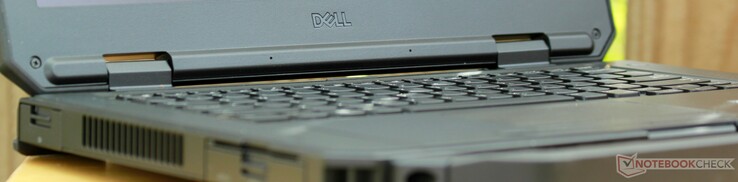
Because of its materials and construction, there is no flex anywhere along the chassis. Gaps are tight and even in order to keep dust out. The lid experiences minimal flexing and twisting only under pronounced directed pressure. The 180-degree hinges are firm and hold the screen in place while typing but are too stiff for one-handed opening. Even when touching the screen, the hinges minimize wobble to an imperceptible motion. The primary issue with the case is the matte finish across the metal and plastic elements; fingerprints and smudges readily show along these surfaces, but these can be wiped away easily.
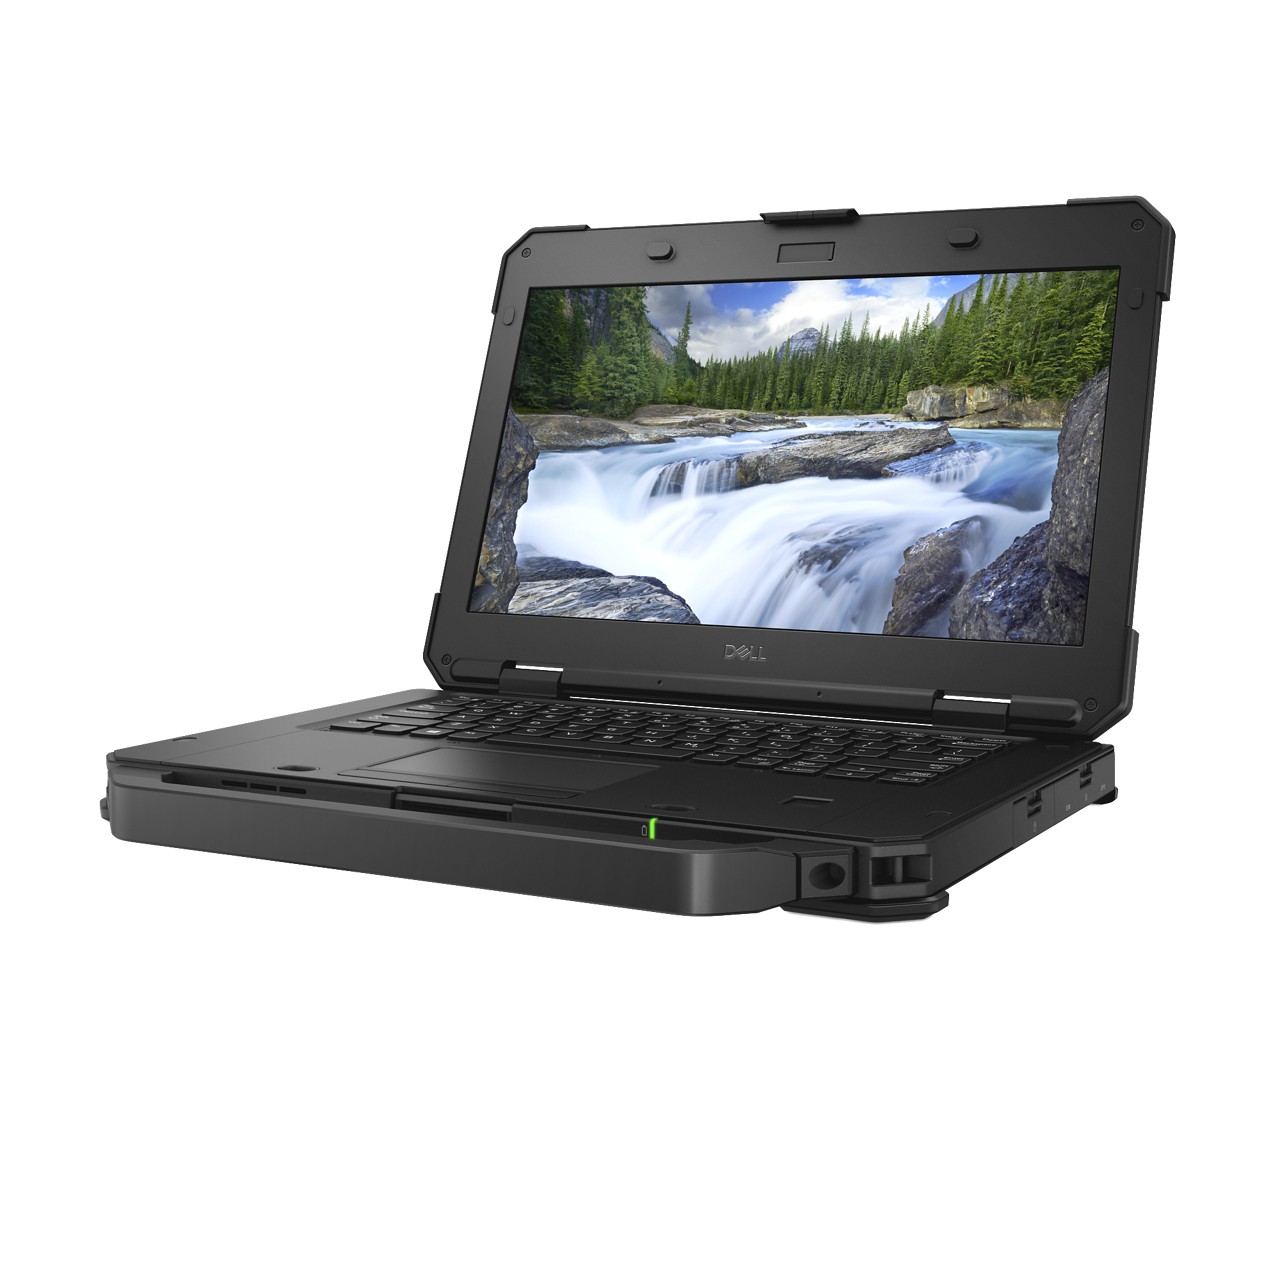
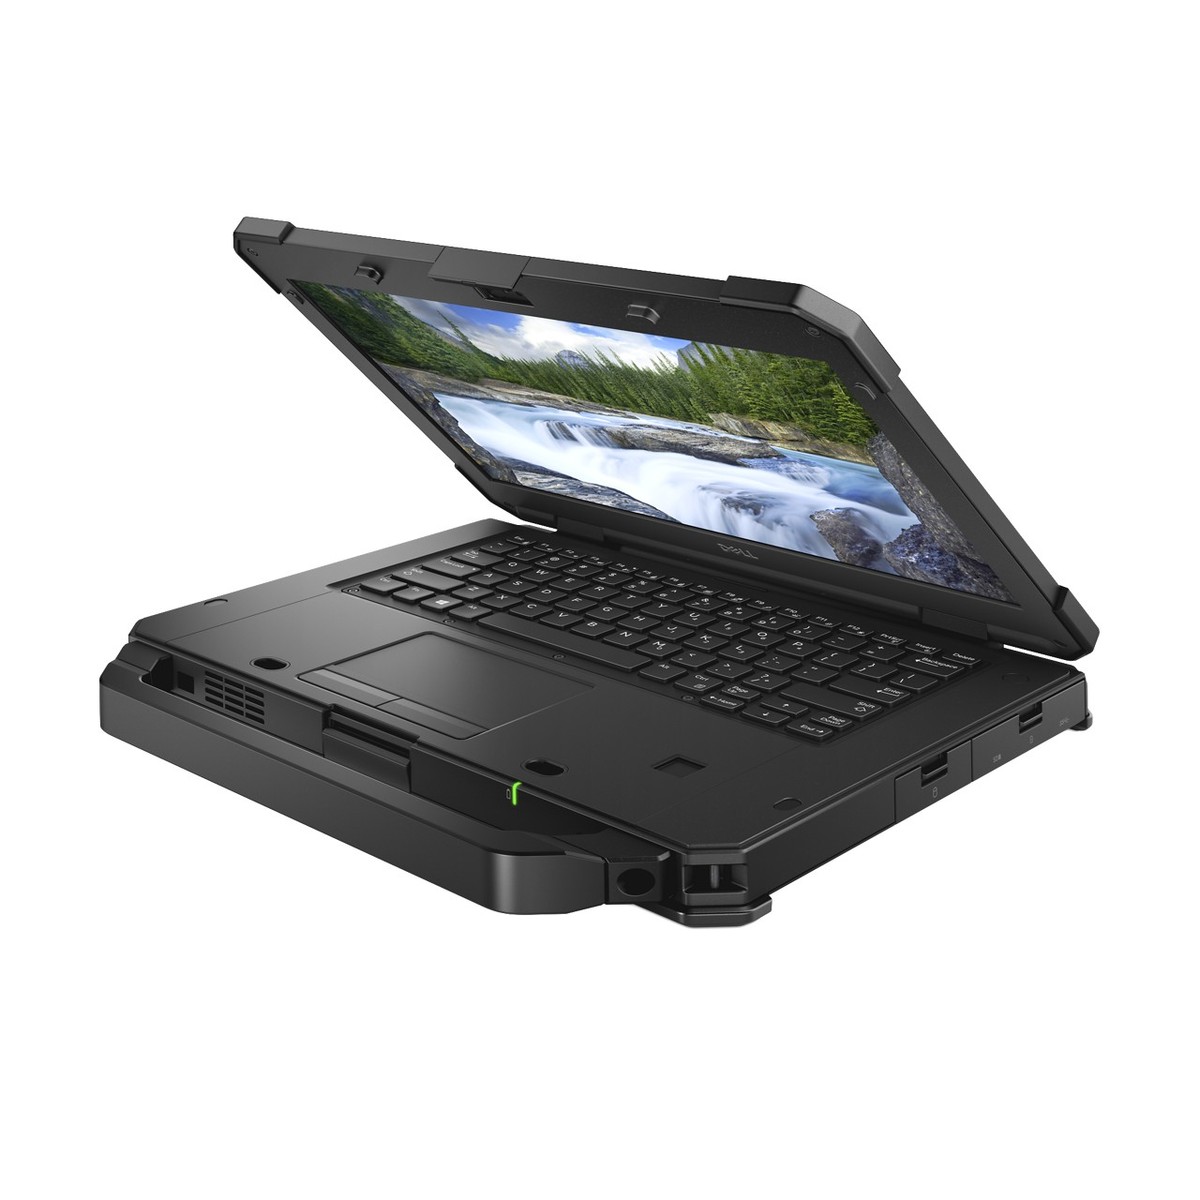
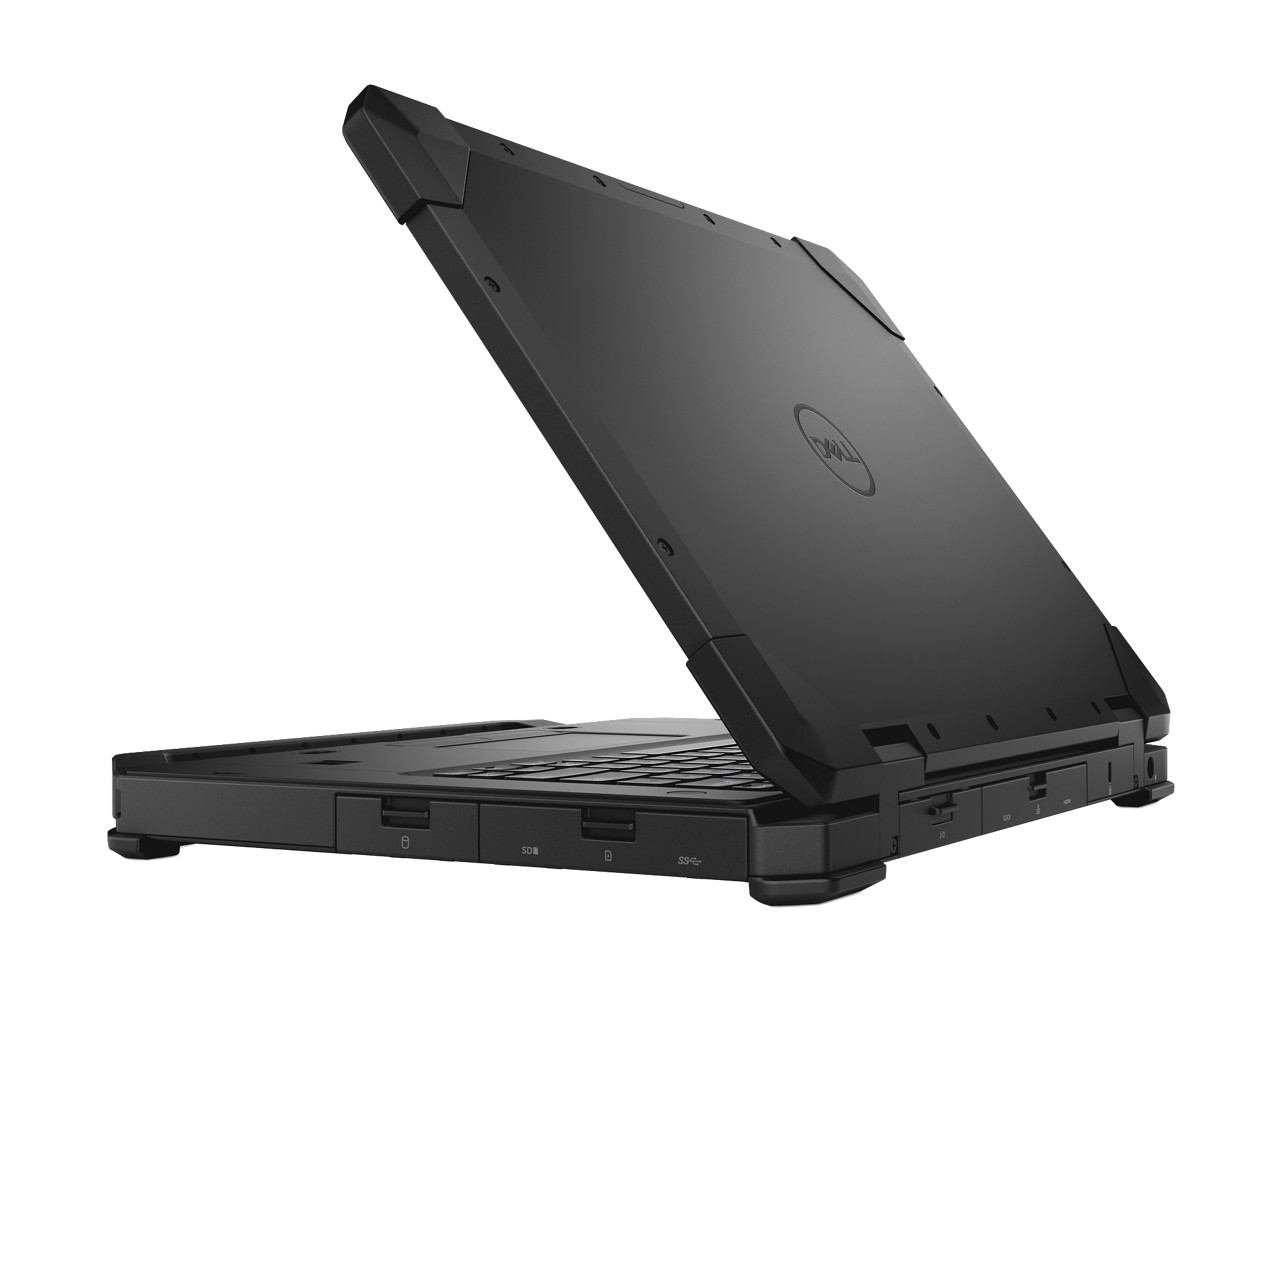
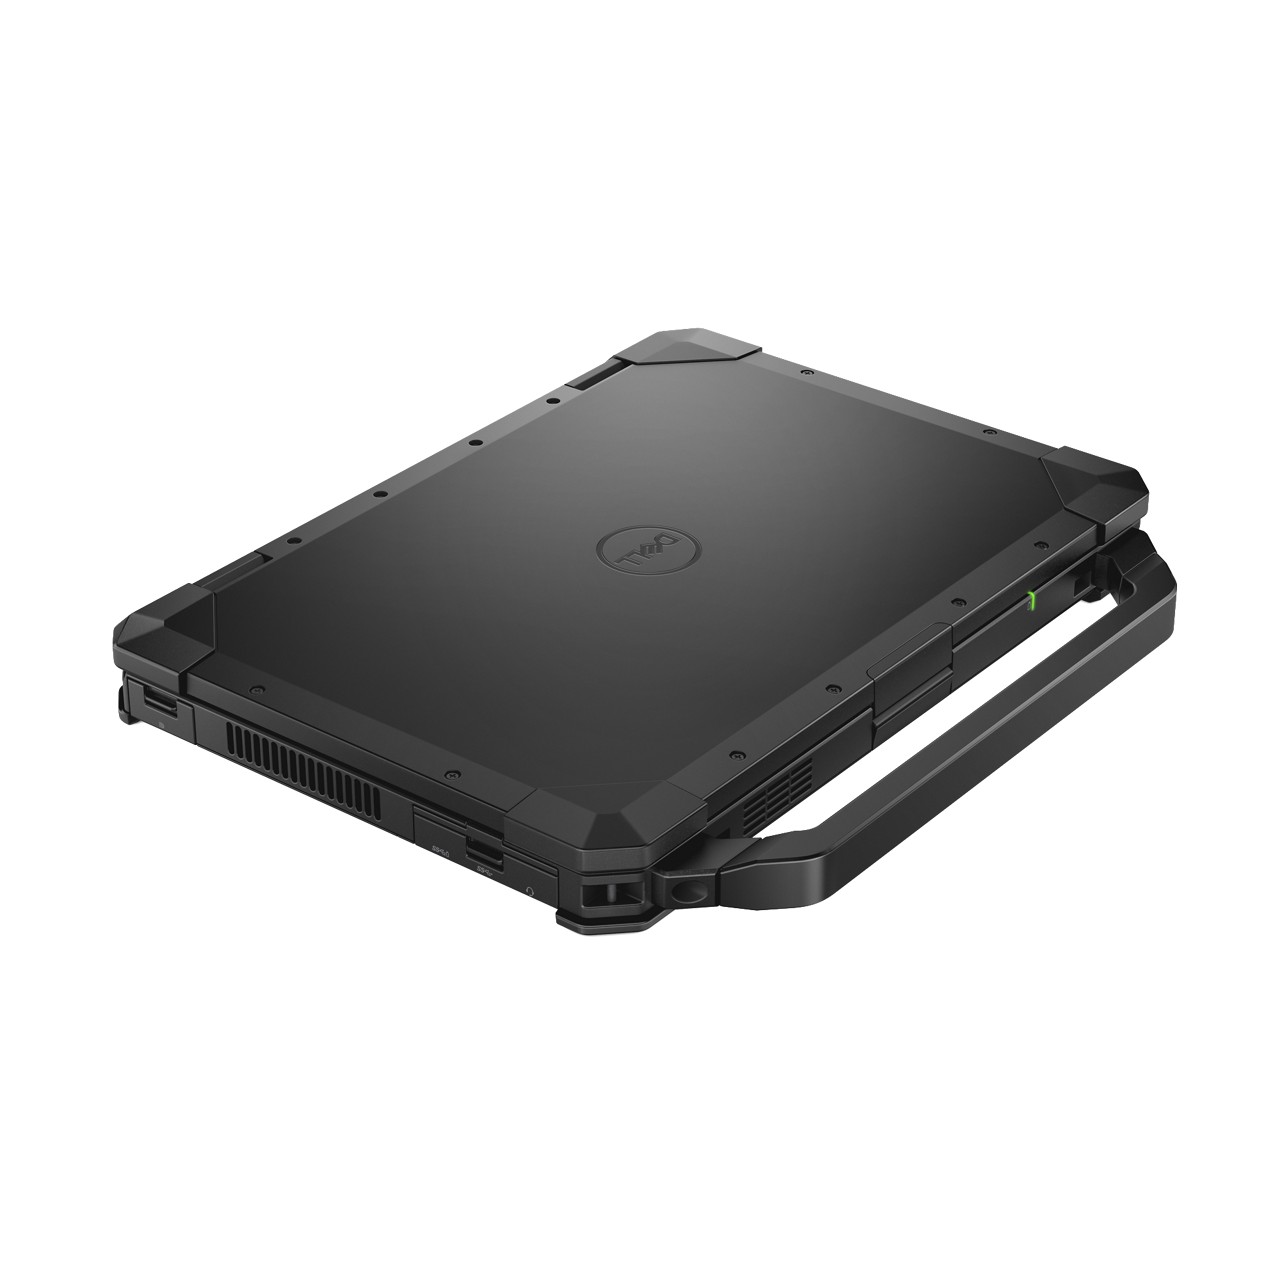
The Latitude 5420 Rugged is large and chunky. It's over twice as thick as other 14-inch laptops (e.g., ThinkPad T480, Latitude 5490) but is comparable to other ruggedized laptops. Weight is the key differentiator; at 2.8 kg, the 5420 Rugged is significantly heavier than even its rugged rivals. However, the firm front handle makes hauling the device much easier. This handle adds quite a bit to the length, but it can be removed via two screws if desired. The Panasonic Toughbook CF-54's retractable handle blends into that machine's case easier, but it doesn't feel as sturdy as the 5420 Rugged's handle.
Connectivity
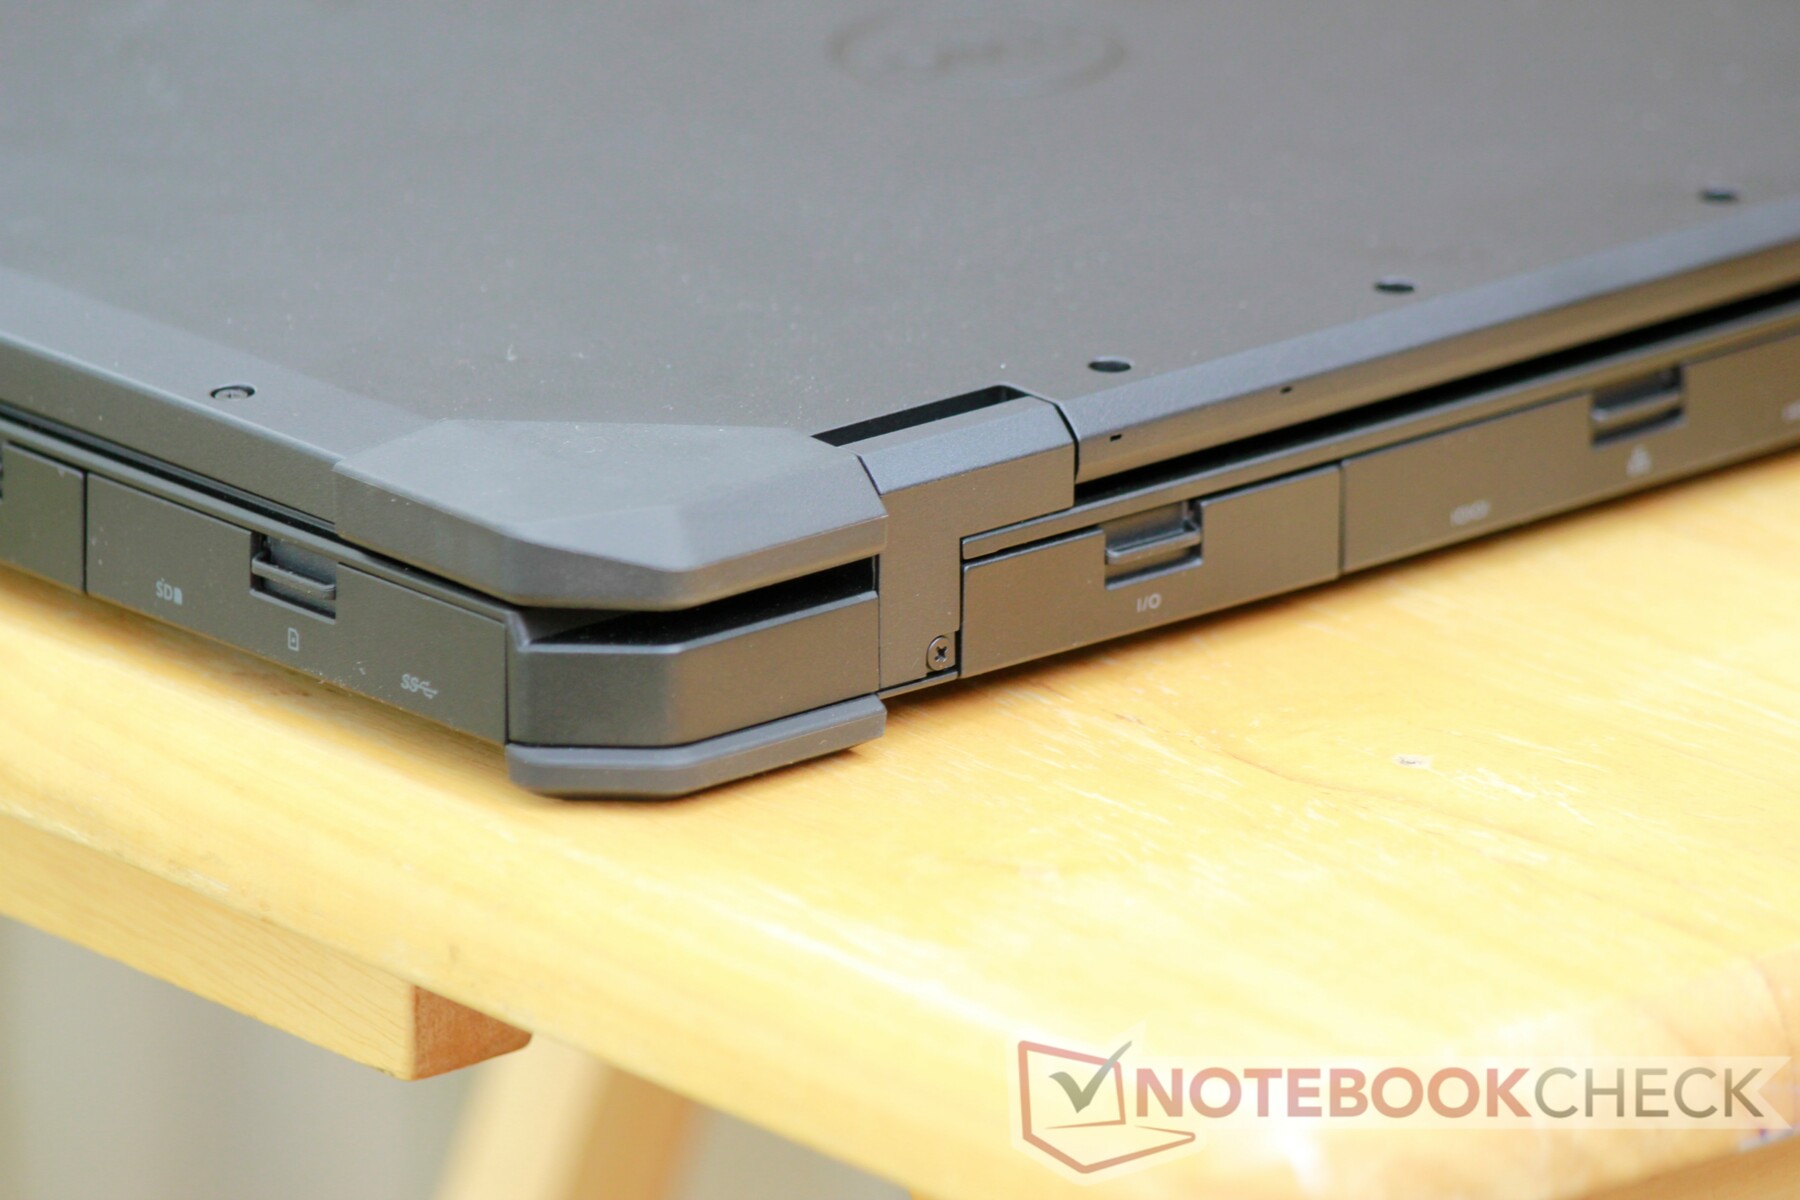
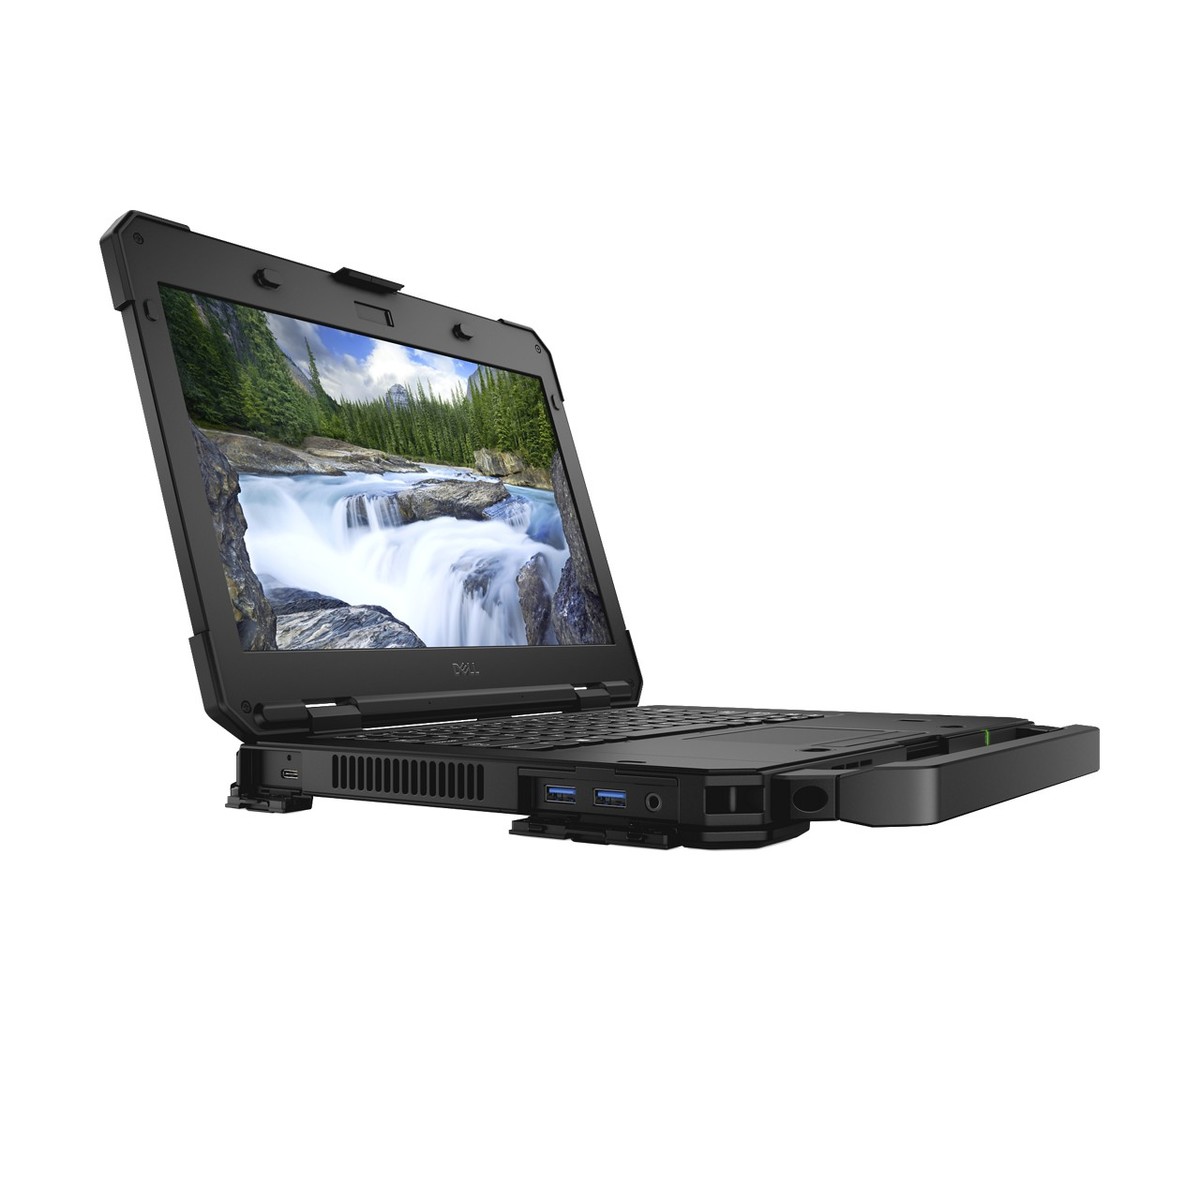
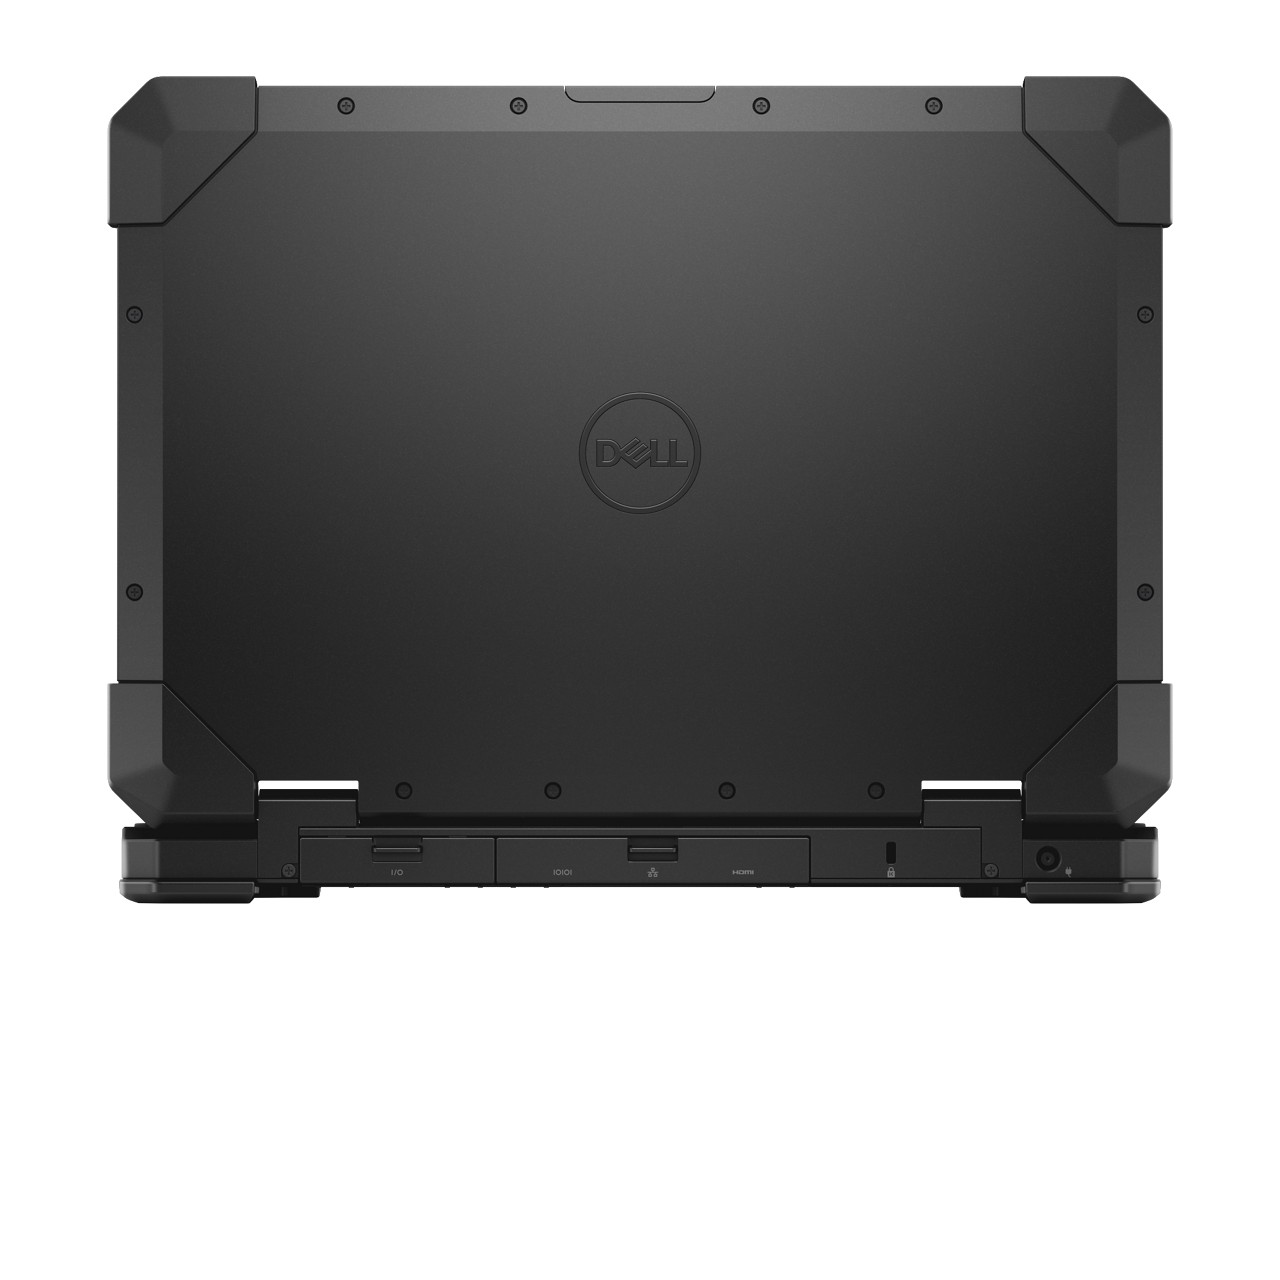
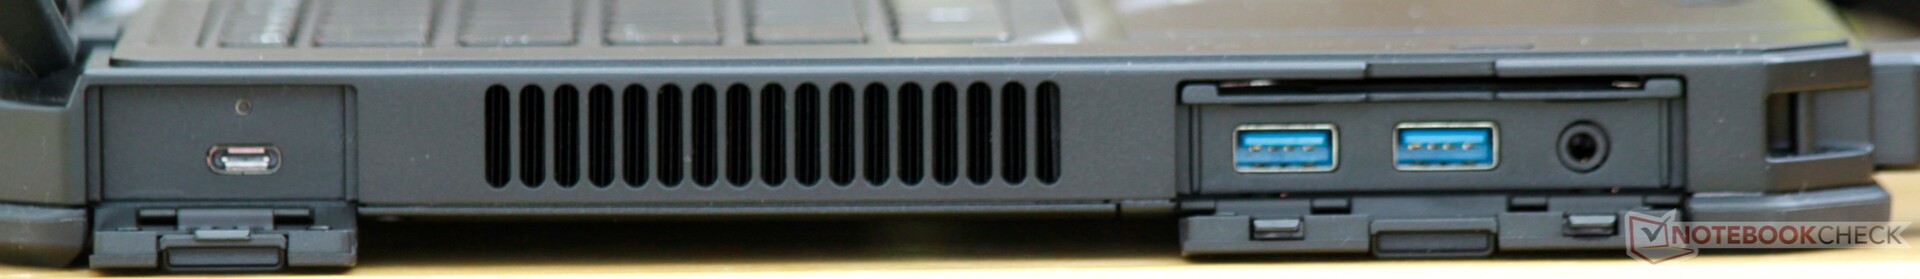
Port selection is excellent. Three USB 3.0 Type-A ports and a single USB 3.1 Gen 1 Type-C port are available for peripherals. Video output is handled by the DisplayPort-compatible USB Type-C port, an HDMI port on the rear, and an optional DisplayPort. Dell also offers different options for rear connections, including either the aforementioned DisplayPort, a second Serial port, a VGA port, or a USB Ficher connector. Other niceties include an NFC pad with Smart Card compatibility, a SIM card slot, and a full-sized SD Card slot. There are also Pogo pins along the bottom panel for docking.
The ports are well-spaced and are contained behind latched doors to keep dust out. It should be noted that these latches are not waterproof like those on some other ruggedized laptops, so water should be avoided even when the latches are closed.
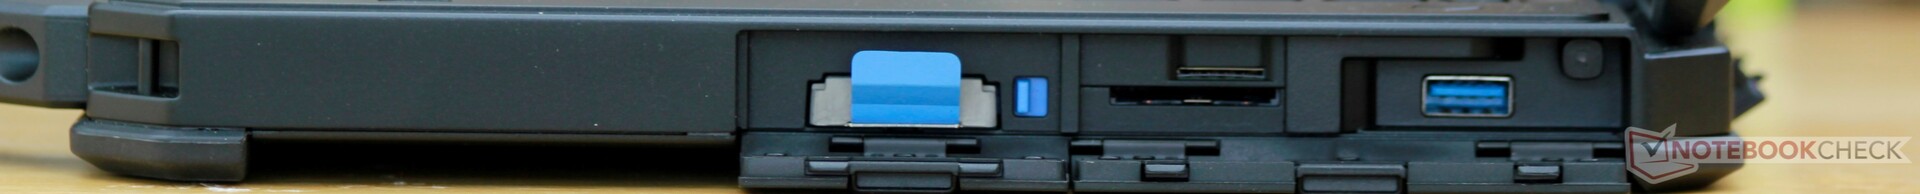

SD Card Reader
The SD card reader is lightning fast. Using our Toshiba Exceria Pro SDXC 64 GB UHS-II reference card, we measure transfer rates between 180-220 MB/s, which should be more than fast enough for even the most demanding professionals.
| SD Card Reader | |
| average JPG Copy Test (av. of 3 runs) | |
| Dell Latitude 5420 Rugged-P85G (Toshiba Exceria Pro SDXC 64 GB UHS-II) | |
| Dell Latitude 5490 (Toshiba Exceria Pro SDXC 64 GB UHS-II) | |
| Panasonic Toughbook CF-54G2999VM (Toshiba Exceria Pro SDXC 64 GB UHS-II) | |
| Average of class Workstation (49.6 - 681, n=14, last 2 years) | |
| Getac S410 (Toshiba Exceria Pro SDXC 64 GB UHS-II) | |
| Lenovo ThinkPad T480-20L50010US (Toshiba Exceria Pro SDXC 64 GB UHS-II) | |
| HP EliteBook 840 G4-Z2V49ET ABD (Toshiba Exceria Pro SDXC 64 GB UHS-II) | |
| maximum AS SSD Seq Read Test (1GB) | |
| Dell Latitude 5420 Rugged-P85G (Toshiba Exceria Pro SDXC 64 GB UHS-II) | |
| Average of class Workstation (87.6 - 1455, n=14, last 2 years) | |
| Dell Latitude 5490 (Toshiba Exceria Pro SDXC 64 GB UHS-II) | |
| Panasonic Toughbook CF-54G2999VM (Toshiba Exceria Pro SDXC 64 GB UHS-II) | |
| Lenovo ThinkPad T480-20L50010US (Toshiba Exceria Pro SDXC 64 GB UHS-II) | |
| Getac S410 (Toshiba Exceria Pro SDXC 64 GB UHS-II) | |
| HP EliteBook 840 G4-Z2V49ET ABD (Toshiba Exceria Pro SDXC 64 GB UHS-II) | |
Communication
Similarly, WiFi connections are extremely quick thanks to the Intel 8265 wireless card. Connections remained perfectly stable up to 40 meters through two interior walls and one exterior brick wall.
Security
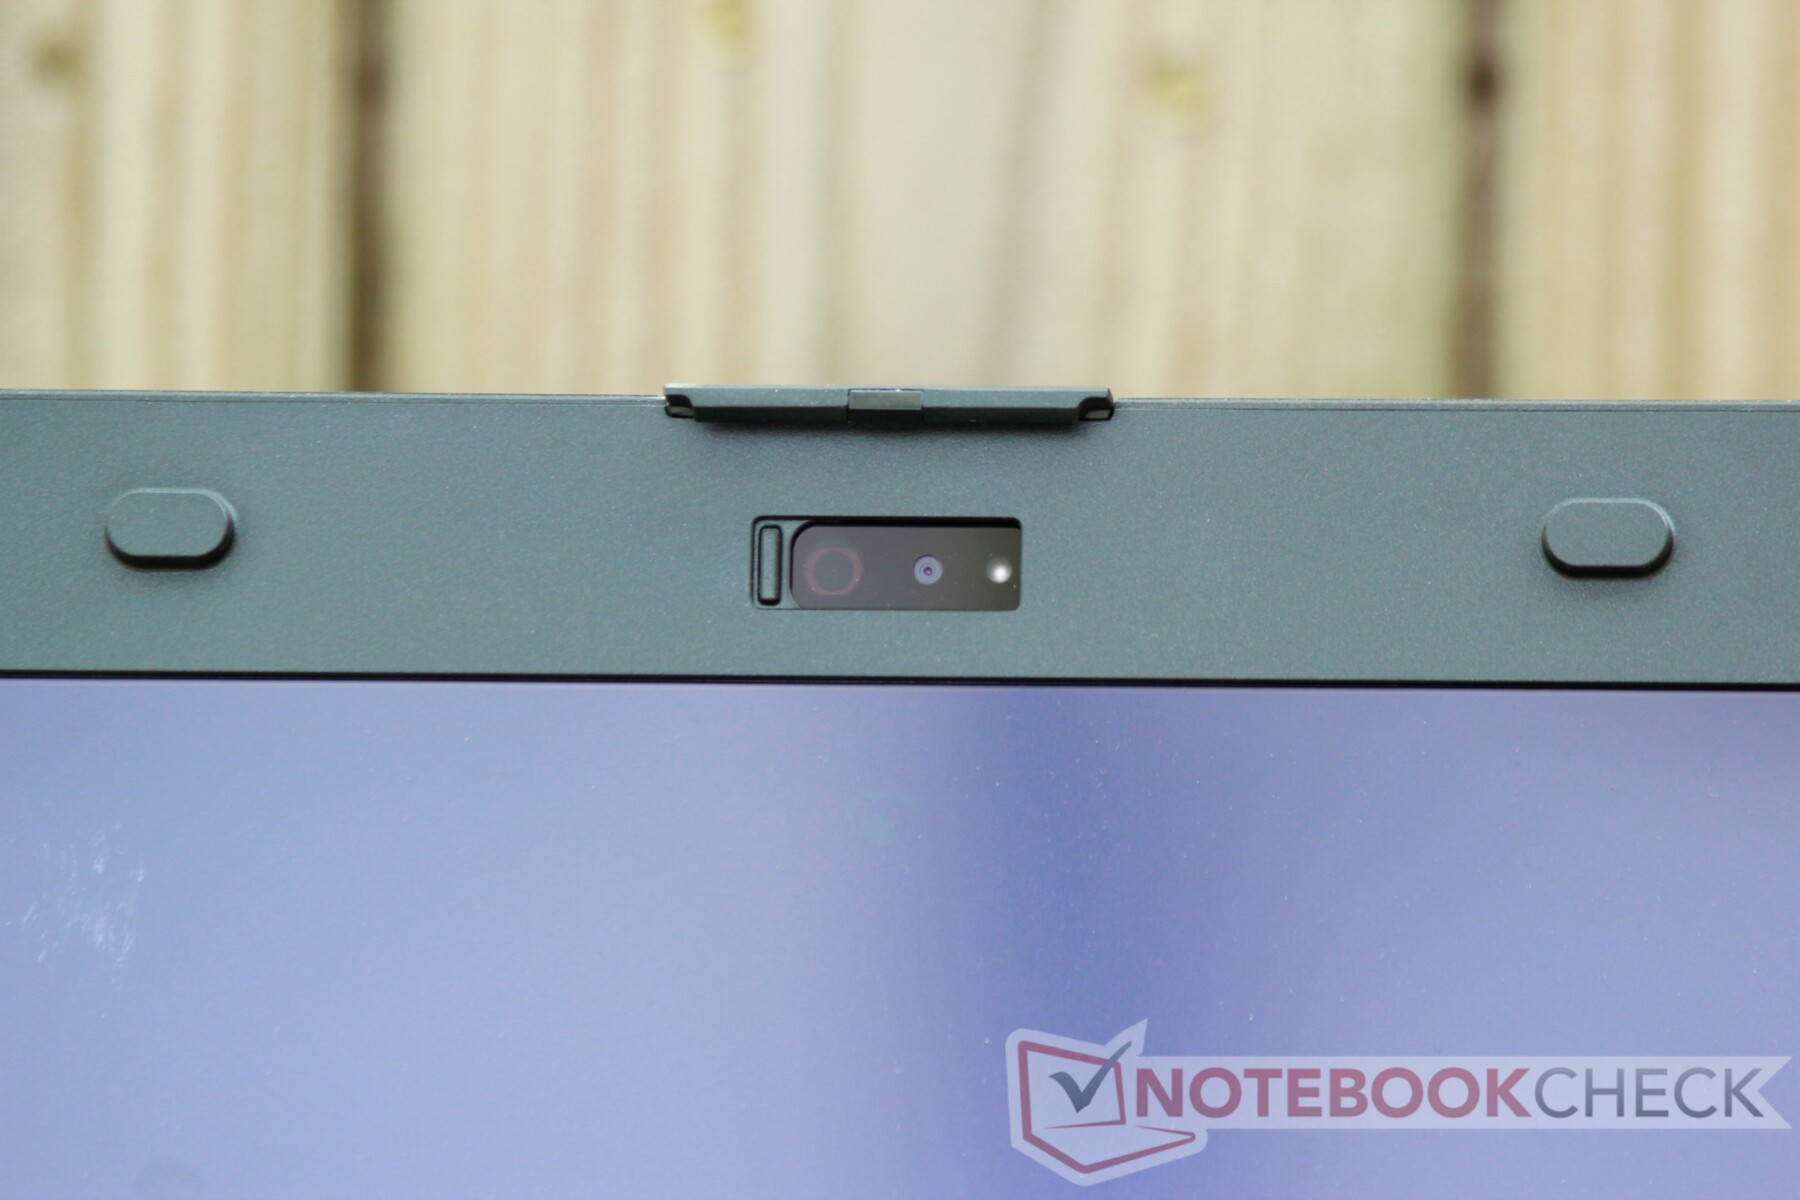
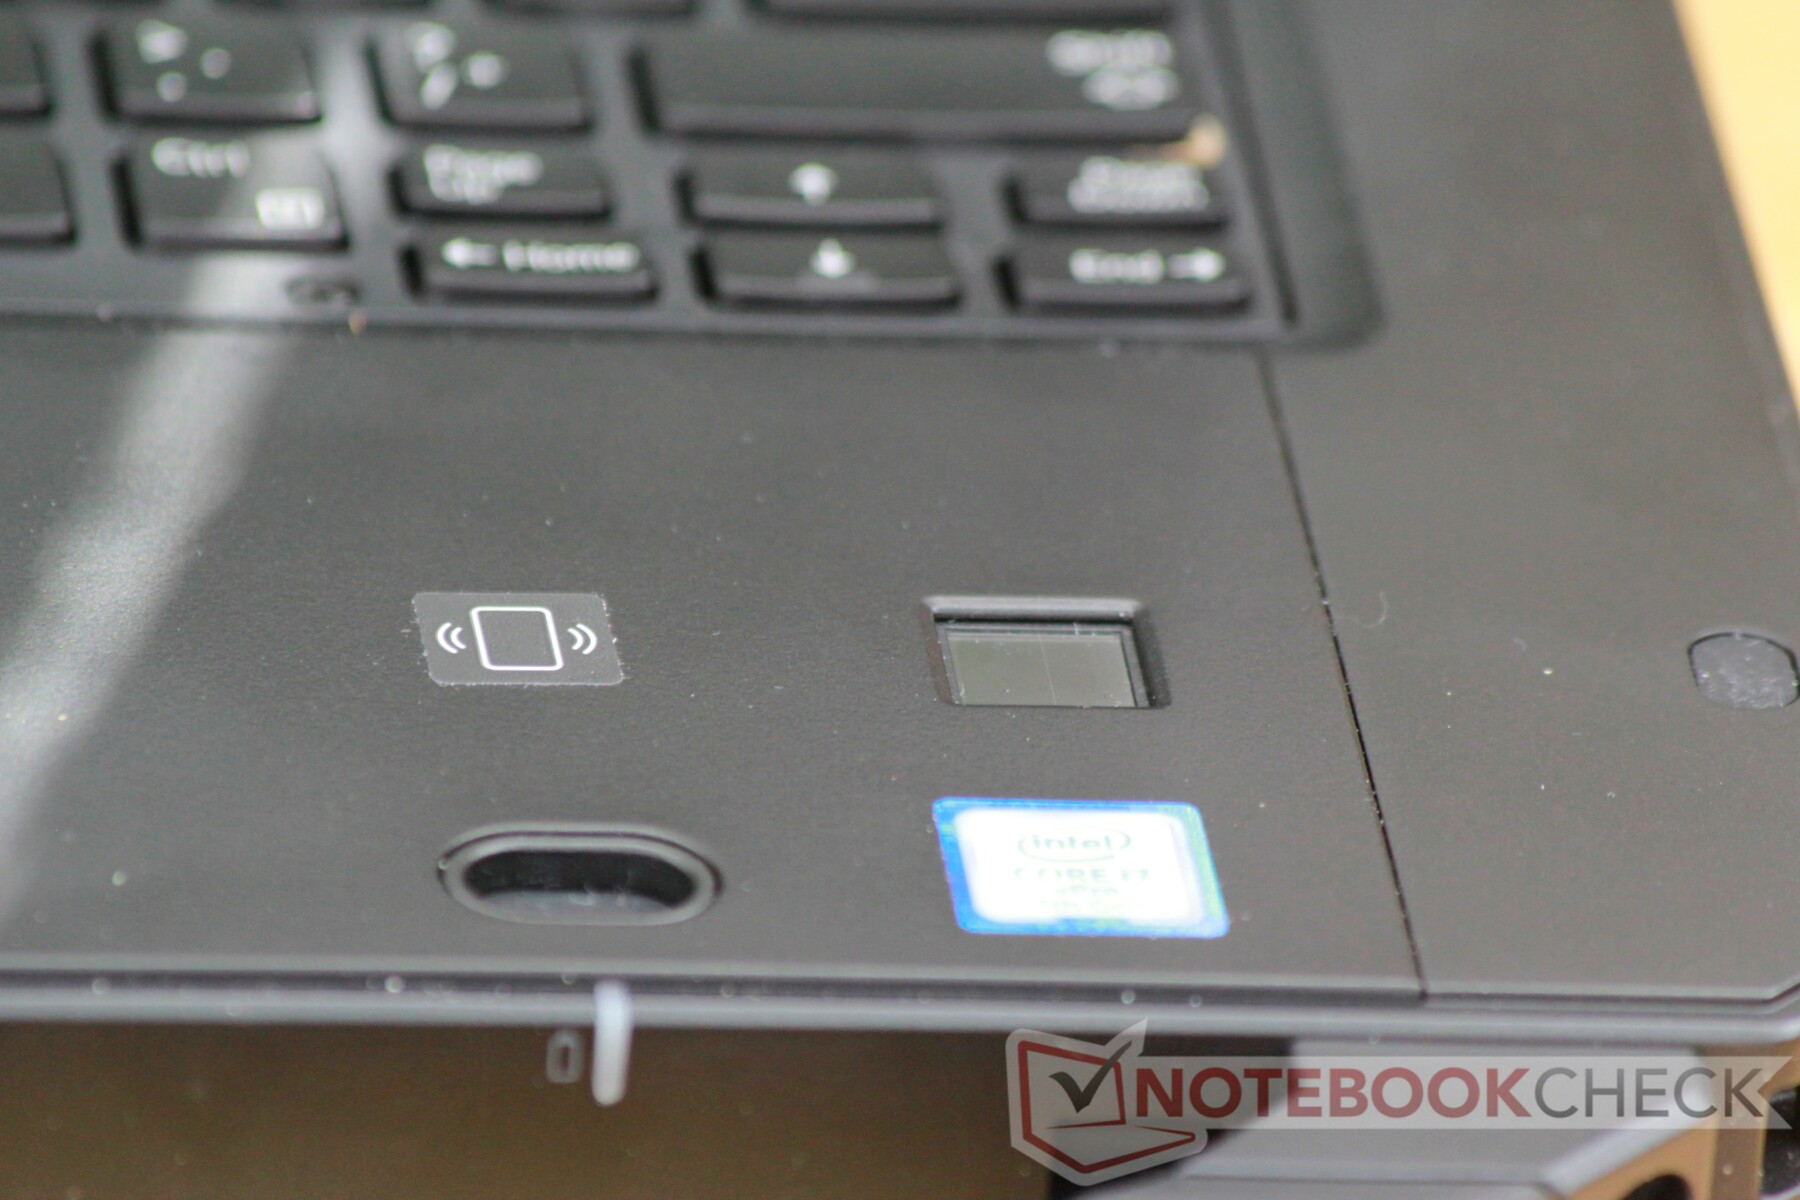
The Latitude 5420 Rugged packs a bevy of security features into its durable shell. Users can log in via the optional contact fingerprint reader, a Smart Card-compatible NFC pad, or an optional RGB or IR camera. Our model has the IR camera option, and logins are near-immediate via Windows Hello. The camera isn't fooled by glasses (unlike with some other devices) and works in dark environments. The fingerprint reader is fairly accurate (~90%) but may not work with dirty or sweaty fingers. Dell also offers options for Intel's vPro system management engine and TPM.
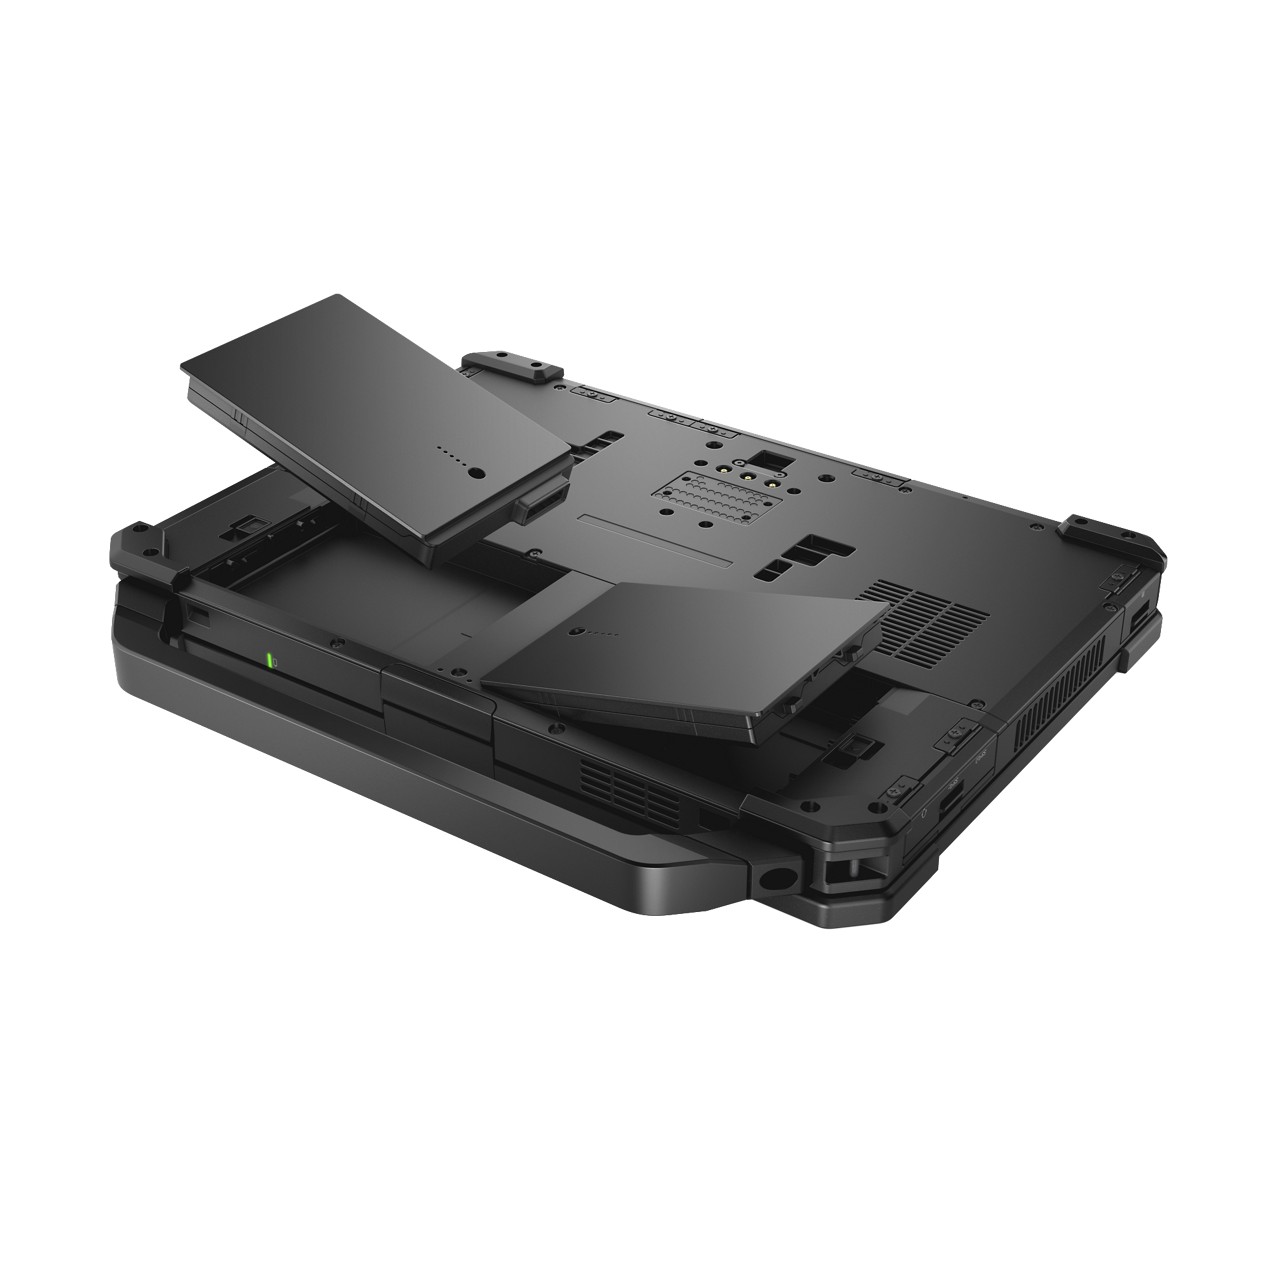
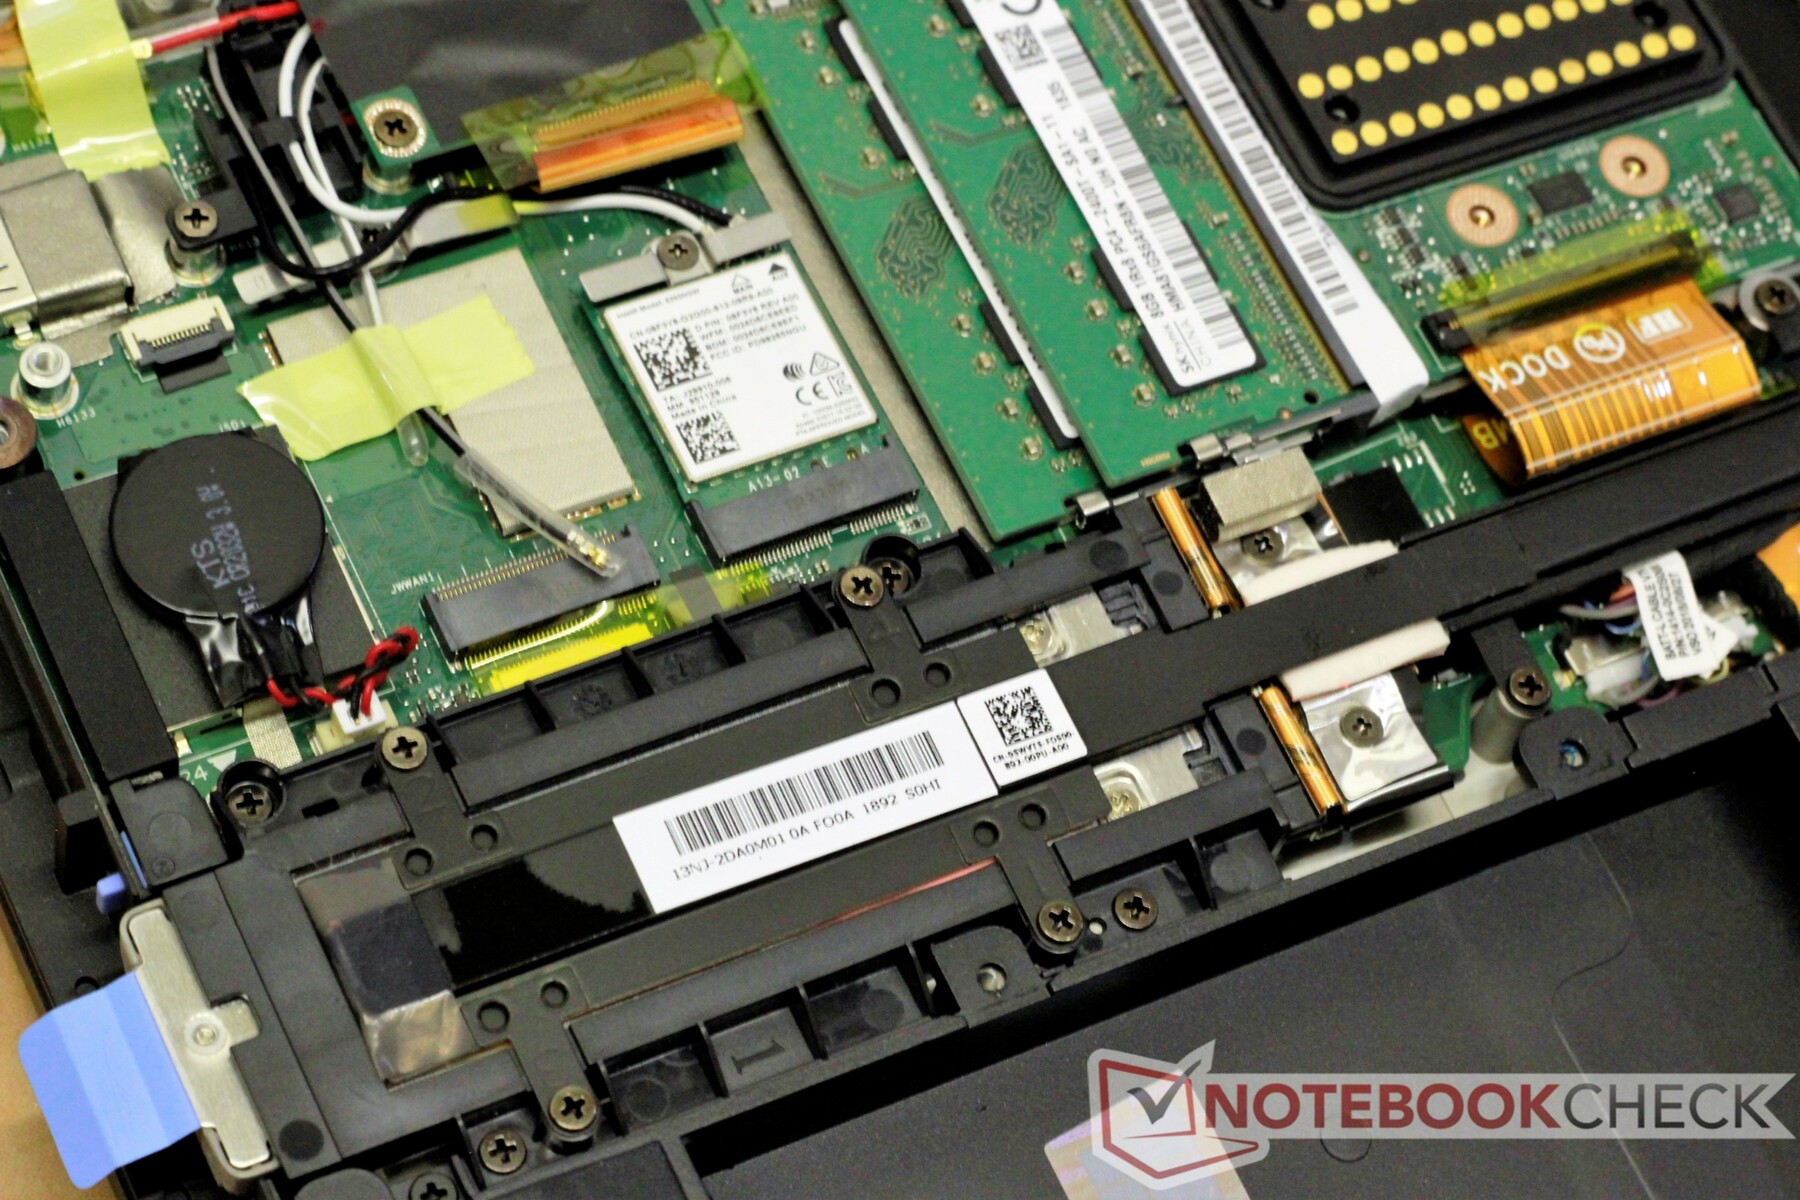
Maintenance
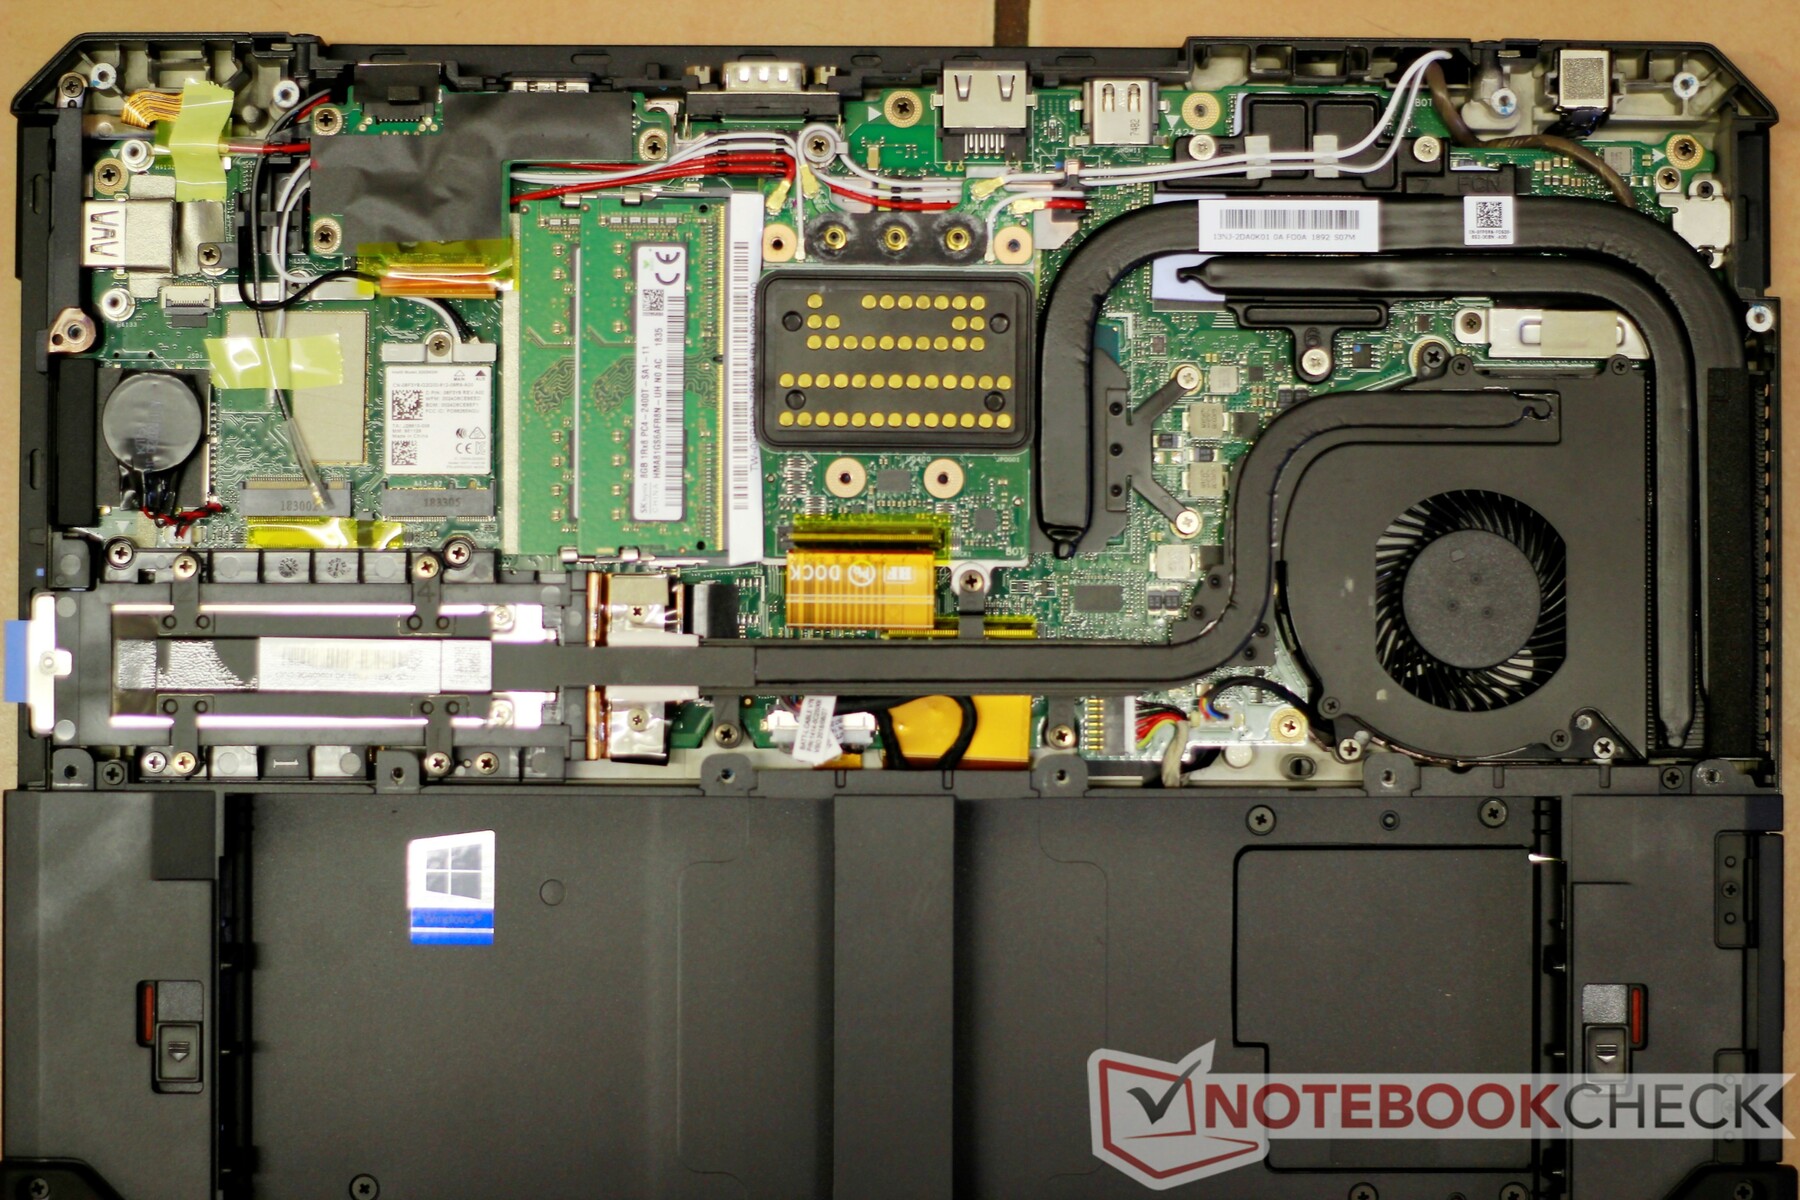
Maintenance and upgrades are a bit of a chore. The keyboard can be replaced by removing six screws and prying up some plastic clips, although it takes quite a bit of force. We did not attempt to remove the keyboard for fear of damaging the plastic. Upgrades can be made by unscrewing 20 Phillips Head screws. Thankfully, the screws are all uniform and the panel has no clips holding it in place. The only components that can be readily accessed are the dual RAM slots, the wireless and LTE cards, and the M.2 drive, although the drive is accessible via the side bay. The machine earns points for easy drive removal and installation.
Warranty
The Latitude 5420 Rugged comes with a standard 3-year warranty with options to extend the warranty up to 5 years and add Dell's ProSupport or ProSupport Plus services. ProSupport subscribers have access to onsite service by certified technicians as well as points-of-contact for specific hardware and software problems. ProSupport even provides support for third-party applications like internet browsers, financial software (e.g., Quicken), video/photo editing programs, and more.
Input Devices
Keyboard
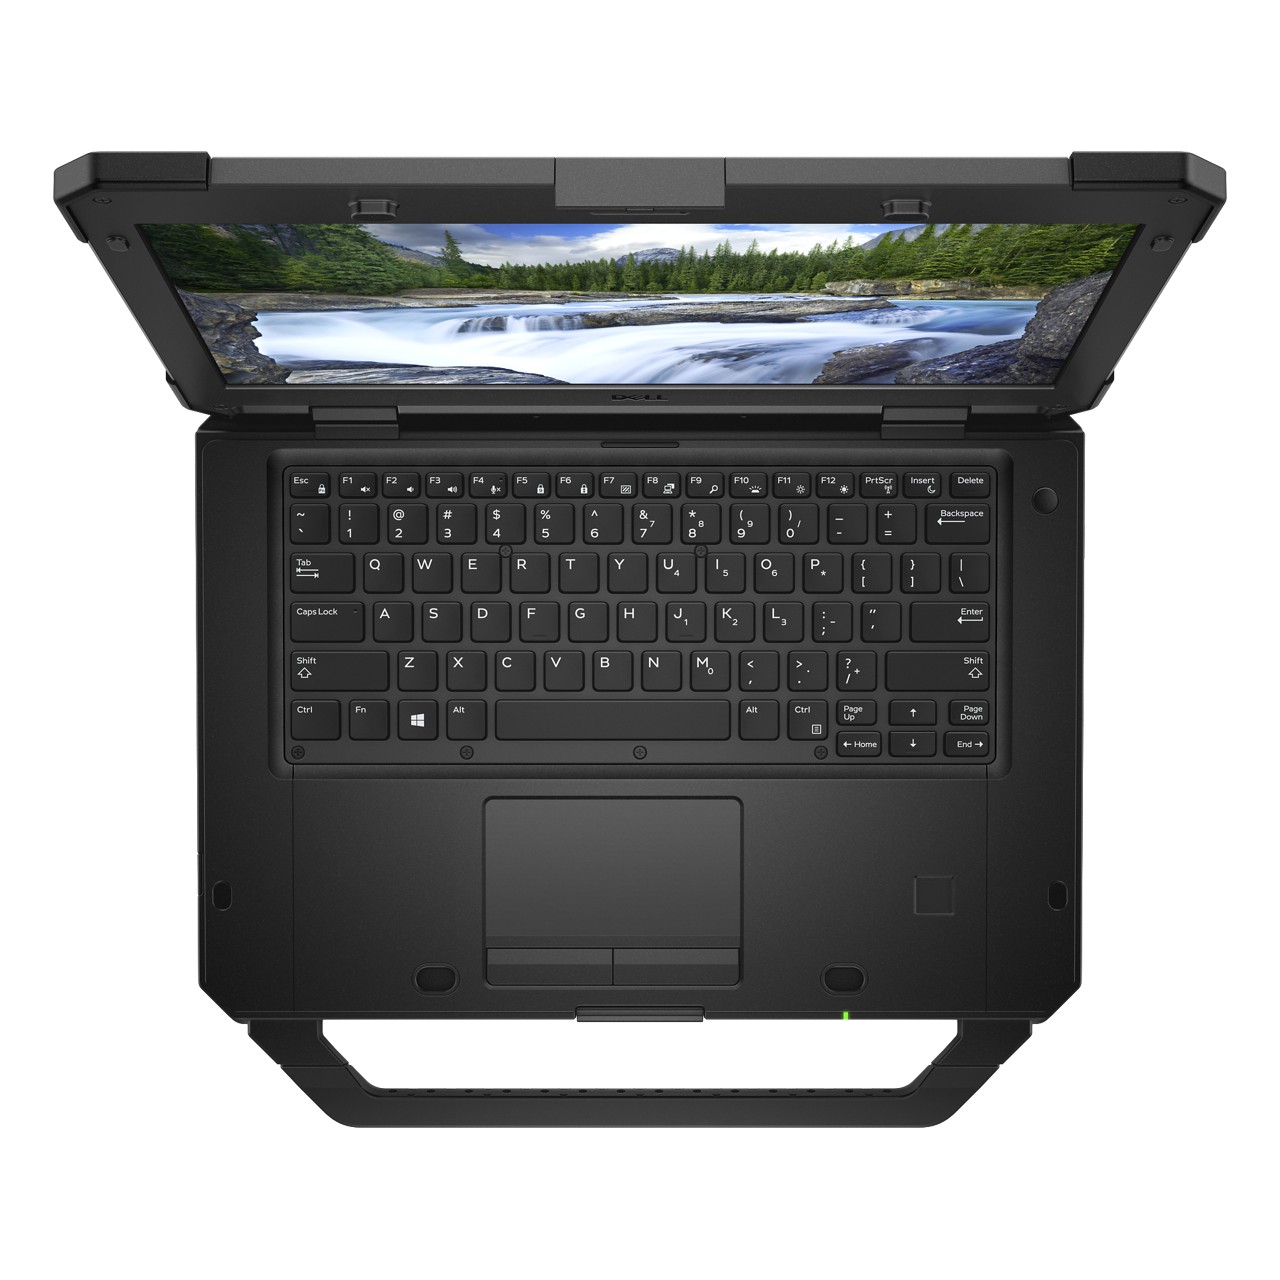
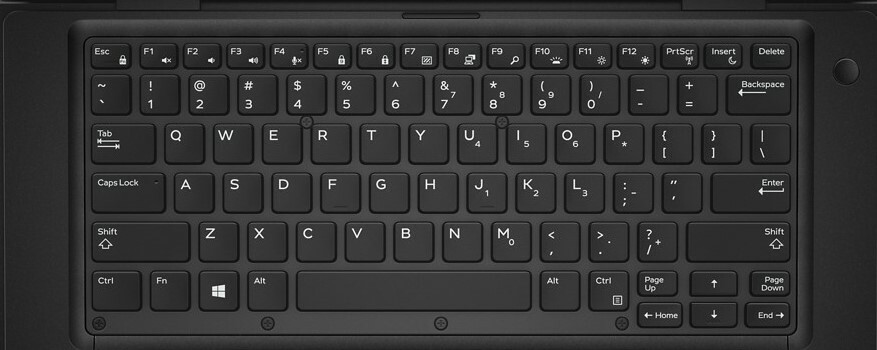
The keyboard is essentially the same as that found on the Latitude 5490 with a more durable backplate behind it. It carries the same soft pressure and quick response. Similarly, typing is very quiet, save for the space bar's occasional clatter. Our primary complaint is the small arrow keys, which take an adjustment to use efficiently. There is an optional 4-stage backlight. We also notice flickering at the highest brightness level, which may be indicative of a low PWM rate and may be distracting to some users.
Touchpad & Touchscreen
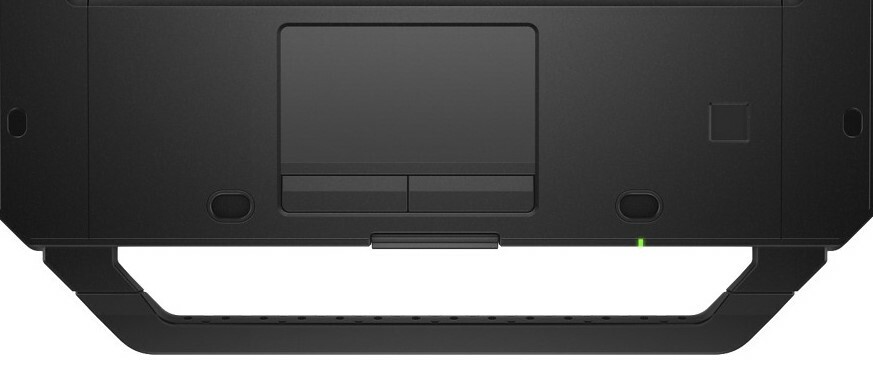
The touchpad is excellent. Unlike other Dell Rugged laptops that opt for resistive touchpads, the 5420 Rugged's touchpad uses the more common capacitive design. Again, the touchpad is extremely similar to that of the Latitude 5490, which is good. Tracking is smooth, gestures fire off accurately, and the textured surface feels good underhand. The pad itself is immovable, and the dedicated buttons feel well-built and offer a quiet, responsive click. There is sadly no option for a pointing stick, which prohibits cursor input for gloved users.
The optional capacitive touchscreen is likewise responsive and accurate. Touch input is precise and scrolling is smooth. Unfortunately, the touchscreen is also unusable with gloves.
Display
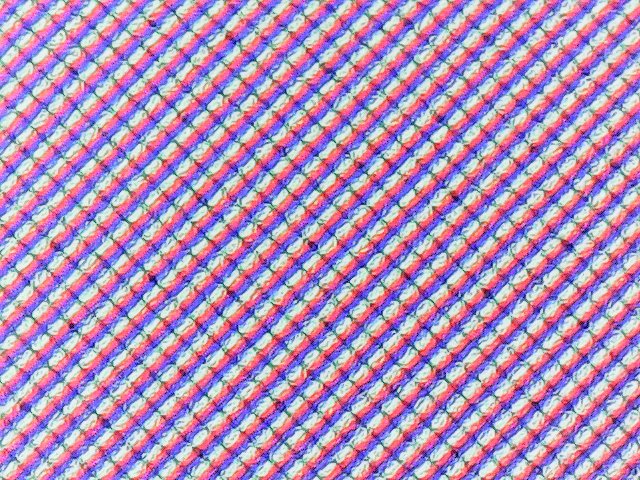
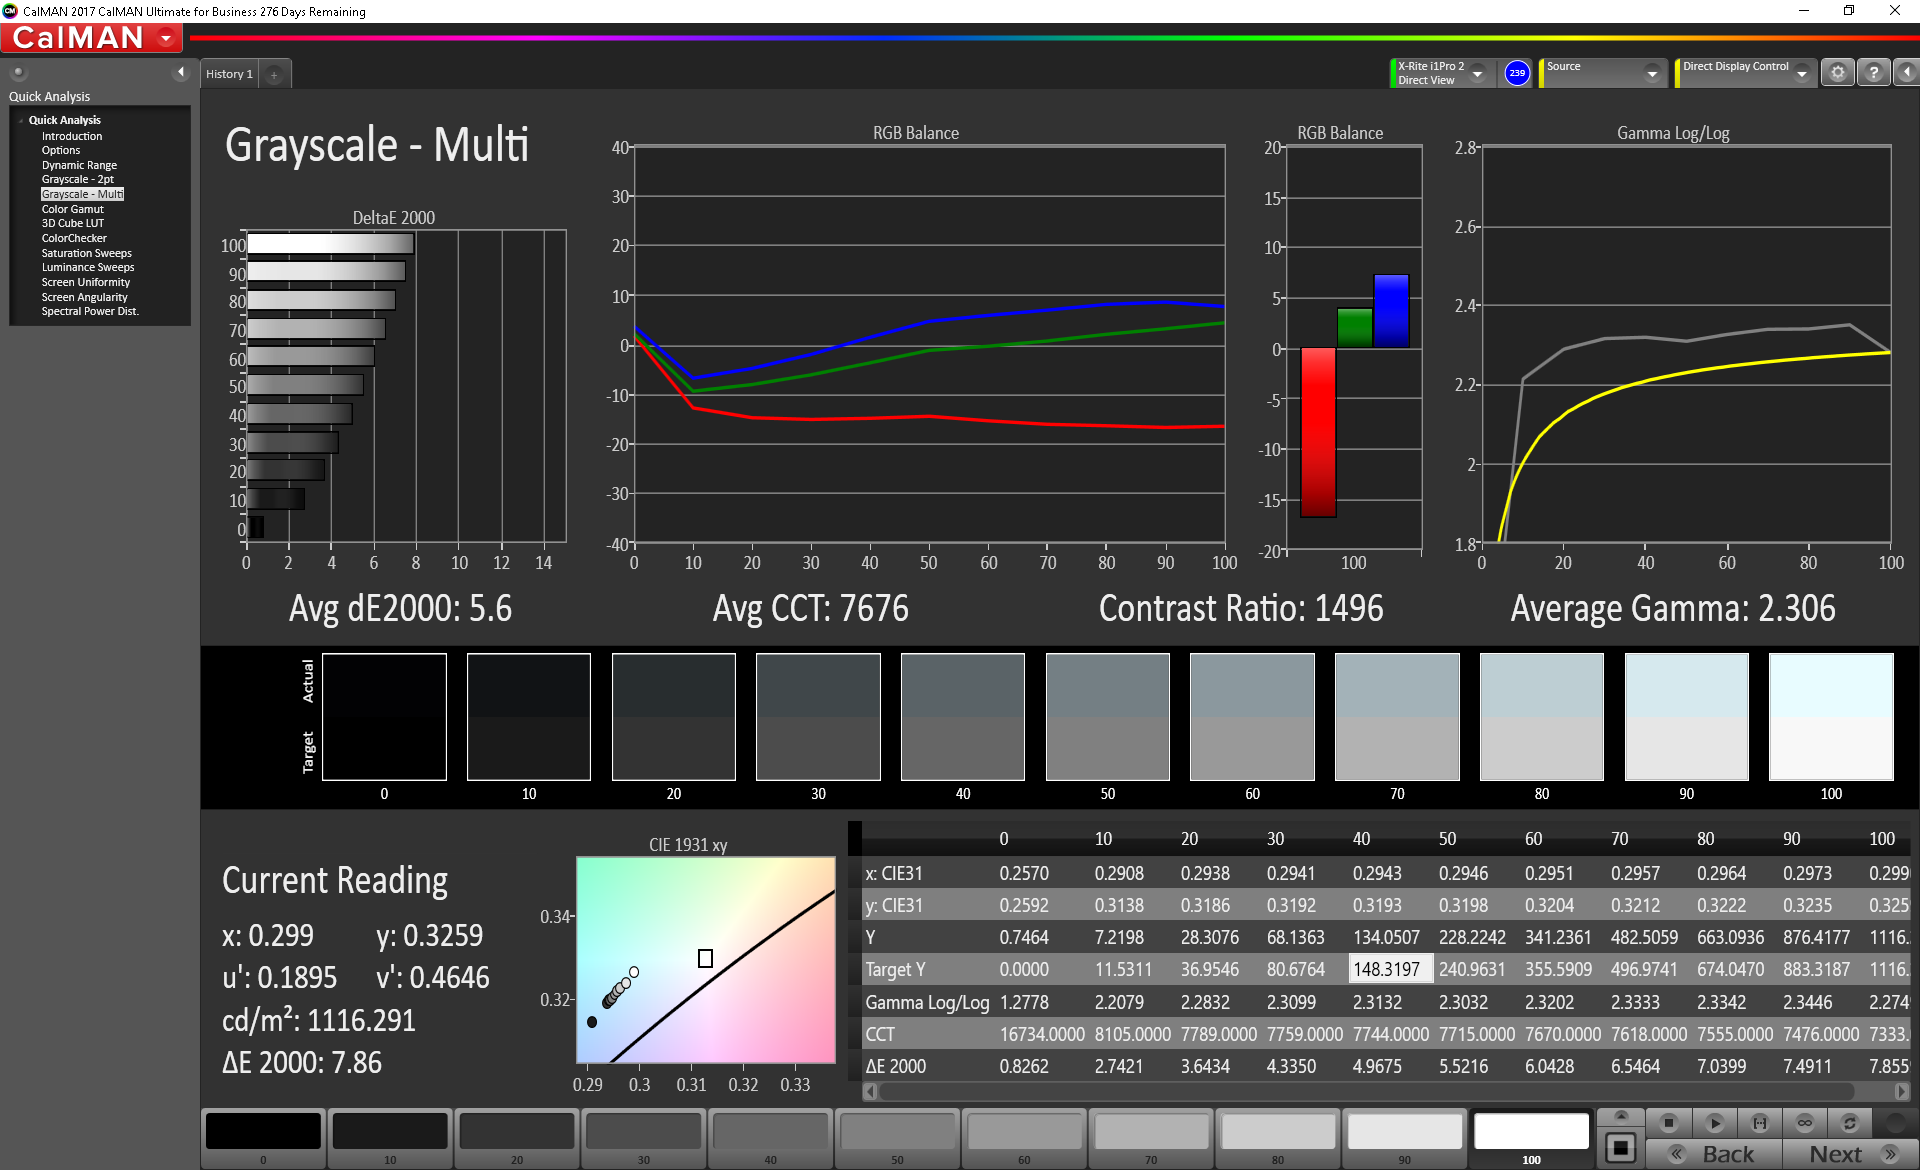
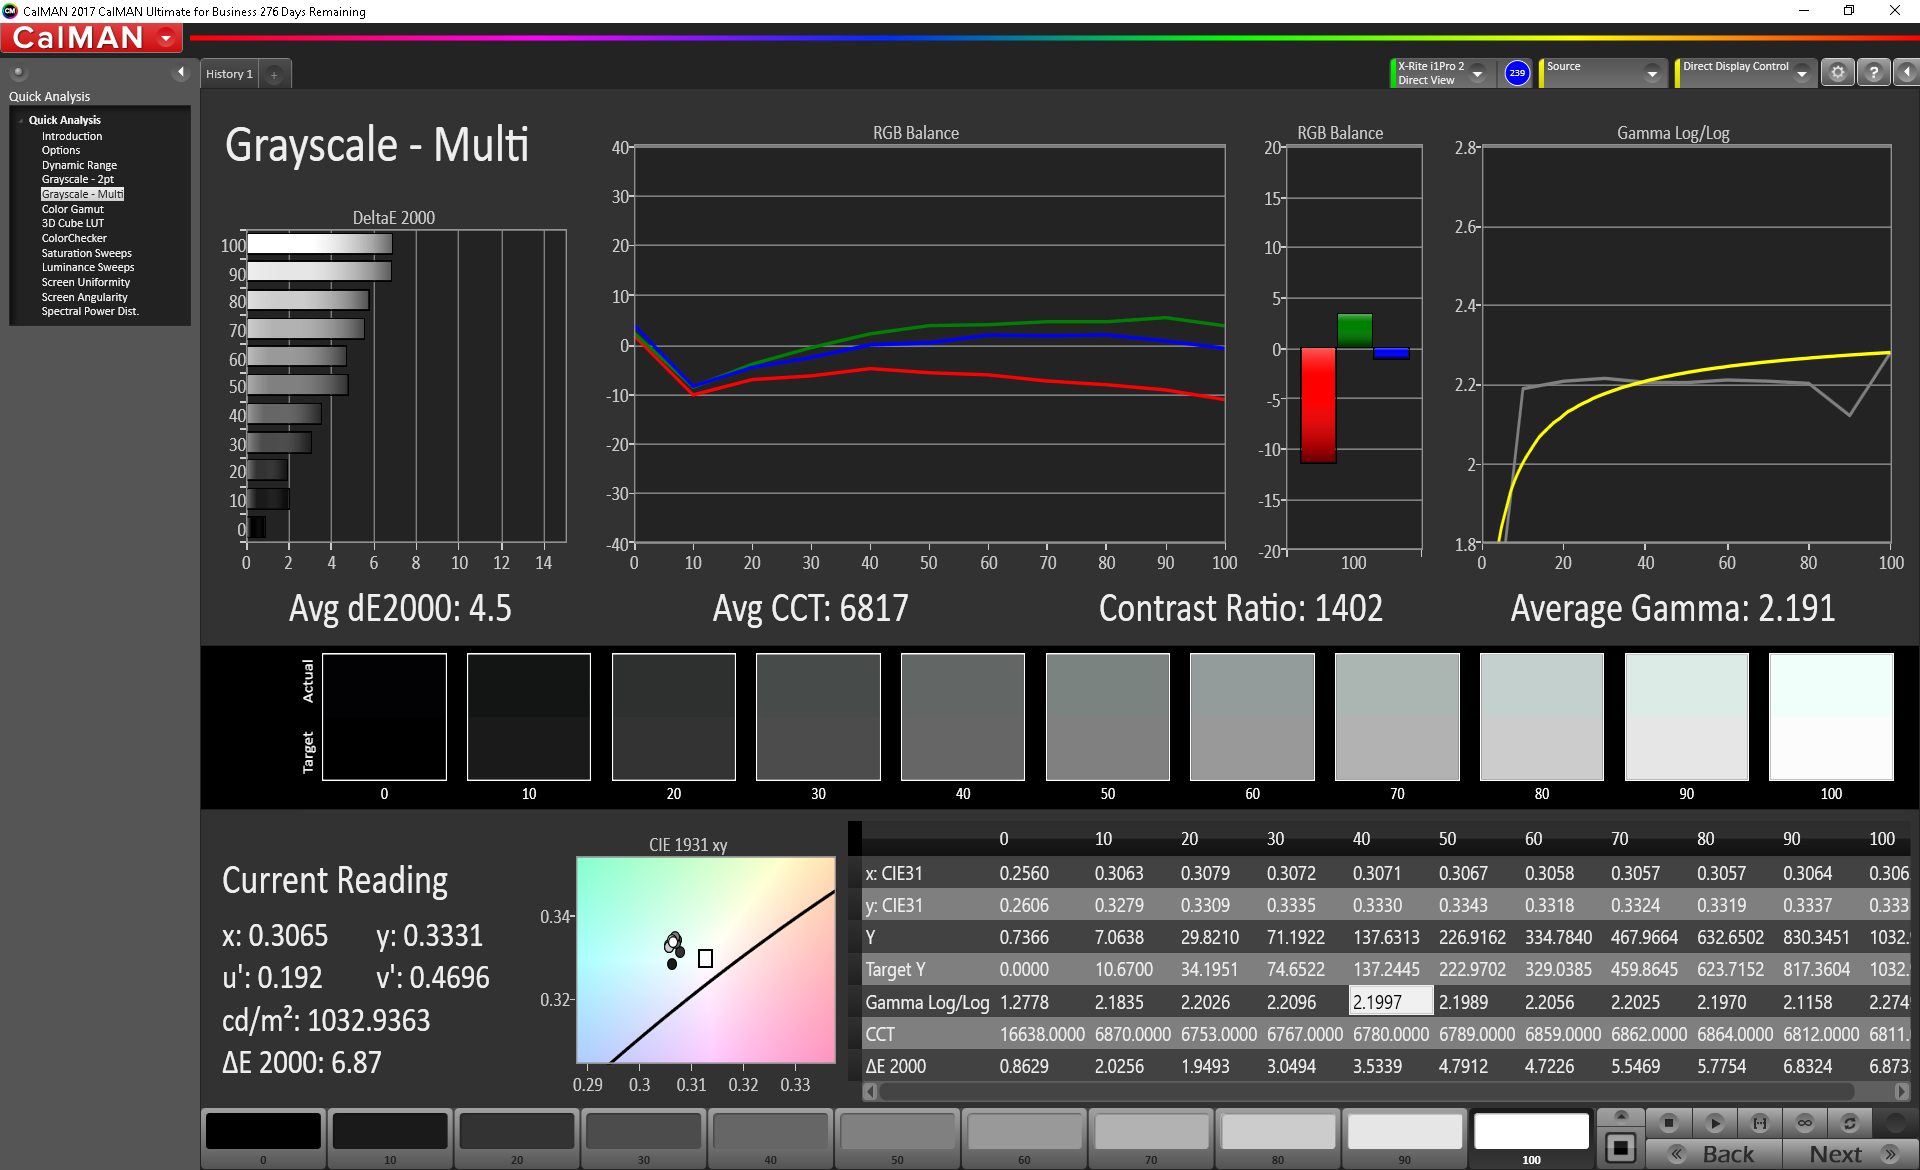
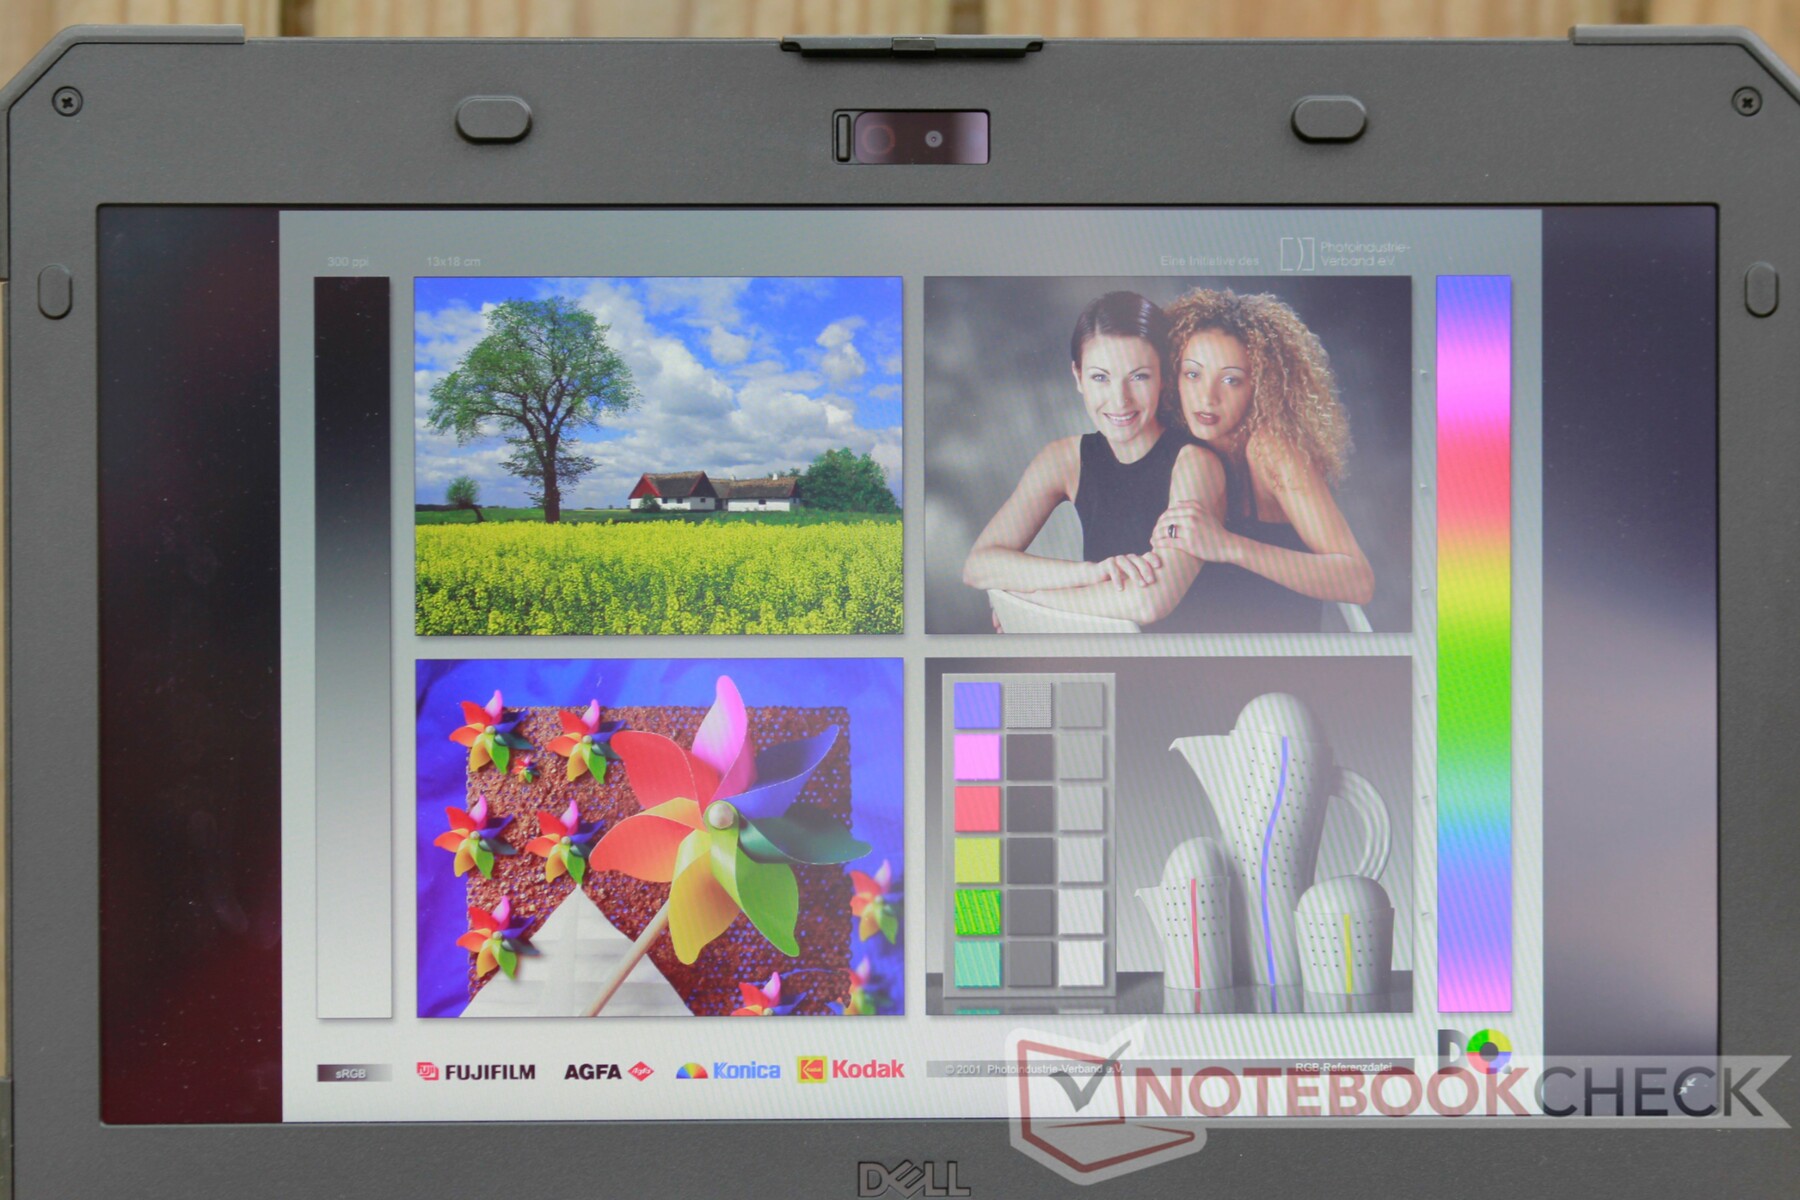
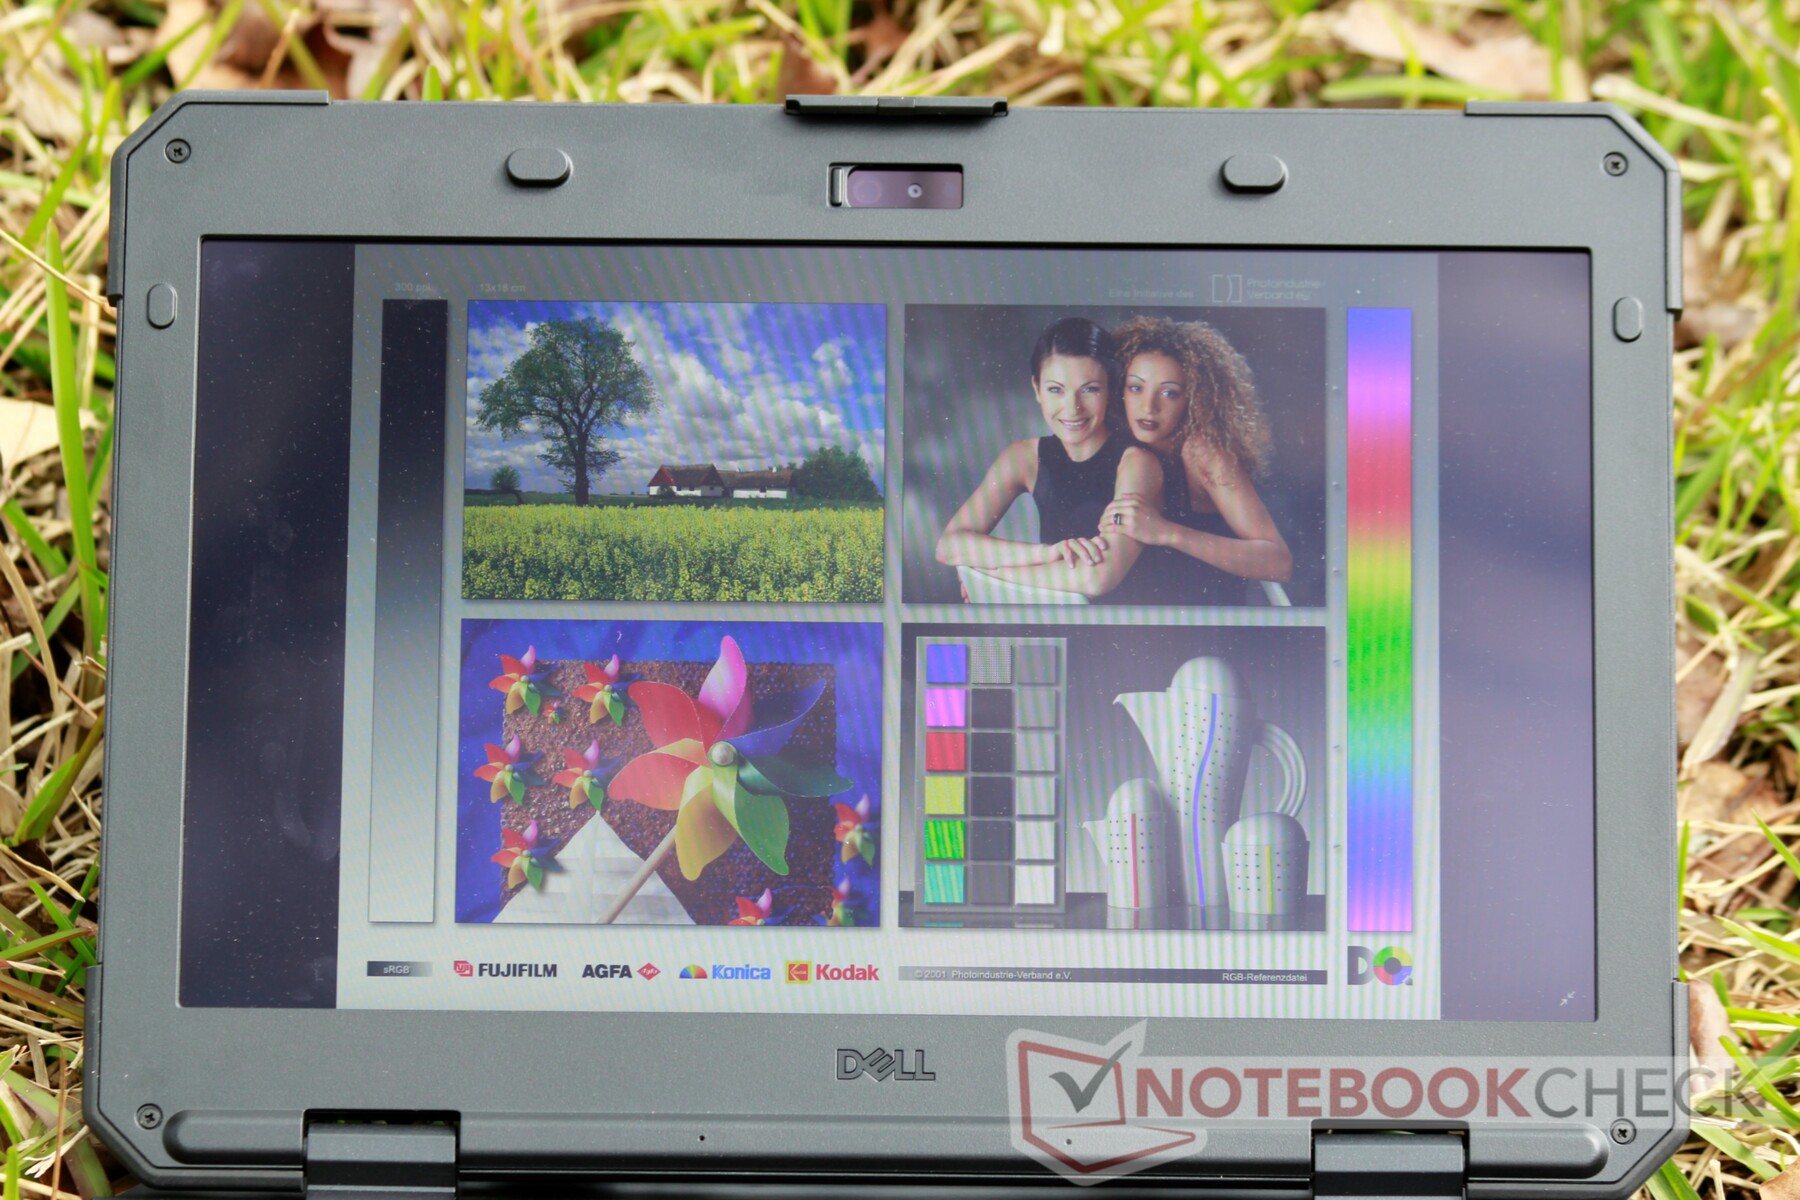
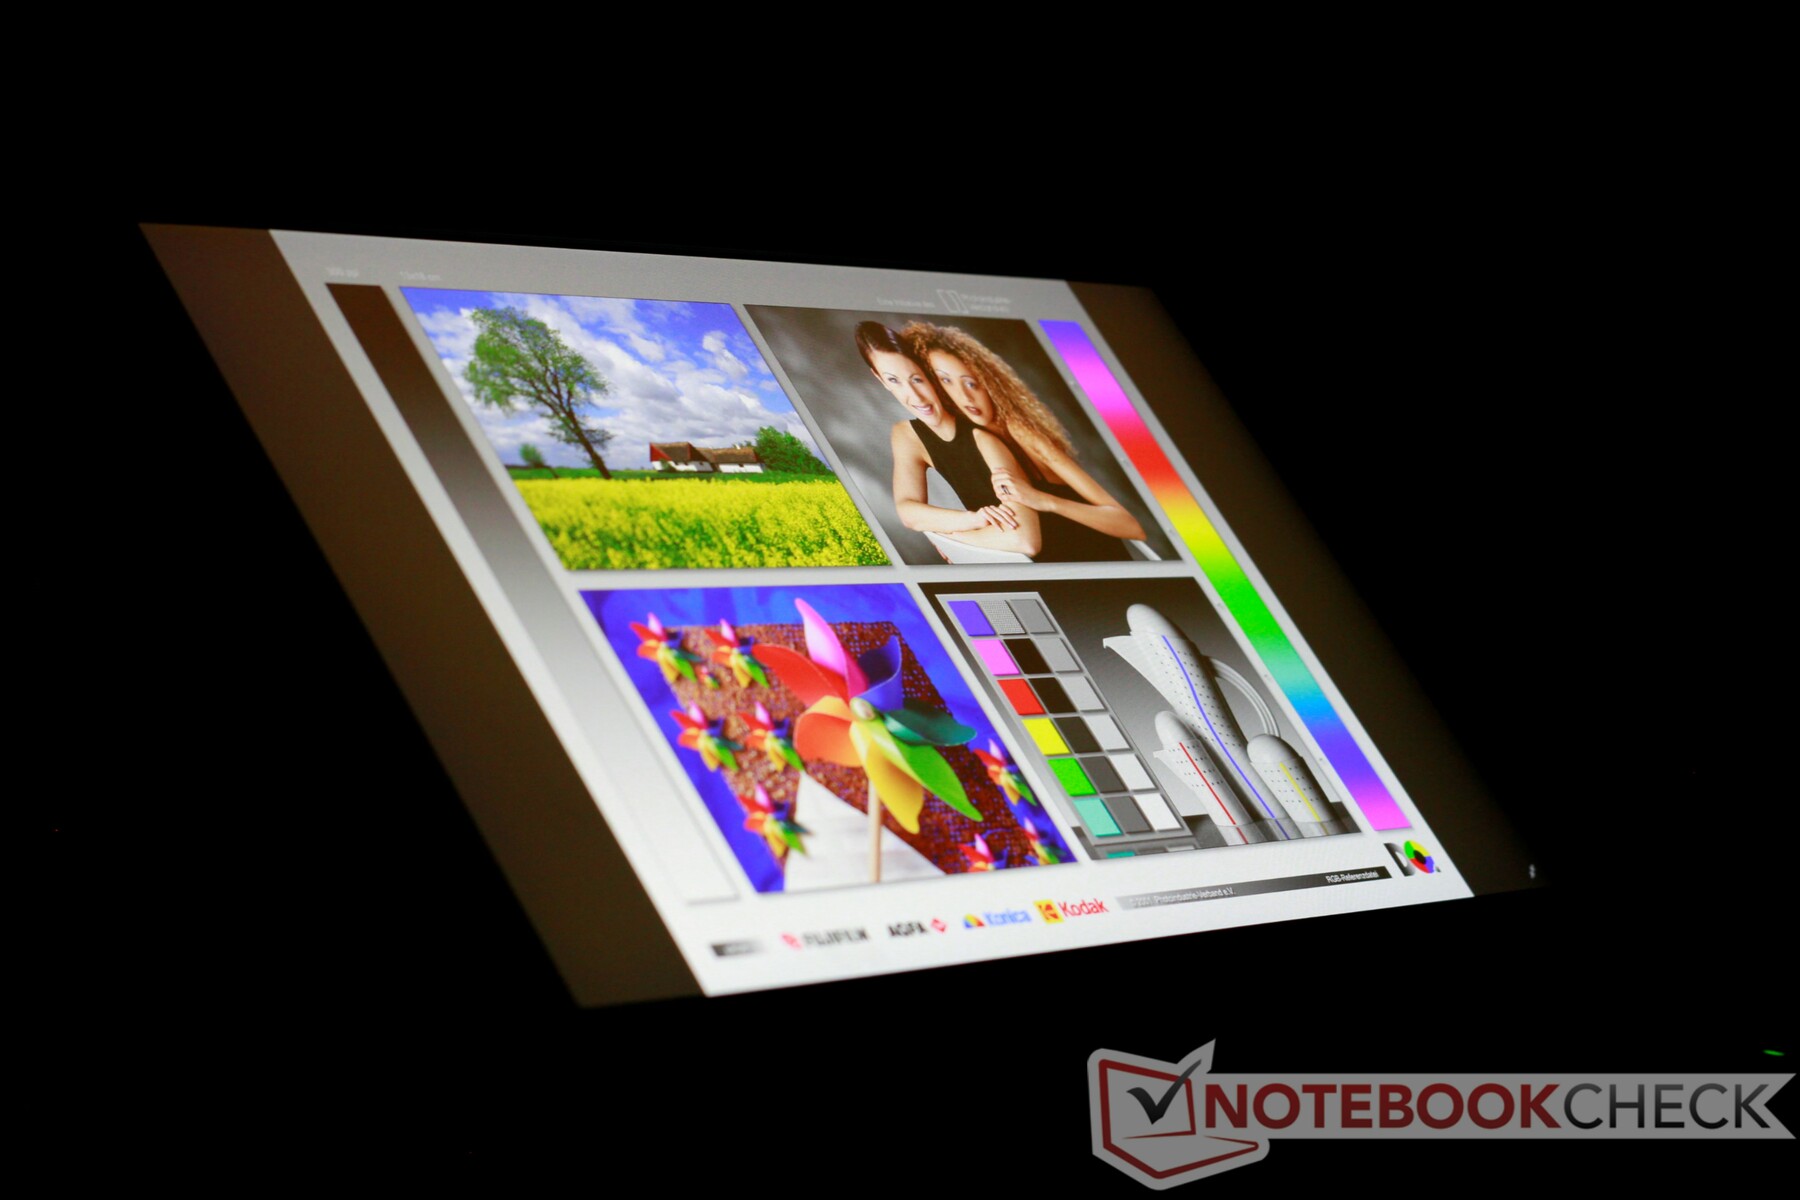
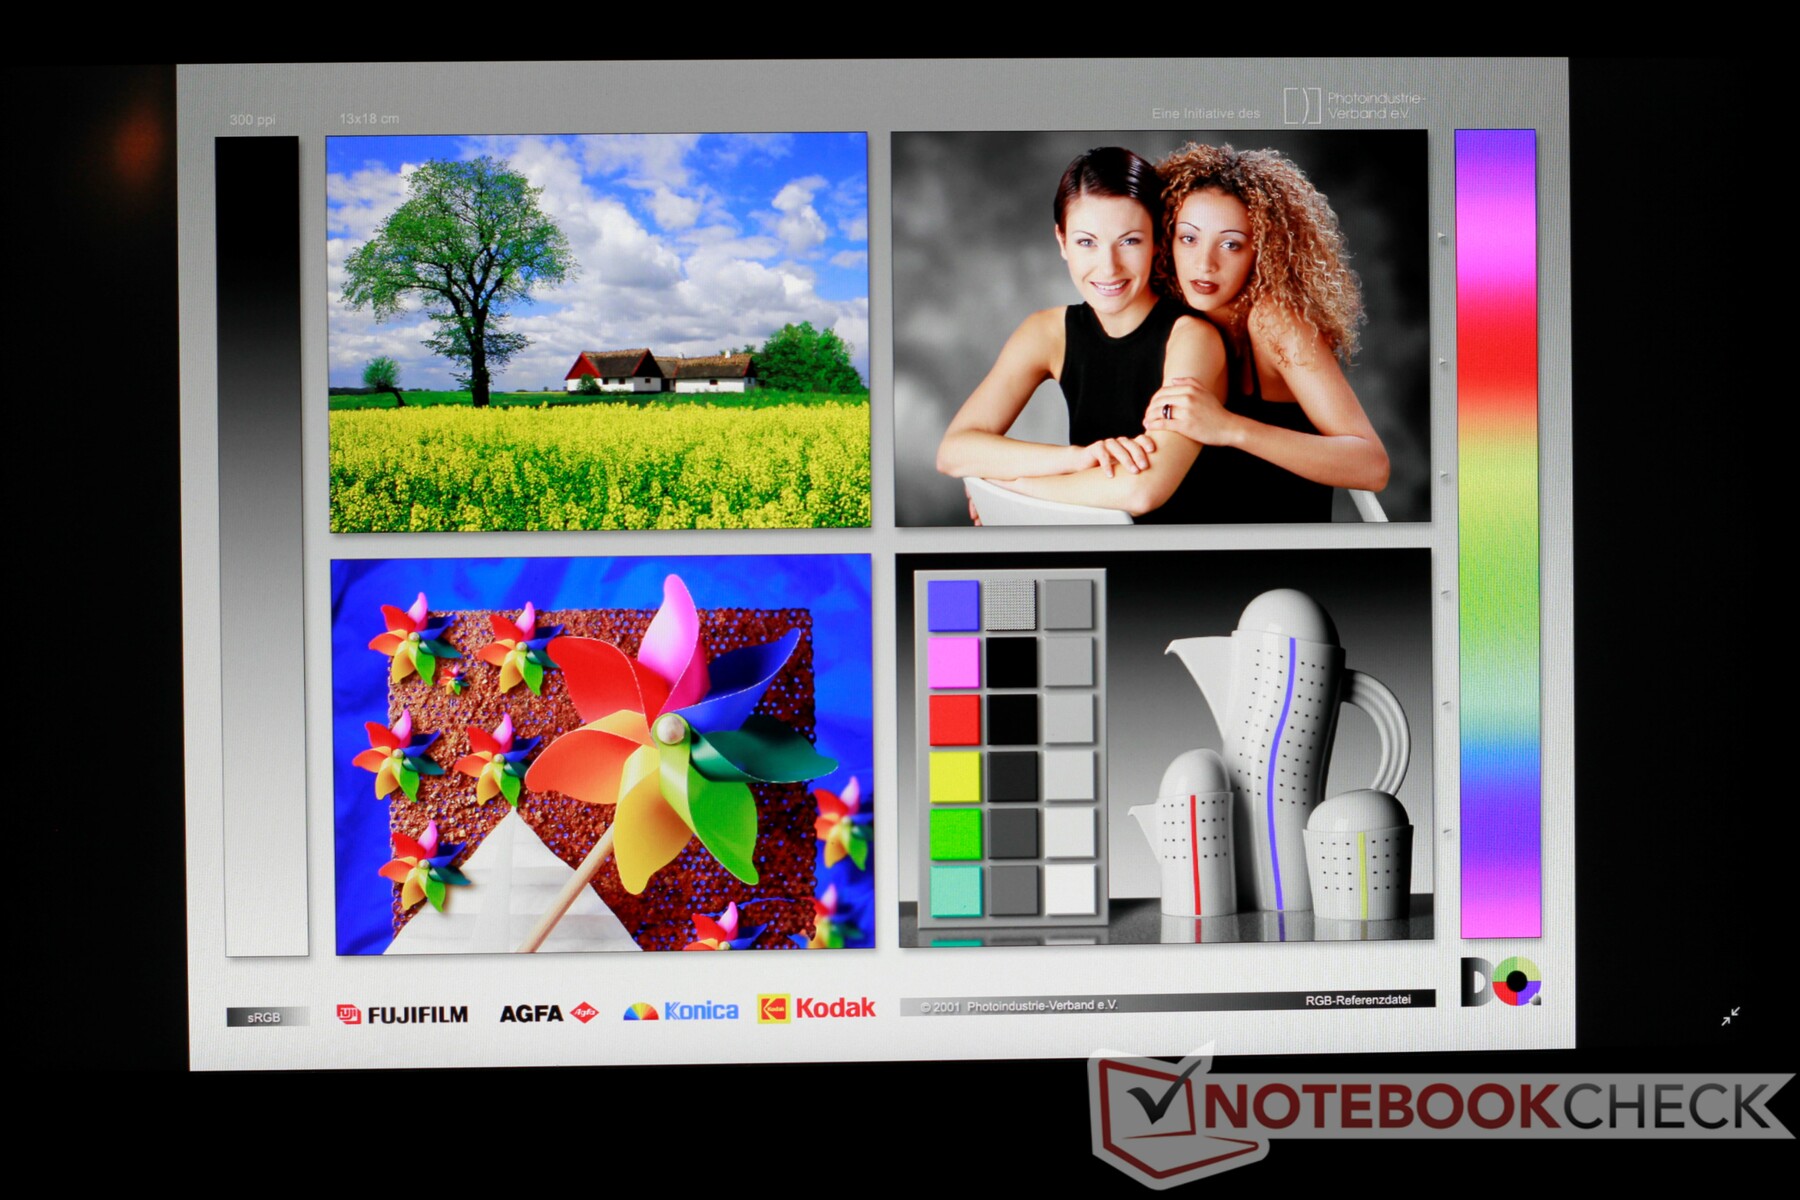
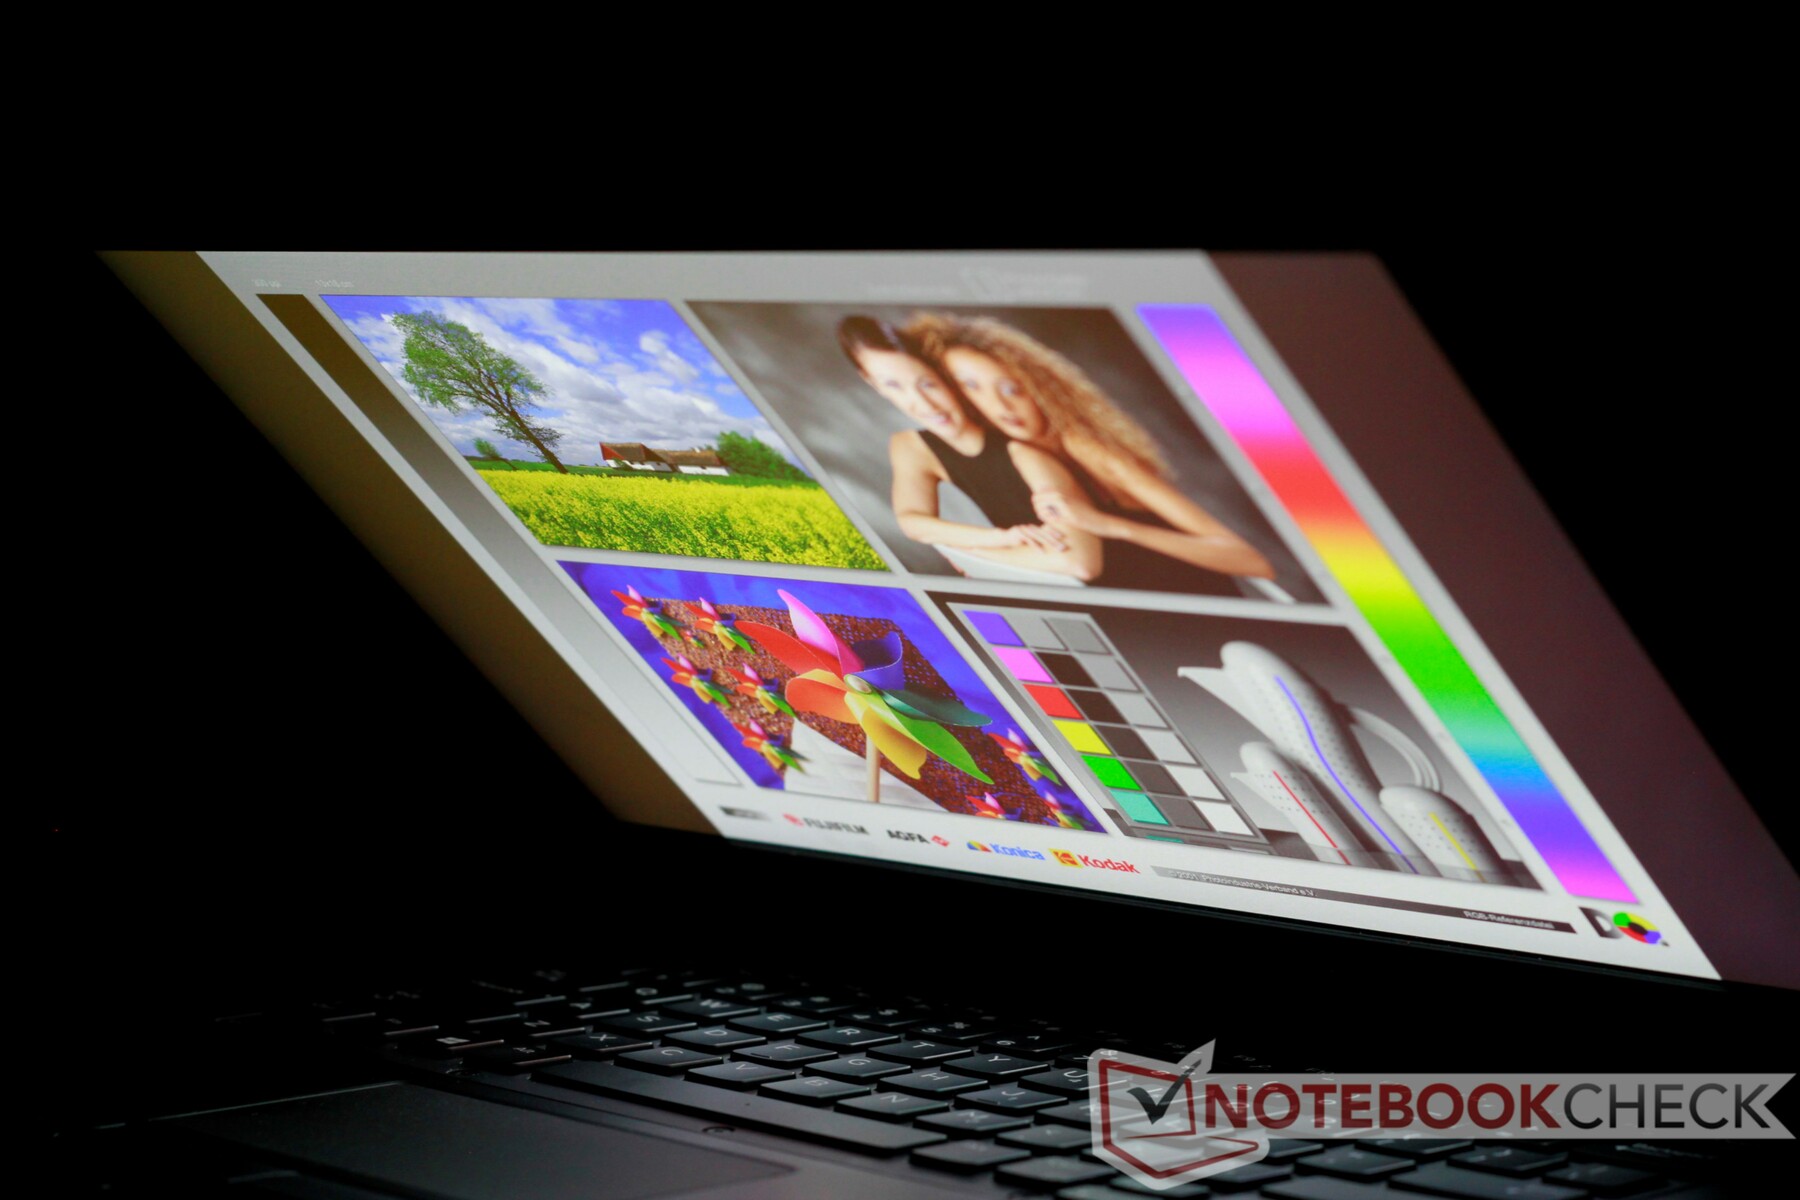
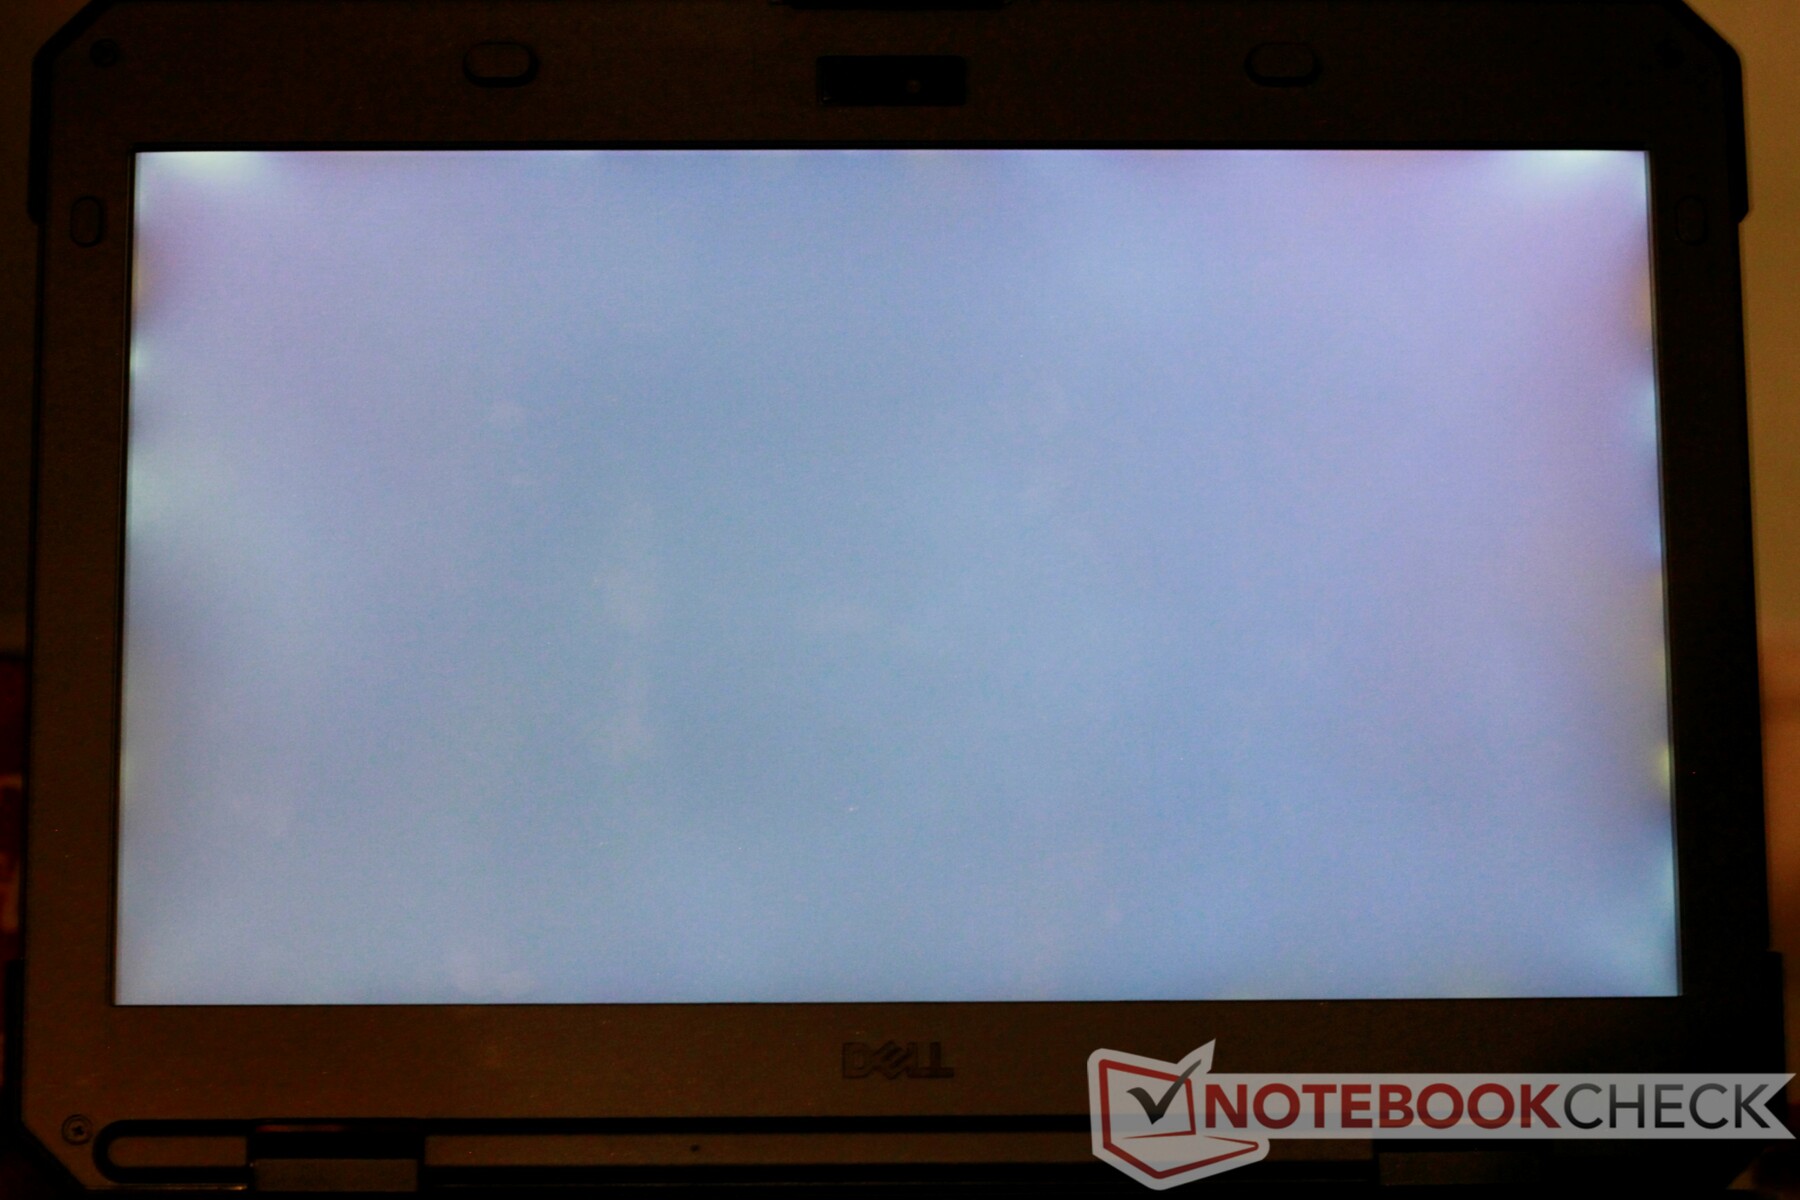
The display is an outdoorsman's dream. At over 1000 nits, the Latitude 5420 Rugged boasts one of the brightest displays we have seen. The Full HD IPS panel is easily readable in any lighting condition, including under direct sunlight. The matte finish across the display also kills reflections, although it does cause whites and bright colors to look grainy from a standard viewing distance. Brightness distribution is a bit uneven, but this is not noticeable, especially at the highest setting. Contrast levels are good (1372:1), and blacks look fairly deep on the bright screen. The screen is a bit cool at 7676 K (ideal is 6500K), and whites have a very slight blue hue.
We do notice some odd behavior. Primarily, there appears to be PWM (735.5 Hz), but only at the highest brightness setting. This is strange, as PWM is typically a trick used to dim a display. All other brightness levels (99% and below) do not exhibit any measurable PWM. Secondly, the lowest brightness setting turns the display off briefly before engaging. Considering the screen drops to about 2 cd/m² at this level, it's likely the backlight is briefly powered off and restarted to get that dim. The display will sometimes cut off for a half second when brightening the backlight, but this does not occur every time.
| |||||||||||||||||||||||||
Brightness Distribution: 80 %
Center on Battery: 1111.7 cd/m²
Contrast: 1372:1 (Black: 0.81 cd/m²)
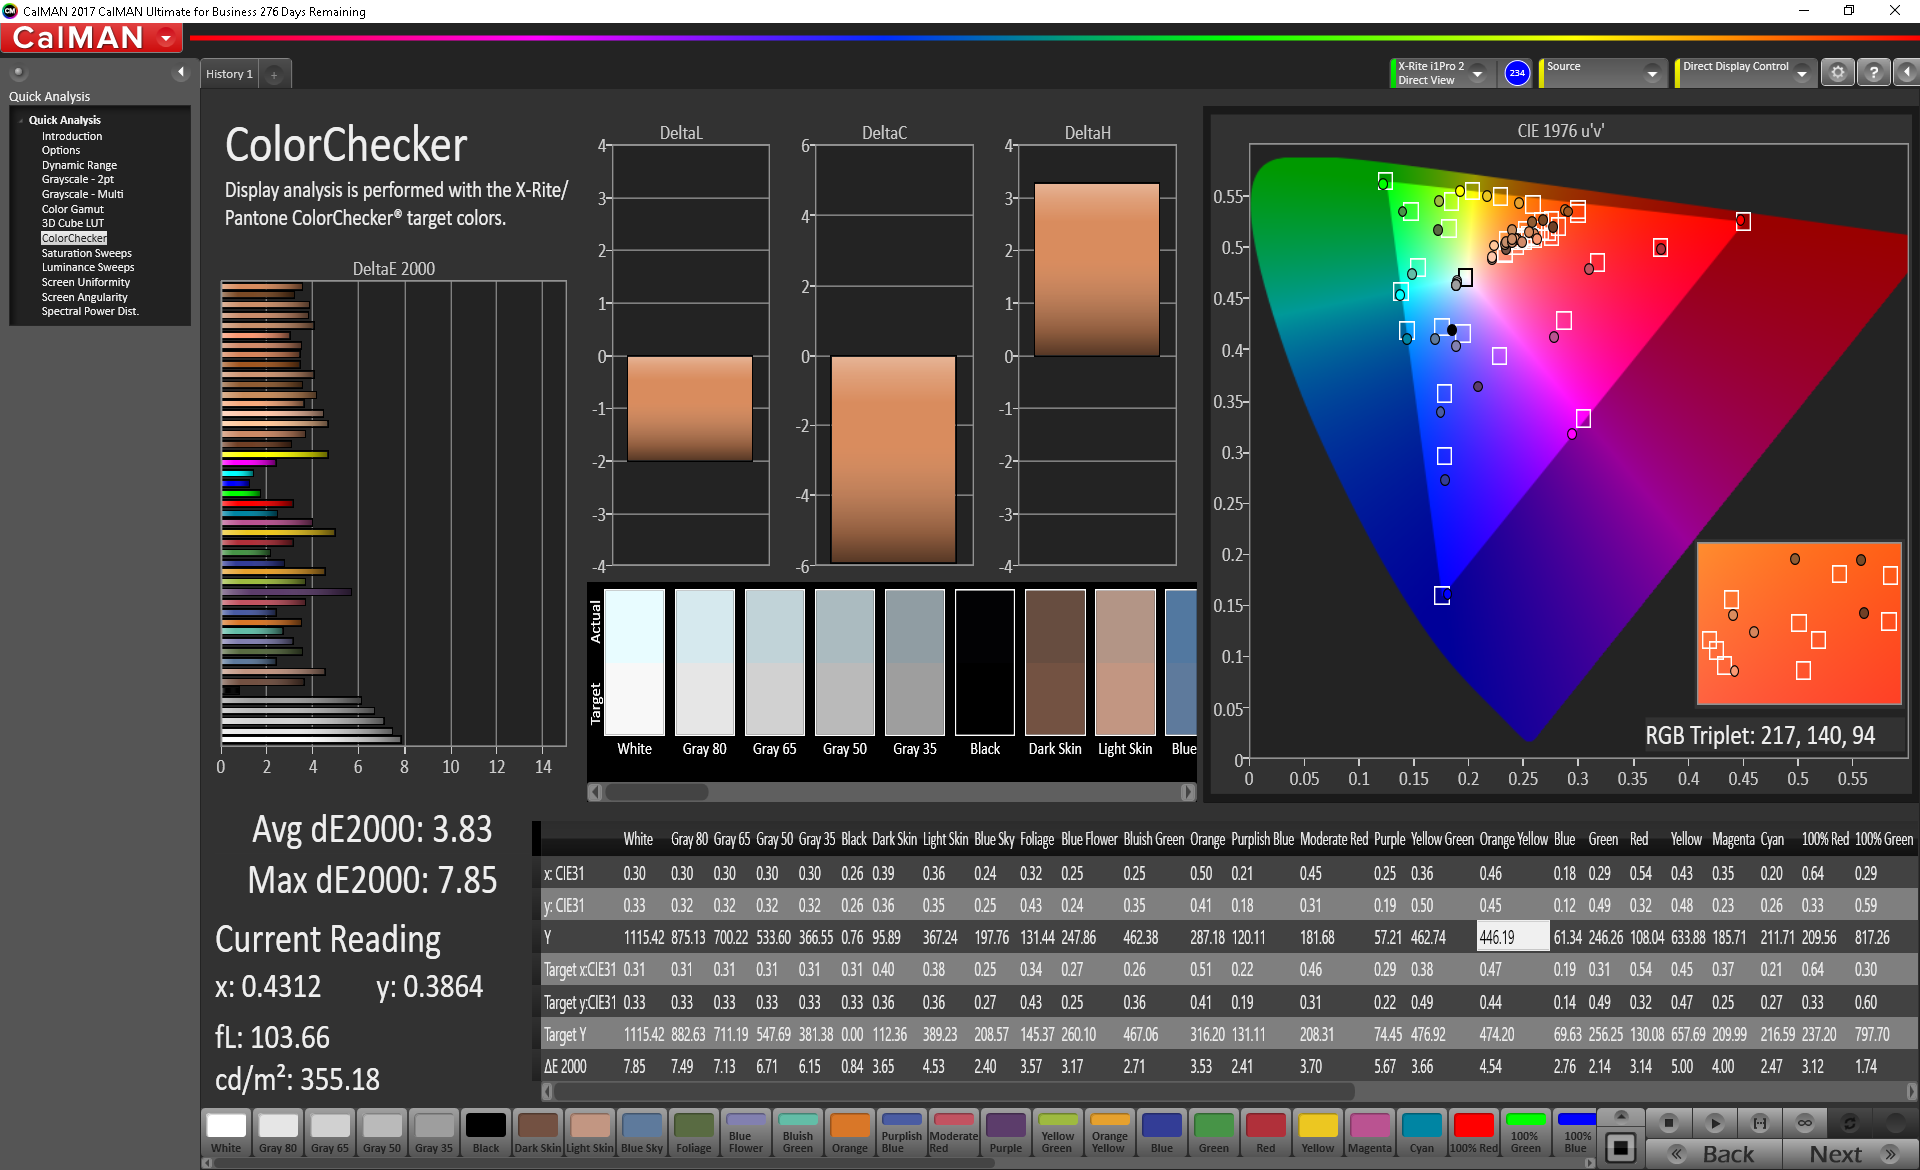
ΔE ColorChecker Calman: 3.83 | ∀{0.5-29.43 Ø4.73}
calibrated: 2.98
ΔE Greyscale Calman: 5.6 | ∀{0.09-98 Ø4.97}
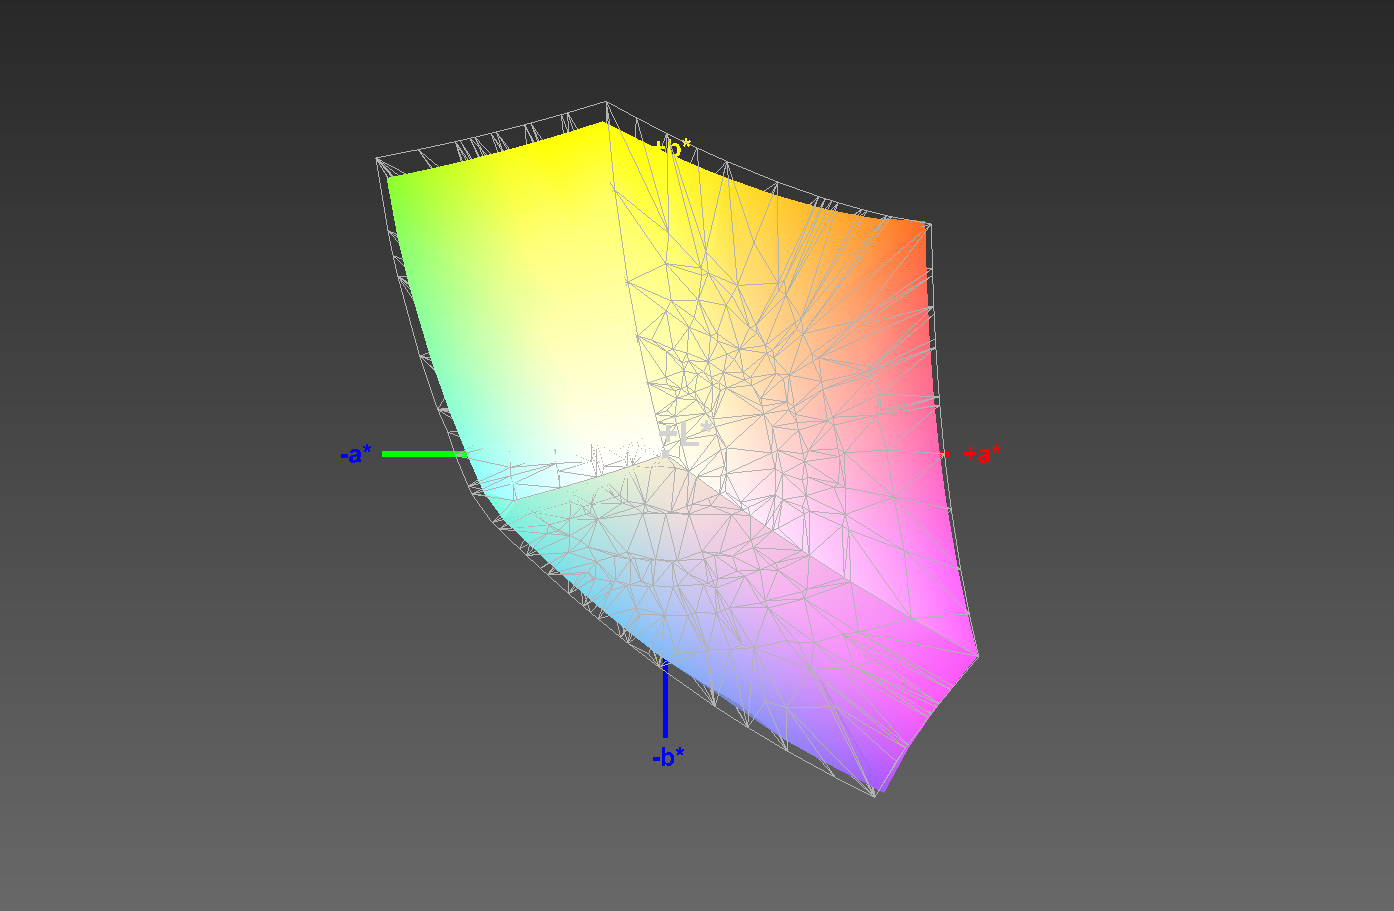
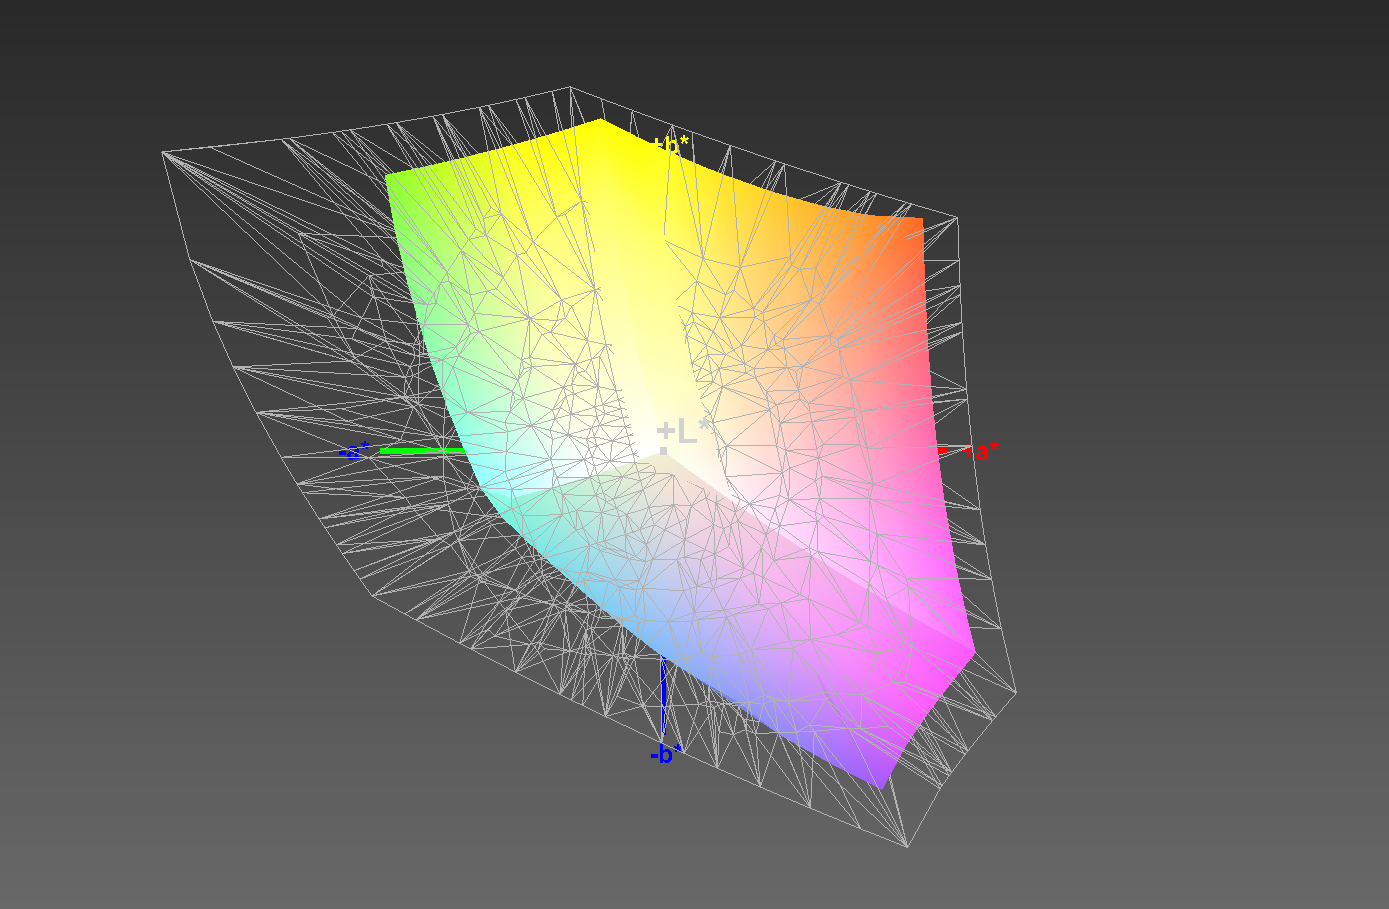
93% sRGB (Argyll 1.6.3 3D)
59% AdobeRGB 1998 (Argyll 1.6.3 3D)
64.2% AdobeRGB 1998 (Argyll 3D)
92.4% sRGB (Argyll 3D)
62.5% Display P3 (Argyll 3D)
Gamma: 2.306
CCT: 7676 K
| Dell Latitude 5420 Rugged-P85G AU Optronics AUO523D, IPS, 14", 1920x1080 | Panasonic Toughbook CF-54G2999VM B140XTN, AUO2E3C, TN LED, 14", 1366x768 | Getac S410 CMN N140BGE-E33, TN PED, 14", 1366x768 | Lenovo ThinkPad T480-20L50010US B140HAK01.0, TFT-LCD, 14", 1920x1080 | Dell Latitude 5490 AUO133D, IPS, 14", 1920x1080 | HP EliteBook 840 G4-Z2V49ET ABD AUO123D, TN, 14", 1920x1080 | |
|---|---|---|---|---|---|---|
| Display | -40% | -35% | -42% | -41% | -11% | |
| Display P3 Coverage (%) | 62.5 | 37.36 -40% | 40.46 -35% | 36.31 -42% | 36.42 -42% | 55.8 -11% |
| sRGB Coverage (%) | 92.4 | 56.1 -39% | 60.9 -34% | 54.5 -41% | 54.6 -41% | 80.7 -13% |
| AdobeRGB 1998 Coverage (%) | 64.2 | 38.62 -40% | 41.8 -35% | 37.51 -42% | 37.62 -41% | 57.7 -10% |
| Response Times | 43% | 49% | 25% | 37% | 38% | |
| Response Time Grey 50% / Grey 80% * (ms) | 68 ? | 43.2 ? 36% | 41.2 ? 39% | 39.2 ? 42% | 30.4 ? 55% | 39 ? 43% |
| Response Time Black / White * (ms) | 33.6 ? | 17.2 ? 49% | 14 ? 58% | 30.8 ? 8% | 27.2 ? 19% | 23 ? 32% |
| PWM Frequency (Hz) | 735 ? | 877 ? | ||||
| Screen | -90% | -87% | -51% | -55% | -53% | |
| Brightness middle (cd/m²) | 1111.7 | 174.5 -84% | 265.1 -76% | 276.7 -75% | 200.6 -82% | 346 -69% |
| Brightness (cd/m²) | 1026 | 164 -84% | 246 -76% | 272 -73% | 204 -80% | 317 -69% |
| Brightness Distribution (%) | 80 | 71 -11% | 81 1% | 90 13% | 87 9% | 86 8% |
| Black Level * (cd/m²) | 0.81 | 0.6 26% | 0.58 28% | 0.21 74% | 0.16 80% | 0.86 -6% |
| Contrast (:1) | 1372 | 291 -79% | 457 -67% | 1318 -4% | 1254 -9% | 402 -71% |
| Colorchecker dE 2000 * | 3.83 | 12.05 -215% | 14.24 -272% | 7.22 -89% | 8.36 -118% | 8.64 -126% |
| Colorchecker dE 2000 max. * | 7.85 | 27.5 -250% | 26.66 -240% | 25.87 -230% | 25.63 -226% | 13.58 -73% |
| Colorchecker dE 2000 calibrated * | 2.98 | 4.34 -46% | 3.94 -32% | 5.01 -68% | 4.6 -54% | |
| Greyscale dE 2000 * | 5.6 | 14.8 -164% | 14.2 -154% | 6.7 -20% | 7.7 -38% | 11.24 -101% |
| Gamma | 2.306 95% | 1.4 157% | 2.03 108% | 2.321 95% | 2.773 79% | 2.62 84% |
| CCT | 7676 85% | 14529 45% | 17152 38% | 6656 98% | 6397 102% | 12530 52% |
| Color Space (Percent of AdobeRGB 1998) (%) | 59 | 35.7 -39% | 38.7 -34% | 34 -42% | 34.5 -42% | 52 -12% |
| Color Space (Percent of sRGB) (%) | 93 | 56.2 -40% | 61 -34% | 54 -42% | 54.2 -42% | 80 -14% |
| Total Average (Program / Settings) | -29% /
-64% | -24% /
-60% | -23% /
-39% | -20% /
-41% | -9% /
-33% |
* ... smaller is better
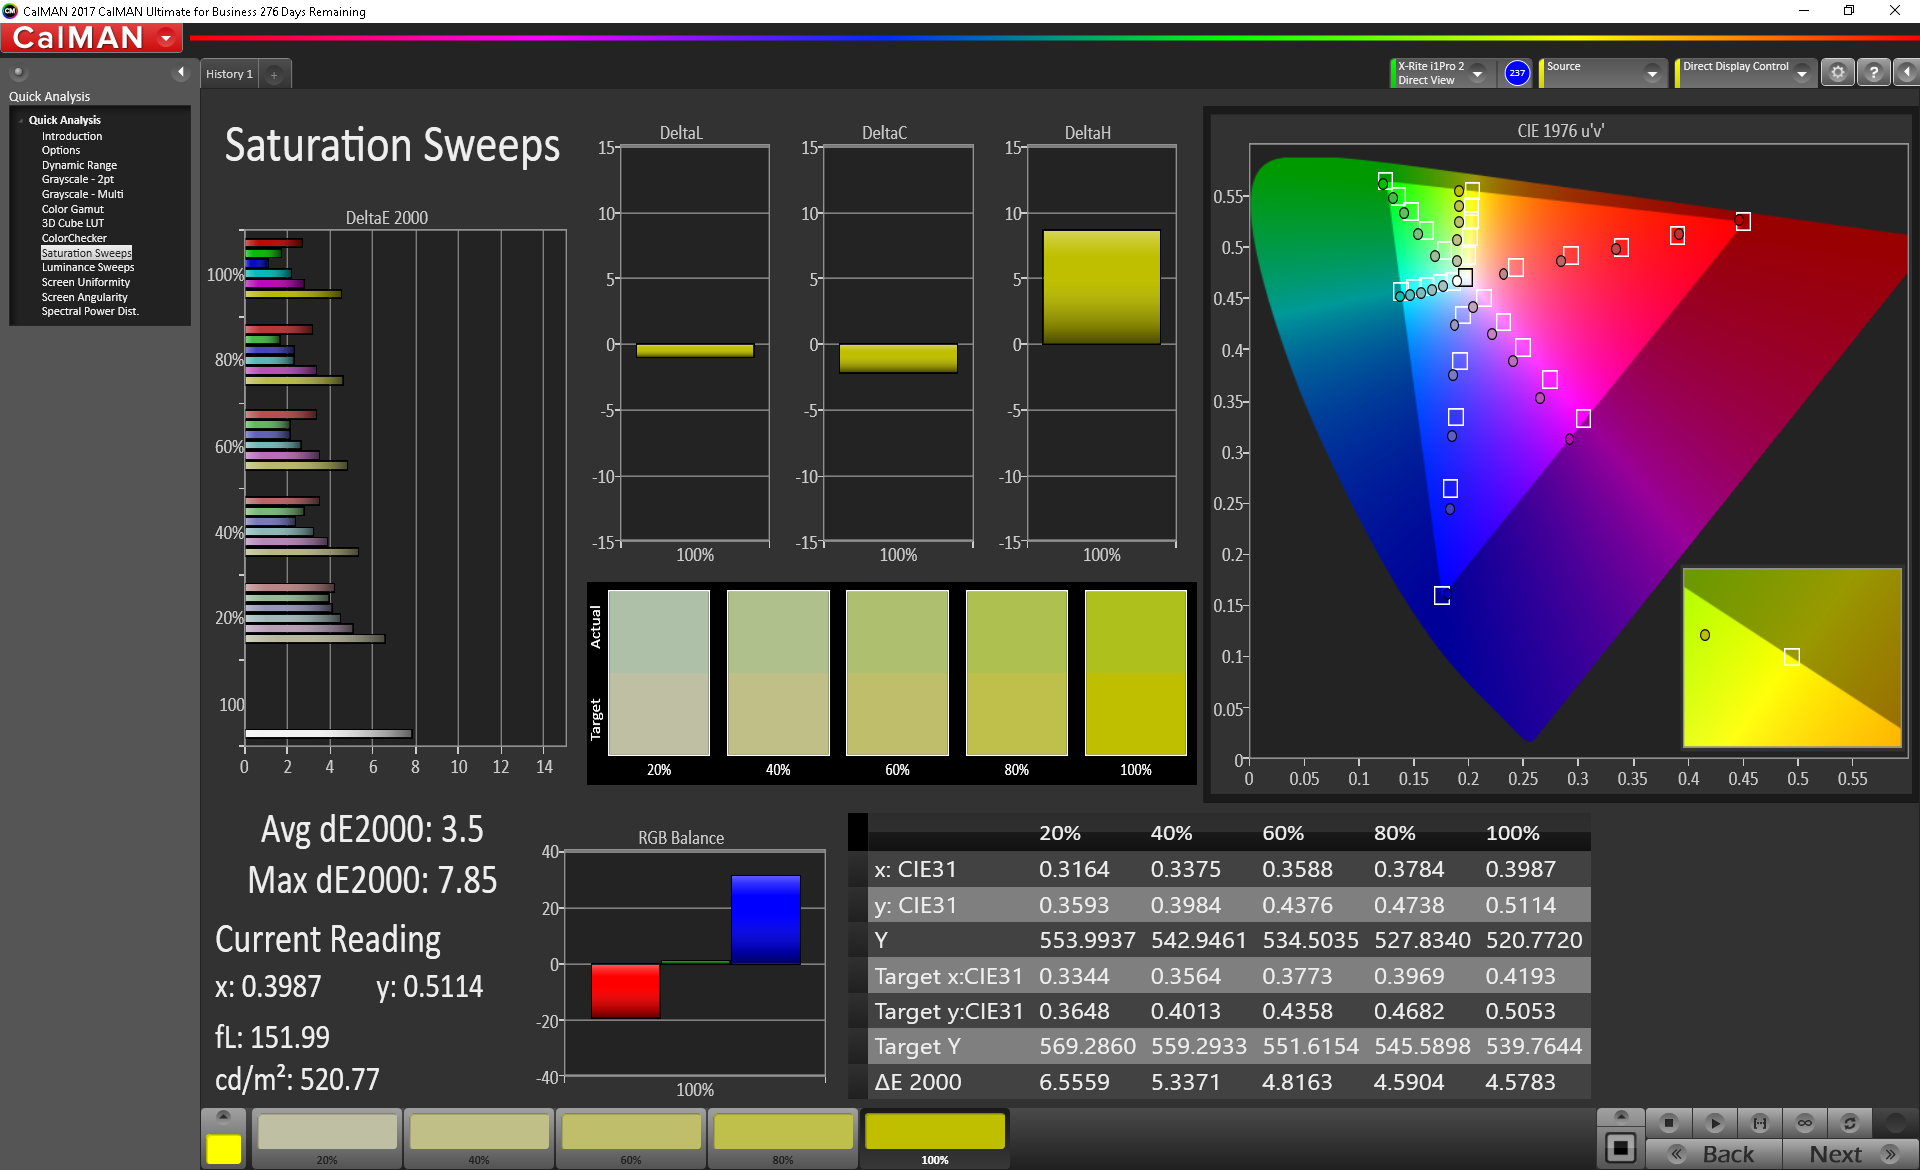
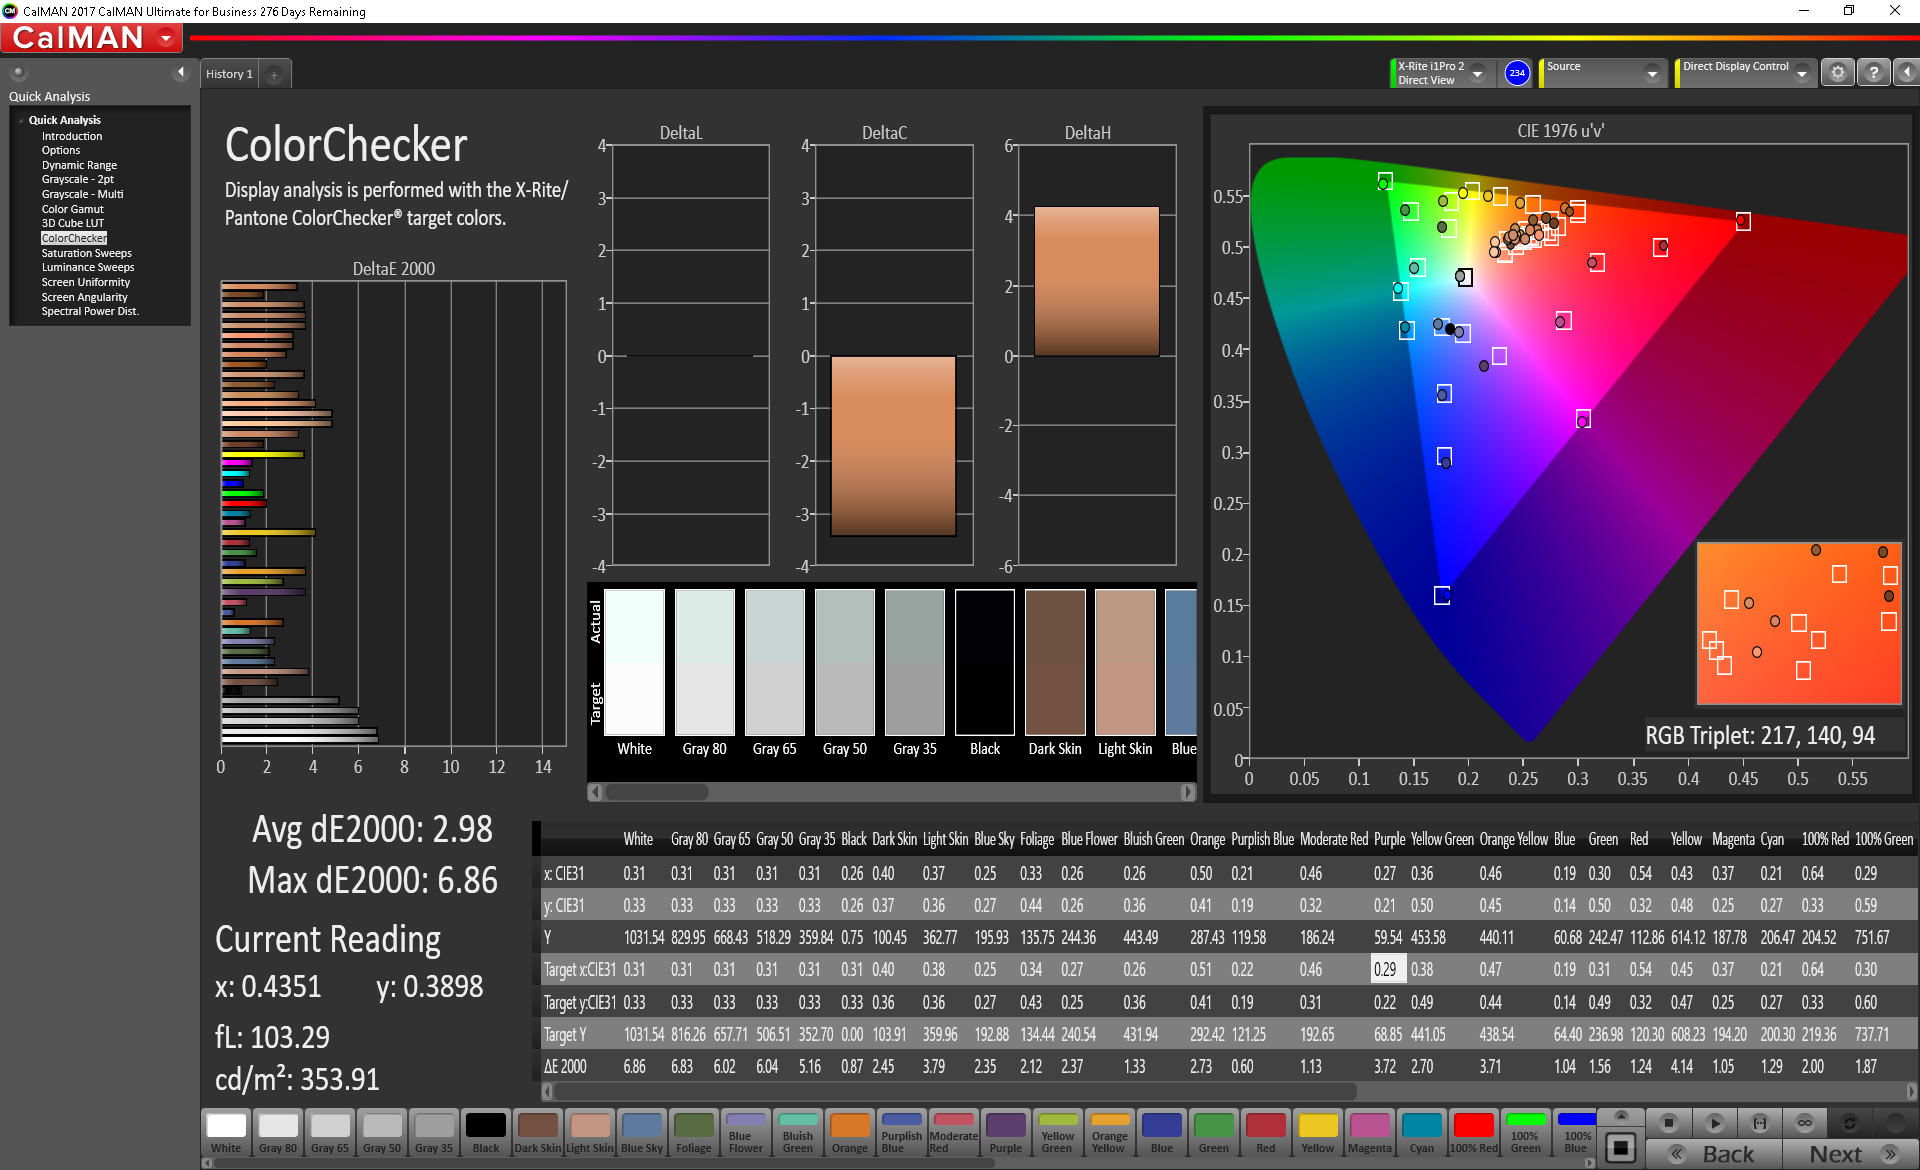
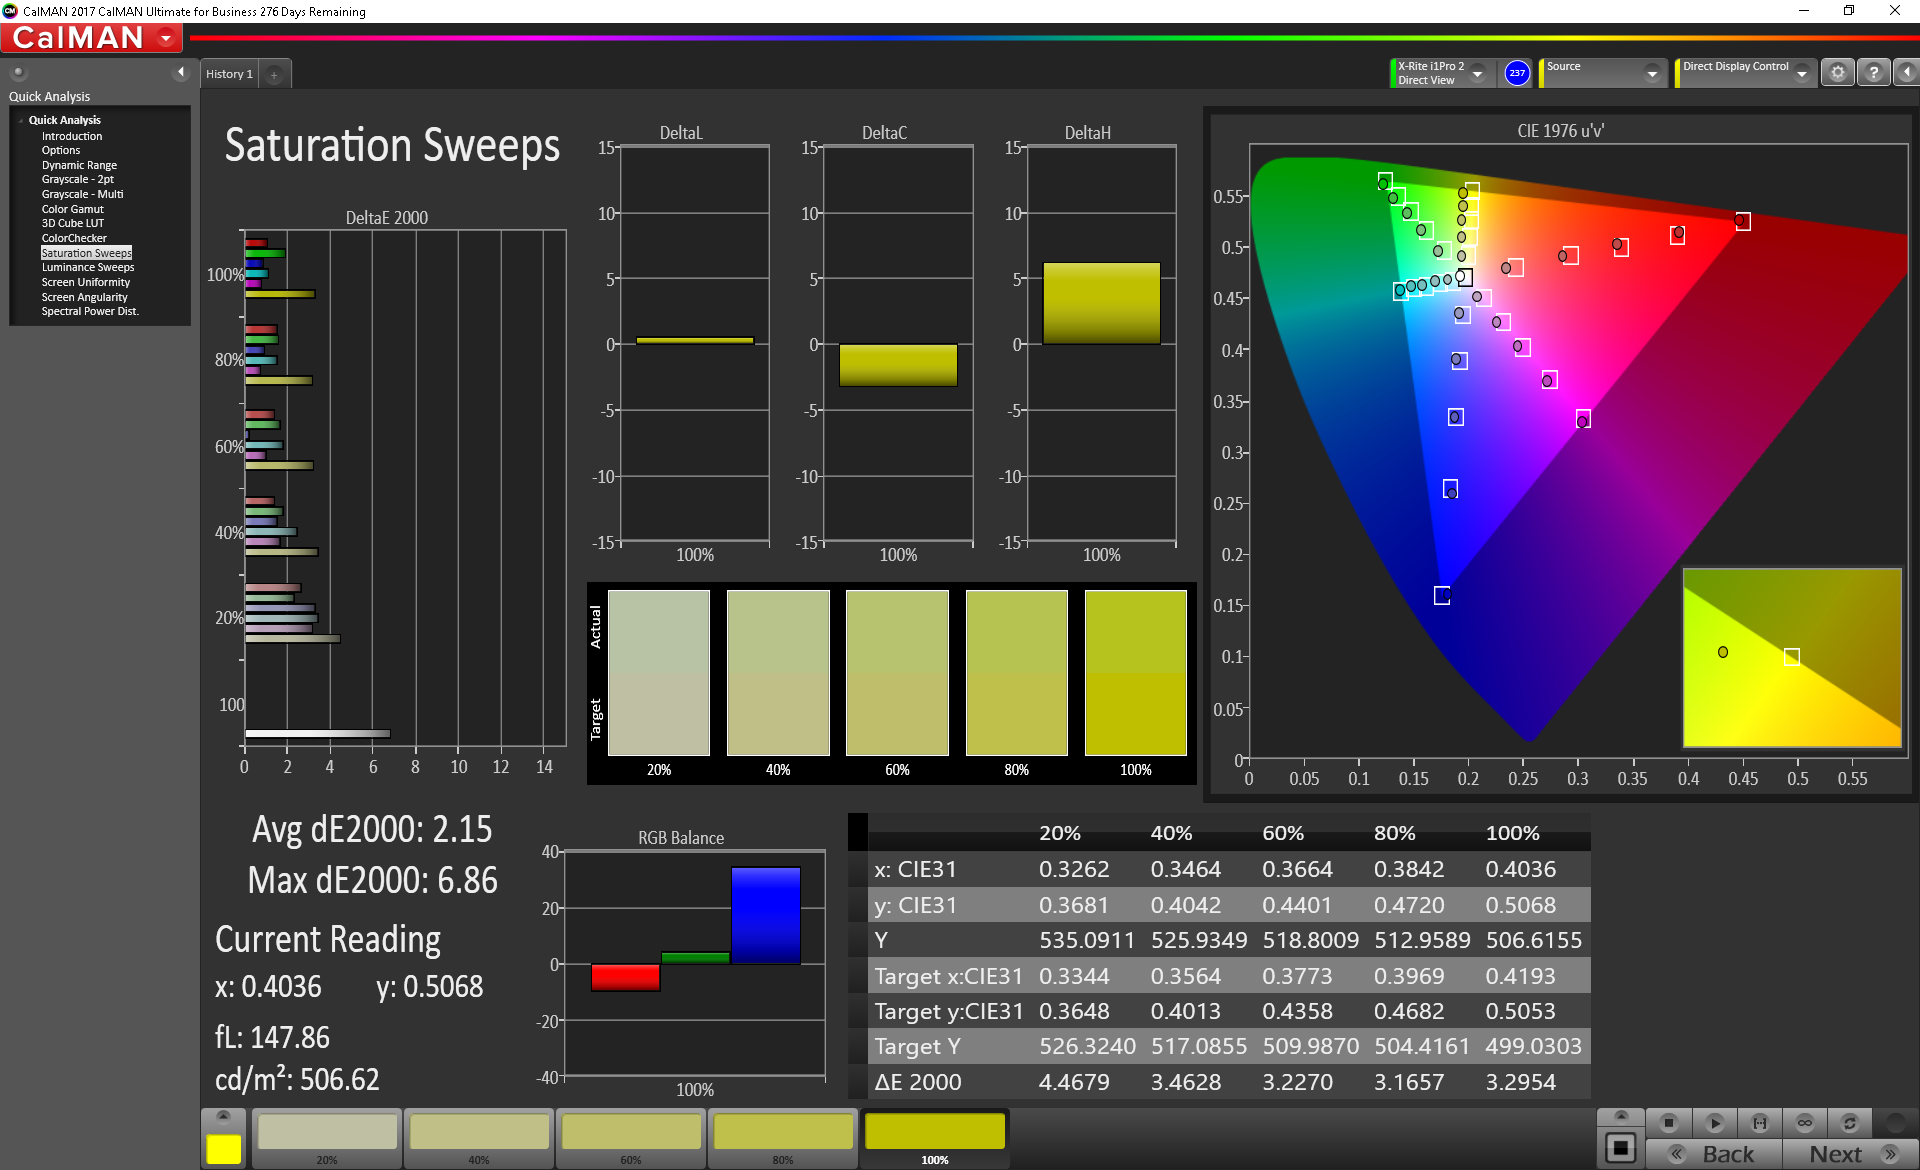
Colors are fairly good out of the box. The DeltaE2000 score for colors and grays sit about 3.83 and 5.6, respectively. These can be improved to 2.98 and 4.5, respectively. (Generally, a DeltaE2000 of 3 or lower is considered acceptable for professional work.) There is a wide range of colors available as well; the display covers 93% of the sRGB gamut and 59% of the AdobeRGB color space. Professional photographers and videographers may want a broader color space to work in, but the Latitude 5420 Rugged should offer enough colors for field work or nature photography.
Thanks to its bright screen, the Latitude 5420 is usable in any lighting condition. Even in direct sunlight, images remain colorful and clear, and text is easy to read. As mentioned, the matte finish completely eliminates any and all reflections, although it does leave grain on lighter backgrounds. Anyone who spends time outdoors, whether doing field work, construction, nature photography, or anything else under the sun, will appreciate the blindingly bright screen.

Display Response Times
| ↔ Response Time Black to White | ||
|---|---|---|
| 33.6 ms ... rise ↗ and fall ↘ combined | ↗ 18.8 ms rise | 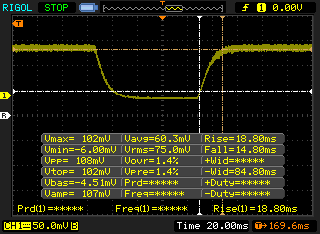 |
| ↘ 14.8 ms fall | ||
| The screen shows slow response rates in our tests and will be unsatisfactory for gamers. In comparison, all tested devices range from 0.1 (minimum) to 240 (maximum) ms. » 90 % of all devices are better. This means that the measured response time is worse than the average of all tested devices (19.9 ms). | ||
| ↔ Response Time 50% Grey to 80% Grey | ||
| 68 ms ... rise ↗ and fall ↘ combined | ↗ 34 ms rise | 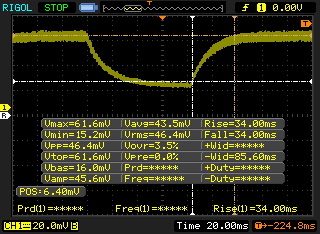 |
| ↘ 34 ms fall | ||
| The screen shows slow response rates in our tests and will be unsatisfactory for gamers. In comparison, all tested devices range from 0.165 (minimum) to 636 (maximum) ms. » 98 % of all devices are better. This means that the measured response time is worse than the average of all tested devices (31.1 ms). | ||
Screen Flickering / PWM (Pulse-Width Modulation)
| Screen flickering / PWM detected | 735 Hz | ≤ 100 % brightness setting | 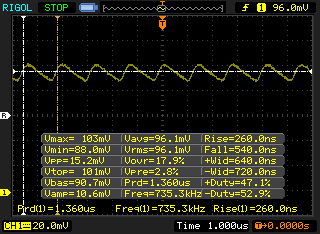 |
The display backlight flickers at 735 Hz (worst case, e.g., utilizing PWM) Flickering detected at a brightness setting of 100 % and below. There should be no flickering or PWM above this brightness setting. The frequency of 735 Hz is quite high, so most users sensitive to PWM should not notice any flickering. In comparison: 52 % of all tested devices do not use PWM to dim the display. If PWM was detected, an average of 7797 (minimum: 5 - maximum: 343500) Hz was measured. | |||
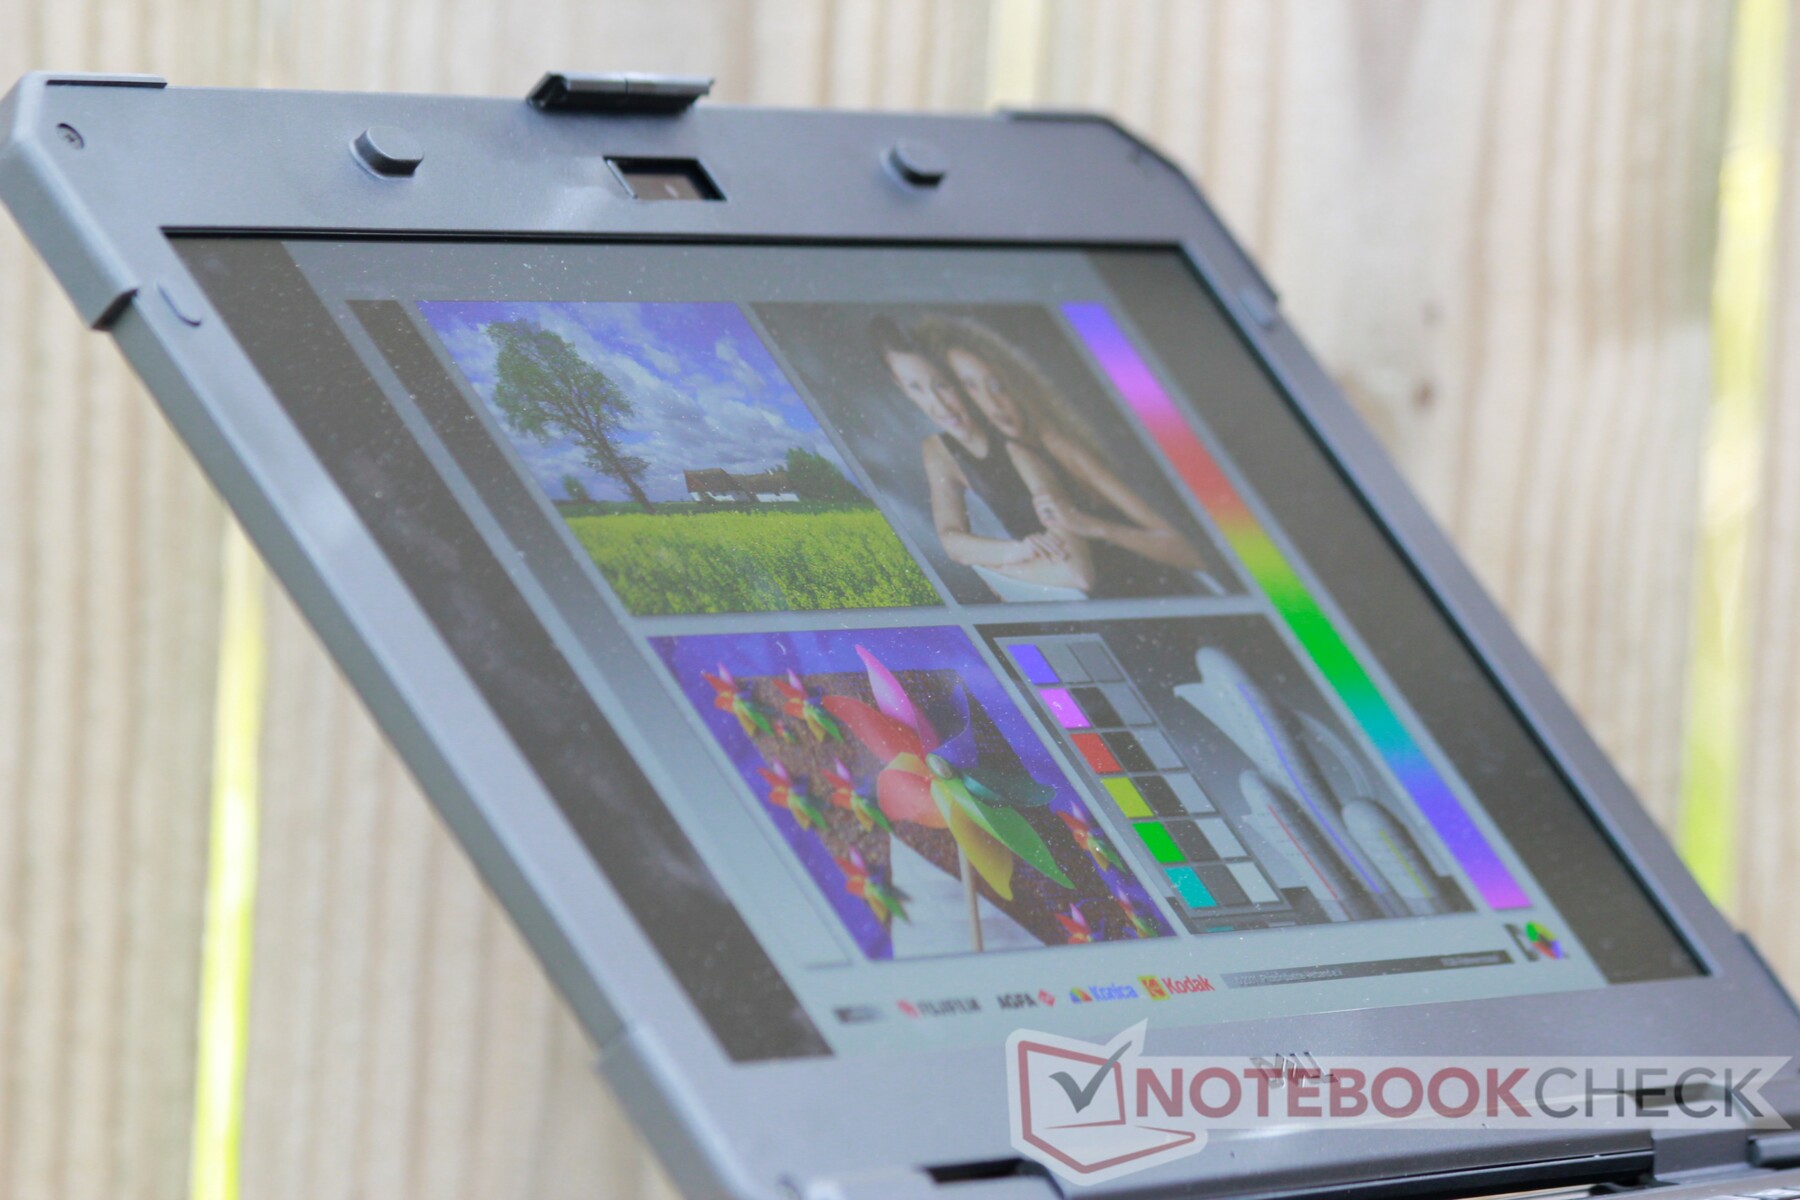
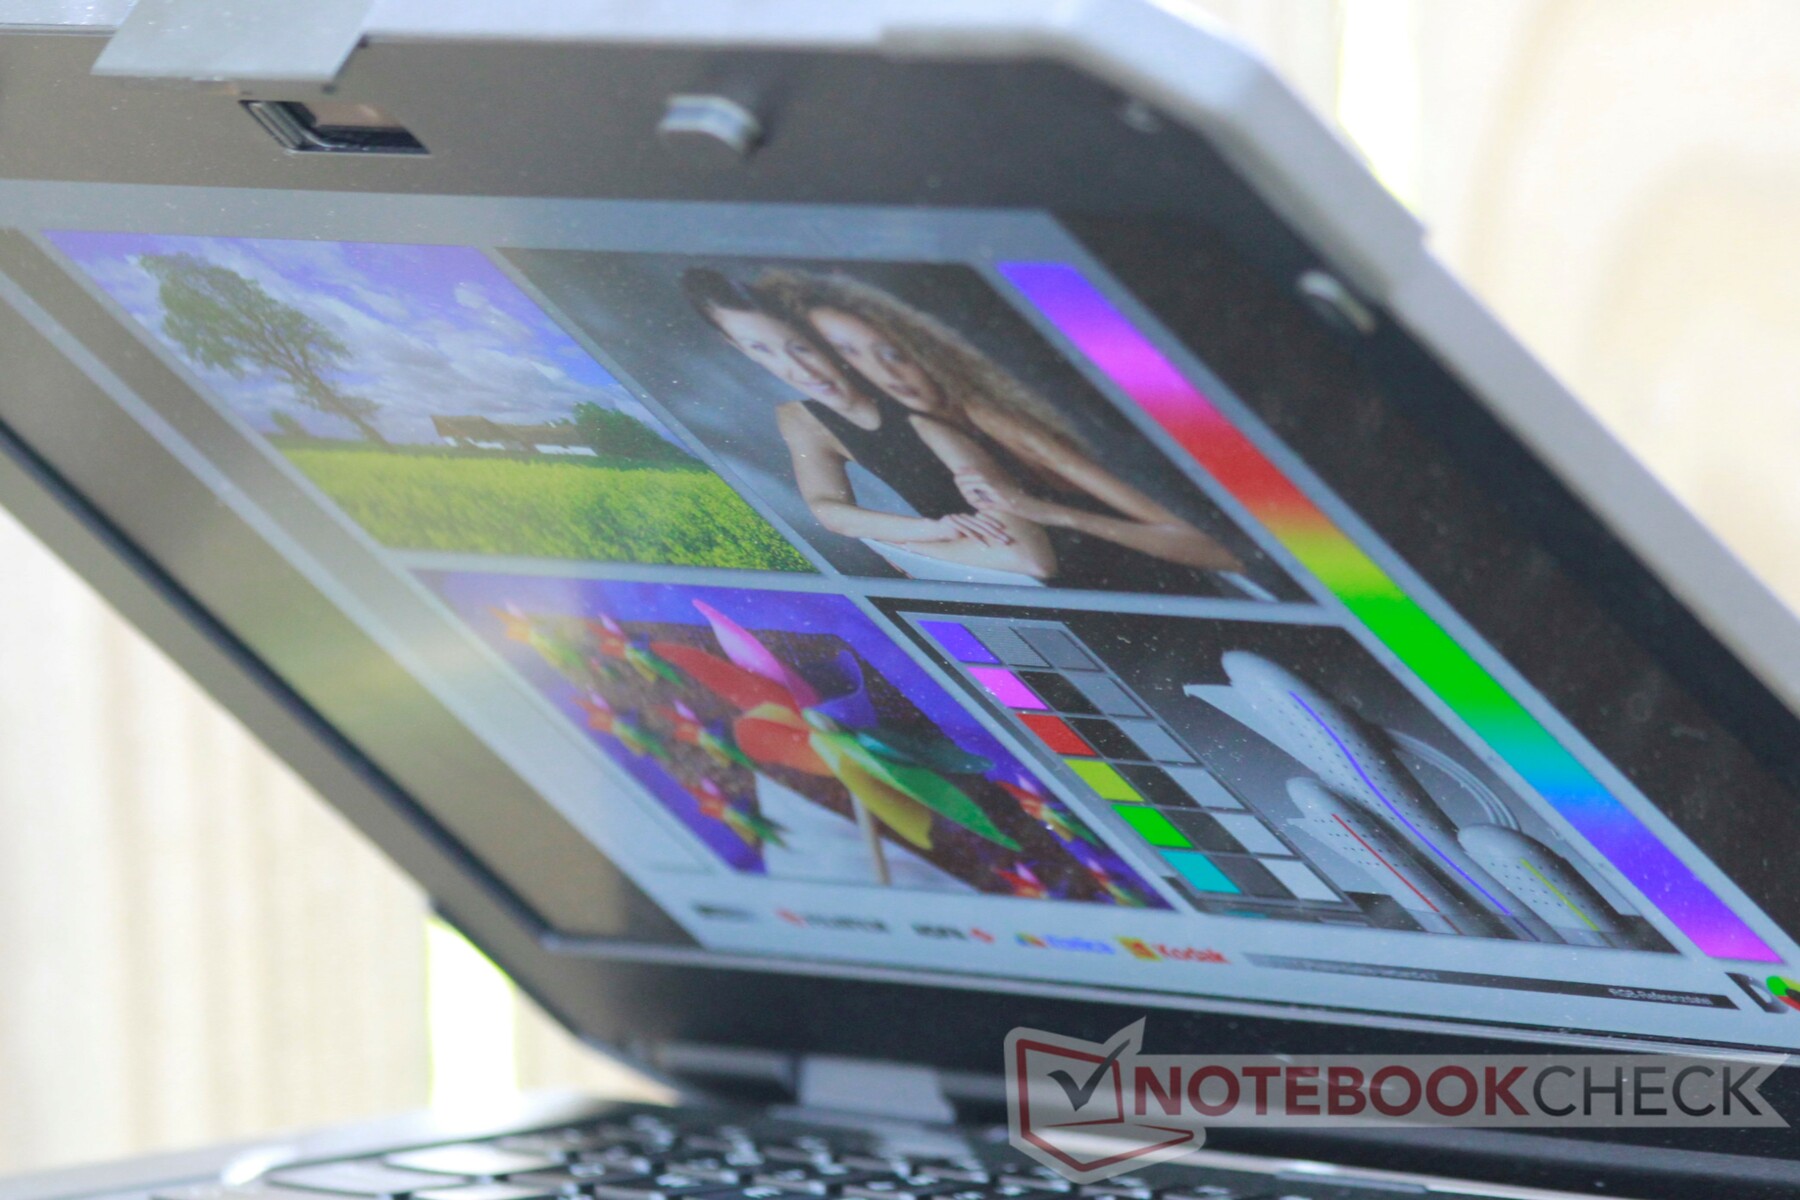
Owing to its IPS panel, the Latitude 5420 Rugged has good viewing angles. The screen noticeably dims on the vertical axis, particularly when viewed from above, but colors stay accurate and the screen is still usable. Backlight bleed is present but minimal, mainly in the corners of the screen.

Performance
Rugged laptops of the past have often been relegated to dual-core CPUs in order to control thermals. The Latitude 5420 Rugged brings a quad-core update to rugged devices with Intel's Core i7-8650U. Coupled with a dedicated AMD GPU, the Latitude 5420 Rugged stands heads and shoulders above other durable laptops.
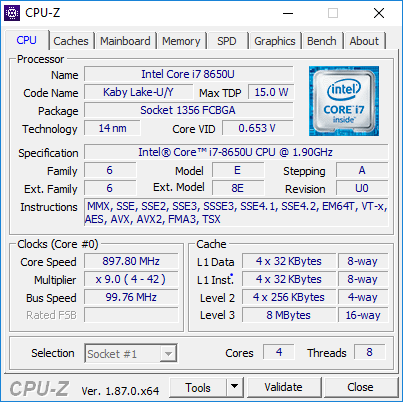
Processor
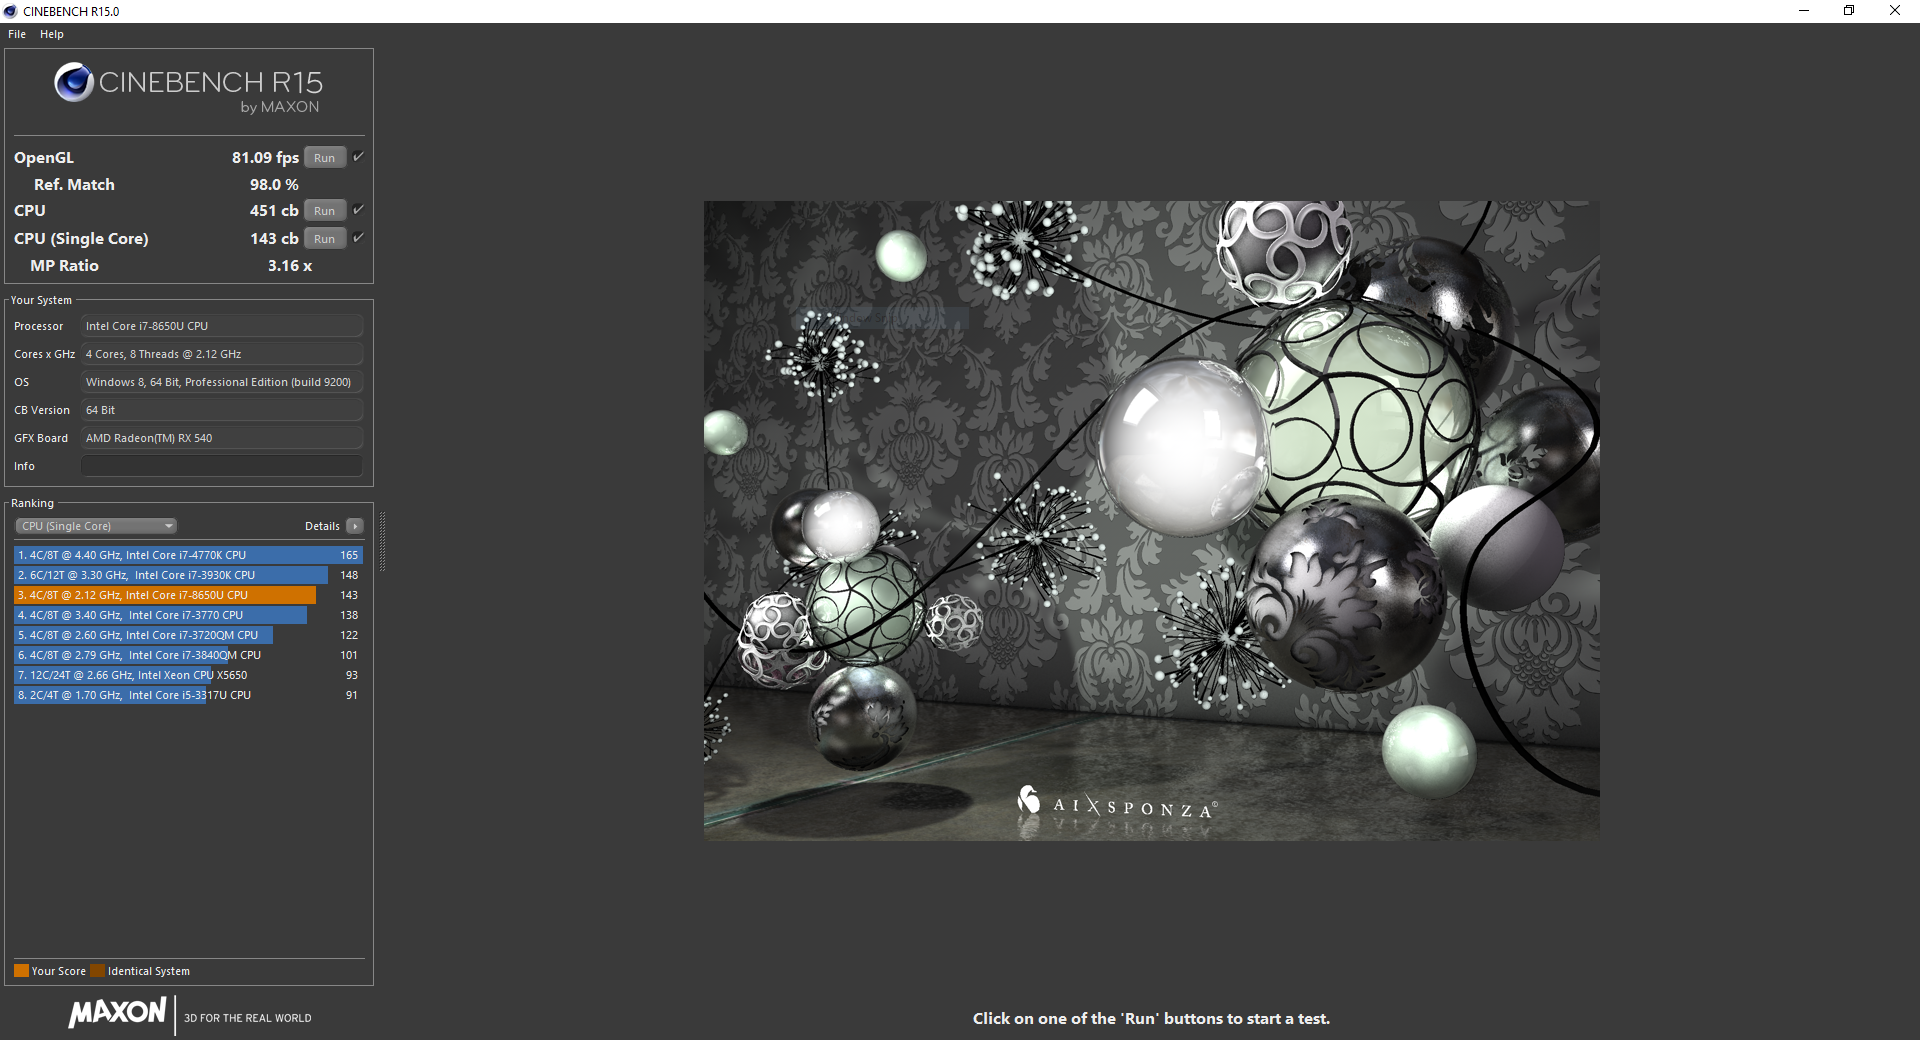
Intel's ULV chips are often the only sensible choice for a ruggedized laptop; anything else would get far too hot in the tightly packed case. The quad-core structure of Intel's Core i7-8650U is thus a welcome upgrade to the Latitude Rugged lineup, cramming twice as many cores into the same thermal package of previous rugged laptops.
There is still room for improvement. The Latitude 5420 Rugged falls 31% behind the similarly-specced Latitude 5490 in Cinebench's multi-threaded benchmark. Interestingly, the Getac S410 edges out the Latitude 5420 Rugged despite its lower-clocked Core i7-8550U. Long-term performance is stable after a small initial drop.
| Cinebench R10 | |
| Rendering Multiple CPUs 32Bit | |
| Average of class Workstation (n=1last 2 years) | |
| Fujitsu Celsius H980 | |
| Average Intel Core i7-8650U (16227 - 21455, n=4) | |
| Dell Latitude 13 7380 | |
| Rendering Single 32Bit | |
| Average of class Workstation (n=1last 2 years) | |
| Fujitsu Celsius H980 | |
| Average Intel Core i7-8650U (5307 - 6782, n=4) | |
| Dell Latitude 13 7380 | |
| wPrime 2.10 - 1024m | |
| Dell Latitude 13 7380 | |
| Dell Latitude 5490 | |
| Average Intel Core i7-8650U (268 - 335, n=3) | |
| Average of class Workstation (n=1last 2 years) | |
* ... smaller is better
System Performance
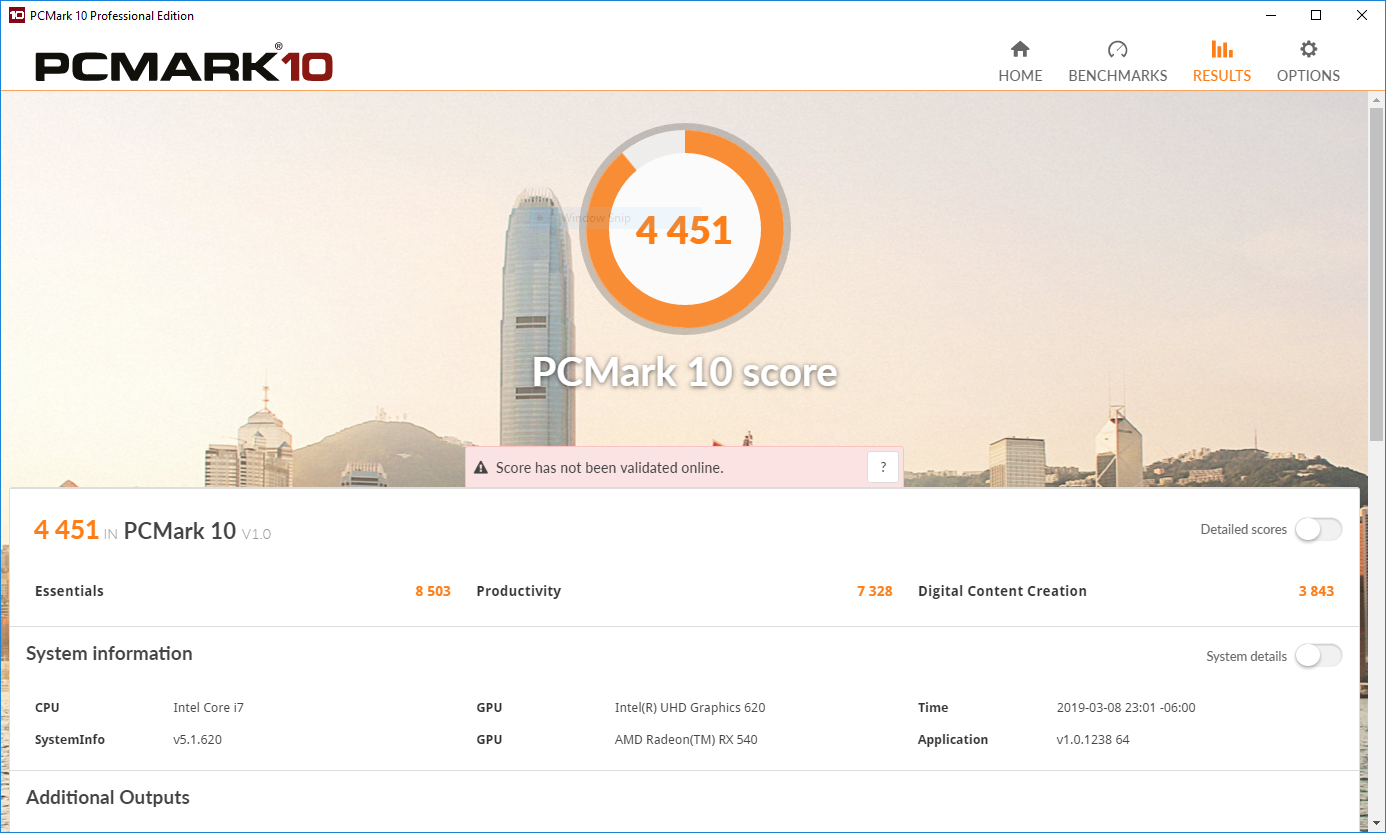
Overall system performance is excellent. The combination of a quad-core multi-threaded CPU, 16 GB of RAM, and a speedy NVMe SSD make for a responsive and quick machine. Apps open immediately and there are no unexpected hiccups.

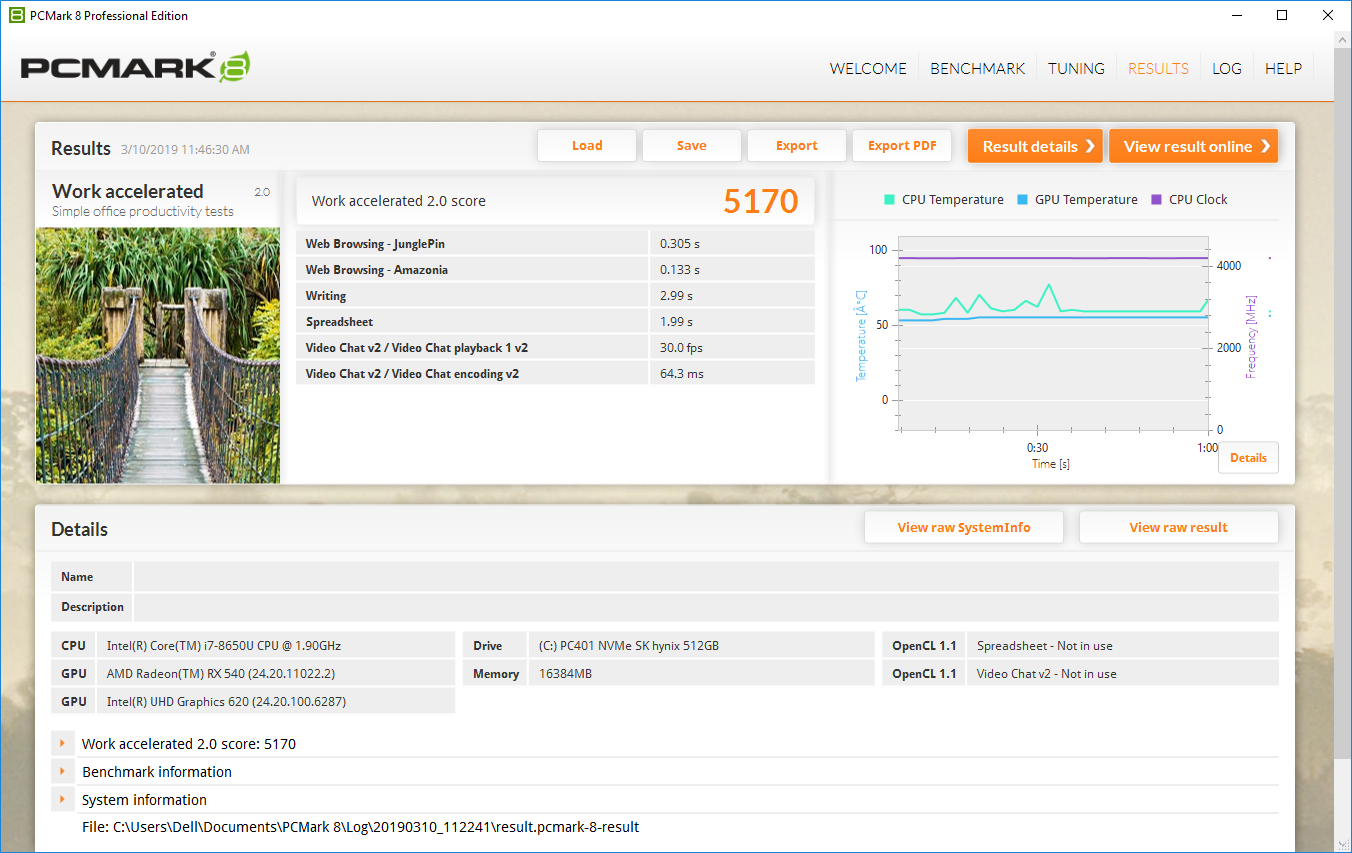
| PCMark 8 Home Score Accelerated v2 | 4038 points | |
| PCMark 8 Work Score Accelerated v2 | 5170 points | |
| PCMark 10 Score | 4451 points | |
Help | ||
Storage Devices
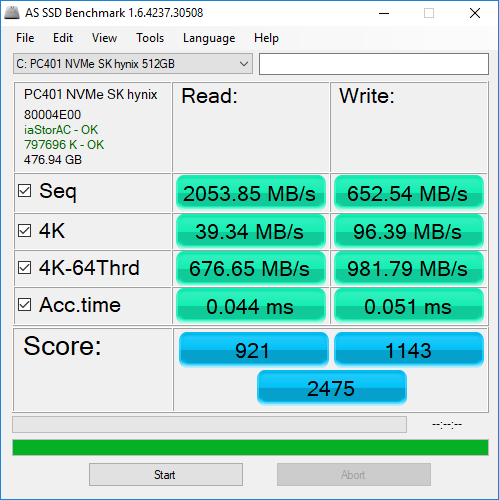
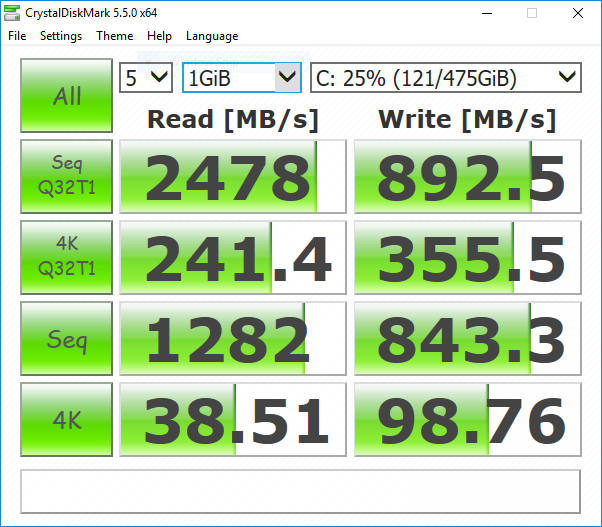
The 512 GB SK Hynix NVMe SSD offers fast read sequential read speeds but mediocre sequential write speeds. In day-to-day tasks, the drive is very quick and shouldn't present any bottlenecks whatever the workflow. If needed, the drive can be easily swapped out by pulling the sled house on the right side of the machine. This could be useful for some professionals (e.g., videographers) that can quickly fill a drive and need fresh storage.
| Dell Latitude 5420 Rugged-P85G SK hynix PC401 NVMe 500 GB | Panasonic Toughbook CF-54G2999VM Seagate BarraCuda Compute 1TB ST1000LM048 | Getac S410 CUKUSA 1 TB SATA SSD Q0526A | Lenovo ThinkPad T480-20L50010US Samsung SSD PM981 MZVLB512HAJQ | Dell Latitude 5490 Samsung PM961 MZVLW256HEHP | Average SK hynix PC401 NVMe 500 GB | |
|---|---|---|---|---|---|---|
| CrystalDiskMark 5.2 / 6 | -96% | -40% | 13% | -14% | 18% | |
| Write 4K (MB/s) | 98.8 | 1.145 -99% | 74 -25% | 123.2 25% | 98.7 0% | 114.3 ? 16% |
| Read 4K (MB/s) | 38.51 | 0.453 -99% | 31.85 -17% | 44.43 15% | 39.46 2% | 37.1 ? -4% |
| Write Seq (MB/s) | 843 | 52.2 -94% | 460.6 -45% | 845 0% | 564 -33% | 1119 ? 33% |
| Read Seq (MB/s) | 1282 | 122.7 -90% | 514 -60% | 865 -33% | 764 -40% | 1577 ? 23% |
| Write 4K Q32T1 (MB/s) | 355.5 | 2.428 -99% | 211.4 -41% | 287.3 -19% | 443.3 25% | 367 ? 3% |
| Read 4K Q32T1 (MB/s) | 241.4 | 1.063 -100% | 203.5 -16% | 360.9 50% | 268.8 11% | 310 ? 28% |
| Write Seq Q32T1 (MB/s) | 893 | 73.7 -92% | 523 -41% | 1718 92% | 796 -11% | 1263 ? 41% |
| Read Seq Q32T1 (MB/s) | 2478 | 120.4 -95% | 554 -78% | 1779 -28% | 875 -65% | 2598 ? 5% |

GPU Performance
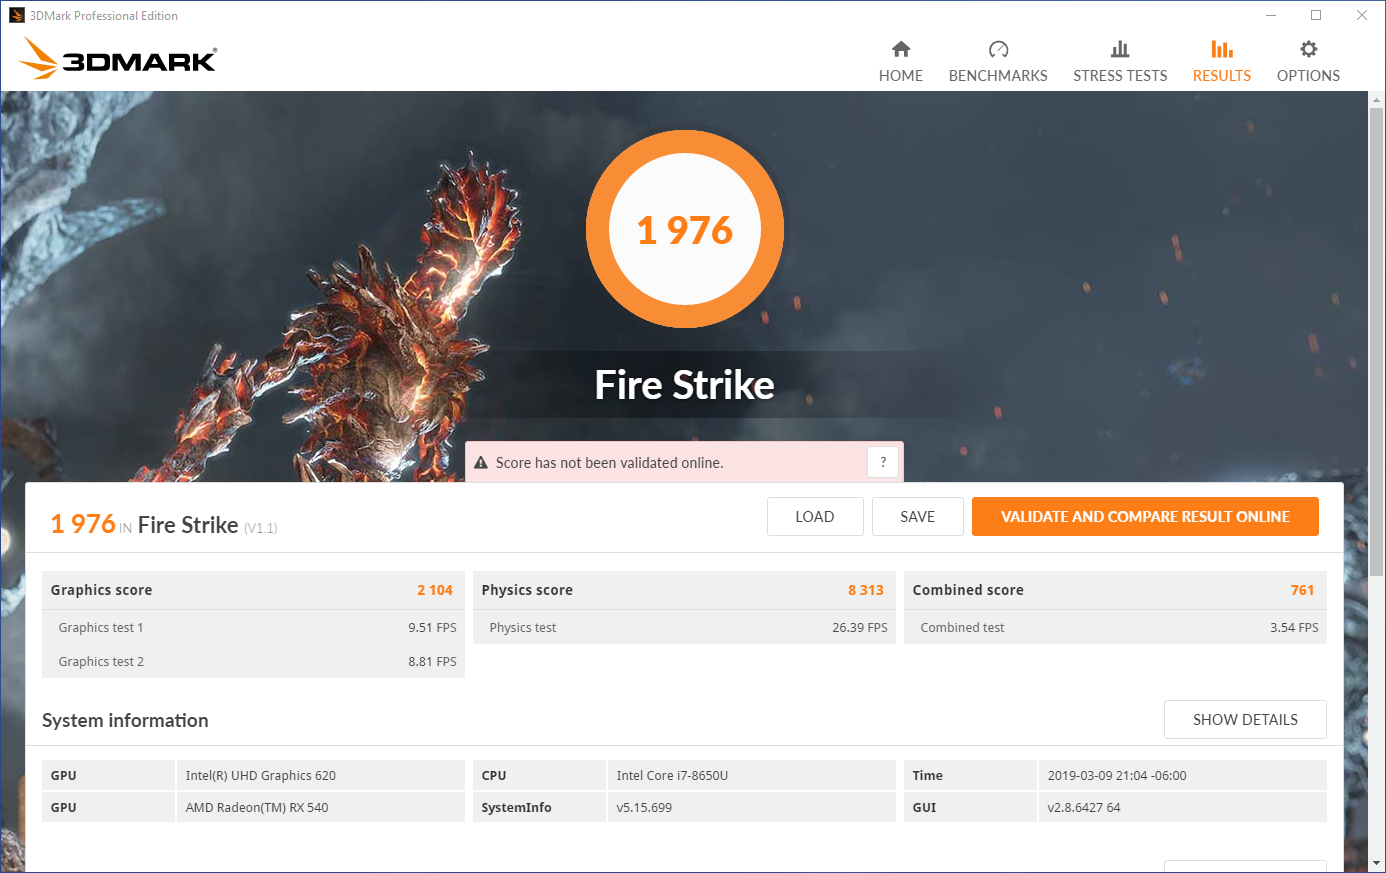
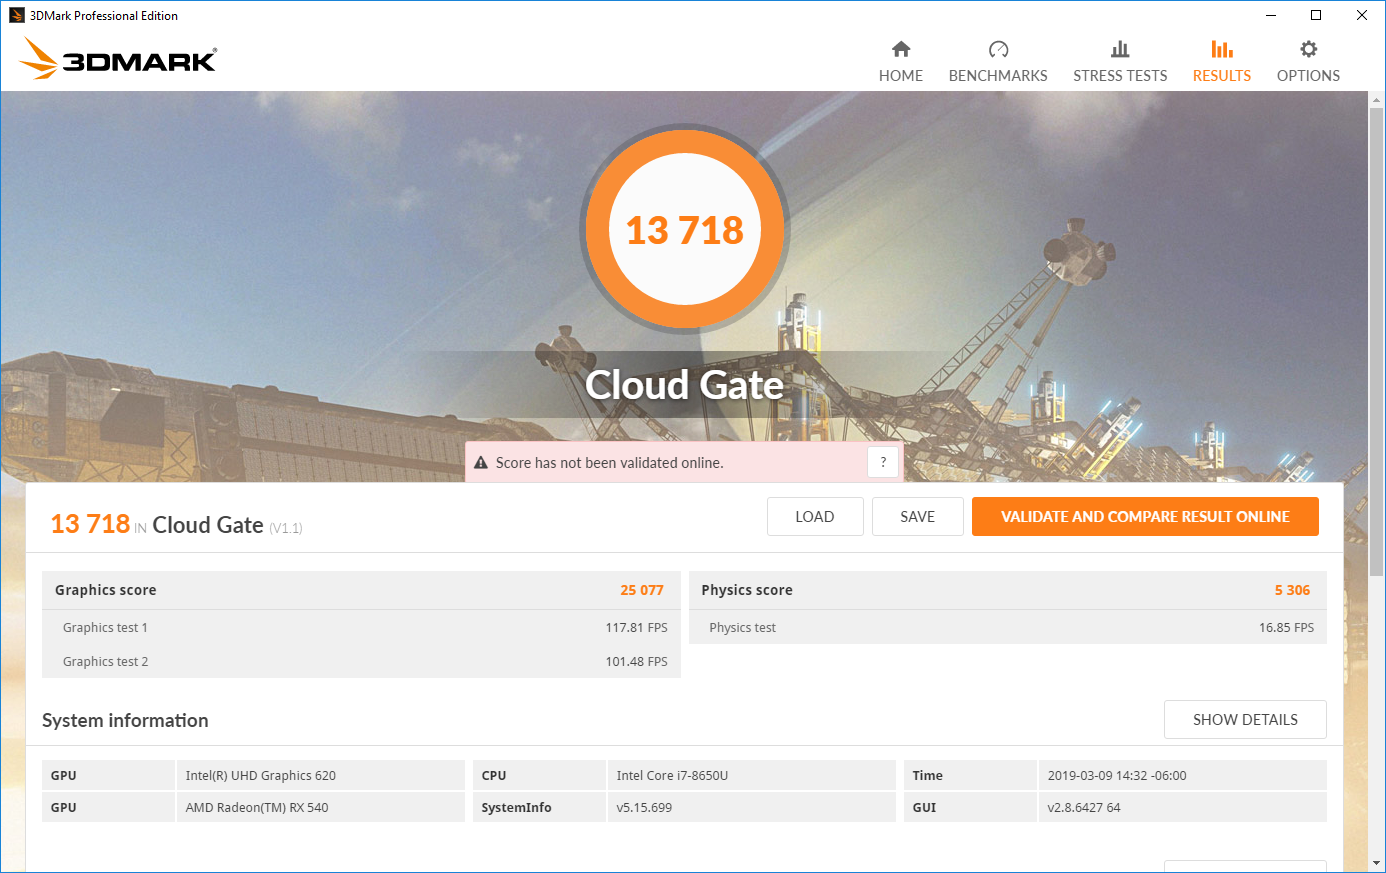
The AMD Radeon RX 540 is a massive upgrade over the integrated graphics usually found in rugged laptops. The Latitude 5420 Rugged scores leagues above its rugged brethren in 3DMark. The RX 540 lands just above the Nvidia GeForce MX150, making it a good option for professionals that need a bit more graphical power. The Latitude 5420 Rugged should handle rudimentary drafting and modeling and should be able to complete simple photo and video editing easily. Those with more demanding workloads should look at laptops with the GeForce GTX 1050, although there aren't currently any ruggedized laptops with this GPU.

| 3DMark 06 Standard Score | 14964 points | |
| 3DMark Vantage P Result | 15191 points | |
| 3DMark 11 Performance | 5179 points | |
| 3DMark Ice Storm Standard Score | 72353 points | |
| 3DMark Cloud Gate Standard Score | 13718 points | |
| 3DMark Fire Strike Score | 3469 points | |
| 3DMark Time Spy Score | 643 points | |
Help | ||
Gaming Performance
Thanks to the dedicated GPU, gaming is possible. The AMD Radeon RX 540 can handle gameplay at Medium/High settings at a resolution of 1366x768. Some older titles (like Bioshock Infinite) can be pushed to Full HD, although settings will need to be reduced. Demanding modern titles are still out of reach.
Long-term gameplay is stable. Over an hour-long play session of The Witcher 3, we notice no unexpected frame drops or other inconsistent behavior.
| BioShock Infinite - 1920x1080 Ultra Preset, DX11 (DDOF) | |
| Asus ZenBook 15 UX533FD | |
| Dell Latitude 5420 Rugged-P85G | |
| Average AMD Radeon RX 540 (18.2 - 36, n=2) | |
| Dell Latitude 5490 | |
| low | med. | high | ultra | |
|---|---|---|---|---|
| Tomb Raider (2013) | 139 | 62 | 61 | 34 |
| BioShock Infinite (2013) | 147 | 78 | 61 | 36 |
| Thief (2014) | 63 | 50.3 | 44.4 | 38 |
| The Witcher 3 (2015) | 48 | 39 | 8 | 6 |
| Rise of the Tomb Raider (2016) | 59 | 38 | 20 | 16 |
| Hitman 2016 (2016) | 53 | 47 | 20 | 19 |
| Ashes of the Singularity (2016) | 36 | 20 | 18 | |
| Doom (2016) | 70 | 54 | 28 | 25 |
| Overwatch (2016) | 95 | 78 | 52 | 36 |
| Deus Ex Mankind Divided (2016) | 48 | 35 | 19 | 9 |
| Mafia 3 (2016) | 42 | 32 | 22 | |
| Civilization 6 (2016) | 74 | 52 | 32 | 23 |
| Farming Simulator 17 (2016) | 174 | 137 | 70 | 59 |
| Dishonored 2 (2016) | 45 | 29 | 31 | 18 |
| Resident Evil 7 (2017) | 135 | 61 | 36 | 15 |
| Mass Effect Andromeda (2017) | 70 | 34 | 20 | 15 |
| Prey (2017) | 108 | 71 | 58 | 40 |
| Rocket League (2017) | 182 | 86 | 58 | |
| Dirt 4 (2017) | 150 | 63 | 42 | 27 |
| Playerunknown's Battlegrounds (PUBG) (2017) | 75 | 31 | 26 | 19 |
| F1 2017 (2017) | 92 | 40 | 28 | 21 |
| Middle-earth: Shadow of War (2017) | 98 | 39 | 27 | 20 |
| Assassin´s Creed Origins (2017) | 55 | 29 | 22 | 15 |
| Fortnite (2018) | 180 | 70 | 55 | 35 |
| Final Fantasy XV Benchmark (2018) | 11 | 3 | 2 | |
| Kingdom Come: Deliverance (2018) | 41 | 15 | 12 | 7 |
| Far Cry 5 (2018) | 42 | 25 | 21 | 17 |
| Monster Hunter World (2018) | 60 | 25 | 21 | 17 |
| F1 2018 (2018) | 62 | 40 | 28 | 21 |
| Shadow of the Tomb Raider (2018) | 55 | 26 | 21 | 16 |
| Hitman 2 (2018) | 29 | 18 | 12 | 8 |
| Battlefield V (2018) | 63 | 31 | 29 | 21 |
Emissions
System Noise
Fan noise is excellent. The single fan only ramps up briefly under extreme load before quickly slowing down to a quiet 30 dB(A). Under light load, the fan remains off. There is no perceptible coil whine.
Noise level
| Idle |
| 28.3 / 28.3 / 28.3 dB(A) |
| Load |
| 29.9 / 38 dB(A) |
 | ||
30 dB silent 40 dB(A) audible 50 dB(A) loud |
||
min: | ||
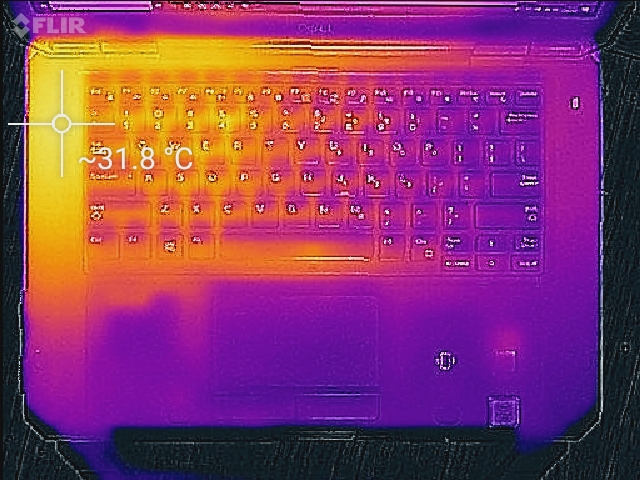
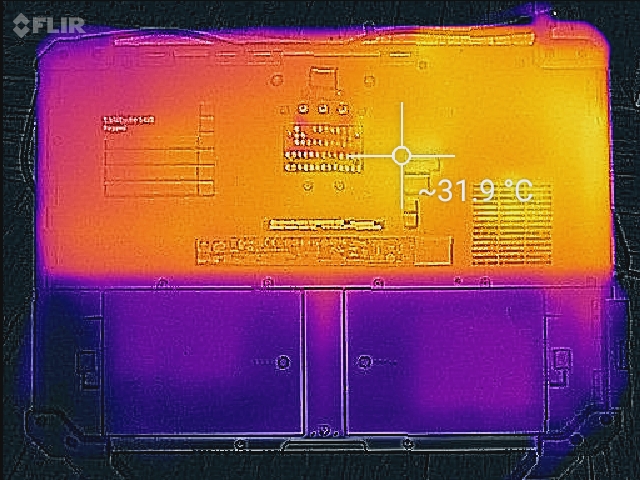
Temperature
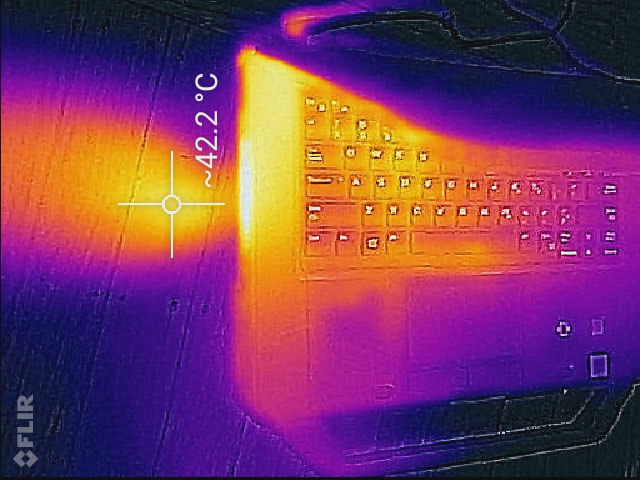
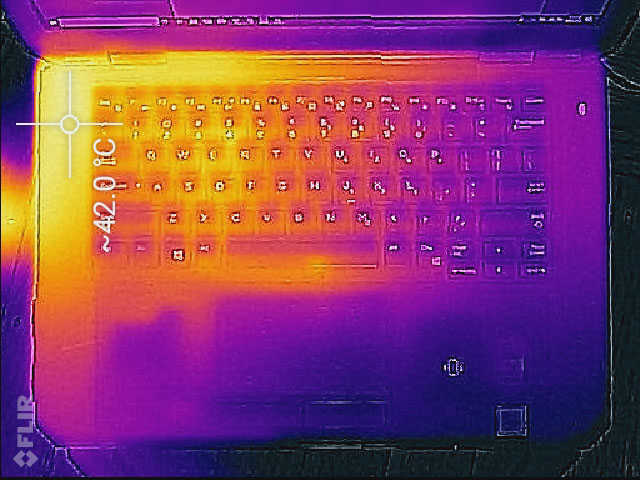
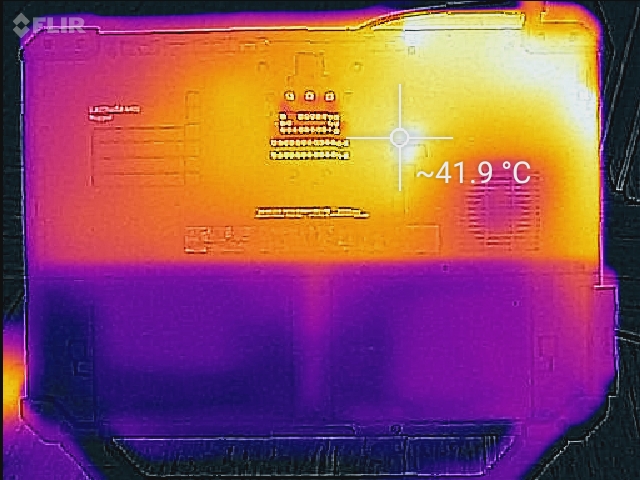
Despite the conservative fan, exterior temperatures are well-managed. Under full load, temperatures stay below 40° C save for some hot spots near the side-mounted vent. The rest of the chassis remains comfortable. The left side of the keyboard grows mildly warm under extended load. When idle, the machine remains at or below room temperature.
Stress Test
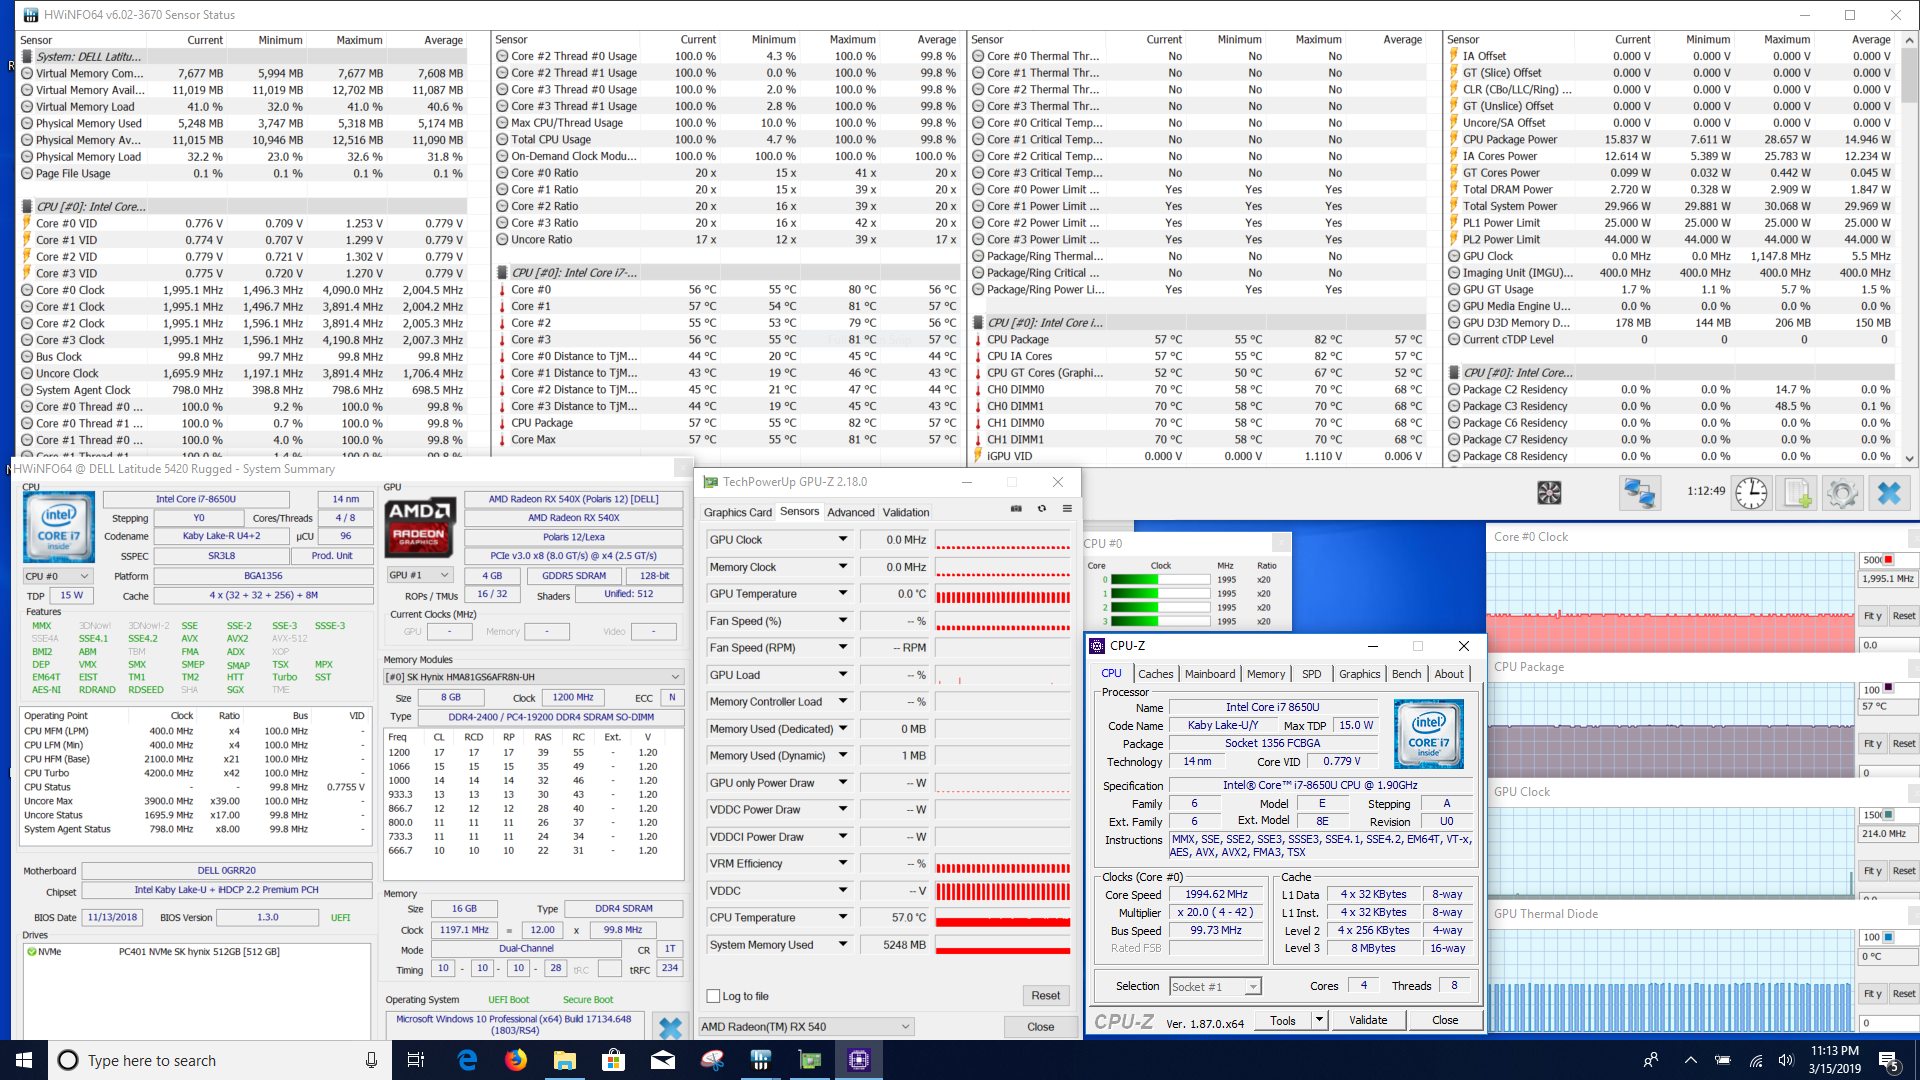
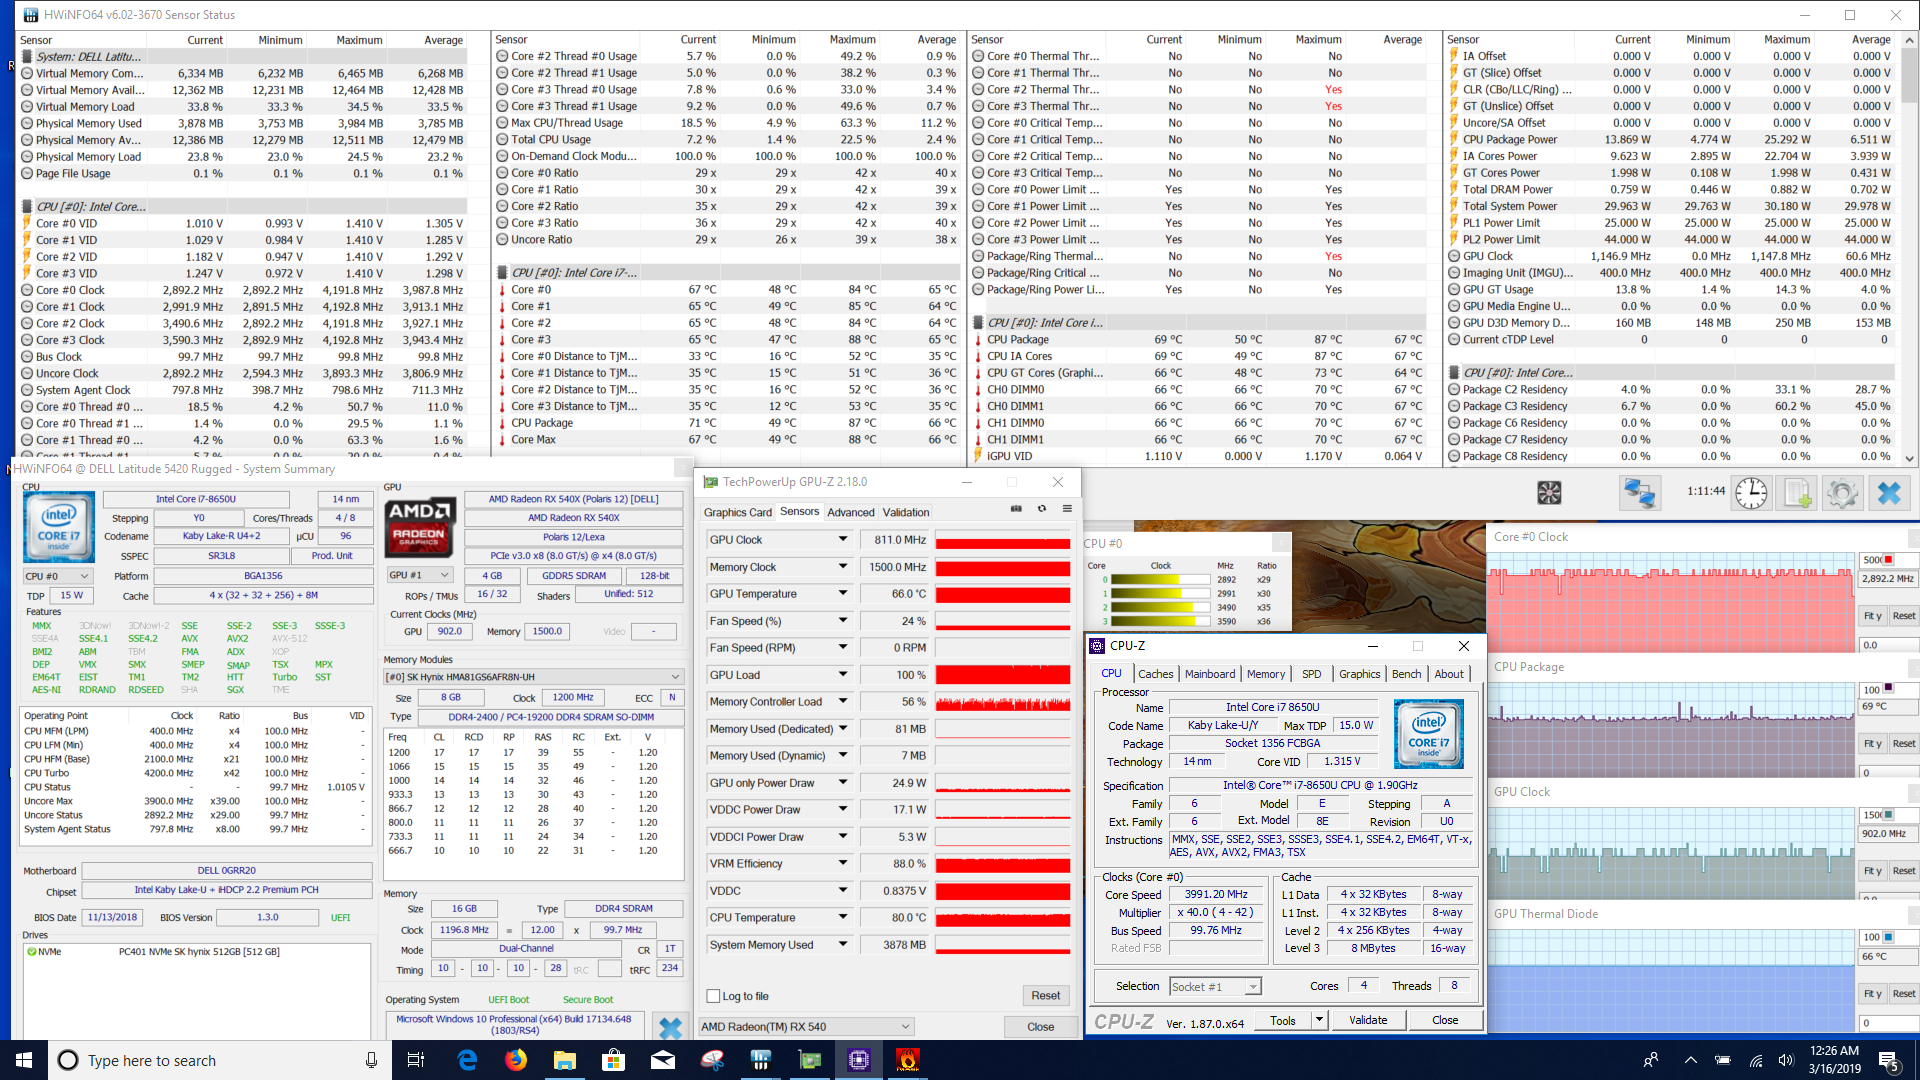
The Latitude 5420 Rugged performs well under extended stress. Using Prime95 to fully load the CPU, the Core i7-8650U maintains a steady 2.0 GHz, just above its base 1.9 GHz clock speed. Temperatures across the CPU die remain below 60° C. Graphical loads are likewise well-handled; the GPU floats around 900 MHz with temperatures around 66° C. Gaming loads present perhaps the most strenuous workloads, but the CPU is able to frequently hit its 4.2 GHz boost clock and the GPU sits comfortably at ~1060 MHz. Temperatures for each sit between 70-75° C.
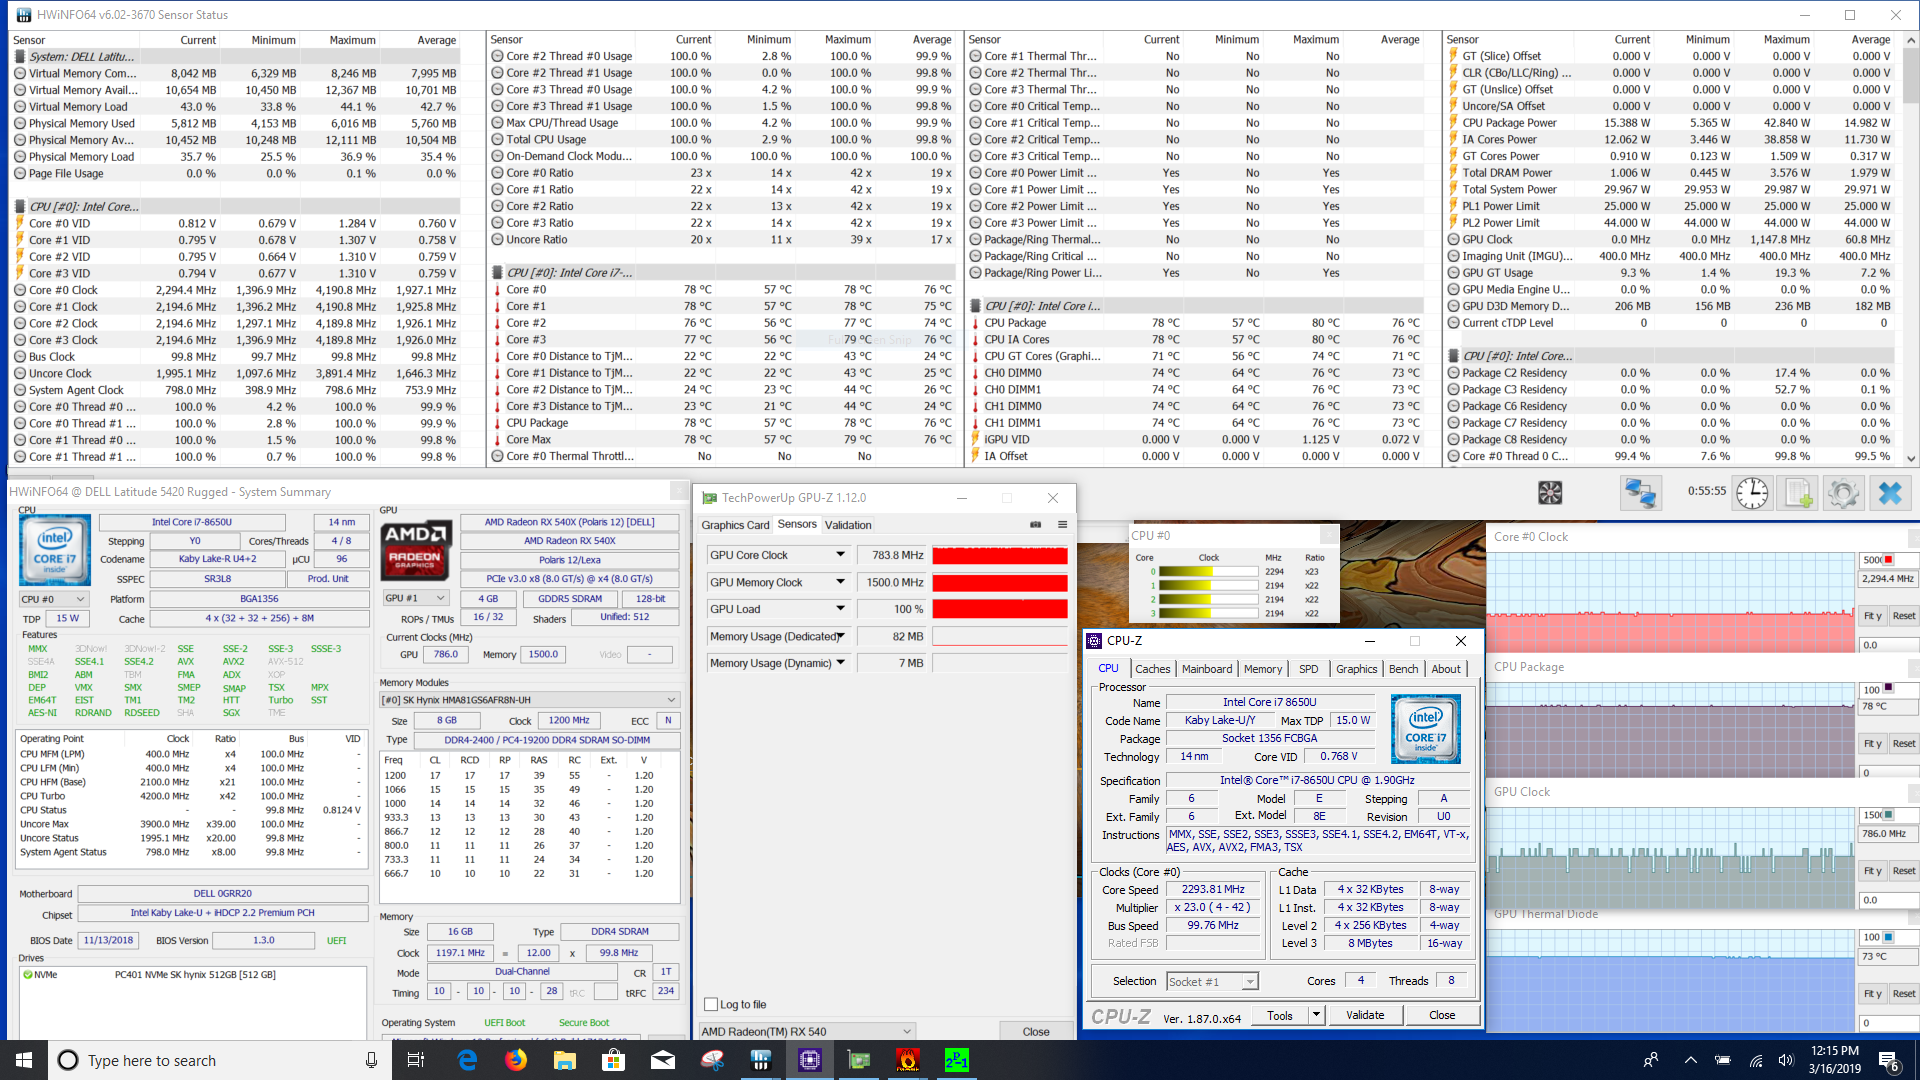
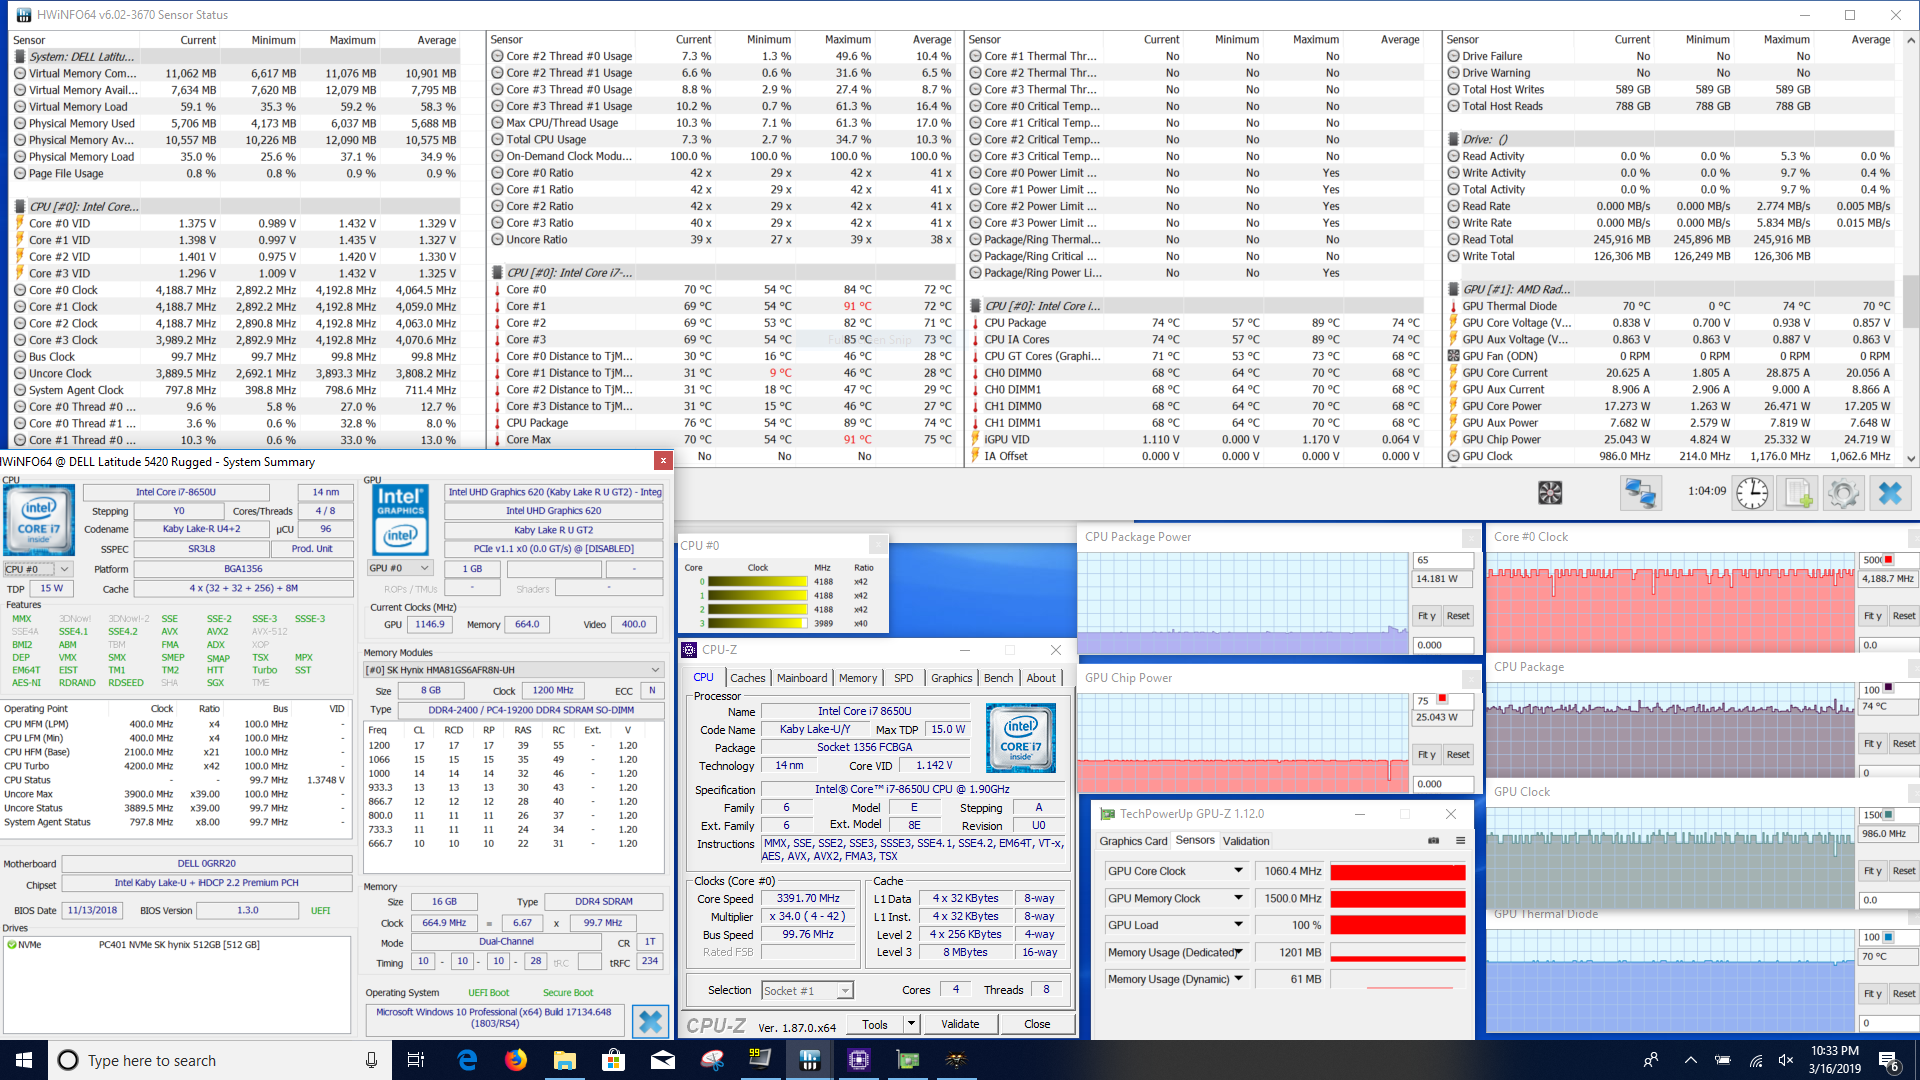
| CPU Clock (GHz) | GPU Clock (MHz) | Average CPU Temperature (°C) | Average GPU Temperature (°C) | |
| Prime95 Stress | 2.0 | - | 57 | - |
| FurMark Stress | 4.0 | 900 | 67 | 66 |
| Prime95 + FurMark Stress | 2.0 | 785 | 78 | 73 |
| Witcher 3 Stress | 4.2 | 1062 | 74 | 70 |
(±) The maximum temperature on the upper side is 42.2 °C / 108 F, compared to the average of 38.2 °C / 101 F, ranging from 22.2 to 69.8 °C for the class Workstation.
(±) The bottom heats up to a maximum of 42 °C / 108 F, compared to the average of 41.1 °C / 106 F
(+) In idle usage, the average temperature for the upper side is 26.5 °C / 80 F, compared to the device average of 32 °C / 90 F.
(+) The palmrests and touchpad are cooler than skin temperature with a maximum of 27.8 °C / 82 F and are therefore cool to the touch.
(±) The average temperature of the palmrest area of similar devices was 27.8 °C / 82 F (0 °C / 0 F).
Speakers

The single front-mounted speaker (behind the right side of the handle) is loud and experiences no distortion at any volume level. Mids and highs are crystal clear. Bass is present but weak. The overall sound is somewhat muffled, however, which hurts multimedia playback. The speaker should be fine for voice and standard audio, but music and media will need headphones.
Dell Latitude 5420 Rugged-P85G audio analysis
(±) | speaker loudness is average but good (74.6 dB)
Bass 100 - 315 Hz
(-) | nearly no bass - on average 16.3% lower than median
(+) | bass is linear (6.1% delta to prev. frequency)
Mids 400 - 2000 Hz
(+) | balanced mids - only 3.2% away from median
(+) | mids are linear (5.8% delta to prev. frequency)
Highs 2 - 16 kHz
(+) | balanced highs - only 2.4% away from median
(+) | highs are linear (4.5% delta to prev. frequency)
Overall 100 - 16.000 Hz
(±) | linearity of overall sound is average (15.8% difference to median)
Compared to same class
» 39% of all tested devices in this class were better, 9% similar, 52% worse
» The best had a delta of 7%, average was 17%, worst was 35%
Compared to all devices tested
» 24% of all tested devices were better, 5% similar, 71% worse
» The best had a delta of 4%, average was 24%, worst was 134%
Panasonic Toughbook CF-54G2999VM audio analysis
(-) | not very loud speakers (65.9 dB)
Bass 100 - 315 Hz
(-) | nearly no bass - on average 25.6% lower than median
(+) | bass is linear (5% delta to prev. frequency)
Mids 400 - 2000 Hz
(±) | higher mids - on average 7.8% higher than median
(-) | mids are not linear (17.3% delta to prev. frequency)
Highs 2 - 16 kHz
(+) | balanced highs - only 4.3% away from median
(±) | linearity of highs is average (7.9% delta to prev. frequency)
Overall 100 - 16.000 Hz
(-) | overall sound is not linear (39.6% difference to median)
Compared to same class
» 99% of all tested devices in this class were better, 1% similar, 1% worse
» The best had a delta of 7%, average was 21%, worst was 53%
Compared to all devices tested
» 95% of all tested devices were better, 0% similar, 5% worse
» The best had a delta of 4%, average was 24%, worst was 134%
Getac S410 audio analysis
(±) | speaker loudness is average but good (76.2 dB)
Bass 100 - 315 Hz
(±) | reduced bass - on average 13.6% lower than median
(+) | bass is linear (6.1% delta to prev. frequency)
Mids 400 - 2000 Hz
(±) | higher mids - on average 6.5% higher than median
(±) | linearity of mids is average (8.4% delta to prev. frequency)
Highs 2 - 16 kHz
(+) | balanced highs - only 3.1% away from median
(+) | highs are linear (6.2% delta to prev. frequency)
Overall 100 - 16.000 Hz
(±) | linearity of overall sound is average (19.9% difference to median)
Compared to same class
» 42% of all tested devices in this class were better, 9% similar, 50% worse
» The best had a delta of 7%, average was 21%, worst was 53%
Compared to all devices tested
» 51% of all tested devices were better, 7% similar, 42% worse
» The best had a delta of 4%, average was 24%, worst was 134%
Energy Management
Power Consumption
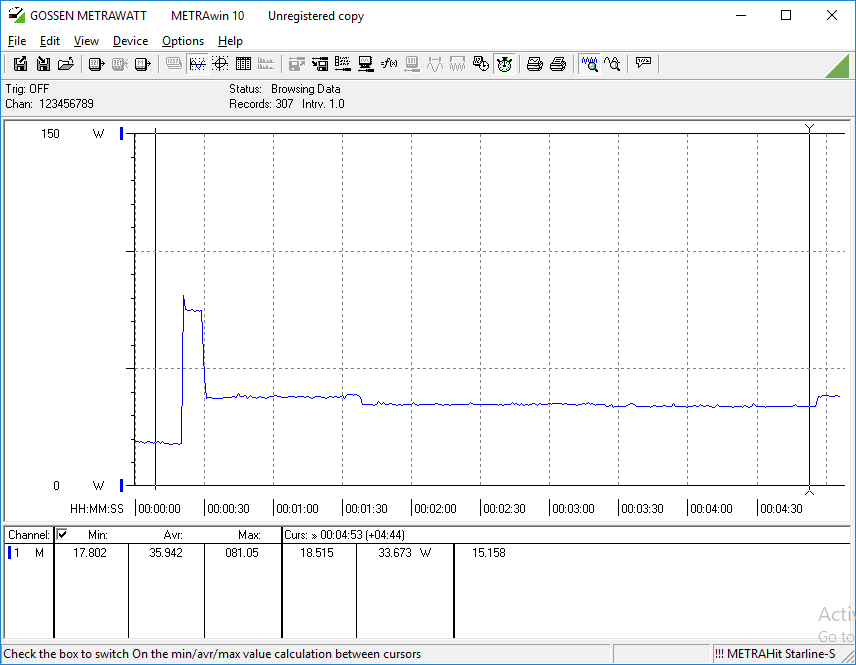
Due to its bright display and dedicated GPU, the Latitude 5420 Rugged draws significantly more power than other ruggedized laptops. Under typical load, the 5420 Rugged pulls about 70 Watts; most competitors draw 35-45 Watts under similar strain. The Latitude 5420 draws a peak of 93.5 Watts, which is higher than the included 90 Watt power supply and may prove problematic under extended workloads.
| Off / Standby | |
| Idle | |
| Load |
|
Key:
min: | |
| Dell Latitude 5420 Rugged-P85G i7-8650U, Radeon RX 540, SK hynix PC401 NVMe 500 GB, IPS, 1920x1080, 14" | Panasonic Toughbook CF-54G2999VM i5-7300U, HD Graphics 620, Seagate BarraCuda Compute 1TB ST1000LM048, TN LED, 1366x768, 14" | Getac S410 i5-8550U, UHD Graphics 620, CUKUSA 1 TB SATA SSD Q0526A, TN PED, 1366x768, 14" | Lenovo ThinkPad T480-20L50010US i7-8650U, UHD Graphics 620, Samsung SSD PM981 MZVLB512HAJQ, TFT-LCD, 1920x1080, 14" | Dell Latitude 5490 i7-8650U, UHD Graphics 620, Samsung PM961 MZVLW256HEHP, IPS, 1920x1080, 14" | HP EliteBook 840 G4-Z2V49ET ABD i5-7200U, HD Graphics 620, Samsung PM961 MZVLW256HEHP, TN, 1920x1080, 14" | |
|---|---|---|---|---|---|---|
| Power Consumption | 44% | 36% | 36% | 40% | 52% | |
| Idle Minimum * (Watt) | 4.8 | 4.4 8% | 5.6 -17% | 3.8 21% | 3.9 19% | 2.9 40% |
| Idle Average * (Watt) | 13.6 | 6.3 54% | 7.9 42% | 7.7 43% | 6.2 54% | 5.6 59% |
| Idle Maximum * (Watt) | 13.8 | 6.5 53% | 8.4 39% | 9.3 33% | 7.7 44% | 8.15 41% |
| Load Average * (Watt) | 67.8 | 36.3 46% | 32.8 52% | 45.7 33% | 43.9 35% | 30.6 55% |
| Witcher 3 ultra * (Watt) | 69.1 | |||||
| Load Maximum * (Watt) | 93.5 | 38.3 59% | 34.3 63% | 46.1 51% | 47.7 49% | 31 67% |
* ... smaller is better
Battery Life
The Latitude 5420 Rugged is a road warrior's dream. The device can be configured with dual 51 Wh hot-swappable batteries. The Latitude 5420 Rugged lasted an astounding 16 hours 12 minutes in our WiFi v1.3 battery test (screen set to 150 nits, opening a new webpage every 30-40 seconds). This blows competitors out of the water. Theoretically, users can extend the Latitude 5420 Rugged's life even longer should they have enough battery cells on hand. The main downside to the machine's excellent battery life is charging; the laptop takes about 3.5-4 hours to fully charge from 5%.
| Dell Latitude 5420 Rugged-P85G i7-8650U, Radeon RX 540, 102 Wh | Panasonic Toughbook CF-54G2999VM i5-7300U, HD Graphics 620, 33 Wh | Getac S410 i5-8550U, UHD Graphics 620, 46.6 Wh | Lenovo ThinkPad T480-20L50010US i7-8650U, UHD Graphics 620, 24 Wh | Dell Latitude 5490 i7-8650U, UHD Graphics 620, 68 Wh | HP EliteBook 840 G4-Z2V49ET ABD i5-7200U, HD Graphics 620, 51 Wh | |
|---|---|---|---|---|---|---|
| Battery runtime | -64% | -68% | -55% | -28% | -28% | |
| Reader / Idle (h) | 31.4 | 19.3 -39% | ||||
| WiFi v1.3 (h) | 16.2 | 5.9 -64% | 5.2 -68% | 7.3 -55% | 11.6 -28% | 9.5 -41% |
| Load (h) | 3.2 | 3.1 -3% |
Pros
Cons
Verdict
The Dell Latitude 5420 Rugged represents a shift in the design ethos of ruggedized laptops. The device manages to retain many of the features that define rugged laptops while cutting the device's thickness in half. The addition of a quad-core CPU and dedicated GPU sweeten the deal and make the Latitude 5420 Rugged very competitive, especially for photographers and videographers who spend a lot of time outdoors.
There are some drawbacks. The laptop is still very heavy and bulky, even compared to similar rugged laptops. CPU performance is also below average and may disappoint some. Also, the Latitude 5420 Rugged eschews some of the rugged features of thicker machines like water-resistance.
That said, the high-quality bright display, great graphical performance, good heat and fan noise management, and remarkable battery life make the Latitude 5420 Rugged a good fit for outdoor professionals who need a long-lasting and durable machine.
Dell Latitude 5420 Rugged-P85G
- 03/18/2019 v6 (old)
Sam Medley
Price comparison
